Genic and non-genic contributions to natural variation of quantitative traits in maize
9
Research Genic and nongenic contributions to natural variation of quantitative traits in maize Xianran Li, 1 Chengsong Zhu, 1 Cheng-Ting Yeh, 2 Wei Wu, 2 Elizabeth M. Takacs, 3 Katherine A. Petsch, 4 Feng Tian, 5 Guihua Bai, 1,6 Edward S. Buckler, 5,6 Gary J. Muehlbauer, 7 Marja C.P. Timmermans, 4 Michael J. Scanlon, 3 Patrick S. Schnable, 2,8 and Jianming Yu 1,8 1 Department of Agronomy, Kansas State University, Manhattan, Kansas 66506, USA; 2 Center for Plant Genomics and Department of Agronomy, Iowa State University, Ames, Iowa 50011, USA; 3 Department of Plant Biology, Cornell University, Ithaca, New York 14853, USA; 4 Cold Spring Harbor Laboratory, Cold Spring Harbor, New York 11724, USA; 5 Institute for Genomic Diversity, Cornell University, Ithaca, New York 14853, USA; 6 United States Department of Agriculture-Agricultural Research Service (USDA-ARS), Manhattan, Kansas 66506, USA; 7 Department of Agronomy and Plant Genetics, University of Minnesota, St. Paul, Minnesota 55108, USA The complex genomes of many economically important crops present tremendous challenges to understand the genetic control of many quantitative traits with great importance in crop production, adaptation, and evolution. Advances in genomic technology need to be integrated with strategic genetic design and novel perspectives to break new ground. Complementary to individual-gene–targeted research, which remains challenging, a global assessment of the genomic distribution of trait-associated SNPs (TASs) discovered from genome scans of quantitative traits can provide insights into the genetic architecture and contribute to the design of future studies. Here we report the first systematic tabulation of the relative contribution of different genomic regions to quantitative trait variation in maize. We found that TASs were enriched in the nongenic regions, particularly within a 5-kb window upstream of genes, which highlights the importance of polymorphisms regulating gene expression in shaping the natural variation. Consistent with these findings, TASs collectively explained 44%–59% of the total phenotypic variation across maize quantitative traits, and on average, 79% of the explained variation could be attributed to TASs located in genes or within 5 kb upstream of genes, which together comprise only 13% of the genome. Our findings suggest that efficient, cost-effective genome-wide association studies (GWAS) in species with complex genomes can focus on genic and promoter regions. [Supplemental material is available for this article.] Cloning of individual large-effect genes underlying qualitative and quantitative traits has provided some insights into the genetic control of trait variation. These studies have most frequently im- plicated nucleotide polymorphisms in genic regions as being causative (Doebley et al. 2006; Miura et al. 2011); however, gen- eralizing from these results may not be appropriate because of as- certainment bias, e.g., preference given to genic regions during the efforts in gene cloning. In addition, it remains challenging to identify, validate, and characterize genes underlying modest-to- small-effect quantitative trait loci (QTLs), which are common contributors to quantitative traits in crops with complex genomes. With these challenges, a different approach is to identify what part of a complex genome can be prioritized. Intuitively, this is known from mutational dissection of ‘‘qualitative phenotypes,’’ but a global assessment for ‘‘quantitative traits’’ is lacking and the relative importance of genic and nongenic portions of the genome has significant bearings on further biological research and crop improvement. By identifying trait-associated SNPs (TASs), genome-wide as- sociation studies (GWASs) can enhance our understanding of the genetic architecture (Meyer et al. 2008; Chang et al. 2009; Teslovich et al. 2010). For example, a survey of 531 human TASs found that most are located in noncoding regions (43% from nongenic regions and 45% from introns), suggesting that the search for functional polymorphisms should extend beyond cod- ing regions (Hindorff et al. 2009). Indeed, some recent individual- gene studies have suggested that functional nongenic poly- morphisms can also contribute to the variation associated with quantitative traits in plants (Frary et al. 2000; Stam et al. 2002; Ashikari et al. 2005; Clark et al. 2006; Salvi et al. 2007). However, previous GWASs in plants focused on single SNP testing or multi- ple regression (Atwell et al. 2010; Huang et al. 2010; Tian et al. 2011) and did not address this critical issue. Hence, a systematic evaluation of TASs in plants can help to answer several important questions: (1) What are the overall contributions of genetic poly- morphisms (i.e., SNPs) in explaining the phenotypic variation of quantitative traits; (2) what are the relative contributions of genic and nongenic polymorphisms; and (3) what is the distribution of maize TASs across different genomic annotation sets (e.g., pro- moter, intron, or coding region)? Here we report genome scans of five quantitative traits with SNPs identified by two complementary next-generation sequenc- ing strategies to identify the underlying TASs, the genomic distri- bution of these TASs, and the relative contributions of genic and nongenic TASs to the phenotypic variation. We found that genic and nongenic TASs contribute approximately equally to the phe- notypic variation of maize quantitative traits. But the distributions of maize TASs in specific annotation sets differed. Specifically, nonsynonymous SNPs are underrepresented among TASs for 8 Corresponding authors Email [email protected] Email [email protected] Article published online before print. Article, supplemental material, and pub- lication date are at http://www.genome.org/cgi/doi/10.1101/gr.140277.112. Freely available online through the Genome Research Open Access option. 2436 Genome Research www.genome.org 22:2436–2444 Ó 2012, Published by Cold Spring Harbor Laboratory Press; ISSN 1088-9051/12; www.genome.org Cold Spring Harbor Laboratory Press on December 1, 2012 - Published by genome.cshlp.org Downloaded from
-
Upload
independent -
Category
Documents
-
view
1 -
download
0
Transcript of Genic and non-genic contributions to natural variation of quantitative traits in maize

Research
Genic and nongenic contributions to natural variationof quantitative traits in maizeXianran Li,1 Chengsong Zhu,1 Cheng-Ting Yeh,2 Wei Wu,2 Elizabeth M. Takacs,3
Katherine A. Petsch,4 Feng Tian,5 Guihua Bai,1,6 Edward S. Buckler,5,6 Gary J. Muehlbauer,7
Marja C.P. Timmermans,4 Michael J. Scanlon,3 Patrick S. Schnable,2,8 and Jianming Yu1,8
1Department of Agronomy, Kansas State University, Manhattan, Kansas 66506, USA; 2Center for Plant Genomics and Department
of Agronomy, Iowa State University, Ames, Iowa 50011, USA; 3Department of Plant Biology, Cornell University, Ithaca, New York 14853,
USA; 4Cold Spring Harbor Laboratory, Cold Spring Harbor, New York 11724, USA; 5Institute for Genomic Diversity, Cornell University,
Ithaca, New York 14853, USA; 6United States Department of Agriculture-Agricultural Research Service (USDA-ARS), Manhattan, Kansas
66506, USA; 7Department of Agronomy and Plant Genetics, University of Minnesota, St. Paul, Minnesota 55108, USA
The complex genomes of many economically important crops present tremendous challenges to understand the geneticcontrol of many quantitative traits with great importance in crop production, adaptation, and evolution. Advances ingenomic technology need to be integrated with strategic genetic design and novel perspectives to break new ground.Complementary to individual-gene–targeted research, which remains challenging, a global assessment of the genomicdistribution of trait-associated SNPs (TASs) discovered from genome scans of quantitative traits can provide insights intothe genetic architecture and contribute to the design of future studies. Here we report the first systematic tabulation ofthe relative contribution of different genomic regions to quantitative trait variation in maize. We found that TASs wereenriched in the nongenic regions, particularly within a 5-kb window upstream of genes, which highlights the importanceof polymorphisms regulating gene expression in shaping the natural variation. Consistent with these findings, TASscollectively explained 44%–59% of the total phenotypic variation across maize quantitative traits, and on average, 79%of the explained variation could be attributed to TASs located in genes or within 5 kb upstream of genes, which togethercomprise only 13% of the genome. Our findings suggest that efficient, cost-effective genome-wide association studies(GWAS) in species with complex genomes can focus on genic and promoter regions.
[Supplemental material is available for this article.]
Cloning of individual large-effect genes underlying qualitative and
quantitative traits has provided some insights into the genetic
control of trait variation. These studies have most frequently im-
plicated nucleotide polymorphisms in genic regions as being
causative (Doebley et al. 2006; Miura et al. 2011); however, gen-
eralizing from these results may not be appropriate because of as-
certainment bias, e.g., preference given to genic regions during the
efforts in gene cloning. In addition, it remains challenging to
identify, validate, and characterize genes underlying modest-to-
small-effect quantitative trait loci (QTLs), which are common
contributors to quantitative traits in crops with complex genomes.
With these challenges, a different approach is to identify what part
of a complex genome can be prioritized. Intuitively, this is known
from mutational dissection of ‘‘qualitative phenotypes,’’ but
a global assessment for ‘‘quantitative traits’’ is lacking and the
relative importance of genic and nongenic portions of the genome
has significant bearings on further biological research and crop
improvement.
By identifying trait-associated SNPs (TASs), genome-wide as-
sociation studies (GWASs) can enhance our understanding of
the genetic architecture (Meyer et al. 2008; Chang et al. 2009;
Teslovich et al. 2010). For example, a survey of 531 human TASs
found that most are located in noncoding regions (43% from
nongenic regions and 45% from introns), suggesting that the
search for functional polymorphisms should extend beyond cod-
ing regions (Hindorff et al. 2009). Indeed, some recent individual-
gene studies have suggested that functional nongenic poly-
morphisms can also contribute to the variation associated with
quantitative traits in plants (Frary et al. 2000; Stam et al. 2002;
Ashikari et al. 2005; Clark et al. 2006; Salvi et al. 2007). However,
previous GWASs in plants focused on single SNP testing or multi-
ple regression (Atwell et al. 2010; Huang et al. 2010; Tian et al.
2011) and did not address this critical issue. Hence, a systematic
evaluation of TASs in plants can help to answer several important
questions: (1) What are the overall contributions of genetic poly-
morphisms (i.e., SNPs) in explaining the phenotypic variation of
quantitative traits; (2) what are the relative contributions of genic
and nongenic polymorphisms; and (3) what is the distribution of
maize TASs across different genomic annotation sets (e.g., pro-
moter, intron, or coding region)?
Here we report genome scans of five quantitative traits with
SNPs identified by two complementary next-generation sequenc-
ing strategies to identify the underlying TASs, the genomic distri-
bution of these TASs, and the relative contributions of genic and
nongenic TASs to the phenotypic variation. We found that genic
and nongenic TASs contribute approximately equally to the phe-
notypic variation of maize quantitative traits. But the distributions
of maize TASs in specific annotation sets differed. Specifically,
nonsynonymous SNPs are underrepresented among TASs for
8Corresponding authorsEmail [email protected] [email protected] published online before print. Article, supplemental material, and pub-lication date are at http://www.genome.org/cgi/doi/10.1101/gr.140277.112.Freely available online through the Genome Research Open Access option.
2436 Genome Researchwww.genome.org
22:2436–2444 � 2012, Published by Cold Spring Harbor Laboratory Press; ISSN 1088-9051/12; www.genome.org
Cold Spring Harbor Laboratory Press on December 1, 2012 - Published by genome.cshlp.orgDownloaded from

maize quantitative traits, suggesting that regulatory variation plays
an important role in phenotypic variation. Our results suggest that
genotyping methods designed to discover SNPs in genes and their
upstream regions can be an economical approach for detecting
genome-wide association signals in future GWAS scans of quanti-
tative traits in crops with complex genomes.
ResultsTo be consistent with the GWAS literature (Hindorff et al. 2009),
a genic region in this study is defined as between the transcription
start site (TSS) and the end of 39 UTR. Toward this end, we first
conducted RNA-seq to identify gene-enriched SNPs. A targeted-
dissection genome scan method was implemented to identify the
TASs for five maize quantitative traits (leaf length, leaf width, up-
per leaf angle, days to anthesis, and days to silking) from 1 million
SNPs merged from the RNA-seq data and the previously defined set
of maize HapMap SNPs (Gore et al. 2009). We then systematically
characterized the genomic distribution and genetic features of the
discovered TASs across regions and traits. Two annotations sets
(high stringent filtered gene set [FGS] and low stringent working
gene set [WGS]) have been released for maize genome (Schnable
et al. 2009). Because the results obtained from the analysis of the
FGS and WGS were similar, for the simplicity of discussion only,
the FGS analysis results are presented in the text, but the results
from the WGS analysis are included in the Supplemental Material.
RNA-seq and SNPs for GWAS
RNA was extracted from shoot apices, which includes the shoot
apical meristem (SAM) and up to five young leaf primordia, of
2-wk-old seedlings from each of the nested association mapping
(NAM) founders (Methods) and used to conduct RNA-seq. To dis-
cover SNPs, the RNA-seq reads were aligned to the B73 maize ref-
erence genome sequence (Schnable et al. 2009). This tissue and
stage of development were selected because we had previously
shown that a substantial percentage of genes is expressed in the
SAM and leaf primordia at this stage of development (Emrich et al.
2007) and because we were interested in testing whether SNPs
identified from genes expressed at this stage of development are
enriched for genes related to leaf architecture traits versus flower-
ing-time traits.
Nearly 1 million SNPs (N = 942,793) were identified from
approximately 600 million 76-bp RNA-seq reads from the 26 in-
bred founders (not including B73) of the NAM population. Of all
discovered SNPs, only 289,461 that could be called with high
confidence (Methods) in >81% of the NAM founders (i.e., more
than 22/27) were used for GWASs (Table 1). As expected based on
their mode of discovery from RNA-seq reads, most of these SNPs
were located within annotated genes. Of the 289,461 SNPs, 87%
were located within 15,097 of the 32,540 FGS genes (46%).
Similarly, we retained 774,754 HapMap (Gore et al. 2009)
SNPs using the same threshold for missing SNP genotypes among
the NAM founders (i.e., >22/27). About half (49%) of the HapMap
SNPs resided within 25,738 genes (79% of the FGS), and 85% of
these genes were expressed in leaves (Li et al. 2010). In total, after
merging the two data sets, just over 1 million (1.01 million) SNPs,
of which 58% were located within 26,382 (81%) FGS genes, were
available for GWAS (Table 1; Supplemental Fig. S1). These SNPs
were projected from the NAM founders to the approximately 5000
recombinant inbred lines (RILs) based on the previous results from
genotyping the NAM population with 1106 tagging SNPs (tSNP;
Methods) (McMullen et al. 2009; Tian et al. 2011).
GWAS of quantitative traits
Genome scans using the 1.01 million merged SNPs identified TASs
underlying five quantitative traits (Supplemental Fig. S2). This was
accomplished using a two-stage scan method made possible by the
genetic design of NAM (Yu et al. 2008). The first stage was a low-
resolution mapping using 1106 tSNPs. This analysis identified 164
QTLs for the five quantitative traits; 44 of the 164 QTL regions were
colocalized by the adjacent or common tSNPs. The 164 target QTL
regions covered ;67% of the maize genome, with an average size
of 400 Mb for each trait. In the second stage of the genome scan,
the 1.01 million SNPs, which had been projected from the NAM
founders to the RILs, were tested for associations with the five
traits. Target regions were defined as the three tSNPs to the left
and the three tSNPs right of the tSNP most strongly associated
with each QTL in the first genome-wide QTL scan (Supplemental
Fig. S3). For each target region, on average, 7319 SNPs located
among the seven tSNPs were analyzed in this step. In terms of
answering the critical aforementioned questions, this targeted
scan is significantly different (see Discussion) from previous
analysis, in which an individual SNP search across a chromosome
is conducted. Here, only the target regions were scanned for TASs
to avoid false discoveries that might otherwise be introduced
from nearby regions. Genome-wide polygenic effects were con-
trolled by including other QTLs in the model during the scan. To
control for multiple testing, a minimum false-discovery rate,
Q-value (Storey and Tibshirani 2003), was calculated for each TAS.
The vast majority of TASs (85%) had a Q-value from 1.0 3 10�4 to
4.7 3 10�105 (Supplemental Table S1). After the genome scan, 40
out of 44 of the colocalized QTL regions were dissected to in-
dependent TASs, demonstrating the high resolving power of this
GWAS (Supplemental Fig. S2). The common TASs detected for
other four colocalized QTL regions were not unexpected because
they were detected for two flowering-time traits that have
a higher phenotypic correlation than other pairs of traits. RNA-
seq SNPs yielded the strongest signals in 16 of the 164 dissected
regions (Supplemental Fig. S1). Meanwhile, of the genes impli-
cated by the highest signals from HapMap SNPs, 58% also har-
Table 1. Distribution of maize SNPs across different genomic annotation sets
Data set NongenicPromoter
5kbPromoter
1kb Intron 59 UTR 39 UTR Syn Nsy
HapMap 394,160 (51%) 149,018 (19%) 77,513 (10%) 109,912 (14%) 47,312 (6%) 33,264 (4%) 98,434 (13%) 83,271 (11%)RNA-seq 36,416 (13%) 8,863 (3%) 2,588 (1%) 5,663 (2%) 15,597 (5%) 62,983 (22%) 101,907 (35%) 66,355 (23%)Merged 424,703 (42%) 156,197 (16%) 79,448 (8%) 114,784 (11%) 57,814 (6%) 88,152 (9%) 176,435 (18%) 134,484 (14%)
Nongenic includes promoter 5kb, which in turn includes promoter 1kb. (UTR) Untranslated region; (Syn) synonymous SNPs; (Nsy) nonsynonymousSNPs.
Genome Research 2437www.genome.org
Genic and nongenic contributions to natural variation
Cold Spring Harbor Laboratory Press on December 1, 2012 - Published by genome.cshlp.orgDownloaded from
bored RNA-seq SNPs with strong association signals, demon-
strating the value of using RNA-seq SNPs for GWAS.
Distribution of TASs
Only ;6% of the maize genome is genic (Schnable et al. 2009).
Knowledge of the relative proportion of TASs located in genic and
nongenic regions would shed light on the relative contributions of
these two regions to quantitative trait variation. To test whether
the final identification of TASs was context independent (i.e., to
confirm that identifying a nongenic TAS was not simply due to
a high proportion of nongenic SNPs within the starting SNP set),
the 164 dissected QTL regions were also separately scanned for
TASs using only the RNA-seq SNPs or only the HapMap SNPs in
addition to the merged SNP data set (Fig. 1; Supplemental Fig. S4).
For each analysis and for each QTL region, we identified the TAS
with the highest signal and classified it as genic or nongenic.
Summarizing the results across all 164 dissected QTL regions pro-
vided a genome-wide picture of the relative distributions of genic
and nongenic TASs (Fig. 1). From the merged SNP set, nongenic
TASs were identified for 46% of the dissected regions even though
only a few (6%) regions were classified as predominantly nongenic
(i.e., containing a higher proportion of nongenic than genic SNPs).
From the gene-enriched RNA-seq SNP set, nongenic TASs were
detected for 16% of dissected QTL regions. When only the HapMap
SNP set was analyzed, however, the classification of TASs obtained
was not independent of the classification of the regions. A similar
pattern was observed when the top five highest associated SNPs
within each region were tabulated as TASs (Supplemental Table S2).
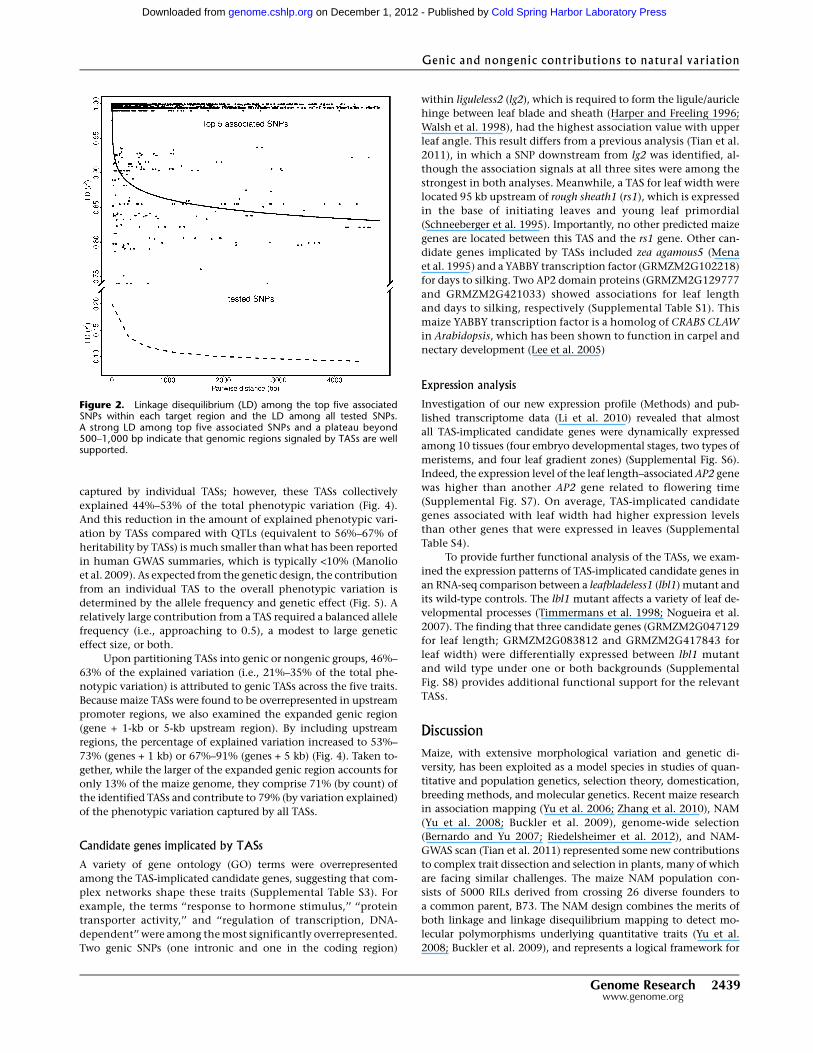
Linkage disequilibrium analysis among the top five highest asso-
ciated SNPs suggested that the identified genomic regions and the
TASs are well supported (Fig. 2). For the majority of these QTLs, the
strongest association signals were concentrated within a window
of 500–1000 bp around the TASs. Moreover, genic or nongenic
TASs were equally likely to be identified within the QTL regions
with either large or small genetic effects, as shown by the well-
mixed pattern of TASs when the QTL effects were sorted in
descending order for each trait (Fig. 1; Supplemental Fig. S4; Sup-
plemental Table S2). Because very few shared TASs (3%) were found
among traits and because the proportion of nongenic TASs was
consistent across traits, our findings from these five traits may
represent a general feature of TASs underlying other quantitative
traits in plants, or at least cross-pollinated crops that have been
subjected to intense selection.
TASs in different genomic annotation sets
We further evaluated the distribution of TASs by testing for their
enrichment in eight sets of genomic annotations (nongenic re-
gion, promoter 5kb, promoter 1kb, 59 UTR, synonymous site,
nonsynonymous site, intron, and 39 UTR) (Table 1). Because pro-
moters are typically located upstream of TSSs, for the purposes
of this analysis, we defined 1 kb of the
TSS as the promoter 1kb, and likewise
5 kb upstream of the TSS as promoter
5kb, respectively. Three annotation sets
(nongenic region, promoter 5kb, and
nonsynonymous) exhibited significantly
different proportions of genic or nongenic
TASs from the tested SNPs (Fig. 3). TASs
were overrepresented in nongenic (P =
0.026) and promoter 5kb regions (P =
0.041) (Supplemental Fig. S5). Although
13% of the 1.01 M SNPs were non-
synonymous, only 4% of TASs were
nonsynonymous SNPs, indicating that
nonsynonymous polymorphisms are un-
derrepresented among maize TASs (P =
2.7 3 10�6).
Of 27 TASs within the promoter 5kb
set, 19 were located upstream of genes
for which duplication or single copy has
been characterized in a maize genome
duplication study (Schnable et al. 2011).
Interestingly, 12 of these TASs are located
in the upstream of genes with duplicated
copies (4507), and seven are located in
the upstream of genes without duplica-
tion (9867).
Variation explained by TASs
In the NAM population, 74%–89% of the
phenotypic variation for each of the five
analyzed quantitative traits is explained
by 28%–37% QTLs. Similar to findings
from other complex trait studies, only a
small fraction of the variation can be
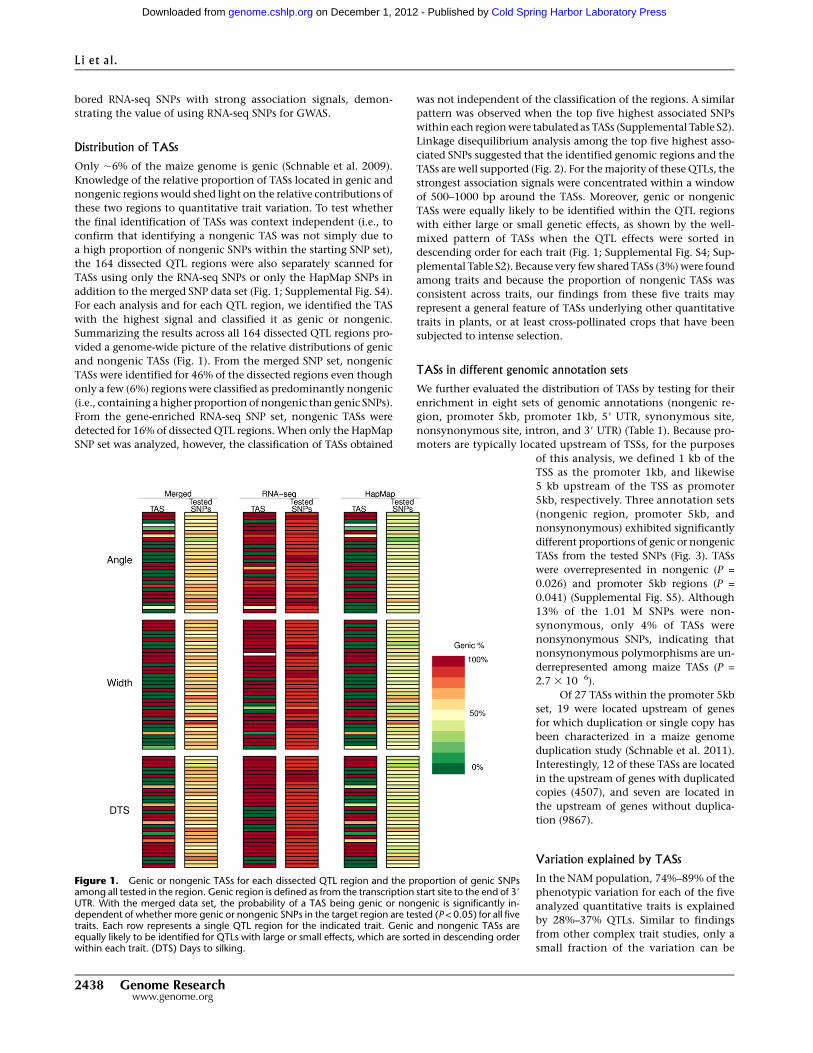
Figure 1. Genic or nongenic TASs for each dissected QTL region and the proportion of genic SNPsamong all tested in the region. Genic region is defined as from the transcription start site to the end of 39
UTR. With the merged data set, the probability of a TAS being genic or nongenic is significantly in-dependent of whether more genic or nongenic SNPs in the target region are tested (P < 0.05) for all fivetraits. Each row represents a single QTL region for the indicated trait. Genic and nongenic TASs areequally likely to be identified for QTLs with large or small effects, which are sorted in descending orderwithin each trait. (DTS) Days to silking.
Li et al.
2438 Genome Researchwww.genome.org
Cold Spring Harbor Laboratory Press on December 1, 2012 - Published by genome.cshlp.orgDownloaded from
captured by individual TASs; however, these TASs collectively
explained 44%–53% of the total phenotypic variation (Fig. 4).
And this reduction in the amount of explained phenotypic vari-
ation by TASs compared with QTLs (equivalent to 56%–67% of
heritability by TASs) is much smaller than what has been reported
in human GWAS summaries, which is typically <10% (Manolio
et al. 2009). As expected from the genetic design, the contribution
from an individual TAS to the overall phenotypic variation is
determined by the allele frequency and genetic effect (Fig. 5). A
relatively large contribution from a TAS required a balanced allele
frequency (i.e., approaching to 0.5), a modest to large genetic
effect size, or both.
Upon partitioning TASs into genic or nongenic groups, 46%–
63% of the explained variation (i.e., 21%–35% of the total phe-
notypic variation) is attributed to genic TASs across the five traits.
Because maize TASs were found to be overrepresented in upstream
promoter regions, we also examined the expanded genic region
(gene + 1-kb or 5-kb upstream region). By including upstream
regions, the percentage of explained variation increased to 53%–
73% (genes + 1 kb) or 67%–91% (genes + 5 kb) (Fig. 4). Taken to-
gether, while the larger of the expanded genic region accounts for
only 13% of the maize genome, they comprise 71% (by count) of
the identified TASs and contribute to 79% (by variation explained)
of the phenotypic variation captured by all TASs.
Candidate genes implicated by TASs
A variety of gene ontology (GO) terms were overrepresented
among the TAS-implicated candidate genes, suggesting that com-
plex networks shape these traits (Supplemental Table S3). For
example, the terms ‘‘response to hormone stimulus,’’ ‘‘protein
transporter activity,’’ and ‘‘regulation of transcription, DNA-
dependent’’ were among the most significantly overrepresented.
Two genic SNPs (one intronic and one in the coding region)
within liguleless2 (lg2), which is required to form the ligule/auricle
hinge between leaf blade and sheath (Harper and Freeling 1996;
Walsh et al. 1998), had the highest association value with upper
leaf angle. This result differs from a previous analysis (Tian et al.
2011), in which a SNP downstream from lg2 was identified, al-
though the association signals at all three sites were among the
strongest in both analyses. Meanwhile, a TAS for leaf width were
located 95 kb upstream of rough sheath1 (rs1), which is expressed
in the base of initiating leaves and young leaf primordial
(Schneeberger et al. 1995). Importantly, no other predicted maize
genes are located between this TAS and the rs1 gene. Other can-
didate genes implicated by TASs included zea agamous5 (Mena
et al. 1995) and a YABBY transcription factor (GRMZM2G102218)
for days to silking. Two AP2 domain proteins (GRMZM2G129777
and GRMZM2G421033) showed associations for leaf length
and days to silking, respectively (Supplemental Table S1). This
maize YABBY transcription factor is a homolog of CRABS CLAW
in Arabidopsis, which has been shown to function in carpel and
nectary development (Lee et al. 2005)
Expression analysis
Investigation of our new expression profile (Methods) and pub-
lished transcriptome data (Li et al. 2010) revealed that almost
all TAS-implicated candidate genes were dynamically expressed
among 10 tissues (four embryo developmental stages, two types of
meristems, and four leaf gradient zones) (Supplemental Fig. S6).
Indeed, the expression level of the leaf length–associated AP2 gene
was higher than another AP2 gene related to flowering time
(Supplemental Fig. S7). On average, TAS-implicated candidate
genes associated with leaf width had higher expression levels
than other genes that were expressed in leaves (Supplemental
Table S4).
To provide further functional analysis of the TASs, we exam-
ined the expression patterns of TAS-implicated candidate genes in
an RNA-seq comparison between a leafbladeless1 (lbl1) mutant and
its wild-type controls. The lbl1 mutant affects a variety of leaf de-
velopmental processes (Timmermans et al. 1998; Nogueira et al.
2007). The finding that three candidate genes (GRMZM2G047129
for leaf length; GRMZM2G083812 and GRMZM2G417843 for
leaf width) were differentially expressed between lbl1 mutant
and wild type under one or both backgrounds (Supplemental
Fig. S8) provides additional functional support for the relevant
TASs.
DiscussionMaize, with extensive morphological variation and genetic di-
versity, has been exploited as a model species in studies of quan-
titative and population genetics, selection theory, domestication,
breeding methods, and molecular genetics. Recent maize research
in association mapping (Yu et al. 2006; Zhang et al. 2010), NAM
(Yu et al. 2008; Buckler et al. 2009), genome-wide selection
(Bernardo and Yu 2007; Riedelsheimer et al. 2012), and NAM-
GWAS scan (Tian et al. 2011) represented some new contributions
to complex trait dissection and selection in plants, many of which
are facing similar challenges. The maize NAM population con-
sists of 5000 RILs derived from crossing 26 diverse founders to
a common parent, B73. The NAM design combines the merits of
both linkage and linkage disequilibrium mapping to detect mo-
lecular polymorphisms underlying quantitative traits (Yu et al.
2008; Buckler et al. 2009), and represents a logical framework for
Figure 2. Linkage disequilibrium (LD) among the top five associatedSNPs within each target region and the LD among all tested SNPs.A strong LD among top five associated SNPs and a plateau beyond500–1,000 bp indicate that genomic regions signaled by TASs are wellsupported.
Genic and nongenic contributions to natural variation
Genome Research 2439www.genome.org
Cold Spring Harbor Laboratory Press on December 1, 2012 - Published by genome.cshlp.orgDownloaded from

conducting genome scans of multiple quantitative traits to answer
the aforementioned questions.
New angle into more important questions
In the current study, GWAS scans of five quantitative traits (three
leaf and two flowering-time traits) were conducted to estimate
the relative contributions of genic and nongenic genetic vari-
ants to phenotypic variation. Instead of searching for signals
on a chromosome base (Tian et al. 2011), the new targeted-
dissection method minimized the influence of other TAS-containing
regions on the search. More importantly, this method also
allowed us to tabulate the TAS findings across regions to sys-
tematically address the contribution of genic and nongenic
polymorphisms to quantitative traits, which was not possible
with the previous analysis. Specifically, two complementary
angles were presented: number of TASs in each class, and the
proportion of phenotypic variation explained by TASs in each
class. Unlike a previous analysis (Tian et al. 2011), the current
study included SNPs derived from the analysis of RNA-seq
reads to enable a valid comparison of
the relative contributions of genic ver-
sus nongenic variants, and included
the analyses of two nonleaf traits
(i.e., flowering time) to enable broader
inferences.
Value of RNA-seq for SNP discovery
RNA-seq has been proposed as a fast
and inexpensive genotyping method
(Barbazuk et al. 2007; Cloonan et al.
2008; Cirulli et al. 2010). Considering
that the total number of HapMap SNPs
is three times that of the RNA-seq SNP
set, a direct comparison between the two
genotyping approaches for association
tests is inappropriate; however, we dem-
onstrated the potential of using RNA-seq
to discover SNPs that are suitable for
GWAS. A total of 16 of the TASs were
identified from the RNA-seq SNP set,
and 58% of the genes captured by the
HapMap TASs also harbored strongly
associated RNA-seq SNPs. Because there
is much overlap between genes expressed
in shoot apices and other tissues (Sekhon
et al. 2011), SNPs discovered from RNA-
seq conducted on RNA isolated from
shoot apices can be used to map a variety
of complex traits. In our study, of these
16 TASs, nine were identified for the two
flowering-time traits and seven for the
three leaf architecture traits. More im-
portantly, having RNA-seq SNPs enabled
us to compare genome scan results with
different proportions of genic SNPs
(RNA-seq, HapMap, and merged). These
comparisons diminished the influence
of the distribution of SNPs on TASs (i.e.,
ascertainment bias), which therefore en-
abled us to evaluate the relative contri-
butions of genic and nongenic polymorphisms on phenotypic
variation of quantitative traits.
Distribution of maize TASs and candidate genes
A long-standing question in evolutionary biology is the nature of
the genetic variation that controls variation in quantitative traits.
That is, is the variation mainly driven by differences in protein
sequence or by differences in gene expression patterns (Clark et al.
2006; Doebley et al. 2006; Alonso-Blanco et al. 2009)? In human
GWASs, nonsynonymous SNPs are overrepresented among TASs
(Hindorff et al. 2009), which is consistent with a major role for
alterations in protein sequences (Stenson et al. 2009). In contrast,
our data demonstrate that among maize TAS, nonsynonymous
sites are significantly underrepresented. This is true regardless of
whether we analyze the FGS (which is predicted to include few
false-positive genes, but to be missing about one-third of genes) or
the WGS (which is expected to include all of maize gene space plus
an estimated approximately 50,000 nongenic sequences) (Sup-
plemental Figs. S9–S11). Interestingly, recent research has dem-
Figure 3. Distribution of TASs and tested SNPs for five quantitative traits across genomic annotationsets. (A) Nongenic versus genic (genic region is defined as from the transcription start site to the end of39 UTR); (B) different annotation sets; and (C ) synonymous versus nonsynonymous. Genic plus 5-kbupstream regions comprise only 13% of the maize genome but account for 71% of TASs. Nongenic andpromoter 5kb regions are overrepresented among TASs. The nonsynonymous set is underrepresentedamong TASs. Note that the nongenic region includes promoter 5kb, which in turn includes promoter1kb, and the genic region includes the untranslated region (UTR), coding region (CDS), and intron.Stars denote that the proportion of TASs from the annotation set significantly differs from that of testedSNPs. (Arrow) Transcription start site.
Li et al.
2440 Genome Researchwww.genome.org
Cold Spring Harbor Laboratory Press on December 1, 2012 - Published by genome.cshlp.orgDownloaded from
onstrated the functional outcomes of synonymous mutations
(Plotkin and Kudla 2011; Waldman et al. 2011). Tabulation of
cloned rice QTLs, which often have larger effects in the respective
populations than the TASs identified in the current study, also
indicated the importance of expression differences (Miura et al.
2011). In addition, no splicing site mutation or premature stop was
found to be TASs. Because the NAM founders were selected to
represent a broad range of genetic diversity, these results suggest
that in maize, alterations in protein sequence were quantitatively
less important during evolution and selection in defining the
natural variation in quantitative traits than changes in gene reg-
ulation, even though this type of protein sequence change muta-
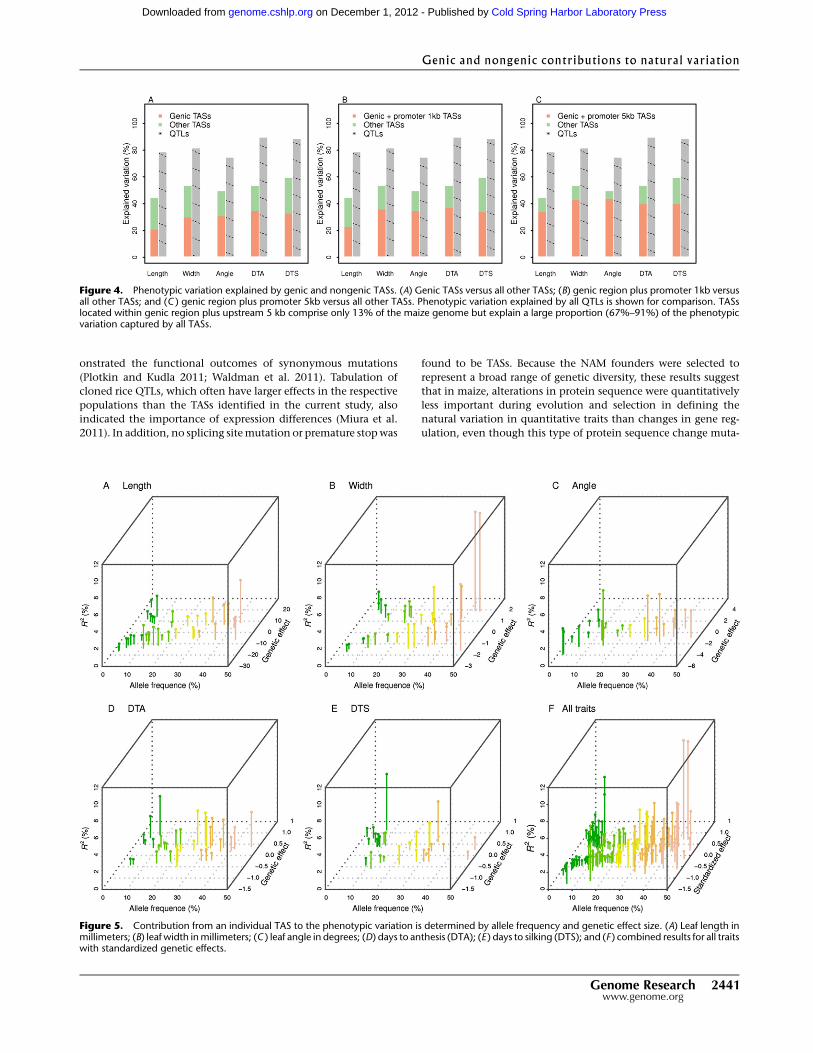
Figure 4. Phenotypic variation explained by genic and nongenic TASs. (A) Genic TASs versus all other TASs; (B) genic region plus promoter 1kb versusall other TASs; and (C ) genic region plus promoter 5kb versus all other TASs. Phenotypic variation explained by all QTLs is shown for comparison. TASslocated within genic region plus upstream 5 kb comprise only 13% of the maize genome but explain a large proportion (67%–91%) of the phenotypicvariation captured by all TASs.
Figure 5. Contribution from an individual TAS to the phenotypic variation is determined by allele frequency and genetic effect size. (A) Leaf length inmillimeters; (B) leaf width in millimeters; (C ) leaf angle in degrees; (D) days to anthesis (DTA); (E ) days to silking (DTS); and (F ) combined results for all traitswith standardized genetic effects.
Genic and nongenic contributions to natural variation
Genome Research 2441www.genome.org
Cold Spring Harbor Laboratory Press on December 1, 2012 - Published by genome.cshlp.orgDownloaded from

tion is often found in genetic studies using individuals with ex-
treme phenotypes. Consistent with this hypothesis, we found that
SNPs from promoter regions (5 kb upstream of the genes) and
nongenic region as a whole were overrepresented among TASs (in
both the FGS and WGS analyses). These findings imply that long-
distance regulatory elements and other forms of causative variants,
like structural variations (Lai et al. 2010; Swanson-Wagner et al.
2010), probably also play important roles in the diverse mor-
phology of maize (Stam et al. 2002; Clark et al. 2006; Salvi et al.
2007).
For TAS-implicated candidate genes, the overrepresentation
of several GO terms and expression analysis among tissues pro-
vided supporting evidence of the dynamic nature of underlying
processes of these quantitative traits. Follow-up studies could be
prioritized for several of them, which were highlighted with ad-
ditional support.
Explained variation and GWAS strategy
As has been observed in the human GWAS (Manolio et al. 2009),
maize TASs also captured a portion of phenotypic variation. One
potential source of unexplained variation in human diseases could
be the action of rare variants having large effects. With the NAM
design, the allele frequency captured within the non-B73 founders
determines the actual frequency in the population, which affects
the phenotypic variation explained. The percentage of variation
explained by the TASs with the lowest possible minor allele fre-
quency in the maize NAM population (2%, i.e., the case where
only one NAM founder has different allele than B73) ranged from
0%–9% for these traits, demonstrating that the contribution of
low-frequency alleles varied among quantitative traits (Fig. 5).
Interestingly, although TASs explained less phenotypic vari-
ation than QTLs, for all five traits TASs yielded a better model fit
than QTLs as indicated by Bayesian information criterion (BIC)
values. While QTL analysis in the first stage required many more
model parameters to capture multiple alleles, the focus of the ge-
nome scan was to identify TASs, all of which were biallelic. Because
of a higher penalty associated with the greater number of model
parameters, the model fit was better for TASs than QTLs. Future
studies may be able to explain more of the phenotypic variation
and achieve a better model fit by considering haplotypes and
functional predictions of multiple SNPs (Dickson et al. 2010;
Singleton et al. 2010).
Efficient GWAS by including promoter regions
One of the main goals of this study was to evaluate the relative
contributions of genic and nongenic polymorphisms to pheno-
typic variation for quantitative traits. Three relevant findings
emerged from this study: (1) approximately half of the dissected
regions had genic TASs and the other half had nongenic TASs,
(2) genic or nongenic TASs contributed nearly half of pheno-
typic variation explained by all TASs, and (3) nongenic poly-
morphisms were significantly overrepresented among TASs,
indicating the importance of analyzing nongenic regions in
GWAS (Hindorff et al. 2009; Yang et al. 2011). But more im-
portantly, because a significant fraction of the nongenic TASs
and their corresponding contributions to the phenotypic var-
iation explained were from the promoter regions upstream of
genes (Figs. 3, 4; Supplemental Figs. S10, S11), targeting poly-
morphisms within genes and their promoter regions deserves
attention.
GWAS across a very large number of samples genotyped by
whole-genome sequencing would provide the most comprehen-
sive understanding of genetic architecture. The cost of such an
approach could, however, be prohibitive, especially for species
with large genomes (Cirulli and Goldstein 2010). Our results sug-
gest that at least in maize, the bulk of TASs are located in genes and
their promoters. Hence, the combination of RNA-seq and exome
capture experiments using long-read (e.g., 454) and paired-end
(Illumina and 454) technologies would facilitate the cost-effective
identification of promoter and genic polymorphisms for routine
GWAS scans in species with complex genomes.
Methods
Maize populationThe NAM population was developed by crossing 25 diversefounders (the NAM founders) to a common parent B73, whosegenome serves as the reference genome for maize (Schnable et al.2009). Approximately 200 RILs were developed from each cross(McMullen et al. 2009). All founders and 4892 RILs (including200 RILs from the intermated B73 3 Mo17 population) weregenotyped with 1106 tSNPs. A consensus genetic map of theNAM population was constructed based on the tSNPs. The maizeHapMap project sequenced genomic DNA from the NAM foundersusing an Illumina Genome Analyzer and discovered SNPs byaligning the reads to the RefGen_v1 B73 genome (Gore et al. 2009).
Discovery of SNPs via RNA-seq
Total RNA was extracted from the shoot apex from 2-wk-oldseedlings of the NAM founders using TRIzol reagent (Invitrogen).The Poly(A) RNA was isolated from total RNA with oligo d(T) beadsand then used to construct the RNA-seq libraries, which were se-quenced using the Illumina Genome Analyzer II instrument.
Raw sequence reads were scanned for low-quality bases. Nu-cleotides with phred quality values less than 15 were trimmed.Each read was examined in two phases. In the first phase, readswere scanned starting at each end, and nucleotides with qualityvalues lower than the threshold were removed. The remainingnucleotides were then scanned using overlapping windows of 10bp, and sequences beyond the last window with average qualityvalue less than the specified threshold were truncated. Trimmedreads were then aligned to the B73 reference genome (RefGen_v1)using GSNAP (Wu and Nacu 2010), and uniquely mapped reads(two or fewer mismatches every 36 bp and #3-bp tails allowed)were used for SNP discovery using the 123SNP software (availableat http://schnablelab.plantgenomics.iastate.edu/software/). SNPsites were called only if the site contains at least three reads sup-porting the base call with error rates <0.03%, and the mostcommon allele must account for at least 80% of all aligned readscovering that nucleotide position.
SNP annotation
SNPs were assigned as genic or nongenic based on their loca-tions relative to two sets of annotated maize genes from maizeRefGen_v1. The FGS (N = 32,540) includes stringently called genesand is therefore expected to include only a low number of false-positive calls but to incompletely sample the full gene space. Basedon an analysis of an independent RNA-seq data, nearly all (99%) ofthe 15,097 genes from the FGS that include SNPs are expressed inmaize seedling leaves (Li et al. 2010). In contrast, the WGS (N =
109,563) was generated using less stringent parameters and is
Li et al.
2442 Genome Researchwww.genome.org
Cold Spring Harbor Laboratory Press on December 1, 2012 - Published by genome.cshlp.orgDownloaded from

therefore expected to sample more of the gene space but includesmore false-positive gene calls. The current estimate of gene num-ber in maize also considers the classical gene set, a collection of N =
464 well-characterized (‘‘true’’) genes, each of which has beencloned, confers a phenotype when mutated, and is supported byat least three citations (Schnable and Freeling 2011). Approxi-mately two-thirds of the classical gene set is included within theFGS, suggesting that the true gene number in maize is about 50,000(3/2 3 32,540). The entire classical gene set is included in the WGS,suggesting that the WGS contains most of the gene space.
For genes with alternative splicing isoforms, the transcriptwith the longest coding region was selected. The functional effectsof SNPs (synonymous mutation, nonsynonymous mutation, splicesite mutation, premature stop, or frame shift) were annotated usingcustom perl scripts.
Statistical analysis
To avoid over-prediction, SNPs for which genotyping data weremissing for more than five of the NAM founders were not includedin the association analysis. Other missing genotypes were imputedby fastPHASE 1.2 using default parameters (Scheet and Stephens2006). The imputed SNPs between two adjacent informative tSNPswere projected from founders to RILs based on information fromtSNPs (Tian et al. 2011).
The phenotypic data were available at the Panzea database(www.panzea.org). In brief, three leaf traits (leaf length, leaf width,and upper leaf angle) and two flowering times (days to anthesisand days to silking) were collected in eight summer environmentsacross 2 yr. The best linear unbiased predictor (BLUP) of each linewas used for linkage and association analysis. Joint linkage analysisacross BLUP phenotype and 1106 of tSNPs was conducted in SAS9.1 with the GLMSelect Procedure. The parameters (populationeffect and tSNP by population effect) were estimated. tSNPs thatmet the significant P-value (7.1 3 10�5) of the marginal F-test inthe final model were identified as QTLs.
GWAS was conducted in R (www.r-project.org). To control forpolygenic background effects, we conducted the scan by includingother QTLs located 10 cM away from the testing region (Supple-mental Fig. S4). A dissected region was bordered by three flankingtSNPs from each side of a QTL tSNP (Supplemental Fig. S4). Eachdissected region was classified as either predominantly genic if itcontains a higher proportion of genic than nongenic SNPs, orpredominantly nongenic if otherwise. The SNP with the highestassociation value was retrieved from each dissected QTL region anddesignated as the TAS. In cases where multiple TASs were tied inassociation signal strength, these TASs were individually classified,and the ratio of genic:nongenic TASs determined the final classi-fication (Fig. 2; Supplemental Fig. S2). Test of independence wasconducted between the classifications of TASs and the target re-gions. To address multiple testing issues, the Q-value (i.e., adjustedP-value by adopting a false-discovery rate controlling procedure)was estimated with Q-value (Storey and Tibshirani 2003).
The likelihood-ratio-based R2 was used for calculating thephenotypic variation explained by all QTLs and the same pro-cedure for all TASs (Sun et al. 2010). The contributions from genicand nongenic TASs were calculated based on sum of squares fromthe combined model with both types of TASs fitted, and the sameprocedure for the contribution from TASs with the lowest minor-allele-frequency.
We mapped the SNPs (including TASs) into eight annotationsets (nongenic region, promoter 5kb, promoter 1kb, intron, 39 UTR,59 UTR, synonymous site, and nonsynonymous site). The nongenicregion included promoter 5kb, which was defined as from the up-stream 5 kb to the TSS. Similarly, promoter 1kb covered the region
from the upstream 1 kb to the TSS. To avoid the overlap issue, theTAS distribution among different annotation used only the datafrom 114 QTL regions with unique TASs. The proportion of TASs ineach annotation set was tested for enrichment or depletion againstthe corresponding proportion of SNPs.
Candidate gene
GO annotations of the filtered gene set from maize RefGen_v1were obtained from MaizeSequence (www.maizesequence.org). Overrepresentation of the GO terms with more than oneTAS-implicated gene was tested by comparing the proportion ofthe specific GO term among all implicated genes against all an-notated maize genes. The significance of overrepresentation wascorrected with the Bonferroni method (Rice 1989).
We sequenced RNA from four developmental stages of theembryo (proembryo, transition phase, coleoptile stage, and L1stage embryo), and SAMs and lateral meristems (from 2-wk-oldseedlings) of B73 (available at www.maizegdb.org). The expressionpatterns of TAS-implicated candidate genes were also analyzedusing previously published transcriptome data from four zones(basal zone, transitional zone, maturing zone, and mature zone)along the proximodistal gradient of maize B73 seedling leaves (Liet al. 2010).
Transcriptome analysis of lbl1 mutants
Whole embryos of lbl1 mutants and wild type (B73 or W22, intowhich lbl1 had been introgressed) were isolated from developingseeds. mRNA from the embryos was then extracted. RNA-seq wasconducted on these samples using an Illumina Genome Analyzer IIwith three replications. The TAS-implicated candidate genes forleaf length and leaf width were screened to determine whetherthey were differentially expressed.
Data accessThe RNA-seq data from shoot apex have been deposited in theNCBI Sequence Read Archive (SRA) (http://www.ncbi.nlm.nih.gov/sra) under accession number SRA050451.
AcknowledgmentsThis work is supported by the National Science Foundation(DBI-0820610).
Author contributions: J.Y., P.S.S., M.C.P.T., G.J.M, E.S.B., andM.J.S. designed the study. X.L. C.Z., C.-T.Y., W.W., E.M.T., K.A.P,and F.T. performed the analyses. X.L., J.Y., P.S.S., M.J.S., M.C.P.T.,G.J.M., and G.B. drafted the manuscript. All of the authors criti-cally revised and provided final approval of this manuscript.
References
Alonso-Blanco C, Aarts MG, Bentsink L, Keurentjes JJ, Reymond M,Vreugdenhil D, Koornneef M. 2009. What has natural variation taughtus about plant development, physiology, and adaptation? Plant Cell 21:1877–1896.
Ashikari M, Sakakibara H, Lin S, Yamamoto T, Takashi T, Nishimura A,Angeles ER, Qian Q, Kitano H, Matsuoka M. 2005. Cytokinin oxidaseregulates rice grain production. Science 309: 741–745.
Atwell S, Huang YS, Vilhjalmsson BJ, Willems G, Horton M, Li Y, Meng D,Platt A, Tarone AM, Hu TT, et al. 2010. Genome-wide association studyof 107 phenotypes in Arabidopsis thaliana inbred lines. Nature 465: 627–631.
Barbazuk WB, Emrich SJ, Chen HD, Li L, Schnable PS. 2007. SNP discoveryvia 454 transcriptome sequencing. Plant J 51: 910–918.
Bernardo R, Yu J. 2007. Prospects for genomewide selection for quantitativetraits in maize. Crop Sci 47: 1082–1090.
Genic and nongenic contributions to natural variation
Genome Research 2443www.genome.org
Cold Spring Harbor Laboratory Press on December 1, 2012 - Published by genome.cshlp.orgDownloaded from

Buckler ES, Holland JB, Bradbury PJ, Acharya CB, Brown PJ, Browne C, ErsozE, Flint-Garcia S, Garcia A, Glaubitz JC, et al. 2009. The geneticarchitecture of maize flowering time. Science 325: 714–718.
Chang BL, Cramer SD, Wiklund F, Isaacs SD, Stevens VL, Sun J, Smith S,Pruett K, Romero LM, Wiley KE, et al. 2009. Fine mapping associationstudy and functional analysis implicate a SNP in MSMB at 10q11 asa causal variant for prostate cancer risk. Hum Mol Genet 18: 1368–1375.
Cirulli ET, Goldstein DB. 2010. Uncovering the roles of rare variants incommon disease through whole-genome sequencing. Nat Rev Genet 11:415–425.
Cirulli ET, Singh A, Shianna KV, Ge D, Smith JP, Maia JM, Heinzen EL,Goedert JJ, Goldstein DB. 2010. Screening the human exome: Acomparison of whole genome and whole transcriptome sequencing.Genome Biol 11: R57. doi: 10.1186/gb-2010-11-5-r57.
Clark RM, Wagler TN, Quijada P, Doebley J. 2006. A distant upstreamenhancer at the maize domestication gene tb1 has pleiotropic effects onplant and inflorescent architecture. Nat Genet 38: 594–597.
Cloonan N, Forrest AR, Kolle G, Gardiner BB, Faulkner GJ, Brown MK, TaylorDF, Steptoe AL, Wani S, Bethel G, et al. 2008. Stem cell transcriptomeprofiling via massive-scale mRNA sequencing. Nat Methods 5: 613–619.
Dickson SP, Wang K, Krantz I, Hakonarson H, Goldstein DB. 2010. Rarevariants create synthetic genome-wide associations. PLoS Biol 8:e1000294. doi: 10.1371/journal.pbio.1000294.
Doebley JF, Gaut BS, Smith BD. 2006. The molecular genetics of cropdomestication. Cell 127: 1309–1321.
Emrich SJ, Barbazuk WB, Li L, Schnable PS. 2007. Gene discovery andannotation using LCM-454 transcriptome sequencing. Genome Res 17:69–73.
Frary A, Nesbitt TC, Grandillo S, Knaap E, Cong B, Liu J, Meller J, Elber R,Alpert KB, Tanksley SD. 2000. fw2.2: A quantitative trait locus key to theevolution of tomato fruit size. Science 289: 85–88.
Gore MA, Chia JM, Elshire RJ, Sun Q, Ersoz ES, Hurwitz BL, Peiffer JA,McMullen MD, Grills GS, Ross-Ibarra J, et al. 2009. A first-generationhaplotype map of maize. Science 326: 1115–1117.
Harper L, Freeling M. 1996. Interactions of liguleless1 and liguleless2function during ligule induction in maize. Genetics 144: 1871–1882.
Hindorff LA, Sethupathy P, Junkins HA, Ramos EM, Mehta JP, Collins FS,Manolio TA. 2009. Potential etiologic and functional implications ofgenome-wide association loci for human diseases and traits. Proc NatlAcad Sci 106: 9362–9367.
Huang X, Wei X, Sang T, Zhao Q, Feng Q, Zhao Y, Li C, Zhu C, Lu T, Zhang Z,et al. 2010. Genome-wide association studies of 14 agronomic traits inrice landraces. Nat Genet 42: 961–967.
Lai J, Li R, Xu X, Jin W, Xu M, Zhao H, Xiang Z, Song W, Ying K, Zhang M,et al. 2010. Genome-wide patterns of genetic variation among elitemaize inbred lines. Nat Genet 42: 1027–1030.
Lee JY, Baum SF, Alvarez J, Patel A, Chitwood DH, Bowman JL. 2005.Activation of CRABS CLAW in the nectaries and carpels of Arabidopsis.Plant Cell 17: 25–36.
Li P, Ponnala L, Gandotra N, Wang L, Si Y, Tausta SL, Kebrom TH, Provart N,Patel R, Myers CR, et al. 2010. The developmental dynamics of the maizeleaf transcriptome. Nat Genet 42: 1060–1067.
Manolio TA, Collins FS, Cox NJ, Goldstein DB, Hindorff LA, Hunter DJ,McCarthy MI, Ramos EM, Cardon LR, Chakravarti A, et al. 2009. Findingthe missing heritability of complex diseases. Nature 461: 747–753.
McMullen MD, Kresovich S, Villeda HS, Bradbury P, Li H, Sun Q, Flint-GarciaS, Thornsberry J, Acharya C, Bottoms C, et al. 2009. Genetic properties ofthe maize nested association mapping population. Science 325: 737–740.
Mena M, Mandel MA, Lerner DR, Yanofsky MF, Schmidt RJ. 1995. Acharacterization of the MADS-box gene family in maize. Plant J 8: 845–854.
Meyer KB, Maia AT, O’Reilly M, Teschendorff AE, Chin SF, Caldas C, PonderBA. 2008. Allele-specific up-regulation of FGFR2 increases susceptibilityto breast cancer. PLoS Biol 6: e108. doi: 10.1371/journal.pbio.0060108.
Miura K, Ashikari M, Matsuoka M. 2011. The role of QTLs in the breeding ofhigh-yielding rice. Trends Plant Sci 16: 319–326.
Nogueira FT, Madi S, Chitwood DH, Juarez MT, Timmermans MC. 2007.Two small regulatory RNAs establish opposing fates of a developmentalaxis. Genes Dev 21: 750–755.
Plotkin JB, Kudla G. 2011. Synonymous but not the same: The causes andconsequences of codon bias. Nat Rev Genet 12: 32–42.
Rice WR. 1989. Analyzing tables of statistical tests. Evolution 43: 223–225.Riedelsheimer C, Czedik-Eysenberg A, Grieder C, Lisec J, Technow F, Sulpice
R, Altmann T, Stitt M, Willmitzer L, Melchinger AE. 2012. Genomic andmetabolic prediction of complex heterotic traits in hybrid maize. NatGenet 44: 217–220.
Salvi S, Sponza G, Morgante M, Tomes D, Niu X, Fengler KA, Meeley R,Ananiev EV, Svitashev S, Bruggemann E, et al. 2007. Conservednoncoding genomic sequences associated with a flowering-timequantitative trait locus in maize. Proc Natl Acad Sci 104: 11376–11381.
Scheet P, Stephens M. 2006. A fast and flexible statistical model for large-scale population genotype data: Applications to inferring missinggenotypes and haplotypic phase. Am J Hum Genet 78: 629–644.
Schnable JC, Freeling M. 2011. Genes identified by visible mutantphenotypes show increased bias toward one of two subgenomes ofmaize. PLoS ONE 6: e17855. doi: 10.1371/journal.pone.0017855.
Schnable PS, Ware D, Fulton RS, Stein JC, Wei F, Pasternak S, Liang C, ZhangJ, Fulton L, Graves TA, et al. 2009. The B73 maize genome: Complexity,diversity, and dynamics. Science 326: 1112–1115.
Schnable JC, Springer NM, Freeling M. 2011. Differentiation of the maizesubgenomes by genome dominance and both ancient and ongoing geneloss. Proc Natl Acad Sci 108: 4069–4074.
Schneeberger RG, Becraft PW, Hake S, Freeling M. 1995. Ectopic expressionof the knox homeo box gene rough sheath1 alters cell fate in the maizeleaf. Genes Dev 9: 2292–2304.
Sekhon RS, Lin H, Childs KL, Hansey CN, Buell CR, de Leon N, Kaeppler SM.2011. Genome-wide atlas of transcription during maize development.Plant J 66: 553–563.
Singleton AB, Hardy J, Traynor BJ, Houlden H. 2010. Towards a completeresolution of the genetic architecture of disease. Trends Genet 26: 438–442.
Stam M, Belele C, Ramakrishna W, Dorweiler JE, Bennetzen JL, Chandler VL.2002. The regulatory regions required for B9 paramutation andexpression are located far upstream of the maize b1 transcribedsequences. Genetics 162: 917–930.
Stenson PD, Mort M, Ball EV, Howells K, Phillips AD, Thomas NS, CooperDN. 2009. The Human Gene Mutation Database: 2008 update. GenomeMed 1: 13. doi: 10.1186/gm13.
Storey JD, Tibshirani R. 2003. Statistical significance for genomewidestudies. Proc Natl Acad Sci 100: 9440–9445.
Sun G, Zhu C, Kramer MH, Yang SS, Song W, Piepho HP, Yu J. 2010. Variationexplained in mixed-model association mapping. Heredity 105: 333–340.
Swanson-Wagner RA, Eichten SR, Kumari S, Tiffin P, Stein JC, Ware D,Springer NM. 2010. Pervasive gene content variation and copy numbervariation in maize and its undomesticated progenitor. Genome Res 20:1689–1699.
Teslovich TM, Musunuru K, Smith AV, Edmondson AC, Stylianou IM, KosekiM, Pirruccello JP, Ripatti S, Chasman DI, Willer CJ, et al. 2010. Biological,clinical and population relevance of 95 loci for blood lipids. Nature 466:707–713.
Tian F, Bradbury PJ, Brown PJ, Hung H, Sun Q, Flint-Garcia S, Rocheford TR,McMullen MD, Holland JB, Buckler ES. 2011. Genome-wide associationstudy of leaf architecture in the maize nested association mappingpopulation. Nat Genet 43: 159–162.
Timmermans MC, Schultes NP, Jankovsky JP, Nelson T. 1998. Leafbladeless1is required for dorsoventrality of lateral organs in maize. Development125: 2813–2823.
Waldman YY, Tuller T, Keinan A, Ruppin E. 2011. Selection for translationefficiency on synonymous polymorphisms in recent human evolution.Genome Biol Evol 3: 749–761.
Walsh J, Waters CA, Freeling M. 1998. The maize gene liguleless2 encodesa basic leucine zipper protein involved in the establishment of the leafblade-sheath boundary. Genes Dev 12: 208–218.
Wu TD, Nacu S. 2010. Fast and SNP-tolerant detection of complex variantsand splicing in short reads. Bioinformatics 26: 873–881.
Yang J, Manolio TA, Pasquale LR, Boerwinkle E, Caporaso N, CunninghamJM, de Andrade M, Feenstra B, Feingold E, Hayes MG, et al. 2011.Genome partitioning of genetic variation for complex traits usingcommon SNPs. Nat Genet 43: 519–525.
Yu J, Pressoir G, Briggs WH, Vroh Bi I, Yamasaki M, Doebley JF, McMullenMD, Gaut BS, Nielsen DM, Holland JB, et al. 2006. A unified mixed-model method for association mapping that accounts for multiple levelsof relatedness. Nat Genet 38: 203–208.
Yu J, Holland JB, McMullen MD, Buckler ES. 2008. Genetic design andstatistical power of nested association mapping in maize. Genetics 178:539–551.
Zhang Z, Ersoz E, Lai CQ, Todhunter RJ, Tiwari HK, Gore MA, Bradbury PJ,Yu J, Arnett DK, Ordovas JM, et al. 2010. Mixed linear model approachadapted for genome-wide association studies. Nat Genet 42: 355–360.
Received March 7, 2012; accepted in revised form June 7, 2012.
Li et al.
2444 Genome Researchwww.genome.org
Cold Spring Harbor Laboratory Press on December 1, 2012 - Published by genome.cshlp.orgDownloaded from