Pasar Farmasi Indonesia - Kalbe Farma
47
Company Update Unaudited YTD September 2015 October 2015 New solution for sore throat
-
Upload
khangminh22 -
Category
Documents
-
view
1 -
download
0
Transcript of Pasar Farmasi Indonesia - Kalbe Farma

Company Update Unaudited YTD September 2015
October 2015
New solution for sore throat

2
Forward Looking Statement This presentation has been prepared for informational purposes only by PT Kalbe Farma Tbk. (“Kalbe” or the “Company”).
This presentation has been prepared solely for use in connection with the release of 30 September 2015 unaudited results of the Company. The information contained in this presentation has not been independently verified. No representation, warranty or undertaking, express or implied, is made as to, and no reliance should be placed on, the fairness, accuracy, completeness or correctness of the information or the opinions contained herein. None of the Company or any of their respective affiliates, and their respective commissioners, directors and employees, advisors or representatives shall have any liability whatsoever (in negligence or otherwise) for any loss howsoever arising from any use of this presentation or its contents or otherwise arising in connection with the presentation. Any decision to purchase or subscribe for securities of the Company should not be made on the basis of the information contained in this presentation.
The presentation is not an offer of securities for sale in the United States. Securities may not be offered or sold in the United States absent registration or an exemption from registration.
This presentation and its contents are confidential unless they are or become generally available as public information in accordance with prevailing laws and regulations (other than as a result of a disclosure by you) and must not be distributed, published or reproduced (in whole or in part) or disclosed by recipients to any other person. This presentation does not constitute a recommendation regarding the securities of the Company.
This presentation, including the information and opinions contained herein, is provided as of the date of this presentation and is subject to change without notice, including change as a result of the issuance of 30 September 2015 unaudited results of the Company .
This presentation includes "forward-looking statements". These statements contain the words "anticipate", "believe", "intend", estimate", "expect" and words of similar meaning. All statements other than statements of historical facts included in this presentation, including, without limitation, those regarding the Company's financial position, business strategy, plans and objectives of management for future operations (including development plans, objectives relating to the Company's products and services and anticipated product launches) are forward-looking statements. Such forward-looking statements are based on numerous assumptions regarding the Company's present and future business strategies and the environment in which the Company will operate in the future. These forward-looking statements speak only as at the date of this presentation. The Company expressly disclaims any obligation or reflection of any change in the Company's expectations with regard thereto, or any change in events, conditions or circumstances on which any statement is based.
Market data and certain industry forecasts used in this presentation were obtained from market research, publicly available information and industry publications which have not been independently verified, and no representation is made as to the accuracy of such information.

Table of Contents
3
Corporate Overview 4
Market Overview 7
Business Overview 11
Financial Overview 29
Strategies and Outlook 2015 35
Appendix 40

SECTION 1
Corporate Overview
Not all collagen is the same, it’s
time to choose the right one
New solution for sore throat

Domestic 95%
Export 5%
• Established in 1966 and headquartered in Jakarta
• A public company since 1991 and listed in the Indonesia Stock Exchange
• The largest publicly-listed pharmaceuticals company in Southeast Asia
• Sales breakdown by segment and by geographical location for YTD September
2015 is as follows:
Largest Publicly-Listed Pharmaceuticals Company in Southeast Asia
Total Sales = Rp 13,128 Bn Total Sales = Rp 13,128 Bn
Corporate Overview
5
Prescription Pharmaceuticals
24%
Consumer Health
18% Nutritionals 28%
Distribution & Logistics
30%
Corporate Strategy
6
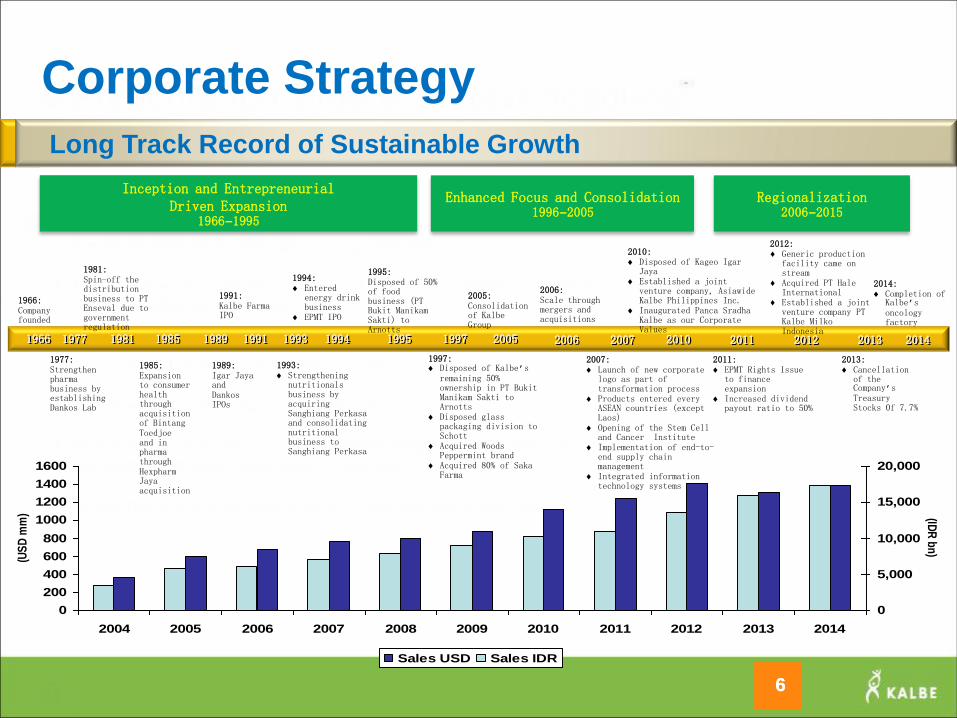
Long Track Record of Sustainable Growth
6
0
200
400
600
800
1000
1200
1400
1600
2004 2005 2006 2007 2008 2009 2010 2011 2012 2013 2014
(US
D m
m)
0
5,000
10,000
15,000
20,000
(IDR
bn
)
Sales USD Sales IDR
1966 1977 1985 1989 1991 1993 2005 1981 1994 1995 1997 2007 2010
1966: Company founded
1977: Strengthen pharma business by establishing Dankos Lab
1981: Spin-off the distribution business to PT Enseval due to government regulation
1985: Expansion to consumer health through acquisition of Bintang Toedjoe and in pharma through Hexpharm Jaya acquisition
1989: Igar Jaya and Dankos IPOs
1991: Kalbe Farma IPO
1993: Strengthening
nutritionals business by acquiring Sanghiang Perkasa and consolidating nutritional business to Sanghiang Perkasa
1994: Entered
energy drink business
EPMT IPO
1995: Disposed of 50% of food business (PT Bukit Manikam Sakti) to Arnotts
1997: Disposed of Kalbe’s
remaining 50% ownership in PT Bukit Manikam Sakti to Arnotts
Disposed glass packaging division to Schott
Acquired Woods Peppermint brand
Acquired 80% of Saka Farma
2005: Consolidation of Kalbe Group
2006
2006: Scale through mergers and acquisitions
2007: Launch of new corporate
logo as part of transformation process
Products entered every ASEAN countries (except Laos)
Opening of the Stem Cell and Cancer Institute
Implementation of end-to-end supply chain management
Integrated information technology systems
2010: Disposed of Kageo Igar
Jaya Established a joint
venture company, Asiawide Kalbe Philippines Inc.
Inaugurated Panca Sradha Kalbe as our Corporate Values
Inception and Entrepreneurial Driven Expansion
1966–1995
Enhanced Focus and Consolidation 1996–2005
Regionalization 2006–2015
2011
2011: EPMT Rights Issue
to finance expansion
Increased dividend payout ratio to 50%
2012
2012: ♦ Generic production
facility came on stream
♦ Acquired PT Hale International
♦ Established a joint venture company PT Kalbe Milko Indonesia 2013
2013: Cancellation
of the Company’s Treasury Stocks 0f 7.7%
2014
2014: Completion of
Kalbe’s oncology factory

SECTION 2
Market Overview
Not all collagen is the same, it’s
time to choose the right one
New solution for sore throat

• Low healthcare expenditure to GDP ratio.
Indonesia’s Health Spending Trends
8
JKN Coverage Roadmap
• National Health Insurance (Jaminan
Kesehatan Nasional or JKN) program has
commenced in January 2014, and covered
more than 50% of the population in 2014. JKN
targets to cover the entire Indonesian
population by 2019.
133 mn people *
Target 170 mn people
Target 250 mn people
100% coverage
* including 76.4 mn people covered by Jamkesmas program
before the launch of JKN.
Source : Roadmap to National Health Insurance 2012 - 2019
2015 2014
2019
3,3%
4,1%
4,2%
4,3%
5,5%
5,8%
9,6%
18,0%
Indonesia
India
Thailand
Malaysia
China
Singapore
United Kingdom
United States
Healthcare Expenditure/GDP 2013 (%)
Source : Centers for Medicare & Medicaid Services, Office of the Actuary; United Kingdom :
Healthcare Report, Economist Intelligence Unit; Kementerian Kesehatan Indonesia, China;
Singapore Government Budget; Economic Survey, India; Frost & Sullivan
6,8 7,9 8,9 10,5 12,2
12,1 13,1
14,5 15,9
18,2
2009 2010 2011 2012 2013
Private Expenditure
Public Expenditure
21.1 23.4
26.4
30.4
19.0
Total Healthcare Expenditure
(USD Bn)
Source : Global Health Expenditure Database, WHO
CAGR
12.5%

Market Share
Kalbe 13%
a 6%
b 5%
c 4%
d 4%
Others 68%
Pharmaceuticals Market Breakdown
9
Kalbe – No. 1 in the Pharma Industry
Kalbe continues to lead in the highly fragmented pharmaceuticals
industry with over 200 players
Total Market FY 2014 Rp 58.2Tn
OTC
41%
Ethicals
(Prescription)
59%
Branded &
Licensed
84%
Unbranded
16%
Pharma Market Breakdown
Pharma Industry
CAGR
12.0%
(in trillion Rupiah)
Source: IMS Health ITMA YTD 12 2014
Note: Restatement of 2012 IMS market data
37,0 41,7 49,4
55,5 58,2
FY 2010 FY 2011 FY 2012 FY 2013 FY 2014

Recent Indonesian Pharmaceuticals Regulatory
10
Ministry of Health Decree No. 436 /Menkes/SK/XI/2013
• Determines the selling price and retail price caps on 535 generics drugs for pharmacies, hospitals and other
healthcare institutions throughout Indonesia.
Ministry of Health Regulation No. 1010/Menkes/PER/XI/2008
• Prohibits foreign pharmaceutical companies from registering drugs in Indonesia unless they have local
production facilities.
Price Caps on Key Generic Drugs
National Healthcare Insurance System
Local Production Facilities Requirements
10
Presidential Decree No. 101 Year 2012 regarding Recipients of Health Insurance Premium Subsidy
• Government will subsidize health insurance premium for poor residents
Presidential Decree No. 111 Year 2013 regarding Health Insurance
• All Indonesians are required to be members of the Health Insurance.
• First stage of implementation in 2014 will cover subsidy recipients, military members, civil servants, and formal
sector workers. Second stage will cover all population members by 1 January 2019.
Ministry of Health Decree No. 63 Year 2014 regarding Drug Procurement based on e-Catalogue
• Procurement for National Health Care Insurance is conducted through electroning purchasing method based on e-
Catalogue.
BPJS Kesehatan Director of Operation’s Circular No. 32 Year 2015 regarding Coordination of Benefit
• Regulating coordination of benefit (COB) mechanism for National Healthcare Insurance members with participating
private health insurance.

SECTION 3
Business Overview
New solution for sore throat

• No. 1 player in Indonesian Prescription Pharma Market.
• The largest medical representatives team in Indonesia with
more than 2,500 personnel.
• Comprehensive product offerings for all income groups.
• Increasing price competition following national healthcare
insurance implementation.
• One-time impact of product recall in 2015.
• Gross Profit Margin (GPM) remained relatively stable at
60.2% in YTD 09 2014 and at 59.8% in YTD 09 2015.
3.201 3.207
30 Sep 2014 (Unaudited)
30 Sep 2015 (Unaudited)
SALES in Rp Bn Licensed Products
28.3%
Unbranded Generics
14.6%
Branded Generics
57.1%
12
Prescription Pharmaceuticals Division
Temporary Deceleration
+0.2%
Total Sales Rp 3,207 Bn
Market Share (ITMA)
FY 2014
Total Market = Rp 34.6Tn
KALBE GROUP
15%
a 8%
b 6%
c 4%
d 4%
e 4% f
3%
OTHERS 56%
Source: IMS Health Prescription Pharmaceuticals
YTD 12 2014
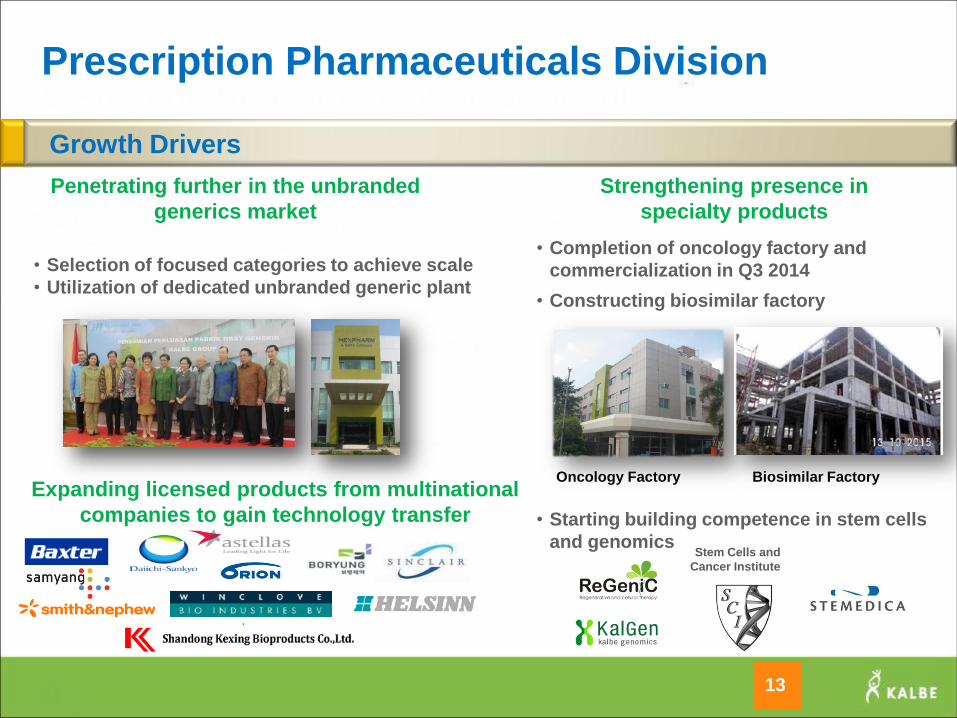
• Completion of oncology factory and
commercialization in Q3 2014
• Constructing biosimilar factory
Oncology Factory Biosimilar Factory
• Starting building competence in stem cells
and genomics
Prescription Pharmaceuticals Division
Penetrating further in the unbranded
generics market
13
Growth Drivers
Expanding licensed products from multinational
companies to gain technology transfer
Strengthening presence in
specialty products
• Selection of focused categories to achieve scale
• Utilization of dedicated unbranded generic plant
Stem Cells and
Cancer Institute

14
Consumer Health Division
Strong Brand Equity with Leading Market Position
Market share of Kalbe’s brands
Source : AC Nielsen YTD 12 2012 and Company’s estimation 2014, in volume
Therapeutic Class Kalbe’s Products Market Share 2014
Antacid Promag, Waisan 75.2%
Anti Diarrhea Neo Entrostop 44.8%
Cough Remedies Komix, Woods, Mextril, Mixadin 33.9%
Cold Remedies Mixagrip Reg, Mixagrip FB, Procold 37.4%
Multivitamin Cerebrovit, Fatigon, Sakatonik Liver 30.8%
Children Multivitamin Cerebrofort, Sakatonik ABC 18.1%
Energy Drink Extra Joss 27.0%
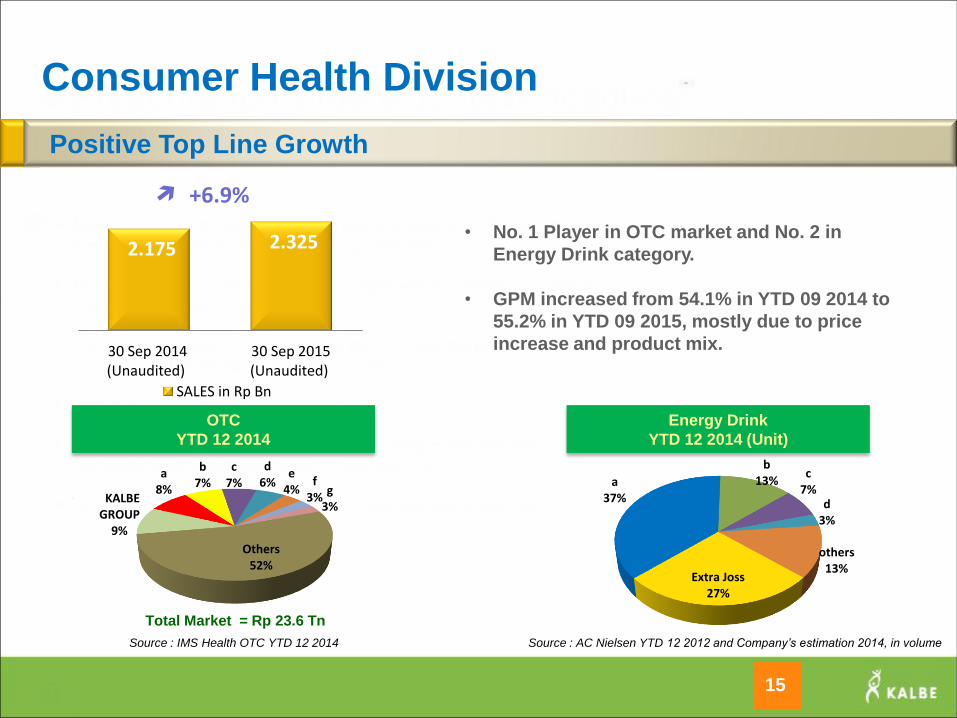
KALBE GROUP
9%
a 8%
b 7%
c 7%
d 6%
e 4%
f 3%
g 3%
Others 52%
• No. 1 Player in OTC market and No. 2 in
Energy Drink category.
• GPM increased from 54.1% in YTD 09 2014 to
55.2% in YTD 09 2015, mostly due to price
increase and product mix.
Consumer Health Division
15
Positive Top Line Growth
Energy Drink
YTD 12 2014 (Unit)
OTC
YTD 12 2014
Total Market = Rp 23.6 Tn
Source : IMS Health OTC YTD 12 2014
+6.9%
Source : AC Nielsen YTD 12 2012 and Company’s estimation 2014, in volume
Extra Joss 27%
a 37%
b 13%
c 7%
d 3%
others 13%
2.175 2.325
30 Sep 2014 (Unaudited)
30 Sep 2015 (Unaudited)
SALES in Rp Bn
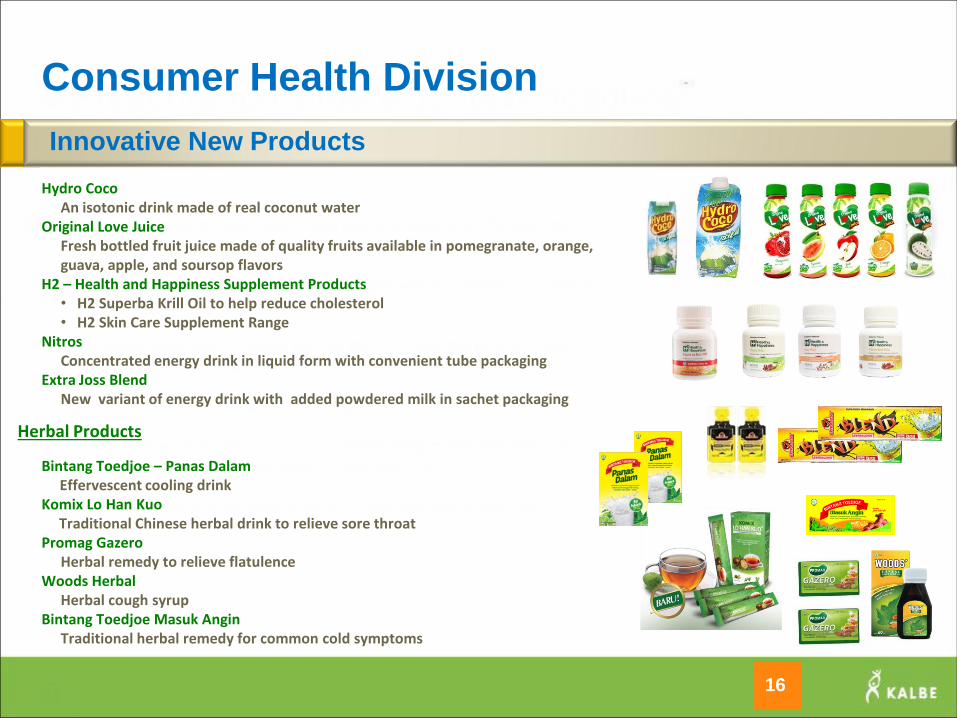
Hydro Coco An isotonic drink made of real coconut water
Original Love Juice Fresh bottled fruit juice made of quality fruits available in pomegranate, orange, guava, apple, and soursop flavors
H2 – Health and Happiness Supplement Products • H2 Superba Krill Oil to help reduce cholesterol • H2 Skin Care Supplement Range
Nitros Concentrated energy drink in liquid form with convenient tube packaging
Extra Joss Blend New variant of energy drink with added powdered milk in sachet packaging
16
Consumer Health Division
Innovative New Products
Bintang Toedjoe – Panas Dalam Effervescent cooling drink
Komix Lo Han Kuo Traditional Chinese herbal drink to relieve sore throat
Promag Gazero Herbal remedy to relieve flatulence
Woods Herbal Herbal cough syrup
Bintang Toedjoe Masuk Angin Traditional herbal remedy for common cold symptoms
Herbal Products

17
Complete Range of Nutritional Products
Teen Expecting Lactating Baby Toddler Kid Tween 25+ 35+ Clinical
• Catered to expecting & lactating mothers, babies, toddlers, children, tweens and
adults.
Nutritionals Division
Nutritionals Division
18
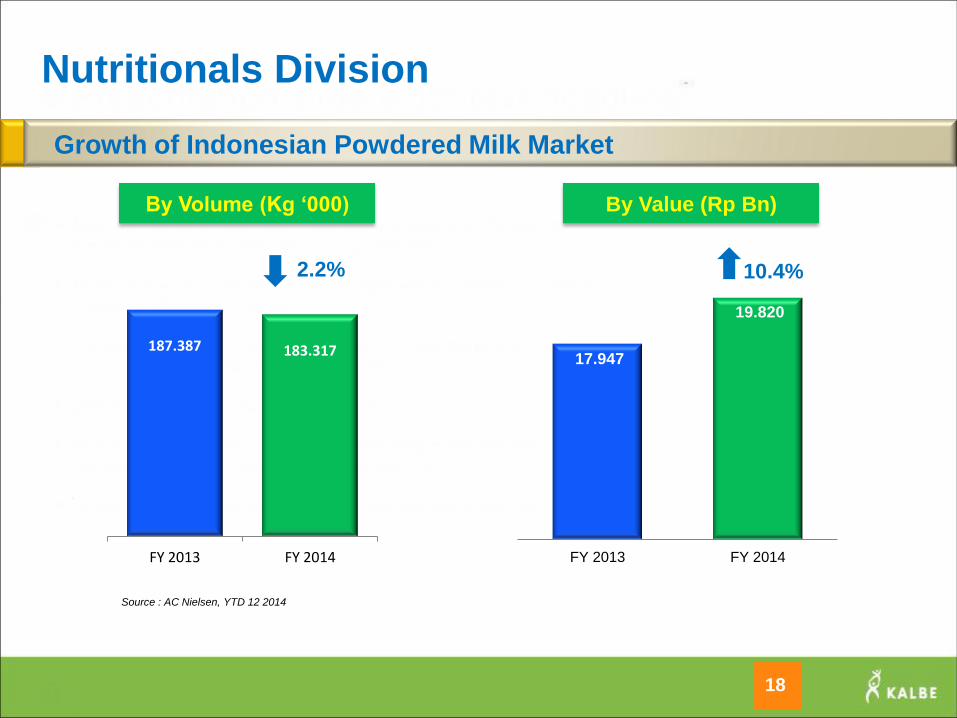
Growth of Indonesian Powdered Milk Market
Source : AC Nielsen, YTD 12 2014
By Value (Rp Bn) By Volume (Kg ‘000)
10.4% 2.2%
187.387
183.317
FY 2013 FY 2014
17.947
19.820
FY 2013 FY 2014
3.325 3.665
30 Sep 2014 (Unaudited)
30 Sep 2015 (Unaudited)
SALES in Rp Bn
Nutritionals Division
19
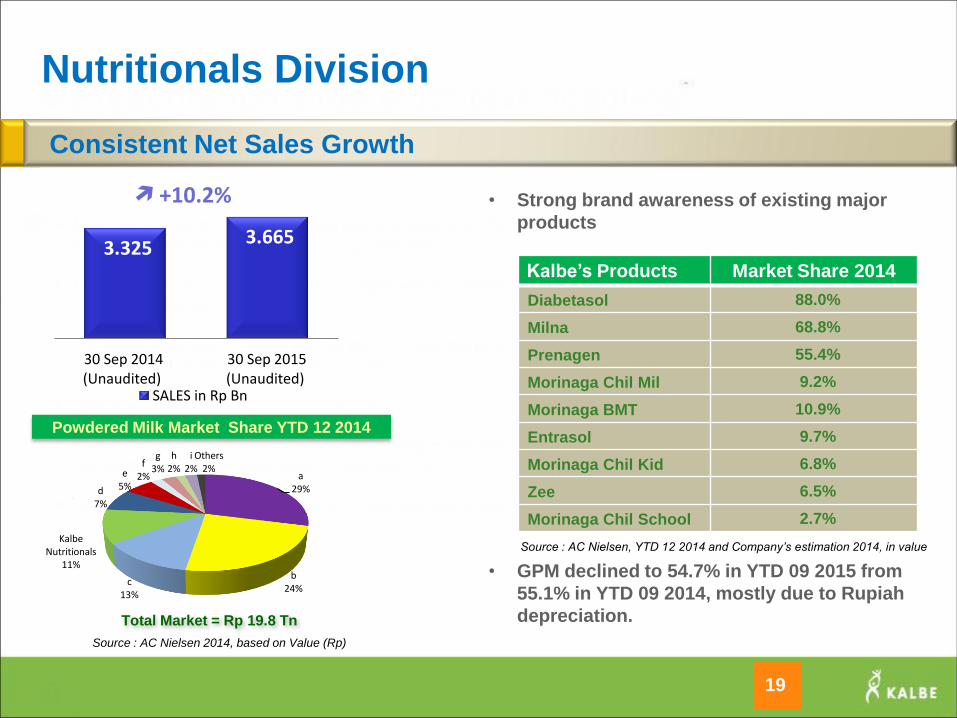
Consistent Net Sales Growth
+10.2% • Strong brand awareness of existing major
products
• GPM declined to 54.7% in YTD 09 2015 from
55.1% in YTD 09 2014, mostly due to Rupiah
depreciation.
Powdered Milk Market Share YTD 12 2014
Total Market = Rp 19.8 Tn
Source : AC Nielsen 2014, based on Value (Rp)
Kalbe’s Products Market Share 2014
Diabetasol 88.0%
Milna 68.8%
Prenagen 55.4%
Morinaga Chil Mil 9.2%
Morinaga BMT 10.9%
Entrasol 9.7%
Morinaga Chil Kid 6.8%
Zee 6.5%
Morinaga Chil School 2.7%
a 29%
b 24%
c 13%
Kalbe Nutritionals
11%
d 7%
e 5%
f 2%
g 3%
h 2%
i 2%
Others 2%
Source : AC Nielsen, YTD 12 2014 and Company’s estimation 2014, in value

Nutrive Benecol
Smoothie with special ingredient to lower cholesterol
Launching of New Products
20
Nutritionals Division
Diva
Fitbar
A healthy snack bar with low calories, zero cholesterol and
zero trans fat.
Health drink with collagen and antioxidant for skin care
Zee
Powdered milk for kids and tweens targeted to the middle
segment, now also available in sachet packaging
Entrasol Quick Start
Cereal drink made of milk and oats with high calcium
and high fiber
Multi Channel Customer Touch Points
21
Nutritionals Division
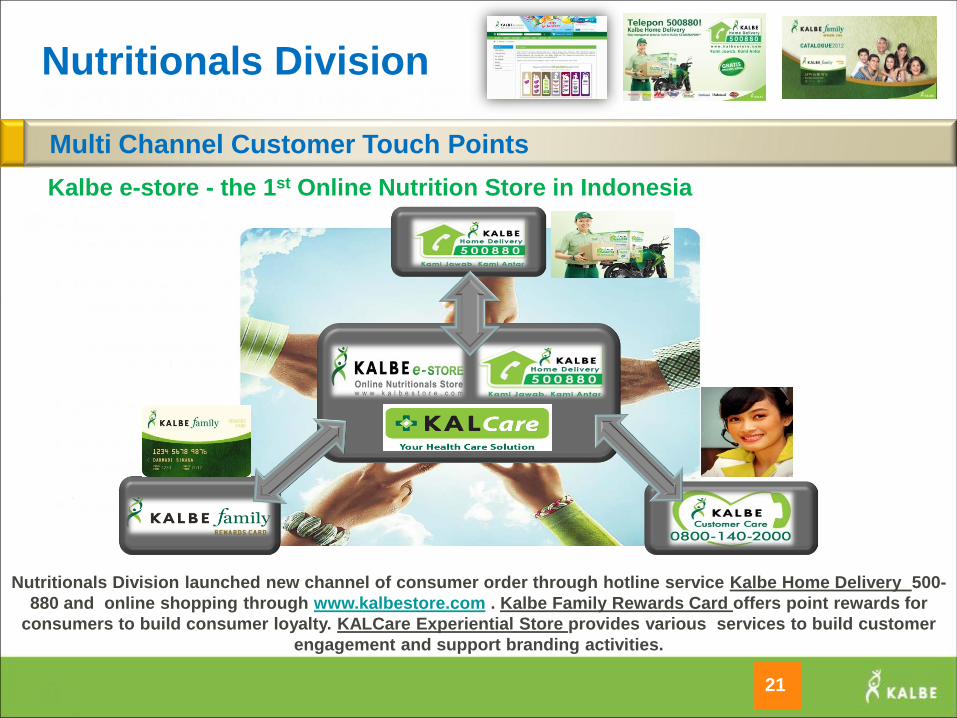
Kalbe e-store - the 1st Online Nutrition Store in Indonesia
Nutritionals Division launched new channel of consumer order through hotline service Kalbe Home Delivery 500-
880 and online shopping through www.kalbestore.com . Kalbe Family Rewards Card offers point rewards for
consumers to build consumer loyalty. KALCare Experiential Store provides various services to build customer
engagement and support branding activities.

Distribution & Logistics Division
22
The Most Extensive Distribution Network
Branches
71 52 Cities RDC
2
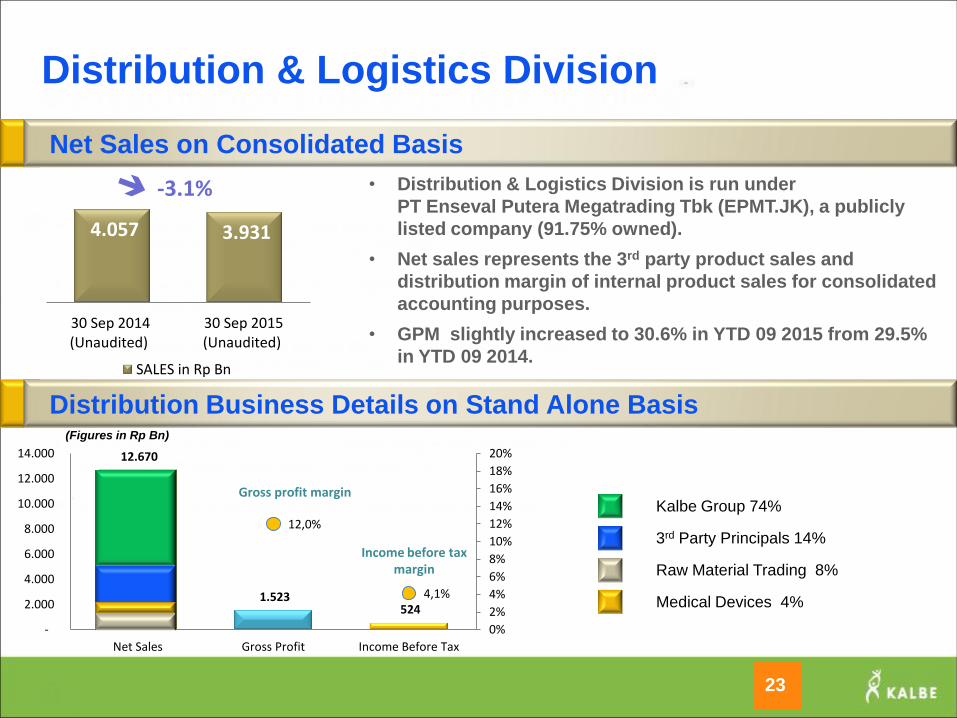
12.670
1.523 524
12,0%
4,1%
0%
2%
4%
6%
8%
10%
12%
14%
16%
18%
20%
-
2.000
4.000
6.000
8.000
10.000
12.000
14.000
Net Sales Gross Profit Income Before Tax
4.057 3.931
30 Sep 2014 (Unaudited)
30 Sep 2015 (Unaudited)
SALES in Rp Bn
23
Net Sales on Consolidated Basis
• Distribution & Logistics Division is run under
PT Enseval Putera Megatrading Tbk (EPMT.JK), a publicly
listed company (91.75% owned).
• Net sales represents the 3rd party product sales and
distribution margin of internal product sales for consolidated
accounting purposes.
• GPM slightly increased to 30.6% in YTD 09 2015 from 29.5%
in YTD 09 2014.
Distribution & Logistics Division
-3.1%
(Figures in Rp Bn)
Gross profit margin
Income before tax margin
Distribution Business Details on Stand Alone Basis
Kalbe Group 74%
3rd Party Principals 14%
Medical Devices 4%
Raw Material Trading 8%

Major Third Party Principals by Category
Prescription
Pharmaceuticals Consumer
Medical Instrument
& Diagnostic
Fine Chemical
Raw Materials
Distribution & Logistics Division
24

Distribution & Logistics Division
25
Growth Drivers
Medical Devices is an area of potential
growth, especially in the implementation
of National Healthcare Insurance
System where demand for medical
devices is projected to grow further.
Net Sales (in Rp Bn)
Retail Health Services : 83 Mitrasana Clinics
• Developing Mitrasana Clinics as a
one-stop service with 4-in-1
concept, including family doctor,
pharmacy, laboratory, and
convenient store.
• A 100% owned subsidiary of EPMT.
• To date, Kalbe has opened 83
Mitrasana clinics in Jakarta and its
Greater Area.
Medical Devices
673
915 870 969
1.142
742
2009 2010 2011 2012 2013 2014*
* Discontinued tender business in 2014

• Exploring potential new 3rd party principals selectively
• Continuing to expand distribution infrastructure
1. Expand into new territories in Indonesia
2. Upgrade existing branch facilities to improve service
quality
3. Establish several Regional Distribution Centers (RDC)
throughout Indonesia
4. Expand warehouse capacity
• Collaborating with sub-distributors to gain territorial expansion
Distribution & Logistics Division
26
Strengthening Distribution Network
• New branch in Sibolga, North Sumatra
• Upgraded RDC Jakarta and upgraded Samarinda branch
2015 updates:
Samarinda

Marketing and Sales Infrastructure
27
The largest sales force for Pharma and Consumer Health in Indonesia
Prescription
Pharmaceuticals Consumer Health Nutritionals
Distribution &
Logistics
Infra-
structures
Indonesia
Coverage
Comments
• Over 2,500 medical
representatives
• Over 1,100 marketing
personnel
• > 2,000 sales &
marketing personnel
• Total of > 5,000
employees
• 71 marketing branches
throughout Indonesia
• 46 branches & 25 at
subsidiaries
• > 1,000 trucks
• > 500 motorcycles
• Directly cover
200,000 outlets
• Products available in
over 1mn outlets or
80% of total
consumer health
market
Market coverage
• 70% of GP market
covered
• 90% of specialist market
covered
• 100% of all hospitals
covered
• 100% pharmacy
coverage
• Largest marketing
team in Indonesia
• Approximately 1,100
marketing and sales
force
• Market Coverage
throughout Indonesia
• Most developed
telemarketing team in
the nutritional sector
• 80% of consumer
health market
•100% of prescription
pharma market
• Largest sales force in
Indonesia

Manufacturing Infrastructure
28
Operates 9 GMP facilities complying with international standards
Facility Products
Manufactured
Building Area
(m2) Production Lines Licenses Certification
Kalbe Farma 435 91,819 14 lines (tablet, capsule, cream, liquid oral,
injection) Astellas
ISO 9001, ISO 14001,
OHSAS18001
Bintang Toedjoe 49 20,849 3 lines; effervescent, powder & liquid -- ISO 9001, ISO 14001,
OHSAS18001, HACCP, SMK3
Dankos Farma 189 23,101 4 factories; Non-betalactam, Penicillin &
Cephalosporin, Oncology lines
Daiichi,
Samyang
ISO 9001, ISO 14001,
OHSAS18001
Sanghiang Perkasa 210 50,000 8 line dry - powdered milk Morinaga ISO 9001, ISO 14001, HACCP,
OHSAS18001
Hexpharm Jaya 85 16,533 Solid tablet (Non-betalactam products) -- ISO 9001, ISO 14001,
OHSAS18001
Finusolprima Farma 26 10,700
Large volume parenteral (LVP) in glass bottle
line, LVP in flexy bag line, Haemodialysis
Solution Line
Baxter ISO 9001, ISO 14001,
OHSAS18001
Kalbe Morinaga 19 33,733 1 wet - drier line, 1 can line, 2 sachet lines Morinaga ISO 9001, ISO 22000, OHSAS
18001
Orange Kalbe Ltd. - 5,000 2 lines; tablet and cream -- NAFDAC (local FDA)
Hale International 6 10,000 Semi hot-filled PET -- ISO 22000/2005 GMP, HACCP

SECTION 4
Financial Overview
New solution for sore throat

3.201 2.175
3.325 4.057
12.758
3.207 2.325
3.665 3.931
13.128
Prescription Pharmaceuticals
Consumer Health Nutritionals Distribution & Logistics Consolidation
30 Sep 2014 (Unaudited)
30 Sep 2015 (Unaudited)
Consolidated Sales
30
Positive Top Line Growth of Internal Kalbe Products
0.2% 6.9% 10.2% -3.1%
2.9%
Net Sales (in Rp Bn)

26,8% 27,8%
4,8% 5,1% 0,8% 0,9%
30 Sep 2014 (Unaudited)
30 Sep 2015 (Unaudited)
Selling & Marketing
General & Administrative
Research & Development
15,7% 15,1%
30 Sep 2014 (Unaudited)
30 Sep 2015 (Unaudited)
48,1% 48,8%
30 Sep 2014 (Unaudited)
30 Sep 2015 (Unaudited)
Consolidated Operating Performance
31
Slight Pressure on Operating Margin
• Marketing efforts to drive brand awareness
• Higher selling & marketing expense to net sales
ratio due to the change in business mix
• Research & development activities to support
product development
Gross Profit
(in Rp bn) Operating Expenses to Net Sales Ratios
Operating Profit
(in Rp bn)
+ 4.6%
-1.0%
32.4%
1,976 1,997
33.8%
6,131 6,411

1.487 1.499
30 Sep 2014 (Unaudited)
30 Sep 2015 (Unaudited)
1.988 2.016
30 Sep 2014 (Unaudited)
30 Sep 2015 (Unaudited)
Consolidated Net Earnings
32
Maintaining Stable Earnings
Income Before Tax
(in Rp bn)
Net Income
(in Rp bn)
• Income before tax margin slightly decreased from
15.6% in YTD 09 2014 to 15.4% in YTD 09 2015, mostly
due to higher operating expenses.
+1.4%
• Net income margin slightly decreased from 11.7% in
YTD 09 2014 to 11.4% in YTD 09 2015, in line with
lower income before tax margin.
+0.8% 15.6% 15.4% 11.4% 11.7%

43 45 44 50
48 48 49 55
142
122 110 115 107
132 125 121
27
38 35
57 41
50 46 45
158
129 120
108 114
131 128 130
2008 (Audited)
2009 (Audited)
2010 (Audited)
2011 (Audited)
2012 (Audited)
2013 (Audited)
2014 (Audited)
30 Sep 2015 (Unaudited)
Days of Account Receivables Days of Inventories
Days of Account Payables Net Operating Cycle
Improvement in days of
inventory
Working Capital Management
33
Gradual Improvement in Net Operating Cycle
End-to-end supply chain
management will be
continuously implemented
to overcome any
fluctuation in inventory
Net Operating Cycle has
decreased by 28 days from
158 days in 2008 to 130 days
in September 2015.
No. of days

14,0 19,0 19,0 17,0 19,0
51% 60%
51% 42% 43%
0%
20%
40%
60%
80%
0,0
5,0
10,0
15,0
20,0
2010 (Audited)
2011 (Audited)
2012 (Audited)
2013 (Audited)
2014 (Audited)
Cash Dividend* (Rp/share) Dividend Payout Ratio (%)
Solid Financial Position
34
Total Debt and Gearing Ratio Cash & Net Cash Balance
Rp 1.7 Trillion of Net Cash Position
Dividend Payment Capital Expenditure
* For Fiscal Year
* Cash dividend are adjusted for stock split impact
* Capital Expenditure in Rp Billion
25 141
205
584
296 411
0,5% 2,3% 2,9%
7,2%
3,2% 4,1%
0,0%
5,0%
10,0%
15,0%
0 100 200 300 400 500 600
2010 (Audited)
2011 (Audited)
2012 (Audited)
2013 (Audited)
2014 (Audited)
30 Sep 2015
(Unaudited)
Total Debt in Rp Billion Gearing Ratio
1.902 2.291 1.860 1.895 1.895 2.125
1.877 2.151
1.655 1.311
1.598 1.713
2010 (Audited)
2011 (Audited)
2012 (Audited)
2013 (Audited)
2014 (Audited)
30 Sep 2015 (Unaudited)
Cash and Cash Equivalent in Rp Billion Net Cash in Rp Billion
470 469
783
994 852
719
2010 (Audited)
2011 (Audited)
2012 (Audited)
2013 (Audited)
2014 (Audited)
30 Sep 2015 (Unaudited)

SECTION 5
Strategies &
Outlook 2015
New solution for sore throat
36
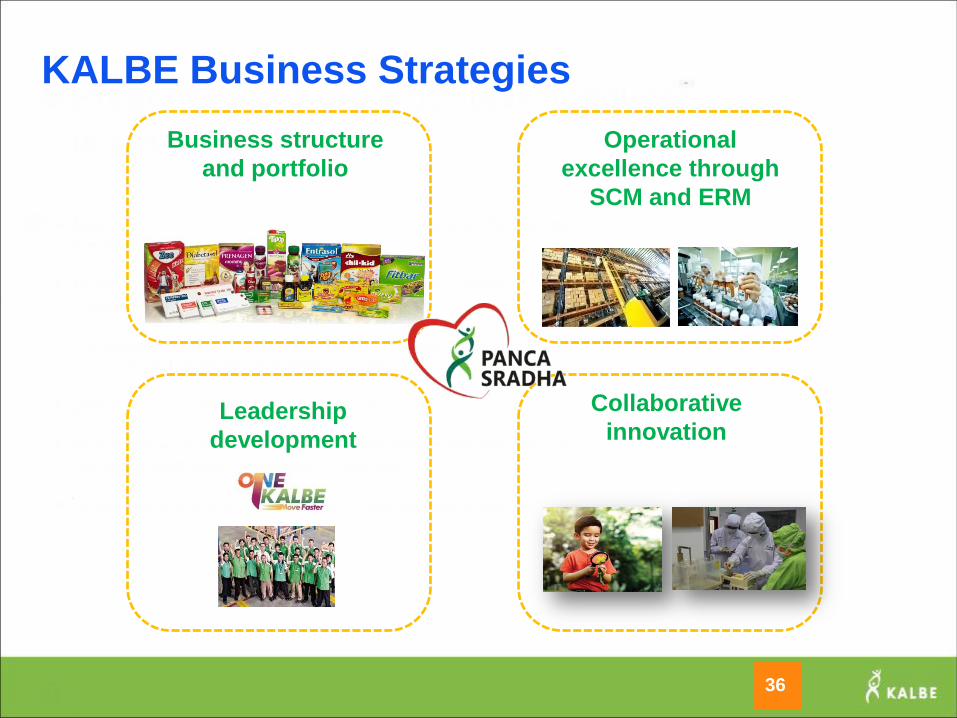
KALBE Business Strategies
Collaborative
innovation Leadership
development
Business structure
and portfolio
Operational
excellence through
SCM and ERM
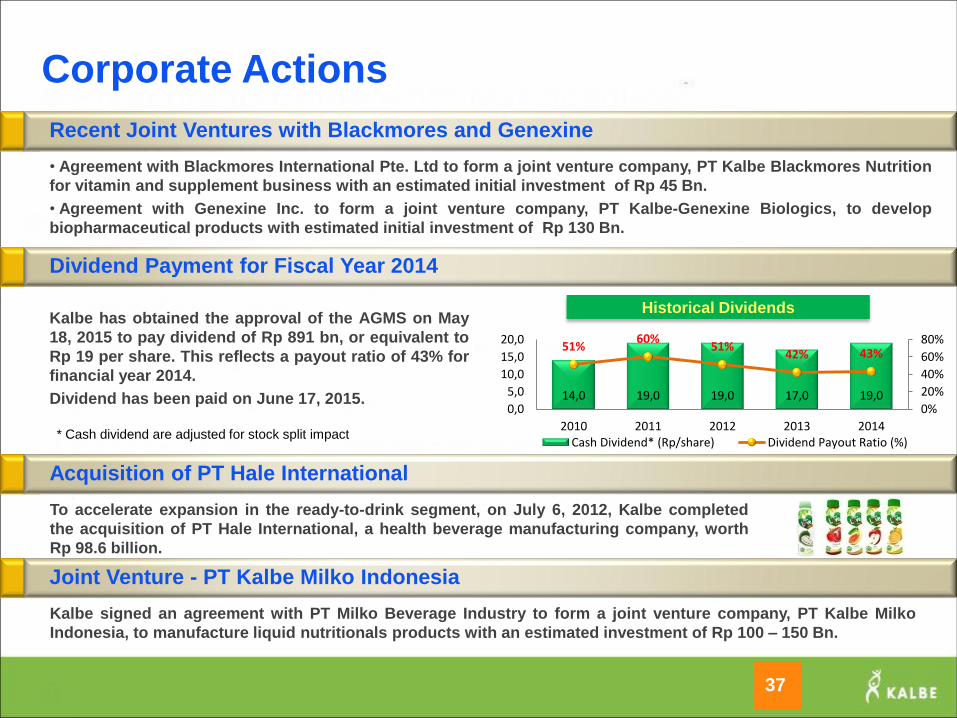
• Agreement with Blackmores International Pte. Ltd to form a joint venture company, PT Kalbe Blackmores Nutrition
for vitamin and supplement business with an estimated initial investment of Rp 45 Bn.
• Agreement with Genexine Inc. to form a joint venture company, PT Kalbe-Genexine Biologics, to develop
biopharmaceutical products with estimated initial investment of Rp 130 Bn.
Recent Joint Ventures with Blackmores and Genexine
Corporate Actions
37
To accelerate expansion in the ready-to-drink segment, on July 6, 2012, Kalbe completed
the acquisition of PT Hale International, a health beverage manufacturing company, worth
Rp 98.6 billion.
Acquisition of PT Hale International
Dividend Payment for Fiscal Year 2014
Kalbe has obtained the approval of the AGMS on May
18, 2015 to pay dividend of Rp 891 bn, or equivalent to
Rp 19 per share. This reflects a payout ratio of 43% for
financial year 2014.
Dividend has been paid on June 17, 2015.
Historical Dividends
Joint Venture - PT Kalbe Milko Indonesia
Kalbe signed an agreement with PT Milko Beverage Industry to form a joint venture company, PT Kalbe Milko
Indonesia, to manufacture liquid nutritionals products with an estimated investment of Rp 100 – 150 Bn.
* Cash dividend are adjusted for stock split impact
14,0 19,0 19,0 17,0 19,0
51% 60%
51% 42% 43%
0%
20%
40%
60%
80%
0,0
5,0
10,0
15,0
20,0
2010 2011 2012 2013 2014 Cash Dividend* (Rp/share) Dividend Payout Ratio (%)
38
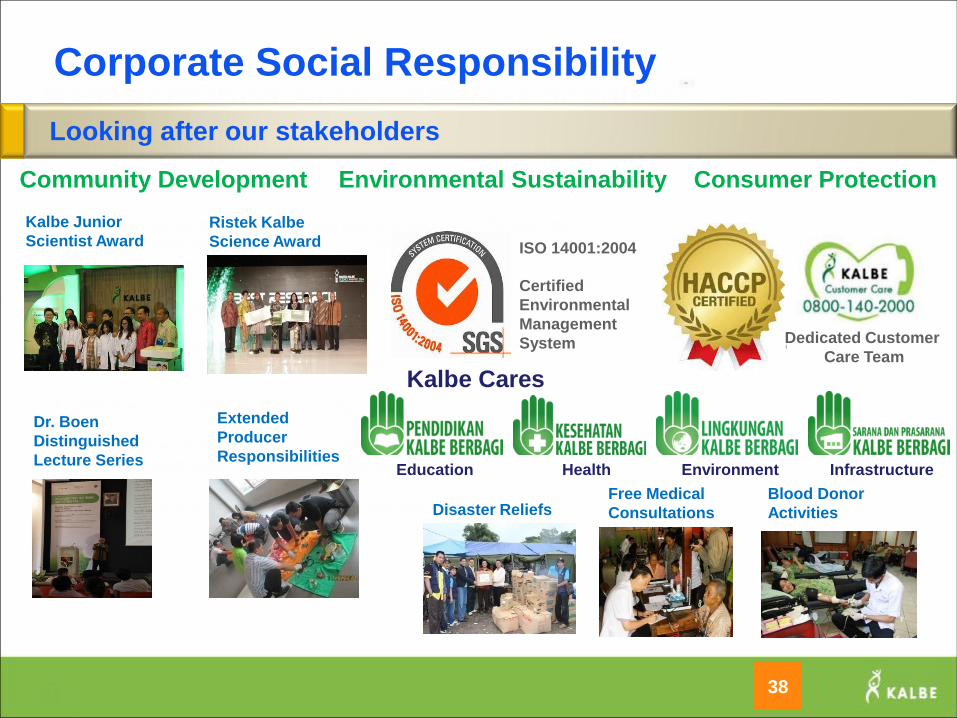
Corporate Social Responsibility
Certified
Environmental
Management
System
ISO 14001:2004
Environmental Sustainability Consumer Protection
Dedicated Customer
Care Team
Kalbe Cares
Education Health Environment Infrastructure
Looking after our stakeholders
Kalbe Junior
Scientist Award Ristek Kalbe
Science Award
Dr. Boen
Distinguished
Lecture Series
Extended
Producer
Responsibilities
Free Medical
Consultations
Blood Donor
Activities Disaster Reliefs
Community Development

Outlook 2015
39
Capex Rp 0.9 – 1.0 Tn for production capacity expansion and distribution network.
1. Year-on-year Sales Growth 2% - 3%
2. Operating Profit Margin 14% - 15%
3. Earnings per Share Growth -3% - -4%
4. Dividend Payout Ratio 40% - 50%
Revised Earnings Guidance 2015

SECTION 6
Appendix
Financial Information YTD September 30, 2015
(Unaudited)
New solution for sore throat

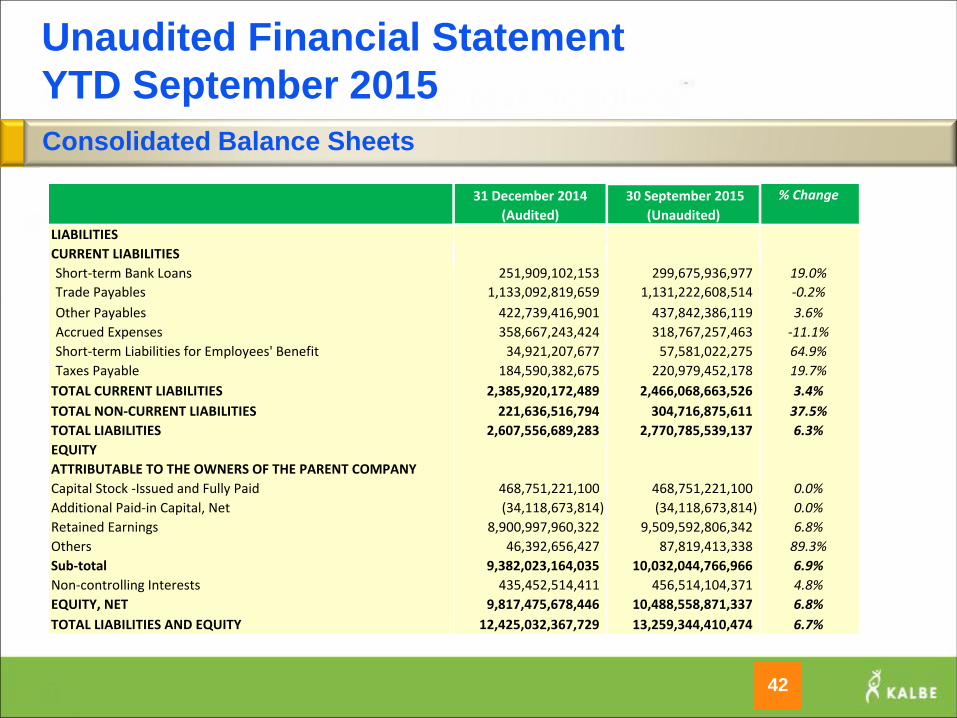
Unaudited Financial Statement
YTD September 2015
Consolidated Balance Sheets
41
ASSETS
CURRENT ASSETS
Cash and Cash Equivalents 1,894,609,528,205 2,124,752,980,457 12.1%
Trade Receivables, Net 2,346,943,653,265 2,652,116,857,346 13.0%
Other Receivables 117,957,876,451 76,881,705,373 -34.8%
Other Current Financial Assets 199,389,672,567 153,310,595,143 -23.1%
Inventories, Net 3,090,544,151,155 3,018,379,321,519 -2.3%
Prepaid Taxes and Expenses 82,698,813,413 134,805,599,139 63.0%
Other Current Assets 388,661,675,136 350,404,502,051 -9.8%
TOTAL CURRENT ASSETS 8,120,805,370,192 8,510,651,561,028 4.8%
TOTAL NON-CURRENT ASSETS 4,304,226,997,537 4,748,692,849,446 10.3%
TOTAL ASSETS 12,425,032,367,729 13,259,344,410,474 6.7%
31 December 2014
(Audited)
30 September 2015
(Unaudited) % Change
Unaudited Financial Statement
YTD September 2015
42
Consolidated Balance Sheets
% Change
LIABILITIES
CURRENT LIABILITIES
Short-term Bank Loans 251,909,102,153 299,675,936,977 19.0%
Trade Payables 1,133,092,819,659 1,131,222,608,514 -0.2%
Other Payables 422,739,416,901 437,842,386,119 3.6%
Accrued Expenses 358,667,243,424 318,767,257,463 -11.1%
Short-term Liabilities for Employees' Benefit 34,921,207,677 57,581,022,275 64.9%
Taxes Payable 184,590,382,675 220,979,452,178 19.7%
TOTAL CURRENT LIABILITIES 2,385,920,172,489 2,466,068,663,526 3.4%
TOTAL NON-CURRENT LIABILITIES 221,636,516,794 304,716,875,611 37.5%
TOTAL LIABILITIES 2,607,556,689,283 2,770,785,539,137 6.3%
EQUITY
ATTRIBUTABLE TO THE OWNERS OF THE PARENT COMPANY
Capital Stock -Issued and Fully Paid 468,751,221,100 468,751,221,100 0.0%
Additional Paid-in Capital, Net (34,118,673,814) (34,118,673,814) 0.0%
Retained Earnings 8,900,997,960,322 9,509,592,806,342 6.8%
Others 46,392,656,427 87,819,413,338 89.3%
Sub-total 9,382,023,164,035 10,032,044,766,966 6.9%
Non-controlling Interests 435,452,514,411 456,514,104,371 4.8%
EQUITY, NET 9,817,475,678,446 10,488,558,871,337 6.8%
TOTAL LIABILITIES AND EQUITY 12,425,032,367,729 13,259,344,410,474 6.7%
31 December 2014
(Audited)
30 September 2015
(Unaudited)

Unaudited Financial Statement
YTD September 2015
43
Consolidated Statement of Income
NET SALES 12,758,469,473,880 13,127,806,587,343 2.9%
COST OF GOODS SOLD 6,627,470,848,873 6,716,910,243,206 1.3%
% to NS 51.9% 51.2% -0.8%
GROSS PROFIT 6,130,998,625,007 6,410,896,344,137 4.6%
% to NS 48.1% 48.8% 0.8%
Selling Expense (3,416,679,276,549) (3,649,133,131,241) 6.8%
% to NS -26.8% -27.8% -1.0%
General and Administrative Expense (614,133,870,380) (667,221,714,046) 8.6%
% to NS -4.8% -5.1% -0.3%
Research and Development Expense (103,209,360,512) (118,500,991,387) 14.8%
% to NS -0.8% -0.9% -0.1%
Interest Expense and Financial Charges (40,456,011,045) (23,617,725,001) -41.6%
Interest Income 41,990,088,627 60,378,579,624 43.8%
Other Operating Expenses (58,446,539,665) (73,398,167,100) 25.6%
Other Operating Income 48,737,375,529 77,282,136,232 58.6%
Share in Net Losses of the Associated Entity (980,985,584) (851,013,789) -13.2%
INCOME BEFORE INCOME TAX
BENEFIT (EXPENSE) 1,987,820,045,428 2,015,834,317,429 1.4%
% to NS 15.6% 15.4% -0.2%
INCOME TAX EXPENSES, NET (461,788,706,115) (481,604,411,536) 4.3%
% to NS -3.6% -3.7% 0.0%
30 September 2014
(Unaudited)
30 September 2015
(Unaudited) % Change

44
Consolidated Statement of Income
Unaudited Financial Statement
YTD September 2015
30 September 2014
(Unaudited)
30 September 2015
(Unaudited) % ChangeINCOME FOR THE PERIOD 1,526,031,339,313 1,534,229,905,893 0.5%
% to NS 12.0% 11.7% -0.3%
OTHER COMPREHENSIVE INCOME (EXPENSES) 1,934,931,420 40,848,681,960 2011.1%
COMPREHENSIVE INCOME FOR THE PERIOD 1,527,966,270,733 1,575,078,587,853 3.1%
% to NS 12.0% 12.0% 0.0%
Income for the Period Attributable to:
Owners of the Parent Company 1,486,756,355,408 1,499,222,166,110 0.8%
Non-controlling Interests 39,274,983,905 35,007,739,783 -10.9%
Total 1,526,031,339,313 1,534,229,905,893 0.5%
% to NS 12.0% 11.7% -0.3%
Comprehensive Income for the Period
Attributable to:
Owners of the Parent Company 1,487,524,969,199 1,539,930,946,901 3.5%
Non-controlling Interests 40,441,301,534 35,147,640,952 -13.1%
Total 1,527,966,270,733 1,575,078,587,853 3.1%
% to NS 12.0% 12.0% 0.0%
Earnings Per Share Attributable
to Owners of the Parent Company 32 32 0.8%

Unaudited Financial Statement
YTD September 2015
Consolidated Statement of Cash Flows
45
CASH FLOWS FROM OPERATING ACTIVITIES
Cash Received from Customers 13,811,617,870,985 14,062,703,018,305 1.8%
Cash Paid to Suppliers and Employees (8,082,825,158,242) (8,249,973,288,619) 2.1%
Cash provided by operations 5,728,792,712,743 5,812,729,729,686 1.5%
Receipts of Claims for Income Tax Refund 21,974,596,310 11,907,066,869 -45.8%
Payments of Income Taxes (487,114,072,241) (478,551,003,419) -1.8%
Payments of Other Operating Expenses, Net (3,610,163,363,492) (3,731,186,651,046) 3.4%
Net Cash Provided by Operating Activities 1,653,489,873,320 1,614,899,142,090 -2.3%
CASH FLOWS FROM INVESTING ACTIVITIES
Proceeds from Sale of Other Current Financial Assets 103,247,693,333 187,029,165,135 81.1%
Interest Income Received 42,192,422,578 61,119,625,338 44.9%
Proceeds from Sales of Property, Plant, and Equipment 25,430,181,489 11,590,135,965 -54.4%
Acquisitions of Property, Plant and Equipment (610,515,106,319) (718,725,455,976) 17.7%
Placements in Other Current Financial Assets (110,613,567,647) (131,300,000,000) 18.7%
Acquisitions from Other Investing Activities, Net 518,908,685 (20,475,900,568) -4046.0%
Net Cash Used in Investing Activities (549,739,467,881) (610,762,430,106) 11.1%
30 September 2014
(Unaudited) % Change
30 September 2015
(Unaudited)

Consolidated Statement of Cash Flows
46
Unaudited Financial Statement
YTD September 2015
30 September 2014
(Unaudited) % Change
30 September 2015
(Unaudited)
CASH FLOWS FROM FINANCING ACTIVITIES
Proceeds from Bank Loans 1,844,926,182,883 659,131,794,591 -64.3%
Receipts of Capital Contributions from
Subsidiaries' Non-controlling Interest 4,887,332,280 532,674,824 -89.1%
Payments of Bank Loans (2,030,290,843,648) (557,453,817,276) -72.5%
Payments of Cash Dividend (807,025,986,361) (905,500,412,589) 12.2%
Payments of Interest Expense and Financial Charges (41,335,437,964) (24,257,064,718) -41.3%
Payments of Pension Funds (19,597,768,441) (21,802,664,190) 11.3%
Payments of Obligations under Finance Leases (87,575,061) - -100.0%
Net Cash Provided by (Used in) Financing Activities (1,048,524,096,312) (849,349,489,358) -19.0%
NET INCREASE (DECREASE) IN CASH AND CASH EQUIVALENT 55,226,309,127 154,787,222,626 180.3%
Net Effect of Changes in Foreign Exchange Rates of Foreign Currency
Denominated Cash and Cash Equivalents (4,043,934,371) 82,408,958,627 2137.8%
CASH AND CASH EQUIVALENTS AT BEGINNING OF YEAR 1,356,186,110,248 1,819,421,532,492 34.2%
CASH AND CASH EQUIVALENTS AT END OF YEAR 1,407,368,485,004 2,056,617,713,745 46.1%
THANK YOU
47
For further information:
PT Kalbe Farma Tbk.
Jalan Let.Jend. Suprapto Kav. 4
Jakarta 10510, Indonesia
Tel. : 62-21-42873888
Fax. : 62-21-42873678
Email : [email protected]
Website : www.kalbe.co.id