Particle Mixing Study in Different Mixers - UNSWorks
261
The University of New South Wales Faculty of Science School of Materials Science and Engineering Particle Mixing Study in Different Mixers Thesis by Musha Halidan Submitted in Partial Fulfilment of the Requirements of the Degree of Doctor of Philosophy in Materials Science and Engineering January 2014
-
Upload
khangminh22 -
Category
Documents
-
view
0 -
download
0
Transcript of Particle Mixing Study in Different Mixers - UNSWorks

The University of New South Wales
Faculty of Science
School of Materials Science and Engineering
Particle Mixing Study in Different Mixers
Thesis by
Musha Halidan
Submitted in Partial Fulfilment of the Requirements of the Degree of
Doctor of Philosophy in
Materials Science and Engineering
January 2014

PLEASE TYPE
Surname or Family name: Halidan
First name: Musha
THE UNIVERSITY OF NEW SOUTH WALES Thesis/Dissertation Sheet
Other name/s:
Abbreviation for degree as given in the University calendar: PhD
School: Material Science and Engineering Faculty: Science
Title: Particle Mixing Study in Different Mixers
Abstract 350 words maximum: (PLEASE TYPE)
Particle m1xmg is an essential unit operation in the manufacture of many granular products, for example, in pharmaceutical, food and chemical engineering industries. A cylindrical mixer, ribbon mixer and rotating drum were investigated for the predictability of the mixture quality using the discrete element method. The mixture quality is known to be affected by variables such as particle properties, operational parameters and geometrical parameters. The particle (or mixture) properties considered are: particle size, particle density, volume fraction and cohesion, of which the predictability is sought only in relation to the first three variables. The effects of these three variables on the mixing behaviour of binary particles can be predicted for all three mixers with the rotating drum being operated in the rolling mode. The prediction equations for the mixers have a similar form but different in the coefficients. Further, the size and density interactions were interpreted using the mechanism of the driving-force generation due to size differences and its completion with the particle weight in the case of a cylindrical mixer.
The effect of cohesion on particle mixing was investigated in micro and macro ribbon mixer systems by creating geometrically and dynamically similar conditions by matching Froude and Bond numbers. A similarity was observed between the two systems in each of the results for mixing index, particle velocity and particle contact forces in the case of non-cohesive mixtures. The quality of the cohesive and noncohesive mixtures each improved with an increase in the shaft speed up to 1 OOrpm after which it deteriorated. A four-bladed ribbon impeller was found to be more effective for mixing cohesive particles and use at a higher fill level. A parametric study on the efiects of impeller geometry showed that the blade pitch, width and clearance significantly affects the particle flow pattern, mixing rate and homogeneity of cohesive particle mixtures. In the case of a four-bladed impeller, the outer blade angle affects the mixing behaviour, but the inner blade angle has no significant effect.
Overall, the present work has used the discrete element method successfully in the study of particle mixing behaviours in three mixers.
Declaration relating to disposition of project thesis/dissertation
1 hereby grant to the University of New South Wales or its agents the right to archive and to make available my thesis or dissertation in whole or in part in the University libraries in all forms of media, now or here after known, subject to the provisions of the Copyright Act 1968. I retain all property rights, such as patent rights. I also retain the right to use in future works (such as articles or books) all or part of this thesis or dissertation.
I also authorise University Microfilms to use the 350 word abstract of my thesis in Dissertation Abstracts International (this is applicable to doctoral theses only).
. .......... M 0 .f) C{ It:' ... . ~C.~rct . .f. .. Witness
The University recognises that there may be exceptional circumstances requiring restrictions on copying or conditions on use. Requests for restriction for a period of up to 2 years must be made in writing. Requests for a longer period of restriction may be considered in exceptional circumstances and require the approval of the Dean of Graduate Research.
FOR OFFICE USE ONLY Date of completion of requirements for Award:
THIS SHEET IS TO BE GLUED TO THE INSIDE FRONT COVER OF THE THESIS

I r·
~-
' !·
. ···. :.· ·"'·\ · ·'!'-"i"'~"'''"'~'!!~.···' '·" !· ·· • · •"• ·~ ··· !". ':Jc~ .. ,. ... , •. ,'l'll-~~ · ..
COPYRIGHT STATEMENT
. ' '
'I hereby grant the University of New South Wales or its agents the right to archive and to make available my thesis or dissertation in whole or part in the University libraries in all forms of media, now or here after known, subject to the provisions of the Copyright Act 1968. I retain all proprietary rights, such as patent rights. I also retain the right to use in future works (such as articles or books) all or part of this thesis or dissertation. I also authorise University Microfilms to use the 350 word abstract of my thesis in Dissertation Abstract International (this is applicable to doctoral theses only). I have either used no substantial portions of copyright material in my thesis or I have obtained permission to use copyright material; where permission has not been granted I have applied/will apply for a partial restriction of the digital copy of my thesis or dissertation.'
Signed .. M ~h.~ .. H.rJ.~-~~ ~ .......................................... . Date .. .lt ... ~, ... ~Jt. .... .... ...................................... .
AUTHENTICITY STATEMENT
'I certify that the Library deposit digital copy is a direct equivalent of the final officially approved version of my thesis. No emendation of content has occurred and if there are any minor variations in formatting, they are the result of the conversion to digital format.'
Signed ./.ff~A~ ... HJ~~.l~0 ......... ...... ...... ....... ............... .. . Date , .Ft .... ~.-~.!t .... ................ .... ...................... ..

r f· ,.
ORIGINALITY STATEMENT
'I hereby declare that this submission is my own work and to the best of my
knowledge it contains no materials previously published or written by another
person, or substantial proportions of material which have been accepted for the
award of any other degree or diploma at UNS W or any other educational institution,
except where due acknowledgement is made in the thesis. Any contribution made to
the research by others, with whom I have worked at UNSW or elsewhere, is
explicitly acknowledged in the thesis. I also declare that the intellectual content of
this thesis is the product of my own work, except to the extent that assistance from
others in the project's design and conception or in style, presentation and linguistic
expression is acknowledged.'
Signed ... A1~ .J.f.J)J.~. ~ ..................................... .
Date ...... . 1.t. ... Mry .... ~.!t ................................ ..
11

iii
ACKNOWLEDGMENT
I would like to express my sincere gratitude to the following people who made it possible for me to complete my research project:
Prof. Aibing Yu, for giving me an opportunity to perform research on the mixing of particles and also for his invaluable guidance on the topic. This work would not have been possible without his direction, inspiration and support.
Dr Rohana Chandratilleke my co-supervisor for providing me support and suggestions during the research for my PhD.
Prof. Sammy Chan my co-supervisor who accepted me into the University of NSW.
Dr Kejun Dong who provided me with his DEM code.
Prof. John Bridgwater of Cambridge University for his invaluable suggestions and comments.
Dr. Ruiping Zou, who paid close attention to the administrative aspects of my work.
The staff and students in the Lab for Simulation and Modelling of Particulate Systems (Simpas)who have helped me in numerous ways during the completion of my research.
The Chinese Scholarship Council and the University of NSW for providing the financial support necessary for this work and their commitment to scientific research.. My Husband Ahmat and my son Ankar for their support during my PhD work.
My parents and parents in law who gave me encouragement, especially my mother in law Nusrat Hajim who provided tremendous support by looking after my 9 month old daughter whilst I was completing my PhD.
My best friends’ Susan and Nick Manousaridis who encouraged me during my PhD work.

iv
ABSTRACT
Particle mixing is an essential unit operation in the manufacture of many granular
products, for example, as in pharmaceutical, food and chemical engineering industries.
However, the predictability of the mixing behaviour of granular materials is limited at
present and case by case studies need to be carried out to find the mixing outcomes. A
cylindrical mixer, ribbon mixer and rotating drum were chosen for the study, and the
predictability of the mixture quality for the mixers was investigated. The mixture
quality is generally well known to be affected by many variables such as particle
properties, operational parameters and geometrical parameters. The particle (or mixture)
properties considered are: particle size, particle density, volume fraction and cohesion,
of which the predictability is sought only in relation to the first three variables. The
operational parameters considered are the shaft speed and fill level; and the geometrical
parameters are pith ratio, blade width, blade clearance, blade angle and blade number.
The discrete element method was used to investigate these effects on the particle mixing
behaviour.
In the first part of the study, a vertically-shafted cylindrical mixer was used and the
effects of particle size, density and volume fraction on the mixing behaviour of binary
mixtures were investigated. The mixture quality showed an improvement if the larger
particles are heavier and small ones lighter. With respect to variations in the size and
volume fractions, each mixture quality showed a peak value. A correlation was
established for predicting the effects of size, density and volume fraction on mixture
quality in a wide range of each variable. The correlation predicts a global peak value at
an optimum condition of size, density and volume fraction. Further, the size and density
interactions were interpreted using the mechanism of the driving-force generation due to
size differences and its completion with the particle weight. A cylindrical mixer can be
used as a standard method in studies of particle mixing with further extensions to the
correlation developed here to include the effects of parameters such as the operating
conditions and material properties.
In the second part of the study, a horizontal ribbon mixer was used and the effect of
cohesion on particles was investigated in micro and macro systems by creating
geometrically and dynamically similar conditions using matched Froud numbers and

v
Bond numbers. There was a similarity in the mixing index, velocity and forces of the
particles in the two systems in non-cohesive mixtures. The effects of the shaft speed and
filling level on cohesive and non-cohesive mixtures were also investigated using light
particles in the large-sized mixer in an attempt to simulate powder mixing behaviour in
the mixer. The quality of the cohesive and non-cohesive mixtures each improved with
an increase in the shaft speed up to 100rpm after which it deteriorated. A four-bladed
impeller was found to be more effective for mixing of cohesive particles and at a higher
fill level. In the parametric study of impeller geometry effects, it was found that the
blade pitch, blade width and blade clearance affect the flow pattern, mixing rate and
homogeneity of cohesive particle mixtures significantly at different cohesion levels. The
outer blade angle of a four-bladed impeller affects the particle mixing but the inner
blade angle has no significant effect. A correlation was established for predicting the
effect of particle size, density and volume fraction on the quality of binary particle
mixtures in the ribbon mixer. The equation has a similar form to that developed for a
cylindrical mixer, suggesting the presence of some similar mixing mechanisms in both
mixers.
In the third part of the study, a rotating drum was used and the segregation flow patterns
investigated for binary particle mixtures of 0.5 volume fraction in the rolling mode of
operation. Depending on the size and density ratios and volume fraction, the mixing and
segregation patterns changed and a correlation was established for predicting their
effects on the mixture quality.
The study shows that the effects of the size and density ratios and volume fraction on
the mixing behaviour of binary particles can be predicted for a cylindrical mixer, ribbon
mixer and rotating drum which is operated in the rolling mode. The prediction equations
for the mixers have a similar form suggesting similar mixing mechanisms in operation
in the mixers. However, differences in coefficients and interacting terms suggest
different degrees of influence of those mixing mechanisms in each mixer. A ribbon
mixer shows a better mixture quality than other mixers for the same conditions when
mixing binary particles, thus can be considered as an effective mixer for binary particle
mixing. Using a proper loading method, the mixing rate can also be improved in ribbon
mixers in addition to its ability to mix cohesive particles effectively. Hence, ribbon
mixers can be considered as a versatile mixer. Overall, the present work has used the

vi
discrete element method successfully in the study of the effect of material properties of
particles on particle mixing in different mixers; the effects of operational and
geometrical parameters of ribbon mixer on mixing have been established; and
predictability of particle mixing behaviours have been identified for different mixers.

vi
TABLE OF CONTENTS Page
Title Page Copyright and Authenticity Statements i Originality statement ii Acknowledgments iii Abstract iv Table of Contents vi List of Figures x List of Tables xvii
CHAPTER 1 Thesis Overview 1-1 CHAPTER 2 Literature Survey 2-7 2.1. Introduction 2-8 2.2. Applications of Powder mixing 2-9 2.3. Issues (segregation) 2-11 2.4. Overcoming the issues 2-12 2.5. Types of powder mixing processes 2-12 2.6. Solid mixing 2-13 2.7. Characterization of mixture 2-14
2.7.1. Qualitative approach 2-14 2.7.2. Quantitative approach 2-15
2.7.2.1. Definition of mixture status 2-15 2.7.2.2. Mixing index 2-16 2.7.2.3. Segregation index 2-16 2.7.2.4. Particle scale mixing index 2-17 2.7.2.5. Powder sampling (in practice) 2-19
2.8. Factors affecting solids mixing 2-21 2.8.1. Size or density differences 2-21 2.8.2. Combination of size and density differences 2-23 2.8.3. Cohesive particle mixing 2-24
2.8.3.1. Types of cohesion 2-24 2.8.3.2. Van der Wall force model 2-26
2.9. Effect of the particle cohesion on mixing in a uniform binary system 2-27 2.10. Effect of the particle cohesion on mixing in a non-uniform binary system 2-29 2.11. Operational conditions (Shaft speed and fill level effect) 2-32 2.12. Types of Mixer Types 2-32 2.13. Helical ribbon mixer 2-37 2.14. Ribbon mixers 2-44
2.14.1. Effect of shaft speed 2-45

vii
2.14.2. Effect of fill level 2-46 2.14.3. Effects of mixer geometry 2-47
2.15. Simulation method 2-49 2.16. Discrete Element Method 2-49
2.16.1. Force model 2-50 2.16.2. Implementation of the DEM 2-52 2.16.3. The application of DEM 2-53
2.17. Summary and Research Proposal 2-57
CHAPTER 3 Prediction of The Mixing Behaviour of Binary 3-60
Mixtures of Particles in a Bladed-Mixer 3.1 Introduction 3-61 3.2 Numerical Method 3-63 3.3 Mixing quantification method 3-65 3.4 Simulation conditions and procedure 3-65 3.5 Results and Discussion 3-68
3.5.1 Effects of density, size and volume fraction 3-68 3.5.2 Particle mixing mechanism 3-71 3.5.3 Mixing trends: Effects of rs and xl 3-78 3.5.4 Formulation of a predictive equation 3-80
3.6 Conclusions 3-82
CHAPTER 4 Effects of Particle Cohesion on Mixing in a Ribbon Mixer 4-86
4.1 Introduction 4-87 4.2 DEM Simulations 4-89 4.3 Mixing quantification method 4-90 4.4 Simulation Conditions 4-91 4.5 Results and Discussion 4-94
4.5.1 Comparison of micro and macro systems 4-94 4.5.1.1. Mixing Index 4-95 4.5.1.2. Coordination number 4-96 4.5.1.3. Velocity field 4-96 4.5.1.4. Quantification of velocity and force 4-99
4.5.2 Effects of cohesion on the homogeneity of the particles mixing 4-102 (Macro-system)
4.5.2.1. Effect of material density 4-103 4.5.2.2. Particle scale mixing index and total coordination number 4-104 4.5.2.3. Cohesion effect on the velocity field and porosity of the mixture 4-106 4.5.2.4. Cohesion effects on the radial, tangential and horizontal velocity 4-108 4.5.2.5. The stress analysis of particles with different cohesion 4-110
4.6 Conclusions 4-111

viii
CHAPTER 5 Mixing Performance of a Ribbon Mixer: Effect of Operational Parameters 5-115
5.1 Introduction 5-116 5.2 Methods to be Evaluated 5-118 5.3 Simulation Conditions 5-119 5.4 Results and Discussion 5-121
5.4.1 Blade Motion and Mixing Dynamics 5-121 5.4.2 Effect of impeller speed 5-122
5.4.2.1 Mixing performance 5-122 5.4.2.2 Velocity and Flow Pattern 5-124 5.4.2.3 Contact forces 5-129
5.4.3 Effect of fill level 5-132 5.4.3.1 Mixing index and mixing rate 5-132 5.4.3.2 Velocity field and quantification of velocity 5-134 5.4.3.3 Contact forces 5-138
5.4.4 Comparison of mixer performances: Ribbon versus cylindrical mixers 5-140 5.5 Conclusions 5-141
CHAPTER 6 DEM Simulation of Powder Mixing in a Ribbon Mixer: Effects of Impeller Geometry 5-144
6.1 Introduction 6-145 6.2 Numerical Method 6-146 6.3 Mixing quantification 6-147 6.4 Simulation conditions and procedures 6-148 6.5 Results and Discussion 6-151
6.5.1 Geometrical effects of type 1 ribbon impellers 6-151 6.5.1.1 Blade number or blade pitches effect 6-151
6.5.1.1.1 Mixing index and mixing rate 6-151 6.5.1.1.2 Coordination number 6-153 6.5.1.1.3 Flow pattern 6-155 6.5.1.1.4 Probability density of velocity and forces 6-156
6.5.1.2 Effect of blade width at different Ha 6-159 6.5.1.2.1 Mixing index and mixing rate 6-159 6.5.1.2.2 Particle flow 6-160 6.5.1.2.3 Velocity and force analysis 6-162
6.5.1.3 Effect of blade clearance at different Ha 6-165 6.5.1.3.1 Mixing quantification 6-165 6.5.1.3.2 Spatial-averaged velocity 6-167 6.5.1.3.3 Velocity and force components 6-169
6.5.1.4 Effect of blade angle 6-173 6.5.2 Comparison of type 1 and type 2 impellers 6-174
6.5.2.1 Blade number (or pitch ratio) effect 6-174 6.5.2.2 Blade width 6-177

ix
6.6 Conclusions 6-180
CHAPTER 7 A Study of Binary Particle Mixtures in a Ribbon Mixer 7-183
7.1 Introduction 7-184 7.2 Method of Analysis 7-186 7.3 Simulation Conditions 7-186 7.4 Results and Discussion 7-190
7.4.1 Effect of density on binary particle mixing 7-190 7.4.1.1 Mixing performances 7-190 7.4.1.2 Velocity and force analysis 7-191
7.4.2 Effect of size ratio rs on particle mixing 7-194 7.4.2.1 Mixing index 7-194 7.4.2.2 Force components and velocity fields 7-196
7.4.3 Prediction Equation 7-198 7.5 Conclusions 7-201
CHAPTER 8 Radial Segregation of a Binary Mixture in a Rotating Drum 8-204 8.1. Introduction 8-205 8.2. Analytical Methods 8-207
8.2.1 DEM Model 8-207 8.2.2 Simulation Conditions 8-208 8.2.3 Segregation index 8-209
8.3. Results and Discussion 8-212 8.3.1. Effect of density ratio on binary particle mixing 8-212
8.3.1.1. Segregation index 8-212 8.3.1.2. Force analysis 8-214
8.3.2. Effect of size ratio rs on particle mixing 8-215
8.3.2.1. Segregation patterns 8-215 8.3.2.2. Force components 8-217
8.3.3. Combined size and density effect 8-217 8.3.3.1 Size ratio r
s and density ratio r
d decrease at the same time 8-217
8.3.3.2 Size ratio rs is decreased and density ratio r
d increased 8-219
8.3.4. Prediction equation 8-220 8.4. Conclusions 8-222
CHAPTER 9 Summary and Future Work 9-225
References 231
List of Publications 241

x
List of Figures
Figure 2.1 Schematic representation of particle contacts: (a) a group of particles in the neighbourhood of particle ‘i’, which can be a particle of W-type or B-type; and (b) shows the contact condition according to which particle X is in contact with Y but not with Z
2-18
Figure 2.2 Sample variance of a fully-random mixture as a function of sample
2-20
Figure 2.3 (i) Effect of sample number on variance, (a) 100, (b) 200 and (c) 500 samples; plots are normalized variance frequency distributions; effect of particle number on variance, (a) 200 pps, (b) 400 pps, and (c) 600 pps, where pps is particles per sample
2-21
Figure 2.4 (a) effect of cohesion on mixing;(b) This Graph is in conjunction with A, plotting the log (intensity of segregation) with revolutions
2-28
Figure 2.5 Effect of cohesion in the smaller particles; (b) Intensity of segregation with time as a function of cohesion within smaller blue particles
2-30
Figure 2.6 The variation of intensity of segregation with time as a function of cohesion within bigger red particles
2-31
Figure 2.7 Intensity of segregation with time as a function of adhesion 2-31 Figure. 2.8 Typical Mixer 2-35 Figure 2.9 (a)Draught tube and screw mixer(b) Nauta mixer with orbiting
screw 2-36
Figure 2.10 Gravity-flow (hopper) mixers 2-36 Figure 2.11 fluidization bed 2-36 Figure 2.12 Helical ribbon impeller. 2-37 Figure 2.13 Ribbon mixer used in the industry 2-44 Figure 2.14 Effect of the blade speed for layered magnesium stearate and
59%fill level 2-46
Figure 2.15 Effect of fill level (59 and 100%) on the mixing performance of the blender with the 3-spoke ribbon blade operated at 20 rpm with an off-center spot injection of magnesium stearate.
2-47
Figure 2.16 Effect of fill level on the mixing performance of a blender with the 5-spoke blade operated at 20 rpm.
2-47
Figure 2.17 Evolution of Metzner and Otto factor with the pitch size for helical ribbon agitators found in literature
2-48
Figure 2.18 Evolution of mixing time number with clearance wall for helical ribbon agitators found in literature
2-49
Figure 2.19 (a) Neighbor region of particles I; and (b) zoning the Neighborhood region
2-53
Figure 3.1 Schematic illustration of : (a) mixer configuration; and (b) initial loading of particles
3-67
Figure 3.2 Mixing curves and steady state values: (a) mixing index M versus time for different rd at rs=0.5 and xl= 0.5; and (b) effect of rd on steady-state values of M for rs =0.5. The solid lines are the predictions based on Eq.(3.6), which will be discussed later.
3-68

xi
Figure 3.3 Mixing curves and steady state values: (a) effect of size ratio rson mixing index M for rd=0.22 at xl= 0.1 with l = 6040 kg/m3; and (b) steady-state values of mixing index M as a function of rs. The solid lines are the predictions based on Eq.(3.6).
3-70
Figure 3.4 Effect of xl at different levels of rs when rd =0.22 with l = 6040 kg/m3; the solid lines are the predictions based on Eq.(3.6).
3-71
Figure 3.5 Instantaneous normalized blade relative velocities of particles in horizontal sections at three heights Z measured from vessel base for different rd with rs=0.875 and xl=0.9: blue represents velocity vectors of small particles, and red, those of large particles.
3-72
Figure 3.6 Instantaneous normalized blade relative velocities in cylindrical sections at steady-state for different rd with rs=0.875: blue represents vectors of small particles, and red, those of large particles.
3-73
Figure 3.7 Instantaneous normalized blade relative velocities of particles in horizontal sections at three heights for different rswhen rd=0.22 at xl=0.9; blue arrows represent velocity vectors of small particles, and red, those of large particles.
3-74
Figure 3.8 The driving force on particles in a uniform system particle of d=5mm, ρ=2500kg/m3 and 17500 particles, laid initially in top-bottom arrangement: (a), instantaneous group-averaged driving force, and (b) time–averages of the driving forces in Figure 3.10(a).
3-76
Figure 3.9 The driving forces on the two types of particles as a function of time for binary particle mixtures with rs =0.5 and xl =0.9: (a), instantaneous group-averaged driving force for rd=0.22 and 0.75; and (b), the time-averaged vertical forces for the cases of rd=0.22, 0.41, 0.579, and 0.75
3-77
Figure 3.10 Snapshots showing the buoyancy and percolation effects of particles t= 5.11s; (a) heavy –large particles penetrate into small particles over blade (buoyancy); and (b) small particles percolation; arrow shows the direction of blade motion
3-78
Figure 3.11 Predicted effect of size ratio on steady-state mixing index at different values of volume fractions xl when rd =1.
3-81
Figure 3.12 Contour maps using Eq.(3-6), demonstrating the equivalence of size and density effects at different volume fractions: (a) xl=0.1, (b) xl=0.5 and (c) xl=0.9.
3-81
Figure 3.13 Equivalence of size and density effects at a given mixturequality M and volume fraction xl
3-82
Figure 4.1 Impeller configuration and initial particle deposition layout 4-94 Figure 4.2 Comparison of micro and macro system in terms of mixing
curves at different cohesion 4-95
Figure 4.3 Coordination number comparison of the micro and macro system at Bo number 0.02
4-96
Figure 4.4 Instantaneous velocity of particles in micro and macro systems 4-97

xii
in a vertically-cur vessel segment between z=300 and 350 for Bo=0.02
Figure 4.5 Instantaneous velocity of particles in micro and macro systems in a vessel segment between z=300 and 350 for Bo=2
4-98
Figure 4.6 Instantaneous velocities of particles in micro and macro systems in the longitudinal segment of the vessel between x=-20 and 20 at Bo=0.02.
4-98
Figure 4.7 Probability density distributions of instantaneous velocity of particles in micro and macro systems at 39th rev.
4-100
Figure 4.8 (a) and (b): Cumulative probability distributions of scaled contact force components of particles in micro and macro system at 39th rev; and (c) the distribution averages
4-101
Figure 4.9 Effect of particle density in the case of Bo=0.2 for side-by-side (SBS) initial arrangements: (a) Axially side-by-side arrangement;(b) Radially side-by-side arrangement
4-104
Figure 4.10 Particle Scale Mixing Index: (a) Particle scale mixing index as a function of shaft revolutions; and (b) Average steady state mixing index at different Bo numbers.
4-105
Figure 4.11 Overall coordination number at different Bo numbers: (a) overall coordination number as a function of shaft revolutions; and (b) overall coordination number at steady-state as a function of Bo number.
4-106
Figure 4.12 Figure 4.13 Figure 4.14 Figure 4.15 Figure 4.16 Figure 4.17
Instantaneous velocities of particles in vessel cross sections XY; Z= 350-400 mm, at three time instances with increasing of bond number: red and blue colour represents vectors of two type particles. Instantaneous velocity fields in the longitudinal section at different Bond numbers: red and blue colour represents vectors of two types of particles Average velocity and porosity of particles at t=25-30s, in a longitudinal segment between x=-20 to 20 and y= -255 to 255. Probability density distributions of velocity components: (a) tangential, (b) radial and (c) axial velocity Time averaged mean velocity components as a function of Bo number: radial velocity Vr, tangential velocity Vt and axial velocity Vz. Probability density distributions of average normal stress in the vessel at steady-state for different Bo numbers
4-107 4-107 4-108 4-109 4-109 4-111
Figure 5.1 Geometry of ribbon impellers: (a), 2-bladed impeller, and (b), 4-bladed impeller.
5-120
Figure 5.2 Snapshots depicting blade motion, axial transport and circumferential motion of particles in two-bladed mixer at 25% fill level (Bo=0.2).
5-122
Figure 5.3. Effect of impeller speed: Comparison of mixing behavious of cohesive and non-cohesive particles at 25% fill-level.
5-123
Figure 5.4 Effect of impeller speed on cohesive mixing: Macroscopic index (Bo=0.2 and 25% fill-level)
5-124

xiii
Figure 5.5 Velocity fields in vessel central segment (between z=350 and 450mm) for non-cohesive and cohesive particles mixing at impeller speeds of 50, 100, and 200 rpm from the top to bottom, respectively, at t=25 s.
5-125
Figure 5.6 Comparison of velocity fields in the two halves of the 2-bladed mixer (at 50 rpm).
5-126
Figure 5.7 Velocity field in a longitudinal section between x=-20 and 20mm at impeller speeds of 50, 100, and 200 rpm from top to bottom, respectively at time t=25s, x being measured horizontally from the shaft-axis perpendicular to it.
5-126
Figure 5.8 Probability density distributions of velocity components at different blade speeds for non-cohesive particles at steady state.
5-127
Figure 5.9 Probability density distributions of velocity components at different shaft speeds for cohesive particles (Bo=0.2) at steady state.
5-128
Figure 5.10 Force-network diagrams at different impeller speeds for cohesive and non-cohesive particles in the vessel segment between the axial positions, z= 350 and 450 mm at t=37-39 s; impeller speeds are 50, 100, and 200 rpm from the top to bottom, respectively; and colours and corresponding ranges of contact forces f are: blue, f < 0.235 N; green, 0.235 < f < 0.936 N; light green, 0.936< f < 1.17 N; and red, 1.17 < f <1.62N
5-129
Figure 5.11 Probability density distributions of force components for non-cohesive mixture at steady state.
5-130
Figure 5.12 Mean values of cumulative probability distributions of the force components for cohesive mixture at steady state
5-131
Figure 5.13 Effect of fill level on the mixing performance of a 2-bladed mixer at different Bo numbers (shaft speed = 100 rpm).
5-133
Figure 5.14 Effect of fill level on the mixing performance of a 4-bladed mixer at different Bo numbers. (shaft speed = 100 rpm).
5-133
Figure 5.15 Mixing rates k for the two-bladed and four-bladed mixers (shaft speed = 100 rpm).
5-134
Figure 5.16 Velocity fields at different fill levels in the two bladed and four bladed mixers at the 80th revolution for the two-bladed and four-bladed mixers in cases of non-cohesive and cohesive mixtures (shaft speed = 100 rpm).
5-135
Figure 5.17 Average velocity and porosity of particles in a longitudinal section between x=-40 and 40 mm at the 30 revolution for non-cohesive mixture in the 2-bladed mixer, x being measured at right angle to the shaft from the shaft axis (shaft speed = 100 rpm).
5-136
Figure 5.18 Probability distributions of velocity components and time-averaged mean velocities at different fill levels for the non-cohesive mixtures in 2-bladed mixer at 100 rpm shaft speed
5-137
Figure 5.19
Probability distributions of velocity components and time-averaged mean velocities at different fill levels for non-cohesive mixtures in the 4-bladed mixer at 100 rpm shaft speed.
5-138

xiv
Figure 5.20 Probability distributions of contact force components of particles of the non-cohesive mixture at different fill levels for the 2-bladed and 4-bladed mixers at 100 rpm shaft speed.
5-139
Figure 6.1 Impeller configurations: Top-row, type-1 impeller and bottom-row, type-2 impeller
6-150
Figure 6.2 Effect of blade number or pitch ratio on mixing at different Hap for type-1 impellers
6-152
Figure 6.3 Dependence of mixing rate on pitch ratio or blade number at different particle cohesion.
6-153
Figure 6.4 Comparison of total coordination number: (a) Total coordination number as a function of Hap; (b) Total coordination number as a function of pitch ratio S/D
6-154
Figure 6.5 Snapshots of particle flow in the mixer for 1.12 pitch ratio at different cohesion (at 40th rev.)
6-154
Figure 6.6 Snapshots of the particle flow in the mixer at pitch ratio 0.75 at different cohesion at 40th rev
6-154
Figure 6.7 The averaged velocity in the mixer at a different pitch ratio S/D and Hap; x =-40–40, y= -260– 260, z= 0 –1000, rev 30th
6-155
Figure 6.8 Probability density function velocities of particles in the mixer at different pitch ratio S/D rev 30 , Hap = 5.54 x 10⁻¹⁸ J
6-157
Figure 6.9 The Probability density function of forces of particles in the mixer at different pitch ratio S/D, rev 30, Hap = 5.54 x 10⁻¹⁸ J
6-158
Figure 6.10 Effect of blade width at different Hap for type-1 impeller 6-159 Figure 6.11 Effect of blade width on mixing rate for a type-1 impeller: (a)
mixing rate as a function of Hap; and (b) mixing rate as a function of blade width W.
6-160
Figure 6.12 Time and cell averaged particle velocities in the mixer at different W and Hap in the longitudinal section, where x values range between -40 and 40 (at 30th rev.)
6-161
Figure 6.13 The Probability density distributions of particle velocity components in the mixer at different blade widths W at Hap = 5.54 x 10⁻¹⁸ J (Bo=0.02) and at the 30th rev for type 1 mixer.
6-163
Figure 6.14 Cumulative probability density distributions of velocities of particles in the mixer at different blade width W, Hap = 5.54 x 10⁻¹⁸ J and rev 30th for type-1 mixer.
6-164
Figure 6.15 The effect of blade clearance at different cohesion (type-1 impeller).
6-166
Figure 6.16 Comparison of mixing rate: (a) Mixing rate as a function of Hap;(b) Mixing rate as a function of clearance C.
6-166
Figure 6.17 The averaged velocity of particles in the mixer at different blade width W and Hap ; x =-40-- 40, y= -260– 260 z= 0 --1000 , 30th rev.
6-168
Figure 6.18 The Probability density function of velocities of particles in the mixer with different blade clearance C, Hap = 5.54 x 10⁻¹⁸ J, 30th rev.
6-170
Figure 6.19 The Probability density function of forces of particles in the mixer at different blade clearance C, Hap = 5.54 x 10⁻¹⁸ J, rev 30th
6-171
Figure 6.20 Mixing index at 30rev as a function of blade clearance, width , pitch ratio and Hap
6-172

xv
Figure 6.21 Effect of outer rake angle (inner blade angle is fixed at 45°): (a) Mixing index variation with shaft revolutions; (b) Mixing rate k as a function of outer blade angle
6-173
Figure 6.22 Effect of blade number (or pitch ratio S/D) on mixing performance for non-cohesive mixtures. (a) type 2 impeller, (b) type 1 impeller (c) mixing rate k as a function of pitch ratio.
6-175
Figure 6.23 Average velocity and porosity of the particle mixture, snap shot at revolution at 38, t=13s,X =-20-20, at ZY plane in type-1 impeller
6-176
Figure 6.24 Velocity fields and snapshots of the mixing states at steady-state for the type-2 impellers of different pitch ratios, blue and red represent the two types of particles initially laid in the side-by-side arrangement
6-177
Figure 6.25 Effect of blade width on mixing behaviour at a pitch rratio of 1.12.
6-178
Figure 6.26 Mixing behaviour for different blade widths for type-1 impeller design. Top: Steady-state velocity fields and spatial distribution of void fraction in the longitudinal central plane; and bottom: snapshot of particles at 80th revolution (t=25s) in the longitudinal central plane, with blue and red representing two types of particles.
6-178
Figure 6.27 Velocity fields and snapshots of the mixing states at steady-state for the type-2 impellers of W=20, 40 and 60 mm: blue and red represent the two types of particles initially laid in side-by-side arrangement
6-179
Figure 7.1 Geometry of ribbon impeller 7-188 Figure 7.2 Particle scale mixing index as a function of revolutions at
different volume fractions when rs=0.66 : (a) xl=0.1; (b) xl=0.5; (c) xl=0.9
7-190
Figure 7.3 Effects of rd and xl on M at rs=0.66: (a), effect of rd at different xl ; and (b), effect of xl at different rd
7-191
Figure 7.4 Effects of rd on contact forces at rs=0.66: (a), normal force ; and (b), tangential force for a volume faction of 0.5.
7-192
Figure 7.5 Effects of rd on velocity field at rs=0.6 at different cylindrical height for a volume faction xl of 0.5
7-193
Figure 7.6 Instantaneous probability density distributions of particle velocity components at different density ratios when size ratio is fixed at rs=0. 6
7-194
Figure 7.7 Particle scale mixing index as a function of revolutions at different values of rs with rd=0.33: (a) xl=0.1; (b) xl=0.5; and (c) xl=0.9
7-194
Figure 7.8 Effect of rs and xl on steady-state values of mixing index (or mixture quality) for rd = 0.33 and l = 6040 kg/m3: (a) effect of rs at different xl; and (b) representation of results in (a) as an effect of xl at different rs
7-195
Figure 7.9 Effects of rs on contact forces when xl =0.9 7-196

xvi
Figure 7.10 Effect of rs on velocity field when rd = 0.33 and xl =0.9 7-197 Figure 7.11 Probability density of velocity components at different size
ratio when rd = 0.33, xl =0.9 at t=50s 7-198
Figure 7.12 Contour maps using the prediction equation, demonstrating the equivalence of size and density effects at different volume fractions, xl of 0. 1, 0.5 and 0.9.
7-200
Figure 7.13
Comparison of the effects of rs, rd and xl on particle mixing behaviour in the cylindrical mixer and ribbon mixer; M is steady-state values of mixing index, solid line is representing prediction: (a) the effect of size ratio when xl =0.9 for cylindrical mixer rd=0.33; for ribbon mixer rd=0.22; (b) density effect when xl =0.1 for cylindrical mixer rs=0.6; for ribbon mixer rs=0.5; (c)volume fraction effect: for cylindrical mixer rs=0.875, rd=0.22; for ribbon mixer rs=0.8, rd=0.33.
7-200
Figure 8.1 Figure 8.2
Initial loading pattern of particles in the rotating drum Effect of density ratio on mixing: (a) Segregation index as a function of time and revolutions when rs=0.66; and (b) steady-state segregation index as a function of density ratio
8-210 8-213
Figure 8.3 Effect of rd on the segregation flow pattern at rs=0.66; blue represents small particles, and red the large ones
8-213
Figure 8.4 Effects of rd on contact forces at rs=0.6: (a) normal force ; and (b) tangential force
8-214
Figure 8.5 Effect of size ratio: (a) Segregation index as a function of time and revolutions when rd=0.33; and (b) Average segregation index as a function of size ratio; the solid line is prediction value.
8-215
Figure 8.6 Effects of rs on the segregation flow pattern when rd = 0.33 8-216 Figure 8.7 Effect of rs on contact forces: (a), normal force ; and (b),
tangential force 8-217
Figure 8.8 Segregation index as a function of the time whenrs and rd are both decreased
8-218
Figure 8.9 Evolution of the segregation flow pattern when rs and rd
decreased; particle condition similar with Fig 8.3 8-218
Figure 8.10 Segregation index as a function of time when rs decreases and rd increases at the same time
8-219
Figure 8.11 Evolution of the segregation flow pattern when rs decreases and rd increases simultaneously.
8-220
Figure 8.12 Contour maps of segregation index using the prediction equation, to demonstrate the effects of size and density on the mixing.
8-222

xvii
List of Tables
Table 2.1 Main finding in the helical and horizontal ribbon impellers 2-38 Table 3.1 Formulae for contact forces and torques 3-64 Table 3.2 Particle details for varying rd at three levels of xlwith rs fixed. 3-66 Table 3.3 Particle details for varying rs at different levels of α with rd
fixed. 3-66
Table 3.4 Particle details for varying rd at different levels of rs with xlfixed
3-67
Table 4.1 Formulae for contact forces and torques 4-90 Table 4.2 DEM Input variables and their values 4-93 Table 4.3 Input values for the macro and micro systems 4-93 Table 4.4 Bond number for a single contact at different values of
Hamaker constant 4-94
Table 5.1 Formulae for contact and non-contact forces and torques 5-118 Table 5.2 Simulation Input variables and their values 5-119 Table 5.3 Bond number for a single contact at different values of 5-120 Hamaker constant
6-170
Table 6.1 Equations used to calculate forces in the DEM simulations 6-147 Table 6.2 Particle material Properties 6-149 Table 6.3 Geometry parameters of ribbon mixer 6-150 Table 7.1. Formulae for contact forces and torques 7-187
Table 7.2 Input variables and their values 7-188
Table 7.3 Particle information for density effect cases 7-189
Table 7.4 Particle information for size effect cases 7-189
Table 7.5 Comparison of mixing index of simulation and mixing index from equation
7-199
Table 8.1 Formulae for contact forces and torques 8-208
Table 8.2 Input variables and their values 8-210
Table 8.3 Particle information for size effect cases 8-211
Table 8.4 Comparison of segregation index and prediction 8-221

CHAPTER 1 Thesis Overview
1-1
Chapter 1
Overview of Thesis

CHAPTER 1 Thesis Overview
1-2
1. INTRODUCTION Powder mixing is a widely used process in pharmaceutical, powder metallurgical and
food industries, to name a few. Assuring the homogeneity of powder mixtures is
essential to improve the quality of products of those industries. Mixing behaviour of
powders is significantly affected by impeller geometry, operational conditions of the
mixer and properties of particles to be mixed. The particle properties of the mixture can
also have a significant effect on the mixing behaviour, the most significant apart from
the size difference being the density difference. An increase in either the size or density
differences results in increased segregation tendencies in cylindrical mixers, for
example (Stewart, Bridgwater et al. 2001, Zhou, Yu et al. 2003). The segregation
mechanism for cylindrical mixers has been investigated (Zhou, Yu et al. 2004).
According to this mechanism, particles in a cylindrical mixer are segregated due to the
generation of vertical forces on particles when there is either a size or density difference
or both. Nevertheless, the scope of the study was mainly limited to the examination of
particle segregation due to size and density differences. The predictability of size and
density effect is still unknown with the exception of rotating drums, where the condition
for transition from mixing to segregation can be predicted. Consequently it is important
to investigate the predictability of the effects of material properties such as size, density
and volume fraction on particle mixing and their mechanisms in different mixers.
The selection of a mixer for a mixing operation depends on the mixture
homogeneity and many other factors (Poux, Fayolle et al. 1991). Ribbon mixers are
considered to be suitable for mixing of dry powders as well as free-flowing granular
material (Poux, Fayolle et al. 1991). It is also reported that a ribbon mixer can produce
an improved uniformity in powder mixing due to large shear stresses in the mixer as
well as that it can handle mixing of different size particles (Muzzio, Llusa et al. 2008).
The impeller speed of the mixer and fill level are parameters that can affect the
performance of the mixer, with regard to mixture quality and stresses on particles. It is
reported that a high impeller speed can have a negative effect on the mixture uniformity
(Muzzio, Llusa et al. 2008). A low speed will reduce shear stresses on particles, but may
result in a poor homogeneity for cohesive mixtures (Muzzio, Llusa et al. 2008). A shaft
speed in the range of 50-70rpm appears to be a favourable speed for obtaining uniform

CHAPTER 1 Thesis Overview
1-3
mixing (Sanoh, Arai et al. 1974). However research on the effects of operational
parameters and geometrical parameters on powder mixing in ribbon mixer are few in
the literature. Further, a mixture of particles with large density and size differences can
also be mixed in a ribbon mixer (Poux, Fayolle et al. 1991). Mixture quality is
significantly affected by size differences of powder particles, and an increase in either
the size or density differences results in increased segregation tendencies (Fan, Gelves-
Arocha et al. 1975, Stephens and Bridgwater 1978). However, research in this regard
using a complicated mixer such as the ribbon mixer are few, and the prediction of the
effects of particle size and density on the mixer performance has not been clearly
established.
In rotating drums, the radial particle segregation flow pattern and segregation
mechanism have been widely investigated due to its simplicity. The particle size
induced radial segregation (Clément, Rajchenbach et al. 1995)(Makse 1999, Eskin and
Kalman 2000) (Thomas 2000) and density induced segregation (Ristow 1994, Ottino
and Khakhar 2000) exist in rotating drums, and the size segregation can be counter-
balanced by density segregation by varying the density of small particles with the size
ratio of a binary particle mixture is fixed (Dury and Ristow 1999). It has been reported
that the transition from mixing to segregation due to the effect of the combination of
size and density differences can be predicted for rotating drums (Alonso, Satoh et al.
1991). Mostly, the percolation and buoyancy effects are combined to enhance the
segregation when smaller particles are heavier. At other times, the peocolation and
buoyancy effects can oppose each other and the segregation reduced (Liu, Yang et al.
2013). The feasibility of prediction of segregation in rotating drums in a wide range of
particle properties still needs to be investigated, and the segregation mechanisms
compared against other mixers.
Here, we are concerned with the particle mixing behaviour in a cylindrical mixer,
ribbon mixer and rotating drum. The discrete element method is used to investigate the
effect of material properties, operational properties and geometrical parameters on the
mixture quality. A particle scale mixing index (Chandratilleke, Yu et al. 2012) based on
the coordination number was primarily used to quantify the mixture quality. The
parameters of interest in the study are as follows:

CHAPTER 1 Thesis Overview
1-4
The material properties:
Particle size ratio
Particle density ratio
Volume fraction
Particle cohesion
The operational parameters are:
Rotational speed
Vessel fill level
The geometry related parameters:
Impeller pitch ratio
Blade width
Blade clearance
Blade angle
Blade number
Types of mixtures:
Mono-sized particles of uniform density,
Binary particle mixtures of different size and density at different volume
fractions,
Cohesive particle mixtures with uniform size and density.
The thesis consists of the following chapters and contents.
Chapter 2 summarizes a literature survey on the particle mixing studies, which include
types of powders, characterization of mixers and factors affecting mixing such as
material properties, geometrical parameters and operational parameters and types of
mixers.
Chapter 3 investigates the effect of size, density and volume fraction on non-cohesive
binary mixtures in a cylindrical mixer. The mechanism of mixing improvement was
examined for binary mixtures. A correlation was established to predict the effect of size,

CHAPTER 1 Thesis Overview
1-5
density and volume fraction. Such an equation can be used to study the effects of such
as particle properties on mixing behaviour in a cylindrical mixer.
Chapter 4 investigates the effect of particle cohesion on mixing behaviour in a ribbon
mixer. The particle mixing behaviours in micro and macro systems were compared
keeping the dimensionless numbers Froude number and Bond number fixed for the two
systems. The two systems show the similarity in the mixing behaviour, velocity field,
contact forces and coordination number in a low-cohesive mixture. The effect of
particle cohesion on mixing behaviour is investigated using large lighter particles in the
macro system.
Chapter 5 investigates the effects of two operational parameters at different mixture
cohesion using different ribbon impellers. The effect of shaft speed on particle mixing
rate, mixture quality, particle velocity and contact forces were investigated in cohesive
and non-cohesive mixtures using a two-bladed ribbon impeller. The effect of the mixer
fill level of particle mixing behaviour was examined for mixtures with different
cohesion both in two-bladed and four-bladed ribbon mixers.
Chapter 6 examines the effect of geometrical parameters of a ribbon impeller for
different cohesive particle mixtures. The effects of pitch ratio, blade width, blade
clearance, blade angle and blade numbers on the mixing behaviour were investigated for
different cohesive mixtures using mixing rate, mixture quality, particle velocity and
contact forces.
Chapter 7 investigates the particle mixing behaviour in a ribbon mixer for non-
cohesive binary mixtures. The effects of particle size, density ratio and volume fraction
on binary particle mixtures in a ribbon mixer were studied. An equation for predicting
steady-state mixture quality at different size and density ratios and volume fraction was
established.
Chapter 8 examines the radial segregation flow pattern of binary mixtures in a rotating
drum. The size and density induced segregation mechanism in the rolling mode was
investigated. An equation for predicting steady-state mixture quality at different size

CHAPTER 1 Thesis Overview
1-6
and density ratios and volume fraction was established. The predictability of the effects
of size and density of particles at volume fraction 0.5 was confirmed.
Finally, Chapter 9 gives an overall summary of the thesis on mixing of particles.
Possible future research is also suggested.

Chapter2
Literature Review

CHAPTER 2 Literature Review
2-8
2.1 Introduction
Powder mixing is essential to control the quality of products manufactured from
granular mixtures in many industries. For example, tablets and capsules in
pharmaceuticals (Hilton and Cleary 2013) and high hardness composite material for
cutting in powder metallurgy industries (Fernandez, Cleary et al. 2011). Plastic
materials (Saberian, Segonne et al. 2002; Metzger and Glasser 2012) and cosmetic
materials (Delaney, Cleary et al. 2012). Hence, the knowledge of the mixing behaviour
of powders is important in processing industries. The size and density differences of the
particles are the most important properties that effect the mixing behaviour of particles
(Fan, Gelves-Arocha et al. 1975; Stephens and Bridgwater 1978; Fan, Chen et al. 1990).
Segregation is enhanced due to an increase in either the size or density differences as
reported in the following cases: a rotating drum (Alonso, Satoh et al. 1991; Metcalfe
and Shattuck 1996; Eskin and Kalman 2000; Xu, Xu et al. 2010; Jayasundara, Yang et
al. 2012); a cylindrical mixer (Zhou, Yu et al. 2003; Chandratilleke, Yu et al. 2011) and
a vibrated granular system (Rosato, Strandburg et al. 1987; Shinbrot and Muzzio 1998;
Yang 2006). It is stated that a prediction equation to quantify the combined effects of
density and size differences would enable us to predict the transition from mixing to
segregation by percolation due to size difference and by buoyancy effect induced by
density differences (Alonso, Satoh et al. 1991). Such a relationship would be valueble to
quantitatively predict the mixing states of not only dry particles, but also wet particles at
low cohesion when the particle flow is in continuous regime in rotating drums (Liu,
Yang et al. 2013). However, predicting the size and density effects in the size-range
where percolation effects are negligible has not been a theme in the reported works.
A ribbon mixer is known to possess a combination of mixing mechanisms such as
convection, diffusion and shear when mixing granular matter. Ribbon mixers are widely
used in practice because they are capable of providing high speed convective mixing. At
present, there is only a limited understanding of the cohesive effects on the mixing
behavior of dry fine particles in the mixers used in practice (Chaudhuri, Mehrotra et al.
2006), particularly in relation to ribbon mixers in the pharmaceutical industry where
they are used for powder mixing purposes (Muzzio, Llusa et al. 2008). The impeller
speed of the mixer is a parameter that can affect the performance of the mixer, with
regard to mixture quality and stresses on particles. The fill level of the blender is the

CHAPTER 2 Literature Review
2-9
next most important operational parameter. The efficiency of such operations and
quality of the resulting mixtures will depend on the impeller geometry. It is important to
understand the effects of the impeller geometry and use the right geometry for the
product to be manufactured based on industry requirements, which can be different
from one industry to another. Some examples of different industries being
pharmaceuticals, food, cosmetics and powder metallurgy industries. Lack of knowledge
about all of the issues we mentioned above provide us the motivation to conduct
systematic research on the effects of size, density and volume fraction in cylindrical
mixers, ribbon mixers and rotating drums as well as the effects of cohesion, operational
parameters and geometry in ribbon mixers.
2.2 Applications of Powder mixing
The mixing quality affects the product quality. For example, in the
manufacturing of polyvinyl chloride (PVC) products, mixing of PVC particles with
appropriate additive particles can modify and enhance the properties of PVC (Saberian,
Segonne et al. 2002). Preparation of ceramics, mixtures for glass manufacture, materials
for high-strength cutting-tools and pharmaceuticals are some further examples. Below, a
brief description is given of how mixing is being used in each of the three typical
industries.
Pharmaceutical industry
The pharmaceutical industry uses a variety of mixers in the preparation of
powder mixtures for subsequent granulation, compaction or encapsulation. Many
mixers used include a variety of tumbling mixers, such as cube mixers, cone mixers, V-
mixers and Y-mixers or ribbon mixers (Hersey). In this industry, quality control of the
mixed material is very important. However, it is said that mixing processes are carried
out largely in an empirical manner and in accordance with arbitrary regulations. If the
product variation is beyond specified limits, a batch of products will be discarded, to
comply with regulations. Such procedures are needed to protect consumers from
possible medical health risks since poor quality can cause different drug-release rates
with possible side-effects. In addition, production costs may rise if tablets are prone to
crumbling in the manufacturing process because of non-uniformity in the structure.
Therefore, the overall quality of a mixture is understood to be crucial for all the parties

CHAPTER 2 Literature Review
2-10
concerned. Similar consideration is applicable to many other applications. For example
micro-scale mixing is shown to improve the strength of a tool-making compound, which
consists of alloyed WC- Co particles and a mixture of TiC and Al2O3 coating particles.
Correspondingly, particle scale mixing has been shown to be important in the cosmetic
industry for improving the efficiency of sun-screen lotions while avoiding skin
irritation (Liang, Ueno et al. 2000).
Food industry
Many mixing devices and agitators are used in the food processing industry
today. Dry food materials that are mixed include flour, sugar, salt, flavouring materials,
flaked cereals, dried milk, and dried vegetables and fruits. Solids mixing or blending of
ingredients is an extensive processing operation used for the preparation of animal feeds,
fertilizers, seed stocks, insecticides, fertilizer, and packaged foods. Solids may be
mixed to facilitate reactions in the preparation of cereal products (Lindley).
Powder metallurgy
The methods of reinforcement used in powder mixing influence the physical and
mechanical properties of the matrix composites. There are three methods for
reinforcement such as powder metallurgy, liquid metal particulate mixing and in-situ
production of dispersions. The powder metallurgy method has some advantages in
obtaining net shaped products but the high cost and limitations for the homogeneity of
the material are still an issue (Parashivamurthy, Kumar et al. 2001). They have shown
that the state of the interface between particles and matrix contributes to the
enhancement of the elastic modulus, yield strength and wear resistance. The metal-
matrix interface coherence and the particle distribution govern the strengthening
mechanism. In terms of powder metallurgy, the mixing quality (uniformity) of the
particles and volume fraction of reinforcement strongly influenced the mechanical
properties of the matrix composites. It is found that the strength of particle-reinforced
matrix composites is higher than that of monolithic material. With a decrease in particle
size of the reinforced particles, 0.2% proof stress and tensile strength tend to increase.
However, the toughness and ductility of the material with the reinforced particulate
mass have decreased (Doel and Bowen 1996). The hardness of the reinforced alloy
matrix has increased with higher volume fraction of reinforcement (Srivatsan and
CHAPTER 2 Literature Review
2-11
Auradkar 1992). The morphology of the TiC reinforcement particle influenced the
properties of the Ti-TiC composites were investigated. Refinement of the secondary
dendrite arm spacing of TiC particles in 3-D was found to dramatically improve the
ultimate tensile strength (UTS) and ductility of the Ti-TiC composites (Lin, Zee et al.
1991). Mechanical properties of in-situ synthesized titanium matrix composites with
2.11 vol.% TiB reinforcements shows the highest tensile strength and lowest steady
state creep rate. Morphology of TiB whiskers was essential to mechanical properties of
high temperature titanium matrix composites (Zhang, Qin et al. 2010).
2.3 Issues
Mixing behavior of powders is significantly affected by several particle
properties of a mixture and they can have a significant effect on the mixing behaviour.
One of the most significant effects (apart from the size difference) being the density
difference. An increase in either size or density differences results in increased
segregation tendencies. On the other hand, the smaller the difference in particle size, the
higher the mixing rate. An increase in either the size or density difference causes an
increase in the rate of segregation in a vertically-shafted cylindrical bladed mixer. The
particles are segregated due to the generation of a vertical force on particles when there
is either a size or density difference or both. However, research shows that the
combination of the size and density ratios would minimize the free surface segregation.
Differences in both size and density increase the rate of mixing and segregation. It is
reported that the powder mixing can be improved under certain size and density
combinations in the case of mixing in rotating drums (Alonso, Satoh et al. 1991).
Although the mechanism of size and density effect is explained using phenomenal
description, it is not fully understood based on a fundamental study. The predictability
of size and density effects is still unknown.
Another issue is that the selection of a mixer for a mixing operation depends on
the product uniformity required and many other factors (Poux, Fayolle et al. 1991). The
impeller speed of the mixer is a parameter that can affect the performance of the mixer
with regard to mixture quality and stresses on particles. It is reported that a high
impeller speed can have a negative effect on the mixture uniformity. A low speed will
reduce shear stresses on particles, and may result in a poor homogeneity for cohesive
mixtures. A shaft speed in the range of 50-70rpm appears to be a favourable speed for

CHAPTER 2 Literature Review
2-12
obtaining uniform mixing. There is very little research on a complicated mixer such as
the ribbon mixer and the relationship of mixture quality to inter-particle forces and
impeller speed has not been quantitatively established. A ribbon mixer displays a
combination of mixing mechanisms such as convection, diffusion and shear when
mixing granular matter. Ribbon mixers are widely used in practice because they are
capable of providing high speed convective mixing. The efficiency of such operations
and quality of the resulting mixtures will depend on the impeller geometry. Thus, it is
important to understand the effects of the blade geometry and use the right geometry for
product manufacture in many industries such as pharmaceuticals and powder metallurgy
industries.
Thus, lack of understanding of the effects of material properties, operational
parameters and geometrical parameters on the powder mixing process in the ribbon
mixer will lead to unstable product quality in industry.
The rotating drum is well known for its simplicity to study the segregation
mechanism such as a percolation and buoyancy due to particle size and density
differences. But the predictability of the segregation or mixing have not been fully
understood so far.
2.4 Overcoming the issues
DEM has been used in order to acquire information on the performance of
different mixers that is difficult and/or expensive to obtain using traditional
experimental approaches (Cleary and Sinnott 2008). Controlling the mixing time can be
used to reduce segregation for example due to size or density effects(Chandratilleke, Yu
et al. 2012). For the mixing time to be controlled, we need to know the mixing
behaviour of particles beforehand for each type of mixtures. Thus the establishment of
mixture quality characteristics (peak values and steady-state ones) will be important. In
order to do this, a mixing index that is not dependent on sample size or number needs to
be used. One solution to this problem is the use of the Particles Scale Mixing index
(Chandratilleke, Yu et al. 2012).
2.5 Types of powder mixing processes
Mixing is an essential process of many processes in the food, pharmaceutical,
paper, plastics, ceramics and rubber industries. There are several types of mixing

CHAPTER 2 Literature Review
2-13
processes, for example: solid-liquid mixing; gas-liquid mixing; three phase mixing; and
solid mixing (Nienow, Harnby et al. 1997).
Solid-liquid mixing
In operations such as crystallization or solid catalysed liquid reactions, it is
necessary to suspend solid particles in a relatively low viscous liquid. This can be
achieved in mechanically agitated vessels where the mixer is used to prevent
sedimentation of solids and to provide conditions suitable for good liquid-solid mass
transfer and chemical reaction. If the agitation is stopped the solids will settle out of the
liquid and float to the surface, depending upon the relative densities of the solid and
liquid phases. At the opposite extreme it may be required to disperse very fine particles
into a highly viscous liquid.
Gas-liquid mixing
Several major industrial operations, e.g. oxidation, hydrogenation, and
biological fermentation, involve the contacting of gases and liquids. The objective of
such processes is to agitate the gas-liquid mixture, generating a dispersion of gas
bubbles in a continuous liquid phase. Mass transfer then takes place across the gas-
liquid interface which is created.
Three-phase contacting
In some penetrations (e.g. hydrogenation, froth flotation and evaporative
crystallization), it is necessary to achieve contact between three phases.
Solid mixing
A feature which tends to be present only in solid mixing is segregation. This is
the tendency of particles to separate out according to size and/or density.
2.6 Solid mixing
The solid mixing is an operation by which two or more solid materials in
particulate form are scattered randomly in a mixer among each other by random
movements of particles. The important aspects of the solid mixing study include: the

CHAPTER 2 Literature Review
2-14
mixing mechanism of the solid mixing; the homogeneity of the mixture; the
characterization methods for uniformity of solid mixing; types of solid mixer; the effect
of material properties of the solids on the solid mixing; and the effect of the operational
and geometrical parameters of the mixer.
Mixing mechanisms
The mixing of powders takes place by three main processes (Poux, Fayolle et al.
1991).
• Mixing by convection
This type of homogenization is characterized by the motion of groups of
particles within the mixture. The components are subdivided into clumps. They are
displaced relative to one another and their size is reduced. This motion creates contact
area between different components and carries out mixing on a large scale.
• Mixing by Ddiffusion
Homogenization is created by motion of individual particles, to ensure mixing
on a fine scale. Diffusive mixing is caused by the random motion of powder particles.
The mechanism has a slow rate of mixing compared to the convective mixing. But the
diffusive mixing is critical for homogenization of a mixture at microscopic or particle
scale.
• Shear mixing
Mixing occurs by slipping of particle planes within the whole volume. This third
mechanism is often considered a combination of the two previous processes, but a
specific mechanical action needs to be considered.
2.7 Characterization of mixture
When is a mixture well mixed? This question can be clarified in two ways:
qualitatively and quantitatively (Harnby 1997).
2.7.1 Qualitative approach
The characterization could be improved by a better quality of mixture
determined by the scale of segregation within the mixture. The “scale of segregation” of

CHAPTER 2 Literature Review
2-15
a mixture is a measure of the size of the region of segregation within the mixture. The
smaller the scale of segregation results in a better mixture. The divergence from the
mean composition is measured using intensity of segregation. Alternatively, the
intensity of segregation can be regarded as the amount of dilution that has happened
within the segregation area. The lower the intensity of segregation means the better the
mixture.
2.7.2 Quantitative approach
The mean composition value usually used to control overall content of key
component. For measuring the quality of the mixture, the standard deviation of
distribution is used. The low standard deviation means a good quality of mixture.
2.7.2.1 Definition of mixture status
The mixture is operated to get a distribution in which each particle of a
constituent is near a particle of another constituent. It is referred to as a perfect mixture.
• Perfect random mixture
The probability of finding a particle of a constituent of the mixture is the same
for all points in the mixture (Poux, Fayolle et al. 1991).
• Random mixture
It requires particles of equal size and weight with little or no surface effects
(Poux, Fayolle et al. 1991). Ordered mixture does not require equally sized or weighted
particles but rather interaction.
• Ordered mixture
This can be observed when a small portion of fine particles adhere to the coarse
particles of different type of materials.
• Homogeneous mixture
The compositions of all constituents are uniform within the whole mixture (Fan,
Chen et al. 1990).

CHAPTER 2 Literature Review
2-16
• Segregation
This occurs within a mixture when differences in particulate properties cause a
preferential movement of particles to certain regions of the mixer. The differences of
particle size is a main reason for causing segregation (Harnby 1997).
2.7.2.2 Mixing index
For characterization of uniformity of a solid mixture, a mixing index is generally
used to measure the degree of mixedness. Over 40 different mixing indexes have been
proposed by various authors. The number of the criteria of the degree of mixedness
shows the complexity of the mixing process (Poux, Fayolle et al. 1991) and the
difficulties in estimating homogeneity (Poux, Fayolle et al. 1991). The index concerned
with a binary mixture is introduced here. Lacey‟s mixing index is defined as follows:
(Lacey 1954)
(2.1)
where, 02
and R2 are sample variances of fully-segregated and fully-random
states respectively as above, and 2 is the sample variance of a mixture at a transition
state between the two states - reference states. This mixing index compares the sample
variance of the actual mixture with respect to the two reference mixing states, the fully-
segregated state, and fully-mixed (or randomly mixed) states of the mixture.
2.7.2.3 Segregation index
Intensity of segregation has been defined by (Missiaen and Thomas 1995) similar
to Lacey‟s mixing index , which is given below.
(2.2)
Here, (2 - R
2) is the residual variance of the actual mixture with respect to the
uniform (or fully-random) mixture, and (02
- R2 ) is the variance of the transition state
with respect to the uniform state. In contrast to Lacey‟s mixing index, I = 0 for the fully
mixed state, and I = 1 for the fully-segregated state. The intensity of segregation
decreases when the mixing proceeds from the unmixed state to a mixed state. It is
220
220
R
M
220
22
R
RI

CHAPTER 2 Literature Review
2-17
reported that I should be independent of the sample size N at any state of the mixing for
I to be considered as an intrinsic characteristic of the actual mixture (Missiaen and
Thomas 1995). The efforts on the relationship between the residual variance 2 - R2)
and sample size N. The composition variations within samples can be neglected when
the residual variance 2 - R2 ) varied in proportion to N (N-1) (Carley-Macauly and
Donald 1962). It is state that the focus of such works is segregation occurring at large
scales (Missiaen and Thomas 1995). On the other hand, Yamane used a slightly
different definition for intensity of segregation in their DEM (Discrete Element Method)
simulations as follows, which uses standard deviations (Yamane 2004):
(2.3)
Further, Danckwerts used the ratio of the variances as the intensity of
segregation as follows (Danckwerts 1952; Danckwerts 1952; Poux, Fayolle et al. 1991;
Muzzio, Robinson et al. 1997):
(2.4)
The use of variance over standard deviation may be more appropriate because the
standard deviation can be both positive and negative.
2.7.2.4 Particle-scale mixing index
Chandratilleke, Bridgewater et al (Chandratilleke, Yu et al. 2012)recently
defined a particle-scale degree of mixing as a particle i in a binary mixture as shown in
Figure. 2.1. It can have several particles, in contact or near-contact with it, and we
consider those particles, including particle „i‟ as a sample at the particle scale. A contact
sphere is defined for each particle i with a diameter of 1.05 d, where d is the maximum
diameter of the particles in the mixture (see Fig.2.1 (b)). If this sphere, belonging to
particle i interacts with another particle the two particles are said to be in contact with
each other. Particle i can either be a particle of W-type or B-type, being a particle of a
binary mixture.
0
I
20
2
I

CHAPTER 2 Literature Review
2-18
Figure 2.1 Schematic representation of particle contacts: (a) a group of particles in the neighbourhood of particle „i‟, which can be a particle of W-type or B-type; and (b) shows the contact condition according to which particle X is in contact with Y but not with Z.
If the number of particles of B-type in the sample is NB, then the number fraction pi
of the B-type key particles to the total number of particles in the sample
is (Chandratilleke, Bridgwater et al.):
(2.5)
where Cni is the total coordination number of particle i. If particle i is of B-type, NB=
Cn B(B) +1, and if it is of W-type, then NB= Cn B(W), where CnB(B) and CnB(W) are B-type
contacts with particle i, which can be either B-type or W-type particle respectively as
indicated by brackets.
Based on the above definition, the particle fraction pi of a target type of particles
could be calculated in a particle-scale sample around each particle i in the mixture, at
time t. by the way a frequency distribution curve for pi at time t is established. Next, it
could settle the average value for this instantaneous frequency distribution as in
Eq.(2.6). Finally, using , we can calculate the variance St2 of the instantaneous
frequency distribution of pi as in Eq.(2.7), where St is the standard deviation of the
instantaneous particle fraction distribution at time t, and N is the total number of
particles.
1
i
Bi Cn
Np
tp
tp
(a) (b)

CHAPTER 2 Literature Review
2-19
(2.6)
(2.7)
The particle-scale degree of mixing M identical to Lacey‟s mixing index are
defined as follows (Chandratilleke, Bridgwater et al.):
(2.8)
where, So2 is the particle scale variance of the fully segregated state, and Sr
2 is
the variance for the fully-mixed state. The population variance at segregated state for a
mixing ratio of p is given by , and S02 is made equal to 0
2 for the reason
that 02 does not depend on the sample size. Sr
2 is not known for a binary sized mixture.
Therefore, to account for the case of mono-sized as well as binary sized particles, we
choose the reference well-mixed state for Eq.(2.8), as the well-mixed state of mono-
sized particles, at the same mixing ratio p as that of the binary mixture; after all, no
better mixing can be obtained than those of mono-sized particles. Therefore, Sr2 is
defined as follows (Chandratilleke, Bridgwater et al.):
(2.9)
Here, n is a particle-scale sample size, and is chosen as 1 + the average total
coordination number.
2.7.2.5 Powder Sampling (In practice)
Powder sampling is an essential procedure that determines the quality of mixture.
Sampling methods used in assessing homogeneity of powder mixtures are affected by
parameters such as sample size, sample shape and sample number.
Ni
iip
Np
1t
1
Ni
ii pp
NS
1
2t
2t
1
220
220
r
t
SSSSM
pp 120
n
ppSr
12

CHAPTER 2 Literature Review
2-20
A small volume of material is analysed to assess the quality of the mixture and
to calculate its composition. A sample can be taken from mixture by probes or on-line
during the mixing operation. The analysis of the composition can be performed using
the Lacey Mixing Index.
The size of the sample must be suitable to the dimensions of the powder
materials. It is obvious that the large volume and small volume of material both led to
error in accordance with the mixing index. Indeed, the volume of the mixture sample
form must have an appropriate scale of size (Poux, Fayolle et al. 1991) . We can see
that when the sample size is very large, the variance of the sample is very small,
indicating that the mixture is in a fully mixed state. However, if we reduce the sample
size, the sample variance starts increasing even when the mixture is at a fully-mixed
state, such that at this time we begin to see the non-uniformities of the mixture.
Therefore, to quantify the homogeneity of the mixture, we have to define a sample size.
Figure 2.2 Sample variance of a fully-random mixture as a function of sample
size
In terms of the number of samples, Poux et al suggest that twenty to forty samples
should generally suffice to obtain correct information on the homogeneity of a
mixture (Poux, Fayolle et al. 1991); evidently, a large number of samples can cause
structural instabilities in a mixture. They point out that even with a small number of
samples; a distribution such as a Student-distribution can be used to obtain a mean value
with certain confidence limits. Although various researchers have attempted to establish
a relationship between the coefficient of variation and sample size, there appears to be
no common consensus yet (Poux, Fayolle et al. 1991).
However, Portillo et al. more recently addressed the issue of sample size and
sample number using a compartment modeling approach (Portillo, Muzzio et al. 2006).
0.00
0.05
0.10
0.15
0.20
0.25
0.30
0 50 100 150
Sam
ple
varia
nce
Sample size
Fully-random
Fully-segregated

CHAPTER 2 Literature Review
2-21
In the compartment modeling approach, the mixer system is discredited into a number
of homogeneous subs-sections each containing a fixed number of particles. Particles are
allowed to enter and exit each compartment using experimentally determined fluxes of
particles between compartments, and changes in the concentrations in the compartments
are then captured, although exact particle positions cannot be determined. Using this
method, a large number of particles can be handled (Portillo, Muzzio et al. 2006).
Figure 2.3 (i) Effect of sample number on variance, (a) 100, (b) 200 and (c) 500
samples; plots are normalized variance frequency distributions; (Siiria and Yliruusi)
effect of particle number on variance, (a) 200 pps, (b) 400 pps, and (c) 600 pps, where
pps is particles per sample (Portillo, Muzzio et al. 2006).
The effect of a sample number is shown in Figure 2.3(i). It shows that increasing
the number of samples makes the distribution narrower. The distribution approaches a
2 (or a chi-squared) distribution; the skewness of the distribution has increased with the
increased sample number. Although increasing either the particle number per sample or
samples number reduces the variance, increasing the particles per sample (pps) is most
effective in reducing the variance as seen from Fig. 2.6 (Siiria and Yliruusi).
2.8 Factors affecting solids mixing
2.8.1 Size or density differences
Mixing behavior of particles is significantly affected by particle size differences,
and an increase in either size or density differences results in increased segregation
tendencies. (Fan, Gelves-Arocha et al. 1975; Stephens and Bridgwater 1978). Further,
according to Fan et al. (1990), several other particle properties of a mixture can also
have a significant effect on the mixing behavior, the most significant apart from the size
difference being the density difference. On the other hand, Eskin et al. (2000)

CHAPTER 2 Literature Review
2-22
investigated that the smaller the difference in particle size, the higher the mixing rate.
Zhou et al. (2003) reported that an increase in either the size or density difference
causes an increase in the rate of segregation in a vertically-shafted cylindrical bladed
mixer. They also showed that the particles are segregated due to the generation of a
vertical force on particles when there is either a size or density difference or both. They
observed that the light particles are mainly collected on the top and outer regions of the
particle bed while heavy (Ahmad and Smalley) particles are collected in the inner and
bottom regions of the mixer. However, the scope of the study was mainly limited to the
examination of particle segregation due to size and density differences.
The segregation phenomena and it‟s mechanism have been studied for many
years. The segregation is inevitable when heavy particles of a binary mixture of light
and heavy equal-size particles of a binary mixture are located near the centre of mass of
particles in the drum(Ristow 1994). Radial segregation will occur in avalanches and
continuous flow regimes in half-filled rotating drum due to the size differences of the
disks(Cantelaube and Bideau 1995). The smaller particles will disperse into the centre
of the mixture while larger ones dwell on the edge of the rotating drum(Clément,
Rajchenbach et al. 1995). It is investigated that the percolation primarily occurs in the
rapid flow layer formed on the bed surface(Cantelaube, Bideau et al. 1997). Khahar
found that the size of the core region increases with an increase of more denser
particles(Khakhar, McCarthy et al. 1997). It is stated the size segregation will counter-
balance the density segregation as size ratio of a binary particle mixture fixed, and
varying the density of small particles (Dury and Ristow 1999). The smallest and
roughest grains being found at the center of the drum when segregation occur due to
different size and surface properties (Makse 1999). Segregation decreased with a
decrease of size difference of the particles(Eskin and Kalman 2000). The flow-induced
segregation occurs due to small differences in either size or density. The denser particles
or smaller particles migrate towards the core of the cylinders(Ottino and Khakhar 2000).
The large beads segregate at the surface as small size ratio, but for high size ratios, the
large beads segregate inside the mixtures(Thomas 2000). Ternary mixtures with
different size and density particles segregate due to size and density driving forces
which may complement or oppose each other(Hajra and Khakhar 2011). Large particle
size ratio or density ratio induce segregation, though segregation can be deteriorated
due to percolation in a ternary or multi sized system (Xu, Xu et al. 2010). The small

CHAPTER 2 Literature Review
2-23
particles in ternary mixtures exhibit reverse segregation as in binary mixtures.
Segregation is nearly independent of the sizes of the medium size and large particles.
Ternary mixtures with particles of different sizes and densities segregate due to size and
density generated driving forces which may complement or oppose each other. (Hajra
and Khakhar 2011). The radial segregation is driven by a density segregation flux,
which results in heavier particles tending to come to rest deeper in the bed, as a result of
their larger mass (Pereira, Sinnott et al. 2011).
2.8.2 Combined effect of size and density differences
The free surface segregation could be deteriorated by an optimum combination of the
size and density differences of particles in the case of a rotating drum (Alonso, Satoh et
al. 1991). Generally, the segregation occurs in the periphery of the tumbling container
for a mixture of particles with uniform density but different size. On the other hand, the
denser particles move to the center of the tumbling container when a mixture of
particles with uniform size but different density. Interestingly, for a binary mixture
where large particles are denser, both the size and density segregation effects come into
play at the same time, cancelling the segregation forces and resulting in good mixing
(Metcalfe and Shattuck 1996). Nitin et al. (2005) also showed that powder mixing can
be improved under certain size and density combinations in the case of mixing in
rotating drums. In particular, when the size ratio rs=dheavy / dlight is substantially larger
than the density ratio rd=ρheavy / ρlight where d and ρ are particle diameter and density
respectively, an improvement in the mixing occurred.
An attempt has been made in a previous work to describe the particle segregation
mechanism in terms of the vertical (buoyancy) forces on particles generated due to
either size or density differences or both (Zhou, Yu et al. 2003). Further, the segregation
mechanism of particles when size or density differences or both exist, has been
described phenomologically as driven by percolation or buoyancy forces (Nitin, Julio et
al. 2005). However, there are only a few studies dealing with the mechanisms of mixing
or segregation when size and density differences of particles coexist.
It is stated that a prediction equation to quantify the combined effects of density and
size differences would enable us to predict transition from mixing to segregation by
percolation due to size difference and buoyancy effect induced by density differences

CHAPTER 2 Literature Review
2-24
(Alonso, Satoh et al. 1991). Such a relationship is promising to quantitatively predict
the mixing states of not only dry particles, but also wet particles at low cohesion when
the particle flow is in continuous regime (Liu, Yang et al. 2013). However, the
equivalence between size and density effects in the size-range where percolation effects
are negligible has not been considered in the present theories.
2.8.3 Cohesive particle mixing
2.8.3.1 Types of cohesion
Both Fan and Bridgwater classified mixtures into two groups such as
cohesionless (free flowing) mixtures and cohesive mixtures. Cohesionless mixtures
include cohesionless (free flowing) particles. Cohesionless powder is a completely
random mixture that they do not agglomerate. A mixture of free flowing particles is
relatively less homogenous due to incomplete mixing and segregation (Bridgwater ; Fan,
Chen et al. 1990). However a cohesive mixture contains one or more cohesive powders
which have strong inter-particulate forces. Mechanism of mixing of cohesive particles
will be introduced in the following section.
Wet, dry and electrostatic and overall studies
A cohesive mixture commonly has a good mixing quality in a wider region,
however there is still some segregation in local areas. The nature and strength of the
inter-particulate forces determine the mixing quality and intensity of segregation. The
inter-particulate forces are determined by moisture, electrostatic charging as well as van
der Waal‟forces (Harnby 1997). The bonding caused by the overlapping of absorbed
layers of neighbouring particles and its strength. The strength of the structure is affected
by packing densities, particle shape and size, as well as particle roughness. The two
solids in mixing will charge each other electrostatically. The particles tend to bond to
the mixer wall or dissimilar particles and produce mixing or segregation depending on
the sign of charge.
Van der Waal‟s force is a natural attractive force between neutral atoms or
molecules which separated by a distance. The Van der Waal‟s force will decrease with
the separation distance according to a power law. It increases because of the transient

CHAPTER 2 Literature Review
2-25
polarization of the atom or molecule. Absorbed moisture increases the Van der Waal‟s
forces when the absorbed layer is considered as a part of the particle, and it decreases
with the inter-particulate distance. The electrostatic forces will be reduced when
humidity causes air to be more conductive and therefore the particle to discharge. The
mechanical forces such as friction and interlocking are reduced by absorbed moisture.
Li experimentally and theoretically studied the cohesive mixing and segregation
in an annular shear cell (Li and McCarthy 2006). The effect of liquid-bridge induced
cohesive forces on particle mixing under shear was analysed using Collision number
which is a newly developed heterogeneous characterization tool. Granular Bond
Number is a main parameter since the pseudo-static system is a no flow-related forces
such as shear forces and drag forces. However in the dynamic system the
collisional/shearing forces begin to play a more important role. Another Collision
number is needed where the collision force is comparable to the cohesion force but
larger than the particle weight. Collision number is equal to the ratio of maximum
capillary force over to collisional force.
The influence of adding liquid into sheared granular flows on mixing process is
studied. The cohesive force and viscous force exist in the wetted granular flows and the
fluctuations, the shear rates and the self-diffusion coefficients are smaller. The self-
diffusion coefficient is increased with decrease liquid volume. Also it linearly increased
with granular temperature and shear rate along the upper wall(Hsiau, Lu et al. 2008).
Also Yang studied the effects of small amounts of added liquid on the segregation
behaviour of granular system under vertical vibration by DEM simulation(Yang 2006).
Fluidized beds have been used in industries with gas-solid system. Various types
of fluidized beds have emerged. Cohesive particles tend to be agglomerate due to strong
interaction forces. Geldart (Geldart1973) classified powders into four groups: A for
aerated, B for bubbling, C for cohesive particle. Vibration in fluidization is one of the
good methods for improving the fluidity of fine cohesive particles. The vibration
decreases the voidage and minimum fluidization velocity. The minimum air velocity
and vibration intensities are essential to have good fluidization(Marring, Hoffmann et al.
1994). The intermittent channel breakage upper limit gas velocity was higher with
increasing gas velocity method than decreasing gas velocity method. The gas velocity

CHAPTER 2 Literature Review
2-26
and bed void fraction are reached maximum from a relationship between gas velocity
and bed pressure job(Mawatari, Tsunekawa et al. 2005).
There are other several methods for improving the fluidization quality of
cohesive particles except for the vibration method which was discussed above. For
example baffles, acoustic field, magnetic field, adding particles and modifying surface
of particles, etc. It is difficult to fluidize cohesive particles (Geldart‟s group C)
compared to the group A particles due to the strong inter-particle force. The fluidization
behaviour is very different due to the particle properties such as density, size, shape,
size distribution etc. Zhou investigated that the fluidization behaviour of cohesive
particles were strongly affected by size, superficial gas velocity and additive particles.
SiC of average size larger than 10um can be fluidized with increasing gas velocity,
however the 5um SiC can‟t be fluidized. Adding right particle in cohesive particles may
decrease the inter-particle cohesive force and improve fluidization behaviour(Zhou and
Li 1999).
The effect of particle size on fluidization quality was studied. The minimum
fluidization velocity decreased for powder C, when powder A is almost constant under
some experimental conditions. The bed expansion ratio is lowered, and the range of
vibration strength and the gas velocity for bed rotation becomes narrower with
decreasing particles diameter. The gas velocity for channel breakage was decreased with
increasing vibration strength. It is supposed that decrease in particle diameter leads to a
more complex bed structure including various sizes of agglomerates, which makes it
difficult for vibration(Mawatari, Koide et al. 2002).
2.8.3.2 Van der Waals force model
Van der Waals force model was used in analysing the solid mixing. Attractive
forces exist between neutral atoms or molecules which are separated by a distance.
These are known as Van der Waals‟ forces. They decrease with the distance apart
according to the reduced power and increase because of transient polarization of an
atom or molecule which will act on the surrounding area to produce spontaneous
fluctuations elsewhere.

CHAPTER 2 Literature Review
2-27
bRHaFv 111
6 2 (2.10)
Here, Ha is known as Hamaker constant, and is a material dependent quantity to
be determined by Eq.(2.11) using the respective Ha values, Ha1 and Ha2 for the pair of
objects under consideration. Similarly, R is an equivalent radius for the pair of objects,
using respective radio r1 and r2 of the object pair; for a flat plate, the radius is infinite
and thus the limiting value for R obtained from Eq.(2.12) should be used. is the
separation distance between the two objects. b is a constant equal to 5.32. is dipole
interaction wavelength (= 10-7m).
21 aa HHHa= (2.11)
21
21
r r rrR=
(2.12)
2.9 Eeffect of the particle cohesion on mixing in a uniform binary system
The effect of cohesion and non-cohesion on particle mixing in uniform binary
system was studied (Chaudhuri, Mehrotra et al. 2006). The computational model system
for this case study consists of 10,000 “green” and 10,000 “red” identical particles of
2mm diameter, loaded initially side-by-side along the axis. The mixing drum in the
simulation has a diameter of 9cm, length 1cm and is rotated at 20rpm。The cohesive
bond number is varied from K=0 to 120 to estimate the effect of cohesion. The end caps
of the drum are made frictionless. The static friction coefficients for particle–particle
and particle–wall contacts are chosen to be 0.4 and 0.7, respectively. Four values of
cohesion are simulated with our model system. The snapshots are taken at time T=0, 1,
3 and 5 revolutions. The free-flowing mixture (K=0) blends faster than the moderately
cohesive (K=60) and highly cohesive (K=90) cases, where we see red particles move in
unison forming a stretchable band. Interestingly, the very mild cohesive case (K=0.1)
shows faster mixing than the free-flowing case. However, the difference is not large;
mixing is only slightly enhanced by the introduction of a small amount of cohesion.

CHAPTER 2 Literature Review
2-28
The intensity decreases and we observe best mixing at K=0.1 but segregation is more
pronounced with further increase in cohesion as shown the Fig 2.4.
Figure .2.4(a) effect of cohesion on mixing;(b) This Graph is in conjunction with
A, plotting the log (intensity of segregation) with revolutions
The effect of blender rotation speed, another commonly studied parameter, is
examined (Chaudhuri, Mehrotra et al. 2006). The homogeneity of the cohesive mixtures
A - -
k=O \
• ~ '-' ~ ~-
~ k=O.l
~ ~ ~ - .,
~ .,..-- ---., -- --
k=60 -.~ .. ...... - . ,.,..---. , -
k=90 • • T = 0 Rev T = 1 Rev T = 3 Rev T = 5 Rev
8
-o.s
-+- K=1 20 -r K=90
-+- K:60
-+ Kdl.1
"*' NC
-!.l .S+-------~---~---~----1 0.00 1.00 2.00 3.00 4.00 5.00
t RQVOiuUons

CHAPTER 2 Literature Review
2-29
is shown to be a function of blender rotation speed, facilitating better mixing at higher
rotation speeds. This result is in agreement with experimental results and in contrast
with previous findings for non-cohesive materials, for which the mixing rate is
independent of the rotation speed (Sudah, Coffin-Beach et al. 2002). A detailed study is
done on the effect of “dry” cohesion/ adhesion in non-uniform binary system
(constituting particles of different sizes). It is shown that the effect of varying cohesion
in small/big particles is more complex than originally thought; mixing rate is optimum
for an intermediate value of cohesion.
Cohesion plays a key role in the mixing/segregation of granular systems.
However, high values of cohesion (typical of commonly used pharmaceutical powders)
show slower mixing, which is attributed to the formation of plug flow in the cascading
layer, causing sluggish thinning of striations of similar particles.
2.10 Effect of the particle cohesion on mixing in a non-uniform binary system
The effect of cohesion in the smaller particles on the homogeneity of binary
mixture of different sizes was studied(Chaudhuri, Mehrotra et al. 2006). The
computational system includes 8000 blue particles (radius1mm) and 2370 red particles
(radius1.5mm). Red particles are considered to be free flowing and there is no adhesive
force acting between the particles.
The smaller particle (blue) as cohesive particles Kbb is varied from 0 to150. Krb
and Krr were fixed 0. It is seen that mixing is optimum for an intermediate value of
Kbb=50 which is better than free flowing materials (Kbb ,Krb and Krr equal to 0 ) as
shown in Fig 2.5.
Subsequently, the effect of cohesion in bigger particles (red) on homogeneity
was investigated. The value keeps Krb =0 and Kbb =50. The value of Krr will vary from
5 to 100. The results showed that the best mixing will be obtained in the value Krr =5
shown as the Fig 2.6.
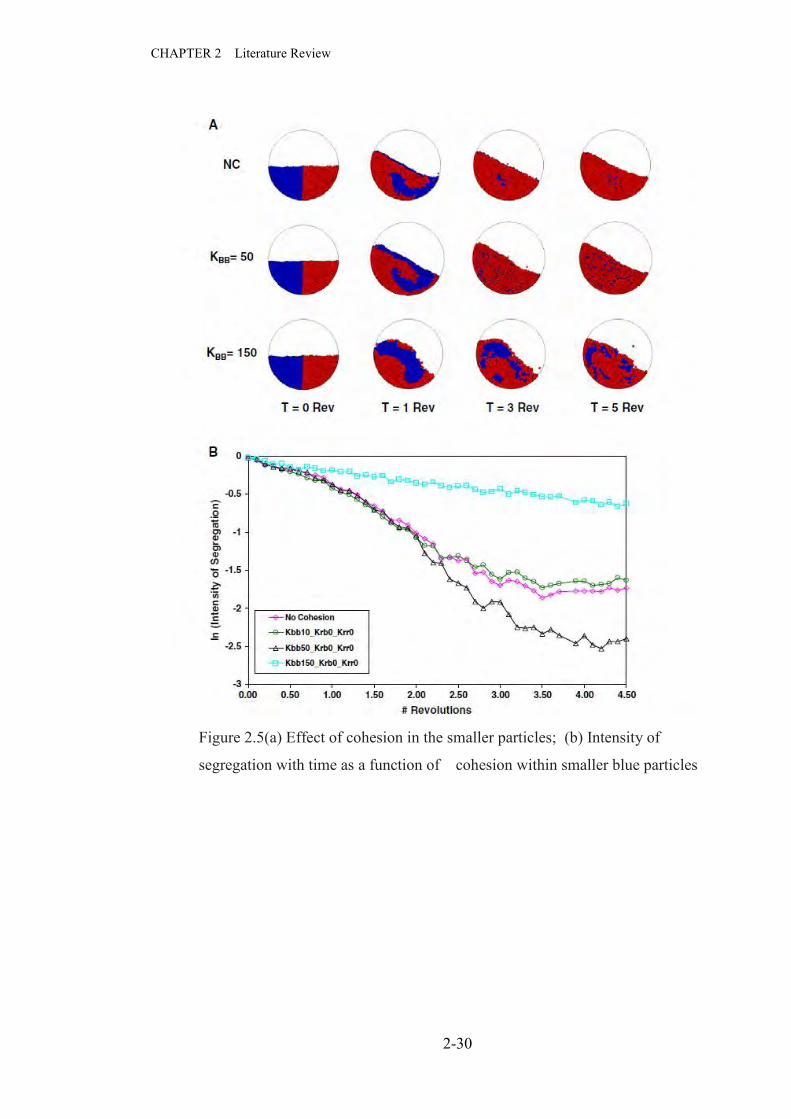
CHAPTER 2 Literature Review
2-30
Figure 2.5(a) Effect of cohesion in the smaller particles; (b) Intensity of
segregation with time as a function of cohesion within smaller blue particles

CHAPTER 2 Literature Review
2-31
Figure 2.6. The variation of intensity of segregation with time as a function of
cohesion within bigger red particles
Finally, the effect of adhesive interaction between two species on uniformity of
a binary system with different particle sizes was investigated. The value keeps Krr =0
and Kbb =50, The value of Krb will vary from 5 to 100.
Figure 2.7. Intensity of segregation with time as a function of adhesion.
These simulation results show that mixing is more effective as the adhesive
force is increased. It is observed that as Krb is increased, the intensity of segregation
decreases, indicating better mixing, and all the curves lay below the non-cohesive case
as shown Figure 2.7.

CHAPTER 2 Literature Review
2-32
2.11 Operational conditions (Shaft speed and fill level effect)
In terms of the effect of impeller speed and fill level and blade number of the
different mixers, the research shows that the axial diffusion coefficient increased with
an increase of blade speed, however, it decreased with an increase of fill level
(Bridgwater 2003). Recent studies of the effect of the fill level and blade speed in the
mixer with single or multiple blades provide us with an excellent reference for our study
(Laurent and Bridgwater 2002). The deteriorated mixing was obtained with a high blade
speed for mixing of free-flowing particles in a cylindrical mixer (Chandratilleke, Zhou
et al. 2010). However, the speed effect on the homogeneity and flow pattern of the
solid from microdynamic aspects have not been fully understood.
2.12 Types of Mixers
Particle motion in a mixer is three dimensional and random. All mixers should
display one of the following three mixing mechanisms (Venables and Wells 2001;
Bridgwater 2012): The mixer can be categorized based on the mixing mechanisms(Poux,
Fayolle et al. 1991).
(1) Convective mixing happens when circulation patterns are set up in a mixer,
due to which particles are conveyed along these pattern paths. Examples of mixers with
a predominating convective mechanism are ribbon mixers, high speed cylindrical
mixers, and nauta mixers.
(2) Shear mixing occurs along with convective mixing due to velocity gradients
present in the mixture. This is the predominant mechanism of pan mixer and mill.
(3) Diffusive mixing is the mixing at a particle scale and is responsible for
mixing once the convection and shearing effects fade away.
Mixer can also be classified into two groups based on the segregation or non-
segregation or based on the shell rotation or not. Here we classify the mixer into two
classes based on the shell movements.
First, the mixer shell rotates and the material slopes around inside (Poux,
Fayolle et al. 1991; Bridgwater 2012). Example of this type of mixers are:

CHAPTER 2 Literature Review
2-33
The cylindrical drum: the drum rotation causes both axial and radial mixing. The
rotating drum is easier to use for slightly cohesive or non-cohesive materials,
and suitable for free flowing or for granulation.
The off-centre drum: the mixing is improved in this mixer by particles sloping
backwards and forwards in the axial direction.
The double cone mixer: this mixer is made of two conical sections, and the
material rolls and folds, breaking the agglomerates by diffusion and shear
mechanism.
The V mixer: These kinds of mixers are suitable for mixing weakly cohesive
powders, but small agglomerates or aggregates of an ingredient might remain
intact in the mixture as shown in the Figure 2.9. This segregation may be
minimized by adding an internal impeller. The degree of fill of the mixer also
affects the mixture quality, and forms a limit on the batch operation performance
of the mixer. The mixer has an advantage in that it gives good access for both
cleaning. Tumbler mixers can handle free-flowing and cohesive powders but not
pastes or dough, and the quality of the mixture can be a problem. Free-flowing
powders can segregate relatively easily on the tumbling surface; the emptying
process also frequently leads to segregation in the mixture. In these mixers,
mixing takes place relatively fast in the radial direction, but slowly in the axial
direction, which is therefore the rate-controlling factor for the mixer.
Second main classes of the mixer, the internal rotor or internal rotor fitted blades
rotating, whilst the shell is stationary. Example of these types (figure 2.8) are:
The centrifugal mixer with horizontal axis: the material in the mixer pushed
circumferential, and displaced axially by the blade moves in the low speed.
At higher speeds, the material is centrifuged.
The centrifugal mixer with vertical axis: the blade pushes particles around
the mixer on low speed. At high speed, the material forms a toroid next to
the wall.
Ribbon mixer: the mixer consists of one or two screws or blades in the
opposite direction. The material is rolled, folded, reversed in direction and
radially dispersed. The wide range of materials can be mixed.

CHAPTER 2 Literature Review
2-34
Planetary mixer: material is rotated on a vertical axis, being brought into the
zone of action of a mixing blade rotating at high speed about an offset
vertical axis. The mechanism is convection and shear. It is not suited for
very cohesive materials.
The draught tube and screw mixer (figure 2.9 a): the material is conveyed to
the free surface by vertical screw contained within a tube, and then the
material falls down the free surface and is recycled back to base of the screw.
Orbiting screw mixer (figure 2.9b): the mixer consists of a screw attached at
the base of the cone confined to the batch mixer. The screw rotates about its‟
own axis while at the same time processing about the vertical axis of the
cone. The material is conveyed upward by the screw and the material is
distributed onto the surface. The mechanisms of this mixer are convection
and diffusion. Suitable for improving mixing purpose.
With a hopper mixer, the particles flow under the influence of gravity, and
this flow can be used for mixing particles at the outlet of the hopper without
any external energy. To avoid dead-zones within the silo, a central cone is
usually installed so that a pronounced velocity gradient is produced in the
vertical direction (see Fig. 2.10) (Brown and Nielsen 1998). To avoid
arching across the annulus and at the outlet, the hopper diameter and section
widths of sections should be chosen appropriately. This design is known as
Binsert (developed by Janike and Johanson Inc.), and can be used for mixing
cohesive bulk solids as well. Depending on the required degree of
homogeneity, the particles may have to be recycled externally, thus causing
considerable axial mixing (Fan, Chen et al. 1990). Due to percolation,
segregation is likely to occur in this type of mixer, both on the free surface
of the hopper and within the bulk of the material (Fan, Chen et al. 1990).
Fluidized mixer: The powders in a fluidized bed mixer receive energy from
gravity and convective effects as shown in Figure 2.11. The gas flow carries
the particles against their weight which is counter balanced by the buoyancy.
The good mixing will be produced by mobility of particles and turbulence if
the gas flow rate is sufficient (Fan, Chen et al. 1990).

CHAPTER 2 Literature Review
2-35
Figure 2.8 Typical Mixer(Bridgwater 2012)
Cy!indricif drum Cfi·c~nue <:rum
•
'+i ¢ f (t'l!ln $hell;
Rotating shells
Centrifugal mlxor with horizontal axis
Vert:>: <- C•irection of rotation
_.---r--._-'\ /
(r-~/F· -~~77'-i-"'"'=+-=' :..v ""
Centrifugal m i xer with verti(;al axis
---· ~ ·,.. Ribbons
Ribbon mtxet Planetart mixer
Plan.:tary 119 ~1StCf

CHAPTER 2 Literature Review
2-36
Figure 2.9 (a) Draught tube and screw mixer(b) Nauta mixer with orbiting
screw(Bridgwater 2012)
Fig. 2.10 Gravity-flow (hopper) mixers Fig.2.11 fluidization bed

CHAPTER 2 Literature Review
2-37
Figure 2.12 Helical ribbon impeller(Masiuk, Lacki et al. 1992)
2.13 Helical ribbon mixer
Mixing of highly viscos fluids is a key step in most chemical and food industries.
Helical ribbon mixers enable keeping the entire vessel contents circulating, which is
very suitable for mixing high viscous liquids, and recognized to be a very efficient
system as shown in Figure 2.12. For comparing performances and understanding the
main findings of the studies of helical ribbon mixer and ribbon mixer, Table 2.1 is
established showing main findings and material and mixer conditions.

CHAPTER 2 Literature Review
2-38
Date author and Title Material and conditions
Main findings
(Bortnikov, Pavlushenko et al.
1973),
Design of an apparatus with a helical ribbon
mixer
Fluid molassesdensity T = 1410 kg/m 3 and viscosity g = 3.14 kg. sec/m2. The flat-bottomed vessel helical ribbon mixer.
Axial forces are 1.6-1.7 times lower for single
helix mixer compare to the dual helix mixers.
Doubling the ribbon width increases axial forces by 40-50% while power consumption
for mixing remains practically constant.
(Novák and Rieger 1975)
Homogenization Efficiency of Helical Ribbon and Anchor
Agitator
Aqueous solutions of corn syrup, glycerol and distilled water were used in the experiments. Three types of agitators : Double helical ribbons Anchor agitators Pitched blade anchor
Helical ribbon agitator is suitable for homogenization of liquids in the creeping flow regime. This is about 7 times higher than for screw agitators with a draught tube. Anchor agitators are inadequate for homogenization of highly viscous liquids in the creeping flow regime. The best efficiency in the creeping flow
regime is with screw agitators with a draught tube. It is very efficient in the region over the creeping flow regime and suitable for mixing of liquids whose viscosity varies considerably during the course of the process.
(Sawinsky, Havas et al. 1976)
Power requirement of
anchor and helical ribbon impellers for the
case of agitating Newtonian and
pseudo-plastic liquids
Newtonian liquids Achor impeller and Helical-ribbon impeller.
Rheological behaviour of pseudo-plastic liquids, the relationship between the shearing stress and the shear rate can be described by means of the Ostwald-de Waele equation.
the prediction equation was established for power consumption in the laminar flow range of pseudo-plastic –liquids
(Patterson, Carreau et
al. 1979)
Mixing with Helical Ribbon Agitators
Newtonian fluids Helical Ribbon Agitator
HRA is admirably suited to low Reynolds number mixing process.
Derived model to predict power consumption of HRA.
( l asi s i and z ys i 1980)
Power requirements of helical ribbon mixers
Fluids in laminar region Re<100 Helical Ribbon Agitator
Presented the equations which enable mixing power to be calculated for helical ribbon mixers within the laminar region of mixing
Table 2.1 Main finding in the helical and horizontal ribbon impellers

CHAPTER 2 Literature Review
2-39
(Le Cardinal, Germain et al. 1980)
The design of stirred batch polymerization
reactor
Laboratory-scale tank reactors Methods used: decolarisation and conductivity measurements
Scaling method proposed Screw mixer with four baffles is best mixer.
(Ottino and Macosko
1980)
An efficiency parameter for batch mixing of viscous
fluids
Newtonian Fluids Six bladed turbine, three inclined blade paddles, helical screw, helical ribbon, propeller in draught tube, anchor
A rational ranking of the mixers, in the sense of criteria (efficiency as a function of time), has been provided using the concept of intermatenal are a generation An efficiency of mixing, applied here for Newtonian liquids, can be extended to other constitutive relations. Generalization for power law fluids is trivial, but other constitutive relations should be managed with care.
Characterization of helical impellers by
circulation times
Newtonian and non-newtonian fluids Helical ribbon impellers
The shear thinning properties of non-newtonian fluids do not affect the helical impellers‟ circulation capacities. In highly shear thinning fluids, the presence of important stagnant zones causes much longer mixing times which consequently do not correlate with circulation parameters.
The wide blade is more efficient on the helical-ribbon impellers but is less efficient than the screw impeller in a draft coil.
(Rieger, Novák et al.
1986)
Homogenization Efficiency of Helical
Ribbon Agitator
Newtonian Fluids Helical ribbon agitators
A greater clearance and has a lower power
consumption but a longer time of
homogenization
With the pitch s = d exhibit higher power
consumptions but shorter homogenization
times.
Agitator with wider blades exhibit higher
power consumption and shorter mixing time.
With an increase of blade number, the power
consumption increases significantly but the
homogenization time decreases considerably.
(Cooker and Nedderman 1987)
A theory of the
Powder Helical ribbon agitators
Stress analyses, using appropriate modifications of Janssen‟s method, performed for both the rotating core and the material between the blades of the helix.
Torques on the vessel wall and the helical

CHAPTER 2 Literature Review
2-40
mechanical of helical ribbon powder agitator
ribbon calculated. Proposed equation can predict the
circulation, geometry and frictional properties.
(Ryan, Janssen et al.
1988)
Circulation time prediction in the scale up of polymerization reactors with helical
ribbon agitators
Newtonian fluids Double helical ribbon impeller
A fundamental model of fluid circulation in
polymerization reactors agitated by helical
ribbon impellers is presented.
An expression is developed for the circulatory
flow generated by a double helical impeller in
a reactor with a draught tube.
The circulation time and ribbon rotational
speed is predicted to be a function only of
geometric variables for Newtonian fluids in the
viscous flow regime.
The circulation of Newtonian fluids in an
experimental reactor is investigated to verify
the model. There is good agreement between
the model and experimental results for
Reynolds numbers less than 500.
At higher Reynolds numbers, inertial effects
increase fluid circulation times. Preliminary
data are also presented for non-Newtonian
fluids.
The implications of these results in the scale-
up of polymerization
(Tanguy, Lacroix et al.
1992)
Finite element analysis of viscous mixing with a helical ribbon screw
impeller
Newtonian fluid Helical ribbon screw impeller
The mixing pattern of viscous Newtonian
fluid in a helical ribbon screw impeller using
a finite element method.
The circulation time and torque were
predicted and compared these with
experimental results.

CHAPTER 2 Literature Review
2-41
(Masiuk and Lacki 1993)
Power consumption and mixing time for Newtonian and non-Newtonian liquids mixing in a ribbon
mixer
Newtonian and non-Newtonian fluids Helical ribbon agitator
The shape of ribbon agitator has a significant
influence on the mixing energy required for
mixing liquid.
Best mixer type presented in terms of mixing
efficiency for the non-Newtonian liquids.
For practical purpose, the general correlation equation proposed for calculating the power consumption, mixing time, and mixing energy.
(Tanguy, Thibault et al.
1997)
Mixing performance induced by coaxial flat
blade-helical ribbon impellers rotating at
different speeds
Newtonian and non-Newtonian fluids Dual impeller mixer composed of a disc turbine and a helical ribbon impeller
The mixing performance (pumping,
dispersion capabilities, power consumption)
at different speeds is investigated.
the dual impeller mixer outperforms the standard helical ribbon in terms of top-to-bottom pumping when the fluid rheology evolves during the process.
The power consumption of this new mixer is also studied which allows to derive a generalized power curve
(Delaplace, Leuliet et al. 2000)
Circulation and mixing times for helical ribbon impellers. Review and
Experiments
Different type of helical ribbon agitator
Homogenization in lamina regime is
controlled by amount of shear imparted in
the gap by agitator and renewal fluids in the
gap.
The circulation time measured by
conductivity and thermal methods are
similar. Circulation time is independent of
the pumping direction.
Helical ribbon agitators better efficiency of
the mixing process if blade width ratio were
more adapted to clearance-wall size.
Increase of blade width ratio enables to improve mixer efficiency.
(Kaneko, Shiojima et al. 2000)
Numerical analysis of
particle mixing characteristics in a
single helical ribbon agitator using DEM
simulation
100000 1mm polypropylene homopolymer DEM method and experimentally
Vertical mixing of particles rather poor during upward and downward flows through the blade and core regions,
In the core region, particles flow in the manner of funnel flow.
In the blade region, the vertical velocity decreases toward the wall and reduces to zero near the boundary between the blade and core regions.
Particles carried up to the bed surface by the

CHAPTER 2 Literature Review
2-42
helical ribbon flow down into the center of the core, and those not carried completely to the surface flow into the outer periphery of the core.
If the bed height is lower than the blade top, particles mix rapidly because of the high fall of particles from the blade top. If the bed height is higher than the blade top, the velocity of particles in the bed surface region is much lower than that of the other region
(Kaneko, Shiojima et al. 2000; Dieulot,
Delaplace et al. 2002) Laminar mixing
performances of a stirred tank equipped with helical ribbon
agitator subjected to steady and unsteady
rotational speed
Highly viscous Newtonian fluids Non-standard helical ribbon impeller
The use of the time dependent rotational speed during the mixing process allows energy savings. For unsteady stirring approaches tested, energy saving can reach up to 60% compared to the energy required to obtain the same mixing time with constant impeller rotational speed.
(Shekhar and Jayanti 2003)
Mixing of
pseudoplastic fluids using helical ribbon
impellers
Pseudoplastic fluids of high viscosity Helical ribbon impeller
Shear rate varies within mixing vessel. Linear relationship between the impeller
speed and local shear rate near the tip of the impeller.
The constant associated with this linear relation dependent on the geometric parameters of the system, but independent of the flow behavior index
(Niedzielska and Kuncewicz 2005)
Heat transfer and
power consumption for ribbon impellers mixing efficiency
fluids Helical ribbon impeller
The heat transfer efficiency of particular impellers was calculated.
Geometrical dimensions of the most efficient ribbon impeller is the impeller with a diameter of d/D=0.94 and ribbon pitch p/d=0.25
(Delaplace, Guerin et
al. 2006)
An analytical model for the prediction of
power consumption for shear thinning fluids
with helical ribbon and helical screw ribbon
impellers
Fluids Helical ribbon and helical screw impeller
A new model based on effective viscosity taking into account the shear-thinning behavior is proposed. The model predicts the value of Ks as a function of the power constant Kp and the geometrical parameters of the helical ribbon mixing systems (wall clearance, blade width) and the flow behavior index of the pseudoplastic fluid.
The model is able to explain the variation of the experimental value of Ks with the flow behaviour index.
The model can predict well the effect of wall clearance on the power demand for both helical ribbon and helical screw ribbon impellers.

CHAPTER 2 Literature Review
2-43
(Robinson and Cleary
2012)
Flow and mixing performance in helical
ribbon mixers
A single helical ribbon mixer creates an axially symmetric circulation cell that moves fluid down the outside of the tank and upward near the center.
Smaller circulation cells near the inside edge of the ribbon superimpose a chaotic mixing flow over this primary flow
The horizontal struts supporting the ribbon generate strong circumferential mixing, but this is only within a narrow horizontal plane with thickness comparable with strut diameter.
(Masiuk 1987)
Power consumption, mixing time and
attrition action for solid mixing in a ribbon
mixer
Ribbon mixer Solid particles
Power consumption in an agitated vessel varies linearly with rotational speed of helical ribbon mixers.
The loading ratio has a strong effect on powder consumption in the mixing of particulate materials.
(Côté and Abatzoglou
2006) Powder and other
divided solids mixing. Scale up and
parametric study of a ribbon blender used in
pharmaceutical powders mixing
Ribbon mixer Mixing endpoint not reached at shaft filling height.
Impeller rotation speed to play important role in the range of conditions.
The mixing time does not play a major role in the specified range.
(Masiuk and Rakoczy
2006) The entropy criterion
for the homogenisation process in a multi-
ribbon blender
Multi ribbon blender
The new form of the entropy criterion estimating the current state of a mixture is proposed.
A mathematical model to describe the variations of the informational entropy during process is developed. For blending process the experimental validation for this model conducted.
(Muzzio, Llusa et al.
2008) Evaluating the mixing
performance of a ribbon blender
Ribbon mixer The loading methods (layering and off-center spot injection) are explored. Layering method create greater homogeneity of the blends, and the reduction of mixing time, blend exposure to shear, and risk of over lubrication.
The fill level effect 3 –spoke blade is significant. Lower fill level yield more homogeneous blends.
For 5-spoke blade, the fill level is not insignificant.
Higher blade speeds increase shear and the risk of over-lubrication.

CHAPTER 2 Literature Review
2-44
2.14 Ribbon mixers
Powder mixing is an essential unit operation for manufacturing processes, for
example, in ceramic, food, pharmaceutical, chemical and agricultural industries, where
a wide variety of high quality products are produced. The ribbon impeller has one or
two helical blades starting from each end, but spiraling in opposite directions as shown
Figure .2.13.
Figure 2.13 Ribbon mixer used in the industry
This ribbon mixer with two helical screws as blades pushes particles in one axial
direction close to the centre and simultaneously the other screw pushes in the opposite
direction close to the wall. Material is rolled, folded, reversed in direction and radially
displaced. The screw makes it easy to push the product to an exit although it can make
cleaning more difficult. The mixer can be used for a wide range of materials from dry
powders to pastes. Radial mixing is good, axial mixing is less so (Metzger and Glasser
2013). A ribbon mixer displays a combination of mixing mechanisms such as
convection, diffusion and shear when granular matter. The ribbon mixer is a good
(Musha, Dong et al. 2013)
Mixing behaviour of cohesive and non-cohesive particle
mixtures in a ribbon mixer
Ribbon mixer Mixing rate increases with impeller speed for both cohesive and non-cohesive mixture up to certain speed.
Particle contact forces increases with an impeller speeds in non-cohesive particles. But for cohesive mixture increase with impeller speed, and then decreases after a certain speed.

CHAPTER 2 Literature Review
2-45
choice for aerating materials. The selection of a mixer for a mixing operation depends
on the product uniformity required and many other factors (Poux, Fayolle et al. 1991).
Ribbon mixers are considered to be suitable for mixing of dry powders as well as free-
flowing granular material (Poux, Fayolle et al. 1991). It is also reported that a ribbon
mixer can produce an improved homogeneity in powder mixing because of large shear
stresses in the mixer. In addition it can handle mixing of different sized particles
(Muzzio, Llusa et al. 2008). Therefore, a ribbon mixer with a horizontal shaft will be the
focus of study here. The literature survey of the effect of operational parameters,
geometrical parameters of a ribbon mixer with a horizontal shaft on the powder mixing
is conducted below.
2.14.1 Effect of shaft speed
Ribbon mixers are widely used in practice because they are capable of providing
high speed convective mixing. The impeller speed of the mixer is a parameter that can
affect the performance of the mixer, with regard to mixture quality and stresses on
particles. Inspection of velocity fields shows that many local recirculation flows exists
in the case of non-cohesive particle mixing, preventing the overall mixing as shown in
Figure 3.15. By contrast, in the case of the cohesive mixture, there exists a
circumferential motion about the shaft and a convective motion in the horizontal axial
direction, improving the particle mixing (Musha, Dong et al. 2013). The Mixing
deteriorated with an increment of blade speed in a continuous ribbon mixer for
obtaining uniform mixing (Sanoh, Arai et al. 1974). The power consumption increased
with an increase of blade speed in a ribbon mixer (Masiuk 1987). Energy usage can be
reduced by up to 60% compared to the energy required to obtain the same mixing time
with constant impeller rotational speed in a ribbon mixer (Dieulot, Delaplace et al.
2002). The uniformity of the mixture was never reached at a high level at the high
impeller rotational speed (Côté and Abatzoglou 2006).

CHAPTER 2 Literature Review
2-46
Figure 2.14 Effect of the blade speed for layered magnesium tstearate and
59%fill level(Muzzio, Llusa et al. 2008)
It is reported that a high impeller speed can have a negative effect on the
uniformity of a mixture; the shear stresses on particles will reduce at a low speed; and
may result in a poor homogeneity for cohesive mixtures as shown in Figure
2.14(Muzzio, Llusa et al. 2008).
2.14.2 Effect of fill level
The fill level of the blender is the next most important operational parameter
(Côté and Abatzoglou 2006). Pascal reported that for an entire batch mixer, the mixing
did not reach the end point when the blender is filled to the shaft level. The mixing
reached the end point when the outer shaft fill level at a blade speed of 20rpm. Muzzio
et al. experimentally investigated the mixing performance of a ribbon mixer (Muzzio,
Llusa et al. 2008) with regard to the effect of loading (layering and off-center spot
loading method) and layering method showed faster mixing and a better homogeneity.
The effect of the fill level is significant for 3 spokes 2-bladed ribbon impeller. The
mixer demonstrates that a lower fill level is more homogeneous, and the effect of fill
level on 5 spokes 2-bladed ribbon impeller is not as significant.

CHAPTER 2 Literature Review
2-47
Figure 2. 15 Effect of fill level (59 and 100%) on the mixing performance of the blender with the 3-spoke ribbon blade operated at 20 rpm with an off-center spot injection of magnesium stearate.
Figure 2.16 Effect of fill level on the mixing performance of a blender with the 5-spoke blade operated at 20 rpm.
2.14.3 Effects of mixer geometry
A ribbon mixer displays a combination of mixing mechanisms such as convection,
diffusion and shear when mixing granular matter. Ribbon mixers are widely used in
practice because they are capable of providing high speed convective mixing. The
efficiency of such operations and quality of the resulting mixtures will depend on the
impeller geometry. Thus, it is important to understand the effects of the blade geometry
and use the right geometry for product manufacture in many industries such as
pharmaceuticals and powder metallurgy industries.
Research on the effect of geometry of a helical ribbon on mixing has been
reported for liquid mixing widely (Masiuk and Lacki 1993). For example, Masiuk et al
(1992) reported that the helix pitch and width have a perceptible influence on the

CHAPTER 2 Literature Review
2-48
mixing time and power consumption for mixing liquids. It is investigated that the axial
forces has increased by 40-50% by doubling the helical ribbon blade width while the
power consumption has remained practically constant (Bortnikov, Pavlushenko et al.
1973). Furthermore, doubling the helical ribbon width has resulted in an increase of 10%
in the power required for mixing ( l asi s i and zys i 1 0) . The lower power
consumption required for a helical ribbon mixer with a greater clearance has, but it
takes a longer time for the homogenization. On the other hand, an agitator with a
smaller clearance has exhibited a greater efficiency (Rieger, Novák et al. 1986). Thus,
the design of a blade has an essential impact on the homogenization of mixtures.
Masiuk et al. (1993) also reported that the shape of the ribbon agitator has a significant
influence on the energy required for mixing the liquid. Takahashi et al. (1988) reported
that even though the primary circulation patterns are approximately the same, the
impeller geometry can strongly affect the secondary circulation flows. The following
parametric effects have been reported for liquid mixing with a helical blade. When the
pitch of the helical blade is decreased with the wall clearance fixed, the shear rate (γ =N
Ks , Ks is a constant that is dependent only on the mixing system geometry; N is
rotational speed (rev/s)) and becomes higher as shown Figure 2.17(Delaplace, Leuliet et
al. 2000). The mixing time (t (s)) obtained for various helical ribbons agitators with
different clearance ratios c/d between blades and wall. It is clear from Figure 2.17
which shows that the mixing process is the most rapid when the narrowest clearance is
not used as shown Figure 2.18 (Delaplace, Leuliet et al. 2000).
Figure 2.17 Evolution of Metzner and Otto factor (1957) with pitch size for helical ribbon agitators found in literature(Delaplace, Leuliet et al. 2000)
Muzzio et al (2008). experimentally investigated the mixing performance of a
ribbon mixer regarding the effect of loading (layering and off-center spot loading

CHAPTER 2 Literature Review
2-49
method). It is reported that the layering method is faster in mixing and produces better
homogeneity. There are significant effects of fill level on 3 spokes 2-bladed ribbon
impeller as shown in Figure 2.15. However the effect of fill level on the mixing in a 5
spokes 2-bladed ribbon impeller is not significant as shown in Figure 2.16. However,
there is limited knowledge in the literature regarding this effect of geometrical
parameters of horizontal ribbon on granular mixing (Muzzio, Llusa et al. 2008). In
addition, there are limited studies of the effects of geometrical parameters on the mixing
of cohesive particles in a horizontal ribbon mixer.
Figure 2.18 Evolution of mixing time number with clearance wall for helical ribbon agitators found in literature(Delaplace, Leuliet et al. 2000).
2.15 Simulation method
There are several discrete modelling techniques which have been developed
such as the Monte Carlo method, cellular automata, smooth particle
hydrodynamics(SPH) and discrete element method(Berthiaux, Mosorov et al.).
2.16 Discrete Element Method
The Discrete element method (Berthiaux, Mosorov et al.) is commonly used for
investigating particle system. DEM simulation can provide dynamic information related
to particle motions such as trajectories, velocities of particles and forces acting on each
individual particle(Cundall and Strack 1979). There are two types of particle/particle
contact modeling method used in DEM, soft particle and hard particle approach. The
soft particle method was developed three decades ago. In this method, particle presumed
overlap, and the overlaps treated as deformations of particles. By the way the
interparticle forces such as elastic, plastic and friction forces are calculated. The motion
of particle is described by Newton‟s law of motion. The soft-sphere models are able to

CHAPTER 2 Literature Review
2-50
describe multiple particle contacts simultaneously. However, the hard-particle processes
collisions sequentially, one collision at a time. The collisions being instantaneous, the
forces between particles are not explicitly considered. The soft-particle methods have
been used to study various phenomena, such as particle packing, transport properties,
heaping or pilling processes, hopper flows, mixing and granulation process (Zhu, Zhou
et al. 2007).
2.16.1 Force model
The model uses two momentum conservation equations to describe the translational and
rotational motion of particle i in a system at time t subjected to the gravity g and
interactions with the neighbouring particles, blade and walls:
ii N
jijv
k
jijdijci
ii m
dtdm
1,
1,, FFFgV
(2.13)
ik
jijij
ii d
dI
1tMT
(2.14)
Fc elastic contact force, Fcn,ij and Fct,ij
Fd damping force, Fdn, ij and Fdt, ij
FV cohesive force
Tij torque
M rolling friction torque
mi, Ii, Vi, and I are mass, moment of inertia, translational and rotational velocity of
particle.
Normal contact force nF ˆ)2()1(3
23212, niijcn RE
(2.15)
Normal damping force n nVF ˆˆ)()1(2
321
212,
ijn
inijdn R
Emc
(2.16)
Tangential contact force
tt
t
i
ijcnijct
F
23
max,
max,,,
,min11
tsF (2.17)

CHAPTER 2 Literature Review
2-51
Tangential damping force ijtt
ttijcnsitijdt Fmc ,
21
max,
max,,,
1 6 VF
(2.18)
Rotational torque ijdtijctiij ,, FFRT (2.19)
Rolling friction torque ιijcnrij F ̂,M (2.20)
The non-contact force due to the van der Wall force F,ij (Thornton and Zhang 2010)
in Eq(2.13) explained as following Equations:
ijjijiji
jijivdwij RRhRhRhhRhRh
RRhRRHa nF ˆ)422()22(
)(646 2222
33
(2.21)
iji
ivdwi hRhh
RHa nF ˆ)2(
23 222
3
(2.22)
)( jiji RRRRR (2.23)
||/)(ˆ jijiij RRRRn
The formulae Eq(2.21) used for particle-particle contacts; and Eq(2.22) used for
particle-wall contacts. Ha in the van der Waals force formulae is the Hamaker constant,
which is material dependent constant. If the two contacting surfaces are of different
materials, Ha is considered as the geometric mean of the Hamaker constants, Ha1 and
Ha2 of the two contacting objects, i.e. Ha= 21 HaHa (Kruusing 2008). R is the
effective radius for a pair of spheres of radii Ri and Rj coming into interaction with each
other, which is determined by the harmonic mean, as given in Eq(2.23). For particle-to-
wall or blade contacts, the same formulae can be used with the radius of the contacting
surface Rj being set to infinity.
JKR model is used for obtaining adhesive force. It is reported that JKR model is not
good enough to describe interaction forces at the micro-scale and in addition that such
forces can be derived from the van der Waals forces (S.Alvo , Lambert et al. 2010).

CHAPTER 2 Literature Review
2-52
2.16.2 Implementation of the DEM
DEM simulation can simulate the motion of every particle in the flow and
modelling each collision between the particles and between particles and their shell of a
mixer.
The collisional forces are determined by the overlap, normal and tangential
velocities by contact force law. There are a number of possible contact force models to
approximate collision dynamics such as a linear model based on the Hook type relation,
non-linear model based on the Hertz theory and non-slip solution of theory developed
by Mindlin and Deresiewicz (Di Renzo and Di Maio 2004). We use a linear spring –
dash pot model. The normal force consists of a linear spring to provide the repulsive
force and a dashpot to dissipate a proportion of relative kinetic energy. The maximum
overlap between particles is calculated by stiffness of spring in normal direction.
Average overlaps are 5% in these simulations. The normal damping coefficient Cn is
chosen to give required coefficient of restitution ε. The total tangential force is limited
by Coulomb frictional limit μFn , at which point the surface contact shears and the
particles begin to slide over each other.
The implementation of the DEM as follows: the particles in contact need to be
determined at each time step. The two strategies such as formation of neighbour list and
use of boxing or zoning methods used for reducing the computation time(Asmar,
Langston et al. 2002). In a neighbour list method, the neighbour list is a single list that
records neighbors at each particle in the bed at any given time using particle indexes.
The particle j is considered as a neighbour of the i particle and recorded in the inventory
of particles i if the particles j falls within a sphere of ro=1.5ri as shown in Figure 2.19
The computation region is divided into cubic cells of ro width, the particle indexes are
recorded under the cell index, maintaining a single cell list(CL) for the bed in addition
to the neighbour list in the zoning method. The particles have moved by a pre-fixed
amount when the CL and NL need to be updated. The particles contacts determined
when the particles recorded in the NL, thus the duplication of contact force calculation
can be avoided(Asmar, Langston et al. 2002).

CHAPTER 2 Literature Review
2-53
(a) (b)
Figure 2.19(a) neighbour region of particles I; and (b) zoning the
neighbourhood region
The forces of each pair of colliding particles or boundary objects are calculated
using spring-dashpot model and then transformed into the simulation frame of reference.
All the forces and torques on the particles and objects are summed and the resulting
equations of motion are integrated. The trajectories of all the particles can be calculated
by integrating the Eel (2.13) and Eel (2.14) with assumption that acceleration is constant
over the time step ∆t.
2.16.3 The application of DEM
The Discrete particles simulation has been used in the particle packing, particles
flow and particle-fluid flow research for many years due to advantages of DEM that the
dynamic information such as trajectories of transient forces acting on individual
particles can be obtained which is difficult in traditional experimental techniques. The
DEM application in fundamental research and applied research of the particle flow is
reported here.
Fundamental research
The fundamental research on particle flow by DEM can be generalized. That is,
simple geometry is used to understand the confined and non-confined flow. Confined
flow, is extensively investigated experimentally and numerically to understand the
quasi-static rheological behaviour of granular materials(Zhu, Zhou et al. 2008). To
measure the bulk strength of materials, the direct shear testers are usually used. The
most popular shear tester is the Janice cell, which is one of the oldest direct shear testers
used in DEM simulation. The particle flow can be measured using annual cell which is
important shear test to measure the shear strength of soils(Howell, Behringer et al.

CHAPTER 2 Literature Review
2-54
1999). The vertical flow is always experienced in the industrial process such as in
hoppers. It is also an important fundamental study due to it is simplicity (Zhou, Yu et al.
2003; Zhou, Yu et al. 2004).
In contrast with confined flow, the unconfined flow studies can help understand
the fundamentals governing the related complex phenomena. The plane shear flow of
uniform particles in a periodic domain investigated at different cohesion(Aarons and
Sundaresan 2006). The fluctuation of the top location of a sand pile was investigated.
For the small interval, avalanches occur continuously either on the left or right side
slope of a sand piles, and the slope on which avalanches take place switches
intermittently(Urabe 2005). The vibrating flow was also investigated in terms of
convection. For example, the flow of convection cells of glass beads in two dimensional
vibrated granular flow investigated by means of DEM. The mass flow rate increased
with bed velocity in power law relation, decreased with fixed bed vibration
acceleration(Yang and Hsiau 2000).
Applied research
The Applied research on the systems considered are more related to the
operations in practice in the applied research of granular flow by means of DEM. The
particle movements are driven by gravity or external mechanical forces as a result of
interaction between particles and devices in this system. The driving force of particle
movement in Hooper is gravity force; for flow in rotating drum, the sliding friction
between particles is a driving force; the vertical force is a driving force in the cylindrical
mixer.
Hoppers are widely used in the industry due to their capacity to enhance flow
conditions for granular materials. The wall stress or pressure, discharge rate and internal
properties in Hopper have been studied by means of DEM. The orifice size and wall
roughness of hoppers, and frictional and damping coefficients between particles has
been investigated. There are four different zones in the hopper flow: a stagnant zone, a
plug flow zone, a converging flow zone, and a transition zone from plug flow to
converging flow. It is reported that the Beverloo equation can describe the relationship
between discharge rate and orifice size; however, the constants in the equation may vary
with the wall friction coefficient, particle friction and damping coefficients. It is

CHAPTER 2 Literature Review
2-55
investigated that the flow and force structures of particles in the hopper are spatially
non-uniform. In particular, porosity is high in the region near the orifice and low in the
upper part and around the bottom corner of the hopper. The particles around the bottom
corner experiences large contact forces, whereas there are small forces in the upper part
and the region near the orifice. However, there is a region above the orifice where
particles experience the maximum total interaction forces between particles; the forces
gradually propagate from this region into the bed and have a minimum value in the
central upper part. The velocity distribution, flow and force structures are affected by
the geometric and physical parameters of the hopper and particles(Zhu and Yu 2004).
Flow in the mixer
It is essential to understand reliable design of mixer and control the mixing
process for obtained controlled quality of product in the industry. DEM method is a
promising approach in this field. The particle flow, mixing, and heat transport in
granular flow system in rotating calciners and impregnators were investigated by means
of DEM. To understand the effect of granular flow and heat on the dry and calciner
performance, their properties are considered in the simulation. The heat transfer and
temperature uniformity of granular bed for both calciner and impregnator increase with
a decrease of rotation speed(Chaudhuri, Muzzio et al. 2006).
Particle mixing and transport pattern investigated both in the tumbling blenders
such as double cone and V-blender using DEM methods. The dynamics of blending
differ significantly between two tumblers, flow in the double-cone is nearly continuous
and steady, while flow in the V-blender is intermittent(Moakher, Shinbrot et al. 2000).
The influence of DEM simulation parameters such as restitution coefficient, normal
stiffness, friction coefficient on the particle behaviour in a V-mixer investigated. The
prediction and experimental results of restitution coefficient value, internal friction
coefficient values and wall friction coefficient value are quite close(Kuo, Knight et al.
2002).
In the toe blender, the mixing and segregation of spherical and free-flowing
material is investigated by using DEM. The simulation results are similar with the
experimental results. The effects of blender geometry on particle velocity and flow
pattern were investigated. The presence of hopper, bin section and axial offset greatly
improved the axial mixing rate(Sudah, Arratia et al. 2005). The DEM method is also
used to investigate qualitative visualization of the particle patterns and quantities

CHAPTER 2 Literature Review
2-56
diagnosed analysis in terms of kinetic energy, rotational energy and collisional granular
pressure within the two simplified Mechanofusion devices(Chen, Dave et al. 2004).
The DEM simulation flow of granules in a bladed mixer compared with the
experimental results of Positron emission particle tracking. PEPT is based on the
detection of gamma rays given off as a result of positron decay. The three dimensional
flow data from both experiment and simulation, made possible comprehensive
quantitative comparisons(Stewart, Bridgwater et al. 2001). The flow in a vertical blade
form a heap in front of blade and then either download on the bed surface over the blade,
and there is a recirculating zone in front of the blade(Zhou, Yu et al. 2003).
Six flow patterns of particles named slipping, slumping, rolling, cascading,
cataracting and centrifuging in a rotating drums, some of them are simulated by DEM
method. The granular flow dynamics in different six regimes were investigated by
varying the rotational speed and particle-wall sliding friction in DEM. It is investigated
that the angle repose of moving particles increased with the rotation speed in cascading
and cataracting regimes and slightly depends on the rotation speed in the slumping and
rolling regimes(Yang, Yu et al. 2008).
The power draw, linear wear rates, linear stresses and energy spectra were
investigated by DEM and compared the experimental results. DEM well predicted the
breakage rates, mill throughput, and equilibrium particle size distribution of
charge(Cleary 2001).
The flow pattern, mixing pattern and power draw, flow velocity and force field
investigated at different flow properties in the IsaMill by DEM method. The effects
relating to particle material such as sliding friction coefficient and damping coefficient;
operational parameter, rotational speed and fill level, were investigated. The flow
velocity and compressive force decreased with an increase of sliding friction. However,
the flow velocity, compressive force and power draw of mill increase with an increase
in rotational speed and loading(Yang, Jayasundara et al. 2006).
The three-dimensional motion of particles in a single helical ribbon agitator was
carried out by means of DEM and compared with experimental results. It is investigated
from DEM simulation that the vertical mixing of particles was deteriorated during
upward and downward flows through the blade and core regions. Particle flow manned
as funnel flow in the core region. The vertical velocity in the blade region decreases
toward the wall and it becomes zero near the boundary between the blade and core

CHAPTER 2 Literature Review
2-57
region. Particles were carried up to the bed surface by helical ribbon and flow down
into the center of the core. The bed height was found to be the most important factor for
mixing and circulation. The particles circulate rather regularly when the bed height is
appropriate and when the blade height is properly adjusted. The particles have higher
velocity when the blade top higher than the bed height due to high falls of particles from
blade top. However, the particles velocity in bed surface region is much lower than that
of the other region(Kaneko, Shiojima et al. 2000). There was no literature found in
relation to the particle flow analysis in ribbon mixer studied by DEM.
The DEM method was originally proposed by Cundall and Stack(Cundall and
Strack 1979), and became widely used to simulated the granular flows. This method
simulated the individual dynamics of all particles in an assembly by numerically
integrating their acceleration resulting from all the contact forces. Particle flows related
to the various industrial problems have been studied by DEM to elucidate the
mechanisms governing the dynamics of granular materials. The DEM is successfully
used in fundamental and application research as well. The advantages of DEM
simulation is obvious, as the flow pattern, velocity field, solid fraction, granular
temperature and force structure can be readily obtained compared to the conventional
studies. The effect of geometry, operation properties of the system and material
properties on the dynamic behaviour of particles flows under different conditions has
been quantified by means of DEM simulations. The limitation of the DEM is that it
cannot deal with large numbers of particles, and most of the studies have focused on
spherical particles.
2.17 Summary and Research Proposal
From the literature survey above, one can conclude that the material properties,
the operational parameter and the geometrical parameters are significantly affecting the
degree of particle mixing. When the particles mixing held with different sizes and
densities, segregation mechanisms will work along with the mixing mechanisms. It is
not very clear how to suppress the segregation mechanisms to make the mixing a
dominant one. One possibility is using different volume fractions of the mixing
materials. Another feasibility is using particles that have a combination of both size and
density differences. In the literature, there is evidence to show that correct combinations
of density, size and volume fractions can counter de-mixing processes. As shown in the
first topic if the predictability of particle mixing is based on the size and density

CHAPTER 2 Literature Review
2-58
differences of the particles in the cylindrical mixer is possible, this is necessary to
control the quality of particles based products in the industry.
The literature review shows that the research of the particle mixing in ribbon
mixer is limited. The knowledge of the effect of operational parameters on final
mixture quality is important in industrial operations. The parameters of interest here are:
operational parameters such as shaft speed and filling level; the geometrical parameters
such as pitch ratio, blade width, blade clearance, blade angle and blade number; material
properties such as particle size, density, volume fraction; and particle cohesion.
Cohesiveness plays a key role in the mixing /segregation on the granular system.
From the literature review it is evident that the effect of cohesiveness on powder mixing
is significant. However, there is almost no published work on the effect of cohesiveness
in the powder mixing in a ribbon mixer. The cohesive force between particles has been
simulated using a square-well potential method and a numerical model have been used
to characterize flow and mixing properties in a tumbling blender. This method has
ended as a demonstration of the effects of cohesiveness between particles but is rather
difficult to relate the results to a real system. Presently we are using the Hamaker
constant to represent the cohesive forces between particle pairs, which is much more
realistic than the square-well approach for dry powders. Some effects of cohesive
particles have already been demonstrated in the case of a cylindrical mixer
(Chandratilleke 2010). When the particle size decreases (or Hamaker constant increases)
the mixing has become difficult to simulate due to the increase of the simulation time.
To simulate cohesive effects in DEM in a limited time, we propose using macro particle
system to represent the micro particle system keeping dynamical similarity using
Froude number and Bond number as done under the second topic.
The literature survey shows some work has been done regarding the effects of
blade speed and fill level on the particle mixing in different mixers. The improved
mixing is obtained with an increase of blade speed and filling level up to a certain value
in cylindrical mixer. However, there is limited research about the the effects of the
operational parameters on the mixing in ribbon mixers. Third topic will be the effect of
operational parameters such as a blade speed and filling level at different cohesive
particles.
The effect of geometrical parameters on powder or liquid mixing are widely
conducted in helical ribbon mixer, experimentally and numerically, but there is limited

CHAPTER 2 Literature Review
2-59
research on the effect of geometrical parameters in horizontal ribbon mixer, though it is
used widely in the industry. Therefore, as the fourth topic, the investigation of the
geometrical effect will contribute to the knowledge of the ribbon mixer for mixer
designers.
It is well known that size, density and volume fraction affect the mixing
behaviour in different mixers, but how they will affect particle mixing in the ribbon
mixer is unknown to date. As the fifth topic, examination of predictability of the particle
mixing in a ribbon mixer will be confirmed as in the first topic.
Radial segregation and its mechanism due to the particle size and density
differences in rotating drum have been studied for many years. It is well known that the
percolation mechanism is due to density induced segregation, and buoyancy mechanism
is due to particle size differences, and these effects can counterbalance each other when
an optimum combination of size and density ratio is used. However, the predictability of
the size and density effects in a rotating drum is still not confirmed. As the sixth
research topic, the predictability of particle mixing of binary mixtures will be confirmed
as in the cases of the cylindrical and ribbon mixers.
As the tool of the investigation, we use Discrete Element Method(Cundall and Strack
1979), which is demonstrated to offer insight into mixing at the particle scale. The
following are the topics of interest in the PhD project:
Investigation of the effects of particle size, density and volume fraction on
particle mixing and establishing a correlation for predicting mixture quality in a
cylindrical mixer;
Effect of particle cohesion on mixing in a ribbon mixer;
Effect of blade speed and fill level on different cohesive mixtures in a ribbon
mixer;
Effect of geometrical parameters on particle mixing at different cohesion in a
ribbon mixer;
Investigation of the effect of size, density and volume fraction on the binary
mixture in the ribbon mixer;
Predictability of binary particle mixing in a rotating drum.

CHAPTER 3 Prediction of The Mixing Behaviour of Binary Mixtures of Particles in a Bladed Mixer
3-60
Chapter 3
Prediction of The Mixing Behaviour of Binary Mixtures of
Particles in a Bladed-Mixer
CHAPTER 3 Prediction of The Mixing Behaviour of Binary Mixtures of Particles in a Bladed Mixer
3-61
3.1 Introduction
It is important to control the quality of products manufactured from granular
mixtures in many industries, some examples of such products being tablets and capsules
in pharmaceuticals (Hilton and Cleary, 2013); high hardness composite materials for
use in cutting tools in powder metallurgy industries (Fernandez et al., 2011), plastic
materials (Metzger and Glasser, 2012; Saberian et al., 2002) and cosmetics (Delaney et
al., 2012). A proper understanding of the mixing behaviour of powders will be very
important for designing unit operations used in the manufacture of such products. There
are several particle properties that can significantly affect the mixing behaviour of
particles, the most important being the particle size and density difference (Fan et al.,
1990; Fan et al., 1975; Stephens and Bridgwater, 1978).
An increase in either of these properties will result in an increase in the tendency
for particles to segregate as observed in mixers such as rotating drums (Alonso et al.,
1991; Eskin and Kalman, 2000; Jayasundara et al., 2012; Metcalfe and Shattuck, 1996;
Xu et al., 2010), vertically-shafted cylindrical mixers (Chandratilleke et al., 2011; Zhou
et al., 2003), as well as in vibrated granular systems (Rosato et al., 1987; Shinbrot and
Muzzio, 1998; Yang, 2006). Further, it is reported that an optimum combination of the
size and density differences can minimize the free surface segregation in the case of a
rotating drum (Alonso et al., 1991). Generally, a binary mixture of particles with
uniform density but different in the size will segregate so that large particles would
collect at the periphery of the rotating drum. On the other hand, a mixture of particles
with uniform size but different density would segregate so that the denser particles
would collect at the centre of the rotating drum. Interestingly, a binary mixture where
large particles are denser shows a different behaviour. Here, both the size and density
segregation effects compete against each other resulting in good mixing (Metcalfe and
Shattuck, 1996). Similarly, Nitin et al. (2005) also investigated that powder mixing can
be improved under certain size and density combinations in the case of rotating drums.
In particular, the mixing will be improved when the size ratio rs=dheavy / dlight is
substantially larger than the density ratio rd=ρheavy / ρlight; here, d and ρ represent the
particle diameters and densities of a binary mixture, respectively.
There are several publications in the literature addressing segregation
phenomena observed in granular media, the mechanisms being described as mainly due
to percolation and Brazilian nut effect, which occur at different particle sizes

CHAPTER 3 Prediction of The Mixing Behaviour of Binary Mixtures of Particles in a Bladed Mixer
3-62
(Bridgwater et al., 1985; Hong et al., 2001; Rosato et al., 1987). In the phenomenon of
the Brazilian nut effect, larger particles move to the top of the container when a
container with two different types of particles is shaken (Rosato et al., 1987). Reverse
effect may also occur depending on the density of the particles; namely, the larger
particles can sink to the bottom (Huerta and Ruiz-Suárez, 2004; Shinbrot and Muzzio,
1998). In addition, it has been shown that percolation and buoyancy can oppose each
other if large-heavy particles and light-small particles are used in a rotating drum (Nitin
et al., 2005). Although the Brazil nut effect has been described as due to buoyancy
(Nitin et al., 2005), studies that illustrate the direct involvement of forces acting on the
particles in the segregation process are rare. For example, a previous study has shown
that the particle segregation mechanism in relation to a binary mixture in a vertically-
shafted cylindrical mixer can be likened to the vertical (buoyancy) forces acting on
particles, which are generated due to either the size or density differences or both (Zhou
et al., 2003). However, there are only a few studies that deal with the mechanisms of
mixing or segregation in vertically-shafted cylindrical mixers when both the size and
density differences of particles coexist.
It has been reported that the transition between states of mixing and segregation
due to size and density differences at a given volume fraction can be predicted for
rotating drums based on an expression (Alonso et al., 1991).The same relationship is
reported to be promising to quantitatively predict the mixing states of not only dry
particles, but also wet particles at low cohesion when the particle flow is in the
continuous flow regime (Liu et al., 2013). However, no such relationship is available in
general for cylindrical mixers. Nevertheless, a recent study has investigated separate
effects of the size and density differences on the mixing behaviour in a vertical bladed
mixer by considering the variation of only one of the differences at a time
(Chandratilleke et al., 2012). Based on the study, the two effects are interchangeable, or
the two effects produce similar mixing states, if the particle weight ratio rd rsis
matched. In other words, an equivalence between the two separate effects has been
found under the tested conditions. Nonetheless, it is not clear whether such a size and
density equivalence would generally exist or if an equation to predict these effects can
be established.
Accordingly, the combined effects of size ratio rs and density ratio rd on the
mixing behavior of binary particles are investigated here for a cylindrical bladed mixer

CHAPTER 3 Prediction of The Mixing Behaviour of Binary Mixtures of Particles in a Bladed Mixer
3-63
with a vertical shaft, using the discrete element method (Cundall and Strack, 1979). The
objectives of the study are firstly to quantify the mixture quality of binary mixtures as a
function of rs, rd and volume fraction xl, and then to find a prediction equation that
quantifies the equivalence between the size and density effects and the mechanism of
the size-density interaction. Establishing such a correlation equation will make it
possible to predict the mixing outcomes beforehand, which has not been possible except
for a rotating drum. Further, if the equation includes the effects of other variables such
as particle size, blade speed and mixer dimensions, the mixing behavior of this mixer
becomes fully predictable and new opportunities will arise. For example, one can use
the cylindrical mixer as a standard mixer, for which the mixing behavior is fully
understood. If a different mixer shows a different mixing behavior in comparison to the
cylinders, one can conclude that different mixing mechanisms are dominant in that
mixer. The concept is investigated in a future work.
The work is organized as follows. First, a brief introduction is given in sections
3.2 and 3.3 on the simulation and quantification methods of mixing, which are then
followed by the simulation conditions and procedure in section 3.4. Results of the
present study are discussed in section 3.5 and subsections therein, the focus in section
3.5.1 being the quantification of the effects of particle density, size and volume fraction
of the mixing particles. In section 3.5.2, the particle mixing mechanism is explained. In
section 3.5.3, mixing trends of effects of size and volume fractions are presented. In
section 3.5.4, the effects of size, density and volume fraction are correlated. Finally, the
conclusions of the study are presented in section 3.6.
3.2 Numerical Method
The DEM model used here is essentially that by Zhou et al. used in their study of
particle mixing in a vertically-shafted cylindrical bladed mixer (1999; 2004). It uses two
momentum conservation equations to describe the translational and rotational motion of
particle i in a system at time t, subjected to the gravity g and interactions with
neighboring particles, blades and walls:

CHAPTER 3 Prediction of The Mixing Behaviour of Binary Mixtures of Particles in a Bladed Mixer
3-64
ik
jijdijci
ii m
dtd
m1
,, FFgV
(3.1)
and
ik
jijij
ii d
dI1t
MT (3.2)
where mi, Ii, Vi and i are the mass, moment of inertia, translational and rotational
velocities of the particle respectively; k is the number of particles in contact with
particle i, Fc, ij represents the contact force which is the summation of the normal and
tangential forces. Fd,ij represents the damping force, which is the summation of the
normal and tangential damping forces at the contact point with particle j. Tij and Mij are
the torque and rolling friction torque on particle i due to particle j. Expressions for the
forces and torques in Eqs. (3.1) and (3.2) are given in Table 1.
Table 3.1 Formulae for contact forces and torques
Forces and torques
Formula Associated definitions
Normal contact force
Normal damping force
Tangential contact force
Tangential damping force
Rotational torque
Rolling friction torque
CHAPTER 3 Prediction of The Mixing Behaviour of Binary Mixtures of Particles in a Bladed Mixer
3-65
3.3 Mixing quantification method
A particle scale mixing index (PSMI) developed previously is used here for the
quantification of mixture quality because of its success in correlating the effects of
particle size and density differences (Chandratilleke et al., 2012). The index is based on
the use of the coordination number to define the particle fraction pi of one type of
particles (referred to as the target particles) in the immediate neighborhood of particle i
in a binary mixture, and the variance St2 of pi is obtained relative to the instantaneous
mean value of pi for the mixture. Next, St2 is used in the calculation of Lacey’s mixing
index M (Lacey, 1954),
)3.3(220
220
R
t
SSSSM
where ppS 120 and /12 ppSR are the variances of the fully-segregated
and fully-mixed mixed states, respectively, with p and ƞ respectively representing the
particle number ratio of the target particles to the total particle number in the binary
mixture and average particle-scale sample size for the mixture. The average sample size
is determined from the average value of the coordination number for the mixture. Here,
Ni
ii pp
NS
1
2t
2t
1 , where N is the total number of particles in the mixer, with tp
representing the average of pi at time t. In determining St2, one has to use a particle-
contact condition, which is taken as an inter-particle gap size of 5% of the small particle
diameter, to be consistent with our previous work (Chandratilleke et al., 2012).
3.4 Simulation conditions and procedure
The mixing equipment used is shown in Figure 3.1(a) and is a vertically-shafted
two-bladed cylindrical mixer. The blades have their wider surfaces vertical (or a rake
angle of 90°), and they have no clearance at the vessel base. The mixer is filled up to the
top edge of the blades as shown Figure 3.1(b), to keep the total volume of a mixture
constant. Here, 43 cases of numerical experiments are conducted, which can be
categorized into three types of experiments. In the first, density ratio rd is changed with
size ratio rs fixed at 0.5, at different values of volume fraction α (see Table 3.2). In the

CHAPTER 3 Prediction of The Mixing Behaviour of Binary Mixtures of Particles in a Bladed Mixer
3-66
second type, rs is changed with γ fixed at 0.22 at different α (see Table 3.3). In the third,
rd is changed with α fixed at 0.9, at different rssee Table 3.4). Particles are deposited
in the mixer, layer by layer until the required number of particles is generated. Initial
loading arrangement of the particles is such that large (or heavy) particles are laid on
top of the small (or light) ones as shown in Figure 3.1(b).
Table 3.2 Particle details for varying rd at three levels of xlwith rs fixed.
Table 3.3 Particle details for varying rs at different levels of α with rd fixed.
1 4 3200 1300 8 3600 6040 0.22 0.5 0.9 0.92 4 3200 2500 8 3600 6040 0.41 0.5 0.9 0.93 4 3200 3500 8 3600 6040 0.58 0.5 0.9 0.94 4 3200 4500 8 3600 6040 0.75 0.5 0.9 0.95 4 3200 6040 8 3600 6040 1.00 0.5 0.9 0.96 4 15800 1300 8 2000 6040 0.22 0.5 7.9 0.57 4 15800 2500 8 2000 6040 0.41 0.5 7.9 0.58 4 15800 3500 8 2000 6040 0.58 0.5 7.9 0.59 4 15800 4500 8 2000 6040 0.75 0.5 7.9 0.5
10 4 15800 6040 8 2000 6040 1.00 0.5 7.9 0.511 4 28800 1300 8 400 6040 0.22 0.5 72 0.112 4 28800 2500 8 400 6040 0.41 0.5 72 0.113 4 28800 3500 8 400 6040 0.58 0.5 72 0.114 4 28800 4500 8 400 6040 0.75 0.5 72 0.115 4 28800 6040 8 400 6040 1.00 0.5 72 0.1
x lcase No
Small Particles Large particlesr d r s)( 3kgml)(mmd s sN )(mmd l lN)( 3kgms ls NN /
1 4 28400 1300 9 300 6040 0.22 0.44 94.67 0.12 5 14500 1300 8 400 6040 0.22 0.63 36.25 0.13 7 5300 1300 8 390 6040 0.22 0.88 13.59 0.14 8 3500 1300 8 400 6040 0.22 1.00 8.75 0.15 4 15800 1300 9 1300 6040 0.22 0.44 12.15 0.56 5 8000 1300 8 2000 6040 0.22 0.63 4.00 0.57 7 2900 1300 8 1900 6040 0.22 0.88 1.53 0.58 8 1900 1300 8 1900 6040 0.22 1.00 1.00 0.59 4 9500 1300 9 2000 6040 0.22 0.44 4.75 0.710 5 5000 1300 8 3000 6040 0.22 0.63 1.67 0.711 7 1700 1300 8 2700 6040 0.22 0.88 0.63 0.712 8 1200 1300 8 3000 6040 0.22 1.00 0.40 0.713 4 3100 1300 9 2500 6040 0.22 0.44 1.24 0.9
14 5 1600 1300 8 3500 6040 0.22 0.63 0.46 0.9
15 7 590 1300 8 3500 6040 0.22 0.88 0.17 0.9
16 8 400 1300 8 3500 6040 0.22 1.00 0.11 0.9
x lcase No
Small Particles Large particlesr d r s)( 3kgml)(mmd s sN )(mmd l lN)( 3kgms
ls NN /

CHAPTER 3 Prediction of The Mixing Behaviour of Binary Mixtures of Particles in a Bladed Mixer
3-67
Table 3.4 Particle details for varying rd at different levels of rs with xlfixed.
(a) (b)
Figure 3.1 Schematic illustration of : (a) mixer configuration; and (b) initial loading
of particles
After the particles have settled down, the impeller is rotated from the stationary
state at a constant acceleration until it reaches a pre-set speed of 20 rpm, at which point
it continues to rotate at that constant speed.
The particle properties used are as follows: Young’s modulus E= 1107 N/m2,
Poisson’s ratio ν= 0.3, damping coefficient (for both normal and tangential) c= 0.3,
static sliding friction coefficient µ= 0.3, and rolling friction coefficient= 0.001d, where
d is the diameter of small particles if particle sizes are different. Details of the binary
mixtures are listed in Tables 3.2, 3.3 and 3.4 for the above three types of experiments,
respectively. The size ratio rs is defined as ls dd / and density ratio rd as ls / , where
s and l refer to small and large particles respectively. Volume fraction xl is the ratio of
1 5 1600 2500 8 3500 6040 0.41 0.63 0.46 0.902 5 1600 3500 8 3500 6040 0.58 0.63 0.46 0.903 5 1600 4500 8 3500 6040 0.75 0.63 0.46 0.904 5 1600 6040 8 3500 6040 1.00 0.63 0.46 0.905 7 590 2500 8 3500 6040 0.41 0.88 0.17 0.906 7 590 3500 8 3500 6040 0.58 0.88 0.17 0.907 7 590 4500 8 3500 6040 0.75 0.88 0.17 0.908 7 590 6040 8 3500 6040 1.00 0.88 0.17 0.909 8 390 2500 8 3900 6040 0.41 1.00 0.10 0.90
10 8 390 3500 8 3900 6040 0.58 1.00 0.10 0.9011 8 390 4500 8 3900 6040 0.75 1.00 0.10 0.9012 8 390 6040 8 3900 6040 1.00 1.00 0.10 0.90
x lcase No
Small Particles Large particlesr d r s)( 3kgml)(mmd s sN )(mmd l lN)( 3kgms
ls NN /
X Y
Z
f249mm

CHAPTER 3 Prediction of The Mixing Behaviour of Binary Mixtures of Particles in a Bladed Mixer
3-68
volume of large particles to the total particle volume. Note that xlrs, and rd are each
less than or equal to 1.
3.5 Results and discussion
The results of the numerical experiments are discussed as follows: in section 3.1,
the effects of rd, rs and xlare discussed; in section 3.2, the mechanism of mixing is
discussed; and in section 3.3, a predictive equation is developed to describe the trends
of the results.
3.5.1 Effects of density, size and volume fraction
Effect of density differences
The effect of rd on the mixture quality is investigated for xl= 0.1, 0.5 and 0.9, in
each case rd being varied with the size ratio rs=0.5 and density of large particles, l =
6040 kg/m3; these cases are listed in Table 3.2.
0.00
0.20
0.40
0.60
0.80
1.00
0 5 10 15 20 25
0 1 2 3 4 5 6 7
Parti
cle
Scal
e M
ixin
g In
dex,
M
Time (s)
Shaft revolutions
1
rd=0.22 0.41
0.57 0.75
0.00
0.10
0.20
0.30
0.40
0.50
0.60
0.70
0.80
0.2 0.3 0.4 0.5 0.6 0.7 0.8 0.9 1
Stea
dy-s
tate
val
ue o
f M
Density ratio, rd
xl = 0.1
xl = 0.9
xl = 0.5
(a) (b)
Figure 3.2 Mixing curves and steady state values: (a) mixing index M versus
time for different rd at rs=0.5 and xl= 0.5; and (b) effect of rd on steady-state
values of M for rs =0.5. The solid lines are the predictions based on Eq.(3.6),
which will be discussed later.

CHAPTER 3 Prediction of The Mixing Behaviour of Binary Mixtures of Particles in a Bladed Mixer
3-69
Figure 3.2 (a) shows a typical example of the effect of rd on mixing using a
diagram of mixing index M as a function of time. A large value of l is chosen here so
that the weight of large particles will counter the vertically upward buoyancy force
which causes segregation as reported previously (Zhou et al., 2003). For this xl, M
improves with a decrease in rdwhen rs=0.5. Though not shown here, similar trends
were observed at the other two xl values tested. The time for M to reach the steady state
decreases with a reduction in rd, a result observed at other xl as well. The steady-state
values of M are shown in Figure 3. 2 (b) for the tested xl values; note that the solid lines
in the figure are trend lines based on a predictive equation developed in this work which
will be discussed later. Figure 3.2 (b) shows that the mixture quality improves with a
decrease in rdat each of the volume fractions for rs=0.5. This implies that when
rdreduced, the weight of large particles gradually increases, which increasingly
suppresses the upward driving force on large particles generated due to the particular
size difference considered. This increasing trend of M is different from that observed in
the case of mono-sized particles (Chandratilleke et al., 2011; Ford, 1972), where the
mixture quality deteriorates with a decrease in rd due to the absence of the size-
difference generated buoyancy force that will counter the increasing particle weight.
Figure 3.2(b) also shows that the mixing quality at xl=0.5 is superior to those at xl=0.1
and 0.9 for any rdThis is probably related to the large porosity of the mixture, which
changes with the value of xl. For example, for smaller xl values, large particle would
find it difficult to penetrate to the vessel base through the small particles at the bottom
of the mixture. On the other hand, larger xl values would allow large particles to move
down through the mixture competing with small ones, which would normally sink to the
bottom (Zhou et al., 2003).
Effect of size differences
Figure 3.3(a) shows a typical example of the effect of size ratio rs on mixing for
xl=0.1 with rd=0.22, the other parameters being listed case 1-4 in Table 3.3. The steady-
state values of mixing index M are shown in Figure 3.3(b) for the tested xl values; note

CHAPTER 3 Prediction of The Mixing Behaviour of Binary Mixtures of Particles in a Bladed Mixer
3-70
that the solid lines in the figure are trend lines based on a predictive equation developed
in this work which will be discussed later. Although all the results are not shown here,
the mixing index M reaches a peak value quite early in the mixing process for a given
volume fraction as seen from Figure 3.3(a) and then either remains at that value or
decreases slowly to reach a steady-state.
0.00
0.20
0.40
0.60
0.80
1.00
4 8 12 16 20
1 2 3 4 5 6
Parti
cle
Scal
e M
ixin
g In
dex,
M
Time (s)
Shaft revolutions
rs=1
0.4
0.875
0.6
0.00
0.20
0.40
0.60
0.80
1.00
0.4 0.5 0.6 0.7 0.8 0.9 1
Stea
dy-s
tate
val
ue o
f M
Size ratio, rs
xl= 0.1
xl = 0.9
xl = 0.5
xl= 0.7
(a) (b)
Figure 3.3 Mixing curves and steady state values: (a) effect of size ratio rson mixing
index M for rd=0.22 at xl= 0.1 with l = 6040 kg/m3; and (b) steady-state values of
mixing index M as a function of rs. The solid lines are the predictions based on
Eq.(3.6), which will be discussed later.
Figure 3.3(b) shows that mixture quality or steady-state value of M can be
improved with an increase of rs up to 0.76 at a given xl value, but it deteriorates as rs
gets closer to 1 because there is still a density difference, rd =0.22. The figure also
shows that the mixing behaviour is similar at any xl, and the condition of (xl =0.5 and
rs= 0.76) yields roughly the maximum for M. Regarding the optimum for xl at rd =0.22,
we examine further. Figure 3.4 shows the steady-state mixing index as a function of xl
at different fixed rs values for rd =0.22. It shows that xl =0.55 is the optimum volume
fraction at a given size ratio for obtaining a maximum for M. Therefore, combining the
results of Figures 3.3(b) and 4, one can conclude that the condition of (xl =0.55 and
rs=0.76) yields the maximum M for rd =0.22.

CHAPTER 3 Prediction of The Mixing Behaviour of Binary Mixtures of Particles in a Bladed Mixer
3-71
0.00
0.20
0.40
0.60
0.80
1.00
0 0.2 0.4 0.6 0.8 1
Stea
dy-s
tate
mix
ing
inde
x
Volume fraction, xl
rs = 0.4
rs = 1
rs = 0.6
rs= 0.875
Figure 3.4 Effect of xl at different levels of rs when rd =0.22 with l = 6040 kg/m3;
the solid lines are the predictions based on Eq.(3.6).
3.5.2 Particle mixing mechanism
Velocity field
Below, the effects of rd and rs on velocity field are investigated. First, to
understand the changes in the mixing behaviour that accompanies the reduction in
density ratio, the velocity fields are examined in the horizontal and co-axial cylindrical
sections. Flow patterns in a vertically-shafted cylindrical two-bladed mixer has been
well established for mono-sized particle mixing (Zhou et al., 2004). For binary particles,
mixing patterns of a two-bladed mixer have been investigated by simulations only for
two types of mixtures where: (i) rdwhile rs=1 and, rswhile rd=1 (Zhou, Yu et al.
2003). Therefore, to illustrate the interaction of density and size differences, we
investigate below the flow patterns of the three cases of rd=0.22, 0.579 and 1 at fixed
size and volume fractions, rs=0.875 and xl=0.9, the three cases being case 15 (of Table
3.3), cases 6 and 8 (of Table 3.4), respectively.
Figure 3.5 shows the instantaneous velocity fields of scaled blade relative
velocity in horizontal sections at three different heights Z, measured from the vessel
base. Further, Figure 3.6 shows the velocity fields in vertical cylindrical sections at 50,
80 and 100 mm radii of an annular width of 4dl, which are unrolled onto a vertical plane,
where dl is the large particle diameter(Chandratilleke et al., 2010).

CHAPTER 3 Prediction of The Mixing Behaviour of Binary Mixtures of Particles in a Bladed Mixer
3-72
Figure 3.5 Instantaneous normalized blade relative velocities of particles in
horizontal sections at three heights Z measured from vessel base for different rd
with rs=0.875 and xl=0.9: blue represents velocity vectors of small particles, and
red, those of large particles.
Note that the velocity vectors of small particles are coloured blue, while those of
large particles are coloured red in both diagrams. The velocity vector of a particle
represents the scaled particle velocity relative to the blade speed at a given radial
position, and is obtained by deducting the blade speed at that radial position from the
circumferential component of the particle velocity and scaling the resulting blade
relative speed by that blade speed. Figure 5 shows that the velocity vectors of the two
types of particles are mostly of equal length in each section, meaning that both particle
types are moving at mostly equal velocities. At Z=8mm, we observe that the number of
blue vectors reduces when rdis reduced from 1 to 0.22, implying that small particles are
few at the bottom, which is consistent with the mixing improvement observed with a
reduction in rd seen from Figure 3.2(b).
color
4
2
β= 0.875γ = 0.22
color
4
2
color
4
2
color
4
2
β= 0.875γ = 0.579
color
4
2
color
4
2
color
4
2
β= 0.875γ = 1
color
4
2
color
4
2
Z= 8 mm Z= 32 mm Z= 48 mm
γ= 0.22
γ= 0.579
γ= 1
(a) rd =0.22
(b) rd =0.579
(c) rd =1

CHAPTER 3 Prediction of The Mixing Behaviour of Binary Mixtures of Particles in a Bladed Mixer
3-73
Color
4
2
γ = 0.22
r= 100 mmr= 80 mmr= 50 mm
Color
4
2
Color
4
2
γ = 0.579
Color
4
2
Color
4
2
Color
4
2
Color
4
2
γ = 1
Color
4
2
Color
4
2
Figure 3.6 Instantaneous normalized blade relative velocities in cylindrical sections
at steady-state for different rd with rs=0.875: blue represents vectors of small
particles and red, those of large particles.
In this section at Z=8mm, particles mainly have circumferential motion except at
the shaft where there is some re-circulation flows for all rdvalues tested. At Z=32mm,
more blue vectors (small particles) are visible for rd=0.22 than for the other two cases.
Re-circulation flows are observed near the shaft in front of the blades, which change a
little with rd changedAt Z=48 mm also, blue vectors (small particles) are visible for
rd=0.22 than for the other two cases, consistent with the mixing results (Figure 3.2(b)).
There are no visible changes in mixing patterns at this height due to changes in rd.
From Figure 3.6, we can confirm that small particles (blue coloured vectors)
have risen to the top of the bed in most sections in the case of rd=0.22, but they are
mostly at the bottom in the case of rd=1, which are also clear from the velocity fields in
horizontal sections. In the case of rd=0.22, one can also observe higher heaps in front of
the blade as a result of small particles rising to the top of the bed. Therefore, a formation
of a weak re-circulating flow in the heap is also observed in this case, which contributes
to mixing.
Secondly, the effect of rs on the velocity field is investigated. Figure 3.7 shows
instantaneous normalized blade relative velocity vectors of particles in horizontal
sections at three heights Z=8, 32 and 48 mm for different rsand 0.875 mm)
(a) rd =0.22
(b) rd =0.579
(c) rd =1

CHAPTER 3 Prediction of The Mixing Behaviour of Binary Mixtures of Particles in a Bladed Mixer
3-74
Z= 8 mm Z= 48 mmZ= 32mm
β= 0.6
β= 0.875
β= 0.5
color
4
2
color
4
2
color
4
2
color
4
2
color
4
2
color
4
2
color
4
2
color
4
2
color
4
2
and fixed values of rd=0.22 and xl=0.9. In the case of rs=0.5 (case 1, Table 3.2), where
the small-light particles (represented by blue coloured vectors) are larger in the number
ratio, they are collected mainly at the base in the outer part of the vessel and in front of
the blades at other heights as seen from the top row figures in Figure 3.7.
Figure 3.7 Instantaneous normalized blade relative velocities of particles in
horizontal sections at three heights for different rswhen rd=0.22 at xl=0.9; blue
arrows represent velocity vectors of small particles, and red, those of large
particles.
When rsis increased up to 0.875 (case 15, Table 3.3), the number of small
particles becomes smaller compared to the large ones, and, thus they become distributed
more uniformly in all sections, indicating better mixing in consistent with the mixture
quality curves of Figure 3.4. As for the flow patterns, the circumferential motion of
particles becomes prominent due to the influence of the large particles which are larger
in number when rsis increased, under the conditions considered.
rs=0.5
rs=0.6
rs=0.875

CHAPTER 3 Prediction of The Mixing Behaviour of Binary Mixtures of Particles in a Bladed Mixer
3-75
Force analysis: effect of rd
To explain improvement in mixing with a reduction in rd, the vertical forces on
particles are analyzed, following Zhou et al. (2003) who used these forces to explain the
segregation of particles in binary mixtures. Eq(3.4) shows the group averaged
instantaneous value of the vertical forces on one type of particles which has a total of Np
particles, and Eq(3.5) the time average of the instantaneous vertical forces, Nt being the
number of data points of instantaneous average values in time t (Zhou et al., 2003).
zijd
k
jijc
N
ii
pz FFgm
Nf
ip
)]([1,
1,
1
(3.4)
tN
zt
tz f
Nf
1
1 (3.5)
To demonstrate the behaviour of the two types of averaged forces, we first
consider the case of a uniform particle system (i.e, rd=1 and rs=1) with d=5mm,
ρ=2500kg/m3 and a total of 17500 particles, in which particles of two different colours
in equal amounts (i.e., are laid in the top-bottom arrangement initially. The
particles in both groups begin to have a downward vertical force on them as shown in
Figure 3.8(a), but with the rotation of the blades, those in the bottom group receive a
larger net upward force or an upward driving force; the instantaneous driving force on a
particle is defined here as the difference between the vertical upward and downward
forces on a particle, the upward direction being positive. On the other hand, the particles
in the top group receive a downward force, and therefore, they will sink to the bottom
while the bottom ones rise to the top, resulting in gradual mixing. As Figure 3.8(a)
shows, the driving forces on the two particle groups each will reach a common value of
zero driving force. Figure 3.8(b) shows the time-averaged driving forces of Figure 3.8(a)
based on Eq(3.5), and the difference between the forces on the two particle groups still
persists within the time span investigated. However, it is anticipated that this difference
will eventually disappear, because the instantaneous values the forces in Figure 3.8(a)
approach each other at the steady state. The result supports the observation that a system
of uniform particles in equal amounts results in a perfectly mixed state in the steady
state (Chandratilleke, Yu et al. 2011).

CHAPTER 3 Prediction of The Mixing Behaviour of Binary Mixtures of Particles in a Bladed Mixer
3-76
-10.0
-8.0
-6.0
-4.0
-2.0
0.0
0 5 10 15 20
Tim
e A
vera
ged
driv
ing
forc
e / P
artic
le w
eigh
t
Time (s)
Top group
Bottom group
-10.0
-8.0
-6.0
-4.0
-2.0
0.0
2.0
0 5 10 15 20
Ave
rage
driv
ing
forc
e / P
artic
le w
eigh
t
Time (s)
Top group
Bottom group
(a) (b)
Figure 3.8 The driving force on particles in a uniform system particle of d=5mm,
ρ=2500kg/m3 and 17500 particles, laid initially in top-bottom arrangement: (a),
instantaneous group-averaged driving force, and (b) time–averages of the driving
forces in Figure 3.8(a).
In order to further understand the mechanism of mixing improvement in binary
particle mixtures, the vertical driving forces on particles are investigated from the start
of the mixing process for the cases, rd=0.22, 0.41, 0.578 and 0.75 when rs=0.5 and
=0.9 (Table 1: cases 1, 2, 3 and 4). The instantaneous driving forces on the two groups
of particles are shown in Figure 3.9 (a) just for the cases of rd =0.22 and 0.75 for clarity,
and the time-averaged upward driving forces for the two groups are shown in Figure3. 9
(b) for all the above cases of rd. First, Figure 3.9 (a) shows that the top group of (large-
heavy) particles initially have a larger driving force downwards than the bottom group.
As a result, these will penetrate into the small particle group eventually. The snapshot of
Figure 3.10 (a) shows that large-heavy particles have in fact penetrated into the small
particle group in the heap in front of the blade (see the circled area). In other parts of the
mixture as well, for example behind the blade, one can see small particles in the spaces
between the large ones as seen from Figure 3.10 (b), although the small particles were
initially at the bottom of the vessel. With the lapse of time, the difference between the
two forces gradually disappears, the scaled forces reaching a steady-state value of about
-0.995, which is mostly the same in both cases. In fact, the trace of the instantaneous
force for rd=0.75 is slighly above that for rd=0.22 when mixing is taking place; the
traces for top group, where the properties are not varied, are mostly identical.

CHAPTER 3 Prediction of The Mixing Behaviour of Binary Mixtures of Particles in a Bladed Mixer
3-77
-1.010
-1.005
-1.000
-0.995
-0.990
-0.985
0 4 8 12 16 20 24 28 32
Ave
rage
driv
ing
forc
e/ P
artic
le w
eigh
t
Time (s)
Top group (Heavy-large)
Bottom group (light-small)r
d=0.22
rd=0.75
rd=0.22
rd=0.75
-1.050
-1.040
-1.030
-1.020
-1.010
-1.000
-0.990
-0.980
4 8 12 16 20
rd=0.22
rd=0.41
rd=0.57
rd=0.75
Tim
e-av
erag
ed d
rivin
g fo
rce
/ Par
ticle
wei
ght
Time (s)
Top-group
Bottom-group
(a) (b)
Figure 3.9 The driving forces on the two types of particles as a function of time for binary
particle mixtures with rs =0.5 and xl =0.9: (a), instantaneous group-averaged driving force
for rd=0.22 and 0.75; and (b), the time-averaged vertical forces for the cases of rd=0.22,
0.41, 0.579, and 0.75 (see Table 3.2: cases 1, 2, 3 and 4).
The time-averaged curves of these two instantaneous group-averaged forces are
shown in Figure 3.9 (b), for example, by the solid upward triangles for rd=0.22. The
initial difference of the two forces, which provides the driving force for mixing, persists
in the averaged force curves although the instantaneous values have converged to a
common value of -0.995 in the steady-state. However, over a longer period of time, the
time-averaged forces of any rd will also converge to about the same value as the
instantaneous forces (i.e. -0.995); this can be stated because the instantaneous forces for
rd=0.41 and 0.57 also converge to about -0.995 although not shown here. It can be seen
from Figure 3.9(b) that the time-averaged forces on the bottom (or light-small) particle
group have almost reached the steady-state at larger times, but those on the top (or
heavy-large) particle group are still gradually approaching the steady-state value even at
20s. Therefore, the initial difference of the driving forces on the two groups persists
over a long period of time, confirming the fact that the initial driving force differences
probably have a strong influence on the mixing behaviour (Zhou et al., 2003).
Figure 3.9(b) shows that the bottom (small-light) particle group receive a larger
time-averaged upward driving force than the top (large-heavy) particle group initially,
promoting mixing. This can be confirmed from the snapshot of Figure 3.10(a), where

CHAPTER 3 Prediction of The Mixing Behaviour of Binary Mixtures of Particles in a Bladed Mixer
3-78
small particles are seen to have moved to the upper parts of the particle bed pushed by
the large ones. Note that smaller particles would have sunken to the bottom causing
segregation if the density ratio is unity as reported previously (Zhou et al., 2003). Thus
the interaction of size and density differences has caused the driving force on small
particles to be larger than those on the large particles.
(a) (b)
Figure 3.10 Snapshots showing the buoyancy and percolation effects of particles
t= 5.11s; (a) heavy -large particles penetrate into small particles over blade (buoyancy);
and (b) small particles percolation; arrow shows the direction of blade motion.
Further, it can be seen from the figure that the difference between the time-
averaged forces become larger compared to that for rd=0.75 when rdis reduced.
Therefore, the improvement in the mixing behaviour with a reduction of rd can be
generally explained using the driving forces, which is observed in mixing index results
and supported by the velocity fields. However, the number of small particles being
small at xl=0.9, the sensitivity of the time-averaged forces to changes in rdis not large
therefore we cannot observe much change in the difference between the initial time-
averaged forces with a change in rdfrom 0.22 to 0.57.
3.5.3 Mixing trends: Effects of rs and xl
Another trend yet to be explained is the change of mixture quality with the size
ratio at fixed values of rdand xl as shown in Figure 3.3 (b). When particle size ratio rs
is increased with xl fixed, the particle number ratio of small to large particles Ns/Nl
decreases as seen from Table 3.4 because the total particle volume is kept constant.

CHAPTER 3 Prediction of The Mixing Behaviour of Binary Mixtures of Particles in a Bladed Mixer
3-79
Therefore, the size effect of Figure 3.3(b) is a manifestation of the interaction of size
and density differences as well as the effect of changes in the particle numbers. At small
size fractions, the small particles are large in number, and as a result, large-heavy
particles (at a small rd such as 0.22) can penetrate into segregated small-particles
groups as seen from the density effect above, Thus, mixing is improved at small size-
ratios. However, when the size ratio increases, small particles become reduced in their
numbers and the weight of large particles becomes smaller, and thus the improvement
in the mixing due to large particles penetrating into segregated small particle groups
becomes weaker. Therefore, the mixing reaches a maximum value at some size ratios.
When the size ratio further increases and approaches unity, the effect of size difference
disappears and the density effect becomes dominant. Therefore, particles will tend to
segregate by the dominant density effect, and mixture quality decreases. The above is a
possible explanation of how the mixing index at steady-state shows a peak value against
the changes in the size ratio at a fixed volume fraction. Yet another trend to be
explained is the variation of mixture quality with xl when both rs and rd are fixed as
shown in Figure 3.4. It shows that there is a peak value when rs and rd are fixed. When
the volume fraction is increased under the above conditions, small particle numbers
decrease (see Table 3.4, for example). At low volume fractions, large particles will find
it difficult to penetrate through the small particle bed, which has smaller interstitial
spaces, and thus, mixing is poor. Conversely, when the volume fraction is high, small
particles are few in their numbers compared to the large ones, and thus, large particles
cannot penetrate in small particle regions, leading to segregation. However, at
moderately high volume fractions, the small particle number is large enough and large
particles with higher density (or for lower rd) can penetrate into small particle regions
improving mixing; the larger the value of rd the smaller the penetration of large
particles and thus, the mixture quality as seen from Figure 3.10. Thus, the observed
peak in the mixture quality with a change in volume fraction can possibly be explained
as above.

CHAPTER 3 Prediction of The Mixing Behaviour of Binary Mixtures of Particles in a Bladed Mixer
3-80
3.5.4 Formulation of a predictive equation
The above results show that xl, rs and rdaffect the mixing behaviour of binary
mixture of particles. It has been reported previously that it is possible to represent the
effect of rs for a binary system of rd=1 and effect of rd for rs=1 system by a single
characteristic curve using the particle weight ratio rd (rs3) in the case of xl=0.5. Here a
first assessment is made to seek a predictive equation for the effects of size, density and
volume fractions using the data points shown in Figures 3.2 and 3.3. A second order
polynomial of three variables with 7 unknown coefficients is used for fitting the dataset
using ‘FindFit’ function of Mathematical software, which results in the equation:
(3.6)
Note that Eq. (3.6) has been chosen so that it can represent the trends of steady-
state values of M (see, Figures. 3.2, 3.3 and 3.44) when either rd or rs or xl is changed
with the other two variables fixed. An interaction term rd rs has also been included to
account for the improvement in M due to the interaction between rd and rs when xl is
fixed, as seen from Figure 3.2(b).
The solid lines of Figures 3.2(b), 3.3(b) and 3.4 show the trends of the effects of
rd, rs , xl as predicted by Eq.(6) respectively. The figure confirms that the general trends
of the data can be described by the predictive equation. However, some deviation can
be observed at smaller values of rd (i.e. rd<0.4) as seen from Figure 3.2(b); for rd>0.4;
the predictions are reasonably good. In addition to the above comparisons, predicted
effect of size ratio rs on the steady-state mixing index in the case of uniform density
system, rd =1 is shown in Figure 3.11 at different volume fractions xl. In reality, mixture
quality at xl=0.5 for a uniform system (i.e. rd =1 and rs=1) should be unity, but Figure
3.11 shows that the mixture quality at rs=1 is slightly less. However, the figure confirms
that the mixture quality deteriorates at a given value of xl with a reduction in the size
ratio, which is a similar to the trend reported elsewhere(Chandratilleke et al., 2012).
Therefore, the developed predictive equation is successful in predicting not only size-
density interactions, but also mixture quality of a system with uniform density.
dssslldlds rrrrxxrxrrM 8.098.374.283.163.142.024.1),,( 222

CHAPTER 3 Prediction of The Mixing Behaviour of Binary Mixtures of Particles in a Bladed Mixer
3-81
0.00
0.20
0.40
0.60
0.80
1.00
0.4 0.5 0.6 0.7 0.8 0.9 1
Pred
icte
d st
eady
-sta
te m
ixin
g in
dex
Size ratio, rs
xl= 0.1
xl = 0.9
xl = 0.5
xl= 0.7
Figure 3.11 Predicted effect of size ratio on steady-state mixing index at different values
of volume fractions xl when rd =1.
To demonstrate the predictions of the size and density effects by Eq.(3-6) at a
given volume fraction, contour plots are drawn for M of Eq.(3-6) at three different
volume fractions as shown in Figure 3.12.
(a) (b) (c)
Figure 3.12. Contour maps using Eq.(3-6), demonstrating the equivalence of size and
density effects at different volume fractions: (a) xl=0.1, (b) xl=0.5 and (c) xl=0.9.
It is clear that one can choose at given volume fraction many size-density
combinations on a contour so that they will produce the identical M value. Therefore,
mixtures with such size-density combinations can be considered equivalent in that they
produce identical mixing states. The figure also demonstrates that the mixture quality is
larger when both rs and rd are close to 1 at a given xl value. The equation in this form

CHAPTER 3 Prediction of The Mixing Behaviour of Binary Mixtures of Particles in a Bladed Mixer
3-82
will be useful in predicting mixing behaviour of binary particles in a wide range of size
and density combinations for volume fractions ranging from 0.1 to 1 at the shaft speed
used in the study.
0.55
0.60
0.65
0.70
0.75
0.80
0.4 0.5 0.6 0.7 0.8 0.9 1
M=0.8; xl=0.5
M=0.5; xl=0.1
M=0.7; xl=0.9
r s
rd
Figure 3.13 Equivalence of size and density effects at a given mixture quality M and
volume fraction xl
Effects of variables such as material properties, blade geometry and vessel scale
on mixing behaviour also need to be addressed in future works. Figure 3.13 shows the
equivalence of the size and density effects at three different xl values for three different
mixture qualities. The curves are in fact the same as the contours of M=0.5, 0.7 and 0.8
in Figure 3.12 and can be obtained by solving Eq.(3.6) for either rs or rd for given
values of xl and M.
3.6 Conclusions
The effects of particle size, density and volume fraction on the mixing behaviour
of binary particles in a vertically-shafted bladed mixer have been studied by means of

CHAPTER 3 Prediction of The Mixing Behaviour of Binary Mixtures of Particles in a Bladed Mixer
3-83
the discrete element method. The mixing states of the mixtures are analyzed by a
particle scale mixing index to avoid sampling issues of conventional mixing indexes,
and the fundamentals underlying the effects on micro-dynamics are investigated
focusing on velocity fields and inter-particle forces of the mixtures. The following
conclusions can be drawn.
The effects of size and density are predictable and can be correlated within the
scope of this study. Binary particle mixtures show a maximum mixture quality at
an optimum size ratio when both density ratio and volume fraction are fixed.
Mixtures also show a quality improvement if the density ratio is reduced with
the size ratio and volume fraction fixed, for a given combination of size and
density ratio, a volume fraction of 0.5 gives the highest mixture quality for a
binary particle mixture.
Forces on particles play a major role in the mixing and segregation mechanism
in the mixer when there are differences in either the particle size or density or
both. Particles in a binary mixture will segregate when there is only either a size
or density difference. On the contrary, combinations of size and density
differences can improve mixing. For example, if the density of the large particles
is chosen large enough to counter the upward forces on them, the light-small
particles will receive a larger average vertical upward force consistently, pushing
them on top of the large ones, leading to an improved mixing behaviour.
A correlation has been established for predicting the mixing behaviour of binary
particles at different size and density ratios and volume fractions. The
relationship can predict well the effects of size and density differences and
volume fraction of binary particle mixtures. Particularly, this relationship is
suitable for use at density ratios larger than 0.4. The regression coefficient of the
equation is about 0.94.
The availability of a predictive relationship for mixing in the cylindrical mixer
makes it suitable to be considered as a standard mixer in studies of particle
mixing. The mixer also has the advantage that its geometry is simple and is

CHAPTER 3 Prediction of The Mixing Behaviour of Binary Mixtures of Particles in a Bladed Mixer
3-84
known to provide complete mixing for uniform particles. The correlation can be
used to study, for example, effects of particle properties on mixing behaviour.
Nomenclature d Particle diameter, (mm) dl Large particle diameter, (mm) ds Small particle diameter, (mm) E Young’s modulus, (N/m2) Fc,ij Contact force vector between i and j, (N) Fd,ij Damping force vector between i and j, (N)
zf Average vertical force on one type of particles (N) t
zf Time average of the instantaneous vertical force zf in time t, (N) g Acceleration due to gravity, (m/s2) Ii Moment of inertia of particle i, (kg m2) ki Number of particles in contact with particle i, (-) M Particle-scale mixing index defined in Eq.(3) , (-) Mij Vector of rolling friction torque on particle, (Nm) Mp Predicted mixing index at steady-state, (-) N Total number of particles in the mixture, (-) Nt The number of sample/data points of instantaneous average values in time t, (-) p Number ratio of the target type particles to all the particles, (-) pi Particle fraction of a target type particle in the neighbourhood of particle i, (-)
tp Average value of pi at time t for the entire mixture, (-) rs Size ratio ls dd / , (-) rd Density ratio ls / , (-) S0 Standard deviation of pi at fully-segregated state, (-) SR Standard deviation of fully-mixed state for uniform-sized particles of particle fraction of p, (-) St Standard deviation of pi with respect to tp at time t, (-) Tij Vector of rolling friction torque on particle i, (Nm) Vb Blade speed, (m/s) Vi Velocity of particle i, (m/s) xl Volume fraction, which is ratio of volume of large particles to total particle
volume (-)
z Height from vessel base, (mm)
Greek letters
Average particle-scale sample size for the mixture, (-)
ik Number of particles in contact with particle i Density of particles of a uniform system, (kg m-3)
l Density of large particle, (kg m-3)

CHAPTER 3 Prediction of The Mixing Behaviour of Binary Mixtures of Particles in a Bladed Mixer
3-85
s Density of small particle, (kg m-3) Shaft rotational speed, (rad/s) i Angular velocity vector of particle i, (rad/s)

CHAPTER 4 Effects of Particle Cohesion on Mixing in a Ribbon Mixer
4-86
Chapter 4
Effects of Particle Cohesion on Mixing in a Ribbon Mixer

CHAPTER 4 Effects of Particle Cohesion on Mixing in a Ribbon Mixer
4-87
4.1 Introduction
Generally, the cohesive particles can be divided into two groups, one with dry
particles where particle sizes is generally less than 10m and the cohesion is due to the
van der Waals force, and another with wet particles where the cohesion is originated
from capillary forces. Mixing processes involving dry fine solid particles play an
important role in manufacturing processes used in many industries that produce
products such as pharmaceuticals, semiconductors, food, ceramics, fertilizers,
petrochemicals and cosmetics. However, at present, there is only a limited
understanding of the cohesive effects on the mixing behaviour of dry fine particles in
industrial mixers (Chaudhuri, Mehrotra et al. 2006), particularly in relation to the
pharmaceutical industry where ribbon mixers are used for powder mixing purposes
(Muzzio, Llusa et al. 2008).
Discrete element method (Cundall and Strack 1979) has been used in the
investigation of cohesion effects on particle mixing. For example, effects of cohesion of
dry particles on the mixing rate and mixture uniformity have been investigated for
uniform and binary particle systems using rotating drums, with the assumption that the
cohesion can be represented by a square-well potential (Chaudhuri, Mehrotra et al.
2006). They found that some degree of cohesion can improve the mixture quality.
Further, cohesive effects on particle mixing have also been studied for a vertically-
shafted cylindrical mixer, which was scaled down to a miniature size to implement the
van der Waals force on particles of 100m diameter (Chandratilleke, Yu et al. 2009).
The study showed that the mixing can deteriorate at high cohesion between particles
and particles as well as particles and walls, when the blades would simply slice through
the particle bed without any mixing happening. Such results are also supported by the
experimental work of Knight et. al., who used the wider surfaces of horizontal blades in
a cylindrical mixer to avoid the occurrence of such bed separations (Knight, Seville et al.
2001).
In practice, a wide range of bladed batch mixers are used for powder mixing,
some such mixers being the orbiting screw (or Nauta) mixer, paddle mixer and ribbon
mixer (Poux, Fayolle et al. 1991). The ribbon mixer is of particular interest in this study
because it is capable of effectively performing a wide range of mixing processes
including blending of liquids, solids and solids-liquids (Cleary 2013). Muzzio et al.

CHAPTER 4 Effects of Particle Cohesion on Mixing in a Ribbon Mixer
4-88
(2008) described the ribbon mixer as an ideal mixer for cohesive mixing as it provides
large shear stresses in all three directions, axial, radial and tangential. Nevertheless the
effect of cohesion on particle flow has not been investigated for this mixer at a
microscopic level. However, some works related to cohesive particle behaviour are
available for other mixers in the literature. Generally, it is reported that the initial
loading pattern, fill level, mixing time, mixer geometry, material properties and impeller
speed significantly affect the quality of cohesive mixtures (Tsuji, Kawaguchi et al. 1993;
Cleary 2000; Sudah, Coffin-Beach et al. 2002).There are quite a few published works
related to mixing in vertical helical ribbon mixers regarding the effects of the fill level,
mixing time, power consumption, heat transfer and impeller geometry due to cohesion
in wet and dry particle systems (Ford 1972; Bortnikov, Pavlushenko et al. 1973; Rieger,
Novák et al. 1986; Masiuk 1987; Poux, Fayolle et al. 1991; Masiuk, Lacki et al. 1992;
Masiuk and Lacki 1993; Delaplace, Leuliet et al. 2000; Dieulot, Delaplace et al. 2002;
Shekhar and Jayanti 2003; Niedzielska and Kuncewicz 2005). Conversely, publications
on powder mixing in horizontal ribbon mixers regarding the effects of fill level, or blade
speed on the homogeneity are rare, one such publication being that of (Muzzio, Llusa et
al. 2008) who investigated experimentally the effects of mixing Magnesium Stearate
powder in a ribbon mixer. However, the effects of cohesion on the particle flow in
ribbon mixers have not been studied so far. The objectives of this study are the
quantification of the particle cohesion effects on the particle flow and mixing at a
particle-scale level for a ribbon mixer.
This paper is organized as follows. First, a brief introduction is given in section
4.2 on the simulation and in section 4.3 mixing quantification methods, which is then
followed by the simulation conditions and procedure in section 4.4. In section4. 5,
results of the present study are discussed, focusing on the comparison of micro and
macro system of the effects of particle cohesion on mixing in section 4.5.1. The
cohesion effect on particle mixing in macro system are investigated in section 4.5.2.
The cohesive particle flow behavior is explained using the particle scale mixing index ,
coordination number, velocity field and porosity of the mixture at different levels of
cohesion. The quantification of the radial, tangential and horizontal velocity at different
levels of cohesion is described. The shear and normal stress the particles encounter are
quantified. Finally, the conclusions of the study are presented in section4.6.

CHAPTER 4 Effects of Particle Cohesion on Mixing in a Ribbon Mixer
4-89
4.2 DEM simulation
The model of the discrete element method used here is based on an extension to
the original DEM model proposed by Cundall and Strack(1979) to account for the
rolling friction of particles, and is essentially the same as that previously developed and
validated by Zhou et al. (1999; 2004). The model uses two momentum conservation
equations to describe the translational and rotational motion of particle i in a system at
time t subjected to the gravity g and interactions with the neighboring particles, blade
and walls:
ii N
jijv
k
jijdijci
ii m
dtdm
1,
1,, FFFgV
(4.1)
ik
jijij
ii d
dI1t
MT (4.2)
Here mi, Ii, Vi and i are the mass, moment of inertia, translational and rotational
velocities of particle i respectively; ki is the number of particles that are in contact with
particle i, Fc,ij represents the elastic contact force which is the summation of the normal
and tangential forces. The tangential force Fd,ij represents the damping force, which is
the summation of the normal and tangential damping forces respectively at the contact
point of particle i with particle j. Tij and Mij are the torque and rolling friction torques on
particle i due to particle j. The contact model used here is the Hertz non-linear contact
model(Zhu, Zhou et al. 2007) and the expressions for the forces and torques in Eqs.(4.1)
and (4.2) can be found in Table 4.1. F,ij represents non-contact force due to the van der
Wall force, and the formulae used are tabulated in Table 4.1. Ha in the van der Waals
force formulae is the Hamaker constant, which is material dependent constant. If the
two contacting surfaces are of different materials, Ha is considered as the geometric
mean of the Hamaker constants, Ha1 and Ha2 of the two contacting objects, i.e. Ha=
21 HaHa (Kruusing 2008). R is the effective radius for a pair of spheres of radii Ri
and Rj coming into interaction with each other, which is determined by the harmonic
mean, as given in Table 4.1. For particle-to-wall or blade contacts, the same formulae
can be used with the radius of the contacting surface Rj being set to infinity.

CHAPTER 4 Effects of Particle Cohesion on Mixing in a Ribbon Mixer
4-90
Table 4.1 Formulae for non-contact forces
Force Equation
Particle-particle non-contact force
ijijijnnnnij RYRY nnvF ˆˆ~1~13
22
2/32
ssssnijs
sij ξFF ˆ/,min11 2/3
max,max,
ijjijiji
jijivdwij RRhRhRhhRhRh
RRhRRHa nF ˆ)422()22(
)(646 2222
33
iji
ivdwi hRhh
RHa nF ˆ)2(
23 222
3
where: ||/)(ˆ jijiij RRRRn , )( jiji RRRRR ,
nss )~1(2~2max, , ||/ˆsss ξξξ
4.3 Mixing quantification method
A particle scale mixing index (PSMI) developed previously is used here for the
quantification of mixture quality because of its success in correlating effects of size and
density differences of particles despite the changes in the sample sizes (Chandratilleke,
Yu et al. 2011). The index is based on the use of the coordination number to define the
particle fraction pi of one type of particle (referred to as the target type particle) in the
immediate neighborhood of particle i in a binary mixture, and the variance St2of pi is
obtained relative to the instantaneous mean value of pi for the mixture.
2
1
2 )/( ppwwS iTi
N
it
(4.3)
where N is the total number of samples, which is here equal to the total number of
particles, and wi/wT is a weighting factor with wi = Ni/N and
N
iiT ww
1
, where Ni is
the total number of particles in a sample. Next, St2is used in the following formula of
Lacey’s mixing index, M to obtain the instantaneous mixing index for the mixture:
220
220
R
t
SSSSM
(4.4)

CHAPTER 4 Effects of Particle Cohesion on Mixing in a Ribbon Mixer
4-91
where, ppS 120 and /12 ppSR are the variances of the fully-segregated
and fully-mixed states respectively, with p and ƞ representing the particle number ratio
of the target type particles to the total particle number in the binary mixture and average
particle-scale sample size for the mixture, respectively. Where n is the instantaneous
average particle-scale sample size, which is equal to and rounded to the nearest number
the average sample size ƞ is equal to
N
ii NN
1
, at any given instant. In determining St2,
one has to use a particle-contact condition, which is taken as an inter-particle gap size
of 5% of the particle diameter to be consistent with our previous work (Chandratilleke,
Yu et al. 2011)
4.4 Simulation conditions and procedure
The ribbon mixer used in this simulation is as shown in Figure 4.1. The impeller
has a horizontal shaft and two helical blades starting from each end, but spiralling in
opposite directions. It is placed axially in a horizontal-axis cylindrical vessel, the
dimensions of which and other input values for DEM simulations are shown in Table
4.2. The dimensionless Bond number, Bo is used for quantifying the cohesiveness of the
particles, which is defined as the cohesive force divided by particle weight for particle-
particle or particle-wall contacts. Note that Bo given in the text is only a representative
value of cohesiveness because it has been calculated using a cohesive force for h=10-9 m,
h being the gap between the two interacting surfaces (see Table 4.3). The cohesive force
increases with a reduction in h, but is assumed to remain constant at a value
corresponding to h=10-9 m even if the two interacting surfaces form an overlap.
Cohesive particle mixing systems can be simplified for the purpose of
simulations in two ways: one is scaling down the mixer, so that the particle size
represents the actual particle size and a reasonable amount of particles can be
considered for the simulations. This system is named the micro system here. The
disadvantage of this method is that the time-step of the simulations can be very small
that the simulations take a long time to complete. The other method is to use the actual
mixing vessel size with the particles being considerably larger than the actual powder
particles. This system is named the macro system here. The advantage of this system is
that the time step can be increased and computation time reduced. The cohesiveness of
large particles based on van der Waals force is very large (see Eqs. in Table 4.1), but Bo

CHAPTER 4 Effects of Particle Cohesion on Mixing in a Ribbon Mixer
4-92
number becomes very small due to their large weight. Therefore, we match Bo number
of the macro system to that of micro system by adjusting Ha values of the macro-system,
where Ha is the Hamaker constant of materials involved.
The simulation conditions for the micro and macro systems are shown in the
Table 4.3. The particle diameter D of the macro system is chosen as 15mm to limit the
number of particles in the system, while D of the micro system was set to 100m to be
consistent with our previous study on cylindrical mixers (Chandratilleke, Yu et al.
2009). The micro-system is the 1/150 scaled-down model of the actual vessel and
particle sizes. The shaft speed is set to 100rpm in the macro-system, and that of the
micro system is calculated matching the Froude numbers (Fr= D2/g) of the two
systems, and is found to be 1220 rpm. Bo numbers used for the micro and macro
systems are listed in Table 4.3 for particle-particle (P-P) and particle-wall (P-W)
contacts. They are calculated as described in Section 2.1. Note that Bo for P-W contacts
is fixed at 0.2 instead of keeping the wall Ha constant, to avoid variation of wall
cohesion when particle cohesion is varied in the simulations. Therefore, the wall Haw
varies when Hap is varied.
The time step of the simulations for the macro-system is set to 2.9x10⁻⁶s based
on the time step criterion (Tsuji, Kawaguchi et al. 1993). On the other hand, the time
step for the micro-system is set to 10-7s. Note that the density of particle material for the
macro system has a reduced value of 417 kg/m3, which was selected after several trial
simulations to avoid momentum effects of the large particle collisions on the mixing
behaviour. Granular (hydro-static) pressure (Remy, Khinast et al. 2009) suggests that
material density of particles in the micro-system needs to be increased as much as the
scaling factor to keep the pressures of the systems equal. Maintaining similar pressures
in the two systems may be necessary to have a similarity in the particle motion in the
two systems. Thus, the material density of particles in the micro system was chosen as
8000 kg/m3 after some trial DEM simulations to investigate changes in time-variation of
the mixing index. To investigate the mixing performance of the mixer, particles of equal
numbers are deposited in the side-by-side arrangement in the axial direction Figure
4.1(b). The mixture quality is quantified by the particle scale mixing index M described
above. The particle properties used are listed in Table 4.1.

CHAPTER 4 Effects of Particle Cohesion on Mixing in a Ribbon Mixer
4-93
Table 4.2 Simulation Input variables and their values
Input variable Value Vessel diameter Vessel length
216 (mm) 970 (mm)
Blade pitch 484 (mm) Blade width 70 (mm) Shaft diameter 31.75 (mm) Rake angle 45°, 135° Blade gap 8.5 (mm) Particle number 18000 Particle dia., d 15 mm Shaft speed, w rpm 100 rpm Young’s mod. E 1108 N/m2 Poisson’s ratio, 0.29 s(P-P) (P-W) 0.3 R (P-P) (P-W) 0.002 Damping Coefficient 0.3 Time step 2.910-6(s) Particle material Thermoset Polyurethane Foam (unreinforced) Shear strength 16 MPa Tensile stress 0.24-103 MPa
Table 4.3 Input values for the macro and micro systems
Macro system Micro system
Hamaker Constant, Hap (J) 5.5E-18 5.5E-17 5.5E-16 3.94e-22 3.94e-21 3.94e-20
Hamaker Constant, Ha(w-p) (J) 8.8E-19 2.8E-18 8.8E-18 2.46e-23 7.79E-23 2.46E-22
Van der wall force (N) 1.7E-03 1.7E-02 1.7E-01 8.21E-10 8.21E-9 8.21E-8
Bo number 2.0E-02 2.0E+01 2.0E 0.02 0.2 2
Particle radius (m) 7.50E-03 5.00E-05
Particle density (kg/m3) 4.17E+02 8.00E+03
shaft angular velocity (rpm) 1.00E+02 1.22E+03
Mixer length (m) 9.70E-01 6.47E-03
Mixer radius (m) 2.16E-01 1.44E-03
h (m) 1.00E-09 1.00E-09

CHAPTER 4 Effects of Particle Cohesion on Mixing in a Ribbon Mixer
4-94
Table 4.4 Bond number for a single contact at different values of Hamaker constant.
Bond number (P-P)
Bond number (P-W)
Hamaker Constant, Hap (J)
Hamaker Constant Hap-w(J)
20.0 0.2 5.55E-15 2.77E-17 14.0
3.88E-15 2.32E-17
8.0
2.22E-15 1.75E-17 2
5.54E-16 8.76E-18
0.2
5.54E-17 2.77E-18 0.02
5.54E-18 8.76E-19
(a) (b)
Figure 4.1 Impeller configuration and initial particle deposition layout
4.5 Results and Discussion
A comparison of the particle mixing behaviours in micro and macro systems is
carried out here using mixing index, coordination number, velocity and contact forces in
the section 4.1. In section 4.2, cohesive effects are investigated using the macro system.
4.5.1 Comparison of micro and macro systems
It is essential to confirm the validity of using the macro system, where the
particle size is 150 times that of the micro system, for investigating the effect of particle
cohesion. The use of the macro-system has an advantage in that the time steps in DEM
simulations can be increased considerably, thus reducing the computation time. To
obtain the dynamic similarity between the two systems, we have imposed the
geometrical similarity while, at the same time, matching Froude numbers and Bo
numbers of the two systems. Below, we compare mixing index, overall coordination
number, flow pattern, particle velocities and contact forces of the two systems.
pitch
width
45°135°

CHAPTER 4 Effects of Particle Cohesion on Mixing in a Ribbon Mixer
4-95
4.5.1.1 Mixing Index
Figure 4.2 shows the mixing curves for the micro and macro systems at three
different Bo numbers, 0.02, 0.2 and 2. Figure 4.2(a) shows that the mixing index and
mixing rate of the micro and macro system are quite identical when the Bo=0.02, which
is almost non-cohesive. Note that particle densities of macro and micro systems are 417
and 8000 kg/m3 respectively. When the cohesion of particles is increased, the mixing
rate for macro system becomes slower and the difference between the mixing curves for
the two systems at a given Bo number increases as seen from the figure. However, the
steady-state values are mostly the same. The observation implies that the effect of
particle material density is different depending on the cohesion or Bo number, which
will be discussed later under velocity field.
Below, the case of Bo=0.02 is further investigated using coordination number
variations, particle flow, and velocity and force distributions. There may be differences
between the two systems if one compares the variation of a variable such as particle
velocity or contact forces, but average values for the particle bed should be similar.
0.000
0.200
0.400
0.600
0.800
1.000
0 20 40 60 80 100
Micro_systemMacro_system
Parti
cle
Scal
e M
ixin
g In
dex
Revolutions
0.000
0.200
0.400
0.600
0.800
1.000
0 20 40 60 80 100
Parti
cle
Scal
e M
ixin
g In
dex
Revolutions
Micro-system
Macro-system
0.000
0.200
0.400
0.600
0.800
1.000
0 20 40 60 80 100
Parti
cle
Scal
e M
ixin
g In
dex
Revolutions
Micro-system
Macro-system
(a) Bo=0.02 (b) Bo=0.2 (c) Bo=2
Figure 4.2 Comparison of micro and macro system in terms of mixing curves at
different cohesion
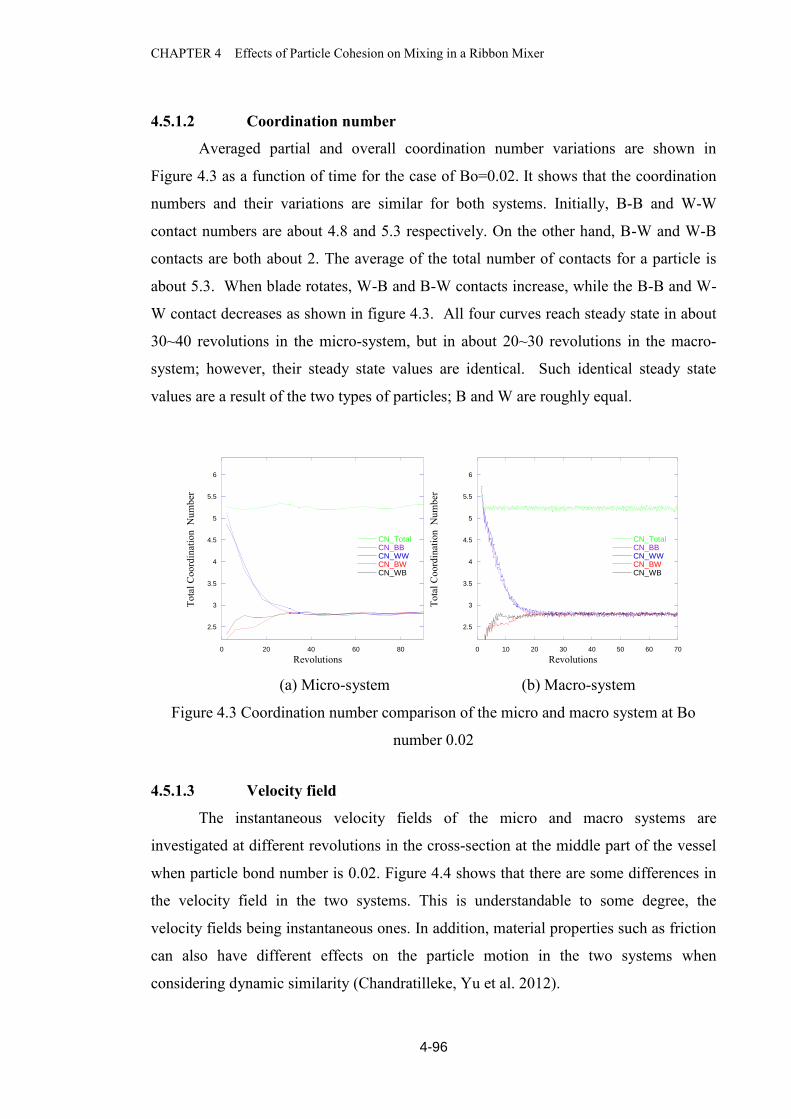
CHAPTER 4 Effects of Particle Cohesion on Mixing in a Ribbon Mixer
4-96
4.5.1.2 Coordination number
Averaged partial and overall coordination number variations are shown in
Figure 4.3 as a function of time for the case of Bo=0.02. It shows that the coordination
numbers and their variations are similar for both systems. Initially, B-B and W-W
contact numbers are about 4.8 and 5.3 respectively. On the other hand, B-W and W-B
contacts are both about 2. The average of the total number of contacts for a particle is
about 5.3. When blade rotates, W-B and B-W contacts increase, while the B-B and W-
W contact decreases as shown in figure 4.3. All four curves reach steady state in about
30~40 revolutions in the micro-system, but in about 20~30 revolutions in the macro-
system; however, their steady state values are identical. Such identical steady state
values are a result of the two types of particles; B and W are roughly equal.
2.5
3
3.5
4
4.5
5
5.5
6
0 20 40 60 80
CN_TotalCN_BBCN_WWCN_BWCN_WB
Tota
l Coo
rdin
atio
n N
umbe
r
Revolutions
2.5
3
3.5
4
4.5
5
5.5
6
0 10 20 30 40 50 60 70
CN_TotalCN_BBCN_WWCN_BWCN_WB
Tota
l Coo
rdin
atio
n N
umbe
r
Revolutions
(a) Micro-system (b) Macro-system
Figure 4.3 Coordination number comparison of the micro and macro system at Bo
number 0.02
4.5.1.3 Velocity field
The instantaneous velocity fields of the micro and macro systems are
investigated at different revolutions in the cross-section at the middle part of the vessel
when particle bond number is 0.02. Figure 4.4 shows that there are some differences in
the velocity field in the two systems. This is understandable to some degree, the
velocity fields being instantaneous ones. In addition, material properties such as friction
can also have different effects on the particle motion in the two systems when
considering dynamic similarity (Chandratilleke, Yu et al. 2012).

CHAPTER 4 Effects of Particle Cohesion on Mixing in a Ribbon Mixer
4-97
Figure 4.4 Instantaneous velocity of particles in micro and macro systems
in a vertically-cur vessel segment between z=300 and 350 for Bo=0.02
Figure 4.5shows the velocity fields in the vessel segment of the vessels of the
macro and micro systems in the case of Bo=2. The figure shows that particles in the
macro-system are lifted to the top part of the vessel and the bottom part is devoid of
particles. On the other hand, in the micro-system, particles are mostly at the bottom and
behave like in the lightly-cohesive case (see Fig. 4.5). Due to the matching of Fr
numbers, the shaft speed of the micro-system has increased by about 12 fold.
Therefore, the tangential velocity gradient, which is equal to Rx/R=has changed.
The velocity gradient is representative of the amount of shearing clustered particles
undergo. Therefore, it is likely that the cohesive forces are easily overcome by the shear
forces present at a high shaft speed in the case of the micro-system, and particles would
behave like non-cohesive particles. Thus, micro system will show a higher mixer rate
than the corresponding macro-system as seen from Fig. 4.2. The matching of Fr
numbers has not resulted in similar mixing curves for micro and macro systems in the
case of higher cohesion, except when cohesion is very low. It will be confirmed later
that this discrepancy is not due to the density difference between the particles of the two
systems. It is of interest to test the two systems at the same shaft speed for the cases of
higher cohesion.
82 Rev19 Rev 39 Rev
Frame 001 20 May 2013 Frame 001 20 May 2013 Frame 001 20 May 2013
Macro-system
Micro-system
Frame 001 13 Oct 2013 Frame 001 13 Oct 2013 Frame 001 13 Oct 2013

CHAPTER 4 Effects of Particle Cohesion on Mixing in a Ribbon Mixer
4-98
Figure 4.5 Instantaneous velocity of particles in micro and macro systems
in a vessel segment between z=300 and 350 for Bo=2
Figure 4.6 Instantaneous velocities of particles in micro and macro systems
in the longitudinal segment of the vessel between x=-20 and 20 at Bo=0.02.
Macro-system Micro-system
Frame 001 13 Oct 2013
Frame 001 13 Oct 2013
Frame 001 13 Oct 2013
Frame 001 13 Oct 2013
82 Rev
19 Rev
39 Rev
Frame 001 13 Oct 2013
Frame 001 13 Oct 2013
Macro-system
Frame 001 10 Jun 2013 Frame 001 10 Jun 2013 Frame 001 10 Jun 2013
82 Rev 19 Rev 39 Rev
Micro-system
Frame 001 06 Nov 2013 Frame 001 06 Nov 2013
Frame 001 06 Nov 2013
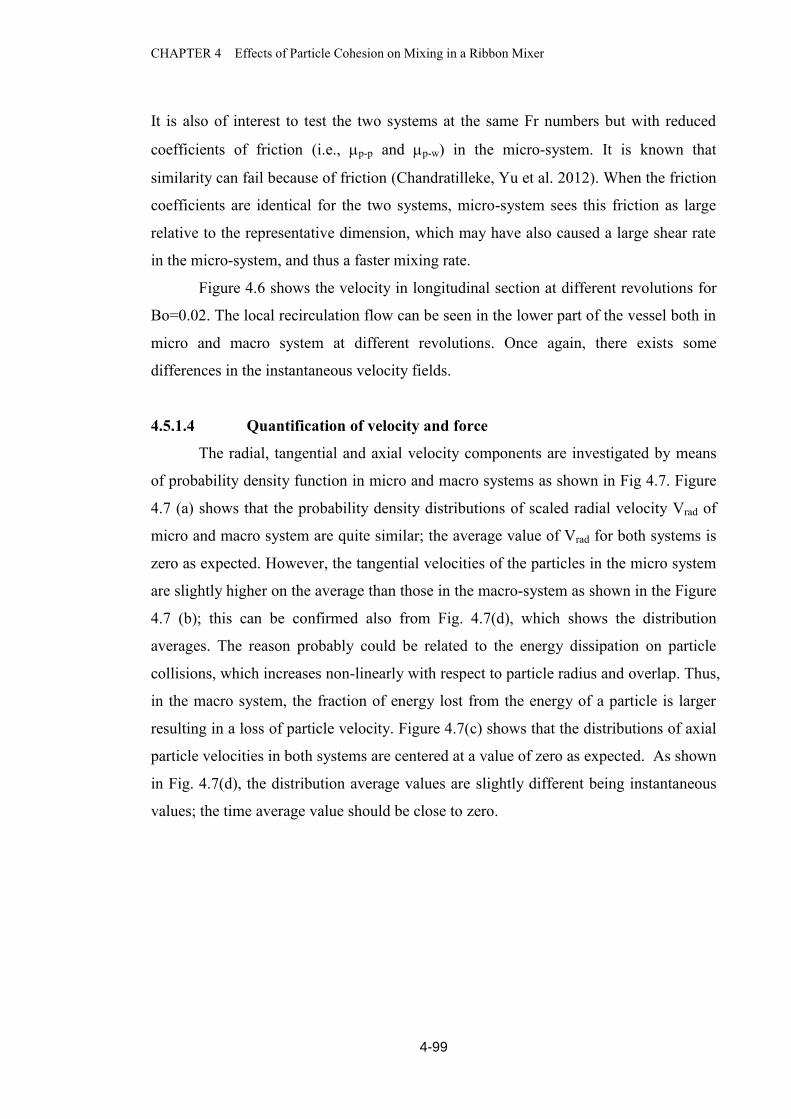
CHAPTER 4 Effects of Particle Cohesion on Mixing in a Ribbon Mixer
4-99
It is also of interest to test the two systems at the same Fr numbers but with reduced
coefficients of friction (i.e., p-p and p-w) in the micro-system. It is known that
similarity can fail because of friction (Chandratilleke, Yu et al. 2012). When the friction
coefficients are identical for the two systems, micro-system sees this friction as large
relative to the representative dimension, which may have also caused a large shear rate
in the micro-system, and thus a faster mixing rate.
Figure 4.6 shows the velocity in longitudinal section at different revolutions for
Bo=0.02. The local recirculation flow can be seen in the lower part of the vessel both in
micro and macro system at different revolutions. Once again, there exists some
differences in the instantaneous velocity fields.
4.5.1.4 Quantification of velocity and force
The radial, tangential and axial velocity components are investigated by means
of probability density function in micro and macro systems as shown in Fig 4.7. Figure
4.7 (a) shows that the probability density distributions of scaled radial velocity Vrad of
micro and macro system are quite similar; the average value of Vrad for both systems is
zero as expected. However, the tangential velocities of the particles in the micro system
are slightly higher on the average than those in the macro-system as shown in the Figure
4.7 (b); this can be confirmed also from Fig. 4.7(d), which shows the distribution
averages. The reason probably could be related to the energy dissipation on particle
collisions, which increases non-linearly with respect to particle radius and overlap. Thus,
in the macro system, the fraction of energy lost from the energy of a particle is larger
resulting in a loss of particle velocity. Figure 4.7(c) shows that the distributions of axial
particle velocities in both systems are centered at a value of zero as expected. As shown
in Fig. 4.7(d), the distribution average values are slightly different being instantaneous
values; the time average value should be close to zero.
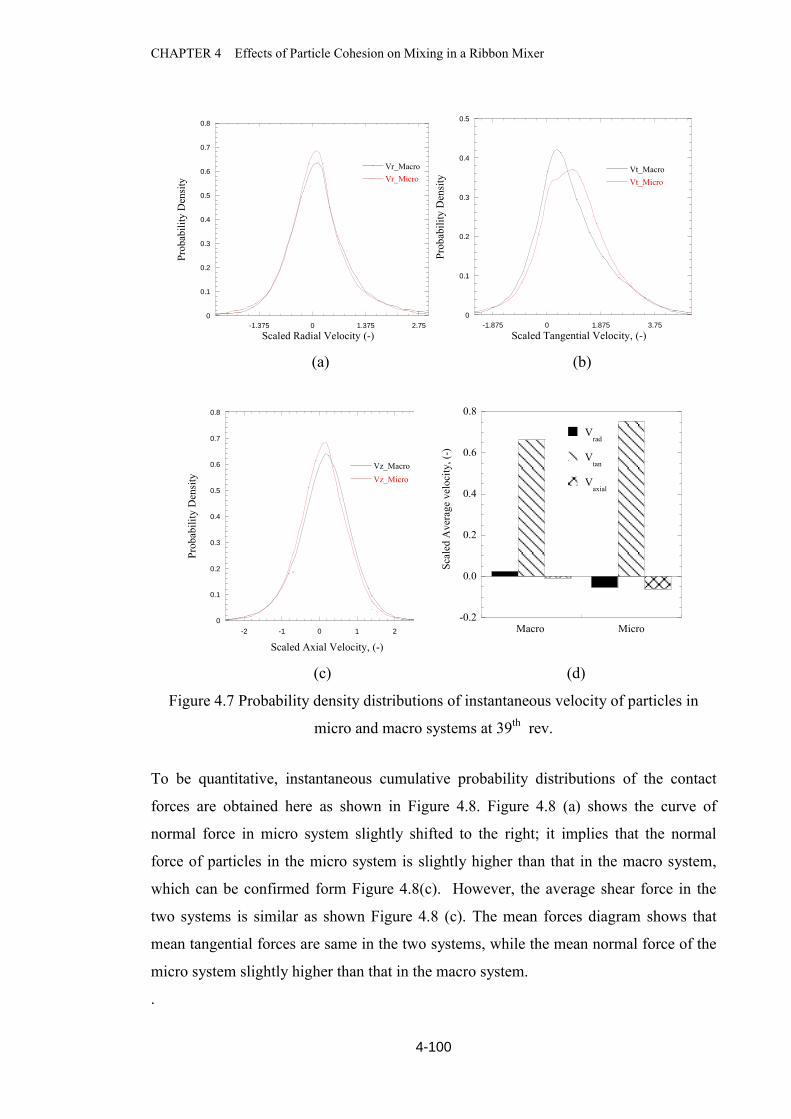
CHAPTER 4 Effects of Particle Cohesion on Mixing in a Ribbon Mixer
4-100
0
0.1
0.2
0.3
0.4
0.5
0.6
0.7
0.8
-1.375 0 1.375 2.75
Vr_MacroVr_Micro
Prob
abili
ty D
ensi
ty
Scaled Radial Velocity (-)
0
0.1
0.2
0.3
0.4
0.5
-1.875 0 1.875 3.75
Vt_MacroVt_Micro
Prob
abili
ty D
ensi
ty
Scaled Tangential Velocity, (-)
(a) (b)
0
0.1
0.2
0.3
0.4
0.5
0.6
0.7
0.8
-2 -1 0 1 2 3
Vz_MacroVz_Micro
Prob
abili
ty D
ensi
ty
Scaled Axial Velocity, (-)
-0.2
0.0
0.2
0.4
0.6
0.8
Macro Micro
Vrad
Vtan
Vaxial
Scal
ed A
vera
ge v
eloc
ity, (
-)
(c) (d)
Figure 4.7 Probability density distributions of instantaneous velocity of particles in
micro and macro systems at 39th rev.
To be quantitative, instantaneous cumulative probability distributions of the contact
forces are obtained here as shown in Figure 4.8. Figure 4.8 (a) shows the curve of
normal force in micro system slightly shifted to the right; it implies that the normal
force of particles in the micro system is slightly higher than that in the macro system,
which can be confirmed form Figure 4.8(c). However, the average shear force in the
two systems is similar as shown Figure 4.8 (c). The mean forces diagram shows that
mean tangential forces are same in the two systems, while the mean normal force of the
micro system slightly higher than that in the macro system.
.

CHAPTER 4 Effects of Particle Cohesion on Mixing in a Ribbon Mixer
4-101
0
0.2
0.4
0.6
0.8
1
10-4
10-3
10-2
10-1
100
101
Fn_MicroFn_Macro
Cum
ulat
ive
Prob
abili
ty
Scaled Normal Force, (-)
0
0.2
0.4
0.6
0.8
1
10-5
10-4
10-3
10-2
10-1
100
101
Ft_MacroFt_Micro
Cum
ulat
ive
Prob
abili
ty
Scaled Shear Force, (-)
(a) (b)
0
0.02
0.04
0.06
0.08
0.1
0.12
0.14
Macro Micro
NormalTangential
Ave
rage
con
tact
forc
e, (-
)
(c)
Figure 4.8(a) and (b): Cumulative probability distributions of scaled contact force
components of particles in micro and macro system at 39th rev; and (c) the distribution
averages
Because of the increased discrepancy between the two systems for mixing of cohesive particles,
the further research is needed for improving the scaling method. Dimensionless numbers such
as Froude number Fr, Reynolds number Re, Schmidt number (H.Willig 2001) and particularly
cohesion number (W.Alexander 2005) should be matched for the dynamic similarity while
maintaining the geometric similarity of the two systems.

CHAPTER 4 Effects of Particle Cohesion on Mixing in a Ribbon Mixer
4-102
4.5.2 Effects of cohesion on homogeneity of the particles mixing (Macro-system)
Above comparisons of the two systems showed that differences appear in the
mixing curves at larger cohesion or Bo numbers, with faster mixing in the micro-system
compared to the macro-system. The faster mixing may have resulted from the breakage
of cohesive bonding at the high shaft speed of the micro-system.
Here, further considerations are made of the diffusion and convection effects. It
is generally known that mixing in the axial direction (convection or diffusion) is slower
compared to that in the circumferential direction in horizontal-axis bladed
mixers(Laurent, Bridgwater et al. 2002; Muzzio, Llusa et al. 2008), and therefore, the
axial diffusion could be one factor governing the mixture quality differences between
the two systems. Fourier number for mass transfer by diffusion can be expressed as:
Fom= t / L2, where is mass diffusivity, t is a characteristic time, and L a
length scale. We can rewrite the above as follows: Fom= /(2 L2), where is shaft
speed (rad/s) and L is the mixer length over which diffusion occurs. If Fourier numbers
of the two systems are set the same for similarity, the mass diffusivity of the micro-
system becomes:
mi=ma mami(Lma/ Lmi)-2 where suffixes ‘ma’ and ‘mi’ represent the macro
and micro systems respectively. After substitution of appropriate values (see Sec. 4.3) in
the above, mi= 3.64x10⁻⁶ma. Thus, the diffusion in the micro-system is very small
compared to that in the macro-system.
To explain the initial rapid mixing-rate of the micro-system in the previous
section, the differences in the particle convection in the axial direction should be
considered for the two systems. The axial convection should be affected by many
factors for a given blade geometry: for example, by particle material density, cohesion,
particle size and shaft speed. Thus, studying cohesive effects is complex even if we use
a micro-system, where the mixer size is reduced to make particle size small. In such a
system, the particle size is still large compared to the mixer size just as in the case of a
macro-system, thus, affecting the velocity field and as a result, mixing. Below, material
density and its effect on axial convection and diffusion are investigated. Next, as a first
step, cohesive effects are investigated using the macro-system to speed up the
computations.

CHAPTER 4 Effects of Particle Cohesion on Mixing in a Ribbon Mixer
4-103
4.5.2.1 Effect of material density
To overcome the longer computation time associated with a large number of
particles, we used large particles with a reduced density to make the particles lighter as
in the case of small particles. However, it is necessary to evaluate the effect of particle
density on the mixing behaviour. Here, we use two particle densities, 2500 and 417
kg/m3, so that the effect of particle density can be clarified. Also two initial particle
layouts are tested: namely, side-by-side (SBS) layouts in axial and radial directions. In
the SBS-radial layout, the major mixing mechanism is radial mixing. In the SBS-axial
layout, axial mixing is the major mechanism.
Figure 4.9 shows the comparisons of mixing curves for the two densities under
the two initial layouts mentioned above. Figure 4.9 (a) shows that the density difference
has very little effect on the mixing behaviour in the macro-system for SBS-axial layout.
However, a close inspection shows that=2500 kg/m3 has a slightly slower initial
mixing rate than =417 kg/m3, but later it shows a better mixing state at the steady-
state. It is generally known that mixing is initially taking place by convection and later
by diffusion (Harnby 2000) (Dodds 1980). Therefore, =2500 kg/m3` has the better
ability to diffuse, but convection in axial direction is rather poor; this is clear for the
reason that for mixing to happen in the case of SBS axially, particles have to move in
the axial direction. Figure b shows that, for the SBS-radial layout,=2500 kg/m3`
still has a slower mixing rate initially, but later a better mixing state than=417 kg/m3`
as in the case of the other layout. The two figures also show that SBS-radial layout
produces faster mixing than SBS-axial layout, where radial mixing is the main
mechanism. Thus, one can say that the axial mixing is slower and a governing factor in
mixing for a ribbon mixer. The figure shows that both the axial and radial mixing rates
can be increased by using =417 kg/m3 or a lower density. It can be also argued that
the reduction of particle density reduces the inertia of particles to stay in orbits around
the shaft, thus improving axial motion. Thus, reducing density will not reduce the
mixing rate in the micro-system either, which was an issue for lager Bo numbers; a
reduction in shaft speed seems necessary in that case to reduce the mixing rate, which
implies that Fr number cannot be matched for cohesive particles. Furthermore, although
not shown here, =2500 kg/m3` failed to produce effect of particle cohesion in trial
simulations in macro-system implying that the momentum effects is too high to sustain

CHAPTER 4 Effects of Particle Cohesion on Mixing in a Ribbon Mixer
4-104
cohesive effects. Therefore, =417 kg/m3 is used here to investigate the effect of
particle cohesion as described below.
0.0
0.20
0.40
0.60
0.80
1.0
0 10 20 30 40 50 60 70 80
=2500 kg/m3
=417 kg/m3
Mix
ing
Inde
x
Revolutions
0
0.2
0.4
0.6
0.8
1
0 10 20 30 40 50 60 70 80
=2500 kg/m3
=417 kg/m3
Mix
ing
Inde
xRevolutions
(a) (b)
Figure 4.9 Effect of particle density in the case of Bo=0.2 for two side-by-side (SBS)
initial arrangements: (a) Axially side-by-side arrangement; (b) Radially side-by-side
arrangement
4.5.2.2 Particle scale mixing index and total coordination number The effect of cohesion on mixture uniformity is investigated using particle
scale mixing index, coordination number, velocity field, porosity and stresses averaged
over cells as well as time. The results are shown in Figure 4.10, which shows that the
mixing rate and homogeneity of the mixture decrease with an increase in Bo number,
the particle mixing deteriorating considerably when Bond Number is 14 or 20. The
average steady-state particle-scale mixing index decreases sharply for Bo numbers
greater than 8 as seen from Figure 4.10(b).
The particle mixing is better at moderate and low cohesion of the particles
since the cohesive bonds between particles are easy to break with a decreased of
cohesion of the mixture. Figure 4.10(a) show the particles with Bo=0.02 reach the
steady state of mixing at revolution 20. However the increase of cohesion of the
particles slows down the time to reach the steady state. For example the mixtures with
Bo=0.2 and 2 reach steady state at revolution 40 and 70 respectively, which are two-
three times that mixture with Bo=0.02. The time to reach steady state mixing value of

CHAPTER 4 Effects of Particle Cohesion on Mixing in a Ribbon Mixer
4-105
the case with Bo=8 is slightly lower than that of the cases with Bo=0.02, 0.2 and 2. The
mixture with Bo=8 reaches steady state mixing index of 0.93 at revolution 80, while
other cases with Bo=0.02, 0.2 and 2 reach mixing indexes of 0.95 and 0.96 at the
revolutions 30 and 40 respectively. The steady state mixing index of the mixture with
Bo=14 and 20 are considerably low. They reach their steady state values of 0.11 and 0.2
at revolution 5 and 10 as shown Figure 4.10(a).
Figure 4.10(b) shows the steady state mixing index M as a function of Bo
number. M decreases slightly with an increase of Bo number up to 8, and exceeding
which M decreases sharply. The overall coordination number is shown in Figure 4.11(a)
as a function of shaft revolutions, and the steady-state values in Figure 4.11(b) as a
function of Bo number. The results show that overall coordination number decreases
steadily with the mixing time (or shaft revolutions) for the mixtures of Bo=0.02, 2 and 8.
However, at high cohesion (Bo=20), it decreases only slightly and reaches steady state
at a high value as shown in Figure 4.11(a). It means that it is difficult to break the bond
between particles at a high cohesion. Therefore, the particle mixing at high cohesion is
slower as shown in Figure 4.10. Figure 4.11(b) shows that the average coordination
number reduces at first with respect to Bo number variation and then steadily increases
with Bond number, which is a sign of deterioration of mixing.
0.000
0.200
0.400
0.600
0.800
1.000
0 20 40 60 80 100
Parti
cle
Scal
e M
ixin
g In
dex
Shaft revolutions
Bo =8
Bo =20 Bo =14
Bo =0.02
Bo =2
Bo =0.2
0.00
0.20
0.40
0.60
0.80
1.00
0 5 10 15 20
Ave
rage
Ste
ady
Stat
e M
ixin
g In
dex,
M
Bond Number (a) (b)
Figure 4.10 Particle Scale Mixing Index: (a) Particle scale mixing index as a
function of shaft revolutions; and (b) Average steady state mixing index at
different Bo numbers.
CHAPTER 4 Effects of Particle Cohesion on Mixing in a Ribbon Mixer
4-106
2.4
2.8
3.2
3.6
4
4.4
4.8
0 20 40 60 80 100
Ove
rall
Coo
rdin
atio
n N
umbe
r
Revolutions
Bo=2
Bo=20
Bo=8 Bo=0.02
2.00
2.50
3.00
3.50
4.00
4.50
0 5 10 15 20Ave
rage
Coo
rdin
atio
n N
umbe
r at S
tead
y-st
ate
Bo Number
(a) (b)
Figure 4.11 Overall coordination number at different Bo numbers: (a) overall
coordination number as a function of shaft revolutions; and (b) overall
coordination number at steady-state as a function of Bo number.
4.5.2.3 Cohesion effect on the velocity field and porosity of the mixture
To further understand the cohesive particle flow during mixing stage, the
effects of cohesion of the particles on the velocity and porosity are examined here. The
particle velocity fields are obtained for the section between Z= 350 and 400mm, at 10,
39 and 82 revolutions respectively, and are shown in Fig. 4.12. The figure shows that
the circumferential flow of the particles increases with an increase of bond number, but
the blue and red coloured particles are clearly separated at higher Bo numbers,
indicating the lack of mixing. There are recirculation flows for Bo=0.02 at 19 and 39
rev, which are reduced when the Bo number increases. Figure 4.13 shows the velocity
field in the longitudinal section obtained at different cohesion at 19, 39 and 82 rev. It
shows that particle-axial flows enable particles to move from both ends to the middle of
the vessel, where they mix. It is clearly seen that the axial flow is deteriorated, and
circumferential flow enhanced with increase of cohesion. Notably particles cannot mix
when bond number 20. The velocity fields in the longitudinal section show that the
more particles are involved in the convective motion with less cohesion between
particles, since they can easily break the cohesive bonding between particles, and be
involved in motions in the horizontal, radial and tangential directions of the mixer as
shown in Figure 4.13.

CHAPTER 4 Effects of Particle Cohesion on Mixing in a Ribbon Mixer
4-107
Figure 4.12 Instantaneous velocities of particles in vessel cross sections XY; Z= 350-400 mm, at three time instances with increasing of bond number: red and blue colour represents vectors of two type particles.
Figure 4.13 Instantaneous velocity fields in the longitudinal section at different Bond numbers: red and blue colour represents vectors of two types of particles
Bo=0.02 Bo=20Bo=2
82 Rev
19 Rev
39 Rev
Bo=8
Frame 001 20 May 2013
Frame 001 20 May 2013
Frame 001 20 May 2013
Frame 001 20 May 2013
Frame 001 20 May 2013
Frame 001 20 May 2013
Frame 001 10 Jun 2013
Frame 001 10 Jun 2013
Frame 001 10 Jun 2013
Frame 001 20 May 2013 Frame 001 20 May 2013 Frame 001 20 May 2013
Bo=20
Bo=8
Bo=2
Frame 001 10 Jun 2013
Frame 001 10 Jun 2013 Frame 001 10 Jun 2013
Frame 001 10 Jun 2013 Frame 001 10 Jun 2013
Bo=0.02
Frame 001 13 Oct 2013
Frame 001 13 Oct 2013
Frame 001 13 Oct 2013 Frame 001 13 Oct 2013
Frame 001 13 Oct 2013
Frame 001 13 Oct 2013
Frame 001 13 Oct 2013
82 Rev 19 rev 39 rev

CHAPTER 4 Effects of Particle Cohesion on Mixing in a Ribbon Mixer
4-108
In order to obtain the time-averaged longitudinal velocity and porosity
distribution in the mixer, the mixer space is divided into cubic cells of size of
40x40x50mm3, and the particle velocities and porosity of each cell are averaged over a
time interval of 5s. Figure 4.14shows the average velocity and porosity in a
longitudinal section between x=-40 and 40 mm at different Bo numbers. The results
show that the axial flow deteriorated with an increase of particle cohesion as seen from
the reduction of arrow lengths. Figure 4.14also shows the average porosities of the cells
by colour. Porosity increased with an increase of Bond number as seen from the
increase of orange colour areas. At high cohesion, particles cannot become free to be
engrained in mixing due to strong cohesion between particles. The average velocities of
the particles in cells decreased with increase of Bo number. Quantification of velocities
in the tangential, radial and horizontal directions is needed to further understand the
particle behaviour.
Figure 4.14Average velocity and porosity of particles at t=25-30s, in a longitudinal
segment between x=-20 to 20 and y= -255 to 255.
4.5.2.4 Cohesion effects on the radial, tangential and horizontal velocity
To obtain the average velocity components of particles for each cell, velocities
of particles in each cell are averaged over a 90s time interval. The probability density
distributions of time-averaged velocity components are shown in Figure 14 (a). It shows
B0=0.02
Frame 001 13 Jun 2013
B0=2
Frame 001 13 Jun 2013
Frame 001 13 Jun 2013
B0=8
Frame 001 13 Jun 2013
B0=20
Z
Y
0 200 400 600 800
-200
0
200
400
600
Porosity
0.95
0.9
0.85
0.8
0.75
0.7
0.65
0.6
0.55
0.5
0.45
Frame 001 13 Jun 2013
V

CHAPTER 4 Effects of Particle Cohesion on Mixing in a Ribbon Mixer
4-109
that the number of cells with larger tangential velocity has increased somewhat with an
increase in the Bo number, which does not lead to improved mixing behavior . The
stronger tangential motion is created by the impeller with increasing Bo number. Figure
4.15 shows that the time-averaged tangential velocity increases with cohesion or Bo
number. On the other hand, the majority of particles receive radial velocities in the cases
of Bo=0.02 and 2 as seen from the wider spread of the distributions. However, the
distributions of radial velocity of particles are sharper around an average value of zero
for Bo=8 and 20 compared to the cases of Bo=0.02 and 2 as in Figure 4.15 (b), implying
that most particles are not moving radially (both ways) with stronger particle cohesion.
Figure 4.15(c) shows the axial velocity distributions. Similar to radial velocity
component, average horizontal (axial) velocity vary significantly with the cohesion,
with most particle showing zero axial velocity with increasing Bo number. Figure 4.16
shows that the average values of both the radial and axial velocity components are close
to zero.
0
0.005
0.01
0.015
0.02
0.025
0.03
-80 -40 0 40 80
Bo=0.02Bo=2Bo=8Bo=20
Prob
abili
ty D
ensi
ty
Average Tangential Velocity (m/s)
0
2
4
6
8
10
-0.9 -0.45 0 0.45 0.9
Bo=0.02Bo=2Bo=8Bo=20
Prob
abili
ty D
ensi
ty
Average Radial Velocity (m/s)
0
0.1
0.2
0.3
0.4
0.5
0.6
0.7
-5 -2.5 0 2.5 5
Bo=0.02Bo=2Bo=8Bo=20
Prob
abili
ty D
ensi
ty
Average Axial Velocity (m/s) (a) (b) (c)
Figure 4.15 Probability density distributions of velocity components: (a) tangential, (b) radial and (c) axial velocity
-2.0
0.0
2.0
4.0
6.0
8.0
10.0
0 5 10 15 20 25
VrVtVz
Mea
n R
adia
l, Ta
ngen
tial V
eloc
ity a
nd V
z
Bo Number
Figure 4.16 Time averaged mean velocity components as a function of Bo number: radial velocity Vr, tangential velocity Vt and axial velocity Vz.

CHAPTER 4 Effects of Particle Cohesion on Mixing in a Ribbon Mixer
4-110
4.5.2.5 The stress analysis of particles with different cohesion
The mixer space is divided into cubic cells of the size 40x40x50mm3 as before,
and the contact stresses of particles in the cells are averaged over a time interval of 10s
at steady state. The equations used for the evaluation of stresses are shown below.
jiji
C
ij tTnRRV
nNnRV
)(121
12 1R
(4.5)
where the summations are over the C contacts in the volume V, R1 and R2 are the radii
of the two spheres in contact, N and T are the magnitudes of the normal and tangential
contact forces for the contact orientation defined by the unit vector normal to the contact
plane ni and ti defines the unit vector parallel to the contact plane. The time and cell
averaged contact stresses of particles are analysed using probability distributions to
interpret the cohesion effects on the stresses in particles forces. Figure 4.17 shows the
stress components in three perpendicular planes, r, and z, in r, z and directions as
identified by rr, r, rz, z and zz, where the first suffix denotes the plane and the
second the direction. Particles received larger radial stresses rr with the increase of Bo
number in the Bo number range of 0.02 to 8, with particles in some cells receiving
radial stresses over 140Pa. However, with the increase of Bo number to 20, all stress
components have become reduced to less than 60 Pa. For this case mixing also has
deteriorated. Generally, the radial stresses rr is the largest, while the axial stress is the
next larger one, both of which being needed to move the particles in tangential and axial
directions. Shear stresses, r, rz, z are responsible for breaking the cohesive bonding
between particles. The particles with lower cohesion have larger radial and axial
stresses, which lead to stronger axial and radial velocities, lower coordination number
contributing to increased particle convective and angular motion and mixing in the
ribbon mixer.

CHAPTER 4 Effects of Particle Cohesion on Mixing in a Ribbon Mixer
4-111
0
0.1
0.2
0.3
0.4
0.5
0.6
0.7
0.8
-20 0 20 40 60 80 100
rr
r
rz
z
zz
Prob
abili
ty D
ensi
ty
Stress (Pa)
0
0.1
0.2
0.3
0.4
0.5
0.6
0.7
0.8
0 20 40 60 80 100 120 140
rr
r
rz
z
zz
Prob
abili
ty D
ensi
ty
Stress (Pa) (a) Bo=0.02 (b) Bo= 2
0
0.1
0.2
0.3
0.4
0.5
0.6
0.7
0.8
-20 0 20 40 60 80 100 120 140
rr
r
rz
z
zz
Prob
abili
ty D
ensi
ty
Stress (Pa)
0
0.1
0.2
0.3
0.4
0.5
0.6
0.7
-20 0 20 40 60 80 100 120 140
rr
r
rz
z
zzPr
obab
ility
Den
sity
Stress (Pa)
(c) Bo=8 (d) Bo=20
Figure 4.17 Probability density distributions of average normal stress in the vessel at
steady-state for different Bo numbers.
4.6 Conclusions
The effect of cohesion on particle mixing behaviour was investigated using DEM. Two
systems, namely micro and macro systems were tested for this purpose by creating
geometrically and dynamically similar conditions. To establish dynamic similarity
between the two systems, Froude and Bond numbers were each made identical in the
two systems. In addition, in the macro system, particle density was made smaller to
make the particles lighter, while in the micro-system, particles were made heavier by

CHAPTER 4 Effects of Particle Cohesion on Mixing in a Ribbon Mixer
4-112
choosing a larger density to account for the differences in momentum effects of the two
systems. The following conclusions are made regarding the two systems.
Under geometric and dynamic similar conditions, the macro and micro systems
displayed similarity in the mixing behaviour, velocity field and coordination
number variation with time when the particles in the two systems are mostly
non-cohesive. With the increase of cohesion, the mixing behaviour of macro-
system becomes increasingly slower compared to the micro system although Bo
numbers are identical. The reason for this discrepancy was considered to be due
to selecting the shaft speed based on Fr number matching, which resulted in a
high shaft speed. Identifying the fact that the shaft speed is the shear rate, led to
the conclusion that the cohesive bonds is easily broken at high shaft speeds of
the micro-system, which may have caused the faster mixing rate compared to the
macro system at higher cohesion. Thus it is not possible to find fixed operational
conditions for the two systems, which will make the two systems dynamically
similar in a wide range of cohesion. Although more work is necessary to
establish the connection between the two systems, the macro-system has the
advantage that computations can be done faster. More work is necessary to
establish the relationship between axial mixing and several other variables such
as particle size, density, cohesion and shaft speed.
Using the macro-system, the effect of particle cohesion on mixing behaviour was
investigated. The followings are the main findings of the effects of cohesion.
At a fixed Bo number, the radial side-by-side particle layout has a faster mixing
rate than the axial side-by-side particle layout. Use of heavier particles led to a
delay in the mixing rate, but better mixture quality at the steady-state. It can be
also deduced from the results that heaver particles are conveyed axially at a
slower rate, which leads to slower mixing.
Using lighter large particles, it was possible to obtain cohesive effects in the
macro-system. The mixing rate and uniformity of mixing are deteriorated with
an increase of cohesion. Overall coordination number increased with an increase
in cohesion. That is,particles showed higher tangential velocity with an increase
in cohesion. Conversely, horizontal or axial velocity increased when Bo number

CHAPTER 4 Effects of Particle Cohesion on Mixing in a Ribbon Mixer
4-113
is reduced. Radial stress is larger than the axial stress and increased with the
cohesion for moderately cohesive mixtures. However, with the increase of Bo
number to 20, all stress components have become reduced to less than 60 Pa.
The study demonstrated that cohesive effects of particles on mixing in a ribbon
mixer can be investigated using lighter large particles in a large-scale system.
Further work is needed to establish the particle size effect on convective and
diffusive mixing in the mixer.
Nomenclature D Vessel diameter, (m) d Particle diameter, (mm) E Young’s modulus, N/m2 Fc,ij Contact force vector between i and j, N Fd,ij Damping force vector between i and j, N Fr Froude number, (-) Fv, ij Cohesive force between particles i and j
zf Average vertical force on one type of particles (N) t
zf Time average of the instantaneous vertical force zf in time t(N) g Acceleration due to gravity, (m/s2) h Gap between two interacting particles, (m) Ha Hamaker constant, J Hap Hamaker constant of particle material, J Haw Hamaker constant of wall material, J Ii Moment of inertia of particle i, (kg m2) ki Number of particles in contact with particle i M Particle-scale mixing index defined in Eq.(3) , (-) Mij Vector of rolling friction torque on particle i, (Dury, Ristow et al.) Mp Predicted mixing index at steady-state, (-) n Actual particle number fraction of the two types of particles, (-) Ni Number of particles in the immediate neighbourhood of particle i Nl
Number of large particles Np Total number of particles of one type in the mixture Ns
Number of small particles Nt The number of sample points of instantaneous average values in time t p Number ratio of the target type particles to all the particles, (-) pi Particle fraction of a target type particle in the neighborhood of particle i, (-)
tp Average value of pi at time t for the entire mixture, (-) R Equivalent radius, m S0 Standard deviation of pi at fully-segregated state, (-) SR Standard deviation of fully-mixed state for uniform-sized particles of particle fraction of p, (-)

CHAPTER 4 Effects of Particle Cohesion on Mixing in a Ribbon Mixer
4-114
St Standard deviation of pi with respect to tp at time t, (-) Tij Vector of rolling friction torque on particle i, N m Vb Blade speed, (m/s) Vi Velocity of particle i, m/s Z Height from vessel base (mm)
Greek letters
α Volume fraction
β Size ratio ls dd / γ Density ratio ls / Average particle-scale sample size for the mixture θ Radial section measured horizontally from mid-plane of the blade
ik Number of particles in contact with particle i Mass diffusivity Density of particles of a uniform system, ( 3kgm )
l Density of large particle, ( 3kgm )
s Density of small particle, ( 3kgm ) Shaft rotational speed, (rad/s) i Angular velocity vector of particle i, (rad/s)

CHAPTER 5 Mixing Performance of Ribbon Mixers: Effect of Operational Parameters
5-115
Chapter 5
Mixing Performance of Ribbon Mixers:
Effect of Operational Parameters

CHAPTER 5 Mixing Performance of Ribbon Mixers: Effect of Operational Parameters
5-116
5.1 Introduction
Powder mixing is an essential unit operation for manufacturing processes, for
example, in ceramic, food, pharmaceutical, chemical and agricultural industries, where
a wide variety of high quality products is produced. The selection of a mixer for a
mixing operation depends on the product uniformity required and many other factors
(Poux et al., 1991). Ribbon mixers are considered to be suitable for mixing of dry
powders as well as free-flowing granular material (Poux et al., 1991). It is also reported
that a ribbon mixer can produce an improved homogeneity in powder mixing because of
large shear stresses in the mixer as well as that it can handle mixing of different size
particles (Muzzio et al., 2008). Therefore, a ribbon mixer with a horizontal shaft will be
the focus of study here.
The impeller speed of the mixer is a parameter that can affect the performance of
the mixer, with regard to mixture quality and stresses on particles. The mixing quality
decreased with an increased blade speed in continues ribbon mixer (Sanoh et al., 1974).
The power consumption increased with an increase of blade speed in ribbon mixers
(Masiuk, 1987). The energy can be saved up to 60% with a constant impeller rotational
speed in a ribbon mixer (Dieulot et al., 2002). The blending endpoint was never reached
at high impeller rotational speeds (Côté and Abatzoglou, 2006). It is reported that a
high impeller speed can have a negative effect on the mixture uniformity. Although a
low speed can reduce shear stresses on particles, it may result in a poor homogeneity for
cohesive mixtures (Muzzio et al., 2008).
The fill level of the blender is the next most important operational parameter. It is
reported that for the entire batch, the mixing never reached ‘end-point’ when the blender
is filled to the shaft filling level. The mixing reached the end-point of the overall end-
batch with the inner shafts fill level at a blade speed of 20rpm (Côté and Abatzoglou
2006). The power consumption per rotational speed increases with an expansion of
loading ratio of the dry sand and water to capacity of the ribbon mixer (Masiuk, 1987).
Muzzio et al. experimentally investigated the mixing performance of a ribbon
mixer(Muzzio et al., 2008) with regard to effect of loading (layering and off-center spot
loading method), and found that the layering method provides faster mixing and better
homogeneity. Fill level had a significant effect in the case of 3-spokes 2-bladed ribbon

CHAPTER 5 Mixing Performance of Ribbon Mixers: Effect of Operational Parameters
5-117
impeller, with a lower fill level resulting in better homogeneity. However, the fill level
did not have a significant effect in the case of 5-spokes 2-bladed ribbon impeller.
In terms of the effect of impeller speed and fill level of the other mixers, research
shows that the axial diffusion coefficient increased with an increase of blade speed,
however it decreases with an increase of the fill level (Martins et al., 2013). Recent
studies of the effects of fill level and blade speed in a mixer with a single or multiple
blades provide some relevance to the present study (Laurent and Bridgwater, 2002;
Laurent and Cleary, 2012; Wachs et al., 2012). Deteriorated mixing states were obtained
with high blade speeds for mixing of free-flowing particles in a cylindrical mixer
(Chandratilleke et al., 2010). However, the speed effect on the homogeneity and flow
pattern of the solid have not been fully clarified from microdynamic aspects in these
studies.
Research on a complicated mixer such as the ribbon mixer are few, and the
effects of the impeller speed, fill level and blade number on non-cohesive and cohesion
particle mixtures on the mixer performance have not been clearly established. The
objective of this study is thus, to investigate the effect of the impeller speed and fill
level on the mixing behaviours of cohesive as well as non--cohesive particle mixtures
for two different ribbon impellers, by using simulations based on the discrete-element-
method (Cundall and Strack, 1979).
This chapter is organized as follows. Section 5.2 discusses the simulation
method and conditions in section 5.3, which is followed by the results and discussions
section, where in Section 5.4, effect of impeller speed is investigated for a two-blade
impeller for both non-cohesive and cohesive particle mixtures. The blade motion and
mixing dynamics introduced in section 5.4.1. In Section 5.4.2, the effect of blade speed
is discussed focusing on both non-cohesive and cohesive particles using a two-bladed
impeller. Next, the effect of filling level is investigated by comparing the performance
of the two-bladed impeller with that of a four-bladed impeller at different fill levels and
different cohesive particles at the fixed shaft speed in section 5.4.3 . In section 5.4.4 the
mixing performance compared both in cylindrical mixer ad ribbon mixer. Finally,
summarizes the conclusions in section 5.5 of the chapter.

CHAPTER 5 Mixing Performance of Ribbon Mixers: Effect of Operational Parameters
5-118
5.2 Methods to be Evaluated
The DEM model used here is essentially the same as that previously developed
and validated by Zhou et al. (Zhou et al., 2004; Zhou et al., 1999).
The model uses two momentum conservation equations to describe the translational and
rotational motion of particle i in a system at time t subjected to the gravity g and
interactions with the neighboring particles, blade and walls:
ii N
jijv
k
jijdijci
ii m
dtdm
1,
1,, FFFgV
(5.1)
and
ik
jijij
ii d
dI1t
MT (5.2)
where mi, Ii, Viand i are the mass, moment of inertia, translational and rotational
velocities of the particle respectively; k is the number of particles that are in contact
with particle i, Fc represents the elastic contact force which is the summation of the
normal and tangential forces.Fd represents the damping force, which is the summation
of the normal and tangential damping force respectively at the contact point with
particle j; and T and Mare the torque and rolling friction torque on particle i due to
particle j. Expressions for the forces and torque in Eqs. (5.1) and (5.2) are given in
Table 5.1.
Table 5.1 Formulae for contact and non-contact forces and torques
Force Equation
Particle-particle
forces
ijijijnnnnij RYRY nnvF ˆˆ~1~13
22
2/32
ssssnijs
sij ξFF ˆ/,min11 2/3
max,max,
ijjijiji
jijivdwij RRhRhRhhRhRh
RRhRRA nF ˆ)422()22(
)(646 2222
33
iji
ivdwi hRhh
RA nF ˆ)2(
23 222
3
where: ||/)(ˆ jijiij RRRRn , )( jiji RRRRR ,
nss )~1(2~2max, , ||/ˆsss ξξξ

CHAPTER 5 Mixing Performance of Ribbon Mixers: Effect of Operational Parameters
5-119
5.3 Simulation Conditions
The impeller geometries of the ribbon mixers used are shown in Figure 5.1. The
impeller in Figure 5.1(a) has two helical blades starting from each end, but spiraling in
opposite directions, and this mixer is called a two-bladed mixer here. The impeller in
Figure 5.1(b) has two more inner blades, and this mixer is called a four-bladed mixer.
The shaft of each impeller is placed horizontally along the axis of a horizontal
cylindrical vessel, the dimensions of which and other input values for DEM simulations
are shown in Table 5.2. Simulations are conducted for the cases of cohesive and non-
cohesive particles for investigating the effect of impeller speeds. Bond numbers of the
particles used in the study of fill level effect are shown in Table.3. Bond number is
defined as the ratio of van der Waals force to particle weight. The mixture quality or
mixing index is quantified by a particle scale mixing index based on coordination
number(Chandratilleke et al., 2012), and also by a macroscopic index, both indexes
being based on Lacey index (Chandratilleke et al., 2010). In both these methods, all the
particles of the mixtures are considered, and the effect due to the sample size not being
constant is also considered (Chandratilleke et al., 2010). To analyze the mixing
performance of the mixers, particles of equal numbers are deposited in the side-by-side
arrangement, and the impeller is rotated at a constant speed.
Table 5.2. Simulation Input variables and their values
Input variable Value
Vessel diameter Vessel length Blade pitch Blade width Shaft diameter Rake angle Blade gap Base Particle number Particle dia, d Shaft speed,ω Fill level Young’s modulus, E Poisson’s ratio , ms(P-P) (P-W) mR(P-P) (P-W)
216 (mm) 970 (mm) 484 (mm) 70 (mm) 31.75 (mm) 45°, 135° 8.5 (mm) 18,000 15 mm 20, 50, 100, 200 r pm 16%, 26%, 46%,56% 1108 N/m2 0.29 0.3 0.002
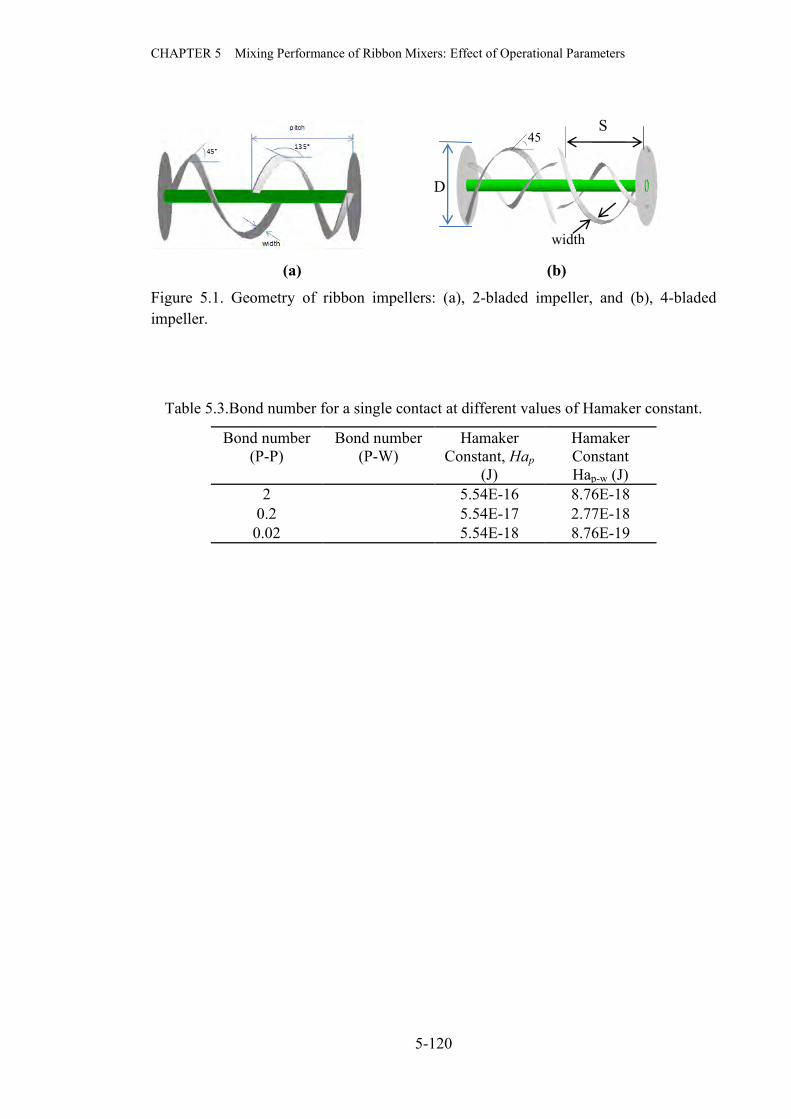
CHAPTER 5 Mixing Performance of Ribbon Mixers: Effect of Operational Parameters
5-120
(a) (b)
Figure 5.1. Geometry of ribbon impellers: (a), 2-bladed impeller, and (b), 4-bladed impeller.
Table 5.3.Bond number for a single contact at different values of Hamaker constant.
Bond number (P-P)
Bond number (P-W)
Hamaker Constant, Hap
(J)
Hamaker Constant Hap-w (J)
2 5.54E-16 8.76E-18 0.2 5.54E-17 2.77E-18 0.02 5.54E-18 8.76E-19
45°
S
D
width

CHAPTER 5 Mixing Performance of Ribbon Mixers: Effect of Operational Parameters
5-121
5.4 Results and Discussion
Below the effects of impeller speed and fill level on particle mixing behaviour are
investigated. The effects are evaluated in terms of the mixing performance using a
mixing index, changes in the flow pattern and contact forces. Finally, the effect of
impeller configuration is investigated by comparing the performance of the two-bladed
impeller with that of a four-bladed impeller at different fill levels and a fixed shaft
speed.
5.4.1 Blade Motion and Mixing Dynamics
Before investigating the effects of shaft speed and fill level, we first examine the
blade and particle motions for one typical particle mixture of the study in the case of the
two blade impeller. Figure 5.2 shows the blade motion and mixing behavior of uniform
particles, deposited initially in the side-by-side arrangement in the axial direction, in
about one revolution of the shaft. If we follow the snapshots in the order of time starting
from t=1.7s, we can see that when one blade (say blade 1) advances towards the vessel
centre from one end of the vessel, the blade from the other end (say blade 2), having
advanced ahead of blade 1 disappears at the vessel centre, the two blades advancing and
disappearing alternately. The reason for the blades to be visible is that there is a void
space behind each of the advancing blades as observed previously in the case of flat
blades (Zhou, 2004). When a blade advances, particles in contact with it are conveyed
towards the vessel centre as can be seen from the interface of the two types of particles
becoming aligned with the shape of the blade. At the same time, the particles in contact
with the blades are rotated in the direction of shaft rotation (clockwise), the result of
which being the formation of two waves above the shaft, one from each blade as seen in
the snapshot for example at t=1.7s. It leads to mixing of particles at the interface of two
types of particles. Further, axial transportation of particles results in flow of particles
over the blade, as seen for example at t=2.3s and 1.4s when red particles flow over the
blade that is in contact with the blue particles. Thus, particle mixing will eventually
occur in all three directions: circumferential, axial and radial. This is the general particle
mixing behavior of this mixer based on visual observations of the animations of particle
motion, and flow patterns which are further clarified by investigating the velocity fields
below. Note also that although the blades have opposite spiraling directions, particles in
either half of the vessel are rotated in the same direction, which is the direction of the
shaft rotation.

CHAPTER 5 Mixing Performance of Ribbon Mixers: Effect of Operational Parameters
5-122
t=1.7s t=2.1s
t=1.8s t=2.0s
t=1.9s t=2.3s
t=2.0s t=2.4s
Figure 5.2 Snapshots depicting blade motion, axial transport and circumferential motion
of particles in two-bladed mixer at 25% fill level (Bo=0.2).
5.4.2 Effect of impeller speed
5.4.2.1 Mixing performance
Figures 5.3(a) and (b) show instantaneous particle-scale mixing index M, as a function
of the number of revolutions for cohesive (Bo number=0.2) and non-cohesive particles,
respectively at different impeller speeds. M is the average for the particle bed. The
figures show that impeller speed affects the mixing characteristics significantly,
especially when the particles are non-cohesive. We define a mixing rate here as the
gradient of the mixing curve initially, using following first order equation:
M=1-(1-M0) e-kt (5.3)
Here, k (s-1) is the mixing rate.The mixing rate generally increases with the
impeller speed in both cases up to 100 rpm, but a further speed increase results in a

CHAPTER 5 Mixing Performance of Ribbon Mixers: Effect of Operational Parameters
5-123
decrease in the mixing rate; note that such a trend has been observed experimentally in a
previous study on ribbon mixers, which reports that the mixing operations should be
carried out preferably in the impeller speed range of about 50 to 70 rpm (Sanoh et al.,
1974). Also affected by the speed in the present work is the steady-state mixing index of
non-cohesive particles, but no such effect is observed for cohesive particles. This will
be discussed in the flow pattern section 3.1.2.
The macroscopic index (Chandratilleke et al., 2010) is also now used to analyze
the results for cohesive mixing shown in Figure 5.3(a), which will enable us to compare
the two indexes. Figure 5.4 shows the results of the analysis. Clearly, there are
differences in the dependence of the rate of mixing on the impeller speed when
evaluated by macroscopic and particle scale indexes. Figure 5.4 shows that 200 rpm
produces a faster mixing rate than 100 rpm, which is opposite in trend to that in Figure
5. 3(a). Also, there is less sensitivity in the results for 20 to 100 rpm. It should be stated
here that the particle-scale index evaluates the mixture quality at the particle-scale,
which is much smaller in scale than the sample size used for the macroscopic index.
Thus, in the first place, the macroscopic index cannot guarantee mixing at a scale
smaller than the sample size. It should be noted that mixing state in a smaller scale
cannot be obtained by simply reducing the sample size of macroscopic index. This is
because, it can be shown that the smaller the sample size, the lower the macroscopic
index even for the well-mixed state of a mixture, when analyzed by the macroscopic
index using samples of equal size.
0
0.2
0.4
0.6
0.8
1
0 20 40 60 80 100
Partt
ical
scal
e m
ixin
g in
dex,
M
Revolutions
20 rpm
50 rpm
100 rpm
200 rpm
0
0.2
0.4
0.6
0.8
1
0 20 40 60 80 100
Parti
cle
scal
e m
ixin
g in
dex,
M
Revolutions
20 rpm
50 rpm
100 rpm
200 rpm
(a) Cohesive mixture (Bo=0.2) (b) Non-cohesive mixture
Figure 5.3 Effect of impeller speed: Comparison of mixing behaviours of cohesive and non-cohesive particles at 25% fill-level.

CHAPTER 5 Mixing Performance of Ribbon Mixers: Effect of Operational Parameters
5-124
Although not shown here, the macroscopic index for non-cohesive particle mixing
at 200 rpm reaches unity in about 33.5 revolutions. Conversely, Figure 5.3(b) shows
that the particle scale index for non-cohesive mixing does not reach unity at 200 rpm
within 100 revolutions tested. Thus, the mixing state reaching unity in the macro scale
does not necessarily mean that mixing at the particle scale will also be well-mixed.
Even in the case of a cylindrical mixer, mixing state did not reach the fully-mixed state
at high shaft speeds (Chandratilleke et al, 2009). In the discussions to follow, we thus
use particle-scale index as the preferred index to maintain the consistency and avoid
discrepancies due to sample size and number.
0
0.2
0.4
0.6
0.8
1
0 20 40 60 80 100
Mac
rosc
opic
mix
ing
inde
x
Revolutions
200 rpm
20, 50, 100 rpm
Figure 5.4 Effect of impeller speed on cohesive mixing: Macroscopic index
(Bo=0.2 and 25% fill-level)
5.4.2.2 Velocity and Flow Pattern
The investigating flow pattern in the mixer is essential because it enables us to
identify mixing mechanisms of the mixer. Flow patterns in the mixer are complicated
because of the unsteady nature of the flow and complex impeller configuration as seen
from Figure 5.1 and 5.2. To analyze the particle flow patterns in the mixer, velocity
fields are examined below, first in the central segment of the vessel between the axial
positions, z=350mm and 450 mm, z being measured from one end of the vessel.
Figure 5.5 shows the velocity fields in the cross-section of the mixer vessel at
impeller speeds of 50, 100 and 200 rpm for both cohesive and non-cohesive particles.
The snapshots were taken at t=25s, and the velocity vectors of the particles of the two
types deposited side-by-side initially are shown coloured red and blue. In the non-
cohesive mixtures, one can observe local re-circulations, which may not be so effective
in the mixing because the particles are deposited axially in side-by-side arrangement

CHAPTER 5 Mixing Performance of Ribbon Mixers: Effect of Operational Parameters
5-125
initially. By contrast, cohesive particles tend to move circumferentially almost in full
circle even at the speed of 50 rpm, which may involve mixing in the axial direction as
well.
Figure 5.5 Velocity fields in vessel central segment (between z=350 and 450mm)
for non-cohesive and cohesive particles mixing at impeller speeds of 50, 100, and
200 rpm from the top to bottom, respectively, at t=25 s.
It would be appropriate to compare the flow patterns of the two sides of the
vessel at this stage because the blades have opposite spiral directions (Figure 5.1(a)) .
Figure 5.6 compares the velocity field in the section between z=350 and 450mm to that
between z= 485 and 600mm. It can be seen that the particles are rotating in the direction
of the shaft rotation despite the fact that the two blades have opposite spiral directions.
This observation has an impact on the circumferential velocity component of particles
as will be discussed later. It can be also noticed that the dominant particle colour is
different on both sides: blue on the left and red on the right.
Cohesive
Material
0.5
Frame 001 01 Feb 2012
Material
0.5
Frame 001 01 Feb 2012
Material
0.5
Frame 001 01 Feb 2012
Non-cohesive
Material
0.5
1
Frame 001 09 May 2012
Material
0.5
1
Frame 001 09 May 2012
Material
0.5
1
Frame 001 09 May 2012
50rpm 100rpm 200rpm
Material
0.5
Frame 001 01 Feb 2012
Material
0.5
1
Frame 001 09 May 2012
20rpm

CHAPTER 5 Mixing Performance of Ribbon Mixers: Effect of Operational Parameters
5-126
(a) z=350 and 450mm (b) z= 485 and 600mm
Figure 5.6 Comparison of velocity fields in the two halves of the 2-bladed mixer
(at 50 rpm).
Figure 5.7 shows the velocity fields in the longitudinal section of the vessel
between x=-20 and +20mm, where x is horizontal distance from the shaft-axis
perpendicular to the shaft. It can be seen that particles circulate mostly in the lower part
of the mixer in the non-cohesive particle mixture for speeds less than 200 rpm. However,
cohesive particles occupy a large area in this longitudinal section, and thus there is more
chance of mixing. This observation is supported by a comparison of Figure 5.3(a) with
3(b), which shows that cohesive particles have a much faster mixing rate than the non-
cohesive ones, below 100 rpm.
(a)Non-cohesive
(b) Cohesive
50rpm 100rpm 200rpm
Figure 5.7 Velocity field in a longitudinal section between x=-20 and 20mm at impeller
speeds of 50, 100, and 200 rpm from top to bottom, respectively at time t=25s, x being
measured horizontally from the shaft-axis perpendicular to it.
Material
0.5
Frame 001 01 Feb 2012
Frame 001 01 Oct 2013
Z
Y
0 200 400 600 800-400
-200
0
200
400
Material
0.5
Frame 001 01 Feb 2012
Z
Y
0 200 400 600 800-400
-200
0
200
400
Material
0.5
Frame 001 01 Feb 2012
Z
Y
0 200 400 600 800-400
-200
0
200
400
Material
0.5
Frame 001 01 Feb 2012
Material
0.5
1
Frame 001 09 May 2012
Material
0.5
1
Frame 001 09 May 2012
Material
0.5
1
Frame 001 09 May 2012

CHAPTER 5 Mixing Performance of Ribbon Mixers: Effect of Operational Parameters
5-127
With a further increase in the impeller speed, the red and blue particles seem to be
more separated in the longitudinal as well as in the cross-sections for non-cohesive
particles than for the cohesive ones. This observation is supported by the particle-scale
mixing curves of Figures 5.3(a) and (b) for 200 rpm.
To quantify the shaft speed effect on the velocity field, the probability density
functions of radial, tangential and axial velocity components of the particles are
considered as shown in Figures 5.8 and 5.9 for non-cohesive and cohesive mixtures,
respectively.
0.0
0.2
0.4
0.6
0.8
1.0
-4 -2 0 2 4
Prob
abili
ty D
ensi
ty
Radial Velocity(m/s)
50 rpm
100 rpm
20rpm200 rpm
0.0
0.5
1.0
1.5
-2 0 2 4 6 8 10
Prob
abili
ty D
ensi
ty
Tangential Velocity(m/s)
50rpm
100rpm
20rpm
200 rpm
(a) (b)
0.0
0.5
1.0
1.5
2.0
-3 -2 -1 0 1 2 3 4
Prob
abili
ty D
ensi
ty
Axial Velocity(m/s)
50 rpm
100 rpm
20rpm
200 rpm
-1
0
1
2
3
4
Vr_non_cohVt_non_cohVz_Non_coh
40 80 120 160 200
Tim
e av
erag
ed m
ean
radi
al v
eloc
ity (m
/s)
Blade speed (rpm)
(c) (d)
Figure 5.8 Probability density distributions of velocity components at different
blade speeds for non-cohesive particles at steady state.
From Figures 5.8 and 5.9, it is clearly seen that the tangential velocity
distributions each have a large spread than the distributions of the other two components
for both mixtures. Therefore, particles generally have a larger tangential velocity

CHAPTER 5 Mixing Performance of Ribbon Mixers: Effect of Operational Parameters
5-128
compared to axial or radial components at a given impeller speed. Figures 5.8(d) and
5.9(d) show that the mean of the tangential particle velocities increases with the shaft
speed, the increase being sharp in the case of non-cohesive mixture. It should be noted
that the mean value of the tangential velocity distribution can not be zero as it is for the
other two velocity components. Figures 5.8(a) and 5.8(c) show that the spread of the
distributions for radial and axial velocity components increase with the shaft speed,
which means more particles are gaining higher axial and radial velocities with the shaft
speed increase, although their average values are close to zero as seen from Figures
5.8(d) due to the mixing vessel being a closed one. Similar arguments apply for the
radial, and axial velocity distributions of Figures 5.9(a) and 5.9(c) for cohesive particles.
0.0
0.5
1.0
1.5
2.0
2.5
3.0
-3 -2 -1 0 1 2 3 4
Prob
abili
ty D
ensi
ty
Radial Velocity(m/s)
50 rpm
100 rpm
20rpm
200 rpm
0.0
0.5
1.0
1.5
2.0
-2 0 2 4 6 8 10
Prob
abili
ty D
ensi
ty
Tangential Velocity(m/s)
50rpm
100rpm
20rpm
200 rpm
(a) (b)
0.0
0.5
1.0
1.5
2.0
2.5
3.0
3.5
-4 -3 -2 -1 0 1 2 3 4
Prob
abili
ty D
ensi
ty
Axial Velocity(m/s)
50 rpm
100 rpm
20rpm
200 rpm
-1
0
1
2
3
4
VtVzVr
40 80 120 160 200
Tim
e av
erag
ed m
ean
radi
al v
eloc
ity (m
/s)
Blade speed (rpm)
(c) (d)
Figures 5.9 Probability density distributions of velocity components at different
shaft speeds for cohesive particles (Bo=0.2) at steady state.
The mixing quality at 200rpm in the case of non-cohesive particles (Figure 5. 3(b))
shows a reduction at the steady-state, which is probably because of the increased

CHAPTER 5 Mixing Performance of Ribbon Mixers: Effect of Operational Parameters
5-129
tangential velocity of particles delaying or preventing the mixing of particles in axial
direction. This will be especially true in the present case where the particles have been
initially deposited in the side-by-side arrangement in the axial direction.
5.4.2.3 Contact forces
The contact forces between particles in the ribbon mixer were investigated at
different impeller speeds for the non-cohesive and cohesive particle mixtures as shown
in Figure 5.10. Figure 5.10 shows an instantaneous network of contact forces among
the particles, with the colors indicating the ranges of magnitudes of the forces and red
being the strongest force (see Figure 5.10 caption for details). The diagrams show that
the contact forces between particles are stronger in the cohesive mixture compared to
the non-cohesive one for impeller speeds less than 100 rpm. In this speed range, the
magnitude of the contact forces increased with the impeller speed in both mixtures.
Figure 5.10 Force-network diagrams at different impeller speeds for cohesive and non-cohesive particles in the vessel segment between the axial positions, z= 350 and 450 mm at t=37-39 s; impeller speeds are 50, 100, and 200 rpm from the top to bottom, respectively; and colours and corresponding ranges of contact forces f are: blue, f < 0.235 N; green, 0.235 < f < 0.936 N; light green, 0.936< f < 1.17 N; and red, 1.17 < f <1.62N
However, at speeds more than 100 rpm, the cohesive mixture shows a reduction
in the strength of the contact forces, which is also true compared to the non-cohesive
mixture at the same speed. As seen from the figure, the contact force network is more
uniformly distributed in the cohesive mixture at 200rpm than in the non-cohesive one,
leading to lesser contact forces in the branches of the force network. Better spreading of
Non-cohesive
Cohesive
50rpm 100rpm 200rpm 20rpm

CHAPTER 5 Mixing Performance of Ribbon Mixers: Effect of Operational Parameters
5-130
particles in the cohesive mixture is probably the reason for its better mixing at 200 rpm
as seen from Figures 5.3(a) and (b).
To be quantitative, Figure 5.11 shows the probability density for normal force,
shear force and axial force in the shaft speed range 20-100rpm. The normal force is
found to be varying between -0.5 and 4 N. The particles received higher normal force
than tangential and axial forces. The increased number of particles receives a higher
normal force with an increment of shaft speed. Figure 5.11(a) shows the normal contact
forces received by the majority of particles are similar at 50rpm and 100rpm blade
speeds which can be confirmed from the force-network diagrams. The increment of
normal contact forces can be observed from Figure 5.11(c), which shows the mean
values of the probability density curve as a function of shaft speed.
0
0.2
0.4
0.6
0.8
1
10-4
10-3
10-2
10-1
100
101
20rpm50rpm100rpm200rpm
Cum
ulat
ive
Prob
abili
ty
Normal Force(N)
0
0.2
0.4
0.6
0.8
1
10-5
10-4
10-3
10-2
10-1
100
101
20rpm50rpm100rpm200rpm
Cum
ulat
ive
Prob
abili
ty
Shear Force(N) (a)
(b)
0.2
0.4
0.6
0.8
1
40 80 120 160 200
FnFt
Mea
n va
lues
of d
istri
butio
ns (N
)
Shaft speed (rpm) (c)
Figure 5.11 Probability density distributions of force components for non-cohesive
mixture at steady state.

CHAPTER 5 Mixing Performance of Ribbon Mixers: Effect of Operational Parameters
5-131
The diagrams that correspond with Figure 5.11 are shown in Figure 5.12 for the
cohesive case (Bo=0.2). In general, the effect of shaft speed is not clear at this cohesion.
However, it can be seen that the curves for both normal and shear forces have moved to
larger force range compared to the non-cohesive case. The mean values of the
distributions are shown in Figure 5.12(c), which shows that both the normal force and
shear force are larger compared to the non-cohesive case at any shaft speed. It also
shows that the mean value does not change with the shaft speed. Further, the difference
between the two forces has increased in this case.
0
0.2
0.4
0.6
0.8
1
10-1
100
101
20rpm50rpm100rpm200rpm
Cum
ulat
ive
Prob
abili
ty
Normal Force(N)
0
0.2
0.4
0.6
0.8
1
10-2
10-1
100
101
20rpm50rpm100rpm200rpm
Cum
ulat
ive
Prob
abili
ty
Shear Force(N) (a) (b)
0.4
0.8
1.2
1.6
2
40 80 120 160 200
Fn
Ft
Mea
n va
lues
of d
istri
butio
ns (N
)
Shaft speed (rpm) (c)
Figure 5.12 Mean values of cumulative probability distributions of the force
components for cohesive mixture at steady state

CHAPTER 5 Mixing Performance of Ribbon Mixers: Effect of Operational Parameters
5-132
5.4.3 Effect of fill level
The effect of fill level on particle mixing is investigated at different cohesion
levels using the particle-scale mixing index and mixing rate for the two bladed and four
bladed mixers. The shaft speed is chosen as 100 rpm in both cases, in order to compare
with the 2-bladed mixer. The velocity fields and flow patterns in the two and four
bladed mixers are also investigated for non-cohesive and cohesive mixtures. The effects
on velocities and forces are quantified using probability distribution curves in the case
of the 2-bladed mixer for the non-cohesive mixture.
5.4.3.1 Mixing Index and mixing rate
To investigate the effect of fill level on mixing, fill level is varied from 16% to
56% using mixtures of different cohesion at a shaft speed of 100 rpm. The mixing rate
is calculated using the following first order Eq (5.3). Bond number (Bo) which is the
van der Waals force scaled by the particle weight is used here for characterizing
differences in cohesion.
Figure 5.13 shows in each diagram the effect of fill level on the mixing
performance of the two-bladed mixer for a mixture of given cohesion, with Bo number
(or the mixture cohesion) being increased from 0 to 2 in diagrams (a) to (c) in that order.
Figure 5.14 shows the corresponding results for a four-bladed mixer. With an increase
in the fill level and Bo number, mixing takes increasingly longer times to reach the
steady state for both mixers. The effect of fill level is much more pronounced with a
two-bladed mixer than with a four-bladed mixer. On the other hand, the two bladed
mixer shows even a deterioration in the steady-state mixture quality for Bo=2, which is
not the case for the four-bladed mixer. Thus, it can be concluded, the four-bladed mixer
is a better mixer than the two-bladed one, especially for mixing of cohesive particles.

CHAPTER 5 Mixing Performance of Ribbon Mixers: Effect of Operational Parameters
5-133
0
0.2
0.4
0.6
0.8
1
0 20 40 60 80 100
Fill level=16%
Fill level=26%
Fill level=46%
Fill level=56%
Part
tical
Sca
le M
ixin
g In
dex
Revolutions 0
0.2
0.4
0.6
0.8
1
0 20 40 60 80 100
Fill level=16%
Fill level=26%
Fill level=46%
Fill level=46%Part
tical
Sca
le M
ixin
g In
dex
Revolutions 0
0.2
0.4
0.6
0.8
1
0 20 40 60 80 100
Fill level=16%
Fill level =26%
Fill level=46%
Fill level=56%
Part
tical
Sca
le M
ixin
g In
dex
Revolutions
(a) Bo=0 (b) Bo=0.2 (d) Bo=2
Figure 5.13 Effect of fill level on the mixing performance of a 2-bladed mixer at
different Bo numbers (shaft speed = 100 rpm).
0
0.2
0.4
0.6
0.8
1
0 20 40 60 80 100
Fill level=16%Fill level=26%Fill level=46%Fill level=56%Pa
rttic
al S
cale
Mix
ing
Inde
x
Revolutions 0
0.2
0.4
0.6
0.8
1
0 20 40 60 80 100
Fill level=16%Fill level=26%Fill level=46%Fill level=56%Pa
rttic
al S
cale
Mix
ing
Inde
x
Revolutions 0
0.2
0.4
0.6
0.8
1
0 20 40 60 80 100
Fill level=16%Fill level=26%Fill level=46%Fill level=56%
Partt
ical
Sca
le M
ixin
g In
dex
Revolutions
(a) Bo=0 (b) Bo=0.2 (c) Bo=2
Figure 5.14 Effect of fill level on the mixing performance of a 4-bladed mixer at
different Bo numbers. (shaft speed = 100 rpm).
Figure 5.15 shows the mixing rate k as a function of the fill level for the two
mixers, the parameter in the diagrams being the Bo number. For both mixers, k
decreases with an increase in the fill level. Similarly k decreases with an increase in Bo
number for both mixers. A comparison of Figures 5.15(b) and 5.15(a) shows that k is
larger for the four bladed mixer for any Bo numbers considered. It can be also observed
that the differences in k due to changes in Bo number become reduced when the fill
level increases. Particularly, in the case of the four-bladed mixer, it disappears for fill
levels more than 45%.

CHAPTER 5 Mixing Performance of Ribbon Mixers: Effect of Operational Parameters
5-134
0
0.05
0.10
0.15
0.20
0.25
10 20 30 40 50 60
Non-cohesive Bo=0.02Bo=0.2Bo=2
Mix
ing
Rat
e, k
(1/s
ec)
Fill level (%)
0
0.05
0.10
0.15
0.20
0.25
10 20 30 40 50 60
Non-cohesive Bo=0.02Bo=0.2Bo=2
Mix
ing
Rat
e, k
(1/s
ec)
Fill level (%)
(a) Two-bladed mixer (b) Four-bladed mixer
Figure 5.15 Mixing rates k for the two-bladed and four-bladed mixers (shaft speed
= 100 rpm)
5.4.3.2 Velocity field and quantification of velocity
The velocity field, and time and cell averaged velocities are produced here to
understand the particle flow behaviour in micro-dynamic aspects for both the non-
cohesive and cohesive mixtures at different fill levels. The probability density
distributions of particle velocities are used to quantify the effects of fill level on the
velocity field.
Figure 5.16 shows the particle flow patterns as investigated from the velocity
fields at different fill levels for the non-cohesive and cohesive mixtures in the two
bladed and four bladed mixers at the 80th revolutions. It can be seen that the flow
patterns as similar to those in a rotating drum in the case of the non-cohesive mixture at
low fill levels. For example, one can see cascading, recirculation and sliding-like
motions in the non-cohesive mixture both for the two bladed and four bladed mixers. In
the case of non-cohesive mixture, the two bladed mixer shows recirculation motion on
the right lower part in the mixer at 26% fill level; similarly, the four bladed mixer shows
such motion at 16% and 26% fill levels. The cascading motion is seen in the mixture
with 26% and 56% fill levels in the non-cohesive mixture for two-bladed as well as the
four-bladed mixers.

CHAPTER 5 Mixing Performance of Ribbon Mixers: Effect of Operational Parameters
5-135
Due to the cohesion between the particles, the particles tend to move together
enhancing the circumferential flow in the case of the cohesive mixture in the 4-bladed
mixer.
Figure 5.16 Velocity fields at different fill levels in the two bladed and four
bladed mixers at the 80th revolution for the two-bladed and four-bladed mixers in
cases of non-cohesive and cohesive mixtures (shaft speed = 100 rpm).
In order to obtain the time-averaged longitudinal velocity distribution in the
mixers, the mixer space is divided into cubic cells of the size 40x40x40mm3, and the
velocities of particles in each cell are averaged over a time interval of 2s. Figure 5.17
shows the average velocity and porosity in a longitudinal section between x=-40 and 40
mm for the non-cohesive mixture in the 2-bladed mixer averaged over 2s up to the
30 rev. It shows that a circulating flow is established from either end of the vessel
towards the centre of the vessel and back towards the vessel ends; although not shown
here, similar flow patterns are observed in the case of 4-blade mixer. However, such a
flow pattern will not improve axial mixing in the present case where a side-by-side
Fill level=16% Fill level=26% Fill level=46% Fill level=56%
2blade-non-cohesive
4blade cohesive
Frame 001 20 Jul 2013 Frame 001 20 Jul 2013 Frame 001 20 Jul 2013 Frame 001 20 Jul 2013
Frame 001 20 Jul 2013 Frame 001 20 Jul 2013 Frame 001 20 Jul 2013 Frame 001 20 Jul 2013
2blade -cohesive
Frame 001 20 Jul 2013 Frame 001 20 Jul 2013 Frame 001 20 Jul 2013 Frame 001 20 Jul 2013
Frame 001 20 Jul 2013 Frame 001 20 Jul 2013
4blade non-cohesive
Frame 001 29 Jul 2013 Frame 001 29 Jul 2013

CHAPTER 5 Mixing Performance of Ribbon Mixers: Effect of Operational Parameters
5-136
initial arrangement has been used. To improve mixing rate, it is thus more appropriate
to deposit particles in top-bottom arrangement or by the layering method as reported
elsewhere (Muzzio et al., 2008). Porosity over the impeller seems to decrease with an
increase in the fill level, which is true for both types of mixers.
Fill level=16% Fill level=26%
Fill level=46% Fill level=56%
Figure 5.17 Average velocity and porosity of particles in a longitudinal section
between x=-40 and 40 mm at the 30 revolution for non-cohesive mixture in the 2-
bladed mixer, x being measured at right angle to the shaft from the shaft axis
(shaft speed = 100 rpm).
To quantify the fill level effect on particle velocities, probability density
distributions of instantaneous velocity components are considered in Figures 5.18 and
5.19 for non-cohesive mixtures in the 2-bladed and 4-bladed mixers, respectively, as
was done in Figure 5.9. Generally, Vz and Vr have their distributions centred around 0,
although there is slight deviation from it due to the velocity being instantaneous.
Particularly, Vz shows a shift towards large positive values in Figure 5.18(c). Its time-
average is not so close to zero over 2s time interval for some fill levels, which indicates
that the traversing of particles from one end to the other may be occurring in a much
Frame 001 29 Jul 2013
Frame 001 29 Jul 2013
Frame 001 29 Jul 2013 Frame 001 29 Jul 2013
Porosity
0.95
0.9
0.85
0.8
0.75
0.7
0.65
0.6
0.55
0.5
0.45
Frame 001 29 Jul 2013

CHAPTER 5 Mixing Performance of Ribbon Mixers: Effect of Operational Parameters
5-137
longer period of time. Vt shows a slight shifting of its mean value in the positive
direction with an increase in the fill level, which means more particles are moving
circumferentially at a higher speed. The time-averaged Vt also show a slight increase
with the fill level. Vr is more or less centered around 0 as expected, and its time-
averaged value is mostly 0.
In the case of the 4-bladed mixer (Figure 5.19), Vt shifts towards higher
velocities with an increase in the fill level as seen from its distribution curve (Figure
5.19 (b)). This effect is clearly seen from the time-averaged Vt shown in Figure 5.19(d).
The time-averaged Vz and Vr are zero at higher fill levels, but show non-zero values at
lower fill levels. The reason could be that particles take longer time to traverse from one
end to the other of the vessel at low fill levels.
0
0.2
0.4
0.6
0.8
1
1.2
-3 -1.5 0 1.5 3
16%26%46%56%
Prob
abili
ty D
ensi
ty
Radial Velocity (m/s)
0
0.1
0.2
0.3
0.4
0.5
0.6
-2.25 0 2.25 4.5
16%26%46%56%
Prob
abili
ty D
ensi
ty
Circumferencial Velocity (m/s) (a) Radial velocity Vr (b) Circumferential velocity Vt
0
0.2
0.4
0.6
0.8
1
-2 -1 0 1 2
16%26%46%56%
Prob
abili
ty D
ensi
ty
Axial Velocity (m/s)
-0.4
-0.2
0
0.2
0.4
0.6
0.8
1
1.2
10 20 30 40 50 60
VrVtVz
Tim
e-av
erag
ed m
ean
velo
city
(m/s
)
Fill level (%) (c) Axial velocity Vz (d) Time-averaged mean velocities
Figure 5.18 Probability distributions of velocity components and time-averaged mean
velocities at different fill levels for the non-cohesive mixtures in 2-bladed mixer at 100
rpm shaft speed.

CHAPTER 5 Mixing Performance of Ribbon Mixers: Effect of Operational Parameters
5-138
0
0.1
0.2
0.3
0.4
0.5
0.6
0.7
0.8
-3 -1.5 0 1.5 3
16%26%46%56%
Prob
abili
ty D
ensi
ty
Radial Velocity (m/s)
0
0.1
0.2
0.3
0.4
0.5
-2.25 0 2.25 4.5
16%26%46%56%
Prob
abili
ty D
ensi
ty
Circumferencial Velocity (m/s) (a) Radial velocity Vr (b) Circumferential velocity Vt
0
0.1
0.2
0.3
0.4
0.5
0.6
-2 0 2 4
16%26%46%56%
Prob
abili
ty D
ensi
ty
Axial Velocity (m/s)
-0.2
0
0.2
0.4
0.6
0.8
1
16% 26% 46% 56%
Vr
Vt
Vz
Tim
e-av
erag
ed m
ean
velo
citie
s (m
/s)
Fill level (%) (c) Axial velocity Vz (d) Time-averaged mean velocities
Figure 5.19 Probability distributions of velocity components and time-averaged
mean velocities at different fill levels for non-cohesive mixtures in the 4-bladed
mixer at 100 rpm shaft speed.
5.4.3.3 Contact forces
The effect of the fill level on the contact forces are analyzed here using
probability density distributions of contact forces in the 2-bladed and 4-bladed mixers
for mixing of non-cohesive particles as done previously in the shaft-speed section. The
results are shown in Figures 5.20, with the left-column showing those for the 2-bladed
mixer and the right column showing those for the 4-bladed one, respectively.

CHAPTER 5 Mixing Performance of Ribbon Mixers: Effect of Operational Parameters
5-139
0
0.2
0.4
0.6
0.8
1
10-5
10-4
10-3
10-2
10-1
100
101
16%26%46%56%
Cum
ulat
ive
Prob
abili
ty
Normal Force(N)
0
0.2
0.4
0.6
0.8
1
10-5
10-4
10-3
10-2
10-1
100
101
16%26%46%56%
Cum
ulat
ive
Prob
abili
ty
Normal Force(N) (a1) Normal forces: 2-bladed (b1) Normal forces: 4-bladed
0
0.2
0.4
0.6
0.8
1
10-5
10-4
10-3
10-2
10-1
100
101
16%26%46%56%
Cum
ulat
ive
Prob
abili
ty
Shear Force(N)
0
0.2
0.4
0.6
0.8
1
10-4
10-3
10-2
10-1
100
101
16%26%46%56%
Cum
ulat
ive
Prob
abili
ty
Shear Force(N) (a2) Shear forces: 2-bladed (b2) Shear forces: 4-bladed
0
0.05
0.1
0.15
0.2
16% 26% 46% 56%
FnFt
Mea
n Fo
rce
of C
PD (N
)
Fill level (%)
0
0.05
0.1
0.15
0.2
20 25 30 35 40 45 50 55
FnFt
Mea
n Fo
rce
of C
PD (N
)
Fill level (%) (a3) Mean values of (a1) and (a2): (b3) Mean values of (a1) and (a2):
2-bladed. 4-bladed.
Figure 5.20 Probability distributions of contact force components of particles of
the non-cohesive mixture at different fill levels for the 2-bladed and 4-bladed
mixers at 100 rpm shaft speed.

CHAPTER 5 Mixing Performance of Ribbon Mixers: Effect of Operational Parameters
5-140
The figure shows that the normal forces are slightly increased with the fill level
in the case of 2-bladed mixer as seen by the slight right-shift in the probability
distribution curves. Conversely, fill level does not affect the normal forces in the case of
4-bladed mixer. The average values shown in Figures 5.20(a3) and (b3) confirm this
observation. As for the shear or tangential contact forces, the fill level has the effect of
increasing the shear force in the case of 2-bladed mixer, but not as much in the case of
4-bladed mixer as seen from a comparison of Figures 5.20(a2) and 5.20(b2), In fact, for
both the 2-bladed and 4-bladed mixers, the contact forces are at about the same level.
With its ability to mix cohesive particles (up to Bo=2) without deterioration in the
steady-state mixture quality, the 4-bladed mixer can thus be considered as a better
choice to mix cohesive particles.
5.4.4 Comparison of mixer performances: Ribbon versus cylindrical mixers
It is also worthwhile to make a statement about the level of normal and shear
forces that particles experienced in the ribbon mixers in comparison with the cylindrical
mixers (Chandratilleke et al., 2009). In a 2-bladed cylindrical mixer with a vertical shaft,
the normal force on the average is about 0.022N at a shaft speed of 100 rpm, which is
about 1/5th of the present normal forces. Shear forces in the cylindrical mixer is about
0.005N at 100 rpm, which is about 1/10th of the present shear forces. However, the
particle number being 18,000 in the present case in comparison to 16,000 of the
cylindrical mixer, one can expect some increase in the contact forces in the ribbon
mixer. However, the effect of this difference is not clear at this stage, but should be
clarified in a future work.
In addition, if we consider the mixing characteristics of Figures 5.4, which is the
macroscopic mixing index for the 2-bladed mixer at 25% fill-level, the fully mixed state
is reached after about 60 revolutions at 100 rpm for particles laid down initially in the
side-by-side configuration in the axial direction. On the other hand, for 16,000 non-
cohesive particles laid down initially in side-by-side configuration in a cylindrical mixer,
the fully mixed state is reached in just about 6 revolutions (Chandratilleke et al., 2009).
Such a difference may have been caused by the size difference of the mixers; the
cylindrical mixer is of 250mm diameter while the length of the ribbon mixer vessel is
970mm. The ratio of vessel diameter to particle size is 50 for the cylindrical mixer and

CHAPTER 5 Mixing Performance of Ribbon Mixers: Effect of Operational Parameters
5-141
that of the vessel length to particle size is 64 for the ribbon mixer. Therefore, as a matter
of fact, mixing in the case of ribbon mixer will be delayed in comparison to the
cylindrical mixer. The strengths of the two mixers need to be thus properly assessed in a
future work.
5.5 Conclusions
The mixing performances of ribbon mixers were investigated using the discrete
element method. The two operational parameters, the shaft speed and fill level were
varied to investigate their effects on the mixing performance. In order to establish the
effect of the shaft speed, a 2-bladed ribbon mixer was used at a fixed fill-level of 25%.
Next, having determined a suitable shaft speed, the fill-level was varied over a wide
range. In the study, both non-cohesive and cohesive mixtures were also used to
highlight how the particle cohesion can influence the effects of the two operational
parameters on the mixing performance. Further, performances of two ribbon impellers
were also compared based on fill-level effects at different particle cohesion levels. A
comparative discussion was also made of ribbon mixers and a vertically-shafted
cylindrical mixer. The following conclusions were drawn.
Shaft speed affects the mixing performance of a 2-bladed ribbon mixer significantly,
especially when the mixture is non-cohesive. A shaft speed of 100 rpm was found
to be suitable for both non-cohesive and cohesive mixtures as it provided the fastest
mixing rate in the range of speeds studied. At speeds exceeding 100 rpm, not only
the mixing rate, but also the steady-state mixing quality deteriorated for non-
cohesive mixtures, although it was not the case with cohesive mixtures.
With an increase in the shaft speed, the circumferential velocity of particles
increased, but the average axial and radial velocity components remained close to
zero, although their absolute values increased with the shaft speed, all of which
contributing to mixing improvement with shaft speed increment.
Shaft speed increased the contact forces of particles in non-cohesive mixtures.
Conversely, the shaft speed did not affect the contact forces in cohesive mixtures.
However, contact forces in cohesive mixtures were larger than those in non-
cohesive mixtures.
The fill level affected the mixing rate, particle flow and particle velocities
significantly in the non-cohesive and cohesive mixtures in both the 2-bladed and 4-

CHAPTER 5 Mixing Performance of Ribbon Mixers: Effect of Operational Parameters
5-142
bladed ribbon mixers. On the other hand, fill level did not affect the contact forces
in both mixers for non-cohesive mixtures. The mixing rate deteriorated with an
increase in the fill level and cohesion in both the mixers. The particle flow
gradually changed from a recirculation flow to a sliding flow to a cascading flow
with an increase in the fill level in non-cohesive mixtures for both mixers tested.
The 4-bladed mixer is more capable of handling mixing at high fill levels,
especially in the case of cohesive mixtures without a sacrifice in the mixture quality
at 100 rpm.
Overall, the ribbon mixers, especially the 4-bladed ones are promising for mixing
of cohesive particles. However, proper comparison work is necessary to highlight its
advantages over the simple vertically-shafted cylindrical mixers, which may provide
faster mixing with lower stresses on the particles to be mixed.
Nomenclature
D Vessel diameter, (m)
d Particle diameter, (mm)
E Young’s modulus, N/m2
Fc,ij Contact force vector between i and j, N
Fd,ij Damping force vector between i and j, N
Fv, ij Cohesive force between particles i and j
g Acceleration due to gravity, (m/s2)
h Gap between interacting two particles, (m)
Ha Hamaker constant, J
Hap Hamaker constant of particle material, J
Haw Hamaker constant of wall material, J
Ii Moment of inertia of particle i, (kg m2)
ki Number of particles in contact with particle i
M Particle-scale mixing index defined in Eq.(3) , (-)
Mij Vector of rolling friction torque on particle i, (Dury et al.)
Mp Predicted mixing index at steady-state, (-)
n Actual particle number fraction of the two types of particles, (-)
Ni Number of particles in the immediate neighbourhood of particle i

CHAPTER 5 Mixing Performance of Ribbon Mixers: Effect of Operational Parameters
5-143
Nl Number of large particles
Np Total number of particles of one type in the mixture
Ns Number of small particles
Nt The number of sample points of instantaneous average values in time t
p Number ratio of the target type particles to all the particles, (-)
pi Particle fraction of a target type particle in the neighborhood of particle i, (-)
tp Average value of pi at time t for the entire mixture, (-)
R Equivalent radius, m
S0 Standard deviation of pi at fully-segregated state, (-)
SR Standard deviation of fully-mixed state for uniform-sized particles of particle
fraction of p, (-)
St Standard deviation of pi with respect to tp at time t, (-)
Tij Vector of rolling friction torque on particle i, N m
Vb Blade speed, (m/s)
Vi Velocity of particle i, m/s
Z Height from vessel base (mm)
Greek letters
α Volume fraction
Average particle-scale sample size for the mixture
θ Radial section measured horizontally from mid-plane of the blade
ik Number of particles in contact with particle i
Density of particles of a uniform system, ( 3kgm )
Shaft rotational speed, (rad/s)
i Angular velocity vector of particle i, (rad/s)

CHAPTER 6 DEM Simulation of Powder Mixing in a Ribbon Mixer: Effects of Impeller Geometry
6-144
Chapter 6
DEM Simulation of Powder Mixing in a Ribbon Mixer: Effects of
Impeller Geometry

CHAPTER 6 DEM Simulation of Powder Mixing in a Ribbon Mixer: Effects of Impeller Geometry
6-145
6.1 Introduction
A ribbon mixer is known to possess a combination of mixing mechanisms such as
convection, diffusion and shear when mixing granular matter. Ribbon mixers are widely used
in practice because they are capable of providing high speed convective mixing, especially in
the circumferencial direction. The efficiency of such operations and quality of the resulting
mixtures will depend on the impeller geometry. Thus, it is important to understand the effects
of the impeller geometry and use the right geometry for the product to be manufactured based
on industry requirements, which can be different from one industry to another, some examples
of different industries being pharmaceuticals, food, cosmetics and powder metallurgy
industries.
Much of the work on the effect of ribbon geometry on mixing has been reported for
liquid mixing (Masiuk and Lacki, 1993). For example, Masiuk et al (1992) and Muzzio, Lusa
et al. (2008) reported that helix pitch and width have a perceptible influence on the mixing
time and power consumption for mixing of liquids. Masiuk et al. (1993) also reported that the
shape of the ribbon agitator has a significant influence on the energy required for mixing of
liquids. Takahashi et al. (1988) reported that even though the primary circulation patterns are
approximately the same, the impeller geometry can strongly affect the secondary circulation
flows. The following parametric effects have been reported for liquid mixing with a helical
blade. When the pitch of the helical blade is decreased with the wall clearance fixed, the shear
rate becomes higher (Delaplace et al., 2000). It is also reported that doubling the width of a
helical ribbon blade increased the axial forces by 40-50% while the power consumption
remained practically constant (Bortnikov et al., 1973). Further, doubling the helical ribbon
width has resulted in an increase of 10% in the power required for mixing of liquids
( ). A helical ribbon mixer with a greater clearance has a lower
power consumption, but it takes a longer time for the homogenization. Conversely, an agitator
with a smaller clearance has exhibited a greater efficiency (Rieger et al., 1986). Thus, the
design of a blade has a significant impact on the homogenization of mixtures. However, there
is not much information available in the literature regarding this effect for granular mixing
(Muzzio et al., 2008). Further, the studies of this effect on the mixing of cohesive particles in
a horizontal ribbon mixer are rare to the best of our knowledge.

CHAPTER 6 DEM Simulation of Powder Mixing in a Ribbon Mixer: Effects of Impeller Geometry
6-146
Muzzio et al. (2008) experimentally investigated the mixing performance of a ribbon
mixer with regard to the effect of loading (layering and off-center spot loading method). They
reported that layering method results in faster mixing and better homogeneity.They also found
that the fill level has a significant effect on the mixing performance of a 3 spokes 2-bladed
ribbon impeller, but not so much on a 5 spokes 2-bladed ribbon mixer.
The objective of this study is to investigate the effect of blade geometry on the mixing
performance of a horizontal ribbon mixer. The discrete elmement method (Cundall and Strack,
1979) is an effective way of acquiring such information because it can be difficult and/or
expensive to use traditional experimental approaches in such a study as has beed reported
elsewhere (Cleary and Sinnott 2008). Therefore, the effect of the impeller geometry of a
ribbon mixer is investigated here by using DEM and the mixing behaviour analyzed by a
particle-scale mixing index (PSMI). Here, the impeller geometry is changed by varying the
blade number, blade angle, blade width, blade pitch and blade clearance, and the
performacnce of the impellers are evaluated with different cohesive mixtures at a fixed fill
level of 35%.
6.2 Numerical Method
The DEM model used here is based on an extension to the original DEM model
proposed by Cundall and Strack (Cundall and Strack, 1979) to account for the rolling friction
of particles, and is essentially the same as that previously developed and validated by Zhou et
al. (Zhou et al., 1999; Zhou et al., 2004). The model uses two momentum conservation
equations to describe the translational and rotational motion of particle i in a system at time t
subjected to the gravity g and interactions with the neighboring particles, blade and walls:
ii N
jijv
k
jijdijci
ii m
dtdm
1,
1,, FFFgV
(6.1)
ik
jijij
ii d
dI1t
MT (6.2)

CHAPTER 6 DEM Simulation of Powder Mixing in a Ribbon Mixer: Effects of Impeller Geometry
6-147
Here mi, Ii, Viand i are the mass, moment of inertia, translational and rotational
velocities of particle i respectively;kiis the number of particles that are in contact with particle
i;Fc,ij represents the elastic contact force, which is the summation of the normal and tangential
forcesrespectively at the contact point with particle j;Fd,ijrepresents the damping force, which
is the summation of the normal and tangential damping force respectively at the contact point
with particle j;and Tij and Mijare the torque and rolling friction torque on particle i due to
particle j respectively. Expressions for the forces as shown in the Table6.1.
Table 6.1. Equations used to calculate forces in the DEM simulations
Force Equation
Particle-particle forces 13, 18-20
ijijijnnnnij RYRY nnvF ˆˆ~1~13
22
2/32
ssssnijs
sij ξFF ˆ/,min11 2/3
max,max,
ij
jijiji
jijivdwij RRhRhRhhRhRh
RRhRRA nF ˆ)422()22(
)(646 2222
33
iji
ivdwi hRhh
RA nF ˆ)2(
23 222
3
where: ||/)(ˆ jijiij RRRRn , )( jiji RRRRR ,
nss )~1(2~2max, , ||/ˆsss ξξξ
6.3 Mixing quantification
The index is based on the use of the coordination number to define the particle
fraction piof one type of particles (or target type particles) at particle i in a binary mixture, and
the variance St2of pi is obtained relative to the instantaneous mean value of pi for the mixture.
Next, St2is used in the following formula of L ce ’ m x g ex , M to obtain the
instantaneous mixing index for the mixture:
220
220
R
t
SSSSM
(6.3)

CHAPTER 6 DEM Simulation of Powder Mixing in a Ribbon Mixer: Effects of Impeller Geometry
6-148
where, ppS 120 and /12 ppSR are the variances of the fully-segregated
and fully-mixed mixed states respectively, with p and ƞ representing the particle number ratio
of the target type particles to the total particle number in the binary mixture and average
particle-scale sample size for the mixture, respectively. The average sample size is determined
from the average value of the coordination number for the mixture. In determining St2, one
has to use a particle-contact condition, which is taken as an inter-particle gap size of 5% of
the small particle diameter, to be consistent with our previous work.
Mixing rate
The mixing rate is calculated using following first order equation:
M=1-(1-M0) e-kt (6.4)
Here, k (s-1) is the mixing rate.
6.4 Simulation conditions and procedures
The mixer used in this study is a horizontal ribbon mixer, and the ribbon impeller
designs tested are shown in Figure 6.11. Two types of impellers are investigated here. In the
first type, the impeller has only outer two blades (see the top row in Figure 6.1, the base case
being the leftmost one). This impeller is termed the type-1 impeller. In the second type, one
inner set of two blades are also used (see bottom row in Figure 6.1, the base case being the
leftmost one again). This impeller is termed here the type-2 impeller.
To investigate its mixing performance, an impeller is placed axially in a horizontal
cylindrical vessel, whose the major dimensions are as listed in Table 6.3. Here, 27 numerical
experiments are conducted to investigate effects of the following four variables related to the
impeller geometry, on mixture quality: blade number, blade angle, blade pitch, and blade
clearance. For mixing studies, two types of particles (different only in color) are laid in the
mixer in the side-by-side arrangement in the axial direction. After the particles have settled
down, the impeller is rotated from the stationary state at a constant speed of 100 rpm.

CHAPTER 6 DEM Simulation of Powder Mixing in a Ribbon Mixer: Effects of Impeller Geometry
6-149
The study is carried out in two parts. In the first part, effects of geometry of type-1
impeller on cohesive particle mixing are investigated. The geometric parameters considered
are blade pitch, width and clearance of blades with the vessel wall. In the second part,
performances of type-1 impellers are compared with those of type-2 impellers using a non-
cohesive particle mixture. Note that when the blade pitch is reduced in the base case geometry
of each type of impellers, blades are needed to be added to fill up the vacant space between
the two end-blades of the impeller. Therefore, the pitch reduction is equivalent to an increase
in the blade number for both types of impellers. The cohesion between the objects in the
system is modelled by the van der Waals force. The values of Hamaker constant, Ha used for
particle-to-particle and particle-to-wall contacts are shown in the Table 6.2. Hamaker constant,
Hap-w for particle-wall contacts is obtained from wp HaHa , where Hap and Haw are Hamaker
constants for particle and wall materials, respectively (Kruusing, 2008).
A total of 18,000 uniform particles of 15 mm dia. are used in the study, the particle
properties used being as follows: You g’ mo u u =1108N/m2 Po o ’ r t o=0.29,
damping coefficient=0.3, static sliding friction coefficient=0.3 and rolling friction
coefficient= 0.002. The time step is chosen as 5.8x10⁻⁶s.
Table 6.2 Particle material properties
Hamaker Constant, Hap (J)
Hamaker Constant Hap-w
(J)
Hamaker Constant Haw(J)
5.54E-16 8.76E-18 1.4E-19 5.54E-17 2.77E-18
5.54E-18 8.76E-19
Table 6.3. Geometry parameters of ribbon mixer

CHAPTER 6 DEM Simulation of Powder Mixing in a Ribbon Mixer: Effects of Impeller Geometry
6-150
Input variable Value
Vessel diameter 432 (mm)
Vessel length 970 (mm)
Blade pitch ratio S/D 1.12, 0.75, 0.56
Blade width W 10, 20, 30, 40, 60 (mm)
Shaft diameter 31.75 (mm)
Rake angle 45 , 135 , 50 , 80
Blade Clearance C 8.5 ,15,22, 27 (mm)
Particle number 18000
Particle dia., d 15 mm
Shaft speed, co 100 rpm
You g’ mod. E 1 108 N/m2
Po o ’ ratio, ν 0.29
ms (P-P) (P-W) 0.3
mR(P-P) (P-W) 0.002
Time step 5.8E-06
S/D1.123 S/D0.748 S/D0.561width
45°
S
D
Inner and outer blade
45°S
D
width
S/D=1.123 S/D=0.748 S/D=0.561
Figure 6.1 Impeller configurations: Top-row, type-1 impeller and bottom-row,
type-2 impeller.
S/D=1.123 S/D=0.748
S/D=0.561

CHAPTER 6 DEM Simulation of Powder Mixing in a Ribbon Mixer: Effects of Impeller Geometry
6-151
6.5 Results and discussions
Below, the results of the numerical experiments are divided into two parts. In the first
part, the mixing performance of a mixer with a type-1 impeller (see Figure 6.1) is investigated
by varying the mpe er’ blade number (or pitch), as well as blade width, blade angle and
clearance of the blades with the vessel wall. In the second part, the performaces of type-1
impellers are compared with those of the type-2 (see Figure 6.1).
6.5.1 Geometrical effects of type-1 ribbon impellers
The geometric effects such as blade number (or pitch ratio), blade width, blade clearance
and blade angle on mixing behaviour in a ribbon mixer with a type-1impeller is investigated
here using DEM method. Such effects are investigated at different cohesion with the objective
of exploring the merits of ribbon mixers for powder mixing. The effects of the blade number
(or pitch ratio) and blade width on particle mixing behavior are examined in terms of a
particle-scale mixing index and mixing rate, coordination number, velocities and forces. The
shaft speed is chosen as 100rpm. The mixing rate, k is calculated using Eq (6.4)
6.5.1.1 Blade number or blade pitch effect
To investigate the effect of number of blades added to the base-case ribbon geometry
(leftmost type-1 impeller in Figure 6.1), the blade number is increased from 2 to 4 as shown in
the top row of Figure. 6.1. To add the new blades into the impeller, the blade pitch S is
reduced. Thus, the increase of blade number corresponds to a decrease in the blade pitch. The
pitch ratio S/D of the impellers are shown below each diagram, where D is the cylindrical
vessel diameter. With the reduction of the blade pitch, the length of the blade measured along
the spiral will increase.
6.5.1.1.1 Mixing index and mixing rate
Figure 6.2 shows the mixing characteric of each impeller of type 1 as a function of shaft
revolutions at different Hap values. The results show that mixing gets delayed with an increase
of cohesion. Mixing rate of the mixing curves are shown in Fig. 6.3 as a function of either S/D
or blade number. Mixing curve for the ribbon impeller with S/D=0.75 (or 3-blades) has a

CHAPTER 6 DEM Simulation of Powder Mixing in a Ribbon Mixer: Effects of Impeller Geometry
6-152
higher mixing rate and the steady-state reached earlier compared to other impellers as shown
in Figs. 6.2 and 6.3, for all Hap values tested. The mixing rate k deteriorated with an increase
of cohesion for 2 and 4-bladed type 1 impellers as shown in Figs. 6.3.
0
0.2
0.4
0.6
0.8
1
0 20 40 60 80 100
S/D=1.12S/D=0.75S/D=0.56
Partt
ical
scal
e m
ixin
g in
dex,
M
Revolutions
0
0.2
0.4
0.6
0.8
1
0 20 40 60 80 100
S/D=1.12S/D=0.75S/D=0.56
Part
tical
sca
le m
ixin
g in
dex,
M
Revolutions
(a) Hap = 5.54 x 10⁻¹⁸ J (Bo=0.02) (b) Hap = 5.54 x 10⁻¹⁷ J (Bo=0.2)
Figure 6.2 Effect of blade number or pitch ratio on mixing at different Hap for type-
1 impellers
The reason of particles mixing in the mixer with pitch ratio 0.75 shows a high mixing
rate and high uniformity probably is that the blade arrangement improves particle axial
movement, mixing easily reached the pick value of the mixing index. However because of
enhanced particle axial movement, the particle flow divided into two parts perform
segregation around 10 revolutions.
Figure 6.3 (a) shows that the mixing rate, as a function of pitch ratio increases and then
decreases with an increase of pitch ratio up to S/D=0.75 and with a decrease of cohesion of
the mixture. It is investigated that the particles in the ribbon impeller with pitch ratio
S/D=0.75 show similar mixing rate in the mixture with cohesion range from Hap = 5.54 x 10-
18 J to Hap = 5.54 x 10⁻¹⁷ J. Figure 6.4 (b) shows the mixing rate as a function of the Ha
constants. It is clearly seen that the mixing rate decrease with an increase of Ha constant.

CHAPTER 6 DEM Simulation of Powder Mixing in a Ribbon Mixer: Effects of Impeller Geometry
6-153
0
0.05
0.1
0.15
0.2
0.5 0.6 0.7 0.8 0.9 1 1.1
Mix
ing
Rat
e, k
(1/s
ec)
Pitch ratio S/D
Hp= 5.54x10⁻¹⁸
Hp= 5.54x10⁻¹⁷
0
0.1
0.2
2 3 4
Mix
ing
Rat
e, k
(1/s
ec)
Blade Number
Hp= 5.54x10⁻¹⁸
Hp= 5.54x10⁻¹⁷
Figure 6.3 Dependence of mixing rate on pitch ratio or blade number at different particle
cohesion.
6.5.1.1.2 Coordination number
Overall coordination number gives an indication of expansion of the particle bed
within the vessel. Figure 6.4 shows the total (overall) coordination numbers as a function of
Ha and Pitch ratio S/D . The results show the total coordination number increases in the
mixer with pitch ratio 0.56 and 1.12, it means that the particles compacted in middle or two
halves and increased total coordination number, thus the mixing deteriorated which is can be
confirmed in mixing curve as shown in Figure 6.4. This is also can be investigated from
snapshots of particle flow when the mixer with the pitch ratio 1.12 at different cohesion at
40th rev as shown in Figure 6.12. The uniformity of mixing deteriorated when the mixture
cohesion increased as shown in Figure 6.5 (a) and (b) . Figure 6.4 (b) shows the total
coordination number decreases up to pitch ratio 0.9, and then increases while the pitch ratio
incremented. The Total coordination number increased when the cohesion decreases with the
pitch ratio range between 0.62 and 1.08. It implies that the geometric dimension with pitch
ratio in this range, the total coordination number decreases with an increase of cohesion of the
mixture due to the porous structure enhanced with an increase of cohesion, thus there are less
contact between particles and no particle compact in the mixer , produce premium particle
mixing.

CHAPTER 6 DEM Simulation of Powder Mixing in a Ribbon Mixer: Effects of Impeller Geometry
6-154
2.6
2.8
3.0
3.2
3.4
3.6
3.8
10-18
10-17
S/D=1.12
S/D=0.75
S/D=0.56
Tota
l Coo
rdin
atio
n N
umbe
r
Hp(J)2.0
2.5
3.0
3.5
4.0
4.5
0.5 0.6 0.7 0.8 0.9 1 1.1 1.2
Hp = 5.54x10⁻¹⁸
Hp = 5.54x10⁻¹⁷
Tota
l Coo
rdin
atio
n N
umbe
r
Pitch ratio S/D
(a) (b)
Figure 6.4 Comparison of total coordination number: (a) Total coordination number
as a function of Hap; (b) Total coordination number as a function of pitch ratio S/D
(a) Hap = 5.54 x 10⁻¹⁸ J (b) Hap = 5.54 x 10⁻¹⁷
Figure 6.5 Snapshots of particle flow in the mixer for 1.12 pitch ratio at different
cohesion (at 40th revolution.)
(a) Hap = 5.54 x 10⁻¹⁸ J (b) Hap = 5.54 x 10⁻¹⁷
Figure 6.6 Snapshots of the particle flow in the mixer at pitch ratio 0.75 at different
cohesion at 40th revolution

CHAPTER 6 DEM Simulation of Powder Mixing in a Ribbon Mixer: Effects of Impeller Geometry
6-155
Figure 6.6 shows the snapshots of particle flow in the mixer with pitch ratio 0.75 at
different cohesion. The uniformity of mixing deteriorated with an increase of cohesion of the
mixture. This is concurring with the Figure 6.4 that the cohesion leads the porosity increase
in the mixture, therefore the coordination number decreases with an increase of the cohesion.
6.5.1.1.3 Flow pattern
To investigate the particle flow at different cohesion and different pitch ratios, the
time and cell averaged paricle velocities are obtained. Note that the mixer space is divided
into cubic cells of the size 40×40×40 mm3, and the velocities of the particles in each cell are
averaged over a time interval of 2s. Figure 6.7 shows the average velocity of the particles in
a longitudinal section between x=-40 and 40mm for different pitch ratio and different
cohesion. Figure 6.7 shows the average velocity Vz, Vy and |V| decreases with an increase of
particle Ha constant in the mixer with a different pitch ratio respectively. However the
concentration of average velocity can be seen in the upper part of the vessel as a red color
when cohesion increased with a higher pitch ratio.
S/D=1.12 S/D=0.75 S/D=0.56
|V|
14
13
12
11
10
9
8
7
6
5
4
3
2
1
Frame 001 13 Jul 2013
Frame 001 13 Jul 2013 Frame 001 13 Jul 2013 Frame 001 13 Jul 2013
Frame 001 13 Jul 2013 Frame 001 13 Jul 2013 Frame 001 13 Jul 2013
Hap = 5.54 x 10⁻¹⁸
Hap = 5.54 x 10⁻¹⁷
Figure 6.7 The averaged velocity in the mixer at a different pitch ratio S/D and Hap;
x =-40–40, y= -260– 260, z= 0 –1000, rev 30th
The particle average velocity shows that the particle movement is symmetric, and the
high velocity located upper and middle part of the vessel. The most particle mixing
y Vz
V

CHAPTER 6 DEM Simulation of Powder Mixing in a Ribbon Mixer: Effects of Impeller Geometry
6-156
movement happened in the middle section of the ribbon with pitch ratio 1.123. The particles
flow or average of Vz and Vy can be seen from very right to the left part of the vessel with
pitch ratio 0.75. The red color located upper and very right part of the vessel represents the
higher average velocity of particles due to pushed by the blades which is tilted to the left axial
direction of the impeller. This blade arrangement and dimensions of the mixer perform higher
mixing rate and homogeneity of the mixture due to particle flow enhanced by the axial and
radial movement of the particles which is initially loaded side by side.
The particle flow in the ribbon mixer with pitch ratio 0.56 as follows: the particle flow
moving from middle to the right and left part of the vessel, show less homogeneity due to the
division of the particle flow into two parts.
6.5.1.1.4 Probability density of velocity and forces
To quantify the pitch ratio effect on particle velocity and force, probability density
distribution of the instantaneous velocity and cumulative probability of instantaneous force
are considered in the mixer with different pitch ratio in Figure 6.8 and Figure 6.9 respectively.
The range of the velocity between -1.26 m/s and 3.25 m/s. The increased number of particles
receives an incremented of radial velocity in the ribbon impeller as shown Figure 6.8 (a). The
radial velocities have not affected by the pitch ratio significantly, however, the axial velocity
of particles increased with an increment of pitch ratio. Overall, mean tangential velocity
higher than the axial and radial velocity.
Figures 6.9 (a) and (b) show respectively the cumulative probability distribution of
normal and tangential forces at 30rev in the mixer with different pitch ratio. The probability
distribution curve of the normal and tangential force each shift to slightly high forces value in
the entire force range, when the pitch ratio increased. It indicates that particles experience
larger inter-particle forces when the pitch ratio increased.

CHAPTER 6 DEM Simulation of Powder Mixing in a Ribbon Mixer: Effects of Impeller Geometry
6-157
0
0.1
0.2
0.3
0.4
0.5
0.6
0.7
0.8
-1.262 0 1.262 2.525
S/D=1.12S/D=0.75S/D=0.56
Prob
abili
ty D
ensi
ty
Radial Velocity (m/s)
0
0.1
0.2
0.3
0.4
0.5
0.6
-1.625 0 1.625 3.25
S/D=1.12S/D=0.75S/D=0.56
Prob
abili
ty D
ensi
ty
Tangential Velocity (m/s)
(a) (b)
0
0.2
0.4
0.6
0.8
-3 -1.5 0 1.5 3
S/D=1.12S/D=0.75S/D=0.56
Prob
abili
ty D
ensi
ty
Axial Velocity (m/s)
-0.05
0
0.05
0.1
0.15
0.2
0.25
0.5 0.6 0.7 0.8 0.9 1 1.1 1.2
VrVtVz
Mea
n V
eloc
ities
of P
roba
bilit
y D
ensi
ty
S/D
(c) (d)
Figure 6.8 Probability density function velocities of particles in the mixer at different
pitch ratio S/D rev 30 , Hap = 5.54 x 10⁻¹⁸ J

CHAPTER 6 DEM Simulation of Powder Mixing in a Ribbon Mixer: Effects of Impeller Geometry
6-158
0
0.2
0.4
0.6
0.8
1
10-3
10-2
10-1
100
S/D=1.12
S/D=0.75
S/D=0.56
Cum
ulat
ive
Prob
abili
ty
Normal Force(N)
0
0.2
0.4
0.6
0.8
1
10-5
10-4
10-3
10-2
10-1
100
S/D=1.12
S/D=0.75
S/D=0.56
Cum
ulat
ive
Prob
abili
ty
Shear Force(N)
(a) (b)
0.02
0.03
0.04
0.05
0.06
0.07
0.08
0.09
0.5 0.6 0.7 0.8 0.9 1 1.1 1.2
Fn
Ft
Mea
n Fo
rces
of C
umul
ativ
e Pr
obab
ility
S/D
(c)
Figure 6.9 The Probability density function of forces of particles in the mixer at
different pitch ratio S/D, rev 30, Hap = 5.54 x 10⁻¹⁸ J

CHAPTER 6 DEM Simulation of Powder Mixing in a Ribbon Mixer: Effects of Impeller Geometry
6-159
6.5.1.2 Effect of blade width at different Ha
Effect of blade width is investigated using mixing index, mixing rate, flow pattern and
particle velocity and contact forces at different cohesion for the base case of type-1 impeller
(see Figure 6.1).
6.5.1.2.1 Mixing index and mixing rate
Figure 6.10 shows that the mixing performance of a type-1 impeller depends on the
blade width at a given Hap value. A larger blade width casuses a cohesive mixture to reach the
steady state quicker. However, such differences disappear with an incrase in the cohesiveness
of the mixture.
0
0.2
0.4
0.6
0.8
1
0 20 40 60 80 100
Partt
ical
scal
e m
ixin
g in
dex,
M
Revolutions
W=10 mm
W=30 mm
W=20 mm
0
0.2
0.4
0.6
0.8
1
0 20 40 60 80 100
Partt
ical
scal
e m
ixin
g in
dex,
M
Revolutions
W=10 mm
W=30 mm
W=20 mm
(a) Hap = 5.54 x 10⁻¹⁸ J (b) Hap = 5.54 x 10⁻¹⁷ J
0
0.2
0.4
0.6
0.8
1
0 20 40 60 80 100
Partt
ical
scal
e m
ixin
g in
dex,
M
Revolutions
W=10 mm
W=30 mm
W=20 mm
(c) Hap = 5.54 x 10⁻¹⁶ J
Figure 6.10 Effect of blade width at different Hap for type-1 impeller

CHAPTER 6 DEM Simulation of Powder Mixing in a Ribbon Mixer: Effects of Impeller Geometry
6-160
Above trends are also clear from the diagrams of mixing rates shown in Fig. 6.18.
Figure 6.11(a) shows the mixing rate k as a function of Hap at fixed blades widths W, and Fig.
6.18(b) shows that k as a function of W at fixed Hap. The two figures show that k is
deteriorated with an increase in Hap at a fixed W. Conversely, k increases with an increase in
W at fixed Hap. k can be represented by the equation, k=c1-c2log10 (Hap), where c1 and c2 are
linear functions of W which can be found from the results in Fig. 6.18(b).
0.0
0.0
0.0
0.1
0.1
0.1
10-18 10-17 10-16 10-15
Hap(J)
Mix
ing
Rat
e, k
(1/s
)
k=-c1-c2 log10
(Hap)
W=10
W=20
W=30
0.0
0.0
0.0
0.1
0.1
0.1
5 10 15 20 25 30 35Width, W
Hp = 5.54x10⁻¹⁸
Hp = 5.54x10⁻¹⁷
Hp = 5.54x10⁻¹⁶ M
ixin
g R
ate,
k (1
/s)
(a) (b)
Figure 6.11 Effect of blade width on mixing rate for a type-1 impeller: (a) mixing rate
as a function of Hap; and (b) mixing rate as a function of blade width W.
Below, the effect of the blade width is investigated by examining the particle flow in
the mixer.
6.5.1.2.2 Particle flow
The particle flow is investigated by obtaining the time averaged velocity in the mixer.
To do so, the mixer space is divided into cubic cells of the size 40x40x40 mm3, and the
velocities of particles in each cell are averaged over a time interval of 2s (or 3.3 rev.). Figure
6.12 shows the time and cell averaged particle velocities in the longitudinal section of the
mixer obtained at the 30th shaft revolution. Particle motion in the axial direction is important
for the mixing process because the particles are initially deposited side-by-side arrangement

CHAPTER 6 DEM Simulation of Powder Mixing in a Ribbon Mixer: Effects of Impeller Geometry
6-161
in the axial diection. The colour shows the magnitude of the particle velocity. Generally,
particles from both ends are transported towards the middle of the vessel, where the mixing
happens. At a given cohesion, particle velocity in the longitudinal section increases with an
increase in the blade width. However, at a given blade width, with an increase in the particle
cohesion, velocity in the longitudinal section decreases sharply, which is consistent with the
reduction in mixing rate with the cohesion. Also, the regions where the magnitude of velocity
is high gradually gets shifted to the ends of the vessel with the increase of cohsesion. At high
cohesion and large blade width, the high velocity region mostly is located at the vessel ends,
and mixing becomes deteriorated as a result.
The effect on the velocity field in the particle bed is quantified below using the
probability density distributions of particle velocity.
W=10 W=20 W=30
Frame 001 15 Jul 2013 Frame 001 15 Jul 2013 Frame 001 15 Jul 2013
|V|
15
14
13
12
11
10
9
8
7
6
5
4
3
2
1
Frame 001 15 Jul 2013
Frame 001 15 Jul 2013 Frame 001 15 Jul 2013 Frame 001 15 Jul 2013
Frame 001 15 Jul 2013 Frame 001 15 Jul 2013 Frame 001 15 Jul 2013
Hap = 5.54 x 10⁻¹⁸
Hap = 5.54 x 10⁻¹⁷
Hap = 5.54 x 10⁻¹⁶
Figure 6.12 Time and cell averaged particle velocities in the mixer at different W and
Hap in the longitudinal section, where x values range between -40 and 40 (at 30th rev.)

CHAPTER 6 DEM Simulation of Powder Mixing in a Ribbon Mixer: Effects of Impeller Geometry
6-162
6.5.1.2.3 Velocity and force analysis
To quantify the blade width effect on particle velocities and contact forces, probability
density distributions of instantaneous velocity and force components are considered in Figures
6.13 and 6.14, respectively. The distributions of radial velocity Vr are shown in Figure
6.13(a). The mean values of Vr are seen to be close to zero as expected because the vessel is a
closed system. To show the effect of W on Vr, the mean of the absolute Vr values are shown
in Figure 6.13(d) as a function of W. It shows that radial particle velocities increase with the
blade width. Similarly, the tangential velocity Vt of the particles increase when the blade
width increases as shown in Figures 6.13(b) and (d). It implies that the number of particles
with a negative Vt decreases with an increase in W, which is clear from the right-shift in the
distribution curves in Figure 6.13(b). Thus, there is a reduction in the recirculation flows in
the vessel cross-sections (or in x-y plane) with an increase in the blade width. Axial velocity
distributions are shown in Fig. 6.13(c), and their mean values are closed to zero as expected
because of the symmetry in the closed vessel. However, if we consider the mean of the
absolute Vz values, it increases with an increase in W as shown in Figure 6.13 (d). This can be
also observed from the flow patterns in Figure 6.12, whic shows that particles are gaining
higher axial velocities with an increase in the blade width. Thus, all velocity components are
increased when the blade width is increased.
The effect of the blade width on contact forces are analyzed below using cumulative
probability distributions of contact forces for a cohesive mixture (Bo=0.02) in the case of a
type-1 mixer. Figure 6.14(a) shows the cumulative probability distributions of normal contact
forces and those of shear contact forces in Figure 6.14(b). The figures show that the
distributions curves shift to the high force range in both cases with an increase in the impeller
blade width. Figure 6.14 shows that both normal and shear contact forces decrease slightly at
W=20mm, but increase again for W>20mm. Thus, W=20mm appears to be an appropriate
value as the blade width in order to reduce particle stresses. However, if one wants a higher
mixing rate, W=30mm is appropriate because the contact forces are then the same as at
W=10mm.

CHAPTER 6 DEM Simulation of Powder Mixing in a Ribbon Mixer: Effects of Impeller Geometry
6-163
0
0.2
0.4
0.6
0.8
-1.375 0 1.375 2.75
W=10W=20W=30
Prob
abili
ty D
ensi
ty
Radial Velocity (m/s)0
0.1
0.2
0.3
0.4
0.5
0.6
0.7
-1.625 0 1.625 3.25
W=10W=20W=30
Prob
abili
ty D
ensi
ty
Tangential Velocity (m/s)
(a) (b)
0
0.2
0.4
0.6
0.8
-2.5 -1.25 0 1.25 2.5
W=10W=20W=30
Prob
abili
ty D
ensi
ty
Axial Velocity (m/s)
0
0.2
0.4
0.6
0.8
1
0
0.2
0.4
0.6
0.8
1
5 10 15 20 25 30 35
Mea
n of
Vt , (
m/s
)
Mea
ns o
f abs
olut
e va
lues
of V
r and
Vz, (
m/s
)
Blade width, W (mm)
Vt
Vz
Vr
(c) (d)
Figure 6.13 Probability density distributions of particle velocity components in the
mixer at different blade widths W at Hap = 5.54 x 10⁻¹⁸ J (Bo=0.02) and at the 30th rev
for type-1 mixer.

CHAPTER 6 DEM Simulation of Powder Mixing in a Ribbon Mixer: Effects of Impeller Geometry
6-164
0
0.2
0.4
0.6
0.8
1
10-3
10-2
10-1
100
W=10
W=20
W=30C
umul
ativ
e Pr
obab
ility
Normal Force (N)
0
0.2
0.4
0.6
0.8
1
10-4
10-3
10-2
10-1
100
W=10W=20W=30
Cum
ulat
ive
Prob
abili
ty
Shear Force(N)
(a) (b)
0
0.02
0.04
0.06
0.08
0.1
5 10 15 20 25 30 35
FnFtM
ean
Con
tact
For
ces (
N)
Blade Width (mm)
(c)
Figure 6.14 Cumulative probability density distributions of velocities of particles in
the mixer at different blade width W, Hap = 5.54 x 10⁻¹⁸ J and rev 30 for type-1 mixer.

CHAPTER 6 DEM Simulation of Powder Mixing in a Ribbon Mixer: Effects of Impeller Geometry
6-165
6.5.1.3 Effect of blade clearance at different Ha
The effect of the clearance between the impeller blades and vessel wall on the mixing
behavior of particles are studied here. To do so, mixing index, mixing rate, flow pattern, and
quantification of velocities and forces of particles are considered as in other sections.
6.5.1.3.1 Mixing quantification
The particle scale mixing index as a function of a time diagram obtained by an
increase of blade clearance and particle cohesion as shown in the Figures 6.15 (a), (b)and (c).
The results show that the higher mixing rate and homogeneity can be obtained with a small
and high of clearance. The mixing in the horizontal ribbon mixer with the medium clearance
needed a the longest time to reach the steady state mixing as shown in the Figure 6.15. The
mixing index shows that the poor mixing rate and homogeneity are obtained in the mixture in
ribbon with 15mm clearance, which is the same as the particle diameter as shown in Figure
6.15. Related to the effect of the clearance, in the casse of the helical ribbon mixer, it is
reported that the mixer with smaller clearance has a grater efficient, and the mixer with a large
greater clearance has a lower power consumption (Rieger et al., 1986).
The mixing rate is calculated using first order equation Eq (6.4). Figure 6.16 (a)
shows that the mixing rate, k as a function of the impeller clearance C at different cohesion. k
decreases and increases when the particle with lower cohesion. The impeller clearance
slightly affects on the mixing rate when the particles have a higher cohesion. Figure 6.16(b)
shows the mixing rate, k as a function of Ha ad it shows that the mixing rate decreased
linearly in the impeller with clearance 8.5mm and 27mm. Mixing rate does not change with
an increase of Ha for the clearances 15mm and 22mm.

CHAPTER 6 DEM Simulation of Powder Mixing in a Ribbon Mixer: Effects of Impeller Geometry
6-166
0
0.2
0.4
0.6
0.8
1
0 20 40 60 80 100
Partt
ical
scal
e m
ixin
g in
dex,
M
Revolutions
C=8.5 mmC=27.0mm
C=22.0mm
C=15.0mm
0
0.2
0.4
0.6
0.8
1
0 20 40 60 80 100
Partt
ical
scal
e m
ixin
g in
dex,
M
Revolutions
C=8.5 mm
C=27.0mm
C=22.0mm
C=15.0mm
(a) Hap = 5.54 x 10⁻¹⁸ J (b) Hap = 5.54 x 10⁻¹⁷ J
0
0.2
0.4
0.6
0.8
1
0 20 40 60 80 100
Partt
ical
scal
e m
ixin
g in
dex,
M
Revolutions
C=8.5 mm
C=27.0mm
C=22.0mm
C=15.0mm
(c) Hap = 5.54 x 10⁻¹⁶ J
Figure 6.15 The effect of blade clearance at different cohesion (type-1 impeller)

CHAPTER 6 DEM Simulation of Powder Mixing in a Ribbon Mixer: Effects of Impeller Geometry
6-167
0.00
0.02
0.04
0.06
0.08
0.10
5 10 15 20 25 30
Hap = 5.54x10⁻¹⁸
Hap = 5.54x10⁻¹⁷
Hap= 5.54x10⁻¹⁶
Impeller Clearance, C
Mix
ing
Rat
e, k
(1/s
ec)
0.00
0.02
0.04
0.06
0.08
10-18 10-17 10-16 10-15
C=8.5C=15C=22C=27
Hap(J)
Mix
ing
Rat
e, k
(1/s
ec)
(a) (b)
Figure 6.16 Comparison of mixing rate: (a) Mixing rate as a function of Hap;
(b) Mixing rate as a function of clearance C
6.5.1.3.2 Spatial- average velocity
In order to obtain the time-averaged longitudinal velocity distribution in the mixers,
the mixer space is divided into cubic cells of the size 40x40x40mm3, and the velocities of
particles in each cell are averaged over a time interval of 2s. Figure 6.17 shows that the
average velocity of the mixture in the ribbon mixer with different blade clearance. It is
investigated from a cross section snapshot of the ribbon that the more particles pushed by the
blade or the particle flow when the clearance either small (8.5mm) or greater (27mm), thus
the particles receive reduced velocity, with a medium the blade clearance 15mm and 22mm.
The particle average velocities decrease significantly with the increase of particle’s Ha
constant. The particles received higher average Vx at the lower part of the ribbon mixer with
lower clearance in the snapshot longitudinal section of the ribbon mixer. Particle axial
movement was enhanced in the ribbon impeller with clearance 8.5mm and 27mm. The reason
for the particles receive higher the mixing rate in the mixer with clearance 8.5 mm probably is
that the particles pushed by the blade at the lower part of the vessel enable particles receive
higher Vx, thus the circumferential and axial movement of the particles were enhanced, and
the mixing rate and homogeneity of the mixture were improved. The particles receive higher
Vz and Vy, therefore the axial flow and homogeneity of the particles were enhanced in the
mixer with clearance 27mm, which is can be confirmed by mixing index in Figure 6.15.

CHAPTER 6 DEM Simulation of Powder Mixing in a Ribbon Mixer: Effects of Impeller Geometry
6-168
C=8.5
C=15
C=22
C=27
Frame 001 16 Jul 2013
Vx
1
0
-1
-2
-3
-4
-5
-6
-7
-8
-9
-10
Frame 001 16 Jul 2013
Vx
1
0
-1
-2
-3
-4
-5
-6
-7
-8
-9
-10
Frame 001 16 Jul 2013
Vx
1
0
-1
-2
-3
-4
-5
-6
-7
-8
-9
-10
Frame 001 16 Jul 2013
Vx
1
0
-1
-2
-3
-4
-5
-6
-7
-8
-9
-10
Frame 001 16 Jul 2013
Vx
1
0
-1
-2
-3
-4
-5
-6
-7
-8
-9
-10
Frame 001 16 Jul 2013
Vx
1
0
-1
-2
-3
-4
-5
-6
-7
-8
-9
-10
Frame 001 16 Jul 2013
Vx
1
0
-1
-2
-3
-4
-5
-6
-7
-8
-9
-10
Frame 001 16 Jul 2013
Vx
1
0
-1
-2
-3
-4
-5
-6
-7
-8
-9
-10
Frame 001 16 Jul 2013
Vx
1
0
-1
-2
-3
-4
-5
-6
-7
-8
-9
-10
Frame 001 16 Jul 2013
Vx
1
0
-1
-2
-3
-4
-5
-6
-7
-8
-9
-10
Frame 001 16 Jul 2013
Vx
1
0
-1
-2
-3
-4
-5
-6
-7
-8
-9
-10
Frame 001 16 Jul 2013
Vx
1
0
-1
-2
-3
-4
-5
-6
-7
-8
-9
-10
Frame 001 16 Jul 2013
yz
x
Hap = 5.54 x 10⁻¹⁷ J Hap = 5.54 x 10⁻¹⁶ JHap = 5.54 x 10⁻¹⁸ J
Figure 6.17 The averaged velocity of particles in the mixer at different blade width
W and Hap ; x =-40-- 40, y= -260– 260 z= 0 --1000 , 30th rev

CHAPTER 6 DEM Simulation of Powder Mixing in a Ribbon Mixer: Effects of Impeller Geometry
6-169
6.5.1.3.3 Velocity and force components
To understand the effect of blade clearance on the particles velocities and forces, the
probability density distribution of instantaneous velocity and force components are considered
here. Figure 6.18 shows the increased number of particles received higher radial, tangential
and axial velocities in the mixer with clearance 8.5mm and 27mm. That is can be confirmed
from Figure 6.17 that the particle axial and radial flow were enhanced in the impeller with
clearance 8.5mm and 27mm. The effect of blade clearance on the contact forces are analyzed
using cumulative probability distributions of contact forces in type 1 impeller. Figure 6.19
shows that the particles encounter higher normal and shear forces in the mixer with clearance
27mm and 8.5mm. The cumulative probability curves of the particles shift left when the
mixer clearance 15mm and 22mm. It implies that the particles receive the smaller normal and
shear forces. These results can be supported by the Figure 6.15 and 6.18(c).

CHAPTER 6 DEM Simulation of Powder Mixing in a Ribbon Mixer: Effects of Impeller Geometry
6-170
0
0.5
1
1.5
-0.817 0 0.817 1.634
C=8.5C=15C=22C=27
Prob
abili
ty D
ensi
ty
Radial Velocity (m/s)0
0.2
0.4
0.6
0.8
1
-1.75 0 1.75 3.5
C=8.5C=15C=22C=27
Prob
abili
ty D
ensi
ty
Tangential Velocity (m/s)
(a) (b)
0
0.2
0.4
0.6
0.8
1
1.2
1.4
-1.5 0 1.5 3
C=8.5C=15C=22C=27
Prob
abili
ty D
ensi
ty
Axial Velocity (m/s)
(c)
Figure 6.18 The Probability density function of velocities of particles in the mixer
with different blade clearance C, Hap = 5.54 x 10⁻¹⁸ J, rev 30

CHAPTER 6 DEM Simulation of Powder Mixing in a Ribbon Mixer: Effects of Impeller Geometry
6-171
0
0.2
0.4
0.6
0.8
1
10-4
10-3
10-2
10-1
100
C=8.5C=15C=22C=27
Cum
ulat
ive
Prob
abili
ty
Normal Force(N)
0
0.2
0.4
0.6
0.8
1
10-4
10-3
10-2
10-1
100
C=8.5C=15C=22C=27
Cum
ulat
ive
Prob
abili
ty
Shear Force(N)
(a) (b)
0.02
0.03
0.04
0.05
0.06
0.07
0.08
0.09
5 10 15 20 25 30
Fn
Ft
Mea
n Fo
rces
of C
umul
ativ
e Pr
obab
ility
Blade Clearance(mm)
(c)
Figure 6.19 Probability density function of forces of particles in the mixer at different
blade clearances C, Hap = 5.54 x 10⁻¹⁸ J, rev 30th
The effect of clearance, width, pitch ratio and Ha on mixing index at 30th rev
combined into one mixing curve. Figure 6.20 shows that the mixing performance at different
cohesion of the particles is similar.

CHAPTER 6 DEM Simulation of Powder Mixing in a Ribbon Mixer: Effects of Impeller Geometry
6-172
0.0
0.2
0.4
0.6
0.8
1.0
C=15 C=27 W=20 S/D=0.56 S/D=1.12M
ixin
g In
dex
at 3
0 re
v
Clearance _Width_Pitch ratio
Hp = 5.54x10⁻¹⁸
Hp = 5.54x10⁻¹⁷
Hp = 5.54x10⁻¹⁶
Hp = 2.22x10⁻¹⁵
Figure 6.20 Mixing index at 30rev as a function of blade clearance, width, pitch ratio
and Hap

CHAPTER 6 DEM Simulation of Powder Mixing in a Ribbon Mixer: Effects of Impeller Geometry
6-173
6.4.1.4 Effect of blade angle
The effects of outer and inner blade angle are investigated using inner and outer
horizontal ribbon blender mixer by means of DEM method. The Particle Scale mixing Index
shows that the inner angles have not any effect on the homogeneity of the cohesive particle
mixture. However, the outer ribbon angles have a slight influence on the uniformity of the
cohesive particle mixture in ribbon mixer. The mixing rate increased with an increase of the
inner blade angle from 45 to 70 as shown in the Figure 6.21.
0
0.2
0.4
0.6
0.8
1
0 10 20 30 40 50 60 70 80
=45?=50?
=80o
Parti
cle
Scal
e M
ixin
g In
dex
Revolutions
0
0.02
0.04
0.06
0.08
0.1
40 50 60 70 80 90
Mix
ing
Rat
e, k
(1/s
ec)
Outer blade angle, ` (a) (b)
Figure 6.21 Effect of outer rake angle (inner blade angle is fixed at 45°):
(a) Mixing index variation with shaft revolutions; (b) Mixing rate k as a function of
outer blade angle

CHAPTER 6 DEM Simulation of Powder Mixing in a Ribbon Mixer: Effects of Impeller Geometry
6-174
6.5.2 Comparison of type 1 and type 2 impellers
To investigate the effect of blade number (or pitch ratio) on homogeneity and mixing
rate, two ribbon designs (type-1 and 2 impellers) are chosen as shown in Figure 6.1. In the
study, non-cohesive particles are used, and the effect is analyzed based on mixing index,
mixing rate and velocity fields. To demonstrate the blade number effect (or pitch ratio), the
performances of the two types of impellers are compared below at fixed pitch ratios (or blade
numbers) and blade widths in the sections 6.4.2.1 and 6.4.2.2, respectively.
6.5.2.1 Blade number (or pitch ratio) effect
Figures 6.22(a) and (b) show the instantaneous particle-scale mixing index M, as a
function of shaft revolutions for different pitch ratios at a fixed blade width of 20mm. The
figures show that the pitch ratio affects the mixing performance of both impellers significantly.
Mixing rate k obtained from Eq. (6.4) is shown in Figure 6.22(c) for both impellers. At a
given pitch ratio, type-2 impeller shows faster mixing compared to the type-1 impeller except
at 1.12 pitch ratio. Generally, both impellers show a peak mixing rate at certain pitch ratio, the
peak being higher for the 4-blade impeller. The peak occurs at about 0.75 patio for this
impeller. The high mixing rate of 4-blade impeller is understood from the fact that the steady
state is reached in about 10 shaft revolutions, compared to 30 revolutions of the type-1
impeller at 0.75 pitch ratio (see Figsures 6.22(a) and (b)). The particle mixing is significantly
delayed with a pitch ratio of 0.56, especially in the case of the type-1 impeller. However, the
mixtures reach the well-mixed state within 100 revolutions with both impellers at higher pitch
ratios such as 0.748 and 1.123, but delaying further at lower pitch ratios such as 0.561.
In fact, Figure 6.22(c) also shows the effect of blade number at a given pitch ratio for a
fixed blade width. Increasing the blade number from 2 to 4 at a fixed pitch ratio and width
results in an increase in the mixing rate as seen from the diagram for over most of the range of
the pitch ratio tested. Having 4 blades is most efficient for the mixing operation when the
pitch ratio is about 0.75. The reason for this increase with 4-blades will be investigated in the
section of the velocity field below.

CHAPTER 6 DEM Simulation of Powder Mixing in a Ribbon Mixer: Effects of Impeller Geometry
6-175
0
0.2
0.4
0.6
0.8
1
0 20 40 60 80 100
Partt
ical
Sca
le M
ixin
g In
dex
Revolutions
S/D=0.561
S/D=0.748
S/D=1.123
0
0.2
0.4
0.6
0.8
1
0 20 40 60 80 100
Partt
ical
Sca
le M
ixin
g In
dex
Revolutions
S/D=0.561
S/D=0.748S/D=1.123
(a) Type-2 impeller (b) Type-1 impeller
0
0.2
0.4
0.6
0.8
1
1.2
0.5 0.6 0.7 0.8 0.9 1 1.1 1.2
Mix
ing
Rate
, k (1
/sec
)
Pitch ratio, S/D
Type-1 impellers
Type-2 impellers
(c) Mixing rate
Figure 6.22 Effect of blade number (or pitch ratio S/D) on mixing performance for
non-cohesive mixtures. (a) type 2 impeller, (b) type 1 impeller (c) mixing rate k as a
function of pitch ratio.
To understand the pitch ratio effect on the particle flow, the time and cell averaged
particle velocities are shown in Figure 6.23 in the central longitudinal planes for the two
bladed mixer at the 38th revolution (or at t=13s). In order to obtain the time-averaged
longitudinal velocity distribution in the mixer, the mixer space is divided into cubic cells of

CHAPTER 6 DEM Simulation of Powder Mixing in a Ribbon Mixer: Effects of Impeller Geometry
6-176
size 40x40x40mm3, and the velocities of particles in each cell are averaged over a time
interval of 2s. Figure 6.23 shows that the particle flow is significantly affected by the pitch
ratio S/D: the mixing behavior for S/D=1. 123 is symmetric with respect to the mid-plane
perpendicular to the shaft, with particles moving towards the vessel center from both ends,
producing steady mixing as shown Figure 6.23(a). The particles are pushed towards the center
by the blades from the left and right of the mixer for S/D=0.748, increased the particle axial
movement and produced higher mixing rate as shown in Figure 6.23(b). The particle flow in
the mixer with pitch ratio 0.56 (Figure 6.23 (c)) shows that the particles pushed primarily to
move in the left and right halves of the mixer, therefore the flow divided into two parts
decreased homogeneity of the mixture, due to the blade arranged backward tilted from middle
to two sides of the mixer. Porosity over impeller seems to increase with a decrease in pitch
ratio.
Frame 001 11 Mar 2013 Frame 001 11 Mar 2013
S/D=0.561S/D=0.748S/D=1.123
Frame 001 11 Mar 2013
(a) (b) (c)
Figure 6.23 Average velocity and porosity of the particle mixture, snap shot at
revolution at 38, t=13s,X =-20-20, at ZY plane in type-1 impeller
For comparison the flow in type-1 ribbon mixer and in the type-2 impeller, the particle
flow in four blade mixer being investigated. The results show that the flow pattern is very
similar to the flow pattern in the two bladed impellers. Snapshots of the particles in Figure
6.24 show that there is particle recirculation movement in the lower part of the vessel with
pitch ratio 0.561 which has contributed to the division of particle flow. This phenomena
decreased with an increase of the pitch ratio that the particles pushed by blade located in the
very right easily moved to left producing higher mixing rate.
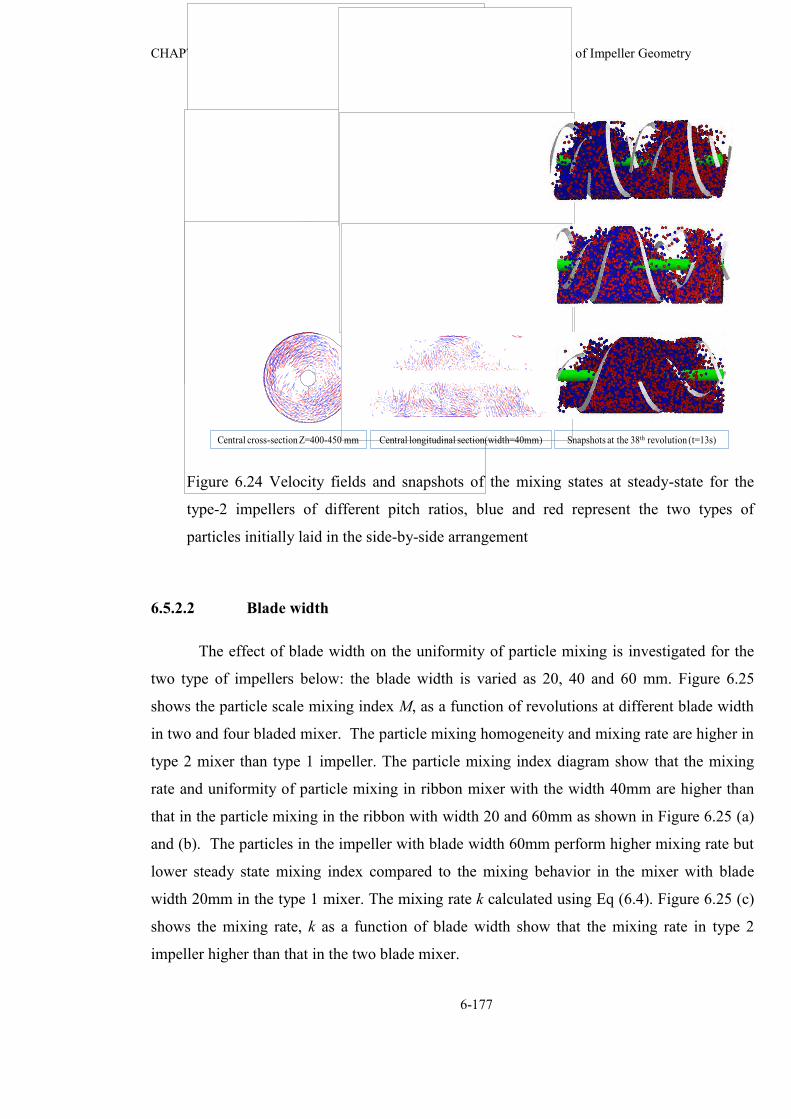
CHAPTER 6 DEM Simulation of Powder Mixing in a Ribbon Mixer: Effects of Impeller Geometry
6-177
S/D=0.748
S/D=0.561
S/D=1.123
F ram e 0 0 1 2 8 Aug 2 0 1 2
F ram e 0 0 1 2 8 Aug 2 0 1 2
F ram e 0 0 1 2 8 Aug 2 0 1 2
Frame 001 11 Mar 2013
Frame 001 11 Mar 2013
Frame 001 11 Mar 2013
Central cross-section Z=400-450 mm Central longitudinal section(width=40mm) Snapshots at the 38th revolution (t=13s)
Figure 6.24 Velocity fields and snapshots of the mixing states at steady-state for the
type-2 impellers of different pitch ratios, blue and red represent the two types of
particles initially laid in the side-by-side arrangement
6.5.2.2 Blade width
The effect of blade width on the uniformity of particle mixing is investigated for the
two type of impellers below: the blade width is varied as 20, 40 and 60 mm. Figure 6.25
shows the particle scale mixing index M, as a function of revolutions at different blade width
in two and four bladed mixer. The particle mixing homogeneity and mixing rate are higher in
type 2 mixer than type 1 impeller. The particle mixing index diagram show that the mixing
rate and uniformity of particle mixing in ribbon mixer with the width 40mm are higher than
that in the particle mixing in the ribbon with width 20 and 60mm as shown in Figure 6.25 (a)
and (b). The particles in the impeller with blade width 60mm perform higher mixing rate but
lower steady state mixing index compared to the mixing behavior in the mixer with blade
width 20mm in the type 1 mixer. The mixing rate k calculated using Eq (6.4). Figure 6.25 (c)
shows the mixing rate, k as a function of blade width show that the mixing rate in type 2
impeller higher than that in the two blade mixer.

CHAPTER 6 DEM Simulation of Powder Mixing in a Ribbon Mixer: Effects of Impeller Geometry
6-178
0
0.2
0.4
0.6
0.8
1
0 20 40 60 80 100
Partt
ical
Sca
le M
ixin
g In
dex
Revolution
W=60
W=40
W=20
0
0.2
0.4
0.6
0.8
1
0 20 40 60 80 100
Partt
ical
Sca
le M
ixin
g In
dex
Revolutions
W60
W40
W20
0
0.02
0.04
0.06
0.08
0.1
10 20 30 40 50 60 70
Mix
ing
Rat
e, k
(1/s
ec)
Width (mm)
2 blade impeller
4 blade impeller
(a) type-2 (b) type-1 (c) Mixing rate
Figure 6.25 Effect of blade width on mixing behaviour at a pitch rratio of 1.12.
The average velocity and porosity counter in the two blade ribbon show that the
average velocity toward the middle section of the ribbon and the recirculation happened in the
bottom part of the mix; the upper part of the mixer has large porosity where less particle areas
in the ribbon mixer with 3 different widths as shown Figure 6.26(a). However the magnitude
of the vector in the ribbon width 40mm width slightly higher compare to the other ribbon.
The high porosity regions, red color, located at the right and left lower part of the ribbon
mixer with width 60mm compare to the other two ribbon mixer.
Frame 001 07 Mar 2013 Frame 001 07 Mar 2013 Frame 001 07 Mar 2013
W40W20 W67
Porosity
0.95
0.9
0.85
0.8
0.75
0.7
0.65
0.6
0.55
0.5
Frame 001 07 Mar 2013
Frame 001 06 Mar 2013 Frame 001 06 Mar 2013 Frame 001 06 Mar 2013
Revolution 80 , t=25s, X =-20-20
W=20 W=40 W=60
Figure 6.26 Mixing behaviour for different blade widths for type-1 impeller design. Top:
Steady-state velocity fields and spatial distribution of void fraction in the longitudinal central
plane; and bottom: snapshot of particles at 80threvolution (t=25s) in the longitudinal central
plane, with blue and red representing two types of particles.
The real mixing can be seen Figure 6.26 (b) red and blue represents of two types of
particles. It is shown that there is significant white space right and left part of the mixer with
60 mm wide, slightly less in the ribbon mixer with 40mm wide as shown in Fig.6.26(b). The
(
a)
(
b)

CHAPTER 6 DEM Simulation of Powder Mixing in a Ribbon Mixer: Effects of Impeller Geometry
6-179
results show that the mixing rate and homogeneity of the mixture in ribbon with 40 and 20mm
width significantly higher than that in the mixer with a width 60mm which is explained in the
particle mixing index in the Figure 6.25.
Figure 6.27 shows the velocity fields in the type-2 ribbon mixer that the particle
cascaded and then pushed by the blade in axial direction of the middle part of the vessel,
enhanced axial movement of particles when the blade width W=40mm which is promoting
uniformity and mixing rate of the particles. The particle circumferential flow of the local area
increased with an increase of blade width, which is delaying the mixing rate.
Frame 001 29 Aug 2012
W=40
W=20
W=60
Frame 001 29 Aug 2012
Frame 001 29 Aug 2012
Frame 001 29 Aug 2012
F ram e 0 0 1 2 9 Aug 2 0 1 2
F ram e 0 0 1 2 9 Aug 2 0 1 2
Central cross-section Z=400-450mm Central longitudinal section(width=40mm) Snapshots at the 40th revolution (t=13.6s) Figure 6.27 Velocity fields and snapshots of the mixing states at steady-state for the
type-2 impellers of W=20, 40 and 60 mm: blue and red represent the two types of
particles initially laid in side-by-side arrangement.
The effect of pitch ratio and a blade width of the type-1 and type-2 ribbon on the
mixing index, mixing rate and particles flow show that the blade number affects the mixing
behavior significantly. Type-2 ribbon impeller is a more efficient mixer than the type-1 mixer.

CHAPTER 6 DEM Simulation of Powder Mixing in a Ribbon Mixer: Effects of Impeller Geometry
6-180
6.6 Conclusions
The effects of blade width, pitch angle, pitch ratio, clearance of the impeller and the
number of blades on cohesive particle mixing in a ribbon mixer are investigated here for two
impeller configurations, i. e., a 2-bladed and 4-bladed ribbon impellers by means of DEM.
Increased blade number enhances the mixing homogeneity, mixing rate, axial flow and
tangential flow. Type 2 mixer shows higher mixing capabilities compared to the type-
1 mixer.
Pitch ratio affects on the flow pattern of the mixture significantly. The convective and
circumferential flow are enhanced by particles with higher axial, tangential and radial
velocities when the pitch ratio moderate or high. Particles primarily move in the right
and left halves of the mixer. Particles encounter higher axial, radial forces, because of
there are more blades in the impeller with S/D=0.56 compare to the other impeller.
Blade width affects the mixing rate, velocity and force of particles. The mixing rate
increases with an increase of blade width. The wider blade width enables particles
have higher velocities in the axial and, tangential directions and higher radial force.
Blade clearance affects the mixing rate significantly. The impeller with larger
clearance enables particles to get involved in circumferential flow pushing particles to
the outer periphery of the vessel, and receiving higher axial, tangential and radial
velocities and forces, thus increasing the mixing rate. The mixing rate deteriorated
when the impeller clearance C is =15mm which is same as particle diameter. In this
case, particles probably cannot pass through the blade clearance and to involved the
circumferential flow reducing the mixing rate.
Nomenclature
D Vessel diameter, (m)
d Particle diameter, (mm)
E You g’ mo u u N/m2
Fc,ij Contact force vector between i and j, N

CHAPTER 6 DEM Simulation of Powder Mixing in a Ribbon Mixer: Effects of Impeller Geometry
6-181
Fd,ij Damping force vector between i and j, N
Fv, ij Cohesive force between particles i and j
g Acceleration due to gravity, (m/s2)
h Gap between two interacting particles, (m)
Ha Hamaker constant, J
Hap Hamaker constant of particle material, J
Haw Hamaker constant of wall material, J
Ii Moment of inertia of particle i, (kg m2)
k Mixing rate, (s-1)
ki Number of particles in contact with particle i
M Particle-scale mixing index defined in Eq.(3) , (-)
Mij Vector of rolling friction torque on particle i, (Dury et al.)
Mp Predicted mixing index at steady-state, (-)
n Actual particle number fraction of the two types of particles, (-)
Ni Number of particles in the immediate neighbourhood of particle i
Nl Number of large particles
Np Total number of particles of one type in the mixture
Ns Number of small particles
Nt The number of sample points of instantaneous average values in time t
p Number ratio of the target type particles to all the particles, (-)
pi Particle fraction of a target type particle in the neighborhood of particle i, (-)
tp Average value of pi at time t for the entire mixture, (-)
R Equivalent radius, m
S0 Standard deviation of pi at fully-segregated state, (-)
SR Standard deviation of fully-mixed state for uniform-sized particles of particle
fraction of p, (-)
St Standard deviation of pi with respect to tp at time t, (-)
Tij Vector of rolling friction torque on particle i, N m
Vb Blade speed, (m/s)
Vi Velocity of particle i, m/s
Z Height from vessel base(mm)

CHAPTER 6 DEM Simulation of Powder Mixing in a Ribbon Mixer: Effects of Impeller Geometry
6-182
Greek letters
α Volume fraction
Average particle-scale sample size for the mixture
θ Radial section measured horizontally from mid-plane of the blade
ik Number of particles in contact with particle i
Density of particles of a uniform system, ( 3kgm )
Shaft rotational speed, (rad/s)
i Angular velocity vector of particle i, (rad/s)
CHAPTER 7 A Study of Binary Particle Mixtures in a Ribbon Mixer
7-183
Chapter 7
A Study of Binary Particle Mixtures in
a Ribbon Mixer

CHAPTER 7 A Study of Binary Particle Mixtures in a Ribbon Mixer
7-184
7.1 Introduction
Powder mixing is an essential unit operation for manufacturing processes, for
example, in ceramic, food, pharmaceutical, chemical and agricultural industries, where
a wide verity of high quality products are produced. The selection of a mixer for a
mixing operation depends on the product uniformity required and many other factors
including the ease with which it can be cleaned (Poux et al., 1991). One type of mixers
often used in mixing operations in pharmaceutical industry is the ribbon mixer, which
has a ribbon impeller with two or more helical blades starting from each end, but
spiraling in opposite directions towards the vessel centre. Thus, the blades on one end of
the vessel push particles axially towards the centre and those at the other end push in the
opposite direction towards the centre thus particles being mixed at the vessel centre. In
this process, material is stretched tangentially and conveyed to and fro axially by the
opposite blades, resulting in stretching and dispersion of material. The helical blades
makes cleaning the mixer difficult because of their complicated design; cleaning is
important when dealing with different mixture compositions.
The mixer can be used for mixing a wide range of materials, from dry powders
to pastes. In this type of mixers, radial mixing is good, but axial mixing is less so
(Metzger and Glasser, 2013). A ribbon mixer displays a combination of mixing
mechanisms such as convection, diffusion and shear when processing granular matter.
Therefore, ribbon mixers are considered to be suitable for mixing of dry powders as
well as free-flowing granular material (Poux, Fayolle et al. 1991). It is also reported that
a ribbon mixer can produce an improved homogeneity in powder mixing because of
large shear stresses in the mixer. Ribbon mixers have been examined in the literature in
the following aspects for powder mixing relationship between power consumption and
blade speed ((Masiuk, 1987); energy saving (Dieulot, Delaplace et al. 2002); mixture
uniformity (Côté and Abatzoglou 2006); loading method (Côté and Abatzoglou, 2006),
stresses, homogeneity and mixing performance in the case of cohesive mixtures, effect
of fill level on the different impellers (Muzzio, Llusa et al. 2008); and fill level (Cite
and Abatzoglou 2006).
It is also reported that a ribbon mixer can handle mixing of different sized
particles (Muzzio, Llusa et al. 2008). Further, a mixture of particles with large density

CHAPTER 7 A Study of Binary Particle Mixtures in a Ribbon Mixer
7-185
and size differences can also be mixed in a ribbon mixer (Poux et al., 1991). Mixture
quality is significantly affected by size differences of powder particles, and an increase
in either the size or density differences results in increased segregation tendencies (Fan
et al., 1975; Stephens and Bridgwater, 1978). The effect of size and density on particle
mixing has been widely investigated for different mixers such as rotating drums
(Alonso et al., 1991; Eskin and Kalman, 2000; Jayasundara et al., 2012; Liu et al., 2013;
Metcalfe and Shattuck, 1996; Xu et al., 2010), a cylindrical mixer (Chandratilleke et al.,
2011; Zhou et al., 2003), and vibrated granular systems (Rosato et al., 1987; Shinbrot
and Muzzio, 1998; Yang, 2006). An optimum combination of the size and density
differences is also shown to exist (Alonso et al., 1991; Metcalfe and Shattuck, 1996;
Nitin et al., 2005; Zhou et al., 2003).
An expression has been developed to predict the transition from mixing to
segregation due to percolation and buoyancy effects under different particle densities
and sizes and volume fractions (Alonso et al., 1991). However, research on a
complicated mixer such as the ribbon mixer are few, and the effects of particle size and
density on the mixer performance have not been clearly established. The objective of
this study is, thus, to investigate the effect of size and density differences of particles on
the mixing behaviours of non-cohesive binary particle mixtures in a ribbon mixer, by
using simulations based on the discrete-element-method (Cundall and Strack, 1979).
This chapter is organized as follows. Sections 7.2 and 7.3 discusses the
simulation method and conditions, which is followed by the results and discussions
section, where in Section 7.4.1, the effect of density ratio is examined when the size
ratio is fixed. In Section 7.4.2, the effect of size ratio is examined when density ratio is
fixed. Next, a prediction equation is developed for the steady-state mixing index
relating it to size and density differences. Finally Section 7.5 summarizes the
conclusions of the chapter.

CHAPTER 7 A Study of Binary Particle Mixtures in a Ribbon Mixer
7-186
7.2 Method of Analysis
The DEM model used here is essentially the same as that previously developed
and validated by Zhou et al. (Zhou et al., 2004; Zhou et al., 1999). The model uses two
momentum conservation equations to describe the translational and rotational motion of
particle i in a system at time t subjected to the gravity g and interactions with the
neighboring particles, blade and walls:
ik
jijdijci
ii m
dtdm
1,, FFgV (7.1)
and
ik
jijij
ii d
dI1t
MT (7.2)
where mi, Ii, Vi and i are the mass, moment of inertia, translational and
rotational velocities of the particle respectively; k is the number of particles in contact
with particle i, Fc, ij represents the contact force which is the summation of the normal
and tangential forces. Fd,ij represents the damping force, which is the summation of the
normal and tangential damping forces at the contact point with particle j. Tij and Mij are
the torque and rolling friction torque on particle i due to particle j. Expressions for the
forces and torques in Eqs. (7.1) and (7.2) are given in Table 7.1.
7.3 Simulation Conditions
The geometry of the ribbon impeller used here is shown in Figure 7.2. The
impeller has two helical blades starting from each end, but spiraling in opposite
directions. The impeller is placed horizontally in a horizontal cylindrical vessel so that
their axes coincide. The dimensions of the impeller, vessel and other input values for
DEM simulations are shown in Table 7.2. The total volume of particles used in the
ribbon mixer is fixed and chosen the same as in the case of the cylindrical mixer used in
Chapter 3. For a fill level of 30% and assuming a void fraction of 0.36, the mixer length
and diameter were chosen. The blade width, pitch, angle and clearance were selected

CHAPTER 7 A Study of Binary Particle Mixtures in a Ribbon Mixer
7-187
based on the optimum values and in the same scale ratio as in the base ribbon mixer of
Chapter 6 (see Table 6.1). Simulations are conducted for the cases of non-cohesive
particles for investigating the effect of particle size and density.
Table 7.1 Formulae for contact forces and torques
The mixture quality or mixing index M is quantified by a particle scale mixing
index based on coordination number (see Chapter 3, section 2) (Chandratilleke et al.,
2012). To analyze the mixing performance of the mixers, particles of equal numbers are
deposited in the side-by-side arrangement in the axial direction, and the impeller is
rotated at a constant speed of 100 rpm. The size ratio rs is defined as ls dd / and density
ratio rd as ls / , where s and l refer to small and large particles respectively. Volume
fraction xl is the ratio of volume of large particles to the total particle volume. The
density of large particles ρl is fixed at 6040 kg/m3 , the diameter of the large particles is
fixed at 8mm in the study.
Forces and torques
Formula Associated definitions
Normal contact force
Normal damping force
Tangential contact force
Tangential damping force
Rotational torque
Rolling friction torque

CHAPTER 7 A Study of Binary Particle Mixtures in a Ribbon Mixer
7-188
Figure 7.1. Geometry of ribbon impeller
Table 7.2 Input variables and their values
Input variable Value Vessel diameter Vessel length Blade pitch Blade width Shaft diameter Rake angle Blade gap Base Particle number Particle dia.,d (large) Shaft speed,ω Fill level Young’s modulus, E Poisson’s ratio , s(P-P) (P-W) R(P-P) (P-W) Time step
120 (mm) 200 (mm) 100 (mm) 11 (mm) 8.5 (mm) 45°, 135° 2.36 (mm) 18,000 8 ( mm) 100 rpm 30% 1108 N/m2 0.29 0.3 0.002 (m) 3.41E-05 (s)

CHAPTER 7 A Study of Binary Particle Mixtures in a Ribbon Mixer
7-189
Table 7.3 Particle information for density effect cases
Table.7.4 Particle information for size effect cases
case DL DS NL NS ρL ρs rs rd Vol
1 8 4.56 810 4374 6040 3624 0.57 0.6 0.5
2 8 4.88 810 3569 6040 5436 0.61 0.9 0.5
3 8 4.8 810 3750 6040 1812 0.6 0.3 0.5
4 8 4.8 810 3750 6040 2416 0.6 0.4 0.5
5 8 4.8 810 3750 6040 4530 0.6 0.75 0.5
6 8 4.56 162 7873 6040 3624 0.57 0.6 0.1
7 8 4.88 162 6423 6040 5436 0.61 0.9 0.1
8 8 4.8 162 6750 6040 1812 0.6 0.3 0.1
9 8 4.8 162 6750 6040 2416 0.6 0.4 0.1
10 8 4.8 162 6750 6040 4530 0.6 0.75 0.1
11 8 4.56 1458 875 6040 3624 0.57 0.6 0.9
12 8 4.88 1458 714 6040 5436 0.61 0.9 0.9
13 8 4.8 1458 750 6040 1812 0.6 0.3 0.9
14 8 4.8 1458 750 6040 2416 0.6 0.4 0.9
15 8 4.8 1458 750 6040 4530 0.6 0.75 0.9
case DL DS NL NS ρL ρs rs rd Vol
1 8 6.4 810 1582 6040 1812 0.8 0.3 0.5
2 8 6.24 810 1707 6040 1812 0.78 0.3 0.5
3 8 7.6 810 945 6040 1812 0.95 0.3 0.5
4 8 4.8 810 3750 6040 1812 0.6 0.3 0.5
5 8 3.2 810 12656 6040 1812 0.4 0.3 0.5
6 8 2.4 810 30000 6040 1812 0.3 0.3 0.5
7 8 6.4 162 2848 6040 1812 0.8 0.3 0.1
8 8 6.24 162 3072 6040 1812 0.78 0.3 0.1
9 8 7.6 162 1701 6040 1812 0.95 0.3 0.1
10 8 4.8 162 6750 6040 1812 0.6 0.3 0.1
11 8 3.2 162 22781 6040 1812 0.4 0.3 0.1
12 8 2.4 162 54000 6040 1812 0.3 0.3 0.1
13 8 6.4 1458 316 6040 1812 0.8 0.3 0.9
14 8 6.24 1458 341 6040 1812 0.78 0.3 0.9
15 8 7.6 1458 189 6040 1812 0.95 0.3 0.9
16 8 4.8 1458 750 6040 1812 0.6 0.3 0.9
21 8 3.2 1458 2531 6040 1812 0.4 0.3 0.9
22 8 2.4 1458 6000 6040 1812 0.3 0.3 0.9

CHAPTER 7 A Study of Binary Particle Mixtures in a Ribbon Mixer
7-190
7.4 Results and Discussion
7.4.1 Effect of density on binary particle mixing
7.4.1.1 Mixing performances
The effect of density ratio on the mixing performance is investigated for
different volume fractions, in each case density being varied with the size ratio fixed at
0.66 and density of large particles ρl =6040 kg/m3; these cases are listed in Table 7.3.
Figure 7.2 shows the effect of density ratio on mixing in mixing index M versus time
diagrams. The particle scale mixing index M decreases initially and reaches steady state
value after 20 revolutions at volume fraction 0.1 as shown Figure 7.2 (a). The
uniformity of mixing decreases with an increase of density ratio at the volume fraction
0.1 because of the dominance of the size effect. For the volume fraction of 0.5, the
mixing rate and steady state mixing index increase slightly and decreases with an
increment of density ratio as shown in Figure 7.2(b). The mixing rate and homogeneity
of the particle mixing at steady state are nearly the same at different density ratios when
the volume fraction is 0.9 as shown in Figure 7.2(c).
0.9
0.92
0.94
0.96
0.98
1
0 10 20 30 40 50 60
rd=0.3
rd=0.4
rd=0.6
rd=0.9Pa
rticl
e Sc
ale
Mix
ing
Inde
x
Revolutions
0.96
0.965
0.97
0.975
0.98
0.985
0.99
0.995
1
0 20 40 60 80 100
rd=0.6
rd=0.9
rd=0.3
rd=0.4
Parti
cle
Scal
e M
ixin
g In
dex
Revolutions 0.6
0.65
0.7
0.75
0.8
0.85
0.9
0.95
1
0 20 40 60 80 100
rd=0.6
rd=0.9
rd=0.3
rd=0.4
Parti
cle
Scal
e M
ixin
g In
dex
Revolutions
(a) (b) (c)
Figure 7.2 Particle scale mixing index as a function of revolutions at different
volume fractions when rs=0.66 : (a) xl=0.1; (b) xl=0.5; (c) xl=0.9
Figure 7.3 shows the particle scale mixing index M at steady-state (or the
mixture quality as will be called below) as a function of density ratio and volume
fraction. The mixing index M at the steady-state will be called as the mixture quality

CHAPTER 7 A Study of Binary Particle Mixtures in a Ribbon Mixer
7-191
below. A higher mixture quality is obtained for the volume fraction of 0.5 than for other
volume fractions, and the density ratio rd is seen to be having no significant effect on M
at this size ratio except at 0.1 volume fraction, where there is a slight effect. However, in
the case of a vertically-shafted cylindrical mixer, the mixture quality showed a gradual
increase with a decrease in rd (Chapter 3, Figure 3.2). Therefore, the effect of rd on
mixture quality is somewhat different here compared to a cylindrical mixer. Figure
7.3(b) shows that mixture quality displays a peak value with increasing volume fraction
as in the case of the cylindrical mixer.
0.88
0.9
0.92
0.94
0.96
0.98
1
0.2 0.3 0.4 0.5 0.6 0.7 0.8 0.9 1
xl=0.1
xl=0.5
xl=0.9
Parti
cle
Scal
e M
ixin
g In
dex
rd
0.92
0.93
0.94
0.95
0.96
0.97
0.98
0.99
1
0 0.2 0.4 0.6 0.8 1
rd=0.3
rd=0.4
rd=0.6
rd=0.9
Parti
cle
Scal
e M
ixin
g In
dex
xl
Figure 7.3 Effects of rd and xl on M at rs=0.66: (a), effect of rd at different xl ; and (b), effect of xl at different rd
7.4.1.2 Velocity and force analysis
To understand the effects of binary particle mixing further, contact forces and
velocity field are examined at the t=50s when mixing is steady. Figure 7.4 shows that
the cumulative probability distributions of normal and tangential contact forces at
different rd values. It shows that both normal and tangential contact forces increase with
an increase in the density ratio when size ratio is fixed at 0.66, even if the effect of
density ratio on mixing index was not significant.

CHAPTER 7 A Study of Binary Particle Mixtures in a Ribbon Mixer
7-192
0
0.2
0.4
0.6
0.8
1
10-6
10-5
10-4
10-3
10-2
10-1
100
rs=0.6; r
d=0.6
rs=0.61; r
d=0.9
rs=0.6; r
d=0.3
rs=0.6; r
d=0.4
Cum
ulati
ve P
roba
bilit
y
Normal Force (N)
0
0.2
0.4
0.6
0.8
1
10-6
10-5
10-4
10-3
10-2
10-1
100
rs=0.6; r
d=0.6
rs=0.6; r
d=0.9
rs=0.6; r
d=0.3
rs=0.6; r
d=0.4
Cum
ulat
ive
Prob
abili
ty
Tangentail Force (N) (a) (b) Figure 7.4 Effects of rd on contact forces at rs=0.66: (a), normal force ; and (b),
tangential force for a volume faction of 0.5.
Figure 7.5 shows instantaneous filed of particle velocity in vertical section at
three different axial positions Z, measured from one end of the vessel. Note that the
velocity vectors of small particles are coloured red, while those of large particles are
coloured blue in diagrams. The particle velocity increased with a decrease of the
density ratio when size ratio fixed at rs=0.6 as seen from the increase of arrow lengths.
The reason probably is that the mass difference of particles increases and small particles
are driven by momentum of large particles, increasing the overall velocity of particles.
The particles are pushed towards the middle part of the vessel by the blades, and
therefore, a larger amount of particles can be seen in the middle sections from the
velocity field. Flow patterns are mostly identical in the corresponding sections even if
the density is changed suggesting that the homogeneity of a mixture is not much
affected by the density ratio when size ratio is fixed at 0.6 and volume fraction at 0.5 as
also can be confirmed from Figure 7.3 (a).

CHAPTER 7 A Study of Binary Particle Mixtures in a Ribbon Mixer
7-193
Figure 7.5 Effects of rd on velocity field at rs=0.6 at different cylindrical height
for a volume faction xl of 0.5
Figure 7.6 shows the distributions of particle velocity components for different
density ratios when the size ratio is fixed. The tangential velocity shows a slightly
increase in velocity when density ratio is 0.6 which is the maximum mixing index for a
volume fraction of 0.5 in Figure 7.2(b). The radial and tangential velocities are mostly
not affected by the density change.
Frame 001 08 Nov 2013
rs=0.6; rd=0.6
Z=90-130
Frame 001 08 Nov 2013 Frame 001 08 Nov 2013
Z=40-60 Z=14-160
Frame 001 08 Nov 2013 Frame 001 08 Nov 2013
rs=0.6; rd=0.9
Frame 001 08 Nov 2013
Frame 001 08 Nov 2013
rs=0.6; rd=0.4
Frame 001 08 Nov 2013 Frame 001 08 Nov 2013

CHAPTER 7 A Study of Binary Particle Mixtures in a Ribbon Mixer
7-194
0
1
2
3
4
5
6
7
8
-0.2 -0.1 0 0.1 0.2 0.3
rd=0.4; r
s=0.6
rd=0.6; r
s=0.6
rd=0.9; r
s=0.6
Prob
abili
ty d
ensi
ty fu
nctio
n
Radial Velocity 0
1
2
3
4
5
6
-0.3 -0.2 -0.1 0 0.1 0.2 0.3 0.4
rd=0.4; r
s=0.6
rd=0.6; r
s=0.6
rd=0.9; r
s=0.6
Prob
abili
ty d
ensi
ty fu
nctio
n
Tangential Velocity 0
1
2
3
4
5
6
7
8
-0.3 -0.2 -0.1 0 0.1 0.2 0.3 0.4
rd=0.4; r
s=0.6
rd=0.6; r
s=0.6
rd=0.9; r
s=0.6
Prob
abili
ty d
ensi
ty fu
nctio
n
Axial Velocity Figure 7.6 Instantaneous probability density distributions of particle velocity
components at different density ratios when size ratio is fixed at rs=0. 6
7.4.2 Effect of size ratio rs on particle mixing
7.4.2.1 Mixing Index
Figure 7.7 shows the effect of size ratio rs on mixing for different values of xl
with rd=0.33, the other parameters being given in Table 7.4. For a given volume
fraction, the mixing index increases to the steady-state value or remain unchanged.
Figure 7.8 (a) and (b) summarizes the steady-state values M as a function of rs at
different xl. Generally, mixture quality shows a peak value with respect to rs as in the
case of a vertically-shafted cylindrical mixer (Chapter 3, and Figure 3.3(b)). The peak
occurs at rs between 0.8 and 0.9, which is somewhat larger compared the cylinder’s
which occurs between 0.7 and 0.8. A higher mixture quality can be obtained when
xl=0.5, which is however is not the optimum value of xl as shown below.
0
0.2
0.4
0.6
0.8
1
0 20 40 60 80 100
rs=0.6
rs=0.78
rs=0.8
rs=0.95
Parti
cle
Scal
e M
ixin
g In
dex
Revolutions
0
0.2
0.4
0.6
0.8
1
0 20 40 60 80 100
rs=0.6
rs=0.78
rs=0.8
rs=0.95
Parti
cle
Scal
e M
ixin
g In
dex
Revolutions0
0.2
0.4
0.6
0.8
1
0 20 40 60 80 100
rs=0.6
rs=0.78
rs=0.8
rs=0.95
Parti
cle
Scal
e M
ixin
g In
dex
Revolutions
(a) (b) (c)
Figure 7.7 Particle scale mixing index as a function of revolutions at different
values of rs with rd=0.33: (a) xl=0.1; (b) xl=0.5; and (c) xl=0.9

CHAPTER 7 A Study of Binary Particle Mixtures in a Ribbon Mixer
7-195
0.75
0.8
0.85
0.9
0.95
1
0.5 0.6 0.7 0.8 0.9 1
xl=0.1
xl=0.5
xl=0.9
Parti
cle
Scal
e M
ixin
g In
dex
rs
0.75
0.8
0.85
0.9
0.95
1
0 0.2 0.4 0.6 0.8 1
rs=0.6
rs=0.78
rs=0.8
rs=0.95
Parti
cle
Scal
e M
ixin
g In
dex
xl
(a) (b)
Figure 7.8 Effect of rs and xl on steady-state values of mixing index (or mixture
quality) for rd = 0.33 and l = 6040 kg/m3: (a) effect of rs at different xl; and (b)
representation of results in (a) as an effect of xl at different rs
Figure 7.8(b) shows the results of Fig. 7.8(a) as a function of xl with rs as the
parameter. The mixture quality shows a peak against xl as in the case of the cylindrical
mixer (Chapter 3, Fig 3.4). The peak occurs at xl=0.35 here, but in the cylindrical mixer
it occurs roughly at xl=0.55. The trends of the curves of mixture quality versus xl is
mostly the same at different size ratios. This result is similar to the trends for the
cylindrical mixer(Chapter3, Figures 3.3(b) and 3.4).
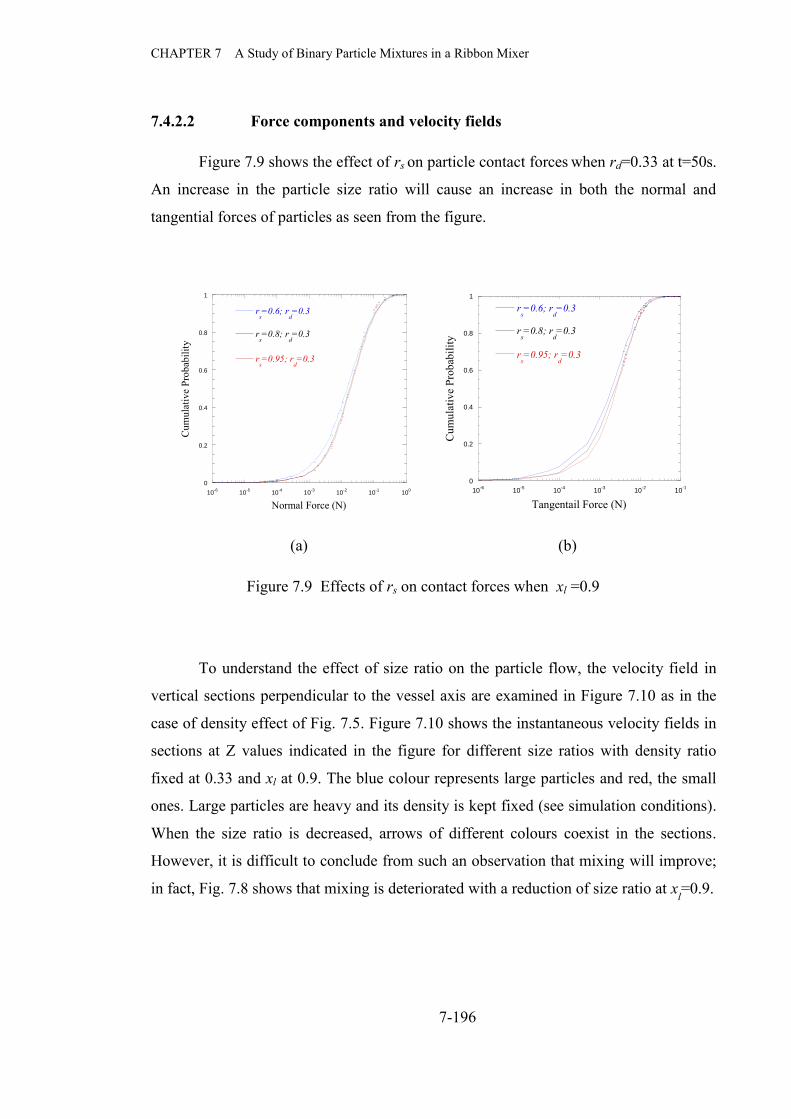
CHAPTER 7 A Study of Binary Particle Mixtures in a Ribbon Mixer
7-196
7.4.2.2 Force components and velocity fields
Figure 7.9 shows the effect of rs on particle contact forces when rd=0.33 at t=50s.
An increase in the particle size ratio will cause an increase in both the normal and
tangential forces of particles as seen from the figure.
0
0.2
0.4
0.6
0.8
1
10-6
10-5
10-4
10-3
10-2
10-1
100
rs=0.8; r
d=0.3
rs=0.95; r
d=0.3
rs=0.6; r
d=0.3
Cum
ulat
ive
Prob
abili
ty
Normal Force (N)
0
0.2
0.4
0.6
0.8
1
10-6
10-5
10-4
10-3
10-2
10-1
rs=0.8; r
d=0.3
rs=0.95; r
d=0.3
rs=0.6; r
d=0.3
Cum
ulat
ive
Prob
abili
ty
Tangentail Force (N)
(a) (b)
Figure 7.9 Effects of rs on contact forces when xl =0.9
To understand the effect of size ratio on the particle flow, the velocity field in
vertical sections perpendicular to the vessel axis are examined in Figure 7.10 as in the
case of density effect of Fig. 7.5. Figure 7.10 shows the instantaneous velocity fields in
sections at Z values indicated in the figure for different size ratios with density ratio
fixed at 0.33 and xl at 0.9. The blue colour represents large particles and red, the small
ones. Large particles are heavy and its density is kept fixed (see simulation conditions).
When the size ratio is decreased, arrows of different colours coexist in the sections.
However, it is difficult to conclude from such an observation that mixing will improve;
in fact, Fig. 7.8 shows that mixing is deteriorated with a reduction of size ratio at xl=0.9.

CHAPTER 7 A Study of Binary Particle Mixtures in a Ribbon Mixer
7-197
Figure 7.10 Effect of rs on velocity field when rd = 0.33 and xl =0.9
Figure 7.11 shows the size ratio effect on the velocity components. The
tangential velocity of the particles for rs=0.8 has slightly improved, and thus, the
circumferential flow is enhanced. For this case, a higher mixing index has been obtained
as shown in Figure 7.8. The size ratio has not affected the radial velocity significantly.
However, axial velocity has reduced with the increase of size ratio as seen from the
sharpening of the peak of the distribution curve in Figure 7.11(c).
rs=0.6; rd=0.3
Z=90-110Z=40-60 Z=140-160
rs=0.8; rd=0.3
rs=0.95; rd=0.3
Frame 001 08 Nov 2013 Frame 001 08 Nov 2013 Frame 001 08 Nov 2013
Frame 001 08 Nov 2013 Frame 001 08 Nov 2013 Frame 001 08 Nov 2013
Frame 001 08 Nov 2013 Frame 001 08 Nov 2013 Frame 001 08 Nov 2013

CHAPTER 7 A Study of Binary Particle Mixtures in a Ribbon Mixer
7-198
0
2
4
6
8
-0.3 -0.2 -0.1 0 0.1 0.2 0.3 0.4
rs=0.6; r
d=0.3
rs=0.8; r
d=0.3
rs=0.95; r
d=0.3
Prob
abili
ty d
ensi
ty
Radial Velocity (m/s) 0
1
2
3
4
5
6
7
-0.3 -0.2 -0.1 0 0.1 0.2 0.3 0.4
rs=0.6; r
d=0.3
rs=0.8; r
d=0.3
rs=0.95; r
d=0.3
Prob
abili
ty d
ensi
ty
Tangential Velocity (m/s) 0
4
8
12
16
-0.15 -0.1 -0.05 0 0.05 0.1 0.15 0.2
rs=0.6; r
d=0.3
rs=0.8; r
d=0.3
rs=0.95; r
d=0.3
Prob
abili
ty d
ensi
ty
Axial Velocity (m/s)
(a) (b) (c)
Figure 7.11 Probability density of velocity components at different size ratio
when rd = 0.33, xl =0.9 at t=50s
7.4.3 Prediction Equation
The above results show that size ratio, density ratio and volume fraction affect
the mixing behavior of binary mixture of the particles. Previously, a prediction equation
has been established for a vertically-shafted cylindrical mixer to account for the effects
of size, density and volume fractions on mixture quality. Here, it would be appropriate
to examine whether a correlation of the form for a vertical cylinder would be valid for
the ribbon mixer. If it exists, that would suggest that similar mixing mechanisms are in
operation in both mixers. A prediction equation of the form of Eq. 7-3 is obtained using
‘FindFit’ function of Mathematica software for the ribbon mixer. Simulation results and
prediction results from the equation have been compared and the error obtained as
shown in Table 7.5. The error is equal or less than 7% as shown in Table 7.5.
MI = 0.2981 + 1.605 rs - 1.074 rs2 + 0.2639 rd - 0.3854 xl
2 + 0.1535 rd xl - 0.259 rd2 + 0.2185 xl (7.3)
Contour plots have been draw in Figure 7.12 to illustrate the effects of the three
variables, size, density and volume fraction on the mixture quality MI using Eq (7.3) in
wide ranges of the three variables. The contour plot also shows the interchangeability
of size and density effects, and there is an optimum combinations of size and density
ratio for a given volume fraction which gives the highest mixture quality. The difference

CHAPTER 7 A Study of Binary Particle Mixtures in a Ribbon Mixer
7-199
between the correlations or predictive equations for the cylindrical mixer and ribbon
mixer is that the size and density interactions are significant in the cylindrical mixer,
which is not the case with the ribbon mixer tested. Conversely, the density and volume
fraction interactions are more significant in the case of the ribbon mixer.
Table 7.5 Comparison of mixing index of simulation and mixing index from equation
rs rd xl MI MI_Eq Error
0.6 0.3 0.1 0.956794 0.952921 0%
0.78 0.3 0.1 0.965042 0.975039 -1%
0.8 0.3 0.1 0.968078 0.973201 -1%
0.95 0.3 0.1 0.936 0.932026 0%
0.6 0.3 0.5 0.96735 0.966245 0%
0.78 0.3 0.5 0.985382 0.988363 0%
0.8 0.3 0.5 0.986659 0.986525 0%
0.95 0.3 0.5 0.973901 0.94535 3%
0.6 0.3 0.9 0.797539 0.856241 -6%
0.78 0.3 0.9 0.854902 0.878359 -2%
0.8 0.3 0.9 0.862373 0.876521 -1%
0.95 0.3 0.9 0.814755 0.835346 -2%
0.66 0.3 0.1 0.97497 0.968027 1%
0.66 0.4 0.1 0.97044 0.977822 -1%
0.66 0.6 0.1 0.97268 0.981872 -1%
0.66 0.9 0.1 0.96478 0.949097 2%
0.66 0.3 0.5 0.98901 0.981351 1%
0.66 0.4 0.5 0.99036 0.997286 -1%
0.66 0.6 0.5 0.99436 1.013616 -2%
0.66 0.9 0.5 0.98986 0.999261 -1%
0.66 0.3 0.9 0.93767 0.871347 7%
0.66 0.4 0.9 0.93243 0.893422 4%
0.66 0.6 0.9 0.93628 0.922032 1%
0.66 0.9 0.9 0.92238 0.926097 0%

CHAPTER 7 A Study of Binary Particle Mixtures in a Ribbon Mixer
7-200
x
l=0.1 x
l=0.5 x
l=0.9
Figure 7.12 Contour maps using the prediction equation, demonstrating the
equivalence of size and density effects at different volume fractions, xl of 0. 1, 0.5 and
0.9.
Figure 7.13 shows the comparison of the effects of size, density and volume
fraction on the particle mixing in the cylindrical and the ribbon mixer. The results show
that the trends of this effect are similar in both mixers. But the mixing indexes are
higher in the ribbon mixer compared to the cylindrical mixer. However, an exact
comparison has not been done here: for example, shaft speeds are different for the two
mixers, being 100 rpm and 20 rpm for the ribbon and cylindrical mixers respectively.
The important fact here is that mixing is less affected by the size and density effect in
the case of the ribbon mixer.
0.00
0.20
0.40
0.60
0.80
1.00
0.4 0.5 0.6 0.7 0.8 0.9 1
MI_cylinderEq_cylinderMI_ribbonEq_ribbon
Stea
dy-s
tate
mix
ing
inde
x, M
Size Ratio, rs, x
l=0.9,
Cylindrical mixer
Ribbon mixer
0.00
0.20
0.40
0.60
0.80
1.00
0.2 0.3 0.4 0.5 0.6 0.7 0.8 0.9 1
MI_cylinderEq_cylinderMI_ribbonEq_ribbon
Stea
dy-s
tate
mix
ing
inde
x
Density Ratio,rd , x
l=0.1
Cylindrical mixer
Ribbon mixer
0.4
0.5
0.6
0.7
0.8
0.9
1
0 0.2 0.4 0.6 0.8 1
MI_cylinderEq_cylinderMI_ribbonEq_ribbonPa
rticl
e -s
tate
mix
ing
inde
x
Volume fraction, xl
Ribbon mixer, rs=0.8
Cylindrical mixer, rs=0.875
(a) (b) (c) Figure 7.13 Comparison of the effects of rs, rd and xl on particle mixing behaviour in the cylindrical mixer and ribbon mixer; M is steady-state values of mixing index, solid line is representing prediction: (a) the effect of size ratio when xl =0.9 for cylindrical mixer rd=0.33; for ribbon mixer rd=0.22; (b) density effect when xl =0.1 for cylindrical mixer rs=0.6; for ribbon mixer rs=0.5; (c)volume fraction effect: for cylindrical mixer rs=0.875, rd=0.22; for ribbon mixer rs=0.8, rd=0.33.

CHAPTER 7 A Study of Binary Particle Mixtures in a Ribbon Mixer
7-201
7.5 Conclusions
The effects of size and density ratios of particles of binary mixtures were
investigated for a ribbon mixer at different volume fractions. There are similarities in
the effects of size ratio, density ratio and volume fraction in relation to those for a
vertically-shafted cylindrical mixer. For example, the mixing index showed a peak
value with respect to the size ratio and volume fraction. However, the effect of density
ratio on mixture quality is not significant in the case of the ribbon mixer. This is an
indication that the mixing mechanisms of the two systems are different.
The predictability of these effects is confirmed again for the ribbon mixer as for
a cylidrical mixer by obtaining a prediction equation for the ribbon mixer. The form of
the prediction equations are similar, but some differences exist. In the case of
cylindrical mixer, the size and density interaction is significant as observed from the
presence of rsrd term in the equation. On the other hand, for the ribbon mixer, density
and volume fraction interaction is significant as seen from the presence of rd xl term.
However, there is still some interation between size and density as both terms are
present in the correlation developed. The error between the DEM results and predictions
of the equation is 7% at the most. The equivalence of the size and density effects is
shown to exist by using the contour maps from the predictive equation. The maps show
that a maximum mixing index can be obtained using an optimum size and density
combinations at different volume fractions.
Nomenclature
d Particle diameter, (mm)
dl Large particle diameter, (mm)
ds Small particle diameter, (mm)
E Young’s modulus, (N/m2)
Fc,ij Contact force vector between i and j, (N)
Fd,ij Damping force vector between i and j, (N)

CHAPTER 7 A Study of Binary Particle Mixtures in a Ribbon Mixer
7-202
g Acceleration due to gravity, (m/s2)
Ii Moment of inertia of particle i, (kg m2)
ki Number of particles in contact with particle i, (-)
M Particle-scale mixing index defined in Eq.(3) , (-)
Mij Vector of rolling friction torque on particle, (Nm)
Mp Predicted mixing index at steady-state, (-)
N Total number of particles in the mixture, (-)
Nt The number of sample/data points of instantaneous average values in time t, (-)
p Number ratio of the target type particles to all the particles, (-)
pi Particle fraction of a target type particle in the neighborhood of particle i, (-)
tp Average value of pi at time t for the entire mixture, (-)
rs Size ratio ls dd / , (-)
rd Density ratio ls / , (-)
S0 Standard deviation of pi at fully-segregated state, (-)
SR Standard deviation of fully-mixed state for uniform-sized particles of particle
fraction of p, (-)
St Standard deviation of pi with respect to tp at time t, (-)
Tij Vector of rolling friction torque on particle i, (Nm)
Vb Blade speed, (m/s)
Vi Velocity of particle i, (m/s)
xl Volume fraction, which is ratio of volume of large particles to total particle
volume (-)
z Height from vessel base, (mm)
Greek letters
Average particle-scale sample size for the mixture, (-)
ik Number of particles in contact with particle i
Density of particles of a uniform system, (kg m-3)
l Density of large particle, (kg m-3)
s Density of small particle, (kg m-3)

CHAPTER 7 A Study of Binary Particle Mixtures in a Ribbon Mixer
7-203
Shaft rotational speed, (rad/s)
i Angular velocity vector of particle i, (rad/s)

CHAPTER 8 Radial Segregation of a Binary Mixture in a Rotating Drum
8-204
Chapter 8
Radial Segregation of a Binary Mixture in a Rotating Drum

CHAPTER 8 Radial Segregation of a Binary Mixture in a Rotating Drum
8-205
8.1 Introduction
Segregation is one of the most intriguing properties of granular flows. It is well
known from experimental results that the perfect mixing cannot be obtained due to
differences in particles shape, surface roughness, size and density (Ahmad and Smalley,
1973; Aranson and Tsimring, 2006; Williams, 1976). The segregation is inevitable
when heavy particles of a binary mixture of light and heavy equal-size particles of a
binary mixture are located near the centre of mass of particles in the drum (Ristow,
1994). A two-dimensional experiment with a rotating drum using disks, shows that the
radial segregation occur in avalanches and continuous flow regimes in a half filled
rotating drum due to the size differences of the disks (Cantelaube and Bideau, 1995). It
is reported that smaller particles are dispersed into the centre of the mixture while the
larger ones dwell on the edge of the rotating drum (Clément et al., 1995). It is observed
that the percolation primarily occur in the rapid flow layer formed on bed surface
(Cantelaube et al., 1997). The size of core region increases with an increase of more
denser particles (Khakhar et al., 1997). The size segregation is counter-balanced by
density segregation when varying the density of small particles with the size ratio of a
binary particle mixture fixed (Dury and Ristow, 1999). It is reported that the segregation
of species of different size and surface properties would occur with the smallest and
roughest grains being found at the center of the drum (Makse, 1999). The mixing rate
increased, segregation deteriorated with a decrease of the size difference of particles
(Eskin and Kalman, 2000). A small difference in either the size or density leads to flow
induced segregation. The denser particles or smaller particles migrate towards the core
of the cylinders (Ottino and Khakhar, 2000). For a small size ratio, there is a
segregation of the large beads at the surface, but for large size ratios, the large beads
segregate inside the mixtures (Thomas, 2000). Ternary mixtures with different size and
density particles segregate due to size and density driving forces which may
complement or oppose each other (Hajra and Khakhar, 2011). Large particle size ratios
or density ratios lead to segregation, though segregation can be deteriorated due to
percolation effect in a ternary or multi sized system (Xu et al., 2010). The small
particles in ternary mixtures exhibit reverse segregation as in binary mixtures.
Segregation is nearly independent of the sizes of the medium size and large particles.
Ternary mixtures with different size and density particles segregate due to size and

CHAPTER 8 Radial Segregation of a Binary Mixture in a Rotating Drum
8-206
density driving forces which may complement or oppose each other. (Hajra and
Khakhar, 2011). The radial segregation is driven by a density segregation flux, which
results in heavier particles tending to come to rest deeper in the bed, as a result of their
larger mass (Pereira et al., 2011). It is stated that a prediction equation to quantify the
combined effects of density and size differences would enable us to predict transition
from mixing to segregation by percolation due to size difference and buoyancy effect
induced by density differences (Alonso et al., 1991). The combined effects of
percolation and buoyancy enhanced segregation when smaller particles are heavier.
Otherwise, the peocolation and buoyancy effects negate each other and segregation is
reduced (Liu et al., 2013). The feasibility of prediction of segregation in rotating drum
still need to be further investigate.
Research on a relationship of the effects of the particle properties such as the
size and density differences of particles on the rotating drum performance have not been
clearly established. The objective of this study is thus, to investigate the effect of size
and density differences of particles on the binary mixing behaviours of non--cohesive
particle mixtures for rotating drum, by using simulations based on the discrete-element-
method (Cundall and Strack, 1979).
This chapter is organized as follows. Section 8.2 discusses the simulation
method, simulation conditions and quantification method, which is followed by the
results and discussions section, where in section 8.3.1, the effect of density ratio when
size ratio fixed. In Section 8.3.2, effect of size ratio is discussed with density ratio fixed.
Next, a prediction equation is developed to account for size and density effects on
mixture quality in section 8.3.4. Finally, Section 8.4 summarizes the conclusions of the
chapter.

CHAPTER 8 Radial Segregation of a Binary Mixture in a Rotating Drum
8-207
8.2 Analytical Methods
8.2.1 DEM Model
The DEM model used here is essentially the same as that previously developed
and validated by Zhou et al. (Zhou et al., 2004; Zhou et al., 1999). The model uses two
momentum conservation equations to describe the translational and rotational motion of
particle i in a system at time t subjected to the gravity g and interactions with the
neighboring particles, blade and walls:
ik
jijdijci
ii m
dtdm
1,, FFgV (8.1)
and
ik
jijij
ii d
dI1t
MT (8.2)
where mi, Ii, Viand i are the mass, moment of inertia, translational and
rotational velocities of the particle respectively; k is the number of particles that are in
contact with particle i, Fc represents the elastic contact force which is the summation of
the normal and tangential forces. Fd represents the damping force, which is the
summation of the normal and tangential damping force respectively at the contact point
with particle j; and T and M are the torque and rolling friction torque on particle i due to
particle j. Expressions for the forces and torques in Eqs. (8.1) and (8.2) are given in
Table 8.1.

CHAPTER 8 Radial Segregation of a Binary Mixture in a Rotating Drum
8-208
Table 8.1 Formulae for contact forces and torques
Forces and torques
Formula Associated definitions
Normal contact force nF ˆ)2(
)1(32321
2, niijcn RE
Normal damping force n nVF ˆˆ)(
)1(23
21
212,
ijn
inijdn R
Emc
iijjijij RRVVV
i
i
RR
n ˆ
Tangential contact force
t
t
t
i
ijcnijct
F
23
max,
max,,,
,min11
tsF
Tangential damping force ijt
t
ttijcnsitijdt Fmc ,
21
max,
max,,,
1 6 VF
nst
)1(2)2(
max,
nnVV ˆˆ, ijijt
Rotational torque
ijdtijctiij ,, FFRT
Rolling friction torque
ιijcnrij F ̂,M ι
ιi
ˆ
8.2.2 Simulation Conditions
The initial loading method is side-by-side axially as shown in Figure 8.1. Due to
the short axial length of the vessel sometimes particles may be mixed already, but we
are interested here on the steady-state mixture quality. Periodic boundary conditions
have been used in the axial direction of the drum. The key parameters used in DEM
simulations are shown in Table 8.2. Here, dS and ρS represent the diameter and density
of small particles, respectively, while dL and ρL denote the size and density of large
particles, respectively. The size ratio and density ratio are defined as rs=dS/dL and rd
=ρS/ρL , respectively. The small particles have dS=1.3mm and ρS=2500 kg/m3, those of
large particles were varied as shown in Table 8.3. The particle number for the
simulations is calculated based on the fixed volume fraction of 0.5 for each type of

CHAPTER 8 Radial Segregation of a Binary Mixture in a Rotating Drum
8-209
particles. The drum’s fill level was fixed at 30%. The drum speed was chosen as 15rpm
to obtain the rolling mode of particle flow(Liu et al., 2013). The simulations were
conducted for the cases of non-cohesive particles for investigating the effect of size and
density. The simulation conditions are summarized in Table 8.2.
8.2.3 Segregation index
The mixture quality is quantified using Segregation index (Yamane, 2004).
20
2
I (8.3)
where, 02
is the sample variance of fully-segregated state and is the sample
variance of the mixture at time t, where pp 120 and p represents the particle
number ratio of the target particles to the total particle number in the binary mixture.
Here,
Ni
ii pp
N 1
2t
2 1 , where N is the total number of particles in the mixer, with
tp representing the average of pi at time t, pi being the fraction of the target type of
particles in each sample. Here, samples are taken at each particle to include only its
contacting particles (i.e. the immediate neighbourhood), and number fraction pi of the
target type of particles in each sample is found from pi=ni/Ni where ni and Ni are the
target type particles and total number of particles in a sample, respectively
(Chandratilleke et al., 2012). To find, tp , pi is averaged over the particle number N. In
determining 2, one has to use a particle-contact condition, which is taken as an inter-
particle gap size of 5% of the small particle diameter, to be consistent with our previous
work (Chandratilleke et al., 2012).

CHAPTER 8 Radial Segregation of a Binary Mixture in a Rotating Drum
8-210
Table 8.2 Input variables and their values
Parameter Value
Number of Particles 7260 ~ 14000
Drum, D × L (mm) 104 × 7.8
Size of small particles, dS (mm) 1.3
Size ratio, dS/dL 0.3 ~ 0.86
Density of small particles, ρS (kg/m3)
2.5 × 10³
Density ratio, ρS/ρL 0.25 ~ 4.0
Elastic modulus, E (Pa) 1.0 × 10⁷
Poisson’s ratio, ν 0.29
Normal damping coefficient, (s-1) 1.0 × 10⁻⁶
Particle- particle sliding friction coefficient, µpp
0.4
Particle- wall sliding friction coefficient, µpw
0.5
Rolling friction coefficient, µr 0.001
Fill level, f (%) 30
Rotation speed, ω (rpm) 15
Figure 8.1. Initial loading pattern of particles in the rotating drum

CHAPTER 8 Radial Segregation of a Binary Mixture in a Rotating Drum
8-211
Table 8.3 Particle information for size effect cases
Cases ρs/ρL ρL ρS ds/dL dL dS 1 0.615385 4062.5 2500 0.333333 3.9 1.3 2 0.64 3906.25 2500 0.363636 3.575 1.3 3 0.444444 5625 2500 0.432526 3.0056 1.3 4 0.5 5000 2500 0.410256 3.16875 1.3 5 0.333333 7500 2500 0.470588 2.7625 1.3 6 0.64 3906.25 2500 0.666667 1.95 1.3 7 0.592593 4218.75 2500 0.8 1.625 1.3 8 0.888889 2812.5 2500 0.714286 1.82 1.3 9 1.262626 1980 2500 0.666667 1.95 1.3 10 0.8 3125 2500 0.551724 2.35625 1.3 11 0.695652 3593.75 2500 0.444444 2.925 1.3 12 0.769231 3250 2500 0.363636 3.575 1.3 13 0.4 6250 2500 0.615385 2.1125 1.3 14 0.333333 7500 2500 0.571429 2.275 1.3 15 0.266667 9375 2500 0.588235 2.21 1.3 16 1.904762 1312.5 2500 0.8 1.625 1.3 17 1.454545 1718.75 2500 0.666667 1.95 1.3 18 1.257862 1987.5 2500 0.5 2.6 1.3 19 1.333333 1875 2500 0.4 3.25 1.3 20 1.454545 1718.75 2500 0.333333 3.9 1.3 21 0.4 6250 2500 0.856898 1.5171 1.3 22 0.333333 7500 2500 0.8 1.625 1.3 23 0.285714 8750 2500 0.761905 1.70625 1.3

CHAPTER 8 Radial Segregation of a Binary Mixture in a Rotating Drum
8-212
8.3 Results and Discussion
The following effects are investigated below for binary mixtures using the
segregation index: the effect of size ratio when density ratio is fixed; effect of density
ratio when size ratio is fixed and combined effect of size and density ratios on flow
pattern and contact forces.
8.3.1 Effect of density ratio on binary particle mixing
8.3.1.1 Segregation Index
The effect of density ratio on mixing is investigated using the segregation index
with the density being varied while keeping ρS =2500 kg/m3 and size ratio at 0.66; these
cases are listed in Table 8.3. Figure 8.2 shows the effect of density ratio on segregation
index I as a function of time or drum revolutions. Segregation index decreases first and
then increases for rd= 0.64, while rd= 1.26 and rd= 1.46 show similar trends with a
steady increase after 2 rev as shown in Figure 8.2(a). Figure 8.2(b) shows the average
steady-state segregation index as a function of density ratio. It shows that the
segregation has slightly enhanced with an increase in density ratio for rd= 0.66. The
trend is the same as in other mixers, where mixing improved with a reduction of density
ratio.
Figure 8.3 shows the evolutions of radial segregation pattern investigated at
different density ratios when the size ratio is fixed at 0.66. Radially, a core of denser
particles (blue) is gradually developed over time due to the buoyancy effect (Zhou et al.,
2003) when small particles are more heavier as a result of an increase of density ratio.
Thus, it can be observed that segregation is enhanced with an increase of density ratio,
the small particles (blue) percolating to the core region. On the other hand, with a lower
density ratio of rd= 0.64, large particles became heavier, the small ones lighter, and the
percolation and buoyancy effects counterbalance each other producing better mixing at
t=35s. The segregation index for this case where rd= 0.64 and rs=0.66, shows a lower
value in Figure 8.2(a). These phenomena have been observed in a previous paper on
rotating drum as well (Liu, Yang et al. 2013)

CHAPTER 8 Radial Segregation of a Binary Mixture in a Rotating Drum
8-213
0.00
0.20
0.40
0.60
0.80
1.00
0 5 10 15 20 25 30 35
0 1 2 3 4 5 6 7 8
rs =0.66; r
d =0.64
rs =0.66; r
d =1.26
rs =0.66; r
d =1.46
Segr
egat
ion
Inde
x
Time (s)
Drum revolutions
0.00
0.20
0.40
0.60
0.80
1.00
0.5 1 1.5
Steady-state values
Eq.Ave
rage
segr
egat
ion
inde
x
Density ratio, rd
(a) (b)
Figure 8.2 Effect of density ratio on mixing: (a) Segregation index as a function
of time and revolutions when rs=0.66; and (b) steady-state segregation index as
a function of density ratio.
Figure 8.3 Effect of rd on the segregation flow pattern at rs=0.66; blue represents small particles, and red the large ones.
t=5s
t=35s
rs =0.66; rd =0.64 rs =0.66; rd =1.26 rs =0.66; rd =1.46

CHAPTER 8 Radial Segregation of a Binary Mixture in a Rotating Drum
8-214
8.3.1.2 Force analysis
To understand the role of density ratio on particle contact forces in the
segregation mechanism, the cumulative probability distributions of contact forces are
produced at t=30s, when the flow is steady. Figure 8.4 shows that the normal and
tangential forces increased with a decrease of density ratio while the size ratio is fixed at
0.66. This is an indication that particle interactions are becoming more dynamic. In the
case where rd= 0.64 and rs=0. 66, the particle rolling flow was enhanced with stronger
tangential forces, and higher normal contact forces of particles improved the buoyancy
and percolation effects, thus reducing the segregation. The buoyancy effect becomes
dominant as seen from the expulsion of large (red) particles to the periphery of the
mixture when rd= 1.26 and 1.46 in which case the normal and tangential force become
smaller and the density difference of particles is lower.
0.00
0.20
0.40
0.60
0.80
1.00
10-6
10-5
10-4
10-3
10-2
rs =0.66; r
d=0.64
rs=0.66; r
d =1.26
rs =0.66; r
d=1.46
Cum
ulat
ive
prob
abili
ty
Normal Force (N)
0.00
0.20
0.40
0.60
0.80
1.00
10-6
10-5
10-4
10-3
10-2
rs =0.66; r
d=0.64
rs=0.66; r
d =1.26
rs =0.66; r
d=1.46
Cum
ulat
ive
prob
abili
ty
Tangential Force (N) (a) (b)
Figure 8.4 Effects of rd on contact forces at rs=0.6: (a) normal force ; and (b) tangential
force

CHAPTER 8 Radial Segregation of a Binary Mixture in a Rotating Drum
8-215
8.3.2 Effect of size ratio rs on particle mixing
8.3.2.1 Segregation patterns Figure 8.5 shows the effect of size ratio rs on the evolutions of radial segregation
pattern for rd=0.33, the other parameters being given in Table 2. The segregation index
steadily decreased to reach the steady state value as shown in Figure 8.5(a). Figure
8.5(b) summarizes average values I at steady-state as a function of rs. A higher
segregation can be seen for rs=0.47 as shown in Figure 8.5(a), and Figure 8.5(b) shows
that the average segregation index decreases with an increase in the size ratio.
0.00
0.20
0.40
0.60
0.80
1.00
0 5 10 15 20 25 30 35
0 1 2 3 4 5 6 7 8
rs =0.47; r
d = 0.33
rs = 0.57; r
d = 0.33
rs =0.8; r
d = 0.33
Segr
egat
ion
Inde
x
Time (s)
Drum revolutions
0.00
0.20
0.40
0.60
0.80
1.00
0.4 0.5 0.6 0.7 0.8 0.9
Average steady-state valueEqA
vera
ge S
egre
gatio
n In
dex
Size ratio, rs
(a) (b) Figure 8.5 Effect of size ratio: (a) Segregation index as a function of time and
revolutions when rd=0.33; and (b) Average segregation index as a function of size ratio;
the solid line is prediction value.
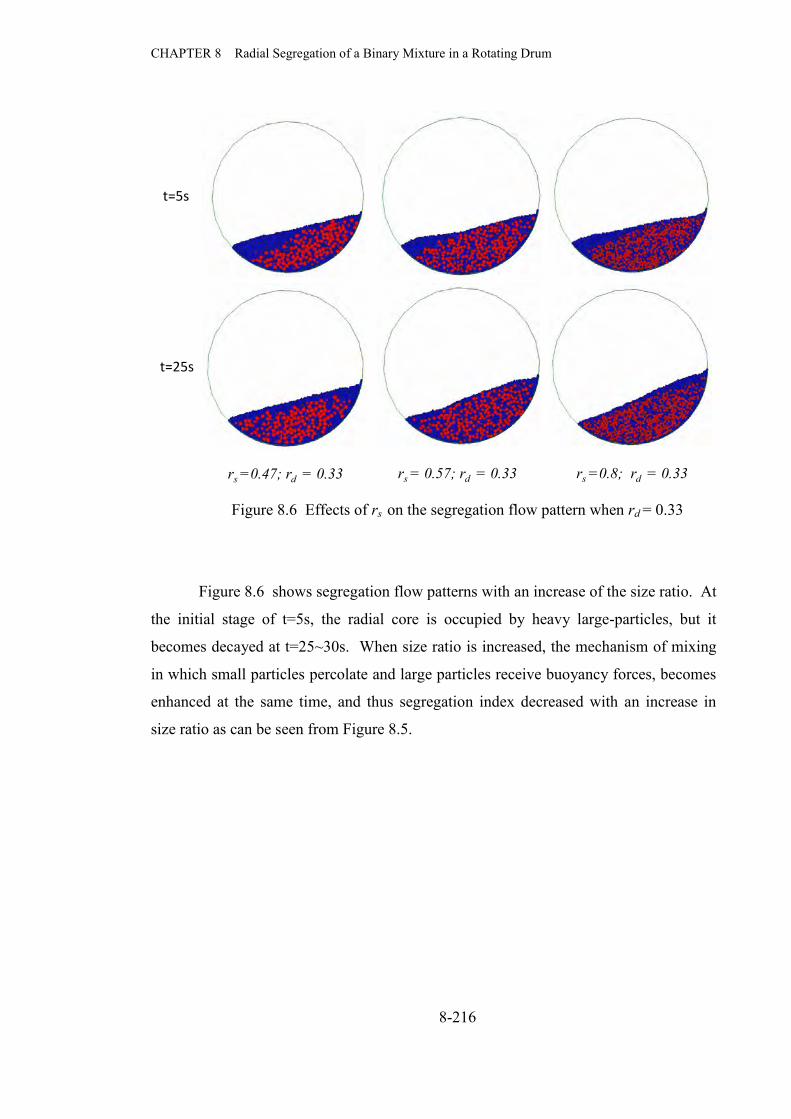
CHAPTER 8 Radial Segregation of a Binary Mixture in a Rotating Drum
8-216
Figure 8.6 Effects of rs on the segregation flow pattern when rd = 0.33
Figure 8.6 shows segregation flow patterns with an increase of the size ratio. At
the initial stage of t=5s, the radial core is occupied by heavy large-particles, but it
becomes decayed at t=25~30s. When size ratio is increased, the mechanism of mixing
in which small particles percolate and large particles receive buoyancy forces, becomes
enhanced at the same time, and thus segregation index decreased with an increase in
size ratio as can be seen from Figure 8.5.
t=5s
t=25s
rs =0.47; rd = 0.33 rs = 0.57; rd = 0.33 rs =0.8; rd = 0.33

CHAPTER 8 Radial Segregation of a Binary Mixture in a Rotating Drum
8-217
8.3.2.2 Force components
Figure 8.7 shows the effect of rs on particle contact forces for rd = 0.33 at t=30s
averaged over 1 s time interval. Stronger normal and tangential forces are seen in the
case of rs= 0.8, rd= 0.33, which shows the lower segregation index in the Figure 8.5(a)
and a lower segregation flow in the Figure 8.6. Particles encounter smaller normal and
tangential forces when the size ratio is decreased to 0.47 (Table 8.3 case 5).
0.00
0.20
0.40
0.60
0.80
1.00
10-6
10-5
10-4
10-3
10-2
rs =0.47; r
d = 0.33
rs = 0.57; r
d = 0.33
rs =0.8; r
d = 0.33
Cum
ulat
ive
prob
abili
ty
Normal Force (N)
0.00
0.20
0.40
0.60
0.80
1.00
10-6
10-5
10-4
10-3
10-2
rs =0.47; r
d = 0.33
rs = 0.57; r
d = 0.33
rs =0.8; r
d = 0.33
Cum
ulat
ive
prob
abili
ty
Tangential Force (N) (a) (b)
Figure 8.7 Effect of rs on contact forces: (a), normal force ; and (b), tangential force
8.3.3 Combined size and density effect
8.3.3.1 Size ratio r
s and density ratio r
d decrease at the same time
The evolution of the segregation pattern is investigated when the size ratio and
density ratio are both decreased at the same time. Figure 8.8 shows that the segregation
index decreased with a decrease of both the size ratio and density ratio at the same time.
Figure 8.9 shows the evolution of the segregation pattern when both the size ratio and
density ratio are reduced at the same time. Here, even if red particles are subjected to an
increase in the size and density at the same time, large particles being still lighter than
the small one, the red particles move to periphery under the buoyancy effect while small
particles percolate to the core region.

CHAPTER 8 Radial Segregation of a Binary Mixture in a Rotating Drum
8-218
0.00
0.20
0.40
0.60
0.80
1.00
0 5 10 15 20 25 30 35
0 1 2 3 4 5 6 7 8
rs =0.8; r
d =1.9
rs =0.67; r
d =1.26
rs =0.5; r
d =1.25
Segr
egat
ion
Inde
x
Time (s)
Drum revolutions
Figure 8.8 Segregation index as a function of the time when
rs and rd are both decreased
Figure 8.9 Evolution of the segregation flow pattern when rs and rd decreased;
particle condition similar with Fig 8.3
rs =0.66; rd =1.26
t=20s
t=5s
rs =0.8; rd =1.9 rs =0.5; rd =1.25

CHAPTER 8 Radial Segregation of a Binary Mixture in a Rotating Drum
8-219
8.3.3.2 Size ratio rs
is decreased and density ratio r
d increased
Figure 8.10 shows that the segregation index increased with a decrease of size
ratio rs , increase of density ratio rd. Figure 8.11 shows the flow patterns for the cases
shown in Figure 8.10.
0.00
0.20
0.40
0.60
0.80
1.00
0 5 10 15 20 25 30 35
0 1 2 3 4 5 6 7 8
rs=0.8; r
d=0.59
rs=0.6; r
d=0.64
rs=0.44; r
d=0.7
rs=0.36; r
d=0.77
rs=0.33; r
d=1.45
Segr
egat
ion
Inde
x
Time (s)
Drum revolutions
Figure 8.10 Segregation index as a function of time when rs decreases and rd
increases at the same time.
Figure 8.11 shows that the buoyancy effect becomes the dominant mechanism
when the size ratio decreases while the density ratio increases. It means that red
particles become larger but less dense when the size ratio decreases and density
decreases. The small particles become smaller and denser. Therefore small particles
percolate to the core of the mixture, while large particles float outside of the core
region.

CHAPTER 8 Radial Segregation of a Binary Mixture in a Rotating Drum
8-220
Figure 8.11 Evolution of the segregation flow pattern when rs decreases and rd
increases simultaneously.
8.3.4 Prediction equation
It has been reported previously that it is possible to represent the effect of rs for a
binary system of rd=1 and effect of rd for rs=1 system by a single characteristic curve
using the particle weight ratio rd rs3 in the case of xl=0.5(Chandratilleke et al., 2012).
The predictability of the effect of size ratio, density ratio and volume fraction in a
cylindrical mixer and ribbon mixer has already been confirmed (see Chapters 3 and 7).
The predictability of these effects for the rotating drum also needs to be investigated.
The predictive relationship is shown by Eq.(8.4), which can predict the segregation
index for binary particles of different sizes and densities with an error up to 17%.
SI = -0.87 – 4.07 rs2 +5.07 rs+ 0.29 rd
2 – 0.197rd– 0.38rsrd (8.4)
t=20s
rs =0.8; rd = 0.59
t=5s
rs =0.44; rd = 0.77 rs =0.33 ; rd =1.45

CHAPTER 8 Radial Segregation of a Binary Mixture in a Rotating Drum
8-221
Eq.(8.4) can predict in wide ranges of size, density and volume fraction their
effects on particle segregation in a rotating drum for the rolling mode as shown in
Figure 8.12. The contour plot also shows the size and density effects are
interchangeable, meaning that one combination of size and density ratios can produce
exactly the same mixing state as another combination of size and density ratios. The
map also shows that an optimum mixing state can be found at a certain size and density
combination.
Table 8.4 Comparison of segregation index and prediction
r s r d SI Eq error0.333333 0.615385 0.298667 0.278544 -2%
0.363636 0.64 0.409114 0.340029 -7%
0.432526 0.444444 0.558076 0.457736 -10%
0.410256 0.5 0.541743 0.420763 -12%
0.470588 0.333333 0.6 0.520793 -8%
0.666667 0.64 0.490458 0.532429 4%
0.8 0.592593 0.466598 0.386781 -8%
0.714286 0.888889 0.490458 0.490038 0%
0.666667 1.262626 0.616944 0.600574 -2%
0.551724 0.8 0.573861 0.550175 -2%
0.444444 0.695652 0.49627 0.465944 -3%
0.363636 0.769231 0.477428 0.350283 -13%
0.615385 0.4 0.573861 0.582431 1%
0.571429 0.333333 0.57 0.591761 2%
0.588235 0.266667 0.663577 0.61182 -5%
0.8 1.904762 0.558076 0.693651 14%
0.666667 1.454545 0.661729 0.6676 1%
0.5 1.257862 0.577386 0.625022 5%
0.4 1.333333 0.635729 0.563164 -7%
0.333333 1.454545 0.652079 0.518006 -13%
0.856898 0.4 0.151397 0.323224 17%
0.8 0.333333 0.5 0.446084 -5%
0.761905 0.285714 0.44671 0.51441 7%

CHAPTER 8 Radial Segregation of a Binary Mixture in a Rotating Drum
8-222
Figure 8.12 Contour maps of segregation index using the prediction equation, to
demonstrate the effects of size and density on the mixing.
8.4 Conclusions
The effect of size and density ratios on radial segregation of binary mixtures
was investigated in a rotating drum by means of the discrete element method. Density
induced segregation occurs with an increase of density ratio, if the size ratio is fixed.
Then, small particles become denser and percolate to the core region of the mixture,
with the increase of the density ratio. The buoyancy and percolation effects compete
with each other when the size ratio is increased while density ratio is fixed, and the
segregation is reduced. When size and density ratios are reduced at the same time, larger
particles become lighter and buoyancy mechanism become dominant, and the large
particles moved outside the core region.
The effect of size and density can interact each other and decrease segregation.
These effects can be predicted. A correlation is established to predicted the segregation
index under different size and density ratios and volume fractions. The predictive
equation is a second order polynomial that is similar in form to those of the cylindrical
and ribbon mixers. It suggests that similar mixing mechanisms are in operation in all
three mixers.

CHAPTER 8 Radial Segregation of a Binary Mixture in a Rotating Drum
8-223
Nomenclature
d Particle diameter, (mm)
dl Large particle diameter, (mm)
ds Small particle diameter, (mm)
E Young’s modulus, (N/m2)
Fc,ij Contact force vector between i and j, (N)
Fd,ij Damping force vector between i and j, (N)
g Acceleration due to gravity, (m/s2)
Ii Moment of inertia of particle i, (kg m2)
ki Number of particles in contact with particle i, (-)
M Particle-scale mixing index defined in Eq.(3) , (-)
Mij Vector of rolling friction torque on particle, (Nm)
Mp Predicted mixing index at steady-state, (-)
N Total number of particles in the mixture, (-)
Nt The number of sample/data points of instantaneous average values in time t, (-)
p Number ratio of the target type particles to all the particles, (-)
pi Particle fraction of a target type particle in the neighborhood of particle i, (-)
tp Average value of pi at time t for the entire mixture, (-)
rs Size ratio ls dd / , (-)
rd Density ratio ls / , (-)
S0 Standard deviation of pi at fully-segregated state, (-)
SR Standard deviation of fully-mixed state for uniform-sized particles of particle
fraction of p, (-)
St Standard deviation of pi with respect to tp at time t, (-)
Tij Vector of rolling friction torque on particle i, (Nm)
Vb Blade speed, (m/s)
Vi Velocity of particle i, (m/s)
xl Volume fraction, which is ratio of volume of large particles to total particle
volume (-)
z Height from vessel base, (mm)

CHAPTER 8 Radial Segregation of a Binary Mixture in a Rotating Drum
8-224
Greek letters
Average particle-scale sample size for the mixture, (-)
ik Number of particles in contact with particle i
Density of particles of a uniform system, (kg m-3)
l Density of large particle, (kg m-3)
s Density of small particle, (kg m-3)
Shaft rotational speed, (rad/s)
i Angular velocity vector of particle i, (rad/s)
CHAPTER 9 Summary and Future Work
9-225
Chapter 9
Summary and Future work

CHAPTER 9 Summary and Future Work
9-226
The mixing behaviours of spherical particles were investigated in three types of mixers by
means of DEM simulations. The mixers tested are: a vertically-shafted cylindrical mixer, a
ribbon mixer and a rotating drum. The study focused on the effects of particle properties,
operational parameters and impeller and mixer geometries. The main conclusions are
summarized below for each of the mixers investigated.
Vertically-shafted cylindrical mixer:
Here, the objectives were the investigation of the effects of size and density ratios at different
volume fractions on mixing behaviour of binary particles at fixed operational conditions and
development of a correlation for predicting the size and density effects at different volume
fractions. The main conclusions are as follows.
The quality of a binary particle mixture varies depending on the particle size ratio,
density ratio and volume fraction of the particles. There is an interaction between each
pair of the variables, and therefore, the mixture quality can be improved by
appropriately selecting the variables. For example, mixture quality can be improved if
the density ratio is reduced with the size ratio and volume fraction fixed. Similarly, a
peak mixture quality is obtained for a given combination of size and density ratios
when the volume fraction is 0.55. Further, a size ratio of 0.76 produces a peak mixture
quality when the density ratio and volume fraction are fixed. A global peak could be
found in a large domain of size, density and volume fraction by developing a
correlation.
The mechanism of mixing improvement is related to the interplay between buoyancy
forces and particle weights in binary mixtures. If large particles are heavy enough to
counter the buoyancy forces on them, the larger particles can compete with lighter
small particles that sink to the vessel base, producing improved mixing.
A predictive equation could be developed to account for the effects of particle size,
density and volume fraction on mixture quality. Although limited in its capabilities at
present, with further work it should be possible to extend the predictive equations to
account for the effects of other variables such as particle number, mixer scale and
material properties. Thus, it may be possible to use a cylindrical mixer in studies of
particle mixing as a standard mixer for which results are predictable.

CHAPTER 9 Summary and Future Work
9-227
Horizontal ribbon mixer:
Here, the objectives were the investigation of the effects of the impeller geometry,
operational variables and particle properties on particle mixing behaviour and development of
a correlation for predicting the size and density effects at different volume fractions. The
blade geometry was varied by changing the following parameters: blade pitch ratio, blade
width, blade clearance, blade angle and blade numbers. The operational variables are shaft
speed and filling level. Particles properties considered are particle size, density, volume
fraction and cohesiveness. The effects of geometrical parameters were examined in uniform
different cohesiveness mixture. The main conclusions are as follows.
The effect of cohesion on particle mixing was investigated in micro and macro
systems by creating geometrically and dynamically similar conditions. To create a
geometrical similarity between the two systems, the micro-system was linearly scaled
down to 1/150 of the size of the macro-system. To create the dynamic similarity,
Froude and Bond numbers were matched. For non-cohesive particles, several
variables showed similar trends: namely, mixing curves, velocity distributions and
contact forces. This was achieved by using lighter particles in the macro-system and
heavier ones in the micro-system. However, for cohesive particles, similarity in the
variables became poorer with an increase in cohesion, the possible reason for this
discrepancy being the Froude number matching, which results in a high shaft speed
and thus, a high shear rate in the micro-system. Thus, further work is required in this
regard. However, the macro-system showed generally expects trends for cohesive as
well as non-cohesive particle mixing, and thus, it was used for a parametric study, the
results of which are summarized below.
The mixing rate and homogeneity of cohesive particle mixtures deteriorated with an
increase in cohesion. The tangential velocity increased, and the radial and axial
velocities of particles decreased with an increase of cohesion. The radial stress was
higher than the axial stress and increased with an increase in cohesion.
The shaft speed showed a significant effect on the mixing behaviour of uniform
particles of cohesive and non-cohesive mixtures in a 2-bladed mixer. The mixing rate
and homogeneity of the cohesive and non-cohesive mixtures increased with an
increase of the shaft speed up to 100rpm due to increase of the circumferential
velocity of particles. The contact force of the particles increased with an increase of
shaft speed in non-cohesive mixtures, but no such effects on cohesive mixtures.

CHAPTER 9 Summary and Future Work
9-228
The fill level affected the mixing rate, particle flow and particle velocities
significantly both in cohesive and non-cohesive mixtures, in both the 2-blade and 4-
blade ribbon mixers. With an increase of the fill level and particle cohesion, the
mixing rate diminished, and a transition in the particle flow from a sliding flow to a
cascading flow was investigated. A 4- blade mixer was found to be more effective for
use at higher fill levels, especially in case of cohesive mixtures.
The mixture homogeneity, mixing rate, axial flow and tangential flow enhanced with
an increase of blade number in the ribbon mixer for 2-bladed and 4-bladed impellers.
The convective and circumferential flow increased with moderate to high pitch ratios
of the ribbon due to higher axial, tangential and radial velocities. A wider blade width
enabled the particles to receive higher axial, tangential and radial forces and velocities,
and thus the mixing rate increased. The particle mixing rate enhanced with a higher
blade clearance. The particles encounter higher axial, tangential and radial velocities
and forces with a larger blade width. The outer blade angle only slightly affected the
mixing rate.
Effects of size, density and volume fraction on binary particle mixtures were also
investigated for the ribbon mixer. There are similarities in these effects to those of the
cylindrical and ribbon mixers. For example, mixing index showed a peak each with
respect to changes in either the size ratio or volume fraction. The density effect is not
so significant on the particle mixing in the size range examined. A correlation has
been established for predicting the effects of size, density and volume fraction on the
behaviour of binary particle mixing. The form of the equation is quite similar to that
developed for a cylindrical mixer, which suggests that similar mixing mechanisms are
present in both mixers.
Rotating drum:
Here, the objectives were the investigation of the effects of size and density ratios at different
volume fractions on mixing behaviour of binary particles at fixed operational conditions in
the rolling mode and development of a correlation for predicting the size and density effects
at volume fraction 0.5. The main conclusions are as follows.
The segregation mechanism that size induced buoyancy competes with the density
induced segregation by percolation was observed in the rolling mode in the rotating
drum. The mechanism can be used to reduce the segregation of particles into a core

CHAPTER 9 Summary and Future Work
9-229
region and the region around it by making small particles lighter and large ones
heavier.
A correlation was developed to predict the size and density effects on mixing of
binary particles in a rotating drum for the rolling mode. The prediction equation
obtained was similar in the form to those developed previously for cylindrical and
ribbon mixers.
Similarities and differences of the mixers
The effects of size, density and volume fraction of the particle mixing behaviour were
similar in the three mixers, vertically-shafted cylindrical mixer, ribbon mixer and
rotating drum.
The prediction equations developed for the three mixers are similar in the form, which
is a second order of polynomial for three variables.
The generation of the driving forces and their competition with the particle weight are
the main mechanisms for the size and density effects in the cylindrical mixer. In a
ribbon mixer too, similar mechanisms can be present as suggested by the similarity in
the prediction equations for the two mixers. However, a ribbon mixer has a higher
shear rate compared to other two mixers as observed from its effectiveness in
cohesive mixing. In rotating drums, Buoyancy and percolation are considered to be
the mechanisms responsible mixing or segregation in the rotating drum, especially in
the rolling mode. These mechanisms are similar to those in other two mixers, but
their effectiveness may be overshadowed by other factors such as forced particle
convection and shearing by the blades.
Overall, the present work has used the discrete element method successfully in the study
of the effect of material properties of particles on particle mixing in different mixers; the
effects of operational and geometrical parameters of ribbon mixer on mixing have been
established; and predictability of particle mixing behaviours have been identified for
different mixers.
Future work
It is essential to further investigate the possibility of achieving dynamic similarity
between the micro and macro systems for mixtures of larger cohesion.

CHAPTER 9 Summary and Future Work
9-230
Scaling methods need to be investigated to take the full advantage of the macro
computational system, which produces computational results quicker.
Velocity field can be a useful method to investigate particle mixing behaviour
because the methods such as PEPT readily generate the velocity field even in an
opaque particle bed. Therefore, predicting the mixing behaviour based on the
velocity field is worthy of exploration for a ribbon mixer as well.
The diffusion, convection and breakage of particles due to strong blade motion in
ribbon mixer need to be investigated.
Different blade arrangements of the ribbon mixers produce different flow patterns,
and thus, further studies should be carried out to obtain such important
information useful for mixer designing.
Vessel shape of the ribbon mixer will effect on the mixture quality. The U shape
and other type of vessels need to be studied for providing an optimum vessel
design of ribbon mixers.
Comparison of the dynamics of the different industrial mixers is essential for
mixer designers.

231
REFERENCES
Aarons, L., Sundaresan, S., 2006. Shear flow of assemblies of cohesive and non-cohesive granular materials. Powder Technology 169, 10-21.
Ahmad, K., Smalley, I.J., 1973. Observation of particle segregation in vibrated granular systems. Powder Technology 8, 69-75.
Alonso, M., Satoh, M., Miyanami, K., 1991. Optimum combination of size ratio, density ratio and concentration to minimize free surface segregation. Powder Technology 68, 145-152.
Alvo, S., P. Lambert., et al. (2010). "A van der Waals Force-Based Adhesion Model for Micromanipulation." Journal Adhesion Scienceand Technology 24(2415–2428).
Aranson, I.S., Tsimring, L.S., 2006. Patterns and collective behavior in granular media: Theoretical concepts. Reviews of Modern Physics 78, 641-692.
Asmar, B.N., Langston, P.A., Matchett, A.J., Walters, J.K., 2002. Validation tests on a distinct element model of vibrating cohesive particle systems. Computers & Chemical Engineering 26, 785-802.
Berthiaux, H., Mosorov, V., Tomczak, L., Gatumel, C., Demeyre, U., 2006. Principal component analysis for characterising homogeneity in powder mixing using image processing techniques. Chemical Engineering and Processing 45, 397-403.
E s. The Chemical Engineering Journal 19, 157-160.
Bortnikov, I.I., Pavlushenko, I.S., Medvedev, V.D., 1973. Design of an apparatus with a helical ribbon mixer. Chemical and Petroleum Engineering 9, 588-590.
Bridgwater, J., 2012. Mixing of powders and granular materials by mechanical means—A perspective. Particuology 10, 397-427.
Bridgwater, J., Foo, W.S., Stephens, D.J., 1985. Particle mixing and segregation in failure zones--theory and experiment. Powder Technology 41, 147-158.
Bridgwater, J., Fundamental powder mixing mechanisms. Powder Technology 15, 215-236.
Cantelaube, F., Bideau, D., 1995. Radial Segregation in a 2d Drum: An Experimental Analysis. EPL (Europhysics Letters) 30, 133.
Cantelaube, F., Bideau, D., Roux, S., 1997. Kinetics of segregation of granular media in a two-dimensional rotating drum. Powder Technology 93, 1-11.
Carley-Macauly, K.W., Donald, M.B., 1962. The mixing of solids in tumbling mixers-I. Chem. Eng. Sci 17, 493–506.
Chandratilleke, G.R., 2010. Microdynamic Study of Flow of Granular Materials in Bladed Mixers. PhD Thesis

232
Chandratilleke, G.R., Bridgwater, J., Yu, A.B., Shinohara, K., Particle-scale Degree of Mixing based on Contact Number by DEM Simulation. To be submitted.
Chandratilleke, G.R., Yu, A.B., Bridgwater, J., 2012. A DEM study of the mixing of particles induced by a flat blade. Chemical Engineering Science 79, 54-74.
Chandratilleke, G.R., Yu, A.B., Bridgwater, J., Shinohara, K., 2012. A particle-scale index in the quantification of mixing of particles. AIChE Journal 58, 1099-1118.
Chandratilleke, G.R., Yu, A.B., Bridgwater, J., Shinohara, K., 2011. A particle-scale index in the quantification of mixing of particles. AIChE Journal.
Chandratilleke, G.R., Yu, A.B., Stewart, R.L., Bridgwater, J., 2009. Effects of blade rake angle and gap on particle mixing in a cylindrical mixer. Powder Technology 193, 303-311.
Chandratilleke, G.R., Zhou, Y.C., Yu, A.B., Bridgwater, J., 2010. Effect of Blade Speed on Granular Flow and Mixing in a Cylindrical Mixer. Industrial & Engineering Chemistry Research 49, 5467-5478.
Chaudhuri, B., Mehrotra, A., Muzzio, F.J., Tomassone, M.S., 2006. Cohesive effects in powder mixing in a tumbling blender. Powder Technology 165, 105-114.
Chaudhuri, B., Muzzio, F.J., Tomassone, M.S., 2006b. Modeling of heat transfer in granular flow in rotating vessels. Chemical Engineering Science 61, 6348-6360.
Chen, W., Dave, R.N., Pfeffer, R., Walton, O., 2004. Numerical simulation of Mechanofusion system. Powder Technology 146, 121-136.
Cleary, P.W., 2000. DEM simulation of industrial particle flows: case studies of dragline excavators, mixing in tumblers and centrifugal mills. Powder Technology 109, 83-104.
Cleary, P.W., 2001. Recent advances in dem modelling of tumbling mills. Minerals Engineering 14, 1295-1319.
Cleary, P.W., 2013. Particulate mixing in a plough share mixer using DEM with realistic shaped particles. Powder Technology 248, 103-120.
Clément, E., Rajchenbach, J., Duran, J., 1995. Mixing of a Granular Material in a Bidimensional Rotating Drum. EPL (Europhysics Letters) 30, 7.
Cooker, B., Nedderman, R.M., 1987. A theory of the mechanics of the helical ribbon powder agitator. Powder Technology 50, 1-13.
Côté, P., Abatzoglou, N., 2006. Powder and Other Divided Solids Mixing. Scale-Up and Parametric Study of a Ribbon Blender Used in Pharmaceutical Powders Mixing. Pharmaceutical Development and Technology 11, 29-45.
Cundall, P.A., Strack, O.D.L., 1979. A discrete model for granular assemblies. Geotechnique 29, 47-65.
Cundall, P.A., Strack, O.D.L., 1979. A distinct element model for granular assemblies. Geotechnique 29, 47-65.

233
Danckwerts, P.V., 1952a. The definition and measurement of some characteristics of mixtures. Appl. Sci. Res 3, 279-296.
Danckwerts, P.V., 1952b. The definition and measurement of some characteristics of mixtures. Applied Science 3, 18.
Delaney, G.W., Cleary, P.W., Hilden, M., Morrison, R.D., 2012. Testing the validity of the spherical DEM model in simulating real granular screening processes. Chemical Engineering Science 68, 215-226.
Delaplace, G., Guerin, R., Leuliet, J.-C., Chhabra, R.P., 2006. An analytical model for the prediction of power consumption for shear-thinning fluids with helical ribbon and helical screw ribbon impellers. Chemical Engineering Science 61, 3250-3259.
Di Renzo, A., Di Maio, F.P., 2004. Comparison of contact-force models for the simulation of collisions in DEM-based granular flow codes. Chemical Engineering Science 59, 525-541.
Dieulot, J.Y., Delaplace, G., Guerin, R., Brienne, J.P., Leuliet, J.C., 2002. Laminar Mixing Performances of a Stirred Tank Equipped with Helical Ribbon Agitator Subjected to Steady and Unsteady Rotational Speed. Chemical Engineering Research and Design 80, 335-344.
Dodds, J.A., 1980. The porosity and contact points in multicomponent random sphere packings calculated by a simple statistical geometric model. Journal of Colloid and Interface Science 77, 317-327.
Doel, T.J.A., Bowen, P., 1996. Tensile properties of particulate-reinforced metal matrix composites. Composites Part A: Applied Science and Manufacturing 27, 655-665.
Dury, C.M., Ristow, G.H., 1999. Radial segregation through axial migration. Europhys. Lett. 48, 60-65.
Dury, C.M., Ristow, G.H., Moss, J.L., Nakagawa, M., 1998. Boundary effects on the angle of repose in rotating cylinders. Physical Review E 57, 4491.
Eskin, D., Kalman, H., 2000. A numerical parametric study of size segregation in a rotating drum. Chemical Engineering and Processing 39, 539-545.
Fan, L.T., Chen, Y.-m., Lai, F.S., 1990. Recent developments in solids mixing. Powder Technology 61, 255-287.
Fan, L.T., Gelves-Arocha, H.H., Walawender, W.P., Lai, F.S., 1975. A mechanistic kinetic model of the rate of mixing segregating solid particles. Powder Technology 12, 139-156.
Fernandez, J.W., Cleary, P.W., Sinnott, M.D., Morrison, R.D., 2011. Using SPH one-way coupled to DEM to model wet industrial banana screens. Minerals Engineering 24, 741-753.
Ford, D.E., Mashelkar, R. A., and Ulbrecht, J. , 1972. Mixing times in Newtonian and non-Newtonian fluids Process Technology International, 803-803.

234
Hajra, S.K., Khakhar, D.V., 2011. Radial segregation of ternary granular mixtures in rotating cylinders. Granular Matter 13, 475-486.
Harnby, N., 1997. The mixing of cohesive powders, in: Harnby, N., Edwards, M.F., Nienow, A.W. (Eds.), Mixing in the Process Industries. Butterworth-Heinemann, Oxford, pp. 79-98.
Harnby, N., 2000. An engineering view of pharmaceutical powder mixing. Pharmaceutical Science & Technology Today 3, 303-309.
Hersey, J.A., Powder mixing: theory and practice in pharmacy. Powder Technology 15, 149-153.
Hilton, J.E., Cleary, P.W., 2013. Dust modelling using a combined CFD and discrete elementformulation. International Journal for Numerical Methods in Fluids 72, 528-549.
Hong, D.C., Quinn, P.V., Luding, S., 2001. Reverse Brazil Nut Problem: Competition between Percolation and Condensation. Physical Review Letters 86, 3423-3426.
Howell, D., Behringer, R.P., Veje, C., 1999. Stress Fluctuations in a 2D Granular Couette Experiment: A Continuous Transition. Physical Review Letters 82, 5241-5244.
Hsiau, S.S., Lu, L.S., Chou, C.Y., Yang, W.L., 2008. Mixing of cohesive particles in a shear cell. International Journal of Multiphase Flow 34, 352-362.
Huerta, D.A., Ruiz-Suárez, J.C., 2004. Vibration-Induced Granular Segregation: A Phenomenon Driven by Three Mechanisms. Physical Review Letters 93, 069901.
Jayasundara, C.T., Yang, R.Y., Yu, A.B., 2012. Discrete particle simulation of particle flow in a stirred mill: Effect of mill properties and geometry. Industrial and Engineering Chemistry Research 51, 1050-1061.
Kaneko, Y., Shiojima, T., Horio, M., 2000. Numerical analysis of particle mixing characteristics in a single helical ribbon agitator using DEM simulation. Powder Technology 108, 55-64.
Khakhar, D.V., McCarthy, J.J., Ottino, J.M., 1997. Radial segregation of granular mixtures in rotating cylinders. Physics of Fluids 9, 3600-3614.
Knight, P.C., Seville, J.P.K., Wellm, A.B., Instone, T., 2001. Prediction of impeller torque in high shear powder mixers. Chemical Engineering Science 56, 4457-4471.
Kruusing, A., 2008. Handbook of liquids-assisted laser processing, 1st. ed. ed. Elsevier, Amsterdam ;.
Kuo, H.P., Knight, P.C., Parker, D.J., Tsuji, Y., Adams, M.J., Seville, J.P.K., 2002. The influence of DEM simulation parameters on the particle behaviour in a V-mixer. Chemical Engineering Science 57, 3621-3638.
Lacey, P.M.C., 1954. Developments in the theory of particle mixing. Journal of Applied Chemistry 4, 257-268.
Laurent, B.F.C., Bridgwater, J., 2002. Performance of single and six-bladed powder mixers. Chemical Engineering Science 57, 1695-1709.

235
Laurent, B.F.C., Bridgwater, J., Parker, D.J., 2002. Convection and segregation in a horizontal mixer. Powder Technology 123, 9-18.
Laurent, B.F.C., Cleary, P.W., 2012. Comparative study by PEPT and DEM for flow and mixing in a ploughshare mixer. Powder Technology 228, 171-186.
Le Cardinal, G., Germain, E., Gelus, M., Guillon, B., 1980. 63 The design of stirred batch polymerisation reactor. Chemical Engineering Science 35, 499-505.
Li, H.M., McCarthy, J.J., 2006. Cohesive particle mixing and segregation under shear. Powder Technology 164, 58-64.
Liang, H., Ueno, A., Shinohara, K., 2000. UV Protection Effectiveness of Plastic Particles Coated with Titanium Dioxide by Rotational Impact Blending. Chemical Engineering Research and Design 78, 49-54.
Lin, Y., Zee, R.H., Chin, B.A., 1991. Insitu Formation of 3-Dimentional TIC Reinforcements in TI-TIC Composites. Metallurgical Transactions a-Physical Metallurgy and Materials Science 22, 859-865.
Lindley, J.A., Mixing processes for agricultural and food materials: 3. Powders and particulates. Journal of Agricultural Engineering Research 49, 1-19.
Liu, P.Y., Yang, R.Y., Yu, A.B., 2013. The effect of liquids on radial segregation of granular mixtures in rotating drums. Granular Matter 15, 427-436.
Makse, H.A., 1999. Continuous Avalanche Segregation of Granular Mixtures in Thin Rotating Drums. Physical Review Letters 83, 3186-3189.
Marring, E., Hoffmann, A.C., Janssen, L.P.B.M., 1994. The effect of vibration on the fluidization behaviour of some cohesive powders. Powder Technology 79, 1-10.
Martins, S., Li, W., Radziszewski, P., Faucher, A., Makni, S., 2013. Experimental and simulated instrumented ball in a tumbling mill - A comparison. Minerals Engineering 43-44, 79-84.
Masiuk, S., 1987. Power consumption, mixing time and attrition action for solid mixing in a ribbon mixer. Powder Technology 51, 217-229.
Masiuk, S., Lacki, H., 1993. Power consumption and mixing time for newtonian and non-newtonian liquids mixing in a ribbon mixer. The Chemical Engineering Journal 52, 13-17.
Masiuk, S., Lacki, H., Strek, F., 1992. Power consumption and mixing times for liquid mixing in a ribbon mixer. The Chemical Engineering Journal 48, 135-140.
Masiuk, S., Rakoczy, R., 2006. The entropy criterion for the homogenisation process in a multi-ribbon blender. Chemical Engineering and Processing 45, 500-506.
Mawatari, Y., Koide, T., Tatemoto, Y., Uchida, S., Noda, K., 2002. Effect of particle diameter on fluidization under vibration. Powder Technology 123, 69-74.
Mawatari, Y., Tsunekawa, M., Tatemoto, Y., Noda, K., 2005. Favorable vibrated fluidization conditions for cohesive fine particles. Powder Technology 154, 54-60.

236
Metcalfe, G., Shattuck, M., 1996. Pattern formation during mixing and segregation of flowing granular materials. Physica A: Statistical Mechanics and its Applications 233, 709-717.
Metzger, M.J., Glasser, B.J., 2012. Numerical investigation of the breakage of bonded agglomerates during impact. Powder Technology 217, 304-314.
Metzger, M.J., Glasser, B.J., 2013. Simulation of the breakage of bonded agglomerates in a ball mill. Powder Technology 237, 286-302.
Missiaen, J.M., Thomas, G., 1995. Homogeneity characterization of binary grain mixtures using a variance analysis of two-dimensional numerical fractions. Journal of Physics Condensed Matter7, 2937-2948.
Moakher, M., Shinbrot, T., Muzzio, F.J., 2000. Experimentally validated computations of flow, mixing and segregation of non-cohesive grains in 3D tumbling blenders. Powder Technology 109, 58-71.
Musha, H., Dong, K., Chandratilleke, G.R., Bridgwater, J., Yu, A.B., 2013. Mixing behaviour of cohesive and non-cohesive particle mixtures in a ribbon mixer. AIP Conference Proceedings 1542, 731-734.
Muzzio, F.J., Llusa, M., Goodridge, C.L., Duong, N.-H., Shen, E., 2008. Evaluating the mixing performance of a ribbon blender. Powder Technology 186, 247-254.
Muzzio, F.J., Robinson, P., Wightman, C., Brone, D., 1997. Sampling practices in powder blending. International Journal of Pharmaceutics 155, 153-178.
Muzzio*, F. J. and a. A. W. Alexander (2005). "Scale Up of Powder-Blending Operations." Pharmaceutical Technology
Niedzielska, A., Kuncewicz, C., 2005. Heat transfer and power consumption for ribbon impellers. Mixing efficiency. Chemical Engineering Science 60, 2439-2448.
Nitin, J., Julio, M.O., Richard, M.L., 2005. Regimes of segregation and mixing in combined size and density granular systems: an experimental study. Granular Matter 7, 69.
Novák, V., Rieger, F., 1975. Homogenization Efficiency of Helical Ribbon and Anchor Agitators. The Chemical Engineering Journal 9, 63-70.
Ottino, J.M., Khakhar, D.V., 2000. Mixing and segregation of granular materials. Annual Review of Fluid Mechanics 32, 55-91.
Ottino, J.M., Macosko, C.W., 1980. An efficiency parameter for batch mixing of viscous fluids. Chemical Engineering Science 35, 1454-1457.
Parashivamurthy, K.I., Kumar, R.K., Seetharamu, S., Chandrasekharaiah, M.N., 2001. Review on TiC reinforced steel composites. Journal of Materials Science 36, 4519-4530.
Patterson, W.I., Carreau, P.J., Yap, C.Y., 1979. Mixing with helical ribbon agitators: Part II. Newtonian Fluids. AIChE Journal 25, 508-516.

237
G G S M D C W L K M G Š I D., 2011. Insights from simulations into mechanisms for density segregation of granular mixtures in rotating cylinders. Granular Matter 13, 53-74.
Portillo, P.M., Muzzio, F.J., Ierapetritou, M.G., 2006. Characterizing powder mixing processes utilizing compartment models. International Journal of Pharmaceutics 320, 14-22.
Poux, M., Fayolle, P., Bertrand, J., Bridoux, D., Bousquet, J., 1991. Powder mixing: Some practical rules applied to agitated systems. Powder Technology 68, 213-234.
Remy, B., Khinast, J.G., Glasser, B.J., 2009. Discrete element simulation of free flowing grains in a four-bladed mixer. AIChE Journal 55, 2035-2048.
Rieger, F., Novák, V., Havelková, D., 1986. Homogenization efficiency of helical ribbon agitators. The Chemical Engineering Journal 33, 143-150.
Ristow, G.H., 1994. Particle Mass Segregation in a Two-Dimensional Rotating Drum. EPL (Europhysics Letters) 28, 97.
Robinson, M., Cleary, P.W., 2012. Flow and mixing performance in helical ribbon mixers. Chemical Engineering Science 84, 382-398.
Rosato, A., Strandburg, K.J., Prinz, F., Swendsen, R.H., 1987. Why the Brazil nuts are on top: Size segregation of particulate matter by shaking. Physical Review Letters 58, 1038.
Ryan, D.F., Janssen, L.P.B.M., van Dierendonck, L.L., 1988. Circulation time prediction in the scale-up of polymerization reactors with helical ribbon agitators. Chemical Engineering Science 43, 1961-1966.
Saberian, M., Segonne, Y., Briens, C., Bousquet, J., Chabagno, J.M., Denizart, O., 2002. Blending of polymers in high speed, vertical mixers: development of a thermal tracer measurement procedure. Powder Technology 123, 25-32.
Sanoh, Y., Arai, C., Beppu, T., 1974. Mixing characteristics of a continuous ribbon mixer. Journal of the Textile Science and Technology, Shinshu University. Ser. B, Engineering 11: 1-10(1974).
Sawinsky, J., Havas, G., Deák, A., 1976. Power requirement of anchor and helical ribbon impellers for the case of agitating Newtonian and pseudo-plastic liquids. Chemical Engineering Science 31, 507-509.
Shekhar, S.M., Jayanti, S., 2003. Mixing of pseudoplastic fluids using helical ribbon impellers. AIChE Journal 49, 2768-2772.
Shinbrot, T., Muzzio, F.J., 1998. Reverse Buoyancy in Shaken Granular Beds. Physical Review Letters 81, 4365.
Siiria, S., Yliruusi, J., 2009. Determining a value for mixing: Mixing degree. Powder Technology 196, 309-317.

238
Srivatsan, T.S., Auradkar, R., 1992. Effect of silicon carbide particulate on cyclic plastic strain response characteristics and fracture of aluminium alloy composites. International Journal of Fatigue 14, 355-366.
Stephens, D.J., Bridgwater, J., 1978. The mixing and segregation of cohesionless particulate materials part II. Microscopic mechanisms for particles differing in size. Powder Technology 21, 29-44.
Stewart, R.L., Bridgwater, J., Zhou, Y.C., Yu, A.B., 2001. Simulated and measured flow of granules in a bladed mixer—a detailed comparison. Chemical Engineering Science 56, 5457-5471.
Sudah, O.S., Arratia, P.E., Alexander, A., Muzzio, F.J., 2005. Simulation and experiments of mixing and segregation in a tote blender. AIChE Journal 51, 836-844.
Sudah, O.S., Coffin-Beach, D., Muzzio, F.J., 2002. Effects of blender rotational speed and discharge on the homogeneity of cohesive and free-flowing mixtures. International Journal of Pharmaceutics 247, 57-68.
Sudah, O.S., Coffin-Beach, D., Muzzio, F.J., 2002. Effects of blender rotational speed and discharge on the homogeneity of cohesive and free-flowing mixtures. International Journal of Pharmaceutics 247, 57-68.
Tanguy, P.A., Lacroix, R., Bertrand, F., Choplin, L., de la Fuente, E.B., 1992. Finite element analysis of viscous mixing with a helical ribbon-screw impeller. AIChE Journal 38, 939-944.
Tanguy, P.A., Thibault, F., Brito-De La Fuente, E., Espinosa-Solares, T., Tecante, A., 1997. Mixing performance induced by coaxial flat blade-helical ribbon impellers rotating at different speeds. Chemical Engineering Science 52, 1733-1741.
Thomas, N., 2000. Reverse and intermediate segregation of large beads in dry granular media. Physical Review E 62, 961-974.
Tsuji, Y., Kawaguchi, T., Tanaka, T., 1993. Discrete particle simulation of two-dimensional fluidized bed. Powder Technology 77, 79-87.
Urabe, C., 2005. Dynamics of Fluctuation of the Top Location of a Sandpile. Physical Society of Japan 74, 5.
Venables, H.J., Wells, J.I., 2001. Powder Mixing. Drug Development and Industrial Pharmacy 27, 599-612.
Wachs, A., Girolami, L., Vinay, G., Ferrer, G., 2012. Grains3D, a flexible DEM approach for particles of arbitrary convex shape - Part I: Numerical model and validations. Powder Technology 224, 374-389.
Williams, J.C., 1976. The segregation of particulates materials. A review. Powder Technol. 15, 245-251.
Willig, S. H. (2001). "Good Manufacturing Practices for Pharmaceuticals." Drugs and the Pharmaceutical Science 109.

239
Xu, Y., Xu, C., Zhou, Z., Du, J., Hu, D., 2010. 2D DEM simulation of particle mixing in rotating drum: A parametric study. Particuology 8, 141-149.
Yamane, K., 2004. Discreter-element method application to mixing and segregation model in industrial blending system. Journal of Materials Research 19, 623-627.
Yang, R.Y., Jayasundara, C.T., Yu, A.B., Curry, D., 2006. DEM simulation of the flow of grinding media in IsaMill. Minerals Engineering 19, 984-994.
Yang, R.Y., Yu, A.B., McElroy, L., Bao, J., 2008. Numerical simulation of particle dynamics in different flow regimes in a rotating drum. Powder Technology 188, 170-177.
Yang, S.C., 2006. Density effect on mixing and segregation processes in a vibrated binary granular mixture. Powder Technology 164, 65-74.
Yang, S.C., 2006b. Segregation of cohesive powders in a vibrated granular bed. Chemical Engineering Science 61, 6180-6188.
Yang, S.C., Hsiau, S.S., 2000. Simulation study of the convection cells in a vibrated granular bed. Chemical Engineering Science 55, 3627-3637.
Zhang, Z.G., Qin, J.N., Zhang, Z.W., Chen, Y.F., Lu, W.J., Zhang, D., 2010. Microstructure effect on mechanical properties of in situ synthesized titanium matrix composites reinforced with TiB and La2O3. Materials Letters 64, 361-363.
Zhou, T., Li, H., 1999. Effects of adding different size particles on fluidization of cohesive particles. Powder Technology 102, 215-220.
Zhou, Y., Yu, A.B., Bridgwater, J., 2003. Segregation of binary mixture of particles in a bladed mixer. Journal of Chemical Technology & Biotechnology 78, 187-193.
Zhou, Y., Yu, A.B., Stewart, R.L., Bridgwater, J., 2004. Microdynamic analysis of the particle flow in a cylindrical bladed mixer. Chemical Engineering Science 59, 1343-1364.
Zhou, Y.C., Wright, B.D., Yang, R.Y., Xu, B.H., Yu, A.B., 1999. Rolling friction in the dynamic simulation of sandpile formation. Physica A 269, 536-553.
Zhou, Y.C., Yu, A.B., Bridgwater, J., 2003. Segregation of binary mixture of particles in a bladed mixer. Journal of Chemical Technology & Biotechnology 78, 187-193.
Zhou, Y.C., Yu, A.B., Stewart, R.L., Bridgwater, J., 2004. Microdynamic analysis of the particle flow in a cylindrical bladed mixer. Chemical Engineering Science 59, 1343-1364.
Zhu, H.P., Yu, A.B., 2004. Steady-state granular flow in a three-dimensional cylindrical hopper with flat bottom: microscopic analysis. Journal of Physics D: Applied Physics 37, 1497.
Zhu, H.P., Zhou, Z.Y., Yang, R.Y., Yu, A.B., 2007. Discrete particle simulation of particulate systems: Theoretical developments. Chemical Engineering Science 62, 3378-3396.

240
Zhu, H.P., Zhou, Z.Y., Yang, R.Y., Yu, A.B., 2008. Discrete particle simulation of particulate systems: A review of major applications and findings. Chemical Engineering Science 63, 5728-5770.

241
List of publications
Conference papers:
Musha, H., G. R. Chandratilleke, S. L. I. Chan, J. Bridgwater and A. B. Yu (2013). "Effects of size and density differences on mixing of binary mixtures of particles." AIP Conference Proceedings 1542(1): 739-742.
Musha, H., K. Dong, G. R. Chandratilleke, J. Bridgwater and A. B. Yu (2013). "Mixing behaviour of cohesive and non-cohesive particle mixtures in a ribbon mixer." AIP Conference Proceedings 1542(1): 731-734.
H. Musha+, K. J. Dong, G. R. Chandratilleke, S.L.I. Chan, and A.B. Yu, DEM, Simulation of Powder mixing in a Ribbon-mixer, DEM6 conference preceedings.
M. Halidan, G. R. Chandratilleke, S.L.I. Chan, A.B. Yu , and John Bridgwater, PREDICTION OF THE MIXING BEHAVIOUR OF BINARY MIXTURES OF PARTICLES IN A BLADED MIXER,(submitted for Journal publication).