Partially Hydrolyzed Guar Gums Reduce Dietary Fatty Acid and Sterol Absorption in Guinea Pigs...
11
1 23 !"#"$% "##$ %%&’(’&%) *+,+-. /0" )%1)%%23.))2’4(%)&(567&() !"#$%"&&’ )’*#+&’,-* ./"# ./01 2-*/3- 4%-$"#’ 5"$$’ 63%* "7* 8$-#+& 691+#:$%+7 %7 ./%7-" !%;1 <7*-:-7*-7$ += >%13+1%$’ !"#$%&$# ($#%$)* !"+,- .)/$,$01+* !"+,- 2345 6 7$8,$ 9$:1;$)
-
Upload
independent -
Category
Documents
-
view
4 -
download
0
Transcript of Partially Hydrolyzed Guar Gums Reduce Dietary Fatty Acid and Sterol Absorption in Guinea Pigs...
1 23
!"#"$%!"##$!%%&'('&%)!*+,+-./0"!)%1)%%23.))2'4(%)&(567&()
!"#$%"&&'()'*#+&',-*(./"#(./01(2-*/3-4%-$"#'(5"$$'(63%*("7*(8$-#+&(691+#:$%+7%7(./%7-"(!%;1(<7*-:-7*-7$(+=(>%13+1%$'
!"#$%&$#'($#%$)*'!"+,-'.)/$,$01+*'!"+,-2345'6'7$8,$'9$:1;$)

1 23
Your article is protected by copyright and allrights are held exclusively by AOCS. This e-offprint is for personal use only and shall notbe self-archived in electronic repositories.If you wish to self-archive your work, pleaseuse the accepted author’s version for postingto your own website or your institution’srepository. You may further deposit theaccepted author’s version on a funder’srepository at a funder’s request, provided it isnot made publicly available until 12 monthsafter publication.
ORIGINAL ARTICLE
Partially Hydrolyzed Guar Gums Reduce Dietary Fatty Acidand Sterol Absorption in Guinea Pigs Independent of Viscosity
Jonathan Santas • Jordi Espadaler •
Jordi Cune • Magda Rafecas
Received: 15 December 2011 / Accepted: 15 May 2012! AOCS 2012
Abstract This study investigated the effect of two par-tially hydrolyzed guar gums (PHGG) on fatty acid and
sterol excretion. PHGG were obtained by chemical
hydrolysis of guar gum (GG) with H2O:EtOH (1:1) at100 "C for 1 h (PHGG1) or 2 h (PHGG2). The viscosity of
the PHGG in a 1 % (w/v) aqueous solution corresponded to
that of a pseudoplastic fluid and was higher for PHGG1than PHGG2. Guinea pigs (n = 8 per group) were fed high
fat diets (17/100 g) that contained 12/100 g of cellulose,
PHGG1, or PHGG2 for 4 weeks. Despite the differences inviscosity, the two PHGG exerted similar physiological
effects. Compared to the control cellulose group, the body
weight gain was lower in animals fed PHGG, although noeffect on food consumption was observed. PHGG increased
the excretion of fatty acids and neutral sterols, but not bile
acids. Consumption of PHGG did not alter the fecal fattyacid profile, while intestinal bioconversion of sterols ten-
ded to increase in response to PHGG2. A reduction in the
viscosity within the range tested did not correlate withlosses in the hypocholesterolemic capacity of PHGG as
both were effective in reducing plasma cholesterol. Thus,we conclude that the chemical hydrolysis of guar gum
renders the gum suitable for inclusion in food products
without significantly altering its beneficial health effects.
Keywords Dietary fiber ! Partially hydrolyzed guar gum !Fatty acids ! Cholesterol ! Bile acids
AbbreviationsBA Bile acid(s)
CA Cholic acid
CDCA Chenodeoxycholic acidCE Cellulose
DCA Deoxycholic acid
FA Fatty acid(s)FAME Fatty acid methyl ester(s)
FID Flame ionization detector
GG Guar gumLCA Lithocholic acid
LDL Low density lipoprotein
MUFA Monounsaturated fatty acid(s)NS Neutral sterol(s)
PHGG Partially hydrolyzed guar gum
PHGG1 Partially hydrolyzed guar gum for 1 hPHGG2 Partially hydrolyzed guar gum for 2 h
PUFA Polyunsaturated fatty acid(s)
SEM Standard error of the meanSFA Saturated fatty acid(s)
TSFA Total saturated fatty acidsTUFA Total unsaturated fatty acids
UDCA Ursodeoxycholic acid
UFA Unsaturated fatty acid(s)
Introduction
Guar gum (GG) is a natural polysaccharide that consists of
a (1 ? 4)-a-D-mannopyranose backbone with single units
of linked a-D-galactopyranose. Given its hypolipidemic andhypoglycemic effects, this gum is considered one of the
most promising water-soluble dietary fibers [1, 2]. There is
J. Santas ! M. Rafecas (&)Department of Nutrition and Food Science, XaRTA-INSA,University of Barcelona, 08028 Barcelona, Spaine-mail: [email protected]
J. Santas ! J. Espadaler ! J. CuneAB-Biotics, S.A., Parc Tecnologic del Valles,08290 Cerdanyola del Valles, Spain
123
Lipids
DOI 10.1007/s11745-012-3682-1
Author's personal copy
strong evidence that GG decreases the incidence of factor
risks associated with cardiovascular diseases, such as highlevels of plasma triglycerides and cholesterol, mainly LDL-
cholesterol [2, 3]. The hypolipidemic effects of this gum
are attributed to its capacity to decrease the absorption ofdietary fat and cholesterol, reduce bile acid reabsorption in
the small intestine, and produce short chain fatty acids by
partial fermentation in the cecum [4, 5].GG is widely known for its water-soluble characteristics
and viscosity [4, 6]. In manufactured or processed foods,gums are commonly used as thickeners and emulsifiers.
However, the high viscosity of GG may limit its use at
physiologically effective concentrations in some foodproducts [7]. Partial hydrolysis has recently been reported
to improve the inclusion of this gum in food products and
increase consumer acceptance [8]. For instance, Sunfiber#
is a PHGG product that is commercially available and has
GRAS status (Generally Recognized As Safe) in the USA
[7]. The viscosity of enzymatically hydrolyzed GG can beas low as 10 mPa s in a 5 % aqueous solution, while that of
commercially available GG is about 2,000–3,000 mPa s in
a 1 % aqueous solution [7]. Nevertheless, it has beenreported that the health benefits of partially hydrolyzed GG
(PHGG) are similar to those of intact GG [7, 9]. Therefore,
it has been proposed that the health benefits of PHGG donot appear to be exclusively dependent on its molecular
weight or viscosity and that hypolipidemic mechanisms
other than viscosity may be involved [8].Various studies have reported the capacity of dietary
fiber to reduce fat absorption. However, dietary fat exerts a
range of effects on lipid metabolism depending on its steroland fatty acid composition [10]. In general, trans fatty
acids and most saturated fatty acids (SFA) are considered
hyperlipidemic. For instance, lauric (C12:0), myristic(C14:0) and palmitic (C16:0) acids increase the plasma
concentration of LDL-cholesterol mainly by decreasing the
activity of its receptors in the liver [11]. In contrast to SFA,monounsaturated (MUFA) and polyunsaturated fatty acids
(PUFA) decrease LDL-cholesterol by a series of mecha-
nisms, such as enhancing the hepatic uptake of LDL par-ticles or the activity of 7a-hydroxylase [12]. To our
knowledge, only a few studies have addressed the effect of
functional ingredients on the absorption of individual fattyacids. Interestingly, some of these ingredients exert selec-
tive fat-binding capacity, thereby affecting plasma and
liver lipid profiles [13, 14]. Given all these considerations,the study of the effect of dietary fiber on each fatty acid is
relevant.
Here, we examined the effect of chemically hydrolyzedguar gum on lipid excretion in order to provide new
insights into its hypolipidemic mechanism. The effect of
PHGG on fat excretion was studied longitudinally and anexhaustive analysis of fecal sterols and fatty acids was
conducted to assess the effect of fiber on fat excretion over
time. For this purpose, we used the guinea pig as it iswidely accepted as a more reliable model of human lipid
metabolism than other more commonly used animals, such
as mice or rats, and because, in contrast to hamsters, guineapigs do not ferment fiber in their stomachs [15].
Materials and Methods
Materials
Fatty acid methyl ester (FAME) standards were of 99 % orhigher purity. Oleic acid (C18:1n-9), linolenic acid
(C18:3n-3) and heneicosanoate acid (C21:0) were pur-
chased from Larodan Fine Chemical AB (Malmo, Swe-den). The remaining FAME standards, bile acids, Sylon
BTZ (3:2:3, BSA ? TMCS ? TMSI) and anhydrous pyr-
idine were from Sigma Chemical Co. (St. Louis, MO,USA). Sterol standards were supplied by Steraloids
(Newport, Rhode Island, USA).
Sodium methylate 0.5 N was prepared by dissolving17 g of sodium in 1 L of dry methanol. N-hexane and
boron trifluoride (20 % in anhydrous methanol) were pur-
chased from Merck (Darmstadt, Germany). Sodium chlo-ride and anhydrous sodium sulfate were from Panreac
(Barcelona, Spain) whereas chloroform, cyclohexane,
methanol, ethanol and diethyl ether were purchased fromScharlau Chemie S.A. (Sentmenat, Spain). All solvents and
reagents were of analytical grade or higher and double
distilled water was used throughout the study.
Production of PHGG
PHGG was obtained by chemical hydrolysis of natural GG
from Cyamopsis tetragonoloba. The hydrolysis was con-
ducted in a reactor vessel with H2O:EtOH (1:1) at 100 "C,4 bar and constant magnetic stirring at 700 rpm. GG was
added into the pre-warmed reactor at a concentration of
15 % (w/v) and hydrolyzed for either 1 h (PHGG1) or 2 h(PHGG2). After hydrolysis, the reactor vessel was allowed
to cool to 50 "C and samples were passed through a filter
plate of porosity No. 2 (40–100 lm, Vidrafoc, S.A., Bar-celona, Spain). The residue was subsequently washed twice
with 100 mL of EtOH 95 % and allowed to dry for 5 h at
40 "C in a vacuum oven.
Determination of Viscosity and Rheological Properties
of PHGG
The viscosity of 1 % aqueous dispersions of PHGG was
determined using a First RM Rheometer from Lamy Rhe-ometers (Champagne au Mont d’Or, France). Homogeneous
Lipids
123
Author's personal copy
polymer dispersions were prepared by sprinkling a given
amount of product into deionised water at 40 "C with vig-orous magnetic stirring (1,000 rpm). After 1 h of incubation,
the preparations were sonicated at 40 "C for 10 min and
finally allowed to stand at room temperature for 4 h. Theviscoelastic properties of the PHGG dispersions were deter-
mined in the same day at 25 "C at shear rates ranging from 1
to 250 s-1.
Diets
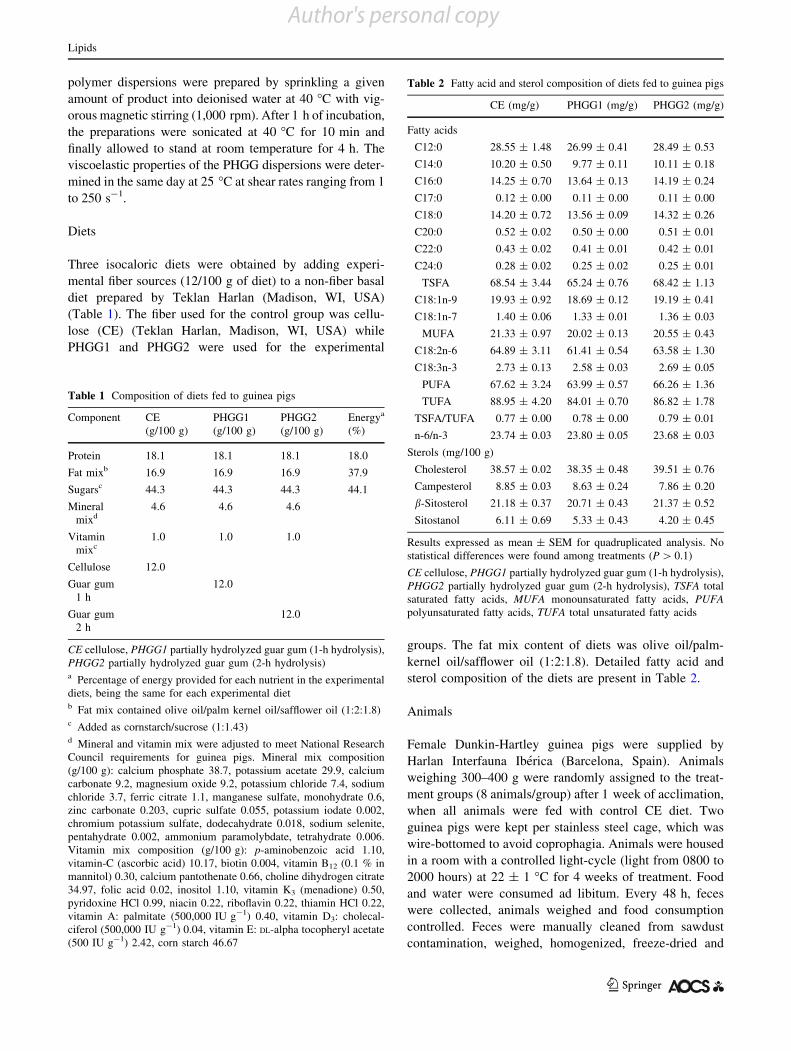
Three isocaloric diets were obtained by adding experi-
mental fiber sources (12/100 g of diet) to a non-fiber basaldiet prepared by Teklan Harlan (Madison, WI, USA)
(Table 1). The fiber used for the control group was cellu-
lose (CE) (Teklan Harlan, Madison, WI, USA) whilePHGG1 and PHGG2 were used for the experimental
groups. The fat mix content of diets was olive oil/palm-
kernel oil/safflower oil (1:2:1.8). Detailed fatty acid andsterol composition of the diets are present in Table 2.
Animals
Female Dunkin-Hartley guinea pigs were supplied by
Harlan Interfauna Iberica (Barcelona, Spain). Animalsweighing 300–400 g were randomly assigned to the treat-
ment groups (8 animals/group) after 1 week of acclimation,when all animals were fed with control CE diet. Two
guinea pigs were kept per stainless steel cage, which was
wire-bottomed to avoid coprophagia. Animals were housedin a room with a controlled light-cycle (light from 0800 to
2000 hours) at 22 ± 1 "C for 4 weeks of treatment. Food
and water were consumed ad libitum. Every 48 h, feceswere collected, animals weighed and food consumption
controlled. Feces were manually cleaned from sawdust
contamination, weighed, homogenized, freeze-dried and
Table 1 Composition of diets fed to guinea pigs
Component CE(g/100 g)
PHGG1(g/100 g)
PHGG2(g/100 g)
Energya
(%)
Protein 18.1 18.1 18.1 18.0
Fat mixb 16.9 16.9 16.9 37.9
Sugarsc 44.3 44.3 44.3 44.1
Mineralmixd
4.6 4.6 4.6
Vitaminmixc
1.0 1.0 1.0
Cellulose 12.0
Guar gum1 h
12.0
Guar gum2 h
12.0
CE cellulose, PHGG1 partially hydrolyzed guar gum (1-h hydrolysis),PHGG2 partially hydrolyzed guar gum (2-h hydrolysis)a Percentage of energy provided for each nutrient in the experimentaldiets, being the same for each experimental dietb Fat mix contained olive oil/palm kernel oil/safflower oil (1:2:1.8)c Added as cornstarch/sucrose (1:1.43)d Mineral and vitamin mix were adjusted to meet National ResearchCouncil requirements for guinea pigs. Mineral mix composition(g/100 g): calcium phosphate 38.7, potassium acetate 29.9, calciumcarbonate 9.2, magnesium oxide 9.2, potassium chloride 7.4, sodiumchloride 3.7, ferric citrate 1.1, manganese sulfate, monohydrate 0.6,zinc carbonate 0.203, cupric sulfate 0.055, potassium iodate 0.002,chromium potassium sulfate, dodecahydrate 0.018, sodium selenite,pentahydrate 0.002, ammonium paramolybdate, tetrahydrate 0.006.Vitamin mix composition (g/100 g): p-aminobenzoic acid 1.10,vitamin-C (ascorbic acid) 10.17, biotin 0.004, vitamin B12 (0.1 % inmannitol) 0.30, calcium pantothenate 0.66, choline dihydrogen citrate34.97, folic acid 0.02, inositol 1.10, vitamin K3 (menadione) 0.50,pyridoxine HCl 0.99, niacin 0.22, riboflavin 0.22, thiamin HCl 0.22,vitamin A: palmitate (500,000 IU g-1) 0.40, vitamin D3: cholecal-ciferol (500,000 IU g-1) 0.04, vitamin E: DL-alpha tocopheryl acetate(500 IU g-1) 2.42, corn starch 46.67
Table 2 Fatty acid and sterol composition of diets fed to guinea pigs
CE (mg/g) PHGG1 (mg/g) PHGG2 (mg/g)
Fatty acids
C12:0 28.55 ± 1.48 26.99 ± 0.41 28.49 ± 0.53
C14:0 10.20 ± 0.50 9.77 ± 0.11 10.11 ± 0.18
C16:0 14.25 ± 0.70 13.64 ± 0.13 14.19 ± 0.24
C17:0 0.12 ± 0.00 0.11 ± 0.00 0.11 ± 0.00
C18:0 14.20 ± 0.72 13.56 ± 0.09 14.32 ± 0.26
C20:0 0.52 ± 0.02 0.50 ± 0.00 0.51 ± 0.01
C22:0 0.43 ± 0.02 0.41 ± 0.01 0.42 ± 0.01
C24:0 0.28 ± 0.02 0.25 ± 0.02 0.25 ± 0.01
TSFA 68.54 ± 3.44 65.24 ± 0.76 68.42 ± 1.13
C18:1n-9 19.93 ± 0.92 18.69 ± 0.12 19.19 ± 0.41
C18:1n-7 1.40 ± 0.06 1.33 ± 0.01 1.36 ± 0.03
MUFA 21.33 ± 0.97 20.02 ± 0.13 20.55 ± 0.43
C18:2n-6 64.89 ± 3.11 61.41 ± 0.54 63.58 ± 1.30
C18:3n-3 2.73 ± 0.13 2.58 ± 0.03 2.69 ± 0.05
PUFA 67.62 ± 3.24 63.99 ± 0.57 66.26 ± 1.36
TUFA 88.95 ± 4.20 84.01 ± 0.70 86.82 ± 1.78
TSFA/TUFA 0.77 ± 0.00 0.78 ± 0.00 0.79 ± 0.01
n-6/n-3 23.74 ± 0.03 23.80 ± 0.05 23.68 ± 0.03
Sterols (mg/100 g)
Cholesterol 38.57 ± 0.02 38.35 ± 0.48 39.51 ± 0.76
Campesterol 8.85 ± 0.03 8.63 ± 0.24 7.86 ± 0.20
b-Sitosterol 21.18 ± 0.37 20.71 ± 0.43 21.37 ± 0.52
Sitostanol 6.11 ± 0.69 5.33 ± 0.43 4.20 ± 0.45
Results expressed as mean ± SEM for quadruplicated analysis. Nostatistical differences were found among treatments (P[ 0.1)
CE cellulose, PHGG1 partially hydrolyzed guar gum (1-h hydrolysis),PHGG2 partially hydrolyzed guar gum (2-h hydrolysis), TSFA totalsaturated fatty acids, MUFA monounsaturated fatty acids, PUFApolyunsaturated fatty acids, TUFA total unsaturated fatty acids
Lipids
123
Author's personal copy
stored at -20 "C. After isoflurane anesthesia, non-fasted
guinea pigs were killed by heart puncture and blood sam-ples were collected in heparinized tubes. Plasma was sep-
arated after centrifugation at 1,5009g for 15 min at 4 "Cand stored at -80 "C until analysis. All procedures wereapproved by the Animal Care and Use Committee of the
University of Barcelona.
Determination of Fatty Acid Content in Feces and Diets
Fatty acids (FA) of diets and feces were determined by gas
chromatography. FAME were obtained directly from
lyophilized samples by in situ basic–acidic derivatizationas previously described [16]. Heneicosanoate acid (C21:0)
was used as the internal standard.
Determination of Neutral Sterols and Bile Acids
Neutral sterols (NS) and bile acids (BA) were extracted aspreviously described by Keller et al. [17]. 5a-Cholestaneand 23-nor-cholic acid were used as internal standards for
NS and BA, respectively. Extracts were evaporated at30 "C under nitrogen flux, dried in a vacuum desiccator
overnight and stored at -20 "C in a nitrogen atmosphere
until silanization and injection. Silanization was carried outby dissolving the samples in an appropriate amount of
anhydrous pyridine and adding an equal volume of Sylon
BTZ. Samples were injected after silanization for 30 min atroom temperature.
GC Conditions
The FAME were analyzed using an Agilent 4890D gas
chromatograph, equipped with a flame ionization detector(FID). A split–splitless injector was used with a split ratio
of 1:30 and the injection volume was 1 lL. The injector
and detector temperatures were kept at 270 and 300 "C,respectively. FAME were separated in a fused-silica cap-
illary column (60 m 9 0.25 mm i.d., 0.2 lm) from Supe-
lco (Bellefonte, PA, USA). The oven temperature wasprogrammed as follows: an initial temperature of 140 "Cfor 3 min, followed by an increase of 6 "C min-1 to
180 "C, then 2 "C min-1 to 200 "C and 7 "C min-1 to240 "C and it was finally left to stand for 5 min at 240 "C.Helium was used as carrier gas and nitrogen as makeup gas
to increase the sensitivity of the detector.NS and BA were analyzed using a Perkin Elmer Auto-
system gas chromatograph equipped with a FID. One
microliter of sample and a split ratio of 1:12.5 were usedfor injection. The injector and detector temperatures were
kept at 290 and 350 "C, respectively. NS and BA were
separated with a 5 % polysilarylene—95 % poly-dimethylsiloxane capillary column (60 m 9 0.25 mm i.d.,
0.25 lm) from Phenomenex (Torrance, CA, USA). Oven
temperature was programmed with an initial temperature of245 "C during 30 s, a rate of 5 "C until 2908 and it was
finally left to stand at this temperature for 30 min.
Chromatographic peaks were identified by comparingthe retention times with those of known standards and by
co-chromatography. FAME, NS and BA were quantified by
the internal standard addition method and using calibrationcurves with R2[ 0.99.
Determination of Plasma Lipids
Total cholesterol, HDL-chol, LDL-chol and triglycerideswere enzymatically determined with a Modular DPE Hit-
achi auto-analyzer from Roche Diagnostics (Mannheim,
Germany).
Statistical Analysis
Data were analyzed by SPSS v.17 for Windows. Significant
differences between treatments were determined by one-way
ANOVA and the exact nature of the differences betweengroups by Duncan’s multirange test. Differences between
initial and final values for each treatment were determined by
the Student’s t test after assessing equality of variances byLeven’s test. Results are expressed as means ± standard
error (SEM). A confidence coefficient of 95 % was used.
Results
Viscosity Measurements
The flow curves of 1 % PHGG aqueous solutions at shearrates ranging from 1 to 250 s-1 are shown in Fig. 1. Vis-
cosity of solutions at these rates ranged from 2,884 to 184
and from 1,720 to 110 mPa s for PHGG1 and PHGG2,respectively. The flow curves corresponded to pseudo-
plastic fluids as the viscosity was dependent on shear rate,
being lower at higher rates. The viscosity of PHGG dis-persions was not time-dependent and showed neither
thixotropic nor rheopectic behavior.
Body Weight and Food Consumption
All animals gained weight during the study, although thegain was significantly lower in the PHGG groups than the
control (Table 3). However, food consumption was not
affected by dietary fiber. This observation implies that foodefficiency was reduced by PHGG ingestion. Food effi-
ciency was slightly lower in animals fed PHGG1 than those
on PHGG2, but differences were not statisticallysignificant.
Lipids
123
Author's personal copy
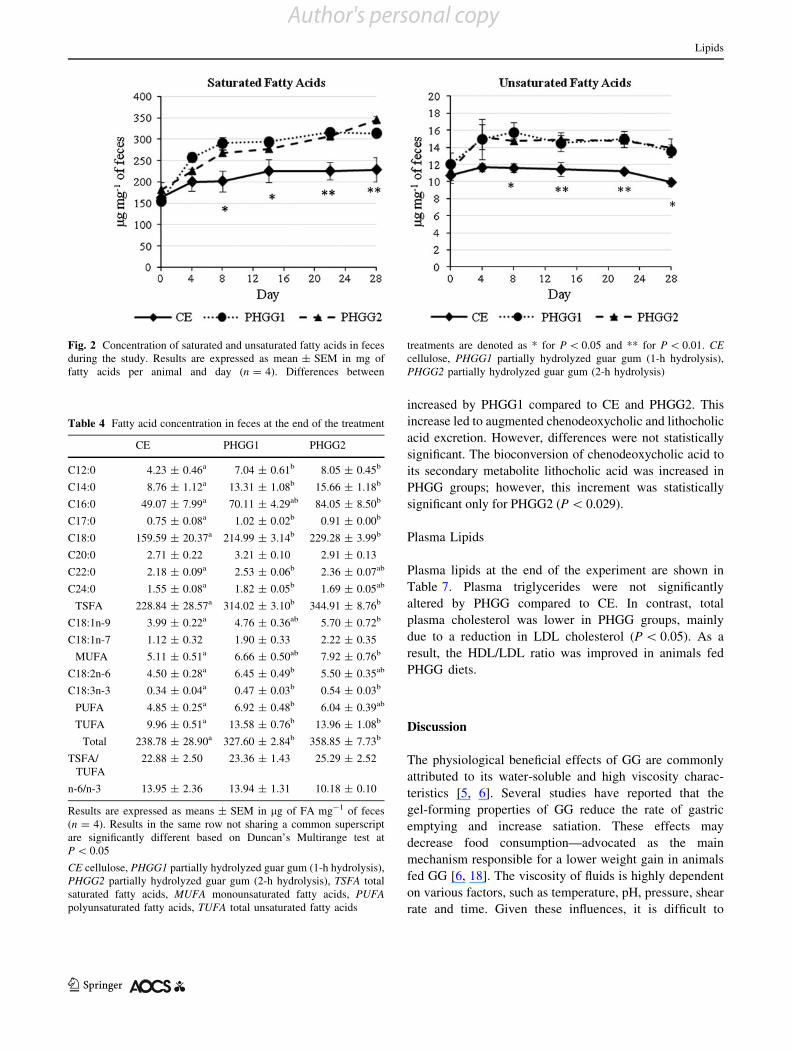
Fatty Acid Excretion
Fecal dry weight was not significantly altered by PHGG
compared to CE during the study (Table 3). In contrast, FA
concentration in feces of the PHGG groups was increasedcompared to the control group (Fig. 2). SFA and UFA
concentration in feces were highly increased by PHGG
during the first week of treatment. After this time, theconcentration in feces tended to stabilize, although a con-
tinuous slight increment in SFA concentration in feces ofall groups was observed.
Table 4 shows the concentration of fecal FA at the end
of the experiment. SFA concentration in feces was higherthan that of UFA. The results reveal a higher excretion of
SFA, especially palmitic (C16:0) and stearic (C18:0) acids,
than of UFA. The concentration of all SFA was increased
by PHGG1 and PHGG2 compared to CE. Among UFA,fecal MUFA were accounted for mainly by oleic acid
(C18:1n-9), whereas linoleic acid (C18:2n-6) was the most
abundant PUFA. As observed for SFA, the consumption ofthe PHGG increased the excretion of MUFA and PUFA. As
a result, the FA profile as well as the TSFA/TUFA ratio in
feces was not altered by PHGG. The same results wereobserved for the n-6/n-3 PUFA isomer ratio. In general, the
effect of PHGG2 on FA excretion was slightly greater thanthat of PHGG1, although differences were not statistically
significant.
NS Excretion
The concentration of fecal NS is shown in Table 5. Theoverall excretion was increased in all groups after 4 weeks
on high fat diets. However, the increment in animals fed
either PHGG1 or PHGG2 was higher than that of CE,reaching final values of 16.07 ± 0.41, 17.98 ± 0.58 and
10.92 ± 0.73 mg of NS per animal and day for PHGG1,
PHGG2 and CE, respectively. PHGG consumptionincreased the excretion of cholesterol, but especially the
excretion of its major metabolic products. We calculated
the coprostanol/cholesterol and the secondary metabolitesof cholesterol/cholesterol ratios in order to assess the effect
of experimental fibers on the intestinal bioconversion of
cholesterol. No statistical differences for these parameterswere found between treatments, although the bioconver-
sion in feces of animals fed PHGG2 was slightly higher.
No effect was observed on phytosterol excretion(P[ 0.05).
BA Excretion
Fecal BA are shown in Table 6. Secondary BA were the
most abundant BA in feces and were accounted for mainlyby lithocholic acid. Total BA excretion was only slightly
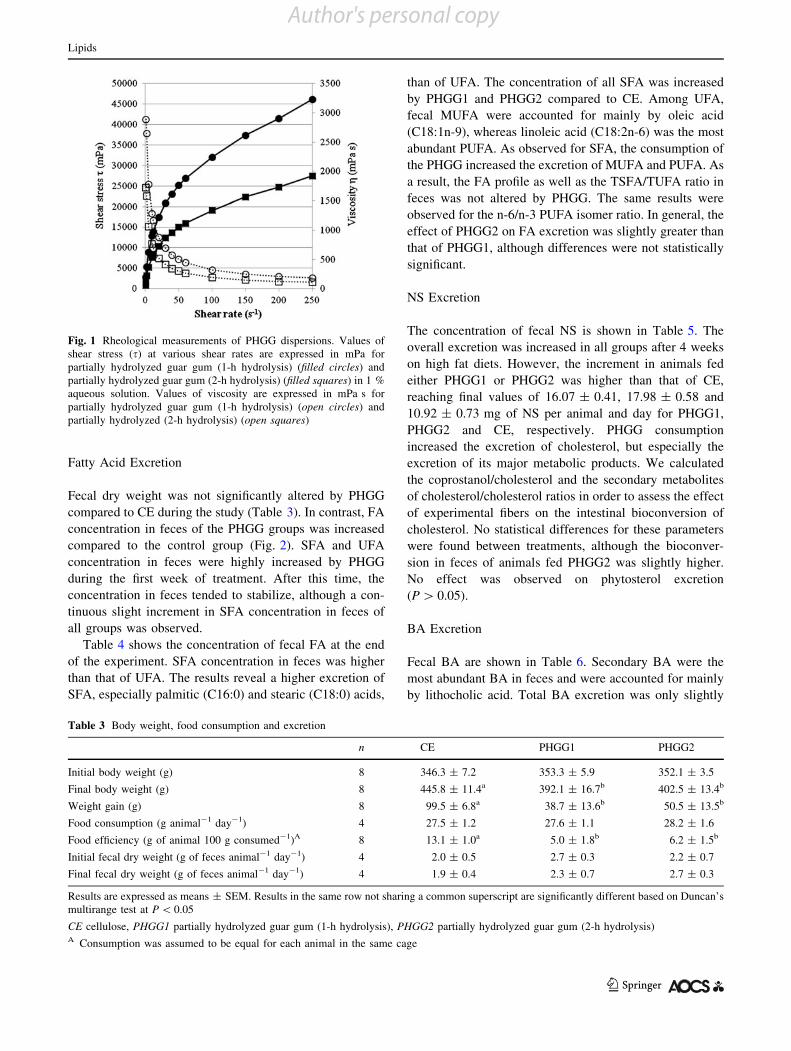
Fig. 1 Rheological measurements of PHGG dispersions. Values ofshear stress (s) at various shear rates are expressed in mPa forpartially hydrolyzed guar gum (1-h hydrolysis) (filled circles) andpartially hydrolyzed guar gum (2-h hydrolysis) (filled squares) in 1 %aqueous solution. Values of viscosity are expressed in mPa s forpartially hydrolyzed guar gum (1-h hydrolysis) (open circles) andpartially hydrolyzed (2-h hydrolysis) (open squares)
Table 3 Body weight, food consumption and excretion
n CE PHGG1 PHGG2
Initial body weight (g) 8 346.3 ± 7.2 353.3 ± 5.9 352.1 ± 3.5
Final body weight (g) 8 445.8 ± 11.4a 392.1 ± 16.7b 402.5 ± 13.4b
Weight gain (g) 8 99.5 ± 6.8a 38.7 ± 13.6b 50.5 ± 13.5b
Food consumption (g animal-1 day-1) 4 27.5 ± 1.2 27.6 ± 1.1 28.2 ± 1.6
Food efficiency (g of animal 100 g consumed-1)A 8 13.1 ± 1.0a 5.0 ± 1.8b 6.2 ± 1.5b
Initial fecal dry weight (g of feces animal-1 day-1) 4 2.0 ± 0.5 2.7 ± 0.3 2.2 ± 0.7
Final fecal dry weight (g of feces animal-1 day-1) 4 1.9 ± 0.4 2.3 ± 0.7 2.7 ± 0.3
Results are expressed as means ± SEM. Results in the same row not sharing a common superscript are significantly different based on Duncan’smultirange test at P\ 0.05
CE cellulose, PHGG1 partially hydrolyzed guar gum (1-h hydrolysis), PHGG2 partially hydrolyzed guar gum (2-h hydrolysis)A Consumption was assumed to be equal for each animal in the same cage
Lipids
123
Author's personal copy
increased by PHGG1 compared to CE and PHGG2. Thisincrease led to augmented chenodeoxycholic and lithocholic
acid excretion. However, differences were not statistically
significant. The bioconversion of chenodeoxycholic acid toits secondary metabolite lithocholic acid was increased in
PHGG groups; however, this increment was statistically
significant only for PHGG2 (P\ 0.029).
Plasma Lipids
Plasma lipids at the end of the experiment are shown in
Table 7. Plasma triglycerides were not significantly
altered by PHGG compared to CE. In contrast, totalplasma cholesterol was lower in PHGG groups, mainly
due to a reduction in LDL cholesterol (P\ 0.05). As a
result, the HDL/LDL ratio was improved in animals fedPHGG diets.
Discussion
The physiological beneficial effects of GG are commonlyattributed to its water-soluble and high viscosity charac-
teristics [5, 6]. Several studies have reported that thegel-forming properties of GG reduce the rate of gastric
emptying and increase satiation. These effects may
decrease food consumption—advocated as the mainmechanism responsible for a lower weight gain in animals
fed GG [6, 18]. The viscosity of fluids is highly dependent
on various factors, such as temperature, pH, pressure, shearrate and time. Given these influences, it is difficult to
Fig. 2 Concentration of saturated and unsaturated fatty acids in fecesduring the study. Results are expressed as mean ± SEM in mg offatty acids per animal and day (n = 4). Differences between
treatments are denoted as * for P\ 0.05 and ** for P\ 0.01. CEcellulose, PHGG1 partially hydrolyzed guar gum (1-h hydrolysis),PHGG2 partially hydrolyzed guar gum (2-h hydrolysis)
Table 4 Fatty acid concentration in feces at the end of the treatment
CE PHGG1 PHGG2
C12:0 4.23 ± 0.46a 7.04 ± 0.61b 8.05 ± 0.45b
C14:0 8.76 ± 1.12a 13.31 ± 1.08b 15.66 ± 1.18b
C16:0 49.07 ± 7.99a 70.11 ± 4.29ab 84.05 ± 8.50b
C17:0 0.75 ± 0.08a 1.02 ± 0.02b 0.91 ± 0.00b
C18:0 159.59 ± 20.37a 214.99 ± 3.14b 229.28 ± 3.99b
C20:0 2.71 ± 0.22 3.21 ± 0.10 2.91 ± 0.13
C22:0 2.18 ± 0.09a 2.53 ± 0.06b 2.36 ± 0.07ab
C24:0 1.55 ± 0.08a 1.82 ± 0.05b 1.69 ± 0.05ab
TSFA 228.84 ± 28.57a 314.02 ± 3.10b 344.91 ± 8.76b
C18:1n-9 3.99 ± 0.22a 4.76 ± 0.36ab 5.70 ± 0.72b
C18:1n-7 1.12 ± 0.32 1.90 ± 0.33 2.22 ± 0.35
MUFA 5.11 ± 0.51a 6.66 ± 0.50ab 7.92 ± 0.76b
C18:2n-6 4.50 ± 0.28a 6.45 ± 0.49b 5.50 ± 0.35ab
C18:3n-3 0.34 ± 0.04a 0.47 ± 0.03b 0.54 ± 0.03b
PUFA 4.85 ± 0.25a 6.92 ± 0.48b 6.04 ± 0.39ab
TUFA 9.96 ± 0.51a 13.58 ± 0.76b 13.96 ± 1.08b
Total 238.78 ± 28.90a 327.60 ± 2.84b 358.85 ± 7.73b
TSFA/TUFA
22.88 ± 2.50 23.36 ± 1.43 25.29 ± 2.52
n-6/n-3 13.95 ± 2.36 13.94 ± 1.31 10.18 ± 0.10
Results are expressed as means ± SEM in lg of FA mg-1 of feces(n = 4). Results in the same row not sharing a common superscriptare significantly different based on Duncan’s Multirange test atP\ 0.05
CE cellulose, PHGG1 partially hydrolyzed guar gum (1-h hydrolysis),PHGG2 partially hydrolyzed guar gum (2-h hydrolysis), TSFA totalsaturated fatty acids, MUFA monounsaturated fatty acids, PUFApolyunsaturated fatty acids, TUFA total unsaturated fatty acids
Lipids
123
Author's personal copy

compare data from studies that have applied distinct
methodologies and conditions. It has been proposed thatoral perception of fluid viscosity correlates well with the
viscosity of the fluid at a shear rate of 10 s-1 [19]. At this
rate, the viscosity of PHGG was significantly different,registering 1,285 and 766 mPa s for PHGG1 and PHGG2,
respectively. This difference can be attributed to the higher
degree of hydrolysis of the latter. However, the viscosity ofPHGG obtained by chemical hydrolysis appears to be
considerably higher than that of enzymatically hydrolyzedGG, which has been published to be about 10 mPa s in 5 %
aqueous solution [7]. Chemical hydrolysis of GG allowed
us to compare the physiological benefits of two PHGG withdistinct degrees of viscosity. The rheological experiments
Table 5 Excretion of neutral sterols
CE PHGG1 PHGG2
Cholesterol
Initial 2.20 ± 0.23 2.80 ± 0.31 2.08 ± 0.19
Final 2.02 ± 0.31a 3.56 ± 0.54b 3.23 ± 0.49ab
Coprostanol
Initial 3.51 ± 0.39 4.52 ± 0.45 3.36 ± 0.60
Final 5.04 ± 0.91a 7.40 ± 0.44b** 9.78 ± 0.57c**
Cholestanol
Initial 1.02 ± 0.11 1.26 ± 0.14 0.94 ± 0.13
Final 1.11 ± 0.16a 1.48 ± 0.06b 1.76 ± 0.04b**
Cholestanone
Initial 0.97 ± 0.12 1.20 ± 0.11 1.01 ± 0.11
Final 1.25 ± 0.14a 1.90 ± 0.24ab* 2.01 ± 0.26b*
b-Sitosterol
Initial 1.11 ± 0.08 1.36 ± 0.11 1.09 ± 0.12
Final 1.16 ± 0.10 1.27 ± 0.10 0.83 ± 0.19
Sitostanol
Initial 0.46 ± 0.03 0.55 ± 0.06 0.44 ± 0.05
Final 0.35 ± 0.13 0.47 ± 0.02 0.37 ± 0.12
Total sterols
Initial 9.27 ± 0.80 11.68 ± 0.98 8.91 ± 1.07
Final 10.92 ± 0.73a 16.07 ± 0.41b** 17.98 ± 0.58c**
Copr./chol.A
Initial 1.64 ± 0.22 1.66 ± 0.23 1.59 ± 0.15
Final 2.86 ± 0.84 2.33 ± 0.57 3.28 ± 0.59
Secd./chol.B
Initial 2.57 ± 0.35 2.56 ± 0.33 2.53 ± 0.17
Final 3.74 ± 1.09 3.34 ± 0.69 4.48 ± 0.68
Results are expressed as means ± SEM in mg of sterol ani-mal-1 day-1 (n = 4). Results in the same row that do not share acommon superscript are significantly different based on Duncan’smultirange test at P\ 0.05. Differences between initial and finalvalues based on Student’s t test are denoted as * for P\ 0.05or** for P\ 0.01. Campesterol was found only in trace amounts
CE cellulose, PHGG1 partially hydrolyzed guar gum (1-h hydrolysis),PHGG2 partially hydrolyzed guar gum (2-h hydrolysis)A Ratio of coprostanol/cholesterolB Ratio of secondary metabolites of cholesterol (coprostanol, cho-lestanol and cholestanone)/cholesterol
Table 6 Bile acid excretion
CE PHGG1 PHGG2
Primary
CA
Initial tr tr tr
Final tr tr tr
CDCA
Initial 0.32 ± 0.12 0.44 ± 0.09 0.31 ± 0.12
Final 0.24 ± 0.07 0.39 ± 0.10 0.37 ± 0.07
Secondary
DCA
Initial nd nd nd
Final nd nd nd
LCA
Initial 2.11 ± 0.62 2.58 ± 0.52 2.14 ± 1.00
Final 1.63 ± 0.43 2.87 ± 0.90 3.15 ± 0.50
UDCA
Initial 1.05 ± 0.39 0.99 ± 0.13 1.00 ± 0.41
Final 0.53 ± 0.15 0.69 ± 0.15 0.66 ± 0.07
Total BA
Initial 3.48 ± 1.13 4.00 ± 0.72 3.45 ± 1.53
Final 2.41 ± 0.51 3.96 ± 1.12 4.18 ± 0.63
LCA/CDCA
Initial 8.04 ± 1.63 6.00 ± 0.54 6.12 ± 0.64
Final 7.16 ± 1.92 7.14 ± 0.99 8.79 ± 0.69*
Results are expressed as means ± SEM in mg of bile acid ani-mal-1 day-1 (n = 4). No statistical differences were found betweentreatments (P[ 0.05). * Differences between initial and final valuesbased on Student’s t test (P\ 0.01)
CE cellulose, PHGG1 partially hydrolyzed guar gum (1-h hydrolysis),PHGG2 partially hydrolyzed guar gum (2-h hydrolysis), CA cholicacid, CDCA chenodeoxycholic acid, DCA deoxycholic acid, LCAlithocholic acid, UDCA ursodeoxycholic acid, Total BA total bileacids, nd not detected, tr traces
Table 7 Plasma lipids
CE PHGG1 PHGG2
Triglycerides 0.63 ± 0.07 0.63 ± 0.07 0.56 ± 0.08
Total cholesterol 2.59 ± 0.68b 1.38 ± 0.20a 0.93 ± 0.11a
HDL-col 0.20 ± 0.06 0.15 ± 0.02 0.11 ± 0.01
LDL-col 2.68 ± 0.74b 1.26 ± 0.19a 0.89 ± 0.11a
HDL/LDL 0.08 ± 0.01a 0.13 ± 0.01ab 0.14 ± 0.02b
Results are expressed as means ± SEM in mmol L-1 (n = 8).Results in the same row that do not share a common superscript aresignificantly different based on Duncan’s multirange test at P\ 0.05
CE cellulose, PHGG1 partially hydrolyzed guar gum (1-h hydrolysis),PHGG2 partially hydrolyzed guar gum (2-h hydrolysis)
Lipids
123
Author's personal copy
of 1 % PHGG aqueous solutions revealed pseudoplastic
(shear-thinning) behavior. Previous studies have reportedsimilar findings for aqueous solutions of GG [20].
In our study, both PHGG reduced body weight gain to a
similar extent. However, this decrease was not correlatedwith changes in food consumption, which is consistent with
the findings of other studies [18]. A reduction in the
absorption of nutrients and thus the calories they providecan be partially responsible for the lower food efficiency of
diets containing PHGG.In good agreement with previous reports, fat excretion
was increased by ingestion of PHGG [21]. The longitudinal
study of PHGG consumption reveals that the effectoccurred from the beginning of the treatment and stabilized
after 1 week. Therefore, no accumulative effect was
observed after the first week.As previously reported [13], the concentrations of
medium and long chain SFA in feces, especially C16:0 and
C18:0, were higher when compared to its concentration indiets. This finding is mainly attributed to the low digest-
ibility of these FA [22]. The FA profile in feces was not
altered by PHGG consumption in a similar way to otherdietary fibers such as pectin [23] and in contrast to others
such as hydroxypropyl methylcellulose [14].
Another hypocholesterolemic property commonlyattributed to soluble dietary fiber is its capacity to increase
the excretion of BA and endogenous and exogenous cho-
lesterol. In vitro [8] and in vivo studies [24] have shownthat PHGG conserves the capacity of the native GG to
increase cholesterol excretion. In our study, NS excretion
was greater after consumption of PHGG, mainly as a resultof an increment in cholesterol metabolites such as
coprostanol and cholestanol. Thus, the bioconversion of
cholesterol tended to increase in animals ingesting PHGG2.Although it is widely accepted that GG increases BA
excretion, thus decreasing its reabsorption [24, 25], con-
troversial results have been reported for PHGG. Our resultsare consistent with the findings of Favier et al. [21], who
reported that total BA excretion was not significantly
altered by PHGG ingestion. However, as seen for NS, theconsumption of PHGG2 increased the bioconversion of
primary BA to their secondary metabolites. Similar results
on BA bioconversion were observed by Gallaher et al. [26],who reported that the lithocholic/chenodeoxycholic ratio in
feces of hamsters fed low viscosity GG was higher than
that of animals on native GG. However, that study wasperformed in hamsters, which partially ferment GG in the
pregastric pouch of the stomach [26] and have a distinct
BA profile in feces to that of guinea pigs [27]. Our resultsshow that this effect is also present in guinea pigs, a more
suitable model for the study of lipid metabolism. GG and
PHGG are partially fermented in the intestine, thus favor-ing increased endogenous bacterial population and activity
[28, 29]. For instance, the growth of intestinal bacteria such
Lactobacillus spp. and Bifidobacterium spp. is enhanced inhumans after PHGG consumption [30]. Hence, an increase
in bacterial activity may result in greater sterol biocon-
version. The lower viscosity of PHGG2 could explain itshigher pre-biotic effect as it favors interaction with intes-
tinal microbiota.
Based on these results, the increase in NS excretionappears to be one of the main mechanisms responsible for
the lower total plasma cholesterol in animals fed PHGGdiets. In addition, it is plausible that the fermentability of
PHGG can contribute to its hypocholesterolemic effect due
to the production of short chain fatty acids, mainly propi-onate, which can decrease the endogenous synthesis of
cholesterol [29, 31].
On balance, within the degree of hydrolysis tested, areduction in the viscosity of PHGG did not correlate with a
loss of hypolipidemic capacity. Current evidence indicates
that consumption of viscous fibers such as GG can alter theviscosity of digesta in the gastrointestinal tract and thereby
decrease the bioaccessibility of fat and cholesterol [6, 26,
32]. Nevertheless, it remains questionable whether altera-tions on in vitro viscosity may result in proportional
physiological responses [32, 33]. For instance, Gallaher
et al. [32] observed that although only small increments inviscosity were necessary to decrease plasma cholesterol,
further increments did not result in larger reductions of
plasma cholesterol. In addition, it has been suggested thatother mechanisms not attributed to viscosity can be com-
plementarily responsible for the hypolipidemic effect of
PHGG. The bioaccessibility of fat and cholesterol waspreviously studied by Minekus et al. [8] using a dynamic
model of the gastrointestinal tract. The authors concluded
that PHGG can also reduce lipid absorption by a depletion-flocculation mechanism, which is typical of polymers that
do not show surface activity. Since the polysaccharide does
not adsorb to the fat droplets, this can result in a regionaround the droplet where the concentration of the poly-
saccharide is lower than in the bulk solution. This phe-
nomenon could cause an osmotic pressure that would favorthe fat droplets flocculating and coalescing. As a result, it
may reduce the emulsifying effect of bile acids and
therefore the bioaccessibility of fat and cholesterol.In conclusion, both PHGG reduced body weight gain
and plasma cholesterol, regardless of their in vitro viscosity
within the ranges tested. Thus, the chemical hydrolysis canimprove the suitability of GG for use in food products
without affecting their rheology or palatability and con-
serving most of its hypolipidemic properties.
Acknowledgments J. Santas was granted a Torres Quevedofellowship. The authors thank A. Aldanondo, S. Scapucci andA. Gonciarz for their support during sample analysis.
Lipids
123
Author's personal copy

References
1. Ellis PR, Wang Q, Rayment P, Ren Y, Ross-Murphy S (2001)Guar gum. In: Handbook of Dietary Fiber. CRC Press, USA
2. Butt MS, Shahzadi N, Sharif MK, Nasir M (2007) Guar gum: amiracle therapy for hypercholesterolemia, hyperglycemia andobesity. Crit Rev Food Sci Nutr 47(4):389–396
3. Shahzadi N, Butt MS, Sharif MK, Nasir M (2007) Effect of guargum on the serum lipid profile of Sprague Dawley rats. LWTFood Sci Technol 40(7):1198–1205
4. Theuwissen E, Mensink RP (2008) Water-soluble dietary fibersand cardiovascular disease. Physiol Behav 94(2):285–292
5. Gunness P, Gidley MJ (2010) Mechanisms underlying the cho-lesterol-lowering properties of soluble dietary fibre polysaccha-rides. Food Funct 1(2):149–155
6. Dikeman CL, Fahey GC (2006) Viscosity as related to dietaryfiber: a review. Crit Rev Food Sci 46(8):649–662
7. Yoon S-, Chu D-, Juneja LR (2008) Chemical and physicalproperties, safety and application of partially hydrolyzed guargum as dietary fiber. J Clin Biochem Nutr 42(1):1–7
8. Minekus M, Jelier M, Xiao JZ, Kondo S, Iwatsuki K, Kokubo S,Bos M, Dunnewind B, Havenaar R (2005) Effect of partiallyhydrolyzed guar gum (PHGG) on the bioaccessibility of fat andcholesterol. Biosci Biotechnol Biochem 69(5):932–938
9. Slavin JL, Greenberg NA (2003) Partially hydrolyzed guar gum:clinical nutrition uses. Nutrition 19(6):549–552
10. Erkkila A, de Mello VDF, Riserus U, Laaksonen DE (2008)Dietary fatty acids and cardiovascular disease: an epidemiologi-cal approach. Prog Lipid Res 47(3):172–187
11. Fernandez ML, West KL, Roy S, Ramjiganesh T (2001) Dietaryfat saturation and gender/hormonal status modulate plasma lipidsand lipoprotein composition. J Nutr Biochem 12(12):703–710
12. Fernandez ML, West KL (2005) Mechanisms by which dietaryfatty acids modulate plasma lipids. J Nutr 135(9):2075–2078
13. Brufau G, Canela MA, Rafecas M (2006) A high-saturated fatdiet enriched with phytosterol and pectin affects the fatty acidprofile in guinea pigs. Eur J Lipid Sci Tech 41(2):159–168
14. Yokoyama W, Anderson WHK, Albers DR, Hong Y-, LanghorstML, Hung S-, Lin J-, Young SA (2011) Dietary hydroxypropylmethylcellulose increases excretion of saturated and trans fats byhamsters fed fast food diets. J Agric Food Chem 59(20):11249–11254
15. Fernandez ML, Volek JS (2006) Guinea pigs: a suitable animalmodel to study lipoprotein metabolism, atherosclerosis andinflammation. Nutr Metab 3(17). doi:10.1186/1743-7075-3-17
16. Lopez-Lopez A, Castellote-Bargallo AI, Lopez-Sabater MC(2000) Comparison of two direct methods for the determinationof fatty acids in infant feces. Anal Biochem 282(2):250–255
17. Keller S, Jahreis G (2004) Determination of underivatised sterolsand bile acid trimethyl silyl ether methyl esters by gas chroma-tography–mass spectrometry–single ion monitoring in faeces.J Chromatogr B 813(1–2):199–207
18. Yamada K, Tokunaga Y, Ikeda A, Ohkura K-, Kaku-Ohkura S,Mamiya S, Beong OL, Tachibana H (2003) Effect of dietary fiberon the lipid metabolism and immune function of aged Sprague–Dawley rats. Biosci Biotechnol Biochem 67(2):429–433
19. Cutler AN, Morris ER, Taylor LJ (1983) Oral perception ofviscosity in fluid foods and model systems. J Texture Stud14(4):377–395
20. Nandhini Venugopal K, Abhilash M (2010) Study of the hydra-tion kinetics and rheological behaviour of guar gum. Int J PharmaSci Res 1(1):28–39
21. Favier M-, Bost P-, Demigne C, Remesy C (1998) The choles-terol-lowering effect of guar gum in rats is not accompanied byan interruption of bile acid cycling. Lipids 33(8):765–771
22. Baer DJ, Judd JT, Kris-Etherton PM, Zhao G (2003) Stearic acidabsorption and its metabolizable energy value are minimallylower than those of other fatty acids in healthy men fed mixeddiets. J Nutr 133(12):4129–4134
23. Brufau G (2007) Phytosterols, but not pectin, added to a high-saturated-fat diet modify saturated fatty acid excretion in relationto chain length. J Nutr Biochem 18(9):580–586
24. Favier M-, Bost P-, Guittard C, Demigne C, Remesy C (1997)The cholesterol-lowering effect of guar gum is not the result of asimple diversion of bile acids toward fecal excretion. Lipids32(9):953–959
25. Overton PD, Furlonger N, Beety JM, Chakraborty J, Tredger JA,Morgan LM (1994) The effects of dietary sugar-beet fiber andguar gum on lipid-metabolism in Wistar rats. Br J Nutr72(3):385–495
26. Gallaher DD, Hassel CA, Lee K-, Gallaher CM (1993) Viscosityand fermentability as attributes of dietary fiber responsible for thehypocholesterolemic effect in hamsters. J Nutr 123(2):244–252
27. Kasbo J, Saleem M, Perwaiz S, Mignault D, Lamireau T, Tuc-hweber B, Yousef I (2002) Biliary, fecal and plasma deoxycholicacid in rabbit, hamster, guinea pig, and rat: comparative studyand implication in colon cancer. Biol Pharm Bull 25(10):1381–1384
28. Flickinger EA, Wolf BW, Garleb KA, Chow J, Leyer GJ, JohnsPW, Fahey GC Jr (2000) Glucose-based oligosaccharides exhibitdifferent in vitro fermentation patterns and affect in vivo apparentnutrient digestibility and microbial populations in dogs. J Nutr130(5):1267–1273
29. Yoon S-, Chu D-, Juneja LR (2006) Physiological functions ofpartially hydrolyzed guar gum. J Clin Biochem Nutr 39(3):134–144
30. Okubo T, Ishihara N, Takahashi H, Fujisawa T, Kim M, Ya-mamoto T, Mitsuoka T (1994) Effects of partially hydrolyzedguar gum intake on human intestinal microflora and its metabo-lism. Biosci Biotechnol Biochem 58(8):1364–1369
31. Velazquez M, Davies C, Marett R, Slavin JL, Feirtag JM (2000)Effect of oligosaccharides and fibre substitutes on short-chainfatty acid production by human faecal microflora. Anaerobe6(2):87–92
32. Gallaher DD, Hassel CA, Lee K- (1993) Relationships betweenviscosity of hydroxypropyl methylcellulose and plasma choles-terol in hamsters. J Nutr 123(10):1732–1738
33. Ellis PR, Dawoud FM, Morris ER (1991) Blood glucose, plasmainsulin and sensory responses to guar-containing wheat breads:effects of molecular weight and particle size of guar gum. Br JNutr 66(3):363–379
Lipids
123
Author's personal copy
All in-text references underlined in blue are linked to publications on ResearchGate, letting you access and read them immediately.