Hepatitis B virus core antigen determines viral persistence in a C57BL/6 mouse model
Upload
independentCategory
view
2download
0
RESEARCH ARTICLE
Intake of Hydrolyzed Casein is Associatedwith Reduced Body Fat Accretion andEnhanced Phase II Metabolism in ObesityProne C57BL/6J MiceMorten Rahr Clausen1*, Xumin Zhang1,2, Christian C. Yde1, Ditte B. Ditlev1, HaldisH. Lillefosse3,4, Lise Madsen3,4, Karsten Kristiansen4, Bjørn Liaset3, Hanne C. Bertram1
1 Department of Food Science, Aarhus University, Aarslev, Denmark, 2 State Key Laboratory of GeneticEngineering, School of Life Sciences, Fudan University, Shanghai, China, 3 National Institute of Nutritionand Seafood Research, Bergen, Norway, 4 Department of Biology, University of Copenhagen, Copenhagen,Denmark
AbstractThe amount and form of dietary casein have been shown to affect energy metabolism and
lipid accumulation in mice, but the underlying mechanisms are not fully understood. We in-
vestigated 48 hrs urinary metabolome, hepatic lipid composition and gene expression in
male C57BL/6J mice fed Western diets with 16 or 32 energy% protein in the form of exten-
sively hydrolyzed or intact casein. LC-MS based metabolomics revealed a very strong impact
of casein form on the urinary metabolome. Evaluation of the discriminatory metabolites using
tandemmass spectrometry indicated that intake of extensively hydrolyzed casein modulated
Phase II metabolism associated with an elevated urinary excretion of glucuronic acid- and
sulphate conjugated molecules, whereas glycine conjugated molecules were more abundant
in urine frommice fed the intact casein diets. Despite the differences in the urinary metabo-
lome, we observed no differences in hepatic expression of genes involved in Phase II metab-
olism, but it was observed that expression of Abcc3 encoding ATP binding cassette c3
(transporter of glucuronic acid conjugates) was increased in livers of mice fed hydrolyzed ca-
sein. As glucuronic acid is derived from glucose and sulphate is derived from cysteine, our
metabolomic data provided evidence for changes in carbohydrate and amino acid metabo-
lism and we propose that this modulation of metabolism was associated with the reduced glu-
cose and lipid levels observed in mice fed the extensively hydrolyzed casein diets.
IntroductionIt is known that intake of dietary proteins as compared to carbohydrates and lipids induces ahigher thermic effect [1,2] and satiety [3–5]. Moreover, intake of high-protein diets has been as-sociated with reduced weight gain both in rodents [6–10] and in humans [11–13]. Interestingly,
PLOSONE | DOI:10.1371/journal.pone.0118895 March 4, 2015 1 / 18
a11111
OPEN ACCESS
Citation: Clausen MR, Zhang X, Yde CC, Ditlev DB,Lillefosse HH, Madsen L, et al. (2015) Intake ofHydrolyzed Casein is Associated with Reduced BodyFat Accretion and Enhanced Phase II Metabolism inObesity Prone C57BL/6J Mice. PLoS ONE 10(3):e0118895. doi:10.1371/journal.pone.0118895
Academic Editor: Antonio Moschetta, IRCCS IstitutoOncologico Giovanni Paolo II, ITALY
Received: February 14, 2014
Accepted: January 8, 2015
Published: March 4, 2015
Copyright: © 2015 Clausen et al. This is an openaccess article distributed under the terms of theCreative Commons Attribution License, which permitsunrestricted use, distribution, and reproduction in anymedium, provided the original author and source arecredited.
Funding: The Danish Strategic Research Council(FØSU) is thanked for financial support through theproject ‘Health-promoting effects of milk-derivedcomponents’ (http://fivu.dk/forskning-og-innovation/rad-og-udvalg/det-strategiske-forskningsrad), and theDanish Research Council FTP for financial supportthrough the project ‘Advances in food quality andnutrition research through implementation ofmetabolomics technologies’ (http://fivu.dk/forskning-og-innovation/rad-og-udvalg/det-frie-forskningsrad).The funders had no role in study design, data

several studies indicate that casein, whey protein and soy protein differ in their ability to induceweight loss [14–17]. In a randomized cross-over study the thermic effect of whey was higherthan that of casein and soy protein [2]. Studies in mice have revealed that whey protein inges-tion also induced lower weight gain in obesity-prone C57BL/6J mice than did casein [16–18].Recently it was suggested that the decreased lipid accretion associated with whey intake could beexplained by increased excretion of citric acid cycle intermediates in the urine [17]. Several linesof evidence therefore indicate that the choice of protein source might modulate metabolism.
In addition to protein source, protein form (i.e. intact vs hydrolyzed) might have impact onmetabolism. Even though some studies report no effect [19,20], several studies report that feed-ing diets with hydrolyzed proteins prevented diet-induced obesity in rodents [21–26]. Othershave reported lower apparent amino acid digestibility in pigs fed diets with hydrolyzed caseinrelative to those fed intact casein [27]. It is also likely that urea excretion increases with ingestionof hydrolyzed proteins [28,29]. Recently, we showed that, at equal energy intake, C57BL/6J micefed Western diets containing extensively hydrolyzed casein gained less adipose tissue mass thanmice fed similar diets with intact casein. Ingestion of hydrolyzed casein induced a decrease in fedplasma glucose and insulin concentrations, indicating altered carbohydrate metabolism [24]. Ina follow up study, we used NMR-based metabolomics to unveil that intake of extensively hydro-lyzed, as compared to intact casein, led to: i) higher fecal fat content, and lower tissue and plasmalipid levels, ii) higher branched-chain amino acid levels in feces and urine, but lower in plasmaand spleen, iii) higher hepatic levels of the sulphur-containing molecules taurine and glutathi-one, iv) increased hepatic glycogen amount, and v) reduced levels of glucose and its metabolitelactate in feces, liver and plasma [30]. Based on these previous studies it is evident that feedingdiets with extensively hydrolyzed casein modulates pathways within amino acid and carbohy-drate metabolism and lipid uptake in the gastrointestinal tract in mice. However, it is still unclearhow modulation of these pathways could lead to the observed divergent phenotypes.
Analysis of urinary excretion can serve as a powerful means to identify metabolic routesthat are altered as a result of dietary intervention or to identify catabolic routes for specific die-tary molecules. While metabolite concentrations in blood and organs, such as the liver, are de-pendent on metabolic status at time of sampling, urine accumulates metabolic products overtime. Hence, the urinary metabolome can effectively distinguish metabolic effects that can beassigned to regulation of metabolism controlled by the dietary constituents [17,31,32].
In the present study, we investigated the metabolic changes in C57BL/6J mice induced by intakeof intact or extensively hydrolyzed casein, and used LC-MS based metabolomics to study 48 hrsurine by an untargeted approach. Urinary excretion of several compounds was significantly alteredand large differences between dietary treatments were observed. Intriguingly, we observed that anumber of metabolites were completely absent in urine frommice fed the intact casein diets versusdiets with extensively hydrolyzed casein, even though the amino acid compositions of the dietswere identical. We therefore pursued identification of these compounds and report that the mostsignificant alterations in the metabolism induced by intake of hydrolyzed casein pertain to Phase IImetabolism. Mice fed diets with extensively hydrolyzed casein had higher urinary excretion of glu-curonic acid- and sulphate-conjugated molecules, relative to those fed intact casein diets. By con-trast, the urinary metabolome from intact casein fed mice revealed higher urinary presence ofglycine-conjugated molecules in comparison to mice fed extensively hydrolyzed casein diets.
Materials and Methods
Dietary protein sourcesIntact casein (prod #02901293) and extensively hydrolyzed casein (prod #02960138) were pur-chased fromMP Biomedicals (Illkirch-Graffenstaden, France). The manufacturer’s web-page
Effect of Hydrolyzed Casein on Metabolism
PLOSONE | DOI:10.1371/journal.pone.0118895 March 4, 2015 2 / 18
collection and analysis, decision to publish, orpreparation of the manuscript.
Competing Interests: The authors have declaredthat no competing interests exist.

states that the casein hydrolysate was produced by enzymatic hydrolysis using pancreatic en-zymes (not further specified). This hydrolysate had, in the form of mixed amino acids and pep-tides, the same amino acid composition as intact casein. The hydrolyzed casein was soluble,and about 41% of total amino acids were present as free amino acids.
Ethics statementAnimal handling and experiments were performed in accordance with the guidelines of theNorwegian State Board of Biological Experiments with Living Animals and the board specifi-cally approved the experiments: Norwegian approval identification No, FOTS Id: 1062 and1840. No adverse events were observed.
Animal study and samplingThe animal experiment and NMR-based metabolomics of organs and biofluids have been de-scribed [24,30]. Male C57BL/6J BomTac (Taconic, Denmark) mice, 8 weeks of age, were assignedto four different experimental diets; i) 16% energy from intact casein (16-I %), ii) 32% energyfrom intact casein (32-I %), iii) 16% energy from hydrolyzed casein (16-H %), and iv) 32% energyfrom hydrolyzed casein (32-H %). All diets had 35% energy from lipids composed of soybean oil(27.3 g/kg feed) and lard (144.2 g/kg feed). For further information about the experimental diets,see Lillefosse et al. [24]. The mice were assigned to the diets by weight to ensure both equal meanstarting weight and similar group standard deviation. The mice were housed individually andmaintained on a 12:12 h light-dark cycle at 28 ± 1°C. To ensure equal energy intake the amount offeed offered was determined by the group with the lowest energy intake. The mice were fed dailyand body weight was recorded twice a week. After 8 weeks of feeding the mice were anesthetizedwith isoflurane (Isoba vet, Schering-Plough, Denmark) before they were sacrificed by cardiacpuncture. In the present study mice from two experiments were included. Experimental groupsconsisted of 30 mice in total (n = 6–8 per group, expt. 1) and 28 mice in total (n = 7 per group,expt. 2), respectively. In both experiments growth curves followed similar patterns and several bio-chemical analyses consistently supported the same physiological effect of the feeding trials in bothexperiments [24]. During the feeding period (after 3 weeks) the mice spent 48 h in metaboliccages for urine collection (expt. 1) used for LC-MS analysis. At sacrifice (after 8 weeks) livers wereharvested, weighed and freeze-clamped in liquid nitrogen and stored at -80°C (expt 1 and 2).
LC-MS sample preparationPrior to LC-MS analysis urine samples were diluted 5 times in acetic acid to a final acetic acidconcentration of 1% and centrifuged. One hundred milligrams of each feed were suspended in1500 μL water, carefully whirl mixed, sonicated for 15 min, and shaken for another 2 h. Afterextraction, 10% acetic acid was added to a final concentration of 1% acetic acid and then thesamples were centrifuged 5 min at 20,000 g. The supernatant was filtered through AmiconUltra 3 kDa cut-off filters (Millipore, Billerica, MA) at 14,000 g for 10 min.
LC-MS analysisLC-MS analyses of urine and feed samples were performed using a MicrOTOF-QMS (Bruker,Bremen, Germany) coupled with an Agilent 1200 series capillary HPLC (Agilent, Santa Clara,CA) following a method reported recently [33]. The HPLC was operated at a flow rate of 12 μL/min and the mobile phases consisted of Solution A (water + 0.1% acetic acid) and Solution B(acetonitrile + 0.1% acetic acid). A double injection program was adopted to load the calibrantsolution (10 mM sodium acetate) and sample individually with 2 min interval. For all analyses,
Effect of Hydrolyzed Casein on Metabolism
PLOSONE | DOI:10.1371/journal.pone.0118895 March 4, 2015 3 / 18

1 μL of calibrant and sample were used. A ZORBAX SB C18 column (0.5 x 150 mm, 3.5 μm,Agilent Technologies, Waldbronn, Germany) was used at 25°C for metabolite separation usingthe following gradient: 0% B for 2 min, linear gradient of 0–60% B in 12 min, 60–90% B in 3min, 90% B for 2 min, 90–0% B in 1 min and 0% B for 10 min. All analyses were carried out intriplicate. MS was operated in negative ion mode, and data were collected in profile format at afrequency of 1 Hz with Active Focus mode off. The m/z range was set to 40–1000 and other op-timized parameters were as follows: end plate offset, −500 V; capillary voltage, +3400 V; nebuliz-er pressure, 0.4 bar; dry gas flow, 4.0 L/min; dry temperature, 180°C; funnel 1 RF, 200 Vpp;funnel 2 RF, 200 Vpp; ISCID energy, 0 eV; hexapole RF, 100 Vpp; quadrupole ion energy, 5.0eV; collision energy, 6.0 eV; collision RF 60 Vpp, transfer time, 98.4 s; pre-pulse storage, 1.0 s.
Data preprocessing of LC-MS dataThe raw data were automatically calibrated using the acetate cluster signals in DataAnalysissoftware (Bruker Daltonics, Bremen, Germany) and converted to MZxml files using Com-passXport software (Bruker Daltonics, Bremen, Germany). The MZxml files were processedusing MZmine (version 2.9.1) [34]. The detailed parameters for each file process step were asdescribed recently [33]. For all of the metabolites discussed in the paper, the molecular for-mulas were further checked by SmartFormula software (Bruker Daltonics, Bremen, Germany)on the basis of high mass accuracy (< 2 mDa) and well-matched isotopic pattern (mSigmaScore< 10).
The full data set after MZmine processing is available as supplemental material (S1 Table).
Multivariate data analysisMultivariate data analysis was performed using the SIMCA-P+ software, version 12.0.1(Umetrics, Umeaa, Sweden). Principal component analysis (PCA) was applied to examineany intrinsic clustering of the data. Orthogonal partial least square analysis discriminantanalysis (OPLS-DA) was performed to maximize the separation between classified groups ofmice fed intact and hydrolyzed casein and to identify putative biomarkers. LC-MS data weremean-centered and scaled to unit-variance and cross-validated using full cross-validation.The quality of the model was determined by the goodness of prediction (Q2) and the fractionof Y explained by the model (R2Y). Furthermore, Cross Validated Analysis Of Variance (CV-ANOVA) [35] and cross-validated scores were used to test the robustness of the model. TheVIP value computed by the SIMCA software was used to select variables that contributed tothe discrimination between groups.
LC-MSmetabolite identificationAfter selection of important variables, MS2 experiments and database searches were applied[36–38] to characterize the discriminatory metabolites. The 50 most important LC-MS featuresidentified by the VIP value were further investigated. Furthermore, the list of discriminatoryfeatures was matched against the result from feed analysis, and m/z values that could be de-tected in feed extracts were excluded from further analyses.
Thiobarbituric acid reactive substances (TBARS)Liver samples were homogenized and the TBARS were quantified (expt. 2) after the principleof Schmedes and Hölmer [39] with modifications as described in detail previously [40].
Effect of Hydrolyzed Casein on Metabolism
PLOSONE | DOI:10.1371/journal.pone.0118895 March 4, 2015 4 / 18
Liver lipid analysisTotal lipids (expt. 2) were extracted from liver samples with chloroform: methanol, 2:1 (v:v).The lipid classes were analyzed on an automated Camaq HPTLC system and separated onHPTLC silica gel 60 F plates as previously described [41].
Quantitative reverse transcriptase PCR (RT-qPCR)Total RNA was purified from liver samples with TRIzol Reagent (Invitrogen, Grand Island,NY) and the quality was assessed with the NanoDrop ND-1000 UV-Vis Spectrophotometer(NanoDrop Technologies, Wilmington, DE) and the Agilent 2100 Bioanalyzer (Agilent Tech-nologies, Santa Clara, CA). A 50 μL reverse transcription (0.5μg total RNA) reaction was per-formed at 48°C for 60 min utilizing a GeneAmp PCR 9700 machine (Applied Biosystems,Foster City, CA). Individual RT reactions contained 1× TaqMan RT buffer (10×), 5.5 mMMgCl2, 500 μM dNTP (of each), oligo dT primers (2.5 μM), 0.4 U/μL RNase inhibitor, 1.25U/μL Multiscribe Reverse Transcriptase (N808–0234, Applied Biosystems, Foster City, CA)and RNase-free water. Quantitative reverse transcriptase PCR was run in 10 μL reactions ona LightCycler 480 Real-Time PCR System (Roche Applied Sciences, Rotkreuz, Switzerland)containing 2.0 μL cDNA and using SYBR Green Master Mix (Light Cycler 480 SYBR Greenmaster mix kit, Roche Applied Sciences, Rotkreuz, Switzerland). Gene-specific primers wereeither bought (Bio-Rad Laboratories, Coralville, IA) as mouse PrimePCR SYBR green Assays,Heme oxidase 1 (Hmox1), NAD(P)H dehydrogenase (quinone 1) (Nqo1), Glutamate—cyste-ine ligase catalytic subunit (Gclc), glutamate-cysteine ligase, modifier subunit (Gclm), Gly-cine-N-acyltransferase (Glyat); or designed (S2 Table) using Primer Express 2.0 (AppliedBiosystems, Foster City, CA). Relative gene expression was normalized to the expression of(Tbp, TATA box binding protein) (expt. 1 and 2).
Statistical analysis of liver dataAll data represent mean ± SE. All data sets were tested for homogeneity of variances usingLevene’s test. Data were analyzed using a factorial ANOVA test with protein level (L) and pro-tein form (F) as categorical predictors. In the case of an interaction effect between L × F, apost-hoc Fisher LSD test was performed. Data with heterogeneous variances were log-trans-formed before statistical analyses. P< 0.05 was considered significant. Statistics were per-formed with STATISTICA 9.0 (StatSoft, Tulsa, OK).
Results and DiscussionPreviously, we reported that at equal energy intake, obesity-prone C57BL/6J mice fed Westerndiets with extensively hydrolyzed casein after 8 weeks intervention had ~55% lower body massgain and ~70% reduction in white adipose tissue mass, as compared to mice fed intact caseindiets [24]. Concomitantly, both lower respiratory exchange ratio and reduced plasma concen-trations of glucose and lactate suggested decreased carbohydrate catabolism in mice fed hydro-lyzed casein diets [24]. NMR-based metabolomics indicated that fecal fat and branched-chainamino acid excretion were higher in mice given hydrolyzed casein diets, which probably couldexplain part, but not all, of the observed differences in the mice fed hydrolyzed vs intact casein[30]. In the present study, a LC-MS-based metabolomics analysis was performed on 48 hrsurine samples from the mice fed hydrolyzed or intact casein in order to further elucidate un-derlying mechanisms contributing to the observed phenotypic differences.
Effect of Hydrolyzed Casein on Metabolism
PLOSONE | DOI:10.1371/journal.pone.0118895 March 4, 2015 5 / 18

Intake of extensively hydrolyzed casein had large impact on the urinarymetabolomePCA was carried out on a total of 638 features detected by LC-MS in negative mode after theapplied preprocessing steps had been performed. The first principal component (PC) of thePCA model accounted for 24.6% of the total variation in the data and a very clear grouping ofthe mice fed intact or hydrolyzed casein was observed in the score plot. A tendency to an effectof protein level (16% versus 32%) was observed; urine from mice receiving 32% protein hadhigher positive and negative scores on PC1 for hydrolyzed and intact casein, respectively(Fig. 1). As PCA is an unsupervised method only directed by the inherent variation of the data-set, this result confirmed that intake of extensively hydrolyzed casein had a very strong and sig-nificant impact on the metabolic response that was decisive for the global urine metaboliteprofile. A valid OPLS-DA model (Q2 = 0.88, R2Y = 0.91, CV-ANOVA, p = 2.6E-12) with hy-drolyzed versus intact casein as the discriminant variable was constructed and an unblemisheddifferentiation of urine samples according to dietary protein source was observed in the cross-validated score plot (S1 Fig.). Based on the VIP values computed in the OPLS-DA model, the50 most important features for differentiating the two diets were identified (Table 1).
Ingestion of extensively hydrolyzed casein affects the urinary excretionof phase II metabolitesWhile the MS instrument allows the use of very accurate masses and isotope patterns for deter-mination of metabolite molecular formulae, identification is still obstructed by the fact thatmany metabolites are not available as authentic standards. The lack of standards reflects thevast number of intermediate metabolites and the diversity of metabolic reactions by whichthese metabolites can be transformed. This leads to a vast number of detected metabolites, ofwhich many have not yet been identified [42]. In the present study, we have determined molec-ular formulae of the most important discriminatory features and used MS2 to identify structur-al units of these compounds. We observed that many compounds could be detected at severalretention times, and attributed this to in-source fragmentation. As an example, a feature withan m/z of 435.140 and a molecular formula of C20H24N2O9 appeared three times in Table 1.The features with multiple appearances could be assigned to metabolites containing either glu-curonic acid, sulphate, or glycine moieties (see below), but an exact molecular assignment wasnot possible. We assumed that such repeated features had similar chemical structures, whiletheir precursors were different, and hence had different retention times. Several features (forinstance the 435.140 peak) were found to form adducts in the mass spectrometer and thereforeMS2 was insufficient to assign the precursor molecules. Therefore, in order to assign the pre-cursor molecules, perfect co-elution between precursor and fragment was required (Table 1).
Of the selected 50 discriminatory features, the majority could be assigned as molecules con-jugated with either glucuronic acid (193 or 175 m/z fragments), sulphate (80 or 97 m/z frag-ments), or glycine (74 m/z fragment). Eighteen features were most abundant in urine frommice given the intact casein diets, whereas 18 other features were most abundant in urine frommice fed the hydrolyzed casein diets. The remaining peaks could either be detected in the dietand were possibly contaminants (10 features) or were artifacts from the sodium acetate clusterused for calibration (4 features, not shown). Tandem mass spectrometry of the discriminatoryfeatures revealed that hydrolyzed casein feeding induced excretion of glucuronic acid conju-gates (11 of 18 features contained glucuronic acid) and sulphate conjugates (5 of 18 features).Interestingly, many of these compounds were completely absent in urine from mice that re-ceived intact casein (Fig. 2). Thus, the present data revealed a strong increase in the urinary ex-cretion of D-glucuronic acid and glucuronic acid- and sulphate-conjugated molecules in mice
Effect of Hydrolyzed Casein on Metabolism
PLOSONE | DOI:10.1371/journal.pone.0118895 March 4, 2015 6 / 18

fed hydrolyzed casein when compared to mice fed intact casein diets. Nine metabolites thatwere more abundant in urine from mice fed intact casein could be assigned as glycine conju-gates, while two metabolites were assigned as sulphate conjugates. One of the glycine conju-gates was tentatively assigned as salicyluric acid, and furthermore salicylic acid was moreabundant in urine from intact casein fed mice.
D-glucuronic acid and sulphate conjugates are Phase II metabolites in mammals and are oftenlinked to the xenobiotic metabolism of substances such as drugs, bilirubin, androgens, estrogens,mineralocorticoids, glucocorticoids, fatty acid derivatives, retinoids, and bile acids. However, whileglucuronidation and sulphation improves water solubility of metabolites and thereby involves a de-toxifying effect, glycine conjugation does not have the same effect on water solubility. This fact indi-cates that glycine conjugation may play another role than detoxification, and it was recentlysuggested that the function of glycine conjugation is to regulate body stores of glycine [43].
Expression of Phase II detoxifying genes is not altered by intake ofhydrolyzed caseinDespite the fact that we found different excretion patterns of conjugated metabolites, there wasno difference between the dietary groups in the hepatic expression of genes encoding enzymesinvolved in glucuronidation reactions (Ugt1a5, Ugt1a6b and Ugt2b34, Uridine 50-diphospho-glucuronosyltransferase), sulphate conjugations (Sult1a1, sulfotransferase) and glycine conju-gations (Glyat, glycine-N-acyltransferase) (Fig. 3). Several factors may explain this discrepancybetween gene expression and the 48 hrs urinary metabolome. Firstly, the 48 hrs urinary meta-bolome reflects metabolic status over time, enabling us to detect minor changes that will resultin phenotypic divergence over time, whereas gene expression data are measures reflecting the
Fig 1. PCA score plot of urinary metabolome data. Urine frommice fed diets containing intact (I) orhydrolyzed (H) casein at 16% energy or 32% energy was analyzed using LC-MS in negative mode.
doi:10.1371/journal.pone.0118895.g001
Effect of Hydrolyzed Casein on Metabolism
PLOSONE | DOI:10.1371/journal.pone.0118895 March 4, 2015 7 / 18

Table 1. Summary of the top 50 VIP features in urine identified from an OPLSDA model with intact versus hydrolyzed casein as discriminatingvariables.
VIPvalue
Rt m/z Molecularformula
Fragments, m/z Precursors Assignment Effecta
2.00 12.30 435.1405 C20H24N2O9 259.1071; 175.0243; 113.0248; 85.0287 533.1103 Glucuronic acid and sulphateconjugate
Hydrolyzed
2.00 14.25 193.036 C6H10O7 131.0721; 111.0073; 87.0047 Glucuronic acid Hydrolyzed
1.97 13.94 451.136 C20H24N2O10 435 + oxygen Hydrolyzed
1.92 15.05 435.141 C20H24N2O9 241.0963; 193.0358; 175.0247; 113.0244 533.1103 Glucuronic acid and sulphateconjugate
Hydrolyzed
1.91 14.11 399.141 C21H24N2O4S 241.1208; 205.0985; 193.0356;113.0252; 89.025
Glucuronic acid conjugate Hydrolyzed
1.91 14.29 433.126 259.1090; 239.0794; 193.0346;175.0275; 113.0244
643.2811 Glucuronic acid conjugate Hydrolyzed
1.90 14.39 435.141 C20H24N2O9 193.0348; 113.0244 Glucuronic acid and sulphateconjugate
Hydrolyzed
1.88 13.04 385.125 C16H22N2O9 No MS2 Hydrolyzed
1.87 14.62 386.138 C16H25N3O6S No MS2 Hydrolyzed
1.86 14.41 287.125 C12H20N2O6 No MS2 Hydrolyzed
1.86 15.05 193.036 C6H10O7 131.720 Glucuronic acid Hydrolyzed
1.85 12.32 371.056 C14H16N2O8S No MS2 Hydrolyzed
1.82 13.35 339.066 C14H16N2O6S 259.107; 181.0496; 153.0699 Sulphate conjugate Hydrolyzed
1.80 13.43 355.061 C14H16N2O7S 275.1021; 153.0713; 121.0298; 96.9605;79.955
Sulphate conjugate Hydrolyzed
1.80 13.18 193.037 C6H10O7 87.0086; 85.0259 387.141 Glucuronic acid Hydrolyzed
1.75 13.28 387.141 193.0355; 175.0254; 131.0328; 113.0247 569.1999 Glucuronic acid conjugate Hydrolyzed
1.73 14.30 401.156 C17H26N2O9 193.048; 113.0244 401.156 Glucuronic acid conjugate Hydrolyzed
1.70 14.10 193.036 C6H10O7 Glucuronic acid Hydrolyzed
1.91 4.69 170.898 No MS2 Intact
1.80 15.17 170.082 C8H13NO3 No MS2 Intact
1.79 16.86 425.18 C22H25N4O5 No MS2 Intact
1.78 18.51 198.113 C10H17NO3 154.1253; 74.0243 Glycine conjugate Intact
1.77 17.41 74.0241 C2H5NO2 Glycine Intact
1.77 4.71 108.902 No MS2 Intact
1.76 17.03 184.098 C9H15NO3 No MS2 Intact
1.76 4.61 390.796 No MS2 Intact
1.75 12.57 323.074 C11H20N2O5S2 204.0689; 158.0641; 126.0925; 96.9576;86.0253; 74.0070
Sulphate and glycineconjugate
Intact
1.75 18.53 199.115 74.0243 Glycine conjugate Intact
1.74 4.63 270.843 Intact
1.74 14.46 423.144 C17H24N6O5S Intact
1.73 16.87 186.079 C8H12NO4 74.0237 Glycine conjugate Intact
1.72 12.71 194.045 C9H9NO4 150.0548; 100.0038; 93.0335; 74.0232 Salicyluric acid, glycineconjugate
Intact
1.72 18.37 355.139 179.1077; 164.0848; 113.0245; 87.0079 Intact
1.71 14.30 137.024 C7H6O3 93.0340 salicylic acid Intact
1.71 14.10 408.09 296.0851; 210.0861; 143.0473; 96.959 Sulphate conjugate Intact
2.00 11.90 226.091 Diet
1.97 11.90 225.088 Diet
1.99 12.48 226.118 Diet
1.98 14.22 241.118 Diet
(Continued)
Effect of Hydrolyzed Casein on Metabolism
PLOSONE | DOI:10.1371/journal.pone.0118895 March 4, 2015 8 / 18

metabolic status of the animal at the time of sampling. Secondly, approximately one third ofthe ingested essential amino acids may be metabolized in the intestine mucosal cells [44], andcould therefore attenuate the amino acid in-flow to the portal vein. Thirdly, genes (cytosolicsulfotransferases and uridine diphosphate-glucuronosyl transferase) that govern the conjuga-tion are only weakly inducible [45], and may therefore not support the present/absent-behaviorof the conjugates detected in the present study. In addition, elevated gene expression is not a re-quirement for an increase in excreted Phase II metabolites, which also could be controlled bypost-translational regulation [46] or excretion in Phase III [47]. In fact, we did find elevated ex-pression of the Phase III enzyme glucuronide transporter Abcc3 (ATP binding cassette) [48] inmice fed hydrolyzed casein and this could contribute to the elevated level of glucuronic acidconjugates (Fig. 3). Finally, it should be noted that in our study we only measured hepatic gene
Table 1. (Continued)
VIPvalue
Rt m/z Molecularformula
Fragments, m/z Precursors Assignment Effecta
1.98 12.90 227.104 Diet
1.91 14.39 275.104 Diet
1.83 11.90 243.081 Diet
1.80 11.85 243.082 C10H16N2O3S Diet
1.75 13.26 291.097 Diet
1.72 13.14 259.076 Diet
a Hydrolyzed, most abundant in urine from mice fed hydrolyzed casein; Intact, most abundant in urine from mice fed intact casein; Diet, feature detected in
the diet
doi:10.1371/journal.pone.0118895.t001
Fig 2. Response patterns of selected LC-MS features in urine.Urine frommice fed diets containing intact (I) or hydrolyzed (H) casein, at 16% energy or32% energy from protein: glucuronic acid and sulphate conjugate, m/z 435.141 (A); glucuronic acid conjugate, m/z 399.141 (B); sulphate conjugate, m/z339.066 (C); glycine conjugate, m/z 214.108 (D); glycine and sulphate conjugate, m/z 323.074 (E); salicyluric acid (a glycine conjugate, F), m/z 194.045.
doi:10.1371/journal.pone.0118895.g002
Effect of Hydrolyzed Casein on Metabolism
PLOSONE | DOI:10.1371/journal.pone.0118895 March 4, 2015 9 / 18

expression. Phase II enzymes are expressed in most tissues and therefore it is possible that theregulation occurs in, for instance, the kidney rather than the liver [49,50].
It has previously been reported that the amount of dietary protein affects Phase I and II me-tabolism [51,52]. However, the exact mechanisms linking intake of hydrolyzed casein to an in-creased level of phase II metabolites in the urine remain unknown. Free amino acids may beabsorbed directly in the intestine. Therefore, the amino acids may be taken up more rapidlyand reach a higher concentration in the portal vein and liver. However, data from humans indi-cate that the difference between hydrolyzed and intact casein absorption is minimal and chemi-cal alterations of the protein source are probably also necessary in order to induce Phase I andPhase II metabolism [26,53]. Other dietary perturbations have also been shown to affect PhaseII metabolism using similar protein and lipid sources as in the present study; mice receiving alow fat diet had elevated RNA levels of hepatic Phase I and Phase II enzymes (Ugt, Sult) relativeto mice receiving a high fat diet [54] and recently, dietary restriction was reported to induceurinary excretion of phase II metabolites and hepatic expression of Phase II enzymes in rats[55]. By contrast, mice receiving a high fat diet excreted higher amounts of glycine conjugatesthan mice receiving a low fat diet [56]. From the literature, it appears that sulphate and
Fig 3. Liver gene expression related to Phase II metabolism.Gene expression in livers frommice fed diets containing intact (I) or hydrolyzed (H) casein at16% energy or 32% energy from protein was analyzed (n = 6–8).). Gene abbreviations: Abcc3, ATP-binding casette, sub-family c, member 3;Glyat, Glycine-N-acyltransferase; Sult1a1, Sulfotransferase Family, Cytosolic, 1A, Phenol-Preferring, Member 1; Ugt1a5, UDP glucuronosyltransferase 1 family,polypeptide A5;Ugt1a6b, UDP glucuronosyltransferase 1 family, polypeptide A6B;Ugt2b34, UDP glucuronosyltransferase 2 family, polypeptide B34. *Significant effect of hydrolysis, p< 0.05.
doi:10.1371/journal.pone.0118895.g003
Effect of Hydrolyzed Casein on Metabolism
PLOSONE | DOI:10.1371/journal.pone.0118895 March 4, 2015 10 / 18

glucuronic acid conjugation are associated with intake of a low fat diet, whereas glycine conju-gation is associated with intake of a high fat diet [55–57]. In the present study, despite all ani-mals receiving the same amount of dietary fat, we found higher contents of glycine conjugatesin the obese mice (fed intact casein) and higher content of sulphate and glucuronic acid conju-gates in the lean mice (fed hydrolyzed casein), supporting diverging roles of these conjugationpathways with regard to body composition.
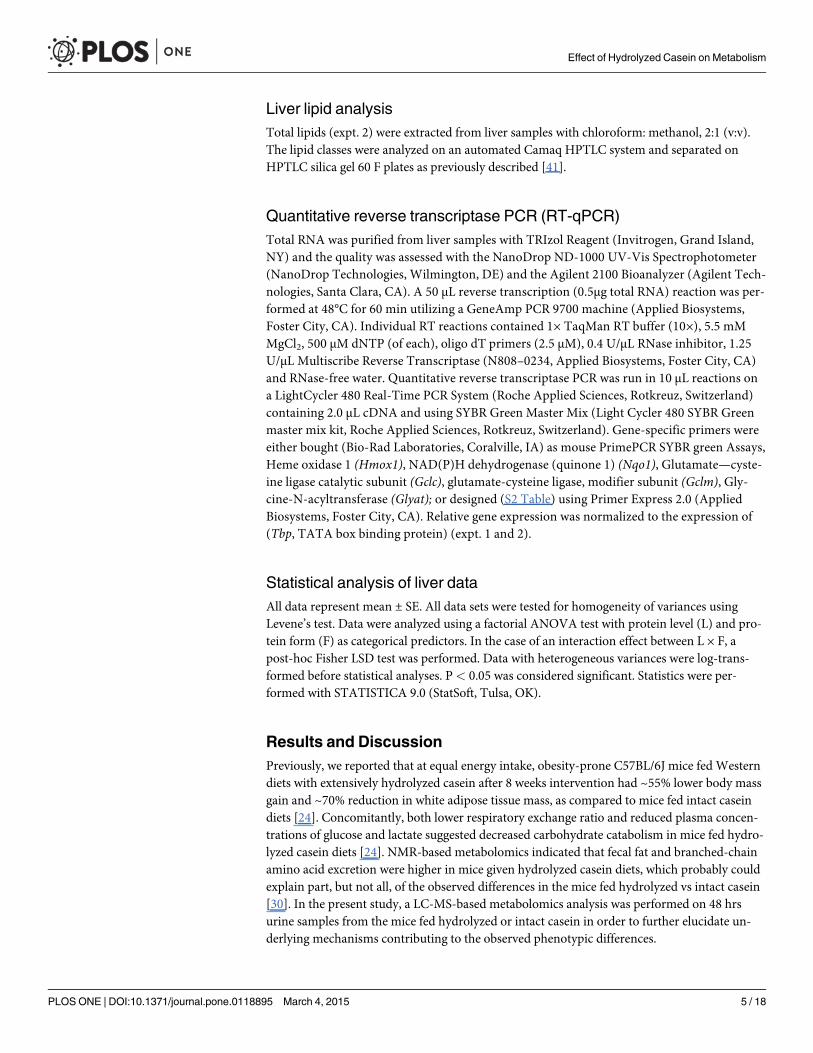
Possible role of Phase II detoxifying reactions in glucose and cysteinemetabolismWe have previously reported that mice fed the hydrolyzed casein diet had reduced fed stateplasma concentrations of glucose and insulin relative to those fed the intact casein diet [24].Moreover, fed state plasma concentration of the glucose catabolism marker lactate was lower,which, together with a tendency toward reduced respiratory quotient during the light phase,strongly indicated less usage of glucose as an energy substrate in the mice fed hydrolyzed caseinas compared to those fed intact casein diets [24]. NMR-based metabolomics confirmed re-duced glucose and lactate concentrations in liver and plasma, whereas hepatic glycogen con-centration was higher in mice fed the hydrolyzed casein as compared to those fed intact caseindiets [30]. Together, our results strongly indicate a shift from usage of carbohydrates as energysubstrate through glycolysis towards alternative metabolic usages of glucose, including storageas glycogen. Interestingly, in the body glucose can be metabolized to UDP-glucose, which sub-sequently can be used either in the synthesis of glycogen, or be further metabolized toD-glucuronic acid. Our LC-MS analyses in the present study suggest that more glucose wasconverted to D-glucuronic acid, facilitating Phase II conjugation and urinary excretion of glu-curonic acid conjugated compounds. Such a redirection of glucose from glycolysis could alsopotentially remove substrates used in de novo lipogenesis. We therefore measured liver lipidcontents and hepatic gene expression levels of enzymes involved in de novo lipogenesis. PCAscores and loadings of these data (Fig. 4A and 4B) showed that mice fed hydrolyzed caseinwere characterized by a decreased expression of genes involved in de novo lipid synthesis anddecreased content of free fatty acids and triacylglycerols. As shown in Fig. 4C–4F, expression oflipogenic genes (Srebf1 (Sterol regulatory element binding transcription factor 1), Acaca (Ace-tyl-Coenzyme A carboxylase alpha), Fasn (Fatty acid synthase), and Scd1 (Stearoyl-CoenzymeA desaturase 1)) was significantly decreased after feeding with hydrolyzed casein, indicatingthat de novo lipid synthesis was repressed. Furthermore, liver free fatty acids (FFA) and lyso-phosphocholine were reduced in mice fed hydrolyzed casein relative to those fed intact caseindiets, while a significant effect on the content of steryl esters (SE) and triacylglycerols (TAG)could not be established (Fig. 4J–4M). Therefore, we speculate that ingestion of extensively hy-drolyzed casein in mice facilitates reduction of glucose concentrations by increasing glycogendeposition [30], as well as by increasing conversion of glucose to D-glucuronic acid, which sub-sequently can lead to decreased deposition of lipids (Fig. 5).
Sulphate is, together with glutathione and taurine, synthesized from the sulphur amino acidcysteine [58]. A major determinant of glutathione synthesis is the availability of cysteine [59],and since the level of free cysteine is kept low in the liver, it has been suggested that glutathioneis a hepatic cysteine reservoir [59,60]. In our previous paper we reported that hepatic concen-trations of glutathione and taurine were increased in mice fed hydrolyzed casein, indicatinghigher cysteine availability relative to those of mice fed intact casein [30]. If availability of cyste-ine was higher in hydrolyzed casein fed mice, it is also likely that more sulphate was synthe-sized from cysteine, which could explain the higher urinary excretion of sulphate conjugatedcompounds in the present study (Fig. 5).
Effect of Hydrolyzed Casein on Metabolism
PLOSONE | DOI:10.1371/journal.pone.0118895 March 4, 2015 11 / 18

Hepatic Nrf-2 and p53 regulated gene expressionIntake of extensively hydrolyzed casein diets increased fed-state plasma β-hydroxybutyrateconcentration, indicating an increased hepatic mitochondrial ketogenesis in mice [24,30]. Mi-tochondrial respiration, including ketogenesis, is a major source of reactive oxygen species andmay result in accumulation of oxidation products. We therefore measured the TBARS level inliver tissue and found a small but significantly higher level of TBARS in mice fed hydrolyzedcasein compared with mice fed intact casein (Fig. 6A), indicating differences in oxidative stressbetween treatment groups.
Regulatory pathways that may be induced by oxidative stress include the nuclear factor ery-throid 2-related factor (Nrf-2) regulated pathways [61]. Wen et al found that an increased level
Fig 4. Liver lipogenic gene expression and lipid composition. PCA score plot (A) and loading plot (B) of liver genes related to lipogenesis and lipidcomposition data frommice fed diets containing intact (I) or hydrolyzed (H) casein, at 16% energy or 32% energy from protein (n = 5–6). Furthermore,selected data of liver gene expression (C-F) and lipid composition (J-M) are shown. These data are presented as means ± SE and p values of the effects ofprotein level (L), protein form (F) and the interaction (L × F) are shown in the inserts. Abbreviations: PS, phosphatidylserine; PI, phosphatidylinositol; PC,phosphatidylcholine; PE, phosphatidylethanolamine; CL, cardiolipin; SM, sphingomyelin; LPC, lyso-phosphatidylcholine; FFA, free fatty acids; Chol,cholesterol (free); SE, sterylester (sterol + fatty acid); TAG, triacylglycerol. Gene abbrevations: Srebf1, Sterol regulatory element binding transcription factor1; Acaca, Acetyl-Coenzyme A carboxylase alpha; Fasn, Fatty acid synthase; Scd1, Stearoyl-Coenzyme A desaturase 1.
doi:10.1371/journal.pone.0118895.g004
Effect of Hydrolyzed Casein on Metabolism
PLOSONE | DOI:10.1371/journal.pone.0118895 March 4, 2015 12 / 18
of Phase II metabolites in urine was caused by activation of the Nrf-2 pathway [55], and hence,in the present study, both increased oxidative stress and excretion of Phase II metabolites sug-gested that the Nrf-2 pathway was activated in mice receiving hydrolyzed casein. Furthermore,Nrf-2 has been shown to inhibit hepatic lipogenesis [62] and an induction of Nrf-2 by high fatdiets has been observed [63]. Therefore, we measured expression of Nrf-2 target genes in liversfrom mice fed intact or hydrolyzed casein. However, no significantly different expression ofgenes encoding the antioxidant enzymes Hmox1 (heme oxidase 1) or Nqo1 (NAD(P)H dehy-drogenase, quinone 1),Me (malic enzyme), the glutathione synthesizing enzymes Gclc (Gluta-mate—cysteine ligase catalytic subunit), Gclm (Glutamate—cysteine ligase modulator subunit)and Gss (glutathione synthase) was observed between the mice fed the different diets (Fig. 6B).However, expression of the gene encoding the negative regulator of the p53 tumor suppressor,Mdm2 (Mouse double minute 2 homolog) was down-regulated in mice fed hydrolyzed casein
Fig 5. Summary of Metabolic alterations induced by ingestion of extensively hydrolyzed casein inmice.Metabolites given in red decreased after intake of hydrolyzed casein, whereas metabolites in blueincreased. Mice fed diets with hydrolyzed casein have reduced plasma glucose levels [24] as well as reducedliver glucose and lactate concentrations [30]. Concomitantly, mice fed hydrolyzed casein diets exhibit ahigher liver glycogen concentration [30], indicating a shift in glucose metabolism from glycolysis toward UDP-glucose synthesis, which is the intermediate substrate used both for glycogen- and D-glucuronic acidsynthesis. The increased urinary abundance of D-glucuronic acid conjugated substances identified in thepresent study further supports such a switch in glucose metabolism by hydrolyzed casein feeding. The liverglutathione and taurine levels were shown to be increased in mice fed hydrolyzed casein [30], indicatinghigher hepatic cysteine availability in these mice. As cysteine is the precursor for sulphate synthesis, higherhepatic cysteine availability could explain the higher urinary content of sulphate-conjugated molecules in thehydrolyzed casein fed mice observed in the present study. In summary, these metabolic alterations inducedby intake of hydrolyzed casein facilitate both the reduced plasma glucose levels and increased urinary levelsof Phase II conjugated molecules.
doi:10.1371/journal.pone.0118895.g005
Effect of Hydrolyzed Casein on Metabolism
PLOSONE | DOI:10.1371/journal.pone.0118895 March 4, 2015 13 / 18

Fig 6. Liver TBARS and gene expression related to oxidative stress and glucosemetabolism. TBARS(A), expression of Nrf-2 (B) and p53 target genes (C) in livers frommice fed diets containing intact (I) orhydrolyzed (H) casein, at 16% energy or 32% energy from protein (n = 6–8). * Significant effect of hydrolysis,p< 0.05.
doi:10.1371/journal.pone.0118895.g006
Effect of Hydrolyzed Casein on Metabolism
PLOSONE | DOI:10.1371/journal.pone.0118895 March 4, 2015 14 / 18

(Fig. 6B), suggesting that p53 regulated pathways were modulated by hydrolyzed casein feed-ing. Interestingly, p53 is involved in regulation of both glucose metabolism and oxidative stressresponse [64]. Therefore, we measured hepatic gene expression of p53 target genes. However,we were unable to detect different expression levels of Gpx1 (glutathione peroxidase 1) or Tigar(TP53-induced glycolysis and apoptosis regulator) between the dietary groups (Fig. 6C).Hence, based on hepatic gene expression analyses, we could not establish a regulatory role ofneither Nrf-2 nor p53 in relation to the observed changes in Phase II metabolism, oxidativestress and lipogenesis in the present study.
ConclusionIntake of extensively hydrolyzed as compared to intact casein has been associated with de-creased body fat accretion and reduced plasma glucose and lipid concentrations. The presentstudy indicated that Phase II and liver lipid metabolism were significantly regulated by intakeof hydrolyzed casein; the excretion pattern of Phase II conjugates and liver lipogenesis werestrongly affected by protein form. Moreover, based on the present and previous studies [24,30],we speculate that the increased urinary excretion of D-glucuronic acid conjugated moleculescontributed to the lower plasma and tissue glucose levels, as well as lower tissue fat accretionobserved in mice fed extensively hydrolyzed casein diets. However, it is uncertain whether thiscontribution is quantitatively important, and further experiments are needed to confirm this.
Supporting InformationS1 Fig. Cross-validated OPLS-DA scoreplot of urinary metabolome data. Urine from micefed diets containing intact (I) or hydrolyzed (H) casein at 16% energy or 32% energy was ana-lyzed using LC-MS in negative mode(DOCX)
S1 Table. Raw LCMS data.(XLSX)
S2 Table. Oligonucleotide probes rt-qPCR(XLSX)
Author ContributionsConceived and designed the experiments: HHL BL KK HCB LM. Performed the experiments:HHL DBD. Analyzed the data: HHL MRC XZ CCY BL. Contributed reagents/materials/analy-sis tools: DBD HHL MRC XZ CCY. Wrote the paper: MRC CCY BL HCB KK. Read and ap-proved the manuscript: HHL BL KK HCB LM DBDMRC XZ CCY BL
References1. Johnston CS, Day CS, Swan PD Postprandial thermogenesis is increased 100% on a high-protein,
low-fat diet versus a high-carbohydrate, low-fat diet in healthy, young women. J Am Coll Nutr. 2002;21: 55–61. PMID: 11838888
2. Acheson K, Blondel-Lubrano A, Oguey-Araymon S, Beaumont M, Emady-Azar S, Ammon-Zufferey C,et al. Protein choices targeting thermogenesis and metabolism. Am J Clin Nutr. 2011; 93: 525–534.doi: 10.3945/ajcn.110.005850 PMID: 21228266
3. Potier M, Darcel N, Tomé D Protein, amino acids and the control of food intake. Curr Opin Clin NutrMetab Care. 2009; 12: 54–58. doi: 10.1097/MCO.0b013e32831b9e01 PMID: 19057188
4. Blouet C, Mariotti F, Azzout-Marniche D, Bos C, Mathé V, Tomé D, et al. The reduced energy intake ofrats fed a high-protein low-carbohydrate diet explains the lower fat deposition, but macronutrient substi-tution accounts for the improved. J Nutr. 2006; 136: 1849–1854. PMID: 16772448
Effect of Hydrolyzed Casein on Metabolism
PLOSONE | DOI:10.1371/journal.pone.0118895 March 4, 2015 15 / 18

5. Pichon L, Huneau J, Fromentin G, Tomé D A high-protein, high-fat, carbohydrate-free diet reduces en-ergy intake, hepatic lipogenesis, and adiposity in rats. J Nutr. 2006; 136: 1256–1260. PMID: 16614413
6. Lacroix M, Gaudichon C, Martin A, Morens C, Mathé V, Tomé D, et al. A long-term high-protein dietmarkedly reduces adipose tissue without major side effects in Wistar male rats. Am J Physiol RegulIntegr Comp Physiol. 2004; 287: R934–R942. PMID: 15155276
7. Klaus S Increasing the protein:carbohydrate ratio in a high-fat diet delays the development of adiposityand improves glucose homeostasis in mice. J Nutr. 2005; 135: 1854–1858. PMID: 16046708
8. Ma T, Liaset B, Hao Q, Petersen RK, Fjære E, Ngo HT, et al. Sucrose counteracts the anti-inflammatoryeffect of fish oil in adipose tissue and increases obesity development in mice. PLoS One. 2011; 6:e21647. doi: 10.1371/journal.pone.0021647 PMID: 21738749
9. Madsen L, Pedersen LM, Liaset B, Ma T, Petersen RK, van den Berg S, et al. cAMP-dependent signal-ing regulates the adipogenic effect of n-6 polyunsaturated fatty acids. J Biol Chem. 2008; 283:7196–7205. PMID: 18070879
10. Hao Q, Lillefosse HH, Fjaere E, Myrmel LS, Midtbø LK, Jarlsby RH, et al. High-glycemic index carbohy-drates abrogate the antiobesity effect of fish oil in mice. Am J Physiol Endocrinol Metab. 2012; 302:E1097–E1112. doi: 10.1152/ajpendo.00524.2011 PMID: 22338077
11. Skov AR, Toubro S, Rønn B, Holm L, Astrup A Randomized trial on protein vs carbohydrate in ad libi-tum fat reduced diet for the treatment of obesity. Int J Obes Relat Metab Disord. 1999; 23: 528–536.PMID: 10375057
12. Layman D, Shiue H, Sather C, Erickson D, Baum J Increased dietary protein modifies glucose and insu-lin homeostasis in adult women during weight loss. J Nutr. 2003; 133: 405–410. PMID: 12566475
13. Foster G, Wyatt H, Hill J, McGuckin B, Brill C, Mohammed S, et al. A randomized trial of a low-carbohy-drate diet for obesity. N Engl J Med. 2003; 348: 2082–2090. PMID: 12761365
14. Baer D, Stote K, Paul D, Harris K, Rumpler W, Clevidence BWhey protein but not soy protein supple-mentation alters body weight and composition in free-living overweight and obese adults. J Nutr. 2011;141: 1–6. doi: 10.3945/jn.110.134106 PMID: 21106929
15. Takahira M, Noda K, Fukushima M, Zhang B, Mitsutake R, Uehara Y, et al. Randomized, Double-Blind,Controlled, Comparative Trial of Formula Food Containing Soy Protein vs. Milk Protein in Visceral FatObesity. Circ J. 2011; 75: 2235–2243. PMID: 21768737
16. Tranberg B, Hellgren LI, Lykkesfeldt J, Sejrsen K, Jeamet A, Rune I, et al. Whey protein reduces earlylife weight gain in mice fed a high-fat diet. PLoS One. 2013; 8: e71439. doi: 10.1371/journal.pone.0071439 PMID: 23940754
17. Lillefosse H, Clausen M, Yde CC, Ditlev DB, Zhang X, Du Z-Y, et al. Loss of Tricarboxylic Acid Cycle In-termediates as Revealed by Metabolomics Studies—An Underlying Mechanism to Reduce Lipid Accre-tion byWhey Protein Ingestion. J Proteome Res. 2014; 13: 2560–2570. doi: 10.1021/pr500039t PMID:24702026
18. Shi J, Tauriainen E, Martonen E, Finckenberg P, Ahlroos-Lehmus A, Tuomainen A, et al. Whey proteinisolate protects against diet-induced obesity and fatty liver formation. Int Dairy J. 2011; 21: 513–522.
19. Aoyama T, Fukui K, Takamatsu K, Hashimoto Y, Yamamoto T Soy protein isolate and its hydrolysatereduce body fat of dietary obese rats and genetically obese mice (yellow KK). Nutrition. 2000; 16:349–354. PMID: 10793303
20. Itoh H, Kishi T, Chibata I Comparative effects of casein and amino acid mixture simulating casein ongrowth and food intake in rats. J Nutr. 1973; 103: 1709–1715. PMID: 4752973
21. Kim KM, Chang UJ, Kang DH, Kim JM, Choi YM, Suh HJ Yeast hydrolysate reduces body fat of dietaryobese rats. Phytother Res. 2004; 18: 950–953. PMID: 15597316
22. Broccali G, Berti M, Pistolesi E, Cestaro B Hydrolyzed milk-serum peptides reduce body weight and fatcontent of dietary obese rats ameliorating their antioxidant status and liver functions. Panminerva Med.2005; 47: 123–129. PMID: 16210997
23. Liaset B, Madsen L, Hao Q, Criales G, Mellgren G, Marschall H-U, et al. Fish protein hydrolysate ele-vates plasma bile acids and reduces visceral adipose tissue mass in rats. Biochim Biophys Acta. 2009;1791: 254–262. doi: 10.1016/j.bbalip.2009.01.016 PMID: 19416649
24. Lillefosse HH, Tastesen HS, Du Z, Ditlev D, Thorsen F, Madsen L, et al. Hydrolyzed Casein ReducesDiet-Induced Obesity in Male C57BL/6J Mice. J Nutr. 2013; 143: 1367–1375. doi: 10.3945/jn.112.170415 PMID: 23843475
25. Liaset B, Hao Q, Jørgensen H, Hallenborg P, Du Z-Y, Ma T, et al. Nutritional regulation of bile acid me-tabolism is associated with improved pathological characteristics of the metabolic syndrome. J BiolChem. 2011; 286: 28382–28395. doi: 10.1074/jbc.M111.234732 PMID: 21680746
26. Stanstrup J, Rasmussen JE, Ritz C, Holmer-Jensen J, Hermansen K, Dragsted LO Intakes of wheyprotein hydrolysate and whole whey proteins are discriminated by LC—MSmetabolomics.
Effect of Hydrolyzed Casein on Metabolism
PLOSONE | DOI:10.1371/journal.pone.0118895 March 4, 2015 16 / 18

Metabolomics. 2013; Available: http://link.springer.com/10.1007/s11306-013-0607-9. Accessed 17January 2014.
27. Yin Y, Huang R, Libao-Mercado A, Jeaurond E, de Lange C, Rademacher M Effect of including purifiedjack bean lectin in casein or hydrolysed casein-based diets on apparent and true ileal amino acid di-gestibility in the growing pig. Anim Sci. 2004; 79: 283–291.
28. Lacroix M, Bos C, Léonil J, Airinei G, Luengo C, Daré S, et al. Compared with casein or total milk pro-tein, digestion of milk soluble proteins is too rapid to sustain the anabolic postprandial amino acid re-quirement. Am J Clin Nutr. 2006; 84: 1070–1079. PMID: 17093159
29. Rérat A Nutritional supply of proteins and absorption of their hydrolysis products: consequences on me-tabolism. Proc Nutr Soc. 1993; 52: 335–344. PMID: 8234355
30. Yde CC, Clausen MR, Ditlev DB, Lillefosse H, Madsen L, Kristiansen K, et al. Multi-block PCA andmulti-compartmental study of the metabolic responses to intake of hydrolysed versus intact casein inC57BL/6J mice by NMR-based metabolomics. Metabolomics. 2014; Available: http://link.springer.com/10.1007/s11306-014-0623-4. Accessed 30 January 2014.
31. Kristensen M, Engelsen SB, Dragsted LO LC—MSmetabolomics top-down approach reveals new ex-posure and effect biomarkers of apple and apple-pectin intake. Metabolomics. 2011; 8: 64–73.
32. Yde CC, Westerhuis J a, Bertram HC, Bach Knudsen KE Application of NMR-based metabonomicssuggests a relationship between betaine absorption and elevated creatine plasma concentrations incatheterised sows. Br J Nutr. 2012; 107: 1603–1615. doi: 10.1017/S0007114511004909 PMID:22673149
33. Zhang X, Clausen MR, Zhao X, Zheng H, Bertram HC Enhancing the power of liquid chromatography-mass spectrometry- based urine metabolomics in negative ion mode by optimization of the additive.Anal Chem. 2012; 84: 7785–7792. doi: 10.1021/ac3013835 PMID: 22888765
34. Pluskal T, Castillo S, Villar-Briones A, Oresic MMZmine 2: Modular framework for processing, visualiz-ing, and analyzing mass spectrometry-based molecular profile data. BMC Bioinformatics. 2010; 11:395. doi: 10.1186/1471-2105-11-395 PMID: 20650010
35. Eriksson L, Trygg J, Wold S CV-ANOVA for significance testing of PLS and OPLS—models. J Che-mom. 2008; 22: 594–600.
36. Wishart DS, Knox C, Guo AC, Eisner R, Young N, Gautam B, et al. HMDB: a knowledgebase for thehuman metabolome. Nucleic Acids Res. 2009; 37: D603–D610. doi: 10.1093/nar/gkn810 PMID:18953024
37. Smith CA, O’Maille G, Want EJ, Qin C, Trauger SA, Brandon TR, et al. METLIN—Ametabolite massspectral database. Ther Drug Monit. 2005; 27: 747–751. PMID: 16404815
38. Wishart DS, Jewison T, Guo AC, Wilson M, Knox C, Liu Y, et al. HMDB 3.0—The Human MetabolomeDatabase in 2013. Nucleic Acids Res. 2013; 41: D801–D807. doi: 10.1093/nar/gks1065 PMID:23161693
39. Schmedes A, Hølmer G A new thiobarbituric acid (TBA) method for determining free malondialdehyde(MDA) and hydroperoxides selectively as a measure of lipid peroxidation. J Am Oil Chem Soc. 1989; 6:813–817.
40. Hamre K, Næss T, Espe M, Holm J, LieØA formulated diet for Atlantic halibut (Hippoglossus hippoglos-sus, L.) larvae. Aquac Nutr. 2001; 7: 123–132.
41. Liaset B, Julshamn K, Espe M Chemical composition and theoretical nutritional evaluation of the pro-duced fractions from enzymic hydrolysis of salmon frames with ProtamexTM. Process Biochem. 2003;38: 1747–1759.
42. Roux A, Xu Y, Heilier J-F, Olivier M-F, Ezan E, Tabet J-C, et al. Annotation of the human adult urinarymetabolome and metabolite identification using ultra high performance liquid chromatography coupledto a linear quadrupole ion trap-Orbitrap mass spectrometer. Anal Chem. 2012; 84: 6429–6437. doi: 10.1021/ac300829f PMID: 22770225
43. Beyoğlu D, Smith RL, Idle JR Dog bites man or man bites dog? The enigma of the amino acid conjuga-tions. Biochem Pharmacol. 2012; 83: 1331–1339. doi: 10.1016/j.bcp.2011.12.031 PMID: 22227274
44. Stoll B, Henry J, Reeds PJ, Yu H, Jahoor F, Burrin DG Catabolism dominates the first-pass intestinalmetabolism of dietary essential amino acids in milk protein-fed piglets. J Nutr. 1998; 128: 606–614.PMID: 9482771
45. Zamek-Gliszczynski MJ, Hoffmaster K a, Nezasa K, Tallman MN, Brouwer KLR Integration of hepaticdrug transporters and phase II metabolizing enzymes: mechanisms of hepatic excretion of sulfate, glu-curonide, and glutathione metabolites. Eur J Pharm Sci. 2006; 27: 447–486. PMID: 16472997
46. Basu NK, Kole L, Owens IS Evidence for phosphorylation requirement for human bilirubin UDP-glucur-onosyltransferase (UGT1A1) activity. Biochem Biophys Res Commun. 2003; 303: 98–104. PMID:12646172
Effect of Hydrolyzed Casein on Metabolism
PLOSONE | DOI:10.1371/journal.pone.0118895 March 4, 2015 17 / 18

47. Xu C, Li CY-T, Kong A-NT Induction of phase I, II and III drug metabolism/transport by xenobiotics.Arch Pharm Res. 2005; 28: 249–268. PMID: 15832810
48. Geier A, Wagner M, Dietrich CG, Trauner M Principles of hepatic organic anion transporter regulationduring cholestasis, inflammation and liver regeneration. Biochim Biophys Acta. 2007; 1773: 283–308.Available: http://www.ncbi.nlm.nih.gov/pubmed/17291602. Accessed 6 June 2014. PMID: 17291602
49. Dooley TP, Haldeman-Cahill R, Joiner J, Wilborn TWExpression profiling of human sulfotransferaseand sulfatase gene superfamilies in epithelial tissues and cultured cells. Biochem Biophys Res Com-mun. 2000; 277: 236–245. Available: http://www.ncbi.nlm.nih.gov/pubmed/11027669. Accessed 17December 2014. PMID: 11027669
50. Shelby M, Cherrington N, NR V, CD K Tissue mRNA expression of the rat UDP-glucuronosyltransfer-ase gene family. Drug Metab Dispos. 2003; 31: 326–333. Available: http://dmd.aspetjournals.org/content/31/3/326.short. Accessed 17 December 2014. PMID: 12584160
51. Butler LE, DautermanWC The Effect of Dietary Protein Levels on Xenobiotic Biotransformations inF344 Male Rats. Toxicol Appl Pharmacol. 1988; 95: 301–310. PMID: 3420617
52. Woodall GM, DautermanWC, DeMarini DM Effect of dietary casein levels on activation of promutagensin the spiral Salmonella mutagenicity assay. II. Studies with induced rat liver S9. Mutat Res. 1996; 360:127–143. PMID: 8649465
53. Calbet JAL, Holst JJ Gastric emptying, gastric secretion and enterogastrone response after administra-tion of milk proteins or their peptide hydrolysates in humans. Eur J Nutr. 2004; 43: 127–139. PMID:15168035
54. Ghose R, Omoluabi O, Gandhi A, Shah P, Strohacker K, Carpenter KC, et al. Role of high-fat diet in reg-ulation of gene expression of drug metabolizing enzymes and transporters. Life Sci. 2011; 89: 57–64.Available: http://www.pubmedcentral.nih.gov/articlerender.fcgi?artid=3156825&tool =pmcentrez&rendertype = abstract. Accessed 18 December 2013. doi: 10.1016/j.lfs.2011.05.005 PMID:21620874
55. Wen H, Yang H-J, An YJ, Kim JM, Lee DH, Jin X, et al. Enhanced phase II detoxification contributes tobeneficial effects of dietary restriction as revealed by multi-platformmetabolomics studies. Mol Cell Pro-teomics. 2013; 12: 575–586. doi: 10.1074/mcp.M112.021352 PMID: 23230277
56. Boulangé C, Claus S, Chou C, Collino S, Montoliu I, Kochhar S, et al. Early Metabolic Adaptation inC57BL/6 Mice Resistant to High Fat Diet InducedWeight Gain Involves an Activation of MitochondrialOxidative Pathways. J Proteome Res. 2013; 12: 1956–1968. doi: 10.1021/pr400051s PMID:23473242
57. Köhle C, Bock KWCoordinate regulation of Phase I and II xenobiotic metabolisms by the Ah receptorand Nrf2. Biochem Pharmacol. 2007; 73: 1853–1862. PMID: 17266942
58. Stipanuk M, Dominy J, Lee J-I, Coloso R Mammalian cysteine metabolism: new insights into regulationof cysteine metabolism. J Nutr. 2006; 136: 1652–1659. PMID: 16702335
59. Lu SC Regulation of hepatic glutathione synthesis: current concepts and controversies. FASEB J.1999; 13: 1169–1183. PMID: 10385608
60. Tateishi N, Higashi T, Naruse A, Nakashima K, Shiozaki H, Sakamoto Y Rat liver glutathione: possiblerole as a reservoir of cysteine. J Nutr. 1977; 107: 51–60. PMID: 13167
61. Motohashi H, Yamamoto M Nrf2-Keap1 defines a physiologically important stress response mecha-nism. Trends Mol Med. 2004; 10: 549–557. PMID: 15519281
62. Kay HY, KimWD, Hwang SJ, Choi H-S, Gilroy RK, Wan Y-JY, et al. Nrf2 inhibits LXRα-dependent he-patic lipogenesis by competing with FXR for acetylase binding. Antioxid Redox Signal. 2011; 15:2135–2146. doi: 10.1089/ars.2010.3834 PMID: 21504366
63. Vomhof-Dekrey EE, Picklo MJ The Nrf2-antioxidant response element pathway: a target for regulatingenergy metabolism. J Nutr Biochem. 2012; 23: 1201–1206. doi: 10.1016/j.jnutbio.2012.03.005 PMID:22819548
64. Bensaad K, Vousden KH P53: New Roles in Metabolism. Trends Cell Biol. 2007; 17: 286–291. PMID:17481900
Effect of Hydrolyzed Casein on Metabolism
PLOSONE | DOI:10.1371/journal.pone.0118895 March 4, 2015 18 / 18
Copyright © 2022 FDOKUMEN


![Peripherally administered [Nle4, D-Phe7]-MSH increases resting metabolic rate, while peripheral AgRP has no effect, in wild type C57BL/6 and ob/ob mice.](https://static.fdokumen.com/doc/165x107/631268023ed465f0570a36fc/peripherally-administered-nle4-d-phe7-msh-increases-resting-metabolic-rate-while.jpg)