Large Melting-Point Hysteresis of Ge Nanocrystals Embedded in SiO2
www.elsevier.com/locate/gca
Geochimica et Cosmochimica Acta 70 (2006) 480–503
Partial melting processes above subducting plates:Constraints from 231Pa–235U disequilibria
Simon Turner a,b,*, Marcel Regelous a, Chris Hawkesworth a, Kia Rostami a
a Department of Earth Sciences, Wills Memorial Building, University of Bristol, Bristol BS8 1RJ, UKb GEMOC, Department of Earth and Planetary Sciences, Macquarie University, Sydney, NSW 2109, Australia
Received 25 April 2005; accepted in revised form 7 September 2005
Abstract
The processes involved in the formation and transport of partial melts above subducting plates remain poorly constrained relative tothose at mid-ocean ridges. In particular, 238U–230Th–226Ra disequilibria, that might normally be used to constrain melting dynamics,tend to be swamped by the effects of fluid addition from the down-going plate. The 231Pa–235U system provides an exciting exceptionto this because the highly incompatible nature of Pa means that fractionation and in-growth during partial melting overwrite the effectsof fluid U addition. We present 231Pa–235U data on 50 well-characterised lavas from seven subduction zones in order to examine partialmelting processes. Measured (231Pa/235U) ratios are all >1 and 15% are >2. Overall (231Pa/235U) shows broad positive correlations with(230Th/238U) and La/Yb and negative trends against Ba/Th and (226Ra/230Th). These systematics can differ from arc to arc but suggestthat (231Pa/235U) tends to be higher in sediment-rich arc lavas where the effects of fluid addition are muted and there is less of a 231Padeficit for melting to overprint. We have explored the effects of decompression melting, frictional drag dynamic melting with and withoutageing subsequent to fluid U addition to the wedge as well as flux melting models. Globally, average (231Pa/235U) appears to correlatenegatively with convergence rate and so in the numerical models we use the local subduction rate for the rate of matrix flow through themelting zone. Using this assumption and reasonable values for other parameters, the melting models can simulate the overall range of(231Pa/235U) and some of the data trends. However, it is clear that local variations in some parameters, especially source composition andextent of melting, exert a major influence on 231Pa–235U disequilibria. Some data, which lie at a high angle to the modelled trends, may beexplained by mixing between small degree hydrous melts formed near the slab and larger degree, decompression melts produced at shal-low depth.� 2005 Elsevier Inc. All rights reserved.
1. Introduction
Understanding the way in which partial melting occurswithin the Earth is crucial to models for heat transferand plate tectonics as well as to the study of volcanism ingeneral. At mid-ocean ridges, adiabatic decompressionprovides a simple and physically robust melting modeland U-series disequilibria data have been used to constrainthe rates at which the up-welling and melting occur as wellas the threshold porosity at which melt is expelled from themantle matrix (McKenzie, 1985; Spiegelman and Elliott,1993). At subduction zones, U-series data have provided
0016-7037/$ - see front matter � 2005 Elsevier Inc. All rights reserved.
doi:10.1016/j.gca.2005.09.004
* Corresponding author. Fax: +61 2 9850 6904.E-mail address: [email protected] (S. Turner).
a wealth of information on the timing and mechanisms offluid addition from the descending plate because of thepreferential mobility of U and Ra relative to Th in oxidis-ing, aqueous fluids (see Turner et al., 2003 for a recent re-view). Nevertheless, in contrast to mid-ocean ridges, muchless is known about the processes of partial melt formationat subduction zones, despite their importance in both theformation and recycling of crustal materials.
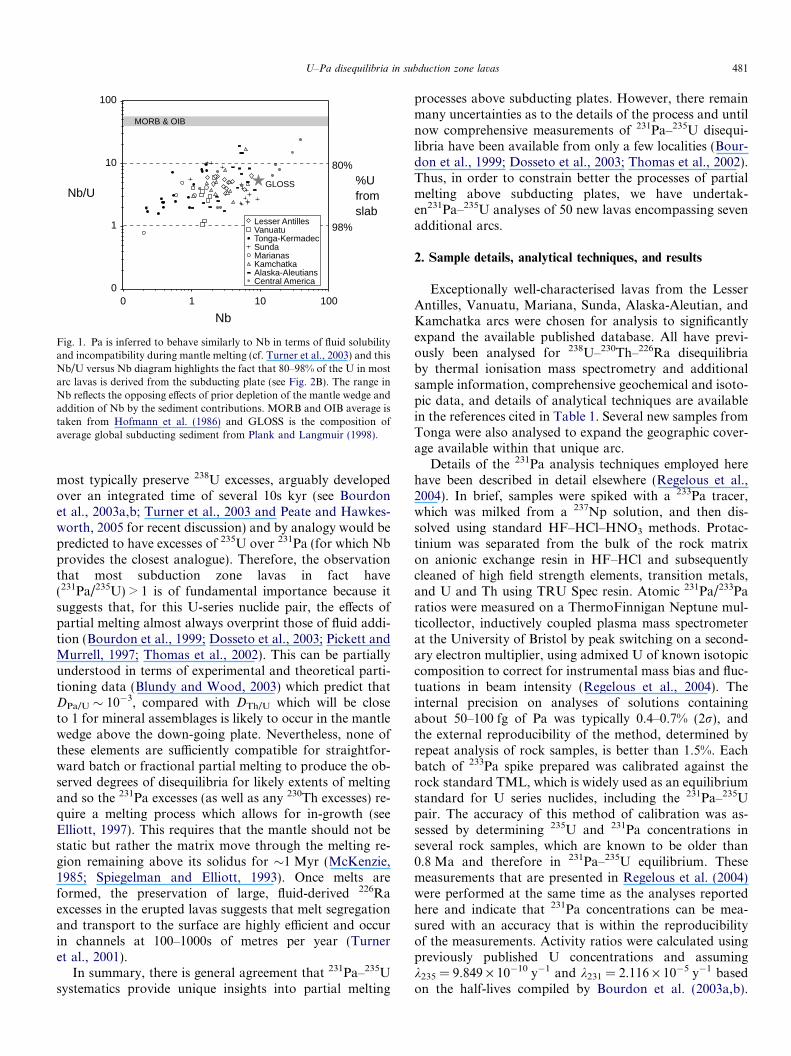
In general, whereas mid-ocean ridge basalts (MORB)are characterised by excesses of 230Th over 238U, whichcan be linked to 230Th in-growth during partial melting(see Lundstrom, 2003 for a recent review), any such meltingsignal in subduction zones is usually obscured by additionof U from the subducting plate which contributes >80% ofthe total U budget in most arc lavas (Fig. 1). These lavas
0
1
10
100
0 1 10 100
Nb
Nb/UGLOSS
MORB & OIB
80%
98%
%Ufromslab
Lesser AntillesVanuatuTonga-KermadecSundaMarianasKamchatkaAlaska-AleutiansCentral America
Fig. 1. Pa is inferred to behave similarly to Nb in terms of fluid solubilityand incompatibility during mantle melting (cf. Turner et al., 2003) and thisNb/U versus Nb diagram highlights the fact that 80–98% of the U in mostarc lavas is derived from the subducting plate (see Fig. 2B). The range inNb reflects the opposing effects of prior depletion of the mantle wedge andaddition of Nb by the sediment contributions. MORB and OIB average istaken from Hofmann et al. (1986) and GLOSS is the composition ofaverage global subducting sediment from Plank and Langmuir (1998).
U–Pa disequilibria in subduction zone lavas 481
most typically preserve 238U excesses, arguably developedover an integrated time of several 10s kyr (see Bourdonet al., 2003a,b; Turner et al., 2003 and Peate and Hawkes-worth, 2005 for recent discussion) and by analogy would bepredicted to have excesses of 235U over 231Pa (for which Nbprovides the closest analogue). Therefore, the observationthat most subduction zone lavas in fact have(231Pa/235U) > 1 is of fundamental importance because itsuggests that, for this U-series nuclide pair, the effects ofpartial melting almost always overprint those of fluid addi-tion (Bourdon et al., 1999; Dosseto et al., 2003; Pickett andMurrell, 1997; Thomas et al., 2002). This can be partiallyunderstood in terms of experimental and theoretical parti-tioning data (Blundy and Wood, 2003) which predict thatDPa/U � 10�3, compared with DTh/U which will be closeto 1 for mineral assemblages is likely to occur in the mantlewedge above the down-going plate. Nevertheless, none ofthese elements are sufficiently compatible for straightfor-ward batch or fractional partial melting to produce the ob-served degrees of disequilibria for likely extents of meltingand so the 231Pa excesses (as well as any 230Th excesses) re-quire a melting process which allows for in-growth (seeElliott, 1997). This requires that the mantle should not bestatic but rather the matrix move through the melting re-gion remaining above its solidus for �1 Myr (McKenzie,1985; Spiegelman and Elliott, 1993). Once melts areformed, the preservation of large, fluid-derived 226Raexcesses in the erupted lavas suggests that melt segregationand transport to the surface are highly efficient and occurin channels at 100–1000s of metres per year (Turneret al., 2001).
In summary, there is general agreement that 231Pa–235Usystematics provide unique insights into partial melting
processes above subducting plates. However, there remainmany uncertainties as to the details of the process and untilnow comprehensive measurements of 231Pa–235U disequi-libria have been available from only a few localities (Bour-don et al., 1999; Dosseto et al., 2003; Thomas et al., 2002).Thus, in order to constrain better the processes of partialmelting above subducting plates, we have undertak-en231Pa–235U analyses of 50 new lavas encompassing sevenadditional arcs.
2. Sample details, analytical techniques, and results
Exceptionally well-characterised lavas from the LesserAntilles, Vanuatu, Mariana, Sunda, Alaska-Aleutian, andKamchatka arcs were chosen for analysis to significantlyexpand the available published database. All have previ-ously been analysed for 238U–230Th–226Ra disequilibriaby thermal ionisation mass spectrometry and additionalsample information, comprehensive geochemical and isoto-pic data, and details of analytical techniques are availablein the references cited in Table 1. Several new samples fromTonga were also analysed to expand the geographic cover-age available within that unique arc.
Details of the 231Pa analysis techniques employed herehave been described in detail elsewhere (Regelous et al.,2004). In brief, samples were spiked with a 233Pa tracer,which was milked from a 237Np solution, and then dis-solved using standard HF–HCl–HNO3 methods. Protac-tinium was separated from the bulk of the rock matrixon anionic exchange resin in HF–HCl and subsequentlycleaned of high field strength elements, transition metals,and U and Th using TRU Spec resin. Atomic 231Pa/233Paratios were measured on a ThermoFinnigan Neptune mul-ticollector, inductively coupled plasma mass spectrometerat the University of Bristol by peak switching on a second-ary electron multiplier, using admixed U of known isotopiccomposition to correct for instrumental mass bias and fluc-tuations in beam intensity (Regelous et al., 2004). Theinternal precision on analyses of solutions containingabout 50–100 fg of Pa was typically 0.4–0.7% (2r), andthe external reproducibility of the method, determined byrepeat analysis of rock samples, is better than 1.5%. Eachbatch of 233Pa spike prepared was calibrated against therock standard TML, which is widely used as an equilibriumstandard for U series nuclides, including the 231Pa–235Upair. The accuracy of this method of calibration was as-sessed by determining 235U and 231Pa concentrations inseveral rock samples, which are known to be older than0.8 Ma and therefore in 231Pa–235U equilibrium. Thesemeasurements that are presented in Regelous et al. (2004)were performed at the same time as the analyses reportedhere and indicate that 231Pa concentrations can be mea-sured with an accuracy that is within the reproducibilityof the measurements. Activity ratios were calculated usingpreviously published U concentrations and assumingk235 = 9.849 · 10�10 y�1 and k231 = 2.116 · 10�5 y�1 basedon the half-lives compiled by Bourdon et al. (2003a,b).
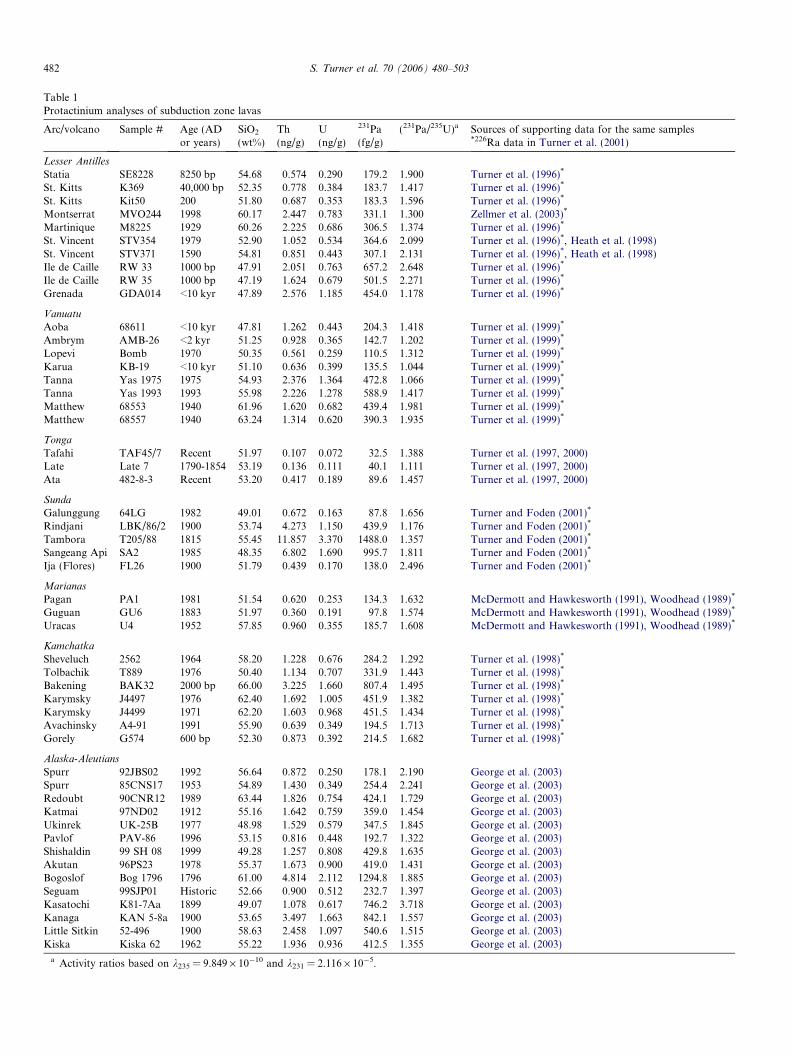
Table 1Protactinium analyses of subduction zone lavas
Arc/volcano Sample # Age (ADor years)
SiO2
(wt%)Th(ng/g)
U(ng/g)
231Pa(fg/g)
(231Pa/235U)a Sources of supporting data for the same samples*226Ra data in Turner et al. (2001)
Lesser Antilles
Statia SE8228 8250 bp 54.68 0.574 0.290 179.2 1.900 Turner et al. (1996)*
St. Kitts K369 40,000 bp 52.35 0.778 0.384 183.7 1.417 Turner et al. (1996)*
St. Kitts Kit50 200 51.80 0.687 0.353 183.3 1.596 Turner et al. (1996)*
Montserrat MVO244 1998 60.17 2.447 0.783 331.1 1.300 Zellmer et al. (2003)*
Martinique M8225 1929 60.26 2.225 0.686 306.5 1.374 Turner et al. (1996)*
St. Vincent STV354 1979 52.90 1.052 0.534 364.6 2.099 Turner et al. (1996)*, Heath et al. (1998)St. Vincent STV371 1590 54.81 0.851 0.443 307.1 2.131 Turner et al. (1996)*, Heath et al. (1998)Ile de Caille RW 33 1000 bp 47.91 2.051 0.763 657.2 2.648 Turner et al. (1996)*
Ile de Caille RW 35 1000 bp 47.19 1.624 0.679 501.5 2.271 Turner et al. (1996)*
Grenada GDA014 <10 kyr 47.89 2.576 1.185 454.0 1.178 Turner et al. (1996)*
Vanuatu
Aoba 68611 <10 kyr 47.81 1.262 0.443 204.3 1.418 Turner et al. (1999)*
Ambrym AMB-26 <2 kyr 51.25 0.928 0.365 142.7 1.202 Turner et al. (1999)*
Lopevi Bomb 1970 50.35 0.561 0.259 110.5 1.312 Turner et al. (1999)*
Karua KB-19 <10 kyr 51.10 0.636 0.399 135.5 1.044 Turner et al. (1999)*
Tanna Yas 1975 1975 54.93 2.376 1.364 472.8 1.066 Turner et al. (1999)*
Tanna Yas 1993 1993 55.98 2.226 1.278 588.9 1.417 Turner et al. (1999)*
Matthew 68553 1940 61.96 1.620 0.682 439.4 1.981 Turner et al. (1999)*
Matthew 68557 1940 63.24 1.314 0.620 390.3 1.935 Turner et al. (1999)*
Tonga
Tafahi TAF45/7 Recent 51.97 0.107 0.072 32.5 1.388 Turner et al. (1997, 2000)Late Late 7 1790-1854 53.19 0.136 0.111 40.1 1.111 Turner et al. (1997, 2000)Ata 482-8-3 Recent 53.20 0.417 0.189 89.6 1.457 Turner et al. (1997, 2000)
Sunda
Galunggung 64LG 1982 49.01 0.672 0.163 87.8 1.656 Turner and Foden (2001)*
Rindjani LBK/86/2 1900 53.74 4.273 1.150 439.9 1.176 Turner and Foden (2001)*
Tambora T205/88 1815 55.45 11.857 3.370 1488.0 1.357 Turner and Foden (2001)*
Sangeang Api SA2 1985 48.35 6.802 1.690 995.7 1.811 Turner and Foden (2001)*
Ija (Flores) FL26 1900 51.79 0.439 0.170 138.0 2.496 Turner and Foden (2001)*
Marianas
Pagan PA1 1981 51.54 0.620 0.253 134.3 1.632 McDermott and Hawkesworth (1991), Woodhead (1989)*
Guguan GU6 1883 51.97 0.360 0.191 97.8 1.574 McDermott and Hawkesworth (1991), Woodhead (1989)*
Uracas U4 1952 57.85 0.960 0.355 185.7 1.608 McDermott and Hawkesworth (1991), Woodhead (1989)*
Kamchatka
Sheveluch 2562 1964 58.20 1.228 0.676 284.2 1.292 Turner et al. (1998)*
Tolbachik T889 1976 50.40 1.134 0.707 331.9 1.443 Turner et al. (1998)*
Bakening BAK32 2000 bp 66.00 3.225 1.660 807.4 1.495 Turner et al. (1998)*
Karymsky J4497 1976 62.40 1.692 1.005 451.9 1.382 Turner et al. (1998)*
Karymsky J4499 1971 62.20 1.603 0.968 451.5 1.434 Turner et al. (1998)*
Avachinsky A4-91 1991 55.90 0.639 0.349 194.5 1.713 Turner et al. (1998)*
Gorely G574 600 bp 52.30 0.873 0.392 214.5 1.682 Turner et al. (1998)*
Alaska-AleutiansSpurr 92JBS02 1992 56.64 0.872 0.250 178.1 2.190 George et al. (2003)Spurr 85CNS17 1953 54.89 1.430 0.349 254.4 2.241 George et al. (2003)Redoubt 90CNR12 1989 63.44 1.826 0.754 424.1 1.729 George et al. (2003)Katmai 97ND02 1912 55.16 1.642 0.759 359.0 1.454 George et al. (2003)Ukinrek UK-25B 1977 48.98 1.529 0.579 347.5 1.845 George et al. (2003)Pavlof PAV-86 1996 53.15 0.816 0.448 192.7 1.322 George et al. (2003)Shishaldin 99 SH 08 1999 49.28 1.257 0.808 429.8 1.635 George et al. (2003)Akutan 96PS23 1978 55.37 1.673 0.900 419.0 1.431 George et al. (2003)Bogoslof Bog 1796 1796 61.00 4.814 2.112 1294.8 1.885 George et al. (2003)Seguam 99SJP01 Historic 52.66 0.900 0.512 232.7 1.397 George et al. (2003)Kasatochi K81-7Aa 1899 49.07 1.078 0.617 746.2 3.718 George et al. (2003)Kanaga KAN 5-8a 1900 53.65 3.497 1.663 842.1 1.557 George et al. (2003)Little Sitkin 52-496 1900 58.63 2.458 1.097 540.6 1.515 George et al. (2003)Kiska Kiska 62 1962 55.22 1.936 0.936 412.5 1.355 George et al. (2003)
a Activity ratios based on k235 = 9.849 · 10�10 and k231 = 2.116 · 10�5.
482 S. Turner et al. 70 (2006) 480–503
0.5
1.0
1.5
2.0
2.5
3.0
0.5 0.7 0.9 1.1 1.3
(230Th/238U)
(231
Pa/
235 U
)(2
31P
a/23
5 U)
0 age fluid U addition
∆231Pa
ageing
Nb/U
DMM
0.0
0.5
1.0
1.5
2.0
2.5
3.0
0 10 20 3 50
GLOSS
wedge + 1%GLOSS
1
23
1
2
3
bulk sediment addition
> 350 kyr addition ofsediment mellt
recent addition of fluidwith 0.02 ppm Upartial melting with231Pa in-growth
zero age fluid U addition
wedge + 1%GLOSS + fluid
MORB
A
B
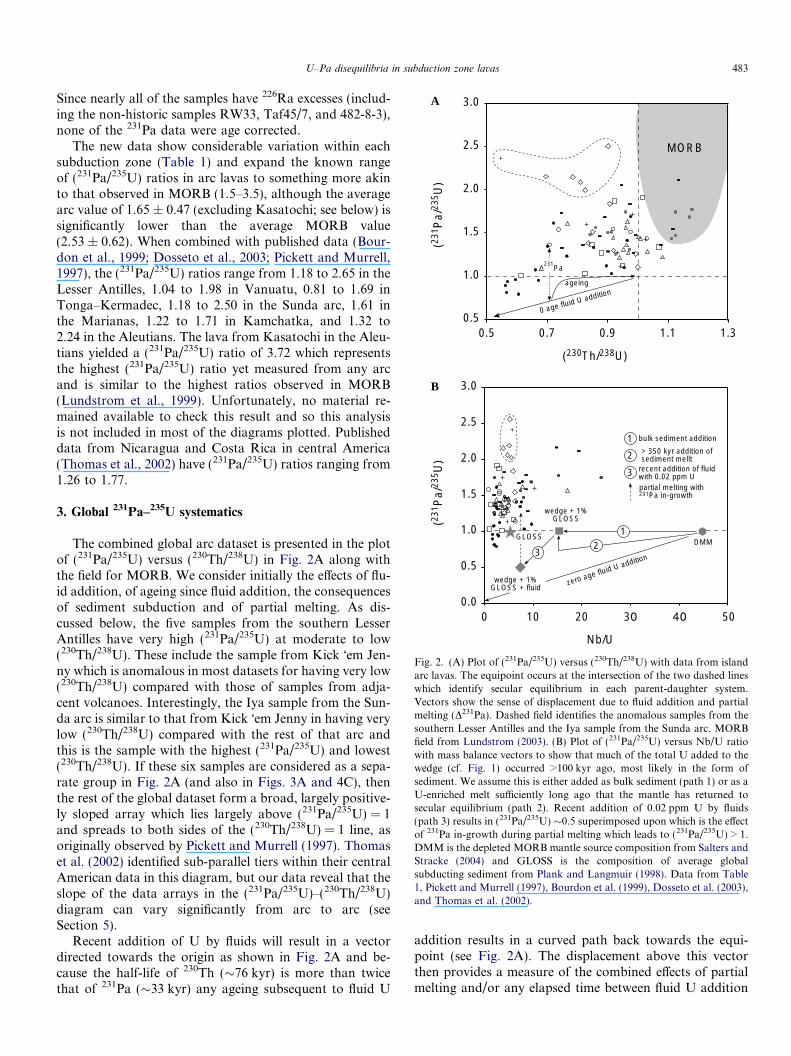
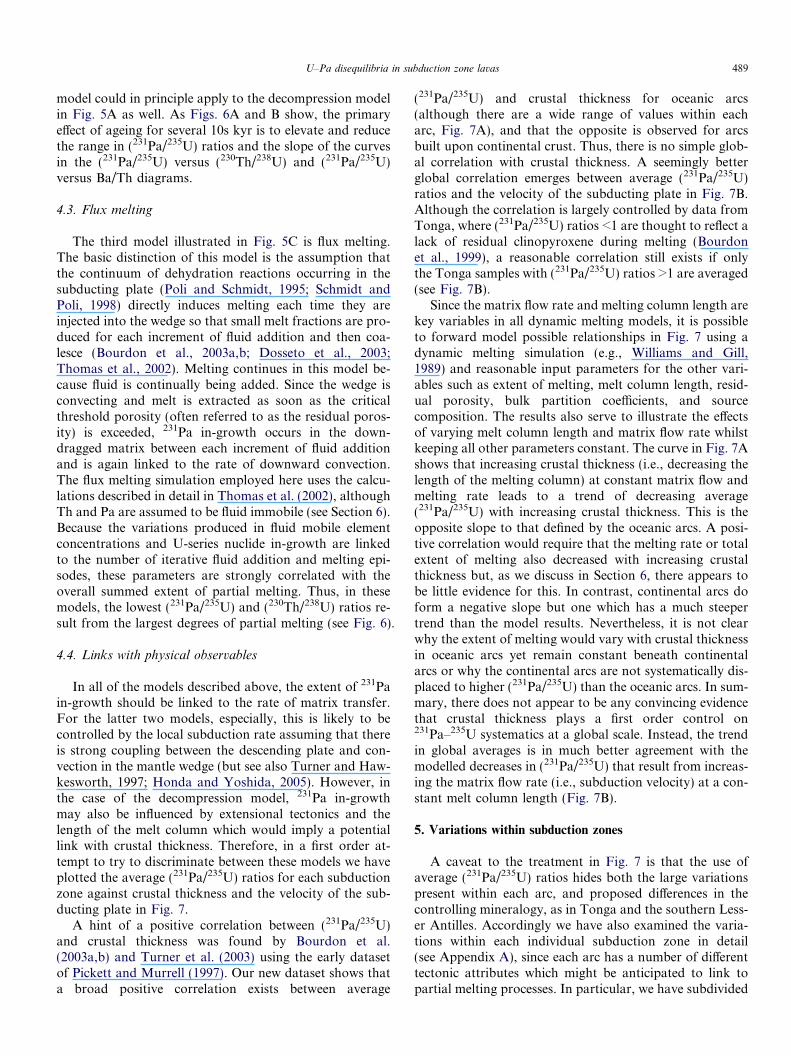
Fig. 2. (A) Plot of (231Pa/235U) versus (230Th/238U) with data from islandarc lavas. The equipoint occurs at the intersection of the two dashed lineswhich identify secular equilibrium in each parent-daughter system.Vectors show the sense of displacement due to fluid addition and partialmelting (D231Pa). Dashed field identifies the anomalous samples from thesouthern Lesser Antilles and the Iya sample from the Sunda arc. MORBfield from Lundstrom (2003). (B) Plot of (231Pa/235U) versus Nb/U ratiowith mass balance vectors to show that much of the total U added to thewedge (cf. Fig. 1) occurred >100 kyr ago, most likely in the form ofsediment. We assume this is either added as bulk sediment (path 1) or as aU-enriched melt sufficiently long ago that the mantle has returned tosecular equilibrium (path 2). Recent addition of 0.02 ppm U by fluids(path 3) results in (231Pa/235U) �0.5 superimposed upon which is the effectof 231Pa in-growth during partial melting which leads to (231Pa/235U) > 1.DMM is the depleted MORB mantle source composition from Salters andStracke (2004) and GLOSS is the composition of average globalsubducting sediment from Plank and Langmuir (1998). Data from Table1, Pickett and Murrell (1997), Bourdon et al. (1999), Dosseto et al. (2003),and Thomas et al. (2002).
U–Pa disequilibria in subduction zone lavas 483
Since nearly all of the samples have 226Ra excesses (includ-ing the non-historic samples RW33, Taf45/7, and 482-8-3),none of the 231Pa data were age corrected.
The new data show considerable variation within eachsubduction zone (Table 1) and expand the known rangeof (231Pa/235U) ratios in arc lavas to something more akinto that observed in MORB (1.5–3.5), although the averagearc value of 1.65 ± 0.47 (excluding Kasatochi; see below) issignificantly lower than the average MORB value(2.53 ± 0.62). When combined with published data (Bour-don et al., 1999; Dosseto et al., 2003; Pickett and Murrell,1997), the (231Pa/235U) ratios range from 1.18 to 2.65 in theLesser Antilles, 1.04 to 1.98 in Vanuatu, 0.81 to 1.69 inTonga–Kermadec, 1.18 to 2.50 in the Sunda arc, 1.61 inthe Marianas, 1.22 to 1.71 in Kamchatka, and 1.32 to2.24 in the Aleutians. The lava from Kasatochi in the Aleu-tians yielded a (231Pa/235U) ratio of 3.72 which representsthe highest (231Pa/235U) ratio yet measured from any arcand is similar to the highest ratios observed in MORB(Lundstrom et al., 1999). Unfortunately, no material re-mained available to check this result and so this analysisis not included in most of the diagrams plotted. Publisheddata from Nicaragua and Costa Rica in central America(Thomas et al., 2002) have (231Pa/235U) ratios ranging from1.26 to 1.77.
3. Global 231Pa–235U systematics
The combined global arc dataset is presented in the plotof (231Pa/235U) versus (230Th/238U) in Fig. 2A along withthe field for MORB. We consider initially the effects of flu-id addition, of ageing since fluid addition, the consequencesof sediment subduction and of partial melting. As dis-cussed below, the five samples from the southern LesserAntilles have very high (231Pa/235U) at moderate to low(230Th/238U). These include the sample from Kick �em Jen-ny which is anomalous in most datasets for having very low(230Th/238U) compared with those of samples from adja-cent volcanoes. Interestingly, the Iya sample from the Sun-da arc is similar to that from Kick �em Jenny in having verylow (230Th/238U) compared with the rest of that arc andthis is the sample with the highest (231Pa/235U) and lowest(230Th/238U). If these six samples are considered as a sepa-rate group in Fig. 2A (and also in Figs. 3A and 4C), thenthe rest of the global dataset form a broad, largely positive-ly sloped array which lies largely above (231Pa/235U) = 1and spreads to both sides of the (230Th/238U) = 1 line, asoriginally observed by Pickett and Murrell (1997). Thomaset al. (2002) identified sub-parallel tiers within their centralAmerican data in this diagram, but our data reveal that theslope of the data arrays in the (231Pa/235U)–(230Th/238U)diagram can vary significantly from arc to arc (seeSection 5).
Recent addition of U by fluids will result in a vectordirected towards the origin as shown in Fig. 2A and be-cause the half-life of 230Th (�76 kyr) is more than twicethat of 231Pa (�33 kyr) any ageing subsequent to fluid U
addition results in a curved path back towards the equi-point (see Fig. 2A). The displacement above this vectorthen provides a measure of the combined effects of partialmelting and/or any elapsed time between fluid U addition
1
2
3
1 2
0
200
400
600
800
1000
1200
0 1
(231Pa/235U)
(231Pa/235U)
Ba/
Th
fluxmelting
dynamicmelting
0
4
5
6
7
(226
Ra/
230 T
h)
A
B
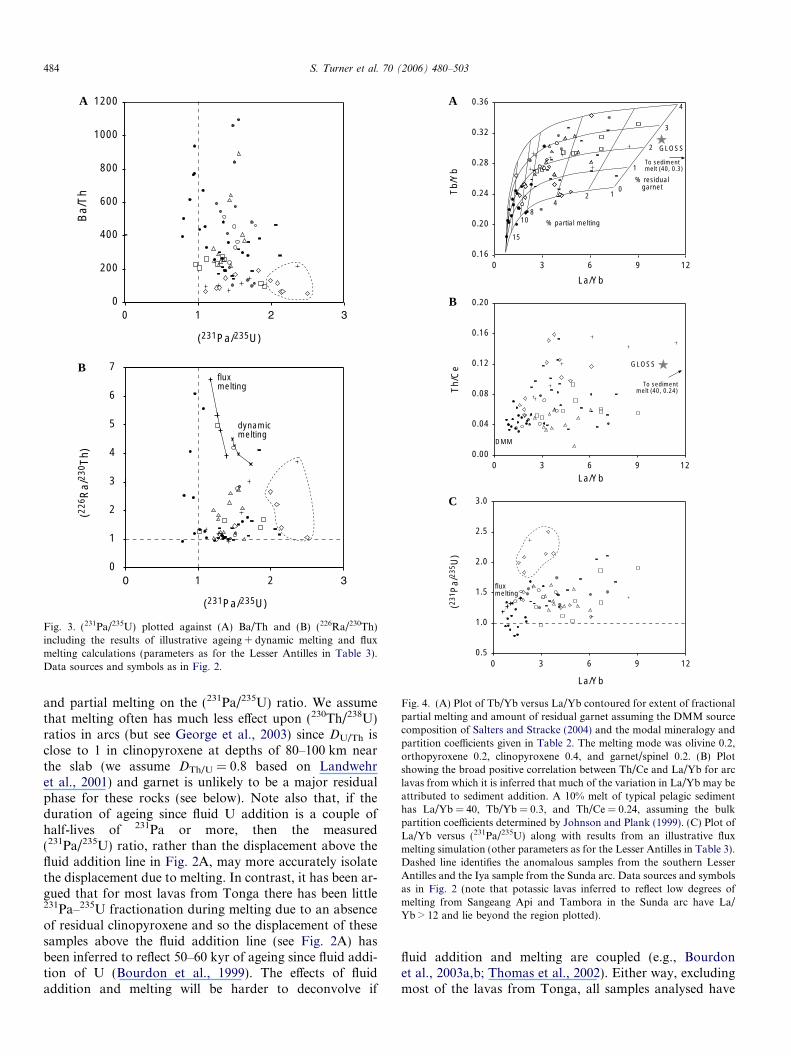
Fig. 3. (231Pa/235U) plotted against (A) Ba/Th and (B) (226Ra/230Th)including the results of illustrative ageing + dynamic melting and fluxmelting calculations (parameters as for the Lesser Antilles in Table 3).Data sources and symbols as in Fig. 2.
To sedimentmelt (40, 0.3)
0.16
0.20
0.24
0.28
0.32
0.36
0 3 6 9 12
La/Yb
La/Yb
La/Yb
Tb/
Yb
0
1
2
3
4
% residualgarnet
124
810
15
% partial melting
0.5
1.0
1.5
2.0
2.5
3.0
0 3 6 9 12
(231
Pa/
235 U
)
GLOSS
fluxmelting
0.00
0.04
0.08
0.12
0.16
0.20
0 3 6 9 12T
h/C
e GLOSS
To sedimentmelt (40, 0.24)
DMM
A
B
C
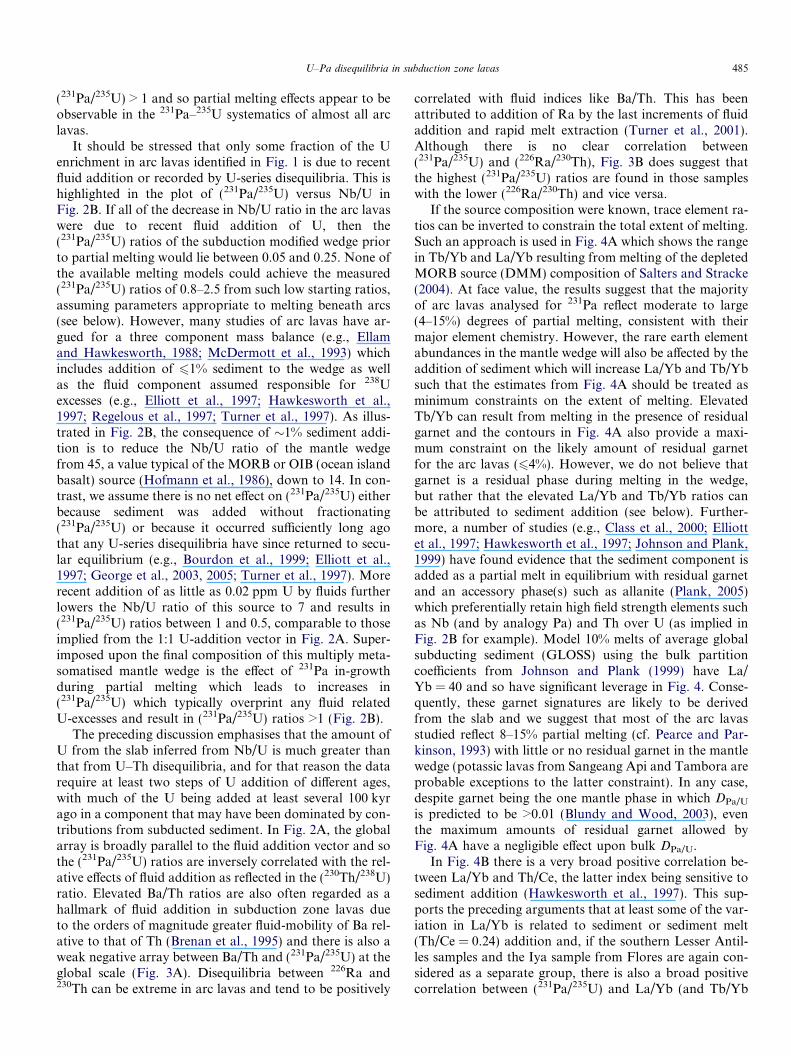
Fig. 4. (A) Plot of Tb/Yb versus La/Yb contoured for extent of fractionalpartial melting and amount of residual garnet assuming the DMM sourcecomposition of Salters and Stracke (2004) and the modal mineralogy andpartition coefficients given in Table 2. The melting mode was olivine 0.2,orthopyroxene 0.2, clinopyroxene 0.4, and garnet/spinel 0.2. (B) Plotshowing the broad positive correlation between Th/Ce and La/Yb for arclavas from which it is inferred that much of the variation in La/Yb may beattributed to sediment addition. A 10% melt of typical pelagic sedimenthas La/Yb = 40, Tb/Yb = 0.3, and Th/Ce = 0.24, assuming the bulkpartition coefficients determined by Johnson and Plank (1999). (C) Plot ofLa/Yb versus (231Pa/235U) along with results from an illustrative fluxmelting simulation (other parameters as for the Lesser Antilles in Table 3).Dashed line identifies the anomalous samples from the southern LesserAntilles and the Iya sample from the Sunda arc. Data sources and symbolsas in Fig. 2 (note that potassic lavas inferred to reflect low degrees ofmelting from Sangeang Api and Tambora in the Sunda arc have La/Yb > 12 and lie beyond the region plotted).
484 S. Turner et al. 70 (2006) 480–503
and partial melting on the (231Pa/235U) ratio. We assumethat melting often has much less effect upon (230Th/238U)ratios in arcs (but see George et al., 2003) since DU/Th isclose to 1 in clinopyroxene at depths of 80–100 km nearthe slab (we assume DTh/U = 0.8 based on Landwehret al., 2001) and garnet is unlikely to be a major residualphase for these rocks (see below). Note also that, if theduration of ageing since fluid U addition is a couple ofhalf-lives of 231Pa or more, then the measured(231Pa/235U) ratio, rather than the displacement above thefluid addition line in Fig. 2A, may more accurately isolatethe displacement due to melting. In contrast, it has been ar-gued that for most lavas from Tonga there has been little231Pa–235U fractionation during melting due to an absenceof residual clinopyroxene and so the displacement of thesesamples above the fluid addition line (see Fig. 2A) hasbeen inferred to reflect 50–60 kyr of ageing since fluid addi-tion of U (Bourdon et al., 1999). The effects of fluidaddition and melting will be harder to deconvolve if
fluid addition and melting are coupled (e.g., Bourdonet al., 2003a,b; Thomas et al., 2002). Either way, excludingmost of the lavas from Tonga, all samples analysed have
U–Pa disequilibria in subduction zone lavas 485
(231Pa/235U) > 1 and so partial melting effects appear to beobservable in the 231Pa–235U systematics of almost all arclavas.
It should be stressed that only some fraction of the Uenrichment in arc lavas identified in Fig. 1 is due to recentfluid addition or recorded by U-series disequilibria. This ishighlighted in the plot of (231Pa/235U) versus Nb/U inFig. 2B. If all of the decrease in Nb/U ratio in the arc lavaswere due to recent fluid addition of U, then the(231Pa/235U) ratios of the subduction modified wedge priorto partial melting would lie between 0.05 and 0.25. None ofthe available melting models could achieve the measured(231Pa/235U) ratios of 0.8–2.5 from such low starting ratios,assuming parameters appropriate to melting beneath arcs(see below). However, many studies of arc lavas have ar-gued for a three component mass balance (e.g., Ellamand Hawkesworth, 1988; McDermott et al., 1993) whichincludes addition of 61% sediment to the wedge as wellas the fluid component assumed responsible for 238Uexcesses (e.g., Elliott et al., 1997; Hawkesworth et al.,1997; Regelous et al., 1997; Turner et al., 1997). As illus-trated in Fig. 2B, the consequence of �1% sediment addi-tion is to reduce the Nb/U ratio of the mantle wedgefrom 45, a value typical of the MORB or OIB (ocean islandbasalt) source (Hofmann et al., 1986), down to 14. In con-trast, we assume there is no net effect on (231Pa/235U) eitherbecause sediment was added without fractionating(231Pa/235U) or because it occurred sufficiently long agothat any U-series disequilibria have since returned to secu-lar equilibrium (e.g., Bourdon et al., 1999; Elliott et al.,1997; George et al., 2003, 2005; Turner et al., 1997). Morerecent addition of as little as 0.02 ppm U by fluids furtherlowers the Nb/U ratio of this source to 7 and results in(231Pa/235U) ratios between 1 and 0.5, comparable to thoseimplied from the 1:1 U-addition vector in Fig. 2A. Super-imposed upon the final composition of this multiply meta-somatised mantle wedge is the effect of 231Pa in-growthduring partial melting which leads to increases in(231Pa/235U) which typically overprint any fluid relatedU-excesses and result in (231Pa/235U) ratios >1 (Fig. 2B).
The preceding discussion emphasises that the amount ofU from the slab inferred from Nb/U is much greater thanthat from U–Th disequilibria, and for that reason the datarequire at least two steps of U addition of different ages,with much of the U being added at least several 100 kyrago in a component that may have been dominated by con-tributions from subducted sediment. In Fig. 2A, the globalarray is broadly parallel to the fluid addition vector and sothe (231Pa/235U) ratios are inversely correlated with the rel-ative effects of fluid addition as reflected in the (230Th/238U)ratio. Elevated Ba/Th ratios are also often regarded as ahallmark of fluid addition in subduction zone lavas dueto the orders of magnitude greater fluid-mobility of Ba rel-ative to that of Th (Brenan et al., 1995) and there is also aweak negative array between Ba/Th and (231Pa/235U) at theglobal scale (Fig. 3A). Disequilibria between 226Ra and230Th can be extreme in arc lavas and tend to be positively
correlated with fluid indices like Ba/Th. This has beenattributed to addition of Ra by the last increments of fluidaddition and rapid melt extraction (Turner et al., 2001).Although there is no clear correlation between(231Pa/235U) and (226Ra/230Th), Fig. 3B does suggest thatthe highest (231Pa/235U) ratios are found in those sampleswith the lower (226Ra/230Th) and vice versa.
If the source composition were known, trace element ra-tios can be inverted to constrain the total extent of melting.Such an approach is used in Fig. 4A which shows the rangein Tb/Yb and La/Yb resulting from melting of the depletedMORB source (DMM) composition of Salters and Stracke(2004). At face value, the results suggest that the majorityof arc lavas analysed for 231Pa reflect moderate to large(4–15%) degrees of partial melting, consistent with theirmajor element chemistry. However, the rare earth elementabundances in the mantle wedge will also be affected by theaddition of sediment which will increase La/Yb and Tb/Ybsuch that the estimates from Fig. 4A should be treated asminimum constraints on the extent of melting. ElevatedTb/Yb can result from melting in the presence of residualgarnet and the contours in Fig. 4A also provide a maxi-mum constraint on the likely amount of residual garnetfor the arc lavas (64%). However, we do not believe thatgarnet is a residual phase during melting in the wedge,but rather that the elevated La/Yb and Tb/Yb ratios canbe attributed to sediment addition (see below). Further-more, a number of studies (e.g., Class et al., 2000; Elliottet al., 1997; Hawkesworth et al., 1997; Johnson and Plank,1999) have found evidence that the sediment component isadded as a partial melt in equilibrium with residual garnetand an accessory phase(s) such as allanite (Plank, 2005)which preferentially retain high field strength elements suchas Nb (and by analogy Pa) and Th over U (as implied inFig. 2B for example). Model 10% melts of average globalsubducting sediment (GLOSS) using the bulk partitioncoefficients from Johnson and Plank (1999) have La/Yb = 40 and so have significant leverage in Fig. 4. Conse-quently, these garnet signatures are likely to be derivedfrom the slab and we suggest that most of the arc lavasstudied reflect 8–15% partial melting (cf. Pearce and Par-kinson, 1993) with little or no residual garnet in the mantlewedge (potassic lavas from Sangeang Api and Tambora areprobable exceptions to the latter constraint). In any case,despite garnet being the one mantle phase in which DPa/U
is predicted to be >0.01 (Blundy and Wood, 2003), eventhe maximum amounts of residual garnet allowed byFig. 4A have a negligible effect upon bulk DPa/U.
In Fig. 4B there is a very broad positive correlation be-tween La/Yb and Th/Ce, the latter index being sensitive tosediment addition (Hawkesworth et al., 1997). This sup-ports the preceding arguments that at least some of the var-iation in La/Yb is related to sediment or sediment melt(Th/Ce = 0.24) addition and, if the southern Lesser Antil-les samples and the Iya sample from Flores are again con-sidered as a separate group, there is also a broad positivecorrelation between (231Pa/235U) and La/Yb (and Tb/Yb
486 S. Turner et al. 70 (2006) 480–503
not shown) in Fig. 4C. Such correlations might be used toinfer a link between 231Pa–235U disequilibria and the inte-grated extent of partial melting (cf. Fig. 4A). Instead, thekey to understanding these correlations may be that themore sediment-rich sources (higher La/Yb and Th/Ce)are less sensitive to the effects of addition of a relativelyconstant amount of U by fluids because they had higherTh and U concentrations to begin with (Elliott et al.,1997; Hawkesworth et al., 1997; McDermott and Hawkes-worth, 1991; Regelous et al., 1997; Turner et al., 1997).Consequently, these sources suffer the least displacementalong the U addition vector in Fig. 2A so that the effectsof partial melting have less of a deficit of 231Pa relative to235U to overprint. Thus, partial melting leads to higherabsolute (231Pa/235U) ratios from more sediment-rich,higher (230Th/238U) sources and contours for a constantpartial melting effect in Fig. 2A are parallel to the fluidaddition vector (see Fig. 17c in Turner et al., 2003). Thisis in contrast to MORB and OIB where the slopes of arraysin (231Pa/235U) versus (230Th/238U) space reflect the clino-pyroxene/garnet ratio in the source (Bourdon and Sims,2003). By analogy lower Ba/Th and (226Ra/230Th) ratiosare found in samples from the more sediment-rich, fluid-in-sensitive sources and these start with higher (231Pa/235U)ratios before melting leading to the broadly negative corre-lations in Fig. 3.
In principle, the effects of any ageing between the time ofU fluid addition and partial melting should be distinguish-able. However, this has proved difficult in practice. Ageingwill reduce the slope of any correlations in Figs. 2A, 3A,and 4C and so it may be that the extent to which any suchageing can be identified relies on the ability to discernslopes on these diagrams within individual arcs and thisis explored in further detail below.
4. Models for partial melting in the mantle wedge
Whereas the main controls on stable trace element ratiosare source composition and residual mineralogy, bulk par-tition coefficients, and the integrated extent of partial melt-ing, U-series isotope ratios are also affected by the timescale of melting. For example, batch melting models re-quire degrees of partial melting less than 1% in order to ob-tain (231Pa/235U) ratios >1.5, and since such small degreesof melting are unlikely for arc magmas (cf. Fig. 4A) thisindicates that in-growth models are required to explainthe arc lava data. Assuming very rapid melt extraction(see below), the key factor in such models is the velocityat which the matrix passes through the melting region be-cause this determines the amount of time available for U-series nuclide in-growth (see Elliott, 1997, and Lundstrom,2003, for overviews). One end-member in-growth meltingmodel produces disequilibria via continuing chromato-graphic equilibration with peridotite wall-rocks as the meltascends large distances (and over time periods of 10s kyr)via porous flow (Spiegelman and Elliott, 1993). However,at subduction zones the rapid channelled melt transport in-
ferred from 226Ra systematics (Sigmarsson et al., 2002;Turner et al., 2001) suggests that such interaction will beminimal and is unlikely to be the origin of the 231Pa excess-es in arc lavas (Bourdon et al., 2003a,b; Dosseto et al.,2003; Turner et al., 2003). Accordingly, most recent modelsfor arc lavas have invoked some variation on the theme ofdynamic melting involving protracted melt production butfast melt extraction using the numerical treatment ofMcKenzie (1985) and Williams and Gill (1989).
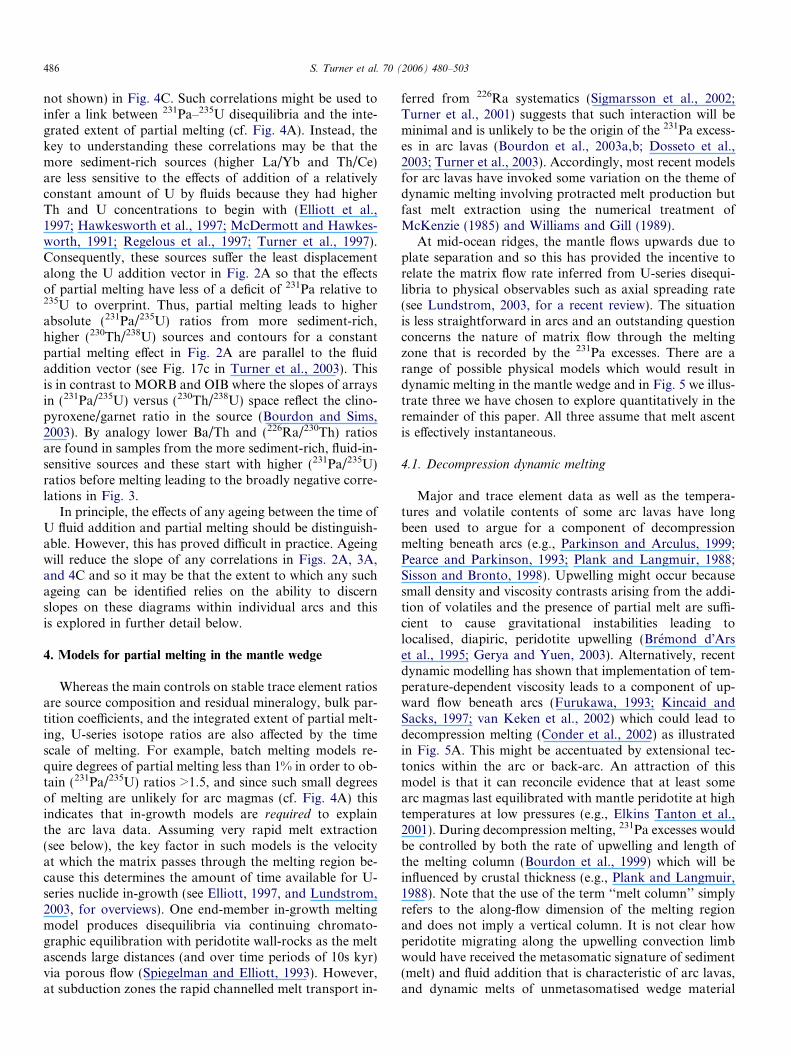
At mid-ocean ridges, the mantle flows upwards due toplate separation and so this has provided the incentive torelate the matrix flow rate inferred from U-series disequi-libria to physical observables such as axial spreading rate(see Lundstrom, 2003, for a recent review). The situationis less straightforward in arcs and an outstanding questionconcerns the nature of matrix flow through the meltingzone that is recorded by the 231Pa excesses. There are arange of possible physical models which would result indynamic melting in the mantle wedge and in Fig. 5 we illus-trate three we have chosen to explore quantitatively in theremainder of this paper. All three assume that melt ascentis effectively instantaneous.
4.1. Decompression dynamic melting
Major and trace element data as well as the tempera-tures and volatile contents of some arc lavas have longbeen used to argue for a component of decompressionmelting beneath arcs (e.g., Parkinson and Arculus, 1999;Pearce and Parkinson, 1993; Plank and Langmuir, 1988;Sisson and Bronto, 1998). Upwelling might occur becausesmall density and viscosity contrasts arising from the addi-tion of volatiles and the presence of partial melt are suffi-cient to cause gravitational instabilities leading tolocalised, diapiric, peridotite upwelling (Bremond d�Arset al., 1995; Gerya and Yuen, 2003). Alternatively, recentdynamic modelling has shown that implementation of tem-perature-dependent viscosity leads to a component of up-ward flow beneath arcs (Furukawa, 1993; Kincaid andSacks, 1997; van Keken et al., 2002) which could lead todecompression melting (Conder et al., 2002) as illustratedin Fig. 5A. This might be accentuated by extensional tec-tonics within the arc or back-arc. An attraction of thismodel is that it can reconcile evidence that at least somearc magmas last equilibrated with mantle peridotite at hightemperatures at low pressures (e.g., Elkins Tanton et al.,2001). During decompression melting, 231Pa excesses wouldbe controlled by both the rate of upwelling and length ofthe melting column (Bourdon et al., 1999) which will beinfluenced by crustal thickness (e.g., Plank and Langmuir,1988). Note that the use of the term ‘‘melt column’’ simplyrefers to the along-flow dimension of the melting regionand does not imply a vertical column. It is not clear howperidotite migrating along the upwelling convection limbwould have received the metasomatic signature of sediment(melt) and fluid addition that is characteristic of arc lavas,and dynamic melts of unmetasomatised wedge material
1000 ˚C
fast meltmigration
flux meltingwith efficientmelt focusing& extraction
decompressionmelting inmatrix ofupwellingconvectionlimb
fast meltmigration
1000 ˚C
fluid
rele
ase
dynamicmelting indown-wellingmatrix afterfluid addition
fast meltmigration
1000 ˚C
wingrowth (λ)
φ φ φ φ φ
w
φφ
φφφ
ingr
owth
(λ)
w
φφ
φφ
φ
ingr
owth
(λ)
fluid
flux
ing
A
B
C
Fig. 5. Illustrationsof thedifferentmeltingmodels investigated in this study.In (A), partial melting occurs predominantly in response to decompressionalong the upwelling limb of convection in the mantle wedge. In (B), partialmeltingoccurs asmantlewedgematerial that has beenhydratedduring prior(up-dip) episodes of fluid addition crosses the hydrous peridotite solidus.The models shown in (A) and (B) are analogous to an inclined dynamicMORB melting column in which the matrix enters the melting region andmelt is extracted in a stepwise fashionwhenever themelt fraction exceeds thethreshold porosity (/). Each parcel of matrix flows through the meltingregion at velocity (W) and U-series nuclide in-growth occurs between eachextraction step in proportion to W and the relevant decay constant (k). In(A), the length of the melting column is limited by the thickness of theoverlying lithosphere, whereas in (B) a primary control on the extent ofU-seriesdisequilibriaproduced isWwhichwill be controlledby the local rateof convergence. The fluxmeltingmodel of Thomas et al. (2002) is illustratedin (C) where fluid addition and partial melting are coupled in a synchronouscontinuum and in-growth again occurs between each step. Note that in allthree models the melt column is inclined and we use of the term ‘‘meltcolumn’’ to refer to the along-flow dimension of the melting region.
U–Pa disequilibria in subduction zone lavas 487
might be expected to resemble MORB unless mixed withdeeper, hydrous melts (see Section 7). Nevertheless, manyback-arc lavas do have elevated H2O contents and preserve238U excesses (e.g., Peate et al., 2001; Stolper and Newman,1994).
4.2. Frictional drag melting with or without ageing since fluid
U addition
It has long been recognised that frictional drag againstthe subducting plate will induce downward directed con-vection in the wedge, at least close to the wedge–plate inter-face. In the second model illustrated (Fig. 5B), 231Pa in-growth reflects the rate of downward convection througha region where partial melting is occurring as this motiontranslates hydrated peridotite across its solidus. It is as-sumed that fluid addition lowers the peridotite solidusbut that this hydrated peridotite does not melt until con-vection drags it across its solidus. In other words, the onsetof melting is controlled by the location of an isotherm(England et al., 2004; Tatsumi et al., 1986) and continuesbecause material is translated obliquely across the iso-therms into increasingly hotter parts of the wedge.
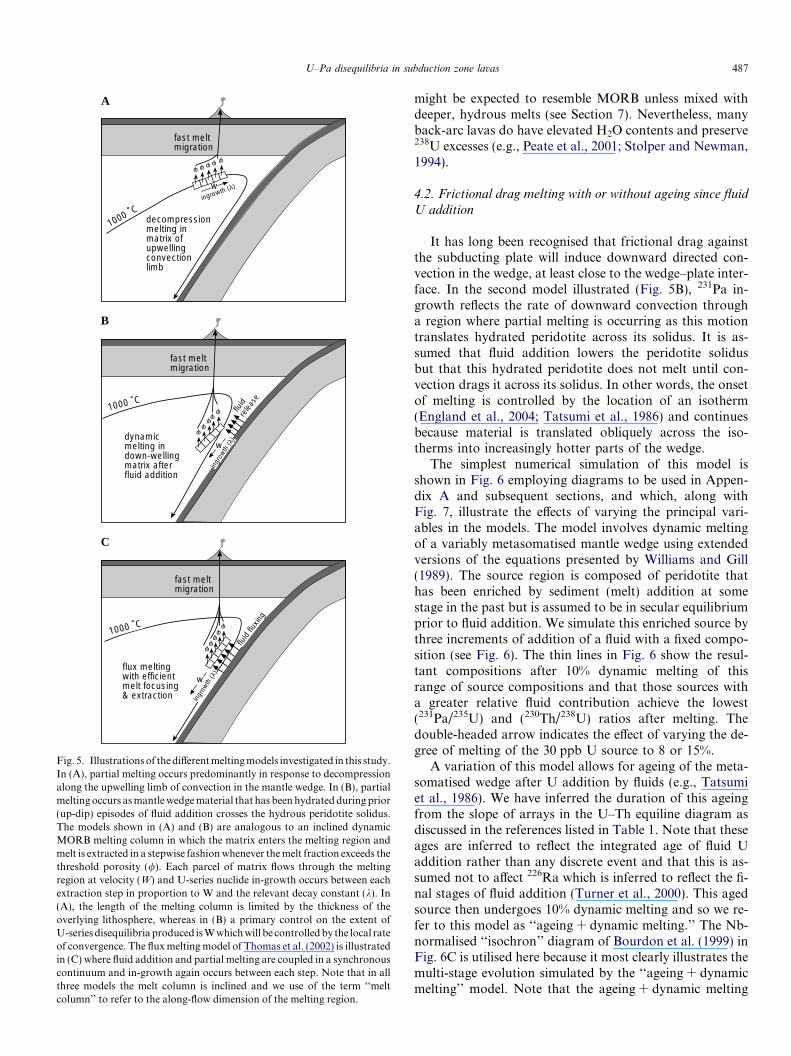
The simplest numerical simulation of this model isshown in Fig. 6 employing diagrams to be used in Appen-dix A and subsequent sections, and which, along withFig. 7, illustrate the effects of varying the principal vari-ables in the models. The model involves dynamic meltingof a variably metasomatised mantle wedge using extendedversions of the equations presented by Williams and Gill(1989). The source region is composed of peridotite thathas been enriched by sediment (melt) addition at somestage in the past but is assumed to be in secular equilibriumprior to fluid addition. We simulate this enriched source bythree increments of addition of a fluid with a fixed compo-sition (see Fig. 6). The thin lines in Fig. 6 show the resul-tant compositions after 10% dynamic melting of thisrange of source compositions and that those sources witha greater relative fluid contribution achieve the lowest(231Pa/235U) and (230Th/238U) ratios after melting. Thedouble-headed arrow indicates the effect of varying the de-gree of melting of the 30 ppb U source to 8 or 15%.
A variation of this model allows for ageing of the meta-somatised wedge after U addition by fluids (e.g., Tatsumiet al., 1986). We have inferred the duration of this ageingfrom the slope of arrays in the U–Th equiline diagram asdiscussed in the references listed in Table 1. Note that theseages are inferred to reflect the integrated age of fluid Uaddition rather than any discrete event and that this is as-sumed not to affect 226Ra which is inferred to reflect the fi-nal stages of fluid addition (Turner et al., 2000). This agedsource then undergoes 10% dynamic melting and so we re-fer to this model as ‘‘ageing + dynamic melting.’’ The Nb-normalised ‘‘isochron’’ diagram of Bourdon et al. (1999) inFig. 6C is utilised here because it most clearly illustrates themulti-stage evolution simulated by the ‘‘ageing + dynamicmelting’’ model. Note that the ageing + dynamic melting
3 fluidincrements
of 5 ppb U eachproduces variably metasomatised source
(231
Pa/
235 U
)
(230Th/238U)
(231
Pa/
235 U
)
Ba/Th
sourceafter 40
kyr ofageing
dynamicmelting ofzero aged
metasomatisedsource
(231
Pa)
/Nb
dpm
/ppm
(235 U)/Nb dpm/ppm
ageing &dynamicmelting
fluxmelting
125810F=15dynamicmelting
equilibriumsource withU=15 ppb
30
2025
0.4
0.9
1.4
1.9
2.4
2.9
0.4 0.6 0.8 1.0 1.2
0.4
0.9
1.4
1.9
2.4
2.9
0 50 100 150
0.002
0.008
0.014
0.020
0.002 0.005 0.008
3 fluidincrementsof 2 ppm Ba each
equilibriumsource withBa = 1.2 ppm
ageing & dynamic melting
fluxmelting
15
2 5 8 10F=1
dynamic melting
15
25
8 10
F=1
equilibriumsource with150 ppb Nb
& U=15 30 ppb20 25
fluxmelting
3.2
7.25.2
F=15
10
8
F=15
10
8
F=15
10
8
ageing &dynamicmelting
A
B
C
Fig. 6. Plots of (A) (231Pa/235U) versus (230Th/238U), (B) (231Pa/235U)versus Ba/Th, and (C) (231Pa)/Nb versus (235U)/Nb to illustrate thevarious melting models investigated. The source region is composed ofperidotite that has been enriched by sediment (melt) addition at somestage in the past but is assumed to be in secular equilibrium prior to fluidaddition. In the dynamic melting models, this enriched source is thenmetasomatised by three increments of addition of a fluid with a fixedcomposition (5 ppb U, 2 ppm Ba). The thin line shows the compositionafter 10% dynamic melting of this range of source compositions and thedouble-headed arrow indicates how the composition of the 30 ppb sourcemelt would vary if the extent of melting were 8 or 15%. The ‘‘ageing anddynamic melting’’ line shows the results of dynamic melting of the samesource (X�s along the curve indicate the same range of initial sourcecompositions) after it has undergone 40 kyr ageing since fluid U addition(see source composition after 40 kyr ageing on (C)). The flux melting curveshows the results of calculations based on the model presented by Thomaset al. (2002) and has the total extent of melting (F) indicated in %. Therelevant parameters for the models shown in Figs. 6 and Fig. 11–18 aregiven in Tables 2 and 3 (see text for discussion).
0.9
1.1
1.3
1.5
1.7
1.9
0 5 10 15 20
0.9
1.1
1.3
1.5
1.7
1.9
0 20 40 60
aver
age
(231
Pa/
235 U
) av
erag
e (2
31P
a/23
5 U)
crustal thickness (km)
subduction velocity (cm/yr)
Ton
Ker
Phil
Aleu
Mar
Van
Ant
Sun
StrAlas
Cen
Kam
Chil
Mex
Ton
Ker
Phil
Aleu
Mar
Van
Ant
Sun
StrAlas
Cen
Kam
Chil
Mex
Ton
Ton
A
B
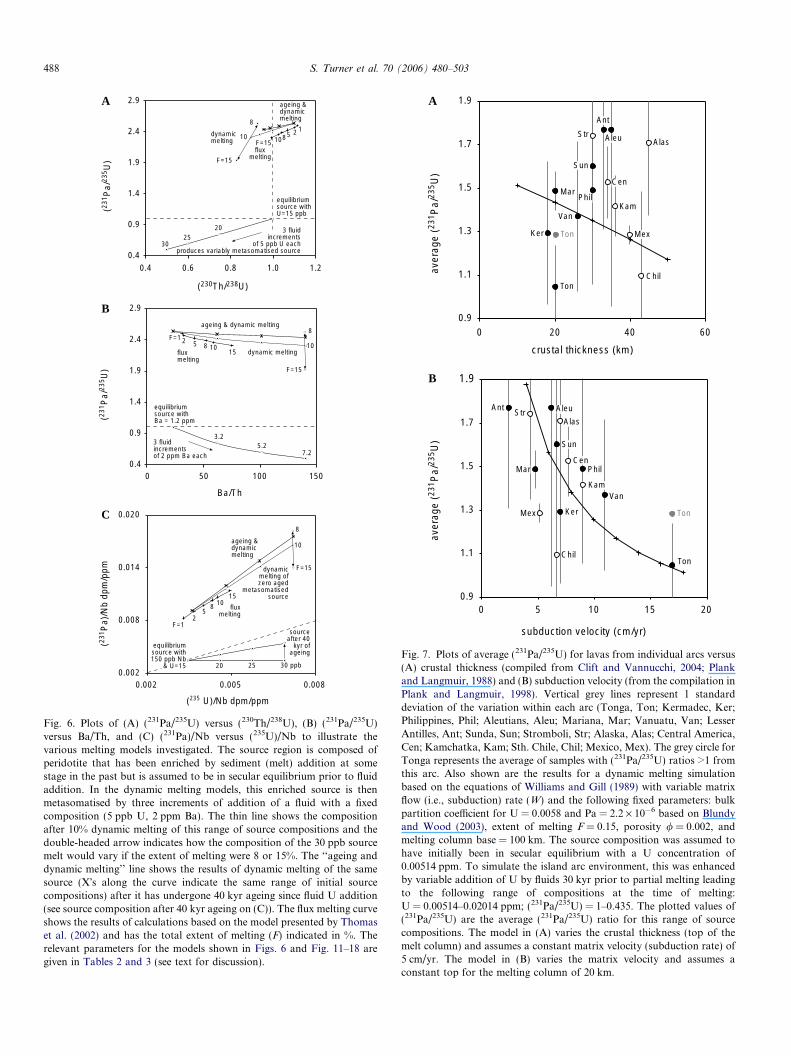
Fig. 7. Plots of average (231Pa/235U) for lavas from individual arcs versus(A) crustal thickness (compiled from Clift and Vannucchi, 2004; Plankand Langmuir, 1988) and (B) subduction velocity (from the compilation inPlank and Langmuir, 1998). Vertical grey lines represent 1 standarddeviation of the variation within each arc (Tonga, Ton; Kermadec, Ker;Philippines, Phil; Aleutians, Aleu; Mariana, Mar; Vanuatu, Van; LesserAntilles, Ant; Sunda, Sun; Stromboli, Str; Alaska, Alas; Central America,Cen; Kamchatka, Kam; Sth. Chile, Chil; Mexico, Mex). The grey circle forTonga represents the average of samples with (231Pa/235U) ratios >1 fromthis arc. Also shown are the results for a dynamic melting simulationbased on the equations of Williams and Gill (1989) with variable matrixflow (i.e., subduction) rate (W) and the following fixed parameters: bulkpartition coefficient for U = 0.0058 and Pa = 2.2 · 10�6 based on Blundyand Wood (2003), extent of melting F = 0.15, porosity / = 0.002, andmelting column base = 100 km. The source composition was assumed tohave initially been in secular equilibrium with a U concentration of0.00514 ppm. To simulate the island arc environment, this was enhancedby variable addition of U by fluids 30 kyr prior to partial melting leadingto the following range of compositions at the time of melting:U = 0.00514–0.02014 ppm; (231Pa/235U) = 1–0.435. The plotted values of(231Pa/235U) are the average (231Pa/235U) ratio for this range of sourcecompositions. The model in (A) varies the crustal thickness (top of themelt column) and assumes a constant matrix velocity (subduction rate) of5 cm/yr. The model in (B) varies the matrix velocity and assumes aconstant top for the melting column of 20 km.
488 S. Turner et al. 70 (2006) 480–503
U–Pa disequilibria in subduction zone lavas 489
model could in principle apply to the decompression modelin Fig. 5A as well. As Figs. 6A and B show, the primaryeffect of ageing for several 10s kyr is to elevate and reducethe range in (231Pa/235U) ratios and the slope of the curvesin the (231Pa/235U) versus (230Th/238U) and (231Pa/235U)versus Ba/Th diagrams.
4.3. Flux melting
The third model illustrated in Fig. 5C is flux melting.The basic distinction of this model is the assumption thatthe continuum of dehydration reactions occurring in thesubducting plate (Poli and Schmidt, 1995; Schmidt andPoli, 1998) directly induces melting each time they areinjected into the wedge so that small melt fractions are pro-duced for each increment of fluid addition and then coa-lesce (Bourdon et al., 2003a,b; Dosseto et al., 2003;Thomas et al., 2002). Melting continues in this model be-cause fluid is continually being added. Since the wedge isconvecting and melt is extracted as soon as the criticalthreshold porosity (often referred to as the residual poros-ity) is exceeded, 231Pa in-growth occurs in the down-dragged matrix between each increment of fluid additionand is again linked to the rate of downward convection.The flux melting simulation employed here uses the calcu-lations described in detail in Thomas et al. (2002), althoughTh and Pa are assumed to be fluid immobile (see Section 6).Because the variations produced in fluid mobile elementconcentrations and U-series nuclide in-growth are linkedto the number of iterative fluid addition and melting epi-sodes, these parameters are strongly correlated with theoverall summed extent of partial melting. Thus, in thesemodels, the lowest (231Pa/235U) and (230Th/238U) ratios re-sult from the largest degrees of partial melting (see Fig. 6).
4.4. Links with physical observables
In all of the models described above, the extent of 231Pain-growth should be linked to the rate of matrix transfer.For the latter two models, especially, this is likely to becontrolled by the local subduction rate assuming that thereis strong coupling between the descending plate and con-vection in the mantle wedge (but see also Turner and Haw-kesworth, 1997; Honda and Yoshida, 2005). However, inthe case of the decompression model, 231Pa in-growthmay also be influenced by extensional tectonics and thelength of the melt column which would imply a potentiallink with crustal thickness. Therefore, in a first order at-tempt to try to discriminate between these models we haveplotted the average (231Pa/235U) ratios for each subductionzone against crustal thickness and the velocity of the sub-ducting plate in Fig. 7.
A hint of a positive correlation between (231Pa/235U)and crustal thickness was found by Bourdon et al.(2003a,b) and Turner et al. (2003) using the early datasetof Pickett and Murrell (1997). Our new dataset shows thata broad positive correlation exists between average
(231Pa/235U) and crustal thickness for oceanic arcs(although there are a wide range of values within eacharc, Fig. 7A), and that the opposite is observed for arcsbuilt upon continental crust. Thus, there is no simple glob-al correlation with crustal thickness. A seemingly betterglobal correlation emerges between average (231Pa/235U)ratios and the velocity of the subducting plate in Fig. 7B.Although the correlation is largely controlled by data fromTonga, where (231Pa/235U) ratios <1 are thought to reflect alack of residual clinopyroxene during melting (Bourdonet al., 1999), a reasonable correlation still exists if onlythe Tonga samples with (231Pa/235U) ratios >1 are averaged(see Fig. 7B).
Since the matrix flow rate and melting column length arekey variables in all dynamic melting models, it is possibleto forward model possible relationships in Fig. 7 using adynamic melting simulation (e.g., Williams and Gill,1989) and reasonable input parameters for the other vari-ables such as extent of melting, melt column length, resid-ual porosity, bulk partition coefficients, and sourcecomposition. The results also serve to illustrate the effectsof varying melt column length and matrix flow rate whilstkeeping all other parameters constant. The curve in Fig. 7Ashows that increasing crustal thickness (i.e., decreasing thelength of the melting column) at constant matrix flow andmelting rate leads to a trend of decreasing average(231Pa/235U) with increasing crustal thickness. This is theopposite slope to that defined by the oceanic arcs. A posi-tive correlation would require that the melting rate or totalextent of melting also decreased with increasing crustalthickness but, as we discuss in Section 6, there appears tobe little evidence for this. In contrast, continental arcs doform a negative slope but one which has a much steepertrend than the model results. Nevertheless, it is not clearwhy the extent of melting would vary with crustal thicknessin oceanic arcs yet remain constant beneath continentalarcs or why the continental arcs are not systematically dis-placed to higher (231Pa/235U) than the oceanic arcs. In sum-mary, there does not appear to be any convincing evidencethat crustal thickness plays a first order control on231Pa–235U systematics at a global scale. Instead, the trendin global averages is in much better agreement with themodelled decreases in (231Pa/235U) that result from increas-ing the matrix flow rate (i.e., subduction velocity) at a con-stant melt column length (Fig. 7B).
5. Variations within subduction zones
A caveat to the treatment in Fig. 7 is that the use ofaverage (231Pa/235U) ratios hides both the large variationspresent within each arc, and proposed differences in thecontrolling mineralogy, as in Tonga and the southern Less-er Antilles. Accordingly we have also examined the varia-tions within each individual subduction zone in detail(see Appendix A), since each arc has a number of differenttectonic attributes which might be anticipated to link topartial melting processes. In particular, we have subdivided
490 S. Turner et al. 70 (2006) 480–503
the different arcs according to their slope in the(231Pa/235U) versus (230Th/238U) diagram. A positive slopemay imply relatively little elapsed time between fluid addi-tion of U and partial melting, and that the slope is largelydetermined by fluid addition, whereas a horizontal slope,as observed in central America (Thomas et al., 2002), ora negative slope requires more complex models.
Although the data trends are often scattered and may re-quire further analyses to firm up in some instances, it isapparent from Appendix A and Figs. 11–18 that thereare significant intra-arc differences in 231Pa–235U behav-iour. In the (231Pa/235U) versus (230Th/238U) diagram, onlyVanuatu and the Alaska-Aleutian arcs form positivetrends; Tonga is also positive but that is because the fluidaddition signal has not been overprinted by the effects ofmelting due to the inferred absence of residual clinopyrox-ene (Bourdon et al., 1999). In comparison, the Mariana,Kermadec, and central American suite form roughly hori-zontal (231Pa/235U)–(230Th/238U) trends (Figs. 12 and 16;Bourdon et al., 1999; Thomas et al., 2002) whereas thenorthern Lesser Antilles, Kamchatka, and possibly Sundaarcs show negative trends.
In presenting the data we also explore the applicabilityof the dynamic, dynamic + ageing, and the flux meltingmodels described above and use the (231Pa/235U) versus(230Th/238U) and (231Pa/235U) versus Ba/Th diagrams fromFig. 6 to facilitate direct comparisons (the possible role fordecompression melting will be revisited in Section 7). Be-cause the rate of matrix flow is likely to be linked to sub-duction rate in all of the models considered here (cf.Fig. 5) and arguably correlates with average (231Pa/235U)in Fig. 7B, we have taken the local subduction rate to beindicative of this matrix flow rate. U, Ba, and Ra are as-sumed to be fluid mobile whereas Th and Pa are not (butsee Section 6). In an effort to permit fair comparison ofthese three different models, we have attempted to makeall common parameters (e.g., partition coefficients, mantlemineralogy, etc.) identical. These and the other key param-eters used for each arc are listed in Tables 2 and 3.
6. Comparison of the partial melting models
Overall, the models do a poor job in simulating the datawhich, admittedly, are often scattered. Although the posi-tions of the model curves can be moved around in Figs.11–18 by varying some of the input parameters in Table
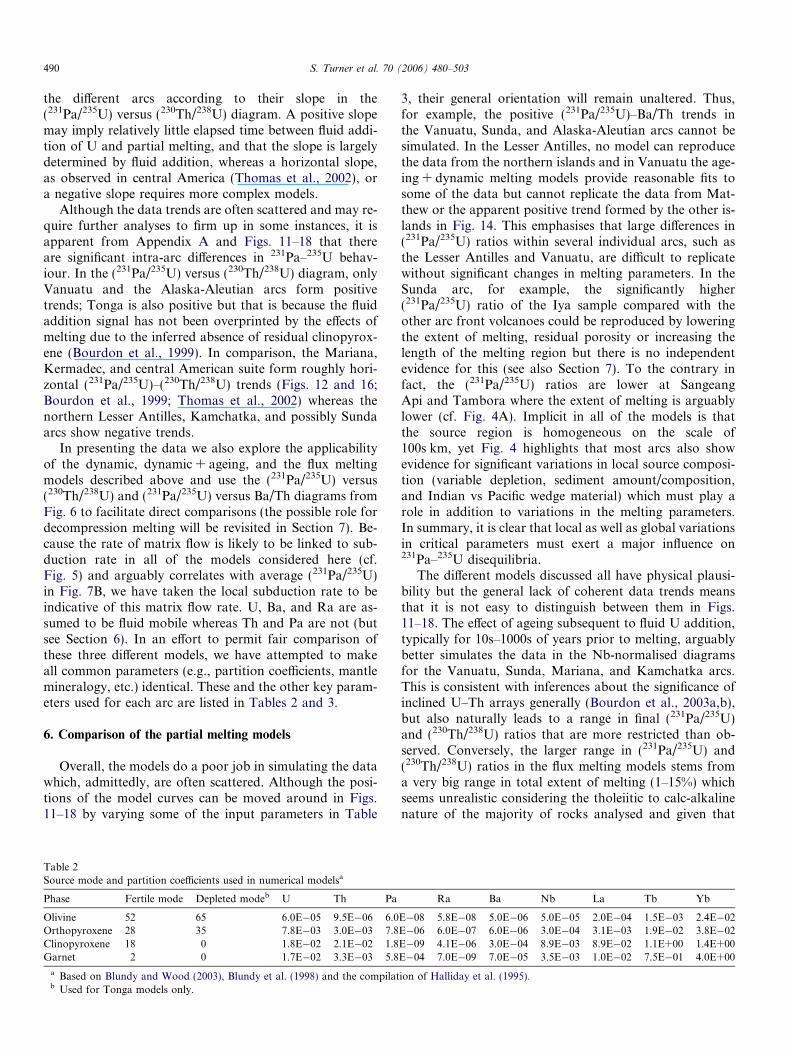
Table 2Source mode and partition coefficients used in numerical modelsa
Phase Fertile mode Depleted modeb U Th Pa
Olivine 52 65 6.0E�05 9.5E�06 6.0Orthopyroxene 28 35 7.8E�03 3.0E�03 7.8Clinopyroxene 18 0 1.8E�02 2.1E�02 1.8Garnet 2 0 1.7E�02 3.3E�03 5.8
a Based on Blundy and Wood (2003), Blundy et al. (1998) and the compilatb Used for Tonga models only.
3, their general orientation will remain unaltered. Thus,for example, the positive (231Pa/235U)–Ba/Th trends inthe Vanuatu, Sunda, and Alaska-Aleutian arcs cannot besimulated. In the Lesser Antilles, no model can reproducethe data from the northern islands and in Vanuatu the age-ing + dynamic melting models provide reasonable fits tosome of the data but cannot replicate the data from Mat-thew or the apparent positive trend formed by the other is-lands in Fig. 14. This emphasises that large differences in(231Pa/235U) ratios within several individual arcs, such asthe Lesser Antilles and Vanuatu, are difficult to replicatewithout significant changes in melting parameters. In theSunda arc, for example, the significantly higher(231Pa/235U) ratio of the Iya sample compared with theother arc front volcanoes could be reproduced by loweringthe extent of melting, residual porosity or increasing thelength of the melting region but there is no independentevidence for this (see also Section 7). To the contrary infact, the (231Pa/235U) ratios are lower at SangeangApi and Tambora where the extent of melting is arguablylower (cf. Fig. 4A). Implicit in all of the models is thatthe source region is homogeneous on the scale of100s km, yet Fig. 4 highlights that most arcs also showevidence for significant variations in local source composi-tion (variable depletion, sediment amount/composition,and Indian vs Pacific wedge material) which must play arole in addition to variations in the melting parameters.In summary, it is clear that local as well as global variationsin critical parameters must exert a major influence on231Pa–235U disequilibria.
The different models discussed all have physical plausi-bility but the general lack of coherent data trends meansthat it is not easy to distinguish between them in Figs.11–18. The effect of ageing subsequent to fluid U addition,typically for 10s–1000s of years prior to melting, arguablybetter simulates the data in the Nb-normalised diagramsfor the Vanuatu, Sunda, Mariana, and Kamchatka arcs.This is consistent with inferences about the significance ofinclined U–Th arrays generally (Bourdon et al., 2003a,b),but also naturally leads to a range in final (231Pa/235U)and (230Th/238U) ratios that are more restricted than ob-served. Conversely, the larger range in (231Pa/235U) and(230Th/238U) ratios in the flux melting models stems froma very big range in total extent of melting (1–15%) whichseems unrealistic considering the tholeiitic to calc-alkalinenature of the majority of rocks analysed and given that
Ra Ba Nb La Tb Yb
E�08 5.8E�08 5.0E�06 5.0E�05 2.0E�04 1.5E�03 2.4E�02E�06 6.0E�07 6.0E�06 3.0E�04 3.1E�03 1.9E�02 3.8E�02E�09 4.1E�06 3.0E�04 8.9E�03 8.9E�02 1.1E+00 1.4E+00E�04 7.0E�09 7.0E�05 3.5E�03 1.0E�02 7.5E�01 4.0E+00
ion of Halliday et al. (1995).
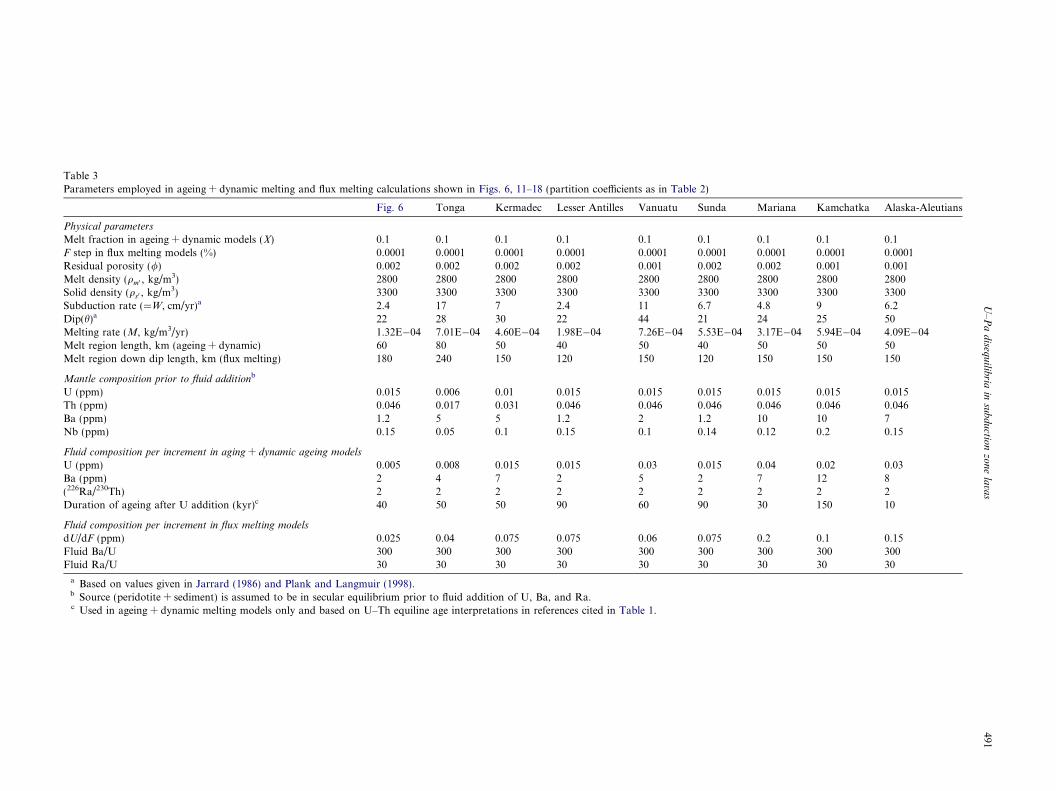
Table 3Parameters employed in ageing + dynamic melting and flux melting calculations shown in Figs. 6, 11–18 (partition coefficients as in Table 2)
Fig. 6 Tonga Kermadec Lesser Antilles Vanuatu Sunda Mariana Kamchatka Alaska-Aleutians
Physical parameters
Melt fraction in ageing + dynamic models (X) 0.1 0.1 0.1 0.1 0.1 0.1 0.1 0.1 0.1F step in flux melting models (%) 0.0001 0.0001 0.0001 0.0001 0.0001 0.0001 0.0001 0.0001 0.0001Residual porosity (/) 0.002 0.002 0.002 0.002 0.001 0.002 0.002 0.001 0.001Melt density (qm0 , kg/m3) 2800 2800 2800 2800 2800 2800 2800 2800 2800Solid density (qs0 , kg/m
3) 3300 3300 3300 3300 3300 3300 3300 3300 3300Subduction rate (=W, cm/yr)a 2.4 17 7 2.4 11 6.7 4.8 9 6.2Dip(h)a 22 28 30 22 44 21 24 25 50Melting rate (M, kg/m3/yr) 1.32E�04 7.01E�04 4.60E�04 1.98E�04 7.26E�04 5.53E�04 3.17E�04 5.94E�04 4.09E�04Melt region length, km (ageing + dynamic) 60 80 50 40 50 40 50 50 50Melt region down dip length, km (flux melting) 180 240 150 120 150 120 150 150 150
Mantle composition prior to fluid additionb
U (ppm) 0.015 0.006 0.01 0.015 0.015 0.015 0.015 0.015 0.015Th (ppm) 0.046 0.017 0.031 0.046 0.046 0.046 0.046 0.046 0.046Ba (ppm) 1.2 5 5 1.2 2 1.2 10 10 7Nb (ppm) 0.15 0.05 0.1 0.15 0.1 0.14 0.12 0.2 0.15
Fluid composition per increment in aging + dynamic ageing models
U (ppm) 0.005 0.008 0.015 0.015 0.03 0.015 0.04 0.02 0.03Ba (ppm) 2 4 7 2 5 2 7 12 8(226Ra/230Th) 2 2 2 2 2 2 2 2 2Duration of ageing after U addition (kyr)c 40 50 50 90 60 90 30 150 10
Fluid composition per increment in flux melting models
dU/dF (ppm) 0.025 0.04 0.075 0.075 0.06 0.075 0.2 0.1 0.15Fluid Ba/U 300 300 300 300 300 300 300 300 300Fluid Ra/U 30 30 30 30 30 30 30 30 30
a Based on values given in Jarrard (1986) and Plank and Langmuir (1998).b Source (peridotite + sediment) is assumed to be in secular equilibrium prior to fluid addition of U, Ba, and Ra.c Used in ageing + dynamic melting models only and based on U–Th equiline age interpretations in references cited in Table 1.
U–Padiseq
uilib
riain
subductio
nzonelavas
491
(231
Pa/
230 T
h)
(238U/230Th)
0.04
0.06
0.08
0.10
0.12
0.14
0.16
0.6 0.8 1.0 1.2 1.4 1.6 1.8 2.0
(231 Pa/2
35 U) = 1
(238 U
/230 T
h) =
1
Antilles Marianas
Tonga
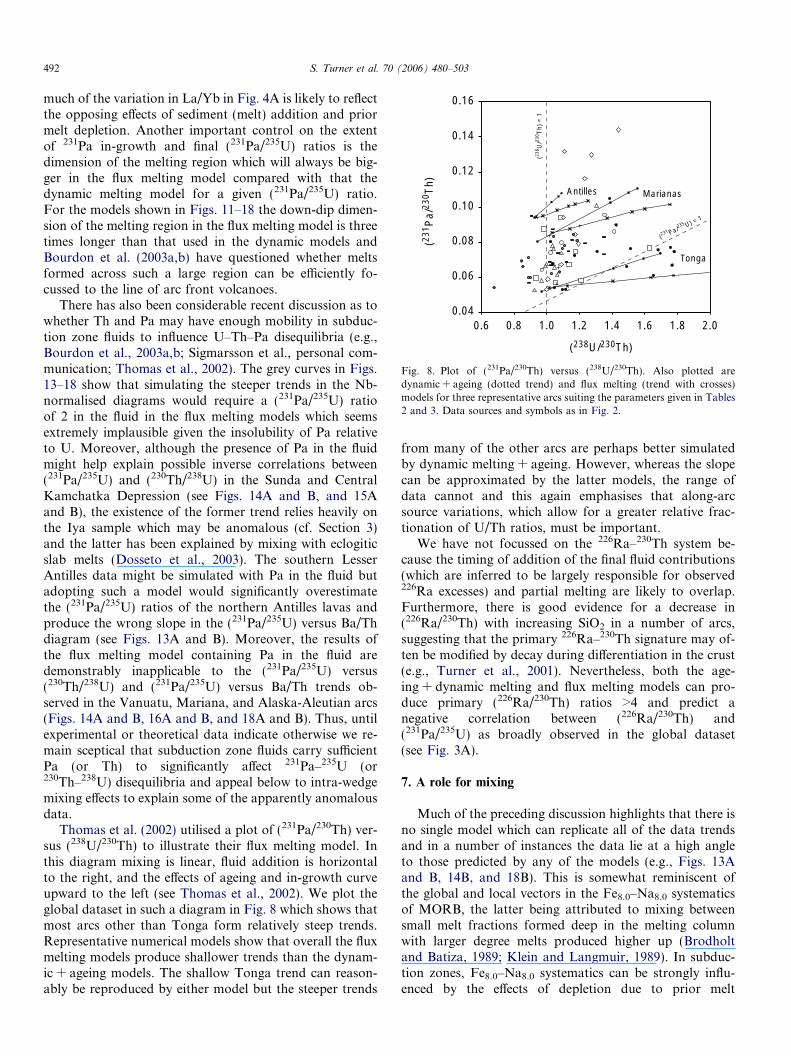
Fig. 8. Plot of (231Pa/230Th) versus (238U/230Th). Also plotted aredynamic + ageing (dotted trend) and flux melting (trend with crosses)models for three representative arcs suiting the parameters given in Tables2 and 3. Data sources and symbols as in Fig. 2.
492 S. Turner et al. 70 (2006) 480–503
much of the variation in La/Yb in Fig. 4A is likely to reflectthe opposing effects of sediment (melt) addition and priormelt depletion. Another important control on the extentof 231Pa in-growth and final (231Pa/235U) ratios is thedimension of the melting region which will always be big-ger in the flux melting model compared with that thedynamic melting model for a given (231Pa/235U) ratio.For the models shown in Figs. 11–18 the down-dip dimen-sion of the melting region in the flux melting model is threetimes longer than that used in the dynamic models andBourdon et al. (2003a,b) have questioned whether meltsformed across such a large region can be efficiently fo-cussed to the line of arc front volcanoes.
There has also been considerable recent discussion as towhether Th and Pa may have enough mobility in subduc-tion zone fluids to influence U–Th–Pa disequilibria (e.g.,Bourdon et al., 2003a,b; Sigmarsson et al., personal com-munication; Thomas et al., 2002). The grey curves in Figs.13–18 show that simulating the steeper trends in the Nb-normalised diagrams would require a (231Pa/235U) ratioof 2 in the fluid in the flux melting models which seemsextremely implausible given the insolubility of Pa relativeto U. Moreover, although the presence of Pa in the fluidmight help explain possible inverse correlations between(231Pa/235U) and (230Th/238U) in the Sunda and CentralKamchatka Depression (see Figs. 14A and B, and 15Aand B), the existence of the former trend relies heavily onthe Iya sample which may be anomalous (cf. Section 3)and the latter has been explained by mixing with eclogiticslab melts (Dosseto et al., 2003). The southern LesserAntilles data might be simulated with Pa in the fluid butadopting such a model would significantly overestimatethe (231Pa/235U) ratios of the northern Antilles lavas andproduce the wrong slope in the (231Pa/235U) versus Ba/Thdiagram (see Figs. 13A and B). Moreover, the results ofthe flux melting model containing Pa in the fluid aredemonstrably inapplicable to the (231Pa/235U) versus(230Th/238U) and (231Pa/235U) versus Ba/Th trends ob-served in the Vanuatu, Mariana, and Alaska-Aleutian arcs(Figs. 14A and B, 16A and B, and 18A and B). Thus, untilexperimental or theoretical data indicate otherwise we re-main sceptical that subduction zone fluids carry sufficientPa (or Th) to significantly affect 231Pa–235U (or230Th–238U) disequilibria and appeal below to intra-wedgemixing effects to explain some of the apparently anomalousdata.
Thomas et al. (2002) utilised a plot of (231Pa/230Th) ver-sus (238U/230Th) to illustrate their flux melting model. Inthis diagram mixing is linear, fluid addition is horizontalto the right, and the effects of ageing and in-growth curveupward to the left (see Thomas et al., 2002). We plot theglobal dataset in such a diagram in Fig. 8 which shows thatmost arcs other than Tonga form relatively steep trends.Representative numerical models show that overall the fluxmelting models produce shallower trends than the dynam-ic + ageing models. The shallow Tonga trend can reason-ably be reproduced by either model but the steeper trends
from many of the other arcs are perhaps better simulatedby dynamic melting + ageing. However, whereas the slopecan be approximated by the latter models, the range ofdata cannot and this again emphasises that along-arcsource variations, which allow for a greater relative frac-tionation of U/Th ratios, must be important.
We have not focussed on the 226Ra–230Th system be-cause the timing of addition of the final fluid contributions(which are inferred to be largely responsible for observed226Ra excesses) and partial melting are likely to overlap.Furthermore, there is good evidence for a decrease in(226Ra/230Th) with increasing SiO2 in a number of arcs,suggesting that the primary 226Ra–230Th signature may of-ten be modified by decay during differentiation in the crust(e.g., Turner et al., 2001). Nevertheless, both the age-ing + dynamic melting and flux melting models can pro-duce primary (226Ra/230Th) ratios >4 and predict anegative correlation between (226Ra/230Th) and(231Pa/235U) as broadly observed in the global dataset(see Fig. 3A).
7. A role for mixing
Much of the preceding discussion highlights that there isno single model which can replicate all of the data trendsand in a number of instances the data lie at a high angleto those predicted by any of the models (e.g., Figs. 13Aand B, 14B, and 18B). This is somewhat reminiscent ofthe global and local vectors in the Fe8.0–Na8.0 systematicsof MORB, the latter being attributed to mixing betweensmall melt fractions formed deep in the melting columnwith larger degree melts produced higher up (Brodholtand Batiza, 1989; Klein and Langmuir, 1989). In subduc-tion zones, Fe8.0–Na8.0 systematics can be strongly influ-enced by the effects of depletion due to prior melt
mixing betweendeep, hydrous-
melts and shallow,anhydrous
decompressionmelts
fast meltmigration
1000 ˚C
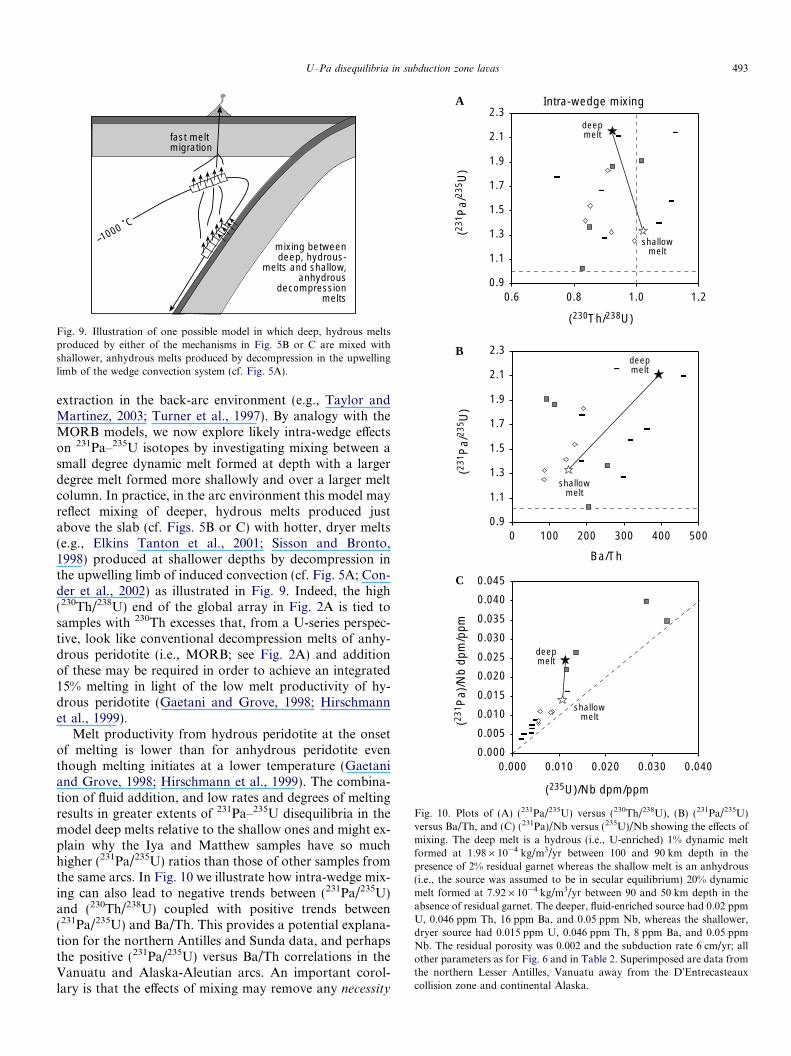
Fig. 9. Illustration of one possible model in which deep, hydrous meltsproduced by either of the mechanisms in Fig. 5B or C are mixed withshallower, anhydrous melts produced by decompression in the upwellinglimb of the wedge convection system (cf. Fig. 5A).
(231
Pa/
235 U
)
(230Th/238U)
(231
Pa/
235 U
)
Ba/Th
(231
Pa)
/Nb
dpm
/ppm
(235U)/Nb dpm/ppm
Intra-wedge mixing
0.9
1.1
1.3
1.5
1.7
1.9
2.1
2.3
0.6 0.8 1.0 1.2
0.9
1.1
1.3
1.5
1.7
1.9
2.1
2.3
0 100 200 300 400 500
0.000
0.005
0.010
0.015
0.020
0.025
0.030
0.035
0.040
0.045
0.000 0.010 0.020 0.030 0.040
deepmelt
shallowmelt
deepmelt
shallowmelt
deepmelt
shallowmelt
A
B
C
Fig. 10. Plots of (A) (231Pa/235U) versus (230Th/238U), (B) (231Pa/235U)versus Ba/Th, and (C) (231Pa)/Nb versus (235U)/Nb showing the effects ofmixing. The deep melt is a hydrous (i.e., U-enriched) 1% dynamic meltformed at 1.98 · 10�4 kg/m3/yr between 100 and 90 km depth in thepresence of 2% residual garnet whereas the shallow melt is an anhydrous(i.e., the source was assumed to be in secular equilibrium) 20% dynamicmelt formed at 7.92 · 10�4 kg/m3/yr between 90 and 50 km depth in theabsence of residual garnet. The deeper, fluid-enriched source had 0.02 ppmU, 0.046 ppm Th, 16 ppm Ba, and 0.05 ppm Nb, whereas the shallower,dryer source had 0.015 ppm U, 0.046 ppm Th, 8 ppm Ba, and 0.05 ppmNb. The residual porosity was 0.002 and the subduction rate 6 cm/yr; allother parameters as for Fig. 6 and in Table 2. Superimposed are data fromthe northern Lesser Antilles, Vanuatu away from the D�Entrecasteauxcollision zone and continental Alaska.
U–Pa disequilibria in subduction zone lavas 493
extraction in the back-arc environment (e.g., Taylor andMartinez, 2003; Turner et al., 1997). By analogy with theMORB models, we now explore likely intra-wedge effectson 231Pa–235U isotopes by investigating mixing between asmall degree dynamic melt formed at depth with a largerdegree melt formed more shallowly and over a larger meltcolumn. In practice, in the arc environment this model mayreflect mixing of deeper, hydrous melts produced justabove the slab (cf. Figs. 5B or C) with hotter, dryer melts(e.g., Elkins Tanton et al., 2001; Sisson and Bronto,1998) produced at shallower depths by decompression inthe upwelling limb of induced convection (cf. Fig. 5A; Con-der et al., 2002) as illustrated in Fig. 9. Indeed, the high(230Th/238U) end of the global array in Fig. 2A is tied tosamples with 230Th excesses that, from a U-series perspec-tive, look like conventional decompression melts of anhy-drous peridotite (i.e., MORB; see Fig. 2A) and additionof these may be required in order to achieve an integrated15% melting in light of the low melt productivity of hy-drous peridotite (Gaetani and Grove, 1998; Hirschmannet al., 1999).
Melt productivity from hydrous peridotite at the onsetof melting is lower than for anhydrous peridotite eventhough melting initiates at a lower temperature (Gaetaniand Grove, 1998; Hirschmann et al., 1999). The combina-tion of fluid addition, and low rates and degrees of meltingresults in greater extents of 231Pa–235U disequilibria in themodel deep melts relative to the shallow ones and might ex-plain why the Iya and Matthew samples have so muchhigher (231Pa/235U) ratios than those of other samples fromthe same arcs. In Fig. 10 we illustrate how intra-wedge mix-ing can also lead to negative trends between (231Pa/235U)and (230Th/238U) coupled with positive trends between(231Pa/235U) and Ba/Th. This provides a potential explana-tion for the northern Antilles and Sunda data, and perhapsthe positive (231Pa/235U) versus Ba/Th correlations in theVanuatu and Alaska-Aleutian arcs. An important corol-lary is that the effects of mixing may remove any necessity
494 S. Turner et al. 70 (2006) 480–503
in our data to mobilise Pa (or Th) in the fluid phase. Inter-estingly, mixing effects also lead to a steep vector on theNb-normalised diagram (Fig. 10C) and so this may also ex-plain why the data from some arcs, such as Sunda, arequite scattered in this diagram (see Fig. 15C) whereas oth-ers, exemplified by the Marianas (Fig. 16C), form well-cor-related linear arrays. Lastly, the effect of mixing is also toproduce a negative correlation between (226Ra/230Th) and(231Pa/235U) as broadly observed in Fig. 3B. Unfortunate-ly, possible 226Ra decay during differentiation makes thisprediction hard to test without an expanded suite of veryprimitive lavas.
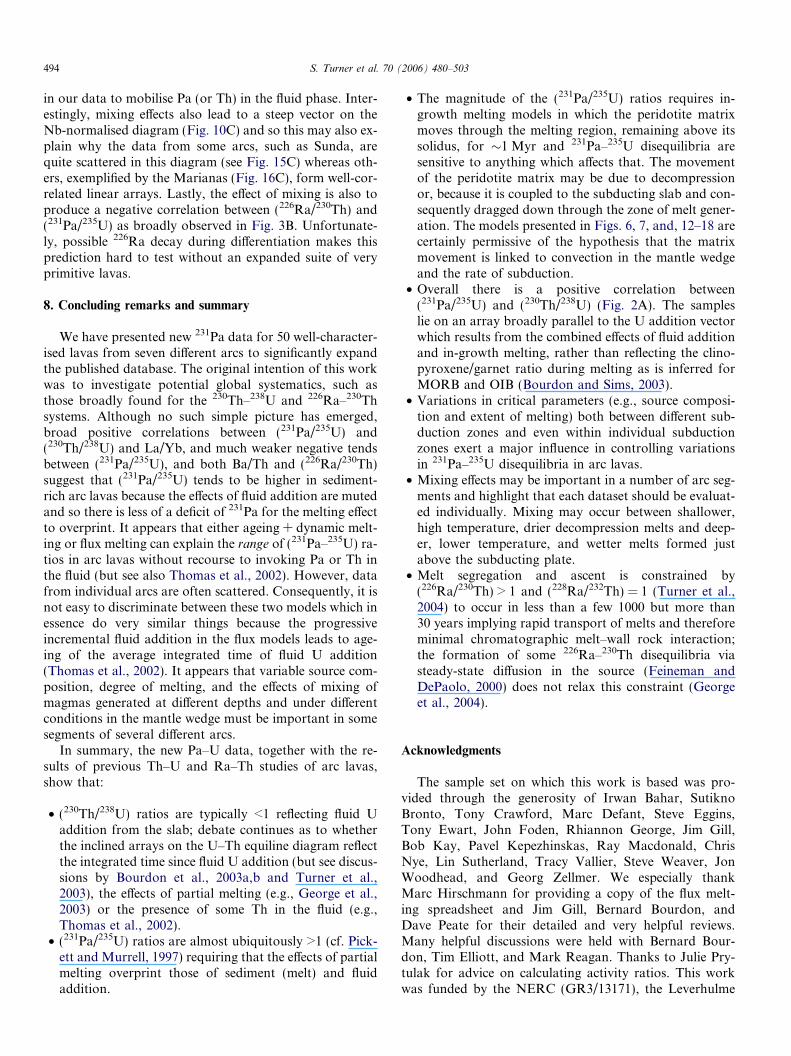
8. Concluding remarks and summary
We have presented new 231Pa data for 50 well-character-ised lavas from seven different arcs to significantly expandthe published database. The original intention of this workwas to investigate potential global systematics, such asthose broadly found for the 230Th–238U and 226Ra–230Thsystems. Although no such simple picture has emerged,broad positive correlations between (231Pa/235U) and(230Th/238U) and La/Yb, and much weaker negative tendsbetween (231Pa/235U), and both Ba/Th and (226Ra/230Th)suggest that (231Pa/235U) tends to be higher in sediment-rich arc lavas because the effects of fluid addition are mutedand so there is less of a deficit of 231Pa for the melting effectto overprint. It appears that either ageing + dynamic melt-ing or flux melting can explain the range of (231Pa–235U) ra-tios in arc lavas without recourse to invoking Pa or Th inthe fluid (but see also Thomas et al., 2002). However, datafrom individual arcs are often scattered. Consequently, it isnot easy to discriminate between these two models which inessence do very similar things because the progressiveincremental fluid addition in the flux models leads to age-ing of the average integrated time of fluid U addition(Thomas et al., 2002). It appears that variable source com-position, degree of melting, and the effects of mixing ofmagmas generated at different depths and under differentconditions in the mantle wedge must be important in somesegments of several different arcs.
In summary, the new Pa–U data, together with the re-sults of previous Th–U and Ra–Th studies of arc lavas,show that:
• (230Th/238U) ratios are typically <1 reflecting fluid Uaddition from the slab; debate continues as to whetherthe inclined arrays on the U–Th equiline diagram reflectthe integrated time since fluid U addition (but see discus-sions by Bourdon et al., 2003a,b and Turner et al.,2003), the effects of partial melting (e.g., George et al.,2003) or the presence of some Th in the fluid (e.g.,Thomas et al., 2002).
• (231Pa/235U) ratios are almost ubiquitously >1 (cf. Pick-ett and Murrell, 1997) requiring that the effects of partialmelting overprint those of sediment (melt) and fluidaddition.
• The magnitude of the (231Pa/235U) ratios requires in-growth melting models in which the peridotite matrixmoves through the melting region, remaining above itssolidus, for �1 Myr and 231Pa–235U disequilibria aresensitive to anything which affects that. The movementof the peridotite matrix may be due to decompressionor, because it is coupled to the subducting slab and con-sequently dragged down through the zone of melt gener-ation. The models presented in Figs. 6, 7, and, 12–18 arecertainly permissive of the hypothesis that the matrixmovement is linked to convection in the mantle wedgeand the rate of subduction.
• Overall there is a positive correlation between(231Pa/235U) and (230Th/238U) (Fig. 2A). The sampleslie on an array broadly parallel to the U addition vectorwhich results from the combined effects of fluid additionand in-growth melting, rather than reflecting the clino-pyroxene/garnet ratio during melting as is inferred forMORB and OIB (Bourdon and Sims, 2003).
• Variations in critical parameters (e.g., source composi-tion and extent of melting) both between different sub-duction zones and even within individual subductionzones exert a major influence in controlling variationsin 231Pa–235U disequilibria in arc lavas.
• Mixing effects may be important in a number of arc seg-ments and highlight that each dataset should be evaluat-ed individually. Mixing may occur between shallower,high temperature, drier decompression melts and deep-er, lower temperature, and wetter melts formed justabove the subducting plate.
• Melt segregation and ascent is constrained by(226Ra/230Th) > 1 and (228Ra/232Th) = 1 (Turner et al.,2004) to occur in less than a few 1000 but more than30 years implying rapid transport of melts and thereforeminimal chromatographic melt–wall rock interaction;the formation of some 226Ra–230Th disequilibria viasteady-state diffusion in the source (Feineman andDePaolo, 2000) does not relax this constraint (Georgeet al., 2004).
Acknowledgments
The sample set on which this work is based was pro-vided through the generosity of Irwan Bahar, SutiknoBronto, Tony Crawford, Marc Defant, Steve Eggins,Tony Ewart, John Foden, Rhiannon George, Jim Gill,Bob Kay, Pavel Kepezhinskas, Ray Macdonald, ChrisNye, Lin Sutherland, Tracy Vallier, Steve Weaver, JonWoodhead, and Georg Zellmer. We especially thankMarc Hirschmann for providing a copy of the flux melt-ing spreadsheet and Jim Gill, Bernard Bourdon, andDave Peate for their detailed and very helpful reviews.Many helpful discussions were held with Bernard Bour-don, Tim Elliott, and Mark Reagan. Thanks to Julie Pry-tulak for advice on calculating activity ratios. This workwas funded by the NERC (GR3/13171), the Leverhulme
(231
Pa/
235 U
)(2
31P
a/23
5 U)
(230 Th/238 U)
Ba/Th
(231
Pa)
/Nb
dpm
/ppm
(235U)/Nb dpm/ppm
Tonga
0.5
0.6
0.7
0.8
0.9
1.0
1.1
1.2
1.3
1.4
1.5
0.5 0.7 0.9 1.1
0.5
0.6
0.7
0.8
0.9
1.0
1.1
1.2
1.3
1.4
1.5
0 200 400 600 800 1000
0.002
0.006
0.010
0.014
0.018
0.022
0.026
0.030
0.003 0.008 0.013 0.018 0.023
ageing &dynamicmelting
fluxmelting
dynamicmelting
initial source
50 kyrsource
dynamicmelting
ageing &dynamic melting
fluxmeltina
A
B
C
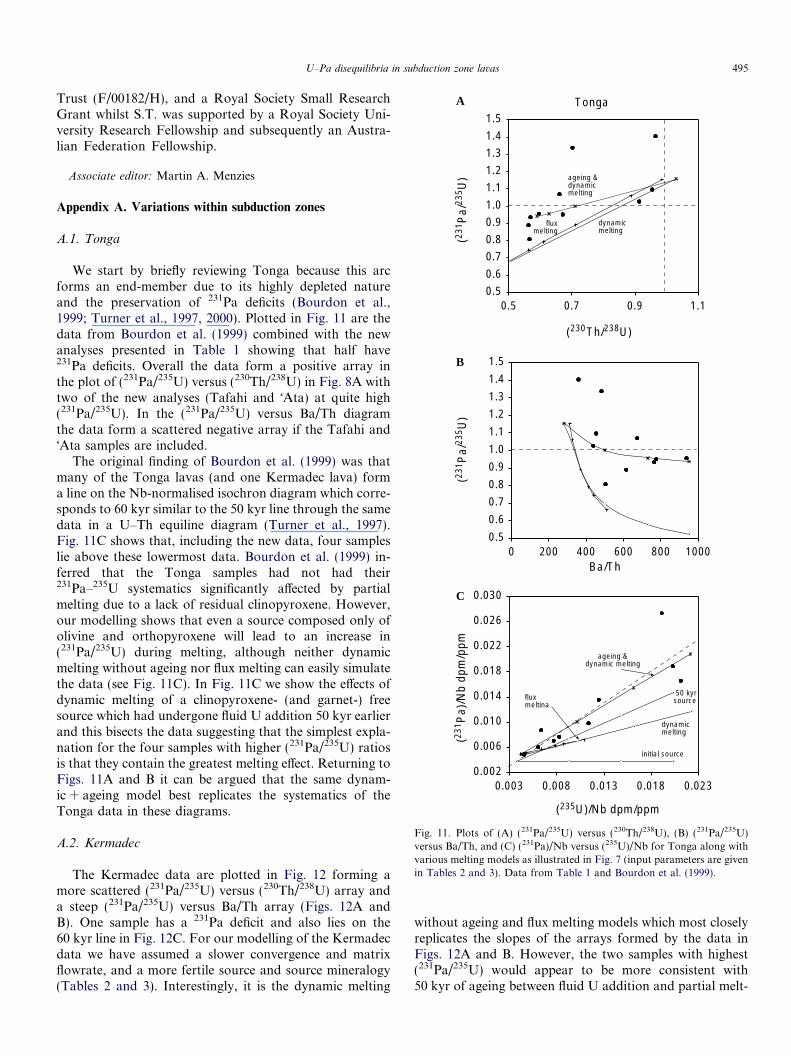
Fig. 11. Plots of (A) (231Pa/235U) versus (230Th/238U), (B) (231Pa/235U)versus Ba/Th, and (C) (231Pa)/Nb versus (235U)/Nb for Tonga along withvarious melting models as illustrated in Fig. 7 (input parameters are givenin Tables 2 and 3). Data from Table 1 and Bourdon et al. (1999).
U–Pa disequilibria in subduction zone lavas 495
Trust (F/00182/H), and a Royal Society Small ResearchGrant whilst S.T. was supported by a Royal Society Uni-versity Research Fellowship and subsequently an Austra-lian Federation Fellowship.
Associate editor: Martin A. Menzies
Appendix A. Variations within subduction zones
A.1. Tonga
We start by briefly reviewing Tonga because this arcforms an end-member due to its highly depleted natureand the preservation of 231Pa deficits (Bourdon et al.,1999; Turner et al., 1997, 2000). Plotted in Fig. 11 are thedata from Bourdon et al. (1999) combined with the newanalyses presented in Table 1 showing that half have231Pa deficits. Overall the data form a positive array inthe plot of (231Pa/235U) versus (230Th/238U) in Fig. 8A withtwo of the new analyses (Tafahi and �Ata) at quite high(231Pa/235U). In the (231Pa/235U) versus Ba/Th diagramthe data form a scattered negative array if the Tafahi and�Ata samples are included.
The original finding of Bourdon et al. (1999) was thatmany of the Tonga lavas (and one Kermadec lava) forma line on the Nb-normalised isochron diagram which corre-sponds to 60 kyr similar to the 50 kyr line through the samedata in a U–Th equiline diagram (Turner et al., 1997).Fig. 11C shows that, including the new data, four sampleslie above these lowermost data. Bourdon et al. (1999) in-ferred that the Tonga samples had not had their231Pa–235U systematics significantly affected by partialmelting due to a lack of residual clinopyroxene. However,our modelling shows that even a source composed only ofolivine and orthopyroxene will lead to an increase in(231Pa/235U) during melting, although neither dynamicmelting without ageing nor flux melting can easily simulatethe data (see Fig. 11C). In Fig. 11C we show the effects ofdynamic melting of a clinopyroxene- (and garnet-) freesource which had undergone fluid U addition 50 kyr earlierand this bisects the data suggesting that the simplest expla-nation for the four samples with higher (231Pa/235U) ratiosis that they contain the greatest melting effect. Returning toFigs. 11A and B it can be argued that the same dynam-ic + ageing model best replicates the systematics of theTonga data in these diagrams.
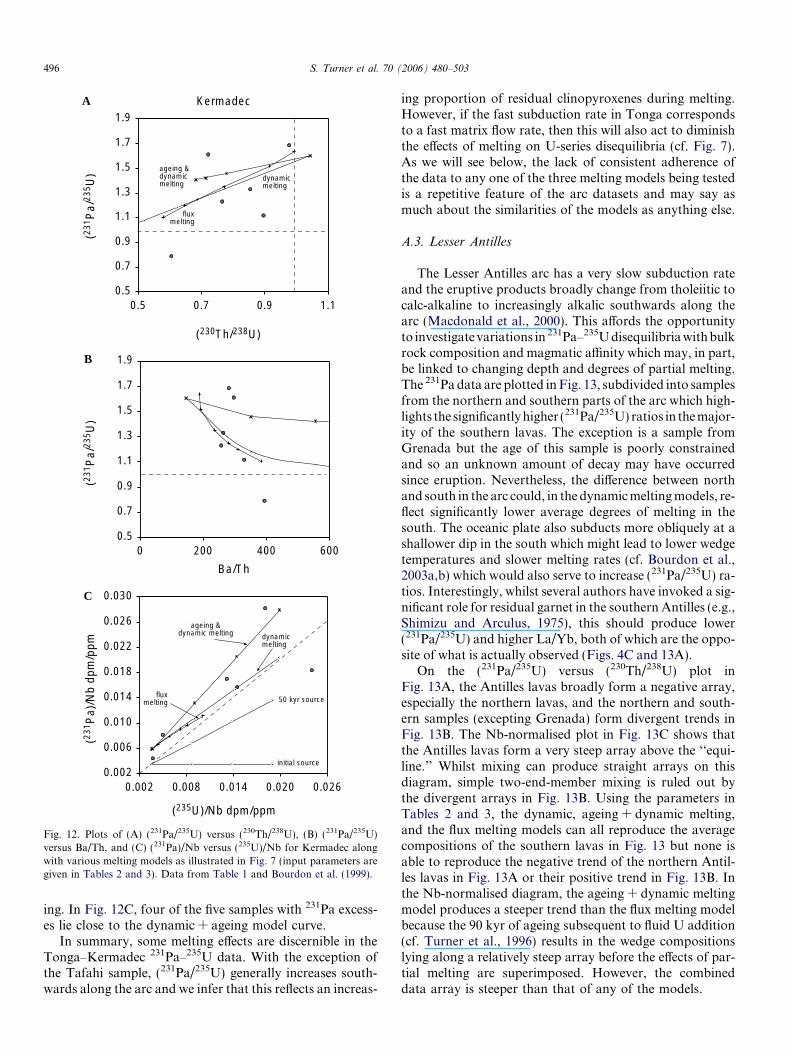
A.2. Kermadec
The Kermadec data are plotted in Fig. 12 forming amore scattered (231Pa/235U) versus (230Th/238U) array anda steep (231Pa/235U) versus Ba/Th array (Figs. 12A andB). One sample has a 231Pa deficit and also lies on the60 kyr line in Fig. 12C. For our modelling of the Kermadecdata we have assumed a slower convergence and matrixflowrate, and a more fertile source and source mineralogy(Tables 2 and 3). Interestingly, it is the dynamic melting
without ageing and flux melting models which most closelyreplicates the slopes of the arrays formed by the data inFigs. 12A and B. However, the two samples with highest(231Pa/235U) would appear to be more consistent with50 kyr of ageing between fluid U addition and partial melt-
(230Th/238U)
(231
Pa/
235 U
)(2
31P
a/23
5 U)
Ba/Th
(231
Pa)
/Nb
dpm
/ppm
(235U)/Nb dpm/ppm
Kermadec
ageing &dynamicmelting
fluxmelting
dynamicmelting
initial source
50 kyr source
dynamicmelting
ageing &dynamic melting
fluxmelting
0.5
0.7
0.9
1.1
1.3
1.5
1.7
1.9
0.5 0.7 0.9 1.1
0.5
0.7
0.9
1.1
1.3
1.5
1.7
1.9
0 200 400 600
0.002
0.006
0.010
0.014
0.018
0.022
0.026
0.030
0.002 0.008 0.014 0.020 0.026
A
B
C
Fig. 12. Plots of (A) (231Pa/235U) versus (230Th/238U), (B) (231Pa/235U)versus Ba/Th, and (C) (231Pa)/Nb versus (235U)/Nb for Kermadec alongwith various melting models as illustrated in Fig. 7 (input parameters aregiven in Tables 2 and 3). Data from Table 1 and Bourdon et al. (1999).
496 S. Turner et al. 70 (2006) 480–503
ing. In Fig. 12C, four of the five samples with 231Pa excess-es lie close to the dynamic + ageing model curve.
In summary, some melting effects are discernible in theTonga–Kermadec 231Pa–235U data. With the exception ofthe Tafahi sample, (231Pa/235U) generally increases south-wards along the arc and we infer that this reflects an increas-
ing proportion of residual clinopyroxenes during melting.However, if the fast subduction rate in Tonga correspondsto a fast matrix flow rate, then this will also act to diminishthe effects of melting on U-series disequilibria (cf. Fig. 7).As we will see below, the lack of consistent adherence ofthe data to any one of the three melting models being testedis a repetitive feature of the arc datasets and may say asmuch about the similarities of the models as anything else.
A.3. Lesser Antilles
The Lesser Antilles arc has a very slow subduction rateand the eruptive products broadly change from tholeiitic tocalc-alkaline to increasingly alkalic southwards along thearc (Macdonald et al., 2000). This affords the opportunityto investigatevariations in 231Pa–235Udisequilibriawithbulkrock composition and magmatic affinity which may, in part,be linked to changing depth and degrees of partial melting.The 231Pa data are plotted inFig. 13, subdivided into samplesfrom the northern and southern parts of the arc which high-lights the significantlyhigher (231Pa/235U) ratios in themajor-ity of the southern lavas. The exception is a sample fromGrenada but the age of this sample is poorly constrainedand so an unknown amount of decay may have occurredsince eruption. Nevertheless, the difference between northand south in the arc could, in the dynamicmeltingmodels, re-flect significantly lower average degrees of melting in thesouth. The oceanic plate also subducts more obliquely at ashallower dip in the south which might lead to lower wedgetemperatures and slower melting rates (cf. Bourdon et al.,2003a,b) which would also serve to increase (231Pa/235U) ra-tios. Interestingly, whilst several authors have invoked a sig-nificant role for residual garnet in the southernAntilles (e.g.,Shimizu and Arculus, 1975), this should produce lower(231Pa/235U) and higher La/Yb, both of which are the oppo-site of what is actually observed (Figs. 4C and 13A).
On the (231Pa/235U) versus (230Th/238U) plot inFig. 13A, the Antilles lavas broadly form a negative array,especially the northern lavas, and the northern and south-ern samples (excepting Grenada) form divergent trends inFig. 13B. The Nb-normalised plot in Fig. 13C shows thatthe Antilles lavas form a very steep array above the ‘‘equi-line.’’ Whilst mixing can produce straight arrays on thisdiagram, simple two-end-member mixing is ruled out bythe divergent arrays in Fig. 13B. Using the parameters inTables 2 and 3, the dynamic, ageing + dynamic melting,and the flux melting models can all reproduce the averagecompositions of the southern lavas in Fig. 13 but none isable to reproduce the negative trend of the northern Antil-les lavas in Fig. 13A or their positive trend in Fig. 13B. Inthe Nb-normalised diagram, the ageing + dynamic meltingmodel produces a steeper trend than the flux melting modelbecause the 90 kyr of ageing subsequent to fluid U addition(cf. Turner et al., 1996) results in the wedge compositionslying along a relatively steep array before the effects of par-tial melting are superimposed. However, the combineddata array is steeper than that of any of the models.
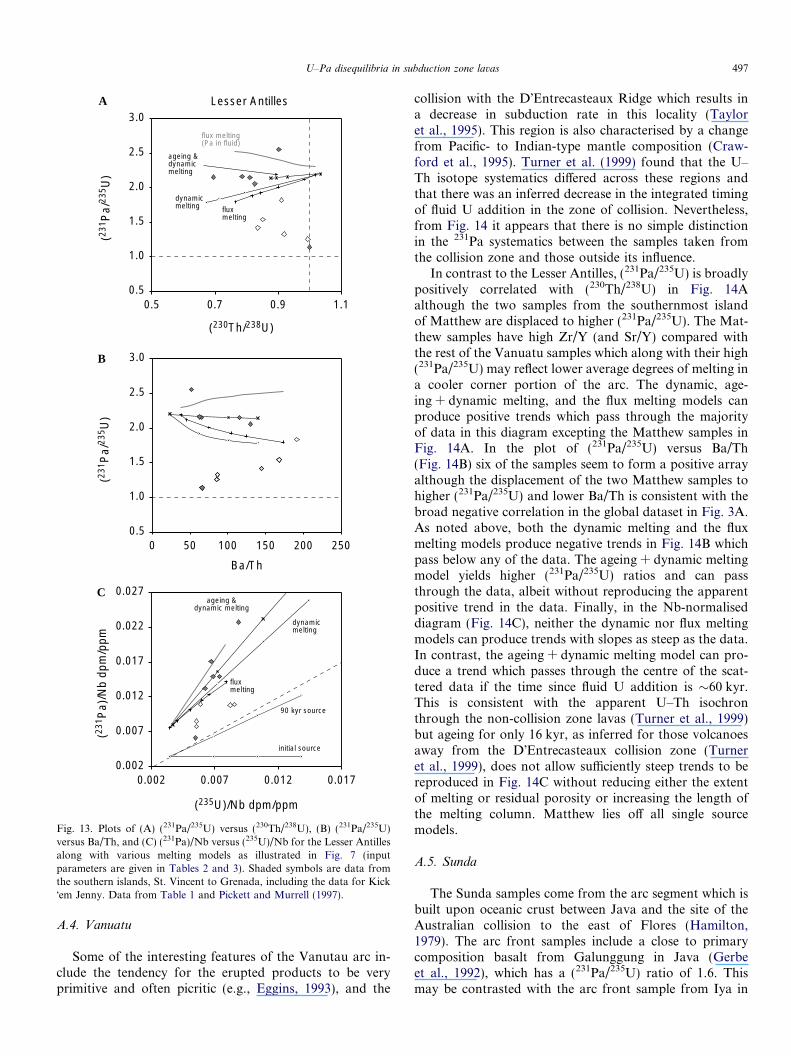
(231
Pa/
235 U
)
(230Th/238U)
(231
Pa/
235 U
)
Ba/Th
initial source
90 kyr source
dynamicmelting
(231
Pa)
/Nb
dpm
/ppm
(235U)/Nb dpm/ppm
Lesser Antilles
0.5
1.0
1.5
2.0
2.5
3.0
0.5 0.7 0.9 1.1
0.5
1.0
1.5
2.0
2.5
3.0
0 50 100 150 200 250
ageing &dynamicmelting
fluxmelting
flux melting(Pa in fluid)
0.002
0.007
0.012
0.017
0.022
0.027
0.002 0.007 0.012 0.017
dynamicmelting
ageing &dynamic melting
fluxmelting
A
B
C
Fig. 13. Plots of (A) (231Pa/235U) versus (230Th/238U), (B) (231Pa/235U)versus Ba/Th, and (C) (231Pa)/Nb versus (235U)/Nb for the Lesser Antillesalong with various melting models as illustrated in Fig. 7 (inputparameters are given in Tables 2 and 3). Shaded symbols are data fromthe southern islands, St. Vincent to Grenada, including the data for Kick�em Jenny. Data from Table 1 and Pickett and Murrell (1997).
U–Pa disequilibria in subduction zone lavas 497
A.4. Vanuatu
Some of the interesting features of the Vanutau arc in-clude the tendency for the erupted products to be veryprimitive and often picritic (e.g., Eggins, 1993), and the
collision with the D�Entrecasteaux Ridge which results ina decrease in subduction rate in this locality (Tayloret al., 1995). This region is also characterised by a changefrom Pacific- to Indian-type mantle composition (Craw-ford et al., 1995). Turner et al. (1999) found that the U–Th isotope systematics differed across these regions andthat there was an inferred decrease in the integrated timingof fluid U addition in the zone of collision. Nevertheless,from Fig. 14 it appears that there is no simple distinctionin the 231Pa systematics between the samples taken fromthe collision zone and those outside its influence.
In contrast to the Lesser Antilles, (231Pa/235U) is broadlypositively correlated with (230Th/238U) in Fig. 14Aalthough the two samples from the southernmost islandof Matthew are displaced to higher (231Pa/235U). The Mat-thew samples have high Zr/Y (and Sr/Y) compared withthe rest of the Vanuatu samples which along with their high(231Pa/235U) may reflect lower average degrees of melting ina cooler corner portion of the arc. The dynamic, age-ing + dynamic melting, and the flux melting models canproduce positive trends which pass through the majorityof data in this diagram excepting the Matthew samples inFig. 14A. In the plot of (231Pa/235U) versus Ba/Th(Fig. 14B) six of the samples seem to form a positive arrayalthough the displacement of the two Matthew samples tohigher (231Pa/235U) and lower Ba/Th is consistent with thebroad negative correlation in the global dataset in Fig. 3A.As noted above, both the dynamic melting and the fluxmelting models produce negative trends in Fig. 14B whichpass below any of the data. The ageing + dynamic meltingmodel yields higher (231Pa/235U) ratios and can passthrough the data, albeit without reproducing the apparentpositive trend in the data. Finally, in the Nb-normaliseddiagram (Fig. 14C), neither the dynamic nor flux meltingmodels can produce trends with slopes as steep as the data.In contrast, the ageing + dynamic melting model can pro-duce a trend which passes through the centre of the scat-tered data if the time since fluid U addition is �60 kyr.This is consistent with the apparent U–Th isochronthrough the non-collision zone lavas (Turner et al., 1999)but ageing for only 16 kyr, as inferred for those volcanoesaway from the D�Entrecasteaux collision zone (Turneret al., 1999), does not allow sufficiently steep trends to bereproduced in Fig. 14C without reducing either the extentof melting or residual porosity or increasing the length ofthe melting column. Matthew lies off all single sourcemodels.
A.5. Sunda
The Sunda samples come from the arc segment which isbuilt upon oceanic crust between Java and the site of theAustralian collision to the east of Flores (Hamilton,1979). The arc front samples include a close to primarycomposition basalt from Galunggung in Java (Gerbeet al., 1992), which has a (231Pa/235U) ratio of 1.6. Thismay be contrasted with the arc front sample from Iya in
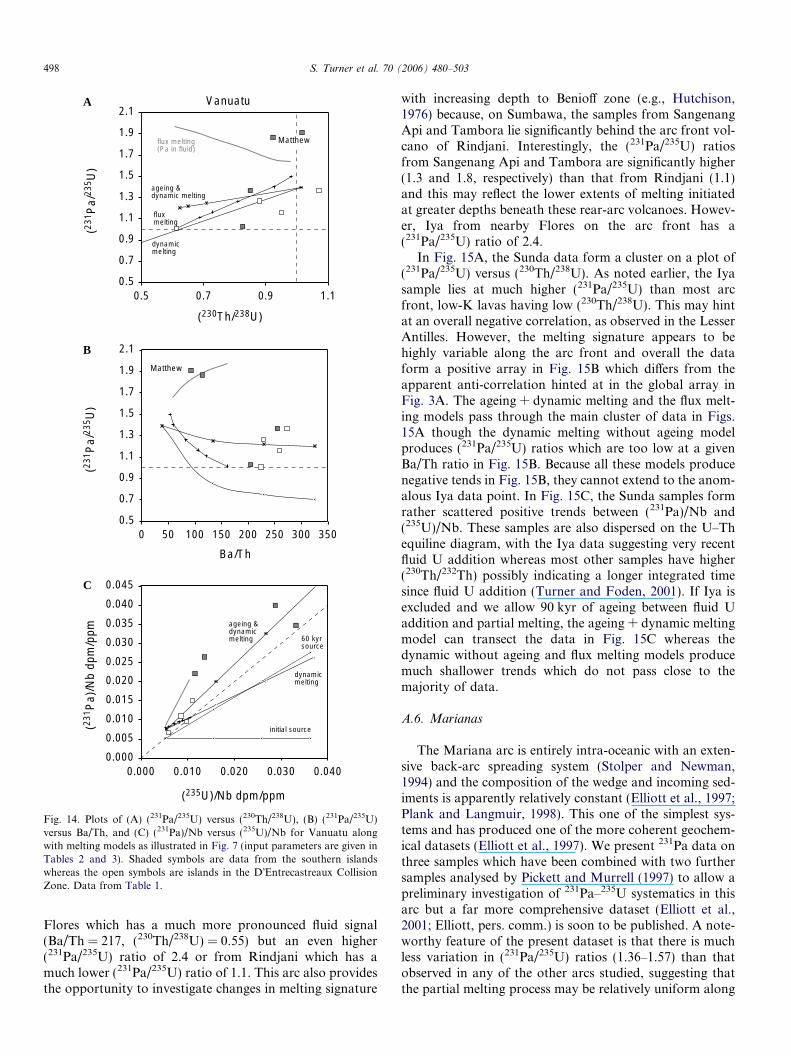
0.000
0.005
0.010
0.015
0.020
0.025
0.030
0.035
0.040
0.045
0.000 0.010 0.020 0.030 0.040
(231
Pa/
235 U
)
(230Th/238U)
ageing &dynamic melting
fluxmelting
(231
Pa/
235 U
)
Ba/Th
initial source
60 kyrsource
dynamicmelting
(231
Pa)
/Nb
dpm
/ppm
(235U)/Nb dpm/ppm
flux melting(Pa in fluid)
Vanuatu
0.5
0.7
0.9
1.1
1.3
1.5
1.7
1.9
2.1
0.5 0.7 0.9 1.1
0.5
0.7
0.9
1.1
1.3
1.5
1.7
1.9
2.1
0 50 100 150 200 250 300 350
dynamicmelting
ageing &dynamicmelting
Matthew
Matthew
A
B
C
Fig. 14. Plots of (A) (231Pa/235U) versus (230Th/238U), (B) (231Pa/235U)versus Ba/Th, and (C) (231Pa)/Nb versus (235U)/Nb for Vanuatu alongwith melting models as illustrated in Fig. 7 (input parameters are given inTables 2 and 3). Shaded symbols are data from the southern islandswhereas the open symbols are islands in the D�Entrecastreaux CollisionZone. Data from Table 1.
498 S. Turner et al. 70 (2006) 480–503
Flores which has a much more pronounced fluid signal(Ba/Th = 217, (230Th/238U) = 0.55) but an even higher(231Pa/235U) ratio of 2.4 or from Rindjani which has amuch lower (231Pa/235U) ratio of 1.1. This arc also providesthe opportunity to investigate changes in melting signature
with increasing depth to Benioff zone (e.g., Hutchison,1976) because, on Sumbawa, the samples from SangenangApi and Tambora lie significantly behind the arc front vol-cano of Rindjani. Interestingly, the (231Pa/235U) ratiosfrom Sangenang Api and Tambora are significantly higher(1.3 and 1.8, respectively) than that from Rindjani (1.1)and this may reflect the lower extents of melting initiatedat greater depths beneath these rear-arc volcanoes. Howev-er, Iya from nearby Flores on the arc front has a(231Pa/235U) ratio of 2.4.
In Fig. 15A, the Sunda data form a cluster on a plot of(231Pa/235U) versus (230Th/238U). As noted earlier, the Iyasample lies at much higher (231Pa/235U) than most arcfront, low-K lavas having low (230Th/238U). This may hintat an overall negative correlation, as observed in the LesserAntilles. However, the melting signature appears to behighly variable along the arc front and overall the dataform a positive array in Fig. 15B which differs from theapparent anti-correlation hinted at in the global array inFig. 3A. The ageing + dynamic melting and the flux melt-ing models pass through the main cluster of data in Figs.15A though the dynamic melting without ageing modelproduces (231Pa/235U) ratios which are too low at a givenBa/Th ratio in Fig. 15B. Because all these models producenegative tends in Fig. 15B, they cannot extend to the anom-alous Iya data point. In Fig. 15C, the Sunda samples formrather scattered positive trends between (231Pa)/Nb and(235U)/Nb. These samples are also dispersed on the U–Thequiline diagram, with the Iya data suggesting very recentfluid U addition whereas most other samples have higher(230Th/232Th) possibly indicating a longer integrated timesince fluid U addition (Turner and Foden, 2001). If Iya isexcluded and we allow 90 kyr of ageing between fluid Uaddition and partial melting, the ageing + dynamic meltingmodel can transect the data in Fig. 15C whereas thedynamic without ageing and flux melting models producemuch shallower trends which do not pass close to themajority of data.
A.6. Marianas
The Mariana arc is entirely intra-oceanic with an exten-sive back-arc spreading system (Stolper and Newman,1994) and the composition of the wedge and incoming sed-iments is apparently relatively constant (Elliott et al., 1997;Plank and Langmuir, 1998). This one of the simplest sys-tems and has produced one of the more coherent geochem-ical datasets (Elliott et al., 1997). We present 231Pa data onthree samples which have been combined with two furthersamples analysed by Pickett and Murrell (1997) to allow apreliminary investigation of 231Pa–235U systematics in thisarc but a far more comprehensive dataset (Elliott et al.,2001; Elliott, pers. comm.) is soon to be published. A note-worthy feature of the present dataset is that there is muchless variation in (231Pa/235U) ratios (1.36–1.57) than thatobserved in any of the other arcs studied, suggesting thatthe partial melting process may be relatively uniform along
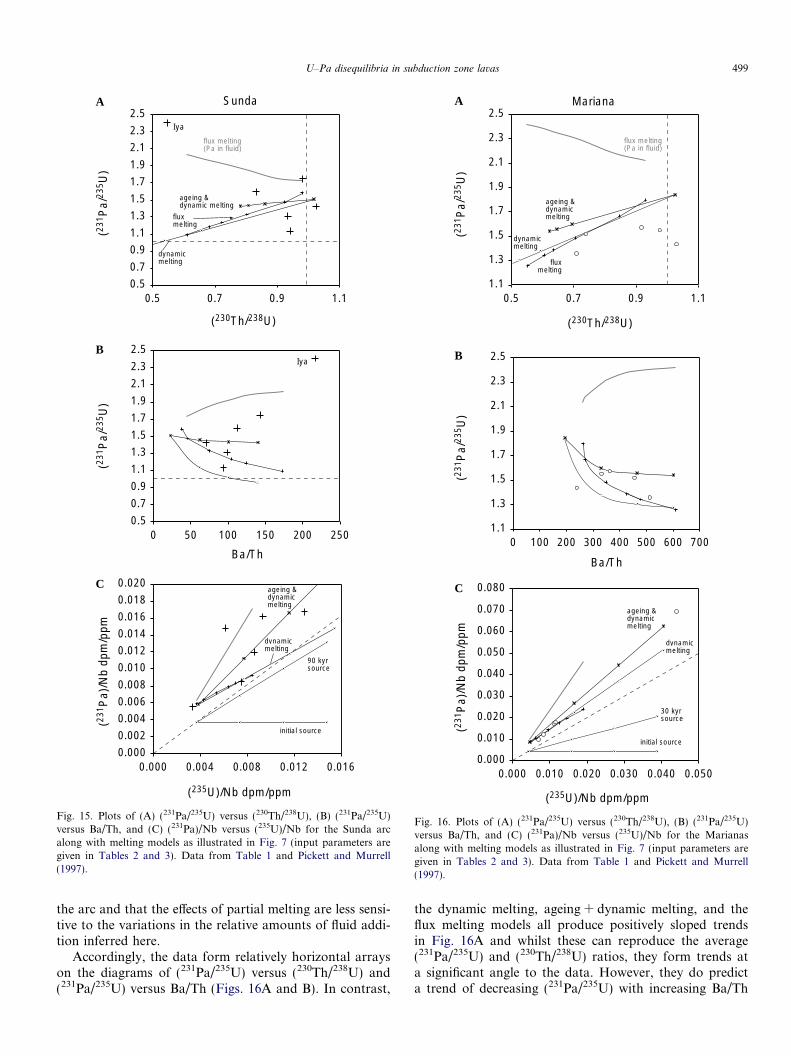
(231
Pa/
235 U
)(2
31P
a/23
5 U)
(230Th/238U)
ageing &dynamic melting
fluxmelting
Ba/Th
initial source
90 kyrsource
(231
Pa)
/Nb
dpm
/ppm
(235U)/Nb dpm/ppm
flux melting(Pa in fluid)
dynamicmelting
Sunda
0.5
0.7
0.9
1.1
1.3
1.5
1.7
1.9
2.1
2.3
2.5
0.5 0.7 0.9 1.1
0.5
0.7
0.9
1.1
1.3
1.5
1.7
1.9
2.1
2.3
2.5
0 50 100 150 200 250
0.000
0.002
0.004
0.006
0.008
0.010
0.012
0.014
0.016
0.018
0.020
0.000 0.004 0.008 0.012 0.016
dynamicmelting
ageing &dynamicmelting
Iya
Iya
A
B
C
Fig. 15. Plots of (A) (231Pa/235U) versus (230Th/238U), (B) (231Pa/235U)versus Ba/Th, and (C) (231Pa)/Nb versus (235U)/Nb for the Sunda arcalong with melting models as illustrated in Fig. 7 (input parameters aregiven in Tables 2 and 3). Data from Table 1 and Pickett and Murrell(1997).
0.000
0.010
0.020
0.030
0.040
0.050
0.060
0.070
0.080
0.000 0.010 0.020 0.030 0.040 0.050
(231
Pa/
235 U
)
(230Th/238U)
ageing &dynamicmelting
fluxmelting
(231
Pa/
235 U
)
Ba/Th
initial source
30 kyrsource
(231
Pa)
/Nb
dpm
/ppm
(235U)/Nb dpm/ppm
flux melting(Pa in fluid)
dynamicmelting
Mariana
1.1
1.3
1.5
1.7
1.9
2.1
2.3
2.5
0.5 0.7 0.9 1.1
1.1
1.3
1.5
1.7
1.9
2.1
2.3
2.5
0 100 200 300 400 500 600 700
dynamicmelting
ageing &dynamicmelting
A
B
C
Fig. 16. Plots of (A) (231Pa/235U) versus (230Th/238U), (B) (231Pa/235U)versus Ba/Th, and (C) (231Pa)/Nb versus (235U)/Nb for the Marianasalong with melting models as illustrated in Fig. 7 (input parameters aregiven in Tables 2 and 3). Data from Table 1 and Pickett and Murrell(1997).
U–Pa disequilibria in subduction zone lavas 499
the arc and that the effects of partial melting are less sensi-tive to the variations in the relative amounts of fluid addi-tion inferred here.
Accordingly, the data form relatively horizontal arrayson the diagrams of (231Pa/235U) versus (230Th/238U) and(231Pa/235U) versus Ba/Th (Figs. 16A and B). In contrast,
the dynamic melting, ageing + dynamic melting, and theflux melting models all produce positively sloped trendsin Fig. 16A and whilst these can reproduce the average(231Pa/235U) and (230Th/238U) ratios, they form trends ata significant angle to the data. However, they do predicta trend of decreasing (231Pa/235U) with increasing Ba/Th
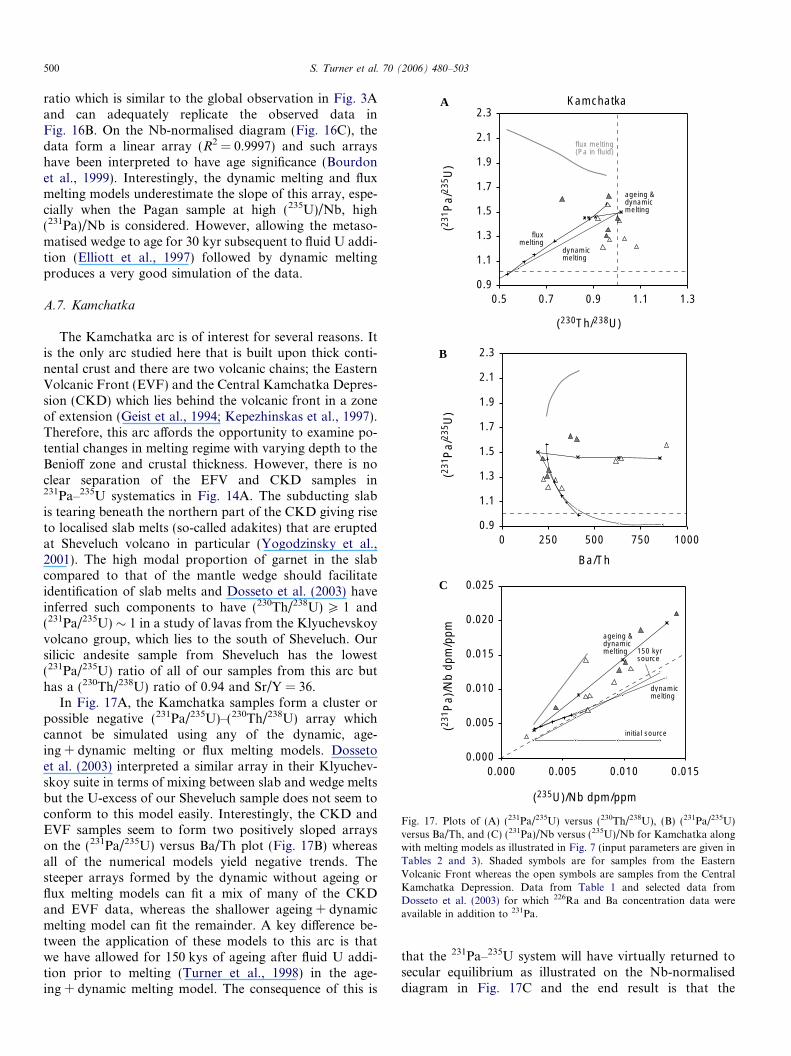
(230Th/238U)
ageing &dynamicmelting
fluxmelting
(231
Pa/
235 U
)(2
31P
a/23
5 U)
Ba/Th
initial source
150 kyrsource
(231
Pa)
/Nb
dpm
/ppm
(235U)/Nb dpm/ppm
flux melting(Pa in fluid)
dynamicmelting
0.000
0.005
0.010
0.015
0.020
0.025
0.000 0.005 0.010 0.015
0.9
1.1
1.3
1.5
1.7
1.9
2.1
2.3
0.5 0.7 0.9 1.1 1.3
0.9
1.1
1.3
1.5
1.7
1.9
2.1
2.3
0 250 500 750 1000
Kamchatka
dynamicmelting
ageing &dynamicmelting
A
B
C
Fig. 17. Plots of (A) (231Pa/235U) versus (230Th/238U), (B) (231Pa/235U)versus Ba/Th, and (C) (231Pa)/Nb versus (235U)/Nb for Kamchatka alongwith melting models as illustrated in Fig. 7 (input parameters are given inTables 2 and 3). Shaded symbols are for samples from the EasternVolcanic Front whereas the open symbols are samples from the CentralKamchatka Depression. Data from Table 1 and selected data fromDosseto et al. (2003) for which 226Ra and Ba concentration data wereavailable in addition to 231Pa.
500 S. Turner et al. 70 (2006) 480–503
ratio which is similar to the global observation in Fig. 3Aand can adequately replicate the observed data inFig. 16B. On the Nb-normalised diagram (Fig. 16C), thedata form a linear array (R2 = 0.9997) and such arrayshave been interpreted to have age significance (Bourdonet al., 1999). Interestingly, the dynamic melting and fluxmelting models underestimate the slope of this array, espe-cially when the Pagan sample at high (235U)/Nb, high(231Pa)/Nb is considered. However, allowing the metaso-matised wedge to age for 30 kyr subsequent to fluid U addi-tion (Elliott et al., 1997) followed by dynamic meltingproduces a very good simulation of the data.
A.7. Kamchatka
The Kamchatka arc is of interest for several reasons. Itis the only arc studied here that is built upon thick conti-nental crust and there are two volcanic chains; the EasternVolcanic Front (EVF) and the Central Kamchatka Depres-sion (CKD) which lies behind the volcanic front in a zoneof extension (Geist et al., 1994; Kepezhinskas et al., 1997).Therefore, this arc affords the opportunity to examine po-tential changes in melting regime with varying depth to theBenioff zone and crustal thickness. However, there is noclear separation of the EFV and CKD samples in231Pa–235U systematics in Fig. 14A. The subducting slabis tearing beneath the northern part of the CKD giving riseto localised slab melts (so-called adakites) that are eruptedat Sheveluch volcano in particular (Yogodzinsky et al.,2001). The high modal proportion of garnet in the slabcompared to that of the mantle wedge should facilitateidentification of slab melts and Dosseto et al. (2003) haveinferred such components to have (230Th/238U) P 1 and(231Pa/235U) � 1 in a study of lavas from the Klyuchevskoyvolcano group, which lies to the south of Sheveluch. Oursilicic andesite sample from Sheveluch has the lowest(231Pa/235U) ratio of all of our samples from this arc buthas a (230Th/238U) ratio of 0.94 and Sr/Y = 36.
In Fig. 17A, the Kamchatka samples form a cluster orpossible negative (231Pa/235U)–(230Th/238U) array whichcannot be simulated using any of the dynamic, age-ing + dynamic melting or flux melting models. Dossetoet al. (2003) interpreted a similar array in their Klyuchev-skoy suite in terms of mixing between slab and wedge meltsbut the U-excess of our Sheveluch sample does not seem toconform to this model easily. Interestingly, the CKD andEVF samples seem to form two positively sloped arrayson the (231Pa/235U) versus Ba/Th plot (Fig. 17B) whereasall of the numerical models yield negative trends. Thesteeper arrays formed by the dynamic without ageing orflux melting models can fit a mix of many of the CKDand EVF data, whereas the shallower ageing + dynamicmelting model can fit the remainder. A key difference be-tween the application of these models to this arc is thatwe have allowed for 150 kys of ageing after fluid U addi-tion prior to melting (Turner et al., 1998) in the age-ing + dynamic melting model. The consequence of this is
that the 231Pa–235U system will have virtually returned tosecular equilibrium as illustrated on the Nb-normaliseddiagram in Fig. 17C and the end result is that the
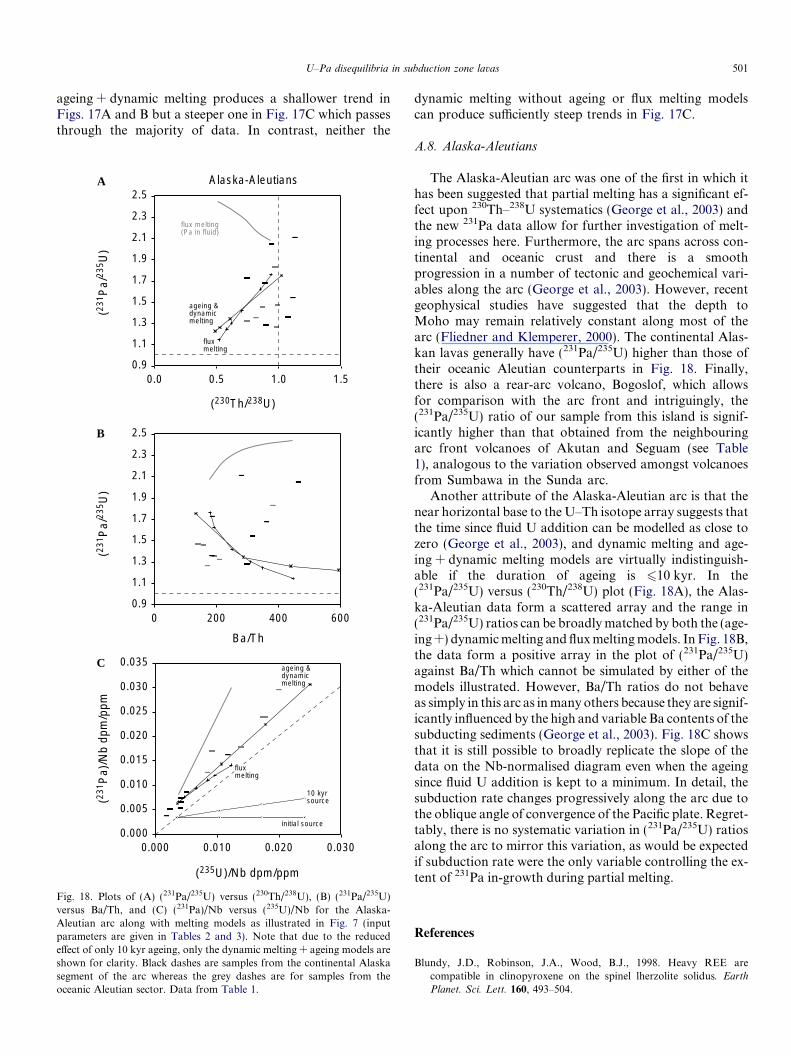
U–Pa disequilibria in subduction zone lavas 501
ageing + dynamic melting produces a shallower trend inFigs. 17A and B but a steeper one in Fig. 17C which passesthrough the majority of data. In contrast, neither the
(230Th/238U)
ageing &dynamicmelting
fluxmelting
(231
Pa/
235 U
)(2
31P
a/23
5 U)
Ba/Th
initial source
10 kyrsource(2
31P
a)/N
b dp
m/p
pm
(235U)/Nb dpm/ppm
flux melting(Pa in fluid)
0.9
1.1
1.3
1.5
1.7
1.9
2.1
2.3
2.5
0.0 0.5 1.0 1.5
0.9
1.1
1.3
1.5
1.7
1.9
2.1
2.3
2.5
0 200 400 600
0.000
0.005
0.010
0.015
0.020
0.025
0.030
0.035
0.000 0.010 0.020 0.030
Alaska-Aleutians
ageing &dynamicmelting
fluxmelting
A
B
C
Fig. 18. Plots of (A) (231Pa/235U) versus (230Th/238U), (B) (231Pa/235U)versus Ba/Th, and (C) (231Pa)/Nb versus (235U)/Nb for the Alaska-Aleutian arc along with melting models as illustrated in Fig. 7 (inputparameters are given in Tables 2 and 3). Note that due to the reducedeffect of only 10 kyr ageing, only the dynamic melting + ageing models areshown for clarity. Black dashes are samples from the continental Alaskasegment of the arc whereas the grey dashes are for samples from theoceanic Aleutian sector. Data from Table 1.
dynamic melting without ageing or flux melting modelscan produce sufficiently steep trends in Fig. 17C.
A.8. Alaska-Aleutians
The Alaska-Aleutian arc was one of the first in which ithas been suggested that partial melting has a significant ef-fect upon 230Th–238U systematics (George et al., 2003) andthe new 231Pa data allow for further investigation of melt-ing processes here. Furthermore, the arc spans across con-tinental and oceanic crust and there is a smoothprogression in a number of tectonic and geochemical vari-ables along the arc (George et al., 2003). However, recentgeophysical studies have suggested that the depth toMoho may remain relatively constant along most of thearc (Fliedner and Klemperer, 2000). The continental Alas-kan lavas generally have (231Pa/235U) higher than those oftheir oceanic Aleutian counterparts in Fig. 18. Finally,there is also a rear-arc volcano, Bogoslof, which allowsfor comparison with the arc front and intriguingly, the(231Pa/235U) ratio of our sample from this island is signif-icantly higher than that obtained from the neighbouringarc front volcanoes of Akutan and Seguam (see Table1), analogous to the variation observed amongst volcanoesfrom Sumbawa in the Sunda arc.
Another attribute of the Alaska-Aleutian arc is that thenear horizontal base to theU–Th isotope array suggests thatthe time since fluid U addition can be modelled as close tozero (George et al., 2003), and dynamic melting and age-ing + dynamic melting models are virtually indistinguish-able if the duration of ageing is 610 kyr. In the(231Pa/235U) versus (230Th/238U) plot (Fig. 18A), the Alas-ka-Aleutian data form a scattered array and the range in(231Pa/235U) ratios can be broadlymatched by both the (age-ing+) dynamicmelting and fluxmeltingmodels. InFig. 18B,the data form a positive array in the plot of (231Pa/235U)against Ba/Th which cannot be simulated by either of themodels illustrated. However, Ba/Th ratios do not behaveas simply in this arc as inmany others because they are signif-icantly influenced by the high and variable Ba contents of thesubducting sediments (George et al., 2003). Fig. 18C showsthat it is still possible to broadly replicate the slope of thedata on the Nb-normalised diagram even when the ageingsince fluid U addition is kept to a minimum. In detail, thesubduction rate changes progressively along the arc due tothe oblique angle of convergence of the Pacific plate. Regret-tably, there is no systematic variation in (231Pa/235U) ratiosalong the arc to mirror this variation, as would be expectedif subduction rate were the only variable controlling the ex-tent of 231Pa in-growth during partial melting.
References
Blundy, J.D., Robinson, J.A., Wood, B.J., 1998. Heavy REE arecompatible in clinopyroxene on the spinel lherzolite solidus. Earth
Planet. Sci. Lett. 160, 493–504.
502 S. Turner et al. 70 (2006) 480–503
Blundy, J., Wood, B., 2003. Mineral–melt partitioning of Uranium,Thorium and their daughters. In: Bourdon, B., Henderson, G.M.,Lundstrom, C.C., Turner, S.P. (Eds.), Uranium-series Geochemistry.Rev. Mineral. Geochem. 52, 59–123.
Bourdon, B., Sims, K.W.W., 2003. U-series constraints on intraplatebasaltic magmatism. In: Bourdon, B., Henderson, G.M., Lundstrom,C.C., Turner, S.P. (Eds.), Uranium-series Geochemistry. Rev. Mineral.
Geochem. 52, 1–21.Bourdon, B., Turner, S., Allegre, C., 1999. Melting dynamics beneath the
Tonga–Kermadec island arc inferred from 231Pa–235U systematics.Science 286, 2491–2493.
Bourdon, B., Turner, S., Dosseto, A., 2003a. Dehydration and partialmelting in subduction zones: constraints from U-series disequilibria. J.Geophys. Res. 108, 2291. doi:10.1029/2002JB001839.
Bourdon, B., Turner, S., Henderson, G.M., Lundstrom, C.C., 2003b.Introduction to Uranium-series geochemistry. In: Bourdon, B., Hen-derson, G.M., Lundstrom, C.C., Turner, S.P. (Eds.), Uranium-series
Geochemistry. Rev. Mineral. Geochem. 52, 1–21.Bremond d�Ars, MJ., Jaupart, C., Sparks, R.S.J., 1995. Distribution of
volcanoes in active margins. J. Geophys. Res. 100, 20421–20432.Brenan, J.M., Shaw, H.F., Ryerson, F.J., Phinney, D.L., 1995. Mineral-
aqueous fluid partitioning of trace elements at 900 �C and 2.0 GPa:constraints on the trace element chemistry of mantle and deep crustalfluids. Geochim. Cosmochim. Acta 59, 3331–3350.
Brodholt, J.P., Batiza, R., 1989. Global systematics of unaveraged mid-ocean ridge basalt compositions: comment on ‘‘Global correlations ofocean ridge basalt chemistry with axial depth and crustal thickness’’ byE.M. Klein and C.H. Langmuir. J. Geophys. Res. 94, 4231–4239.
Class, C., Miller, S.L., Goldstein, S.L., Langmuir, C.L., 2000. Distin-guishing melt and fluid subduction components in Umnak volcanics.Geochem. Geophys. Geosyst. 1. doi:10.1029/1999GC000010.
Clift, P., Vannucchi, P., 2004. Controls on tectonic accretion versus erosionin subduction zones: implications for the origin and recycling of thecontinental crust. Rev. Geophys. 42. doi:10.1029/2003RG000127.
Conder, J.A., Wiens, D.A., Morris, J., 2002. On the decompressionmelting structure at volcanic arcs and back-arc spreading centers.Geophys. Res. Lett. 29. doi:10.1029/2002GL015390.
Crawford, A.J., Briqueu, L., Laporte, C., Hasenaka, T., 1995. Coexistenceof Indian and Pacific ocean upper mantle reservoirs beneath the centralNew Hebrides island arc. In: Taylor, B., Natlund, J. (Eds.), ActiveMargins and Marginal Basins of the Western Pacific. AmericanGeophysical Union Geophysical Monograph 88, 199–217.
Dosseto, A., Bourdon, B., Joron, J.L., Dupre, B., 2003. U–Th–Pa–Rastudy of the Kamchatka arc: new constraints on the genesis of arclavas. Geochim. Cosmochim. Acta 67, 2857–2877.
Eggins, S.M., 1993. Origin and differentiation of picritic arc magmas,Ambae (Aoba), Vanuatu. Contrib. Mineral. Petrol. 114, 79–100.
Ellam, R.M., Hawkesworth, C.J., 1988. Elemental and isotope variationsin subduction related basalts: evidence for a three component model.Contrib. Mineral. Petrol. 98, 72–80.
Elliott, T., 1997. Fractionation of U and Th during mantle melting; areprise. Chem. Geol. 139, 165–183.
Elliott, T., Plank, T., Zindler, A., White, W., Bourdon, B., 1997. Elementtransport from slab to volcanic front at the Mariana arc. J. Geophys.Res. 102, 14991–15019.
Elliott, T., Heumann, A., Koetsier, G., 2001. U-series constraints onmelting beneath the Marianas. In: Intra-oceanic Subduction Systems:
Tectonic and Magmatic Processes. Geol. Soc. Lond. Abstr.Elkins Tanton, L.T., Grove, T.L., Donnelly-Nolan, J., 2001. Hot, shallow
mantle melting under the Cascades volcanic arc. Geology 29, 631–634.England, P., Engdahl, R., Thatcher, W., 2004. Systematic variation in the
depths of slabs beneath arc volcanoes. Geophys. J. Int. 156, 377–408.Feineman, M.D., DePaolo, D.J., 2000. Steady-state 226Ra/230Th disequi-
librium in mantle minerals: implications for melt transport rates inisland arcs. Earth Planet. Sci. Lett. 215, 339–355.
Fliedner, M.M., Klemperer, S.L., 2000. Crustal structure transition fromoceanic arc to continental arc, eastern Aleutian Islands and AlaskaPeninsula. Earth Planet. Sci. Lett. 179, 567–579.
Furukawa, F., 1993. Magmatic processes under arcs and formation of thevolcanic front. J. Geophys. Res. 98, 8309–8319.
Gaetani, G.A., Grove, T.L., 1998. The influence of water on melting ofmantle peridotite. Contrib. Mineral. Petrol. 131, 323–346.
Geist, E.L., Vallier, T.L., Scholl, D.W., 1994. Origin, transport, andemplacement of an exotic island-arc terrane exposed in easternKamchatka, Russia. Geol. Soc. Am. Bull. 106, 1182–1194.
George, R., Turner, S., Hawkesworth, C., Morris, J., Nye, C., Ryan, J.,Zheng, S.-H., 2003. Melting processes and fluid and sedimenttransport rates along the Alaska-Aleutian arc from an integrated U–Th–Ra–Be isotope study. J. Geophys. Res. 108, 2252. doi:10.1029/2002JB001916.
George, R., Reagan, M., Turner, S., Gill, J., Bourdon, B., 2004. Commenton ‘‘Steady-state 226Ra/230Th disequilibrium in mantle minerals:implications for melt transport rates in island arcs’’ by M.D. Feinemanand D.J. DePaolo [Earth Planet. Sci. Lett. 215 (2003) 339–355]. EarthPlanet. Sci. Lett. 228, 563–567.
George, R., Turner, S., Morris, J., Plank, T., Hawkesworth, C., Ryan, J.,2005. Pressure–temperature–time paths of sediment recycling beneaththe Tonga–Kermadec arc. Earth Planet. Sci. Lett. 233, 195–211.
Gerbe, M.-C., Gourgaud, A., Sigmarsson, O., Harmon, R.S., Joron, J.-L.,Provost, A., 1992. Mineralogical and geochemical evolution of the1982–1983 Galunggung eruption (Indonesia). Bull. Volcanol. 54, 284–298.
Gerya, T.V., andYuen, D.A., 2003. Rayleigh–Taylor instabilities fromhydration and melting propel �cold plumes� at subduction zones. EarthPlanet. Sci. Lett. 212, 47–62.
Halliday, A.N., Lee, D.-C., Tommasini, S., Davies, G.R., Paslick, C.R.,Fitton, J.G., James, D.E., 1995. Incompatible trace elements in OIBand MORB and source enrichment in the sub-oceanic mantle. EarthPlanet. Sci. Lett. 133, 379–395.
Hamilton, W., 1979. Tectonics of the Indonesian region. USGS Prof. Pap.1078.
Hawkesworth, C., Turner, S., Peate, D., McDermott, F., van Calsteren,P., 1997. Elemental U and Th variations in island arc rocks:implications for U-series isotopes. Chem. Geol. 139, 207–222.
Heath, E., Macdonald, R., Belkin, H., Hawkesworth, C., Sigurdsson, H.,1998. Magma genesis at Soufriere volcano, St. Vincent, Lesser Antillesarc. J. Petrol. 39, 1721–1764.
Hirschmann, M.M., Asimow, P.D., Ghiorso, M.S., Stolper, E.M., 1999.Calculation of peridotite partial melting form thermodynamic modelof minerals and melts III. Controls on isobaric melt production andthe effect of water on melt production. J. Petrol. 40, 831–851.
Hofmann, A.W., Jochum, K.P., Seufert, M., andWhite, WM, 1986. Nband Pb in oceanic basalts: new constraints on mantle evolution. EarthPlanet. Sci. Lett. 79, 33–45.
Honda, S., Yoshida, T., 2005. Application of the model of small-scaleconvection under the island arc to the NE Honshu. Geochem. Geophys.
Geosyst. 6. doi:10.1029/2004GC000785.Hutchison, C.S., 1976. Indonesian active volcanic arc: K, Sr and Rb
variation with depth to the Benioff zone. Geology 4, 407–408.Jarrard, R.D., 1986. Relations among subduction parameters. Rev.
Geophys. 24, 217–284.Johnson, M.C., Plank, T., 1999. Dehydration and melting experiments
constrain the fate of subducted sediments. Geochem. Geophys. Geosyst.
1. doi:10.1029/1999GC000014.Kepzhinskas, P., McDermott, F., Defant, M.J., Hochstaedter, A.,
Drummond, M.S., Hawkesworth, C.J., Koloskov, A., Maury, R.C.,Bellon, H., 1997. Tace element and Sr-Nd-Pb isotopic constraints on athree-component model of Kamchatka arc petrogenesis. Geochim.
Cosmochim. Acta 61, 577–600.Kincaid, C., Sacks, I.S., 1997. Thermal and dynamic evolution of the
upper mantle in subduction zones. J. Geophys. Res. 102, 12295–12315.Klein, E.M., Langmuir, C.H., 1989. Local versus global correlations in
ocean ridge basalt composition: a reply. J. Geophys. Res. 94, 4241–4252.Landwehr, D., Blundy, J., Chamorro-Perez, E.M., Hill, E., Wood, B.J.,
2001. U-series disequilibria generated by partial melting of spinellherzolite. Earth. Planet. Sci. Lett. 188, 329–348.
U–Pa disequilibria in subduction zone lavas 503
Lundstrom, C.C., Sampson, D.E., Perfot, M.R., Gill, J., Williams, Q.,1999. Insights into mid-ocean ridge basalt petrogenesi; U-seriesdisequilibria from the Siqueiros Transform, Lamont Seamounts, andEast Pacific Rise. J. Geophys. Res. 104, 13035–13048.
Lundstrom, C.C., 2003. Uranium-series disequilibria in Mid-ocean RidgeBasalts: observations and models of Basalt Genesis. In: Bourdon, B.,Henderson, G.M., Lundstrom, C.C., Turner, S.P. (Eds.), Uranium-
series Geochemistry. Rev. Mineral. Geochem. 52, 175–214.Macdonald, R., Hawkesworth, C.J., Heath, E., 2000. The Lesser
Antilles volcanic chain: a study in arc magmatism. Earth Sci. Rev.
49, 1–76.McDermott, F., Defant, M.J., Hawkesworth, C.J., Maury, R.C., 1993.
Isotope and trace element evidence for three component mixing in thegenesis of North Luzon arc lavas (Philippines). Contrib. Mineral.
Petrol. 113, 9–23.McDermott, F., Hawkesworth, C., 1991. Th, Pb, and Sr isotope variations
in young island arc volcanics and oceanic sediments. Earth Planet. Sci.
Lett. 104, 1–15.McKenzie, D., 1985. 230Th–238U disequilibrium and the melting process
beneath ridge axes. Earth Planet. Sci. Lett. 72, 149–157.Parkinson, I.J., Arculus, R.J., 1999. The redox state of subduction zones:
insights from arc-peridotites. Chem. Geol. 160, 409–423.Pearce, J.A., Parkinson, I.J., 1993. Trace element models for mantle
melting: application to volcanic arc petrogenesis. J. Geol. Soc. Lond.76, 373–403.
Peate, D.W., Hawkesworth, C.J., 2005. U series disequilibria: insights intomantle melting and the timescales of magma differentiation. Rev.
Geophys. 43. doi:10.1029/2004RG000154.Peate, D.W., Kokfelt, T.F., Hawkesworth, C.J., van Calsteren, P.W.,
Hergt, J.M., Pearce, J.A., 2001. U-series isotope data on Lau Basinglasses: the role of subduction-related fluids during melt generation inback-arc basins. J. Petrol. 42, 1449–1470.
Pickett, D.A., Murrell, M.T., 1997. Observations of 231Pa/235U disequi-librium in volcanic rocks. Earth Planet. Sci. Lett. 148, 259–271.
Plank, T., Langmuir, C.H., 1988. An evaluation of the global variations inthe major element chemistry of arc basalts. Earth Planet. Sci. Lett. 90,349–370.
Plank, T., Langmuir, C.H., 1998. The chemical composition of subductingsediment and its consequences for the crust and mantle. Chem. Geol.
145, 325–394.Plank, T., 2005. Constraints from Thorium/Lanthanum on sediment
recycling at subduction zones and the evolution of the continents. J.Petrol. 46, 921–944.
Poli, S., Schmidt, M.W., 1995. H2O transport and release in subductionzones: experimental constraints on basaltic and andesitic systems. J.Geophys. Res. 100, 22299–22314.
Regelous, M., Collerson, K.D., Ewart, A., Wendt, J.I., 1997. Traceelement transport rates in subduction zones: evidence from Th, Sr andPb isotope data for Tonga–Kermadec arc lavas. Earth Planet. Sci.
Lett. 150, 291–302.Regelous, M., Turner, S., Elliott, T.R., Rostami, K., Hawkesworth, C.J.,
2004. Rapid measurement of femtogram quantities of Protactinium insilicate rock samples by multicollector inductively coupled plasmamass spectrometry. Anal. Chem. 76, 3584–3589.
Salters, V.J.M., Stracke, A., 2004. Composition of the depleted mantle.Geochem. Geophys. Geosyst. 5. doi:10.1029/2003GC000597.
Schmidt, M.W., Poli, S., 1998. Experimentally based water budgets fordehydrating slabs and consequences for arc magma generation. EarthPlanet. Sci. Lett. 163, 361–379.
Shimizu, N., Arculus, R.J., 1975. Rare earth element concentrations in asuite of basabitoids and alkali olivine basalts from Grenada, LesserAntilles. Contrib. Mineral. Petrol. 50, 231–240.
Sigmarsson, O., Chmeleff, J., Morris, J., Lopez-Escobar, L., 2002. Originof 226Ra–230Th disequilibria in arc lavas from southern Chile andmagma transfer time. Earth Planet. Sci. Lett. 196, 189–196.
Sisson, T.W., Bronto, S., 1998. Evidence for pressure-release meltingbeneath magmatic arcs from basalt at Galunggung, Indonesia. Nature
391, 883–886.
Spiegelman, M., Elliott, T., 1993. Consequences of melt transport foruranium series disequilibrium. Earth Planet. Sci. Lett. 118, 1–20.
Stolper, E., Newman, S., 1994. The role of water in the patrogenesis ofMariana trough magmas. Earth Planet. Sci. Lett. 121, 293–325.
Tatsumi, Y., Hamilton, D.L., Nesbitt, R.W., 1986. Chemical character-istics of fluid phase released from a subducted lithosphere and origin ofarc magmas: evidence from high-pressure experiments and naturalrocks. J. Volcanol. Geotherm. Res. 29, 293–309.
Taylor, F.W., Bevis, M.G., Schultz, B.E., Kuang, D., Recy, J., Calmant,S., Charley, D., Regnier, M., Perin, B., Jackson, M., Reichenfeld, C.,1995. Geodetic measurements of convergence at the New Hebridesisland arc indicate arc fragmentation caused by an impinging aseismicridge. Geology 23, 1011–1014.
Taylor, B., Martinez, F., 2003. Back-arc basin basalt systematics. EarthPlanet. Sci. Lett. 201, 481–497.
Thomas, R.B., Hirschmann, M.M., Cheng, H., Reagan, M.K., Edwards,R.L., 2002. (231Pa/235U)–(230Th/238U) of young mafic volcanic rocksfrom Nicaragua and Costa Rica and the influence of flux melting on U-series systematicsof arc lavas. Geochim.Cosmochim.Acta66, 4287–4309.
Turner, S., Hawkesworth, C., van Calsteren, P., Heath, E., Macdonald,R., Black, S., 1996. U-series isotopes and destructive plate marginmagma genesis in the Lesser Antilles. Earth Planet. Sci. Lett. 142, 191–207.
Turner, S., Hawkesworth, C., Rogers, N., Bartlett, J., Worthington, T.,Hergt, J., Pearce, J., Smith, I., 1997. 238U–230Th disequilibria, magmapetrogenesis and flux rates beneath the depleted Tonga–Kermadecisland arc. Geochim. Cosmochim. Acta 61, 4855–4884.
Turner, S., McDermott, F., Hawkesworth, C., Kepezhinskas, P., 1998. AU-series study of lavas from Kamchatka and the Aleutians: constraintson source composition and melting processes. Contrib. Mineral. Petrol.
133, 217–234.Turner, S.P., Peate, D.W., Hawkesworth, C.J., Eggins, S.M., Crawford,
A.J., 1999. Two mantle domains and the time scales of fluid transferbeneath the Vanuatu arc. Geology 27, 963–966.
Turner, S., Bourdon, B., Hawkesworth, C., Evans, P., 2000. 226Ra–230Thevidence for multiple dehydration events, rapid melt ascent and thetime scales of differentiation beneath the Tonga–Kermadec island arc.Earth Planet. Sci. Lett. 179, 581–593.
Turner, S., Foden, J., 2001. U, Th and Ra disequilibria, Sr, Nd and Pbisotope and trace element variations in Sunda arc lavas: predominanceof a subducted sediment component. Contrib. Mineral. Petrol. 142, 43–57.
Turner, S., Evans, P., Hawkesworth, C., 2001. Ultra-fast source-to-surfacemovement of melt at island arcs from 226Ra–230Th systematics. Science292, 1363–1366.
Turner, S., Bourdon, B., Gill, J., 2003. Insights into magma genesis atconvergent margins from U-series isotopes. In: Bourdon, B., Hender-son, G.M., Lundstrom, C.C., Turner, S.P. (Eds.), Uranium-series
Geochemistry. Rev. Mineral. Geochem. 52, 255–315.Turner, S., Black, S., Berlo, K., 2004. 210Pb–226Ra and 228Ra–232Th
systematics in young arc lavas: implications for magma degassing andascent rates. Earth Planet. Sci. Lett. 227, 1–16.
van Keken, P.E., Kiefer, B., Peacock, S.M., 2002. High-resolution modelsof subduction zones: implications for mineral dehydration reactionsand the transport of water into the deep mantle. Geochem. Geophys.
Geosyst. 3. doi:10.1029/2001GC000256.Williams, R.W., Gill, J.B., 1989. Effects of partial melting on the uranium
decay series. Geochim. Cosmochim. Acta 53, 1607–1619.Woodhead, J.D., 1989. Geochemistry of the Mariana arc (western Pacific):
source composition and processes. Chem. Geol. 76, 1–24.Yogodzinsky, G.M., Lees, J.M., Churikova, T.G., Dorendorf, F.,
Worner, G., Volynets, O.N., 2001. Geochemical evidence for themelting of subducting oceanic lithosphere at plate edges. Nature 409,500–504.
Zellmer, G.F., Hawkesworth, C.J., Sparks, R.S.J., Thomas, L.E.,Harford, C.L., Brewer, T.S., Loughlin, S.C., 2003. Geochemicalevolution of the Soufriere Hills volcano, Montserrat, Lesser Antillesvolcanic arc. J. Petrol. 44, 1349–1374.
Copyright © 2022 FDOKUMEN