part-time farming in ohio,with special reference
292
PART-TIME FARMING IN OHIO,WITH SPECIAL REFERENCE TO ITS USE AS A ROUTE TO FULL-TIME FARMING DISSERTATION Presented in Partial Fulfillment of the Requirements for the Degree Doctor of Philosophy in the Graduate School of The Ohio State University By WILLIAM ALLEN WATT, B.S., M.S, The Ohio State University 1956 /Approved by: Department of Agricultural Economics and Rural Sociology
-
Upload
khangminh22 -
Category
Documents
-
view
1 -
download
0
Transcript of part-time farming in ohio,with special reference

PART-TIME FARMING IN OHIO,WITH SPECIAL REFERENCE TO ITS USE AS A ROUTE TO FULL-TIME FARMING
DISSERTATION
Presented in Partial Fulfillment of the Requirements for the Degree Doctor of Philosophy in the
Graduate School of The Ohio State University
ByWILLIAM ALLEN WATT, B.S., M.S,
The Ohio State University1956
/Approved by:
Department of Agricultural Economics and Rural Sociology

ACKNOWLEDGMENTS
The author wishes to take this opportunity to express his appreciation and gratitude to members of the Department of Agricultural Economics and Rural Sociology for their assistance, constructive criticism, and encouragement in the preparation of this manuscript.
To Dr. Virgil R. Wertz, Major Adviser, for his invaluable assistance, patience and helpful suggestions in preparation of the manuscript.
To Dr. John H. Sitter ley, for his especially helpful suggestions in regard to organization and integration of the material presented.
To Dr. Mervin G. Smith, Department Chairman, for his consideration in enabling the author to avoid committee assignments and other staff duties.
And especially to Professor Henry Russell Moore, of the Ohio Agricultural Experiment Station, for his counsel, cooperation, and invaluable assistance throughout this study, from its inception to the completion of this manuscript.
To all those part-time farmers, former part-time farmers. Production and Marketing Administration Committeemen, Secretaries of Production Credit Associations and National Farm Loan Associations, Rural Bankers, County Extension Agents, Soil Conservation Service representatives, and all the others who provided -üie basic data, without which this study would not have been possible.
ii

To The Ohio State University and The Ohio Agricultural Experiment Station for providing the intellectual environment and financial assistance necessary for graduate training and research.
To the clerical and stenographic staff for assistance in processing of the data and preparation of the manuscript. Especially the author wishes to express his debt of gratitude to Miss Shirley Brooks for her conscientious and efficient work in typing this manuscript.
To his parents for providing a home environment conducive to learning, and their assistance without which the undergraduate training could not have been acconplished.
Last, but by no means least, to his wife and family, who have provided understanding and comfort during the years of graduate study.
iii

TABIE OF CONTENTSPage
CHAPTERI PART-TIME FARMING.............................. . 1
Purpose of Study.•••••••••••••••••••••*••••••••••••••• 1Part-Time Farming Not a New Development..*...*.*..#... 2The Problem of Definition........ 12Part-Time Farming in Ohio........................ l6Method, of Study and D e f i n i t i o n s . 23 Selection of Samples.............................. 26
II WHY DO PEOPLE ENGAGE IN PART-TIME FARMING?.............. 3^Desire for Country Living.. .... 37Get Started in Farming................................ 4lIncrease Earnings - Lower Living C o s t s . 42 Children........................................... 44Retirement Plans................................... 44Relatives and Inherited Property...................... 4^Housing....................................... 46Summary.. «..... 31
III WHAT KIND OF PEOPLE ARE PART-TIME FARMERS?............. 53Place of Rearing.................... ...... . ...... 53Age Characteristics 59Household Characteristics............................. 63Educational Characteristics................ ......... 71Number of Years as a Part-Time Farmer................. 75Years of Residence on Present Farm. .............. 79Type of Nonfarm Work.•.......é .................... 8lYears of Work at Present Nonfarm Job.................. 85Summary. .... .............. 88
IV HOW DO PART-TIME FARMERS OBTAIN AGRICULTURAL RESOURCES?.. 90Size of Part-Time Farms............................... 90Obtaining the Use of Real Estate - Tenure............. 96Obtaining Title to Land - Inheritance................. 106Obtaining Title to Land - P u r c h a s e 108 Previous Use of Land Now in Part-Time Farms........... I19Obtaining Chattel Property - Machinery and Equipment., ipp Net Worth and Capital Accumulation.................... 128Credit in Capital Accumulation........................ 137Summary. ..... 140
XV

CHAPTER PageV HOW DO PART-TIME FARMERS OPERATE?.......... .......... ... 1^3
Intensity of Land Use and of Farming............... 143How Large are Part-Time Farms - Productive Man Work Units............ 154Income, Farm and Nonfarm, of Part-Time Farmers.......... I63
Related to Family Cycle. . . 1 6 9 Background and Income. 1?4Formal Education and Income.......................... 176
Income, Part-Time Farmers En Route to Full-Time Farming. 179 Labor Utilization by Part-Time Farmers.................. I83Distance to Work and Travel T i m e . . . I 88 Summary. ..... 194
VI IS PART-TIME FARMING A SATISFACTORY ROUTE TO FULL-TIMEFARMING? ....... 197
Case Studies of Part-Time Farmers With a Full-Time Farming Goal........... .......... ..................... 193Sli^t Achievement Toward Goal........... 198Substantial Progress Toward Full-Time Farming Goal... 205 "Established" But Still Operating as Part-Time Farmer 212 Former Part-Time Farmers - Now Full-Time operators... 223
Factors in Success and Failure.................... 238summary...... 245
VII CONCLUSIONS AND SUGGESTIONS FOR FURTHER STUDY............. 246
APPENDIX A - TWO MEASURES OF iART-TIMB FARMING COMPARED ......257APPENDIX B - GENERAL SURVEY SCHEDULE........... 264APPENDIX C - ESTABLISHED IN FARMING SCHEDUIE........... 269APPENDIX D - LETTER AND MAIL QUESTIONNAIRE....... 275BIBLIOGRAPHY ............................................. .AUTOBIOŒÎAEEÎY............. 279

list of tabiesPage
1. Characteristics of Ohio Farms by Economic Class, 19^9.... l8
2. Total Farms, Number and Percentage of Total Farms Reporting 100 or More Days of Off-Farm Work, and Farm Families Reporting Nonfarm Income in Excess of Farm Income, by Economic Areas, Ohio,1949....................................................... 20
3 . Number and Percentage of Ohio Farm Operators Reporting Off-FarmWork, and Other Income of Family in Excess of Value of Farm Products Sold by Size of Farm, 1949* ..... 22
4. Number Referred and Number of Cases Included in Sample of Operators Who Had Used Part-Time Farming to Become Established on Commercial Scale by Area and County, 19$4..... 32
5. Stated Reasons For Engaging in Part-Time Farming, in Order ofFrequency, 244 Part-Time Farmers, Ohio, 1953* ........ ...... 38
6. Types and Sizes of Property Desired by I60 Families With Nonfarm Employment But Interested in Country Living, by Size ofTract Nov Occupied, Northeastern Ohio, 1953*»*•••••••••••••••••• 40
7 . Value Per Farm and Per Acre of Ohio Farm Real Estate, by Sizeof Tract, 1949..........................................é....... 49
8. Place of Rearing of Farm Operators and Their Wives, 242 Part-Time Farms, l4 Ohio Counties, 1953 ........... ....... 55
9 . Age of 242 Part-Time Farm Operators, and Background of Operatorand Wife, l4 Ohio Countie#, 1953................ 56
10. Place of Rearing of 55 Part-Time Farmers Achieving Substantial Progress Toward Full-Time Farming, 1953» . . . . . . . . . . . . . 58
11. Place of Rearing of Operator and Wife From 62 Farm Families WhoUsed Part-Time Farming to Become Established on Commercial Farms, Ohio, 1954....... .... 98
12. Number of Part-Time Farmers Occurring in Different Age Groups, Classified by Type of Farm, Area of State, and Place of Rearing,14 Ohio Counties, 1953 ........ . ... 60
13. Age of Operator by Economic Class of Farm, Ohio, 1 9 4 9 . . . 6l14. Average Age of Operators of 242 Part-Time Farms by Area and
Place of Rearing, l4 Ohio Counties, 1 9 5 3 . . . . . . 6lVi

Page15. Average Age of Operators of 242 Part-Time Farms, by Class of
Farm and Area of State, l4 Ohio Counties, 1953** .... 62
16• Average Age of Operator and Wife, 242 Part-Time Farms, bySize of Farm Operated, l4 Ohio Counties, 19^3*•••••••••••••••• ^3
17. Household Composition of 242 Part-Time Farm Families by Ageof Operator, l4 Ohio Counties, 1953....... . . ......... 64
18. Household Composition of 242 Part-Time Farm Families, by Area,l4 Ohio Counties, 1953»»*»**................ .....•• 65
19. Household Composition of 242 Part-Time Farm Families by Classof Farm, l4 Ohio Counties, 1953 .... 66
20. Household Composition by Class of Farm and Age of Household Members, 242 Part-Time Farms, l4 Ohio Counties, 1953*••••••••• 67
21. Distribution of Household Members and Sex Ratios by Class of Farm, 242 Part-Time Farm Families, l4 Ohio Counties, 1953«**«* 69
22. Household Conposition of 55 Part-Time Farm Families Achieving Substantial Success Toward Full-Time Farming, 1953*••••••••••• 70
2 3. Household Composition of 62 Farm Families Who Used Part-Time Farming to Become Established on Commercial Farms, Ohio, 195^» 71
24. Educational Attainment of 235 Part-Time Farm Operators and Wives, by Area, l4 Ohio Counties, 1953.... 72
2 5. Years of School Completed by 235 Part-Time Farm Operators and Their Wives, by Place of Rearing, l4 Ohio Counties, 1953****** 74
2 6. Average Number of Years of Farming Part-Time Reported by 242 Farmers, by Area and Class of Part-Time Farm, l4 Ohio Counties,1953.................................................... 76
27. Average Yeeirs Spent as Part-Time Farmers by 242 Part-Time Farm Operators, by Background, l4 Ohio Counties, 1953.... 77
28. Average Number of Years in Residence on Present Farm by Area of State and Type of Farm, 242 Part-Time Farm Operators, l4Ohio Counties, 1953**# ...... *........ ... .... 79
29. Nonfarm Enployment of 242 Part-Time Farm Operators, l4 Ohio Counties, I953...... 82
30. Source of Employment of 242 Part-Time Farm Operators, byArea of State, l4 Ohio Counties, 1953********** ************** 83
vii

Page31. Average Muinber of Years the Operator Has Worked at Present
Nonfarm Job, 242 Part-Time Farm Operators, by Area and Classof Part-Time Farm, l4 Ohio Counties, ••.••••» 86
32. Average Acreage Operated by 242 Part-Time Farmers, by Areaof State and Class of Part-Time Farm, l4 Ohio Counties, 1953*•• 91
33. Total Acreage, Crop Acreage, and Ratio of Crop to Total Acreage Operated by Ohio Part-Time Farmers Classified by Progress Toward Full-Time Commercial Farming, 1954,..................... 93
34. Real Estate Used by Part-Time Farmers and How Acquired, 242Ohio Operators, l4 Ohio Counties, 1953*«••••••••••••••••••••••• 97
35 « Acreage Involved According to Tenure Class of Operator, byArea and Class of Farm, 242 Part-Time Farms, l4 Ohio Counties,1953......................................... 98
36. Present Farm Operations of 49 Part-Time Farmers Who Previously Operated as Full-Time Farmers at Present Location, Ohio, 1953•• 102
37. Average Acreage Operated by 55 Ohio Part-Time Farmers Achieving Substantial Progress Toward Full-Time Farming by TenureClass and Area, 1953........... IO3
38. Average Acreage Operated by 62 Ohio Farmers, Now Established Through Part-Time Farming, by Tenure Class, Farming Area and Operating Class, 1954........... 104
39. Price Paid at Time of Acquisition of Real Estate by 180 Ohio Part-Time Farmers Purchasing I90 Tracts of Real Estate From Unrelated Persons, by Size of Tract, l4 Ohio Counties, 1953*... IO9
40. Real Estate Valuation for Tax Purposes of 233 Part-Time Farms,by Size of Tract, l4 Ohio Counties, 1953. ....... ........ m
41. Price Paid at Time of Acquisition of Real Estate by I80 Part- Time Farmers Purchasing I90 Tracts of Real Estate From Unrelated JE rsons, by Geographic Area, l4 Ohio Counties, 1953...... 112
42. Real Estate Acquisition by Purchase, Mean Acreage Purchased,Cost and Mean Size of Mortgage for Those Using Recorded Mortgage, 45 Ohio Part-Time Farms Classified by Area of State,1953.......................................... 115
4 3. Real Estate Acquisition by Purchase, Mean Acreage Purchased,Cost and Mean Size of Mortgage Given, 54 Part-Time FarmersNow Established on Full-Time Farms, I954............ II8
viii

Bage44. Previous Use of Farm and Acreage Included in 242 Part-Time
Farms, Classified by Status of Previous Operator and Area of State, l4 Ohio Counties, 19^4...•••»•••••••••»••••••••••••• 1 ^
45» Number of Specified Items of Farm Machinery and Equipment Owned, Average Age, and Whether New or Used When Acquired by 242 Part-Time Farms, l4 Ohio Counties, 1953 *............... 124
46. Investment in Machinery and Equipment, 242 Part-Time Farms,by Class of Part-Time Farm, l4 Ohio Counties, 1953*#»**«*#*»»# 125
4 7. Mean Investment in Farm Machinery and Equipment by 62 Operators Now "Established" in Commercial Farming Through Part-Time Farming, by Area, Ohio, 1954.•••••••••••••••••••••••••... 127
48. Indicated Average Farm Assets, Indebtedness, and Net Worth of 242 Part-Time Farm Families, by Area of State, l4 Ohio Counties, 1953................................................129
4 9. Indicated Average Farm Assets, Indebtedness and Net Worth of 242 Part-Time Farm Families by Class of Farm, l4 Ohio Counties, 1953.............................................. 131
50. Indicated Average Annual Rate of Capital Accumulation and Range of Individual Cases, 242 Part-Time Farmers, Classifiedby Area, and by Class of Farm, l4 Ohio Counties, 1953#**»**»»* 132
51# Indicated Average Farm Assets, Indebtedness and Net Worth of 55 Part-Time Farmers Making Substantial Progress Toward Full- Time Farming, by Area, 1953 * ******* ####..... ....... . 134
52. Financial Position of 62 Farm Operators Who Used Part-TimeFarming to Become Established in Ccamercial Full-Time Farming, by Present Farm Status, and Farming Area, 1954................ 136
53* Range in Total Assets, Indebtedness, and Net Worth of 62 Farm Operators Who Used Part-Time Farming to Become Established in Commercial Farming, by Farming Area, and Present Farm Status,1954.................................................................
54. Percentage of Total Land in Farms Devoted to Specified Use byArea of State, Sample Farms and All Farms.....•••••••••••••••• l46
55* Type of Farming Engaged in by l82 Commercial and Semi-Commercial Part-Time Farmers, Classified by Relative Importanceof Sales, and General O^e of Farming Area, Ohio, 1953******** 149
IX

Page56, Source of Gross Cash Receipts, 62 Farm Operators Established
Through Part-Time Farming, by Area, 19^4.••••••••••••••••••••• 15257» Mean Days Labor Spent on Farm, Productive Man Work Units, and
Gross Cash Sales, 242 Part-Time Farms, by Class of Farm, 14 Ohio Counties, 1953*••••••••••••••••••••••••*••••••••••••••••• 456
58* Productive Man Work Units, I8 Operators Wow Farming Full-Timeand 44 "Established" But Still Farming Part-Time, Ohio, 1954», I61
59» Mean Gross Farm Sales, Wonfarm Income, and Total Cash Income Per Farm, 242 Part-Time Farms, l4 Ohio Counties, by Area of State, 1953 .......................... .......»..........167
60. Mean Gross Farm Sales, Wonfarm Income, and Total Cash Income Per Farm, 242 Part-Time Farms, l4 Ohio Counties, by Class of Part-Time Farms, 1953»»»,»»»»»»»»»»»»»»»»»»»»»»»»»»»»»»»*»»*»» I68
61. Average Gross Family Income of 242 Part-Time Farms as Relatedto Age of Operator, l4 Ohio Counties, 1953*» » 171
62. Average Hours of Family Labor Resources Utilized by 242 Part- Time Farm Families, Classified by Age of Operator, l4 Ohio Counties, 1953*.................... . 173
63. Mean Cash Farm Sales, Wonfarm Income, and Total Cash Income of 235 Part-Time Farm Families by Place of Rearing and Formal Educational Attainment, l4 Ohio Counties, 1953•»•»•••••••••••» 175
64. Average Gross Farm Sales of 235 Part-Time Farms, by Area and Years of Formal Education, l4 Ohio Counties, 1 9 5 4 , I76
65. Average Wonfarm Income Per Farm Operator, by Area and Yearsof Formal Education, 235 Part-Time Farms, l4 Ohio Counties,1953*. .............. 177
66. Average Total Gross Cash Income, 235 Part-Time Farm Operatorsby Area and Years of Formal Education, l4 Ohio Counties, 1953. I78
67. Mean Gross Farm Sales, Wonfarm Income and Total Cash Income Per Farm, 55 Part-Time Farmers Achieving Substantial Progress Toward l'un-Time Farming, 1953» I80
68. Mean Farm Sales, Wonfarm Income, and Total Cash Family Tncomm of 18 Full-Time Farms, and 44 Operators Still Part-Time by Farming Areas, 1954............,,,....... 1ÔI

Page69» Mean Gross Sales, Man Work Itoits, and Gross Return Per Hour
and Per Man Work Unit, by Class of Farm, 242 Part-Time Farms, l4 Ohio Counties, 19^3****«***••••••••••••••••••••••••••••••• 185
7 0# Mean Gross Sales, Man Work Units, and Gross Returns Per Hour and Per Man Work Unit, by Area of State, 242 Part-Time Feurms, l4 Ohio Counties, 1 9 9 3 ........ 187
71. Average Distance Traveled and Time Spent En Route to Nonfarm Eng)loyment by 222 Part-Time Farmers in l4 Ohio Counties, by Area and Economic Class of Farm, 1953*«*•••••••••••••••*••••• 190
7 2. Present Situation and Type of Location Desired by 160 Families With Nonfarm Employment, But Interested in Country Living, by Size of Tract, Northeastern Ohio, 1953*•••••••••••••••••••••• 191
73* Distance and Travel Time One Way to Nonfarm Employment by 222Part-Time Farmers in 14 Ohio Counties, 1953....... 193
xi

LIST OF ILLUSTRATIONSPage
FIGURE1 Number and Percentage of Total Farms Reporting 100 or
More Days of Off-Farm Work by Operator, 19^9««*••••••••••• 8
2 Comparison of Two Measures of Part-Time Farming in Ohioby Economic Areas in 19^9*•••••••••••••••••••••••••••••••• 21
3 Counties Selected for Sampling in General Study..*....... 274 Crop Acres and Total Acres Operated by Present and
Former Part-Time Farmers in Ohio............... 95 Acreage Owned and Total Operated by Present and Former
Part-Time Farmers in Ohio... ................ ....... 1096 Productive Man Work Units on Present and Former Part-Time
Farms in Ohio...... ...................................... l607 Gross Cash Income, Farm and Nonfarm, of Present and Former
Part-Time Farmers in Ohio, 1953-54........................ 1Ô1
Xll

CHAPTER I PART-TIME FARMING
Purpose of StudyPart-time farmers have become increasingly important in the
social fabric of rural Ohio* The rural population now contains a high proportion of families who combine some agricultural operations with other jobs or occupations. This study was undertaken to provide a better understanding of the role of part-time farming in our agricultural econony* Specifically it seeks to shed light on the following questions :
Why Are They Part-Time Farmers?What are the goals and objectives of this segment of our rural
population that led them to their present situation? Are they now satisfied with their arrangements, or is part-time farming a stage in process toward another goal? If the latter, what is the direction of movement? Is it a movement of former farmers toward nonfarm employment, or vice versa? Such information is needed in explanation of the past growth and as a guide to forecasting probable future trends.
What Kind of People Are Engaged in Part-Time Farming?Are operators of part-time farms young people or older farmers?
What is their family background and early training? What is their educational level?
Such information is needed by the Extension Service and agricultural agencies in order to more effectively serve this group of people.
- 1 —

- 2 -
How Do Part-Time Farmers Operate?How much do they farm? What type of farming do they do? How do
they acquire the necessary resources? How is the farm operation combined with the nonfarm job? What is their level of income?
Answers to questions of this nature should be helpful to personnel engaged in agricultural education and in those business enterprises dealing with farm people* They should be especially helpful to those institutions engaged in providing agricultural credit*
Is Part-Time Farming an Effective Route Toward Becoming an Established Full-Time Farmer?
In recent years a number of young people have been considering part-time operation as a method of accumulating capital and getting command of sufficient resources to farm on a commercial scale* This study attempts to analyze some of the success factors and to point out problems encountered by those now following such plans*
In this study only occasional reference is made to former fulltime farmers who are now operating on a part-time basis. The problems and adjustments of this group is generally outside the bounds of this study. At the inception of work in this area other personnel had planned to conduct a companion study of the managerial adjustments and contributing reasons for the movement of former full-time operators to a part-time basis.
Part-Time Farming is Not a Hew DevelopmentIn early human history, the agricultural and nonagricultural
activities of the family were integrated. The development of division

- 3 -
of labor and job specialization began to break this pattern and some individuals became clearly agricultural workers, or "farmers," while others followed nonfarm, occupations. As the factory replaced the home industry and the "putting out" system declined, occupations and jobs became more definitive. More attention appears to have been directed to the specialist than to those who continued to follow agriculture and another occupation.
The early settlers in America in one sense were, of necessity, part-time farmers. Until specialized facilities were developed, the self-sufficient family was engaged in agriculture and also such crafts as carpentry, masonry, cloth manufacture, shoe making, and some in metal work) while some in time, became clesirly nonfarm employed specialists, others retained the combination of work. The local blacksmith, building tradesman, school teacher, and minister were Areq.uently farmers too.
In later years, enphasis was placed on the specialist. Writers described urban life and work, or farming and farm life. In order to study, describe, and analyze behavior and development, one needed a homogenous group. With increased use of statistical presentation, the population has been grouped and subgrouped, divided and subdivided by definition. Population became rural and urban. In time, urban was subdivided by size of the urban unit) rural became rural farm anri rural nonfarm.
Rather definite characteristics or attributes are associated with the polar groups of the continuum.
FARM.......................... .CITY

HI If. ■■
They are attributes with respect to place of residence^ place of en5)loyment, type of major employment, secondary interest (either employment or hobby), association groups, type of resources owned and enployed, etc. Dividing population into farm and nonfarm, and devotr- ing attention to the polar groups has tended to obscure the fact that many persons have interests that cut across the definitional lines. The "part-time farmer" is such a group. It may cover a wide range of situations; from cases where the individual farmer or farm family is primarily oriented socially and economically toward farming, to cases of primarily city oriented people who pursue some interest in horticultural or livestock production, or who are incidentally carrying on some operations regarded as farming in order to gain the amenities of rural living.
In the introduction to "Part-Time Farming in the South-East,"Mr. Allen points out:
The clear cut distinction that came to be made between rural and urban activities has perhaps blinded many students of socio-economic life to the fact that there always have been spme workers who managed to combine the two. Such combinations have existed in New England from the beginning of the nineteenth century, for the soil was stoney and the opportunity for a supplemental cash wage was offered in many rural locations by small factories...In the South, industrial development came tardily, and for a generation longer than in other areas, the weaver, the cabinent maker, the wheelwright, and the cooper plied their trades in sparsely settled areas. With limited markets for their services, they made part of their living from the land.^
A. H. Allen et al, "Part-Time Farming in the South East." Division of Social Research, Works Progress Administration. Mimeo. IX, (Washington, D.C.:Government Printing Office, 1937), p. XV .

- 5 -
While part-time farming is not new, it has taken on new aspects in different areas. The concentration of part-time farming varies from state to state, and region to region within the state. Its development is worthy of note. In the 1^40 Yearbook of Agriculture, Arthur P. Chew writes;
The urban interest in part-time farming is substantial and growing. Part-time farming is important in every state in the Union. In some states, half or more than half of the farmers are part-time farmers. Such farms, though less numerous than the rural residence of urban people, account for a larger acreage. Most part-time farms depend directly on nearby cities; the occupants have city jobs and work on their small farms in their spare time.Some part-time farmers work in other purely rural occupations. City people with part-time farms who have connections in the city and roots in the soil, develop a dual viewpoint which helps obviate conflicts between urban and rural people
Since the time when the above was written, many changes have taken place in our agricultural as well as our industrial economy. These are in large part extensions of changes then in progress.The growth of nonfarm employment opportunities was an invitation to farmers whose scale of operation was such as to give an unsatisfactory level of living. Thoughts of country living have appealed to more urban people as evidenced by the large suburban movement of the past 10 years. That these were an extension of earlier trends, see Allen's comment:
^ Arthur P. Chew, "The City Man's Stake in the Land," l$4o Year- book of Agriculture, Department of Agriculture, (Washington, D.C.: Government Printing Office, 19^0), p. 38O

- 6 -
With the coming of the automobile and inrproved roads, the rural dweller was placed within the reach of industrial employment in the city and the urban industrial worker was placed within reach of land on a scale that had not existed since the rise of the factory system.3
Part-time farming in Ohio is definitely taking on a new importance in the scheme of rural life. In Ohio, the industrial East merges with the agricultural Midwest. Among the 48 states, Ohio ranks 34th in land area, 11th in value of agriculture production,4th in value of manufactures and 6th in population. This close association of industrial and agricultural opportunities has led to part-time farming development. Farm people are taking advantage of industrial opportunities while urban residents are looking toward the country as a place to live.
Growth of part-time farming in Ohio is difficult to measure. Concepts and definitions of what constituted a farm were not the same for the agricultural census in each year of enumeration. As an indication of growth, however, the proportion of Ohio farmers reporting work off their farms of 100 days or more has doubled since 1930. The proportions as calculated from quinquennial agricultural census of Ohio have been;
1930.............. 14.0^1935.................... 1 5 .2
1940.....................21.31945.................... 2 6 .7
1950.....................31.5,
3 Allen, op. cit., p . %Yi,

- 7 -
In 1950, the operators of nearly one-third of all farms in the state reported work off their farms of 100 days or more during theprevious year. (Figure l)
The growth of part-time farming in the state has created numerous problems for farm organizations and those agencies serving farm people. Evidence of such concern are the following excerpts from the 1951 annual reports of the Agricultural Extension Service from various Ohio counties
A second problem confronting the organizer of a rural youth program is the fact that 4o^ of "üiose enrolledin such programs will be from nonjfarm homes.5
Part-time farming has the effect of removing one incentive of 4-E Club work from the members minds - that incentive is knowing he will be on the farm in the future and that his living may depend on how well he learns to operate the farm."
Rural-urban, relationships are constantly improving.This is partly due to the large numbers of city employed people living in rural areas. Church, fraternal, and social gatherings bring the rural-urban people together on common grounds and an opportunity is provided for a better understanding of each others problems .7
Urban people are still moving to the country; many to small farms of five to 20 acres. Most of these people lack farm experience. They rely quite heavily on the Extension Service to provide guidance and information.Some will, no doubt, buy equipment and try their hand at farming. Others will rent out their farm land to a neighboring farmer.
^ Unpublished reports made available by Office of Director of Agricultural Extension Service, Columbus, Ohio.
5 Annual Report of Franklin County Agricultural Extension Service,1951, p. 2 3.
^ Ibid., p. 24.7 Annual Report of Montgomery Coun-ty Agricultural Extension Service,
1951, p. 8 .

FIGURE INUMBER AND EERCENIAGE OF TOTAL FARMS REPORTING
lOO OR MORE DAYS OFF-FARM WORK BY OPERATOR,2.9h9
H C N R V
284 A A N O U A K 'V485 2 2 . %D E F IA N C E 807
50 .8g21.4a S U M M IT
155663.09
S E W E C48919.4^P U T N A M
361 13.99VA N W E R T
289 15.096
W A Y N EeC H U A N OA L L E N 1874
48.2 43.0^JC A R R O L LV lA R IO NI4.WU N IO N
40319.336
S N E L B V
464 21.4% Ha r r i s o n
478 36.7%
83631.9%960
22.3% U I C K 1 N ÛM U S K IN G U Mf r a n k l i nA O IS O N
P R E B L E
64327.2%
6&NONTOOM ERV
1421 43.6%
H O C K IN OBu t l e r
895 36.2%
WASH
936
I
001
SOURCE: Appendix Tabie I STATE TOTAL 62,84831.5%

- 9 -
Dayton businessmen are continuing to buy more farm land. They express the desire to place some of their wealth in farm property. Too, it becomes a home upon retirement. Quite a few businessmen are having their first experience in managing farms. They continually seek the opinion and advice of the County Agent. The new land owners are usually sincere in their efforts to become good farmers. They are quick to accept recommendations for improved farm practices.°
There is a growing interest in agriculture because many of the folks who have never lived in a semi- rural area have moved onto a small tract of land and are attenrpting to make the acres produce part of their living. Many office and telephone calls are from the new city farmers
Approximately half of these (1-H swine) projects are carried out in connection with part-time farming operations. Many of the animals were not marketed, but found their way to the family food supply. The project books currently used in connection with swine projects do not necessarily fit the part-time farming as carried on in this county...
The number asking for help is increasing. A broad classification of these, not actually working full-time in agriculture but interested and taking advantage of some form of contact with the Extension Agents would include; part- time farmers, would-be farmers - not owning farms, and absentee landlords or operators.^
8 Ibid., p. 91,9 Annual Report of Hamilton County Agricultural Extension Service,
1951, p. 5.Ibid., p. 34.Annual Report of Cuyahoga County Agricultural Extension Service,1951, p. 3 .

12
- 10 -
As the county continues to urbanize, the projects elected will be those adfepted to small areas. City bc^s enrolling in agricultural projects will find it difficult to take livestock projects. A greater knowledge of agriculture and home economics would promote greater harmony between rural and urban areas.^
Franklin and Green Townships, the two southernmost townships in the county, are the two townships where most full-tjme farming is being done. Very little full-time farming is done in the other townships.
The population (of the county) is 6 3.3 rural, which included farm and nonfarm population. One studying rural problems must recognize the fact that there is a large part-time farming program.
50^ of the (industrial) workers are now from the rural areas and are urban workers. The indus - trial plants are interested in help that lives in rural areas. The manager of one large concern says that they are excellent workers and stable... .Farm real estate buyers report that there are fewer buyers of farms to farm. A number of farms have been sold to industrial workers who want onJy a place tolive.
With the increase in part-time farming, it becomes increasingly difficult to get these young people together for meetings. They work different shifts and some of them can come at one time and some another
Annual Report of Summit County Agricultural Extension Service, 1951, p. 77.jbid«, p. 7 8.
l4 Annual Report of Washington County Agricultural Extension Service,1951, p. 4 7.Ibid., p. 48.Annual Report of Trumbull County Agricultural Extension Service, 1951, p. 24.

- 11 -
Approximately 32,000 people live in the county outside of the three al>ove mentioned cities (Hamilton, Middletown, and Oxford)• Half of this number are farmers, and the other half reside in smsJJL community centers or live on very small tracts throughout the countryside. Only about 1,633 of the 2,4?1 farms listed in the last census can be considered commercial farms. The remaining number are small tracts belonging to part-time farmers and city workers.^7
Excerpt from a letter from Assistant State Conservationist in Ohio -
We are puzzled about how we csui best work with these "part-time" people. We have had rather disappointing experiences with many of them in -tiiat we have spent a lot of time developing plans and then find that none of the plan gets applied. Of course, there are exceptions and some very nice programs have been developed.
Teachers and administrators of vocational agriculture in Ohio have been increasingly concerned with the growth of part-time farming. Howard W. Nowels said:
Approximately one-half of the boys in classes taught by Ohio teachers (of vocational agriculture) in 1951-52 were from full-time farms while one-half of them were not from full-time farms.Forty and four-tenths percent of the students were from part-time farms, while 9»1 percent were from miscellaneous situations, including nonfarm.19
17 Annual Report of Sutler County Agricultural Extension Service,1951, p. 4.Letter from Horton Alger to J. I. Falconer, Chairman of Department of Agricultural Economics and Rural Sociology, The Ohio State University, December 1951»
^9 Howard W . Nowels, "Some Background Information on the Extent of Part-Time Farming in Ohio." Mimeo. of "the Department of Agricultural Education, The Ohio State University, Columbus, Ohio,1952, pp. 10-14.

- 12 -
Mr. Nowels pointed out that in some administrative districts in the state nearly two-thirds of the students were not from fulltime farms - and in 12 departments of Vocational Agriculture, 80 percent or more were not from full-time farms.
In view of these questions. The Ohio Agricultural Experiment Station in 1953 established a research project entitled, "Economic and Social Aspects of Part-Time Farming in Ohio." This study is in large part an outgrowth of work done in association with that project. The data presented are, as yet, unpublished results of that study.
The Problem of DefinitionDefinitions are employed by research workers in order to de
limit the area to be studied. Different writers have used different definitions and the same source may use a different definition at different times. The Bureau of the Census has used various definitions of a farm. The appropriate definition for one treatment is not necessarily the best for another treatment. Students in agriculture have strongly criticized the definition of a farm in popular statistical usage, and have searched diligently for a better one. The problems involved in definitions were discussed in a 1944 article in the Journal of Farm Economics, "Need For a New Classification of Farms."
20 M. R. Benedict, H. R» Tolley, F. F. Elliott, and Conrad Taeuber, "Need For a New Classification of Farms," Journal of Farm Economics, Vol. XXVI, Nov. 1944, pp. 694-7o57

- 13 -
Part-time farms are a special category of farm and so carry the limitations of the farm definition as well as those to separate part- time from other farms. The late Leonard A. Salter, Jr. discussed the problem of formulating definitions, and lack of comparability of definitions of part-time farms in an article in the Journal of Farm Economics in 1936.^^ At that time, eight studies were considered - no two of which used exactly the same definition. In that article he suggested a classification of part-time farms and some delineating definitions•
In 1940, Salter with Larry F. Diehl, considered a total of 24publications concerning part-time farming. The writers say;
In a previous article it was shown that the confusion of part-time farming concepts and definitions have made it incessible to compare results of studies and very difficult to interpret the results of some of them. While the number of part-time farming studies has since more than doubled, little improvement can be found in the clarity of part-time farming concepts or definitions used.^^
Examination of studies published since 1940 indicate little improvement in standsurdization of definition.
In the proposed classification of Mr. Benedict and others, was included a category of "Part-Time Farms," regarding which the authors stated:
Leonard A. Salter, Jr. "What is Part-Time Farming?" Journal ofFarm Economics. Vol. XVIII, Feb. 1936, pp. 191-197*L. A. Salter, Jr. and L. F. Diehl. "Part-Time Farming Research."Journal of Farm Economics, Vol. XXII, Aug. 1940, p. 582.

- 14 -
We suggest that these he defined as farms having a value of products at 1939 prices of less than $600 and with work off the farm by the operator amounting to 100 days or more. This group of farms is easy to distinguish and is one that will probably grow in importance after peace is restored.The interests of the operators of these farms are different from and broader than those of the other small farm groups. In general, they probably have a higher economic status and enjoy a better standard of living. There are many farms on which the value of products will be more than $600 though the operator works more than 100 days off the farm.It is felt, however, that most of them will require the major portion of the time of some worker whether it be the operator, family, or hired workers. However, on farms having a scale of business of $600 and above, the characteristics of the farm and the interests of the operator are likely to be more like those for the family-commercial farm group than for the small part-time farm group. 3
The classification of farms used in the 1950 Census of Agriculture in general follow that proposed classification, and appears to have had fairly wide acceptance. According to that definition, a farm was considered as (a) three or more acres if the value of agricultural products exclusive of the home garden amounted to $150 or more, or (b) places of less than three acres if the value of salesof agricultural products in 19^9 was $150 or more.^^
"Part-time farms" were those with sales of farm products of$250 to $1,1)9 , if (1) the operator reported 100 or more days workoff the farm in 19^9, or (2) the nonfarm income received by the farm-
23 M. R. Benedict, et. al. op. cit., p. 705»pk U. s. Bureau of the Census, United States Census of Agriculture,
Counties and State Economic Areas, Vol. 1, .Part 3, (Washington, D. C.: Government Printing Office, 1952), p. XII.

- 15 ”
er and members of his family was greater than the value of agricul-25tural products sold. ^
Changes in the price level of farm products had changed the specific class limits above suggested by Mr. Benedict and others.In 19^9, the index of fai*m products prices in the United States was 162 percent higher than in 1939»
This would have moved the upper class limit of the part-time farm group to a value of farm products at 19^9 prices of nearly $1600 per farm. The 1950 census upper class limit for this group was $1 ,1 9 9 of sales. (Over this period, the Ohio and the United States farm product prices index followed the same inflationary trend, being respectively 260 and 262 percent of the 1939 level.)
According to the above mentioned 1950 census, 28,099 farms in Ohio were classified as part-time. This represented a little more than l4 percent of all farms in the state. Part-time farming is more important in Ohio than in the United States at large. For the United States as a whole, units designated as part-time farms numbered 639,230, comprised 1 1 .9 percent of all farms, and contained 1 1 .9 percent of all land in farms.^^
"Part-time farmer" and "part-time farm" are two concepts frequently used as though they were interchangeable - and for a wide range of situations, this appears to be true. However, one pertains to the farm unit, the other to the operator. If, by full-time farms we mean ones that provide productive full-time employment for an able-
Ibid., p. XIX.p6 United States Bureau of the Census, United States Census of Agri
culture, Special Reports. Vol. V, Part 6, (Washington, D. C.: Government Printing Office, 1952), p. 55.

- l6 -
bodied man, then certainly many full-time farmers are on part-time farms. The size of unit and intensity of operation in many cases are such as to under -employ the operator without other employment. This is one of the situations considered by T. W. Shultz as "Low Production Family Farms." He estimated that in 1940 this situation described over one million farms and about one-fifth of the total farms in the United States(Residential family farms of retired persons might also be included in such a category.)
A part-time fanner is one who divides his time between farming and some other occupation* The farm unit may range from small to very large as measured either in acres, output, or number of hours of profitable employment it could provide. What is a part-time farm with one operator may be a full-time farm with another - or the same operator may be at one time a part-time farmer and at another a full-time farm operator. A part-time farmer mi^t operate a full-time farm by hiring labor to replace himself, or by utilizing the family labor supply more efficiently.
Bhe definition of a part-time farm as used in the 1950 Agricultural Census excluded many in this latter category. The author believes that the definition understates both part-time farms and part-time farmers under existing conditions in Ohio.
Part-Time Farming in OhioIn 1949, according to the census definition, there were 28,099
part-time farms in Ohio representing a little over l4 percent ofT. W. Shultz. Agriculture in an Unstable Economy. (New York;McGraw-Hill Book Co., 1945), p. 199.

- 17 -
the total farms in the state. In that same year there were 62,848 farm operators who reported working off the farm 100 days or more; and a total of 65,575 operators who reported other income of the family exceeded the value of farm products sold. Of the total (199,359) farms in the state these represent 31.5 percent and 32*9
percent respectively. The author believes these figures to be more nearly representative of the importance of part-time farming in Ohio. Nearly one-third of Ohio farms thus are operated as part- time farms on some scale.
According to the census classification, in 194-9, there were in Ohio 18,205 operators classified as "commercial" farmers who worked off the farm 100 or more days. This number represented nearly 29
percent of the total 63,492 classified Ohio farmers who reported such off-farm work in 1949, and was nearly l4 percent of the total number of commercial farmers in the state.
While the definition of off-farm work of 100 or more days relates to the farm operator only, there are numerous cases where the wife or other members of the farm family contribute income from nonfarm sources. In 1949, there were 65 ,931 classified farms in Ohio with other income of the family exceeding the value of farm products sold. Of this number, l6,9l4 or over 25 percent, were farms with sufficient farm products sales value to be classed as commercial farms. Except for Class VI commercial farms (where such nonfarm income caused a classification of "part-time farms") there were some farm families in each commercial farm subgroup that reported

TABIE 1Characteristics of Ohio Farms by Economic Class, 19^9
Ccaxsus Economic Class oif FarmItem Commercial Farms Other Farms
Total I II III IV V VI Ft .Time Resdntl.Farms (Ho.) 134,995 1,738 12,037 33,211 39,838 30,870 16,901 27,871 36,651
Average Size (Acres) 134.4 405.4 250.7 167.3 120.8 91.0 70.4 55.2 37.3
Value, Land & Bldgs. Per Farm Per Acre
$18,151134.33
$75,417 $39,501180.94 157.94
$23,814142.58
$15,250126.98
$10,098109.83
$6,97995.69
$7,82413830
$6,213165.35
Crop Land Harvested Per Farm (Acres) 76.2 280.3 161.3 102.6 64.8 4o.o 24.2 18.5 8 .2
Farms With Other Family Income Exceeding Value of Farm Products SoM (Ho.) 16,914 82 448 1,577 5,161 9,646 23,606 25,366
Operator Work Off-Farm 100 Dfiys or More (No.) 18,205 133 701 2,495 5,776 9,100 21,331 23,936
Average Age (Years) 49.7 47.2 45.6 45.8 48.8 51.8 59.0 49.4 50.8
Average Years on Aresent Farm 15 16 14 14 15 15 20 12 12
03I
Source: Economic Area Table 8, p. 22k, Vol. 1, Part 3, Ohio, 1950, U. S. Census of Agriculture.

- 19 -
other income of the family as being in excess of the value of farm products sold. See Table 1.
Tht^ we have two measures which serve as estimates or indications of the extent of part-time farming in the state, (l) operators reporting 100 or more days of work off the farm, and (2) farm families reporting other income in excess of value of farm products sold.
The numbers classified by each of these definitions provide an estimate of part-time farming in the state. While the absolute number and proportion given for these two measures are near each other, they are not exactly measures of the same situations. When correlated by Ohio counties, using number of farm operators reporting 100 days or more off-the-farm work as the independent variable, the coefficient, "r" yielded a value of .958. This would indicate that nearly 92 percent of the situations of other family income exceeding farm income was accounted for by the operator working off the farm 100 days or more.
While this high degree of relationship exists for the state as a whole, it covers up some inportant county to county variation. See Table 2 and Figure 2.

TABIE 2Two Measures of Part-Time Farming Compared
Total Farms, Humber and Percentage of Total Farms Reporting 100 or More Days of Off-Farm Work, and Farm Families Reporting Honfarm Income
in Excess of Farm Income by Economic Areas, Ohio,19 9
EconomicArea
TotalFarms
Measure I Off-Farm Work 100 or More Days
Measure II Family Nonfarm Income Exceeded Farm Income
Measure II Greater Than Measure I
No. Pet. No. Pet. No. Pet.Area 1 and a 23,625 4,960 , 21.0 4,632 19.6 -328 -6.6Area 2 23,979 4,988 20.8 4,665 19.5 -323 -6.5Area 3 h,c,d 36,337 10,205 28.1 9,782 26.9 -473 -4.2Area 4 a,e 9,259 3,721 40.2 3,536 38.2 -185 -5.0Area 4 h 12,673 4,061 32.0 3,754 29.6 -307 -7 .6Area 5 f,g,h 23,883 11,807 49.4 11,519 48.2 -288 -2.4Area 6 a 10,929 3,369 30.8 3,411 31.2 42 1.2Area 6 b,j 18,224 6,760 37.1 7,686 42.2 926 13.7Area 7 k 15,698 4,425 28.2 5,061 32.2 636 14.4Area 8 a,l 12,213 4,785 39.2 6,321 51.8 1,536 32.1Area 8 b 12,539 3,767 30.0 5,208 41.5 1,441 38.2
STATE TOTAL 199,359 62,848 31.5 65,575 32.9 2,677 4 .3
Source: Conçiled from 1950 Census of Agriculture.

- 21 -FIGURE 2
COMPARISON OF TWO MEASURE^OF PART-TIME FARMING ECONOMIC /JHEAS OF OHIO• I9I+9
______ Measures agree,within 5^ margin of error.
Measure 1 exceeds sure 2 by 5 to 25^.
_______Measure 2 exceedsmeasure 1 by 5 to 25$.
Measure 2 exceeds measure 1 by more than 25$S3 wj maLTA'
Souroet Table 2

. 22 -
From the map it is apparent that in the counties of southeastern Ohio the number of farms with nonfarm income exceeding farm income is generally greater than the number with operators reporting 100 or more days work off the farm. In western and northern Ohio the number of farmers working off the farm 100 days or more generally exceed the number reporting nonfarm income in excess of farm income. This, taken together with the higher absolute and proportionate number of such farms in southeastern Ohio, is one indication of the relatively poorer farm income opportunities in the rougher sections of the state.
TABLE 3Number and Percentage of Ohio Farm Operators Reporting Off-Farm
Work, and Other Income of Family in Excess of Value of Farm Products Sold, by Size of Farm, 19^9
Operators , Working Off-Faïm Other Family**Acreage All Farms* Total 100 Days or More Income
No. Pet. No. Pet. No. Pet.Under 10 17,411 12,482 72 11,406 66 11,424 6610-29 24,094 16,102 67 14,177 59 15,191 6330-49 18,807 11,337 60 9,252 49 9,805 5250-69 18,159 9,608 53 7,281 4o 7,796 4370-99 31,505 13,487 43 8,892 28 9,315 30100-139 31,399 11,531 37 6,480 21 6,761 22140-179 21,240 6,585 31 2,855 13 2,760 13180-219 11,419 3,310 29 1,270 11 1,246 11220-259 7,004 1,847 26 686 10 636 9260-499 10,036 2 ,788 28 957 10 871 9500-999 1,513 474 31 204 13 153 101000 & over 177 46 35 32 18 11 6
TOTAL 192,764 89,597 46)6 63,492 33)6 65,931 34)6* Total of all farms classified by size based on sample of total
farms.** Other income of farm family in excess of value of farm products sold.Source: 1950 Census of Agriculture - Ohio> Vol. 1, Part 3, p. 152.

- 23 -
From the above table, it is apparent that work off the farm by the operators is not limited to small farms only. At least 25 percent of the operators in each acreage classification reported some work off the farm and 10 percent or more in each category represented 100 or more days of such employment. With the larger sized farm opera* tions, a smaller proportion of the farmers reported other family income exceeding farm income although it was true of some cases in all size categories. Thus, it appears that individual cases have developed a blend of farming with nonfarm work in nearly all possible family situations.
Method of Study and DefinitionsIn consideration of the facts presented above, it appeared
desirable to study the whole range of situations in which farming operations were combined with nonfarm employment. Definitions for use in this study were so developed. For purposes of analysis the wide range of situations surveyed were grouped into subclasses of part-time farms. Definitions used follow:
Farm - Three acres or more on which the operator or his familycarried out some agricultural operations either for home use or for sale.
Part-Time Farm - A farm on which the operator worked off the farm 100 or more days in the previous year; providing he was not being replaced on the farm by another adult able-bodied male, whether hired or a member of the family, who devoted

- 2.h- —
full time to farm work. The definition does include those situations with more than one adult male, if each spent 100 or more days at off-the-farm work.
Subclasses of Part-Time Farms1. Residential Part-Time Farms - Those part-time farms,
regardless of acreage, with a total value of agricultural production of less than $250.
2. Subsistence Part-T^mm Faums - Those part-time farmswith total farm production in excess of $250, thefarming operations primarily for home use, and sales incidental to that production and use, sales of farm products of less than $250.
3* Semi-Commercial Part-Time Farms - Those part-time farms on which subsistence is still of importance, but with sales of more than $250 and less than $1,200.
4. Commercial Part-Time Farms - Those part-time farms with sales as primary consideration, such sales totaling $1,200 or more a year.
(in a few instances when drought, fire, or other such circumstances resulted in abnormal production or sales in the specified year the farm operation was included in the group in which it would normally be classed.)
Most of the data presented in this study were, secured by interviews with part-time farm families. The type of information needed

- 25 -
required response of those now operating, or who had previously-operated as part-time farmers* Two separate schedule forms for
28recording interview data were developed. The first was used for a general sample of part-time farmers; the second for another group of operators who had used part-time farming to become established as farmers on a commercial scale. A description of these samples and method of selection follows.
Either the operator or his wife were the respondents to the questions during the interview. In numerous instances the farm operator was at work so the wife was the respondent. In cases where she was not able to supply the requested information an attempt was made to revisit at a time when the operator was home. In the opinion of -fche author "the fact that the wife supplied answers to farm operation da-ta was not a serious defect in the information procured. In the day-to-day operation of mar y part-time farms the wife frequently functions in a managerial capacity in addition to actually performing some of -the farm work.
In addition to the information supplied by the informant at time of interview, some additional information was obtained from public records. Such information pertained to tax valuation of the real estate, deeds of transfer, and recording of real estate and chattel mortgages. Study of the deed and mortgage instruments revealed data with respect to price paid for real estate, evidence of inheritance through transfers between related parties, and extent28 ' ---These schedule forms are found in Appendix pp. 264 to 274.

— 26 —
of use of mortgage fiuarxcirig in acquisition of the real estate. In most cases where the consideration paid for real estate was not given it was possible to estimate the purchase price from the cancelled revenue stamps on deeds of transferInformation with regard to assessed valuation of land and buildings is some indication of the quality of the land and permanent in^rovements made on the real estate.
Selection of SamplesSample 1. The first sample consisted of the part-time farmers
in selected square mile areas of l4 Ohio counties. The ih counties were purposely selected to represent characteristics of the principal type of farming areas in different sections of the state. The counties selected for sanrpling were Belmont, Champaign, Fairfield, Lake, Licking, Monroe, Morgan, Morrow, Paulding, Preble, Trumbull, Warren, Washington, and Wood,
In order to avoid personal bias of the interviewer, an attempt was made to complete a schedule for all households that met the definition of part-time farmer whose place of residence was a farm in the selected square mile area. The square mile areas to be included were selected by applying a mechanical pattern. The first square mile was to be the one that lay on the main road north of the county seat town and just beyond the intensive fringe area. The second was that square mile two miles east and two miles north of the first.The third was two miles east and two miles north of that; continuing29 ' ~ ' ~ ' ——Revenue stamps in amount of 55 cents per 500 dollars of consider
ation or fraction thereof are required by law to be affixed to the deeds of transfer.

W IL L IA M S
T T A W A
H E M P V5 A N O U 5K V LORAlD E F I A N C E
RUL'blNG s u m m i tM U R O N M EDIN A
P U T N A M MAHONINGIa s h l a w d
W A Y N E S T A R KYANDOTVAN W E R T RICHLANDC O L U M B IA N AA L L E N
M A R IO N
K N O XL O O A N /U N IO N
H A R R IS O N
l i c k i n gB E L M O N TM IA M I MUSKINGUM
m  d Î s Ô n T ^ a n k u i n
prSble MONTGOMERV
P IC K A W A Y
^warSen^ H O C K IN G
A N DH A M L T O N
A D A M S
IfO
Figure 3. Connt-ies Selected for aeaeral Part-Jime Farm Survey, Sample 1«

- 28 -
the pattern to the county line.In each county the sangle was to include at least four square
miles and at least twelve cases. In a county where the geographic location of the county seat was such that these limits could not he fulfilled, the pattern was extended in the opposite (south and west) direction, and square mile areas surveyed until the minimum requirements were met. In the l4 counties a total of 83 square miles were surveyed in this manner.
In each of the square miles all resident households were classified hy the interviewer as (l) full-time farmer, (2) part-time farmer, or (3) rural resident. A sketch of the land ownership pattern in each square mile area was made from the plat book at the County Engineer's Office. The use of each tract was also classified with reference to the three categories above. Some land situated in the square mile areas was devoted to nonagricultural use or not currently used.
The 83 square miles contained 88I dwelling units which were classed as follows:
289 full-time farms occupying..................33,240 Acres291 part-time farms occupying................. l6,88l Acres341 rural residences occupying............. 2,397 AcresAn additional 94 other tracts of land in the square mile areas
were identified as follows:64 parcels of idle land, 19 tracts with rural business use, three parcels of mineral lands, three held apparently for real estate development, two country estates, two recreational

- 29 -
areas, and one parcel of public land as a roadside park.
Interviews were conducted and schedules secured from 2kh of the 251 part-time farmers in the square mile areas. Insofar as two records were only partially completed, much of the following analysis is in terms of 242 cases from this sanrple.
In terms of the classes of part-time farms defined above, the 242 cases were distributed as follows: Class I - 36 farms; Class II -24 farms; Class III - 67 farms; and Class IV - 115 farms.
Subsample - 55 Cases Making "Substantial" Progress Toward Full-Time Farming Goal
Records of 55 part-time farmers from the 242 general survey cases were selected for separate analysis. The selected cases were of those operators who had stated their goal was to become full-time farmers on a commercial scale, and who had achieved substantial progress toward that goal. All expressed the opinion that they would be farming fulltime within a few years.
These individual families had obtained command of sufficient resources to achieve a scale of operation comparable with that of other operators in the area currently devoting full-time to the farm, or had maintained a rate of progress toward that goal to reasonably expect to achieve it in a few more years.
Some were cases of previously full-time farmers who had, for various reasons, taken off-farm work. Some were World War II veterans who had farmed full-time while engaging in the Veteran's on-the-farm training program and receiving subsistence payments.

- s o
others, though they had never farmed full-time, had obtained command of sufficient resources and achieved a scale of business that they were reasonably well established in farming. However, their circumstances of indebtedness, desire for a larger unit, to make extensive improvements or to accumulate working capital, had led them to postpone trying to do without the nonfarm income at the time they were interviewed. All expressed the thought that they would be farming full-time within a few years.
In the process of conducting the interviews in the general sample, incidental references led to collection of case studies of five former part-time farmers who were now farming full-time. Three of these were located in Trumbull County, one in Warren, and one in Wood County. These records were analyzed in conjunction with the second sample.
Sample 2. The second sample was selected to provide more information relevant to the part-time farm route to full-time farming. It includes: (l) full-time farmers who used part-time farmingto become established, and (2) part-time farmers who, though still working at a nonfarm job, had the goal of becoming full-time farmers and had attained an acceptable level of farm operation. In the latter case the age of those now operating part-time could not be more than 50 years. This was done to eliminate those operators whose goal of "full-time" farming was normally conceived as a supplement to expected retirement income after q,uitting the nonfarm job. Consideration of those still farming part-time was further

- 31 -
limited to those now operating sufficient land, whether owned or rented, and who commanded capital sufficient to reasonably expect to operate full-time in the near future*
The second sample was drawn from four Ohio counties representing the general type of farming areas in the state* They were Ashland, as representative of the Northeastern dairy farming area.Perry of the Southeastern general farming area. Union of the Western Ohio cash grain and livestock area. The fourth county. Licking, is located in a tremsition zone and has farm patterns somewhat representative of the three areas mentioned above.
The individual cases selected in each of the above counties were selected by application of random numbers to lists of operators. These sample prospect lists were compiled by cross reference from informants in the local areas in an attempt to get a complete enumeration of all operators falling within the confines of the defined categories. Primary sources of information for names on these lists were members of the local (township) committee of the Production and Marketing Administration. The lists were supplemented by names referred by the County Agricultural Extension Agent, Soil Conservation Service feirm planners, Vocational Agriculture teachers, and operators of local credit agencies including secretaries of production credit association and federal land banks, and farm loan offices of rural banks.30 " ' ~An arbitrary minimum acreage was specified below which the farm
was not considered as representative of full-time commercial farming. These minima were 8o acres for northeastern and western Ohio counties, and 100 acres for the southeastern area.

- 32 -
Some individual might be mentioned by several of the above mentioned informants, others by only one. The final saog?ling list included the names of some operators about whom the informants were not completely certain of the farmer's intent or scale of operation. For this reason, when the samples were drawn, alternates were also drawn for replacements if the original selection was not usable. The number of names on the final sample lists and the number of schedules congpleted by type of farming areas is indicated in Table 4,
TABLE 4Number Referred and Number in Saagile of Operators Who Had
Used Part-Time Farming to Become Established on Commercial Scale, by Area and County, 195^
Type of Farm Area and County
Number of Cases Referred for Sampling
Number of Cases Included in
SampleNortheastern DairyAshland County 133 13N. W. Licking County 57 5Area Total 190 18
Southeastern General LivestockPerry County 102 13Eastern Licking County 33 5Area Total 135 16
Western Cash Grain and Lives1x)ckUnion County 97 15S. W. Licking County 33 6Area Tot;al 130 21
TOTAL 459 57

- 33 -
When the interviews with these selected cases were conducted, some operators were currently farming full-time; others although still working off the farm, had achieved a size of farm unit and size of business comparable to that of full-time farms in their respective communities. Of the 57 cases interviewed, 44 were still farming part-time and 13 had given up the nonfarm job to spend full-time on the farm. These 13 cases, plus the five cases secured previously through incidental reference while collecting the 242 schedules, constitute the 1Ô cases of full-time farmers included in the later analysis.
Incidental reference is also directed to results of a mail questionnaire addressed to certain employees of a large industrial corporation with plants situated in northeastern Ohio.
In 1950, Earl D. Merril, Director of Agricultural Extension Bureau of Republic Steel Corporation sent out a return post card form to some 6,000 employees of that corporation. Some 2,800 of the cards were returned indicating varying degrees and areas of present and prospective interest in agricultural activity and resources. Two thousand, two hundred and ninety of those respondent cards were made available to the Ohio Agricultural Experiment Station project; a questionnaire was prepared and mailed to those respondents.3^ Returns of the mail questionnaire was relatively low, I86
usable schedules or about an eight percent return. Returns were received from 16 northeastern Ohio counties, the largest number being from Stark, Trumbull, Mahoning, and Cuyahoga.31 " 'See Appendix p.276 for an example of this questionnaire.

CHAPTER IIWEÏ DO EEOPIE EMGAGE IN. PART-TIME FARMING?
Part-time farmers are not a homogeneous group in terms of goals, type of farm operations, or the scale of that operation. Backgrounds of these farm families are varied and the direction of movement on the farm . . . . city continuum is to some extent reflected by their goals. Some were previously full-time farmers, now only part-time operators. Others were previously nonfarmers who are moving toward the goal of farming full-time. Some are younger operators approaching farming with youthful goals and ambitions, others are older men thinking more strongly of security and retirement. Some are actively engaged in part-time farming as a preconceived step toward a definite goal. Others were placed in their present circumstances more by chance than design.
After determination that the respondent met the study definition for part-time farmer, information was obtained with respect to family background, type of nonfarm work engaged in, and length of time operating as a part-time farmer. Then a question was asked, "What was your reason for choosing to farm part-time?" Although it was a free answer question, some anticipated categories of reply were listed on the schedule to be checked by the interviewer. Space was provided to write in answers other than the check categories, or for explanatory notes.
In Table 5 are summarized the major reasons stated by the respondent for the part-time farm operations of the family. In most
- 3^ -

- 35 -
cases, more than one reason was given - with some as many as four or five. The 244 families interviewed gave 612 reasons, an average of about two and a half reasons per family. The statement of numerous reasons may be a reflection of more than one objective by the same individual or of the fact that the part-time farm situation means different things to different members of the family. The respondent frequently identified a member of the family with the objective as "I wanted to get started in farming and my wife wanted more space for the children."
The same situation may be viewed as contributing additional income or lowering living costs to the family budget maker, a better house and more conveniences by the mother, play space and opportunities for pets by the children, or virtually all the tabulated reasons in some degree.
A southwestern Ohio case may illustrate this point. An SO-acre farm with a large modern farmhouse was purchased jointly by a family with their eldest married son. In this case the respondent was the wife of the married son. They bad lived on the farm about one year and her husband did much of the farm work. She stated the reasons the various adults were interested in joint purchase of a farm to operate as a part-time unit. The parents had been reared on farms and saw the part-time farm as eventually a retirement proposition for the father. To his wife, it was viewed as a nice country home. The son saw it as additional income and/or lower living costs. His wife thought of it as a nice place to rear their children.

- 36 -
The goals of part-time farmers are not fixed and unchanging* Families modify or change their goals with added e::qperience, change in family cycle, health, and other circumstances brought by passing years. Some of those interviewed had begun part-time farming 20 or more years ago* Are the goals they stated now the same as they would have stated at the time they began to farm part-time?
Factors influencing the changed goals may be external to the farm and family; or internal, and reflect changes in the family composition and interests.
Such external conditions might be illustrated by the abrupt change in our general price level over the past 20 years, chsuage in nonfarm en^loyment opportunities (over all change in employment and shifts in industrial location), increased urbanization of some rural areas and increased site value of the real estate. Changed location or new highways, construction of dams or reservoirs, as well as land purchase for industrial plant sites, has resulted in some farms being reduced in size and income potential to the point that they they no longer provide full-time productive employment for the operator.
Among the external influence, perhaps the most important, contributing to part-time farming by former full-time farmers is the the change in agricultural technology* The size of farm or scale of business for profitable operation has been so enlarged by mechanical development that the acreage previously full-time can now be operated with much less labor. Scarcity of additional land

- 37 -
for expansion of the farm operation, coupled with nonfarm employment opportunities, had led numerous former full-time farmers to seek nonfarm employment and continue to operate the farm on a part-time basis, or to sell the unit to someone seeking only a part-time farm.
Internal influences that make for changes in goals are changes in family coioposition, health, movement to a different point in the family life cycle, death, military service, and financial difficulties associated with such changes. Perhaps fire, livestock disease, or crop failure may be the motivation for æeking nonfarm employment; after which the operator may decide to continue for a time in order to make desired improvements, to permit his son to take over more of the farm operation, or because he discovers he likes the off-farm work.
Thus, the statements made in response to why people are farming part-time may be reasons now, or reasons (or rationalizations) of why they now think they made a decision several years ago.
While the individual's ends or goals vary widely from case to case, there are numerous instances where the stated goals of the sample farmers have enough similarities to warrant classification into broad categories.
In the table below are classified the major reasons stated by part-time farmers for their choice. As these categories are rather broad, some elaboration appears to be in order.
Desire for Country LivingThe one thing most part-time farmers have in common is the de
sire for, or an appreciation of, rural living. This was the most fre-

- 38 -
TABLE 5Stated Reasons For Engaging in Part-Time Farming, in Order
of Frequency, 244 Part-Time Fanners, Ohio, 1953
ReasonStated
Rank of Reason
NumberStatingReason
Pet. of Total Stating Reason
Pet. of Total Reasons Given
Like the Country 1 118 48.0 1 9 .3Get Started in Farming 2 91 3 7 .0 14.9Increase Earnings 3 68 2 7 .6 1 1 .1Children 4 52 2 1 .5 8 .5Retirement Plans 5 43 1 7 .5 7 .0Lower Living Costs 6 39 1 5 .9 6.4Relatives 7 31 12.6 5 .1Inherited Property 8 28 11.4 4.6Unemployment 9 27 11.0 4.4Housing 10 25 10.2 4.1Health 11 18 7 .3 2 .9Like Nonfarm Work 12 16 6 .5 2.6Other* — — 56 2 3 .7 9 .1
Real estate development project, 7J freedom and independence, 6j pay off debts, 6; to permit boys to taJce over farm, 6; place for parents, 4; rural business reasons, 4; medical bills, 4j livestock disease, 35 farm improvements, 35 timber operations, 35 supplemental income during strikes, 3; security, 2; investment, 2j prestige of nonfarm job, 1; security of tenure and location, I5 spare time in slack season, 1.
quently stated reason, and was stated by neariy half of the respondents. It is the author's opinion that if the answers had been checked off by the respondent, an even larger number would have checked this response. Those persons who were previously full-time farmers, or those who were operating larger acreages, were less likely to give this response than those operating the smaller places in the residential or subsistence part-time farm categories. The amenities of rural living might be associated with one or more of the other categories; especially with children, relatives, or health reasons.

- 39 -
In a summary of responses to the questionnaire by the northeastern Ohio Industrial employees, the replies indicate some of the associations made by urban employed people with rural living. A total of 127 respondents gave reasons for the choice of situations they had selected or would like to have. They gave a total of I63 reasons for their choice. From this group, 56 or percent, gave reasons associated with country life. Such replies made up one-third of all reasons given.
The 56 responses were made up as follows:Like outdoor living and w o r k . ....1^Relaxation................................. .14Love nature and gardening......................11Good living....... ..10Peace and privacy.......................... $Living space................................. 2
Total grouped as "Like Country"........... .5 6
This group was conposed more heavily of those persons who had just a residence in rural areas or still lived on a city lot (over two-thirds had less than three acres). Ihus, their replies are perhaps more indicative of the reasons persons do move or would like to move out into the rural areas to live.
Desire for country living thus may provide a strong motivation to purchase rural property. In other instances, the motivation is not so strong, but sufficient to cause persons who have inherited rural real estate to decide to occupy the property.
Table 6 summarizes the present situation and type of property the northeastern Ohio industrial employees responding to the question-

TABIE 6Types and Size of Property Desired by l6o Families With Nonfarm Employment But
Interested in Country Living, by Size of Tract Now Occupied,Northeastern Ohio, 1953
Type of Property Desired
Size of Tract Now Occupied (Acres)Total Per
centLess Than One 1-2.9 3-? 10-29 30-49 50-79
8o or More
Residence Only (No.) 0 2 0 1 0 0 0 3 1.9Residence and Garden (No.) 30 20 3 3 0 0 1 57 35.6Part-Time Farm (No.) 27 21 13 5 8 2 4 80 50.0
Range in Size (Acres) 2-70 1-80 3-50 5-50 25-42 12-60 1-80 XXAverage Size (Acres) 10 Ik 17 29 36 10 4l 18 XX
Full-Time Farm (No.) 3 3 3 1 0 4 6 20 12.5Range in Size (Acres) 5-120 10-200 20-50 - - 75-160 25-200 5-200 XXAverage Size (Acres) 62 120 30 150 124 124 101 XXTOTAL RESPONDENTS (NO.) 60 46 19 10 8 6 n 160 100.0

- 41 -
naire would select. Th.ir1y-seveu percent wanted only a residence or residence and home garden. Of the i06 currently living on less than three acres, 52 or half of the total, would prefer only a residence and garden.
Get Started in FarmingAs noted in the introductory chapter, farming is an ill defined
term. The level or intensity of farming operation concerned varied widely from one respondent to another. Some respondents who had previously farmed full-time might better be described as getting "reestablished" in farming. Part-time farming may be engaged in by a previous full-time tenant as a means of acquiring sufficient capital to become a full-time owner or part owner.
To farm full-time as the means of earning their income was the goal of numerous younger part-time farmers, especially those with a farm background. With older part-time farmers the goal of farming full-time might be more clearly conceived as a supplemental source of income and work activity after retirement from the nonfarm job.
In Table 6 above was indicated the type of property preferred by l6o northeastern Ohio industrial employees. Those thinking of farming part-time indicated they considered part-time farms with a range of from one to eighty acres, with an average of eighteen acres. The twenty respondents who wanted a full-time farm named sizes ranging from five to two hundred acres, and averaging about one hundred acres. Obviously, the concept of full-time farms in the smaller acreage range was associated with retirement, older age, or health difficulties•

- 1+2 -
The latter part of this study deals with those who are now and have been attenqpting to use part-time farming to achieve the goal of farming full-time.
Some respondents whose stated goal was to get started in farming appeared in reality to be thinking of opportunity to do more part-time farming, rather than to depend on it for their livelihood entirely.This response might then be associated with lower living costs, utilization of inherited property, increased earnings, etc.
Increase Earnings - Lower Living CostsTo increase earnings or lower living costs ranked third and sixth
respectively among the various reasons stated for engaging in part- time farming. To some extent these two groups are related, but opposite expressions of the same problem.
To increase earnings was mentioned by over one-fourth of the respondents in the general survey. The background and primary orientation of the Individual family influence its meaning. From the standpoint of a previous full-time farmer this may be an expression of inadéquate size of farm businessj crop failure, livestock disease or other misfortune; desire to add to, or make ioprovements on the real estate (either the farm or farm home); or an awareness of the higher rates per hour paid for nonfaim employment. In such cases, the individual may be seeking a nonfarm job demanding less of his time than the forty hours a week common to industrial employment. A local milk route, school bus driving, insurance salesman, or building trades job may provide additional income and not compete too seriously with the

- 43 -
farm dexnands for his time. The need for added income might be indicated for a definite period of time or specific expenditure, such as to pay large medical bills, to liquidate indebtedness for real estate, equipment, or livestock.
To the urban family with regular nonfarm engployment, the farm may be viewed as the source of increased earnings. The five-day - 40-hour week does not fully utilize the time some men are willing to devote to paid employment. Farming provides more opportunities for such additional employment than most occupations because of the ease with which it can utilize small increments of labor. Farms also more readily provide for use of the labor resources of other family members. This objective (increase earnings) of part-time farmers, might tend more toward commercial production than its reverse statement (lower living costs) which is the more likely goal of subsistence part-time farmers.
Most part-time farmers raise a garden. Some grow vegetables primarily for home use as fresh supplies in season. Others process (can or freeze) substantial amounts for later use. The most frequent estimates as to size of garden were one-ei^th to one-fourth acres, but ranged from about one-tenth to more than one acre. The mean size estimated was about four-tenths acre. The garden area of some respondents also included trees and small fruits.
Home production of some livestock products may be a valuable contribution toward the family food supply. A small poultry flock, one or two cows, or scane pigs were most frequently mentioned.

- 44 -
These objectives of Increased earnings or lower living costs may also be associated with retirement plans.
Some families dependent on seasonal or uncertain en^loyment were using a part-time farm to utilize the surplus time. Coal mining, timber operations, and school teaching are examples of some such occupations •
The lower living costs reason was frequently given by those respondents who also mentioned fear of becoming unemployed. In the author's opinion some of those mentioning unemployment could substantially reduce living costs and perhaps earn a living on a reduced level from the farm if they became unenployed. Others would experience great difficulty in trying to make a living with the resources at their command.
ChildrenAbout one-fifth of all respondents made reference to the chil
dren when considering the question of why they were part-time farming. Those with a farm background were interested in their children having similar experiences « 4-E club work, farm work habits, association with living things, freedom and space to play were frequently mentioned in this reference. In several cases this reason was associated with responses of housing, rural living, or with lack of suitable nonfarm housing for children.
Retirement PlansThis reason for seeking a part-time farm was mentioned by about
one-sixth of the respondents in the general survey. It ranked fifth

- 45 -
among the reasons given. The increase in number of older persons in our socielqr has diverted more attention to planned retirement. In 1900 only about four percent of the population of the United States was sixty-five years of age or older. By 1950 this population had Increased to eight percent of the total or over 12 million persons. Increasing numbers of older people and planned retirement appears to be a contributing factor in the growth in importance of part-time and residential farms.
Under existing Social Security regulations the retired person is permitted to earn up to $1^200 of self enployment income without loss of retirement benefits. Part-time farming now, with the thought of farming some for sirpplemental income later, is part of the retirement plans of some workers. It might be noted again in this connection the ease with which labor can be used in small increments in agriculture. In recent years with inflation reducing the purchasing power of annuities and retirement income many older persons have taken supplemental employment.
The availability of modern conveniences have increased the attractiveness of retirement in rural areas to former urban residents. It might also be noted that more farmers are retiring on the farm instead of moving to town as was once a more common practice.
Relatives and Inherited PropertyIt is not entirely coincidence that these two items are close
together in frequency of response. In a number of Cases, the care of relatives or desire to live near relatives resulted in and was
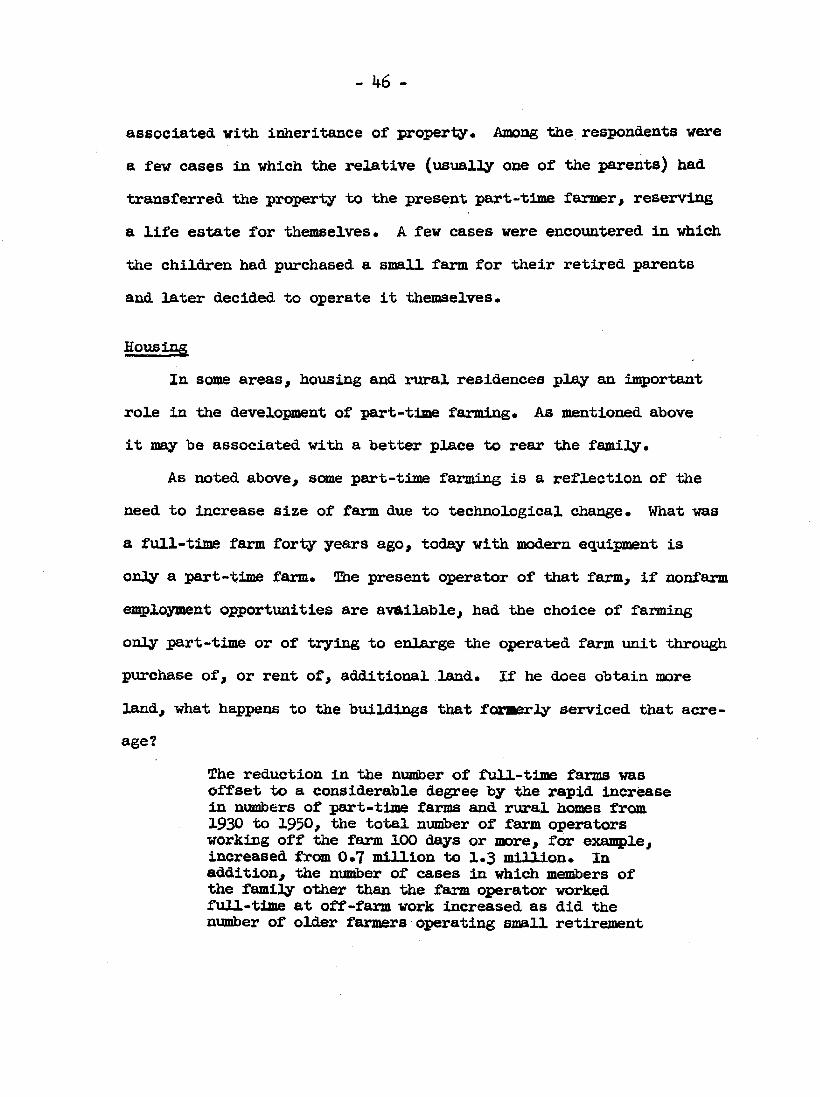
- 46 -
associated with inheritance of property. Among the respondents were a few cases in which the relative (usually one of the parents) had transferred the property to the present part-time farmer, reserving a life estate for themselves. A few cases were encountered in which the children had purchased a small farm for their retired parents and later decided to operate it themselves.
HousingIn some areas, housing and rural residences play an important
role in the development of part-time farming. As mentioned above it may be associated with a better place to rear the family.
As noted above, some part-time farming is a reflection of ttie need to increase size of farm due to technological change. What was a full-time farm forty years ago, today with modern equipment is only a part-time farm. The present operator of that farm, if nonfarm employment opportunities are available, had the choice of farming only part-time or of trying to enlarge the operated farm unit through purchase of, or rent of, additional land. If he does obtain more land, what happens to the buildings that formerly serviced that acreage?
The reduction in the number of full-time farms was offset to a considerable degree by the rapid increase in numbers of part-time farms and rural homes from 1930 to 1950, the total number of farm operators working off the farm 100 days or more, for example, increased from 0.7 million to I .3 million. In addition, the number of cases in which members of the family other than the farm operator worked full-time at off-farm work increased as did the nunher of older farmers operating small retirement

- 4? -
imlts. The estimated mmber of part-time and residential units increased from 1.0 million in 1930 to 1*7 million in 1950.
It appears to the author that an important contributing factor in the increase in part-time fama and rural residences is a relative surplus of farm dwellings, over and above the number now needed to service a given area of agricultural land, if used as full-time farms.
Such dwellings may be purchased, perhaps also with a small acreage, by persons interested more in the amenities of rural living. A number of respondents expressed the idea that such houses could be purchased at a much lower cost than a similar house in town. One family, now farming part-time on a considerable scale and with a new goal to ultimately farm full-time, was originally attracted to a rural area by an available residence. Although tie house was the primary consideration at the time of purchase, later they decided to use the land and even to acquire additional land.
Theoretically, it is possible that a part-time farmer could afford to pay more for a small farm than a full-time farmer who wants to add it to his existing acreage. If the full-time farmer already has a suitable dwelling and other buildings to service the land the marginal value of the Improvements (sunk capital) on the proposed tract are of little value to him. To a nonfarm resident, however, the dwelling could have a value equal to its replacement cost at some other location.
^ Jackson V. McËlveen and Kenneth L. Bochman, Low Production Farms. (Washington, D. C.: Government Printing Office, 1953)f Bureauof Agricultural Economics Information Bulletin No. 108, p. $.

- 48 -
Some support for the theoretical conclusion that part-timefarmers may bid up the price of farm real estate is to be found inthe 1951 Ohio Agricultural Experiment Station Bulletin, "Ohio FarmReal Estate Prices,"
Distance to a center of population, industry and trade influences the pattern of farm real estate values in the surrounding area. The influence of Ohio's larger cities On farm real estate values is measurable in a radius of more.than twenty miles*A smaller and flatter pyramid of farm real estate value exists around towns of smaller size. Each area tends to have its own pattern.An increase in the intensity of land use as centers of population are approached, mainly takes the form of more capital investment in buildings and in the pr eve lance of small farms. The increase in value of land alone is relatively small as compared with the increases in value of improvements on the smaller tracts
Later in speaking of variation of price related to size oftract, the authors state:
Small tracts of farm real estate have, on the average, a greater proportion of their value in buildings than the larger tracts. Also, more building value is on the land close to the county seat, or other centers of population, regardless of the size of the tract... . This implies that a large share of site value is associated with the location as a place to live, rather than a place to farm. Because a few acres are entirely adequate as a rural home site, about as much total value for this purpose is attached to a small tract as to a large farm, 3
2 H. R. Moore and R. A, Bailey. Ohio Farm Real Estate Pricer (Wooster, Ohio: Ohio Agricultural Experiment Station, 1931) Research BulletinNo. 711, p. 3*
^ IblA., p. 2 6,

- 49 -
The indicated value of buildings on smaller tracts of land is shown in Table 7* Increasing from an average size tract of 5*3 acres to 39*2 acres, the value of the real estate increased on the average from $7,058 to $7,529» Adding 3^ acres of land to the buildings added only $471 to the value of the average tract in the smaller size range. This is some indication that a nonfarm buyer might consider himself as purchasing a dwelling with varying amounts of land "thrown in" at little added cost. How much part-time farmers do pay for land and what was its previous use will be considered later in this study.
TABLE 7Value Per Farm and Per Acre of Ohio Farm Real
Estate, 1949, by Size of Tract
Size of Tract Average Value Per Farm Average Size Average Value
Per Acre
Under 10 acres $ 7 ,058 5 .3 $1,32710- 29 7,385 1 8 .1 40430- 49 7 ,529 3 9 .2 19150- 69 8 ,667 5 8 .4 14770- 99 11,010 8 3 .0 132
100-139 14,171 1 1 6 .1 122140-179 18,704 157 .4 119180-219 23 ,773 197 .3 120220-259 29,275 2 3 6 .8 123260-499 40 ,381 3 3 1 .1 121500-999 68,118 634 .3 107Over 1,000 201,832 1,526 .2 129
ALL TRACTS $ 14,563 . 105 .7 $ 137
Source: 1950 United States Census of Agriculture. Ohio. Vol. 1,Part 3, Table 5, P» 152.

- 50 -
In speaking of the conqparatively small over all difference ofsale price of bare land compared with sale of land with buildings,Moore and Bailey said;
Small holdings are often purchased by nearby land owners who may bid up prices because additional land can be serviced by existing buildings, increasing the efficiency of the entire farm.^
Part-time farmers have been acquiring land, however, and although the prices being paid may not be above that paid by full-time farmers, the fact that they are buying such tracts is an indication they have some competitive strength.
As indicated above, some of the present part-time farmers had previously operated as full-time farmers on this and other farms. Forty-nine operators had operated as full-time farmers from their present residence, some with only their present unit. These had farmed full-time an average of eight years. They were more likely to be presently operating larger acreages than all part-time farmers, but for various reasons were at present spending only part-time on the farm. About half of the hS cases were located in the Southeastern Ohio area.
Ten cases were those of younger men who farmed full-time (no other occupation) while receiving subsistence payments and attending school under the Veterans* On-The-Farm training program. The average time the operator had farmed full-time under this arrangement was nearly three years. These men still had the goal of farming full-time but had taken nonfarm employment to become better established, li Ibid., p. 20.

- 51 -
Eleven more of the 49 expressed, the Idea of nonfarm employment being a better opportunity as contrasted with their farm income expectations * In some instances it was related to the size of the preseht farm and lack of opportunity to rent additional land.
Two additional cases became part-time farmers tanporarily when disease forced liquidation of the major livestock enterprise.
Seven more cases of the 49 had taken nonfarm employment \dien sons were able to carry on more of the work, or to give the sons the opportunity to farm.
Other reasons given and frequeiwy of occurance were as follows: Health - inability to stand farm work..............5Preference for nonfarm work........................4Estate settlement, debt or too small a unit left...3Farmed full-time during depression era .....3Purchased farm, was tenant here.................,*3Added eacpenses of family. .............. .1
The above Illustrates the number of things that may cause a full-time farm operator to shift to part-time farming.
SummaryFamilies are engaged in part-time farming for a variety of
reasons. They have in general at least one common bond, that is their appreciation for the amenities of rural living. A part-time farm is for some families a step toward full-time farming] for others it is a means of continuing to live in the community of early resi-

- 52 -
deuce and friends while deriving income from other sources. To some operators the farm is the focal point of interest with the other work as a secondary consideration; others view the farm as c(%nplementary to the off-farm job.
As the acreage that can be operated by a farmer with mechanical devices has increased some former farm dwellings became surplus. These may thus be purchased as residences by persons with regular nonfarm work. Because the buildings are of value to the prospective part-time farmer or rural resident he may be able to outbid a farmer planning to add that unit to an existing farm.

cmriER 111 w m T Knm of people: are part-time farmers?
The evident Increasing importance of part-time farmers in our rural economy has raised numerous questions relating to their characteristics* Are they farm or city people? What is their educational level? How long have they been farming part-time? Are they young families or older people?
This section is designed to answer some of these questions, and present information relating to the background and experiences of Ohio part-time farmers.
Place of RearingMost of the present part-time farm operators came from a farm
background*^ They were children of farm people and were familiar with farm life and work before they became part-time farmers* As indicated above, some had been full-time farmers prior to engaging in nonfarm enployment*
Three-fourths of the operators interviewed had been reared on a farm, and most of them had married a farm reared girl* In over half of the cases both the operator and his wife had been reared on a farm.In 85 percent of the cases either the operator or his wife was farm reared* Only 36 cases, or 15 percent, of the 2h2 cases interviewed in the general sample were situations in which neither the operator
^ Information of the respondent indicated part of the childhood and adolescent years were spent on a unit operated as a farm or part- time farm*
- 53 -

- $4 -
nor his vife had a farm background. Some of these had been reared in a rural area although not on a farm.
Some variation is evident when one geographical area of the state is compared with another in regard to background of the part- time farmers.
In the more industrially developed areas of Ohio, the northeastern and southwestern quarters of the state, more of the part-time farmers are former urban residents who have moved into rural areas; and fewer are former full-time farmers who shifted to part-time farming. Ihe location of last residence previous to moving to their present situation was nonfarm for 42.$ percent of the total cases interviewed. In the northeastern and southwestern areas 4?.% percent of the respondents had moved from a nonfarm location compared to 3 6 .5 percent of those located in the northwestern and southeastern areas.
Table 8 indicates the place of rearing of part-time farmers grouped by geographic areas. Eighty percent of the part-time farm operators in northwestern and southeastern Ohio had been reared on a farm, while only about two-thirds of those in northeastern and southwestern Ohio had such a background. Variation in type of background by area was less for the wives than for the men interviewed. About 4o percent of all the wives were nonfarm reared, ranging fr«n 52 percent in the northwestern to 33 percent in the southeastern area.
There appeared to be no significant difference between areas in the proportion of the cases where both the husband and the wife

TA£I£ 8Place of Hearing of Farm Operators and Their Wives,* 242 Part-Time
Farms, Ik Ohio Counties, 1953
Area Operator Wife BothFarm
BothNonfarm
Farm Man Nonfarm .Wife
Nonfarm Man
Farm WifeTotalCasesFarm** Nonfarm*** Farm Nonfarm
Northwest 20 5 12 13 11 4 9 1 25Southwest 36 1? 34 19 27 10 9 7 53Southeast 8o 17 63 31 55 9 22 8 94Northeast 46 21 39 26 31 13 13 8 65
TOTAL 182 60 148 89 124 36 53 24 237PERCENT 75 25 62 38 52 15 23 10 100
* A total of 23? wives, acme operators were unmarried or widowers*** Farm includes part-time farms.*** Nonfarm includes four operators and eleven wives reared in rural areas not on full or part-time farms.
vnvn

- $6 -
were from either a farm or nonfarm home. When the husband and wife were from different backgrounds, usually it was a farm boy who had married a nonfarm girl. This situation accounted for nearly one- fourth of all cases interviewed* In only 2k cases, or 10 percent of the total, was the farm operated by a nonfarm boy who had married a farm girl.
Among the respondents to the mall q^uestionnaire, a smaller proportion had a farm background. As noted above this group of persons appeared to be more interested in rural living than in commercial scsile farming and nearly two-thirds occupied less than three acres when they replied to the questionnaire. Only one-third of the husbands and one-fourth of the wives of this group were reared on farms, Ana in only about 10 percent of the cases did both report farm backgrounds. In over half (53 percent) of the cases in this groiq>, both the husband and the wife were from nonfarm homes.
TABI£ 9Age of 2k2 Part-Time Farm Operators, and Background of
Operator and Wife, l4 Ohio Counties, 1953Age of Operator
Number of Operators
Where Reared (Pet.) Farm Nonfarm
Pet. of Operators With Nonfarm Wife
25-1+0 75 19 21 4841-55 112 76 2k 3256-75 55 71 29 34TOTAL 242 77 23 39

- 57 -
There was some tendency for the younger part-time farm operators to be those with a farm background, but a greater proportion of them had married a nonfarm girl. The average (mean and median) age of operators with a farm reared wife was 48 years, with a nonfarm wife, 46 years.
The part-time farmer with a farm background was more frequently associated with a larger farm and farm business. While 00 percent of the operators of commercial and semi-conmercial part-time farms reported having been reared on a farm, only 63 percent of the operators of subsistence and residential part-time farms reported a farm background. On 65 percent of the larger farms, the wife was farm reared, conq>ared to 5$ percent of the residential and subsistence farms.
More of the part-time farm operators moving toward full-time farming had been farm reared. In the group of 55 operators, selected from the general study, who had made substantial progress toward full-time farming, 47 men or 85 percent of the total had farm backgrounds; 71 percent of the wives were farm reared. Both the operator and wife had been farm reared in 62 percent of the cases. See Table 10.
Among the 62 farm families who had used part-time farming to become established as commercial farmers, 8l percent of the men and 65 percent of the wives reported having been reared on a farm. With this group 34 farms, 55 percent, were cases with both the operator and the wife from a farm background, six were situations in which both were from a nonfarm background.

- 58 -
table: 10Place of Rearing of 55 Part-Time Farmers Achieving Substan
tial Progress Toward Full-Time Farming,* 1953
Farm Area of Ohio
Number of Cases
Place of RearingFarm Bo'Ui Farm Man Nonfarm Man
Man Wife Farm Nonfarm Wife Farm WifeWestern 20 17 15 13 4 2Northeastern 16 12 12 10 2 2Southeastern 19 18 12 11 6 1
TOTAL 55 47 39 34 12 5
* Selected from the general sample of 2k2 cases, l4 Ohio counties.
It would appear that while the experiences associated with farm rearing are not absolutely essential, such experiences are associated with the larger operations and volume of business needed for successful commercial farm operation.
TABLE 11Place of Rearing of Operator and Wife for 62 Farm Families
Who Used Part-Time Farming to Become Established on Commercial Farms, Ohio, 195^
Farm Area of Ohio
Number of Cases
Place of RearingFarm Both Farm Man Nonfarm Man
Man Wife Farm Nonfarm Wife Farm WifeWestern 23 19 16 19 5 2Northeastern 21 l6 12 10 6 2Southeastern 18 15 12 10 5 2
TOTAL 62 50 4o 34 16 6

- ^ 9 -
Age Characteristics of Part-Time FarmersOperators of part-time farms range in age from near 20 to over 70
years of age* In the sample drawn by square mile areas, the age of operator extremes were 25 and 75 years. More than half of the operators were between 39 and 55 years of age, with a median of 47 years.
Table 12 indicates the general age composition of operators of part-time farms. The average age of operators in the sangple is somewhat less than that of all Ohio farmers or of the part-time farmers reported in the 1950 census. That census recorded the average age of all farmers as 4 9 .9 and of the "part-time" group as 49*4 years. This divergence imy in part be accounted for by reference to a breakdown of the census farm classes.
Since the farmers in Class VI were specifically those who worked off the farm less than 100 days and with income to the family from the farm being greater than from nonfarm sources, no representatives of this group could appear in the sample used in this study. These farmers, with relatively low income, from either farm or nonfarm sources, averaged nearly lO years older than all Ohio farmers. Almost half of the sample part-time farms operated on a scale such as to be included in the central classes of the "commercial" farm group of the census classification. Farm operators in these classes of the "corniercial" group have average ages generally younger than
Ithe total farm operator population.There was little difference in age observed between those oper
ators who were reared on a farm compared to those with nonfarm rear-

TABIZ 12Kunber of Part-Time Farmers Occurring in Different Age Groups Classified by lÿpe
of Farm Area of State, and Place of Rearing,1À Ohio Counties, I953
AgeGroup
TotalNimber
Farm Clasis Area of State Place of RearingI 11 111* IV RE SE Stf Pam** Nonfarm***
25-3^ 30 5 3 7 15 7 8 8 7 22 83 -kk 69 12 10 18 29 23 31 9 6 52 17
45-54 77 12 6 21 38 21 31 19 6 59 1855-64 48 5 4 16 23 10 23 12 3 36 1265-75 16 2 1 5 10 6 4 15 3 14 4TOTAL 242 36 24 67 115 67 97 53 25 183 59
S'
* Farm Classes: 1 Residential; II Subsistence; III Semi-Comnercial; IV Commercial#** Includes part-time farm#*** Includes those reared in rural areas, but nonfarm#

- 61 -
ing. All areas covered a vide age range and there appeared to he no more than random variation in the age pattern of the four areas of the state.
TABIE 13Average Age of Operator hy Economic Class of Farm,
Ohio, 19^9
Economic Class Average Age of Operators (Years)
A H Farms 49.9Part-Time 49.4Residential 50.8All Commercial 49.7Class 1 47.2
Class IX 45.6Class III 45.8Class IV 48.8Class V 51.8Class VI 59.0
—
Source: Census of Agriculture. Ohio. 1950» Economic Area Tahle 8,p i 224.
TABIE 14Average Age of Operators of 242 Part-Time Farms by
Area and Place of Rearing, 14 Ohio Counties,1953
No. of Farm Reared Nonfarm Reared All FarmsCases Median Range Mean Median Range Mean Median Mean
Northwest 25 49 26-74 46 33 30-45 36 43 45Southwest 53 47 28-72 47 51 25-68 51 48 48Northeast 67 45 25-68 47 50 30-64 47 45 47Southeast 97 48 27-75 48 49 27-72 48 49 48
TOTAL 242 47 25-75 47 50 25-72 47 47 48

- 62 -
. When the operators were classed by type of part-time farm, there was scane tendency for younger operators to be associated with the subsistence and residential part-time farms*
TABLE 15Average Age of Operators of 242 Part-Time Farms, by Class
of Farm and Area of State, l4 Ohio Counties, 1953
Part-Time Farm Class
No.ofCases
Area AllAreasNorth
westSouthwest
Southeast
Northeast
Residential 36 32 46 52 45 46Subsistence 24 — — 56 45 38 46Semi -Conmer c ial 67 37 50 48 49 48Commercial 115 47 47 48 48 48
TOTAL 242 45 48 48 47 48
The above may be in part a reflection of the difficulty encount er- ed by younger men in obtaining resources to farm on a larger scale. Since most part-time farm operators are owners or part owners, the size of the operating unit is rather closely restricted to the size of the ownership unit. The range of ages exhibited in any acreage class, however, indicates the variation that may occur within a given size group.
The 55 operaix>rs who had made subst^uitial progress toward fulltime farming averaged 42 years of age, and ranged from 25 to 55 years.
The 62 opérateurs who had used part-time farming to become established as commercial farmers averaged 38 years of age, and ranged from

- 63 -
21 to 51 years, (it should, be iu)ted that these latter, tvo groups carried a maximum age restriction to eliminate operateurs planning to farm full-time only after retirement from other work.)
TABIE 16
Average Age of Operator and Wife, 242 Part-Time Farms, by Size of Farm Operated, l4 Ohio Counties, 1953
Size of farm Acres
No.ofCases
Age of Operators Age of WivesMedian Range Mean Median Range Mean
3- 9 4l 49 30-72 49 46 26-65 4610-29 46 48 26-72 49 43 25-72 4430-49 28 47 27-68 47 42 30-63 43
50-69 25 50 30-64 48 45 25-63 4470-99 39 50 25-74 49 47 23-70 46100 or more 63 45 25-75 45 40 23-72 4l
TOTAL 242 47 25-75 48 44 23-72 44
Household CharacteristicsThe size of household of the 242 part-time farm families inter-
2viewed ranged from one to eleven persons. The median size was four persons and mean size was 3*9^ persons per household. Nearly an of the households contained more than one person, there being only two cases of single men living alone. Three other households of single (unmarried, divorced or widowed) men also contained a parent, sister, or other relatives.
Household was defined as all persons living as a unit. This would include related parties not members of the immediate family.

TABIE 17Household Cong)osition of 242 Part-Time Farm Families by Âge of
Operator, 14 Ohio Counties, 1953
Age of Operator
No.ofCases
Single* Operator-
Operators Reporting Number Couple Children at Home
1 2 3 ^ 5-more
Avg.SizeFam-iV
Other Hshld. Members** No. No.
Reptg. Rgkd.
TotalHouseholdMembers
PersonsPerHousehold
25-34 30 1 4 2 7 9 5 2 4 .3 6 9 145 4.835-44 69 3 12 10 13 16 8 7 4.2 14 21 318 4.645-54 77 0 23 16 20 19 5 3 3 .6 10 14 292 3 .8
55-64 48 1 26 10 4 6 1 0 2 .8 5 13 148 3.0
65-75 18 0 12 5 0 0 1 0 2 .8 4 11 56 3 .1
TOTAL 242 5 77 43 44 4l 20 12 3.7 39 68 959 4.0
I
* Single, divorced, or widower.** durent, grandchildren, brother, or other relatives,

TABIE 18Household Con^sitiou of 242 Fart^ime Farm Familles, by Area,
l4 Ohio Counties, I953
Area Ho. of Cases
SingleOperator
CouplesOnly
Operators Reporting Humber of Children at Hcane
Othersin
Household
TotalAvg. Ho. Per Household1 2 3 4 5-more
N. W. 25 0 7 4 7 3 3 1 4 100 4.0S. W. 53 0 23 8 8 9 3 2 17 199 3 .8
N. £. 67 2 19 14 15 10 3 4 19 256 3 .8
S. £. 97 3 28 17 14 19 11 5 28 4o4 4.2TOTAL 242 5 77 ^3 44 4l 20 12 68 959 4.0
&

TABIE 19Household Coniposltioii of 2kZ Part-Time Farm Families, by Class of Farm,
14 Ohio Counties, I953
ClassofFarm
No. of Cases
SingleOperator
CouplesOnly
Operators Reporting Number of Children at Home
Others in
House- . hold
TotalAvg. No. Per Household1 2 3 4 5-more
I 36 0 14 2 11 4 2 3 11 147 4.1XI 24 0 5 3 2 6 3 3 0 110 4.6III 67 3 23 16 8 11 4 2 14 246 3.7
IV 115 2 35 22 23 13 11 4 33 456 4.0TOTAL 242 5 77 43 44 41 20 12 68 959 4.0

TABÎE 20Distribution of Household Members and Sex Ratios* by Class of Farm,
242 Part-Time Farm Families, l4 Ohio Counties, 1953
* Number of males per 100 females.** Adult here inclvdes all household members 20 years of age or older.
Part-Time Farm Class
Less ühan 10 Years
10 to 19 yrs. 20 yrs. or Over Total Sex Ratio of
HouseholdM FM F M F M F Total Adult**I 21 16 15 9 39 47 75 72 104.2 83.6'II 14 16 15 l6 25 24 54 56 96.4 104.1III 21 27 24 18 82 74 127 119 106.7 110.8IV 37 43 54 43 151 128 242 214 113.1 118.0TOTAL 93 102 108 86 297 273 498 461 108.0 108.0SEX RATIO 91.2 125.6 108.8 IO8..O XXX

- 68 -
Seventy-seven households^ 32 percent of the total, were composed of operator and wife only* Some were childless couples, others were couples whose children were grown and no longer at home. Thus, about two-thirds of the households had one or more children at home, with a median number of two, and nine being the largest number rqoorted.
Table 17 indicates the household compositions relative to ageof operator. As might be expected, the larger families occurred inlower age groups since the question referred to number of childrenliving at home. The mean size of the immediate family was 3*7
3persons.*'Thiriy-nine operators reported someone other than immediate
family members residing in the household, usually one other person; a parent, other relative or in-law of the present operator or his wife. A total of 68 additional household memhers were so reported to bring the average size of household to 3*96 persons.
There was no significant difference in size of family or size of household related to area of the state. Families with one, two or three children at home appeared to be fairly evenly distributed over the areas surveyed.
A larger farming operation was not necessarily associated with a larger family or more household members. The number of children per family and total household size was somewhat larger, on the average, for the Class I and II farms (residential and subsistence), lAian for the Class III and IV (semi-commercial and commercial) farms.3 ' " : ■Immediate family includes the operator, wife and their children living in the home.

- 69 -
Half of the operators of Class I and II farms were under 4$ years of age ca#ared to 38 percent of the cqperators of larger part-time farms. Since the proportion of the operators who were reared nonfarm was also higher in the Class I and 11 it might be Inferred that to a larger extent these groups represent urban people with larger families Seeking more living space, lower living costs, etc,, in the rural areas. Over half of the children in these groups were under 10 years of age, compared to 41 percent of the children in the Class III and IV farms,
TABIE 21Household Composition by Class of Farm and Age of Household Members, 242 Part-time Farms, l4 Ohio Counties,
1953
Age Composition of Household
class I & II No, Pet, Dist,
Class III & Iv No, Pet. Dist,
All Classes , No. Pet. Dist.
Children of Operators Family5 0 .8 .65 41,2 44.2Less Than 10 Years 1.07 .75
10-19 Years .87 41.3 .74 46,9 .77 45 .120 or Older .17 7.9 .19 11 ,9 .18 10.7TOTAL 2.11 100.0 1.58 100.0 1.70 100.0Age Total Household MembersLess Than 10 Years 1,12 2 6 .1 .70 18 .2 ,81 20 .310-19 Years ,92 21.4 .76 19 .8 .80 20,220 or Older 2,25 52.5 2.^ _ 62.0 2 .36 59.5TOTAL 4,28 100.0 3.86 100.0 3 .96 100,0
Bo-üi number and proportion of the total household members who were over 20 years of age was slightly larger on the farms where more farming operations were carried on. It might be added also that the sex ratio (number of males per 100 females) was higher on the larger

- 70 -
scale part-time farms. This was particularly true with reference to the ratio of adult (20 years and older) household members; the adult sex ratio was H5*3 for Class III and XV part-time farms compared with $0.1 for Classes 1 and II combined.
The mean number of household members was somewhat larger for the 35 families with substantial progress toward commercial farming^ averaging 4.3 persons compared to 4.0 in the general sangle total. Size of household ranged from two to nine persons.
table 22Household Composition of 35 Part-Time Farm Families Achieving
Substantial Progress Toward Full-Time Farming,* 1953Farm Area
of Ohio
Number of Cases
Household MembersMeanNumber
Range in No
Tot. • Male
ChildrenFemale
OtherMembers*
Western 20 3.8 2-6 22 13 1Northeastern 16 4.2 2-9 15 15 5Southeastern 19- 4.9 2-6 21 31 5TOTAL 55 4.3 2-9 58 59 11
* Selected from general sasple of 242 cases, l4 Ohio counties.** Not members of immediate family, but related to family.
For the 62 cases who had become established on a commercial scale the mean size of household was 4.5 members.
The larger size of household was to be expected for the 33 and 62 farm samples mentioned above since they were younger families with more children at home. For example, the 62 cases above reported a total of 118 children less than 12 years of age.

- 71 -
TABLE 23Household Composition of 62 Farm Families Who Used Part-Time Farming to Become Established on Commercial Farms, Ohio,
1954Farm Area
of Ohio
Number of Cases
Household MembersMeanNunber
Range in No
Tot. • Male
ChildrenFemale
OtherMembers*
Western 23 4.4 2-8 38 18 0Northeastern 21 4.5 2-7 21 30 3Southeastern 18 4 .5 2-7 24 22 0
TOTAL 62 4 .5 2 -8 83 70 3
* Related but not members of the immediate family.
Educational CharacteristicsThe formal educational training of persons engaged in part-time
farming covers a wide range. Among the 235 operators reporting, school attainment ranged from completion of the 5th grade of elementary school to seven years of college. School achievement of the 230 wives reported ranged from 6th grade to college graduates.
Table 24 indicates the levels of school attainment.About one-third of the operators reported schooling did not go
beyond the elementary grades. Of the 158 operators with more than elementary school education, 50 percent graduated from high school,37 percent did not complete high school, and I3 percent had attended college. The mean number of years schooling for all part-time farm operators was 10.3 years; the median was 10 years.

TABIE 24Educational Attainment of 235 Part-Time Farm Operators and Wives, by
Area, l4 Ohio Counties, I953
AreaHighest Level of Attainment, Humber Reporting Elem. Only Hi^ School CollegeDid Grad- Did Grad- Did Grad-not uate not uate not' uatefin, fin, fin.
TotalCases
Average Years of School Completed
NorthwestOperatorWifeSouthwestOperatorWife
10
64
43107
74
159
815
1927
20
15
3321
2525
5353
11,411,2
10,310,9
To
NortheastOperatorWife 31 1614 8
43034
47 32 6462
10,811,2
SoutheastOperatorWifeTOTALOPERATORWIFE
62
167
3126
6150
2817
5834
2240
79116
54 11
1216
97
9390
235230
9.810,5
10,310.9
PERCENT OP TOTALOPERATOR 6,8 26.4 25,1 32,8 5 ,1 3 ,8 100.0WIFE 3 .1 21,7 14,8 50,4 7 .0 3.0 100,0
XXXX

- 73 -
Some variations appeared in level of schooling of operators in different areas of the state* The years of schooling was higher in the northern areas than in southern areas of the state* In the northern areas, the median age of operators is lower and incidence of operators with nonfarm background is somewhat higher.
The wife of the part-time farm operator has had more formal schooling than her husband, on the average; years of school cospleted averaged 10*9 for the wives and 10*3 for the operators. Median yeuars of school completed by the wives was 12 years. Sixty percent of the wives had a high school education or better conpared with only 42 percent of the husbands. One-fourth of the wives reported less than nine years of school conpared with one-third of the husbands.
As might be expected, the older part-time farm operator generally had less formal educational training. Among the operators 33 years of age or older, over half had completed eight grades or less, compared with l4 percent of those under 33 years of age. About one-fifth of the older operators (53 years or older) had at least a high school education compared to over half of those operators who were under 35
years of age.The part-time farm operator who had not been reared on a farm
generally had more formal education than those farm reared. See Table 23*
The farm reared operators averaged 10 years of school compared to 11*3 years for those from a nonfarm background. The years of school* ing was also less for farm reared men than for farm reared women. Only

- 74 -
35 percent of the farm reared operators had reported completing high school or more compared with 63 percent of those nonfarm reared, and 37 percent reported elementary school education or less, compared to 19 percent of those reared in a nonfarm situation* The farm reared girls averaged nearly one more year of school than the farm reared hoys, Fifly-eight percent of the farm reared wives reported completion of high school or more compared to 35 percent of the farm reared husbands. School achievement was about the same for both boys and girls reared nonfarm, averaging 11*3 years.
TABIE 25
Years of School Completed by 235 Part-Time Farm Operators and Their Wives, by Place of Rearing, 14 Ohio Counties, 1953
Years of School
Operators WivesFarm Reared No, Pet*
Nonfarm Reared No* Pet*
Farm Reared No* Pet,
Nonfarm Reared No* Pet*
Less Than 8 15 8*4 1 1,8 4 3 .5 2 2 .3Eight years 52 2 9 .2 10 17 .5 35 24*5 15 1 7 .49 - 1 1 49 2 7 .5 10 1 7 .5 21 14*6 13 1 5 .112 years 50 2 8 ,2 27 47*4 75 5 2 .0 4l 4 7 .813 or more 12 6 .7 9 1 5 .8 8 5 .6 15 17*4TOTAL 178 100,0 57 100*0 144 100*0 86 100*0AVG* YEARS 10*0 XXX 1 1 .3 XXX 10*7 XXX 1 1 .3 XXX
The level of educational achievement was somewhat higher for the residential and comnercial part-time farms (Classes X and IV) than for the subsistence and semi-commercial units (Classes II and III), averaging nearly one more year of school completed*
The average operator in the subgroip of 55 cases with substantial progress toward commercial farming had completed 11 years of schooling*

- 75 -
A U lu this group had cou >leted the eighth grade and some had attended college. The wives of this group averaged completion of 11.5 years of school.
The average years of schooling was 11.5 years for the operators On the Ô2 farms now established In cotanerclal farming. The wife had completed 12.2 years on the average. One operator had less than eighth grade education, 37 had completed high school, eight more had attended college with four of that number having graduated from college.
N114BER OF YEARS AS A BART-TIME FARMERSome Ohio farmers have been for many years dividing their time
between the farm operation and a nonfarm job or occupation. A 72- year old carpenter in southwestern Ohio reported he had been combining farming with his carpenter trade since lg0 3, or was In his 51st year as a part-time farmer. Twenty-two of the 242 cases interviewed had completed only one year or less as a part-time farmer. The median years of operation for all cases was eight years. It would appear that part-time farming had not been practiced so long generally in the western as In the eastern portions of the state. The médian years of operation was five in the northwestern and seven in the southwestern area.
The average (mean) number of years of operation for the 242 part- time farmers interviewed was 11 years. With this measure also, those located In the northwestern area had been part-time farmers for a sOMWhat shorter period of time than in other areas, averaging eight years, while those In the southeastern area averaged over 12 years.

- 76 -
TABI£ 26Average Number of Years of Farming Part-Time R^orted by 242
Farmers, by Area and Class of Part-Time Farm, l4 Ohio Counties, 1953
AreaofState
Mean Years of Class Class I II
Part-TimeClassIII
ClassClassIV
AllClasses
MedianYears
Northwest 2.0 4.0 9.8 8.5 5.0Southwest 7.0 25.7 11.1 7.6 9.8 7.0Northeast 8.3 2.8 12.6 12.3 10.8 8.0Southeast 13.5 10.0 14.2 11.8 12.1 8.0MeanAll Areas 9.3 11.4 12.7 10.5 11.0 XXXMedianAll Areas 7.5 7.0 10.0 7.0 XXX 8.0
The operators of the semi-commercial (Class III) farms had been operating as part-time farmers for a longer period of time on the average than other operators. A disproportionate number of these farms were located in eastern Ohio where part-time farming has been practiced more generally for a longer period of time. Another possible explanation might be with reference to the size of farm. The average size of ownership unit in this class was 49 acres, the operated unit was $0 acres. This middle size farm may thus have become an inefficient size of unit somewhat earlier with the development of mechanized agriculture. About one-fourth of the Class 111 farms were reported to have been operated as a full-time farm by the previous operator, compared to about $4 percent of the farms in Class IV.
Those part-time farmers who had been reared on a farm had generally been part-time farmers for a longer time than those with a nonfarm

- 77 -
backgrotmd.. The average Dumber of years as a part-time farmer for those with a farm background, was about two years more than those nonfarm reared* This difference appeared to hold true both to class of farm and area of state considered*
table 27Average Years Spent as Part-Time Farmer by 2k2 Part-Time Farm
Operators^ by Background, l4 Ohio Counties, 19^3Background
ofOperator
Class of Part-Time Farm Total Area of StateI II III IV Cases NW SW NE SE
Farm 10*0 1 1 .9 13*8 10*6 11*6 9*3 10.2 11*0 1 3 .1
Nonfarm 8*8 6*5 10*0 10*1 9 .5 5 .2 9.6 10*5 9 .4
ALL CASES 9 .3 11.4 1 2 .7 10*5 11*0 8*5 9 .8 10*8 12.1
Most of the part-time farming operations of the 242 cases interviewed had occurred on the present farm* Vhereas the average number of years as a part-time farmer was about eleven years, the average years part-time farming on the present farm was over nine years* Only 52 cases or twenty-one percent of the operators had farmed part-time on another tract* Eighty-five percent of t±ie operators of residential and subsistence (Class I and II) part-time farms had operated on this tract only, conq ared with 76 percent of the operators of commercial and semi-conmercial part-time units*
The 52 opera-tors who had been part-time farmers on other tracts reported an average of nine years in part-time farming before coming to the present farm, on which they had farmed nearly as long* Data

. 78 .
were not available for all cases as to the relative size of tracts now operated compared to the previous unit, or the motivating reason for the move. The available information does indicate a variety of reasons as: moving from tenant to owner status, moving to get larger farm with a goal to obtaining a full-time unit, moving to an area of better nonfarm eaçloyment opportunity, or reducing scope of farming operations because of age, health, etc.
The 55 operators who had made substantial progress toward commercial farming reported they had operated as part-time farmers for nine years on the average. This included both time as operator on the present farm and on others previous to moving to this unit. They had been part-time farmers on the present unit an average of seven years. The range in years for this group is perhaps more meaningful than the average, especially to those persons who anticipate trying this route to full-time farming. The range in total years as a part-time farmer was from two to 33 years*
The operator reporting 33 years had operated both part-time and full-time on this unit. He was a carpenter and the past 15 years ihe time spent at carpenter work had been more to accomodate neighbors than from need of income. His volume of farm business was comparable with that of full-time farmers in his area.
The 62 farmers who used part-time farming to become established had farmed part-time for an average of nearly seven years. Since this sample was composed of younger operators on the average, more had experienced military service during World War II and had used Veterans' bene-

- 79 -
fits to assist in becoming established* Reference will be made to this situation later in connection with accumulation of resources for use in farming*
Years of Residence on Present FarmThe total number of years in residence on the present farm was
somevrtiat higher than the years of part-time farming on the present farm* The respondents reported having lived on the present farm for an average of over 12 years, euad had operated it as a part-time farm for over nine years* Some had purchased for residential purposes originally, then later decided to farm* Some were lifelong residents of the present farm, but years of farming either part-time or fulltime was limited to adult years* Some were former full-time farmers on this tract who now farmed only part-time*
TABIE 28Average Number of Years in Residence on Present Farm by Area of
State and Tÿpe of Farm, 242 Part-Time Farm Operators, l4Ohio Counties, 1953
Area ClassI
ClassII
ClassIII
ClassIV Total
Northwest 2*0 4.7 10*8 9 .4
Southwest 7.0 8*5 15 .2 7.7 9 .7
Northeast ^ 9.6 2.7 11.4 13.7 11.5
Southeast 12*8 8.7 17.3 15 .8 14.8TOTAL 9.7 7.9 14*7 12.4 12 .2

- So -Years of residence on the present farm averaged higher in the
eastern areas of the state* Years of residence was also higher on those part-time farms carrying on more extensive farming operations* More of the operators of these farms prevlonsly had been full-time farmers at the present location* (Some previously had larger operations by renting in additional land, or by keeping more livestock.) Some operators regarded themselves as only temporarily engaging in part-time farming because of misfortune - disease, fire, family medical expenses, etc*, or were using nonfarm income to improve either the living facilities or the income earning capacity of the farm. These operators had farmed full-time for an average of eight years on the present farm, and reported an average of over eleven years as a part-time farmer*
The 55 part-time farmers who had made substantial progress toward commercial farming had lived on the present farm for 10*3 years as an average* Seventeen had farmed full-time while residing at their present location. Two had lived on the farm as a full-time tenant and began to work off the farm after th^ began to purchase the real estate. Eight had farmed full-time while receiving Veterans' on-the-farm training, averaging nearly three years for those who had so operated* The total group had averaged seven years as part-time farmers in their present location, ranging from one to 26 years*
The 62 cases selected as having become established in farming on a commercial scale through part-time farming had lived on the present

- 8 1 -
f a m an average of 4.7 years. As noted above they had fanned part- time for an average of about seven years.
Type of Nonfarm WorkAmong part-time farm operators^ one is likely to find representa
tives of nearly all types of nonfarm employment. The variation in kind of work and in nunber of hours worked at the nonfarm Job covers a wide range of situations. As might be expected, industrial and manufacturing establishments are the most ingortant source of nonfarm employment opportunity for the part-time farm operator. But the occurance of part- time farming is not limited to such Jobs. Industrial employment accounted for Just about half of the nonfarm Jobs reported by the part-time farmers interviewed, varying frcsa about one-third to two-thirds in different areas of the state.
While we generally think of nonfarm Jobs as demanding about 40 to 4$ hours a week of the employee, this is not always true. The amount of time devoted to the nonfarm Job varies with the type of Job as well as with the individual making the combination of farm and nonfarm work.See Table 29. Within most categories^ the range in hours worked was from 1,220 to 2,400 or more hours a year. Within the industrial group, those cases of less than 2,000 hours a year were generally the result of working a full work week for less than a full year rather than less hours per week during a full year. This situation was also common for construction and building trade workers.
The variation in employment of miners was more likely to result from variation in days worked per week throughout the year. Truck

- 82 -TABIE 29
Nonfarm Employment of 242 Part-Time Farm Operators, l4 Ohio Counties,1953
lype of Nonfarm Number Employment Reporting
Avg. No. Days Worked Annually
Range of Hrs. Worked Annually
Industrial Enployment (Tot.) 118 253 1,200-2 ,800Office Work 11 264 1,200-2,200Skilled Work 31 273 1,320-2,400Semi-Skilled 47 252 1,200-2,800Unskilled 29 254 1,200-2,400
Transportation (Tot.) 14 31 247 900-2 ,800Road or RR Construction 255 1,280-2,400and Maintenance
Truck or Bus Operators 17 240 900-2 ,8 0 0
Salesmen and Storekeepers (Tot,.) 25 251 900-2 ,800Salesmen 13 209 900-2,400Storekeepers 12 290 2,400-2,800
Constriction and BuildingTrades (Tot.) 24 23Ô 1,000-2,400Carpenter or Mason 8 192 1,000-2,200Contractor or Builder 5 266 2,000-2,400Electrician 5 270 1,600-2,400Painter or Plasterer 3 233 1,800-2 ,000Plumber or Roofer 3 216 1,200-2,400
Mining and Minerals (Tot.) 13 216 1,040-2,400Coal Miner 6 206 1,440-1,840Oil and Gas 5 194 1,040-2,000Stone or Gravel 2 300 2,000-2,400
Timber and Sawmill (Tot.) 4 208 1,500-2 ,000
Teacher 4 207 l,W0-2,200Home Industry* 9 217 900-2 ,600
Miscellaneous** 14 245 800-2 ,800
TOTAL 242 248 800-2 ,800
* Home auto or farm eqjuipment repair shop, rug maker, hroom maker, cabinent shop, slaughter house, barber, etc.
** Prod, credit field man, A.S.C. office manager, landscape gardener, public official, prison guard, chiropodist, and miscellaneous odd jobs.

- 83 “
ATV=t bus operators might Include variation of each tgrpe. One local milk route driver might work three or four hours a day^ every day in the year, while another might work only occasionally aa a substitute, or work regulary on a five-day a week basis * The time spent off the farm by operators driving the local school bus would vary with the season of the year as well as with the length of the route.
About one-fourth of all the part-time farm operators were self- engplqyed, independent contractors or operated their own business# The hours spent at the nonfarm work were thus more at the discretion of the individual, rather than dependent on the employment policies of an employer# In such a situation, the time spent at the nonfarm work might be more readily adjusted to the work demands of the farm operation#
TABIE 30Source of Employment of 242 Part-Time Farm Operators, by
Area of State, 14- Ohio Counties,1953
Area IndustrialEmployment
SelfEmployed
OtherEmployers
TotalCases
Northwest 9 8 8 25Southwest 32 13 8 53Northeast 42 17 8 67Southeast 35 24 38 97
TOTAL 118 62 62 242EESRCENT 48.8 25.6 2 5 .6 100.0

. 84 -
There appeared to be no slgalflcaut difference in the proportion of operators who were self eioplcyed among the various classes of part- time farms, although there was some tendency for the self employed operator with a larger farm operation to report fewer days of nonfarm work.
Of the 242 cases of part-time farming surveyed, in 28 cases or 11 percent of the total, the wife was also reported working at nonfarm esqployment. After the operator, the wife was next most important as responsible for the nonfarm income of the family unit. The 28 wives worked an average of 236 days at nonfarm work, ranging from 100 to 300 days from case to case.
Two of the wives were self engplc ed at a home shop, one as a storekeeper, the other with a home beauty parlor. The remaining 26 worked for an employer. Manufacturing and industrial firms provided jobs for l4 of the above mentioned wives, nine in the production force and five in the office. Other types of work e%#l(ying the wives were storekeeping and restaurant work, five; teaching school, four; and hospital work, two. The proportion of cases reporting the wife holding outside engployment was slightly higher with smaller fam operations than with the commercial part-time farm group.
The proportion of the total employed in industrial work was about the same for the selected cases with substantial progress toward commercial farming as in the total sangle from the general survey, being 3I percent and 49 percent respectively. The average number of days worked per year for this group averaged about 10 days less

— 85 -
than the toteil sanqple from which th^ were drawn* Five of this group were cases in which the wife as well as the farm operator was eioploy- ed in off-farm work.
Of the 62 farmers considered as established on a commercial scale, about half of them were employed at industrial jobs now or had held such employment before starting to farm full-time* This group of 62 included I8 situations where the operator was currently farming fulltime and 44 situations in which the operator was still working off the farm at the time of the interview* Those still enplqyed r^orted having worked an average of 238 days in the previous year* Those currently farming full-time had worked an average of 208 days during the last year of engployment prior to beginning to farm full-time, Eight of the eighteen had held jobs requiring 240 or more days; the remaining ten had worked less than 200 days during the last year employed at a nonfarm job*
Years of Work at Present Nonfarm JobThe length of time the operator had worked at the present non
farm job varied from less than one year to as high as 4l years* Nearly one-third had worked at the present job less than five years* The median number of years at the present job was ei^t years for all operators; the arithmetic mean was 11*5 years* Table 3I indicates the average number of years at the present job by class of farm area of the state*
There appears to be no significant difference between the various classes of part-time farms with respect to this item* Since more of

- 86 -
the Class IV farms had previously been farmed by the present operators as full-time farms, and some operators were temporarily part-time, the author had expected this group to have shorter tenure at the present job; such does not appear to be the case*
TABIE 31Average Number of Years the Operator Has Worked at Present Nonfarm Job, 242 Part-Time Farm Operators by Area and Class of Part-Time
Farm, l4 Ohio Counties, 1953Area Mean Years at Present Job 'of Class Class Class Class All ClassesState I II III IV Mean MedianNorthwest 4.0 13.3 8.4 8.6 6Southwest 15.4 16.2 15.0 11.4 13.2 11Northeast 12.4 15.0 10.6 12.2 12.0 11Southeast 13.3 9.0 10.8 11.5 11.1 8MeanAll Areas 12.8 11.2 11.7 11.1 11.5 XXMedianAll Areas 9 8 9 8 XX 8
There did, however, appear to be eome difference between areas of the state with regard to length of time at the present job. Those part- time farmers in the northeastern and southwestern areas of the state generally reported longer tenure at the present job. This may be a reflection of the more general availability for a longer time of nonfarm employment opportunities in those areas.
The 28 wives who now also worked at nonfarm employment reported an average tenure of 5*7 years at the job. The range in years for the wives was from less than one year to 18 years, with a median of four years.

- 87 -
Nearly half (48 percent) of the operators reported they had worked at the present job for a longer period of time than they had lived on the present farm. Over 40 percent Indicated tlxb they had held the present job for a longer period of time than they had operated as a part-time farmer. Only about 10 percent of the cases reported equal tenure on the present farm, the present job, and years of operation as a part-time farmer.
The 55 part-time farmers who had made substantial progress toward commercial scale farming bad worked at their present off-farm job for an average of nearly nine years, ranging from less than one to 28 years. The 28 part-time farmers with industrial jobs had been employed at the same job for nearly ten years. In northeastern Ohio the average years at the indoistrial job was nearjy 12 years compared to only about eight in the western areas of the state.
Among the 62 farm operators regarded as now established in commercial scale farming, those still employed in an off-farm job had held that job for an average of five years, ranging from one to 21 years. Those now farming full-time had held their last nonfarm job for an average of five years, ranging from one to 20 years. Those with industrial jobs had held such jobs a little longer, averaging nearly seven years.

SUMMARYThe foregoing presentation has attend ted to provide some insight
into the characteristics of part-time farm families and their mode of operation. Most of the adults involved in a part-time farm situation were farm reared and possessed some knowledge of farm life and work before they became part-time farmers. While such experiences are not absolutely essential to success in farming they did appear to be associated with the larger volume of business needed for successful operation on a commercial scale.
Part-time farm families are typically composed of younger people. The average age of part-time farm operators is less than that of all farm operators. The energy required for carrying on a part-time farm as well as holding another job may in part e qplain the prevalence of younger operators. The goal of trying to use an off-farm job along with a part-time farm is more likely to be associated with youthful ambition. While young people predominate, a considerable number of part-time farmers were considering the farm unit as a supplement to retirement income.
While there was no significant difference in total size of household unit by area of state or class of part-time farm, there was some tendency for the larger part-time farms to be those with a larger' potential labor force of adult males. Conposition of the subsistence and residential units,indicate those classes of part-time farms are more heavily weighted by former nonfarm residents with larger families of young children seeking the benefits of rural living.
- 88 -

- 89 -
The ecLucatloual background, of part-time farmers covers a vide range from less than elementary schooling to post graduate college study. The farm vife had usuaUy completed more formal schooling than her husband, and those operators reared nonfarm had more schooling than the farm reared men.
Published materials intended for use by part-time farmers should be aimed at readers with about a 10th grade school attainment. Those younger operators who had made substantial progress toward or who were established in farming on a commercial scale reported average school achievement somewhat higher than all part-time farmers.
Part-time farmers, as a group, appear to be a stable part of the population with regard to their employment habits as well as length of tenure in a community. The average part-time farmer has been a part-time farmer eight or more years, most of that time being spent on the present farm. Length of tenure in their nonfarm job% about half of which were in industrial employment, averaged about 10 years.

CHAEIER IV
HOW DO mRT-IIMB FARMERS OBTAIN AGRICULTURAL RESOURCES?
What agricultural resources do part-time farmers use? How large are their farms? How do part-time farmers obtain command of agricultural resources? How and from whom do they obtain farm land? How do -üiey obtain farm chattels? This section is designed to provide information relating to the above questions.
The goals and interests of part-time operators and their ability to command agricultural resources are varied. In order to most effectively deal with questions relating to acquisition of resources it appears desirable to have some knowledge of the size of part-time farms. The following will consider two measures of size of part-time farms - total acreage and acres of harvested crop land.
Size of Part-Time FarmsThe 242 part-time farms operated by families included in the
general survey averaged nearly seventy acres in size. That this average covers a wide range of situations is evident in that the range of operated acreage was from two to 48o acres,^
Table 32 indicates the average acreage operated by farmers of the different part-time farm classes in the different areas of the state. The average acreage of crop land is indicated also in this
^ The two-acre units included were part of larger units in situations where the part-time farmer rented out his crop land, except possibly a garden, and fed out his share of the crops to livestock owned and cared for by him along with his family labor force. The 480 acres were operated by two brothers, each with nonfarm employment, as a joint venture.
- 90 -

- 91 -
table since variation in interest and ability of operators, coupled with variation in quality of land place some limitations on the value of total acreage as a measure of the scope of the farm business.
TABIE 32Average Acreage Operated by 2k2 Part-Time Farmers, by Area of
State and Class of Part-Time Farm, l4 Ohio Counties, 1953Mean Acreage in Farm Range Mean
Area ClassI
ClassII
ClassIII
ClassIV
AllClasses
inAcreage
CropAcres
Northwestern 1 3 .5 6.0 9 5 .9 7 8 .8 5-480 6 1 .3
Southwestern 10.1 6.0 2 3 .6 7 4 .7 4 7 .5 2-231 2 6 .2
Northeastern 2 9 .4 2 2 .5 3 3 .8 9 5 .2 58 .5 2-236 20.4Southeastern 2 2 .7 4 5 .2 7 4 .7 130 .4 8 5 .8 3-360 22.6ALL AREAS 2 2 .7 3 4 .9 4 9 .9 102.0 6 9 .2 XX XX
Remge in Acreage 2-185 4-156 5-360 2-480 XX 2-480 XXMean Crop Acres .9 4.1 1 3 .4 4 7 .4 XX XX 2 6 .8
In general the larger part-time farm business was associated with a larger total farm acreage. The residential (Class I) part-time farms were smallest averaging about 23 acres. Size of farm increased on the average to over 100 acres for the commercial (Class IV) part-time farmsi The presence of extreme variation from this average pattern is indicated by the range in sizes of units for any given farm class.
The difference between classes of part-time farms is more clearly demonstrated when they are conpared on the basis of acres devoted to

- 92 -
harvested field crops, rather than total acreage* The field crop acreage harvested (including hay but not pasture) averaged less than one acre for the residential units*^ The harvested crop land per farm increased steadily to 4? acres for the commercial (Class IV) farms* While in over all acreage commercial part-time farms were about five times as large as those in the residential class, th^ were many times larger on the basis of acreage of harvested crops*
If semi-commercial and commercial (Class III and IV) part-time farms are considered together, compared to residential and subsistence (Class I and II) part-time farms, the latter were one-third as large in total acres, but harvested only one-sixteenth as many acres of field crops per farm*
The relationship between different classes of farms was fairly consistent in the different areas of the state; although the ratio of harvested crop land to total acreage was quite a bit higher in the western part of the state, followed in order by the northeastern and southeastern areas*
The 55 part-time farmers, with the goal of full-time farming, selected from the general sample of two hundred and forty-two cases, operated an average of ll6 acres* Their farms were about 65 percent larger than the average of sevenly acres for all part-time farmers*The crop acres harvested by operators in this group averaged about 57 acres, or was more than double the 27 acre average for an those in the general survey*g ■ — — —Gardens were excluded from the harvested crop land consideration*

- 93 -
The 62 part-time farmers, who had used or were using part-time farming to become established on a commercial full-time farming basis operated an average of 157 acres per farm, about two and one-fourth times the acreage of the average part-time farmer. In terms of crop acres this group averaged 86 acres of harvested crops per farm, over three times the average of a U part-time farmers in the general survey, and fifty percent larger than the average of the 55 operators who had made substantial progress toward full-time farming.
As noted above, 18 of the sixty-two were now actually farming full-time, while 44 continued to work some off the farm. Those still working at a job off the farm operated an average of l49 acres, of which 78 was in harvested crops. Those who had given up the nonfarm job operated I83 acres, of which 105 acres were in harvested crops.
TABIE 33Total Acreage, Crop Acreage, and Ratio of Crop to Total Acreage
Operated by Ohio Part-Time Farmers Classified by Progress Toward Full-Time Commercial Farming
Class of Operator
No.Cases
Mean Acreage Total
in Class Crop
Pet. Crop Acres of Total Acres
General Saogple* 242 69 27 37Sub8ang)le** 55 116 57 49"Established"***But Still PTE- 44 149 78 52Former PTF***Now Full-Time 18 183 105 57
* All cases of part-time farmers, 83 square mile area, l4 Ohio counties.
** Subsample of those with substantial progress toward "full-time" farm goal.
*** From the random sample, 4 counties, of these established on — commercial scale.

- 9% -
Total acres, crop acres, and the ratio of crop to total acres Increased throng the samples in the order presented. See Table 33 and Figure 4.
Flgur* ij. Crop Aorss and Total Acres Operated by Present and Former Part-Time Farmers in Ohio.
2U2 Part-Time Farmers
55 Rrogressing to Full-TimeLL Established, Still Part-Time
18 Former Part- Tia», No* Full-
Time
1 E ΠN D CropsOther * I
Source; Table 33
For the total of 62 cases in the "established" in farming group, crop acres made up fifty-five percent of the total acreage operated. The increase in ratio of crop acres to total acreage is largely accounted for by the prevalent practice in renting additional land.
It is a common practice with those part-time farmers trying to attain a full-time farm size of business to try to expand acreage by renting additional fields. Since most such fields are devoted to

- 95 -
crops rather than, pasture the ratio of crops to total acreage is increased when such field renting is practiced.
As noted above, acreage either total or of harvested crops, has limitations as a measure of size of the fanning business, gross sales, or income to the operator. The average of 70 acres total wiih 27 crop acres, indicated for the general part-time farmer group is clearly below the size of unit needed to provide profitable full-time employment to a farm family with typical Ohio farming systems. However, some families operate as full-time farmers with such acreages. The sub- sample of 55, operating ll6 acres with 57 acres of crops, apparently do not feel such a unit without off-farm work will provide the level of income they are willing to accept. This is, however, a size of farm that is larger than the average Ohio farm, and it approaches the average of those classed as "commercial" by the 1950 census,3
The 44 cases classified as established but who are still working off the farm to some degree have a size of farm larger than the average commercial farm in Ohio, but have not yet developed a size of farming business or degree of securiiy to feel able to give up the off-farm job.
In all these classes, while the averages indicate the general position of the operators, there is overlapping between groups in size of farm and farm business. Some operators in the 242 case sample had as large a unit as those in hi^er classed groups but had no intention of relinquishing the nonfarm job until retirement, Some3 The 1950 census reported the average size of all farms in Ohio as
1 0 5 .2 acres, and the average commercial farm as 133,7 acres.

- 96 -
la the subgroup of 55 cases were as well established, as other operators In the second sangle who had already quit nonfarm work* Their size of farm and volume of sales exceeded that of many full-time farmers in the census "commercial" class
Some operators In the group of 44 considered as established but not yet operating as full-time farmers had a larger farm business than those now farming full-time. This was true whether compared on the basis of total acres, crop acres, gross farm sales, or productive man work units provided by the farm* The range of total operated acreage of the 242 part-time farmer cases was from 2 to 480 acres, the 55 farmer subsangple from 19 to 258, üie 44 "established" but still farming part-time from 49 to 3^4, and the I8 now full-time operators from 85 to 400 acres*
Obtaining The Use of Real Estate - TenureMost part-time farmers own land, holding title to all or part of
the land they operate*5 Almost 90 percent of the 242 cases interviewed owned land; as a group they owned over three-fourths of the land involved in their part-time farming operations*
How part-time farmers acquire the use of real estate is shown in Table 34*jj— --------------- ---- ------------------------------------------------------------------ -
It might be noted again that the census "commercial" farm class includes a considerable number of operators who reported either work off the farm of 100 or more days or nonfarm income of the family in excess of gross farm sales*
5 Ownership as used in the context means holding title to the real estate, thou^ not necessarily debt free*

- 97 -
TABIE 34
Real Estate Used by Part-Time Farmers and How Aoqioired, 2k2 Ohio Farmers, l4 Counties, 1953
HumberPart-TimeFarmers
Percent of Total Operators
How Obtain Use of Real Estate
AcreageInvolved
Percent of Total Acreage
165 66 .2 Purchase only 10,057 56 ,426 1 0 .7 Rent only 2,595 14.533 1 3 .6 Inherit 2 ,027 11.4
Purchase 524 2 .9Rent 157 .918 7 .5 Purchase 1 ,203 6 .7Rent 1,282 7.2242 100,0 XXXX 17,845 100.0
Of the total of 5I operators who rented land involving four thousand and thixty-four acres, 21 operators, renting almost half of the rented land, rented either from relatives or on a cash rent basis.
One hundred and fifty-one operators, 62 percent of the total nuio- ber, owned all the land they operated. An additional 40 operators, 17 percent of the total, owned more land than they operated, renting out a part of their land to other farmers. Twenty-five operators,10 percent of the total, were part owners who owned some land but rented in additional acreage so that the operating unit was larger than the amount of land owned. Only 26 cases, or 11 percent of the operators, rented all the land involved in their part-time farm.The average acreage involved in these tenure classes is shown in Table 35*

TABIE 35Average^ Acreage Involved, According to Tenure Class of Operator, by Area and
Class of Farm, 2k2 Part-Time Farms, lU Ohio Counties, 1953
Area orFullTenant
Part-Owner® Full Owner-
Operator* Operator-Lsndlord®Class
No,Avg.
, Acres No,Avg.
1 OwnAcresOp. No.
Avg.Acres No.
Avg.Own
Acrespp.
AREANorthwest 7 81 3 42 202 11 66 4 51 16
Southwest 8 80 k 44 99 33 4l 8 59 18
Northeast k 103 7 71 119 43 53 13 52 30
Southeast 7 140 U 114 151 64 76 15 79 54
FARM CIASS I 3 70 26 18 7 42 20
II k 6o 1 31 41 14 36 5 30 11
III 2 11.8 5 109 328 47 4l 13 62 42IV 17 112 19 78 148 64 99 15 86 45
TOTAL 26 99.8 25 82.2 139.8 151 61.9 4o 63,2 35.2
VO00
& Arithmetic mean.b Full-tenants - rent in all the land they operate.^ Part-owners - own some land and rent in additional acreage.
Full owner-operators - own all th^ land they operate.® Operator - landlord - operate only a part of land th^ own, renting out some to other operators,

- 99 -
Part-owners generally had the largest scale of part-time farm operation, averaging l4o acres. This acreage was made up of an average of Ô2 acres owned and an additional $8 acres rented. The mean acreage of tenants who rented all their land was 100 acres. Crop acres harvested averaged 60 acres for the part-owner groijp and 4$ acres for the full tenants. Full-owners operated an average of 62
acres, while landlord-operators used only ahout 35 acres of their land, and rented out 28 acres.
Tenure status of the operator is in general related to his age. The average age of those who rented in all the land they operated was 35 years. Part-owners, averaged 43 years of age, full-owners were 49 years of age, and landlord-operators averaged 52 years of age. There were naturally exceptions to this general pattern; for example, full tenants ranged in age from 25 to 50 years and full-owners from 27 to 75 years of age.
Host of those renting in land, either as part-owners or full tenants, were concentrated in the commercial part-time farm class. Class IV contained 47 percent of the 242 part-time farm operators hut contained 70 percent of those who rented in land. Â substantial number of these indicated future plans to farm full-time.
The comparatively small number of part-time farm operators with rented land is not entirely due to lack of desire to farm on a larger scale. A number of such operators expressed the desire to rent additional land hut had encountered difficulty in obtaining it. There was some indication of reluctance of land owners to rent to

- 100 -
operators who did not spend full time at farming. This is understandable in areas ere share leases are the predominant form of tenure contract. Nearly half of the part-time farm operators who rented land either paid cash or rented from parties related to them. Other cases included some former full-time tenant farmers who had taken nonfarm employment after moving to the present farm.
Some part-time farmers own more land than th^ want to operate and so rent out land to others to farm. In general the 40 part-time farmers classed as "landlord-operators" were older^ with a mean age of 52 years. Some have previously farmed more and were now decreasing the scope of their farm activities. Age alone, however, will not explain the operations of this group. Age of operator in this grovç) ranged from 32 to 75 years. A disporportionate number of the younger operators in t^is group were from a manfarm background. Some others were operators who, though farm reared, had acquired the farm through inheritaxwe and were primarily interested in it as a place to live. Lack of sufficient equipment at present, lack of time to devote to both crops and livestock, and lack of knowledge of crop production were all expressed as additional reasons why some part-time farmers rent out land.
Some of these " landlord-operators" have more land than th^ want to operate because they bought a unit of land and buildings, primarily for the house and site location, and incidentally the la-ns that was in that unit. In other cases operators have purchased road frontage in order to control the occupancy of land near their country

- 101 -
home* The depth of purchase necessary to acquire the frontage may have resulted in a considerable acreage* In either case, such an owner has only the alternative of farming it personally, or renting it out, since an unused area of land does not normally make a desirable setting for his country home*
Reference was made in Chapter II to former full-time farmers who had shifted to part-time farming* Most of these were in the "commercial” or "semi-commercial" part-time farm classes, and now have a size of unit that might be operated as a full-time farm but for various reasons are presently spending only part-time on the farm* Twenty- four farmers in this group of kÿ formerly full-time farmers now own just -ttie land they operate; seven own more land than they now operate, renting out some land; eleven are part-owners; the remaining seven are tenants* Table 36 indicates the present scope of farming operations and land involved in tenure relationship for the 49 cases*These data indicate that the present farming operation of these average out larger than those of all part-time farmers*
Those renting out land are doing less farming than they formerly did* They may now be renting out crop land and feeding their share of the crops to their own livestock, or continuing to crop some acreage but rent out other crc^ land.
The average size of the ownership unit of the 42 operators who owned real estate was 95 acres* The average size of farm unit for the 24 full owner-operators was 107 acres; the eleven part-owners on the average owned 86 acres and rented in an additional 79 acres

- 102 -
to operate 165 acres; the seven full tenant operators averaged 126
acres* The seven part-time farmers vho owned more land than they currently operated owned an average of 69 acres and rented out 33- acres with the remaining 38 acres frequently devoted to hay and pasture*
TABIE 36
Present Farm Operations of 49 Part-Time Farmers Who Previously Operated as Full-Time Farmers at Present
Location, Ohio, 1953Area and Farm Class
Item m sw HE SE TotalIV III IV III IV II III IV
Number of Cases 6 2 7 2 8 1 2 21 49
Yrs* Full-Time (Mean) 9 22 5 9 9 5 11 5 8Acres Owned (Mean) 92 38 16 74 81 16 38 H 3 82
Acres Rent In (Mean) 87 0 70 20 34 0 7 20 36
Acres Rent Out (Mean) 12 23 0 12 2 0 0 3 5Acres Operated (Mean) 167 15 86 82 113 16 45 130 113
Among the 55 part-time farmers who had made substantial progress toward full-time farming, about two-thirds owned all of the land (operated, and only five operators rented all of their farm* The total group owned nearly three-fourths of the total acreage operated* The distribution of the 55 operators and acnreage involved by farming areas is shown in Table 37*
Of the 62 farm operators classed as “established" in commercial scale farming, only six were tenants. The other 56 were divided even

- K)3 -
ly between those who owned all the land they operated, and part-owners who rented additional land. The 62 operators held title to ahout two- thirds of all the land they operated, varying from less than half in western Ohio to nearly nine-tenths of that operated in the southeastern area.
TABIE 37Average Acreage Operated by 55 Ohio Part-Time Farmers Achiev
ing Substantial Progress Toward Full-Time Farming, by Tenure Class, and Area, 1953*
Area FuHOwner
NumberPartOwner
FullTenant
Avg. Acreage Owned Rented
Total CropAcres
Western 10 5 5 5 2 .9 6 0 .8 113 .7 8 5 .3
Northeastern 13 3 - 9 0 .8 14.5 10 3 .1 41.3Southeastern 14 5 - 114.0 1 6 .4 129.3 40.2
TOTAL 37 13 5 8 5 .1 32 .0 116.0 5 6 .9
* Selected from the general saiqple of 242 part-time farmers in 14 _ Ohio counties.
Renting of additional land, was more prevalent and involved larger acreages among the former part-time farmers who had given up their off-farm job. The distribution of cases and average acreage involved is shown in Table 3 6. Those who had gone to full-time faurming had acquired a larger operating unit largely through renting additional land. In the eastern areas the owned acreage averaged out almost exactly the same for the full-time and still part-time operators in this group. See Figure 5 .

- 104 -
TABIE 38
Average Acreage Operated By 62 Ohio Fanners, Now Established Throu^ Part-Time Farming by Tenure Class, Farming Area,
and Operating Class, 1954
Type of Farm AreaNumber £5
Tenure Class Mean Acreage Operatedand Operating Class Full.
OwnerPartOwner Tenant Owned Rented Total
Western Area Still Work Off-Farm Now Full-Time
81 91
13*
6749
57221144270
Total 9 10 4^ 79 92 171
Northeastern AreaStill Work Off-Farm 6 7 0 i n 30 I4lNow Fuliyrime 3 5 0 1D9 32 l4lTotal 9 12 0 n o 31 141Southeastern AreaStill Work Off-Farm 7 5 1 139 14 153Now Full-Time 3 1 1 137 28 164Total 10 6 2 138 18 156
All AreasStill Work Off-Farm 21 21 2 113 36 149Now Full-Time 7 . ■ 7 4 100 83 183Total 26 2Ü 6 107 50 157
* One operator who was tenant on farm where Interviewed had just completed arrangements to purchase another farm*
ÎBae Inability to rent In land for part-time farm operations could limit the use of part-time farming as a method of getting established as a full-time farmer* It means that the beginning operator, to use this route, must In most cases start by buying a farm*
Theoretically, It Is generally considered that the rate of return on money Invested In operating capital Is greater than on money Invested In land* If this assunptlon Is true, then the beginning operator with limited Initial capital would be at acone disadvantage

- 105 -
if as a part-time farmer he must begin by investing money in real estate. His ability to accumulate capital out of earnings from his farming operation would be decreased if his money were invested in land*
Figure 5 • Acreage Owned and Total Operated by Present and Former Part-Time Farmers in Ohio,
21*2 Part-Time I'armers
55 Progressing to Full-Time
Established, Still Part-Time
18 Former Part- Time, Now Full-
Time
Acres
I£OBHD OwnedRented I I
Source * T?b!
However, in a period of inflation, the money value of an individual's assets could be expected to Increase more rapidly if his investments were of a kind subject to a high degree of appreciation in value. The fact that the part-time farmers interviewed were thus tacitly forced to buy land has enabled them to ride vp on the increasing side of a land price cycle. On the average, th^ began purchase of their farms about ten years ago.

- 106 -
Obtaining Title to Land - InlerltanceIn the preceding section it was demonstrated that most part-time
farmers own «-i i or part of the land they operate « To what extent is Inheritance of importance in the acquisition of land for part-time farming?
In the general saoq>le of 242 part-time farmers, 2l6 of the operators owned land, most of which had been acquired through purchase. Thirty-three operators, about l4 percent of the toteü. part- time operators interviewed, and 15 percent of those owning some land, indicated some inheritance of farm real estate. The amount of land indicated as being acquired through inheritance was 2,027 acres, or about 15 percent of the total acreage owned by the total group of part-time farmers. Some of the 33 had acquired 524 additional acres of land through purchase to bring the total owned by the 33 to 2,551
acres or an average of 77 acres. The average acreage inherited was 6l, ranging from 7 to I96 acres. Estimated value of the land inherited ranged from $500 to over $15,000. Some of those inheriting farm real estate lived in the house, rented out most of the crop land; others farmed just the inherited unit, while still others rented or purchased additional land to farm.
Among those operators who both inherited and purchased land, a conmion pattern was one in which the present operator had inherited part of the farm and had purchased the remainder of the unit from the other heirs. This was particularly true of the larger tracts more frequently found in the semi-commercial and commercial part

- 107 -
time farm classes* In some instances the present operator had title to the real estate, subject to a life estate of the surviving parent.
If a part-time farmer received a cash inheritance or urban property which was later sold or traded for the rural real estate the value of such inheritance would not have been revealed by the questions used in the general study. While inheritance may have been of great value to the recipient, it appears to play only a minor role in the way part-time farmers acquire the land they use.
Seven of the 55 operators regarded as having made substantial progress toward full-time farming reported some direct inheritance of farm real estate. The average size of unit inherited was 86 acres. Inheritance figured in the acquisition of some 600 acres, or only about 13 percent of the total owned acreage in this group of part-time farmers.
This does not preclude the possibility of that some funds received through inheritance or gift assisted in the purchase of -Utie real estate in other cases. Of the 45 families purchasing land only 35 had used mortgage financing.
Of the 62 families regarded as "estiablished" on a commercial scale, only 2 of the 56 owning land had received it through gift or inheritance. The remaining 54 had purchased land, and 52 used mortgage financing. With this group of 62 cases, specific questions were asked relating to inheritance and gifts. Twenty-two respondents had received some assistance of this type, averaging about $4,270 for the recipients. This would amount to only about $1,500 if averaged over the entire group of 62 operators.

- 108 -
Four of the l8 now farming full-time had received gifts or inheritance averaging $4,8$0^ ranging frtm $900 to $10,000. The average date of receipt of the inheritance was 14 years before the interview. This amount of inheritance would average out to less than $1,100 for the entire group of l8 now farming full-time.
Obtaining Title to Land - PurchaseMost part-time farmers own farm real estate, sued most of those
who own acquired their interest in the property by purchase. How much did they pay, and how did they finance the purchase? In some cases this information was given by the respondent. In other cases, and also to serve aa a check on the information stated by the respondent, the price was estimated by the revenue stands affixed to deeds of transfer of record in the county recorder's office.
The cost of acquisition of real estate varies widely from case to case; influenced by size of tract, existence of buildings and condition of the improvements, location with respect to urban areas, agricultural production potential, and time of purchase relative to the general level of prices.
Shown in Table 39 are average prices paid for real estate in part-time farms at the time the property was purchased by the present owners. The figures pertain to I90 tracts of real estate purchased by 180 part-time farmers. Since some operators had acquired their farm in two or more tracts at different times, the number of tracts exceeds the number of operators purchasing the tracts.

TABI£ 39Price Paid* at Time of Acquisition of Real Estate by l80 Ohio Part-Time Farmers
Purchasing I90 Tracts of Real Estate From Unrelated Persons, by Size of Tract, l4 Counties, 1953
Size of Tract (Acres) Years Owned Price Per Tract Price Per AcreRange Average Range Average Range Average Range Average
3- 9 6.2 1-38 11 $1,000-9,000 $3,338 $200-1,700 $54010-29 17.6 1-36 8 500-11,000 6,030 50-1,100 34230-49 38.5 1-19 . 8 1,500-17,000 5,239 4o- 360 13650-79 60.3 l-40 11 1,500-26,000 7,287 30- 370 12180 and over 116.9 1-28 10 500-34,000 8,844 6- 300 75
ALL ORACTS 57.7 l-40 10 $ 500-34,000 $6,572 $ 6-1,700 $114
iI
* Price paid as evidenced by cancelled revenue stamps on deeds of transfer*

- 110 -
The extremes of variation in acquisition cost of real estate were from $$00 to $3^,000 per tract, and from $6 .00 to $1,700 per acre. The state of improvements on the land at time of purchase varied and could not he determined precisely. Some were tracts of unimproved land being added to an existing unit. Other tracts were unimproved at time of purchase and subsequent ingirovements were added by the present operator. Quality of the inçrovements, as well as quality differences in the land, contribute to wide variation in prices within a given area. Changes in price level may also cause marked differences in the price paid for real estate in the same area in different years.
The effect of value of buildings on the total price of the tract is demonstrated in the price per acre paid by size of tract. The small tracts averaged about six acres and cost an average of $$40 per acre. This average declined steadily to only $75 per acre for tracts of 80 acres and over.
Indications of this are also to be found in the average price paid for the real estate by class of part-time farms. Whereas, the average cost of the average tract of $8 acres was $ll4 per acre, the average tract used for residential and subsistence part-time farm was 24 acres that cost $162 per acre, and those tracts in semi-commercial and commercial part-time farms averaging 69 acres per tract cost only $108 per acre.
Further indications of this relationship are evident from an examination of tax assessment valuations on real estate in part-time

- Ill -
farms* The average valuation of land and ‘buildings for tax purposes was $4 ,7 3 4 per farm, made up 52 percent of value of land and 48 percent value of ‘buildings* The proportion of tax valuation ‘base on land and on buildings is shown for the 233 part-time farms for which valuation was available, by size of tract*
TABLE 40Real Estate Valuation for Tax Purposes of 233 Part-Time
Farms, by Size of Tract, l4 Ohio Counties, 1953
Acres in Tract
MeanAcreage
Mean Appraised Value Land Buildings Total
Building Value as Pet. of Total
3- 9 6 $ 482 $1,753 $2,235 78
10-29 19 1 ,0 2 9 2,018 3,047 6630-49 39 1,640 2 ,5 4 9 4 ,1 8 9 61
50-69 58 2 ,0 7 3 2,466 4,539 54
70-99 85 3 ,5 7 2 2 ,134 5 ,706 37100-139 116. 3 ,334 2 ,7 8 0 6,114 46l4o and over 202 5 ,018 2,243 7 ,2 6 1 31
TOTAL 74 $2,462 $2 ,272 $4 ,7 3 4 48
Wide variation existed in prices paid for similar sized tracts and similar buildings relative to time of purchase. Part-time farmers purchasing real estate during the period 1949-53 paid an average of 117 percent more per acre than those who purchased in 1933-3 8 .
From the period 1933-38 to 1949-53 the index of a U Ohio farm real estate prices increased 200 percent*

TABIE 41Price Paid* at Time of Acquisition of Real Estate by l80 Part-Time Farmers Purchasing
190 Tracts of Real Estate From Unrelated Persons, by Geographic Areas,l4 Ohio Counties, 1953
AreaAverage Size
of TractAcreage**PerFarm
Average Price Per Tract Average Price Per Farm
Average Price Per Acre3-9 Acres Over 80 Acres All Sizes
Northwest 53 66 $5,200 $13,617 $7,998 $9,879 $150Southwest 48 ^9 3,242 I8,4l6 8,760 8,985 184
Northeast 53 56 3,682 7,992 6,075 6,184 116Southeast 67 68 2,808 6,502 5,335 5,648 78
TOTAL 58 61 $3,338 $ 8,844 $6,572 $6,937 $n4
* Price paid as evidenced by cancelled revenue stamps on deeds of transfer.** Some farms contained more than one tract of land purchased at different times.

- 113 -
Table 4l indicates the average cost of the real estate purchased by part-time farmers in the different areas of the state. There was virtually no difference in the average nuinber of years elapsed since date of purchase in the different areas.
Part-time farmers must pay more for land in the better agricultural areas than in areas ^ere land has lower agricultural value. Prices paid were quite a bit higher in western Ohio than in the northeastern or southeastern areas. This was more pronounced in the case of the larger tracts than in the case of the smaller ones. In order to obtain the use of land for part-time farming the part-time farmer must be prepared to bid in competition with full-time farmers seeking additional land. Part-time farmers are not always successful in obtaining small parcels of land because the neighboring farmer may be willing to pay a higher price for such tracts because of the effect the addition will have on his total operation.
Two-thirds of the 180 part-time farmers purchasing real estate from unrelated parties, used credit in obtaining the land.^ These 122 operators used credit in varying amounts, from numerous sources and on various terms. Some had used land purchase contracts which later were completed with money from other sources, or exchanged for deed and mortgage from the seller. In some of the smaller part-time farms the btyer apparently obtained the land without the use of credit and then borrowed to make inqorovements later.7 Use of credit as evidenced by records in county recorder's office.
Credit may have been used in other cases where the instruments were not recorded.

- 114 -
On the average, those operators using credit at time of acquisition of the real estate borrowed about 60 percent of the purchase price * The range of borrowing was from onjy $300 to $18,000 on purchase prices of $1,500 and $27,000 respectively. The range in percent borrowed was from 15 percent of a $4,000 purchase to 100 percé nt on a farm purchased for $10,000. The average loan obtained was for $4,400 on farms having an average purchase price of $7,300.
Purchase price of the real estate, both on a per tract and per acre basis, averaged somewhat higher in the cases using credit to finance purchase. The average price paid by those using credit to purchase was $120 per acre compared to the average of all purchases of $ll4. There was no appreciable difference in extent of financing by areas, or by class of part-time farm purchased.
Individuals, banks, savings and loan companies, and building and loan companies, in that order, were the most frequently used sources of credit. Those four sources accounted for over 85 percent of the recorded real estate loans made to part-time farmers. In numerous cases of loans from individuals the,creditor was also the grantor of the deed to the property.
Other sources of credit were the Federal Land Bank, life insurance ccmçanies, churches, and the United States Government. The latter was involved in Vetereins' Administration and Bankhead-Jones Tenant Purchase Loans.
Forty-five of the 55 part-time farmers making substantial progress toward full-time farming had purchased land. As noted above.

- 115 -
five in this group were tenants, and seven had inherited some land. Data pertaining to the purchase of the land hy the 45 operators who acquired title throu^ purchase is shown in Table 42. The farms purchased by operators in this group averaged larger than those of all part-time farmers. The average cost per farm averaged higher but since, they were larger farms the cost per acre averaged less than the average cost of all part-time farms in the area. The number of years elapsed since purchase of the real estate averaging nearly 10 years, was not significantly different for this group and the larger group from which they were drawn.
TABLE 42Real Estate Acquisition by Purchase, Mean Acreage Purchased, Cost
and. Mean Size of Mortgage for Those Using Recorded Mortgage,45 Ohio Part-Time Farmers* Classified by Area of State,
1953
AreaNumberPurchaS'ing
Avg.- Acre
ageAvg. Cost Per Per Farm Acre
YearsSincePurchase
Mortgage** No. Avg;''
Western 13 6 3 .2 $9,604 $143 9 .0 12 $7,712
Northeastern 14 85 .8 7,124 83 H.9 12 4,742Southeastern 18 111.4 6,647 60 7 .2 11 4,323
TOTAL 45 9 1 .6 $7,650 $ 84 9 .6 35 $5,629
* Operators achieving substantial progress toward goal of farming full-time, selected from general sample of 242 cases in l4 Ohio counties•
** Mortgages recorded in connection with purchase of the real estate. -- Number using and original amounts recorded.

- u 6 -
Over three-fourths of those purchasing real estate in this group used, credit, and the average loan was about 25 percent larger, than that of all part-time farmers using cred.it to purchase land.* The sources of cred.it were essentially the same for this group as for the larger group discussed above* Some analysis was made of repayment terms of loans for this group*
In some cases details regarding terms of repayment are not included in the recorded documents* Rates of interest charged, where indicated, ranged from three to seven percent* Length of contract was from one year to 34 l/2 years* Most contracts provided for amortization payments or permitted principa 1 payments at interest due dates* The amortized loans mi^t call for annual, semi-annual, monthly, or even weekly payments*
In nearly half of the cases providing for amortization, the repayment schedule called for monthly or weekly payments* This type of repayment plan is clearly more applicable to earnings from nonfarm sources than to payments to be made from farm production* To the extent such contracts are used they may tend to prevent a part-time farmer giving up a job with regular payments for the more uncertain and irregular income from the farm* The type of farming with receipt patterns more nearly in line with such loan terms would be dairy or poultry enterprises.
Bart-time farmers have used different methods in acquiring sufficient real estate to operate as a full-time farm* As noted above, scmse are tenants, some are part-owners who own some land «.na rent additional acreage, while others are fuU-owners* Some of those who own

- 117 -
land made only one purchase transaction in acquiring the farm. Others began with one purchase, and at later dates purchased adjoining or nearby land to operate with the original unit. Still others have found it necessary to move frcaa one farm to another in the process of accumulation of a full-time size of farm.
It was noted in Chapter III that numerous operators had reported farming part-time for a longer period than they had occupied their present farm. Among the 62 operators regarded as being established in farming the average years on the present farm was a little over four, and years as a part-time averaged nearly seven years.
In this group of 62 operators, 1Ô had been tenants on a farm previous to the present operation. Fourteen had carried on farming operations, either part-time or full-time on the present tract only. Twenty-eight operators had owned real estate previous to purchase of the present farm. Thirteen of the previous owners of real estate had owned farm property other than that they now used, the other fifteen farmers had owned urban real estate which they sold when they purchased the farm. Some had made more than one removal from owned property before acquisition of the present property.
Six operators had acquired the real estate owned at present in two separate tracts at different times. These transactions were six years apart in space of time on the average, but ranged from two to 13 years. Table 43 below indicates the purchase acquisition of real estate by this group.
There was little difference in the size of owned acreage for the 18 now farming full-time, congared to the 44 still farming part-time.

- Xlâ “
Those now full-time did pay sli^tly higher prices for their farm. If prices paid for real estate is a good index of land value then there is some indication that those now full-time farming had purchased better land. Whereas there was no difference in the number of years elapsed since purchase, averaging 5»? years, the 15 fulltime operators who had purchased land paid an average of $97 per acre, conçared to $87 for the 4l operators still part-time who had purchased land.
TAEIE 43Real Estate Acquisition by Purchase, Mean Acreage Purchased,Cost and Mean Size of Mortgages Given, 54 Part-Time Farm
ers Classified by Area of State, 1954
AreaNumberPurchasing..
Avg.Acreage
Avg. Cost Per Per Farm Acre
ŸëarsSincePurchase
Original Mortgage
No. Avg. AmtWestern 17 106.2 $12,660 $119 5.5 17 $9,724Northeastern 21 110.2 10,919 99 4 .9 20 7,578
Southeastern 16 149.6 8,138 54 6 .7 15 5,667
TOTAL 54 120.7 $10,643 $ 88 5 .7 52 $7,728
There was no appreciable difference in the extent of financing between those now part-time farming and those who had gone to fulltime. The sources of credit were also about the same for both groups.
In this group of 62 cases six operators who were veterans had used the G.I. insured loan provisions in obtaining farm real estate.

- 119 -
Six other operators had received credit assistance throiigh the Farmers Home Administration*
Previous Use of Land Now in Part-Time FarmsHow was the land used before the part-time farmers obtained con
trol of it? This is a common question in relation to part-time farming. In Chapter II it was suggested that prospective buyers in search of housing might consider purchase of a farm witi a dwelling as an alternative to buying a house in town. It was also noted that under some conditions the entire farm unit might be purchased by someone primarily seeking a dwelling, while in other cases the dwellings with a small tract of land might be sold or rented to one party, while most of the acreage was used by another party.
During the interviews of the general sample of 242 part-time farmers, in connection with inquiry of how the present operator obtained the use of farm real estate, a question was asked regarding the operation of the land by the previous user. Had the land been used by another part-time farmer or by someone who farmed full-time? Was it only a part of what had been a full-time farm? In 220 cases the respondent had knowledge of its previous use. That so large a proportion of the respondents possessed such knowledge is not surprising in li^t of the fact, as was noted above, about 90 percent of the present operators owned all or part of the land operated.
The following presentation has the limitation of not being related to each tract in cases where the operator had obtained the use of more than one tract of land through either purchase or lease. In some

- 120 -
cases a part-time farmer as owner of a farm, may rent out crop land to a full-time farmer. The following discussion of acreage is in terms of total acreage operated hy the part-time farmer whether obtained throu^ purchase, or lease, carries the implicit as sumption that the entire unit follows the pattern of the tract containing the residence.
Among the 2h2 part-time farmers interviewed, in 92 instances or 38 percent of the cases and involving about 2J percent of the land in part-time farms, the previous operator was also a part-time farmer.In 35 percent of the cases and involving 58 percent of the land, the previous operator had farmed the unit full-time. In I8 percent of the cases with about 10 percent of the land involved, the present unit had been only part of a former full-time farm. The remaining situations and acreages either could not be classified because of lack of information or had been idle or unused land.
TABIE 44Previous Use of Farm and Acreage Included in 242 Part-Time Farms, Classified by Status of Previous Operator* and Area of State,
14 Ohio Counties, 1953
AreaFarm of Part-Time Farmer
Farm of Full-Time Farmer
Part of Farm of Full-Time
FarmerOther** Total
No. Acres Wo. Acres No,. Acres No. Acres JIp. AcresN. W. S. W. N. E.5 . E .
4122848
146536
1 ,0802 ,7 9 1
9142437
8311 ,3252,5044,945
918107
818376155329
3955
175279189 .257
25536797
1 ,9702 ,5163 ,9 2 88 ,322
TOTAL 92 4,553 84 9 ,605 44 1 ,6 7 8 22 900 242 1^,736
PCT. OFTOTAL
* Aft i nfl i38 27
1 fv fim 1mi35 58 18 10 9 5 100 100
** Idle land, had been rented by variously classed operators, or lack of information.

- 121 -
Table hk above provides some support for the contention that part- time farming is longer established and more prevalent in the eastern areas of Ohio, and that more recently in western Ohio land of former full-time farmers is going to part-time operators*
In the western Cftiio areas only l6 operators, being about one- fifth of the total number, reported the land in their farm was operated as a part-time farm by the previous operator. These operators farmed an average of 36 acres, and their land made up only about fifteen percent of the land incorporated in the saople part-time farms from that area* In the eastern Ohio areas, 46 percent of the sample farms, with 32 percent of the land in part-time farms, reported the previous operator was a part-time farmer.
Fifty western Ohio part-time faurmers, representing 64 percent of the total sample for the area, and using 75 percent of the land in part-time farms, reported the land was all or part of a unit operated previously by a full-time operator. In the eastern Ohio areas sli^t- ly less than half of the operators, using about 65 percent of the land involved in part-time farming rported it was previously used by a full-time farmer.
One might reasonably expect a part-time farmer who bought a unit previously operated as a full-time farm to farm on a larger scale than other part-time farmers. In 54 percent of the total cases of commercial (Class IV) part-time farms, involving 6l percent of the land in Class IV farms, the unit had previously been the farm of a full-time farmer. In 65 percent of the cases involving 72 percent of the land in Class IV farms, the land was all or part of a previously full-time farm.

- 122 -
la western Ohio areas, 2? cases, over one-third of the total part-time farms surveyed, had obtained only part of a previously full-time farm. In the eastern Ohio areas, only 17, or about 10 percent of the part-time farmers, had obtained a part of a previously full-time farm.
Among the 55 part-time farmers selected from the above grotgp who had made substantial progress toward the goal of commercial farming, 29 or over half had obtained what was previously used as a fulltime farm. Sixteen of this group had obtained land farmed by the previous farmer as a part-time farm, and seven had obtained part of what was a full-time farm to the previous operator.
In the sangle of the 62 operators who had used part-time farming to become established on a commercial scale, no information was obtained relative to the previous use of the real estate.
There is sufficient movement of people and land both ways between part-time and full-time farming to prevent a concise statement regarding the source of land for part-time farms. However, the foregoing data do suggest a net movement of people and land from fulltime farming to only part-time operation.
Obtaining Chattel Property - Machinery and EquipmentFarm power and equipment to do field work is a problem to the
part-time farmer. With less time to spend on farming tasks, because of the off-farm work, part-time farmers need equipment to enable them to work effectively when they do spend time on the farm. This usual-

- 123 -
ly pipana large machines. Conversely^ most part-time farmers do not operate sufficient acreage to economically JustliV ownership of such machines.
Contrary to populsr belief, part-time farmers do not generally own an excessive amount of equipment nor have a large amount of capital invested in it. They have used numerous methods to avoid high equipment investment relative to the size of their farm business. Some part-time farmers do not own any heai/y machinery. These operators depend on custom operators to perform work on their farms for pay, or they rent out the crop land, feeding their share of the crops to their own livestock. Some part-time farmers still do the field work with horses, though this is not so common a practice. Most part-time farmers own some equipment and exchange witii others or depend on custom operators with machinery to do the work requiring more specialized equipment. Some part-time farmers purchase their minimum needs of new equipment \diile others may purchase more items in the form of used equipment. Some operators obtain equipment in joint ownership.
In the general survey of part-time farmers, questions were asked relating to ownership of farm equipment, size and age of such equipment, whether obtained as new or used, and an estimate of value of equipment owned. Table 4$ indicates how operators obtained the majnr items of equipment owned.
Only 73 percent of the operators owned a tractor, the most frequently owned item. Twelve operators reported owning one or more horses, and had a total ownership of 33 head. Tdking into consideration

— 124 —
the entire line of equipment owned. Just about half had been acquired new and heuLf used. Frequently a tractor "outfit” would be purchased as a unit including the tractor, plows, and cultivators. Some part- time farmers were using some converted horse drawn equipment with tractor power. Disc and other harrows, manure and lime spreaders, and mowing machines were frequently so converted.
TABLE 45
Number of Specified* Items of Farm Machinery and Equipment Owned, Average Age, and Whether New or Used When Acquired by
242 Part-Time Farmers, l4 Ohio Counties, 1953Ma.chinery or Equip. Item Owned
Average* * Age -
Number Acquired New Used
TotalOwned
Tractor*** 7 100 76 176Plows -- 6 87 77 164Cultivators 6 85 65 150Disc 7 74 60 134Mower 9 55 56 111Grain Drill 10 39 56 95Corn Planter H 35 43 78Manure Spreader 9 33 45 78Hay Rake 10 24 46 70Combine 7 13 13 26Corn Picker 7 11 10 21Hay Baler 4 10 3 13,
* Other items not listed included trailers and wagons, cultipackers, rotary hoe, spring tooth harrows, hay loaders, lime spreaders, ensilage cutters, grain binders, weed sprayers, threshing machine, feed grinders, etc.
** Mean age at time of interview, both new and used.*** Excludes garden tractors.
The mean amount invested (current value) in farm machinery and equipment by part-time farmers was about $1 ,800 for those owning, or

- 125 -
$1,450 if averaged over the entire group of 242 operators. The amount invested by most part-time farmers in equipment is not excessive. The average of about $49 indicated investment per crop acre is in a comparable range with the reported investment per acre of Ohio farm account
Qrecord keepers.The average per crop acre was lowest in the western Ohio areas,
averaging only about $30 per crop acre, compared to about $55 in the southeastern, and $72 in the northeastern area.
TABLE 46Investment in Machinery and Equipment, 242 Part-Time Farmers,
by Class of Part-Time Farm, l4 OhioCounties, 1953
FarmClass
Mean InvestmentRange Per Farm
in ClassPer Farm Owning
Per Crop Acre
I $ 0-2,000 $ 299 $ 599 $283.55
II 50-1 ,800 308 389 75.20III 150-3,900 963 1,324 5 7 .0 1
IV 150-6 ,200 2 ,3 3 1 2,460 4 5 .5 9
TOTAL $ 0-8,200 $1 ,4 5 1 $1,800 $ 48.73
Within all areas and types of part-time farms some extreme cases would depart widely from the arithmetic mean. Individual, cases ranged8 Type of Farm Business Analysis Reports 1953 - Sunmary Analysis of Ohio Farm Account Records prepared by Department of Agricultural Economics and Rural Sociology, The Ohio State IMlversity.

— 126 —
from no equipment to in excess of $8,000 in the general sample#Among the 55 cases making substantial progress toward full-time
farming the patterns of acquisition of equipment were the same as those described above. Generally, amounts of equipment owned were larger as was size of farm operated. The average operator in this group owned nearly $2,800 worth of equipment, with an average of nearly $4$ per crop acre harvested.
Among the 62 part-time farmers now regarded as established on a commercial scale, the current value of machinery averaged slightly over $5,000 per farm. Investment in machinery and equipment per farm was much higher for the l8 operators who had already shifted to full-time farming than for the forty-four still operating part- time. This was true both on a farm and on a per crop acre basis.It also averaged consistently higher in each area for the full-time over the still part-time operator. See Table 4?. The author had expected the reverse to be true of investment per crop acre, since the full-time operators were renting a considerably higher acreage of additional land. However, it appears that those still part-time have been concentrating more on reducing Indebtedness and mak-ing improvements on the real estate, rather than in investment in equipment. The range in investment in equipment per farm was from $2,500 to $7^500 in the southeastern area, $2,500 to $11,000 in the northeastern, and $7>000 to $l6,000 in the western areas.
In financing the acquisition of equipment part-time farmers use numerous sources of credit, including banks, production credit associations, equipment dealers, individuals. Farmers' Home Administra-

- 127 -
tion, loan cong>anie8, ancL company credit unions. Some used credit extensively while others had no recorded chattel debt. As a group the chattel debt of part-time farmers was relatively low.
TABIE 47
Mean Investment in Farm Machinery and Equipment by 62 Operators Now "Established" in Commercial Farming Through Part-
Time Farming, by Area, Ohio, 1954y ■ Mean Investment in Machinery
® Farmers Now Full-Time Farmers Still Part-TimePer Farm Per Crop Acre Per Farm Per Crop Acre
Western $9,900 $51.30 $4,092 $44.48Northeastern 6,967 91.67 4,957 64.38Southeastern 5,1^0 81.59 3,660 60.00
ALL AREAS $7,274 $69.28 $4,220 $52.79
Among the 242 part-time operators only 6l had recorded chattel debt, averaging about $1,700 for those having such debt. Household items and automobiles were both also included in this recorded indebtedness* Only 36 cases, or about 1$ percent of the total cases had both chattel and real estate debt. Of the $5 case subsample achieving substantial progress toward full-time farming, 19 operators had chattel debt recorded, averaging $2,400 for those operators with recorded debt. Eleven operators had both recorded chattel and real estate debt.
Among the 62 cases regarded as now established on a full-time commercial scale, 36 reported they were indebted on chattel property averaging $2,524 per, farm reporting. In the group of I8 qperatcrs

- 128 -
now farming full-time, eight reported chattel debt averaging $3,827
per farm reporting. The above indicates that part-time farmers are willing to use credit for obtaining equipment and other personal property, and are able to find sources of such credit in trying to acquire command of capital needed to farm.
BTet Worth and Capital AccumulationIn the general sample of part-time farms in scattered square
mile areas of l4 Ohio counties the schedule of questions did not provide for working out a net worth statement. However, data were obtained with respect to ownership of the farm real estate, farm chattels, automobiles, etc. Data were also obtained with regard to recorded indebtedness on both real property and chattels.
Analysis of these data give some indication of the net worth position and capital accumulation achievement of part-time farmers.In the process of interview the enumerator was usually able to get an estimate of net worth as of a previous point in time. Such estimates normally resulted from conversation relative to a time of crises or change in the history of the part-time farmer.
The following kinds of statements are exanrples; "We bought this place on a shoe string - we had about $100 left after we made the down payment," or "When I got out of the army we bad $3,600 saved and owned owe car and household goods," or "We got $4,500 from our house in town and used that on the place here."
By use of the estimates of current financial position relative to that at some indicated past time it was possible to derive esti-

- 129 -
mates of flnanciaJL progress. It should, be enqphaslzecL that these data are estimates. The "current indicated net worth" data has the limitations that it does not include liquid assets or value of the other real estate the farmer might own. This could result in an understatement of assets. The data on indebtedness relate only to recorded indebtedness and thus would not include personal loans or other debts if unrecorded. Recorded indebtedness was adjusted to current liability on the basis of repayment plans unless other data
Qindicated such was not the case.*
TABIE 48Indicated Average Farm Assets,* Indebtedness,** and Net Worth
of 242 Part-Time Farm Families by Area of State, l4Ohio Counties, 1953
- i sNorthwest $ 445 $1,773 $5 ,8 6 8 : $1 8 ,9 6 8 $24 ,836 $1 ,672 $23,164Southwest 984 1 ,1 6 0 5 ,215 1 5 ,329 20 ,544 3,304 17,240Northeast 783 1 ,653 4 ,9 7 4 9 ,8 7 2 14 ,896 2,640 12 ,206
Southeast 1 ,217 1 ,3 3 6 5 ,2 7 9 9 ,1 7 2 14 ,451 1 ,5 3 0 12 ,921
TOTAL $ 966 $1 ,4 5 1 $5,242 $11 ,726 $16 ,968 $2,241 $14 ,727
* Estimated value of farm real estate farm and home chattels.** Recorded real estate and chattel debt adjusted for time and repay
ment terms.*** Total chattels includes estimated value of household goods and automobiles.
^ The mortgages of some operators had been released long before due according to the repayment plans. In other cases, especially concerning chattels, new mortgages of equal amount were recorded at the expiration term of the old loan. Chattel mortgages are not always cancelled on the records even when paid.

- 130 -
The margin, of error with such data is large for individual cases; however, the author believes the estimates to be of value in describing the general capital position of part-time farmers* Table 48 presents these data for the general sample cases by area of the state*
The above figures would indicate the average part-time farmer to be in a fairly strong financial position* Current assets to liabilities ratio averages more than seven to one* The mean chattel debt was $433, and real estate debt, $l,8o8 when averaged over the entire group* Chattel debt averaged $1,718 for the 6l cases having such recorded debt, and real estate debt averaged $4,6^4 for the 94 cases with recorded mortgage debt* Only 36 cases had both recorded chattel and real estate debt averaging $6,244 for those with both* Over half of the cases had no recorded debt*
When the 242 part-time farms were grouped by class of part-time farms, the larger sized commercial and semi-commercial operations had more assets, more debt, and also higher indicated net worth*Class XI (subsistence) part-time farms had the lowest average indicated net worth, and also lowest ratio of assets to indebtedness*The capital position of the 242 classified by type of farm is indicated in Table 49*
It might be noted that about 70 percent of the total assets for this group of part-time farmers is represented by real estate value* The favorable financial position of these part-time farmers is undoubtedly enhanced by the fact that most own real estate, purchased ten years ago on the average, which has increased in value due to inflation*

- 131 -
lABIE 49Indicated Average Farm Assets,* Indebtedness,** and Net Worth
of 242 Part-Time Farm Families, by Class-of Farm, l4 Ohio Counties, 1953
Classof
FarmLive-Stock
Indicated Ownership (Means) TotalDebt
NetWorthFarm
EquxP #Total*** Farm Real Chattels- Estate
TotalAssets
I $ 95 $ 299 $3,337 $7 ,278 $10,615 $1 ,380 $ 9,235
II 250 308 3 ,306 6 ,198 9 ,504 1 ,7 6 6 7 ,7 3 8
III 507 963 4,448 11,362 15,810 2 ,0 1 1 13 ,799
IV 1 ,656 2 ,3 3 1 6,704 14,484 2 1 ,188 2 ,743 18,445
TOTAL $ 966 $1 ,451 $5,242 $11,726 $16 ,968 $2,241 $14,727
* Estimated value of farm real estate, farm and heme chattels. Recorded real estate and chattel debt adjusted for time and repayment terms•
*** Total chattels include estimated value of household goods and — automobiles.
The above data would indicate owner equity of about 85 percent of the total investment in the part-time farming operation.
As was noted above it was possible to estimate for most of these part-time farmers what had been their financial position at the time they began to farm. If that base point is subtracted from their present net worth it yields an estimate of value accumulated over the intervening years of farming. Dividing that sum by the number of years provides an estimate of average annual rate of capital accumulation. Such estimates were made for cases in the general sangple of 242 part-time farmers.
If we assume that at age 21 most young men have no capital accumulated, on the average, then the present financial position would repre

- 132 -
sent accmulation since that age* Dividing the present indicated net worth by present age minus 21 would yield another estimate of annual rate of capital accumulation. Estimates of capital accumulations were also made on this basis*
TABLE 50Indicated Average Annual Rate of Capital Accumulation and Range of
Individual Cases, 242 Part-Time Farmers Classified by Area, and by Class of Farm, l4 Ohio Counties, 1953
Area or Class
Annual Rate of Capital Accumulation on Farm
Annual Rate of Capital Accumulation Since Age 21
Range Mean Range __ MeanAREA
Northwest $ 0 to 2,500 $l,oi6 $ 200 to 2,000 $893
Southwest -500 to 2,200 662 14 to 2,200 535Northeast -1,600 to 1,300 405 -125 to 1,300 427Southeast -1,000 to 2,000 482 40 to 2,000 474
CIASSI $ 0 to 1,400 $ 318 $ 150 to 700 $340
II -500 to 1,000 370 60 to 2,000 360
III -1,600 to 2,200 511 14 to 2,200 513
IV -125 to 2,500 694 -125 to 2,000 609
TOTAL $-1,600 to 2,500 $ 555 $-125 to 2,200 $518
Table 50 indicates rates of capital accumulation estimated by the two above methods* The data indicated that rate of capital accumulation was somewhat hi^er for the years on the farm than the estimate

- 133 -
related to years elapsed since age 21. This might be due only to ability to accumulate faster by coaçîounding previous capital with increasing age, or it may be an indication of more opportunity to accumulate after engaging in part-time farming. It might also be noted that some part-time farmers incur serious losses and experience deterioration of their previous financial position. Some operators have placed increasingly higher mortgages on their property without apparent benefit in terms of more productive farms or hi^er valued property. Investment in a line of new equipment can deteriorate rapidly through obsolescence and depreciation if not properly used and cared for. This aspect is more fully dealt with in some case studies below in Chapter VI.
The current financial position of the operators making substantial progress toward full-time farming is shown in Table $1.These data indicate that this group of part-time farmers have ownership equity amounting to over 80 percent of the total investment in their operation.
These operators have larger farms, own more livestock and equipment, and more total assets than Hie general sample of part-time farmers. Their total indebtedness is also greater, averaging $835 of chattel debt and $2,490 of real estate debt per farm. Thirigr-four part-time farmers in this group have some debt averaging nearly $5,400 for those having debt. Nineteen have chattel debt averaging $2,400 for those having debt, and 11 have both chattel and real estate debt averaging nearly $7,000 for those with both.

- 13^ -
TABIE 51Indicated Average Farm Assets,® Indebtedness.^ and Net Worth of 55 Part-Time Farmers® MaJting Substantial Progress
Toward Full-Time Farming, by Areas, 1953Indicated Hëàn Ownership
MeanDebt
NetWorthArea Live
stockFarmEquip.
Total^ Farm Real Chattels Estate
MeanAssets
Western $l,4l4 $2 ,723 $6 ,872 $19,825 $26,697 $3,905 $22 ,792
N. E. 1 ,370 3,200 7,105 12 ,344 19 ,449 3 ,907 15 ,541
S . E . 2 ,347 2,460 7 ,438 10,735 18,173 2 ,225 15,948TOTAL $1,724 $2 ,7 7 8 $7,135 $14,508 $21,644 $3,325 $18,319
® Estimated value of farm real estate, farm and home chattels.^ Recorded real estate and chattel debt adjusted for time and repay
ment plans.® Selected from the general sample of 242 cases in fourteen Ohio
counties.Total chattels include estimated value of household goods and automobiles.
The indicated average annual rate of capital accumulation since beginning to farm part-time for this group of 55 operators was $724 per year or about 30 percent hi^er than for the general group of part-time farmers. The rate of capital accumulation related to age was also higher, averaging $687 per year for this group, cotqpared to the $510 average for the 242 operators in the total sample. By areas these cases foUuwed the same pattern as indicated above for the total sample.
The schedule for interview of farm operators who had used part- time farming to become established in commercial full-time farming provided for completion of a financial statement. As indicated above those operators now farming full-time had a larger size of farm in

- 135 -
terms of both total acreage and crop acreage* They were using more total capital^ both owned and borrowed in their business* Their invested capital in livestock, equipment, and other chattel property averaged higher per farm than those regarded as established on a commercial scale but still working off the farm. Table 52 indicates the average financial position by areas for those still farming part- time and those now full-time* Most of these part-time farms have a 70 to 80 percent equity in the total invested in their farming operation*
The ramge of situations of individual part-time and full-time farm operators is perhaps more meaningful in description of accumulation than averages* Financial position alone does not determine whether the individual will continue to farm part-time or relinquish the off-farm job* The range of financial position of individual cases is shown in Table 53* An operator can farm full-time as a tenant with considerably less capital than is needed for part-time farming as an owner or part-owner of the real estate used* As noted above, however, most part-time farmers must begin by purchase of real estate*
The indicated rate of capital accumulation for farmers in this group regarded as established in farming has averaged considerably higher than for all part-time farmers* The average indicated annnAi rate of accimrulation since age 21 for those now farming full-time was nearly $1,400 a year, and nearly $1,200 a year for those still part-time* If capital accumulation is related to years engaged in

TAB1£ $2Financial Position of 62 Farm Operators Who Used Part-Time Farming to Become Established
in Commercial Full-Time Farming, by Present Farm Status, and Farming Area, 195Western Northeastern Southeastern
Item NowFull-Time
StillPart-Time
NowFull-Time
StillPart-Time
NowFull-Time
StillPart-Time
No. Cases 5 18 8 13 5 13
ASSETS Real Estate Machinery and Equipment Livestock Other Chattels* Liquid Assets**
$17,1409,9003,4006,500
54
$18,3004,092
2,473
1,584
$17,0636,967
4,0256,429537
$18,3074,9572,8425,929681
$18,7565,1403,7656,4361,010
$12,3923,660
3,0184,738
296
w m . $36,994 $32,425 $35,021 $32,716 $35,107 $24,104LIABILITIES Real Estate Debt Chattel Debt Other***
$10,7801,460
5$ 5,328
970 769
$ 7,674 2,194
270
$ 6,108 1,834 467
$ 2,372 1,153 120
$ 3,454 1,612
820
TOTAL $12,245 $ 7,067 $10,138 $ 8,409 $ 3,645 $ 5,886NET WORTH $24,749 $25,358 $24,883 $24,307 $31,462 $18,218
* Feed and supplies on hand, automobiles, household goods, etc. #* Stocks, bonds, savings, and checking accounts, cash on hand.
Personal notes, open accounts, installment accounts.
O n

- 137 -
faxmiag part-time, those still part-time were accumulating at an
average rate of about $1,700 per year, those full-time now had
accumulated at an average rate of nearJy $2,000 per year while they operated part-time*
ÏABIE 53Range in Total Assets, Indebtedness, and Net Worth of 62 Farm
Operators Who Used Part-Time Farming to Become Established in Commercial Farming, by Farming Area, and Present
Farm Status, 195^Area and Present Operator Status
Range of Total Assets
Range of Indebtedness
Range of Net Worth
WesternFull-TimePart-Time
$12,100-66,30019,200-52,900
$3,200-31,6000-24,700
$ 9,600-40,100 10,100-47,200
NortheasternFull-TimePart-Time
28,100-44,700 18,700-50,200
300-22,800100-26,000
11,700-41,20011,500-34,700
SoutheasternFull-TimePart-Time
17,400-66,5005,800-47,800
0-16,400200-16,700
7,500-66,5005,600-39,100
ALL AREAS FULL-TIME PART-TIME
$12,100-66,5005,800-52,900
$ 0-31,600 0-26,000
$ 7,500-66,500 5,600-47,200
Credit in Capital Accumulation
Those part-time farmers who had been able to accumulate capital
at a rapid rate were good managers, and usuaUy had made wise use of
credit. The past 15 years, during which most of these operators were starting, was a period in which extensive use of credit was very
profitable* The rising price level increased the value of assets

- 138 -
purchased with borrowed funds without increasing the level of indebtedness .
The net worth statanents above indicated the extensive use of credit. About two-thirds of the l8o part-time farmers in the general survey who purchased land had used credit in acquiring real estate. They borrowed about 6o percent of the purchase price, an average of 10 years before the interview. Thirty-five of the 4$ part-time farmers making substantial progress toward full-time farming who had purchased land had used credit in the transaction. Of the 62 operators regarded as established in commercial farming, $2 of the 54 purchasing land had used credit in the transaction.
Six had used G. I. insured loans, and six had used Farmers Home Administration Finance.^ F.HJl. loans of 100 percent of the purchase price amounted to as much as $20,000. As an average those borrowing, borrowed nearly three-fourths of the purchase price. Forty-four of the 62 are currently obligated on real estate loans averaging nearly $7^900 for those owing. Thirty-six of the 62 currently have chattel debt averaging nearly $2,600 for those with such debt. Other credit in the form of dealer accounts, personal loans, etc. averaging nearly $800 per farmer were reported by 39 of the 62 operators regarded as established in commercial scale farming.
In the capital accumulation process, part-time farmers have relied heavily on nonfarm employment. Even before engaging in part-135 ■— — ------------------- -Although the policy of F.HJV. was not to finance part-time farmers,
a local loan supervisor observed that "good loans" to part-time farmers were better than "delinquent loans" of those operators full-time on too small a farm.

- 139 -
time farming most of the 62 operators had accumulated a "nest egg” of savings from nonfarm sources* This may have been based on the earnings of the husband or the wife, or received from sale of equity in urban or rural property representing family savings* Such a nucleus of capital is necessary to permit use of credit in most cases* In a few instances family assistance or support provided the margin of security required by the creditor*
This section on capital accumulation would not be complete without some reference to the G*I* On-The-Farm Training Erogram* Nearly half, 28 of the 62 operators classified as established in farming had seen military service* Average time spent on active military duty was a little over two years* Twenty of the 28 had participated in the On-The-Farm training program* They were "full-time farmers” during the period of training and while receiving subsistence payments, Sixteen of the 20 took a nonfarm job at the termination of the G,I, training period compensation* By 195^ nine of those were again farming full-time. At the termination of the G*I* training the level of farm income had not been satisfactory to meet living expenses and carry debt repayment obligations* However, four of the nine operators mentioned above who were now farming full-time reported their wife had a nonfarm job* By contrast, of 23 other operators (without G*I* benefits) who had started to farm since lg44 only three were farming full-time in 195^ and two of those had working wives* The Veterans* Program had definitely helped many of these operators to accumulate capital for farm operation*

— l A O —
As a group part-time farmers have made suhstautial average annual additions to their net worth position. A part of this Is undoubtedly due to Inflation of the owned resources. Some Is due to reinvesting savings and earnings from both farm and nonfarm work into the farm. Some of the Increase In value of the farm property results from using their own labor to make extensive Improvements. Of the 62 operators classed as "established" In farming, 56 owned land. Fifty-two of the 56 reported they had built Improvements or made additions to the property since acquisition. The total estimated value of these im- provanents (largeiy on a cost of materials basis) totaled over $190,000
or averaged nearly $3,800 per farm.The Indicated rate of net annual Increase In capital position of
part-time farmers averages out as being equal to about 10 percent of their current annual gross Income from the farm and nonfarm sources combined.
SUMMARYThe farms of part-time farmers range from two or three acres to
full scale commercial farms of over 400 acres. The average acreage in a part-time farm Is about 70 acres, with about 27 crop acres harvested. The farms of some part-time farmers, especially of those attempting to become established In full-time farming, are as large or larger than farms operated as full-time farms by other Ohio operators. Althou^ part-time farming encong»asse8 a two-way movement of people and land both into and out of full-time farming. Its growth appears In large part to result from a net movement of land ant people from previously full-time to part-time farm operation.

- l4l -
Reluctance of leuadlords to rent to part-time farmers, results in most part-time farmers being land owners. Nine out of 10 part- time farmers have title to all or part of the land they farm; as a group th^ own three-fourths of all the land they operate. Although some part-time farmers have inherited farm real estate, most have purchased the land they own. The necessity of purchase can be either detnrimental or beneficial i>o part-time farmers. The lower rate of return on capital invested in land has been counterbalanced by appreciation of value due to inflation in recent years. The average part- time farmer, having owned his land for ten years has inproved his capital position through inflation.
In purchase of farm real estn,te part-time farmers have used credit extensively. They borrow from numerous sources and frequently the repayment plans are tailored to the regular flow of nonfarm income. This could be detrimental to the operator planning to shift to the more uncertain and irregular flow of income from farming operations. Although part-time farmers use credit extensively the average debt level is not excessively high in relation to assets. Part-time farmers as a group hold more than a ^0 percent equiiy in their operations.
Obtaining operating equipment and machinery is a problem to the part-time farmer as well as the full-time operator. Despite the tesptation to substitute equipment for labor and time because of the nonfarm job commitment, most part-time farmers are not over-capitalized in equipment. Investment per crop acre is in the range normal for full-time farmers with a comparable scale of farm operation.

- 142 -
As a group these part-time farmers have improved tibeir financial
position over the years of farm operations* The data indicate they
have made additions to net worth averaging about $$00 per year, or roughly 10 percent of their current levels of total gross income from farm and nonfarm sources*
The Veterans' "On-The-Farm" training program has assisted many
younger farmers in getting started in farming, but frequently they
have found it necessary to seek nonfarm employment to supplement
farm income for a period of time after lapse of the subsistence payments of 0*1. training.

CHAPTER V HOW DO PART-TIME FARMERS OPERATE?
The preceding chapter was devoted to questions relating to capital accumulation and acquisition of agricultural resources, by part-
time farmers. Here attention is focused on how part-time farmers
utilize the resources at their command. What type of farming do they
do? Is it different from that of other farmers? How much farming do
they do, and how is it accomplished?
The previous chapter presented data relating to total acreage
and crop acreage as measures of the size of part-time farms. To more
adequately describe the size of the business unit operated by part-
time farmers, data is presented here concerning the utilization of
the farm resources and gross income derived from their use.
Intensity of Land Use and Type of Farming
The type of farming activities that predominate in a given area
are the result of the interaction of certain physical and economic
factors. The i^e of soil, topography and climate, together with
such economic factors as demand, transportation and market facilites
give some types of farming a comparative advantage over others in a
given localii^. While the preferences and abilities of the individual
farm operator help shape the production pattern of a particular farm,
he cannot completely disregard the physical capabilities of the land.
In general, the land use pattern of part-time farmers is little
different from that of their full-time farming neighbors. In the dis-
- 143 -

— —
cussioEL of tenure relationship above it was noted that while most part- time farmers are full owner-operators, some rent additional land to operate while others rent land to other operators. It appears to the author that if land is supra-marginal it will likely be Used whether owned by a full-time farmer, a part-time farmer, or a nonfarm landlord. The acreage of crop land harvested on part-time farms as a percentage of total acreage in those farms in a given area coogiares favorably to that of all farms in the area.^
In some cases residential or subsistence class part-time farms were situated on large tracts of land, for the most part currently
^ While it would be most desirable to compare the operations of part- time farmers to those of strictly full-time farmers such data is not available. As noted above the census classification of "commercial" farms includes situations with operators working off the farm. Data compiled from Ohio Farm Account records also contain some such situations* The percentage that harvested crop land was of total acreage was compared to similar calculations for all farms in the 1950 census by economic areas and by counties surveyed, and to type of farm in Ohio Farm Account Record summaries *The Farm Account Records summarized in 1953 included averages in western Ohio for 34 dairy-hog, 36 cash crop, and 47 general livestock farms; in northeastern Ohio for 53 dairy, 40 dairy-poultry, and 35 cash crop farms; in southeastern Ohio for 44 dairy, I9 dairy-poultry, and 37 general livestock farms.The 62 case sample of farm operators who used part-time farming to become established in full-time farming were conpared to the total list of over 400 cases referred for sampling and to the total farm listings in the IMA office of the respective counties. Those IM& listings for each farm give total acreage, crop land acreage and open pasture land acreage. There was no more than rauadom difference in classification of the land of the sample farms, conpared to the total referral list, or to the total farms classed for the county or township. Variation ftom township to township of proportion of land classed as crop land was higher than the differences between sample farms and an farms, or sample farms and referred farms for sampling.

- 14$ -
unused or used only for pasture* The inquiry regarding previous use usually indicated the tract had been unused or used only for grazing
pby the previous owner or occupant* The very poor quality of land thus occupied by some residential and subsistence part-time farmers reduces somewhat the proportion of crop land harvested to total acreage occupied in some areas.
The residential class part-time farms reported harvesting crops from only about five percent of their land; subsistence part-time farmers harvested crops from 22 percent of their land; and the semicommercial and commercial group harvested crops from 35 percent and 65 percent of their land respectively*
In addition to the comparison of part-time farms to all farms on the basis of crop land harvested^ some analysis was also made of the acreage devoted to specific crops* Here again there is little to indicate that part-time farmers use land more or less intensively than all farmers* The proportions of their total acreage that farmers devote to specified uses in the different 1ypes of farming areas are indicated in Table $4* Those part-time farmers in Class III and IV generally had more of their land in intensive use than Class I and II operators*
Those farmers who were attempting to use part-time farming as a route to full-time farming frequently had a larger proportion of theirp ' I .. I - ■
In northeastern Ohio, about 25 miles from Cleveland, a family rents a 185 acre tract with buildings for $75 a month* It is rough brush land held by the owner for probable real estate development* The present occupants are using the land primarily for horse pasture bridal paths for use of customers who hire ilieir horses* Numerous respondents in southeastern Ohio indicated the land was virtually unused before they purchased the house primarily as a place to live.

TABIE $4Percentage of Total Land in Farms Devoted to Specified Use, by
Area of State, Sangle Farms, and all FarmsArea All Farms Sample Farmsand Range Farm Census 62 55 FCF , 242Item Account Records®* 19%)" Established® Progress® PTF®
WESTERN AREACom 19-25 22 21 23 25Wheat 14-16 14 11 12 10Oats^ 6- 8 6 9 6Hay 13-17 9 17 13 11Crop land harvested 60-85 62 66 75 66
NORTHEASTERN AREA 14-16Corn 13 19 14 9Wheat 8-13 10 10 8 7Oats 7- 9 — 4 6 5Hay 18-33 12 17 15 16Crop land harvested 53-69 46 54 40 39
SOUTHEASTERN AREA5- 6 8 8Corn 7 11
Wheat 5- 6 4 8 5 4Oats 2- 4 -- 3 4 3Hay 15-16 10 15 17 12Crop land harvested 30-38 24 39 31 28
g
Range of means for different l^e of farming record summaries for the area, Ohio Farm Account Record Summaries, 19 3*Census reports by economic area. Here the western area includes Ohio economic areas, 1, 2, 3,and 7i northeastern includes areas 4a, 4b, $, and 6a; southeastern includes 6b, 8a, and 8b.The 62 operators regarded as established on a commercial scale.The 55 operators selected from the 242 as making substantial progress toward their goal offarming full-time.General sangple of 242 of part-time farmers from l4 Ohio counties.Not available in census economic area tables.

- 147 -
total operated acreage la crops. This appears to be largely the result of renting additional crop land as fields rather than an entire farm unit. There was no significant difference between the cropping pattern of the l8 former part-time farmers now farming full-time and the 44 who were still working off the farm. Both groups harvested crops from 54 percent of their operated acreage, and 17 percent of the land was in corn.
Crop yields and production reported on the part-time farms do not differ appreciably from those of all farmers. Weighted average yields for the major crops were computed based on reported acreages and production. The resulting average yield figures do not depart greatly from average yields for all farmers as reported in Ohio Agricultural Statistics for those years. Variation of yields computed for sample farms did not depart consistently from the averages for all farms - for some crops sample yields averaged higher and for others lower than the averages for all farms. In all cases the average crop yields of part-time farmers, and also of those who had used part-time farming to become established in full-time farming, were within the range of average yields reported in Farm Account Record Summaries,^
The data pertaining to crop land harvested as related to total farm land and to yields per acre for the crops would not indicate3 " . ' "" " '■ .Average yields per acre for 1953 crops for the sample of 242 part- time farmers were: com, 6o bu,; wheat, 28 bu,; oats, 37 bu,; soybeans, 19 bu,; and hay, 1,8 tons. Average yields per acre for the 62 operators now established in farming for the 1954 crop year were: corn, 63 bu,; wheat, 27 bu,; oats, 46 bu,; soybeans, I7 bu,;and hay, 1.8 tons per acre.

— i48 —
that part-time farmers as a group use the Hand resource more or less intensively or effectively than all farmers.The type of farming carried on by part-time farmers is little dif
ferent from that of neighboring full-time farmers. The farm production of part-time farmers are those products adapted to the physical character of the area in which they are located and the same as those of their neighbors. If an area is well suited to roughage consuming livestock, such stock will be found on part-time as well as on fulltime farms. If the market demands and facilities give advantage to mii_k production, part-time farmers also keep dairy cows.
Type of farming patterns are usually developed or described by the importance of individual enterprises or combinations of various groups of farm products, relative to the total value of farm products sold. Analysis in that manner is shown below for the Class III and IV (semi-commercial and commercial) part-time farms. Such analysis is of little value for the Class I and II (residential and subsistence) part-time farms. The production of the latter classes is primarily for home use with sales only incidental to such production for use.If those incidental sales were classified for the latter two groups, most would be classed either as cash crop (from the sale of wheat, orchard or garden produce) or as livestock specialty (from the sale of a few hogs, a beef, some wool, or surplus eggs) • Only 37 of the 2k2 part-time farmers reported no livestock.
The type of farming classification of the commercial and semicommercial part-time farmers are shown in Table 55» Over half of

- 149 -
TABIE 55llype of Fanning Engaged in by 1Ô2 Commercial and Semi-Commercial
Part-Time Farmers, Classified by Relative Importance of Sales, and General oype of Farming Areas, Ohio, 1953
Type of Farm General Type of Farming Area AllClass Western Northeastern Southeastern Areas
Specialized®'Dairy®' 3 4 19 26Beef 2 7 8 17Hog 5 2 4 11Sheep 2 - 1 3Poultry 3 5 5 13
Cash Crop^ 23 9 7 39Dairy - Poultry® 1 6 5 12Dairy - Ho^ - 2 1 3Dairy - Cash Crop® Cash Crop - Beef®
2 1 2 54 1 1 6Cash Crop - Dair^ Cash Crop - Hogs®
S - - - 62 1 - 3
Cash Crop - Poultry‘S 1 - 1Hog - Beef® 2 1 1 4Hog - Poultry® 1 1 1 3General Livestock^ 9 6 15 30
TOTAIS 65 47 70 182
"Specialized" production indicates 75 percent or more of the total sales resulted from that enterprise alone.
Crop sales (corn, vheat, oats, soybeans, tobacco, hay, etc.) made up 75 percent or more of total farm product sales.
Dairy enterprise sales accounted for 50-74 percent of the total sales with the second listed item second in inportance »
Cash crop sales accounted for 50-74 percent of total sales with the second listed item second in inportance.
These two enterprises ranked most important r^resenting over 75 percent of total sales with neither alone over 50 percent.Livestock accounted for over 50 percent of sales with no enterprise of three or more representing over 25 percent of the total.
the part-time farmers in western Ohio derived 50 percent or more of the gross farm sales from cash crops, compared to about one-fourth in the northeastern and less than one-tenth in the southeastern area. Similarly, dairy accounted for over 50 percent of the farm income of

- 150 -
about one-third of the southeastern, about one-fourth of the northeastern, and less than ten percent of the western area part-time farmers* Hogs were proportionately more important in sales of western than of eastern Ohio part-time farmers*
The poultry enterprise accounted for 75 percent of gross sales of 13 of the 182 part-time farms and was âecond in importance on 16
more*The dairy enterprise accounted for 75 percent of total sales on
26 farms, of 50-7^ percent on 20 more farms, and was of second place importance on at least six more* Most Ohio part-time farmers keep some poultry and dairy animals for home use and frequently have these products for sale*
Dairy and poultry are somewhat better adapted than other enterprises to utilizing the labor of the wife and children in the part- time farmer's family* Frequently the respondents indicated the chore- labor for the dairy and poultry enterprises was not supplied entirely by the farm operator who worked off the farm* In some instances he cared for the livestock, either morning or evening (depending on his work shift) with other family members providing the care at other times*
For those operators planning later to shift from part-time to full-time farming, dairy and poultry enterprises will more nearly provide the regular flow of income to which the family has become accustomed, and which their mortgage contracts frequently require*
There appears to the author to be some tendency for those operators farming part-time to gear their farming operation more to cash

- 15X -
crops than to livestock. Another observation of similar nature is for them to concentrate on livestock requiring less labor if family help is not readily available - i.e., to keep beef rather than dairy to consume farm produced roulage.
Among the 55 part-time farmers selected from the 242 as having made substantial progress toward full-time farming, 25 reported dairy as accounting for over 50 percent of gross farm sales. Twelve reported the dairy enterprise accounted for over 75 percent of the sales. This was particularly true of those in the eastern areas of the state. Those in the western area were more frequently expanding toweurd full-time farming through renting additional land for cash crops or intensifying with hogs and beef cattle*
The 62 cases of operators who had used or were using part-time farming to become established on a full-time commercial farm scale were distributed with approximately one-third in the western, one- third in the northeastern, and one-third in the southeastern type of farming areas. Table 5^ indicates the source of gross cash receipts for the 62 cases, by the enterprise and area.
Dairying was the most important single enterprise in both the northeastern and southeastern areas and ranked second in western Ohio. Receipts from crop sales ranked first in western Ohio and second in the other two areas.
The same types of enterprises were found in all areas, the significant difference being the relative importance of specific enterprises. When individual farms are considered, even relative inpor-

- 152 -
TABUE 56Source of Gross Cash Receipts, 62 Ohio Farm Operators Established.
Through Part-Time Farming, by Area, 195^
Item Western Northeastern Southeastern Total
Nuznber of Farms Surveyed 23 21 18 62
Source of Receipts Average Per Farm (Dollars)Dairy* $1,762 $3,813 $1,716 $2,444Beef Animals 494 280 779 504Hogs 881 325 288 521
Sheep 178 75 37 103
Poultry 799 210 485 508
Crop Sales 4,185 1,862 870 2 ,436
Miscellaneous** 58 231 163 147TOTAL $8,358 $6,797 $4 ,3 3 8 $6,662
Proportion of Receipts From Each Source (Percent)Dairy 2 1 .1 5 6 .1 3 9 .6 3 6 .7
Beef Animals 5 .9 4.1 1 7 .9 7 .6
Hogs . 10.5 4.8 6 .6 7 .8
Sheep 2 .1 1 .1 .9 1 .5
Poultry 9 .6 3 .1 H.2 7 .6
Crop Sales 5 0 .1 2 7 .4 2 0 .1 3 6 .6
Mis cellaneous .7 3 .4 3 .7 2 .2
TOTAL 100.0 100.0 100 .0 100 .0
* Dairy includes sale of dairy products, veal calves and cull cows.** Primarily from custom work, timber sales, etc.

- 153 -
tance does not show a clear cut difference between areas. What type of farming operations are carried on by part-time farmers moving toward full-time and those who have gone to full-time farming? How does it differ by areas? To what extent is there a tendency to intensify or to enlarge the farming operation when the operator quits the nonfarm job?
In the sample taken in the northeastern Ohio area, eight operators were farming full-time in 195^» Of this eight, six were classed as specialized dairy farms and the other two were farms with the first emphasis on dairying. In the same area, out of 13 cases where the operator still held nonfarm employment in 195 » ei^t were classified as dairy farms, five as specialized dairy operations. Four were cash crop with in each case some secondary livestock enterprise. One was a specialized livestock farm, with beef production given temporary emphasis with the plan to shift to dairy production later. In this area, the primary emphasis was on dairy production with a strong inclination to specialize, particularly when the final step had been taken to full-time farming.
Of the l8 southeastern Ohio farms contacted, five operators were farming full-time in 195^* Of the five, two were dairy farms (one specialized). The other three were classed as general farms - one giving emphasis to dairying, one to poultry, suad one to cash crops.On the 13 farms where the operator still had nonfarm employment, six were dairy farms, three were classed as cash crop, idiree as specialized livestock, and one general livestock. In all cases some livestock enterprises were carried on.

- 1^4 -
Of the 23 western Ohio farms contacted, five operators were farming full-time in 1954. Of the five, one was a dairy farm, three cash crops, and one general. Of the 18 farms with the operator still holding a nonfarm job, four were dairy, seven cash crop, three specialized livestock and four general farms.
Of the total 62 cases, 27 were classed as dairy farms, I7 as cash crop, seven specialized livestock, and 11 as general farms.There were thus a strong inclination to rely on dairying both during and after the period of nonfarm employment. Of all 1Ô operators farming full-time in 1954, half were giving major eng>hasis to dairying, a third to diversified crops and livestock, and a sixth to cash crops.
The above data tends to indicate (l) the type of farming used by part-time farmers en route to full-time farming reflects the influence of the type of farming area in which the farms are located, (2) the force of circumstances influencing the process of getting established in farming - i.e., the available labor, capital, land, managerial aptitudes and personal inclinations" - led a high proportion of the operators to follow a relatively intensive type of farming on medium sized farms.
How large Are Part-Time Farms - Productive Man Work UnitsThe foregoing has indicated that part-time farmers engage in about
the same type of farming activities as full-time farmers in their com- munily. In the previous chapter the land resources of part-time farms were indicated in terms of total acreage and crop acres harvested. How

- 155 -
large a farm operation do part-time farmers manage in terms of standard labor inputis? This question pertains to both the intensity of use of crop land and to utilization of crops by livestock.
The size of the part-time farms studied was measured in terms of the productive employment they provided. How many days productive employment of labor did they provide? This was measured in terms of productive man work units. One productive man work unit was considered as the amount of work performed in a ten-hour day by an average worker with typical methods and equipment on the ordinary commercial farm.^ This measure was applied to the crops and livestock cared for on the part-time farms surveyed.
The average Ohio commercial family farm provides about 250 to 300 productive man work units a year. A full-time farm would be considered small if it supplied less than 220 or 225 a year. How large arethe operations of part-time farmers by this measure?
^ Following is the number of man work units accorded to different units of farm production;
CROPS UKTD MWU LIVESTOCK UNIT MWTICorn Acre 1.00 Dairy Cows Per Head Per Yr. 12.00Wheat II .65 Dairy Replacement I t 2.00Oats II .50 Dairy Calves II •10Soybeans II .60 Ewes II .50Alfalfa II .65 Lambs M .80Other Hay II .40 Beef Cows II 1 .50Tobacco II 30.00 Beef Heifers II 1 .00Orchard II 20.00 Beef Calves II 1 .00Vineyard II 20.00 and SteersGarden It 10.00 Brood Sows II 3 .00Market Hogs II .25Laying Hens II .25Broilers Per 100 1 .60Turk^s II 7 .10
Hereafter MWU will be used as an abbreviation of productive work units. man

- 156 -
The number of MWÜ provided by the 242 part-time farms surveyed averaged 76, ranging from practically zero to nearly 340* Because part-time farm production varies so much from one situation to another ; this Tni ght. be best considered relative to the farm classes of part-time farms surveyed. See Table 57 «
TABI2 57Mean Days Labor Reported Spent on Farm, Productive Man Work Units, and Gross Cash Sales, 242 Part-Time Farms, by Class of Farm,
14 Ohio Counties, 1953Days Labor GrossPart-Time Reported* Productive Man Work Units Cash
Farm Class Spent on„ Garden Crops Livestock Total g jLes Farm
I 39 2 2 5 9 $ 10II 52 3 3 20 26 171
III 93 2 10 31 43 638
IV 160 3 4o 84 127 3,358
TOTAL 112 3 22 51 76 $1,786
* Hours reported spent by operator and others converted to 10-hour days.
About 15 percent of the cases (Class I part-time farms) in the general saaçle produced practically nothing for sale although using three or more acres for agricultural purposes. This group averaged only nine MWU per farm. The average size tract occupied by this group was 23 acres, with only one acre used for crops. Total time reported spent at farm work by these families, including maintenance work, averaged 39 ten-hour days.

- 157 -
The part-time farms in Class II, about 10 percent of the total, were those with sales less than $250 per family, but producing more for home use than the first group* These farms on the average provided 26 MWU, and reported 52 man days or labor used on the farm for all purposes. The average size tract for this group was 35 acres, with five used for crops*
The semi -commercial part-time farms. Class III, representing 28 percent of the 242 farms, provided an average of 4-3 MWU per farm* These farmers operated an average of 50 acres with 17 acres in crops* In this groi^ livestock accounted for about three-fourths of the MWU and about 70 percent of the gross farm sales averaging $638* The labor reported spent on these farms averaged the equivalent of 93 10-hour days*
The fourth group, commercial part-time farms, required 127 standard man days (MWU) of labor to carry their volume of production and reported spending the equivalent of I60 ten-hour days at farm work* This group had an average of 52 acres in crops out of the 102 acres in the farm* MWU spent with livestock accounted for about two-thirds of the total and livestock sales made up about 72 percent of the gross farm sales* In terms of man work units, this group would average out as about half-time farms*
There were 10 individual cases of Class IV part-time farms with MWU in excess of the 25O considered about the average for commercial full-time farms* Four of these are included below in the 55 cases making substantial progress toward full-time farming* These either

- 158 -
had large debts or were on rented farms • In either case they believed their opportunities for capital accumulation were better with the nonfarm job. Two others had the goal of full-time farming but their financial position was such as to preclude their being placed in the "substantial" progress subclass. Each was on a rented farm, had considerable debt on chattel properly, and had an indicated net worth of less than $1,000. In each case half of the MWU was tobacco production. The remaining five cases had farmed full-time in the past before beginning part-time farming. Two made this move to permit sons to do more of the farming, two because disease had forced liquidation of livestock, and the remaining one because of preference for nonfarm work. (The latter, in the author*s opinion, had originally farmed full-time with his wife's inheritance.)
In Table 57 was indicated the hours of labor reported as spent on the farm by the operator or others, converted to 10-hour days. A certain amount of that labor would necessarily be used for maintenance and repair of buildings and equipment, the remainder for farm production. The calculated MWU for the Class IV farms accounted for almost 8o percent of the average of l60 ten-hour days of labor reported as spent on the farm. On Class II and III farms MWU accounted for only about half of the reported labor, and on Class I farms for only about one-fourth the labor reported. This could be an indication of the inflexible nature of the maintenance requirement on the dwelling and outbuildings regardless of the size of farm on which they are erected; or it could be an indication of lower efficiency in use of labor on the smaller units. It was indicated above, concerning

- 159 -
machinery and equipment, that those operators on smaller tracts also had a smaller investment in farm equipment «
The M&TU per farm averaged highest on the southwestern area farms and lowest on northeastern area farms - with not much difference from area to area in total MWU provided by the average part-time farm. There was, however, considerable variation from area to area as to kind of enterprise providing the MfU as was to be expected from the data relative to type of farm presented above. Livestock accounted for only about 37 percent of the MfU on farms in the northwestern area, about 60 percent in the southwest area, and over 70 percent on the farms in the eastern areas.
The number of MWU supplied by the farm business is a measure of the realized capacity of the farm. How do the various groups of part-time farmers en route to full-time farming compare by this measure?
The 55 part-time farmers previously discussed as having made substantial progress txward full-time farming averaged 135 MWU per farm. This would be about half the volume of production of a typical full-time farm in Ohio. The range in this group was from a low of l6 to a high of 338 MWU. The case with only l6 MWU was a farmer who had started as a part-time farmer, farmed full-time for about seven years, and was now farming part-time again. He had retained his equipment and planned to farm full-time «gain in the future after coopletion of some major building changes. The operator with 338 MWU had been a full-time tenant farmer in Kentucky.

- 160 -
He had purchased his farm In 1^47 ard had taken nonfarm employment to liquidate his debts more rapidly. His financial situation is satisfactory to him now but he wants to make some improvements that require added finances. He now sells Grade B milk and he wants to meet Grade A requirements. His statement was that he about "breaks even" on the farm and can't "get ahead" as fast without the nonfarm job.
On these 55 part-time farms about 30 percent of the MWU were supplied by crops and 70 percent by livestock - practically the same proportions found in the sample of operators engaged in full-time farming,
Ihe size of farm business of the 62 operators who used part-time farming to become established on a commercial full-time scale is shown in Table 58* Those considered as "established" but still farming part-time averaged 1Ô3 MfU per farm. Those farming full-time in 195^ had an average of 254 MWU per farm. For a comparison of MWU on the different farms relative to progress toward full-time farming see Figure 6,
6, Productive Man Work Units on Present and Former Part-Time Farms in Ohio.
2iZ Part-Time Farmers
55 Progressing to Full-Time
Productive Man Work Unitsgo 100 150 300 250
W Established, Still PaTt-TlM
18 Former Part- Time, Now Full.
Time
LEGEND Crops I IL, Stock
100
SourceÎ Tables 57,58

- I6l -
TABIE 58Productive Man Work Units, I8 Operators Now Farming Full-Time,
and 44 "Established” But Still Farming Part-Time, Ohio,1954
No*Cases
kean Ifen Work Units Per Perm Wange inArea Provided Provided
by Crops by L.Stock Tot*Percent
Crop L.StockTot* MWU Per Farm
WestN*E*S*E*
i5
Now Farming Full-Time137 145 282 56 197 247 40 198 238
492317
517783
192-526142-44099-398
TOTAL 18 74 180 254Still Farming Part-Time 29 71 99-526
West 18 62 146 208 30 70 62-475N*E* 13 49 153 202 24 76 59-360S*E* 13 38 111 149 25 75 52-281TOTAL 44 51 137 188 27 73 52-475
It is the deviation from the averages that merit some further consideration* In all three areas some operators were now farming full-time with less MWU than the minimum considered necessary to provide full-time employment* The extreme situations indicated by the ranges are to some extent abnormal* In a few cases operators had accumulated the necessary land and capital to farm full-time but had deferred building up the livestock enterprises until after they quit the nonfarm job. In one case the operator had also temporarily reduced his crop program to provide more time to personally remodel farm buildings* (in the meantime the wife was maintaining family income by teaching school*) The lowest case in MWU is likely to continue on a reduced scale for personal reasons *
At the other extreme a few cases were operating at a level about double that considered normal for an average family farm* In

— 2à6S "*
individual cases the greater output was the result of more family labor or hired help; but primarily it must be explained by the ability of some operators to accozsplish substantially more than the standard number of work units* (By working longer hours or more effectively*)
It mi^t be noted here the overlapping of extreme cases in the various samples considered* Among the 2h2 part-time farmers WWU ranged from nearly zero to 338 MWU; of the 55 sub sample progressing toward full-time farming the range was from 16 to 338 MWU; the 44 "established" cases ranged from 52 to 475 MWU; and the I8 now fulltime ranged from 99 to 526 MWU* It will be recalled that a similar overlapping existed when the farms were measured in terms of acreage operated* A similar situation could be described in the farm sales* However, the averages for these various samples indicate a progression in acreage, MWU, and farm sales* The average MWU provided by the 44 cases was clearly less than the I8 now full-time and also less than that considered satisfactory for a full-time family farm*
Overcoming the deficiency in MWU is the last step taken by many operators in developing a full-time farm business* As has been indicated, some quit the nonfarm job before the farm is in full production* In making the step to full-time operation most frequently the plan is to intensify by incnreasing the amount of livestock kept.This part (livestock) accounted for nearly three-fourths of the productive MWU on the 18 farms whose operators were now full-time farmers* This deficiency in MWU is apparent in the gross farm sales of many part-time farmers.

- 163 -
Income j Farm and Nonfarm^ of Part-Time FarmersData was obtained from the part-time farmers Interviewed relative
to sales of farm products and nonfarm earnings* While some questions were asked relating to home use of farm produced products, data was not obtained to measure the value of the total contribution of the farm to family living. Such data would be very helpful In appraising the over all contribution of the farm to capital accumulation as well as to family living.^
During the past five years. It Is estimated that. Items other than farm marketings represented about 15 percent of the gross farm Income to a U Ohio farmers* These other Items Include government payments, rental value of farm dwellings, and value of products used for consumption In the farm home*^
On smaller part-time farms the gross farm products sales would undoubtedly be outwelghted In importance by the rental value of the residence and value of products for home use* This would be especially true If the latter were valued to the family at retail rather than at wholesale prices* Data pertaining only to gross sales thus understate the total contribution of the part-time farm to family living and capital accumulation *6 To have obtained this Information would have necessitated questions relative to the amount and kind of garden and orchard produce (both fresh and canned or frozen) used by the family. Inventory changes, estimate of the rental value of the residence, etc* Such additional questions would have so increased the time required for interview so as to have been practically prohibitive* The typical Interview, with the schedule used, required nearly two hours to comgolete*
7 "The Farm Income Situation," Agricultural Marketing Service, United States Department of Agriculture, Washington, D* C*, FIS 156 December l6, 1955> P# 24*

- 164 -
Most part-time farmers were not able to state their net cash farm income with precision. Undoubtedly, a large share of the reported gross cash farm income would be required to pay cash costs of farm operation and allow for depreciation reserves, thus leaving a disposable income for family living that is considerably less than the gross sales figures. Some operators stated that they had lost money on the farm in the year preceding interview, others "about broke even," while other operators reported their net farm income calculated for income tax purposes was a thousand dollars or more.
Net farm income of Ohio farmers in recent years, with allowance for inventory changes, has been estimated at about 4o percent of total gross farm income, or about 4-5 percent of total gross receipts from farm marketings.^ (These net income estimates include rental value of the farm home and products used on the farm where produced.)
As indicated above, data were not available for calculating net farm income of part-time farmers; however, an attempt was made to make some approximation of net income on the basis of data that were available, together with estimates of other items. Data were obtained relative to cost of purchased feed, lime and fertilizer, hired labor, and custom work expenditures. Estimates were made for machinery repair and depreciation, real estate taxes, insurance, tractorB------ ;-------------------------- —Ibid.j p. 24.

- 165 -
fuel, and seed expendituresThese estimated cash expenditures re- q,uired about two-thirds of the cash receipts from farm marketings of part-time farmers as a group. The estimated net cash farm income of all part-time farmers averaged about $650.
Residential and subsistence part-time farmers generally had estimated cash o^enses in excess of gross farm products sales; thus a part of the cash costs of the farm operation was being met from nonfarm income. The semi-commercial part-time farmers as a group were selling enough farm products to just about equal estimated cash farm expenditures. Such net farm income as accrued to this group was in the form of the family living items produced by the farm. The commercial part-time farm group had gross products sales that averaged about double their estimated cash farm expenditures.
The above data are presented with the thought that although they are estimates, they will help in evaluating the gross farm income data to follow.
The nonfarm income figures are also gross income in some respects.Withholding taxes, retirement and insurance deductions would reducethe take home pay from the wages or salaries reported. Travel costsand union assessments would further reduce the amount of the total _ 'Machinery repair and depreciation estimated at 10 percent of valuation, real estate taxes at 20 mills per $1.00 appraised valuation, insurance at 55 cents per $100 valuation of buildings. Tractor fuel and seed expenditures per crop acre were estimated on the basis of average expenditures from farm account records. Fuel expenditures per crop acre was estimated at $4.25 in western Ohio, $4.70 in northeastern, and $4*90 in the southeastern area. Seed expenditures were estimated at $2.00 per crop acre in western Ohio, $2.50 in northeastern, and $1.65 in the southeastern area.

— X66 —
salary or wages available as disposable family income. Such deductions and expenses, thou^ important, are a considerably smalXer proportion of the total nonfarm Income, in most cases, than are farm esqpenses as a proportion of gross farm sales. Distance traveled to work and mode of transportation will influence the proportion of nonfarm income that can be counted as net income*
The value of farm products produced and sold from the farms of part-time farmers ranges from near zero to in excess of $10 ,000 annually* The mean gross value of farm product sales by the 242 part- time farms surveyed in the general sample was $1,786 per farm* The average gross sales per farm were approximately $3 ,0 0 0 in northwestern Ohio, $2,000 in southwestern, $1,700 in northeastern, and $1,500 in the southeastern area*
As indicated above, relative to type of farming, the source of gross farm sales has wide variation from farm to farm* 8cane part- time farmers sell only crops; other sell only livestock and livestock products; most sell both crops and livestock products* One hundred and seventy-nine, 74 percent of the farms, in the total sample reported some sales of livestock and livestock products * The average sales per farm reporting such sales was over $1 ,7 0 0 per farm* Ninety percent of the Class IV farms reported livestock sales averaging nearly $2 ,7 0 0 per farm selling*
Livestock sales accounted for about 70 percent of the total sales for the entire group, but accounted for less than 30 percent of the total sales in the northwestern area and nearly 90 percent

- 16? -
in the southeastern area. Farm product sales as a proportion of total cash family income were more important on the western Ohio part-time farms than those in the eastern Ohio areas. This difference in importance between the two areas is more a reflection of difference in level of farm sales than of levels of nonfarm wages. Table 59 shows the data relating to average incomes per farm by source.
TABLE 59Mean Gross Farm Sales, Honfarm Income, and Total Cash Income
Per Farm, 242 Part-Time Farms, l4 Ohio Counties, byArea of State, 1953
Area of State
GrossFarmSales(Mean)
NonfarmIncome(Mean)
TotalCashIncome(Mean)
Farm Sales as Percent of Total Income
Livestock Sales as Percent of Farm Sales
Northwestern $2,971 $4,532 $7,503 39 .6 28
Southwestern 1,970 4,479 6,449 30.5 76
Northeastern 1,662 4,923 6,585 2 5 .2 74
Southeastern 1,466 3,896 5,362 27 .3 88
TOTAL $1,786 $4,374 $6,160 29 .0 71
The variation present in average nonfarm income per farm is in part a reflection of variation in wage rates, in part due to number of days worked during the year, and in part to number of workers with nonfarm jobs.
In addition to the operator, other family members of some part- time farm families worked at off-farm employment. For the 242 part- time farms, 275 persons were reported as having worked at nonfarm

- 168 -
jobs dviring the previous year* Average noufarm income per worker was about $3,850, varying from $4,175 per worker in the northeastern area to $3,670 in the southeastern area* Nonfarm wages per day worked averaged $17*00 in the northeastern area, $l6*6o in the western areas, and $15*30 in the southeastern area, or about $16*25 a day for off-farm work in all areas *^^ The average farm sales and nonfarm income by class of part-time farm is shown in Table 60 below*
XAB1£ 60Mean Gross Farm Sales, Nonfarm Income, and Total Cash Income
Per Farm, 242 Part-Time Farms, l4 Ohio Counties, by Classof Part-Time Farm, 1953
Class of Part-Time Farm
GrossFarmSales(Mean)
NonfarmIncome(Mean)
TotalCashIncome(Mean)
Farm Sales as Percent of Total Income
Livestock Sales as Percent of Farm Sales
Class I $ 10 $5 ,088 $5 ,098 *2 7Class II 171 3 ,751 3 ,922 4*4 63
Class III 638 4 ,510 5,148 12*4 69
Class IV 3 ,3 5 8 4,200 7 ,558 44*4 72
ALL CLASSES $1 ,786 $4 ,374 $6,160 2 9 .0 71
No consistent relationship was apparent between reported levelof nonfarm incane and gross farm sales* Some operators with thehigher levels of nonfarm income also had a large farm business* 0th-10 The nonfarm earnings of part-time farmers are comparable with those
of all workers in nonfarm employment* Average weekly earnings of all workers in covered employment in Ohio averaged about $80 per week in 1953 and 1954, and $87 per week in manufacturing* See "Average Weekly Earnings in Industries Ihider Ohio Unemployment Compensation Law by Counties 1943-54," Div* of Research and Statistics, Ohio Bureau of Unemployment Compensation, Columbus, Ohio, Mlmeo*9-13-55.

- x69 -
er cases were very low in terms of both sales and nonfarm income* Individual cases of Class IV farm operators ranged from $900 to over $12,500 in reported income from nonfarm work, from $1,207 to $11,880 gross farm sales, and ccmibined sales and nonfarm income ranged from $2 ,180 to $19,340.
Income Related to Family CycleThe income of the part-time farm family as related to age of
operator follows a cycle somewhat similar to that of full-time operators as described by Heady and others.^ Gross income of the part- time farm family increases with age of operator reaching a peak in the middle age years (45-54) and then declines « Individual cases will depart from this general pattern because of health, employment opportunity and the host of uncertain occurrences that can disrupt the family income flow. With the part-time farmer the cycle of farm income is not so distinct as the pattern of nonfarm income (perhaps because of failure to consider the value of products produced for family living). Host of the part-time farmers reported raising some garden for family use. The most frequent estimates of size were one-eighth to one-fourth acre; and ranged from one-tenth to more than one acre. The average size garden of those estimating size was about four-tenths acre.
11 Earl O. Heady, W* B. Bach, and G. A. Peterson. Interdependence Between the Farm Business and the Farm Household With Implications on Economic Efficiency. (Ames, Iowa : Iowa Agricultural Eaqper i -ment Station, 1953) Research Bulletin No. 39Ô, pp. 4lO- 4ll.
- 170 -
That the two congponeats, farm and aoufarm iaccme, do not follow the same course exactly Is to be ejected with a group of persons with such diverse interests and goals. The variation in emphasis on farming operations is wide for any particular age group^ and difference in family size associated with a given age group influences the amount of labor available to use. The farm income will also vary with the agricultural resources at the command of the family firm.
We might conceive of the family unit (firm) as having ccmmand of certain productive resources to employ. The supply of the human energy resource (labor) would vary with the number and ages of the family members available for work.
The productive employment of the operator alone would be expected to increase to a peak in his prime of life and then gradually decline. The productive effort of the wife could be ea^cted to follow a similar pattern. With smal1 children her work, for the most part, would be restricted to the home. As the children grew, they would be more able to do things for themselves and to contribute to the family labor pool until they left home to shift for üiemselves.
Some of the present part-time farmers who formerly farmed fulltime explained that they sought nonfarm employment when other family members were able to do much of the farm work. Some indicated it was easier for them to get a job and/or at hi^er rates of pay than their son - even thou^ he was able to do a man's work on the farm.
In such a case we might think of the nonfarm eaployment as an alternative enterprise being added to the family farm business. It

lABIE 6lAverage Gross Family* Income of 242 Part-Time Farms as Related to Age of
Operator, l4 Ohio Covmties, 1953Income Age of Operator AverageSource 25-3t 3544 45-54 55-64 _ 65-75 AllNorthwestFarm $1,551 $4,038 $2,829 $ 4,943 $2,465 $2,971Nonfarm** 3.286 4,858 5,167 8,417 4,532TOTAL-- $5,837 $8,896 $7,976 $13,350 $4,098 $7,503
SouthwestFarm $2,368 $1,288 $2,190 $ 2,254 $1,045 $1,970Nonfarm t,p5 3,950 5,084 4,812 2^900 4,479
TOTAL $6,1*93 $5,238 $7,27^ $ 7,076 $3,945 $6,41)9
NortheastFarm $2,021 $1,122 $2,084 $1,830 $1,562 $1,662Nonfarm t,357 4,870 _ 4,350 ,5,000 4,923
TOTAL $6,378 $5,992 $7,503 $6,180 $6,562 $6,585SoutheastFarm $1,363 $1,524 $1,721 $1,182 $1,108 $1,466Nonfarm 3, W 3 .^ 1 4,144 3,755 3,125 ^3,896
TOTAL $ï,® 3 $5,485 $5,665 $4,937 $4,233 $5,362Total CasesFarm $1,814 $1,578 $2,022 $1,834 $1,468 $1,786Nonfarm 3,806 4,341 4,804 4,449 - - - 4,374
TOTAL $5,620 $5,919 $6,826 $6,283 $4,970 $6,160* Family income here Includes gross cash farm sales plus nonfarm income from paid engployment vhether
to operator or other members of the farm family,** “Nonfarm income per family" is total gross nonfarm wages divided by number of families. Since the
242 farms r^rted 275 eiqplQyed persons (average l,l4 per farm), average nonfarm income per employed worker was $3,650,
I;I

- 172 -
is an alternative choice to enlarging the farm or intensifying farm
operations to employ the additional available labor.In other instances the farm operations are being added to the
nonfarm job which holds the position of the primary enterprise.
Xhus a family may begin living in the country on a small tract be
cause of the amenities of rural living and expand into more serious
farming activities as the family labor simply increases.
In periods of full employment and relatively large demand for
workers, the physical ability and desire of the individual sets the
upper limit on total time to be spent in productive enplqyment.
The man situated as a part-time farmer thus may choose how or idiere
to employ his time - in overtime or extra work nonfarm, or in carry
ing on a larger farm operation. This choice may be contingent on
the kinds of nonfarm jobs available and the labor demands of those
jobs. Different kinds of nonfarm employment vary as to the demand
for time of the worker, both in total hours req.uired and in the
distribution of those hours during the year.
The family labor utilization does tend to follow such a family
life cycle. Table 62 indicates the average employment of the family labor supply by age groups.
The amount of time spent by the family head at nonfarm enploy-ment ranged from about 600 hours to 2,600 hours annually, averaging
a little over 1,900 hours.^ The time spent at farming by the family12 ---
A minimum of 100 days of off-farm work was reqjuired to meet the definition of part-time farmer used in this study. Nonfarm employment probably ranges a U the way from one or two to 365 days a year as extreme cases.

TABLE 62Average Hours of Family Labor Resource Utilized, Farm and Nonfarm, by 242 Part-Time
Farm Families Classified by Age of Operator, 4 Ohio Counties, 19 3Labor Age of Operator (Family Head) in Years AverageUtilized . ... 25-3^ _ - 35-44 45-54 55-04 65-74 AllOperatorFarm 86? 812 813 834 807 823Nonfarm -.1,938 _ _ 1,939 .... 1, ^ _ 1,905TOTAL 2,7% 2,750 2,752 2,733 2,466 2,7^
Othw Family MembersFarm 206 225 400 297 215 292Nonfarm 111 172 292 363 306 248TOTAL 317 397 692 U o 521 54o
Total FamilyFarm 1,073 1,037 1,213 1,131 1,022 1,1L5Nonfarm 1,990 2.110 2^231 2.262 .1,965 . 2,153TOTAL 3,063 3,147 3,444 3,393 2,987 3,268
Total Utilization as Percent of AverageOperatorFarm 105.3 98.8 98.8 101.3 98.1 100.0Nonfarm -98.6 101.7 101.3 99.7 87.1 100.0TOTAL 100.7 100.8 100.9 100.2 90.4 100.0
Other Family MembersFarm 70.5 77.1 137.0 101.7 73.6 100.0Nonfarm 44.8 69.4 117.7 146.4 123.4 100.0TOTAL 58.7 73.5 128.1 122.2 96.5 100.0
Total Family LaborFarm 96.2 93.0 108.8 101.4 91.7 100.0Nonfarm 92.4 98.0 103.6 105.1 91.3 100.0TOTAL 93.7 96.3 105.4 103.9 91.4 100.0
Ii:wI

- 174 -
head varied from, practically zero to about 2,^00 hours annually and averaged over 800 hours a year* The combined time spent by the family head at farm and nonfarm work averaged over 2,700 hours, but ranged from about 1,400 to over 4,500 hours annually*
Operators of the larger part-time farms, those with gross sales of $1,200 or more, reported an average of 1,100 hours a year spent at farm work and 1,800 hours at nonfarm employment. The total family labor on these farms averaged about 1,600 hours a year used In farming and 2,050 hours at nonfarm work.
Background and TncomeAs noted earlier the gross cash farm income of the part-time
farmers interviewed varied from zero to over $10,000 in 1953# averaging about $1,800 per farm; and nonfarm inccme varied from less than $1,000 to over $12,000 per family, averaging nearly $4,400.
Those operators of part-time farms who had been reared on a farm generally were carrying on a larger farm business than those with a nonfarm background* While 75 percent of all the 242 part- time farmers interviewed had been reared on a farm, 82 percent of the operators of commercial part-time farms were farm reared compared to only 44 percent of those who operated residential part- time farms* The mean cash farm sales of families whose operator reported a farm background was over $2,000 compared to $1,100 for those whose operator was nonfarm reared* The median cash farm sales for these same groups was $1 ,478 and $500 respectively*

- 175 -
There appeared to he no significant difference between those part-time farms with both the operator and wife having a farm background compared to cases of a farm reared operator with a nonfarm reared wife. There was, however, some tendency for more farming operations to be carried on where a nonfarm man had married a farm reared wife than when both were reared nonfarm. The cash average farm sales for these latter two groups were: means, $1,393 and$939, and medians $628 and $470 respectively.
The nonfarm income of the part-time farm operators with a non- farm background averaged somewhat higher than those whose operators were farm reared. A part of this variation may be accounted for by the higher average level of education of the operator with a nonfarm background. Table 63 below indicates the average gross cash income of part-time farm families related to background and level of educational achievement.
TABIfi 63
Mean Cash Farm Sales, Nonfarm Income, and Total Cash Incomes of 235 Part-Time Farm Families by Place of Rearing and Formal
Education Attainment, 14 Ohio Counties, 1953Highest Level of
Operator Farm Reared Operator Nonfarm Reared Gross Income Gross Incoae
EducationAttainment
No.Cases
FarmSales
Non- To- No. Farm tal Cases
FarmSales
Non- To- Farm tal
8 Yrs. or Less 67 $1,700 $4 ,259 $5,959 11 $1,413 $3,841 $5,254
9 - 1 1 49 1,927 4 ,256 6,183 10 1,325 4,280 5,605
12 50 2,582 4 ,216 6,798 27 728 4 ,769 5,497
13 Yrs. or Over 12 2,023 5,375 7,401 9 1,65s 5,694 7,346Average All 178 $2,040 $4 ,320 $6,360 57 $1,H7 $4,648 $5,765

- 176 -
The median nonfarm income for each educational and background group was $4,000; except for those with more than a hi^ school education where the median was $5,000 for farm reared, and $6,250 for nonfarm reared operators* The over all median (and mode) for both background groups was $4,000.
In ccmtparing total gross cash incomes, those with a farm background had higher incomes than those with a nonfarm background.Their income advantage in farm operation appeared to more than offset their disadvantage for income in nonfarm employment.
Formal Education and IncomeDoes more formal education pay? There are some indications
that the answer is yes - but. Table 64 below indicates the relationship of gross farm sales of the 235 part-time farm operators related to years of school ccmpleted. Lower farm produce sales and low level of educational achievement was only pronounced in the lowest educational achievement group.
TABIE 64Mean Gross Farm Sales of 235 Part-Time Farmers, by Area
and Years of Formal Education, 14 Ohio Counties,1954
Formal School Yrs.
Mean Gross Farm SalesNorthwest
Southwest
Northeast
Southeast
• All Areas
As Pet. of Avg.
Less lhan 8 $1,844 $ 826 $1,037 $ 816 $ 926 50.9Completed 8 3,332 2,386 1,378 1,668 1,826 100.49 - 1 1 2,503 2,151 2,460 1 ,258 1 ,816 99 .9Completed 12 3,218 2,152 1,714 1,755 1,983 109 .1Over 12 >170 816 1.510 1,712 1.864 202.5MEAN $2,971 $1,970 $1,685 $1,513 $1,818 100.0

- 177 -
Once the coogsletlon of elementary school level was attained there was no significant difference in farm sales*
When related to the nonfarm earnings of the part-time farmer, earnings progressed with higher levels of educational achievement* The most marked increase in average earnings over the previous level was in those who reported some training beyond high school* See Table 65* This is not to say that the higher education is the cause for the higher earnings - but does bear some relationship to it* The same ambition and qualities present for educational achievement may be rewarded by hi^er income in earnings pursuit*
TABIE 65
Mean Nonfarm Income Per Farm Operator, by Area and Years of Formal Education, 235 Part-Time Farms, l4 Ohio Counties,
1953Formal School
YearsNorthwest
Southwest
Northeast
Southeast
AllAreas
As Pet* of Avg*
Less Than 8 $4,000 $3,536 $3,600 $3,600 $3,597 90.5Completed 8 5,550 3,408 3,794 3,582 3,794 94*49 - 1 1 3,336 4,241 3,850 3,815 3,816 96.0Completed 12 2,895 3,952 4,336 4,145 4,026 101*3Over 12 5,850 4,375 6,786 3,584 ^5,261 132.4MEAN $3,907 $3,892 $4,315 $3,783 $3,973 100*0
Individual cases will exhibit a wide range from the average indicated in Table 65. With a job qualification stress on educational achievement there appears to be some tendency for the more educated man to obtain a higher paying job*
Neither the farm nor nonfarm income above will give a true picture of the earning ability of the individual who is dividing

- 178 -
his time and Interest between two jobs in varying degrees. Table 66 indicates the average gross cash income from both farm and nonfarm sources to the operators, grouped by educational achievement. Here the progression of income is somewhat more regular with higher levels of educational achievement, particularly with respect to completion of a commonly defined educational block, as completion of elementary school, high school or college.
TABIE 66
Mean Total Gross Cash Income,* 235 Part-Time Farm Operators, by Area and Years of Formal Eduoation, l4 Ohio Counties,
1953Formal School
YearsNorthwest
Southwest
Northeast
Southeast
AllAreas
As Pet. of Avg.
Less Than 6 $5,844 $4 ,362 $4 ,637 $4,4l6 $4 ,5 2 3 7 8 .1Conpleted o 8,882 5 ,794 5 ,172 5,250 5,575 9 6 .39 - 11 5,839 6 ,392 6 ,310 5,073 5,632 9 7 .3Conpleted 12 6,113 6,104 6 ,050 5 ,900 6 ,009 103 .8Over 12 9,020 5 ,191 8 ,296 5 ,296 7,125 123.0MEAN $6 ,978 # , # 2 $6,000 $5 ,296 $5 ,7 9 1 100.0
* Gross farm sales plus nonfarm income of operator (excludes incomes earned off-farm by other family workers).
The income of elementary school graduates averaged 12 percent higher than non -graduates ; high school graduates averaged eight percent higher than elementary graduates and college graduates averaged 50 percent higher than high school graduates. College graduates also averaged 26 percent higher than those who attended college but did not graduate. (The nine college graduates had an average gross in- ccane of $9#010 made up of $6,670 nonfarm and $2,3^0 gross farm sales.)

- 179 -
The above dlscviBsion of incarne related to educational level pertains to the operator only. Family nonfarm income tended to average a little higher in the lower educational group because in a greater proportion of the cases there was more than one nonfarm income included in the family total. About l6 percent of operators with less than eigth grade education reported more than one income earner in the family - declining to five percent of operators with educational training beyond high school.
Income - Part-Time Farmers Bn Route to Full-T mf» FarmingAmong the 55 part-time farmers selected from the general sample
as having made substantial progress toward full-time farming, farm sales averaged over $3/000 per farm. Gross farm sales accounted for nearly half of the total family cash income, with sales of livestock and livestock products accounting for about 70 percent of farm product sales. The same area patterns noted for the general sample were evident in this subsample - i.e., livestock products were more important in the total sales of the eastern areas, while total farm sales in those areas made up a smaller percentage of total farm family income. Data for the income sources of this group is shown in Table 67.
Farm product sales for this grovrp were just about double those of the total groixp from which they were selected. Since nonfarm incomes averaged somewhat lower than for the total part-time farmer group, farm sales accounted for nearly half of the total family income in this subgroup. It is also evident that livestock played a

- 180 -
more ingportant role in their farm operation, since livestock sales averaged $3,000 per farm selling and nearly $2,800 per all farms.
How do gross sales of the $$ cases compare with the 62 cases regarded as "established" in full-time farming? The 62 cases regarded as established in commercial farming average over $6,600 of farm product sales, about 75 percent higher than the 55 with substantial progress. Nonfarm income for the 62 cases averaged over $2,900. The total cash income of nearly $9,600 for these cases were made up of about JO percent gross farm sales and 30 percent nonfarm income.
TABIE 67Mean Gross Farm Sales, Nonfarm Income, and Total Cash Income Per
Farm, 55 Part-Time Farmers* Achieving Substantial Progress Toward Full-Time Farming, 1953
AreaofState
GrossFarmSales(Mean)
NonfarmIncome(Mean)
TotalCashIncome(Mean)
Farm Sales as Percent of Total Income
Livestock Sales as Percent of Farm Sales
Western $4 ,566 $3,895 $8,461 54 .0 54 .7
Northeastern 3,768 4,275 8,043 46.8 70 .5
Southeastern 3,074 3,653 6,727 4 5 .7 93.4TOTAL $3,818 $3,922 $7,740 4 9 .3 7 0 .0
* Selected from 242 part-time farmers, l4 Ohio Counties, 1953*
Income as a measure of the size of farm business is most significant in ccmparing the positions of the 18 of the 62 now full-time with the 44 operators still part-time. See Table 68 and Figure 7 .

- 181 —
Mean Farm Sales, Nonfarm Income, and Total Cash Family Income of 18 Full-Time Farmers, and 44 Operators Still Part-Time by
Farming Areas, 1954Farming Areas All
AreasItem Western
Northeastern
Southeastern
Gross Farm Sales Full-Time Part-Time $14,9596,524 $8,745
5,598$6,450
3,526$9,834
5,365
Nonfarm Income Full-Time * Part-Time -
$ 700 3,600
$1,2133,785
$1,2703,731
$1,0863,693
Total Cash Income Full-Time Part-Time $15,65910,124 $9,958
9,383$7,720
7,257$10,920
9,058
Nonfarm income to operators working off-farm less than 100 days, or to his wife. In some cases operators had q.uit nonfarm job during year interviewed.
Figure 7. Gross Cash Income^ Farm and Nonfarm, of Present and Former Part-Time Farmers in Ohio, 1953-5U.
Dollars0 2000 liOOO 6000 8000 10000 120002U2 Part-Time
Farmers55 IVogressing to Full-TimeU2i Established, Still Part-Time
18 Former Part- Time, Now Full-
Time
I£CEND
Other (
Source* Tables

— ids —
Those operators now faming full-time had fam sales dO percent higher than those operators still working off the fam. In western Ohio this Increase In fam business came from renting additional land for cash crops. Cash crop sales of those full-time were $10^82$ compared to $2,3^0 for those still part-time. Livestock sales were not significantly different, being $3>950 for those full-time and $4,150 for those still part-time.
In eastern Ohio those farming full-time had intensified with more livestock production. In southeastern areas cash crops remained about the same for both groups at $1,000 or less while livestock sales for those now full-time increased from $2,600 to $5,000.
In northeastern Ohio, cash crop sales were about $1,000 less for those now full-time, but livestock sales were $4,000 higher.It will be recalled that the total acreage and crop acreage was about the same in eastern Ohio for those still part-time and those now fulltime in the "established" groups, while in western Ohio those fulltime were operating a larger acreage, primarily through renting additional land.
When the positions of those now full-time and those still part- time are compared in terms of their total cash family income, including that from nonfarm sources, there is little difference between the two groups. In fact, since a larger part of the nonfarm income will be net income, the spendable family inccme would appear to be higher for those still part-time. If this is true it mi^t help to explain the reluctance of some part-time farmers to give up the nonfarm job

- 183 -
even after they have developed a size of farm business comparable vith that of full-time farmers in their area. The gross farm sales of scmte operators In the 44 still farming part-time greatly exceeded those of some of the I8 other operators who had relinquished the non- farm job to devote their full time to the farm.
Labor Utilization by Part-Time FarmersIt was noted above that the labor use reported on part-time
farms averaged over 1,100 hours per farm, with the operator providing about 800 hours and other family members an additional 300 hours. The individual farm situation would vary greatly fr<m this average, depending on size of farm, age of household members, motivation, and type of farm operated. Time reported spent at farm work by the household head varied from 23 hours on Class 1 farms to 2,500 hours on some Class IV farms. Time spent at farm work by other family members ranged from zero to 2,400 hours. Total family labor reported used on the part-time farm varied from as little as 100 hours to about 3,750
hours.On some part-time farms the labor was used entirely for main
tenance and in production of garden and other products for home consumption. On other farms the labor was used primarily to produce marketable products. (Some of the reported labor time of part-time farmers, as with full-time farmers, was apparently spent watching the crops or livestock grow rather than in productive work.) There was evidently some over-estimation of labor used in some cases and under -estimations in others. On the average, however, the labor re-

- i m
ported used by part-time farmers appeared to have been used effectively, This vas especially true on the larger part-time farms.
The total productive man work units calculated for the 2k2 part- time farms accounted for about two-thirds of total time reported spent by the family at farm work. This would mean either 33 percent of the total hours were spent in maintenance and work not included in the MHU calculation, or their labor was used at a lower level of efficiency than that assumed in the MWU calculation. Probably scaoe of each category was present. A substantial number of part-time farmers, especially on the subsistence and residential units were devoting a considerable amount of time to remodeling buildings, fencing, etc.It should also be obvious that, to the extent the operators of smaller part-time farms did keep a cow, or family poultry flock, the time spent on the livestock enterprises per imit of output would be proportionately larger than if more units were handled. (Some efficiencies of scale are definitely assumed in the MfU weighting used.)
If the gross sales are distributed over the MWU of the average part-time farm, what is the rate of return to the labor? The 242 part-time farms surveyed totaled 17,620 MWU in crop and livestock production (excluding home garden)• The average gross sales per MWU was nearly $2$ - or an average per man work unit hour of $2.46.The return per man work unit hour ranged from 16 cents per hour on Class I farms to $2.74 per hour on Class IV farms.
When the gross sales were distributed over the number of hours reported worked by part-time farm family members, the gross return

- 185 -
per hour averaged $1.60; ranging from three cents on Class I farms to $2.12 on Class IV farms. Table 69 indicates these measures by class of part-time farm.
TABIB 69
Mean Gross Sales Man Work Units and Gross Return Per Hour and Per MWU, by Class of Farm, 242 Part-Time Farms, 14 Ohio
Counties, 1953
Class ofPart-TimeFarm
GrossFarmSales
CropandLivestockMWU*
Sales Per MWU Crop and Livestock
Gross Return Per Hour Reported To To
Farm** Family***
Total MWU as Pet. of Reports Time Worked
I $ 10 7 $ 1 .6 0 $ .0 3 $ .02 17
II 171 23 7 .3 0 .3 3 .30 45
III 638 41 1 5 .6 0 •69 .64 44IV 3 ,3 5 8 124 2 7 .4 0 2 .1 2 2 .0 3 77TOTAL $1 ,7 8 6 73 $2 4 .6 0 $1 .6 0 $1 .5 3 67
* MWU devoted to crops and livestock, excludes gardens.Gross sales divided by total hours reported spent at farm work.Gross sales adjusted for hired labor and custom work, divided
— by hours r^orted worked by family.Since the farm production and resulting gross sales were not
entirely the result of the family labor force some adjustment was made for use of hired labor and custom work. The adjusted returns per hour to family labor ranged from two cents on Class I farms to $2 .0 3 on Class IV farms. Custcaa work is more important than hired day labor on part-time farms, as might be expected from the relatively small, investment in machinery on part-time farms.
One hundred and thirty-three of the 242 part-time farms had hired some custaa work performed. Such work averaged a .little over

- 186 -
$100 per farm hiring. About two-thirds of the semi-commercial and commercial part-time farms reported hiring some custom work. The average cost to those hiring was $144 on Class IV and $6l on Class XXI farms. Farmers in these classes^ harvesting an average of 52 and 17 crop acres respectively, depend on other farmers to provide the specialized equipment needed for some jobs. Combining small grain, picking com, or baling hay were the jobs most frequently mentioned, thou^ an occasional operator had hired plowing, seeding, or other operations performed.
Only l8 part-time farm operators, all on Class IV farms, reported hiring any labor in addition to custom work. Those reporting an average of $369 spent for such labor, ranging from $15 by one operator for help in baling straw to $1 ,6 0 0 for help on a dairy farm. The operator r^orting the large amount of hired labor last year was more of an "involuntary" part-time farmer. He has a farm inclement business in western Ohio and purchased the farm as an investment and lives in one of the modern dwellings on the farm. He rented to a tenant on a livestock share basis with the major engpha- sis on dairy. The tenant left after some disagreement and Mr. Q decided to operate the farm himself with some hired labor. Ibis generally has been unsatisfactory and at the time of interview he had sold the dairy herd and was shifting to beef and sheep. He was also giving serious thought to selling the farm.
Table 70 indicates the gross return to labor on part-time farms by area of state. Gross returns per MWU averaging nearly $42 were highest in the northwestern area where cash grain farm

- 187 -
ing was the predominant type of farming done by part-time farmers. Income per hour reported spent by the family was also highest in this area^ averaging about three dollars an hour. Returns both per MWU and per hour reported were lowest in the southeastern area, averaging about $20 per MfU and $1.20 per hour labor reported spent at farm work.
TABIE TOMean Gross Sales, Man Work Units, and Gross Returns Per Hour
and Per MWU, by Area of State, 2k2 Part-Time Farms, l4 Ohio Counties, 1953
Areaof
StateGrossFarmSales
CropandLive-StockMWU*
Sales Per MWU Crop and Livestock
Gross Return Per Hour Reported To To Farm** Family***
Total MWU as Pet. of Reported Time Worked
Northwest $2,971 72 $41 .70 $3.04 $2 .9 3 77Southwest 1,970 83 24.10 1 .95 1 .85 83Northeast 1 ,662 64 26.00 1.46 1.40 59Southeast 1,466 75 19 .80 1.24 1 .1 7 64TOTAL $1,786 73 $24.60 $1 .6 0 $1 .5 3 67
* MWU devoted to crops and livestock, excludes gardens.** Gross sales divided by total hours reported spent at farm work.
Gross sales adjusted for hired labor and custom work, divided — by hours reported worked by family.
The pattern of labor utilization on the 55 part-time farms making substantial progress toward full-time farming was essentially the same as that of all Class IF farms in the total sanple. The calculated MWU accounted for about 79 percent of the total hours reported spent at farm work. Return per MWU for the 55 averaged a lit-

- 188 -
tie over $28 and return per hour of family labor was $2.18. The variation from this average by area was substantially the same as that for all part-time farmers. Data relating to hours spent at farm work was not secured from the 62 operators regarded as now established in farming on a full-time scale.
The indicated gross return of $1.53 per hour of labor reported spent on part-time farms is not high in congiarison to the hourly earnings in the off-farm work. However, it is to be considered that this was primarily labor of the operator in addition to that spent in nonfarm employment together with unpaid labor of other family members. The marginal cost of such labor is not high. Part- time farmers, as a group, could hardly be criticized on their utilization of their labor resources. This would be particularly true of the larger part-time farms. The group IV part-time farms, in terms of MWU and reported labor time used on the farm, average out as about half size farms. Reports of cash receipts of all Ohio farms indicate gross sales have averaged about $5,500 per farm in recent y e a r s .^3 Over all efficiency in the utilization of the labor resource is probably the strongest single factor in the prevalence of part-time farming.
Distance to Work and Travel TimeHow far do part-time farmers travel to the nonfarm job? How long
do they spend en route? Neither of these questions can be answeredMervin G. Smith and others. "Estimated Cash Receipts by Ohio Farmers From the Sale of Agricultural Products and Government Payments, by Counties." 1953 and 1954. (Wooster, Ohio: Agricultural Experiment Station and Ohio State University) Mimeographed Bulletins Nos. A.E. 249 and 259.

- 189 -
precisely since nearly every part-time farmer's situation is a little different from the others.
A few part-time farmers work "just across the road" frcaa the farm. Most travel from five to 20 miles one way to a regular place of employment. Scmae part-time farmers travel much greater distances; a few travel more than $0 miles to work regularly. Others have indefinite work and travel schedules. Bxaaples of the latter are construction workers, self-employed salesmen, railroad maintenance employees, milk route men, etc. Some could more aptly be called weekend farmers; they travel to the work area once a week - rooming in the town where the job is located.
In üae general sample of 242 part-time operators interviewed,222 had a definite place of employment and stated its distance both in miles and minutes of travel time. The average (mean and median) was about 13 miles; travel time one way averaged about 30 minutes.See Table 71.
While the respondents to the mail questionnaire drove shorter distances (average nine miles) to work, they indicated a willingness to move out further from work in order to get the desired facilities. In response to a question of choice of location for living while working at üie present job, three-fifths indicated they would choose a location like their present one, one-third were willing to move to a more distant location (as much as 20 or 23 miles), and only seven percent would choose to move closer to work. See Table 72. While the indicated distance they would prefer to travel appeared to be about 12-14 miles, some Indicated a willingness to travel as much as

- 190 -
23 miles to get the kind of living and farming facilities they wanted.
!EftBIE 71Average Distance Traveled emd Time Spent En Route to Nonfarm
Eng»loyment by 222 Part-Time Farmers in l4 Ohio Counties, by Area and Economic Class
of Farm, 1953Economic Class Northwest
Southwest
Northeast
Southeast " Total
Mean Distance and TimeResidential PEFDistance (miles) 14 20 11 10 13Travel Time (minutes) 23 39 29 24 30Subsistence PÏFDistance 7 20 11 11Travel Time 21 4l 26 26
Semi-Commercial FTFDistance 6 17 16 13 14Travel Time 12 34 34 30 31Commercial FEFDistance 11 17 14 11 13Travel Time 23 34 29 27 28Total All ClassesDistance 11 17 14 12 13Travel Time 22 33 31 27 29
Median Distance and TimeDistance 12 20 12 7 12Time 20 37 20 30 30
As might be expected, distance and travel time are positively correlated, those traveling further spend more time (r = *907) • However, other factors, age, type of road, size of employment center, hours of work and traffic conditions also influence travel time. The number

ÏA£1£ 72Present Situation and lÿpe of Location Desired by 160 Families With Rbnfarm Employment, but
Interested in Country Living, by Size of Tract, Northeastern Ohio, 19^3
Èize of ibract Now Occigied (Acres)Item Less Than
One 1-2.? 3"? 10-29 30-491 50-7980 or
' MoreTotal
Percent
Cases in Bangle 60 50 25 13 9 6 13 178 XXMiles to Work (Range) 1-18 1-20 2-35 4-25 2-35 13-56 2-29 1-56 XXMiles to Work (Mean) 6.4 8.6 11.6 10.4 11.1 26.3 11.7 9.3 XXAverage Travel Time One Way (Minutes) 21 24 30 26 27 46 24 28 XX
Choice of Location* (Total Respondents No*) 60 44 20 11 9 5 12 161 100.0
Like Rresent One (No.) 23 31 14 8 9 3 11 99 61.5
Closer to Work (No.) 1 3 3 2 0 1 1 11 6.8More Distant (No.) 36 10 3 1 0 1 0 51 31.7
Miles Limit (Range) 5-20 5-20 5-25 20-25 5-25 XXMiles Limit (Mean) 12 14 14 23 l4 XX
?I
* Choice of location desired by respondent if moving, but keeping present job,

- 192 -
of minutes spent per mile decreases with Increase in distance traveled•
Those part-time farm operators traveling five miles or less averaged
12.4 minutes to go 3.1 miles; or four minutes per mile. Minutes spent
per mile decreased rapidly to about two minutes per mile for those
traveling l6 to 20 miles and remained fairly constant at that rate^
declining only slightly as additional miles were traveled.
Individual part-time farmers* experience might depart widely from
these averages. Reported travel time of individuals going five miles
varied from eight to 20 minutes; those going 10 miles varied from 18
to 4$ minutes; those going 22 miles ranged from 2$ to 60 minutes.
The above indicated that part-time farming and rural living is not confined to a narrow zone about cities in states like Ohio. Per
sons are willing to drive considerable distances to get the facilities
they desire. The travel time of part-time farmers does not appear
excessive conpared to that spent by industrial employees who live and
work in the same town.
If rural houses are available to rent or to purchase at prices
coaparable with or below urban properties, this could be a factor in
fluencing future expansion of part-time farming and rural living.
There was no appreciable difference in miles traveled and time
spent en route to work by direction of movement of the part-time farm
families. Those former full-time farmers who had taken nonfarm jobs
did not drive further to work than those formerly urban residents who
had moved out to a part-time farm or rural residence. This further
supports the contention that people are willing to travel a consider-

TABIE 73Distance and Travel Time One Way to Nonfarm Engployment by
222 Part-^ime Farmers in Ik Ohio Counties, l ^ kMnutes TotalTravelTime 0-5 6-10 11-15 16-20 2I-65 26-30 31-35 s6-4o 41-45 46-50 50-55 Cases
100-109 1 1
90-99 1 1 2
80-8970-79 3 3 1 7
60-69 1 1 2 8 3 1 16
50-59 2 2 3 1 8
1*0-49 1 4 12 11 9 37
30-39 9 19 12 2 42
20-29 5 17 9 2 1 3410-19 33 13 1 470- 9 28 28
TOTALCASES 66 40 36 27 18 23 7 3 1 1 222
I

- 194 -
able distance between home and work if necessary to get the kind of
living facilities they desire.
The former full-time farmers were driving an average of l4 miles to work compared to 15 for those operators who had the goal of fulltime farming. The 55 cases of operators who had made substantial progress toward commercial full-time farming also averaged 15 miles.
Distance to work for the 62 regarded as now established in farm
ing had averaged l4 miles with a range of from one or less up to 50
miles.
It thus appears that distance between the farm and work is not
of special significance in relation to direction of movement or to achievement in the move to full-time farming.
Most part-time farmers travel to work by private automobile, although a few reported rider pools and trading with neighbors the
responsibility for providing transportation to work. Few operators expressed inconvenience or loss of work due to transportation difficulty during the winter months. About one-third of the general sangple
of part-time farmers lived along main traveled highways, about one-
third on paved secondary roads, and one-third on gravel or stone sur
faced roads. Only six of the 242 part-time farms were located on unimproved roads•
SUMMARYThe type of farming operations of part-time farmers, az^ inten
sity of land use is little different from that of their neighbors who farm full-time. Acreage devoted to crops and yields per acre

- 195 -
of those crops are not appreciably different from those of full-time
farmers•
Part-time farms cover a wide range of situations in terms of
productive man work units, labor reported used on the farm, and
gross cash sales, part-time farms average out as about one-third
to one-half time farms by these measures. In progressing toward
full-time farming, part-time farmers increase the size of the farm
business in part by renting additional land and in part by intensi
fying on the existing acreage by producing more livestock and live
stock products for sale.
The gross farm sales account for nearly one-third of the total
cash family income on the average part-time farm^ but range from a negligible proportion on some farms to almost half on others. Non
farm incomes to part-time farmers of about $4,300 a year result from
work of the operator and other family members at engployment paying
an average of about $l6.00 per worker per day worked. No inverse relationship was apparent between farm sales and nonfarm income.
Total family income did appear to be related to family life qycle, and to background and educational achievement of the farm operator.
The labor utilized on part-time farms is, for the most part,
productively used. Gross farm product sales related to total labor
spent on part-time farms averaged over $1.50 per man hour. The total
family income resulting from efficient labor utilization is a strong
factor in explaining the competitive position of the part-time farm.
Estimates of cash e:cpenses of part-time farmers from the farm would indicate that those operators in Classes I through III must

- 196 -
receive their income from part-time farm operation in lower living costs or non monetary retmrns rather than in an excess of cash farm
receipts over expenses. The Class IV part-time farms were indicated
to have about 50 percent of their cash receipts from farm marketings
to apply toward building depreciation, interest on investment, pay
ments for family labor, etc.Most part-time farmers do not spend an excessive amount of time
in travel to the nonfarm job. The average part-time farmer drives
less than 15 miles, spending about a half hour en route each way.In order to satisfy their personal goals by combining rural liv
ing and nonfarm employment some part-time farmers will drive more than
50 miles between the farm and tbeir work, though most do not need to
travel more than 15 miles in order to find an acceptable situation.
The distribution of nonfarm enqplc^ment opportunities in Ohio places
most rural areas in the commuting range of nonfarm eng)loyment opportunities.

CHAPTER VIIS PART-TIME FARMING A SATISFACTCRY ROUTE TO FULL-TIME FARMING?
The preceding chapters have presented data relating to part-time
farmers having expressed various goals^ with specific reference to
those attempting to use part-time farming to accumulate the capital and obtain command of the resources needed to operate as a full-time
farmer* In the statistical presentation above, although the averages
were q.uite meaningful^ the ranges of individual situations were also
escpressed* The situation of each part-time farmer is at least a
little different from that of another*
How satisfactory is part-time farming as a method of achieving
the full-time farming goal? The reply to a gpery of this type would
not be the same when applied to all the part-time farms studied*
Some have been very successful* Some have achieved a lesser degree
of success* Others have achieved little; in terms of their original goal, they failed*
The measure of success acceptable to one part-time farm family
would be unacceptable to some others* As indicated above some of tiiose currently farming full-time have smaller operations according
to various measures, as conpared with other operators still farming only part-time* What is a satisfactory level of income? What is a
safe margin of owner equity in the total farm business investment?
Must one own all the real estate, or is part-owner or tenant status
acceptable? The answers to these questions have elements of relative weighting of personal values that each individual must answer for himself*
- 197 -

- 198 -
In the general survey of part-time farmers, some operators with
the full-time farming goal were found in all of the four classes de
fined* [Qie 95 cases in the subsample were selected as those oper
ators having made "substantial" progress toward that goal. The second
saaple contained those "established", but only 1Ô of Idie 62 were
actually farming full-time when interviewed in 195^* Scane of the 1Ô were still partially dependent on nonfarm income of the operator frcm
employment amounting to less tian 100 days a year, or nonfarm earn
ings of the wife. When the size of farm business had been increased
to the point it required most of the operator's time, but would not
yield a satisfactory level of income for family living and debt retirement, frequently the wife had taken nonfarm employment to permit her husband to devote his time to the farm.
case studies OF SCME EART-TIME FARMERS WITH A FULL-TIME FARMING GOALThe following case studies will present pertinent details of
individual situations relative to their degree of success in achieve
ment of their goal to farm full-time.
Slight Achievement Toward Goal(l) Mr. "S" was kj years of age when interviewed on his western
Ohio part-time farm. He had completed eight years of school; his
wife, seven years. During the early 1930's he was a hired farm
worker. In 1937 he secured an "agricultural" loan (probably Farm
Security) to purchase equipment and begin tenant farming. He farmed on one farm two years and moved to another. He was farming with

- 199 -
horses and. had difficulty getting the work done at the proper time.
He expressed his problem as "bad luck" and told of being late with
his corn one year when his mare foaled at corn planting time. He
had to leave that farm and could not find another to rent, his loan
was delinquent and so "the government sold him out."
He worked in town from 19^2 to 19^6 when he purchased five acres
of unimproved land, on which he built a five-room house, small barn, and some other outbuildings. He used building materials dealer
credit until the construction was sufficiently eompleted to mortgage. He then began to purchase used equipment with the intent of renting additional land and performing custcm operations for other farmers.
These plans did not materialize. He was unable either to rent more l&uad or to get custom work jobs. (A neighbor called him unde
pendable.) In the year preceding interview he raised one acre of com and three and one-half acres was in pasture. He had started
the year with one cow, two dairy calves, four pigs, and 50 baby
chicks. During the year both calves and two of the pigs died. Ver
min and disease reduced the 50 baby chicks to 10 laying hens,. Production was entirely for home use with no sales.
Mortgages on the real estate have been repeatedly renewed at
$2,500. Recorded chattel debt totaled $2,100, mostly to dealers or
personal finance congoanies. Indicated net worth was about $2,500
and rate of capital accumulation since part-time farming was -$100
per year. (Included on a chattel mortgage form were the hogs - two
had died - one had been butchered and eaten - and the last was marked for home slaughter the following week.) As a result of the recurring

- 200 -
financial difficulties the wife had also entered nonfarm engployment,
keeping the eldest dau^ter (age 1$) at hcmie to care for the younger
children.
Part-time farming toward full-time farming has not helped this
family. The capital shortage and type of credit used have enabled
little iXQ>rovement in financial position. This couple, though farm
reared, definitely fail to demonstrate the managerial ability nec
essary to succeed. The failure to succeed as a tenant when reason
ably financed from 1937 to 19^2, the h i ^ rate of livestock mortality,
use of the farm equipment owned relative to its potential, and financial judgment demonstrated all point to a lack of managerial ability.
(2) Mr. "M", age 40, operates 200 acres of rented land in an
eastern Ohio farming area. His father was also a tenant operator
on the 120 acr^ comprising the home farm. He moved to the farm and received his father's inventory of used equipment as payment for
providing care for the aged parent. He found that the tenant share
from the 120 acres did not provide a satisfactory family income.
Farm income was still unsatisfactory after renting do acres of additional land so he took a nonfarm job. This farm is located in an
area of rough rolling and broken land in which less than $0 percent of the total acreage would be classified as crop land. Production
MWU for the farm for the year preceding interview were only 58 with
93 fr<m crops.
Mr. "M" has lived on this farm for ei^t years, has been a part-
time farmer for six years. He hopes to use his nonfarm income to fl-

- 201 -
nance the purchase either of additional farm equipment and more and
better livestock to farm on a larger scale on rented land, or to pur
chase his own farm* He sold his livestock when he took nonfarm em
ployment and now concentrates on crop production. His share of the
gross crop value in the year preceding interview was $2,300. He ex
pressed a preference for avoiding debt and so depends on use of capi
tal acquired through savings* His current indicated net worth of
about $3 ,6 0 0 does not indicate that he has made much progress toward
the full-time farming goal* He owns some farm equipment, hires some
custom operations performed, and does some exchange work with other farmers *
It would appear to the author that the nonfarm income of nearly $5 ,0 0 0 a year, in comparison with the farm income potential of the
present farm, will keep Mr* "M" a part-time farmer for some years in
the future* His reluctance to obtain credit even when it could be productively used has been a weakness in his plans* It would also
appear that keeping some livestock to utilize roughages produced
and pasture available on the farm would make more efficient use of
the total resources at the command of the operator* Indicated annual
rate of capital accumulation since farming part-time was about $400 a year.
(3) Mr* "A", 36 years of age at the time of interview, had been
a part-time farmer for three years in eastern Ohio* Both he and his
wife were reared on rented farms operated by their parents* The "A" family moved to their present farm from a rented rural residence*

- 202 -
They have three daughters ages 10 to 13, aud a 4-year old son» While
Mrs. "A" is a high school graduate, her husband had completed only
six years of school when death of his parents caused interruption of
his education. The goal of Mr. "A" is to own and operate a 240-250
acre dairy farm.At present the farm operated is 31 acres, purchased in 1950,
plus 10 acres of rented crop land. When he paid $4,000 for the real
estate Mr. "A" gave a mortgage for $2,000. This mortgage is still
in force. He then began to purchase equipment with the plan of rent
ing additional land and doing custom work. In addition to a tractor
and common tillage tools, he purchased a mower, a side delivery rake,
baler, and corn picker, and has half ownership of a manure spreader.
All the above were purchased new at a cost of nearly $7,000. Since
the barn is poor and small on his farm, most of the above mentioned
equipment stands outside all year.In the year preceding interview the crop program of Mr. "A"
included 11 acres of corn, six acres of oats, and two acres of
hay. He had three grade dairy cows, two brood sows from which he raised eight pigs, and about a dozen chickens. Gross farm products
sales were about $200. Receipts from custom work totaled about $600.Total debt of approximately $5,000 almost equals his equity in
the total farm investment of $12,000. Considering the rate of depre
ciation that would have to be applied to the equipment with such
care, it is very doubtful if acquisition and operation of the part-
time farm have made any addition to the net worth of this family.

- 203 -
An. injury had limited the nonfarm employment opportunities of Mr. "A"
so at the time of interview he was on the farm full-time euid his wife
worked in a local store, earning about $2,700 a year. At the present
rate of capital accumulation, and with the indicated level of managerial ability the goal of ownership of a large dairy farm will not
soon be attained.
(4) Mr. "V", age 4%, had been a part-time farmer for 15 years at the time of interview. Both he and his wife were reared on farms and graduated from high schools in the southeastern Ohio area. They began housekeeping in a rented house in town and Mr. "V" was employed by the State Highway Department.
In 1939 ibey began the peirt-time route to full-time farming by
purchase of a 40-acre farm for which they paid $2,500 of which $2,000
was given as a mortgage to the grantor of title. In 1946 an additional tract of 56 acres was added to the farm. A mortgage covering that
tract and the previous purchase, financed the entire $1,500 purchase price of the second tract of real estate. These mortgages were re
leased in 1948. In 1950, the "V’s" began to build a new six-room
home to replace the old dwelling. They incurred a bank mortgage of $4 ,8 0 0 in conjunction with the new construction. This mortgage was
released in 1953 so at the time of the interview there was no recorded debt on the real estate or chattels.
Mr. "V" gradually acquired a line of used farm equipment. Equip
ment currently owned had a depreciated value of about $2,500. He depends on custom operators for combining small grain, baling hay, anA

— 20^ —
picking corn. In 1953 his crop operations included six acres of corn,
one acre of barley, four acres of soybeans, and nine acres of bay.
His livestock program was six grade dairy cows (sells Grade B milk)
with three replacement heifers; two pigs purchased to feed for home
use, and a small flock of chickens for home use. Gross farm sales
in 1953 were less than $1,200. To some extent the livestock program
has been temporarily reduced because of the time spent on construction
of improvements on the real estate. Operating as he had been during
the preceding two years, Mr. "V” estimated a net loss of $300 a year
on the farm. His indicated net worth position in 1953 was $20,000.
By 1953 he had attained about the situation he had set as a goal 15 years earlier. However, he now had over I8 years of work with the Highway Department and was an equipment operator earning
a little over $3,000 a year. He likes that work and the people with whom he works. His son, 1Ô years of age in 1954, is interested in
farming more and the farm operation can not readily be expanded to a two-man full-time operation. Wow Mr. "V" has changed his goal,
the farm will continue to be operated part-time by him and his son who now works at a local dairy. It will probably continue on that
basis until Mr. "V" retires from the nonfarm job.
The rate of achievement toward the full-time farming goal had
been such that by the time Mr. "V” felt himself financially secure
on what was once a full-time farm, that farm was too small to fully
employ the family labor supply with modern equipment, and he had
achieved enough security in the nonfarm employment so as to prefer

- 205 -
that to farming full-time. The expectation of income from nonfarm
sources were at that point still more attractive than those from the
farm.
The above illustrates one of the hazards of the part-time route
to full-time farming. The lapse of time in process, bringing with it change in location in the family cycle, and changed weighting of the
relative values of security versus opportunity may lead a part-time
farmer who has become "established" to change his goal.
Substantial Progress Toward Fu].l-Time Farming Goal
(l) Mr. "H" was U2 years of age at the time of interview on
his western Ohio part-time farm. Both he and his wife are high
school graduates; she was farm reared, while he spent his boyhood
years in a rural nonfarm home. He had worked at his present nonfarm job before entering military service, from which he returned in 19^6 .
In 19^7 the "H" family decided they wanted to farm. They paid $12,000 for their 39-acre farm, giving mortgage for $5,000. They began to remodel the house and made Improvements on other buildings. He continued
to work at his nonfarm job for three years after moving to the farm.
By 1950f Mr. "H" had accumulated sufficient equipment and livestock that he rented 30 acres of additional land and began to farm
full-time, while participating in the G.I. on-the-farm training program. He began to build up a dairy herd, selling Grade 0 milk. He
reported that after one year the Veterans Administration farm super
visor wanted him to make improvements to sell Grade A milk. With his
existing level of indebtedness Mr. "H" refused to make the change and

- 2o6 -
was dropped from the G.I* subsistence program. He also reported the Veterans Administration farm supervisor did not want him to work off the farm even if on a neighbor’s farm. So Mr. "H" has again returned to his former job.
He still plans to farm full-time when he has been able to improve his financial position and perhaps obtain more land. In 1953 on his own land and that he rented he produced 30 acres of corn, seven acres of oats and l4 of hey. His livestock program consisted of seven good grade dairy cows, six beef steers, and seven sows (he raised 50
hogs to market wei^t), and 50 chickens; his gross farm sales were over $5#000. His other income, part of the year from the Veterans Administration, and part from the nonfarm job was about $2,000. His ownership of agricultural resources valued at about $21,000 was ample security for his $4,000 indebtedness. His indicated average rate of capital accumulation was $000 a year. Mr. "H" might be further along toward his goal of farming full-time if some of the funds used in remodeling the farm home had been used in equiping the farm to meet Grade A milk requirements.
(2) Mr. "B" operates an 8©-acre cash crop farm in western Ohio. Neither he nor his wife were farm reared. Both are college graduates. At the time of interview Mr. "B" was 4l years of age and had been a part-time farmer for seven years.
The "B" family originally purchased and moved to the farm primarily as a place to live. He rented out the crop land and kept just a few livestock for his own use during the first three years they
- 207 -
ovmed the farm. He was dissatisfied with the work of the tenant (who rented several other farms) and began to get equipment to operate the
farm himself. Generally his efforts have been successful and his goal
is now to add 80 more acres to the farm unit and operate a full-time
grain and livestock farm.In the year preceding the interview he grew kO acres of corn and
35 acres of soybeans. The livestock program was primarily for home use with some eggs sold. Gross farm sales were nearly $8,000. This level of sales, together with nonfarm income of $6,000, has enabled the "B" family to accumulate capital rapidly. In addition to the farm, for which he paid $l8,000, he has a rather complete line of farm equipment. Combining is the only custom work hired. The total ownership of farm and household property estimated as worth $32,000, compared to indebtedness of only $5,000, would indicate this family has made substantial progress toward full-time farming despite the lack of early farm training.
(3) Mr. "R" was 38 years of age, and had been a part-time farmer for seven years when interviewed on his southeastern Ohio farm. Both he and his wife were reared on farms in that area. His wife completed high school, he completed only the 10th grade.
During World War II, Mr. "R" worked at a factory job and saved his money toward purchase of a farm. In late 19 4-5 he purchased his
100-acre farm for $6,500, paying $4,000 from savings and giving a
mortgage for $2,500. He worked at various jobs during the next few
years in addition to farming. At the time of interview he had been driving a truck for a dairy the past four years.

- 208 -
He took a nonfana job to help pay off debts, obtain better machinery, and make improvements on the farm. Since purchase of the real estate, he has built a new barn and garage ; modernized the house in terms of water, gas, and electricity; and tiled one field.
In addition to the real estate he has acquired a conçlete line of tillage and harvesting equipment except for a combine and corn picker. Except for his tractor, he purchased used equipment. The depreciated value of this equipment at time of interview was estimated at $4,000.
In the preceding year, Mr. "R" grew l6 acres of corn, I3 acres of wheat, seven acres of oats, and made 27 acres of hay. He sold Grade A milk from 10 good grade cows, fattened nine hogs, and kept a flock of 150 laying hens. Gross farm sales totaled $4,300. Income from the nonfarm job was about $4,000.
His plans are to clear more pasture land, and to increase the size of the farm either by purchase or rental . He expects in two more years to be able to relinquish the nonfarm job.
At the time of interview, Mr. "R" had paid off the mortgage on the real estate in addition to making the above mentioned improvements . Recorded indebtedness was about $2,000 to the production credit association. His indicated net worth of almost $19,000 would give an apparent rate of capital accumulation averaging $800 a year.
(4) Mr. ”C", a 4o-year-old operator in the southwestern Ohio area, is attempting to use part-time farming to move from tenant to owner status. Mr. "C" came from a farm background in another

- 209 -
state, his wife was reared in a city. He is another former hired farm hand who started operating as a tenant with a Farm Security Loan in 1938. He rented a dairy farm and sold Grade C milk. When the landlord would not assist in making the changes necessary to equip for Grade A milk sales, he left that farm and purchased the present 40- acre tract. He kept his equipment and three of his best cows. His present plans are to farm part-time for a few years while he builds up a registered dairy herd and acquires more capital to purchase a larger farm. In the year preceding the interview he grew six acres of corn, eight acres of wheat, two acres of oats, and made 10 acres of hay. In addition to his three registered dairy cows he has two heifers, two beef cows, one steer; hogs and chickens are kept only for home consumption. Gross farm sales were about $1,400. His industrial job earned him an additional $4,000.
When Mr. "C" purchased the 4o-acre tract for Which he paid $12,000, he gave a mortgage for $3,000. At the time of interview there was no evidence of current debt, either on the real estate or the chattels. Total indicated net worth was then $21,000. Since purchase of the real estate he has repainted all the buildings, put a water system in the house and barn, and was currently installing a bath room.
Mrs. "C" has adapted herself well to farm work and frequently works in the field in addition to doing chore work when he is working at the nonfarm job. They have made substantial progress toward their goal of ownership of the kind of farm they want to operate.

- 210 -
(5) Mr. "K" operates 172 acres as a part-time farm in northeastern Ohio. Forty-eight years of age at the time of interview in 19^4, Mr. ”K" has been a part-time farmer since 1935» Both Mr. "K" and his wife were reared on Ohio farms, both attended high school. He coQ^leted the 10th grade and she graduated. He has worked at the same nonf&rm job for 25 years except for periods of temporary unemployment in the 1930's. It was during such a period of unemployment that Mr. "K" decided to seek the engloyment security of the farm.He planned to farm full-time.
In 1935 Mr. "K" purchased a tract of 108 acres from the Kentucky Joint Stock Land Bank for $3,500, paying $500 down and giving a mortgage for the balance. He began farming with some used equipment. He farmed almost full-time for several years during the later 1930's but did return to work at the nonfarm job whenever he was recalled. He still planned to use the nonfarm income merely to supplement the farm and to reduce indebtedness.
During World War II he worked as much as 70 hours a week at the mill in addition to doing farm work. It was during that period that he shifted from dairy to beef cattle. In 1950 he purchased an additional 64 acres for which he paid $8,000 - giving a mortgage for $4,800 to the Federal Land Bank.
During the crop year 1953, Mr. "K" produced 12 acres of corn,20 acres of wheat, 12 acres of oats, five acres of soybeans, and made hay on 25 acres. His only livestock enterprise in recent years has been a beef fattening operation in which he usually feeds out 25-30 head a year.

- 211 -
Although he began with used equipment, as it wore out he has re
placed it with mostly new items. The current, depreciated value at
time of interview of his full line of equipment was nearly $8,000.
His total farm investment at that time was estimated at about
$31,000 wlüi Indebtedness of less than $4,000. He has certainly
attained a capital position and size of farming unit sufficient to
farm full-time. What has happened to his goal of farming full-time?
In response to a question of this nature, Mr. "K" indicated he "may" farm full-time - but "now (in 1954) seems like a poor time to quit the mill." His nonfarm Income at that time approached $6,000 a year, and "with 25 years of seniority maybe that income is more secure than the farm."
The period over which Mr, "K" has operated as a part-time farmer was a particularly favorable one for accumulating capital, especially with extensive use of credit. Inflation of the prices of owned resources has boosted the value of such resources to give Mr. "K" an indicated average rate of capital accumulation of nearly $1 ,500 a year. (One indication of the role of inflation is demonstrated in . the prices paid for the land. In 1935 the tract of real estate, including the buildings, sold for less tlian $33 per acre, the 64-acre tract purchased in I95O without buildings sold for $125 per acre.) Would he have fared so well if he had started at another time?
"Established" in Full-Time FarmingThe following cases were selected from the second sang)le of oper
ators who had used part-time farm operation to become established on a

- 212 -
full-time commercial scale* As noted above, some operators are still devoting only part of their time to the farm operation although the size of farm in acres, in productive MWU, and/or gross sales is such that it would compare favorably with the farm operation of farmers who do spend their full time on the farm. Financial statements were completed for all farmers surveyed in this group so that the net worth and capital accumulation data relate to the status at the time of interview. These statements included other real estate, cash, and intangible property, in the assets, and all current liabilities. The statements for this group should be more accurate than those above which were noted as "indicated" value of agricultural and home assets minus the recorded indebtedness.
"Established" But Still Operating as Part-Time Farmers(l) Mr. "X" is using part-time farming to help make the transition
from full-time tenant to full-time owner-operator. He was 36 years of age at time of interview in 195^* Both he and his wife were reared on farms in the southeastern Ohio farming area. Both congileted 10th grade in school.
After returning in 1946 from three years in the Navy, Mr. "X" rented his sister's l60-acre farm, applied savings to the purchase of used equipment, and began to farm. He paid cash rent for the farm.From 1946 to 1949 he was enrolled in the G.I. on-the-farm training program. He continued to spend his full time on the rented farm from 1949 to 1951» During the five year period he had accumulated livestock and a good line of equipment. He decided to try to buy a farm and gave notice of giving up the rented farm.

- 213 -
His tenure on the rented feurm eaqplred before he found a satisfactory farm to purchase. He had already planned to liquidate most of his chattel property in order to purchase real estate so proceeded to sell his equipment and livestock. He then took industrial entploy- ment, working the second shift, while he continued to examine prospective farms to purchase. After two or three months he purchased his present farm,
Mr. "X" paid $8,000 for this farm in 1952, paying the full purchase price in cash. He then mortgaged the real estate for $3,000 to the local bank in order to obtain equipment and begin to rebuild his livestock program. He has continued to work at the industrial job while making inçrovements on the real estate, reducing indebtedness, and accumulating working capital.
Working the second shift permits him some daylight hours on the farm the year around. He earns $6o a week at the nonfarm job.
The 195^ farm program totaled l88 productive MWU. His livestock program contains five beef brood cows, three heifers, and I7 calves.He plans to expand this number by keeping the promising calves. He also had 10 brood sows, and kept 200 laying hens. Gross farm sales in 195^ were about $4,000; $800 from sale of wheat, the remainder from the hogs and poultry.
Combining, corn picking, and hay baling costing about $500 were performed by custom operators. He hired about $250 worth of other occasional labor. His line of equipment is generally old but in fairly good condition. He estimated its market value at about $1,700.

- 2 1 k -
His total ownership in 195^ was estimated at about $10,000, indebtedness at $1,700, leaving a net worth of over $l6,000. Since purchase of the real estate he has remodeled the kitchen, and put a water system in the house. He has also refenced some land and added a new machinery storage and granary building. He estimated the material cost of the improvements at $2,000. Neither he nor his wife have received any substantial gifts or inheritance.
Mr. "X's" future plans were to work about three more years. During that time he expects to liquidate his remaining indebtedness and build up the farm livestock program to provide full-time employment and a satisfactory level of income. While Mr. "X" continues to work off the farm, his indicated rate of capital accumulation in excess of $1 ,000 a year, the size of his current farm business in terms of acreage, MWU, and sales indicate he is likely to succeed with his plans. His present size of business and financial position should justify his being classed as "established" on a full-time commercial farm scale•
(2) Mr. and Mrs. "P" were interviewed on their western Ohio 137- acre dairy-hog farm. Both were then 37 years of age, both high school graduates, and both were reared on farms in the western Ohio area.They now have two sons, ages 2 and 5# and a 7-year-old daughter. The "P's" have received financial assistance in the form of a house in town valued at $6,000 which she inherited. This had added to their financial stability but not necessarily to their progress toward the full-time farm goal. They were living in that house when they decided

- 215 -
to start their move toward full-time farming. Mr. "P" returned from three years of anaqy service in 19^6.
In 19^7 they rented a 120-acre farm and began to operate it while he took G.I. on-the-farm training. They used accumulated savings to purchase used equipment. (The savings had resulted from his military service pay and her office work during the war years.) After one year on the 120-acre tract, that farm was sold. In 19^8 they purchased a 40-acre tract, rented other land, and continued to farm while he continued in the Veterans training program. When the training period and subsistence payments ended in 1951 he took a nonfarm job while continuing to farm. In 1952 they purchased an 87-acre tract they had been renting, increasing the total acreage owned to 127 « They had purchased the 4o-acre tract for $6,500, paying $3,000 down. By 1952 this mortgage had been reduced so they were able to borrow on both tracts a total of $11,000 and purchased the 87-acre tract which cost $9,000. Mr. "P" has continued nonfarm work; his present job pays about $50 a week.
The 195k crop program included 28 acres of corn (six used for silage), 13 acres of wheat, l4 acres of oats, and 20 acres of hay.The livestock program was 16 grade dairy cows, with 10 heifers and calves, seven brood sows from which they sold 60 weanling pigs, and a flock of 60 laying hens. Their gross cash sales were nearly $7,000. In the past year they hired custom work totaling $250, and other labor totaling about $300. About half of the latter was used in painting buildings and help on silo construction.

- 216 -
Since acquisition of the real estate, the "P's" estimate they have spent $7^000 on improvements. Included were a bath and water system in the house ($700), a new milk house, silo, barn shed, poultry house, fencing and tiling land. (They still hold title to the house in town which they have rented at $35 a month.)
The total indebtedness at time of interview was $13j 300, but adequately covered by owned assets estimated at $37,300, to have a current net worth of $24,000.
The current level of farm sales, productive MWU, size of farm, and financial position would indicate this family is "established" in farming. Their future plans to expand the dairy herd while continuing with about the same amount of hogs should, as they expect, increase the farm income to a satisfactory level where he can give up the nonfarm work. Mrs. "P" looks forward to the time when he will be home full-time to carry more of the work and managerial responsibility.
(3) Mr. "D" also operates as a part-time farmer in western Ohio. He also spent three years in military service, started to farm while taking G.I. training, and had a current net worth at time of interview about equal to that of Mr. "P" above. However, the "D" family did not receive any financial assistance or inheritance to be a part of their present financial picture.
Mr. "D" spent bis childhood and early years on farms operated variously by his grandfather, a step-father, and others. Mrs. "D" was raised in a rural village where her father was a carpenter. Mrs.

- 217 -
"D” completed, high school, her husband went to work after completing the 10th grade. He was 31 years of age at the time of interview.The "D"'s have a family of four boys, ranging in age from one to eight years.
When Mr. "D" decided to try to get started in farming in 19^7 he had about $1,000, some clothing and a 10-year old automobile. He was still single.
He purchased the 68-acre farm he owns with a 100 percent (G.I. insured) loan, and entered the G.I. on-the-farm training program.He converted the 1936 automobile to a power unit; purchased used horse drawn equipment which he converted to use with the car, and began to farm. As he was able, he obtained other equipment including a used tractor. He made some improvements on the real estate, purchased a few head of livestock, and gradually developed a farm business. Soon after purchase of the farm, he married and the "D's" began housekeeping there.
After three years of on-the-farm training program, Mr. "D" took an Industrial job 22 miles from the farm. He earns about $4,000 a year at that work.
In 1954 the farm unit consisted of the 68 acres owned and 20 acres of hay land he regularly rented. The cropping program that year was 35 acres of corn, and 16 acres of oats on the home farm.His livestock program included four dairy cows, and three dairy heifers; seven brood sows, from which he raised over 100 pigs; and 100 laying hens. Productive MWU totaled I88. Gross sales of livestock and livestock products were nearly $8,000. He hired $600

- 2X8 -
worth of skilled labor for carpenter work, tiling land, etc*He has acquired, some purchased new and some used, a complete
line of equipment including a corn picker and combine. The estimated depreciated value of his equipment was about $5,500* Since the date of acquisition of the real estate, he estimates improvements of fencing, tiling, remodeling barn, and installing a water system and bath in the house cost $5,000*
Ownership of real estate and chattel property added up to total assets of over $28,000; liabilities were about $3,000* Since 1^46, from the farm and off-farm work, the "D's" have added to net worth at an average annual rate of over $2,500 a year.
His future plans are to equip his barn to e:q>and the dairy enterprise, to qualify for Grade A milk, quit the job, rent additional land and farm full-time. He expected to achieve these plans within the next two or three years at time of interview. With his demonstrated managerial ability as evidenced by rate of capital accumulation, MWU handled on a "spare time" basis, and livestock efficiency, he should reach his goal.
(4) Mr* "0", age 37, operates as a part-time farmer with a 156- acre dairy farm in the northeastern area of Ohio* His part-time farm route to full-time farming which began in 1^4o was interrupted by military service, but he began again in 1946* He did not use the on-the- farm training program, preferring the higher income from the nonfajrm job*
Mr* "0" was the seventh child in a family of eight* His father was a carpenter and part-time farmer on 60 acres* Mr, "0" quit school

- 219 -
and went to work after conqpleting the 8th grade* Mrs. "0" who was reared on a l40-acre general farm in this area, completed high school.
The "0*s" were married in I936 and started housekeeping in a furnished apartment (Mr. "0" said, "After we paid the preacher, we had $28 left."). They lived in the apartment for a time and then purchased a lot and huilt their own house. They sold the house and lot for $1 ,5 00 more than it cost, and purchased a 40-acre farm for $2,500. The farm was purchased primarily as a place to live, though they did keep a cow and some chickens. The 4o-acre place was sold for $3,300 when Mr. "0" left to enter the armed services. When he returned to civilian life in 19^6, in addition to their household goods, they had $4,000 cash savings. They used $3,000 as a down payment on the 156- acre farm they now own. The buildings, fences, and general facilities of the farm were poor; the purchase price was $6,000 - or $38 per acre. The balance of the purchase price was borrowed from the local bank*Mr. "0" began to acquire machinery again, to build up a dairy herd, and to farm part-time while working at an industrial plant located four miles from the farm.
They also began to make improvements on the real estate. They moved and modernized the house; rebuilt the barn, adding a milk house and milking parlor; rebuilt fences, and tiled some more land. Total cost of inrprovements were estimated at $10,000 to $12,000. The day before the interview the "o*s" installed a pipeline milker and were now ready to sell Grade A milk.
In addition to the I56 acres owned, Mr. "0" rented 80 acres; a 50-acre farm, a 20-acre field, and a 10-acre field. He harvested I3

- 220 -
acres of corn, I3 acres of oats, 10 acres of soybeans, and 40 acres of hay. Ten good grade and two registered Holstein cows, with six heifers comprise his livestock program. Gross cash sales in the previous year were $4,$00. The only hired help was custom baling of the hay. The family labor force in addition to Mr. and Mrs. "0" is a 14- year -old son. They also have a daughter aged 9 aad another son aged3.
At the time of interview the "0" family had assets of $32,500 and liabilities of about $100. This would indicate an average rate of capital accumulation of about $2,000 a year.
The future plans of Mr. "O" are to obtain some additional equipment, principally a forage harvester; to construct a trench silo; and expand his dairy herd to 20-2$ cows. He plans to work off the farm only one or two more years. If he carries out these plans he would have a full-time farm. If he doubles his herd, increasing to over 300 productive MWU, with his present rate of milk production, he should be able to increase his gross sales to the level he anticipates will yield a satisfactory income. Mr. "0" clearly demonstrates that it is possible for a couple willing to work toward a goal and with managerial ccanpetence to succeed without substantial financial assistance .
(5) Mr, "G" was 38 years of age at the time of interview in 1954. He operates a dairy farm in central Ohio. Both Mr. and Mrs. "G" were farm reared. He is a college graduate; she finished high school.They now have a family of six children, a boy aged l4, and five daugh-

- 221 -
ters ranging in age from two to 13 years. When Mr. "G" graduated from college in 1937 he reported he had no savings; neither was he in debt. Mr. "G" began to teach mathematics in a high school located in a typical southeastern Ohio farming area. He also began to farm part-time.
They began to purchase a house in town^ and a year later purchased 22 acres of land with some buildings located nine miles from town. It was on this unit that Mr. "G" began to farm. Th^continued to live in town, but used the 22 acres as headquarters for the farming operations. The buildings housed his livestock and provided feed storage. He rented additional land; at one time renting 130 acres of additional land. He obtained credit from the local bank.
In 1943 the "G*s" sold their house in town and bought their present farm. (They held the small farm until 1954 before selling it.) When they purchased the present farm of 77 acres they borrowed $4,400 of the $7,000 purchase price. Mr. "G“ took an industrial job for a few months. Then he began to teach school in the area to which they had moved. They soon began to make improvements on the property-.
Since acquisition of the present farm in 19^3 they have built a new nine-rocm house, a 40 x 30 dairy bam, with milk house, have built three farm ponds, drilled new wells at house and barn, built fences and done some tiling. They estimated they had spent $l4,000 on the improvements as well as contributing much of the labor.
At the present location Mr. "G" used his 77-acre farm as a sort of base of operations. He rents various amounts of additional land;

-' 222 -
same as entire farms, some as fields; some is share rented, some is cash rented. In 195^ he rented 20? acres.
In that year he had the following crops on the owned and rented acreage: 6o acres of corn, 39 acres of wheat, six acres of oats, 35acres of soybeans. He made alfalfa hay on 57 acres and clover hay on 65 acres. He has a 20 cow milking herd, (five registered - remainder good grade) with a production average of about 9^500 pounds of milk per cow. He also has 20 head of young dairy stock. The 195^ gross sales of Grade A milk and crops sold totaled over $l6,000. The above totals up to over 450 productive MWU - or about a one and a half man full-time farm.
Mr. "G" hires no regular labor. In 1954 he hired two men at day wages to help with hay harvest and corn picking. He hired custom operators to fill the silo and hired a man with a bull dozer to help clear some land. The total labor and custom work hired totaled about $1,300. Mr. "G" has a full line of equipment including two tractors, corn picker, combine, etc. While he began by purchasing used equipment, eill his present equipment, except for the corn picker, were purchased new. The estimated depreciated value of his present equipment was about $10,000.
The financial position of the "G" family at time of interview totaled assets of $49,800, against liabilities of $2,600, to leave a net worth of $47,200. This yields an indicated average rate of capital accumulation of about $3,000 a year since he began to farm part-time.
Mr. "G" expected to quit teaching school the following year. He indicated one of the reasons he had not stopped previously was the difficulty of obtaining a replacement teacher. Mr. "G" clearly illus-

- 223 -
trates that some operators who use part-time farming toward full-time farming, continue to farm only part-time even though well established, as measured in terms of size of unit operated, productive MWU, gross farm sales, or net worth position.
When to relinquish the nonfarm job in order to farm full-time is a personal decision, and one that cannot be readily predicted, in terms of the measures considered in this study. Let's now examine the situations and case histories of some operators now farming fulltime who used the part-time route.
Former Part-Time Farmers - Now Full-Time Operators(l) Mr. ”T" was 50 years of age at the time of interview. Since
1945, he has operated a full-time dairy farm in the northeastern Ohio area. At nine years of age he came to the United States with his immigrant father. His father was employed in a steel mill and rented a part-time farm. Mr* “T" completed elementary school and started to work at a steel mill at the age of 15. He continued to live at home and help on the part-time farm.
Mrs. "T" was the daughter of foreign born parents. She was reared in the towns where her father was a mill worker. After the “T*s” were married they lived in a rented house in town until 1931 when they moved to a rented farm.
Mr. "T" borrowed to purchase bred heifers and continued to work off the farm until his dairy herd came into production. He later began to purchase the farm on a land contract. Then Mr. "T" discovered he had some T.B. reactors in the herd. This made necessary their sale

- 224 -
at a loss; so he vas still la debt to the bank. The bank loaned him additional money to buy more cattle, but the price of milk had fallen until he could not meet the payments of his notes* He talked with the banker, signed additional chattel mortgages on his household goods, and agreed to assign his entire milk check to the bank to apply against the debts. In 1933> when the banks were pressed for cash, the entire debt was foreclosed. His father also lost his farm that same year.
In the fall of 1933 Mr. ”T" was again employed part-time in the steel mill, and he moved to a 136-acre farm on a one-third share arrangement. The landlord also owned the equipment and livestock. He farmed until I9W on that basis with dairy and truck crops while continuing to work at the mill whenever employment was available. That farm was sold in I9W.
He then moved to the present farm of 103 acres for which he paid $1,500, borrowing $700 from a sister. (He feels that the bank had treated him unfairly and so has refused to again use that source of credit.) The 103 acres had no buildings and was virtually unused land. He began by building a tool shed in which the family lived while they built the house. He now had steady employment and concentrated on the construction of the home in his spare time, Mr. and Mrs. ”T*' cleared off some of the brush land, fertilized heavily and grew truck crops, which she sold in the local city produce market.The wife took the produce to market while he was at work in the mill.
After completing the house, the tool shed was converted to a dairy barn and he began to build up a dairy herd. For the construction he purchased sometimes new and sometimes used materials, and per

- 225 -
formed most of the labor himself* Since obtaining the land in 1^40, he has constructed a full set of buildings including a five-room modern house, 70 X 26 dairy barn, 20 x 60 tool and machine shed, and a 26 X 60 hay barn and granary. The cost of purchased building materials was estimated at $15,000, He also cleared, fertilized, limed and tiled much of the land.
Mr, "T" quit the nonfarm job in 19^5, and since then had devoted his full time to the farm. In the year preceding interview he produced 10 acres of corn, I5 acres of wheat, eight acres of oats, eight acres of barley, and made 20 acres of clover hay. He had a l4-cow dairy herd, plus six replacement heifers, and sells Grade A milk. To his $6 ,000 crop and livestock sales he added about $1,000 from custom work.
Mr. "T" now has a fairly conqplete line of equipment, all in good condition. Most of his present inventory was purchased new. He depends on hired custom operators for com picking and combining, but he does enough custom baling to net the $1,000 difference added above. He estimated his inventory of equipment as having a current value of $12,000.
At the time of interview in 1954, the financial statement of Mr. “T" showed total assets of $41,450, and liabilities of only $300.Since 1933 he has added to his net worth at an average annual rate of $2,000 a year.
The case of Mr. "T” illustrates the importance of the time at which an operator starts the part-time route, and the adverse forces

- 226 “
that may impede his progress. However, the “T" family now look back at their accomplishments with a great deal of pride.
This case also illustrates very aptly the teamwork of the husband and wife in the process of capital accumulation. This was demonstrated both by the willingness of the wife to labor at farm work, and to forego some of the needed facilities in the home until the farm business had been developed.
(2) The "E" family operate a southeastern Ohio general livestock farm of l6l acres. Mr* "E", who had just recently begun to spend fulltime on the farm, was 42 years of age at time of interview. He had been reared on the general crop and livestock farms in this area that his father operated as a tenant. Mrs. "E" was also farm rearedê Both finished high school and Mrs. "E" ccmçleted one year of college before taking nurse's training. They now have a family of three girls and two boys, ages one to seven years.
When Mr. "E" returned from nearly four years of military service in 1946, he took a job as a farm hand. After one year he rented a 50- acre farm on a share basis for one year. That farm was where the family started housekeeping. He had some equipment and borrowed other items frcm the neighbors.
In 1948 Mr. "E" obtained an FHA loan of 100 percent of the purchase price of $11,000 and purchased the l6l-acre farm. He farmed full-time and obtained G.I. subsistence payments while attending Veterans school until 1952. In that year, since subsistence payments ended and the farm income would not provide a satisfactory

- 227 -
level of income for both family living and debt retirement, he took a nonfarm job. He worked at various industrial jobs until early 195^ when he returned full-time to the farm. When he returned to the farm, Mrs. "E" began to work at a nearby hospital; at that job she earns $2,800 to $3,000 a year. He cares for the children and farms.
The farm is not located in a particularly productive land area. The topography is rough and broken; less than 50 percent of the I6I acres in this farm are suitable for crops. Mr. "E*s” crop program included 28 acres of corn, 20 acres of wheat, two acres of oats, and 22
acres of hay, seven of which was alfalfa. His livestock include: I5
dairy cows (two registered, the remainder fair to good grade), eight dairy and beef animals of varying ages kept as beef, three brood sows from which he sold 20 fat hogs; 30 ewes, and 200 laying hens. Gross farm sales in the year preceding interview were about $5,500.
He has a fairly good line of equipment, most of which he purchased in used condition, having a depreciated current value of about $3,000. He borrows a grain drill and exchanges corn picking for combine work.
Since acquisition of the real estate he has made ing»rovmnents estimated as having a value of $1,500. Most of these improvements were to the house in adding a furnace, remodeling the kitchen emd installing a hot water system. He also has built a chicken house and milk house.
At the time of interview, the "E" family had total assets invested in their home and farm business valued at nearly $24,000. Against these assets were liabilities totaling over $16,000, leaving a net

- 228 -
worth of about $7,500. The real estate mortgage was at the same level as when secured in 19^8 - only interest payments having been made in the six intervening years. At the time of interview, the ”E" family owned only about 31 percent of the total invested in their farm operation. The gross farm sales, relative to the 310 productive MWU, wererather low. The indicated average annual rate of capital accumulationwas about $400 a year.
This case was selected to illustrate the wide range of situations regarded as acceptable to the individuals concerned. This rate of capital accumulation, level of farm income, and net worth/debt ratio would apparently be unacceptable to the farm families discussed as established but still farming only part-time. If success is measured by achievement of a position wherein the farm operator spends his full time on the farm, without regard to the level of income he earns or the longer term implications of his financial structure, Mr. "S" has succeeded. However, without the nonfarm income, currently supplied by the wife, this farm family could not continue as farm owners. The current level of sales is entirely too low to provide for debt retirement in addition to needs of the family.
In the opinion of the writer, Mr. "E" might have been further ahead to have continued to farm part-time for a while longer, concentrating his livestock program more on the hogs and poultry with which he is relatively mere successful. His wife's nonfarm earnings are about $1,200 per year less than he was able to earn. At present his indicated level of managerial competence would not indicate that his time is equally as valuable on the farm.
- 229 -
(3) The "L" family are now operating a full-time dairy farm in the northeastern Ohio area. They began the process of moving toward the farm in 1939» neither Mr. ”L" nor his wife were farm people; his father was a coal miner, her father died when she was small and she was reared in town. Mr. "L", now 33, vas the oldest «£ fiv* children. After completing three years of high school he quit school and worked at odd jobs, mostly with a construction company, for about two years. Then he obtained work with a United States Arsenal, again primarily carpenter work.
It was while working at the arsenal that Mr. "L" married, and rented his first farm. It was a place of 8% acres of relatively poor land, and his primary interest was in renting the house. The farming was more of a "hobby," and an afterthought. He continued to farm in this manner from 1939 to 19U2 when he entered the armed forces. He spent two years in an armored unit.
When Mr. "L" returned from the military service they purchased a small farm of I8 acres; and he was employed in a factory about l4
miles away. He gave $6,000 for the faira, $5,500 of which was mortgage. He now had a family of two daughters and one son, all too small to give assistance in farming. He began to accumulate some equipment and farmed the I8 acres for two years, largely as a subsistence unit, and spent some time in In^roving the farm buildings. Then he rented in the fields and barn of a retired farmer located about three miles away. This farm of IO9 acres, he used primarily for grain crops and he began commercial hog production. He kept some

- 230 -
dairy cattle, primarily for home use# His off-the-farm earnings varied, from $2 ,800 to $4,200 a year over the nine year period of his part-time farming (derations# Mr# "L" continued on this basis until1954#
In the spring of 1954 a full-time dairy farmer in the community was forced to retire because of health# He had a 105-acre dairy farm, herd and equipment. He and Mr# "L" traded farms and he accepted Mr# "L's" mortgage for the balance due on the farm, equipment and herd# Mr# "L's" 18-acre farm was valued at $8,000 in the trade and the dairy farm at $15,000# Mr# "L" received the farm, herd and equipment, giving in return his farm plus a mortgage of $9,500# Mr# "L" thus became a full-time farmer#
He continues to operate the rented I09 acres in addition to his newly acquired dairy farm of I05 acres# Since he was interviewed early in the crop year his yields could not be determined; but his acreage of crops in 1954 were as follows: com, I8 acres; wheat, 12
acres; oats, 18 acres; soybeans, five; mixed clover hay, 2 7# The remainder of the operated acreage was in pasture and wood land# Last year (1953) his yields and production were about average for the area# Based on current rates of production his farm should, have gross sales of about $10,000 this year#
He now has a 15-cow dairy, keeps two or three sows and a fitnai 1 flock of chickens# He has the equipment he needs for the normal tillage operations and still relies on custom operators for major harvesting machinery# His operation totals 254 MWU#

- 231 -
At the present time, Mr. "L" has command of an Investmient in farming of about $30,000 and a net worth of about $17,000.
Over the nine year period since his return from the service this family has had an average rate of capital accumulation of slightly less than $2,000 a year.
Despite the lack of early farm experience, Mr."L" had demonstrated ability to learn and has farmed in such a way as to earn the respect of his neighbors.
(4) In 1946, Mr. "F" was 21 years of age, married, the father of a one-year-old son, and 20 percent disabled after two years of military service. He wanted to farm.
Mr. "F" was reared on his father*s crop and livestock farm in this county. They had owned approximately 80 acres of land and rented 80 more. Mr. ”F" had one year of 4-H work, but no vocational agriculture in his high school. He was the only boy in a family of three and had considerable farm experience from work on his father's and neighbor's farms. His wife was not a farm girl, though reared in a rural area, where her father was a truck driver. Both are high school graduates.
In the spring of 1946, when Mr. "F" returned frcm military service, his principal assets were: 1. His strong desire to farm; 2.His rearing and early experience on farms; 3. His wife - who shared his goal and ambition to farm; 4. Prospects of Veterans assistance. His net worth was probably less than $1,000.
- 232 -
The first few months after returning to civilian life, Mr* "F" worked for the State Highway Department* His wife and son had lived with her parents while he was in military service* The family now rented a furnished apartment in üie county seat town* Mr* "F" was not satisfied with either his work or the thought of living in town*
In the fan of lg46 he took a job as a janitor of a rural high school located in a good farm land area* Along with his salary of $3^000 a year, a house was provided for his use. He was permitted to hire some additional labor at the school and so at times his wife worked there also - adding another $400-500 a year to the family income*
The first year in the rural community Mr* "F" began buying and repairing pieces of used farm equipment* The following s^ing he was able to cash rent 8o acres of land near the school* He had equipment now to do his own tillage work and used custom operators for haarvest- ing* Again the next year he farmed the rented 80 acres* He made good crops.
As indicated earlier, in most areas where crop-share renting is more prevalent, farm owners are reluctant to rent to operators who spend time at another off-farm job* In these years, Mr* "F" "proved himself" in that community* The following year he was able to rent 120 acres more land and for the next three seasons farmed the 200
acres along with his job at the school*Eie winter of 1951-52 he worked at the job only for half the year.
In the spring of 1952 he was able to rent 200 acres of additional land

- 233 -
And at that point, Mr. "F" ceased to be a part-time farmer. He now operated kOO acres and had acquired a line of equipment to handle such an acreage. He attended Veterans School. As the original pieces of equipment wore out they were replaced with new ones; and other items were added as his finances and credit would permit.
For two years, Mr. "F" was a tenant farmer on the 400 acres of land. In the spring of 195^ he had an opportunity to move toward ownership. With a Farmers' Home Administration loan he was able to bty 100 acres of the land he had been operating. He continues to rent the remaining 300 acres.
Mr. "F" is starting to build up a beef herd, beginning with heifers, and to develop a flock of sheep to utilize some of the rougher land he operates. The family is now composed of the man and wife smd two children. The son, now nine years of age, and a daughter of six are both in school. The children are interested in the farm, and the family are proud of their accomplishments. In addition to the physical assets named above, Mr. "F" has certainly demonstrated managerial ability considerably above the average. He produces good crops, uses recommended practices, and fertilizes at rates generally above the average for that area. His farm is located in an area that ccmçprises some of the best agricultural land in the state thou^ his is not the best farm in the area. His 1953 crop program was: 57 acresof corn, 77 acres of wheat, 72 acres of oats, 68 acres of soybeans, and 15 acres of sweet clover combined for seed. Gross value of product sales were nearly $23,000 and his owner and operator share about $14,000.

- 23^ -
Since 19^6 when the "F's" began moving toward farming their total nonfarm revenue had been $26,772» By August of 1954 he had command of over $40,000 and a net worth of over $21,000» This gives an indicated average annual rate of capital accumulation of in excess of $2,500.
The case of Mr. "F" demonstrates again the results a husband and wife team with a common goal, ambition, managerial ability, and hard work can accomplish through part-time farming.
(5) Mr. "N" is now a full-time farmer in the southeastern Ohio area. A somewhat older man than the other cases, he began and became established in farming through the part-time route without aid of inheritance or family assistance. He was 42 years of age when he began spending his full time on the farm. The household is now composed of Mr. "N", age 47, his wife, 46, and their l6-year-old son. Three daughters, somewhat older, are married or live and work in a neighboring city.
Mr. "K" was the oldest of four children. His father was a part- time ffiurmer and coal miner* They lived on small farms or in rural villages of this area when Mr. "N" was in his late teens, Mrs, "N" was a farm girl, reared on her father's 12$-acre general farm in a neighboring county. Both are high school graduates with no special agricultural training.
When they were first married, Mr* and Mrs. "N" began housekeeping on a small rented farm and he worked in the mines. In the early 1930's coal mining «nployment opportunities were limited and Mr. "N" rented a

- 235 -
302-acre farm in this area, farming nearly full-time, with occasional employment in the mines. When he worked his nonfarm income was $70- 80 a month^ he usually worked five or six months of the year.
In 193Ô he bought a small 4o-acre farm and was eiirployed more regularly at the mine. He purchased the "farm" at a tax sale for less than $2 75» Four years later he sold it for $500 , after having made some Improvements. At that time he purchased a farm of I60 acres.This farm contained more crop land, some of it creek and river bottoms. He paid $3,200 for that farm, borrowing the full amount from an individual.
From 19^2 to 1950 he operated that as a beef cattle and poultry farm. He kept about 50 head of beef cattle. Along with the farm work, Mr. "N" worked at a sawmill, taking timber from his farm and other farms of the area. His revenue from nonfarm employment during this period averaged about $3,000 a year. He paid off his debt and made a number of improvements on the farm. In the latter years of his stay on that farm he reduced the off-farm work and planned to farm full-time there.
In 1950 that farm was purchased by the State of Ohio, along with a number of others, as a part of a dam construction project.He received $11,000 for the farm and was permitted to buy some of the improvements (outbuildings, fences, etc.). Mr. "N" then purchased his present farm.
This farm of 292 acres, has about I30 acres of crop land and 100 acres of non-crop - open pasture. He paid $12,000 for this farm, and was able to purchase it outright without a mortgage. Since buying

- 236 -
this farm he has made extensive improvements to the real estate including rebuilding the outbuildings moved from his previous farm, refenc- ing|,suid installing a furnace in the house. These have cost approximately $2,OCX) in materials. They have added an estimated $3,000 to $4,000 to the value of the farm.
In the year preceding interview, Mr. "N" harvested 12 acres of corn, 13 acres of wheat, two acres of soybeans, and 31 acres of hay including six acres of alfalfa. Much of the present farm is in pasture and Mr. "W" has plans for bringing much more of the farm into rotated crop land and improving the permanent pasture.
He now has four dairy cows, 3O beef cows and I8 younger beef animals, one sow, and 250 laying hens. His plans are to extend the beef and hog enterprise in the future. He sold I6 pigs from this sow last year.
Mr. "N" has a complete line of equipment to operate this farm, including combine, hay baler, and corn picker. Last year with his specialized equipment he did custom work for a gross revenue of about $1,900. This he added to gross farm sales of about $4,700.
At present Mr. "N" has free of debt his home, equipment, and livestock. His net worth is over $33,(X)0.
(6) Mr. "W" had just made the shift to full-time farming when interviewed early in 1955* He operates a dairy farm in western Ohio.He was 33 years of age at the time of interview. Mr. "W" was reared on a farm in that area. His wife was also farm reared. Both were high school graduates. They have two sons, ages 4 and 9, and a dau^- ter aged 11.

- 237 -
Prior to going to the amor in 1^42, Mr. "W" had farmed some with his father and had accumulated some equipment and livestock. Upon his return from military service in 1946 he again wanted to farm. Just prior to his return to civilian life his wife and father contracted a farm for him to rent. At that time the "W*s” had about $1,000 in savings and spent $1,400 for a beginning line of equipment. He enrolled in the Veterans on-the-farm training program and began to operate the rented 143-acre farm. At times he used additional equipment borrowed from his father.
After three years on this farm he moved to another farm of I78
acres, and at the same time rented another tract of I08 acres. Later he moved to another farm of 119 acres retaining his lease on the IO8
acres. In 1952, the "W"*s felt some financial stress and Mr. "W" took a nonfarm job as bins it e supervisor for the local A .8.0. committee. This job required about half-time work and paid him about $1,800 a year. He held this job two years, and then again became a full-time farmer. (However, after he quit work, Mrs. "W" took a factory job at which she earns about $3 ,800 a year.)
In 1954 Mr. "W" grew 48 acres of corn (eight for silage), 30 acres of wheat, 25 acres of oats, 11 acres of soybeans, and made 26 acres of hay. His livestock program included 17 dairy cows plus 21 head of young dairy stock, seven beef brood cows, two brood sows, 4? ewes, and 30 chickens. Sales of crops and livestock were $14,300 with the operator's share under the present lease terms amounting to about $7,700.
Mr. "W" now had a conplete line of equipment, most of which had been purchased new, with a depreciated value of about $9,000. At the

- 238 -
time of interview the "W" family had a total investment in the farm business and home of about $22,000 and indebtedness of $3,000 - leaving a net worth of about $19,000.
Six months after the initial interview the author again had opportunity to visit the *'W" family. During the interim they had entered into a land contract to purchase the 119-acre tract, making a down payment of $2,600 on the purchase price of about $200 per acre, with provisions to receive title and shift to mortgage when one-half of the principal sum has been paid. So now the family has taken another step, this toward owner-operator status. With the indicated managerial ability of Mr. "W”, his present farm operation handling over 500 productive MWU with little hired labor, and his indicated average rate of capital accumulation of about $2,000 a year, he should succeed in the present real estate venture. The contract drawn for a 15-year term really requires only that the interest be paid currently, permits variable payments in good and poor years, and provides that required principal payments may be reduced in a given year by the amount of capital in^rovements made on the real estate.
Factors in Success and FailurePart-time farming has been a successful route to full-time farm
ing for some families that have tried to use this route* Others who tried have not attained the degree of success they desired, and expected, at the inception of their plan.
What factors appeared to play a crucial role with the successful families? The following factors are enumerated for convenience and

- 239 -
ease of reference, the numbering does not indicate relative importance
of the factors listed.
1. Hard vork - No one should anticipate attempting this route
to farm operation without realizing it will demand long hours and
strenuous pl^sical work. At times the work demands for both farm and
nonfarm jobs are such as to tax the physical endurance of the oper
ator and his family. This is particularly true while trying to operate without needed equipment, and at some seasons of the year.
2. Family cooperation - Both the husband and wife must desire
the goal with sufficient intensity to be willing to perform the hard work together and to share responsibility for its accomplishment.
The wife of a part-time farmer is frequently called upon to participate in managerial decisions, especially those that occur in the day-
to-day operation of the farm. She is also frequently expected to help
with some farm work. Participation or responsibility for the dairy or
poultry chore work is a good example. The farm operators personally was
spending about three-fourths of the total family labor time reported
spent on the farm; the remainder was provided by other family members,
usually the wife. In addition to participating in the farm operation
some of the wives have also used their income from nonfarm employmentin the capital accumulation process. This was especially true after
the farm business had been developed to the point that the man was
needed on the farm full-time but when the income was not yet sufficient
to support the demands fijr both family living and debt retirement.
Family cooperation and understanding is necessary, also in maki ng decisions regarding the use of scarce resources. Which should come

- s4o -
first - a milk cooler or a clothes dryer - a new tractor or a bath
room in the house? Some families have not achieved the hoped for goal that included all these things because they could not agree on
the order in which they should try to attain them.3» Managerial ability - This factor in success appears to the
author to be most important, yet least subject to objective measure
ments, It is relatively easy to see its effects in the operations
of superior farmers and its absence in inferior operators, but dif
ficult to ascribe degrees of such ability.
It is the opinion of the author that successful part-time farm
ing requires a higher degree of managerial con^etence than to farm
full-time on a conçarable sized unit. With a given amount of his
time commited to nonfarm work, the part-time operator is required
to do more careful planning to utilize his remaining time most effectively, This is a critical factor at certain times as for exam
ple, planting and harvesting of crops, and breeding and parturition times with livestock.
It is this factor that encompasses the whole part-time farm business, blessing it with success, or condemning it to failure.This includes acquisition and utilization of all the resources at the command of the manager,
4, Initial capital, savings and credit - Those part-time farmers who attained their goal of full-time farming had usually made
judicious use of credit, (Some of the cases who failed did so by overindulgence in borrowed funds.)

- 241 -
In order to use credit to facilitate the move to full-time farm
ing, it was necessary to have some "nest egg" of accumulated funds.
This is a critical stage for beginning farmers who choose either the
part-time route or some other route to full-time farming. This is
also a stage demanding family cooperation to prevent the potential savings being used for current consultation. Even such liberal credit
terms as are available under the Veterans Guaranteed Loan, or Farmers
Home Administration, usually require some evidence on the part of the
borrower other than mere need of funds.
In light of the demonstrated need of most part-time farmers to begin by purchase of real estate, the accumulation of the beginning
capital is a serious problem to be solved. Even if this were not
true, and part-time farmers could readily rent land, most landlords
are interested only in the tenant who has at his command a line of
equipment, and operating capital sufficient to do the work on that farm.
5» Farm experience - In most of the successful cases who used
the part-time farming route to full-time farming, as with most of the other part-time farmers with a substantial size of farm operation,
the operators reported early experience on farms. Some families who had succeeded did not have early or childhood experiences on the
farm; but most had. For those who lack such experience, part-time
farming is a possible way of overcoming that deficiency, since the nonfarm income can sustain the family while they learn.
6. Family assistance - This item is not always forthcoming, «nd
its absence need not deter families who feel they possess all the be

- 242 -
fore mentioned items in sufficient quantities. It does, however, play
an important role in getting established in farming by the part-time
route as it does in other routes» In all cases the assistance was
not specifically inheritance or gifts of substantial sums* At times
it took the form of loaning equipment to a son or brother; in others
the assisting relative co-signed a note so that the beginnii^ farmer
could borrow for machinery or real estate*
7» Other assistance - A type of other assistance definitely im-
porteuit in the cases presented in this study was the Veterans on-the-
farm training program. The subsistence income, as well as the educa
tional training, was of great value to many of the cases studied.The subsistence psyments permitted the veteran to work on the farm, improve the real estate, and still receive an income over and above
what his labor, capital and land would currently produce in that use. To that extent it has permitted greater investment toward future earnings and a rate of capital accumulation not otherwise possible.
The ingportahce of the subsistence payments is indicated in a definitive manner by the number of those operators who turned to
sources of nonfarm income to become better established after they had
used their entitlement under the Veterans program,. It might also be
inferred that the expectation of such income would carry weight with potential creditors if approached for a loan.
8. Inflation - It might simply be said that most beginning farm
ers are generally debtors - and debtors are helped by inflation. It
should be noted that most of the part-time farm operators studied had

- 243 -
begun their farming operations on a rising price level. Undoubtedly
the current net worth position of these farmers, as with farmers gen
erally, is in part due to the inflated value of the property owned,
relative to the time when it was acquired. The fact that part-time farmers were practically forced to purchase land in order to obtain
its use, and that subsequently its value was increased by inflation,
has definitely played a part in the rate of capital accumulation by the farmers included in this study,
9 . Real estate transactions - The number of part-time farmers
for whom real estate transactions figured in their success is sufficiently large to warrant mention here. Some of those who have made substantial progress, and some who are now established, used
their equity in ein urban residence or a small farm toward acquisition
of a larger farm unit. Some part-time farmers have reported several
other such transactions. In many cases the real estate was improved or enhanced in value by unpaid labor of the part-time farmer who used this increase in value as "savings" for his next purchase. In other
cases instead of attempting to purchase a full-size farm the operator
purchased a smaller tract in the beginning and added to it as his
finances and capacity to operate more land expanded. One difficulty with this latter plan is that when the operator is ready to expand
he may be unable to locate suitable additional land. It was also in
dicated that the real estate market is such that smaller tracts of
land sell for relatively high prices per acre compared to larger
tracts, A part of this is due to the value of improvements, as was

- 2 h k -
incLicated; a part also undoubtedly is due to a more competitive market for such tracts.
Length of Time RequiredThe part-time route to full-time fanning may be a long, tortuous
route - as in the cases of Mr. "T", Mr. "M", and Mr. "K". Or it may
be comparatively short as in the cases of Mr. "W", Mr. "E" or Mr. "F". Its length depends on the factors listed above and also on the height
of the goal.If the required eimount of capital to operate a full-time farm as
a tenant is the goal, the total amount of investment required will be less than if the goal is part-owner, or full-owner of such a unit.
The total amount of funds required divided by the average annual rate
of accumulation will yield the time required. A young man l8 or 20 years of age, without a great deal of assistance from some source
cannot expect to move to owner-operator status on a full-size commercial farm in just a few years. If the total capital required to
be a full owner-operator is $60,000 and his average annual rate of
accumulation is $2,000 per year he w i U be nearly 50 years of age before debt free ownership is achieved. If he holds to a nonfarm job
for that length of time he may, as with Mr. ”K" and Mr. "V" then feel more security in the nonfarm job than in the farm.
In this study, it will be remembered, some of the operators now
farming full-time had a smaller farm, smaller farm business in pro
ductive MWU and gross sales, and lower owner equity in their total
business than other operators -vdio were still farming only part-time.

- 245 -
Since most of those classed as established were on medium sized or
smaller commercial scale farms, their future progress may depend on
again turning to nonfarm work, expanding still more their size of farm
and farm business, or being willing to accept a relatively low level
of living compared with others in our society. Technological change
and the move to more efficient and also more expensive equipment con
tinues to increase the size of farm needed for efficiency.
It would be desirable if these same fsmners and farm areas could
be revisited five or ten years hence to note the changes that will
have come about by that time.
SUMMARYThe case studies presented above indicate degrees of individual
family achievement toward the goal of full-time farming. These cases also serve to illustrate factors in success or failure according to
the defined goal. Not all these factors were amenable to statistical
methods of presentation, i.e., managerial ability, episodic inter
ruptions in the course of movement whether beneficial or detrimental
to the family concerned.
Some of those who "failed" in terms of their original goal con
tinue to farm part-time as the most desirable (for them) compromise
of the reality of their ability with the unattained but hoped for goal. Other part-time farmers have achieved varying degrees of attain
ment of their goal. To some extent success or failure is related to the degree of being established, and the tenure status acceptable to
the particular family. Some of those now "established" or successful

- 246 -
in temfâ of their original goal may later again elect to farm part-
time to attain a higher goal of success. Degree of success thus depends on the individuals measuring it - part-time farming has been a
satisfactory route for some families. Some of these families have attained a degree of success and rate of capital accumulation that
would have been difficult to achieve by any other means.

CHAPTER VIICONCLUSIONS AND SUGGESTIONS FOR FURTHER STUDY
A part-time farm means different things to the different farm
families involved. Their reasons for becoming part-time farmers varied from simple preference for living in rural areas, to selecting part-
time farming as a means toward some other ultimate goal, to those who
saw part-time farming as providing permanently personal satisfaction
for them directly and economic ends indirectly.
The size of farm operated by peurt-time farmers is somewhat related to their goals and ambitions. Not all farms of part-time farmers
are small subsistence units. There are a number of these units but a-
about half of the farms operated by part-time farmers are large enough
to be of economic significance commercially. The farm operations of
some part-time farmers are larger than the units of other operators
who spend their full time on the farm. The census definition in cur
rent use of a part-time farm definitely understates the importance of part-time farming as an operational concept.
Part-time farming represents a two-way movement of human and land
resources - full-time farms and farmers to part-time operation, and part-time farmers and rural nonfarm people acquiring land for full
time farming. While this two-way movement is present, there appears
to be a net movement of both land and people from full-time to part- time farming.
- 246 0/

- 2^7 -
About three-fourths of the operators of part-time farms inter
viewed had been farm reared* They were thus familiar with farm life
and work before becoming part-time farmers. Most of the wives of part-
time farmers were also farm reared, though a farm background was not
so prevalent, among the wives as among the husbands.
The part-time farm families are more likely to be younger people.
While people covering a wide range of ages are engaged in part-time
farming, the average age of part-time farmers is less than that of all
farm operators.Part-time farmers, as a group, appear to be a stable part of the
population with regard to their employment habits as well as length of tenure in the farm community. The average part-time farmer had
followed that mode of operation eiglit years or more, and most of that
time was spent on his present farm. Length of tenure in nonfarm employment, about half of which was industrial, averaged about 10 years.
Few areas of Ohio are not now being influenced to some extent by part-time farming. Part-time farmers have indicated a willingness to
drive 25 miles in order to make the kind of combination of farm liv
ing and nonfarm employment that they desire. While the average dis
tance driven now was only about 13 miles, some operators currently
drive over 50 miles one-way to work daily. The distribution of non
farm employment opportunities in Ohio place most rural areas in the
commuting range to nonfarm employment opportunities.
Most part-time farmers own their land, and generally have acquir
ed the real estate through purchase. Inheritance did not seem to play
a particularly iniportant role in the transfer of land resources from

- 248 -
full-time to part-time farming.The high proportion of owner-operators in peurt-time farming stems
in part from the reluctance of land owners to rent to operators only-
spending part-time on the farm. This situation may be detrimental to
prospective part-time farmers obtaining land resources, but in the
past due to inflation, has contributed to the rate of capital accumu
lation by part-time farmers.
One method of evaluating part-time farming is in relationship to
the varied goals of the part-time farmers. Does the part-time farm
provide a satisfactory situation in terms of "the personal goals and
objectives of -the particular families involved? In general it must
be concluded that it is. While some part-time farm families would pre
fer to have things somewhat different, most were satisfied with either
their present situation or with the degree of progress being made to
ward the ultimate goal. Very few indicated a desire to leave the farm.
This satisfaction relative to goals appeared in some cases to have resulted from the families having modified the goals to make them more
compatible with -the level of achievement, and -the realized abilities of
the operator family, rather than pursuing the original goal without
satisfactory accomplishment. In some cases, for example, the goal of country living had been changed to one of becoming a full-time farmer; in others the rate of progress towsLrd the full-time farming goal had
been such that the families have satisfied themselves with the thought of part-time farming until retirement from the nonfarm job.
This conclusion may be tenpered by the recollection that the cases
interviewed were those actually farming part-time, and not those who

- 249 -
may have become so disillusioned and dissatisfied as to leave the farm.
However, since the range in years of operation as part-time farmers was
from one to over 50 years, and the sample was designed to tsJte all the
cases in a square mile area, the author does not believe this consti
tutes a serious limitation on the findings.
Another basis for evaluation of part-time farming is from the
public point of view. Is this good or bad from a public policy stand
point? How does the efficiency of the utilization of resources by
psirt-time farmers compare with their potential use by other operators?The observations of the interviewers were that the agricultural
operations of the part-time farmers did not differ appreciably from
those of full-time farmers in the same area. This observation is substantiated by reference to the acreage devoted to harvested crops
on part-time farms relative to all farms in the respective areas.
Yields per acre were also conçjarable with those of other farmers, This
would indicate that part-time farmers use the land resource about as efficiently as other farmers.
Is the capital invested in machinery and equipment on part-time
farms less efficiently used than on other farms? Again the evidence
does not indicate that it is. The fact that part-time farmers have
frequently purchased used equipment, and depend on custom operators to provide other items has kept the investment per crop acre in a
range comparable with the investment of other farmers, (it should be recognized again at this point that the comparisons are in terms of
averages. Some part-time farmers are over equipped and some under
equipped, The same is true of the farms of full-time operators.)

- 250 -
There were some indications that the efficiency of livestock on part-time farms is less than that of full-time farm operators. The
dairy animals of part-time farmers, where dairy products were sold,
were more frequently used for production of manufacturers ' milk or
cream than for fluid consumption. The size of herd was often too
small to economically justify the costs needed to meet Grade A requirements. The observations of the interviewers was that somewhat
fewer livestock, and that of lower quality, was likely to be found on
part-time farms. This could result quite logically from the smaller
amount of time available for livestock care. The place of livestock
in most farm operations is to provide for utilization and sale of farm resources not otherwise salable (as pasture) or for conversion
of crops into a higher value product. The keeping of livestock enables
the farm operator, in the form of livestock products, to sell labor
over and above that used for crop production. Part-time fsormers with a market for that labor in the nonfarm job do not have such a strong
incentive to engage in livestock production on the scale of full-time farmers.
From the standpoint of efficiency in the use of their total labor resource, part-time farmers would appear to be more efficient than
other farmers. To give a definitive answer to this question would re
quire a comparison of net labor income per hour for part-time farmers and other farmers. Insofar as the part-time farmers were concerned,
this would have required net farm income as well as the net nonfarm income.

- 251 -
Such figures were not obtained; in most cases data were not avail
able. If such data were secured for this group, comparable figures for
full-time fanners are not available.
Gross cash returns per hour of labor reported spent on the farm
are not too different from rates calculated from farm account record
summaries. When the total gross cash income, from both farm and non
farm sources, is compared with the gross sales of farm account record
keepers it would appear that part-time farm families do realize a net
income in excess of that of many full-time farm families. This would be especially true if compared by size of farm classes.
The number of productive man work units, on all part-time farms
was lower relative to total time reported spent on the farm than is generally believed to be true of full-time commercial farms. On the
larger (Class IV) part-time farms, however, the relationship between productive man work units and hours reported spent on the farm indicates
that reported time to have been as productively used as on full-time farms.
Perhaps the best indication that part-time farmers do achieve
over all efficiency in their utilization of resources is their competi
tive strength in the acquisition of those resources. It has been demon
strated that, for the most part, operators of part-time farms have ob
tained their land and capital resources through purchase in the open
market in competition with other prospective users of those resources.
They have purchased land, obtained credit from the same sources as do
other farm operators, purchased equipment and hired labor in competition with other farmers. The growth of part-time farming, in total

- 252 -
number of operators and proportion relative to the total number of
farms, would indicate that part-time farming has competitive strength in the acquisition and utilization of resources.
It might be reasoned that since part-time farmers are in a position
to sell (use) their labor in either the farm or nonfarm market, that
they are therefore better able to equate the marginal cost with the mar
ginal revenue in each use. Part-time farmers do make such decisions as
for exanç)le, working or not working overtime at the nonfarm job, to go
to work or to stay home when farm work is demanding their time. Those
operators with the goal of farming full-time certainly make such a
choice when they must decide whether or not to quit the nonfarm job,
and when to make that move. It has been demonstrated that some individuals see this as weighing relative security and opportunity.
That individuals have moved into part-time farming from both directions, former full-time farmers adding a nonfarm job to their
farm family business and nonfarm employed people adding farm operations
to their family firm, would indicate each of these groups saw promise
of higher total returns as the result of such a move. This higher re
turn is not necessarily measured in monetary terms. The personal satisfactions derived from associations in both the agricultural and non
farm activities were not subject to measurement in this study, but these factors do influence people in their personal decisions.
It would appear that while part-time farmers do not possess unique
ability to utilize physical agricultural resources, neither are they
at a distinct disadvantage in utilizing such resources under all con-

- 253 -
ditious. From a purely economic point of view, it appears that part-
time farming does make more efficient use of the human resources, so
that when total returns from farming and nonfarm sources are combined,
the total realized labor income ia higher than on similar size fulltime farms* This could lead part-time farming to occupy a dominant
place in the utilization of agricultural resources in some areas for many years to come.
Throughout the state one contributing factor in the growth of part-time farming is the inflexibility of land tenure processes. Ad
justment of size of farm to changes in technological development is relatively slow - either by sale or rental arrangements. All farmers
cannot buy out the neighbors to increase the size of their own farms. The difficulty of obtaining sufficient additional land, either by pur
chase or rental, in a location so it can be integrated into a larger
operating unit is compounded by surplus buildings, majjo traveled high
ways (over which operators do not want to move livestock and equipment),
and intervening blocks of land held by other farmers also desiring to
expand their operations. A shortage of capital with which to exp^d
his present operation to a more efficient scale may also deter this
change to larger and more efficient units. Under such conditions, if
faced with an alternative opportunity to increase family i ncome with
out additional investment, more farmers are likely to become part-time farmers.
To the extent the buildings, not needed in an expanded size farm unit by a farmer wanting to annex that land, cause that land to have greater value to a nonfarm employed family seeking the amenities of

- 254 -
rural living, another tract of land will be used by a part-time farm
er.These factors in development of part-time farming seem particular
ly applicable to those areas, such as eastern Ohio, where the topogra
phy and soils result in only scattered fields or patches of supra-mar
ginal land. More farmers in that region will find it difficult to command land in sufficient quantity and quality so situated so as to pro
vide them with a farm unit capable of producing a satisfactory level
of living when they spend all their time on the land. If nonfarm job
opportunities exist with roads that place them in commuting distance
of such farms, part-time farming can be expected to increase in those areas. The rate of return on labor sold off the farm, relative to
its return in agriculture in that area, will likely encourage the
nonfarm employment. While for non-economic reasons the population of such areas will not choose to move out in search of more remunerative
employment, they will drive considerable distances to work, if they can continue to keep their "roots" in the home community.
While part-time farmers in the future are likely to be found on farms covering a wide range of sizes of units, it is the opinion of
the author that there will be a tendency toward concentration of num
bers at two points on the size of farm scale. Individuals interested
primarily in the amenities of rural living and some production for sub
sistence purposes will concentrate on very small tracts. Those inter
ested in engaging in more serious farm operations are likely to be concentrated on farms of about JO acres and over.

- 255 -
Those on the small units, using productively a smaller percentage
of the reported labor used, and with higher investment in equipment
per crop acre may be able to justify such higher cost by pricing the
output to the family at retail prices* Those, however, who are pro
ducing primarily for sale are subject to the same pressure to achieve efficiency as other commercial farmers*
This conclusion is based primarily on observation of the author and expressions of problems of operators in the "in-between" size
group* These "in-between" acreages are too large to depend strictly
on hand labor, and too small to justify the ownership of sufficient
equipment to get the job done* The operators on these acreages had
an investment in machinery and equipment per crop acre that was relatively high compared to operators on larger tracts*
However, they indicated they still had problems of obtaining custom operators, trading work, or renting the land in very small fields*
The acreage devoted to a given crop, if trying to maintain a balanced rotation, was sufficiently small that custom operators or those seeking land to rent preferred larger units*
These factors, over a period of time, would appear to the author to direct the movement of part-time farmers toward either end of the size of farm scale*
Part-time fanaii^ is a method whereby certain individuals have
been able to accumulate the capital needed to farm on a full-time com
mercial scale* It, like other routes to full-time farming, does not
carry a guarantee of success* Some have tried and failed - others have succeeded*

- 256 -
The qualities that enable a young family to achieve their full
time farming goal by this route, are the same as with other routes,
namely; hard work, managerial ability, family cooperation, judicious
use of credit, e:gerlence and ability to learn from experience, and
doing the right thing at the right time. The latter is easiest to
say the most difficult to practice.
SUGGESTIONS FOR FURTHER STUDYSome of the conclusions set forth in this study must be regarded
as tentative. It would be extremely valuable if these areas and these operators could be revisited again at some future date, five or ten years hence. Such a study might also include an attempt to discover
where and why operators have gone who were included in this study and
would not be there at that future date.A further study of part-time fanning might well include in its
design provisions for pairing part-time and full-time farmers in the
same area, so that definitive conclusions could be drawn with regard
to efficiency of resource use. In order to be most useful such a
study would need to include data to ultimately enable some distribution of the returns to the productive resources.
An additional area for further investigation is to study what changes transpire in the operation and management of a farm unit
when the operator shifts from full-time to part-time farming. What
happens to the farm currently as a producing unit, and what do these developments indicate for the future of that unit?

- 257 -
APPENDIX A
TWO MEASURES OF PART-TIME FARMING COMPARED

APPENDIX TABLE ITWO MEASURES OF PART-TIME FARMING COMPARED
Total Farms, Number and Percentage of Total Farms Reporting 100 or More Days of Off-Farm Work and Farm Families Reporting Nonfarm Income
in Excess of Farm Income, by County, and Economic Area,Ohio, 1949
Area and Measure 1; Off-Farm WorkTotal
Measure 2 ; Family NonCarm Income Exceeded Farm Income
Measure 2 Congaared to Measure 1oounty Number Percent Number Percent Number
STATE TOTAL 199,359 62,848 31.5 65,575 32.9 2,677
Area 1 and aDefiance 1,914 374 19.5 345 18.0 -29Fulton 2,48o 491 19.8 454 18.3 -37Henry 2,254 284 12.6 253 11.2 -31Lucas 2,042 888 43.5 881 43.1 -7Ottawa 1,527 451 29.5 423 27.7 -28Paulding 1.509 279 18.5 272 18.0 -7Putnam 2,601 361 13.9 320 12,3 -4lSandusky 2,130 485 22.8 435 20.4 -50Van Wert 1,932 289 15.0 262 13.6 -27Williams 2,159 4oi 18.6 4oi 18.6 0Wood 3,077 657 21.4 586 19.0 -71
TOTAL 23,625 4,960 21.0 4,632 19.6 -328
Iro\jiCDI

APPENDIX TABLE I (Continued)
Area and Couniy Total
Measure 1: Off-Farm. Work 100 or More DaysNumber Percent
Measure 2 ; Family Nonfarm Income Exceeded Farm Income
Number Percent
Measure 2 CoiQ*&red to Measure 1
Number
Area 2Allen 2,560 815 31.8 736 28.8 79Auglaize 2,216 471 21.3 481 21.7 /lOCrawford 1,926 46l 23.9 392 20.4 -69Hancock 2,565 407 15.9 397 15.5 -10Hardin 2,071 ■ 299 14.4 297 14.3 -2Logan 2,165 513 23.7 506 23.4 -7Marion 1,530 329 21.5 255 16.7 -74Mercer 2,556 483 18.9 451 17.6 -32Seneca 2,524 489 19.4 483 19.1 -6Union 2,086 403 19.3 391 18.7 -12Wyandot 1,780 318 17.8 276 15.5 -42
TOTAL 23,979 4,988 20.8 4,665 19.5 -323
ItovnVOI

APEEKDK TABLE I (Contiaued)
Area and County Total
Measure 1: Off-Farm Work 100 or More Days
Measure 2 ; Family Nonfarm Income Exceeded Farm Income
Measure 2 Corngpared to Measure 1
Number Percent Number Percent Number
Area 3 b,c, & d Butler 2,471 895 36.2 863 34.9 -32Clark 1,853 586 31.6 533 28.9 -53Ghaiîçjaign 2,013 485 24.1 495 24.6 /lOClinton 1,827 363 19.9 382 20.9 /19Darke 4,307 960 22.3 938 21.8 -22Delaware 2,347 706 3:0.1 719 30.6 /I3Fayette 1,362 203 14.9 149 10.9 -54Franklin 2,641 924 35.0 857 32.4 -67Greene 1,914 492 25.7 505 26.4 /13Madison 1,344 207 15.4 206 15.3 -1Miami 2,527 768 30.4 745 29.4 -23Montgomery 3,259 1,421 43.6 1,332 40.9 -89Pickaway 1,750 312 17.8 288 16.5 -24Preble 2,361 643 27.2 637 27.0 -6Shelby 2,167 464 21.4 4oo 18.5 -64Warren 2,194 776 35.4 733 33.4 -43
TOTAL 36,337 10,205 28.1 9,782 26.9 -473
Area 4 a & cCuyahoga 1,589 807 50.8 782 49.2 -25Erie 1,272 393 30.9 368 28.9 -25Huron 2,345 682 29.1 670 28.6 -12Lake 1,178 603 51.2 598 50.7 -5Lorain 2,875 1,236 43.0 1,118 38.9 -118
TOTAL 9,259 3,721 40.2 3,536 38.2 -185

APPEHDK TABLE I (Continued)
Area and County Total
Measure 1; Off-Farm Work 100 or More Days
Measure 2 : Family Nonfarm Income Exceeded Farm Income
Measure 2 Compared to Measure 1 .
Number Percent Number Percent Number
Area 4bAshland 2,097 677 32.3 699 33.3 /22Holmes 2,122 445 21.0 374 17.6 -71Medina 2,628 996 37.8 1,009 38.3 /13Bichland 2,538 1,075 42.4 931 36.7 -144Wayne 3,288 868 26.4 741 22.5 -127
TOTAL 12,673 4,061 32.0 3,754 29.6 -307
Area 5 f,g,hAshtabula 3,843 1,696 44.1 1,760 45.8 /64Columbiana 3,028 1,301 43.0 1,266 41.8 -35Geauga 1,911 868 45.4 851 44.5 -17Mahoning 2,306 1,138 49.3 1,031 44.7 -107Portage 2,930 1,442 49.2 1,486 50.7 /44Stark 3,887 1,874 48.2 l,604 41.3 -270Summit 2,469 1,556 63.0 1,531 62.0 -25Trumbull 3,509 1,932 55.1 1,990 56.7 /58
TOTAL 23,883 11,807 49.4 11,519 48.2 -288
Area 6aFairfield 2,782 823 29.6 931 33.5 108Knox 2,449 720 29.4 689 28.1 -31Licking 3,457 1,201 34.7 1,145 33.1 -56Morrow 2,241 625 27.9 646 28.8 /21
TOTAL 10,929 3,369 30.8 3,411 31.2 /42
;I

APEEHDIX TABLE I (Continued)
Area and County Total
Measure 1: Off-Farm Work 100 or More Days
Measure 2: Family Nonfarm Income Exceeded Farm Income
Measure 2 Comçpared to Measure 1
Number Percent Number Percent Number
Area 6b & jBelmont 2,707 960 35.5 1,201 44.4 /24lCarroll 1,680 618 36.8 638 38.0 /20Coshocton 2,074 662 31.9 664 32.0 2Guernsey 2,247 680 30.3 899 40.0 219Harrison 1,301 478 36.7 558 43.0 80Jefferson 1,465 699 47.7 801 54.7 102Muskingum 2,660 967 36.4 1,087 40.8 120Perry 1,570 568 36.2 764 48.7 196Tuscarawas 2,520 1,128 44.8 1,074 42.6 -54
TOTAL 18,224 6,760 37.1 7,686 42.2 926
Area 7 & kAdams 2,601 398 15.3 626 24.1 228Brown 2,913 533 18.3 563 19.3 30Clermont 3,013 1,252 41.5 1,381 45.8 129Hamilton 2,133 948 44.4 992 46.5 44Highland 2,652 472 17.8 538 20.3 6Ross 2,386 822 34.5 961 40.3 139TOTAL 15,698 4,425 28.2 5,061 32.2 636
IfO

APEEKDEC TABLE I (Continued)
Area and County Total
Measure 1: Off-Farm. Work 100 or More Days
Measure 2 : Family Nonfarm Income Exceeded Farm Income
Measure 2 Coiigpared to Measure 1
Number Percent Number Percent Number
Area 8a & 1Gallia 2,447 689 28.2 945 38.6 256Socking 1,237 522 42.2 713 57.6 191Jackson 1,506 566 37.6 678 45.0 112Lawrence 2,155 989 45.9 1,408 65.3 419Pike 1,437 478 33.3 689 47.9 211Scioto 2,373 1,116 47.0 1,314 55.3 198Vinton 1,058 425 40.2 574 54.3 149
TOTA.L 12,213 4,785 39.2 6,321 51.8 1536
Area 8bAthens 2,025 765 37.8 1,028 50.8 263Meigs 1,891 595 ' 31.5 822 43.5 227Monroe 2,238 588 26.3 954 42.6 366Morgan 1,766 486 27.5 666 37.7 180Noble 1,695 4l8 24.7 494 29.1 76Washington 2,924 915 31.3 1,244 42.5 329TOTAL 12,539 3,767 30.0 5,208 41.5 l44l
Source: 1950 United States Census of Agriculture, Ohio, Part 3, County Table 1.
Counties and State Economic Areas, Volume 1,

26k -
APIEIÏDIX B GENERAL SURVEY SCHEDULE
The schedule form for recording data secured in interview and from other sources was mimeographed on file folders. The facing sheets on this stiff material made it possible to use the schedule without clip-board or other supporting surface in the field work, and the coarpleted schedules could be handled directly as sort cards. A printed form would have been more desirable since the mimeographed reproduction on smooth surfaced file folders tended to smudge in use.

IHiII
I
GO
O H I O A S / l t C U L T l i n A l E 3 f P ? r < M E N T S T / i T Î O H — P A R I T I M E F A B M II jO P R O J E C T R E C O R O N 0 _
TWP _ _ _ _ _ _ _ _ _ _ _ _ S E P . B D > TY-PE NO DATENAME" ADDRESf
T I M E , S P E NT ON FA RM . ^ 0 NON FARM WORK 8 Y , H O U S E HOLD fC H g E RSI e A R S OKMEMBER O F ' : I , ,
HOUSEHOLD ' SE X : AGE I NON FARM J O B i W E R E I S J O B LO CA T E D | T H I S J O B {NON FARM J O B [HO URS S P E N T P E R W EE K
f a r m ' v/ o r k
HUSBAND
4 - m m
W I F EC H I L D R E NI
s _ _ . . . . . . . . . . . . . : . : . . . . . . . . . . . . . . . . . . . . . . . . . . .... 1
1- T - -
4 1 . . . i - -'
. . . . . . . . , . . . . . , . . . . . ,! ;
5 : ' 1 I '.. ... . . . . . . . . 1 - . !O T H E R S 1 : '
D I S T A N C E TO WORK_
AUTOS
T R A V E L T I M E METHOD DA Y S WORKED L A S T Y E A R
F T T p t ' r: ; ' V i c ;0 i R :R E A R E O »H U S S A N D ] ^ " \ ^ \ | ;
T Y P E AND S C A L E E D U C A T IO N
W I F E
L I V E D HERE
i i I I
Y E A R S , L O V E D HERE FROM
:I
Y E A R S P . T , F A R M E R ;

R f  S O N S F O R C H O O S W G P A R T T I M E F h ^ M I N gT " iNCRÉ i '^S E Ï - * V C O S T S X " ) H E A L T H ( )■ G E T T E R HOWS'UN EM PLOYM EN T( ) PLAN FO R r , E T I R E M E f ' T ( ) L I K E C O U N T R Y ^ ) I N H E R I T E D P R O P E R T Y ( ) C H i l D R E N _ ( ) H I S H C O S T O F HOUSE NO HO USE IN TOWN( ) TE N E A R R E L A T I V E S ^ ) 6 E T S T A R T IN F \ R N I N G { ) L I K E NON FARM W ORK( )
IHCD
CD
I?
%Ifl)d-I
F U T U R E P L ' J J S ' 1 . BECOME F U L L T I M E F A R M E R : S C A L E
2 , c o n t i n u e P A R T T I M E ; S C A L E MOVE T O T O ' N
HOW SOON CAN YOU CHANGE
O B S T A C L E S T O C H A N G E ( i o a 2 ) C f i E 0 I T ( )L A N O I M P h OVETï N T ( ) B U I L D | f - G S ( } M A C H ! N E R Y ( ) L ! V E S T O C K { ) L A B 0 R ( )
MORE LAND { ;
■ACRES O k N E O - WHEN PU RCHASED MORTGAGE LAND CO N T R A C T
• ■ P R E V I O U S U S E • A C R E S OEWTEO OUT A C R E S R E N T ED IN
" C R 5 P r n A O r E A G É 1 9 5 3 1 P R O d u C E O r ' S O L b " " ; U S E D [L I V E S T O C K ' NUMBER * GRA DE T S A L E S U S t C T T------ :---1— --- -— r-— — '— —r— -------— '"T..........■'■■--- —- - - - - - - - - - - - - - - - - i i_— I— „i------------ i— J --------- i— _CORN
WHEAT X M Î L K
O A T S C A L V E S
i
SOY BEAN.; i : ;b . COWS : :
HAY . . . . . . . . . . . . . . . . . . . . . . . ! . : . U l v e s . . . . : ,.......1P A S T U R E i
T ! : ■ ' - '__ 4 - - . . . . . . . . . . pows .
ORCHARD[ y-'"'"- '• ' . . . . 1 . r , ; : PIGS
GA RDEN; ' ■ .
. . . . . : j ewes ' , , , . . . . . . . . .
T O D S.. . . ! : - ' - " ' ' ■* .
1 ! I A M B S i - "
W A ST E i . 1 t ‘ . i ‘ 'L _ - - - - - - - - J - - - - - - - - - i . »

I05
05!I%
fe+I
F E E D P O R C H A S E O t- K IN D f E R T L W e
POWER AND M A C H IN E R Y P U R C H A S E D NEW U S E D AGE
REMARKS P U R O I A S E O R E M ARK S NEW U S E D AGE
H O R S E S t r u c k
T S A C I O R - S I Z E MOWER
Plow CORN P I C K E R
C U L T I V A T O R c œ s i N E
D I S C B A L E R 1
D R I L L f o r a g e HARV
CORN p l a n t e r ^ RAKE
MANURE S P R E A D E R F E E D G R I N D
NEW OR P R E S E N T VA LU E ?:
M A C H IN E R Y J O I N T L Y 0 " N E O M A C H IN E WORK T RADED
M A C H IN E WORK H I R E D f C USTO M WORK FO R O T H E R S %
H I R E D LABOR P A S T Y E A R
REMARKS ON P R O D U C T IO N F O R U S E AND S A L E
COU LD YOU T AKE L I V I N G ON T H I S P L A C E W I T H NO O T H E R EMPLOYMENT
iI

CO
HOME \N0 COMMUNITY CONVENIENCES ‘HOUSE TYPE? BRICK, STUCCO, PAINTED frame{5 )u«paimteb FRAME, ETC.(2 ) ACE SEPARATE OININR ROOM y(6 )w(3
14VING ROC'M FiroirMNlSHEO? y(6 )n(2 ) LIVING ROOM -(ALL CONSTRUCTION! piaster, waubparo{5 ) CE)iiUG,Efc{2
LIVING ROOM LOUNGE S BED, COT, BENCH, sone(2 ) OIYAH,STUB 10,COUCH,DAY BEo{5 ) NUDE UN LIGHTING y{5 ) ü(2 )
g W ATER P I P E D IN HOUSE v(Ÿ ) n{3 ) S O U R C E : W E L L ( ) C I S T E B N ( ) S P R I N G ( ) G ( ) F ( ) P ( ) R E F R I G E R A T O R Y ( 5 } n ( |
D E E P F R E E Z E OR TOWN L OCKE R r { 6 ) n { 3 ) F U R N I T U R E I N S ' R E D ? v ( G ) » ( 3 ) MODERN H 8 K SC O R E
d i s t a n c e s M A I L D E L I v e r y ( ) P H 0 N E ( ) S C H O O L ( ) SCHOOL B U S ( ) C H t ! R C H ( ) BAKERY 0 E L I V E R Y ( )COWOOITY^ ARE YOU A 'M E M B E R O F FARM BU R E A U ( ) G R A N G E ( ) FARM U N I ^ N ( ) P T A ( ) C I V I C C n O U P _ _ _ _ _ _ _ _ _ _ _ _ _ _ G R O U P
O T H E R G R O U P S ( V E T E R A N , F R A T E R N A L , I BOR E T O ) . . . . . . . . . . . . . . . . . . . . . . . . . . . . . . . . . . . . . . . . . . . . . . . . . . . . . . . . . . . . . .S'p , DO YOU A T T EN D C H U R C H ? Y N W H E 'E O T H E R S IN T H I S COMMUNITY A T T E N D ? Y H SOMEWHERE E L S E 'E ' WÎD L E A D E R S H I P , P A R T I C I P A T I O N ( h ) _ _ _ _ _ _ _ _ _ _ _ ~ ( w )
0 0 C L O S E S T F R I E N D S L I V E +H N E IG H B O R H O O D ? IN COU NTRY E I S E U H E R E ^ I N TCWN = 'd- °WHERE OCTYOrCET YOUR IN F O R M A T IO N ABOUT FARM P R A C T I C E S ?
^ HAVE YOU C ON TA CTED COUNTY A G E N T { )HOME A G T ( ) S C S ( ) PM A( ) F L B ( ) P C A ( ) F H A ( ) G l T R A I N ( ) VO AG{ I
g WHAT DO YOtrOO FOR'RECREAT ION? (h ) (W) _ _ _ _ _ _ _ _ _ _(D (Dc+ S O I L T Y P E ■ % S U I T A B L E FOR C R O P S TOPO G RA P H Y
O R A t l l A G E _ _ _ _ _ _ _ _ _ _ _ _ E R O S IO N $ LAND C L A S S I 2 3 4 5 . 6 ? _ _ _ _ _ 8 _
HOUSE 6 F P 0 ( S I Z E ) ~ BARN G F P 0 ( S I Z E ) _ _ _ _ _ _ _ _ _ _ _ _ _ _
OT HE R B U I L D I N G S
CA S H INCOME FiTOM FARM A B C f l E F F A M IL Y INCOME F R W NON FARM J O B A B C 0 E F G
A I B T

- 269 -
APPENDIX C
Schedule used in recording interview data of those cases referred as established through using part-time farming.

TXMÏ3 ROU033 TO FULL TIME FARMING
Reco^rcl No.
Dato ___/- .Clcbros s
Co u-i ioy J3?t-7X>_ JRd Type Nui'.ibca:*
HoxxsoLoId Conrpos jL~b±oi
OcQ\xpa.-b3.011 ( ii%c3_%_icL±r
HuLsbcL: id M
Ba.clcgjroi_uia. oT HTj.slDa.nc3. aiici W ife
F o r s o n j Vo - V.g h - H NuimTd Cl? LarotLci'S
Nuint>ej7 { P ia c e i n fii£i-fco2rs 1 iaiA i l."V SotiooX
M i l i t a r y S e r v i CO
Hasfcaiid. J1
W ife !i
l-fcciil HuslDancL W ideF a t h e r s o c c u p a t io n * j ( i-e cponcLent a g e 15-"19 1
!£■ Jf’a.a-'iueari Sise & Type (I'espoi-icLei'i'b cige EiirpLoyiiiciit Recoarcl Lo-s-b joL p cla.-bc3s o.iiivtG.X wa.se____
Ii~Lïaoir i-fcgxnco Ç es pe ctocl ) jTmicls J (u.-'Go )~b iXi~fcy J F e n s io n
O-fciiLi

•271 -
0
g
tH'H0I
u
I•rlE4
I0g
"D
I
0CÎ1
a0
is htH0 02 •riCl U dp 02d P A0 12 02p •H P5 A g
o,
rj0
0A
02U
X)'‘I§o;au0
tQ•A
d
W0S)N•HCQ
0
0aM
EtH0■a0a0■pr.g§
ti
02 02%%t! -P
i fI
AA
h
Ü
IÜ%
A
w0•H■PI,!Nd"-j
i
8Y-l-iJaILQ8Ü,
0 tà)to
0)0 0d Üd flH CJd H« d Ü
W ft 02H X NCJ OJ •Hd d ra*rl 02 02M 02 02 r]•H C2 d hk 0 d0 fl M m
M
5•HdP
g0
H
ffiA0§'rl■P*ri ■ COI0àa5wIi>0
a
•1-5I
<a-J?p0a
0tûfj02d
1u0d•H
''d02 P
§h
I H Î

ERESEMT LAJ3D USE; Acjrea-gej yields, and u~fclXxz£ ~fclor- of Crops pz-oaucad.Cro-D I Acreage | Px'Qau.GtiQvi j Spi<i j,(Feea ooed), . 1 Rciiirlia
________ I________ __J__________ L _ Used, o.-v Home |C u m
I /i.cr'eo.ge j Y xeXcl
Soybean
CXover ■ mixed_
RoaXc & Farmstead.Xlvestoclc - Inventory and production ;
! Hoiae Use ori SoJ.esj Herd. EuXargementFroductioni Fur cH;
Dairy Ccv/sHeii
EeeX cows
E r . Sow;Pigs
Paying Hons

Did you begin building foundation livestock in a Vo-ng or
Q, I, training prograia
Machinery and Equipmc|!.t ;
Kind1
)ize , iige : Approx. Value Share (if joint owed)Acquisition (nev, usodj etc.)M-WJ"* ' ‘ ““T
Tractor (i) ,*,» * 1 - • n ip
Tragtor._{2) .
Ploy(.s) i !
Disc 1 !i :
Harrov • ;
Dorn Planter!Cultivator
iI1
I
wI

“5-Fiiaa.ri.ciaX Statement aiaà Het Worth/..saetsKiiaX
Laud. & BXdgs (this )M a c i i & L d u i p .
-■-utoi'.io’b iXeLivestockFeed o.ud suppiiesHotseiioXd.Other Heal Estate Stocks and Bonds Savings Lcct.Chech heat.#ash cm hand.
XIotal
Vaiu.eLiabiXitiesKinaR . E . MortgageChattel Mtg.
Uncleared notes Installraent aects Open accounts Other debts
Value
Total
Sources ol credit

- 275 -
APPENDIX D
Letter and Questionnaire sent to the Republic Steel Corporation list of employees who had indicated an interest in gardening and/or farming*

■ 2?6 ■
2 2° t W £ > *• J O <
ii=w za jwg a .è':S3: g Ic:
I 8ra tiP5 " nS IÛ> Q)
1 1m w
tt c. ZÜ) X <a o
u . z u 0 < < . C JW 3 J(T r- Uw J rd 6 =Q -æ
0 •0
I g0 h S
8 % f•H 3 [0 (30Ü 0 41
a S i S ■8 “S .I> ft U U■rl r! « to rl 0 -P 0 S
g'H 0/30 3 0 g k0 Î-I H 0 0 ■H +3 (!) 0 Ma ' s r a0 co-P fJ p ® da a f l a r j a > «1
a B a -PwOrl 3 p P•H a m !h 81 S 0 a 5! a 'H > p af( P ’ri p H d H a8j rl Pm d ft a X'ri a w
dftaPk
808 I5 » 8 ?
OP (J 0 ft a i M
ft.98'a
iH ,0, (3 d • d)- - ' i a S ê
1 ffl a
a K) d a d I u p d'd •H tI tj S ft
ri ftftbOp p 0 a 05 H k f t d
» r . ad • a 0 a dd ft H p0 ap PP a 0 a I 0- -j ft P -r a d ft ft >
■ri f t a a p d 10 ftd ■ft r l d 0 dt> 0 a f t d a•rl 'ft ft r)p a ■ '3 _ , dÜ ft B ftd Ü0 a d a d
, I S S S “0 0 d 0 a I : ft u 'ft ft 0d - d a " p a m a p 'ft3 5 ! 8 . 3a p a ' f t B P■ft I f t a ' r l 0 f t r l a f t r l
. " 3 S M S S4h ‘H i ) 'H -rl
d ftp > a a r l • B a / d 0 - p 0 a d■H P 'H d p d , 0d a a 9 t i a f t a d d p 60 0 f t p d ID aft B B ft 'H ■0 la a a p r l
érj<i
-P ' r i 0 H -P 0 % W Ü -H i1 Pd q d S d a
■H p o d 0 0 p _ a d d Oft ■H d a a f t a 0 'H a
a a a 3 a d 60H f t d d
P a 0 - r i 0a a c3 f t 'H f t f t f t P 60 m 0 0 'H a a d p
B c a -ft s Q a ' f t r l t« t o P d d P H P d
p 81 ft ftd ft0 r : 0 d a ,. .Ü 0 f t 0 0 f t ; î t a p s
d ft0 od■rl a P B B81 a 0a a ri dp a td'H d ap g 0 8a5:38ySp'-'ft
■HUPrl a a
r d r la 0 S 0 0 O ' H «1 P Æ
3 a M
p a d
r| n p ■H t! a ^Pft
d ft 0 a 0 'J ft 60 ■H 0 Q 8 0 P ■H 0 P 8!O P 0 f t
O P
o p * ill u p G a
a d d 'H ■H 0 a d ft I idad a a
.)B'V§•Hpu
a 0 ft■H a r i a P p ffl pd 0 a ft a r l
3 “8H3PPrl Bsrrlftp ah'a dft 00 a >1
■:'r. rl lf\
illd 'p a a (0B > 'H 0 r i r l rl ftu a8:3M :P ' - / 0
r ift a a a to d > ® a op0 ft 0 ^ ° P a a a
a , d
A g kfd B
388
63
5 : »siH0 a0 p 0• a
M U.-s« Ù, LUH rw yjz >- >• 03< < L 1o}r D _JÜ 1 § J32 1- U.0>■ i 2 0 <
w J u (2 < c W COz i 0 Q 1< 0 JC Z Xh Û w T z C" < < zÜ 0 UJ C5 wc 5 J hIII 0 0 W <>< u3 0H S 6 z J
"sZ 0 uJkh < z 3 Z w3 c Ü.' 0 h 30 K w W 2 XH' h: 0 2 < < 0z <L L Jzo m Ü I W 30t- LI k Ü2 0h 05Û.0 Ü LU- ■i Z 0 3z > c J 0 WwM J a. Z CfJ h% lU “i z iL w 0. <c < t0 - 0 0 0 khZ w ? < <w CM
w«-J h2 k3 «c Ul 0. z GQ 0 5 W Ü <CLÜ w ÜJ <k X z< Û.U z XÜ H 0 > LÜJ 1 u. Z C >u h3 k32 H h z 0 02. 2 0 Z 3w LI < <0 W 0 wH It: W 0 u u. Gz % Z z 0 00 u uI k r c Wh 3 ! H 0 Ü< CJ 2. COUl <J <J
§ UJ>LU z z Q-
z k < < <h z J J 30 0è 2 0 H- mw H 3 KZ z n C W
0 u. z< tilOœ k «
h: <2 < Z UJw z -i CDUJ 0 X a. 0X W 0 QÜ < 1- W J< y I Ç 3J X c o < Q
0 < c 0 J 3Z < b. Lu J Û.tr z u< z X h Ü < < 0u. X 0 2 Z'. <
< 2 ÜJ JL u. v5 2 CL0 z w 80 C.u 2 0. J WNM Î
iL Xh
a (0 2.0 m
w s

- 277 -
BIBLIOGRAPHY
Agricultural Marketing Service, The Farm Income Situation* United States Department of Agriculture, Washington, D. C.: GovernmentPrinting Office, 1955*
ALLEN, A* H, "Part-Time Farming in the South East." Division of Social Research, Works Progress Administration, Mimeograph IX. Washington, D. 0.: Government Printing Office, 1937*
Annual reports of County Agricultural Extension Service, unpublished copies. Office of the Director of Ohio Agricultural Extension Service, College of Agriculture, The Ohio State University, 1951.
BENEDICT, M. R., et. al. "Need For a New Classification of Farms." Journal of Farm Economics, XXVI (Noveniber 1944) .
CHEW, A, P. "The City Man's Stake in the Land." 1940 Yearbook of Agriculture, United States Department of Agriculture. Washington, D. C*: Government Printing Office, 1940.
HEADY, E. O., BACH, W. B., AND PETERSON, G. A. Interdependence Between the Farm Business and the Farm Household With Implications on Economic Efficiency. Research Bulletin No. 39#, Ames; Iowa Agricultural Experiment Station, 1953.
McELVEEN, J. V., and BACHMAN, K. L. Low Production Fai^, Bureau of Agricultural Economics Information Bulletin No. 108. Washington, D. C.: Government Printing Office, 1953*
MOORE, H. R., and BAIIEY, R. A, Ohio Farm Real Estate Prices. Research Bulletin No. 7H* Wooster, Ohio: Ohio Agricultural Experiment Station, 1951*
NOWIES, H. N. "Some Background Information on the Extent of I^t- Time Farming in Ohio." Mimeograph of Department of Agricultural Education. Columbus, Ohio: The Ohio State University, 1952.
Ohio Bureau of Unemployment Compensation, "Average Weekly Earnings in Industries Under Ohio Unenployment Compensation Law by Counties 1943-54." Division of Research and Statistics, Bureau of Unemployment Compensation, Columbus, Ohio: Mimeograph 9-13-55*
SAIÆER, L, A*, JR. "What is Part-Time Farming?" Journal of Farm Economics, XVIII, (February 193^)*
SALTER, L, A., JR., and DIEHL, L. F, "Part-Time Farming Research." Journal of Farm Economics, XXII, (August 194o).

- 278
SCHULTZ, T. W. Agriculture in an Unstable Economy» New York, N. Y#i McGraw-Hill Book Co., 19^5»
SMITH, MERVIN G* and GREENBAUM, HARRY* "Estimated Cash Receipts by Ohio Farmers From the Sale of Agricultural Products and From Government Payments, by Counties, 195^*" Columbus, Ohio; Department of Agricultural Economics and Rural Sociolo^, The Ohio State University, Mimeograph Bulletin No* AE 259* 1955*
"Type of Farm Business Analysis Reports, 1953*" Summary Analysis of Ohio Farm Account Records, Department of Agricultural Economics and Rural Sociology. Columbus, Ohio: The Ohio State University,1953 (Mimeograph) *
United States Bureau of the Census * United States Census of Agriculture, Counties and State Economic Areas, Vol. I, Part 3, Washington, D* C*; Government Printing Office, 1952*
United States Bureau of the Census* United States Census of Agriculture, Special Reports, Vol. V, Part 6* Washington, D* cT: Government Printing Office, 1952*

- 279 -
AUTOBIOGRAPHY
I, William Allen Wayt, was born February 20, 1921, on a farm in Marshall County near Mound-sville, West Virginia, I received my elementary education in the one and two room schools of that county. My secondary school education was obtained in the public school at Moundsville, West Virginia, My undergraduate training was received at West Liberty State Teachers College and West Virginia University, From the latter I obtained the degree of Bachelor of Science in Agriculture in 1943# From 19^3 to 19^5 I was a member of the United States Armed Forces in the European Theater of Operations, I received the degree of Master of Science in Rural Economics from The Ohio State University in 19^7, In January^ 1948, I received the appointment of Instructor in the Department of Agricultural Economics and Rural Sociology at The Ohio State University and began the work for the degree of Doctor of Philosophy, In Octobe: 1953^ I received the appointment of Instructor in the Department of Agricultural Economics from The Ohio Agricultural Experiment Station, It was while holding these joint appointments that the requirements for the degree of Doctor of Philosophy were comnleted.