Parity among interpretation methods of MLEE patterns and disparity among clustering methods in...
20
Parity among interpretation methods of MLEE patterns and disparity among clustering methods in epidemiological typing of Candida albicans Marcelo Fabiano Gomes Boriollo a, * , Edvaldo Antonio Ribeiro Rosa b , Reginaldo Bruno Gonc ¸alves a , Jose ´ Francisco Ho ¨ fling a a Microbiology and Immunology Laboratory, Dental School of Piracicaba, State University of Campinas, Piracicaba, Brazil b Stomatology Laboratory, Center of Biological and Health Sciences, Pontifical Catholic University of Parana ´, Curitiba, Brazil Received 25 May 2004; received in revised form 17 May 2005; accepted 24 May 2005 Available online 11 July 2005 Abstract The typing of C. albicans by MLEE (multilocus enzyme electrophoresis) is dependent on the interpretation of enzyme electrophoretic patterns, and the study of the epidemiological relationships of these yeasts can be conducted by cluster analysis. Therefore, the aims of the present study were to first determine the discriminatory power of genetic interpretation (deduction of the allelic composition of diploid organisms) and numerical interpretation (mere determination of the presence and absence of bands) of MLEE patterns, and then to determine the concordance (Pearson product-moment correlation coefficient) and similarity (Jaccard similarity coefficient) of the groups of strains generated by three cluster analysis models, and the discriminatory power of such models as well [model A: genetic interpretation, genetic distance matrix of Nei (d ij ) and UPGMA dendrogram; model B: genetic interpretation, Dice similarity matrix (S D1 ) and UPGMA dendrogram; model C: numerical interpretation, Dice similarity matrix (S D2 ) and UPGMA dendrogram]. MLEE was found to be a powerful and reliable tool for the typing of C. albicans due to its high discriminatory power (N 0.9). Discriminatory power indicated that numerical interpretation is a method capable of discriminating a greater number of strains (47 versus 43 subtypes), but also pointed to model B as a method capable of providing a greater number of groups, suggesting its use for the typing of C. albicans by MLEE and cluster analysis. Very good agreement was only observed between the elements of the matrices S D1 and S D2 , but a large majority of the groups generated in the three UPGMA dendrograms showed similarity S J between 4.8% and 75%, suggesting disparities in the conclusions obtained by the cluster assays. D 2005 Elsevier B.V. All rights reserved. Keywords: Candida albicans ; MLEE patterns; Interpretation methods; Cluster analysis 0167-7012/$ - see front matter D 2005 Elsevier B.V. All rights reserved. doi:10.1016/j.mimet.2005.05.012 * Corresponding author. Laboratatory of Microbiology and Immunology, Department of Oral Diagnostic, Dental School of Piracicaba, State University of Campinas, Av. Limeira 901, CEP13414-903 CP052, Piracicaba, SP, Brazil. Tel.: +55 19 3412 5321; fax: +55 19 3412 5218. E-mail address: [email protected] (M.F.G. Boriollo). Journal of Microbiological Methods 64 (2006) 346 – 365 www.elsevier.com/locate/jmicmeth
Transcript of Parity among interpretation methods of MLEE patterns and disparity among clustering methods in...

www.elsevier.com/locate/jmicmeth
Journal of Microbiological Methods 6
Parity among interpretation methods of MLEE patterns and
disparity among clustering methods in epidemiological
typing of Candida albicans
Marcelo Fabiano Gomes Boriollo a,*, Edvaldo Antonio Ribeiro Rosa b,
Reginaldo Bruno Goncalves a, Jose Francisco Hofling a
aMicrobiology and Immunology Laboratory, Dental School of Piracicaba, State University of Campinas, Piracicaba, BrazilbStomatology Laboratory, Center of Biological and Health Sciences, Pontifical Catholic University of Parana, Curitiba, Brazil
Received 25 May 2004; received in revised form 17 May 2005; accepted 24 May 2005
Available online 11 July 2005
Abstract
The typing of C. albicans by MLEE (multilocus enzyme electrophoresis) is dependent on the interpretation of enzyme
electrophoretic patterns, and the study of the epidemiological relationships of these yeasts can be conducted by cluster analysis.
Therefore, the aims of the present study were to first determine the discriminatory power of genetic interpretation (deduction of
the allelic composition of diploid organisms) and numerical interpretation (mere determination of the presence and absence of
bands) of MLEE patterns, and then to determine the concordance (Pearson product-moment correlation coefficient) and
similarity (Jaccard similarity coefficient) of the groups of strains generated by three cluster analysis models, and the
discriminatory power of such models as well [model A: genetic interpretation, genetic distance matrix of Nei (dij) and
UPGMA dendrogram; model B: genetic interpretation, Dice similarity matrix (SD1) and UPGMA dendrogram; model C:
numerical interpretation, Dice similarity matrix (SD2) and UPGMA dendrogram]. MLEE was found to be a powerful and
reliable tool for the typing of C. albicans due to its high discriminatory power (N0.9). Discriminatory power indicated that
numerical interpretation is a method capable of discriminating a greater number of strains (47 versus 43 subtypes), but also
pointed to model B as a method capable of providing a greater number of groups, suggesting its use for the typing of C.
albicans by MLEE and cluster analysis. Very good agreement was only observed between the elements of the matrices SD1 and
SD2, but a large majority of the groups generated in the three UPGMA dendrograms showed similarity SJ between 4.8% and
75%, suggesting disparities in the conclusions obtained by the cluster assays.
D 2005 Elsevier B.V. All rights reserved.
Keywords: Candida albicans; MLEE patterns; Interpretation methods; Cluster analysis
0167-7012/$ - s
doi:10.1016/j.mi
* Correspondin
University of C
E-mail addre
4 (2006) 346–365
ee front matter D 2005 Elsevier B.V. All rights reserved.
met.2005.05.012
g author. Laboratatory of Microbiology and Immunology, Department of Oral Diagnostic, Dental School of Piracicaba, State
ampinas, Av. Limeira 901, CEP13414-903 CP052, Piracicaba, SP, Brazil. Tel.: +55 19 3412 5321; fax: +55 19 3412 5218.
ss: [email protected] (M.F.G. Boriollo).

M.F.G. Boriollo et al. / Journal of Microbiological Methods 64 (2006) 346–365 347
1. Introduction
Multilocus enzyme electrophoresis (MLEE or
MEE), also known as isoenzymatic typing, has been
employed for a number of decades as a standard
method for the genetic analysis of populations in
eukaryotes (Ayala, 1976; Nevo et al., 1980; Selander
and Whittam, 1983). Pioneer work conducted in the
1980s employing MLEE in the genetic analysis of
Escherichia coli and Shigella, stirred enormous inter-
est among medical microbiologists (Selander and
Levin, 1980; Selander et al., 1986). Since then, nu-
merous studies were performed with innumerable
results contributing to the understanding of the natural
history of infectious diseases. MLEE has been con-
sidered the gold standard in the study of the popula-
tion genetics of microorganisms (Boerlin, 1997). In
the field of medical mycology, isoenzymatic typing
has been shown to be of great potential in taxonomy,
systematics, genetics, evolution and epidemiology,
especially in the characterization of C. albicans
(Arnavielhe et al., 1997; Barchiesi et al., 1998; Boer-
lin et al., 1996; Boriollo et al., 2005; Caugant and
Sandven, 1993; Lehmann et al., 1989; Mata et al.,
2000; Pujol et al., 1993a,b, 1997; Rosa et al., 1999,
2000a,b, 2001, 2003).
Enzyme reactions can be carried out in gels (for
example, amide gels) and electrophoretic bands visu-
alized according to enzyme activity, indicating the
existence of isoenzymes or isozymes (Markert and
Moller, 1959). Isoenzymes constitute multiple molec-
ular forms of the same enzyme with individual affinity
for the same substrate, catalyzing the same reaction in
the cell (Dixon and Webb, 1979). Their expression is
controlled genetically by one or more alleles or genes,
situated at one or various loci (Harris, 1975; Markert,
1975; Scandalios, 1969). Isoenzymes controlled by
alleles of a single locus are called alloenzymes or
allozymes (Conkle et al., 1982; Prakash et al.,
1969). Because the net electrostatic charge and,
hence, the rate of migration of a protein during elec-
trophoresis are determined by its amino acid sequence,
mobility variants (electromorphs or allozymes) of an
enzyme can be directly equated with alleles at the
corresponding structural gene locus (Selander et al.,
1986).
The capacity of isoenzymatic analysis in the dis-
tinction of fungal species depends on intrapopula-
tional genetic variability. Organisms with high
genetic variability can express highly variable pheno-
types and therefore conceal inter-or intraspecific
differences. This is evident mainly with various
non-metabolic enzymes which exhibit high structural
variation as a result of intense environmental selective
pressure (Brown and Langley, 1979; Huettermann et
al., 1979; Johnson, 1974; Newman, 1985; Racine and
Langley, 1980). On the contrary, metabolic enzymes
show low vulnerability to environmental selection,
whereby they are usually employed as isoenzyme
markers (Whittam et al., 1983). The patterns of iso-
enzyme electrophoretic bands are frequently predict-
able, since they depend on the genetic and nuclear
conditions of each organism. However, various
mycologists limit the interpretations of electrophoretic
results to mere counting of bands (Rosa et al., 1999,
2000a,b, 2001, 2003; Shannon et al., 1973; Shecter,
1973). Genetic interpretation, when possible, fur-
nishes a large amount of additional information
about the nuclear, genetic and taxonomic conditions
of a group of organisms (Harris and Hopkinson, 1976;
Micales et al., 1998; Siciliano and Shaw, 1976).
Therefore, different criteria for interpretation have
been employed for haploid and diploid organisms
(Harris and Hopkinson, 1976; Murphy et al., 1990;
Pasteur et al., 1987; Selander et al., 1986). Based on
these criteria, allelic composition has been determined
from a group of 10 to 30 metabolic enzymes consid-
ered representative of the total genome (Boerlin,
1997; Soll, 2000).
Since each form of data (genetic and numerical
interpretation) has its own peculiarities that must be
taken into consideration for computer-assisted analy-
sis and storage, another final interpretation must
involve a measurement of similarity or distance
among the data collected for every possible pair of
isolates analyzed. These measurements are then used
to generate similarity matrices or distance matrices
and dendrograms (phylogenetic trees) for cluster
analysis (Soll, 2000). Such dendrograms can then
be generated by the unweighted pair-group method
using arithmetic averages (UPGMA), first used by
Rohlf (1963) and discussed in detail by Sneath and
Sokal (1973), or a comparable method. UPGMA,
which has been used frequently to generate dendro-
grams based on matrices of a variety of distance or
similarity coefficients, is relatively straightforward

M.F.G. Boriollo et al. / Journal of Microbiological Methods 64 (2006) 346–365348
and has been widely used in fingerprinting infectious
fungi (Soll, 2000).
The typing of C. albicans by MLEE is initially
dependent on the interpretation of enzyme electro-
phoretic patterns, and the study of the epidemiolog-
ical relationship of these yeasts can be determined by
cluster analysis. Therefore, the aim of the present
study was (i) to determine the discriminatory power
of genetic interpretation (deduction of the allelic
composition of diploid organisms) and the numerical
interpretation (mere counting of bands present and
absent) of MLEE patterns, and then (ii) to determine
the parity or disparity among groups of identical and
highly related isolates obtained by three cluster
assays commonly used for the typing of fungal
infections.
2. Materials and methods
2.1. Yeast isolates
The study involved 75 specimens of C. albicans
isolated from the oral cavity of 75 clinically healthy
children, characterized previously by the group of
investigators at the Laboratory of Microbiology and
Immunology of the Department of Oral Diagnostics,
Dental School of Piracicaba, State University of Cam-
pinas (Moreira et al., 2001; Boriollo et al., 2005).
2.2. Enzyme extraction
Yeast cultures were grown in flasks containing 50
mL of YEPD medium [1% (wt/vol) yeast extract, 2%
(wt/vol) peptone and 2% (wt/vol) D-glucose] at 37 8Cfor 18h, under constant shaking at 150 rpm (Shaker
Incubator mod. NT 712, Nova Tecnica Instrumentos e
Equipamentos de Laboratorio Ltda.). After growth,
cells were centrifuged at 3000 �g for 5 min and
washed twice in 0.9% (wt/vol) NaCl, submitting
each wash to the same centrifugal force. Pellets
(~500 AL) were transferred to 2-mL microtubes (Bios-
pec Products, Inc.) containing cold distilled water
(approximately 8 8C) and glass beads (1 :1 :1).
These mixtures were kept on ice (4 8C) for 5 min
and afterwards agitated 4 times in a BeadBeater ma-
chine (Biospec Products, Inc.) at 4200 rpm for 30 s, at
one-minute intervals. Cell fragments were centrifuged
at 5000 �g at 4 8C for 5 min. The resulting upper
aqueous phase was applied to Whatman n3 filter
papers (wicks), 12�5mm in size, and maintained at
�70 8C until time of use (Rosa et al., 2003; Boriollo
et al., 2005).
2.3. Electrophoresis and specific enzyme staining
Enzymes were separated in starch gels (Penetrose
30R- Refinacoes de Milho Brasil Ltda) at 13% (wt/
vol), with dimensions of 200�120�10mm. Wicks
were then immediately soaked in 5 AL (0.02% wt/
vol) of bromophenol-blue solution, and afterwards
applied perpendicularly onto a gel cut longitudinally
(20 mm). Electrophoresis was performed in a hori-
zontal and continuous system, at 130 V at 4 8Covernight (bromophenol-blue migration equivalent
to 80 mm). To assure reproducible results, the C.
albicans CBS-562 enzymes (Centralbureau voor
Schimmelcultures, Delft, The Netherlands) were in-
cluded in each gel. After the electrophoretic run, the
gel was put on an acrylic base and sliced into 1.5 mm
sections with the aid of rulers and n15 nylon thread.
The sections were carefully placed inside white por-
celain containers and submitted to a staining process
by methods previously described for 11 enzymes (15
enzyme loci) (Alfenas, 1998; Boriollo et al., 2005;
Pujol et al., 1997; Selander et al., 1986). The enzy-
matic activities determined were: alcohol dehydroge-
nase, sorbitol dehydrogenase, manitol-1-phosphate
dehydrogenase, malate dehydrogenase, isocitrate de-
hydrogenase, glucose dehydrogenase, glucose-6-phos-
phate dehydrogenase, aspartate dehydrogenase,
catalase, peroxidase, and leucine aminopeptidase
(Table 1). Enzymatic expressions of malate dehydro-
genase, isocitrate dehydrogenase, and sorbitol dehy-
drogenase showed two and three genetically
interpretative loci (Mdh-1, Mdh-2, and Mdh-3; Idh-1
and Idh-2; Sdh-1 and Sdh-2).
2.4. Genetic interpretation of MLEE patterns
Pattern interpretation was performed following the
general rules commonly accepted in the deduction of
the allelic composition and of the genotype of dip-
loid organisms. The bands on the gels were num-
bered in order of decreasing mobility, and the
corresponding alleles were numbered by using the

Table 1
Systems and solutions utilized for MLEE analysis from metabolic enzymes of C. albicans
Enzyme Compound for staining
EC number Name Symbol Substrate Buffer Salt Coenzyme Dye catalyser
1.1.1.1. Alcohol dehydrogenase ADH Ethanol (3 mL)
isopropanol (2 mL)
200mM Tris–HCl
pH 8.0 (50 mL)aNAD 1%
(2 mL)
PMS 1% (500 AL)MTT 1.25% (1 mL)
1.1.1.14. Sorbitol dehydrogenase SDH Sorbitol (250 mg) Tris–HCl 50 mM
pH 8.0 (50 mL)bNAD 1%
(2 mL)
PMS 1% (500 AL)MTT 1.25% (1 mL)
1.1.1.17. Mannitol-1-phosphate
dehydrogenase
M1P Mannitol-1-phosphate
(5 mg)
Tris–HCl 100 mM
pH 8.5 (50 mL)cNAD 1%
(2 mL)
PMS 1% (500 AL)MTT 1.25% (1 mL)
1.1.1.37. Malate dehydrogenase MDH 2M Malic acid
(6 mL)dTris–HCl 200 mM
pH 8.0 (40 mL)aNAD 1%
(2 mL)
PMS 1% (500 AL)MTT 1.25% (1 mL)
1.1.1.42. Isocitrate dehydrogenase IDH 1M Isocitric acid
(2 mL)eTris–HCl 200 mM
pH 8.0 (40 mL)a100 mM
MgCl2(1 mL)f
NADP 1%
(1 mL)
PMS 1% (500 AL)MTT 1.25% (1 mL)
1.1.1.47. Glucose dehydrogenase GDH D-glucose (500 mg) Tris–HCl 200 mM
pH 8.0 (50 mL)aNAD 1%
(2 mL)
PMS 1% (500 AL)MTT 1.25% (1 mL)
1.1.1.49. Glucose-6-phosphate
dehydrogenase
G6PDH Glicose-6-phosphate
disodium salt (100 mg)
Tris–HCl 200 mM
pH 8.0 (50 mL)a100 mM
MgCl2(1 mL) f
NADP 1%
(1 mL)
PMS 1% (500 AL)MTT 1.25% (1 mL)
1.4.3.x. Aspartate dehydrogenase ASD Aspartic acid (50 mg) Sodium phosphate
pH 7.0 (50 mL)gNAD 1%
(2 mL)
PMS 1% (500 AL)MTT 1.25% (1 mL)
1.11.1.6. Catalaseh CAT
1.11.1.7. Peroxidase PO H2O2 3% (1 mL) 100 mM Sodium
acetate pH 4.5 (50 mL)io-dianisidine 2HCl
(16 mg)
3.4.11.1. Leucine aminopeptidase LAP L-leucine
b-naphthylamide HCl
(30 mg)
100 mM Potassium
phosphate pH 5.5
(50 mL)j
100 mM
MgCl2(1 mL)f
Black K (30 mg)
Electrode buffer: Tris–citrate pH 8.0 [83.2 g of C4H11NO3 (Tris), 33.09 g of C6H8O7 . H2O (Citric acid), 1 L of H2O]; Gel buffer: Electrode buffer diluted 1 :29.a 24.2 g of C4H11NO3 (Tris), 1 L of H2O (pH adjusted with HCl);b 6.05 g of C4H11NO3 (Tris), 1 L of H2O (pH adjusted with HCl);c 12.1 g of C4H11NO3 (Tris), 1 L of H2O (pH adjusted with HCl);d 26.8 g of C4H6O5 (DL-malic acid) and 16 g of NaOH in 0.1 L of H2O (caution: potentially explosive reaction);e 29.41 g of C6H5O7Na3. 2H2O (DL-isocitric acid) in 0.1 L of H2O;f 2.03 g of MgCl2. 6HCl (Magnesium chloride) in 0.1 L of H2O;g Mix equal parts of 27.6 g of NaH2PO4. H2O (Sodium phosphate monobasic monohydrate) in 1 L of H2O and 53.6 g of Na2HPO4. 7H2O (Sodium phosphate dibasic heptahydrate)
in 1 L of H2O, then dilute the mixture 1 :25 with H2O;h Incubate gel slice for 30 min at 0 8C in 50 mL of 0.1 M sodium phosphate pH 7.0 buffer, then pour off solution, and immerse it in 50 mL of 1.5% potassium iodide solution (KI)
for 2 min. Therefore, rinse gel slice with water, and immerse it in 50 mL of 0.03% hydrogen peroxide (H2O2) solution. Mix gently and remove stain solution when white zones appear
on dark-blue background;i 13.61g of C2H3O2Na. 3H2O (Sodium acetate), 1 L of H2O;j 13.61 g of KH2PO4 (Potassium phosphate), 1 L of H2O.
M.F.G.Borio
lloet
al./JournalofMicro
biologica
lMeth
ods64(2006)346–365
349

M.F.G. Boriollo et al. / Journal of Microbiological Methods 64 (2006) 346–365350
same nomenclature. Lack of demonstrable activity
for an enzyme was scored as two null alleles at
the corresponding gene locus. Each unique combi-
nation of alleles over the 15 enzyme loci examined
results in an electrophoretic type (ET)–subtype or
strain (Alfenas, 1998; Harris and Hopkinson, 1976;
Pasteur et al., 1987; Selander et al., 1986; Soll,
2000).
2.5. Numerical interpretation of MLEE patterns
Pattern interpretation was performed employing
values of relative mobility (Rf), given by: Rf ¼ dD�
100, where d corresponds to the distance traveled by
the isoenzyme (mm) and D corresponds to the dis-
tance traveled by the bromophenol-blue front (mm).
Each unique combination of bands for the 11 en-
zymes examined results in an electrophoretic type
(ET)–subtype or strain (Alfenas, 1998; Boriollo et
al., 2000; Rosa et al., 1999, 2000a,b, 2001, 2003;
Sneath and Sokal, 1973).
2.6. Evaluation of interpretation methods by the
numerical index of discriminatory power
The discriminatory power of the MLEE method
based on both genetic and numerical interpretation of
the electrophoretic patterns was established by the
numerical index of discrimination (D), according to
the probability that two unrelated strains sampled
from the test population will be placed into different
typing groups. This probability can be calculated by
Simpson’s index of diversity, which was developed
for the description of species diversity within an
ecological habitat (Simpson, 1949). This index can
be derived from elementary probability theory (Armi-
tage and Berry, 1987) and is given by the following
equation: D ¼ 1� 1N N�1ð Þ
PSj¼1 nj nj � 1
� �, where N
is the total number of strains in the sample population,
s is the total number of types described, and nj is the
number of strains belonging to the jth type. This
equation is derived as follows. The probability that
two strains sampled consecutively will belong to that
group isnjðnj�1ÞNðN�1Þ. These probabilities can be summed
for all the described types to give the probability that
any two consecutively sampled strains will be the
same type. This summation can be subtracted from
1 to give the equation above. This equation can be
applied both to a direct comparison of the discrim-
inating power of typing methods and to analysis of
the discriminating power of combined typing
schemes. An index of greater than 0.90 would be
desirable if the typing results are to be interpreted
with confidence (Hunter and Fraser, 1989; Hunter
and Gaston, 1988).
2.7. Cluster analysis
The set of data furnished by genetic interpretation
of MLEE patterns was submitted to cluster analysis
(final interpretation of data) by two different models:
1) Model A: the statistic dij of Nei (1972) was used
to estimate the genetic distance among all the
isolates of C. albicans: dij¼� Inh P
k xkixkj�� ��� �
=ffiffiffiffiffiffiffiffiffiffiffiffiffiffiffiffiffiffiffiPk x
2kix
2kj
q� i, a measure of genetic distance
(range from 0 to infinity) based on the identity
of genes (frequency of alleles for all loci, includ-
ing monomorphic loci) among populations. This
genetic distance measures the accumulated allele
differences per locus, and it can also be estimated
from amino acid sequences of proteins even for a
distantly related species. Thus, if enough data are
available, genetic distance between any pair of
organisms can be measured in terms of dij. In
addition, this measure is applicable to any kind
of organism regardless of ploidy or mating
scheme. Its interpretation in terms of enzyme
loci infers that, on average, 0 to an infinite
number of allelic substitutions are detected (by
electrophoresis) in every 100 loci, from a com-
mon ancestral strain (Nei, 1972; Selander et al.,
1986; Alfenas, 1998).
2) Model B: The similarity coefficient Dice (1945)
was used to estimate the genetic similarity among
all of the isolates (Pujol et al., 1997; Sneath and
Sokal, 1973; Soll, 2000): SD ¼ 2a2aþbþc
, a pair-
function that measures the agreement (range
from 0 to 1) between pairs of OTUs (operational
taxonomic units) over an array of two-state char-
acters, which are for convenience coded 0 or 1
(Sneath and Sokal, 1973). In this case, the code 0
or 1 represents respectively the absence of pres-
ence of a given isoenzyme genotype. This coeffi-
cient omits consideration of negative matches (d)
and gives more weight to the positive matches (a)

M.F.G. Boriollo et al. / Journal of Microbiological Methods 64 (2006) 346–365 351
than to mismatches (b and c). This SD1 measures
the proportion of identical genotypes of two iso-
lates, where a is the number of genotypes shared
by strains A and B, b is the number of genotypes
unique to strain A, and c is the number of geno-
types unique to strain B. For the present model,
an SD1 of 1.00 represents identically matched
genotypes (i.e., all genotypes of isolates A and
B match), an SD1 of 0.0 represents no matches,
and SD1 ranging from 0.01 to 0.99 represent
increasing proportions of matched genotypes.
The combined data furnished by the numerical
interpretation of MLEE patterns was submitted to
cluster analysis (final interpretation of data) by a
single model:
1) Model C: the similarity coefficient Dice (1945)
was also used to determine the similarity among all
the isolates (Pujol et al., 1997; Sneath and Sokal,
1973; Soll, 2000). The code 0 or 1 was used to
represent respectively the absence or presence of a
given isoenzyme activity band, (Sneath and Sokal,
1973). This SD2 measures the proportion of bands
with the same relative mobility (Rf) in the patterns
of two isolates, where a is the number of bands shared
by strains A and B, b is the number of bands unique to
strain A, and c is the number of bands unique to strain
B. For the present model, an SD2 of 1.00 represents
identically matched bands (i.e., all bands in the pat-
terns of isolates A and B match), an SD2 of 0.0
represents no matches, and SD2 ranging from 0.01
to 0.99 represent increasing proportions of matched
bands.
Trees with two-dimensional classifications, called
dendrograms, based on matrix dij (model A), matrix
SD1 (model B), and matrix SD2 (model C) were
generated by the SAHN method (sequential, agglom-
erative, hierarchic, nonoverlapping clustering meth-
ods) UPGMA algorithm (unweighted pair-group
method using an arithmetic average) (Sneath and
Sokal, 1973). Since MLEE provide all levels of relat-
edness that must be resolved by DNA fingerprinting
methods (i.e., identify the same strain in independent
isolates, identify microevolutionary changes in a
strain, identify cluster of moderately related isolates,
and identify completely unrelated isolates), thresholds
(average values: dijP
; SD1P
and SD2P
) were established
in dendrograms to identify clusters of identical iso-
lates and highly related isolates (dijP
Ndijz0; SD1P
bSD1V1; and SD2
PbSD2V1) (Pujol et al., 1997; Soll, 2000).
All of these analyses were obtained employing the
program NTSYS-pc 1.70 (Rohlf, 1988).
2.8. Evaluation of the cluster models
The Pearson product-moment correlation coeffi-
cient was used as a measure of the agreement
(range from �1 to +1) between elements of two
matrices (dij�SD1, dij�SD2, and SD1�SD2)
obtained by different techniques or based on different
characters. This coefficient, computed between OTUs
j and k, is
rjk ¼
Xni¼1
Xij � XP
j
� �Xik � X
Pk
� �ffiffiffiffiffiffiffiffiffiffiffiffiffiffiffiffiffiffiffiffiffiffiffiffiffiffiffiffiffiffiffiffiffiffiffiffiffiffiffiffiffiffiffiffiffiffiffiffiffiffiffiffiffiffiffiffiffiffiffiffiffiffiffiffiXni¼1
Xij � XP
j
� �2 Xni¼1
Xik � XP
k
� �2s
where Xij stands for the character state value of
character i in OTU j, XP
j is the mean of all state
values for OTU j, and n is the number of characters
sampled (Sneath and Sokal, 1973). Such concordance
was interpreted in the following manner: 0.9V r—very
good concordance; 0.8V rb0.9—good concordance;
0.7V r b0.8—weak concordance; r b0.7—very weak
concordance (Rohlf, 1988).
The similarity among the clusters containing
identical isolates and highly related isolates (dijPNdijz
0versusSD1P
bSD1V1versusSD2P
bSD2V1 ) was estab-
lished by the Jaccard coefficient: SJ ¼ aaþbþc
, a pair-
function that also measures the agreement (range from
0 to 1) between pairs of OTUs over an array of two-
state characters, which are for convenience coded 0 or
1 (Sneath and Sokal, 1973). In this case, the code 0 or
1 represents respectively the absence or presence of a
given strain of C. albicans. This coefficient omits also
consideration of negative matches (d) and gives the
same weight to positive matches (a) and mismatches
(b and c). SJ measures the proportion of identical
strains of two clusters, where a is the number of
strains shared by clusters A and B, b is the number
of strains unique to cluster A, and c is the number of
strains unique to cluster B. For the present model, an
SJ of 1.00 represents identically matched strains (i.e.,
all strains of clusters A and B match), an SJ of 0.0

M.F.G. Boriollo et al. / Journal of Microbiological Methods 64 (2006) 346–365352
represents no matches, and SJ ranging from 0.01 to
0.99 represent increasing proportions of matched
strains.
The discriminatory power of the three models of
cluster analysis was calculated by Simpson’s index of
diversity, based on the probability that two unrelated
strains sampled from the test population will be placed
into different typing clusters (dijP
Ndijz0; SD1P
bSD1V1orSD2
PbSD2V1) (Hunter and Fraser, 1989; Hunter
and Gaston, 1988).
3. Results
3.1. Genetic and numerical interpretations of MLEE
patterns
The genetic interpretation of MLEE patterns of
C. albicans isolates allowed the identification of 14
(93.3%) polymorphic loci for one, two or three
alleles [1 alelle: Idh-2 (frequency of allele b or c
b1%); 2 alleles: Cat, Gdh (frequency of allele c or
db1%), Mdh-2, Mdh-3 (frequency of allele a
b1%), Po and Sdh-2 (frequency of allele c or d
b1%); 3 alleles: Adh, Asd, G6pdh, Idh-1, Lap,
M1p, Mdh-1]. Only 1 (6.7%) locus was monomor-
phic for one allele (Sdh-1). The combinations of the
alleles existing in all the loci showed 43 ETs in the
population of isolates (Fig. 1). These results indi-
cate that 31 healthy children harbored in the oral
cavity distinct ETs of the yeast C. albicans. Still,
12 ETs shared among 44 children (Table 2). The
discriminatory power of the MLEE method based
on the genetic interpretation of electrophoretic pat-
terns was 0.966, that is, 96.6% probability of two
C. albicans isolates sampled from the test popula-
tion belonging to different typing groups (i.e., elec-
trophoretic type- ET).
The numerical interpretation of the MLEE pat-
terns of the population of isolates of C. albicans
permitted the identification of polymorphism in all
the enzymes studied (i.e., for each enzyme the fre-
quency of the most common band was b99%) total-
ing 43 distinct types of electrophoretic bands (Fig.
1). The combination of bands for the 11 enzymes
examined showed 47 ETs in the population of iso-
lates. These results indicate that 36 healthy children
harbor orally distinct ETs of the yeast C. albicans.
Moreover, 11 ETs were shared among 39 children
(Table 3). The discriminatory power of the MLEE
method based on the numerical interpretation of the
electrophoretic patterns was 0.970, that is, 97% prob-
ability of two C. albicans isolates sampled from the
test population belonging to different typing groups
(i.e., electrophoretic type- ET).
3.2. Evaluation of the cluster assays
Very good agreement was observed among the
elements of the matrices SD1 and SD2 (r =0.909),
while negative agreement (correlation) was observed
among elements of the matrices dij and SD1
(r =�0.548) or dij and SD2 (r=�0.487). In addition,
when the elements dij of the genetic distance matrix
were converted into similarity elements (Sdij =1�dij)
a very poor agreement was observed among the ele-
ments of the matrices dij and SD1 (r =0.505) or dij and
SD2 (r =0.566).
The three cluster assays showed the following
results (Fig. 2):
a) Model A: 63 isolates distributed among 10 groups
(mean of 6.3 isolates/cluster; standard deviation of
F6.53 isolates; discriminatory power equal to
0.810) and 13 moderately related isolates and/or
unrelated isolates;
b) Model B: 60 isolates distributed among 13 groups
(mean of 4.61 isolates/cluster; standard deviation
of F4.64 isolates; discriminatory power equal to
0.874) and 16 moderately related isolates and/or
unrelated isolates;
c) Model C: 63 isolates distributed among 12 groups
(mean of 5.25 isolates/cluster; standard deviation
of F5.61 isolates; discriminatory power equal to
0.847) and 13 moderately related isolates and/or
unrelated isolates.
Only 3 pairs of groups showed 100% similarity SJ[group 7 of model A (A7) and group 12 of model B
(B12); group 10 of model B (B10) and group 11 of
model C (C11); group 13 of model B (B13) and group
12 of model C (C12)], all with a very small number of
isolates (only 2 isolates/group or 2.6% of the sample
population). One pair showed 95% similarity SJ[group 3 of model B (B3–19 isolates or 25% of the
sample population) and group 2 of model C (C2–20

Fig. 1. Zymogram of MLEE patterns of oral isolates of C. albicans and resultant genetic (above) and numerical (below) interpretations. The migration of enzymes occurred from the
negative pole (cathode) to the positive pole (anode). The isolates are labeled from left to right 1 to 76 (52=CBS 562).
M.F.G.Borio
lloet
al./JournalofMicro
biologica
lMeth
ods64(2006)346–365
353

Fig.1(continued).
M.F.G. Boriollo et al. / Journal of Microbiological Methods 64 (2006) 346–365354

Fig.1(continued).
M.F.G. Boriollo et al. / Journal of Microbiological Methods 64 (2006) 346–365 355

Fig.1(continued).
M.F.G. Boriollo et al. / Journal of Microbiological Methods 64 (2006) 346–365356

Table 2
Allelic profiles of 43 ETs of C. albicans isolated from oral cavity of 75 clinically healthy children
ET No. of
isolates
Alleles of 15 enzyme locia
Adh Asd Cat G6pdh Gdh Idh-1 Idh-2 Lap M1p Mdh-1 Mdh-2 Mdh-3 Po Sdh-1 Sdh-2
CBS 562 bb bb aa cc bb aa aa aa bb ab ab cc ab aa bb
1 2 ab ab aa ab bb aa aa aa bb aa ab cc ab aa bb
2 1 ab ab aa bb ab ac aa aa bb aa ab cc ab aa bb
3 1 ab ab aa cc ab ac aa aa aa aa ab cc aa aa aa
4 2 ab ab aa cc ab ac aa aa ab aa ab cc aa aa ab
5 1 ab ab aa cc bb aa aa aa bb aa ab cc aa aa ab
6 1 ab ab aa cc bb aa aa aa bb aa ab cc aa aa bb
7 1 ab bb aa bb bb aa aa aa bb aa ab cc ab aa bb
8 1 ab bb aa cc bb aa aa aa bb aa ab cc aa aa ab
9 2 ab bb aa cc bb aa aa aa bb aa ab cc aa aa bb
10 4 ab bb aa cc bb aa aa aa bb aa ab cc ab aa bb
11 1 ab bb aa cc bb aa aa aa bb aa ab – aa aa bb
12 1 ab bb aa cc bb aa aa aa bb aa ab – ab aa ab
13 1 ab bb aa cc bb aa aa aa bb aa ab – ab aa bb
14 1 ab bb aa cc bb aa aa ab bb ab ab – aa aa bb
15 1 ab bb aa cc bb aa – aa bb ab bb – ab aa bb
16 1 bb ab aa aa bb ac aa aa bb aa ab cc aa aa bb
17 1 bb ab aa aa bb – aa aa bb aa ab cc ab aa bb
18 1 bb ab aa bb bb aa aa aa bb aa ab – ab aa bb
19 1 bb ab aa bb bb ac aa aa bb aa ab cc ab aa bb
20 1 bb ab aa cc ab ac aa aa ab aa ab cc aa aa bb
21 1 bb ab aa cc ab ac aa aa ab aa ab cc ab aa bb
22 1 bb ab aa cc ab ac aa ab bb aa ab cc ab aa bb
23 6 bb ab aa cc bb aa aa aa bb aa ab cc aa aa bb
24 6 bb ab aa cc bb aa aa aa bb aa ab cc ab aa bb
25 1 bb ab aa cc bb aa aa aa bb aa ab – ab aa bb
26 1 bb ab aa cc bb aa aa aa bc aa ab bb aa aa bb
27 1 bb ab aa cc bb ac aa aa bb aa ab cc aa aa bb
28 3 bb ab aa cc bb ac aa aa bb aa ab cc ab aa bb
29 1 bb ab aa cc cd bb bc aa cc cc – ab ab aa bb
30 1 bb bb aa bb bb aa aa aa bc aa ab bb ab aa bb
31 2 bb bb aa cc bb aa aa aa bb aa ab cc aa aa bb
32 10 bb bb aa cc bb aa aa aa bb aa ab cc ab aa bb
33 3 bb bb aa cc bb aa aa aa bb aa ab – aa aa bb
34 2 bb bb aa cc bb aa aa aa bb aa ab – ab aa bb
35 1 bb bb aa cc bb aa – aa bb aa ab cc aa aa bb
36 1 bb bb aa cc bb aa – aa bb aa ab cc ab aa bb
37 2 bb bb aa cc bb aa – aa bb aa ab – aa aa bb
38 1 bb bb aa cc bb aa – aa bb aa ab – ab aa aa
39 1 bb bb aa cc bb aa – aa bb aa ab – ab aa bb
40 1 bb bb aa cc bb aa – aa bb aa bb – ab aa bb
41 1 bb cc bb bb ab ac aa aa ab aa ab cc ab – cd
42 1 bc bb aa cc bb aa – aa bb aa ab cc aa aa bb
43 1 cc bb aa cc bb aa aa cc bb aa ab cc bb aa bb
Genetic interpretation.a Heterozygotes are present as ab, ac, bc, and cd. [–] null allele.
M.F.G. Boriollo et al. / Journal of Microbiological Methods 64 (2006) 346–365 357
isolates or 26.3% of the sample population)]. Forty-
two pairs of groups showed 4.8–42.9% similarity SJand sixteen pairs of groups showed 53.8–75% simi-
larity SJ (Table 4).
4. Discussion
Specific and reliable laboratory procedures are
needed to determine the genetic relationship of micro-
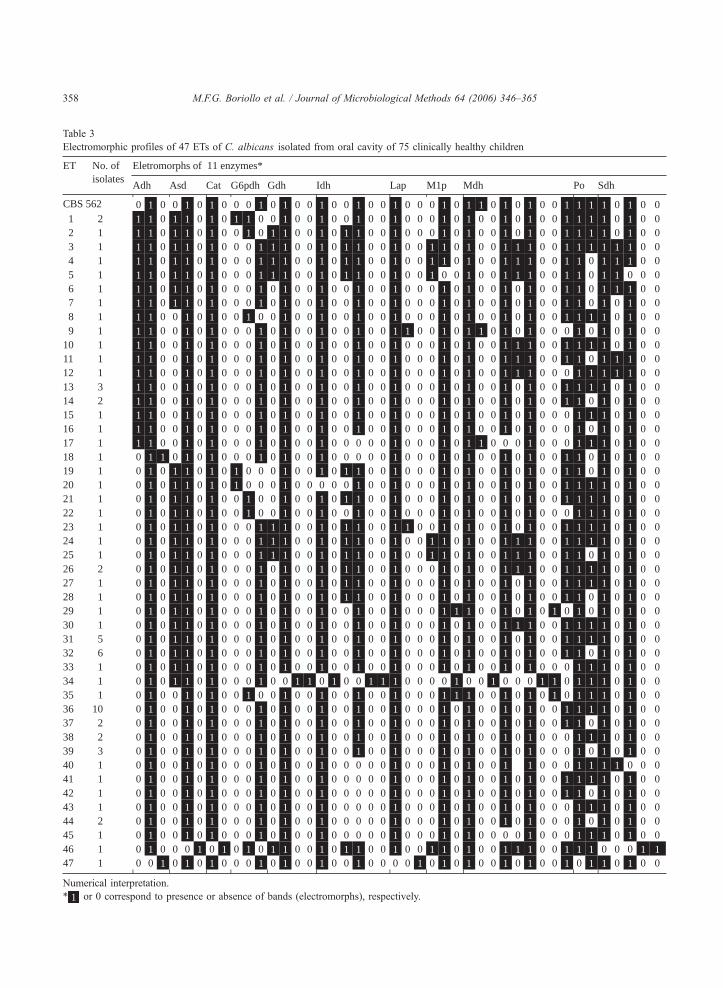
Table 3
Electromorphic profiles of 47 ETs of C. albicans isolated from oral cavity of 75 clinically healthy children
Eletromorphs of 11 enzymes*ET No. of isolates
Adh Asd Cat G6pdh Gdh Idh Lap M1p Mdh Po Sdh
CBS 562 0 1 0 0 1 0 1 0 0 0 1 0 1 0 0 1 0 0 1 0 0 1 0 0 0 1 0 1 1 0 1 0 1 0 0 1 1 1 1 0 1 0 02 1 1 0 1 1 0 1 0 1 1 0 0 1 0 0 1 0 0 1 0 0 1 0 0 0 1 0 1 0 0 1 0 1 0 0 1 1 1 1 0 1 0 01 1 1 0 1 1 0 1 0 0 1 0 1 1 0 0 1 0 1 1 0 0 1 0 0 0 1 0 1 0 0 1 0 1 0 0 1 1 1 1 0 1 0 01 1 1 0 1 1 0 1 0 0 0 1 1 1 0 0 1 0 1 1 0 0 1 0 0 1 1 0 1 0 0 1 1 1 0 0 1 1 1 1 1 1 0 01 1 1 0 1 1 0 1 0 0 0 1 1 1 0 0 1 0 1 1 0 0 1 0 0 1 1 0 1 0 0 1 1 1 0 0 1 1 0 1 1 1 0 01 1 1 0 1 1 0 1 0 0 0 1 1 1 0 0 1 0 1 1 0 0 1 0 0 1 0 0 1 0 0 1 1 1 0 0 1 1 0 1 1 0 0 01 1 1 0 1 1 0 1 0 0 0 1 0 1 0 0 1 0 0 1 0 0 1 0 0 0 1 0 1 0 0 1 0 1 0 0 1 1 0 1 1 1 0 01 1 1 0 1 1 0 1 0 0 0 1 0 1 0 0 1 0 0 1 0 0 1 0 0 0 1 0 1 0 0 1 0 1 0 0 1 1 0 1 0 1 0 01 1 1 0 0 1 0 1 0 0 1 0 0 1 0 0 1 0 0 1 0 0 1 0 0 0 1 0 1 0 0 1 0 1 0 0 1 1 1 1 0 1 0 01 1 1 0 0 1 0 1 0 0 0 1 0 1 0 0 1 0 0 1 0 0 1 1 0 0 1 0 1 1 0 1 0 1 0 0 0 1 0 1 0 1 0 01 1 1 0 0 1 0 1 0 0 0 1 0 1 0 0 1 0 0 1 0 0 1 0 0 0 1 0 1 0 0 1 1 1 0 0 1 1 1 1 0 1 0 01 1 1 0 0 1 0 1 0 0 0 1 0 1 0 0 1 0 0 1 0 0 1 0 0 0 1 0 1 0 0 1 1 1 0 0 1 1 0 1 1 1 0 01 1 1 0 0 1 0 1 0 0 0 1 0 1 0 0 1 0 0 1 0 0 1 0 0 0 1 0 1 0 0 1 1 1 0 0 0 1 1 1 1 1 0 03 1 1 0 0 1 0 1 0 0 0 1 0 1 0 0 1 0 0 1 0 0 1 0 0 0 1 0 1 0 0 1 0 1 0 0 1 1 1 1 0 1 0 02 1 1 0 0 1 0 1 0 0 0 1 0 1 0 0 1 0 0 1 0 0 1 0 0 0 1 0 1 0 0 1 0 1 0 0 1 1 0 1 0 1 0 01 1 1 0 0 1 0 1 0 0 0 1 0 1 0 0 1 0 0 1 0 0 1 0 0 0 1 0 1 0 0 1 0 1 0 0 0 1 1 1 0 1 0 01 1 1 0 0 1 0 1 0 0 0 1 0 1 0 0 1 0 0 1 0 0 1 0 0 0 1 0 1 0 0 1 0 1 0 0 0 1 0 1 0 1 0 01 1 1 0 0 1 0 1 0 0 0 1 0 1 0 0 1 0 0 0 0 0 1 0 0 0 1 0 1 1 0 0 0 1 0 0 0 1 1 1 0 1 0 01 0 1 1 0 1 0 1 0 0 0 1 0 1 0 0 1 0 0 0 0 0 1 0 0 0 1 0 1 0 0 1 0 1 0 0 1 1 0 1 0 1 0 01 0 1 0 1 1 0 1 0 1 0 0 0 1 0 0 1 0 1 1 0 0 1 0 0 0 1 0 1 0 0 1 0 1 0 0 1 1 0 1 0 1 0 01 0 1 0 1 1 0 1 0 1 0 0 0 1 0 0 0 0 0 1 0 0 1 0 0 0 1 0 1 0 0 1 0 1 0 0 1 1 1 1 0 1 0 01 0 1 0 1 1 0 1 0 0 1 0 0 1 0 0 1 0 1 1 0 0 1 0 0 0 1 0 1 0 0 1 0 1 0 0 1 1 1 1 0 1 0 01 0 1 0 1 1 0 1 0 0 1 0 0 1 0 0 1 0 0 1 0 0 1 0 0 0 1 0 1 0 0 1 0 1 0 0 0 1 1 1 0 1 0 01 0 1 0 1 1 0 1 0 0 0 1 1 1 0 0 1 0 1 1 0 0 1 1 0 0 1 0 1 0 0 1 0 1 0 0 1 1 1 1 0 1 0 01 0 1 0 1 1 0 1 0 0 0 1 1 1 0 0 1 0 1 1 0 0 1 0 0 1 1 0 1 0 0 1 1 1 0 0 1 1 1 1 0 1 0 01 0 1 0 1 1 0 1 0 0 0 1 1 1 0 0 1 0 1 1 0 0 1 0 0 1 1 0 1 0 0 1 1 1 0 0 1 1 0 1 0 1 0 02 0 1 0 1 1 0 1 0 0 0 1 0 1 0 0 1 0 1 1 0 0 1 0 0 0 1 0 1 0 0 1 1 1 0 0 1 1 1 1 0 1 0 01 0 1 0 1 1 0 1 0 0 0 1 0 1 0 0 1 0 1 1 0 0 1 0 0 0 1 0 1 0 0 1 0 1 0 0 1 1 1 1 0 1 0 01 0 1 0 1 1 0 1 0 0 0 1 0 1 0 0 1 0 1 1 0 0 1 0 0 0 1 0 1 0 0 1 0 1 0 0 1 1 0 1 0 1 0 01 0 1 0 1 1 0 1 0 0 0 1 0 1 0 0 1 0 0 1 0 0 1 0 0 0 1 1 1 0 0 1 0 1 0 1 0 1 0 1 0 1 0 01 0 1 0 1 1 0 1 0 0 0 1 0 1 0 0 1 0 0 1 0 0 1 0 0 0 1 0 1 0 0 1 1 1 0 0 1 1 1 1 0 1 0 05 0 1 0 1 1 0 1 0 0 0 1 0 1 0 0 1 0 0 1 0 0 1 0 0 0 1 0 1 0 0 1 0 1 0 0 1 1 1 1 0 1 0 06 0 1 0 1 1 0 1 0 0 0 1 0 1 0 0 1 0 0 1 0 0 1 0 0 0 1 0 1 0 0 1 0 1 0 0 1 1 0 1 0 1 0 01 0 1 0 1 1 0 1 0 0 0 1 0 1 0 0 1 0 0 1 0 0 1 0 0 0 1 0 1 0 0 1 0 1 0 0 0 1 1 1 0 1 0 01 0 1 0 1 1 0 1 0 0 0 1 0 0 1 1 0 1 0 0 1 1 1 0 0 0 0 1 0 0 1 0 0 0 1 1 0 1 1 1 0 1 0 01 0 1 0 0 1 0 1 0 0 1 0 0 1 0 0 1 0 0 1 0 0 1 0 0 0 1 1 1 0 0 1 0 1 0 1 0 1 1 1 0 1 0 0
10 0 1 0 0 1 0 1 0 0 0 1 0 1 0 0 1 0 0 1 0 0 1 0 0 0 1 0 1 0 0 1 0 1 0 0 1 1 1 1 0 1 0 02 0 1 0 0 1 0 1 0 0 0 1 0 1 0 0 1 0 0 1 0 0 1 0 0 0 1 0 1 0 0 1 0 1 0 0 1 1 0 1 0 1 0 02 0 1 0 0 1 0 1 0 0 0 1 0 1 0 0 1 0 0 1 0 0 1 0 0 0 1 0 1 0 0 1 0 1 0 0 0 1 1 1 0 1 0 03 0 1 0 0 1 0 1 0 0 0 1 0 1 0 0 1 0 0 1 0 0 1 0 0 0 1 0 1 0 0 1 0 1 0 0 0 1 0 1 0 1 0 01 0 1 0 0 1 0 1 0 0 0 1 0 1 0 0 1 0 0 0 0 0 1 0 0 0 1 0 1 0 0 1 1 1 0 0 0 1 1 1 1 0 0 01 0 1 0 0 1 0 1 0 0 0 1 0 1 0 0 1 0 0 0 0 0 1 0 0 0 1 0 1 0 0 1 0 1 0 0 1 1 1 1 0 1 0 01 0 1 0 0 1 0 1 0 0 0 1 0 1 0 0 1 0 0 0 0 0 1 0 0 0 1 0 1 0 0 1 0 1 0 0 1 1 0 1 0 1 0 01 0 1 0 0 1 0 1 0 0 0 1 0 1 0 0 1 0 0 0 0 0 1 0 0 0 1 0 1 0 0 1 0 1 0 0 0 1 1 1 0 1 0 02 0 1 0 0 1 0 1 0 0 0 1 0 1 0 0 1 0 0 0 0 0 1 0 0 0 1 0 1 0 0 1 0 1 0 0 0 1 0 1 0 1 0 01 0 1 0 0 1 0 1 0 0 0 1 0 1 0 0 1 0 0 0 0 0 1 0 0 0 1 0 1 0 0 0 0 1 0 0 0 1 1 1 0 1 0 01 0 1 0 0 0 1 0 1 0 1 0 1 1 0 0 1 0 1 1 0 0 1 0 0 1 1 0 1 0 0 1 1 1 0 0 1 1 1 0 0 0 1 1
123456789
1011121314151617181920212223242526272829303132333435363738394041424344454647 1 0 0 1 0 1 0 1 0 0 0 1 0 1 0 0 1 0 0 1 0 0 0 0 1 0 1 0 1 0 0 1 0 1 0 0 1 0 1 1 0 1 0 0
Numerical interpretation.
* 1 or 0 correspond to presence or absence of bands (electromorphs), respectively.
M.F.G. Boriollo et al. / Journal of Microbiological Methods 64 (2006) 346–365358

M.F.G. Boriollo et al. / Journal of Microbiological Methods 64 (2006) 346–365 359
organisms of medical interest. Such procedures have
been essential to understand the dynamics of infectious
organisms in human populations, decipher the com-
plex relationship between infection and commensal-
ism, to identify the origin of an infection or to monitor
the emergence of drug-resistant strains (Soll, 2000).
Along this line, various methods have been employed
to determine the genetic relationship of C. albicans,
which include electrophoretic karyotyping (Barchiesi
et al., 1995; Doi et al., 1994; Vazquez et al., 1994; Voss
et al., 1995), RFLP analysis (Bart-Delabesse et al.,
1993; Magee et al., 1992; Vazquez et al., 1991; Whe-
lan et al., 1990), RAPD analysis (Bostock et al., 1993;
Holmberg and Feroze, 1996; Lehmann et al., 1992;
Robert et al., 1995), Southern blot hybridization with a
variety of moderately repetitive DNA probes (Lasker
et al., 1992; Lockhart et al., 1995; Mahrous et al.,
1990; Scherer and Stevens, 1988) and MLEE (Boerlin
et al., 1995, 1996; Boriollo et al., 2005; Caugant and
Sandven, 1993; Le Guennec et al., 1995; Lehmann et
al., 1989; Pujol et al., 1993a, 1993b; Reynes et al.,
1996). In the majority of these investigations, the
patterns generated by the fingerprinting methods
were not characterized with regard to discriminatory
power (Pujol et al., 1997).
Typabililty, reproducibility and discriminatory
power have been developed and recommended to
determine the efficiency of various methods. Typabil-
ity and reproducibility represent quantitative systems
and are frequently expressed as percentages. In this
case, the typability of a method corresponds to the
percentage of distinct strains obtained and the repro-
ducibility corresponds to the percentage of strains that
show the same results in repeated assays (Hunter and
Gaston, 1988). In the present study, the high repro-
ducibility of the results obtained by MLEE was guar-
anteed by the inclusion of the enzymes of C. albicans
CBS-562 in each gel and by obtaining identical ETs
for the same isolate with the three electrophoretic
assays. In turn, the discriminatory power of a method
corresponds to its ability to differentiate between un-
related strains (Hunter and Gaston, 1988).
The use of Simpson’s diversity index has been
suggested for comparing the discriminatory power
among phenotypic or genotypic typing methods of
C. albicans (Boerlin et al., 1996; Clemons et al.,
1997; Hunter and Fraser, 1989; Hunter and Gaston,
1988). The discriminatory power of MLEE based on
both genetic and numerical electrophoretic interpreta-
tions was shown to be higher than 0.9, therefore
proving to be a powerful and reliable tool for typing
C. albicans in epidemiological studies (Hunter and
Fraser, 1989; Hunter and Gaston, 1988). Such result
corroborates those obtained by Boerlin et al. (1996)
and Pujol et al. (1997), and is even shown to be
superior to that described previously for MLEE
(Hunter, 1991). We should mention that the different
discriminatory values for the MLEE method observed
in various studies is due to the different enzymes
analyzed, size of the microbial populations and origin
of the pathogen (immunocompetent or immunocom-
promised patients). Moreover, numerical interpreta-
tion of the MLEE patterns discriminated a greater
number of oral strains of C. albicans in a population
of clinically healthy children (47 ETs identified by
numerical interpretation versus 43 ETs identified by
genetic interpretation).
The present study also applied Simpson’s diversity
index to compare the discriminatory power of three
cluster analysis models (based on the probability that
two unrelated strains sampled from the test population
will be placed into different typing clusters). The three
models for cluster analysis that were evaluated
showed a discriminatory higher than 0.8 and lower
than 0.9. However, further inferences on the interpre-
tation of these values were not made, except for the
fact that a greater discriminatory power was observed
in model B [discriminatory power equal to 0.874; 60
isolates distributed among 13 groups (genetic inter-
pretation; matrix SD1; UPGMA dendrogram); mean of
4.61 isolates/cluster; standard deviation of F4.64 iso-
lates; 16 moderately related isolates and/or unrelated
isolates], followed by model C [discriminatory power
equal to 0.847; 63 isolates distributed among 12 groups
(numerical interpretation; matrix SD2; UPGMA den-
drogram); mean of 5.25 isolates/cluster; standard de-
viation of F5.61 isolates; 13 moderately related
isolates and/or unrelated isolates] and model A [dis-
criminatory power equal to 0.810; 63 isolates distrib-
uted among 10 groups (genetic interpretation; matrix
dij; UPGMA dendrogram); mean of 6.3 isolates/clus-
ter; standard deviation of F6.53 isolates; 13 moder-
ately related isolates and/or unrelated isolates].
The determination of discriminatory power point-
ed to numerical interpretation of MLEE patterns as a
method capable of discriminating a greater number of

1 8 58 72 69 70 63 5 74 9 29 21 37 3 4 67 76 68 62 25 27 28 57 35 41 42 47 48 50 52 24 56 60 20 32 34 31 33 38 7 26 44 23 45 30 51 39 40 46 11 61 64 71 43 54 55 6 17 18 36 66 75 16 19 12 13 22 49 2 10 59 73 65 53 15 14
18 58726970635 743 4 62766768252728573541425047482456527 26449 296 6020313234383621375433552345404643303951532 1011161961647166171875121322495973651415
16164713 4 627667688 58726970635 13669 29252728573541425047485220313234213730513954743675122 10115973655316171819156 7 26442456602233385523454046434914
0.0 0.3 0.5 0.8 1.0 0.0 0.3 0.5 0.8 1.0 1.0 0.8 0.5 0.3 0.0
0.0 0.3 0.5 0.8 1.0 0.0 0.3 0.5 0.8 1.0 1.0 0.8 0.5 0.3 0.0
945.02 =DS
1
2°
3
4
5
6
7
8
9
10
11
12
1
2
3°
4
5
6
7
8
9
10
11
12
13
1
2
3
4
5
6
7
8
9
10
903.01 =DS 012.0=ijd
M.F.G. Boriollo et al. / Journal of Microbiological Methods 64 (2006) 346–365360

Table 4
Similarity (SJ) among groups of C. albicans obtained from three cluster analysis models
Similaridade (SJ)
1–10% 11–20% 21–30% 31–40% 41–50% 51–60% 61–70% 71–80% 81–90% 91–100%
A1�B2 A1�B3 A9�C3 A1�B1 A2�B3 B1�C1 A3�B9 A10�B8 – A7�B12
A2�B4 A1�B11 A10�C4 A1�C1 B4�C4 – A3�C5 B6�C3 – B3�C2
A2�B7 A1�C2 B9�C6 A2�C2 – – A5�B10 B11�C7 – B10�C11
A4�C1 A1�C7 – A4�B2 – – A5�C11 – – B13�C12
A8�B3 A2�B6 – A4�B7 – – A6�B13 – – –
B5�C2 A2�C1 – A4�C8 – – A6�C12 – – –
– A2�C3 – A8�B4 – – A7�C9 – – –
– A3�C6 – A8�C4 – – B12�C9 – – –
– A8�B5 – A10�C6 – – – – – –
– A8�C2 – B8�C4 – – – – – –
– A9�B6 – B9�C5 – – – – – –
– A9�B7 – – – – – – – –
– B2�C1 – – – – – – – –
– B4�C1 – – – – – – – –
– B6�C9 – – – – – – – –
– B7�C1 – – – – – – – –
– B7�C3 – – – – – – – –
– B7�C8 – – – – – – – –
– B8�C6 – – – – – – – –
– B11�C10 – – – – – – – –
R =6 R =20 R =3 R =11 R =2 R =1 R =8 R =3 R =0 R =4
The letters A, B and C correspond to the models A (dij), B (SD1) and C (SD2) of the cluster assays, respectively.
M.F.G. Boriollo et al. / Journal of Microbiological Methods 64 (2006) 346–365 361
strains of C. albicans, but then also indicated model
B (based on genetic interpretation of MLEE patterns;
matrix SD1; UPGMA dendrogram) as a method ca-
pable of furnishing a greater number of groups of
highly related strains of C. albicans. Therefore, we
recommend the use of model B, and thus the initial
genetic interpretation of MLEE patterns for the typing
of C. albicans by MLEE and cluster analysis. This
could be very useful in the identification of different
groups of highly related or unrelated C. albicans in
one or more types of infections in a variety of im-
munocompromised or immunocompetent patients.
Moreover, possible correlations among groups and
host parameters (age, sex, weight, medical character-
istics, predisposing conditions, prosthetic devices,
geographic location, socioeconomic factors, associa-
tion with other individuals, etc.) and/or pathogen
characteristics (patterns of sugar assimilation, antige-
nicity, secretion of proteinases, drug sensitivity pro-
file, hyphae formation, phenotypic switching, etc)
Fig. 2. Genetic diversity of oral isolates of C. albicans derived from clinic
cluster analysis models. The symbols5,E andn indicate groups that are 1
could be determined (Soll, 2000). In addition, genetic
interpretation, which not always it is possible to use
for certain molecular markers such as RAPD, pro-
vides additional information about the nuclear, genet-
ic and taxonomic conditions of a group of organisms
(Harris and Hopkinson, 1976; Micales et al., 1998;
Siciliano and Shaw, 1976). In this manner, such
results also suggest that the number of strains of C.
albicans is overestimated by the numerical interpre-
tation of MLEE patterns and the number of groups of
strains is reduced by cluster analysis (model C: nu-
merical interpretation of MLEE patterns, matrix SD2;
UPGMA dendrogram).
The agreement between elements of two matrices
(dij�SD1, dij�SD2, and SD1�SD2), obtained from
the use of different coefficients on the combined
findings from the interpretations of MLEE patterns,
was established by the Pearson product-moment cor-
relation coefficient. Very good agreement (r =0.909)
was only observed between the elements of the ma-
ally healthy children. UPGMA dendrograms obtained from the three
00% similar (SJ) and the symbol B indicates groups 95% similar (SJ).

M.F.G. Boriollo et al. / Journal of Microbiological Methods 64 (2006) 346–365362
trices SD1 (model B) and SD2 (model C). The appli-
cation of this correlation coefficient as a measure of
concordance between (i) similarity values derived
from dendrograms and those of the original similarity
matrices, (ii) matrices of cophenetic values represent-
ing two dendrograms or ordinations, or (iii) two sim-
ilarity matrices determined by different techniques or
based on different characters was widely discussed by
Sneath and Sokal (1973). However, the great majority
of groups generated in the three UPGMA dendro-
grams (models A, B, and C) showed similarity SJbetween 4.8% and 75%. Together, these findings
suggest disparities in the conclusions obtained by
the three cluster analysis models, such as distinct
origins of infection, transmission route, correlations
among groups and host parameters or pathogen char-
acteristics, and relationships among highly related
and/or moderately related groups of C. albicans.
From a practical point of view, we can conclude in
part the following: clinically healthy children A, B
and C shared highly related strains [such strains could
have occurred from a common ancestral strain as a
consequence of the loss of an allele by mitotic recom-
bination or chromosomal rearrangement (Reynes et
al., 1996; Scherer and Magee, 1990); children A, B,
C and D shared highly related strains; and children A,
B, C, E,. . ., R and S shared such strains (Fig. 2: group
7 in SD1, group 11 in SD2 and group 1 in dij). It should
be noted that this fact could have great epidemiolog-
ical relevance especially in the identification of nos-
ocomial outbreaks of C. albicans.
A reason for employing only the UPGMA algo-
rithm for cluster assays in the present study is that it
has been used frequently to generate dendrograms
from matrices of a variety of distance/similarity coef-
ficients; and furthermore, it is relatively straightfor-
ward and has been used widely in fingerprinting
infectious fungi (Soll, 2000). In addition, when com-
pared with other algorithms, such as WPGMA
(weighted pair-group method using arithmetic
averages), UPGMC (unweighted pair-group centroid
method), complete linkage and single linkage, the
UPGMA algorithm was able to generate dendrograms
based on similarity/distance matrices that gave the
best representation when measured by cophenetic cor-
relation coefficients (Sneath and Sokal, 1973).
The lack of consensus among investigators with
regard to the choice of similarity, dissimilarity or
distance coefficient, because the interpretation data
of the fingerprinting patterns allow the use of one or
another, has been observed among typing studies of
C. albicans by MLEE and cluster analysis. However,
various investigators have employed the genetic dis-
tance coefficient of Nei (1972) and the similarity
coefficient Dice (1945), for the elaboration of matrices
or distance and similarity, respectively, in studies on
molecular epidemiology of bacterial and fungal infec-
tions, especially for the diploid yeast C. albicans and
its typing by MLEE (Alfenas, 1998; Boerlin et al.,
1995, 1996; Le Guennec et al., 1995; Nebavi et al.,
1998; Nei, 1972; Selander et al., 1986; Pujol et al.,
1997; Soll, 2000). However, such fact could represent
a limited way to evaluate all the possible relationships
among strains (or clusters of strains) once innumerous
coefficients of similarity, dissimilarity or genetic dis-
tance were written in the literature (Alfenas, 1998;
Sneath and Sokal, 1973; Legendre and Legendre,
1983). Therefore, studies aimed at identifying a coef-
ficient or a group of coefficients (including coeffi-
cients of similarity, dissimilarity or genetic distance)
capable of providing highly discriminatory, concor-
dant and similar results for cluster analysis and mo-
lecular typing of C. albicans should be conducted
separately. Such a study could be easily conducted
by different commercially available computer pro-
grams, and could also help investigators in choosing
a standard model for cluster analysis capable of being
stored and compared directly with other data from
identical models in the same line of research.
Acknowledgements
The authors acknowledge the financial support of
FAPESP – Fundacao de Amparo a Pesquisa do Estado
de Sao Paulo (Proc. 00/03045-5). Dr. A. Leyva pro-
vided English language editing.
References
Alfenas, A.C., 1998. Eletroforese de isoenzimas e proteınas afins;
fundamentos e aplicacoes em plantas e microrganismos. Editora
UFV, Vicosa.
Armitage, P., Berry, G., 1987. Statistical Methods in Medical
Research. Blackwell Scientific Publications Ltd, Oxford,
pp. 49–53.

M.F.G. Boriollo et al. / Journal of Microbiological Methods 64 (2006) 346–365 363
Arnavielhe, S., Blancark, A., Mallie, M., Quilici, M., Bastide, J.M.,
1997. Multilocus enzyme electrophoresis analysis of Candida
albicans isolates from three intensive care units. An epidemio-
logical study. Mycoses 40, 159–167.
Ayala, F.J., 1976. Molecular Evolution. Sinauer Associates, Sunder-
land, Mass.
Barchiesi, F., Hollis, R.J., Del Poeta, M., McGough, D.A., Scalise,
G., Rinaldi, M.G., et al., 1995. Transmission of fluconazole-
resistant Candida albicans between patients with AIDS and
oropharyngeal candidiasis documented by pulsed-field gel elec-
trophoresis. Clin. Infect. Dis. 21, 561–564.
Barchiesi, F., Arzeni, D., Del Prete, M.S., Sinicco, A., Falconi Di
Francesco, L., et al., 1998. Fluconazole susceptibility and strain
variation of Candida albicans isolates from HIV-infected
patients with oropharyngeal candidosis. J. Antimicrob. Che-
mother. 41, 541–548.
Bart-Delabesse, E., Boiron, P., Carlotti, A., Dupont, B., 1993.
Candida albicans genotyping in studies with patients with
AIDS developing resistance to fluconazole. J. Clin. Microbiol.
31, 2933–2937.
Boerlin, P., 1997. Applications of multilocus enzyme electrophoresis
in medical microbiology. J. Microbiol. Methods 28, 221–231.
Boerlin, P., Boerlin-Petzold, F., Durussel, C., Addo, M., Pagani, J.-
L., Chave, J.-P., et al., 1995. Cluster of oral atypical Candida
albicans isolates in a group of human immunodeficiency virus-
positive drug users. J. Clin. Microbiol. 33, 1129–1135.
Boerlin, P., Boerlin-Petzold, F., Goudet, J., Durussel, C., Pagani,
J.-L., Chave, J.-P., et al., 1996. Typing Candida albicans oral
isolates from human immunodeficiency virus-infected patients
by multilocus enzyme electrophoresis and DNA fingerprinting.
J. Clin. Microbiol. 34, 1235–1248.
Boriollo, M.F.G., Rosa, E.A.R., Rosa, R.T., Hofling, J.F., 2000. Cri-
teria for Candida albicans numerical analysis based on electro-
phoretic protein patterns. Rev. Argent. Microbiol. 32, 123–128.
Boriollo, M.F.G., Rosa, E.A.R., Bernardo, W.L.C., Spolidorio,
D.M.P., Goncalves, R.B., Hofling, J.F., 2005. Multilocus en-
zyme electrophoresis typing of Candida albicans populations
isolated from healthy children according to socioeconomic
background. Rev. Bras. Epidemiol. 8, 1–16.
Bostock, A., Khattak, M.N., Matthews, R., Burnie, J., 1993. Com-
parison of PCR fingerprinting, by random amplification of
polymorphic DNA, with other molecular typing methods for
Candida albicans. J. Gen. Microbiol. 139, 2179–2184.
Brown, A.J.L., Langley, C.H., 1979. Re-evaluation of level of genic
heterozygosity in natural populations of Drosophila melanoga-
ster by two-dimensional electrophoresis. Proc. Natl. Acad. Sci.
U. S. A. 76, 2381–2384.
Caugant, D.A., Sandven, P., 1993. Epidemiological analysis of
Candida albicans strains by multilocus enzyme electrophoresis.
J. Clin. Microbiol. 31, 215–220.
Clemons, K.V., Feroze, F., Holmberg, K., Stevens, D.A., 1997.
Comparative analysis of genetic variability among Candida
albicans isolates from different geographic locales by three
genotypic methods. J. Clin. Microbiol. 35, 1332–1336.
Conkle, M.T., Hodgskiss, P.D., Nunnally, L.B., Hunter, S.C., 1982.
Starch gel electrophoresis of conifer seeds; a laboratory manual.
Berkeley, Pacific Southwest Forest and Range Experiment Sta-
tion, U.S. Forest Service, U.S. Department of Agriculture (Gen.
tech. rep. PSW-64).
Dice, L.R., 1945. Measures of the amount of ecologic association
between species. Ecology 26, 297–302.
Dixon, H., Webb, E.C., 1979. Enzymes. Academic Press, NewYork.
Doi, M., Homma, M., Iwaguchi, S.I., Horibe, K., Tanaka, K., 1994.
Strain relatedness of Candida albicans strains isolated from
children with leukemia and their bedside parent. J. Clin. Micro-
biol. 32, 2253–2259.
Harris, H., 1975. Isoenzymes. Academic Press, New York.
Harris, H., Hopkinson, D.A., 1976. Handbook of Enzyme Electro-
phoresis in Human Genetics. (And Supplement 1978). North-
Holland Publishing Co., Amsterdam.
Holmberg, K., Feroze, F., 1996. Evaluation of an optimized system
for random amplified polymorphism DNA (RAPD)-analysis for
genotypic mapping of Candida albicans strains. J. Clin. Lab.
Anal. 10, 59–69.
Huettermann, A., Volger, C., Schorn, R., Ahnert, G., Ganser, H.G.,
1979. Studies on isoenzyme polymorphism in Fomes annosus.
Eur. J. For. Pathol. 9, 265–274.
Hunter, P.R., 1991. A critical review of typing methods for
Candida albicans and their applications. Crit. Rev. Microbiol.
17, 417–434.
Hunter, P.R., Gaston, M.A., 1988. Numerical index of the discrim-
inatory ability of typing systems and application of Simpson’s
index of diversity. J. Clin. Microbiol. 26, 2465–2466.
Hunter, P.R., Fraser, C.A.M., 1989. Application of a numerical
index of discriminatory power to a comparison of four physio-
chemical typing methods for Candida albicans. J. Clin. Micro-
biol. 27, 2156–2160.
Johnson, G.B. (Ed.), 1974. Enzyme Polymorphism and Metabolism,
Science, vol. 184, pp. 28–37.
Lasker, B.A., Page, L.S., Lott, T.J., Kobayashi, G.S., 1992. Isola-
tion, characterization, and sequencing of Candida albicans
repetitive element 2. Gene 116, 51–57.
Le Guennec, R., Reynes, J., Mallie, M., Pujol, C., Janbon, F.,
Bastide, J.-M., 1995. Fluconazole-and itraconazole-resistant
Candida albicans strain from AIDS patients: multilocus enzyme
electrophoresis analysis and antifungal susceptibilities. J. Clin.
Microbiol. 33, 2732–2737.
Legendre, L., Legendre, P., 1983. Numerical Ecology. Elsevier,
New York.
Lehmann, P.F., Kemker, B.J., Hsiao, C.-B., Dev, S., 1989. Isoenzyme
biotypes of Candida species. J. Clin. Microbiol. 27, 2514–2521.
Lehmann, P.F., Lin, D., Lasker, B.A., 1992. Genotypic identifica-
tion and characterization of species and strains within the genus
Candida by using random amplified polymorphic DNA. J. Clin.
Microbiol. 30, 3249–3254.
Lockhart, S., Fritch, J.J., Meier, A.S., Schroeppel, K., Srikantha,
T., Galask, R., et al., 1995. Colonizing populations of Candida
albicans are clonal in origin but undergo microevolution
through C1 fragment reorganization as demonstrated by
DNA fingerprinting and C1 sequencing. J. Clin. Microbiol.
33, 1501–1509.
Magee, P.T., Bowdin, L., Staudinger, J., 1992. Comparison of
molecular typing methods for Candida albicans. J. Clin. Micro-
biol. 30, 2674–2679.

M.F.G. Boriollo et al. / Journal of Microbiological Methods 64 (2006) 346–365364
Mahrous, M., Lott, T.J., Meyer, S.A., Awant, A.D., Ahearn, D.G.,
1990. Electrophoretic karyotyping of typical and atypical Can-
dida albicans. J. Clin. Microbiol. 28, 876–881.
Markert, C.L., 1975. Biology of isoenzymes. In: Markert, C.L.
(Ed.), Isoenzymes. Academic Press, New York, pp. 1–9.
Markert, C.L., Moller, F., 1959. Multiple forms of enzymes: tissue,
ontogenic, and species specific patterns. Proc. Natl. Acad. Sci.
U. S. A. 45, 753–763.
Mata, A.L., Rosa, R.T., Rosa, E.A.R., Goncalves, R.B., Hofling,
J.F., 2000. Clonal variability among oral Candida albicans
assessed by allozyme electrophoresis analysis. Oral Microbiol.
Immunol. 15, 350–354.
Micales, J.A., Alfenas, A.C., Bonde, M.R., 1998. Izoenzimas na
taxonomia e na genetica de fungos. In: Eletroforese de iso-
enzimas e proteınas afins. In: Alfenas, A.C. (Ed.), Fundamen-
tos e aplicacoes em plantas e microrganismos. UFV, Vicosa,
pp. 477–512.
Moreira, D., Spolidorio, D.M.P., Rodrigues, J.A.O., Boriollo,
M.F.G., Pereira, C.V., Rosa, E.A.R., et al., 2001. Candida
spp. Biotypes in the oral cavity of school children from different
socioeconomic categories in Piracicaba – SP, Brazil. Pesqui.
Odontol. Bras. 15, 187–195.
Murphy, R.W., Sites, J.W., Buth, D.G., Haufler, C.H., 1990. Pro-
teins I: isoenzyme electrophoresis. In: Hillis, D.M., Moritz, C.
(Eds.), Molecular Systematics. Sinauer Associates Inc. Publish-
ers, Sunderland, Mass, pp. 45–126.
Nebavi, F., Arnavielhe, S., Le Guennec, R., Menan, E., Kacou, A.,
Combe, P., et al., 1998. Oropharyngeal candidiasis in AIDS
patients from Abidjan (Ivory Coast): antifungal susceptibilities
and multilocus enzyme electrophoresis analysis of Candida
albicans isolates. Pathol. Biol. 46, 307–314.
Nei, M., 1972. Genetic distances between populations. Am. Nat.
106, 283–292.
Nevo, E., Beiles, A., Ben-Shlomo, R., 1980. The evolutionary
significance of genetic diversity: ecological, demographic and
life history correlates. Lect. Notes Biomath. 53, 13–213.
Newman, P., 1985. Variation amongst isozymes of Rhynchosporium
secalis. Plant Pathol. 34, 329–337.
Pasteur, N., Pasteur, G., Bonbomme, F., Catalan, J., Britton-Davi-
dian, J., 1987. Manuel technique de genetique par electropho-
rese des proteines. Technique et documentation. Lavoisier, Paris.
Prakash, S., Lewontin, R.C., Hubby, J.L., 1969. A molecular ap-
proach to the study of genic heterozygosity in natural popula-
tions. IV patterns of genetic variation in central, marginal and
isolated populations of Drosophila pseudobscura. Genetics 61,
841–858.
Pujol, C., Reynes, J., Renaud, F., Mallie, M., Bastide, J.-M., 1993a.
Genetic analysis of Candida albicans strains studies by isoen-
zyme electrophoresis. J. Mycol. Med., Suppl. 3, 14–19.
Pujol, C., Reynes, J., Renaud, F., Raymond, M., Tibayrenc, M.,
Ayala, F.J., et al., 1993b. The yeast Candida albicans has a
clonal mode of reproduction in a population of infected
human immunodeficiency viry-positive patients. Proc. Natl.
Acad. Sci. U. S. A. 90, 9456–9459.
Pujol, C., Joly, S., Lockhart, S.R., Noel, S., Tibayrenc, M., Soll,
D.R., 1997. Parity among the randomly amplified polymorphic
DNA method, multilocus enzyme electrophoresis, and Southern
blot hybridization with the moderately repetitive DNA probe
Ca3 for fingerprinting Candida albicans. J. Clin. Microbiol. 35,
2348–2358.
Racine, R.R., Langley, C.H., 1980. Genetic heterozygosity in a
natural population of Mus musculus assessed using two-dimen-
sional electrophoresis. Nature 283, 855–857.
Reynes, J., Pujol, C., Moreau, C., Mallie, M., Renaud, F., Janbon,
F., et al., 1996. Simultaneous carriage of Candida albicans
strains from HIV-infected patients with oral candidiasis: multi-
locus enzyme electrophoresis analysis. FEMS Microbiol. Lett.
137, 269–273.
Robert, F., Lebreton, F., Bougnoux, M.E., Paugam, A., Wasser-
mann, D., Schlotterer, M., et al., 1995. Use of random amplified
polymorphic DNA as a typing method for Candida albicans in
epidemiological surveillance of a burn unit. J. Clin. Microbiol.
33, 2366–2371.
Rohlf, F.J., 1963. Classification of Aedes by numerical taxonomic
methods (Diptera: Culicidae). Ann. Entomol. Soc. Am. 56,
798–804.
Rohlf, F.J., 1988. NTSYS-pc Numerical Taxonomy and Multivari-
ate Analysis System. Exeter Software Publishing, New York.
Rosa, E.A.R., Pereira, C.V., Rosa, R.T., Hofling, J.F., 1999. Eval-
uation of different dehydrogenases to recognize Candida spe-
cies commonly isolated from human oral cavities. Rev. Argent.
Microbiol. 31, 165–172.
Rosa, E.A.R., Rosa, R.T., Pereira, C.V., Hofling, J.F., 2000a. Group-
ing oral Candida species by multilocus enzyme electrophoresis.
Int. J. Syst. Evol. Microbiol. 50, 1343–1349.
Rosa, E.A.R., Rosa, R.T., Pereira, C.V., Boriollo, M.F.G., Hofling,
J.F., 2000b. Analysis of parity between protein-based electro-
phoretic methods for characterization of oral Candida species.
Mem. Inst. Oswaldo Cruz 95, 801–806.
Rosa, E.A.R., Rosa, R.T., Pereira, C.V., Hofling, J.F., 2001. Inter
and Intra-specific genetic variability of oral Candida species.
Rev. Iberoam. Micol. 18, 60–64.
Rosa, E.A.R., Rosa, R.T., Boriollo, M.F.G., Bernardo, W.L.C.,
Hofling, J.F., 2003. Oral Candida albicans and Candida dubli-
niensis differentiation by multilocus enzyme electrophoresis and
sodium dodecylsulphate-polyacrylamide gel electrophoresis.
Rev. Argent. Microbiol. 35, 24–28.
Scandalios, J.G., 1969. Genetic control of multiple molecular forms
of enzymes in plants; a review. Biochem. Genet. 3, 37–79.
Scherer, S., Stevens, D.A., 1988. A Candida albicans dispersed,
repeated gene family and its epidemiologic applications. Proc.
Natl. Acad. Sci. U. S. A. 85, 1452–1456.
Scherer, S., Magee, P.T., 1990. Genetics of Candida albicans.
Microbiol. Rev. 54, 226–241.
Selander, R.K., Levin, B.R., 1980. Genetic diversity and structure in
Escherichia coli populations. Science 210, 545–547.
Selander, R.K., Whittam, T.S., 1983. Protein polymorphism and the
genetic structure of populations. In: Nei, M., Koehn, R.K.
(Eds.), Evolution of Genes and Proteins. Sinauer Associates,
Sunderland, Mass, pp. 89–114.
Selander, R.K., Caugant, D.A., Ochman, H., Musser, J.M., Gilmour,
M.N., Whittam, T.S., 1986. Methods of multilocus enzyme
electrophoresis for bacterial population genetics and systemat-
ics. Appl. Environ. Microbiol. 51, 873–884.
M.F.G. Boriollo et al. / Journal of Microbiological Methods 64 (2006) 346–365 365
Shannon, M.C., Ballal, S.K., Harris, J.W., 1973. Starch gel electro-
phoresis of enzyme from nine species of Polyporus. Am. J. Bot.
60, 96–100.
Shecter, Y., 1973. Symposium on the use of electophoresis in the
taxonomy of algae and fungi. Bull. Torrey Bot. Club 100,
253–312.
Siciliano, M.J., Shaw, C.R., 1976. Separation and visualization of
enzymes on gels. In: Smith, I., et al., (Eds.), Chromatographic
and Electrophoretic Techniques. A.W. Heinemann Medical
Books, London, pp. 185–209.
Simpson, E.H., 1949. Measurement of diversity. Nature 163, 688.
Sneath, P.H.A., Sokal, R.R., 1973. Numerical Taxonomy. W.H.
Freeman and Company, San Francisco.
Soll, D.R., 2000. The ins and outs of DNA fingerprinting the
infectious fungi. Clin. Microbiol. Rev. 13, 322–370.
Vazquez, J.A., Beckley, A., Sobel, J.D., Zervos, M.J., 1991. Com-
parison of restriction enzyme analysis versus pulsed-field gra-
dient gel electrophoresis as a typing system for Candida
albicans. J. Clin. Microbiol. 29, 962–967.
Vazquez, J.A., Sobel, J.D., Demitriou, R., Vaishampayan, J., Lynch,
M., Zervos, M., 1994. Karyotyping of Candida albicans isolates
obtained longitudinally in women with recurrent vulvovaginal
candidiasis. J. Infect. Dis. 170, 1566–1569.
Voss, A., Pfaller, M.A., Hollis, R.J., Rhine-Chalberg, J., Doebbel-
ing, B.N., 1995. Investigation of Candida albicans transmission
in a surgical intensive care unit cluster by using genomic DNA
typing methods. J. Clin. Microbiol. 33, 576–580.
Whelan, W.L., Kirsch, D.R., Kwon-Chung, K.J., Wahl, S.M.,
Smith, P.D., 1990. Candida albicans in patients with the ac-
quired immunodeficiency syndrome: absence of a novel or
hypervirulent strain. J. Infect. Dis. 162, 513–518.
Whittam, T.S., Ochman, H., Selander, R.K., 1983. Multilocus ge-
netic structure in natural populations of Escherichia coli. Proc.
Natl. Acad. Sci. U. S. A. 80, 1751–1755.