Research Methods
69
Research Methods in Education Acknowledgement These materials were developed for use in the graduate course in research methods in education at Southern Illinois University, Edwardsville, and were used by study teams composed of four or five students. As these materials were being developed, students made many suggestions to improve their effectiveness. The final form of the lessons represents a refinement achieved through this kind of helpful interaction with the instructor over a period of years. Jerome A. Popp Copyright 2010 Introduction The content of this book is best studied in conjunction with actual research articles. Readers are advised to select one or more articles in educational research, preferably ones in which they have interest, and evaluate them using the critique guidelines at the end of each of the seven lessons. There are practice questions included in each lesson, solutions for which are provided at the end of the book. Contents Lesson 1: Research Problems Lesson 2: Research Hypotheses Lesson 3: Research Samples Lesson 4: Measurement in Research Lesson 5: Research Designs Lesson 6: Analysis of the Data Lesson 7: Interpreting the Data
Transcript of Research Methods
Research Methods in Education
Acknowledgement
These materials were developed for use in the graduate course in research methods in education
at Southern Illinois University, Edwardsville, and were used by study teams composed of four or
five students. As these materials were being developed, students made many suggestions to
improve their effectiveness. The final form of the lessons represents a refinement achieved
through this kind of helpful interaction with the instructor over a period of years.
Jerome A. Popp
Copyright 2010
Introduction
The content of this book is best studied in conjunction with actual research articles. Readers are
advised to select one or more articles in educational research, preferably ones in which they have
interest, and evaluate them using the critique guidelines at the end of each of the seven lessons.
There are practice questions included in each lesson, solutions for which are provided at the end
of the book.
Contents
Lesson 1: Research Problems
Lesson 2: Research Hypotheses
Lesson 3: Research Samples
Lesson 4: Measurement in Research
Lesson 5: Research Designs
Lesson 6: Analysis of the Data
Lesson 7: Interpreting the Data

2
Lesson One
Research Problems
Purpose of the Lesson:
This lesson helps identify the research problem in a published research report, and presents the
criteria for adequate research problems. After studying this lesson, you will be able to write a
critique of the introduction of the problem in a given research report.
Directions for Study
1. Read the definitions of the types of question forms.
2. Read the criteria for research problems.
3. Do the exercises provided.
4. Write a critique of the presentation of the research problem in the article provided.
Expository Material
1. What is inquiry?
To inquire is to ask or to question. All inquiry begins with asking, and educational inquiry or
educational research originates when someone asks about education.
2. Logic of Questions
A question is an interrogative sentence. Such sentences express problems. An educational
research problem is a question.
Any question will take one of two syntactical forms (grammatical forms).
(1) Selected-Response Questions
Selected-response questions, which make up true-false, multiple-choice, and matching tests,
require a selection from alternatives provided by the question itself.
These questions can readily be converted into declarative sentences. For example, "Did James
Madison sign the Declaration of Independence?" can be re-stated as, "James Madison signed the
Declaration of Independence." True or False?
(2) Constructed Response Questions
Constructed-response questions (completion, short-answer, and essay) require the creation of a
response within the structure provided by the question.

3
'What', 'When', 'How', 'Why' questions cannot be converted into declaratives without adding
some meaning not contained in the question. It is this type of question that should be used for
expressing the research problem, because this question form leaves it open as to just what the
answer (hypothesis) will be. The problem should be formed without a bias for any given answer.
Any question that requires the answerer to create an answer is an open-ended question. For
example: What is the capitol city of Maine?
3. Criteria of Adequacy
(1) The Rule of Form: A research problem should be expressed using the constructed-response
question form. This is the only form that does not already contain an answer or answers within
it. Solution or answer forming is a different activity than problem forming.
For example, consider the following questions: "Does a hydrogen atom have one proton?" "How
many protons does a hydrogen atom have?" The first question contains the answer, "Hydrogen
atoms have one proton." The second question requires that a response be constructed.
(2) The Rule of Reference: A research problem should identify a specific group or population
that is being asked about. This group is referred to as the target population.
(Lesson Three will further clarify this rule.)
(3) The Rule of Incompleteness:
The author of a research report should attempt to show the reader that the question being asked
does not already have a true answer in the research literature.
In other words, if the question being asked has been answered adequately by previous
researchers, then this question is not worth pursuing further. An adequately answered question
cannot be a significant research problem.
(4) The Rule of Utility: Every question that does not have a true answer is not necessarily
significant. A significant question must have some importance beyond just not being truly
answered.
Perhaps the question is unanswered because no one cares what the correct answer is. It is the
burden of the author of the research report to show the reader why he or she thinks the answer to
the question being asked has utility or usefulness to education. One can think of the usefulness
of the problem as the justification or rationale of the problem. Such usefulness could be of two
different types.
Theoretical Utility: Some questions help us develop theoretical inquiry, i.e., research. This type
of inquiry is the 'R' of 'R and D'; it is research as opposed to development.
Practical Utility: Some questions have answers that help us improve teaching (or other school
practices). Does the research problem, if answered adequately, improve teaching? If so, it is of
practical utility.

4
Note that the above distinction is not always considered explicitly by authors. Thus, it may be
impossible to decide if the rationale or justification of any given problem is practical or
theoretical in nature.
This distinction will become clearer if one considers, for example, the difference between
science and educational administration.
Science strives for the creation of new problems. Science is trouble making. A scientific
"breakthrough" is the opening up of many new problems.
However, a practical breakthrough would be the reduction of new problems. An administrator
whose decisions caused new problems would be considered incompetent. Yet if a scientist's
work never produced new problems, that work would be considered at least ineffective.
Practical and theoretical inquiries serve different values.
Practice (answers provided at end of book)
1. Identify the following as either (1) constructed-response or (2) selected-response questions.
___ A. What time is it?
___ B. Is Louisville or Frankfort the capitol of Kentucky?
___ C. Does punishment discourage motivation?
__ D. Are SRA materials effective?
___ E. What methods of teaching work best?
___ F. Why do girls read better than boys at the primary level?
___ G. Is Vermont the Green Mountain State, the Mountain State, or the Granite State?
___ H. What state is the Flickertail State?
2. Write a critique of the introduction of a research article, applying each of the four criteria.
(An example critique is included at the end of this lesson.)
What If You Have to Write?
These lessons assume that you are a reader of educational research and not a producer of it.
There are times, however, when you might have to write a term paper, research paper, or a
research proposal. Let's take a little time to think about what you would be doing. It will help
you appreciate what researchers have to do.
When researchers begin to plan their research effort they know that major changes will have to
be made as the project takes a more precise form. In a sense, when they plan a project of this
sort they plan to make modifications in their plan as they get experience with what is involved.
Human experience in such matters has generated several general norms or guidelines that can
assist you in your attempts to create a comprehensive and flexible map of what will be
undertaken.
5
'Inquiry' literally means 'to ask.' The place to begin research is with a question. There have
been countless students before you who have thought they understood the topic they had selected
only to discover that they could not write a question that captured what they had in mind.
Consider the times when you have read a research article and found yourself asking, "What are
they trying to say...what are they trying to prove?" Until we understand the question that any
article or chapter is trying to answer, we do not really understand what we are reading.
The best place to focus your initial efforts is on questioning. But you should recognize that there
are two syntactical forms questions take, since these forms play different roles in research.
Write down as many questions as you can think of. Carry a small notebook or a pocket recorder
around with you. Eventually, some questions will begin to emerge as more and more central to
your interests. Do not try to push yourself into finding that one best question. Perhaps you will
have the luxury of being able to select the problem for your dissertation from several very good
possibilities.
Given a research question, the author has the responsibility to show readers that the question is
not already answered in the research literature. Part of the justification of any research problem
is a kind of status report that makes an argument for the unansweredness of the question being
posed.
Perhaps twenty researchers have written papers that deal with your question. Does this mean
that you have to select another question? No. What it means is that you have to develop an
argument that shows that even after this much research on that particular problem, there is,
nevertheless, something unanswered about this matter. As a writer, you owe your readers an
explanation of why you think more research should be conducted in this area.
When you do a review of the literature, you are not just writing a report of who has done what.
You are critically analyzing what has been missed by the researchers in this area, or what has not
been completed in an adequate fashion by them. And in the literature demarcated by the
question asked, you have incurred the responsibility of becoming an expert.
You might show in an essay that this question has never been researched by anyone before. It is
wise, however, to suspect that there may be a reason why the question has been overlooked.
Perhaps no one cares what the answer is.
How do you demonstrate in your essay that the question being asked is an important one? You
must develop a value argument that concludes that the question is significant. And just what
makes a question significant? Asking is a preliminary to knowing. It is the knowledge sought
that gives significance to the questions asked. To put it the other way around, we do not go
around asking questions because there is some value in questions apart from their answers.
Questions are instrumentalities that assist us in finding out what we want to know.
What do educators want to know about education? The questions asked about education can be
divided into two main types. Practical questions are questions about how educators should

6
conduct themselves to be effective and professional. They are questions that identify obstacles
to the conduct of teaching and administrating. Solving practical problems about educational
practice removes these obstacles.
Theoretical knowledge derives from solving theoretical problems. For example, when Jonas
Salk asked, 'What is polio, and how does it affect the human body?' he was not asking a practical
question. Physicians, of course, were asking the practical question, 'How we prevent people
from getting polio?" From his research, Salk was able to produce the vaccine and this vaccine
then answered the practical questions of the physicians. But Dr. Salk made clear in his lectures
that the way he found the vaccine was to study the organism. How does polio carry on life
functions? Where in its life cycle is it the most vulnerable to chemical attack? Literally
hundreds of these types of questions were asked. And once the various life processes were
understood, the medical researchers could pursue the practical problem of how to attack the
virus. The solution of this practical problem was by no means trivial, when compared with the
theoretical questions. Theoretical knowledge is not self-applying. Solving practical problems
requires creativity and intelligence, every bit as much as does science and philosophy.
The parallel with education is obvious. We cannot successfully pursue the practical question,
“How can we teach better?” until we understand the various processes involved. The
understanding of these processes derives from research, i.e., theoretical inquiry. However,
theoretical inquiry alone will not make the life of one school child better. The clients of the
schools will be served by practical wisdom, and your job is to contribute to it in some way.
While practical problem solvers seek to reduce the number of problems to be faced, researchers
hope to produce more problems. They hope that their work will produce a breakthrough--which
is an explosion of new questions. As was mentioned before, scientists are trouble makers.
Theoretical goals are set to improve the study of education, not the practice of education.
Suppose that twenty studies of drug D have found that D cures type C carcinoma, with a 5%
chance of error. Moreover, no studies of drug D have found D to be ineffective with C. Is there
sufficient evidence that D is effective for C to have researchers continue to study this drug?
Most assuredly. Is there sufficient evidence for us to ask the Federal Drug Administration to
release D for standard medical practice? No.
One can see that there are two different values functioning in this context--on this evidence.
There are practical, ethical concerns for the safety of those who would take the drug. It is a
major issue to decide how sure one has to be to use a drug with the general public. There are
decisions to be made as to the value of various results for the course of further theorizing. For
example, is there adequate evidence to spend precious research dollars on this drug?
As a writer and researcher in education, you should ask yourself what values are to be promoted
by your efforts. Is your study aimed at improving professional practice or is it aimed at
improving research?
7
Critique Guidelines
(Research Problem)
As you write your critique, keep in mind that people with different experience with the literature
may come to different conclusions. For example, teachers who have read many articles on
teaching reading may evaluate a research report on reading research differently than teachers
who are unfamiliar with this literature.
A complete set of criteria can be found at the end of this book.
0. Citation
Give the reference or citation for the article being critiqued. Be as complete as possible. Unless
instructed otherwise, use the American Psychological Association style. Examples of this style
can be found online. Always write down the complete reference if it is not contained in the
photocopy you make.
1. Research Problem
1.1 Rule of Form
(a) What was the actual research problem in this study? Express it in the proper form. (b) How
adequately was the problem presented in this study?
Example:
(a) What are the factors associated with underachievement in seventh-graders?
(b) The problem of the study was clearly indicated by the title of the article. It is also
evident in the abstract and first paragraphs of the article.
1.2 Rule of Reference
(a) What is the target population of this study?
(b) How well is the target population specified in this study?
Example:
(a) The problem makes it clear that bright but underachieving seventh-graders are the
target population of the study.
(b) The target population was obvious in the title and introduction to the study.
1.3 Rule of Incompleteness
(a) How did the author(s) show that the problem has not already been answered in the research
literature? (b) Is this attempt adequate?
Example:
(a) The authors reviewed the findings of eight studies that reported factors related to
underachievement and accepted the conclusions of these studies.
(b) The present study sought differences between a group of achieving bright students and an
underachieving group of bright students. It was not made clear that the question was

8
unanswered. The study attempted to identify which factors described in the literature would
explain the difference in the two groups.
1.4 Rule of Utility
(a) Was the study's value practical or theoretical, according to the author(s)? (b) What reasons
were given that led you to this conclusion?
Example:
(a) The authors did not address the distinction between theoretical versus practical
justification, directly or indirectly.
Lesson Two
Research Hypotheses
Purpose of the Lesson:
This lesson will help you identify the hypothesis in a research report, and use the criteria
developed in the lesson to write an evaluation of that hypothesis.
Directions for Study
1. Review the definitions of terms used in the lesson.
2. When you have considered the definitions and think that you understand them as well as you
can, try to complete the practice questions provided. These questions have been carefully
constructed to help you evaluate how well you understand the concepts involved in this lesson.
3. Examine the two types of hypotheses and how they were analyzed by charting them. Try to
construct some analysis charts for some of the "practice hypotheses" provided. Do enough of
these analyses until you are satisfied that you understand how these analyses are done. You
might want to save some of the practice hypotheses for a later time.
Expository Material
As has been seen, scientific inquiry is asking questions and posing answers to them. The activity
of posing answers is commonly called "hypothesizing." We hypothesize when we propose
answers to questions asked. Note that proposing an answer is not the same as testing a proposed
answer. Testing hypotheses will be considered in later lessons.
A hypothesis is a complex logical entity but if we examine each part, we can rather quickly come
to understand what is involved. A hypothesis relates properties. But what is a property? Let's
begin there.

9
What Is a Property?
Social science is concerned with groups of persons. You have already learned that a research
problem targets a specific population for study. The members of a population are usually people.
The members of the population targeted are the objects of study.
The objects of study have characteristics, attributes or properties. Things are named by nouns
and properties are named by adjectives. In the phrase "The red ball," what is the object and what
is the property? Correct, "ball" is the object and "red" is the property of the ball.
Think of all the people in a given population, e.g., the people in a university classroom. They
will have many properties, including height, weight, age, years teaching experience, sex, race,
political leanings and so forth.
They will also have the property of being in this classroom. In fact, the population was defined
using this property.
While everyone in the room has the property of height, not everyone is the same height. Height
varies within this population. Height is a variable property, or as it is more commonly stated, a
variable.
Are all properties variables? No, because the property "being in this room" does not vary for this
population—it is a constant because it defines the population. The properties used to define
populations will obviously be constants for those populations. So, some properties vary and
some are constant. There may be other properties that also turn out to be constants. These are
accidental constants in the sense that they were not part of the defining properties. Finding such
accidental constants could be of great scientific import.
Two Types of Variables
There are two and only two basic ways that a variable can vary. Everyone in the room has height
but in different amounts or degrees. There is an endless list of possible heights. Everyone in the
room also has the property of gender. There are only two possibilities in this case. The gender
variable varies in distinct types or kinds.
Thus, there are two ways that a variable can vary: degree or kind. The way a variable varies is
referred to as its "type of variation."
Researchers use different pairs of terms to express the type of variation.
---------------------------------------------
kind versus degree
quality versus quantity
category versus continuous
---------------------------------------------
Hypothetical Relationships

10
What the hypothesis actually does is to propose a relationship between two or more properties.
In scientific analysis, the concern is with causes or directions of influence. The hypothesis
asserts or declares that a relationship exists between two or more properties in a given
population. This relationship is the hypothetical relationship. It proposes that something causes,
influences, or is associated with something else.
The hypothesis, "Smoking causes lung disease.", asserts a relationship between two conditions.
Note that there are two possibilities:
1. Smoking causes lung disease.
2. Lung disease causes smoking.
Obviously, the first is what is intended by the hypothesis. The point is that there is more to the
hypothesis than stating two or more variables.
Independent vs. Dependent Variables
In the shop talk of researchers, the cause is known as the independent variable and the effect is
known as the dependent variable. Every hypothesis must have at least one of each.
Ind. Var. → Depend. Var.
Cause → Effect
Smoking → Lung Disease
X → Y
Within this hypothesis, smoking is the independent variable and lung disease is dependent on the
cause. The cause, or X, is the independent variable and "Y" is used to stand for the dependent
variable. X causes Y.
Analysis of Hypotheses
Given any hypothesis, it is possible to analyze it along the lines just discussed. One can find the
variables, their types of variation, which are independent and which are dependent variables, and
what the relationship between the variables is claimed to be.
(X) Independent Variable ____________
(Y) Dependent Variable ____________
(X) Kind of Independent Variable: continuous or categorical?
(Y) Kind of Dependent Variable: continuous or categorical?
Relationship: ______________________
These elements of a hypothesis are presented in the following analytical chart.

11
Analysis of Hypothesis
Independent Variable (X) Dependent Variable (Y)
Variable
Type of Variable
Relationship
Relationship & Type of Variation
As you might expect, the type of variation of the variables of the hypothesis affects the kind of
relationship being expressed. As you will see, three cases are logically possible.
Type I Hypotheses
All variables of a Type I Hypothesis are continuous. In other words, no categories are involved.
As one quantity changes, another quantity also changes. Example: As the temperature of a
closed system increases, so does the pressure. As X increases, Y increases.
There are four basic relationships for Type I hypotheses:
as X increases, Y increases
as X increases, Y decreases
as X decreases, Y increases
as X decreases, Y decreases
Analysis of Type I Hypothesis
Consider the following hypothesis. The more time students spend engaged in on-task activities,
the greater their academic achievement.
(X) Independent Variable: Time on Task
(Y) Dependent Variable: Academic Achievement
(X) Kind of Independent Variable: continuous
(Y) Kind of Dependent Variable: continuous
Relationship: As X increases, Y increases
Type II Hypotheses

12
All variables in the Type II hypothesis are categorical. This type of hypothesis relates two
categories or sets. For example, "Everyone who takes high school physics goes to college." The
independent variable is "takes high school physics" and the dependent variable is "goes to
college."
Sometimes the relationship is partial. For example, "20% of high school graduates go to
college." This hypothesis claims that only part of the Xs are also Ys.
Type II hypotheses are sometimes referred to as "statistical hypotheses." "High school
graduates" is the reference class and "goes to college" is the attribute class. (See Wesley
Salmon, The Foundations of Scientific Inference (Pittsburgh: Univ. of Pittsburgh Press, 1970).)
Type III Hypotheses
This type of hypothesis can be thought of as a "mixed variable type" hypothesis. Typically the
independent variable is categorical and the dependent variable is continuous. The research
strategy is to try different types of teaching and see what amount of achievement results.
Let's examine an example of the analysis of a Type III hypothesis. "Sixth-grade boys achieve in
reading at a lower level than sixth-grade girls."
(X) Independent Variable: Gender
(Y) Dependent Variable: Reading Level
(X) Kind of Independent Variable: categorical: A Boy, B Girl
(Y) Kind of Dependent Variable: continuous
Relationship: Y is lower for XA than for XB
Analysis of Hypothesis
Independent Variable (X) Dependent Variable (Y)
Variable
Gender
Reading Level
Type of Variable
Categorical
A. Boy
B. Girl
Continuous
Relationship
Y is lower for XA than for XB
13
Criteria of Adequacy for Hypotheses
The Rule of Form: The hypothesis should be stated as a declarative sentence that expresses a
relationship between two or more variables.
The Rule of Utility: The hypothesis should answer a significant research question. Note that the
hypothesis is not required to truly answer the question. A false hypothesis can be the solution to
a research problem. (Not all answers to questions are true or adequate answers.)
Common Misconceptions about Hypotheses
Misconception 1. A hypothesis is a prediction. This confuses a data statement with a
hypothesis. A prediction is a data statement in the future tense. Hypotheses, typically, have no
tense. Hydrogen always had, and always will have one proton.
Misconception 2. A hypothesis may be written as a selected-response question: "Do primary
boys read as well as primary girls?" This so-called hypothesis is not the solution to a research
problem. The best grammar is a declarative sentence.
Misconception 3. The research hypothesis should be stated in the "null" form. The null
hypothesis is the chance hypothesis. Why should researchers have to state their proposed answer
as a chance hypothesis?
Misconception 4. The hypothesis should contain clear implications for testing. Many
hypotheses were well understood before anyone figured out how to test them. For example,
check out the refutation of the great "ether" hypothesis in 1881.
Misconceptions 5. The hypothesis should be stated operationally. For example, those who
complete program A will score higher on test T than those who complete program B. This
confuses the measure of a variable with the variable itself. Hypothesis construction is being
confused with measurement selection. Many variables may be measured in many different ways.
Actually this idea suggests the old "operationalism" of Bridgeman, a philosopher of science
writing early in the 20th Century.
Practice
(Solutions at end of book)
1. Complete the following sentences:
"A hypothesis is a declaration of relationship between......"
An attribute, characteristic, or property may be either a constant or a ....."
2. A variable that varies such that between any two instances of it, there is always another
instance is called a _________________________ variable.
3. In the Type III hypothesis example above, the word 'gender' was used, but the term did not
appear in the hypothesis. How do you explain this?

14
4. Classify each of the following as (1) categorical variable or (2) continuous variable..
Rule of Thumb: If the variable is a quantity, there can be more or less of it!
Zip Code
Month of Birth
Years Teaching
Weight
State of Residence
Height
Marital Status
I. Q. Score
Income
Reading Level
Political Affiliation
Blood Type
Body Temperature
Ring Size
Blood Count
Number of Children
Self-Confidence
House Number
5. If one thinks of the independent/dependent relationship as a cause/effect relationship, the
cause would be the ____________ variable.
6. If X is said to be a function of Y, then Y is the __________variable.
7. A hypothesis that has both categorical and continuous variables is a Type ____ hypothesis.
8. To what does "type of variation" refer?
9. A statistical hypothesis is a Type ___ hypothesis.
10. In a mixed variable type hypothesis, the ___________ variable is typically the categorical
variable.
11. In the following hypothesis, what is the dependent variable?
Classrooms that devote more time
to on-task activities show greater
gains in student academic achievement.
12. What is the independent variable in the above hypothesis?
13. Explain why most educational research studies contain Type III hypotheses.
14. Can a false hypothesis answer a research question?
15. Is knowing that a hypothesis is false a type of scientific knowledge?
16. Write the hypothesis that is outlined below.
Independent Variable (X): Mode of Presentation
Categorical:

15
A. Show film then read
B. Read then show film
Dependent Variable (Y): Course Achievement
Continuous
Relationship: Y for XA is greater than Y for XB
Practice Hypotheses
Draw a hypothesis chart, like the one above, for each of the following hypotheses.
1. Greater achievement will occur in classrooms organized cooperatively than in classrooms
organized competitively.
2. Team study methods are better liked by students than either peer tutoring or individualized
instruction.
3. Time-on-task behavior is greater for classrooms organized on cooperative task structures than
in classrooms organized on either competitive or individual task structures.
4. Greater achievement will occur with an individualized reward structure than with a
competitive reward structure.
5. As the amount of student cooperation increases, so does the academic achievement of
students.
6. The number of racial conflicts is lower for schools that use team study methods than for
schools that use traditional teaching methods.
7. The more socioeconomically balanced the student population of a school, the lower the
frequency of absenteeism of students.
8. Boys who are beginning readers will achieve at a greater rate when taught by men than when
taught by women.
9. The more children read, the less they will prefer TV.
10. Pupil participation in class discussions will be more empathic in classrooms using
cooperative task structures than in classrooms using competitive task structures.

16
Critique Guidelines
(Research Hypothesis)
2. Research Hypothesis(es)
2.1 Rule of Form
(a) Outline the hypothesis(es), if the study reports one. (b) How well formed is (are) the
hypothesis(es)?
Example:
There was no hypothesis stated or implied in this study. The study investigated the differences
in two groups and did not hypothesize about these differences.
2.2 Rule of Utility
How well do the problem and hypothesis relate to each other? If the study does not contain a
hypothesis, then decide if this was an omission.
Lesson Three
Research Samples
Purpose of the Lesson:
To understand a research article, we must understand the relationships among target populations,
accessible populations, and samples. In addition, we must know the various kinds sampling
procedures that are used, and be able to judge their appropriateness in specific studies.
Directions for Study
Read the expository material and work through the practice exercises. Check your answers and
then critique the sampling procedures of a research article.
Expository Material
Definitions:
1. A population is a set or collection of people.
2. The target population is the population identified in a research problem.
3. An accessible population is a population, all of whose members are available to us for study.
Consider the population of "five year old children." Is this an accessible population? It is not
accessible because there are no time and place limitations stated. Some five-year-olds have not
been born yet. Any theories about five-year-olds, unless specified otherwise, applies to children
who have not as yet been born.
17
Stated differently, scientific statements have no tense. When we say that water boils at 100oC (at
standard temperature and pressure), we mean to be referring to water as it is now, as it has
always been, and how it will be in the future. If we mean to speak of water in a more limited
context, then we must specify the limitations. The same general point applies to many of the
concepts in educational research.
4. An inaccessible population is a population all of whose members are not available for study.
5. A target population may be accessible or inaccessible. Since a target population is
determined by the research problem, and there are no limits on what researchers may ask, a
targeted population may take any form.
In basic theoretical scientific research the target population is typically inaccessible since it
ranges over time and place. However, in qualitative research or field studies, the targeted
population may be quite small. For example, if a jury trial received much attention in the print
and electronic media, a researcher might want to interview the jury, once the verdict was in. In
this case the people on the jury may constitute a target population.
Would these results not apply to other juries, and hence to a larger target population? The
answer is possibly yes, but note that researchers are all powerful when it comes to defining a
targeted population. Their questions set the limits in the studies. The fact that one researcher
can see a wider context for another researcher's conclusion does not mean that within the limits
of the study the target population must be reported as, say, twelve people.
Researchers doing field studies such as single case studies will see small target populations as a
strength of the study, while researchers pursuing general causal theories will view extremely
large target populations as more desirable. This is the distinction between purposive and
probability samples mentioned in what follows.
6. A sample is a subset of a population.
In set theory, every set is a subset of itself. In research terms, a "100% sample" would be the
entire population. Typically, however, a sample is smaller than the population from which it was
drawn.
7. The goal of sampling is to obtain a sample that is representative of the accessible population
from which it was drawn.
8. A representative sample is a sample that is like the population from which it was drawn in all
relevant ways. The sample will not be exactly like the population--for example the sample is
usually smaller. By 'representative', one means that it is similar enough to make a sound
inference from sample to population.
9. A biased sample is a sample formed in a way that every member of the population did not
have an equal chance of being selected. In other words, the sampling method was biased in
favor of some people and against others. Note that 'biased' does not mean that the sample is not
18
representative. 'Representative' does not mean the same as 'unbiased'.
10. Probability Sampling Methods:
The goal of probability sampling is to produce a representative sample that can form the basis of
an inference back to the accessible population from which it was drawn. Probability sampling is
contrasted with purposive sampling.
Random Sampling In a random sample, every member of the population being sampled has an
equal chance of being selected for the sample by the sampling process.
Systematic Sampling In systematic sampling, the sample is selected by a process that depends
on the order in the population. For example, a class counts off by fours, and four groups are
formed. A survey team interviews every 10th person entering a retail store. The people
interviewed are selected because of the order in which they entered the store.
Stratified Sampling The population to be sampled is divided into cells or strata. The strata do
not have to be of equal size. It is not assumed that the people within strata are the same. It is not
assumed that the strata are similar. Note these differences with cluster sampling. Random
sampling is done within each stratum. For example, suppose we want to know how residents
feel about a certain social issue. We could randomly sample the city, but our funding will place
limits on sample size. A small random sample might work, but if there is great ethnic diversity
in a city, a small sample might omit some groups. If it is known that neighborhoods are
ethnically homogenous, we could divide the city into, say, nine areas and randomly sample
within each area one ninth of our overall sample. The sampling is now protected from the
random omissions of some areas of the city.
Cluster Sampling A population is divided into clusters and then some of the clusters are selected
at random. It is assumed that the people in each cluster are not different one from another. For
example, large cities of the U.S are taken as clusters, and then four cities are selected randomly.
Convenience Sample Some samples have no logic behind them except the fact that they were
easy to come by. Convenience samples are biased samples. In some cases it may be better to
use a convenience sample than not to do the study at all.
11. Purposive Sampling
Sampling in natural or qualitative research studies often involves selecting non-probability
samples. In field studies it may not be possible to specify in advance just who will be studied.
For instance, researchers will make decisions about whom to interview as the day's research
develops. A good example of this is snowball sampling.
Snowball Sample Sometimes the members of a sample can become the source of additional
members for the sample. For example, if we are studying students who bring guns to school,
these students may tell us about other members of the sample in which we have interest.

19
12. Sampling Error is the difference between the sample's characteristics and those of the
population. There are statistical methods of estimating this error. Recall the political polls
frequently used by the media. The results are stated with an accuracy of "plus or minus five
percent."
13. Does random sampling guarantee that a representative sample will be produced?
No, but as the sample size increases, the probability of the sample being representative of the
target population increases.
14. A random sample is a sample that was drawn in a certain way. Randomness is not a
characteristic of the sample that could be discovered by examining the sample itself. What
makes the sample a random sample is the method of selection.
15. To sample a population means that at least some members of that population must be
accessible.
What Happened?
One of the most famous sampling mistakes took place in 1936, in the midst of the Great
Depression. Franklin D. Roosevelt was running against Alf Landon for president. A popular
magazine, the Literary Digest, conducted a survey at a cost of thousands of (1936) dollars. The
magazine predicted Landon in a landslide. Of course, F.D.R. won in a landslide. The Digest,
having lost credibility, went under shortly thereafter. What went wrong?
The firm hired to do the voter survey conducted two separate studies. Each study produced the
same findings. That seemed, apparently, to produce confidence in the validity of the study.
First, they randomly sampled by telephone. Random numbers were called and the people were
asked about voting preferences. In the second study, they went to the 48 state houses and
obtained the addresses of people who had registered autos. These people were mailed forms.
What went wrong? Who had telephones and autos in 1936? (See Mildred Parten, Surveys,
Polls, and Samples (New York: Harper & Row, 1950), pp. 24f and 392f.)
Practice Questions
(Solutions provided at end of book)
1. What is a population? ____________
2. A target population is ___________
3. A sample is ________________
4. How is an accessible population different from an inaccessible population?
5. Give an example of an accessible population.
6. Give an example of an inaccessible population.
7. A target population is always accessible. T/F
8. Sample always comes from an accessible populations. T/F

20
9. A representative sample is ____________
10. The goal of sampling is to achieve ________
11. A random sample is _____________
12. A systematic sample is ____________
13. Cluster sampling is _____________
14. A biased sample is _____________
15. A biased sample is biased because of the way it was drawn. T/F
16.The larger the random sample the better the chance of it being representative. T/F
17. A biased sample cannot be representative. T/F
18. The larger sample is always better than a smaller one. T/F
19. Everyone in this class whose social security number ends with an even digit is in the sample.
What kind of sample is this?
20. All accessible populations will provide samples that are representative of the target
population that contain that accessible population. T/F
21. Cluster sampling is the same as systematic sampling. T/F
22. Cluster samples are always random. T/F
23. Cluster samples are always representative. T/F
24. What do we call a sample that was selected in such a way that every member of the
population had an equal chance of being selected for the sample?
25. Systematic sampling requires some use of randomization. T/F
Critique Guidelines
(Sampling)
3.1 Accessible Population
(a) What was the accessible population used? (b) How well was the accessible population
identified? (c) Did this accessible population adequately represent the target population
described in 1.2?
3.2 Sampling Process
(a) Describe the sampling process. (b) How representative was the sample?
Example
The accessible population was six introductory chemistry classes from four high schools. The
accessible is clearly specified. The target population was beginning chemistry students. The
accessible does not represent this target population.
Three of the six classes were randomly selected. This sample does represent the limited
accessible population.
Lesson Four
Measurement in Research

21
Purpose of the Lesson:
Knowledge of the types of measurement is important for both classroom teachers and
researchers. This lesson will help you understand the characteristics of adequate measurements.
Directions for Study:
1. Work through the expository material provided. Then complete the practice exercises.
2. Complete the individual quiz.
Expository Material
I. Two Basic Types of Measurement
Recall that there are two types of variance: categorical and continuous. A category is a quality
and a continuous variable is a quantitative property. There is: (1) nominal measurement or the
measurement of qualities by naming them, and (2) quantitative measurement or the
determination of amount.
To measure a categorical variable, we must classify the instance being measured via some
classification system. For example, Mrs. Smith is an authoritarian teacher, as opposed to being
either laissez faire or "democratic." Classification of instances is nominal measurement.
('Nominal' in the sense of naming, not in the sense of minimal.) Quantitatively, Mrs. Smith is 5
ft. 2 in tall and 29 years old.
A Zip code uses a number as a name of a post office. A Zip code is a nominal measurement.
II. Three Types of Quantitative Measurement
Ordinal measurement is measurement based upon order. If the items to be measured can be
ranked in some way, then one has ordered them--thus, the term "ordinal." In ordinal
measurement, all that is known is the position of the measured items relative to some standard.
One knows that one thing is larger, bigger, more than another thing but it is not known by how
much. John was third in the 100 yard dash. This is ordinal measurement. Why?
Interval measurement requires an interval scale. The distances between the rankings are equal.
If Joan scores 30 units, Bob scores 20 units, and John scores 10 units, and if we know that the
scale is an interval one, then Joan out-scored Bob by the same amount as Bob out-scored John.
We know this because the units of measurement are of equal size. This is not true for ordinal
measurement, as has been seen.
Ratio measurement requires a ratio scale, which is an interval scale with a zero point. The real
numbers (the ones used every day) are a ratio scale. Most scientific measurements today assume
a ratio scale.

22
A helpful example for understanding the difference between interval and ratio scales of
measurement can be found in the measurement of temperature.
Why do scientists prefer to measure temperature in degrees C rather than degrees F? Is it not an
arbitrary choice (flip a coin)? Actually it is not. Why?
Consider the measurement 40oF. This is 8 degrees above freezing. At what temperature would it
be twice as warm? It would be 48oF because this is 16
oF above freezing (2 X 8 = 16).
We intuitively think that twice as warm as 40oF should be 80
oF, but as we have seen, it is not.
What is going wrong here is the fact that the zero point is in the wrong place.
Now consider 40oC. That measurement is 40 degrees above freezing. 80
oC is twice as warm as
40oC and things work out much better. (2 X 40 = 80.) The second way of measuring
temperature uses a ratio scale. That is why scientists prefer one scale over the other.
The first scale was only interval, not a ratio scale.
III. Reliability of Measurement
Reliability is the stability of the measurement or test score. For example, suppose that you have
a volt meter and plug the device into one of your wall sockets. The meter reads, "101". You
extract the meter--which now reads "0", and immediately re-measure the current in that same
socket. The meter now reads, "220". Surprised, you try a third time and find that the meter
reads, "150".
What can you conclude from this? Either the volt meter is not working properly (not reliable,
i.e., not giving stable results) or the voltage in your wall socket is varying wildly--which in turn
should make the lights and appliances rather short-lived.
In a classroom testing context, an example would be to ask: How likely is it that a student will
make the same score on this test if it were given on another day? A reliable test would pretty
much assure us of a stable reading on different applications of the test.
How Is Test Reliability Measured?
There are five procedures to estimate test reliability.
1. Test-Retest Administer the same test twice to a group of students and correlate the two sets
of scores. This method is not appropriate to the classroom.
2. Equivalent-forms reliability compares the scores made by a set of students who took two
tests either concurrently or at different times. This would be a waste of classroom time.
3. Split-half reliability is a measure of internal consistency and may be estimated by comparing
two independent halves of a single test. The most common method is to determine a score for the
odd-numbered items on a test and a score for the even-numbered items. Using the Pearson

23
product-moment correlation formula the teacher can measure the internal consistency as an
estimate of a test's reliability. This is the most appropriate method for a classroom teacher to
use.
4. Kuder-Richardson formulas measure the internal consistency of a test and estimate test
reliability from one administration of the test. The computations are somewhat involved, and are
more demanding than other methods, so are usually avoided by most classroom teachers.
5. Scorer reliability compares the scoring or reading of a set of student responses by more than
one person or two sets of measures determined independently by one person. This method is
often used with constructed-response items. Usually a teacher is not fortunate enough to have
another qualified person who will spend the time reading a set of tests.
What is correlation?
If you gave your class a test on how fast they could read and another test on reading
comprehension, you would wonder about the relationship between these two results. Do people
who read more quickly do so with less comprehension? Or is it the case that fast readers are also
comprehending more?
What you are seeking is the correlation between these two sets of test scores. The actual value of
the correlation is referred to as r. Do not be concerned with how to calculate the value of 'r'.
You can understand what a square root is and can obtain the square root of any number using a
calculator without knowing how to compute it using the "long hand" algorithm. The same point
holds for correlation. Correlation is the amount or degree of overlap in the two sets of scores.
Important Note! It is very common for teachers and administrators to think of correlation as a
percent. For example, you find that the correlation between reading speed and reading
comprehension for your class is .70. Some people will think of the overlap between the reading
speed test scores and the reading comprehension test scores for that class as 70%. This is wrong.
To find the percent of overlap in the scores one must square the 'r' and then convert to percent. If
r = .70, then the percent of overlap is 49%. This is less than half--and much less than 70%.
Notice how one could misadvise a student by making this mistake. The 'r' for test 'T' scores and
job success is .80, which leads the advisor to think there is an 80% chance of John's high score
on 'T' relating to a high probability of job success. Actually there is only a 67% probability of
job success. As an advisor, one should investigate that missing 33%--one-third of what is
involved.
You can find the reliability values for all standardized tests in Buros Mental Measurements
Yearbook.
IV. The Validity of Measurement
The most important characteristic of a test is validity. To be valid, a test must measure what it is
intended to measure. Any attempt to increase the adequacy of a test is either directly or indirectly
related to the improvement of that test's validity.
24
Every test is constructed to measure some characteristic. A test is valid to the degree that it
accurately measures that characteristic. An intelligence test is valid to the degree that a student's
score on it indicates a true measure of the capacity to function at a particular intellectual level.
Two students who have different capacities should have that difference shown to the same
degree in the difference between their test scores. The degree to which the test measures those
capacities determines the degree of validity for the test. Most classroom tests are prepared to
measure student achievement toward stated or implied goals. Valid tests are necessary to help
make useful judgments about the students who took the test and to assess the educational
program.
The use of standardized tests of achievement also requires that the tests have acceptable levels of
validity. The classroom teacher has a better opportunity to build valid achievement tests for a
particular class of students than standardized test makers do, because that teacher, more than
anyone else, knows what content has been covered and the behaviors expected. Constructors of
standardized achievement tests are not able to build specificity into a test as well as classroom
teachers, because standardized tests are designed for use in a wide range of classes with different
objectives, different combinations of subject-matter topics studied, and different emphasis on the
several topics. These tests tend to lose their validity as the characteristics of the group being
tested depart from the characteristics of the norm group. The teacher has the best opportunity to
build classroom tests and to select standardized tests with high validity.
What Is Degree of Validity?
Tests should not be classified as either totally valid or totally invalid, but as being valid to a
particular degree. The validity of a test is relative to a specific situation and depends on a unique
set of circumstances. A test that has high validity for one purpose may have moderate or low
validity for another.
What Are the Four Types of Test Validity?
Three points must be remembered when establishing the degree of validity for a test: first,
validity is always specific to some particular use; second, validity is a matter of degree; third,
validity pertains to the results of the test and is only indirectly related to the instrument itself. In
general, there are four types of validity: construct validity, logical or face validity, predictive
validity and content validity.
1. Construct Validity
An intelligence test is supposed to measure the concept or construct of intelligence. A
theoretical concept is developed or defined, and a test is built to measure this concept. A test that
does this is said to have construct validity. This idea is the most controversial of the types of
validity mentioned. (See Jerome A. Popp, "What Is the Problem of Construct Validity?," ERIC
Document ED 109 248; H. P. Bechtold, "Construct Validity: A Critique," American
Psychologist, Vol. 14, pp. 619-629.)

25
2. Logical validity
Experts certify that the content of the test is valid for what the test is supposed to be measuring.
3. Predictive Validity
The test for welders is validated by the fact that everyone who scores high on the test is later
rated by their supervisors as being a good welder. Those who score low on the test are later rated
by supervisors as being poor or incompetent welders. Actual experience with the test scores and
work experience validate the test.
4. Content Validity
Since teachers are particularly concerned with content validity, this idea will be developed more
fully. For a test to have a high degree of content validity, it must get at the subject matter
actually studied--and to the degree of emphasis the content received in the classroom. A test's
validity is weak when the relative importance of various topics does not correspond to the
instructional emphasis given. A test valid for one subject at a grade level may not be valid for
another class at the same grade level. The content validity for a given achievement test is
determined by comparing the content of the test with the content of classroom instruction.
V. Norm-Referenced versus Criterion-Referenced Tests
The fundamental difference between norm-referenced and criterion-referenced tests is the way
that scores from a test are made meaningful for evaluative purposes. In general, interpretation
for norm-referenced tests is accomplished by comparing scores with the performance of other
subjects/students who have taken the test. Interpretation for criterion-referenced tests is achieved
through teacher/researcher judgment about acceptable or unacceptable levels of performance on
the test itself. The choice between norm- or criterion-referenced evaluation will be related to the
research problem and hypothesis. For some measurement problems criterion referencing is
appropriate but for some problems norm referencing is better.
VI. Guidelines for Test Making
What Are Selected-Response Questions?
Selected-response items (true-false, multiple-choice, matching, and classification) present tasks
that are responded to by the selection of an alternative from those provided by the test itself.
They can be tied to a wide range of instructional objectives at all levels of the cognitive domain.
They are easy to score because the scorer does not make judgments about the quality of the
responses, but only compares answers to a key, so the tests can be scored mechanically. Several
specific strengths are associated with selected response items.
1. Scoring is objective.
2. Scoring is easy and can be done quickly.
3. In a short testing time the test can comprehensively cover the subject matter.

26
4. Well-written items reduce ambiguity.
5. A student's handwriting or mastery of language expression cannot affect the scoring.
6. Selected-response items are adaptable to most content areas, as well as to a wide range of
behaviors.
Selected-response items have several weaknesses.
1. Guessing will reduce test reliability.
2. Construction of good selected-response items is time consuming and difficult.
3. Because items for the lower levels of the cognitive domain are easier to write, there may be an
overbalance of these items.
4. There is no opportunity for originality or expression of opinion by the test taker.
5. It is difficult to remove clues in the question which might tip off a test-wise student to a
correct answer without understanding the concept.
Rules for Writing "True-False" Questions
1. State true-false items simply and directly. Base the item on an important idea that is clearly
true or clearly false.
2. It is generally a good idea to avoid specific determiners which unintentionally give clues to the
correct response, such as always, never, all, usually, often, most, may and should. Sometimes
always or never may be good items. See Lesson Three practice.
3. Avoid adding the word 'not' to a true statement to make it false.
4. Avoid long, complex, and involved statements.
5. Write false items so that statements sound plausible to someone who has not studied the area
being tested.
6. Include about the same number of false items as true items.
7. State cause-effect relationships so that the student clearly must react to the effect and not the
cause. Since two ideas come into play here, the first must be stated clearly as a given premise
and not a part to be judged.
8. Avoid words that mean different things to different persons.
Writing Multiple-Choice Questions
1. Set a definite task in the stem of the item. The stem is the direct question or incomplete
statement which is followed by alternatives.
2. When the item is presented in statement form, write alternatives to finish an incomplete
sentence.
3. Place as much of the wording in the stem as possible.
4. Avoid the use of negative words in the stem and alternatives.
5. Present the stem in a form to avoid making the item essentially true-false in which one
alternative is true and the other alternatives are false.
6. Construct all alternatives to be parallel in form with the stem of the item, and make all
alternatives about the same length.
7. Place alternatives in a vertical list to improve the readability.
8. Avoid using "All of the above" as an alternative. A student may feel penalized for choosing
27
another correct answer.
9. Eliminate verbal clues in the stem which might eliminate one or more alternatives.
10. Make each of the distracters (wrong answers) plausible to a student who does not know the
correct response.
11. Avoid trickery in items.
12. Randomly position the correct alternative so that each position is used about the same
number of times.
13. Try to have four or five alternatives, because theoretically those numbers help reliability. As
the number of alternatives is reduced, the chance of guessing the correct response increases.
Writing Matching Questions
1. Develop matching items to avoid a series of multiple choice items that measure a single topic.
2. Create lists that will not give clues to the correct responses.
3. Keep the list of premises and responses to a maximum of 12.
4. When phrases or sentences are used in a list of premises or responses, shorter phrases should
be used for the responses.
5. Indicate the basis for establishing the relationship to be used in the matching process.
Writing Classification Questions
1. Make sure each of the words or statements belongs definitely to one class category.
2. Provide a clear explanation of the task and classification system.
3. Limit the number of classes to 5. Too few classes increase the chance of guessing correctly.
4. Use categories in the key list of alternatives that are exhaustive, mutually exclusive, and yet
have a relationship within a structure.
What Are Constructed Response Questions?
Constructed-response items (completion, short-answer, and essay) present tasks that require the
examinee to create responses within the structure provided by each item. The completion item
usually measures the learning of facts at the recall level. Short-answer items measure the recall,
not the recognition of facts. The essay question is the most likely constructed-response item to
measure the higher behaviors in the cognitive domain.
Rules for Writing "Fill-the-Blank" Questions
1. Have the omission near or at the end of the sentence. The blank at the end allows the student
to identify the task before the omitted word is called for.
2. Word each item so that all students have the same frame of reference.
3. Make all blank spaces the same size.
4. Omit only important words.
5. Write completion items with only one blank or a related series of blanks.
6. Write items so that there is only one correct response for each blank.
7. Check the grammar of the sentence to make sure that it does not include any clues to the
correct response.

28
Rules for Writing Essay Questions
1. Provide the same amount of space for each response.
2. Include rules for responding in the item or directions, such as units to be used, length of
responses.
3. Do NOT use an essay item to measure simple recall of facts.
4. Prepare the item so that the question presented or implied is explicit, clear, and concise.
5. Establish within each item the scope expected in the response and the detail to be included, by
defining the expected response.
6. When setting the task, use descriptive words that are clear in their meaning.
7. Usually give all students the same set of items, not a choice from a list of optional items.
Comparisons of differences in the set of scores can be made only when each score is based on
the same set of items.
8. Choose the extended-response essay item only as a vehicle to measure written expression,
communication, or organization of material. The use of this item type for content other than
language arts should be limited.
Norm-Referenced versus Criterion-Referenced Measures
The fundamental difference between norm-referenced and criterion-referenced tests is the way
scores from a test are made meaningful for evaluative purposes. In general, interpretation for
norm-referenced tests is made using performance of other students who have taken the test.
Interpretation for criterion-referenced tests is made through teacher judgment about acceptable or
unacceptable levels of performance on the test itself. The choice between norm- or criterion-
referenced evaluations will be made on the basis of facilitating positive changes in student
behavior. For some needs criterion referencing is appropriate but for other needs norm
referencing is better.
Uses of Criterion Referenced Measures
1. CRM can be used to measure attributes of the cognitive domain where mastery is expected.
2. CRM structures the measurement process so that appraisal of affective attributes is facilitated.
3. CRM is useful for measuring the psychomotor domain.
4. CRM works well with individualized instruction.
5. CRM can be used for content subjects and cognitive skill development as a diagnostic
procedure to point up an area of difficulty.
Weaknesses of Criterion-Referenced Measures
1. Scores from CRM do not indicate a student's level of achievement relative to peers.
2. Relatively few areas of cognitive learning, and only parts of other areas, are amenable to being
reduced solely to a list of specific instructional objectives.
3. Instruction solely to a set of specific behaviors does not allow for expansion of learning by
taking advantage of ongoing classroom activities.

29
Uses of Norm-Referenced Measures
1. NRM can be used to measure attributes that relate to the cognitive domain where each student
is allowed and encouraged to learn at maximum potential.
2. NRM is appropriate for interpreting performance at the higher levels of the affective and
psychomotor domains.
3. NRM is especially valuable for the higher levels of the cognitive domain as student
development focuses on complex learning strategies.
4. NRM is valuable when a set of students is moved through an instructional sequence together,
but different performance levels are expected from the students.
Weaknesses of Norm-Referenced Measures
1. If material or topics are sequenced, NRM cannot be used satisfactorily to indicate when a
student is ready to move from one topic to another.
2. NRM is not appropriate for measuring mastery of certain material and skills.
3. NRM does not indicate specific tasks a student can perform and does not allow direct
interpretation of performance from a test score.
Practice
1. If a measurement is nominal, is it categorical or continuous?
2. If a measurement is ordinal, does the measurement tell us the amount of difference between
any two scores?
3. What type of measurement has a zero point?
4. A teacher ranks the classroom team study teams on how well each team did on a given test.
What type of measurement is called for in this case?
5. What makes a measurement scale a ratio scale?
6. A smoke detector is silent when no smoke is present but sounds when a minimal amount of
smoke is present. What type of measurement is this? Is the smoke detector producing reliable
measures?
7. The smoke detector in the physics lab reads, "millions of particulates per cubic meter." What
type of measures is it producing?
8. If a smoke detector sometimes sounds when no smoke is present but always sounds when
smoke is present, is this smoke detector producing reliable measurements?
9. Can an instrument be valid, but not reliable?
10. Can an instrument be reliable, but not valid?
11. An oven is always 25 degrees warmer than its dial setting. Is the oven reliable?
12. A gas gauge in a car always reads one-quarter when the tank is empty. Is the gauge reliable?
13. How could you establish the reliability of your oven's dial setting?
14. How could you establish the validity of your car's gas gauge?
15. What would make a gas gauge unreliable?
16. Does 'stability of a measure' refer to its reliability or validity?
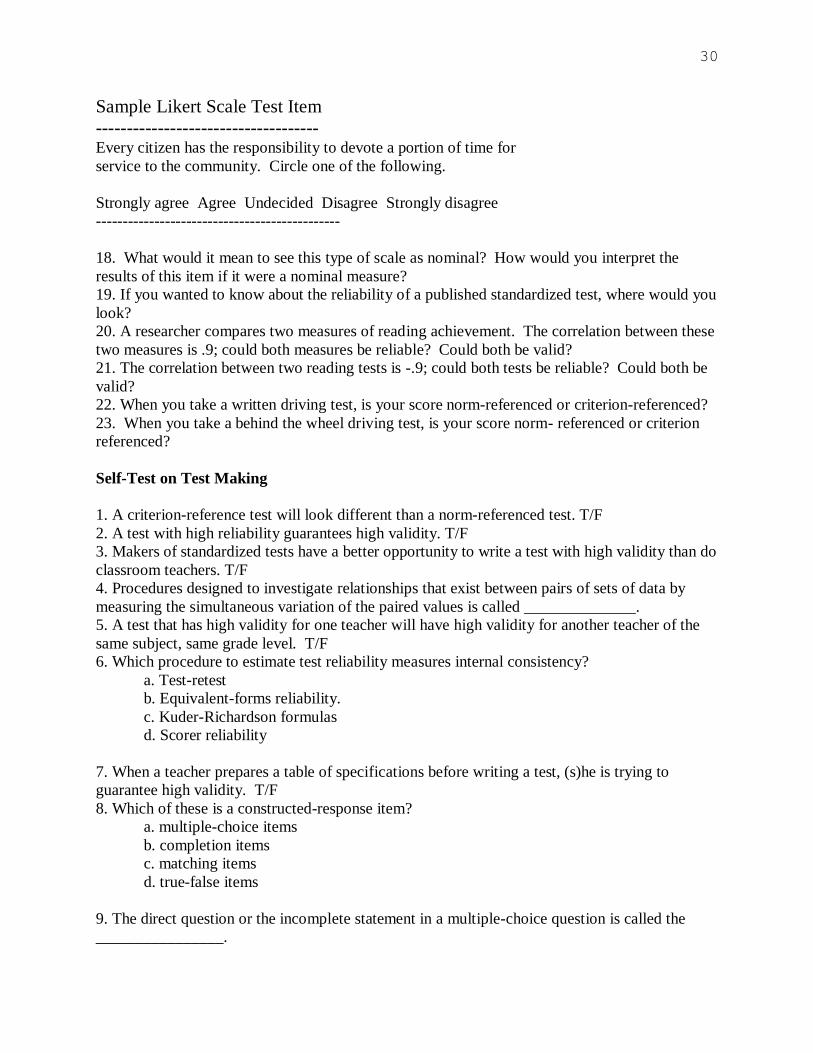
17. Consider the "Likert Scale" test item below. Why do you suppose that some researchers are
reluctant to think of this as an interval scale?
30
Sample Likert Scale Test Item
------------------------------------ Every citizen has the responsibility to devote a portion of time for
service to the community. Circle one of the following.
Strongly agree Agree Undecided Disagree Strongly disagree
----------------------------------------------
18. What would it mean to see this type of scale as nominal? How would you interpret the
results of this item if it were a nominal measure?
19. If you wanted to know about the reliability of a published standardized test, where would you
look?
20. A researcher compares two measures of reading achievement. The correlation between these
two measures is .9; could both measures be reliable? Could both be valid?
21. The correlation between two reading tests is -.9; could both tests be reliable? Could both be
valid?
22. When you take a written driving test, is your score norm-referenced or criterion-referenced?
23. When you take a behind the wheel driving test, is your score norm- referenced or criterion
referenced?
Self-Test on Test Making
1. A criterion-reference test will look different than a norm-referenced test. T/F
2. A test with high reliability guarantees high validity. T/F
3. Makers of standardized tests have a better opportunity to write a test with high validity than do
classroom teachers. T/F
4. Procedures designed to investigate relationships that exist between pairs of sets of data by
measuring the simultaneous variation of the paired values is called ______________.
5. A test that has high validity for one teacher will have high validity for another teacher of the
same subject, same grade level. T/F
6. Which procedure to estimate test reliability measures internal consistency?
a. Test-retest
b. Equivalent-forms reliability.
c. Kuder-Richardson formulas
d. Scorer reliability
7. When a teacher prepares a table of specifications before writing a test, (s)he is trying to
guarantee high validity. T/F
8. Which of these is a constructed-response item?
a. multiple-choice items
b. completion items
c. matching items
d. true-false items
9. The direct question or the incomplete statement in a multiple-choice question is called the
________________.
31
10. Criterion-reference testing works well with individualized instruction. T/F
11. Criterion-reference testing is valuable for the higher levels of the cognitive domain. T/F
12. Test items tend to be relatively easier in norm-reference tests. T/F
13. A table of test specifications plans for the two dimensions of ___________________ and
________________.
Answer Key to Self-Test: 1. False; 2. False; 3. False; 4. Correlation ; 5. False; 6. C; 7. True; 8. B; 9. Stem; 10. True;
11. False; 12. False; 13. Topics and behaviors
Critique Guidelines
(Measurement)
4. Instruments
What measurement devices were used in the study? List all standardized tests and inventories.
If a researcher-made instrument was used, what attempt was made to show that this device was
valid? If observers or raters were used, how well were the ratings standardized and made
reliable?
Example:
California Achievement Test, student questionnaires, parent questionnaires and teacher
questionnaires were used. No reliability or validity evidence for the questionnaires was
presented.
Lesson Five
Research Designs
Purpose of the Lesson:
To understand a research report, we require knowledge of the structure of typical designs used in
educational research, along with their conventional names. We also obviously require
knowledge of the weaknesses of typical designs.
Directions for Study:
Read the expository material included and then use the practice as explained.
Expository Material
What is a Research Design?

32
Given that a sample has been identified and that the measurement instruments are at hand, the
researcher's next question is that of how the actual data will be generated or collected. The plan
for this data-generating process is called the "research design."
Two Basic Types of Research Designs
To understand what is read in the published research literature, it is necessary to distinguish two
basic types of research designs: quantitative and qualitative. It has been stated that all research
begins with a question. We could pursue answers to our questions with either type of design, so
it is not the type of question that determines the type of design used in the study. Furthermore, if
the research is designed around testing a hypothesis, we could use either type of design. The
difference between quantitative and qualitative designs is to be found in how the researchers
view the role of their own behavior in the data collection or generation process.
A quantitative research design is a very formal, objective, and highly specified plan for
generating or collecting data. The design will describe the standardized measurement devices,
along with when and how they are to be used. For some designs, specification of the use of the
instruments is all that is required. The design for surveys, for example, will describe when and
how the subjects of the study will be measured. Other designs must also specify how, and how
many of, the subjects will be exposed to the independent or treatment variables of the study. The
ability to replicate the study is of utmost importance. It is felt by some that results that are not
duplicable are not worth reporting.
Some researchers have felt that quantitative research places too much emphasis on overly formal
measurement techniques and data analysis procedures. By always focusing on that which could
be measured by the standard methods, we could be missing the important dimensions of
teaching. Also the emphasis on accountability, and hence teacher and program evaluation, led
some to question the ability of the traditional research apparatus to serve well the problems of
educational evaluation.
An alternative approach to the research design places emphasis on the researcher's reaction to the
data collection context. In "field studies" as opposed to laboratory research, the researcher is not
constrained by any previously written set of procedures. The "qualitative" researcher or
ethnologist enters the situation with a clearly formulated question or set of questions in mind.
However, in the pursuit of the answers to this question, the researcher is free to follow whatever
leads present themselves. For example, in qualitative research it is much more common for the
investigator to use interview techniques than to use the standardized measurement devices so
common to quantitative research designs. In an interview with a teacher, the researcher may have
in mind several general aspects of the situation that the teacher will be asked about. During the
conduct of the interview, it may well turn out that an unexpected avenue presents itself, and the
researcher will explore that previously unconsidered or even rejected area of investigation. Such
face to face conversations allow the researcher the freedom to explore various avenues as they
appear. By contrast, in the formal quantitative design such deviations would not be considered
appropriate, and might even be seen as a weakness or limitation of the study.
In qualitative designs, the researcher becomes a kind of instrument. Researchers note their

33
reactions to the various persons and situations involved in the evaluation or investigation.
Previously, researchers were taught to keep themselves completely out of the process for fear of
biasing the data generated or collected. If the design of the study specified collecting one or two
kinds of data, the researchers followed the plan and collected only that data. However, the
qualitative approach not only allows a departure from the original plan but requires the
departure, when events suggest to the researcher that it would lead to greater understanding if
some aspect of the problem situation were pursued. Researchers are always seeking unknown
avenues that, if analyzed, might contribute to better understanding of the problematic situation.
The demands of replication are not felt by ethnologists; they are driven by the fear of allowing
the unique or unusual case to get away without having been documented.
It should also be noted that in quantitative research designs the sample and the sampling process
are not considered to be part of the design. However, in qualitative designs the decision as to
who is and who is not a member of the sample is a decision that is made in the field by the
researcher. During the process of an interview, it may be discovered that some unexpected
person or group should also be interviewed. Such "mid-stream" changes are not permitted by
quantitative methodology.
What Is a Good Quantitative Design?
The point of the construction of a research design is to control variation. A good design
accomplishes two things: (1) the independent or "treatment" variable must vary in the way
described by the hypothesis, and (2) all other extraneous variables must be controlled. In other
words, all potentially confounding extraneous variation must be regulated in such a way that we
know the effect of this variation is not confounding.
Within the context of a given research design, all possible variables will be classified as one of
the following classes of variation:
Class I Variables: The variables mentioned in the hypothesis--the independent and dependent
variables.
Class II Variables: Controlled extraneous variation.
Class III Variables: Uncontrolled extraneous variation (confounding variables).
Good designs eliminate all Class III variation .
What are some common sources of confounding variation?
1. History: the effects of outside events on research. Example: An experiment is being
conducted to determine the effects of political literature on attitudes of voters. During the run of
the study, a member of the political party whose material was being used was accused of a
serious crime. This outside factor may render the study invalid because the effects of the
newspaper and TV stories could completely overrun the lesser effects of the materials being used
in the study.
2. Maturation: changes in the subjects themselves. Example: An exercise program is said to
promote early walking in children. A group of six month old children are given special exercises

34
for one year. At the end of the year, all the children in the study are walking. Should we
conclude that the program works? How could this problem be overcome? Some sort of control
group is required.
3. Testing: The effects of first test on second test (effects of the pretest on the posttest). Example:
a study uses the same test for both pretest and posttest. An increase in posttest scores could be
due to learning from the first test experience and not the treatment. A new test requires some
time to get the feel of the form of the questions as well as a sense of how to answer them. Using
the same test as a posttest could give the students more time on the posttest because they already
know the form of the test.
4. Instrumentation: changes in the measurement devices. Example: Raters observe a class in
August and again in June. A gain in skills is found when the two sets of observations are
compared. The gain may be due to changes in the raters. If you have ever graded a set of essay
tests, you know how difficult it is to hold the same criteria in mind for the first paper as for the
last paper. There are various techniques used to get around this problem. Sometimes raters are
"trained" until they all rate the same way. This "training" may wear off, however. Another way
is to use guidelines--the rule book in baseball is an example. Nevertheless, there are difficult
"calls" to make.
5. Selection Bias: nonequivalent groups are used. Example: A study used girls as an
experimental group and boys as the control group. Sex differences may render these groups
unequal. A control group is a group just like the experimental group except for one thing--there
is no treatment given. In medical research, patients may receive a "shot" that is a saline solution
and not the drug being tested. However, if the two groups are not very similar at the beginning,
nothing is learned because the initial differences may be greater than anything the drug could
produce.
Pause for a minute and make sure that you are clear on the difference between "random
sampling" as opposed to "random assignment" to groups. These are not the same thing. When
you see the word "random" in an article, make sure that you understand which of the above is
being indicated.
There is a technique called "matching" that is sometimes used in educational and medical
research. Some studies are based on matched pairs of subjects who have been identified on the
basis of certain specific characteristics. The research creates, in other words, a number of
matched pairs. The pairs are then separated randomly and two separate groups are created. The
point of the matching activity is to get two groups that are equal in how they will respond to the
proposed treatment.
Another approach to matching uses performance matching. Students are given a fixed and
predetermined amount of practice and then tested. Their scores can be used to create two or
more equal groups, or the students who achieve at a given level of competence can be randomly
placed in the groups. This latter procedure has several advantages. The groups formed are better
matched on the practiced activity than simple random assignment would do. The variability in
the data produced will be smaller than random assignment. Sometimes each subject can be given

35
the treatment and posttested before all subjects have completed the practice. This allows
researchers to better budget time.
Some researchers object to matching. They claim that no matter how well matched the groups
are, there will always be some characteristics on which the groups are not matched. So the
matching gives only the illusion of equal groups. Moreover, these researchers fear that having
the groups form as a result of researcher manipulation introduces the possibility of bias
(researcher contamination). Thirdly, when subjects are matched, this will almost always result in
some members of the sample not being used in the study. This could drastically weaken the
generalizability of the study (see Lesson Seven). Since the unmatched subjects are discarded, the
data reflect more average cases. This happens because the extreme cases are more difficult to
match. If they do not have a match, they are not in the sample.
In medical research it is now possible to have two equated groups of animals. In fact, through
the process of cloning, two identical groups are possible. But in educational research, we know
that the matching objection cannot be avoided. So should we accept studies that use matching or
reject them?
The best policy seems to be to consider the criteria on which the subjects were matched. Then
consider the variables being tested in the study. If there is a doubt as to which factors are related
to the variables in the study, then no matter what matchings are done, we do not know how well
matched the subjects were on relevant factors. On the other hand, if we judge that the related
factors are those very characteristics on which the subjects were matched, then we might accept
the matching procedure as a manner of establishing equal groups. In general, if you are planning
the research, do not use matching to divide the sample. Use random selection. Then you will
know that any and all characteristics are randomly distributed within the groups of the study. Of
course the groups will not be exactly equal, but what error exists in the equating of the groups
will be random error. That means that any biasing factors will be distributed through the groups
in a chance fashion. The statistical techniques to be used in the analysis of the data will take
such random error into account.
6. Mortality: loss of subjects. Example: Students may move away during the run of an
experiment, or a serious round of the flu may cause the loss of too many students to have
confidence in the results. For example, if it turns out that the higher scoring students are the ones
ill, the resulting posttest average will be lower than it would have been otherwise.
7. Hawthorne Effect: experimental subjects try harder because they are aware they are in a study.
Example: First discovered in studies in a Western Electric plant in Hawthorne, Ohio. When
music was played for workers in the plant, production went up. But when the music was
removed, production also went up. This effect wears off, however. Think of some researcher
observing your teaching. At first, you would be unusually self-conscious; but eventually you
would settle back to your typical style.
8. John Henry Effect: control group tries harder to overcome the effects of not having been
given the treatment. Similar to Hawthorne Effect. (Actually, the 'John Henry Effect' should
refer to what happens when a person tries to out work a machine. Recall the legendary American

36
hero, John Henry, who outperformed the steel drivin' machine.)
9. Reactive Measure: pretest has an effect on the treatment. Example: When subjects take the
pretest, they learn what the lesson is about. Students who do not take the pretest, do not do as
well on the lesson. The pretest is actually serving as a kind of treatment. Students are learning
from the pretest. For example, what if one of the questions is, "At room temperature, is water a
liquid, solid, or gas?" The student may learn from this question that matter may take three states.
10. Regression toward the mean: decay of extreme scores toward the average. Example: When
high and/or low scoring students on the pretest are used in a study, chance alone will lower the
high scorers and raise the low scorers on the posttest. High scorers had a good day and are less
likely to repeat their performances. The low scorers had a bad day and are also unlikely to repeat
their scores. Moral: do not pull off high or low scores. Keep the class together.
11. Test Ceiling Factor: applies to gain scores. Example: When the pretest score is subtracted
from the posttest score, we get a gain score. Students who score low on the pretest have a better
chance to show gains than do students who scored high on the pretest. Gain scores favor the low
scoring students. (Remember this when you attempt to grade students on how much they have
gained.)
Additive and Subtractive Designs
A common approach to research is to create two groups that are subsequently treated exactly
alike, except that something is added or subtracted from one group. The factor that is added or
subtracted is the "treatment variable" or the independent variable of the hypothesis. The other
group that has not had this factor added or taken away is said to "control" for the effects of the
treatment variable.
Confounding Factors as Alternative Explanations
The reason we do the experiment is to determine if a treatment is effective. If we can show, for
example, that the group that received the treatment out- scored the groups that did not, then we
have evidence for claiming that the treatment is effective. However, if the control group lost
subjects (mortality), then perhaps the experimental group out-scored the control group because
the control group scores were lowered by factors having nothing to do with the study.
The effectiveness of the treatment explains why the experimental group did better. However, we
have an alternative explanation. The experimental group did better because the control group
lost its high scorers. Which explanation is the right one? No one knows. The study did not
generate strong enough evidence because of the loss of subjects. Another way to put this is to say
that the research hypothesis is what we want to be the only good explanation. In general, when
there is a confounding factor present, this factor becomes a competing explanation for the
explanation of the results. We want to have it turn out that the only possible explanation of the
results is that the treatment was effective.
At the other extreme, is the survey. A survey is simply a measurement. There is no treatment

37
variable or control. In a survey, we obtain data on some system at some given point in time. A
survey collects data.
Between the experiment and the survey are studies that do not have the controls of an experiment
but can gather causal data that surveys cannot. Suppose there is a train derailment near a large
city. Television and radio report that there is a danger to citizens in the area. Social scientists
could examine the effects of the information on the community. Researchers do not control the
information--how much, what type, and when. But from the record of events, they can check the
effects of known events. This type of design is often referred to as ex post facto research--after-
the-fact investigations.
The following chart may help in understanding three different basic types of research designs.
Three Types of Quantitative Designs:
-----------------------------------------
Are there Known Treatment (Causal) Variables?
(A) If not, then we have a survey.
(B) If so, then are the variables researcher controlled?
(B1) If yes, then we have an experiment.
(B2) If no, then we have an ex post facto study.
Note: qualitative research studies also make use of sampling and ex post facto methods. (e.g.
interviewing people who were involved in an earthquake.)
What Are the Common Types of Research Designs? What Are Their Strengths and
Weaknesses?
The following discussion is intended as an introduction to the theory of research design. It is
presented for pedagogical reasons and is not intended as a summary or encyclopedia of all
possible research designs. It is desirable for researchers to be creative and to discover new
designs. So, the designs the reader will find in the literature do not always fall neatly into one of
the following categories.
1. The Survey
M
In a survey, all that is done is the taking of a measurement. There are no treatments involved.
2. One Shot Case Study
One group is given a treatment and then measured.
T --> M
The weakness in this design is the lack of data with which to compare the scores obtained.
3. Static Group Comparison
Two nonequivalent groups are used, one being given the treatment and the posttest and the other
given only the posttest.
T -> M (group A)

38
-------
M (group B)
Here we do have comparative data in that we can compare the posttest results of the two groups
to determine if there is a difference; however, this data is of questionable value since we do not
know if the two groups were alike. Non-equivalence of groups is a confounding effect.
Sometimes more than one treatment may be involved. We have two unequal groups and each is
given a different treatment.
Ta -> Ma
-----------
Tb -> Mb
The results of this design are weak because we do not know if the groups would respond in the
same way if the treatments were switched.
4. One-Group Pretest-Posttest Design
M --> T --> M
There is comparative data--pre-post comparisons but we do not know if history, maturation, etc.
has produced the differences we are observing
5. Non-equivalent Pretest-Posttest Design
M --> T --> M (group A)
-------------
M ---------> M (group B)
We can determine if the two groups are similar at the beginning of the study. However, we do
not know if the two groups are maturing at the same rate. We do not know if outside events are
affecting both groups in the same way. This design looks all right but it actually gives us very
weak inferences or tests of hypotheses.
6. Pretest-Posttest Control Group Design
R M -> T -> M
-------------
R M ------> M
This design contains a very important addition. The 'R's mean that the two groups were created
randomly. We take the sample and randomly divide it into two groups. This means that if there
are any differences in the two groups, these differences are random differences. The larger the
groups, the less these random differences will make a serious difference.
The problem with this design is the possibility of a reactive measure. Any time there is a pretest,
a reactive measure is possible.
7. Posttest Only Control Group Design
R T -> M
-------------
R M
Notice that there can be no reactive measure in this design. This is a favorite design for many
researchers.
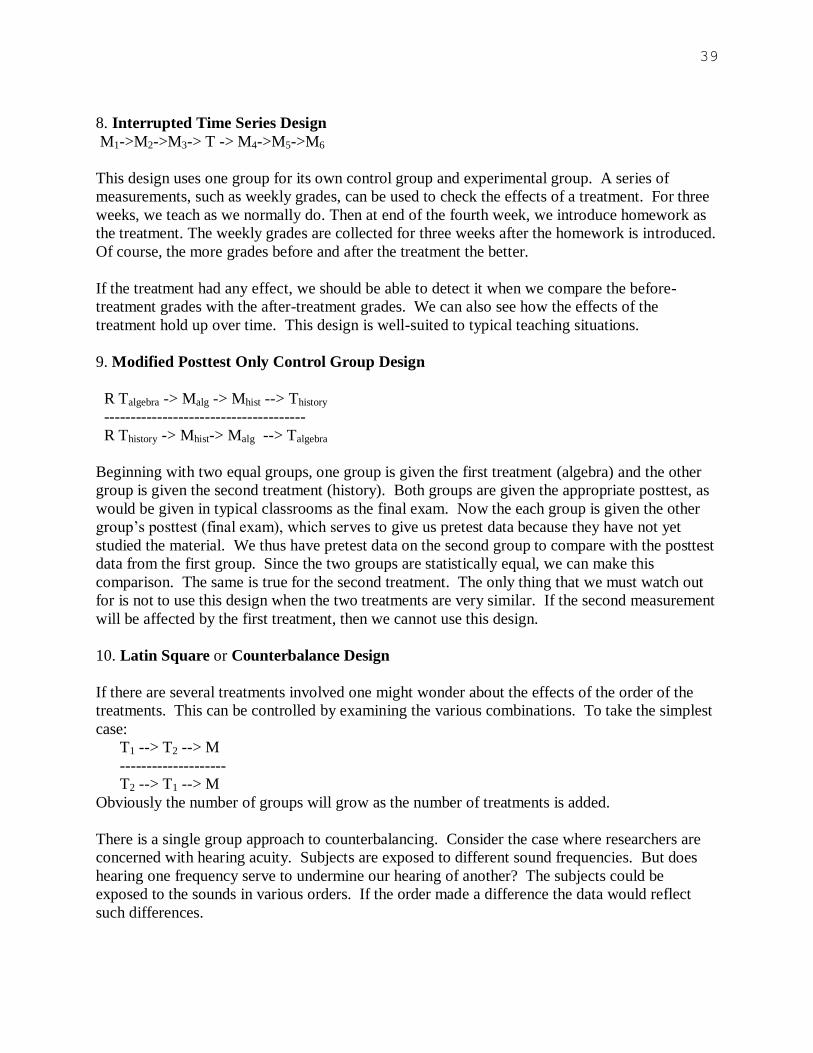
39
8. Interrupted Time Series Design
M1->M2->M3-> T -> M4->M5->M6
This design uses one group for its own control group and experimental group. A series of
measurements, such as weekly grades, can be used to check the effects of a treatment. For three
weeks, we teach as we normally do. Then at end of the fourth week, we introduce homework as
the treatment. The weekly grades are collected for three weeks after the homework is introduced.
Of course, the more grades before and after the treatment the better.
If the treatment had any effect, we should be able to detect it when we compare the before-
treatment grades with the after-treatment grades. We can also see how the effects of the
treatment hold up over time. This design is well-suited to typical teaching situations.
9. Modified Posttest Only Control Group Design
R Talgebra -> Malg -> Mhist --> Thistory
--------------------------------------
R Thistory -> Mhist-> Malg --> Talgebra
Beginning with two equal groups, one group is given the first treatment (algebra) and the other
group is given the second treatment (history). Both groups are given the appropriate posttest, as
would be given in typical classrooms as the final exam. Now the each group is given the other
group’s posttest (final exam), which serves to give us pretest data because they have not yet
studied the material. We thus have pretest data on the second group to compare with the posttest
data from the first group. Since the two groups are statistically equal, we can make this
comparison. The same is true for the second treatment. The only thing that we must watch out
for is not to use this design when the two treatments are very similar. If the second measurement
will be affected by the first treatment, then we cannot use this design.
10. Latin Square or Counterbalance Design
If there are several treatments involved one might wonder about the effects of the order of the
treatments. This can be controlled by examining the various combinations. To take the simplest
case:
T1 --> T2 --> M
--------------------
T2 --> T1 --> M
Obviously the number of groups will grow as the number of treatments is added.
There is a single group approach to counterbalancing. Consider the case where researchers are
concerned with hearing acuity. Subjects are exposed to different sound frequencies. But does
hearing one frequency serve to undermine our hearing of another? The subjects could be
exposed to the sounds in various orders. If the order made a difference the data would reflect
such differences.
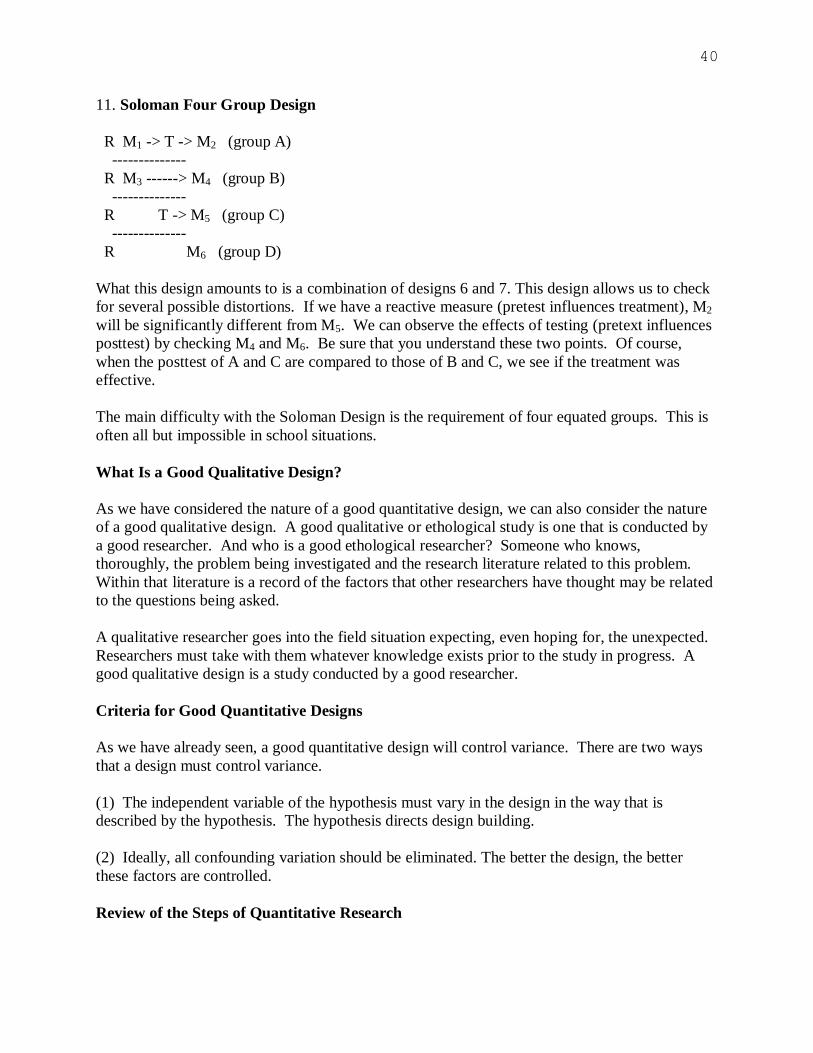
40
11. Soloman Four Group Design
R M1 -> T -> M2 (group A)
--------------
R M3 ------> M4 (group B)
--------------
R T -> M5 (group C)
--------------
R M6 (group D)
What this design amounts to is a combination of designs 6 and 7. This design allows us to check
for several possible distortions. If we have a reactive measure (pretest influences treatment), M2
will be significantly different from M5. We can observe the effects of testing (pretext influences
posttest) by checking M4 and M6. Be sure that you understand these two points. Of course,
when the posttest of A and C are compared to those of B and C, we see if the treatment was
effective.
The main difficulty with the Soloman Design is the requirement of four equated groups. This is
often all but impossible in school situations.
What Is a Good Qualitative Design?
As we have considered the nature of a good quantitative design, we can also consider the nature
of a good qualitative design. A good qualitative or ethological study is one that is conducted by
a good researcher. And who is a good ethological researcher? Someone who knows,
thoroughly, the problem being investigated and the research literature related to this problem.
Within that literature is a record of the factors that other researchers have thought may be related
to the questions being asked.
A qualitative researcher goes into the field situation expecting, even hoping for, the unexpected.
Researchers must take with them whatever knowledge exists prior to the study in progress. A
good qualitative design is a study conducted by a good researcher.
Criteria for Good Quantitative Designs
As we have already seen, a good quantitative design will control variance. There are two ways
that a design must control variance.
(1) The independent variable of the hypothesis must vary in the design in the way that is
described by the hypothesis. The hypothesis directs design building.
(2) Ideally, all confounding variation should be eliminated. The better the design, the better
these factors are controlled.
Review of the Steps of Quantitative Research
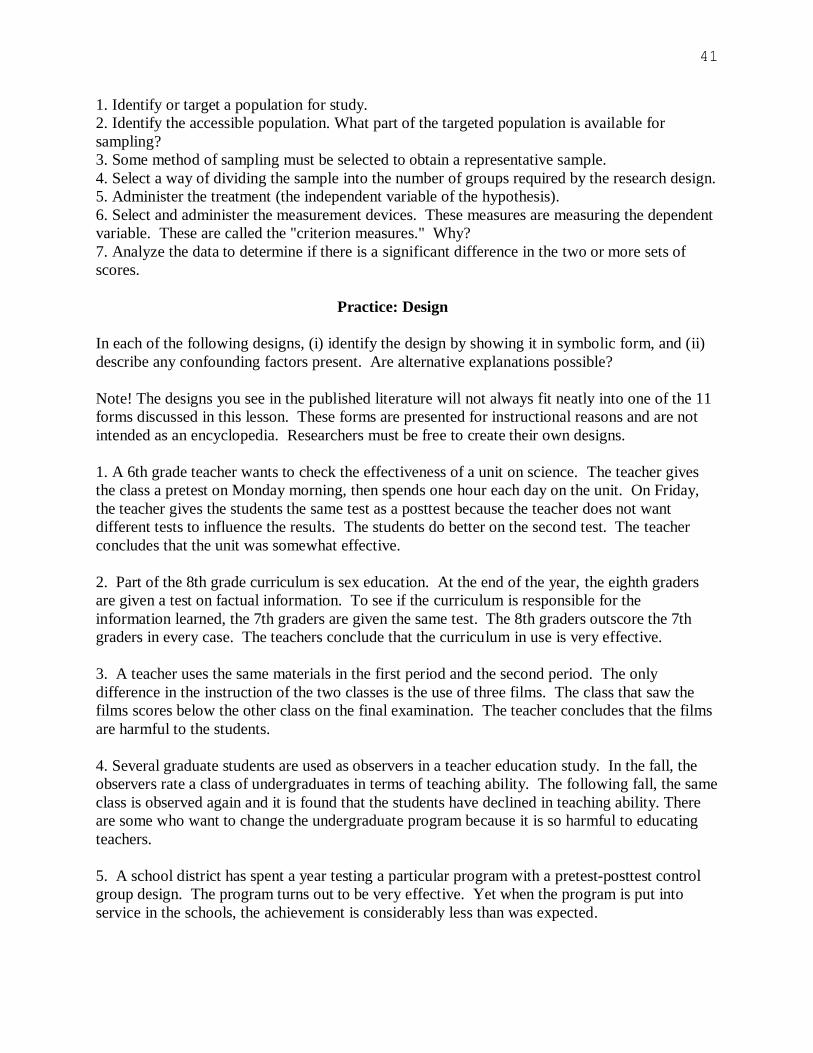
41
1. Identify or target a population for study.
2. Identify the accessible population. What part of the targeted population is available for
sampling?
3. Some method of sampling must be selected to obtain a representative sample.
4. Select a way of dividing the sample into the number of groups required by the research design.
5. Administer the treatment (the independent variable of the hypothesis).
6. Select and administer the measurement devices. These measures are measuring the dependent
variable. These are called the "criterion measures." Why?
7. Analyze the data to determine if there is a significant difference in the two or more sets of
scores.
Practice: Design
In each of the following designs, (i) identify the design by showing it in symbolic form, and (ii)
describe any confounding factors present. Are alternative explanations possible?
Note! The designs you see in the published literature will not always fit neatly into one of the 11
forms discussed in this lesson. These forms are presented for instructional reasons and are not
intended as an encyclopedia. Researchers must be free to create their own designs.
1. A 6th grade teacher wants to check the effectiveness of a unit on science. The teacher gives
the class a pretest on Monday morning, then spends one hour each day on the unit. On Friday,
the teacher gives the students the same test as a posttest because the teacher does not want
different tests to influence the results. The students do better on the second test. The teacher
concludes that the unit was somewhat effective.
2. Part of the 8th grade curriculum is sex education. At the end of the year, the eighth graders
are given a test on factual information. To see if the curriculum is responsible for the
information learned, the 7th graders are given the same test. The 8th graders outscore the 7th
graders in every case. The teachers conclude that the curriculum in use is very effective.
3. A teacher uses the same materials in the first period and the second period. The only
difference in the instruction of the two classes is the use of three films. The class that saw the
films scores below the other class on the final examination. The teacher concludes that the films
are harmful to the students.
4. Several graduate students are used as observers in a teacher education study. In the fall, the
observers rate a class of undergraduates in terms of teaching ability. The following fall, the same
class is observed again and it is found that the students have declined in teaching ability. There
are some who want to change the undergraduate program because it is so harmful to educating
teachers.
5. A school district has spent a year testing a particular program with a pretest-posttest control
group design. The program turns out to be very effective. Yet when the program is put into
service in the schools, the achievement is considerably less than was expected.

42
6. The teachers in an elementary school are selected for a study. Graduate students observe and
rate these teachers once a week. At the end of the year the achievement test scores of the
students of the teachers who were rated are much higher than their past scores. The principal
concluded that researchers tampered with the data.
7. A teacher wants to use two different methods of teaching. He divides his class alphabetically
between 'm' and 'n'. The two groups use different methods for a month. An achievement test is
given and it is found that the two methods produced the same results.
8. In the fall, all freshmen are tested; the 15 highest and the 15 lowest scoring freshmen are
combined to form an experimental class of 30 students. This class is allowed to study on its own
in a math lab. In the spring, the 30 students are tested again. It was found that the math lab
helped the lower achieving students but the better students showed achievement much lower than
expected.
Critique Guidelines
(Research Design)
5. Design
5.1 The Design
Describe the design of the study. (Use the "T"s and "M"s if it is helpful. Remember that the
lesson on design was not intended to be a complete list of possible designs.)
5.2 Confounding Variation
State all sources of confounding variance, and explain why they are taken to be confounding.
Example:
A two group posttest only design was used. It was not clear how the two groups were formed.
Randomization was not mentioned.
Lesson Six
Analysis of the Data
Purpose of the Lesson:
In this lesson, the following concepts are presented: the statistical concepts of mean and
standard deviation; the Null Hypothesis in research; the levels of statistical significance; the
distinction between Type I and Type II Errors, and finally, how to read an ANOVA table. The
more familiar you can become with the concepts beneath these terms, the better you will be able
to appreciate good research.
I. Mathematics and the Information Age
43
Before we begin the study of the role of statistics in research, let us pause and reflect on our
attitudes and goals.
Math Phobia Mathematics never hurt any human being, so why do many people fear it? Why do
students fear an expression such as '3X2'? How could this expression cause harm? The answer is
that this expression is not only a mathematics symbol but is also a symbol, for many, of personal
inadequacy and limitation. Is it true that we are actually inadequate and limited in this area?
Roughly half of the adults in America can pass Piagetian tests of formal operations; this means
that these adults are not inadequate or limited in the ways that math phobia suggests. Moreover,
one would expect that more than half of college graduates could function at the level of formal
operations. This means that when college graduates express math phobia, there is reason to
doubt the adequacy of their fears.
How do students learn to fear '3X2'? When we experience failure, we feel pain and we associate
this pain with the situation in which it was encountered. Math phobia usually begins with
arithmetic. If students do not function well as calculators, they conclude that they are not good
at math. Sadly, when this conclusion is reached there is less opportunity to study mathematics.
As the nation's teachers, how can we claim to be preparing students for the information age when
we lead them to fear mathematics?
The good news is that humans no longer do arithmetic. Machines do that. What humans have to
be able to do is to understand what the machines are doing. For example, you do not have to
know how to calculate a square root by the longhand method to know what a square root is. All
you require is a pocket calculator to perform the computation.
Let us approach the study of statistics in this same spirit. In the information age, you do not have
to be able to make statistical calculations; what you must be able to do is to interpret statistical
calculations. That is our goal.
Expository Material
Part I: Basic Statistics
Objectives:
Ability to calculate the
1. mean, median, and mode
2. standard deviation
3. standard scores
Directions for Study
1. Read the definitions provided.
2. Work through examples provided.

44
3. Work through the practice material
Expository Material
What is a distribution?
A distribution is a set of scores. For example: 80, 60, 50, 50, 50, 40, 20.
What are measures of central tendency?
The mean, median, and mode are measures of central tendency. It is often useful to determine
the point around which the scores of a distribution cluster. There are three such points: The
mean is the arithmetic average. The mode is the most frequent score. The median is the mid-
point score. In the above distribution, the mean is 50, the mode is 50, and the median is 50.
What is variance?
When we know the mean, we know a central point of the distribution but we do not know how
widely spread the scores are. Consider the four distributions below:
I II III IV
-----------------------------
7 9 5 8
6 7 5 7
5 5 5 6
4 3 5 5
3 1 5 4
Note that the means of three of the four distributions is 5. Yet the three distributions are very
different.
What is not captured by the mean is how dispersed the scores are. How tightly clustered are the
scores? How dense is the distribution? The variance is a measure of the compactness of a set of
scores.
Note that distribution IV is distribution I with a constant added, so I and IV should have the same
amount of variation.
Distribution II is the most dispersed and III is the least. In fact, the variance for distribution III
should be zero. Why?
But what is the variance of II? We require a method of determining the variance of any
distribution.

45
How do we find the variance?
1. Subtract the mean from each score in the distribution.
I
7 - 5 = 2
6 - 5 = 1
5 - 5 = 0
4 - 5 = -1
3 - 5 = -2
This produces deviation scores. (deviations from the mean.)
Note that the mean of the deviation scores is zero.
2. Square the deviation scores.
We get:
4
1
0
1
4
(A negative number squared becomes positive.)
3. Add the squared deviation scores. (Researchers would say, "Sum the deviation scores.")
We get: 10
This number is referred to as the "sum of squares."
4. Divide the sum of squares by the number of scores in the distribution. This is know as the
"mean square."
We get:
10 divided by 5 is 2
This mean square is the variance of the distribution. The larger the variance, the more spread
out are the scores. The smaller the variance, the more tightly packed are the scores.
As practice, find the variance for distribution II above.
What is the standard deviation?

46
If all we wanted to know is how dispersed the scores are in a distribution, we could simply use
the variance. But in one more step, we get much more information about the distribution.
The square root of the variance is the standard deviation.
If we know the standard deviation of a distribution, we can use it to find several important points
in that distribution.
Two standard deviations above mean
One standard deviation above mean
One standard deviation below mean
Two standard deviations below mean
Practice Problems
1. What are the mean, median, and mode of the following distributions?
10, 9, 8, 8, 6, 5, 3 Mean _ Med _ Mode _
20, 18, 12, 12, 10, 10, 10, 8, 7, 3 Mean _Med _ Mode _
2. What is the variance in the following distributions?
a. 10, 8, 5, 4, 3 Var. ___
b. 17, 12, 10, 7, 4 Var. ___
c. 97, 88, 75, 70, 62, 57, 41 Var. ___
3. Determine the standard deviation in the three distributions in problem 2.
a. SD = b. SD = c. SD =
What are standard scores?
Let's say that your score on the Calf. Test of Mental Maturity is 120. The mean of all
standardized IQ tests is 100. The SD will vary from test to test.
The SD for the CTMM is 10. Now what do we know about your score?
Subtract the mean: 120 - 100 = 20.
The deviation score is 20. Divide the deviation score by the SD:
20 divided by 10 is 2
That means that you scored 2 SDs above the mean. Only 2% of the people scored higher than
you on the CTMM.
The 2 is a standard score. The general formula is:
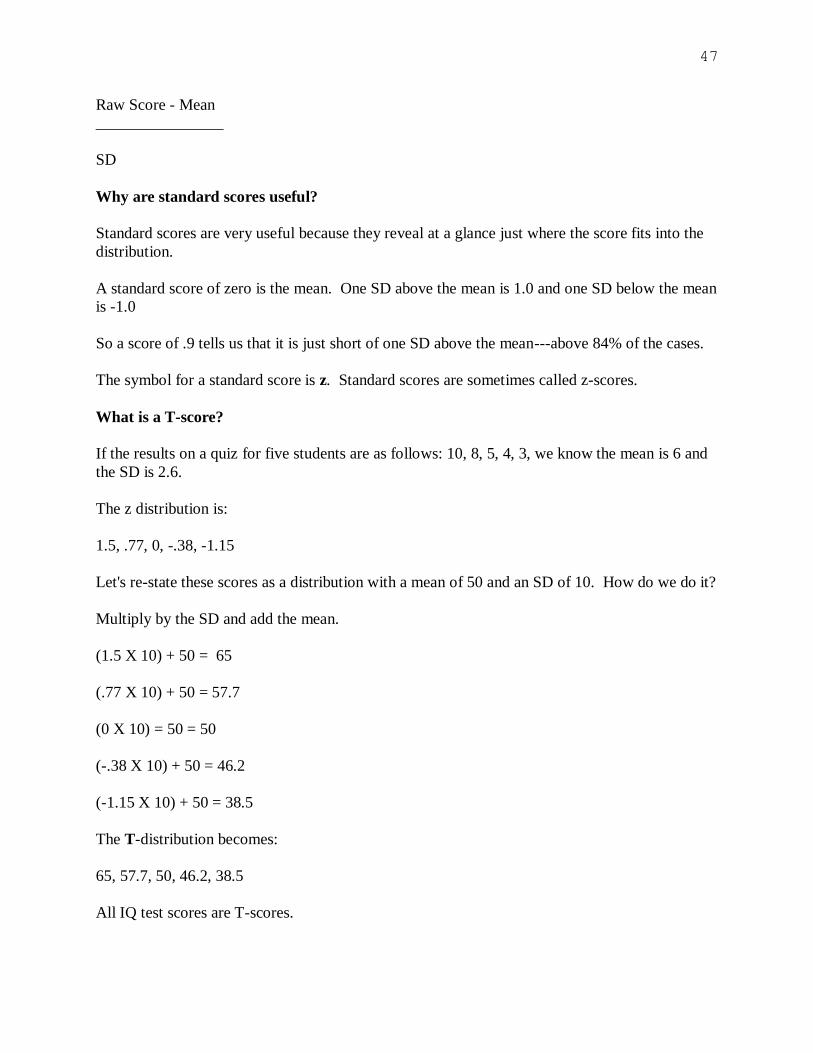
47
Raw Score - Mean
________________
SD
Why are standard scores useful?
Standard scores are very useful because they reveal at a glance just where the score fits into the
distribution.
A standard score of zero is the mean. One SD above the mean is 1.0 and one SD below the mean
is -1.0
So a score of .9 tells us that it is just short of one SD above the mean---above 84% of the cases.
The symbol for a standard score is z. Standard scores are sometimes called z-scores.
What is a T-score?
If the results on a quiz for five students are as follows: 10, 8, 5, 4, 3, we know the mean is 6 and
the SD is 2.6.
The z distribution is:
1.5, .77, 0, -.38, -1.15
Let's re-state these scores as a distribution with a mean of 50 and an SD of 10. How do we do it?
Multiply by the SD and add the mean.
(1.5 X 10) + 50 = 65
(.77 X 10) + 50 = 57.7
(0 X 10) = 50 = 50
(-.38 X 10) + 50 = 46.2
(-1.15 X 10) + 50 = 38.5
The T-distribution becomes:
65, 57.7, 50, 46.2, 38.5
All IQ test scores are T-scores.

48
Practice:
Convert the distribution in practice 2-b to a set of T-scores.
Technical Note!
If you are using a scientific calculator, you may be getting different results than those reported in
the material. The explanation for this is as follows.
The calculations made in these materials are in terms of descriptive statistics. The mean of 8, 6,
4, and 2, is 5 because 8 + 6 + 4 + 2 = 20 and 20/4 is 5. In inferential statistics (which your
scientific calculator is very likely using) the division of the sum of the scores is one less than the
total number of scores (N-1). In the above case, 20 is divided by 3 (N-1) with a resulting mean
of 6.67.
Part II: Data Analysis
The Question of Significance
When there are scores from two groups on the posttest, it then must be asked if these scores are
really all that different. If the experimental group mean is 89 and the control group mean is 83,
we wonder if this 6 point difference is significant.
We are asking if this difference could have occurred by chance. Does chance alone explain the
differences in these two groups? A statistically significant difference is a difference beyond
chance.
A statistically significant difference is the opposite of a chance difference.
The Null Hypothesis
Imagine having test data for two groups of a study. The null hypothesis is the hypothesis that
claims that there is no significant difference in the means of the two groups. Stated
differently, the null hypothesis asserts that any observed difference in the two groups is due
solely to chance. Thus, the null is sometimes called the chance hypothesis.
Establishing a significant difference is a matter of refuting the null hypothesis. Why?
Level of Statistical Significance
How do we know that the experimental group mean of 89 is nothing more than a chance
difference from the 84 of the control group? Of course, we cannot know for sure, but we can
know how probable it is that this difference occurred by chance. This probability is called "the
level of statistical significance."

49
This probability is reported in the studies as a lower case 'p'. For example, one finds expressions
such as, "p < .05" in research reports. This means that the probability that these particular results
could have occurred by chance is less than 5 percent.
Rejecting the Null Hypothesis
To show that a treatment was effective, we have to show that the actual results cannot be
explained by chance alone. If the probability that these results occurred by chance is less than
5%, then the probability that these results are explained by something other than chance is
greater than 95%.
When we read in the report that "the null hypothesis was rejected at the five percent level," we
are being told that the null hypothesis does not apply, and is being rejected. The five percent
level means that less than five percent of the time these results will be due to chance alone.
Type I Errors
The significance level is the probability that these results are due to chance. Another way to
think of this is to note that the significance level can be seen as a probability of error.
A Type I Error is the probability of saying 'Yes' (saying there is a significant difference) when
we should have said 'No'. We chose the wrong “state of nature,” as they say.
But where does the .05 in 'p<.05' come from? Later in this lesson we will discuss Fisher's
method of determining this probability. For now, it should be noted that one common way
researchers determine the probability of making a Type I Error is to use the F Test. Make sure
that you understand that, for example, the ".05" is a probability. It is the probability of a Type I
Error.
Type II Errors
The other possible mistake is saying 'No' (there is no significant difference) when we should
have said 'Yes'. This is the error of "false acceptance" of the null hypothesis. This error is
seldom explicitly mentioned in the research literature, so we will not pursue it further.
We are asking if there is a statistically significant difference within the scores of the various
groups in the study. If we conclude there is such a difference, we reject the null hypothesis. If
we conclude that there is no such a difference, we accept the null hypothesis.

50
Decision Matrix
Null Hypothesis
is True
Null Hypothesis
is False
Reject Null
Hypothesis
Type I Error
OK
Accept Null
Hypothesis
OK
Type II Error
Confusions in Nomenclature
Note that the expression "null hypothesis" is typically misused in research. One often reads that
the hypothesis of the study "is stated in the null form." What does this mean? If we want to
study the relative effectiveness of peer tutoring and team study, we could design an appropriate
experiment.
One might expect to find in the report that, "The hypothesis of this study is: The team-study class
will show greater achievement than the peer-tutored class." However, many advisors require
students to state the hypothesis as follows: There will be no significant difference between peer
tutoring scores and team study scores.
This move confuses the research hypothesis with the null hypothesis. The research hypothesis is
an answer to the question that generated the research. What is being confused is the statistical
device of the null hypothesis and the relationship in the hypothesis that was developed to solve a
problem. The null hypothesis is the chance hypothesis. The probability that these results could
have occurred by chance is what we judge the research hypothesis against.
Test for Means: t-test
As noted, the F test determines the probability of a Type I Error. This test may be used for any
number of groups. Sometimes when researchers are concerned with only two groups, they will
use the t-test. It is in effect the same test:
Mathematically t2 = F
You should note that when you read about t-tests in articles, there are only two groups involved
in that test.
Chi Square

51
Chi Square is a statistical method for determining if there is a significance in categorical data.
For example, if you toss a coin 100 times and get the following results, H = 52, T = 48, is this a
chance difference or is it significant in the sense of beyond chance? Chi Square is a method to
determine this.
Factor Analysis
This statistical technique attempts to find the number of distinct factors required to explain a
given data set.
Other Tests
Sometimes you will read studies that use ANOCVA which refer to analysis of covariance.
Covariance measures how two variables vary together. In any of these tests, the point is to find
the probability of a Type I Error. This will be delivered to you as a .01 or .05 number. In all
statistical tests, the point of it all is to test the null hypothesis. Do not be put off by strange
sounding statistical terms. You now know what the game is all about.
How to Read an ANOVA Table
'ANOVA' is researcher talk for "ANalysis Of VAriance". The results of an analysis of variance
are presented in table form in many research articles. Sometimes students will avoid examining
such tables because the tables seem overly technical, obscure and unhelpful. In this part of the
lesson, we will see that knowing how to read tables is actually a quick and painless way to glean
information from a published report. The tables in an article can serve as a kind of advance
organizer for what will be presented in the article. Being able to read an ANOVA table also
helps check our understanding of what has been read in the article.
Consider the following example.
Sample ANOVA Table
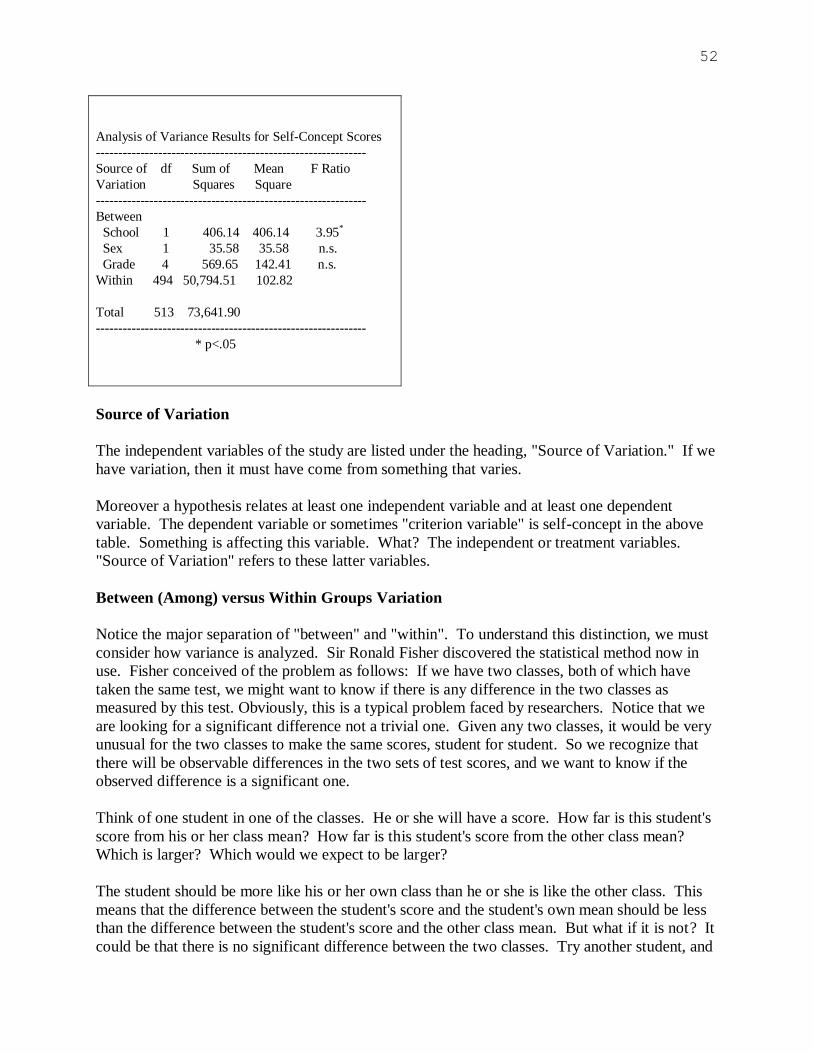
52
Analysis of Variance Results for Self-Concept Scores
-------------------------------------------------------------
Source of df Sum of Mean F Ratio
Variation Squares Square
-------------------------------------------------------------
Between
School 1 406.14 406.14 3.95*
Sex 1 35.58 35.58 n.s.
Grade 4 569.65 142.41 n.s.
Within 494 50,794.51 102.82
Total 513 73,641.90
-------------------------------------------------------------
* p<.05
Source of Variation
The independent variables of the study are listed under the heading, "Source of Variation." If we
have variation, then it must have come from something that varies.
Moreover a hypothesis relates at least one independent variable and at least one dependent
variable. The dependent variable or sometimes "criterion variable" is self-concept in the above
table. Something is affecting this variable. What? The independent or treatment variables.
"Source of Variation" refers to these latter variables.
Between (Among) versus Within Groups Variation
Notice the major separation of "between" and "within". To understand this distinction, we must
consider how variance is analyzed. Sir Ronald Fisher discovered the statistical method now in
use. Fisher conceived of the problem as follows: If we have two classes, both of which have
taken the same test, we might want to know if there is any difference in the two classes as
measured by this test. Obviously, this is a typical problem faced by researchers. Notice that we
are looking for a significant difference not a trivial one. Given any two classes, it would be very
unusual for the two classes to make the same scores, student for student. So we recognize that
there will be observable differences in the two sets of test scores, and we want to know if the
observed difference is a significant one.
Think of one student in one of the classes. He or she will have a score. How far is this student's
score from his or her class mean? How far is this student's score from the other class mean?
Which is larger? Which would we expect to be larger?
The student should be more like his or her own class than he or she is like the other class. This
means that the difference between the student's score and the student's own mean should be less
than the difference between the student's score and the other class mean. But what if it is not? It
could be that there is no significant difference between the two classes. Try another student, and

53
so on. Fisher's approach was to do this for all students in both classes. The variation of all the
students to their own mean is called the "within groups variance" and the variation of all the
students to the other class mean is called the "between groups variance." Fisher put these two
variances into a fraction or ratio.
Between Groups Variance
--------------------
Within Groups Variance
We have a ratio (Fisher's ratio or better known as the F ratio) that expresses the difference
between the two classes. If the ratio is nearly one, then there is no difference between the two
classes (because for any subject, they are as much like the other group as they are like their own
group). For there to be a strong difference, the ratio must be large. Notice that the numerator is
the comparison of students with the other group. If there is a difference in the two groups this
number will get very large.
Degrees of Freedom
The expression 'df' stands for degrees of freedom. This is a useful part of the table for it tells us
how many of what things were in the study. (Note that the symbol '=Df', found more in logic than
research, stands for "equals by definition").
Suppose we have three students and three seats. We instruct the first student to take any seat
desired. The student has to make a decision. Next we instruct the second student to take a seat.
The second student has to make a decision. Now we instruct the third student to take a seat.
There is no decision to be made, as there is only one open seat. Of the three students, how many
decisions were made? Right! Two. To generalize, the degrees of freedom are one less than the
number of people involved. If 'N' is the total number of students involved, then df = (N-1).
How many total students were involved in the study? If the table reads 513 as total source of
variance, we know to add one and find that 514 student were involved.
Sum of Squares
To find the ratio of the variances, we find the distance between Johnny's score and his class
mean. We then find the distance between Johnny's score and the other class mean. In the actual
mathematics, these two distances are squared. If we determine these distances squared for each
student in the two classes, and then add these squared distances together, we get "the sum of
squares."
Mean Square
The mean square is found by dividing the sum of squares by the degrees of freedom. This gives
us the average sum of squares, but in researcher talk this is referred to as the variance. That is,
the variance is the sum of squared differences divided by the degrees of freedom. The mean
square is the variance.

54
The F ratio is formed by taking each mean square and dividing it by the within groups variance.
Think about it. The within groups variance is the amount of variation within a given class. This
is the chance difference involved in the variables and their measurement. Whatever this variance
is, to conclude that there is a significant difference between the two classes, the variance between
the two classes must greatly exceed that of the variance within the classes. This is why the
within groups variance is in the denominator of the ratio.
What does "p<.05" mean?
When an actual F ratio has been determined, it is possible to calculate the probability of making
a Type I Error, given this ratio and the N of the study. The probability of a Type I Error is
reported in the above table as a starred footnote. There are two levels of error typically
mentioned—.01 and .05. (n.s. means “not significant.”) That would mean the F ratio was nearly
(or even below) 1. An F ratio less than 1 could not possibly be significant. Why?
When Is a Difference Not a Difference?
At the risk of having the readers with math phobia delete this book, one further point should be
noted. Please stay with me for one more step.
Sometimes we hear it said that the trouble with research is that for every study that shows
something is effective, there is another study that shows that it isn't. In researcher talk, we might
say that one study found a significant difference (at the .05 level) and a second study did not find
a significant difference.
Researchers will hold absolutely to the "p<.05" test for significant results. But imagine this
situation. Study A found a significant difference with p = .049. Since this is below the .05 level,
the null hypothesis can be rejected. Study B realized no significance-- say, p = .051. Since this
is not less than .05, the researchers will accept the null hypothesis (or perhaps "fail to reject" as
some prefer to say).
One study had p = .049 and the other study had p = .051. The difference is .002 or two
thousandths. It is possible that a difference in the design of the two studies accounts for this
difference. For our purposes, the two studies produced the same results even though different
conclusions were drawn as to statistical significance. This example shows that we should
examine the actual values when several studies seem to be getting different results.
Statistics Practice: Part II
1. What is the difference between observed differences and significant differences?
2. What is the null hypothesis? How is it used in research?
3. What is significance level? How is it reported in a study?
4. What is the highest significance level typically allowed by researchers?
5. What does it mean to reject the null hypothesis?
6. What is a Type I Error?

55
7. Could we make a Type I Error even though the significance level is below 5%? Y/N
8. 100 studies are done on teaching; all 100 reject the null at the 5% level. Does this mean that
five of those 100 studies made a Type I Error? Y/N
9. If we find that a posttest only control group design gets results significant at the .01 level, do
we know that there is a significant difference in these two groups? Do we know that one
treatment was more effective than the other?
10. If you read that the null hypothesis was rejected at the 1% level, what are you being told?
11. If p = .049 or if p = .051, would this make any difference to a researcher? Y/N
12. .051 - .049 = .002 Is it possible to have a study decide whether it had a significant difference
on the basis of .002? Y/N
13. Does a significant difference prove that a treatment was effective? Y/N
14. What besides a significant difference is required to know that our treatment was effective?
15. What is between-groups variance?
16. What is within-groups variance?
17. What is a mean square?
18. What is an F ratio?
19. What does 'F' stand for?
20. What is the sum of squares?
21. What are degrees of freedom?
22. What do researchers mean by ANOVA?
23. What is a t-test? What does it measure?
24. What is a Chi Square? How is it used?
25. What is a Type II Error?
26. Medical Example
A new drug has been developed. Two groups of carcinoma patients are given a drug. Results
are calculated by means of an F test.
(a) What would it mean for medical practice if we make a Type I Error in this drug decision
case? Who is harmed by this type of error?
(b) What would it mean to make a Type II Error in this decision context?
Who would be hurt if the FDA made this type of error?
27. Do exercise 26 for the conclusions of one of the research articles you are now reading.
28. Explain how what researchers refer to as "the mean square" relates to what we have been
calling "the variance".
Critique Guidelines (Analysis of Data)
6. Analysis of Data
(a) What standard data analysis techniques were used? For example, analysis of variance
(ANOVA or F-test), analysis of covariance, Chi square, t-tests, factor analysis, etc. (b) How
well were the results of this analysis presented to the reader?
Graphical Summary

56
Target Population
Independent Variable
(Treatment Variable)
T M
M
Measures of
Dependent Variable
Lesson Seven
Interpretation of Data
Purpose of the Lesson:
In order to determine the value or usefulness of any research study, we have to make two distinct
kinds of judgments; that is, we must judge the internal validity and external validity of the study.
These judgments are at the heart of the "interpretation of the data."
Directions for Study:
1. Study the description of internal validity, then consider the data cases given for the Soloman
design. Construct an explanation for the results of each of the cases provided.
2. Study the description of external validity. Note that there are two aspects to external validity.
Make sure that you understand the difference between the two types of validity.
3. Review the criteria for evaluating the adequacy of the concluding discussions; note how the
notions of external and internal validity relate to the evaluation of these discussions.
Sample
Accessible Pop.
E
C
57
4. Complete this lesson by writing your response to parts 7, 8 and 9 of the critique guidelines.
Examine the sample critique included, and then write a critique of an article you have selected.
Expository Material
Two Types of Research Validity
Recall from Lesson Five that testing and reactive measures are confounding effects that result
from less than desirable designs. What you were doing was assessing, in part, the "internal
validity" of the study.
What is internal validity?
The question of internal validity is: How confident are we as to what produced the results of this
study? Do we know what happened? The confounding factors already studied are factors that
reduce the internal validity of a study. The presence of these factors means that we do not know
what produced the observed results. Researchers would say that the internal validity is low for
the study. High internal validity means that we do know what produced the observed results.
In general, the more confounding factors present, the lower the internal validity. (See J. A.
Popp, "Toward a Quantitative Estimate of Internal Validity," ERIC Document ED 164 611)
Critiquing Internal Validity
There is no mechanical way to evaluate the internal validity of a research report. In general, one
should list all serious flaws in the design of the study and then make an overall judgment. One
could use a three category system as follows: high, medium, low. For the purposes of this
course, such a system will suffice.
(a) Experimental Research
When the study is focused on finding causal relationships among the research variables, the
research design must control all other factors. Internal validity is an estimate as to how well this
was done.
(b) Qualitative Research
In ex post facto and survey research, data is collected not generated, because control of variables
is not present. The evaluation of the internal validity of such studies is a matter of reviewing
how the data was collected, in light of the conclusions being drawn in the study. For example, in
the interviewing, are any questions conspicuous by their absence?
What Is External Validity?
The question of external validity is: How generalizable are these results? Note that
generalizability has two aspects.

58
On the one hand, we can wonder about the inference from the sample to the accessible
population. This is a typical inductive inference. Such inferences are called "ampliative," since
the conclusion always contains more content than the premises. If the sample is representative of
the accessible population, then we have some reason to think that the external validity of the
study may be high. Good sampling leads to good ampliative inferences.
On the other hand, we must consider the inference from the accessible population to the target
population. If the accessible population is representative of the target population, then we have
the basis for a good inference; however, if we have doubts as to the representativeness of the
accessible population, then we doubt the external validity of the study.
To have high external validity--high generalizability--both of the above inferences must be
acceptable. One can see how important the sampling process is to the conclusions that can be
drawn from the data generated.
External Validity In Qualitative Studies
A common concern in qualitative studies is that the small sample sizes make generalizing
impossible. Some consider purposeful sampling biased sampling.
In evaluating the sample of qualitative studies, we should ask ourselves: Was the sample used
appropriate for the conclusions advanced? If conclusions were concerned, for example, with
explaining why one school in a given district always produces higher than expected SAT scores,
then we should consider the people interviewed. Were there any obvious omissions? Does the
research reveal any preconceived ideas about what causes what?
Knowledge does not come from one study, i.e., knowledge is not built as one constructs a brick
wall. To determine what we know about education, the various studies of education must be
viewed in composite. This means that experimental and qualitative research have their place in
explaining educational relationships.
Is Low External Validity Ever Useful?
A research report does not have to have high external validity for the study to be useful to us. If
we are considering a policy decision about a middle school, we might review the research
literature to determine if the literature contains any helpful discussions of our problem situation.
In the late 1970's, the research on cooperative learning was mainly concerned with middle-grades
math teaching. If we had reviewed several of these studies at that time, we might well have
written, "The external validity of these results must be rated as low because the students used in
these studies tend to be limited the fifth through eighth grades."
When judged in the abstract, this would be the correct conclusion. Technically, the external
validity of a research study should be judged in terms of how confident we are that the results of
the study are generalizable to the entire target population.
59
However, since we were concerned with just these grades, for us these studies had high external
validity. In a practical sense, we have high confidence in these conclusions. Judging external
validity is not an absolute decision, but is relative to the decision or research situation.
Begin with the problem you are investigating. Consider the external validity of a study in terms
of this problem. This might mean that a study that you rated highly as to external validity could
be rated as inadequate by another person working on a different problem. Published research
may come to be used by readers in ways that were never considered by the original researchers.
Like any form of literature, one cannot predict what the future value of the writing will be--or
how one's work will be remembered.
Critiquing External Validity
As is the case with internal validity, for purposes of this book, the categories high, medium, and
low can be used. However, as noted, one should recognize that external validity is related to the
goals of the evaluator's problem situation. Different evaluators may well rate the external
validity of the same study differently. One must ask, how generalizable are these results to my
situation?
Evaluating Concluding Discussions
Most every research report will end with a section titled "Discussion." In this section of the
report, researchers are free to review any aspects of the research that they think are important.
Limitations of the study are often mentioned here. More importantly for the reader, the research
reports will often make suggestions as to what the study means for teaching or school decision-
making.
Readers must evaluate what is written in terms of what they know of the internal and external
validity of the research study. Readers cannot assume that just because the report draws a certain
conclusion, this conclusion logically follows from the data generated or collected. Authors
wanting to make a serious contribution (or to put the best face on their work) may
unintentionally overstate their case.
The final step in evaluating a research report is to decide if the discussion is accurate and does
not mislead teachers and administrators.
Are any new variables, such as attitude or motivation, introduced in the discussion of the report?
Writers may express something they have learned in their conduct of the research, and report this
to the readers. For example, "We found that the groups that studied by means of the computer
were much more excited about learning than groups that received direct teaching." As readers,
we must distinguish this observation and other subjective judgments by the authors from the
factors that were controlled and measured in the study.
Are any relationships presented to the readers as if the relationships were stronger than the data
suggests? For example, "We found that the CAI taught groups learned the same amount of
material in less time than the directly taught groups." To a casual reader, this suggests that it is a
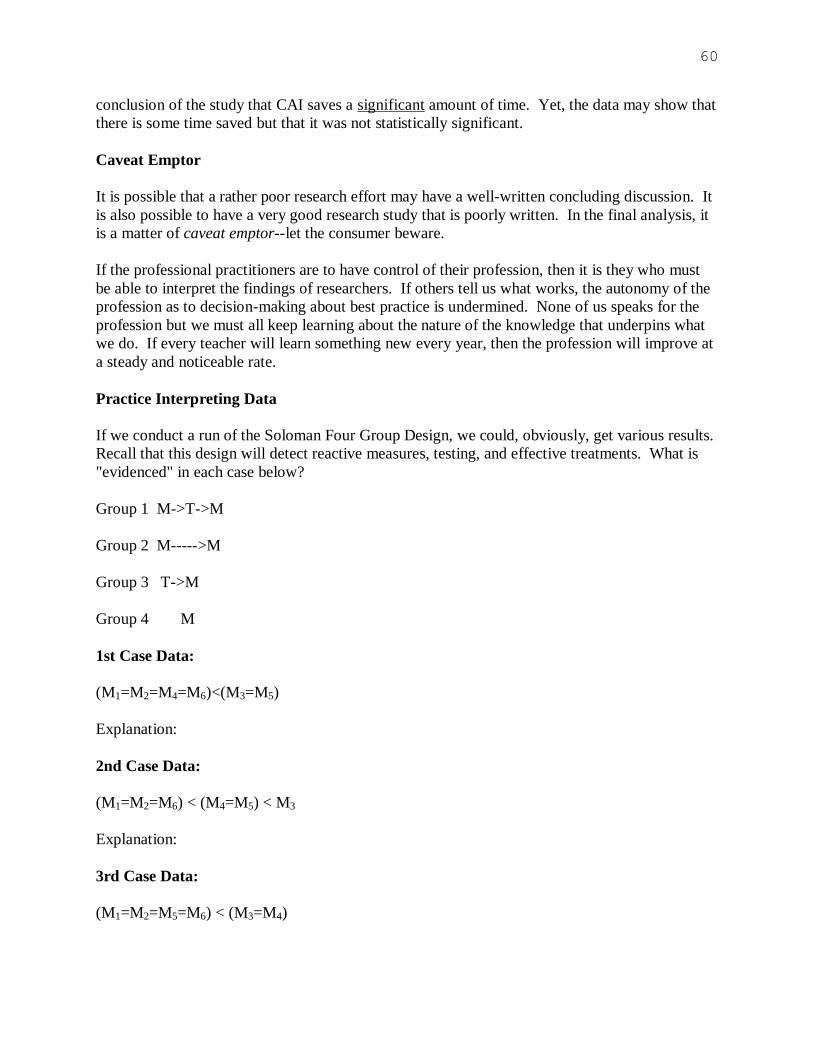
60
conclusion of the study that CAI saves a significant amount of time. Yet, the data may show that
there is some time saved but that it was not statistically significant.
Caveat Emptor
It is possible that a rather poor research effort may have a well-written concluding discussion. It
is also possible to have a very good research study that is poorly written. In the final analysis, it
is a matter of caveat emptor--let the consumer beware.
If the professional practitioners are to have control of their profession, then it is they who must
be able to interpret the findings of researchers. If others tell us what works, the autonomy of the
profession as to decision-making about best practice is undermined. None of us speaks for the
profession but we must all keep learning about the nature of the knowledge that underpins what
we do. If every teacher will learn something new every year, then the profession will improve at
a steady and noticeable rate.
Practice Interpreting Data
If we conduct a run of the Soloman Four Group Design, we could, obviously, get various results.
Recall that this design will detect reactive measures, testing, and effective treatments. What is
"evidenced" in each case below?
Group 1 M->T->M
Group 2 M----->M
Group 3 T->M
Group 4 M
1st Case Data:
(M1=M2=M4=M6)<(M3=M5)
Explanation:
2nd Case Data:
(M1=M2=M6) < (M4=M5) < M3
Explanation:
3rd Case Data:
(M1=M2=M5=M6) < (M3=M4)

61
Explanation:
4th Case Data:
(M1=M2=M4=M6) < M5 < M3
Explanation:
5th Case Data:
(M1=M2=M6) M4 < M5 < M3
Explanation:
Critique Guidelines
(Interpretation of Data)
7. Internal Validity
How well can this study explain the results obtained? In other words, how confident can we be
about what caused these results? What are the major alternative hypotheses--alternative
explanations for what produced these results? Each uncontrolled (confounding) factor gives rise
to an alternative hypothesis.
Example:
(a) Internal validity of this study must be rated high because the simplicity of the design allowed
for no confounding factors.
(b) There are no alternative hypotheses.
8. External Validity
(a) What can we conclude about the accessible population given these results and your judgment
about the internal validity of the study?
(b) What can we conclude about the target population?
Example:
(a) The accessible population was limited to one county in an Atlantic coastal state. It also was
comprised of white middle class students.
(b) The external validity of this study should be rated as medium since there are obvious
members of the target population who were not represented.
9. Conclusion Discussion
62
How well thought out was the discussion of the article? State anything reported in the
concluding discussion that could seriously mislead a reader. For example, were any factors
mentioned in the discussion that were not introduced earlier in the report?
Example:
(a) A complete review of the results was presented along with some "speculations on the
underachiever dilemma." (b) The concluding discussion of the report was accurate and helpful.
Solutions to Practice
Solutions to Lesson One Practice
The Research Problem
1. Identify the following as either (1) constructed-response or (2) selected-response questions.
1 A. What time is it?
2 B. Is Louisville or Frankfort the capitol of Kentucky?
2 C. Does punishment discourage motivation?
2 D. Are SRA materials effective?
1 E. What methods of teaching work best?
1 F. Why do girls read better than boys at the primary level?
2 G. Is Vermont the Green Mountain State, the Mountain State, or the Granite State?
1 H. What state is the Flickertail State?
Solutions to Lesson Two Practice
Research Hypotheses
1. ...two or more variables
...variable
2. continuous
3. The hypothesis uses the categories not the name of the variable.
4. Zip Code 1
Month of Birth 1
Years Teaching 2
Weight 2
State of Residence 1
Height 2
Marital Status 1
I. Q. Score 2
Income 2
Reading Level 1
Political Affiliation 1
Blood Type 1

63
Body Temperature 2
Ring Size 1 (rings come in sizes such as 5 or 6, and in half sizes)
Blood Count 2
Number of Children 2
Self-Confidence 2
House Number 1
5. independent
6. independent
7. III
8. the way the variable varies
9. II
10. independent
11. (student) academic achievement
12. time-on-task
13. What researchers are often doing is looking at how various types of teaching or school
programs affect achievement. Achievement is usually taken to be an amount or degree of
something.
14. Yes. Being an answer does not make it a true answer--as every teacher knows.
15. Yes.
16. Students will show better achievement if shown a film before having them read the
assignment than if they first read the assignment before they view the film. (Or something such
as this.)
Solutions to Analysis of Hypotheses
Check your charts by means of the information
presented as given as follows:
Ind. Var.
Dep. Var.
Relationship
-------------------
1. Classroom Organization—
cat. A team, B peer, C ind.
Academic Achievement-- Continuous
Y is > for Xa than Xb
2. Study Method cat. A coop, B comp
Student Preference Continuous
Y is higher for Xa than either Xb or Xc
3. Soc-Econ Bal. continuous
Absenteeism continuous
As X increases, Y decreases
4. Amount of Reading- continuous
Preference for TV- continuous

64
As X increases, Y decreases
5. St. Coop continuous
Academic continuous
As X increases, Y increases
6. Teaching Method
Cat. A team and B trad.
Reported Racial Conflict continuous
Y < for Xa than Xb
7. Soc-Econ Bal. continuous
Absenteeism continuous
As X increases, Y decreases
8. Teacher Sex
Cat. A men and B women
Reading Achievement continuous
Y > for Xa than Xb
9. Amount of Reading continuous
Preference for TV continuous
As X increases, Y decreases
10. Type of Classroom Task Structure
Cat. A coop B comp
Student Empathy continuous
Y > for Xa than for Xb
Solutions to Lesson Three Practice
Sampling
True
8, 15, 16, 18
False
7, 17, 20, 21, 22, 23, 25
19 is a systematic sample if the Social Security numbers are dispensed in serial order. If not,
then it is some sort of cluster sample.
For answers to 1-6, 9-14, and 24, please see the text material.
Solutions to Lesson Four Practice
Measurement
65
1. categorical Nominal measurement is in terms of categories.
2. No. Requires a ratio scale.
3. ratio
4. ordinal
5. interval with a zero point
6. nominal. yes.
7. ratio
8. Not valid. False alarms are invalid messages. Over all, unreliable--different readings under
same conditions. Unreliable for positive indication--some false positives. Reliable for negative
indications--no false negatives.
9. No. Unreliability indicates some measures not correct. Two different readings for the same
instance cannot both be accurate.
10. Yes.
11. Yes.
12. Yes.
13. Place a thermometer in the oven.
14. Put known amounts of gas in tank.
15. Different readings for empty, etc.
16. Reliability
17. They worry that the difference between "strongly agree" and "agree" is not equal to "agree"
and "undecided", etc.
18. Results would be categorical: 25% of respondents strongly agree while 75% were undecided.
This is different from concluding that the average score on the item was .5.
19. Buros
20. yes/yes
21. Yes, both could be reliable. No, there is no way both could be valid since they are reporting
different readings for the same instance.
22. norm-referenced
23. criterion-referenced (even though a checklist may be used and a "score" generated)
Solutions to Lesson Five Practice
Research Design
Note that these solutions are not always complete, in that more factors can be found in some
cases.
1. M -> T -> M; testing
2. static group comparison; nonequivalent groups because of maturation.
3. static group comparison; nonequivalent groups
4. M -> T -> M; instrumentation (raters may have changed--perhaps because they now know
more than they did when they first rated)
5. pretest-posttest control group; reactive measure highly likely
6. insufficient information given to establish the design; Hawthorne Effect
7. static group comparison; unequal groups
8. M --> T --> M; regression toward the mean

66
Solutions to Lesson Six Practice
Part I Statistics
1. 7, 8, 8 and 11, 10, 10
2. a. 6.8, b. 19.6, c. 307.4
3. 2.6, 4.4, 17.5
Solutions to Part II Statistics Practice
1. observed could be chance differences
2. chance hypothesis--the one to beat
3. probability of Type I Error (p<xxx)
4. .05
5. To say there is a difference
6. false rejection of null
7. Y
8. Y
9. Y, N (depends on design)
10. reject null, 1% chance of wrong
11. Y
12. Y; Shows importance of good design
13. N
14. Good design
15. Student-to-other-group-mean differences
16. Student-to-own-mean differences
17. the variance
18. between over within variances
19. Fisher
20. sum of all individual variances
21. number of cases
22. analysis of variance
23. differences in groups means
24. differences in categorical variance
25. false acceptance
26. (a) Administer ineffective drug
(b) Withhold an effective drug
Solutions to Lesson Seven Practice
Interpretation of the Data
These cases were included to give you a sense of what it means to interpret data. Imagine
researchers studying the results of a statistical analysis, trying to develop an explanation of how
these results could have occurred. Notice how important a good design is when one has to
explain such results.

67
1st case:
Effective treatment. Only higher means followed treatments.
2nd case:
testing + effective treatments (possible reactive measure)
Posttest 4 is higher than its pretest; the only way this could occur is to have the pretest pushing
up the posttest. Since test 4 is the same as test 5, we conclude that the effects of testing are equal
to the effects of treatments. This also explains why test 3 is the highest--it gets a double push. If
this posttest is too high, however, it might mean that test 1 is helping the treatment--a reactive
measure. In principle, we have a reactive measure if:
(M3-M1) > [(M4-M2) + (M5-M1)]
Group A gains are greater than the effects of testing and the effects of treatment, together.
3rd case:
Testing + ineffective treatment (only pretested groups show gains).
4th case:
Effective treatments + reactive measure.
Since measure 2 equals measure 4, we know that there is no testing present. The only way that
measure 3 could exceed measure 5 would be the effects of a reactive measure.
Note that if measure 5 had been higher than measure 3 in this case, a reactive measure would be
present, but it would be one that did not raise the posttest scores but suppressed them.
5th case:
Testing + effective treatment. Possible reactive measure if (M4-M6) + (M5-M4) is not equal to
(M3-M6).
Gains on control posttest (testing) plus treatment gains beyond effects of testing should not be
less than gains of pretested treatment group.
Complete Critique Guidelines
These guidelines are provided to help you formulate your review of research reports. The
guidelines will help you write a complete review of research articles. They could also be used to
help you structure your own research proposals, term papers, and reports. If you view these
guidelines as a set of questions to be answered for each article, your reviews will tend to lack
literary value. Use the guidelines as reference points while your write your own creative
reviews. You may write your review in outline form or as an essay. The sample critiques
provided use the outline form to assist you in relating each guideline to its application.

68
0. Citation
Give the reference or citation for the article being critiqued. Be as complete as possible. Unless
instructed otherwise, use the American Psychological Association style.
1. Research Problem
1.1 Rule of Form
(a) What was the actual research problem in this study? Express it in the proper form. (b) How
adequately was the problem presented in this study?
1.2 Rule of Reference
(a) What is the target population of this study? (b) How well is the target population specified in
this study?
1.3 Rule of Incompleteness
(a) How did the author(s) show that the problem has not already been answered in the research
literature? (b) Is this attempt adequate?
1.4 Rule of Utility
(a) Was the study's value practical or theoretical, according to the author(s)? (b) What reasons
were given that led you to this conclusion?
2. Research Hypothesis(es)
2.1 Rule of Form
(a) Chart the hypothesis(es), if the study reports one. (b) How well formed is (are) the
hypothesis(es)?
2.2 Rule of Utility
How well do the problem and hypothesis relate to each other? If the study does not contain a
hypothesis, then decide if this was an omission.
3. The Sample
3.1 Accessible Population
(a) What was the accessible population? (b) How well was the accessible population identified?
(c) Did this accessible population adequately represent the target population described in 1.2?
3.2 Sampling Process
(a) Describe the sampling process. (b) How representative was the sample?
4. Instruments
What measurement devices were used in the study? List all standardized tests and inventories.
If a researcher-made instrument was used, what attempt was made to show that this device was
69
valid? If observers or raters were used, how well were the ratings standardized and made
reliable?
5. Design
5.1 The Design
Describe the design of the study. (Use the "T"s and "M"s if it is helpful. Remember that the
lesson on design was not intended to be a complete list of possible designs.)
5.2 Confounding Variation
State all sources of confounding variance, and explain why they are taken to be confounding.
6. Analysis of Data
(a) What standard data analysis techniques were used? For example, analysis of variance
(ANOVA or F-test), analysis of covariance, Chi square, t-tests, factor analysis, etc. (b) How
well were the results of this analysis presented to the reader?
7. Internal Validity
(a) How well can this study explain the results obtained? In other words, how confident can we
be about what caused these results?
(b) What are the major alternative hypotheses?
8. External Validity
(a) What can we conclude about the accessible population, given these results and your judgment
about the internal validity?
(b) What can we conclude about the target population?
9. Conclusion Discussion
(a) How well thought out and presented was the discussion section of the article?
(b) State anything reported in the concluding discussion that could seriously mislead a reader.