
Introduction to Research Methods in Psychology Research Methods in Psychology Third edition
473
Introduction to Research Methods in Psychology Third edition Dennis Howitt and Duncan Cramer
-
Upload
independent -
Category
Documents
-
view
0 -
download
0
Transcript of Introduction to Research Methods in Psychology Research Methods in Psychology Third edition

Introduction to Research Methods
in Psychology Third edition
Introduction to Research Methods
in Psychology Third edition
Dennis Howitt and Duncan Cramer
Introduction to Research
Meth
od
s in P
sycho
log
yD
ennis How
itt and D
uncan Cram
er
Third edition
Comprehensive, straightforward and clear, Introduction to Research Methods in Psychology, third edition is the essential student guide to understanding and undertaking quantitative and qualitative research in psychology.
Revised throughout, this new edition includes coverage of the latest advances in online research and data management, including RefWorks, Web of Science and PsycINFO, to provide a thorough, accessible and up to date coverage of the field.
Key features of the third edition:
• ‘Key ideas’ are highlighted to help students grasp and revise the main topics and concepts. • ‘Talking Points’ address some of the controversial issues to critically engage students with the debates in the field. • Examples of published research with ‘how to’ advice and guidance on writing up reports, helps students to develop a practical, as well as theoretical, understanding. • User-friendly boxed features and illustrations across the book help to bring the subject to life.
www.pearson-books.com
Cover photograph©
Getty Im
ages
The third edition of this book will be an asset to undergraduate students, seeing them through all three years at university. This is by far the best introduction to research methods in psychology, and I will continue to recommend it to my students.Dr Claire Fox, Keele University
About the authors
Dennis Howitt is Reader in Psychology and Duncan Cramer is Professor of Psychology at Loughborough University.
The book is supported by a companion website featuring a range of resources to help students check and further their understanding of the subject. Features include multiple choice questions, flashcards and interactive roadmaps to help you develop your understanding of the research process. Go to www.pearsoned.co.uk/howitt to find out more.
CVR_HOWI6074_03_SE_CVR.indd 1 18/10/10 11:32:35

Introduction to Research Methods in Psychology
Visit the Introduction to Research Methods in Psychology, third edition Companion Website atwww.pearsoned.co.uk/howitt to find valuable student learning material including:
Overview: A short introduction to each chapter gives students a feel for the topics coveredMultiple choice questions: A set of MCQ’s for every chapter allow students to checkknowledge and understandingEssay questions: Between 6–8 essay questions for every chapter help students to plan forcoursework and examsEthical dilemmas: 12 cases, each with different scenarios and questions, encouragestudents consider the wider implications of a research projectGuide to statistical computations: A short guide to statistical tools and techniques for easyreference when onlineRoadmaps: A set of visual guides to help students find the right test to use to analyse a set of data
A01_HOWI4994_03_SE_FM.QXD 10/11/10 14:58 Page i

We work with leading authors to develop the strongest educational materials in psychology, bringing cutting-edgethinking and best learning practice to a global market.
Under a range of well-known imprints, includingPrentice Hall, we craft high-quality print andelectronic publications which help readers to understandand apply their content, whether studying or at work.
To find out more about the complete range of ourpublishing, please visit us on the World Wide Web at:www.pearsoned.co.uk
A01_HOWI4994_03_SE_FM.QXD 10/11/10 14:58 Page ii

Introduction toResearch Methods in PsychologyThird Edition
Dennis Howitt Loughborough University
Duncan Cramer Loughborough University
A01_HOWI4994_03_SE_FM.QXD 10/11/10 14:58 Page iii

Pearson Education LimitedEdinburgh GateHarlowEssex CM20 2JEEngland
and Associated Companies throughout the world
Visit us on the World Wide Web at:www.pearsoned.co.uk
First published 2005Second edition 2008Third edition published 2011
© Pearson Education Limited 2005, 2011
The rights of Dennis Howitt and Duncan Cramer to be identified as authors of this work have been asserted bythem in accordance with the Copyright, Designs and Patents Act 1988.
All rights reserved. No part of this publication may be reproduced, stored in a retrieval system, or transmittedin any form or by any means, electronic, mechanical, photocopying, recording or otherwise, without either theprior written permission of the publisher or a licence permitting restricted copying in the United Kingdomissued by the Copyright Licensing Agency Ltd, Saffron House, 6–10 Kirby Street, London EC1N 8TS.
All trademarks used herein are the property of their respective owners. The use of any trademark in this textdoes not vest in the author or publisher any trademark ownership rights in such trademarks, nor does the useof such trademarks imply any affiliation with or endorsement of this book by such owners.
Pearson Education is not responsible for the content of third party internet sites.
ISBN 978-0-273-73499-4
British Library Cataloguing-in-Publication DataA catalogue record for this book is available from the British Library
Library of Congress Cataloging-in-Publication DataHowitt, Dennis.
Introduction to research methods in psychology / Dennis Howitt, Duncan Cramer. -- 3rd ed.
p. cm.Includes bibliographical references and index.ISBN 978-0-273-72607-41. Psychology--Research--Methodology. I. Cramer, Duncan. II. Title.BF76.5.H695 2011150.72--dc22
2010036374
10 9 8 7 6 5 4 3 2 114 13 12 11 10
Typeset in 9.5/12pt Sabon by 35Printed by Ashford Colour Press Ltd, Gosport
A01_HOWI4994_03_SE_FM.QXD 10/11/10 14:58 Page iv

Contents vii
Guided tour of the book xvi
Introduction xviii
Acknowledgements xx
Part 1 The basics of research 1
1 The role of research in psychology 32 Aims and hypotheses in research 253 Variables, concepts and measures 404 The problems of generalisation and decision-making in research:
Chance findings and sample size 555 Research reports: The total picture 766 Examples of how to write research reports 1037 The literature search 1238 Ethics and data management in research 144
Part 2 Quantitative research methods 161
9 The basic laboratory experiment 16310 Advanced experimental design 18811 Cross-sectional or correlational research: Non-manipulation studies 20712 Longitudinal studies 22013 Sampling and population surveys 232
Part 3 Fundamentals of testing and measurement 247
14 Psychological tests: Their use and construction 24915 Reliability and validity 26616 Coding data 280
Part 4 Qualitative research methods 291
17 Why qualitative research? 29318 Qualitative data collection 30619 Transcribing language data: The Jefferson system 319
Brief contents
A01_HOWI4994_03_SE_FM.QXD 10/11/10 14:58 Page v

vi BRIEF CONTENTS
20 Thematic analysis 32821 Grounded theory 34322 Discourse analysis 35823 Conversation analysis 37124 Interpretative phenomenological analysis 38325 Evaluating and writing up qualitative research 396
Part 5 Research for projects, dissertations and theses 409
26 Developing ideas for research 411
Glossary 427
References 434
Index 440
A01_HOWI4994_03_SE_FM.QXD 10/11/10 14:58 Page vi

Contents
Guided tour of the book xvi
Introduction xviii
Acknowledgements xx
Part 1 The basics of research 1
1 The role of research in psychology 3Overview 3
1.1 Introduction 4
1.2 Reading 5
1.3 Evaluating the evidence 7
1.4 Inferring causality 8
1.5 Types of research and the assessment of causality 11
1.6 Practice 22
1.7 Conclusion 22
Key points 23
Activities 24
2 Aims and hypotheses in research 25Overview 25
2.1 Introduction 26
2.2 Types of study 27
2.3 Aims of research 29
2.4 Research hypotheses 30
2.5 Four types of hypothesis 32
2.6 Difficulties in formulating aims and hypotheses 36
2.7 Conclusion 38
Key points 39
Activities 39
A01_HOWI4994_03_SE_FM.QXD 10/11/10 14:58 Page vii

viii CONTENTS
3 Variables, concepts and measures 40Overview 40
3.1 Introduction 41
3.2 The history of the variable in psychology 42
3.3 Types of variable 43
3.4 Independent and dependent variables 45
3.5 Measurement characteristics of variables 45
3.6 Stevens’ theory of scales of measurement 48
3.7 Operationalising concepts and variables 52
3.8 Conclusion 53
Key points 54
Activities 54
4 The problems of generalisation and decision-making in research: Chance findings and sample size 55Overview 55
4.1 Introduction 56
4.2 Universalism 57
4.3 Sampling and generalisation 58
4.4 Statistics and generalisation 62
4.5 Directional and non-directional hypotheses again 65
4.6 More on the similarity between measures of effect (difference) and association 67
4.7 Sample size and size of association 69
4.8 Conclusion 74
Key points 74
Activities 75
5 Research reports: The total picture 76Overview 76
5.1 Introduction 77
5.2 Overall strategy of report writing 79
5.3 The sections of the research report in detail 84
5.4 Conclusion 100
Key points 102
Activities 102
6 Examples of how to write research reports 103Overview 103
6.1 Introduction 104
6.2 A poorly written practical report 105
A01_HOWI4994_03_SE_FM.QXD 10/11/10 14:58 Page viii

CONTENTS ix
6.3 Analysis of the report 109
6.4 An improved version of the report 116
6.5 Conclusion 121
Key points 121
Activity 122
7 The literature search 123Overview 123
7.1 Introduction 124
7.2 Library classification systems 125
7.3 Electronic databases 129
7.4 Obtaining articles not in your library 138
7.5 Personal bibliographic database software 140
7.6 Conclusion 141
Key points 142
Activities 143
8 Ethics and data management in research 144Overview 144
8.1 Introduction 145
8.2 APA ethics: The general principles 146
8.3 Research ethics 147
8.4 Ethics and publication 154
8.5 Obtaining the participant’s consent 156
8.6 Data management 157
8.7 Conclusion 158
Key points 159
Activities 159
Part 2 Quantitative research methods 161
9 The basic laboratory experiment 163Overview 163
9.1 Introduction 164
9.2 Characteristics of the true or randomised experiment 167
9.3 More advanced research designs 174
9.4 Conclusion 186
Key points 186
Activity 187
A01_HOWI4994_03_SE_FM.QXD 10/11/10 14:58 Page ix
x CONTENTS
10 Advanced experimental design 188Overview 188
10.1 Introduction 189
10.2 Multiple levels of the independent variable 190
10.3 Multiple dependent variables 194
10.4 Factorial designs 195
10.5 The psychology and social psychology of the laboratory experiment 200
10.6 Conclusion 204
Key points 205
Activities 206
11 Cross-sectional or correlational research: Non-manipulation studies 207Overview 207
11.1 Introduction 208
11.2 Cross-sectional designs 209
11.3 The case for non-manipulation studies 211
11.4 Key concepts in the analysis of cross-sectional studies 213
11.5 Conclusion 218
Key points 219
Activities 219
12 Longitudinal studies 220Overview 220
12.1 Introduction 221
12.2 Panel designs 223
12.3 Different types of third variable 225
12.4 Analysis of non-experimental designs 228
12.5 Conclusion 231
Key points 231
Activities 231
13 Sampling and population surveys 232Overview 232
13.1 Introduction 233
13.2 Types of probability sampling 233
13.3 Non-probability sampling 236
13.4 National surveys 237
13.5 Socio-demographic characteristics of samples 240
13.6 Sample size and population surveys 241
13.7 Conclusion 245
Key points 246
Activities 246
A01_HOWI4994_03_SE_FM.QXD 10/11/10 14:58 Page x

CONTENTS xi
Part 3 Fundamentals of testing and measurement 247
14 Psychological tests: Their use and construction 249Overview 249
14.1 Introduction 250
14.2 The concept of a scale 251
14.3 Scale construction 254
14.4 Item analysis or factor analysis? 263
14.5 Other considerations in test construction 264
14.6 Conclusion 264
Key points 265
Activities 265
15 Reliability and validity 266Overview 266
15.1 Introduction 267
15.2 Reliability of measures 269
15.3 Validity 272
15.4 Types of validity 273
15.5 Conclusion 278
Key points 279
Activity 279
16 Coding data 280Overview 280
16.1 Introduction 281
16.2 Types of coding 282
16.3 Reliability and validity 287
16.4 Qualitative coding 288
16.5 Conclusion 289
Key points 289
Activities 290
Part 4 Qualitative research methods 291
17 Why qualitative research? 293Overview 293
17.1 Introduction 294
A01_HOWI4994_03_SE_FM.QXD 10/11/10 14:58 Page xi

xii CONTENTS
17.2 What is qualitative research? 295
17.3 History of the qualitative–quantitative divide in psychology 298
17.4 The quantification–qualitative methods continuum 301
17.5 Evaluation of qualitative versus quantitative methods 303
17.6 Conclusion 304
Key points 305
Activity 305
18 Qualitative data collection 306Overview 306
18.1 Introduction 307
18.2 Major qualitative data collection approaches 308
18.3 Conclusion 317
Key points 317
Activities 318
19 Transcribing language data: The Jefferson system 319Overview 319
19.1 Introduction 320
19.2 Jefferson transcription 321
19.3 Advice for transcribers 326
19.4 Conclusion 327
Key points 327
Activities 327
20 Thematic analysis 328Overview 328
20.1 Introduction 329
20.2 What is thematic analysis? 331
20.3 A basic approach to thematic analysis 332
20.4 A more sophisticated version of thematic analysis 335
20.5 Conclusion 342
Key points 342
Activity 342
21 Grounded theory 343Overview 343
21.1 Introduction 344
21.2 Development of grounded theory 346
21.3 Data in grounded theory 347
A01_HOWI4994_03_SE_FM.QXD 10/11/10 14:58 Page xii

CONTENTS xiii
21.4 How to do grounded theory analysis 348
21.5 Computer grounded theory analysis 351
21.6 Evaluation of grounded theory 355
21.7 Conclusion 356
Key points 357
Activity 357
22 Discourse analysis 358Overview 358
22.1 Introduction 359
22.2 Important characteristics of discourse 362
22.3 The agenda of discourse analysis 363
22.4 Doing discourse analysis 365
22.5 Conclusion 369
Key points 369
Activities 370
23 Conversation analysis 371Overview 371
23.1 Introduction 372
23.2 Precepts of conversation analysis 375
23.3 Stages in conversation analysis 376
23.4 Conclusion 381
Key points 381
Activities 382
24 Interpretative phenomenological analysis 383Overview 383
24.1 Introduction 384
24.2 Philosophical foundations of interpretative phenomenological analysis 385
24.3 Stages in interpretative phenomenological analysis 387
24.4 Conclusion 394
Key points 394
Activities 395
25 Evaluating and writing up qualitative research 396Overview 396
25.1 Introduction 397
25.2 Evaluating qualitative research 399
25.3 Validity 401
A01_HOWI4994_03_SE_FM.QXD 10/11/10 14:58 Page xiii

xiv CONTENTS
25.4 Criteria for novices 406
25.5 Conclusion 407
Key points 408
Activities 408
Part 5 Research for projects, dissertations and theses 409
26 Developing ideas for research 411Overview 411
26.1 Introduction 412
26.2 Why not a replication study? 414
26.3 Choosing a research topic 416
26.4 Sources of research ideas 418
26.5 Conclusion 424
Key points 425
Activity 426
Glossary 427
References 434
Index 440
A01_HOWI4994_03_SE_FM.QXD 10/11/10 14:58 Page xiv

Supporting resourcesVisit www.pearsoned.co.uk/howitt to find valuable online resources
Companion Website for studentsOverview: A short introduction to each chapter gives students a feel for the topics coveredMultiple choice questions: A set of MCQ’s for every chapter allow students to check knowledge andunderstandingEssay questions: Between 6–8 essay questions for every chapter help students to plan for courseworkand examsEthical dilemmas: 12 cases, each with different scenarios and questions, encourage studentsconsider the wider implications of a research projectGuide to statistical computations: A short guide to statistical tools and techniques for easy referencewhen onlineRoadmaps: A set of visual guides to help students find the right test to use to analyse a set of data
Also: The Companion Website provides the following features:
Search tool to help locate specific items of contentE-mail results and profile tools to send results of quizzes to instructorsOnline help and support to assist with website usage and troubleshooting
For more information please contact your local Pearson Education sales representative or visitwww.pearsoned.co.uk/howitt
A01_HOWI4994_03_SE_FM.QXD 10/11/10 14:58 Page xv

Guided tour
Clear Overview
Introduces the chapter to give students a feel forthe topics covered
Key Ideas
Outlines the important concepts in more depth togive you a fuller understanding
The role of research in psychology
Overview
CHAPTER 1
Research is central to all the activities of psychologists as it is to modern life in general.A key assumption of psychology is that the considered and careful collection of researchdata is an essential part of the development of the discipline.
The vast majority of psychology involves the integration of theoretical notions with theoutcomes of research. Psychology characteristically emphasises causal explanations.Many psychologists adhere to the belief that a prime purpose of research is to testcausal propositions.
A first-rate psychologist – researcher or practitioner – needs to be familiar with the wayin which good research is carried out. This enables them to determine the adequacyand value of the findings claimed from a particular study.
All psychologists need the resources to be able to read research reports in detail, forexample, studies reported in journals of psychological research. This requires anunderstanding of the purposes, advantages and disadvantages of the different researchmethods used to investigate issues.
Research reports become much clearer and easier to understand once the basics ofpsychological research methods are known. Very often research reports are conciselywritten and so assume a degree of knowledge of the topic and research methods. Thestudy of research methods will help prepare students for this.
Psychologists have traditionally distinguished between true experiments and non-experiments. True experiments are typical of laboratory studies in psychology whereasnon-experiments are more typical of more naturalistic studies in the field (communityor other real-life settings).
CHAPTER 9 THE BASIC LABORATORY EXPERIMENT 169
belief that they had been given alcohol was the key causal variable. Since the effects ofalcohol are well known, participants believing that they have taken alcohol may behaveaccordingly. By giving both groups alcohol, both groups will believe that they havetaken alcohol. The only thing that varies is the key variable of the amount of alcoholtaken. In good experimental research the effectiveness of the experimental manipulationis often evaluated. This is discussed in Box 9.1. In this case, participants in the experimentmight be asked about whether or not they believed that they had taken alcohol in adebriefing interview at the end of the study.
The condition having the lower quantity of alcohol is referred to as the control condition. The condition having the higher quantity of alcohol may be called the experimental condition. The purpose of the control condition is to see how participantsbehave when they receive less of the variable that is being manipulated.
Checks on the experimental manipulation
Box 9.1 Key Ideas
It can be a grave mistake to assume that simply because an experimental manipulation has been introduced by the researcher that the independent variable has actuallybeen effectively manipulated. It might be argued that if the researcher finds a difference between the experimentaland control conditions on the dependent variable that the manipulation must have been effective. Things are notthat simple.
Assume that we are investigating the effects of anger on memory. In order to manipulate anger, the researcherdeliberately says certain pre-scripted offensive commentsto the participants in the experimental group whereas nicethings are said to the participants in the control group. It is very presumptuous to assume that this procedure willwork effectively without subjecting it to some test.
For example, the participants might well in some circumstances regard the offensive comments as a jokerather than an insult so the manipulation may make themhappier rather than angrier. Alternatively, the control may find the nice comments of the experimenter to bepatronising and become somewhat annoyed or angry as aconsequence. So there is a degree of uncertainty whetheror not the experimental manipulation has actually worked.One relatively simple thing to do in this case would be to get participants to complete a questionnaire about theirmood containing a variety of emotions, such as angry,happy and sad, which the participant rates in terms oftheir own feelings. In this way it would be possible toassess whether the experimental group was indeed angrierthan the control group following the anger manipulation.
Alternatively, at the debriefing session following par-ticipation in the experiment, the participants could beasked about how they felt after the experimenter said theoffensive or nice things. This check would also demon-strate that the manipulation had had a measurable effecton the participants’ anger levels.
Sometimes it is appropriate, as part of pilot work trying out one’s procedures prior to the study proper, toestablish the effectiveness of the experimental manipula-tion as a distinct step in its own right. Researchers need tobe careful not to assume that simply because they obtainstatistically significant differences between the experimentaland control conditions this is evidence of the effective-ness of their experimental manipulation. If the experimentalmanipulation has had an effect on the participants but notthe one intended, it is vital that the researcher knows this.Otherwise, the conceptual basis for their analysis may beinappropriate. For example, they may be discussing theeffects of anger when they should be discussing the effectsof happiness.
In our experience, checks on the experimental mani-pulation are relatively rare in published research and are, probably, even rarer in student research. Yet suchchecks would seem to be essential. As we have seen, thedebriefing session can be an ideal opportunity to interviewparticipants about this aspect of the study along with itsother features. The most thorough researchers may alsoconsider a more objective demonstration of the effective-ness of the manipulation as above when the participants’mood was assessed.
Practical Advice
Gives you handy hints and tips on how to carry outresearch in practice
86 PART 1 THE BASICS OF RESEARCH
drudgery but an opportunity to establish the value of your research. Get it wrong, andthe reader may get the impression that you are confused and muddled – bad news if thatperson is giving you a grade or possibly considering your work for possible publication.
You will find examples of abstracts in any psychology journal Figure 5.3 shows thecomponents of a report to be summarised in the abstract.
Important points to summarise in the abstract
Box 5.2 Practical Advice
Ideally, the following should be outlined in the abstract.Normally subheadings are not used except in structuredabstracts though this rule may be broken if necessary.They are given here simply for purposes of clarity. Theyrelate to the major subheadings of the report itself:
Introduction This is a brief statement justifying theresearch and explaining the purpose, followed by ashort statement of the research question or the mainhypotheses. The justification may be in terms of thesocial or practical utility of the research, its relevanceto theory, or even the absence of previous research. Theresearch question or hypotheses will also be given.Probably no more than 30 per cent of the abstract willbe such introductory material.
Method This a broad orientation to the type ofresearch that was carried out. Often a simple phrasewill be sufficient to orient the reader to the style ofresearch in question. So phrases like ‘Brain activity wasstudied using PET (positron emission tomography) andFMRI (functional magnetic resonance imaging) . . .’, ‘A controlled experiment was conducted . . .’, ‘Theinterview transcripts were analysed using discourseanalysis . . .’ and ‘A survey was conducted . . .’ suggesta great deal about the way in which the research wascarried out without being wordy.
Participants This will consist of essential detail aboutthe sample(s) employed. For example, ‘Interview datafrom an opportunity sample consisting of young carersof older relatives was compared with a sample of youngpeople entering the labour market for the first time,matched for age’.
Procedure This should identify the main measuresemployed. For example, ‘Loneliness was assessed usingthe shortened UCLA loneliness scale. A new scale wasdeveloped to measure social support’. By stipulatingthe important measures employed one also identifies
the key variables. For an experiment, in addition it wouldbe appropriate to describe how the different conditionswere created (i.e. manipulated). For example, ‘Levels ofhunger were manipulated by asking participants torefrain from eating or drinking for 1 hour, 3 hours and6 hours prior to the experiment’.
Results There is no space in an abstract for elaboratepresentations of the statistical analyses that theresearcher may have carried out. Typically, however,broad indications are given of the style of analysis. For example, ‘Factor analysis of the 20-item anxietyscale revealed two main factors’, ‘The groups werecompared using a mixed-design ANOVA’ or ‘Binomiallogistic regression revealed five main factors which differentiated men and women’. Now these statisticaltechniques may be meaningless to you at the momentbut they will not be to most researchers. They refer to very distinct types of analysis so the terms are veryinformative to researchers. In addition, the majorfindings of the statistical analysis need to be reported.Normally this will be the important, statisticallysignificant features of the data analysis. Of course,sometimes the lack of significance is the most import-ant thing to draw attention to in the abstract. There isno need and normally no space to use the succinctmethods of the reporting of statistics in the abstract. So things like (t = 2.43, df = 17, p < 0.05) are rare inabstracts and best omitted.
Discussion In an abstract, the discussion (and conclu-sions) need to be confined to the main things that thereader should take away from the research. As ever,there are a number of ways of doing this. If you havealready stated the hypothesis then you need do littleother than confirm whether or not this was supported,given any limitations you think are important concerningyour research, and possibly mention any crucial recom-mendations for further research activity in the field.
A01_HOWI4994_03_SE_FM.QXD 10/11/10 14:58 Page xvi

GUIDED TOUR xvii
Research Example
Explores a real example of research being carriedout, giving you an insight into the process
Talking Point
Investigates an important debate or issue inresearch
368 PART 4 QUALITATIVE RESEARCH METHODS
Discourse analysis
Box 22.2 Research Example
In research on menstruation, Lovering (1995) talked with11- and 12-year-old boys and girls in discussion groups.Among a range of topics included on her guide for conduct-ing the discussions were issues to do with menstruation.These included questions such as: ‘Have you heard ofmenstruation?’; ‘What have you been told about it?’; ‘Whatdo you think happens when a woman menstruates?’; ‘Whydoes it happen?’; and ‘Who has told you?’ (Lovering,1995, p. 17). In this way relatively systematic materialcould be gathered in ways closer to ordinary conversationthan would be generated by one-on-one interviews. Shetook detailed notes of her experiences as soon as possibleafter the discussion groups using a number of headings (p. 17):
How she (Lovering) felt
General emotional tone and reactions
Non-verbal behaviour
Content recalled
Implications and thoughts.
This is a form of diary writing of the sort discussedalready in relation to grounded theory. The difference perhaps is that she applied it to the data collection phaserather than the transcription phase. Lovering transcribedthe tape-recording herself – eventually using the Jeffersonsystem described in Chapter 19. She also employed a computer-based analysis program (of the sort that NVivois the modern equivalent). Such a program does not do the analysis for you; it allows you to store and work witha lot of text, highlight or mark particular parts of the text,sort the text and print it out. All of these things can beachieved just using pencil and paper, but a computer ismore convenient.
The next stage was to sort the text into a number ofcategories – initially, she had more than 50. She developedan analysis of the transcribed material partly based on her awareness of a debate about the ways in which maleand female bodies are socially construed quite differently.Boys’ physical development is regarded as a gradual andunproblematic process, whereas in girls the process ismuch more problematic. The following excerpts from atranscript illustrate this:
A: They [school teachers] don’t talk about the boysvery much only the girls = yes = yes.
A: It doesn’t seem fair. They are laughing at us. Notmuch seems to happen to boys.
A: Girl all go funny shapes = yes = like that = yes.
A: Because the boys, they don’t really . . . changevery much. They just get a little bit bigger.
A: It feels like the girls go through all the changesbecause we are not taught anything about the boysREALLY.
(Lovering, 1995, pp. 23–4)
Menstruation was learnt about from other people –predominantly female teachers or mothers. Embarrass-ment dominated, and the impression created was thatmenstruation was not to be discussed or even mentionedas a consequence. Talk of female bodies and bodily func-tions by the youngsters features a great deal of sniggering.In contrast, when discussing male bodies things becomemore ordinary and more matter of fact. Furthermore, boys are also likely to use menstruation as a psychologicalweapon against girls. That is, menstruation is used tomake jokes about and ridicule girls. In Lovering’s analysis,this is part of male oppression of females: even in sex education lessons learning about menstruation is associatedin girls’ minds as being ‘laughing at girls’.
Of course, many more findings emerged in this study.Perhaps what is important is the complexity of the processby which the analysis proceeds. It is not possible to saythat if the researcher does this and then does that, a goodanalysis will follow. Nevertheless, it is easy to see how the researcher’s ideas relate to key aspects of discourseanalytic thinking. For example, the idea that menstruationis used as a weapon of oppression of females clearly has itsroots in feminist sexual politics which suggests that malesattempt to control females in many ways from domesticviolence through rape to, in this example, sex educationlessons. One could equally construe this as part of Edwardsand Potter’s (1993) discursive action model. This suggests,among other things, that in talk, conversation or text, onecan see social action unfolding before one’s eyes. One doesnot have to regard talk, text or conversation as the external
82 PART 1 THE BASICS OF RESEARCH
Generally introductions are the longest section of a research report. Some authoritiessuggest about a third of the available space should be devoted to the introduction. Ofcourse, adjustments have to be made according to circumstances. Research which collectsdata on numerous variables may need to devote more space to the results section.
A rule of thumb is to present the results of calculations to no more than two decimalplaces. There is a danger of spuriously implying a greater degree of accuracy than psychological data usually possess. Whatever you do, be consistent. You need tounderstand how to round to two decimals. Basically, if the original number ends witha figure of 5 or above then we round up, otherwise we round down. So 21.4551 gives21.46 rounded whereas 21.4549 gives 21.45 rounded.
Avoiding bias in language
Box 5.1 Talking Point
Racism, sexism, homophobia and hostility to minoritiessuch as people with disabilities are against the ethics ofpsychologists. The use of racist and sexist language andother unacceptable modes of expression are to be avoidedin research reports. Indeed, such language may result inthe material being rejected for publication. We wouldstress that the avoidance of racist and sexist language cannot fully be reduced to a list of dos and don’ts. Thereason is that racism and sexism can manifest themselvesin a multiplicity of different forms and those forms maywell change with time. For example, Howitt and Owusu-Bempah (1994) trace the history of racism in psychologyand how the ways it is manifest have changed over time.While it is easy to see the appalling racism of psychologyfrom a century ago, it is far harder to understand its opera-tion in present day psychology. For detailed examples ofhow the writings of psychologists may reinforce racism see Owusu-Bempah and Howitt (1995) and Howitt andOwusu-Bempah (1990).
Probably the first step towards the elimination of racismand sexism in psychological research is for researchers toundergo racism and sexism awareness training. This isincreasingly available in universities and many work loca-tions. In this way, not only will the avoidance of offensivelanguage be helped but, more important, the inadvertentpropagation of racist and sexist ideas through researchwill be made much more difficult.
A few examples of avoidable language use follow:
Writing things like ‘the black sample . . .’ can readilybe modified to ‘the sample of black people . . .’ or, ifyou prefer, ‘the sample of people of colour . . .’. In thisway, the most important characteristic is drawn atten-tion to: the fact that you are referring to people first
and foremost who also happen to be black. You mightalso wish to ask why one needs to refer to the race ofpeople at all.
Avoid references to the racial (or gender) characteristicsof participants which are irrelevant to the substance ofthe report. For example, ‘Female participant Y was ablack lone-parent . . .’. Not only does this contain theelements of a stereotypical portrayal of black people as being associated with father absence and ‘brokenfamilies’, but the race of the participant may be totallyirrelevant to what the report is about.
Do not refer to man, mankind or social man, for exam-ple. These terms do not make people think of man andwoman but of men only. Words like ‘people’ can be substituted. Similarly referring to ‘he’ contributes to theinvisibility of women and so such terms should not beused.
Of course, the use of demeaning and similar language isnot confined to race and gender. Homophobic languageand writings are similarly to be avoided. Equally, carefulthought and consideration should be given when writingabout any disadvantaged or discriminated against group.So people with disabilities should be treated with dignityin the choice of language and terms used. So, for example,the phrase ‘disabled people’ is not acceptable and shouldbe replaced with ‘people with disabilities’.
The website of the American Psychological Associationcontains in-depth material on these topics – race and ethnic-ity, gender and disabilities. Should your report touch on anyof these, you are well advised to consult the Association’sguidance. The following location deals with variousaspects of APA style: http://www.apastyle.org/index.aspx
Conclusion/Key Points
Each chapter has a conclusion and set of keypoints to help summarise chapter coverage whenyou’re revising a topic
Activities
Each chapter concludes with activities to help youtest your knowledge and explore the issues further
186 PART 2 QUANTITATIVE RESEARCH METHODS
9.4 Conclusion
The basics of the true or randomised experiment are simple. The major advantage of sucha design is that it is easier to draw conclusions about causality since care is taken toexclude other variables as far as possible. That is, the different experimental conditionsbring about differences on the dependent variable. This is achieved by randomly allocatingparticipants to conditions or orders and standardising procedures. There are a numberof problems with this. The major one is that randomisation equates groups only in thelong run. For any particular experiment, it remains possible that the experimental andcontrol groups differ initially before the experimental manipulation has been employed.The main way of dealing with this is to employ a pre-test to establish whether or not the experimental and control groups are very similar. If they are, there is no problem. If the pre-test demonstrates differences then this may bring about a different inter-pretation of any post-test findings. Furthermore, the more complicated the manipulation is, the more likely it is that variables other than the intended one will be manipulated.Consequently, the less easy it is to conclude that the independent variable is responsiblefor the differences. The less controlled the setting in which the experiment is conducted,the more likely it is that the conditions under which the experiment is run will not be the same and that other factors than the manipulation may be responsible for anyobserved effect.
The laboratory experiment has the potential to reveal causal relationships with a certainty which isnot true of many other styles of research. This is achieved by random allocation of participants andthe manipulation of the independent variable while standardising procedures as much as possibleto control other sources of variability.
The between-subjects and within-subjects designs differ in that in the former participants take partin only one condition of the experiment whereas in the latter participants take part in all conditions(or sometimes just two or more) of the conditions. These two different types of design are analysedusing rather different statistical techniques. Within-subjects designs use related or correlated tests.This enables statistical significance to be achieved with fewer participants.
The manipulated or independent variable will consist of only two levels or conditions in the most basiclaboratory experiment. The level of the manipulated variable will be higher in one of the conditions.This condition is sometimes referred to as the experimental condition as opposed to the control condition where the level of the manipulated variable will be lower.
Within-subjects (related) designs have problems associated with the sensitisation effects of servingin more than one of the conditions of the study. There are designs that allow the researcher to detectsensitisation effects. One advantage of the between-subjects design is that participants will not beaffected by the other conditions as they will not have taken part in them.
Pre-testing to establish that random allocation has worked in the sense of equating participants on the dependent variable prior to the experimental treatment sometimes works. Nevertheless, pre-testing may cause problems due to the sensitising effect of the pre-test. Complex designs areavailable which test for these sensitising effects.
Key points
24 PART 1 THE BASICS OF RESEARCH
ACTIVITIES1. Choose a recent study that has been referred to either in a textbook you are reading or in a lecture that you have
attended. Obtain the original publication. Were the study and its findings correctly reported in the textbook? Do youthink that there were important aspects of the study that were not mentioned in the text or the lecture that should havebeen? If you do think there were important omissions, what are these? Why do you think they were not cited? Did thestudy test a causal proposition? If so, what was this proposition? If not, what was the main aim of this study? In termsof the designs outlined in this chapter what kind of design did the study use?
2. Either choose a chapter from a textbook or go to the library and obtain a copy of a single issue of a journal. Workthrough the material and for every study you find, classify it as one of the following:
correlational or cross-sectional study
longitudinal study
experiment – or study with randomised assignment.
What percentage of each did you find?
A01_HOWI4994_03_SE_FM.QXD 10/11/10 14:58 Page xvii

The third edition of Introduction to Research Methods in Psychology is one of threebooks designed to cover the major approaches to psychological research and analysis asthey are currently practised. We do not believe that with this intention in mind, researchmethods and data analysis can be covered satisfactorily in a single volume, though youwill find examples of successful textbooks based on this formula in almost any universitybookshop. Modern psychology is extremely varied in the styles of research it employsand the methodological and statistical sophistication that it currently enjoys would havebeen undreamt of even just a few years ago. It does students a disservice to provide themwith those few basics which once would have been sufficient but now are hopelesslyinadequate to meet their needs. To our minds, the incredible progress of modern psy-chology means that teaching resources must struggle to keep up to date and to cope with the variety of different educational experiences provided by different universities.At heart, each volume in our trilogy Introduction to Research Methods in Psychology,Introduction to Statistics in Psychology and Introduction to SPSS Statistics in Psychologyis modularly constructed. That is, we do not expect that all their contents will be coveredby lecturers and other instructors. Instead, there is a menu of largely self-contained chaptersfrom which appropriate selections can be made.
This is illustrated by the coverage of Introduction to Research Methods in Psychology.This is unusual in that both quantitative and qualitative research are covered in depth.These are commonly but, in our opinion, wrongly seen as alternative and incompatibleapproaches to psychological research. For some researchers, there may be an intellectualincompatibility between the two. From our perspective, it is vitally important that students understand the intellectual roots of the two traditions, how research is carriedout in these traditions, and what each tradition is capable of achieving. We believe thatthe student who is so informed will be better placed to make intelligent and appropriatechoices about the style of research appropriate for the research questions they wish toaddress. On its own, the qualitative material in this third edition effectively supportsmuch of the qualitative research likely to be carried out today. There is as much detailedpractical advice and theory as is available in most books on qualitative research methods.(If more is required, Dennis Howitt’s Introduction to Qualitative Research in Psychology[Howitt, 2010] will probably meet your requirements.) But this is in addition to thequantitative coverage, which easily outstrips any competition in terms of variety, depthand authority. We have tried to provide students with resources to help them in wayslargely ignored by most other texts. For example, the chapter on literature searches iscomprehensive and practical. Similarly, the chapter on ethics meets the most recent standards and deals with them in depth. The chapter on writing research reports placesreport writing at the centre of the research process rather than as an add-on at the end.We would argue that a student requires an understanding of the nature of research inpsychology to be able to write a satisfactory research report. However, we have includeda chapter which illustrates many of the problems that are found in research reports inresponse to requests for such material.
Introduction
A01_HOWI4994_03_SE_FM.QXD 10/11/10 14:58 Page xviii

INTRODUCTION xix
As far as is possible, we have tried to provide students with practical skills as well as the necessary conceptual overview of research methods in modern psychology.Nevertheless, there is a limit to this. The bottom line is that anyone wishing to under-stand research needs to read research, not merely plan, execute, analyse and write-upresearch. Hence, almost from the start we emphasise that reading is not merely unavoid-able but crucial. Without such additional reading, the point of this book is missed. It isnot intended as a jumble of technical stuff too boring to be part of any module otherthan one on research methods. The material in the book is intended to expand students’understanding of psychology by explaining just how researchers go about creating psy-chology. At times this can be quite exciting as well as frustrating and demanding.
This is the fifth book the authors have written together. It is also the one that cameclose to spoiling a long friendship. What became very clear while writing this book is howemotive the topic of research methods can be. We found out, perhaps for the first time, howdifferent two people’s thinking can be, even when dealing with seemingly dry topics. As aconsequence, rather than smooth over the cracks, making joins when this was not possible,you will find that we have incorporated the differences of opinion. This is no differentfrom the disparity of positions to be found within the discipline itself – probably less so.
The main features of this book are:
in-depth coverage of both quantitative and qualitative methods;
a range of pedagogic features including summaries, exercises, boxes and step-by-stepinstructions where appropriate;
analysis strategies provided for the research designs discussed;
detailed information about the structure, purpose and contents of research reports;
the use of databases and other resources;
suggestions about how to develop research ideas for projects and similar studies;
ethics as an integral feature of the work of all psychologists.
Introduction to Research Methods in Psychology is part of the trilogy of books whichalso includes Introduction to Statistics in Psychology and Introduction to SPSS Statisticsin Psychology. In Introduction to Research Methods in Psychology we have tried to makethe presentation both clear in terms of the text but with additional visual learning aidsthroughout the book. The main new additions to the other two more statistically orientedbooks, apart from colour, are in terms of the statistical techniques of power analysis andmoderator effects. These reflect our determination to provide resources to studentswhich are both user-friendly and professionally oriented. Increasingly research is part ofmany of the different sorts of careers which psychology students enter – we simply hopethat our books speed the user towards a considered, mature approach to research.
Introduction to Statistics in Psychology, we feel, remains the best introduction to statistical concepts for students at all levels. The intention is to provide an introductionto statistics for the beginner which will take them through to the professional levelunproblematically. Introduction to SPSS Statistics in Psychology is a quicker approachto learning and carrying out statistical procedures than Introduction to Statistics inPsychology. Instead of detailed explanations of theory together with practical details,Introduction to SPSS Statistics in Psychology provides a short conceptual introductionto each statistical routine together with step-by-step screenshots and instructions abouttheir calculation using SPSS Statistics.
Education is a cooperative effort. So should you find errors then please let us know.These can be difficult to spot but easy to correct – some can be made when a book isreprinted. Ideas and comments of any sort would be most welcome.
A01_HOWI4994_03_SE_FM.QXD 10/11/10 14:58 Page xix

■ Authors’ acknowledgementsThe authors would like to express their gratitude to the following for the immense contribution that they have made to this book:
Janey Webb – our editor at Pearson Education who was indefatigable in planning and progressing this third edition. As ever, Janey was remarkably supportive at everystage.
Catherine Morrissey – Janey’s assistant at Pearson Education kept things flowing buthas now moved on to a new job. Good luck to Catherine in that.
Mary Lince and Georgina Clark-Mazo – they took charge of production of the bookand made sure that everything happened when it should have happened and that theimpossible was routine.
Kevin Ancient – was responsible for the text design without which the book wouldbe much harder to read and navigate around.
Nicola Woowat – provided the cover design which continues the tradition of strikingcovers for this book and the others in the set.
Ros Woodward – she copy-edited our manuscript into the lively structure of the finalbook and generally made the manuscript work as a book.
Rose James – proof-read the book and spotted the things which the authors neverwould.
Annette Musker – was responsible for the index which makes navigation through thebook so much easier.
Louise Newman – was responsible for the accompanying website which does so muchto make the book even more useful.
Authors are highly dependent on academic reviewers for new ideas and general feedback.The following were tremendously helpful in planning this third edition:
Deborah Fantini, University of Essex
Claire Fox, Keele University
Koen Lamberts, University of Warwick
Jane Walsh, National University of Ireland, Galway
Dr Paul Seager, University of Central Lancashire
Dennis Howitt and Duncan Cramer
Acknowledgements
A01_HOWI4994_03_SE_FM.QXD 10/11/10 14:58 Page xx
ACKNOWLEDGEMENTS xxi
■ Publisher’s acknowledgementsWe are grateful to the following for permission to reproduce copyright material:
Screenshots
Screenshots 7.3, 7.4, 7.5, 7.6, 7.7 from Thomson Reuters, Thomson Reuters; Screenshot 7.8from Loughborough University Ex Libris Ltd, Ex Libris Ltd; Screenshots 7.9, 7.10 fromreproduced by permission of SAGE Publications, London, Los Angeles, New Delhi andSingapore, from SAGE journals online; Screenshot 7.11 from The PsycINFO® Database,reproduced with permission of the American Psychological Association, publisher of the PsycINFO database, all rights reserved. No further reproduction or distribution ispermitted without written permission from the American Psychological Association.Images produced by ProQuest. Inquiries may be made to: ProQuest, P.O. Box 1346, 789 E.Eisenhower Parkweay, Ann Arbor, MI 48106-1346 USA. Telephone (734) 761-7400; E-mail: [email protected]; Web-page: www.proquest.com; Screenshot 7.12 from ThePsycINFO® Database, reproduced with permission of the American Psychological Asso-ciation, publisher of the PsycINFO database, all rights reserved. No further reproductionor distribution is permitted without written permission from the American PsychologicalAssociation. Images produced by ProQuest. Inquiries may be made to: ProQuest, P.O.Box 1346, 789 E. Eisenhower Parkweay, Ann Arbor, MI 48106-1346 USA. Telephone(734) 761-7400; E-mail: [email protected]; Web-page: www.proquest.com, PsycINFOis a registered trademark of the American Psychological Association (APA). The PsycINFODatabase content is reproduced with permission of the APA. The CSA Illumina internetplatform is the property of ProQuest LLC. and Image published with permission ofProQuest. Further reproduction is prohibited without permission.; Screenshot 7.13 from The PsycINFO® Database, reproduced with permission of the American Psycho-logical Association, publisher of the PsycINFO database, all rights reserved. No furtherreproduction or distribution is permitted without written permission from the AmericanPsychological Association. Images produced by ProQuest. Inquiries may be made to:ProQuest, P. O. Box 1346, 789 E. Eisenhower Parkweay, Ann Arbor, MI 48106-1346 USA.Telephone (734) 761-7400; E-mail: [email protected]; Web-page: www.proquest.com;Screenshot 7.14 from The PsycINFO® Database, reproduced with permission of theAmerican Psychological Association, publisher of the PsycINFO database, all rights reserved.No further reproduction or distribution is permitted without written permission fromthe American Psychological Association. Images produced by ProQuest. Inquiries maybe made to: ProQuest, P.O. Box 1346, 789 E. Eisenhower Parkweay, Ann Arbor, MI48106-1346 USA. Telephone (734) 761-7400; E-mail: [email protected]; Web-page:www.proquest.com; Screenshot 7.15 from The PsycINFO® Database, reproduced withpermission of the American Psychological Association, publisher of the PsycINFO database,all rights reserved. No further reproduction or distribution is permitted without writtenpermission from the American Psychological Association. Images produced by ProQuest.Inquiries may be made to: ProQuest, P.O. Box 1346, 789 E. Eisenhower Parkweay, AnnArbor, MI 48106-1346 USA. Telephone (734) 761-7400; E-mail: [email protected];Web-page: www.proquest.com; Screenshot 20.1 from QSR International Pty Ltd, Courtesyof QSR International Pty Ltd.
Tables
Table on page 241 from http://www.britsocat.com, British Social Attitudes Survey (2007),National Centre for Social Research; Table 21.1 after reproduced by permission of SAGEPublications, London, Los Angeles, New Delhi and Singapore, from J. A. Smith, R. Harre
A01_HOWI4994_03_SE_FM.QXD 10/11/10 14:58 Page xxi

xxii ACKNOWLEDGEMENTS
and L. V. Langenhove, Rethinking Methods in Psychology, ‘Grounded theory’, p. 39,Charmaz, K. (© SAGE, 1995); Table 26.1 adapted from The 100 most eminent psycho-logists of the 20th century, Review of General Psychology, 6, 139–52 (Haggbloom, S. J.,Warnick, R., Warnick, J. E., Jones, V. K., Yarbrough, G. L., Russell, T. M. et al. 2002),American Psychological Association.
In some instances we have been unable to trace the owners of copyright material, andwe would appreciate any information that would enable us to do so.
A01_HOWI4994_03_SE_FM.QXD 10/11/10 14:58 Page xxii

The basics of research
PART 1
M01_HOWI4994_03_SE_C01.QXD 10/11/10 14:59 Page 1

M01_HOWI4994_03_SE_C01.QXD 10/11/10 14:59 Page 2

The role of research in psychology
Overview
CHAPTER 1
Research is central to all the activities of psychologists as it is to modern life in general.A key assumption of psychology is that the considered and careful collection of researchdata is an essential part of the development of the discipline.
The vast majority of psychology involves the integration of theoretical notions with theoutcomes of research. Psychology characteristically emphasises causal explanations.Many psychologists adhere to the belief that a prime purpose of research is to testcausal propositions.
A first-rate psychologist – researcher or practitioner – needs to be familiar with the wayin which good research is carried out. This enables them to determine the adequacyand value of the findings claimed from a particular study.
All psychologists need the resources to be able to read research reports in detail, forexample, studies reported in journals of psychological research. This requires anunderstanding of the purposes, advantages and disadvantages of the different researchmethods used to investigate issues.
Research reports become much clearer and easier to understand once the basics ofpsychological research methods are known. Very often research reports are conciselywritten and so assume a degree of knowledge of the topic and research methods. Thestudy of research methods will help prepare students for this.
Psychologists have traditionally distinguished between true experiments and non-experiments. True experiments are typical of laboratory studies in psychology whereasnon-experiments are more typical of more naturalistic studies in the field (communityor other real-life settings).
M01_HOWI4994_03_SE_C01.QXD 10/11/10 14:59 Page 3

4 PART 1 THE BASICS OF RESEARCH
Many psychologists believe that true experiments (laboratory studies) in general providea more convincing test of causal propositions. Others would dispute this on the groundsthat such true experiments often achieve precision at the expense of realism.
Conducting one’s own research is a fast route to understanding research methods.Increasingly, research is seen as an integral part of the training and work of all psychologists irrespective of whether they are practitioners or academics.
1.1 Introduction
Research is exciting – the lifeblood of psychology. To be sure, the subject matter of psychology is fascinating, but this is not enough. Modern psychology cannot be fullyappreciated without some understanding of the research methods that make psychologywhat it is. Although initially psychology provides many intriguing ideas about the natureof people and society, as one matures intellectually the challenges and complexities ofthe research procedure that helped generate these ideas are increasingly appreciated.Psychological issues are intriguing: for example, why are we attracted to some peopleand not to others? Why do we dream? What causes depression and what can we do toalleviate it? Can we improve our memory and, if so, how? What makes us aggressive andcan we do anything to make us less aggressive? What are the rules which govern everydayconversation? The diversity of psychology means that our individual interests are wellcatered for. It also means that research methods must be equally diverse if we are toaddress such a wide range of issues. Psychology comes in many forms and so does goodpsychological research.
Students often see research methods as a dull, dry and difficult topic which is toleratedrather than enjoyed. They much prefer their other lecture courses on exciting topics such as interpersonal attraction, mental illness, forensic investigation, brain structureand thought. What they overlook is that these exciting ideas are created by active andcommitted researchers. For these psychologists, psychology and research methods areintertwined – psychology and the means of developing psychological ideas throughresearch cannot be differentiated. For instance, it is stimulating to learn that we areattracted to people who have the same or similar attitudes to us. It is also of some interest to be given examples of the kinds of research which support this idea. But is this all that there is to it? Are there not many more questions that spring to mind? For example, why should we be attracted to people who have similar attitudes to ourown? Do opposites never attract? When does similarity lead to attraction and when does dissimilarity lead to attraction? The answer may have already been found to such ques-tions. If not the need for research is obvious. Research makes us think hard – which isthe purpose of any academic discipline. The more thinking that we do about research,the better we become at it.
Box 1.1 contains definitions of various concepts such as ‘variable’ and ‘correlation’ towhich you may need to refer to if you are unfamiliar with these terms.
M01_HOWI4994_03_SE_C01.QXD 10/11/10 14:59 Page 4

CHAPTER 1 THE ROLE OF RESEARCH IN PSYCHOLOGY 5
Some essential concepts in research
Box 1.1 Key Ideas
Cause Something which results in an effect, action orcondition.
Data The information from which inferences are drawnand conclusions reached. A lot of data are collected innumerical form but it is equally viable to use data in theform of text for an analysis.
Randomised experiment This refers to a type of researchin which participants in research are allocated at random(by chance) to an experimental or control condition.Simple methods of random assignment include flipping acoin and drawing slips of paper from a hat. The basic ideais that each participant has an equal chance of being allocated to the experimental or control conditions. Theexperimental and control conditions involve differences
in procedure related to the hypothesis under examination.So by randomisation, the researcher tries to avoid any systematic differences between the experimental and con-trol conditions prior to the experimental manipulation.Random selection is covered in detail in Chapter 13, pp. 233–236.
Reference In psychology, this refers to the details of thebook or article that is the source of the ideas or data beingdiscussed. The reference includes such information as theauthor, the title and the publisher of the book or the journalin which the article appears.
Variable A variable is any concept that varies and can bemeasured or assessed in some way. Intelligence, height andsocial status are simple examples.
1.2 Reading
The best way of understanding psychological research methods is to read in detail aboutthe studies which have been done and build on this. Few psychological textbooks giveresearch in sufficient detail to substitute effectively for this. Developing a better under-standing of how research is carried out in a particular area is greatly helped when onereads some of the research work in its original form that lecturers and textbook writersrefer to. Admittedly, some psychologists use too much jargon in their writing but ignorethese in favour of the many good communicators among them wherever possible. Univer-sity students spend only a small part of a working week being taught – they are expectedto spend much of their time on independent study, which includes reading a great deal aswell as independently working on assignments. Glance through any textbook or lecturecourse reading list and you will see the work of researchers cited. For example, the lectureror author may cite the work of Byrne (1961) on attraction and similarity of attitude.Normally a list of the ‘references’ cited is provided. The citation provides informationon the kind of work it is (for example, what the study is about) and where it has beenpresented or published. The details are shown in the following way:
Byrne, D. (1961). Interpersonal attraction and attitude similarity. Journal ofAbnormal and Social Psychology, 62, 713–15.
M01_HOWI4994_03_SE_C01.QXD 10/11/10 14:59 Page 5

6 PART 1 THE BASICS OF RESEARCH
The format is standard for a particular type of publication. Details differ accordingto what sort of publication it is – a book is referenced differently from a journal articleand an Internet source is referenced differently still. For a journal article, the last nameof the author is given first, followed by the year in which the reference was published.After this comes the title of the work. Like most research in psychology, Byrne’s study was published in a journal. The title of the journal is given next together with thenumber of the volume in which the article appeared together with the numbers of the first and last pages of the article. These references are generally listed alphabeticallyaccording to the last name of the first author in a reference list at the end of the journalarticle or book. Where there is more than one reference by the same author or authors,they will be listed according to the year the work was presented. This is known as the Harvard system or author–date system. This is described in much more detail inChapters 5 and 6 which are about writing a research report. We will cite references inthis way in this book. However, we will cite very few references compared with psycho-logy texts on other subjects as many of the ideas we are presenting have been previouslysummarised by other authors (although usually not in the same way) and have been generally accepted for many years.
Many of the references cited in lectures or textbooks are to reports of research thathas been carried out to examine a particular question or small set of questions. Researchstudies have to be selective and restricted in their scope. As already indicated, the primelocation for the publication of research is journals. Journals consist of volumes whichare usually published every year. Each volume typically comprises a number of issues orparts that come out say every three months but this is variable. The papers or articlesthat make up an issue are probably no more than 4000 or 5000 words in length thoughit is not uncommon to find some of them 10 000 words long. Their shortness necessitatestheir being written concisely. As a consequence, they are not always easy to read andoften require careful study in order to master them. An important aim of this book is toprovide you with the basic knowledge which is required to read these papers – and evento write them. Often there appear to be obstacles in the way of doing the necessary reading.For example, there are many different psychology journals – too many for individuallibraries to stock, so they subscribe to a limited number of them. If the reference that youare interested in is important and is not available locally, then you may be able to obtainit from another library or it is worthwhile trying to obtain a copy (usually called offprints)from the author. Nowadays many papers are readily available in electronic files (usuallyin Portable Digital Format, PDF) which can be easily accessed or e-mailed as attachments.Chapter 7 on searching the literature suggests how you can access publications whichare not held in your own library. Fortunately, it is becoming increasingly common thatuniversity libraries subscribe to digital versions of journals. That means that often youcan download to your computer articles which, otherwise, would not be available atyour university. The convenience of this is significant and there are no overdue fines.
One of the positive things about psychology is that you may have questions about a topic that have not been addressed in lectures or textbooks. For example, you maywonder whether attraction to someone depends on the nature of the particular attitudesthat are shared. Are some attitudes more important than others and, if so, what arethese? If you begin to ask questions like these while you are reading something then thisis excellent. It is the sort of intellectual curiosity required to become a good researcher.Furthermore, as you develop through your studies, you probably will want to know whatthe latest thinking and research are on the topic. If you are interested in a topic, thenwanting to know what other people are thinking about it is only natural. Your lecturerswill certainly be pleased if you do. There is a great deal to be learnt about finding outwhat is happening in any academic discipline. Being able to discover what is happeningand what has happened in a field of research is a vitally important skill. Chapter 7 discusseshow we go about searching for the current publications on a topic.
M01_HOWI4994_03_SE_C01.QXD 10/11/10 14:59 Page 6

CHAPTER 1 THE ROLE OF RESEARCH IN PSYCHOLOGY 7
1.3 Evaluating the evidence
Psychology is not simply about learning what conclusions have been reached on a par-ticular topic. It is perhaps more important to find out and carefully evaluate the evidencewhich has led to these conclusions. Why? Well, what if you have always subscribed tothe old adage ‘opposites attract’? Would you suddenly change your mind simply becauseyou read in a textbook that people with similar attitudes are attracted to each other?Most likely you would want to know a lot more about the evidence. For example, whatif you checked and found that the research in support of this idea was obtained simplyby asking a sample of 100 people whether they believed that opposites attract? In thiscase, all the researchers had really established was that people generally thought it wastrue that people are attracted to other people with similar attitudes. After all, simplybecause people once believed the world was flat did not make the world flat. It may beinteresting to know what people believe, but wouldn’t one want different evidence inorder to be convinced that attraction actually is a consequence of similarity of attitudes?You might also wonder if it is really true that people once believed the world to be flat.Frequently, in the newspapers and on television, one comes across startling findings frompsychological research. Is it wise simply to accept what the newspaper or television reportclaims or would it be better to check the original research in order to evaluate what theresearch actually meant?
We probably would be more convinced of the importance of attitude similarity inattraction if a researcher measured how attracted couples were to each other and thenshowed that those with the most similar attitudes tended to be the most attracted to oneanother. Even then we might still harbour some doubts. For example, just what do wemean by attraction? If we mean wanting to have a drink with the other person at a pubthen we might prefer the person with whom we might have a lively discussion, that is,someone who does not share our views. On the other hand, if willingness to share a flatwith a person were the measure of attraction then perhaps a housemate with a similaroutlook to our own would be preferred. So we are beginning to see that the way in whichwe choose to measure a concept (or variable) such as attraction may be vital in terms ofthe answers we get to our research questions.
It is possibly even more difficult to get a satisfactory measure of attitudes than it is to measure attraction. This is partly because there are many different topics that we canexpress attitudes about. So, for example, would we expect attraction to be affected inthe same way if two people share the view that there is life on Mars than if two peopleshare the same religious views? Would it matter that two people had different tastes inmusic than if they had different views about openness in relationships? That is, maybesome attitudes are more important than others in determining attraction – perhaps similarity on some attitudes is irrelevant to the attraction two people have for eachother. One could study this by asking people about their attitudes to a variety of differ-ent topics and then how important each of these attitudes is to them. (Sometimes this iscalled salience.) Alternatively, if we thought that some attitudes were likely to be moreimportant than others, we could focus on those particular attitudes in some depth. So itshould be clear from all of this that the process of evaluating the research in a particularfield is not a narrow, nit-picking exercise. Instead it is a process by which new ideas aregenerated as well as stimulating research to test these new propositions.
These various propositions that we have discussed about the relationship betweenattraction and similarity are all examples of hypotheses. A hypothesis is merely a sup-position or proposition which serves as the basis of further investigation, either throughthe collection of research data or through reasoning. The word hypothesis comes fromthe Greek word for foundation – perhaps confirming that hypotheses are the foundation
M01_HOWI4994_03_SE_C01.QXD 10/11/10 14:59 Page 7

8 PART 1 THE BASICS OF RESEARCH
on which psychology develops. Precision is an important characteristic of good hypotheses.So, our hypothesis that similarity of attitudes is related to attraction might benefit fromrefinement. It looks as if we might have to say something more about the attitudes thatpeople have (and what we mean by attraction for that matter) if we are going to pursueour questions any further. If we think that the attitudes have to be important, then thehypothesis should be reformulated to read that people are more attracted to those withsimilar attitudes on personally important topics. If we thought attraction was based onhaving a similar attitude towards spending money, we should restate the hypothesis tosay that people are more attracted to those with similar attitudes towards spendingmoney.
The evaluation of research evidence involves examining the general assertion that the researcher is making about an issue and the information or data that are relevant tothis assertion. We need to check whether the evidence or data support the assertion orwhether the assertion goes beyond what could be confidently concluded. Sometimes, inextreme cases, researchers draw conclusions which seem not to be justified by their data.Any statement that goes beyond the data is speculation or conjecture and needs to berecognised as such. There is nothing wrong with speculation as such since hypotheses,for example, are themselves often speculative in nature. Speculation is necessary in orderto go beyond what we already know. However, it needs to be distinguished from whatcan legitimately be inferred from the data.
1.4 Inferring causality
The concept of causality has been important throughout most of the history of psychology.Other disciplines might consider it almost an obsession of psychology. The meaning ofthe term is embodied in the phrase ‘cause and effect’. The idea is that things that happenin the world may have an effect on other things. So when we speak of a causal relationshipbetween attitude similarity and attraction we mean that attitude similarity is the causeof attraction to another person. Not all data allow one to infer causality with confidence.Sometimes researchers suggest that their research demonstrates a causal relationshipwhen others would claim that it demonstrates no such thing – that there may be a rela-tionship but that one thing did not cause the other. In strictly logical terms, some claimsof a causal relationship can be regarded as an error since they are based on researchmethods which by their nature are incapable of establishing causality with certainty.Frequently research findings may be consistent with a causal relationship but they are,equally, consistent with other explanations.
FIGURE 1.1 Looking for causal relationships
M01_HOWI4994_03_SE_C01.QXD 10/11/10 14:59 Page 8

CHAPTER 1 THE ROLE OF RESEARCH IN PSYCHOLOGY 9
A great deal of psychology has as its focus causes of things even though the word‘cause’ is not used directly. Questions such as why we are attracted to one person ratherthan another, why people become depressed and why some people commit violentcrimes are typical examples of this. The sorts of explanation that are given might be, for example, some people commit violent crimes because they were physically abused as children. In other words, physical abuse as a child is a cause of adult violent crime.There may be a relationship between physical abuse and violent crime, but does thisestablish that physical abuse is a cause? To return to our main example, suppose a studyfound that people who were attracted to each other had similar attitudes. Pairs of friends were compared with pairs of strangers in terms of how similar their attitudes were (seeFigure 1.1). It emerged that the friends had more similar attitudes than pairs of strangers.Could we conclude from this finding that this study showed that similar attitudes causepeople to be attracted towards one another? If we can conclude this, on what groundscan we do so? If not, then why not?
There are at least three main reasons why we cannot conclude definitively from thisstudy that similar attitudes lead to people liking each other:
Attraction, measured in terms of friendship, and similarity of attitudes are assessedonce and at precisely the same time (see Figure 1.2). As a consequence we do not knowwhich of these two came first. Did similarity of attitudes precede friendship as itwould have to if similar attitudes led to people liking each other? Without knowingthe temporal sequence, definitive statements about cause and effect are not possible(see Figure 1.3).
FIGURE 1.2 Cross-sectional study: measures taken at the same point in time
FIGURE 1.3No time lag between the measurement of attitude similarity and attraction: no evidence of causality
M01_HOWI4994_03_SE_C01.QXD 10/11/10 14:59 Page 9

10 PART 1 THE BASICS OF RESEARCH
Friendship may have preceded similarity of attitudes. In other words, friends developsimilar attitudes because they happen to like one another for other reasons. Once againthe basic problem is that of the temporal sequence. Because this study measures bothfriendship and similarity of attitudes at the same time we cannot tell which came first.In other words we cannot determine which caused which (see Figure 1.4).
FIGURE 1.4Attraction is more likely to cause similarity in this example because of the timelag involved
The development of attraction and similarity may be the result of the influence of athird factor. For example, if one moves to university one begins to be attracted to newpeople and, because of the general influence of the campus environment, attitudes beginto change. In these circumstances, the relationship between attraction and similarityis not causal (in either direction) but the result of a third factor, which is the effect ofthe move to campus (see Figure 1.5).
FIGURE 1.5 Confounding variables in research: all measures taken at the same point in time
Care needs to be taken here. It is not being suggested that the research in question isworthless simply because it cannot definitively establish that there is a causal relationship.The findings of the research are clearly compatible with a causal hypothesis and onemight be inclined to accept the possibility that it is a causal relationship. Nevertheless,one cannot be certain and may find it difficult to argue against someone who rejects the idea. Such divergence of opinion sometimes becomes a controversy in psychology.Divergence of opinion in research is a positive thing as it leads to new research designedto resolve that disagreement.
Some of the most characteristic research methods of psychology are geared towardsaddressing the issue of causality. Some of these will be outlined in due course. Mostimportantly, the contrast between randomised experiments so familiar to psychologistsin the form of laboratory experiments and research outside the laboratory has this issueat its root.
The role of causality in psychology is a controversial topic. (See Box 1.2 for a discussionof this.)
M01_HOWI4994_03_SE_C01.QXD 10/11/10 14:59 Page 10

CHAPTER 1 THE ROLE OF RESEARCH IN PSYCHOLOGY 11
Causal explanations: psychology’s weakest link?
Box 1.2 Talking Point
It is well worth taking the time to study the history of psy-chology. This will help you to identify the characteristicsof the discipline (e.g. Hergenhahn, 2001; Leahy, 2004).What is very obvious is that psychology has been muchmore concerned about causality than many of its closelyrelated disciplines – sociology is a good example. Thereare a number of reasons why this should be the case:
Psychology was much more influenced by the philo-sophies of positivism and logical positivism than theseother disciplines. Broadly speaking, positivism is adescription of the methods of the natural sciences such as physics and chemistry. It basically holds thatknowledge is obtained through observation. So themore focused and precise the empirical observation the better. Hence, a precisely defined cause and an equallyprecisely defined effect would be regarded as appropri-ate. Positivism is a concept originating in the work ofthe French sociologist Auguste Comte (1798–1857). It refers to the historical period when knowledge wasbased on science rather than, say, religious authority.Logical positivism is discussed in some detail inChapter 17.
Psychology has traditionally defined itself as much as a biological science as a social science. Consequently,methods employed in the natural sciences have found asubstantial place in psychology. In the natural sciences,laboratory studies (experiments) in which small num-bers of variables at a time are controlled and studiedare common, as they have been in psychology. The success of disciplines such as physics in the nineteenthcentury and later encouraged psychologists to emulatethis approach.
By emulating the natural sciences approach, psycholo-gists have tended to seek general principles of humanbehaviour just as natural scientists believe that their lawsapply throughout the physical universe. Translated intopsychological terms, the implication is that findingsfrom the laboratory are applicable to situations outsidethe psychological laboratory. Randomised laboratoryexperiments tend to provide the most convincing evid-ence of causality – that is what they are designed to do.
Modern psychology is much more varied in scope thanit ever was in the past. The issue of causality is not as crucial as it once was. There is a great deal of research thatmakes a positive contribution to psychology which eschewsissues of causality. For example, the forensic psychologistwho wishes to predict suicide risk in prisoners does nothave to know the causes of suicide among prisoners. So ifresearch shows that being in prison for the first time is thestrongest predictor of suicide then this is a possible pre-dictor. It is irrelevant whether the predictor is in itself thedirect cause of suicide. There are a multitude of researchquestions which are not about causality.
Many modern psychologists regard the search forcausal relationships as somewhat counterproductive. Itmay be a good ideal in theory, but in practice it may havea negative influence on the progress of psychology. Onereason for this is that the procedures which can help estab-lish causality can actually result in highly artificial andcontrived situations, with the researcher focusing on finedetail rather than obtaining a broad view, and the findingsof such research are often not all that useful in practice.One does not have to study psychology for long before itbecomes more than apparent that there is a diversity ofopinion on many matters.
1.5 Types of research and the assessment of causality
In this section we will describe a number of different types of study in order to achievea broad overview of research methods in psychology. There is no intention to prioritisethem in terms of importance or sophistication. They are:
M01_HOWI4994_03_SE_C01.QXD 10/11/10 14:59 Page 11

12 PART 1 THE BASICS OF RESEARCH
correlational or cross-sectional studies;
longitudinal studies;
experiments – or studies with randomised assignment.
As this section deals largely with these in relation to the issue of causality, all of thetypes of research discussed below involve a minimum of two variables examined in rela-tion to each other. Types of study which primarily aim to describe the characteristics ofthings are dealt with elsewhere. Surveys, for example, are discussed in Chapter 13, andqualitative methods are covered in depth in Chapters 17 to 25.
■ Correlational or cross-sectional studiesCorrelational (or cross-sectional) studies are a very common type of research. Basicallywhat happens is that a number of different variables (see Box 1.1) are measured moreor less simultaneously for a sample of individuals (see Figure 1.6). Generally in psychology,the strategy is to examine the extent to which these variables measured at a single pointin time are associated (that is correlated) with one another. A correlation coefficient is a statistical index or test which describes the degree and direction of the relationshipbetween two characteristics or variables. To say that there is a correlation between twocharacteristics merely means that there is a relationship between them.
The correlation coefficient is not the only way of testing for a relationship. There aremany other statistical techniques which can be used to describe and assess the relationshipbetween two variables. For example, although we could correlate the extent to whichpeople are friends or strangers with how similar are their attitudes using the correlationcoefficient there are other possibilities. An equivalent way of doing this is to examine dif-ferences. This is what is normally done in this kind of study. One would look at whetherthere is a difference in the extent to which friends are similar in their attitudes comparedwith how similar random pairs of strangers are. If there is a difference between the twoin terms of degrees of attitude similarity, it means that there is a relationship betweenthe variable friends/strangers and the variable similarity of attitudes. So a test of dif-ferences (e.g. the t-test) is usually applied rather than a correlation coefficient. A more accurate term for describing these studies is cross-sectional in that they measure vari-ables at one point in time or across a slice or section of time. This alternative term leavesopen how we analyse the data statistically since it implies neither a test of correlationnor a test of differences in itself. Issues related to this general topic are discussed in depthin Chapter 4.
FIGURE 1.6 Structure of a cross-sectional study: all measures taken at the same point in time
M01_HOWI4994_03_SE_C01.QXD 10/11/10 14:59 Page 12

CHAPTER 1 THE ROLE OF RESEARCH IN PSYCHOLOGY 13
Correlational or cross-sectional studies are often carried out in psychology’s sub-disciplines of social, personality, developmental, educational, and abnormal or clinicalpsychology. In these areas such research designs have the advantage of enabling theresearcher to measure a number of different variables at the same time. Any of thesevariables might possibly explain why something occurs. It is likely that anything that weare interested in explaining will have a number of different causes rather than a singlecause. By measuring a number of different variables at the same time, it becomes possibleto see which of the variables is most strongly related to what it is we are seeking to explain.
■ Confounding variablesA major reason why we cannot infer causality is the problem of the possible influence ofunconsidered variables. Sometimes this is referred to as the third variable problem. Forexample, it could be that both friendship and similarity of attitudes are determined bythe area, or kind of area, in which you live (such as a campus as mentioned earlier). Youare more likely to make friends with people you meet, who are more likely to live in thesame area as you. People living in the same area also may be more likely to have the sameor similar attitudes. For example, they may be more likely to share the same religiousattitudes or eat the same food. When a researcher asks people such as students to takepart in a study they are likely to come from different areas. It could be that it is the area,or kind of area, that people come from that determines both who their friends are andtheir attitudes. Variables which either wholly or partially account for the relationshipbetween two other variables are known as confounding variables. Area, or type of area,could be a confounding variable which we may need to check (see Figure 1.7).
One could try to hold constant in several ways the area from which people come. Forexample, one could select only people from the same area. In this way the influence ofdifferent areas is eliminated. If you did this, then there may still be other factors whichaccount for the fact that people are attracted to others who have similar attitudes tothem. It is not always obvious or easy to think what these other factors might be.Because we have to study in this research a number of friendships, it is likely that thepeople making up these friendships will differ in various ways. It would be very difficultto hold all of these different factors constant. One such additional factor might be age.Pairs of friends are likely to differ in age. Some pairs of friends will be older than otherpairs of friends. It could be that any association or relationship between being friendsand having similar attitudes is due to age. People are more likely to be friends with peoplewho are similar in age to them. People of a similar age may have similar attitudes, suchas the kind of music they like or the kinds of clothes they wear. So age may determine
FIGURE 1.7 Stylised diagram of the confounding (third variable) problem
M01_HOWI4994_03_SE_C01.QXD 10/11/10 14:59 Page 13

14 PART 1 THE BASICS OF RESEARCH
both who becomes friends with whom and what their attitudes are. The easiest way to control for confounding variables is to try to measure them and to control for themstatistically. There is another way, which we will mention shortly.
■ Longitudinal studiesSuppose we measured both friendship and similarity of attitudes at two (or more) dif-ferent points of time, could we then determine whether friendship led to having similarattitudes? This kind of study is known as a longitudinal study as opposed to a cross-sectional one. It is more difficult to organise this kind of study, but it could and has beendone. We would have to take a group of people who did not know each other initiallybut who would have sufficient opportunity subsequently to get to know each other. Someof these people would probably strike up friendships. One possible group of participantswould be first-year psychology students who were meeting together for the first time atthe start of their degree. It would probably be best if any participants who knew eachother before going to university or came from the same area were dropped from theanalysis. We would also need to measure their attitudes towards various issues. Thenafter a suitable period of time had elapsed, say three or more months, we would find outwhat friendships had developed and what their attitudes were (see Figure 1.8).
Suppose it were found that students who subsequently became friends started off ashaving the same or similar attitudes and also had the same or similar attitudes subsequently,could we then conclude that similar attitudes lead to friendship? In addition, those whodid not become friends started off dissimilar in attitudes and were still dissimilar threemonths later. This analysis is illustrated in Figure 1.9 in the left-hand column. Well, it iscertainly stronger evidence that similarity of attitudes may result in friendship than weobtained from the cross-sectional study. Nevertheless, as it stands, it is still possible forthe sceptic to suggest that there may be other confounding variables which explain boththe friendships and the similarity in attitudes despite the longitudinal nature of our newstudy. It might be that this association between friendship and attitude similarity can beexplained in terms of confounding variables (see Figure 1.10). For example, the idea wasdiscussed earlier that people who come from similar kinds of areas may be the mostlikely to become friends as they find out they are familiar with the same customs or haveshared similar experiences. They may also have similar attitudes because they come fromsimilar areas. Thus similarity of area rather than similarity of attitudes could lead tofriendships, as illustrated in Figure 1.10.
FIGURE 1.8Longitudinal study of friendship and attitude similarity with variables measuredtwice
M01_HOWI4994_03_SE_C01.QXD 10/11/10 14:59 Page 14
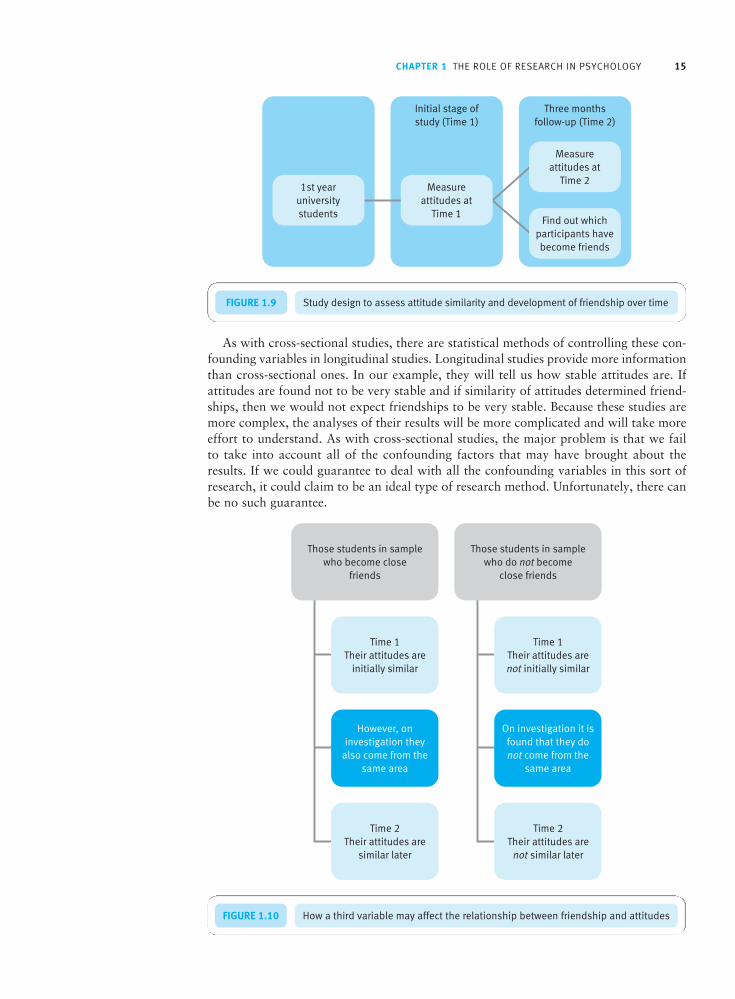
CHAPTER 1 THE ROLE OF RESEARCH IN PSYCHOLOGY 15
As with cross-sectional studies, there are statistical methods of controlling these con-founding variables in longitudinal studies. Longitudinal studies provide more informationthan cross-sectional ones. In our example, they will tell us how stable attitudes are. Ifattitudes are found not to be very stable and if similarity of attitudes determined friend-ships, then we would not expect friendships to be very stable. Because these studies aremore complex, the analyses of their results will be more complicated and will take moreeffort to understand. As with cross-sectional studies, the major problem is that we failto take into account all of the confounding factors that may have brought about theresults. If we could guarantee to deal with all the confounding variables in this sort ofresearch, it could claim to be an ideal type of research method. Unfortunately, there canbe no such guarantee.
FIGURE 1.9 Study design to assess attitude similarity and development of friendship over time
FIGURE 1.10 How a third variable may affect the relationship between friendship and attitudes
M01_HOWI4994_03_SE_C01.QXD 10/11/10 14:59 Page 15

16 PART 1 THE BASICS OF RESEARCH
■ Studies with randomised assignment – experimentsWe have now identified a basic problem. Researchers simply do not and cannot knowjust what other variables may affect their key measures. Is there any way in which allconfounding variables can be taken into account when we do not know what those vari-ables are? For some psychologists, the answer to the major problems of research designlies in the process of randomisation. Basically we would form two groups of participantswho are given the opportunity to interact in pairs and get to know each other better. Inone condition, the pairs are formed by choosing one member of the pair at random andthen the other member selected at random from the participants who had similar attitudesto the first member of the pair. In the other condition, participants are selected at randombut paired with another person dissimilar in attitude to them, again selected at random.By allocating participants to similarity and dissimilarity conditions by chance, any dif-ferences between the conditions cannot be accounted for by these confounding variables.By randomising in this way, similarities and dissimilarities in the areas from which the participants come, for example, would be expected to be equalised between groups. This particular example is illustrated in Figure 1.11 and the more general principles ofexperimental design in Figure 1.12.
The simplest way of randomisation in this example is to allocate participants to thedifferent conditions by tossing a coin. We would have to specify before we tossed the coinwhether a coin landing heads facing upwards would mean that the person was pairedwith a person with the same attitude as them or with a different attitude from them. If wetossed a coin a fixed number of times, say 20 times, then it should come up heads 10 times
FIGURE 1.11 The experimental design to investigate attitude similarity and friendship
M01_HOWI4994_03_SE_C01.QXD 10/11/10 14:59 Page 16
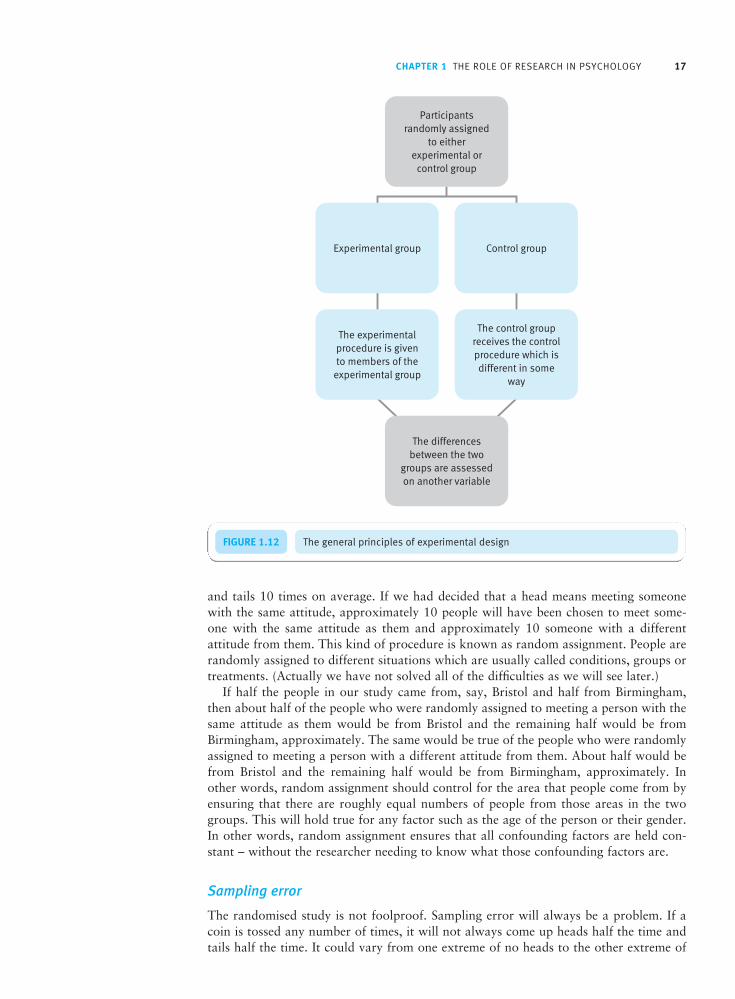
CHAPTER 1 THE ROLE OF RESEARCH IN PSYCHOLOGY 17
and tails 10 times on average. If we had decided that a head means meeting someonewith the same attitude, approximately 10 people will have been chosen to meet some-one with the same attitude as them and approximately 10 someone with a different attitude from them. This kind of procedure is known as random assignment. People arerandomly assigned to different situations which are usually called conditions, groups ortreatments. (Actually we have not solved all of the difficulties as we will see later.)
If half the people in our study came from, say, Bristol and half from Birmingham, then about half of the people who were randomly assigned to meeting a person with thesame attitude as them would be from Bristol and the remaining half would be fromBirmingham, approximately. The same would be true of the people who were randomlyassigned to meeting a person with a different attitude from them. About half would befrom Bristol and the remaining half would be from Birmingham, approximately. In other words, random assignment should control for the area that people come from byensuring that there are roughly equal numbers of people from those areas in the twogroups. This will hold true for any factor such as the age of the person or their gender.In other words, random assignment ensures that all confounding factors are held con-stant – without the researcher needing to know what those confounding factors are.
Sampling error
The randomised study is not foolproof. Sampling error will always be a problem. If acoin is tossed any number of times, it will not always come up heads half the time andtails half the time. It could vary from one extreme of no heads to the other extreme of
FIGURE 1.12 The general principles of experimental design
M01_HOWI4994_03_SE_C01.QXD 10/11/10 14:59 Page 17

18 PART 1 THE BASICS OF RESEARCH
all heads, with the most common number of heads being half or close to half. In otherwords, the proportion of heads will differ from the number expected by chance. Thisvariability is known as sampling error and is a feature of any study. A sample is the num-ber of people (or units) that are being studied. The smaller that the sample is, the greaterthe sampling error will be. A sample of 10 people will have a greater sampling error than one of 20 people. Although you may find doing this a little tedious, you could checkthis for yourself in the following way. Toss a coin 10 times and count the number ofheads (this is the first sample). Repeat this process, say 30 times in total, which gives you 30 separate samples of coin tossing. Note the number of times heads comes up foreach sample. Now do this again but toss the coin 20 times on each occasion rather than10 times for each sample. You will find that the number of heads is usually closer to halfwhen tossing the coin 20 times on each occasion rather than 10 times (see Figure 1.13).Many studies will have as few as 20 people in each group or condition because it isthought that the sampling error for such numbers is acceptable. See our companionstatistics text, Introduction to Statistics in Psychology (Howitt and Cramer, 2011a) fora more detailed discussion of sampling error.
The intervention or manipulation
So, in many ways, if the purpose of one’s research is to establish whether two variablesare causally related, it is attractive to consider controlling for confounding variablesthrough random assignment of participants to different conditions. To determine whethersimilar attitudes lead to friendship, we could randomly assign people to meet strangerswith either similar or dissimilar attitudes to themselves as we have already described.Remember that we have also raised the possibility that people’s attitudes are related to
FIGURE 1.13 A sampling ‘experiment’
M01_HOWI4994_03_SE_C01.QXD 10/11/10 14:59 Page 18

CHAPTER 1 THE ROLE OF RESEARCH IN PSYCHOLOGY 19
other factors such as the area or kind of area they come from. Assuming that this is the case, participants meeting strangers with the same attitudes as themselves might bemeeting people who come from the same area or kind of area as themselves. On theother hand, participants meeting strangers with different attitudes from them may wellbe meeting people who come from a different area or kind of area to themselves. In otherwords, we still cannot separate out the effects of having the attitude similarity from thepossible confounding effects of area similarity. It is clear that we need to disentanglethese two different but interrelated factors. It is not possible to do this using real strangersbecause we cannot separate the stranger from the place they come from.
Let’s consider possible approaches to this difficulty. We need to ensure that thestranger expresses similar attitudes to the participant in the same attitudes condition.That is, if they did not share attitudes with a particular participant, they would never-theless pretend that they did. In the different attitudes condition, then, we could ensurethat the stranger always expresses different attitudes from those of the participant. Thatis, the stranger pretends to have different attitudes from the participant. See Table 1.1for an overview of this. In effect, the stranger is now the accomplice, confederate, stoogeor co-worker of the researcher with this research design.
The number of times the stranger does not have to act as if they have a different attitudefrom the one they have is likely to be the same or similar in the two conditions – that is,if participants have been randomly allocated to them. This will also be true for the numberof times the stranger has to act as if their attitude is different from the one they have.
Unfortunately, all that has been achieved by this is an increase in complexity of theresearch design for no other certain gain. We simply have not solved the basic problem ofseparating similarity of attitude from area. This is because in the same attitude conditionsome of the strangers who share the same attitude as the participant may well be attractiveto the participant actually because they come from the same area as the participant – forexample, they may speak with similar accents. Similarly, some of the participants in thedifferent attitudes condition will not be so attracted to the stranger because the strangercomes from a different area. Quite how this will affect the outcome of the research cannotbe known. However, the fact that we do not know means that we cannot assess thecausal influence of attitude similarity on attraction with absolute certainty.
We need to try to remove any potential influence of place entirely or include it as a variable in the study. Probably the only way to remove the influence of place entirelyis by not using a real person as the stranger. One could present information about astranger’s attitude and ask the participant how likely they are to like someone like that.This kind of situation might appear rather contrived or artificial. We could try to makeit less so by using some sort of cover story such as saying that we are interested in findingout how people make judgements or form impressions about other people. Obviouslythe participants would not be told the proposition that we are testing in case their behaviour is affected by being told. For example, they may simply act in accordance withtheir beliefs about whether or not people are attracted to others with similar attitudes.Not telling them, however, does not mean that the participants do not come to their own
Table 1.1 Manipulating similarity of attitude
Condition Participant Stranger
Same attitude Same as stranger No actingDifferent from stranger Act as if the same
Different attitude Same as stranger Act as if differentDifferent from stranger No acting
M01_HOWI4994_03_SE_C01.QXD 10/11/10 14:59 Page 19

20 PART 1 THE BASICS OF RESEARCH
conclusions about what the idea behind the study is likely to be and, perhaps, act accordingly.
What we are interested in testing may not be so apparent to the participants becausethey take part in only one of the two conditions of the study. Consequently they are notso likely to realise what was happening (unless they talked to other people who hadalready participated in the other condition of the study). We could further disguise thepurpose of our study by providing a lot more information about the stranger over andabove their attitudes. This additional information would be the same for the stranger inboth conditions – the only difference is in terms of the information concerning attitudesimilarity. In one condition attitudes would be the same as those of the participant whilein the other condition they would be different.
If (a) the only difference between the two conditions is whether the stranger’s attitudesare similar or dissimilar to those of the participant and (b) we find that participants aremore attracted to strangers with similar than with dissimilar attitudes then this differ-ence in attraction must be due to the only difference between the two conditions, that is,the influence of the difference in attitudes. Even then there are problems in terms of howto interpret the evidence. One possibility is that the difference in attraction is not directlydue to differences in attitudes themselves but to factors which participants associate withdifferences in attitudes. For example, participants may believe that people with the sameattitudes as themselves may be more likely to come from the same kind of area or be ofthe same age. Thus it would be these beliefs which are responsible for the differences inattraction. In other words when we manipulate a variable in a study we may, in fact,inadvertently manipulate other variables without realising it. We could try to hold theseother factors constant by making sure that the stranger was similar to the participant inthese respects, or we could test for the effects of these other factors by manipulatingthem as well as similarity of attitude.
This kind of study where:
the presumed cause of an effect is manipulated,
participants are randomly assigned to conditions, and
all other factors are held constant
was called a true experiment by Campbell and Stanley (1963). In the latest revision of their book, the term ‘true’ has been replaced by ‘randomised’ (Shadish, Cook andCampbell, 2002, p. 12). If any of the above three requirements do not hold then thestudy may be described as a non-experiment or quasi-experiment. These terms will beused in this book. True or randomised experiments are more common in the sub-disciplines of perception, learning, memory and biological psychology where it is easierto manipulate the variables of interest. The main attraction of true experiments is thatthey can provide logically more convincing evidence of the causal impact of one variableon another. There are disadvantages which may be very apparent in some fields of psychology. For example, the manipulation of variables may result in very contrived andimplausible situations as was the case in our example. Furthermore, exactly what thenature of the manipulation of variables has achieved may not always be clear. Studiesare often conducted to try to rule out or to put forward plausible alternative inter-pretations or explanations of a particular finding. These are generally beneficial to the development of knowledge in that field of research. We will have more confidence in aresearch finding if it has been confirmed or replicated a number of times, by differentpeople, using different methods and adopting a critical approach.
It should be clear by now that the legitimacy of assertions about causal effects dependson the research design that has been used to study them. If we read claims that a causaleffect has been established, then we might be more convinced if we find that the studiesin question which showed this effect were true experiments rather than quasi-experiments.
M01_HOWI4994_03_SE_C01.QXD 10/11/10 14:59 Page 20
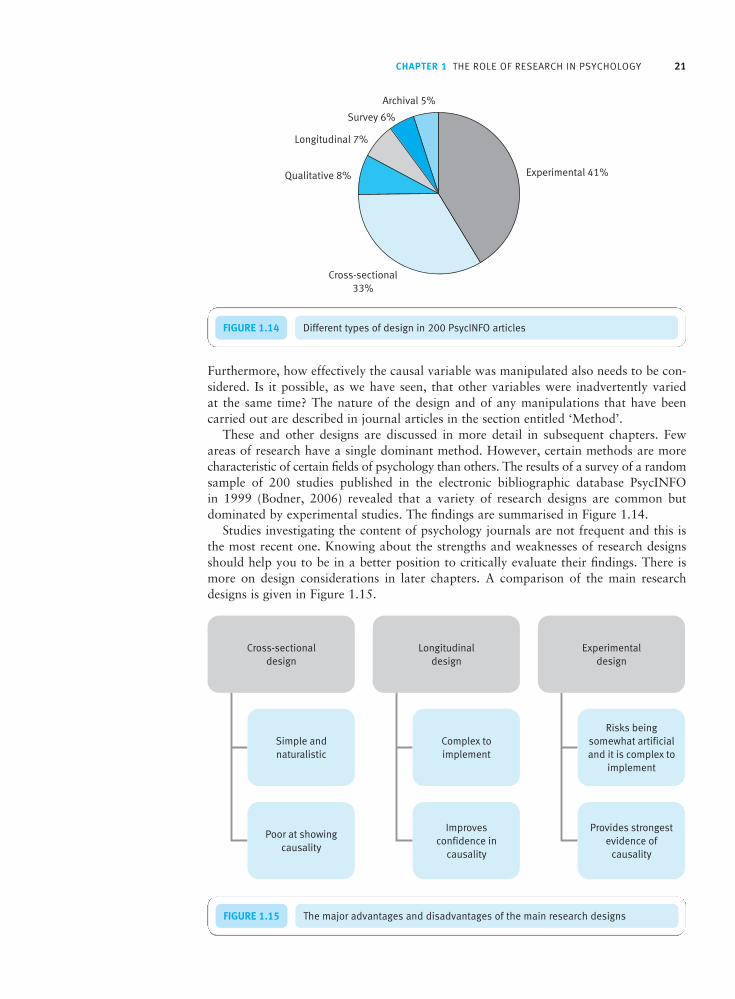
CHAPTER 1 THE ROLE OF RESEARCH IN PSYCHOLOGY 21
Furthermore, how effectively the causal variable was manipulated also needs to be con-sidered. Is it possible, as we have seen, that other variables were inadvertently varied at the same time? The nature of the design and of any manipulations that have been carried out are described in journal articles in the section entitled ‘Method’.
These and other designs are discussed in more detail in subsequent chapters. Fewareas of research have a single dominant method. However, certain methods are morecharacteristic of certain fields of psychology than others. The results of a survey of a randomsample of 200 studies published in the electronic bibliographic database PsycINFO in 1999 (Bodner, 2006) revealed that a variety of research designs are common but dominated by experimental studies. The findings are summarised in Figure 1.14.
Studies investigating the content of psychology journals are not frequent and this isthe most recent one. Knowing about the strengths and weaknesses of research designsshould help you to be in a better position to critically evaluate their findings. There ismore on design considerations in later chapters. A comparison of the main researchdesigns is given in Figure 1.15.
FIGURE 1.14 Different types of design in 200 PsycINFO articles
FIGURE 1.15 The major advantages and disadvantages of the main research designs
M01_HOWI4994_03_SE_C01.QXD 10/11/10 14:59 Page 21

22 PART 1 THE BASICS OF RESEARCH
1.6 Practice
Psychologists believe in the importance of the empirical testing of research ideas. Con-sequently, doing research is a requirement of most degrees in psychology. For example,to be recognised by the British Psychological Society as a practising psychologist youneed to show that you have a basic understanding of research methodology and the skillsto carry it out. This is the case even if you do not intend to carry out research in yourprofession. Training in research is an important part of the training of most practitionerssuch as educational and clinical psychologists. Practising psychologists simply cannotrely on academic psychologists to research all of the topics from which psychologicalpractice might benefit. The concept of practitioner–researcher has developed in recentyears. This is the idea that practitioners such as occupational psychologists and forensicpsychologists have a responsibility to carry out research to advance practice in their fieldof work. To be brutally frank, a student who is not prepared to develop their researchskills is doing themselves and the discipline of psychology no favours at all.
1.7 Conclusion
Most psychological ideas develop in relation to empirical data. Propositions are made,tested and emerge through the process of collecting and analysing data. The crucialactivity of psychologists is the dissemination of ideas and findings which emerge largelythrough empirical work in the many fields of psychology. The prime location to findsuch developments and ideas is in the academic and practitioner journals which describethe outcomes of psychological research. Other important contexts for this are academicand practitioner conferences geared to the presentation of ongoing research develop-ments in psychology and, to a lesser degree, academic books. These various forms ofpublication and presentation serve a dual purpose:
To keep psychologists abreast with the latest thinking and developments in their fieldsof activity.
To provide psychologists with detailed accounts of developing research ideas and theory so that they may question and evaluate their value.
Although the issue of causality has had less of a role in psychological research inrecent years, it remains a defining concern of psychology – and is less typical of somerelated fields. The basic question involved in causality is the question of whether a par-ticular variable or set of variables causes or brings about a particular effect. Many wouldargue, though this is controversial, that the best and most appropriate way of testingcausal propositions is by conducting ‘true’ experiments in which participants have beenrandomly assigned to conditions which reflect the manipulation of possible causal vari-ables. The archetypal true experiment is the conventional laboratory experiment. Eventhen, there is considerable room for doubt as to what variable has been manipulated ina true experiment. It is important to check out the possibility that the experimentalmanipulation has not created effects quite different from the ones that were intended.Alternative interpretations of the findings should always be a concern of psychologists.However, the biggest problem is that there are many variables which simply cannot bemanipulated by the researcher: for example, it is not possible to manipulate variablessuch as schizophrenia, gender, social economic status or intelligence for the convenienceof testing ideas using true experiments. However, the variety and stimulation of using
M01_HOWI4994_03_SE_C01.QXD 10/11/10 14:59 Page 22

CHAPTER 1 THE ROLE OF RESEARCH IN PSYCHOLOGY 23
the more naturalistic or realistic research methods which are often the only rationalchoice in field settings is a challenge which many psychologists find rewarding.
Often these are described as non-experimental designs which, from some points ofview, might be regarded as a somewhat pejorative term. It is a bit like describing womenas non-men. It implies that the randomised experiment is the right and proper way ofdoing psychology. The truth is that there is no right and proper way of intellectualprogress. The development of psychology is not dependent on any single study but thecollective activity of a great many researchers and practitioners. Until there is widespreadacceptance and adoption of an idea, it is not possible to judge its value.
As a research-based discipline, psychology requires a high degree of sophistication about researchand research methods, even as part of the training of psychologists. A vital link in this process is theresearch article or paper published in academic journals. All psychologists should be able to critically,but constructively, evaluate and benefit from reading such publications.
Research articles take time to read as they will refer to other research as well as principles of researchmethodology with which one at first may not be familiar. As one becomes more familiar with theresearch in an area and with the principles of doing research, the importance of the contents ofresearch papers becomes much quicker and easier to appreciate.
One major feature of a research study is the design that it uses. There are various designs. A verybasic distinction is between what has been called a true or randomised experiment and everythingelse which can be referred to as a non-experiment.
True experiments involve the deliberate manipulation of what is presumed to be the causal variable,the random assignment of participants to the conditions reflecting that manipulation and the attemptto hold all other factors constant. Whether or not true experiments should hold a hallowed place inpsychology is a matter of controversy. Many researchers and practitioners never have recourse totheir use or even to the use of their findings.
Even if their value is accepted, the use of true experiments is not straightforward. The manipulationof the presumed causal variable and holding all other factors constant is often very difficult. Con-sequently, a study is never definitive in itself since it requires further research to rule out alternativeinterpretations of the manipulation by allowing for particular factors which were not held constant inthe original study.
Psychologists generally favour the true experiment because it appears to be the most appropriateway for determining causal effects. If you have manipulated only one variable, held all else constantand found an effect, then that effect is likely to be due to the manipulation. At the same time, however,this is also a potential fatal flaw of true experiments. In real life, variables do not operate independentlyand one at a time so why should research assume that they do?
Furthermore, it is not always possible to manipulate the variable presumed to be a cause or to manipulate it in a way which is not contrived. Anyway, not all psychologists are interested in testingcausal propositions. Hence the trend for psychologists to increasingly use a wide variety of non-experimental research designs.
Because of the centrality of research to all aspects of psychology, psychology students are generallyrequired and taught to carry out and write up research. This experience should help them understandwhat research involves. It also gives them an opportunity to make a contribution to a topic that interests them.
Key points
M01_HOWI4994_03_SE_C01.QXD 10/11/10 14:59 Page 23

24 PART 1 THE BASICS OF RESEARCH
ACTIVITIES1. Choose a recent study that has been referred to either in a textbook you are reading or in a lecture that you have
attended. Obtain the original publication. Were the study and its findings correctly reported in the textbook? Do youthink that there were important aspects of the study that were not mentioned in the text or the lecture that should havebeen? If you do think there were important omissions, what are these? Why do you think they were not cited? Did thestudy test a causal proposition? If so, what was this proposition? If not, what was the main aim of this study? In termsof the designs outlined in this chapter what kind of design did the study use?
2. Either choose a chapter from a textbook or go to the library and obtain a copy of a single issue of a journal. Workthrough the material and for every study you find, classify it as one of the following:
correlational or cross-sectional study
longitudinal study
experiment – or study with randomised assignment.
What percentage of each did you find?
M01_HOWI4994_03_SE_C01.QXD 10/11/10 14:59 Page 24

Aims and hypotheses in research
Overview
CHAPTER 2
Different research methods are effective at doing different things. There are methodswhich are particularly good at describing a phenomenon in some detail, estimatinghow common a particular behaviour is, evaluating the effects of some intervention,testing a causal proposition or statistically summarising the results of a number ofsimilar studies. No method satisfies every criterion.
The aims and justification of the study are presented in the first section or introduc-tion of the report or paper. All research should have clear objectives and needs clearjustification for the expenditure of time and effort as well as the procedures carriedout in the research.
Hypotheses are a key component of research studies in the mainstream of psychology.Hypotheses are usually formally stated in a clear and precise form. They also need tobe justified. It should be made apparent why it is important to test the hypothesesand what the basis or rationale is for them.
Alternatively, the general aims and objectives of the research can be summarised ifthe research in question is not particularly conducive to presentation as a hypothesisabout the relationships between small numbers of variables.
Hypotheses are the basic building blocks of much of psychology. Some researchattempts to test hypotheses, other research attempts to explore hypotheses, and yetother research seeks to generate hypotheses.
In their simplest form, hypotheses propose that a relationship exists between a minimumof two variables.
There is an important distinction between research hypotheses (which guide research)and statistical hypotheses (which guide statistical analyses). Research hypotheses
M02_HOWI4994_03_SE_C02.QXD 10/11/10 15:00 Page 25

26 PART 1 THE BASICS OF RESEARCH
are evaluated by a whole range of different means, including statistics. Statisticalhypothesis testing employs a very restricted concept of hypothesis.
Of course, frequently the researcher has an idea of what the relationship is betweentwo variables. That is, the variables are expected or predicted to be related in a particularway or direction. So wherever possible, the nature (or direction) of the relationshipshould be clearly stated together with the reasons for this expectation.
The variable that is manipulated or thought to be the cause of an effect on anothervariable is known as the independent variable. The variable that is measured orthought to be the effect of the influence of another variable is known as the depend-ent variable.
The terms ‘independent’ and ‘dependent’ are sometimes restricted to true experimentswhere the direction of the causal effect being investigated is clearer. However, theyare frequently used in a variety of contexts and are terms which can cause confusion.
The hypothetico-deductive method describes a dominant view of how scientists goabout their work. From what has been observed, generalisations are proposed (i.e.hypotheses) which are then tested, ideally by using methods which potentially coulddisconfirm the hypothesis. The scientist then would either reformulate their hypothesisor test the hypothesis further depending on the outcome.
2.1 Introduction
By now, it should be clear that research is an immensely varied activity with many dif-ferent objectives and purposes. In psychology, these range as widely, perhaps more so,as in any other discipline. In this chapter we will look in some detail at the keystones ofmost research in psychology: the aims and hypotheses underlying a study. Research is athoughtful, rational process. It does not proceed simply by measuring variables andfinding out what the relationship is between them. Instead, research is built on a senseof purpose on the part of the researcher who sees their work as fitting in with, and build-ing on, established psychological knowledge in their chosen field. This sense of directionin research is not simply something that happens, it has to be worked at and workedtowards. The idea of research is not simply to create new information or facts but tobuild on, expand, clarify and illuminate what is already known. To collect data withouta sense of direction or purpose might be referred to, cruelly, as mindless or rampantempiricism. Simply collecting data does not constitute research.
The sense of purpose in research has to be learnt. Most of us develop it slowly as partof learning to appreciate the nature of psychology itself. That is, until one has begun tounderstand that psychology is more than just a few facts to learn then good researchideas are unlikely. There are a number of aspects to this:
It is vital to understand how real psychologists (not just textbook authors) go aboutpsychology. The only way to achieve this is to read and study in depth the writings ofpsychologists – especially those interested in the sorts of things that you are interested in.
The way in which real psychologists think about their discipline, their work and thework of their intellectual colleagues has to be studied. Throughout the writings ofpsychologists, one will find a positive but sceptical attitude to theory and research.
M02_HOWI4994_03_SE_C02.QXD 10/11/10 15:00 Page 26

CHAPTER 2 AIMS AND HYPOTHESES IN RESEARCH 27
There is a sense in which good psychologists regard all knowledge as tentative andeven temporary – the feeling that, collectively, psychologists could always do better.
2.2 Types of study
One useful way of beginning to understand the possible aims of psychological researchis to examine some broad research objectives in psychology and decide what each ofthem contributes. We will look at the following in turn:
descriptive or exploratory studies;
evaluation or outcome studies;
meta-analytic studies.
■ Descriptive or exploratory studiesAn obvious first approach to research in any field is simply to describe in detail the characteristics and features of the thing in question. Without such descriptive material,it is difficult for research to progress effectively. For example, it is difficult to imagineresearch into, say, the causes of schizophrenia without a substantial body of knowledgewhich describes the major features and types of schizophrenia. Descriptions require thatwe categorise in some way the observations we make. Curiously, perhaps perversely,psychology is not replete with famous examples of purely descriptive studies. In Part 4of this book we discuss in detail qualitative research methods. Typical of this type ofresearch is the use of textual material which is rich in detail and this may include descrip-tive analyses as well as analytic interpretations.
Case studies are reports that describe a particular case in detail. They are common in psychiatry though, once again, relatively uncommon in modern psychology. An earlyand often cited instance of a case study is that of ‘Albert’ in which an attempt was madeto demonstrate that an 11-month-old boy could be taught or conditioned to becomefrightened of a rat when he previously was not (Watson and Rayner, 1920). Whether ornot this is a purely descriptive study could probably be argued either way. Certainly the study goes beyond a mere description of the situation; for example, it could also beconceived as investigating the factors that can create fear.
In some disciplines (such as sociology and media studies), one sort of descriptivestudy, known as content analysis, is common. The main objective of this is to describethe contents of the media. So, it is common to find content analyses which report the features of television’s output. For example, the types of violence contained in televisionprogrammes could be recorded, classified and counted. That is to say, the main interestof these studies lies in determining how common certain features are. Actually we havealready seen a good example of content analysis. One aim of the study by Bodner (2006)mentioned in Chapter 1 was to find out the characteristics of studies published in 1999in PsycINFO. The type of research design employed was one of the categories used bythe researchers to classify the contents of the journal.
■ Evaluation or outcome studiesOther research has as its aim to test the effectiveness of a particular feature or interven-tion. Generally speaking, such studies simply concentrate on the consequences of certainactivities without attempting to test theoretical propositions or ideas – that is to say, they
M02_HOWI4994_03_SE_C02.QXD 10/11/10 15:00 Page 27

28 PART 1 THE BASICS OF RESEARCH
tend to have purely empirical objectives. They often do not seek to develop theory. Goodexamples of an intervention into a situation are studies of the effectiveness of pscho-therapeutic treatments. Ideally in such studies participants are randomly assigned to the different treatments or conditions and, usually, one or more non-treated or control conditions. These studies are sometimes referred to as evaluation or outcome studies.When used to evaluate the effectiveness of a clinical treatment such as psychotherapy,evaluation studies are known as randomised controlled trials. Usually the purpose of the evaluation study is to assess whether the intervention taken as a whole is effective.Rarely is it possible to assess which aspects of the intervention are producing theobserved changes. Nevertheless, one knows that the intervention as a whole has (or hasnot) achieved its desired ends. Since interventions usually take place over an extendedperiod of time, it is much more difficult to hold other factors constant than it would inmany laboratory studies that last just a few minutes.
So evaluation studies frequently seek to examine whether an intervention has had its intended effect. That is, did the intervention cause the expected change? However,explanations about why the intervention was successful are secondary or disregarded asthe primary objective is not theory development.
■ Meta-analytic studiesA meta-analysis has the aim of statistically summarising and analysing the results of therange of studies which have investigated a particular topic. Of course, any review ofstudies tries to integrate the findings of the studies. Meta-analysis does this in a systematicand structured way using statistical techniques. Because it provides statistical methodsfor combining and differentiating between the findings of a number of data analyses, itforms a powerful integrative tool. For example, we may be interested in finding outwhether cognitive behaviour therapy is more effective in treating phobias or intense fearsthan no treatment. If we obtain reports of studies which have investigated this question,they will contain information about the statistical trends in the findings of each of thesestudies. These trends may be used to calculate what is known as an effect size. This ismerely a measure of the size of the trend in the data – depending on the measure usedthen this may be adjusted for the variability in the data.
There are several different measures of effect size. For example, in Chapter 35 of the companion volume Introduction to Statistics in Psychology (Howitt and Cramer,2011a), we describe the procedures using the correlation coefficient as a measure ofeffect size. As the correlation coefficient is a common statistical measure, it is familiar tomost researchers. There are other measures of effect size. For example, we can calculatethe difference between the two conditions of the study and then standardise this bydividing by a measure of the variability in the individual scores. Variability can either be the standard deviation of one of the conditions (as in Glass’s ∆) or the combined standard deviation of both conditions of the study (as in Cohen’s d ) (see Rosenthal,1991). We can calculate the average effect size from any of these measures. Because thisdifference or effect size is based on a number of studies, it is more likely to give us a moreclear assessment of the typical effects found in a particular area of research.
We can also see whether the effect size differs according to the ways in which thestudies themselves might differ. For example, some of the studies may have been carriedout on student volunteers for a study of the treatment of phobias. Because these partici-pants have not sought professional treatment for their phobias these studies are some-times referred to as analogue studies. Other studies may have been conducted on patientswho sought professional help for their phobias. These studies are sometimes called clinical studies. We may be interested in seeing whether the effect size differs for thesetwo types of study. It may be easier to treat phobias in students because they may be lesssevere. That is, the effect size will be greater for studies of the treatment of phobias using
M02_HOWI4994_03_SE_C02.QXD 10/11/10 15:00 Page 28

CHAPTER 2 AIMS AND HYPOTHESES IN RESEARCH 29
student volunteers. If there are differences in the effect size for the two kinds of study,we should be more cautious in generalising from analogue studies to clinical ones.Actually, any feature of the studies reviewed in the meta-analysis may be considered inrelation to effect size even, for example, such things as the year in which it was pub-lished. The results of earlier research may be compared with later research.
When reading the results of a meta-analysis, it is important to check the reports of atleast a few of the studies on which the meta-analysis was based. This will help you tofamiliarise yourself with specifics of the designs of these studies. Some social scientistshave argued against the use of meta-analyses because they combine the results of well-designed studies with poorly designed ones. Furthermore, the results of different typesof studies might also be combined. For example, they may use studies in which partici-pants were randomly assigned to conditions together with ones in which this has notbeen done (Shadish and Ragsdale, 1996). Differences in the quality of design are morelikely to occur in evaluation studies which are more difficult to conduct without adequateresources. However, one can compare the effect size of these two kinds of studies to seewhether the effect size differs. If the effect size does not differ (as has been found in somestudies), then the effect size is unlikely to be biased by the more poorly designed studies.Sometimes, meta-analytic studies have used ratings by researchers of the overall qualityof each of the studies in the meta-analysis. In this way, it is possible to investigate therelationship between quality of the study and the size of the effects found. None of thisamounts to a justification for researchers conducting poorly designed studies.
While few students contemplate carrying out a meta-analysis (though it is difficult to understand this reluctance), meta-analytic studies are increasingly carried out in psychology. The biggest problem with them is the need to obtain copies of the originalstudies from which to extract aspects of the original analysis.
2.3 Aims of research
Already it should be abundantly clear that psychological research is an intellectuallyhighly organised and coherent activity. Research, as a whole, does not proceed willy-nilly at the whim of a privileged group of dilettante researchers. The research activitiesof psychologists are primarily directed at other psychologists. In this way, individualresearchers and groups of researchers are contributing to a wider, collective activity.Research which fails to meet certain basic requirements is effectively excluded. Researchwhich has no point, has a bad design, or is faulty in some other way has little chance ofbeing published, heard about and read. The dissemination of research in psychology issubject to certain quality controls which are largely carried out by a peer review processin which experts in the field recommend whether a research report should be publishedor not.
Researchers have to account for the research they do by justifying key aspects of theirwork. Central to this is the requirement that researchers have a good, sound purpose fordoing the research that they do. In other words, researchers have to specify the aims oftheir research. This is two fold:
The researcher needs to have a coherent understanding of what purposes the researchwill serve and how likely it is to serve these purposes. A researcher who cannot seethe point of what they are doing is likely to be a dispirited, bad researcher. Obviously,this is most likely to be the case with student researchers doing research under timepressure to meet course requirements. So clarity about the aims of research is, in thefirst instance, an obligation of the researcher to themselves.
M02_HOWI4994_03_SE_C02.QXD 10/11/10 15:00 Page 29

30 PART 1 THE BASICS OF RESEARCH
The researcher needs to be able to present the aims of their studies with enough clarityto justify the research to interested, but critical, others. This is always done in researchreports, but it is also necessary, for example, in applications for research funds to out-side bodies.
Clearly stated aims are essential means of indicating what the research can contribute.They also help clarify just why the research was done in the way in which it was done.By clarity, we mean a number of things. Of course it means that the aims are presentedas well-written, grammatical sentences. More importantly, the aims of the research needto be clearly justified by providing their rationale. The introduction of any research reportis where the case for the aims of the research is made. Justifying the aims of research caninvolve the following:
Explaining the relevance of the research to what is already known about the topic.The explanation of and justification for the aims of a piece of research may includeboth previous theoretical and empirical advancements in the field. For many topics inpsychology there may well be a great deal of previous research literature. This can bedaunting to newcomers. (Chapter 7 on searching the literature describes how one canefficiently and effectively become familiar with the relevant research literature on atopic.) Examples of the sorts of reasons that can justify doing research on a particulartopic are discussed in Chapter 26.
Reference to the wider social context for research. Psychological research is often a response to the concerns of broader society as exemplified by government, socialinstitutions such as the legal and educational system, business and so forth. Of course,there are substantial amounts of published material which emanate from thesesources – government publications, statistical information, discussion documents andprofessional publications. These are largely not the work of psychologists but are relevant to their activities.
2.4 Research hypotheses
The use of hypotheses is far more common in psychological research than in disciplinessuch as sociology, economics and other related disciplines. It is a concept which derivesfrom natural sciences such as physics, chemistry and biology which have influencedmainstream psychology more than other social and human sciences. The aims of a greatdeal of research in psychology (but by no means all) may be more precisely formulatedin terms of one or more working suppositions about the possible research findings.These are known as hypotheses. A hypothesis does not have to be true since the point ofresearch is to examine the empirical support or otherwise for the hypothesis. So hypo-theses are working assumptions or propositions expressing expectations linked to theaims of the study.
In practice, it is not a difficult task to write hypotheses once we have clarified justwhat our expectations are. Since a hypothesis is merely a statement which describes therelationship expected to hold between two (or more) variables, at a minimum we needto identify what two variables we are interested in and propose that there is a relationshipbetween the two. We could go one step further and specify the nature of that relationship.Taking the idea that we introduced in Chapter 1 that people are attracted to other peopleon the basis of having similar attitudes to each other, what would the hypothesis be? Thetwo variables which derive from this might be ‘attitude similarity’ and ‘attraction’. The
M02_HOWI4994_03_SE_C02.QXD 10/11/10 15:00 Page 30

CHAPTER 2 AIMS AND HYPOTHESES IN RESEARCH 31
hypothesised relationship between the two is that the greater the attitude similarity thenthe greater the attraction to the other person. Expressed as a hypothesis this could readsomething like: ‘Higher levels of attitude similarity lead to higher levels of attraction.’However, there are many ways of writing the same thing as the following list of alter-natives demonstrates:
People with more similar attitudes will be more attracted to each other than peoplewith less similar attitudes.
Greater attitude similarity will be associated with greater interpersonal attraction.
Attitude similarity is positively linked with interpersonal attraction.
The terms positive and negative relationship or association are fundamental conceptsin research. It is important to understand their meaning as they are very commonly usedphrases:
A positive or direct association is one in which more of one quality (attitude similarity)goes together with more of another quality (interpersonal attraction).
A negative or inverse association is one in which more of one quality (attitude similarity)goes together with less of another quality (interpersonal attraction).
An example of a negative or inverse association would be that greater attitude similarityis associated with less attraction. This is not the hypothesis we are testing, though somemight consider it a reasonable hypothesis – after all there is an old saying which suggeststhat opposites attract. Both past research and theory have led us to the expectation thatsimilarity leads to attraction. If that did not exist, then we would have little justificationfor our choice of hypothesis.
The precise phrasing of a hypothesis is guided by considerations of clarity and preci-sion. Inevitably, different researchers will use different ways of saying more or less thesame thing.
Hypotheses can be somewhat more complex than the above example. For instance, athird variable could be incorporated into our hypothesis. This third variable might bethe importance of the attitudes to the individual. So it might be suggested that the moreimportant the attitude is to the person the more they will be attracted to someone witha similar attitude. So this hypothesis actually contains three variables:
‘attitude importance’;
‘attitude similarity’;
‘interpersonal attraction’.
In this case, the hypothesis might be expressed something like this: ‘The relationshipbetween attitude similarity and attraction will be greater when the attitudes are important.’This is quite a technically complex hypothesis to test. It requires a degree of sophisticationabout aspects of research design and statistical analysis. So, at this stage, we will try toconfine ourselves to the simpler hypotheses that involve just two variables.
Few researchers do research which has a single aim. Usually studies involve severalinterrelated aims. This helps the researcher to take advantage of economies of time and other resources. A study which tests several hypotheses at the same time also poten-tially has more information on which to base conclusions. Another advantage is thatthere is a better chance that the researcher has something more interesting and morepublishable. Of course, studies carried out as part of training in psychological researchmethods may be equally or more effective for teaching purposes if a single hypothesis isaddressed.
M02_HOWI4994_03_SE_C02.QXD 10/11/10 15:00 Page 31

32 PART 1 THE BASICS OF RESEARCH
FIGURE 2.1 Alternative ways of writing about a causal relationship
2.5 Four types of hypothesis
The distinction between relationships and causal relationships is important. Hypothesesshould be carefully phrased in order to indicate the causal nature or otherwise of therelationships being investigated.
The statement that attitude similarity is associated with attraction is an example of anon-causal hypothesis. It indicates that we believe that the two variables are interrelatedbut we are not indicating that one variable is causing the other. An association betweentwo variables is all that we can infer with confidence when we measure two variables at the same time. Many psychologists would argue that, strictly speaking, hypothesesshould be presented in a non-causal form when a non-experimental design is used. Whena true experimental design is used, then the use of terms which refer directly or indirectlyto a causal relationship is appropriate. True experimental designs involve the manipulationof the causal variable, participants are randomly assigned to conditions and all else isheld constant. Expressing the hypothesis of a true experiment in a non-causal form failsto give credit to the main virtue of this design.
There is a range of terms which psychologists use which indicate that a causal rela-tionship is being described or assumed. Some of these are illustrated in Figure 2.1. Thesephrases are so associated with questions of causality that they are best reserved for whencausality is assumed to avoid confusion.
The direction of the expected relationship should be incorporated into the wording ofthe hypothesis if at all possible. But this is not a matter of whim and there should begood reasons for your choice. Hypotheses which indicate direction could be:
Greater attitude similarity will lead to greater attraction.
Greater attitude similarity will be associated with greater interpersonal attraction.
M02_HOWI4994_03_SE_C02.QXD 10/11/10 15:00 Page 32

CHAPTER 2 AIMS AND HYPOTHESES IN RESEARCH 33
Since such hypotheses indicate the direction of the relationship expected they arereferred to as directional hypotheses. There are circumstances in which we may not beable to make predictions as to the direction of the relationship with any confidence. Forexample, there may be two different, but equally pertinent, theories which lead us toexpect contradictory results from our study. For example, social learning theory predictsthat watching aggression should lead to greater aggression whereas the idea of catharsispredicts that it should lead to less aggression. Of course, it is not always possible to pina direction to a relationship. Sometimes hypotheses have to be stated without specifying adirection simply because there are reasonable arguments to expect either outcome andthere is no strong reason to predict a particular direction of outcome. There are import-ant issues connected with the statistical analyses of such hypotheses. These are discussedin Box 2.1.
Direction, hypotheses and statistical analysis
Box 2.1 Key Ideas
It is important to differentiate between:
assessing the adequacy of the research hypothesiswhich underlies the research study in question;
testing the null hypothesis and alternate hypothesis insignificance testing (or statistical inference) as part ofthe statistical analysis.
These are frequently confused. The hypothesis testing modelin statistical analysis deals with a very simple question: arethe trends found in the data simply the consequence ofchance fluctuations due to sampling? Statistical analysis inpsychology is guided by the Neyman–Pearson hypothesistesting model although it is rarely referred to as such andseems to be frequently just taken for granted. Thisapproach had its origins in the 1930s. In the Neyman–Pearson hypothesis testing model there are two statisticalhypotheses offered:
That there is no relationship between the two variablesthat we are investigating – this is known as the nullhypothesis.
That there is a relationship between the two variables– this is known as the alternate hypothesis.
The researcher is required to choose between the nullhypothesis and the alternate hypothesis. They must acceptone of them and reject the other. Since we are dealing with probabilities, we do not say that we have proven thehypothesis or null hypothesis. In effect, hypothesis testing
assesses the hypothesis that any trends in the data may bereasonably explained by chance due to using samples ofcases rather than all of the cases. The alternative is that the relationship found in the data represents a substantialtrend which is not reasonably accountable for on the basisof chance.
To put it directly, statistical testing is only one aspectof hypothesis testing. We test research hypotheses in otherways in addition to statistically. There may be alternativeexplanations of our findings which perhaps fit the dataeven better, there may be methodological flaws in theresearch that statistical analysis is not intended to, andcannot, identify, or there may be evidence that the hypo-theses work only with certain groups of participants, forexample. So significance testing is only a minimal test of a hypothesis – there are many more considerations whenproperly assessing the adequacy of our research hypothesis.
Similarly, the question of direction of a hypothesis comesup in a very different way in statistical analysis. Once again,one should not confuse direction when applied to a researchhypothesis with direction when applied to statistical signi-ficance testing. One-tailed testing and two-tailed testing arediscussed in virtually any statistics textbook (for example,Chapter 17 of our companion statistics text Introductionto Statistics in Psychology (Howitt and Cramer, 2011a) is devoted to this topic). Quite simply, one-tailed testing istesting a directional hypothesis whereas two-tailed testingis for testing non-directional hypotheses. However, thereare exacting requirements which need to be met beforeapplying one-tailed testing to a statistical analysis:
M02_HOWI4994_03_SE_C02.QXD 10/11/10 15:00 Page 33
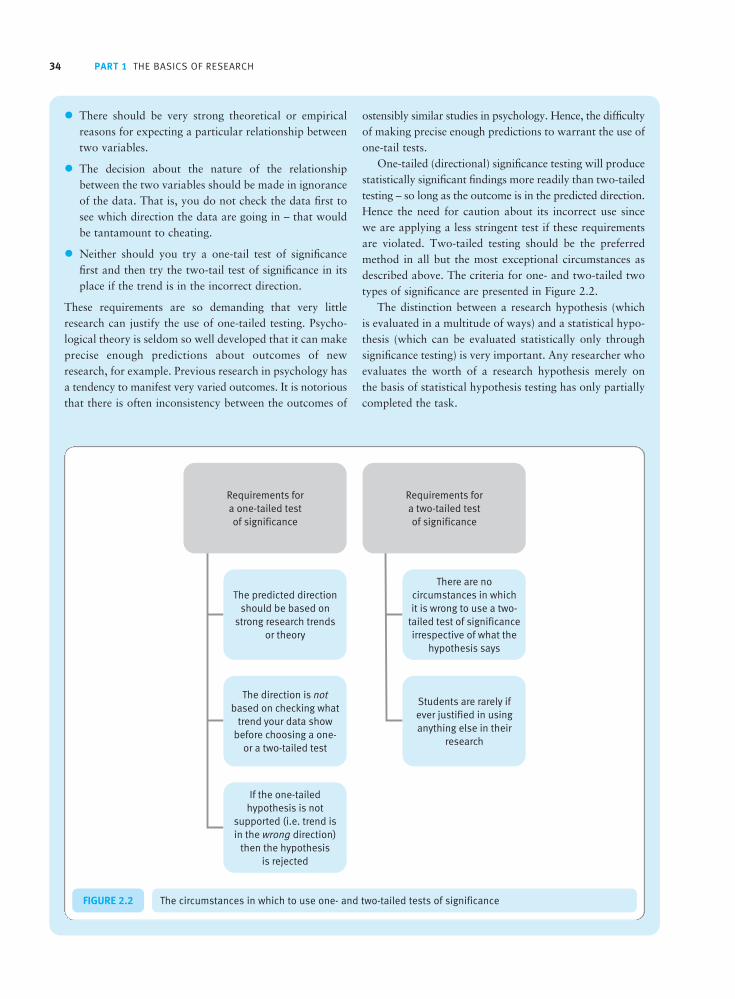
34 PART 1 THE BASICS OF RESEARCH
There should be very strong theoretical or empiricalreasons for expecting a particular relationship betweentwo variables.
The decision about the nature of the relationshipbetween the two variables should be made in ignoranceof the data. That is, you do not check the data first tosee which direction the data are going in – that wouldbe tantamount to cheating.
Neither should you try a one-tail test of significancefirst and then try the two-tail test of significance in itsplace if the trend is in the incorrect direction.
These requirements are so demanding that very littleresearch can justify the use of one-tailed testing. Psycho-logical theory is seldom so well developed that it can makeprecise enough predictions about outcomes of newresearch, for example. Previous research in psychology hasa tendency to manifest very varied outcomes. It is notoriousthat there is often inconsistency between the outcomes of
ostensibly similar studies in psychology. Hence, the difficultyof making precise enough predictions to warrant the use ofone-tail tests.
One-tailed (directional) significance testing will producestatistically significant findings more readily than two-tailedtesting – so long as the outcome is in the predicted direction.Hence the need for caution about its incorrect use since we are applying a less stringent test if these requirementsare violated. Two-tailed testing should be the preferredmethod in all but the most exceptional circumstances asdescribed above. The criteria for one- and two-tailed twotypes of significance are presented in Figure 2.2.
The distinction between a research hypothesis (which is evaluated in a multitude of ways) and a statistical hypo-thesis (which can be evaluated statistically only throughsignificance testing) is very important. Any researcher whoevaluates the worth of a research hypothesis merely on the basis of statistical hypothesis testing has only partiallycompleted the task.
FIGURE 2.2 The circumstances in which to use one- and two-tailed tests of significance
M02_HOWI4994_03_SE_C02.QXD 10/11/10 15:00 Page 34

CHAPTER 2 AIMS AND HYPOTHESES IN RESEARCH 35
Figure 2.3 summarises the four possible types of hypothesis which can be generatedby considering the causal versus non-causal and directional versus non-directional distinc-tions. The letters A and B refer to the two variables. So A could be attitude similarityand B interpersonal attraction.
It should be stressed that without a rationale for a hypothesis based on theory or previous research, the case for examining the relationship between two variables isweakened. Consequently, consideration should be given to other reasons for justifyingresearching the relationship between two variables. Given the billions of potential variables that could be available to psychologists, why choose variable 2 743 322 and variable 99 634 187 for study? Research is not about data collection and analysisfor its own sake. Research is part of a systematic and coordinated attempt to under-stand its subject matter. Until one understands the relationship between research andadvancement of understanding, research methods will probably remain a mass of buzzingconfusion.
The aims and hypotheses of a study are its driving force. Once the aims and hypothesesare clarified, other aspects of the research fall into place much more easily. They helpfocus the reading of the published literature on pertinent aspects since the aims andhypotheses help indicate what is most relevant in what we are reading. Once the pastresearch and writings relevant to the new research study have been identified with the help of clear aims and hypotheses, the introduction can be written using more convincing and coherent justifications for them. The aims and hypotheses clarify whatvariables will need to be measured. Similarly, the aims and hypotheses help guide theresearcher towards appropriate research design. The data will support or not support the hypotheses, either wholly or partially. Finally, the discussion of the results will primarily refer back to the aims and hypotheses. It is hardly surprising, then, to find thatthe aims and hypotheses of a study can be the lynchpin that holds a report together. If they are incoherent and confused then little hope can be offered about the value of the study.
FIGURE 2.3 The four different types of hypotheses according to directionality and causality
*An alternative would be to predict ‘less’.
M02_HOWI4994_03_SE_C02.QXD 10/11/10 15:00 Page 35
36 PART 1 THE BASICS OF RESEARCH
2.6 Difficulties in formulating aims and hypotheses
The aims or objectives of published studies are usually well defined and clear. They are,after all, the final stage of the research process – publication. It is far more difficult to beconfident about the aims and hypotheses of a study that you are planning for yourself.One obvious reason for this is that you are at the start of the research process. Refiningone’s crude ideas for research into aims and hypotheses is not easy – there is a lot ofreading, discussing, planning and other work to be done. You will usually have a roughidea of what it is that you want to do but you are not likely to think explicitly in termsof aims and hypotheses – you probably have little experience after all. Take some comfort in personal construct theory (Kelly, 1955) which suggests that humans act likescientists and construct theories about people and the nature of the world. You mayrecognise yourself behaving like this when you catch yourself thinking in ways such as‘if this happens, then that should happen’. For example, ‘if I send a text message then hemight invite me to his party in return’.
This kind of statement is not different from saying ‘if someone has the same attitudeas someone else, then they will be attracted to that person’ or ‘the more similar someone’sattitude is to that of another person, the more they will be attracted to that individual’.These are known as conditional propositions and are clearly not dissimilar fromhypotheses. This kind of thinking is not always easy to recognise. Take, for example, the belief or statement that behaviour is determined by one’s genes. At first sight thismay not appear to be a conditional or ‘if . . . , then . . .’ proposition. However, it can be turned into one if we restate it as ‘if someone has the same genes as another person,they will behave in the same way’ or ‘the more similar the genes of people are, the moresimilar they will behave’.
There is another fundamental thing about developing aims and hypotheses for psy-chological research. If people are natural scientists testing out theories and hypotheses,they also need to have a natural curiosity about people and the world. In other words,research ideas will only come to those interested in other people and society. Researchcan effectively be built on your interests and ideas just so long as you remember thatthese must be integrated with what others have done starting with similar interests.
Hypothetico-deductive method
Box 2.2 Key Ideas
The notion of the hypothesis is deeply embedded in psy-chological thinking and it is also one of the first ideas thatpsychology students learn about. However, it is a mistaketo think that the testing of hypotheses is the way in whichpsychological research must invariably proceed. The processof hypothesis testing, however, particularly exemplifies theapproach of so-called scientific psychology. Karl Popper,the twentieth-century philosopher, is generally regarded asthe principal advocate and populariser of the hypothetico-deductive method, although it has its origins in the work
of the nineteenth-century academic William Whewell. Thefoundation of the method, which is really a description ofhow scientists do their work, is that scientists build fromthe observations they make through the process of induc-tive reasoning. Induction refers to making generalisationsfrom particular instances. These inductions in the scientificmethod are referred to as hypotheses, which comes from aGreek word meaning ‘suggestion’. Thus when scientistsdevelop hypotheses they are merely making a sugges-tion about what is happening in general based on their
M02_HOWI4994_03_SE_C02.QXD 10/11/10 15:00 Page 36

CHAPTER 2 AIMS AND HYPOTHESES IN RESEARCH 37
observations. Notice that induction is a creative processand that it is characteristic of much human thinking, notjust that of scientists.
In the scientific method, hypotheses are tested to assesstheir adequacy. There are two main ways of doing this: (1) by seeking evidence which confirms the hypothesis and(2) by seeking evidence which disconfirms the hypothesis.There are problems in using confirmatory evidence sincethis is a very weak test of a hypothesis. For example, takeSigmund Freud’s idea that hysteria is a ‘disease’ of women.We could seek confirmatory evidence of this by studyingwomen and assessing them for hysteria. Each woman who has hysteria does, indeed, confirm the hypothesis.The women who do not have hysteria do not refute thehypothesis since there was no claim that all women sufferhysteria. However, by seeking confirmatory evidence, wedo not put the hypothesis to its most stringent test. Whatevidence would disconfirm the hypothesis that hysteria is a disease of women? Well, evidence of the existence of hysteria in men would undermine the hypothesis, forexample. So a scientist seeking to evaluate a hypothesis bylooking for disconfirming evidence might study the inci-dence of hysteria in men. Any man found to have hysteriaundermines the stated hypothesis. In other words, a nega-tive instance logically should have much greater impactthan any number of confirmatory instances. So, the word‘deductive’ in ‘hypothetico-deductive’ method refers to the
process of deducing logically a test of a hypothesis (which,in contrast, is based on inductive reasoning).
In this context, one of Karl Popper’s most importantcontributions was his major proposal about what it iswhich differentiates scientific thinking from other forms of thinking. This is known as demarcation since it con-cerns what demarcates the scientific approach from non-scientific approaches. For Popper, an idea is scientific onlyif it is falsifiable and, by implication, a theory is scien-tific only if it is falsifiable. So some ideas are intrinsicallynon-scientific, such as the view that there is a god. It is not possible to imagine the evidence which disconfirmsthis so the idea is not falsifiable. Popper criticised the scientific status of the work of Sigmund Freud becauseFreud’s theories, he argued, were often impossible to falsify.
The hypothetico-deductive method can be seen as aprocess as illustrated in Figure 2.4. Disconfirmation of ahypothesis should lead to an upsurge in the creative pro-cess as new hypotheses need to be developed which takeaccount of the disconfirmation. On the other hand, findingsupport for the hypothesis does not imply an end to theresearcher’s attempts to test the hypothesis since there aremany other possible ways of disconfirming the hypothesis.This is part of the reason why psychologists do not speakof a hypothesis as being proven but say that it has beensupported.
FIGURE 2.4 Stages in the hypothetico-deductive process
M02_HOWI4994_03_SE_C02.QXD 10/11/10 15:00 Page 37

38 PART 1 THE BASICS OF RESEARCH
■ The comparative methodCharacteristically, hypotheses in psychology imply a comparison between two or moregroups. Sometimes this comparison is taken for granted in the expression of hypothesesso is not overtly stated. Unless one recognises this implicit comparison in hypotheses, it may prove difficult to formulate satisfactory ones and, furthermore, it may not beobvious that the appropriate research design should involve a comparison of two ormore groups. Suppose we are interested in physical abuse in romantic relationships. One possible reason for such abuse is that one or both of the partners in the relationshipare very possessive of the other person. So the violence may occur whenever a partnerfeels threatened by what the other person does or does not do. The research we carryout examines whether or not abusive partners are possessive. So the hypothesis is that abusive partners are possessive. We give out questionnaires measuring possessiveness to 50 people known to have physically abused their partner. Suppose we find that 70 percent of people in abusive relationships are possessive. What can we conclude on the basisof this? Well it is certainly true that most abusive people are possessive. However, we donot know how many people not in abusive relationships are also possessive. That is,when it is suggested that abusive people are possessive, there is an implication that non-abusive people are not possessive.
The problem does not stem from how we have tested our hypothesis but from ourunderstanding of the hypothesis itself. What the hypothesis implies is that abusive part-ners are more possessive than non-abusive partners. Just by looking at abusive partnerswe cannot tell whether they are more possessive than non-abusive partners. It could bethat 70 per cent or even 90 per cent of non-abusive partners were possessive. If this werethe case, abusive partners are not more possessive than non-abusive partners. They mayeven be less possessive than non-abusive partners.
Had the hypothesis been put as ‘There is a relationship between possessiveness and abuse’ then the comparison is built in but may still not be entirely obvious to thosestarting research for the first time. Probably the best rule of thumb is the assumption that psychological hypotheses almost invariably include or imply comparisons betweengroups of people.
2.7 Conclusion
It is almost a truism to suggest that the aims and hypotheses of research should be clear.This does not mean that the aims and hypotheses are obvious at the earliest stages of theresearch project. Since research is part of the ways in which psychological knowledgeand ideas develop, it is almost inevitable that aims and hypotheses go through a develop-mental process. Reformulation of the aims and objectives of a study will commonlyoccur in the research planning stage, and sometimes after. All research is guided by aims,but hypotheses are only universal in certain types of research – especially true experiments– where it is possible to specify likely outcomes with a great deal of precision. Hypothesesare best included wherever possible since they represent the distillation of the researcher’sthoughts about the subject matter. Sometimes, for non-experimental studies, the formu-lation of hypotheses becomes too cumbersome to be of value. Hence, many excellentstudies in psychology will not include hypotheses.
The true experiment (for example, the laboratory experiment) has many advantagesin terms of the testing of hypotheses – that is (a) its ability to randomise participants toconditions, (b) the requirement of manipulating the independent variable rather thanusing already existing variables such as gender, and (c) the control over variables.
M02_HOWI4994_03_SE_C02.QXD 10/11/10 15:00 Page 38

CHAPTER 2 AIMS AND HYPOTHESES IN RESEARCH 39
Although we have largely discussed the testing of a single hypothesis at a time, very little research in real life is so restricted. Remember, most research studies have severalaims and several hypotheses in the same study because we are usually interested in theway in which a number of different variables may be related to one another. It wouldalso be more costly in terms of time and effort to investigate these hypotheses one at atime in separate studies.
In the penultimate section of this book on qualitative research methods, we will seethat important research in psychology can proceed using a quite different approach to investigation in which the idea of specified aims and hypotheses is something of an anathema. Nevertheless, much research in mainstream psychology either overtly or tacitly subscribes to hypothesis testing as an ideal. Chapter 17 overviews the theoreticalbasis to these different approaches to research.
Research studies have different general aims. Most seem to be concerned with testing causal proposi-tions or hypotheses. Others may describe a phenomenon or intervention in detail, estimate how commona behaviour is in some population, evaluate the effects of interventions or statistically summarise theresults of similar studies. The aim or aims of a study should be clearly and accurately stated.
Studies which test causal propositions should describe clearly and accurately what these proposi-tions are.
The research study should make a contribution to the topic. While research usually builds on previousresearch in an area, the contribution of the study should be original to some extent in the sense thatthe particular question addressed has not been investigated in this way before.
A hypothesis describes what the relationship is expected to be between two or more variables. Thehypothesis should be stated in a causal form when the study is a true experiment. It should be statedin a non-causal form when the study is a non-experiment.
When suggesting that variables may be related to one another, we usually expect the variables to berelated in a particular way or direction. When this is the case, we should specify in the hypothesiswhat this direction is.
The variable thought to be the cause may be called the independent variable and the variable pre-sumed to be the effect the dependent variable. Some researchers feel that these two terms shouldbe restricted to the variables in a true experiment. In non-experiments the variable assumed to be thecause may be called the predictor and the variable considered to be the effect the criterion.
Key points
ACTIVITIES1. Choose a recent study that has been referred to either in a textbook you are reading or in a lecture that you have
attended. What kind of aim or aims did the study have in terms of the aims mentioned in this chapter? What were thespecific aims of this study? What kinds of variables were manipulated or measured? If the study involved testinghypotheses, were the direction and the causal nature of the relationship specified? If the hypothesis was stated in acausal form was the design a true (i.e. randomised) one?
2. You wish to test the hypothesis that we are what we eat. How could you do this? What variables could you measure?
M02_HOWI4994_03_SE_C02.QXD 10/11/10 15:00 Page 39

Variables, concepts and measures
Overview
CHAPTER 3
The variable is a key concept in psychological research. A variable is anything whichvaries and can be measured. There is a distinction between a concept and how it ismeasured.
Despite the centrality and apparent ubiquity of the concept of variable, it wasimported into psychology quite recently in the history of the discipline and largelyfrom statistics. The dominance of ‘variables’ has been criticised because it tends toplace emphasis on measurement rather than theoretical and other conceptual refine-ments of basic psychological concepts.
In psychology, the distinction between independent and dependent variables isimportant. Generally, the independent variable is regarded as having an influence onthe dependent variable. This is especially so in terms of experimental designs whichseek to identify cause-and-effect sequences and the independent variable is themanipulated variable.
Nominal variables are those which involve allocating cases to two or more categories.Binomial means that there are two categories, multinomial means that there are morethan two categories. A quantitative variable is one in which a numerical value or scoreis assigned to indicate the amount of a characteristic an individual demonstrates.
Stevens’ theory of measurement suggests that variables can be measured on one offour different measurement scales – nominal, ordinal, interval and ratio. These havedifferent implications as to the appropriate mathematical and statistical procedureswhich can be applied to them. However, generally in psychological research wheredata are collected in the form of numerical scores, the analysis tends to assume thatthe interval scale of measurement underlies the scores.
M03_HOWI4994_03_SE_C03.QXD 10/11/10 15:00 Page 40

Operational definitions of concepts describe concepts in terms of the procedures orprocesses used to measure those concepts. This is an idea introduced by psychologistsfrom the physical sciences which attempts to avoid a lack of clarity in the definitionof concepts. There is a risk that this places too great an emphasis on measurementat the expense of careful understanding of concepts.
Mediator variables intervene between two variables and can be regarded as responsiblefor the relationship between those two variables. Moderator variables, on the otherhand, simply show that the relationship between an independent and a dependentvariable is not consistent but may be different at different levels of the moderator variable. For example, the relationship between age and income may be different formen and women. In this case, gender would be the moderator variable.
Hypothetical constructs are not variables but theoretical or conceptual inventionswhich explain what we can observe.
3.1 Introduction
Variables are what we create when we try to measure concepts. So far we have used the term variable without discussing the idea in any great detail. Yet variables are at the heart of much psychological research. Hypotheses are often stated using the namesof variables involved together with a statement of the relationship between the variables.In this chapter we will explore the idea of variables in some depth. A variable is anycharacteristic or quality that has two or more categories or values. Of course, what thatcharacteristic or quality is has to be defined in some way by the researcher. Saying that a variable has two or more categories or values simply reminds us that a variablemust vary by definition. Otherwise we call it a constant. Researchers refer to a numberof different types of variable, as we will discuss in this chapter. Despite the apparentubiquity of the idea of variables in psychology textbooks, the centrality of the conceptof variables in much of modern psychology should be understood as applying largely to quantitative mainstream psychology. The concept is not normally used in qualitativepsychology. Furthermore, historically the concept of a variable is a relatively modernintroduction into the discipline, largely from statistics.
Variables are the things that we measure; they are not exactly the same thing as theconcepts that we use when trying to develop theories about something. In psychologicaltheories we talk in terms of concepts: in Freudian psychology a key concept is the ego; insocial psychology a key concept is social pressure; in biological psychology a key conceptmight be pheromones. None of these, in itself, constitutes a variable. Concepts are aboutunderstanding things – they are not the same as the variables we measure. Of course, a major task in research is to identify variables which help us measure concepts. Forexample, if we wished to measure social influence we might do so in a number of differentways such as the number of people in a group who disagree with what a participant ina group has to say.
CHAPTER 3 VARIABLES, CONCEPTS AND MEASURES 41
M03_HOWI4994_03_SE_C03.QXD 10/11/10 15:00 Page 41

42 PART 1 THE BASICS OF RESEARCH
3.2 The history of the variable in psychology
The concept of variable has an interesting history in that psychology existed almost withno reference to variables for the first 50 or so years of the discipline’s modern existence.The start of modern psychology is usually dated from the 1870s when Wilhelm Wundt(1832–1920) set up the first laboratory for psychological research at the University ofLeipzig in 1879. Search through the work of early psychologists such as Sigmund Freud(1856–1939) and you find that they discuss psychological phenomena and not variables.The term ‘independent variable’, so familiar to all psychology students nowadays, washardly mentioned at all in psychology publications before 1930. Most psychologists use the term without questioning the concept and it is probably one of the first pieces ofpsychological jargon that students come across. Psychology textbooks almost invariablydiscuss studies, especially laboratory experiments, in terms of independent and dependentvariables; these terms are used instead of the names of the psychological phenomena orconcepts that are being studied.
Variables, then, were latecomers in the history of psychology. It probably comes asno surprise to learn that the term ‘variable’ has its origins in nineteenth century math-ematics, especially the field of statistics. It was introduced into psychology from thework of Karl Pearson (1857–1936) who originated the idea of the correlation coefficient.By the 1930s, psychologists were generally aware of statistical ideas, so familiarity withthe term variable was common.
Edward Tolman (1886–1959), who is probably best remembered for his cognitivebehavioural theory of learning and motivation, was the first to make extensive use of theword variable in the 1930s when he discussed independent variables and dependent vari-ables together with his new idea of intervening variables. The significance of this can beunderstood better if one tries to discuss Freudian psychology, for example, in terms ofthese three types of variable. It is difficult to do so without losing the importance andnuances of Freudian ideas. In other words, these notions of variables tend to favour orfacilitate certain ways of looking at the psychological world.
Danziger and Dzinas (1997) studied the prevalence of the term ‘variables’ in fourmajor psychological journals published in 1938, 1949 and 1958. In the early journalsthere is some use of the term ‘variable’ in what Danziger and Dzinas describe as the‘softer’ areas of psychology such as personality, abnormal and social psychology; sur-prisingly laboratory researchers were less likely to use the term. The increase in the useof the word ‘variable’ cannot be accounted for by an increase in the use of statistics inpublished articles since this was virtually universal in research published in the journalsstudied from 1938 onwards. The possibility that this was due to a rapidly expanding useof the term ‘intervening variable’ can also be dismissed on the basis that these wererarely mentioned in the context of empirical research – it was a term confined almostexclusively to theoretical discussions.
The use of the concepts of independent variable and dependent variable was beingencouraged by experimental psychologists to replace the terminology of stimulus–response. Robert Woodworth (1869–1962), a prominent and highly influential authorof a dominant psychology textbook of the time (Woodworth, 1938), adopted the newterminology and others followed his lead. Perhaps influenced by this, there was a sub-stantial increase in the use of the terms independent variable and dependent variableover the time period that the journals were studied.
Danziger and Dzinas argue that the term variable took prominence because psycho-logists reconstrued psychological phenomena in terms of the variables familiar from
M03_HOWI4994_03_SE_C03.QXD 10/11/10 15:00 Page 42

CHAPTER 3 VARIABLES, CONCEPTS AND MEASURES 43
statistics. In this way, psychological phenomena became mathematical entities or, atleast, the distinction between the two was obscured. Thus psychologists write of personality variables when discussing aspects of personality which have not yet evenbeen measured as they would have to be to become statistical variables. This amountsto a ‘prestructuring’ or construction of the psychological world in terms of variables andthe consequent assumption that psychological research simply seeks to identify thisstructure of variables. Thus variables ceased to be merely a technical aspect of how psychological research is carried out but a statement or theory of the nature of psy-chological phenomena:
When some of the texts we have examined here proceeded as if everything that existspsychologically exists as a variable they were not only taking a metaphysical position,they were also foreclosing further discussion about the appropriateness of their pro-cedures to the reality being investigated.
(Danziger and Dzinas, 1997, p. 47)
So are there any areas of psychology which do not use the concept of variable? Well it is very difficult to find any reference to variables in qualitative research, forexample. Furthermore, it might be noted that facet theory (Canter, 1983; Shye andElizur, 1994) regards the measures that we use in research simply as aspects of the worldwe are trying to understand. The analogy is with cutting precious stones. There are manydifferent possible facets of a diamond depending on the way in which it is cut. Thus ourmeasures simply reflect aspects of reality which are incomplete and less than the full pictureof the psychological phenomena we are interested in. In other words, our measures areonly a very limited sample of possible measures of whatever it is we are interested in theoretically. So the researcher should avoid confusing the definition of psychologicalconcepts with how we measure them, but explore more deeply the definition of the conceptat the theoretical level.
3.3 Types of variable
There are numerous different types of variable in psychology which may be indicative ofthe importance of the concept in psychology. Some of these are presented in Table 3.1,which indicates something of the relationship between the different types. However, the important thing about the table is that certain meanings of variable are primarily of theoretical and conceptual interest whereas others are primarily statistical in nature. Of course, given the very close relationships between psychology and statistics, manyvariables do not readily fall into just one of these categories. This is sometimes becausepsychologists have taken statistical terminology and absorbed it into their professionalvocabulary to refer to slightly different things. There is an implication of the table whichmay not appear obvious at first sight. That is, it is very easy to fall into the trap of dis-cussing psychological issues as if they are really statistical issues. This is best exemplifiedwhen psychologists seek to identify causal influences of one variable on another. Theonly way in which it is possible to establish that a relationship between two variables is causal is by employing an appropriate research design to do this. The randomisedexperiment is the best example of this by far. The statistical analysis employed cannotestablish causality in itself.
M03_HOWI4994_03_SE_C03.QXD 10/11/10 15:00 Page 43

44 PART 1 THE BASICS OF RESEARCH
Table 3.1 Some of the main types of variable
Type of variable
Binomial variable
Causal variable
Confounding variable
Continuous variable
Dependent variable
Discrete variable
Dummy variable
Hypothetical construct
Independent variable
Interval variable
Intervening variable
Mediator variable
Moderator variable
Multinomial variables
Nominal (category or categorical) variable
Ordinal variable
Score variable
Suppressor variable or masking variable
Third variable
Domain – psychologicalor statistical
Statistical
Psychological
Psychological
Statistical
Both
Statistical
Statistical
Psychological
Both
Statistical
Primarily psychologicalbut also statistical
Primarily psychologicalbut also statistical
Statistical
Statistical
Statistical
Statistical
Statistical
Statistical
Statistical
Comments
A variable which has just two possible values.
It is not possible to establish cause-and-effect sequences simply on the basis of statistics. Cause and effect can be established only by the use of appropriate research designs.
A general term for variables which cause confusion as to theinterpretation of the relationship between two variables of interest.
A variable for which the possible scores have every possible valuewith its range. So any decimal value, for example, is possible for thescores.
The variable assumed to be affected by the independent variable.
A variable for which the possible scores have a limited number of‘discrete’ (usually whole number) values within its range – that is, not every numerical value is possible.
Used to describe the variables created to convert nominal categorydata to approximate score data.
Not really a form of variable but an unobservable psychologicalstructure or process which explains observable findings.
The variation in the independent variable is assumed to account for all or some of the variation in the dependent variable. As apsychological concept, it tends to be assumed that the independentvariable has a causal effect on the dependent variable. This is not thecase when considered as a statistical concept.
Variables measured on a numerical scale where the unit ofmeasurement is the same size irrespective of the position on the scale.
More or less the same as a mediator variable. It is a variable (concept)which is responsible for the influence of variable A on variable B. In other words it intervenes between the effect of variable A onvariable B.
A variable (concept) which is responsible for the influence of variable A on variable B. In other words it mediates the effect of variable A on variable B.
A moderator variable is one which changes the character of therelationship between two variables.
A nominal variable which has a number of values.
Any variable which is measured by allocating cases to namedcategories without any implications of quantity.
A variable which is measured in a way which allows the researcher toorder cases in terms of the quantity of a particular characteristic.Derives from Stevens’ theory of measurement.
Any variable which is measured using numbers which are indicative ofthe quantity of a particular characteristic.
A suppressor variable is a third variable which hides (reduces) thetrue relationship between two variables of interest.
A general term for variables which in some way influence therelationship between two variables of interest.
M03_HOWI4994_03_SE_C03.QXD 10/11/10 15:00 Page 44

CHAPTER 3 VARIABLES, CONCEPTS AND MEASURES 45
3.4 Independent and dependent variables
The concept of independent and dependent variables is common in psychological writings.The distinction between the two is at its clearest when we consider the true experimentand, in an ideal world, would probably best be confined to laboratory and similar true experiments. The variable which is manipulated by the researcher is known as theindependent variable. Actually it is totally independent of any other variable in a trueexperimental design since purely random processes are used to allocate participants tothe different experimental treatments. Nothing in the situation, apart from randomness,influences the level of the independent variable. The variable which is measured (ratherthan manipulated) is the dependent variable since the experimental manipulation isexpected to influence how the participants in the experiment behave. In other words, thedependent variable is subject to the influence of the independent variable.
The concepts of independent and dependent variables would appear to be quite simple,that is, the independent variable is the manipulated variable and the dependent variableis the measured variable which is expected to be influenced by the manipulated variable.It becomes rather confusing because the distinction between independent and depend-ent variables is applied to non-experimental designs. For example, the term independentvariable is applied to comparisons between different groups. Thus, if we were comparingmen and women in terms of their computer literacy then gender would be the independentvariable. Computer literacy would be the dependent variable.
Of course, gender cannot be manipulated by the researcher – it is a fixed characteristicof the participant. Variables which cannot be or were not manipulated and which arecharacteristic of the participant or subjects are sometimes called subject variables. Theyinclude such variables as how old the person is, how intelligent they are, how anxiousthey are and so on. All of these variables may be described as the independent variable bysome researchers. However, how can a variable be the independent variable if the causaldirection of the relationship between two variables is not known? In non-experiments itmay be better to use more neutral terms for these two types of variable such as predictorvariable for the independent variable and criterion variable for the dependent variable.In this case we are trying to predict what the value of the criterion variable is from thevalues of the predictor variable or variables.
Things get a little complicated since in non-experimental designs, what is the inde-pendent variable for one analysis can become the dependent variable for another andvice versa. This may be all the more reason for confining the independent–dependentvariable distinction to experimental designs.
3.5 Measurement characteristics of variables
Measurement is the process of assigning individuals to the categories or values of a vari-able. Different variables have different measurement characteristics which need to beunderstood in order to plan and execute research effectively. The most important wayin which variables differ is in terms of the nominal versus quantitative measurement.These are illustrated in Figure 3.1.
■ Nominal variables (also known as qualitative, category orcategorical variables)Nominal variables are ones in which measurement consists of categorising cases in termsof two or more named categories. The number of different categories employed is alsoused to describe these variables:
M03_HOWI4994_03_SE_C03.QXD 10/11/10 15:00 Page 45

46 PART 1 THE BASICS OF RESEARCH
Dichotomous, binomial or binary variables These are merely variables which aremeasured using just two different values. (The term dichotomous is derived from theGreek meaning equally divided or cut in two: dicho is Greek for apart, separate or intwo parts while ‘-ous’ is Latin for characterised by.) For example, one category couldbe ‘friend’ while the other category would be anyone else.
Multinomial variables When a nominal variable has more than two values it isdescribed as a multinomial, polychomous or polytomous variable (poly is Greek formany). We could have the four categories of ‘friend’, ‘family member’, ‘acquaintance’and ‘stranger’.
Each value or category of a dichotomous or multinomial variable needs to beidentified or labelled. For example, we could refer to the four categories friend, familymember, acquaintance and stranger as category A, category B, category C and category D.We could also refer to them as category 1, category 2, category 3 and category 4. Theproblem with this is that the categories named in this way have been separated fromtheir original labels – friend, family member, acquaintance and stranger. This kind ofvariable may be known as a nominal, qualitative, category, categorical or frequencyvariable. Numbers are simply used as names or labels for the different categories. Wemay have to use numbers for the names of categories when analysing this sort of dataon a computer. The only arithmetical operation that can be applied to dichotomous andmultinomial variables is to count the frequency of how many cases fall into the differentcategories.
■ Quantitative variablesWhen we measure a quantitative variable, the numbers or values we assign to each personor case represent increasing levels of the variable. These numbers are known as scoressince they represent amounts of something. A simple example of a quantitative variable
FIGURE 3.1 The different types of scales of measurement and their major characteristics
M03_HOWI4994_03_SE_C03.QXD 10/11/10 15:00 Page 46

CHAPTER 3 VARIABLES, CONCEPTS AND MEASURES 47
might be social class (socio-economic status is a common variable to use in research).Suppose that social class is measured using the three different values of lower, middleand upper class. Lower class may be given the value of 1, middle class the value of 2 andupper class the value of 3. Hence, higher values represent higher social status. Theimportant thing to remember is that the numbers here are being used to indicate differentquantities of the variable social class. Many quantitative variables (such as age, income,reaction time, number of errors or the score on a questionnaire scale) are measured usingmany more than three categories. When a variable is measured quantitatively, then therange of arithmetic operations that can be carried out is extensive – we can, for example,calculate the average value or sum the values.
The term dichotomous can be applied to certain quantitative variables as it was to some nominal variables. For example, we could simply measure a variable such asincome using two categories – poor and rich, which might be given the values 1 and 2.Quite clearly the rich have greater income than the poor so the values clearly indicatequantities. However, this is true of any dichotomous variable. Take the dichotomousvariable sex or gender. For example, females may be given the value of 1 and males the value of 2. These values actually indicate quantity. A person who has the value 2 has more maleness than a person given the value 1. In other words, the distinctionbetween quantitative and qualitative variables is reduced when considering dichotomousvariables.
Mediator versus moderator variables
Box 3.1 Key Ideas
Conceptually, modern psychologists speak of the distinc-tion between mediator and moderator variables. Thesepresent quite different views of the role of third variablesin relationships among measures of two variables (e.g. the independent and dependent variables). Mediator andmoderator variables are conceptual matters which aremore important to research design and methodology than they are to statistical analysis as such. If we considerthe relationship between the independent and dependent variable then a mediator variable is a variable which isresponsible for this relationship. For example, the inde-pendent variable might be age and the dependent variablemay be scores on a pub quiz or some other measure ofgeneral knowledge. Older people do better on the generalknowledge quiz.
Age, itself, is not directly responsible for higher scoreson the pub quiz. The reason why older people have greatergeneral knowledge might be because they have had moretime in their lives to read books and newspapers, watchtelevision, and undertake other educational experiences. Itis these learning experiences which are responsible for therelationship between age and general knowledge. In thisinstance, then, we can refer to these educational experi-ences as a mediator variable in the relationship betweenage and general knowledge.
M03_HOWI4994_03_SE_C03.QXD 10/11/10 15:00 Page 47

48 PART 1 THE BASICS OF RESEARCH
Another way of describing this is that there is an indir-ect effect of age on the scores on the pub quiz. Of course,there may be more than one mediator variable in the relationship between an independent and a dependentvariable. There is no substantial difference between amediator variable and an intervening variable other thanthat intervening variables are regarded as hypotheticalvariables whereas mediator variables seem not to beregarded as necessarily hypothetical.
A moderator variable is completely distinct from this.A moderator variable is one which shows that the rela-tionship between an independent variable and a depend-ent variable is not consistent throughout the data. Forexample, imagine that a researcher investigates the rela-tionship between age and scores on a pub quiz but adds afurther dimension, that is, they consider the relationshipfor men and women separately. They may find that therelationship between the two is different for men andwomen. Perhaps there is a strong correlation of 0.7
between age and scores on the pub quiz for women but aweak one of 0.2 between age and scores on the pub quizfor men. Thus the relationship is not the same throughoutthe data. This implies quite different conclusions for men and for women. In other words, gender moderatesthe relationship between age and scores on the pub quiz.Having established that gender is a moderator variable inthis case does not explain in itself why the relationship isdifferent for men and women. One possibility is that thepub quiz in question had a gender bias such that most ofthe questions were about topics which are of interest towomen but not to men. Consequently, we might expectthat the relationship would be reduced for men.
The interpretation of moderator variables is dependenton whether or not the independent variable in the independ-ent variable–moderator variable–dependent variable chainis a randomised variable or not. Only where it is randomisedcan the researcher be sure of the causal sequence. Otherwisethere is uncertainty about what is causing what.
3.6 Stevens’ theory of scales of measurement
The previous section describes the measurement principles underlying variables in themost useful and practical way possible. However, there is another approach which iscommon in textbooks. Research methods textbooks are full of ideas which appear to bethe uncontroversial bedrock of the discipline. A good example of this is the theory of scalesof measurement put forward by the psychologist Stanley Stevens (1906–1973) in 1946.You may have heard of other of his ideas but that of the different scales of measuresalready discussed in this chapter is probably the most pervasive one. Few psychologistsnowadays, probably, could name Stevens as the originator of the idea of nominal, ordinal,interval and ratio scales. Remarkably, his ideas are surrounded by controversy in specialiststatistical publications but one would be forgiven for thinking that they are indisputable‘facts’ given the way they are uncritically presented in research methods and statisticstextbooks. So in this section we will look at Stevens’ theory in a somewhat critical wayunlike other sources that you will find. You might be glad of the enlightenment.
By measurement, Stevens is taken to mean the allocation of a number (or symbol) tothings using some consistent rule. So, for example, we could measure sweets in a numberof different ways: (a) we could allocate a colour (blue, red, yellow are linguistic symbols,of course) to each sweet; (b) we could measure each sweet’s weight as a number of grams;or (c) we could grade them in terms of how good they taste. Measurement, conceptually,amounts to quite a simple process as these examples illustrate. It is clear that these threeways of measurement are somewhat different in terms of how the measurement wouldbe carried out. Stevens argued that there are four different types of measurement whichhave somewhat different mathematical properties. This means that the mathematicalprocedures that can be applied to each type of measurement differ. The mathematicaloperations which are appropriate for one type of measurement may be inappropriate foranother. One consequence of this is that the sort of statistical analysis that is appropriate
M03_HOWI4994_03_SE_C03.QXD 10/11/10 15:00 Page 48

CHAPTER 3 VARIABLES, CONCEPTS AND MEASURES 49
for one sort of variable may be inappropriate for a different type of variable. Choosinga statistical technique appropriate to the sort of data one has is one of the skills that hasto be learnt when studying statistics in psychology.
Stevens’ four types of measurement are usually put in the order nominal, ordinal,interval and ratio scales of measurement. This is actually a hierarchy from the least power-ful data to the most powerful data. The later in the series the scale of measurement is in,the more information is contained within the measurement. Thus variables measured ina manner indicative of a ratio scale are at the highest level of measurement and containmore information, all other things being equal. The different measurement scales are oftenreferred to as different levels of measurement which, of course, in itself implies a hierarchy.Let us take each of these in turn, starting with the highest level of the hierarchy.
1. Ratio measurement scales The key feature of a ratio measurement scale is that itshould be possible to calculate a meaningful ratio between two things which havebeen measured. This is a simpler idea than it sounds because we are talking ratioswhen we say things like Grant is twice as tall as Michelle. So if we measure the weightsof two chocolates in grams we can say that the coffee cream chocolate was 50 per centheavier than the strawberry truffle chocolate. In order to have a ratio measurementscale it is necessary for there to be a zero point on the scale which implies zero quantityfor the measurement. Weights do have a zero point – zero grams means that there isno weight – weight is a ratio measurement scale. A common measurement which doesnot have a proper zero (implying zero quantity) is temperature measured in terms ofCelsius or Fahrenheit. To be sure, if you look at a thermometer you will find a zeropoint on both Celsius and Fahrenheit scales but this is not the lowest temperature possible. Zero on the Celsius scale is the freezing point of water but it can get a lotcolder than that. What this means is that for temperature, it is not possible to say that something is twice as hot as something else if we measure on the temperaturescales familiar to us all. Thirty degrees Celsius cannot be regarded as twice as hot as15 degrees Celsius. Any statistical procedure can be applied to ratio data. For example,it is meaningful to calculate the mean of ratio data – as well as ratios. There is anotherfeature of ratio measurement scales, that there should be equal intervals betweenpoints on the scale. However, this requirement of equal intervals is also a requirementof the next measurement scale – the interval measurement scale – as we shall see.
2. (Equal) interval measurement scale This involves assigning real numbers (as opposedto ranks or descriptive labels) to whatever is being measured. It is difficult to givecommon examples of interval measures which are not also ratio measures. Let us lookon our bag of sweets: we find a sell-by date. Now sell-by date is part of a measurementscale which measures time. If a bag of sweets has the sell-by date of 22nd Februarythen this is one day less than a sell-by date of 23rd February. Sell-by date is beingmeasured on an equal interval measure on which each unit is a day and that unit isconstant throughout the scale of measurement, of course. However, there is not a zeropoint on this scale. We all know that the year 0 is not the earliest year that there hasever been since it is the point where bc changes to ad. We could, if we wanted to,work out the average sell-by date on bags of sweets in a shop. The average would bemeaningful because it is based on an equal-step scale of measurement. There are manystatistical techniques which utilise data which are measured on interval scales of measurement. Indeed, most of the statistical techniques available to researchers canhandle interval scale data. Conceptually, there is a clear difference between intervalscale measurements and ratio scale measurements though in most instances it makeslittle difference, say, in terms of the appropriate statistical analysis – it is only import-ant when one wishes to use ratios which, in truth, is not common in psychology.
3. Ordinal measurement scales This involves giving a value to each of the things beingmeasured which indicates the relative order on some sort of characteristic. For example,
M03_HOWI4994_03_SE_C03.QXD 10/11/10 15:00 Page 49

50 PART 1 THE BASICS OF RESEARCH
you might wish to order the chocolates in a box of chocolates in terms of how muchyou like each of them. So you could put the ones that you most like on the left-handside of a table, the ones that you like a bit less to the right of them, and so forth untilthe ones that you most dislike like are on the far right-hand side of the table. In thisway, the chocolates have been placed in order from the most liked to the least liked.This is like ordinal measurement in that you have ordered them from the most to theleast. Nothing can really be said about how much more that you like, say, the hazelnutcluster from the cherry delight, only that one is preferred to the other because you putthem at different points on the table. It is not possible to say how much more you likeone of the chocolates than another. Even if you measured the distance between whereyou put the hazelnut cluster and where you put the cherry delight, this gives no preciseindication of how much more one chocolate is liked than another. Ordinal numbers(first, second, third, fourth . . . last) could be applied to the positions from left to rightat which the chocolates were placed. These ordinal numbers correspond to the rankorder. The hazelnut cluster might be eighth and the cherry delight might be ninth.However, it still remains the case that although the hazelnut cluster is more liked thanthe cherry delight, how much more it is liked is not known. Ordinal measurements,it is argued, are not appropriate for calculating statistics such as the mean. This is cer-tainly true for data which have been converted to ranks since the mean rank is totallydetermined by the number of items ranked. However, psychologists rarely collect datain the form of ranks but in the form of scores. In Stevens’ measurement theory anynumerical score which is not on a scale where the steps are equal intervals is definedas ordinal. Stevens argued that the mode and the median are more useful statistics forordinal data and that the mean is inappropriate. Ordinal measurements are frequentlyanalysed using what are known as non-parametric or distribution-free statistics. Theyvary, but many of these are based on putting the raw data into ranks.
4. Nominal (or category/categorical) measurement scales This measurement scale involvesgiving labels to the things being measured. It is illustrated by labelling sweets in anassorted bag of sweets in terms of their colour. Colour names are linguistic symbolsbut one could use letters or numbers as symbols to represent each colour if we sowished. So we could call red Colour A and blue Colour B, for instance. Furthermore,we could use numbers purely as symbols so that we could call red Colour 1 and blueColour 2. Whether we use words, letters, numbers or some other symbol to representeach colour does not make any practical difference. It has to be recognised that if weuse numbers as the code then these numbers do not have mathematical properties anymore than letters would have. So things become a little more complicated when wethink about what numerical procedures we can perform on these measurements. Weare very restricted. For example, we cannot multiply red by blue – this is meaningless.Actually the only numerical procedure we could perform in these circumstances wouldbe to count the number of red sweets, the number of blue sweets, and the number ofyellow sweets, for example. By counting we mean the same thing as calculating thefrequency of things so we are able to say that red sweets have a frequency of 10, bluesweets have a frequency of 5, and yellow sweets have a frequency of 19 in our par-ticular bag of sweets. We can say which is the most frequent or typical sweet colour(yellow) in our bag of sweets but little else. We cannot meaningfully calculate thingssuch as the average red sweet, the average blue sweet and the average yellow sweetbased on giving each sweet a colour label. So in terms of statistical analysis, onlystatistics which are designed for use with frequencies could be used. Confusion canoccur if the symbols used for the nominal scale of measurement are numbers. Thereis nothing wrong with using numbers as symbols to represent things so long as oneremembers that they are merely symbols and that they are no different from words orletters in this context.
M03_HOWI4994_03_SE_C03.QXD 10/11/10 15:00 Page 50

CHAPTER 3 VARIABLES, CONCEPTS AND MEASURES 51
It is not too difficult to grasp the differences between these four different scales ofmeasurement. The difficulty arises when one tries to apply what has been learnt to thevast variety of different psychological measures. It will not have escaped your attentionhow in order to explain interval and ratio data physical measurements such as weightand temperature were employed. This is because these measures clearly meet the require-ments of these measurement scales. When it comes to psychological measures, it is muchmore difficult to find examples of interval and ratio data which everyone would agreeabout. There are a few examples but they are rare. Reaction time (the amount of time ittakes to react to a particular signal) is one obvious exception, but largely because it is aphysical measure (time) anyway. Examples of more psychological variables which reflectthe interval and ratio levels of measurement are difficult to find. Take, for example, IQ(intelligence quotient) scores. It is certainly possible to say that a person with an IQ of140 is more intelligent than a person with an IQ of 70. Thus we can regard IQ as anordinal measurement. However, is it possible to say that a person with an IQ of 140 istwice as intelligent as someone with an IQ of 70, which would make it a ratio meas-urement? Are the units that IQ is measured in equal throughout the scale? Is the difference between an IQ of 70 and an IQ of 71 the same difference as that between an IQ of 140 and an IQ of 141? They need to be the same if IQ is being measured on anequal interval scale of measurement. One thing that should be pointed out is that oneunit on our measure of IQ is in terms of the number involved being the same no matterwhere it occurs on the scale. The problem is that in terms of what we are really inter-ested in – intelligence – we do not know that each mathematical unit is the same as eachpsychological unit. If this is not clear, then consider using electric shocks to cause pain.The scale may be from zero volts to 6000 volts. This is clearly an interval and also a ratioscale in terms of the volts, in terms of the resulting pain this is not the case. We all knowthat if we touch the terminals of a small battery this has no effect on us, which means thatat the low voltage levels no pain is caused, but this is not true at higher voltage levels.Thus, in terms of pain this scale is not equal interval.
Not surprisingly, Stevens’ theory of measurement has caused many students greatconsternation especially given that it is usually taught in conjunction with statistics,which itself is a difficult set of ideas for many students. The situation is that anyone usingthe theory – and it is a theory – will generally have great difficulty in arguing that theirmeasures are on either an interval or ratio scale of measurement simply because there isgenerally no way of specifying that each interval on the scale is in some way equal to allof the others to start with. Furthermore, there are problems with the idea that a measureis ordinal. One reason for this is that psychologists rarely simply gather data in the form of ranks as opposed to some form of score. These scores therefore contain more information than that implied merely by a rank though the precise interpretation of these scores is not known. There is no way of showing that these scores are on an equalinterval scale so they should be regarded as ordinal data according to Stevens’ theory.Clearly this is entirely unsatisfactory. Non-parametric statistics were frequently advocatedin the past for psychological data since these do not assume equality of the measurementintervals. Unfortunately, many powerful statistical techniques are excluded if one choosesthe strategy of using non-parametric statistics.
One argument, which we find convincing, is that it is not the psychological implica-tions of the scores which is important but simply the mathematical properties of thenumbers involved. In other words, so long as the scores are on a numerical scale thenthey can be treated as if they are interval scale data (and, in exceptional circumstanceswhere there is a zero point, as ratio scale data). The truth of the matter, and quiteremarkable given the dominance of Stevens’ ideas about measurement in psychology, isthat researchers usually treat any measures they make involving scores as if they wereinterval data. This is done without questioning the status of their measures in terms ofStevens’ theory. Actually there are statistical studies which partly support this in which
M03_HOWI4994_03_SE_C03.QXD 10/11/10 15:00 Page 51

52 PART 1 THE BASICS OF RESEARCH
ordinal data are subject to statistical analyses which are based on the interval scale ofmeasurement. For many statistics, this makes little or no difference. Hence, in that sense,Stevens’ theory of measurement leads to a sort of wild goose chase.
Hypothetical constructs
Box 3.2 Key Ideas
Hypothetical constructs were first defined by KennethMacCorquodale (1919–1986) and Paul E. Meehl (1920–2003) in 1948. They are not variables in the sense we havediscussed in this chapter. Essentially a hypothetical constructis a theoretical invention which is introduced to explainmore observable facts. It is something which is not directlyobservable but nevertheless is useful in explaining thingssuch as relationships between variables which are foundduring a research study. There is a wide variety of hypo-thetical constructs in psychology. Self-esteem, intelligence,the ego, the id and the superego are just some examples.None of these things is directly observable yet they are
discussed as explanations of any number of observablephenomena. Some of them, such as intelligence, might atfirst sight seem to be observable things but, usually, theyare not since they are based on inferences rather thanobservation. In the case of the hypothetical construct ofintelligence, we use observables such as the fact that achild is top of their class, is a chess champion, and has agood vocabulary to infer that they are intelligent. Perhapsmore crucially, the Freudian concept of the id is notobservable as such but is a way of uniting observable phenomena in a meaningful way which constitutes anexplanation of those observables.
3.7 Operationalising concepts and variables
There is a crucial distinction to be made between a variable and the measure of that vari-able. Variables are fundamentally concepts or abstractions which are created and refinedas part of the advancement of the discipline of psychology. Gender is not a tick on aquestionnaire, but we can measure gender by getting participants to tick male or femaleon a questionnaire. The tick on the questionnaire is an indicator of gender, but it is notgender. Operationalisation (Bridgman, 1927) is the steps (or operations) that we take tomeasure the variable in question. Percy Williams Bridgman (1882–1961) was a physicalscientist who, at the time that he developed his ideas, was concerned that concepts in thephysical sciences were extremely poorly defined and lacked clarity. Of course, this is fre-quently the case in the softer discipline of psychology too. Operationalism was, however,introduced into psychology largely by Stanley Stevens, who we have earlier discussed interms of measurement theory. For Bridgman, the solution was to argue that precision isbrought to the definition of concepts by specifying precisely the operations by which aconcept is measured. So the definition of weight is through describing the measurementprocess, for example, the steps by which one weighs something using some sort of meas-urement scale. Of course, operationalising concepts is not guaranteed to provide precisionof definition unless the measurement process is close to the concept in question and themeasurement process can be precisely defined. So, for example, is it possible to providea good operational definition of a concept like love? By what operations can love bemeasured is the specific question. One possible operational definition might be to measurethe amount of time that a couple spends in each other’s company in a week. There areobvious problems with this operational definition which suggests that it is not whollyadequate. It has little to do with our ideas about what love is. Imagine the conversation:
M03_HOWI4994_03_SE_C03.QXD 10/11/10 15:00 Page 52

CHAPTER 3 VARIABLES, CONCEPTS AND MEASURES 53
‘Do you love me?’ ‘Well I spend a lot of time with you each week, don’t I?’ This shouldquickly paint a picture of the problem with such an operational definition.
Nevertheless, some researchers in psychology argue that the best way of defining the nature of our variables is to describe how they are measured. For example, there arevarious ways in which we could operationalise the concept or variable of anxiety. Wecould manipulate it by putting participants in a situation which makes them anxious andcompare that situation with one in which they do not feel anxious. We could assess anxi-ety by asking them how anxious they are, getting other people to rate how anxious theyseem to be, or measuring some physiological index of anxiety such as their heart rate.These are different ways of operationalising anxiety. If they all reflect what we considerto be anxiety we should find that these different methods are related to one another. Sowe would expect participants in a situation which makes them anxious to report beingmore anxious, be rated as being more anxious and to have a faster heart rate than thosein a situation which does not make them anxious. If these methods are not related to oneanother, then they may not all be measuring anxiety.
Operationalisation has benefits and drawbacks. The benefit is that by defining a con-cept by the steps involved in measuring it, the meaning of the concept could not be moreexplicit. The costs include that operationalisation places less onus on the researcher toexplicate the nature of their concepts and encourages the concentration on measurementissues rather than conceptual issues. Of course, ultimately any concept used in researchhas to be measured using specific and specified operations. However, this should not be at the expense of careful consideration of the nature of what it is that the researcherreally is trying to understand – the theoretical concepts involved. Unfortunately, we cannot escape the problem that operational definitions tend to result in a concentrationon measurement in psychology rather to the detriment of the development of the ideasembedded in psychological theory.
3.8 Conclusion
Perhaps the key thing to have emerged in this chapter is that some of the accepted ideasin psychological research methods are not simply practical matters but were importantphilosophical contributions to the development of the methods of the discipline. A con-cept such as a variable has its own timeline, is not universal in the discipline, and bringsto psychology its own baggage. Although some of these ideas seem to be consensuallyaccepted by many psychologists, it does not alter the fact that they are not the only wayof conceptualising psychological research, as later parts of this book will demonstrate.While the idea of operational definitions of concepts pervades much of psychology, onceagain it should be regarded as a notion which may have its advantages but also can belimiting in that it encourages psychologists to focus on measurement but not in the con-text of a thorough theoretical and conceptual understanding of what is being measured.
The concept of a variable has many different ramifications in psychology. Many ofthese are a consequence of the origins of the concept in statistics. Intervening variables,moderator variables, mediating variables, continuous variables, discrete variables, inde-pendent variables, dependent variables and so forth are all examples of variables but allare different conceptually. Some have more to do with statistics than others.
Measurement theory introduced the notions of nominal, ordinal, interval and ratiomeasurement. While these ideas are useful in helping the researcher not to make funda-mental mistakes such as suggesting that one person is twice as intelligent as anotherwhen such statements require a ratio level of measurement, they are actually out of stepwith psychological practice in terms of the statistical analysis of research data.
M03_HOWI4994_03_SE_C03.QXD 10/11/10 15:00 Page 53

54 PART 1 THE BASICS OF RESEARCH
The concept of variable firmly ties psychology to statistics since it is a statistical concept at root.There are many different types of variable which relate as much to theoretical issues as empiricalissues. For example, the distinction between independent and dependent variables and the distinc-tion between moderator and mediating variables relate to explanations of psychological phenomenaand not simply to empirical methods of data collection.
Stevens’ measurement theory has an important place in the teaching of statistics but is problematicin relation to the practice of research. Nevertheless, it can help prevent a researcher from makingtotally erroneous statements based on their data. Most research in psychology ignores measurementtheory and simply assumes that data in the form of scores (as opposed to nominal data) can be analysed as if they are based on the interval scale of measurement.
Psychologists stress operational definitions of concepts in which theoretical concepts are defined in terms of the processes by which they are measured. In the worst cases, this can encourage the concentration of easily measured variables at the expense of trying to understand the fundamentalconcept better at a conceptual and theoretical level.
Key points
ACTIVITIES1. Try to list the defining characteristics of the concept love. Suggest how love can be defined using operational definitions.
2. Could Stevens’ theory of measurement be applied to measures of love? For example, what type of measurement woulddescribe classifying relationships as either platonic or romantic love?
M03_HOWI4994_03_SE_C03.QXD 10/11/10 15:00 Page 54

The problems ofgeneralisation anddecision-making in researchChance findings and sample size
Overview
CHAPTER 4
Psychological research is based on a complex decision-making process which is irreducible to a simplistic formula or rules-of-thumb.
A number of factors are especially influential on setting the limits to generalisationfrom any data. The sampling procedures used and the statistical significance of thefindings are very important. At the same time, psychologists generalise because psy-chology has a tendency towards universalism which assumes that what is true of onegroup of people is true of all people.
Psychological research (as opposed to psychological practice) is usually concernedwith samples of people rather than specific individuals. This allows general trends tobe considered at the expense of neglecting the idiosyncratic aspects of individuals.
Much psychological research depends on samples being selected primarily becausethey are convenient for the researcher to obtain. The alternative would be randomsampling from a clearly specified population which is much more expensive of timeand other resources.
Characteristically, a great deal of psychological research is concerned with study-ing principles of human behaviour that are assumed to apply generally. As the
M04_HOWI4994_03_SE_C04.QXD 10/11/10 15:00 Page 55

56 PART 1 THE BASICS OF RESEARCH
generalisations being tested are assumed to be true of people in general, the neces-sity to ensure that the sample is representative is minimised.
Statistical analysis is often concerned with answering the simple question of howsafe it is to generalise from a particular study or sample of data. The usual model ofstatistical testing in psychology is based on postulating what would happen if the nullhypothesis were true and then comparing this with what was actually obtained in theresearch.
The probability of accepting that the results are not due to chance sampling if the nullhypothesis were true is usually set at the .05 or 5 per cent level. This means that theprobability of the finding being due to chance when the null hypothesis is in fact trueis 5 times out of 100, or less. Results that meet this criterion are called statisticallysignificant, otherwise they are statistically non-significant.
The bigger the sample the more likely it is that the results will be statistically significant– all other things being equal. Consequently, it is necessary to look at the size of theresult as well as its statistical significance when evaluating its importance.
4.1 Introduction
This chapter discusses in some detail the process of generalisation of research findings.Are we justified in making more general statements about the findings of our researchbeyond the research itself? This is a crucial step in any research. There are three import-ant themes that need consideration:
The lack of limitations placed on generalisation by the universalism of psychologicaltheory.
The limitations placed on generalisation by the sampling methods used.
The limitations placed on generalisation by the strictures of statistical significance testing.
We will deal with each of these in turn. They are equally important but there is more to be said about qualitative analysis and generalisation in this context and so this willreceive a disproportional amount of space. Each of these has a different but importantinfluence on the question of the extent to which a researcher is wise or correct to generalise beyond the immediate setting and findings of their research study. There maybe a temptation to regard statistical considerations as technical matters in research, but this is not altogether the case. Many statistical considerations are better regarded as having a bearing on important conceptual matters. For example, one might be less likely to generalise in circumstances in which your measures of concepts or variables are relatively weak or ineffective. This will tend to yield poor or low correlations betweensuch variables and others – hence the disinclination to generalise from this finding withconfidence. However, statistics can help show you such things as what the correlationwould be if the measures were good and reliable. This may revise your opinion of whatcan be said on the basis of your data. See Figure 4.1 for a summary of some of the issuesto do with generalisation.
It is important to realise that issues such as the generalisability of data are really aspectsof the process of decision-making that a researcher makes throughout their research. The
M04_HOWI4994_03_SE_C04.QXD 10/11/10 15:00 Page 56

CHAPTER 4 THE PROBLEMS OF GENERALISATION AND DECISION-MAKING IN RESEARCH 57
FIGURE 4.1 The main issues in the generalisation of psychological research findings
task of the researcher is to reach a balanced judgement at every stage of their researchbased on the information that they have in front of them and reasoned evaluations of theavailable choices of action available at that point in time. It is impossible to reduce thisdecision-making process to a few rules of thumb. It might be appealing to students to havesuch rules of thumb but it distorts the reality of research too much to try to reduce it to anysimplistic formula. So even things such as significance testing which are often reduced to a formula in statistics textbooks turn out to be much more of a matter of judgementthan that implies. Research is not simply a matter of deciding whether a hypothesis issupported by one’s data or not. There are important issues such as whether it is desirableto develop further questions for further research in the area, whether an important nextstep is to establish whether one’s findings apply in very different circumstances or withvery different groups of participants or using very different methods, and the degree ofconfidence one should have in one’s findings. There are other questions, of course, suchas the desirability of abandoning this particular line of research. Again this is not simplya matter of failing to find support for a hypothesis in a particular study but a decision-making process based not simply on basic statistical outcomes but on a finer judgementas to whether the hypothesis had been given a fair chance in the research study.
4.2 Universalism
One of the characteristics of psychology is its tendency towards universalism. This is thefundamental assumption that the principles of psychology will not vary. Psychologicalfindings will apply anywhere and are the same for all people irrespective of their society
M04_HOWI4994_03_SE_C04.QXD 10/11/10 15:00 Page 57

58 PART 1 THE BASICS OF RESEARCH
and their culture. So when psychologists propose a hypothesis there is an implicitassumption that it is true of all people – unless it is one of those rare cases where it isstated or implied that the principle applies only to restricted groups of people. In otherwords, psychologists in practice appear to be interested in making generalisations aboutbehaviour that apply unrestrained by context and circumstances. Psychological principlesare assumed to be laws of human behaviour anywhere. Increasingly psychologists ques-tion this idea of universalism and argue that a culturally specific approach to psychologyis more realistic and productive (Owusu-Bempah and Howitt, 2000). Historically, manyof the principles put forward by psychologists are assumed to apply not only to peoplebut also to other animals. So it was only natural that studies of basic processes were car-ried out on animals and the findings applied to human beings. Examples of this includeclassical conditioning theory (Pavlov, 1927) and operant conditioning theory (Skinner,1938).
While universalism is characteristic of a great deal of psychological thinking, it israrely, if ever, stated as such in modern psychology. Nowadays psychologists are likelyto be aware of the problem but, nevertheless, this awareness is not built into their practicesfor designing their research studies. Universalism operates covertly but reveals itself in anumber of different ways – such as when university students are used unquestioninglyas participants in a great deal of academic research as if what were true for universitystudents will be true for every other grouping and sector in society. Seldom do psycho-logists build into their research a variety of groups of participants specifically to assesswhether their findings apply throughout.
Universalism defines quantitative research in psychology much more than it doesqualitative research, of course. Qualitative researchers invariably adopt a relativist perspective which rejects the idea of a single reality which can be discovered throughresearch. Instead, qualitative researchers assume that there is a multiplicity of viewpointson reality. This is clearly incompatible with universalism and is discussed in more detailin Part 4 of this book on qualitative research methods.
4.3 Sampling and generalisation
Many criticisms have been made of psychology for its restricted approach to sampling.As already mentioned, psychological research has sometimes been described as the psychology of psychology students or sophomores (Rosenthal and Rosnow, 1969, p. 59)(a sophomore is a second-year student in the USA). This criticism only means somethingif the idea of universalism in psychological research is being questioned, otherwise itwould not matter since the laws of human behaviour might just as well be determinedfrom studies using psychology students as any other group of participants. Whatever thegroup used, it would reveal the same universal laws. The emphasis of psychology on the processes involved in human behaviour and interaction is a strength of the discipline and not something to which sampling has anything particular to contribute from oneperspective. So although sampling methods in psychology may to some extent be foundto be lacking, this is not the entire story by any means.
Not all research has or needs a sample of participants. The earliest psychological researchtended to use the researcher themselves as the principal or only research participant.Consequently, experimental psychologists would explore phenomena on themselves. Thiswas extremely common in introspectionism (or structuralism) which was the dominantschool of psychology at the start of modern psychology and was eventually replaced bybehaviourism early in the twentieth century. Similarly, and famously, Ebbinghaus (1913)studied memory or forgetting. There are circumstances in which a single case may be an
M04_HOWI4994_03_SE_C04.QXD 10/11/10 15:00 Page 58

CHAPTER 4 THE PROBLEMS OF GENERALISATION AND DECISION-MAKING IN RESEARCH 59
appropriate unit for study. Some psychologists still advocate using single cases or rela-tively few cases in order to investigate changing a particular individual’s behaviour(Barlow and Hersen, 1984) and this is common in qualitative research too. A single-caseexperimental study in quantitative research involves applying the independent variableat different random points in time. If the independent variable is having an effect thenthe participant should respond differently at the points in time that the independent vari-able is applied than when it is not. Its obvious major advantage is that it can be helpfulwhen the particular sort of case is very rare. For example, if a particular patient has avery unusual brain condition then such a procedure provides a way of studying the effectof that condition. Clinical researchers working with a particular patient are an obviousset of circumstances in which this style of research might be helpful.
The problems with the approach are largely to do with the high demands on the participant’s time. It also has the usual problems associated with participants beingaware of the nature of the design – it is somewhat apparent and obvious what is happening – which may result in the person being studied cooperating with what theysee as the purpose of the study. Although this sort of ‘single-case’ method has never beenvery common in mainstream psychology and appears to be becoming less so (Forsyth et al., 1999), its use questions the extent to which researchers always require substantialsamples of cases in order for the research to be worthwhile or effective.
■ Representative samples and convenience samplesMost research studies are based on more than a few participants. The mean number ofparticipants per study in articles published in 1988 in the Journal of Personality andSocial Psychology was about 200 (Reis and Stiller, 1992). This is quite a substantialaverage number of participants. So:
How big should a sample be in order for us to claim that our findings apply generally?
How should samples be selected in order for us to maximise our ability to generalisefrom our findings?
If everyone behaved in exactly the same way in our studies, we would only need to select one person to investigate the topic in question – everyone else would behaveexactly the same. The way in which we select the sample would not have any bearing on the outcome of the research because there is no variability. We only need samplingdesigns and statistics, for that matter, because of this variability. Psychology would alsobe a very boring topic to study.
Fortunately, people vary in an infinite number of different ways. Take, for example,something as basic as the number of hours people say they usually sleep a day. Whilemost people claim to sleep between seven and eight hours, others claim that they sleepless than six hours and others that they sleep more than ten hours (Cox et al., 1987, p. 129). In other words, there is considerable variation in the number of hours claimed.Furthermore, how much sleep a person has varies from day to day – one day it may besix hours and the next day eight hours. Differences between people and within a personare common just as one might expect. So our sampling methods need to be planned with the awareness of the issue of variability together with an awareness of the level ofprecision that we need in our estimates of the characteristics of people.
The necessary size of the samples used in research should partially reflect the conse-quences of the findings of the research. Research for which the outcome matters cruciallymay have more stringent requirements about sample size than research for which theoutcome, whatever it is, is trivial. For example, what size sample would one require if the outcome of the study could result in counselling services being withdrawn by ahealth authority? What size sample would one require if the study is just part of the
M04_HOWI4994_03_SE_C04.QXD 10/11/10 15:00 Page 59

60 PART 1 THE BASICS OF RESEARCH
training of psychology students – a practical exercise? What size sample would onerequire for a pilot study prior to a major investigation? While they might disagree aboutthe exact sample size to use, probably psychologists would all agree that larger samplesare required for the study that might put the future of counselling services at risk. Thisis because they know that a larger sample is more likely to demonstrate a trend in thestudy if there is one in reality.
Also, as we have mentioned, many psychologists also tend to favour larger samplesizes because they believe that this is likely to result in greater precision in their estimatesof what is being measured. For example, it is generally the case that larger samples areemployed when we are trying to estimate the frequency, or typical value, of a particularbehaviour or characteristic in the population. If we wanted an estimate of the meannumber of reported hours of sleep in, say, the elderly, then we are likely to use a biggersample. What this means is that it is possible to suggest that the average number of hoursof sleep has a particular value and that there is only a small margin of error involved in this estimate. That is, our estimate is likely to be pretty close to what the average is inreality. On the other hand, if we want to know whether the number of hours slept isrelated to mental health then we may feel that a smaller sample will suffice. The reasonfor this is that we only need to establish that sleep and mental health are related – weare less concerned about the precise size of the relationship between the two. (If the aimis to produce an estimate of some characteristic for the population, then we will havemore confidence in that estimate if the sample on which that estimate is based is selectedin such a way so as to be representative of the population. The basic way of doing thisis to draw samples at random. However, ways of selecting a representative sample willbe discussed in Chapter 13 along with other sampling methods in some detail. Of course,the more representative we can assume our sample to be the more confidence we canhave in our generalisations based on that sample.)
Probably most sampling in psychological research is what is termed convenience samples. These are not random samples of anything but groups of people that are rela-tively easy for the researcher to get to take part in their study. In the case of universitylecturers and students, the most convenient sample typically consists of students – oftenpsychology students. What is convenient for one psychologist may not be convenient foranother, of course. For a clinical psychologist psychotherapy patients may be a moreconvenient sample than undergraduate students. Bodner (2006) noted that for a randomsample of 200 studies selected from PsycINFO in 1999 only 25 per cent of them usedcollege students, ranging from 5 per cent in clinical or health psychology to 50 per centin social psychology.
Convenience samples are usually considered to be acceptable for much psychologicalresearch. Since psychological research often seeks to investigate whether there is a rela-tionship between two or more variables, a precisely defined sample may be unnecessary(Campbell, 1969, pp. 360–2). Others would argue that this is very presumptuous aboutthe nature of the relationship between the two variables – especially that it is consistentover different sorts of people. For example, imagine that watching television violence isrelated to aggressiveness in males, but inversely related to aggressiveness in females. Bytaking a sample of psychology students, who tend to be female, a convenience sample ofuniversity students will actually stack things in favour of finding that watching televisionis associated with lower levels of aggressiveness.
Whether it is possible to generalise from a sample of psychology students, or evenstudents, to the wider population is obviously an empirical question for any one topic of research. It is also a matter of credibility since it would be scarcely credible to study post-partum depression simply on the basis of a general convenience sample of univer-sity students. There are many circumstances in which it would seem perverse to choose tostudy students rather than other groups. For example, if a researcher was interested inthe comprehensibility of the police caution then using university students might seem less
M04_HOWI4994_03_SE_C04.QXD 10/11/10 15:00 Page 60

CHAPTER 4 THE PROBLEMS OF GENERALISATION AND DECISION-MAKING IN RESEARCH 61
appropriate than using a sample of people with poor educational attainment. Obviously,if one is addressing an issue that is particular to a certain group such as children or psycho-therapy patients, then it is important to select this group of people. The use of studentsas a primary group for study has its advantages in the context of their education andtraining as it is time-consuming to contact other groups; on the other hand it has severedifficulties for virtually any other purposes. Getting the balance right is a matter for theresearch community in general, not students learning to do psychology.
Often in psychological research, it is difficult to identify the population that is of concern to the researcher. Although common sense would suggest that the population is that which is represented by the actual participants in the research, this usually doesnot appear to be what is in the researcher’s mind. Probably because psychologists tend to see research questions as general propositions about human behaviour ratherthan propositions about a particular type of person or specific population, they have a tendency to generalise beyond the population which would be defined by the researchsample. The difficulty is, of course, just when the generalisation should stop – if ever.Similarly, there tends to be an assumption that propositions are not just true at one pointin time but true across a number of points in time. That is, psychological processes first identified more than a lifetime ago are still considered relevant today. Gergen (1973)has argued for the historical relativity of psychological ideas which Schlenker (1974) hasquestioned.
So there appears to be a distinction between the population of interest and the popu-lation defined clearly by the sample of participants utilised in the research. Of course, it would be possible to limit our population in time and space. We could say that our population is all students at Harvard University in 2010. However, it is almost certainthat having claimed this we would readily generalise the findings that we obtain to students at other universities, for example. We may not directly state this but we wouldwrite in a way which is suggestive of this. Furthermore, people in our research may besamples from a particular group simply because of the resource constraints affecting our options. For example, a researcher may select some, but not all, 16-year-olds froma particular school to take part in research. Within this school, participants are selectedon a random basis by selecting at random from the school’s list of 16-year-olds. Whilethis would be a random sample from the school and can be correctly described as such,the population as defined by the sample would be very limited. Because of the extremelyrestricted nature of the initial selection of schools, the results of the study may not beseen as being more informative than a study where this random selection procedure wasnot used but a wider variety of research locations employed.
The question of the appropriateness of sampling methods in most psychologicalresearch is a difficult one. Psychological researchers rarely use random sampling from aclearly defined population. Almost invariably some sort of convenience sample of parti-cipants is employed – where randomisation is used it is in the form of random allocationto the conditions of an experiment or the sequence of taking part in the conditions. Thisis as true of the best and most influential psychological research as less auspicious andmore mundane research. In other words, if precise sampling were the criterion for goodresearch, psychology textbooks may just as well be put through the shredder. This is notto say that sampling in psychological research is good enough – there is a great deal tobe desired in terms of current practices. However, given that the major justification forcurrent practice lies in the assumed generality of psychological principles, things probablywill not change materially in the near future.
Another factor needs to be considered when evaluating the adequacy of psychologicalsampling methods: participation rates in many sorts of research are very low. Participa-tion rates refer to the proportion of people who take part in the research compared withthe number asked to take part in the research, that is, the proportion who supply usabledata. Random sampling is considerably undermined by poor participation rates; it cannot
M04_HOWI4994_03_SE_C04.QXD 10/11/10 15:00 Page 61

62 PART 1 THE BASICS OF RESEARCH
FIGURE 4.2 Factors in the generalisation of psychological research findings
be assumed that those who do not participate are a random sample of the peopleapproached. They do not participate for a variety of reasons, some of which may meanthat certain sorts of participants exclude themselves. These reasons may be systematic-ally related to the research topic – maybe potential participants are simply uninterestedin the topic of the research. Alternatively, there may be more technical reasons why participation rates are low. A study which involves the completion of a questionnaire is likely to result in less literate potential participants declining to take part. In otherwords, issues to do with sampling require the constant attention, consideration and vigi-lance of researchers planning, analysing and evaluating research. The issues are complexand impossible to provide rules of thumb to deal with. The lesson is that simply usingrandom selection methods does not ensure a random sample. In these circumstances,convenience samples may be much more attractive propositions than at first they appearto be – if poor participation rates systematically distort the sample then what is to begained by careful sampling? Figure 4.2 displays some points about the kinds of samplestypically used by psychologists.
4.4 Statistics and generalisation
Statistical analysis serves many important roles in psychology – as some students willfeel they know to their cost. There are numerous statistical techniques that helpresearchers explore the patterns in their data, for example, which have little or nothing
M04_HOWI4994_03_SE_C04.QXD 10/11/10 15:00 Page 62

CHAPTER 4 THE PROBLEMS OF GENERALISATION AND DECISION-MAKING IN RESEARCH 63
to do with what is taught on introductory statistics courses. Most students, however, aremore familiar with what is known as ‘inferential statistics’ or, more likely, the conceptof ‘significance testing’. Significance testing is only one aspect of research but is a crucialone in terms of a researcher’s willingness to generalise the trends that they find in theirdata. While students are encouraged to believe that statistical significance is an import-ant criterion, it is just one of two really important things. The other is the size of thetrend, difference, effect or relationship found in the research. The bigger that these are,then the more important the relationship. Furthermore, statistical significance is not themost important thing in evaluating one’s research. One needs a fuller picture than justthat when reaching decisions about research.
Moreover, as a consequence of the tendency of psychologists to emphasise statisticalsignificance, they can overlook the consequences of failing to show that there is a trendin their data when, in reality, there is a trend. This can be as serious as mistakenly con-cluding that there is a trend when in reality there is no trend and that our sample hascapitalised on chance. For example, what if the study involves an innovative treatmentfor autism? It would be a tragedy in this case if the researcher decided that the treatmentdid not work simply because the sample size used was far too small for the statisticalanalysis to be statistically significant. Essentially this boils down to the need to planone’s research in the light of the significance level selected, the minimum size of the effector trend in your data that you wish to detect, and the risk that you are prepared to takeof your data not showing a trend when in reality there is a trend. With these thingsdecided, it is possible to calculate, for example, the minimum sample size that your study will need to be statistically significant for a particular size of effect. This is a ratherunfamiliar area of statistics to most psychologists, which known as statistical poweranalysis. It is included in the new edition of the statistics textbook which accompaniesthis book (Howitt and Cramer, 2011a).
■ Chance findings and statistical significanceWhen investigating any research question, one decides what will be an appropriate sample size largely on the basis of the size of the effect or association expected. The biggerthe effect or association, the smaller the sample can be in purely statistical terms. This isbecause bigger effects are more likely to be statistically significant with small samplesizes. A statistically significant finding is one that is large enough that it is unlikely to becaused by chance fluctuations due to sampling. (It should be stressed, the calculation of statistical significance is normally based on the hypothetical situation defined by thenull hypothesis that there is no trend in the data.) The conventionally accepted level of significance is the 5 per cent or .05 level. This means that a finding as big as ours can be expected to occur by chance on 5 or fewer occasions if we tested that finding on100 occasions (and assuming that the null hypothesis is in fact true). A finding or effectthat is likely to occur on more than 5 out of 100 times by chance is described as beingstatistically non-significant or not statistically significant. Note that the correct term is non-significant, not that it is statistically insignificant, although authors sometimes use thisterm. Insignificant is a misleading term since it implies that the finding is not statisticallyimportant – but that simply is not what is meant in significance testing. The importanceof a finding lies in the strength of the relationship between two variables or the size ofthe difference between two samples. Statistical significance testing merely refers to thequestion whether the trend is sufficiently large in the data so that it is unlikely that itcould be the result of chance factors due to the variability inherent in sampling, that is,there is little chance that the null hypothesis of no trend or difference is correct.
Too much can be made of statistical significance if the size of the trend in the data isdisregarded. For example, it has been argued that with very large samples, virtually anyrelationship will be statistically significant though the relationship may itself be a very
M04_HOWI4994_03_SE_C04.QXD 10/11/10 15:00 Page 63

64 PART 1 THE BASICS OF RESEARCH
small one. That is, a statistically significant relationship may, in fact, represent only avery small trend in the data. Another way of putting this is that very few null hypothesesare true if one deals with very large samples and one will accept even the most modestof trends in the data. What this means, though, in terms of generalisation is that smalltrends found in very large samples are likely not to generalise to small samples.
The difference between statistical significance and psychological significance is at theroot of the following question. Which is better: a correlation of .06 which is statisticallysignificant with a sample of 1000 participants or a correlation of .8 that is statistic-ally significant with a sample of 6 participants?
This is a surprisingly difficult question for many psychologists to answer.While the critical value of 5 per cent or .05 or less is an arbitrary cut-off point,
nevertheless it is one widely accepted. It is not simply the point for rejecting the nullhypothesis but is also the point at which a researcher is likely to wish to generalise their findings. However, there are circumstances in which this arbitrary criterion ofsignificance may be replaced with an alternative value:
The significance level may be set at a value other than 5 per cent or .05. If the findinghad important consequences and we wanted to be more certain that our finding wasnot due to chance, we might set it at a more stringent level. For example, we may have developed a test that we found was significantly related at the 5 per cent level to whether or not someone had been convicted of child abuse. Because people may want to use this test to help determine whether someone had committed, or was likelyto commit, child abuse, we may wish to set the critical value at a more stringent or conservative level because we would not want to wrongly suggest that someonewould be likely to commit child abuse. Consequently, we may set the critical value at, say, 0.1 per cent or .001, which is 1 out of 1000 times or less. This is a matter ofjudgement, not merely one of applying rules.
Where a number of effects or associations are being evaluated at the same time, thiscritical value may need to be set at less than the 5 per cent or .05 level. For example,if we were comparing differences between three groups, we could make a total ofthree comparisons altogether. We could compare group 1 with group 2, group 1 withgroup 3, and group 2 with group 3. If the probability of finding a difference betweenany two groups is set at 5 per cent or .05, then the probability of finding any of the three comparisons statistically significant at this level is three times as big, in other words 15 per cent or .15. Because we want to maintain the overall significancelevel at 5 per cent or .05 for the three comparisons, we could divide the 5 per cent or the .05 by 3, which would give us an adjusted or corrected critical value of 1.67 per cent (5/3 = 1.666) or .017 (.05/3 = .0166). This correction is known as aBonferroni adjustment. (See our companion statistics text, Introduction to Statisticsin Psychology, Howitt and Cramer, 2011a, for further information on this and otherrelated procedures.) That is, the value of, say, the t-test would have to be significantat the 1.67 per cent level according to the calculation in order to be reported as statistically significant at the 5 per cent level.
For a pilot study using a small sample and less than satisfactory measuring instruments,the 5 per cent or .05 level of significance may be an unnecessarily stringent criterion.The size of the trends in the data (relationship, difference between means, etc.) is possibly more important. For the purposes of such a pilot study, the significance levelmay be set at 10 per cent or .1 to the advantage of the research process in these circumstances. There may be other circumstances in which we might wish to be flexibleabout accepting significance levels of 5 per cent or .05. For example, in medicalresearch, imagine that researchers have found a relationship between taking hormonereplacement therapy and the development of breast cancer. Say that we find this
M04_HOWI4994_03_SE_C04.QXD 10/11/10 15:00 Page 64

CHAPTER 4 THE PROBLEMS OF GENERALISATION AND DECISION-MAKING IN RESEARCH 65
relationship to be statistically significant at the 8 per cent or .08 level, would we will-ingly conclude that the null hypothesis is preferred or would we be unwilling to takethe risk that the hypothesis linking hormone replacement therapy with cancer is infact true? Probably not. The point is not that significance testing is at fault but that a whole range of factors impinge on what we do as a consequence of the test of ourhypotheses. Research is an intellectual process requiring considerable careful thoughtin order to make what appear to be straightforward decisions on the basis of statisticalsignificance testing.
However, students are well advised to stick with the 5 per cent or .05 level as a matterof routine. One would normally be expected to make the case for varying this and thismay prove difficult to do in the typical study.
4.5 Directional and non-directional hypotheses again
The issue of directional and non-directional hypotheses was discussed in Box 2.1, butthere is more that should be added at this stage. When hypotheses are being developed,researchers usually have an idea of the direction of the trend, correlation or differencethat they expect. For example, who would express the opinion that there is a differencebetween the driving skills of men and woman without expressing an opinion as to whatthat difference – such as women are definitely worse drivers – is? In everyday life, a per-son who expresses such a belief about women’s driving skills is likely to be expressingprejudices about women or joking or being deliberately provocative – they are unlikelyto be a woman. Researchers, similarly, often have expectations about the likely outcomeof their research – that is, the direction of the trend in their data. A researcher would notexpress such a view on the basis of a whim or prejudice but they would make as strongan argument as possible built on evidence suggestive of this point of view. It should alsobe obvious that in some cases there will be very sound reasons for expecting a particulartrend in the data whereas in other circumstances no sound grounds can be put forwardfor such an expectation. Research works best when the researcher articulates coherent,factually based and convincing grounds for their expectations.
In other words, often research hypotheses will be expressed in a directional form. Instatistical testing, a similar distinction is made between directional and non-directionaltests but the justifications are required to be exacting and reasoned (see Box 2.1). In a statistical analysis, as we saw in Chapter 2, there are tough requirements before adirectional hypothesis can be offered. These requirements are that there are very strongempirical or theoretical reasons for expecting the relationship to go in a particular direction and that researchers are ignorant of their data before making the prediction. It would be silly to claim to be making a prediction if one is just reporting the trendobserved in the data. These criteria are so exacting that they probably mean that littleor no student research should employ directional statistical hypotheses. Probably themain exceptions are where a student researcher is replicating the findings of a classicstudy, which has repeatedly been shown to demonstrate a particular trend.
The reason why directional statistical hypotheses have such exacting requirements isthat conventionally the significance level is adjusted for the directional hypothesis. Thedirectional hypothesis is referred to as one-tailed significance testing. The non-directionalhypothesis is referred to as two-tailed significance testing. In two-tailed significance testing, the 5 per cent or .05 chance level is split equally between the two possibilities – that the association or difference between two variables is either positive or negative.So if the hypothesis is that cognitive behaviour therapy has an effect then this would be
M04_HOWI4994_03_SE_C04.QXD 10/11/10 15:00 Page 65

66 PART 1 THE BASICS OF RESEARCH
supported by cognitive behaviour therapy either being better in the highest 2.5 per centor .025 of samples or worse in the lowest 2.5 per cent or .025 of samples. In one-tailedtesting the 5 per cent is piled just at one extreme – the extreme which is in the directionof the one-tailed hypothesis. Put another way, a directional hypothesis is supported byweaker data than would be required by the non-directional hypothesis. The only goodjustification for accepting a weaker trend is that there is good reason to think that it is correct, that is, either previous research has shown much the same trend or theorypowerfully predicts a particular outcome. Given the often weak predictive power ofmuch psychological theory, the strength of the previous research is probably the mostuseful of the two.
If the hypothesis is directional, then the significance level is confined to just one halfof the distribution – that is, the 5 per cent is just at one end of the distribution (not both) which means, in effect, that a smaller trend will be statistically significant with a directional test. There is a proviso to this and that is that the trend is in the predicteddirection. Otherwise it is very bad news since even big trends are not significant if they are in the wrong direction. The problem with directional hypotheses is, then, whathappens when the researcher gets it wrong, that is the trend in the data is exactly thereverse of what is suggested in the hypothesis. There are two possibilities:
That the researcher rejects the hypothesis.
That the researcher rejects the hypothesis but argues that the reverse of the hypothesishas been demonstrated by the data. The latter is rather like having one’s cake and eating it, statistically speaking. If the original hypothesis had been supported using theless stringent requirements then the researcher would claim credit for that finding. If,on the other hand, the original hypothesis was actually substantially reversed by thedata then this finding would now find favour. The reversed hypothesis, however, wasdeemed virtually untenable once the original directional hypothesis had been decidedupon. So how can it suddenly be favoured when it was previously given no credencewith good reason? The only conclusion must be that the findings were chance findings.
So the hypothesis should be rejected. The temptation, of course, is to forget about the original directional hypothesis and substitute a non-directional or reverse directionalhypothesis. Both of these are totally wrong but who can say when even a researcher willsuccumb to temptation?
Possibly the only circumstances in which a student should employ directional statisticalhypotheses is when conducting fairly exact replication studies. In these circumstances thedirection of the hypothesis is justified by the findings of the original study. If the researchsupports the original direction then the conclusion is obvious. If the replication actuallyfinds the reverse of the original findings then the researcher would be unlikely to claimthat the reverse of the original findings is true since it only would apply to the replica-tion study. The situation is one in which the original findings are in doubt as are the newfindings since they are diametrically opposite.
■ One- versus two-tailed significance levelSplitting the 5 per cent or .05 chance or significance level between the two possible outcomes is usually known as the two-tailed significance level because two outcomes(directions of the trend or effect) both in a positive and a negative direction are beingconsidered. We do this if our hypothesis is non-directional as we have not specifiedwhich of the two outcomes we expect to find. Confining the outcome to one of the twopossibilities is known as the one-tailed significance level because only one outcome ispredicted. This is what we do if our hypothesis is directional, where we expect the resultsto go in one direction.
M04_HOWI4994_03_SE_C04.QXD 10/11/10 15:00 Page 66
CHAPTER 4 THE PROBLEMS OF GENERALISATION AND DECISION-MAKING IN RESEARCH 67
To understand what is meant by the term ‘tailed’, we need to plot the probability ofobtaining each of the possible outcomes that could be obtained by sampling if the nullhypothesis is assumed to be true. This is the working assumption of hypothesis testingand reference to the null hypothesis is inescapable if hypothesis testing is to be under-stood. The technicalities of working out the distribution of random samples if the nullhypothesis is true can be obtained from a good many statistics textbooks. The ‘trick’ toit all is employing the information contained in the actual data. This gives us informa-tion about the distribution of scores. One measure of the distribution of scores is thestandard deviation. In a nutshell, this is a sort of average of the amount scores in a samplediffer from the mean of the sample. It is computationally a small step from the standarddeviation of scores to the standard error of the means of samples. Standard error is asort of measure of the variation of sample means drawn from the population defined bythe null hypothesis. Since we can calculate the standard error quite simply, this tells ushow likely each of the different sample means are. (Standard error is the distribution ofsample means.) Not surprisingly, samples very different from the outcome defined by thenull hypothesis are increasingly uncommon the more different they are from what wouldbe expected on the basis of the null hypothesis.
This is saying little more than that if the null hypothesis is true, then samples that are unlike what would be expected on the basis of this null hypothesis are likely to beuncommon.
4.6More on the similarity between measures of effect(difference) and association
Often measures of the effect (or difference) in experimental designs are seen as unlikemeasures of association. This is somewhat misleading. Simple basic research designs inpsychology are often analysed using the t-test (especially in laboratory experiments) andthe Pearson correlation coefficient (especially in cross-sectional or correlational studies).The t-test is based on comparing the means (usually) of two samples and essentiallyexamines the size of the difference between the two means relative to the variability inthe data. The Pearson correlation coefficient is a measure of the amount of associationor relationship between two variables. Generally speaking, especially in introductorystatistics textbooks, they are regarded as two very different approaches to the statisticalanalysis of data. This can be helpful for learning purposes. However, they are actuallyvery closely related.
A t-test is usually used to determine whether an effect is significant in terms ofwhether the mean score of two groups differ. We could use a t-test to find out whetherthe mean depression score was higher in the cognitive behaviour therapy group than inthe no treatment group. A t-test is the mean of one group subtracted from the mean ofthe other group and divided by what is known as the standard error of the mean:
t =
The standard error of the mean is a measure of the extent to which sample means arelikely to differ. It is usually based on the extent to which scores in the data differ so it isalso a sort of measure of the variability in the data. There are different versions of the t-test. Some calculate the standard error of the mean and others calculate the standarderror of the difference between two means.
mean of one group − mean of other group
standard error of the mean
M04_HOWI4994_03_SE_C04.QXD 10/11/10 15:00 Page 67
68 PART 1 THE BASICS OF RESEARCH
The value of t can be thought of as the ratio of the difference between the two meansto the degree of the variability of the scores in the data. If the individual scores differwidely, then the t value will be smaller than if they do not differ much. The bigger the tvalue is, the more likely it is to be statistically significant. To be statistically significantat the two-tailed .05 level, the t value has to be 2.00 or bigger for samples of more than61 cases. The t value can be slightly less than 2.00 for bigger samples. The minimumvalue that t has to exceed to be significant at this level is 1.96, which is for an infinitenumber of cases. These figures can be found in the tables in some statistics texts such asIntroduction to Statistics in Psychology (Howitt and Cramer, 2011a).
Bigger values of t generally indicate a bigger effect (bigger difference between the sam-ple means relative to the variability in the data). However, this is affected by the samplesize so this needs to be taken into consideration as well. Bigger values of t also tend toindicate increasingly significant findings if the sample size is kept constant.
The Pearson’s correlation shows the size of an association between two quantitativevariables. It varies from –1 through 0 to 1:
A negative value or correlation means that lower values on one variable go togetherwith higher values on the other variable.
A positive value or correlation means that higher values on one variable go togetherwith higher values on the other variable.
A value of zero or close to zero means that there is no relationship or no linear rela-tionship between the two groups and the outcome measure.
Note that Pearson’s correlation is typically used to indicate the association between two quantitative variables. Both variables should consist of a number of values, the fre-quencies of which take the shape of a bell approximately. The bell-shaped distributionis known as the normal distribution. (See the companion book Introduction to Statisticsin Psychology, Howitt and Cramer, 2011a, or any other statistics textbook for a detaileddiscussion of precisely what is meant by a normal distribution.) Suppose, for example,we are interested in what the relationship is between how satisfied people are with theirleisure and how satisfied they are with their work. Suppose the scores on these two meas-ures vary from 1 to 20 and higher scores indicate greater satisfaction. A positive corre-lation between the two measures means that people who are more satisfied with theirleisure are also more satisfied with their work. It could be that these people are gener-ally positive or that being satisfied in one area of your life spills over into other areas. Anegative correlation indicates that people who are more satisfied with their leisure areless satisfied with their work. It is possible that people who are dissatisfied in one areaof their life try to compensate in another area.
A correlation of zero or close to zero shows that either there is no relationshipbetween these two variables or there is a relationship but it does not vary in a linear way.For example, people who are the most and least satisfied with their leisure may be lesssatisfied with work than people who are moderately satisfied with their lives. In otherwords, there is a curvilinear relationship between leisure and work satisfaction. The simplest and the most appropriate way of determining whether a correlation of zero or close to zero indicates a non-linear relationship between two variables is to draw ascattergram or scatterplot as shown in Figure 4.3. Each point in the scatterplot indi-cates the position of one or more cases or participants in terms of their scores on the twomeasures of leisure and work satisfaction.
The t values which compare the means of two unrelated or different groups of casescan be converted into a Pearson’s correlation or what is sometimes called a point–biserial correlation, which is the same thing. The following formula is used to convertan unrelated t value to a Pearson’s correlation (which is denoted by the letter r; and n is,of course, the sample size):
M04_HOWI4994_03_SE_C04.QXD 10/11/10 15:00 Page 68

CHAPTER 4 THE PROBLEMS OF GENERALISATION AND DECISION-MAKING IN RESEARCH 69
FIGURE 4.3A scatterplot showing a non-linear relationship between leisure and worksatisfaction
r =
Alternatively, we could calculate the value of r directly from the data. Suppose highervalues on the measure of depression indicate greater depression and that the cognitivebehaviour therapy group shows less depression than the no treatment group. If we codeor call the no treatment group 1 and the cognitive behaviour therapy group 2, then wewill have a negative correlation between the two groups and depression when we calcu-late the Pearson correlation value.
Because of the interchangeability of the concepts of correlation and tests of differenceas shown, it should be apparent that we can speak of a difference between two groupsor alternatively of a correlation or an association between group membership andanother variable. This is quite a sophisticated matter and important when developing amature understanding of research methods.
4.7 Sample size and size of association
Now that we have provided some idea as to what statistical significance is and how toconvert a test of difference into a correlation, we can discuss how big a sample shouldbe in order to see whether an effect or association is statistically significant. The biggerthe correlation is, the smaller the sample can be for that correlation to be statisticallysignificant. In Table 4.1 we have presented 11 correlations decreasing in size by .10 from ±1.00 to 0.00 and the size that the sample has to exceed to be significant at theone-tailed 5 per cent or .05 level. So, for example, if we expect the association to beabout .20 or more, we would need a sample of more than 69 for that association to be statistically significant. It is unusual to have an overall sample size of less than 16.The size of an effect may be expected to be bigger when manipulating variables as in an
t2
t2 + n − 2
M04_HOWI4994_03_SE_C04.QXD 10/11/10 15:00 Page 69

70 PART 1 THE BASICS OF RESEARCH
experiment rather than simply measuring two variables as in a cross-sectional study.This is because the researcher, normally, does everything possible to reduce extraneoussources of variation in an experiment using procedural controls such as standardisation– this is another way of saying that error variance is likely to be less in a true experi-ment. Consequently, sample sizes are generally smaller for true experiments than non-experiments.
When dealing with two groups it is important that the two groups are roughly equalin size. If there were only a few cases in one of the groups (very disproportionate groupsizes) we cannot be so confident that our estimates of the population characteristicsbased on these is reasonably accurate The conversion of a t value into a Pearson’s correlation presupposes that the variation or variance in the two groups is also similarin size. Where there is a big disparity, the statistical outcome is likely to be somewhatimprecise. Where there are only two values, as in the case of two groups, one shouldensure, if possible, that the two groups should be roughly similar in size. So it is import-ant that the researcher should be aware of exactly what is happening in their data inrespect of this.
A correlation of zero is never significant no matter how big the sample – since that isthe value which best supports the null hypothesis. Correlations of 1.00 are very unusualas they represent a perfect straight-line or linear relationship between two variables. Thiswould happen if we correlated the variable with itself. You need to have a minimumsample of three to determine the statistical significance of a correlation, though we wouldnot suggest that you adopt this strategy since the size of the relationship would have tobe rather larger than we would expect in psychological research. Thus a correlation of.99 or more would be significant at the one-tailed 5 per cent or .05 level if the samplewas 3. Consequently, no sample size has been given for a correlation of 1.00. These sample sizes apply to both positive correlations and negative ones. It is the size of thecorrelation that matters for determining statistical significance and not its sign (unlessyou are carrying out a directional test).
Table 4.1Size of sample required for a correlation to be statistically significant at the one-tailed 5 per cent or 0.05 level
Correlation Sample size Verbal label for size Percentage of Verbal label for size (r ) (n) of correlation variance shared of shared variance
±1.00 perfect 100 perfect
±.90 4 81 large
±.80 6 large, strong or high 64
±.70 7 49
±.60 9 modest or moderate 36
±.50 12 25
±.40 18 16
±.30 32 small, weak or low 9 medium
±.20 69 4
±.10 270 1 small
.00 none 0 none
M04_HOWI4994_03_SE_C04.QXD 10/11/10 15:00 Page 70

CHAPTER 4 THE PROBLEMS OF GENERALISATION AND DECISION-MAKING IN RESEARCH 71
■ The size of an association and its meaningThe size of a correlation is often described in words as well as in numbers. Correlationsof .80 or above are usually talked of as being ‘large’, ‘strong’ or ‘high’. This size of correlation may be obtained when we measure the same variable, such as depression, ontwo separate occasions two weeks apart. In such a case, we may say there was a strongcorrelation between the first and second test of depression. Correlations of .30 or lessare usually spoken of as being small, weak or low. Correlations of this size are typicallyfound when we measure different variables, such as depression and social support, onthe same or different occasions. Correlations between .30 and .80 are commonly said tobe moderate or modest. They are usually shown when we assess very similar measures,but which are not the same, such as (1) how supportive one sees a partner as being and(2) how satisfied one is with that relationship.
These labels may be misleading in that they may seem to be underestimating thestrength of a correlation. The meaning of the size of a correlation is better understood if we square the correlation value – this gives us something called the coefficient of determination. So a correlation of .20 when squared gives a coefficient of determinationof .04. This value represents the proportion of the variation in a variable that is sharedwith the variation in another variable. Technically this variation is measured in terms ofa concept or formula called variance. The way to calculate variance can be found in astatistics textbook such as the companion book Introduction to Statistics in Psychology(Howitt and Cramer, 2011a).
A correlation of 1.00 gives a coefficient of determination of 1.00, which means thatthe two variables are perfectly related. A correlation of zero produces a coefficient ofdetermination of zero, which indicates that the variables are either totally separate orthey do not have a straight-line relationship such as the relationship between work andleisure satisfaction in Figure 4.3. These proportions may be expressed as a percentage,which may be easier to understand. We simply multiply the proportion by 100 so .04becomes 4 (.04 × 100). The percentage of the variance shared by the correlations inTable 4.1 is shown in the fourth column of that table.
If we plot the percentage of variance shared against the size of the correlation as shownin Figure 4.4 we can see that there is not a straight-line or linear relationship between
FIGURE 4.4 Relationship between correlation and percentage of shared variance
M04_HOWI4994_03_SE_C04.QXD 10/11/10 15:00 Page 71
72 PART 1 THE BASICS OF RESEARCH
the two but what is called an exponential relationship. The percentage of varianceincreases at a faster rate at higher than lower correlations. As the size of a correlationdoubles, the corresponding size of the percentage of shared variance quadruples. To give an example of this, a correlation of .40 is twice as big as one of .20. If we expressthese correlations as the percentage of shared variance we can see that a percentage of16 is four times as big as one of 4. This should tell you that it is helpful to consider the amount of variation explained by a correlation and not simply the numerical size. A correlation of .40 is not twice as good as a correlation of .2 because in terms of the amount of variation (variance) explained, the larger correlation accounts for fourtimes the amount of variation. Table 4.1 gives the figures for the amounts of variationexplained.
The verbal labels generally used to describe different sizes of the shared variance have tended to differ in the research literature from those given to the correlations thatcorrespond to them. Where the percentage of shared variance is about 1, the size of theeffect or the association has been called ‘small’ (Cohen, 1988, pp. 24–7). Where it isabout 5 it has been described as being ‘medium’. Where it is more than about 10 it hasbeen referred to as being ‘large’. These judgements are obviously subjective or personalto some extent. What one psychologist considers to be a large effect, another might thinkof as being small. We are inclined to think that 10 may be considered medium and above20 as large. However, such a judgement does depend on a great many factors such aswhat is being measured and how accurately or reliably it can be measured. One wouldexpect lower values for the coefficient of determination if it is based on variables whichcannot be measured accurately.
Justification for the use of these labels might come from considering just how manyvariables or factors may be expected to explain a particular kind of behaviour. Racialprejudice is a good example of such behaviour. It is reasonable to assume that racialprejudice is determined by a number of factors rather than just a single factor. The tendency towards authoritarianism has a correlation of .30 with a measure of racial prejudice (Billig and Cramer, 1990). This means that authoritarianism shares 9 per centof its variance with racial prejudice. On the face of things, this is not a big percentage of the variance. What if we had, say, another ten variables that individually and inde-pendently explained (accounted for) a similar proportion of the variance? Then we could claim a complete account of racial prejudice. The problem in psychology is findingout what these other ten variables are – or whether they exist. Actually a correlation of .30 is not unusual in psychological research and many other variables will explain considerably less of the variance than this.
There is another way of looking at this issue. That is to ask what the value is of a correlation of .30 – a question which is meaningless in absolute terms. In the aboveexample, the purpose of the research was basically associated with an attempt to theorise about the nature of racial prejudice. In this context, the correlation of .30 would seem to imply that one’s resources would be better applied to finding more effective explanations of racial prejudice than can be offered on the basis of authorit-arianism. On the other hand, what if the researcher was interested in using cognitivebehaviour therapy in suicide prevention? A correlation of .30 between the use of cognitive behaviour therapy and decline in the risk of suicide is a much more importantmatter – it amounts to an improvement in the probability of suicide prevention from .35 to .65 (Rosenthal, 1991). This is in no sense even a moderate finding: it is of majorimportance. In other words, there is a case against the routine use of labels when assessing the importance of a correlation coefficient.
There is another reason why we should be cautious about the routine application of labels to correlations or any other research result. Our measures are not perfectly reliable or valid measures of what they are measuring (see Chapter 15 for a detailed discussion of reliability and validity). Because they are often relatively poor measures of
M04_HOWI4994_03_SE_C04.QXD 10/11/10 15:00 Page 72

CHAPTER 4 THE PROBLEMS OF GENERALISATION AND DECISION-MAKING IN RESEARCH 73
what they are intended to measure, they tend usually to underestimate the true or realsize of the association. There is a simple statistical procedure for taking into account theunreliability of the measures called the correction for attenuation (see the companionbook Introduction to Statistics in Psychology, Howitt and Cramer, 2011a, Chapter 36).Basically it gives us an idealised version of the correlation between two variables as ifthey were perfect measures. The formula for the corrected correlation is:
corrected correlation =
If the correlation between the two measures is .30 and their reliability is .75 and .60,respectively, the corrected correlation is .45:
corrected correlation = = = = .45
This means that these two variables share about 20 per cent of their variance. If this isgenerally true, we would only need another four variables to explain what we are inter-ested in. (Though this is a common view in the theory of psychological measurement,the adjustment actually redefines each of the concepts as the stable component of thevariables. That is, it statistically makes the variables completely stable [reliable]. Thisobviously is to ignore the aspects of a variable which are unstable, for example, whydepression varies over time, which may be as interesting and important to explain as thestable aspects of the variable.)
How do we know what size of effect or association to expect if we are just setting outon doing our research?
Psychologists often work in areas where there has already been considerable research.While what they propose to do may never have been done before, there may be similarresearch. It should be possible from this research to estimate or guestimate how bigthe effect is likely to be.
One may consider collecting data on a small sample to see what size of relationshipmay be expected and then to collect a sample of the appropriate size to ensure thatstatistical significance is achieved if the trend in the main study is equal to that foundin the pilot study. So if the pilot study shows a correlation of .40 between the twovariables we are interested in, then we would need a minimum of about 24 cases in our main study. This is because by checking tables of the significance of the correlation coefficient, we find that .40 is statistically significant at the 5 per cent level(two-tailed test) with a sample size of 24 (or more). These tables are to be found inmany statistics textbooks – our companion statistics text, Introduction to Statistics inPsychology (Howitt and Cramer, 2011a), has all you will need.
Another approach is to decide just what size of relationship or effect is big enough to be of interest. Remember that very small relationships and effects are significantwith very large samples. If one is not interested in small trends in the data then thereis little point in depleting resources by collecting data from very large samples. Thedifficulty is deciding what size of relationship or effect is sufficient for your purposes.Since these purposes vary widely no simple prescription may be offered. It is partly amatter of assessing the value of the relationship or effect under consideration. Thenthe consequences of getting things wrong need to be evaluated. (The risk of gettingthings wrong is higher with smaller relationships or effects, all other things being equal.)It is important not simply to operate as if statistical significance is the only basis fordrawing conclusions from research.
.30
.67
.30
.45
.30
.75 × .60
correlation between measures 1 and 2
measure 1 reliability × measure 2 reliability
M04_HOWI4994_03_SE_C04.QXD 10/11/10 15:00 Page 73

74 PART 1 THE BASICS OF RESEARCH
Psychologists are often concerned with testing generalisations about human behaviour that arethought to apply to all human beings. This is known as universalism since it assumes that psycho-logical processes are likely to apply similarly to all people no matter their geographical location, culture or gender.
The ability of a researcher to generalise from their research findings is limited by a range of factorsand amounts to a complex decision-making process. These factors include the statistical significanceof the findings, the representativeness of the sample used, participation and dropout rates, and thestrength of the findings.
Participants are usually chosen for their convenience to the researcher, for example, they are easilyaccessible. A case can be made for the use of convenience samples on the basis that these peopleare thought for theoretical purposes to be similar to people in general. Nonetheless, researchers areoften expected to acknowledge this limitation of their sample.
The data collected to test a generalisation or hypothesis will be either consistent with it or not consistent with it. The probability of accepting that the results or findings are consistent with the generalisation is set at .05 or 5 per cent. This means that these results are likely to be due to chance 5 times out of 100 or less. Findings that meet this criterion or critical value are called statistically significant. Those that do not match this criterion are called statistically non-significant.
Key points
It is probably abundantly clear by now that purely statistical approaches to general-isation of research findings are something of an impossibility. Alongside the numbers onthe computer output is a variety of issues or questions that modify what we get out ofthe statistical analysis alone. These largely require thought about one’s research findingsand the need not to simply regard any aspect of research as routine or mechanical.
4.8 Conclusion
Psychologists are often interested in making generalisations about human behaviour thatthey believe to be true of, or apply to, people in general, though they will vary in theextent to which they believe that their generalisations apply universally. If they believethat the generalisation they are testing is specific to a particular group of people they willstate what that group of people is. Because all people do not behave in exactly the sameway in a situation, many psychologists believe that it is necessary to determine the extentto which the generalisation they are examining holds for a number, or sample, of people.If they believe that the generalisation applies by and large to most people and not to a particular population, they will usually test this generalisation on a sample of peoplethat is convenient for them to use.
The data they collect to test this generalisation will be either consistent or not con-sistent with it. If the data are consistent with the generalisation, the extent to which theyare consistent will vary. The more consistent the data are, the stronger the evidence willbe for the generalisation. The process of generalisation is not based solely on simple criteria about statistical significance. Instead it involves considerations such as the natureof the sampling, the adequacy of each of the measures taken, and an assessment of thevalue or worth of the findings for the purpose for which they were intended.
M04_HOWI4994_03_SE_C04.QXD 10/11/10 15:00 Page 74

CHAPTER 4 THE PROBLEMS OF GENERALISATION AND DECISION-MAKING IN RESEARCH 75
ACTIVITIES1. Choose a recent quantitative study that has been referred to either in a textbook you are reading or in a lecture that you
have attended. What was the size of the sample used? Was a one- or a two-tailed significance level used and do youthink that this tailedness was appropriate? What could the minimum size of the sample have been to meet the criticallevel of significance adopted in this study? What was the size of the effect or association, and do you think that thisshows that the predictor or independent variable may play a reasonable role in explaining the criterion or dependentvariable? Are there other variables that you think may have shown a stronger effect or association?
2. Choose a finding from just about any psychological study that you feel is important. Do you think that the principle ofuniversalism applies to this finding? For example, does it apply to both genders, all age groups and all cultures? If not,then to which groups would you be willing to generalise the finding?
M04_HOWI4994_03_SE_C04.QXD 10/11/10 15:00 Page 75

Research reportsThe total picture
Overview
CHAPTER 5
The research report is the key means of communication for researchers. Laboratoryreports, projects, master’s and doctoral dissertations and journal articles all use asimilar and relatively standard structure.
Research reports are more than an account of how data were collected and analysed.They describe the entire process by which psychological knowledge develops.
Research reports have certain conventions about style, presentation, structure andcontent. This conventional structure aids communication once the basics have beenlearnt.
The research report should be regarded as a whole entity, not a set of discrete parts.Each aspect – title, abstract, tables, text and referencing – contributes to how well thetotal report communicates.
This chapter describes the detailed structure of a research report and offers practicaladvice on numerous difficulties.
M05_HOWI4994_03_SE_C05.QXD 10/11/10 15:00 Page 76

5.1 Introduction
Research is not just about data collection and analysis. The major purpose is to advanceunderstanding of the subject matter, that is, to develop theory, concepts and informationabout psychological processes. The research report describes the role that a particularstudy plays in this process. Research is not the application of a few techniques withoutrhyme or reason. Equally, the research report is not a number of unarticulated sectionsbut a fully integrated description of the process of developing understanding and know-ledge in psychology. To fully appreciate a research report requires an understanding ofthe many different aspects of research. Not surprisingly, writing a research report is ademanding and sometimes confusing process.
Despite there being different types of research report (laboratory report, dissertation,thesis, journal article, etc.), a broadly standard structure is often employed. Accounts of research found in psychology journals – journal articles – are the professional end of the continuum. At the other end are the research reports or laboratory reports writtenby undergraduate students. In between there is the final-year project, the master’s dis-sertation and the doctoral dissertation. An undergraduate laboratory report is probably 2000 words, a journal article 5000 words, a final-year project 10 000 words, a master’sdissertation 20 000–40 000 words and a doctoral dissertation in Europe 80 000 wordsbut shorter where the programme includes substantial assessment of taught courses.Although there is a common structure which facilitates the comprehension of researchreports and the absorption of the detail contained therein, this structure should be regardedas flexible enough to cope with a wide variety of contingencies. Psychology is a diversefield of study so it should come as no surprise to find conflicting ideas about what aresearch report should be. Some of the objections to the standard approach are discussedin the chapters on qualitative methods (Chapters 17–25).
There are two main reasons why research reports can be difficult to write:
The research report is complex with a number of different elements, each of whichrequires different skills. The skills required when reviewing the previous theoreticaland empirical studies in a field are not the same as those involved in drawing conclu-sions from statistical data. The skills of organising research and carrying it out arevery different from the skills required to communicate the findings of the researcheffectively.
When students first start writing research (laboratory) reports their opportunities toread other research reports – such as journal articles – are likely to have been verylimited. There is a bit of a chicken-and-egg problem here. Until students have under-stood some of the basics of psychological research and statistics they will find journalarticles very difficult to follow. At the same time, they are being asked essentially towrite a report using much the same structure as a journal article. Hopefully, some ofthe best students will be the next generation of professional researchers writing thejournal articles.
This chapter on writing the research report comes early in this book. Other books haveit tucked away at the end. But to read and understand research papers it helps to under-stand how and why a research report is structured the way it is. Furthermore writing areport should not be regarded as an afterthought but as central to the process of doingresearch. Indeed, it may be regarded as the main objective of doing research. Apart from training and educational reasons, there is little point in doing research which is notcommunicated to others. The structure of the research report is broadly a blueprint ofthe entire research process though perhaps a little more organised and systematic thanthe actual research itself. For example, the review of previous research (literature review)
CHAPTER 5 RESEARCH REPORTS 77
M05_HOWI4994_03_SE_C05.QXD 10/11/10 15:00 Page 77

78 PART 1 THE BASICS OF RESEARCH
would appear to be done first judging by most research reports – it follows the title andsummary (abstract) after all. Nevertheless, most researchers would admit that they arestill reading relevant publications even after the first draft of the report is completed. It cannot be stressed too much that the research report actually prioritises what shouldbe done in research. In contrast, a tiny minority of researchers (see Chapter 23) rejectthe idea that the literature review should come first – some claim that only after the data has been collected and analysed should the previous research be examined to assessits degree of compatibility with the new findings. This is not sloppiness or laziness ontheir part. Instead, it is a desire to analyse data unsullied by preconceptions, but it doesmean that building on previous research is not central to this alternative formulation.Put another way, a research report is largely the way it is because the methodology ofpsychology is the way it is. Departures from the standard practice serve to emphasise thenature and characteristics of the psychological method.
The conventional report structure, then, gives us the building blocks of conventionalresearch. Good research integrates all of the elements into a whole – a hotchpotch ofunrelated thoughts, ideas and activities is not required. At the same time, research reportsdo not give every last detail of the process but a clear synthesis of the major and criticalaspects of the research process. A research report contains a rather tidy version of events,of course, and avoids the messy detail of the actual process in favour of the key stagespresented logically and coherently. Writing the research report should be seen as a con-structive process which can usefully begin even at the planning stage of the research.That is, the research report is not the final stage of the research process but integral to it. If this seems curious then perhaps you should consider what many qualitativeresearchers do when analysing their textual data. They begin their analysis and analyticnote-taking as soon as the first data become available. Such forethought and planningare difficult to fulfil but regard them as an ideal to be aimed at.
Something as complex as a research report may be subject to a degree of incon-sistency. Journals, for example, publish detailed style instructions for those submittingmaterial to them. The American Psychological Association (APA) publishes a very sub-stantial manual. There is no universal manual for student research reports so, not surprisingly, different lecturers and instructors have varying views of the detail of thestructure and style of undergraduate student research reports. Different universities have different requirements for doctoral theses, for example. The problem goes beyondthis into professional research reports. A quick search of the Internet using the searchterm ‘psychology research report’ will locate numerous websites giving advice andinstruction about writing a good research report. These sites far from speak with onevoice. Nevertheless, there is a great deal of overlap or unanimity of approach. It is essential for a student to understand the local rules for the research report just as it isfor the professional researcher to know what is acceptable to the journal to which theysubmit work for possible publication. Probably students will receive advice from theirlecturers and instructors giving specific requirements. In this chapter, we have opted touse the style guidelines of the American Psychological Association wherever practicable.This helps prepare students for a possible future as users and producers of psycho-logical research. It should be remembered that research is increasingly regarded as an important skill for practitioners of all sorts and not just academic psychologists. Nolonger is research confined to universities; practitioner research is commonplace. Indeedthe description researcher-practitioner describes the role of many psychologists outsideuniversities.
M05_HOWI4994_03_SE_C05.QXD 10/11/10 15:00 Page 78
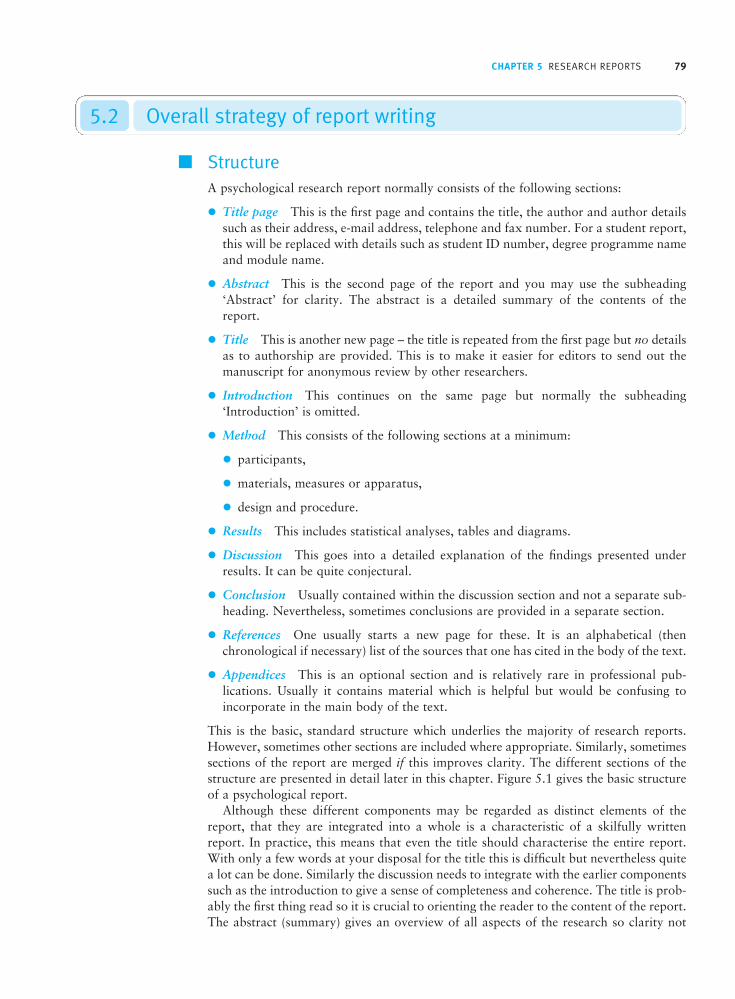
CHAPTER 5 RESEARCH REPORTS 79
5.2 Overall strategy of report writing
■ StructureA psychological research report normally consists of the following sections:
Title page This is the first page and contains the title, the author and author detailssuch as their address, e-mail address, telephone and fax number. For a student report,this will be replaced with details such as student ID number, degree programme nameand module name.
Abstract This is the second page of the report and you may use the subheading‘Abstract’ for clarity. The abstract is a detailed summary of the contents of the report.
Title This is another new page – the title is repeated from the first page but no detailsas to authorship are provided. This is to make it easier for editors to send out themanuscript for anonymous review by other researchers.
Introduction This continues on the same page but normally the subheading‘Introduction’ is omitted.
Method This consists of the following sections at a minimum:
participants,
materials, measures or apparatus,
design and procedure.
Results This includes statistical analyses, tables and diagrams.
Discussion This goes into a detailed explanation of the findings presented underresults. It can be quite conjectural.
Conclusion Usually contained within the discussion section and not a separate sub-heading. Nevertheless, sometimes conclusions are provided in a separate section.
References One usually starts a new page for these. It is an alphabetical (thenchronological if necessary) list of the sources that one has cited in the body of the text.
Appendices This is an optional section and is relatively rare in professional pub-lications. Usually it contains material which is helpful but would be confusing toincorporate in the main body of the text.
This is the basic, standard structure which underlies the majority of research reports.However, sometimes other sections are included where appropriate. Similarly, sometimessections of the report are merged if this improves clarity. The different sections of thestructure are presented in detail later in this chapter. Figure 5.1 gives the basic structureof a psychological report.
Although these different components may be regarded as distinct elements of thereport, that they are integrated into a whole is a characteristic of a skilfully writtenreport. In practice, this means that even the title should characterise the entire report.With only a few words at your disposal for the title this is difficult but nevertheless quitea lot can be done. Similarly the discussion needs to integrate with the earlier componentssuch as the introduction to give a sense of completeness and coherence. The title is prob-ably the first thing read so it is crucial to orienting the reader to the content of the report.The abstract (summary) gives an overview of all aspects of the research so clarity not
M05_HOWI4994_03_SE_C05.QXD 10/11/10 15:00 Page 79

80 PART 1 THE BASICS OF RESEARCH
only creates a good impression but helps reassure the reader that the report and theresearch it describes are of a high quality.
■ Overall writing styleClarity is essential since there is a great deal of information contained within a researchreport. The material contained in the report should be geared to the major theme of thereport. This is particularly the case with the introduction in which the research literatureis reviewed. It is a bad mistake to simply review research in the chosen field and fail tointegrate your choice with the particular aspects addressed by your research.
A number of stylistic points (as summarised in Figure 5.2) should be remembered:
Keep sentences short and as simple as possible. Sentences of eight to ten words areprobably the optimum. Check carefully for sentences over 20 words in length. Thereader will have forgotten the beginning of the sentence by the time the end isreached! With modern word processing it is possible to check for sentence length. InMicrosoft Word, for example, the spelling and grammar checker does this and it ispossible to get readability statistics by selecting the appropriate option. If you havethe slightest problem about sentence length then you should consider using this facil-ity. (Readability statistics are based on such features as average sentence length. Assuch they provide a numerical indication of stylistic inadequacies.)
Paragraphing needs care and thought. A lack of paragraphing makes a report difficultto read. Probably a paragraph should be no more than about half a printed page.Equally, numerous one-sentence paragraphs make the report incoherent and unread-able. Take a good look at your work as bad paragraphing looks odd. So always checkyour paragraphs. Break up any very long paragraphs. Combine very short paragraphs,especially those of just one or two sentences in length.
It is useful to use subheadings (as well as the conventional headings). The reason forthis is that subheadings indicate precisely what should be under that subheading – andwhat should not be. Even if you delete the subheadings before submitting the final
FIGURE 5.1 The basic structure of a psychological report
*Or the Discussion and Conclusions may be combined into a Discussion andConclusions section.
M05_HOWI4994_03_SE_C05.QXD 10/11/10 15:00 Page 80

CHAPTER 5 RESEARCH REPORTS 81
report, you will benefit by having a report in which the material is in meaningfulorder. If you think that your draft report is unclear, try to put in subheadings. Oftenthis will help you spot just where the material has got out of order. Then it is a mucheasier job to put it right.
Make sure that your sentences are in a correct and logical order. It is easy to get sentences slightly out of order. The same is true for your paragraphing. You will findthat subheadings help you spot this.
It is normally inappropriate to use personal pronouns such as ‘I’ and ‘we’ in aresearch report. However, care needs to be taken as this can lead to lengthy passivesentences. In an effort to avoid ‘We gave the participants a questionnaire to com-plete.’ the result can be the following passive sentence: ‘Participants were given aquestionnaire to complete.’ It would be better to use a more active sentence structuresuch as ‘Participants completed a questionnaire.’ This is shorter by far. In the activesentence it is the subject that performs the action; for example, ‘We [subject] wrote[verb] the report [object]’. In a passive sentence the subject suffers the action, as in‘The report [subject] was written [verb]’.
The dominant tense in the research report is the past tense. This is because the bulkof the report describes completed activities in the past (for example, ‘The question-naire measured two different components of loneliness.’). That is, the activities completed by the researcher in the process of collecting, analysing and interpretingthe data took place in the past and are no longer ongoing. Other tenses are, however,sometimes used. The present tense is often used to describe the current beliefs ofresearchers (for example, ‘It is generally considered that loneliness consists of twomajor components . . .’). Put this idea into the past tense and the implications areclearly different (for example, ‘It was generally considered that loneliness consists oftwo major components . . .’). The future tense is also used sometimes (for example,‘Clarification of the reasons for the relationship between loneliness and lack of socialsupport will help clinicians plan treatment strategies.’).
Remember that the tables and diagrams included in the report need to communicateas clearly and effectively as the text. Some readers will focus on tables and diagramsbefore reading the text since these give a quick overview of what the research and theresearch findings are about. Too many tables and diagrams are not helpful and everytable and diagram should be made as clear as possible by using headings and clearlabels.
Avoid racist and sexist language, and other demeaning and otherwise offensive lan-guage about minority groups. The inclusion of this in a professional research reportmay result in the rejection of the article or substantial revision to eliminate such material (see Box 5.1).
Numbers are expressed as 27, 3, 7, etc. in most of the text except where they occuras the first words of the sentence. In this case, we would write; ‘Twenty-seven airlinepilots and 35 cabin crew completed the alcoholism scale.’
It is a virtue to keep the report reasonably compact. Do not waffle or put in materialsimply because you have it available. It is not desirable to exceed word limits so some-times material has to be omitted. It is not uncommon to find that excess length canbe trimmed simply by judicious editing of the text. A quarter or even a third of wordscan be edited out if necessary.
Do not include quotations from other authors except in those cases where it is undesirable to omit them. This is particularly the case when one wishes to disputewhat a previous writer has written. In this instance, only by quoting the origin can itsnuances be communicated.
M05_HOWI4994_03_SE_C05.QXD 10/11/10 15:00 Page 81

82 PART 1 THE BASICS OF RESEARCH
Generally introductions are the longest section of a research report. Some authoritiessuggest about a third of the available space should be devoted to the introduction. Ofcourse, adjustments have to be made according to circumstances. Research which collectsdata on numerous variables may need to devote more space to the results section.
A rule of thumb is to present the results of calculations to no more than two decimalplaces. There is a danger of spuriously implying a greater degree of accuracy than psychological data usually possess. Whatever you do, be consistent. You need tounderstand how to round to two decimals. Basically, if the original number ends witha figure of 5 or above then we round up, otherwise we round down. So 21.4551 gives21.46 rounded whereas 21.4549 gives 21.45 rounded.
Avoiding bias in language
Box 5.1 Talking Point
Racism, sexism, homophobia and hostility to minoritiessuch as people with disabilities are against the ethics ofpsychologists. The use of racist and sexist language andother unacceptable modes of expression are to be avoidedin research reports. Indeed, such language may result inthe material being rejected for publication. We wouldstress that the avoidance of racist and sexist language cannot fully be reduced to a list of dos and don’ts. Thereason is that racism and sexism can manifest themselvesin a multiplicity of different forms and those forms maywell change with time. For example, Howitt and Owusu-Bempah (1994) trace the history of racism in psychologyand how the ways it is manifest have changed over time.While it is easy to see the appalling racism of psychologyfrom a century ago, it is far harder to understand its opera-tion in present day psychology. For detailed examples ofhow the writings of psychologists may reinforce racism see Owusu-Bempah and Howitt (1995) and Howitt andOwusu-Bempah (1990).
Probably the first step towards the elimination of racismand sexism in psychological research is for researchers toundergo racism and sexism awareness training. This isincreasingly available in universities and many work loca-tions. In this way, not only will the avoidance of offensivelanguage be helped but, more important, the inadvertentpropagation of racist and sexist ideas through researchwill be made much more difficult.
A few examples of avoidable language use follow:
Writing things like ‘the black sample . . .’ can readilybe modified to ‘the sample of black people . . .’ or, ifyou prefer, ‘the sample of people of colour . . .’. In thisway, the most important characteristic is drawn atten-tion to: the fact that you are referring to people first
and foremost who also happen to be black. You mightalso wish to ask why one needs to refer to the race ofpeople at all.
Avoid references to the racial (or gender) characteristicsof participants which are irrelevant to the substance ofthe report. For example, ‘Female participant Y was ablack lone-parent . . .’. Not only does this contain theelements of a stereotypical portrayal of black people as being associated with father absence and ‘brokenfamilies’, but the race of the participant may be totallyirrelevant to what the report is about.
Do not refer to man, mankind or social man, for exam-ple. These terms do not make people think of man andwoman but of men only. Words like ‘people’ can be substituted. Similarly referring to ‘he’ contributes to theinvisibility of women and so such terms should not beused.
Of course, the use of demeaning and similar language isnot confined to race and gender. Homophobic languageand writings are similarly to be avoided. Equally, carefulthought and consideration should be given when writingabout any disadvantaged or discriminated against group.So people with disabilities should be treated with dignityin the choice of language and terms used. So, for example,the phrase ‘disabled people’ is not acceptable and shouldbe replaced with ‘people with disabilities’.
The website of the American Psychological Associationcontains in-depth material on these topics – race and ethnic-ity, gender and disabilities. Should your report touch on anyof these, you are well advised to consult the Association’sguidance. The following location deals with variousaspects of APA style: http://www.apastyle.org/index.aspx
M05_HOWI4994_03_SE_C05.QXD 10/11/10 15:00 Page 82

CHAPTER 5 RESEARCH REPORTS 83
Psychological terms may not have a standard definition which is accepted by allresearchers. Consequently, you may find it necessary to define how you are usingterms in your report. Always remember that definitions in psychology are rarelydefinitive and they are often problematic in themselves.
Layout: normally the recommendation is to double space your work and word-processit. However, check local requirements on this. Leave wide margins for comments. Useunderlining or bold for headings and subheadings. The underlying assumption behindthis is that the report is being reviewed by another person. A report that will not becommented upon might not require double spacing. Check the local rules where youare studying.
FIGURE 5.2 Essential writing style for psychological reports
M05_HOWI4994_03_SE_C05.QXD 10/11/10 15:00 Page 83

84 PART 1 THE BASICS OF RESEARCH
5.3 The sections of the research report in detail
■ TitleThe title is not used as a heading or subheading. Often it is given twice – once on thetitle page and again just before the introduction.
The title of a research report serves two main purposes:
To attract the attention of potential readers. This is especially the case for profes-sional research reports since the potential reader probably comes across the title eitherin a database or by browsing through the contents of a journal.
To inform the reader of the major features of the research paper. In other words, itamounts to a summary of the contents of the research report in no more than about12 words (although 20 words might be used if necessary). This includes any sub-heading. You require a good understanding of your research before you can write agood title. It is a good discipline to try to write a title even before you have finishedthe research. This may need honing into shape since initial attempts are often a littleclumsy and too wordy. Enlist the help of others who are familiar with your researchas they may be able to help you to rephrase your initial efforts. The key thing is thatthe reader gains a broad idea of the contents of the report from the title.
The following suggestions may help you write a clear and communicative title foryour work:
Phrases such as ‘A study of . . .’, ‘An investigation into . . .’ and ‘An experiment investigating . . .’ would normally not be included in well-written titles since they are not really informative and take up precious words. They should be struck out innormal circumstances.
Avoid clever or tricky titles which, at best, merely attract attention. So titles like ‘Thejourney out of darkness’ for a report on the effectiveness of therapy for depressionfails the informativeness test. It may be a good title for a novel but not a psycholo-gical research report. Better titles might include ‘Effectiveness of cognitive behaviouraltherapy in recovery from depression during long-term imprisonment’. This titleincludes a great deal of information compared with the previous one. From our new title, we know that the key dependent variable is depression, that the popula-tion being researched is long-term prisoners, and that the key independent variable is cognitive behavioural therapy. Occasionally you may come across a title which istricky or over-clever but nevertheless communicates well. For example, one of us published a paper with the title ‘Attitudes do predict behaviour – in mails at least’.The first four words clearly state the overriding theme of the paper. The last fourwords do not contain a misprint but an indication that the paper refers to letter post.Another example from a recent study is ‘Deception among pairs: “Let’s say we hadlunch and hope they will swallow it!”’ All in all, the best advice is to avoid being this smart.
If all else fails, one can concentrate on the major hypothesis being tested in the study(if there is one). Titles based on this approach would have a rudimentary structuresomething like ‘The effects of (variable A) on (variable B)’. Alternatively, ‘The rela-tionship between (variable A) and (variable B)’. A published example of this is ‘Theeffects of children’s age and delay on recall in a cognitive or structured interview’. The basic structure can be elaborated as in the following published example: ‘Effectsof pretrial juror bias, strength of evidence and deliberation process on juror decisions:
M05_HOWI4994_03_SE_C05.QXD 10/11/10 15:00 Page 84
CHAPTER 5 RESEARCH REPORTS 85
New validity evidence of the juror bias scale scores’. The phrase ‘Effects of . . .’ maycreate some confusion. It may mean ‘the causal effect of variable A on variable B’ butnot necessarily so. Often it means ‘the relationship between variable A and variable B’.‘The effects of’ and ‘the relationship between’ are sometimes used interchangeably. Itis preferable to restrict ‘Effects of’ to true experiments and ‘Relationships between’ tonon-experiments.
■ AbstractThe abstract is best given this heading in a student’s report although the title ‘Abstract’is not normally included in psychology journals. Since the abstract is a summary of manyaspects of the research report, normally it is written after the main body of the reporthas been drafted. This helps prevent the situation in which the abstract refers to thingsnot actually in the main body of the report. Since the abstract is crucially important,expect to write several drafts before it takes its final shape. The brevity of the abstract isone major reason for the difficulty.
The key thing is that the abstract is a (fairly detailed) summary of all aspects of theresearch report. It is usually limited to a maximum number of words. This maximummay vary, but limits of 100 to 200 words are typical. With space available for only 10to 20 short sentences, inevitably the summary has to be selective. Do not cope with theword limit by concentrating on just one or two aspects of the whole report, for example,the hypotheses and the data collection method used would be insufficient on their own.When writing an abstract you should take each of the major sections of the report inturn and summarise the key features of each. There is an element of judgement in thisbut a well-written abstract will give a good overview of the contents of the report.
It is increasingly common to find ‘structured abstracts’. The structure may vary but agood structure is four subheadings:
Purpose
Methods
Results
Conclusions.
This structure ensures that the abstract covers the major components of the research.You could use it to draft an abstract and delete these headings after they have servedtheir purpose of concentrating your mind on each component of the research.
Although this does not apply to student research reports, the abstract (apart from the title) is likely to be all that potential readers have available in the first instance.Databases of publications in psychology and other academic disciplines usually includejust the title and the abstract together, perhaps, with a few search terms. Hence, theabstract is very important in a literature search – it is readily available to the researcherwhereas obtaining the actual research report may require some additional effort. Moststudents and researchers will be able to obtain abstracts almost instantly by usingInternet connections to databases. A badly written abstract may deter some researchersfrom reading the original research report and may cause others to waste effort obtaininga report which is not quite what they expected it to be. The clearer and more compre-hensive the information in the abstract, the more effective will be the decision of whetheror not to obtain the original paper for detailed reading.
The other function of the abstract is that it provides a structure for when one is reading the entire paper. In other words, the reader will know what to expect in thereport having read the abstract, and this speeds up and simplifies the task of reading.Since first impressions are important, writing the abstract should not be regarded as a
M05_HOWI4994_03_SE_C05.QXD 10/11/10 15:00 Page 85

86 PART 1 THE BASICS OF RESEARCH
drudgery but an opportunity to establish the value of your research. Get it wrong, andthe reader may get the impression that you are confused and muddled – bad news if thatperson is giving you a grade or possibly considering your work for possible publication.
You will find examples of abstracts in any psychology journal. Figure 5.3 shows thecomponents of a report to be summarised in the abstract.
Important points to summarise in the abstract
Box 5.2 Practical Advice
Ideally, the following should be outlined in the abstract.Normally subheadings are not used except in structuredabstracts though this rule may be broken if necessary.They are given here simply for purposes of clarity. Theyrelate to the major subheadings of the report itself:
Introduction This is a brief statement justifying theresearch and explaining the purpose, followed by ashort statement of the research question or the mainhypotheses. The justification may be in terms of thesocial or practical utility of the research, its relevanceto theory, or even the absence of previous research. Theresearch question or hypotheses will also be given.Probably no more than 30 per cent of the abstract willbe such introductory material.
Method This a broad orientation to the type ofresearch that was carried out. Often a simple phrasewill be sufficient to orient the reader to the style ofresearch in question. So phrases like ‘Brain activity wasstudied using PET (positron emission tomography) andFMRI (functional magnetic resonance imaging) . . .’, ‘A controlled experiment was conducted . . .’, ‘Theinterview transcripts were analysed using discourseanalysis . . .’ and ‘A survey was conducted . . .’ suggesta great deal about the way in which the research wascarried out without being wordy.
Participants This will consist of essential detail aboutthe sample(s) employed. For example, ‘Interview datafrom an opportunity sample consisting of young carersof older relatives was compared with a sample of youngpeople entering the labour market for the first time,matched for age’.
Procedure This should identify the main measuresemployed. For example, ‘Loneliness was assessed usingthe shortened UCLA loneliness scale. A new scale wasdeveloped to measure social support’. By stipulatingthe important measures employed one also identifies
the key variables. For an experiment, in addition it wouldbe appropriate to describe how the different conditionswere created (i.e. manipulated). For example, ‘Levels ofhunger were manipulated by asking participants torefrain from eating or drinking for 1 hour, 3 hours and6 hours prior to the experiment’.
Results There is no space in an abstract for elaboratepresentations of the statistical analyses that theresearcher may have carried out. Typically, however,broad indications are given of the style of analysis. For example, ‘Factor analysis of the 20-item anxietyscale revealed two main factors’, ‘The groups werecompared using a mixed-design ANOVA’ or ‘Binomiallogistic regression revealed five main factors which differentiated men and women’. Now these statisticaltechniques may be meaningless to you at the momentbut they will not be to most researchers. They refer to very distinct types of analysis so the terms are veryinformative to researchers. In addition, the majorfindings of the statistical analysis need to be reported.Normally this will be the important, statisticallysignificant features of the data analysis. Of course,sometimes the lack of significance is the most import-ant thing to draw attention to in the abstract. There isno need and normally no space to use the succinctmethods of the reporting of statistics in the abstract. So things like (t = 2.43, df = 17, p < 0.05) are rare inabstracts and best omitted.
Discussion In an abstract, the discussion (and conclu-sions) need to be confined to the main things that thereader should take away from the research. As ever,there are a number of ways of doing this. If you havealready stated the hypothesis then you need do littleother than confirm whether or not this was supported,given any limitations you think are important concerningyour research, and possibly mention any crucial recom-mendations for further research activity in the field.
M05_HOWI4994_03_SE_C05.QXD 10/11/10 15:00 Page 86

CHAPTER 5 RESEARCH REPORTS 87
■ IntroductionUsually, the introduction to a report is not given a heading or subheading – to do somerely states the obvious. The introduction sets the scene for the research, the analysisand discussion which follow it. In effect, it is an explanation of why your chosenresearch topic deserved researching and the importance of the particular aspect of thetopic you have chosen to focus on.
Explanations or justifications for a particular research topic include the following:
There is a need to empirically test ideas that have been developed in theoretical discussions of the topic. In other words, the advancement of theory may be offered asfull or partial reasons for engaging in research.
There is a pressing concern over a particular issue which can be informed by empiricaldata. Often social research is carried out into issues of public concern but the stimulusmay, instead, come from the concerns of organisations such as health services, industryand commerce, the criminal justice system, and so forth.
There is an unresolved issue arising out of previous research on a topic which may beilluminated by further research – especially research which constructively replicatesthe earlier research.
Just being interested in the topic is not a good or sufficient reason for doing research inacademic terms. You should make the intellectual case for doing the research, not thepersonal case for doing so.
The introduction contains a pertinent review of previous research and publications onthe topic in question, partly to justify the new research. One explains the theoretical issues,the problems with previous research, or even the pressing public interest by reference towhat other researchers have done and written before. Research is regarded as part of a collective enterprise in which each individual contribution is part and builds on thetotality. The keyword is pertinent – or relevant – previous research and publications.
FIGURE 5.3 The components of a report to be summarised in the abstract
M05_HOWI4994_03_SE_C05.QXD 10/11/10 15:00 Page 87

88 PART 1 THE BASICS OF RESEARCH
Just writing vaguely about the topic of the research using any material that is to hand isnot appropriate. The literature that you need to incorporate is that which most directlyleads to the research that you have carried out and are about to describe later in thereport. In other words, the literature review needs to be in tune with the general thrustof your research. That it is vaguely relevant is not a good reason for the inclusion of anything and you may well find that an unfocused review is counterproductive.
Students sometimes face problems stemming from their use of secondary sources, forexample, a description given in a textbook. This may contain very little detail about, say,a particular study or theory. As a consequence, the student lacks information when theywrite about the study or theory. Often they introduce errors because they read into thesecondary source things that they would not if they had read the original source. Thereis no easy way around this other than reading sources that cover the topic in depth. Ideallythis will be the original source but some secondary sources are better than others.
The introduction should consistently and steadily lead to a statement of the aims ofyour research and to the hypotheses (though there is some research for which hypothesesare either not possible or are inappropriate). There is a difference between the aims andthe hypotheses. Aims are broad, hypotheses more specific. For example, ‘the aim of thisstudy was to investigate gender differences in conversation’ might include the hypothesis‘Males will interrupt more than females in mixed-gender dyads’.
It is usually suggested that the introduction should be written in the past tense. Thismay generally be the case but is not always so. The past perfect tense describes activitieswhich were completed in the past. I ran home, the car broke down, the CD finished play-ing are all examples of the past tense. Unfortunately, it is not always possible to use thepast tense – sometimes to do so would produce silly or confusing writing. For example,the sentence ‘The general consensus among researchers is that loneliness is a multifacetedconcept’ is in the present tense. The past tense cannot convey the same meaning. ‘Thegeneral consensus among researchers was that loneliness is a multifaceted concept’ actu-ally implies that this is no longer the general consensus. Hence one needs to be aware ofthe pitfalls of the present tense for communicating certain ideas. However, since most of the material in the introduction refers to completed actions in the past then most ofit will be in the past tense. Sentences like, ‘Smith and Hardcastle (1976) showed thatintelligence cannot be adequately assessed using motor skills alone’ refer to past events.Similarly, ‘Haig (2004) argued for the inclusion of “waiting list” control groups in studiesof the effectiveness of counselling’ cannot be expressed well using a different tense.
Putting all of this together, a typical structure of an introduction is as follows:
A brief description of the topic of the research.
Key concepts and ideas should be explained in some detail or defined if this is possible.
Criticisms of aspects of the relevant research literature together with synthesis wherethe literature clearly leads to certain conclusions.
A review of the most important and relevant aspects of the research literature:
Theoretical matters pertinent to the research
Describe and discuss as necessary the key variables to be explored in your research.
List your aims and hypotheses as summary statements at the end of the introduction.
■ MethodThis is a major heading. The method section can be tricky to write since the overall strategy is to provide sufficient information for another researcher to replicate yourstudy precisely. At the same time, the minutiae of the procedures that you carried outare not included. Clearly getting the balance between what to include and what to omitis difficult. Too much detail and the report becomes unclear and difficult to read. Too
M05_HOWI4994_03_SE_C05.QXD 10/11/10 15:00 Page 88

CHAPTER 5 RESEARCH REPORTS 89
little detail and significant aspects of the research may be difficult for other researchersto reproduce. Really the task is to describe your methods in sufficient detail that the readerhas a clear understanding of what you did – they could probably replicate the research,more or less. In a sense it is rather like a musical score: broadly speaking the musicianswill know what and how to play, but they will have to fill in some of the detail them-selves. Nevertheless, it is inevitable that the method section contains a greater density ofdetail than most other sections, which tend to summarise and take an overview.
Abbreviations
Box 5.3 Talking Point
Abbreviations should be used with caution in a researchreport. Their main advantage is brevity. Before the days of computerisation, typesetting was very expensive, andthe use of abbreviations saved some considerable expense.This is no longer really the case. Student writing rarelybenefits from the use of abbreviations. If they are used badlyor inappropriately, then they risk confusing the readerwho may then feel that the student is confused.
The major disadvantage of abbreviations is that theyhamper communications and readability. Ss, DV, n, SDand SS are examples of abbreviations that sometimes wereincluded in reports. The trouble is that we assume that the reader knows what the abbreviations refer to. If thereader is not familiar with the abbreviation then their
use hampers rather than aids communication and clarity.The problem is not solved simply by stating the mean-ing of the abbreviation early in the report (for example,‘The dependent variable (DV) was mental wonderment(MW)’). The reader may not read your definition or theymay forget the meaning of the abbreviation the next timeit appears. Acronyms for organisations can similarly taxreaders unnecessarily. This is because acronyms are com-monly used by those involved with an organisation but an outside reader may be unfamiliar with their use. Werecommend using abbreviations only in exceptional circum-stances and where their use is conventional – as when yousuccinctly report your statistical findings (for example,t(27) = 2.30, p = .05).
Independent and dependent variables
Box 5.4 Key Ideas
In student research reports, it is common to identify whatvariable(s) is the independent variable (IV) and what vari-able(s) is the dependent variable (DV). This is much lesscommon in professional research reports. In general, it isprobably a useful thing for students new to research to do.However, it is something that few professional researchersdo and, consequently, might best be left out as soon aspossible. The problem in professional research is that theindependent variables and dependent variables are ofteninterchangeable. This is especially the case in regressionanalyses. The independent variable is the variable which is expected to affect the value of the dependent variable.There is no necessary assumption that there is a causallink at all. In controlled experiments (see Chapter 9) theindependent variable is always the variable(s) defined by
the experimental manipulation(s). So if the level of angerin participants is manipulated by the experimenter thenanger level is the independent variable. In an experiment,any variables which might be expected to be affected byvarying the level of anger or any other independent vari-able is called a dependent variable. The dependent variable is the one for which we calculate the means andstandard deviations, etc. In a controlled or randomisedexperiment, the effect of the independent variable on thedependent variable is regarded as causal. In this case, theindependent variable is expected to have a direct effect onthe scores of the dependent variable. In non-randomisedresearch, all that is established is that there is an asso-ciation or relationship between the independent anddependent variable.
M05_HOWI4994_03_SE_C05.QXD 10/11/10 15:00 Page 89

90 PART 1 THE BASICS OF RESEARCH
The method section may include as many as six or more sections if the procedures areespecially complex. These include:
participants (sometimes archaically referred to as subjects);
materials or apparatus (or even both);
procedure (always);
design (possibly);
stimuli (if these require detailed description);
ethical considerations (recommended).
Of these, design and stimuli would only be used if they are not simple or straightforwardin these respects; it is a matter of judgement whether to include them or not. Oneapproach would be to include them in the early draft of your report. If they seem un-necessary or if you write very little under them (just a few sentences) then they can becombined quickly with a few mouse clicks on the word processor. An ethical consid-erations section is becoming increasingly common and is required in some professionalwritings. While students should not carry out any research which does not use well-established, ethically sound procedures, including an ethics section demonstrates that the ethical standing of the research has been considered.
Normally the methods heading is given as a major title, perhaps centred and underlinedor in bold. The section headings are subheadings and are aligned to the left margin. It is usual to go straight from the methods heading to the participants subheading. Nopreamble is required.
Participants
This section should contain sufficient information so that the reader knows how manyparticipants you had in total, how many participants were in each condition of thestudy, and sufficient detail about the characteristics of the participants to make it clearwhat the limitations on generalising the findings are likely to be. Given that much studentresearch is conducted on other students, often the description will be brief in these cases.It is old-fashioned (and misleading; see Box 5.5) to refer to those taking part in yourresearch as subjects. Avoid doing so. Once in a while the word subjects will occur in relationto particular statistical analyses which traditionally used the term (e.g. related-subjectsanalysis of variance). It is difficult to change this usage.
We would normally expect to include the following information to describe the participants:
The total number of participants.
The numbers of participants in each of the groups or conditions of the study.
The gender distribution of the participants.
The average age of the participants (group by group if they are not randomly allocated to conditions) together with an appropriate measure of the spread of the characteristic (for example, standard deviation, variance or standard error – these are equally understandable to most researchers and more-or-less equivalent in thiscontext).
Major characteristics of the participants or groups of participants. Often this will beuniversity students but other research may have different participant characteristics,for example, preschool children, visitors to a health farm, etc. These may also be pre-sented in numerical form as frequencies.
M05_HOWI4994_03_SE_C05.QXD 10/11/10 15:00 Page 90

CHAPTER 5 RESEARCH REPORTS 91
How the participants were contacted or recruited initially.
How the participants were selected for the research. Rarely are participants formallysampled using random sampling in psychological research. Convenience sampling ismuch more common (see Chapter 13).
It is good practice, but not universal, to give some indication of refusal rates anddropout rates for the participants. Refusal rates are the numbers who are asked totake part in the research but say no or otherwise fail to do so. Dropout rates are thenumbers who initially take part in the research but for some reason fail to completeall of the stages. Sometimes this is known alarmingly as ‘the mortality rate’ or the‘experimental mortality’.
Any inducements or rewards given to participants to take part in the study. So, for example, giving the participants monetary rewards or course credits would bementioned.
Materials/apparatus
The materials or apparatus section describes psychological tests, other questionnairemeasures, laboratory equipment and other such resources which are essential com-ponents of the research. Once again the idea is to supply enough detail so that anotherresearcher could essentially replicate the study and the reader gains a clear impression of the questionnaire, tests and equipment used. These requirements allow for a degreeof individual interpretation, but experience at writing and considering other people’s writings in research journals, especially, will help improve your style and hone the levelof detail that you include. Remember that the degree of detail you go into should besufficient to help the reader contextualise your research but not so detailed that thewood cannot be seen for the trees. So trivial detail should be omitted. Details such as themake of the stopwatch used, the colour of the pen given to participants, and the phys-ical dimensions of the research setting (laboratory, for example) would not normally begiven unless they were especially pertinent. If the study were, for example, about theeffects of stress on feelings of claustrophobia then the physical dimensions of the labor-atory would be very important and ought to be given. Provide the name and address ofsuppliers of specialised laboratory equipment, for example, but not for commonplace
No subjects – just participants
Box 5.5 Talking Point
One of the most misleading terms ever in psychology wasthe concept of ‘subject’. Monarchs have subjects, psycho-logists do not. In the early days of psychological research,terms such as reactors, observers, experimentees and indi-viduals under experiment were used. Danziger (1985) pointsout that these early research studies used other professors,students and friends which may explain the lack of use ofthe slightly hostile term ‘subjects’. Although the term subjectshad a long history in psychological writing, it is inadequatebecause it gives a false picture of the people who take part
in research. The term implies a powerful researcher and amanipulated subject. Research has long since dispelled thismyth – people who take part in research are not passive butactively involve themselves in the research process. They formhypotheses about the researcher’s hypotheses, for example.As a consequence they must be regarded as active contri-butors in the research process. In the 1990s, psychologicalassociations such as the American Psychological Associ-ation and the British Psychological Society recommended/insisted on the modern terminology for their journals.
M05_HOWI4994_03_SE_C05.QXD 10/11/10 15:00 Page 91

92 PART 1 THE BASICS OF RESEARCH
items such as stopwatches. When using computers in psychological research, details of thesoftware used to present experimental stimuli, for example, would normally be given.
It is also usual to give details of any psychological tests and measures employed. Thiswould probably include the official name of the test, the number of items used in themeasure, broadly what sorts of items are employed, the response format, basic informa-tion that is available about its reliability and validity, and any adjustments or alterationsyou may have made to the psychological test. Of course, you may be developing yourown psychological measures (see Chapter 14), in which case more detail should be provided about the items included in the questionnaire and so forth. It is unlikely thatyou would include the full test or measure in the description though this may be includedin an appendix if space is available. The method section is normally the place where oneoutlines how questionnaires etc. were quantified (scored) or coded.
Remember that the materials and apparatus are related to the variables being measuredand the procedures being employed. Hence, it is important to structure this sectionclearly so that the reader will gain a good understanding of the key aspects of the study.In other words, an organised description of the materials and apparatus communicateskey features of the research procedures and design. Jumble this section and your readerwill have trouble in understanding the research clearly.
Procedure
The procedure subsection describes the essential sequence of events through which youput participants in your research. The key word is sequence and this implies a chrono-logical order. It is a good idea to list the major steps in your research before writing theprocedure. This will help you get the key stages in order – and space allocated propor-tional to their importance. The instructions given to participants in the research shouldbe given and variations in the contents of these instructions (e.g. between experimentaland control group) should be described. Do not forget to include debriefing and similaraspects of the research in this section.
Also you should mention any randomisation that was involved – random allocationto conditions, for example, or randomisation of the order of presentation of materialsor stimuli. An experimental design will always include randomisation.
It is difficult to recommend a length for the procedure section since studies vary enormously in their complexity in this respect. A complex laboratory experiment maytake rather more space to describe than a simple study of the differences in mathematicalability in male and female psychology students. Of course, a great deal of research usesprocedures which are very similar to those of previous research studies in that field. Bychecking through earlier studies you should gain a better idea of what to include andexclude – this is not an invitation to plagiarise the work of others.
Finally, it may be appropriate to describe broadly the strategy of the statistical analysisespecially, for example, if specialised computer programs or statistics are employed. Thisis in order to give an overview should one seem necessary.
Design
The additional subheading Design might be included if the research design is not simple.A diagram may be appropriate if it is difficult to explain in words alone. The design sub-heading may be desirable when one has a between-subjects or repeated measures design,for example (see Chapters 9 and 10).
■ ResultsThe results section also has a main heading. Like many other aspects of the report, it islargely written in the past tense. The results section is mainly about the outcome of the
M05_HOWI4994_03_SE_C05.QXD 10/11/10 15:00 Page 92

CHAPTER 5 RESEARCH REPORTS 93
statistical analysis of your data. Statistical outcomes of your research are not the sameas the psychological interpretation of your statistical findings. Statistical analysis israther more limited than psychological analysis, which involves the development of psy-chological knowledge and theory. Thus the outcomes of your analyses should normallybe reported without conjecture about what they mean – you simply say what the findingsare. That is, say that there is a significant difference in the means of two groups or a correlation between two variables. Draw no further inferences than that there is a rela-tionship or a difference. Since the statistical analysis is often related to the hypotheses,it is perfectly appropriate to present the results hypothesis by hypothesis. It is also appro-priate to indicate whether the statistical evidence supports or fails to support each of thehypotheses.
The results section will vary in length according, in part, to the numbers of variablesand type of statistical analysis employed. It is not usual to go into a detailed descriptionof the statistical tests used – just the outcome of applying them. There is no need to mention how the computations were done. If you used a statistical package such as SPSS Statistics then there is no need to mention this fact – or even that you did your calculations using a calculator. Of course, there may be circumstances in which you areusing unusual software or highly specialised statistical techniques. In this case thenessential details should be provided. Sometimes this would be put in the methods sectionbut not necessarily so.
One common difficulty occurs when the standard structure is applied to researchwhich does not involve hypothesis or theory testing. That is, largely, when we are notcarrying out laboratory experiments. Sometimes it is very difficult to separate thedescription of the results of the study from a discussion of those results (i.e. the next section). Ultimately, clarity of communication has to take precedence over the standardconventions and some blurring of the boundaries of the standard structure for reportsmay be necessary.
Statistical analyses, almost without exception in psychology, consist of two components:
Descriptive statistics which describe the characteristics of your data. For example, themeans and standard deviations of all of your variables, where appropriate.
Inferential statistics which indicate whether your findings are statistically significantin the sense that they are unlikely to be due to chance. The correlation coefficient andt-test are examples of the sorts of inferential statistics that beginning researchers use.
Both descriptive and inferential statistics should be included in the results section thoughnot to the extent that they simply cloud the issues. The statistical analysis is not adescription of everything that you did with the data but the crucial steps in terms ofreaching the conclusions that you draw.
Conventionally, the raw, unprocessed data are not included in the results section. Themeans, standard deviations and other characteristics of the variables are given instead.This convention is difficult to justify other than on the basis of the impracticality ofincluding large data sets in a report. Students should always consider including their raw data in an appendix. All researchers should remember the ethical principle of theAPA which requires that they should make their data available to any other researcherwho has a legitimate reason to verify their findings.
Tables and diagrams are common in the results section. They are not decorations.They are a means of communicating one’s findings to others. We suggest a few rules-of-thumb for consideration:
Keep the number of tables and diagrams to a minimum. If you include too many theybecome confusing. Worse still, they become irritating. For example, giving separatetables for many very similar variables can exhaust the reader. Far better to have fewertables and diagrams but ones which can allow comparisons, say, between the variables
M05_HOWI4994_03_SE_C05.QXD 10/11/10 15:00 Page 93

94 PART 1 THE BASICS OF RESEARCH
in your study. In the analysis of your data, you may have produced many differenttables, graphs and the like. But those were for the purpose of exploring and analysingthe data and many of them will be of little interest to anyone other than the researcher.So do not try to include tables and diagrams which serve no purpose in the report.
Always take care about titling and labelling your tables and diagrams. If the title andlabels are unclear then the whole table or diagram becomes unclear. It is easy to usemisleading or clumsy titles and labels, so check them and revise them if necessary.
Some readers will look at tables and diagrams before reading your text. So for themthe quality of the tables and diagrams is even more important. Those used to statisticalanalyses will be drawn to such tables as they often are quicker to absorb than whatyou say about the data in the text.
Tables and diagrams should be numbered in the order they appear.
Tables and diagrams must be referred to in your text. At the very least you need tosay what the table or diagram indicates – the important features of the table or diagram.
Tables and diagrams are readily created in SPSS Statistics, Excel and other computerprograms. The difficulty is that the basic versions (the default options) of tables anddiagrams are often unclear or in some other way inadequate. They need editing tomake them sufficiently clear. Tables may need simplifying to make them more acces-sible to the reader. Much student work is spoilt by the use of computer-generatedtables and diagrams without modification. Think very carefully before using anyunmodified output from a computer program in your report.
A glance at any psychology research journal will indicate that relatively little space is devoted to presenting the key features of each statistical analysis. Succinct methods are used which provide the key elements of the analysis simply and clearly. These are discussed in detail in the companion book Introduction to Statistics in Psychology,Chapter 16 (Howitt and Cramer, 2011a). Basically the strategy is to report the stat-istical test used, the sample size or the degrees of freedom, and the level of statisticalsignificance. So you will see things like:
t(14) = 2.37, p = .05(t = 2.37, N = 16, p < .05)(t = 2.37, df = 14, p = 5%)
All of these are much the same. They give the statistic used, an indication of the samplesize(s) or degrees of freedom (df ), and the level of statistical significance.
■ DiscussionThis is a main heading. The past tense will dominate the discussion section but you willalso use the present and future tenses from time to time. It all depends on what you arewriting about. The material in the discussion should not simply rehash that in the intro-duction. You may need to move material between the introduction and the discussionsections to ensure this. A previous study may be put in the discussion rather than theintroduction. A research report is no place to be repetitive.
If your study tested a hypothesis, then the discussion is likely to begin with a statementindicating whether or not your hypothesis was supported by the statistical analysis (i.e. the results). Remember that most statistical analyses are based on samples and sothe findings are probabilistic, not absolute. Consequently, researchers can only find their hypotheses to be supported or not supported. Research based on samples (i.e. most research) cannot definitely establish the hypothesis’s truth or falsity since a different
M05_HOWI4994_03_SE_C05.QXD 10/11/10 15:00 Page 94

CHAPTER 5 RESEARCH REPORTS 95
sample might produce different outcomes. Consequently it grates to read that the hypo-thesis was ‘proved’ or ‘not proved’. It suggests that the writer does not fully understandthe nature of statistical inference.
Your research findings should be related to those of previous research. They maycompletely, partially or not support those of previous studies. The differences betweenthe current research and past research should be described as well as the similarities.Sometimes, previous research findings may cast light on the findings of your study.Where there is a disparity between the new findings and previous findings, attemptsshould be made to explain the disparity. Different types of sample, for example, may bethe explanation though it may not be as simple as that. In the discussion section one hasnew findings as well as older ones from previous research. The task is to explain howour knowledge is extended, enhanced or complicated by the new findings. It may be thatthe new findings tend to support one interpretation of implications of the previousresearch rather than another. This should be drawn out.
Of course there may be methodological features which may explain the disparitybetween the new and older findings. Notice that we use the term methodological featuresrather than methodological flaws. The influence of methodological differences cuts bothways – your research may have problems and strengths but the previous research mayhave had other problems and strengths. Try to identify what these may be. Accuracy inidentifying the role of methodological features is important since vague, unspecified sug-gestions leave the reader unclear as to what you regard as the key differences betweenstudies. Try to identify the role of methodological features as accurately and precisely asyou can – merely pointing out that the samples are different is not very helpful. Betterto explain the ways in which the sample differences could produce the differences in thefindings. That is, make sure that it is clear why methodological factors might affect thefindings differentially. And, of course, it is ideal if you can recommend improvements toyour methodology.
Try not to include routine commonplaces. The inclusion of phrases such as ‘A largersample size may result in different findings’ is not much of a contribution, especiallywhen you have demonstrated large trends in your data.
The discussion should not simply refer back to the previous research, it should includethe theoretical implications which may be consequent on your findings. Perhaps the theory is not quite so rigorous as you initially thought. There may be implications ofyour findings. Perhaps you could suggest further research or practical applications.
Finally, the discussion should lead to your conclusion. This should be the main thingthat the reader should take away from your research. It is not typically the case that a separate heading is included for the conclusions. It can seem clumsy or awkward to do so in non-experimental research especially. But this is a matter of choice – and judgement.
■ ReferencesThis a major heading and should start on a fresh page. Academic disciplines consider it important to provide evidence in support of all aspects of the argument that you aremaking. This can clearly be seen in research reports. The research evidence itself andyour interpretation of it is perhaps the most obvious evidence for your argument.However, your report will make a lot of claims over and above this. You will claim thatthe relevant theory suggests something, that previous studies indicate something else,and so forth. In order for the reader of your report to be in a position to check the accuracyor truth of your claims, it is essential to refer them to the sources of information andideas that you use. Simply suggesting that ‘research has found that’ or ‘it is obvious that’is not enough. So it is necessary to identify the source of your assertions. This includestwo main components:
M05_HOWI4994_03_SE_C05.QXD 10/11/10 15:00 Page 95

96 PART 1 THE BASICS OF RESEARCH
You cite your sources in the text as, say, (Donovan & Jenkins, 1963). ‘Donovan & Jenkins’ gives the name of the authors and 1963 is the date of publication (dis-semination) of the work. There are many systems in use for giving citations, but inpsychology it is virtually universal to use this author–date system. It is known as the Harvard system but there are variants of this and we will use the AmericanPsychological Association’s version which is the basis of those employed throughoutthe world by other psychological associations.
You provide an alphabetical list of references by the surname of the first author.There is a standard format for the references though this varies in detail according towhether it is a book, a journal article, an Internet source and so forth. The referencecontains sufficient information for a reader to track down and, in most cases, obtaina copy of the original document.
The citation
While the citation in the text seems to be very straightforward, there are a number ofthings that you need to remember:
The citation should be placed adjacent to the idea which it supports. Sometimes confusion can be caused because the citation is placed at the end of a sentence whichcontains more than one idea. In these circumstances, the reader may be misled aboutwhich of the ideas the citation concerns. For that reason, think very carefully aboutwhere you insert the citation. You may choose to put it part-way through the sentenceor at the end of the sentence. The decision can be made only in the light of the structureof the sentence and whether things are clear enough with the citation in a particularposition.
Citations should be to your source of information. So if you read the information inSmith (2004) then you should cite this as the source really. The trouble is that Smith(2004) may be a secondary source which is explaining, say, Freud’s theory of neurosis,Piaget’s developmental stages, or the work of some other theorist or researcher.Students rarely have time or resources to read all of the original publication fromwhich the idea came although it is a good idea to try to read some of it. So althoughuncommon in professional report writing, student research reports will often containcitations such as (Piaget, 1953, cited in Atkinson, 2005). In this way the ultimatesource of the idea is acknowledged but the actual source is also given. To attribute toAtkinson ideas which the reader might recognise as those of Piaget might cause someconfusion and would be misleading anyway. In your reference list you would listAtkinson (2005) and also Piaget (1953).
Citations with several authors are given as Smith et al. (1976) with the et al followedby a full stop to indicate an abbreviation. In the past, et al. was in italics to indicatea foreign word or phrase but, increasingly, this is not done. APA style does not itali-cise et al.
Student writing (especially where students have carried out a literature review) canbecome very stilted because they write things like ‘Brownlow (1989) argued that children’s memories are very different from those of adults. Singh (1996) found evidence of this. Perkins and Ottaway (2002) confirmed Singh’s findings in a groupof 7-year-olds.’ The problem with this is that the sentence structure is repetitive andthe person who you are citing tends to appear more important than their ideas. It is a good idea to keep this structure to a minimum and bring their contributions tothe fore instead. For example: ‘Memory in children is different from that of adults(Brownlow, 1989). This was initially confirmed in preschool children (Singh, 1996)
M05_HOWI4994_03_SE_C05.QXD 10/11/10 15:00 Page 96

CHAPTER 5 RESEARCH REPORTS 97
and extended to 7-year-olds by Perkins and Ottaway (2002).’ Both versions containsimilar information but the second illustrates a greater range of stylistic possibilities.
When you cite several sources at the same time (Brownlow, 1989; Perkins & Ottaway,2002; Singh, 2002, 2003) do so in alphabetical order (and then date order if necessary).
Sometimes an author (or authors) has published more than one thing in a particularyear and you want to cite all of them. There may be two papers by Kerry Brownlowpublished in 2009. To distinguish them, the sources would be labelled Brownlow(2009a) and Brownlow (2009b). The order of the title of the books or articles in thereport determines which is ‘a’ and which is ‘b’. In the references, we include the ‘a’and ‘b’ after the date so that the sources are clearly distinguished. Remember to dothis as soon as possible to save you from having to re-read the two sources later toknow which contains what. If you were citing both sources then you would condensethings by putting (Brownlow, 2009a, b).
It is important to demonstrate that you have read up-to-date material. However, donot try to bamboozle your lecturers by inserting citations which you have not read ina misguided attempt to impress. Your lecturer will not be taken in. There are manytell-tale signs such as citing obscure sources which are not in your university libraryor otherwise easily obtainable.
Citing what you have not actually read!
Box 5.6 Talking Point
The basic rules of citations are clear. You indicate thesource of the idea in the text just like this (Conqueror,1066) and then put where the information was found in the reference list. This is all very well in theory but inpractice causes problems in relation to student work. Thedifficulty is that the student may only have read textbooksor other secondary sources and they may not be able to get their hands on Conqueror (1066). Now one could simply cite the textbook from which the information came but this has problems. If one cites the secondarysource it reads like the secondary source was actuallyresponsible for the idea which they were not. So what does the student do?
There are three, probably equally acceptable, ways ofdoing this in student work:
In the main body of the text give the original sourcefirst followed by ‘cited in’ then the secondary source(Conqueror, 1066, cited in Bradley, 2004). Then in the reference list simply list Bradley (2004) in full in the usual way. This has the advantage of keeping the reference list short.
In the main body of the text give the original source(Conqueror, 1066). Then in the reference list insert
Conqueror, W. (1066). Visual acuity in fatallywounded monarchs. Journal of Monocular VisionStudies, 5 (3), 361–72. Cited in Bradley, M.(2004). Introduction to Historical Psychology(Hastings: Forlorn Hope Press).
This method allows one to note the full source of boththe primary information and the secondary information.
In the main body of the text give the original source(Conqueror, 1066). Then in the reference list insert
Conqueror, W. (1066). Cited in Bradley, M.(2004). Introduction to Historical Psychology(Hastings: Forlorn Hope Press).
This is much the same as the previous version but thefull details of the original source are not given.
It might be wise to check which version your lecturer/supervisor prefers. Stick to one method and do not mixthem up in your work.
M05_HOWI4994_03_SE_C05.QXD 10/11/10 15:00 Page 97

98 PART 1 THE BASICS OF RESEARCH
Some of the problems associated with citations and reference lists can be avoided byusing a reference and citation bibliographic software such as RefWorks and Endnote (see Chapter 7). These are basically databases in which you enter essential details suchas the authors, the date of publication, the title of the publication, and the source of thepublication. One can also insert notes as to the work’s contents. It is also possible to down-load details of publications directly from some Internet databases of publications whichcan save a lot of typing. If you do this properly and systematically, it is possible to use theprogram in conjunction with a word processing program to insert citations at appropriateplaces and to generate a reference list. Even more useful is that the software will do thecitations and reference list in a range of styles to suit different journal requirements, etc.The researcher can easily change the references to another style should this be necessary.
The main problem with these programs may be their cost. Bona fide students may get heavily discounted rates. Increasingly universities have site licences for this sort ofbibliographic software so check before making any unnecessary expenditure.
Reference list
References will be a main heading at the end of the report. There is a difference betweena list of references and a bibliography. The reference list only contains the sources whichyou cite in the main body of your report. Bibliographies are not usually included inresearch reports. A bibliography lists everything that you have read which is pertinentto the research report – even if it is not cited in the text. Normally just include the references you cite unless it is indicated to you to do otherwise.
Items in reference lists are not numbered in the Harvard system (APA style), they aremerely given in alphabetical order by surname of the author.
One problem with reference lists is that the structure varies depending on the ori-ginal source. The structure for books is different from the structure for journal articles.Both are different from the structure for Internet sources. Unpublished sources have yetanother structure. In the world of professional researchers, this results in lengthy styleguides for citing and referencing. Fortunately, the basic style for references boils downto just a few standard patterns. However, house styles of publishers differ. The housestyle of Pearson Education, for example, as seen in the references at the end of this bookdiffers slightly from that recommended here. We would recommend that you obtainexamples of reference lists from journal articles and books which correspond to theapproved style. These constitute the most compact style guide possible.
Traditionally journal names were underlined as were book titles. This was a printer’sconvention to indicate that emphasis should be added. In the final printed version, it is likely that what was underlined appeared in italics. If preparing a manuscript for publication, this convention is generally no longer followed. If it is a report or thesis then it is appropriate for you to use italics for emphasis instead of the underline. Do not use underlining in addition to italics. The use of italics has the advantage of beingless cluttered and has positive advantage for readers with dyslexia as underlining oftenmakes the text harder to read.
The following is indicative of the style that you should adopt for different kinds ofsource.
Books
Author family name, author initials or first name, year of publication in brackets,stop/period, title of book in lower case except for the first word (or words – where thefirst letter is usually capitalised) as in example, stop/period, place of publication, colon,publisher details.
Howitt, D. (2002). Forensic and criminal psychology. Harlow: Pearson.
M05_HOWI4994_03_SE_C05.QXD 10/11/10 15:00 Page 98

CHAPTER 5 RESEARCH REPORTS 99
Journal articles
Author family name, author initials or first name, year of publication in brackets,stop/period, journal article title in lower case except for first word, stop/period, title ofjournal in italics or underlined, with capitals on first letter of first word and significantparts of the title, comma, volume of journal in italics, comma, pages of journal in italics.The latest version of the APA’s Publication Manual recommends that the number thatis used to identify the electronic source of an article (a DOI or Digital Object Identifier)should be presented at the end of the reference where it is available. However, this maynot be necessary for student work.
Schopp, R. F. (1996). Communicating risk assessments: Accuracy, efficacy, andresponsibility. American Psychologist, 9, 939–944.
Web sources
For a journal on the World Wide Web then simply add the source:
Schopp, R. F. (1996). Communicating risk assessments: Accuracy, efficacy, andresponsibility. American Psychologist, 9, 939–944. Retrieved from PsyKnow database.
This is a developing area and the style depends a little on the source. Search theAmerican Psychological Association site for further information and details.
The use of quotations
Box 5.7 Talking Point
The most straightforward approach to quotations is neverto use them. It is generally best to put things in your ownwords. The use of quotations tends to cause problemsbecause they are often used as a substitute for explainingand describing things yourself. The only legitimate use ofquotations, we would suggest, is when the wording of thequotation does not lend itself to putting in your own wordsfor some reason. Sometimes the nuances of the wording areessential. The use of a quotation really should always beaccompanied by some commentary of your own. This mightbe a critical discussion of what the quoted author wrote.
Quotations should always be clearly identified as suchby making sure that they appear in quotation marks andindicating just where they appear in the original source.There are two ways of doing this. One is simply to put the page number into the citation: (Smith, 2004: 56). Thismeans that the quotation is on page 56 of Smith (2004).Alternatively the pages can be indicated at the end of thequotation as (pp. 45–6) or (p. 47). This latter style isfavoured by the APA.
■ Appendix/appendicesIn some types of publication appendices are a rarity. This is because they are space consuming. The main reason for using appendices is to avoid cluttering up the mainbody of the report with overlong detail which may confuse the reader and hamper goodpresentation. So, for example, it may be perfectly sensible to include your 50 item ques-tionnaire in your report but common sense may dictate that it is put at the very end ofthe report in the section for appendices. In this case, it would be usual to give indicative
M05_HOWI4994_03_SE_C05.QXD 10/11/10 15:00 Page 99

100 PART 1 THE BASICS OF RESEARCH
Some essentials of the research report at a glance
Box 5.8 Practical Advice
Title
This is normally centred and is often emphasised in bold.
Should be informative about study.
Usually no more than 12 words but sometimes longer.
Avoid uninformative phrases such as ‘A study of’.
A good title will orient the reader to the contents of theresearch report.
Abstract or summary
Usually 100 to 200 words long but this may vary.
The abstract is a summary of all aspects of the report.It should include key elements from the introduction,method, findings and conclusions.
The abstract is crucial in providing access to your studyand needs very careful writing and editing.
examples of questions under materials. Similar considerations would apply to the mul-titude of tables that the statistical analysis may generate but which are too numerous toinclude in the results section. These too may be confined to the appendices. Remember:
to refer to the relevant appendix in the main text where appropriate;
to number and title the appendices appropriately in order to facilitate their location;
that you may be partly evaluated on the basis of the contents of your appendices. Itis inappropriate simply to place a load of junk material there.
5.4 Conclusion
It should be evident that research reports require a range of skills to be effective. That iswhy they are among the most exacting tasks that any researcher can undertake. Thereseems to be a great deal to remember. In truth, few professional researchers would haveall of the detail committed to memory. Not surprisingly, details frequently need to bechecked. The complexity, however, can be very daunting for students who may feel overwhelmed by having so much to remember. It will clearly take time to become skilledat writing research reports. The key points are as follows:
Make sure that the text is clearly written with attention paid to spelling and grammar.
Keep to the conventional structure (title, abstract, introduction, method, etc.) as faras is possible at the initial stages.
Ensure that you cite your sources carefully and include all of them in the list of references.
Carefully label and title all tables and diagrams. Make sure that they are helpful andthat they communicate effectively and efficiently.
Remember that reading some of the relevant research literature will not only improvethe quality of your report but also quickly familiarise you with the way in which professionals write about their research.
M05_HOWI4994_03_SE_C05.QXD 10/11/10 15:00 Page 100

CHAPTER 5 RESEARCH REPORTS 101
Introduction
This is not normally given a heading in researchreports, unless it is a very long thesis.
It should be a focused account of why the research wasneeded. All material should be pertinent and lead to thequestion addressed by the research.
It should contain key concepts and ideas together withany relevant theory.
Avoid using quotations unless their content is to be discussed in detail. Do not use them as a substitute forwriting in your own words.
Consider using subheadings to ensure that the flow ofthe argument is structured. They can easily be removedonce the report is complete.
Make sure that the argument leads directly to the aimsof your research.
Method
This is a centred, main heading.
Sections should include participants, materials or apparatus, procedure, design where not simple, stimuliand (recommended) ethical considerations.
It is difficult to judge the level of detail to include.Basically the aim is to provide enough detail that anotherresearcher could replicate the study in its essence.
Do not regard the structure as too rigid. It is moreimportant to communicate effectively than to includeall sections no matter whether they apply or not.
Results
This is a centred, main heading.
The results are intended to be the outcomes of the statistical analysis of the data. Quite clearly, this is notappropriate for many qualitative studies.
Do not evaluate the results or draw general conclusionsin the results section.
Remember that tables and diagrams are extremelyimportant and need to be very well done. They helpprovide a structure for the reader. So good titles,labelling and general clarity are necessary.
Do not leave the reader to find the results in your tablesand diagrams. You need to write what the results are –you should not leave it to the reader to find them forthemselves.
Discussion
The discussion is the discussion of the results. It is notthe discussion of new material except in so far as thenew material helps in understanding the results.
Do not regurgitate material from the introduction here.
Ensure that your findings are related back to previousresearch findings.
Methodological differences between your study andprevious studies which might explain any disparities inthe findings should be highlighted. Explain why the dis-parities might explain the different outcomes.
The discussion should lead to the conclusions you maywish to draw.
References
This is a centred, main heading.
It is an alphabetical list of the sources that you cite inthe text of the report.
A bibliography is not normally given. This is an alpha-betical list of all the things that you have read whenpreparing the report.
The sources are given in a standard fashion for each ofjournal articles, books, reports, unpublished sourcesand Internet sites. Examples of how to do this are givenon pages 98 and 99.
Multiple references by the same author(s) published ina single year are given letters, starting with ‘a’, after thedate to distinguish each (for example, 2004a, 2004b).
If you wish to cite sources which you have only obtainedfrom secondary sources (i.e. you have not read the originalbut, say, read about it in textbooks) then you must indi-cate this. Box 5.6 gives several ways of doing this.
Appendix
Appendix (or appendices) is a centred, main heading.
These are uncommon in published research reportslargely because of the expense. However, they can be a place for questionnaires and the like. For studentreports, they may be an appropriate place for provid-ing the raw data.
The appendices should be numbered (Appendix 1,Appendix 2, etc.) and referred to in the main text. Forexample, you may refer to the appropriate appendix byputting in brackets (see Appendix 5).
M05_HOWI4994_03_SE_C05.QXD 10/11/10 15:00 Page 101
102 PART 1 THE BASICS OF RESEARCH
As much work should go into the appendices as othercomponents of the report. They should be clear, care-fully structured and organised.
Tables and diagrams
These should be placed in the text at appropriatepoints and their presence indicated in the text (withphrases such as ‘see Table 3’). In work submitted forpublication tables and diagrams are put on separatepages. Their approximate location in the text is indi-cated by the phrase ‘Insert Table 5 about here’ put inthe text and centred.
Tables and diagrams are key features of an effectivelycommunicating report. There should be a balance
between keeping their numbers low and providingsufficient detail.
They should be numbered and given an accurate anddescriptive title.
All components should be carefully labelled, for example, axes given titles, frequencies indicated to befrequencies and so forth.
Avoid using a multitude of virtually identical tables by combining them into a clear summary table or diagram.
Remember that well-constructed tables and diagramsmay be helpful to the reader as a means of giving anoverview of your research.
The research report draws together the important features of the research process and does not simplydescribe the details of the empirical research. As such, it brings the various aspects of the researchprocess into an entirety. It is difficult to write because of the variety of different skills involved.
There is a basic, standard structure that underlies all research reports, which allows a degree of flex-ibility. The detail of the structure is too great to remember in detail and style manuals are availablefor professional researchers to help them with this.
Although quality of writing is an important aspect of all research reports, there are conventions whichshould be followed in all but exceptional circumstances. For example, most of the report is written inthe past tense, avoids the personal pronoun, and uses the active, not passive, voice.
A research report needs to document carefully the sources of the evidence supporting the argumentsmade. Citations and references are the key to this and should correspond to the recommended format.
All parts of the report should work to communicate the major messages emerging from the empiricalresearch. Thus the title and abstract are as important in the communication as the discussion andconclusions.
Key points
ACTIVITIES1. Photocopy or print an article in a current psychology journal held in the library. Draw up a list of any disparities between
this article and the conventional structure described in this chapter. Why did the author(s) make these changes?
2. Find a recent practical report that you have written. Using the material in this chapter, list some of the ways in whichyour report could be better.
M05_HOWI4994_03_SE_C05.QXD 10/11/10 15:00 Page 102

Examples of how towrite research reports
Overview
CHAPTER 6
Writing up a research study is a complex business which takes time to master. Itneeds thought and practice since it involves the full range of knowledge and skillsemployed by research psychologists. So there is a limit to how much one can short-cut the process by reducing it to a set of ‘rules’ to follow. Nevertheless, this chapteris intended to provide easy-access practice in thinking about report writing.
A fictitious laboratory report is presented of a study which essentially replicatesLoftus and Palmer’s (1974) study of the effect of questioning on the memory of aneye-witnessed incident. This is a classic in psychology and illustrates the influence ofquestioning on memory for witnessed events.
This should be read in conjunction with Chapter 5 which explains the important features of a good write-up of research. Box 5.8 may be especially useful to refer to.Chapter 5 takes the components of the research report in turn and describes goodpractice and pitfalls. So you may wish to check back as you read through the researchstudy written up in this chapter.
This chapter presents a short laboratory report which is evaluated in terms of thepresence or absence of important features, its logical structure and the numerousaspects of a good laboratory report. Of course, there are many other styles of researchbut, almost without exception, the basic structure of the laboratory report can bemodified to provide a satisfactory structure for any style of research.
Looking at psychological research journals will add to your understanding of how psy-chological research is written up. Indeed, having a published article for comparisonis a very useful guide as to the important elements of any report you are writing. Thisis really what your lecturers would like you to be able to emulate so using a journal
M06_HOWI4994_03_SE_C06.QXD 10/11/10 15:01 Page 103

104 PART 1 THE BASICS OF RESEARCH
article as a template for your own work is not a bad idea. Just make sure that the article is from a core psychology journal so that the ‘psychology’ style of doing thingsis used.
There is a ‘model’ write-up given of the same study. This is not intended as ‘per-fection’ but as a way of indicating some of the features of better than average work.This write-up gives a clear impression of a student who is on top of the research that they conducted, understands the basics of report writing, and can accuratelycommunicate ideas.
6.1 Introduction
The bottom line is that it is not easy to write an entirely satisfactory research report, as wesaw in the previous chapter. Each new study carried out brings up new difficulties oftenquite different from ones previously encountered. We, like many other researchers, still findit difficult to write the reports of our own research simply because of the complexity ofthe task of putting all of the elements of the research into one relatively brief document.Not surprisingly, then, newcomers who perhaps have never even read a psychologicalresearch report will find report writing a problem. Although everyone will get better withpractice there will always be errors and criticisms no matter how sophisticated one becomes.Furthermore, a novice researcher looking at the reports of research in psychologicaljournals will almost certainly be daunted by what they find. These reports are usually thework of seasoned professionals and have been through quality-checking procedures ofthe peer-review system in which other researchers comment upon manuscripts submittedto journals. This means that the work has been reviewed by two or three experts in thatfield of research who will identify problems in the report – they may also insist that thesedifficulties are corrected. The work of students is largely their unaided effort and usuallyhas not been reviewed by their lecturers before it is submitted for marking.
In this chapter, there is a sample research report which contains numerous errors andinadequacies but also some good features for you to learn by. Your task is to spot thegood and bad elements. You may identify more than we mention – there is always a subjective aspect to the assessment of any academic work. Of course, there is a problemin supplying a sample research report since this is a learning exercise, not an exercise inmarking. Although we could provide an example of the real work of students, such aresearch report is unlikely to demonstrate a sufficiently wide range of problems. So,instead, we have written a report which features problems in various areas to illustrate thekinds of error that can occur as well as some of the good points. We then ask you toidentify what these problems are and to make suggestions about how to correct them.We have indicated many problem areas in the research report by the use of highlightednumbers which may serve as a clue as to where we think that there are problems. You maywell find problems which we have failed to notice. Our ideas as to how the report couldbe improved follow the report. It is unlikely that your own research reports will have suchdetailed feedback as we have provided for this example, so do not assume that if theassessor of your report has not commented on aspects of it that these parts cannot beimproved. Assessors cannot be expected to remark on everything that you have written.
One of the most famous studies in modern psychology is Elizabeth Loftus’s study ofmemory (Loftus and Palmer, 1974) in which participants were shown a video of a vehicleaccident and then asked one of a variety of questions such as ‘About how fast were the
M06_HOWI4994_03_SE_C06.QXD 10/11/10 15:01 Page 104

CHAPTER 6 EXAMPLES OF HOW TO WRITE RESEARCH REPORTS 105
cars going when they smashed each other?’ Other participants were given words such ashit, collided, bumped or contacted instead of smashed. Participants gave different estimatesaccording to the particular version of the question asked. Those who were asked aboutthe speed when the cars ‘contacted’ gave an average estimate of 31 miles per hour but thoseasked about the cars which ‘smashed’ each other estimated a speed 10 miles per hourfaster than this on average. The argument is, of course, that this study demonstrates thatmemory can be modified by the kind of question asked after the event. We have decidedto write up a fictional study which replicates Loftus and Palmer’s study but with somevariations. The report is brief compared with, say, the length a journal article would be,and in parts it is truncated as a consequence. Nevertheless, it is about 2000 words in length,which is probably in the middle of the range of word-lengths that lecturers demand. Ofcourse, it would be too short for a final-year project/dissertation. Nevertheless, many of thepoints we make here would apply to much more substantial pieces of writing.
It would be wise to familiarise yourself with the contents of Chapter 5 on writingresearch reports before going further. Then read through the following practical report,carefully noting what you believe to be the problems and the good qualities of the report.You should then make suggestions about how the report could be improved. It is easierto spot problems than identify good elements so you will find that the former dominatesin our comments. Remember that the highlighted numerals shown at various points of thereport roughly indicate the points at which we have something to comment on. Do notforget that there is likely to be some variation in how your lecturers expect you to write upyour research. This is common in psychology. For example, different journals may insiston slightly different formats for manuscripts. So you may be given specific instructions onwriting up your research which differ slightly from our suggestions. If so, bear this advicein mind alongside our comments.
Notice that our research report introduces a novel element into the study which wasnot part of the Loftus and Palmer original. It is a variation on the original idea whichmight have psychological implications. Depending on the level of study, the expectationof originality for a student’s work may vary. Introductory level students are more likelyto be given precise instructions about the research that they are to carry out whereasmore advanced students may be expected to introduce their own ideas into the researchthat they do. We have taken the middle ground in which the student has been encouragedto replicate an earlier study, introducing some relevant variation in the design. This isoften referred to as a constructive replication.
You will find it helpful to have a copy of a relevant journal article to hand when you write your own reports. You may find such an article helpful when studying ourfictitious report. It would be a good idea to get hold of Palmer and Loftus’s originalreport, though this may have variations from what is now the accepted style of writingand presenting research reports. Of course, whatever journal article you use shouldreflect the mainstream psychology style of writing reports. So make sure that you use anarticle from a core psychology journal as other disciplines often have different styles.Remember too, that research reports in the field that you carry out your research will begood guides for your future research reports. Of course, the important thing is to usethem as ‘guides’ or ‘models’ – do not copy the material directly as this is bad practicewhich is likely to get you into trouble for plagiarism (see Chapter 8).
6.2 A poorly written practical report
Particular issues are flagged with numbers in the report and then explained in detail inthe analysis that follows.
M06_HOWI4994_03_SE_C06.QXD 10/11/10 15:01 Page 105
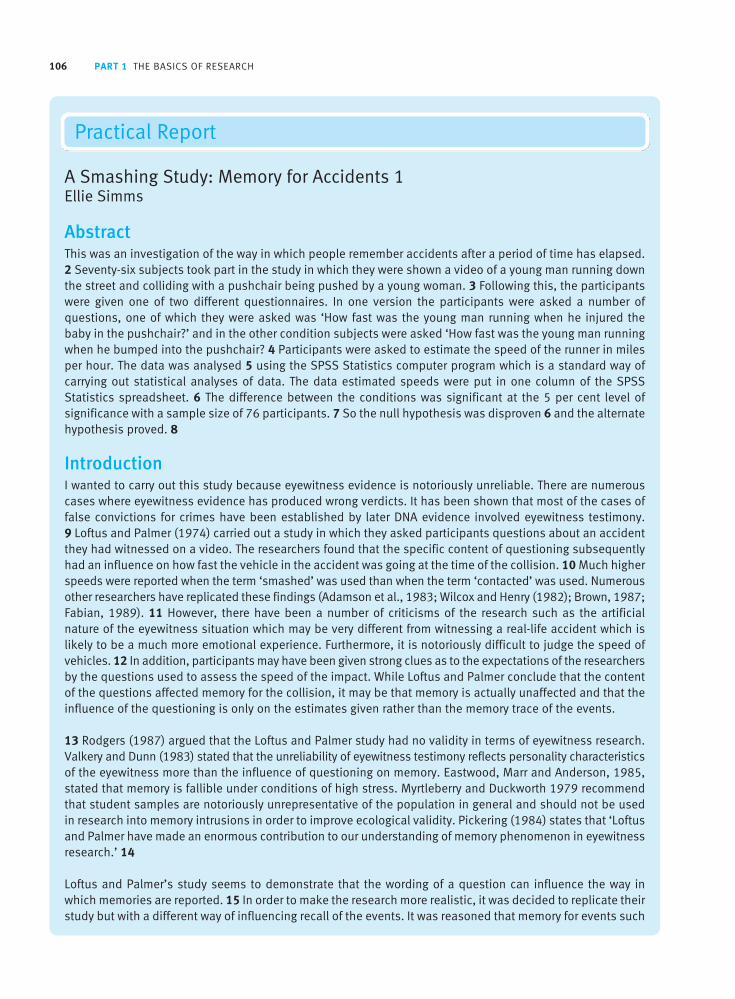
106 PART 1 THE BASICS OF RESEARCH
A Smashing Study: Memory for Accidents 1Ellie Simms
AbstractThis was an investigation of the way in which people remember accidents after a period of time has elapsed.2 Seventy-six subjects took part in the study in which they were shown a video of a young man running downthe street and colliding with a pushchair being pushed by a young woman. 3 Following this, the participantswere given one of two different questionnaires. In one version the participants were asked a number of questions, one of which they were asked was ‘How fast was the young man running when he injured the baby in the pushchair?’ and in the other condition subjects were asked ‘How fast was the young man runningwhen he bumped into the pushchair? 4 Participants were asked to estimate the speed of the runner in miles per hour. The data was analysed 5 using the SPSS Statistics computer program which is a standard way ofcarrying out statistical analyses of data. The data estimated speeds were put in one column of the SPSSStatistics spreadsheet. 6 The difference between the conditions was significant at the 5 per cent level of significance with a sample size of 76 participants. 7 So the null hypothesis was disproven 6 and the alternatehypothesis proved. 8
IntroductionI wanted to carry out this study because eyewitness evidence is notoriously unreliable. There are numerouscases where eyewitness evidence has produced wrong verdicts. It has been shown that most of the cases offalse convictions for crimes have been established by later DNA evidence involved eyewitness testimony. 9 Loftus and Palmer (1974) carried out a study in which they asked participants questions about an accidentthey had witnessed on a video. The researchers found that the specific content of questioning subsequentlyhad an influence on how fast the vehicle in the accident was going at the time of the collision. 10 Much higherspeeds were reported when the term ‘smashed’ was used than when the term ‘contacted’ was used. Numerousother researchers have replicated these findings (Adamson et al., 1983; Wilcox and Henry (1982); Brown, 1987;Fabian, 1989). 11 However, there have been a number of criticisms of the research such as the artificialnature of the eyewitness situation which may be very different from witnessing a real-life accident which islikely to be a much more emotional experience. Furthermore, it is notoriously difficult to judge the speed ofvehicles. 12 In addition, participants may have been given strong clues as to the expectations of the researchersby the questions used to assess the speed of the impact. While Loftus and Palmer conclude that the contentof the questions affected memory for the collision, it may be that memory is actually unaffected and that theinfluence of the questioning is only on the estimates given rather than the memory trace of the events.
13 Rodgers (1987) argued that the Loftus and Palmer study had no validity in terms of eyewitness research.Valkery and Dunn (1983) stated that the unreliability of eyewitness testimony reflects personality characteristicsof the eyewitness more than the influence of questioning on memory. Eastwood, Marr and Anderson, 1985,stated that memory is fallible under conditions of high stress. Myrtleberry and Duckworth 1979 recommendthat student samples are notoriously unrepresentative of the population in general and should not be usedin research into memory intrusions in order to improve ecological validity. Pickering (1984) states that ‘Loftusand Palmer have made an enormous contribution to our understanding of memory phenomenon in eyewitnessresearch.’ 14
Loftus and Palmer’s study seems to demonstrate that the wording of a question can influence the way inwhich memories are reported. 15 In order to make the research more realistic, it was decided to replicate theirstudy but with a different way of influencing recall of the events. It was reasoned that memory for events such
Practical Report
M06_HOWI4994_03_SE_C06.QXD 10/11/10 15:01 Page 106

CHAPTER 6 EXAMPLES OF HOW TO WRITE RESEARCH REPORTS 107
as accidents may be influenced by the consequence of an accident such as whether or not someone wasinjured in the accident. Does the consequence of an accident influence the way in which it was perceived? 16This was believed to be a more realistic aspect of eyewitness behaviour than the rather unsubtle questioningmanipulation employed in the Loftus and Palmer’s research. 17
It was hypothesised that an accident which results in injury to an individual will be regarded as involvingmore dangerous behaviour. The null hypothesis states that accidents which result in injury to individuals willbe regarded as involving less dangerous behaviour. 18
Participants 1976 students at the University were recruited to participate in the study using a convenience sampling method.Those who agreed to take part were allocated to either the experimental (n = 29) or control condition (n = 47). 20
Materials and apparatusA specially prepared video of an accidental collision between a running man and a woman pushing apushchair with what appeared to be a baby in it. The video lasted 2 minutes and shows the man initially walkingdown a street but then he begins to run down what is a fairly crowded street. Turning a corner, he collides withthe woman pushing the pushchair. The video was filmed on a digital video camera by myself with the help ofother students. A Pananony S516 camera was used which features a 15× zoom lens and four mega-pixelsimage resolution. It was mounted on a Jenkins Video Tripod to maximise the quality of the recording.
The participants were given a short self-completion questionnaire including two versions of the critical questionwhich comprised the experimental manipulation. The first version read ‘How fast do you think the man wasrunning in miles per hour when he collided with the woman with the pushchair and the baby was injured?’.The second version read ‘How fast do you think the man was running in miles per hour when he collided withthe woman with the pushchair and baby?’ The questionnaire began with questions about the gender of theparticipant, their age, and what degree course they were taking. The critical questions were embedded in asequence of five questions which were filler questions designed to divert the participant’s attention from thepurpose of the study. These questionnaires were ‘What colour was the man’s shirt?’, ‘How many people sawthe collision occur?’, ‘What was the name of the shop outside of which the accident occurred?’, ‘Was the running man wearing trainers?’, and ‘Was the woman with the pushchair wearing jeans?’.
ProcedureParticipants were recruited from psychological students on the university campus. 21 They were recruited randomly. 22 It was explained to them that the research was for an undergraduate project and that partici-pation was voluntary and that they could withdraw from the study at any stage they wished. The participantsin the research were offered a bonus on their coursework of 5 per cent for taking part in three different piecesof research but that does not appear to have affected their willingness to take part in the research. Studentsfailing to participate in research are referred to the Head of Department as it is part of their training.Participants were taken to a small psychological laboratory in the Psychology Department. A data projectorwas used to show them the short video of the running man and his collision with the woman with a pushchair.The video was two minutes long and in colour. After the video had been shown, the participants were giventhe questionnaire to complete. Finally they were thanked for their participation in the research and left.
EthicsThe research met the current British Psychological Society ethical standards and complied with the UniversityEthical Advisory Committee’s requirements. 23 The participants were free to withdraw from the research atany time and they were told that their data would be destroyed if they so wished. All participants signed toconfirm that they agreed to these requirements.
M06_HOWI4994_03_SE_C06.QXD 10/11/10 15:01 Page 107

108 PART 1 THE BASICS OF RESEARCH
ResultsGroup Statistics 24
group N Mean Std Deviation Std Error Mean
speed 1.00 29 4.7138 1.66749 .30964
2.00 47 3.1500 1.37161 .20007
The scores on ERS 25 were compared between the two groups using the Independent Samples t-Test on SPSSStatistics. 26 SPSS Statistics is the internationally accepted computer program for the analysis of statisticaldata. 27 The t-test is used where there are two levels of the independent variable and where the dependentvariable is a score. 28
The mean scores for the two groups are different with the scores being higher where the baby was injured in the collision. 29 The difference between the two means was statistically significant at the .000 30 levelusing the t-test. 31
t = 4.443 32, df = 74, p = .000 33
Thus the hypothesis was proven and the null hypothesis shown to be wrong. 34
Independent Samples Test 35
Levene’s Test for t-test for Equality of MeansEquality of Variances
Sig. Mean Std Error F Sig. t df (2-tailed) Difference Difference
Speed Equal variances .784 .379 4.443 74 .000 1.56379 .35195assumed
Equal variances 4.242 50.863 .000 1.56379 .36866not assumed
Discussion and conclusionsThis study supports the findings of Loftus and Palmer (1974) in that memory is affected by being asked questions following the witnessed incident. 36 Memory can be changed by events following the incident witnessed. Everyone will be affected by questions which contain information relevant to the witnessed eventand their memories will change permanently. 37 In addition, it is clear that memory is not simply affected by asking leading questions of the sort used by Loftus and Palmer, but perceptions of the events leading to theincident are affected by the seriousness of the consequences of those actions.
It is not clear why serious consequences should affect memory in this way but there are parallels with theLoftus and Palmer research. When asked questions about vehicles smashing into each other then this impliesa more serious consequence than if the vehicles had only bumped. This is much the same as the presentresearch in which memories of events are affected by the injury to the baby which is an indication of the seriousness of the accident. The faster the man ran then the more likely it is that someone would get hurt.
M06_HOWI4994_03_SE_C06.QXD 10/11/10 15:01 Page 108

CHAPTER 6 EXAMPLES OF HOW TO WRITE RESEARCH REPORTS 109
The study provides support for the view that eyewitness evidence is unreliable and cannot be trusted. Manyinnocent people have spent years in prison for crimes that they did not commit because judges have not paidattention to the findings of Loftus and Palmer and many other researchers. 38
There are a number of limitations on this study. In particular, the use of a more general sample of participantsthan university students would be appropriate and would provide more valid data. 39 A larger sample of participants would increase the validity of the research findings. 40 It is suggested that a further improvementto the research design would be to add a neutral condition in which participants simply rated the speed ofthe runner with no reference to the accident. This could be achieved by having a separate group estimate thespeed of the runner.
It was concluded that eyewitness testimony is affected by a variety of factors which make its value difficult toassess. 41
ReferencesAdamson, P. T. & Huthwaite, N. (1983). Eyewitness recall of events under different questioning styles.
Cognitive and Applied Psychology, 18, 312–321. 42
Brown, I. (1987). The gullible eyewitness. Advances in Criminological Research. 43
Myrtleberry, P. I. E. & Duckworth, J. (1979). The artificiality of eyewitness research: Recommendations for improv-ing the fit between research and practice. Critical Conclusions in Psychology Quarterly, 9, 312–319. 44
Eastwood, A., Marr, W. & Anderson, P. (1985). The fallibility of memory under conditions of high and lowstress. Memory and Cognition Quarterly, 46, 208–224. 45
Fabian (1989). The Fallible Mind. London: University of Battersea Press. 46
Howitt, D. & Cramer, D. (2011). Introduction to SPSS Statistics in Psychology (4th edn). Harlow: Pearson. 47
Loftus, E. F. & Palmer, J. C. (1974). Reconstruction of automobile destruction: An example of the interactionbetween language and memory. Journal of Verbal Learning and Verbal Behaviour, 13, 585–589.
Pickering, M. (1984). Elizabeth Loftus: An Appreciation. Genuflecting Psychology Review, 29, 29–43. 48
Rodgers, T. J. (1987). The Ecological Validity of Laboratory-based Eyewitness Research. Critical Psychologyand Theory Development, 8 (1), 588–601. 49
Valkery, Robert O., Dunn, B. W. (1983). The unreliable witness as a personality disposition. Personality andForensic Psychology, 19 (4), 21–39. 50
Wilcox, A. R. and Henry, Z. W. (1982). Two hypotheses about questioning style and recall. Unpublished paper,Department of Psychology, University of Northallerton. 51
6.3 Analysis of the report
■ Title1 The title is clever but not very informative as to the research you are describing.Make sure that your title contains as much information as possible about the contentsof your report. Loftus and Palmer, themselves, entitled their study ‘Reconstructions ofautomobile destruction: An example of the interaction between language and memory’.This is more informative but probably could be improved on since all of the useful information is in the second part of the title. A better title might be ‘The relation betweenmemory for witnessed events and later suggestive interviewing’. This would also be agood title for our study though it might be better as ‘The influence of later suggestive
M06_HOWI4994_03_SE_C06.QXD 10/11/10 15:01 Page 109

110 PART 1 THE BASICS OF RESEARCH
interviewing on recall of witnessed events: A constructive replication of Loftus andPalmer’s classic study’. An alternative title might be ‘The effect of question wording on eyewitness recall’. Using the term ‘effect’ suggests that the study employs a true orrandomised design. Note that it is not necessary to preface this title with a phrase suchas ‘An experimental study of ’ or ‘An investigation into’ because we can assume that thereport is of a study and so this phrase is redundant.
■ Abstract2 The description of the purpose of the study is not accurate and precise enough. Thestudy is one on the influences of leading questioning on memory for events not on recallof eye-witnessed events over a period of time, as such. This may confuse the reader as itis inconsistent with what is described in the rest of the report.
3 Subjects is an old-fashioned and misleading term for participants, which is the modern and accurate way of characterising those who take part in research, though yousometimes still see it. Also note that the abstract says little about who the participantswere. Finally, often there are tight word limits for abstracts so shortening sentences isdesirable where possible. Changing the sentence to read ‘Seventy-six undergraduateswatched a video of a young man running down the street and colliding with a pushchair’corrects these three main errors and so is more acceptable.
4 The wording of these two sentences could be improved. At present the second sentencecould be read to suggest that participants given the second version of the questionnairewere only asked one question, which was not the case. One way of rewriting these twosentences is as follows: ‘They were then given a questionnaire consisting of six questionsin which the wording of a question about how fast the man was running was varied. In one version the baby was described as injured while in the other version there was nomention of this’.
5 The word ‘data’ is plural so this should read ‘data were’.
6 There is a lot of unnecessary detail about SPSS Statistics and data entry which addsnothing to our understanding of the research. This could be deleted without loss. By doingso, space would be freed for providing more important information about the studywhich is currently missing from the abstract. This information would include a cleardescription of what the hypothesis was.
7 The findings of the study are not very clear from this sentence and the reader wouldhave to guess what was actually found. A better version would be ‘The speed of the runner was estimated to be significantly faster when the baby was injured. t(74) = 4.43,p < .001’. This contains more new information and presents the statistical findings in asuccinct but professional manner. However, statistical values such as t and probabilitylevels are not usually presented in abstracts mainly because of the shortness of abstracts.It is important to state whether the results being presented are statistically significant and this can be done by using the adjective ‘significant’ or the adverb ‘significantly’. Notethat the sample size is mentioned twice in the original which is both repetitive and wasteswords which are tight in an abstract.
8 Hypotheses can be supported, confirmed or accepted but they cannot be proven (ordisproved for that matter). It would be better to say that the research provided supportfor the hypothesis. But notice that the writer has not said what the hypothesis was so howmeaningful to the reader is this part of the write-up? Ideally the main aim or hypothesisof a study should be described earlier on in the abstract. If this had been done, then wewould know what the hypothesis was, in which case it would not be necessary to repeatit here. Also, the reader is left without a clear idea of what the researcher has concluded
M06_HOWI4994_03_SE_C06.QXD 10/11/10 15:01 Page 110

CHAPTER 6 EXAMPLES OF HOW TO WRITE RESEARCH REPORTS 111
from this study. Leaving it as simply a test of a hypothesis fails to place the study in itswider context. While significance testing is usually taught in terms of the null and thealternate hypothesis, the results of research are generally more simply described in termsof whether the (alternate) hypothesis was confirmed or not. In other words, it is not necessary to mention the null hypothesis. If the alternate hypothesis is confirmed, thenwe can take as read that the null hypothesis has been disconfirmed.
■ Introduction9 There are a number of problems with these first few lines of introduction: (a) it is notthe convention to write in the first person; (b) what has been written is not particularlyrelevant to the research that was actually carried out and so is something of a waste ofspace; (c) the sources of the statement are not cited so the reader does not know wherethe information came from; and (d) these statements mislead the reader into thinkingthat the research to be described is about the fallibility of eyewitness evidence. It is not.Of course, the extent to which relevance is an issue depends on the space available andwhat comes later in the report anyway. If the researcher is arguing that most of the fallibility of eyewitnesses is because of the intrusive effects of later questioning then theseintroductory lines become more relevant.
10 This sentence is inaccurately expressed. The question asked did not affect the actualspeed of the car. It affected the estimated speed of the car.
11 There are a number of problems with these citations: (a) they are not in alphabeticalorder; (b) they are not separated consistently by a semi-colon; (c) ‘et al’ should have a full stop after ‘al’, but also this is the first occurrence of the citation and it would bemore usual to list the authors in full; (d) the citations are quite dated and the impressionis created that the student is relying on a fairly elderly textbook for the information; and(e) since it appears that the writer has not read the sources that they are citing it wouldbe better to be honest and cite one’s actual source, for example, by writing something like(Fabian, 1989, cited in Green, 1997).
12 Not only is this comment not documented with a citation, but it is not clear whatthe argument is. If we assume that the comment is true, in just what way does it implya criticism of the original study? As it stands, the comment seems irrelevant to the pointbeing made. It would, therefore, be better deleted.
13 It is good to indent the first line of every paragraph. This gives a clear indication asto the paragraph structure of the report. Without these indentations, it is not alwaysclear where one paragraph ends and another begins, which makes the report harder toread. This is especially a problem where one paragraph ends at the right-hand margin atthe very bottom of one page and the new paragraph begins at the start of the new page.Without the indentation the division between the two paragraphs is not clear.
14 This entire paragraph is stylistically clumsy since it consists of the name of aresearcher followed by a statement of what they did, said, wrote or thought. It is thensucceeded by several sentences using exactly the same structure. The entire paragraphneeds rewriting so that the issues being discussed are the focus of the writing. Generally,avoid citing an authority at the beginning of sentences as this poor style is the result.Discuss their idea and then cite them at the end. But there are other problems. The paragraph seems to be a set of unconnected notes which have been gleaned from somesource or other without much attempt to process the material into something coherent.Just how each point contributes to the general argument being made in the report isunclear. Furthermore, be very careful when using direct quotations. The writer, in this case, has failed to give the page or pages from where the quotation was obtained.
M06_HOWI4994_03_SE_C06.QXD 10/11/10 15:01 Page 111

112 PART 1 THE BASICS OF RESEARCH
Also, it needs to be questioned just what purpose using the quotation serves. The writercould probably have said it just as clearly in their own words and there is obviously nodiscussion of the quotation – it is just there and serves no particular purpose. Quotationsmay be used but there needs to be a good reason for them such as where a report goes on to discuss, question or criticise what is in the quote in some way. A more minorpoint is that the reference to Eastwood, Marr and Anderson and to Myrtleberry andDuckworth should have the date or year in brackets.
15 Why is the phrase ‘seems to’ used? If the study does not demonstrate what theresearchers claim of it then its validity should be questioned as part of the discussion ofthe material.
16 This is an interesting idea but is it really the case that there is no relevant researchto bring in at this point? Certainly no citations are given to research relevant to thispoint. One would look for previous research on whether the consequences of events aretaken into account when assessing the seriousness of the behaviours which led to theseevents.
17 It is not clear how the questions used by Loftus and Palmer were unsubtle. Theways in which their question manipulation is unsubtle needs to be explained. It is goodto see a critical argument being used but the presentation of the argument could be clearer.
18 The hypothesis is not sufficiently clearly or accurately stated. It might be better tobegin by describing the hypothesis more generally as ‘It was hypothesised that memoryfor a witnessed event will be affected by later information concerning the consequencesof that event’. It might be preferable to try to formulate it in a way which relates moreclosely to what was actually tested. For example, we might wish to hypothesise that ‘Theestimated speed of an object will be recalled as faster the more serious the impact thatthat object is later said to have had’. The null hypothesis reveals a misunderstanding ofthe nature of what a null hypothesis is. A null hypothesis is simply a statement that thereis no relationship between two variables. It does not imply a relationship between thetwo variables in question. The null hypothesis is not usually presented in reports as it is generally assumed that the reader knows what it is. It is also better to describe thehypothesis in terms of the independent and dependent variables and to state what thedirection of the results are expected to be if this can be specified. For example, we couldsay that ‘Participants who were informed that the baby was injured were predicted togive faster estimates of running time than those who were not told this’.
■ Method19 The main section following the Introduction is the Method section and should betitled as such. This overall title is missing from the report. The Method section is brokendown into subsections which in this case starts with Participants and ends with Ethics.You may wish to make the distinction between sections and subsections clearer by centringthe titles of the sections.
20 (a) Numbers such as 76 would be written in words if they begin a sentence. (b) Theway in which participants were allocated to the conditions should be clearly stated. It isnot clear whether this was done randomly, systematically or in some other way. (c) Whatcondition is the experimental one and what condition is the control should be describedclearly as this has not been previously done. To work out what is the experimental andcontrol group requires that we search elsewhere in the report, which makes the reportharder to read. (d) More information should be given about the participants. It should beindicated whether the sample consisted of both men and women and, if so, what numbersof each gender there were. In addition, the mean age of the sample should be given as
M06_HOWI4994_03_SE_C06.QXD 10/11/10 15:01 Page 112

CHAPTER 6 EXAMPLES OF HOW TO WRITE RESEARCH REPORTS 113
well as some indication of its variability. Variability is usually described in terms of standard deviation but other indices can be used, such as the minimum and maximum age.
21 The students were not psychological. They were psychology students.
22 In the Participants subsection it was stated that participants were a convenience sample which means that they were recruited at the convenience of the researcher, notrandomly or systematically. In psychology the term ‘random’ or ‘randomly’ has a specifictechnical meaning and should be used only when a randomised procedure is employed.If such a procedure had been used, it is necessary to describe what the population consisted of (for example, all psychology undergraduates at that university), what the target sample was (for example, 10 per cent of that population) and what the selectionprocedure was (for example, numbering the last name of each psychology undergraduatealphabetically, generating 100 numbers randomly and then approaching the studentsgiven those numbers). When a random or systematic procedure has not been used, as seemsto be the case in this study, it is not necessary to describe the selection procedure in anydetail. It may be sufficient simply to state that ‘An e-mail was sent to all psychologyundergraduates inviting them to participate in the study’ or ‘Psychology undergraduatesin practical classes were invited to take part in the study’.
23 This sentence is inaccurate as the research did not meet all the ethical requirementsof the BPS. For example, it is not stated that they were debriefed at the end of their participation which they should have been. The previous paragraph describes severalethically dubious procedures which the writer does not appear to acknowledge.
■ Results24 (a) All tables need to be given the title ‘Table’ followed by a number indicating theorder of the tables in the report. As this is the first table in the report it would be calledTable 1. (b) The table should have a brief label describing its contents. For example, thistable could be called ‘Descriptive statistics for speed in the two conditions’. (c) In general,it is not a good idea to begin the Results section with a table. It is better to present thetable after the text which refers to the content of the table. In this case this would beafter the second paragraph where the mean scores are described. (d) SPSS Statistics tablesshould not be pasted into the report because generally they contain too much statisticalinformation and are often somewhat unclear. For example, it is sufficient to describe all statistical values apart from probability levels to two decimal places. Values for the standard error of the mean need not be presented. Notice that the table does notidentify what group 1.00 is and what 2.00 is. (e) Tables should be used only where doingso makes it easier to understand the results. With only two conditions it seems preferableto describe this information as text. For example, we could report the results very con-cisely as follows: ‘The mean estimated running speed for those told the baby was injured(M = 4.71, SD = 1.67) was significantly faster/slower, unrelated t(74) = 4.43, 2-tailed p < .001, than those not told this (M = 3.15, SD = 1.37)’. (In order to be able to writethis, we need to know which group is Group 1.00 and which group is Group 2.00 in thetable.) The Results section will be very short if we report the results in this way but thisconcise description of the results is sufficient for this study. There is no need to make itlonger than is necessary. If our sample included a sufficient number of men and womenwe could have included the gender of the participants as another variable to be analysed.If this were the case we could have carried out a 2 (condition) × 2 (gender) unrelatedanalysis of variance (ANOVA).
25 It is generally better not to use abbreviations to refer to measures when writing upa study. If you do use abbreviations, you need to give the full unabbreviated name firstfollowed by the abbreviation in brackets when the measure is first mentioned. In this
M06_HOWI4994_03_SE_C06.QXD 10/11/10 15:01 Page 113

114 PART 1 THE BASICS OF RESEARCH
case, we have to guess that ERS refers to ‘estimated running speed’ as it has not previouslybeen mentioned.
26 As we have discussed under number 24, we can describe the results of this study ina single sentence. The term ‘unrelated t’ refers to the unrelated t-test which SPSS Statisticscalls the Independent Samples t-Test. In our summary sentence, it is clear that we areusing the unrelated t-test to compare the mean of the two groups so it is not necessaryto state this again. We do not have to state how the t-test was calculated. We generallydo not need to mention the type of statistical software used for this kind of analysis. We may only need to do this if we were carrying out some more specialist statistics such as structural equation modelling or hierarchical linear modelling which employs lessfamiliar software than SPSS Statistics which is unlikely for student work.
27 As we discussed under number 26, we do not usually need to mention the statisticalsoftware we used so this sentence should be omitted. The sentence basically givessuperfluous detail anyway.
28 As the t-test should be very familiar to psychologists, there is no need to describewhen it should be used.
29 If it was thought advisable to present a table of the mean and standard deviation ofrunning speed for the two groups, we need to refer to this table in the text. At present,the table is not linked to the text. We could do this here by starting this sentence with aphrase such as ‘As shown in Table 1’ or ‘As can be seen from Table 1’. It would also bemore informative if the direction of the difference was described in this sentence ratherthan simply saying that the means differ. Notice that this is the first sentence in the reportwhich enables us to identify which condition is associated with the highest scores.
30 The level of statistical significance or probability can never be zero. Some readerswould see a probability of .000 as being zero probability. This figure is taken from theoutput produced by SPSS Statistics which gives the significance level to three decimalplaces. What this means is that the significance level is less than .0005. For most purposesit is sufficient to give the significance level to three decimal places in which case somepsychologists would round up the third zero to a 1. In other words the significance levelhere is .001. Strictly speaking the significance level is equal to or less than a particularlevel such as .001, although the symbol for this (≤) is rarely used.
31 We have previously stated that the t-test was used so it is not necessary to state it again.
32 It is sufficient to give statistical values other than the significance level to two decimalplaces. In this case we can write that t = 4.44.
33 As presently displayed, these statistical values appear to hang on their own andseem not to be part of a sentence. They should be clearly incorporated into a sentence.We have already shown under number 24 how this can be concisely done by placingthese values in brackets.
34 As discussed under number 8 hypotheses cannot be proven or shown to be wrong.Saying that a hypothesis has been proved or disproved implies that other results are notpossible. Another study might find that there is no difference between the two conditionsor that the results are in the opposite direction to that found here. Consequently, whenthe results are consistent with the hypothesis it is more accurate to describe them asbeing confirmed, accepted or supported rather than proved. When the results are notconsistent with the hypothesis it is better to describe them as not confirmed, not acceptedor not supported rather than disproved. It is not necessary to mention the null hypothesis.If we know the results for the alternate hypothesis, we will know the results for the nullhypothesis.
M06_HOWI4994_03_SE_C06.QXD 10/11/10 15:01 Page 114

CHAPTER 6 EXAMPLES OF HOW TO WRITE RESEARCH REPORTS 115
35 As previously mentioned under number 24, we need to label any tables to indicatewhat they refer to. Also, we should not paste in tables from SPSS Statistics output. We have been able to describe succinctly the results of our analysis in a single sentence whichincludes the essential information from this table, so there is no need to include the table.If you want to show the results of your SPSS Statistics output, then it is better to appendthis to your report rather than include it in the Results section.
■ Discussion36 It is usual to begin the Discussion section by reporting what the main findings of the study are. In this case it would be saying something along the lines that ‘The hypothesis that the memory of a witnessed event is affected by later information aboutthe consequences of that event was supported in that participants who were informedthat the baby was injured estimated the speed of the man running into the pushchair assignificantly faster than those not told this’.
37 This assertion is not supported by any evidence. No information is presented to showthat everyone was affected let alone will be affected or that the change was permanent.
38 No evidence is cited to support this statement. It would be difficult to test this assertion. How can we determine whether someone is innocent when the evidence isoften circumstantial? How can we show that these wrong convictions were due to theway in which the witnesses were questioned? These are not easy questions to test or tocarry out research on. It would be much easier to find out how familiar judges were withresearch on eyewitness testimony and whether this knowledge affected the way in whichthey made their judgements. Unless evidence can be found to support this assertion, itwould be better to describe it as a possibility rather than a fact. In other words, we couldrewrite this sentence as follows: ‘Many innocent people may have spent years in prisonfor crimes that they did not commit because judges may have not paid attention to thefindings of Loftus and Palmer and many other researchers’.
39 It would be better to say in what way the data would be more valid if a more general sample of participants was used. For example, we might say that the use of amore general sample would determine the extent to which the findings could be replicatedin a more diverse group of people.
40 It is not stated how a larger sample would improve the validity of the findings. This would not appear to be the case. As the size of sample used in this study producedsignificant findings, we do not have to use a larger sample to determine the replicabilityof the results. However, it would be more informative if we could suggest a further studywhich would help our understanding of why this effect occurs or the conditions underwhich it occurs rather than simply repeat the same study.
41 No evidence is presented in the discussion of a variety of factors affecting eyewitnesstestimony so this cannot be a conclusion. As it stands, it is a new idea introduced rightat the end of the report. It is also unclear what the term ‘value’ means so the writer needsto be more specific. If eyewitness testimony has been shown to be affected by variousfactors it is unclear why this makes its value difficult to assess. One or more reasons needto be given to support this assertion.
■ References42 It is important to use a consistent style when giving full details of the references. Itis usual to italicise the title and volume number of journals. As this is done for the otherjournals, this should be done here.
M06_HOWI4994_03_SE_C06.QXD 10/11/10 15:01 Page 115

116 PART 1 THE BASICS OF RESEARCH
43 Although this may not be immediately obvious, there seem to be three errors here. Itis usual to italicise the names of books, journals and the titles of unpublished papers. Thename of a book is followed by the place of publication and the name of the publisher.As this was not done here, it implies that the subsequent title refers to the name of a journal. If this is the case, then (a) the title of the paper should not be italicised, (b) thetitle of the journal should be italicised, and (c) the volume number and the page numbersof the journal should be given for that paper.
44 This reference has not been placed in the correct alphabetical order of the last nameof the first author. This reference should come after Loftus and Palmer.
45 Underlining is usually used to indicate to publishers that the underlined text is to be printed in italics. This convention was developed when manuscripts were written with manual typewriters. As it is easy to italicise text in electronic documents there isless need for this convention. As the journal titles of the other references have not beenunderlined, this title should not be underlined and should be italic.
46 The initial or initials of this author are missing. The titles of books are often presented in what is called in Microsoft Word ‘sentence case’. This means that the firstletter of the first word is capitalised but the first letters of the subsequent words are notunless they refer to a name.
47 Although we hope that the student has used this book to help them analyse theirresults, they have not cited it and so it should not be listed as a reference.
48 The titles of journal papers are usually presented in sentence case. The first letter of‘Appreciation’ should be small case.
49 The title of this journal paper should be in sentence case as most of the titles ofother papers are. It is considered important that you are consistent in the way you present references. The number of the issue in which the paper was published is given.This is indicated by the number in brackets after the volume number. This is not usuallydone and in this paper is not generally done, so decide what you want to do and do itconsistently.
50 The ampersand sign (&) indicating ‘and’ is missing between the two authors. Thisis usually placed between the initials of the penultimate author and the last name of thelast author. First names of authors are not usually given and have not been given for the other authors listed here, so should not be shown here.
51 ‘and’ is used instead of the & to link the names of the two authors. Once again, you need to be consistent in how you do this. The American Psychological Associationuses ‘&’ while some other publishers use ‘and’. This book uses ‘and’ since this is part ofthe standard style of Pearson Education, its publisher.
6.4 An improved version of the report
While a lot may be learnt by studying examples of below-par work, it is helpful to havea good example to hand, so a better write-up of the study follows. This is not to say thatthe report is perfect – you may well find problems remain – but that it is an improvementover the previous version. Look through this version and see what you can learn fromit. We would suggest that you take note of the following:
Notice how the reader is given clear information in both the title and the abstract.These summarise the research very well and give the reader a good idea of what to
M06_HOWI4994_03_SE_C06.QXD 10/11/10 15:01 Page 116
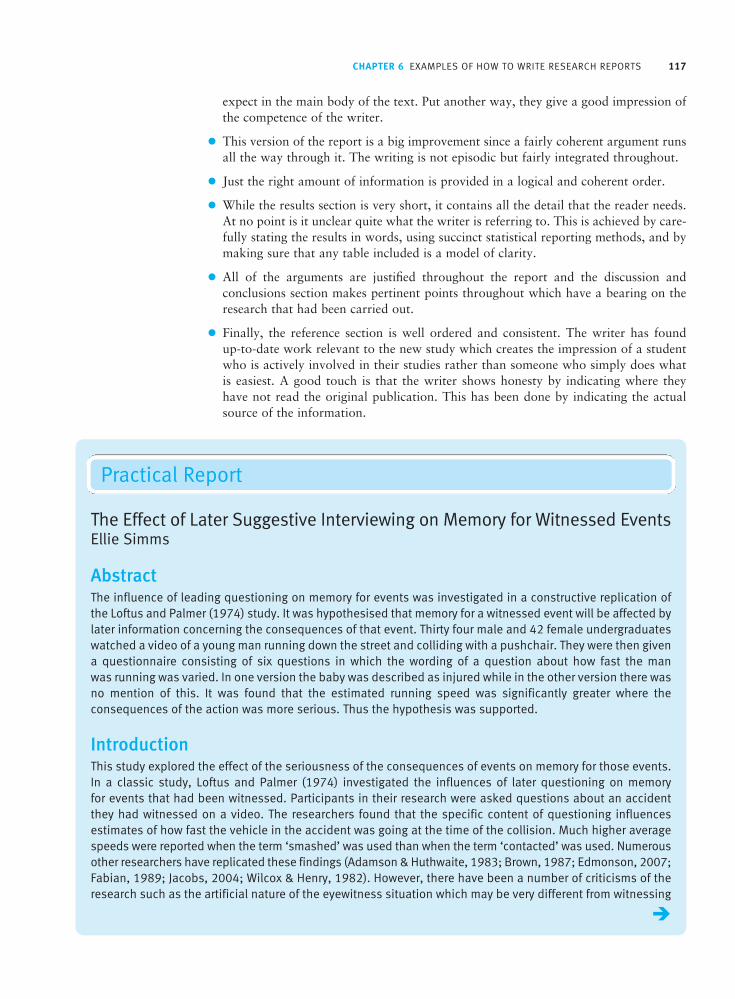
CHAPTER 6 EXAMPLES OF HOW TO WRITE RESEARCH REPORTS 117
expect in the main body of the text. Put another way, they give a good impression ofthe competence of the writer.
This version of the report is a big improvement since a fairly coherent argument runsall the way through it. The writing is not episodic but fairly integrated throughout.
Just the right amount of information is provided in a logical and coherent order.
While the results section is very short, it contains all the detail that the reader needs.At no point is it unclear quite what the writer is referring to. This is achieved by care-fully stating the results in words, using succinct statistical reporting methods, and bymaking sure that any table included is a model of clarity.
All of the arguments are justified throughout the report and the discussion and conclusions section makes pertinent points throughout which have a bearing on theresearch that had been carried out.
Finally, the reference section is well ordered and consistent. The writer has found up-to-date work relevant to the new study which creates the impression of a studentwho is actively involved in their studies rather than someone who simply does whatis easiest. A good touch is that the writer shows honesty by indicating where theyhave not read the original publication. This has been done by indicating the actualsource of the information.
The Effect of Later Suggestive Interviewing on Memory for Witnessed EventsEllie Simms
AbstractThe influence of leading questioning on memory for events was investigated in a constructive replication ofthe Loftus and Palmer (1974) study. It was hypothesised that memory for a witnessed event will be affected bylater information concerning the consequences of that event. Thirty four male and 42 female undergraduateswatched a video of a young man running down the street and colliding with a pushchair. They were then givena questionnaire consisting of six questions in which the wording of a question about how fast the man was running was varied. In one version the baby was described as injured while in the other version there was no mention of this. It was found that the estimated running speed was significantly greater where the consequences of the action was more serious. Thus the hypothesis was supported.
IntroductionThis study explored the effect of the seriousness of the consequences of events on memory for those events.In a classic study, Loftus and Palmer (1974) investigated the influences of later questioning on memory for events that had been witnessed. Participants in their research were asked questions about an accidentthey had witnessed on a video. The researchers found that the specific content of questioning influences estimates of how fast the vehicle in the accident was going at the time of the collision. Much higher averagespeeds were reported when the term ‘smashed’ was used than when the term ‘contacted’ was used. Numerousother researchers have replicated these findings (Adamson & Huthwaite, 1983; Brown, 1987; Edmonson, 2007;Fabian, 1989; Jacobs, 2004; Wilcox & Henry, 1982). However, there have been a number of criticisms of theresearch such as the artificial nature of the eyewitness situation which may be very different from witnessing
Practical Report
M06_HOWI4994_03_SE_C06.QXD 10/11/10 15:01 Page 117

118 PART 1 THE BASICS OF RESEARCH
a real-life accident, which is likely to be a much more emotional experience (Slatterly, 2006). Furthermore, itis notoriously difficult to judge the speed of vehicles (Blair & Brown, 2007). In addition, participants may havebeen given strong clues as to the expectations of the researchers by the questions used to assess the speedof the impact. While Loftus and Palmer conclude that the content of the questions affected memory for thecollision, it may be that memory is actually unaffected and that the influence of the questioning is only on the estimates given rather than the memory trace of the events (Pink, 2001).
The validity of Loftus and Palmer’s research in terms of its relevance to eyewitness evidence in real-life situations has been questioned by Rodgers (1987) who argues that the study has poor validity. Furthermore,student populations may be unrepresentative of the more general population and should be avoided toimprove the ecological validity of research in this field (Myrtleberry & Duckworth, 1979). These views are notshared by all researchers, thus Pickering (1984) writes of the important contribution that the Loftus andPalmer study has made to our understanding of eyewitness memory.
Loftus and Palmer demonstrated that the form of questioning following a witnessed event can influence the way in which those events are later recalled. However, there is evidence that evaluations of crime areinfluenced by the consequences of the crime rather than the criminal actions involved (Parker, 2001). So, for example, a burglary which results in the victim having subsequent psychological problems is judged to be more serious than an identical crime which led to no serious consequence. It was reasoned that memoryfor events such as accidents may be influenced by the consequence of an accident such as whether or notsomeone was injured in the accident. Does the consequence of an accident influence the way in which theevents leading up to the accident are recalled?
Based on this, it was hypothesised that memory for a witnessed event will be affected by later informationconcerning the consequences of that event. In particular, it was predicted that where the consequences ofthe event were more severe the events leading up to the accident would be perceived as more extreme thanwhen the consequences were less severe.
Method
ParticipantsThirty four male and 42 female psychology students at the University were recruited to participate in the studyusing a convenience sampling method which involved inviting them in lectures and elsewhere to participatein the research. Those who agreed to take part were randomly allocated to either the experimental (n = 29) orcontrol condition (n = 47). There were 15 male and 14 female participants in the experimental group and 19 maleand 28 female participants in the control group. The mean age of participants was 20.38 years (SD = 1.73).
Materials and apparatusA specially prepared two-minute video of an accidental collision between a running man and a woman pushing a pushchair with what appeared to be a baby in it was shown. Initially, the young man is seen walking down a street but then he begins to run down what is a fairly crowded street. Turning a corner, he collides with the woman pushing the pushchair. The video was filmed using a good-quality digital video camera mounted on a tripod with a high degree of image resolution by myself with the help of other students.A data projector was used to show the video.
The participants were given a short self-completion questionnaire including two versions of the criticalquestion which comprised the experimental manipulation. The first version which was given to the experimentalgroup read ‘How fast do you think the man was running in miles per hour when he collided with the woman withthe pushchair and the baby was injured?’ The second version which was given to the control group read ‘Howfast do you think the man was running in miles per hour when he collided with the woman with the pushchairand baby?’ These questions were embedded in the questionnaire among other questions which started withones concerning the gender of the participant, their age and what degree course they were taking. The criticalquestions were placed at the end of five questions which were filler questions designed to divert the participants’attention from the purpose of the study. These questions were ‘What colour was the man’s shirt?’, ‘How many
M06_HOWI4994_03_SE_C06.QXD 10/11/10 15:01 Page 118

CHAPTER 6 EXAMPLES OF HOW TO WRITE RESEARCH REPORTS 119
people saw the collision occur?’, ‘What was the name of the shop outside of which the accident occurred?’,‘Was the running man wearing trainers?’, and ‘Was the woman with the pushchair wearing jeans?’
Design and procedureThe study employed an experimental design in which participants were randomly assigned to these conditionson the basis of the toss of a coin. The experimental group witnessed events which led to the serious consequenceof an injury to a baby and the control group witnessed the same events but with no serious consequence.
Participants took part in the study individually in a small psychology laboratory on the University campus.Prior to showing the video, it was explained to them that the research was for an undergraduate project andthat participation was voluntary and that they could withdraw from the study at any stage if they wished.Psychology students are encouraged to volunteer as participants in other students’ studies for educationalreasons though there is no requirement that they should do so. A data projector was used to show them theshort video of the running man and his collision with the woman with a pushchair. The video was two minuteslong and in colour. After the video had been shown, the participants were given one of the two different versionsof the questionnaire to complete. Finally, they were thanked for their participation in the research anddebriefed about the study and given an opportunity to ask questions. Participants were asked if they wishedto receive a brief summary of the research findings when these were available.
EthicsThe research met the current British Psychological Society ethical standards and complied with the UniversityEthical Advisory Committee’s requirements. In particular, the voluntary nature of participation was stressedto participants and care was taken to debrief all participants at the end of their involvement in the study. All data were recorded anonymously. All participants signed to confirm that they had been informed of theethical principles underlying the research.
ResultsTable 1 gives the mean estimates of the running speed in the video for the serious consequence and the no-consequence conditions. The mean estimated running speed for those told the baby was injured (M = 4.71, SD = 1.67) was significantly faster, t(74) = 4.43, 2-tailed p < .001, than those not told this (M = 3.15, SD = 1.37).
Table 1 Descriptive statistics on estimated running speed in the two conditions
Condition Sample size M SD
Serious consequence 29 4.71 1.67
No consequence 47 3.15 1.37
This finding supports the hypothesis that memory for a witnessed event will be affected by later informationconcerning the consequences of that event.
Discussion and conclusionsThis study supports the findings of Loftus and Palmer (1974) in that memory was affected by the nature ofquestions asked following the witnessed incident. Memory can be changed by events following the incidentwitnessed. There was a tendency for those who believed that the incident had led to a serious injury to estimate that the runner who was responsible for the accident was running faster than did members of the
M06_HOWI4994_03_SE_C06.QXD 10/11/10 15:01 Page 119

120 PART 1 THE BASICS OF RESEARCH
control group. This is important because it illustrates that the consequences of an action may influence the perceptions of the characteristics of that action.
However, the study does not explain why the serious consequences of an incident should affect memory inthis way but there are parallels with the Loftus and Palmer research which may be helpful. Asking questionsabout vehicles ‘smashing’ into each other implies a more serious consequence than if the vehicles had only‘bumped’. This is much the same as the present research in which memories of events were affected by theinjury to the baby, which is an indication of the seriousness of the accident. The faster the man ran then the more likely it was that someone would get hurt.
There are implications of the study for the interviewing of witnesses. In particular, the research raises thequestion of the extent to which the police should give additional information unknown to the witness duringthe course of an interview. In real life, an eyewitness may not know that the victim of an accident had, say,died later in hospital. Is it appropriate that the police should provide this information in the light of the findings of the present study?
There are a number of limitations on this study. In particular, the use of a more representative sample of the general population would provide an indication of the generalisability of the findings of the presentsample. A further improvement would be to add a neutral condition in which participants simply rated thespeed of the runner with no reference to the accident. This could be achieved by having a separate group estimate the speed of the runner without any reference to a collision in the question. Finally, the speed of therunner is not the only measure that could be taken. For example, questions could be asked about the reasonwhy the man was running, whether he was looking where he was running, and whether the woman pushingthe pushchair was partly responsible for the collision.
It is concluded that memory for eyewitnessed events is affected by information about the consequencesof those events. This may have implications for police interviews with eyewitnesses and the amount of information that the police supply in this context.
ReferencesAdamson, P. T., & Huthwaite, N. (1983). Eyewitness recall of events under different questioning styles.
Cognitive and Applied Psychology, 18, 312–321.
Blair, A., & Brown, G. (2007). Speed estimates of real and virtual objects. Traffic Psychology, 3, 21–27.
Brown, I. (1987). The gullible eyewitness. Advances in Criminological Research, 3, 229–241.
Edmonson, C. (2007). Question content and eye-witness recall. Journal of Criminal Investigations, 5, 31–39.Cited in D. Smith (2008), Introduction to cognition. Lakeside, UK: Independent Psychology Press.
Fabian, G. (1989). The fallible mind. London: University of Battersea Press.
Jacobs, D. (2004). Eyewitness evidence and interview techniques. Forensic Investigation Quarterly, 11, 48–62.
Loftus, E. F., & Palmer, J. C. (1974). Reconstruction of auto-mobile destruction: An example of the interactionbetween language and memory. Journal of Verbal Learning and Verbal Behaviour, 13, 585–589.
Myrtleberry, P. I. E., & Duckworth, J. (1979). The artificiality of eyewitness research: Recommendations forimproving the fit between research and practice. Critical Conclusions in Psychology Quarterly, 9, 312–319.
Parker, V. (2001). Consequences and judgement. Applied Cognitive Behavior, 6, 249–263.
Pickering, M. (1984). Elizabeth Loftus: An appreciation. Genuflecting Psychology Review, 29, 29–43.
Pink, J. W. (2001). What changes follow leading interviews: The memory or the report of the memory? EssentialPsychology Review, 22, 142–151.
Rodgers, T. J. (1987). The ecological validity of laboratory-based eyewitness research. Critical Psychology andTheory Development, 8, 588–601.
Slatterly, O. (2006). Validity issues in forensic psychology. Criminal and Forensic Research, 2, 121–129.
Wilcox, A. R., & Henry, Z. W. (1982). Two hypotheses about questioning style and recall. Unpublished paper,Department of Psychology, University of Northallerton.
M06_HOWI4994_03_SE_C06.QXD 10/11/10 15:01 Page 120

CHAPTER 6 EXAMPLES OF HOW TO WRITE RESEARCH REPORTS 121
6.5 Conclusion
It is not easy to write a good research report. You need to provide a strong and convinc-ing argument for what you have done. To be convincing the argument has to be clearotherwise the reader will not be able to follow it. It also has to be accurate. You shouldtry to ensure that what you write is an accurate description of what you are writingabout. When you refer to the work of others, it is important that you are familiar withtheir work so you know in what way their work is relevant to your own. In writing yourreport it is important to check it carefully sentence by sentence to make sure that itmakes sense and is clearly and accurately articulated. It is sometimes difficult for us toevaluate our own work because we often interpret what we have written in terms ofwhat we know but which we have not mentioned in the report itself. Although we maybe able to find other people to check what we have written, we cannot always be surehow thoroughly or critically they will do this. They may not want to offend us by beingcritical or they may not be sufficiently interested in having a thorough grasp of what wehave done and to question what we have written. Consequently, we need to check whatwe have written ourselves. It is often useful to leave the work for a few days and toreturn to it when we are less familiar with it. It may then be easier to spot anything thatis not as clear as it should be.
To help you become more skilled in evaluating your own report writing we have presented you with a report which contains a number of examples of poor practice. We hope you have been able to spot many of these errors and will not make them whenwriting your own reports.
Writing research reports is a complex task. We have to have a clear idea of what we want to say andto say it clearly. We need to present a strong and convincing argument as to why we believe ourresearch is important and how exactly it makes a contribution to what is already known about thetopic we are studying.
A research report consists of the following major parts: a title, an abstract, an introduction, a methodsection, a results section, a discussion section and a list of references. All of these components of areport are important and deserve careful consideration. It is a pity to spoil an otherwise good reportwith a clumsy title or an insufficiently detailed abstract.
It is useful to bear in mind what the main aims or hypotheses of your study are and to use these tostructure your report. These should be clearly stated. They are generally stated and restated in variousparts of the report. When doing this it is important to make sure that you do not change what they areas this will cause confusion. They should be most fully described in the introduction and should formthe basis of the discussion section. They should be briefly mentioned in the abstract and it should beclear in the results section how they were analysed and what the results of these analyses were.
We need to describe the most relevant previous research that has been carried out on the topic andto show how this work is related to what we have done and how it has not addressed the question orquestions that we are interested in.
The abstract is written last. It may be useful to have a working title which you may change later on sothat it captures in as few words as possible what your study is about.
Key points
M06_HOWI4994_03_SE_C06.QXD 10/11/10 15:01 Page 121
122 PART 1 THE BASICS OF RESEARCH
ACTIVITYYou might like to offer to read and to provide constructive criticism of a report written by one of your fellow students. Whereappropriate, you could ask them to clarify or to better substantiate what they are saying or to suggest an alternative wayof saying it.
Your views on what you write may change as you think more thoroughly about what you have doneand as you become more familiar with your research and your understanding of it improves. Youshould expect to have to revise what you have already written in terms of what you choose to say ina later draft subsequently. For example, writing about your findings in the discussion section maylead you to carry out further analyses or to change or add material to the introduction.
If you are having difficulty in writing any part of your report, look at how authors of published researchhave handled this part of their report. This is usually best done by looking at journal articles whichare the most relevant or most strongly related to your own research.
Writing the report is ultimately your own responsibility. You need to read and re-read it carefully anumber of times. It is often a good idea to let some time elapse before re-reading your report so thatyou can look at it again with a fresh mind.
M06_HOWI4994_03_SE_C06.QXD 10/11/10 15:01 Page 122

The literature search
Overview
CHAPTER 7
The literature search is an integral part of the research process. Pertinent researchstudies and theoretical papers obtained in this way provide the researcher with anoverview of thinking and research in a particular area. Although time-consuming, it isessential to developing ideas about the issues to be addressed and what more needsto be explored.
The literature search is best seen as a process of starting broadly but moving asrapidly as possible to a more narrow and focused search. One common strategy is to focus, first, on the most recent research and writings on a topic. These contain thefruits of other researchers’ literature searches as well as up-to-date information ofwhere current research has taken us. The current literature is likely to alert us to whatstill needs to be done in the field. Of course, the major limitation of starting with current publications is that important ideas from earlier times can become ignoredand neglected without justification.
Computers and computerised databases are the modern, highly efficient way of search-ing the research literature through electronic databases such as Web of Science andPsycINFO. Among a great deal of information of various sorts, they provide a briefabstract or summary of the publication. The abstract in the Web of Science is that ofthe article itself whereas this may not be the case in PsycINFO.
Abstracts in research reports, if well-written, contain a great deal of information whichwill provide a degree of detail about the research in question and the theoretical context. Usually abstracts contain enough information to help the reader decidewhether or not to obtain the original article or report. Almost certainly local collegeand university libraries are unlikely to have anything other than a small fraction ofthese publications in stock although the use of electronic versions of journals bylibraries is changing that situation. Consequently, it is necessary to obtain the article bysome means from elsewhere. There are various ways of doing this, including visitingother libraries, e-mailing the author for a copy of the article, or getting the library toobtain a copy or photocopy of the article in question.
M07_HOWI4994_03_SE_C07.QXD 11/11/10 11:35 Page 123

124 PART 1 THE BASICS OF RESEARCH
There are a number of reasons why it may be essential to obtain the original article.For example, it is the only way of obtaining an overview of the methods and proceduresemployed. Sometimes one may be suspicious of how sound the conclusions of thestudy are and may wish to evaluate, say, the statistical analysis carried out or considerpossible flaws in the method.
You should keep a careful record of the publications that you consider important toyour research. Although initially this is time-consuming it is far less frustrating in thelong run. There are a number of ways of doing this, including computerised databases(such as RefWorks or EndNote), simple hand-written index cards or computer files towhich material may be copied and pasted.
7.1 Introduction
How the literature search is conducted depends a little on one’s starting point. A pro-fessional researcher with a well-established reputation will have much of the previousresearch and theory readily at their command. A beginning student will have little or noknowledge. If one knows very little about a topic, then a sensible first stage is to readsome introductory material such as that found in textbooks. A relatively recent textbookis likely to cover fairly recent thinking on the topic although in brief overview form. Atthe same time, the textbook is likely to provide a fairly rapid access to a field in general.This is especially useful for students doing research for the first time in practical classes.Because it is readily to hand, material in the college or university library or accessiblefrom the Internet will be your first port of call. Getting material from elsewhere may takea little time and cause problems in managing your time – and getting your assignmentsin before the deadline. Of course, professional researchers regularly keep up to date, perhaps searching the new literature on a monthly basis.
It cannot be stressed too much that professional researchers are part of complex networks of individuals and groups of individuals sharing ideas and interests. As such,information flows through a variety of channels and few researchers would rely exclusivelyon the sources described in this chapter. For one thing, no matter how efficient the system– and it is impressive – there is always a delay between research being done and the finalreport being published. This can be a year or two in many cases. So if one needs to be moreup to date than that then one needs to rely on conferences and other sources of contactand information. This would be characteristic of the activities of most researchers.
Searching one’s college or university library usually involves using its electronic cataloguesystem via computer terminals. As there are a number of such systems, these may differacross universities. Many British university libraries use the OPAC system (Online PublicAccess Catalogue). Leaflets about using the local system are likely to be available fromthe library, there may be induction or training sessions for new library users, or you maysimply seek help from members of the library staff. If you have, say, a specific book inmind then its title and author will quickly help you discover where it is located in thelibrary. However, if you simply are searching with a general keyword such as ‘memory’or ‘intelligence’ then you are likely to find more entries or hits. Perhaps too many.Sometimes it may be quicker to go to the section of the library where items with particularkeywords are likely to be held, though this is less systematic and others on the course mayhave beaten you there. Library classification systems need to be understood in general ifone is to use this sort of method.
M07_HOWI4994_03_SE_C07.QXD 11/11/10 11:35 Page 124

CHAPTER 7 THE LITERATURE SEARCH 125
FIGURE 7.1 Some psychology subcategories in the Dewey Decimal Classification
7.2 Library classification systems
There are two main systems for classifying and arranging non-fiction (mostly) books ina library. It is sufficient to know how to find the books in the library without having adetailed knowledge of the system used by your library.
One scheme is the Dewey Decimal Classification (DDC) system developed by Melvil Dewey in 1876 which is reputedly the world’s most widely used libraryclassification system, although not necessarily in university libraries (Chan andMitchell, 2003; Dewey Services, n.d.). Each publication is given three whole numbers followed by several decimal places as shown in Figure 7.1. These numbers
M07_HOWI4994_03_SE_C07.QXD 11/11/10 11:35 Page 125

126 PART 1 THE BASICS OF RESEARCH
FIGURE 7.2 Ten major classes of the Dewey Decimal Classification for cataloguing library material
are known as call numbers in both systems. The first of the three whole numbers indicates the classes of which there are 10 as shown in Figure 7.2. So psychologymainly comes under 1 _ _ although certain areas fall into other classes. For example,abnormal or clinical psychology is classified under 6 _ _. The second whole num-ber shows the divisions. Much of psychology comes under 1 5 _. The third whole number refers to the section. The decimal numbers indicate further subdivisions of the sections.
M07_HOWI4994_03_SE_C07.QXD 11/11/10 11:35 Page 126

CHAPTER 7 THE LITERATURE SEARCH 127
The other main system for organising non-fiction material in a library is the Libraryof Congress classification system (Chan, 1999; Library of Congress ClassificationOutline, n.d.) which was developed by that library in the United States. Each publica-tion is assigned one or two letters, signifying a category, followed by a whole numberbetween 1 and 9999. There are 21 main categories labelled A to Z but excluding I,O, W, X and Y. These categories are shown in Table 7.1. Psychology largely comesunder BF. Some of the numbers and categories under BF are presented in Table 7.2.
Table 7.2 Some psychology subcategories in the Library of Congress classification system
Letter (category) Number (subcategory) Subject
BF 1–1999 Psychology, parapsychology, occult sciences
1–990 Psychology
38–64 Philosophy, relation to other topics
173–175.5 Psychoanalysis
176–176.5 Psychological tests and testing
180–198.7 Experimental psychology
203 Gestalt psychology
207–209 Psychotropic drugs and other substances
231–299 Sensation, aesthesiology
309–499 Consciousness, cognition
Table 7.1Twenty-one major categories of the Library of Congress classification system forcataloguing non-fiction
Letter Subject Letter Subject(category) (category)
A General works M
B Philosophy, psychology, religion N
C Auxiliary sciences of history P
D History: (general) and history Qof Europe
E History: AmericaR
F History: AmericaS
G Geography, anthropology, T
recreation
H Social sciences
U
J Political science
V
K Law
Z
L Education
Music
Fine arts
Language and literature
Science
Medicine
Agriculture
Technology
Military science
Naval science
Bibliography, library science,information resources
M07_HOWI4994_03_SE_C07.QXD 11/11/10 11:35 Page 127

128 PART 1 THE BASICS OF RESEARCH
The psychology of the literature search
Box 7.1 Practical Advice
Carrying out literature searches can be daunting especiallyas a newcomer to a research area. Professional researchersand academics are more likely to update a literature searchthan carry out a completely new one. Students sometimesseem overwhelmed when their attempts at a literaturesearch do not initially go well. Furthermore, carrying outa literature search can involve a lot of time and there is noabsolute certainty that it will be fruitful. The followingmay be of help to keep the task of searching the literaturemanageable:
As a student you will have only a limited amount oftime to devote to the literature search. It is better toconcentrate on material published in recent years sincethis demonstrates that you are aware of up-to-dateresearch, is more easily obtainable, and is likely to contain references to the older material some of whichremains important in your field of interest or has beenforgotten but perhaps warrants reviving.
Literature searches on topics rising out of a student’sgeneral knowledge of psychology are less likely to present problems than where the idea being pursued is not already based on reading. Where the student has anidea based on their novel experiences then difficulties tendto arise. For one reason, the appropriate terminologymay elude the student because their common-sense terminology is not what is used in the research literature.For example, a common-sense term may be rememberingwhereas the appropriate research literature might referto reminiscence. Finding appropriate search terms canbe difficult and often many different ones will need to betried.
Many students avoid carrying out a literature searchbecause the cost of obtaining the material seems pro-hibitive. However, nowadays authors can be contactedby e-mail and many of them are delighted to e-mail youcopies of their articles. This is without cost of courseand often very quick. This does not apply to obtainingcopies of books for obvious reasons.
Most databases count the number of ‘hits’ that yoursearch terms have produced. If this number is large (saymore than 200) and they appear to be largely irrelevant
then you need to try more restricted search terms whichproduce a manageable number of pertinent publications.If the database yields only a small number of articles (sayfewer than ten) then this can be equally problematicespecially where they are not particularly relevant toyour interests. You need to formulate searches whichidentify more papers.
There may be research areas that you are interested inwhich have only a rudimentary or non-existent researchbase. In these cases, your search may well be fruitless.The trouble is that it can take some time to determinewhether or not this is the case since it could be yoursearch terms which are at fault.
Most databases contain advanced search optionswhich can be used to maximise the number of ‘hits’you make on relevant material and may reduce thenumber of times you find irrelevant material. Usually itis advantageous to confine your search to the titles orabstracts sections rather than to, say, anywhere on thedatabase.
When you find articles which are relevant to your inter-ests, examine their database entries in order to get cluesas to the sorts of keywords or terms you should besearching for to find articles like the one you are look-ing for. Furthermore, as many databases now includethe full reference lists from the original article, theseshould be perused as they are likely to contain otherreferences pertinent to your interests.
The articles which the database identifies on the basisof your search need to be examined in order to decidewhether they are actually pertinent. It is probably bestto restrict this on-screen to the article’s title. Reading a lot of abstracts in one sitting on the computer canbecome very tiring. Once potential articles have beenselected on the basis of their title, you should then savethe details of the article including the abstracts for laterperusal. This can be done often by ticking a box onscreen and e-mailing the text to yourself or by employ-ing a cut-and-paste procedure to put the text into a file. It is then much easier to carefully select the articleswhich you wish to follow up.
M07_HOWI4994_03_SE_C07.QXD 11/11/10 11:35 Page 128

CHAPTER 7 THE LITERATURE SEARCH 129
7.3 Electronic databases
Using the library catalogue in this way is clearly a rather haphazard process. It is totallydependent on what books (and other publications) are actually in the library. Conse-quently you may prefer to go directly to electronic databases (as opposed to catalogues).There are a number of different electronic databases that contain information relevantto psychology. Generally libraries have to pay for access to these but research and scholarship would be severely hampered without them. The web pages for your librarywill usually provide details as to what is available to you at your university or college.For those databases that are only available on the web, you will generally need to havea username and password. This is obtained from your library or computer centre. Two databases that you may find especially useful are called ISI Web of Science andPsycINFO. ISI stands for Institute for Scientific Research though we will refer to thisdatabase as just the Web of Science. PsycINFO is short for Psychological Informationand is produced by the American Psychological Association. Each of these has its advantages and disadvantages and it is worth becoming familiar with both of them (andothers) if they are available. Both PsycINFO and Web of Science are essentially archivesof summaries of research articles and other publications. These summaries are known as abstracts. Apart from reading the full article, they are probably the most completesummary of the contents of journal articles.
PsycINFO is more comprehensive in its coverage of the content of psychology journals than Web of Science. It includes what was formerly published as PsychologicalAbstracts and contains summaries of the content of psychology books and sometimesindividual chapters but primarily PsycINFO is dominated by journal articles. For books,it goes back as far as 1840. Abstracts of books and chapters make up 11 per cent of itsdatabase (PsycINFO Database Information, n.d.). However, it also includes abstracts ofpostgraduate dissertations called Dissertation Abstracts International which constitute afurther 12 per cent of the data. These abstracts are based on postgraduate work whichhas not been specially reviewed for publication unlike the vast majority of published researchreports. The dissertations themselves are often the length of a short book and ratherdifficult to get access to – certainly they are difficult to obtain in a hurry. Consequently,their use is problematic when normal student submission deadlines are considered.
Web of Science contains the abstracts of articles published since 1945 for science articles and since 1956 for social science articles. It covers only those in journals that are thought to be the most important in a discipline (Thomson Reuters, n.d.). It rangesthrough a number of disciplines and is not restricted to psychology. Moreover, likePsycINFO it may be linked to the electronic catalogue of journals held by your library.If so, it will inform you about the availability of the journal in your library. This facil-ity is very useful as there are a large number of psychology journals and your library willsubscribe to only some of them.
■ Using Web of ScienceWeb of Science is currently accessed through Web of Knowledge. This may appear as in Figure 7.3. It is not possible in the limited space available here to show you all its different facilities. Once you have tried out one or two basic literature searches you maywish to explore its other capabilities. Find out from your college library whether you canaccess it and, if so, how to do so. Once you are logged into Web of Knowledge and haveselected ISI Web of Science, the home page shown in Figure 7.4 will appear.
Quick Search is sufficient in most cases. To restrict your search you may wish to de-select the Arts & Humanities Citation Index and, possibly, the Science Citation Index
M07_HOWI4994_03_SE_C07.QXD 11/11/10 11:35 Page 129

130 PART 1 THE BASICS OF RESEARCH
FIGURE 7.3 ISI Web of Knowledge home page (from Thomson Reuters)
FIGURE 7.4 ISI Web of Science home page (from Thomson Reuters)
M07_HOWI4994_03_SE_C07.QXD 11/11/10 11:35 Page 130

CHAPTER 7 THE LITERATURE SEARCH 131
Expanded by clicking on the box containing the tick mark. If too many inappropriatereferences come up when the number of databases is not restricted, then go back andlimit your search.
Enter the key words or terms that describe the topic that you want to conduct thesearch on. If too many references are found, limit your search by adding further keywords.There is a help facility if you want more information on what to do. Suppose you wantto find out what articles there are on the topic of interpersonal attraction and attitudesimilarity. You type in these terms in the box provided combining them with the wordor search operator ‘and’. Then press the Return key or select the Search option.
The first part of the first page of the Summary of the results of this search is shownin Figure 7.5. Of course, if you search using these terms now you will get newer publica-tions than these as this example was done in April 2010. Articles are listed in order ofthe most recent ones unless you have selected them in order of the highest relevance of thekeywords. This option is shown in the Sort by box in Figure 7.5. With this option articlescontaining more of these terms and presenting them closer together are listed first.
Four kinds of information are provided for each article listed in the summary:
the family name of the authors and their initials;
the title of the article;
the name of the journal together with the volume number, the issue number in parentheses, the first and last page numbers of the article, and the month and the yearthe issue was published; and
the number of times the article has been cited by other papers.
FIGURE 7.5ISI Web of Science first summary page of the results of search (from Thomson Reuters)
M07_HOWI4994_03_SE_C07.QXD 11/11/10 11:35 Page 131

132 PART 1 THE BASICS OF RESEARCH
If your library has this software, just below this last entry may be the SFX icon. Selectingthis icon enables you to find out whether your library has this journal. The use of thisprocedure is described below.
For the first article shown in Figure 7.5, the authors are Lemay, Clark and Greenberg.The title of the article is ‘What Is Beautiful Is Good Because What Is Beautiful Is Desired:Physical Attractiveness Stereotyping as Projection of Interpersonal Goals’. The journal isPersonality and Social Psychology Bulletin.
It does not seem possible to tell from the title of this article whether it is directly relevant to our topic as the title does not refer to attraction. To see whether the articleis relevant and to find out further details of it we select the title which produces the FullRecord shown in Figure 7.6. The keyword ‘interpersonal attraction’ is listed as one ofthe Author Keywords and ‘attitude similarity’ as one of the KeyWords Plus. From theAbstract it would seem that this paper is not directly concerned with interpersonalattraction and attitude similarity and so we would be inclined to look at some of theother references.
Web of Science includes the references in the paper. To look at the references selectReferences near the top of the full record as shown in Figure 7.7.
If you have this facility, select the SFX icon in Figure 7.6 just below the title of thepaper to find out whether your library has this paper. SFX may produce the kind of webpage shown in Figure 7.8. We can see that Loughborough University Library has accessto the electronic version of this paper. If we select Go the window in Figure 7.9 appears.We can now read and download this article (Figure 7.10). We can search for our twokeywords by typing them in the Find box towards the top of the screen. If we do this we can see that this paper does not look at the relation between interpersonal attractionand attitude similarity.
FIGURE 7.6 ISI Web of Science full record of an article (from Thomson Reuters)
M07_HOWI4994_03_SE_C07.QXD 11/11/10 11:35 Page 132

CHAPTER 7 THE LITERATURE SEARCH 133
FIGURE 7.7 ISI Web of Science cited references of an article (from Thomson Reuters)
FIGURE 7.8 SFX window (from Loughborough University Ex Libris Ltd)
There are several ways of saving the information on Web of Science. Perhaps the easiest method is to move the cursor to the start of the information you want to save,hold down the left button of the mouse and drag the cursor down the page until youreach the end of the information you want to save. The address is useful if you want to contact the authors. This area will be highlighted. Select the Edit option on the bar atthe top of the screen which will produce a dropdown menu. Select Copy from this menu.Then paste this copied material into a Word file.
M07_HOWI4994_03_SE_C07.QXD 11/11/10 11:35 Page 133

134 PART 1 THE BASICS OF RESEARCH
■ Using PsycINFOPsycINFO operates somewhat differently from Web of Science. Its use is essential as its coverage of psychology is more complete. It is generally accessed online which is theversion we will illustrate. You may need to contact your college library to see if you canaccess it and, if so, how. After you have selected PsycINFO, you may be presented witha window like that shown in Figure 7.11.
FIGURE 7.9 Electronic access to a full article (from SAGE Publications)
FIGURE 7.10 Start of an electronic article (from SAGE Publications)
M07_HOWI4994_03_SE_C07.QXD 11/11/10 11:35 Page 134

CHAPTER 7 THE LITERATURE SEARCH 135
We will again search using the terms ‘interpersonal attraction’ and ‘attitude similarity’.It is better to use the Advanced Search option so that you can specify that you only wantmaterial which has these keywords in their Abstract. Otherwise you will be presentedwith material which has these keywords elsewhere such as in the references listed at theend of a paper. The Advanced Search option is shown in Figure 7.12 with the keywordsin the two boxes connected by the operator ‘and’ and restricted to be found in the‘Abstract’. To select ‘Abstract’, select the button on the relevant row of the rightmostbox when a menu will appear as shown in Figure 7.13. ‘Abstract’ is the sixth keywordon this list. Then press the Return key or select Search. This will produce the kind of list shown in Figure 7.14. Your list will, of course, be more up to date if you follow these steps now. Note that this list is somewhat different from that for Web of Scienceshown in Figure 7.5. However, the same three kinds of information are provided for eachrecord or reference – the title of the reference, the authors and where it was published.Also shown are the first few lines of the Abstract. You can restrict what publications arelisted by selecting Peer-Reviewed Journals.
If you want to see the full abstract for an item, select View Record. The first part ofthe complete record for the peer-reviewed paper by Singh and colleagues is presented in Figure 7.15. Note that the record also contains the references included in the originalarticle. To keep a copy of the details of a search it is probably easiest to select and copythe information you want and then paste it into a Word file as described for Web ofScience.
PsycINFO Quick Search home page (Source: The PsycINFO® Database,reproduced with permission of the American Psychological Association, publisher of the PsycINFO database, all rights reserved. No further reproduction
FIGURE 7.11 or distribution is permitted without written permission from the AmericanPsychological Association. Images produced by ProQuest, www.proquest.com.Image published with permission of ProQuest. Further reproduction is prohibitedwithout permission.)
M07_HOWI4994_03_SE_C07.QXD 11/11/10 11:35 Page 135

PsycINFO Advanced Search (Source: The PsycINFO® Database, reproduced withpermission of the American Psychological Association, publisher of the PsycINFOdatabase, all rights reserved. No further reproduction or distribution is permittedwithout written permission from the American Psychological Association. Images
FIGURE 7.12 produced by ProQuest, www.proquest.com. PsycINFO is a registered trademarkof the American Psychological Association (APA). The PsycINFO Databasecontent is reproduced with permission of the APA. The CSA Illumina internetplatform is the property of ProQuest LLC. Image published with permission ofProQuest. Further reproduction is prohibited without permission.)
PsycINFO Advanced Search drop-down menu (Source: The PsycINFO® Database,reproduced with permission of the American Psychological Association, publisher
FIGURE 7.13of the PsycINFO database, all rights reserved. No further reproduction or distributionis permitted without written permission from the American PsychologicalAssociation. Images produced by ProQuest, www.proquest.com. Image publishedwith permission of ProQuest. Further reproduction is prohibited without permission.)
M07_HOWI4994_03_SE_C07.QXD 11/11/10 11:35 Page 136

CHAPTER 7 THE LITERATURE SEARCH 137
PsycINFO list of records (Source: The PsycINFO® Database, reproduced withpermission of the American Psychological Association, publisher of the PsycINFO
FIGURE 7.14database, all rights reserved. No further reproduction or distribution is permittedwithout written permission from the American Psychological Association. Imagesproduced by ProQuest, www.proquest.com. Image published with permission ofProQuest. Further reproduction is prohibited without permission.)
PsycINFO full record (Source: The PsycINFO® Database, reproduced withpermission of the American Psychological Association, publisher of the PsycINFO
FIGURE 7.15database, all rights reserved. No further reproduction or distribution is permittedwithout written permission from the American Psychological Association. Imagesproduced by ProQuest, www.proquest.com. Image published with permission ofProQuest. Further reproduction is prohibited without permission.)
M07_HOWI4994_03_SE_C07.QXD 11/11/10 11:35 Page 137

138 PART 1 THE BASICS OF RESEARCH
7.4 Obtaining articles not in your library
There are a large number of journals published which are relevant to psychology. As the budgets of libraries are limited, your library will subscribe to only some of them.Furthermore, it may not have a complete set of a journal. Consequently, it is likely thatsome of the articles you are interested in reading will not be available in your library. Ifthis occurs, there are at least five different courses of action you can take:
You may have friends at other universities or there may be other universities near to where you live. You can check in their catalogue to see if they have the journal volume you need using the web pages of your local library in many cases.
Libraries provide an inter-library loan service where you can obtain either a photo-copy of a journal article or a copy of the issue in which the article was published. It is worth obtaining the issue if there is more than one article in that issue which is of interest to you. This service is generally not free and you may be expected to payfor some or all of these loans. You will need to check locally what arrangements arein place for using such a service. This service is relatively quick and you may receivethe photocopied article in the post or an e-mailed electronic copy within a week ofrequesting it.
Sometimes it may be worth travelling to a library such as the British Lending Libraryat Boston Spa in Yorkshire to photocopy these yourself. The number of articles youcan request in a day at this library is currently restricted to 16 if you order five work-ing days in advance and a further 8 on the day itself. It is worth checking beforegoing. You will find contact details on the following website: http://www.york.ac.uk/library/libraries/britishlibrary/#bspa
Many journals now have a web-based electronic version which you may be able to access. Information about this may be available on your library’s website. If yourlibrary subscribes to the electronic version of a journal then this is very good newsindeed since you can obtain virtually instant access to it from your computer whichallows you to view it on the screen, save a copy, or print a copy.
You may write to or e-mail the author (or one of the authors if there is more thanone) of the paper and ask them to send you a copy of it. It should be quicker to e-mailthe author than to mail them. Authors may have an electronic copy of the paperwhich they can send to you as an attachment to their reply. Otherwise you will haveto wait for it to arrive by post. Some authors may have copies of their papers whichyou can download from their website. Perhaps the easiest way to find an author’s e-mail address is to find out where they currently work by looking up their mostrecently published paper. This is readily done in Web of Science or PsycINFO. Thenuse an Internet search engine such as Google by typing in their name and the name of the institution. You need to include your postal address in your e-mail so thatauthors know where to send the paper should they not have an electronic copy. It iscourteous to thank them for sending you the paper. Some databases routinely providean author’s e-mail address.
M07_HOWI4994_03_SE_C07.QXD 11/11/10 11:35 Page 138

CHAPTER 7 THE LITERATURE SEARCH 139
Judging the reputation of a publication
Box 7.2 Talking Point
There is a form of pecking-order for research journals inall disciplines and that includes psychology. To have anarticle published in Nature or Science signals something ofthe importance of one’s work. Researchers are attracted topublishing in the most prestigious journals for professionaladvancement. Virtually every journal has a surfeit ofmaterial submitted to it so very good material may some-times be rejected. The rejection rate of articles submittedfor publication in journals is relatively high. In 2008,rejection rates varied from 35 per cent for Experimentaland Clinical Pharmacology to 89 per cent for Teaching of Psychology with an average of 69 per cent across thenon-divisional journals published by the leading AmericanPsychological Association (American PsychologicalAssociation, 2009). Not unexpectedly, agreement betweenreferees or reviewers about the quality of an article may beconsiderably less than perfect (Cicchetti, 1991). Quality,after all, is a matter of judgement. Authors may well findthat an article rejected by one journal will be accepted bythe next journal they approach.
The impact factor is a measure of the frequency withwhich the average article in a journal has been cited withina particular period. This may be regarded as a useful indicator of the quality of the journal. More prestigiousjournals should be more frequently cited than less pre-stigious ones. The Institute for Scientific Informationwhich produces the Web of Science also publishes JournalCitation Reports annually in the summer following the yearthey cover. The impact factor of a particular journal maybe found using these reports either online, on CD-ROM oron microfiche. The period looked at by the Journal CitationReports is the two years prior to the year being considered(Institute for Scientific Information, 1994). For example, if the year being considered is 2011, the two years prior to that are 2009 to 2010. The impact factor of a journalin 2011 is the ratio of the number of times in 2011 thatarticles published in that journal in 2009 and 2010 werecited in that and other journals to the number of articlespublished in that journal in 2009 and 2010:
journal’s impact factor 2011 =
citations in 2011 of articles published
in journal in 2009–2010
number of articles published in journal in 2009–2010
So, for example, if the total number of articles publishedin 2009 and 2010 was 200 and the number of citations ofthose articles in 2011 was 200, the impact factor is 1.00.The impact factor excludes what are called self-citationswhere authors refer to their previous articles.
Taking into account the number of articles published in a particular period controls for the size of the journal.If a journal publishes more articles than another journal,then that journal is more likely to be cited simply for thatreason if all else is equal. This correction may not be neces-sary as it was found by Tomer (1986) that the corrected andthe uncorrected impact factor correlates almost perfectly(0.97).
The impact factors for a selection of psychology journalsfor the years 2004 to 2008 are presented in Table 7.3. The impact factor varies across years for a journal. Forexample, for the British Journal of Social Psychologyit decreased from 1.99 in 2007 to 1.71 in 2008. It also differs between journals. For these journals in 2008, thehighest impact factor is 5.04 for the Journal of Personalityand Social Psychology and the lowest is 0.59 for TheJournal of Psychology. An impact factor of about 1.00means that the average article published in that journalwas cited about once in the previous two years taking intoaccount the number of articles published in that journal in those two years. The Web of Science includes only thosejournals that are considered to be the most important(Thomson Reuters, n.d.).
However, even the Institute for Scientific Informationwhich introduced the impact factor measure says that theusefulness of a journal should not be judged only on itsimpact factor but also on the views of informed colleaguesor peers (Institute for Scientific Information, 1994). Theimpact factor is likely to be affected by a number of variablessuch as the average number of references cited in a journalor the number of review articles that are published by ajournal. The relationship between the citation count of ajournal and the subjective judgement of its standing bypsychologists has not been found to be strong.
For example, Buss and McDermot (1976) reported a rank-order correlation of 0.45 between the frequency of citations for 64 psychology journals in the period1973–1975 and a five-point rating made of those journals
M07_HOWI4994_03_SE_C07.QXD 11/11/10 11:35 Page 139

140 PART 1 THE BASICS OF RESEARCH
by the chairs or heads of 48 psychology departments inthe United States in an earlier study by Mace and Warner(1973). This relationship was stronger at 0.56 when it wasrestricted to the ten most highly cited journals. In otherwords, agreement was higher when the less highly citedjournals were excluded. Rushton and Roediger (1978)found a Kendall’s tau correlation of 0.45 between the ratings of these journals by these departmental heads andtheir impact factor. Chairs of departments are an influ-ential group of people in that they are often responsible for selecting, giving tenure and promoting academic staff.However, it is possible that nowadays chairs are moreaware of the impact factor and so the relationship betweenthe impact factor and the rating of the journal may behigher.
There appears not to be a strong relationship betweenthe number of times a published paper is cited by otherauthors and either the quality or the impact of the paperas rated by about 380 current or former editors, associateeditors and consulting editors of nine major psychologyjournals who had not published papers in those journals(Gottfredson, 1978). Because the distribution of the number
of citations was highly skewed with most articles notbeing cited, the logarithm of the citation number wastaken. The correlation between this transformed numberwas 0.22 for the quality scale and 0.36 for the impactscale. The number of times a paper is cited is given by Web of Science just below the journal title as shown inFigure 7.5. If you select the number after Times Cited(provided that it is not zero), you will see details of thepapers that have cited this reference.
The lack of agreement about the quality of publishedpapers was dramatically illustrated in a study by Peters andCeci (1982) in which 12 papers which had been publishedin highly regarded American psychology journals wereresubmitted to them 18 to 32 months later using fictitiousnames and institutions. Of the 38 editors and reviewerswho dealt with these papers, only three realised that theywere resubmissions. Of the nine remaining papers, eight of these previously published papers were rejected largelyon the grounds of having serious methodological flaws.This finding emphasises the importance of the reader beingable to evaluate the worth of a paper by themselves andnot relying entirely on the judgements of others.
Table 7.3 Impact factors for some psychology journals for 2008 to 2004
Journal 2008 2007 2006 2005 2004
British Journal of Social Psychology 1.71 1.99 1.42 2.11 1.59
Journal of Personality and Social Psychology 5.04 4.51 4.22 4.21 3.63
The Journal of Psychology 0.59 0.54 0.59 0.53 0.42
Journal of Social and Personal Relationships 1.10 0.87 0.99 0.72 0.82
The Journal of Social Psychology 0.73 0.86 0.66 0.60 0.60
Personality and Social Psychology Bulletin 2.46 2.58 2.42 2.09 1.90
Social Psychology Quarterly 1.14 2.07 1.30 1.06 1.40
7.5 Personal bibliographic database software
There is much bibliographic database software which enables you to quickly store thedetails of references of interest to you from electronic databases such as Web of Scienceand PsycINFO. These include EndNote, RefMan, ProCite and RefWorks. If you look atthe Web of Science screenshots in Figure 7.5 or 7.6 you will see that there is an optionto Save to EndNote, RefMan and ProCite. In the PsycINFO screenshot in Figure 7.14there is a RefWorks icon which if you select will permit you to save references toRefWorks. For example, we could save the details of the reference in Figure 7.14 bySingh and colleagues in RefWorks as shown in Figure 7.16. You can also use this kindof software to write out the references that you cite in your work in a particular style,
M07_HOWI4994_03_SE_C07.QXD 11/11/10 11:35 Page 140

CHAPTER 7 THE LITERATURE SEARCH 141
FIGURE 7.16Full details of a reference in RefWorks (Source: RefWorks is a registeredtrademark of Elsevier B.V.)
FIGURE 7.176th edition APA publication style of a RefWorks reference (Source: RefWorks is aregistered trademark of Elsevier B.V.)
such as that recommended by the American Psychological Association. For example, wecould format the Singh reference in terms of 6th edition of the APA Publication manualas presented in Figure 7.17. This does not mean that we do not have to familiarise ourselveswith the details of this particular style, as we still have to check whether the softwareand our use of it has presented the references in the appropriate style.
7.6 Conclusion
The development of any discipline is the collective effort of numerous researchers actingto a degree independently. It is necessary for researchers to communicate their findingsand ideas in publications such as journal articles. Similarly, researchers need to be able
M07_HOWI4994_03_SE_C07.QXD 11/11/10 11:35 Page 141

142 PART 1 THE BASICS OF RESEARCH
to access the work of other researchers in order to make an effective contribution todeveloping the field of research in question. Effectively searching the literature involvesa number of skills. In this chapter we have concentrated on efficient searches of avail-able databases. Of course, professional researchers have a wider variety of informationsources available. For example, they go to conferences and hear of new work there, theyget sent copies of reports by colleagues doing research elsewhere, and they have anextensive network of contacts through which news of research elsewhere gets com-municated. Students have fewer options at first.
Searching the literature on a topic takes time and unless this is taken into account,students may have problems fitting it into their schedule. No one can expect that allmaterials will be available in their university or college library. There are ways of obtaining material which are increasingly dependent on the World Wide Web. If you areunfamiliar with the research on a particular topic, it may be helpful to find a recentlypublished book which includes an introduction to that topic to give you some idea ofwhat has been done and found. Electronic databases such as Web of Science andPsycINFO are a very convenient way to find out what has been published on a particulartopic. These electronic databases provide short abstracts or summaries of publicationswhich should give you a clearer idea of whether the publication is relevant to your needs.You may not always realise the importance or relevance of a paper when you first comeacross it. Consequently, it may be better to make a note of a paper even if it does notappear immediately relevant to your needs. This is easily done with the copy and pastefunctions of the computer software you are using. You need to learn to judge the valueof a research paper in terms of what has been done rather than simply accepting it asbeing important because it has been published or has been published in what is reputedlya good journal.
The key to carrying out a successful literature research in any discipline lies in using the various available sources of information. Of these, modern research is most heavily dependent on the use of electronic databases such as Web of Science and PsycINFO. These are generally available in universities and elsewhere. Students will find them useful but often the materials available via theirlibrary catalogue will take priority because of their ease of availability.
The major databases essentially consist of abstracts or summaries of research publications includingboth journal articles and books. An abstract gives a fairly detailed summary of the research articleand is an intermediate step to help the reader decide whether or not the complete article or book isrequired. In addition, these databases frequently contain enough information to enable the author tobe contacted – often this goes as far as including an e-mail address.
Databases are not identical and one may supplement another. Furthermore, there may well be othersources of information that some researchers can profitably refer to. For example, the fields of biology,medicine, sociology and economics might provide essential information for researchers in some fieldsof psychology. Knowledge of these builds up with experience.
Abstracts and other information may be copied and pasted on your computer. In this way it is possibleto build up a record of the materials you feel will be useful to you.
There are numerous ways of obtaining published research. The Internet and e-mail are increasinglyrich sources. It can be surprisingly easy to get in touch with academics all over the world. Many arequite happy to send copies of their work either in the mail or electronically.
Key points
M07_HOWI4994_03_SE_C07.QXD 11/11/10 11:35 Page 142

CHAPTER 7 THE LITERATURE SEARCH 143
ACTIVITIES1. If you do not already know this, find out what electronic databases are available in your library and how to access them.
The best way of checking how good a system is and how to use it is to try it out on a topic that you are familiar with. Itshould produce information you are already aware of. If it does not do this, then you can try to find out how to locatethis information in this system. Try out a few systems to see which suits your purposes best.
2. Many university libraries provide training in the use of their resources and systems. These are an excellent way ofquickly learning about the local situation. Enquire at your library and sign up for the most promising. Afterwards try to turn your effort into better grades by conducting a more thorough search as preparation for your essays, practicalreports and projects. Using information sources effectively is a valuable skill, and should be recognised and rewarded.
M07_HOWI4994_03_SE_C07.QXD 11/11/10 11:35 Page 143

Ethics and datamanagement in research
Overview
CHAPTER 8
Psychological ethics are the moral principles that govern psychological activity.Research ethics are the result of applying these broader principles to research. Occasionsarise when there is a conflict between ethical principles – ethical dilemmas – whichare not simply resolved.
Psychology’s professional bodies (for example, the American Psychological Associationand the British Psychological Society) publish detailed ethical guidelines. They overlapsignificantly. This chapter is based on recent revisions of the ethical principles ofthese bodies.
Deception, potential harm, informed consent and confidentiality are commonly thefocus of the debate about ethics. However, ethical issues stretch much more widely.They include responsibilities to other organisations, the law and ethical committees,circumstances in which photos and video-recording are appropriate, and the publica-tion of findings, plagiarism and fabricating data.
Significantly, ethical considerations are the responsibility of all psychologists includingstudents in training.
It is increasingly the norm that a researcher obtains formal consent from their participants that they agree to take part in the research on an informed basis.
Data management refers to the ways that you may need to store and handle the personaldata which you collect in research in order to maintain confidentiality. Data itemswhich are anonymous are not included in the requirements of the Data Protection Actin the UK.
M08_HOWI4994_03_SE_C08.QXD 10/11/10 15:02 Page 144

8.1 Introduction
Quite simply, ethics are the moral principles by which we conduct ourselves. Psycholo-gical ethics, then, are the moral principles by which psychologists conduct themselves. Itis wrong to regard ethics as being merely the rules or regulations which govern conduct.The activities of psychologists are far too varied and complex for that. Psychologicalwork inevitably throws up situations which are genuinely dilemmas which no amountof rules or regulations could effectively police. Ethical dilemmas involve conflictsbetween different principles of moral conduct. Consequently psychologists may differ interms of their position on a particular matter. Ethical behaviour is not the responsibilityof each individual psychologist alone but a responsibility of the entire psychologicalcommunity. Monitoring the activities of fellow psychologists, seeking the advice of otherpsychologists when ethical difficulties come to light and collectively advancing ethicalbehaviour in their workplace are all instances of the mutual concern that psychologistshave about the conduct of the profession. Equally, psychological ethics cannot be entirelyseparated from personal morality.
The American Psychological Association’s most recent ethical code was first publishedin 2002. It came into effect on 1 June 2003. It amounts to a substantial ethical programmefor psychological practitioners, not just researchers. This is important since unethicalbehaviour reflects on the entire psychological community. The collective strength of psy-chology lies largely in the profession’s ability to control and monitor all aspects of thework of psychologists. The code, nevertheless, only applies to the professional activitiesof the psychologist – their scientific, professional and educational roles. For example, it requires an ethical stance in psychology teaching – so that there is a requirement offidelity in the content of psychology courses such that they should accurately reflect thecurrent state of knowledge. These newest ethical standards do not simply apply to mem-bers of the American Psychological Association but also to student affiliates/members.Ignorance of the relevant ethical standards is not a defence for unethical conduct andneither is failure to understand the standards properly. Quite simply, this means that allpsychology students need a full and mature understanding of the ethical principles whichgovern the profession. It is not something to be left until the student is professionallyqualified. Whenever scientific, professional and educational work in psychology isinvolved so too are ethics, irrespective of the status. We have chosen to focus on theAmerican Psychological Association’s ethical guidelines as they are the most compre-hensive available, considering rather wider issues than any others. As such, they bring toattention matters which otherwise might be overlooked. We believe that it is no excuseto disregard them simply because they are not mentioned by one’s own professionalethics, for example.
What is the purpose of ethics? The answer to this may seem self-evident, that is, psychologists ought to know how to conduct themselves properly. But there is more toit than that. One of the characteristics of the professions (medicine being the primeexample) is the desire to retain autonomy. The history of the emergence of professionssuch as medicine during the nineteenth century illustrates this well (Howitt, 1992a).Autonomy implies self-regulation of the affairs of members by the professional body. It is not possible to be autonomous if the activities of members are under the detailedcontrol of legislation. So professions need to stipulate and police standards of conduct.There is another important reason why psychological work should maintain high ethicalstandards. The good reputation of psychology and psychologists among the general public,for example, is essential for the development of psychology. If psychologists collectivelyenjoyed a reputation for being dishonest, exploitative, prurient liars then few would employtheir services or willingly participate in their research. Trust in the profession is essential.
CHAPTER 8 ETHICS AND DATA MANAGEMENT IN RESEARCH 145
M08_HOWI4994_03_SE_C08.QXD 10/11/10 15:02 Page 145
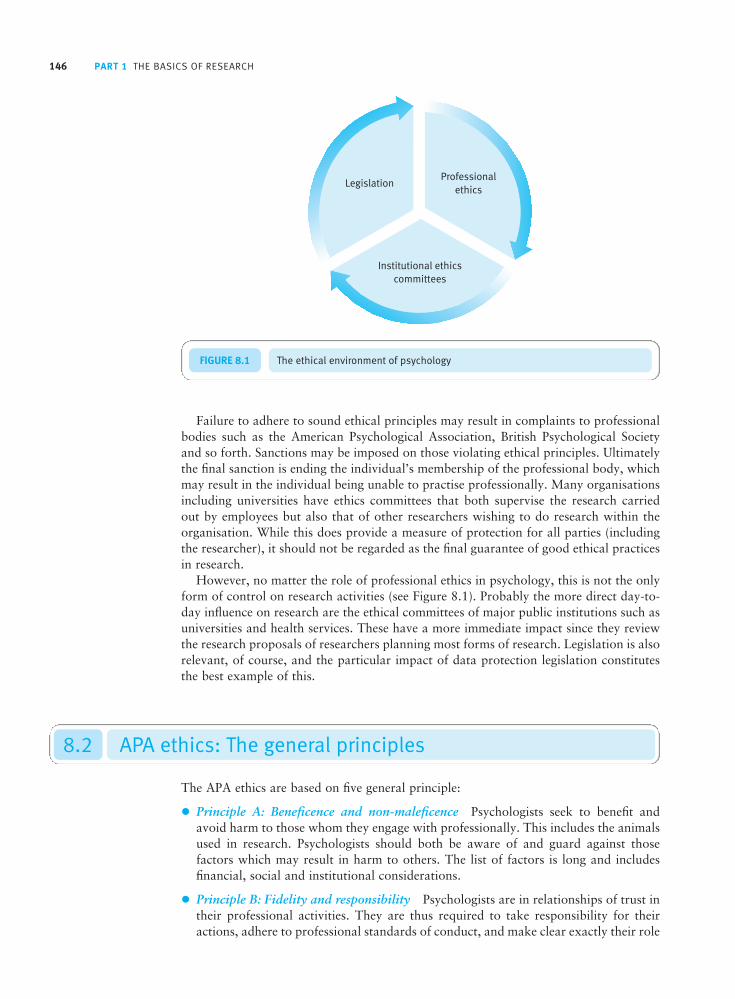
146 PART 1 THE BASICS OF RESEARCH
FIGURE 8.1 The ethical environment of psychology
Failure to adhere to sound ethical principles may result in complaints to professionalbodies such as the American Psychological Association, British Psychological Societyand so forth. Sanctions may be imposed on those violating ethical principles. Ultimatelythe final sanction is ending the individual’s membership of the professional body, whichmay result in the individual being unable to practise professionally. Many organisationsincluding universities have ethics committees that both supervise the research carried out by employees but also that of other researchers wishing to do research within theorganisation. While this does provide a measure of protection for all parties (includingthe researcher), it should not be regarded as the final guarantee of good ethical practicesin research.
However, no matter the role of professional ethics in psychology, this is not the onlyform of control on research activities (see Figure 8.1). Probably the more direct day-to-day influence on research are the ethical committees of major public institutions such asuniversities and health services. These have a more immediate impact since they reviewthe research proposals of researchers planning most forms of research. Legislation is alsorelevant, of course, and the particular impact of data protection legislation constitutesthe best example of this.
8.2 APA ethics: The general principles
The APA ethics are based on five general principle:
Principle A: Beneficence and non-maleficence Psychologists seek to benefit andavoid harm to those whom they engage with professionally. This includes the animalsused in research. Psychologists should both be aware of and guard against those factors which may result in harm to others. The list of factors is long and includesfinancial, social and institutional considerations.
Principle B: Fidelity and responsibility Psychologists are in relationships of trust intheir professional activities. They are thus required to take responsibility for theiractions, adhere to professional standards of conduct, and make clear exactly their role
M08_HOWI4994_03_SE_C08.QXD 10/11/10 15:02 Page 146

CHAPTER 8 ETHICS AND DATA MANAGEMENT IN RESEARCH 147
and obligations in all aspects of their professional activities. In relation to researchand practice, psychologists are not merely concerned with their own personal activitiesbut with the ethical conduct of their colleagues (widely defined). It is worthwhilequoting word for word one aspect of the professional fidelity ethic: ‘Psychologistsstrive to contribute a portion of their professional time for little or no compensationor personal advantage.’
Principle C: Integrity – accuracy, honesty, truthfulness Psychologists are expectedto manifest integrity in all aspects of their professional work. One possible exception to this is circumstances in which the ratio of benefits to harm of using deception islarge. Nevertheless, it remains the duty of psychologists even in these circumstancesto seriously assess the possible harmful consequences of the deception including theensuing distrust. The psychologist has a duty to correct these harmful consequences.The problem of deception is discussed in more detail later.
Principle D: Justice – equality of access to the benefits of psychology This meansthat psychologists exercise careful judgement and take care to enable all people toexperience just and fair psychological practices. Psychologists should be aware of thenature of their biases (potential and actual). They should not engage in, or condone,unjust practices and need to be aware of the ways in which injustice may manifestitself.
Principle E: Respect for people’s rights and dignity According to the AmericanPsychological Association, individuals have the rights of privacy, confidentiality andself-determination. Consequently, psychologists need to be aware of the vulnerabilitiesof some individuals that make it difficult for them to make autonomous decisions.Children are an obvious example. The principle also requires psychologists to beaware of and respect differences among cultures, individuals and roles. Age, culture,disability, ethnicity, gender, gender identity, language, national origin, race, religion,sexual orientation and socio-economic status are among these differences. Psycholo-gists should avoid and remove biases related to these differences while being vigilantfor, and critical of, those who fail to meet this standard.
Detailed recommendations about ethical conduct are provided on the basis of these prin-ciples. In this chapter we will concentrate on those issues which are especially pertinentto research.
8.3 Research ethics
Ethical issues are presented by the American Psychological Association’s documentationin the order in which they are likely to be of concern to the researcher. Hence the liststarts with the preparatory stages of planning research and culminates with publication.
■ Institutional approvalMuch research takes place in organisations such as the police, prisons, schools andhealth services. Many, if not all, of these require formal approval before the researchmay be carried out in that organisation or by members of that organisation. Sometimesthis authority to permit research is the responsibility of an individual (for example, aheadteacher) but, more likely, it will be the responsibility of a committee which considersethics. In addition, in universities the researcher is usually required to obtain permissionto carry out their research from their school, department or an ethics committee such
M08_HOWI4994_03_SE_C08.QXD 10/11/10 15:02 Page 147

148 PART 1 THE BASICS OF RESEARCH
as an Institutional Review Board (IRB). It is incumbent on the researcher to obtainapproval for their planned research. Furthermore, the proposal they put forward shouldbe transparent in the sense that the information contained in the documentation and anyother communication should accurately reflect the nature of the research. The organisa-tion should be in a position to understand precisely what the researcher intends on thebasis of the documentation provided by the researcher and any other communications.So any form of deceit or sharp practice such as lies, lying by omission and partial truthsis unacceptable. Finally, the research should be carried out strictly in accordance with theprotocol for the research as laid down by the researcher in the documentation. Materialchanges are not permissible and, if unavoidable, may require additional approval toremain ethical.
The next set of ethical requirements superficially seem rather different from each other.Nevertheless, they all indicate that participation in research should be a freely made decisionof the participant. Undue pressure, fear, coercion and the like should not be present orimplied. In addition, participants need to understand just what they are subjecting them-selves to by agreeing to be part of the research. Without this, they may inadvertentlyagree to participate in something which they would otherwise decline to do.
■ Informed consent to researchThe general principle of informed consent applies widely and would include assessment,counselling and therapy as well as research. People have the right to have prior knowledgeof just what they are agreeing to before agreeing to it. Only in this way is it possible forthem to decide not to participate. Potential participants in research need to have the natureof the research explained to them in terms which they could reasonably be expected tounderstand. So the explanation given to a child may be different from that given to auniversity student. According to the ethical principles, sometimes research may be con-ducted without informed consent if it is allowed by the ethical code or where the lawand other regulations specifically permit. (Although one might question whether researchis ethical merely because the law permits it.)
The main provisions which need to be in place to justify the claim of informed consentare as follows:
The purpose, procedures and approximate duration of the research should be providedto potential participants.
Participants should be made aware that they are free to refuse to take part in theresearch and also free to withdraw from the research at any stage. Usually researchersaccept that this freedom to withdraw involves the freedom to withdraw any data provided up to the point of withdrawal. For example, the shredding of questionnairesand the destruction of recordings are appropriate ways of doing this if the withdraw-ing participant wishes. Or they may simply be given to the participant to dispose ofas they wish.
The participant should be made aware of the possible outcomes or consequences ofrefusing to take part in the research or withdrawing. Frequently, there are no conse-quences but this is not always the case. For example, some organisations require thatclients take part in research as part of the ‘contract’ between the organisation and client.Failure to take part in research might be taken as an indicator of non-cooperation.The sex offender undergoing treatment who declines to take part in the researchmight be regarded as lacking in contrition. Such judgements may have implicationsfor the future disposal of the client. The researcher cannot be responsible for the original contract but they should be aware of the (subtle) pressure to participate andstress the voluntary nature of participation.
M08_HOWI4994_03_SE_C08.QXD 10/11/10 15:02 Page 148

CHAPTER 8 ETHICS AND DATA MANAGEMENT IN RESEARCH 149
The participants should be informed of those aspects of the research which mightinfluence their decision to participate. These include discomforts, risks and adverseoutcomes. For example, one might include features of the study which might offend thesensibilities of the participant. Research on pornography in which pornographic imageswill be shown may offend the moral and/or social sensibilities of some participants.
Similarly, the participant should be informed of the benefits that may emerge from theresearch. A wide view of this would include benefits for academic research, benefitsfor the community, and even benefits for the individual participant. In this way, thepotential participant is provided with a fuller picture of what the research mightachieve which otherwise might not be obvious to them.
Participants should be told of any limits to the confidentiality of information providedduring the research. Normally, researchers ensure the anonymity of the data that theycollect and also the identity of the source of the data. But this is not always possible:for example, if one were researching sex offenders and they disclosed other offencesof which authorities were unaware. It may be a requirement placed on the researcherthat such undisclosed offences are reported to the authorities. In these circumstances, theappropriate course of action might be to indicate to the participant that the researcherwould have to report such previously undisclosed offences to the authorities.
Participants should be informed of the nature of any incentives being made to participate.Some participants may agree to take part as an act of kindness or because they believethat the research is important. If they are unaware of a cash payment, they may feelthat their good intentions for taking part in the research are compromised when thepayment is eventually offered.
Participants should be given contact details of someone whom they may approach for further details about the research and the rights of participants in the research.This information allows potential participants to ask more detailed questions and to obtain clarification. Furthermore, it has the benefit of helping to establish the bonafides of the research. For example, if the contact is a professor at a university, thenthis would help establish the reputability of the research.
Special provisions apply to experimental research involving potentially beneficialtreatments which may not be offered to all participants (see Box 8.1).
Informed consent for recordings and photography
Taking voice recordings, videos or photographs of participants is subject to the usualprinciple of informed consent. However, exceptions are stipulated in the ethical code:
Informed consent is not necessary if the recording or photography takes place in apublic place and is naturalistic (that is, there is no experimental intervention). This isethical only to the extent that there is no risk of the inadvertent participants beingidentified personally or harmed by the recording or photography.
If the research requires deception (and that deception is ethical) then consent for usingthe recording may be obtained retrospectively during the debriefing session in whichthe participant is given information about the research and an opportunity to askquestions. Deception is discussed below.
Circumstances in which informed consent may not be necessary
The ethical guidelines do not impose an invariant requirement of informed consent. Theysuggest circumstances in which it may be permissible to carry out research without prior
M08_HOWI4994_03_SE_C08.QXD 10/11/10 15:02 Page 149

150 PART 1 THE BASICS OF RESEARCH
consent of this sort. The overriding requirement is that the research could not beexpected to (i.e. can be regarded as not likely to) cause distress or harm to participants.Additionally, at least one of the following should apply to the research in question:
The study uses anonymous questionnaires or observations in a natural setting orarchival materials – even then such participants should not be placed at risk of harmof any sort (even to their reputation) and confidentiality should be maintained.
The study concerns jobs or related organisational matters in circumstances where theparticipant is under no risk concerning employment issues and the requirements ofconfidentiality are met.
The study concerns ‘normal educational practices, curricula or classroom managementmethods’ in a context of an educational establishment.
The ethics also permit research not using informed consent if the law or institutionalregulations permit research without informed consent. This provision of the ethical principles might cause some consternation. Most of us probably have no difficulty withthe principle that psychologists should keep to the law in terms of their professionalactivities. Stealing from clients, for example, is illegal as well as unethical. However,
Informed consent in intervention experiments
Box 8.1 Talking Point
When a psychologist conducts intervention research theremay be issues of informed consent. This does not refer toevery experiment but those in which there may be significantadvantages to receiving the treatment and significant dis-advantages in not receiving the treatment. The treatment,for example, might be a therapeutic drug, counselling ortherapy. Clearly, in these circumstances many participantswould prefer to receive the treatment rather than not receivethe treatment. If this were medical research it would beequivalent to some cancer patients being in the control groupand dying because they are not given the newly developeddrug that the experimental group benefits from. In psycho-logical research, someone may be left suffering depressionsimply because they are allocated to the control group not receiving treatment. Owing to these possibilities, theresearcher in these circumstances should do the following:
The experimental nature of the treatments should beexplained at the outset of the research.
It should be made clear the services or treatmentswhich will not be available should the participant beallocated to the control condition.
The method of assignment to the experimental or thecontrol conditions should be explained clearly. If
the method of selection for the experimental and control conditions is random then this needs to beexplained.
The nature of the services or treatments available tothose who choose not to take part in the researchshould be explained.
Financial aspects of participation should be clarified. Forexample, the participant may be paid for participation,but it is conceivable that they may be expected to con-tribute to the cost of their treatment.
The classic study violating the above principles is knownas the Tuskegee Experiment (Jones, 1981). Significantly,the study involved only black people as participants. Theywere suffering from syphilis at a time when this was a killerdisease. The researchers, unbeknown to the participants,allocated them to experimental and control conditions.Hence those in the control had effective treatment with-held, so were at a serious health risk as a consequence.This may have been bad enough but there was worse.Even when it had become clear that the treatment waseffective, the members of the control group were left tosuffer from the disease because the researchers also wishedto study its natural progression!
M08_HOWI4994_03_SE_C08.QXD 10/11/10 15:02 Page 150

CHAPTER 8 ETHICS AND DATA MANAGEMENT IN RESEARCH 151
there is a distinction to be made between what is permissible in law and what is ethical.A good example of this is the medical practitioner who has consenting sex with apatient. This may not be illegal and no crime committed in some countries. However, itis unethical for a doctor to do so and the punishment imposed by the medical professionis severe: possibly removal from the register of medical practitioners. There may be apotential conflict between ethics and the law. It seems to be somewhat lame to prefer thepermission of the law rather than the constraints of the ethical standards.
■ Research with individuals in a less powerful/subordinateposition to the researcherPsychologists are often in a position of power relative to others. A university professorof psychology has power over his or her students. Clients of psychologists are dependenton the psychologists for help or treatment. Junior members of research staff are depend-ent on senior research staff and subordinate to them. It follows that some potentialresearch participant may suffer adverse consequences as a result of refusing to take partin research or may be under undue pressure to participate simply because of this powerdifferential. Any psychologist in such a position of power has an ethical duty to protectthese vulnerable individuals from such adverse consequences. Sometimes, participationin research is a requirement of particular university courses or inducements may be given to participate in the form of additional credit. In these circumstances, the ethicalrecommendation is that fair alternative choices should be made available for individualswho do not wish to participate in research.
■ Inducements to participateFinancial and other encouragement to participate in research are subject to the follow-ing requirements:
Psychologists should not offer unreasonably large monetary or other inducements (for example, gifts) to potential participants in research. In some circumstances suchrewards can become coercive. One simply has to take the medical analogy of offeringpeople large amounts of money to donate organs in order to understand the undesir-ability of this. While acceptable levels of inducements are not stipulated in the ethics,one reasonable approach might be to limit payments where offered to out-of-pocketexpenses (such as travel) and a modest hourly rate for time. Of course, even this pro-vision is probably out of the question for student researchers.
Sometimes professional services are offered as a way of encouraging participation inresearch. These might be, for example, counselling or psychological advice of somesort. In these circumstances, it is essential to clarify the precise nature of the services,including possible risks, further obligations and the limitations to the provision ofsuch services. A further requirement, not mentioned in the APA ethics, might be thatthe researcher should be competent to deliver these services. Once again, it is difficultto imagine the circumstances in which students could be offering such inducements.
■ The use of deception in researchThe fundamental ethical position is that deception should not be used in psychologicalresearch procedures. There are no circumstances in which deception is acceptable if there is a reasonable expectation that physical pain or emotional distress will be caused.However, it is recognised that there are circumstances in which the use of deception may be justified. If the proposed research has ‘scientific, educational or applied value’
M08_HOWI4994_03_SE_C08.QXD 10/11/10 15:02 Page 151
152 PART 1 THE BASICS OF RESEARCH
(or the prospect of it) then deception may be considered. The next step is to establishthat no effective alternative approach is possible which does not use deception. These are not matters on which individual psychologists should regard themselves as their ownpersonal arbiters. Consultation with disinterested colleagues is an appropriate course of action.
If the use of deception is the only feasible option, it is incumbent on the psychologistto explain the deception as early as possible. This is preferably immediately after thedata have been collected from each individual, but it may be delayed until all of the datafrom all of the participants have been collected. The deceived participant should be giventhe unfettered opportunity to withdraw their data. Box 8.2 discusses how deception has been a central feature of social psychological research. The ethics of the BritishPsychological Society indicate that a distinction may be drawn between deliberate liesand omission of particular details about the nature of the research that the individual isparticipating in. This is essentially the distinction between lying by omission and lyingby commission. You might wonder if this distinction is sufficient justification of any-thing. The British Psychological Society indicates that a key test of the acceptability isthe response of participants at debriefing when the nature of the deception is revealed.If they express anger, discomfort or otherwise object to the deception then the deceptionwas inappropriate and the future of the project should be reviewed. The BPS guidelinesdo not specify the next step, however.
Deception in the history of social psychology
Box 8.2 Talking Point
The use of deception has been much more characteristic of the work of social psychologists than any other branchof psychological research. Korn (1997) argues that thiswas the almost inevitable consequence of using laboratorymethods to study social phenomena. Deception first occurredin psychological research in 1897 when Leon Solomonsstudied how we discriminate between a single point touch-ing our skin and two points touching our skin at the sametime. Some participants were led to believe that there weretwo points and others that there was just one point.Whichever they believed made a difference to what theyperceived. Interestingly, Solomons told his participantsthat they might be being deceived before participation.
In the early history of psychology deception was indeeda rare occurrence, but so was any sort of empirical research.There was a gradual growth in the use of deception between1921 and 1947. The Journal of Abnormal and SocialPsychology was surveyed during this period. Fifty-two per cent of articles involved studies using misinformationas part of the procedure while 42 per cent used ‘false coverstories’ (Korn, 1997). Little fuss was made about deception
at this time. According to a variety of surveys of journals,the use of deception increased between 1948 and 1979despite more and more questions about psychologicalethics being asked. Furthermore, there appears to be nomoderation in the scale of the sort of deceptions employedduring this period. Of course, the purpose of deception in many cases is simply to hide the true purpose of theexperiment. Participants threatened with a painful injec-tion might be expected to behave differently if they believethis is necessary for a physiological experiment than ifthey know that the threat of the injection is simply a wayof manipulating their stress levels.
Many of the classic studies in social psychology – onesstill discussed in textbooks – used deceit of some sort oranother. These did not necessarily involve trivial matters.In Milgram’s studies of obedience in which participantswere told that they were punishing a third party with electric shock, it appeared at one stage that the victim of the shock had been severely hurt. All of this was a lieand deception (Milgram, 1974). Milgram tended to referto his deceptions as ‘technical illusions’ but this would
M08_HOWI4994_03_SE_C08.QXD 10/11/10 15:02 Page 152

CHAPTER 8 ETHICS AND DATA MANAGEMENT IN RESEARCH 153
■ DebriefingAs soon as the research is over (or essential stages are complete), debriefing should be carried out. There is a mutual discussion between researcher and participant to fullyinform the participant about matters such as the nature of the result, the results of theresearch and the conclusions of the research. The researcher should try to correct themisconceptions of the participant that may have developed about any aspect of research.Of course, there may be good scientific or humane reasons for withholding some information – or delaying the main debriefing until a suitable time. For example, it maybe that the research involves two or more stages separated by a considerable interval of time. Debriefing participants after the first stage may considerably contaminate theresults at the second stage.
Debriefing cannot be guaranteed to deal effectively with the harm done to participantsby deception. Whenever a researcher recognises that a particular participant appears tohave been (inadvertently) harmed in some way by the procedures then reasonable efforts should be made to deal with this harm. It should be remembered that researchersare not normally qualified to offer counselling, and other forms of help and referral to relevant professionals may be the only appropriate course of action. There is a body of research on the effects of debriefing (for example, Epley and Huff, 1998; Smith andRichardson, 1983).
appear to be nothing other than a euphemism. In studiesby other researchers, participants believed that they werein an emergency situation when smoke was seeping into a laboratory through a vent – again a deliberate deception(Latane and Darley, 1970). Deception was endemic androutine in social psychological research. It had to be, given the great stress on laboratory experimentation in the social psychology of the time. Without the staging ofsuch extreme situations by means of deception, experi-mental social psychological research would be difficult ifnot impossible.
Sometimes the deceptions seem relatively trivial andinnocuous. For example, imagine that one wished to studythe effects of the gender of a student on the grades thatthey get for an essay. Few would have grave concernsabout taking an essay and giving it to a sample of lectur-ers for marking, telling half of them that the essay was by a male and the other half the essay was by a woman. It would seem to be important to know through researchwhether or not there is a gender bias in marking whichfavours one gender over the other. Clearly there has beena deception – a lie if one prefers – but it is one which probably does not jeopardise in any way the participants’psychological well-being though there are circumstancesin which it could. Believing that you have endangered
someone’s life by giving them dangerous levels of electricshock is not benign but may fundamentally affect a person’sideas about themselves. In some studies, participants havebeen deceitfully abused about their abilities or competencein order to make them angry (Berkowitz, 1962).
How would studies like these stand up to ethical scrutiny?Well, deception as such is not banned by ethical codes.There are circumstances in which it may be justifiable.Deception may be appropriate when the study has, orpotentially has, significant ‘scientific, educational or appliedvalue’ according to the APA ethical principles. Some mightquestion what this means. For example, if we wanted to study the grieving process, would it be right to tellsomeone that the university had been informed that theirmother had just died? Grief is an important experienceand clearly it is of great importance to study the phenomenon. Does that give the researcher carte blancheto do anything?
Deception is common in our society. The white lie is a deception, for example. Does the fact that deception isendemic in society justify its use in research? Psychologistsare professionals who as a group do not benefit fromdeveloping a reputation as tricksters. The culture of deception in research may lead to suspicion and hostilitytowards participation in the research.
M08_HOWI4994_03_SE_C08.QXD 10/11/10 15:02 Page 153
154 PART 1 THE BASICS OF RESEARCH
8.4 Ethics and publication
The following few ethical standards for research might have particular significance forstudent researchers.
■ Ethical standards in reporting researchIt is ethically wrong to fabricate data. Remember that this applies to students. Of course, errors may inadvertently be made in published data. These are most likely to be
Ethics and research with animals
Box 8.3 Talking Point
Nowadays, few students have contact with laboratory animals during their education and training. Many uni-versities simply do not have any facilities at all for animalresearch. However, many students have active concernsabout the welfare of animals and so may be particularlyinterested in the ethical provision for such research in psychology. It needs to be stressed that this is an area wherethe law in many countries has exacting requirements thatmay be even more stringent than those required ethically.The first principle is that psychologists involved in researchwith animals must adhere to the pertinent laws and regulations. This includes the means by which laboratory animals are acquired, the ways in which the animals arecared for, the ways in which the animals are used, and theway in which laboratory animals are disposed of or retiredfrom research.
Some further ethical requirements are as follows:
Psychologists both experienced and trained in researchmethods with laboratory animals should adopt asupervisory role for all work involving animals. Theirresponsibilities include consideration of the ‘comfort,health and humane treatment’ of animals under theirsupervision.
It should be ensured that all individuals using animalshave training in animal research methods and the careof animals. This should include appropriate ways oflooking after the particular species of animal in questionand the ways in which they should be handled. Thesupervising psychologist is responsible for this.
Psychologists should take appropriate action in orderthat the adverse aspects of animal research should beminimised. This includes matters such as the animals’pain, comfort, freedom from infection and illnesses.
While in some circumstances it may be ethically accept-able to expose animals to stress, pain or some form ofprivation of its bodily needs, this is subject to require-ments. There must be no alternative way of doing theresearch. Furthermore, it should be done only when itis possible to justify the procedures on the basis of its‘scientific, educational or applied value’.
Anaesthesia before and after surgery is required to minimise pain. Techniques which minimise the risk ofinfection are also required.
Should it be necessary and appropriate to terminate the animal’s life, this should be done painlessly and asquickly as possible. The accepted procedures for doingso should be employed.
One suspects that many will regard this list as inadequate.The list makes a number of assumptions – not the leastbeing that it is ethically justifiable to carry out research onanimals in certain conditions. But is this morally acceptable?Some might question whether cruelty to animals (and theunnecessary infliction of pain is cruel) is defensible in anycircumstances. Others may be concerned about the lack ofclarity in terms of when animal research is appropriate.Isn’t any research defensible on the grounds of scientificprogress? What does scientific progress mean? Is it achievedby publication in an academic psychology journal?
M08_HOWI4994_03_SE_C08.QXD 10/11/10 15:02 Page 154

CHAPTER 8 ETHICS AND DATA MANAGEMENT IN RESEARCH 155
computational or statistical error. The researcher, on spotting the error, should take reasonable efforts to correct it. Among the possibilities are corrections or retractions in the journal in question.
■ Plagiarism
Plagiarism is when the work of another person is used without acknowledgement and asif it was one’s own work. Psychologists do not plagiarise. Ethical principles hold thatmerely occasionally citing the original source is insufficient to militate against the chargeof plagiarism. So, copying chunks of other people’s work directly is inappropriate evenif they are occasionally cited during this procedure. Of course, quotations clearly identifiedas such by the use of quotation marks, attribution of authorship, and citation of thesource are normally acceptable. Even then, quotations should be kept short and withinthe limits set by publishers, for example.
■ Proper credit for publications
It is ethically inappropriate to stake a claim on work which one has not actually doneor in some way contributed to substantially. This includes claiming authorship on publications. The principal author of a publication (the first-named) should be the individual who has contributed the most to the research. Of course, sometimes such adecision will be arbitrary where contributions cannot be ranked. Being senior in termsof formal employment role should not be a reason for principal authorship. Being in charge of a research unit is no reason for being included in the list of authors. Thereare often circumstances in which an individual makes a contribution but less than asignificant one. This should be dealt with by a footnote acknowledging their contribu-tion or some similar means. Authorship is not the reward for a minor contribution ofthis sort.
It is of particular importance to note that publications based on the dissertations of students should credit the student as principal (first) author. The issue of publicationcredit should be raised with students as soon as practicable by responsible academics.
■ Publishing the same data repeatedly
When data are published for the second or more time then the publication should clearlyindicate the fact of republication. This is acceptable. It is not acceptable to repeatedlypublish the same data as if for the first time.
■ The availability of data for verification
Following the publication of the results of research, they should be available for check-ing or verification by others competent to do so. This is not carte blanche for anyone to take another person’s data for publication in some other form – that would requireagreement. It is merely a safeguard for the verification of substantive claims made by theoriginal researcher. The verifying psychologist may have to meet the costs of supplyingthe data for verification. Exceptions to this principle of verification are:
circumstances in which the participants’ confidentiality (e.g. anonymity) cannot beensured;
if the data may not be released because another party has proprietary rights over thedata which prevent their release.
M08_HOWI4994_03_SE_C08.QXD 10/11/10 15:02 Page 155

156 PART 1 THE BASICS OF RESEARCH
8.5 Obtaining the participant’s consent
It is commonplace nowadays that the researcher both provides the potential participantwith written information about the nature of the study and obtains their agreement orconsent to participation in the study. Usually these include a statement of the parti-cipant’s rights and the obligations of the researcher. The things which normally wouldgo into this sort of documentation are described separately for the information sheet/study description and the consent form. It is important that these are geared to your particular study so what follows is a list of things to consider for inclusion rather thana ready-made form to adopt.
■ The information sheet/study description
The information sheet or study description should be written in such a way that it com-municates effectively to those taking part in the study. It should therefore avoid complexlanguage and, especially, the use of jargon which will be meaningless to anyone not trainedin psychology. The following are the broad areas which should be covered in what youwrite. Some of these things might be irrelevant to your particular study:
The purpose of the study and what it aims to achieve.
What the participant will be expected to do in the study.
Indications of the likely amount of time which the participant will devote to the study.
The arrangements to deal with the confidentiality of the data.
The arrangements to deal with the privacy of any personal data stored.
The arrangements for the security of the data.
A list of who would have access to the data.
The purposes for which the data will be used.
Whether participants will be personally identifiable in publications based on the research.
Participation is entirely voluntary.
It is the participants right to withdraw themselves and the data from the study withoutgiving a reason or explanation (possibly also a statement that there will be no con-sequences of doing so such as the withdrawal of psychological services if the contextof the research requires this).
What benefits might participation in the research bring the individual and others.
Any risks or potential harm that the research might pose to those participating.
If you wish to contact the participant in future for further participation in theresearch, it is necessary to get their permission to do so at this stage. If you do not,you cannot contact them in the future under the terms of the British Data Protec-tion Act.
Give details for the research team or your supervisor if you are a student from whichthe participant can obtain further information if necessary and the contact details ofthe relevant Ethics Committee in case of issues which cannot be dealt by the researchteam or the supervisor.
M08_HOWI4994_03_SE_C08.QXD 10/11/10 15:02 Page 156

CHAPTER 8 ETHICS AND DATA MANAGEMENT IN RESEARCH 157
■ The consent formThe consent form provides an opportunity for the participants to indicate that theyunderstand the arrangements for the research and give their agreement to take part inthe research in the light of these. The typical consent form probably should cover the following points, though perhaps modified in parts:
The title of the research project.
I have been informed about and understand the nature of the study. Yes/No
Any questions that I had were answered to my satisfaction. Yes/No
I understand that I am free to withdraw myself and my data from the research at any time with no adverse consequences. Yes/No
No information about me will be published in a form which might potentially identify me. Yes/No
My data, in an anonymous form, may be used by other researchers. Yes/No
I consent to participate in the study as outlined in the information sheet. Yes/No
Space for the signature of the participant, their name in full, and the dateof the agreement.
8.6 Data management
Data management includes some issues very closely related to ethical matters; however,it is different. Ethical matters, as we have seen, are not driven primarily by legislationwhereas data management issues have a substantial basis in legislation. Data protection,in European countries, is required by legislation to cover all forms of recorded informa-tion whether it is digitally stored on a computer, for example, or in hard copy form infiling cabinets. The university or college that you study at should have a data protectionpolicy. The department that you study in is also likely to have its own policy on dataprotection. Now data protection is not mainly or substantially about data in research; itis far wider than that. Data protection covers any personal data which are held by anorganisation for whatever purpose. There are exemptions but the legislation is likely to apply to anything that you do professionally and even as a student of psychology. It covers things such as application forms, work and health records, and much more –anything which involves personal data period. So it is vital to understand data manage-ment in relation to your professional work in psychology in the future since you willalmost certainly collect information from clients and others which comes under the legislation. Research is treated positively in data protection legislation in the UK.
The good news is that data protection legislation does not apply if the personal dataare in anonymous form. Essentially this means that the data should be anonymous at thepoint of collection. This could be achieved, for example, by not asking those completinga questionnaire to give their name or address or anything like that. It might be wise toavoid other potentially identifiable information in order to be on the safe side – forexample, just ask for their year of birth rather than the precise date if the latter risksidentifying participants. All of this needs some thought. It obviously imposes some limits on what you can do – for example, you could not contact the participant to takepart in a follow-up to the study and you cannot supplement the data that you have withadditional information from other sources. But most of the time you would not want todo these things anyway.
M08_HOWI4994_03_SE_C08.QXD 10/11/10 15:02 Page 157

158 PART 1 THE BASICS OF RESEARCH
Of course, some data inevitably will allow for the identification of a research participant.Just because they are not named does not mean that they are not identifiable. For example,videoed research participants may well be identifiable and individuals with a particularjob within an organisation may also be identifiable by virtue of that fact. So it is possiblethat data protection legislation applies. It is immaterial in what form the data are stored– hard copy, digital recording media, or what-have-you: if the data are personal and theperson is identifiable then the act applies. What follows will be familiar from parts of theprevious section. Data protection requires that the researcher must give consideration tothe safe keeping of identifiable personal data. So it includes the question of which peoplehave access to the data. Probably this is all that you need to know about data protectionbut organisations will have their own data protection officers from whom you may seekadvice if necessary.
8.7 Conclusion
Research ethics cover virtually every stage of the research process. The literature review,for example, is covered by the requirements of fidelity and other stages of the processhave specific recommendations attached to them. It is in the nature of ethics that they do not simply list proscribed behaviours. Frequently they offer advice on what aspectsof research require ethical attention and the circumstances in which exceptions to thegenerally accepted standards may be considered. They impose a duty on all psychologiststo engage in consideration and consultation about the ethical standing of their researchas well as that of other members of the psychological community. Furthermore, the processdoes not end prior to the commencement of data collection but requires attention andvigilance throughout the research process since new information may indicate ethicalproblems where they had not been anticipated.
One important thing about ethics is that they require a degree of judgement in theirapplication. It is easy for students to seek rules for their research. For example, is itunethical to cause a degree of upset in the participants in your research? What if yourresearch was into experiences of bereavement? Is it wrong to interview people aboutbereavement knowing that it will distress some of them? Assume that you have carefullyexplained to participants that the interviews are about bereavement. Is it wrong then to cause them any distress in this way? What if the research was just a Friday afternoonpractical class on interviewing? Is it right to cause distress in these circumstances? Whatif it were a Friday workshop for trainee clinical psychologists on bereavement counselling?Is it any more acceptable? All of this reinforces the idea that ethics are fine judgements,not blanket prohibitions for the most part. Of course, ethics committees may take awaysome of this need for fine judgement from researchers.
The consideration of ethics is a fundamental requirement of the research process thatcannot be avoided by any psychologist – including students at any level. It starts withnot fiddling the data and not plagiarising. And what if your best friend fiddles the dataand plagiarises?
M08_HOWI4994_03_SE_C08.QXD 10/11/10 15:02 Page 158

CHAPTER 8 ETHICS AND DATA MANAGEMENT IN RESEARCH 159
Psychological associations such as the American Psychological Association and the BritishPsychological Society publish ethical guidelines to help their members behave morally in relation totheir professional work. Self-regulation of ethics is a characteristic of professions.
Ethics may be based on broad principles, but frequently advice is provided in guidelines about their specific application, for example, in the context of research. So one general ethical principle isthat of integrity, meaning accuracy, honesty and truthfulness. This principle clearly has differentimplications to the use of deception in research from those when reporting data.
Informed consent is the principle that participants in research should willingly consent to taking partin research in the light of a clear explanation by the researcher about what the research entails. Atthe same time, participants in research should feel in a position to withdraw from the research at anystage with the option of withdrawing any data that have already been provided. There are exceptionswhere informed consent is not deemed necessary – especially naturalistic observations of peoplewho might expect to be observed by someone since they are in a public place.
Deception of participants in research is regarded as problematic in modern psychology despite beingendemic in some fields, particularly social psychology. Nevertheless, there is no complete ban ondeception, only the requirements that the deception is absolutely necessary since the research isimportant and there is no effective alternative deception-free way of conducting it. The response ofparticipants during debriefing to the deception may be taken as an indicator of the risks inherent inthat deception.
The publication of research is subject to ethical constraints. The fabrication of data, plagiarism of the work of others, claiming the role of author on a publication to which one has only minimally contributed, and the full acknowledgement by first authorship of students’ research work are all covered in recent ethical guidelines.
Increasingly there are more formal constraints on researchers such as those coming from ethics committees and the increased need to obtain research participant’s formal consent. Although dataprotection legislation can apply to research data, data in an anonymous/unidentifiable form areexempt from the legislation.
Key points
ACTIVITIESAre any principles of ethical conduct violated in the following examples? What valid arguments could be made to justifywhat occurs? These are matters that could be debated. Alternatively, you could list the ethical pros and cons of eachbefore reaching a conclusion.
(a) Ken is researching memory and Dawn volunteers to be a participant in the research. Ken is very attracted to Dawn andasks for her address and mobile phone number, explaining that she may need to be contacted for a follow-up inter-view. This is a lie as no such interviews are planned. He later phones her up for a date.
(b) A research team is planning to study Internet sex offenders. They set up a bogus Internet pornography site – ‘All tastessex’. The site contains a range of links to specialised pages devoted to a specific sexual interest – bondage, maturesex, Asian women and the like. Visitors to the site who press these links see mild pornographic pictures in line withthe theme of the link. The main focus of the researchers is on child pornography users on the Internet. To this end
M08_HOWI4994_03_SE_C08.QXD 10/11/10 15:02 Page 159
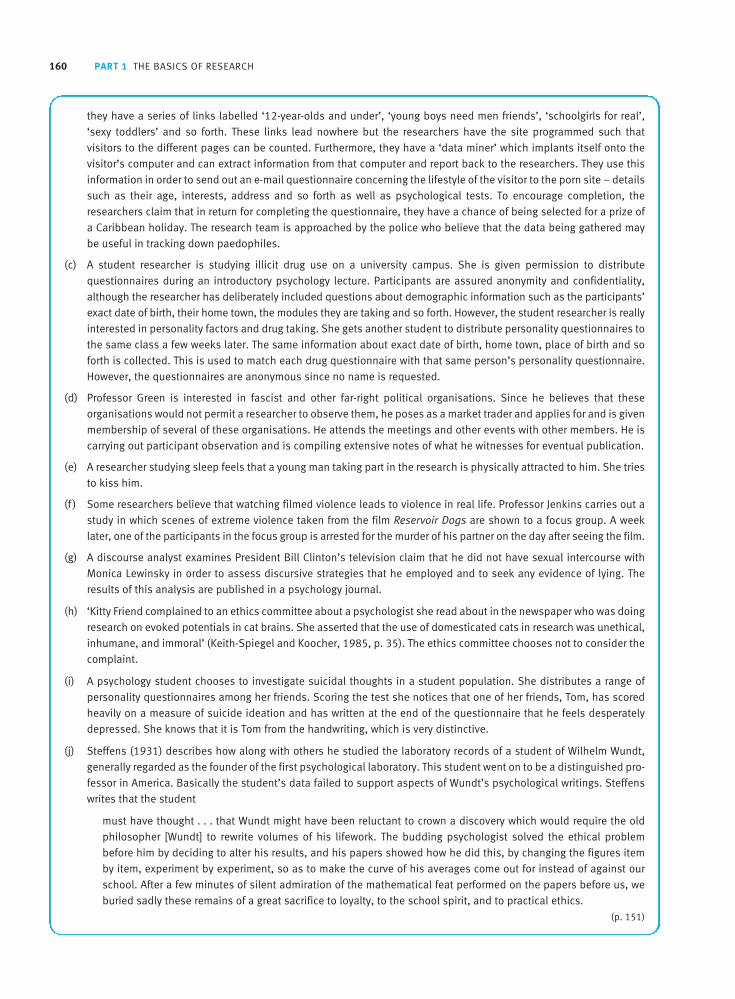
160 PART 1 THE BASICS OF RESEARCH
they have a series of links labelled ‘12-year-olds and under’, ‘young boys need men friends’, ‘schoolgirls for real’,‘sexy toddlers’ and so forth. These links lead nowhere but the researchers have the site programmed such that visitors to the different pages can be counted. Furthermore, they have a ‘data miner’ which implants itself onto thevisitor’s computer and can extract information from that computer and report back to the researchers. They use thisinformation in order to send out an e-mail questionnaire concerning the lifestyle of the visitor to the porn site – detailssuch as their age, interests, address and so forth as well as psychological tests. To encourage completion, theresearchers claim that in return for completing the questionnaire, they have a chance of being selected for a prize ofa Caribbean holiday. The research team is approached by the police who believe that the data being gathered maybe useful in tracking down paedophiles.
(c) A student researcher is studying illicit drug use on a university campus. She is given permission to distribute questionnaires during an introductory psychology lecture. Participants are assured anonymity and confidentiality,although the researcher has deliberately included questions about demographic information such as the participants’exact date of birth, their home town, the modules they are taking and so forth. However, the student researcher is reallyinterested in personality factors and drug taking. She gets another student to distribute personality questionnaires tothe same class a few weeks later. The same information about exact date of birth, home town, place of birth and soforth is collected. This is used to match each drug questionnaire with that same person’s personality questionnaire.However, the questionnaires are anonymous since no name is requested.
(d) Professor Green is interested in fascist and other far-right political organisations. Since he believes that these organisations would not permit a researcher to observe them, he poses as a market trader and applies for and is givenmembership of several of these organisations. He attends the meetings and other events with other members. He iscarrying out participant observation and is compiling extensive notes of what he witnesses for eventual publication.
(e) A researcher studying sleep feels that a young man taking part in the research is physically attracted to him. She triesto kiss him.
(f ) Some researchers believe that watching filmed violence leads to violence in real life. Professor Jenkins carries out astudy in which scenes of extreme violence taken from the film Reservoir Dogs are shown to a focus group. A weeklater, one of the participants in the focus group is arrested for the murder of his partner on the day after seeing the film.
(g) A discourse analyst examines President Bill Clinton’s television claim that he did not have sexual intercourse withMonica Lewinsky in order to assess discursive strategies that he employed and to seek any evidence of lying. Theresults of this analysis are published in a psychology journal.
(h) ‘Kitty Friend complained to an ethics committee about a psychologist she read about in the newspaper who was doingresearch on evoked potentials in cat brains. She asserted that the use of domesticated cats in research was unethical,inhumane, and immoral’ (Keith-Spiegel and Koocher, 1985, p. 35). The ethics committee chooses not to consider thecomplaint.
(i) A psychology student chooses to investigate suicidal thoughts in a student population. She distributes a range of personality questionnaires among her friends. Scoring the test she notices that one of her friends, Tom, has scoredheavily on a measure of suicide ideation and has written at the end of the questionnaire that he feels desperatelydepressed. She knows that it is Tom from the handwriting, which is very distinctive.
(j) Steffens (1931) describes how along with others he studied the laboratory records of a student of Wilhelm Wundt,generally regarded as the founder of the first psychological laboratory. This student went on to be a distinguished pro-fessor in America. Basically the student’s data failed to support aspects of Wundt’s psychological writings. Steffenswrites that the student
must have thought . . . that Wundt might have been reluctant to crown a discovery which would require the oldphilosopher [Wundt] to rewrite volumes of his lifework. The budding psychologist solved the ethical problembefore him by deciding to alter his results, and his papers showed how he did this, by changing the figures itemby item, experiment by experiment, so as to make the curve of his averages come out for instead of against ourschool. After a few minutes of silent admiration of the mathematical feat performed on the papers before us, weburied sadly these remains of a great sacrifice to loyalty, to the school spirit, and to practical ethics.
(p. 151)
M08_HOWI4994_03_SE_C08.QXD 10/11/10 15:02 Page 160

Quantitative researchmethods
PART 2
M09_HOWI4994_03_SE_C09.QXD 10/11/10 15:02 Page 161

M09_HOWI4994_03_SE_C09.QXD 10/11/10 15:02 Page 162
The basic laboratoryexperiment
Overview
CHAPTER 9
The laboratory experiment has a key role in psychological research in that it allows theinvestigation of causal relationships between variables. In other words, it identifieswhether one variable affects another in a cause and effect sequence.
Essentially an experiment involves systematically varying the level of the variable thatis thought to be causal then measuring the effect of this variation on the measuredvariable while holding all other variables constant.
The simplest experimental design used by psychologists consists of two conditions.One condition has a higher level of the manipulated variable than the other condition.The former condition is sometimes known as the experimental condition while thecondition having the lower level is known as the control condition. The two experimentalconditions may also be referred to as the independent variable. The researcher assesseswhether the scores on the measured variable differ between the two conditions. Themeasured variable is often referred to as the dependent variable.
If the size of the effect differs significantly between the two conditions and all variablesother than the manipulated variable have been held constant, then this difference ismost likely due to the manipulated variable.
There are a number of ways by which the researcher tries to hold all of the variablesconstant other than the independent and dependent variables. These include: randomlyassigning participants to the different conditions (which ensures equality in the longrun), carrying out the study in the controlled setting of a laboratory where hopefullyother factors are constant, and making the conditions as similar as possible for allparticipants except as far as they are in the experimental or control condition.
M09_HOWI4994_03_SE_C09.QXD 10/11/10 15:02 Page 163

164 PART 2 QUANTITATIVE RESEARCH METHODS
In between-subjects designs participants are randomly assigned to just one of theconditions of the study. In within-subjects designs the same participants carry out all conditions. Rather than being randomly assigned to just one condition, they arerandomly assigned to the different orders in which the conditions are to be run.
Random assignment of participants only guarantees that in the long run the participantsin all conditions start off similar in all regards. For any individual study, random assign-ment cannot ensure equality. Consequently, some experimental designs use a priormeasure of the dependent variable (the measured variable) which can be used toassess how effective the random assignment has been. The experimental and controlgroups should have similar (ideally identical) mean scores on this pre-measure. Thisprior measure is known as a pre-test while the measurement after the experimentalmanipulation is known as a post-test. The difference between the pre-test and post-testprovides an indication of the change in the measured variable.
A number of disadvantages of the basic laboratory experiment should be recognised.The artificiality of the laboratory experiment is obvious so it is always possible thatthe experimental manipulation and the setting fail to reflect what happens in morenatural or realistic research settings. Furthermore, the number of variables that canbe manipulated in a single experiment is limited, which can be frustrating when oneis studying a complex psychological process.
9.1 Introduction
When used appropriately, the randomised laboratory experiment is one of the mostpowerful tools available to researchers. This does not mean that it is always or evenoften the ideal research method. It simply means that the laboratory is an appropriateenvironment for studying many psychological processes – particularly physiological,sensory or cognitive processes. The use of the laboratory to study social processes, for example, is not greeted with universal enthusiasm. Nevertheless, many studies in psychology take place in a research laboratory using true or randomised experimentaldesigns. Any psychologist, even if they never carry out a laboratory experiment in theirprofessional career, needs to understand the basics of laboratory research. Otherwise agreat deal of psychological research will pass over their heads.
It is essential to be able to differentiate between two major sorts of research designs(see Figure 9.1):
Experiments in which different participants take part in different conditions are knownvariously as between-subjects, between-participants, independent-groups, unrelated-groups or uncorrelated-groups designs. A diagram of a simple between-subjects designwith only two conditions is shown in Figure 9.2a.
Designs in which the same participants take part in all (or sometimes some) of the various conditions are called within-subjects, within-participants, repeated-measures,dependent-groups, related-groups or correlated-groups designs. A diagram of a simplewithin-subjects design with only two conditions is presented in Figure 9.2b.
An example of a between-subjects design would be a study that compared the numberof errors made entering data into a computer spreadsheet for a sample of people listening
M09_HOWI4994_03_SE_C09.QXD 10/11/10 15:02 Page 164

CHAPTER 9 THE BASIC LABORATORY EXPERIMENT 165
to loud popular music with the number of errors made by a different control sample listening to white noise at the same volume. That is to say, two different groups of peopleare compared. An example of a within-subjects design would be a study of the numberof keyboard errors made by a group of 20 secretaries, comparing the number of errorswhen music is being played with when music is not being played. That is to say, the per-formance of one group of people is compared in two different circumstances.
One of the reasons why it is important to distinguish between these two broad typesof design is that they use rather different methods of analysis. For example, they use different statistical tests. The first design which uses different groups of participants for each condition would require an unrelated statistical test (such as the unrelated oruncorrelated t-test). The latter design in which the same group of participants take partin every condition of the experiment would require a related statistical test (such as therelated or correlated t-test).
Although it is perfectly feasible to do experiments in a wide variety of settings, a custom-designed research laboratory is usually preferred. There are two main reasonsfor using a research laboratory:
Practicalities A study may require the use of equipment or apparatus that may betoo bulky or too heavy to move elsewhere, or needs to be kept secure because it maybe expensive or inconvenient to replace.
FIGURE 9.1 The two major types of experimental design and the various names given to each
M09_HOWI4994_03_SE_C09.QXD 10/11/10 15:02 Page 165

166 PART 2 QUANTITATIVE RESEARCH METHODS
Experimental control In an experiment it is important to try to keep all factors constant other than the variable or variables that are manipulated. This is obviouslyeasier to do in a room or laboratory that is custom designed for the task and in which all participants take part in the study. The lighting, the temperature, the noiseand the arrangement of any equipment can all be kept constant. In addition, other distractions such as people walking through or talking can be excluded. You will oftenfind great detail about the physical set up of the laboratory where the research wasdone in some reports of laboratory experiments.
The importance of holding these extraneous or environmental factors constant dependson how strong the effect of the manipulated variable is on the measured variable.Unfortunately, the researcher is unlikely to know in advance what their effect is in somecases. To the extent that the extraneous variable seems not to, or has been shown notto, influence the key variables in the research, one may consider moving the research to a more appropriate or convenient research location. For example, if you are carryingout a study in a school, then it is unlikely that that school will have a purpose-built psychology laboratory for you to use. You may find yourself in a small room which isnormally used for other purposes. If it is important that you control the kind or the levelof the noise in the room, then you could be able to do this by playing what is called‘white noise’ through earphones worn by each participant. If it is essential that the studytakes place in a more carefully controlled setting, then the pupils will need to come toyour laboratory. The essential point to realise is that the setting of the study may be lesscritical than its design.
FIGURE 9.2(a) Between-subjects designs with two conditions; (b) within-subjects designwith two conditions
M09_HOWI4994_03_SE_C09.QXD 10/11/10 15:02 Page 166

CHAPTER 9 THE BASIC LABORATORY EXPERIMENT 167
It should be stressed that while researchers may aim for perfection, most research isto a degree a compromise between a number of considerations. The perfect researchstudy has probably never been designed and is probably an oxymoron – that should notstop you trying for the best possible, but it should be remembered when your researchseems not to be able to reach the highest standard.
Because of the important role it plays in psychological research, we introduced theconcept of a true experiment in Chapter 1 on the role and nature of research in psychology.As we saw, studies employing a true or randomised experimental design were the mostcommon kind of study published in a random selection of psychology journals in 1999(Bodner, 2006). They constituted 41 per cent of all the studies sampled in that year. The proportion of studies using a true or randomised experimental design was higher in areas such as learning, perception, cognition and memory, which have traditionallybeen called experimental psychology because of the use of this design.
9.2 Characteristics of the true or randomised experiment
The most basic laboratory experiment is easily demonstrated. Decide on an experimentaland control group and allocate participants to one or other on the basis of a coin toss.Put the experimental group through a slightly different procedure from that of the control group. This is known as the experimental manipulation and corresponds to avariable which the researcher believes might affect responses on another variable calledthe dependent variable. After the data have been collected, the researcher examines theaverage score for the two conditions to see whether or not there is a substantial differencebetween them. For many purposes, such a simple design will work well.
In order to be able to run experiments satisfactorily one needs to understand the three essential characteristics of the true or randomised experiment – and more (seeFigure 9.3):
Experimental manipulation.
Standardisation of procedures – that is the control of all variables other than the independent variable.
Random assignment to conditions or order.
We will consider each of these in turn.
■ Experimental manipulation
Only the variable that is assumed to cause or affect another variable is manipulated (varied). This manipulated variable is often referred to as the independent variable becauseit is assumed to be varied independently of any other variable. If it is not manipulatedindependently, then any effect that we observe may be due to those other variables. An example of an independent variable is alcohol. If we think that alcohol increases thenumber of mistakes we make and we are interested in seeing whether this is the case,alcohol (or more strictly speaking, the level or amount of alcohol) is the independentvariable which we manipulate. The variable that is presumed to be affected by the independent or manipulated variable is called the dependent variable because it is thoughtto be dependent on the independent variable. It is the variable that we measure. In thisexample, the dependent variable is the number of mistakes made in a task such as walkingalong a straight line.
M09_HOWI4994_03_SE_C09.QXD 10/11/10 15:02 Page 167

168 PART 2 QUANTITATIVE RESEARCH METHODS
In the most basic true or randomised experiment, we would only have two conditions(also known as levels of treatment or groups). In one condition, a lower amount of alcohol would be given to the participant while in the other condition the participantreceives a higher level of alcohol. The amount of alcohol given would be standard for all participants in a condition. So, in condition 1 the amount might be standardised as 8 millilitres (ml). This is about the amount of alcohol in a glass of wine. In the second condition the amount may be doubled to 16 ml. If the size of the effect variesdirectly with the amount of alcohol given, then the more the two groups differ the bigger the effect.
Why did we choose to give both groups alcohol? After all, we could have given theexperimental group alcohol but the control group no alcohol at all. Both groups aregiven alcohol in the hope that by doing so participants in both groups are aware thatthey have consumed alcohol. Participants receiving alcohol probably realise that theyhave been given alcohol. Unless the quantity of alcohol was very small, participants are likely to detect it. So two things have happened – they have been given alcohol and they are also aware that they have been given alcohol. However, if one group receivedno alcohol then, unless we deliberately misled them, members of this group will notbelieve that they have taken alcohol. So we would not know whether the alcohol or the
FIGURE 9.3 Essential features in a simple experimental design summarised
M09_HOWI4994_03_SE_C09.QXD 10/11/10 15:02 Page 168

CHAPTER 9 THE BASIC LABORATORY EXPERIMENT 169
belief that they had been given alcohol was the key causal variable. Since the effects ofalcohol are well known, participants believing that they have taken alcohol may behaveaccordingly. By giving both groups alcohol, both groups will believe that they havetaken alcohol. The only thing that varies is the key variable of the amount of alcoholtaken. In good experimental research the effectiveness of the experimental manipulationis often evaluated. This is discussed in Box 9.1. In this case, participants in the experimentmight be asked about whether or not they believed that they had taken alcohol in adebriefing interview at the end of the study.
The condition having the lower quantity of alcohol is referred to as the control condition. The condition having the higher quantity of alcohol may be called the experimental condition. The purpose of the control condition is to see how participantsbehave when they receive less of the variable that is being manipulated.
Checks on the experimental manipulation
Box 9.1 Key Ideas
It can be a grave mistake to assume that simply because an experimental manipulation has been introduced by the researcher that the independent variable has actuallybeen effectively manipulated. It might be argued that if the researcher finds a difference between the experimentaland control conditions on the dependent variable that the manipulation must have been effective. Things are notthat simple.
Assume that we are investigating the effects of anger on memory. In order to manipulate anger, the researcherdeliberately says certain pre-scripted offensive commentsto the participants in the experimental group whereas nicethings are said to the participants in the control group. It is very presumptuous to assume that this procedure willwork effectively without subjecting it to some test.
For example, the participants might well in some circumstances regard the offensive comments as a jokerather than an insult so the manipulation may make themhappier rather than angrier. Alternatively, the control may find the nice comments of the experimenter to bepatronising and become somewhat annoyed or angry as aconsequence. So there is a degree of uncertainty whetheror not the experimental manipulation has actually worked.One relatively simple thing to do in this case would be to get participants to complete a questionnaire about theirmood containing a variety of emotions, such as angry,happy and sad, which the participant rates in terms oftheir own feelings. In this way it would be possible toassess whether the experimental group was indeed angrierthan the control group following the anger manipulation.
Alternatively, at the debriefing session following par-ticipation in the experiment, the participants could beasked about how they felt after the experimenter said theoffensive or nice things. This check would also demon-strate that the manipulation had had a measurable effecton the participants’ anger levels.
Sometimes it is appropriate, as part of pilot work trying out one’s procedures prior to the study proper, toestablish the effectiveness of the experimental manipula-tion as a distinct step in its own right. Researchers need tobe careful not to assume that simply because they obtainstatistically significant differences between the experimentaland control conditions that this is evidence of the effective-ness of their experimental manipulation. If the experimentalmanipulation has had an effect on the participants but notthe one intended, it is vital that the researcher knows this.Otherwise, the conceptual basis for their analysis may beinappropriate. For example, they may be discussing theeffects of anger when they should be discussing the effectsof happiness.
In our experience, checks on the experimental mani-pulation are relatively rare in published research and are, probably, even rarer in student research. Yet suchchecks would seem to be essential. As we have seen, thedebriefing session can be an ideal opportunity to interviewparticipants about this aspect of the study along with itsother features. The most thorough researchers may alsoconsider a more objective demonstration of the effective-ness of the manipulation as above when the participants’mood was assessed.
M09_HOWI4994_03_SE_C09.QXD 10/11/10 15:02 Page 169

170 PART 2 QUANTITATIVE RESEARCH METHODS
In theory, if not always in practice, the experimental and control conditions shouldbe identical in every way but for the variable being manipulated. It is easy to overlookdifferences. So, in our alcohol experiment participants in both groups should be giventhe same quantity of liquid to drink. But it is easy to overlook this if the low alcoholgroup are, say, given one glass of wine and the high alcohol group two glasses of wine.If the participants in the control condition are not given the same amount to drink, thenalcohol is not being manipulated independently of all other factors. Participants in theexperimental condition would have been given more to drink while participants in the control condition would have been given less to drink. If we find that reaction timewas slower in the experimental condition than in the control condition, then we couldnot be certain whether this difference was due to the alcohol or the amount of liquiddrunk. This may seem very pernickety in this case but dehydration through having lessliquid may have an effect on behaviour. The point of the laboratory experiment is thatwe try to control as many factors as possible but, as we have seen, this is not as easy asit sounds. Of course, variations in the volume of liquid drunk could be introduced intothe research design in order to discover what the effect of varying volume is on errors.
■ Standardisation of proceduresA second essential characteristic of the true experiment is implicit in the previous characteristic. That is, all factors should be held constant apart from the variable(s)being investigated. This is largely achieved by standardising all aspects of the proceduresemployed. Only the experimental manipulation should vary. We have already seen theimportance of this form of control when we stressed in our alcohol study that the twoconditions should be identical apart from the amount of alcohol taken. So participantsin both conditions were made aware that they will be given alcohol and that they aregiven the same amount of liquid to drink.
There are other factors which we should try to hold constant which are not so obvious.The time of day the study is carried out, the body weight of the participants, the amountof time that has lapsed since they have last eaten and so forth are all good examples of this.Such standardisation is not always easy to achieve. For example, what about variationsin the behaviour of the experimenter during an experiment? If the experimenter’sbehaviour differs systematically between the two groups then experimenter behaviourand the effects of the independent variable will be confounded. We may confuse the variability in the behaviour of the experimenter with the effects of different quantities ofalcohol. There have been experiments in which the procedure is automated so that thereis no experimenter present in the laboratory. For example, tape-recorded instructions to the participants are played through loudspeakers in the laboratory. In this way, theinstructions can be presented identically in every case and variations in the experimenter’sbehaviour eliminated.
Standardisation of procedures is easier said than done but remains an ideal in the laboratory experiment. It is usual for details such as the instructions to participants to be written out as a guide for the experimenter when running the experiment. One of the difficulties is that standardisation has to be considered in relation to the tasks being carried out by participants, so it is impossible to give advice that would apply inevery case. Because of the difficulty in standardising all aspects of the experiment, it isdesirable to randomly order the running of the experimental and control conditions. For example, we know that cognitive functions vary according to the time of day. It is very difficult to standardise the time of day that an experiment is run. Hence it isdesirable to decide randomly which condition the participant who arrives at 2.30 p.m.will be in, which condition the participant who arrives next will be in, and so forth. Inthis way there will be no systematic bias for one of the conditions of the experiment tobe run at different times of the day from the other conditions.
M09_HOWI4994_03_SE_C09.QXD 10/11/10 15:02 Page 170

CHAPTER 9 THE BASIC LABORATORY EXPERIMENT 171
■ Random assignmentRandom assignment is the third essential feature of an experiment. There are two mainprocedures according to the type of experimental design:
Participants are put in the experimental or control condition at random using aproper randomisation procedure (which may be simply the toss of a coin – heads theexperimental group, tails the control group). There are other methods of randomisationas we will see. Random assignment to conditions is used when the participants onlytake part in one condition.
Alternatively, if participants undertake more than one condition (in the simplest caseboth the experimental and control conditions), then they are randomly assigned to thedifferent orders of those two conditions. With just two conditions there are just twopossible orders – experimental condition first followed by control condition second,or control condition first followed by experimental condition second. Of course, withthree or more conditions there is a rapidly increasing numbers of possible orders.
It is easy to get confused about the term ‘random’. Random assignment requires the useof a proper random procedure. This is not the same thing at all as a haphazard or casualchoice. By random we mean that each possible outcome has an equal chance of beingselected. We do not want a selection process which systematically favours one outcomerather than another. (For example, the toss of a coin is normally a random process butit would not be if the coin had been doctored in some way so that it lands heads up mostof the time.) There are a number of random procedures which may be employed. Wehave already mentioned the toss of a coin but will include it in the list of possibilitiesagain as it is a good and simple procedure:
With two conditions or orders you can toss a coin where the participant will beassigned to one of them if the coin lands ‘heads’ up and to the other if it lands ‘tails’ up.
Similarly, especially if there are more than two conditions, you could throw a die.
You could write the two conditions or orders on two separate index cards or slips ofpaper, shuffle them without seeing them and select one of them.
You could use random number tables where, say, even numbers represent one conditionor order and odd numbers represent the other one.
Sometimes a computer can be used to generate a sequence of random numbers. Againyou could use an odd number for the experimental group and an even number forallocating the participant to the control group (or vice versa).
One can either go through one of these randomisation procedures for each successiveparticipant or you can draw up a list in advance for the entire experiment. However,there are two things that you need to consider:
You may find that you have ‘runs’ of the same condition such as six participants insequence all of which are in, say, the control group. If you get runs like this you mayfind, for example, that you are testing one condition more often at a particular timeof day. That is, despite the randomisation, the two conditions are not similar in allrespects. For example, these six participants may all be tested in the morning ratherthan spread throughout the day.
Alternatively, you may also find that the number of participants in the two conditionsor orders is very different. There is even a remote possibility that all your participantsare assigned to one condition or order.
M09_HOWI4994_03_SE_C09.QXD 10/11/10 15:02 Page 171

172 PART 2 QUANTITATIVE RESEARCH METHODS
Randomisation only equates things in the long run. In the short run, it merely guaranteesthat there is no systematic bias in the selection. In the short term, chance factors maynevertheless lead to differences between the conditions.
There is no need to go into technical details, but if it is possible to have equal numbersin each condition of an experimental design then you should try to do so. Most statisticaltests work optimally in these circumstances. If equal numbers are impossible then so be it. However, there are ways in which one can ensure that there are equal numbers of participants in each condition. For example, one can employ matched or block randomisation. That is, the first participant of every pair of participants is assigned atrandom using a specified procedure while the second participant is assigned to the remain-ing condition or order. So, if the first participant has been randomly assigned to the control condition, the second participant will be allocated to the experimental condition.If you do this, you will end up with equal numbers of participants in the two conditionsor orders if you have an equal number of participants. Box 9.2 discusses how you canpair off participants to ensure that the different groups have similar characteristics.
In the between-subjects design (in which participants serve in just one condition of the experiment), any differences between the participants are usually controlled by random assignment. The prime purpose of this is to avoid systematic biases in the allocation of participants to one or other condition. If the experimenter merely decidedon the spot which group a participant should be in then all sorts of ‘subconscious’ factors may influence this choice and perhaps influence the outcome of the experimentas a consequence. For example, without randomisation it is possible that the researcherallocates males to the experimental group and females to the control group – and doesnot even notice what they have done. If there is a gender difference on the dependentvariable, the results of the experiment may confuse the experimental effect with the biasin participant selection.
Matching
Box 9.2 Key Ideas
One way of ensuring that the participants in the experi-mental and control group are similar on variables whichmight be expected to affect the outcome of the study is touse matching. Participants in an experiment will vary inmany ways so there may be occasions when you want toensure that there is a degree of consistency. For instance,some participants may be older than others unless weensure that they are all the same age. However, it is difficult,if not impossible, to control for all possible individual differences. For example, some participants may have hadless sleep than others the night before or gone withoutbreakfast. Some might have more familiarity with the typeof task to be carried out than others and so on.
We could try to hold all these factors constant by making sure, for example, that all participants were female,aged 18, weighed 12 stone (76 kilograms), had slept
7 hours the night before and so on. But this is far fromeasy. It is generally much more practicable to use randomassignment. To simplify this illustration, we will think of all these variables as being dichotomous or only having two categories such as female/male, older/younger,heavier/lighter and so on. If you look at Table 9.1, youwill see that we have arranged our participants in orderand that they fall into sets of individuals who have thesame pattern of characteristics on these three variables.For example, the first three individuals are all female,older and heavier. This is a matched set of individuals. Wecould choose one of these three at random to be in theexperimental condition and another at random to be inthe control condition. The third individual would not bematched with anyone else so they cannot be used in ourmatched study in this case. We could then move on to the
M09_HOWI4994_03_SE_C09.QXD 10/11/10 15:02 Page 172

CHAPTER 9 THE BASIC LABORATORY EXPERIMENT 173
next set of matched participants and select one of them atrandom for the experimental condition and a second forthe control condition.
You might like to try this with the rest of the cases inTable 9.1 which consists of information about the gender, the age and the weight of 24 people who we are going torandomly assign to two groups.
Matching is a useful tool in some circumstances. Thereare a few things that have to be remembered if you usematching as part of your research design:
The appropriate statistical tests are those for relateddata. So a test like the related t-test or the Wilcoxonmatched pairs test would be appropriate.
Variables which correlate with both the independentand dependent variables are needed for the matchingvariables. If a variable is unrelated to either one or bothof the independent or dependent variables then there is no point in using it as a matching variable. It couldmake no difference to the outcome of the study.
The most appropriate variable to match on is mostprobably the dependent variable measured at the start of the study. This is not unrelated to the idea of pre-testing though in pre-testing participants havealready been allocated to the experimental and controlconditions. But pre-testing, you’ve guessed it, also hasits problems.
Table 9.1 Gender, age and weight details for 24 participants
Number Gender Age Weight
1 female older heavier
2 female older heavier
3 female older heavier
4 female older lighter
5 female older lighter
6 female older lighter
7 female younger heavier
8 female younger heavier
9 female younger heavier
10 female younger lighter
11 female younger lighter
12 female younger lighter
13 male older heavier
14 male older heavier
15 male older heavier
16 male older lighter
17 male older lighter
18 male older lighter
19 male younger heavier
20 male younger heavier
21 male younger heavier
22 male younger lighter
23 male younger lighter
24 male younger lighter
M09_HOWI4994_03_SE_C09.QXD 10/11/10 15:02 Page 173

174 PART 2 QUANTITATIVE RESEARCH METHODS
9.3 More advanced research designs
We have stressed that there is no such thing as a perfect research design that can be used irrespective of the research question and circumstances. If there were such a thingthen not only would this book be rather short but research would probably rank in thetop three most boring jobs in the world. Research is intellectually challenging because it is problematic. The best research that any of us can do is probably a balance betweena wide range of different considerations. In this chapter we are essentially looking at the simplest laboratory experiment in which we have a single independent variable. But even this basic experimental design gathers levels of complexity as we try to plug theholes in the simple design. The simplest design, as we are beginning to see, has problems.One of these problems is that if a single study is to be relied on, then the more that we can be certain that the experimental and control conditions are similar prior to theexperimental manipulation the better. The answer is obvious: assess the two groupsprior to the experimental manipulation to see whether they are similar on the dependentvariable. This is a good move but, as we will see, it brings with it further problems to solve.It should be stressed that none of what you are about to read reduces the importance ofusing random allocation procedures for participants in experimental studies.
■ Pre-test and post-test sensitisation effectsThe pre-test is a way of checking whether random assignment has, in fact, equated theexperimental and control groups prior to the experimental manipulation. It is crucialthat the two groups are similar on the dependent variable prior to the experimentalmanipulation. Otherwise it is not possible to know whether the differences following theexperimental manipulation are due to the experimental manipulation or to pre-existingdifferences between the groups on the dependent variable.
The number of mistakes is the dependent variable in our alcohol-effects example. Ifmembers of one group make more mistakes than do members of the other group beforedrinking alcohol, then they are likely to make more mistakes after drinking alcohol. Forexample, if the participants in the 8 ml alcohol condition have a tendency to make moreerrors regardless of whether or not they have had any alcohol, then they may make moremistakes after drinking 8 ml of alcohol than the participants who have drunk 16 ml.
This situation is illustrated in Figure 9.4. In this graph the vertical axis represents thenumber of mistakes made. On the horizontal axis are two marks which indicate participants’performance before drinking alcohol and after drinking alcohol. The measurement of theparticipants’ performance before receiving the manipulation is usually called the pre-test
FIGURE 9.4 Performance differences before the manipulation
M09_HOWI4994_03_SE_C09.QXD 10/11/10 15:02 Page 174

CHAPTER 9 THE BASIC LABORATORY EXPERIMENT 175
and the measurement after receiving the manipulation the post-test. The results of thepost-test are usually placed after those of the pre-test in graphs and tables as time is usuallydepicted as travelling from left to right.
Without the pre-test measure, there is only the measure of performance after drinkingalcohol. Just looking at these post-test measures, people who drank 8 ml of alcohol mademore mistakes than those who drank 16 ml. In other words drinking more alcohol seems to have resulted in making fewer mistakes (and not more mistakes as we mighthave anticipated). This interpretation is incorrect since, by chance, random assignmentto conditions resulted in the participants in the 8 ml condition being those who tend tomake more mistakes. Without the pre-test we cannot know this, however.
It is clearer to see what is going on if we calculate the difference between the number of mistakes made at pre-test and at post-test (simply by subtracting one fromthe other). Now it can be seen that the increase in the number of mistakes was greaterfor the 16 ml condition (12 − 4 = 8) than for the 8 ml condition (14 − 10 = 4). In otherwords, the increase in the number of mistakes made was greater for those drinking more alcohol.
We can illustrate the situation summarised in Figure 9.4 with the fictitious raw datain Table 9.2 where there are three participants in each of the two conditions. Each participant is represented by the letter P with a subscript from 1 to 6 to indicate the six different participants. There are two scores for each participant – the first for the pre-test and the second for the post-test. These data could be analysed in a number of different ways. Among the better of these would be the mixed-design analysis of variance. This statistical test is described in some introductory statistics texts such as thecompanion book Introduction to Statistics in Psychology (Howitt and Cramer, 2011a).However, this requires more than a basic level of statistical sophistication. Essentially,though, you would be looking for an interaction effect. A simpler way of analysing thesame data would be to compare the differences between the pre-test and post-test measuresfor the two conditions. An unrelated t-test would be suitable for this.
Experimental designs which include a pre-test are referred to as a pre-test–post-testdesign while those without a pre-test are called a post-test-only design. There are two mainadvantages of having a pre-test:
As we have already seen, it enables us to determine whether randomisation hasworked.
Table 9.2 Fictitious data for a pre-test–post-test two-group design
Pre-test Post-test
Condition 1 P1 9 13
P2 10 15
P3 11 14
Sum 30 42
Mean 30/3 == 10 42/3 == 14
Condition 2 P4 3 12
P5 4 11
P6 5 13
Sum 12 36
Mean 12/3 == 4 36/3 == 12
M09_HOWI4994_03_SE_C09.QXD 10/11/10 15:02 Page 175

176 PART 2 QUANTITATIVE RESEARCH METHODS
It allows us to determine whether or not there has been a change in performancebetween pre-test and post-test. If we just have the post-test scores, we cannot tellwhether there has been a change in those scores and what that change is. For example,the post-test scores may show a decline from the pre-test. Without the pre-test, wemay suggest incorrectly that the independent variable is increasing the scores on thedependent variable.
Look at the data shown in the graph in Figure 9.5. Concentrate on the post-test scores and ignore the pre-test. That is, pretend that we have a post-test-only design forthe moment. Participants who had drunk 16 ml of alcohol made more errors than thosewho had drunk 8 ml. From these results we may conclude that drinking more alcoholincreases the number of mistakes made. If the pre-test number of errors made were as shown in Figure 9.5, this interpretation would be incorrect. If we know the pre-testscores we can see that drinking 16 ml of alcohol decreased the number of errors made(10 − 14 = −4) while drinking 8 ml of alcohol had no effect on the number of errors (6 − 6 = 0). Having a pre-test enables us to determine whether or not randomisation has been successful and what, if any, was the change in the scores. (Indeed, we are not being precise if we talk of the conditions in a post-test-only study as increasing ordecreasing scores on the dependent variable. All that we can legitimately say is that thereis a difference between the conditions.)
Whatever their advantages, pre-tests have disadvantages. One common criticism ofpre-test designs is that they may alert participants as to the purpose of the experimentand consequently influence their behaviour. That is, the pre-test affects or sensitises participants in terms of their behaviour on the post-test (Lana, 1969; Solomon, 1949;Wilson and Putnam, 1982). Again we might extend our basic research design to take this into account. We need to add to our basic design groups which undergo the pre-testand other groups which do not. Solomon (1949) called this a four-group design since ata minimum there will be two groups (an experimental and control group) that include apre-test and two further groups that do not have a pre-test as shown in Figure 9.6.
One way of analysing the results of this more sophisticated design is to tabulate the data as illustrated in Table 9.3. This contains fictitious post-test scores for three participants in each of the four conditions. The pre-test scores are not given in Table 9.3.Each participant is represented by the letter P with a subscript consisting of a numberranging from 1 to 12 to denote there are 12 participants.
The analysis of these data involves combining the data over the two conditions. Thatis, we have a group of six cases which had a pre-test and another group of six caseswhich did not have the pre-test. The mean score of the group which had a pre-test is 8 whereas the mean score of the group which had no pre-test is 2. In other words we areignoring the effect of the two conditions at this stage. We have a pre-test sensitisation effect
FIGURE 9.5 Change in performance between pre-test and post-test
M09_HOWI4994_03_SE_C09.QXD 10/11/10 15:02 Page 176

CHAPTER 9 THE BASIC LABORATORY EXPERIMENT 177
if the means for these two (combined) conditions differ significantly. In our example, theremay be a pre-test sensitisation effect since the mean score of the combined two conditionswith the pre-test is 8 which is higher than the mean score of 2 for the two conditionswithout the pre-test combined. If this difference is statistically significant we have a pre-testsensitisation effect. (The difference in the two means could be tested using an unrelatedt-test. Alternatively, one could use a two-way analysis of variance. In this case we wouldlook for a pre-test–no pre-test main effect.)
Of course, it is possible that the pre-test sensitisation effect is different for the experimental and control conditions (conditions 1 and 2):
For condition 1 we can see in Table 9.3 that the difference in the mean score for thegroup with the pre-test and the group without the pre-test is 5 − 1 = 4.
FIGURE 9.6 Solomon’s (1949) four-group design
Table 9.3 Fictitious post-test scores for a Solomon four-group design
Had pre-test Had no pre-test Row means
Condition 1 P1 = 4 P7 = 0
P2 = 5 P8 = 1
P3 = 6 P9 = 2
Sum 15 3 18
Mean 15/3 = 5 3/3 = 1 18/6 = 3
Condition 2 P4 = 10 P10 = 2
P5 = 11 P11 = 3
P6 = 12 P12 = 4
Sum 33 9 42
Mean 33/3 = 11 9/3 = 3 42/6 = 7
Column sums 48 12
Column means 48/6 = 8 12/6 = 2
M09_HOWI4994_03_SE_C09.QXD 10/11/10 15:02 Page 177

178 PART 2 QUANTITATIVE RESEARCH METHODS
For condition 2 we can see that the difference in the mean score for the group withthe pre-test and the group without the pre-test is 11 − 3 = 8.
In other words, the mean scores of the two conditions with the pre-test and the two conditions without the pre-test appear to depend on, or interact with, the conditionin question. The effect of pre-test sensitisation is greater for condition 1 than for condition 2. The difference between the two in our example is quite small, however. This differential effect of the pre-test according to the condition in question would be termeda pre-test/condition interaction effect. (We could test for such an interaction effect using atwo-way analysis of variance. How to do this is described in some introductory statisticstexts such as the companion volume Introduction to Statistics in Psychology, Howitt andCramer, 2011a. If the interaction between the pre-test and the experimental condition is statistically significant, we have a pre-test sensitisation interaction effect.)
If you are beginning to lose the plot in a sea of numbers and tables, perhaps the follow-ing will help. Pre-test sensitisation simply means that participants who are pre-tested onthe dependent variable tend to have different scores on the post-test from the participantswho were not pre-tested. There are many reasons for this. For example, the pre-test maysimply coach the participants in the task in question. However, the pre-test/conditioninteraction means that the effect of pre-testing is different for the experimental and thecontrol conditions. Again there may be many reasons why the effects of pre-testing willdiffer for the experimental group. For example, participants in the experimental groupmay have many more clues as to what the experimenter is expecting to happen. As a consequence, they may change their behaviour more in the experimental condition thanin the control condition.
Pre-test sensitisation in itself may not be a problem whereas if it interacts with thecondition to produce different outcomes it is problematic:
A pre-test sensitisation interaction effect causes problems in interpreting the results of a study. We simply do not know with certainty if the effect is different in the different conditions. Further investigation would be needed to shed additional lighton the matter. If we are interested in understanding this differential effect we need toinvestigate it further to find out why it has occurred.
A pre-test sensitisation effect without a pre-test sensitisation interaction effect wouldnot be a problem if we are simply interested in the relative effect of an independentvariable and not its absolute effect. For example, it would not be a problem if we just wanted to know whether drinking a greater amount of alcohol leads to makingmore errors than drinking a smaller amount. The size of the difference would be similar with a pre-test to without one. On the other hand, we might be interested in the absolute number of errors made by drinking alcohol. For example, we may want to recommend the maximum amount of alcohol that can be taken withoutaffecting performance as a driver. In these circumstances it is important to knowabout pre-test sensitisation effects if these result in greater errors. In this case wewould base our recommendation on the testing condition which resulted in the greaternumber of errors.
If one wishes to use a pre-test but nevertheless reduce pre-test sensitisation effects to aminimum then there are techniques that could be used:
Try to disguise the pre-test by embedding it in some other task or carrying it out in a different context.
Increase the length of the interval between the pre-test and the manipulation so thatthe pre-test is less likely to have an effect on the post-test. So if the pre-test serves asa practice for the post-test measure, then a big interval of time may result in a reducedpractice effect.
M09_HOWI4994_03_SE_C09.QXD 10/11/10 15:02 Page 178

CHAPTER 9 THE BASIC LABORATORY EXPERIMENT 179
If the effects of the manipulation were relatively short-lived we could give the ‘pre-test’ after the post-test. For example, if we were studying the effects of alcoholon errors then we could test the participants a couple of hours later when the effectsof alcohol would have worn away. The two groups could be tested to see if they madesimilar numbers of errors once the effects of alcohol had dissipated.
While there are many studies which use a pre-test and a post-test measure fruitfully,the same is not true of the Solomon four-groups design. Such studies are scarce. That is, while it is important to be aware of pre-test sensitisation effects, we know of very few published studies which have tested for pre-test sensitisation effects.
■ Within-subjects designWhere the same participants take part in all conditions, this effectively controls for manydifferences between participants. For example, we may have a participant who makesnumerous errors irrespective of condition. Because this person is in every condition of theexperiment, the pre-existing tendency for them to make a lot of errors will apply equallyto every condition of the experiment. In other words, they would make more errors inevery condition. The effects, say, of alcohol will simply change the number of errors theymake differentially. The advantage of the within-subjects design is that it provides a moresensitive test of the difference between conditions because it controls for differencesbetween individuals. Having a more sensitive test and having the same participants takepart in all conditions means that, ideally, fewer participants can be used in a within-subjectsthan in a between-subjects design.
The extent to which this is the case depends on the extent to which there is a correlation between the scores in the experimental and control conditions. Many of thestatistical tests appropriate for within-subjects designs will give an indication of this correlation as well as a test for the significance of the difference between the two con-ditions. This is discussed in more detail in Chapter 12 of our companion statistics text,Introduction to Statistics in Psychology (Howitt and Cramer, 2011a). It is also discussedin Box 9.3 below. So long as the correlation is significant then there is no problem. If itis not significant then the test of the difference between the two means may well be notvery powerful.
In a within-subjects design the effects that may occur as a result of doing the conditions in a particular order must be controlled. In a design consisting of only two conditions, these order effects are dealt with by counterbalancing the two orders so that both orders occur equally frequently. This counterbalancing is important sincethe data may be affected by any of a number of effects of order. The main ones are as follows:
Fatigue or boredom Participants may become progressively more tired or bored withthe task they are performing. So the number of mistakes they make may be greater in the second than in the first condition, regardless of which condition, because they are tired. An example of a fatigue effect is illustrated in the bar chart in Figure 9.7 for the effect of two different amounts of alcohol on the number of mistakes made.The vertical axis shows the number of errors made. The horizontal axis shows thetwo conditions of 8 ml and 16 ml of alcohol. Within each condition, the order inwhich the conditions were run is indicated. So ‘1st’ means that that condition was runfirst and ‘2nd’ that that condition was run second. We can see that there is a similarfatigue effect for both conditions. More errors are made when the condition is runsecond than when it is run first. In the 8 ml condition 6 errors are made when it is run second compared with 4 when it is run first. The same difference holds for the 16 ml condition where 12 errors are made when it is run second compared with 10when it is run first.
M09_HOWI4994_03_SE_C09.QXD 10/11/10 15:02 Page 179

180 PART 2 QUANTITATIVE RESEARCH METHODS
Practice Participants may become better at the task they are carrying out. So thenumber of mistakes they make may be less in the second than in the first condition,regardless of which condition, because they have learnt to respond more accurately.Sometimes the term ‘practice effect’ is used to cover both learning as described hereand fatigue or boredom.
Carryover, asymmetrical transfer or differential transfer Here the effect of an earlier condition affects a subsequent one but not equally for all orders. (One canrefer to this as an interaction between the conditions and the order of the conditions.)For example, if the interval between the two alcohol conditions is close together, the carryover effect of drinking 16 ml of alcohol first may be greater on the effect ofdrinking 8 ml of alcohol second than the carryover effect of drinking 8 ml of alcoholfirst on the effect of drinking 16 ml of alcohol second. This pattern of results is illustrated in Figure 9.8. When the 8 ml condition is run second the number of mistakes made is much greater (12) than when it is run first (4) and is almost the sameas the number of mistakes made when the 16 ml condition is run first (10). When the 16 ml condition is run second the number of mistakes made (13) is not much different from when it is run first. This asymmetrical transfer effect reduces the over-all difference between the 8 and 16 ml conditions. If one finds such an asymmetricaltransfer effect then it may be possible to make adjustments to the research design to get rid of them. In the alcohol example, one could increase the amount of time
FIGURE 9.7 Fatigue effect in within-subjects design
FIGURE 9.8 Asymmetrical transfer effect in a within-subjects design
M09_HOWI4994_03_SE_C09.QXD 10/11/10 15:02 Page 180

CHAPTER 9 THE BASIC LABORATORY EXPERIMENT 181
between the two conditions. In this way, the alcohol consumed in the first conditionmay have worked its way out of the blood system. Of course, this has disadvantages.It might involve participants returning to the laboratory at a later time rather than the entire study being run at the same time. This increases the risk that participantsmay not return. Worse still, you may find that participants in one of the conditions mayfail to return at different rates from participants in the other condition.
Of course, this implies that counterbalanced designs are not always effective at balancingany effects of order. They clearly do balance out order effects in circumstances in whichthere is no significant interaction between the conditions and the order in which the conditions are run. If there is a significant interaction between the conditions and the orderin which they are run, we need to describe what this interaction is. We can illustrate theinteraction summarised in Figure 9.8 with the fictitious raw data in Table 9.4 wherethere are three participants who carry out the two different orders in which the two conditions are run. Each participant is signified by the letter P with a subscript consistingof two whole numbers. The first number refers to a particular participant and varies from1 to 6 as there are six participants. The second number represents the two conditions.We could analyse these data with a mixed analysis of variance. This statistical test isdescribed in some introductory statistics texts such as the companion text Introductionto Statistics in Psychology (Howitt and Cramer, 2011a).
With counterbalancing, it is obviously important that equal numbers of participantsare included in each condition. The random assignment of participants to different ordersin a within-subjects design is necessary to ensure that the orders are exactly the sameapart from the order in which the conditions are run. For example, in our study of theeffects of alcohol on the number of errors made it is important that the proportion ofpeople who are inclined to make more errors is the same in the two different orders. Soif the proportion is not the same, then there may be a difference between the two orderswhich may result in a significant interaction effect.
If there is a significant interaction effect in a counterbalanced design, the analysisbecomes a little cumbersome. Essentially, one regards the study as having two differentparts – one part for each different order. The data from each part (order) are then analysed to see what is the apparent effect of the experimental treatment. If the sameconclusions are reached for the different orders, then all is well as far as one’s findingsare concerned. Things become difficult when the conclusions from the different orders
Table 9.4 Fictitious scores for a within-subjects design with two conditions
Condition 1 Condition 2
Condition 1 first P1,1 = 3 P1,2 = 11
P2,1 = 4 P2,2 = 10
P3,1 = 5 P3,2 = 9
Sum 12 30
Mean 12/3 = 4 30/3 = 10
Condition 1 second P4,1 = 11 P4,2 = 13
P5,1 = 12 P5,2 = 12
P6,1 = 13 P6,2 = 14
Sum 36 39
Mean 36/3 = 12 39/3 = 13
M09_HOWI4994_03_SE_C09.QXD 10/11/10 15:02 Page 181

182 PART 2 QUANTITATIVE RESEARCH METHODS
are not compatible with each other. Also note that this also effectively reduces the maximum sample size and so takes away the advantage of a within-subjects design.
Of course, researchers using their intelligence would have anticipated the problem for a study such as this in which the effects of alcohol are being studied. To the extentthat one can anticipate problems due to the order of running through conditions thenone would be less inclined to use a within-subjects design. This is a case where notingproblems with counterbalanced designs identified by researchers investigating similartopics to one’s own may help decide whether a within-subjects design should be avoided.
Stable individual differences between people are controlled in a within-subjects designby requiring the same participants to carry out all conditions. Nevertheless, it remains a requirement that assignment to different orders is done randomly. Of course, this doesnot mean that the process of randomisation has not left differences between the orders.This may be checked by pre-testing participants prior to the different first conditions tobe run. One would check whether the pre-test means were the same for those who tookcondition 1 first as for those who took condition 2 first. In other words, it is possible tohave a pre-test–post-test within-subjects design. It would also be possible to extend theSolomon four-group design to investigate not only the effects of pre-testing but also theeffects of having participants undertake more than one condition.
Statistical significance
Box 9.3 Key Ideas
Statistical significance is one of those ideas that many students have difficulty with. So it can be usefully returnedto from time to time so that the ideas are reinforced. Wecan explain the concept of statistical significance with theexperiment on the effects of alcohol on errors. Supposethat we find in our study of the effects of alcohol on making errors that the participants who drink less alcoholmake fewer errors than those who drink more alcohol. Wemay find that we obtain the results shown in Table 9.5. All the participants who drink less alcohol make fewererrors than those who drink more alcohol.
The mean number of errors made by the participantswho drink less alcohol is 2 compared with a mean of 5 forthose who drink more alcohol. The absolute differencebetween these two means, which ignores the sign of thedifference, is 3 (2 − 5 = 3). (To be precise, this should bewritten as ( |2 − 5 | = 3), which indicates that the absolutevalue of the difference should be taken.) Can we concludefrom these results that drinking more alcohol causes us tomake more mistakes?
We cannot draw this conclusion without determiningthe extent to which we may find this difference simply by chance as it is possible to obtain a difference of 3 bychance. If this difference has a probability of occurring
by chance of 5 per cent or .05 or less we can conclude that this difference is quite unusual and unlikely to be dueto chance. It represents a real difference between the twoconditions. If this difference has a probability of occurringby chance of more than 5 per cent or .05, we would conclude that this difference could be due to chance andso does not represent a real difference between the twoconditions. It needs to be stressed that the 5 per cent or .05 significance level is just a conventional and generallyaccepted figure. It indicates a fairly uncommon outcome if differences between groups were simply due to chancefactors resulting from sampling.
We can demonstrate the probability of this differenceoccurring by chance in the following way. Suppose that itis only possible to make between 1 and 6 mistakes on thistask. (We are using this for convenience; it would be moreaccurate in terms of real statistical analysis to use the samefigures but arranged in a bell-shaped or normal distribu-tion in which scores of 3 and 4 are the most common andscores of 1 and 6 were the most uncommon.) If we onlyhave three participants in each condition and the resultswere simply determined by chance, then the mean for anygroup would be the mean of the three numbers selected by chance. We could randomly select these three numbers
M09_HOWI4994_03_SE_C09.QXD 10/11/10 15:02 Page 182

CHAPTER 9 THE BASIC LABORATORY EXPERIMENT 183
in several ways. We could toss a die three times. We couldwrite the six numbers on six separate index cards or slipsof paper, shuffle them, select a card or slip, note down thenumber, put the card or slip back, shuffle them again andrepeat this procedure three times. We could use a statisticalpackage such as SPSS Statistics. We would enter the numbers 1 to 6 in one of the columns. We would then selectData, Select Cases . . . , Random sample of cases, Sample. . . , Exactly, and then enter one case from the first six cases.We would note down the number of the case selected andrepeat this procedure twice.
As we have two groups we would have to do this oncefor each group, calculate the mean of the three numbersfor each group and then subtract the mean of one groupfrom the mean of the other group. We would then repeatthis procedure 19 or more times. The results of our doingthis 20 times are shown in Table 9.6.
The mean for both the first two groups is 2.00 so thedifference between them is zero. As the six numbers are equiprobable, the mean of three of these numbersselected at random is likely to be 3.5. This value is close tothe mean for the 40 groups which is 3.52. However, themeans can vary from a minimum of 1 [(1 + 1 + 1)/3 = 1]to a maximum of 6 [(6 + 6 + 6)/3 = 6].
The distribution of the frequency of an infinite numberof means will take the shape of an inverted U or bell asshown by the normal curve in Figure 9.9 which has beensuperimposed onto the histogram of the means in Table 9.6.Of these means, the smallest is 1.67 and the largest is 5.67.The distribution of these means approximates the shape
of an inverted U or bell as shown in the histogram inFigure 9.9. The more samples of three scores we select atrandom, the more likely it is that the distribution of themeans of those samples will resemble a normal curve. Thehorizontal width of each rectangle in the histogram is0.50. The first rectangle, which is on the left, ranges from1.50 to 2.00 and contains two means of 1.67. The lastrectangle which is on the right, varies from 5.50 to 6.00and includes two means of 5.67.
If the means of the two groups tend to be 3.5, then thedifference between them is likely to be zero. They will varyfrom a difference of −5 (1 − 6 = −5) to a difference of 5 (6 − 1 = 5) with most of them close to zero as shown by thenormal curve superimposed on the histogram in Figure 9.10.Of the 20 differences in means in Table 9.6 the lowest is −2.33 and the highest is 3.00. If we plot the frequency of these differences in means in terms of the histogram in Figure 9.10 we can see that its shape approximates thatof a normal curve. If we plotted an infinite number or avery large number of such differences then the distributionwould resemble a normal curve. The horizontal width ofeach rectangle in this histogram is 1.00. The first rectangle,which is on the left, ranges from −3.00 to −2.00 and con-tains two differences in means of −2.33. The last rectanglewhich is on the right, varies from 2.00 to 3.00 and includestwo differences in means of 2.67 and 3.00.
We can see that the probability of obtaining by chancea difference as large as −3.00 is quite small. One test for
Table 9.5 Fictitious data for a two-group between-subjects post-test only design
Post-test
Condition 1 P1,1 = 1
P2,1 = 2
P3,1 = 3
Sum 6
Mean 6/3 == 2
Condition 2 P4,2 = 4
P5,2 = 5
P6,2 = 6
Sum 15
Mean 15/3 == 5
M09_HOWI4994_03_SE_C09.QXD 10/11/10 15:02 Page 183
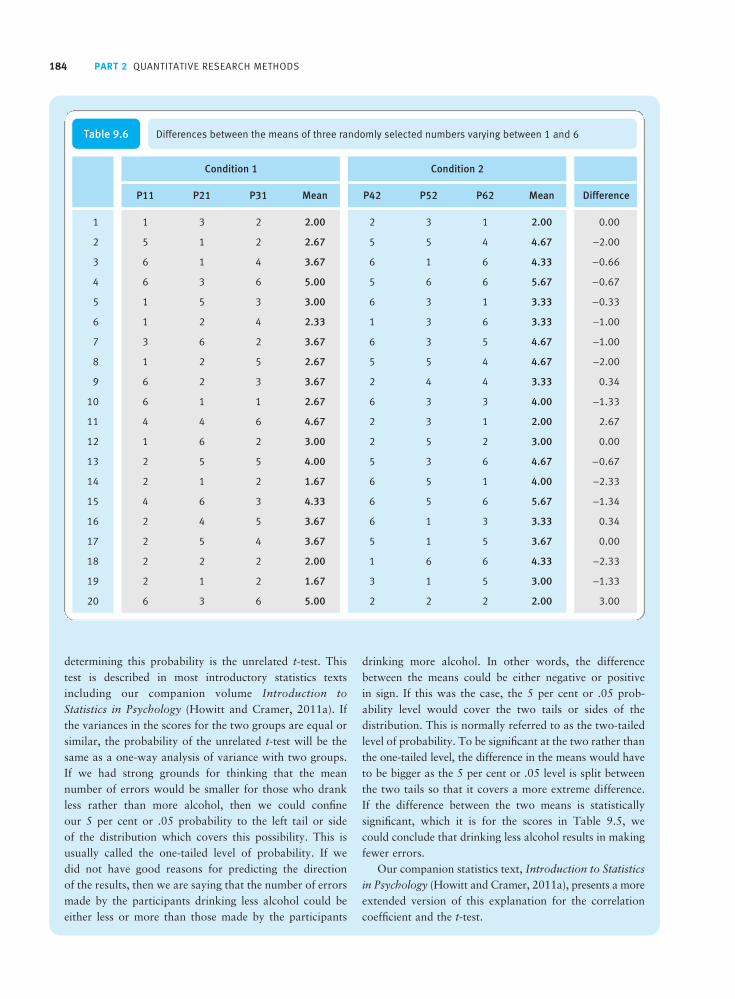
184 PART 2 QUANTITATIVE RESEARCH METHODS
determining this probability is the unrelated t-test. Thistest is described in most introductory statistics textsincluding our companion volume Introduction toStatistics in Psychology (Howitt and Cramer, 2011a). Ifthe variances in the scores for the two groups are equal orsimilar, the probability of the unrelated t-test will be thesame as a one-way analysis of variance with two groups.If we had strong grounds for thinking that the mean number of errors would be smaller for those who drankless rather than more alcohol, then we could confine our 5 per cent or .05 probability to the left tail or side of the distribution which covers this possibility. This is usually called the one-tailed level of probability. If we did not have good reasons for predicting the direction of the results, then we are saying that the number of errorsmade by the participants drinking less alcohol could beeither less or more than those made by the participants
drinking more alcohol. In other words, the differencebetween the means could be either negative or positive in sign. If this was the case, the 5 per cent or .05 prob-ability level would cover the two tails or sides of the distribution. This is normally referred to as the two-tailedlevel of probability. To be significant at the two rather thanthe one-tailed level, the difference in the means would haveto be bigger as the 5 per cent or .05 level is split betweenthe two tails so that it covers a more extreme difference. If the difference between the two means is statisticallysignificant, which it is for the scores in Table 9.5, we could conclude that drinking less alcohol results in making fewer errors.
Our companion statistics text, Introduction to Statisticsin Psychology (Howitt and Cramer, 2011a), presents a moreextended version of this explanation for the correlationcoefficient and the t-test.
Table 9.6 Differences between the means of three randomly selected numbers varying between 1 and 6
Condition 1 Condition 2
P11 P21 P31 Mean P42 P52 P62 Mean Difference
1 1 3 2 2.00 2 3 1 2.00 0.00
2 5 1 2 2.67 5 5 4 4.67 −2.00
3 6 1 4 3.67 6 1 6 4.33 −0.66
4 6 3 6 5.00 5 6 6 5.67 −0.67
5 1 5 3 3.00 6 3 1 3.33 −0.33
6 1 2 4 2.33 1 3 6 3.33 −1.00
7 3 6 2 3.67 6 3 5 4.67 −1.00
8 1 2 5 2.67 5 5 4 4.67 −2.00
9 6 2 3 3.67 2 4 4 3.33 0.34
10 6 1 1 2.67 6 3 3 4.00 −1.33
11 4 4 6 4.67 2 3 1 2.00 2.67
12 1 6 2 3.00 2 5 2 3.00 0.00
13 2 5 5 4.00 5 3 6 4.67 −0.67
14 2 1 2 1.67 6 5 1 4.00 −2.33
15 4 6 3 4.33 6 5 6 5.67 −1.34
16 2 4 5 3.67 6 1 3 3.33 0.34
17 2 5 4 3.67 5 1 5 3.67 0.00
18 2 2 2 2.00 1 6 6 4.33 −2.33
19 2 1 2 1.67 3 1 5 3.00 −1.33
20 6 3 6 5.00 2 2 2 2.00 3.00
M09_HOWI4994_03_SE_C09.QXD 10/11/10 15:02 Page 184

CHAPTER 9 THE BASIC LABORATORY EXPERIMENT 185
FIGURE 9.9Distribution of the frequency of the 40 means in Table 9.6 with a normal curvesuperimposed
FIGURE 9.10Distribution of the frequency of the 20 differences in means in Table 9.6 with anormal curve superimposed
M09_HOWI4994_03_SE_C09.QXD 10/11/10 15:02 Page 185

186 PART 2 QUANTITATIVE RESEARCH METHODS
9.4 Conclusion
The basics of the true or randomised experiment are simple. The major advantage of sucha design is that it is easier to draw conclusions about causality since care is taken toexclude other variables as far as possible. That is, the different experimental conditionsbring about differences on the dependent variable. This is achieved by randomly allocatingparticipants to conditions or orders and standardising procedures. There are a numberof problems with this. The major one is that randomisation equates groups only in thelong run. For any particular experiment, it remains possible that the experimental andcontrol groups differ initially before the experimental manipulation has been employed.The main way of dealing with this is to employ a pre-test to establish whether or not the experimental and control groups are very similar. If they are, there is no problem. If the pre-test demonstrates differences then this may bring about a different inter-pretation of any post-test findings. Furthermore, the more complicated the manipulation is, the more likely it is that variables other than the intended one will be manipulated.Consequently, the less easy it is to conclude that the independent variable is responsiblefor the differences. The less controlled the setting in which the experiment is conducted,the more likely it is that the conditions under which the experiment is run will not be the same and that other factors than the manipulation may be responsible for anyobserved effect.
The laboratory experiment has the potential to reveal causal relationships with a certainty which isnot true of many other styles of research. This is achieved by random allocation of participants andthe manipulation of the independent variable while standardising procedures as much as possibleto control other sources of variability.
The between-subjects and within-subjects designs differ in that in the former participants take partin only one condition of the experiment whereas in the latter participants take part in all conditions(or sometimes just two or more) of the conditions. These two different types of design are analysedusing rather different statistical techniques. Within-subjects designs use related or correlated tests.This enables statistical significance to be achieved with fewer participants.
The manipulated or independent variable will consist of only two levels or conditions in the most basiclaboratory experiment. The level of the manipulated variable will be higher in one of the conditions.This condition is sometimes referred to as the experimental condition as opposed to the control condition where the level of the manipulated variable will be lower.
Within-subjects (related) designs have problems associated with the sensitisation effects of servingin more than one of the conditions of the study. There are designs that allow the researcher to detectsensitisation effects. One advantage of the between-subjects design is that participants will not beaffected by the other conditions as they will not have taken part in them.
Pre-testing to establish that random allocation has worked in the sense of equating participants on the dependent variable prior to the experimental treatment sometimes works. Nevertheless, pre-testing may cause problems due to the sensitising effect of the pre-test. Complex designs areavailable which test for these sensitising effects.
Key points
M09_HOWI4994_03_SE_C09.QXD 10/11/10 15:02 Page 186

CHAPTER 9 THE BASIC LABORATORY EXPERIMENT 187
The extent to which random assignment has resulted in participants being similar across either conditions or orders can be determined by a pre-test in which participants are assessed on thedependent variable before the manipulation is carried out.
Any statistical differences between the conditions in the dependent variable at post-test are verylikely to be due to the manipulated variable if the dependent variable does not differ significantlybetween the conditions at pre-test and if the only other difference between the conditions is themanipulated variable.
ACTIVITYDesign a basic randomised experiment to test the hypothesis that unemployment leads to crime. After thinking about thisyou may find it useful to see whether and how other researchers have tried to study this issue using randomised designs.How are you going to operationalise these two variables? Is it possible to manipulate unemployment and how can you doso? If you are going to carry out a laboratory experiment you may have to operationalise unemployment in a more contrivedway than if you carry out an experiment in a more natural or field setting. How can you reduce the ethical problems thatmay arise in the operationalisation of these variables? How many participants will you have in each condition? How willyou select these participants? Will you pre-test your participants? Will you use a between- or a within-subjects design? How will you analyse the results? What will you say to participants about the study before and after they take part?
M09_HOWI4994_03_SE_C09.QXD 10/11/10 15:02 Page 187

Advanced experimental design
Overview
CHAPTER 10
Few laboratory experiments consist of just an experimental and control group. Theinformation obtained from such a study would be very limited for the time, money andeffort expended. The simple experimental group–control group is often extended toinclude perhaps four or five different conditions. Naturally it is important that everycondition of an experiment should be justifiable. A typical justification is that eachgroup will produce a different outcome relative to the other groups.
Most behaviours are multiply affected by a range of factors (i.e. variables).Consequently, it can be advantageous to study several factors at the same time. Inthis way the relative effects of the factors can be compared. The number of variablesthat can be manipulated in a study should be kept to an optimum. Typically no morethan two or three should be used. If more are employed, the interpretation of the statistical findings becomes extremely complex and, possibly, misleading.
The factors that are studied may include those which cannot be randomised (ormanipulated) such as gender, age and intelligence. These are sometimes referred to as subject variables.
It is common for researchers to use more than one dependent variable. This isbecause the independent variables may have a range of effects and also becauseusing a number of measures of the dependent variable can be informative. Wherethere are several dependent variables it may be worthwhile controlling for any ordereffects among these variables by varying the order. This can be done systematicallyusing a Latin square.
Latin squares are also used to systematically vary the order of the conditions run in a within-subjects (i.e. related) design where there are a number of different conditions.
M10_HOWI4994_03_SE_C10.QXD 10/11/10 15:02 Page 188

CHAPTER 10 ADVANCED EXPERIMENTAL DESIGN 189
10.1 Introduction
In this chapter we will extend our understanding of experimental design in three ways.First of all, we will look at increasing the number of levels of the independent variableso that there are three or more groups. Then we will consider more advanced designs forexperiments including those in which there are two or more independent variables. Thisleads to extra efficiency in terms of the amount of information which can be obtainedfrom a single study. Experimental designs where more than one dependent variable is usedare also considered. In addition, we will look at aspects of experimental design which,unless carefully considered and acted upon, may result in problems in the interpretationof the findings of the research. Some of these are conventionally termed experimentereffects and come under the general rubric of the social psychology of the laboratoryexperiment.
The simple two-groups design – experimental and control group – provides theresearcher with relatively little information for the effort involved. The design may beextended by using a greater variety of conditions but, perhaps more likely, the singleindependent variable is extended to two or three independent variables, perhaps more:
Just having two conditions or levels of an independent variable, such as the amount ofalcohol consumed (as in the example used in the previous chapter), tells us little aboutthe shape of the relationship between the independent and the dependent variable. Is the relationship a linear one or curvilinear? What kind of curvilinear relationshipis it? Having a number of levels of the dependent variable helps us to identify thenature of the trends because of the extra information from the additional conditions.
If we have several independent variables then we can answer the question does the independent variable interact with other independent or subject variables? Forexample, is the effect of alcohol on the number of errors made similar for both malesand females or is it different in the two genders?
Does the independent variable affect more than one dependent variable? For example,does alcohol affect the number of errors made on a number of different tasks?
These three main ways of extending the basic two-group design are discussed below andhighlighted in Figure 10.1.
Planned and unplanned comparisons in factorial designs have rather differentrequirements in terms of statistical analysis. Comparisons planned in advance ofdata collection have distinct advantages, for example, in terms of the ease of makingmultiple comparisons.
Quite distinct from any of the above, the advanced experimenter should considerincluding means of controlling for potential nuisances in the research design. The use of placebos, double-blind procedures and the like help make the methodologymore convincing. Quasi-controls to investigate the experience of participants in theresearch might be regarded as good practice as, in part, they involve discussions afterthe study between participant and researcher as part of a process of understandingthe findings of the research. They are essentially a variant of the post-experimentaldebriefing interviews discussed in Chapter 9 but with a more focused and lessexploratory objective.
M10_HOWI4994_03_SE_C10.QXD 10/11/10 15:02 Page 189

190 PART 2 QUANTITATIVE RESEARCH METHODS
10.2 Multiple levels of the independent variable
Multiple levels of the independent variable occur when there are three or more differentlevels of that variable. This is sometimes described as having several levels of the treat-ment. An example of this is to be found in Figure 10.2. The independent variable mayvary in one of two different ways – quantitative or qualitative:
Quantitative would be, for example, when the amount of alcohol consumed in thedifferent conditions can be arranged in order of numerical size. In general the orderis from smaller quantities to larger ones ordered either across or down a table oracross a graph such as Figure 10.2.
Qualitative would be, for example, when we study the effects of the kind of musicbeing played in the different conditions. There is generally no one way in which thelevels or categories can be ordered in terms of amount. The categories will reflect a number of different characteristics such as the date when the music was recorded, the number of instruments being played and so forth. In other words, qualitative is the equivalent of a nominal, category or categorical variable. When studying theeffect of a qualitative variable which varies in numerous ways, it is not possible toknow what particular features of the qualitative variable produce any differences thatare obtained in the study.
■ Multiple comparisonsThe analysis of designs with more than two conditions is more complicated than onewith only two conditions. For one reason, there are more comparisons to make the moreconditions there are. If there are three levels or conditions we can compare:
FIGURE 10.1 The three main ways of building more complex experimental designs
M10_HOWI4994_03_SE_C10.QXD 10/11/10 15:02 Page 190

CHAPTER 10 ADVANCED EXPERIMENTAL DESIGN 191
condition 1 with condition 2,
condition 1 with condition 3, and
condition 2 with condition 3.
That is, a total of up to three different comparisons. With four conditions, there are six different comparisons we can make. With five conditions there are ten different comparisons and so on. (The number of comparisons is the sum of numbers from 1 to the number of conditions minus 1. That is, for four conditions, one less than the number of conditions is 4 – 1 or 3. So we add 1 + 2 + 3 which gives us 6 comparisons.)Whether or not one makes all possible comparisons depends on the purpose of one’sresearch. The temptation is, of course, to do all possible comparisons. For example, youmay have a study in which there are two experimental groups and two control groups.You may, for this particular study, only be interested in the differences between theexperimental groups and the control groups. You may not be interested in whether the control groups differ from each other or even whether the experimental groups differ from each other. If a comparison does not matter for your purposes, then there isno necessity to include it in your analysis. In research, however, the justification forwhatever number of comparisons are to be made should be presented clearly.
The more comparisons we make, so the likelihood increases of finding some of thesecomparisons to be statistically significant by chance. If these comparisons are completelyindependent of each other, the probability of finding one or more of these comparisonsstatistically significant can be calculated with the following formula:
probability of statistically significant comparison = 1 − (1 − .05)number of comparisons
where .05 represents the 5 per cent or .05 significance level. With three comparisons, this probability or significance level is about 14 per cent or .14 [1 − (1 − .05)3 = .14].With four comparisons it is 19 per cent or .19 [1 − (1 − .05)4 = .19]. With five comparisons it is 23 per cent or .23 [1 − (1 − .05)5 = .23] and so on. This probabilityis known as the family-wise or experiment-wise error rate because we are making a number, or family, of comparisons from the same study or experiment. The point is that by making a lot of comparisons we increase the risk that some of our findings from
FIGURE 10.2 Number of errors as a function of amount of alcohol consumed
M10_HOWI4994_03_SE_C10.QXD 10/11/10 15:02 Page 191

192 PART 2 QUANTITATIVE RESEARCH METHODS
the data are due to chance. So if some comparisons serve no purpose in a particularstudy, leaving them out means that there is less chance of making this sort of ‘error’ inthe interpretation of our findings. Box 10.1 discusses this sort of interpretation ‘error’and related issues.
Data which consist of more than two conditions or more than two independent variables, would normally be analysed by a group of tests of significance known collectively as the analysis of variance (ANOVA). However, there may not always be a need to do this. If we had good grounds for predicting which conditions would beexpected to differ from each other and the direction of those differences, then an over-all or omnibus test such as an analysis of variance may be unnecessary (e.g. Howell, 2010; Keppel and Wickens, 2004). An omnibus test simply tells us whether overall the independent variable has a significant effect but it does not tell us which conditionsare actually different from each other. Regardless of whether we carry out an omnibus
The risks in interpreting trends in our data
Box 10.1 Key Ideas
Since research data in psychology are based on samples of data rather than all of the data then there is always a risk that the characteristics of our particular sample ofdata do not represent reality accurately. Some outcomes of sampling are very likely and some are very unlikely to occur in any particular study. Most randomly drawn samples will show similar characteristics to the populationfrom which they were drawn. In statistical analysis, theworking assumption usually is the null hypothesis whichis that there is no difference between the different conditionson the dependent variable or that there is no relationshipbetween two variables. In other words, the null hypothesissays that there is no trend in reality. Essentially in statisticalanalysis we assess the probability that the null hypothesisis true. A statistically significant statistical analysis meansthat it is unlikely that the trend would have occurred bychance if the null hypothesis of no trend in reality weretrue. The criterion which we impose to make the decisionis that a trend which is likely to occur in 95 per cent ofrandom samples drawn from a population where there is no trend is not statistically significant. However, trendswhich are so strong that they fall into the 5 per cent ofoutcomes are said to be statistically significant and we acceptthe hypothesis that there is in reality a trend between twovariables – a difference or a relationship. The upshot of allof this, though, is that no matter what we decide there isa risk that we will be wrong.
Type I error refers to the situation in which we decideon the basis of our data that there is a trend but in actualitythere is really no trend (see Figure 10.3). We have set the
risk of this at 5 per cent. It is a small risk but neverthelessthere is a risk. Psychologists tend to be very concernedabout Type I errors.
Type II error refers to a different situation. This is the situation in which in reality there is a trend involvingtwo variables but our statistical analysis fails to detect this trend at the required 5 per cent level of significance.Psychologists seem to be less worried about this in general.However, what it could mean is that really importanttrends are overlooked. Researchers who studied a treatmentfor dementia but their findings did not reach statisticalsignificance – maybe because the sample size was too small – would be making a Type II error. Furthermore, by other criteria this error would be a serious one if theconsequence was that this treatment were abandoned as aresult. This stresses the importance of using other criteriarelevant to decision-making in psychological research.Statistical significance is one criterion but it is most certainly not the only criterion when reaching conclusionsbased on research. Many professional researchers go toquite considerable lengths to avoid Type II errors by con-sidering carefully such factors as the level of statisticalsignificance to be used, the size of the effect (or trend)which would minimally be of interest to the researchers,and the sample size required to achieve these ends. This is known as power analysis. It is covered in detail in our companion book An Introduction to Statistics inPsychology (Howitt and Cramer, 2011a). Figure 10.3 givessome of the possible decision outcomes from a statisticalanalysis.
M10_HOWI4994_03_SE_C10.QXD 10/11/10 15:02 Page 192

CHAPTER 10 ADVANCED EXPERIMENTAL DESIGN 193
test, the conditions we expect to differ still have to be compared. These comparisonshave been called planned or a priori comparisons. (A priori is Latin for ‘from what isbefore’.) We can use a test such as a simple t-test to determine which conditions differfrom each other provided that we test a limited number of comparisons (for example,Howell, 2010; Keppel and Wickens, 2004). If we make a large number of comparisons,then we should make an adjustment for the family-wise error rate. The point is that ifwe plan a few comparisons we have effectively pinpointed key features of the situation.The more comparisons we make then the less precision is involved in our planning.Hence the need to make adjustments when we have a high proportion of all of the possible comparisons to make. Very little student research, in our experience, involvesthis degree of pre-planning of the analysis. It is hard enough coming up with researchquestions, hypotheses and research designs to add to the burden by meticulously planningin advance on a theoretical, empirical, or conceptual basis just what comparisons we willmake during the actual data analysis.
The more common situation, however, is when we lack good reasons for expecting a particular difference or for predicting the direction of a difference. The procedure in these circumstances is to employ an omnibus statistical test such as an analysis of variance. If this analysis is significant overall, unplanned, post hoc or a posterioricomparisons can be carried out. These comparisons determine which conditions differsignificantly from each other. Post hoc is Latin for ‘after this’ and a posteriori is Latinfor ‘what comes after’. With the post hoc test, it is necessary to adjust the significance of the statistical test to take into account the number of comparisons being made. The simplest way to do this is to divide the .05 level of statistical significance by the number of comparisons to be made. This is known as a Bonferroni adjustment or test. So with three comparisons, the adjusted level is about .0167 (.05/3 = .0167).With four comparisons it is .0125 (.05/4 = .0125) and so on. Be careful! What this means is that a comparison has to be statistically significant at this adjusted level to be
FIGURE 10.3 The various correct and incorrect decisions that a researcher may make based on their data
M10_HOWI4994_03_SE_C10.QXD 10/11/10 15:02 Page 193

194 PART 2 QUANTITATIVE RESEARCH METHODS
reported as being statistically significant at the .05 level of significance. So if we makefour comparisons, only differences which are statistically significant at the .0125 levelcan be reported as being significant at the .05 level. It is easier to do this with SPSSStatistics output since the exact probability found for a comparison simply has to bemultiplied by the number of comparisons to give the appropriate significance level. Thefinding is significant only if the multiplied exact significance is below .05. This is dis-cussed in the companion text Introduction to Statistics in Psychology (Howitt andCramer, 2011a).
The Bonferroni test is a conservative test if we are comparing all the conditions becauseat least one of the comparisons will not be independent of the others. Conservative basically means less likely to give statistically significant results. Suppose we wanted tocompare the mean scores for three conditions which are 2, 4 and 8, respectively. If we workout the differences for any two of the comparisons, then we can derive the difference for the third comparison by subtracting the other two differences from each other. Forinstance, the differences between conditions 1 and 2 (4 − 2 = 2) and conditions 1 and 3(8 − 2 = 6) are 2 and 6, respectively. If we subtract these two differences from each other(6 − 2 = 4) we obtain the difference between conditions 2 and 3 (8 − 4 = 4), which is 4.In other words, if we know the differences for two of the comparisons, we can work outthe difference for the third comparison.
So, in this situation, the Bonferroni test is a conservative test in the sense that the test assumes three rather than two independent comparisons are being made. The prob-ability level is lower for three comparisons (.05/3 = .017) than for two comparisons(.05/2 = .025), and so is less likely to occur.
There is some disagreement between authors about whether particular multiple comparison tests such as the Bonferroni test should be used for a priori or post hoccomparisons. For example, Howell (2010) suggests that the Bonferroni test should beused for making planned or a priori comparisons while Keppel and Wickens (2004) recommend that this test be used for making a small number of unplanned or post hoccomparisons! The widely used statistical package SPSS Statistics also lists the Bonferronitest as a post hoc test. There are also tests for determining the shape of the relationshipbetween the levels of a quantitative independent variable and the dependent variable,which are known as trend tests (for example, Kirk, 1995).
In many instances such disagreements in the advice of experts will make little or no difference to the interpretation of the statistical analysis – that is the findings will be unaffected – even though the numbers in the statistical analyses differ to a degree.Since multiple comparison tests are quickly computed using SPSS Statistics and other statistical packages, it is easy to try out a number of multiple comparison tests. Only in circumstances in which they lead to radically different conclusions do you really have a problem. These circumstances are probably rare and equally probably mean that some comparisons which are significant with one test are marginally non-significantwith another. In these circumstances, it would be appropriate to highlight the problemin your report.
10.3 Multiple dependent variables
Sometimes researchers may wish to use a number of different measures of the dependentvariable within a single study. For example, we can assess the effects of alcohol on task performance in terms of both the number of errors made and the speed with which the task is carried out. Performance on a number of tasks such as simple reactiontime, complex reaction time, attention span and distance estimation could be studied.
M10_HOWI4994_03_SE_C10.QXD 10/11/10 15:02 Page 194

CHAPTER 10 ADVANCED EXPERIMENTAL DESIGN 195
One could, of course, carry out separate studies for each of these different measures ofperformance. However, it would be more efficient to examine them in the same study.In these circumstances, it may be important to control for potential order effects in themeasurement of the various dependent variables by randomising the order of presentation.Univariate analysis of variance (ANOVA) is not appropriate for analysing these data sinceit deals with only one dependent variable. Multivariate analysis of variance (abbreviated toMANOVA) is used instead since it deals with multiple dependent variables. A descriptionof MANOVA can be found in Chapter 26 in the companion text Introduction toStatistics in Psychology (Howitt and Cramer, 2011a) together with instructions abouthow to carry one out.
There are circumstances where one would not use MANOVA. Sometimes a researcherwill measure tasks such as reaction time several times in order to sample the participant’sperformance on this task. These data are better dealt with by simply averaging to give a mean score over the several trials of what is the same task. There would be nothing to gain from treating these several measures of the same thing as multiple dependentvariables.
10.4 Factorial designs
A study which investigates more than one independent variable is known as a factorialdesign – see Table 10.1. Variables such as gender may be referred to as subject variables.These are characteristics of the participants which cannot be independently manipulated(and randomly assigned). Gender, age and intelligence are good examples of subject variables. They are also referred to as independent variables if they are seen as potentialcauses of variations in the dependent variable.
Terms such as two-way, three-way and four-way are frequently mentioned in connec-tion with factorial research designs. The word ‘way’ really means factor or independentvariable. Thus a one-way design means one independent variable, a two-way designmeans two independent variables, a three-way design means three independent variablesand so forth. The phrase is also used in connection with the analysis of variance. So a two-way analysis of variance is an appropriate way of analysing a two-way researchdesign. The number of factors and the number of levels within the factors may be indicated by stating the number of levels in each factor and by separating each of thesenumbers by an ‘×’ which is referred to as ‘by’. So a design having two factors with two levels and a third factor with three levels may be called a 2 × 2 × 3 factorial design.The analysis of factorial designs is usually through the use of ANOVA. There are versions of ANOVA that cope with virtually any variation of the factorial design. Forexample, it is possible to have related variables and unrelated variables as independentvariables in the same design (i.e. a mixed ANOVA).
Table 10.1A simple factorial design investigating the effects of alcohol and gender onperformance
Females Males
8 ml alcohol
16 ml alcohol
M10_HOWI4994_03_SE_C10.QXD 10/11/10 15:02 Page 195

196 PART 2 QUANTITATIVE RESEARCH METHODS
When quantitative subject variables such as age, intelligence or anxiety are to be usedin a factorial design and analysed using ANOVA, they can be categorised into ranges orgroups of scores. Age, for example, may be categorised as ages between 18 and 22, 23and 30, 31 and 40, and so on. The choice of ranges to use will depend on the nature ofthe study. Some researchers may prefer to use the subject variable as a covariate in ananalysis of covariance design (ANCOVA) which essentially adjusts the data for subjectdifferences before carrying out a more or less standard ANOVA analysis. The use ofranges is particularly helpful if there is a non-linear relationship between the subjectvariable and the dependent variable. This would be assessed by drawing a scatterplot ofthe relationship between the subject variable and the dependent variable. If the relation-ship between the two seems to be a curved line then there is a non-linear relationshipbetween the two.
The use of subject variables in factorial designs can result in a situation in which thedifferent conditions (cells) in the analysis contain very different numbers of participants.This can happen in all sorts of circumstances but, for example, it may be easier to recruit female participants than male participants. The computer program will calculatestatistics for an analysis of variance which has different numbers of participants in each condition. Unfortunately, the way that it makes allowance for these differences isless than ideal. So, if possible, it is better to have equal numbers of participants in each condition. Not using subject variables, this is generally achieved quite easily. But if thereis no choice, then stick with the unequal cell sizes.
There is an alternative way of analysing complex factorial designs which is to usemultiple regression. This statistical technique identifies the pattern of independent variableswhich best account for the variation in a dependent variable. This readily translates toan experimental design which also has independent and dependent variables. If there areany subject variables in the form of scores then they may be left as scores. (Though thisrequires that the relationship between the subject variable and the dependent variable is linear.) Qualitative variables (i.e. nominal, category or categorical variables) may alsobe included as predictors. They may need to be converted into dummy variables if thequalitative variable has more than two categories. A good description of dummy variablesis provided by Cohen, Cohen, West and Aiken (2003), and they are explained also in thecompanion text Introduction to Statistics in Psychology (Howitt and Cramer, 2011a).Basically, a dummy variable involves taking each category of a nominal variable andmaking it into a new variable. Participants are simply coded as having the characteristicto which the category refers or not. For example, if the category variable is cat, dog and other (the question is ‘What is the participant’s favourite animal?’) then this can be turned into two dummy variables such as cat and dog. Participants are coded aschoosing cat or not and choosing dog or not. There is always one fewer dummy variablethan the number of categories. Participants choosing ‘other’ will be those who have notchosen cat and dog.
The advantages of using multiple regression to analyse multifactorial designs include:
the subject variables are not placed into fairly arbitrary categories;
the variation (and information) contained in the subject variable is not reduced byturning the subject variable into a small number of categories or ranges of scores.
There are three main advantages to using a factorial design:
It is more efficient, or economical, in that it requires fewer cases or observations forapproximately the same degree of precision or power. For example, a two-factor factorialdesign might use just 30 participants. To achieve the same power running the two-factor factorial design as two separate one-factor designs, twice as many participantswould be needed. That is, each one-factor design would require 30 participants. In the
M10_HOWI4994_03_SE_C10.QXD 10/11/10 15:02 Page 196

CHAPTER 10 ADVANCED EXPERIMENTAL DESIGN 197
multifactorial design, the values of one factor are averaged across the values of theother factors. That is to say, the factorial design essentially can be considered as severalnon-factorial designs – hence, the economy of numbers.
Factorial designs enable greater generalisability of the results in that a factor is investigated over a wider range of conditions. So, for example, we can look at theeffects of alcohol under two levels of noise rather than, say, a single one, and infemales and males rather than in just one of these two groups.
A third advantage is that a factorial design allows us to determine whether there is an interaction between two or more factors in that the effect of one factor dependson the effect of one or more other factors. Box 10.2 deals with interactions.
The nature of interactions
Box 10.2 Key Ideas
One of the consequences of employing multifactorialdesigns is that the combined influences of the variables onthe dependent variable may be identified. An interaction isbasically a combination of levels of two or more variableswhich produces effects on the dependent variable whichcannot be accounted for by the separate effects of the variables in question. Interactions must be distinguishedfrom main effects. A main effect is the influence of a variable acting on its own – not in combination with anyother variable. Interactions can only occur when there aretwo or more independent variables.
Interactions may be most easily grasped in terms of agraph such as Figures 9.4 and 9.5 in the previous chapterwhere the vertical axis represents the dependent variable,the horizontal axis represents one of the independent variables and the lines connecting the points in the graphrepresent one or more other independent variables. Thusthe vertical axis shows the number of errors made, thehorizontal axis represents the time of testing (pre-test andpost-test) and the two lines the two alcohol conditions, 8 and 16 ml. An interaction effect occurs if the lines in the graph are substantially out of parallel, such as whenthe lines diverge or converge (or both). In Figures 9.2 and9.3 the effect of differing amounts of alcohol appears to depend on the time of testing. In other words thereseems to be an interaction between the amount of alcoholconsumed and the time of testing. In both figures the difference in errors between the two amounts of alcohol is greater at the pre-test than the post-test. Of course, in terms of a true or randomised pre-test–post-test experi-
mental design we would hope that the pre-test scores weresimilar, as illustrated in Figure 10.4, as the main purposeof randomisation is to equate groups at the pre-test. Butrandomisation is randomisation and what the researcherhopes for does not always happen.
In Figure 10.4 there still appears to be an interactionbut the difference between the two amounts of alcohol is greater at post-test than at pre-test. Drinking 16 ml ofalcohol has a greater effect on the number of errors madethan 8 ml of alcohol which is what we would anticipate.In pre-test–post-test experimental designs this is the kindof interaction effect we would expect if our independentvariable had an effect.
FIGURE 10.4An interaction effect in a pre-test–post-test design
M10_HOWI4994_03_SE_C10.QXD 10/11/10 15:02 Page 197

198 PART 2 QUANTITATIVE RESEARCH METHODS
There are special problems facing a researcher designing a related design study. If participants are to be studied in every possible condition of the study then the orderought to be counterbalanced such that no order is more common than any other order.These designs are known as Latin square designs. These are discussed in Box 10.3.
The absence of an interaction between time of testingand alcohol is illustrated in Figure 10.5 as the two linesrepresenting the two alcohol conditions are more or lessparallel. There also appears to be a main effect for the timeof testing in that the number of errors made at post-testseem to be greater than the number made at pre-test, but there does not seem to be a difference between the two alcohol conditions.
Figure 10.6 shows an apparent interaction effect for a between-subjects factorial design which consists of thetwo factors of amount of alcohol and level of noise. The difference in the number of errors made between the two alcohol conditions is greater for the 60 dB conditionthan the 30 dB condition.
Figure 10.7 illustrates the lack of an interaction effectfor these two factors. The difference in performancebetween the two alcohol conditions appears to be similarfor the two noise conditions.
There are circumstances where one should be verycareful in interpreting the results of a study. These are circumstances such as those illustrated in Figure 10.6. In this diagram we can see that the only differencebetween the conditions is the 16 ml/60 dB condition. Allother three conditions actually have a similar mean on the numbers of errors. This is clearly purely an inter-action with no main effects at all. The problem is that theway the analysis of variance works means it will tend to
identify main effects which simply do not exist. That isbecause to get the main effects, two groups will be com-bined (the two 30 dB groups and the two 60 dB groups forinstance). In other words, at least part of the interactionwill be subsumed under the main effects.
It is not possible to determine whether there is an interaction between two or more factors simply by looking at the plot of the scores on a graph. It is neces-sary to establish that this is a statistically significant interaction by carrying out a test such as an analysis ofvariance.
FIGURE 10.6An interaction effect in a between-subjects design
FIGURE 10.5No interaction effect in a pre-test–post-test design
FIGURE 10.7No interaction effect in a between-subjects design
M10_HOWI4994_03_SE_C10.QXD 10/11/10 15:02 Page 198

CHAPTER 10 ADVANCED EXPERIMENTAL DESIGN 199
Latin squares to control order effects
Box 10.3 Key Ideas
In a within-subject design you need to control for ordereffects by running the levels or conditions in differentorders. The more conditions you have, the more ordersthere are for running those conditions. With three con-ditions called A, B and C, there are six different orders:ABC; ACB; BAC; BCA; CAB; and CBA. With four con-ditions there are 24 possible orders. With five conditionsthere are 120 possible orders and so on. We can work outthe number of potential orders by multiplying the numberof conditions by each of the numbers that fall below thatnumber. For three conditions this is 3 × 2 × 1 which gives6. For five conditions it is 5 × 4 × 3 × 2 × 1 which gives120. Often there are more possible orders than actual participants. Suppose, for example, you only required 12 participants in a within-subjects design which has fourconditions. In this situation, it is not possible to run all 24 possible orders. To determine which orders to run, onecould randomly select 12 out of the 24 possible orders.However, if you do this, you could not guarantee thateach condition would be run in the same ordinal position(for example, the first position) the same number of timesand that each condition precedes and follows each con-dition once. In other words, you could not control for theseorder effects. The way to control for these order effects isto construct a Latin square.
A Latin square has as many orders as conditions. So a Latin square with four conditions will have four orders.To make a Latin square, perform the following steps:
Create a random order of the conditions. This randomorder will be used to generate the other orders in theLatin square. There are several ways to create this initial random order. Suppose there are four conditionslabelled A, B, C and D. One way is to write each letteron a separate slip of paper or index card, thoroughlyshuffle the papers or cards and choose a sequence.(Randomisation is dealt with on p. 171.)
Suppose the starting random order from step 1 is BACD.Sequentially number the conditions in this randomorder starting with 1. For this example, B = 1, A = 2, C = 3 and D = 4.
To create the first order in the Latin square, put the last number or condition (N) in the third position asfollows:
1, 2, 4, 3
which corresponds to the conditions as initially letteredB, A, D, C. If we had more than four conditions, thenevery subsequent unevenly numbered position (e.g. 5, 7 and so on) would have one less than the previousunevenly numbered position as shown in Table 10.2.
To create the second order in the Latin square add 1 to each number apart from the last number N, whichnow becomes 1. So, in terms of our example with fourconditions, the order is:
2 (1 + 1), 3 (2 + 1), 1 (N), 4 (3 + 1)
which corresponds to the conditions as first lettered A,C, B, D.
To create further orders we simply proceed in the sameway by adding 1 to the previous numbers except thatthe last number (4) becomes the first number (1). So,the order of the third row in our example becomes:
3 (2 + 1), 4 (3 + 1), 2 (1 + 1), 1
which corresponds to the conditions as originally lettered C, D, A, B.
Our Latin square will look as follows:
B, A, D, CA, C, B, DC, D, A, BD, B, C, A
Table 10.2 Position of unevenly numbered conditions in the first order of a Latin square
Order number 1 2 3 4 5 6 7 8 9 10
Condition number 1 2 N 3 N − 1 4 N − 2 5 N − 3 6
M10_HOWI4994_03_SE_C10.QXD 10/11/10 15:02 Page 199
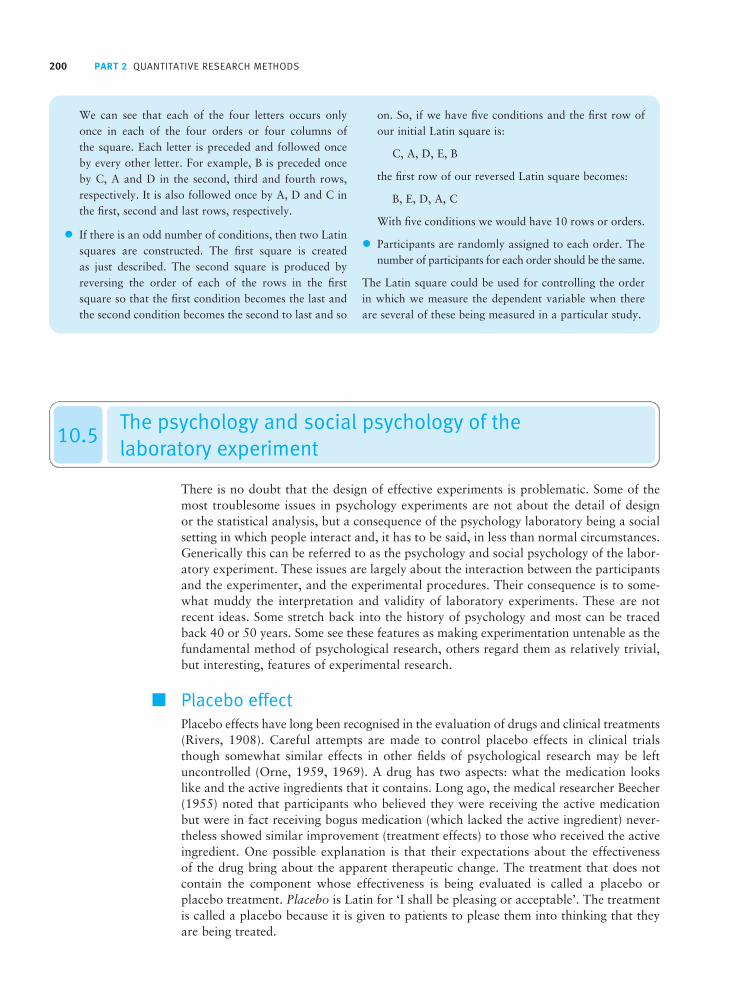
200 PART 2 QUANTITATIVE RESEARCH METHODS
We can see that each of the four letters occurs onlyonce in each of the four orders or four columns of the square. Each letter is preceded and followed onceby every other letter. For example, B is preceded once by C, A and D in the second, third and fourth rows,respectively. It is also followed once by A, D and C inthe first, second and last rows, respectively.
If there is an odd number of conditions, then two Latinsquares are constructed. The first square is created as just described. The second square is produced byreversing the order of each of the rows in the firstsquare so that the first condition becomes the last andthe second condition becomes the second to last and so
on. So, if we have five conditions and the first row ofour initial Latin square is:
C, A, D, E, B
the first row of our reversed Latin square becomes:
B, E, D, A, C
With five conditions we would have 10 rows or orders.
Participants are randomly assigned to each order. Thenumber of participants for each order should be the same.
The Latin square could be used for controlling the orderin which we measure the dependent variable when thereare several of these being measured in a particular study.
10.5The psychology and social psychology of the laboratory experiment
There is no doubt that the design of effective experiments is problematic. Some of themost troublesome issues in psychology experiments are not about the detail of design or the statistical analysis, but a consequence of the psychology laboratory being a socialsetting in which people interact and, it has to be said, in less than normal circumstances.Generically this can be referred to as the psychology and social psychology of the labor-atory experiment. These issues are largely about the interaction between the participantsand the experimenter, and the experimental procedures. Their consequence is to some-what muddy the interpretation and validity of laboratory experiments. These are notrecent ideas. Some stretch back into the history of psychology and most can be tracedback 40 or 50 years. Some see these features as making experimentation untenable as thefundamental method of psychological research, others regard them as relatively trivial,but interesting, features of experimental research.
■ Placebo effectPlacebo effects have long been recognised in the evaluation of drugs and clinical treatments(Rivers, 1908). Careful attempts are made to control placebo effects in clinical trialsthough somewhat similar effects in other fields of psychological research may be leftuncontrolled (Orne, 1959, 1969). A drug has two aspects: what the medication lookslike and the active ingredients that it contains. Long ago, the medical researcher Beecher(1955) noted that participants who believed they were receiving the active medicationbut were in fact receiving bogus medication (which lacked the active ingredient) never-theless showed similar improvement (treatment effects) to those who received the activeingredient. One possible explanation is that their expectations about the effectiveness of the drug bring about the apparent therapeutic change. The treatment that does notcontain the component whose effectiveness is being evaluated is called a placebo orplacebo treatment. Placebo is Latin for ‘I shall be pleasing or acceptable’. The treatmentis called a placebo because it is given to patients to please them into thinking that theyare being treated.
M10_HOWI4994_03_SE_C10.QXD 10/11/10 15:02 Page 200

CHAPTER 10 ADVANCED EXPERIMENTAL DESIGN 201
In clinical trials of the effectiveness of drugs or clinical treatments, participants aretold that either (a) they are being given the treatment (even though they are not) or (b) that they may receive either the placebo or the treatment but they are not told whichthey are receiving. In other words, they may not be aware of (that is they may be ‘blind’to) which they are receiving. Furthermore, the person administrating the study should, ideally, be ignorant of what is actually happening to the participant. It is believed thatthe person responsible for, say, giving out the treatment may unconsciously convey to the participant information about which sort of treatment they are receiving. If theadministrator does not know what treatment is being given, then no subtle cues may be communicated about whether or not the placebo was given, for example. In otherwords, it may be ideal if the administrator is not aware of, or is blind to, the treatmentthey are giving. This is known as a ‘double-blind’ – which means both the participantsin the research and the administrator of the research are ignorant of whether the activeor the placebo treatment has been given.
Sheldrake (1998) surveyed experimental papers that were published in importantjournals in a number of fields. One feature of this survey was the low frequency of theuse of blind experimental procedures. Blind procedures were by far the most common inthe field of parapsychology, where over four out of five studies used blind procedures.This is important since parapsychological research (i.e. into supernatural phenomena) isone type of research about which there is a great deal of scepticism. Hence the need forresearchers in this field to employ the most exacting research methods since critics arealmost certain to identify methodological faults. Equally clearly, some fields of researchdo not equally fear similar criticisms – or else blind procedures would be rather morecommon. So there may be an important lesson – that the more likely one’s findings areto be controversial, the greater the need for methodological rigour in order to avoid public criticism.
■ Experimenter effectsIn all of the concern about experimental design and statistical analysis, it is easy to overlook some important parameters of the experimental situation. If we concentrate on what participants do in an experiment we may ignore what effect the researcher ishaving. There is some evidence that the role of the researcher is not that of a neutral and unbiased collector of scientific data. Instead there is evidence that different charac-teristics of the experimenter may affect the outcome of the research. Some of these characteristics would include factors such as the race and gender of the researcher. Butthere are other features of experimenters which are shared by experimenters in general.An important one of these is that experimenters generally have a commitment to theirresearch and the outcomes of their research. Rosnow (2002) indicates something of the extent to which the experimenter can influence the accuracy of the observations they record. For example, in an overview of a sizeable number of studies involving the observations of several hundreds of researchers, something like one in every hundredobservations are incorrect when measured against objective standards. Some of the inaccuracy appears to be just that, but given that about two-thirds of the errors tendedto support the experimenters’ hypotheses then it would appear fair to accept that thereis a small trend for researchers to make errors which favour their position on a topic(Rosenthal, 1978). Whether or not these ‘consistent’ errors are sufficient to determinethe findings of studies overall is difficult to assess. However, even if they are insufficientacting alone, there is a range of other influences of the researcher which may be com-pounded with recording errors.
Of course, here we are talking about non-intentional errors of which the researcherswould probably be unaware. Furthermore, we should not assume that biases solely existat the level of data collection. There are clearly possibilities of the literature review or
M10_HOWI4994_03_SE_C10.QXD 10/11/10 15:02 Page 201

202 PART 2 QUANTITATIVE RESEARCH METHODS
the conclusions including some form of systematic bias. One of the best ways of dealingwith these is to be always sceptical of the claims of other researchers and check out keyelements of their arguments, including those of Rosenthal. That is the essence of thenotion of the scientific method anyway.
Experimenter expectancy effect
Rosenthal (1963, 1969) raised another potential problem in experimental studies. Theidea is that experimenters may unintentionally influence participants into behaving inthe way that the experimenter wants or desires. Barber (1973, 1976) described this asthe experimenter unintentional expectancy effect. A typical way of investigating thiseffect involves using a number of student experimenters. Participants in the study areasked to rate the degree of success shown in photographs of several different people(Rosenthal and Rubin, 1978). Actually the photographs had been chosen because pre-vious research had shown them to be rated at the neutral midpoint of the success scale.In this study, the student experimenters were deceived into believing either that previousresearch had shown the photographs to be rated as showing success or that the previousresearch had shown the photographs to be showing failure. However, of the 119 stud-ies using this experimental paradigm (procedure), only 27 per cent found that studentexperimenters were affected by their expectations based on the putative previousresearch. So in most cases there was no evidence for expectancy effects. Nevertheless, if over a quarter of studies found evidence of an effect, then it should always be con-sidered a possibility when designing research. Very few studies have included controlconditions to determine to what extent expectancy effects may occur when the focus ofthe study is not the examination of expectancy effects.
■ Demand characteristicsOrne (1962, 1969) suggested that when participating in an experiment, participants areinfluenced by the totality of the situation which provides cues that essentially convey a hypothesis for the situation and perhaps indications of how they should behave. Inmany ways, the concept of demand characteristics cannot be separated from the notionof helpful and cooperative participants. Orne, for example, had noticed that participantsin research when interviewed afterwards make statements indicating that they are awarethat there is some sort of experimental hypothesis and that they, if acting reasonably,should seek to support the researcher in the endeavour. So, for example, a participantmight say ‘I hope that was the sort of thing you wanted’ or ‘I hope that I didn’t mess upyour study’. The demand characteristics explanation takes account of the totality of cuesin the situation – it is not specifically about the experimenter’s behaviour. The primefocus is on the participants and the influence of the totality of the situation on them. Heproposed that certain features or cues of the experimental situation, including the waythat the experimenter behaves, may lead the participant to behave in certain ways. Thesecues are called the demand characteristics of the experiment. This effect is thought to belargely unconscious in that participants are not aware of being affected in this way. Ofcourse, some might question this as the cognitive processes involved seem quite complex.Orne only gives a few examples of studies where demand characteristics may be operatingbut these examples do not seem to quite clinch the matter.
One study examined sensory deprivation effects. The question was whether theapparent effects which researchers had found for the apparent effects of the deprivationof sensory stimulation for several hours could be the result of something else. Could itbe that sensory deprivation effects were simply the result of the participants’ expectationsthat they should be adversely affected (Orne and Scheibe, 1964)? To test this, a study wasdesigned. In one condition participants underwent various procedures which indicated
M10_HOWI4994_03_SE_C10.QXD 10/11/10 15:02 Page 202

CHAPTER 10 ADVANCED EXPERIMENTAL DESIGN 203
that they may be taking part in a study which had deleterious effects. For example, theywere given a physical examination and were told that if they could not stand being inthe sensory deprivation condition any longer then they could press a red ‘panic’ buttonand they would be released from the situation. In the other condition participants wereput in exactly the same physical situation but were simply told that they were acting asthe controls in a sensory deprivation study. The effects of these two conditions wereexamined in terms of 14 different measures (an example of a study using multiple dependentvariables). However, there were significant differences in only 3 of the 13 measures wherethis difference was in the predicted direction.
It has to be stressed that Orne did not regard demand characteristics as just anothernuisance source of variation for the experimenter to control. Indeed, the demand characteristics could not be controlled for, for example, by using sophisticated controlconditions. Instead the demand characteristics needed to be understood using one majorresource – the participants in the study themselves. Rosnow (2002) likens the role ofdemand characteristics to the greengrocer whose thumb is always on the scale. The biasmay be small but it is consistent and in no sense random.
Orne’s solution was to seek out information which would put the researcher on a better track to understanding the meaning of their data. Quasi-control strategies wereoffered which essentially change the status of the participants in the research from that ofthe ‘subject’ to a role which might be described as co-investigators. In the post-experimentinterview, once the participant has been effectively convinced that the experiment isover, the experimenter and participant are free to discuss all aspects of the study. Thingssuch as the meaning of the study as experienced by the participant could be explored.Of course, the participant needs to understand that the experimenter has concerns aboutthe possibility that demand characteristics influenced behaviour in the experiment.
An alternative to this is to carry out a pre-inquiry. This is a mind game really in whichthe participants are asked to imagine that they are participating in the actual study. Theexperimental procedures are described to the participants in the mind experiment in agreat deal of detail. The participant is then asked to describe how they believe that theywould behave in these circumstances. Eventually, the experimenter is in a position tocompare the conjectures about behaviour in the study with what actually happens in thestudy. An assessment may be made of the extent to which demand characteristics mayexplain the participants’ actual behaviours. The problem is, of course, that the behaviourscannot be decisively identified as the consequence of demand characteristics.
Imagine an experiment (disregarding everything you learnt in the ethics chapter) inwhich the experimental group has a lighted cigarette placed against their skin whereasthe control group has an unlighted cigarette placed against their skin. In a quasi-controlpre-inquiry, participants will probably anticipate that the real participants will showsome sort of pain reaction. Would we contemplate explaining such responses in the realexperiment as the result of demand characteristics? Probably not. But what, for example,if in the actual experiment the participants in the lighted cigarette condition actuallyshowed no signs of pain? In these circumstances the demand characteristics explanationsimply is untenable. What, though, if the pre-inquiry study found that participantsexpected that they would remain stoical and stifle the expression of pain? Would we notaccept the demand characteristics explanation in this case? This would surely clarify themeaning of the findings of a study in which participants know that they are participantsof a study.
There are a number of demonstrations by Orne and others that participants in experiments tend to play the role of good participants. That is, they seem especially will-ing to carry out tasks which, ordinarily away from the laboratory, they would refuse todo or question. So it has been shown that participants in a laboratory will do endlessbody press-ups simply at the request of the experimenter. This situation of ‘good faith’in which the participant is keen to serve the needs of the experiment may not always
M10_HOWI4994_03_SE_C10.QXD 10/11/10 15:02 Page 203

204 PART 2 QUANTITATIVE RESEARCH METHODS
exist and it is a very different world now from when these studies were originally carriedout in the middle of the twentieth century. But this too could be accommodated by thenotion of demand characteristics.
Not surprisingly, researchers have investigated demand characteristics experimentally,sometimes using aspects of Orne’s ideas. Demand characteristics have been most commonlyinvestigated in studies manipulating feelings of elation and depression (Westermann, Spies,Stahl and Hesse, 1996).
Velten (1968) examined the effect of demand characteristics by having participants inthe control conditions read various information about the corresponding experimentalcondition – for example, by describing the procedure used in this condition, by askingparticipants to behave in the way they think that participants in that condition wouldbehave, and by asking them to act as if they were in the same mood as that conditionwas designed to produce. These are known as quasi-control studies. Participants in an elation condition rated their mood as significantly less depressed than those in the elation demand characteristics condition and participants in the depression conditionrated their mood as significantly more depressed than those in the depression demandcharacteristics condition.
What to conclude? Orne-style quasi-control studies of the sort described above haveone feature that would be valuable in any study, that participants and researcher gettogether as equals to try to understand the experience of participants in the research. Outof such interviews, information may emerge which can help the researcher understandtheir data. Not to talk to research participants is a bit like burying one’s head in the sandto avoid exposure to problems. Researchers should want to know about every aspect oftheir research – whether or not this knowledge is comfortable. On the other hand, studiesinto the effects of demand characteristics often produce at best only partial evidence of theireffects as we saw above. That is, quasi-participants who simply experience descriptionsof the experimental procedures rarely if ever seem to reproduce the research findings infull. Whether such ‘partial replications’ of the findings of the original study are sufficientto either accept or reject the notion of demand characteristics is difficult to arbitrate on.Furthermore, it is not clear to what extent interviews with participants may themselvesbe subject to demand characteristics where participants tend to give experimenters thekinds of answers that participants think the experimenter wants to hear.
The important lesson learnt from the studies of the social psychology of the laboratoryexperiment is the futility of regarding participants in research as passive recipients ofstimuli which affect their behaviour. The old-fashioned term subject seems to encapsulatethis view better than anything. The modern term participants describes the situationmore accurately.
10.6 Conclusion
Most true or randomised experimental designs include more than two conditions andmeasure more than one dependent variable, which are more often than not treated separately. Where the design consists of a single factor, the number of conditions is lim-ited and may generally consist of no more than four or five conditions. The number offactors that are manipulated in a true or randomised design should also be restricted andmay usually consist of no more than two or three manipulated variables. The reason forthis advice partly rests on the difficulty of carrying out studies with many independentvariables – the planning of them introduces many technical difficulties. Furthermore, the statistical analysis of very complex factorial designs is not easy and may stretch the statistical understanding of many researchers to the limit. For example, numerous
M10_HOWI4994_03_SE_C10.QXD 10/11/10 15:02 Page 204

CHAPTER 10 ADVANCED EXPERIMENTAL DESIGN 205
complex interactions may emerge which are fraught with difficulties of interpretation. A computer program may do the number crunching for you but there its responsibilityends. It is for the researcher to make the best possible sense of the numbers, which isdifficult when there are too many layers of complexity.
Hypotheses often omit consideration of effects due to basic demographic factors such as gender and age. Nevertheless, factorial designs can easily and usefully includesuch factors when numbers of participants permit. Of course, where the participants are, for example, students, age variation may be too small to be worthy of inclusion.Alternatively, where the numbers of females and males are very disproportionate it mayalso be difficult to justify looking for gender differences.
It is wise to make adequate provision in terms of participant numbers for trends to be statistically significant. Otherwise a great deal of effort is wasted. A simple but goodway of doing this is to examine similar studies to inform yourself about what may be theminimum appropriate sample size. Alternatively, by running a pilot study a more directestimate of the likely size of the experimental effect can be made and a sample size chosen which gives that size of effect the chance of being statistically significant. Themore sophisticated way of doing this is to use power analysis. This is discussed in thecompanion book Introduction to Statistics in Psychology (Howitt and Cramer, 2011a).The way in which the results of factorial randomised designs are analysed can also beapplied to the analysis of qualitative variables in non-randomised designs such as surveys,as we shall see in the next chapter.
A pilot study is also an opportunity for exploring the social psychological charac-teristics of the experiment being planned. In particular, it can be regarded as an opportunity to interview participants about their experience of the study. What theyhave to say may confirm the appropriateness of your chosen method but it, equally, may provide food for thought and a stimulus to reconsider some of the detail of theplanned experiment.
Advanced experimental designs extend the basic experimental group–control group paradigm in anumber of ways. Several experimental and control groups may be used. More than one independentvariable may be employed and several measures of the dependent variable.
Because considerable resources may be required to conduct a study, the number of conditions runmust be limited to those which are considered important. It is not advisable simply to extend thenumber of independent variables since this can lead to problems in interpreting the complexity of the output. Further studies may be needed when the interpretation of the data is hampered by a lackof sufficient information.
Multifactorial designs are important since they are not only efficient in terms of the numbers of participants needed, but they can help identify interactions between the independent variables in thestudy. Furthermore, the relative influences of the various factors is revealed in a factorial design.
Research which has insufficient cases to detect the effect under investigation is a waste of effort. The numbers in the cells of an experimental design need to be sufficient to determine that an effectis statistically significant. Previous similar studies may provide indications of appropriate samplesizes or a pilot study may be required to estimate the likely size of the effect of the factors. From this,the minimum sample size to achieve statistical significance may be assessed.
Key points
M10_HOWI4994_03_SE_C10.QXD 10/11/10 15:02 Page 205
206 PART 2 QUANTITATIVE RESEARCH METHODS
ACTIVITIES1. Answer the following questions in terms of the basic design that you produced for the exercise in Chapter 9 to inves-
tigate the effect of unemployment on crime. Can you think of reasons for breaking down the independent variable ofunemployment into more than two conditions? If you can, what would these other conditions be? Are there ways inwhich you think participants may be affected by the manipulation of unemployment which are not part of unemploymentitself? In other words, are there demand-type characteristics which may affect how participants behave? If there are,how would you test or control these? Which conditions would you compare and what would your predictions be aboutthe differences between them? Is there more than one way in which you can operationalise crime? If there is, would you want to include these as additional measures of crime? Are there any subject or other independent variables that you think are worth including? If there are, would you expect any of these to interact with the independent variableof unemployment?
2. What is your nomination for the worst experiment of all time for this year’s Psycho Awards? Explain your choice. Whowould you nominate for the experimenter’s hall of fame and why?
As with most designs, it is advantageous if the cells of a design have the same number of cases. This, for factorial designs, ensures that the effects of the factors are independent of one another. The extent to which factors are not independent can be determined by multiple regression. Many statistical tests work optimally with equal group sizes.
Placebos and double-blind procedural controls should be routinely used in the evaluation of theeffects of drugs to control for the expectations that participants and experimenters may have aboutthe effects of the drugs being tested. Some of these procedures are appropriate in a variety of psychological studies.
In general, it would seem that few researchers incorporate checks on demand characteristics andother social psychological aspects of the laboratory experiment. This may partly be explained by therelative lack of research into such effects in many areas of psychological research. However, since it is beneficial to interview participants about their experiences of the experimental situation, it ispossible to discuss factors such as demand characteristics and expectancy effects with participantsas part of the joint evaluation of the research by experimenter and participants.
M10_HOWI4994_03_SE_C10.QXD 10/11/10 15:02 Page 206

Cross-sectional orcorrelational researchNon-manipulation studies
Overview
CHAPTER 11
Various terms describe research that, unlike the true or randomised experiment, doesnot involve the deliberate manipulation of variables. These terms include ‘correlationalstudy’, ‘survey study’, ‘observational study’ and ‘non-experiment’.
Non-manipulation study is seen as the most accurate and most generic term to describethis type of study as there are problems with the others.
There are many reasons why laboratory/experimental research cannot fulfil all of the research needs of psychology. Sometimes important variables simply cannot bemanipulated effectively. Laboratory experiments can handle only a small number ofvariables at any one time, which makes it difficult to compare variables in terms of theirrelative influence. One cannot use experiments to investigate patterns or relationshipsamong a large number of variables.
Cross-sectional designs are typical of most psychological research. In cross-sectionaldesigns, the same variable is measured on only one occasion for each participant. Thequestion of causality cannot be tested definitively in cross-sectional designs thoughthe relationships obtained are often used to support potential causal interpretations.These designs, however, help determine the direction and the strength of the associationbetween two or more variables. Furthermore, the extent to which this association isaffected by controlling other variables can also be assessed.
M11_HOWI4994_03_SE_C11.QXD 10/11/10 15:03 Page 207

208 PART 2 QUANTITATIVE RESEARCH METHODS
11.1 Introduction
The most common alternative to the true or randomised experiment is variously referredto as a non-experimental, correlational, passive observational, survey or observationalstudy. There are inadequacies with each of these terms. An experiment has the implica-tion of some sort of intervention in a situation in order to assess the consequences of this intervention. This was more or less its meaning in the early years of psychologicalresearch. Gradually the experiment in psychology took on the more formal charac-teristics of randomisation, experimental and control groups, and control of potentially confounding sources of variation. However, in more general terms, an experiment isgenerally defined along the lines of being a test or trial (Allen, 1992) which does not neces-sarily involve all of the formal expectations of the randomised psychology experiment.In this more general context, we could be interested in testing whether one variable, such as academic achievement at school, is related to another variable, such as parentalincome. However, this would be a very loose use of language in psychology and the keyrequirement of the manipulation of a variable is the defining feature. This is clear, forexample, when Campbell and Stanley (1963, p. 1) state that an experiment is taken to refer to ‘research in which variables are manipulated and their effects upon other variables observed’. It should be clear from this that a non-experiment in psychologyrefers to any research which does not involve the manipulation of a variable. However,it may be better to state this directly by referring to a non-manipulation rather than anon-experimental study.
Campbell and Stanley (1963, p. 64) use the term ‘correlational’ to describe designswhich do not entail the manipulation of variables. Today it is a very common term to describe this sort of research. Later, however, Cook and Campbell (1979, p. 295)point out that the term ‘correlational’ describes a statistical technique, not a researchdesign. So correlational methods can be used to analyse the data from an experiment just as they can be used in many other sorts of quantitative research. A particular set of statistical tests have traditionally been applied to the data from experiments (e.g. t-tests, analyses of variance). However, it is perfectly feasible to analyse the same experiment with a correlation coefficient or multiple regression or other techniques. It is important to appreciate that the common distinction between correlation and differences between means is more apparent than real (see Box 11.1). In the same way,data from non-experimental studies can frequently be analysed using the statistical techniques common in reports of experiments – t-tests and analyses of variance, forexample. We would most probably apply a two-way analysis of variance to deter-mine whether the scores on a measure of depression varied according to the gender and the marital status of participants. Although researchers would not normally do this, the same data could be analysed using multiple regression techniques. In otherwords, analysis of variance and multiple regression are closely linked. This is quite asophisticated matter.
Although it never gained popularity, Cook and Campbell (1979, p. 296) suggested theterm passive observational to describe a non-manipulation study. The adjective passiveimplies that the study does not involve a manipulation in this context. However, to refer to most research procedures as being passive reflects the situation very poorly. Forinstance, observation itself is often thought of as active rather than passive. However,like other forms of human perception, there is a degree of selectivity in terms of what isbeing observed (Pedhazur and Schmelkin, 1991, p. 142). Furthermore, even the value of the term ‘observational’ in this context is problematic since it can be equally applied to the data collection methods in experiments and other types of research. As observationcan be used in a true or randomised experiment, this term does not exclude randomised
M11_HOWI4994_03_SE_C11.QXD 10/11/10 15:03 Page 208

CHAPTER 11 CROSS-SECTIONAL OR CORRELATIONAL RESEARCH 209
studies. Cook and Campbell (1979, p. 296) themselves objected to using the term ‘observational study’ because it would apply to what they called quasi-experimentswhich did not involve randomisation.
The term ‘survey’ is also not particularly appropriate either. It too refers to a methodof data collection which typically involves asking people questions. It also has the con-notation of drawing a precise sample from a population such as in stratified randomsampling (see p. 233). Many studies in psychology have neither of these features and yetare not randomised experiments.
In view of the lack of a satisfactory term, we have given in to the temptation to use non-manipulation study to refer to this kind of study. This term is less general thannon-experimental, refers to the essential characteristic of an experiment and does notdescribe a method of data collection. However, we realise we are even less likely thanCook and Campbell (1979, p. 295) ‘to change well-established usage’. In the majorityof the social sciences, the distinction would not be very important. In psychology it isimportant for the simple reason that psychology alone among the social sciences has astrong commitment to laboratory experiment. Of course, medicine and biology do havea tradition of strict experimentation and may have similar problems over terminology.Psychology has its feet in both the social and the biological sciences.
11.2 Cross-sectional designs
The most basic design for a cross-sectional study involves just two variables. These variables may both be scores, may both be nominal categories, or there may be a mixtureof nominal and score variables. For example, we could examine the relationship betweengender and a diagnosis of depression. In this case both variables would consist of
Tests of correlation versus tests of difference
Box 11.1 Key Ideas
Although at first there may seem to be a confusing mass of different statistical techniques, many of them are veryclosely related as they are based on the same general statistical model. For example, both a Pearson’s productmoment correlation (r) and an unrelated t-test for datawith similar variances can be used to determine the rela-tionship between a dichotomous variable such as genderand a continuous variable such as scores on a measure of depression. Both these tests will give you the samesignificance level when applied to the same data. The relationship between the two tests is
r = t2
t2 + df
where df stands for the degrees of freedom. The degrees of freedom are two fewer than the total number of cases.
The dichotomous variable could equally be the experi-mental condition versus the control condition. Hence the applicability of both tests to simple experiments. The dichotomous variable is coded 1 and 2 for the two different values whether the variable being consideredis gender or the independent variable of an experiment(this is an arbitrary coding and could be reversed if one wished).
M11_HOWI4994_03_SE_C11.QXD 10/11/10 15:03 Page 209

210 PART 2 QUANTITATIVE RESEARCH METHODS
two binary values – male versus female, diagnosed as depressed versus not diagnosed asdepressed. Such basic designs would provide very limited information which can restricttheir interest to researchers and consequently their use in professional research. They are probably too simple to warrant the time and effort expended when they could benefit from the collection of a wider variety of data with possibly little or no more effort on the part of an experienced researcher. This would be the more usual approachand it is one that should be naturally adopted by student researchers.
So, ideally, you should think in terms of a minimum of three variables for a cross-sectional study but realistically there are advantages in extending this further. The reason for considering a minimum of three variables is that the third variable introducesthe possibility of including controls for potentially confounding variables or investigat-ing possible intervening variables. There is often every advantage of introducing morevariables and more than one measure of the same variable. This is not an invitation tothrow into a study every variable that you can think of and have a means of measuring.The reasons for adding in more than the minimum number of variables is that the additional information they yield has the potential to clarify the meaning of the relation-ship between your primary variables of interest. Ideally this is a careful and consideredprocess in which the researcher anticipates the possible outcomes of the research andadds in additional variables which may contribute positively to assessing just what theoutcome means. Merely throwing in everything is likely to lead to more confusion ratherthan clarification. So don’t do it.
The cross-sectional design is as difficult to execute as any other form of study, includ-ing the laboratory experiment. The skills required to effectively carry out field work are not always the same as those for doing experiments, but they are in no sense lessdemanding. Indeed, when it comes to the effective statistical analysis of cross-sectionaldata, this may be more complex than that required for some laboratory experiments.The reason for this is that non-manipulation studies employ statistical controls forunwanted influences whereas experimental studies employ procedural controls to a similar end. Furthermore, the cross-sectional study may be more demanding in terms of numbers of participants simply because the relationship between the variables ofinterest is generally smaller than would be expected in a laboratory experiment. In the laboratory, it is possible to maximise the obtained relationships by controlling for the ‘noise’ of other variables – that is by standardising and controlling as much as possible. In a cross-sectional design, we would expect the relationships between variables to be small and a correlation of about .30 would be considered quite a promising trend by many researchers. For a correlation of this size to be statisticallysignificant at the two-tailed 5 per cent or .05 level would require a minimum sample size of over 40.
The need for statistical controls for the influence of third variables in cross-sectionaland all non-manipulation studies makes considerable demands on the statistical know-ledge of the researcher. Many of the appropriate statistics are not discussed in manyintroductory statistics texts in psychology. One exception to this is Introduction toStatistics in Psychology (Howitt and Cramer, 2011a). Given the complexity of some of the statistical techniques together with the substantial numbers of variables that can be involved means that the researcher really ought to use a computer program capable of analysing these sorts of data well. The companion computing text Introduction toSPSS Statistics in Psychology (Howitt and Cramer, 2011b) will help you make lightwork of this task.
Because many variables which are of interest tend to be correlated with each other,samples have to be larger when the relationship between three or more variables areinvestigated together. It is difficult to give an exact indication of how big a sampleshould be because this depends on the size of the associations that are expected, but ingeneral the size of the sample should be more than 60.
M11_HOWI4994_03_SE_C11.QXD 10/11/10 15:03 Page 210

CHAPTER 11 CROSS-SECTIONAL OR CORRELATIONAL RESEARCH 211
11.3 The case for non-manipulation studies
There are a number of circumstances which encourage the use of non-manipulation studiesjust as there are other circumstances in which the randomised laboratory experimentmay be employed to better effect (see Figure 11.1):
Naturalistic research settings Generally speaking, randomised experiments have adegree of artificiality which varies but is probably mostly present. Although there havebeen a number of successful attempts to employ randomised experiments in the ‘field’(natural settings), these have been relatively few and risked losing the advantages ofthe laboratory experiment. Consequently, given that research is a matter of choices,many psychologists prefer not to do randomised experiments at all. There are argumentson all sides, but research is a matter of balancing a variety of considerations and thatbalance will vary between researchers and across circumstances. So non-manipulationstudies can seem to be much more naturalistic.
Manipulation not possible It is not always possible, practical or ethical to manipulatethe variable of interest. This would be the case, for example, if you were interested in looking at the effects of divorce on children. In this situation you could compare
FIGURE 11.1 A summary of the various uses of non-manipulative studies
M11_HOWI4994_03_SE_C11.QXD 10/11/10 15:03 Page 211

212 PART 2 QUANTITATIVE RESEARCH METHODS
children from parents who were together with children from parents who were divorced.However, divorce cannot be assigned at random by the researcher.
Establishing an association You may wish to see whether there is a relationshipbetween two or more variables before committing resources to complex experimentsdesigned to identify causal relationships between those variables. For example, youmay wish to determine whether there is an association between how much conflictthere is in a relationship and how satisfied each partner is with the relationship beforeseeing whether reducing conflict increases satisfaction with the relationship. Findingan association does not mean that there is a causal relationship between two variables.This could be an example of where a third variable is confusing things. For example,low income may make for stressful circumstances in which couples are in conflictmore often and are less satisfied with their relationship because shortage of cash makesthem less positive about life in general. In this example, this confounding factor ofincome makes it appear that conflict is causally related to dissatisfaction when it isnot. Conversely, the failure to find an association between two variables does not necessarily mean that those variables are not related. The link between the variablesmay be suppressed by other variables. For instance, there may be an association betweenconflict and dissatisfaction, but this association may be suppressed by the presence of children. Having children may create more conflict between partners, but may alsocause them to be more fulfilled as a couple.
Natural variation In experiments, every effort is made to control for variables whichmay influence the association between the independent and dependent variables. In a sense, by getting rid of nuisance sources of variation, the key relationship will be revealed at its strongest. But what if your desire is to understand what the relationship is when these other factors are present, as they normally would be in reallife? For example, when manipulating a variable you may find that there is a verystrong association between the dependent variable and the independent variable butthis association may be weaker when it is examined in a natural setting.
Comparing the sizes of associations You may want to find out which of a numberof variables are most strongly associated with a particular variable. This may helpdecide which ones would be the most promising to investigate further or which onesneed controlling in a true experiment. For example, if you wanted to develop a programme for improving academic achievement at school, it would be best to lookat those variables which were most strongly related to academic achievement ratherthan those which were weakly related to it.
Prediction and selection You may be interested in determining which variables best predict an outcome. These variables may then be used for selecting the mostpromising candidates. For example, you may be interested in finding out which criteria best predict which prospective students are likely to be awarded the highestdegree marks in psychology and use these criteria to select applicants.
Explanatory models You may want to develop what you consider to be an explan-atory model for some behaviour and to see whether your data fit that model beforechecking in detail whether your assumptions about causes are correct. For example,you may think that children with wealthier parents perform better academically than children with poorer parents because of differences in the parents’ interest inhow well their children do academically. It may be that children with wealthier parents have parents who show more interest in their academic progress than childrenwith poorer parents. As a consequence, children of wealthier parents may try harderand so do better. If this is the case, parental interest would be a mediating or inter-vening variable which mediates or intervenes between parental wealth and academicachievement.
M11_HOWI4994_03_SE_C11.QXD 10/11/10 15:03 Page 212

CHAPTER 11 CROSS-SECTIONAL OR CORRELATIONAL RESEARCH 213
Structure You may be interested in determining what the structure is of some characteristic such as intelligence, personality, political attitudes or love. For example, you may be interested in seeing whether there is a general factor of intelligence orwhether there are separate factors of intelligence such as memory, verbal ability, spatial ability and so on.
Developing or refining measures You may want to develop or refine a measure inwhich you compare your new or refined measure with some criterion. For instance,you may want to refine a measure of social support. More social support has beenfound to be related to less depression so you may wish to see whether your refinedmeasure of social support correlates more strongly with depression than the originalmeasure.
Temporal change You may wish to see whether a particular behaviour changes overtime and, if it does, to what variables those changes are related. For example, has theincidence of divorce increased over the last 50 years and, if so, with what factors isthat increase associated?
Temporal direction of associations You may wish to determine what the temporaldirection of the association is between two variables. For example, does parentalinterest in a child’s academic achievement at school affect the child’s achievement or is the causal direction of this association the other way round with the child’s academic achievement influencing the parents’ interest in how well their child is doingacademically? Of course, both these casual sequences may be possible. An associationwhere both variables affect each other is variously known as a bi-directional, bilateral,non-recursive, reciprocal or two-way association.
Chapter 12 discusses methods of researching changes over time.
11.4 Key concepts in the analysis of cross-sectional studies
There are a number of conceptual issues in the analysis of cross-sectional studies whichneed to be understood as a prelude to the more purely statistical matters (see Figure 11.2).
■ Varying reliability of measuresThe concept of reliability is quite complex and is dealt with in detail in Chapter 15.There are two broad types of reliability. The first type is the internal consistency of apsychological scale or measure (i.e. how well the items correlate with the other itemsostensibly measuring the same thing). This may be measured as the split-half reliabilitybut is most often measured as Cronbach’s (1951) alpha which is a more comprehensiveindex than that of split-half reliability. Generally speaking a reliability of about .70would be regarded as satisfactory (Nunnally, 1978). The other type of reliability is thestability of the measure over time. This is commonly measured using test–retest reliability.All of these measures vary from 0 to 1.00 just like a correlation coefficient.
The crucial fact about reliability is that it limits the maximum correlation a variablemay have with another variable. The maximum value of the correlation of a variable witha reliability of .80 with any other variable is .80, that is, the figure for reliability. Themaximum value that the correlation between two variables may have is the square rootof the product of the two reliabilities. That is, if one reliability is .80 and the reliabilityof the other measure is .50 then the maximum correlation between these two variables
M11_HOWI4994_03_SE_C11.QXD 10/11/10 15:03 Page 213
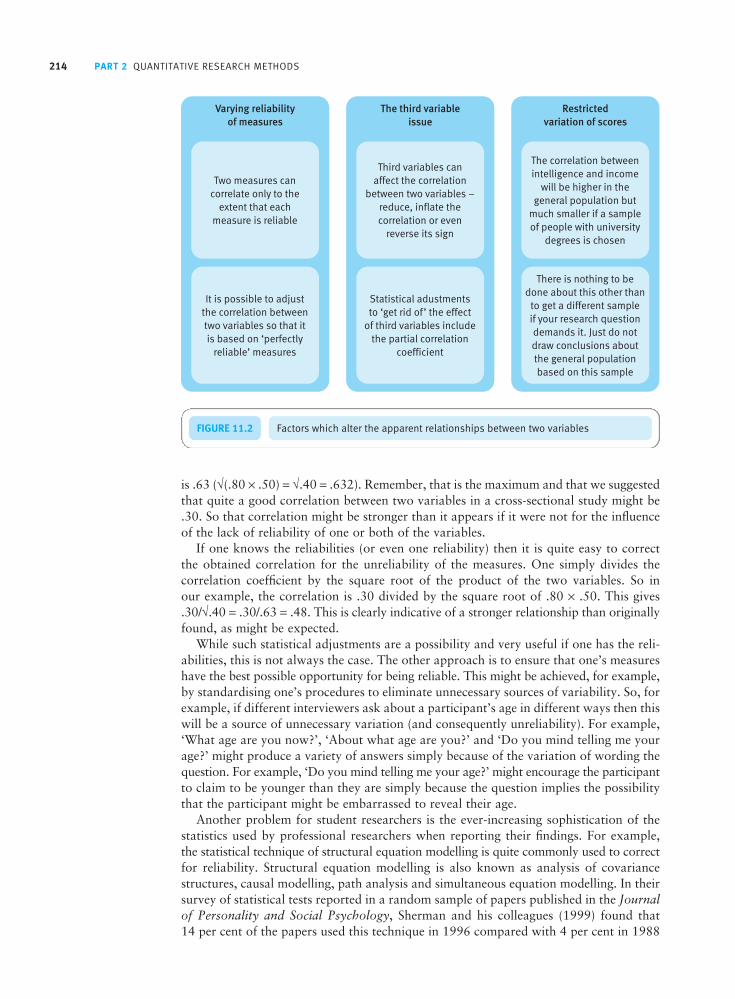
214 PART 2 QUANTITATIVE RESEARCH METHODS
is .63 (√(.80 × .50) = √.40 = .632). Remember, that is the maximum and that we suggestedthat quite a good correlation between two variables in a cross-sectional study might be.30. So that correlation might be stronger than it appears if it were not for the influenceof the lack of reliability of one or both of the variables.
If one knows the reliabilities (or even one reliability) then it is quite easy to correctthe obtained correlation for the unreliability of the measures. One simply divides thecorrelation coefficient by the square root of the product of the two variables. So in our example, the correlation is .30 divided by the square root of .80 × .50. This gives.30/√.40 = .30/.63 = .48. This is clearly indicative of a stronger relationship than originallyfound, as might be expected.
While such statistical adjustments are a possibility and very useful if one has the reli-abilities, this is not always the case. The other approach is to ensure that one’s measureshave the best possible opportunity for being reliable. This might be achieved, for example,by standardising one’s procedures to eliminate unnecessary sources of variability. So, forexample, if different interviewers ask about a participant’s age in different ways then thiswill be a source of unnecessary variation (and consequently unreliability). For example,‘What age are you now?’, ‘About what age are you?’ and ‘Do you mind telling me yourage?’ might produce a variety of answers simply because of the variation of wording thequestion. For example, ‘Do you mind telling me your age?’ might encourage the participantto claim to be younger than they are simply because the question implies the possibilitythat the participant might be embarrassed to reveal their age.
Another problem for student researchers is the ever-increasing sophistication of thestatistics used by professional researchers when reporting their findings. For example,the statistical technique of structural equation modelling is quite commonly used to correctfor reliability. Structural equation modelling is also known as analysis of covariancestructures, causal modelling, path analysis and simultaneous equation modelling. In theirsurvey of statistical tests reported in a random sample of papers published in the Journalof Personality and Social Psychology, Sherman and his colleagues (1999) found that 14 per cent of the papers used this technique in 1996 compared with 4 per cent in 1988
FIGURE 11.2 Factors which alter the apparent relationships between two variables
M11_HOWI4994_03_SE_C11.QXD 10/11/10 15:03 Page 214

CHAPTER 11 CROSS-SECTIONAL OR CORRELATIONAL RESEARCH 215
and 3 per cent in 1978. A brief introduction to structural equation modelling may be foundin our companion book, Introduction to SPSS Statistics in Psychology (Howitt and Cramer,2011b). For the example above, structural equation modelling gives a standardisedcoefficient which has the same value as the correlation corrected for unreliability. Wecannot imagine that undergraduate students would use this technique except when closelysupervised by an academic but postgraduate students may well be expected to use it.
■ The third variable issueThe confounding variable problem is the classic stumbling block to claiming causal relationships in non-experimental research. The problem is really two fold. The firstaspect is that we cannot be sure that the relationship between two variables cannot beexplained by the fact that both of them are to a degree correlated with a third variable;these relationships may bring about the original correlation. This, remember, is in thecontext of trying to establish whether variable A is the cause of variable B. The otherproblem is that it is very difficult to anticipate quite what the effect of a third variable is– it actually can increase correlations as well as decrease them. Either way it confuses themeaning of the correlation between variables A and B.
Suppose we find that the amount of support in a relationship is positively related tohow satisfied partners are. The correlation is .50 as shown in Figure 11.3. Further supposethat the couple’s income is also positively related to both how supportive the partners areand how satisfied they are with the relationship. Income is correlated .60 with supportand .40 with satisfaction. Because income is also positively related to both support andsatisfaction it is possible that part or all of the association between support and satisfactionis accounted for by income. To determine if this is the case, we can partial out the influenceof income. In other words, we can remove the influence of income. One way of doingthis is to use partial correlation. This is the statistical terminology for what psychologistswould normally call controlling for a third variable. That is, partialling = controlling.
Partialling is quite straightforward computationally. The basic formula is relativelyeasy to compute. Partialling is discussed in detail in the companion book Introductionto Statistics in Psychology (Howitt and Cramer, 2011a). However, we recommend using SPSS Statistics or some other package since this considerably eases the burden of calculation and risk of error when controlling for several variables at the same time.It is also infinitely less tedious.
The (partial or first-order) correlation between support and satisfaction is .35 onceincome has been partialled out. This is a smaller value than the original (zero order) correlation of .50. Consequently, income explains part of the association between support and satisfaction. How is this calculated?
The following formula is used to partial out one variable where A refers to the first variable of support, B to the second variable of satisfaction and C to the third orconfounding variable of income:
rAB.C = rAB − (rAC × rBC)
(1 − r2AC) × (1 − r2
BC)
FIGURE 11.3 Correlations between support, satisfaction and income
M11_HOWI4994_03_SE_C11.QXD 10/11/10 15:03 Page 215

216 PART 2 QUANTITATIVE RESEARCH METHODS
We can substitute the correlations in Figure 11.3 in this formula:
rAB.C = = = .35
Sometimes the influence of the third variable is to make the association between thetwo main variables bigger than it actually is. This kind of variable is known as a suppressorvariable. The sign of the partial correlation can also be opposite to that of the originalcorrelation (Cramer, 2003). This radical change occurs when the correlation has thesame sign as, and is smaller than, the product of the other two correlations. An exampleof this is shown in Figure 11.4. The correlation between support and satisfaction is .30.The signs of all three correlations are positive. The product of the other two correlationsis .48 (.60 × .80 = .48) which is larger than the correlation of .30 between support and satisfaction. When income is partialled out, the correlation between support and satisfaction becomes −.38. In other words, when income is removed, more support isassociated with less rather than greater satisfaction. Rosenberg (1968) refers to variableswhich when partialled out change the direction of the sign between two other variablesas distorter variables. He discusses these in terms of contingency tables of frequenciesrather than correlation as is done here. Cohen and Cohen (1983), on the other hand,include change of sign as a suppressor effect. Different types of third variables are dis-cussed in detail in Chapter 12.
■ Restricted variation of scoresThis is probably the most technical of the considerations which lower the correlationbetween two variables. Equally, it is probably the least well recognised by researchers.A good example of a reduced correlation involves the relationship between intelligenceand creativity in university students. University students have a smaller range of intelligencethan the general population because they have been selected for university as they aremore intelligent. The correlation between intelligence and creativity is greater in sampleswhere the range of intelligence is less restricted.
To be formal about this, the size of the correlation between two variables is reducedwhen:
the range or variation of scores on one variable is restricted and
when the scatter of the scores of two variables about the correlation line is fairly constantover the entire length of that line (e.g. Pedhazur and Schmelkin, 1991, pp. 44–5).
A correlation line is the straight line which we would draw through the points of a scattergram (i.e. it is a regression line) but the scores on the two variables have been turned into z-scores or standard scores. This is simply done by subtracting themean of the scores and then dividing it by the standard deviation. This straight line
.260
.733
.50 − (.60 × .40)
(1 − .602) × (1 − .402)
FIGURE 11.4Partialling leading to a change in sign of the association between support andsatisfaction
M11_HOWI4994_03_SE_C11.QXD 10/11/10 15:03 Page 216

CHAPTER 11 CROSS-SECTIONAL OR CORRELATIONAL RESEARCH 217
best describes the linear relationship between these two variables (see, for example,Figure 11.5). If the scatter of scores around the correlation line is not consistent, then it is not possible to know what the size of the correlation is as this will vary accordingto the scatter of the scores.
The effects of restricting range can be demonstrated quite easily with the small set of ten scores shown in Table 11.1. The two variables are, respectively, called A and B.The scores of these two variables are plotted in the scattergram in Figure 11.5 which alsoshows the correlation line through them. Although the set of scores is small we can seethat they are scattered in a consistent way around the correlation line. The correlationfor the ten scores is about .74. If we reduce the variation of scores on B by selecting thefive cases with scores either above or below 5, the correlation is smaller at about .45.The correlation is the same in these two smaller groups because the scatter of scoresaround the correlation line is the same in both of them.
Of course, you need to know whether you have a potential problem due to therestricted range of scores. You can gain some idea of this if you know what the mean orthe standard deviation of the unrestricted scores is:
FIGURE 11.5 Scattergram with a correlation line
Table 11.1 Scores on two variables for ten cases
Case number A B Case number A B
1 1 1 6 6 8
2 1 3 7 7 4
3 2 4 8 8 6
4 3 6 9 9 7
5 4 2 10 9 9
M11_HOWI4994_03_SE_C11.QXD 10/11/10 15:03 Page 217

218 PART 2 QUANTITATIVE RESEARCH METHODS
If the mean score is much higher (or lower) than the mean score of unrestricted scores,then the variation in scores is more likely to be restricted as the range for scores to be higher (or lower) than the mean is reduced. For example, the mean score for thetwo variables in Table 11.1 is 5.00. The mean score for the five cases scoring higherthan 5 on variable B is 7.20 [(6 + 8 + 6 + 7 + 9)/5 = 36/5 = 7.20]. As the mean forthese five scores is higher than the mean of 5.00 for the ten cases, the potential rangefor these five scores to be higher is less than that for the ten scores.
The standard deviation (or variance) is a direct measure of variance. If the standarddeviation of a set of scores is less than that for the unrestricted scores, then the variance is reduced. The standard deviation for variable B of the ten scores is about2.63, whereas it is about 1.30 for the five scores both above and below the mean scoreof 5.
It is important to understand that generally in your research the effects of the rangeof scores may be of no consequence. For example, if one is interested in the relation-ship between creativity and intelligence in university students then there is no problem.However, it would be a problem if one were interested in the general relationship betweenintelligence and creativity. In this case, the restriction on the range of intelligence in theuniversity sample might be so great that no significant relationship emerges. It is mis-leading to conclude from this that creativity is not related to intelligence since it may well be in the general population. Equally, you may see that studies, ostensibly on thesame topic, may appear to yield seemingly incompatible findings simply because of thedifferences in the samples employed.
Another implication, of course, is of the undesirability of using restricted sampleswhen exploring general psychological processes. The study of university students as the primary source of psychological data is not bad simply because of the restrictions of the sampling but also because of the restrictions likely on the distributions of the keyvariables.
There is more information on statistics appropriate to the analysis of cross-sectionaldesigns in Chapter 12. Multiple regression and path analysis are discussed there and canhelp the researcher take full advantage of the fullness of the data which cross-sectionaland other non-manipulation designs can provide.
11.5 Conclusion
There are numerous examples of research which cannot meet the requirements of the randomised controlled experiment. Indeed, psychology is somewhat unusual in itsemphasis on laboratory experiments compared with other social science disciplines. We have used the term non-manipulation design for this sort of study though weacknowledge the awkwardness of this and the many other terms for this type of design.Non-manipulation designs are also used to determine the size of the association betweenvariables as they occur naturally. Studies using these designs generally involve testingmore cases than true or randomised experiments because the size of the associations or effects are expected to be weaker. Most of these studies use a cross-sectional designwhere cases are measured on only one occasion (Sherman et al., 1999). Although thecausal order of variables cannot generally be determined from cross-sectional designs,these studies often seek to explain one variable in terms of other variables. In otherwords, they assume that one variable is the criterion or dependent variable while theother variables are predictor or independent variables.
M11_HOWI4994_03_SE_C11.QXD 10/11/10 15:03 Page 218

CHAPTER 11 CROSS-SECTIONAL OR CORRELATIONAL RESEARCH 219
The main alternative to controlled and randomised experiments is the cross-sectional or non-manipulation study. There are numerous problems with the available terminology. We have used the term non-manipulation study.
Non-manipulation studies enable a large number of variables to be measured relatively easily undermore natural conditions than a true or randomised study. This allows the relationships between thesevariables to be investigated. The cost is that these studies can be complex to analyse especially whenquestions of causality need to be raised.
The more unreliable measures are, the lower the association will be between those measures.Adjustments are possible to allow for this.
Partial correlation coefficients which control for third variable effects are easily computed though acomputer is probably essential if one wishes to control for several third variables.
Restricting the range of scores on one of the variables will reduce the correlation between two variables.
Key points
ACTIVITIES1. Design a non-manipulation study that investigates the hypothesis that unemployment may lead to crime. How would
you measure these two variables? What other variables would you investigate? How would you measure these othervariables? How would you select your participants and how many would you have? What would you tell participants thestudy was about? How would you analyse the results?
2. What would be the difficulties of studying in the psychology laboratory the hypothesis that unemployment may lead to crime?
M11_HOWI4994_03_SE_C11.QXD 10/11/10 15:03 Page 219

Longitudinal studies
Overview
CHAPTER 12
Longitudinal studies examine phenomena at different points in time.
A panel or prospective study involves looking at the same group of participants ontwo or more distinct occasions over time.
Ideally exactly the same variables are measured on all occasions, although you willfind studies where this is not achieved.
Longitudinal studies may be used to explore the temporal ordering or sequence of thesevariables (i.e. patterns of variation over time). This is useful in determining whetherthe association is two-way rather than one-way, that is, both variables mutually affectingeach other although possibly to different degrees.
The concepts of internal and external validity apply particularly to longitudinal studies. The researcher needs to understand how various factors such as history andchanges in instrumentation may threaten the value of a study.
Cross-lagged correlations are the correlations between variable X and variable Y whenthese variables are measured at different points in time. A lagged correlation is thecorrelation between variable X measured at time 1 and variable X measured at time 2.
Multiple regression and path analysis are important statistical techniques in the ana-lysis of complex non-manipulation studies. The extra information from a longitudinalstudy adds considerably to their power.
M12_HOWI4994_03_SE_C12.QXD 10/11/10 15:03 Page 220
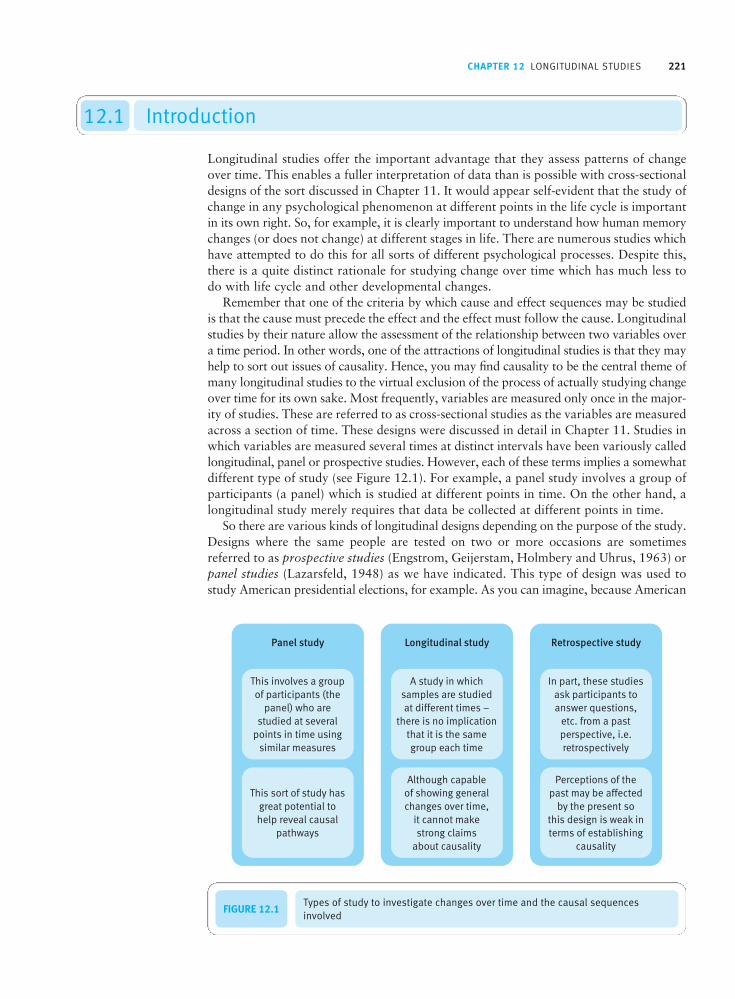
CHAPTER 12 LONGITUDINAL STUDIES 221
12.1 Introduction
Longitudinal studies offer the important advantage that they assess patterns of changeover time. This enables a fuller interpretation of data than is possible with cross-sectionaldesigns of the sort discussed in Chapter 11. It would appear self-evident that the study ofchange in any psychological phenomenon at different points in the life cycle is importantin its own right. So, for example, it is clearly important to understand how human memorychanges (or does not change) at different stages in life. There are numerous studies whichhave attempted to do this for all sorts of different psychological processes. Despite this,there is a quite distinct rationale for studying change over time which has much less todo with life cycle and other developmental changes.
Remember that one of the criteria by which cause and effect sequences may be studiedis that the cause must precede the effect and the effect must follow the cause. Longitudinalstudies by their nature allow the assessment of the relationship between two variables overa time period. In other words, one of the attractions of longitudinal studies is that they mayhelp to sort out issues of causality. Hence, you may find causality to be the central theme ofmany longitudinal studies to the virtual exclusion of the process of actually studying changeover time for its own sake. Most frequently, variables are measured only once in the major-ity of studies. These are referred to as cross-sectional studies as the variables are measuredacross a section of time. These designs were discussed in detail in Chapter 11. Studies inwhich variables are measured several times at distinct intervals have been variously calledlongitudinal, panel or prospective studies. However, each of these terms implies a somewhatdifferent type of study (see Figure 12.1). For example, a panel study involves a group ofparticipants (a panel) which is studied at different points in time. On the other hand, alongitudinal study merely requires that data be collected at different points in time.
So there are various kinds of longitudinal designs depending on the purpose of the study.Designs where the same people are tested on two or more occasions are sometimesreferred to as prospective studies (Engstrom, Geijerstam, Holmbery and Uhrus, 1963) orpanel studies (Lazarsfeld, 1948) as we have indicated. This type of design was used tostudy American presidential elections, for example. As you can imagine, because American
FIGURE 12.1Types of study to investigate changes over time and the causal sequencesinvolved
M12_HOWI4994_03_SE_C12.QXD 10/11/10 15:03 Page 221

222 PART 2 QUANTITATIVE RESEARCH METHODS
elections take place over a number of months every four years, voters are subject to agreat deal of media and other pressure. Some change their minds about the candidates,some change their minds about the parties they were intending to vote for. Some changetheir minds again later still. So there are enormous advantages in being able to interviewand re-interview the same group of participants at different points during the election.The alternative would be to study the electorate at several different points during theelection but using different samples of the electorate each time. This causes difficultiessince although it is possible to see what changes over time, it is not possible to relate thesechanges to what went before easily. So such a design might fail to provide the researcherwith information about what sort of person changed their minds under the influence of,say, the media and their peers.
There would be enormous benefit in being able to study criminals over the long term.Some such studies have been done. For example, Farrington (1996) has studied the same
Threats to internal and external validity
Box 12.1 Key Ideas
The concepts of internal and external validity originate in the work of Campbell and Stanley (1963). They areparticularly important and salient to longitudinal studies.
Internal validity is concerned with the question ofwhether or not the relationship between two variables iscausal. That is, does the study help the researcher identifythe cause and effect sequence between the two variables?It also refers to the situation where there is no empiricalrelationship between two variables. The question is, then,whether this means that there is no causal relationship or whether there is a relationship which is being hiddendue to the masking influence of other variables. Cook andCampbell (1979) list a whole range of what they refer to as ‘threats to internal validity’. Some of these are listedbelow and described briefly:
History Changes may occur between a pre-test and a post-test which are nothing to do with the effect ofthe variable of interest to the researcher. In laboratoryexperiments participants are usually protected from thesefactors. Greene (1990) was investigating the influenceof eyewitness evidence on ‘juries’ under laboratory conditions. She found that a spate of news coverage of a notorious case where a man had been shown to beunjustly convicted on the basis of eyewitness evidenceaffected things in the laboratory. Her ‘juries’ were, fora period of time, much less likely to convict on thebasis of eyewitness testimony.
Instrumentation A change over time may be due tochanges in the measuring instrument over time. In thesimplest cases, it is not unknown for researchers to use
different versions of a measuring instrument at differ-ent points in time. But the instrumentation may changefor other reasons. For example, a question asking how‘gay’ someone felt would have had a very differentmeaning 50 years ago from today.
Maturation During the course of a longitudinal studya variety of maturation changes may occur. Participantsbecome more experienced, more knowledgeable, lessenergetic and so forth.
Mortality People may drop out of the study. Thismay be systematically related to the experimental condition or some other characteristics. This will notbe at random and may result in apparent changes whennone has occurred.
Statistical regression If groups of people are selectedto be, say, extremely high and extremely low on aggres-sion at point 1 in time, then their scores on aggressionat point 2 in time will tend to converge. That is, thehigh scorers get lower scores than before and the lowscorers get higher scores than before. This is purely astatistical artefact known as regression to the mean.
Testing People who are tested on a measure may bebetter on that measure when they are retested later simply because they are more familiar with its contentsor because they have had practice.
External validity is closely related to the issue of gener-alisation discussed in detail in Chapter 4. It has to do withgeneralising findings to other groups of individuals, othergeographic settings and other periods of time.
M12_HOWI4994_03_SE_C12.QXD 10/11/10 15:03 Page 222

delinquent children from early childhood through adulthood. As can be imagined, thelogistical difficulties are enormous. Another example is the study of criminals who starttheir criminal careers late on in life. This is much more problematic to study and is, as aconsequence, little investigated. If you wished to study the criminal careers of late-onsetcriminals then an enormous sample of children would be required. Some may turn outto be late-onset criminals but the vast majority would not. It is obviously easier to startwith a sample of delinquents and study their progress than to try to obtain a sample ofchildren, some of whom will turn criminal late in life. Hence the rarity of such studies.
Retrospective studies are ones in which information is sought from participants about events that happened prior to the time that they were interviewed. Usually thisalso involves the collection of information about the current situation. Of course, it is perfectly possible to have a study which combines the retrospective design and theprospective design. The sheer logistical requirements of longitudinal studies cannot beoverestimated: following a sample of delinquent youth from childhood into middle agehas obvious organisational difficulties. Furthermore, the timescale is very long – possiblyas long as a typical academic career – so alternatives may have to be contemplated suchas using retrospective studies in which the timescale can be truncated in real time by carrying out retrospective interviews with the offenders as adults to find informationabout their childhood. These adults can then be studied into middle age within a morepractical timescale. However, their recollections may not be accurate. Not surprisingly,longitudinal research of all sorts is uncommon though there are good examples available.
12.2 Panel designs
Panel or prospective studies are used to determine the changes that take place in peopleover time. For example, in the late 1920s in the United States there were a number of growth or developmental studies of children such as the Berkeley Growth Study(Jones, Bayley, MacFarlune and Honzik, 1971). This study was started in 1928 and wasdesigned to investigate the mental, motor and physical development in the first 15 monthsof life of 61 children. It was gradually expanded to monitor changes up to 54 years ofage. In the UK the National Child Development Study was begun in 1958 when datawere collected on 17 000 children born in the week of 3–9 March (Ferri, 1993). Thiscohort has been surveyed on six subsequent occasions at ages 7, 11, 16, 23, 33 and 41/42.Most panel studies are of much shorter duration.
Figure 12.2 gives a simple example of a panel design with three types of correlation (seeFigure 12.1). Data are collected at two different points in time on the same sample ofindividuals. One variable is the supportiveness of one’s partner and the other variable is
FIGURE 12.2 Types of correlation coefficients in longitudinal analyses
CHAPTER 12 LONGITUDINAL STUDIES 223
M12_HOWI4994_03_SE_C12.QXD 10/11/10 15:03 Page 223

224 PART 2 QUANTITATIVE RESEARCH METHODS
relationship satisfaction. The question is: does supportiveness lead to relationship satisfaction?In Figure 12.3 there are essentially two measures of that relationship measured, but atdifferent points in time. That is, there is a relationship between supportiveness and satisfac-tion measured at Time 1 and another measured at Time 2. These relationships assessed atthe same time are known as cross-sectional or synchronous correlations. Generally speaking,they are just as problematic as any other cross-sectional correlations to interpret and thereis no real advantage to having the two synchronous correlations available in itself.
There is another sort of relationship to be found in Figure 12.3. This is known as a cross-lagged relationship. A lag is, of course, a delay. The cross-lagged relationships in this case are the correlation of supportiveness at Time 1 with satisfaction at Time 2, and the correlation of satisfaction at Time 1 with supportiveness at Time 2.
So perhaps we find that supportivenessTime1 is correlated with satisfactionTime2. Doesthis correlation mean that supportiveness causes satisfaction? It would be congruentwith that idea but there is something quite simple that we can do to lend the ideastronger support. That is, we can partial out (control for) satisfactionTime1. If we find thatby doing so, the correlation between supportivenessTime1 and satisfactionTime2 reduces to zero then we have an interesting outcome. That is, satisfactionTime1 is sufficient toaccount for satisfactionTime2.
Of course, there is another possibility which has not been eliminated. That is, there isanother causal sequence in which satisfaction may be the cause of supportiveness. Atfirst this may seem less plausible, but if one is satisfied with one’s partner then they areprobably seen as more perfect in many respects than if one is dissatisfied. Anyway, thisrelationship could also be tested using cross-lagged correlations. A correlation betweensatisfactionTime1 with supportivenessTime2 would help establish the plausibility of thiscausal link. However, if we control for supportivenessTime1 and find that the correlationdeclines markedly or becomes zero, then this undermines the causal explanation in thatsupportiveness at Time 1 is related to supportiveness at Time 2.
The cross-lagged correlations should generally be weaker than the cross-sectional orsynchronous correlations at the two times of measurement because changes are morelikely to have taken place during the intervening period. The longer this period, the moreprobable it is that changes will have occurred and so the weaker the association should be.This also occurs when the same variable is measured on two or more occasions. The longerthe interval, the lower the test–retest or auto-correlation is likely to be. If both cross-lagged correlations have the same sign (in terms of being positive or negative) but one issignificantly stronger than the other, then the stronger correlation indicates the temporaldirection of the association. For example, if the association between support at Time 1 andsatisfaction at Time 2 is more positive than the association between satisfaction at Time 1and support at Time 2, then this difference implies that support leads to satisfaction.
There are several problems with this sort of analysis:
The size of a correlation is affected by the reliability of the measures. Less reliablemeasures produce weaker correlations as we saw in Chapter 11. Consequently, thereliability of the measures needs to be taken into account when comparing correlations.
FIGURE 12.3 A two-wave panel design
M12_HOWI4994_03_SE_C12.QXD 10/11/10 15:03 Page 224

The difference between the two cross-lagged correlations does not give an indicationof the size of the possible causal association between the two variables. For example,the cross-lagged correlation between support at Time 1 and satisfaction at Time 2 will most probably be affected by satisfaction at Time 1 and support at Time 2. Todetermine the size of the cross-lagged association between support at Time 1 and satisfaction at Time 2 controlling for satisfaction at Time 1 and support at Time 2 wewould have to partial out satisfaction at Time 1 and support at Time 2.
This method does not indicate whether both cross-lagged associations are necessary inorder to provide a more satisfactory explanation of the relationship. It is possible thatthe relationship is reciprocal but that one variable is more influential than the other.
The solution to the above problems may lie in using structural equation modellingwhich is generally the preferred method for this kind of analysis. It takes into accountthe unreliability of the measures. It provides an indication of the strength of a pathwaytaking into account its association with other variables. It also offers an index of theextent to which the model fits the data and is a more satisfactory fit than models whichare simpler subsets of it. There are various examples of such studies (e.g. Cramer,Henderson and Scolt, 1996; Fincham, Beach, Harold and Osborne, 1997; Krause, Liangand Yatomi, 1989). However, one of the problems with structural equation modelling isthat once the test–retest correlations are taken into account, the size of the cross-laggedcoefficients may become non-significant. In other words, the variable measured at thelater point in time seems to be completely explained by the same variable measured atthe earlier point in time (for example, Cramer, 1994, 1995).
12.3 Different types of third variable
The general third-variable issue was discussed in the previous chapter. Conceptually thereis a range of different types of third variable (see Figure 12.4). They are distinguishableonly in terms of their effect and, even then, this is not sufficient. We will illustrate thesedifferent types by reference to the issue of whether the supportiveness of one’s partnerin relationships leads to greater satisfaction with that partner.
■ Mediator (or intervening or mediating) variablesA variable which reduces the size of the correlation between two other variables may act as an explanatory link between the other two variables. In these circumstances it is described as a mediating or intervening variable. Making the distinction between aconfounding and an intervening variable is not usually easy to do theoretically. Withcross-sectional data it is not possible to establish the causal or the temporal directionbetween two variables. Nonetheless, researchers may suggest a direction even thoughthey cannot determine this with cross-sectional data. For example, they may suggest thathaving a supportive relationship may lead to greater satisfaction with that relationshipwhen it is equally plausible that the direction of the association may be the other wayround or that the direction may be both ways rather than one way.
Suppose that we think that the direction of the association between supportiveness andsatisfaction goes from support to satisfaction. With a variable which can change, likeincome, it is possible to argue that it may act as an intervening variable. For example,having a supportive partner may enable one to earn more which, in turn, leads to greatersatisfaction with the relationship. It is easier to argue that a variable is a confoundingone when it is a variable which cannot change like age or gender. Support cannot affect
CHAPTER 12 LONGITUDINAL STUDIES 225
M12_HOWI4994_03_SE_C12.QXD 10/11/10 15:03 Page 225

226 PART 2 QUANTITATIVE RESEARCH METHODS
age or gender, and so this kind of variable cannot be an intervening one. However, manyvariables in psychology can change and so are potential intervening variables.
■ Moderator (moderating) variablesThe size or the sign of the association between two variables may vary according to thevalues of a third variable, in which case this third variable is known as a moderator ormoderating variable. For example, the size of the association between support and satisfac-tion may vary according to the gender of the partner. It may be stronger in men than inwomen. For example, the correlation between support and satisfaction may be .50 in menand .30 in women. If this difference in the size of the correlations is statistically significant,we would say that gender moderates the association between support and satisfaction.
If we treated one of these variables, say support, as a dichotomous variable and theother as a continuous variable, we could display these relationships in the form of agraph, as shown in Figure 12.5. Satisfaction is represented by the vertical axis, supportby the horizontal axis and gender by the two lines. The difference in satisfaction betweenwomen and men is greater for those with more support than those with less support. Inother words, we have an interaction between support and gender like the interactionsdescribed for experimental designs. A moderating effect is an interaction effect.
If the moderating variable is a continuous rather than a dichotomous one, then thecut-off point used for dividing the sample into two groups may be arbitrary. Ideally the two groups should be of a similar size, and so the median score which does this canbe used. Furthermore, the natural variation in the scores of a continuous variable is lostwhen it is converted into a dichotomous variable. Consequently, it is better to treat acontinuous variable as such rather than to change it into a dichotomous variable.
The recommended method for determining the statistical significance of an interactionis to conduct a hierarchical multiple regression (Baron and Kenny, 1986). The two mainvariables or predictors, which in this example are support and gender, are standardised andentered in the first step of the regression to control for any effects they may have. The inter-action is entered in the second step. The interaction is created by multiplying the twostandardised predictors together provided that neither of these are a categorical variable
FIGURE 12.4 Three important types of ‘third variable’
M12_HOWI4994_03_SE_C12.QXD 10/11/10 15:03 Page 226

with more than two categories. If this interaction is significant, there is a moderatingeffect as this means that the interaction accounts for a significant proportion of the variance in the criterion, which in this example is satisfaction. The nature of the inter-action effect needs to be examined. One way of doing this is to divide the sample intotwo based on the median of the moderating variable, produce a scatterplot of the othertwo variables for the two samples separately and examine the direction of the relationshipin the scatter of the two variables. The calculation steps to assess for moderator variablescan be found in the companion statistics text, Introduction to Statistics in Psychology(Howitt and Cramer, 2011a).
■ Suppressor variablesAnother kind of confounding variable is one that appears to suppress or hide the asso-ciation between two variables so that the two variables seem to be unrelated. This typeof variable is known as a suppressor variable. When its effect is partialled out, the twovariables are found to be related. This occurs when the partial correlation is of the opposite sign to the product of the other two correlations and the other two correlationsare moderately large. When one of the other correlations is large, the partial correlationis large (Cramer, 2003). Typically the highest correlations are generally those in whichthe same variable is tested on two occasions that are not widely separated in time. Whenboth the other correlations are large, the partial correlation is greater than 1.00! Theseresults are due to the formula for partialling out variables and arise when correlationsare large, which is unusual.
There appear to be relatively few examples of suppressor effects. We will make up an example to illustrate one in which we suppose that support is not correlated with thesatisfaction with the relationship (i.e. r = .00). Both support and satisfaction are positivelyrelated to how loving the relationship is, as shown in Figure 12.6. If we partial out love,the partial correlation between support and satisfaction changes to −.43. In other wordswe now have a moderately large correlation between support and satisfaction whereasthe original or zero-order correlation was zero. This partial correlation is negative becausethe product of the other two correlations is positive.
FIGURE 12.5 The association between support and satisfaction moderated by gender
CHAPTER 12 LONGITUDINAL STUDIES 227
FIGURE 12.6 Example of a suppressed association
M12_HOWI4994_03_SE_C12.QXD 10/11/10 15:03 Page 227

228 PART 2 QUANTITATIVE RESEARCH METHODS
12.4 Analysis of non-experimental designs
It should be clear by now that the analysis of non-experimental designs is far from simple both conceptually and statistically. Furthermore, the range and scope of studiesare much wider than we have suggested so far. Subsumed under this heading is everystudy which does not meet the requirements of a randomised experimental design. Quiteclearly it is unlikely that any single chapter can cover every contingency. So you will find in many of the remaining chapters of this book a whole range of different styles of non-experimental data collection and analysis methods. To the extent that they arequantitative studies, they share a number of characteristics in terms of analysis strategies.In this section, we will briefly review two of these as examples. They are both dealt within detail in the companion statistics text, Introduction to Statistics in Psychology(Howitt and Cramer, 2011a). Although some such designs may be analysed using therelated t-test and the related analysis of variance, for example, the variety of measuresusually included in such studies generally necessitates the use of more complex statisticsdesigned to handle the multiplicity of measures.
■ Multiple regressionMultiple regression refers to a variety of methods which identify the best pattern of variables to distinguish between higher and lower scorers on a key variable of interest.For example, multiple regression would help us identify the pattern of variables whichdifferentiates between different levels of relationship satisfaction. Using this optimumpattern of variables, it is possible to estimate with a degree of precision just how muchsatisfaction a person would feel given their precise pattern on the other variables. Thiscould be referred to as a model of relationship satisfaction. (A model is a set of variablesor concepts which account for another variable or concept.)
Another way of looking at it is to regard it as being somewhat like partial correlation.The difference is that multiple regression aims to understand the components which go to make up the scores on the key variable – the criterion or dependent variable. Inthis case, the key variable is relationship satisfaction. There is a sense in which multipleregression proceeds simply by partialling out variables one at a time from the scores on relationship satisfaction. How much effect on the scores does removing income, thensocial class, then supportiveness have? If we know the sizes of these effects, we can evaluate the possible importance of different variables on relationship satisfaction.
Technically, rather than use the partial correlation coefficient, multiple regression usesthe part correlation coefficient or semi-partial correlation coefficient. The proportion ofvariance attributable to or explained by income or supportiveness is easily calculated. Theproportion is simply the square of the part or semi-partial correlation. (This relationshipis true for many correlation coefficients too.) We use the part or semi-partial correlationbecause it is only one variable that we are adjusting (relationship satisfaction). Partialcorrelation actually adjusts two variables, which is not what we need.
The part correlation between support and satisfaction partialling out income for thecorrelations shown in Figure 11.3 is .33 which squared is about .11. What this means is that support explains an additional 11 per cent of the variance in satisfaction to the16 per cent already explained by income. The following formula is used to calculate the part correlation in which one variable is partialled out, where B refers to satisfaction,A to support and C to income:
rBA.C = rBA − (rBC × rAC)
(1 − r2AC)
M12_HOWI4994_03_SE_C12.QXD 10/11/10 15:03 Page 228

CHAPTER 12 LONGITUDINAL STUDIES 229
If we insert the correlations of Figure 11.3 into this formula, we find that the part correlation is .33:
= = .33
Multiple regression has three main uses:
To predict what the likely outcome is for a particular case or group of cases. Forexample, we may be interested in predicting whether a convicted prisoner is likely tore-offend on the basis of information that we have about them.
To determine what the size, sign and significance of particular associations or pathsare in a model which has been put forward to explain some aspect of behaviour. Forexample, we may wish to test a particular model which seeks to explain how peoplebecome involved in criminal activity. This use is being increasingly taken over by themore sophisticated statistical technique of structural equation modelling.
To find out which predictors explain a significant proportion of the variance in thecriterion variable such as criminal activity. This third use differs from the second inthat generally a model is not being tested.
There are three main types of multiple regression for determining which predictorsexplain a significant proportion of the variance in a criterion:
Hierarchical or sequential multiple regression In this, the group of predictors is enteredin a particular sequence. We may wish to control for particular predictors or sets ofpredictors by putting them in a certain order. For example, we may want to control forbasic socio-demographic variables such as age, gender and socio-economic status beforeexamining the influence of other variables such as personality or attitudinal factors.
Standard or simultaneous multiple regression All of the predictors are entered atthe same time in a single step or block. This enables one to determine what the proportion of variance is that is uniquely explained by each predictor in the sense thatit is not explained by any other predictor.
Stepwise multiple regression In this, statistical criteria are used to select the order of the predictors. The predictor that is entered first is the one which has a significantand the largest correlation with the key variable (the criterion or dependent variable).This variable explains the biggest proportion of the variation of the criterion variablebecause it has the largest correlation. The predictor that is entered second is the onewhich has a significant and the largest part correlation with the criterion. This, there-fore, explains the next biggest proportion of the variance in the criterion. This partcorrelation partials out the influence of the first predictor on the criterion. In this way,the predictors are made to contribute independently to the prediction. The predictor thatis entered next is the one that has a significant and the next highest part correlationwith the criterion. This predictor partials out the first two predictors. If a predictorthat was previously entered no longer explains a significant proportion of the variance,it is dropped from the analysis. This process continues until there is no predictor thatexplains a further significant proportion of the variance in the criterion.
One important feature of multiple regression needs to be understood otherwise we mayfail to appreciate quite what the outcome of an analysis means. Two or more predictorsmay have very similar correlations or part correlations with the criterion, but the onewhich has the highest correlation will be entered even though the difference in the sizeof the correlations is tiny. If the predictors themselves are highly related then those with the slightly smaller correlation may not be entered into the analysis at all. Their
.26
.80
.50 − (.40 × .60)
(1 − .602)
M12_HOWI4994_03_SE_C12.QXD 10/11/10 15:03 Page 229

230 PART 2 QUANTITATIVE RESEARCH METHODS
absence may give the impression that these variables do not predict the criterion whenthey do. Their correlation with the criterion may have been slightly weaker because the measures of these predictors may have been slightly less reliable. Consequently, when interpreting the results of a stepwise multiple regression, it is important to look at the size of the correlation between the predictor and the criterion. If two or more predictors are similarly correlated with the criterion, it is necessary to check whetherthese predictors are measuring the same rather than different characteristics.
An understanding of multiple regression is very useful as it is commonly and increas-ingly used. Sherman and his colleagues (1999) found that 41 per cent of the papers they randomly sampled in the Journal of Personality and Social Psychology used it in1996 compared with 21 per cent in 1988 and 9 per cent in 1978.
■ Path analysisA path is little more than a route between two variables. It may be direct but it can beindirect. It can also be reciprocal in that two variables mutually affect each other. For aset of variables, there may be a complex structure of paths, of course. Figure 12.7 hasexamples of such paths and various degrees of directness. Multiple regression can be usedto estimate the correlations between the paths (these are known as path coefficients).However, structural equation modelling is increasingly used instead. This has three mainadvantages over multiple regression:
The reliabilities of measures are not taken into account in multiple regression but they are in structural equation modelling. As explained earlier, reliability places astrict upper limit on the maximum correlation between any two variables.
Structural equation modelling gives an index of the extent to which the model provides a satisfactory fit to the data. This allows the fit of a simpler subset of themodel to be compared with the original model to see if this simpler model providesas adequate a fit as the original model. Simpler models are generally preferred to morecomplicated ones as they are easier to understand and use.
Structural equation modelling can explain more than one outcome variable at thesame time, like the two presented in the path diagram of Figure 12.7.
The path diagram or model in Figure 12.7 seeks to explain the association betweendepression and satisfaction with a romantic relationship in terms of the four variables ofattitude similarity, interest similarity, love and negative life events. The path diagram showsthe assumed relationship between these six variables. The temporal or causal sequencemoves from left to right. The direction of the sequence is indicated by the arrow of the line.So interest similarity leads to love which in turn leads to satisfaction. There is a directassociation between interest similarity and satisfaction, and an indirect association whichis mediated through love. In other words, interest similarity has, or is assumed to have,both a direct and an indirect effect. The association between satisfaction and depression
FIGURE 12.7 A path diagram with six variables
M12_HOWI4994_03_SE_C12.QXD 10/11/10 15:03 Page 230

CHAPTER 12 LONGITUDINAL STUDIES 231
is a reciprocal one as the arrows go in both directions. Being satisfied results in lessdepression and being less depressed brings about greater satisfaction. The lack of a linebetween two variables indicates that they are not related. So attitude similarity is not relatedto negative life events, depression or satisfaction. The curved line with arrows at eitherend shows that interest similarity and attitude similarity are related but that they are notthought to affect each other. Ideally we should try to develop a model such as we have donehere to explain the relationships between the variables we have measured in our study.
12.5 Conclusion
Where the primary aim is to determine the temporal ordering of variables a panel orprospective study is required. In these, the same participants are studied on two or moreoccasions. The main variables of interest should be measured on each of these occasionsso that the size of the temporal associations can be compared. Statistical analysis fornon-manipulation studies is generally more complicated than that of true or randomisedstudies. This is especially the case when causal or explanatory models are being tested.Familiarity with statistical techniques such as multiple regression is advantageous for aresearcher working in this field.
Panel or prospective designs measure the same variables in the same cases on two or more occasions.It is possible to assess whether variables may be mutually related.
Longitudinal studies may be especially influenced by a number of threats to their internal validity andexternal validity. For example, because of the time dimension involved the participants may simplychange because they have got a little older.
There are a number of types of variable which may play a role in the relationship between two variables.These include intervening variables and suppressor variables. Conceptually it is important to dis-tinguish between these different sorts of third variables although they are very similar in practice.
The complexity of these designs encourages the use of complex statistical techniques such as multiple regression and path analysis.
Key points
ACTIVITIES1. Draw a path diagram for the following:
Couples who are similar fall in love more intensely.They marry but tend to grow apart and stop loving each other.
2. Couples who love each other tend to have better sexual relationships with each other. It is found that once coupleshave a baby, the physical side of their relationship declines. What sort of variable is the baby?
M12_HOWI4994_03_SE_C12.QXD 10/11/10 15:03 Page 231

Sampling andpopulation surveys
Overview
CHAPTER 13
When we want to make inferences about a finite population such as the people ofBritain, ideally we should obtain a representative sample of that population.
The size of the sample to use is determined by various factors. How confident we are that the results of the sample represent those in the population is usually set atthe 95 per cent or .95 level although it might be set higher. The bigger the variation is in the characteristic that we are interested in estimating, the bigger the sample has to be. The smaller we want the sampling error or margin of error to be, the largerthe sample has to be.
Probability sampling is where every unit or element in the population has an equaland a known probability of being selected.
Where the population is spread widely, multi-stage sampling may be used where thefirst stage is to select a limited number of areas from which further selections will bemade.
M13_HOWI4994_03_SE_C13.QXD 10/11/10 15:03 Page 232
13.1 Introduction
As we have seen, when psychologists test a generalisation or hypothesis they always doso on a relatively limited sample of people, usually those who are convenient to recruit.Although these people are typically no longer students (Bodner, 2006), they are gener-ally not a representative or random sample of people. The time, effort and expense ofrecruiting such a sample are deterrents. Research psychologists are usually under somepressure to conduct their research as quickly and economically as possible. Obtaining amore representative sample of participants would hinder their work by introducing moreconstraints in terms of time and money. To the extent that one believes that the ideabeing tested applies widely, then one would be disinclined to test a more representativesample – it wouldn’t really be necessary. If you thought that different types of peoplewere likely to produce rather different responses in the study, then you might includethese groups in your study to see if this were the case – that is, you would seek toimprove the degree to which your sampling of participants was representative. However,even in these circumstances a sample with very different characteristics to the ones alreadystudied might be just as informative as a more representative sample.
The issue of whether the assumption that findings apply widely (i.e. are generalisable)ought to be more controversial than it is in psychology. Just to indicate something of the problem, there have been very carefully controlled laboratory studies which haveproduced diametrically opposite findings from each other. For example, using moresophisticated students from the later years of their degree has on occasion producedfindings very different from the findings of a study using first year students (Page andScheidt, 1971). So what is true of one type of participant is not true for another type. Thevariability of findings in research, although partly the consequence of sampling variation,is also due to other sources of variability such as the characteristics of the sample. Sopossibly the question of whether to use convenience samples rather than representativesamples is best addressed by considering what is known about the behaviour of differentgroups of people in relation to the topic in question. Past research on a particular topic, forexample, may indicate little or no evidence that different samples produce very differentfindings. In that case, the researcher may feel confident enough to use a conveniencesample for their research.
Researchers should know how representative samples may be obtained – if only as apossible ideal sampling scenario for the quantitative researcher. Furthermore, some studieshave as their aim to make statements about a representative sample of people. Researcherswho are interested in how the general public behave may be less inclined to pay muchattention to the results of a study which is solely based on students. Sociologists, forexample, have lampooned psychology, sometimes unfairly, for its dependency on univer-sity students. Studies which have found similar results in a more representative sample lendextra credibility to their findings and allow generalisation. Figure 13.1 shows differenttypes of sampling.
13.2 Types of probability sampling
The characteristics of very large populations can be estimated from fairly small samplesas is argued towards the end of this chapter. The problem is ensuring that the sample isrepresentative of the population if you want to generalise your results to that population.A distinction is made between probability and non-probability sampling:
CHAPTER 13 SAMPLING AND POPULATION SURVEYS 233
M13_HOWI4994_03_SE_C13.QXD 10/11/10 15:03 Page 233

234 PART 2 QUANTITATIVE RESEARCH METHODS
Probability sampling is typically used when we have a clearly defined and accessiblepopulation which we want to make inferences about or when we want to know howcharacteristic a behaviour is of a particular population, such as the people of Britain.
Non-probability sampling is normally used in psychological research. This is becausewe are generally not interested in getting precise population estimates of a particularfeature or characteristic in psychology. In psychology, the emphasis in research tendsto be on relationships between variables and whether or not this relationship differssignificantly from a zero relationship.
The main advantage of probability sampling is that every person or element in thepopulation has an equal and known probability of being selected. Suppose we want touse probability sampling to select 10 per cent or 100 people out of a total population of 1000 people. In accordance with the concept of random sampling, everyone in thatsample should have an equal probability of .10 of being selected (100/1000 = .10). Thesimplest procedure is to give each member of the population a number from 1 to 1000and draw a hundred of these numbers at random.
There are various ways of drawing a sample of 100 numbers representing the 100 people we need for the probability sampling:
FIGURE 13.1 The different types of sample
M13_HOWI4994_03_SE_C13.QXD 10/11/10 15:03 Page 234

CHAPTER 13 SAMPLING AND POPULATION SURVEYS 235
We could use a statistical package such as SPSS Statistics. We would enter the num-bers 1 to 1000 in one of the columns. We would then select Data, Select cases . . . ,Random sample of cases, Sample . . . , Exactly, and then enter 100 cases from the first 1000 cases. The 100 numbers that were selected would be the 100 people inthe sample. Alternatively, you will find applets on the Web which will generate a
random sample of cases for you.
We could write the numbers 1 to 1000 on 1000 index cards or slips of paper, shufflethem and then select 100 cards or slips of paper. These 100 numbers would representthe people in our sample.
We could use a table of random numbers which can be found in the back of manyintroductory textbooks on statistics. These tables usually consist of rows and columnsof pairs of numbers such as 87 46 and so on. The 1000th person is represented by the number 000. Each person in the population has a distinct three digit number. Sowe need a way of selecting three-digit numbers from the table of random numbers.There are no rules for this and you can decide on your own system. One could simplychoose a random starting point in the table (eyes shut, using a pin) and record the first three digits after this as the first random selection. The person corresponding tothis number is the first participant selected to be in the sample. The next three digitswould give the number of the second member of the sample and so forth. Of course,one could go backwards through the table if one chose. If we select the same numbermore than once, we ignore it as we have already selected the individual representedby that number. Our sample of 100 individuals would be complete once we hadselected 100 sets of three numbers from the table. As long as one is consistent, onecan more or less decide on whatever rule one wishes for selecting numbers.
This form of probability sampling is called simple random sampling. An alternative pro-cedure is to select every 100th person on the list. We have to decide what our starting pointis going to be which can be any number from 1 to 100 and which we can choose using arandom procedure. Let us suppose it is 67. This would be the first person we select. Wethen select every 100th person after it, such as 167, 267, 367 and so on. This procedureis known as systematic sampling. The advantage of systematic sampling is that it is simplerto use with a printed list such as a register of electors. It is quicker than random samplingand has the advantage that people close together on the list (for example, couples) willnot be selected. Its disadvantage is that it is not completely random. The list may not bearranged in what is effectively a random order for some reason. Generally speaking, though,so long as the complete list is sampled from (as the above method will ensure), there areunlikely to be problems with systematic sampling. If the entire list is not sampled, thenthis method may introduce biases. For example, if the researcher simply took every, say,75th case then those at the end of the list could not be included in the sample.
Neither simple random sampling nor systematic sampling ensure that the sample will be representative of the population from which the sample was taken. For example,if the population contained equal numbers of females and males, say 500 of each, it ispossible that the sample will contain either all, or a disproportionate number of, femalesor males. It may be important that the sample is representative of the population inrespect of one or more characteristics such as gender. This is achieved by dividing thepopulation into groups or strata representing that characteristic, such as females andmales. Then the random sampling is essentially done separately for each of these twogroups. In terms of our example of selecting a sample of 100 people, we would select 50from the 500 females and 50 from the 500 males. This form of sampling is known asstratified random sampling or just stratified sampling.
As the proportion of females in the sample (.50) is roughly the same as the proportion of females in the population (approximately .50), this kind of stratified sampling may be called proportionate stratified sampling. It may be distinguished from
M13_HOWI4994_03_SE_C13.QXD 10/11/10 15:03 Page 235
236 PART 2 QUANTITATIVE RESEARCH METHODS
disproportionate stratified sampling in which the sampling is not proportionate to the size of the group in the population. Disproportionate stratified sampling is usedwhen we want to ensure that a sufficient number of people are sampled of whom thereare relatively few in the population. For example, we may be keen to determine thebehaviour of unemployed people in our population of 1000 people. Suppose there areonly 50 unemployed people in our population. If we used proportionate stratified sampling to select 10 per cent or 100 people from our population, then our sample ofunemployed people is 5 (10/100 × 50 = 5) which is too few to base any generalisationson. Consequently, we may use disproportionate stratified sampling to obtain a biggersample of unemployed people. Because the number of unemployed people is small, wemay wish to have a sample of 25 of them, in which case the proportion of unemployedpeople is .50 (25/50 = .50) instead of .10 (5/50 = .10). As our overall sample may be stilllimited to 100 people, the number of people in our sample who are not unemployed isnow 75 instead of 95. So, the proportion of people who are not unemployed is smallerthan (95/950 = .10) and is about .08 (75/950 = .0789).
One of the problems with stratified sampling is that relevant information about the characteristic in question is needed. For a characteristic such as gender this is easilyobtained from a person’s title (Mr, Miss, Ms or Mrs) but this is the exception rather than the rule. Otherwise, more work is involved in obtaining information about thatcharacteristic prior to sampling.
If our population is dispersed over a wide geographical area we may use what is calledcluster sampling in order to restrict the amount of time taken to draw up the samplinglist or for interviewers to contact individuals. For example, if we wanted to carry out a probability survey of all British students it would be difficult and time-consuming todraw up a list of all students from which to select a sample. What we might do insteadis to select a few universities from around the country and sample all the students withinthose universities. The universities would be the group or cluster of students which we would sample. The clusters need not be already existing ones. They may be createdartificially. For example, we may impose a grid over an area and select a number ofsquares or cells within that area. The advantage of cluster sampling is that it saves timeand money. Its disadvantage is that it is likely to be less representative of the populationbecause the people within a cluster are likely to be more similar to one another. Forexample, students at one university may be more inclined to come from fee-paying ratherthan state schools or to be female rather than male.
Another form of probability sampling is called multi-stage sampling in which samplingis done in a number of stages. For example, we could have a two-stage sample of univer-sity students in which the first stage consists of sampling universities and the secondstage of sampling students within those universities.
The representativeness of a sample can be evaluated against other information aboutthe population from which it was drawn. For example, in trying to determine whetherour sample is representative of the British population we can compare it with census orother national data on characteristics such as gender, age, marital status and employmentstatus. It should be noted that these other sources of information will not be perfectlyaccurate and will contain some degree of error themselves.
13.3 Non-probability sampling
The cost, effort and time involved in drawing up a representative or probability sampleare clearly great. A researcher without these resources may decide to use a quota sampleinstead. In a quota sample an attempt is made to ensure different groups are represented
M13_HOWI4994_03_SE_C13.QXD 10/11/10 15:03 Page 236

CHAPTER 13 SAMPLING AND POPULATION SURVEYS 237
in the proportion in which they occur within that society. So, for example, if we knowthat 5 per cent of the population are unemployed, then we may endeavour to ensure that5 per cent of the sample are unemployed. If our sample consists of 100 people, we willlook for 5 people who are unemployed. Because we have not used probability samplingthen we may have a systematically biased sample of the unemployed. The numbers ofpeople in the different groups making up our sample do not have to be proportionate to their numbers in society. For example, if we were interested in looking at how age isrelated to social attitudes, we may choose to use equal numbers of each age group nomatter their actual frequencies in the population.
Where we need to collect a sample of very specific types of people then we may usesnowball sampling. So this would be an appropriate way of collecting a sample of drugaddicts, banjo players or social workers experienced in highly publicised child abusecases. Once we have found an individual with the necessary characteristic we ask themwhether they know of anyone else with that characteristic who may be willing to takepart in our research. If that person names two other people and those two people nametwo further individuals then our sample has snowballed from one individual to seven.
There are a number of other versions of non-probability sampling: (a) quota samplingis used in marketing research, etc. and requires that the interviewer approaches people whoare likely to fill various categories of respondent required by the researcher (e.g. femalesin professional careers, males in manual jobs, etc.); (b) convenience sampling is used inmuch quantitative research in psychology and simply uses any group of participantsreadily accessible to the researcher; (c) purposive sampling is recruiting specified types of people because they have characteristics of interest to the theoretical concerns of theresearcher; and (d) theoretical sampling comes from grounded theory (see Chapter 21)and occurs after some data are collected and an analysis formulated such that furtherrecruits to the study inform or may challenge the developing theory in some way.
In general, psychologists would assume a sample to be a non-random one unless it isspecifically indicated. If it is a random sample, then it is necessary to describe in somedetail the particular random procedure used to generate that sample. In most psycho-logical research the sample will be a convenience one and it may be sufficient to refer toit as such.
13.4 National surveys
Most of us are familiar with the results of the national opinion polls which are fre-quently reported in the media. However, national studies are extremely uncommon in psychological research. Using them would be an advantage but not always a big one.Generally, there is no great need to collect data from a region or country unless you areinterested in how people in that region or country generally behave. Researchers fromother social sciences, medical science and similar disciplines are more likely to carry outnational surveys than psychologists. This is partly because these researchers are moreinterested in trends at the national and regional levels. Nonetheless the results of thesesurveys are often of relevance to psychologists.
It is not uncommon for such surveys to be placed in an archive accessible to otherresearchers. For example, in Britain many social science surveys are archived at theEconomic and Social Research Council (ESRC). The datasets that are available there for further or secondary analysis are listed at the following website: http://www.data-archive.ac.uk/
Major surveys include the British Crime Survey, British Social Attitudes and theNational Child Development Study. International datasets are also available. Students
M13_HOWI4994_03_SE_C13.QXD 10/11/10 15:03 Page 237

238 PART 2 QUANTITATIVE RESEARCH METHODS
are not allowed direct access to these datasets but they may be obtained via a lecturerwho has an interest in them and the expertise to analyse them. This expertise includesan ability to use a statistical computer package such as SPSS Statistics which is widelyused and taught to students. There are books which show you how to use SPSS such asthe companion computing text, Introduction to SPSS Statistics in Psychology (Howittand Cramer, 2011b).
A national representative survey
Box 13.1 Research Example
The British Social Attitudes Survey is a good example ofthe use of a representative sample in research which maybe of relevance to psychologists. The detail is less import-ant to absorb than the overall picture of the meticulousnature of the process and the need for the researcher tomake a number of fairly arbitrary decisions. This surveyhas been carried out more or less annually since 1983. Thetarget sample for the 2008 survey was 9060 adults aged18 or over living in private households (Park et al., 2010,p. 270). The sampling list or frame was the PostcodeAddress File. This is a list of addresses (or postal deliverypoints) which is compiled by, and which can be boughtfrom, the Post Office. The multi-stage sampling designconsisted of three stages of selection:
selection of postcode sectors;
selection of addresses within those postcode sectors;
selection of an adult living at an address.
The postcode sector is identified by the first part of thepostcode. It is LE11 3 for Loughborough, for example.Any sector with fewer than 1000 addresses was combinedwith an adjacent sector. Sectors north of the CaledonianCanal in Scotland were excluded due to the high cost ofinterviewing there. The sectors were stratified into:
37 sub-regions;
three equal-sized groups within each sub-region varyingin population density; and
ranking by the percentage of homes that were owner-occupied.
The sampling frame may look something like that shownin Table 13.1 (Hoinville and Jowell, 1978, p. 74).
The total number of postcode sectors in the UnitedKingdom in 2005 was then 11 598 (Postal Geography, n.d.)from which 302 sectors were selected. The probability
of selection was made proportional to the number ofaddresses in each sector. The reason for using this proce-dure is that the number of addresses varies considerablyamong postcode sectors. If postcode sectors have an equal probability of being selected, the more addresses apostcode sector has, the smaller the chance or probabilityis that an address within that sector will be chosen. So notevery address has an equal probability of being selectedfor the national sample.
To ensure that an address within a sector has an equalprobability of being chosen, the following procedure wasused (Hoinville and Jowell, 1978, p. 67). Suppose we havesix postcode sectors and we have to select three of thesesectors. The number of addresses in each sector is shownin Table 13.2. Altogether we have 21 000 addresses. If weuse systematic sampling to select these three sectors, then weneed to choose the random starting point or address fromthis number. We could do this using a five-digit sequencein a table of random numbers. Suppose this number was09334. If we add the number of addresses cumulatively asshown in the third column of Table 13.2, then the randomstarting point is in the second postcode sector. So thiswould be the first postcode sector chosen randomly.
In systematic sampling we need to know the samplinginterval between the addresses on the list. This is simplythe total number of addresses divided by the number ofsamples (21 000/3 = 7000). As the random starting pointis greater than 7000, a second point is 7000 below 9334which is 2334 (9334 − 7000 = 2334). This point fallswithin the first postcode sector which is the second post-code sector to be selected. A third point is 7000 above9334 which is 16 334 (9334 + 7000 = 16 334). This pointfalls within the fourth postcode sector which is the thirdpostcode sector to be chosen. So these would be our threesectors.
Thirty addresses were systematically selected in each ofthe 302 postcode sectors chosen. This gives a total of 9060
M13_HOWI4994_03_SE_C13.QXD 10/11/10 15:03 Page 238

CHAPTER 13 SAMPLING AND POPULATION SURVEYS 239
addresses (30 × 302 = 6200). A random start point waschosen in each sector and 30 addresses selected at equalfixed intervals from that starting point. The numbers ofadults aged 18 and over varies at the different addresses.A person was selected at random at each address using acomputerised random selection procedure.
Response rates were affected by a number of factors:
About 10 per cent of the addresses were out of thescope of the survey (for example, they were empty,derelict or otherwise not suitable).
About 30 per cent of the 9060 refused to take partwhen approached by the interviewer.
About 4 per cent of the 9060 could not be contacted.
Table 13.1 Part of sampling frame for the British Social Attitudes Survey
Region 01 Percentage owner or non-manual occupiers
Highest density group
Postcode sector 65%
Postcode sector 60%
.
.
.
Postcode sector 40%
Intermediate density group
Postcode sector 78%
Postcode sector 75%
.
.
.
Postcode sector 60%
Lowest density group
Postcode sector 79%
Postcode sector 74%
.
.
.
Postcode sector 55%
.
.
.
Region 37
.
.
.
Source: adapted from Hoinville and Jowell (1978)
M13_HOWI4994_03_SE_C13.QXD 10/11/10 15:03 Page 239

240 PART 2 QUANTITATIVE RESEARCH METHODS
13.5 Socio-demographic characteristics of samples
National samples usually gather socio-demographic information about the nature of thesample studied. Which characteristics are described depends on the kind of participantsand the purpose of the study. If the participants are university students, then it maysuffice to describe the number of female and male students and the mean and standarddeviation of their age either together or separately. If a substantial number or all of theparticipants are not students, then it is generally necessary to provide further socio-demographic information on them such as how well educated they are, whether they areworking and what their social status is. These socio-demographic characteristics are notalways easy to categorise, and the most appropriate categories to use may vary over timeas society changes and according to the particular sample being studied. When decidingon which characteristics and categories to use, it is useful to look at recent studies on thetopic and see what characteristics were used. Two socio-demographic characteristicswhich are problematic to define and measure are social status and race or ethnicity.
In the United Kingdom one measure of social status is the current or the last job oroccupation of the participant (e.g. Park et al., 2010, pp. 276–8). The latest governmentscheme for coding occupations is the Standard Occupational Classification 2000 (GreatBritain Office for National Statistics, 2000; http://www.ons.gov.uk/about-statistics/classifications/current/ns-sec/cats-and-classes/analytic-classes/index.html). The previousversion was the Standard Occupational Classification 1990 (OPCS, 1991). The mainsocio-economic grouping based on the latest scheme is the National Statistics Socio-Economic Classification which consists of the following eight categories:
Employers in large organisations and higher managerial and professional occupations.
Lower professional and managerial and higher technical and supervisory occupations.
Intermediate occupations.
About 5 per cent of the original 9060 did not respondfor some other reason.
This means that the response rate for the final survey wasabout 50 per cent of the original sample of 9060. This is
quite a respectable figure and many surveys obtain muchlower return rates. Of course, the non-participation ratemay have a considerable impact on the value of the dataobtained. There is no reason to believe that non-participantsare similar to participants in their attitudes.
Table 13.2 Example of sampling sectors with probability proportional to size
Sector Size Cumulative size Points
1 4 000 0–4 000 2 334 2nd point
2 6 000 4 001–10 000 9 334 random start
3 5 000 10 001–15 000
4 2 000 15 001–17 000 16 334 3rd point
5 3 000 17 001–20 000
6 1 000 20 001–21 000
Source: adapted from Hoinville and Jowell (1978)
M13_HOWI4994_03_SE_C13.QXD 10/11/10 15:03 Page 240

CHAPTER 13 SAMPLING AND POPULATION SURVEYS 241
Employers in small organisations and own account workers.
Lower supervisory and technical occupations.
Semi-routine occupations.
Routine occupations.
Never worked and long-term unemployed.
Previous schemes include the Registrar General’s Social Class, the Socio-EconomicGroup and the Goldthorpe (1987) schema. There is a computer program for codingoccupations based on the Standard Occupational Classification 2000 (Great BritainOffice for National Statistics, 2000; http://www.ons.gov.uk/about-statistics/classifications/current/SOC2000/about-soc2000/index.html) called Computer-Assisted StructuredCOding Tool (CASCOT). CASCOT is available free online (http://www2.warwick.ac.uk/fac/soc/ier/publications/software/cascot/choose_classificatio/).
A measure of race may be included to determine how inclusive the sample is andwhether the behaviour you are interested in differs according to this variable. Since 1996 the British Social Attitudes Survey measured race with the following question andresponse options (http://www.britsocat.com/). The percentage of people choosing thesecategories in the 2007 survey is shown after each option.
To which one of these groups do you consider you belong?
Black: of African origin 1.21%
Black: of Caribbean origin 1.65%
Black: of other origin (please state) 0.13%
Asian: of Indian origin 2.04%
Asian: of Pakistani origin 1.43%
Asian: of Bangladeshi origin 0.62%
Asian: of Chinese origin 0.43%
Asian: of other origin (please state) 1.18%
White: of any European origin 88.09%
White: of other origin (please state) 1.10%
Mixed origin (please state) 1.07%
Other (please state) 0.69%
None of the 4123 people in the sample did not know which category they fell in andonly 0.39 per cent or 16 people did not answer this question.
13.6 Sample size and population surveys
When carrying out research, an important consideration is to estimate how big a sample is required. For surveys, this depends on a number of factors:
How big the population is.
How many people you will be able to contact and what proportion of them are likelyto agree to participate.
M13_HOWI4994_03_SE_C13.QXD 10/11/10 15:03 Page 241

242 PART 2 QUANTITATIVE RESEARCH METHODS
How variable their responses are.
How confident you want to be about the results.
How accurate you want your estimate to be compared with the actual population figure.
Not everyone who is sampled will take part. Usually in national sampling some sort oflist of members of the population is used. This is known as the sampling frame. Lists of the electorate or telephone directories are examples of such lists though they bothhave obvious inadequacies. Some of the sample will have moved from their address toan unknown location. Others may not be in when the interviewer calls even if they arevisited on a number of occasions. Others refuse to take part. It is useful to make a noteof why there was no response from those chosen to be part of the sample. The responserate will differ depending on various factors such as the method of contact and the topicof the research. The response rate is likely to be higher if the interviewer visits the potential participant than if they simply post a questionnaire. The most probable responserate may be estimated from similar studies or from a pilot or exploratory study.
How variable the responses of participants are likely to be can be obtained in similarways. It is usually expressed in terms of the standard deviation of values which is similarto the average extent to which the values deviate from the mean of the sample.
■ Confidence intervalWhen one reads about the findings of national polls in the newspapers, statements likethis appear: ‘The poll found that 55 per cent of the population trust the government. The margin of error was plus or minus 2 per cent.’ Of course, since the finding is basedon a sample then we can never be completely confident in the figure obtained. Usuallythe confidence level is set at 95 per cent or .95. The interval is an estimate based on thevalue obtained in the survey (55 per cent of the population) and the variability in the data. The variability is used to estimate the range of the 95 per cent of samples thatare most likely to be obtained if our data were precisely the same as the values in theentire population. The single figure of 55 per cent trusting the government is known asa point estimate since it gives a single value. Clearly the confidence interval approach is more useful since it gives some indication of the imprecision we expect in our data.This is expressed as the margin of error.
One could think of the confidence interval being the range of the most common sample values we are likely to obtain if we repeated our survey many times. That is, the95 most common sample values if we repeated the study 100 times. If this helps you toappreciate the meaning of confidence intervals then all well and good. Actually it is notquite accurate since it is true only if our original sample data are totally representativeof the population. This is not likely to be the case of course, but in statistics we operatewith best guesses, not certainties. If the confidence interval is set at 95 per cent or .95 it means that the population value is likely to be in the middle 95 per cent of possiblesample means given by random sampling.
The confidence level is related to the notion of statistical significance that was introduced in Chapter 4. A detailed discussion of confidence intervals may be found inChapter 37 of the companion text Introduction to Statistics in Psychology (Howitt andCramer, 2011a). Confidence intervals apply to any estimate based on a sample. Hence,there are confidence intervals for virtually all statistics based on samples. Both statisticalsignificance and the confidence level are concerned with how likely it is that a result will occur by chance. Statistical significance is normally fixed at 5 per cent or .05. This means that the result will be obtained by chance on 5 times out of 100 or less. Ifwe find that a result is statistically significant it means that the result is so extreme thatit is unlikely to occur by chance. A statistically significant finding is one which is outsideof the middle 95 per cent of samples defined by the confidence interval.
M13_HOWI4994_03_SE_C13.QXD 10/11/10 15:03 Page 242

CHAPTER 13 SAMPLING AND POPULATION SURVEYS 243
■ Sampling error (margin of error) and sample sizeHow accurately one’s data reflect the true population value is dependent on somethingknown as sampling error. Samples taken at random from a population vary in terms oftheir characteristics. The difference between the mean of your sample and the mean ofthe population of the sample is known as the sampling error. If several samples are takenfrom the same population their means will vary by different amounts from the value in thepopulation. Some samples will have means that are identical to that of the population.Other samples will have means which differ by a certain amount from the population value.The variability in the means of samples taken from a population is expressed in terms ofa statistical index known as the standard error. This is a theoretical exercise really as wenever actually know what the population mean is – unless we do research on the entirepopulation. Instead we estimate the mean of the population as being the same as the meanfor our sample of data. This estimate may differ from the population mean, of course,but it is the best estimate we have. It is possible to calculate how likely the sample meanis to differ from the population mean by taking into account the variability within the sample (the measure of variability used is the standard deviation of the sample). Thevariability within the sample is used to estimate the variability in the population whichis then used to estimate the variability of sample means taken from that population.
If we want to be 95 per cent or .95 confident of the population mean, then we can workout what the sampling error is using the following formula, where t is the value for this con-fidence level taking into account the size of the sample used (Cramer, 1998, pp. 107–8):
sampling error = t ×
The standard deviation is calculated using the data in our sample. The sample size weare considering is either known or can be decided upon. The appropriate t value can befound in the tables of most introductory statistics textbooks such as the companion textIntroduction to Statistics in Psychology (Howitt and Cramer, 2011a).
If we substitute values for the standard deviation and the sample size, we can see thatthe sampling error becomes progressively smaller the larger the sample size. Say, forexample, that the standard deviation is about 3 for scores of how extroverted people are (Cramer, 1991). For a sample size of 100 people, the t value for the 95 per centconfidence level is 1.984 and so the sampling error is about 0.60:
sampling error = 1.984 × = 1.984 × = = 0.5952 = 0.60
If the mean score for extroversion for the sample was about 16, then the sample meanwould lie between plus or minus 0.60 on either side of 16 about 95 per cent of the timefor samples of this size. So the mean would lie between 15.40 (16 − 0.60 = 15.40) and16.60 (16 + 0.60 = 16.60). These values would be the 95 per cent or .95 confidence limits. The confidence interval is the range between these confidence limits which is 1.20 (16.60 − 15.40 = 1.20). The confidence interval is simply twice the size of the sampling error (0.60 × 2 = 1.20). It is usually expressed as the mean plus or minus the appropriate interval. So in this case the confidence interval is 16.00 ± 0.60.
If the sample size is 400 people instead of 100, the t value for the 95 per cent con-fidence level is slightly smaller and is 1.966. The sampling error for the same standarddeviation is also slightly smaller and is about 0.29 instead of about 0.60:
1.966 × = 1.966 × = = 0.2949 = 0.295.898
20
3
20
3
400
5.952
10
3
10
3
100
standard deviation
sample size
M13_HOWI4994_03_SE_C13.QXD 10/11/10 15:03 Page 243

244 PART 2 QUANTITATIVE RESEARCH METHODS
In other words, the sampling error in this case is about half as small for a sample of 400as for a sample of 100.
We can also see that if the variation or standard deviation of the variable is greater,then the sampling error will be greater. If the standard deviation was 6 instead of 3 withthis sample and confidence level, then the sampling error would be about 0.59 insteadof about 0.29:
1.966 × = 1.966 × = = 0.5898
The sampling error is sometimes known as the margin of error and may be expressed asa percentage of the mean. If the mean of the extroversion scores is 16 and the samplingerror is about 0.60, then the sampling error expressed as a percentage of this mean is 3.75 per cent (0.60/16 × 100 = 3.75). If the sampling error is about 0.29, then the sampling error given as a percentage of this mean is about 1.81 per cent (0.29/16 × 100= 1.8125). A margin of error of 2 per cent for extroversion means that the mean of thepopulation will vary between 0.32 (2/100 × 16 = 0.32) on either side of 16 at the 95 percent confidence level. In other words, it will vary between 15.68 (16 − 0.32 = 15.68) and16.32 (16 + 0.32 = 16.32).
Suppose that we want to estimate what sample size is needed to determine the population mean of extroversion for a population of infinite size at the 95 per cent con-fidence level with a margin of error of 2 per cent. We apply the following formula, where1.96 is the z value for the 95 per cent confidence level for an infinite population:
sample size =
If we substitute the appropriate figures in this formula, we can see that we need a sample of 346 to determine this:
= = = 345.60
If the margin of error was set at a higher level, then the sample size needed to estimatethe population characteristic would be smaller. If we set the margin of error at, say, 5 per cent rather than 2 per cent, the sampling error would be 0.80 (5/100 × 16 = 0.80)instead of 0.32 and the sample required would be 54 instead of 346.
= = = 54.00
Remember that the above formula only deals with a situation in which we have specified a particular margin of error. It has very little to do with the typical situation inpsychology in which the researcher tests to see whether or not a relationship differssignificantly from no relationship at all.
It should be noted that the formula for calculating sampling error for proportionatestratified sampling and cluster sampling differs somewhat from that given above whichwas for simple random sampling (Moser and Kalton, 1971, pp. 87, 103). Compared withsimple random sampling, the sampling error is likely to be smaller for proportionatestratified sampling and larger for cluster sampling. This means that the sample can besomewhat smaller for proportionate stratified sampling but somewhat larger for clustersampling than for simple random sampling.
34.56
0.64
3.84 × 9
0.64
1.962 × 32
0.802
34.56
0.10
3.84 × 9
0.10
1.962 × 32
0.322
1.962 × sample standard deviation2
sampling error2
11.796
20
9
20
6
400
M13_HOWI4994_03_SE_C13.QXD 10/11/10 15:03 Page 244

CHAPTER 13 SAMPLING AND POPULATION SURVEYS 245
■ Sample size for a finite populationThe previous formula assumes that we are dealing with an infinitely large population.When dealing with big populations, this formula is sufficient for calculating the size of the sample to be used. When the populations are fairly small, we do not need as many people as this formula indicates. The following formula is used for calculating theprecise number of people needed for a finite rather than an infinite population where nis the size of the sample and N is the size of the finite population (Berenson, Levine andKrehbiel, 2009):
adjusted n =
We can see this if we substitute increasingly large finite populations in this formulawhile the sample size remains at 346. This has been done in Table 13.3. The first columnshows the size of the population and the second column the size of the sample needed toestimate a characteristic of this population. The sample size can be less than 346 withfinite populations of less than about 250 000.
When carrying out a study we also need to take account of the response rate or thenumber of people who will take part in the study. It is unlikely that we will be able tocontact everyone or that everyone we contact will agree to participate. If the responserate is, say, 70 per cent, then 30 per cent will not take part in the study. Thus, we haveto increase our sample size to 495 people (346/.70 = 494.29). A 70 per cent responserate for a sample of 495 is 346 (.70 × 495 = 346.50). Often response rates are muchlower than this.
13.7 Conclusion
Most psychological research is based on convenience samples which are not selected randomly and which often consist of students. The aim of this type of research is oftento determine whether the support for an observed relationship is statistically significant.It is generally not considered necessary to ascertain to what extent this finding is characteristic of a particular population. Nonetheless where this is possible, it is usefulto know the degree to which our findings may be typical of a particular population.
n × N
n + (N − 1)
Table 13.3Sample size for varying finite populations with 95 per cent confidence level, 2 percent sampling error and standard deviation of 3
Population size Sample size
1 000 257
5 000 324
10 000 334
100 000 345
250 000 346
infinite 346
M13_HOWI4994_03_SE_C13.QXD 10/11/10 15:03 Page 245

246 PART 2 QUANTITATIVE RESEARCH METHODS
Consequently, it is important to understand what the basis is for selecting a samplewhich is designed to be representative of a population. Furthermore, in some cases, thepopulation will be limited in size so that it is possible with relatively little effort to selecta sample randomly. For example, if we are interested in examining the content of, say,recorded interactions or published articles, and we do not have the time or the resourcesto analyse the whole content, then it is usually appropriate to select a sample of that content using probability sampling. The great advantage of probability sampling is thatthe sample is likely to be more representative of the population and that the samplingwill not be affected by any biases we have of which we may not even be aware.
A random or probability sample is used to estimate the characteristics of a particular finite population.The probability of any unit or element being selected is equal and known.
The population does not necessarily consist of people. It may comprise any unit or element such asthe population of articles in a particular journal for a certain year.
The size of the sample to be chosen depends on various factors such as how confident we want to bethat the results represent the population, how small we want the sampling error to be, how variablethe behaviour is and how small the population is. Bigger samples are required for higher confidencelevels, smaller sampling errors, more variable behaviour and bigger populations.
Fairly small samples can be used to estimate the characteristics of very large populations. The samplesize does not increase directly with the population size.
Where the population is widely dispersed, cluster sampling and multi-stage sampling may be used.In the first stage of sampling a number of clusters such as geographical areas (for example, postcodesectors) may be chosen from which further selections are subsequently made.
Where possible the representativeness of the sample needs to be checked against other availabledata about the population.
Where the sample is a convenience one of undergraduate students, it may suffice to describe thenumber of females and males, and the mean and standard deviation of their ages. Where the sampleconsists of a more varied group of adults, it may be necessary to describe them in terms of othersocio-demographic characteristics such as whether or not they are employed, the social standing oftheir occupation and their racial origin.
Key points
ACTIVITIES1. How would you randomly select ten programmes from the day’s listing of a major TV channel to which you have ready
access?
2. How would you randomly select three 3-minute segments from a 50-minute TV programme?
3. How would you randomly select ten editions of a major Sunday newspaper from last year?
M13_HOWI4994_03_SE_C13.QXD 10/11/10 15:03 Page 246
Fundamentals of testingand measurement
PART 3
M14_HOWI4994_03_SE_C14.QXD 10/11/10 15:04 Page 247

M14_HOWI4994_03_SE_C14.QXD 10/11/10 15:04 Page 248

Psychological testsTheir use and construction
Overview
CHAPTER 14
Psychological tests and measures are commercially available, can be sometimesfound in the research literature or may be created by the researcher. The constructionof a psychological test is relatively easy using statistical packages.
Tests used for clinical and other forms of assessment of individuals need to be wellstandardised and carefully administered. Measures used for research purposes onlydo not need the same degree of precision to be useful.
Psychologists tend to prefer ‘unidimensional’ scales which are single dimensional‘pure’ measures of the variable in question. However, multidimensional scales maybe more useful for practical rather than research applications.
Item analysis is the process of ‘purifying’ the measure. Item–total correlations simplycorrelate each individual item with the score based on the other items. Those itemswith high correlations with the total are retained. An alternative is to use factor analysis,which identifies clusters of items that measure the same thing.
M14_HOWI4994_03_SE_C14.QXD 10/11/10 15:04 Page 249
250 PART 3 FUNDAMENTALS OF TESTING AND MEASUREMENT
14.1 Introduction
Standardised tests and measures are the major tools used extensively in psychologicalwork with clients (for example, clinical psychology, educational psychology, occupationalpsychology). They are also frequently used in research. In many ways standardised testsand measures are very characteristic of psychology. The term standardised can mean several things:
That consistency of results is achieved by the use of identical materials, prescribedadministration procedures and prescribed scoring procedures. That is to say, vari-ability in the ways in which different psychologists administer the test or measure isminimised. Way back in 1905 when Alfred Binet and Theodore Simon presented the world’s first psychological scale – one to essentially measure intelligence – he wasadamant about the detail of the assessment setting. For example, he suggested an isolated, quiet room in which the child was alone with the test administrator and, ideally, an adult familiar to the child to help reassure the child. However, the familiaradult should be ‘passive and mute’ and not intervene in any way (Binet and Simon,1904, 1916).
That the consistency of interpretation of the test is maximised by providing normativeor standardisation data for the test or measure. This means that the test or measurehas been administered to a large, relevant sample of participants. In this way, it is possible to provide statistical data on the range and variability of scores in such asample. As a consequence, the psychologist is able to compare the scores of their participants with those of this large sample. These statistical data are usually referredto as the norms (or normative data) but they are really just the standard by whichindividual clients are judged. Often tables of percentiles are provided which indicatefor any given score on the test or measure, the percentage of individuals with that scoreor a lower score (see the companion book Introduction to Statistics in Psychology,Howitt and Cramer, 2011a). Norms may be provided for different genders and/or agegroups, and so forth.
Standardised tests and measures are available for many psychological characteristicsincluding attitudes, intelligence, aptitude, ability, self-esteem, musicality, personality andso forth. Catalogues of commercially available measures are published by a number ofsuppliers. These may be quite expensive, elaborate products. Their commercial potentialand practical application partly explains the cost. For example, there is a big market for tests and measures for the recruitment and selection of employees by businesses,especially in the USA. Selection interviews are not necessarily effective ways of assess-ing the abilities and potential of job applicants. Standardised selection tests assessingaptitude for various types of employment may help improve the selection process. Byhelping to choose the best employee, the costs of training staff and replacing those whoare unsuited to the work are minimised.
Similarly there are commercially available tests and measures designed for work withclinical patients or schoolchildren. In these contexts, tests and measures may be used as screening instruments in order to identify potential difficulties in individuals. Forexample, if there were a simple effective test for dyslexia then it could be given to classesof children en masse in order to identify individuals who may require further assessmentand treatment/support for dyslexia.
Although many of these commercially available tests and measures are employed inresearch, they are often designed primarily with the needs of practitioners in mind. Theymay not always be the ideal choice for research:
M14_HOWI4994_03_SE_C14.QXD 10/11/10 15:04 Page 250

CHAPTER 14 PSYCHOLOGICAL TESTS 251
They are often expensive to buy. Given that research tends to use large samples, thecost may be prohibitive.
They are often expensive to administer. Many commercial tests and measures areadministered on a one-to-one basis by the psychologist. Psychologists may also requiretraining in their use which is a further cost. Some tests may take as much as two hoursor more to administer, and this is not only a further cost, but may also be a deterrentto individuals from participating in the research.
They are often intended for use with special populations. The tests and measures usedby clinical psychologists, for example, may be helpful in identifying schizoid thoughttendencies in psychiatric settings but have no value when applied to non-clinical populations.
Some of the tests and measures are restricted in their circulation, such as to qualifiedclinical psychologists. Students, especially, may have no access to them. Universitydepartments, though, often have a variety of tests for use by students under the super-vision of a member of staff.
There is no guarantee that there is a test or measure available for the variables that theresearcher needs to measure.
As a consequence, researchers may need to consider constructing new tests or measuresrather than relying on commercially available ones. There are many research instrumentswhich have been developed which are not available through commercial sources. Thesecan often be found in relevant journal articles, books, websites or directly from theirauthor. Locating these tests and measures will entail a review of the literature in theresearch field in question. Research studies in your chosen field will often describe ormake use of these research instruments. One advantage of using the same measures asother researchers is that they are recognised by the research community as effective measures. Care needs to be taken, however, since the purposes of your research may notbe exactly the same as that of previous researchers or the instrument may be unsuitablefor other reasons. For example, the research instrument may have been designed for adifferent culture or a different age group. Hence it may need some modification to makeit suitable for the particular group on which you wish to use it. There are circumstancesin which the research instrument appears so unsatisfactory that the researcher decides tocreate an entirely new instrument.
The mechanics of test construction are fairly straightforward and, with the availabilityof SPSS Statistics and other computer packages, it is feasible to produce bespoke measur-ing instruments even as part of student research.
14.2 The concept of a scale
Psychologists frequently refer to scales in relation to psychological tests and measures.In general English dictionaries, the term ‘scale’ is defined as a graded classification system.This will probably suffice to understand the use of the concept in test construction. Thatis, individuals are numerically graded in terms of their scores on the measure. There aretwo important ways of creating such graded scales:
Providing a series of test or measurement items which span the range from lowest to highest. So, if a measure of intelligence is required, a whole series of questions is provided which vary in terms of their difficulty. The most difficult question that the participant can answer is an indicator of their level of intelligence. The difficulty
M14_HOWI4994_03_SE_C14.QXD 10/11/10 15:04 Page 251

252 PART 3 FUNDAMENTALS OF TESTING AND MEASUREMENT
of an item is assessed simply by working out the percentage of a relevant sample who answer the question correctly. This approach was applied to the assessment of attitudes using the Thurstone Scale. For example, in order to measure racial attitudes a series of statements is prepared from the least racist to the most racist. The items are judged by a panel of judges in terms of the extent of the racism in the statement. The most hostile item that a participant agrees with is an indicator of their level of racism. This is known as the ‘method of equal-appearing intervals’because the test constructor endeavours to make the items cover all points of the possible range evenly.
A much more common way of constructing psychological tests and measures operateson a quite distinct principle, although the outcomes of the two methods are often substantially the same. In the method of summated scores the researcher develops apool of items to measure whatever variable is to be measured. The final score is basedon the sum of the items. Usually, an additional criterion is introduced which is thatthe items should correlate with the total scores on the test or measure. We will returnto this in the next section. It is the most commonly used method.
Psychological tests and measures are frequently described as unidimensional or multi-dimensional. A unidimensional scale is one in which the correlations of the items witheach other are determined as a result of a single underlying dimension. This is analogousto measuring the weights of 30 people using ten different sets of bathroom scales – there will be strong intercorrelations between the weights as assessed by different sets of bathroom scales. A multidimensional scale has two or more underlying dimensionswhich result in a pattern of intercorrelations between the items in which there are distinctclusters or groups of items which tend to intercorrelate with each other but not with otheritems so well or not at all. This is analogous to measuring the weights of 30 people usingten different sets of bathroom scales and their heights using five different tape measures.In this case, we would expect for the sample of people:
strong intercorrelations of their weights as measured using the different sets of bathroomscales;
strong intercorrelations of the heights as measured with the five different tape measures;
poor intercorrelations between the ten sets of bathroom scale measures and the fivesets of tape measure measures.
This is simply because our 15 different measures (analogous to 15 different items on aquestionnaire) are measuring two different things: weight and height.
Which of these is the best? The short answer is that for most purposes of researchthe ideal is a unidimensional scale since this implies a relatively ‘pure’ measurementdimension. That is, a unidimensional scale can be thought of as aiming to measure a single concept. However, multidimensional scales are sometimes more useful in practicalsituations. For example, a multidimensional measure of intelligence is likely to predictsuccess at university better than a unidimensional one. This is because university perform-ance is determined by a variety of factors (for example, maths ability, comprehension,motivation and so forth) and not just one. Consequently a measure based on a varietyof factors is more likely to be predictive of university success.
Measurement in psychology is beset with a number of fundamental and generallyunavoidable problems. Many of these are to do with the weakness or imprecision ofmeasurement in psychology. In the physical world, a centimetre is a standard, well-established and precisely measurable amount. Psychological variables cannot be measuredwith the same degree of precision. Every psychological measure that we know of suffersfrom a degree of variability, that is to say, the measurement will vary somewhat each time
M14_HOWI4994_03_SE_C14.QXD 10/11/10 15:04 Page 252

CHAPTER 14 PSYCHOLOGICAL TESTS 253
it is taken – apparently in an unsystematic or random fashion. If we measure age by askingparticipants their age, we might expect a degree of imprecision – some participants maydeliberately lie, others will have forgotten their age, we may mishear what they say andso forth. This occurs when we are measuring something as easy to define as age so onecan imagine that the problem is worse when measuring a difficult to define (or unclear)concept such as self-esteem, happiness or cognitive distortions.
Since psychological concepts are often not precisely definable, psychologists tend tomeasure concepts using a variety of test or measurement items rather than a single item.The idea is that by using a number of imprecise measures of the concept in question, theaggregate of these measures is likely to be a better measure than any of the constituentindividual items.
There is nothing wrong with using a single item to measure a psychological variable– one would not measure age by using a 20-item age scale, for example. However, wewould use a long scale to measure a less clear variable such as happiness. So the use ofscaling is really confined to circumstances in which you wish to get a decent measure of a variable that is difficult to measure. Thus, you would not use scaling if you wishedto measure gender or age. A single question will generally produce high quality andhighly valid answers to these questions.
It’s a bit like finding out the cost of the tube fare to Oxford Street in London by asking lots of friends. Probably none of your friends knows the precise fare, but several would have a rough idea. By combining several rough estimates together by averaging, the probable outcome is a reasonable estimate of the train fare. Obviously it would be better to use a more accurate measure (e.g. phone London Underground) but if this is not possible the rough estimates would do. In other words, there is an objective reality (the actual fare that you will pay) but you cannot find that out directly.This is much the same as psychological variables – there may be an objective reality of happiness but we can only measure it indirectly using an aggregate of imprecise measures.
14.3 Scale construction
At this point, it is important to stress that psychological tests and measures are not created simply on the back of statistical techniques. Ideally, the psychologist constructinga measure will be familiar with the relevant theory and research concerning the thing to be measured. They may also be familiar with related concepts, the opinion of experts,and information from samples of individuals about how they understand and experienceaspects of the concept. For example, just what is depression like experientially? Suchinformation concerning the concept can contribute to a more insightful and pertinent set of items to begin the research. The following are worth emphasising:
Every effort should be made to specify the nature of the concept we wish to measure– just what do we mean by loneliness, depression or staff burnout, for example? Oftenby reflecting on this we begin to realise that potentially there may be many differentfeatures of the concept which we need to incorporate into the pool of items fromwhich we will develop the test or measure.
Even after we have developed our understanding of the concept as well as we can, we may find it impossible to phrase a single question to assess it. Take loneliness; is a question such as ‘How many friends do you have?’ a good measure of loneliness?It depends on many things – what an individual classifies as a friend, whether loneliness is determined by the number rather than the quality of friendships, the
M14_HOWI4994_03_SE_C14.QXD 10/11/10 15:04 Page 253
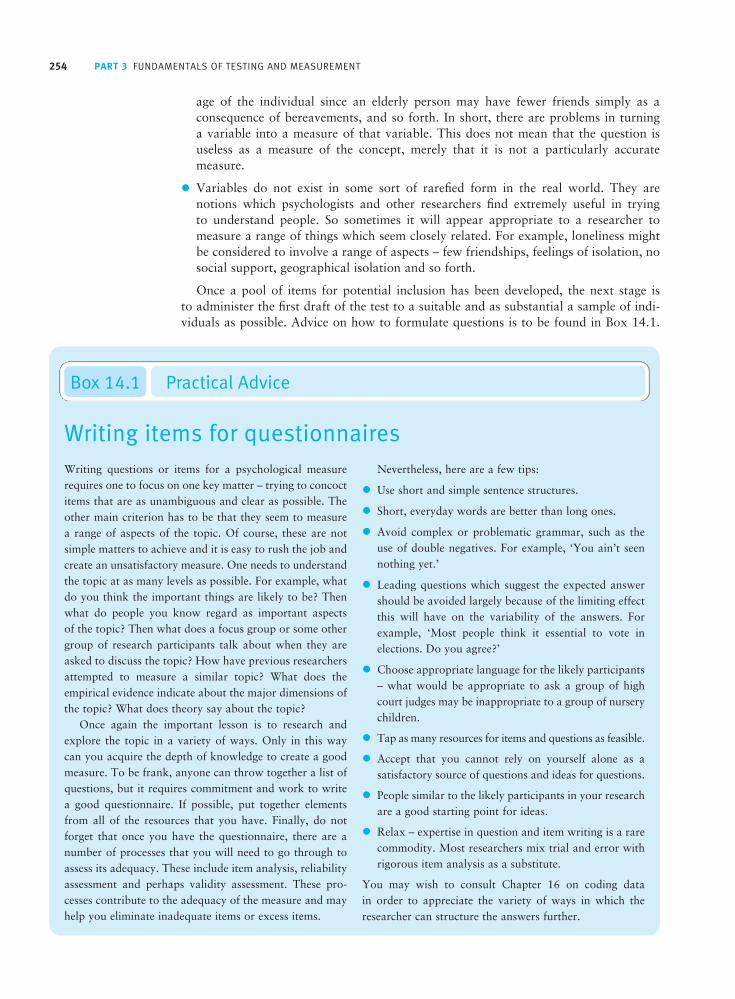
254 PART 3 FUNDAMENTALS OF TESTING AND MEASUREMENT
age of the individual since an elderly person may have fewer friends simply as a consequence of bereavements, and so forth. In short, there are problems in turning a variable into a measure of that variable. This does not mean that the question is useless as a measure of the concept, merely that it is not a particularly accurate measure.
Variables do not exist in some sort of rarefied form in the real world. They arenotions which psychologists and other researchers find extremely useful in trying to understand people. So sometimes it will appear appropriate to a researcher to measure a range of things which seem closely related. For example, loneliness mightbe considered to involve a range of aspects – few friendships, feelings of isolation, nosocial support, geographical isolation and so forth.
Once a pool of items for potential inclusion has been developed, the next stage is to administer the first draft of the test to a suitable and as substantial a sample of indi-viduals as possible. Advice on how to formulate questions is to be found in Box 14.1.
Writing items for questionnaires
Box 14.1 Practical Advice
Writing questions or items for a psychological measurerequires one to focus on one key matter – trying to concoctitems that are as unambiguous and clear as possible. Theother main criterion has to be that they seem to measure a range of aspects of the topic. Of course, these are notsimple matters to achieve and it is easy to rush the job andcreate an unsatisfactory measure. One needs to understandthe topic at as many levels as possible. For example, whatdo you think the important things are likely to be? Thenwhat do people you know regard as important aspects of the topic? Then what does a focus group or some othergroup of research participants talk about when they areasked to discuss the topic? How have previous researchersattempted to measure a similar topic? What does theempirical evidence indicate about the major dimensions ofthe topic? What does theory say about the topic?
Once again the important lesson is to research andexplore the topic in a variety of ways. Only in this way can you acquire the depth of knowledge to create a goodmeasure. To be frank, anyone can throw together a list ofquestions, but it requires commitment and work to writea good questionnaire. If possible, put together elementsfrom all of the resources that you have. Finally, do not forget that once you have the questionnaire, there are anumber of processes that you will need to go through toassess its adequacy. These include item analysis, reliabilityassessment and perhaps validity assessment. These pro-cesses contribute to the adequacy of the measure and mayhelp you eliminate inadequate items or excess items.
Nevertheless, here are a few tips:
Use short and simple sentence structures.
Short, everyday words are better than long ones.
Avoid complex or problematic grammar, such as theuse of double negatives. For example, ‘You ain’t seennothing yet.’
Leading questions which suggest the expected answershould be avoided largely because of the limiting effectthis will have on the variability of the answers. Forexample, ‘Most people think it essential to vote in elections. Do you agree?’
Choose appropriate language for the likely participants– what would be appropriate to ask a group of highcourt judges may be inappropriate to a group of nurserychildren.
Tap as many resources for items and questions as feasible.
Accept that you cannot rely on yourself alone as a satisfactory source of questions and ideas for questions.
People similar to the likely participants in your researchare a good starting point for ideas.
Relax – expertise in question and item writing is a rarecommodity. Most researchers mix trial and error withrigorous item analysis as a substitute.
You may wish to consult Chapter 16 on coding data in order to appreciate the variety of ways in which theresearcher can structure the answers further.
M14_HOWI4994_03_SE_C14.QXD 10/11/10 15:04 Page 254

CHAPTER 14 PSYCHOLOGICAL TESTS 255
Let us assume that we have gone through that process and have a list of such items. For illustrative purposes we have ten different items but the list would probably be 30or 40 items. We have decided to attempt to measure honesty. Our ten items are:
Several things are readily apparent about this list:
There is a wide range of items which seem to be measuring a variety of things.Probably all of the items are measuring something that may be regarded as honesty(or lack of it).
Some of the items are positively worded in terms of honesty (for example, Items 1, 6and 8). That is, agreeing with these items is indicative of honesty. Other items are negatively worded in that disagreeing with them is indicative of honesty (for example,Items 7, 9 and 10). Often positively and negatively worded items are both includeddeliberately in order to help deal with ‘response sets’. Briefly, it has been establishedthat some people tend to agree with items no matter the content of the item. Thusthey have a tendency to agree with an item but also agree with an item worded in the opposite direction. That is they might agree with the statement that ‘I am an honest person’ and also agree with the statement that ‘I am not an honest person’.One way of dealing with this is to use both positively and negatively worded items –mixing items for which agreement is indicative of the variable with those for whichdisagreement is indicative of the variable. Many questionnaires can be found whichdo not do this, however.
You must remember to reverse score the negatively worded items – if scored in thesame way as the positively worded items then the positively worded items would becancelled out by the negatively worded ones.
One of the items (Item 4: I have never told even the slightest untruth) seems unlikelyto be true of any human. Items like this are sometimes included in order to assess faking ‘good’ or ‘social desirability’, that is, trying to give an impression of meetingsocial standards even unobtainable ones. On the other hand, it is possible that theresearcher has simply written a bad item. That is, if everyone disagrees with an itemthen it cannot discriminate between people in terms of, in this case, honesty. Usefulitems need to demonstrate variability (variance) among participants in the research.
A careful reading through of the items seems to suggest that there are at least two dif-ferent sorts of honesty being measured – one is verbal honesty (not lying, basically) andthe other is not stealing. It could well be that this questionnaire is multidimensional inthat it is measuring two distinct things. The usual way of assessing this is by examiningempirically whether the people who are verbally honest also tend not to steal. Basicallythis is a matter of correlating the different items one with another.
Item 1 I am an honest person.
Item 2 I have frequently told little lies so as not to offend people.
Item 3 If I found money in the street I would hand it in to the police.
Item 4 I have never told even the slightest untruth.
Item 5 I would always return the money if I knew that I had been given too much change in a shop.
Item 6 I would never make private phone calls from work.
Item 7 I have shoplifted.
Item 8 It is always best to tell the truth even if it hurts.
Item 9 I usually tell the boss what I think they would like to hear even if it is not true.
Item 10 If I were to have an affair, I would never tell my partner.
M14_HOWI4994_03_SE_C14.QXD 10/11/10 15:04 Page 255

256 PART 3 FUNDAMENTALS OF TESTING AND MEASUREMENT
Scaling – or the process of developing a psychological scale – deals with the ways inwhich items are combined in order to get a better measure of a concept than could beachieved using a single item. The common methods of psychological scaling employedby most modern researchers are built on one of two general principles:
If we sum the scores on the individual items of a test or measure to give the totalscore, then each of the individual items should correlate with this total score if the items are measuring the same thing as each other. Items which do not correlatewith the total score are simply not measuring what the majority of the other items are measuring and may be eliminated from the scale. This is also known as theitem–whole or item–total approach to scale construction.
If items on the scale are measuring the same thing then they should correlate substantially with each other (and the total score as well for that matter). Items whichmeasure very different things will correlate with each other either very poorly or notat all. This is the basis of internal consistency approaches to scale construction as well as the factor analytic methods. These are discussed later in this chapter. With a multidimensional scale, sometimes you will find distinct groups of items which correlate well with each other but not with other groups of items.
We will consider each of these approaches in turn. They are known as item analysistechniques; see Box 14.2 and Figure 14.1.
■ Item–whole or item–total approach to scale constructionThe purpose of item analysis is to eliminate bad items that do not measure the samething as the scale in general. These are not laborious statistical techniques if one uses a
Item analysis
Box 14.2 Key Ideas
Item analysis refers to the process of examining each itemon the scale in order to identify its good features and inad-equacies. The following are the main features involved:
Items which show little variation over the sample shouldbe dropped. This is because such items contribute littleor nothing to variations in the total score on the test.Low variability may be assessed by calculating a measureof variation (for example, variance, standard error orstandard deviation) or by examining a histogram of thescores on each item.
Ideally, all items should show similar levels of variationand as much variation in response as possible. If theitems do not have similar variability then problems mayarise if one simply sums the scores on the items on the scale to get a total. If the items do not have similar variabilities, then the proper procedure would be to turnthe scores on the individual items into standard scores(see the companion book Introduction to Statistics in
Psychology (Howitt and Cramer, 2011a, Chapter 5).In some psychological tests and measures, you will find that certain items are given extra scoring weight.This is to take into account this very problem. All otherthings being equal, an item with large variability wouldbe preferred over one with low variability.
Items which are omitted (not replied to) or are com-mented on by a number of participants should be considered for dropping from the scale. Comments andomissions are indicative that the participants are havingdifficulty knowing the meaning of the item. Rephrasingthe item is an option but this means that the scaleshould be re-administered to a new sample.
The final stage of item analysis is to examine the con-sistency with which the individual items contribute towhatever is being measured by the total scale. Item–wholecorrelation and factor analytic approaches to doingthis are discussed in the main body of the text.
M14_HOWI4994_03_SE_C14.QXD 10/11/10 15:04 Page 256
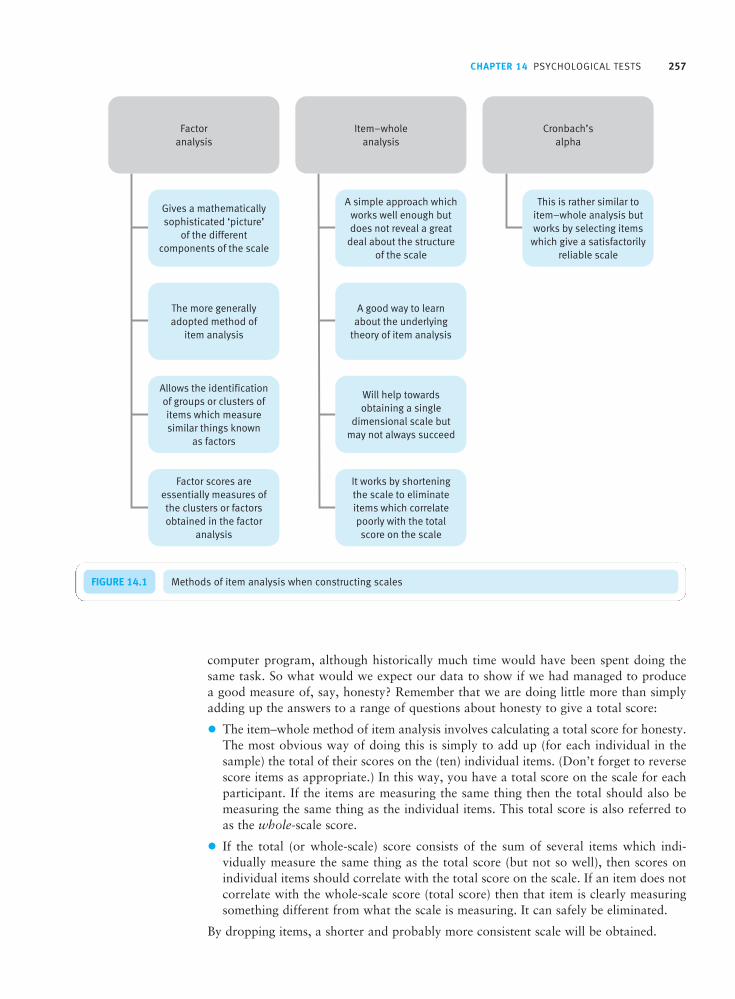
CHAPTER 14 PSYCHOLOGICAL TESTS 257
computer program, although historically much time would have been spent doing thesame task. So what would we expect our data to show if we had managed to produce a good measure of, say, honesty? Remember that we are doing little more than simplyadding up the answers to a range of questions about honesty to give a total score:
The item–whole method of item analysis involves calculating a total score for honesty.The most obvious way of doing this is simply to add up (for each individual in thesample) the total of their scores on the (ten) individual items. (Don’t forget to reversescore items as appropriate.) In this way, you have a total score on the scale for eachparticipant. If the items are measuring the same thing then the total should also bemeasuring the same thing as the individual items. This total score is also referred toas the whole-scale score.
If the total (or whole-scale) score consists of the sum of several items which indi-vidually measure the same thing as the total score (but not so well), then scores onindividual items should correlate with the total score on the scale. If an item does notcorrelate with the whole-scale score (total score) then that item is clearly measuringsomething different from what the scale is measuring. It can safely be eliminated.
By dropping items, a shorter and probably more consistent scale will be obtained.
FIGURE 14.1 Methods of item analysis when constructing scales
M14_HOWI4994_03_SE_C14.QXD 10/11/10 15:04 Page 257

258 PART 3 FUNDAMENTALS OF TESTING AND MEASUREMENT
Another way of doing much the same thing is to take extreme groups on the wholeor total test. That is, we could take the top 25 per cent of scores and the bottom 25 percent of scores on the entire scale. Items which are answered very differently by high scorers on the entire scale compared with low scorers are good items and should beretained. Items which are answered similarly by high scorers and low scorers are not discriminating and may be dropped from the scale. There is no advantage of this methodover using item–whole correlations.
Table 14.1 contains, among other things such as the average of scores on the fullscale, the item–total correlations for our honesty scale. What does it tell us? The firstthing to note is that all but one of the relationships are positive and this one case is very close to zero. If there were any substantial negative relationships, especially sizeableones, then that item has probably been scored the wrong way round. That is, it mightbe a negatively worded item which has not been reversed scored. The researcher needs to check that this is indeed the case. Wrongly scored items should be rescored in theopposite direction. (This can be easily done using recoding procedures such as those inSPSS Statistics.) The calculations have all to be redone because the total score will beincorrect – one more good reason for using a computer.
The most important function of the item–whole correlation coefficients, though, isthat they show us which of the items correlate poorly with the total score, that is, theitems which correlate weakly with whatever it is that the scale measures. Looking atTable 14.1, it is clear that some of the items correlate rather better with the total scorethan others. If we wished to shorten the scale (though this one is not very long anyway),then the obvious items to drop are the ones which relate poorly to the total score. Theitems which have good correlations with the total score are retained for inclusion in the final scale – by doing so we increase the likelihood that all of our remaining itemsare measuring much the same thing. This is a matter of judgement, of course, but is easily reversible if it seems that too many items have been omitted. However, since items have been dropped then the total score and the item–whole correlations have to be recalculated. Again, statistical computer software such as SPSS Statistics make this afairly minimal chore.
Item 8 on the honesty scale (‘It is always best to tell the truth even if it hurts’) is theobvious item to drop first given its near zero correlation with the total of items.
Table 14.1 Item–total correlation
Scale mean if Scale variance Corrected item–total item deleted if item deleted correlation
Honest 26.00 40.33 0.38
Offend 25.38 37.76 0.43
Street 25.77 37.36 0.46
Untruth 25.69 35.23 0.74
Change 26.00 37.00 0.56
Phone 25.31 36.40 0.55
Shoplift 25.85 36.97 0.69
Hurts 25.23 44.86 −0.04
Boss 25.38 37.76 0.43
Affair 25.54 37.94 0.36
M14_HOWI4994_03_SE_C14.QXD 10/11/10 15:04 Page 258

CHAPTER 14 PSYCHOLOGICAL TESTS 259
So as a reminder, just what has dropping items achieved?
One result is that the scale becomes a more refined measure of whatever it is that itmeasures. That is to say, remaining items increasingly tend to measure the same thing.
The scale is shortened – this may be very important in some research contexts becauseparticipants may be more prepared to complete a short measure than a long measure,for example. Be careful though since a short scale may not be as reliable as a longerscale (see Chapter 15 for a discussion of reliability) all other things being equal.
What constitutes a good item–whole correlation cannot be defined in absolute terms.It would be unwise to retain items which fail to meet the minimum criterion of statisticalsignificance. For tests and measures developed solely for the purpose of research withsubstantial samples of participants, tests and measures with just a few items may be preferred simply because they place less demand on participants. There is a trade-offbetween length of the test or measure and the number of participants in the study. Thegreater the number of participants then the shorter the scale may be.
A small refinement
Item–total correlation analysis may be refined especially when the scale consists of relatively few items. This modification involves correlating the item with the total scoreminus the score on that particular item. Put another way, this is merely the correlationof the item with the sum of all of the other items. Because the item–whole correlationsinclude the correlation of the item with itself, then this figure will always be inflatedsomewhat. The extent of the inflation depends on the number of items contributing to the total score on the test – the fewer the items then the greater the impact of any oneitem. So by dropping the item in question from the total score on the test or measure,we get a better indicator. This amount of inflation of the correlation is probably negligible when we have a lot of items; it is more influential when we have few items.The adjustment is straightforward and is recommended as the preferred approach.Computer programs such as SPSS Statistics will do both versions of the analysis so thereis virtually no additional effort required.
This form of item analysis is very much a process and not a single step. By reducingthe number of items one at a time, the value and influence of each variable may beassessed. The researcher simply removes items from the scale in order of their item–whole correlations. The item with the lowest item–whole correlation at any stage is normally the next candidate for omission. Box 14.3 explains another approach – howCronbach’s (1951) alpha coefficient may be used similarly to shorten scales and toincrease measurement consistency.
■ The factoring approachThe item-analysis approach described above is important since it is the basis of manycommon psychological tests and measures. There is an alternative – factor analysis – whichis much more feasible than in the past because of the availability of high-speed computers.Factor analysis was developed early in the history of modern psychology as a means ofstudying the structure of intelligence (and consequently measures of intelligence). Its primary uses are in the context of psychological test and measure construction. Once it was a specialised field but now it is readily available and calculated in seconds usingstatistical packages such as SPSS Statistics.
First, in factor analysis the computer calculates a matrix of correlations between allof the items on the test or measure (this is provided in Table 14.2). Then mathematicalroutines are calculated which detect patterns in the relationships between items on thepsychological test. These patterns are presented in terms of factors. A factor is simply
M14_HOWI4994_03_SE_C14.QXD 10/11/10 15:04 Page 259

260 PART 3 FUNDAMENTALS OF TESTING AND MEASUREMENT
an empirically based hypothetical variable which consists of items which are stronglyassociated with each other. Usually, there will be several factors which emerge in a factor analysis. The precise number depends on the data and it can be that there is simply one significant or dominant factor. More practical details on factor analysis canbe found in the two companion texts Introduction to Statistics in Psychology (Howittand Cramer, 2011a) and Introduction to SPSS Statistics in Psychology (Howitt andCramer, 2011b).
Using Cronbach’s alpha to shorten scales and increaseconsistency of items
Box 14.3 Practical Advice
There is another way of eliminating items which are notmeasuring what the scale measures particularly well. Thisis based on (Cronbach’s) coefficient alpha. This is dealtwith in more detail in Chapter 15. It can be regarded fornow as an index of the consistency with which all of theitems on the scale measure whatever the scale is measuring.It is possible (using a computer program such as SPSSStatistics) to compute the alpha coefficients of the test. Thereis an option which computes the alpha coefficients of thetest with each of the items omitted in turn. This meansthat there will be as many alpha reliabilities as items in thetest. Items which are not measuring the same thing as theother items may be dropped without reducing the size ofthe alpha reliability coefficient – simply because they are
adding nothing to the consistency of the test. (This is bydefinition since if they added something to the consistencyof the test, removing them would lower the reliability ofthe test.)
The researcher simply looks through the list of alphacoefficients, and the lowest alpha reliability is selected. The item with this alpha may be omitted from the scale as this item is not a good measure of what the scale itself measures. This process is repeated for the ‘new’ scale andan item dropped. Eventually a shortened scale will emergewhich has a sufficiently high alpha coefficient. One of .70or so is usually regarded as satisfactory.
Cronbach’s alpha coefficient is also known as the alphareliability (see Chapter 15).
Table 14.2 Correlation matrix for the ten-item honesty scale
Honest Offend Street Untruth Change Phone Shoplift Hurts Boss Affair
Honest 1 −0.169 0.540 0.583 0.553 0.431 0.476 0.239 −0.169 −0.283
Offend −0.169 1 −0.037 0.196 −0.027 0.046 0.303 0.090 0.999 0.676
Street 0.540 −0.037 1 0.554 0.464 0.583 0.448 −0.004 −0.037 0.082
Untruth 0.583 0.196 0.554 1 0.771 0.720 0.703 −0.077 0.196 0.208
Change 0.553 −0.027 0.464 0.771 1 0.553 0.717 0.035 −0.027 0.078
Phone 0.431 0.046 0.583 0.720 0.553 1 0.341 −0.288 0.046 0.504
Shoplift 0.476 0.303 0.448 0.703 0.717 0.341 1 0.144 0.303 0.164
Hurts 0.239 0.090 −0.004 −0.077 0.035 −0.288 0.144 1 0.090 −0.314
Boss −0.169 0.999 −0.037 0.196 −0.027 0.046 0.303 0.090 1 0.676
Affair −0.283 0.676 0.082 0.208 0.078 0.504 0.164 −0.314 0.676 1
M14_HOWI4994_03_SE_C14.QXD 10/11/10 15:04 Page 260

CHAPTER 14 PSYCHOLOGICAL TESTS 261
Each individual test item has some degree of association with each of the major patterns (i.e. the factors found through factor analysis). This degree of association ranges from a zero relationship through to a perfect relationship. In factor analysis, therelationship of a test item to the factor is expressed in terms of a correlation coefficient.These correlation coefficients are known as factor loadings. So a factor loading is thecorrelation coefficient between an item and a factor. Usually there will be more than onefactor but not necessarily so. So each test item has a loading on each of several factors.This is illustrated for our honesty scale in Table 14.3. This table is a factor-loadingmatrix – it gives the factor loadings of each of the test items on each of the factors. Since they are correlation coefficients, factor loadings can range from −1.0 through 0.0to +1.0. They would be interpreted as follows:
A factor loading of 1.0 would indicate a perfect correlation of the item with the factorin question. It is unlikely that you will get such a factor loading.
Phi and point–biserial correlation coefficients
Box 14.4 Key Ideas
Before computers, psychological test construction requirednumerous, time-consuming calculations. The phi and point–biserial correlation coefficients were developed as ways ofspeeding up the calculations by using special formulae in special circumstances. These formulae are now obsoletebecause computers can do the calculations quickly andeasily – see the companion text Introduction to SPSSStatistics in Psychology (Howitt and Cramer, 2011b).
The phi coefficient is merely the Pearson correlationcoefficient calculated between two binary (binomial or
yes/no) variables. Many psychological tests have this form– one simply agrees or disagrees with the test item. So the phi coefficient provided a quicker way of calculating acorrelation matrix between the items on a test.
The point–biserial correlation is merely the Pearsoncorrelation calculated between a binary (yes/no) test variableand a conventional score. Thus item–whole (item–total)correlations could be calculated using the point–biserialcorrelation. One variable is the binomial (yes/no) item andthe other variable is the total score on the test.
Table 14.3 Factor loadings for the honesty scale
Factor 1 Factor 2 Factor 3
Honest 0.641 −0.520 0.260
Offend 0.278 0.904 0.276
Street 0.700 −0.261 0.009
Untruth 0.919 −0.007 −0.003
Change 0.818 −0.262 0.005
Phone 0.777 −0.002 −0.492
Shoplift 0.797 0.003 0.331
Hurts −0.002 −0.119 0.873
Boss 0.278 0.904 0.276
Affair 0.353 0.794 −0.370
M14_HOWI4994_03_SE_C14.QXD 10/11/10 15:04 Page 261

262 PART 3 FUNDAMENTALS OF TESTING AND MEASUREMENT
A factor loading of .8 would be a high value and you would often find such values ina factor analysis. It means that the item correlates well with the factor though lessthan perfectly.
A factor loading of .5 would be a moderate value for a factor loading. Such factorloadings are of interest but you should bear in mind that a correlation of .5 actuallymeans that only .25 of the variation of the item is accounted for by the factor. (SeeChapter 4 of this book and Chapter 7 of the companion text Introduction to Statisticsin Psychology, Howitt and Cramer, 2011a.)
A factor loading of .2 generally speaking should be regarded as very low and indicatesthat the item is poorly related to the factor.
A factor loading of .0 means that there is no relationship between that item and thefactor. That is, none of the variation in the item is associated with that factor.
Negative (−) signs in a factor loading should be interpreted just as a negative cor-relation coefficient would be. If the item were to be reverse scored, then the sign of itsfactor loadings would be reversed. So a negative factor loading may simply indicatean item which has not been reverse scored.
All of this may seem to be number crunching rather than psychological analysis.However, the end point of factor analysis is to put a psychological interpretation on the factors. This is done in a fairly straightforward manner, though it does require adegree of creativity on the researcher’s part. The factor loadings refer to items which areusually presented verbally. It is possible to take the items with high factor loadings and see what the pattern is which defines the factor. This merely entails listing the itemswhich have high loadings with factor 1, first of all. If we take our cut-off point as .5 thenthe items which load highly on factor 1 in descending order of size are:
Item 4 (loading = .919) ‘I have never told even the slightest untruth.’
Item 5 (loading = .818) ‘I would always return the money if I knew that I had been giventoo much change in a shop.’
Item 7 (loading = .797) ‘I have shoplifted.’
Item 6 (loading = .777) ‘I would never make private phone calls from work.’
Item 3 (loading = .700) ‘If I found money in the street I would hand it in to the police.’
Remember that some of the items would have been reverse scored so that a high scoreis given to the honest end of the continuum.
The next step is to decide what is the common theme in these high loading items. This simple step may be enough for you to say what the factor is. It can be helpful tocompare the high loading items on a factor with the low loading items – they should be very different. The success of this process depends as much on the insight of theresearcher about psychological processes as it does on their understanding of the mechanicsof factor analysis.
Looking at the items which load highly on the first factor, mainly they seem to relateto matters of theft or white-collar crime (e.g. abusing the phone at work). So we mightwish to label this factor as ‘financial honesty’ but there may be better descriptions.Further research may cause us to revise our view but in the interim this is probably asgood as we can manage.
The process is repeated for each of the factors in turn. It is conventional to identifythe factors with a brief title.
M14_HOWI4994_03_SE_C14.QXD 10/11/10 15:04 Page 262

CHAPTER 14 PSYCHOLOGICAL TESTS 263
Just what can be achieved with factor analysis?
It demonstrates the number of underlying dimensions to your psychological test.
It allows you to dispense with any items which do not load highly on the appropriatefactors, that is, the ones which do not seem to be measuring what the test is designedto measure. In this way, it is possible to shorten the test.
It is possible to compute factor scores. This is easy with SPSS Statistics – see the companion text Introduction to SPSS Statistics in Psychology (Howitt and Cramer,2011b). A factor score is merely a score based on the participants’ responses to thetest items which load heavily on the various factors. So instead of being a score onthe test, a factor score is a score on one of the factors. One advantage of using factorscores is that they are standardised scores unaffected by differences in the variance of each of the items. As an alternative, it is possible to take the items which load heavily on a factor and derive a score by totalling those items. This is not so accurateas the factor score method. A disadvantage of using factor scores is that they are likelyto vary from sample to sample.
Factor analysis generates variables (factors) which are pure in the sense that the itemswhich load highly on a factor are all measuring the same underlying thing. This is nottrue of psychological tests created by other means.
14.4 Item analysis or factor analysis?
We have described item analysis and factor analysis. In many ways they seem to be doingrather similar jobs. Just what is the difference between the two in application?
Factor analysis works using the intercorrelations of all of the items with one another.Item analysis works by correlating the individual items with the total score. Factoranalysis is more subtle as a consequence since the total score obtained by addingtogether items in item analysis might include two or more somewhat distinct sets ofitems (though they are treated as if they were just a single set).
Factor analysis allows the researcher to refine their conceptualisation of what theitems on the test measure. That is, the factors are fairly refined entities which mayallow psychological insight into the scale. Item analysis merely provides a fairly roughway of ridding a scale of bad items which are measuring somewhat different thingsfrom those measured by the scale. In that sense it is much cruder.
It should be mentioned that extremely refined scales may not be as effective at measuring complex things as rather cruder measures. For example, we could hone ourhonesty scale down by factor analysis such that we have just one measure. The troubleis that honest behaviour, for example, may be multiply determined such that a refinedmeasure does not predict honesty very well. In contrast, a cruder test that measures different aspects of honesty may do quite a good job at predicting honest behaviour simply because it is measuring more aspects of honesty. In other words, there may be a difference between a test useful for the development of psychological theory and a test which is practically useful for the purpose of, say, clinical, educational or forensicpractice.
M14_HOWI4994_03_SE_C14.QXD 10/11/10 15:04 Page 263
264 PART 3 FUNDAMENTALS OF TESTING AND MEASUREMENT
14.5 Other considerations in test construction
Of course, this chapter just outlines some of the central features of psychological testconstruction. There are numerous other considerations that warrant attention:
There should be instructions for the participants about the completion of the test and, usually, instructions for the researcher to indicate the standard methods ofadministering the test. These instructions can be extremely detailed and for some tests fairly complex manuals are provided.
Tests intended for administration to individuals as part of a psychological assessmentmay contribute significantly to decisions made about the future of that individual. In these circumstances precision is of major importance. Often the researcher will provide tables of norms which are data on how the general (or some other) populationscore on the test. In this way, a particular clinical client may be compared with otherindividuals in the test. Norms, as they are called, are often presented as percentileswhich are the cut-off points for the bottom 10 per cent, bottom 20 per cent or bottom50 per cent of scores in that population. Norms may be subdivided by features suchas gender or age for greater precision in the comparison.
Tests for research purposes do not require the same degree of precision or developmentas tests for practical purposes. This does not mean that the same high standards thatare needed for clinical work are inappropriate, merely that for research involving asubstantial number of participants sometimes circumstances will demand that a weakeror less precise test is used.
14.6 Conclusion
Writing appropriate and insightful items to measure psychological characteristics can be regarded as a skill involving a range of talents and abilities. In contrast, the creationof a worthwhile psychological scale based on these items is relatively simple once thebasics are appreciated. The modern approach based on factor analysis using high-speedcomputers can be routinely applied to data requiring scaling. Since factor analysisidentifies the major dimensions underlying the intercorrelations of the items of the test, the outcome of the process may be a unidimensional scale or a multidimensional scaleaccording to the choices made by the researcher. It is up to the researcher whether the items selected constitute a single dimension or whether more than one dimension is retained. Scaling basically works to make the items of the scale consistent with eachother and to remove any which are not consistent with the others. However, at the endof the process we will have, hopefully, a scale high on internal consistency. This does not mean that the scale is anything other than internally consistent. There is anotherimportant job to be done, that is, to assess the fitness of the measure for its purpose. Thisis largely a question of its validity but to some extent also one of its reliability. These aredealt with in Chapter 15.
M14_HOWI4994_03_SE_C14.QXD 10/11/10 15:04 Page 264

CHAPTER 14 PSYCHOLOGICAL TESTS 265
Standardised tests are available for assessment purposes. They may be suitable for research purposesalso but not necessarily so. They may be too long, too time-consuming or in some other way not fullyappropriate to the purpose of the research. Hence a researcher may find it necessary to develop newmeasures.
Many psychological characteristics are difficult to measure with precision using any single item orquestion. Consequently, it is common to combine several items in order to obtain a more satisfactorymeasure. This involves selecting sets of items which empirically appear to be measuring much thesame thing. This process is known as item analysis.
The most common methods of item analysis are item–whole (or item–total) correlations and factoranalysis. The item–whole method simply selects items which correlate best with the sum of the items.That is, items which measure the same thing as the total of the items are good items. Factor analysisis a set of complex mathematical procedures which identifies groups of items which empirically arehighly intercorrelated with each other. A factor then is the basis of a single dimensional scale.
There are other skills required in scale construction such as the ability to write good items, though theprocesses of item analysis may well get rid of badly worded items because they do not empiricallyrelate well to other items.
Some items need to be reverse scored if they are worded in the opposite direction to the majority ofitems.
Internal consistency of items does not in itself guarantee that the scale can be vouchsafed as a useful measure of the thing it is intended to measure.
Key points
ACTIVITIES1. We made up the data for the honesty scale. Why don’t you carry out the research properly? Take our items, turn them
into a questionnaire, get as many people as possible to fill it in, and once that is done analyse them using SPSSStatistics. This is quite easy if you use the companion text Introduction to SPSS Statistics in Psychology (Howitt andCramer, 2011b). Were our made-up data anything like your data?
2. Try extending our honesty scale by including items which measure extra facets of honesty which were not included inour original. How satisfactory empirically is your new scale? How could you assess its validity?
M14_HOWI4994_03_SE_C14.QXD 10/11/10 15:04 Page 265

Reliability and validity
Overview
CHAPTER 15
Reliability and validity are the means by which we evaluate the value of psychologicaltests and measures.
In addition, objectivity indicates the extent to which different administrators of thetest would get the same outcome when testing a particular participant or client.
Reliability is about (a) the consistency of the items within the measure and (b) theconsistency of a measure over time. Validity concerns the evidence that the measureactually measures what it is intended to measure.
Both reliability and validity are multifaceted concepts and there are a number ofapproaches to each. For example, validity ranges from a measure’s correlation withsimilar measures through to a thorough empirical and theoretical assessment of howthe measure performs in relation to other variables.
Reliability and validity are not inherent characteristics of measures. They are affectedby the context and purpose of the measurement. So, for example, a measure that isvalid for one purpose may not be valid for another purpose.
M15_HOWI4994_03_SE_C15.QXD 10/11/10 15:04 Page 266

15.1 Introduction
We have created our measure using the item analysis procedures described in Chapter 14.What next? Usually the answer is to assess the reliability and validity of the measure. Thereare several different sorts of reliability and validity which need to be differentiated. Reliabil-ity includes internal, test–retest and alternate-forms reliabilities. Validity includes face,content, concurrent and construct validity. These different types of reliability and validityare not different ways of assessing the same thing but different ways of assessing differentaspects of reliability and validity. A measure produced using the item-analysis methodsdescribed in Chapter 14 may be useful for many purposes, but what these are dependspartly on the reliability and validity of the measure. Many psychological measures, for example, consist of a list of questions which, at best, can only partially capture the characteristics of the things to which they refer. Depression, for instance, cannot be fullycaptured by the words used to measure it. Consequently, the question of just how wella test or measure captures the essence of a particular concept needs to be asked.
There are a number of criteria to consider. These apply to both the assessment of individuals and measures being used for research purposes:
Objectivity The test or measure should yield similar outcomes irrespective of whois administering the measure – though this is only true with trained personnel who know just how the test should be administered. The opposite of objectivity issubjectivity, that is, the outcome of the measure will depend on who is administeringthe test. There are some measures which are more reliant on the judgement of theadministrator (for example, Hare’s psychopathology scale) than others. Training maybe more intense in the use of such scales.
Reliability This term has a number of distinct meanings as we will see later. Oneimportant meaning is reliability or consistency of the measure at different points intime or across different circumstances. If one realistically expects a psychologicalcharacteristic to remain relatively stable over time, the measure used for this charac-teristic should be relatively stable. A measure of dyslexia which one month indicatesthat ten children in a school class may have a problem of dyslexia but the next monthpicks out ten totally different children from the same class would not be reliable. Since dyslexia is a stable characteristic, then the test is patently useless. A reliable testwould pick out more or less the same group of children as potentially dyslexic nomatter when the test was administered. Of course, if the psychological characteristicis relatively unstable – perhaps a person’s mood such as how happy they feel – thenwe would not expect that measure to be particularly stable. Such a measure may bestable in the short term, that is, with a similar mood on Monday morning comparedwith Monday afternoon but unstable from week to week. There are relatively fewmeasures which involve unstable characteristics so generally reliability over time isregarded as important in psychology.
Validity Broadly speaking, this refers to the extent to which a measure assesses what it is claimed to measure. There are a variety of ways of assessing validity – none of which is identical to any of the others. The types of question raised in judgingvalidity range from whether the items in the measure appear to assess what they areintended to measure (face validity) to whether the measure of variable A is capable ofdistinguishing variable A from, say, variables C and D (discriminative validity).
The different types of reliability and validity will be dealt with in detail in subsequentsections.
The concepts of reliability and validity need to be understood in relation to reasonableexpectations about the characteristics of a good measure of the psychological concepts
CHAPTER 15 RELIABILITY AND VALIDITY 267
M15_HOWI4994_03_SE_C15.QXD 10/11/10 15:04 Page 267

268 PART 3 FUNDAMENTALS OF TESTING AND MEASUREMENT
in question. We have seen that this is not quite the same as suggesting that a good measurewill maximise reliability and validity – although often they will. Reliability and validity arenot in built qualities of psychological measures. Reliability and validity will vary with thecontext and purpose of the measurement, and among different samples of participants.Measurements designed purely for research purposes can be useful despite relatively lowlevels of reliability and validity. On the other hand, tests designed for the assessment of individuals in, say, clinical or educational settings of necessity have to have muchhigher levels of reliability and validity since they are used to assess individuals. The inadequacies of measures for research purposes can be partially compensated for by having larger sample sizes though this may be problematic in itself. Different criteriaapply to research and individual assessment. In other words, there may be measuringinstruments that are adequate for research purposes but unsatisfactory for assessing individuals and vice versa. The reasons for this include the following:
Research is almost always based on a sample of individuals rather than a particularcase. That means that a psychological test that discriminates between groups of people may be useful for research purposes despite being hopelessly imprecise for theassessment of individuals. A forensic psychologist, for example, may need to assessthe intelligence of an offender to determine whether their intellectual functioning is solow as to render them incapable of a plea because they are incapable of understandingrelevant concepts.
It takes quite a long period of time and substantial effort to maximise the reliabilityand validity of a measure. Measures may be required for variables which have not yetbeen adequately researched. The upshot of this is that the researcher may be left witha choice between constructing a new measure for research purposes or using a poorlydocumented measure simply because it is available.
Even if there appears to be a satisfactory measure already available, one should notassume that it is satisfactory without carefully examining the measure and researchon it or using it. For example, depression as a clinical syndrome may be different fromdepression as it is experienced by people in general. To use a clinical measure, then,may be problematic if the research is on depression in non-clinical samples since the test was intended for extreme (clinical) groups, and may not discriminate amongnon-clinical individuals.
Measures useful for the assessment of individuals often take a lot of time to administer:perhaps more than two hours for a major test. This amount of time may not be availableto the researcher who is dealing with large samples. Hence, a less good measure mightbe the pragmatic choice.
Where does one find out information concerning the properties of ready-made psy-chological tests? The following are the main sources of information about psychologicalmeasures:
The instruction manual for the test (if there is one). Students may find that theirdepartment has a collection of tests and measures for teaching and research purposes.
Books or journal articles about the measure. Published research on a particular measuremay be accessed through normal psychological databases (see Chapter 7). The publishedresearch may be extensive or sparse – it largely depends on the measure in question.
Catalogues of published tests. These are obtainable from test publishers. Many university departments of psychology hold copies of such catalogues.
The Internet is a useful source – some tests are published on it.
Of course, exercise caution – what may be seen as a perfectly satisfactory test or measureby others may be flawed from your perspective.
M15_HOWI4994_03_SE_C15.QXD 10/11/10 15:04 Page 268

CHAPTER 15 RELIABILITY AND VALIDITY 269
FIGURE 15.1 Types of reliability
15.2 Reliability of measures
This section reviews the major types of reliability (see Figure 15.1). All reliability concernsthe consistency of the measure but the type of consistency varies in the different types ofreliability. The broad types of consistency dealt with are internal consistency and con-sistency over different measurements, such as different points in time. Internal consistencywas discussed in Chapter 14. There are several measures of internal consistency whichcan be readily computed using programs such as SPSS Statistics – Cronbach’s (1951)coefficient alpha and split-half reliability are examples. Stability across measures involvesthe stability of the measure over different versions of the test or across different pointsin time. Consistency over time has to be evaluated in the light of the interval betweenadministrations of the test. Reliability over a one-week period will be greater than reli-ability for the same measure over a month. Reliability and validity are both essentiallyassessed in the form of variants of the correlation coefficient.
■ Internal reliabilityInternal reliability indicates how consistently all of the items in a scale measure the concept in question. If a scale is internally reliable, any set of items from the scale could be selected and they will provide a measure that is more or less the same as anyother group of items taken from that scale. One traditional way of calculating internalreliability is to calculate scores on half of the items in the test and correlate these scoreswith those for the same individuals on the remainder of the test. Such procedures form
M15_HOWI4994_03_SE_C15.QXD 10/11/10 15:04 Page 269

270 PART 3 FUNDAMENTALS OF TESTING AND MEASUREMENT
the basis of several measures of internal reliability. Alpha reliability may be construed asjust a variant on this theme:
Split-half reliability The first half of the items on the test are summed then the second half of the items summed (for each participant). The Pearson correlation betweenthe two halves is calculated – this is referred to as the split-half reliability (though acorrection for length of the scale is sometimes applied such that the reliability is forthe full-length scale).
Odd–even reliability The two halves are created differently for this. One half is the odd-numbered items (for example, items 1, 3, 5, 7, etc.) and the other half is theeven-numbered items (for example, items 2, 4, 6, 8, etc.). The correlation betweenthese two sets of scores is the odd–even reliability. Once again, an adjustment for thelength of the scale is often made.
Alpha reliability (Cronbach’s alpha) Split-half and odd–even reliability are dependenton which items are selected for inclusion in the two halves. Alpha reliability improveson this merely by being an average of every possible half of the items correlated with every possible other half of the items. Thus alpha reliability is the average of all possible split-half reliabilities. Since alpha reliability takes all items into account andall possible ways of splitting them, then the alpha reliability gives the best overall picture. Fortunately, the calculation of alpha reliability can be achieved more directlyusing an analysis of variance-based method. This is described in the companion textIntroduction to Statistics in Psychology (Howitt and Cramer, 2011a). All of theseforms of reliability are easily calculated using SPSS Statistics.
The first two measures of internal reliability or consistency have a minor drawback, thatis, they are the internal reliability of halves of the items rather than a measure of theinternal reliability of the entire scale. It is possible to estimate the reliability of the entirescale by employing what is known as the Spearman–Brown formula. In general, whatthis does is to indicate the reliability of a scale longer or shorter than the actual scalelength. Thus it can be used to estimate the reliability of the full scale, or it could be usedto estimate what the reliability of an even shorter scale would be. (If one can achieve thedesired level of reliability with a short scale then this may be preferred.) The procedureis given in the companion book Introduction to Statistics in Psychology (Howitt andCramer, 2011a) – it is relatively simple to compute by hand. SPSS Statistics does notcompute the Spearman–Brown formula but it can give the Guttman reliability. TheGuttman reliability coefficient is much like the split-half reliability adjusted to the full-scalelength using the Spearman–Brown formula and is actually more generally applicable thanthe Spearman–Brown method.
Why is the internal reliability important? The better the internal reliability of a measurethen the better the measure (all other things being equal). Furthermore, the better themeasure then the higher will be the correlation between that measure and other variables.It is fairly intuitive that a bad measure of honesty, say, will correlate less well with, say,lying to get out of trouble than would a good measure of honesty. One reason why ameasure is bad is because it has low internal reliability. The correlation of any variablewith any other variable is limited by the internal reliability of the variable. So wheninterpreting any correlation coefficient then information on the reliability of the variablesinvolved is clearly desirable. The maximum size that the correlation between variablesA and B can be is the square root of the product of the reliability of variable A and the reliability of variable B (for example, .8 × .9 = .85). Without knowing this, the researcher who obtains a correlation of .61 between variable A and variable B might feelthat the correlation is just a moderate one. So it is between the two measures, but actuallythe correlation between two variables could be only .85 at most. Hence the correlationof 0.61 is actually quite an impressive finding given the unreliability of the measures.
M15_HOWI4994_03_SE_C15.QXD 10/11/10 15:04 Page 270

CHAPTER 15 RELIABILITY AND VALIDITY 271
There is a simple correction which allows one to adjust a correlation by the reliabilitiesof one or both of the variables. This is described in Chapter 4. Given the difference thatthis adjustment can make to the interpretation of the obtained relationships, it is probablytoo often neglected by researchers.
Finally, a note of caution is appropriate. Many textbooks stress that internal reliabilityis an important and essential feature of a good measure. This is true, but only up to apoint. If one is trying to measure a carefully defined psychological construct (intelligence,extroversion, need for achievement) then internal reliability should be as high as can bepractically achieved. On the other hand, the measurement of such refined psychologicalconcepts may not be the main objective of the measure. Since much human behaviour is multiply determined (being the result of the influence of a number of variables thoughnot necessarily all of them) then a measure that measures a lot of different variables mayactually be better at predicting behaviour.
A good example of this is Hare’s psychopathy checklist (Hare, 1991). Psychopaths areknown to be especially common in criminal populations, for example. The checklist isscored by simply adding up all of the features of psychopathy that an individual possesses.These features include glibness, pathological lying, manipulativeness and grandiose estimates of self-worth. The score is simply the number of different characteristics ofpsychopathy manifested by that individual. For a characteristic such as psychopathy whichis a syndrome of diagnostic features, internal reliability is less crucial than including allpossible diagnostic features of the syndrome.
■ Stability over time or different measuresPsychologists also apply the consistency criterion to another aspect of measurement:how their tests and measures perform at a time interval or across similar versions of atest. There are several different types of this:
Test–retest reliability This is simply the correlation between scores from a sample of participants on a test measured at one point in time with their scores on the sametest given at a later time. The size of test–retest reliability is basically limited by theinternal reliability of the test. Of course, the test–retest reliability is affected by anynumber of factors in addition. The longer the interval between the test and retest the more opportunity there is for the characteristics of individuals to simply change,thus affecting the test–retest reliability adversely. However, test–retest reliability maybe affected by carry-over from the first administration of the test to the second. That is, participants may simply remember their answers to the first test when theycomplete the retest.
Alternate-forms reliability A test may be affected by ‘memory’ contamination if it is used as a retest instrument. This may be a simple learning effect, for example.Consequently, many tests are available in two versions or two forms. Since these contain different items, some of the ‘memory’ contamination effects are cancelled out – though possibly not all. The relationship between these two alternate forms isknown as the alternate-forms reliability. Once again, the maximum value of alternate-forms reliability is the product of the two internal reliabilities. If the alternate-formsreliability is similar to this value then it seems clear that the two forms of the test are assessing much the same things. If the alternate-forms reliability is much lowerthan the maximum possible, then the two forms are measuring rather different things.A correlation between two tests does not mean that they are measuring the same thing – it means that they are partially measuring the same thing. The bigger the correlation up to the maximum given the reliabilities of the tests, the more they aremeasuring substantially the same things. As with test–retest reliability, alternate-formsreliability is limited by the internal reliability of the tests.
M15_HOWI4994_03_SE_C15.QXD 10/11/10 15:04 Page 271
272 PART 3 FUNDAMENTALS OF TESTING AND MEASUREMENT
The reason for the close relationship between internal reliability and other forms of reliability has already been explained. To repeat, the lower the internal reliability of a testthen the lower the maximum correlation of that test with any other variable (includingalternate forms of the test and retests on the same variable). The bigger the internal reliability value then, all other things being equal, the bigger the correlation of the testwith any other variable it correlates with. In other words, there is a close relationshipbetween different forms of reliability despite their superficial differences.
A measure should be reliable over time if the concept to which it refers is chronolo-gically stable. We do not expect a thermometer to give the same readings day after day.However, we might expect that bathroom scales will give more or less stable readings ofour weight over a short period of time. That is, we expect the temperature to vary butour weight should be largely constant. In the same way, reliability over time (especiallytest–retest reliability) should only be high for psychological characteristics which arethemselves stable over time. Psychological characteristics which are not stable over time(attention, happiness, alertness, etc.) should not necessarily give good levels of test–retestreliability. Characteristics which we can assume to be stable over time (intelligence, honesty, religious beliefs) should show strong test–retest reliability. In other words, reliability must be carefully assessed against how it is being measured and what is beingmeasured. That accepted, psychologists tend to want to measure stable and enduringpsychological characteristics, hence test–retest reliability is generally expected to be goodfor most psychological tests and measures.
15.3 Validity
Validity is usually defined as ‘whether a test measures what it is intended to measure’.This fits well with the dictionary definition of the term valid as meaning whether some-thing is well founded, sound or defensible. The following should be considered whenexamining the validity of a test:
Validity is not a property of a test itself but a complex matter of the test, the sample on which a test is used, the social context of its use and other factors. A test which is good at measuring religious commitment in the general population may be hopelessly inadequate when applied to a sample of priests. A test which is a good measure in research may prove to be flawed as a part of job selection in which applicants will put their best face forward (that is, maybe not tell the truth).Famously this issue is often put as a question ‘Valid for what?’ The implication of thisis that validity is not an inherent feature of a test or measure but something thatshould be expected to vary according to the purpose to which the test or measure isbeing put.
Reliability and validity are, conceptually, quite distinct and there need not be any neces-sary relationship between the two. So be very wary about statements which imply thata valid test or measure has to be reliable. We have already seen that in psychology theemphasis in measurement is generally on relatively stable and enduring characteristicsof people (for example, their creativity). Such a measure should be consistent overtime (reliable). It also ought to distinguish between inventors and the rest of us if it isa valid measure of creativity. A measure of a characteristic which varies quite rapidlyover time will not be reliable over time – if it is then we might doubt its validity. Forexample, a valid measure of suicide intention may not be particularly stable (reliable)over time though good at identifying those at risk of suicide. How reliable it is willdepend on the interval between the test and retest.
M15_HOWI4994_03_SE_C15.QXD 10/11/10 15:04 Page 272

CHAPTER 15 RELIABILITY AND VALIDITY 273
FIGURE 15.2 Types of validity
Since validity is often expressed as a correlation between the test or measure and someother criterion, the validity coefficient (as it is called) will be limited by the reliabilityof the test or measure. Once again, the maximum correlation of the test or measurewith any other variable has an upper limit determined by the internal reliability.
15.4 Types of validity
There are a number of generally recognised types of validity – face, content, criterion;that is, concurrent and predictive validity, construct, known-group and convergentvalidity (see Figure 15.2). (Other types of validity such as internal validity and externalvalidity concern research design rather than measurement as such. These are dealt within Chapter 12.) Over the years, the distinction between these different types of validityhas become a little blurred in textbooks. We will try to reinstate the distinctive featuresof each.
M15_HOWI4994_03_SE_C15.QXD 10/11/10 15:04 Page 273
274 PART 3 FUNDAMENTALS OF TESTING AND MEASUREMENT
■ Face validityThis form of validity can only be assessed informally. One inspects the test items in orderto assess whether on the face of things (that is, in terms of the content of the items) the testwould appear to be a measure of the psychological concept concerned. Generally speaking,the researcher inevitably applies this form of validity criterion while constructing the testsince the measure will include items which the researcher considers to be viable. Theproblems with face validity are obvious given the need for item-analysis techniques. Itwould appear that the mere inspection of the items is no guarantee that the retaineditems form a valid measure. There are lots of reasons for this. For example, items whichappear valid to the researcher may be understood very differently by the participants.
Face validity is a very minimum measure of validity which is subjective in that differentresearchers will come to different conclusions about the face validity of a test. Some testsand measures are constructed to measure what they measure without the researcher beingconcerned about what the test might correlate with or predict. In these circumstances facevalidity may be crucial. For example, if a researcher wished to measure opinions about thecauses of crime, the content of the items on the measure would be important. Whether ornot these opinions are associated with something else might not concern the researchers.
■ Content validityIn its classic formulation, good content validity follows from the careful creation of a broadrange of items. These items are carefully collected together to reflect a wide variety of thefacets of the concept being assessed. Using diverse means of eliciting potential items forinclusion is important. Such diversity would include the research literature, interviewswith people similar to potential participants, established theory in the field and so forth.By seeking items from a wide domain, the content validity of the measure is enhanced.
Some authors present a rather different version of what constitutes content validity.They suggest that content validity is achieved by reference to experts on the topic beingmeasured. The task of the expert is to offer insight into whether the items cover therange needed or whether significant aspects of the construct being measured have beenomitted. This is a very limited view of what content validity is, although it is one aspectof it. By concentrating on such a limited aspect of content validity, authors such asCoolican (2009) misleadingly imply that content validity is merely a version of facevalidity, although it is a slightly more sophisticated version.
■ Concurrent validityThis is simply how well the test correlates with an appropriate criterion measured at thesame time. One way of doing this is to correlate the test with another (possibly betterestablished) test of the same thing applied to the same group of participants at the same time.So if one proposed replacing examinations with multiple-choice tests then the concurrentvalidity of the multiple-choice test would be assessed by correlating the multiple-choicetest scores with the marks from an examination given at the same time. It stands to reasonthat a new test which purports to measure the same thing as the examination should correlate with examination marks. The better the correlation, the more confidence thatcan be placed in the new measure. Concurrent validity is assessed against a criterion, aswe have seen. The next form of validity, predictive validity, is equally criterion based.
■ Predictive validityThis is the ability of the measure to predict future events. For example, does our measureof honesty predict whether a person will be in prison in five years’ time? Predictive validitycan be measured by the correlation between the test and the future event. Of course, the
M15_HOWI4994_03_SE_C15.QXD 10/11/10 15:04 Page 274

CHAPTER 15 RELIABILITY AND VALIDITY 275
predictive validity will depend on the nature of the future event that is being predicted.Many psychological tests are not really intended for the prediction of future events sotheir lack of validity in this respect is of no consequence. It is a bonus if a test does predictfuture events when it is not intended to. A measure intended to predict future events does not always have to be rich in psychological detail in order to be effective – and there is good reason why it should show internal consistency. For example, if we wished to predict future offending then a measure consisting of variables such as number of previous convictions and gender may be the best way of predicting. Predicting from psychological traits may be relatively ineffective in these circumstances. Again, since thisis a criterion-based assessment of validity, the researcher must have expectations that the test or measure will relate highly to future events and also know what these futureevents might be. In these circumstances, given that prediction is the prime concern, thecontent of the test as such probably does not matter. The important thing is that it doespredict the future event.
■ Construct validityFor some researchers, life is not quite so simple as the criterion-based validity methodsimply. Take a concept such as self-esteem, for example. If we develop what we see as beingan effective measure of self-esteem, can we propose criteria against which to assess theconcurrent and predictive validity? We might think that self-esteem is inversely relatedto future suicide attempts though probably very weakly. Alternatively, we might thinkthat the measure of self-esteem should correlate with other measures of self-esteem as in concurrent validity. However, what if we developed a measure of self-esteem whichutilised new theoretical conceptualisations of self-esteem? In these circumstances, relatingour new measure of self-esteem to existing measures would not be sufficient. Since ournew measure is regarded as an improvement then its lack of concurrent validity witholder methods of measurement might be a good thing.
Construct validity is generally poorly understood and even more poorly explained inresearch methods textbooks. The reason is that it is presented as a technical measure-ment issue whereas, in its original conceptualisation, construct validity should be moreabout theory development and general progress of knowledge. So it is much more aboutbeing able to specify the nature of the psychological construct that underlies our measurethan demonstrating that a test measures what it is supposed to measure. In one of theoriginal classic papers on construct validity, Cronbach and Meehl (1955) put the essenceof construct validity in the form of a graphic example very apposite for students:
Suppose measure X correlates .50 with Y, the amount of palmar sweating inducedwhen we tell a student that he has failed a Psychology I exam. Predictive validity ofX for Y is adequately described by the coefficient, and a statement of the experimentaland sampling conditions. If someone were to ask, ‘Isn’t there perhaps another way tointerpret this correlation?’ or ‘What other kinds of evidence can you bring to supportyour interpretation?’, we would hardly understand what he [sic] was asking becauseno interpretation has been made. These questions become relevant when the correlationis advanced as evidence that ‘test X measures anxiety proneness.’ Alternative inter-pretations are possible; e.g., perhaps the test measures ‘academic aspiration’, in whichcase we will expect different results if we induce palmar sweating by economic threat.It is then reasonable to inquire about other kinds of evidence.
(p. 283)
Cronbach and Meehl then report a variety of ‘findings’ from other studies which help usunderstand the nature of test X better:
M15_HOWI4994_03_SE_C15.QXD 10/11/10 15:04 Page 275

276 PART 3 FUNDAMENTALS OF TESTING AND MEASUREMENT
Test X has a correlation of .45 with the ratings of the students’ ‘tenseness’ made byother students.
Test X correlates .55 with the amount of intellectual inefficiency which follows theadministration of painful electric shocks.
Test X correlates .68 with the Taylor anxiety scale.
The order of means on test X is highest in those diagnosed as having an anxiety state,next highest in those diagnosed with reactive depression, next highest in ‘normal’ people, and lowest in those with a psychopathic personality.
There is a correlation of .60 between palmar sweat when threatened with failure inpsychology and when threatened with failure in mathematics.
Test X does not correlate with social class, work aspirations and social values.
The reason Cronbach and Meehl include all of this extra information is that it seems to confirm that academic aspiration is not the explanation of the relationship betweentest X and palmar sweating. The above pattern of findings better supports the originalinterpretation that the relationship between test X and palmar sweating is due to anxiety.Cronbach and Meehl go on to suggest that, if the best available theory of anxiety predictsthat anxiety should show the pattern of relationships manifested by test X, the idea thattest X measures anxiety is even more strongly supported.
So delving into the origins of the concept of construct validity clearly demonstrates itto be a complex process. Test X is assessed in relation to a variety of information aboutthat test, but also other variables associated with it. Put another way, construct validityis a method of developing psychological understanding that seeks to inform theresearcher about the underlying psychological construct. In this sense, it is about theorybuilding because we need constructs upon which to build theory. So when authors suchas Bryman (2008) suggest that construct validity is about suggesting hypotheses aboutwhat a test will correlate with and Coolican (2009) says construct validity is about howa construct explains a network of findings, they are giving only partial accounts and notthe totality of construct validity. It should also be clear that construct validity is much morean attitude of mind on the part of the researcher than it is a technical methodologicaltool. If one likes, construct validity is a methodological approach in the original sense ofthe term ‘methodological’, that is, strategies for enhancing and developing knowledge.In modern usage, methodological simply refers to the means of collecting data. There is more to knowledge than just data. So it is possible for a construct to be refined andclarified during the progress of research in a field – the definition of a construct is notfixed for all time.
Construct validity may include a vast range of types of evidence, including some thatwe have already discussed – the correlations between items, the stability of the measureover time, concurrent and predictive validity findings, and so forth. What constitutessupport for the construct depends on what we assume to be the nature of the construct.Finding that a test tends to be stable over time undermines the validity of a test whichmeasures transitory mood, as we have already indicated.
Anyone struggling to understand how construct validity fits in with their work shouldnote the following: ‘The investigation of a test’s construct validity is not essentially different from the general scientific procedures for developing and confirming theories’(Cronbach and Meehl, 1955, p. 300). This does not particularly help one apply con-struct validity to one’s own research – it merely explains why the task is rather difficult.Construct validity is so important (and difficult) because it basically involves manyaspects of the research process.
The following types of validity can be considered to be additional ways of tacklingthe complex issue of construct validity.
M15_HOWI4994_03_SE_C15.QXD 10/11/10 15:04 Page 276

CHAPTER 15 RELIABILITY AND VALIDITY 277
Known-groups validity
If we can establish that scores on a measure differ in predictable ways between twospecified groups of individuals then this is evidence of the value of the test – and its known-groups validity. For example, a test of schizoid thought should give higherscores for a group of people with schizophrenia than a group of individuals withoutschizophrenia. If it does, then the test can be deemed valid by this method. But we needto be careful. All that we have established is that the groups differ on this particular test. It does not, in itself, establish definitively that our test measures schizoid thought.Many factors may differentiate people with schizophrenia from others – our measuremight be assessing one of these and not schizoid thought. For example, if people withschizophrenia are more likely to be men than women then the variable gender will differentiate the two groups. Gender is simply not schizoid thought.
A measure which has good known-groups validity is clearly capable of more-or-lessaccurately differentiating people with schizophrenia from others. Being able to do thismay add little to our scientific understanding of the construct of schizoid thought. It isonly when it is part of a network of relationships that it is capable of adding to ourconfidence in the scientific worth of the construct – or not.
Triangulation
Triangulation uses multiple measures of a concept. If a relationship is established usingseveral different types of tests or measures then this is evidence of the validity of the rela-tionship, according to Campbell and Fiske (1959). Ideally, the measures should be quitedifferent, for example, using interviewer ratings of extroversion compared with using apaper and pencil measure of the same concept. In some ways triangulation can be seen asa combination of concurrent and predictive validity. The basic assumption is that if twodifferent measures of ostensibly the same construct both correlate with a variable which theconstruct might be expected to relate to, then this increases our confidence in the construct.
For triangulation to help establish the construct, all three components of the triangleought to correlate with each other as in Figure 15.3. All of the arrows represent a rela-tionship between the three aspects of the triangle. If test A and test B correlate then thisis the basic requirement of demonstrating concurrent validity. If test A correlates withvariable X, and test B also correlates with variable X then this is evidence of the predictivevalidity of tests A and B. Notice that in effect this approach is building up the networkof associations which Cronbach and Meehl regard as the essence of construct validation.As such, it is much more powerful evidence in favour of the construct than either the evidence of concurrent validity and predictive validity taken separately. Imagine tests Aand B both predict variable X, but tests A and B do not correlate. The implication of thisis that tests A and B are measuring very different things although they clearly predict different aspects of variable X.
Triangulation might be regarded as a rudimentary form of construct validation. It is clearly an important improvement over the crude empiricism of criterion validity (predictive and concurrent validity). Nevertheless it is not quite the same as constructvalidity. Its concerns about patterns of relationships are minimal. Similarly, triangulationhas only weak allegiances with theory.
■ Convergent validityThis introduces a further dimension to the concept of validity, that is, measures of, say,honesty should relate irrespective of the nature or mode of the measure. This means that:
For example, a self-completion honesty scale should correlate with a behaviouralmeasure of honesty (for example, handing in to the police money found in the street)
M15_HOWI4994_03_SE_C15.QXD 10/11/10 15:04 Page 277

278 PART 3 FUNDAMENTALS OF TESTING AND MEASUREMENT
FIGURE 15.3 Triangulation compares several types of test of a concept
and assessments of lying on a polygraph (lie detector) test. All should correlate witheach other well and be distinguishable from measures of different but partially relatedconcepts such as religiousness.
The type of measure should not unduly determine the relationships. If we find thatour best correlations among measures of honesty and religiosity all use self-completionquestionnaires then there may be a validity issue. The domain of measurement (self-completion) seems to be having greater bearing on the relationships than the construct being measured. If self-completion measures of religiousness and honestyhave higher correlations with each other than self-completion measures of honesty havewith behavioural measures of honesty there is clearly a validity problem. In otherwords, validity is enhanced by evidence that the concept may be measured by a multi-plicity of measures from a wide variety of domain. This is a reasonable criterion ofvalidity, but some of its underlying assumptions might be questioned. One of theseassumptions is that there should be a strong relationship between different types ofmeasure of a concept. This is a debatable assumption in some cases. For example,would we expect a strong relationship between racial attitudes as assessed by a self-completion attitude questionnaire and a behavioural measure of racial attitudes suchas abusive racist behaviour in the street? Many people with racist attitudes are unlikelyto express their attitudes in crude racist chants at a football match simply because‘they do not do that sort of thing’ or they fear arrest by the police.
■ Discriminant validityConvergent validities indicate that measures which are measuring the same thing oughtto correlate with each other substantially. Discriminant validity is just the opposite. Ifmeasures are apparently measuring different things then they should not correlate stronglywith each other. It should be obvious, then, that convergent and discriminant validityshould be considered together when assessing the validity of a measure.
It is fairly obvious that there is a degree of overlap in the different sorts of validitythough broadly speaking they are different.
15.5 Conclusion
A crucial feature of the concepts of reliability and validity is that they are tools for thinking and questioning researchers. Employed to their fullest potential they constitutea desire to engage with the subject matter of the research in full. They should not beregarded as kitemark standards which, if exceeded, equate to evidence of the quality of
M15_HOWI4994_03_SE_C15.QXD 10/11/10 15:04 Page 278

CHAPTER 15 RELIABILITY AND VALIDITY 279
the test or measure. Properly conceived, they invite researchers to explore both the theoretical and the empirical relationships of their subject matter. The value of a measurecannot be assessed simply in terms of possessing both high validity and high reliability.What is reasonable by way of reliability and validity is dependent on the nature of whatis being measured as well as what ways are available to measure it.
All measures need to be assessed for objectivity, reliability and validity. There is no minimum criterionof acceptable standards of each of these since the nature of what is being measured is also crucial.
Information about the reliability and validity of some measures is readily available from standarddatabases, journal articles and the Internet. However, this is not always the case for every measure.
Reliability is about consistency within the measure or over time.
Cronbach’s alpha, split-half reliability and odd–even reliability are all measures of internal reliability.Cronbach’s alpha is readily computed and should probably be the measure of choice.
Reliability is also assessed at correlating a measure given at different time points (test–retest reliability)and between different versions of the test (alternate-forms reliability).
Reliability over time should be high for measures of stable psychological characteristics but low forunstable psychological characteristics.
Validity is often described as assessing whether a test measures what it is supposed to measure. Thisimplies different validities according to the purpose to which a measure is being put.
Face validity is an examination of the items to see if they appear to be measuring what the test isintended to measure.
Content validity refers to the processes by which items are developed – sampling from a wide varietyof sources, using a wide variety of informants and using a variety of styles of item may all contributeto content validity.
Construct validity involves a thorough understanding of how the measure operates compared withother measures. Does the pattern of relationships between the measures appear meaningful for avariety of other constructs? Does the measure do what pertinent theory suggests that it should?
Construct validity is an extensive and complex process which relates more to the process of thedevelopment of science than to a single index of validity.
Known-groups validity, triangulation and convergent validity can all be seen as partial aspects of construct validity. After all, they each examine the complex patterns of relationships between themeasure, similar measures, different measures and expectations of what types of person are differ-entiated by the measure.
Key points
ACTIVITYYou ask your partner if they love you. Their reply is ‘yes, very much so’. How would you assess the reliability and validityof this measure using the concepts discussed in this chapter?
M15_HOWI4994_03_SE_C15.QXD 10/11/10 15:04 Page 279

Coding data
Overview
CHAPTER 16
Coding is the process of categorising the raw data, usually into descriptive categories.
Coding is a basic process in both quantitative and qualitative research. Sometimescoding is a hidden process in quantitative research.
In precoding, the participants are given a limited number of replies to choose from,much as in a multiple-choice test.
Whenever data are collected qualitatively in an extensive, rich form, coding is essential.However, some researchers will choose to impose their own coding categories whereasothers will endeavour to develop categories which match the data as supplied by theparticipants and which would be meaningful from the participants’ perspectives.
Coding schedules may be subjected to measures of inter-coder reliability and agree-ment when quantified.
M16_HOWI4994_03_SE_C16.QXD 10/11/10 15:04 Page 280

16.1 Introduction
This chapter marks the dividing line between the quantitative and qualitative parts ofthis book. Perhaps a better way of regarding it is as a major point of intersection betweenquantitative and qualitative research. More than any other part of this book, coding bringstogether quantitative and qualitative research.
Coding in some form or another is central to all psychological research. This is trueirrespective of the style of research involved – quantitative or qualitative. Inevitably whenwe research any complex aspect of human activity, we have to simplify this complexity orrichness (note the very different ways of describing the same thing) in order to describeand even explain what is happening. No researcher simply videos people’s activities andcompiles these for publication, no matter how much they abhor quantification. There is always some form of analysis of what is occurring. In this way, all researchers imposestructure on the social and psychological world. Coding is quintessentially about howwe develop understanding of the nature of the psychological world. Nevertheless, thereare radical differences in the way that quantitative and qualitative researchers generallygo about the categorisation process. It is important to recognise these differences and to appreciate their relative strengths. Then we may recognise the considerable overlapbetween the two.
Figure 16.1 indicates the four possible combinations of quantitative and qualitativedata collection and analysis methods. Three of the combinations are fairly commonapproaches. Only the qualitative analysis of quantitative data is rare or non-existent,although some researchers have suggested that it is feasible. The crucial thing about thefigure is that it differentiates between the data collection and the data analysis phases ofresearch. The important consequence of this distinction is that it means that quantitativeanalysis may use exactly the same data collection methods as qualitative analysis. Thus,in-depth interviews, focus groups, biographies and so forth may be amenable to quanti-tative analysis just as they are amenable to qualitative analysis.
Coding has two different meanings in research:
The process by which observations, text, recordings and generally any sort of data are categorised according to a classificatory scheme. Indeed, categorisation is a betterdescription of the process than is the word coding.
CHAPTER 16 CODING DATA 281
FIGURE 16.1Relation between quantitative and qualitative data collection, and quantitativeand qualitative data analysis
M16_HOWI4994_03_SE_C16.QXD 10/11/10 15:04 Page 281
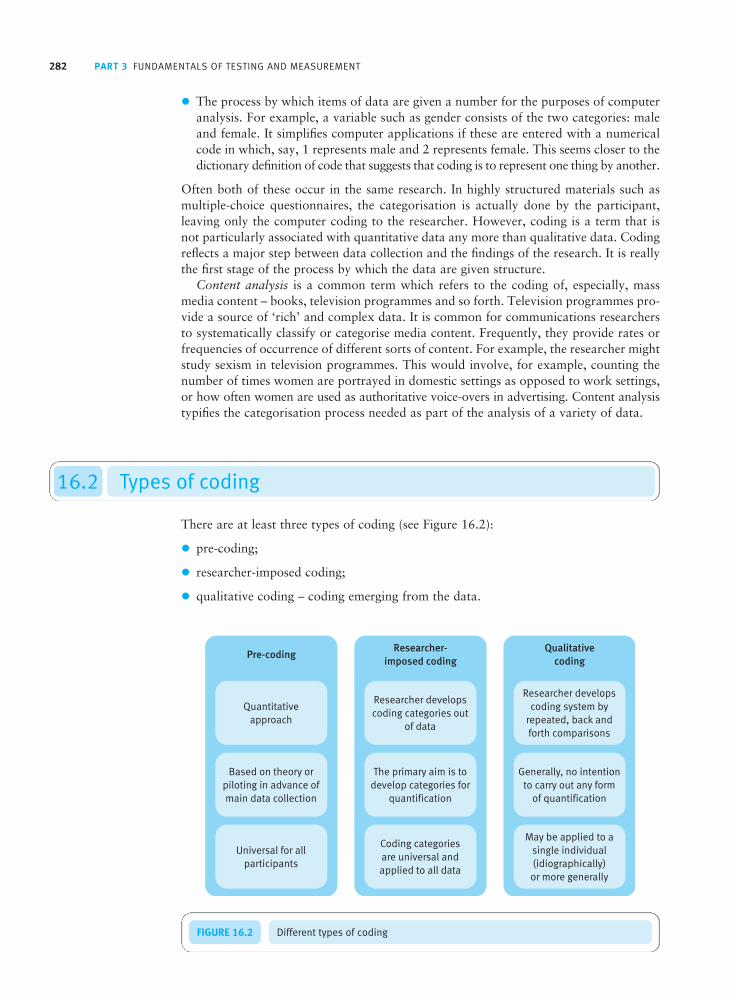
282 PART 3 FUNDAMENTALS OF TESTING AND MEASUREMENT
FIGURE 16.2 Different types of coding
The process by which items of data are given a number for the purposes of computeranalysis. For example, a variable such as gender consists of the two categories: maleand female. It simplifies computer applications if these are entered with a numericalcode in which, say, 1 represents male and 2 represents female. This seems closer to thedictionary definition of code that suggests that coding is to represent one thing by another.
Often both of these occur in the same research. In highly structured materials such asmultiple-choice questionnaires, the categorisation is actually done by the participant,leaving only the computer coding to the researcher. However, coding is a term that isnot particularly associated with quantitative data any more than qualitative data. Codingreflects a major step between data collection and the findings of the research. It is reallythe first stage of the process by which the data are given structure.
Content analysis is a common term which refers to the coding of, especially, massmedia content – books, television programmes and so forth. Television programmes pro-vide a source of ‘rich’ and complex data. It is common for communications researchersto systematically classify or categorise media content. Frequently, they provide rates orfrequencies of occurrence of different sorts of content. For example, the researcher mightstudy sexism in television programmes. This would involve, for example, counting thenumber of times women are portrayed in domestic settings as opposed to work settings,or how often women are used as authoritative voice-overs in advertising. Content analysistypifies the categorisation process needed as part of the analysis of a variety of data.
16.2 Types of coding
There are at least three types of coding (see Figure 16.2):
pre-coding;
researcher-imposed coding;
qualitative coding – coding emerging from the data.
M16_HOWI4994_03_SE_C16.QXD 10/11/10 15:04 Page 282

CHAPTER 16 CODING DATA 283
The final form of coding is most characteristic of qualitative data analysis. Aspects of it arecovered in Chapter 21 on grounded theory, for example. The other two are rather morecharacteristic of quantification. Pre-coding is characteristic of highly structured materialssuch as self-completion questionnaires. Researcher-imposed coding is more typical ofcircumstances in which the data have been collected in a fairly rich or qualitative form,but the researcher’s intention is to carry out a quantitative or statistical analysis. Codingemerging from the data is probably much more typical of research that is not intendedto be analysed numerically or statistically.
■ Pre-codingThis is very familiar since it is the basis of much quantitative research in psychology. So common is it that it has a taken for granted quality. It is also very familiar from magazine and other popular entertainment surveys, so widely has its influence spread.Typical examples of pre-coding are found in attitude and personality questionnaires. In these the participant replies to a series of statements relevant to a particular area ofinterest. However, typically the respondent only has a very limited predetermined list of alternative replies. In the simplest of cases, for example, participants may be asked to do no more than agree or disagree with statements like ‘Unemployment is the mostimportant issue facing the country today.’
The key feature of pre-coding is, of course, that it occurs prior to data collection. That is, the coding categories are predetermined and are not amenable to change or re-coding (other than the possibility of combining several categories together for the purposes of data analysis). Furthermore, it is participants who code their own ‘responses’into one of the available coding categories. As a consequence the researcher is obliviousto how the coding is actually done. Let us examine the reasons for pre-coding by takingan example of a simple research study. A researcher asks a group of young people at aschool to answer the following question:
Q 43: What is your favourite television programme? _____
A sample of a hundred young people might write down as many as 100 different television programmes. There may be overlaps, so the actual total may be lower. Whatcan one do with these data which might include football, Glee, The Simpsons and X Factor? Given that a primary purpose of research is to give structure to data, simply listing all of the named programmes is not in itself the solution. The researcher must categorise (or code) the replies of the participants. There is no single and obvious wayof doing this. It is important to understand the aims of the research. If the research is toinvestigate violent television programmes then the researcher could code the favouriteprogramme as violent or not, or even code the level of violence characteristic of the programme. If the researcher is interested in whether children are watching programmesput on late at night for adults then it would be necessary to code the programme in terms of the time at which the programme was transmitted.
If the researcher has a clear conception as to the purpose of the question, coding categories that are both simple and obvious may suggest themselves. So in some circum-stances, the researcher may choose to pre-code the range of answers that the respondentmay give. Take the following question:
Q 52: Which one of the following is your favourite type of television programme?(a) Sport(b) Films(c) Music(d) Cartoons(e) Other c. 61
M16_HOWI4994_03_SE_C16.QXD 10/11/10 15:04 Page 283

284 PART 3 FUNDAMENTALS OF TESTING AND MEASUREMENT
In Q 52 the favourite television programme has been pre-coded by asking the respondentto nominate their favourite from a few broad types of programme. Also notice the boxc. 61 to the right of the question. This is so that the computer code for the participant’schosen answer may be entered – it also identifies which variable is being referred to on the computer spreadsheet. Apart from putting the respondent’s replies in a form suitable for the computer, the researcher’s input is minimal (but nevertheless crucial)with pre-coded material. Notice that the pre-coding has limited the information receivedfrom the participant quite considerably. That is, in this example nothing at all is knownabout the specific programmes which the participant likes. In other words, pre-coding of this sort produces very limited information that is of little value to the qualitativeresearcher. In fact, it misses the point of qualitative data analysis entirely. It is the sortof research that qualitative data analysts often rail against.
Pre-coding is not exclusively a feature of the analysis of self-completion questionnaires.A questionnaire may be used as part of an interview and administered by the researcheror some other interviewer. Furthermore, pre-coding may be employed in studies otherthan questionnaires. For example, the researcher may be intending to observe behaviour.Those observations may be taken in the form of notes, but there is no reason why theobservation categories cannot be pre-coded. Leyens, Camino, Parke and Berkowitz(1975) used a pre-coded observational schedule in order to observe the aggressivebehaviour of boys before and after they had seen violent or non-violent films. Such pre-coded observations will obviously greatly facilitate matters such as calculating thedegree of agreement between different observers. That is, inter-observer or inter-raterreliability becomes easy to calculate using pre-coded observation schedules.
Pre-coding means that the data collected have largely been limited by the nature ofthe categories created by the researcher. Unless the participant adds something in themargin or qualifies what they choose, no one would be the wiser. If one is interviewingbut only ticking the categories pre-coded on the questionnaire, then much of what theinterviewee is saying is likely to simply be disregarded. Pre-coding reduces the richnessof the data to a level manageable by the researcher and adequate to meet the purposes ofthe research. Inevitably, pre-coding means that nuances and subtleties are filtered out.This is neither a good nor a bad thing in any absolute sense. For some purposes, theresearcher-imposed broad-brush categories may be perfect; for other purposes, pre-codingis woefully inadequate.
So where do the pre-coded categories come from? There is a range of answers to thisquestion as a perusal of the research literature will demonstrate:
Conventional formats Some pre-coding formats are conventional in the sense thatthey have been commonly used by researchers over several decades. For example, theyes–no, agree–disagree pre-coded response formats are so established that we tend totake them for granted. However, even using such a simple format raises questions.For example, what if someone does not disagree and does not agree? In considerationof this, some response formats include a ‘don’t know’ or ‘?’ category. Similarly, thefive-point Likert scale answer format (strongly agree, agree, ?, disagree and stronglydisagree) is conventional and generally works well for its purpose. But there is no reason why seven- or nine-point scales cannot be used instead. Actually, there is noabsolutely compelling reason why the middle, neutral or ‘?’ point cannot be left outto leave a four-, six- or eight-point scale. Some argue that the neutral point allows the participants to take the easy option of not making a choice between one end of the scale and the other.
Piloting Many researchers will try out or pilot their materials on a group of indi-viduals similar to the eventual sample. This is done in such a way as to encourage the participants to raise questions and problems which make it difficult to completethe questionnaire. In this way, difficulties with the response format may be raised.
M16_HOWI4994_03_SE_C16.QXD 10/11/10 15:04 Page 284

CHAPTER 16 CODING DATA 285
Of course, given the small number of gradations in this sort of answer format,inevitably there may be difficulties in finally making a choice. The danger is that participants may feel forced into making arbitrary and, to them, rather meaninglesschoices between limited answer categories. As a consequence, they may feel alienatedfrom the research. They may feel that the researcher is not really interested in theiropinions, that the researcher is incompetent by not getting at what they really thinkor feel, or that there is little point in putting any effort into thinking about the issues.On the other hand, they may feel very relieved that completing the questionnaire is sosimple and straightforward.
Focus groups, etc. By using focus groups or individual interviews (see Chapter 18),the researcher may develop an understanding of the major types of response to a ques-tion. Some themes may be very common and others so rare that they apply to only afew individuals. Some of the themes may appear crucial and others totally mundane.Some may seem irrelevant to the research. Knowing the dominant responses helps theresearcher identify useful pre-coded answers.
Often the pre-coded categories are just the invention of the researchers themselves.What they create will be influenced by the particular set of priorities for the research.The purpose of the research, the consumers of the research and the insightfulness ofthe researchers are among the factors which will affect what pre-coding categories are selected. There is no reason to expect pre-coding to be inferior or superior to other forms of coding simply because of this reason. The value of research can neverbe assessed in terms of absolute standards. Fitness for purpose should be the main criterion. Of course, to the extent that the coding categories are created prior to collecting the data, they may match the data poorly for the simple reason that theywere created without reference to the data.
■ Researcher-imposed codingSometimes researchers collect data in qualitative form because it is not possible to pre-structure the response categories. For example, the researcher may feel that they cannotanticipate the nature of the data or otherwise identify the likely major issues sufficientlywell to allow the pre-structuring of their research instruments. As a consequence the data are collected in a richer, fuller format which can then be used to develop a codingscheme. While this material may be ‘ethnographically’ coded (see Chapters 17–25 forsome of the possibilities), the researcher may prefer to quantify the data. Quantificationis achieved through measuring features of the data, that is, imposing coding categoriesand counting frequencies in the categories.
There are any number of factors which influence the nature of the coding categoriesdeveloped. The following are some of the possibilities:
The researcher’s interest in a theory which strongly suggests a system of analysis.
The research may be guided by matters of public policy or may address a politicallyimportant topic. Hence the coding categories employed need to reflect those sameissues.
The researcher is interested only in strong trends in the data so simple, very broad categories may be appropriate.
The research task may be so big that the researchers have to employ workers to dothe coding. This tends to demand simpler coding categories.
Many coding categories do not work (i.e. produce inconsistent or unreliable resultsacross different coders) or are virtually unusable for other reasons.
M16_HOWI4994_03_SE_C16.QXD 10/11/10 15:04 Page 285
286 PART 3 FUNDAMENTALS OF TESTING AND MEASUREMENT
The coding schedule is a very important document, as is the coding manual. The coding schedule is the list of coding categories applied to the data in question. It is usedto categorise the data. The coder would normally have this list of coding categories –usually one schedule per set of data from a participant – and the data would be codedusing the schedule. Often it is advantageous to use a coding schedule which is computer-friendly. This is usually achieved by using numbered squares corresponding to the variousvariables on the computer data spreadsheet. In some respects the coding schedule israther like a self-completion questionnaire but it consists of a list of implied questions(do the data fit this category?) about which categories fit the data best. Usually the coding schedule is a relatively brief document which lists very simple descriptions of the coding categories.
Sometimes the person drawing-up the coding schedule is not the same person as thecoder. The person doing the coding needs to be informed in detail about the meaning ofthe various categories on the coding schedule. To this end, the coding manual is providedwhich gives detailed definitions of the coding categories, examples of material whichwould fit into each category and examples of problematic material. There are no rulesabout how detailed the manual needs to be, and it may be necessary for coders to gettogether to resolve difficulties. The basic idea, though, is to develop a coding processwhich can be delegated to a variety of individuals to enable them to code identical material identically. This is an ideal, of course, and may be only partially met.
Methodologically, another ideal is that each individual’s data are coded independentlyby a minimum of two coders. In this way, the patterns of agreement between coders can be assessed. This is generally known as inter-rater or inter-coder reliability. It isprobably more common that two coders are used on only a sample of the material ratherthan all of the data. There are obvious time and expense savings in doing so. There arealso disadvantages in that coders may become sloppy if they believe nobody is checking their coding. Another risk is that over the research period the meaning of the coding categories is subtly altered by the coders, but evidence of inter-coder reliability is collectedonly in the initial stages of the research. Obviously, it might be best if the inter-rater reliability was assessed at various stages in the coding process. However, if the checkingis done early on problems can be sorted out; problems identified later on are much moredifficult to correct.
Inter-rater reliability is rarely perfect. This raises the question of how disagree-ments between coders should be handled. The possible solution varies according to circumstances:
If the second coding is intended just as a reliability check, then nothing needs to bedone about the disagreements. The codings supplied by the main coder may be usedfor the further analysis. Inter-rater reliability assessments should nevertheless be given.
If coders disagree then they may be required to reach agreement or a compromisewhenever this arises. This might involve a revision of the coding manual in seriouscases. In minor cases, it may simply be that one of the coders had made an error andthe coding schedule or manual needs no amendment.
Reaching a compromise is a social process in which one coder may be more influentialthan the other. Consequently, some researchers prefer to resolve disagreements by anequitable procedure. For example, coding disagreements may be resolved by a randomprocess such as the toss of a coin. Randomisation is discussed in Chapters 9 and 13.
If the coding category is a rating (that is a score variable), then disagreements betweenraters may be dealt with by averaging. For example, the coders may be required torate the overall anxiety level of an interviewee. Since the ratings would be scores, thenoperations such as averaging are appropriate. If the data are simply named categories,then averaging is impossible.
M16_HOWI4994_03_SE_C16.QXD 10/11/10 15:04 Page 286

CHAPTER 16 CODING DATA 287
16.3 Reliability and validity
Like any other form of measurement, the issues of reliability and validity apply to codingcategories. Validity is a particularly problematic concept in relation to coding categories.Quite what does validity mean in this context? One could apply many of the conceptu-alisations of validity which were discussed in the previous chapter. Face and contentvalidity are probably the most frequent ways of assessing the validity of coding. It is moredifficult to measure things such as concurrent and predictive validity since it is often hardto think of criteria against which to validate the coding categories. Qualitative researchers,however, have a particular problem since the development of categories is often the nubof their research. So this brings about the questions of just what is the value of this sortof research. In response, a wide range of ideas have been put forward concerning howissues such as validity may be tackled in qualitative research. These are dealt with insome detail in Chapter 25 and more extensively in Howitt (2010).
The assessment of the reliability of codings is much more common than the issue of validity. Reliability of codings is actually less straightforward than for scales and measurements. The following goes some way to explaining why this is the case:
Where ratings (scores) are involved, the reliability of the coding is easily calculatedusing the correlation coefficient between the two sets of ratings. However, it is harderto establish the degree of agreement between raters on their ratings since the correla-tion coefficient simply shows that the two sets of ratings correlate – not that they areidentical. They may correlate perfectly but both coders’ ratings can be entirely different.Correlation only establishes covariance, not overlap or exact agreement.
The percentage agreement between the two coders in terms of which coding categorythey use might be considered. However, there is a difficulty. This is because agreementwill tend to be high for codings which are very common. The overlap between codersmay largely be a consequence of the coders choosing a particular coding category frequently. Rarely used coding categories may appear to have low levels of agreementsimply because the categories are so rarely chosen. Suppose two raters, for example,code whether or not people arrested by the police are drunk. If they both always decidethat the arrestees were drunk then the agreement between the coders is perfect. But thisperfect agreement is not very impressive. Far more impressive are the circumstancesin which both raters rate, say, half of the arrestees as being drunk and the other halfas sober. If the two raters agree perfectly, then this would be impressive evidence ofthe inter-rater reliability or agreement between the raters.
For this reason, indices which are sensitive to the frequency with which a category is checked should be chosen as they are more appropriate. Coefficient kappa (see the companion statistics book, Introduction to Statistics in Psychology, Howitt andCramer, 2011a, Chapter 36) is one such reliability formula. Coefficient kappa is sensitive to situations in which both raters are not varying the coding categories used much or using one coding to the exclusion of the others. Coefficient kappa is available on SPSS Statistics and is discussed in Chapter 31 of the companion com-puting text Introduction to SPSS Statistics in Psychology (Howitt and Cramer,2011b).
What are the requirements of a good coding schedule and manual? We have seen thata coding schedule can be construed as a questionnaire – albeit one which is addressed tothe researcher and not the participant. So all of the requirements of a good set of ques-tions on a questionnaire would be desirable, such as clarity, which might be translatedas the appropriateness of the category names and language for the coder, who may not
M16_HOWI4994_03_SE_C16.QXD 10/11/10 15:04 Page 287

288 PART 3 FUNDAMENTALS OF TESTING AND MEASUREMENT
be as familiar with the aims and objectives of the research as the researchers in chargeof the research, and so forth. The following are some further considerations:
For any variable, the number of possible coding categories may be potentially large.All other things being equal it is probably best to err in the direction of using toomany categories rather than too few. As computers are almost always used nowadaysin research, the computer can be used to amalgamate (collapse) categories if it laterproves to be appropriate.
It is usual, and probably essential, to have an ‘other’ category for every variable sinceeven the best set of coding categories is unlikely to be able to cope with all of the dataprovided. Sometimes the ‘other’ category becomes a dominant category in terms ofcoding. This is clearly unsatisfactory as it basically means that there is little clarityabout many participants’ data. Generally, it is best to make a brief note of the essenceof data being coded in the ‘other’ category when that category is used, that is, the sort of material that was being coded as ‘other’ needs to be recorded. Later on, the‘other’ category may be reviewed in order to try to identify any pattern in the othercategory which might justify re-coding some or all of the data. That is, it becomesapparent that certain ‘themes’ are very common in the ‘other’ category. Where the‘other’ category just consists of a variety of very different material nothing needs tobe done. Unfortunately, if the other category gets large then it may swamp the actualcoding categories used.
Serious consideration should be given to whether or not any variable may be multi-coded. That is, will the coder be confined to using just one of the coding categoriesfor each case or will they be allowed to use more than one category? Generally speak-ing, we would recommend avoiding multi-coding wherever possible because of thecomplexity it adds to the statistical analysis. For example, multi-coding may wellmean that dummy variables will have to be used. Their use is not too difficult, but isnevertheless probably best avoided by novices.
Coding categories should be conceptually coherent in themselves. While it is possibleto give examples of material which would be coded into a category, this does not, initself, ensure the coherence of the category. This is because the examples may not begood examples of the category. Hence the coder may be coding into the category onthe basis of a bad example rather than that the data actually fits the category.
The process of developing a coding schedule and coding manual is often best regardedas a drafting and revision process rather than something achieved in a single stage –trial and error might be the best description. The reason is obvious, it is difficult toanticipate the richness of the data in advance of examining the data.
16.4 Qualitative coding
The final type of coding process is that adopted in qualitative data analysis.Characteristically this form of coding seeks to develop coding categories on the basis ofan intimate and detailed knowledge of the data. This is an ideal which some qualitativeanalyses fail to reach. For example, one finds qualitative analyses which do no more thanidentify a few major themes in the data.
The next part of the book contains a number of chapters on various aspects of qualitative data analysis. Anyone wishing to carry out a qualitative analysis needs tounderstand its historical roots as well as some of the practicalities of qualitative analysis.
M16_HOWI4994_03_SE_C16.QXD 10/11/10 15:04 Page 288

CHAPTER 16 CODING DATA 289
Through coding, in quantitative research, data are structured into categories which may be quantifiedin the sense that frequencies of occurrence of categories and the co-occurrence of categories may bestudied. In qualitative research, often the end point is the creation of categories which fit the detailof the data.
Coding is a time-consuming activity which is sometimes economised on by pre-coding the data, thatis, the participants in the research are required to choose from a list of response categories. In thisway, the data collection and coding phases of research are combined. This is essentially a form ofquantitative data collection.
Coding of data collected qualitatively (that is, through in-depth interview, focus groups, etc.) may besubject to researcher-imposed coding categories which have as their main objective quantification ofcharacteristics judged important by the researcher for pragmatic or theoretical reasons, or becausethey recognise that certain themes emerge commonly in their data.
Coding requires a coding schedule which is a sort of questionnaire with which the researcher inter-rogates the data in order to decide in what categories the data fit. A coding manual details how codingdecisions are to be made – what the categories are, how the categories are defined and perhapsexamples of the sorts of data that fit into each category.
Such coding, which is almost always intended for quantitative and statistical analysis, may be sub-jected to reliability tests by comparing the codings of two or more independent coders. This mayinvolve the use of coefficient kappa if exact correspondence of codings needs to be assessed.
If the analysis is intended to remain qualitative, then the qualitative analysis procedures discussedin the chapters on Jefferson coding, discourse analysis and conversation analysis, for example,should be consulted (Chapters 19, 22 and 23). The general principles of qualitative research are that the coding or categorisation process is central and that the fit of the categories to the data andadditional data is paramount.
Key points
Qualitative analysis is not any analysis which does not include statistics. Qualitativeanalysis has its own theoretical orientation that is highly distinctive from the dominantpsychological approaches that value quantification, hypothesis testing, numbers andobjectivity.
16.5 Conclusion
The process of turning real life into research involves a number of different stages.Among the most important of these is that of coding or categorisation. All researchcodes reality in some way or another, but the ways in which the coding is achieved varies radically. For some research, the development of the coding categories is the mainpurpose of the research endeavour. In other research, coding is much more routine andstandardised, as in self-completion questionnaires with a closed answer format. Not only are there differences in the extent and degree of elaboration of the coding process,but there are differences in terms of who does the coding. The participant does the coding in self-completion questionnaires using codes (multiple choices, etc.) developedby the researcher.
M16_HOWI4994_03_SE_C16.QXD 10/11/10 15:04 Page 289

290 PART 3 FUNDAMENTALS OF TESTING AND MEASUREMENT
ACTIVITIES1. Create a list of the characteristics that people say make other people sexually attractive to them. You could interview
a sample to get a list of ideas. Formulate a smaller number of coding categories which effectively categorise these characteristics. Try half the number of categories as characteristics first, then halve this number, until you have two orthree overriding categories. What problems did you have and how did you resolve them? Is there a gender differencein the categories into which the characteristics fall?
2. Obtain a pre-coded questionnaire, work through it yourself (or use a volunteer). What were the major problems in completing the questionnaire using the pre-coded categories? What sorts of things did you feel needed to be com-municated but were not because of the format?
M16_HOWI4994_03_SE_C16.QXD 10/11/10 15:04 Page 290

Qualitative researchmethods
PART 4
M17_HOWI4994_03_SE_C17.QXD 10/11/10 15:04 Page 291

M17_HOWI4994_03_SE_C17.QXD 10/11/10 15:04 Page 292

Why qualitativeresearch?
Overview
CHAPTER 17
This chapter presents the essential background to doing qualitative research. It isimportant to understand the underlying theoretical stance common to much qualita-tive research before looking in detail at methods of data collection, recording andanalysis.
Qualitative research concentrates on describing and categorising the qualities ofdata. In contrast, quantitative research concentrates on quantifying (giving numbersto) variables.
Quantitative research is often described as being based on positivism, which isregarded as the basis of the ‘hard’ sciences such as physics and chemistry.
The search for general ‘laws’ of psychology (universalism) is held to stem from posi-tivism and is generally regarded as futile from the qualitative point of view.
Qualitative researchers attempt to avoid some of the characteristics of positivism byconcentrating on data which are much more natural.
M17_HOWI4994_03_SE_C17.QXD 10/11/10 15:04 Page 293

294 PART 4 QUALITATIVE RESEARCH METHODS
17.1 Introduction
Superficially, at least, qualitative research is totally different from quantitative research.Qualitative research focuses on the description of the qualities (or characteristics) ofdata. Probably, historically, case studies of an individual person were the most commonqualitative method in psychology though, frequently, they had little in common withmodern qualitative methods. By individual case study we mean the detailed descrip-tion of the psychological characteristics of, usually, one person (or perhaps a singleorganisation). Sigmund Freud’s psychoanalyses of individual patients are early examplesof the case study. Other classic examples of case studies would include The Man WhoMistook His Wife for a Hat by Oliver W. Sacks (1985). This book includes a detailedaccount of how a man with neurological problems dealt with his memory and per-ceptual problems. Such individual case studies often utilising but sometimes helping to develop psychological theory are very different from recent qualitative approaches in psychology. Modern qualitative research generally involves a detailed study of text,speech and conversation (which generically may be termed text) and not the specific psychological characteristics of interesting individuals. Text is anything which may begiven meaning.
Qualitative research often concentrates on conversational and similar exchangesbetween people in interviews, the media, counselling and so forth. It is rarely, if ever,concerned with analysis at the level of individual words, phrases or even sentences. Itanalyses broader units of text, though what the minimum unit of analysis is depends onthe theoretical orientation of the qualitative analysis.
One major problem facing anyone wishing to learn to do qualitative research is that it is not fully established as being part of the core of psychological research and theory. That is, one can study certain research fields in psychology for years, and rarelyif ever come across qualitative research and theory. This may be changing. In contrast to qualitative approaches, quantitative research is undeniably at the centre of psychology.Indeed, quantification characterises most psychology more effectively than the subjectmatter of the discipline. Take virtually any introductory psychology textbook off the shelfand it is likely to consist entirely of research and theory based on quantitative researchmethods. References to personality tests of many sorts, intelligence quotients, ability andaptitude measures, attitude scales and similar feature heavily as do physiological measuressuch as blood pressure, brain rhythms, PET (positron emission tomography) scans andso forth. While all of these measure qualities ascribed to the data (usually called variablesin the quantitative context), they are quantified in that they are assigned numerical values or scores. The magnitude of the numerical value indicates the extent to whicheach individual possesses the characteristic or quality.
Probably the most famous quantitative measure in psychology is the IQ (intelligencequotient) score which assigns a (usually) single number to represent such a complex thingas a person’s mental abilities. Comparisons between individuals and groups of individualsare relatively straightforward. Sometimes quantitative data are gathered directly in theform of numbers (such as when age is measured by asking a participant’s age in years).Sometimes the quantification is made easy by collecting data in a form which is rapidlyand easily transformed into numbers. A good example of this is the Likert attitude scale in which participants are asked to rate their agreement with a statement such as‘University fees should be abolished’. They are asked to indicate their agreement on a scaleof strongly agree, agree, neutral, disagree and strongly disagree. These different indicatorsare assigned the numbers 1 to 5. So common are self-completion questionnaires andscales in psychological research that there is a danger of assuming that such methods aresynonymous with quantitative methods and not merely examples of them.
M17_HOWI4994_03_SE_C17.QXD 10/11/10 15:04 Page 294

CHAPTER 17 WHY QUALITATIVE RESEARCH? 295
The growth of psychology into a major academic discipline and field of practice was possible because of the growth of quantification. It is also partly responsible for psychology’s closeness to scientific disciplines such as biology, physiology and medicine.Historically, many decisive moments in psychology are associated with developmentswhich enabled quantification of the previously unquantifiable:
Psychophysics was an early such development which found ways of quantifying sub-jective perceptual experiences.
The intelligence test developed in France by Alfred Binet at the start of the twentiethcentury provided a means of integrating a wide variety of nineteenth-century ideasconcerning the many qualities of intellectual functioning.
Louis Thurstone’s methods of measuring attitudes in social psychology and the morefamiliar methods today of Likert were methodological breakthroughs which allowedthe development of empirical social psychology.
The development of a good quantitative technique encourages the development of thatfield of research since it facilitates further research. Examples of research fields spurredon by quantification are topics such as authoritarianism, psychopathy, suggestibility andmany other psychological concepts as well as, for example, the MIR (millimetre-waveimaging radiometer) scan. All of this documents a great, collective achievement. Never-theless, the consequence has been to squeeze out other, less quantifiable, subject matter.Consequently, the history of psychology is dotted with critiques of the focus of psycho-logical knowledge (for example, Hepburn, 2003). Often these critiques are portrayed as‘crises’ though probably the term serves the interest of the complainants better than itreflects the view of the majority of researchers and practitioners.
There is a danger of presenting quantitative and qualitative research as almost separatefields of research. This is to neglect the numerous examples of apparently quantitativeresearch which actually include a qualitative aspect. Examples of this are quite commonin the history of psychology. Even archetypal, classic laboratory studies sometimes col-lected significant amounts of qualitative material (for example, Milgram, 1974). It hasto be said, though, that recent developments in qualitative methods in psychology wouldprobably eschew this combined approach. Whatever, it is evidence of an underlying viewof many psychologists that quantification alone only provides partial answers.
17.2 What is qualitative research?
So is qualitative research that which is concerned with the nature or characteristics of things? One obvious problem with this is that does not all research, qualitative or quantitative, seek to understand the nature and characteristics of its subject matter?Perhaps this indicates that the dichotomy between qualitative and quantitative researchis more apparent than real. If the distinction is of value then it should be apparent in therelationship between qualitative and quantitative research. Immediately we explore thisquestion, we find that several different claims are made about the interrelationship:
Qualitative methods are a preliminary stage in the research process which contributesto the eventual development of adequate quantification. Quantification is, in this formulation, the ultimate goal of research. There is a parallel with the physical sciences.In many disciplines (such as physics, biology and chemistry) an early stage involvesobservation and classification. For example, botanists collected, described and organisedplants into ‘families’ – groups of plants. Members of a ‘family’ tended to be similarto each other in terms of their characteristics and features. In chemistry, exploration
M17_HOWI4994_03_SE_C17.QXD 10/11/10 15:04 Page 295
296 PART 4 QUALITATIVE RESEARCH METHODS
of the characteristics of different elements led to them being organised into the important analysis tool – the periodic table – which allowed their characteristics to bepredicted and undiscovered elements to be characterised. This was done on the basisof features such as the chemical reactivity and the electrical conductivity of elements.In many disciplines, qualitative methods (which largely involve categorisation) haveled to attempts to quantify the qualities so identified. The model for this is:
Qualitative analysis→Quantitative analysis
This process is not uncommon in psychology. If we return again to the commonexample of intelligence testing, we can illustrate the process. During the nineteenthcentury under the influence of an Austrian, Franz Joseph Gall, the idea that differentparts of the brain had different mental functions developed. Unfortunately thingswent wrong in some ways as one of the immediate consequences was the emergenceof phrenology as a ‘science’. Phrenology holds that the different parts of the brain aredifferent organs of the mind. Furthermore, the degree of development of differentparts of the brain (assessed by the size of the ‘bumps’ on the skull at specific locations)was believed to indicate the degree of development of that mental faculty (or mentalability). Gall believed that the degree of development was innate in individuals. Therange of mental faculties included features such as firmness, cautiousness, spiritualityand veneration, which are difficult to define, and others such as constructiveness, self-esteem and destructiveness, which have their counterparts in current psychology.The point is that these mental faculties could only be suggested as a result of attemptsto describe the characteristics of the mind, that is, a process of categorising what wasobserved. Phrenology’s approach to quantification was immensely crude, that is, thesize of different bumps. But the idea that the mind is organised into various facultieswas a powerful one, and attempts to identify what they were formed the basis of the conceptualisation of intelligence, which was so influential on Alfred Binet whodeveloped the seminal measure of intelligence. For Binet, intelligence was a variety ofabilities, none of which in themselves defined the broader concept of intelligence butall of which were aspects of intelligence. The idea that qualitative research is a firststep to quantification is valuable but neglects the fact that the process is not entirelyone way. There are many quantitative techniques (for example, factor analysis andcluster analysis) which identify empirical patterns of interrelationships which mayhelp develop theoretical categorisation or classification systems.
Qualitative methods provide a more complete understanding of the subject matter of the research. Some qualitative researchers argue that quantification fails to come toterms with or misses crucial aspects of what is being studied. Quantification encour-ages premature abstraction from the subject matter of research and a concentrationon numbers and statistics rather than concepts. Because quantification ignores a great deal of the richness of the data, the research instruments often appear to becrude and, possibly, alienating. That is, participants in quantitative research feel thatthe research is not about them and may even think that the questions being asked of them or tasks being set are simply stupid. Some research is frustrating since, try as the participant may, the questionnaires or other materials cannot be responded toaccurately enough. They simply are not convinced that they have provided anythingof value to the researcher. Of course, the phrase ‘richness of data’ might be regardedas a euphemism for unfocused, unstructured, unsystematic, anecdotal twaddle by the critical quantitative researcher. We will return to the issue of richness of data insubsequent chapters.
A more humanistic view of qualitative data is that human experience and interactionare far too complex to be reduced to a few variables as is typical in quantitativeresearch. This sometimes is clearly the case especially when the research involves the
M17_HOWI4994_03_SE_C17.QXD 10/11/10 15:04 Page 296
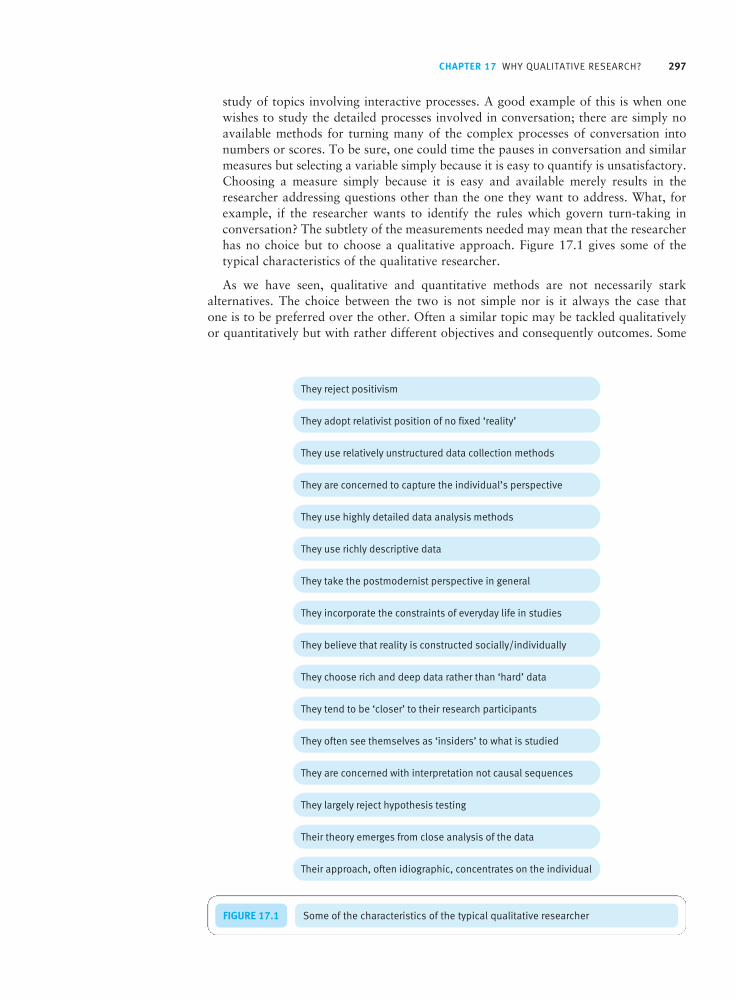
CHAPTER 17 WHY QUALITATIVE RESEARCH? 297
study of topics involving interactive processes. A good example of this is when onewishes to study the detailed processes involved in conversation; there are simply noavailable methods for turning many of the complex processes of conversation intonumbers or scores. To be sure, one could time the pauses in conversation and similarmeasures but selecting a variable simply because it is easy to quantify is unsatisfactory.Choosing a measure simply because it is easy and available merely results in theresearcher addressing questions other than the one they want to address. What, forexample, if the researcher wants to identify the rules which govern turn-taking in conversation? The subtlety of the measurements needed may mean that the researcherhas no choice but to choose a qualitative approach. Figure 17.1 gives some of the typical characteristics of the qualitative researcher.
As we have seen, qualitative and quantitative methods are not necessarily stark alternatives. The choice between the two is not simple nor is it always the case that one is to be preferred over the other. Often a similar topic may be tackled qualitativelyor quantitatively but with rather different objectives and consequently outcomes. Some
FIGURE 17.1 Some of the characteristics of the typical qualitative researcher
M17_HOWI4994_03_SE_C17.QXD 10/11/10 15:04 Page 297

298 PART 4 QUALITATIVE RESEARCH METHODS
research successfully mixes the two. Many of the classic studies in some fields of psychologytook the mixed approach, though often it would not be apparent from modern descrip-tions of this research. Examples include Stanley Milgram’s electric shock/obedienceexperiments (Milgram, 1974) which we have already mentioned. In these cases, the two approaches are complementary and supplementary. There are certain researcherswho invariably choose quantification irrespective of their research question. Equallythere are other researchers who avoid quantification when it would be straightforwardand appropriate. There are a number of reasons for this diversity:
Quantification requires a degree of understanding of the subject matter. That is, it isnot wise to prematurely quantify that which one cannot describe with any accuracy.
Quantification may make the collection of naturalistic data difficult or impossible.Quantification (such as the use of questionnaires or the use of laboratory apparatus)by definition implies that the data are ‘unnatural’. Quantified data are collected inways which the researcher has highly structured.
Some researchers see flaws in either quantification or qualitative research and so areattracted to the other approach.
Some research areas have had a long tradition of quantification which encourages the further use of quantification. Research in new areas often encourages qualitativemethods because measurement techniques have not been developed or because littleis known about the topic.
Apart from career quantifiers and career non-quantifiers who will not or can not employthe other method, many researchers tailor their choice of methods to the situation and,in particular, the research question involved. All researchers should have some appreciationof the strengths and weaknesses of each approach. Probably the healthiest situation iswhere researchers from both perspectives address similar research questions.
17.3 History of the qualitative–quantitative divide in psychology
Laboratory experiments and statistical analyses dominate the contents of most introductorytextbooks in psychology. One short explanation of this is that skills in experimentationand quantitative analysis are very marketable commodities in and out of academia. Fewdisciplines adopted such an approach, though it has the advantage that it suggests thatpsychologists are detached and objective in their work. These characteristics also tendedto position psychology closely to the physical sciences. The setting-up of the psychologylaboratory at Leipzig University by Wilhelm Wundt in 1879 was a crucial moment forpsychologists according to psychology’s historians (Howitt, 1992a). A number of famousAmerican psychologists trained at that laboratory. Wundt, however, did not believe thatthe laboratory was the place for all psychological research. He regarded the laboratoryas a hapless context to study matters related to culture, for example. Nevertheless, thepsychological laboratory was regarded as the dominant icon of psychology.
The term positivism dominates the quantitative–qualitative debate. Some use it as apejorative term though it is a word which, seemingly, is often misunderstood. For example,some writers appear to imply that positivism equals statistics. It does not. Positivism isa particular epistemological position. Epistemology is the study of, or theory of, knowledge.It is concerned with the methodology of knowledge (how we go about knowing things)and the validation of knowledge (the value of what we learn). Prior to the emergence ofpositivism during the nineteenth century, two methods of obtaining knowledge dominated:
M17_HOWI4994_03_SE_C17.QXD 10/11/10 15:04 Page 298
CHAPTER 17 WHY QUALITATIVE RESEARCH? 299
Theism, which held that knowledge was grounded in religion which enabled us to knowbecause truth and knowledge were revealed spiritually. Most religious texts containexplanations and descriptions of the nature of the universe, morality and social order.While these are matters studied by psychologists, there is little in modern psychologywhich could be conceived as being based on theism.
Metaphysics, which held that knowledge was about the nature of our being in the worldand was revealed through theoretical philosophising. Relatively little psychology isbased on this.
Neither theism nor metaphysics has retained its historical importance. Religious knowledgewas central throughout the history of civilisation. Only recently has its pre-eminence faltered in terms of the human timescale. Metaphysics had only a brief period of ascendancy during the period of the Enlightenment (eighteenth century) when reason andindividualism were emphasised. Positivism is the third major method of epistemologyand directly confronts theism and metaphysics as methods of achieving knowledge.Positivism was first articulated in the philosophy of Auguste Comte in the nineteenthcentury in France. He stressed the importance of observable (and observed) facts in the valid accumulation of knowledge. It is a small step from this to appreciating howpositivism is the basis of the scientific method in general. More importantly in this context, positivism is at the root of so-called scientific psychology.
It should be stressed that positivism applies equally to quantitative methods and toqualitative research methods. It is not the province of quantitative psychology alone. Thereis very little work in either quantitative or qualitative psychology which does not rely onthe collection of observed information in some way. Possibly just as a fish probably doesnot realise that it is swimming in water, qualitative researchers often fail to recognisepositivism as the epistemological basis of their work. Silverman (1997) makes a numberof points which contradict the orthodox qualitative research view of positivism:
Unfortunately, ‘positivism’ is a very slippery and emotive term. Not only is it difficultto define but there are very few quantitative researchers who would accept the label . . .Instead, most quantitative researchers would argue that they do not aim to producea science of laws (like physics) but simply to produce a set of cumulative, theoreticallydefined generalizations deriving from the critical sifting of data. So, it became increas-ingly clear that ‘positivists’ were made of straw since very few researchers could befound who equated the social and natural worlds or who believed that research wasproperly theory-free.
(pp. 12–13)
The final sentence is very important. It highlights the difficulty which is that, althoughpositivism stresses the crucial nature of observation, it is the end point or purpose of the observation which is contentious. The real complaint about positivism is that it operates as if there were permanent, unchanging truths to be found. That is, underlyingour experiences of the world are consistent, lawful and unchanging principles. The phrase‘the laws of psychology’ reflects this universality. The equivalent phrases in the naturalsciences are ones like ‘the laws of planetary motion’, ‘the laws of thermodynamics, ‘theinverse square law of light’, that e = mc2 and so forth. These physical laws are believedto be universally applicable and apply no matter where in the universe. The trouble isthat universalism encourages psychologists to seek principles of human nature in, say,New York which they would then apply unchanged in Addis Ababa, Beijing or Cairoand, equally, in 1850 as in 2050.
There were psychologists who were very important in their time who operated moreor less according to the positivist maxims and the quest for the laws of human activity in
M17_HOWI4994_03_SE_C17.QXD 10/11/10 15:04 Page 299

300 PART 4 QUALITATIVE RESEARCH METHODS
particular. These were members of the Behaviourist School of Psychology which dominatedmuch psychology between the 1920s and the 1960s and beyond. Virtually everythingthey did reeked of the quest for general laws of psychology. First of all, they argued thebasic positivistic position that knowledge comes from observation. So they stressed thatpsychology should study the links between the incoming stimulus and the outgoing response.There was no point in studying what could not be tested directly through observation.They were primarily interested in the experimental method. If one is seeking universalprinciples of human behaviour then these should apply in the psychology laboratory justas much as anywhere else. Since the laboratory had other advantages, then why notstudy human psychology exclusively in such laboratories? They went so far as to wearwhite coats in the laboratory to emulate scientists from the physical sciences, probablymore to enhance their stature by association than because of any direct practical advantage.Famous names in behavioural psychology are B. F. Skinner (1904–1990), Clark Hull(1884–1952) and John Watson (1878–1958), the founder of behaviourism.
Realism would be a term applied to positivism of this sort (that is, there is a realitywhich research is trying to tap into). Subjectivism would take the view that there is no reality to be grasped and in Trochim’s (2006) phrase ‘we’re each making this all up’.Since many psychologists nowadays would not accept the view that universal laws of human psychology are possible or desirable, some would argue that psychology is currently in a post-positivist stage. Postmodernism has virtually the same meaning in this context. Psychology’s allegiance is still to the importance of observation. However,its aspirations of what knowledge is possible have changed. Probably the failure of the out-and-out positivists to come up with anything which constitutes a worthwhilegeneral law of psychology has led to the present situation. Silverman (1997), in theabove quotation, characterises the quest of many modern researchers as being for ‘cumulative, theoretically defined generalisations deriving from the critical sifting ofdata’. Perhaps psychologists, more than some other disciplines, remain inclined towardsgross, decontextualised generalisations. They write as if the statements they make con-cerning their research findings apply beyond the context in which they were studied.Owusu-Bempah and Howitt (2000) are among a number of writers who point out thatsuch a tendency makes psychology practically unworkable beyond limited Western populations and incapable of working with the cultural diversity to be found withinmodern Western communities.
Qualitative researchers tend to regard the search for the nature of reality as a futilequest. Critical realism is the philosophy that can be summed up as accepting that thereis a ‘reality’ out there but we can at best view it through an infinite regress of windows.That is, there is always yet another window that we are looking through and that eachwindow distorts reality in some way. While this implies that there will always be differ-ent views of reality depending on which particular window we are looking through, themajor problem is the degree of distortion that we are experiencing. Some qualitative analysts will point to the fact that much research in psychology and the social sciencesrelies on data in the form of language. Language, however, they say, is not reality but justa window on reality. Furthermore, different speakers will give a different view of reality.They conclude that the search for reality is a hopeless task and, to push the metaphorbeyond the bounds of endurance, that we should just study the diversity of what is seenthrough the different windows. Well, that is one approach but not the only one basedon critical realism (which only demands that researchers try to get close to reality whilerealising that they can never achieve that goal). Every method of measuring reality is fallible, but if we use many different measures and they concur, then maybe we are gettingtowards our goal might be the typical response of a mainstream psychologist. One of thereasons why our data are problematic is that our observations are theory laden. That is,the observer comes to the observation with baggage and expectations. That baggage willinclude our culture, our vested interests and our general perspective on life, for example.
M17_HOWI4994_03_SE_C17.QXD 10/11/10 15:04 Page 300

CHAPTER 17 WHY QUALITATIVE RESEARCH? 301
Psychologists are not born with the ability to see the world without these windows. Onestrategy to overcome our preconceptions is to throw our observations before others fortheir critical response as part of the process of analysing our observations.
We have seen that there is no justification for some of the characteristics attributed to positivism. As discussed, some critiques of mainstream psychology labour under theimpression that positivism equates to statistical analysis. Yet some of the most importantfigures in positivistic psychology such as Skinner had little or no time for statistics and didnot use them in their work. The use, or not, of statistics does not make for positivism.Similarly, atheoretical empiricism – virtually the collection and analysis of data for theirown sake – has nothing to do with positivism which is about knowing the world ratherthan accumulating data as such.
17.4 The quantification–qualitative methods continuum
The conventional rigid dichotomy of quantitative–qualitative methodologies is inadequateto differentiate different types of research. It implies that research inevitably falls intoone or other of these apparently neat boxes. This is not necessarily the case. There issome research which is purely quantitative and other research which is purely qualitative.However, this is to neglect much research that draws on both. Conceptually, researchmay be differentiated into two major stages:
data collection;
data analysis.
Of course, there are other stages but these are the important ones for now.At the data collection stage, there is a range of possibilities. The degree of quantifica-
tion (assigning of numbers or scores) and qualification (collecting data in terms of richdetail) may vary:
Pure quantitative The data are collected using highly structured materials (such asmultiple-choice questionnaires or physiological indexes such as blood pressure levels)in relatively highly structured settings (such as the psychological laboratory). A goodexample of such a study would be one in which the levels of psychoticism (measuredusing a self-completion question) were compared in sex offenders versus violentoffenders (as assessed by their current conviction).
Pure qualitative The data are collected to be as full and complete a picture as theresearcher can possibly make it. This is done, for example, by video or audio-recordingextensive amounts of conversation (say between a counsellor and client). There maybe no structuring to the data gathered than that, though sometimes the researchermight choose to interview participants in an open-ended manner. Many qualitativeresearchers try to use as much naturalistic material as possible.
Mixed data collection Between these extremes of quantification and qualitativedata gathering are many intermediary possibilities. Some researchers choose to collect data in a quantitative form where there are good means of quantifying variables and concepts but use open-ended and less structured material where the concepts andvariables cannot be measured satisfactorily for some reason. Sometimes the researcherwill use a mixture of multiple-choice type questions with open-ended questions whichmay help paint a fuller picture of the data.
However, we ought also to consider the data analysis stage of research in terms of thequalitative–quantitative distinction. The same options are available to us:
M17_HOWI4994_03_SE_C17.QXD 10/11/10 15:04 Page 301

302 PART 4 QUALITATIVE RESEARCH METHODS
Pure quantification If data have been collected solely in quantitative form, thenthere is little option but to analyse the data quantitatively. However, data may havebeen collected in qualitative form but the researcher wishes to quantify a number ofvariables or create scores based on the qualitative data. The commonest method of doingthis is through a process known as coding (see Chapter 16). In this the researcherdevelops a categorisation (coding) scheme either based on pre-existing theoretical andconceptual considerations, or develops a categorisation system based on examiningthe data. This can involve the researcher rating the material on certain characteristics.For example, a global assessment of a participant’s hostility to global environmentalissues may be obtained by having the researcher rate each participant on a scale.Usually another rater will also independently rate the participant on the same ratingscale and the correspondence between the ratings assessed (inter-rater reliability).
Pure qualitative This option is generally available only if the data have been collectedin qualitative form (quantitative data are rarely suitable for qualitative analysis, forobvious reasons). Quite what the qualitative analysis should be depends to a degreeon the purpose of the research. As conversation (interviews or otherwise) is a commonsource of qualitative data, then discourse analysis and/or conversation analysis maybe helpful. But this is a complex issue, which may best be left until qualitative methodshave been studied in a little more depth.
Mixed data analysis This may follow from mixed data collection but equally maybe the result of applying qualitative and quantitative methods to qualitative data. Thisis quite a common approach though it is often fairly informally applied. That is, theresearcher often has a primarily quantitative approach which is extended, illustratedor explicated using simple qualitative methods. For example, the researcher may giveillustrative quotations from the open-ended material that is collected in addition tothe more quantitative main body of the data. Such approaches are unlikely to satisfythe more demanding qualitative researcher.
The main points to emerge out of this are that we should distinguish data collection fromdata analysis and appreciate that quantitative and qualitative methods may be appliedat either stage – this is summarised in Figure 17.2.
FIGURE 17.2 Varieties of data collection and analysis
M17_HOWI4994_03_SE_C17.QXD 10/11/10 15:04 Page 302

CHAPTER 17 WHY QUALITATIVE RESEARCH? 303
17.5 Evaluation of qualitative versus quantitative methods
Denzin and Lincoln (2000) claim that there are five major features distinguishing quan-titative from qualitative research styles. Some of these have already been touched on inthis chapter but they are worth reiterating systematically:
Use of positivism and post-positivism Quantitative and qualitative methods are bothbased on positivism and many qualitative researchers have applied ‘positivist ideals’to messy data. However, qualitative researchers are much more willing to accept thepost-positivist position that whatever reality there is that might be studied, our know-ledge of it can only ever be approximate and never exact. In their actions, quantitativeresearchers tend to reflect the view that there is a reality that can be captured despite allof the problems. Language data would be regarded by them as reflecting reality whereasthe qualitative researcher would take the view that language is incapable of represent-ing reality. Quantitative researchers often treat reality as a system of causes and effectsand often appear to regard the quest of research as being generalisable knowledge.
Qualitative researchers accept other features of the postmodern sensibility This reallyrefers to a whole range of matters which the traditional quantitative researcher largelyeschewed. Examples of this include verisimilitude, in that the researcher studies thingswhich appear to be real rather than the synthetic product of psychology laboratoriesfor example. The qualitative researcher is represented as having an ethic of caring aswell as political action and dialogue with participants in the research. The qualitativeresearcher has a sense of personal responsibility for their actions and activities.
Capturing the individual’s point of view Through the use of in-depth observation andinterviewing, the qualitative researcher believes that the remoteness of the researchfrom its subject matter (people) as found in some quantitative research may be overcome.
Concern with the richness of description Quite simply, qualitative researchers valuerich description almost for its own sake, whereas quantitative researchers find thatsuch a level of detail actually makes generalisation much more difficult.
Examination of the constraints of everyday life It is argued that quantitativeresearchers may fail to appreciate the characteristics of the day-to-day social worldwhich then become irrelevant to their findings. On the other hand, being much morewedded in society through their style of research, qualitative researchers tend to havetheir ‘feet on the ground’ more.
Probably the majority of these claims would be disputed by most quantitative researchers.For example, the belief that qualitative research is subjective and impressionistic wouldsuggest the lack of grounding of qualitative research in society, not higher levels of it.
The choice between quantitative and qualitative methods when carrying out psycholo-gical research is not an easy one to make. The range of considerations is enormous.Sometimes the decision will depend as much on the particular circumstances of theresearch, such as the resources available, as on profound philosophical debates about the nature of psychological research.
■ When to use quantificationThe circumstances in which quantification is most appropriate include the following:
When addressing very clearly specified research questions.
When there is a substantial body of good-quality theory from which hypotheses canbe derived and tested.
M17_HOWI4994_03_SE_C17.QXD 10/11/10 15:04 Page 303

304 PART 4 QUALITATIVE RESEARCH METHODS
In addressing research questions for which there is high-quality research which hastypically employed quantification.
When it can be shown that there are very satisfactory means of collecting informationusing measures.
When the researcher has a good understanding of quantitative methods combinedwith a lack of interest or knowledge concerning qualitative methods.
■ When to use qualitative research methodsA researcher might consider using qualitative research methods in the following circumstances:
When the researcher wishes to study the complexity of something in its natural setting.
When there is a lack of clarity about what research questions should be asked andwhat the key theoretical issues are.
When there is generally little or no research into the topic.
When the research question relates to the complex use of language, such as inextended conversation or other textual material.
When the researcher has read qualitative research in some depth.
Where the use of structured materials, such as multiple-choice questionnaires, maydiscourage individuals from participating in the research.
17.6 Conclusion
The divide between quantitative and qualitative research is not easy to cross. In manyways there are two cultures in psychology and often they are seeking answers to radicallydifferent sorts of questions. However, there is more to it than that since if there weresimply two camps of psychologists – quantitative and qualitative – who just do totallydifferent things then that would be fine. After all, specialities within psychology are verycommon. It is virtually unknown to come across psychologists who are well versed inmore than a couple of sub-disciplines of psychology. Where it seems an unsatisfactorysituation to have quantitative and qualitative camps is in so far as psychologists shouldbe interested in the topic of research and not be straitjacketed within methods. So ourpreference is for all psychologists to have the choice of approaches from which to selectwhen planning their research. This is a convoluted way of saying that the research problemshould have primacy. The best possible answer to the question that the researcher is raisingcannot lie in any particular method.
This and the next few chapters are our modest answer to uniting the quantitative andqualitative camps in a joint enterprise, not a battle.
M17_HOWI4994_03_SE_C17.QXD 10/11/10 15:04 Page 304

CHAPTER 17 WHY QUALITATIVE RESEARCH? 305
Qualitative research, especially in the form of case studies, has been a significant but relatively minoraspect in the history of psychological methods. Nowadays, interest in qualitative methods hasincreased especially in terms of the analysis of language-based data such as conversations, mediacontent and interviews.
Advances in quantification, nevertheless, have often been significant foci of new psychologicalresearch.
Qualitative research can be regarded as a prior stage to quantitative research. However, there areresearch questions which are difficult to quantify especially with complex processes such as conversation.
Positivism is a philosophical position on how knowledge can be obtained which is different from theism (religious basis of knowledge) and metaphysics (knowledge comes from reflecting on issues).Positivism required an empiricist (observational) grounding for knowledge. However, it becameequated with relatively crude and quantified methods. Qualitative researchers often overlook theirallegiance to positivism.
Quantification may be applied to data collection or data analysis. Research data collected throughthe ‘rich’ methods may be quantified for analysis purposes. Whether or not this is appropriatedepends on circumstances.
Key points
ACTIVITYMany psychology students are unfamiliar with examples of qualitative research. Qualitative research needs a positive orientation and a great deal of reading. So now is the time to start. Spend half an hour in the library looking through likelypsychology journals for examples to study. Failing that,
MacMartin, C. and Yarmey, A. D. (1998). ‘Repression, dissociation, and the recovered memory debate: Constructing scientific evidence and expertise’, Expert Evidence, 6, 203–26.
is an excellent example which crosses a range of issues relevant to the work of many psychologists.
M17_HOWI4994_03_SE_C17.QXD 10/11/10 15:04 Page 305

Qualitative datacollection
Overview
CHAPTER 18
The commonest qualitative data collection methods are probably the in-depth inter-view, participant observation and focus groups. These are discussed in this chapterto illustrate the range of concerns of qualitative analysts.
Virtually all qualitative approaches to data collection have an equivalent structuredapproach. For example, in-depth or semi-structured interviews may be compared withthe structured interview common in market research.
Qualitative data may, in appropriate circumstances, be analysed quantitatively orqualitatively depending on the objectives of the researcher and the characteristics ofthe data. Qualitative data collection should not be confused with qualitative dataanalysis.
Aspects of observation, focus groups and interviewing as means of collecting quali-tative data are presented.
M18_HOWI4994_03_SE_C18.QXD 10/11/10 15:05 Page 306

18.1 Introduction
Qualitative data collection is not necessarily followed by qualitative data analysis.Qualitatively collected data may be analysed, sometimes, quantitatively. Qualitativedata collection methods essentially provide extensive, detailed and ‘rich’ data for lateranalysis. Nevertheless, the primary purpose of the analysis is to turn the complexity of the data into relatively structured numerical analyses. At first sight this may seem a little pointless since we know that researchers often collect data in quantitative form so why bother with qualitative data collection if the analysis is to be quantitative?However, there are circumstances in which it is simply impossible, or undesirable, to collect data quantitatively prior to quantitative analysis:
It is difficult to design, for example, a self-completion questionnaire which will effec-tively collect a biographical record of an individual or capture the detail of a complexsequence of events.
There may be factors that militate against some individuals supplying quantitative data.For example, a researcher wishing to collect accounts of the experience of depressionfrom seriously depressed individuals may find greater success through giving the participants attention by interviewing them than by sending them a questionnairethough the post. Some individuals may not have the intellectual resources or even thewriting and reading skills to complete a self-completion question. It would be silly, forexample, to carry out research into illiteracy through a questionnaire.
The researchers may not have sufficient familiarity with the research topic to enableeffective structuring of quantitative materials. They may have chosen an entirely novelarea of research, for example, so they cannot draw ideas from previous researchers.Some researchers will collect data qualitatively since this allows a degree of explora-tion of the topic with the participants. Interviews and similar techniques may be partof an exploration process.
The range of methods by which appropriate data for qualitative studies may beobtained is wide. Indeed, any data that are ‘rich and detailed’ rather than ‘abstracted andhighly structured’ may be candidates for qualitative analysis. Some of the more familiardata collection methods for qualitative analysis include the following:
Observation: relatively unstructured observation and participation would be typicalexamples. Observation that involves just a few restricted ratings would probably notbe appropriate.
Biographies (or narratives) which are accounts of people’s lives or aspects of their lives.
Focus groups.
In-depth interviews.
Recordings of conversations including research interviews and recordings made forother purposes.
Mass media output.
Documentary and historical records.
Internet sources.
Often qualitative analysis uses material from a range of different types of methods. Thematerial, in general, is overwhelmingly textual. Observations, for example, will be recordedin words. This does not mean that other forms of material (including the visual) cannot
CHAPTER 18 QUALITATIVE DATA COLLECTION 307
M18_HOWI4994_03_SE_C18.QXD 10/11/10 15:05 Page 307

308 PART 4 QUALITATIVE RESEARCH METHODS
be used, but as, in effect, these are transformed into words, then the dominance of wordsor text is obvious. (Text has a wider meaning in qualitative research – it refers to any-thing imbued with meaning.) It is not the broad method by which the data are collectedwhich determines whether the data collected are suitable for qualitative analysis. Forexample, interviews may be used to collect quantitative data only or they may be usedto collect qualitative data. It is the detail, expansiveness and richness of the data thatdetermine their suitability for qualitative analysis. Imagine that researchers wish to studyviolence in television programmes. They might consider two options:
They could count the number of acts of violence which occur in a sample of televisionprogrammes. The relative frequency of such violence in different types of televisionprogramme (for example, children’s programmes or imported programmes) could beassessed as part of this.
Episodes of violence on television could be videoed, transcribed and described inprolific detail.
The first version of the research is clearly quantitative as all that has happened is thata total amount of a certain category of content has been obtained. The second versionof the research appears to be much more amenable to qualitative analysis strategies. Itis the richness of the detail which makes the difference. The researchers may be studyingexactly the same television programmes in both cases, but the nature of the data obtainedis radically different. The qualitative research approach might allow the researcher to saymuch more about the context of the violence. However, without counting, the numberof violent episodes cannot be assessed.
Generally speaking, although the quality of the research data is of paramount import-ance, what the best data are depends on a range of factors. These include, for example,the precise nature of the research questions, the nature of participants, the stage of thedevelopment of that particular field, the researcher’s personal preferences and the resourcesavailable, among many other considerations.
18.2 Major qualitative data collection approaches
The key feature of qualitative data is encapsulated in the phrase ‘richness of data’. But,as we have seen, there are many associated characteristics, such as unstructured data collection, extensive and interactive textual material, such as that collected in some interviews, the talk of politicians and so forth. Richness does not necessarily relate tointeresting or similar ideas. Some qualitative researchers actually like dull, mundanematerial as this challenges their analytic skills greatly. The range of qualitative data col-lection methods (and sources of qualitative data) is remarkable. Consequently, it is possibleto give only a few examples of the dominant approaches taken to qualitative data collection.We will concentrate on participant observation, focus groups and interviews.
■ Method 1: Participant observationParticipant observation would seem to offer the opportunity to gather the richly detaileddata that qualitative researchers seek. Ethnography is the more modern term in some disciplines such as sociology where participant observation is seen as part of a widercomplex of methods for collecting data in the field. Of course, cultural anthropology can be seen as part of the history of participant observation although many early anthropologists did not collect their data by immersion in a culture but from secondary
M18_HOWI4994_03_SE_C18.QXD 10/11/10 15:05 Page 308

CHAPTER 18 QUALITATIVE DATA COLLECTION 309
sources such as the accounts of travellers. The origins of ethnography and participantobservation in the more modern period are usually attributed to the work of the so-calledChicago School of Sociology, starting in the 1920s. The key aim of participant observa-tion is to describe and explain the social world from the point of view of the actors or participants in that world. By being a participant and not just an observer, access tothe point of view of the participant is assured. According to Bryman (2008), the majorcharacteristics of participant observation are as follows:
The researcher is ‘immersed in a social setting’ (p. 163) for a considerable period oftime. The social setting could be, for example, an informal social group, an organisationor a community.
The researcher observes the behaviours of members in that social setting.
The researcher attempts to accurately record activity within that setting.
The researcher seeks to identify the ‘meanings’ that members of that setting give tothe social environment within which they operate and the behaviour of people withinthat setting.
In some disciplines, participant observation has been a central research tool. Forexample, observational research into human social activity is an evident feature of several centuries of cultural or social anthropology. Stereotypically, the cultural anthro-pologist is a committed researcher who spends years living and working among an aboriginal group isolated from Western culture. The researcher is, therefore, mostdefinitely an alien to the aboriginal culture – a fact which is regarded as part of thestrength of the method. After all, it is hard to recognise the distinctive characteristics of routine parts of our lives. This anthropological approach has occasionally found someresonance with psychology. For example, Margaret Mead’s Coming of Age in Samoa(1944) argued that adolescence is not always a period of upset, rebellion and conflict asit is characterised in Western cultures. It would appear that societies which do not havethe West’s rigid separation of childhood and adulthood may avoid the typical Westernpattern of the adolescent in turmoil; though the adequacy of Mead’s study has beenquestioned.
The term participant observation is a blanket term for a variety of related approaches.There are a number of important dimensions which identify the different forms of participant observation (Dereshiwsky, 1999 web pages; also based on Patton, 1986):
The observer’s role in the setting Some observers are best described as outsiderswith little involvement in the group dynamics whereas others are full members of thegroup (see Figure 18.1).
The group’s knowledge of observation process Overt observation is when the participants know that they are being observed and by whom. Covert observation is when the participants in the study do not know that they are being observed and,obviously, cannot know by whom they are being observed (see Figure 18.1).
Explication of the study’s purpose This is more than a single dimension and mayfall into at least one of the following categories:
There is a full explanation given as to the purpose of the research prior to startingthe research.
Partial explanation means that the participants have some idea of the purpose ofthe study but this is less than complete for some reason.
There is no explanation of the study’s purpose because the observation is covert.
There is a misleading or false explanation as to the purpose of the study.
M18_HOWI4994_03_SE_C18.QXD 10/11/10 15:05 Page 309

310 PART 4 QUALITATIVE RESEARCH METHODS
Length The observation may be a single session of a very limited length (for example,a single session of one hour) or there may be multiple observation sessions of consider-able length which may continue for weeks or years.
Focus The researcher may focus very narrowly on a single aspect of the situation;there may be an ‘expanded’ focus on a lengthy but nevertheless predetermined list of variables; there may be a holistic or ‘rich data’ approach which involves the observation of a wide variety of aspects in depth.
It is very difficult to set out the minimum requirements for a participant observationstudy. For example, what is required to justify the observation being described as a participant observation? Participant observation is uncommon in psychological researchthough it is frequently a topic for research methods modules – and textbooks. One of itsmajor difficulties as a means of psychological research lies in its frequent dependency onthe observations of a single individual. That is, participant observation may be accusedof subjectivity because it is dependent on uncorroborated observations. It would beregarded as more objective if the strength of the agreement between different participantobservers could be established, which is rarely the case.
■ Method 2: Focus groupsIn some respects, focus groups are like the daytime television discussion shows in whichthe presenter throws in a few issues and questions, and the audience debates them amongthemselves. It is the dynamic quality of the focus group situation which differentiates itfrom interviews and is the main advantage of the method. Focus groups generate datawhich are patently the product of a group situation and so may, to some extent, generatedifferent findings from individual interviews. Focus groups originated in the work of thefamous sociologist Robert Merton when he researched the effectiveness of propagandausing a method he termed focused interviewing (Merton and Kendall, 1946). In sub-sequent decades it was taken up by advertising and market researchers until eventuallybecoming more accepted in academic research. Focus groups allowed the researcher toconcentrate on matters which market research interviews fail to assess adequately. Inrecent years, researchers have increasingly regarded focus groups as a means of generat-ing ideas and understanding, especially for new research topics, perhaps prior to anothermore quantitative approach. In effect, the members of the focus group are given the task
FIGURE 18.1 Key aspects of participant observation
M18_HOWI4994_03_SE_C18.QXD 10/11/10 15:05 Page 310
CHAPTER 18 QUALITATIVE DATA COLLECTION 311
of making sense of the issue. This is achieved through the group dynamics, that is, throughthe relatively normal processes of discussion and debate among ordinary people. This isvery difficult to achieve through conventional interviewing techniques involving a singleinterviewee.
Focus groups may be used in at least three different ways:
As an early stage of research in order to explore and identify what the significantissues are.
To generate broadly conversational data on a topic to be analysed in its own right.This is a controversial area and lately qualitative researchers have preferred more naturalistic conversation sources.
To evaluate the findings of research in the eyes of the people that the research isabout. That is, discussion of research conclusions.
For the researcher, the focus group has other advantages; that is, most of the resourcescome from the participants. The researcher generally ‘facilitates’ the group processes inorder to ensure that a pre-planned range of issues is covered but at the same time allowingunexpected material to enter the discussion. So, ideally, the researcher does not dominatethe proceedings. If necessary, the researcher steers the discussion along more productivelines if the group seems to be ‘running out of steam’. The researcher running the focusgroup is known as the moderator or the facilitator.
In order to organise focus group research effectively, the following need some consideration:
Allow up to about two hours running time for a focus group. Short running timesmay indicate an unsatisfactory methodology.
A single focus group is rarely if ever sufficient even if the group seems very productivein terms of ideas and discussion. The researcher will need to run several groups inorder to ensure that a good range of viewpoints has been covered. It is difficult to say just how many groups are needed without some knowledge of the purpose of theresearch. Indeed, the researcher may consider running groups until it appears thatnothing new is emerging. In a sense this is subjective, but it is also practical within theethos of qualitative methodology.
The size of a focus group is important. If there are too many participants some willbe inhibited from talking or unable to find the opportunity to participate; too few andthe stimulation of a limited range of viewpoints will risk stultifying the proceedings.Generally it appears that the ideal is six to ten individuals, though this is not a rule.
Participants in focus groups are not intended to be representative of anything otherthan variety. They should be chosen in order to maximise the productivity of the discussion. This is, of course, a matter of judgement which will get better with experience in focus group methodology. However, Gibbs (1997) offers the followingpractical advice, which is worthwhile considering:
Don’t tell focus group members too much in advance of the meeting. If you dothere is a risk that they will figure out their own particular thoughts and attitudeson the topic of the focus group and, consequently, they may be unresponsive to theinput of others in the group.
Unless there is a very good reason for doing otherwise, ensure that the focus groupmembers are strangers to each other prior to the meeting.
Focus group members should generally be varied (heterogeneous) in terms of obvious factors. That is, they should vary in educational level, race and ethnicity,
M18_HOWI4994_03_SE_C18.QXD 10/11/10 15:05 Page 311

312 PART 4 QUALITATIVE RESEARCH METHODS
gender and social economic status. However, it should be appreciated that some ofthese factors in some circumstances may be inhibitory. For example, a discussion ofrace may be affected by having different races present.
The tasks of the focus group moderator include (Gibbs, 1997):
explaining the purpose and objectives of the focus group session;
creating a positive experience for the group members and making them feel comfort-able in the situation;
prompting discussion by posing questions that may open up the debate or by focusingon an issue;
enabling participation by all members of the group;
highlighting differences in perspective between people so that they are encouraged toengage in the nature of this difference in the discussion;
stopping conversational drifts from the point of the topic of the focus group.
Among the characteristics required of the focus group moderator are:
the ability not to appear judgemental;
the ability to keep their personal opinions to themselves.
It is nonsensical to evaluate a focus group in the same terms as, say, an individual interview. A focus group is not intended to be a convenient substitute for the individualinterview and cannot compete with it in all respects. In particular, focus groups cannotbe used to estimate population characteristics should these be a focus of the study. Anyattempt to use focus group data as indicative of the typical attitudes, beliefs or opinionsof people in general is mistaken. Focus groups do not involve, say, random sampling fromthe population so they are not indicative of population characteristics. Focus groupshave a number of disadvantages, which mean that they should not be undertaken withoutclear reasons:
They take a great deal of time and effort to organise, run and transcribe. For example,bringing a group of strangers together is not always straightforward logistically.
The focus group takes away power from the researcher to direct the research processand the sorts of data collected. Consequently, it is difficult to imagine a profitable use ofthe focus group as a method of collecting data for the typical laboratory experiment.
Among the advantages of the focus group is the motivation aroused in the participantssimply through being in a group situation. The participant is not a somewhat alienatedindividual filling in a rather tedious questionnaire in isolation. Instead the participant isa member of a group being stimulated by other members of the group. So the experienceis social, interesting and to a degree fun. Furthermore, membership of a focus group can be, in itself, empowering. Members of a focus group are given a voice to, perhaps,communicate to the management of their organisation via the focus group and theresearcher.
The analysis of focus group data may follow a number of routes. The route chosen willlargely be dependent on why the focus group approach was selected for data collection.If the focus group is largely to generate ideas for further research or as a preliminary to more structured research, the researcher may be satisfied simply by listing the majorand significant themes emerging in the focus group discussions. On the other hand, the focus group may have served as a means of generating verbal data for detailed textual analysis of some sort. Detailed data analysis of this sort requires transcriptionsto be made of the group discussion from the audio or video-recording. The Jefferson
M18_HOWI4994_03_SE_C18.QXD 10/11/10 15:05 Page 312

CHAPTER 18 QUALITATIVE DATA COLLECTION 313
transcription system (Chapter 19), for example, may be appropriate in many cases.However, the level of detail recorded in Jefferson transcription may be too much forsome research purposes. Appropriately transcribed data may be analysed using the broadprinciples of grounded theory, discourse analysis or conversation analysis in particular(see Chapters 21, 22 and 23). Of these, grounded theory analysis may suit more researchersthan the other more specific approaches. In other words, the analysis, as ever, needs tobe tailored to the purpose of the research.
■ Method 3: InterviewsThe interview is a very diverse situation with very little evidence of a common strategy beingused by the majority of researchers. Our short coverage can only give some indicationof the range of activities that constitute the interview. Interviews can be highly structured(little different in many ways from a self-completion questionnaire). These would beknown as structured interviews. Alternatively, interviews may be unstructured such thatemerging issues can be explored rather than questions asked and answers recorded. Theseare qualitative interviews.
Structured interviews
Market research interviewers are everywhere – in the streets, on our phones, etc. Few ofus have not been subjected to their questions. Characteristically the questions are highlystructured and a range of response alternatives provided from which we choose. Theinterviewer mostly tries to stick to the ‘script’ of the questionnaire. Such interviews havea number of advantages so far as the researcher is concerned:
Since the interviewers have quotas of persons to interview, the approach ensures satisfactory numbers of completed questionnaires are obtained. There is usually littleor nothing in the interview that could not have been achieved by the questionnairebeing completed by the interviewee alone.
Probably the main reason why interviews are used is that the participants are recruitedon the spot. Mailing questionnaires to a sample of people is likely to result in derisoryreturn rates and derisory sample sizes as a consequence.
The pre-coded, multiple-choice format allows quick computer analysis of the data.
The process is quick and it is perfectly feasible to plan research and have some sortof report ready for clients in a very short period of time – even just a few days.
Variants on structured interviewing are employed by academic researchers, and the strengths and weaknesses remain much the same. Nevertheless, if the structuredapproach is adequate for the purposes of one’s research, then it should be considered ifonly for reasons of economy.
In-depth interviews
Sometimes also referred to as semi-structured interviews, these reverse the principles of the structured interview. Consequently, the qualitative ethos pervades research usingsuch interviews. Some researchers are attracted to in-depth interviews because of theirconversational characteristics. However, it is wrong to view them as normal conversa-tion. They are a highly specialised form of conversation which occur in a very differentcontext from normal conversation. For one thing, they are intended to be much moreone-sided in terms of input. That is, the rule is that the interviewee is talking about them-selves whereas the interviewer will spend little or no time doing this. Most conversation
M18_HOWI4994_03_SE_C18.QXD 10/11/10 15:05 Page 313

314 PART 4 QUALITATIVE RESEARCH METHODS
taxes neither of the participants. In-depth interviews are likely to be difficult for inter-viewee and interviewer. The interviewee will be pressed on detail about matters beyondwhat is normal in everyday conversation. The interviewer will have prepared extensivelyfor the interview; in addition the interviewer of necessity must absorb a lot of informa-tion during the course of the interview in order to question and probe effectively. Havinga recorder does not do away with this demand since the recording cannot be referred toduring the course of the interview. In other words, one should expect in-depth interviewsto be taxing. Table 18.1 extends the comparison of structured interviewing and qualita-tive interviewing (drawing on Bryman and Bell, 2007).
Almost invariably, the interviewer in qualitative interviewing will have at the minimumthe skeleton of the interview in the form of a list of topics or questions to be covered.This is known as the interview guide. The guide may be added to as the researcher inter-views more participants and becomes aware of issues which could not or had not beenanticipated at the start of the research. The guide is often little more than a memory aidwhich gives the basics of what the researcher intends to cover and probably is a poorreflection of the contents of the interviews themselves. This is only to be expected if the
Table 18.1 Structured and qualitative interviewing contrasted
Structured interview
Researcher has highly specific and well-formulated questions that require answers.
The format allows ready assessment of reliability and validity.
The research addresses concerns that emerge from the status of the researcher – which has research-based knowledge and theory as part of the components.
Participants are ‘forced’ to stick to the point and there is little or no scope for them to express idiosyncratic points of view. Sometimes token questions such as ‘Is thereanything that you think should be mentionedbut has not been?’ are appended.
Structured interviews allow little or no departure of the interviewer from the questionnaire in the interests of standardisation.
Inflexible.
Answers generated are supposed to be readily and quickly coded with the minimum of labour.
Repeat interviewing is rare except in longitudinal studies in which participants may be interviewed on a number of separate occasions.
Qualitative interview
The researcher has a less clear agenda in terms of content and the agenda is less clearlyresearcher-led.
Reliability and validity are rather problematic orcomplex concepts in this context.
The research normally is led in part by the agenda of concerns as felt by the participant. The researcher has a broader agenda whichaccommodates this.
According to some, rambling accounts are to beencouraged in qualitative interviewing as thispushes the data far wider than the researcher may have anticipated.
Qualitative interviewers expect to rephrasequestions appropriately, formulate new questionsand probes in response to what occurs in theinterview, and generally to engage in a relativelyrelaxed approach to standardisation.
Flexible.
The researcher is looking for rich and detailedanswers which result in extensive and labour-intensive coding processes (for example, seeChapter 21 on grounded theory).
Repeat interviewing is not uncommon since itallows the researcher to ‘regroup’ – to reformulatetheir ideas during the course of the research.Checking and gathering data that had previouslybeen omitted from the first interview, etc. areamong these characteristics.
M18_HOWI4994_03_SE_C18.QXD 10/11/10 15:05 Page 314

CHAPTER 18 QUALITATIVE DATA COLLECTION 315
ideals of qualitative research are met by the researcher. That is, the topics are partiallyformulated by the participant, the enterprise is very exploratory, and rich detail (whichby definition is not routine) is the aim. Experienced researchers will probably refer verylittle to the interview guide – perhaps only using it as a check at the end of the interviewin order to ensure that the major issues have been covered.
Certain considerations need to be addressed in preparing the interview guide:
The researcher may wish to record some routine, basic information in a simple struc-tured form. Matters such as the participant’s age, gender, qualifications, job and soforth may be dealt with by using a simple standardised list of answer categories, forexample, the highest level of academic qualification obtained.
The formulation of questions and topics should not simply be a list of obvious ques-tions or questions included because the replies just might be interesting. The questionsneed to be developed in terms of the requirements of the research. Just what sorts of information would help the researcher address what they regard as the importantthings about the research topic? The interview guide may need modifying part-waythrough the research to take account of things learnt during the earlier interviews.
The questions or topics should be structured in a sensible and helpful order. This makesthem easier for the interviewer and interviewee to deal with. There is a lot of memorywork and other thinking for both participants so a logical structure is important.
Frame the interview schedule using the appropriate language for the participant group.Children will require different language from adults, for example. However, this isalso true for adult groups. What is appropriate may not be known to the researcherwithout talking to members of that group or without piloting the methodology.
If in-depth interviewing sounds easy then the point has been missed. This is probablybest illustrated by asking what the researcher is actually doing when conducting theinterview. We can begin by suggesting what they do not do:
The researcher is not taking detailed notes. A high-quality audio or video-recordingof the interview is the main record. Some researchers may make simple notes but thisis not a requisite of the sort that the recording is. These notes are more useful as amemory aid during the course of the interview rather than as data for future analysis.It is very easy to be overawed by the interview situation and forget one’s place in theschedule or forget what has been said.
So what is the interviewer doing? The following are the ideal from the perspective ofqualitative methods though difficult to achieve:
The interviewer is actively building as best they can an understanding of what theyare being told. In contrast, it hardly matters in a structured interview whether theinterviewer gets an overview of this sort since they merely write down the answers to individual questions. However, without concentrating intensely on the content ofthe interview, the qualitative researcher simply cannot function effectively.
The interviewer formulates questions and probes in a way which clarifies and extendsthe detail of the account being provided by the participant. Why did they say this?Who is the person being described by the participant? Does what is being said makesense in terms of what has been said before? Is what is being communicated unclear?The list of questions is, of course, virtually endless. But this aspect of the task is verydemanding on the cognitive and memory resources of the interviewer as it may alsobe for the participant.
The interviewer is cognisant of other interviews which they (and possibly co-workers)have conducted with other participants. Issues may have emerged in those which
M18_HOWI4994_03_SE_C18.QXD 10/11/10 15:05 Page 315

316 PART 4 QUALITATIVE RESEARCH METHODS
appear missing in the current interview. Why is that? How does the participantrespond when specifically asked about these issues?
The objective of the interviewer’s activity is to expand the detail and to interrogatethe information as it is being collected. This is very much in keeping with the viewthat qualitative data analysis starts at the stage of data collection. It also reflects thequalitative ideal that progress in research depends on the early and repeated processingof the data.
In addition to all of this, there are practical issues which are too easily overlooked by theresearcher but may have a significant impact on the quality of the research generated bythe in-depth interview:
Just how many different researchers will be conducting the interviews? Using two or more different interviewers produces problems in terms of ensuring similarity andevenness of coverage across interviews.
How are developments communicated between the interviewers? It is probably worthconsidering the use of semi-structured interviews if the logistics of using several inter-viewers become too complex.
The data are usually no more than whatever is on the recording. As a consequence, itis important to obtain the best possible recording as this greatly facilitates the speedand quality of the final transcription (for example, see Chapter 19). Beginners tend toassume that a recorder that functions well enough when spoken into by the researcherwill be adequate to pick-up an interview between two people, physically set apart, inperhaps a noisy environment. Consider the best equipment available as an investmentin terms of the quality of recording commensurate with the saving in transcriptiontime. A recorder which allows the recording to be monitored through an earphone asit is being made will help ensure that the recording quality is optimised.
The physical setting of the interview needs to be considered. Sometimes privacy will beregarded as essential for the material in question. In other circumstances privacy maynot be so important (that is, if the topic is in no way sensitive). Taking the researchto the home or workplace of the participants may be the preferred option over invitingthe participants along to the researcher’s office, for example. Interviews at home mayunexpectedly turn into family interviews if one does not take care to ensure that it isunderstood that this is an individual interview. Many homes will have just a coupleof places in which the interview may take place so be prepared to improvise.
Much of the available advice to assist planning an interview is somewhat over general.What is appropriate in one sort of interview may be inappropriate in another. What maybe appropriate with adults may not work with youngsters with learning difficulty. If onegets the impression that good interviewing requires social skills, quickness of thought or a great deal of concentration, and resourcefulness, then that is just about right. Forexample, Child Abuse Errors (Howitt, 1992b) contains psychological research based onin-depth qualitative interview methods. The research essentially addresses the questionof the processes by which parents become falsely accused of child abuse. This was partlystimulated by the cases in Cleveland in England where a number of parents were accusedof child sexual abuse against their own children. The children were given a simple medical test which was erroneously believed by some doctors to be indicative of analabuse. But these are not the only circumstances in which parents are accused, apparentlyfalsely, of child abuse. The problems of this research in many ways are the ones whichstimulate in-depth interviewing in general. That is, at the time there was virtually noresearch on the topic, indeed there was virtually nothing known about such cases. Soinevitably the task was to collect a wide variety of accounts of the parents’ experiences
M18_HOWI4994_03_SE_C18.QXD 10/11/10 15:05 Page 316

CHAPTER 18 QUALITATIVE DATA COLLECTION 317
Qualitative data analysis is not the same thing as qualitative data collection. Qualitative data collectionmay in some cases become a quantitative analysis if quantifiable coding techniques are developedfor the data.
All qualitative data collection methods vary in terms of their degrees of structuring across differentresearch studies. That is, there is no agreed standard of structuring which is applied in every case.
Participant observation essentially has the researcher immersed as a member of a social environment.It has its origins in anthropology as a means of studying cultures. There is no strong research traditionof its use in psychology.
Focus groups are increasingly popular in psychology and other disciplines as a means of collectingrich, textual material. It is a rather social research method in which the participants actively interactwith others, under the gentle steering of the researcher. Because it highlights similarities and differ-ences between group members, it is very useful for generating ideas about the topic under researchas part of the pilot work, though it is equally suitable for addressing more developed research questions.
Interviewing may be structured or unstructured. Generally, somewhat unstructured interviews are mostlikely to be the foundation of qualitative research simply because the lack of structure provides ‘richer’unconstrained textual data. In-depth interviewing places a lot of responsibility on the interviewer interms of the questioning process, coping with the emotions of the interviewee, and ensuring that theissues have been covered exhaustively.
Key points
from a wide variety of circumstances. The initial interviews were, consequently, ‘stabs inthe dark’. The parents taking part in the study were participants with much, in general,to say about their experiences. Consequently, there was a complex account to absorbvery quickly as the participants spoke. Furthermore, these were, of course, emotionalmatters for the parents who essentially had their identity as good parents and their roleof parent removed. The complex and demanding nature of the in-depth interviewer’stask in such circumstances is obvious.
18.3 Conclusion
The main criterion for an effective qualitative data collection method is the richness of the data it provides. Richness is difficult to define but it refers to the lack of constrainton the data which would come from a highly structured data collection method. Part of the richness of data is a consequence of qualitative data collection methods being suitable for exploring unknown or previously unresearched research topics. In these circumstances the researcher needs to explore a wide variety of aspects of the topic, notselected features. Some of the qualitative data collected by researchers using methodslike those described in this chapter will be analysed in a traditional positivist way withthe participants’ contributions being used as something akin to representing reality. Otherdata collected using these self-same methods might be subjected to discourse analysis, for example, which would eschew the representational nature of the material in favourof the language acts that are to be seen in the text.
M18_HOWI4994_03_SE_C18.QXD 10/11/10 15:05 Page 317

318 PART 4 QUALITATIVE RESEARCH METHODS
ACTIVITIES1. Write a schedule for a structured interview on text messaging. Interview a volunteer using the schedule. Re-interview
them using the schedule as a guide for a qualitative interview. What additional useful information did the structuredinterview uncover?
2. Get a group of volunteers together for a focus group on text messaging. What did you learn from the focus group compared with the interviews above?
M18_HOWI4994_03_SE_C18.QXD 10/11/10 15:05 Page 318

Transcribing language dataThe Jefferson system
Overview
CHAPTER 19
Transcription is the process by which recordings are transformed into written text.
The transcription of auditory and visual recordings is a vital stage in analysing muchqualitative data.
Transcription techniques are much better developed for auditory than for visualrecordings.
Transcription inevitably loses information from the original recording. Methods andtranscribers differ in the extent that they can deal with the nuances of the material onthe original recording.
The detail required of the transcription is dependent on the purposes of the researchand the resources available.
The Jefferson transcription method places some emphasis on pauses, errors ofspeech and people talking over each other or at the same time.
It is evident from research that ‘errors’ are not uncommon in transcriptions.
M19_HOWI4994_03_SE_C19.QXD 10/11/10 15:05 Page 319

320 PART 4 QUALITATIVE RESEARCH METHODS
19.1 Introduction
Research imposes structure on its subject matter. The structuring occurs at all stages of the research process. For example, the way the researcher decides to collect researchdata affects the nature of the research’s outcome. If the researcher takes notes during an interview, what is recorded depends on a complex process of questioning, listening,interpreting and summarising. It could not be otherwise. Research is the activity ofhumans, not super-humans. If a researcher audio records conversation then all that isavailable on permanent record is the recording. Visual information such as body postureand facial expression are not recorded. Once the recording is transcribed as text, furtheraspects of the original events are lost. The intonation of the speaker, errors of speech andother features cannot be retained if the recording is merely transcribed from the spokenword to the written word. This does not make the transcription bad, it just means that it may be useless for certain purposes. If the researcher wishes to obtain ‘factual’accounts of a typical day in the life of a police officer, the literal transcription may beadequate. (That is, the researcher is using language as a representation of reality andwould have no problems with such a transcription. Qualitative researchers who arguethat this view is wrong would regard such a transcription as useless.)
Research may have a vast range of valid purposes. Take, for example, the needs of aresearcher who is interested in the process of conversation. The literal words used areinadequate to understand the nuances of conversation. On the other hand, a speechtherapist might well be interested in transcribing particular features of speech which are most pertinent to a speech therapist’s professional activities. Thus pronunciation ofwords may be critical as may be recording speech impediments such as stuttering. Inother words, the speech therapist may be disinclined to record information which helps to understand the structuring of conversation as opposed to the speech of a singleindividual (Potter, 1997). So there is a test of ‘fitness for purpose’ which should beapplied when planning transcription.
An example may be helpful. Take the following sentence as an example of ‘literal’text:
Dave has gone on his holidays.
Strictly grammatically and literally, this sentence may mean something quite different in the context of a real-life conversation. Perhaps the researcher has actually transcribedthe sentence as:
Dave has gone on errrrr [pause] his holidays.
This second version could be understood to mean that Dave is in prison. The ‘errrrr’is not a word and the pause is not a word. They are paralinguistic features which help usto revise what the meaning of the sentence is. Given this, researchers studying language inits social context need to incorporate paralinguistic elements since they provide evidenceof how the words are interpreted by participants in conversation. The paralinguistic features of language often have subtle implications. For example, ‘errrr’, which is alonger version of ‘er’, may often imply different things. ‘Errrr’ implies a deliberate searchfor an appropriate meaning, whereas ‘Er’ may often simply signal that one has forgottenthe word. The experts on the subtle use of language are ordinary, native speakers of thelanguage. One may describe this as an ethnographic approach to social interaction sincewe need to understand the conversation much as the participants in the conversationwould. Of course, there is no fixed link between paralinguistic features of language and
M19_HOWI4994_03_SE_C19.QXD 10/11/10 15:05 Page 320

CHAPTER 19 TRANSCRIBING LANGUAGE DATA 321
the meaning they add. So the presence of a particular feature should be regarded asinformative rather than indicative.
19.2 Jefferson transcription
One popular system for transcribing speech is the system developed by Gail Jefferson.This has its origins in her work with Harvey Sacks, the ‘founding-parent’ of conversationanalysis (see Chapter 23). The Jefferson system can appear a little confusing to novices– and not easy for those familiar with it – but using it is a skill which will improve withpractice.
Jefferson’s system has no special characters so it can be used by anyone using a standard computer or typewriter keyboard. Consequently, some familiar keystrokeshave a distinctive meaning in Jefferson transcription. These keystrokes are used as symbols to indicate the way in which the words are delivered in the recording. Thismeans, for example, that conventional punctuation may have its conventional meaningor may have a distinctive Jefferson meaning. Thus capital letters may indicate the startof a sentence or a proper noun, but they may indicate that the speaker has said a wordwith considerable emphasis using greater emphasis than the surrounding words. Themain Jefferson conventions are given in Table 19.1. There are symbols which are usedto indicate pauses, elongations of word sounds, where two speakers are overlapping andso forth. Refer back to this table whenever necessary to understand what is happeningin a transcript. You may also spot that there are slight differences between transcriberson certain matters of detail.
Jefferson transcription is not unproblematic in every instance. To illustrate this, takethe following:
For:::get it
The ::: indicates that the For should be extended in length. However, just what is the standard length of ‘for’ in ‘forget’? In some dialects, the For will be longer than inothers. And just what is the difference between for:::get and for::get?
■ Example of Jefferson transcriptionThe excerpt on p. 323 is from a study of police interviews with paedophile suspects(Benneworth, 2004). The researcher had access to police recordings of such interviews.As a consequence, the data consist solely of audio-recorded text without any visualinformation. Of course, the researcher might have wanted to video-record the interviewsin order to get evidence of facial expression, etc., but this was not an available option.Sound recordings are routine for British police interviews so the transcription may beregarded as being of a naturally produced conversation – a recorded police interview –not an artefact of the research process. The people involved in the transcribed materialbelow are a detective constable (DC) and the suspect being interviewed (Susp). The issueis about the suspect’s use of pornography in his dealings with a young girl. Transcriptscan vary markedly in terms of how closely they adopt the Jefferson system and just whatfeatures are regarded as of significance in the recording. Furthermore, the Jefferson systemhas evolved over the years as Jefferson developed it. So transcriptions from differentperiods may show varying conventions and characteristics. Benneworth’s transcriptionseems to us to be well balanced in that it is clear to read even by relative novices to transcription:
M19_HOWI4994_03_SE_C19.QXD 10/11/10 15:05 Page 321

322 PART 4 QUALITATIVE RESEARCH METHODS
Table 19.1 Main features of the Jefferson transcription system
Jefferson symbol
CAPITALS
Underlining
Aster*isk
Numbers in brackets (1.2)
A dot (.) in brackets
[ ]
//
; or :
?;
?Janet;
. . .
??;
[. . .]
°I agree°
→
↑↓
Heh heh
I’ve wai::ted
Hhh
(what about)
((smiles))
(? ?)
I don’t accept your argument = and another thing I don’t think you are talking sense
= signs placed vertically on successive lines by different speakers
[ ] placed vertically on successive lines by different speakers
>that’s all I’m saying<
< that’s it>
For more details of Jefferson coding see Hutchby and Wooffitt (1998).
Meaning
Indicate that the word(s) is louder than the surrounding words.
Indicates emphasis such as on a particular syllable.
The speaker’s voice becomes squeaky.
Placed in text to indicate the length of a pause between words.
This is a micropause – a noticeable but very short pause in the speech.
Square brackets are used when two (or more) speakers are talking together. The speakers are given different lines and the brackets should be in line where the speech overlaps.
Another way of indicating the start of the second overlapping speaker’s utterance.
Used to separate the speaker’s name from their utterances.
Indicates that the speaker is not recognisable to the analyst of the transcript.
Indicates a strong likelihood that Janet is the speaker.
Three dots are used to indicate a pause of untimed length.
Two or more ? marks indicate that this is a new unidentified speaker from the lastunidentified speaker.
Indicates material has been omitted at that point.
Words between signs ° are spoken more quietly by the speaker.
This is not part of the transcription. It is placed next to lines which the analyst wishes to bring to the reader’s attention.
Used to indicate substantial movements in pitch. They indicate out of the ordinarychanges, not those characteristic of a particular dialect, for instance.
Indicates laughter which is voiced rather almost as if it were a spoken word rather than the uncontrolled noises that may constitute laughter in some circumstances.
The preceded sound is extended proportionate to the number of colons.
Expiration – breathing out sounds such as when signalling annoyance.
Words in brackets are the analyst’s best guess as to somewhat inaudible passages.
Material in double brackets refers to non-linguistic aspects of the exchange.
Inaudible passage approximately the length between the brackets.
Placed between two utterances to indicate that there is no identifiable pause between the two. Also known as latching.
In this context, the = sign is an indication that two (or more) speakers are overlapping on the text between the = signs.
As above, but instead the [ ] brackets are used to indicate that two (or more) speakers are overlapping on the text between the brackets.
Talk between > and < signs is speeded up.
Talk between < and > signs is slowed down.
M19_HOWI4994_03_SE_C19.QXD 10/11/10 15:05 Page 322

CHAPTER 19 TRANSCRIBING LANGUAGE DATA 323
363 DC: What made you feel okay about showing them to a
364 [eleven year old girl]
365 Susp: [accidentally ] she first saw them when
366 I opened my boot one day I forgot they were
367 there and then she (1.8) °expressed an interest
368 in them and like looking at them and that’s how
369 it developed.°
370 DC: So you felt confident about showing them to (.)
371 Lucy whereas you wouldn’t have shown them to
372 [your wife].
373 Susp: [yeah I was] I was (3.8) s::::exually (0.8) umm
374 (4.0) unconfident anymore about sex and Lucy
375 showing an interest in me and that was
376 flattering in itself and .hhh cos there was no
377 sexual relationships with my wife.
378 DC: Was it easier to feel confident with Lucy
379 because she was so young? <And you were an
380 adult and [more in control.>]
381 Susp: [no it’s just that] >it was the first
382 .hhh first young lady that’s ever expressed an
383 interest in me during my troubled (.) marriage
384 over the past three years< (.) °I said°.
Source: Benneworth (2004)
You will probably have noted a number of features of the transcript:
Each line is numbered 363, 364, etc., so it is clear that this is just an excerpt from amuch longer transcript. The numbering is fairly arbitrary in the sense that anotherresearcher may have produced lines of a different length and hence different numberswould be applied in their transcriptions. Notice that the lines do not correspond tosentences or any other linguistic unit.
Look at lines 364 and 365. The words enclosed in square brackets [ ] are parts of the conversation where the two participants overlap. It would not be possible to transcribe this if the system did not utilise arbitrary line lengths.
The use of Jefferson notation is not only time-consuming for the researcher, but itmakes it difficult for readers unskilled in the Jefferson system. Simply attempting toread the literal text ignoring the transcription conventions is not easy.
Jefferson transcription cannot be done by untrained personnel such as secretaries.
The researcher would almost certainly have used a transcription machine whichallows rapid replays of short sections of the recording. In other words, transcriptionis a slow, detailed process that should only be undertaken if the aims and objectivesof the research study require it.
M19_HOWI4994_03_SE_C19.QXD 10/11/10 15:05 Page 323

324 PART 4 QUALITATIVE RESEARCH METHODS
It is also worthwhile noting that Jefferson’s transcriptions of the identical material willvary from researcher to researcher. It is probably fair to say that this transcription is atan intermediate level of transcription detail. In other words, by this stage the researcherhas made a contribution to the nature of the data available for further analysis. Anyonecarrying out Jefferson transcription will experience a degree of uncertainty as to whetherthey have achieved an appropriate level of transcription detail. It should be rememberedthat qualitative researchers tend to be very familiar with their texts before the transcrip-tion is complete. This familiarity will help them set the level of detail that is appropriatefor their purposes.
An important question is what the Jefferson transcription enables which a secretary’sword-by-word transcription might miss out. The following gives the above transcriptionwith notation omitted. Often a secretary would fail to give the overlapping talk so thedominant voice at the time of the overlap would be transcribed and the other voice perhaps noted as inaudible. This is possibly because a secretary would regard text as linear much as when taking dictation from the secretary’s boss. The following is a guessas to what a typical secretary’s transcription of the same type might be. Two people talking together would probably be regarded as inaudible:
DC: What made you feel okay about showing them to a eleven-year-old girl?
Susp: (inaudible) she first saw them when I opened my boot one day I forgot theywere there and then she expressed an interest in them and like looking at themand that’s how it developed.
DC: So you felt confident about showing them to Lucy whereas you wouldn’t haveshown them to your wife.
Susp: (inaudible) I was sexually unconfident anymore about sex and Lucy showingan interest in me and that was flattering in itself and cos there was no sexualrelationships with my wife.
DC: Was it easier to feel confident with Lucy because she was so young? And youwere an adult and more in control?
Susp: (inaudible) it was the first first young lady that’s ever expressed an interestin me during my troubled marriage over the past three years I said.
Source: Benneworth (2004)
It has to be said that even in this version of the text there is a great deal that strikes oneas important. For example, the following:
The way in which the suspect presents the pornography as something that the girlhappened on by chance and as a result of her actions. There is no indication that thesuspect actively created a situation in which she was exposed to the pornography.
The way in which the suspect excuses his offending by blaming his troubled marriageand his wife.
The way in which the offender represents his non-normative relationship (an adultman with an 11-year-old girl) as if two adults were involved. So the 11-year-old girlis represented as a ‘young lady’ indicating maturity rather than a ‘young girl’ whichrepresents an immature person.
Researchers and practitioners with knowledge and experience of paedophiles and othersex offenders have themselves noted such ‘denial’ and ‘cognitive distortion’ strategies(Howitt, 1995). Indeed, much of the therapy for sex offenders involves group therapy
M19_HOWI4994_03_SE_C19.QXD 10/11/10 15:05 Page 324

CHAPTER 19 TRANSCRIBING LANGUAGE DATA 325
methods of modifying such cognitions. The above excerpt is perhaps not altogether typicalof the sort of text used by qualitative researchers. For one thing, it is the sort of text whichis unfamiliar to many and so is quite different from the everyday, routine conversationstudied by many qualitative researchers. The implication is that unfamiliar subject matteris likely to reveal a lot because it contrasts markedly with more familiar sorts of con-versation from everyday life. It is likely that at least some researchers would find in thissimple transcription all that they require for their research purposes. For example, if aresearcher was interested in the types of denial and cognitive distortions demonstratedby offenders, the transcription process may not need the Jefferson-style of elaboration.
So what does the Jefferson transcription system add which a secretary’s transcriptionomits? There are a few obvious things:
The Jefferson transcription gives a lot more information about what happened in theconversation. The secretary’s version gives the impression of a smooth, unproblematicconversational flow. The Jefferson transcription demonstrates a variety of turn-takingerrors, quite lengthy pauses in utterances, and dynamic qualities of the way that theconversation is structured, for example, the very quiet passages.
The Jefferson transcription allows parts of the conversation to be rapidly referred to.
Even by carefully reading the transcription, let alone doing the transcription, a readerhas a more intimate knowledge of the text. Consequently, the extra detailed workdone in order to produce a Jefferson transcript means that the researcher becomesvery familiar with the material. They may begin to conceptualise what is happeningin the text sooner. This early and detailed familiarity with the data is claimed to beone of the analytic virtues of qualitative research, though this is greatly underminedif researchers do not do their own transcription.
What else does the researcher gain by using the Jefferson transcription system? Afterall, some may regard the Jefferson system as merely providing irrelevant and obscuringdetail. Suggestions include:
If we look carefully for what the Jefferson transcription adds to the information available to the researcher, we find in line 373/4 the following: Susp: [yeah I was] I was (3.8) s::::exually (0.8) umm (4.0) unconfident anymore about sex. Not only isthe word sexually highlighted in speech by the elongation into s::::exually but it is alsoisolated by lengthy gaps of four or so seconds on each side. Benneworth (2004) refersto this as a ‘conversational difficulty’ which takes the form of ‘hesitant speech’ and‘prolonged pauses’. This may have led her to pointing out that the term ‘sexually’ ispart of a particular language repertoire which the suspect only applies to relationshipswith an adult. When speaking of the child, he employs what Benneworth (2004)describes as ‘relationship discourse and euphemism’. ‘Lucy showing an interest in me. . . that was flattering in itself ’. The offender does not use the term ‘victim’ of thechild, though it is a term that most of us would use. That is, the offender is not usinglanguage repertoire that would indicate the child has been abused sexually as opposedto the language repertoire used to indicate a mutual relationship.
The use of Jefferson transcription clearly encourages the researcher to concentrateclosely on the text as a matter of a social exchange rather than information requestedand supplied. For example, Benneworth notes how the detective constable constantlybrings the youth of the girl into the conversation which contrasts with the offender’srepresentation of the girl as if she were a mature female rather than a child. Furthermore,by taking this excerpt and contrasting it with other excerpts from other interviews, theresearcher was able to explore different interview styles – one is more confrontationaland challenging of the suspect, whereas the other almost colludes with the offender’s‘distorted’ cognitions.
M19_HOWI4994_03_SE_C19.QXD 10/11/10 15:05 Page 325

326 PART 4 QUALITATIVE RESEARCH METHODS
Similarly, the use of the Jefferson transcription facilitates the linking of the text under consideration with established theory in the field. So Benneworth argues thatthe words ‘I opened my boot one day’ in line 366 grounds the offender’s account in common day-to-day experience rather than the more extraordinary abuse of a child.Such a device may be seen as a discursive device for creating a sense of ordinariness(Jefferson, 1984) and essentially creates a distance from the suspect’s actions and thecriminal consequences ensuing from them.
19.3 Advice for transcribers
It should be emphasised that the Jefferson system is only one of a number of systems oftranscription that can be employed. Indeed, there is no reason why a researcher shouldnot contemplate developing their own system if circumstances require it. O’Connell andKowal (1995) evaluated a number of text transcription systems employed by researchers,including that of Jefferson. They suggest that transcription is not and cannot be ‘a genuinephotograph of the spoken word’ (p. 105). Generally all transcription systems attempt torecord the exact verbal words said. Nevertheless, transcription systems vary considerablyin terms of transcribing other features of speech, indeed in some cases other features arenot included. So some systems include prosodic features such as how a word was spoken(loudly, softly, part emphasised, etc.), paralinguistic features (such as words said with alaugh or sigh) and extralinguistic features (facial expressions, gestures, etc.) – some systemsexclude some or all of them.
The following is some of the generic advice offered to transcribers by O’Connell andKowal:
The principle of parsimony: only those features of speech which are to be analysedshould be transcribed. That is, there is little point in including extralinguistic featuressuch as gestures in the transcription if they will not be part of the analysis.
Similarly, the transcriptions provided in reports should only include whatever is necessary to make the analysis intelligible to the reader.
Subjectively assessed aspects of conversation should not be included in the transcrip-tion as if they are objective measurements. For example, transcribers may subjectivelyestimate the lengths of short pauses (0.2) but enter them as if they are precise measures. O’Connell and Kowal report that transcribers omitted almost four out offive of such pauses in radio interviews. This begs the question why the other pauseswere included.
Transcribers make frequent, uncorrected errors. For example, verbal additions, deletions,relocations and substitutions are commonly found when a transcript is comparedwith the original recording. Qualitative researchers often stress the importance ofchecking the transcription against the original source to minimise this problem.
There is other, perhaps more routine, advice available to transcribers. For example, Potter(2004) suggests that technological advances have made transcription easier. Transcriptionis labour-intensive and 20 hours of transcription may be necessary for 1 hour of recording.It is obvious that high-quality digital recordings using, say, a mini-disc player will beenormously beneficial – and result in fewer errors. Furthermore, there are digital editingprograms (for example, Cool Edit) which allow the transcription of recordings on screen.As the recording is held as a file on the computer, the system allows frequent checkingagainst the original. Since the recording may be displayed as a visual waveform, it becomeseasier to measure precisely gaps and pauses in conversation and speech.
M19_HOWI4994_03_SE_C19.QXD 10/11/10 15:05 Page 326

CHAPTER 19 TRANSCRIBING LANGUAGE DATA 327
19.4 Conclusion
Although normally described as a transcription system, Jefferson’s approach is also alow-level coding or categorisation system. If researchers want a perfect transcription of the recording then what better than their original recording? Of course, what theywant is a simplified or more manageable version of the recording. Inevitably this means coding or categorising the material and one can only capture what the system of codingcan capture. Conversational difficulties, for example, are highlighted by the Jeffersonsystem so these are likely to receive analytic consideration. Facial expression is not usually included so facial expressions (which may totally negate the impression createdin a conversation) are overlooked.
Transcription is a very time-consuming process. The Jefferson system is more detailedthan most and takes up even more time. So there is little point in using any system of transcription unless it adds something to achieving the sort of analysis the researcherrequires. Transcription is generally regarded by qualitative researchers as a task for the researcher themselves. Ideally it is not something farmed out to junior assistants orclerical workers. Qualitative researchers need intimate familiarity with their material –this is facilitated by doing one’s own transcriptions.
Transcription is the stage between the collection of data in verbal form and analysis. Usually it is producing a written version of audio-recordings, but video material may also be transcribed.
In qualitative data analysis, transcription may take into account more than the words spoken by indicating how the words are spoken. That is, errors of speech are included, pauses are indexed, andtimes when people are speaking at the same time are noted.
Transcription is not regarded as a necessary chore but one of the ways in which the researcherbecomes increasingly familiar with their data. Transcription is not usually passed over to others.
Inevitably transcription omits aspects of the original and there is the risk that the transcription isinadequate. It is normally recommended that the researcher refers back to the original recording whenthe transcription appears complete or considers asking another researcher to assess the veracity of it.
The commonest form of transcription is the Jefferson method which has its roots in conversation analysis. It is very commonly used by qualitative researchers but can be unnecessarily time-consumingif the analysis is only of the words.
Key points
ACTIVITIES1. In pairs, act out the conversation which was subject to Jefferson transcription in the main body of the chapter between
the police and the suspect. Record the conversation if you can and compare the product of the attempts of differentpairs of actors.
2. Record a conversation, select an interesting part, transcribe it and annotate it with Jefferson transcription symbols. Listthe difficulties you experience for discussion.
M19_HOWI4994_03_SE_C19.QXD 10/11/10 15:05 Page 327
Thematic analysis
Overview
CHAPTER 20
Thematic analysis is one of the most commonly used methods of qualitative analysis.However, as a method it has received little detailed attention and accounts of how tocarry out a thematic analysis are scarce. Furthermore, many researchers gloss overwhat they actually did when carrying out a thematic analysis. This means that themethod is not so easily accessed by novices as some other approaches.
Thematic analysis is not as dependent on specialised theory as some other qualita-tive techniques such as discourse analysis (Chapter 22) and conversation analysis(Chapter 23). As a consequence, thematic analysis is more accessible to novicesunfamiliar with the relevant theory in depth.
In thematic analysis the task of the researcher is to identify a limited number ofthemes which adequately reflect their textual data. This is not so easy to do wellthough the identification of a few superficial themes is generally quite simple butdoes not reflect the required level of analysis adequately.
As with all qualitative analysis, it is vitally important that the researcher is extremelyfamiliar with their data if the analysis is to be expedited and insightful. Thus datafamiliarisation is a key to thematic analysis as it is for other qualitative methods. Forthis reason, it is generally recommended that researchers carry out their data collectionthemselves (for example, conduct their own in-depth interviews) and also transcribethe data themselves. Otherwise, the researcher is at quite a disadvantage.
Following data familiarisation, the researcher will normally code their data. That is,they apply brief verbal descriptions to small chunks of data. The detail of this processwill vary according to circumstances including the researcher’s expectations aboutthe direction in which the analysis will proceed. Probably the analyst will be making
M20_HOWI4994_03_SE_C20.QXD 11/11/10 11:34 Page 328

codings every two or three lines of text but there are no rules about this and someanalyses may be more densely coded than others.
At every stage of the analysis, the researcher will alter and modify the analysis in thelight of experience and as ideas develop. Thus the researcher may adjust earlier codingsin the light of the full picture of the data. The idea is really to get as close a fit of thecodings to the data as possible without having a plethora of idiosyncratic codings.
On the basis of the codings, the researcher then tries to identify themes which integratesubstantial sets of these codings. Again this is something of a trial-and-error processin which change and adjustment will be a regular feature. The researcher needs to beable to define each theme sufficiently so that it is clear to others exactly what thetheme is.
The researcher needs to identify examples of each theme to illustrate what the analysishas achieved.
As in all report writing, the process of writing up the analysis and the results of theanalysis is part of the analysis process and a good researcher may re-think and re-doparts of their analysis in the course of the write-up.
There is no reason why researchers cannot give numerical indications of the incidenceand prevalence of each theme in their data. For example, what percentage of participantsmention things which refer to a particular theme?
20.1 Introduction
Almost certainly, thematic analysis is the approach to qualitative analysis most likely tobe adopted by newcomers to qualitative analysis. There are good reasons for this sincethematic analysis needs less knowledge of the intricacies of the theoretical foundationsof qualitative research than most other qualitative techniques. Compared with, say, dis-course analysis or conversation analysis, thematic analysis does not require the subtle andsophisticated appreciation of a great deal of the theory underlying the method. Hence,it is amenable to novices. No particular theoretical orientation is associated with thematicanalysis and it is flexible in terms of how and why it is carried out. So one will see thematicanalyses carried out by researchers who would not seem to have any particularly strongaffinity to qualitative research. In a sense, it is at entry level a somewhat undemandingapproach to the analysis of qualitative data – interviews in particular. Thematic analysisdoes not demand the intensely closely detailed analysis which typifies conversation analysis,for example. All of this adds up to strong praise for thematic analysis or damning criticism,depending on one’s point of view. Like anything else in research, thematic analysis canbe well done or poorly done. It is important for you to know the difference – until you do then you cannot expect to do good work. All-in-all, with a little care, it can berecommended as a useful initiation for students into qualitative research.
There is a downside to all of this. Thematic analysis is not a single, identifiableapproach to the analysis of qualitative data. There is no accepted, standardised approachto carrying out a thematic analysis, so different researchers do things differently. Whilethis is typical of qualitative methods in general, it clearly is an obstacle to carrying outthematic analysis. So it is impossible to provide a universally acceptable set of guidelineswhich, effortlessly, will lead to a good thematic analysis. Actually this is true for many
CHAPTER 20 THEMATIC ANALYSIS 329
M20_HOWI4994_03_SE_C20.QXD 11/11/10 11:34 Page 329
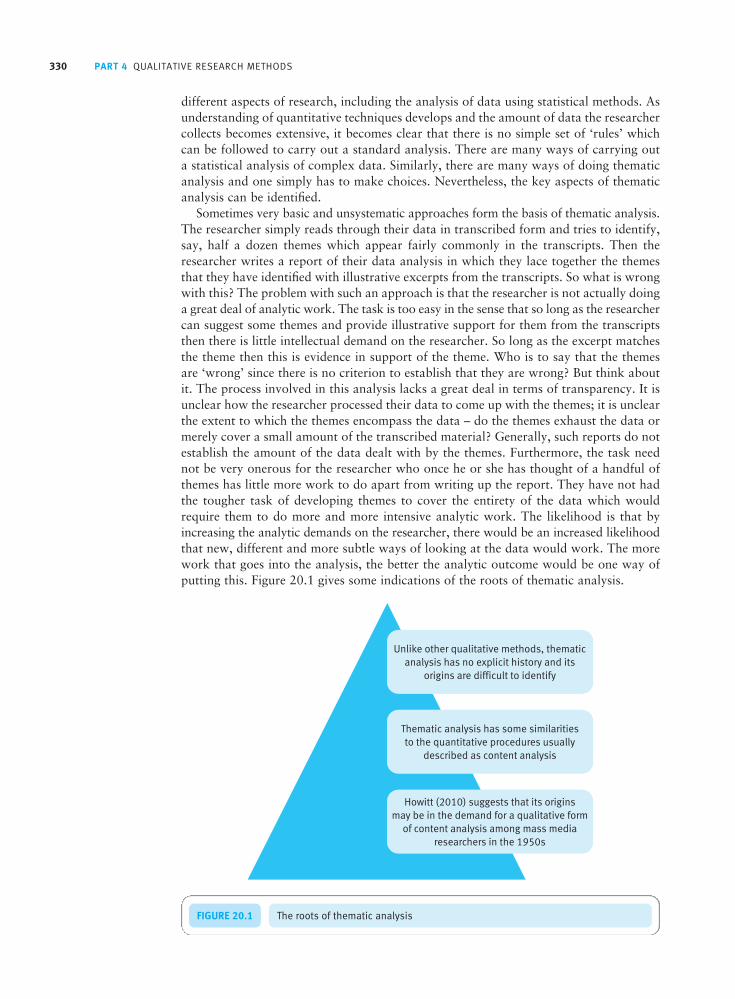
330 PART 4 QUALITATIVE RESEARCH METHODS
different aspects of research, including the analysis of data using statistical methods. Asunderstanding of quantitative techniques develops and the amount of data the researchercollects becomes extensive, it becomes clear that there is no simple set of ‘rules’ whichcan be followed to carry out a standard analysis. There are many ways of carrying outa statistical analysis of complex data. Similarly, there are many ways of doing thematicanalysis and one simply has to make choices. Nevertheless, the key aspects of thematicanalysis can be identified.
Sometimes very basic and unsystematic approaches form the basis of thematic analysis.The researcher simply reads through their data in transcribed form and tries to identify,say, half a dozen themes which appear fairly commonly in the transcripts. Then theresearcher writes a report of their data analysis in which they lace together the themesthat they have identified with illustrative excerpts from the transcripts. So what is wrongwith this? The problem with such an approach is that the researcher is not actually doinga great deal of analytic work. The task is too easy in the sense that so long as the researchercan suggest some themes and provide illustrative support for them from the transcriptsthen there is little intellectual demand on the researcher. So long as the excerpt matchesthe theme then this is evidence in support of the theme. Who is to say that the themesare ‘wrong’ since there is no criterion to establish that they are wrong? But think aboutit. The process involved in this analysis lacks a great deal in terms of transparency. It isunclear how the researcher processed their data to come up with the themes; it is unclearthe extent to which the themes encompass the data – do the themes exhaust the data ormerely cover a small amount of the transcribed material? Generally, such reports do notestablish the amount of the data dealt with by the themes. Furthermore, the task neednot be very onerous for the researcher who once he or she has thought of a handful ofthemes has little more work to do apart from writing up the report. They have not hadthe tougher task of developing themes to cover the entirety of the data which wouldrequire them to do more and more intensive analytic work. The likelihood is that byincreasing the analytic demands on the researcher, there would be an increased likelihoodthat new, different and more subtle ways of looking at the data would work. The morework that goes into the analysis, the better the analytic outcome would be one way ofputting this. Figure 20.1 gives some indications of the roots of thematic analysis.
FIGURE 20.1 The roots of thematic analysis
M20_HOWI4994_03_SE_C20.QXD 11/11/10 11:34 Page 330
CHAPTER 20 THEMATIC ANALYSIS 331
20.2 What is thematic analysis?
The phrase thematic analysis first appeared in the psychological journals in 1943 but ismuch more common now. Nevertheless, thematic analysis is something of the poor relativein the family of qualitative methods. It has few high-profile advocates and, possibly as aconsequence, has not been formalised as a method. Users of thematic analysis pay scantattention to the method in their reports and provide very few details about what it is theydo. As a result, there is very little available by way of systematic instruction into how tocarry out a thematic analysis. Since the method tends to be glossed over in reports, it isdifficult to use published papers as a guide to how to do thematic analysis. Typically,instead of describing in detail how the analysis was done, thematic analysts simply writesomething like ‘a thematic analysis was carried out on the data’. In other cases, reportswhich describe themes identified in qualitative data may make no reference at all to thematicanalysis; for example, Gee, Ward and Eccleston (2003) report ‘A data-driven approachto model development (grounded theory) was undertaken to analyse the interview transcripts’ (p. 44). Thematic analysis is also a poor relative of other qualitative methodssince it often appears to be sloppily carried out and very subjective in terms of thefindings which emerge. Such claims are easy to make since in thematic analysis the detailof the analysis process is usually omitted so the reader of the report may be forgiven for thinking that the researcher merely perused a few transcripts and then identified anumber of themes suggested by the data. The only support provided for the analysis isthat each of the themes is illustrated by quotes taken from the data which one assumesare among the most convincing examples that can be found. Put this way, thematic analysis does not amount to much and, to be frank, there do seem to be some publishedthematic analyses to which these comments would apply. However, carried out properly,thematic analysis is quite an exacting process requiring a considerable investment of time and effort by the researchers.
Just as the label says, thematic analysis is the analysis of textual material (newspapers,interviews and so forth) in order to indicate the major themes to be found in it. A theme,according to The Concise Oxford Dictionary is ‘a subject or topic on which a personspeaks, writes, or thinks’. This is not quite the sense of the word ‘theme’ used in thematicanalysis. When a lecturer stands up and talks about, say, eyewitness testimony for anhour, the theme of the lecture would be eyewitness testimony according to the dictionarydefinition. However, in thematic analysis the researcher does not identify the overalltopic of text. Instead the researcher would dig deeper into the text of the lecture to identifya variety of themes which describe significant aspects of the text. For example, the follow-ing themes may be present in the lecture: the unreliability of eyewitness testimony, the waysof improving the accuracy of testimony, and methodological problems with the researchinto eyewitness testimony. This may not be the most scintillating thematic analysis evercarried out, but nevertheless it does give us some understanding of this particular lectureas an example of text. Of course, a lecture is normally a highly organised piece of textualmaterial which has been split up by the lecturer into several different components andgiven a structure so that everything is clear to the student. This is not the case with manytexts such as in-depth interviews or transcripts of focus groups. People talking in thesecircumstances simply do not produce highly systematic and organised speech. Thus theanalytic work is there for the researcher to organise the textual material by defining the main themes which seem to represent the text effectively. While it is possible to carryout thematic analysis on a single piece of text, more generally researchers use materialfrom a wider range of individuals or focus groups, for example.
There are other methods of qualitative research which seem to compete with thematicanalysis in the sense that they take text and, often, identify themes. Grounded theory
M20_HOWI4994_03_SE_C20.QXD 11/11/10 11:34 Page 331

332 PART 4 QUALITATIVE RESEARCH METHODS
(Chapter 21) is a case in point. Indeed, if the basic processes involved in carrying out a grounded theory analysis are compared with those of thematic analysis then differ-entiating between the two is difficult. But there is a crucial difference: grounded theory is intended as a way of generating theory which is closely tied to the data. Theory development is not the intention of thematic analysis. Of course, any process whichleads to a better understanding of data may lead subsequently to the development of theories.
Thematic analysis is not aligned with any particular theory or method though over-whelmingly it is presented from a qualitative perspective which is data-led. However,sometimes the approach taken is to develop themes based on theory and then test the themes against the actual data – though this violates basic assumptions from mostqualitative perspectives. One also sees from time to time thematic analyses quantified in the sense that the researcher counts the number of interviews, for example, in whicheach theme is to be found. Thematic analysis, used in this way, is difficult to distinguishfrom some forms of content analysis described in Chapter 16. The lack of a clear theor-etical basis to thematic analysis does not mean that theory is not appropriate to yourresearch – it merely means that the researcher needs to identify the theoretical allegianceof his or her research. For example, is the research informed by feminist thinking, is it phenomenological in nature, or does it relate to some other theory? Purely empirical thematic analyses may be appropriate in some cases but they may not be academicallyvery satisfying as a consequence.
Given all of these comments, it should be obvious that the term ‘thematic analysis’refers to a wide range of different sorts of analysis ranging from the atheoretical to the theoretically sophisticated, the relatively casual to the procedurally exacting, and thesuperficial to the sophisticated in terms of the themes suggested. At the most basic level,thematic analysis can be described as merely empirical as the researcher creates the themessimply from what is in the text before him or her; this may be described as an inductiveapproach. On the other hand, the researcher may be informed by theory in terms ofwhat aspects of the text to examine and in terms of the sorts of themes that should beidentified and how they should be described and labelled. If there is a theoretical positionwhich informs the analysis, then this should be discussed by the researcher in the reportof their analysis; in this sense, the analysis may be theory driven.
20.3 A basic approach to thematic analysis
The basic essential components of a thematic analysis are shown in Figure 20.2. Theyare transcription, analytic effort and theme identification. It is important to note that thethree stages are only conceptually distinct: in practice they overlap considerably. Briefly,the components can be described as follows:
Transcribing textual material This can be based on any qualitative data collectionmethod including in-depth interviews and focus groups. The level of transcriptionmay vary from a straightforward literal transcript much as a secretary would produceto, for example, a Jeffersoned-version of the text which contains a great deal moreinformation than the literal transcription (see Chapter 19). Generally speaking, therewould appear to be no reason for using Jefferson transcription with thematic analysisbut, by the same token, if a researcher sees a place for it then there is nothing to prevent that. No qualitative researcher should regard transcription as an unfortunate but necessary chore since the work of transcribing increases the familiarity of the
M20_HOWI4994_03_SE_C20.QXD 11/11/10 11:34 Page 332

CHAPTER 20 THEMATIC ANALYSIS 333
researcher with his or her material. In other words, the transcription process is partof the process of analysis. In the best case circumstances, the researcher would haveconducted the interviews or focus groups themselves and then transcribed the datathemselves. Thus the process of becoming familiar with the text starts early and probably continues throughout the analysis.
Analytic effort This refers to the amount of work or processing that the researcherapplies to the text in order to generate the final themes which are the end point of thematic analysis. There are several components to analytic effort: (a) the process ofbecoming increasingly familiar with the text so that understanding can be achievedand is not based on partial knowledge of the data; (b) the detail with which theresearcher studies his or her data which may range from a line-by-line analysis to amuch broader brush approach which merely seeks to summarise the overall themes;(c) the extent to which the researcher is prepared to process and reprocess the data inorder to achieve as close a fit of the analysis to the data as possible; (d) the extent towhich the researcher is presented with difficulties during the course of the analysiswhich have to be resolved; and (e) the willingness of the researcher to check andrecheck the fit of his or her analysis to the original data.
Identifying themes and sub-themes While this appears to be the end point of a thematic analysis, researchers will differ considerably in terms of how carefully orfully they choose to refine the themes which they suggest on the basis of their analysis. The researcher may be rapidly satisfied with the set of themes since they seem to doa ‘good enough’ job of describing what they see as key features of the data. Anotherresearcher may be dissatisfied at this stage with the same themes because they realisethat the themes, for example, describe only a part of the data and there is a lot ofmaterial which could not be coded under these themes. Hence the latter researchermay seek to refine the list of themes in some way, for example, by adding themes and removing those which seem to do a particularly poor job of describing the data.Of course, by being demanding in terms of the analysis, the researcher may find that they need to refine all of the themes and may find that for some of the themessubstantial sub-themes emerge. Also, again as a consequence of being demanding, the researcher may find it harder to name and describe the new or refined themesaccurately. All of this continues the analytic work through to the end of the total thematic analysis.
On the basis of this, the flow diagram of the process perhaps is as shown in Figure 20.2.In the next section, we go on to provide a more sophisticated version of thematic analysis.An example of thematic analysis is described in Box 20.1.
FIGURE 20.2 Basic thematic analysis
M20_HOWI4994_03_SE_C20.QXD 11/11/10 11:34 Page 333

334 PART 4 QUALITATIVE RESEARCH METHODS
Thematic analysis
Box 20.1 Research Example
Sheldon and Howitt (2007) compared offenders con-victed of using the Internet for sexual offending purposes(for example, downloading child pornography) with childmolesters (the traditional paedophile). They were inter-ested in (a) the ‘function(s)’ of Internet child pornographyfor Internet sex offenders and (b) the concept of desistancefrom child molestation. Internet offenders have a strongsexual proclivity towards children (for example, they aresexually aroused by children) but mainly do not go on tosexually molest children. Despite their close similarities totraditional paedophiles, Internet offenders were desistingfrom offending against children. How do Internet offendersexplain why they do not express their paedophilic ori-entation towards children by directly assaulting children sexually? The researchers carried out a thematic analysisof what the offenders told them about the functions ofInternet child pornography in their lives and their desistance from offending directly against children. Theoffenders provided detailed data on a topic which has notbeen extensively researched.
So during the course of lengthy interviews, Internetoffenders were asked why they did not contact offend (i.e.physically offend) against children and contact paedophileswere asked why they used child pornography on the Internetas a substitute for contact offending. All of the fieldworkfor this study was conducted by one researcher who there-fore had (a) interviewed all of the participants in the studyherself and (b) transcribed in full all of the interviews usingdirect literal (secretarial) methods. The transcriptions werenot ‘Jeffersoned’ (see Chapter 19) since the researcherssimply wanted to study broadly how offenders accountedfor these aspects of their offending.
Of course, the interviews and transcripts containedmuch data irrelevant to the question of desistance (forexample, matters such as childhood experiences, details ofthe offending behaviour and their cognitive distortions).Hence, the researchers needed to identify relevant materialfor this aspect of the study which was confined to answersto specific questions (for example, their reasons for notengaging in a particular sort of offending behaviour). Thiswas done by copying and pasting the material from thecomputer files of the transcripts into a new file but it couldhave been done by highlighting the relevant text with ahighlighter pen or highlighting the material on the com-puter with a different font or font colour. Because of the
sheer volume of data in this study coming from over 50offenders it was best to put the pertinent material into arelatively compact computer file. In this way, the materialcan easily be perused for the coding process.
The phases of thematic analysis are very similar to thoseof other forms of qualitative analysis. The process beganwith a descriptive level of coding with minimal inter-pretation. The researchers applied codes to ‘chunks’ of data,that is, a word, phrase, sentence or even a paragraph. For example, one of the functions of child pornographyaccording to offenders was to avoid negative feelings/moods encountered in their everyday lives and so wascoded as ‘negavoidance’ each time this occurred in thetranscripts. Coding was not a static process so initial codeswere revised as the researcher proceeded through the transcript. Some codes became subdivided or revised if theinitial codes were not adequate or some codes were com-bined as there was too much overlap in meaning. Jottingdown of ideas and codes was an integral part of this earlystage. As the researcher had conducted the interviews, shewas also very familiar with the material.
The next formal level of coding involved a greater degreeof interpretation. More superordinate constructs wereidentified which captured the overall meaning of some of the initial descriptive codes used at the earlier stage.Throughout the entire process of analysis the researchermoved constantly backwards and forwards between theinterview extracts and the codes. This stage also involvedan early search for themes. This process of moving towardsidentifying themes involved writing the codings onto different postcards (together with a brief description ofthem) and organising them into ‘theme piles’. This allowedthe researcher to check whether the themes worked inrelation to the coded extracts.
In the final stage of this particular thematic analysis,psychological theories were drawn upon to aid interpreta-tion of the codings and to identify the overarching themes.At the same time, it was essential that the analysis remainedgrounded in the actual data. Engaging with previous researchand theory was very important in this particular study asit helped in understanding the meaning and implicationsof the patterns in the codings or the themes identified. Atthe same time, the researcher was engaged in the processof generating clear definitions and names for each theme.Overall, this thematic analysis generated only a few themes
M20_HOWI4994_03_SE_C20.QXD 11/11/10 11:34 Page 334

CHAPTER 20 THEMATIC ANALYSIS 335
but these themes represented more general concepts withinthe analysis and subsumed the lower level codes.
If themes are clearly defined then it is possible within aqualitative analysis to add a quantitative component. Justhow common are the themes in the data? There are dif-ferent ways of doing this. It can be asked just how preva-lent a theme is, meaning just how many of the participantsmention a particular theme in their individual accounts.Alternatively, one might ask how many incidents of a par-ticular theme occur in a particular account. In this study,following the thematic analysis, each interview was studiedagain and the percentage of each type of sex offender mentioning a particular theme at least once was assessed.Ideally, there should be several instances of a theme acrossthe data but more instances of a theme does not necessarilymean the theme is any more crucial. Key themes capturesomething important in terms of the research question and this is not entirely dependent on their frequency ofoccurrence in the data.
There were three strong themes identified in what theoffenders told the researchers about desistance: (a) focuson fantasy contact, (b) moral/ethical reasoning and (c) fearof consequences. These are very different themes andprobably not entirely predictable. Certainly the idea ofmoral/ethical reasoning in terms of child pornography and child molestation is not a common-sense notion. The
themes identified by the study were illustrated by excerptssuch as the following:
Focus on fantasy contact ‘I never got to the pointwhere I would want to touch . . . looking at the imagesis enough, though a lot of people will disagree . . . I meanI’ve met people in prisons . . . who are in for the samething and . . . their talk was never of actual sexual contact. Definitely. No. No. I would never.’
Moral/ethical reasoning ‘No . . . because as an adultyou’ve got to be thinking for the child . . . they’ve gotto live with it for the rest of their life.’
Fear of consequences ‘Partly because I wouldn’t wantthe guy to go “Ahh! This man’s trying to grope me!”. . . and I’d have his big brothers’ mates coming withbaseball bats.’
Notice that if one checks the excerpts against the name ofthe theme then only the one theme seems to deal with thedata in each case. Try to switch around the names of the themes with the different excerpts and they simply donot fit. This is an illustration of back-checking the themesagainst the data, though in the study proper the researcherswere far more comprehensive in this checking process.
We are grateful to Kerry Sheldon for her help with this box.
20.4 A more sophisticated version of thematic analysis
Braun and Clarke (2006) provide what is probably the most systematic introduction todoing thematic analysis to date. This is a fully fledged account of thematic analysis whichseeks to impose high standards on the analyst such that more exacting and sophisticatedthematic analyses are developed. They write of the ‘process’ of doing a thematic analysiswhich they divide into six separate aspects that very roughly describe the sequence of the analysis, though there may be a lot of backtracking to the earlier aspects of the process in order to achieve the best possible analysis. The simple approach as describedpreviously includes some elements similar to the Braun–Clarke approach but they areaiming for a somewhat more comprehensive and demanding kind of thematic analysiswhich, to date, has only been rarely approached. Their six aspects or steps are:
familiarisation with the data;
initial coding generation;
searching for themes based on the initial coding;
review of the themes;
theme definition and labelling;
report writing.
M20_HOWI4994_03_SE_C20.QXD 11/11/10 11:34 Page 335

336 PART 4 QUALITATIVE RESEARCH METHODS
The entire process is summarised in Figure 20.3. Notice that the figure indicates a sort offlow from one aspect to the next but there are many loops back to the earlier aspects of theanalysis should circumstances demand it. In truth, at practically any stage of the processthe analyst may go back to any of the earlier stages for purposes of refinement and clari-fication. The six steps in the analysis not only loop back to earlier stages but the stages arebest regarded as conceptually distinct since in practice there may be considerable overlap.
Familiarisation with the data
This is the early stage in which the researcher becomes involved actively with the data.The familiarisation process depends partly on the nature of the text to be analysed. If thetext is interview data, for example, the researcher has probably been actively involved ininterviewing the participants in the research. Inevitably, while interviewing the participantsthe interviewer will gain familiarity with what is being said. Unless the interviewer is so overwhelmed by the interview situation they fail to pay proper attention to what the participant is saying, features of what each interviewee is saying will become familiar to the researcher. Equally, over a series of interviews, most interviewers will begin to formulate ideas about what is being said in the interview just as we get ideas about thisin ordinary conversation. In the research context, the researcher will be well aware thatthey will eventually have to produce some sort of analysis of the interviews. Thus, morethan in ordinary conversation, there is an imperative to absorb as much of what is beingsaid as possible and to develop ideas for the analysis. Of course, the more interviews that have been carried out the easier it is to begin to recognise some patterns. These maystimulate very preliminary ideas about how the data will be coded and, perhaps, ideasof the themes apparent in the data.
Furthermore, interview data has to be transcribed from the recording, partly because this facilitates more intense processing of the text by the researcher at the later stagewhen the text needs to be read and re-read but also because excerpts of text are usuallyincluded in the final report to illustrate the themes. Usually in thematic analysis the transcription is a literal transcription of the text much as a secretary would do. It is far less common to use Jefferson transcription with thematic analysis (Chapter 19).Jefferson transcription is more laborious than literal transcription. The choice of howthe transcribing is done depends partly on whether the thematic analysis can effectivelyutilise the additional information incorporated in the Jefferson transcription. In thematicanalysis, the researcher tends to have a realist perspective on the text, that is, the beliefthat the text represents a basic reality and so can largely be understood literally – hencethere is little need for the Jefferson system. The process of transcription in qualitative
Step 1
FIGURE 20.3 Braun and Clarke’s model of thematic analysis
M20_HOWI4994_03_SE_C20.QXD 11/11/10 11:34 Page 336

CHAPTER 20 THEMATIC ANALYSIS 337
analysis should be regarded as a positive thing despite the tedium that may be involved.Ideally, doing the transcription will make the researcher even more familiar with theresearch data. There are limitations to this because transcription proceeds slowly andusually involves just a few words at a time which makes getting the full picture moredifficult. Finally, the transcriptions will be read and re-read a number of times to furtherfamiliarise the researcher with the material and as an aide memoire. Researchers who do not themselves actively collect and transcribe the text they intend to analyse will beat a disadvantage; they would need to spend much more time on reading the transcripts.There are no shortcuts in this familiarisation process if a worthwhile analysis is to beperformed. All other things being equal, a researcher who is well immersed in their datawill have better ideas about later stages of the process and may, early on, have ideasabout the direction in which the analysis will go. Writing notes to oneself about whatone is reading is part of the process of increasing familiarity with the data but also constitutes an earlier stage in the coding process which technically comes next.
Initial coding generation
Initial coding is a step in the process by which themes are generated. The research suggestscodings for the aspects of the data which seem interesting or important. The initial codingprocess involves the analyst working through the entirety of the data in a systematic way,making suggestions as to what is happening in the data. Probably this is best done on a line-by-line basis but sometimes this will be too small a unit of analysis. The decisionabout how frequently to make a coding depends partly on the particular data in questionbut also on the broader purpose of the analysis. As a rule of thumb, a coding should bemade at fairly regular intervals – every line may be too frequent, every two or three lineswould probably be acceptable. The chunk of the text being coded does not have to beexactly the same number of lines each time a coding is made. We are analysing people’stalk, which does not have precise regularity. The initial codings are intended to capturethe essence of a segment of the text and, at this stage, the objective is not to developbroader themes. At first, the initial codings may seem like jottings or notes rather thana sophisticated analysis of the data. If so, all well and good, because this is precisely whatyou should be aiming for. Of course, the analyst will be pretty familiar with the textalready so the initial codings will be on the interviews that the researcher conducted andthe transcripts which the researcher made of the interviews in the first stage of datafamiliarisation. As a consequence, they will already have an overview of the material andso they are not simply responding to a short piece of the text in isolation.
There may be two different approaches depending on whether the data are data-ledor theory-led, according to Braun and Clarke (2006):
The data-led approach This is dominated by the characteristics of the data and thecodings are primarily guided by a careful analysis of what is in the data.
The theory-led approach The structure for the initial codings is suggested by the keyelements of the theory being applied by the researcher. Feminist theory, for example,stresses that relationships between men and women are dominated by the power anddominance of the male gender over the female gender in a wide variety of aspects ofthe social world including employment, domestic life and the law. Thus a thematicanalysis based on feminist theory would be oriented to the expression of power rela-tionships in any textual material.
Step 2
As a novice researcher it is likely that you will have to do all of the data collection and transcriptions yourself. This is an asset, not a hindrance.
Useful tip
M20_HOWI4994_03_SE_C20.QXD 11/11/10 11:34 Page 337

338 PART 4 QUALITATIVE RESEARCH METHODS
Of course, there is something of a dilemma here since it is unclear how a researcher can avoid applying elements of a theoretical perspective during the analysis process. Justhow would it be possible to differentiate between a theory-led coding and a data-ledcoding unless the researcher makes this explicit in their writings?
Usually in reports of thematic analyses, such initial codings are not included by theresearcher for the obvious reason that there is rarely sufficient space to include all of the data let alone the codings in addition. Consequently, those new to thematic analysismay assume that the initial codings are more sophisticated than they actually are. Thefollowing is a brief piece of transcript provided by Clarke, Burns and Burgoyne (2006)which includes some initial codings for a few lines of text:
Initial codingit’s too much like hard work I mean how much paper 1. Talked about with have you got to sign to change a flippin’ name no I I partnermean no I no we we have thought about it ((inaudible)) 2. Too much hassle tohalf heartedly and thought no no I jus’ – I can’t be change namebothered, it’s too much like hard work. (Kate F07a)
The initial codings can be seen to be little more than a fairly mundane summary of a few lines of text. Thus, the coding ‘too much hassle to change name’ is not very differentfrom ‘it’s too much like hard work’ and ‘I can’t be bothered, it’s too much like hardwork’ which occur in the text at this point. So the initial coding stage is not really aboutgenerating substantial insights into the data but merely a process of identifying and summarising the key things about what is going on in the text. Of course, this same piece of text could be coded in any number of different ways. For example, ‘half heartedly’ in the text might have been coded ‘lack of commitment’. Of course, the researcher willnormally have some ideas about the direction in which the analysis is going by this stage in the analysis. Consequently, the codings do not have to be exhaustive of all possibilities and, indeed, over-coding at this stage may make it difficult for the analystto move on to the later phases of the analysis because too much coding obscures whatis going on; it is important to remember that the initial codings are brief summaries ofa chunk of text and not the minutiae of the text expressed in a different way. Theresearcher is trying to simplify the text not complicate it.
Also notice that in the example, the same segment of the text is coded in more thanone way. This is more likely where one is coding bigger chunks of text than if the codingis line by line.
At this stage, the analyst will typically wish to collate the data which have so far been given a particular initial code. In this way, the researcher is essentially linking a particular code with the parts of the text to which the code has been applied. So, forexample, the researcher would bring together the different parts of the text which havebeen coded as ‘Talked about with partner’ in the same place. A simple way of doing thisis to copy and paste the relevant text material under the title of that particular initialcoding. It is possible at this stage that the analyst will feel it appropriate to change theinitial codings name to fit better with the pattern of textual material which has receivedthat particular code. Furthermore, it is likely that the researcher will notice that two or more initial codings mean much the same thing despite being expressed in differentwords. For example, ‘discussed matter with husband’ may be the same as ‘talked aboutwith partner’ so should not be regarded as a distinct coding.
Initial coding development (and the later development of themes) is an active process on the part of the researcher. Braun and Clarke (2006) are extremely dismissive of theidea that codings (and themes) ‘emerge’, that is, suddenly appear to the researcher aspart of the analysis process. Codings and themes are synthesised actively from the databy the researcher; they are not located in the data as such but created by the minds andimaginations of researchers.
M20_HOWI4994_03_SE_C20.QXD 11/11/10 11:34 Page 338

CHAPTER 20 THEMATIC ANALYSIS 339
Searching for themes based on the initial coding
The relationship between text, codings and themes is illustrated in Figure 20.4. The initialcodings, of course, are likely to be used quite frequently in the coding of the text thoughwe illustrate them as occurring only once. Then the themes are essentially obtained byjoining together (or collapsing together) several of the codings in a meaningful way.Thus the process of initial coding has involved the researcher in formulating descriptivesuggestions for the interesting aspects of their data. As we have seen, these codings arefairly close to the text itself. So, if you like, a theme can be seen as a coding of codings.Thus themes identify major patterns in the initial codings and so are a sort of secondlevel of interpretation of the text where the analyst focuses on the relationships betweenthe codings. In some instances, it is possible that a theme is based simply on one of theinitial codings. Of course, it is difficult for the analyst to separate the coding phase fromthe theme-generation phase so one might expect the occasional close correspondencebetween a single coding and a theme.
This begs the question of how an analyst suggests the themes which bring together the initial codings in a meaningful way. Of course, this may be instantly obvious but notalways. One way of identifying themes would be to write each of the different initial codings onto a separate piece of paper or card. Then the initial codings may be sorted intoseparate piles of codings which seem to be similar. The remaining task would be to putwords to the ways in which the similar codings are, indeed, similar. Since the sortingprocess has an element of trial and error, this procedure will allow the analyst to changethe groupings (piles) as their analytic ideas develop. Alternatively, one could place the slips
Step 3
FIGURE 20.4 Relationship between text, codings and themes
As a novice, it would be very daunting to write down codings without some practice so whynot select a page of transcript which you found particularly interesting and try to code thatmaterial first?
Useful tip
M20_HOWI4994_03_SE_C20.QXD 11/11/10 11:34 Page 339

340 PART 4 QUALITATIVE RESEARCH METHODS
of paper on a table top and physically move them around so that initial codings whichare similar are next to each other and those which are dissimilar are physically apart. Inthis way, the relationships between the codings may be made more apparent. It may bethat it becomes clear that some apparently very different codings are merely the oppositesof each other. So maybe they actually should be part of the same theme.
The entire process is one of trying to understand just what are the overarching themeswhich bring together the individual codings in a meaningful way. Of course, the themeshave to be related back to the original data so the data associated with each theme need to be compiled/collated; in this way, the themes can be related back easily to theoriginal textual data. Moreover, the more systematic the analysis is the greater the datamanagement tasks involved in collating the themes with the original material. The useof computers – if only word-processing programs – should greatly facilitate the process of linking together the data for the themes that the researcher is developing. There arespecialist computer programs which also do much the same job.
Review of the themes
By this stage you will have a set of tentative themes which help one understand what is inthe transcriptions. However, these themes probably are not very refined at this stage andneed to be tested against the original data once again. There are a number of possibilities:
You may find that there is very little in the data to support a theme that you haveidentified so the theme may have to be abandoned or modified in the light of this.
You may find that a theme needs to be split up since the data which are supposed tolink together into the theme imply two different themes or sub-themes.
You may feel that the theme works, by and large, but does not fit some of the datawhich initially you believed were part of that theme, so you may have to find a newtheme to deal with the non-fitting data. You may need to check the applicability ofyour themes to selected extracts as well as to the entire dataset.
Theme definition and labelling
All academic work aims at accuracy and precision. The definition and labelling of themesby the researcher is unlikely to meet these criteria without considerable refinement. Inparticular, just what is it about a particular theme which differentiates it from otherthemes? In other words, part of the definition of any theme includes the issue of what itis not as well as the issue of what it is. This is probably not so complicated as it soundsin most instances and the less ambitious your analysis then the less likely it is to be aproblem; where one is trying to provide themes for the entire data then it is likely to bea more exacting and difficult process. At this stage, the analyst may find it appropriateto identify sub-themes within a theme which adds to the task of defining and labellingthese accurately. Of course, defining themes and sub-themes precisely cannot take placein a vacuum but needs to be done in relation to the data too. So the researcher would
Step 5
Step 4
Unfortunately, developing themes will be easier the harder that you work. Just sitting andstaring at a computer screen or the coded transcript will waste time. So any of the active procedures we have suggested in this section are recommended. Spreading the themes ona table top and actively moving them together or apart depending on how similar they are islikely to lead to dividends.
Useful tip
M20_HOWI4994_03_SE_C20.QXD 11/11/10 11:34 Page 340

CHAPTER 20 THEMATIC ANALYSIS 341
Report writing
All research reports tell a story that you want to tell about your data and this appliesequally to reports of thematic analysis. Of course, the story being told relates back to theresearch question which initiated your research – and the stronger the research question,then, all other things being equal, the more coherent a story you can tell. One should notregard report writing as merely telling a story about the steps in your research; thereport-writing stage is a further opportunity for reflecting on one’s data, one’s analysis,and the adequacy of both with respect to each other. So what emerges at the end of thereport-writing process may be a somewhat different and probably more refined storythan was possible before starting the report. In other words, report writing is anotherstage in the analysis and not just a chore to be completed to get one’s work published orthe grades one wants for a psychology degree.
The final report requires that you illustrate your analysis using extracts from your data.Of course, it is more than appropriate to choose the most apposite extracts to illustratethe outcome of your analysis. But, in addition, the selected extracts may be the mostvivid of the instances that you have. The final report also provides the opportunity todiscuss your analysis in the light of the previous research literature. This may be either(a) the literature that you choose to discuss in order to justify why you have chosen toresearch a particular research question in a particular way or (b) relating your analysesto the findings and conceptualisations of other analysts. In what way does your analysisprogress things beyond theirs? What distinguishes your analysis from theirs? Is it possibleto resolve substantial differences?
Step 6
have to go through the data once again to ensure that the themes (and sub-themes)which have been defined in this stage actually still effectively account for the data sincethe definition imposes a structure and clarity that may not have been present in the initial coding process and the identification of themes. As you do this, you may well findthat there are data which have not previously been coded which can be coded now usingyour refined themes and better level of understanding of the material.
Thematic analysis involves three crucial elements – the data, the coding of data and theidentification of themes. The procedure described above essentially stresses the way inwhich the researcher constantly loops back to the earlier stages in the process to checkand to refine the analysis. In other words, the researcher constantly juxtaposes the dataand the analysis of the data to establish the adequacy of the analysis and to help refinethe analysis. A good analysis requires a considerable investment of time and effort.
At this stage, you might wish to go ‘public’ with your ideas. By this we mean that discussingyour analysis with others may pay dividends as you have to explain your themes clearly towhat may be a sceptical friend or colleague. You have, in this way, a challenge to your themedefinition and labelling which may stimulate further thought or revision.
Useful tip
Most reports of thematic analysis avoid describing in any detail just how the analysis wascarried out. Do not emulate this but instead try to be as systematic as you possibly can beabout just how the analysis was done. If there are problems defining a theme then identifythese and do not simply sweep difficulties under the carpet.
Useful tip
M20_HOWI4994_03_SE_C20.QXD 11/11/10 11:34 Page 341

342 PART 4 QUALITATIVE RESEARCH METHODS
The secret of a good thematic analysis lies in the amount of analytic work that the researcher contributes to the process. Researchers unwilling to spend the time and effort required in terms of familiarisation with the data, coding, recoding, theme development and so forth will tend to produce weaker and less convincing analyses. They have only superficially analysed their data so produce less insightful and comprehensive themes.
It improves a report of a thematic analysis if detail of the method used by the researcher is included.It is insufficient (and perhaps misleading) to merely say that a thematic analysis was carried out andthat certain themes ‘emerged’ during the course of the analysis. This gives no real indication of howthe analysis was carried out or the degree to which the researcher is active in constructing the themeswhich their report describes.
A good thematic analysis can be quantified in terms of the rates of the prevalence and incidents ofeach of the themes. Prevalence is the number of participants who say things relevant to a particulartheme and incidence is the frequency of occurrence of the theme throughout the dataset or the average number of times it occurs in each participant’s data.
Key points
ACTIVITYThematic analysis can be carried out on any text. For example, it could be tried out on two or three pages of a novel youare reading (or a magazine article for that matter). Try to develop initial codes of each line of a few pages of a novel or someother text. What themes can these be sorted into? How good is the fit of the set of themes to the actual text? Do some linesof text fail to appear in at least one theme?
20.5 Conclusion
Probably thematic analysis can best be seen as a preferred introduction to qualitativedata analysis. The lack of bewildering amounts of theoretical baggage makes it relativelyuser-friendly to novices to qualitative analysis. Nevertheless, it is an approach which can fail to be convincing if not performed in sufficient depth. The simplicity of thematicanalysis is superficial and disguises the considerable efforts that the analyst needs tomake in order to produce something that goes beyond the mundane (or, perhaps, whatmerely states what the researcher ‘knew’ already). While the temptation may be to pickout a few themes which then become ‘the analysis’, the researcher must push further thanthis. Simple notions such as ensuring that as much of the material in the data is coveredby the themes help ensure that the analysis challenges the researcher. So thematic analysisis as demanding as any other form of analysis in psychology. The important thing is thatthe researcher does not stint on the analytic effort required to produce an outcomewhich is stimulating and moves our understanding of the topic on from the common-sensical notions which sometimes pass as thematic analysis. But this is no different fromthe challenge facing most researchers irrespective of the method they employ.
M20_HOWI4994_03_SE_C20.QXD 11/11/10 11:34 Page 342

Grounded theory
Overview
CHAPTER 21
Grounded theory basically involves a number of techniques which enable researchersto effectively analyse ‘rich’ (detailed) qualitative data effectively.
It reverses the classic hypothesis-testing approach to theory development (favouredby some quantitative researchers) by defining data collection as the primary stageand requiring that theory is closely linked to the entirety of the data.
The researcher keeps close to the data when developing theoretical analyses – in thisway the analysis is ‘grounded’ in the data rather than being based on speculative the-ory which is then tested using hypotheses derived from the theory.
It employs a constant process of comparison back and forwards between the differentaspects of the analysis and also the data.
Grounded theory does not mean that there are theoretical concepts just waiting in thedata to be discovered. It means that the theory is anchored in the data.
In grounded theory, categories are developed and refined by the researcher in orderto explain whatever the researcher regards as the significant features of the data.
M21_HOWI4994_03_SE_C21.QXD 10/11/10 15:05 Page 343

344 PART 4 QUALITATIVE RESEARCH METHODS
21.1 Introduction
Sometimes qualitative data analysis is regarded as being an easy route to doing research.After all, it does not involve writing questionnaire items, planning experimental designsor even doing statistics. All of these tasks are difficult and, if they can be avoided, arebest avoided. Or so the argument goes. Superficially, qualitative data analysis does seemto avoid most of the problems of quantification and statistical analysis. Carry out anunstructured interview or conduct a focus group or get a politician’s speech off theInternet or something of the sort. Record it using an audio-recorder or video-recorder,or just use the written text grabbed from the World Wide Web. Sounds like a piece ofcake. You are probably familiar with the caricature of quantitative researchers as boffinsin white coats in laboratories. The qualitative researcher may similarly be caricatured.The qualitative researcher is more like a manic newspaper reporter or television reporterwho asks a few questions or takes a bit of video and then writes an article about it.
What is the difference between the qualitative researcher and the TV reporter with theaudio-recorder or camera crew? The answer to this question will take most of this chapter.
We can begin with one of the most important and seminal publications in qualitativeresearch. The book, Discovery of Grounded Theory (Glaser and Strauss, 1967), is regardedas a classic and remains a major source on the topic of grounded theory despite numerousdevelopments since then. Historically, Glaser and Strauss’s approach was as much areaction to the dominant sociology of the time as it was radically innovative. Basically,the book takes objection to the largely abstract sociological theory of the time whichseemed divorced from any social or empirical reality. Indeed, empirical research was asatheoretical as the theoretical research was unempirical in sociology at the time. In itsplace was offered a new, data-based method of theory development. Grounded theoryreversed many of the axioms of conventional research in an attempt to systematise manyaspects of qualitative research. As such, it should be of interest to quantitative researcherssince it highlights the characteristics of their methods.
However, many readers of this chapter will not yet have read any research that involvesthe use of grounded theory. So what are the characteristics of a grounded theory analysis?Ultimately the aim is to produce a set of categories into which the data fit closely andwhich amounts to a theoretical description of the data. Since the data are almost certainto be textual or spoken language the major features of most grounded theory analyses arefairly similar. A word of warning: to carry out a grounded theory analysis is a somewhatexacting task. Sometimes authors claim to have used grounded theory though perusal of their work reveals no signs of the rigours of the method. Sometimes the categoriesdeveloped fit the data because they are so broad that anything in the data is bound to fitinto one or other of the coding categories. Like all forms of research, there are excellentgrounded theory analyses, but also inadequate or mundane ones.
Like properly done qualitative data analyses in general, grounded theory approachesare held to be time-consuming, arguably because of the need for great familiarity withthe data but also because the process of analysis can be quite exacting. Grounded theoryemploys a variety of techniques designed to ensure that researchers enter into the requiredintimate contact with their data as well as bringing into juxtaposition different aspectsof the data. The approach has a lot of aficionados across the wide cross-section of qualitative research – though its use is less than universal.
Just to stress, grounded theory methods result in categories which encompass the data(text or speech almost invariably) as completely and unproblematically as the researchercan manage. In this context, theory and effective categorisation are virtually synonymous.This causes some confusion among those better versed in quantitative methods who tend to assume that theory means an elaborate conjectural system from which specific
M21_HOWI4994_03_SE_C21.QXD 10/11/10 15:05 Page 344

CHAPTER 21 GROUNDED THEORY 345
hypotheses are derived for testing. That is not what grounded theory provides – the categorisation system is basically the theory though the method does involve attempts to generalise the theory beyond the immediate data. Furthermore, researchers seeking atheory that yields precise predictions will be disappointed. While grounded theory maygeneralise to new sets of data, it is normally incapable of making predictions of a moreprecise sort. Charmaz (2000) explains:
. . . grounded theory methods consist of systematic inductive guidelines for collectingand analyzing data to build middle-range theoretical frameworks that explain the collected data. Throughout the research process, grounded theorists develop analyticinterpretations of their data to focus further data collection, which they use in turn toinform and refine their developing theoretical analyses.
(p. 509)
Several elements of this description of grounded theory warrant highlighting:
Grounded theory consists of guidelines for conducting data collection, data analysisand theory building, which may lead to research which is closely integrated to socialreality as represented in the data.
Grounded theory is systematic. In other words, the analysis of data to generate theoryis not dependent on a stroke of genius or divine inspiration, but on perspiration andapplication of general principles or methods.
Grounded theory involves inductive guidelines rather than deductive processes. This isvery different from what is often regarded as conventional theory building (sometimesdescribed as the ‘hypothetico-deductive method’). In the hypothetico-deductive method,theory is developed from which hypotheses are derived. In turn, these hypotheses maybe put to an empirical test. Research is important because it allows researchers to testthese hypotheses and, consequently, the theory. The hypothetico-deductive methodcharacterised psychology for much of its modern history. Without the link betweentheory building and hypothesis testing, quantitative research in psychology probablydeserves the epithet of ‘empiricism gone mad’. Particularly good illustrative examplesof the hypothetico-deductive approach are to be found in the writings of psychologistssuch as Hans Eysenck (for example, Eysenck, 1980). However, grounded theory, itself,was not really a reaction against the hypothetico-deductive method but one againstoverly abstracted and untestable social theory.
Grounded theory requires that theory should develop out of an understanding of the complexity of the subject matter. Theories (that is, coding schemes) knit the complexity of the data into a coherent whole. Primarily, such theories may be testedeffectively only in terms of the fit between the categories and the data, and by applyingthe categories to new data. In many ways this contrasts markedly with mainstreamquantitative psychology where there is no requirement that the analysis fits all of the data closely – merely that there are statistically significant trends, irrespective ofmagnitude, which confirm the hypothesis derived from the theory. The unfitting dataare regarded as measurement error rather than a reason to explore the data further inorder to produce a better analysis, as it may be in qualitative research.
The theory-building process is a continuous one rather than a sequence of critical testsof the theory through testing hypotheses. In many ways, it is impossible to separatethe different phases of the research into discrete components such as theory develop-ment, hypothesis testing, followed by refining the theory. The data collection phase,the transcription phase and the analysis phase all share the common intent of build-ing theory by matching the analysis closely to the complexity of the topic of interest.
M21_HOWI4994_03_SE_C21.QXD 10/11/10 15:05 Page 345

346 PART 4 QUALITATIVE RESEARCH METHODS
21.2 Development of grounded theory
Grounded theory is usually described as being a reaction against the dominant sociologyof the twentieth century, specifically the Chicago School of Sociology. Some of thefounders of this school specifically argued that human communities were made up ofsub-populations, each of which operated almost on a natural science model – they werelike ecological populations. For example, sub-populations showed a pattern wherebythey began to invade a territory, eventually reaching dominance, and finally receding asanother sub-population became dominant. This was used to explain population changesin major and developing cities such as Chicago. Large-scale social processes and not theexperiences of individuals came to be the subject of study. The characteristics which areattributed to the Chicago School are redolent of a lot of psychology from the sameperiod. In particular, the Chicago School sought to develop exact and standard measur-ing instruments to measure a small number of key variables that were readily quantified.In sociology, research in natural contexts began to be unimportant in the first half oftwentieth century – the corresponding change in psychology was the increased importanceof the psychological laboratory as a research base. In sociology, researchers undertookfield research mainly in order to develop their measuring instruments. Once developed,they became the focus of interest themselves. So social processes are ignored in favour ofbroad measures such as social class and alienation, which are abstractions. The theoristand the researcher were often different people, so much so that much research becamealienated from theory, that is, atheoretical (Charmaz, 1995).
Grounded theory methodology basically mirror-imaged or reversed features of thedominant sociology of the 1960s in a number of ways:
Qualitative research came to be seen as a legitimate domain in its own right. It wasnot a preliminary or preparatory stage for refining one’s research instruments prior toquantitative research.
The division between research and theory was undermined by requiring that theorycomes after or as part of the data collection and is tied to the data collected.Furthermore, data collection and their analysis were reconstrued as being virtuallyinseparable. That is, analysis of the data was encouraged early in the collection ofdata and this early analysis could be used to guide the later collection of data.
In order to achieve these ends, grounded theory had to demonstrate that quantitativeresearch could be made rigorous, systematic and structured. The idea that quantitativedata analysis is no more than a few superficial impressions of the researcher was no partof grounded theory. Equally, case studies are considered in themselves not to achieve thefull potential of qualitative research.
Despite being the mirror image of mainstream research, grounded theory analysisdoes not share all of the features of other qualitative methods such as discourse analysisand conversation analysis. In particular, some users of grounded theory reject realism(the idea that out there somewhere is a social reality which researchers will eventuallyuncover) whereas others accept it. Similarly, some grounded theorists aim for objectivemeasures and theory development that does not depend on the researcher’s subjectivity.Others regard this as a futile and inappropriate aim. See Figure 21.1 for some of the keyaspects of the development of grounded theory.
M21_HOWI4994_03_SE_C21.QXD 10/11/10 15:05 Page 346

CHAPTER 21 GROUNDED THEORY 347
FIGURE 21.1 The roots of grounded theory
21.3 Data in grounded theory
Grounded theory is not primarily a means of collecting data but the means of data analysis. However, grounded theory does have things to say about the way in which data should be collected in a manner guided by the needs of the developing groundedtheory. Grounded theory does not require any particular type of data although sometypes of data are better for it than others. There is no requirement that the data are qualitative, especially in the early formulations of grounded theory. So, for example,grounded theory can be applied to interviews, biographical data, media content, observations, conversations and so forth or anything else which can usefully inform the developing theory. All of these sources potentially may be introduced into any study. The key thing is, of course, that the primary data should be as richly detailed as possible, that is, not simple or simplified. Charmaz (1995, p. 33) suggests that richlydetailed data involve ‘full’ or ‘thick’ written descriptions. So, by this criterion, much of the data collected by quantitative researchers in the quantitative approach would be unsuitable as the primary data for analysis. There is little that a grounded theoryresearcher could do with answers to a multiple-choice questionnaire or personality scale.Yes–no and similar response formats do not provide detailed data – though the findingsof such studies may contribute more generally to theory building in grounded theory.The data for grounded theory analysis mostly consist of words, but this is typical ofmuch data in psychology and related disciplines. As such, usually data are initially transcribed using a transcription system though normally Jefferson’s elaborate method(Chapter 19) would be unnecessary. Some lessons from grounded theory could be useful to all sorts of researchers. In particular, the need for richness of data, knowingone’s data intimately and developing theory closely in line with the data would benefita great deal of research.
M21_HOWI4994_03_SE_C21.QXD 10/11/10 15:05 Page 347

348 PART 4 QUALITATIVE RESEARCH METHODS
21.4 How to do grounded theory analysis
Potter (1998) likens grounded theory to a sophisticated filing system. This filing systemdoes not merely put things under headings, there is also cross-referencing to a range ofother categories. It is a bit like a library book that may be classified as a biography, butit may also be a political book. Keep this analogy in mind as otherwise the temptationis to believe that the data are filed under only one category in grounded theory analysis.It is notorious that Glaser and Strauss did not see eye-to-eye academically speaking later in their careers so rather different versions of grounded theory evolved. The maindifference between them was in the extent to which the researcher should come to the data with ideas and thoughts already developed or, as far as possible, with no preconceptions about the data. There seems to be a general acceptance that groundedtheory analysis has a number of key components and the following summarises some of the important analytic principles that broadly can be described as grounded theory.These are outlined below.
■ ComparisonCrucially, grounded theory development involves constant comparisons at all stages ofthe data collection and analysis process – without comparing categories with each otherand with the data, categories cannot evolve and become more refined:
People may be compared in terms of what they have said or done or how they haveaccounted for their actions or events, for example.
Comparisons are made of what a person does or says in one context with what theydo and say in another context.
Comparisons are made of what someone has said or done at a particular time with asimilar situation at a different time.
Comparisons of the data with the category which the researcher suggests may accountfor the data.
Comparisons are made of categories used in the analysis with other categories usedin the analysis.
So, for example, it is a common criticism of quantitative research that the researcherforces observations into ill-fitting categories for the purpose of analysis; in grounded theorythe categories are changed and adjusted to fit the data better. This is often referred to as the method of constant comparisons. Much of the following is based on Charmaz’s(1995, 2000) recommendations about how to proceed.
■ Coding/namingGrounded theory principles require that the researcher repeatedly examines the data closely.The lines of data will be numbered at some stage to aid comparison and reference. In the initial stage of the analysis, the day-to-day work involves coding or describing thedata line-by-line. It is as straightforward as that – and as difficult. (Actually, there is norequirement that a line be the unit of analysis and a researcher may choose to operate at the level of the sentence or the paragraph, for example.) The line is examined and a description (it could be more than one) is provided by the researcher to describe whatis happening in that line or what is ‘represented’ by that line. In other words, a name isbeing given to each line of data. These names or codings should be generated out of what
M21_HOWI4994_03_SE_C21.QXD 10/11/10 15:05 Page 348

CHAPTER 21 GROUNDED THEORY 349
is in that particular line of data. In many ways, describing this as coding is a little mis-leading, because it implies a pre-existing system, which is not the case. Others describethe process in slightly different terms. For example, Potter (1997) describes the processas being one of giving labels to the key concepts that appear in the line or paragraph.
The point of the coding is that it keeps the researcher’s feet firmly in the grounds ofthe data. Without coding, the researcher may be tempted to over-interpret the data byinappropriately attributing ‘motives, fears or unresolved personal issues’ (Charmaz, 1995,p. 37) to the participants. At the end of this stage, we are left with numerous codings ordescriptions of the contents of many lines of text.
It is difficult to give a brief representative extract of grounded theory style codings.Table 21.1 reproduces a part of such codings from Charmaz (1995) which illustratesaspects of the process reasonably well. Take care though since Table 21.1 contains avery short extract from just one out of nearly two hundred interviews conducted by her.It can be seen that the codings/categories are fairly close to the data in this example. Itshould be noted that hers are not the only codings which would work with the data.
■ CategorisationQuite clearly, the analyst has to try to organise these codings. Remember that codings arepart of the analysis process and the first tentative steps in developing theory. These are thesmallest formal units in the grounded theory analysis. While they may describe the datamore-or-less well, by organising them we may increase the likelihood that we will be ableto effectively revise them. This is a sort of reverse filtering process: we are starting withthe smallest units of analysis and working back to the larger theoretical descriptions. So thenext stage is to build the codings or namings of lines of data into categories. This is a basicstrategy in many sorts of research. In quantitative research, there are statistical methodswhich are commonly used in categorising variables into groupings of variables (forexample, factor analysis and cluster analysis). These statistical methods are not generallyavailable to the grounded theorist, so the categorisation process relies on other methods.Once again, the process of constant comparison is crucial, of course. The analyst essentiallyhas to compare as many of the codings with the other codings as possible. That is, is thecoding for line 62 really the same as that for line 30 since both lines are described in verysimilar words? Is it possible to justify coding lines 88 and 109 in identical fashion sincewhen these data lines are examined they appear to be very different?
The constant comparing goes beyond this. For example, does there seem to be a different pattern of codings for Mr X than for Mrs Y? That is, does the way that theytalk about things seem to be different? We might not be surprised to find different patternsfor Mr X and Mrs Y when we know that this is a couple attending relationship counsellingor that one is the boss of a company and the other an employee. The data from a person
Table 21.1 A modified extract of grounded theory coding based on Charmaz (1995, p. 39)
Interview transcript Coding by researcher
If you have lupus, I mean one day it’s my liver Shifting symptoms
One day it’s in my joints; one day it’s in my head, and Inconsistent days
It’s like people really think you’re a hypochondriac if you keep Interpreting images of self
. . . It’s like you don’t want to say anything because people are Avoiding disclosuregoing to start thinking
Source: Charmaz (1995)
M21_HOWI4994_03_SE_C21.QXD 10/11/10 15:05 Page 349
350 PART 4 QUALITATIVE RESEARCH METHODS
at a particular point in time or in a particular context may be compared with data fromthe same person at a later point in time or in different contexts.
It need not stop there. Since the process is one of generating categories for the codings of the data which fit the data well and are coherent, one must also compare the categories with each other as they emerge or are developed. After all, it may become evident, for example, that two of the categories cannot be differentiated – or you mayhave given identical titles to categories which actually are radically different. The process of categorisation may be facilitated by putting the data or codings or both ontoindex cards which can be physically moved around on a desk or table in order to placesimilar items close together and dissimilar items further apart. In this way, relationshipscan begin to be identified in a more active visual way.
■ Memo writingThe stages in grounded theory analysis are not as distinct as they first appear. The processof analysis is not sequential, although explaining grounded theory analysis makes it appearso. It is a back-and-forward process. Memo writing describes the aspect of the researchin which the data are explored rather than described and categorised. The memo may be just as one imagines – a notebook – in which the researcher notes suggestions as to how the categories may be linked together in the sense that they have relationshipsand interdependencies. But the memo does not have to be a purely textual thing. A diagram – perhaps a flow diagram – could be used in which the key concepts are placedin boxes and the links between them identified by annotated arrows. What do we meanby relationships and interdependencies? Imagine the case of male and female. They areconceptually distinct categories but they have interdependencies and relationships. Onecannot understand the concept of male without the concept of female.
The memo should not be totally separated from the data. Within the memo oneshould include the most crucial and significant examples from the data which are indicative and typical of the more general examples. So the memo should be replete with illustrative instances as well as potentially ill-fitting or problematic instances of ideas,conceptualisations and relationships that are under development as part of the eventualgrounded theory:
If you are at a loss about what to write about, look for the codes that you have usedrepeatedly in your data collection. Then start elaborating on these codes. Keep collecting data, keep coding and keep refining your ideas through writing more andfurther developed memos.
(Charmaz, 1995, p. 43)
In a sense, this advice should not be necessary with grounded theory since the pro-cesses of data collection, coding and categorisation of the codes are designed to makethe researcher so familiar with their data that it is very obvious what the frequentlyoccurring codings are. However, it is inevitable that those unaccustomed to qualitativeanalysis will have writing and thinking blocks much the same as a quantitative researchermay have problems writing questionnaire items or formulating hypotheses.
Sometimes the memo is regarded as an intermediary step between the data and the final written report. As ever in grounded theory, though, in practice the distinctionbetween the different stages is not rigid. Often the advice is to start memo writing justas soon as anything strikes one as interesting in the data, the coding or categorisation.The sooner the better would seem to be the general consensus. This is very different from the approach taken by quantitative researchers. Also bear in mind that the processof theory development in grounded theory is not conventional in that the use of a
M21_HOWI4994_03_SE_C21.QXD 10/11/10 15:05 Page 350
CHAPTER 21 GROUNDED THEORY 351
small number of parsimonious concepts is not a major aim. (This is essentially Occam’srazor which is the logical principle that no more than the minimum number of conceptsor assumptions is necessary. This is also referred to as the principle of parsimony.)Strauss and Corbin (1999) write of conceptual density which they describe as a richnessof concept development and relationship identification. This is clearly intended to bevery different from reducing the analysis to the very minimum number of concepts as is characteristic of much quantitative research.
■ Theoretical samplingTheoretical sampling is about how to validate the ideas developed within the memo. Ifthe ideas in the memo have validity then they should apply to some samples of data butnot to others. The task of the researcher is partly to suggest which samples the categoriesapply to and which they should not apply to. This will help the researcher identify newsources of data which may be used to validate the analysis to that point. As a consequenceof the analysis of such additional data, subsequent memo writing may be more closelygrounded in the data which it is intended to explain.
■ Literature reviewIn conventional methodological terms, the literature review is largely carried out in advanceof planning the detailed research. That is, the new research builds on the accumulatedprevious knowledge. In grounded theory, the literature review should be carried outafter the memo-writing process is over – signed, sealed and delivered. In this way, thegrounded theory has its origins in the data collected not the previous research and theoretical studies. So why bother with the literature review? The best answer is that theliterature review should be seen as part of the process of assessing the adequacy of the grounded theory analysis. If the new analysis fails to deal adequately with the olderresearch then a reformulation may be necessary. On the other hand, it is feasible that thenew analysis helps integrate past grounded theory analyses. In some respects this can beregarded as an extension of the grounded theory to other domains of applicability.
That is what some grounded theorists claim. Strauss and Corbin (1999) add that thegrounded theory methodology may begin in existing grounded theory so long as they‘seem appropriate to the area of investigation’ and then these grounded theories ‘may be elaborated and modified as incoming data are meticulously played against them’ (pp. 72–3). An overall picture of the stages of grounded theory are shown in Figure 21.2.This includes an additional stages of theory development which do not characterise allgrounded theory studies in practice.
21.5 Computer grounded theory analysis
A number of commercially available grounded theory analysis programs are available.Generically they are known as CAQDAS (Computer-Assisted Qualitative Data AnalysisSoftware). NUD*IST was the market leader but it has been replaced by NVivo, which isvery similar, and there are others. These programs may help with the following aspectsof a grounded theory analysis:
There is a lot of paperwork with grounded theory analysis. Line-numbered transcriptsare produced, coding categories are developed, and there is much copying and pastingof parts of the analysis in order to finely tune the categories to the data. There is
M21_HOWI4994_03_SE_C21.QXD 10/11/10 15:05 Page 351
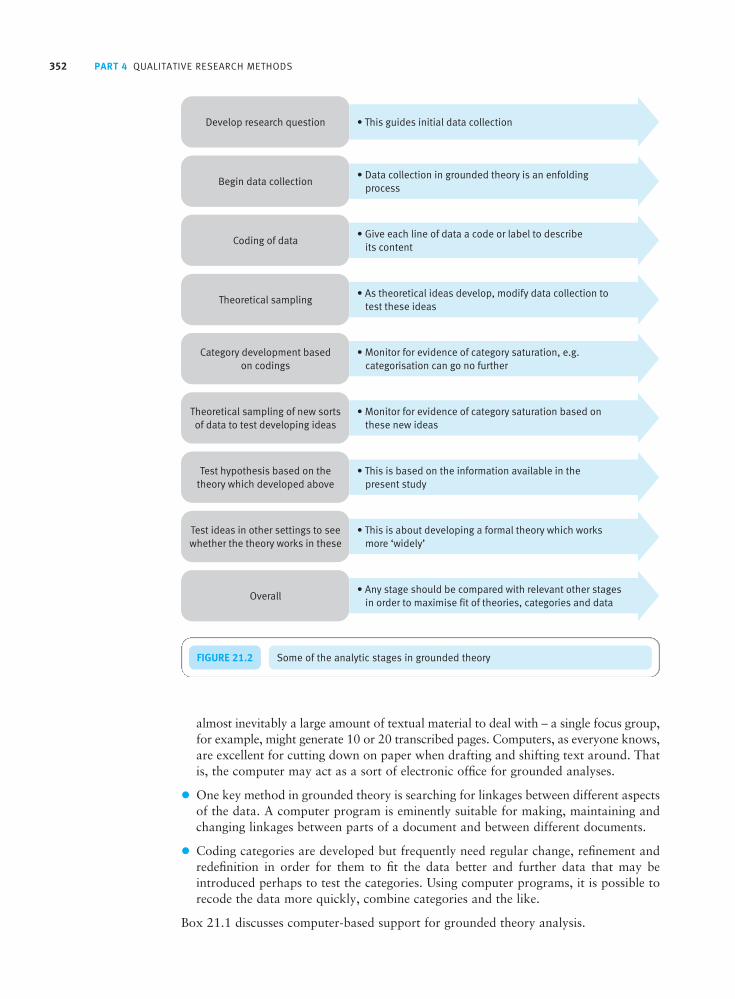
352 PART 4 QUALITATIVE RESEARCH METHODS
almost inevitably a large amount of textual material to deal with – a single focus group,for example, might generate 10 or 20 transcribed pages. Computers, as everyone knows,are excellent for cutting down on paper when drafting and shifting text around. Thatis, the computer may act as a sort of electronic office for grounded analyses.
One key method in grounded theory is searching for linkages between different aspectsof the data. A computer program is eminently suitable for making, maintaining andchanging linkages between parts of a document and between different documents.
Coding categories are developed but frequently need regular change, refinement andredefinition in order for them to fit the data better and further data that may be introduced perhaps to test the categories. Using computer programs, it is possible torecode the data more quickly, combine categories and the like.
Box 21.1 discusses computer-based support for grounded theory analysis.
FIGURE 21.2 Some of the analytic stages in grounded theory
M21_HOWI4994_03_SE_C21.QXD 10/11/10 15:05 Page 352
CHAPTER 21 GROUNDED THEORY 353
Computers and qualitative data analysis: Computer-Assisted Qualitative Data Analysis Software (CAQDAS)
Box 21.1 Practical Advice
Using computer programs for the analysis of qualitativedata is something of a mixed blessing for students new tothis form of analysis. The major drawback is the invest-ment of time needed to learn the software. This is mademore of a problem because no qualitative analysis pro-gram does all of the tasks that a qualitative analyst mightrequire. Thus it is not like doing a quantitative analysis ona computer program such as SPSS Statistics where you cando something useful with just a few minutes of training orjust by following a text. Furthermore, qualitative analysissoftware is much more of a tool to help the researcherwhereas SPSS Statistics, certainly for simple analyses, does virtually all of the analysis. So think carefully beforeseeking computer programs to help with your qualitativeanalysis, especially if time is short, as it usually is for student projects. There is little or nothing that can as yet be done by computers which cannot be done by aresearcher using more mundane resources such as scissors,glue, index cards and the like. The only major drawbackto such basic methods is that they become unwieldy withvery substantial amounts of data. In these circumstances,a computer may be a major boon in that it keeps every-thing neat and tidy and much more readily accessible onfuture occasions.
There are two main stages for which computer programsmay prove helpful: data entry and data analysis.
Data entry
All students will have some word-processing skills whichmay prove helpful for a qualitative analysis. The first majortask after data have been collected is to transcribe it. Thisis probably best done by a word processing program suchas Microsoft’s Word which is by far the most commonlyused of all such programs. Not only is such a program thebest way of getting a legible transcript of the data but it is also useful as a resource of text to be used in illustrat-ing aspects of the analysis in the final research report.Word-processing programs can be used for different sortsof transcription including Jefferson transcription (seeChapter 19) which utilises keyboard symbols universallyavailable. Of course, the other big advantage of word-processing programs is that they allow for easy text
manipulation. For example, one can usually search for (find)strings of text quickly. More importantly, perhaps, onecan copy-and-paste any amount of text into new locationsor folders. In other words, key bits of text can be broughttogether to aid the analysis process simply by having thekey aspects of the text next to each other.
Computers can aid data entry in another way. If thedata to be entered are already in text form (e.g. magazinearticles or newspaper reports) then it may be possible toscan the text directly into the computer using programssuch as TextBridge. Alternatively, some may find it helpfulto use voice recognition software to dictate such text intoa computer as an alternative to typing. Of course, suchprograms are still error-prone but then so is transcribingwords from the recording by hand. All transcripts requirechecking for accuracy no matter how they are produced.
In the case of discourse analysis or conversation analysis(see Chapters 22 and 23) features of the data such as pauses,voice inflections and so forth need to be recorded. So editingsoftware such as CoolEdit (now known as Adobe Audition)are useful for these specialised transcription purposes.This program, for example, has the big advantage that itshows features of the sound in a sort of continuous graph-ical form which allows for the careful measurement oftimes of silences and so forth. There is a free-to-downloadcomputer program which helps one transcribe sound files. It is known as SoundScriber and can be obtained athttp://www-personal.umich.edu/~ebreck/sscriber.html.
The downside is that by saving the researcher time, the computer program reduces their familiarity with their data. This undermines one of the main strategies ofqualitative analysis which is to encourage the researcher to repeatedly work through the analysis in ways whichencourage greater familiarity.
Data analysis
There are many different forms of analysis of qualitativedata so no single program is available to cope with all ofthese. For example, some analyses simply involve countsof how frequently particular words or phrases (or types
M21_HOWI4994_03_SE_C21.QXD 10/11/10 15:05 Page 353

354 PART 4 QUALITATIVE RESEARCH METHODS
of words or phrases) occur in the data or how commonlythey occur in close physical proximity. Such an analysis isnot typical of what is done in psychology and, of course,it is really a type of quantitative analysis of qualitativedata rather than a qualitative data analysis as such. Themost common forms of qualitative analysis tend to involvethe researcher labelling the textual data in some way (cod-ing) and then linking the codings together to form broadercategories which constitute the bedrock of the analysis.The most famous of the computer programs helping theresearcher handle grounded theory analyses is NUD*IST,which was developed in the 1980s, and NVivo, which was developed a decade or so later but is closely related toNUD*IST. The researcher transcribes their data (usuallythese will be interviews) and enters the transcription intoone of these programs usually using RTF (rich text format) files which Word can produce. The programs thenallow you to take the text and code or label small piecesof it. Once this is complete the codes or labels can begrouped into categories (analogous to themes in thematicanalysis – Chapter 20). The software company whichowns NVivo suggests that it is useful for researchers todeal with rich-text data at a deep level of analysis. Theyidentify some of the qualitative methods discussed in thisbook as being aided by NVivo such as grounded theory,conversation analysis, discourse analysis and phenomen-ology. The software package is available in a student versionat a moderate price but you may find that a trial downloadis sufficient for your purposes. This was available at thefollowing address at the time of writing: http://www.qsrinternational.com/products_free-trial-software.aspx.
The system allows the user to go through the data coding the material a small amount at a time (the unit ofanalysis can be flexible) or one can develop some codingcategories in a structured form before beginning to applythem to the data. In NVivo there is the concept of nodeswhich it defines as ‘places where you store ideas and categories’. There are two important types of nodes in theprogram which are worth mentioning here:
Free nodes These can most simply be seen as codings or brief verbal descriptions or distillations of a chunkof text. These are probably best used at the start of theanalysis before the researcher has developed clear ideasabout the data and the way the analysis is going.
Tree nodes These are much more organised than the free nodes (and may be the consequence of joiningtogether free nodes). They are in the form of a hierarchywith the parent node leading to the children nodes whichmay lead to the grandchildren nodes. The hierarchy is given a numerical sequence such as 4 2 3 where the
parent node is here given the address 4, one of the childnodes is given the address 2 and where the grandchildis given the address 3. Thus 4 2 3 uniquely identifies aparticular location within the tree node. So, for exam-ple, a researcher may have as the parent node problemsat work, one of the child nodes may be interpersonalrelationships (another child node might be redundancy,for example), and one of the grandchild nodes might besexual harassment.
These nodes are not fixed until the researcher is finallysatisfied but can be changed, merged together or evenremoved should the researcher see fit. This is the typicalprocess of checking and reviewing that makes qualitativeresearch both flexible and time-consuming.
NVivo has other useful features such as a ‘modeller’which allows the researcher to link the ideas/conceptsdeveloped in the analysis together using connectors whichthe researcher labels. There is also a search tool whichallows the researcher to isolate text with particular con-tents or which has been coded in a particular way.
An alternative to NUD*IST/NVivo is to use CDC EZ-Text which is free-to-download at http://www.cdc.gov/hiv/SOFTWARE/ez-text.htm if you want to access a qualitative analysis program without the expense of thecommercial alternatives. EZ-Text is available for researchersto create and manage databases for semi-structured qualitative interviews and then analyse the data. The useracts interactively with the computer during the process of developing a list of codes to be applied to the data (i.e. creating a codebook) which can then be used to givespecific codes to passages in the material. The researchercan also search the data for passages which meet theresearcher’s own preset requirements. In many respects,this is similar to NVivo.
There is no quick fix for learning any of these systems.There are training courses for NVivo, for example, lastingseveral days, which suggests that the systems cannot bemastered quickly.
Example of a NVivo/NUD*IST analysis
Pitcher and her colleagues (2006) studied sex work byusing focus group methodology (see Chapter 18) in whichresidents in a particular area talked together under thesupervision of a facilitator. NUD*IST was used to analysethe data originally. In order to demonstrate NVivo, wehave taken a small section of their data and re-analysed it.This is shown in the screenshot (Figure 21.3). Of course,different researchers with different purposes may analysethe same qualitative data very differently. We have done themost basic coding by entering free nodes for the interview
M21_HOWI4994_03_SE_C21.QXD 10/11/10 15:05 Page 354

CHAPTER 21 GROUNDED THEORY 355
passage. This will give you some idea of how complexeven this initial coding can be with NVivo – notice thepane at the side of the screenshot where the sections codedare identified between horizontal square brackets. Also,notice how the sections coded can overlap. It is possible to give several distinct codings or free nodes to the sameselection of text. Basically, the researcher highlights a section of text, chooses an existing coding for that section
or adds a new coding by typing in the lower box, and thenselects the code. Of course, this is just the start since theresearcher may wish to revise the codings, put the codings(free nodes) into a tree node structure, identify all of thetext with a particular coding and so forth.
We are grateful to Maggie O’Neil and Jane Pitcher forhelp with this box.
FIGURE 21.3 A screenshot of NVivo coding (from QSR International Pty Ltd)
21.6 Evaluation of grounded theory
Potter (1998) points out that central to its virtues is that grounded theory:
. . . encourages a slow-motion reading of texts and transcripts that should avoid thecommon qualitative research trap of trawling a set of transcripts for quotes to illustratepreconceived ideas.
(p. 127)
M21_HOWI4994_03_SE_C21.QXD 10/11/10 15:05 Page 355

356 PART 4 QUALITATIVE RESEARCH METHODS
This is probably as much a weakness as a strength since the size of the task may welldefeat the resources of novices and others. Certainly it is not always possible to be convinced that preconceived ideas do not dominate the analysis rather than the dataleading the analysis. There are a number of criticisms which seem to apply to groundedtheory:
It encourages a pointless collection of data, that is, virtually anything textual or spokencould be subject to a grounded theory analysis. There are no clear criteria for decid-ing, in advance, what topics to research on the basis of their theoretical or practicalrelevance. Indeed, the procedures tend to encourage the delay of theoretical and otherconsiderations until after the research has been initiated.
Potter (1998) suggests that ‘The method is at its best where there is an issue that istractable from a relatively common sense actor’s perspective . . . the theoretical notionsdeveloped are close to the everyday notions of the participants’ (p. 127). This meansthat commonsensical explanations are at a premium – explanations which go beyondcommon sense may be squeezed out. Potter puts it another way elsewhere ‘how far is thegrounding derived not from theorizing but from reproducing common sense theoriesas if they were analytic conclusions?’ (Potter, 1998, p. 127). This may be fair criticism.The difficulty is that it applies to any form of research which gives voice to its participants.Ultimately, this tendency means that grounded theory may simply codify how ordinarypeople ordinarily understand the activities in which they engage.
There is a risk that grounded theory, which is generally founded on admirable ideals,is used to excuse inadequate qualitative analyses. It is a matter of faith that groundedtheory will generate anything of significant value, yet at the same time, done properly,a grounded theory analysis may have involved a great deal of labour. Consequently,it is hard to put aside a research endeavour which may have generated little but cost a lot of time and effort. There are similar risks that grounded theory methods will be employed simply because the researcher has failed to focus on appropriateresearch questions, so leaving themself with few available analysis options. Theserisks are particularly high for student work.
Since talk and text are analysed line by line (and these are arbitrarily divided – they arenot sentences, for example) the researcher may be encouraged to focus on small unitsrather than the larger units of conversation as, for example, favoured by discourseanalysts (Potter, 1998). Nevertheless, grounded theory is often mentioned by suchanalysts as part of their strategy or orientation.
So it is likely that grounded theory works best when dealing with issues that areamenable to common-sense insights from participants. Medical illness and interpersonalrelationships are such topics where the theoretical ideas that grounded theory maydevelop are close to the ways in which the participants think about these issues. Thismay enhance the practicality of grounded theory in terms of policy implementation. The categories used and the theoretical contribution are likely to be in terms which arerelatively easy for the practitioner or policymaker to access.
21.7 Conclusion
Especially pertinent to psychologists is the question of whether grounded theory is reallya sort of Trojan horse which has been cunningly brought into psychology, but is reallythe enemy of advancement in psychology. Particularly troubling is the following fromStrauss and Corbin (1999):
M21_HOWI4994_03_SE_C21.QXD 10/11/10 15:05 Page 356

CHAPTER 21 GROUNDED THEORY 357
. . . grounded theory researchers are interested in patterns of action and interactionbetween and among various types of social units (i.e., ‘actors’). So they are not especiallyinterested in creating theory about individual actors as such (unless perhaps they arepsychologists or psychiatrists).
(p. 81)
Researchers such as Strauss and Corbin are willing to allow a place for quantitativedata in grounded theory. So the question may be one of how closely psychological con-cepts could ever fit with grounded theory analysis which is much more about the social(interactive) than the psychological.
Grounded theory is an approach to analysing (usually textual) data designed to maximise the fit ofemerging theory (categories) to the data and additional data of relevance.
The aim is to produce ‘middle range’ theories which are closely fitting qualitative descriptions (categories) rather than, say, cause-and-effect or predictive theories.
Grounded theory is ‘inductive’ (that is, does not deduce outcomes from theoretical postulates). It is systematic in that an analysis of some sort will almost always result from adopting the system. It is a continuous process of development of ideas – it does not depend on a critical test as in thecase of classic psychological theory.
Comparison is the key to the approach – all elements of the research and the analysis are constantlycompared and contrasted.
Coding (or naming or describing) is the process by which lines of the data are given a short descrip-tion (or descriptions) to identify the nature of their content.
Categorisation is the process by which the codings are amalgamated into categories. The processhelps find categories which fit the codings in their entirety, not simply a few pragmatic ideas whichonly partially represent the codings.
Memo writing is the process by which the researcher records their ideas about the analysis through-out the research process. The memo may include ideas about categorisation but it may extend toembrace the main themes of the final report.
Computer programs are available which help the researcher organise the materials for the analysisand effectively alter the codings and categories.
A grounded theory analysis may be extended to further critical samples of data which should be pertinent to the categories developed in the analysis. This is known as theoretical sampling.
The theoretical product of grounded theory analysis is not intended to be the same as conventionalpsychological theorisation and so should not be judged on those terms.
Key points
ACTIVITYGrounded theory involves the bringing of elements together to try to forge categories which unite them. So choose a favourite poem, song or any textual material, and write each sentence on a separate sheet of paper. Choose two at random. What unites these two sentences? Then choose another sentence. Can this be united with the previous two sentences? Continue the exercise until you cease coming up with new ideas. Then start again.
M21_HOWI4994_03_SE_C21.QXD 10/11/10 15:05 Page 357

Discourse analysis
Overview
CHAPTER 22
There are two main forms of discourse analysis in psychology. One is the social con-structionist approach of Potter and Wetherell (1995) which this chapter concentratesupon as it is the more student friendly. The other approach is that of Foucauldian discourse analysis which is rather more demanding and is not accessible so readilyby newcomers. Discourse analysis refers to a variety of ways of studying and under-standing talk (or text) as social action.
The intellectual roots of discourse analysis are largely in the linguistic philosophy ofthe 1960s. Most significant in this regard is the conceptualisation that discourse isdesigned to do things linguistically and that the role of the discourse analysts is tounderstand what is being done and how it is done through speech and text.
At one level, discourse analysis may be regarded as a body of ideas about the nature of talk and text which can be applied to the great mass of data collected bypsychologists in the form of language.
A number of themes are common in discourse analysis – these include rhetoric,voice, footing, discursive repertoires and the dialogical nature of talk.
The practice of discourse analysis involves a variety of procedures designed toencourage the researcher to process and reprocess their material. These include transcription, coding and re-coding.
M22_HOWI4994_03_SE_C22.QXD 10/11/10 15:06 Page 358

22.1 Introduction
There are two major types of discourse analysis in psychology. They are equally import-ant but one is less amenable to the needs of students new to qualitative research whereasthe other has numerous applications to student work throughout psychology. We shall,of course, devote more of this chapter to the latter than to the former. The first sort ofdiscourse analysis originates in the work of Michel Foucault (1926–1984), the Frenchacademic. Foucault was trained in psychology at one stage though he is better describedas a philosopher and historian. His work focused on critical studies of social institutionssuch as psychiatry, prisons, human sciences and medicine. Foucault saw in language the way in which institutions enforce their power. So for example, he argued that thenineteenth century medical treatment of mentally ill people was not a real advance on the crudity and brutality which characterised the treatment of ‘mad’ people before this time. Mental illness had become a method of controlling those who challenged themorality of bourgeois society. Madness is not a permanently fixed social category butsomething that is created through discourse to achieve social objectives. Foucauldian discourse analysis largely made its first appearance in psychology in the book Changingthe Subject: Psychology, social regulation, and subjectivity (1984) by Henriques,Hollway, Urwin, Venn and Walkerdine. Other examples of the influence of Foucauldianideas on psychology can be found in the work of Ian Parker, particularly in the field of mental health, in the books Deconstructing Psychopathology (Parker, Georgaca,Harper, McLaughlin and Stowell-Smith, 1995) and Deconstructing Psychotherapy(Parker, 1999). This branch of discourse analysis is closely linked to critical discourseanalysis.
The other approach to discourse analysis also has its roots outside psychology. It canbe described as a social constructionist approach to discourse analysis and came intopsychology through the work of Jonathan Potter and Margaret Wetherell (1987). It isthis that we will concentrate upon. According to The Oxford Companion to the EnglishLanguage (McArthur, 1992) its early origins lie in the work which extended linguisticsinto the study of language beyond the individual sentence. Perhaps the earliest of thesewas Zellig Harris who worked in the USA in the 1950s on issues such as how text isrelated to the social situation within which it was created. A little later, a linguisticanthropologist, Dell Hymes, investigated forms of address between people – that isspeech as it relates to the social setting. In the 1960s, a group of British linguisticphilosophers (J. L. Austin, J. R. Searle and H. P. Grice) began to regard language associal action – a key idea in discourse analysis. Potter (2001) takes the roots back earlier to the first half of the twentieth century by adding the philosopher LudwigWittgenstein into the melting pot of influences on discourse analysis theory. Particularlyimportant is Wittgenstein’s idea that language is a toolkit for doing things rather than ameans of merely representing things (see Figure 22.1).
It is a largely wasted effort to search for publications on discourse analysis by psychologists before the 1980s. The term first appears in a psychology journal in 1954but applied to ideas very different from its current meaning. However, despite its lateappearance in psychology, the study of discourse began to grow rapidly in the 1960s inother disciplines. Consequently, discourse analysis draws from a variety of disciplines,each of which has a different take or perspective on what discourse analysis is. Becauseof the pan-disciplinary base for discourse analysis, a psychologist, no matter how wellversed in other aspects of psychology, may feel overawed when first exploring theapproach. Not all psychologists have, say, the detailed knowledge of linguistics, sociologyand other disciplines that contribute to the field. Furthermore the distinctive contributionmade by psychologists to discourse analysis is not always clear.
CHAPTER 22 DISCOURSE ANALYSIS 359
M22_HOWI4994_03_SE_C22.QXD 10/11/10 15:06 Page 359

360 PART 4 QUALITATIVE RESEARCH METHODS
So discourse analysis studies language in ways very different from traditional linguistics.The latter is largely concerned with:
word sounds (phonetics and phonology);
units which make up words (morphology);
meaning (semantics);
word order within sentences (syntax).
Beaugrande (1996) refers to this traditional style of linguistics, in a somewhat derogatoryfashion, as ‘language science’. For him, traditional linguistics was at fault for profoundlydisconnecting language from real-life communications – to just study sounds, words andsentences. In discourse analysis, language is regarded as being much more complex.Discourse is how language operates in real-life communicative events. Discourse analysisinvolves the analysis of speech, text and conversation so its concerns are with analysesbeyond the level of the sentence. Hence, Stubbs (1983, p. 1) defines discourse analysis asbeing about the way in which language is used at the broader level than the sentence andother immediate utterances. A good illustration of this (Tannen, 2007) are the two signsat a swimming pool:
Please use the toilet, not the pool.Pool for members only.
Considered separately, just as sentences, the signs convey clear messages. However, ifthey are read as a unit of two sentences, then they either constitute a request for non-members to swim in the toilet or an indication that members have exclusive rights to urinate in the swimming pool! Analysing just two sentences at a time as in this examplecauses us to re-write the meaning of both sentences.
Discourse analysis emphasises the ways in which language interacts with society, especially in the nature of dialogue in ordinary conversation. Above all, then, discourse
FIGURE 22.1 The roots of discourse analysis
M22_HOWI4994_03_SE_C22.QXD 10/11/10 15:06 Page 360

CHAPTER 22 DISCOURSE ANALYSIS 361
analysis is a perspective on the nature of language. Discourse analysis does not treat language as if it were essentially representational – language is not simply the means ofarticulating internal mental reality. Quite the reverse, discourse analysis is built on theidea that truth and reality are not identifiable or reachable through language.
Language for the discourse analyst is socially situated and it matters little whether the text under consideration is natural conversation or written text in the form, say, ofnewspaper headlines. Each of these provides suitable material for analysis. Since dis-course analysis is a shift in the way language is conceptualised, what language doesbecomes more important than what is represented by language. Researchers in this fieldhave different emphases, but it is typically the case that language is regarded as doingthings and especially it is regarded as doing things in relation to other people in a con-versation. As such, discourse analysis employs ‘speech act theory’ (Austin, 1975) whichregards language as part of a social performance. In the course of this performance,social identities are formed and maintained, power relations are created, exercised andmaintained, and generally a lot of social work is done. None of these can be effectivelyconstrued as language simply and directly communicating internal thought. Language inthis context becomes a practice, not a matter of informal or formal structures.
The phrase discourse analysis may arouse pictures of a well-established empiricalmethod of analysing people talking, interviews and so forth. In a sense it is. However,discourse analysis is not merely a number of relatively simple analytical skills that canquickly be learnt and easily applied. Some aspects are relatively simple. For example,transcription methods such as Jefferson’s (Chapter 19) are relatively easily assimilated.Discourse analysts themselves have frequently presented the definition and practice ofdiscourse analysis as problematic. For example, Edley (2001) wrote:
. . . there is no simple way of defining discourse analysis. It has become an ever broad-ening church, an umbrella term for a wide variety of different analytic principles andpractices.
(p. 189)
and Potter (2004) adds to the sense of incoherence:
. . . in the mid 80s it was possible to find different books called Discourse Analysiswith almost no overlap in subject matter; the situation at the start of the 00s is, if anything, even more fragmented.
(p. 607)
and Taylor (2001) reinforces the view that discourse analysis should not be regarded asmerely another variant or sub-discipline of methods:
. . . to understand what kind of research discourse analysis is, it is not enough to studywhat the researcher does (like following a recipe!). We also need to refer back to theseepistemological debates and their wider implications.
(p. 12)
Even discourse analysts with backgrounds in psychology do not offer a united front onits nature. Different viewpoints exist partly because they draw on different intellectualroots. Consequently, one needs to be aware that there is no consensus position whichcan be identified as the core of discourse analysis. This would help heighten and facilitatethe theoretical debate, it is not a criticism.
M22_HOWI4994_03_SE_C22.QXD 10/11/10 15:06 Page 361

362 PART 4 QUALITATIVE RESEARCH METHODS
22.2 Important characteristics of discourse
Within discourse analysis, there is a variety of ideas, observations and concepts thatbroadly suggest ways in which language and text should be analysed. These are discussedin this section.
■ Speech actsOf particular importance to psychologists working in discourse analysis is the theory ofspeech acts. This originated in the work of Austin (1975). Performatives was his term forutterances which have a particular social effect. For Austin, all words perform social acts:
Locution This is simply the act of speaking.
Illocution This is what is done by saying these words.
Perlocution This is the effect or consequence on the hearer who hears the words.
To speak the words is essentially to do the act (speech act). For the words to have aneffect certain conditions have to be met. These were illustrated in Searle (1969) using thefollowing utterances:
Sam smokes habituallyDoes Sam smoke habitually?Sam. Smoke habitually!Would that Sam smoked habitually.
Saying the words constitutes an utterance act or locutory act. They constitute the act ofuttering something. At the same time, they are also propositional acts because they referto something and predicate something. Try introducing any of them into a conversationwith a friend. It is unlikely that the sentence could be said without some sort of responsefrom the other person on the topic of Sam, smoking or both. Each of the sentences also constitutes an illocutory act because they do things like state, question, command,promise, warn, etc.
For example, in some contexts each of these sentences may contain an unstated indication that the speaker wishes to do something about Sam’s smoking. ‘Would thatSam smoked habitually’ may be a slightly sardonic way of suggesting that it would begreat if Sam could be persuaded to smoke as infrequently as habitually! Equally, if theywere uttered by a shopkeeper about his customer Sam who spends large amounts onchocolates for his wife every time he calls in for a packet of cigarettes, the same wordswould constitute a different illocutory act. The sentences are also perlocutionary acts inthat they have an effect or consequence on the hearer though what this effect is dependson circumstances. For example, the locution ‘Sam smokes habitually’ might be taken asa warning that the landlord is unhappy about Sam smoking in violation of his tenancycontract if said by Sam’s landlord to Sam’s wife. In speech act theory, the indirect natureof speech is inevitably emphasised since the interaction between language and the socialcontext is partially responsible for meaning.
■ Grice’s maxims of cooperative speechAnother contribution which comes from the philosophy of language are Grice’s (1975)maxims. These indicate something of the rule-based nature of exchanges between people.The overriding principle is conversational cooperativeness over what is being communicatedat the time. Cooperativeness is achieved by obeying four maxims:
M22_HOWI4994_03_SE_C22.QXD 10/11/10 15:06 Page 362

CHAPTER 22 DISCOURSE ANALYSIS 363
Quality, which involves making truthful and sincere contributions.
Quantity, which involves the provision of sufficient information.
Manner, which involves making one’s contributions brief, clear and orderly.
Relation, which involves making relevant contributions.
These maxims contribute to effective communications. They are not the only principlesunderlying social exchanges. For example, unrestrained truthfulness may offend when itbreaches politeness standards in conversation.
■ FaceSimilarly, language often includes strategies for protecting the status of the various participants in the exchange. The notion of ‘face’ is taken from the work of Goffman(1959) to indicate the valued persona that individuals have. We speak of saving face ineveryday conversation. Saving face is a collective phenomenon in which all members ofthe conversation may contribute, not simply the person at risk of losing face.
■ RegisterThe concept of register highlights the fact that when we speak the language style that we use varies according to the activity being carried out. The language used in a lectureis not the same as that used when a sermon is being given. This may be considered a matter of style but it is described as register. Register has a number of componentsincluding:
field of activity (for example, police interview, radio interview);
medium used (for example, spoken language, written language, dictated language);
tenor of the role relationship in a particular situation (for example, parent–child,police officer–witness).
22.3 The agenda of discourse analysis
It should be clear by now that discourse analysis is not a simple to learn, readily appliedtechnique. Discourse analysis is a body of theory and knowledge accumulated over aperiod of 50 years or more. It is not even a single, integrated theory. Instead it providesan analytical focus for a range of theories contributed by a variety of disciplines such as philosophy, linguistics, sociology and anthropology. Psychology as somewhat a latecomer to the field is in the process of setting its own distinctive stamp on discourseanalysis. What is the agenda for a discourse analysis-based approach to psychology? Tore-stress the point, there are no short cuts to successful discourse analysis. Intellectualand theoretical roots are more apparent in the writings of discourse analysts than practically any other field of psychology. In other words, the most important practicalstep in using discourse analysis is to immerse oneself in its theoretical and research literature. One cannot just get on with doing discourse analysis. Without understandingin some depth the constituent parts of the discourse analytic tradition, the objectives ofdiscourse analysis cannot be appreciated fully. This would be equally true of designingan experiment – we need to understand what it does, how it does it, why it does it, andwhen it is inappropriate.
M22_HOWI4994_03_SE_C22.QXD 10/11/10 15:06 Page 363

364 PART 4 QUALITATIVE RESEARCH METHODS
The agenda of psychological discourse analysis according to Potter and Wetherell(1995) includes the following:
Practices and resources Discourse analysis is not simply an approach to the social use of language. It focuses on discourse practices – the things that people do in talkand writings. But it also focuses on the resources that people employ when achievingthese ends. For example, the strategies employed in their discourse, the systems of categorisation they use, and the interpretative repertoires that are used. Interpretativerepertoires are the ‘broadly discernible clusters of terms, descriptions, and figures ofspeech often assembled around metaphors or vivid images’ (Potter and Wetherell,1995, p. 89). So, for example, when newspapers and politicians write and talk about drugs they often use the language repertoire of war and battle. Hence the ‘waron drugs’, ‘the enemy drugs’ and so forth. Discourse analysis seeks also to providegreater understanding of traditional (socio-)psychological topics such as the nature ofindividual and collective identity, how to conceive social action and interaction, thenature of the human mind, and constructions of the self, others and the world.
Construction and description During conversation and other forms of text, peoplecreate and construct ‘versions’ of the world. Discourse analysis attempts to understandand describe this constructive process.
Content Talk and other forms of discourse are regarded as the important site of psychological phenomena. No attempt is made to postulate ‘underlying’ psychological
Critical discourse analysis
Box 22.1 Key Ideas
The term ‘critical discourse analysis’ has a rather narrowerfocus than the words might imply. Critical does not meancrucial in this context and neither does it imply a gener-ally radical stance within the field of discourse analysis.Critical discourse analysis is simply a school of thoughtwhich emphasises power and social inequality in the inter-pretation of discourse. Critical discourse analysis studiesthe way in which power is attained and maintained throughlanguage. According to van Dijk (2001), dominance is theexercise of social power by elites, institutions and socialgroups. Consequences of the exercise of power includevarieties of social inequality – ethnic, racial and genderinequality, for example. Equally, language has the potentialto serve the interests of disadvantaged groups in order to redress and change the situation. The phrase ‘black isbeautiful’, for example, was used to counter destructiveeffects on the self-image of black children of racist viewsof themselves.
Dominance is achieved using language in a variety ofways. For example, the way a group is represented in lan-guage, how language is used to reinforce dominance, and
the means by which language is used to deny and concealdominance:
. . . critical discourse analysts want to know whatstructures, strategies or other properties of text, talk,verbal interaction or communicative events play a rolein these modes of reproduction.
(van Dijk, 2001, p. 300)
Brute force is an unacceptable means of achievingpower in modern society. Persuasion and manipulationthrough language provide a substitute for violence, and sopower is achieved and maintained through language.
Others extend the notion of ‘critical’ to include a wider set of concerns than van Dijk. Hepburn (2003) suggests that it also includes issues of politics, moralityand social change. These are all components or facets ofvan Dijk’s notion of power. Concerns such as these link toa long tradition of concerned psychology in which power,politics, morality and social change are staple ingredients(for example, Howitt, 1992a).
M22_HOWI4994_03_SE_C22.QXD 10/11/10 15:06 Page 364

CHAPTER 22 DISCOURSE ANALYSIS 365
mechanism to explain that talk. So racist talk is regarded as the means by which dis-crimination is put into practice. There is no interest in ‘psychological mechanisms’such as authoritarian personalities or racist attitudes.
Rhetoric Discourse analysis is concerned with how talk can be organised so as to beargumentatively successful or persuasive.
Stake and accountability People regard others as having a vested interest (stake) inwhat they do. Hence they impute motives to the actions of others which may justifydismissing what these others say. Discourse analysis studies these processes.
Cognition in action Discourse analysis actively rejects the use of cognitive conceptssuch as traits, motives, attitudes and memory stores. Instead it concentrates on thetext by emphasising, for example, how memory is socially constructed by people,such as when reminiscing over old photographs.
This agenda might be considered a broad framework for psychological discourse analysis.It points to aspects of text which the analyst may take into account. At the same time,the hostility of discourse analysis to traditional forms of psychology is apparent.
22.4 Doing discourse analysis
It cannot be stressed too much that the objectives of discourse analysis are limited in a number of ways – especially the focus on the socially interactive use of language. In anutshell, there is little point in doing a discourse analysis to achieve ends not shared bydiscourse analysis. Potter put the issue as follows:
To attempt to ask a question formulated in more traditional terms (‘what are the factors that lead to condom use among HIV+ gay males’) and then use discourse analytic methods to answer it is a recipe for incoherence.
(Potter, 2004, p. 607)
Only when the researcher is interested in language as social action is discourse analysisappropriate. Some discourse analysts have contributed to the confusion by offering it as a radical and new way of understanding psychological phenomena; for example,when they suggest that discourse analysis is anti-cognitive psychology. This, takensuperficially, may imply that discourse analysis supersedes other forms of psychology. Itis more accurate to suggest that discourse analysis performs a different task. A discourseanalysis would be useless for biological research on genetic engineering but an excellentchoice to look at the ways in which the moral and ethical issues associated with geneticengineering are dealt with in speech and conversation.
Although a total novice can easily learn some of the skills of discourse analysis (forexample, Jefferson transcription), doing a good discourse analysis is far harder. Readingis crucial but experience and practice also play their parts. The best way to get a feel ofwhat a discourse analysis is would be to read the work of the best discourse analysts. Thatwould apply to all forms of research. A report of a discourse analysis makes frequentreference to research and theory in the field. We have outlined some of this but ideas aredeveloping continually.
There is a degree of smog surrounding the steps by which a discourse analysis is done.It is not like calculating a t-test or chi-square in a step-by-step fashion. No set of proceduresexists which, if applied, guarantee a successful discourse analysis. Potter (2004) puts itas follows:
M22_HOWI4994_03_SE_C22.QXD 10/11/10 15:06 Page 365

366 PART 4 QUALITATIVE RESEARCH METHODS
There is no single recipe for doing discourse analysis. Different kinds of studiesinvolve different procedures, sometimes working intensively with a single transcript,other times drawing on a large corpus. Analysis is a craft that can be developed withdifferent degrees of skill. It can be thought of as the development of sensitivity to the occasioned and action-oriented, situated, and constructed nature of discourse.Nevertheless, there are a number of ingredients which, when combined together arelikely to produce something satisfying.
(p. 611)
The use of the word ‘craft’ suggests the carpenter’s workshop in which nothing of worth can be produced until the novice has learnt to sharpen tools, select wood, markout joints, saw straight and so forth. Likewise in discourse analysis, the tools are slowlymastered. Actually, Potter (1997) put it even more graphically when he wrote that forthe most part:
. . . doing discourse analysis is a craft skill, more like bike riding or chicken sexingthan following the recipe for a mild chicken rogan josh.
(p. 95)
Publications which seek to explain the process of discourse analysis often resort to a simple strategy: students are encouraged to apply the concepts developed by majorcontributors to discourse theory. In other words, tacitly the approach encourages thenovice discourse analyst to find instances in their data of key discourse analytic concepts.For example, they are encouraged to identify what register is being employed, what awkwardness is shown in the conversation, what rhetorical devices are being used, what discourse repertoires are being employed and so forth. Some of this is redolent ofthe work of expert discourse analysts. If one initially attempts to understand the textunder consideration using standard discourse analytic concepts, the later refinement andextension of these concepts will be facilitated. Areas which are problematic in terms ofthe application of standard concepts will encourage the revision of those concepts. Atthis stage, the analysis may begin to take a novel turn.
The features of language which need to be examined in a discourse analysis can be listed. This may be described as an itinerary for discourse analysis (Wetherell andTaylor, 2001). Where to go and what to look for, as well as the dead-ends that shouldbe ignored, are part of this. So one may interrogate one’s data to find out which of thefollowing are recognisable or applicable to the particular text in question:
Language is an inappropriate way of accessing reality. Instead language should beregarded as constructive or constitutive of social life. Through discourse, individualsand groups of individuals build social relations, objects and worlds.
Since discourse constructs versions of social reality, an important question of any textis why a particular version of reality is being constructed through language and whatdoes this particular version accomplish?
Meaning is produced in the context of speech and does not solely reside in a culturalstorehouse of agreed definitions. Discourse analysts refer to the co-production ofmeaning. The analysis partly seeks to understand the processes by which meaning iscreated. Meaning, for example, is a ‘joint production’ of two or more individuals inconversation.
Discursive practice refers to the things which happen in language to achieve particularoutcomes.
M22_HOWI4994_03_SE_C22.QXD 10/11/10 15:06 Page 366

CHAPTER 22 DISCOURSE ANALYSIS 367
Discursive genres are the type of language extract under consideration. So the dis-course analyst may study the particular features of news and how it differs from othertypes of language. There are cues in news speech which provide indicators that it isnews speech rather than, say, a sermon (contextualisation cues).
Footing (a concept taken from the sociologist Goffman) refers to whether the speakertalks as if they are the author of what is being said, the subject of the words that arebeing said, or whether they are presenting or animating the words of someone else.These different footings are not mutually exclusive and all may be present in any text.
Speech is dialogical. That is, when we talk we combine or incorporate things fromother conversations. Sometimes this is in the form of reporting what ‘he said’ or what ‘she replied’. More often, however, the dialogical elements are indirect and nothighlighted directly as such. For example, children who say something like ‘I mustn’tgo out on my own’ reflect previous conversations with their parents and teachers.
Taylor (2001) characterises discourse analysis as an ‘open-ended’ and circular (or iterative) process. The task of the researcher is to find patterns without a clear idea of whatthe patterns will be like. She writes of the ‘blind faith’ that there must be something thereworthy of the considerable effort of analysis. The researcher will need to go through thedata repeatedly ‘working up’ the analysis on the basis of what fits and does not fit tentativepatterns. ‘Data analysis is not accomplished in one or two sessions’ (pp. 38–9). Taylorindicates that the process of examination and re-examination may not fit comfortablywith conventional research timescales. The direction or end point of the analysis is alsodifficult to anticipate. She feels that qualitative data are so ‘rich’ (that is detailed) that theremay be more worth studying in the data even when the possibilities seem to be exhausted.
The process of carrying out a discourse analysis can be summarised in the six stepsillustrated in Figure 22.2. The steps are superficially straightforward but this belies theneed for a level of intensity in examining and re-examining the data. What the analyst islooking for are features which stand out on reading and re-reading the transcript. Theseare then marked (coded) systematically throughout the transcript to be collected togetherlater – simply by copying and pasting the excerpts from the transcript into one file, perhaps.It is this collection that is subject to the analytic scrutiny of the researcher concentratingon things like deviant cases which do not seem to fit the general pattern. When the analysisis complete, then the issue of validity may be addressed by, for example, getting the participants in the research to comment on the analysis from their perspective.
FIGURE 22.2 The steps involved in a typical discourse analysis
M22_HOWI4994_03_SE_C22.QXD 10/11/10 15:06 Page 367

368 PART 4 QUALITATIVE RESEARCH METHODS
Discourse analysis
Box 22.2 Research Example
In research on menstruation, Lovering (1995) talked with11- and 12-year-old boys and girls in discussion groups.Among a range of topics included on her guide for conduct-ing the discussions were issues to do with menstruation.These included questions such as: ‘Have you heard ofmenstruation?’; ‘What have you been told about it?’; ‘Whatdo you think happens when a woman menstruates?’; ‘Whydoes it happen?’; and ‘Who has told you?’ (Lovering,1995, p. 17). In this way relatively systematic materialcould be gathered in ways closer to ordinary conversationthan would be generated by one-on-one interviews. Shetook detailed notes of her experiences as soon as possibleafter the discussion groups using a number of headings (p. 17):
How she (Lovering) felt
General emotional tone and reactions
Non-verbal behaviour
Content recalled
Implications and thoughts.
This is a form of diary writing of the sort discussedalready in relation to grounded theory. The difference perhaps is that she applied it to the data collection phaserather than the transcription phase. Lovering transcribedthe tape-recording herself – eventually using the Jeffersonsystem described in Chapter 19. She also employed a computer-based analysis program (of the sort that NVivois the modern equivalent). Such a program does not do the analysis for you; it allows you to store and work witha lot of text, highlight or mark particular parts of the text,sort the text and print it out. All of these things can beachieved just using pencil and paper, but a computer ismore convenient.
The next stage was to sort the text into a number ofcategories – initially, she had more than 50. She developedan analysis of the transcribed material partly based on her awareness of a debate about the ways in which maleand female bodies are socially construed quite differently.Boys’ physical development is regarded as a gradual andunproblematic process, whereas in girls the process ismuch more problematic. The following excerpts from atranscript illustrate this:
A: They [school teachers] don’t talk about the boysvery much only the girls = yes = yes.
A: It doesn’t seem fair. They are laughing at us. Notmuch seems to happen to boys.
A: Girl all go funny shapes = yes = like that = yes.
A: Because the boys, they don’t really . . . changevery much. They just get a little bit bigger.
A: It feels like the girls go through all the changesbecause we are not taught anything about the boysREALLY.
(Lovering, 1995, pp. 23–4)
Menstruation was learnt about from other people –predominantly female teachers or mothers. Embarrass-ment dominated, and the impression created was thatmenstruation was not to be discussed or even mentionedas a consequence. Talk of female bodies and bodily func-tions by the youngsters features a great deal of sniggering.In contrast, when discussing male bodies things becomemore ordinary and more matter of fact. Furthermore, boys are also likely to use menstruation as a psychologicalweapon against girls. That is, menstruation is used tomake jokes about and ridicule girls. In Lovering’s analysis,this is part of male oppression of females: even in sex education lessons learning about menstruation is associatedin girls’ minds as being ‘laughing at girls’.
Of course, many more findings emerged in this study.Perhaps what is important is the complexity of the processby which the analysis proceeds. It is not possible to saythat if the researcher does this and then does that, a goodanalysis will follow. Nevertheless, it is easy to see how the researcher’s ideas relate to key aspects of discourseanalytic thinking. For example, the idea that menstrua-tion is used as a weapon of oppression of females clearlyhas its roots in feminist sexual politics which suggests that males attempt to control females in many ways fromdomestic violence through rape to, in this example, sexeducation lessons. One could equally construe this as part of Edwards and Potter’s (1993) discursive actionmodel. This suggests, among other things, that in talk,conversation or text, one can see social action unfoldingbefore one’s eyes. One does not have to regard talk, text
M22_HOWI4994_03_SE_C22.QXD 10/11/10 15:06 Page 368

CHAPTER 22 DISCOURSE ANALYSIS 369
or conversation as the external manifestation or symptomof an underlying mental state such as an attitude. A topicsuch as menstruation may be seen to generate not merelyhostility in the form of laughter towards the female body,but also as a means of accessing concepts of femininity in which the female body is construed as mysterious, to be embarrassed about, and sniggered over by both sexes.Horton-Salway (2001) uses the same sort of model toanalyse how the medical profession went about presenting
the medical condition ME in a variety of ways throughlanguage.
Discourse analysis, like other forms of qualitative ana-lysis, is not amenable to short summaries. This might beexpected given that a discourse analysis seeks to provideappropriate analytic categories for a wide range of texts.The consequence is that anyone wishing to understanddiscourse analytic approaches will need to read originalanalyses in detail.
Discourse analysis is based on early work carried out by linguists, especially during the 1950s and1960s, which reconstrued language much as a working set of resources to allow things to be donerather than regarding language as merely being a representation of something else.
The analysis uses larger units of speech than words or sentences such as a sequence of conversa-tional exchanges.
Precisely how discourse analysis is defined is somewhat uncertain as it encompasses a wide rangeof practices as well as theoretical orientations.
Central to most discourse analysis is the idea of speech as doing things – such as constructing andconstruing meaning.
Discourse analysis has its own roadmap which should be considered when planning an analysis.Discourse practices and resources, for example, are the things that people do in constructing conversations, texts and writings. Rhetoric is about the wider organisation of language in ways thatfacilitate its effectiveness. Content is regarded for what it is rather than what underlying psychologicalstates it represents.
Critical discourse analysis has as its central focus the concept of power. It primarily concerns howsocial power is created, reaffirmed and challenged through language.
Key points
22.5 Conclusion
One of the significant achievements of discourse analysis is that of bringing to psychologya theoretically fairly coherent set of procedures for the analysis of the very significantamounts of textual material which forms the basis of much psychological data. It has tobe understood that discourse analysis has a limited perspective on the nature of this data.In particular, discourse analysts reject the idea that language is representational, that is, in language there is a representation of, say, the individual’s internal psychologicalstate. Instead they replace it with the idea that language is action and is designed to dosomething, not represent something. As a consequence, discourse analysis is primarily of use to researchers who wish to study language as an active thing. In this way, discourseanalysis may contribute a different perspective on many psychological processes, but itdoes not replace or supersede the more traditional viewpoints within psychology.
M22_HOWI4994_03_SE_C22.QXD 10/11/10 15:06 Page 369

370 PART 4 QUALITATIVE RESEARCH METHODS
ACTIVITIES1. When having a coffee with friends, note occasions when the conversation might be better seen as speech acts rather
than taken literally. Better still, if you can record such a conversation, transcribe a few minutes’ worth and highlight inred where literal interpretations would be appropriate and in yellow where the concept of speech act might be moreappropriate.
2. Study day-to-day conversations of which you are part. Is there any evidence that participants spare other participantsin the conversation embarrassment over errors? That is, to what extent does face-saving occur in your day-to-day experience?
3. Choose a chapter of your favourite novel: does discourse analysis have more implications for its contents than moretraditional psychology?
M22_HOWI4994_03_SE_C22.QXD 10/11/10 15:06 Page 370

Conversation analysis
Overview
CHAPTER 23
Conversation analysis studies the structure of conversation by the detailed examinationof successive turns or contributions to a conversation.
It is based on ethnomethodological approaches derived from sociology that stressthe importance of participants’ understandings of the nature of the world.
Many of the conventions of psychological research are turned on their head in conversation analysis. The primacy of theory in developing research questions andhypotheses is replaced by an emphasis on the importance of the data in generatingexplanations.
Because of its reversal of conventional psychological research methodology, con-versation analysis warrants the careful attention of all psychologists since it helpsdefine the nature of psychological research.
M23_HOWI4994_03_SE_C23.QXD 10/11/10 15:06 Page 371

372 PART 4 QUALITATIVE RESEARCH METHODS
23.1 Introduction
Conversation analysis has its intellectual roots in ethnomethodology championed in the 1960s by the American sociologist Harold Garfinkel (1967). He wanted to under-stand the way in which interactions in everyday life are conducted. In particular, ethnomethodologists were concerned with ordinary everyday conversation. The term‘ethnomethodology’ signifies Garfinkel’s method of studying the common-sense ‘meth-odology’ used by ordinary conversationalists to conduct social interactions. Just how isinteraction constructed and managed into largely unproblematic sequences?
One of Garfinkel’s major contributions was to show that everyday interactionbetween people involves a search for meaning. Care is needed because this is not sayingthat everyday interaction is meaningful as such – only that participants in that inter-action regard it as meaningful. To demonstrate this he relied on a form of experimentalresearch. In one example of this, students attended a ‘counselling’ session in a university’spsychiatry department (McHugh, 1968). The situation was such that participants com-municated only indirectly with the ‘counsellor’ who, totally at random, replied to theclient with either ‘yes’ or ‘no’. In this instance, essentially the real world was chaotic andmeaningless (unless, of course, one is aware of the random process and the purpose ofthe study). Nevertheless the participants in the research dealt with this chaotic situationof random responses by imposing a meaningful and organised view of the situation. Theconcern of ethnomethodologists such as Garfinkel and Aaron Cicourel with the fine detailof this sense-making process influenced others – the most important of whom was HarveySacks, who is regarded as the founder of conversation analysis. Also influential on Sackswas the work of Erving Goffman who stressed the nature of social interaction as a socialinstitution which imposed norms and obligations on members (see Figure 23.1).
During the 1960s, Sacks became interested in the telephone calls made to hospitalemergency departments (Sacks, 1992). While some researchers might have sought toclassify the types of call made, for example, Sacks had a much more profound approachto his chosen subject matter. Substantial numbers of callers to the emergency department
FIGURE 23.1 The roots of conversation analysis
M23_HOWI4994_03_SE_C23.QXD 10/11/10 15:06 Page 372
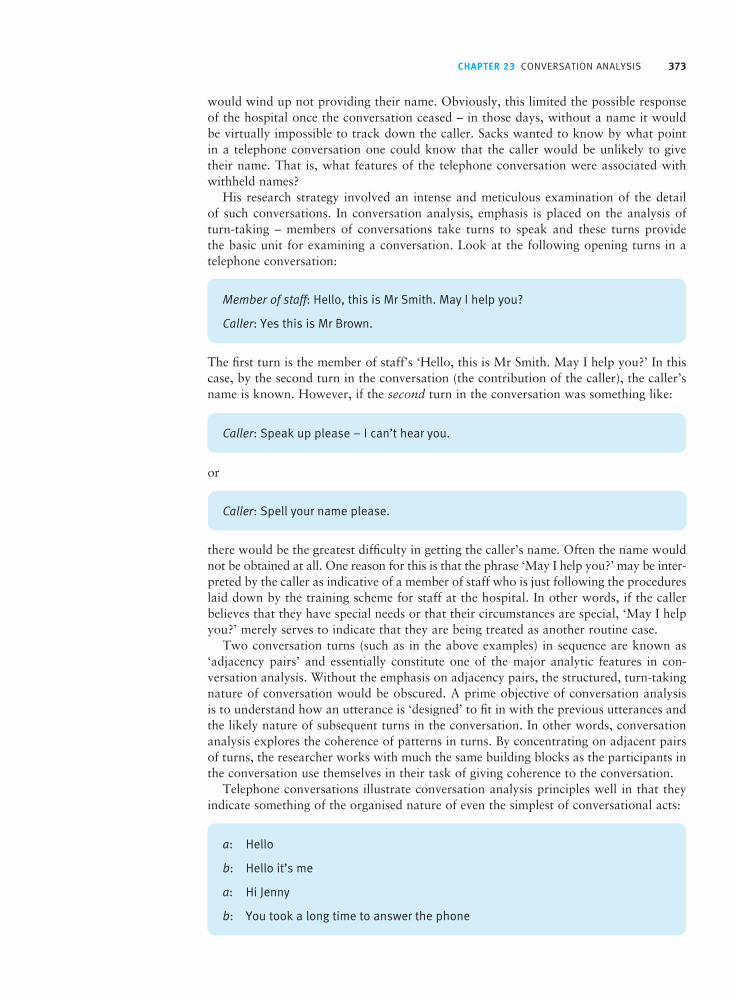
CHAPTER 23 CONVERSATION ANALYSIS 373
would wind up not providing their name. Obviously, this limited the possible responseof the hospital once the conversation ceased – in those days, without a name it would be virtually impossible to track down the caller. Sacks wanted to know by what point in a telephone conversation one could know that the caller would be unlikely to givetheir name. That is, what features of the telephone conversation were associated withwithheld names?
His research strategy involved an intense and meticulous examination of the detail of such conversations. In conversation analysis, emphasis is placed on the analysis ofturn-taking – members of conversations take turns to speak and these turns provide the basic unit for examining a conversation. Look at the following opening turns in atelephone conversation:
Member of staff: Hello, this is Mr Smith. May I help you?
Caller: Yes this is Mr Brown.
The first turn is the member of staff’s ‘Hello, this is Mr Smith. May I help you?’ In thiscase, by the second turn in the conversation (the contribution of the caller), the caller’sname is known. However, if the second turn in the conversation was something like:
Caller: Speak up please – I can’t hear you.
or
Caller: Spell your name please.
there would be the greatest difficulty in getting the caller’s name. Often the name wouldnot be obtained at all. One reason for this is that the phrase ‘May I help you?’ may be inter-preted by the caller as indicative of a member of staff who is just following the procedureslaid down by the training scheme for staff at the hospital. In other words, if the callerbelieves that they have special needs or that their circumstances are special, ‘May I helpyou?’ merely serves to indicate that they are being treated as another routine case.
Two conversation turns (such as in the above examples) in sequence are known as‘adjacency pairs’ and essentially constitute one of the major analytic features in con-versation analysis. Without the emphasis on adjacency pairs, the structured, turn-takingnature of conversation would be obscured. A prime objective of conversation analysis is to understand how an utterance is ‘designed’ to fit in with the previous utterances andthe likely nature of subsequent turns in the conversation. In other words, conversationanalysis explores the coherence of patterns in turns. By concentrating on adjacent pairsof turns, the researcher works with much the same building blocks as the participants inthe conversation use themselves in their task of giving coherence to the conversation.
Telephone conversations illustrate conversation analysis principles well in that theyindicate something of the organised nature of even the simplest of conversational acts:
a: Hello
b: Hello it’s me
a: Hi Jenny
b: You took a long time to answer the phone
M23_HOWI4994_03_SE_C23.QXD 10/11/10 15:06 Page 373

374 PART 4 QUALITATIVE RESEARCH METHODS
It is quite easy to see in this the use of greetings such as Hello to allow for the voiceidentification of the speaker. There is also an assumption that the hearer should be able to recognise the voice. Finally there is an expectation that the ring of a telephoneshould initiate the response fairly rapidly in normal circumstances. It does not take agreat deal to figure out that this is likely to be a call between close friends rather than, say,a business call. This interpretation may not be sophisticated in terms of the principles of conversation analysis, but it does say a good deal about the nature of turn-taking ingeneral and especially in telephone calls.
It is one of the assumptions of conversation that the speaker will either indicate toanother speaker that it is their turn to speak or provide the opportunity for another to take their turn. So it is incumbent on the speaker to include a ‘transition relevancespace’ which provides the opportunity for another speaker to take over speaking. Theapproach in conversation analysis is to study the various things which can occur nextand not the most likely thing to occur next as probably would be the objective of a mainstream quantitative psychologist. Figure 23.2 illustrates the basic situation and the possible broad outcomes. Although there is a conversationally presented opportunity for another person to take over the conversation, there is no requirement that they do.Hence there are two possible things which can happen next – one is that the conversationshifts to another speaker and the other is that the original speaker carries on speaking.The question is just how this happens and the consequences for the later conversation ofits happening.
For anyone grounded in the mainstream methods of psychology, there is a major ‘culture shock’ when confronted with a research paper on conversation analysis. It isalmost as if one is faced with a research paper stripped bare. The typical features of apsychology report may well be missing. For example, the literature review may be absentor minimal, details of sampling, or participant or interaction selection are often sparse,and generally detail of the social context in which the conversation took place is largelymissing. Some of the reasons for this are the traditions and precepts of conversationanalysis. More important though to understanding conversation analysis is the realisationthat what is crucial in terms of understanding everyday conversation is the way in which the conversation is understood structurally by the participants. As such, theoreticaldiscussions would obstruct ethnomethodological understanding since the theory is notbeing used by the participants in the conversation. Similarly, details of the social contextof the conversation, while important from some perspectives, for a conversation analystmiss the point. The key idea is that in conversation analysis the principles of conversa-tion are regarded as directly governing the conversation. The consideration of factorsextraneous to the conversation merely diverts attention away from this.
FIGURE 23.2 The turn relevance space in a conversation
M23_HOWI4994_03_SE_C23.QXD 10/11/10 15:06 Page 374

CHAPTER 23 CONVERSATION ANALYSIS 375
In conversation analysis the study of how ordinary life conversation is conductedinvolves the following stages:
The recording stage, in which conversation is put on video or audio-only recordingequipment.
Transcription, in which the recording or parts of the recording are transcribed usingthe minutely detailed methods of Gail Jefferson’s transcription system (see Chapter 19).This system does not merely include what has been said but, crucially, a great deal ofinformation about the way in which it has been said.
Analysis consists of the researcher identifying aspects of the transcription of note for some reason, then offering suggestions as to the nature of the conversationaldevices, etc. which may be responsible for the significant features. But things do notcome quite as easily as this implies.
Conversation analysis essentially eschews the postulate that there are key psychologicalmechanisms which underlie conversation. Interaction through talk is not regarded as the external manifestation of inner cognitive processes. In this sense, whether or not participants in conversation have intentions, motives or interests, personality and character is irrelevant. The domain of interest in conversation analysis is the structure ofconversation (Wooffitt, 2001). This, of course, refers to the psychological theorising of the researcher – the participants in the conversation may well incorporate psychological factors into their understanding of the conversation and, more importantly, refer tothem in the conversation.
23.2 Precepts of conversation analysis
So the major objective of conversation analysis is the identification of repeated patternsin conversation that arise from the joint endeavour of the speakers in the production of conversation. One example of such a pattern is the preference of members of a conversation to allow conversational errors to be self-corrected (as opposed to beingcorrected by other participants in the conversation). The next person to speak after theerror may offer some device to prompt or initiate the ‘repair’ without actually makingthe repair. For example, a brief silence may provide the opportunity for the person whohas said the wrong thing to correct themselves.
Drew (1995) provided a list of methodological precepts or principles for doing a conversation analysis:
A participant’s contribution (turn) is regarded as the product of the sequence of turnspreceding it in the conversation. Turns are basically subject to a requirement that they fit appropriately and coherently with the prior turn. That is, adjacency pairs fittogether effectively and meaningfully. Of course, there will be deviant cases when thisdoes not happen.
Participants develop analyses of each other’s verbal conduct. The nature of these analyses is to be found in the detail of each participant’s utterances. Contributors toa conversation interpret one another’s intentions and attribute intention and meaningto each other’s turns as talk. (Notice that intention and meaning are not being providedby the researcher but by the participants in the conversation.)
Conversation analysts study the design of each turn in the conversation. That is, they seek to understand the activity that a turn is designed to perform in terms of thedetails of its verbal construction.
M23_HOWI4994_03_SE_C23.QXD 10/11/10 15:06 Page 375

376 PART 4 QUALITATIVE RESEARCH METHODS
The principal objective of conversational analysis is to identify the sequential organ-isation or patterns in conversation.
The recurrence and systematic nature of patterns in conversation are demonstratedand tested by the researcher. This is done by reference to collections of cases of theconversational feature under examination.
Data extracts are presented in such a way as to enable others to assess or challengethe researcher’s analysis. That is, detailed transcriptions are made available in a conventional transcription format (Jefferson transcription).
To make things more concrete, conversation analysts have a special interest in:
how turn-taking is achieved in conversation;
how the utterances within a person’s turn in the conversation are constructed;
how difficulties in the flow of a conversation are identified and sorted out.
Having addressed these basic questions or issues, conversation analysts then attempt to apply them to other domains of conversation. So they might study what happens inhearings in courts of law, telephone conversations, when playing games or during inter-views. In this way, the structure of conversation can be explored more deeply and morecomparatively.
23.3 Stages in conversation analysis
Unlike most other approaches to research, conversation analysis rejects prior theoret-ical speculation about the significant aspects of conversation. A conversation analysisdoes not start with theory which is explored or tested against conversation. The conversation analyst’s way of studying conversation is to understand the rules that ordinary people are using in conversation. So the ethnomethodological orientation ofconversation analysis strategy stresses the importance of the participant’s interpretationsof the interaction as demonstrated in the conversation – the priorities are not to be laid down by the researcher in this sense. The participants’ interpretations as revealed in the conversation are assumed to be much more salient than any arbitrary, theory-led speculative set of priorities established by researchers (Wooffitt, 2001). That is, conversation analysis does not involve hypothesis testing based on cumulative and all-embracing theory.
The conversation analyst’s fundamental strategy is to work through the fragments ofconversation, making notes of anything that seems interesting or significant. There is nolimit to the number of observations that may be written down as part of the analysis process. However, it is crucial that the conversation analyst confines themselves solelyto the data in question. They must not move beyond the data to speculate whether, forexample, the participant has made a revealing Freudian slip or that in reality they meantto say something quite different. If you like, this is the conversation analysis mindset –a single-minded focus on seemingly irrelevant, trivial detail. Nothing in the interactionbeing studied can be discarded or disregarded as inconsequential. Consequently, thetranscripts used in conversation analysis are messy in that they contain many non-linguistic features. In order to ensure the transcript’s fidelity to the original recording,transcripts contain such things as false starts to words and the gaps between words and participants’ turns. In conversation analysis, tidying up transcripts is something ofa cardinal sin.
M23_HOWI4994_03_SE_C23.QXD 10/11/10 15:06 Page 376
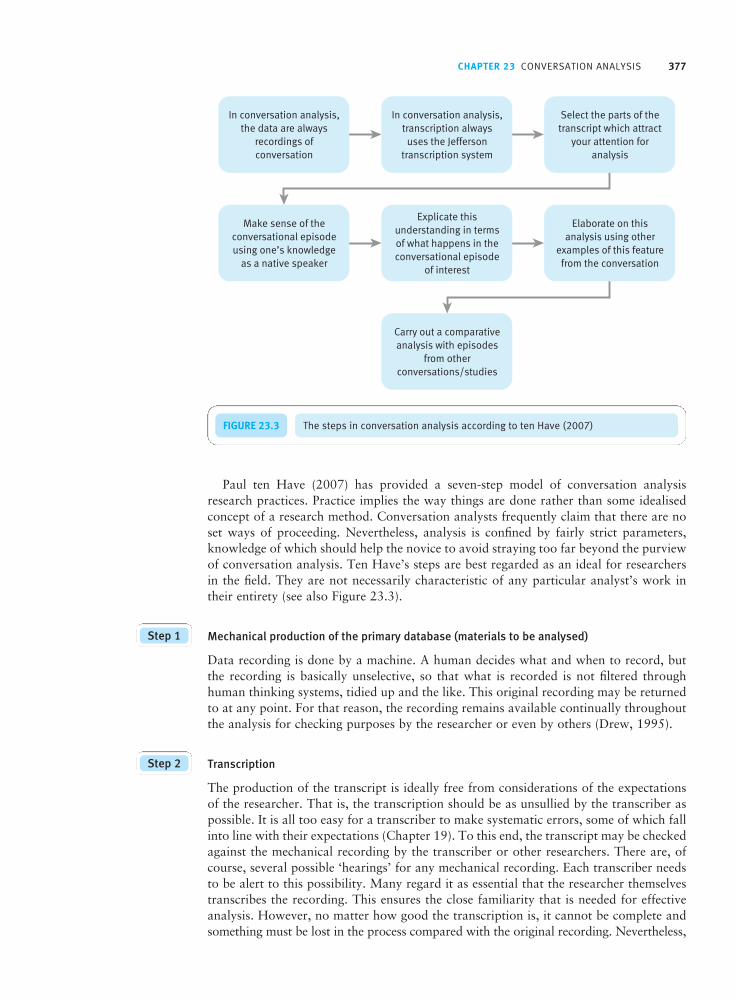
CHAPTER 23 CONVERSATION ANALYSIS 377
Paul ten Have (2007) has provided a seven-step model of conversation analysisresearch practices. Practice implies the way things are done rather than some idealisedconcept of a research method. Conversation analysts frequently claim that there are noset ways of proceeding. Nevertheless, analysis is confined by fairly strict parameters,knowledge of which should help the novice to avoid straying too far beyond the purviewof conversation analysis. Ten Have’s steps are best regarded as an ideal for researchersin the field. They are not necessarily characteristic of any particular analyst’s work intheir entirety (see also Figure 23.3).
Mechanical production of the primary database (materials to be analysed)
Data recording is done by a machine. A human decides what and when to record, butthe recording is basically unselective, so that what is recorded is not filtered throughhuman thinking systems, tidied up and the like. This original recording may be returnedto at any point. For that reason, the recording remains available continually throughoutthe analysis for checking purposes by the researcher or even by others (Drew, 1995).
Transcription
The production of the transcript is ideally free from considerations of the expectationsof the researcher. That is, the transcription should be as unsullied by the transcriber aspossible. It is all too easy for a transcriber to make systematic errors, some of which fallinto line with their expectations (Chapter 19). To this end, the transcript may be checkedagainst the mechanical recording by the transcriber or other researchers. There are, ofcourse, several possible ‘hearings’ for any mechanical recording. Each transcriber needsto be alert to this possibility. Many regard it as essential that the researcher themselvestranscribes the recording. This ensures the close familiarity that is needed for effectiveanalysis. However, no matter how good the transcription is, it cannot be complete andsomething must be lost in the process compared with the original recording. Nevertheless,
Step 2
Step 1
FIGURE 23.3 The steps in conversation analysis according to ten Have (2007)
M23_HOWI4994_03_SE_C23.QXD 10/11/10 15:06 Page 377
378 PART 4 QUALITATIVE RESEARCH METHODS
the transcription enables the researcher to both confront but also cope with the rich detailof the conversation. The presence of the transcript in the research report means that theanalyst and others must be precise in their analysis of the detail of the conversation. Thisdirect link with the data is not possible in some other styles of research. The summarytables of statistics, for example, found in much psychological research cannot be relateddirectly back to the data that were collected by the reader. The links are too deeplyburied in the analysis process for this to happen. Few researchers present their data insuch a relatively raw form as is conventional in conversational analysis.
Selection of the aspects of the transcript to be analysed
There are no formal rules for this and it can simply be a case of the analyst beingintrigued by certain aspects of the conversation. Others may be interested in particularaspects of an interaction – as Sacks was when he investigated name-giving in telephoneconversations to emergency units. Others may wish to concentrate on the contributionsof particularly skilled contributors to a conversation such as where a major shift in theconversation is achieved. Just one adjacency pair (the minimum unit that makes up aconversation) may be sufficient to proceed.
Making sense of/interpreting the conversational episode
Researchers are part of the culture that produced the conversational episode. Hence,they can use their own common-sense knowledge of language to make sense of theepisode. This is appropriate since it reflects exactly what participants in the interactiondo when producing and responding in the conversation (constructing adjacency pairs).Typically the analyst may ask what aspects of the conversation do or achieve duringspecific conversational exchanges. The relation between different aspects of conversationcan then be assessed.
Explication of the interpretation
Because the conversation analyst is a member of the broad community whose conversa-tions he or she studies, the researcher’s native or common-sense understanding of whathappens in an episode is clearly a useful resource as we have seen. Nevertheless, this isinsufficient as an explication without bringing the links between this resource and thedetail of the conversational episode together. That is, the analyst may feel they know whatis happening in the conversation, but they need to demonstrate how their understandinglinks to the detail of the conversation. Just what is it which happens in each turn of theconversation which leads to what follows and why?
Elaboration of the analysis
Once a particular episode has been analysed, the rest of the transcription can be used toelaborate on it. Later sequences in the conversation may in some way, directly or indirectly,relate back to the analyst’s central conversational episode. The conversationalists mayhark back to the earlier episode and reveal ways in which they understood it. As a consequence, the analyst may need to reformulate the analysis in some way or even substitute a completely different analysis.
Comparison with episodes from other conversations
The analysis process does not end with a particular transcription and its analysis. It continues to other instances of conversation which are apparently similar. This is vital
Step 7
Step 6
Step 5
Step 4
Step 3
M23_HOWI4994_03_SE_C23.QXD 10/11/10 15:06 Page 378

CHAPTER 23 CONVERSATION ANALYSIS 379
because a particular conversational episode is not considered to be unique since thedevices or means by which a conversational episode is both recognised and produced bythe conversationalists are the same for other conversationalists and conversations. Somestudies specifically aim to collect together different ‘samples’ of conversation in orderthat these different samples may be compared one with the other. In this way, similaritiesand dissimilarities may encourage or demand refinement of the analysis.
Steps 4 to 7 may seem less distinct in the analysis process itself than is warranted bydescribing them as separate steps. Ten Have’s steps are schematic. They do not alwaysconstitute a precise and invariant sequence of steps which analysts must follow invariablyand rigidly. Ultimately the aim of most conversational analysts is not the interpretationof any particular episode of conversation. Conversation analysis delves into its subjectmatter thoroughly and deeply, which means that a psychologist more familiar withmainstream psychological research may find the attention to detail somewhat daunting.Instead of establishing broad trends, conversation analysis seeks to provide a full accountof the phenomena in conversation which are studied. So the ill-fitting case may be givenas much emphasis as common occurrences.
Conversation analysis
Box 23.1 Research Example
There are a number of good examples of conversationanalysis in the work of psychologists – even though it is difficult to specify how the work of a sociologist, forexample, analysing the same conversation would be different. The following are particularly useful in that they clearly adopt some of the sensibilities of mainstreampsychology.
Cold reading
Psychic phenomena are controversial. Wooffitt (2001)studied ‘cold reading’, which is the situation when, on thebasis of very little conversation with a client, the mediumseems to have gathered a great deal of information frombeyond the grave. Some commentators suggest that themedium simply uses the limited interaction with the clientto gather information about the client. This information is then fed back to the client as evidence of the medium’spsychic powers.
Conversation analysts might be expected to have something to say about these ‘conversations’ between a medium and a client. The following excerpt from such aconversation is typical of what goes on between a psychic(P) and a client (S) (Wooffitt, 2001):
Extract 31
P: h Ty’ever though(t) o(f ) .h did you want to go into a caring profession early on, when you werechoosing which way you were gonna go.
(.)
S: yeah I wanted to: go into child care actually when I
P: MMMmmm. . . .
S: =when I left school
P: That’s right yeah >well< h (.) ’m being shownthat>but (t)-< h it’s (0.2) it’s not your way ye(t) actually but i(t) y’y may be caring for (t-)ch- children or whatever later on okay?
Although this excerpt is written using Jefferson transcrip-tion methods (Chapter 19 will help you decode this), inthis case the importance of the excerpt can be understoodsimply on the basis of the sequence of words.
M23_HOWI4994_03_SE_C23.QXD 10/11/10 15:06 Page 379

380 PART 4 QUALITATIVE RESEARCH METHODS
What happens? Well first of all the psychic asks a question about caring professions. Then the client repliesbut the reply is fairly extended as the client explains thatthey wanted to go into child care. The psychic then inter-rupts with ‘MMMmmm’. The client carries on talking but quickly at the first appropriate stage the psychic takes over the conversation again with ‘That’s right yeah’. The information is then characterised by the psychic asemanating from the spiritual world. In terms of the conventional explanation of cold reading phenomena, thisis a little surprising. One would expect that the psychicwould allow the client to reveal more about themselves ifthe purpose of the conversation is to extract informationwhich is then fed back to the client as if coming from thespiritual world.
In contrast, what appears to be happening is that the psychic rapidly moves to close down the turn by theclient. Wooffitt (2001) argues that the first turn in thesequence (when the medium asks the question) is con-structed so as to elicit a relatively short turn by the client(otherwise the psychic might just as well have asked theclient to tell the story of their life). So ideally the client will simply agree with what the psychic says in the secondturn of the sequence. This does not happen in the aboveexample. If it had, then the floor (turn to speak) wouldhave returned quickly to the psychic. As it happens, thepsychic has to interrupt the client’s turn as quickly as possible.
By analysing many such excerpts from psychic–clientconversations, it was possible to show that if the clientgives more than a minimal acceptance of what the psychicsays, then the psychic will begin to overlap the client’sturn, eventually forcing the client’s turn to come to anend. Once this is done, the psychic can attribute their first statement (question) to paranormal sources. Wooffittdescribes this as a three-turn series of utterances: a proposalis made about the sitter, this is accepted by the sitter, andthen it is portrayed in terms of being supernatural in origin. Without the emphasis on the structure of turnswhich comes from conversation analysis, Wooffitt maywell have overlooked this significant pattern.
Date rape
One notable feature of conversation analysis is that itdwells on the everyday and mundane. Much of the datafor conversation analysis lack any lustre or intrinsic interest.This is another way of saying that conversation analysishas explored ordinary conversation as a legitimate researchgoal. However, it is intriguing to find that the principlesoriginating out of everyday conversation can find resonance
in the context of more extraordinary situations – date rape,for example. Training courses to help young women preventdate rape often include sessions teaching participants howto say ‘no’, that is, refusal skills in this case for unwantedsexual intercourse (Kitzinger and Frith, 2001).
Research by conversation analysts about refusals following invitations has revealed the problematic natureof saying ‘no’ irrespective of the type of invitation. That is, saying ‘yes’ to an invitation tends to be an extremelysmooth sequence without gaps or any other indication of conversational hiccups. Refusing an invitation, on theother hand, produces problems in the conversation. Forexample, there is likely to be a measurable delay of half asecond between invitation and refusal. Similarly, ‘umm’ or‘well’ is likely to come before the refusal. Palliative phrasessuch as ‘That’s really kind of you but . . .’ may be used.Finally, refusal is likely to be followed by justifications or excuses for the refusal whereas acceptance requires nojustification. Kitzinger and Frith (2001) argue that daterape prevention programmes fail by not recognising theeveryday difficulties inherent in refusing an invitation.That it is problematic (even when refusing sexual inter-course) can be seen in the following exchange betweentwo young women:
Liz: It just doesn’t seem right to say no when you’re upthere in the situation.
Sara: It’s not rude, it’s not rude – just sounds awful tosay this, doesn’t it.
Liz: I know.
Sara: It’s not rude, but it’s the same sort of feeling. It’slike, ‘oh my god, I can’t say no now, can I?’
(Kitzinger and Frith, 2001, p. 175)
Using a focus group methodology, Kitzinger and Frith (2001) found that young women who participated in these groups deal with the problem of refusing sexualintercourse on dates by ‘softening the blow’ with a ‘moreacceptable excuse’:
. . . young women talk about good excuses as beingthose which assert their inability (rather than theirunwillingness) to comply with the demand that theyengage in sexual intercourse: from the vague (and per-haps, for that reason, irrefutable) statement that theyare ‘not ready’, through to sickness and menstruation.
(p. 176)
M23_HOWI4994_03_SE_C23.QXD 10/11/10 15:06 Page 380
CHAPTER 23 CONVERSATION ANALYSIS 381
23.4 Conclusion
Conversation analysis provides psychology with an array of analytical tools and methodsthat may benefit a range of fields of application. Nevertheless, essentially conversationanalysis springs from rather different intellectual roots from the bulk of mainstream psy-chology and specifically excludes from consideration many quintessential psychologicalapproaches. Furthermore, in terms of detailed methodological considerations, conversationanalysis reverses many of the conventional principles of mainstream research methods.For example, the context of the conversation studied is not a particular concern of con-versation analysts so detail about sampling and so forth may appear inadequate. Thisreversal of many of the assumptions of conventional psychological research methodswarrants the attention of all researchers as it helps define the assumptions of conventionalresearch. That is, understanding something about conversation analysis is to understandmore about the characteristics of mainstream psychology.
Like other areas of qualitative research, some practitioners are gradually beginning toadvocate the use of quantification in the analysis of data. This is obviously not popularwith all qualitative researchers. However, if a conversation analyst makes claims thatimply that there are certain relationships between one feature of conversation and another,it might seem perverse to a mainstream psychologist not to examine the likelihood thatone feature of conversation will follow another.
Conversation analysis emerged in the 1960s in the context of developments in sociological theory.
Ethnomethodology was developed by Garfinkel almost as the reversal of the grand-scale sociologicaltheories of the time. Ethnomethodology concerned itself with everyday understandings of ordinaryevents constructed by ordinary people.
Harvey Sacks is considered to be the founder of conversation analysis. His interest was in the wayconversation is structured around turns and how one turn melds with the earlier and later turns.
Conversation analysis requires a detailed analysis and comparison of the minutiae of conversationas conversation. It draws little on resources outside the conversation (such as the social context, psychological characteristics of the individuals and so forth).
Superficially, some of the features characteristic of conversation analysis may seem extremelysloppy. For example, the downplaying of the established research literature in the field prior to thestudy of data, the lack of contextual material on the conversation, and the apparent lack of concernover such matters as sampling are reversals of the usual standards of psychological research.
Carrying out conversation analysis involves the researcher in close analysis of the data in a numberof ways. In particular, the Jefferson conversation transcription system encourages the researcher toexamine the detail rather than the broad thrust of conversation. The transcription is interpreted, rein-terpreted, checked and compared with other transcriptions of similar material in the belief that thereis something ‘there’ for the analyst.
Conversation analysis is commonly applied to the most mundane of material. Its primary concern,after all, is understanding the structure of ordinary or routine conversation. However, the insightsconcerning ordinary conversation highlight issues for researchers attempting to understand less ordinary situations.
Key points
M23_HOWI4994_03_SE_C23.QXD 10/11/10 15:06 Page 381

382 PART 4 QUALITATIVE RESEARCH METHODS
ACTIVITIES1. Collect samples of conversation by recording ‘natural’ conversations. Does turn-taking differ between genders? Does
turn-taking differ cross-gender? Is there any evidence that ‘repairs’ to ‘errors’ in the conversation tend to be left to the‘error-maker’?
2. Make a list of points which explain what is going on in an episode of conversation. Which of your points would beacceptable to a conversation analyst? Which of your points involve considerations beyond the episode such as psy-chological motives or intentions, or sociological factors such as social class?
3. Charles Antaki has a conversation analysis tutorial at the following web address: http://www-staff.lboro.ac.uk/~ssca1/sitemenu.htm. Go to this site and work through the exercises there to get an interesting, practical, hands-oninsight into this form of analysis, which includes the source material in the form of a video.
M23_HOWI4994_03_SE_C23.QXD 10/11/10 15:06 Page 382
Interpretativephenomenologicalanalysis
Overview
CHAPTER 24
Interpretative phenomenological analysis (IPA) is a recent psychology-based qualitativemethod which is gaining popularity among researchers.
It is primarily concerned with describing people’s personal experiences of a particularphenomenon. Additionally, it seeks to interpret the psychological processes that mayunderlie these experiences. In other words, it aims to explain people’s accounts oftheir experiences in psychological terms.
IPA assumes that people try to make sense of their experiences and the methoddescribes how they do this and what it may mean.
The method has its roots in phenomenology which was a major branch of philosophyduring the twentieth century and it also has close links with hermeneutics and symbolicinteractionism.
The data for IPA generally come from semi-structured interviews in which peoplefreely recall their experiences, although other sources of accounts can be used. Thequestioning style used ideally encourages participants to talk about their experiencesat length.
The whole interview is usually sound recorded and then transcribed in a literal, secretarial style though other information may be included if appropriate.
One account is usually analysed first before other accounts are looked at in detail.Subsequent accounts may be examined in relation to this first account which is a way of exploring the adequacy of the initial analysis. Subsequent accounts may be analysed in terms of the themes of the initial account or each account may beexamined afresh. Similarities and differences between accounts may be noted.
M24_HOWI4994_03_SE_C24.QXD 10/11/10 15:06 Page 383

384 PART 4 QUALITATIVE RESEARCH METHODS
Each account is read several times to enable the researcher to become familiar withthe material. Any impressions may be noted in the left-hand margin of the account asit is being read. There is no set way of doing this and no rules that must be followed.
After familiarising themselves with the account, the researcher looks for themes inthe material. Although themes are clearly related to what was said, they are usuallyexpressed at a slightly more abstract or theoretical level than the original words used by the participant in the research. Themes are usually described in terms ofshort phrases of only a few words and these are written in the right-hand margin of the account.
Once the main themes have been identified, the researcher tries to group themtogether in broader and more encompassing superordinate themes. These super-ordinate themes and their subordinate components may be listed in a table in orderof their assumed importance starting with the most important. Next to each thememay be a short verbatim example which illustrates it together with a note of its locationin the account.
The themes that have been identified are discussed in terms of the existing literatureon that topic in the report.
Interpretative phenomenological analysis, unlike some other forms of qualitativeanalysis, deals with internal psychological processes and does not eschew the use ofpsychology in general as part of the understanding of people’s experiences.
24.1 Introduction
Interpretative phenomenological analysis (IPA) is a recent qualitative approach whichhas rapidly grown in popularity since Jonathan Smith first outlined it (Smith, 1996). Ithas been used in numerous research studies and articles in peer-reviewed journals andbooks. Applications of IPA have been largely in the fields of health and clinical psychologythough it can be applied more generally than that. As its name implies, its primary concernis with providing a detailed description and interpretation of the accounts of particularexperiences or phenomena as told by an individual or a small number of individuals. A good example is research on the experience of chronic back pain (Smith and Osborn,2007). A basic assumption of the approach is that people try to make sense of their experiences and understanding this is part of the aims of an IPA study. So the researcherneeds to (a) describe people’s experiences effectively and (b) try to make sense of theseexperiences. In other words, the researcher attempts to interpret the interpretations ofthe individual. Interpretative phenomenological analysis acknowledges, however, thatthe researcher’s own conceptions form the basis of the understanding of the phenom-enological world of the person that is being studied. This means that the researcher cannever, entirely, know this personal world but can only approach somewhere towardsaccessing it.
The approach has been used to address the following questions among others:
What does paranoia feel like (Campbell and Morrison, 2007)?
How do feelings affect the use of private and public transport (Mann and Abraham,2006)?
M24_HOWI4994_03_SE_C24.QXD 10/11/10 15:06 Page 384

CHAPTER 24 INTERPRETATIVE PHENOMENOLOGICAL ANALYSIS 385
FIGURE 24.1 The roots of interpretative phenomenological analysis
What does it feel like to opt to have surgery to control obesity (Ogden, Clementi andAylwin, 2006)?
How does alcohol drinking in adolescents result in having unprotected sex (Colemanand Cater, 2005)?
Notice that these are fairly open and general research questions and specific hypothesesare not involved.
24.2Philosophical foundations of interpretativephenomenological analysis
It is important when trying to understand the variety of research methods to appreciateprecisely what set of ideas one is ‘buying into’ if a particular method is adopted. Thiscan be difficult since the underlying assumptions of the major psychological methods are rarely directly spelt out by their advocates. This is particularly the case for much of the psychology which dominates introductory psychology textbooks and lectures. InChapter 17 we explained the assumptions of logical positivism which is at the root ofmuch of what is written and taught as psychology. These assumptions are not shared byall psychological methods, as was explained. Qualitative methods, in particular, generallyreject most if not all of the assumptions of logical positivism and positivism more generally.So a mature understanding of research methods such as interpretative phenomenologicalanalysis requires that their philosophical basis is clear to us.
Just like all other forms of qualitative analysis, interpretative phenomenological analysishas its own philosophical and theoretical roots. It may share some of the assumptions of other forms of qualitative analysis but does not necessarily give the same weight toeach as other qualitative approaches. Not surprisingly, phenomenology contributes, asdo symbolic interactionism and hermeneutics (see Figure 24.1):
M24_HOWI4994_03_SE_C24.QXD 10/11/10 15:06 Page 385

386 PART 4 QUALITATIVE RESEARCH METHODS
Phenomenology is the study of conscious experiences. The origins of phenomenologylie in the work of the Austrian-born German philosopher Edmund Husserl in LogischeUntersuchungen (1900/1970) though he used the term first in a later book publishedin 1913 (Ideen zu einer reinen Phänomenolgie und phänomenologischen Philosophie).While Husserl is usually described as a philosopher, the distinction between philosophyand psychology was not so strong when he was writing as now. So important earlypsychologists such as Franz Brentano were particularly influential on Husserl. The basicassumption of phenomenology is that reality is not something which is independentof human experience but is made up of things and events as perceived by consciousexperience. In other words, it eschews the idea of an objective reality. It is thus a wayof understanding consciousness from the point of view of the person who has theexperience. The phenomena studied from a phenomenological perspective include somefamiliar and some less familiar psychological concepts such as thought, memory, socialaction, desire and volition. The structure of experience involves conscious intentionality,that is to say, experience involves something in terms of particular ideas and imageswhich together constitute the meaning of a particular experience. Phenomenology indifferent guises had major influences on twentieth century academic thinking includingthe existentialism of such people as Jean-Paul Sartre and, in American sociology, majordevelopments such as ethnomethodology.
Symbolic interactionism is based on the idea that the mind and the self emerge out ofsocial interactions involving significant communications. It is a sociological approachto small-scale social phenomena rather than the major structures of society. It has inthe past been influential on social psychological thinking, especially what is some-times termed sociological social psychology. Probably the best example of this is thework of Erving Goffman which has been influential on social psychology. Goffman’shighly influential book Asylums published in 1961 examined institutionalisation whichis the patient’s reaction to the structures of total institutions. In order to understandinteractions in these contexts Goffman adopted the basic phenomenological perspective.George Herbert Mead was the major influence on symbolic interactionism though the term is actually that of Herbert Blumer. The approach is to regard mind and selfas developing through social interaction which constitutes the dominant aspect of theindividual’s experiences of the world. Of course, these social processes and socialcommunication exist prior to any individual so, in this sense, the social is the explana-tion of the psychology of the individual. The conversation of gestures is an early stagein which the individual (such as a young child) is communicating with others sincethey respond to the gesture but the child is unaware of this. This is communicationwithout conscious intent. However, out of this the individual progresses towards themore advanced forms of social communication whereby they can communicate throughthe use of significant symbols. Significant symbols are those where the sender of thecommunication has the same understanding of the communication as those who receivethe communication. Language consists of communication using such significant symbols.Communication is not an individual act but one involving two individuals at a minimum.It provides the basic unit through which meaning is learnt and established and meaningis dependent on interactions between individuals. The process is one in which there is a sender, a receiver and a consequence of the communication. It is in this way thatthe mind and understanding of self arise. Of course, there develops an intentionalityin communication because the individual learns to anticipate the responses of other individuals to the communication and can use these to achieve the desired responseof others. So the self is purposive. It is in the context of communication or social interaction that the meaning of the social world comes about.
Hermeneutics is, according to its Greek roots, the analysis of messages. It is abouthow we study and understand texts in particular. As a consequence of the influentialAlgerian/French philosopher Jacques Derrida, a text in this context is not merely
M24_HOWI4994_03_SE_C24.QXD 10/11/10 15:06 Page 386

CHAPTER 24 INTERPRETATIVE PHENOMENOLOGICAL ANALYSIS 387
something written down but can include anything which people interpret in their day-to-day lives which includes their experiences. It is relevant to interpretative phenomenological analysis because of its emphasis on understanding things from thepoint of view of others. Meaning is a social and a cultural product and hermeneuticsapplies this basic conceptualisation to anything which has meaning. So it can be appliedto many aspects of human activity which seem far removed from the biblical texts to which the term ‘hermeneutics’ originally applied. But the wider usage of the term‘hermeneutics’ gives a primacy to matters to which tradition makes an important contribution. So hermeneutics studies the meaning and importance of a wide range of human activity primarily from the first-person perspective. Looking at parts of thetext in relation to the entirety of the text in a sort of looping process leads to under-standing the meaning of the text. Hermeneutics is also responsible for originating the term ‘deconstruction’. This was introduced by the German philosopher MartinHeidegger but with a different emphasis from its modern usage. Basically he realisedthat the interpretation of texts tended to be influenced by the person interpreting thetext. In other words, the interpreter was constructing a meaning of the text whichmay be different in some respects from the original meaning of the text. So in orderto understand the influence of these interpretations one needs to deconstruct the interpretations to reveal the contributing constructions of the interpreters. Religioustexts are clearly examples where constructions by interpreters essentially alter themeanings of texts. Thus there are various constructions of Islam though the originaltexts on which each is based are the same. However, deconstruction under the influenceof Derrida has come to mean a form of criticism of the interpreter’s influence on themeaning of the text, whereas it was originally merely the identification of traditionsof the understanding of text.
It is easy to see aspects of interpretative phenomenological analysis in phenomenology,symbolic interactionism and hermeneutics. However, analysts using the method do notsimply take what the studied individual has to say as their interpretation. The analyst addsto the interpretation and does not act with straightforward empathy to the individual beingstudied. The approach includes what Smith and Osborn (2003) describe as a questioninghermeneutics (see later). To illustrate this they offer the following comment:
. . . IPA is concerned with trying to understand what it is like, from the point of view of the participants, to take their side. At the same time, a detailed IPA analysiscan also involve asking critical questions of the texts from participants, such as the following: What is the person trying to achieve here? Is something leaking out herethat wasn’t intended? Do I have a sense of something going on here that maybe theparticipants themselves are less aware of?
(p. 51)
In this, the need for the use of the word ‘interpretative’ in interpretative phenomenologicalanalysis becomes apparent since the researcher is being encouraged not simply to take theinterpretative side of the participant in the research but to question that interpretationin various ways. These are tantamount to critical deconstructions.
24.3 Stages in interpretative phenomenological analysis
The key thing when planning an IPA analysis is to remember that it is primarily concernedwith describing and understanding people’s experiences in a specified area of interest. Sowhatever the textual material used, it needs to involve detailed accounts of such experiences.
M24_HOWI4994_03_SE_C24.QXD 10/11/10 15:06 Page 387

388 PART 4 QUALITATIVE RESEARCH METHODS
FIGURE 24.2 The process of IPA analysis
This rules out a lot of textual material simply because they are not or are only tangentiallyconcerned with people’s perceptions of things which happen to them. Of course, the easiest way to get suitable rich textual material is to ask people to discuss in an inter-view things which happen in their lives. So long as the researcher takes care to maximisethe richness of the description obtained by using carefully thought out and relevant questions, then a semi-structured interview will generally be the appropriate form ofdata collection though not exclusively so. In other words, the primary thing with IPAdata collection is to remember what sort of information one is collecting. This is quitedifferent from other forms of qualitative analysis where a particular domain of contentmay not be so important.
Smith and his colleagues have described how an IPA study may be carried out (Smithand Eatough, 2006; Smith and Osborn, 2003). They acknowledge that other researchersmay adapt the method to suit their own particular interests, that is, the method is nothighly prescriptive in terms of how a study should be carried out. A crucial part of interpretative phenomenological analysis is getting the semi-structured interviews rightas this is the main source of data in this form of analysis. The interview consists of aseries of open questions designed to enable participants to provide lengthy and detailedanswers in their own words to the questions asked by the researcher. As with any otherstudy, piloting of the research instruments is advisable, so the IPA researcher should tryout their questions on a few participants. In this way, the researcher can check to makesure that the questions are suitable for their purpose, that is, the participants answerfreely in terms of their experiences and views. Other forms of personal account such asdiaries or autobiographic material could be used if their content is appropriate.
There are two major aspects of interpretative phenomenological analysis:
data collection;
data analysis.
We will deal with each of these in turn (see Figure 24.2).
■ Data collectionSmith and Osborn (2003) go into detail about the formulation of research questions ininterpretative phenomenological analysis. There is no specific hypothesis as such since
M24_HOWI4994_03_SE_C24.QXD 10/11/10 15:06 Page 388

CHAPTER 24 INTERPRETATIVE PHENOMENOLOGICAL ANALYSIS 389
the approach is exploratory of the area of experience that the researcher is concernedwith. However, generally the IPA research question is to find out the perceptions thatthe individual has concerning a given situation they experience and how they make senseof these experiences.
The IPA procedures involve almost exclusively the use of semi-structured interviewsto provide data. Interviews are intended to be flexible in their application and the questions are not read to the participant in a fixed order since the intention is that theinterviewer should be free to probe matters of interest which arise during the course ofthe interview. In particular, the interview can be led by the participant’s particular issuesrather than simply being imposed by the researcher. To some extent, the researcher canpre-plan the sorts of additional probes which are asked of participants in order to getthem to supply more information on a particular topic. So these probes can be includedin the interview schedule. There is also advice provided by Smith and Osborn about howto construct the interview questions (pp. 61–2):
Questions should be neutral rather than value-laden or leading.
Avoid jargon or assumptions of technical proficiency.
Use open, not closed, questions.
Generally this is the sort of advice appropriate for framing questions for any in-depthinterviewing strategy aimed at eliciting rich data (see Chapter 18).
The semi-structured interview usually opens with a general question which is normallyfollowed by more specific questions. For example, in a study on back pain the researchermay begin by asking a participant to describe their pain before asking how it started and whether or not anything affects it (Smith and Osborn, 2007). The researcher shouldmemorise the interview schedule so that the interview can flow more smoothly and naturally. The order in which the questions are asked and the nature of the questionsasked may vary according to what the participant says. So if the participant has alreadyprovided information to a question that has yet to be asked, there is no need to obtainthat information again by asking that question. For example, if the participant in answerto the first question on describing their pain also said how it started, it would not beappropriate to ask the question on how it had started as this question has already beenanswered. The participant may raise issues which the researcher had not anticipated andwhich seem of interest and relevance to the topic. Where this happens, the researchermay wish to question the participant about these matters even though questions on these issues were not part of the original interview schedule. The researcher may wish to include questions on this issue when interviewing subsequent cases. In other words,researchers should be sensitive to the material that participants provide and should notnecessarily be bound by their original set of questions.
However, Smith and Osborn (2003) suggest that good interviewing technique ininterpretative phenomenological analysis would comply with the following (p. 63):
Avoid rushing to the main area of interest too quickly as this may be quite personaland sensitive. It takes time for the appropriate trust and rapport to build up.
While the effective use of probes ensures good-quality data, the overuse of probes canbe distracting to the participant and disrupt the quality of the narrative.
Ask just one question at a time and allow the participant time to answer it properly.
Be aware of the effect that the interview is having on the participant. Adjustmentsmay need to be made to the style of questioning, etc. should there appear to be problems or difficulties.
M24_HOWI4994_03_SE_C24.QXD 10/11/10 15:06 Page 389

390 PART 4 QUALITATIVE RESEARCH METHODS
The interview is usually sound-recorded so that the researcher has a full record ofwhat has been said. Recording the interview also has the advantage of allowing theresearcher to pay closer attention to what is being said as the participant is speakingsince the interviewer is not preoccupied with the task of taking detailed notes as theinterview progresses. Generally, the advice is to transcribe the interviews prior to analysissince the resulting transcript is quicker to read and check than it is to locate and replayparts of the interview. Furthermore, a transcript makes it easier for the researcher to seethe relation between the material and the analysis which is to be carried out. With inter-pretative phenomenological analysis, the transcription may be the literal secretarial-styletranscription which simply consists of a record of what was said. There is no need forthe Jefferson-style transcription (Chapter 19), which includes other features of the interview such as voice inflections and pauses, though it is not debarred. However, insome circumstances it may be worthwhile to note some of these additional features suchas expressions of emotions if these help convey better just what the participant in theinterview has said. It would be usual to have wide margins on either side of the pages of the transcript where one can put one’s comments as the transcribed material is beinganalysed. While making the transcription, the researcher should make a note of anythoughts or impressions they have about what the interviewee is saying since otherwisethese may be forgotten or overlooked subsequently. These comments may be put in theleft-hand margin of the transcription next to the text to which it refers (the right-handmargin is used for identifying themes). This sort of transcription of the recording cantake up to about eight times the time taken to play the recorded material and it is some-thing which cannot be rushed if the material is to be transcribed accurately.
Smith and his co-workers suggest, as do many other qualitative researchers, thatbecause the process of data collection, transcription and analysis is time-consuming, it is possible to interview only a small number of participants. Nevertheless, the numberof cases in published studies has varied from 1 (Eatough and Smith, 2006) to as manyas 64 (Coleman and Cater, 2005) though the latter is exceptional. The size of samplethought suitable for a study will vary according to its aims and the resources theresearcher has. So, for student projects, there may be time and resources available to dealwith only three to six cases. It is recommended by Smith and Osborn (2003) that thesample should consist of relatively similar (homogeneous) cases rather than extremelydifferent ones. It should be recognised that interpretative phenomenological analysis is at its roots idiographic and primarily focused on the individual (as in any case study)as someone to be understood. That is one reason why single case studies are commonand acceptable in this sort of analysis. Of course, research may move from what hasbeen learnt of the one individual to others but primarily focuses on individuals to be understood in their own right. The distinction between idiographic and nomotheticapproaches to knowledge was introduced into psychology in the 1930s by GordonAllport, though the concepts were originally those of the German philosopher WilhelmWindelband. Idiographic understanding concerns the individual as an individual in his or her own right and emphasises the ways in which that individual is different from other individuals. Nomothetic understanding is based on the study of groups ofindividuals who are seen as representing all individuals in that class. Hence it is possiblein nomothetic approaches to formulate abstract laws or generalisations about people in general.
■ Data analysisThe analysis of the data is seen as consisting of four to six main stages depending on the number and duration of interviews carried out. Many of these steps are very similarto those of other forms of qualitative analysis:
M24_HOWI4994_03_SE_C24.QXD 10/11/10 15:06 Page 390
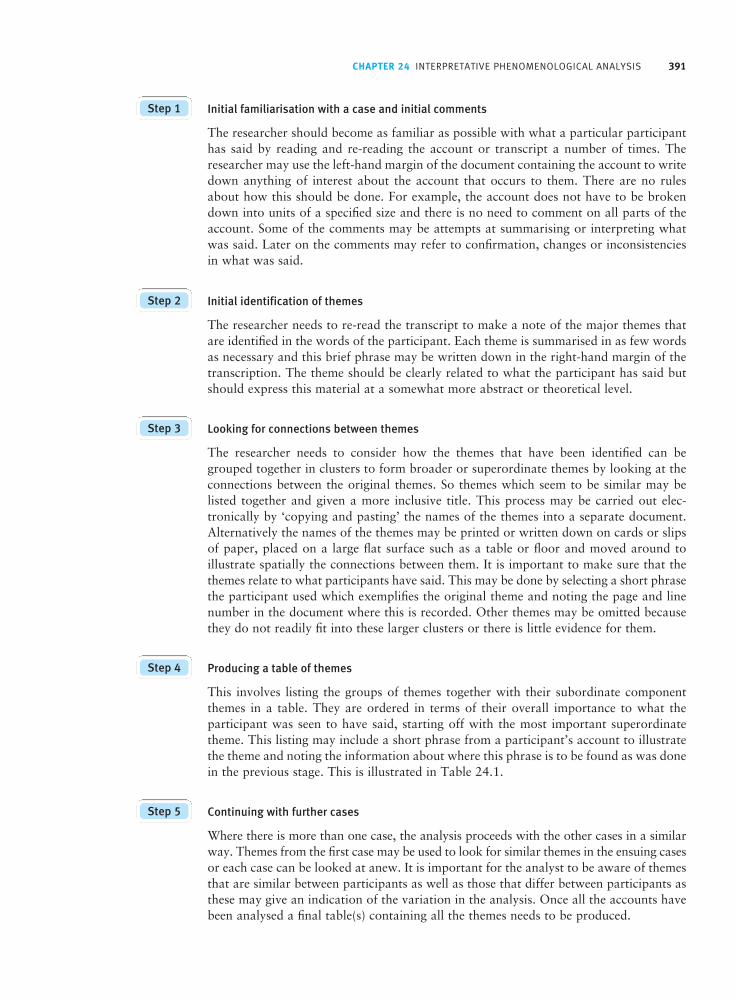
CHAPTER 24 INTERPRETATIVE PHENOMENOLOGICAL ANALYSIS 391
Initial familiarisation with a case and initial comments
The researcher should become as familiar as possible with what a particular participanthas said by reading and re-reading the account or transcript a number of times. Theresearcher may use the left-hand margin of the document containing the account to writedown anything of interest about the account that occurs to them. There are no rulesabout how this should be done. For example, the account does not have to be brokendown into units of a specified size and there is no need to comment on all parts of theaccount. Some of the comments may be attempts at summarising or interpreting whatwas said. Later on the comments may refer to confirmation, changes or inconsistenciesin what was said.
Initial identification of themes
The researcher needs to re-read the transcript to make a note of the major themes thatare identified in the words of the participant. Each theme is summarised in as few wordsas necessary and this brief phrase may be written down in the right-hand margin of thetranscription. The theme should be clearly related to what the participant has said butshould express this material at a somewhat more abstract or theoretical level.
Looking for connections between themes
The researcher needs to consider how the themes that have been identified can begrouped together in clusters to form broader or superordinate themes by looking at theconnections between the original themes. So themes which seem to be similar may belisted together and given a more inclusive title. This process may be carried out elec-tronically by ‘copying and pasting’ the names of the themes into a separate document.Alternatively the names of the themes may be printed or written down on cards or slipsof paper, placed on a large flat surface such as a table or floor and moved around to illustrate spatially the connections between them. It is important to make sure that thethemes relate to what participants have said. This may be done by selecting a short phrasethe participant used which exemplifies the original theme and noting the page and linenumber in the document where this is recorded. Other themes may be omitted becausethey do not readily fit into these larger clusters or there is little evidence for them.
Producing a table of themes
This involves listing the groups of themes together with their subordinate componentthemes in a table. They are ordered in terms of their overall importance to what the participant was seen to have said, starting off with the most important superordinatetheme. This listing may include a short phrase from a participant’s account to illustratethe theme and noting the information about where this phrase is to be found as was donein the previous stage. This is illustrated in Table 24.1.
Continuing with further cases
Where there is more than one case, the analysis proceeds with the other cases in a similarway. Themes from the first case may be used to look for similar themes in the ensuing casesor each case can be looked at anew. It is important for the analyst to be aware of themesthat are similar between participants as well as those that differ between participants asthese may give an indication of the variation in the analysis. Once all the accounts havebeen analysed a final table(s) containing all the themes needs to be produced.
Step 5
Step 4
Step 3
Step 2
Step 1
M24_HOWI4994_03_SE_C24.QXD 10/11/10 15:06 Page 391

392 PART 4 QUALITATIVE RESEARCH METHODS
Interpretative phenomenological analysis
Box 24.1 Research Example
Campbell and Morrison (2007) studied how people ex-perience paranoia. They point out that it has recently beenestablished that the sort of persecutory ideas that charac-terise paranoia are exaggerations of normal psychologicalprocesses. For example, individuals who show non-clinicallevels of paranoia also tend to demonstrate self-consciousnessin both public and private situations. One possible con-sequence of this sort of self-examination process is that self-recognised shortcomings may be projected onto otherpeople who are then seen as threatening in situations whichare in some way threatening. Negative beliefs that sufferershave about the condition of paranoia, the world in general,and the self are responsible for the distress caused by psychoses such as paranoia. Campbell and Morrison pointout that there have been no previous studies that haveinvestigated the subjective experience of paranoia.
Based on these considerations, Campbell and Morrisondesigned a study to explore subjective experiences of
paranoia by comparing patients and non-patients. They hada group of six clinical patients and a group of six otherindividuals who had no clinical history although they hadendorsed two questions on the Peters Delusions Inventory.One of these asked whether they ever feel like they arebeing persecuted in some way and the other asked whetherthey ever feel that there is a conspiracy against them.
The participants were interviewed using a semi-structuredmethod. Questions were asked about a number of issuesincluding the following (p. 77):
Content of paranoia For example, ‘Can you tell mewhat sort of things you have been paranoid about?’
Beliefs about paranoia For example, ‘What are yourthoughts about your paranoid ideas?’
Functions of paranoia For example, ‘Do you thinkthat your paranoid ideas have any purpose?’
Writing up the analysis
The final stage is to write up the results of the analysis. The themes seen as being importantto the analysis need to be described and illustrated with verbatim extracts which providea clear and sufficient example of these themes. The researcher tries in the analysis write-upto interpret or make sense of what a participant has said. It should be made clear whereinterpretation is being provided and the basis on which it has been done. There are twoways of presenting the results in a report. One way is to divide the report into a separate‘Results’ and ‘Discussion’ section. The ‘Results’ section should describe and illustrate thethemes while the ‘Discussion’ section should relate the themes to the existing literatureon the topic. The other way is to have a single ‘Results and Discussion’ section where thepresentation of each theme is followed by a discussion of the literature that is relevantto that theme.
Before attempting to carry out an interpretative phenomenological analysis, it is impor-tant to familiarise yourself with the method by reading reports of other studies that haveused this approach. There are an increasing number of such reports to draw upon andyou should choose those that seem most relevant to what you want to do. As you aremost probably unlikely to be able to anticipate the themes that will emerge in your study,you will need to spend some time after the analysis has been completed seeing what therelevant literature is on the themes that you have found.
IPA researchers have provided relatively detailed and clear explanations of their methods including examples of the questions used to collect data and the stages in the analysis of the data giving examples of codings and theme developments (Smith andOsborn, 2003; Smith and Eatough, 2006). These can be consulted in order to develop afiner-tuned understanding of the method.
Step 6
M24_HOWI4994_03_SE_C24.QXD 10/11/10 15:06 Page 392

CHAPTER 24 INTERPRETATIVE PHENOMENOLOGICAL ANALYSIS 393
Traumatic life experiences For example, ‘Have you everexperienced anything very upsetting or distressing?’
Trauma and paranoia For example, ‘Do you think thatyour paranoid ideas relate to any of your past experiences?’
Through a process of reading and re-reading each ofthe transcripts, initial thoughts and ideas about the datawere noted in the left-hand margin of the transcripts andthese led to the identification of themes which were notedin the right-hand margin of the transcripts. Following this,the researchers compiled a list of the themes which hadbeen identified. Superordinate themes were then identifiedwhich brought together a number of themes. These super-ordinate themes may have been themes already identifiedbut sometimes they were new concepts. Interestingly, theresearchers checked their analysis with the participants in the research as a form of validity assessment, which ledto some updating and revision of the themes where theanalysis was not accepted by the participants.
The researchers suggest that there were four super-ordinate themes of note which emerged in the analysis andwhich they define as:
the phenomenon of paranoia;
beliefs about paranoia;
factors that influence paranoia;
the consequences of paranoia.
They produce tables which illustrate these superordinatethemes, the ‘master’ themes which are grouped togetherunder this heading, and the subcategories of each ‘master’theme. So, by way of illustration, we can take the super-ordinate theme described as the phenomenon of paranoia.This includes three master themes: (A) the content of
paranoia, (B) the nature of paranoia and (C) insight intoparanoia. Again by way of illustration, we can take the firstof these ‘master’ themes, the content of paranoia, whichbreaks down into the following subcategories: (a) percep-tion of harm, (b) type of harm, (c) intention of harm and(d) acceptability of belief. In their discussion, Campbelland Morrison illustrate each of the subcategories by a representative quotation taken from the transcripts of thedata. This is done in the form of tables – there is one foreach of the superordinate themes. Each master theme ispresented and each subcategory listed under that heading.It is the subcategories which are illustrated by a quotation.Although this is a simple procedure, it is highly effectivebecause the reader has each subcategory illustrated but bylooking at the material for all of the subcategories the‘master’ theme is also illustrated. The general format ofthis is illustrated in Table 24.1. We have only partiallygiven detail in the table to keep it as simple as possible inappearance and we have used fictitious quotes. Of course,this tabular presentation limits the lengths of quotationsused and, inevitably, results in numerous tables in somecases. Thus it is only suitable when the number of super-ordinate themes is relatively small since this determinesthe number of tables. Nevertheless, the systematic natureof the tabular presentations adds clarity to the presenta-tion of the analysis.
A further feature of the analysis, not entirely typical of qualitative analyses in general, was the comparisonbetween the clinical group and the normal group in termsof paranoia. For example, in terms of ‘intention of harm’it was found that there was a difference between the two groups. For the normal group the harm tended to besocial harm whereas for the patient group it tended to be physical or psychological harm.
Table 24.1 The structure of the illustrative quotations table for theme (1) The phenomenon of paranoia
(A) The content of paranoia (B) Another master theme (C) Another master theme
(a) Perception of harm (a) Subcategory (a) Subcategory‘People would sit around talking about me, I thought.’ Illustrative quote Illustrative quoteVictor 1
(b) Type of harm (b) Subcategory (b) Subcategory‘It felt like people I hardly knew were backstabbing me.’ Illustrative quote Illustrative quoteJanet 1
(c) Intention of harm (c) Subcategory‘It felt like I was being deliberately persecuted.’ Norman 2 Illustrative quote
(d) Acceptability of the belief‘It was MI5 that was behind all of the plotting and telephone tapping.’ Mary 1
M24_HOWI4994_03_SE_C24.QXD 10/11/10 15:06 Page 393

394 PART 4 QUALITATIVE RESEARCH METHODS
Interpretative phenomenological analysis was first introduced as an analytic technique in the 1990s.It draws heavily on some of the more important developments in philosophy, psychology and sociology,inter alia, in the twentieth century. These have been identified as phenomenology, hermeneutics andsymbolic interactionism.
Interpretative phenomenological analysis is a variant of phenomenological analysis, though, to date,it has been second-party research in which a researcher guides the data collection and analysis, thoughphenomenological analysis can be solely first-party research in its original form. The aims of IPA researchare to describe people’s experiences in a particular aspect of life and draw together explanations ofthese experiences. Much of the research to date has been in the field of health psychology.
Interpretative phenomenological analysis shares many of the techniques of other qualitative methods.In particular, the primary aim of the analysis is to identify themes in what participants have to sayabout their experiences. The main processes of analysis involve the literal transcription of pertinentinterview data which is then processed by suggesting themes which draw together aspects of thedata. Further to this, the researcher may seek to identify superordinate themes which embrace a number of the major themes emerging in the analysis.
The precise ways in which interpretative phenomenological analysis differs from other forms of qualitative analysis are complex. It departs from, say, discourse analysis, for example, in having little interest in language as such other than the medium through which the researcher can learnabout how individuals experience particular phenomena. In other words, language helps to revealthe subjective realities of consciousness. Thus it refers to internal psychological states of the sortwhich are often eschewed by the qualitative researcher. Of course, it shares with these otherapproaches the rejection of physical reality as the focus of research but, at the same time, it assumesthat in the data provided by participants lies their reality of their experiences.
Key points
24.4 Conclusion
Interpretative phenomenological analysis can be seen as being a much more specificapproach to qualitative research than, say, thematic analysis or grounded theory and discourse analysis or conversation analysis. This is because its focus is quite different fromthese. Discourse analysis is really a theory of language-as-action and so can be seen as partof a theory of language use and its application. It focuses on how we talk about things.Conversation analysis is a very fine-grained approach to the study of how conversationproceeds and is organised. In contrast, interpretative phenomenological analysis is not abouthow we talk about our experiences but, instead, it concentrates on what our experiencesare. It is not particularly interested in how language is used but it is interested in whatpeople can tell us about their experiences through language. Indeed, in great contrast todiscourse analysis, in particular, interpretative phenomenological analysis is about internalpsychological states since it is about the conscious experience of events. There seems tobe a clarity and transparency about data presentation in interpretative phenomenologicalanalysis which is not always emulated in other forms of qualitative research. The use of tables of data in interpretative phenomenological analysis is in many ways redolent ofthe use of tables in quantitative analysis. The tables are systematic in interpretative phenomenological analysis but they are different from quantitative tables in that they onlyprovide illustrations of the themes by illustrative quotations from the transcriptions.
M24_HOWI4994_03_SE_C24.QXD 10/11/10 15:06 Page 394

CHAPTER 24 INTERPRETATIVE PHENOMENOLOGICAL ANALYSIS 395
ACTIVITIES1. Although interpretative phenomenological analysis has not been used in this way, phenomenological research can
involve the researcher investigating his or her own experiences. Write a narrative account in the first person about yourexperiences of exams. Then explore your narrative using interpretative phenomenological analysis. What are the majorthemes you can identify? What are the superordinate themes and what are the subordinate themes?
2. Plan a semi-structured interview on a topic such as childbirth, going to a doctor for a consultation or a turn on a fairground ride. Carry out and record an interview on this topic. Draw a table of superordinate themes, subordinatethemes and illustrative quotes.
M24_HOWI4994_03_SE_C24.QXD 10/11/10 15:06 Page 395

Evaluating and writingup qualitative research
Overview
CHAPTER 25
The evaluation of qualitative research emphasises the value of the analysis – that is the coding and theory-building process typically rather than the data collectioninstruments.
Evaluating qualitative research requires a clear understanding of the intellectualroots and origins of qualitative research in psychology. Hence you need to studyChapters 17 to 24 for this chapter to be most helpful.
Many criteria are similar in some ways to those applied to quantitative analysis.However, great emphasis is placed on ensuring that the analysis corresponds closelyto qualitative ideals.
Suggestions are made as to how a newcomer to qualitative research should tackleself-evaluation of their work.
M25_HOWI4994_03_SE_C25.QXD 10/11/10 15:06 Page 396

25.1 Introduction
Surely qualitative research is evaluated in much the same ways as quantitative research?This is not so. Qualitative research may be evaluated in a number of ways, none ofwhich can be regarded as a final seal of approval. Some of the criteria are quite close to the positivistic position (reliability and validity) but, as we saw in Chapter 17, this iseschewed by at least some qualitative researchers. Some of these prefer to emphasise theradically different philosophies which straddle the quantitative–qualitative divide if notcontinuum. For example, quantitative researchers take it for granted that observationsshould be reliable in the sense that different researchers’ observations of the same eventsare expected to be similar. That is, different observers should observe the same thing if the data are of value. In contrast, some qualitative researchers argue that this is an inappropriate criterion for evaluating qualitative data. They point out that differentreaders of any text will have a different interpretation (reading) of the text. The diversityof interpretations, they argue, is the nature of textual material and should be welcomedby qualitative analysts. As a consequence, different ‘readings’ of the data should not be regarded as methodological flaws. The underlying difference between quantitativeand qualitative researchers is not a matter of numbers and statistics. It is much more fundamental. At its most extreme, quantitative and qualitative research are alternativeways of seeing the world, not just different ways of carrying out research. It is, after all,the difference between the modern (scientific) approach with its emphasis on cause andthe postmodern approach with its emphasis on interpretation.
It may be useful to consider that, according to Denscombe (2002), there are a numberof features that distinguish good research of all types from not so good research (seeFigure 25.1). Among the features that he lists are the following:
The contribution of new knowledge.
The use of precise and valid data.
The data are collected and used in a justifiable way.
The production of findings from which generalisations can be made.
These are tantalisingly simple criteria which are hard to question. Perhaps the difficultyis that they are so readily accepted. Some might suggest that we are all so imbued withpositivist ideas that we no longer recognise them in our thinking. Phrases such as ‘newknowledge’, ‘precise/valid data’, ‘justifiable’ and ‘generalisation’ may be more problematicthan at first appears. What is new knowledge for example? By what criteria do we decidethat research has contributed new knowledge? What is precise and valid data? How precise need data be to make them acceptable in research? For what purposes do thedata need to be valid to make them worthwhile? Why should worthwhile knowledge be generalisable? Should knowledge that works for New York City be generalisable toa village in Mali?
This boils down to the problematic nature of evaluation criteria. If it is difficult tosuggest workable criteria for quantitative research, just what criteria should be appliedto qualitative research? One approach is to recognise that much qualitative research has its intellectual roots in postmodernist ideas which, in themselves, are a reactionagainst the modernist ideas of traditional science and positivism. That is, it would seemthat the criteria should be different for qualitative and quantitative research given this. Neverthless, in some ways, it would seem better to seek criteria which are equallyapplicable to both qualitative and quantitative research. One such set of criteria is thatwhich determines high standards of scholarship in any field. What are these criteria?Careful analysis, detachment, accuracy, questioning and insight are among the suggestions.
CHAPTER 25 EVALUATING AND WRITING UP QUALITATIVE RESEARCH 397
M25_HOWI4994_03_SE_C25.QXD 10/11/10 15:06 Page 397

398 PART 4 QUALITATIVE RESEARCH METHODS
But there is nothing in such criteria which clarifies what is good psychology and what isbad. As we saw in Chapter 17, the intellectual roots of qualitative analysis are outsidepsychology, where different priorities exist. And why is detachment a useful criterion,for example? It hints that the researcher ideally is an almost alienated figure. Indeed, criteria such as detachment have been criticised for encouraging research to be anodyne(for example, Howitt, 1992a).
Universal criteria for evaluating what is good psychology may be a futile quest andpossibly an undesirable one. Such an endeavour would seem to miss the point since epistemological bases of qualitative and quantitative research are in many ways incom-patible. Many of the precepts of quantitative research are systematically reversed bycoteries of qualitative researchers. For example, when qualitative researchers reject psychological states as explanatory principles, they reject much psychology. The alter-native to finding universal evaluation criteria is to evaluate qualitative and quantitativemethods by their own criteria, that is, in many respects differently.
FIGURE 25.1 Validity criteria in qualitative research
M25_HOWI4994_03_SE_C25.QXD 10/11/10 15:06 Page 398

CHAPTER 25 EVALUATING AND WRITING UP QUALITATIVE RESEARCH 399
25.2 Evaluating qualitative research
The distinction between qualitative data collection and qualitative data analysis is para-mount (Chapter 18). If the researcher seeks to quantify ‘rich’ data collected through in-depth methods such as open-ended interviewing then criteria appropriate to qualitativeanalyses may not always apply. It is fair to say that qualitative researchers do not speakwith one voice about what the evaluative criteria should be. Qualitative research is anumbrella term covering a multitude of viewpoints, just as quantitative research is.
Taylor (2001) discusses a number of evaluative criteria for qualitative research. Some of them apply to research in general but often they take on a special significancein qualitative research. Others are criteria which best make sense only when consider-ing qualitative research. The following are some of Taylor’s more general criteria forevaluating qualitative research. We will discuss her more specific criteria and those ofothers later:
How the research is located in the light of previously published research Traditionallyin psychological research, knowledge grows cumulatively through a process whichbegins with a literature search, through development of an idea based on this searchand data collection, to finally reporting one’s findings and conclusions. This is not thecase in all forms of qualitative research. Some qualitative researchers begin with textualmaterial that they wish to analyse, and delay referring back to previous research untilafter their analysis is completed. The idea is that the previous literature is an additionalresource, more text if one likes, with which to explore the adequacy of the currentanalysis and its fit with other circumstances. The delay also means that the researcheris not so tempted to take categories off the peg and apply them to their data. In someforms of qualitative analysis – especially conversation analysis – reference to the publishedresearch can be notably sparse. So the research literature in qualitative research isused very differently from its role in quantitative research. In quantitative research,knowledge is regarded as building out of previous knowledge, so one reviews the stateof one’s chosen research and uses it as a base from which to build further research.Traditionally, quantitative research demands the support of previous research inorder to demonstrate the robustness and replicability of findings across samples andcircumstances. Often, in the quantitative tradition, researchers resort to methodologicalconsiderations as an explanation of the variability in past and current findings. In thequalitative tradition, any disparity between studies is regarded much more positively andas less of a problem. Disparity is seen as a stimulus to refining the analytic categoriesused, which is the central activity of qualitative research anyway.
How coherent and persuasive the argument is rather than emotional Argumentationand conclusion-drawing in psychology are typically regarded as dependent on preciselogical sequences. It is generally not considered appropriate to express oneself emotionally or to engage in rhetorical devices in psychological report writing. This is quite a different matter from being dispassionate or uninvolved in one’s subjectmatter. A great deal of fine psychological writing has been built on the commitmentof the researcher to the outcomes of the research. Nevertheless, the expectation is that the researcher is restrained by the data and logic. In this way, the researcher isless likely to be dismissed as merely expressing personal opinions. This is the case nomatter what research tradition is being considered.
Data should not be ‘left to speak for themselves’ and the analysis should involve systematic investigation The meaning of data does not reside entirely in the datathemselves. Data needs to be interpreted in the light of a variety of considerations of both a methodological and a theoretical nature. Few if any data have intrinsic,
M25_HOWI4994_03_SE_C25.QXD 10/11/10 15:06 Page 399
400 PART 4 QUALITATIVE RESEARCH METHODS
indisputable and unambiguous meanings. Hence the role of the researcher as inter-preter of the data has to be part of the process. This interpretation has to be done with subtlety. There is a temptation among newcomers to qualitative analysis to feel thatthe set of data should speak ‘for itself’. So large amounts of text are reproduced andlittle by way of analysis or interpretation offered. To do so, however, is to ignore acentral requirement of research which is to draw together the data to tell a story indetail. In qualitative research this is through the development of closely fitting codingcategories in which the data fit precisely but in a way which synthesises aspects of thedata. Qualitative research may cause problems for novice researchers because theysubstitute the data for analysis of the data. Of course, ethnographically meaningfuldata should carry its meaning for all members of that community. Unfortunately, to push this version of the ethnographic viewpoint too far leaves no scope for the input of the psychologist. If total fidelity to the data is more important than the analysis of the data, then researchers may just as well publish recordings or videos oftheir interviews, for example. Indeed, there would be no role for the researcher asanyone could generate a psychological analysis. But, of course, this is not true. It takestraining to be capable of quality analyses.
Fruitfulness of findings Assessing the fruitfulness of any research is not easy. Thereare so many ways in which research may be fruitful and little research is fruitful inevery respect. Most research, however, can be judged only in the short term, andlonger-term matters such as impact on the public or other researchers may simply beinappropriate. Fruitfulness is probably best judged in terms of the immediate pay-offfrom the research in terms of the number of new ideas and insights it generates. Nowit is very difficult to catalogue just what are new ideas and insights but rather easierto recognise work which lacks these qualities.
Relevance to social issues/political events Qualitative research in psychology oftenclaims an interest in social issues and politics. There are a number of well-knownstudies which deal with social and political issues. The question needs to be asked,however, just how social and political issues need to be addressed in psychology, and from what perspective? Mainstream psychology has a long tradition of interestin much the same issue. Institutionally, the Society for the Study of Social Issues in the USA has actively related psychology to social problems (Howitt, 1992a), for example, for most of psychology’s modern history. There is a distinct tradition of socially relevant quantitative research. Given the insistence of many qualitativeresearchers that their data are grounded in the mundane texts of the social world, onemight expect that qualitative research is firmly socially grounded. One criticism ofqualitative research though is that it has a tendency to regard the political and socialas simply being more text that can be subjected to qualitative analysis. As such thesocial and political text has no special status other than as an interesting topic for textual analysis. Some qualitative researchers have been very critical of the failure ofmuch qualitative research to deal effectively with the social and political – conceptssuch as power, for instance (Parker, 1989). Since power is exercised through socialinstitutions then one can question the extent to which analysis of text in isolation issufficient analysis.
Usefulness and applicability The relevance of psychological research of any sort isa vexed question. Part of the difficulty is that many researchers regard their work asone aspect of an attempt to understand its subject matter for its own sake without theconstraints of application. Indeed, applied research in psychology has often been seenas a separate entity from academic research and often somewhat derided as ordinaryor pedestrian. Nevertheless, this point of view seems to have reduced in recent yearsand it is increasingly acceptable to consider the application of research findings as an
M25_HOWI4994_03_SE_C25.QXD 10/11/10 15:06 Page 400
CHAPTER 25 EVALUATING AND WRITING UP QUALITATIVE RESEARCH 401
indication of the value of, at least, some research. It is fairly easy to point to examplesfrom mainstream psychology of the direct application of psychological research –clinical, forensic and educational psychology all demonstrate this in abundance. Part of the success of psychology in these areas is in finding ways of dealing with thepractical problems of institutions such as prisons, schools and the mental health system.Success in the application of psychology stems partly from the power of researchfindings to support practical activities. Qualitative researchers have begun to overlapsome of these traditional fields of the application of psychology. Unfortunately theclaim that qualitative research is subjective tends to undermine its impact from thepoint of view of mainstream psychology. Nevertheless, topics such as counselling/psychotherapy sessions and medical interview are to be found in the qualitative psychology literature. As yet, it is difficult to give examples of the direct applicationof the findings of such psychological research.
The above criteria are in some ways similar to those which we might apply to quantitative research. They are important in the present context since it clarifies theirimportance in qualitative research too. They sometimes take a slightly different form inthe two types of research.
25.3 Validity
The concept of validity is difficult to apply to qualitative research. Traditionally validityin psychology refers to an assessment of whether a measure actually measures what it isintended to measure. This implies there is something fixed which can be measured. Theemphasis is really on the validity of the measures employed as indicators of correspondingvariables in the actual world. So the validity of a measure of schizophrenia is the extentto which it corresponds with schizophrenia in the actual world beyond that measure.This is not usually an assumption of qualitative research. In qualitative research, theemphasis of validity assessment is in terms of the question of how well the analysis fitsthe data. A good analysis fits the data very well. In quantitative research, often a verymodest fit of the hypothesis to the data is acceptable – so long as the minimum criterionof statistical significance is met.
As we saw in Chapter 15, there are a number of ways of assessing validity in quantitative research. They all imply that there is something in actuality that can be measured by our techniques. This is unlikely to be the case with qualitative research for a number of reasons. One is the insistence by some qualitative researchers that texthas a multiplicity of readings and that extends to the readings by researchers. In otherwords, given the postmodernist emphasis on the impossibility of observing ‘reality’ otherthan through a looking glass of subjectivity, validity cannot truly be assessed as a generalaspect of measurement.
Discussions of validity by qualitative researchers take two forms:
It is very common to question the validity of quantitative research. That is, to encour-age the view that qualitative research is the better means to obtaining understandingof the social and psychological world.
The tendency among qualitative researchers to treat any text (written or spoken) asworthwhile data means that the validity of the data is not questioned. The validity of the transcription is sometimes considered, but emphasis is placed on ways in whichthe fidelity of the transcription, say to the original audio-recording, may be maximised.The greatest emphasis is placed on ways in which the validity of the qualitative analysis
M25_HOWI4994_03_SE_C25.QXD 10/11/10 15:06 Page 401

402 PART 4 QUALITATIVE RESEARCH METHODS
as a qualitative analysis may be maximised. This really is the primary meaning ofvalidity in qualitative research. So many of the criteria listed by qualitative researchersare ones which are only meaningful if we understand the epistemological origins of qualitative research. That is, there are some considerations about the worth ofqualitative data which do not normally apply to quantitative research.
Potter (1998) uses the phrase ‘justification of analytic claims’ alongside using theword validity. The phrase ‘justification of analytic claims’ emphasises the value of theanalysis rather than the nature of the data. He suggests four considerations which formthe ‘repertoire’ with which to judge qualitative research. Different researchers mayemphasise different combinations of these:
Participant’s own understandings When the qualitative material is conversation or similar text, we need to remember that speakers actually interpret the previous contributions by previous speakers. So the new speaker’s understanding of what wentbefore is often built into what they say in their turn. For example, a long pause anda change of subject may indicate that the speaker disagrees with what went before butdoes not wish to express that disagreement directly. Potter argues that by very carefullypaying attention to such details in the analysis, the analyst can more precisely analysethe conversation in ways which are relevant to the participant’s understandings. It isa way of checking the researcher’s analysis.
Openness to evaluation Sometimes it is argued that the readers of a qualitative analysis are more in contact with the data than typically is the case in quantitativeresearch in which tables and descriptive statistics are presented but none of the original data directly. Qualitative analyses often incorporate substantial amounts of textual material in support of the analytic interpretation. Because of this, the qualitative analysis may be more open to challenge and questioning by the readerthan other forms of research. Relatively little qualitative research is open in this way,however. Potter suggests that for much reported grounded theory and ethnographicresearch, very little is presented in a challengeable form and a great deal has to betaken on trust, just as with quantitative research. Even where detailed transcripts areprovided, however, Potter’s ideal may not be met. For example, what checking can bedone if the researcher does not report the full transcript but rather selected highlights?Furthermore, what avenues are open to the reader who disagrees with an analysis tochallenge the analysis?
Deviant instances In quantitative research, deviant cases are largely treated as irrelevant. The participant who bucks the trend of the data is largely ignored – as ‘noise’ or randomness. Sometimes this is known as ‘experimental error’, but it isreally an indicator of how much of the data is actually being ignored in terms ofexplanation. Often no attempt is made to explain why some participants are not representative of the trend. In qualitative research, partly because of the insistence on detailed analysis of sequences, the deviant case may be much more evident.Consequently the analysis needs to be modified to include what is truly deviant aboutit. It may be discovered that the seemingly deviant case is not really deviant – or itmay become apparent why it ‘breaks the rules’. It may also prove a decisive reasonfor abandoning a cherished analytic interpretation.
Coherence with previous discourse studies Basically the idea here is that qualitativestudies which cohere with previous studies are more convincing than ones which are in some way at odds with previous research. There is a sense in which this is areplicability issue since not only does coherence add conviction to the new study but italso adds conviction to the older studies. This is also the case with quantitative studies.But there are difficulties with this form of validity indicator. Qualitative research
M25_HOWI4994_03_SE_C25.QXD 10/11/10 15:06 Page 402

CHAPTER 25 EVALUATING AND WRITING UP QUALITATIVE RESEARCH 403
varies in terms of its fidelity to previous research when a replication is carried out.Some research will be close to the original and some may be substantially different.In this context, if a qualitative study is merely designed to apply the theoretical conceptsderived from an earlier study then the findings are more likely to cohere with the earlierstudies. Studies not conceived in this way will be a more effective challenge to whathas gone before – and provide greater support if they confirm what went before.
Additional criteria for the evaluation of qualitative research are available (Taylor,2001). These are not matters of validity, but do offer means of evaluating the relativeworth of different qualitative studies:
Richness of detail in the data and analysis The whole point of qualitative analysisis to develop descriptive categories which fit the data well. So one criterion of thequality of a study is the amount of detail in the treatment of the data and its analysis.Qualitative research requires endless processing of the material to meet its aims.Consequently, if the researcher just presents a few broad categories and a few broadindications of what sorts of material fit that category, then one will be less convincedof the quality of the analysis. Of course, richness of detail is not a concept which is readily tallied so it begs the question of how much detail is richness. Should it beassessed in terms of numbers of words, the range of different sources of text, the verbal complexity of the data, or how? Similar questions may be applied to the issueof the richness of detail in the analysis. Just what does this mean? Is this a matter of thecomplexity of the analysis and why should a complex analysis be regarded as a virtuein its own right? In quantitative research, in contrast, the simplicity of the analysis isregarded as a virtue if it accounts for the detail of the data well. It is the easiest thingin the world to produce coding categories which fit the data well – if one has a lot ofcoding categories then all data are easily fitted. The fact that each of these categories fitsonly a very small part of the data means that the categories may not be very useful.
Explication of the process of analysis If judged by the claims of qualitative analystsalone, the process of producing an adequate qualitative analysis is time-consuming,meticulous and demanding. As a consequence of all of this effort, the product is both subtle and true to the data. The only way that the reader can fully appreciate the quality of the effort is if the researcher gives details of the stages of the analysisprocess. This does not amount to evidence of validity in the traditional sense, but isa quality assurance indicator of the processes that went into developing the analysis.
Using selected quantitative techniques Some qualitative researchers are not againstusing some of the techniques of quantitative analysis. There is no reason in their viewwhy qualitative research should not use systematic sampling to ensure that the dataare representative. Others would stress the role of the deviant or inconsistent case inthat it presents the greatest challenge to the categorisation process. The failure ofmore traditional quantitative methods to deal with deviant cases other than as ‘noise’,error or simply irrelevant should be stressed again in this context.
Respondent validation Given the origins of much qualitative research in ethno-methodology, the congruence of the interpretations of the researcher with those of themembers of the group being studied may be seen as a form of validity check. This isalmost a matter of definition – the meanings arrived at through research are intendedto be close to those of the people being studied in ethnomethodology. Sometimes it is suggested that there is a premium in the researcher having ‘insider status’. That is,a researcher who is actually a member of the group being studied is at an advantage.This is another reflection of the tenets of ethnomethodology. There is always thecounter-argument to this that such closeness actually stands in the way of insightfulresearch. However, there is no way of deciding which is correct. Owusu-Bempah and
M25_HOWI4994_03_SE_C25.QXD 10/11/10 15:06 Page 403

404 PART 4 QUALITATIVE RESEARCH METHODS
Howitt (2000) give examples from cross-cultural research of such insider perspectives.Of course, the importance of these criteria is largely the consequence of allegiance toa particular theoretical stance. It is difficult to argue for universality of this criterion.
Triangulation This concerns the validity of findings. When researchers use very differ-ent methods of collecting data yet reach the same findings on a group of participants,this is evidence of the validity of the findings. Or, in other words, their robustness acrossdifferent methods of data collection or analysis. The replication of the findings occurswithin settings and not across settings. This is then very different from triangulationwhen it is applied to quantitative data. In that case, the replication is carried out inwidely different studies from those of the original study. The underlying assumptionis that of positivist universality, an anathema to qualitative researchers.
Writing up a qualitative report
Box 25.1 Practical Advice
In some ways, writing up a report of qualitative researchis potentially beset with problems. There are many reasonsfor this especially because no set format has yet emergedwhich deals effectively with the structure of qualitativepractical reports. The conventional structure explained inChapter 5 is clearly aimed at quantitative research and, at first sight, there may be questions about its relevance to qualitative research. However, they both have as theiroverriding consideration the need for the utmost academicrigour and, in part, that is what the standard report structure in psychology helps to achieve. However, wehave already explained in Chapter 5 that the conventionalreport structure often needs some modification whenquantitative research departs from the basic laboratoryexperiment model. By modifying the basic structure, many of its advantages are retained in terms of clarity of structure and reader-friendliness resulting from its basic familiarity. Our recommendation is that you writeup qualitative research studies using the traditional laboratory report structure which you modify by addingadditional headings or leaving out some as necessary. Of course, you would probably wish to consult journal articles which employ similar methods to your own forideas about how to structure your report. These can, ifchosen wisely and used intelligently, provide an excellentmodel for your report and are an easy way of accessingideas about how to modify the conventional laboratoryreport structure for your purposes. Occasionally, you willcome across a qualitative journal article which is some-what ‘off the wall’ in terms of what you are used to but wewould not recommend that you adopt such extreme styles.
You are writing a qualitative report in the context of thepsychological tradition of academic work and you will dobest by respecting the academic pedigree of this.
By adopting but adapting the conventional laboratoryreport structure you are doing yourself a favour.Quantitative report writing is likely to be familiar to youand you will have had some opportunity to develop your skills in this regard in all probability. Everyone has difficulties writing quantitative reports but this partlyreflects the academic rigour that writing such reportsdemands. The reader of your report will benefit from thefact that they are reading something which has a more-or-less familiar structure where most of the material is whereit is expected to be in the report. There will be differences,of course. In particular, it is unlikely (but possible) thatyou would include hypotheses in a qualitative report just as it is fairly unlikely that you would include any statistical analysis (but again possibly especially with techniques such as thematic analysis). Many forms ofqualitative research are methodologically demanding andthe analysis equally so. It would not be helpful to you toproduce sloppy reports given this. Bear the following inmind when writing your qualitative report:
The introduction is likely to discuss in some lengthconceptual issues concerning the type of analysis thatyou are performing. This is most likely to be the casewhen conducting a discourse analysis which is highlyinterdependent with certain theories of language. Youprobably will spend little time discussing conceptualissues like these when conducting a thematic analysiswhich is not based particularly on any theory.
M25_HOWI4994_03_SE_C25.QXD 10/11/10 15:06 Page 404

CHAPTER 25 EVALUATING AND WRITING UP QUALITATIVE RESEARCH 405
The literature review is generally as important in qualitative write-ups as quantitative ones. Indeed, especially when using qualitative methods in relation toapplied topics, you may find that you need to refer toresearch and theory based on quantitative methods aswell as qualitative research. While it is not common forquantitative methods to be looking at exactly the sameissues as qualitative studies, there are circumstances in which each can inform the other. Although pro-fessional publications using conversation analysis oftenhave very few references (as conversation analysis seesitself as data-driven and not theory-driven in terms of analysis), we would not recommend that studentsemulate this. As in any other writing you do as a student, we would recommend that you demonstratethe depth and extent of your reading of the relevant literature in your writings. You cannot expect creditfor something that you have not done.
Although preliminary hypotheses are inappropriate formost qualitative analyses (since hypotheses come froma different tradition in psychological research), youshould be very clear about the aims of your research inyour report. This helps to focus the reader in terms ofyour data collection and analysis as well as demon-strating the purposive nature of your research. In otherwords, clearly stated aims are a helpful part of tellingthe ‘story’ of your research.
The method section for a qualitative report should becomparable to one for a quantitative report in scopeand level of detail. There are numerous methods of datacollection in qualitative research so it is impossible to give detailed suggestions which apply to each ofthese. Nevertheless, there is a temptation to give too little detail when reporting qualitative methods sinceoften the methods are quite simple compared with theprocedures adopted in some laboratory studies, forexample. So it is best to be precise about the proceduresused even though these may at times appear to be relatively simple and straightforward compared withother forms of research.
Too frequently qualitative analysts fail to give sufficientdetail about how they carried out their analysis. Writingthings like ‘a grounded theory analysis was performed’or ‘thematic analysis was employed’ is to say too little.There is more to qualitative analysis than this and greatvariation in how analyses are carried out. To the reader,such brief statements may read more like an attempt tomystify the analysis process than to elucidate import-ant detail. It is especially important for students toexplain in some detail about how they went about theiranalysis since, by doing so, not only does the reader get
a clearer idea about the analytic procedures employedbut the student demonstrates their understanding andmastery of the method. As ever in report writing, it isvery difficult to stipulate just how much detail shouldbe given – judgement is involved in this rather thanrules – but we would suggest that it is best to err on theside of too much detail.
There is a difficulty in deciding just how much datashould be presented in a report. A few in-depth inter-views can add up to quite a bulky number of pages of transcripts. However, in terms of self-presentation,these transcripts (especially if they involved Jeffersontranscription methods) are a testament to how carefullyand thoroughly the researcher carried out the analysis.Not to include them in your report as an appendixmeans that the reader has no idea of the amount ofeffort that went into your analysis but, also, the readeris denied the opportunity to check the analysis or to get a full picture of what happened in the interviews.Normally transcriptions do not count towards wordlimits though you might wish to check this locally withyour lecturers.
You should make sure that you include analysis in your report – sometimes researchers simply reproducenumerous quotations from their data which are weaklylinked together by a simple narrative. This may notconstitute an analysis at all in a meaningful sense of theterm. A commentary on a few quotations is not what ismeant by qualitative analysis.
Your analytic claims should actually be supported bythe data. So you need to check that your interpretation ofyour data actually is reflected in the excerpts that you use.
It is possible to be systematic in the presentation of youranalysis of qualitative data. A good example of this is theway in which IPA analysts (see Chapter 24) producetables to illustrate the themes which they identify. In this way, themes can be linked hierarchically andillustrative excerpts from the data included for eachtheme in a systematic manner.
Furthermore, with thematic analysis especially, it canbe very helpful to give some basic statistical informationabout the number of interviews, for example, in whichthe theme was to be found or some other indication oftheir rates of occurrence.
When it comes to discussing the findings from yourqualitative research, you will find numerous criteria by which the adequacy of a qualitative study can beassessed in this chapter. Why not incorporate some ofthese criteria when evaluating your research findings?
M25_HOWI4994_03_SE_C25.QXD 10/11/10 15:06 Page 405

406 PART 4 QUALITATIVE RESEARCH METHODS
25.4 Criteria for novices
There is probably no qualitative study that effectively embraces all of the criteria of quality that we have discussed. The criteria are not normally discussed within a qualitativereport and are more often referred to in theoretical discussions of qualitative methodology.Hence, it is difficult to provide researchers new to qualitative research with a well-established set of procedures which serve as routine quality assurance checks. In thisway, quantitative research is very different. Significance testing, reliability estimates,validity coefficients and so forth are minimum quality indicators. Similarly, the literaturereview is part of the process of assessing the worth of the new findings. Of course, manyother indicators of quality are neglected in quantitative reports, just as they often are inqualitative ones.
While these criteria of the worth of a qualitative study can be seen to be intrinsicallyof value (once the intellectual roots of qualitative research are understood), it is likelythat the complexity of the criteria will defeat some novice researchers in the field. They certainly do not gel as a set of principles to help launch good-quality qualitativeresearch by newcomers. So in this section we will suggest some of the criteria whichbeginners might wish to adopt as a more pragmatic pathway to successful qualitativeresearch (see also Figure 25.2):
Have you immersed yourself in the qualitative research literature or undergone training in qualitative research? Analytic success is a long journey and you need tounderstand where you are heading.
Why are you not doing a quantitative analysis? Have you really done a quantitativeanalysis badly and called it qualitative research?
Can you identify the specific qualitative method that you are using and why?Qualitative research is not an amorphous mass but a set of sometimes interlinkingapproaches.
FIGURE 25.2 Some quality indicators for novice researchers
M25_HOWI4994_03_SE_C25.QXD 10/11/10 15:06 Page 406

CHAPTER 25 EVALUATING AND WRITING UP QUALITATIVE RESEARCH 407
What resources are you devoting to your data collection and analysis? Qualitativedata analysis probably requires more personal research skills than much quantitativedata analysis. It requires a good interviewing technique, for example, to obtain therichness of data required. Qualitative data require transcription (or quantitative coding), which is time-consuming and exacting. If you do not understand the point ofthis then your research is almost certainly of dubious quality.
Have you coded or categorised all your data? If not, why not? How do you know that your categories work unless you have tested them thoroughly against the entiretyof what you want to understand? If you can only point to instances of categories youwish to use then how do you know that you have a satisfactory fit of your categorieswith the data?
Has there been a process of refining your categories? Or have you merely used categories from other research or thought of a few categories without these beingworked up through revisions of the data?
Can you say precisely what parts of your data fit your categories? Phrases such as‘Many participants . . .’, ‘Frequently . . .’ and ‘Some . . .’ should not be used to coverup woolliness about how your data are coded.
How deeply engaged were you in the analysis? Did it come easily? If so, have youtaken advantage of the special gains which may result from qualitative research?
25.5 Conclusion
Very few of the traditional criteria which we apply to quantitative research apply toqualitative research directly. They simply do not have the same intellectual roots and, to some extent, they are in conflict. There are a number of criteria for evaluating qualitative research, but these largely concentrate on evaluating the quality of the coding or categorisation process (the qualitative analysis). These criteria can be appliedbut, as yet, there is no way of deciding whether the study is of sufficient quality. Theyare merely indicators. This contrasts markedly with quantitative and statistical researchwhere there are rules of thumb which may be applied to decide on the worth of theresearch. Significance testing is one obvious example of this when we apply a test ofwhether the data are likely to have been obtained simply by sampling fluctuations.Internal consistency measures of reliability such as alpha also have such cut-off rules.This leaves it a little uncertain how inexperienced qualitative researchers can evaluatetheir research. It is clearly the case that qualitative researchers need to reflect on thevalue of their analysis as much as any other researcher.
M25_HOWI4994_03_SE_C25.QXD 10/11/10 15:06 Page 407

408 PART 4 QUALITATIVE RESEARCH METHODS
Since qualitative research is a reaction to positivism and its influence on research, qualitativeresearch needs to be evaluated in part in its own terms.
Some criteria apply to both quantitative and qualitative research. The criteria include how theresearch is located in relation to previously published research, the coherence and persuasivenessof the argument, the strength of the analysis to impose structure on the data, the potential of theresearch to stimulate further research or the originality and quantity of new insights arising from theresearch, and the usefulness of applicability of the research.
Yet other criteria which may be applied are much more specific to qualitative research. These includethe correspondence of the analysis with the participant’s own understandings, the openness of thereport to evaluation, the ability of the analysis to deal with otherwise deviant instances in the data,the richness of detail in the analysis, which is dependent on the richness of the data in part, and howclearly the process of developing the analysis is presented.
The criteria that novice researchers use to evaluate their own research may be a little more routine.Considerations include factors related to the amount of effort devoted to developing the analysis, the degree to which the analysis embraces the totality of the data, and even questioning whether aquantitative study would have been more appropriate anyway.
Key points
ACTIVITIES1. Could a qualitative researcher simply make up their analysis and get away with it? List the factors that stop this
happening.
2. Develop a set of principles by which all research could be evaluated.
M25_HOWI4994_03_SE_C25.QXD 10/11/10 15:06 Page 408

Research for projects,dissertations and theses
PART 5
M26_HOWI4994_03_SE_C26.QXD 10/11/10 15:07 Page 409

M26_HOWI4994_03_SE_C26.QXD 10/11/10 15:07 Page 410

Developing ideas for research
Overview
CHAPTER 26
If you are planning a research project, ideally this will be firmly based on your knowledgeof psychology in general and the pertinent research literature in particular. Rarely is itpersonally satisfactory to simply reproduce (replicate) what other researchers havedone. It is better to use their work creatively and intelligently to produce a valuablevariation or extension of what has already been achieved. In this way, one’s work ismore appreciated by lecturers. Sometimes, student researchers hit upon ideas whichhave not been effectively researched previously. Occasionally, their research may bepublishable.
Typically, one only has a rudimentary research idea for a project. This idea will be‘knocked into shape’ by a process of reading, discussion with a supervisor or peers,and exploring the possibilities in a systematic, disciplined fashion.
Initially, try drawing up a list of ideas which may then be honed down into a list ofmanageable and feasible research ideas. There are practical limits of time and otherresources which mean that sometimes very good ideas have to be set aside. Althoughpsychology is a fascinating subject, be careful to concentrate on just a few ideassince the time involved in reading pertinent material can be considerable. Hence, donot spread your resources too thinly over too many possibilities.
The research idea you ultimately focus upon ought to be satisfying to you in differentways. It should be of interest to you, it should be capable of making a contribution to the research field in question, and it should be feasible within your limits of timeand available resource. Student research is confined by a fixed time schedule and the most brilliant student research project ever is a waste if essential deadlines aremissed.
M26_HOWI4994_03_SE_C26.QXD 10/11/10 15:07 Page 411

412 PART 5 RESEARCH FOR PROJECTS, DISSERTATIONS AND THESES
It is not uncommon for students to find it difficult to come up with ideas for a researchproject or dissertation. Don’t worry too much if you are one of these. Having goodideas comes with practice and learning to have ideas is part of the process of learningto become a researcher. There are a number of ways of helping yourself through thisdifficult stage.
After a number of years at university and having lived for a while, there will be sometopics that you have studied or some life experiences that you have had which haveinterested you. It is likely that you have even clearer ideas of the sorts of thing whichyou find boring and which you would find it hard to generate interest in. Our bestadvice is to avoid these even if they could otherwise make good studies.
At some stage, and the sooner the better, every researcher has to start reading therecently published literature on the topics which interest them the most. This may be simply to ‘keep up with the field’ but it is more likely to be to survey an area that one is or is becoming interested in. This is not easy and takes time – one has to try to understand what others have done, how they have done it, and why they havedone it. It is not unknown for other researchers to have made life difficult in thisrespect. Once one has understood what others have done, it may remain necessaryto appreciate why they have done it.
You should also bear in mind just what you are trying to emulate. Think of what youbelieve a professor of psychology should be. Are they not expected to adopt a curious,questioning and critical attitude to whatever they read? Furthermore, they are verycautious people unwilling to take things for granted and demand evidence for everything– even things which seem self-evident to regular people. Reading like a professor shouldhelp you come up with a number of ideas about what needs to be done further.
The more one reads, the more ideas come to one. It is a bit like writing a tune. Mostof us would struggle to write a tune, whereas a skilled musician who has listened toand studied innumerable melodies would do so easily. Having heard and playedthousands of tunes curiously makes it easier not harder to write a tune.
Substantial student research projects are largely modelled on the style of academicpublications – final year dissertations, for example. Consequently, some of the betterstudent projects may be worthy of publication although this is not their prime purpose.While there is no guarantee that the results of your study will be publishable, it is agoal worth aiming at.
26.1 Introduction
The research conducted by students has as its primary purpose demonstrating what the student has achieved. Does their work demonstrate the necessary skills involved indesigning, planning, analysing and reporting their psychological research? Demonstratingsuch a level of achievement is the first requirement. To this is then added an assessmentof the layer of extra finesse that relates to the quality of the research ideas involved andthe execution of the research. It is almost universal that psychology students have tocarry out a research project as part of their training – at the undergraduate level, thepostgraduate level or both.
M26_HOWI4994_03_SE_C26.QXD 10/11/10 15:07 Page 412

CHAPTER 26 DEVELOPING IDEAS FOR RESEARCH 413
It is only natural that students vary considerably in the extent that they can use theirown ideas as the basis of their work. Departments of psychology will vary in the extentto which they expect this of student research as will members of staff within the depart-ment in question. Some departments require students to carry out research on topics outlined already by members of staff in a sort of apprenticeship system. At the other endof the range, other departments will positively encourage students to come up with theirown research ideas. Both of these are reasonable options and have their own advantagesand disadvantages. This situation is very much like academic research in general. Forexample, many junior research staff are employed simply to carry out the research plansof more senior staff – such as when they are employed as research assistants. In othersituations you may be offered a rough idea of what to do, which you need to developinto a project yourself. Whatever the case where you study, remember that the qualityof the outcome may have an important bearing on your future and so you should satisfyyourself that what you choose to do is worthwhile.
There are three main broad considerations that student researchers need to reflectupon when they plan to carry out a research project (see Figure 26.1):
Motivation We all differ to some extent in terms of what motivates us best. Some students work best in fields which are especially pertinent to their experiences. Forexample, many students draw on their personal experiences as a basis for planningresearch – they want psychology to be relevant to their everyday life. Research intothe experience of cancer, alcoholism, dyslexia and relationships may be firmly weddedto things which have happened in their lives. While it is often argued that academicresearchers should be dispassionate, it does not follow from this that this excludestopics for research which are of personal relevance. Other students may be attractedto topics which are solely of intellectual interest to them – they may not expect orrequire the grounding of their research in real life. Given that a research project is along-term investment of time and energy, it is a mistake to adopt a topic for researchthat cannot sustain one over a period of months. Many students find research projectsand dissertations a major trial of stamina and character.
Practicality There is little point in risking failure with a student research project. So be very cautious about planning research which is dependent on unknown orunpredictable contingencies for completion. For example, it might be a wonderfulidea to study cognitive processes in a group of serial killers and, if properly done, theresearch might make a major contribution and even save a few lives. But what are the
FIGURE 26.1 Some primary considerations when planning research
M26_HOWI4994_03_SE_C26.QXD 10/11/10 15:07 Page 413

414 PART 5 RESEARCH FOR PROJECTS, DISSERTATIONS AND THESES
practicalities of something like this for a student research project? Fortunately, mostof us do not know any serial killers and probably would need to resort to getting thecooperation of the prison service in order to obtain a sample. The likelihood of theprison service cooperating ought to be assessed seriously alongside the seriousness of the consequences should the prison service says no – as it is likely to in this case.Be very cautious of vague or even seemingly firm and well-intentioned promises of cooperation – we have seen cases where cooperation has been withdrawn at a latestage, leaving the student having to revamp their plans completely.
Academic value Student research is most likely to be judged using conventional academic criteria. Research can be valuable for many other reasons but this does notnecessarily mean that its weight in academic content is strong. For example, it maybe very important for practitioners to know young people’s attitudes to safe sex andAIDS (auto-immunodeficiency syndrome). The information gathered in a survey ofyoung people may be highly valued by such practitioners. On the other hand, in termsof academic weight such a survey may meet few of the requirements of academics.The research might be seen by them as being atheoretical and merely a simple data-gathering task. Many academics would prefer research which helps develop new theories,validates theories, or is simply very smart or clever. So a student should try to ensurethat their research is operating in the right playing field. Usually, the issue is one ofensuring that the theoretical concerns of the dissertation are made sufficiently strong –that is, there should be evidence that the research has an orientation towards theory.
26.2 Why not a replication study?
Although research projects such as final year projects and dissertations are in part judgedin terms of their technical competence, they are also judged in the same terms as anyother research work; for example, on the extent to which the research potentially makesa useful or interesting contribution. One must be realistic about what any single researchstudy can contribute, of course. Many published papers make only a small contributionthough, it should be stressed, there will probably be some disagreement as to the actualworth of any particular study. Excellence is often in the eye of the beholder. We havealready seen that even experts can disagree widely as to whether a particular paper is of publishable quality (Cicchetti, 1991). Major theoretical or conceptual breakthroughsare not expected from student research or the run of the mill professional research paperfor that matter. However, it is not unknown for student projects, if they are of top quality, to be published in academic journals. For example, the undergraduate projectsof a number of our students have been published (for example, Cramer and Buckland,1995; Cramer and Fong, 1991; Medway and Howitt, 2003; Murphy, Cramer and Lillie,1984). This is excellent, especially where the student has ambitions towards a career in research.
Not all research projects stand an even chance of being regarded as of good or highquality. Some projects are likely to find less favour than others simply because theyreflect a low level of aspiration and fail to appreciate the qualities of good research. Hereare a few examples and comments:
A study which examines the relationship between a commercial (ready-made) test ofcreativity and another commercially available test measuring intelligence. This study,even if it could be related to the theoretical literature on creativity and intelligence,does not allow the student to demonstrate any special skill in terms of method oranalysis. It has also probably been carried out many times before. The value of the
M26_HOWI4994_03_SE_C26.QXD 10/11/10 15:07 Page 414
CHAPTER 26 DEVELOPING IDEAS FOR RESEARCH 415
study might be improved if the variables measured were assessed using newly developedmeasuring instruments created by the researcher.
A study which looks at, say, gender differences on a variable or age differences. Some research questions are mundane. Gender differences or age differences may well be important but it is difficult to establish their importance without an elaboratecontext which demonstrates why they are important. Sometimes the technicalities of demonstrating the gender difference are challenging and would compensate for thelack of complexity of the research question. Simply showing a gender difference foran easily measured variable has probably little going for it in terms of demonstratinga student’s ability.
Replication studies are an interesting case in point. It is important to understand whysome replication studies would be highly valuable whereas others would be regarded asrather mundane. A replication study that simply repeats what has already been done will probably be regarded as demonstrating technical and organisational proficiency atbest. What it does not show is evidence of conceptual ability, creativity and originality– that extra little spark. Replications do have an important part to play in research – theyare crucial to the question of the replicability of the findings. For example, if it werefound that eating lettuce was associated with reductions in the risk of cancer then onepriority would be to replicate this finding. Regrettably, replications are not accorded the high status that they warrant even in professional psychological research. No matterhow important replication is in research work, it is not particularly effective at demon-strating the full range of a researcher’s skills. This does not mean that a straightforwardreplication is easy – the information in a journal article, for example, may well beinsufficient and the researcher doing the replication may have to contribute a great manyideas of their own. Even simple things such as the sorts of participant are difficult toreplicate in replication research.
Relatively few straight or direct replication studies are to be found in the psychologyresearch literature despite the great emphasis placed on replicability in the physical sciences. One reasonable rule of thumb suggests that direct replication is only valued tothe extent that the original study was especially important or controversial – and that insome way additional value has been added by the inclusion of additional manipulations,checks or measures. For example, you might consider the circumstances in which theoriginal findings are likely to apply and those where they do not. Extra data could becollected to assess this possibility.
However, as soon as one begins to think of a replication study in this way then thereplication becomes something very different from a simple, direct or straight replication.One is including conditions which were not part of the original study and one is alsothinking psychologically and conceptually. So we are talking about a part or partialreplication here. A replication study can only confirm the original findings wholly or to some extent disconfirm them. Built into a partial replication is the likelihood thatsomething new will be learnt over and above this. They are worthwhile because of this extra value which is added: they provide information about the conditions underwhich a finding holds in addition to showing the extent to which the original finding isreplicable.
Examples of straight replication and partial replication may help:
Straight replication Suppose a study found that women were more accurate at recognising emotions than men. We need not be concerned with the exact details ofhow this study was done. One approach would be to video people acting variousemotions, play these videos to women and men, and ask them to report what emotionswere expressed. The outcome of the replication would simply establish the extent towhich the original findings were reliable.
M26_HOWI4994_03_SE_C26.QXD 10/11/10 15:07 Page 415

416 PART 5 RESEARCH FOR PROJECTS, DISSERTATIONS AND THESES
Partial replication What if we noticed that the people asked to act out the emotionswere all, or predominantly, women? We may then be inclined to think that the resultssimply showed that women were more accurate than men at judging the emotions ofwomen; we would not assume that women were generally more accurate at judgingemotion than men. In order to extend our understanding we may want to knowwhether women are also more accurate than men at recognising the emotions of men.This could be achieved simply by ensuring that the video material included bothwomen acting out emotions (as in the original study) as well as men acting out theemotions (unlike the original study). Obviously it would be important to ensure thatthe emotions acted by the men and women were the same ones, for example. This new research design is a partial replication since it actually accurately reproduces the original study when using videos of women acting emotionally but extends it tocover men acting emotionally. Why is this more worthwhile? Simply because it allowsus to answer more questions such as:
Are women better at recognising emotions in general?
Are women only better at recognising emotions exhibited by members of their owngender?
Now knowing this may not seem to be a huge amount of progress but it begins toopen up theoretical and other issues about emotion recognition between and withinthe genders. Just what would account for the research findings? Has somethingimportant been established which warrants careful future research? (It is one of thecuriosities about research in psychology that the study that answers a research ques-tion definitively seems to have a lower status than one that stimulates a plethora offurther studies to sort out a satisfactory answer to the original research question.)
Although a straight replication increases our confidence in the original findings, it does nothing to further our understanding of the topic. If the new findings do not reflect the original findings, then this is of interest but does nothing in itself to explain the discrepancy between the findings of the original study and the replication. We couldspeculate as to the reasons why this is the case but this is sound evidence of nothing.Always there is more to be gained from investigating the new questions generated by the original study than merely replicating it. So, with care, a creative replication has alot to commend it as a basis for student research.
26.3 Choosing a research topic
Most researchers are, at times, stuck for ideas for their future research if their expecta-tions are high. They may be extremely well known and expert in their fields, yet researchideas do not flow simply because of this. It can be hard work to generate a good idea forresearch no matter one’s level of expertise. It takes even more effort to convince othersthat you have a good idea! Once one has a good idea, there is a great deal of intellectualsweat and labour to turn it into a feasible, detailed plan for research. Consequently, donot expect to wake up one morning with a fully formed research question and plan inyour mind. At first there is a vague idea that one would like to do research on a particulartopic or research question and, perhaps, a glimmering recognition that the idea isresearchable. The process is then one of discussing one’s tentative ideas with anyonewilling to listen and chip in thoughts, reading a lot around the topic and discarding whatideas do not seem to be working well. Usually some ideas with potential will establish
M26_HOWI4994_03_SE_C26.QXD 10/11/10 15:07 Page 416

CHAPTER 26 DEVELOPING IDEAS FOR RESEARCH 417
themselves worthy of development. Sometimes one’s ideas are too productive and notpracticable as a consequence and so it is necessary to limit them in some way.
It is a good idea to think about the styles of research which appeal to you. These canhave an impact on what is possible in terms of research. For example, if you have beenparticularly interested in in-depth interviewing as a means of data collection, you mightask yourself what can be done on the topic using this method. On the other hand, if you think that a well-designed laboratory experiment is your preferred mode of data collection then you can ask yourself what limitations this puts on the sorts of researchquestions you can ask.
Towards the end of their degree course, most students have found some topics fromtheir lecture courses which are of interest to them. The research project is an opportunityto tackle something that interests you but in depth. Perhaps you will be spoilt for choicesince there seem to be too many different things which intrigue you. There are severalways in which you may try to narrow down this choice:
Try focusing on the topic that first aroused your interest in psychology. Does it stillinterest you? Have you been unable to satisfy your interest in the topic, perhapsbecause it was not covered in any of the courses you took?
Try choosing a topic that may be relevant to the kind of work you intend to go intoafter graduating from university. For example, if you intend to go into teaching it may be useful to look at some aspect of teaching, such as what makes for effectiveteaching. This is a really good idea as not only is it relevant to your future career but it is a way of establishing that you have an interest in matters to do with that profession. It can work wonders at interviews, for instance.
Choose a topic that interests you, which is part of a lecture course that you will betaking at the same time as doing the research project. In this way, the research andyour studies will complement each other and you are likely to have a greater in-depthknowledge to bring to the lecture course as a consequence.
If your attempts to focus down to a topic are not helping, try brainstorming a range of topics which you have some interest in. Try reading in depth into these, possibly starting with what you see as your best bet. Does one of them emerge as afront-runner for your interests? Does your reading on one topic have anything thatmight be transferred to another topic?
If all else fails, try spending a couple of hours on a computer terminal simply skimmingthrough the latest research abstracts irrespective of topic. Out of what you read doesanything stand out as especially interesting? This is a quick way of getting an idea ofthe range of topics psychologists have studied and how they study them.
Regardless of how you approach selecting a topic, it is best to start thinking about the research possibilities a topic offers as soon as possible. Make a note of any ideas thatcome to you as you listen to lectures or read the literature. Although ideas may springfrom your own experience and your observation of what happens around you, the greatestsource of ideas is likely to come from reading and thinking about the ideas of others.Without studying the work of others, it is very difficult to develop your own ideas. This reading explains how researchers have conceived the topic of interest. It would beundesirable to ignore all of this past work since it amounts to a repository of hard thinking,good analysis and ways of conceptualising the important issues. Authors may proposein the discussion section of their paper one or more specific suggestions about furtherwork that may be worth carrying out on the topic that they have been investigating. Thebasic formula is that reading makes ideas that work (see Figure 26.2).
M26_HOWI4994_03_SE_C26.QXD 10/11/10 15:07 Page 417

418 PART 5 RESEARCH FOR PROJECTS, DISSERTATIONS AND THESES
FIGURE 26.2 The basic idea-generating formula for research
It is surprising that there are big gaps in psychological knowledge and many areas ofresearch simply have received little or no previous coverage. Nevertheless, sometimesstudents get disconcerted when they come across research which is similar to that whichthey are planning or doing. Of course, there is always the chance that someone else publishes work similar to yours before your project is completed. This seems to occurvery infrequently, however. Perhaps this is because the way we think about a topic isusually very different from the way that other people think about it. Whatever the reason, it is unlikely that someone will be about to publish the study that you are currently thinking of doing. However, if this does occur, simply acknowledge it in your report and remember to evaluate the two studies and describe their similarities and differences.
26.4 Sources of research ideas
Research into how psychologists get their research ideas seems conspicuously absent – agood research for a dissertation?! So there is little to be written based on this. McGuire(1997) suggested 49 different ways or heuristics of generating hypotheses which is oneless than the number of ways to leave your lover! Our list of suggestions about sourcesof research ideas is more modest than this. Really our suggestions are of things to thinkabout and they are not mutually exclusive. Several different aspects of our list might be adopted in order to come up with ideas. Ours is not an exhaustive list either. Otherswill have other ideas and if they work for you then they have done their job. We willillustrate our potential sources of ideas with a brief example or two of the kind of ideasthey might generate wherever possible (see Figure 26.3).
Detailed description of a phenomenon It is often important to try to obtain a thorough and accurate description of what occurs before trying to understand why it occurs. It is possible that previous studies may have done this to some extent buttheir descriptions may omit what appears to you to be certain critical aspects of thephenomenon. For example, we do not know why psychotherapy works. One way oftrying to understand what makes it effective is to ask patients in detail how it hashelped them to cope with or to overcome their problem.
Theory No matter what your chosen field of research, attention to the relevant per-tinent theories is invaluable. Remember that the purpose of research is not primarilyto produce more data but to extend our conceptual understanding of our chosen subject matter. Researchers are well advised to emphasise the relevant theory in theirchosen field as a consequence. An absence of theory means that the conceptualisationof the relevant issues is much harder for the researcher. After all, the purpose of theory is to present a conceptual scheme to describe and understand a phenomenon.If there is an absence of theory in the published writings in the field then are there theories in other, perhaps similar, fields which can be used? These may help illuminate
M26_HOWI4994_03_SE_C26.QXD 10/11/10 15:07 Page 418

CHAPTER 26 DEVELOPING IDEAS FOR RESEARCH 419
the field better than most purely empirical studies would. The integration of theorywith empirical work is the best combination. It is more than a matter of testing theory in your study since many theories are too imprecise for such a test. On theother hand, the theory may have potential for integrating various aspects of youranalysis and report in general. It is a useful minimum requirement that you seek tointroduce relevant theory into your writings. If you can achieve some integration oftheory beyond this minimum then you are doing very well in your report. If yourresearch can explore the application of theory to a particular topic then this generallyhas a powerful effect on your report’s quality. The big limitation is that theory in psychology tends to deal with a modest level of generalisation which can make itdifficult to apply in new contexts. Deductions from theories are discussed later. Box 26.1 shows that psychologists who make the biggest impact on the discipline areoverwhelmingly those with a lot to say theoretically.
Deductions from theories Much of psychology is concerned with developing theories to explain behaviour. Theories which attempt to explain a wider variety ofbehaviours are generally more useful than those which have a narrower focus for that very reason. While some aspects of these theories may have been extensivelytested, other aspects of them may have received little or no attention but may beworth investigating.
FIGURE 26.3 Some sources of ideas for research
M26_HOWI4994_03_SE_C26.QXD 10/11/10 15:07 Page 419

420 PART 5 RESEARCH FOR PROJECTS, DISSERTATIONS AND THESES
Competing theoretical explanations In the classic view of scientific progress, thereis an idea that competing theories used to describe a phenomenon may be put to acritical decisive test. While many psychologists would believe that few psychologicaltheories are so precise that this is possible, nevertheless attempts to do so are wellregarded. For example, there are a number of theories for explaining the occurrenceof depression. It may be an intellectually satisfying challenge to take the main theoriesof depression and examine how they might be put to some sort of crucial test. So whynot consider evaluating competing theoretical explanations of your chosen topic asthe basis of your research project? While it is unlikely that a death blow will be struck against one of the competing theories, your contribution would be part of thelonger-term process of evaluating the tenability of the theory.
Everyday issues Frequently there are a number of different ways in which somethingcan be done in our everyday lives. There may be no research to help choose which is the most effective procedure to adopt or what the consequences might generally be of using a particular approach. We could carry out some research to help answerthese questions. For example, if we concentrate on research itself for the moment, are potential participants less likely to agree to complete a longer than a shorter questionnaire? If they do fill in the longer questionnaire, are their answers likely to be less reliable or accurate than if they complete a shorter questionnaire? Does theorder of the questions affect how accurate they are when disclosing more sensitive orpersonal information about themselves?
New or potential social, technological or biological developments We live in changing times when new biological, technological and social developments are beingintroduced, the significance of which we are not sure. Their effects or what peopleperceive as being their potential effects may be a topic of great public concern. Whatis the influence of the Internet or text messaging on our social behaviour? Has thedevelopment and spread of the human immunodeficiency virus (HIV) affected oursexual behaviour in any way? Do student fees influence the occupational aspirationsof students?
The antecedent–behaviour–consequences (A–B–C) model It may be useful toremember that any behaviour (B) that we are interested in often has both antecedents(A) and consequences (C). For example, the antecedents of depressive behaviour may include unsatisfactory childhood relationships and negative experiences. Theconsequences may be unsatisfactory personal relationships and poor school or workattendance. Deciding whether we are more interested in the antecedents than the consequences of a particular behaviour may also help us focus our minds when developing a research question. Once this decision has been made, we might try toinvestigate neglected antecedents of depression.
Predicting or changing behaviour How could you go about changing a particularbehaviour? Do you think that you could predict when that behaviour is likely tooccur? Addressing these questions would require you to think about the variableswhich are most likely to be, or have been found to be, most strongly associated withthe behaviour in question. These variables would form part of an explanation for this behaviour. You could investigate whether these variables are in fact related to the behaviour in question. This approach may encourage you to think of how yourknowledge of psychology could be applied to practical problems.
Elaborating relationships There may be considerable research showing that a relationship exists between two variables. For example, there is probably substantialamounts of research which demonstrates a gender difference such as females beingless aggressive than males. The next step once this has been established would be to
M26_HOWI4994_03_SE_C26.QXD 10/11/10 15:07 Page 420

CHAPTER 26 DEVELOPING IDEAS FOR RESEARCH 421
Top of the citations
Box 26.1 Talking Point
It is intriguing to find that many of the most cited psy-chologists in psychology journals are very familiar namesto most psychology students. Many of the most cited psy-chologists include those who have made highly influentialtheoretical contributions. Freud, for example, was a majortheorist but a minor contributor of research. Rememberthat the theories referred to in journals are those which are influential on research. Haggbloom and his colleagues(2002) generated a list which ranked the 100 psychologistsmost frequently cited in journals according to how often
they have been cited. The first 25 of these are shown inTable 26.1. (Beside the name of each psychologist we havegiven one major contribution that this person is knownfor although we do not know whether this contribution isthe reason why they have been cited.) Not all the peopleon this list have put forward a major theory. For example,Ben Winer who is ranked fourth is most probably cited for his writings on statistical analysis. There are, of course,many other theories which are not listed which may be ofgreater interest to you.
Table 26.1 The 25 psychologists cited most often in journals
Rank Psychologist Citations Contribution
1 Sigmund Freud 13 890 Psychoanalytic theory
2 Jean Piaget 8821 Developmental theory
3 Hans J. Eysenck 6212 Personality theory; behaviour therapy
4 Ben J. Winer 6206 Statistics
5 Albert Bandura 5831 Social learning theory
6 Sidney Siegel 4861 Statistics
7 Raymond B. Cattell 4828 Personality theory
8 Burrhus F. Skinner 4339 Operant conditioning theory
9 Charles E. Osgood 4061 Semantic differential scale
10 Joy P. Guilford 4006 Intelligence and personality models
11 Donald T. Campbell 3969 Methodology
12 Leon Festinger 3536 Cognitive dissonance theory
13 George A. Miller 3394 Memory
14 Jerome Bruner 3279 Cognitive theory
15 Lee J. Cronbach 3253 Reliability and validity
16 Erik H. Erikson 3060 Psychosocial developmental theory
17 Allen L. Edwards 3007 Social desirability
18 Julian B. Rotter 3001 Social learning theory
19 Don Byrne 2904 Reinforcement-affect theory
20 Jerome Kagan 2901 Children’s temperaments
21 Joseph Wolpe 2879 Behaviour therapy
22 Robert Rosenthal 2739 Experimenter expectancy effect
23 Benton J. Underwood 2686 Verbal learning
24 Allan Paivio 2678 Verbal learning
25 Milton Rokeach 2676 Values
Adapted from The 100 most eminent psychologists of the 20th century, Review of General Psychology, 6, 139–52(Haggbloom, S. J., Warnick, R., Warnick, J. E., Jones, V. K., Yarbrough, G. L., Russell, T. M. et al. 2002), American Psychological Association.
M26_HOWI4994_03_SE_C26.QXD 10/11/10 15:07 Page 421

422 PART 5 RESEARCH FOR PROJECTS, DISSERTATIONS AND THESES
try to understand why this gender difference exists – what the factors are which are responsible for this difference. If you believe that the factors are likely to be biological, you look for biological differences which may explain the differences inaggression. If you think that the factors are probably psychological or social, youinvestigate these kinds of factors. If you are interested in simply finding out whetherthere are gender differences in some behaviour, then it is more useful and interestingto include one or more factors which you think may explain this difference. In otherwords, it is important to test for explanations of differences or relationships ratherthan merely establish empirically that a relationship exists.
Developing and validating measures Where there is no measure for assessing a variable that you are interested in studying, then it is not too difficult to develop your own. This will almost certainly involve collecting evidence of the measure’s reliability and, probably, its validity. For some variables there may be a number ofdifferent measures that already exist for assessing them, but it may be unclear whichis the most appropriate in particular circumstances or for a particular purpose.Alternatively, is it possible to develop a more satisfactory measure than the oneswhich are currently available? Your new measure may include more relevant aspectsof the variable that you want to assess. Would a shorter or more convenient measurebe as good a measure as a longer or less convenient one? Do measures which seem toassess different variables actually assess the same variable? For example, is a measureof loneliness distinguishable from a measure of depression in practice?
Alternative explanations of findings A researcher may favour a particular explana-tion for their findings but there may be others which have not been considered ortested. Have you come across a research publication which has intrigued you but you are not absolutely convinced that the researcher has come up with the best explanation? Do you have alternative ideas which would account for the findings? If so, why not try to plan research which might be decisive in helping you choosebetween the original researcher’s explanation and yours? This is not quite as easy asit sounds. One of the reasons is that you need to read journal articles in a question-ing way rather than as being information which should be accepted and digested. For much of your education, you have probably read uncritically merely to gain information. To be a researcher, you need a rather different mindset which says ‘convince me’ to the author of a research paper rather than ‘you’re the expert so I accept what you say’.
Methodological limitations Any study, including important ones, may suffer froma variety of methodological limitations. An obvious one for much research is the issue of high internal validity but low external validity. Basically this is a consequenceof using contrived laboratory experiments to investigate psychological processes.Theseexperiments may be extremely well designed in their own terms, but have little relevanceto what happens in the real world. For example, there are numerous laboratory studies of jury decision-making but would one be willing to accept their findings asrelevant in the world beyond the psychology laboratory? A study which explores innaturalistic settings phenomena which have been extensively studied in the psycho-logy laboratory would be a welcome addition in many fields of research. Any variablemay be operationalised in a number of different ways. How sound are the measuresused in the research? For example there are numerous studies of aggression which relyon the (apparent) delivery of a noxious electrical shock as a measure of aggressiveness.As you probably know from the famous Stanley Milgram studies of obedience, thissame measure would be used by some researchers as an indicator of obedience ratherthan a measure of aggressiveness. Yet these are identical measures but are claimed tomeasure different things. Clearly there is the opportunity to question many measuresincluding those used in classic research studies.
M26_HOWI4994_03_SE_C26.QXD 10/11/10 15:07 Page 422

CHAPTER 26 DEVELOPING IDEAS FOR RESEARCH 423
Temporal precedence or order of variables Studies that involve a dynamic com-ponent of change over a period of time are relatively uncommon in psychology despitemany researchers advocating their use. They are also uncommon in student research.Obviously time constraints apply, which may account partially for their rarity.Longitudinal or panel designs, such as those outlined in Chapter 12 that measure the same variables on the same individuals at two or more points in time, enable thetemporal relationships between variables to be examined and compared. Often this sort of research takes place in a less contrived setting than is possible using anexperimental design. Consider the possibility of using a longitudinal design since notonly is it more challenging than other types of research but it may also generate newpossibilities for research in fields which are perhaps otherwise heavily researched.
Causality Student researchers can often benefit from concentrating on the possibil-ity of carrying out an experimental study in their chosen field. Despite there being lim-itations to the experimental method for some purposes, it remains the quintessentialresearch method in psychology. Consequently, an experimental design will garnerfavour. Remember that the main purpose of student research is for the student todemonstrate that they have mastered the crucial skills of research. Experimentaldesigns are a good way of doing this.
More realistic settings One of the common criticisms of psychology, especially thatwhich is taught at university, is that it dwells on the laboratory experiment too muchand neglects research carried out in more naturalistic settings. Is it possible to takeone of these somewhat contrived laboratory experiments and recast it in a more nat-uralistic and less contrived fashion? Often the way in which we study a phenomenon may be contrived in order to control for variables which may affect our findings. Butthis is not the only reason. For example, take the example once again of StanleyMilgram’s famous study of obedience in which participants ostensibly gave massiveelectric shocks to another person in the context of a study of learning. One might askabout obedience in real-life settings, for example. Just what are the determinants ofobedience to authority in real-life settings such as a sports team? What determineswhether the captain’s instructions are adhered to? Sometimes it can be useful to see ifsimilar findings can be obtained in less contrived circumstances than the original studyin order to assess just how robust the original findings are.
Generalising to other contexts Theories or findings in one area may be applicableto those in other areas. For example, theories which have been developed to explainpersonal relationships may also apply to work relationships and may be tested inthese contexts.
Conflicting or inconsistent findings It is a common comment that psychologicalresearch on a given topic has some studies finding one outcome and other studiesfinding the reverse outcome. That is, the findings of studies on a particular topic areless than consistent with each other. For example, some studies may find no differ-ence between females and males for a particular characteristic, others may findfemales show more of this characteristic, while others may find females show less ofthis characteristic. Why might this be the case? If the majority of studies obtain a sim-ilar kind of finding, the findings of the inconsistent remaining studies may be due tosampling error and many psychologists will ignore the inconsistent studies as a con-sequence. However, it is often better to regard the inconsistency as something to beexplained and taken into account. Is it possible to speculate about the differencesbetween the studies that might account for the difference in outcomes? In this situa-tion it is not very fruitful to repeat the study to see what the results will be becausewe already know what the possible outcomes are. While it may not be easy to do this,it is better to think of variables which may explain these inconsistent findings and to
M26_HOWI4994_03_SE_C26.QXD 10/11/10 15:07 Page 423

424 PART 5 RESEARCH FOR PROJECTS, DISSERTATIONS AND THESES
see whether or not this is the case. One could perhaps consider carrying out a meta-analysis of the studies in order to explore a number of differences which mightaccount for the variation in the outcomes of the studies. Meta-analysis can be carriedout using quite simple procedures. The technique is described in detail in the com-panion statistics text, Introduction to Statistics in Psychology (Howitt and Cramer,2011a) at a level which is within the capabilities of most students.
26.5 Conclusion
Research projects are intended to be major means to develop a student’s intellectualdevelopment and, at the same time, to assess this. While most psychology students dosome research at each stage of their education and training, early on it is likely that they carry out a study according to a plan more or less given to them in finished formby academic staff. Individual research projects come at the end of a degree programmesimply because a student needs to have mastered many skills before they can do a goodjob of planning and carrying out research of their own. The better that everything that has gone before is mastered, the more likely a student is to make a good job of independent research. For example, unless you have read examples of how researchersformulate and justify their research ideas, you will not know how to formulate psycho-logical research questions. At its root, this process is one of reading and study. Eventhen, students can find it difficult to come up with a good idea for a research project. Itis something that cannot be done in a hurry and adequate time needs to be laid aside in order to develop ideas. Usually students who have had a positive approach to readingand studying will have fewer problems in generating research ideas. They have startedthe ground work after all.
It is never too early to start thinking about research projects. While it may be exceptional to find a student who thinks a whole year ahead, the sooner that you canfind time to think about research ideas the better. If you have given yourself enoughtime, you may find it helpful to keep a range of possible research topics on the table for consideration. This will minimise the damage if it should happen that the topic that you set your heart on does not turn into a workable idea. One learns to think psychologically about things through a fairly lengthy process of reading and activelystudying and the same applies to thinking like a researcher.
You can get to understand how psychologists actually do research by reading a varietyof research papers in any field that interests you. When you are planning research, however,you need to focus on and familiarise yourself with the established research literature onthe topic – especially recent research. By reading in this way you will learn somethingabout what are sensible research questions to pose. You will gain insight into how people interested in the same issue as yourself have construed the topic and planned the research. You will know about what sorts of measures are typically taken and whatprocedures for doing research seem to work well in this field.
However, do not prevent yourself from asking what might seem to be obvious ques-tions about the topic that do not seem to have been addressed. These obvious questionsmay have escaped the attention of researchers and may form the basis of your ownresearch. Think also of situations in which the findings may not apply. We may have atendency to seek instances which confirm what we know rather than instances whichdisconfirm our preconceptions. Thinking of situations in which the findings may notapply will make us aware of the extent to which we cannot generalise these findings toall contexts.
M26_HOWI4994_03_SE_C26.QXD 10/11/10 15:07 Page 424

CHAPTER 26 DEVELOPING IDEAS FOR RESEARCH 425
Practicalities may prevent you doing what you really want to do. Always try to anticipate these and consider more modest possibilities. For example, it is unlikely thatyou would be able to evaluate the effectiveness of, say, a substantial therapeutic inter-vention, but you may be able to investigate people’s preference for or attitude to thatintervention. Doing one’s own research provides one of the few in-depth opportunitiesto learn about a topic and to make a contribution, however modest, to understandingthat topic. It allows you to show and to see just what you are capable of intellectually.For many students, it will be the most fulfilling and possibly the most frustrating part oftheir studies. Hopefully what you have learnt from this will provide you with a soundunderstanding of research methods and with resources to help you develop further.Nevertheless you cannot learn to be a researcher just from a book. Conducting researchis a skill which requires practice. We would be delighted to know that this book hasstimulated your appetite for research.
Alternatively, there is always Plan B!
Developing good research ideas is not easy. Even once you have the necessary academic skills, ittakes time to choose a topic and to familiarise yourself with the research on that topic. The sooneryou start thinking about your research ideas the better.
Be realistic about what you can achieve with the limited resources that are available to you. Much ofthe research that you read about has probably taken a great deal more time to conceive and to carryout than you have available. Nonetheless, students at all levels can and have carried out research ofvalue – some of which has been published.
Simply replicating research that has already been done is unlikely to advance our understanding ofthat topic. It is also unlikely to impress those assessing your work. While replication is important todetermine how reliable a finding is, it is sensible to do more than just replicate the original study. Atthe same time as doing the replication, it is often possible to address new questions which emergefrom the original research report. It is better to distinguish this kind of replication by calling it part orpartial replication. Much research is partial replication.
Choose a topic that interests you or that may be relevant to what you want to do in your future careeror further studies. Think of a few topics that interest you and start reading around your favourite. Ifnecessary go on to the next topic once you understand why your first choice has not been productive.
There is no single, foolproof way of generating a good idea for research. However, ideas are mostlikely to be generated as one reads and ponders over the research that other people have reported.Often what you do will involve a variation of what has been previously done and may clear up an unresolved issue. It is also likely to raise a number of other issues that in turn need to be answered.
Carrying out a piece of original research is your opportunity to make a contribution to the topic thatinterests you. Make the most of this opportunity.
Key points
M26_HOWI4994_03_SE_C26.QXD 10/11/10 15:07 Page 425
426 PART 5 RESEARCH FOR PROJECTS, DISSERTATIONS AND THESES
ACTIVITYThink of three topics that you would like to do research on. Decide which of these three is the most promising for you andstart thinking what you would like to know about it or what you think should be known about it. Do a literature searchpreferably using an electronic database such as Web of Science or PsycINFO. Try to locate the most recent research on thetopic and read it. When reading the research adopt a critical and questioning attitude to what has been written. Try to readsome of the references cited to see whether they have been accurately cited and are relevant to the point being made inthe paper you are currently reading. Are the views in these references generally consistent with those in the paper? If theyare not consistent, what seem to be the reasons for this? Which view do you generally support? In terms of the study, howwere the main variables operationalised? Are there better ways of operationalising them? What suggestions were made for further research and do these seem worth pursuing? What questions remain to be answered? How would you design astudy to test these?
M26_HOWI4994_03_SE_C26.QXD 10/11/10 15:07 Page 426

a priori comparison: An analysis between two group meansfrom several means in which the direction of the differencehas been predicted on the basis of strong grounds andbefore the data have been collected.
abstract: The summary of a publication.action: Behaviour which is meaningful rather than reflexive.adjacency pairs: A unit consisting of two turns in a conversa-
tion which follow a standard pattern.alpha reliability (Cronbach’s alpha): A measure of internal
reliability (consistency) of items. It is effectively the meanof all possible split-half reliabilities adjusted for the smallernumber of variables making up the two halves.
alternate (alternative) hypothesis: A statement or expressionof a proposed relationship between two or more variables.
alternate forms reliability: The correlation between differentversions (forms) of a measure designed to assess the samevariable. The reliability coefficient indicates the extent towhich the two forms are related. Alternate forms are usedto avoid the practice effects which might occur if exactlythe same measure is given twice.
American Psychological Association (APA): The largestorganisation in the USA of professional psychologists.
analysis of covariance (ANCOVA): An analysis of variance in which the relation between the dependent variable andone or more other variables is controlled.
analysis of variance (ANOVA): A parametric test which deter-mines whether the variance of an effect differs significantlyfrom the variance expected by chance.
analytic induction: The process of trying to develop workingideas or hypotheses to explain aspects of one’s data. It isthe opposite of deduction where ideas are developed outof theory.
ANCOVA see analysis of covariance.ANOVA see analysis of variance.APA see American Psychological Association.appendix: The section at the end of a publication or report
which contains supplementary further information.applied research: Research which has as its primary objective
the search of solutions to problems.archive: A collection of documents.attrition: The loss of research participants during a study
such as when they drop out or fail to attend.
basic laboratory experiment: A true or randomised experimentwhich is conducted in a controlled environment. Randomassignment to the groups or conditions is an essential feature.
Behaviourist School of Psychology: An approach which holdsthat progress in psychology will be advanced by study-ing the relation between external stimuli and observablebehaviour.
between-subjects design: A study in which subjects or parti-cipants are randomly assigned to different conditions orgroups.
bias: The influence of pre-existing judgements on a researchstudy.
Bonferroni test: The significance level of a test multiplied bythe number of comparisons to be made to take account of the fact that a comparison is more likely to be significantthe more comparisons that are carried out.
bracketing: The attempt to suspend normal judgements by theresearcher/analyst.
British Crime Survey: A regular nationally representative survey of people in Britain looking at their views andexperience of crime.
British Psychological Society: The largest organisation of professional psychologists in Britain.
British Social Attitudes Survey: A regular nationally repre-sentative survey of adults in Britain about a variety of different social issues.
CAQDAS (Computer-Assisted Qualitative Data AnalysisSystem): Computer software used to help carry out theanalysis of qualitative data.
carryover, asymmetrical/differential transfer: The finding of adifferent effect depending on the order in which conditionsare run in a within-subjects design.
CASCOT see Computer-Assisted Structured COding Tool.case: A specific instance of the thing chosen for study – such
as a single research participant.case study: A study based on a single unit of analysis such as
a single person or a single factory.categorisation: The classification of objects of a study into
different groups.category/categorical variables see nominal variable.causal explanation: An explanation in which one or more
variables are thought to be determined (affected) by one ormore other variables.
causal hypothesis: A hypothesis which states that one or morevariables are brought about by one or more other variablesin a cause-and-effect sequence.
causality: The idea that one or more variables affect one ormore other variables.
GLOSSARY
Z01_HOWI4994_03_SE_GLOS.QXD 10/11/10 15:07 Page 427

428 GLOSSARY
cause: A variable that is thought to affect one or more othervariables.
chance finding: A result or outcome which generally has aprobability of occurring more than five times out of a hundred.
check on experimental manipulation: The process of deter-mining whether a particular intervention has varied whatit was supposed to have varied. It assesses whether theexperimental manipulation has been effective in creating a particular difference between the experimental and control groups. It cannot be assessed simply by comparingmeans on the dependent variable.
Chicago School of Sociology: An approach to sociology whichemphasised quantification and the study of large groups.
citation: A reference to another source of information such asa research article.
cluster sampling: The selection of spatially separate subgroupswhich is designed to reduce the time and cost to obtain asample because members of each cluster are physicallyclose together.
coding data: The process of applying codes or categories toqualitative data (or sometimes quantitative data).
coding frame: The list of codes which may be applied to thedata such as in content analysis.
coefficient of determination: The square of a correlationcoefficient which gives the proportion of the varianceshared between two variables.
comparative method: A comparison of one group of objectsof study with one or more other groups to determine howthey are similar and different in various respects.
computer grounded-theory analysis: The use of computersoftware to help carry out a grounded theory analysis.
Computer-Assisted Structured COding Tool (CASCOT):Software for assigning the occupations of participantsaccording to the Standard Occupation Classification2000.
concept: A general idea which is developed from specificinstances.
conclusion: The final section of a publication in which themain arguments are restated.
concurrent validity: The extent to which a measure is relatedto one or more other measures all assessed at the sametime.
condition: A treatment usually in a true experimental designwhich is part of the independent variable.
confidence interval: The range between a lower and a highervalue in which a population estimate may fall within witha certain degree of confidence which is usually 95 per centor more.
confidentiality: The requirement to protect the anonymity ofthe data provided by participants in research.
confounding variable: A variable which wholly or partlyexplains the relation between two or more other variables.It can bring about a misinterpretation of the relationshipbetween the other two variables.
construct validity: The extent to which a measure has beenfound to be appropriately related to one or more othervariables of theoretical relevance to it.
constructivism: The idea that people have a role in creatingknowledge and experience.
content analysis: The coding of the content of some data suchas television programmes or newspapers.
control condition: A condition which does not contain or hasless of the variable whose effect is being determined. Itforms a sort of baseline for assessing the effect of theexperimental condition.
convenience sample: A group of cases which have beenselected because they are relatively easy to obtain.
convergent validity: The extent to which a measure is relatedto one or more other measures to which it is thought to berelated.
conversation analysis: The detailed description of how partsof conversation occur.
correlational research see correlational/cross-sectional study.correlational/cross-sectional study: Research in which all the
measures are assessed across the same section or momentof time.
covert observation: Observation of behaviour when thosebeing observed are not aware they are being observed.
crisis: the stage in the development of a discipline when commonly accepted ways of understanding things becomeuntenable thus motivating the search for radically newapproaches to the discipline.
critical discourse analysis: A form of discourse analysis whichis primarily concerned with observing how power andsocial inequality are expressed.
critical realism: The idea that there is more than one versionof reality.
Cronbach’s alpha see alpha reliability.cross-lagged relationship: The association between two dif-
ferent variables which have been measured at differentpoints in time.
cross-sectional design: A design where all variables are measured at the same point in time.
cross-sectional study: Research in which all variables aremeasured at the same point in time.
data: Information which is used for analysis.debriefing: Giving participants more information about the
study after they have finished participating in it and gathering their experiences as participants.
deception: Deliberately misleading participants or simply not giving them sufficient information to realise that theprocedure they are taking part in is not what it appears.
deconstruction: The analysis of textual material in order toexpose its underlying contradictions and assumptions.
deduction: The drawing of a conclusion from some theoreticalstatement.
demand characteristics: Aspects of a study which wereassumed not to be critical to it but which may havestrongly infiuenced how participants behaved.
dependent variable: A variable which is thought to depend onor be influenced by one or more other variables, usuallyreferred to as independent variables.
design: A general outline of the way in which the main vari-ables are studied.
Z01_HOWI4994_03_SE_GLOS.QXD 10/11/10 15:07 Page 428

GLOSSARY 429
determinism: The idea that everything is determined by thingsthat went before.
deviant instance: A case or feature which appears to be dif-ferent from most other cases or features.
Dewey Decimal Classification (DDC) system: A widely usedscheme developed by Dewey for classifying publications in libraries which uses numbers to refer to different sub-jects and their divisions.
dichotomous, binomial/binary variable: A variable which hasonly two categories such as ‘Yes’ and ‘No’.
dialogical: In the form of a dialogue.directional hypothesis: A hypothesis in which the direction of
the expected results has been stated.discourse analysis: The detailed description of what seems to
be occurring in verbal communication and what languagedoes.
discriminant validity: The extent to which a measure does not relate highly to one or more variables to which it isthought to be unrelated.
discussion: A later section in a publication or report whichexamines alternate explanations of the main results of thepublication and which considers how these are related tothe results of previous publications.
disproportionate stratified sampling: The selection of morecases from smaller sized groups or strata than would beexpected relative to their size.
Economic and Social Science Research Council (ESRC): Amajor organisation in Britain which awards grants fromgovernment funds for carrying out research and for sup-porting postgraduate research studentships and fellowships.
electronic database: A source of information which is storedin digital electronic form.
emic: The understanding of a culture through the perspectiveof members of that culture.
empiricism: The belief that valid knowledge is based onobservation.
ESRC see Economic and Social Science Research Council.essentialism: The idea that things have an essential nature
which may be identified through research.ethics: A set of guidelines designed to govern the behaviour of
people to act responsibly and in the best interest of others.ethnography: Research based on the researcher’s observations
when immersed in a social setting.etic: The analysis of cultures from perspectives outside of that
culture.evaluation/outcome study: Research which is primarily con-
cerned with the evaluation of some intervention designedto enhance the lives and welfare of others.
experimental condition: A treatment in a true experimentwhere the variable studied is present or present to agreater extent than in another treatment.
experimental control: A condition in a true experiment whichdoes not contain or has less of the variable whose effect is being determined. It forms a baseline against which theeffect of the experimental manipulation is measured.
experimental manipulation: The deliberate varying of thepresence of a variable.
experimenter effect: The systematic effect that characteristicsof the person collecting the data may have on the outcomeof the study.
experimenter expectancy effect: The systematic effect that theresults expected by the person collecting the data may haveon the outcome of the study.
external validity: The extent to which the results of a studycan be generalised to other more realistic settings.
extreme relativism: The assumption that different methods of qualitative research will provide different but valid per-spectives of the world.
face validity: The extent to which a measure appears to bemeasuring what it is supposed to be measuring.
factor analysis: A set of statistical procedures for determininghow variables may be grouped together in terms of beingmore closely related to one another.
factorial design: A design in which there are two or moreindependent or subject variables.
feasibility study: A pilot study which attempts to assess theviability and practicality of a future major study.
fit: The degree to which the analysis and the data match.focus group: Usually a small group of individuals who have
been brought together to discuss at length a topic or relatedset of topics.
Grice’s maxims of cooperative speech: Principles proposed byGrice which he believed led to effective communication.
grounded theory: A method for developing theory based onthe intensive qualitative analysis of qualitative data.
group: A category or condition which is usually one of twoor more groups which go to make up a variable.
hierarchical or sequential multiple regression: Entering individual or groups of predictor variables in a particularsequence in a multiple regression analysis.
hypothesis: A statement expressing the expected relationbetween two or more variables.
hypothetico-deductive method: The idea that hypothesesshould be deduced from theory and tested empirically inorder to progress scientific knowledge.
idiographic: The intensive study of an individual.illocution: The effect of saying something.illocutory act: The function that saying something may have.independent variable: A variable which is thought and designed
to be unrelated to other variables thus allowing its effectto be examined.
in-depth interview: An interview whose aim is to explore atopic or set of topics at length and in detail.
indicator: A measure which is thought to reflect a theoreticalconcept or construct which may not be directly observed.
induction: The development of theory out of data.inferring causality: The making of a statement about the
causal relation between two or more variables.informed consent: Agreement to taking part in a study after
being informed about the nature of the study and aboutbeing able to withdraw from it at any stage.
Z01_HOWI4994_03_SE_GLOS.QXD 10/11/10 15:07 Page 429

430 GLOSSARY
Institutional Review Board (IRB): A committee or board inuniversities in the United States which consider the ethicsof carrying out research proposals.
interaction: When the relation between the criterion variableand a predictor variable varies according to the values ofone or more other predictor variables.
internal reliability: A measure of the extent to which casesrespond in a similar or consistent way on all the variablesthat go to make up a scale.
internal validity: The extent to which the effect of the depen-dent variable is the result of the independent variable andnot some other aspect of the study.
interpretative phenomenological analysis (IPA): A detaileddescription and interpretation of an account of some phenomenon by one or more individuals.
intervening or mediating variable: A variable which isthought to explain wholly or partly the relation betweentwo variables.
intervention manipulation: An attempt to vary the values ofan independent variable.
intervention research: A study which evaluates the effect of atreatment which is thought to enhance well-being.
interview: Orally asking someone questions about some topicor topics.
introduction: The opening section of a research paper whichoutlines the context and rationale for the study. It is usuallynot titled as such.
item analysis: An examination of the items of a scale to determine which of them should be included and whichcan be dispensed with as contributing little of benefit tothe measure.
item-whole or item-total approach: The relation between thescore of an item and the score for all the items includingor excluding that item.
Jefferson transcription: A form of transcription which notonly records what is said but also tries to convey some ofthe ways in which an utterance is made.
known-groups validity: The extent to which a measure variesin the expected way in different groups of cases.
laboratory experiment see basic laboratory experiment.Latin squares: The ordering of conditions in which each
condition is run in the same position the same number oftimes and each condition precedes and follows each othercondition once.
levels of treatment: The different conditions in an independentvariable.
Library of Congress Classification system: A scheme, developedfor the library of the US Congress, that uses letters to classifymain subject areas with numbers for their subdivisions.
Likert response scale: A format for answering questions inwhich three or more points are used to indicate a greateror lesser quantity of response such as the extent to whichsomeone agrees with a statement.
literature review: An account of what the literature search hasrevealed, which includes the main arguments and findings.
literature search: A careful search for literature which is relevant to the topic being studied.
locution: The act of speaking.locutory: The adjective for describing an act of speaking.longitudinal study: Research in which cases are measured at
two or more points in time.
MANOVA see multivariate analysis of variance.margin of error see sampling error.matching: The selection of participants who are similar to
each other to control for what are seen as being importantvariables.
materials/apparatus/measures: The subsection in the methodsection of a research paper or report which gives details ofany objects or equipment that are used such as question-naires or recording devices.
measurement characteristics of variables: A four fold hier-archical distinction proposed for measures comprisingnominal, ordinal, equal interval and ratio scales.
mediating variable see intervening or mediating variable.memo-writing: The part of a grounded theory analysis in
which a written record is kept of how key concepts maybe related to one another.
meta-analytic study: Research which seeks to find all thequantitative studies on a particular topic and to summarisethe findings of those studies in terms of an overall effect size.
metaphysics: Philosophical approaches to the study of mind.method: The section in a research report which gives details
of how the study was carried out.moderating variable: A variable where the relation between
two or more other variables seems to vary according tothe values of that variable.
multidimensional scale: A measure which assesses several distinct aspects of a variable.
multinomial variables: A variable having more than twoqualitative categories.
multiple comparisons: A comparison of the relation or differ-ence between three or more groups two at a time.
multiple dependent variables: More than one dependent variable in the same study.
multiple levels of independent variable: An independent variable having more than two groups or conditions.
multiple regression: A parametric statistical test which assessesthe strength and direction of the relation between a criterionvariable and two or more predictor variables where theassociation between the predictor variables is controlled.
multi-stage sampling: A procedure consisting of the initialselection of larger units from which cases are subsequentlyselected.
multivariate analysis of variance (MANOVA): An analysis ofvariance which has more than one dependent variable.
national representative survey: A study of cases from a nationstate which is designed to reflect all the cases in that state.
national survey: A study of cases which selects cases fromvarious areas of that state.
naturalistic research setting: A situation which has not beendesigned for a particular study.
Z01_HOWI4994_03_SE_GLOS.QXD 10/11/10 15:07 Page 430

GLOSSARY 431
Naturalism: The belief that psychology and the social sciencesshould adopt the methods of the natural sciences such asphysics and chemistry.
Neyman–Pearson hypothesis testing model: The formulationof a hypothesis in the two forms of a null hypothesis andan alternate hypothesis.
nominal variable: A variable which has two or more qualitativecategories or conditions.
nomothetic: The study of a sufficient number of individualsin an attempt to test psychological principles.
non-causal hypothesis: A statement of the relation betweentwo or more variables in which the causal order of thevariables is not specified.
non-directional hypothesis: A statement of the relationbetween two or more variables in which the direction ofthe relation is not described.
non-experiment: A study in which variables are not manipulated.
non-manipulation study: A study in which variables are notdeliberately varied.
NUD*IST: Computer software designed to aid the qualita-tive analysis of qualitative data – now known as NVivo.
null hypothesis: A statement which says that two or morevariables are not expected to be related.
NVivo: Computer software to aid the qualitative analysis ofqualitative data.
objective measure: A test for which trained assessors willagree on what the score should be.
observation: The watching or recording of the behaviour ofothers.
Occam’s razor: The principle that an explanation should consist of the fewest assumptions necessary for explaininga phenomenon.
odd–even reliability: The internal consistency of a test inwhich the odd numbered variables are summed togetherand then correlated with the sum of the even-numbereditems with a statistical adjustment of the correlation to thefull length of the scale.
one-tailed significance level: The significance cut-off point orcritical value applied to one end or tail of a probabilitydistribution.
Online Public Access Catalogue (OPAC): A computer soft-ware system for recording and showing the location andavailability of publications held in a library.
open-ended question: One which does not constrain theresponses of the interviewee to a small number of alternatives.
operationalising concepts/variables: The procedure or opera-tion for manipulating or measuring a particular concept orvariable.
panel design: A study in which the same participants areassessed at two or more points in time.
paradigm: A paradigm, in Thomas Kuhn’s ideas, is a broadway of conceiving or understanding a particular researcharea which is generally accepted by the scientific/researchcommunity.
partial replication: A study which repeats a previous studybut extends it to examine the role of other variables.
participant: The recommended term for referring to the people who take part in research.
participant observation: The watching and recording of thebehaviour of members of a group of which the observer ispart.
passive observational study: Research in which there is no attempt on the part of the researcher to deliberatelymanipulate any of the variables being studied.
PASW Statistics: The name of SPSS in 2008–9. PASW standsfor Predictive Analytic Software.
Pearson correlation coefficient: A measure of the size anddirection of the association between two score variableswhich can vary from −1 to 1.
percentile: The point expressed out of a hundred whichdescribes the percentage of values which fall at and below it.
perlocution: The effect of the speaker’s words on a hearer.phenomenology: The attempt to understand conscious experi-
ence as it is experienced.phi: A measure of association between two binomial or
dichotomous variables.piloting: The checking of the procedures to be used in a study
to see that there are no problems.placebo effect: The effect of receiving a treatment which does
not contain the manipulation of the variable whose effectis being investigated.
plagiarism: The use of words of another person withoutacknowledging them as the source.
point estimate: A particular value for a characteristic of apopulation inferred from the characteristic in a sample.
point-biserial correlation coefficient: A Pearson correlationbetween a binomial and a score variable.
pool of items: The statements or questions from which asmaller number are selected to make up a scale.
positivism: A philosophical position on knowledge which emphasises the importance of the empirical study of phenomena.
post hoc comparison: A test to determine whether two ormore groups differ significantly from each other which isdecided to be made after the data have been collected.
postmodernism: Philosophical positions which are critical ofpositivism and which concentrate on interpretation.
postpositivism: Philosophical perspectives which are criticalof positivism.
pre-coding: The assignment of codes or values to variablesbefore the data have been collected.
predictive validity: A measure of the association between avariable made at one point in time and a variable assessedat a later point in time.
pre-test/post-test sensitisation effects: The effect that famil-iarity with a measure taken before an intervention mayhave on a measure taken after the intervention.
probability sampling: The selection of cases in which eachcase has the same probability of being selected.
procedure: The subsection of the methods section in aresearch report which describes how the study was carried out.
Z01_HOWI4994_03_SE_GLOS.QXD 10/11/10 15:07 Page 431

432 GLOSSARY
prospective study: A study in which the same cases areassessed at more than one point in time.
psychological test: A measure which is used to assess a psy-chological concept or construct.
PsycINFO: An electronic database produced by the AmericanPsychological Association which provides summarydetails of a wide range of publications in psychology andwhich for more recent articles includes references.
purposive sampling: Sampling with a particular purpose in mindsuch as when a particular sort of respondent is soughtrather than a representative sample.
qualitative coding: The categorisation of qualitative data.qualitative data analysis: The analysis of qualitative data
which does not involve the use of numbers.qualitative variable see nominal variable.quantitative data analysis: The analysis of data which at the
very least involves counting the frequency of categories inthe main variable of interest.
quantitative variable: At its most basic, a variable whose categories can be counted.
quasi-experiment: A study in which cases have not been randomly assigned to treatments or the order in whichthey are given.
questionnaire item: A statement which is part of a set of statements to measure a particular construct.
quota sample: The selection of cases to represent particularcategories or groups of cases.
random assignment: The allocation of cases to conditions in which each case has the same probability of being allocated to any of the conditions.
random sampling see stratified random sampling.randomised experiment: A study in which one or more variables
have been manipulated and where cases have been randomlyassigned to the conditions reflecting those manipulationsor to the order in which the conditions have been run.
realism: A philosophical position which believes that there isan external world which is knowable by humans.
reference: A book or article which is cited in a publication.register: A list of cases.Registrar General’s Social Class: A measure of the social stand-
ing of individuals which is used by the British civil service.relativism: The philosophical view that there is no fixed reality
which can be studied.reliability: The extent to which a measure or the parts mak-
ing up that measure give the same or similar classificationor score.
replication study: A study which repeats a previous study.representative sample: A group of cases which are represent-
ative of the population of cases from which that grouphave been drawn.
representativeness of sample: The extent to which a group ofcases reflects particular characteristics of the populationfrom which those cases have been selected.
retrospective study: A study in which past details of cases aregathered.
rhetoric: Language designed to impress or persuade others.
sampling: The act of selecting cases.sampling error (margin of error): The variability of groups
of values from the characteristics of the population fromwhich they were selected.
scale: A measuring instrument.simple random sampling: A method in which each case has
the same probability of being chosen.snowball sampling: The selection of cases who have been
proposed by other cases.socio-demographic characteristic: A variable which describes
a basic feature of a person such as their gender, age oreducational level.
speech act: The act of making an utterance.split-half reliability: The association of the two halves of a
measure as an index of its internal consistency.SPSS see Statistical Package for the Social Sciences and PASW
Statistics.stability over time: The extent to which a construct or measure
is similar at two or more points in time.stake: The investment that people have in a group.standard deviation: The square root of the mean or average
squared deviation of the scores around the mean. It is a sortof average of the amount that scores differ from the mean.
standard multiple regression: A multiple regression in whichall the predictor variables are entered into or analysed ina single step.
Standard Occupational Classification 2000: A system developedin the United Kingdom for categorising occupations.
standardisation of a procedure: Agreement on how a procedureshould be carried out.
standardised test: A measure where what it is and how it is tobe administered is clear and for which there are normativedata from substantial samples of individuals.
statistical hypothesis: A statement which expresses the statist-ical relation between two or more variables.
Statistical Package for the Social Sciences (SPSS): The name of a widely used computer software for handling and statistically analysing data which was called PASW Statisticsin 2008–9.
statistical significance: The adoption of a criterion at or belowwhich a finding is thought to be so infrequent that it isunlikely to be due to chance.
stepwise multiple regression: A multiple regression in whichpredictor variables are entered or removed one at a time interms of the size of their statistical significance.
straight replication: The repetition of a previous study.stratified random sampling: The random selection of cases
from particular groups or strata.structural equation modelling: A statistical model in which
there may be more than one criterion or outcome variableand where the specified relations between variables istaken into account.
structured interview: An interview in which at least the exactform of the questions has been specified.
subject variable: A characteristic of the participant whichcannot or has not been manipulated.
subjectivism: The philosophical position that there is not asingle reality that is knowable.
Z01_HOWI4994_03_SE_GLOS.QXD 10/11/10 15:07 Page 432

GLOSSARY 433
suppressor variable: A variable which when partialled out of the relation between two other variables substantiallyincreases the size of the relation between those two variables.
synchronous correlation: An association between two variablesmeasured at the same point in time.
systematic sampling: The selection of cases in a systematicway such as selecting every 10th case.
temporal change: The change in a variable over time.temporal precedence/order of variable: A relation where the
association between variable A assessed at one time andvariable B assessed later is significantly stronger than theassociation between variable B measured at the earlierpoint and variable A at the later point.
test–retest reliability: The correlation between the same ortwo similar tests over a relatively short period of time suchas two weeks.
theism: The belief in gods or a god.theoretical sampling: A group of values in which each value
has the same probability of being selected.theory: A set of statements which describe and explain some
phenomenon or group of phenomena.third variable issue: The possibility that the relation between
two variables may be affected by one or more other variables.
title: A brief statement of about 15 words or less whichdescribe the contents of a publication.
transcription: The process of putting spoken words into arepresentative written format.
triangulation: The use of three or more methods to measurethe same variable or variables.
true or randomised experiment: A study in which the variablethought to affect one or more other variables is manipu-lated and cases are randomly assigned to conditions thatreflect that manipulation or to different orders of thoseconditions.
t-test: A parametric test which determines whether the meansof two groups differ significantly.
two-wave panel design: A panel design in which the samecases are assessed at two points in time or waves.
unidimensional scale: A measure which is thought to assess asingle construct or variable.
universalism: The assumption that there are laws or principleswhich apply to at least all humans.
utterance act: The act of saying something.
validity: An index of the extent to which a measure assesseswhat it purports to measure.
variable: A characteristic that consists of two or more categ-ories or values.
Web of Science: An electronic database originally developedby the Institute of Information which provides summarydetails and the references of articles from selected journalsin the arts, sciences and social sciences.
web source: The address of information listed on the web.within-subjects design: A research design in which the same
cases participate in all the conditions.
Z01_HOWI4994_03_SE_GLOS.QXD 10/11/10 15:07 Page 433
Allen, R. E. (1992) (ed.). The Oxford English Dictionary,2nd edn, CD-ROM (Oxford: Oxford University Press).
American Psychological Association (2009). ‘Updatedsummary report of journal operations, 2008’, AmericanPsychologist, 64, 504–505. http://www.apa.org/pubs/journals/features/2008-operations.pdf
Austin, J. L. (1975). How To Do Things with Words(Cambridge, MA: Harvard University Press).
Barber, T. X. (1973). ‘Pitfalls in research: Nine investigatorand experimenter effects’, in R. M. W. Travers (ed.),Second Handbook of Research on Teaching (Chicago,IL: Rand McNally), 382–404.
Barber, T. X. (1976). Pitfalls in Human Research: Ten pivotal points (New York: Pergamon Press).
Barlow, D. H., and Hersen, M. (1984). Single CaseExperimental Designs: Strategies for studying behaviorchange, 2nd edn (New York: Pergamon Press).
Baron, R. M., and Kenny, D. A. (1986). ‘Themoderator–mediator variable distinction in socialpsychological research: Conceptual, strategic, andstatistical considerations’, Journal of Personality andSocial Psychology, 51, 1173–82.
Beaugrande, R. D. (1996). ‘The story of discourse analysis’,in T. van Dijk (ed.), Introduction to Discourse Analysis(London: Sage), 35–62.
Beecher, H. K. (1955). ‘The powerful placebo’, Journal ofthe American Medical Association, 159, 1602–6.
Benneworth, K. (2004). ‘A discursive analysis of policeinterviews with suspected paedophiles’, Doctoraldissertation (Loughborough University, England).
Berenson, M. L., Levine, D. M., and Krehbiel, T. C. (2009).Basic Business Statistics: Concepts and applications, 11th edn (Upper Saddle River, NJ: Prentice Hall).
Berkowitz, L. (1962). Aggression: A social psychologicalanalysis (New York: McGraw-Hill).
Billig, M., and Cramer, D. (1990). ‘Authoritarianism anddemographic variables as predictors of racial attitudes inBritain’, New Community: A Journal of Research andPolicy on Ethnic Relations, 16, 199–211.
Binet, A. and Simon, T. (1904). ‘Méthodes nouvelles pour le diagnostic du niveau intellectual des onormaux’,L’Année Psychologique, 11, 191–244. Reprinted in H. H. Goddard (ed.) and translated by E. S. Kite (1916) as ‘New methods for the diagnosis of the intellectuallevel of subnormals’. This translation by Elizabeth S. Kite first appeared in 1916 in The Development of
Intelligence in Children (Baltimorc, MD: Wilkins andWilkins). http://psychclassics.yorku.ca/Binet/binet1.htm
Bodner, T. E. (2006). ‘Designs, participants, andmeasurement methods in psychological research’,Canadian Psychology, 47, 263–72.
Braun, V., and Clarke, V. (2006). ‘Using thematic analysisin psychology’, Qualitative Research in Psychology, 3,77–101.
Bridgman, P. W. (1927). The Logic of Modern Physics(New York: Macmillan).
Bryman, A. (2008). Social Research Methods, 3rd edn(Oxford: Oxford University Press).
Bryman, A., and Bell, E. (2007). Business ResearchMethods, 2nd edn (Oxford: Oxford University Press).
Buss, A. R., and McDermot, J. R. (1976). ‘Ratings ofpsychology journals compared to objective measures of journal impact’, American Psychologist, 31, 675–8(comment).
Campbell, D. T. (1969). ‘Prospective: Artifact and control’,in R. Rosenthal and R. L. Rosnow (eds), Artifact inBehavioural Research (New York: Academic Press),351–82.
Campbell, D. T., and Fiske, D. W. (1959). ‘Convergent anddiscriminant validation by the multitrait–multimethodmatrix’, Psychological Bulletin, 56, 81–105.
Campbell, D. T., and Stanley, J. C. (1963). Experimentaland Quasi-experimental Designs for Research (Boston,MA: Houghton Mifflin).
Campbell, M. L. C., and Morrison, A. P. (2007). ‘Thesubjective experience of paranoia: Comparing theexperiences of patients with psychosis and individualswith no psychiatric history’, Clinical Psychology andPsychotherapy, 14, 63–77.
Canter, D. (1983). ‘The potential of facet theory for applied social psychology’, Quality and Quantity, 17, 35–67.
Chan, L. M. (1999). A Guide to the Library of CongressClassification, 5th edn (Englewood, CO: LibrariesUnlimited).
Chan, L. M., and Mitchell, J. S. (2003). Dewey DecimalClassification: A practical guide (Dublin, OH: OCLC).
Charmaz, K. (1995). ‘Grounded theory’, in J. A. Smith, R. Harre and L. V. Langenhove (eds), RethinkingMethods in Psychology (London: Sage), 27–49.
Charmaz, K. (2000). ‘Grounded theory: Objectivist and constructivist methods’, in N. K. Denzin and
REFERENCES
Z02_HOWI4994_03_SE_REF.QXD 10/11/10 15:07 Page 434

REFERENCES 435
Y. S. E. Lincoln (eds), Handbook of QualitativeResearch, 2nd edn (Thousand Oaks, CA: Sage), 503–35.
Cicchetti, D. V. (1991). ‘The reliability of peer review formanuscript and grant submissions: A cross-disciplinaryinvestigation’, Behavioural and Brain Sciences, 14,119–86.
Clarke, V., Burns, M., and Burgoyne, C. (2006). ‘Whowould take whose name?’: An exploratory study ofnaming practices in same-sex relationships. Unpublishedmanuscript.
Cohen, J. (1988). Statistical Power Analysis for theBehavioural Sciences, 2nd edn (Hillsdale, NJ: LawrenceErlbaum Associates).
Cohen, J., and Cohen, P. (1983). Applied MultipleRegression/Correlation Analysis for the BehavioralSciences, 2nd edn (Hillsdale, NJ: Lawrence ErlbaumAssociates).
Cohen, J., Cohen, P., West, S. G., and Aiken, L. S. (2003),Applied Multiple Regression/Correlation Analysis for theBehavioral Sciences, 3rd edn (Hillsdale, NJ: LawrenceErlbaum Associates).
Coleman, L. M., and Cater, S. M. (2005). ‘A qualitativestudy of the relationship between alcohol consumptionand risky sex in adolescents’, Archives of SexualBehavior, 34, 649–61.
Cook, T. D., and Campbell, D. T. (1979). Quasi-experimentation: Design and Analysis Issues for Field Settings (Chicago, IL: Rand McNally).
Coolican, H. (2009). Research Methods and Statistics inPsychology, 5th edn (London: Hodder Education).
Cox, B. D., Blaxter, M., Buckle, A. L. J., Fenner, N. P.,Golding, J. F., Gore, M., Huppert, F. A., Nickson, J.,Roth, M., Stark, J., Wadsworth, M. E. J., andWhichelow, M. (1987). The Health and Lifestyle Survey (London: Health Promotion Research Trust).
Cramer, D. (1991). ‘Type A behaviour pattern,extraversion, neuroticism and psychological distress’,British Journal of Medical Psychology, 64, 73–83.
Cramer, D. (1994). ‘Psychological distress and neuroticism:A two-wave panel study’, British Journal of MedicalPsychology, 67, 333–42.
Cramer, D. (1995). ‘Life and job satisfaction: A two-wavepanel study’, Journal of Psychology, 129, 261–7.
Cramer, D. (1998). Fundamental Statistics for SocialResearch: Step-by-step calculations and computertechniques using SPSS for Windows (London:Routledge).
Cramer, D. (2003). ‘A cautionary tale of two statistics:Partial correlation and standardised partial regression’,Journal of Psychology, 137, 507–11.
Cramer, D., and Buckland, N. (1995). ‘Effect of rationaland irrational statements and demand characteristics on task anxiety’, Journal of Psychology, 129, 269–75.
Cramer, D., and Fong, J. (1991). ‘Effect of rational andirrational beliefs on intensity and “inappropriateness” of feelings: A test of rational-emotive theory’, CognitiveTherapy and Research, 15, 319–29.
Cramer, D., Henderson, S., and Scott, R. (1996). ‘Mentalhealth and adequacy of social support: A four-wavepanel study’. British Journal of Social Psychology, 35,285–95.
Cronbach, L. J. (1951). ‘Coefficient alpha and the internalstructure of tests’, Psychometrika, 16, 297–334.
Cronbach, L. J., and Meehl, P. E. (1955). ‘Constructvalidity in psychological tests’, Psychological Bulletin,52, 281–302.
Danziger, K. (1985). ‘The origins of the psychologicalexperiment as a social institution’, AmericanPsychologist, 40 (2), 133–40.
Danziger, K., and Dzinas, K. (1997). ‘How psychology got its variables’, Canadian Psychology, 38, 43–48.
Denscombe, M. (2002). Ground Rules for Good Research:A 10 point guide for social researchers (Buckingham:Open University Press).
Denzin, N. K., and Lincoln, Y. S. E. (2000). ‘Introduction:The discipline and practice of qualitative research’, in N. K. Denzin and Y. S. E. Lincoln (eds), Handbook ofQualitative Research, 2nd edn (Thousand Oaks, CA:Sage), 1–28.
Dereshiwsky, M. (1999). ‘The five dimensions of participantobservation’, http://jan.ucc.nau.edu/~mid/edr725/class/observation/fivedimensions/
Dewey Services (n.d.). http://www.oclc.org/dewey/Drew, P. (1995). ‘Conversation analysis’, in J. A. Smith,
R. Harre and L. V. Langenhove (eds), RethinkingMethods in Psychology (London: Sage), 64–79.
Eatough, V., and Smith, J. A. (2006). ‘I feel like a scrambled egg in my head: An idiographic case study of meaning making and anger using interpretativephenomenological analysis’, Psychology andPsychotherapy: Theory, Research and Practice, 79, 115–35.
Ebbinghaus, H. (1913). Memory: A contribution toexperimental psychology (New York: Teacher’s College, Columbia University; Reprint edition, New York: Dover, 1964).
Edley, N. (2001). ‘Analysing masculinity: Interpretativerepertoires, ideological dilemmas and subject positions’,in M. Wetherell, S. Taylor and S. J. E. Yates (eds),Discourse as Data: A guide for analysis (London: Sage),189–228.
Edwards, D., and Potter, J. (1993). ‘Language andcausation: A discursive action model of description andattribution’, Psychological Review, 100 (1), 23–41.
Engstrom, L., Geijerstam, G., Holmberg, N. G., and Uhrus, K. (1963). ‘A prospective study of therelationship between psycho-social factors and course of pregnancy and delivery’, Journal of PsychosomaticResearch, 8, 151–5.
Epley, N., and Huff, C. (1998). ‘Suspicion, affectiveresponse, and educational benefit as a result of deceptionin psychology research’, Personality and SocialPsychology Bulletin, 24, 759–68.
Eysenck, H. J. (1980). The Causes and Effects of Smoking(London: Sage).
Z02_HOWI4994_03_SE_REF.QXD 10/11/10 15:07 Page 435

436 REFERENCES
Farrington, D. P. (1996). ‘Psychosocial influences on thedevelopment of antisocial personality’, in G. Davies, S. Lloyd-Bostock, M. McMurran and C. Wilson (eds),Psychology, Law and Criminal Justice: InternationalDevelopments in Research and Practice (Berlin: Walter de Gruyter), 424–44.
Ferri, E. (1993) (ed.). Life at 33: The fifth follow-up of theNational Child Development Study (London: NationalChildren’s Bureau).
Fincham, F. D., Beach, S. R. H., Harold, G. T., andOsborne, L. N. (1997). ‘Marital satisfaction anddepression: Different casual relationships for men andwomen?’, Psychological Science, 8, 351–7.
Forsyth, J. P., Kollins, S., Palav, A., Duff, K., and Maher, S. (1999). ‘Has behavior therapy drifted from its experimental roots? A survey of publication trends inmainstream behavioral journals’, Journal of BehaviorTherapy and Experimental Psychiatry, 30, 205–20.
Garfinkel, H. (1967). Studies in Ethnomethodology(Englewood Cliffs, NJ: Prentice-Hall).
Gee, D., Ward, T., and Eccleson, L. (2003). ‘The functionof sexual fantasies for sexual offenders: a preliminarymodel’, Behaviour Change, 20, 44–60.
Gergen, K.J. (1973). ‘Social psychology as history’, Journal of Personality and SocialPsychology, 26 (2), 309–320.
Gibbs, A. (1997). ‘Focus groups’, Social research update,19, http://www.soc.surr.ac.uk/sru19.html
Glaser, B. G., and Strauss, A. L. (1967). The Discovery ofGrounded Theory: Strategies for qualitative research(New York: Aldine de Gruyter).
Goffman, E. (1959). The Presentation of Self in EverydayLife (Garden City, New York: Doubleday).
Goffman, E. (1961). Asylums: Essays on the social situationof mental patients and other inmates (Garden City, New York: Anchor).
Goldthorpe, J. H. (1987). Social Mobility and ClassStructure in Modern Britain, 2nd edn (Oxford:Clarendon Press).
Gottfredson, S. D. (1978). ‘Evaluating psychologicalresearch reports: Dimensions, reliability, and correlatesof quality judgments’, American Psychologist, 33,920–34.
Great Britain Office for National Statistics (2000). StandardOccupational Classification 2000: Vol. 1, Structure anddescriptions of unit groups and Vol. 2, The coding index(London: Stationery Office). http://www.statistics.gov.uk/nsbase/methods_quality/ns_sec/soc2000.asp
Greene, E. (1990). ‘Media effects on jurors’, Law andHuman Behavior, 14 (5), 439–50.
Grice, H. P. (1975). ‘Logic and conversation’, in P. Coleand J. Morgan (eds), Syntax and Semantics 3: Speechacts (New York: Academic Press), 41–58.
Haggbloom, S. J., Warnick, R., Warnick, J. E., Jones, V. K.,Yarbrough, G. L., Russell, T. M. et al. (2002). The 100most eminent psychologists of the 20th century. Reviewof General Psychology, 6, 139–52.
Hare, R. D. (1991). The Hare Psychopathy Checklist –Revised (Toronto: Multi-Health Systems).
Henriques, J., Hollway, W., Urwin, C., Venn, C., andWalkerdine, V. (1984). Changing the Subject: Psychology,social regulation and subjectivity (London: Methuen).
Hepburn, A. (2003). An Introduction to Critical SocialPsychology (London: Sage).
Hergenhahn, B. R. (2001). An Introduction to the Historyof Psychology, 4th edn (Belmont, CA: WadsworthThomson Learning).
Hoinville, G., and Jowell, R. (1978). Survey ResearchPractice (London: Heinemann Educational Books).
Horton-Salway, M. (2001). ‘The construction of ME: Thediscursive action model’, in M. Wetherell, S. Taylor andS. J. E. Yates (eds), Discourse as Data: A Guide forAnalysis (London: Sage), 147–88.
Howell, D. C. (2010). Statistical Methods for Psychology,7th edn (Belmont, CA: Wadsworth).
Howitt, D. (1992a). Concerning Psychology: Psychologyapplied to social issues (Milton Keynes: Open UniversityPress).
Howitt, D. (1992b). Child Abuse Errors (London:Harvester Wheatsheaf).
Howitt, D. (1995). Paedophiles and Sexual OffencesAgainst Children (Chichester: Wiley).
Howitt, D. (2008). Introduction to Forensic and CriminalPsychology, 3rd edn (Harlow: Prentice Hall).
Howitt, D. (2010). Introduction to Qualitative ResearchMethods in Psychology (Harlow: Pearson Education).
Howitt, D., and Cramer, D. (2011a). Introduction toStatistics in Psychology, 5th edn (Harlow: Prentice Hall).
Howitt, D., and Cramer, D. (2011b). Introduction to SPSSStatistics in Psychology, 5th edn (Harlow: Prentice Hall).
Howitt, D., and Owusu-Bempah, J. (1990). ‘Racism in aBritish journal?’, The Psychologist: Bulletin of the BritishPsychological Society, 3 (9), 396–400.
Howitt, D., and Owusu-Bempah, J. (1994). The Racism ofPsychology (London: Harvester Wheatsheaf).
Husserl, E. (1900/1970). Logical Investigations, trans. J. N. Findlay (London: Routledge and Kegan Paul).
Husserl, E. (1913/1962). Ideas: A General Introduction toPure Phenomenology, trans. W. R. Boyce Gibson(London: Collier).
Hutchby, I., and Wooffitt, R. (1998). ConversationAnalysis: Principles, practices and applications(Cambridge: Polity Press).
Institute for Scientific Information (1994). ‘The impact factor’,Current Contents, 20 June, http://thomsonreuters.com/products_services/science/free/essays/impact_factor/
Jefferson, G. (1984). ‘On stepwise transition from talkabout a trouble to inappropriately next positionedmatters’, in J. M. Atkinson and J. Heritage (eds),Structures of Social Action: Studies in conversationanalysis (Cambridge: Cambridge University Press),191–222.
Jones, H. (1981). Bad Blood: The Tuskegee SyphilisExperiment (New York: Free Press).
Jones, M. C., Bayley, N., MacFarlane, J. W., and Honzik,M. P. (1971). The Course of Human Development(Waltham, MA: Xerox Publishing Company).
Z02_HOWI4994_03_SE_REF.QXD 10/11/10 15:07 Page 436

REFERENCES 437
Keith-Spiegel, P., and Koocher, G. P. (1985). Ethics inPsychology: Professional standards and cases (Hillsdale,NJ: Lawrence Erlbaum Associates).
Kelly, G. A. (1955). The Psychology of Personal Constructs.Volume 1: A theory of personality (New York: Norton).
Keppel, G., and Wickens, T. D. (2004). Design andAnalysis: A researcher’s handbook, 4th edn (UpperSaddle River, NJ: Pearson).
Kirk, R. C. (1995). Experimental Design, 3rd edn (Pacific Grove, CA: Brooks/Cole).
Kitzinger, C., and H. Frith (2001). ‘Just say no? The use of conversation analysis in developing a feministperspective on sexual refusal’, in M. Wetherell, S. Taylorand S. J. E. Yates (eds), Discourse Theory and Practice:A reader (London, Sage), 167–85.
Korn, J. H. (1997). Illusions of Reality: A history ofdeception in social psychology (New York: StateUniversity of New York Press).
Krause, N., Liang, J., and Yatomi, N. (1989). ‘Satisfactionwith social support and depressive symptoms: A panelanalysis’, Psychology and Aging, 4, 88–97.
Lana, R. E. (1969). ‘Pretest sensitisation’, in R. Rosenthaland R. L. Rosnow (eds), Artifact in BehaviouralResearch (New York: Academic Press), 119–41.
Latane, B., and Darley, J. M. (1970). The UnresponsiveBystander: Why doesn’t he help? (New York: Appleton-Century-Crofts).
Lazarsfeld, P. F. (1948). ‘The use of panels in socialresearch’, Proceedings of the American PhilosophicalSociety, 92, 405–10.
Leahy, T. H. (2004). A History of Psychology: Maincurrents in psychological thought, 6th edn (UpperSaddle, NJ: Prentice Hall).
Leyens, J. P., Camino, L., Parke, R. D., and Berkowitz, L.(1975). ‘The effect of movie violence on aggression in a field setting as a function of group dominance andcohesion’, Journal of Personality and Social Psychology,32, 346–60.
Library of Congress Classification Outline (n.d.).http://www.loc.gov/catdir/cpso/lcco/
Loftus, E. F., and Palmer, J. C. (1974). ‘Reconstruction ofauto-mobile destruction: An example of the interactionbetween language and memory’, Journal of VerbalLearning and Verbal Behaviour, 13, 585–9.
Lovering, K. M. (1995). ‘The bleeding body: Adolescentstalk about menstruation’, in S. Wilkinson and C. Kitzinger (eds), Feminism and Discourse:Psychological perspectives (London: Sage), 10–31.
MacCorquodale, K., and Meehl, P. E. (1948). ‘On adistinction between hypothetical variables and interveningvariables’, Psychological Review, 55, 95–107.
Mace, K. C., and Warner, H. D. (1973). ‘Ratings ofpsychology journals’, American Psychologist, 28, 184–6 (Comment).
Mann, E., and Abraham, C. (2006). ‘The role of affect inUK commuters’ travel mode choices: An interpretativephenomenological analysis’, British Journal ofPsychology, 97, 155–76.
McArthur, T. (1992). The Oxford Companion to theEnglish Language (Oxford: Oxford University Press).
McGuire, W. J. (1997). ‘Creative hypothesis generating inpsychology: Some useful heuristics’, Annual Review ofPsychology, 48, 1–30.
McHugh, P. (1968). Defining the Situation: TheOrganization of Meaning (Evanston, IL: Bobbs-Merrill).
Mead, M. (1944). Coming of Age in Samoa(Harmondsworth: Pelican).
Medway, C., and Howitt, D. (2003). ‘The role of animal cruelty in the prediction of dangerousness’, in M. Vanderhallen, G. Vervaeke, P. Van Koppen and J. Goethals (eds), Much Ado About Crime: Chapters inpsychology and law (Brussels: Politeia), 245–50.
Merton, R., and Kendall, P. (1946). ‘The focused interview’,American Journal of Sociology, 51, 541–7.
Milgram, S. (1974). Obedience to Authority (New York:Harper & Row).
Moser, C. A., and Kalton, G. (1971). Survey Methods inSocial Investigation, 2nd edn (London: Gower).
Murphy, P. M., Cramer, D., and Lillie, F. J. (1984). ‘The relationship between curative factors perceived bypatients in their psychotherapy and treatment outcome’,British Journal of Medical Psychology, 57, 187–92.
Nunnally, J. (1978). Psychometric theory, 2nd edn (New York: McGraw-Hill).
O’Connell, D. C., and Kowal, S. (1995). ‘Basic principles of transcription’, in J. A. Smith, R. Harré, and L. VanLangenhove (eds), Rethinking Methods in Psychology(London: Sage), 93–105.
Ogden, J., Clementi, C., and Aylwin, S. (2006). ‘The impact of obesity surgery and the paradox ofcontrol: A qualitative study’, Psychology and Health, 21, 273–93.
OPCS (1991). Standard Occupational Classification;Volume 3 (London: HMSO).
Orne, M. T. (1959). ‘The nature of hypnosis: Artifact andessence’, Journal of Abnormal and Social Psychology,58, 277–99.
Orne, M. T. (1962). ‘On the social psychology of thepsychological experiment: With particular reference todemand characteristics and their implications’, AmericanPsychologist, 17, 776–83.
Orne, M. T. (1969). ‘Demand characteristics and theconcept of quasi-controls’, in R. Rosenthal and R. L. Rosnow (eds), Artifact in Behavioural Research(New York: Academic Press), 143–79.
Orne, M. T., and Scheibe, K. E. (1964). ‘The contributionof nondeprivation factors in the production of sensorydeprivation effects: The psychology of the “panicbutton”’, Journal of Abnormal and Social Psychology,68, 3–12.
Owusu-Bempah, J., and Howitt, D. (1995). ‘HowEurocentric psychology damages Africa’, ThePsychologist: Bulletin of the British PsychologicalSociety, 8, 462–5.
Owusu-Bempah, J., and Howitt, D. (2000). PsychologyBeyond Western Perspectives (Leicester: BPS Books).
Z02_HOWI4994_03_SE_REF.QXD 10/11/10 15:07 Page 437

438 REFERENCES
Page, M., and Scheidt, R. J. (1971). ‘The elusive weaponseffect’, Journal of Personality and Social Psychology, 20, 304–9.
Park, A., Curtice, J., Thomson, K., Phillips, L., Clery, E.,and Butt, S. (2010) (eds). British Social Attitudes: The26th report (London: Sage).
Parker, I. (1989). The Crisis in Modern Social Psychology(London: Routledge).
Parker, I. (ed.) (1999). Deconstructing Psychotherapy(London: Sage).
Parker, I., Georgaca, E., Harper, D., McLaughlin, T., and Stowell-Smith, M. (1995). DeconstructingPsychopathology (London: Sage).
Patton, M. Q. (1986). How To Use Qualitative Methods inEvaluation (London: Sage).
Pavlov, I. P. (1927). Conditioned Reflexes: An investigationof the physiological activity of the cerebral cortex, trans.G. V. Anrep (London: Oxford University Press).
Pedhazur, E. J., and Schmelkin, L. P. (1991). Measurement,Design and Analysis: An integrated approach (Hillsdale,NJ: Lawrence Erlbaum Associates).
Peters, D. P., and Ceci, S. J. (1982). ‘Peer-review practicesof psychological journals: The fate of published articles,submitted again’, The Behavioral and Brain Sciences, 5,187–255.
Pitcher, J., Campbell, R., Hubbard, P., O’Neill, M., andScoular, J. (2006). Living and Working in Areas of Street Sex Work: From Conflict to Co-existence(Bristol: Policy Press).
Postal Geography (n.d.).http://www.statistics.gov.uk/geography/postal_geog.asp
Potter, J. (1997). ‘Discourse analysis as a way of analysingnaturally occurring talk’, in D. Silverman (ed.),Qualitative Research: Theory, methods and practice(London: Sage), 144–60.
Potter, J. (1998). ‘Qualitative and discourse analysis’, in A. S. Bellack and M. Hersen (eds), ComprehensiveClinical Psychology, Vol. 3 (Oxford: Pergamon), 117–44.
Potter, J. (2001). ‘Wittgenstein and Austin’, in M.Wetherell, S. Taylor and S. J. Yates, Discourse Theoryand Practice: A reader (London: Sage), 39–56.
Potter, J. (2004). ‘Discourse analysis’, in M. Hardy and A. Bryman (eds), Handbook of Data Analysis(London: Sage), 607–24.
Potter, J., and Wetherell, M. (1987). Discourse and Social Psychology: Beyond attitudes and behaviour(London: Sage).
Potter, J., and Wetherell, M. (1995). ‘Discourse analysis’, in J. A. Smith, R. Harré and L. V. Langenhove (eds),Rethinking Methods in Psychology (London: Sage),80–92.
PsycINFO Database Information (n.d.).http://www.apa.org/pubs/databases/psycinfo/index.aspx
Reis, H. T., and Stiller, J. (1992). ‘Publication trends inJPSP: A three-decade review’, Personality and SocialPsychology Bulletin, 18, 465–72.
Rivers, W. H. R. (1908). The Influence of Alcohol andOther Drugs on Fatigue (London: Arnold).
Rosenberg, M. (1968). The Logic of Survey Analysis(London: Basic Books).
Rosenthal, R. (1963). ‘On the social psychology of thepsychological experiment: The experimenter’s hypothesisas unintended determinant of experimental results’,American Scientist, 51, 268–83.
Rosenthal, R. (1969). ‘Interpersonal expectations: Effects of the experimenter’s hypothesis’, in R. Rosenthal and R. L. Rosnow (eds), Artifact in Behavioural Research(New York: Academic Press), 181–277.
Rosenthal, R. (1978). ‘How often are our numbers wrong?’,American Psychologist, 33, 1005–8.
Rosenthal, R. (1991). Meta-analytic Procedures for SocialResearch, rev. edn (Newbury Park, CA: Sage).
Rosenthal, R., and Rosnow, R. L. (1969). ‘The volunteersubject’, in R. Rosenthal and R. L. Rosnow (eds),Artifact in Behavioural Research (New York: AcademicPress), 59–118.
Rosenthal, R., and Rubin, D. B. (1978). ‘Interpersonalexpectancy effects: The first 345 studies’, The Behavioraland Brain Sciences, 3, 377–415.
Rosnow, R. L. (2002). ‘The nature and role of demandcharacteristics in scientific enquiry’, Prevention andTreatment, 5, no page numbers.
Rushton, J. P., and Roediger, H. L., III. (1978). ‘Anevaluation of 80 psychology journals based on theScience Citation Index’, American Psychologist, 33,520–3 (comment).
Sacks, H. (1992). ‘Lecture 1: Rules of conversationalsequence’, in E. Jefferson (ed.), H. Y. Sacks Lectures on Conversation; Vol. 1, 3rd edn (Oxford: Blackwell).
Sacks, O. (1985). The Man Who Mistook his Wife for aHat (London: Picador).
Schlenker, B. R. (1974). ‘Social psychology and science’,Journal of Personality and Social Psychology, 29, 1–15.
Searle, J. (1969). Speech Acts: An essay in the philosophy of language (Cambridge: Cambridge University Press).
Shadish, W. R., and Ragsdale, K. (1996). ‘Random versusnonrandom assignment in controlled experiments: Doyou get the same answer?’, Journal of Consulting andClinical Psychology, 64, 1290–305.
Shadish, W. R., Cook, T. D., and Campbell, D. T. (2002).Experimental and Quasi-experimental Designs forGeneralised Causal Inference (New York: HoughtonMifflin).
Sheldon, K., and Howitt, D. (2007). Sex Offenders and theInternet (Chichester: Wiley).
Sheldrake, R. (1998). ‘Experimenter effects in scientificresearch: How widely are they neglected?’, Journal ofScientific Exploration, 12, 1–6.
Sherman, R. C., Buddie, A. M., Dragan, K. L., End, C. M.,and Finney, L. J. (1999). ‘Twenty years of PSPB: Trendsin content, design, and analysis’, Personality and SocialPsychology Bulletin, 25, 177–87.
Shye, S., and Elizur, D. (1994). Introduction to FacetTheory: Content Design and Intrinsic Data Analysis inBehavioural Research (Thousand Oaks, CA: Sage).
Z02_HOWI4994_03_SE_REF.QXD 10/11/10 15:07 Page 438

REFERENCES 439
Silverman, D. (1997). ‘The logics of qualitative research’, inG. Miller and R. Dingwall (eds), Context and Method inQualitative Research (London: Sage), 12–25.
Skinner, B. F. (1938). The Behavior of Organisms(New York: Appleton-Century-Crofts).
Smith, J. A. (1996). ‘Beyond the divide between cognitionand discourse: Using interpretative phenomenologicalanalysis in health psychology’, Psychology and Health,11, 261–71.
Smith, J. A., and Eatough, V. (2006). ‘Interpretativephenomenological analysis’, in G. M. Breakwell, S. Hammond, C. Fife-Schaw and J. A. Smith (eds),Research Methods in Psychology, 3rd edn (London: Sage), 322–41.
Smith, J. A., and Osborn, M. (2003). ‘Interpretativephenomenological analysis’, in J. A. Smith (ed.),Qualitative Psychology: A practical guide to researchmethods (London: Sage), 51–80.
Smith, J. A., and Osborn, M. (2007). ‘Pain as an assault on the Self: An interpretative phenomenological analysisof the psychological impact of chronic benign low backpain’, Psychology and Health, 22, 517–34.
Smith, S. S., and Richardson, D. (1983). ‘Amelioration of deception and harm in psychological research: Theimportant role of debriefing’, Journal of Personality and Social Psychology, 44, 1075–82.
Solomon, R. L. (1949). ‘An extension of control groupdesign’, Psychological Bulletin, 46, 137–50.
Steffens, L. (1931). Autobiography of Lincoln Steffens(New York: Harper & Row).
Stevens, S. S. (1946). ‘On the theory of scales ofmeasurement’, Science, 103, 677–80.
Strauss, A., and Corbin, J. (1999). ‘Grounded theorymethodology: An overview’, in A. Bryman and R. G. Burgess (eds), Qualitative Research; Vol. 3(Thousand Oaks, CA: Sage), 73–93.
Stubbs, M. (1983). Discourse Analysis (Oxford: Blackwell).
Tannen, D. (2007). ‘Discourse analysis’, Linguistic Society of America, http://www.lsadc.org/info/ling-fields-discourse.cfm
Taylor, S. (2001). ‘Locating and conducting discourseanalytic research’, in M. Wetherell, S. Taylor and S. J. E. Yates (eds), Discourse as Data: A Guide forAnalysis (London: Sage), 5–48.
ten Have, P. (2007). ‘Methodological issues in conversationanalysis’, http://www2.fmg.uva.nl/emca/mica.htm
Thomson Reuters (n.d.). ‘The Thomson Reuters journalselection process’, http://isiwebofknowledge.com/benefits/essays/journalselection/
Tomer, C. (1986). ‘A statistical assessment of two measuresof citation: The impact factor and the immediacy index’, Information Processing and Management, 22,251–8.
Trochim, W. M. K. (2006). ‘Positivism and post-positivism’,http://www.socialresearchmethods.net/kb/positvsm.htm
van Dijk, T. (2001). ‘Principles of critical discourseanalysis’, in M. Wetherell, S. Taylor and S. J. E. Yates(eds), Discourse Theory and Practice: A reader(London: Sage), 300–17.
Velten, E., Jr (1968). ‘A laboratory task for induction of mood states’, Behaviour Research and Therapy, 6,473–82.
Watson, J. B., and Rayner, R. (1920). ‘Conditionedemotional reactions’, Journal of ExperimentalPsychology, 3, 1–14.
Westermann, R., Spies, K., Stahl, G., and Hesse, F. W.(1996). ‘Relative effectiveness and validity of moodinduction procedures: A meta-analysis’, EuropeanJournal of Social Psychology, 26, 557–80.
Wetherell, M. S., and Taylor, S. (2001) (eds). Discourse asData: A guide for analysis (London: Sage).
Wilson, V. L., and Putnam, R. R. (1982). ‘A meta-analysisof pretest sensitization effects in experimental design’,American Educational Research Journal, 19, 249–58.
Woodworth, R. S. (1938). Experimental Psychology, New York: Holt.
Wooffitt, R. (2001). ‘Researching psychic practitioners:Conversation analysis’, in M. Wetherell, S. Taylor and S. J. E. Yates (eds), Discourse as Data: A Guide forAnalysis (London: Sage), 49–92.
Z02_HOWI4994_03_SE_REF.QXD 10/11/10 15:07 Page 439

a posteriori comparison 193a priori comparison 193A-B-C model 420abbreviations 89abstract 79, 85–6, 110–11academic value 414adjacency pairs 373Adobe Audition 353advanced experimental design 188–206
activities 206box: interactions 197–8box: Latin squares 199–200factorial design 195–200key points 205–6multiple dependent variables 194–5multiple levels of independent variable 190–4overview 188–9psychology of laboratory experiment 200–4
advanced research designs 174–85pre-test/post-test sensitisation effects 174–9within-subjects design 179–85
aims and hypotheses in research 25–39activities 39box: direction, hypotheses and statistical analysis 33–4box: hypothetical-deductive method 36–7difficulties in aims/hypotheses formulation 36–8hypotheses types 32–5key points 39overview 25–6research aims 29–30research hypotheses 30–1types of study 27–9
Allport, Gordon 390alpha reliability (Cronbach’s alpha) 270alternate-forms reliability 271alternate hypothesis 33alternative explanations of findings 422American Psychological Association (APA) 78, 145, 146
ethics 146–7analysis of covariance (ANCOVA) 196analysis of cross-sectional studies 213–18
reliability 213–15restricted variation of scores 216–18third variable issue 215–16see also cross-sectional or correlational research
analysis of variance (ANOVA) 193, 195analytic effort 333ANCOVA see analysis of covarianceanimal research see ethics and animal research
ANOVA see analysis of varianceAPA see American Psychological Associationappendices 79, 99–100argumentation and conclusion 399articles not in library 138–40association size and meaning 71–4
coefficient of determination 71Austin, J. L. 359authoritarianism 295
basic laboratory experiment 163–87activity 187advanced research designs 174–85between-subjects design 164–7box: checks on experimental manipulation 169box: matching 172–3box: statistical significance 182–5experimental control 166key points 186–7overview 163–4practicalities 165true or randomised experiments 167–73within-subjects design 164–7
basics of research 1–160behaviour prediction/change 420Behaviourist School of Psychology 300Berkeley Growth Study 223between-subjects design 164–7bibliographic database software 140–1Binet, Alfred 250, 295, 296biographies 307Blumer, Herbert 386Bonferroni test 193–4books 98Brentano, Franz 386British Crime Survey 237British Psychological Society 22, 146
deception 151–2British Social Attitudes Survey 237, 238, 241
CAQDAS (computer assisted qualitative data analysis) 351carryover, asymmetrical/differential transfer 180–1CASOC see Computer-Assisted Standard Occupational
Codingcategorical scale 50categorisation 349–50category scale 50category/categorical variables see nominal variablescausal explanations 11
INDEX
Z03_HOWI4994_03_SE_IDX.QXD 10/11/10 15:07 Page 440

INDEX 441
causal hypothesis 32–5causality 423
see also inferring causality; research types and causalityassessment
cause 5CDC EZ-Text 354chance findings
and sample size see generalisation problemsand statistical significance 63–5
checks on experimental manipulation 169Chicago School of Sociology 346choice of research topic 416–18citations 96–8, 421cluster sampling 236coding data 280–90
activities 290coding types 282–6content analysis 282key points 289overview 280qualitative coding 288–9quantitative and qualitative data analysis 281reliability and validity 287–8
coding types 282–6pre-coding 283–5researcher imposed coding 285–6
coding/naming 348–9coefficient of determination 71cognition in action 365coherence with previous discourse studies 402–3comparative method 38comparison 348
of association size 212computer grounded-theory analysis 351–5Computer-Assisted Structured Coding Tool (CASCOT) 241Computer Assisted Qualitative Analysis Software
(CAQDAS) 351, 353–5Comte, Auguste 299concepts, essential 5conclusion 79concurrent validity 274conditions 168confidence interval 242
point estimate 242conflicting/inconsistent findings 423–4confounding variables 13–14consent form 157consent, obtaining 156–7
consent form 157information sheet/study description 156
construct validity 275–7known-groups validity 277triangulation 277
construction and description 364content 364–5
analysis 27, 282content validity 274control condition 169convenience samples see representative/convenience samplesconventional formats 284convergent validity 277–8
conversation analysis 371–82activities 382analysis 375comparison with episodes from other conversations
378–9elaboration of analysis 378examples 379–80explication of interpretation 378key points 381making sense/interpreting 378mechanical production of primary database 377overview 371precepts 375–6recording 375search for meaning 372selection of transcript aspects 378stages 376–80transcription 375, 377–8
CoolEdit 353correlation vs difference tests 209correlational research see cross-sectional or correlational
researchcorrelational/cross-sectional studies 12–13covert observation 309criteria for novices 406–7critical discourse analysis 364
dominance 364power and social inequality 364
critical realism 300–1Cronbach’s alpha 260, 270cross-lagged relationship 224cross-sectional or correlational research 207–19
activities 219analysis of cross-sectional studies 213–18box: correlation vs difference tests 209cross-sectional designs 209–10key points 219non-manipulation studies 211–13overview 207passive observational 208
cross-sectional designs 209–10
data 5availability for verification 155
data analysis 302, 390–2, 399box: Computer Assisted Qualitative Analysis Software
(CAQDAS) 353–5case/initial comments 391computer grounded-theory analysis 351–5connections between themes 391continuing with further cases 391data in grounded theory 347grounded theory development 346–7grounded theory evaluation 355–6grounded-theory analysis 348–51identification of themes 391mixed data 302pure qualitative 302pure quantification 302table of themes 391writing up 392
Z03_HOWI4994_03_SE_IDX.QXD 10/11/10 15:07 Page 441

442 INDEX
data collection 301, 388–90mixed data 301pure qualitative 301pure quantitative 301
data familiarisation 336–7data-led approach 337data management157–8data protection 157–8debriefing 153deception
in history of social psychology 152–3in research 151–2
demand characteristics 202–4dependent variable 167
see also multiple dependent variablesDerrida, Jacques 386–7descriptive/exploratory studies 27
content analysis 27design 92detail in data and analysis 403detailed description of phenomenon 418developing or refining measures 213development of research ideas 411–25
academic value 414activity 425box: top of citations 421choice of research topic 416–18key points 425motivation 413overview 411–12planning 413practicality 413–14replication study 414–16sources of research ideas 418–23
deviant instances 402Dewey Decimal Classification (DDC) system 125–6dichotomous, binomial/binary variables 46difficulties in aims/hypotheses formulation 36–8
comparative method 38direction, hypotheses and statistical analysis 33–4directional hypothesis 33directional and non-directional hypotheses 65–7
one-tailed vs two-tailed significance level 66–7statistical hypotheses 65
discourse analysis 358–70activities 370agenda 363–5box: critical discourse analysis 364definition 361discourse characteristics 362–3doing discourse analysis 365–9example 368–9key points 369overview 358
discourse analysis agenda 363–5cognition in action 365construction and description 364content 364–5practices and resources 364rhetoric 365stake and accountability 365
discourse characteristicsface 363Grice’s maxims of cooperative speech 362–3register 363speech acts 362
discriminant validity 278discussion 79, 94–5, 115disproportionate stratified sampling 236documentary and historical records 307dominance 364dummy variables 196
Economic and Social Science Research Council (ESRC) 237
electronic databases 129–37PsycINFO 129, 134–7, 140Web of Science 129–33, 140
EndNote 140equal interval scale 49ESRC see Economic and Social Science Research Councilestablishing association 212ethics and animal research 154ethics and publication 154–5
data availability for verification 155ethics in reporting research 154–5plagiarism 155publication credit 155republication of data 155
ethics in research 144–60activities 159–60APA ethics 146–7box: deception in history of social psychology 152–3box: ethics and animal research 154box: informed consent in intervention experiments
150consent, obtaining 156–7ethics and publication 154–5key points 159overview 144research ethics 147–54
evaluating evidence 7–8hypotheses 7–8
evaluating qualitative research 396–408activities 408argumentation and conclusion 399box: qualitative report writing 404–5criteria for novices 406–7data analysis 399findings 400key points 408overview 396published research 399relevance to social/political issues 400usefulness and applicability 400–1validity 401–6see also qualitative research
evaluation of tests and measures see reliability and validity
evaluation/outcome studies 27–8everyday issues 420experimental control 166
Z03_HOWI4994_03_SE_IDX.QXD 10/11/10 15:07 Page 442

INDEX 443
experimental manipulation 167–70conditions 168control condition 169dependent variable 167experimental condition 167–70groups 168independent variable 167
experimenter effects 201–2experimenter expectancy effect 202
explanatory models 212explication
of analysis process 403of study’s purpose 309
face 363validity 274
facet theory 43factor analysis 256factorial design 195–200
analysis of covariance (ANCOVA) 196analysis of variance (ANOVA) 195–6dummy variables 196interactions 197–8Latin squares 199–200multiple regression 196–7subject variables 196
factoring approach 259–63fatigue or boredom 179findings 400finite population sample size 245focus 310focus groups 285, 307, 310–13, 380
focused interviewing 310free nodes 354Freud, Sigmund 37, 42, 294
Gall, Franz Joseph 296Garfinkel, Howard 372generalisation problems 55–75
activities 75directional and non-directional hypotheses 65–7key points 74measures of effect (difference) and association 67–9overview 55–6sample size and association size 69–74sampling and generalisation 58–62statistics and generalisation 62–5universalism 57–8
generalising to other contexts 423Goffman, Erving 386Goldthorpe schema 241Grice, H. P. 359Grice’s maxims of cooperative speech 362–3grounded theory 343–57
activity 357development 346–7evaluation 355–6key points 357overview 343
grounded theory analysis 348–51categorisation 349–50
coding/naming 348–9comparison 348literature review 351memo writing 350–1theoretical sampling 351see also data analysis
groups 168
Harris, Zellig 359Heidegger, Martin 387hermeneutics 386–7hierarchical or sequential multiple regression 229Hull, Clark 300Husserl, Edmund 386Hymes, Dell 359hypotheses 7–8, 30–1hypotheses types 32–5
causal hypothesis 32–5directional hypothesis 33–4, 35non-causal hypothesis 32–5non-directional hypothesis 32–5
hypothetical constructs 52hypothetical-deductive method 36–7, 345
illocution 362illocutory act 362in-depth (semi-structured) interviews 307, 313–17independent and dependent variables 42, 45independent variable 167
see also multiple levels of independent variableinducements to participate 151inferring causality 8–11information sheet/study description 156informed consent in intervention experiments 150
intervention research 150Tuskegee Experiment 150
informed consent to research 148–51informed consent not necessary 149–51recordings and photography 149
initial codinggeneration 337–9searching for themes based on 339–40
institutional approval 147–8intelligence quotient (IQ) 294interactions 197–8internal and external validity 222–3internal reliability 269–71
alpha reliability (Cronbach’s alpha) 270odd-even reliability 270split-half reliability 270
interpretative phenomenological analysis (IPA) 383–95activities 395data analysis 390–2data collection 388–90example 393–4key points 395overview 383–4philosophical foundations 385–7stages in 387–94
interval scale 49intervening or mediating variables 225–6
Z03_HOWI4994_03_SE_IDX.QXD 10/11/10 15:07 Page 443

444 INDEX
intervention/manipulation 18–21non-experiment 20quasi-experiment 20true experiment 20
interviews 310–11, 313–17in-depth (semi-structured) interviews 307, 313–17interview guide 314structured interviews 313, 314
introduction 79, 87–8, 111–12item analysis 256item analysis or factor analysis 263item-whole or item-total approach 256–9
Jefferson, Gail 321Jefferson system see transcribing language datajournal articles 99judging publication reputation 139–40justification of analytic claims 402
known-groups validity 277
laboratory experiment see basic laboratory experimentlanguage see discourse analysislanguage bias
avoidance 82Latin squares 199–200library classification systems 125–7
Dewey Decimal Classification (DDC) system 125–6Library of Congress Classification system 127
Library of Congress Classification system 127Likert attitude scale 294literature review 351literature search 123–43
activities 143articles not in library 138–40box: judging publication reputation 139–40box: psychology of 128electronic databases 129–37key points 142library classification systems 125–7overview 123–4personal bibliographic database software 140–1
locution 362locutory act 362longitudinal studies 14–15, 220–31
activities 231box: internal and external validity threats 222–3key points 231non-experimental design analysis 228–31overview 220panel designs 221, 223–5prospective studies 221retrospective studies 222third variable types 225–7
MacCorquodale, Kenneth 52manipulation not possible 211–12MANOVA see multivariate analysis of variancemargin of error see sampling errormass media output 307matching 172–3
materials/apparatus 91–2Mead, George Herbert 386measurement, Stevens’ theory of scales of 48–52measurement characteristics of variables 45–8
nominal (qualitative; category; categorical) variables 45–6
quantitative variables 46–8measurement scales
(equal) interval 49nominal (category/categorical) 50ordinal 49–50ratio 49Steven’s theory of 48–52
measuresdevelopment and validation 422of effect (difference) and association 67–9
mediating variables see intervening or mediating variablesmediator vs moderator variables 47–8Meehl, Paul E. 52memo writing 350–1meta-analytic studies 28–9metaphysics 299method 79, 88–92, 112–13
design 92materials/apparatus 91–2participants 90–1procedure 92
methodological limitations 422Milgram, Stanley 298millimetre-wave imaging radiometer (MIR) 295moderator (moderating) variables 47–8, 226–7motivation 413multi-stage sampling 236multidimensional scale 252multinomial variables 46multiple comparisons
analysis of variance (ANOVA) 192, 195Bonferroni test 193–4post hoc comparison 193a priori comparison 193
multiple dependent variables 194–5analysis of variance (ANOVA) 192, 195multivariate analysis of variance (MANOVA) 195
multiple levels of independent variable 190–4multiple comparisons 190–4
multiple regression 196–7, 228–30hierarchical or sequential multiple regression 229standard (simultaneous) multiple regression 229stepwise multiple regression 229
multivariate analysis of variance (MANOVA) 195
National Child Development Study 223, 237national representative survey 238–40national surveys 237–8natural variation 212naturalistic research setting 211new/potential developments 420nominal scale 50nominal variables 45–6
dichotomous, binomial/binary variables 46multinomial variables 46
Z03_HOWI4994_03_SE_IDX.QXD 10/11/10 15:07 Page 444
INDEX 445
non-causal hypothesis 32–5non-directional hypothesis 32–5non-experimental design analysis 228–31
multiple regression 228–30path analysis 230–1
non-manipulation studies 211–13comparing association size 212developing or refining measures 213establishing association 212explanatory models 212manipulation not possible 211–12natural variation 212naturalistic research setting 211prediction and selection 212structure 213temporal change 213temporal direction of associations 213see also cross-sectional or correlational
researchnon-probability sampling 233–4, 236–7
quota sample 236–7snowball sampling 237
NUD*IST 351, 353–4null hypothesis 33
one-tailed vs two-tailed significance level 66–7NVivo 351, 353–4
objectivity 267, 268observation 307observer’s role 309Occam’s razor 351odd-even reliability 270one-tailed vs two-tailed significance level 66–7
null hypothesis 67standard deviation 67
Online Public Access Catalogue (OPAC) 124openness to evaluation 402operationalising concepts and variables 52–3ordinal scale 49–50
panel designs 221, 223–5Berkeley Growth Study 223cross-lagged relationship 224National Child Development Study 223structural equation modelling 225synchronous correlations 224two-wave panel design 224
participant 90–1understandings 402
participant observation 308–10covert observation 309explication of study’s purpose 309focus 310length 310observer’s role 309
passive observational 208PASW Statistics (SPSS) 238, 258, 259path analysis 230–1Pearson, Karl 42Pearson correlation coefficient 68–9percentiles 250
perlocution 362personal bibliographic database software 140–1phenomenology 386phi and point-biserial correlation coefficients 261phrenology 296piloting 284–5placebo effect 200–1plagiarism 155planning 413–14point estimate 242pool of items 253Popper, Karl 36, 37population of interest 61positivism 298
and post-positivism 303post hoc comparison 193postmodernism 300, 303post-positivism 300power and social inequality 364practicality 413–14practice 22, 180practices and resources 364pre-coding 283–5
conventional formats 284focus groups 285piloting 284–5pre-coded categories 285
pre-test/post-test sensitisation effects 174–9prediction and selection 212predictive validity 274–5probability sampling types 233–6
cluster sampling 236disproportionate stratified sampling 236multi-stage sampling 236non-probability sampling 233–4, 236–7probability sampling 234–5representativeness of sample 236simple random sampling 235stratified (random) sampling 235systematic sampling 235
procedure 92ProCite 140projects, dissertations and theses see research for projects,
dissertations and thesesprospective studies 221psychological tests 249–65
activities 265box: Cronbach’s alpha 260box: item analysis 256box: phi and point-biserial correlation coefficients
261box: writing questionnaire items 254item analysis or factor analysis 263key points 265overview 249percentiles 250research instruments 251scale 251–4scale construction 253–63standardised tests and measures 250–1test construction factors 264
Z03_HOWI4994_03_SE_IDX.QXD 10/11/10 15:07 Page 445

446 INDEX
psychology of laboratory experiment 200–4demand characteristics 202–4experimenter effects 201–2placebo effect 200–1
psychopathy 295psychophysics 295PsycINFO 129, 134–7, 140publication credit 155published research 399
qualitative coding 288–9qualitative data collection 306–18
activities 318biographies 307documentary and historical records 307focus groups 307, 310–13in-depth interviews 307interviews 310–11, 313–17key points 317mass media output 307observation 307overview 306participant observation 308–10recordings of conversations 307
qualitative report writing 404–5qualitative research 293–305
activity 305key points 305overview 293qualitative methods 295–7qualitative/quantitative divide in psychology 298–301qualitative/quantitative methods evaluation 303–4quantification-qualitative methods continuum 301–2see also evaluating qualitative research
qualitative research methods 291–408qualitative variables see nominal variablesqualitative/quantitative divide in psychology 298–301
critical realism 300–1metaphysics 299positivism 298post-positivism 300realism 300subjectivism 300theism 299see also psychological tests
qualitative/quantitative methods evaluation 303–4in everyday life 303individual point of view 303positivism and post-positivism 303qualitative researchers and postmodernism 303richness of description 303when to use qualitative research methods 303–4when to use quantification 304
quantification-qualitative methods continuum 301–2data analysis 302data collection 301varieties of data collection and analysis 302
quantitative and qualitative data analysis 281quantitative research methods 161–246quantitative techniques 403
quantitative variables 46–8quota sample 236–7quotations 99
random assignment 171–2random sampling see stratified samplingrandomised assignment/experiments 5, 16–21
intervention/manipulation 18–21sampling error 17–18
ratio scale 49reading 5–6realism 300realistic research setting 423recordings
of conversations 307and photography 149
reference list 98references 5–6, 79, 95–9, 115–16
books 98citations 96–8journal articles 99reference list 98web sources 99
RefMan 140RefWorks 140, 141register 363Registrar General’s Social Class 241relationship elaboration 420–2relevance to social/political issues 400reliability 213–15, 267, 268reliability and validity 266–79
activity 279key points 279objectivity 267, 268overview 266reliability 267, 268reliability of measures 269–72validity 267, 268, 272–3validity types 273–8
reliability of measures 269–72internal reliability 269–71stability over time or different measures 271–2
replication study 414–16partial replication 416straight replication 415
report analysis 109–16abstract 110–11discussion 115introduction 111–12method 112–13references 115–16results 113–15title 109–10
report writingactivity 122examples 103–22key points 121–2overview 103–4practical report: improved version 116–21practical report: poorly written 105–9
Z03_HOWI4994_03_SE_IDX.QXD 10/11/10 15:07 Page 446

INDEX 447
qualitative 404–5report analysis 109–16thematic analysis 341
representative/convenience samples 59–62population of interest 61
representativeness of sample 236republication of data 155research
aims 29–30, 252with individuals in less powerful position 151instruments 251for projects, dissertations and theses 409–25role in psychology 3–24
research ethics 147–54debriefing 153deception in research 151–2inducements to participate 151informed consent to research 148–51institutional approval 147–8research with individuals in less powerful position 151see also ethics in research
research report sections 84–100abstract 85–6appendices 99–100discussion 94–5introduction 87–8method 88–92references 95–9results 92–4title 84–5
research report writing strategy 79–83structure 79–80writing style 80–3
research reports 76–102activities 102box: abbreviations 89box: abstract 86–7box: avoiding language bias 82box: citations 97box: independent and dependent variables 89box: participants 91box: quotations 99box: research report at a glance 100–2difficulties 77key points 102length 77overview 76report writing strategy 79–83research report sections 84–100see also ethics and publication
research types and causality assessment 11–21confounding variables 13–14correlational/cross-sectional studies 12–13longitudinal studies 14–15randomised assignment/experiments 16–21
researcher imposed coding 285–6respondent validation 403–4restricted variation of scores 216–18results 79, 92–4, 113–15retrospective studies 222
rhetoric 365role of research psychology 3–24
activities 24box: causal explanations 11box: essential concepts 5evaluating evidence 7–8inferring causality 8–11key points 23overview 3–4practice 22reading 5–6research types and causality assessment 11–21
Sacks, Harvey 321, 372–3Sacks, Oliver W. 294sample size and association size 69–74
association size and meaning 71–4sample size and population surveys 237–40
confidence interval 242sample size for finite population 245sampling error (margin of error) and sample size
243–4sampling error 17–18, 243sampling error (margin of error) and sample size 243–4
sampling error 243standard error 243
sampling and generalisation 58–62representative/convenience samples 59–62
sampling and population surveys 232–46activities 246box: national representative survey 238–40key points 246national surveys 237–8non-probability sampling 233–4overview 232probability sampling types 233–6sample size and population surveys 241–5socio-demographic sample characteristics 240–1
sampling frame 242Sartre, Jean-Paul 386scale 251–4
multidimensional scale 252unidimensional scale 252
scale construction 253–63factor analysis 256factoring approach 259–63item analysis 256item-whole or item-total approach 256–9pool of items 253scaling 256small refinement 259
scales of measurement, Stevens’ theory of 48–52scaling 256Searle, J. R. 359simple random sampling 235simultaneous multiple regression 229size see sample sizeSkinner, B. F. 300, 301snowball sampling 237Society for the Study of Social Issues 400
Z03_HOWI4994_03_SE_IDX.QXD 10/11/10 15:07 Page 447

448 INDEX
socio-demographic sample characteristics 240–1British Social Attitudes Survey 241Computer-Assisted Structured Coding Tool (CASCOT)
241Goldthorpe schema 241Registrar General’s Social Class 241Socio-Economic Group schema 241Standard Occupational Classification 1990 240Standard Occupational Classification 2000 240, 241
Socio-Economic Group schema 241SoundScriber 353sources of research ideas 418–23
A-B-C model 420alternative explanations of findings 422behaviour prediction/change 420causality 423competing theoretical explanations 420conflicting/inconsistent findings 423–4deductions from theories 419detailed description of phenomenon 418everyday issues 420generalising to other contexts 423measures development and validation 422methodological limitations 422new/potential developments 420realistic settings 423relationship elaboration 420–2temporal precedence/order of variables 423theory 418–19, 422
speech acts 362illocution 362illocutory act 362locution 362locutory act 362perlocution 362utterance act 362
split-half reliability 270SPSS see Statistical Package for the Social Sciencesstability over time or different measures 271–2
alternate-forms reliability 271internal reliability 271test–retest reliability 271
stake and accountability 365standard deviation
one-tailed vs two-tailed significance level 67standard (simultaneous) multiple regression 229Standard Occupational Classification 1990 240Standard Occupational Classification 2000 240, 241standardisation of procedures 170standardised tests and measures 250–1statistical hypotheses 65Statistical Package for the Social Sciences (SPSS) 353statistical significance 182–5statistics and generalisation 62–5
chance findings and statistical significance 63–5stepwise multiple regression 229Stevens, Stanley 48Stevens’ theory of scales of measurement 48–52stratified (random) sampling 235structural equation modelling 225
structure 79–80, 213abstract 79appendices 79conclusion 79discussion 79introduction 79method 79references 79results 79title 79title page 79
sub-themes, identifying 333subject variables 196subjectivism 300suggestibility 295suppressor variables 227symbolic interactionism 386synchronous correlations 224systematic sampling 235
t-test 67–8temporal change 213temporal direction of associations 213temporal precedence/order of variables 423test construction factors 264test–retest reliability 271testing and measurement fundamentals 247–90tests and measures evaluation see reliability and validityTextBridge 353textual material, transcribing 332–3theism 299thematic analysis 328–42
activity 342analytic effort 333basic approach 332–5box: research example 334–5data familiarisation 336–7definition 331–2identifying themes and sub-themes 333initial coding generation 337–9key points 342more sophisticated version 335–41overview 328–9report writing 341review of themes 340searching for themes based on initial coding 339–40theme definition and labelling 340–1transcribing textual material 332–3
themesbased on initial coding 339–40connections between 391definition and labelling 340–1identifying 333initial identification 391review 340table 391
theoretical sampling 351theory 418–19, 422theory led approach 337third variable issue 215–16
Z03_HOWI4994_03_SE_IDX.QXD 10/11/10 15:07 Page 448

INDEX 449
third variable types 225–7intervening or mediating variables 225–6moderating variables 226–7suppressor variables 227
Thurstone, Louis 295title 79, 84–5, 109–10
page 79Tolman, Edward 42transcription of language data 319–27
activities 327advice for transcribers 326Jefferson transcription 321–6key points 327overview 319
transcription of textual material 332–3tree nodes 354triangulation 277, 404true or randomised experiments 167–73
experimental manipulation 167–70random assignment 171–2standardisation of procedures 170
Tuskegee Experiment 150two-wave panel design 224types of studies 27–9
descriptive/exploratory studies 27evaluation/outcome studies 27–8meta-analytic studies 28–9
unidimensional scale 252universalism 57–8usefulness and applicability 400–1utterance act 362
validity 267, 268, 272–3, 401–6coherence with previous discourse studies 402–3detail in data and analysis 403deviant instances 402explication of analysis process 403justification of analytic claims 402openness to evaluation 402participant understandings 402
quantitative techniques 403respondent validation 403–4triangulation 404
validity types 273–8concurrent validity 274construct validity 275–7content validity 274convergent validity 277–8discriminant validity 278face validity 274predictive validity 274–5
variables 5, 40–54activities 54box: mediator vs moderator 47–8history of, in psychology 42–3independent and dependent variables 42, 45intervening 42key points 54measurement characteristics 45–8operationalising concepts and 52–3overview 40–1types 43–4
Watson, John 300Web of Science 129–33, 140web sources 99Whewell, William 36Windelband, Wilhelm 390within-subjects design 164–7, 179–85
carryover, asymmetrical/differential transfer 180–1fatigue or boredom 179practice 180
Wittgenstein, L. 359writing
data analysis 392qualitative report 404–5questionnaire items 254style 80–3see also report writing
Woodworth, Robert 42Wundt, Wilhelm 298
Z03_HOWI4994_03_SE_IDX.QXD 10/11/10 15:07 Page 449

Introduction to Qualitative Methods in Psychology 1st edition
ISBN 9780132068741
Introduction to Statistics in Psychology 5th edition
ISBN 9780273734307
Introduction to SPSS Statistics in Psychology 5th edition
ISBN 9780273734260
Z03_HOWI4994_03_SE_IDX.QXD 10/11/10 15:07 Page 450