Article Jurnal Psychology Research-Issue 11
91
-
Upload
independent -
Category
Documents
-
view
3 -
download
0
Transcript of Article Jurnal Psychology Research-Issue 11
Psychology Research
Volume 4, Number 11, November 2014 (Serial Number 41)
David Publishing Company
www.davidpublishing.com
PublishingDavid
Publication Information: Psychology Research is published monthly in hard copy (ISSN 2159-5542) and online (ISSN 2159-5550) by David Publishing Company located at 240 Nagle Avenue #15C, New York, NY 10034, USA.
Aims and Scope: Psychology Research, a monthly professional academic journal, has three main columns: General Psychology, Developmental and Educational Psychology, Applied Psychology, which cover all sorts of psychology researches on Biopsychology, Cognitive Psychology and Psycholinguistics, Child Psychiatry, Clinical Psychology, Community Psychology, Comparative Psychology, Experimental Psychology, Industrial and Organizational Psychology, Personality Psychology, Physiological Psychology/Psychobiology, Psychometrics and Quantitative Psychology, Social Psychology, Psychological Statistics, Psychology of Human Resource Management, Psychometrics, Counseling Psychology, Cognitive Psychology, Interpersonal Relation Psychology, Culture Psychology, Philosophical Psychology, Management Psychology, Psychology Research Methods, Advertising and Transmitting Psychology, Public Psychology, Consumption Psychology, Evolutionary Psychology, Abnormal Psychology, Group Psychology, Literary Psychology, Labor Psychology, Aerospace Psychology, Traveling Psychology, Medico-Psychology, Color Psychology, Decision-making Psychology, Love Psychology, Positive Psychology, Criminal Psychology, Sport Psychology, Peace Psychology, as well as other issues.
Editorial Board Members: Hanna Brycz Sharma Basu Elena Fabiola Ruiz Ledesma Lim Wee Hun Stephen Ungsoo Samuel Kim
Abootaleb Seadatee Shamir Sanja Tatalovic Vorkapic Arcady Putilov Di You Konstantin Chichinadze
Tal Dotan Ben Soussan Hari Narayanan. V. Neelam Kumar Yulia Solovieva Siddharth Agarwal
Chao-Ming Cheng Alina Georgeta Mag
Manuscripts and correspondence are invited for publication. You can submit your papers via Web submission, or E-mail to [email protected] and [email protected]. Submission guidelines and Web submission system are available at http://www.davidpublishing.com.
Editorial Office: 240 Nagle Avenue #15C, New York, NY 10034, USA Tel: 1-323-984-7526, 323-410-1082; Fax: 1-323-984-7374, 323-908-0457 E-mail: [email protected], [email protected], [email protected]
Copyright©2014 by David Publishing Company and individual contributors. All rights reserved. David Publishing Company holds the exclusive copyright of all the contents of this journal. In accordance with the international convention, no part of this journal may be reproduced or transmitted by any media or publishing organs (including various websites) without the written permission of the copyright holder. Otherwise, any conduct would be considered as the violation of the copyright. The contents of this journal are available for any citation. However, all the citations should be clearly indicated with the title of this journal, serial number and the name of the author.
Abstracted/Indexed in: Database of EBSCO, Massachusetts, USA Hein Online Database, W.S.HEIN, USA Chinese Database of CEPS, American Federal Computer Library Center (OCLC), USA Chinese Scientific Journals Database, VIP Corporation, Chongqing, P.R.C. Ulrich�’s Periodicals Directory
Excellent papers in ERIC ProQuest/CSA Social Science Collection, Public Affairs Information Service (PAIS), USA Summon Serials Solutions Google Scholar J-Gate SCRIBD Academic Key Pubicon Science CiteFactor
Electronic Journals Library Scientific Indexing Services Newjour Scholarsteer Sherpa/Romeo Pubget WZB (Berlin Social Science Center) ResearchBible S-Journal Index
Subscription Information: Price (per year): Print $450 Online $320; Print and Online $600
David Publishing Company 240 Nagle Avenue #15C, New York, NY 10034, USA Tel: 1-323-984-7526, 323-410-1082; Fax: 1-323-984-7374, 323-908-0457 E-mail: [email protected]
David Publishing Companywww.davidpublishing.com
DAVID PUBLISHING
D

Psychology Research
Volume 4, Number 11, November 2014 (Serial Number 41)
Contents General Psychology
Hindsight Bias in Cause Analysis of Accident 843
Atsuo Murata, Yasunari Matsushita
Recall of Events Affects Perception of Happiness 852
Angelica Moè
Developmental and Educational Psychology
Relation of Family Conditions and School Success 859
Vlasta Cabanová
Internationalization of Psychology Education in Indonesia 868
Sarlito W. Sarwono
Conceptions in Teaching and Didactic Activities and Assessment of University Teachers 876
José Armando Peña Moreno, Ma. Concepción Rodríguez Nieto, Víctor Manuel Padilla Montemayor
The Participation of a Brazilian Family in Psychosocial Counseling of Obese Children and Adolescents 885
Maria Alexina Ribeiro, Vladimir de Araújo Albuquerque Melo, Heron Flores Nogueira, Marília Marques da Silva, Ilckmans Bergma Moreira Mugarte, Aldenira Barbosa Cavalcante, Jamile Xavier Fernandes de Castro
Relationships Between Parenting Style, Self-Perception and Shyness Among Chinese Early Adolescents 897
Chen YingMin, Wu YunPeng, Zhang YuanJin, Wang Peng, Han Lei, Gao FengQiang
Assessment of Negative Self-Image and Fear of Negative Evaluation Among Adolescents and Young Adults 905
Agbu Jane-Frances, Ibida Ebele
Applied Psychology
The Leadership Effect on Employees Motivation 915
Henrique Guilherme Scatolin, Rafael Barranco, Robson Pereira de Torres
The Experiences With Nurses Trainings Concerning Prevention of Violence in the Czech Republic in Years 2010-2013 922
Jaroslav Pekara, Marie Trešlová, Petr Hulinský
Psychology Research, ISSN 2159-5542 November 2014, Vol. 4, No. 11, 843-851
Hindsight Bias in Cause Analysis of Accident
Atsuo Murata, Yasunari Matsushita Okayama University, Okayama, Japan
It is suggested that hindsight becomes an obstacle to the objective investigation of an accident, and that the proper
countermeasures for the prevention of such an accident is impossible if we view the accident with hindsight.
Therefore, it is important for organizational managers to prevent hindsight from occurring so that hindsight does
not hinder objective and proper measures to be taken and this does not lead to a serious accident. In this study, a
basic phenomenon potentially related to accidents, that is, hindsight was taken up, and an attempt was made to
explore the phenomenon in order to get basically insights into the prevention of accidents caused by such a
cognitive bias.
Keywords: hindsight, cognitive bias, overestimation of probability, crucial accident
Introduction Fischhoff (1975a; 1975b; 1977) showed how fictional knowledge of the outcome affected the
estimation of probabilities of various possible outcomes, and demonstrated a hindsight bias. The participants were given the description of the event (historical struggle between British and Gurkha armies) together with the following four possible outcomes, and required to estimate the occurrence probability of each outcome:
(1) British victory; (2) Gurkha victory; (3) Military stalemate with no peace settlement; (4) Military stalemate with a peace settlement. The participants were divided into five groups. The control group was not provided with the information
on which of the four outcomes above occurred. Other four groups were provided with the information on which of the four outcomes above occurred. Consequently, they found that the estimated probability increased when the outcome was informed as compared with when the outcome was not informed (control group). This shows that the estimated probability of outcome increases due to the hindsight bias.
After some serious accident occurred, one tends to overestimate the occurrence probability of such an accident. For example, we hesitate to ride on an airplane immediately after a serious aviation accident due to the overestimation of a fatal aviation accident. This property corresponds to the hindsight, and is regarded to distort our decision-making. Hindsight becomes an obstacle to the objective survey of an accident, and the proper countermeasures for the prevention of such an accident may be impossible if we view the accident with
Atsuo Murata, professor, Department of Intelligent Mechanical Systems, School of Natural Science and Technology, Okayama University.
Yasunari Matsushita, graduate student (Master Course), Department of Intelligent Mechanical Systems, School of Natural Science and Technology, Okayama University.
DAVID PUBLISHING
D
HINDSIGHT BIAS IN CAUSE ANALYSIS OF ACCIDENT 844
the hindsight. The experiment above (Fischhoff, 1975a; 1975b; 1977) was based on the fictional knowledge (historical struggle between British and Gurkha armies). Although Dekker (2006) pointed out the presence of hindsight bias in investigating and understanding the causes of human errors or accidents, it has not been empirically explored whether the hindsight bias occurs in the evaluation and the identification processes of root cause of crucial accidents or disasters.
It tends that such a hindsight bias makes us pay attention to only the identified root (main) cause of the analyzed accident, and ignore other important factors that might have led to a similar crucial accident. It is generally regarded that the root (main) cause of Fukushima Daiichi nuclear power plant accident is the earthquake and tsunami. Although there are a lot of other potential causes of station blackout leading to meltdown such as terrorism attack, severe attack by typhoon or hurricane beyond expectation, sabotage of workers and crash of airplane to a nuclear power plant, we tend to only pay attention to the countermeasure for the earthquake and tsunami. Such a situation makes it impossible to be cautious to and prepare for potential causes other than the earthquake and tsunami. In this study, therefore, it has been examined whether the hindsight bias increases the estimated probability with which a root (main) cause leads to a crucial accident if the information on the root (main) cause was given in advance.
Problems and Aim We tend to overestimate the occurrence probability of a fatal aviation accident, and hesitate to be boarding
an airplane immediately after such an aviation accident due to the hindsight bias. Hindsight forces us to pay attention to only the identified cause and ignore other potential causes, and thus becomes an obstacle to the objective survey of cause analysis of accident. It becomes impossible for us to take a proper countermeasure for the prevention of such an accident, if we view the accident with hindsight. Therefore, it has been empirically demonstrated that such a basic phenomenon, that is, hindsight bias is found even when surveying and identifying the root cause of an accident.
Methods Participants
Sixty undergraduate students (from 20 to 23 years old) took part in the experiment. All received a brief explanation of the aim and the contents of the experiment, and agreed with the participation.
Task In the experiment, the participants were required to estimate the probability of leading to an accident of
each cause. The participants were divided into two groups according to whether information on the root (main) cause of an accident was provided with or not. One was a group of participants to whom no information on the root (main) cause of an accident was informed. Another was a group of participants to whom the information on which of the multiple causes corresponded to a main (root) cause of an accident was informed. This group was further divided into five small groups as mentioned below.
The experimental task was to read the text concerning the crucial accidents below (five potential causes related to the accident were also added to the text), and estimated the probability of leading to an accident of Cause (1)�—Cause (5). One group was provided with no information on which of five causes (Cause (1)�—Cause (5)) actually contributed most and as a root (main) cause of the accident. Other group was
HINDSIGHT BIAS IN CAUSE ANALYSIS OF ACCIDENT 845
instructed in advance which of the five causes most contributed to the accident. In other words, this group was given information on which of the five potential factors contributed most to the occurrence of the accident.
The outline of the accident used in this study was as follows. Fire accident occurred on the large-scale passenger ship �“Diamond Princess�” under construction at Nigasaki shipbuilding yard, Mitsubishi Heavy Industry on October 1st, 2002.
The passenger ship had 14 decks. At the guest room 302 of the third zone on the fifth deck, the fire broke out at 5:15 p.m.. As almost all of guest rooms around this area have finished their interior decoration, this area was designated as the special control area where the treatment of fire must be strictly restricted. However, due to the direct sweating below the guest room 302, the fire broke out. As the first detector of the fire informed workers around the fire site of the fire desperately, and alarmed, about 1,000 workers evacuated safely. As the workers by themselves tried to put out a fire, this caused the report to the fire station delay by 34 minutes (The report to the fire station was completed at 5:49 p.m.).
The damage by this fire accident is estimated to be about $300 million. When the worker was sweating furniture for piping directly on the ceiling, the fire due to sweating caused inflammables put on the floor of the same story with the ceiling break out, and spread. According to the rule of workplace, the worker must apply the permission of direct sweating on the ceiling for his immediate superior, and allocate a watchman on the floor of the same story with the ceiling. However, the worker ignored and violated the rule as usual. Although the worker�’s direct superior noticed that the worker tried to conduct his job by ignoring the rule necessary for sweating directly on the ceiling, he committed omission and pretended to know nothing about the worker�’s violation of the rule.
During the construction, similar fire accidents had occurred four times before this crucial accident. Although foretasting minor fire accidents repeatedly occurred, the managers did not recognize the risk of crucial fire accident, and were lack in the ability of crisis management. To make matters worse, the scheduled term of construction was delayed.
The lack of skilled workers or the decrease of workers�’ motivation due to restructuring of the organization was regarded as one of the causes of the crucial fire accident. The deterioration of profit led to the decreased quality of worker�’s education or training, especially safety education and the delayed renewal of equipments. Such a factor might also be one of the causes of such crucial accidents. The workers relied too much on operation manuals, and did not make efforts to tax their brain for a solution of a variety of problems. Due to the promotion of organizational sectionalism, workers carry out their own job not cooperatively and dependently but independently. These two were also regarded as one of the causes of the crucial accident.
On the basis of the analysis above, the causes in this accident were identified as follows: Cause (1): Violation of rules which must be obeyed when welding by a worker; Cause (2): Climate of workplace that does not blame violation of rules frequently occurred in workplaces; Cause (3): Workers have no self-discipline and always rely on operation manuals; Cause (4): Managers leave minor accident, and do not learn from this; Cause (5): Insufficient safety education and training for workers, and inappropriate equipment in workplaces.
Design and Procedure The experimental factor was whether the participant was provided with information on which causes
HINDSIGHT BIAS IN CAUSE ANALYSIS OF ACCIDENT 846
actually contributed as a root (main) cause to the accident or not. This was a between-subject variable. One group was provided with no information on which of five causes (Cause (1)�—Cause (5)) actually
contributed most and as a root cause to the accident. Other five groups (group (Cause (1)), �…, group (Cause (5))) were instructed in advance that one of the five causes most contributed to the accident. In other words, these groups were given information that one of the five causes contributed most to the occurrence of the accident. For one group (group (Cause (1))), the participants were told that the root (main) cause of the accident was Cause (1) above. For other group (group Cause (5)), the participant was provided with the information that the root cause of the accident was Cause (5).
The participant was required to estimate the probability of leading to an accident of each cause so that the sum of each probability was equal to one.
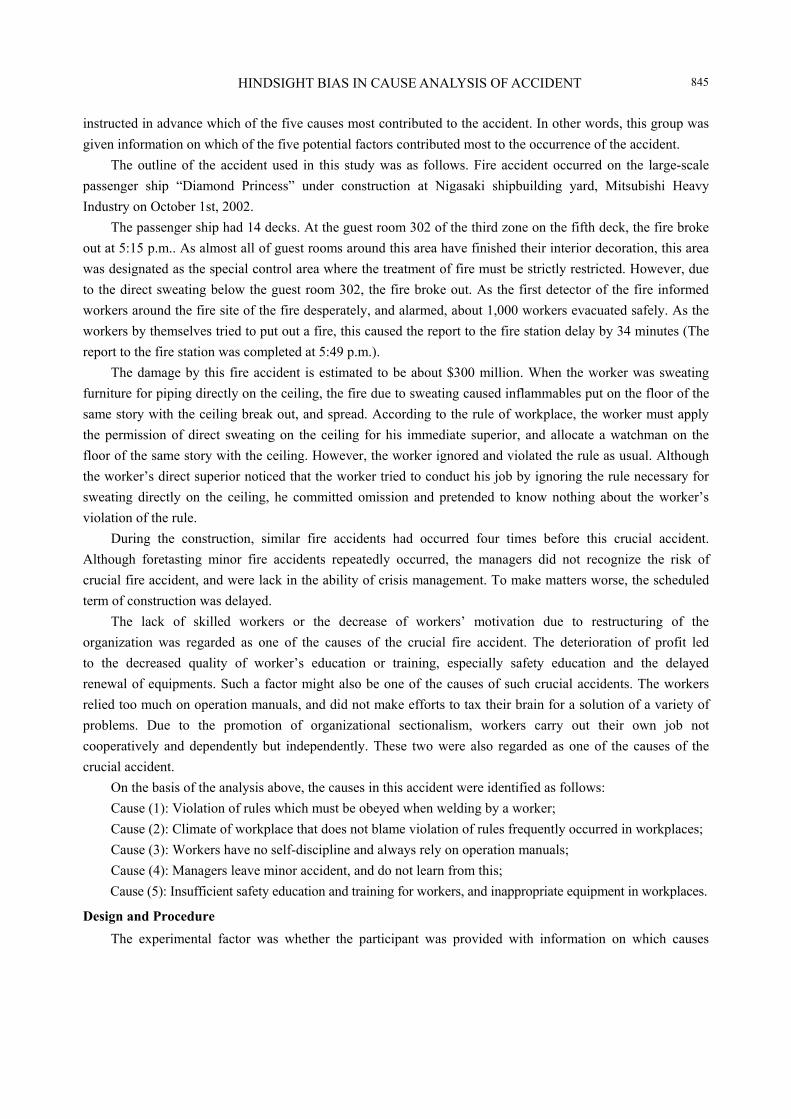
Results As expected, the group of participants whom we informed of the information that one of the multiple
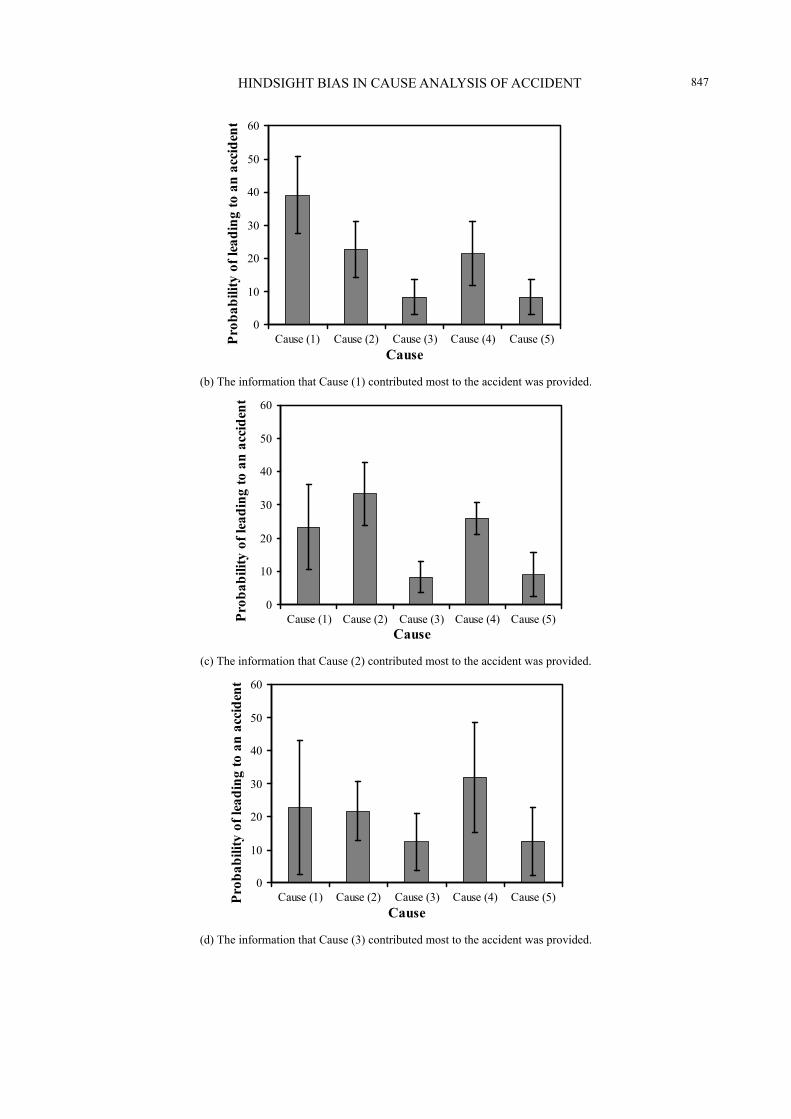
potential factors was the root (main) cause of the accident tended to estimate the probability of leading to an accident of the root cause larger, which is indicative of the hindsight bias (see Figure 1(b)-1(f)).
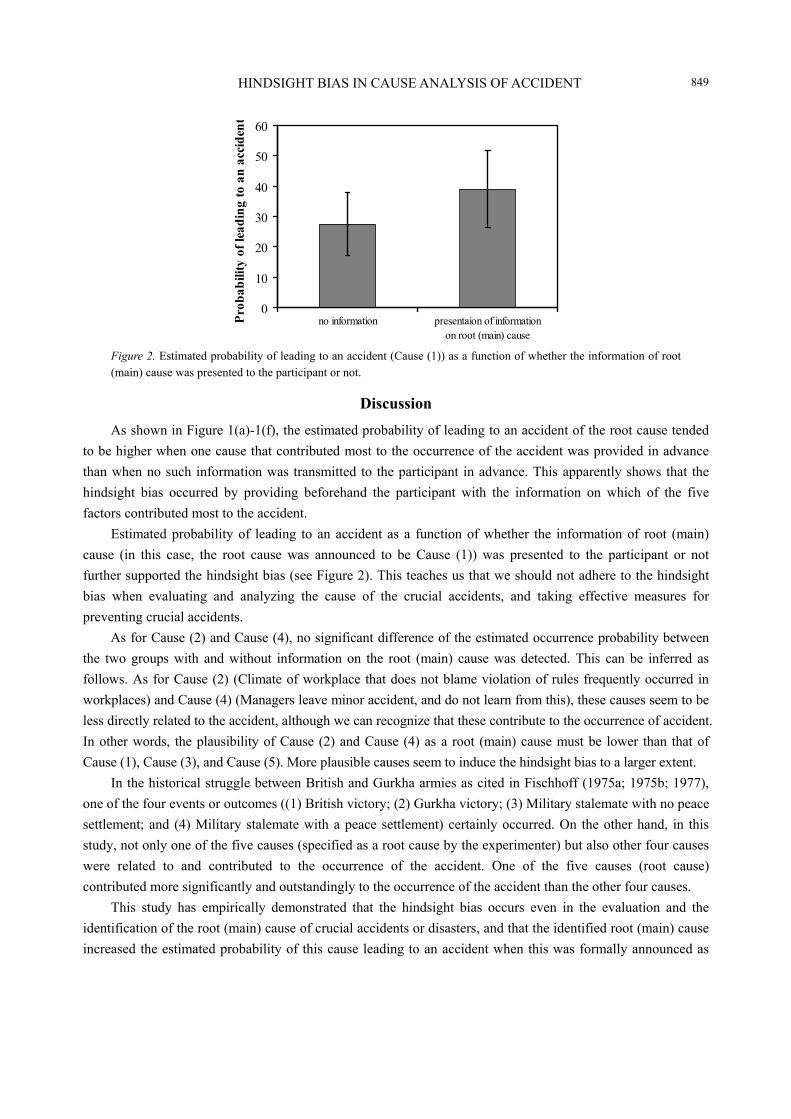
The data of all participants were rearranged to compare the estimated probability of leading to an accident of the root (main) cause according to whether the information of root (main) causal factor was presented to the participant (like Figure 1(b)-1(f)) or not (like Figure 1(a)). As shown in Figure 2, the estimated probability of leading to an accident of the root cause tended to be higher for the presentation group of information on the root (main) cause than for the group without such information. This further demonstrates and proves the existence of hindsight. In this case, the probability of leading to an accident for Cause (1) was compared between two groups without and with information on root (main) cause. The mean probabilities with and without information were 39.05% and 27.85%, respectively. As a result of a t-test conducted on the estimated probability, a significant difference between two groups was detected (t = 2.314, p < 0.05).
(a) No prior information on which of five potential factors contributed most to the occurrence of accident occurred was provided.
0
10
20
30
40
50
60
Cause (1) Cause (2) Cause (3) Cause (4) Cause (5)Cause
Prob
abili
ty o
f lea
ding
to a
n ac
cide
nt
HINDSIGHT BIAS IN CAUSE ANALYSIS OF ACCIDENT 847
(b) The information that Cause (1) contributed most to the accident was provided.
(c) The information that Cause (2) contributed most to the accident was provided.
(d) The information that Cause (3) contributed most to the accident was provided.
0
10
20
30
40
50
60
Cause (1) Cause (2) Cause (3) Cause (4) Cause (5)Cause
Prob
abili
ty o
f lea
ding
to a
n ac
cide
nt
0
10
20
30
40
50
60
Cause (1) Cause (2) Cause (3) Cause (4) Cause (5)Cause
Prob
abili
ty o
f lea
ding
to a
n ac
cide
nt
0
10
20
30
40
50
60
Cause (1) Cause (2) Cause (3) Cause (4) Cause (5)Cause
Prob
abili
ty o
f lea
ding
to a
n ac
cide
nt
HINDSIGHT BIAS IN CAUSE ANALYSIS OF ACCIDENT 848
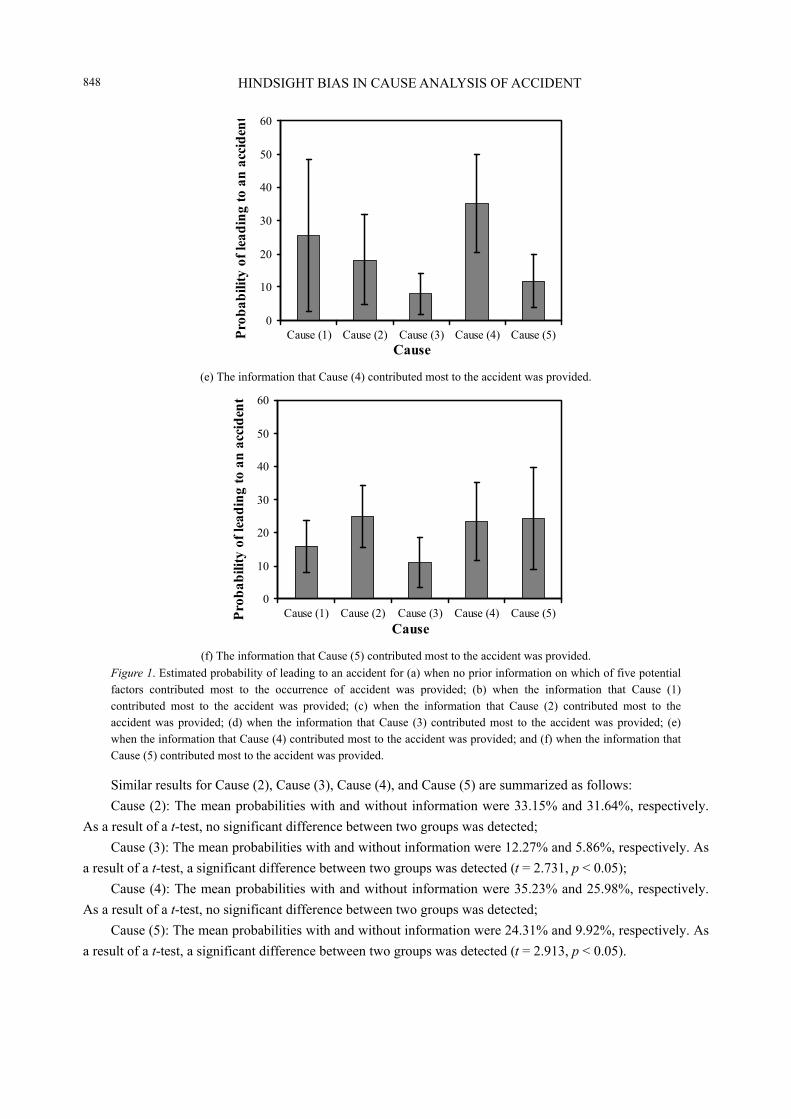
(e) The information that Cause (4) contributed most to the accident was provided.
(f) The information that Cause (5) contributed most to the accident was provided.
Figure 1. Estimated probability of leading to an accident for (a) when no prior information on which of five potential factors contributed most to the occurrence of accident was provided; (b) when the information that Cause (1) contributed most to the accident was provided; (c) when the information that Cause (2) contributed most to the accident was provided; (d) when the information that Cause (3) contributed most to the accident was provided; (e) when the information that Cause (4) contributed most to the accident was provided; and (f) when the information that Cause (5) contributed most to the accident was provided.
Similar results for Cause (2), Cause (3), Cause (4), and Cause (5) are summarized as follows: Cause (2): The mean probabilities with and without information were 33.15% and 31.64%, respectively.
As a result of a t-test, no significant difference between two groups was detected; Cause (3): The mean probabilities with and without information were 12.27% and 5.86%, respectively. As
a result of a t-test, a significant difference between two groups was detected (t = 2.731, p < 0.05); Cause (4): The mean probabilities with and without information were 35.23% and 25.98%, respectively.
As a result of a t-test, no significant difference between two groups was detected; Cause (5): The mean probabilities with and without information were 24.31% and 9.92%, respectively. As
a result of a t-test, a significant difference between two groups was detected (t = 2.913, p < 0.05).
0
10
20
30
40
50
60
Cause (1) Cause (2) Cause (3) Cause (4) Cause (5)Cause
Prob
abili
ty o
f lea
ding
to a
n ac
cide
nt
0
10
20
30
40
50
60
Cause (1) Cause (2) Cause (3) Cause (4) Cause (5)Cause
Prob
abili
ty o
f lea
ding
to a
n ac
cide
nt
HINDSIGHT BIAS IN CAUSE ANALYSIS OF ACCIDENT 849
Figure 2. Estimated probability of leading to an accident (Cause (1)) as a function of whether the information of root (main) cause was presented to the participant or not.
Discussion As shown in Figure 1(a)-1(f), the estimated probability of leading to an accident of the root cause tended
to be higher when one cause that contributed most to the occurrence of the accident was provided in advance than when no such information was transmitted to the participant in advance. This apparently shows that the hindsight bias occurred by providing beforehand the participant with the information on which of the five factors contributed most to the accident.
Estimated probability of leading to an accident as a function of whether the information of root (main) cause (in this case, the root cause was announced to be Cause (1)) was presented to the participant or not further supported the hindsight bias (see Figure 2). This teaches us that we should not adhere to the hindsight bias when evaluating and analyzing the cause of the crucial accidents, and taking effective measures for preventing crucial accidents.
As for Cause (2) and Cause (4), no significant difference of the estimated occurrence probability between the two groups with and without information on the root (main) cause was detected. This can be inferred as follows. As for Cause (2) (Climate of workplace that does not blame violation of rules frequently occurred in workplaces) and Cause (4) (Managers leave minor accident, and do not learn from this), these causes seem to be less directly related to the accident, although we can recognize that these contribute to the occurrence of accident. In other words, the plausibility of Cause (2) and Cause (4) as a root (main) cause must be lower than that of Cause (1), Cause (3), and Cause (5). More plausible causes seem to induce the hindsight bias to a larger extent.
In the historical struggle between British and Gurkha armies as cited in Fischhoff (1975a; 1975b; 1977), one of the four events or outcomes ((1) British victory; (2) Gurkha victory; (3) Military stalemate with no peace settlement; and (4) Military stalemate with a peace settlement) certainly occurred. On the other hand, in this study, not only one of the five causes (specified as a root cause by the experimenter) but also other four causes were related to and contributed to the occurrence of the accident. One of the five causes (root cause) contributed more significantly and outstandingly to the occurrence of the accident than the other four causes.
This study has empirically demonstrated that the hindsight bias occurs even in the evaluation and the identification of the root (main) cause of crucial accidents or disasters, and that the identified root (main) cause increased the estimated probability of this cause leading to an accident when this was formally announced as
0
10
20
30
40
50
60
no information presentaion of informationon root (main) cause
Prob
abili
ty o
f lea
ding
to a
n ac
cide
nt
HINDSIGHT BIAS IN CAUSE ANALYSIS OF ACCIDENT 850
compared with when the information on the root (main) cause was not given. It is possible that hindsight biases make us intensively note only the identified root (main) cause of the analyzed accident, and ignore other important causes that might have led to a similar crucial accident. It is generally accepted that the root (main) causes of Fukushima Daiichi nuclear power plant accident are the earthquake and Tsunami, and we tend to pay attention to such causes and overestimate the occurrence probability of them, although there are a lot of other causes such as terrorism attack, severe attack by typhoon beyond expectation, and sabotage of workers. We should be cautious to not only the identified or accepted root (main) cause but also other potential causes so that we should not be trapped into hindsight biases.
Poulton (1994) stated the relationship between foresight and hindsight, and proposed a memory-distortion model to explain interactions between hindsight and foresight. Loftus (1979), from the viewpoint of cognitive psychology of memory, showed that the testimony in a court of law is different from what the witness really saw, and is only a compromise between what he or she really saw and what the police or the prosecution suggested to the witness. In such a way, the judgment interferes with retroactive memory, and is degraded by memory. The hindsight bias pointed out in this study might be mediated by such a function of memory.
Arkes, Worthmann, Saville, and Harkness (1981) showed that hindsight also affects medical diagnosis. Their experiment also showed that the estimated probability of disease was higher when the actual and true diagnosis was given than when this was not given to the participants. Slovic and Fischoff (1977) also pointed out that hindsight belittled and distorted the review outcome of submitted manuscript for publication in a scientific journal. Hoch and Lowenstein (1989) suggested that the difference between the forecasted and the known or clarified outcomes decreases the probability of the forecasted outcome and increases that of the known outcome. They also insisted that both knowledge of unpredicted outcome and confidence in such an outcome increases due to hindsight. This must also increase the estimated probability with which a root (main) cause leads to a crucial accident as suggested by this study.
The removal of such hindsight biases is essential for conducting a rational and effective investigation of crucial accidents, and preventing a similar accident from occurring repeatedly. Gigerenzer, Todd, and ABC Research Group (1999) described systematically methods to remove cognitive biases including hindsight. Hell, Gigerenzer, Gauggel, Mall, and Müller (1988) showed that letting the participants know their falling into a trap of hindsight bias, and require them to ignore this is effective for removing hindsight. Akres et al. (1988) also indicated that having the participants give reasons for estimating the probability of outcome would be effective for removing cognitive biases (debiasing). In future research, we should propose an effective method how the hindsight bias should be removed in order to assure safety by paying attention to all potential risk factors without hindsight.
Conclusions When the participants were beforehand informed of which of the five causes contributed most to the
occurrence of an accident, they tended to increase the estimated probability (or risk) with which the root cause led to a crucial accident. Thus, the hindsight bias was empirically demonstrated. As clarified in this study, even when the root cause must be identified among many other causes in the analysis and the investigation of a crucial accident, the relative importance of the causes that are responsible for the accident (outcome) changes so that these are more compatible with the root cause which is already known due to the functioning of hindsight.
HINDSIGHT BIAS IN CAUSE ANALYSIS OF ACCIDENT 851
References Arkes, H. R., Worthmann, R. L., Saville, P. D., & Harkness, A. R. (1981). Hindsight bias among physicians weighting the
likelihood of diagnoses. Journal of Applied Psychology, 66, 252-254. Dekker, S. (2006). The field guide to understanding human error. V.T.: Burlington, Ashgate. Fischoff, B. (1975a). Hindsight foresight: The effect of outcome knowledge on judgment under uncertainty. Journal of
Experimental Psychology: Human Perception and Performance, 1, 288-299. Fischoff, B. (1975b). �“I knew it would happen�”: Remembered probability of once-future things. Organizational Behavior and
Human Performance, 13, 1-16. Fischoff, B. (1977). Perceived inforamativeness of facts. Journal of Experimental Psychology: Human Perception and
Performance, 3, 349-358. Gigerenzer, G., Todd, P. M., & ABC Research Group. (1999). Simple heuristic that make us smart. N.Y.: New York, Oxford
University Press. Hell, W., Gigerenzer, G., Gauggel, S., Mall, M., & Müller, M. (1988). Hindsight bias: An interaction of automatic and
motivational factors? Memory and Cognition, 16, 533-538. Hoch, S. J., & Lowenstein, G. F. (1989). Outcome feedback: Hindsight and information. Journal of Experimental Psychology:
Human Perception and Performance, 15, 605-619. Loftus, E. F. (1979). Eyewitness testimony. M. A: Cambridge, Harvard University Press. Poulton, E. C. (1994). Behavioral decision theory: A new approach. N.Y.: New York, Cambridge University Press. Slovic, P., & Fischoff, B. (1977). On the psychology of experimental surprises. Journal of Experimental Psychology: Human
Perception and Performance, 3, 544-551.
Psychology Research, ISSN 2159-5542 November 2014, Vol. 4, No. 11, 852-858
Recall of Events Affects Perception of Happiness*
Angelica Moè University of Padua, Padua, Italy
This study assessed the relationships between recall of positive and negative events, API (attention to positive) and
ANI (attention to negative information), and perception of happiness, with the hypothesis that recall affects the
perception of happiness and that ANI and API affect recall. One hundred and five women filled in the APNI scale
to assess API and ANI and were asked to listen to and recall a story presenting both positive and negative events,
and provide an assessment of the character perceived happiness. Finally, they were asked to choose an ending for
the story. Results showed that recall is related to the perception of happiness more than API and ANI, and that
relationships occur among recall, API, ANI, and perception of happiness. A positive ending for the story was
preferred. Discussion focuses on the implications of individual differences in paying attention to and recall positive
and negative information.
Keywords: recall, happiness, individual differences
Life Is Not What One Lived, But What One Remembers and How One Remembers It in Order to Recount It
Gabriel Garcia Márquez Research has long studied ways for improving recall with the aim to favour learning (e.g., De Beni & Moè,
2003; Moè & De Beni, 2005). However, recall is important not only for educational purposes. What we recall can affect our happiness. Recalling positive events, joyful experiences, and cheerful people induces happy judgments, while retrieving bad events, frustrating experiences, sad people, and negative facts induces unhappy ones. This is the leading hypothesis of this study.
Diener and Biswas-Diener (2008) demonstrated the validity of a technique called AIM (Attention, Interpretation and Memory) based on paying attention, doing interpretations in a positive way and recalling positive events or the positive side of neutral or even negative events. They also introduced the �“savouring�” construct which means staying on recall of the positive in order to increase happiness.
Here, the assumption that happiness could depend on the content of recall was tested experimentally, by examining the link between recall of positive and negative events and perception of happiness. To the best of our knowledge, this has never been explored before, while previous studies have found that a stable tendency in focusing more on positive or negative information affects perception of happiness (Noguchi, Gohm, & Dalsky, 2006).
This individual difference in attending to the positive or negative aspects of events which occur to
*Acknowledgements: The author would like to thank Roberto Micciulla, Marta Romanato, Giorgia Roncon, and Francesca Tessari for their help in data collection.
Angelica Moè, Department of General Psychology, University of Padua, e-mail: [email protected].
DAVID PUBLISHING
D
RECALL OF EVENTS AFFECTS PERCEPTION OF HAPPINESS 853
ourselves and to others is called API (attention to positive information) and ANI (attention to negative information). Research has shown that it has an influence on people�’s lives, because it can lead them to assess events which happen to them or others in a more positive or negative manner (Dalsky, Gohm, Noguchi, & Shiomura, 2008) and to recollect positive and/or negative aspects of events in the long term (Noguchi, Gohm, Dalsky, & Sakaamoto, 2007). More interestingly, Noguchi et al. (2006), studying the relationships of API and ANI with the perception of happiness of a character in a story read aloud, showed that the more people attend to positive events, the higher their evaluation of happiness, while ANI did not relate with perception of happiness.
This tendency in focusing on positive (API) or negative (ANI) events can be measured with a questionnaire devised by Noguchi et al. (2006). They demonstrated that the two dimensions, API and ANI, are differently related to affective, dispositional, and motivational factors. API is positively related to positive effect, optimism, life satisfaction, reward sensitivity, fun seeking, affiliation, extraversion, agreeableness, conscientiousness, openness to experience and negatively related to negative effect and neuroticism. ANI is positively related to negative effect, behavioural inhibition system, neuroticism, and negatively related to life satisfaction, and optimism.
However, the heuristic value of API and ANI in predicting other cognitive functions such as recall has never been examined. This is surprising, because of the central role played by recall in shaping judgments, such as those relating to the perception of happiness (Kemp, Burt, & Furneaux, 2008) and in leading us to pay attention to congruent information (Bower, 1981).
It therefore appeared interesting to test the hypothesis that happiness judgments are related not only to API and ANI but also to the number of positive and negative events recalled, which may differ among participants because of their different life histories. Hence, to control the ratio of positive to negative events, rather than asking participants to judge their own lives, in this research we used the same story, read aloud, for all our subjects, which narrate events happening to a same gender character with whom participants can identify. It must be noted that judging a character�’s happiness is not the same as judging one�’s own happiness. However, this methodological device greatly increases control over the quantity/quality of events on which a person focuses when recalling. Having asked subjects to recall personal life histories should have confused the effects due to the percentage of positive over negative events (different for each participant) with those due to their recall.
It was predicted that greater recall of positive events would correspond to higher perception of happiness and that greater recall of negative events would lower it. API and ANI were also expected to be related with perception of happiness, increasing or decreasing it. Noguchi et al. (2006) found that API but not ANI relates with perception of happiness. This result may depend on the story used, which contained the same number of positive and negative events and may thus persuade participants to rate the character as moderately happy. Here a story having mainly negative events was used in order to induce participants to provide unhappy judgments. This in turn would favor the occurrence of relationships with API, ANI, and recall. In addition here, perception of happiness was measured along a continuum rather than a �“yes�” or �“no�” question.
A further aim was to test the mediation of recall. API and ANI may affect perception of happiness directly or through the mediation of the recall of positive or negative events. It was hypothesized that paying attention would favour the recall of either positive or negative events and, in turn, that recall would influence the
RECALL OF EVENTS AFFECTS PERCEPTION OF HAPPINESS 854
happiness judgment. Lastly, predictions were made about the endings chosen. Participants were presented four endings (two positive and two negative) and asked to choose one. We expected that recall of positive events and API would lead more participants to choose positive endings and that recall of negative events and ANI would lead them to do the opposite.
Method Participants
A convenience sample of 105 women participated on a voluntary basis. Seventy-five were college students, enrolled for course requirement, and 30 were workers. Their mean age was 26.08 (SD = 9.82), age range 19-57.
Materials Attention to positive (API) and negative (ANI) information was assessed on APNI (the attention to
positive and negative information scale), a self-assessment instrument composed of 22 items: 11 assess API (e.g., �“I pay attention to things that lift me up�”) and 11 assess ANI (e.g., �“I can�’t forget the times I have performed poorly at something�”). Participants were asked to rate them on a 5-point Likert-type scale ranging from 1 (�“Very untrue of me�”) to 5 (�“Very true of me�”). The instrument devised by Noguchi et al. (2006) was validated in Italian (deleted for peer review) and gave the following values: 2/df = 3.28, RMSEA = 0.07, GFI = 0.87, AGFI = 0.85, SEMR = 0.08, satisfactory, according to Hu and Bentler (1999). Here, the alpha values for API and ANI were 0.73 and 0.66, respectively, close to those obtained in the English validation.
A story about a young woman experiencing many problems, such as difficulty at school, divorced parents, being involved in an accident, and being robbed, containing seven negative events and three positive events (201 words) was devised and tested in a small sample of college students (n = 33, aged 20 to 35, M = 22.94, SD = 2.70, 8 men) participating for extra credit. They were asked to rate each event on a 7-point Likert scale from �“Absolutely negative�” to �“Absolutely positive�”, �“4�” being the mid-point (�“Neither negative nor positive�”) and to recall the story. The mean value for negative events (nos. 1, 3, 4, 5, 6, 9 and 10) was 2.41, SD = 0.50 (means for each evaluation from 1.97 to 2.85; see Appendix A) and that for the positive events was 5.90, SD = 0.49 (means from 5.76 to 6.15). The difference between the two was significant, t(32) = 31.98, p < 0.001, thus indicating that both positive and negative events are perceived as such. Finally, four alternative endings to the story were prepared. Stemming from the model of Russell (1980), endings (a) and (d) expressed positive effect with high and low arousal, respectively, and endings (b) and (c) expressed negative effect with low and high arousal, respectively (see Appendix B for the four endings).
Procedure Participants, tested in small groups, were asked to fill in the APNI scale, without time limits. Then they
listened to the story, recorded by a female voice. This task was presented with the following instruction: �“Please listen to a short passage lasting 90 seconds�”. After, they were given a sheet of paper and asked to write down all the information they could remember, without time limits. Then, they were asked to express their perception of the happiness of the character of the story by putting a cross on a 10-cm line ranging from �“Very unhappy�” to �“Very happy�”. Finally, they were required to choose an ending for the story among the four presented (see Materials). The instruction was �“In your opinion how will the story end? (chose one of the following options by putting a cross on (a), (b), (c), or (d))�”.
RECALL OF EVENTS AFFECTS PERCEPTION OF HAPPINESS 855
Results Scoring
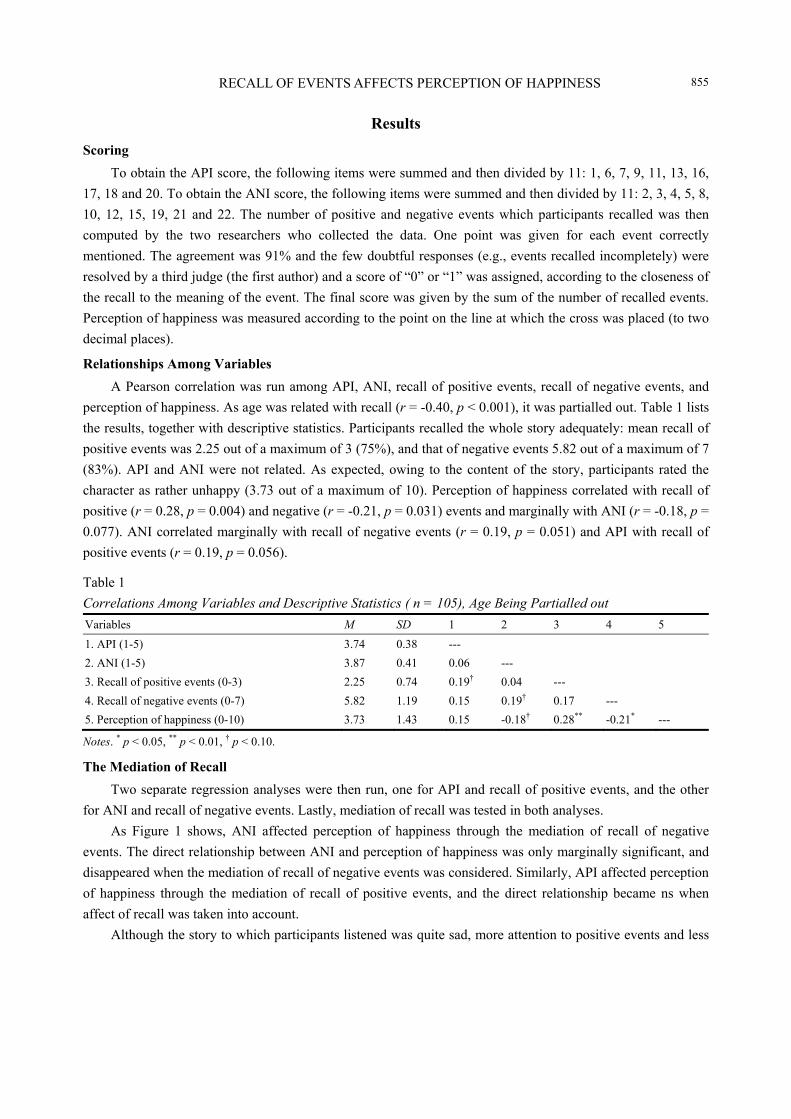
To obtain the API score, the following items were summed and then divided by 11: 1, 6, 7, 9, 11, 13, 16, 17, 18 and 20. To obtain the ANI score, the following items were summed and then divided by 11: 2, 3, 4, 5, 8, 10, 12, 15, 19, 21 and 22. The number of positive and negative events which participants recalled was then computed by the two researchers who collected the data. One point was given for each event correctly mentioned. The agreement was 91% and the few doubtful responses (e.g., events recalled incompletely) were resolved by a third judge (the first author) and a score of �“0�” or �“1�” was assigned, according to the closeness of the recall to the meaning of the event. The final score was given by the sum of the number of recalled events. Perception of happiness was measured according to the point on the line at which the cross was placed (to two decimal places).
Relationships Among Variables A Pearson correlation was run among API, ANI, recall of positive events, recall of negative events, and
perception of happiness. As age was related with recall (r = -0.40, p < 0.001), it was partialled out. Table 1 lists the results, together with descriptive statistics. Participants recalled the whole story adequately: mean recall of positive events was 2.25 out of a maximum of 3 (75%), and that of negative events 5.82 out of a maximum of 7 (83%). API and ANI were not related. As expected, owing to the content of the story, participants rated the character as rather unhappy (3.73 out of a maximum of 10). Perception of happiness correlated with recall of positive (r = 0.28, p = 0.004) and negative (r = -0.21, p = 0.031) events and marginally with ANI (r = -0.18, p = 0.077). ANI correlated marginally with recall of negative events (r = 0.19, p = 0.051) and API with recall of positive events (r = 0.19, p = 0.056).
Table 1 Correlations Among Variables and Descriptive Statistics ( n = 105), Age Being Partialled out Variables M SD 1 2 3 4 5 1. API (1-5) 3.74 0.38 --- 2. ANI (1-5) 3.87 0.41 0.06 --- 3. Recall of positive events (0-3) 2.25 0.74 0.19�† 0.04 --- 4. Recall of negative events (0-7) 5.82 1.19 0.15 0.19�† 0.17 --- 5. Perception of happiness (0-10) 3.73 1.43 0.15 -0.18�† 0.28** -0.21* ---
Notes. * p < 0.05, ** p < 0.01, �† p < 0.10.
The Mediation of Recall Two separate regression analyses were then run, one for API and recall of positive events, and the other
for ANI and recall of negative events. Lastly, mediation of recall was tested in both analyses. As Figure 1 shows, ANI affected perception of happiness through the mediation of recall of negative
events. The direct relationship between ANI and perception of happiness was only marginally significant, and disappeared when the mediation of recall of negative events was considered. Similarly, API affected perception of happiness through the mediation of recall of positive events, and the direct relationship became ns when affect of recall was taken into account.
Although the story to which participants listened was quite sad, more attention to positive events and less
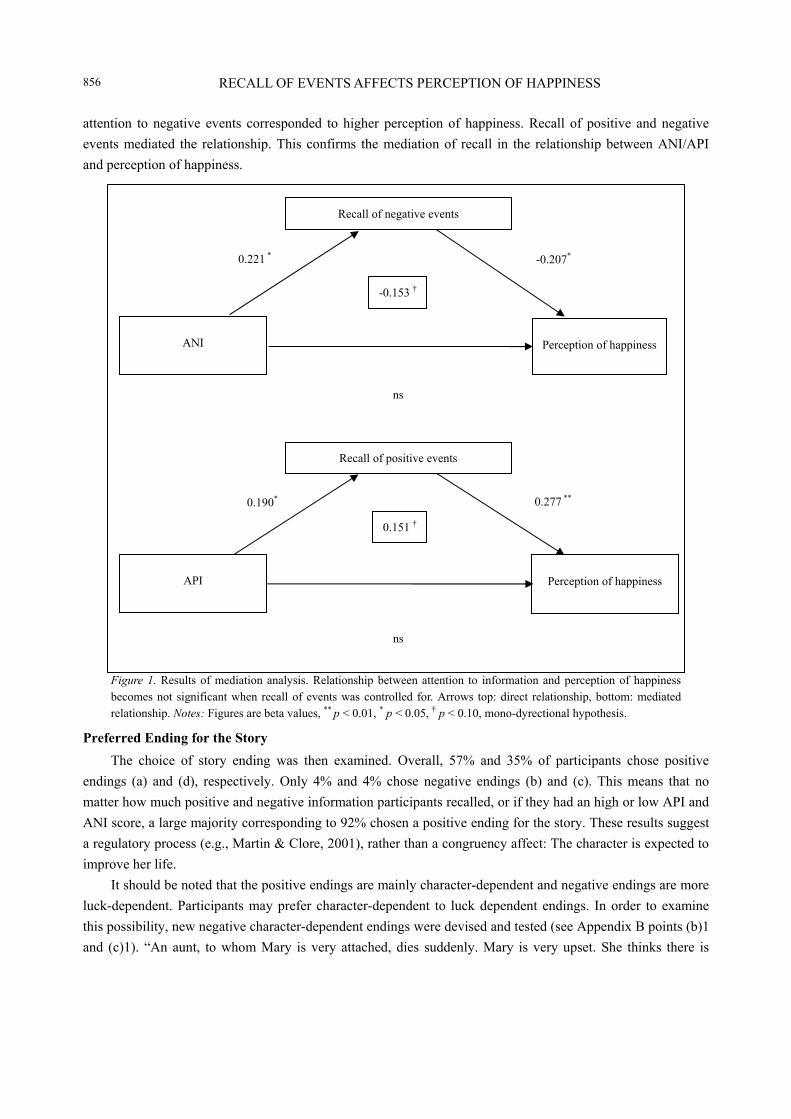
RECALL OF EVENTS AFFECTS PERCEPTION OF HAPPINESS 856
attention to negative events corresponded to higher perception of happiness. Recall of positive and negative events mediated the relationship. This confirms the mediation of recall in the relationship between ANI/API and perception of happiness.
Figure 1. Results of mediation analysis. Relationship between attention to information and perception of happiness becomes not significant when recall of events was controlled for. Arrows top: direct relationship, bottom: mediated relationship. Notes: Figures are beta values, ** p < 0.01, * p < 0.05, �† p < 0.10, mono-dyrectional hypothesis.
Preferred Ending for the Story The choice of story ending was then examined. Overall, 57% and 35% of participants chose positive
endings (a) and (d), respectively. Only 4% and 4% chose negative endings (b) and (c). This means that no matter how much positive and negative information participants recalled, or if they had an high or low API and ANI score, a large majority corresponding to 92% chosen a positive ending for the story. These results suggest a regulatory process (e.g., Martin & Clore, 2001), rather than a congruency affect: The character is expected to improve her life.
It should be noted that the positive endings are mainly character-dependent and negative endings are more luck-dependent. Participants may prefer character-dependent to luck dependent endings. In order to examine this possibility, new negative character-dependent endings were devised and tested (see Appendix B points (b)1 and (c)1). �“An aunt, to whom Mary is very attached, dies suddenly. Mary is very upset. She thinks there is
Recall of negative events
0.221 * -0.207*
-0.153 �†
ANI Perception of happiness
Recall of positive events
0.151 �†0.190* 0.277 **
API Perception of happiness
ns
ns
RECALL OF EVENTS AFFECTS PERCEPTION OF HAPPINESS 857
nothing else worth doing and is very sad�”, was replaced with �“Mary quarrels with her boy-friend, they split up, and she falls into a state of great sadness. She thinks it will be impossible to get back in touch with him and is upset�”, and �“Mary witnesses a car accident in which the driver is badly hurt. She is so upset that she cannot do anything. She trembles and cannot even manage to call for help�” with �“Mary cannot overcome all the misunderstandings among the members of the band. Although she likes playing, she decides to withdraw. She is angry with herself and feels sorry about the decision which has been taken�”. These new endings were proposed to a group of 33 participants different from those of the study, who were also asked for positive or negative evaluations of each event. All participants chose the positive endings: (a) 76% and (d) 24%. The regulatory process was thus confirmed also with the new endings.
Discussion The results confirmed the hypothesized relationship of recall with perception of happiness. Even if the
character underwent many negative events, greater recall of the few positive events corresponded to higher perception of happiness. This adds information to the existing literature (e.g., Emmons & McCollough, 2003), showing that thinking about positive events favors physical and psychological well-being. API and ANI affected recall of positive and negative events respectively, which in turn affected perception of happiness.
It was difficult to rate high perception of happiness for a character whose misadventures were more numerous than positive events. However, 17% of participants scored higher than the mid-point of 5. Low ANI and poor recall of negative events and high API and good recall of positive events helped this high evaluation of happiness.
In the main, a positive ending for the story was chosen, even if the character underwent mainly negative events. This result suggests that participants prefer a positive ending in any case, and are not affected by the quantity of positive and negative events recalled or API/ANI.
Noguchi et al. (2006) found relationships only with API, not ANI. However, the present research differs from that of the above authors because perception of happiness was assessed by means of a single continuum measure rather than a �“yes/no�” question and participants were asked to choose an ending for the story. That the negative (recall of negative events and ANI) mattered may be interpreted in the light of the negativity bias, that is the general greater tendency to recall and focus on negative rather than positive information (Rozin & Royzman, 2001).
It has been found that what is recalled can help in providing better evaluations of happiness, especially when positive events are retrieved in the face of misadventures. In addition, individual differences in ANI have been shown to affect the recollection of negative events and, consequently, the assessment of happiness. Future research should explore ways for reducing ANI and sustain recall of positive events, considering longitudinal rather than cross-sectional studies.
In addition, it would be interesting to assess long-term effects. Our results were obtained in only one experimental session, and we therefore cannot speculate on the more durable effects of a chronic tendency to pay more attention to negative as opposed to positive information. A second point relates to the inference that judging the character in a story as happy or unhappy may represent transferral of the same evaluation in assessing one�’s own life. Some mechanisms will probably differ. However, using a story having as its main character a person with whom our participants could identify seemed to us a way of avoiding confounding effects due to the story itself (a happy/unhappy life) with those due to recall and/or attention to positive and
RECALL OF EVENTS AFFECTS PERCEPTION OF HAPPINESS 858
negative information. In this research, only female participants and characters were considered. In order to generalize the results properly, future studies should also include male participants and male characters. Finally, the results are based on just a single story. In future studies, it would be interesting to extend the results here obtained with different stories and type of events.
Conclusions Being happy and satisfied with life are facets of well-being which favor psychological adjustment,
physical health, resiliency in the face of adversity, and longevity (e.g., see, for a review, Diener & Biswas-Diener, 2008). A wide range of factors can help in this process. The present research stresses the importance of recall and attention to positive and negative information. Our results confirm that individual differences in attending to and recalling events affects perception of happiness. Remembered life is not �“lived�” life, but it is one of the aspects which can help us toward better living.
References Bower, G. H. (1981). Mood and memory. American Psychologist, 36, 129-148. Dalsky, J. D., Gohm, L. C., Noguchi, K., & Shiomura, K. (2008). Mutual self-enhancement in Japan and the United
States. Journal of Cross-Cultural Psychology, 39, 215-223. De Beni, R., & Moè, A. (2003). Imagery and rehearsal as study strategies for written or orally presented passages. Psychonomic
Bulletin & Review, 10(4), 975-980. Diener, E., & Biswas-Diener, R. (2008). Happiness: Unlocking the mysteries of psychological wealth. Malden, M.A.: Blackwell
Publishing. Emmons, R. A., & McCollough, M. E. (2003). Counting blessings versus burdens: An experimental investigation of gratitude and
subjective well-being in daily life. Journal of Personality and Social Psychology, 84(2), 377-389. Hu, L., & Bentler, P. M. (1999). Cut-off criteria for fit indexes in covariance structure analysis: Conventional criteria versus new
alternatives. Structural Equation Modeling, 6, 1-55. Kemp, S., Burt, C. D. B., & Furneaux, L. (2008). A test of the peak-end rule with extended autobiographical events. Memory &
Cognition, 36(1), 132-138. Martin, L. L., & Clore, G. L. (2001). Theories of mood and cognition. Hillsdale: Erlbaum. Moè, A., & De Beni, R. (2005). Stressing the efficacy of the Loci method: Oral presentation and the subject-generation of the loci
pathway with expository passages. Applied Cognitive Psychology, 19, 95-106. Noguchi, K., Gohm, L. C., Dalsky, J. D., & Sakaamoto, S. (2007). Cultural differences related to positive and negative
valence. Asian Journal of Social Psychology, 10, 68-76. Noguchi, K., Gohm, C. L., & Dalsky, D. J. (2006). Cognitive tendencies of focusing on positive and negative information.
Journal of Research in Personality, 40, 891-910. Rozin, P., & Royzman, E. B. (2001). Negativity bias, negativity dominance, and contagion. Personality and Social Psychology
Review, 5(4), 296-320. Russell, J. A. (1980). A circumplex model of affect. Journal of Personality and Social Psychology, 39, 1164-1178.
Psychology Research, ISSN 2159-5542 November 2014, Vol. 4, No. 11, 859-867
Relation of Family Conditions and School Success*
Vlasta Cabanová
University of �Žilina, �Žilina, Slovakia
Each family has its own specifications and different volume of cultural capital which more or less stimulates the
child development. Very specific is the case of book ownership in the family. The paper analyzes material and
cultural environment of present-day families in the north-western part of Slovak republic. The author presents the
results of observation of some material conditions in Slovak families with primary school children and finds out
their impact on the children�’s school success.
Keywords: culture, material, and cultural conditions of families, ownership of books in the family, children�’s
attitude to books, borrowing books in the public library, education of parents and borrowing books, school
success
Introduction
It is undisputed that the culture of the family is determining in relation to society. In the education in the family, development of socio-affective aspect of child�’s personality, his culture is a priority: �“The education of children to the culture is easier if parents themselves read books, visit theatres, museums, galleries and the like. They enrich their children�’s knowledge and enhance the education�” (Makarenko, 1947). The condition of obtaining a relation to a book in the family resides in the presence, possibility of contact, handling and games with the book what causes a positive attitude to books (�Šmelová, 2004) as soon as possible. �“Considering pre-reading period, building a relation to the book lies especially in adults reading books, viewing folding picture-books, but child experimentation and various games with book toys are significant as well�” (Cabanová, 2004).
Theoretical Basis
The Czech author J. Pr cha (2004) belongs among the first experts in the field of education in Central Europe who characterized the family as a place where social inequalities are reproduced. A man is reflected in a family. Parents trying to pass on their life experience on children�—�“to pass craft�” maintain existing condition. Tendency of parents to pass experience on �“how to live�”, they contribute to maintain social inequalities, because workers educate workers and doctors (Katr ák, 2004).
In general, parents with higher education also have higher incomes and better material facilities in families and parents from lower classes do not have a volume of economic capital as parents with higher social status
* This paper has been written with the support of European Social Fund, project Innovation and Internationalization of Education�—instruments to increase the quality of the University of �Žilina in the European educational area (ITMS code 26110230079). Modern Education for the Knowledge Society/Project is funded by EU.
Vlasta Cabanová, associate professor, Department of Pedagogical Studies, Faculty of Humanities, University of �Žilina.
DAVID PUBLISHING
D
RELATION OF FAMILY CONDITIONS AND SCHOOL SUCCESS 860
(Leláková & Ba ová, 2014). However, relationship between material environment of family and school performance of a child who grows up in this family is not direct, but is mediated by way of family life, parental attitudes to children and study (compliance with school duties), to the school. Neither the lack of economic capital directly affects the child�’s school performance, but rather indicates a specific lifestyle of family and specific definition of the world of parents and children who observe access to school and education (Katr ák, 2004).
Implementation and Results of Research Department of Pedagogical Studies of University of �Žilina, focused on the preparation of social educators,
has been devoted to Slovak families and their specific problems in the northern part of Central Slovakia for years. It is also for this reason that its employees implemented the research in 2007 under the grant project VEGA 1-0737-8 called �“socio-cultural context of family education in the Slovak regional transformations (especially Liptov rural) communities and community schools�”. They focused on the detection of socio-cultural conditions of families with school children, the analysis of these conditions and their relations to school performance of 7th and 8th class pupils of primary schools, while selectively focusing on the region of the lower Liptov.
There were involved 738 families (nearly 5,200 household members) in the research and within time interval of four years, we made a much smaller comparative research on sample of 240 families in 2014, and ultimately, a survey in the �Žilina region as part of the final thesis under the author�’s leadership (Gabri�šová, 2014). The aim of the research was to analyse the material and cultural conditions of families of the 7th and 8th class pupils, comparing the profit and material environment. In this paper, we focus on the findings in the context of a number of books in the families surveyed. We also wanted to find whether there are differences in the conditions of pupils in urban and rural schools in Slovakia. Due to the large scope of the data obtained, we present only some interesting findings.
The Existence of Books in the Family In the first part of the research, we analysed the relation of children to books and their ownership.
According to the findings (tool of questionnaire research), 87.95% of children had their own library. Most of the children of the total number stated that they had books at home in the range of 11 to 20 books which represents 28.92% and less than 18.07% stated they did not have their own books or more than five books. Therefore, we can conclude that most children had books at home in the range of six to 20 books. The next question was about what kind of books prevailed among children. Most of children of the total number who have their own books, almost half (46.57%), stated that there was the same proportion of popular science literature and fiction in their own library. 28.77% of children had mostly non-fiction literature, dictionaries, and maps at home.
The existence, range and focus of the books constitute material and cultural environment of the family, but we were interested in what kind of relation children have to books and how often they read books. The question whether they liked reading books, 57.83% of children answered �“Yes�”, which is a surprising result. We live in times when children lose interest in reading, so books are replaced by movies and the Internet.
RELATION OF FAMILY CONDITIONS AND SCHOOL SUCCESS 861
As to the children who responded that they liked reading books, we tried to find who had brought them to reading. The largest number of children stated that their own interest brought them in reading books�—own initiative, which represents 39.58% of the number of children who like reading books. The other most frequent answer was mother and family members which does not surprise us, because the family environment is the first place where a child at an early age meets with a book. Only 14.58% of children stated the influence of teacher on the initiation of reading books.
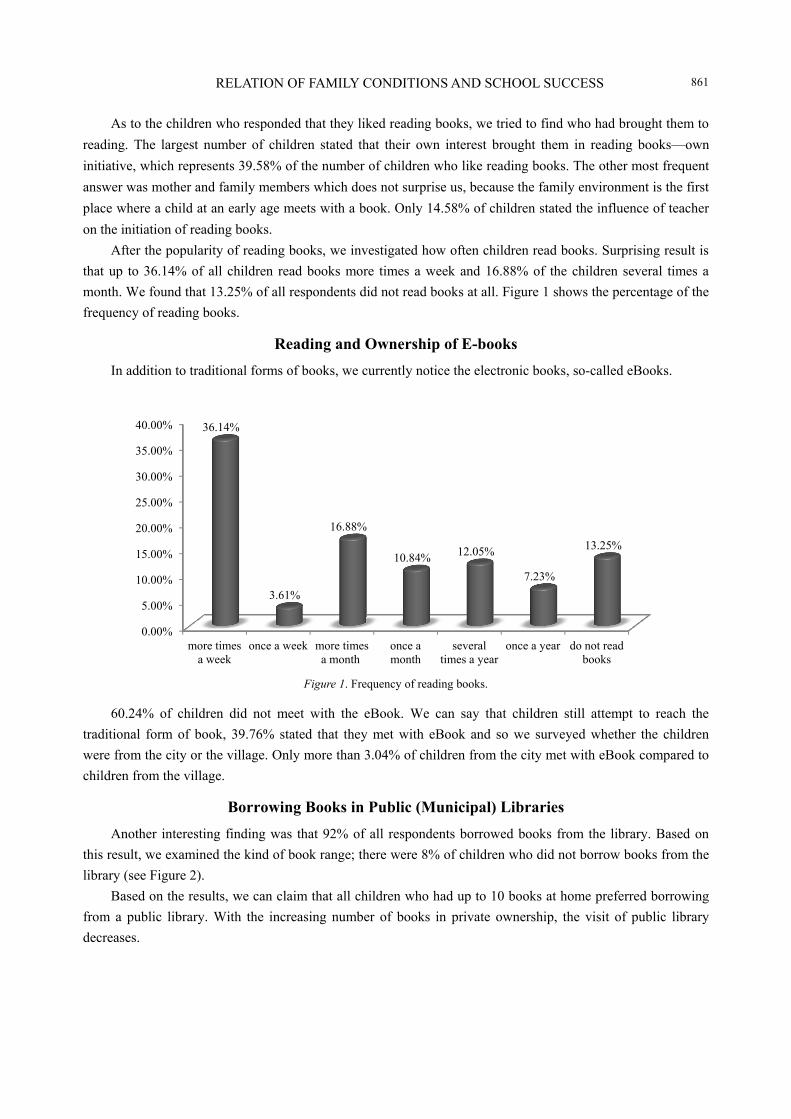
After the popularity of reading books, we investigated how often children read books. Surprising result is that up to 36.14% of all children read books more times a week and 16.88% of the children several times a month. We found that 13.25% of all respondents did not read books at all. Figure 1 shows the percentage of the frequency of reading books.
Reading and Ownership of E-books In addition to traditional forms of books, we currently notice the electronic books, so-called eBooks.
Figure 1. Frequency of reading books.
60.24% of children did not meet with the eBook. We can say that children still attempt to reach the traditional form of book, 39.76% stated that they met with eBook and so we surveyed whether the children were from the city or the village. Only more than 3.04% of children from the city met with eBook compared to children from the village.
Borrowing Books in Public (Municipal) Libraries Another interesting finding was that 92% of all respondents borrowed books from the library. Based on
this result, we examined the kind of book range; there were 8% of children who did not borrow books from the library (see Figure 2).
Based on the results, we can claim that all children who had up to 10 books at home preferred borrowing from a public library. With the increasing number of books in private ownership, the visit of public library decreases.
0.00%
5.00%
10.00%
15.00%
20.00%
25.00%
30.00%
35.00%
40.00%
more times a week
once a week more times a month
once a month
several times a year
once a year do not read books
36.14%
3.61%
16.88%
10.84% 12.05%
7.23%
13.25%

RELATION OF FAMILY CONDITIONS AND SCHOOL SUCCESS 862
Figure 2. Children visit to school and local library.
The Relation of Book Ownership at Home and Results at School In order to assess the impact on school success, an important variable in the research has become the
results achieved in the year-end school report in the subjects of Slovak language and literature, mathematics, and English language.
As the great result, we classified the assessment by marks 1 and 2 and 60.24% of children achieved such result in the last school report (we considered only the last year-end report). 24.10% of children had an average result. We classified marks 4 and 5 as below average result achieved by the smallest percentage of children (15.66%).
The first question for parents we tried to find what range constituted their family library. We divided the range of books for parents into six categories. Most parents (33.73%) stated that they had at home 21-50 books. 25.30% of families had up to 100 books, 21.69% up to 20 books, 10.84% up to 200 books, 4.82% up to 300 books, and only 3.61% of parents had more than 300 books.
Compared with the results of Luk�šík research (2012), we came to relatively similar results, 25.8% of households owned 50 books in the parent library, 19.4% of families had up to 100 books, 9% up to 200 books, and 10.8% more than 200 books. Less than 35% of families stated that they did not have their own library.
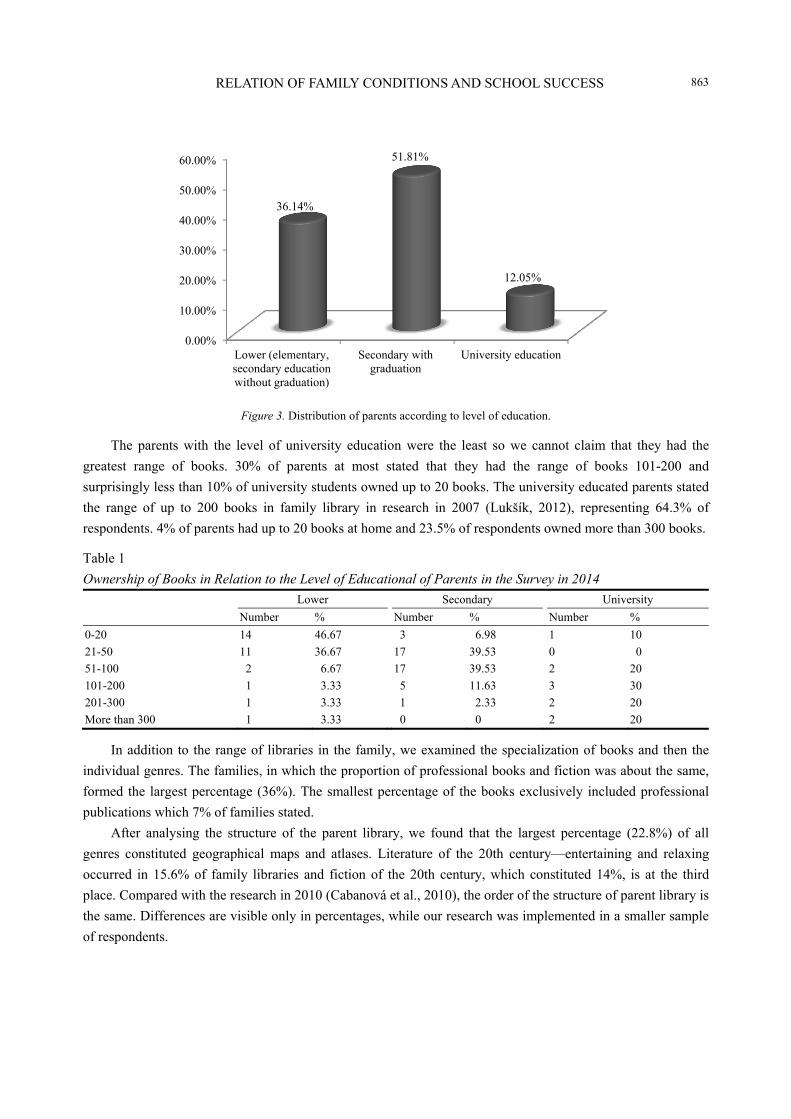
Since we tried to find the level of education of parents in next question, we compared whether the level of education of parents affected the number of books in the family library. The largest group consisted of parents with completed secondary education with graduation (51.81%), followed immediately by parents with elementary and secondary special education without graduation (36.14%), and 12.05% were parents with a university education.
We can claim from the comparison of the range of books to the level of education of parents that: There were represented all categories of the range of books for parents with lower education, while 46.67% of parents stated that they had up to 20 books at home. Cabanová et al. (2010) state in the research implemented at Liptov that up to 72.4% of parents having books in the range of 20 to 100 had more than 300 books at home, similarly to research in 2014, only 3.6% have more than 300 books at home.
92%
8%
Yes No
RELATION OF FAMILY CONDITIONS AND SCHOOL SUCCESS 863
Figure 3. Distribution of parents according to level of education.
The parents with the level of university education were the least so we cannot claim that they had the greatest range of books. 30% of parents at most stated that they had the range of books 101-200 and surprisingly less than 10% of university students owned up to 20 books. The university educated parents stated the range of up to 200 books in family library in research in 2007 (Luk�šík, 2012), representing 64.3% of respondents. 4% of parents had up to 20 books at home and 23.5% of respondents owned more than 300 books.
Table 1 Ownership of Books in Relation to the Level of Educational of Parents in the Survey in 2014
Lower Secondary University
Number % Number % Number % 0-20 14 46.67 3 6.98 1 10 21-50 11 36.67 17 39.53 0 0 51-100 2 6.67 17 39.53 2 20 101-200 1 3.33 5 11.63 3 30 201-300 1 3.33 1 2.33 2 20 More than 300 1 3.33 0 0 2 20
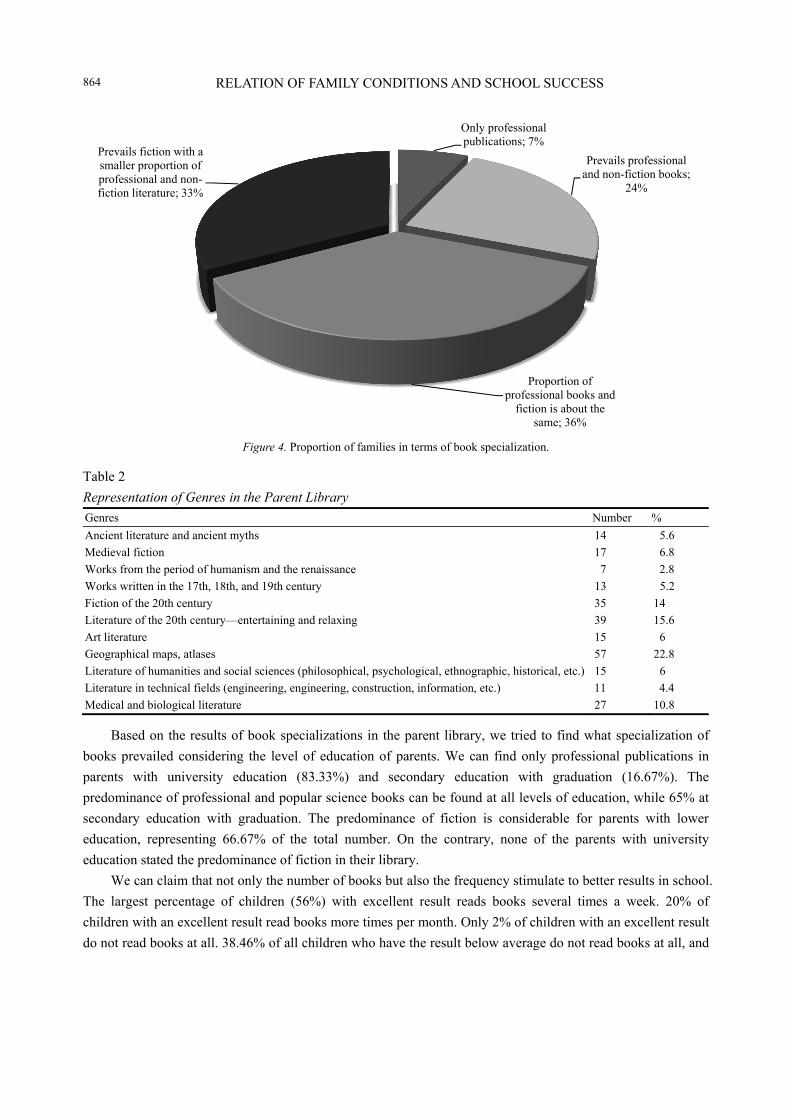
In addition to the range of libraries in the family, we examined the specialization of books and then the individual genres. The families, in which the proportion of professional books and fiction was about the same, formed the largest percentage (36%). The smallest percentage of the books exclusively included professional publications which 7% of families stated.
After analysing the structure of the parent library, we found that the largest percentage (22.8%) of all genres constituted geographical maps and atlases. Literature of the 20th century�—entertaining and relaxing occurred in 15.6% of family libraries and fiction of the 20th century, which constituted 14%, is at the third place. Compared with the research in 2010 (Cabanová et al., 2010), the order of the structure of parent library is the same. Differences are visible only in percentages, while our research was implemented in a smaller sample of respondents.
0.00%
10.00%
20.00%
30.00%
40.00%
50.00%
60.00%
Lower (elementary, secondary education without graduation)
Secondary with graduation
University education
36.14%
51.81%
12.05%
RELATION OF FAMILY CONDITIONS AND SCHOOL SUCCESS 864
Figure 4. Proportion of families in terms of book specialization.
Table 2 Representation of Genres in the Parent Library Genres Number % Ancient literature and ancient myths 14 5.6 Medieval fiction 17 6.8 Works from the period of humanism and the renaissance 7 2.8 Works written in the 17th, 18th, and 19th century 13 5.2 Fiction of the 20th century 35 14 Literature of the 20th century�—entertaining and relaxing 39 15.6 Art literature 15 6 Geographical maps, atlases 57 22.8 Literature of humanities and social sciences (philosophical, psychological, ethnographic, historical, etc.) 15 6 Literature in technical fields (engineering, engineering, construction, information, etc.) 11 4.4 Medical and biological literature 27 10.8
Based on the results of book specializations in the parent library, we tried to find what specialization of books prevailed considering the level of education of parents. We can find only professional publications in parents with university education (83.33%) and secondary education with graduation (16.67%). The predominance of professional and popular science books can be found at all levels of education, while 65% at secondary education with graduation. The predominance of fiction is considerable for parents with lower education, representing 66.67% of the total number. On the contrary, none of the parents with university education stated the predominance of fiction in their library.
We can claim that not only the number of books but also the frequency stimulate to better results in school. The largest percentage of children (56%) with excellent result reads books several times a week. 20% of children with an excellent result read books more times per month. Only 2% of children with an excellent result do not read books at all. 38.46% of all children who have the result below average do not read books at all, and
Only professional publications; 7%
Prevails professional and non-fiction books;
24%
Proportion of professional books and
fiction is about the same; 36%
Prevails fiction with a smaller proportion of professional and non-fiction literature; 33%

RELATION OF FAMILY CONDITIONS AND SCHOOL SUCCESS 865
the same percentage of children read a couple of times a year. Table 2 shows the frequency of reading books compared to the result achieved.
Figure 5. Specialization of books in relation to the level of educational.
Table 2 Frequency of Children Reading Books in Relation to the Results Achieved
Excellent Average Below average
Number % Number % Number % More times a week 28 56 2 10 0 0 Once a week 2 4 1 5 0 0 More times a month 10 20 4 20 0 0 Once a month 4 8 4 20 1 7.69 Several times a year 4 8 1 5 5 38.46 Once a year 1 2 3 15 2 15.38 Do not read books 1 2 3 15 5 38.46
Next, we compared the relation between the range of parental library and school success of children (see Table 3). 40% of children in the range of 51 to 100 books in the parent library achieved excellent result. We have not recorded an excellent result in the least number of books. The average result occurred in the range up to 100 books, while 60% of children had such a result in the range of 21 to 50 books. Below average result was significantly demonstrated in children whose parents had the least books at home. 84.62% of the children had below average result where the least parental library.
When examining what influences or affects school success, we tried to find the relation between the education of parents achieved and the success of children in school (see Table 4). We can find a considerable dependence between school success of children and the education of parents. 80% of children whose parents
0
0.1
0.2
0.3
0.4
0.5
0.6
0.7
0.8
0.9
Only professional publications
Prevails professional and
non-fiction books
Proportion of professional books and
fiction is about the same
Prevails fiction with a smaller proportion of
professional and non-fiction literature
10%
33.33%
66.67%
16.67%
65% 66.67%
33.33%
83.33%
25%
Lower (elementary, secondary education without graduation)
Secondary with graduation
University education
RELATION OF FAMILY CONDITIONS AND SCHOOL SUCCESS 866
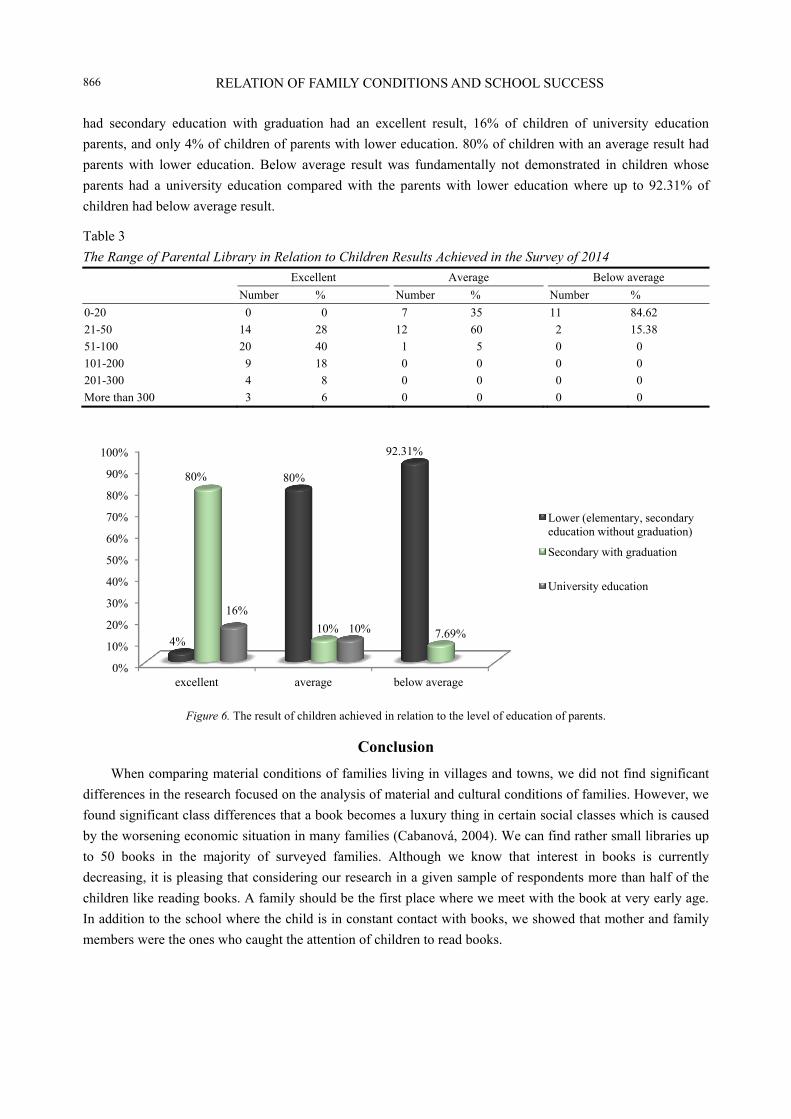
had secondary education with graduation had an excellent result, 16% of children of university education parents, and only 4% of children of parents with lower education. 80% of children with an average result had parents with lower education. Below average result was fundamentally not demonstrated in children whose parents had a university education compared with the parents with lower education where up to 92.31% of children had below average result.
Table 3 The Range of Parental Library in Relation to Children Results Achieved in the Survey of 2014
Excellent Average Below average
Number % Number % Number % 0-20 0 0 7 35 11 84.62 21-50 14 28 12 60 2 15.38 51-100 20 40 1 5 0 0 101-200 9 18 0 0 0 0 201-300 4 8 0 0 0 0 More than 300 3 6 0 0 0 0
Figure 6. The result of children achieved in relation to the level of education of parents.
Conclusion When comparing material conditions of families living in villages and towns, we did not find significant
differences in the research focused on the analysis of material and cultural conditions of families. However, we found significant class differences that a book becomes a luxury thing in certain social classes which is caused by the worsening economic situation in many families (Cabanová, 2004). We can find rather small libraries up to 50 books in the majority of surveyed families. Although we know that interest in books is currently decreasing, it is pleasing that considering our research in a given sample of respondents more than half of the children like reading books. A family should be the first place where we meet with the book at very early age. In addition to the school where the child is in constant contact with books, we showed that mother and family members were the ones who caught the attention of children to read books.
0%
10%
20%
30%
40%
50%
60%
70%
80%
90%
100%
excellent average below average
4%
80%
92.31%
80%
10% 7.69%
16%10%
Lower (elementary, secondary education without graduation)
Secondary with graduation
University education
RELATION OF FAMILY CONDITIONS AND SCHOOL SUCCESS 867
References Cabanová, V. (2004). Formovanie vz ahu ku knihe v pred�školskom období. Rodina A �Škola, 52(3), 12. Cabanová, V. et al. (2010). Rodina a rodinná výchova ako faktor rozvoja osobnosti (p. 83). �Žilina: EDIS Publishing, University of
�Žilina. Gabri�šová, E. (2014). Kultúra rodiny a jej prejavy v �škole. FHV �ŽU�Ž (final thesis). Katr ák, T. (2004). Odsouzení k manuální práci (p. 189). Praha: Slon. Leláková, E., & Ba ová, B. (2014). Development and innovation of curriculum in foreign language. In Proceedings of INTED
2014: The 8th International Technology, Education and Development Conference, pp. 0163-0169, Valencia, Spain. IATED Academy, CD-ROM.
Luk�šík, I. A. Kol. (2012). Kultúra �škôl a výchovných zariadení (p. 209). Bratislava: Comenius University in Bratislava. Makarenko, A. S. (1947). O výchov d tí v rodin (p. 111). Praha: Svoboda. Pr cha, J. (2004). Interkulturní psychologie: Sociopsychologické zkoumání kultur, etnik, ras a národ (p. 199). Praha: Portál. �Šmelová, E. (2004). Kniha v rodin p ed�školáka (online). Retrieved from http://www.rodina.cz/clanek3877.htm
Psychology Research, ISSN 2159-5542 November 2014, Vol. 4, No. 11, 868-875
Internationalization of Psychology Education in Indonesia
Sarlito W. Sarwono Persada Indonesia University, Jakarta, Indonesia
Psychology in Indonesia was born from a medical faculty in 1953, a few years after the independence of Indonesia.
It was founded primarily to get the right man in the right place that is very urgent at that time after the Dutch
colonial government left many vital public and private positions empty. From the time it was born, the Indonesian
psychology has moved vice-versa from indigenous psychology to universalism, from East to West, and from
qualitative to quantitative methodology. The internationalization process of Indonesian psychology is discussed
from the author�’s personal view.
Keywords: Indonesian psychology, internationalization, personal networks
Foundation and Growth of Psychology in Indonesia Psychology education in Indonesia was started in 1953, when a psychiatrist, Prof. R. Slamet Iman Santoso,
MD, in his oration as a new professor at the University of Indonesia, stated that psychiatrists can no longer work alone. Psychiatrists need psychologists to administer psychological tests, particularly IQ and personality test, to avoid diagnostic error due to the post war situation1.
The first psychology education was then established as a study program within the Faculty of Medicine, UI (University of Indonesia), which became an independent faculty of psychology in 1960. The first faculty of psychology was followed by other faculties of psychology each year. Currently, there are 128 faculties of psychology at state and private universities throughout Indonesia2.
The first psychology lecturers at UI consisted of some Dutch lecturers (before they left Indonesia) teaching philosophy and statistics. Medical doctors and psychiatrists from the faculty of medicine teaching anatomy, physiology, neurology, and psychotherapy, and some new graduates coming home from the Netherlands and Germany3, bringing in psychoanalysis and projective tests.
Sarlito W. Sarwono, Ph.D., professor, Faculty of Psychology, Outstanding International Psychologists Awardees from Division
52 (International Psychology, American Psychological Association (2013)), Persada Indonesia University. 1 Indonesia proclaimed its independence from the Dutch colonial government in 1945. In 1949, the Dutch government acknowledged the independence. Most of Dutch personnel left Indonesia to go back to their home country, leaving many empty public and private posts that have to be filled by Indonesian personnel who were undereducated and unprofessional. Most of the Indonesian personnel were ex military or paramilitary who were not fit and proper for the empty posts, causing psychological complaints such as psychosomatics. Psychologists were needed to get the right man in the right place. 2 Indonesia is an archipelago, as big as the mainland USA or Western Europe, with a population of 240,000,000, 60% of them living in Java Island, which is only 7% of the country�’s land. The population consists of hundreds of ethnics and five major religions (90% are Muslims), but a national language (Bahasa Indonesia) is compulsory for every Indonesian and can be the bounding factor for the whole nation. 3 After the World War II, some Indonesians (some of them were military personnel) went to the Netherland and Germany to study psychology. When they came back in early 1960s, some were posted at the University of Indonesia, whereas the military personnel were posted at Bandung, to build the Psychological Center of the Indonesian Army and also a faculty of psychology (the second one after UI) under the state university Padjadjaran University.
DAVID PUBLISHING
D
INTERNATIONALIZATION OF PSYCHOLOGY EDUCATION IN INDONESIA 869
In its early stages, the objective of psychology in Indonesia is �“the right man in the right place�”. Misplacement in government and business institutions (due to lack of qualified human resource after WWII) caused mental illness and mismanagement. Psychology is needed as a method to select and to cure mentally ill people. Therefore, the focus of the study and practice in the past were clinical, IO (industrial and organizational), child and development, and educational psychology (Faculty of Psychology, University of Indonesia, 2002).
Indonesian Psychology From Past to Current In its more than 60 years�’ history, Indonesian psychology has changed significantly. Not only in numbers
of new faculties of psychology, but also concerning the methodology, theories and schools of theories, and policies of implementation.
As I have said earlier, psychology in Indonesia was born from the Faculty of Medicine, UI, taught by medical doctors and psychiatrists, clinical psychology became the main field of study and psychoanalysis dominated the school of thinking. On the other hand, the strong influence of social sciences (anthropology and sociology) and philosophy (phenomenology and existentialism) encouraged the psychology faculties to adopt qualitative methods in its earlier researches. Quantitative method was limited for inventing and adjusting new IQ and achievement tests only. Only after the establishment of the Social Psychology Department at the Faculty of Psychology, UI, the faculty started to use quantitative research methods more widely, not only to measure intelligent quotient, but also to measure different psychological concepts such as attitude, intention, attribution, relationship, and even emotion.
However, after more Indonesian psychologists get the opportunity to study abroad or participating in international congresses, the influence of American schools of psychology is getting stronger and stronger. It is due to the American dominated psychology global trend. Books and journals mostly came from the US. Consequently, the methodology of Indonesian psychology tends to swift towards quantitative ones. At one point, after I retired from UI, my successor, the Dean of Faculty of Psychology, UI, issued a regulation that requires all Bachelor and Master thesis to use quantitative methods. Also social sciences courses that are considered irrelevant to the study of psychology were deleted from the curriculum. Students who are interested to study the social science subjects were referred to other faculties.
After the regulation was issued, I had difficulty in examining a Bachelor thesis dealing with a clinical case. Many significant symptoms and phenomena were missing from the script because they cannot be reflected in scores. Criticism came also from psychologists who prefer qualitative method. They say that using only the quantitative method might reduce the human existence of a person into numbers and categories only, causing the psychologist failed to describe personalities holistically.
In the mean time, new psychology trends, known as indigenous psychology and cross cultural psychology emerge globally in the last two or three decades. The faculties of psychology in Indonesia quickly adopt the new trends. In 1999, when I was the psychology Dean of UI, I introduced cross-cultural psychology, and put it as a compulsory subject in the curriculum. In 2009, after I retired from UI and moved to a private university called UPI (the Persada Indonesia University) and became the Dean of its Faculty of Psychology, I add indigenous psychology as a new compulsory subject for graduate students4. Both subjects (cross-cultural and
4 There are three major programs at the graduate level, i.e., Master of science (research), Master of applied psychology (social intervention, health psychology, psychology of human resorce developmeny, psychometrics, knowledge psychology), and Master of psychology (clinical/one-to-one method, producing psychologists majoring in clinical, child, IO, and education).
INTERNATIONALIZATION OF PSYCHOLOGY EDUCATION IN INDONESIA 870
indigenous psychology) are still in the curriculum of most faculties of psychology in Indonesia until today. At least, they can fill in the gap that has been left by the absence of sociology and anthropology.
Following the reemerging spirit of qualitative and phenomenological psychology (through cross-cultural and indigenous psychology), other new schools of psychology, such as positive psychology, affirmative inquiry, humanistic psychology, social representation, become more popular in Indonesia. Concerning the methodology, the mixed method (mixture of qualitative and quantitative method) (Tashakkori & Teddie, 2010) was introduced, followed, and applied by more and more psychologists in Indonesia.
Development of Indonesian Psychology: From Indigenous to Western Psychology In its early stage, there were only three branches of psychology at UI, i.e., clinical, IO, and experimental
psychology. New branches of psychology appear one by one in line with the development of psychology in Indonesia. At the University of Indonesia, clinical psychology was divided into adult clinical psychology and child clinical psychology. Later, child clinical psychology was divided again into developmental psychology and educational psychology. In the 1970s, social psychology department was founded. Currently at the University of Indonesia, there are six departments under the faculty of psychology, which are clinical psychology, developmental psychology, IO psychology, educational psychology, social psychology, and methodology and experimental psychology. Since other faculties of psychology always consider UI�’s faculty of psychology as a model, almost all other faculties of psychology in Indonesia adopt the UI�’s version of division of psychology.
The psychology division in the national psychological organization, Himpsi (Himpunan Psikologi Indonesia/Indonesian Psychological Association), also reflects the model used in the universities. Currently, the existing divisions of Himpsi are clinical psychology, IO psychology, social psychology, child and developmental psychology, educational psychology, school psychology, sport psychology, moslem religious psychology, christian religious psychology, psychotherapy, flight psychology, health psychology, and forensic psychology.
As for its orientation, in the early stages (until 1970s), Indonesian psychology preferred to look for indigenous values within Indonesia. Therefore, when Prof. Slamet Iman Santoso was still the dean of the faculty of UI, he taught a subject called �“symbolism�”, describing various symbols used by different ethnics in Indonesia. Each symbol reflects a particular psychological state of the symbol user. By understanding the symbols, it will be easier for a psychologist to comprehend the behavior of his/her client/subject. However, in the 1970s, there are more grants available for Indonesians to study abroad or to participate in international scientific events. Since then, Indonesian psychology becomes more open to foreign paradigms, including universalism and measurability of human mind. American influence (behaviorism, cognitive and quantitative method) becomes stronger.
It is not before the 1990s, after getting influenced by European and other non-American psychology, Indonesian psychology moves back to qualitative schools and methodology, including cross-cultural psychology, indigenous psychology, and qualitative methodology.
One�’s impression after learning the development of Indonesian psychology from time to time is that it constantly swings back and forth, from indigenous to foreign influence, from East to West. In this regard, beside indigenization, internationalization of psychology education is inevitable. Without internationalization, Indonesian psychology wouldn�’t be able to respond properly to the need of people who have to face the
INTERNATIONALIZATION OF PSYCHOLOGY EDUCATION IN INDONESIA 871
constant rapid change due to the advancement of technology, particularly information technology. Norms, values and social standards change quickly, making what has been psychologically considered as normal in the past, no longer can be called as normal. On the other hand, what is used to be abnormal becomes normal nowadays. Some ways of internationalization which have been practiced in Indonesia are sending staff to study abroad, exchange of professors, exchange of students, joint research, interuniversity collaboration, participate in international organizations and conventions, organize international conventions in Indonesia, publish articles in international journals and publish international books, establish regional organizations, etc..
Personal Experiences As a psychology professor who was graduated from the first faculty of psychology in Indonesia, which is
at UI, and taught there for more than 40 years until retire and moved to a private university as a dean of the faculty of psychology, I might represent other Indonesian psychology lecturers in the internationalization process of psychology in Indonesia, although not precisely because everybody has his/her own experience. Especially the younger generation might have different experience.
I join the faculty of psychology UI, as undergraduate student in 1961. My class was very small. There were only around 40 students in the first year class or 200-student body of the whole faculty. Psychology was not popular then. People still confused between psychology and psychiatry. It is also considered as a non-lucrative profession. The national psychology student body at that moment was identical to the UI�’s psychology student body. I still remember that when I enrolled in UI in 1961, the applicants was only 250. Sixty were accepted as new students and only 40 continued to enroll. It was very different when I was Dean of the same faculty (1997-2004). Average enrollment was 150-200 students per year, out of 4,000 applicants.
Today I am the psychology Dean of UPI (the Persada Indonesia University), a private university in Jakarta, with around 300 new undergraduate student enrollments per year. The whole student body (including graduate students) of the faculty is around 1,500. If we multiply the numbers of student bodies by the number of existing faculties of psychology in Indonesia (although many faculties are much smaller than UI and YAI). We can imagine how big the psychology student body in Indonesia is. The interesting thing is that almost the entire graduates get no difficulty in getting a job after graduation. In other words, psychology is much more popular now if compared to its situation back in the 1960s.
Back in the 1960s, the academic atmosphere was very local. Some Dutch lecturers have left, and some young psychologists who were just graduated from European universities came home and started to become our first lecturers. They started to introduce us (the students) some Western theories and practices (including psychoanalysis and projective techniques of psycho diagnostics). I would call it as the era of Indonesian psychology�’s first encounter with Western psychology. From then on, the Western aroma dominates Indonesian psychology. However, the first Dean of psychology, Prof. Slamet Iman Santoso (himself is a psychiatrist) discourages his staff and students to take further education in foreign (Western) countries. Only in 1970s, under the second dean, Prof. Dr. Fuad Hassan (himself was graduated in Canada), UI started sending its psychology staff abroad.
I was a young faculty member when send to the University of Edinburgh, Scotland, to study community development in 1972-1973. A few years later, i.e., in 1976, as a Doctoral student of UI, I was sent to the University of Leiden, the Netherland to do my data processing. I got my doctoral degree at UI in 1978.
INTERNATIONALIZATION OF PSYCHOLOGY EDUCATION IN INDONESIA 872
I started my activities in psychological organization by joining the Indonesian Psychological Association (Himpunan Psikologi Indonesia/Himpsi), serving as the national co-Chairman and Chairman of Jakarta Chapter in the 1980s.
Internationally, I was invited by EWC (the East West Center), Hawaii, USA to be a participant in their seminars on Adolescent Reproductive Health in 1986 and 1990 (at Honolulu) and 1992 (Shanghai). In the mean time, I joined international organizations and participated in their international conventions almost every year, i.e., ICP (International Council of Psychologists), APA (American Psychological Association), IAAP (International Association of Applied Psychology), and also founded APsyA (Asian Psychological Association) in 2005. Then I organize ICP Regional Convention in Jakarta 1988, followed 10 years later by another ICP Regional Convention in Bali 1998, and ICP International Convention in Jakarta, in 2013. After I founded the Asian Psychological Association in Jakarta, 2005, I organized its first biannual convention in Bali 2006, followed by its second convention at Kuala Lumpur, 2008, that I organized while I was working at the University of Malaya as a visiting professor.
Being a visiting professor is another way for me to be internationalized and also to internationalize Indonesian psychology. Beside the University of Malaysia, I have been also invited to be a visiting professor at the University of Nijmegen (the Netherlands, 1996), Cornell University (USA, 1996), and Victoria University (New Zealand, 2007).
Internationalization of Universities Through Personal Networks My international experience automatically makes my international networks grow. In the era of Internet,
the networks grow even faster that give me (and other internationally experienced psychologists) much advantage in terms of the internationalization of universities.
In the year 2000, as the psychology Dean of UI, I initiated a twinning program for Bachelor degree with UQ (the University of Queensland), Australia. After two years�’ negotiation between the two universities, the Rector of UI and Vice Chancellor of UQ signed a MOU (Memorandum of Understanding) in Jakarta. Under the MOU, a program is developed, where Indonesian psychology bachelor students can obtain double degrees after studying two years at UI and another two years at UQ. After finishing the whole joint curriculum of four years, the students will get an Indonesian degree (SPsi/Sarjana Psikologi) from UI and BA (Psy) degree from UQ. The value added of getting a double degree is that the student may proceed with his/her career or study in Indonesia or abroad (English speaking countries), because the degrees are acknowledged in its respective countries. The program is successful and still going on until today (14 years). Additional exchange of faculty members and visiting professors is also included in the program, making it more beneficial for both universities and the students (retrieved from http://www.psikologi.ui.ac.id/pages/ kelas-internasional).
Another advantage of having personal international networks is the relative easy means to invite international psychologists to share his/her expertise as a guest lecturer. In 2013, for example, I have invited five foreign psychologists5 who attended the 2013 ICP convention at UPI, Jakarta, to lecture to five faculties of psychology of different universities in Jakarta. For the host faculties, it is a golden opportunity to get a free international lecture, because the international psychologists gave the lectures voluntarily. In the last three years, 5 They are: (1) Dr. Ludwig Lowenstein (UK), (2) Dr. Tara Pir (USA), (3) Dr. RoselineDavido (France), (4) Dr. Consuelo Barreda-Hanson (Australia), and (5) Dr. Sandra Neil (Australia).
INTERNATIONALIZATION OF PSYCHOLOGY EDUCATION IN INDONESIA 873
as the Dean of the faculty of psychology UPI, I also have invited other international psychologists as guest lecturers6.
Another way to internationalize psychology is through student exchange program. In 2013, a group of psychology students from UM (the University Malaya), accompanied by their lecturers visited UPI. A program was set for them at the faculty of psychology, from sitting in classes, sport competition, and cultural performance to sightseeing. In 2014, a similar program was arranged for some psychology students of UPI to visit the psychology students of the UM. In both events, the number of visiting students is between 20 and 30, and length of stay 4-5 days. During the visit, the Indonesian students stayed at the student dormitory at UM campus, however, since UPI has no dormitory, the Malaysian students were placed in a large guest house, nearby UPI campus, so they can reach the campus easily. During the visits, host students always accompanied the visiting students. The result of interaction is friendship and networking between students of the two countries, particularly because the students speak two almost similar languages, i.e., Bahasa Indonesia and Bahasa Malaysia.
International Publication Last but not least, just like in other disciplines, the internationalization of Indonesian psychology can be
accomplished through international publication. There are a few ways to publish internationally, i.e., by publishing in international psychology journals, presenting in international congresses, writing chapters in international books, and publishing independent international book.
The main constraint for Indonesian psychologists to go international is language barrier. Only a small portion of psychology community in Indonesia is fluent in English. Even less in English writing, let alone English journal writing. This is not typical of psychology community, because Indonesians by and large don�’t speak English as the mother language, although English is taught in schools. However, this constraint shouldn�’t be the reason of the scarcity of international publication by Indonesian scholars, which is currently the case. In Table 1, it is obvious that compared to other ASEAN (Association of South East Asian Nations) countries, Indonesian universities are the lowest in terms of international publication (Scopus league). Even much lower than Thailand, which is also a non-English speaking country (in Singapore and Malaysia, English is widely used as a second language).
Table 1 Number of Publication of Top Universities in Four ASEAN Countries (Scopus League) University Country Total publication Publication in 2012 Bandung Institute of Technology (ITB) Indonesia 2,607 398 Mahidol University Thailand 18,716 2,675 University of Malaya Malaysia 18,838 2,617 National University Singapore 69,505 5,188 Source: Retrieved July 13, 2014, from http://www.kopertis12.or.id/2013/03/04/publikasi-perguruan-tinggi-indonesia-di-mata- dunia.html
I think Indonesia has to find out how Thailand universities could perform much better than Indonesia. In my own experience, I have written four chapters in four different international books (Sarwono, 2004a;
6 (1) Dr. Roseloine Davido (France), (2) Dr. Jas Laile (Malaysia), and (3) Dr Sherri McCarthy (Norhern Arizona, USA).
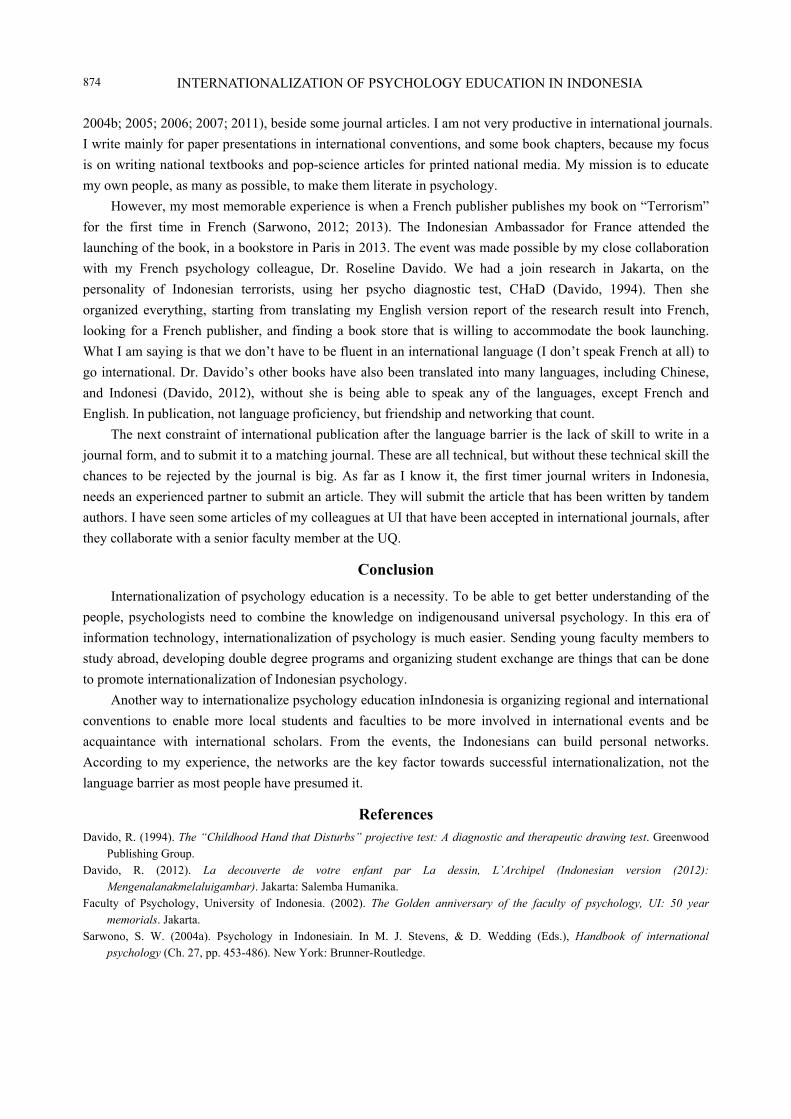
INTERNATIONALIZATION OF PSYCHOLOGY EDUCATION IN INDONESIA 874
2004b; 2005; 2006; 2007; 2011), beside some journal articles. I am not very productive in international journals. I write mainly for paper presentations in international conventions, and some book chapters, because my focus is on writing national textbooks and pop-science articles for printed national media. My mission is to educate my own people, as many as possible, to make them literate in psychology.
However, my most memorable experience is when a French publisher publishes my book on �“Terrorism�” for the first time in French (Sarwono, 2012; 2013). The Indonesian Ambassador for France attended the launching of the book, in a bookstore in Paris in 2013. The event was made possible by my close collaboration with my French psychology colleague, Dr. Roseline Davido. We had a join research in Jakarta, on the personality of Indonesian terrorists, using her psycho diagnostic test, CHaD (Davido, 1994). Then she organized everything, starting from translating my English version report of the research result into French, looking for a French publisher, and finding a book store that is willing to accommodate the book launching. What I am saying is that we don�’t have to be fluent in an international language (I don�’t speak French at all) to go international. Dr. Davido�’s other books have also been translated into many languages, including Chinese, and Indonesi (Davido, 2012), without she is being able to speak any of the languages, except French and English. In publication, not language proficiency, but friendship and networking that count.
The next constraint of international publication after the language barrier is the lack of skill to write in a journal form, and to submit it to a matching journal. These are all technical, but without these technical skill the chances to be rejected by the journal is big. As far as I know it, the first timer journal writers in Indonesia, needs an experienced partner to submit an article. They will submit the article that has been written by tandem authors. I have seen some articles of my colleagues at UI that have been accepted in international journals, after they collaborate with a senior faculty member at the UQ.
Conclusion Internationalization of psychology education is a necessity. To be able to get better understanding of the
people, psychologists need to combine the knowledge on indigenousand universal psychology. In this era of information technology, internationalization of psychology is much easier. Sending young faculty members to study abroad, developing double degree programs and organizing student exchange are things that can be done to promote internationalization of Indonesian psychology.
Another way to internationalize psychology education inIndonesia is organizing regional and international conventions to enable more local students and faculties to be more involved in international events and be acquaintance with international scholars. From the events, the Indonesians can build personal networks. According to my experience, the networks are the key factor towards successful internationalization, not the language barrier as most people have presumed it.
References Davido, R. (1994). The �“Childhood Hand that Disturbs�” projective test : A diagnostic and therapeutic drawing test . Greenwood
Publishing Group . Davido, R. (2012). La decouverte de votre enfant par La dessin, L�’Archipel (Indonesian version (2012):
Mengenalanakmelaluigambar). Jakarta: Salemba Humanika. Faculty of Psychology, University of Indonesia. (2002). The Golden anniversary of the faculty of psychology, UI: 50 year
memorials. Jakarta. Sarwono, S. W. (2004a). Psychology in Indonesiain. In M. J. Stevens, & D. Wedding (Eds.), Handbook of international
psychology (Ch. 27, pp. 453-486). New York: Brunner-Routledge.
INTERNATIONALIZATION OF PSYCHOLOGY EDUCATION IN INDONESIA 875
Sarwono, S. W. (2004b). Violence in Indonesia. In L. L. Adler, & F. Denmark (Eds.), International perspectives on violence (Ch. 6, pp. 95-110). Westport, Connecticut: Praeger.
Sarwono, S. W. (2005). Families in Indonesia. In J. L. Roopnarine, & U. P. Gielen (Eds.), Families in global perspective (Ch. 7, pp. 104-119). Boston: Pearson.
Sarwono, S. W. (2007). What is in their minds? The Psychology of suicide bombers in Indonesia. In A. L. Comunian, & R. Roth (Eds.), International perspectives in psychology: Proceedings of the 64th Annual International Council of Psychologists, pp. 413-419, July 10-13, 2006, Kos, Greece. Aachen: Shaker Verlag.
Sarwono, S. W. (2011). An Indonesian perspective on psychological literacy. In J. Cranney, & D. S. Dunn (Eds.), The psychologically literate citizen: Foundations and global prespectives. Oxford: Oxford University Press.
Sarwono, S. W. (2012). Déradicalisation de la personnalitéd�’ex-terroristes, à l�’aide du Davido-ChaD, Edilivre, Paris (The Indonesian version (2013): MenakarJiwaTeroris Indonesia, melaluiTesDavidoCHaD). Jakarta: Salemba Humanika.
Tashakkori, A., & Teddie, C. (2010). SAGE handbook of mixed method in social and behavioral research. Singapore: Sage.
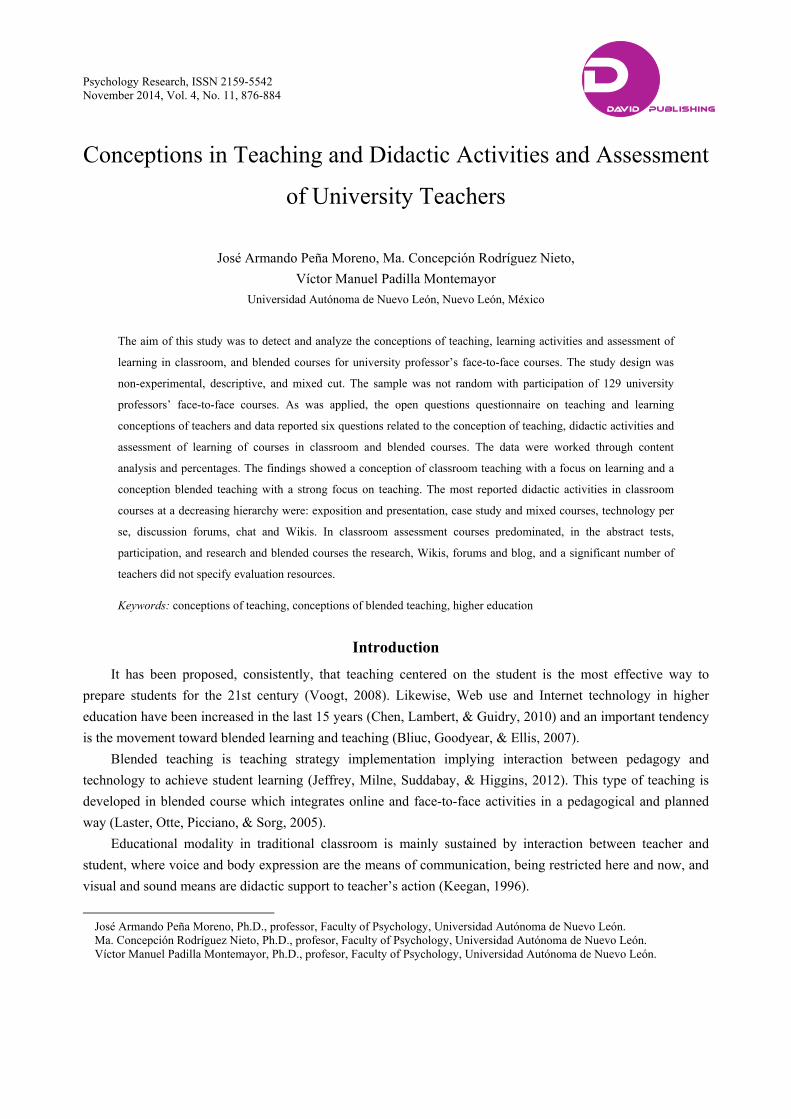
Psychology Research, ISSN 2159-5542 November 2014, Vol. 4, No. 11, 876-884
Conceptions in Teaching and Didactic Activities and Assessment
of University Teachers
José Armando Peña Moreno, Ma. Concepción Rodríguez Nieto, Víctor Manuel Padilla Montemayor
Universidad Autónoma de Nuevo León, Nuevo León, México
The aim of this study was to detect and analyze the conceptions of teaching, learning activities and assessment of
learning in classroom, and blended courses for university professor�’s face-to-face courses. The study design was
non-experimental, descriptive, and mixed cut. The sample was not random with participation of 129 university
professors�’ face-to-face courses. As was applied, the open questions questionnaire on teaching and learning
conceptions of teachers and data reported six questions related to the conception of teaching, didactic activities and
assessment of learning of courses in classroom and blended courses. The data were worked through content
analysis and percentages. The findings showed a conception of classroom teaching with a focus on learning and a
conception blended teaching with a strong focus on teaching. The most reported didactic activities in classroom
courses at a decreasing hierarchy were: exposition and presentation, case study and mixed courses, technology per
se, discussion forums, chat and Wikis. In classroom assessment courses predominated, in the abstract tests,
participation, and research and blended courses the research, Wikis, forums and blog, and a significant number of
teachers did not specify evaluation resources.
Keywords: conceptions of teaching, conceptions of blended teaching, higher education
Introduction It has been proposed, consistently, that teaching centered on the student is the most effective way to
prepare students for the 21st century (Voogt, 2008). Likewise, Web use and Internet technology in higher education have been increased in the last 15 years (Chen, Lambert, & Guidry, 2010) and an important tendency is the movement toward blended learning and teaching (Bliuc, Goodyear, & Ellis, 2007).
Blended teaching is teaching strategy implementation implying interaction between pedagogy and technology to achieve student learning (Jeffrey, Milne, Suddabay, & Higgins, 2012). This type of teaching is developed in blended course which integrates online and face-to-face activities in a pedagogical and planned way (Laster, Otte, Picciano, & Sorg, 2005).
Educational modality in traditional classroom is mainly sustained by interaction between teacher and student, where voice and body expression are the means of communication, being restricted here and now, and visual and sound means are didactic support to teacher�’s action (Keegan, 1996).
José Armando Peña Moreno, Ph.D., professor, Faculty of Psychology, Universidad Autónoma de Nuevo León. Ma. Concepción Rodríguez Nieto, Ph.D., profesor, Faculty of Psychology, Universidad Autónoma de Nuevo León. Víctor Manuel Padilla Montemayor, Ph.D., profesor, Faculty of Psychology, Universidad Autónoma de Nuevo León.
DAVID PUBLISHING
D
CONCEPTIONS IN TEACHING AND DIDACTIC ACTIVITIES AND ASSESSMENT 877
Difference between traditional and blended classroom courses implies instructors extend teaching to planning, implementation and assessment areas (Gilakjani & Branch, 2012). Effective integration of information and communication technology (TIC, in Spanish) depends on interactions between technology, content and pedagogy allowing significant results in student�’s learning (Angeli & Valanies, 2009).
Nowadays, there is an increase of TIC use in higher education (Brouwer, Ekimova, Jasinska, Van Gastel, & Virgailaite-Meckauskaite, 2009) and consequently, it is probable that instructors, who have worked in traditional classroom, add technology to teaching. Instructors are active agents in changing processes, thus, their conceptions can support or obstruct the success of TIC usage so as to achieve learning (Levin & Wadmany, 2006).
TIC incorporation to education should be accompanied by a conceptual change in teaching-learning and in teaching methodology, considering the means it is taking place, either face-to-face or by technology (Kirkwood & Price, 2011). This context is a layer of issues like: what are the teaching conceptions and their components of didactic activities and assessment in traditional classroom courses and blended courses for teachers who teach in classrooms and who potentially shall need to implementblended courses? This is the objective of this study. It was started from differences in conceptions from teachers concerning educational modalities, focusing more on classroom courses learning.
Knowledge of teaching conceptions from teachers due to their influence on teaching methodology and on learning results of the student which could lead to a reflection provoking improvement favorable changes in teaching and learning. Furthermore, it may be useful for designing teaching formation programs inblended courses and its effective implementation.
Conceptions of Teaching University teaching conceptions are teaching actions shaped and influenced by judgments and beliefs
about teaching and learning (Canbay & Beceren, 2012). Since the 1990s, approaches of instructors�’ teaching conceptions can be placed in a continuum (Prosser &
Trigwell, 2001) where teaching centered on instructor is placed on one side, and teaching centered on the student is on the other side (Akerlind, 2007; Trigwell, Prosser, & Waterhouse, 1999).
Results from previous researches�’ revision, Kember (1997) proposes five teaching conceptions: orientation centered on teaching formed by information and transmission of structured knowledge; teaching as interaction performing as a bridge between the two orientations and the orientation centered on learning by components to facilitate comprehension and conceptual change and intellectual development.
Gao and Watkins (2002) found five teaching conceptions: impartationof knowledge, preparation for exams, skills development, attitudes promotion, and guided behavior. The first two ones focused on teaching and knowledge transmission and the last three ones are focused on learning where teacher is a learning facilitator and model of attitudes allowing student to learn interacting and communicating appropriately with his fellows, teachers, school authorities, and parents.
A research from Smith (2006) revealed four categories of teaching conceptions: transmission of subject program, program comprehension, program adaptation, and independent learning. The first two ones are focused on teaching where teacher imparts his knowledge, corrects the student if he is wrong and encourages him to apply knowledge in real life�’s situations. The last two ones focused on learning where instructor is

CONCEPTIONS IN TEACHING AND DIDACTIC ACTIVITIES AND ASSESSMENT 878
aguide whose intention is to make student achieve independent learning and construct new conceptions of subjects of study.
Conceptions of Blended Teaching Teachers�’ conceptions strongly affect technology integration (Gilakjani & Branch, 2012). A study from
Becker and Ravitz (1999) showed teachers�’ conceptions about teaching and teaching methodology in a based TIC environment are in a continuum, where teaching as impartation, is positioned on one end, and teaching as facilitation of student�’s knowledge restructuration is on the other end.
Kember and Kwan (2000) detected that blended teaching can be integrated in two big categories. On one side, professor visualizes technology in terms of capacity to store and transmit information or access and recovery of resources. On the other side, teachers think that facilitation of communication and synchronic or diachronic dialogue can be achieved. These positions are associated to approach on teaching and learning, respectively.
Ellis, Steed, and Aplebee (2006) found four blended teaching conceptions. Categories A and B correspond to approach learning and categories C and D are approached teaching where technology is used to transmit information and teacher�’s role is to provide a variety of accesses to information.
In a research made by González (2007), three teaching conceptions were identified in bachelor�’s instructors, in online face-to-face courses: to provide academic and administrative information related to the course; to create, construct, and share knowledge. The first one focused on teaching and the other two ones on learning, where TIC is used to improve discussion, debate, comprehension development and knowledge construction (González, 2013).
Didactic and Assessment Activities Teaching and assessment conceptions of instructors are essential to predict their practice, decision-making
and teaching approach (Winterbottom, Brindley, Taber, Fisher, Finney, & Riga, 2008). In teaching approach conception, instructors have informed the use of exposition didactic activities (Gao
& Watkins, 2002) and presentation of facts, data and explanations (Tsai, 2002). Assessment resources are multiple option tests, false or true, to be completed, and student�’s presentation of a subject (Aydeniz, 2006; Gao & Watkins, 2002) being limited to knowledge acquisition imparted by the teacher (Tsai, 2002).
In learning approach conception, teaching has been reported by interaction between student and professor (Gao & Watkins, 2002), problems�’ solution, self-discovery experiences (Tsai, 2002) and group activities (Smith, 2006). The most frequent forms of assessment are essays, case study, problem-solving tasks (Gow & Kember, 1993) and collaborative projects (Delandshere, 2002).
Moreover, on learning approach, it has been informed the application of knowledge to non-familial problems and use of inferences, discussion, and laboratory practices where students register data are organized logically and analyzed to obtain conclusions (Aydeniz, 2009). Assessment is used to monitor student�’s progress in order to receive an adequate feedback (Tsai, 2002).
In TIC integration courses, on teaching approach, some didactic activities are the transmission of information related to the course, lecture notes and access to resources online, through technological resources (Ellis et al., 2006; González, 2013).
CONCEPTIONS IN TEACHING AND DIDACTIC ACTIVITIES AND ASSESSMENT 879
In a meta-analysis about assessment, made by Thomson and Falchikov (2007), when using technology, it was detected that in more than half of articles, the use of multiple option tests was reported and that discussion forums and student�’s collaborative work were unusual. Hounsell et al. (2007), in other meta-analysis, found that in many of the studies reviewed, multiple option exams were used.
In blended courses, on learning approach, activities are used to develop skills of thought, reflection, application of real world concepts and among them is the approach based on evidence, problems analysis (Ellis et al., 2006), discussion forums, Wikis or Web-video conference (Giesbers, Rienties, Gijselaers, Segers, & Tempelaar, 2009) and collaborative work (Van Merriënboer & Paas, 2003). These activities are used for teaching and assessment.
Method Design of Study
Design of study is no-experimental, descriptive, cross-sectional and blended methodology.
Sample Sample is: no probabilistic sample, participating129 university teachers of traditional classroom courses.
Instruments Instruments are: open-ended questionnaire about teaching and learning conceptions of face-to-face courses�’
teachers (Moreno, Rodriguez, & Padilla, n.d.). In this study, six questions data are reported: (1) What is the meaning for you of classroom teaching (face-to-face)? (2) What is the meaning for you of blended teaching (hybrid, online, supported by computers)? (3) What are the didactic activities (teaching-learning-teaching) featuring classroom teaching (face-to-face)? (4) What are the didactic activities (teaching-learning techniques) featuring blended courses (hybrids, online, supported by computers)? (5) How students�’ learning is evaluated in classroom teaching (face-to-face)? and (6) How students�’ learning is evaluated in blended courses (hybrids, online, supported by computers)?
In questions, constructs used as well or employed to refer types of courses and didactic activities were incorporated in parenthesis, by accepting conceptual differences and at the same time the presence of central shared elements that could facilitate the understanding of teacher�’s questioning, considering the diversity of previous knowledge that they could have.
Procedure Procedure is: Instrument application was individual in an exposition, without limit of time. In qualitative
phase, instructors�’ answers were treated by content analysis. Analysis categories are based on central aspects of a group of teaching conceptions�’ descriptions, by considering approach on teaching and learning, reported in specialized literature.
Teachers�’ answers were analyzed and discussed by two persons so as to minimize overlapping and patterns�’ identification of each category of teaching conceptions and didactic and assessment activities. Qualitative data were transformed in numerical codes and treated with percentages.
Results In the results, teachers showed a classroom teaching conception focused on learning, and a blending
teaching conception strongly focused on teaching (see Table 1).
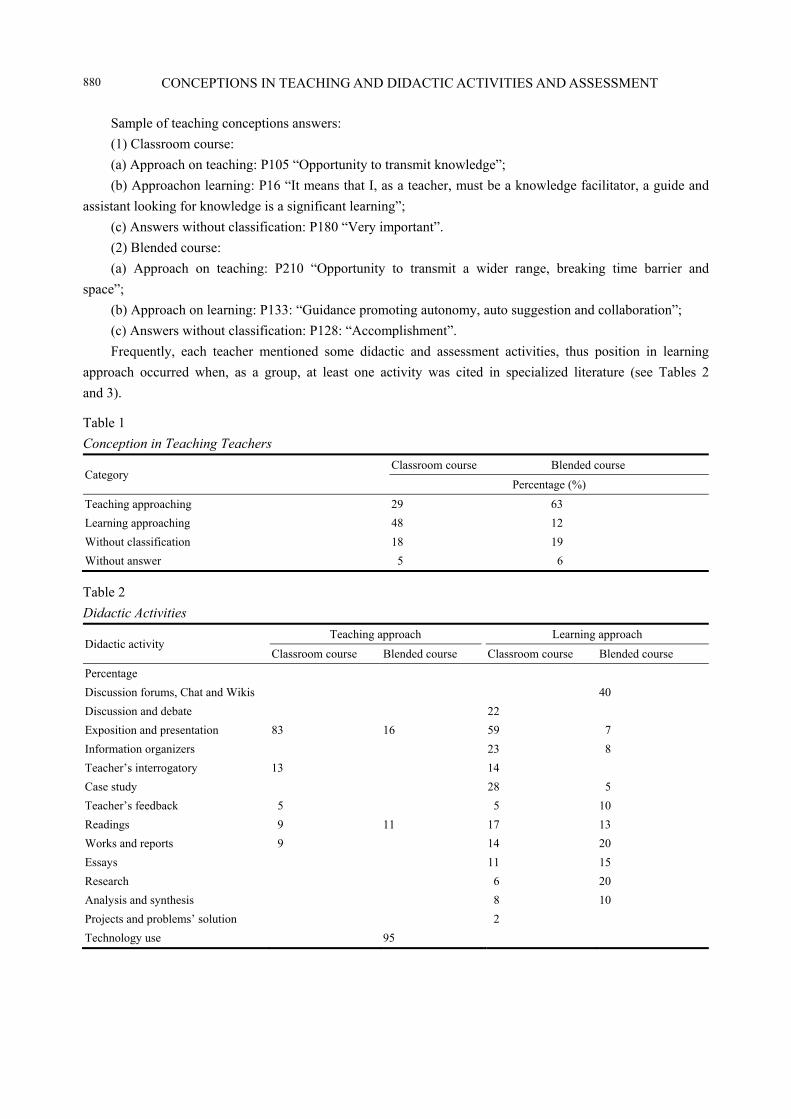
CONCEPTIONS IN TEACHING AND DIDACTIC ACTIVITIES AND ASSESSMENT 880
Sample of teaching conceptions answers: (1) Classroom course: (a) Approach on teaching: P105 �“Opportunity to transmit knowledge�”; (b) Approachon learning: P16 �“It means that I, as a teacher, must be a knowledge facilitator, a guide and
assistant looking for knowledge is a significant learning�”; (c) Answers without classification: P180 �“Very important�”. (2) Blended course: (a) Approach on teaching: P210 �“Opportunity to transmit a wider range, breaking time barrier and
space�”; (b) Approach on learning: P133: �“Guidance promoting autonomy, auto suggestion and collaboration�”; (c) Answers without classification: P128: �“Accomplishment�”. Frequently, each teacher mentioned some didactic and assessment activities, thus position in learning
approach occurred when, as a group, at least one activity was cited in specialized literature (see Tables 2 and 3).
Table 1 Conception in Teaching Teachers
Category Classroom course Blended course
Percentage (%) Teaching approaching 29 63 Learning approaching 48 12 Without classification 18 19 Without answer 5 6
Table 2 Didactic Activities
Didactic activity Teaching approach Learning approach
Classroom course Blended course Classroom course Blended course Percentage Discussion forums, Chat and Wikis 40 Discussion and debate 22 Exposition and presentation 83 16 59 7 Information organizers 23 8 Teacher�’s interrogatory 13 14 Case study 28 5 Teacher�’s feedback 5 5 10 Readings 9 11 17 13 Works and reports 9 14 20 Essays 11 15 Research 6 20 Analysis and synthesis 8 10 Projects and problems�’ solution 2 Technology use 95

CONCEPTIONS IN TEACHING AND DIDACTIC ACTIVITIES AND ASSESSMENT 881
Examples of didactic activities�’ answers: (1) Classroom course: (a) Approach on teaching: P73 �“I, the teacher, speak; you, the student, listen�”; (b) Approach on learning: P114 �“Exposition, small groups discussion, brainstorm, direct interrogatory�”; (c) Answers with classification: P67 �“Varied�”. (2) Blended course: (a) Approach on teaching: P103 �“The student, when entering platform, reviews files, and there, he shall be
able to see objects and contents of document, as well as the way to resolve it and its application�”; (b) Approach on learning: P202 �“Participation in forums, Wiki, sign-in logs, blog designs, expositions,
essays writing, mental map preparation, group activities, assessment, self-assessment�”; (c) Answers without classification: P26 �“I do not know it�”. The position of evaluation activities �“without classification�” was drawn from inaccurate information or
difficulty to define their meaning if they could have characteristics of both teaching approaches (see Table 3).
Table 3 Assessment Activities
Activity Without classification Learning approach
Classroom course Blended course Classroom course Blended course Percentage (%)
Without specification 28 40 Exams 56 7 54 34 Participation 28 1 20 3 Works 19 17 18 19 Expositions 18 3 15 3 Essays 15 9 Researches 28 53 Signatures 1 Wiki forum, blog 44
Descriptions of assessment resources�’ answers: (1) Classroom courses: (a) Approach on learning: P38 �“Learning may be evaluated by exams, projects, essays, interventions,
researches, etc.�”; (b) Answers without classification: P12 �“I think knowledge is better founded�”. (2) Blended courses: (a) Approach on learning: P113 �“Participation in forums, project preparation, case study, task delivery,
graphic organizers, summaries, essays, objective exams online�”; (b) Answers without classification: P129 �“Because of knowledge acquired�”.
Discussion Differences on teaching conceptions and didactic and assessment activities were detected. In classroom
teaching conceptions, tendency was higher on learning approach and in teaching blended courses. Therefore,
CONCEPTIONS IN TEACHING AND DIDACTIC ACTIVITIES AND ASSESSMENT 882
assumption of differences between the two educational modalities was verified as well as conceptions on higher approach on learning in classroom courses than in blended courses.
In both types of courses, a higher diversity of didactic activities was showed on learning approach than on teaching one. In didactic activities associated to classroom learning approach, it stands out the limited mention of problems solution, collaborative projects, inference use and activities to construct knowledge, among others (Aydeniz, 2009; Smith, 2006). In blended courses, Wikis and discussion forums stood out (Giesbers, et al., 2009), and the few references to approach based on evidence, problems analysis (Ellis et al., 2006) and collaborative work (Van Merriënboer & Paas, 2003).
On teaching approach, exposition and presentation were stood out in classroom (Gao & Watkins, 2002; Tsai, 2002); and in blended courses, technology per se can be related to information transmission so as to place line courses�’ materials and access to technology (Ellis et al., 2006; González, 2013).
Concerning classroom assessment focused on learning, the most reported resources were abstract exams, researches, participation and exposition and blended courses, researches and Wiki, discussion forums and blog, being this last time an incongruent result from low use of these tools, detected in Thomson and Falchikov�’s meta-analysis (2007).
In both types of courses, an important number of teachers did not specify assessment resources, especially in blended courses. From this result, it is possible to infer the need of a higher and deeper knowledge from teachers about assessment resources, particularly for blended courses.
Didactic function and/or assessment of activities like cases of study, exposition, researches, discussion forums, Wikis, etc., mentioned herein serve as a deep reflection to instructors and teaching methodology responsible personnel. From this situation, it can be inferred the need of a knowledge that allows characterizing and differentiating theses resources in each function to be used pertinently, adjusted to objective.
Predominancein blended courses of a teaching conception focused on teaching, the higher rate of technological reference per se and TIC limited resources for didactic and assessment activities mentioned by the teachers, allow suggesting the need of a teaching methodology which integrates, in a pedagogical manner, technology to classroom courses.
References Åkerlind, G. (2007). Constraints on academics�’ potential for developing as a teacher. Studies in Higher Education, 32(1), 21-37. Angeli, C., & Valanides, N. (2009). Epistemological and methodological issues for the conception, development, and assessment
of ICT-TPCK: Advances in technology and pedagogical content knowledge (TPCK). Computers and Education, 52, 154-168.
Aydeniz, M. (2006). Understanding the challenges to the implementation of assessment reform in science classrooms: A case study of science teachers�’ conceptions and practices of assessment (electronic). Theses, Treatises and Dissertations. Paper 266.
Aydeniz, M. (2009). Defining and measuring science teachers�’ conceptual ecology for assessment of students�’ learning in science. Paper presented at the Annual International Meeting of the National Association for Research in Science Teaching, Garden Grove, C.A..
Becker, H., & Ravitz, J. (1999). The influence of computer and Internet use on teachers�’ pedagogical practices and perceptions. Journal of Research on Computing in Education, 31(4), 356-384.
Bliuc, A. M., Goodyear, P., & Ellis, R. A. (2007). Research focus and methodological choices in studies into students�’ experiences of blended learning in higher education. The Internet and Higher Education, 10(4), 231-244.
Brouwer, N., Ekimova, L., Jasinska, M., Van Gastel, L., & Virgailaite-Meckauskaite, E. (2009). Enhancing mathematics by online assessments, two cases of remedial education considered. Industry and Higher Education, 23(4), 277-284.

CONCEPTIONS IN TEACHING AND DIDACTIC ACTIVITIES AND ASSESSMENT 883
Canbay, O., & Beceren, S. (2012). Conceptions of teaching held by the instructors in English language teaching departments. Turkish Online Journal of Qualitative Inquiry, 3(3), 71-78.
Chen, P. S. D., Lambert, A. D., & Guidry, K. R. (2010). Engaging online learners: The impact of Web-based learning technology on college student engagement. Computers & Education, 54(4), 1222-1232.
Delandshere, G. (2002). Assessment as inquiry. Teachers College Record, 104(7), 1461-1484. Ellis, R. A., Steed, A. F., & Applebee, A. C. (2006). Teacher conceptions of blended learning, blended teaching and associations
with approaches to design. Australasian Journal of Educational Technology, 22(3), 312-335. Gao, L., & Watkins, D. A. (2002). Conceptions of teaching held by school science teachers in P.R. China: Identification and cross
cultural comparisons. International Journal of Science Education, 24(1), 61-79. Giesbers, B., Rienties, B., Gijselaers, W. H., Segers, M., & Tempelaar, D. T. (2009). Social presence, web videoconferencing and
learning in virtual teams. Industry and Higher Education, 4(23), 301-310. Gilakjani, A. P., & Branch, L. (2012). EFL teachers�’ beliefs toward using computer technology in English language teaching.
Journal of Studies in Education, 2(2), 62-80. González, C. (2007). Variation in lecturers�’ experiences of teaching undergraduate on campus courses using the web. In R. J.
Atkinson, C. McBeath, S. K. A. Soong, & C. Cheers (Eds.), ICT: Providing choices for learners and learning, Proceedings ASCILITE Singapore 2007, pp. 333-338. Centre for Educational Development, Nanyang Technological University, Singapore.
González, C. (2013). E-teaching in undergraduate university education and its relationship to approaches to teaching. Informatics in Education, 12(1), 81-92.
Gow, L., & Kember, D. (1993). Conceptions of teaching and their relationship to student learning. British Journal of Educational Psychology, 63, 20-33.
Hounsell, D., Falchikov, N., Hounsell, J., Klampfleitner, M., Huxham, M., Thomson, K., & Blair, S. (2007). Innovative assessment across the disciplines: An analytical review of the literature. Higher Education Academy. Retrieved 2012 from http://www.heacademy.ac.uk/assets/York/documents/ourwork/research/Innovative_assessment_LR.pdf
Jeffrey, L. M., Milne, J., Suddabay, G., & Higgins, A. (2012). Research report: Help or hindrance: Blended approaches and student engagement. Publishers AkoAotearoa National Centre for Tertiary Teaching Excellence.
Keegan, D. (1996). Foundations of distance education. Publisher: Routledge. Kember, D. (1997). A reconceptualisation of the research into academics�’ conceptions of teaching. Learning and Instruction, 7(3),
255-275. Kember, D., & Kwan, K. P. (2000). Lecturers�’ approaches to teaching and their relationship to conceptions of good teaching.
Instructional Science, 28(5), 469-490. Kirwood, A., & Price, L. (2011). Enhancing learning and teaching through technology: A guide to evidence-based practice for
academic developers. Higher Education Academy, York, UK. Laster, S., Otte, G., Picciano, A. G., & Sorg, S. (2005). Redefining blended learning. Presentation at the Sloan-C Workshop on
Blended Learning, Chicago, I.L. Levin, T., & Wadmany, R. (2006). Teacher�’s beliefs and practices in technology-based classrooms: A developmental view.
Journal of Research on Technology in Education, 39(2), 157-181. Moreno, J. A., Rodríguez, N. M. C., & Padilla, V. M. (n.d.). Cuestionario de preguntas abiertas sobre conceptions de enseñanza
y aprendizaje de profesores de cursos presenciales. Prosser, M., & Trigwell, K. (2001). Understanding learning and teaching: The experience of higher education. The Society for
Research into Higher Education, Buckingham. Smith, L. (2006). Teachers�’ conceptions of teaching at a gulf university: A starting point for revising a teacher development
program. Learning and Teaching in Higher Education: Gulf Perspectives, 1, 1. Retrieved September 22, 2007, from http://www.zu.ac.ae/lthe/vol3no1/documents/lthe03_01_02.htm
Thomson, K., & Falchikov, N. (2007). An analytical review of innovation in assessment and its relationship to practice. Enhancing Higher Education, Theory and Scholarship, Proceedings of the 30th HERDSA Annual Conference, Adelaide, July 8-11. Retrieved 2012, from http://www.herdsa.org.au/wpcontent/uploads/conference/2007/papers/p83.pdf
Trigwell, K., Prosser, M., & Waterhouse, F. (1999). Relations between teachers�’ approaches to teaching and students�’ approaches to learning. Higher Education, 37, 57-90.
Tsai, C. (2002). Nested epistemologies: Science teachers�’ beliefs of teaching, learning and science. International Journal of Science Education, 24(8), 771-783.

CONCEPTIONS IN TEACHING AND DIDACTIC ACTIVITIES AND ASSESSMENT 884
Van Merriënboer, J. J. G., & Paas, F. (2003). Powerful learning and the many faces of instructional design: Towards a framework for the design of powerful learning environments. In E. De Corte, L. Verschaffel, N. Entwistle, & J. J. G. Van Merriënboer (Eds.), Powerful learning environments: Unraveling basic components and dimensions (pp. 3-20). Oxford: Elsevier Science.
Voogt, J. (2008). IT and the curriculum processes: Dilemmas and challenges. In J. Voogt, & G. Knezek (Eds.), International Handbook of Information Technology in Primary and Secondary Education (pp. 117-132). New York: Springer.
Winterbottom, M., Brindley, S., Taber, K. S., Fisher, L. G., & Finney, J., & Riga, F. (2008). Conceptions of assessment: Trainee teachers�’ practice and values. Curriculum Journal, 19(3), 193-213.
Psychology Research, ISSN 2159-5542 November 2014, Vol. 4, No. 11, 885-896
The Participation of a Brazilian Family in Psychosocial
Counseling of Obese Children and Adolescents*
Maria Alexina Ribeiro, Vladimir de Araújo Albuquerque Melo, Heron Flores Nogueira, Marília Marques da Silva, Ilckmans Bergma Moreira Mugarte, Aldenira Barbosa Cavalcante,
Jamile Xavier Fernandes de Castro Catholic University of Brasilia (UCB), Brasília, Brazil
Regarded by the World Health Organization as a public health matter, an analysis of the statistics shows a
significant increase of obesity in children, adolescents, and adults in many parts of the world. Family inclusion in
childhood obesity treatment has been recommended in many scientific studies, and an intervention including
families presupposes knowledge of their dynamics and influence on disease onset and maintenance. In this sense,
the present work aims to present data of research with one family that is part of psychosocial counseling of families
with obese children and adolescents. The sample family is composed of the father, 43 years old, the mother, 36, and
their obese daughter, 10, currently weighing 178 pounds and 1.25 meters in height. The data were collected through
an interview focusing on the family life cycle, from the new couple stage through the present. Data analysis
revealed that the following features interfere with child obesity treatment: parental omission in the daughter�’s diet;
the mother�’s illness complicating fulfillment of parental functions; parents�’ marital difficulties; lack of marital
harmony between parents endangering their complicity in the child�’s protection and education; and family
resistance in accepting and adhering to child obesity treatment. The data reinforce the need for understanding
dynamics of families with obese children and for family inclusion in childhood obesity treatment.
Keywords: childhood obesity, family, systems approach
Introduction The diet has always held an important position, both for survival and as a part of social and interpersonal
human relations. From the time of Greek banquets and Roman food symbolism, through the advent of fast food restaurants that put an end to the ritual that surrounded mealtimes in the 1970s, eating habits followed politics and the sociocultural changes that influenced human behavior in all cultures. Nowadays, we see a mix between
*Acknowledgements: This study is part of a research project funded by CNPq (National Counsel of Technological and Scientific Development) and was developed with the participation of the following students who joined the Scientific Initiation program: Flora Mota de Paula, Ana Paula Oliveira, Denise Mourão de Abreu, Maria Teresa Messias, Lidiane Guimarães Monte, Luiz Henrique Cruz, Flávia Valadares, Larissa Carvalho, and Karine Vilas Boas de Moura.
Maria Alexina Ribeiro, MSc., Psy.D., professor, Catholic University of Brasilia (UCB). Vladimir de Araújo Albuquerque Melo, Master, Catholic University of Brasília (UCB). Heron Flores Nogueira, MSc., Ph.D. student, Catholic University of Brasília (UCB). Marília Marques da Silva, Psy.D., professor, Catholic University of Brasília (UCB). Ilckmans Bergma Moreira Mugarte, MSc., Ph.D. student, Catholic University of Brasília (UCB). Aldenira Barbosa Cavalcante, MSc., Ph.D. student, Catholic University of Brasília (UCB). Jamile Xavier Fernandes de Castro, Catholic University of Brasília (UCB).
DAVID PUBLISHING
D
THE PARTICIPATION OF A BRAZILIAN FAMILY IN PSYCHOSOCIAL COUNSELING 886
low cost and standardized food consumption and out-of-home meals, in addition to the comforts of modern life that result in a sedentary lifestyle. One of the consequences of this combination is the increase of obesity in children, adolescents, and adults in many parts of the world.
Obesity is a chronic disease, of multifactorial etiology and numerous associated complications, according to World Health Organization (2014a). Considered one of the most serious public health problems around the world at this time, obesity has high morbidity and mortality rates, worrying governments and the scientific community alike. Described as �“abnormal or excessive fat accumulation that may impair health�”, obesity can promote the development of severe diseases. It is presumed that over 300 million adults in the world are obese and, together with overweight people, they rank the fifth among the most deadly risk factors in the world. At least 2.8 million adults die every year due to obesity and excessive weight (World Health Organization, 2014b).
In Brazil, the statistics are also alarming. According to the most recent research done by Vigilance System of Chronic Disease Risk Factors by Telephone Survey (Ministry of Health/Brazil, 2013), 17.4% of the Brazilian population is obese, while 51% are overweight. These figures are up from the previous years�’ obesity rate of 15.8% and overweight rate of 48.5% (Ministry of Health/Brazil, 2013). The increasing tendency in Brazil confirms epidemic proportions of obesity all over the world.
It is estimated that half of all obese children become obese adults, with enhanced possibilities of suffering advanced effects, like Diabetes Mellitus, cardiovascular diseases, arterial hypertension, orthopedic and joint problems, higher risk of surgery, among other complications (Kunkel, Oliveira, & Peres, 2009). Camargo, Barros Filho, Antonio, and Giglio (2013) emphasize of the influence obese parents exercise in their children�’s lives; inappropriate dietary practices can contribute to permanent childhood obesity, as environmental conditions are one of the factors most contributing to obesity, and in case of an absence of change inhabits, rarely do obese children lose weight and remain at a healthy weight.
Among the 10 factors in obesity to which World Health Organization (2014a) calls attention, two involve the social and family environment. The first one asserts that positive societal and health messaging are fundamental to shape individuals�’ choices and prevent obesity. The second is that children�’s diet, choices, and physical activity are all influenced by their environment. Moraes and Dias (2012) attribute the epidemic prevalence to changes in families�’ lifestyle due to the progress of urbanization, industrialization, professionalization of women, the high quality of life, and education, among other social changes that have increased access to sweet and fatty foods.
Research into childhood obesity has demonstrated the significant role of family as a factor contributing to the disease�’s emergence and maintenance. Savage, Fisher, and Birch (2007) verified parental influence on children�’s eating habits through the food offered to them by parents, not only by the type of food, but also by the amount. This study recommends that parents should become more aware of their influence and apply new strategies to intervene in children�’s food preferences, for there are works associating the parents�’ push and control with the less fruits and vegetables intake. Another very influential factor on children�’s eating habits connected to family life is marketing, as children on average watch five hours of television per day (Moura, 2010).
Eckstein et al. (2006) have studied the perception of parents who have obese and overweight children and came to the conclusion that parents who recognized their children were overweight were more likely to be concerned about them. These authors pointed out the benefits of identifying health orientations to increase parents�’ concern and awareness, with the purpose of improving their adherence to programs targeting
THE PARTICIPATION OF A BRAZILIAN FAMILY IN PSYCHOSOCIAL COUNSELING 887
overweight children. Boa-Sorte et al. (2007) have done comparative research between maternal perception and children�’s self-perception and verified that lack of appropriate perception between mother and child was likely presented in cases of excessive weight. Other studies also evaluated parents�’ perception and confirmed that many of them distorted the nutritional condition of their obese children. This distortion was even more pronounced in cases of young children�’s parents (Macedo, Festas, & Vieira, 2012; Tenorio & Cobayashi, 2011).
The advantages of including parents in childhood obesity treatment are already recognized. Golan, Weizman, Apter, and Fainaru (1998), for example, conducted research that compared the conventional treatment with a treatment regime carried out with obese children�’s parents, focusing on the children. There was greater weight loss in children and lower rates of discontinuance in the parents�’ group, highlighting the importance of parents in childhood obesity treatment. Therefore, the results revealed that the treatment involving parents was more effective than conventional treatment in many respects, including cost savings. The habits adopted by parents, as well as those applying to the children�’s other social environments, also become targets of change in the case of obesity prevention. Carvalho et al. (2013) argue that: �“The intervention in the family environment begins early, in intrauterine life, stimulating a healthy diet from birth onwards and physical activity starting in the initial months of life�” (p. 81).
The habits modeled by parents in the day-to-day of the family influence the risks to children�’s health. Haines et al. (2013) evaluated the effectiveness of interventions that changed home routines in association with the risk of obesity in children between two and five years old from low-income families. The decrease of BMI (body mass index) was observed in families participating in the motivational intervention called �“Healthy Habits, Happy Homes�” that consists of encouraging families to adopt healthy habits. The effects of this intervention on children included an increase in sleeping time and a decrease in time spent in front of the television.
Regarding the parents�’ relationships in families with childhood obesity, Schmeer (2012) found an increase of BMI and risk of excess weight and obesity in children of three to five years old with mothers who were separated or lived without a mate for two years or more. The study states that not all separations are harmful to children, but it suggests that presence of the mate represents protection from the risk of obesity to the child, even though the same doesn�’t apply to the mother, who tends to gain weight in cohabitation.
The works presented above highlight eating habits and physical activity in childhood obesity. On the other hand, they do not target the analysis or comprehension of the family organization and function from the point of view of system theory, although they underscore the importance of parents�’ involvement in the treatment of childhood obesity. The positive outcomes of system interventions are confirmed by Flodmark and Ohlsson�’s study (2008), in which the results of family therapy were 40% more effective than conventional treatment (including checkup and nutritional counseling). It is worth mentioning that the intervention chosen in this research used techniques that gave the family the responsibility of changing their lifestyle, where the therapist takes the position of facilitator. Tassara, Norton, Marques, and Walter (2010) also understand that the socio-family context, not the child, is responsible for the obesity. Thus, treatment should provide relational changes through a co-construction between family members and professionals of the multidisciplinary team.
An intervention that includes the family presupposes familiarity with the couple�’s and the family�’s dynamics. Accordingly, this article aims to present data about a family participating in psychosocial counseling for families of obese children and adolescents. It comprises part of wider research involving 30 families in
THE PARTICIPATION OF A BRAZILIAN FAMILY IN PSYCHOSOCIAL COUNSELING 888
these conditions and seeks to construct a methodology of counseling to include the whole family of children and adolescents diagnosed with obesity (Ribeiro, 2013). The data discussed in the present work were collected through a family life cycle interview, one of the research activities. The family also participated in the multi-family group that involved four other families, but this activity�’s data will be presented on another occasion.
Method The method elected in this study is the qualitative method, an effort against logical positivism and to
encompass the complexity of the human being (M. C. Dessen, Silva, & M. A. Dessen, 2009). For Martins (2008), it is increasingly common for scientific studies to be oriented by qualitative evaluation, featuring description, comprehension and interpretation of facts and phenomena. Minayo (1994) states that this kind of research facilitates understanding and interpretation of reality, dealing with the whole universe of meanings, motivations, values and attitudes, i.e., a deeper space of relations.
This method was selected for this case study and is justified due to the complexity of the phenomenon and our interest in a deeper analysis of the topic. This kind of study is characterized as a research strategy by allowing the study to investigate deeper phenomena from many angles (Roesch, 1999). Confirming this idea, Gil (1999) points out that the case study is marked by deeper and exhaustive examination of a small number of objects, in order to allow for wider and more detailed knowledge, a task almost impossible in other methods considered.
The Participating Family The family is formed by the father Robert (all names used are fictitious), a 43-year-old landscaper; the
mother Mary, a 36-year-old homemaker, and the daughter Sofia, a third grade student 10 years of age, obese, currently 178 pounds and 4 feet 1 inch tall. Sofia is dyslexic and has many difficulties in school. Sara, Mary�’s sister, lives temporarily with the family. The couple has been married for 12 years, lives in their own home in a region of Brazil�’s Federal District, and has a monthly income of US$ 363 (about four times of the federal minimum salary). Mary has a 16-year-old daughter from her first marriage who has two children, a boy of 18 months and a girl one month old. She is the third daughter of four siblings and has a very close relationship with her 40-year-old sister, Sara. This sister was present in the interview and answered most of the questions put to the mother, showing intimacy with the nuclear family and knowledge of the couple�’s affairs.
Instruments A family life-cycle semi-structured interview was used to collect data, with questions involving the whole
family�’s history, since the beginning of the parents�’ relationship until the present, mainly focusing on issues about the children�’s and family�’s dietary habits. We also used a genogram (Carter & McGoldrick, 1995), a graphic representation of family, containing all members�’ age, kinship and roles.
Procedures The family was referred to us to participate in the research by the Nutrition Program of the Catholic
University of Brasília, where they were being counseled. After the referral, the family was contacted by telephone and the interview was scheduled. The mother Mary, the sister Sara, and the child Sophia, who was diagnosed with obesity, were present. Mary signed the Free and Informed Consent Agreement, which had been approved previously for the research project by the Research Ethics Committee of Catholic University of
THE PARTICIPATION OF A BRAZILIAN FAMILY IN PSYCHOSOCIAL COUNSELING 889
Brasília. The interview was based on an outline created for this purpose, lasting 60 minutes, and the audio was recorded for later transcription.
Data Analysis The interview data were transcribed and interpreted in light of qualitative epistemology, supported by
three principles: (1) Knowledge is a constructive-interpretative process; (2) The production process of knowledge has an interactive character; and (3) The meaning of singularity as legitimate level of knowledge. The qualitative investigation, founded on qualitative epistemology, is not designed to produce final outcomes that can be taken as universal and unchanging references about the subject, but to produce new theoretical moments that can be joined organically to the general process of knowledge production (González Rey, 1999).
Data analysis has three phases, according to González Rey (2010): (1) pre-analysis: The data are read and reread until the content and meaning are apprehended by the researcher; (2) indicator collection: Elements given meaning through the investigator�’s interpretation are constructed on the base of implicit and indirect information; and (3) construction of zones of meaning: Zones of outcome synthesis that summarize the indicators found.
Outcomes and Discussion The data analysis allowed the construction of three zones of meaning that will be presented and discussed
below.
Zone of Meaning 1:�“Sofia Was Born Fat�”: The Beginning of Obesity The mother and the aunt described Sofia as a baby who was already born fat, a kind of baby that attracts
everybody�’s attention. According to the aunt:
She was born large. She was always a large child. Always overweight, since she was a baby. She was never a little baby with a little waist, was never a petite thing. She was a strong little baby, the type people see and say �“Oh what a beautiful baby�”...
Mary breastfed Sofia until her fourth birthday, and then fed her with baby bottle, but did not report when she began to introduce other kinds of food. Currently, Sofia usually drinks soda instead of eating. About the soda, Mary added that she has a one-year-old grandson who does not drink a bottle, but is �“addicted to Coke�”; she said:
He looks at a (soda) bottle and complains! A one-year-old baby pushes us to go there and fill his bottle. Look at this, his intelligence is amazing.
Mary attributes his behavior to intelligence and does not seem to be aware that offering soda to a very young child is inappropriate behavior for adults.
The child�’s diet is the responsibility of the adults who take care of them. They buy, choose, prepare and offer the food to the child, thus, mold habits that can be healthy or not. Mary and Sara�’s calling Sophia a �“fat baby�” is seen as something positive; they do not see how this can represent a risk to the child�’s health. These data lead Tassara (2012) to declare that there is a social belief related to diet, whereby playing the role of mother is to nurture the child, and the relationship between parents and children is based on the following belief: If the child is thin, the parents are not taking care of the child; it is starving. Even though there are many awareness campaigns about the importance of a healthy diet, this belief is still strong in Brazil. Other authors,
THE PARTICIPATION OF A BRAZILIAN FAMILY IN PSYCHOSOCIAL COUNSELING 890
such as Savage, Fisher and Birch (2007), also refer to the influence of parents in type and amount of food ingested by children.
The perception of parents about the obese child is also important in his/her treatment, for when there is no awareness about excess weight and the risks associated with it, this complicates the success of prevention and treatment, even as the resultant decrease of obesity prevalence in childhood (Tenório & Cobayashi, 2011). According to the author, to facilitate this perception a better understanding of factors associated with parents�’ behavior is necessary to stimulate their closer engagement in obesity treatment. Other studies also evaluated the parents�’ perception of children�’s weight and revealed that those who recognize the children�’s weight problem were more susceptible to be concerned about their children (Eckstein et al., 2006). Macedo, Festas, and Vieira (2012) report a significant sample of parents show distortion in relation to their children�’s nutrition and state of obesity, a distortion that was even higher among younger parents. Based on these data, Fisberg (2005) states that the treatment of childhood obesity should include general changes in parents�’ and children�’s attitudes, in relation to eating habits, lifestyle, physical exercise, and long-term alimentary correction.
Sofia was already obese when she started school and had problems, because she did not tolerate being called �“fat�” by schoolmates. The family says that in this phase she started being reclusive, so they decided to take her to a nutritionist. According to Mary, at the beginning they took care with her diet, but later Sofia only ate whatever she wanted and rejected healthy food. From this time forward, mother and aunt failed to give attention to her diet.
She was already fat when she came to school. It was a tough period, because she did not tolerate being called fat by the other kids, and she became reclusive because of this. We were also being counseled by a nutritionist�… I managed in the beginning, we took care of her diet, but she was growing up and did not want to keep on eating what she was supposed to eat�… So she went ahead and gave it up.
Obese people, including children, are frequently victims of bullying, mostly in family and school. Children participating in this research report nicknames and insults related to their weight, not only by schoolmates and friends, but also in the family, such as jokes by siblings and even parents.
Sofia�’s sister has two children. According to Sara, the relationship between them was very nice, but when the children came along, Sofia�’s niece and nephew, she became quiet and reclusive, something noticed even by the teacher. Sara comments:
I went to her school to talk to the teacher because when I do homework with her, I was surprised�… I went there to have a conversation, and so they told me she suffered when her nephew was born�… She started crying more, eating more and became sensitive. Every word spoken to her made her cry.
According to Sara, Sofia is a very reclusive child in school. A psycho-pedagogue was available to help her in solving this problem and diagnosed the dyslexia. She does not read yet, and her father and aunt try to help her in school. The issue of obesity seems to point to the rise of other problems in school that have damaged her development, such as poor socialization, weak school performance and troubles with schoolmates.
With the purpose of highlighting the importance of the relationship between family members and other systems, Minuchin and Fishman (2003) call our attention to the fact that families are multi-individual systems of extreme complexity, but are subsystems of wider unities, like the extended family, the neighborhood, school and the society as a whole. The interaction with these wider subsystems, or holons, as they are also called, produces a significant part of the family�’s problems and responsibilities.
THE PARTICIPATION OF A BRAZILIAN FAMILY IN PSYCHOSOCIAL COUNSELING 891
The teacher said that all the time she is reclusive, she doesn�’t like to play, doesn�’t take a walk, doesn�’t participate in anything. The school has done what it can, and there is nothing else to do.
According to Mary, Sofia suffered when her niece and nephew were born, showing a change of behavior. System theory treats the family as a live organism, dynamic, in continuous oscillation, tending towards (re)equilibrium and able to reach new levels even more complex (Minuchin, 1982). This flotation compared to the live organism can be already noticed in early stages of the family rise, for the system responds to predictable and unpredictable stressors that produce anxiety, especially on family life-cycle transition points (Carter & McGoldrick, 1995).
Bradt (1995) points out that the family life-cycle event that has the greatest impact on the nuclear family is the birth of a child and emphasizes the importance of a closer relationship between parents in the task of taking care of the child. Possibly the birth of the niece and nephew took more of the adults�’ time and attention and, for this reason, the child felt depreciated and rejected, which led her to become more reclusive, including in school. Her eating habits were also affected, after the birth of the children, according to the mother. The family noticed these changes, as confirmed by the school, but did not take measures to solve or ameliorate the problems. The mother refers to her �“neglect�” of her daughter�’s diet, at the time she began to reject the food offered to her. This should not happen, for it is the function of the parents and/or adults in the family to care for, orient, protect and educate the children. In this family, the parental role collapsed, which will be discussed in the following section.
Zone of Meaning 2: �“I Let Her Eat�”: Difficulty in Limiting Children Asked about what the family thinks about eating, Mary recognizes that her diet is wrong, but she does not
care and, thus, let Sofia eat whatever she wants. She knows this eating pattern can harm her daughter�’s health, but �“I do not think about it�”.
It�’s wrong �… But I don�’t care about this food stuff. I let her eat. Sofia, for example, if she eats and there is Coke and I say �“Sofia, have lunch first and then you can drink soda�”, she can skip the food, because she is autonomous. She does it, period!
As the interviewer called the mother�’s attention to Sofia�’s diet and to other health problems obesity that can bring, Mary said she�’s aware, but didn�’t know what to say to change this situation. She considers it her obligation to provide her husband�’s meals because he works.
I don�’t think about it�… Cause I don�’t let him go without food, because in my opinion he has to have his food because he works. So, I think it�’s my obligation to prepare the food he�’s going to take with him.
Once more we see the family�’s neglect related to the diet of the child. Mary seems to be more worried about the husband�’s diet than daughter�’s, as if she didn�’t feel able to carry out both functions and had to choose one of them. This neglect is not only about the matter of nutrition, but other dimensions of the child�’s life, too; according to the mother, she doesn�’t impose rules regarding eating or sleeping times, leaving the child to decide on her own how she�’s going to take care of herself. About her routine, the mother says:
She stays awake until midnight, and so you go to the refrigerator�… Get a yogurt and something else. We say she should eat 2 or 3 cookies only, so she gets angry and doesn�’t eat anything. When she feels like it, she sneaks there and eats an entire package. She likes to eat potato chips and cookies like Prestigio (coconut), Passatempo (chocolate)...
For Minuchin (1982), parents should be able to nurture, control and guide, using authority when necessary,
THE PARTICIPATION OF A BRAZILIAN FAMILY IN PSYCHOSOCIAL COUNSELING 892
and should preponderate the hierarchy of parents over children. These relations, according to the author, suffer changes with the growth of the child, and the functions and rules need to be adjusted for each stage of development. We can see in this family an inability on the part of the parents to perform parental functions, mainly in this important moment of the life cycle, which can result in more serious consequences related to obesity, as well as to health and family development as a whole.
On the other hand, Mary states she recognizes that her daughter needs help:
I�’m going to help her, because she needs my help�… I think I�’ll succeed�… Because it wasn�’t like this I�’m better, I�’m feeling I�’m better, I got to take care of her.
Sofia says that she eats whatever she wants. She knows she should eat less to lose weight, but doesn�’t think she could change anything in her diet: �“I want to keep eating whatever I want�”. The mother says, �“Everything she wants is fatty. She sneaks to the refrigerator, that�’s why she�’s like this. At home, for example, we buy the pizza she likes, but if she has to eat rice she might refuse�”.
Mary and Sara say that there are no clear rules, in general, in the family. Those that exist and are followed are defined by Sara, indicating that this family depends on an external member to establish limits. It is in this moment of the family life cycle, i.e., a family with young children, that parents experience difficulties: In general, they don�’t accept the generational boundary between them and their offspring, while at the same time they complain about the struggle to control the children and establish limits, hoping that children will behave like adults (Carter & McGoldrick, 1995). On the other hand, Sara says that Sofia does not respect her in some situations:
Except someone goes there and turns off the light, like I did with the shower today, I went there and turned off the shower, and so my sister came and clutched at straws. She eats everything she wants, and if she says, �“I won�’t take a bath right now�”, she won�’t. If she goes to the computer and says, �“I�’m staying right here�”, she will and nobody takes her away.
According to Mary, food is used to compensate the father�’s lack of attention. Before, the father used to take a walk with the daughter, was kind, gave her gifts, but now it�’s all compensated with soda, cookies with filling, and instant noodles. The aunt agrees that the absence of the father is compensated with food:
I say they reward Sofia with food. He says he doesn�’t do anything, and she answers: �“Daddy, then give me this�”. And they go to the market and buy whatever she wants.
According to Otto (2007) and Otto and Ribeiro (2012), hunger is the physiological expression of the body�’s need for energy, while the appetite is the psychological desire to eat, which can give someone an anticipatory and particular pleasure. Hunger produces appetite, but the appetite can exist independently and can be stimulated by other means, i.e., a person�’s emotional state is reflected by appetite. Therefore, for obese individuals, the act of eating is felt as a relaxant, as a way to situate anxiety and anguish, given difficulties in dealing with frustration and limits. Food can be used as well to punish or gratify people, as we saw in the statement of Sara, who believes that Sofia�’s father gives her food when he feels distanced from her. The food acquires an emotional value and gains the functions of bringing people affectively together and attempting to create or straiten bonds between family members.
Zone of Meaning 3: �“Sofia Sleeps With Them�…�”: The Mother�’s Illness as a Complicating Factor of the Husband-Daughter Relationship
Robert and Mary have been married for 12 years. She says that in the beginning of the relationship, the
THE PARTICIPATION OF A BRAZILIAN FAMILY IN PSYCHOSOCIAL COUNSELING 893
couple was very close, but after the birth of Sofia, they started become distant, as the girl always slept in their bed. When asked about the marital relationship, Mary answered that it was good, but then the sister spoke up and said:
It�’s useless to hide it�… They�’re a couple, but since Sofia was born she sleeps with them, and now Sofia is grown up and is not used to sleeping alone. Their life as a couple is a little frayed by the lack of intimacy.
About parenthood and conjugality, Carter and McGoldrick (1995) state that the presence of children in the first stages of the family life cycle impedes the formation of an exclusive partner-to-partner relationship preceding the parent function; however, the space of every subsystem needs to be maintained, and in the family studied, we see a clear problem of delimiting the boundaries that give protection and define family roles, putting, in this case, the subsystems�’ healthy functioning at risk.
Mary had anorexia nervosa when she became pregnant with Sofia and then depression. She�’s still in treatment and believes it influences their relationship. She compares it to the way she raised her first daughter:
With the other, �“no�” meant �“no�”, but with Sofia it�’s different, I need to repeat something three or four times and get angry or serious, or else she disobeys me.
She associates this lack of authority with the fact of being sick when she got pregnant with Sofia.
When I got pregnant with my daughter I got sick, I had anorexia, and I�’m still in treatment�… I get a little lax with the medications, and then Sofia doesn�’t obey what I say�… I let her do what she wants to avoid getting upset. I don�’t know how to educate Amanda, but this isn�’t what I want. I need help too. Because if she�’s so fat, I guess it�’s not a good thing�… she makes her own food, gets by...
About the participation of her husband in their daughter�’s education, Mary says that she doesn�’t count on him, because �“he�’s on his own, working and getting home at night, tired �… He speaks very little, to hear something at home we have to turn on the radio or something else�”. Mary says Sofia complains that her parents don�’t go out with her. The girl doesn�’t have friends or relate to schoolmates. According to the mother, the girl doesn�’t like to be with others:
When I got sick she became this way, we were living together, just the two of us. She�’s embarrassed, and I guess she�’s depressed too. I�’m paralyzed. I don�’t want to go anywhere. I guess it�’s because of depression. I don�’t like visiting neighbors or doing anything. So, that�’s what I�’m passing on to her. My life, my routine is to take care of the house and lie down, just that! I take medication everyday.
Her sister said Mary�’s health problems also influence the couple�’s relationship:
Their life as a couple is a little frayed by a lack of intimacy�… Couple�’s stuff, like you get home at night and talk. The time they talk most, I noticed, is during breakfast. They wake up at the same time, and they have contact at that time. They talk about things at home, when they are together.
About the relationship with the husband, Mary says:
It�’s true that she still sleeps with me. My husband sleeps in the other bedroom. After she was born, he wanted to do it, and then it continued when she grew up�… and when we talk about taking her out of our bed, like now that my grandson�’s bedroom is empty, then I said: �“Sofia, now I�’m going to make your bedroom here�”. But she never likes the idea. �“Oh! Mommy now I want my own bedroom�”�—She doesn�’t say it�… so I don�’t feel comfortable taking her out of the bed yet, because she feels alone.
When Mary talks about her past, mentions that she had anorexia nervosa when she became pregnant with
THE PARTICIPATION OF A BRAZILIAN FAMILY IN PSYCHOSOCIAL COUNSELING 894
Sofia and still has depression, and that she takes medication and has medical checkups, we perceive her emotional condition and fragility. She recognizes her incompetence in taking care of her daughter and complains about her husband�’s distance, in that he�’s away from home for so long and has poor communication with her.
In view of this, we see a couple with a damaged relationship, with no commitment in the fulfillment of parental functions. For family therapists, parents are responsible for promoting health and the healthy development of children and the family as a whole. Minuchin and Fishman (1990), for example, states that parents should adapt as children grow up, taking into consideration the changing needs of their offspring, giving them more autonomy, without losing the right of establishing limits and caring for the family as a system. He synthesizes the parental adaptation throughout childhood development in these words: �“Adults who established educational patterns should now change them, developing appropriate methods to keep control, even as they encourage growth�” (p. 34).
The fact that Sofia still sleeps in her parents�’ bed leads us to Bowen (2013), who developed the concept of triangle. In this case, we could say that Sofia would be �“triangulated�” with her genitors, since she performs the important role of intermediating the relationship between father and mother. The function of the child in the homeostatic mechanism of the family is well described by the author. Bowen (2013) understands that the �“problem of �‘triangulated�’ child represents one of the most serious difficulties in family psychotherapy�” (p. 62). For the author, it�’s a projection of family problems onto the child and happens frequently in the regular functioning of systems. However, when it happens intensively, parents cannot distinguish the child�’s problems and convert the couple�’s experience in a poor life experience.
We understand that couples with parental and marital issues may let the child take a place in their bed. This is strong evidence that a relationship needs more attention and that the couple may not be prepared to solve their issues, choosing a child to divert focus from marital troubles.
Parents are seen in terms of their parental functions as the agents for the promoting of changes in the eating behavior of the child, but there are few descriptions of conjugal dynamics in this specific context. Satir (1993), for example, makes clear the influence of conjugal conflict in parental functions, an area still under-researched in studies of childhood obesity. If the couple is in constant conflict, the parental rules which should define what would do and who would be the child will certainly be affected (Satir, 1993, p. 61).
The parental subsystem, in this family, should be consolidated, for a spirit of unity of the couple is essential in guiding the family as a whole, as it is considered the axis of family relations, indispensable to the coherence between what they think and what they do for the general welfare. Although the challenge is great and their responsibilities go further, they should seek to be role models in their actions and standards that afford, mainly for the children, affective and emotional security. The couple needs to care for themselves as the family subsystem responsible for promoting health (Ribeiro, Nogueira, Melo, & Valadares, 2013).
Conclusions The data analysis leads us to identify the following features in the dynamic of the family studied, which
can be related to the child�’s obesity: parental neglect towards the child�’s diet and other behaviors; the interference of the aunt in the family�’s routine, including in the child�’s education; genitor illness complicating the fulfillment of parental functions; difficulties in the parents�’ conjugal relationship; the lack of a unified spirit in the parental couple, making the necessary commitment to the child�’s education and protection difficult; and
THE PARTICIPATION OF A BRAZILIAN FAMILY IN PSYCHOSOCIAL COUNSELING 895
family resistance to accept and engage in treatment of their child�’s obesity. After the interview with the family, three other activities were proposed as continuance of the research
project: family, multi-family group, and children�’s group psychotherapy. The family didn�’t come to all activities, demonstrating resistance to accept and engage in treatment. Family psychotherapy was offered when the research group identified concerns: for the child, who was more obese each meeting; mother, who appeared fragile; and the father, whose distance was evident in his absence from all but one session. However, the family came to the first meeting scheduled and the mother told us, by telephone, that she was unmotivated and that the father couldn�’t come due to work. The non-acceptance of counseling offered by the research group showed family opposition to accepting the gravity of the daughter�’s problem and to taking action to protect and orient her. These data confirm, in our view, that childhood obesity treatment should take into account these features of the family dynamic.
We believe that the responsibility for the problem of childhood obesity is not the child�’s, but of the social-family context. Therefore, treatment should essay relational changes in the whole system through a co-construction between family members and professionals of a multidisciplinary group. Studies have shown that childhood obesity treatment with family therapy is more effective than conventional treatment (which includes medical checkups and nutritional counseling). It�’s worth mentioning that the intervention adopted in studies has used techniques which give the family the responsibility to change their lifestyle, establishing the researcher/therapist as facilitator. The participation of other professionals from medicine and nutrition is also important, for achieving the necessary changes will only be possible by a co-construction between family members and professionals of a multidisciplinary group.
References Bowen, M. (2013). De la familia al individuo (5th ed.). Barcelona: Paidós. Boa-Sorte, N. et al. (2007). Percepção materna e autopercepção do estado nutricional de crianças e adolescentes de escolas
privadas. Jornal de Pediatria, 83, 349-356. Bradt, J. O. (1995). Tornando-se pais: Famílias com filhos pequenos. In: B. Carter, & M. McGoldrick (Eds.), As mudanças no
ciclo de vida famíliar (2nd ed.). Porto Alegre: Artmed. Brazil. Ministry of Health. Secretary of Vigilance in Health. Vigitel Brazil. (2013). Vigilance system of chronic disease risk
factors by telephone survey (p. 132). Ministry of Health, Secretary of Vigilance in Health, Brasília: Ministry of Health. Camargo, A. P. P. M., Barros Filho, A. A., Antonio, M. A. R. G. M., & Giglio, J. S. (2013). A não percepção da obesidade pode
ser um obstáculo no papel das mães de cuidar de seus filhos. Ciência & Saúde Coletiva, 18(2), 323-333. Carter, B., & McGoldrick, M. (1995). As mudanças no ciclo de vida familiar: Uma estrutura para a terapia familiar. In B. Carter,
& M. McGoldrick (Eds.), As mudanças no ciclo de vida familiar (2nd ed.). Porto Alegre: Artmed. Carvalho, E. A. A. et al. (2013). Obesidade: Aspectos epidemiológicos e prevenção. Revista Médica de Minas Gerais, 23(1),
74-82. Dessen, M. C., Silva, S. C., & Dessen, M. A. (2009). Pesquisa com famílias: Integrando métodos quantitativos e qualitativos. In L.
Weber, & Dessen, M. A. (Eds.), Pesquisando a família: Instrumentos para coleta e análise de dados. Curitiba: Juruá. Eckstein, et al. (2006). Parents�’ perceptions of their child�’s weight and health. Pediatrics, 117(3), 681-690. Fisberg, M. (2005). Atualização em obesidade na infância e adolescência. São Paulo: Atheneu. Flodmark, C. E., & Ohlsson, T. (2008). Childhood obesity: From nutrition to behaviour. Proceedings of the Nutrition Society,
67(4), 356-362. Golan, M., Weizman, A., Apter, A., & Fainaru, M. (1998). Parents as the exclusive agents of change in the treatment of childhood
obesity. American Journal of Clinical Nutrition, 67(6), 1130-1135. González Rey, F. (1999). La investigación cualitativa en psicología: Rumbos y desafíos. São Paulo: EDUC. González Rey, F. (2010). Pesquisa qualitativa e subjetividade: Os processos de construção da informação. São Paulo: Cengage
Learning.
THE PARTICIPATION OF A BRAZILIAN FAMILY IN PSYCHOSOCIAL COUNSELING 896
Gil, A. C. (1999). Métodos e técnicas de pesquisa social. São Paulo: Atlas. Haines, J., McDonald, J., O�’Brien, A., Sherry, B., Bottino, C. J., Schmidt, M. E. et al. (2013). Healthy habits, happy homes:
Randomized trial to improve household routines for obesity prevention among preschool-aged children. JAMA Pediatrics. Retrieved October 12, 2013, from http://archpedi.jamanetwork.com/article.aspx?articleid=1735654
Kunkel, N., Oliveira, W. F., & Peres, M. A. (2009). Excesso de peso e qualidade de vida relacionada à saúde em adolescentes de Florianópolis, SC. Revista de Saúde Pública, 43(2), 226-235.
Macedo, L., Festas, C., & Vieira, M. (2012). Percepções parentais sobre estado nutricional, imagem corporal e saúde em crianças com idade escolar. Revista de Enfermagem Referência, v. ser III, 191-200.
Martins, G. A. (2008). Estudo de caso: Uma estratégia de pesquisa. São Paulo: Atlas. Minayo, M. C. S. (1994). O desafio do conhecimento: Pesquisa qualitativa em saúde. São Paulo: Hucitec. Minuchin, S. (1982). Famílias: Funcionamento e tratamento. Porto Alegre: Artes Médicas. Minuchin, S., & Fishman, H. C. (1990). Técnicas de terapia familiar. Porto Alegre: Artes Médicas. Moraes, P. M., & Dias, C. M. S. B. (2012). Obesidade infantil a partir de um olhar histórico sobre alimentação. Interação em
Psicologia, Curitiba, 16(2), 317-326. Moura, N. C. (2010). Influência da mídia no comportamento alimentar de crianças e adolescentes. Revista Segurança Alimentar e
Nutricional, Campinas, 17(1), 113-122. Otto, A. F. N. (2007). Obesidade e transtorno da compulsão alimentar periódica�—Um estudo sobre a dinâmica familiar (Master
dissertation presented to the Postgraduate Program in Catholic University of Brasília, 192f). Otto, A. F. N., & Ribeiro, M. A. (2012). Unidos em torno da mesa: A dinâmica familiar na obesidade. Estudos de
Psicologia, Natal, 17(2), 255-263. Ribeiro, M. A. (2013). Construção de metodologia de atendimento psicossocial de crianças e adolescentes com transtornos
alimentares e suas famílias (Research project of Master and PhD�’s program of Catholic University of Brasília�—financial resources from CNPq/CAPES).
Ribeiro, M. A., Nogueira, H. F., Melo, V. A. A., & Valadares, F. S. A. (2013). Pesquisa e intervenção com famílias de crianças e adolescentes com obesidade utilizando a metodologia do Grupo Multifamiliar. In: A. Garcia, M. D. C.Macedo, & T. A. Nunes (Eds.), Relações interpessoais e saúde (pp. 55-67). Vitória: CIPRI-UFES.
Roesch, S. M. A. (1999). Projetos de estágio e de pesquisa. São Paulo: Ed. Atlas. Savage, J. S., Fisher, J. O., & Birch, L. L. (2007). Parental influence on eating behavior: Conception to adolescence. Journal of
Law, Medicine & Ethics, 35(1), 22-34. Satir, V. (1993). Terapia do grupo familiar (5th ed.). Rio de Janeiro: Francisco Alves. Schmeer, K. K. (2012). Family structure and obesity in early childhood. Social Science Research, 41(4), 820-832. Tassara, V. (2012). Obesidade na infância e interações familiares: Uma trama complexa. Belo Horizonte: Coopmed. Tassara, V., Norton, R. C., Marques, C., & Walter, E. U. (2010). Importância do contexto sociofamiliar na abordagem de crianças
obesas. Revista Paulista de Pediatria, São Paulo, 28(3), 309-314. Tenorio, A. E. S., & Cobayashi, F. (2011). Obesidade infantil na percepção dos pais. Revista Paulista de Pediatria, 29, 634-639. World Health Organization. (2014a). Obesity and overweight. Retrieved February 20, 2014, from http://www.Who.Int/Features/
Factfiles/Obesity/Facts/En/Index1.Html. World Health Organization. (2014b). 10 facts on obesity. Retrieved February 20, 2014, from http://www.who.int/features/factfiles
/obesity/facts/en/index1.html

Psychology Research, ISSN 2159-5542 November 2014, Vol. 4, No. 11, 897-904
Relationships Between Parenting Style, Self-Perception and
Shyness Among Chinese Early Adolescents
Chen YingMin, Wu YunPeng, Zhang YuanJin, Wang Peng, Han Lei, Gao FengQiang Shandong Normal University, Ji�’nan, China
The current study investigated the parenting style, self-perception, and shyness level of 1,338 junior high school
students, so as to explore relationships between these variables. Results indicated that (1) The levels of the
unassuming shyness, shyness when facing negative evaluation are higher than other dimensions of shyness; (2) The
acceptance/involvement and strictness/supervision are negatively related with shyness; the acceptance/participation
and strictness/supervision are positively correlated with self-perception; self-perception was negatively related with
shyness; and (3) Parents�’ acceptance/participation can indirectly affect shyness through the self-perception; parents�’
strictness/supervision can affect shyness directly and indirectly through the self-perception.
Keywords: shyness, parenting style, self-perception, early adolescents
Introduction Shyness refers to wariness and anxiety in the face of social novelty and perceived social-evaluation in
spite of a desire to interact socially (Coplan, Findlay, & Nelson, 2004). Shyness is very common in interpersonal relationships. Even in countries like America, the percentage of shy individuals is up to 40%-50% (Henderson & Zimbardo, 1998). However, in Asian countries like China and Japan, the incidence of shyness is even higher, which is close to 60% (Pilkonis & Zimbardo, 1979). Generally speaking, moderate shyness is a normal reaction. But the higher level of shyness may have more negative influences on individual social interactions, social adaption, and development (Schwartz, Snidman, & Kagan, 1999). As a result, western countries carried out systematic research on shyness since 1970s, Chinese researchers started to pay attention to this field since the end of the 20th century. Shyness studies have become a hot topic of psychological studies.
The shyness studies found that the shyness level has a trend to increase with the age. For instance, Zimbardo�’s survey with grade 4-6 pupils found that shy students account for 42% of samples; while this proportion increased to 54% among grades 7-8 students (Zimbardo & Radl, 1999). Similarly, studies also
* Acknowledgments: This research was funded by two projects of Humanities and Social Sciences of the Ministry of Education of China (12YJC190004, 12YJC190009), by project of National Social Science Foundation of China (13BSH061) and Science and Technology Development Plan Projects of Shandong Province (2013GSF11802), the Key Discipline Construction Program of 12th Five-year Plan of Shandong province (Developmental and Educational Psychology).
Chen YingMin, Ph.D., School of Psychology, Shandong Normal University. Wu YunPeng, Ph.D. candidate, School of Psychology, Shandong Normal University. Zhang YuanJin, M.A., School of Psychology, Shandong Normal University. Wang Peng, Ph.D., School of Psychology, Shandong Normal University. Han Lei, Ph.D., School of Psychology, Shandong Normal University. Gao FengQiang (Correspondence author), Ph.D., School of Psychology, Shandong Normal University. Email:
DAVID PUBLISHING
D

PARENTING STYLE, SELF-PERCEPTION AND SHYNESS 898
reported that, compared with the elementary students, middle school students are more likely to describe themselves as being shy (Simmons & Rosenberg, 1975). Junior high school students who are in early adolescents are experiencing a special development stage of life. During this period, the dramatic physical and psychological changes and the rapid development of self may lead to intensification of individual shyness. This may cause distress to many aspects of their life including academic, emotion, behavior, and interpersonal interaction. Therefore, it is of theoretical and practical significance to focus on the shyness of junior high school students, and explore its influencing factors.
Buss assumed that excessive attention from parents and negative self-evaluation in childhood lead some individuals to be shy (Crozier, 2001), which means that individual shyness is related to parenting styles and self-consciousness. On this basis, the present study is to investigate the relationship of the parenting styles, self-perception, and shyness.
Parenting styles, which are often referred as family rearing, are the collection of parenting attitudes, behaviors, and non-verbal expression. It reflects the characteristics of parent-child interaction and shows cross-situational stability (Darling & Steinberg, 1993). Parenting styles have important influence on individual growth. With specific reference to shyness, many studies have found the close relationship between shyness and parenting styles. Typically, authoritative parents often refuse or deny their child, punish their child severely, excessively interfere or overprotect their children. These practices often lead to or exacerbate child�’s shyness (Be�ši & Kerr, 2011; Mills & Rubin, 1998). However, can the conclusions obtained in Western subjects be applied to Chinese subjects? This is a problem that the current study plans to explore.
Self-perception is the subjective evaluation of aspects of oneself (Harter, 1982), and it is the cognitive component of self-awareness. Studies have shown that there is a close relationship between self-consciousness and shyness. According to the reasons of shyness or the contexts that induce shyness, Buss (1986) classified shyness into fearful shyness and self-consciousness shyness. Fearful shyness is a kind of shyness which mainly pointed to strange and novel stimuli (including people and situations), which does not involve self-awareness activities. The self-consciousness shyness refers to the shyness one experiences when going through public attention, supervision, or evaluation. This kind of shyness is directly related with self-consciousness. The researchers also found that fearful shyness appeared very early, and it may appear in two months after birth; whereas self-consciousness shyness appeared fairly late, usually three to six years old, and it did not emerge until the development of self-consciousness. Previous study also found that young children associated shyness with worries about meeting strangers, while the older children associated shyness with being evaluated (Crozier & Burnham, 1990). Experiencing rapid development of self-consciousness may be a critical factor for high prevalence of shyness during early adolescents.
In addition, many studies have found that parenting styles are closely related to self-perception. Studies indicated that authoritative parenting styles were predictive of higher academic competence. Meanwhile, authoritarian and permissive parenting styles were predictive of lower self-reliance (Kim & Chung, 2003). Studies in China also found the relationship between parenting style and the self-concept in junior high school students (Zhang, 2004). Based on previous studies, the current study intends to focus on Chinese junior high school students, so as to explore (1) the general features of shy status of Chinese teenagers; and (2) the relationship between parenting, self-perception and shyness among early adolescents. We hypothesized that (1) The strictness/supervision of parenting is positively associated with shyness, and the acceptance/involve is negatively associated with shyness; (2) Parenting is positively associated with self-perception; and (3) There is
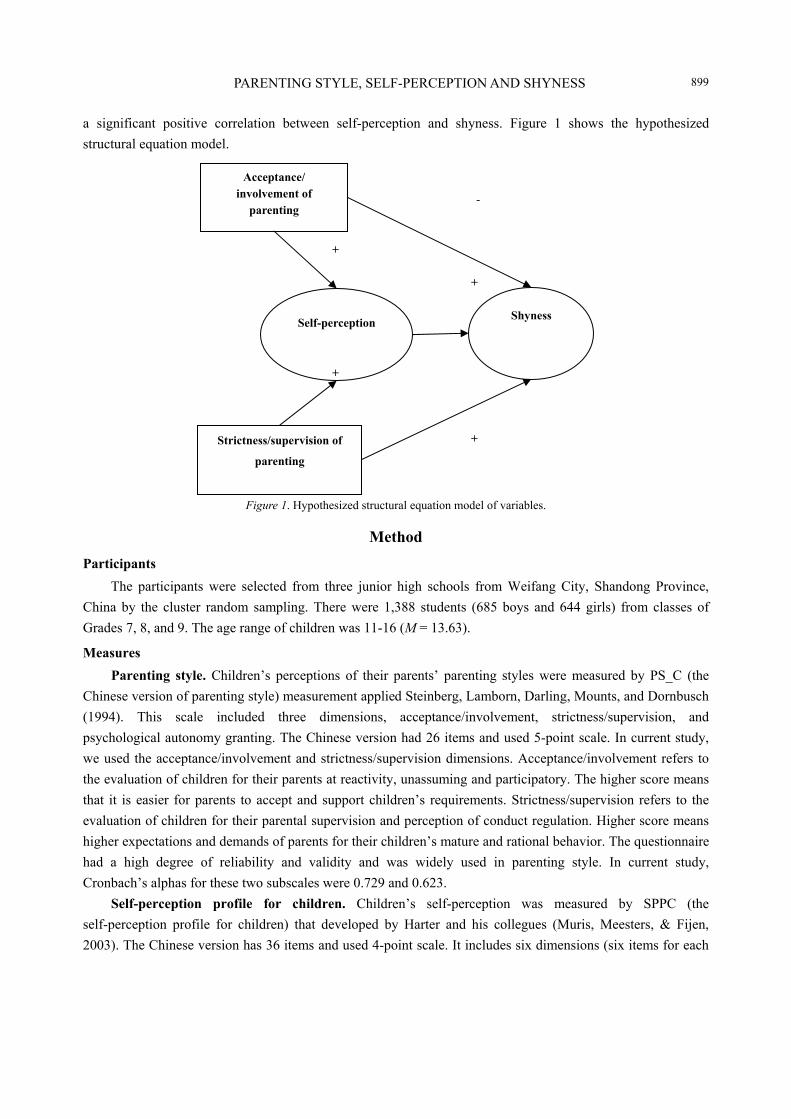
PARENTING STYLE, SELF-PERCEPTION AND SHYNESS 899
a significant positive correlation between self-perception and shyness. Figure 1 shows the hypothesized structural equation model.
Figure 1. Hypothesized structural equation model of variables.
Method Participants
The participants were selected from three junior high schools from Weifang City, Shandong Province, China by the cluster random sampling. There were 1,388 students (685 boys and 644 girls) from classes of Grades 7, 8, and 9. The age range of children was 11-16 (M = 13.63).
Measures Parenting style. Children�’s perceptions of their parents�’ parenting styles were measured by PS_C (the
Chinese version of parenting style) measurement applied Steinberg, Lamborn, Darling, Mounts, and Dornbusch (1994). This scale included three dimensions, acceptance/involvement, strictness/supervision, and psychological autonomy granting. The Chinese version had 26 items and used 5-point scale. In current study, we used the acceptance/involvement and strictness/supervision dimensions. Acceptance/involvement refers to the evaluation of children for their parents at reactivity, unassuming and participatory. The higher score means that it is easier for parents to accept and support children�’s requirements. Strictness/supervision refers to the evaluation of children for their parental supervision and perception of conduct regulation. Higher score means higher expectations and demands of parents for their children�’s mature and rational behavior. The questionnaire had a high degree of reliability and validity and was widely used in parenting style. In current study, Cronbach�’s alphas for these two subscales were 0.729 and 0.623.
Self-perception profile for children. Children�’s self-perception was measured by SPPC (the self-perception profile for children) that developed by Harter and his collegues (Muris, Meesters, & Fijen, 2003). The Chinese version has 36 items and used 4-point scale. It includes six dimensions (six items for each
-
+
Self-perception
+
Acceptance/ involvement of
parenting
Strictness/supervision of
parenting
Shyness
+
+
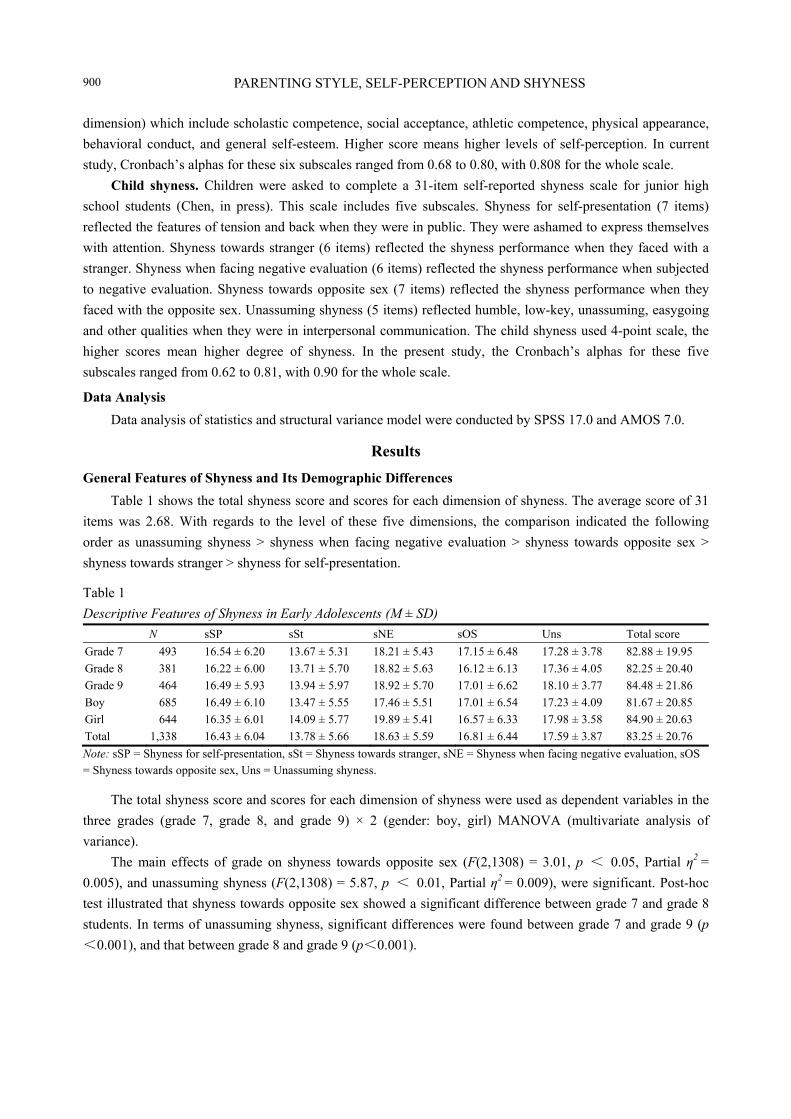
PARENTING STYLE, SELF-PERCEPTION AND SHYNESS 900
dimension) which include scholastic competence, social acceptance, athletic competence, physical appearance, behavioral conduct, and general self-esteem. Higher score means higher levels of self-perception. In current study, Cronbach�’s alphas for these six subscales ranged from 0.68 to 0.80, with 0.808 for the whole scale.
Child shyness. Children were asked to complete a 31-item self-reported shyness scale for junior high school students (Chen, in press). This scale includes five subscales. Shyness for self-presentation (7 items) reflected the features of tension and back when they were in public. They were ashamed to express themselves with attention. Shyness towards stranger (6 items) reflected the shyness performance when they faced with a stranger. Shyness when facing negative evaluation (6 items) reflected the shyness performance when subjected to negative evaluation. Shyness towards opposite sex (7 items) reflected the shyness performance when they faced with the opposite sex. Unassuming shyness (5 items) reflected humble, low-key, unassuming, easygoing and other qualities when they were in interpersonal communication. The child shyness used 4-point scale, the higher scores mean higher degree of shyness. In the present study, the Cronbach�’s alphas for these five subscales ranged from 0.62 to 0.81, with 0.90 for the whole scale.
Data Analysis Data analysis of statistics and structural variance model were conducted by SPSS 17.0 and AMOS 7.0.
Results General Features of Shyness and Its Demographic Differences
Table 1 shows the total shyness score and scores for each dimension of shyness. The average score of 31 items was 2.68. With regards to the level of these five dimensions, the comparison indicated the following order as unassuming shyness > shyness when facing negative evaluation > shyness towards opposite sex > shyness towards stranger > shyness for self-presentation.
Table 1 Descriptive Features of Shyness in Early Adolescents (M ± SD) N sSP sSt sNE sOS Uns Total score Grade 7 493 16.54 ± 6.20 13.67 ± 5.31 18.21 ± 5.43 17.15 ± 6.48 17.28 ± 3.78 82.88 ± 19.95 Grade 8 381 16.22 ± 6.00 13.71 ± 5.70 18.82 ± 5.63 16.12 ± 6.13 17.36 ± 4.05 82.25 ± 20.40 Grade 9 464 16.49 ± 5.93 13.94 ± 5.97 18.92 ± 5.70 17.01 ± 6.62 18.10 ± 3.77 84.48 ± 21.86 Boy 685 16.49 ± 6.10 13.47 ± 5.55 17.46 ± 5.51 17.01 ± 6.54 17.23 ± 4.09 81.67 ± 20.85 Girl 644 16.35 ± 6.01 14.09 ± 5.77 19.89 ± 5.41 16.57 ± 6.33 17.98 ± 3.58 84.90 ± 20.63 Total 1,338 16.43 ± 6.04 13.78 ± 5.66 18.63 ± 5.59 16.81 ± 6.44 17.59 ± 3.87 83.25 ± 20.76 Note: sSP = Shyness for self-presentation, sSt = Shyness towards stranger, sNE = Shyness when facing negative evaluation, sOS = Shyness towards opposite sex, Uns = Unassuming shyness.
The total shyness score and scores for each dimension of shyness were used as dependent variables in the three grades (grade 7, grade 8, and grade 9) × 2 (gender: boy, girl) MANOVA (multivariate analysis of variance).
The main effects of grade on shyness towards opposite sex (F(2,1308) = 3.01, p ˘ 0.05, Partial 2 = 0.005), and unassuming shyness (F(2,1308) = 5.87, p ˘ 0.01, Partial 2 = 0.009), were significant. Post-hoc test illustrated that shyness towards opposite sex showed a significant difference between grade 7 and grade 8 students. In terms of unassuming shyness, significant differences were found between grade 7 and grade 9 (p ˘0.001), and that between grade 8 and grade 9 (p˘0.001).
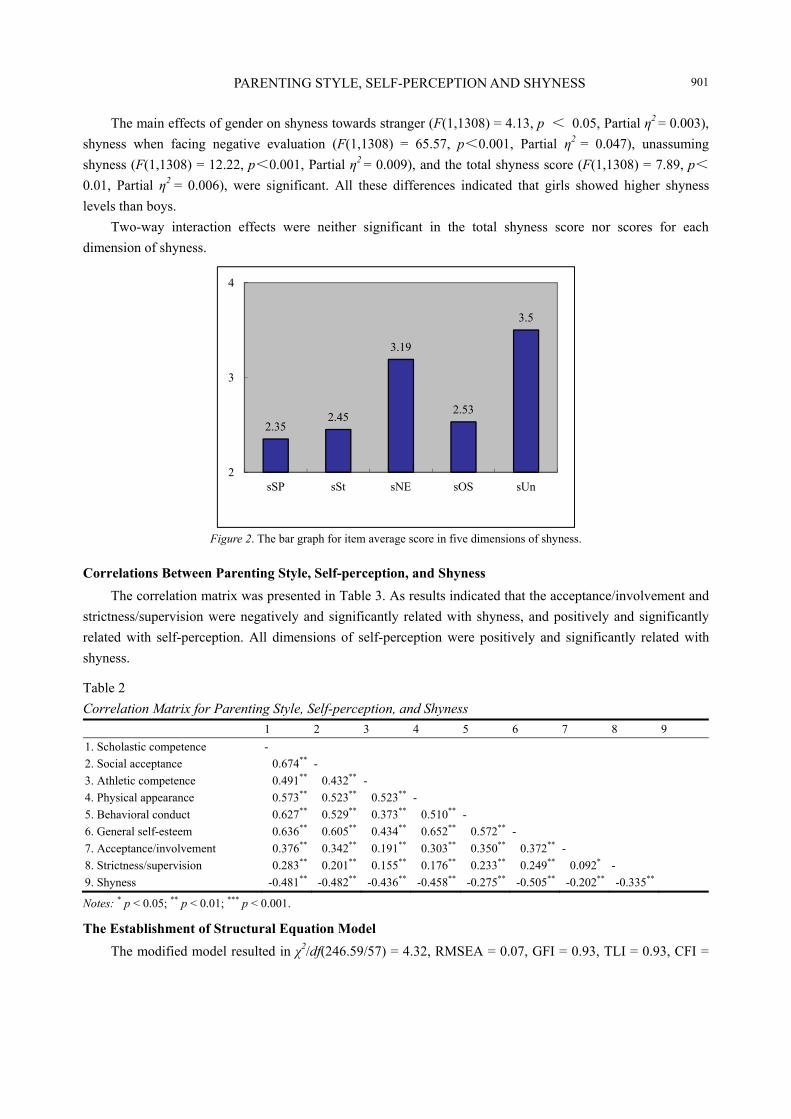
PARENTING STYLE, SELF-PERCEPTION AND SHYNESS 901
The main effects of gender on shyness towards stranger (F(1,1308) = 4.13, p ˘ 0.05, Partial 2 = 0.003), shyness when facing negative evaluation (F(1,1308) = 65.57, p˘0.001, Partial 2 = 0.047), unassuming shyness (F(1,1308) = 12.22, p˘0.001, Partial 2 = 0.009), and the total shyness score (F(1,1308) = 7.89, p˘0.01, Partial 2 = 0.006), were significant. All these differences indicated that girls showed higher shyness levels than boys.
Two-way interaction effects were neither significant in the total shyness score nor scores for each dimension of shyness.
Figure 2. The bar graph for item average score in five dimensions of shyness.
Correlations Between Parenting Style, Self-perception, and Shyness The correlation matrix was presented in Table 3. As results indicated that the acceptance/involvement and
strictness/supervision were negatively and significantly related with shyness, and positively and significantly related with self-perception. All dimensions of self-perception were positively and significantly related with shyness.
Table 2 Correlation Matrix for Parenting Style, Self-perception, and Shyness 1 2 3 4 5 6 7 8 9 1. Scholastic competence - 2. Social acceptance 0.674** - 3. Athletic competence 0.491** 0.432** - 4. Physical appearance 0.573** 0.523** 0.523** - 5. Behavioral conduct 0.627** 0.529** 0.373** 0.510** - 6. General self-esteem 0.636** 0.605** 0.434** 0.652** 0.572** - 7. Acceptance/involvement 0.376** 0.342** 0.191** 0.303** 0.350** 0.372** - 8. Strictness/supervision 0.283** 0.201** 0.155** 0.176** 0.233** 0.249** 0.092* - 9. Shyness -0.481** -0.482** -0.436** -0.458** -0.275** -0.505** -0.202** -0.335**
Notes: * p < 0.05; ** p < 0.01; *** p < 0.001.
The Establishment of Structural Equation Model The modified model resulted in 2/df(246.59/57) = 4.32, RMSEA = 0.07, GFI = 0.93, TLI = 0.93, CFI =
2.352.45
3.19
2.53
3.5
2
3
4
sSP sSt sNE sOS sUn
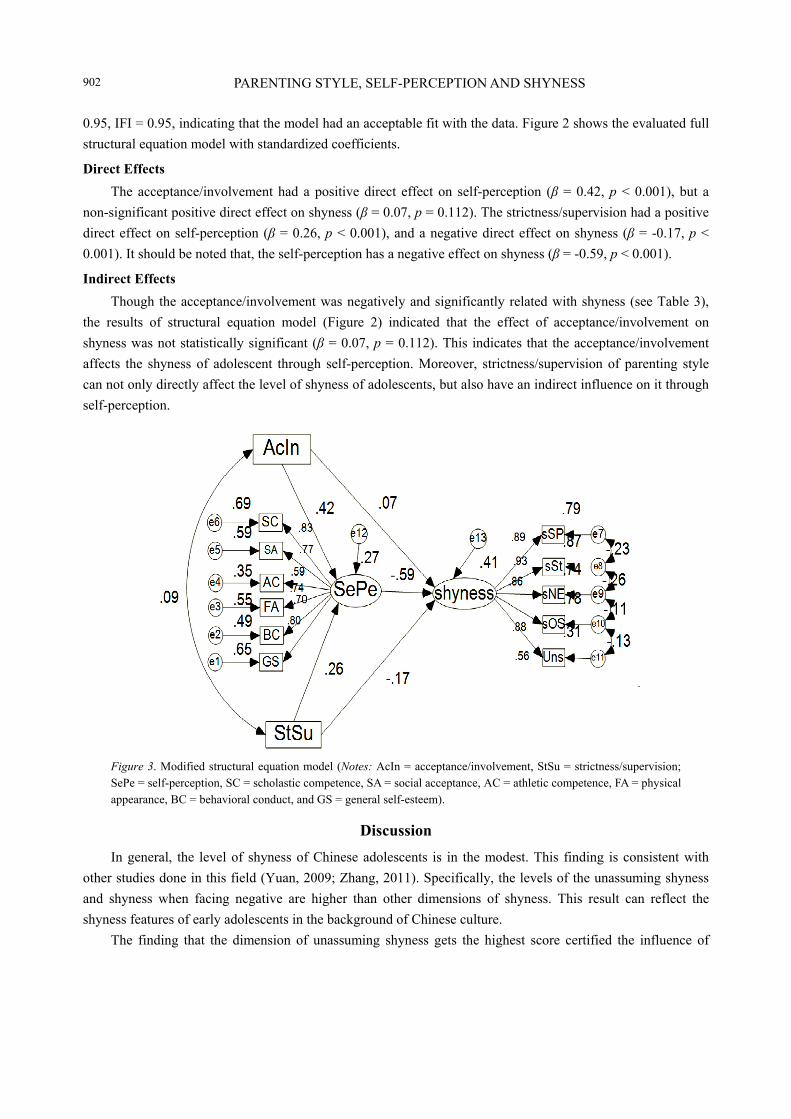
PARENTING STYLE, SELF-PERCEPTION AND SHYNESS 902
0.95, IFI = 0.95, indicating that the model had an acceptable fit with the data. Figure 2 shows the evaluated full structural equation model with standardized coefficients.
Direct Effects The acceptance/involvement had a positive direct effect on self-perception ( = 0.42, p < 0.001), but a
non-significant positive direct effect on shyness ( = 0.07, p = 0.112). The strictness/supervision had a positive direct effect on self-perception ( = 0.26, p < 0.001), and a negative direct effect on shyness ( = -0.17, p < 0.001). It should be noted that, the self-perception has a negative effect on shyness ( = -0.59, p < 0.001).
Indirect Effects Though the acceptance/involvement was negatively and significantly related with shyness (see Table 3),
the results of structural equation model (Figure 2) indicated that the effect of acceptance/involvement on shyness was not statistically significant ( = 0.07, p = 0.112). This indicates that the acceptance/involvement affects the shyness of adolescent through self-perception. Moreover, strictness/supervision of parenting style can not only directly affect the level of shyness of adolescents, but also have an indirect influence on it through self-perception.
Figure 3. Modified structural equation model (Notes: AcIn = acceptance/involvement, StSu = strictness/supervision; SePe = self-perception, SC = scholastic competence, SA = social acceptance, AC = athletic competence, FA = physical appearance, BC = behavioral conduct, and GS = general self-esteem).
Discussion In general, the level of shyness of Chinese adolescents is in the modest. This finding is consistent with
other studies done in this field (Yuan, 2009; Zhang, 2011). Specifically, the levels of the unassuming shyness and shyness when facing negative are higher than other dimensions of shyness. This result can reflect the shyness features of early adolescents in the background of Chinese culture.
The finding that the dimension of unassuming shyness gets the highest score certified the influence of

PARENTING STYLE, SELF-PERCEPTION AND SHYNESS 903
Chinese traditional culture. China is a collectivism-oriented country. The Chinese people hold the thought of being friendly while getting along with others, and always act with humility, present with a low profile, show an unassuming characteristic in interpersonal interactions, so as to avoid confliction and earn a positive evaluation. As a result, the prevalence of shyness level is relatively high in China. One possible reasons for this is the fact that, in China, the unassuming shyness is not considered as inappropriate, and in the contrast, it is even be considered as a merit that deserves praise and encouragement. In addition, shyness when facing negative evaluation is also higher. This result reflected that along with the growth of self-awareness, junior high school students become particularly sensitive to the evaluation, especially negative evaluation, of others. This may make it easier for them easier to become shy. This result supported the viewpoint of Buss (1986).
Consistent with previous studies (Yuan, 2009), the current study also found the tendency that shyness is increasing with age. This result indicated that, in China, the shyness level of individual may increase with age increase during early adolescent stage. Unsurprisingly, Chinese early adolescent girls showed higher level of shyness than boys in current study. Similar findings have been found in studies with the population of pre-school children (Y. Wu, J. Wu, Chen, L. Han, P. Han, Wang, & Gao, 2014) and primary school children (Wu, Chen, & Gao, 2013) in China.
The acceptance/involvement and strictness/supervision can indirectly influence child shyness through self-perception. Both two dimensions of parenting related with higher self-perception, while self-perception was related with lower shyness. Meanwhile, it is somewhat surprising to note that the strictness/supervision had a negative effect on child shyness. It is inconsistency with results in western samples may result from culture differences. As researches indicated that, for Chinese and Asian American children, not for White Americans, an authoritarian parenting style was found to bring about more positive outcomes than an authoritative style (Steinberg et al., 1994). In the Chinese culture background, the term �“guan�” means to �“govern�” as well as to �“love�” (Chao, 1994). The attention and high requirement from parents may also guarantee children�’s opportunities for learning social skills and motivations to make improvements.
References Be�ši , N., & Kerr, M. (2011). Shy adolescents�’ perceptions of parental overcontrol and emotional coldness: Examining
bidirectional links. Merrill-Palmer Quarterly, 57(4), 375-401. Buss, A. H. (1986). Two kinds of shyness. In Schwarzer (Ed.), Self-related cognition in anxiety and motivation (pp. 65-75).
Hillsdale, N.J.: Erlbaum. Chao, R. K. (1994). Beyond parental control and authoritarian parenting style: Understanding Chinese parenting through the
cultural notion of training. Child Development, 65(4), 1111-1119. Chen, Y. (in press). Development of shyness scale for Chinese junior high school students. Journal of Shandong Normal
University (Natural Science). Coplan, R. J., Findlay, L. C., & Nelson, L. J. (2004). Characteristics of preschoolers with lower perceived competence. Journal of
Abnormal Child Psychology, 32(4), 399-408. Crozier, W. R. (2001). Understanding shyness: Psychological perspectives. Palgrave Macmillan. Crozier, W. R., & Burnham, M. (1990). Age-related differences in children�’s understanding of shyness: Age-related differences in
children�’s understanding of shyness. British Journal of Developmental Psychology, 8, 179-185. Darling, N., & Steinberg, L. (1993). Parenting style as content: An integrative modle. Developmental Psychological, 113,
487-496. Harter, S. (1982). The perceived competence scale for children. Child Development, 53, 87-97. Henderson, L., & Zimbardo, P. (1998). Shyness: Encyclopedia of mental health. San Diego: Academic Press. Kim, H., & Chung, R. H. G. (2003). Relationship of recalled parenting style to self-perception in Korean American college
students. The Journal of Genetic Psychology, 164(4), 481-492.
PARENTING STYLE, SELF-PERCEPTION AND SHYNESS 904
Mills, R. S. L., & Rubin, K. H. (1998). Are behavioral and psychological control both differentially associated with childhood aggression and social withdrawal? Canadian Journal of Behavioral Science, 30, 132-136.
Muris, P., Meesters, C., & Fijen, P. (2003). The self-perception profile for children: Further evidence for its factor structure, reliability, and validity. Personality and Individual Differences, 35(8), 1791-1802. doi:10.1016/S0191-8869(03)00004-7
Pilkonis, P. A., & Zimbardo, P. G. (1979). The personal and social dynamics of shyness. In Emotions in personality and psychopathology (pp. 131�–160). US: Springer.
Schwartz, C. E., Snidman, N., & Kagan, J. (1999). Adolescent social anxiety as an outcome of inhibited temperament in childhood. Journal of the American Academy of Child and Adolescent Psychiatry, 38(8), 1008-1015.
Simmons, R. G., & Rosenberg, F. (1975). Sex, sex roles, and self-image. Journal of Youth and Adolescence, 4, 229-258. Steinberg, L., Lamborn, S. D., Darling, N., Mounts, N. S., & Dornbusch, S. M. (1994). Over-time changes in adjustment and
competence among adolescents from authoritative, authoritarian, indulgent, and neglectful families. Child Development, 65(3), 754-770.
Wu, Y., Chen, Y., & Gao, F. Q. (2013). The development and application of self-reported shyness scale for primary school children. China Journal of Health Psychology (in Chinese), 21(11), 1698-1701.
Wu, Y., Wu, J., Chen, Y., Han, L., Han, P., Wang, P., & Gao, F. (2014). Shyness and school adjustment among Chinese preschool children: Examining the moderating effect of gender and teacher-child relationship. Early Education & Development.
Yuan, B. (2009). The characteristics of shyness and its relationships with self-efficiency and subjective happiness among middle school students. Shan�’xi Normal University.
Zhang, D. (2011). The development and application of middle school student shyness scale. Shandong Normal University. Zhang, X. (2004). The relationship between self-concept and parenting style among junior high school students. Chinese Journal
of School Health, 25(1), 82-83. Zimbardo, P. G., & Radl, S. L. (1999). The shy child (reprinted). Los Altos, C.A.: Malor Press.
Psychology Research, ISSN 2159-5542 November 2014, Vol. 4, No. 11, 905-914
Assessment of Negative Self-Image and Fear of Negative
Evaluation Among Adolescents and Young Adults
Agbu Jane-Frances National Open University of Nigeria, Lagos, Nigeria
Ibida Ebele Federal University, Wukari, Nigeria
Concern with real or imagined defect in physical appearance can become a major preoccupation during adolescence
and young adult years. This is because, changes of puberty, rapid physical growth, and resulting sexual maturation
that characterizes this age can trigger feelings of self-consciousness and awkwardness about body-image
perceptions. In addition, the �“perfect�” body-image as dictated in the social culture could become a measure of
self-worth, and this is capable of triggering negative self-image and social anxiety among adolescents. This study
seeks to assess the incidence of negative self-image (preoccupation with real or imagined defect in physical
appearance) and social anxiety characterized by fear of negative evaluation, among adolescents and young adults.
Samples of 329 participants in the age range of 16-25 were drawn from the first and second years students of
Federal University Wukari and University of Lagos, Nigeria. Participants completed a socio-demographic data
sheet as well as NSII (Negative Self-Image Inventory) and revalidated version of FNE (Fear of Negative
Evaluation). Findings revealed that there is a correlation between negative self-image and fear of negative
evaluation; males manifested higher symptoms of negative self-image than females; young adults aged 21-25
presented higher negative self-image that those aged 16-20, adolescents and young adults from Lagos metropolis
experience higher manifestation of fear of negative evaluation than those from Wukari axis. This study therefore
adds to knowledge in this area.
Keywords: assessment, negative self-image, fear of negative evaluation, adolescents
Introduction Observations show that the ideal female constructed by mass media in contemporary times is young, tall,
thin, and white, with at least moderately large breasts. This iconic image is framed by themes that are social norms and elements of a �“thinness schema�”, such as (1) Women are naturally invested in their beauty assets; and (2) The slender beauty ideal is not an enjoyable fantasy based on digital technology but rather is normal, healthy, and achievable through personal dedication. The male body ideal is more variable. Also tall and lean, it typically has one or two added features: well groomed and expensively, fashionably dressed; and/or exceptional (�“chiseled�” or �“ripped�”) muscularity. Since the 1980s, there has been a trend toward magazines and movies featuring a muscular, action-ready male body in a state of objectified undress. This development has been accompanied by increased media attention to exercise and weightlifting as paths to sexual (not romantic) prowess, and by glorification of �“bulked up�” dominating, hypermasculine action figures in the form of heavily
Agbu Jane-Frances, Ph.D., School of Health Sciences, National Open University of Nigeria. Ibida Ebele, M.Sc., Department of Psychology, Federal University.
DAVID PUBLISHING
D
NEGATIVE SELF-IMAGE AND FEAR OF NEGATIVE EVALUATION 906
marketed toys for younger boys and video game characters for older males (Cash, 2008). Thus the social pressure to achieve the �“ideal�” body image could trigger negative self-image and fear of negative evaluation among many. Generally, a person with negative self-image views self as socially inept, unappealing, or inferior to others and this could result in emotional and interpersonal difficulties. On the other hand, fear of negative evaluation could trigger avoidance-seeking behaviour and social anxiety thus intensifies poor self-esteem (Cash, 2008; DePreester & Knockaert, 2005; Veale & Neziroglu, 2010).
The theory that adolescence and sometimes early adulthood is a period of disturbance of the child�’s self-image is among the most widely accepted idea in behavioural sciences. The age was originally described as the age of �“storm and stress�” (Hall, 1904). This age was also perceived by Erikson (1968) as a time of identity crisis, in which the child grapples for a stable sense of self. To the psychoanalytic perspective, the burgeoning sexual desires of puberty spark a resurgence of oedipal conflict (Bios, 1962; Freud, 1958). Also, the physiological changes of puberty and early adulthood and the increase in sexual desire challenge the child�’s view of the self in fundamental way, with radical interferences on the self-image (Simons & Rosenberg, 1973; Gorgan, 2008). There is also an increased value placed on peer acceptance and approval, and a heightened attention to external influences and social messages about cultural norms. Such changes of puberty, rapid physical growth and resulting sexual maturation that characterizes adolescent and young adult age can trigger feelings of self-consciousness and awkwardness about self-image perceptions.
Negative self-image is thus defined in this study as preoccupation with real or imagined defect in physical appearance, with resultant emotional and social difficulties. Many are unaware that negative self-image could trigger a psychopathological condition known as BDD (Body Dysmorphic Disorder). The Diagnostic and Statistical Manual of Mental Disorders defined BDD as a preoccupation with an imagined or minor defect in appearance which causes clinically significant distress or impairment in social, occupational, or other important areas of functioning (APA (American Psychiatric Association), 2000). The disorder generally is diagnosed in those who are extremely critical of their physique or self-image even though there may be no noticeable disfigurement or defect, or a minor defect which is not recognized by most people (APA, 2000). Some people wish that they could change or improve some aspect of their physical appearance; but people suffering from BDD are generally of normal or even highly attractive appearance, believe that they are so unspeakably hideous that they are unable to interact with others or function normally for fear of ridicule and humiliation about their appearance. They tend to be very secretive and reluctant to seek help because they fear that others would think them vain or because they feel too embarrassed. It has also been suggested that fewer men seek help for the disorder than women (Philips, 1996).
Ironically, BDD is often misunderstood as vanity-driven obsession, whereas it is quite the opposite, because people with BDD believe themselves to be irrevocably ugly or defective. BDD combines obsessive and compulsive aspects, linking it, among psychologists, to the obsessive-compulsive spectrum disorders. People with BDD may compulsively look at themselves in the mirror or avoid mirrors, typically think about their appearance for at least one hour a day (and usually more), and in severe cases may drop all social contact and responsibilities as they become a recluse (Cash, 2011). Chronically, low self-esteem is characteristic of those with BDD, because the assessment of one�’s value is so closely linked with the perception of the appearance. BDD is diagnosed equally in men and women, and causes chronic social anxiety for its sufferers (Philips, 1996). According to the DSM IV, to be diagnosed with BDD, a person must fulfill the following criteria: preoccupation with an imagined defect in appearance. If a slight physical anomaly is present, the person�’s
NEGATIVE SELF-IMAGE AND FEAR OF NEGATIVE EVALUATION 907
concern is markedly excessive. The preoccupation causes clinically significant distress or impairment in social, occupational, or other important areas of functioning. The preoccupation is not better accounted for by another mental disorder (e.g., dissatisfaction with body shape and size in Anorexia Nervosa) (APA, 2000; Cash, 2008; DePreester & Knockaert, 2005; Veale & Neziroglu, 2010).
Common symptoms of body dysmorphic disorder include: Obsessive thoughts about perceived appearance defect, obsessive and compulsive behaviors related to perceived appearance defect, delusional thoughts and beliefs related to perceived appearance defect, social and family withdrawal, social phobia, loneliness and self-imposed social isolation, suicidal ideation, anxiety and chronic low self-esteem. Others include: feeling self-conscious in social environments (thinking that others notice and mock their perceived defect), strong feelings of shame, decreased academic performance (problems maintaining grades, problems with school/college attendance), problems initiating and maintaining relationships (both intimate relationships and friendships), repetitive behaviour such as constantly applying make-up and often applying it quite heavily, seeing slightly varying image of self upon each instance of observation in mirror/reflective surface (Philips, 2005).
Some compulsive symptoms of negative self-image identified by Philip (2005) include: compulsive mirror checking behaviour, an inability to look at one�’s own reflection or photographs of oneself, attempting to camouflage imagined defect: for example, using cosmetic camouflage, wearing baggy clothing, maintaining specific body posture or wearing hats, excessive grooming behaviours-skin-picking, combing hair, plucking eyebrows, shaving, compulsive skin-touching, especially to measure or feel the perceived defect, becoming hostile toward people for no known reason, especially those of the opposite sex, reassurance-seeking from loved ones, excessive dieting and exercise.
Review of Literature Given the overwhelming prevalence of thin and lean female images and strong and lean male images
common to all westernized societies, body image concerns have become widespread among adolescents and young adults. Research showed that: 50%-88% of adolescent girls feel negatively about their body shape or size (Field, Cheung, Wolf, Herzog, Goatmaker, & Colditz, 1999); Only 33% of girls say they are at the �“right weight for their body�”, while 58% want to lose weight. Just 9% want to gain weight (Rand, Resnick, & Sieldman, 1997); Females are much more likely than males to think their current size is too large (66% vs. 21%) (Rand et al., 1997); Over one third of males think their current size is too small, while only 10% of women consider their size too small (Rand et al., 1997). Rand et al. (1997) further reported that 30% of older adolescents surveyed consider their current size acceptable to them, 85% of females and 95% of males considered their current size socially acceptable for others. A report by the American Association of University Women indicated that for girls, �“the way I look�” is the most important indicator of self-worth, while for boys, self-worth is based on abilities, rather than looks. Going through puberty can amplify body image concerns. Puberty for boys brings characteristics typically admired by society�—height, speed, broadness, and strength. Puberty for girls brings with it characteristics often perceived as less laudable, as girls generally get rounder and have increased body fat. These changes can serve to further enhance dissatisfaction among girls (O�’Dea JA, Abraham, 1999). Going through puberty later or earlier than peers can have an impact on body image as well as psychological health. Generally, early development for girls and late development for boys present the greatest challenges to healthy body image (Siegel, Yancey, Aneshensel, & Schuler, 1999).
NEGATIVE SELF-IMAGE AND FEAR OF NEGATIVE EVALUATION 908
Radovanovic and Glavak (2003) in their study determined which aspects of self-concept and social perception could predict fear of negative evaluation as an aspect of social anxiety among participants. They studied 225 high school students (105 males and 120 females) from Zagreb. Fear of negative evaluation scale and Rosenberg self-esteem scale were administered. Participants evaluated themselves and their classmates regarding five aspects of adolescent self-concept: school achievement, peer acceptance, self-competence, intelligence, and general physical appearance. Results showed that adolescents�’ self-evaluations of their intelligence were the highest, followed by self-evaluations of peer acceptance. They expected the highest peer evaluations of intelligence, and the lowest peer evaluations of their physical appearance. Peer evaluations of physical appearance were the lowest. There was a tendency of overestimation�—adolescents�’ self-evaluations of peer acceptance, intelligence, and physical appearance were higher than peer evaluations. Stepwise regression analysis was conducted which resulted in two significant predictors (result on Rosenberg self-esteem scale and peer evaluation of adolescent�’s self-competence) and two suppressor variables (self-evaluations of peer acceptance and intelligence). These variables accounted for 22% of the total variance of criteria variable (result on fear of negative evaluation scale). The result on fear of negative evaluation scale will be higher with a lower result on Rosenberg self-esteem scale and lower peer evaluation of adolescent�’s self-competence.
Gilbert and Meyer (2005) replicated the cross-sectional relationship between restrictive eating attitudes and a fear of being negatively evaluated by others and tested whether negative evaluation fears longitudinally predict changes in eating attitudes over a seven-month period. During the first week of an academic year, and again during Week 33, 143 female students completed FNE (the Fear of Negative Evaluation Scale), RSE (the Rosenberg Self-Esteem Scale), HADS (the Hospital Anxiety and Depression Scale), and EDI (the three eating scales of the Eating Disorders Inventory). The exclusive link between heightened negative evaluation fears and restrictive eating attitudes was replicated cross-sectionally. However, the longitudinal model predicting the development of restriction was nonsignificant. In contrast, alongside depression, negative evaluation fears predicted an increase in bulimic attitudes, whereas self-esteem predicted an increase in body dissatisfaction. The findings support a model whereby individuals with heightened fears of negative evaluation may use restrictive pathology to raise their status among peers. If this mechanism of dealing with negative evaluation fears is not sufficient in the long term, individuals may develop bulimic symptoms to deal with their negative evaluation fears.
Thus in a bid to add to existing knowledge in this area, the research presents the following objectives, questions, and hypotheses.
Objectives of the Study This study aims to: (1) determine the correlation between negative self-image and fear of negative evaluation; (2) determine the influence of gender on manifestations of negative self-image and fear of negative
evaluation among adolescents and young adults; (3) determine the influence of age on manifestations of negative self-image and fear of negative evaluation
among adolescents and young adults; (4) identify the role of area of geographical location on the manifestations of negative self-image and fear
of negative evaluation among adolescents and young adults.
NEGATIVE SELF-IMAGE AND FEAR OF NEGATIVE EVALUATION 909
Research Questions The study raises the following questions: (1) Will negative self-image correlate significantly with fear of negative evaluation? (2) Will gender influence manifestation of negative self-image and fear of negative evaluation among
adolescents and young adults? (3) Will age influence manifestations of negative self-image and fear of negative evaluation among
adolescents and young adults? (4) Will geographic location influence manifestations of negative self-image and fear of negative
evaluation among adolescents and young adults?
Research Hypotheses (1) There will be significant correlation between negative self-image and fear of negative evaluation. (2) The level of negative self-image and fear of negative evaluation will be significantly higher in females
than in males. (3) Older participants (21-25 years) will present significantly higher level of negative self-image and fear
of negative evaluation than the younger ones (16-20 years). (4) Adolescents and young adults from Wukari district will have significantly lower level of negative
self-image and fear of negative evaluation than those from Lagos metropolis.
Method Study Location
Participants for this study were drawn from first and second year students of Federal University Wukari, Taraba State Nigeria and University of Lagos, Lagos, Nigeria. Taraba state is located in the North East Nigeria and predominantly of Jukun tribe. It is a semi-rural community made up of Christians, Muslims, and Traditionalist. It is less cosmopolitan to Lagos state. Lagos state on the other hand is located at South-West Nigeria. It is a cosmopolitan community made up of diverse tribes in Nigeria. It is regarded as the economic hub of Nigeria.
Participants Participants were the first and second year students drawn from Federal University Wukari and University
of Lagos. They comprised 329 participants in the age range of 16-25 years. In terms of gender, 170 (51.67%) were males while 159 (48.33%) were females. In terms of age, 169 (51.37%) were between 16-20 years while 160 (48.63%) were aged 21-25. In terms of study location, 174 (52.89%) were drawn from Lagos metropolis, while 155 (47.11%) were drawn from Wukari axis.
Instruments Two psychological instruments were employed, namely: Negative Self-Image Inventory (NSII) and Fear
of Negative Evaluation (FNE). NSII is a 40-item instrument developed by Agbu (2011) to measure symptoms and manifestations of
negative self-image. These include dissatisfaction with real or imagined defects in physical appearance as well as the associated behavioural, emotional, social, and interpersonal factors that sustain a negative perception of self. It has a norm score of 90.58, split-half reliability of 0.78 and test-retest reliability coefficient of 0.82.
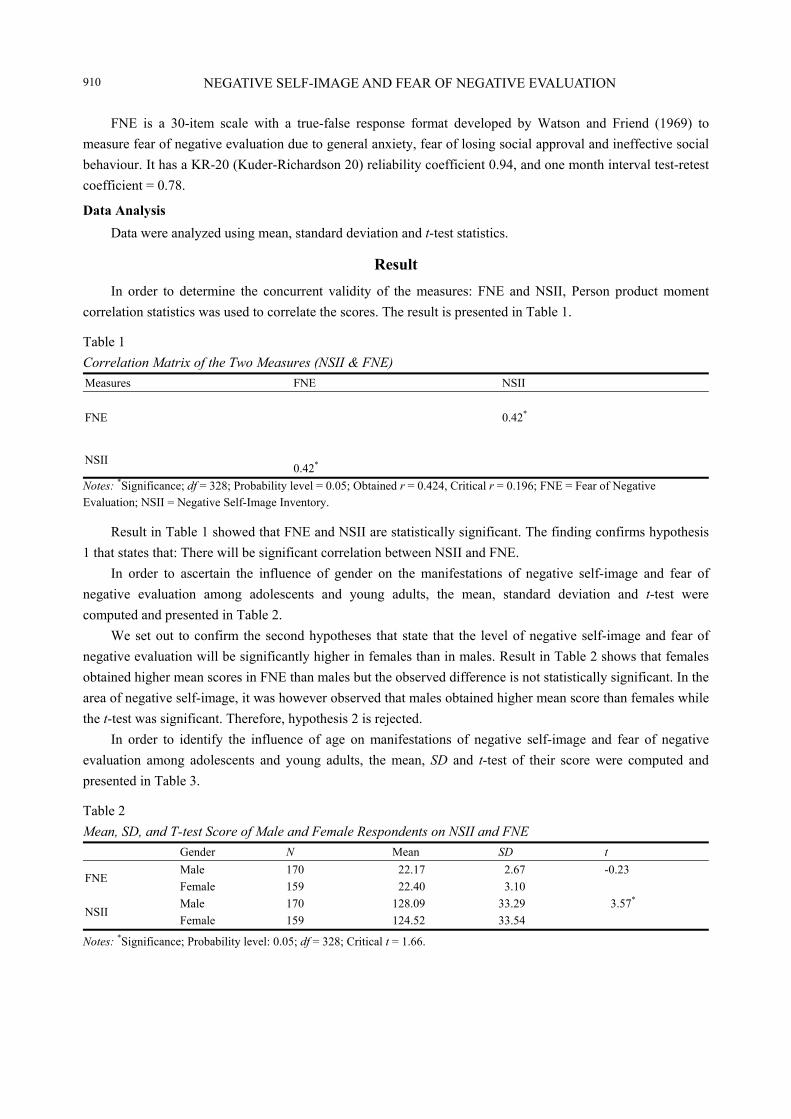
NEGATIVE SELF-IMAGE AND FEAR OF NEGATIVE EVALUATION 910
FNE is a 30-item scale with a true-false response format developed by Watson and Friend (1969) to measure fear of negative evaluation due to general anxiety, fear of losing social approval and ineffective social behaviour. It has a KR-20 (Kuder-Richardson 20) reliability coefficient 0.94, and one month interval test-retest coefficient = 0.78.
Data Analysis Data were analyzed using mean, standard deviation and t-test statistics.
Result In order to determine the concurrent validity of the measures: FNE and NSII, Person product moment
correlation statistics was used to correlate the scores. The result is presented in Table 1.
Table 1 Correlation Matrix of the Two Measures (NSII & FNE) Measures FNE NSII
FNE 0.42*
NSII 0.42*
Notes: *Significance; df = 328; Probability level = 0.05; Obtained r = 0.424, Critical r = 0.196; FNE = Fear of Negative Evaluation; NSII = Negative Self-Image Inventory.
Result in Table 1 showed that FNE and NSII are statistically significant. The finding confirms hypothesis 1 that states that: There will be significant correlation between NSII and FNE.
In order to ascertain the influence of gender on the manifestations of negative self-image and fear of negative evaluation among adolescents and young adults, the mean, standard deviation and t-test were computed and presented in Table 2.
We set out to confirm the second hypotheses that state that the level of negative self-image and fear of negative evaluation will be significantly higher in females than in males. Result in Table 2 shows that females obtained higher mean scores in FNE than males but the observed difference is not statistically significant. In the area of negative self-image, it was however observed that males obtained higher mean score than females while the t-test was significant. Therefore, hypothesis 2 is rejected.
In order to identify the influence of age on manifestations of negative self-image and fear of negative evaluation among adolescents and young adults, the mean, SD and t-test of their score were computed and presented in Table 3.
Table 2 Mean, SD, and T-test Score of Male and Female Respondents on NSII and FNE Gender N Mean SD t
FNE Male 170 22.17 2.67 -0.23 Female 159 22.40 3.10
NSII Male 170 128.09 33.29 3.57* Female 159 124.52 33.54
Notes: *Significance; Probability level: 0.05; df = 328; Critical t = 1.66.
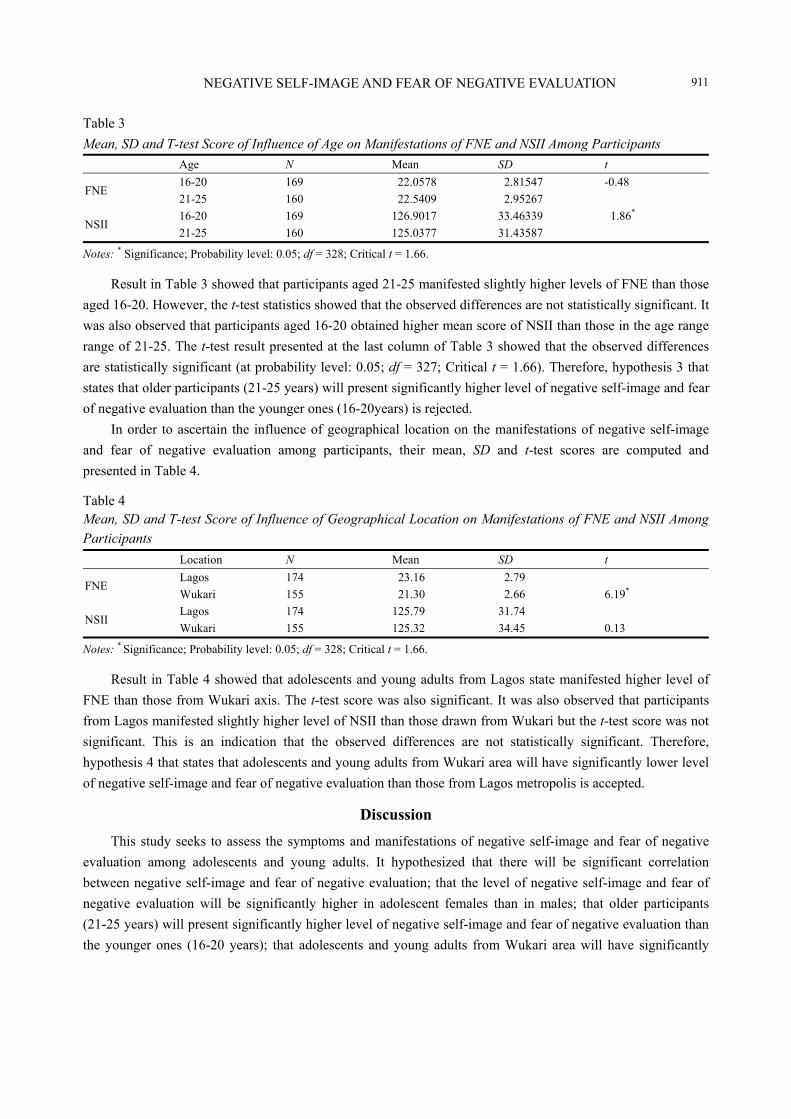
NEGATIVE SELF-IMAGE AND FEAR OF NEGATIVE EVALUATION 911
Table 3 Mean, SD and T-test Score of Influence of Age on Manifestations of FNE and NSII Among Participants Age N Mean SD t
FNE 16-20 169 22.0578 2.81547 -0.48 21-25 160 22.5409 2.95267
NSII 16-20 169 126.9017 33.46339 1.86* 21-25 160 125.0377 31.43587
Notes: * Significance; Probability level: 0.05; df = 328; Critical t = 1.66.
Result in Table 3 showed that participants aged 21-25 manifested slightly higher levels of FNE than those aged 16-20. However, the t-test statistics showed that the observed differences are not statistically significant. It was also observed that participants aged 16-20 obtained higher mean score of NSII than those in the age range range of 21-25. The t-test result presented at the last column of Table 3 showed that the observed differences are statistically significant (at probability level: 0.05; df = 327; Critical t = 1.66). Therefore, hypothesis 3 that states that older participants (21-25 years) will present significantly higher level of negative self-image and fear of negative evaluation than the younger ones (16-20years) is rejected.
In order to ascertain the influence of geographical location on the manifestations of negative self-image and fear of negative evaluation among participants, their mean, SD and t-test scores are computed and presented in Table 4.
Table 4 Mean, SD and T-test Score of Influence of Geographical Location on Manifestations of FNE and NSII Among Participants Location N Mean SD t
FNE Lagos 174 23.16 2.79 Wukari 155 21.30 2.66 6.19*
NSII Lagos 174 125.79 31.74 Wukari 155 125.32 34.45 0.13
Notes: * Significance; Probability level: 0.05; df = 328; Critical t = 1.66.
Result in Table 4 showed that adolescents and young adults from Lagos state manifested higher level of FNE than those from Wukari axis. The t-test score was also significant. It was also observed that participants from Lagos manifested slightly higher level of NSII than those drawn from Wukari but the t-test score was not significant. This is an indication that the observed differences are not statistically significant. Therefore, hypothesis 4 that states that adolescents and young adults from Wukari area will have significantly lower level of negative self-image and fear of negative evaluation than those from Lagos metropolis is accepted.
Discussion This study seeks to assess the symptoms and manifestations of negative self-image and fear of negative
evaluation among adolescents and young adults. It hypothesized that there will be significant correlation between negative self-image and fear of negative evaluation; that the level of negative self-image and fear of negative evaluation will be significantly higher in adolescent females than in males; that older participants (21-25 years) will present significantly higher level of negative self-image and fear of negative evaluation than the younger ones (16-20 years); that adolescents and young adults from Wukari area will have significantly
NEGATIVE SELF-IMAGE AND FEAR OF NEGATIVE EVALUATION 912
lower level of negative self-image and fear of negative evaluation than those from Lagos metropolis. This section presents discussions on the findings.
Result presented in Table 1 showed negative self-image correlated significantly with fear of negative evaluation with significant score of 0.42, critical r = 0.196 at 0.05 significant level. This is an indication that dissatisfactions with real or imagined defect in physical appearance could trigger social anxiety as well discomfort associated negative evaluations by peers and significant others. In their findings, Phillips (1991), Hollander, Neville, and Frenkel (1992), and Phillips, Dwight, and McElroy (1998) assert that individuals with negative self-image frequently report high levels of social anxiety and shame because of a fear of negative evaluation of their appearance by others. Cash (2008) added that people with BDD often exhibit some fear of negative evaluation or have a phobic avoidance of certain situations or activities that are anxiety�—provoking. Research has also established that fear of negative evaluation drives social processing biases and social anxiety, and similar mechanisms have been hypothesized to be at play in shaping coping strategies in disfiguring conditions (Cash, 2008). Subtle safety-seeking behaviors, such as presenting the body so as to hide the affected area, and contextual avoidance, such as never going swimming or avoiding certain attire, were seen to be related to the cognitive factors described above. Thus, many skin conditions typically vary in their intensity over time, as does the occurrence of triggers such as social events, and for these reasons adjustment is �“ongoing�” and may also be influenced by everyday hassles (Cash, 2008).
In Table 2, it was observed that males manifested higher manifestations of negative self-image than females. It is important to note that fixations with appearance naturally thought to be the burden of the feminine gender appear to be gradually tilting towards the males. Result from this finding shows clearly that body image is important to young men as well as young women. This could be fuelled the dictates of the mass media as well as evaluations from significant others. In contemporary times, the male body appears to be tall and lean, typically has one or two added features: well groomed and expensively, fashionably dressed; and/or exceptional (�“chiseled�” or �“ripped�”) muscularity. In The Adonis Complex, Harrison Pope reports that on average, boys of all ages crave to be more muscular than their current body size. Other work has also shown that many adolescent boys are dissatisfied with their muscle size, strength, shoulders, biceps, and chests, and generally desire more muscle in these areas while maintaining a generally lean physique (McCabe & Ricciardelli, 2001).
Result in Table 3 showed that young adults in the age range of 21-25 manifested significantly higher score on negative self-image than adolescents aged 16-20. Work that has looked at body image concerns in younger and older adults has produced some interesting findings. The idealized slender body shape is generally associated with youth. Women in particular are expected to try to maintain a youthful appearance, since youthfulness for women is valued in many societies. Cepanec and Payne (2000) argue that there is significant social pressure on women to maintain a youthful look, a pressure, and for men, the pressure to maintain a trim and muscular look could trigger unnecessary dieting and over-exercise particularly weightlifting to remain youthful.
In Table 4, we found out that adolescents and young adults from Lagos metropolis manifested higher level of fear of negative evaluation than those from Wukari area. Lagos, just like almost all huge mega cities is fuelled by high level of competitiveness of which looking good could sometime define success and physical acceptance, unlike that obtainable in Wukari which could be define as a semi-urban area. This could heighten apprehension associated with physical social evaluation and thus fear of negative evaluation.

NEGATIVE SELF-IMAGE AND FEAR OF NEGATIVE EVALUATION 913
Conclusion In order to add to existing knowledge in the area of body image dissatisfaction, this study presented
findings from adolescents and young adults. It was observed that males appeared more fixated with appearance concerns than women, which is an anomaly. But going with currently developmental experiences of the digital age, men are note alienated from the visual cues and dictates of the mass media. Since the 1980s, there has been a trend toward magazines and movies featuring a muscular, action-ready male body in a state of objectified undress. This development has been accompanied by increased media attention to exercise and weightlifting as paths to sexual (not romantic) prowess, and by glorification of the �“bulked up�” male (Cash, 2008). Findings further revealed that age and geographic location influences manifestations of negative self-image and fear of negative evaluation among adolescents and young adults, while negative self-image correlated significantly with fear of negative evaluation. Findings from this study are by no means conclusive as it represents just a fraction of adolescent and young adult population. However, studies such as this show that dissatisfaction with real or imagined defects in physical appearance is not only a Western reality, but also our local reality, especially in the digital age characterized by availability and exchange of ideas, culture and mode of life.
References Agbu, J. O. (2011). Development and validation of negative self-image inventory. ASEAN Journal of Psychiatry, 12(2), 169-177. APA (American Psychiatric Association). (2000). Diagnostic and statistical manual of mental disorders (text revision).
Washington, D.C.: Author Bios, P. (1962). On adolescence: A psychoanalytic interpretation. New York: Free Press. Cepanec, D., & Payne, B. (2000). �“Old Bags�” under the knife: Facial cosmetic surgery among women. In B. Miedema, J. M.
Stoppard, & V. Anderson (Eds.), Women�’s bodies, women�’s lives. Toronto, Canada: Sumach Press. Cash, T. F. (2008). The body image workbook: An 8 step programme for learning to like your looks. Oakland, C.A.: New
Harbinger . Cash, T. F. (2011). Cognitive-behavioral perspectives on body image. In T. F. Cash, & L. Smolak (Eds.), Body image: A
handbook of science, practice, and prevention (pp. 39-47). New York: Guilford Press. DePreester, H., & Knockaert, K. (2005). Body image and body schema interdisciplinary perspectives on the body. Amsterdam:
John Benjamins Publishing Company. Erikson, E. H. (1968). Identity: Youth and crisis. New York: Norton. Field, A. E., Cheung, L., Wolf, A. M., Herzog, D. B., Gortmaker, S. L., & Colditz, G. A. (1999). Exposure to the mass media and
weight concerns among girls. Pediatrics, 103(3), E36. Freud, A. (1958). Adolescence. Psychoanalytic Study of the Child, 15, 255-278. Gilbert, N., & Meyer, C. (2005). Fear of negative evaluation and the development of eating psychopathology: A longitudinal
study among nonclinical women. International Journal of Eating Disorders, 37(4), 307-317. Grogan, S. (2008). Body image understanding body dissatisfaction in men, women, and children (2nd ed.). London: Routledge. Hall, G. S. (1904). Adolescence: Its psychology and its relation to physiology, anthropology, sociology, sex, crime, religion, and
education (Vols. I & II). Englewood Cliffs, N.J.: Prentice-Hall. Hollander, E., Neville, D., & Frenkel, M. (1992). Body dysmorphic disorder: Diagnostic issues and related disorders.
Psychosomatics, 33(2), 156-165. McCabe, M. P., Ricciardelli, L. A., & Banfield, S. (2001). Body image, strategies to change muscles and weight, and puberty: Do
they impact on positive and negative affect among adolescent boys and girls? Eating Behaviors, 2, 129-149. O�’Dea, J. A., & Abraham, S. (1999). Onset of disordered eating attitudes and behaviors in early adolescence: Interplay of pubertal
status, gender, weight, and age. Adolescence, 34(136), 671-679. Phillips, K. A. (1991). Body dysmorphic disorder: The distress of imagined ugliness. American Journal of Psychiatry, 148(9),
1138-1149. Phillips, K. A. (1996). The broken mirror understanding and treating body dysmorphic disorder. New York: Oxford University
Press.
NEGATIVE SELF-IMAGE AND FEAR OF NEGATIVE EVALUATION 914
Phillips, K. A., Dwight, M. M., & McElroy, S. L. (1998). Efficacy and safety of fluvoxamine in body dysmorphic disorder. Journal of Clinical Psychiatry, 59(4), 165-171.
Phillips, K. A. (2005). Placebo-controlled study of pimozide augmentation of fluoxetine in body dysmorphic disorder. American Journal of Psychiatry, 162(2), 377-379.
Rand, C. S., Resnick, J. L., & Seldman, R. S. (1997). Assessment of socially acceptable body sizes by university students. Obes. Res., 5(5), 425-429.
Radovanovic, N., & Glavak, R. (2003). The relationship of fear of negative evaluation with self-concept and social perception among adolescents. Drustvena Istrazivanja: Journal for General Social Issues, 12(6), 68.
Siegel, J. M., Yancey, A. K., Aneshensel, C. S., & Schuler, R. (1999). Body image, perceived pubertal timing, and adolescent mental health. J. Adolesc Health, 25(2), 155-165.
Simons, R. G., & Rosenberg, F. (1973). Disturbance in the self image at adolescence. American Sociological Review, 38, 253-565. Veale, D., & Neziroglu, F. (2010). Body dysmorphic disorder a treatment manual. U.K.: Wiley-Blackwell Pub. Watson, D., & Friend, R. (1969). Measurement of social evaluative anxiety. Journal of Consulting and Clinical Psychology, 33(4),
448-457.
Psychology Research, ISSN 2159-5542 November 2014, Vol. 4, No. 11, 915-921
The Leadership Effect on Employees Motivation
Henrique Guilherme Scatolin, Rafael Barranco, Robson Pereira de Torres Uniararas, São Paulo, Brazil
This paper discusses the effect that the leadership causes on employees�’ motivation within the organizations, in
order to show the reader that leadership is an external stimulus necessary to awaken the employees�’ intrinsic
feelings, among them, the motivation. The leader faces constant challenges in the organization day by day and he
is responsible for understanding his lead team, as well as their several natures and cultural models. In the classical
theory, people worked in a mechanistic manner with the motivation, but with the industrial development and the
competitiveness incitement, it was observed that to survive on the market, companies need to extract as much as
possible of the intellectual capital of its human factor. Therefore, it is necessary to establish conditions under
which people feel motivated to work towards the goals outlined by the companies, thus obtaining satisfactory
results. This article concludes that motivation is an internal force that is directly affected by external factors in
which the manager is responsible for identifying what really motivates each employee in the search for the best
results.
Keywords: leadership, motivation, satisfaction
Introduction The world societies are living in an era where the globalization, information speed, and technology are
quickly renewed, increasing the markets competitiveness. For settling into such competitive market, companies need to extract the best from their employees, placing them in a position to accomplish their goals and commitments within deadlines, ensuring total satisfaction to their customers and thus keeping fully heated in the market. For this purpose, �“Structure is required where leadership and motivation walk together to achieve the final product with satisfactory results�” (Nakamura et al., 2005).
Although there is no concrete and fully applicable definition, many authors have already discussed the motivation and leadership topic and presented several theories related to the topic. Among them, the following are highlighted: Abraham Maslow, Victor Vroom, McGregor, Bowditch and Buono, White and Lippitti, Rensis Likert, among others.
Therefore, this paper highlights, through a bibliographical review, that to achieve results within an organization, it is necessary that �“The entire team is with one goal in common, and this difficult trajectory should be guided by the leader, who needs to have a broad and directional vision within an organization�” (Russo et al., 2005, p. 3).
Henrique Guilherme Scatolin, Doctor and master�’s degree in Psychology from the Pontifical Catholic University of São Paulo,
graduated in Psychology from Unimep (Methodist University of Piracicaba). Currently, is a professor in the Accounting Course of FHO Uniararas. Rafael Barranco, Graduated in Accounting from FHO Uniararas. Robson Pereira de Torres, Graduated in Accounting from FHO Uniararas.
DAVID PUBLISHING
D
THE LEADERSHIP EFFECT ON EMPLOYEES MOTIVATION 916
Research Methodology This article is based on a bibliographical review through research in books and papers on human resources,
scientifically contributing for the study of the intrinsic relationship between leadership and motivation. For Cervo and Bervian (2004):
The bibliographical research is the formation means for excellence and constitutes the basic procedure for the monographic studies, by which the state-of-the-art domain is searched on the given topic. As an original scientific work, the research itself is constituted in the human sciences area. As a subject summary, it usually constitutes the first step of any scientific research. (p. 65)
Theoretical Referential Work Development History
According to Nobre (2010), since prehistoric times, man realized that work was essential for his survival and with that he started to value the other human beings. Then the teamwork was proposed, which soon took large proportions and men began to live in society.
With this came the need for someone that was a leading reference for the members of the new organizations. This individual would be responsible for the establishment and compliance of rules that would govern societies. Consequently, the figure of the leader was born.
The years were passing and the human being became more civilized and organized, until passing through the period known as the Industrial Revolution, in which the artisanal work structure was transformed into manufacturing.
From 1860, the companies had a super production increase, generating a disorganized growth in industries. Soon, several work understanding methods began to emerge, such as that of Frederick Taylor, focusing on the production standardization, and Fayol�’s that worked the company organization as a whole. Unlike Taylor and Fayol, Elton Mayo develops the human relations theory, which establishes the person as the organization primary focus, and the well-being at work, leadership and motivation concepts are created.
Currently, the world passes through a technical revolution and the global economy has been increasingly balanced, and several countries that were �“poor�” before are now in total ascension and being known as emerging. The work efficiency is no longer brachial and became intellectual, and companies have already noticed that innovation is essential in this so competitive market. Therefore, �“Innovation is no longer in machines but in the human intellect�” (Nobre, 2010, p. 30).
Current Scenario of People Management Given this scenario, the issue on how to awaken the knowledge stored within the man began to be
discussed, and it was noticed that quality leadership is one of the keys to awake the human motivation. A properly led environment within the skills developed, such as respect, understanding, and altruism
create a motivation to lead, making the entire process of a project, from the beginning until the end if its execution, leave the target audience satisfied. Many studies on the subject show that �“Employees motivated and recognized for their work produce better and this makes the members of a team have the same goals to accomplish and be within the company�’s strategy�” (Nakamura et al., 2005, pp. 20-25).
For Chiavenato (2004), �“The administrator needs to know the human nature and know how to conduct people, i.e., to lead�” (p. 122). In view of this quote, we can launch the following questions: Do current leaders
THE LEADERSHIP EFFECT ON EMPLOYEES MOTIVATION 917
�“create�” an environment favorable to their subordinates and, do they know the difference between power and authority? Let us remember that for many long years, the figure of a leader was related to the ultimate authority of power. Under no circumstances, he could be questioned, receive opinions or praise his led by the goal achieved. This way, he could lose his control power.
Since the early 20th century to the present day, there are still teams working in a hostile environment, inspired by the classical tayorist-fordist theory where there is a maximum efficiency in production and management able to exert full control over the workers. If, on one hand, there is a scenario inspired in the classical theory, on the other, there is an ideal scenario where the great business managers know that, to keep their companies in the unstable market, the human factor must come in the foreground.
So, people are different regarding motivation, because the needs vary according to each person�’s personality and this produces, according to Chiavenato (1999), different behavioral patterns�… due to the cultural values of each individual (pp. 88-89).
Motivational Theories One of the most remembered theories on motivation is the one of Abraham Maslow that defines
motivation as �“something constant and complex found in all human beings�” (as cited in França et al., 2002, p. 251).
For Maslow:
Man is an animal that desires and that rarely reaches a state of complete satisfaction, except for a short time. As he satisfies a desire, comes another one to take its place. When this is pleased another arises in the background. It is the human being characteristic, and his entire life, he always desires something. (as cited in França et al., 2002, p. 251)
Abraham Maslow formulated his theory about the motivation based on a hierarchy of needs, which were divided into the primary physiologic needs and the security and secondary needs that would be the �“social needs, the esteem needs, and the self-realization needs�” (Chiavenato, 1999, pp. 88-89).
The physiological and safety needs are the basis of Maslow�’s pyramid. The physiological needs are related to primary needs such as hunger, thirst, and sex, and the safety needs are related to concerns with safety and shelter. After the satisfaction of this need, people start worrying about the social needs.
Social needs are the needs including friends, girlfriend/boyfriend, wife/husband, children, etc.. The individual feels the need to be estimated by other people and this is perhaps the area of the greatest danger within the human motivation.
The need for self-esteem is a result of satisfaction even if partial of the other three, because the human being starts to need self-confidence feelings, sense of usefulness and value to the world. Finally, it appears the self-realization need that comprises �“the realization of all other needs. This occurs when the man reaches the maximum potential and becomes more than he really is as a person�” (França, 2002, p. 253).
For Victor Vroom, each individual has preferences for certain results and this influences the productivity of each person. For Vroom (as cited in Chiavenato, 1999, pp. 88-89), �“An individual increases its capacity and performance when three factors are gathered: personal objectives, relation perceived between satisfaction and high productivity, and perception of his capacity to influence his productivity�”. These three factors are crucial in the motivation of the organization member.
Another known theory is the X and Y, proposed in 1957 by McGregor (as cited in Nobre, 2010). The X is referring to organizations based on the traditional management mode, where the employee is understood as a

THE LEADERSHIP EFFECT ON EMPLOYEES MOTIVATION 918
frivolous human being and without growth perspectives, which can be controlled by financial incentives. And the Y refers to the organizations that have a modern management, based on human development, providing confidence and autonomy for the tasks definition. The Y, according to Nobre (2010), �“decentralizes the power and creates a democratic and participatory environment, by which people feel motivated by the conditions proposed in the management�” (pp. 47-48).
Figure 1. Source: Retrieved from http://motivaeinova.blogspot.com.br/2012/02/piramide-de-maslow-entenda-hierarquia.html
Each theory above presents an understanding regarding the human nature and no theory can tell you all about the motivation of each person. In view of this, the motivation is extremely subjective and it is influenced not only by extrinsic factors, but also by intrinsic factors that �“vary from person to person, and this peculiarity makes it too complex to deal with motivational processes�” (França, 2002, p. 257).
Against this complexity, a question hangs over the companies: The own person is auto-motivated or motivation must be managed? For Chiavenato (1994), �“Motivation is one of the main managerial responsibilities�” (p. 166). The motivation is within the individual, but the leader is responsible for influencing this motivation through a quality environment, where the intrinsic factors join to the extrinsic factors.
Leadership Theories and Styles There are several definitions of leadership, among which we mention the one of Bowditch and Buono
(1992) that defined it as �“an influence process, usually from a person, through which an individual or group is oriented for the establishment and achievement of goals�” (p. 118).
In addition to this definition, many theorists have formulated theories and styles regarding leadership in organizations. Regarding the leadership styles, White and Lippitt (as cited in Chiavenato, 1994) analyzed the impact caused by three basic types of leadership: the autocratic, liberal, and democratic. Autocratic leadership presented a great workload, but there were signs of tension and frustration, the liberal leadership was bad in
SELF-REALIZATION
EGO OR ESTEEM
SOCIAL
SAFETY
PHYSIOLOGICAL
THE LEADERSHIP EFFECT ON EMPLOYEES MOTIVATION 919
production and quality, and with strong signs of individualist and disrespect towards the leaders. And in the democratic leadership, the groups did not produce as the autocratic leadership, but the work quality, satisfaction and commitment were amazing. With this, it was concluded that �“the autocracy overloads the leader, the liberalism overloads the subordinates, and the democracy balances the responsibilities of the individuals involved in the organization�” (Chiavenato, 1994, pp. 149-150).
Other two leadership styles are the leadership centered on the task, which deals with a leadership style focused on defining the task and obtaining results through the work standardization, using a classical model closer to a company classified in the theory X. Another is the leadership centered on person, in which there is a greater concern with the subordinates and which seeks to keep a team motivated and focused on the goal, and not only in methods. This leadership model is �“more interactive and the leader acts more as a supporter and shows full confidence in his team�” (Chiavenato, 1994, pp. 151-152).
Rensis Likert (as cited in Quimet, 2002) argues that managers are members of two groups within an organization. In one group, he is responsible for the people, in other words, it would be the low group, and the other would be the top group, in which he is the subordinate of his superiors. In this theory, the effective leadership would exert influence over the top group and, at the same time, he would be able to lead the low group. This would be, according to Bowditch and Buono (1992), the link to encourage the team to obtain the results for their superiors, providing a real satisfaction to the leader towards both groups (pp. 123-124).
Effects on the Accounting Management Bringing these motivation and leadership theories to the accounting and administrative field where the
accountant usually coordinates a group of people, and he is also responsible for providing relevant information for decision-making; the accountant needs to exert an important leadership activity towards his led team, where he learns to observe his leadership style in order to strengthen his individual performance and evaluate the situation he is living within the organization.
An organization without motivated personal and with a work environment unfavorable has a vital strategic deficiency. People without personal and professional development are also a problem of business management. It is favorable that �“The accounting manager keeps a management focused on developing people with high performance expectations and professional challenges�” (Bernardi, 2003, p. 136).
The accountant/controller needs to have confidence in his team, because there is no way to manage people without providing them confidence. When the manager transmits safety to the team, he informally establishes a cooperation agreement with the involved and this provides the commitment of the person with his own, making the organization interests align with his personal and professional growth interests. A leadership with little confidence creates controls that leave the company very hierarchical and bureaucratic. This frustrates, according to Covey (2002), �“to achieve goals because the processes become very exhaustive and this reflects directly on the desired result�” (pp. 145-146).
The controller occupies an important position in the organization management team. He is the information man and who has the future vision, being able to identify the failures to be corrected and to indicate the best paths for the organization success. The controller must be ethical and fair, a people manager and mentor of new professionals. He should be, according to Crepaldi (2008), �“a helper of other managers, assisting all Responsible for the controllership department and the analysis of the companies�’ quantitative information.
THE LEADERSHIP EFFECT ON EMPLOYEES MOTIVATION 920
departments to achieve their goals. His criticisms should be constructive and through respectful and suggestive means�” (pp. 29-30).
The company controllership area is fueled by information from the accountant, and being analyzed and processed by the controller, who assumes the responsibility of centralizing the efforts and ordering the organization managers actions. And within those procedures �“are the behavioral changes necessary to ensure that the company can achieve its mission and maximize the wealth of all those involved in the institution�” (Borba, 2009, p. 30).
Conclusion Motivation is an inner strength that makes people search for the self-realization. Even in the face of major
challenges and obstacles, the motivated individual struggles to win and overcome. The leader that knows the motivational basis of his team can deal with people in an individualized way, in
order to establish a relationship of trust and with this he �“will generate a motivational impulse in people, transforming the inner motivation in attitudes and consequently, he will get the maximum of his subordinates�” (Davis & Newstron, 2004, pp. 45- 46).
Currently we live in a technological era and the information circulation is constant. Every moment, the market changes and a product must always be renewed. Therefore, the company needs to adapt to the market, i.e., innovate and anticipate to the facts.
For materializing the planning into results, the organization needs people capable of achieving the goals and developing improvements, being the innovation a key factor in today�’s world. To achieve the innovation, it is necessary to have human capital and this capital needs to be extracted and drawn by external factors, such as through the leadership, confidence, and autonomy. This will arouse the motivation necessary to develop new skills and produce new ideas. And although there is a maximal theory to achieve people motivation awakening, the leader needs to identify the personality of each component of his team, in order to extract the best from each individual and obtain results that will reflect in the corporation balance sheets and income statements.
References Bejarano, V. C., & Pilatti, L. A. (2008). External elements essential to the teams implementation. Revista de Administração,
43(1). Bernardi, L. A. (2003). Entrepreneurship and management handbook: Fundamentals, strategies and dynamics. São Paulo: Atlas. Borba, V. S. (n.d.). The importance of the controller role in the economic management. Retrieved March 10th, 2012, from
http://www.avm.edu.br Bowditch, J. L., & Buono, A. F. (1992). Elements of organizational behavior. São Paulo: Pioneira Thomson. Brandt, J. A., & Oliveira, I. C. (2009). Analysis of the supervisors relations with their teams in the work organizations. Psicologia
USP, 20(4). Cervo, A. L., & Bervian, P. A. (2004). Scientific methodology (5th ed.). São Paulo: Prentice Hall. Chiavenato, I. (1999). Human resource management (4th ed.). São Paulo: Atlas. Chiavenato, I. (2004). Administration in new times (2nd ed.). Rio de Janeiro: Elsevier. Chiavenato, I. (1994). Managing people (3rd ed.). São Paulo: Makron Books. Covey, S. R. (2002). Principle-based leadership (7th ed.). Rio de Janeiro: Elsevier. Crepaldi, S. A. (2008). Accounting management: Theory and practice (4th ed.). São Paulo: Atlas. Davis, K., & Newstrom, J. W. (2004). Human behavior at work (1st ed.). São Paulo: Thomson Learning. França, A. C. L. (2002). People in the organization (6th ed.). São Paulo: Gente.
THE LEADERSHIP EFFECT ON EMPLOYEES MOTIVATION 921
Mourão, L., & Marins, J. (2010). Who is motivated to learn in the courses offered by the companies? Revista Paidéia, 20(46). Nakamura, C. C. et al. (2005). Motivation at work. Revista de Ciências Empresariais, 2(1). Nobre, T. L. (2010). Motivation: The human resources management challenges today. Curitiba: Juruá. Quimet, G. (2002). The Pitfalls of Leadership Paradigms. Revista de Administração, 42(2). Russo, R. et al. (2005). Leadership and influence in the project management phases. Revista Produção, 15(3).
Psychology Research, ISSN 2159-5542 November 2014, Vol. 4, No. 11, 922-927
The Experiences With Nurses Trainings Concerning Prevention
of Violence in the Czech Republic in Years 2010-2013
Jaroslav Pekara The College of Nursing;
University of South Bohemia
Ceske Budejovice;
City of Prague Emergency Medical
Services, Prague, Czech Republic
Marie Tre�šlová University of South Bohemia Ceske
Budejovice,
Ceské Bud jovice,
Czech Republic
Petr Hulinský Ministry of Education, Youth
and Sports, Prague, Czech Republic
The aim of this paper is to analyze the results from the implemented projects and trainings which were aimed to
minimize violence in health care area in CR (the Czech Republic) in years 2010-2013. The paper describes the
results and experience from the communication trainings which were gained within the projects: CR lacks the
support of government agencies so as employers and research on the issue, medical staff are not professional
enough in communication, there are more requirements for the quality of lecturers; there is no existing general
system of monitoring of violent incidents; there is no relevant education at schools. The article contains also new
general ways about how to resolve mentioned problems. These results include the special mini project where
educated 550 staff members in the health care area in a short time period and taught them key skills for how to
approach the aggressive patients�—50.6% respondents used successfully the gained skills in their practice
(negotiation with patients, aggressive related); 42.7% respondents also used successfully the gained skills in their
private life. It was found out that with the used skills the courage by conflict resolution was created.
Keywords: violence, research, CR (the Czech Republic), communication, training, prevention
Introduction CR (the Czech Republic) has a problem with violence in the health care area. CR lacks the support of
government agencies, employers and research on the issue. Gradually, however, efforts have begun to emerge, aiming to minimize violence in health care. In the CR, several projects have been undertaken to minimize violence and the experience from the projects suggests deficiencies in staff training and the importance of educating employees and trying to minimize violence in health care.
The aim of this paper is to analyze the results from the implemented projects and trainings. The author is a medical employee and communication lecturer. He prepares improvements for staff members in the health care and their patients in the CR on the basis of an analysis and comparison of the relevant projects.
The researches on violence mostly focus on psychiatric hospitals and ICU (Intensive Care Units) and these
Jaroslav Pekara, MSc., R.N., The College of Nursing; University of South Bohemia Ceske Budejovice; City of Prague Emergency Medical Services.
Marie Tre�šlová, Ph.D., R.N., University of South Bohemia Ceske Budejovice. Petr Hulinský, Ministry of Education, Youth and Sports.
DAVID PUBLISHING
D
THE EXPERIENCES WITH NURSES TRAININGS 923
data are transferred to non-psychiatry wards automatically (general wards, non-intensive wards). Likewise, the preventive and strategic arrangements are transferred from the ICU and psychiatry wards to the general wards and non-intensive wards. But the general wards are specific in a different way (Beech & Leather, 2006). The violence seen most often in the general wards is based on escalated negative emotions which get out of control. This type of violent behavior could be de-escalated by proper communication and specific approaches. The health care workers in CR are not trained and skilled enough in such approaches. This is due to the fact that the education at schools is not sufficient (Pekara, 2011).
Three projects (2010-2013) have been implemented in CR for education and prevention of violence in the health care area. The paper describes the results and experience from the communication trainings which were gained within the projects.
Methodology Data analyze of existing surveys in CR on the topic violence in the framework of provision of care in
health and social system are as follows.
2004-2010 In 2004, research organized jointly by the Ministry of Health and IHPE (Institute of Health Policy and
Economics) set out to determine any facts concerning violence in the Czech health care system. The research was planned to continue to the year 2009, but the IHPE was closed down, and so it took place for only two years. During those two years, an empirical quantitative research was carried out among 675 employees in the health care in the CR (Háva et al., 2004).
The study found that violence in the healthcare system in the CR is a serious problem. 42% of staff members had experience of verbal violence and 13% staff had experience of physical violence. The incidence of physical violence was the highest in comparison with other countries (Thailand, Bulgaria, Brasil, Libanon, and Portugal). The study contained also qualitative interview with patients who were victims of violence to the medical staff, such as patients who were coming for operations were attacked by medical staff via verbal violence (non-professional communication, arrogant behavior) (Hnilicová, 2007).
This fact was confirmed by means of another qualitative study in 2006 which was aimed to the violence in the emergency medical services in CR. Interviews were performed with the managers of emergency medical services in the CR. The findings are as follows: The verbal aggression is present in every third intervention; physical violence is present in 13% of all interventions; and 15% of violent incidents were due to the behavior of the staff of emergency medical services in the CR (when the staff provoke potential aggressors to the attack due to non-professional communication) (Pekara, 2007).
Within the above-mentioned time, other studies about violence in the health care system in the CR were carried out. Unfortunately, these research undertakings failed to contain valid data and the numbers of respondents were too few.
We can determine the general points in researches in the years 2004-2010: (1) Violence is a serious problem in the healthcare system in the CR; (2) Verbal violence prevails over physical violence; (3) Absence of both central and local data on violence in the healthcare; (4) The last surveys included a low number of respondents;
THE EXPERIENCES WITH NURSES TRAININGS 924
(5) Violent incidents are partly caused by medical staff via their non-professional behavior; (6) Absence of education in schools.
2010-2013 Czech-Moravian Confederation of Trade Unions started the project called Prevention of Violence in
Health and Social Systems in the CR in 2010. It was a quantitative study covering 1,500 employees, which found that violence in the workplace was experienced by 31% of employees (health and social workers) in the previous year. The physical violence was admitted in 17% and the psychological violence was admitted in 41% (mobbing, sexual harassment, bossing, and racial harassment). The number of violent verbal attacks was similar to the number of violence attacks shown in the projects of the year 2004. The incidence of physical violence was even higher. The changes were also in the approach of the management of hospitals and social areas�—60% managers adopted the measures against the occurrence of violence at their premises (measures associated with the safety and occupational health screening and patient). Unfortunately, there were still persisting deficiencies in the work environment, human resources development, increasing staff numbers, or staff training in communication skills. Even though six years passed from a similar project, the main problems remain the same. That is overworked staff, non-professional communication, and unawareness (Hofmannová, 2010).
Unlike in the first project in 2004, the medical staff wasn�’t educated practically. Generally, 1,004 staff members in this project, so-called key people for violence in the health care, were educated. Every person was educated during five days: one day in the management of violence, two days in communication skills, and two days in physical self-defense. In this project, an idea to create 14 violence prevention teams should try to minimize violence in individual regions. Unfortunately, this activity currently works only in one region (Pilsen). As time went on, it was found that the education in this project was not effective. The selection of so-called key people did not have any criteria and the five educating days were not effective because many of the 1,004 persons didn�’t repeat the knowledge gained. The lecturers weren�’t experts. The lecturers were people from different workplaces and departments, minimum of them worked in the immediate contact with patients. Some educating days were aimed to prevent violence a lot but some educating days weren�’t aimed at violence at all. Despite the criticism, this project was coming to a greater offer of communication trainings for health care professionals throughout the country, especially in the health care area. Most of the courses were unfortunately one-off, and if they are not repeated, the knowledge and training aren�’t beneficial for practice.
In the years 2011-2013, another big educational project for medical staff in CR was performed. The organizer of the project was the Ministry of Health plus Aesculap Academy. The project was unique in its practical approach. It was the only educating project without quantitative research, but a great emphasis was placed on the quality and experience of the lecturers. One of the topics of education was the safety of staff members in the health care area. 1,948 staff members in the health care were educated in 26 seminars and nine conferences in total. A mini project was included in this project. 550 health staff members from the hospital in the town of Jihlava were educated in the approach and communication with aggressive patients or their relatives (Kovrzek, 2012). Nurses were educated during 14 seminars (One seminar was for max; 40 staff members and took 120 minutes). The main goal of this mini project was whether is possible to educate staff members in the health care area in a short time period and to teach them key skills for how to approach the aggressive patients. The evaluation was done after 12 months from start of the mini project. Seminars were unique not only because of evaluations but also with the own contain (impact by experiences, influence by
THE EXPERIENCES WITH NURSES TRAININGS 925
emotions and infinite number of real situations). The feedback of questionnaires was 42%. Main results: 50.6% respondents used successfully the gained skills in their practice (negotiation with patients, aggressive related). 42.7% respondents also used successfully the gained skills in their private life. It was find out that with the used skills the courage by conflict resolution was created. 70% respondents plan to use the skills in the future.
The development of violence prevention in the Czech Republic in the year 2010-2013 (based on the projects):
(1) The researchers focus on a greater number of respondents; (2) The frequency of violent incidents stays the same; (3) Medical staff are not professional enough in communication; (4) Conferences and seminars more focus on the professionalism in communication; (5) There are more requirements for the quality of lecturers; (6) There is no existing general system of monitoring of violent incidents, the medical staff aren�’t
motivated to report any possible incidents; (7) There is no relevant education at schools; (8) There is no continuous repetition of the knowledge and skills gained; (9) If the communicational education is aimed to presentation model situations with real facts, then
influence of educational course impacts positive experience and enables change of our behavior.
The Planned Research Currently, a small project is running in CR which is targeted only on Prague. Prague wasn�’t included in
previous projects. The project is targeted on TPV (the third party violence) (medical staff, patients, and relations). The main coordinator of project is the Trade Union, and the project takes place with a considerable support by Norway. The main aim of this project is to train 200 medical staff. These people should be educated to become lecturers and educate other people after the project will be finished. The project should be realized without deficiencies shown in previously projects. There was created a five member team of experts�—a psychologist with experience in TPV, a lecturer of communication and researcher TPV in CR, a lecturer of self-defense, and the trade union representatives. The psychologist and an expert of TPV are incessantly supervising the preparation of trainings for 200 medical staff (includes 10 organizations provide health or social care). The project started in September 2013 and will end in October 2014. The training will be organized like the interactive seminars. These seminars will prepare medical staff for managing violence incidents in the future. The aim of the project is to train 200 medical staff which should be well-orientated in the problematic of TPV and they should help to deal with the violence incidents at their workplace. Organizer of the project currently plans to create the interventions teams which will be specially educated (Two members from ever organization will be educated in approach of monitoring incidents in their own department and of provide effective feedback after violence incidents).
Medical staff in the project will be trained during five days: (1) Three days: communication�—verbal self-defense, victimology, analysis of TPV incidents; (2) One day: management of TPV; (3) One day: physical self-defense�—defensive approach, light techniques. The preparations for this project have revealed several shortcomings that exist in the TPV situation in CR:

THE EXPERIENCES WITH NURSES TRAININGS 926
(1) Deficiency of experts and explorers in this field; (2) Absence of an institution for TPV; (3) Ignorance of procedures for dealing with TPV at departments; (4) Low level of national monitoring of TPV; (5) Measures for TPV are often only temporary.
New General Way? Another great contribution for the improvement of mentioned situation should be a dissertation work on
this topic. Since 2004, the violence in health care in the CR occurs only in the context of short studies or final reports of the projects. Most of the reports are only for informative purposes�—the number of attacks and forms of attacks. Elaboration attacks lack in the studies, also missing test cases and ways how to solve of them. There is an absence of reflection about training days for TPV, many of them have a design such a one-day course. A major drawback is the establishment of a center for the capture of violent incidents�—their subsequent analysis by experts and draw conclusions. All of these shortcomings will saturate dissertation, which aims to create a manual for management violence in the health sector in the CR.
Based on the analysis of the foreign literature and practical experience of relevant experts, recommended procedures will be produced to monitor and minimize the problem. There will be also created how to make an effective research, and how to make an effective education for medical staff in this problematic area. We try currently to create system for monitoring violence incidents via special website (currently is under construction) in CR. This is the main point for the optimal start in this problematic. We can present the case interpretation from this system and then we can give several solutions for preventing and solving the situations.
Conclusion The violence in CR is a serious problem. There were seen many situations of non-professional behavior on
the side of the medical staff. There is an absence of effective education in approach to aggressive patients and their relations in CR. The professional staff lacks professional approach, the members of the management avoid solving violent situations, and the examples from foreign countries are rarely followed. The projects offered brought forward temporary solutions only and serve as a plaster on the wound rather than a cure. The researches over the past 20 years have shown a positive contribution of education and communication skills training for health professionals. The courses have measurable results and nurses themselves considered them as beneficial. Acquired behavioral skills increase the patient�’s satisfaction with how the patients learn and understand health care.
As it turns out that any form of repression does not provide qualitative and expected changes, the only possible way to cope with violence is to re-seek practical training in communication with patients and colleagues. An essential part of such trainings must, however, provide feedback, medical personnel must be aware of how to �“see�” their patient.
References Beech, B., & Leather, P. (2006). Workplace violence in the health care sector: A review of staff training and integration of
training evaluation models. Aggression and Violent Behavior, 11, 27-43. Pekara, J. (2011). Prevence násilí v o�šet ovatelství. Prevence úraz , otrav a násilí, 2, 187-191.

THE EXPERIENCES WITH NURSES TRAININGS 927
Háva, P. et al. (2004). Násilí na pracovi�šti v oblasti zdravotnických a sociálních slu�žeb R (p. 140). Vstupní teoretické studie, Empirické �šet ení, Kostelec nad ernými lesy.
Hnilicová, H. (2007). Násilí na pracovi�šti ve zdravotnictví. Zdravotnické Noviny, 46, 16-18. Pekara, J. (2007). Napadení zdravotnických záchraná . Florence, 4, 175-176. Hofmannová, K. (2010). Pracovní násilí a jeho zdroje. Florence, 11(10), 1. Kovrzek, T. (2012). A safe healthcare environment with respect to patient-clinic communication. Global Aesculap Academy,
Newsletter, 2, 7.