
Research Methods for Business - SU LMS
447
-
Upload
khangminh22 -
Category
Documents
-
view
3 -
download
0
Transcript of Research Methods for Business - SU LMS


An easy way to help students learn, collaborate, and grow.Designed to engage today’s student, WileyPLUS Learning Space will transform any course into a vibrant, collaborative learning community.
www.wileypluslearningspace.com
Identify which students are struggling early in the semester.Educators assess the real-time engagement and performance of each student to inform teaching decisions. Students always know what they need to work on.
Facilitate student engagement both in and outside of class. Educators can quickly organize learning activities, manage student collaboration, and customize their course.
Measure outcomes to promote continuous improvement. With visual reports, it’s easy for both students and educators to gauge problem areas and act on what’s most important.


Seventh Edition
Research Methods for Business


Uma Sekaranand
Roger Bougie
Seventh Edition
Research Methods for Business
A Skill-Building Approach

Copyright © 2016, 2013 John Wiley & Sons Ltd.
All effort has been made to trace and acknowledge ownership of copyright. The publisher would be glad to hear from any
copyright holders whom it has not been possible to contact.
Cover image credit: ©Peshkova. Used under license from Shutterstock.com
Registered office
John Wiley & Sons Ltd, The Atrium, Southern Gate, Chichester, West Sussex, PO19 8SQ, United Kingdom.
For details of our global editorial offices, for customer services and for information about how to apply for permission to
reuse the copyright material in this book please see our website at www.wiley.com.
The rights of Uma Sekaran and Roger Bougie to be identified as the authors of this work have been asserted in accordance
with the UK Copyright, Designs and Patents Act 1988.
All rights reserved. No part of this publication may be reproduced, stored in a retrieval system, or transmitted, in any form
or by any means, electronic, mechanical, photocopying, recording or otherwise, except as permitted by the UK Copyright,
Designs and Patents Act 1988, without the prior permission of the publisher.
Wiley publishes in a variety of print and electronic formats and by print‐on‐demand. Some material included with standard
print versions of this book may not be included in e‐books or in print‐on‐demand. If this book refers to media such as a CD
or DVD that is not included in the version you purchased, you may download this material at http://booksupport.wiley.com.
For more information about Wiley products, visit www.wiley.com.
Designations used by companies to distinguish their products are often claimed as trademarks. All brand names and product
names used in this book are trade names, service marks, trademarks or registered trademarks of their respective owners. The
publisher is not associated with any product or vendor mentioned in this book. This publication is designed to provide accurate
and authoritative information in regard to the subject matter covered. It is sold on the understanding that the publisher is
not engaged in rendering professional services. If professional advice or other expert assistance is required, the services of a
competent professional should be sought.
Library of Congress Cataloging‐in‐Publication Data
Names: Sekaran, Uma, author. | Bougie, Roger, author.
Title: Research methods for business : a skill-building approach / Uma
Sekaran and Roger Bougie.
Description: Seventh edition. | Chichester, West Sussex, United Kingdom :
John Wiley & Sons, [2016] | Includes bibliographical references and index.
Identifiers: LCCN 2015051045 | ISBN 9781119165552 (pbk.)
Subjects: LCSH: Business—Research—Methodology.
Classification: LCC HD30.4 .S435 2016 | DDC 650.072—dc23 LC record available at http://lccn.loc.gov/2015051045
ISBN: 9781119165552 (pbk)
ISBN: 9781119266846 (ebk)
A catalogue record for this book is available from the British Library.
Set in 10/12 Minion Pro by SPi Global
Printed and bound in Italy by Printer Trento Srl.

vii
CONTENTS
About the Authors xixPreface xxiAcknowledgments xxiii
1 Introduction to research 1
Introduction 1Business research 2The role of theory and information in research 3Research and the manager 3
Types of business research: applied and basic 5Applied research 6Basic or fundamental research 7
Managers and research 8Why managers need to know about research 8The manager and the consultant–researcher 9
Internal versus external consultants/researchers 10Internal consultants/researchers 10
Advantages of internal consultants/researchers 10
Disadvantages of internal consultants/researchers 11
External consultants/researchers 11Advantages of external consultants/researchers 11
Disadvantages of external consultants/researchers 12
Knowledge about research and managerial effectiveness 12Ethics and business research 13Summary 13Discussion questions 14Case: The Laroche Candy Company 15
2 The scientific approach and alternative approaches to investigation 18
Introduction 18The hallmarks of scientific research 19
Purposiveness 19Rigor 19Testability 20Replicability 20Precision and confidence 21
viii contents
Objectivity 21Generalizability 22Parsimony 22
The hypothetico-deductive method 23The seven-step process in the hypothetico-deductive method 23
Identify a broad problem area 23
Define the problem statement 23
Develop hypotheses 23
Determine measures 24
Data collection 24
Data analysis 24
Interpretation of data 24
Review of the hypothetico-deductive method 26Some obstacles to conducting scientific research in the management area 27
Alternative approaches to research 28Positivism 28Constructionism 28Critical realism 29Pragmatism 29Conclusion 29
Summary 30Discussion questions 31
3 Defining and refining the problem 33
Introduction 33The broad problem area 33Preliminary research 37
Nature of information to be gathered 37Background information on the organization 37
Information on the topic or subject area 38
Defining the problem statement 39What makes a good problem statement? 39Basic types of questions: exploratory and descriptive 43
Exploratory research questions 43
Descriptive research questions 43
Causal research questions 44
The research proposal 45Managerial implications 47Ethical issues in the preliminary stages of investigation 47Summary 48Discussion questions 49

contents ix
4 The critical literature review 51
Introduction 51How to approach the literature review 54
Data sources 54Textbooks 54
Journals 54
Theses 55
Conference proceedings 55
Unpublished manuscripts 55
Reports 55
Newspapers 55
The Internet 55
Searching for literature 56Evaluating the literature 56Documenting the literature review 57
Ethical issues 59Summary 60Discussion questions 61Practice project 62Appendix 63Some online resources useful for business research 63Bibliographical databases 66Apa format for referencing relevant articles 66Referencing and quotation in the literature review section 69
5 Theoretical framework and hypothesis development 71
Introduction 71The need for a theoretical framework 72Variables 72
Dependent variable 73Independent variable 74Moderating variable 75
The distinction between an independent variable and a moderating variable 77
Mediating variable 79How theory is generated 81
The components of the theoretical framework 82Hypothesis development 83
Definition of a hypothesis 84Statement of hypotheses: formats 84
If–then statements 84

x contents
Directional and nondirectional hypotheses 84Null and alternate hypotheses 85
Managerial implications 90Summary 91Discussion questions 92Practice project 94
6 Elements of research design 95
Introduction 95The research design 95Elements of research design 96
Research strategies 96Experiments 97
Survey research 97
Ethnography 97
Case studies 98
Grounded theory 98
Action research 98
Extent of researcher interference with the study 99Study setting: contrived and noncontrived 100Unit of analysis: individuals, dyads, groups, organizations, cultures 102Time horizon: cross-sectional versus longitudinal studies 104
Cross-sectional studies 104
Longitudinal studies 105
Mixed methods 106Trade-offs and compromises 107Managerial implications 108Summary 108Discussion questions 109
7 Interviews 111
Introduction 111Primary data collection methods 111Interviews 113
Unstructured and structured interviews 113Unstructured interviews 113
Structured interviews 115
Review of unstructured and structured interviews 116
Training interviewers 116Some tips to follow when interviewing 117
Establishing credibility and rapport, and motivating individuals to respond 117
The questioning technique 118
Review of tips to follow when interviewing 119

contents xi
Face-to-face and telephone interviews 119Face-to-face interviews: advantages and disadvantages 120
Telephone interviews: advantages and disadvantages 120
Additional sources of bias in interview data 120Computer-assisted interviewing 120
CATI and CAPI 121
Software packages 121
Group interviews 121Focus groups 121
Expert panels 122
Advantages and disadvantages of interviews 123Summary 123Discussion questions 124
8 Data collection methods: Observation 126
Introduction 126Definition and purpose of observation 127Four key dimensions that characterize the
type of observation 127Controlled versus uncontrolled observational studies 127Participant versus nonparticipant observation 128Structured versus unstructured observational studies 128Concealed versus unconcealed observation 129
Two important approaches to observation 130Participant observation: introduction 130The participatory aspect of participant observation 130The observation aspect of participant observation 131What to observe 133Structured observation: introduction 134The use of coding schemes in structured observation 136
Advantages and disadvantages of observation 137Summary 139Discussion questions 140
9 Administering questionnaires 142
Introduction 142Types of questionnaires 142
Personally administered questionnaires 143Mail questionnaires 143Electronic and online questionnaires 143
Guidelines for questionnaire design 145Principles of wording 146
Content and purpose of the questions 146

xii contents
Language and wording of the questionnaire 146
Type and form of questions 146
Sequencing of questions 149
Classification data or personal information 149
Principles of measurement 150General appearance or “getup” of the questionnaire 150
Review of questionnaire design 154Pretesting of structured questions 155Electronic questionnaire and survey design 155
International dimensions of surveys 155Special issues in instrumentation for cross-cultural research 156Issues in cross-cultural data collection 156
Review of the advantages and disadvantages of different data collection methods and when to use each 157
Multimethods of data collection 158Managerial implications 159Ethics in data collection 159
Ethics and the researcher 159Ethical behavior of respondents 160
Summary 160Discussion questions 161
10 Experimental designs 165
Introduction 165The lab experiment 167
Control 168Manipulation 168Controlling the contaminating exogenous or “nuisance” variables 170
Matching groups 170
Randomization 170
Internal validity of lab experiments 171External validity or generalizability of lab experiments 171
The field experiment 172External and internal validity in experiments 172
Trade-off between internal and external validity 172Factors affecting the validity of experiments 173
History effects 173
Maturation effects 174
Testing effects 174
Selection bias effects 175
Mortality effects 175
Statistical regression effects 176
Instrumentation effects 176
Identifying threats to validity 177

contents xiii
Review of factors affecting internal and external validity 178Types of experimental design and validity 179
Quasi-experimental designs 179Pretest and posttest experimental group design 179
Posttests only with experimental and control groups 179
Time series design 180
True experimental designs 181Pretest and posttest experimental and control group design 181
Solomon four-group design 181
Double-blind studies 183
Ex post facto designs 184Simulation 184Ethical issues in experimental design research 185Managerial implications 186Summary 187Discussion questions 189Appendix: Further experimental designs 190
The completely randomized design 190Randomized block design 191Latin square design 191Factorial design 192
11 Measurement of variables: Operational definition 193
Introduction 193How variables are measured 193Operational definition (operationalization) 195
Operationalization: dimensions and elements 196
Operationalizing the (multidimensional) concept of achievement motivation 197
Dimensions and elements of achievement motivation 198
What operationalization is not 202Review of operationalization 203
International dimensions of operationalization 204Summary 204Discussion questions 205
12 Measurement: Scaling, reliability and validity 206
Introduction 206Four types of scales 207
Nominal scale 207Ordinal scale 208Interval scale 209Ratio scale 209

xiv contents
Ordinal or interval? 210Review of scales 212
Rating scales 213Dichotomous scale 213Category scale 214Semantic differential scale 214Numerical scale 214Itemized rating scale 215Likert scale 215Fixed or constant sum scale 216Stapel scale 216Graphic rating scale 217Consensus scale 218Other scales 218
Ranking scales 218Paired comparison 218Forced choice 218Comparative scale 219
International dimensions of scaling 219Goodness of measures 220
Item analysis 220Validity 220
Content validity 221
Criterion-related validity 221
Construct validity 222
Reliability 223Stability of measures 224
Internal consistency of measures 224
Reflective versus formative measurement scales 225What is a reflective scale? 225What is a formative scale and why do the items of a formative scale not necessarily hang together? 225
Summary 226Discussion questions 227Appendix: Examples of some measures 229
Measures from behavioral finance research 229Measures from management accounting research 230Measures from management research 230Measures from marketing research 232
13 Sampling 235
Introduction 235Population, element, sample, sampling unit, and subject 236
Population 236

contents xv
Element 237Sample 237Sampling unit 237Subject 237
Sample data and population values 237Parameters 238Representativeness of Samples 238Normality of Distributions 238
The sampling process 239Defining the population 240Determining the sample frame 240Determining the sampling design 240Determining the sample size 241Executing the sampling process 241
Probability sampling 242Unrestricted or simple random sampling 242Restricted or complex probability sampling 243
Systematic sampling 243
Stratified random sampling 244
Cluster sampling 246
Double sampling 247
Review of probability sampling designs 247Nonprobability sampling 247
Convenience sampling 247Purposive sampling 248
Judgment sampling 248
Quota sampling 248
Review of nonprobability sampling designs 249Intermezzo: examples of when certain sampling designs would be appropriate 252
Simple random sampling 252Stratified random sampling 252Systematic sampling 253Cluster sampling 254Area sampling 254Double sampling 255Convenience sampling 255Judgment sampling: one type of purposive sampling 255Quota sampling: a second type of purposive sampling 256
Issues of precision and confidence in determining sample size 257Precision 257Confidence 258Sample data, precision, and confidence in estimation 258Trade-off between confidence and precision 259
Sample data and hypothesis testing 260

xvi contents
The sample size 261Determining the sample size 262Sample size and type II errors 264Statistical and practical significance 264Rules of thumb 264Efficiency In Sampling 265
Sampling as related to qualitative studies 265Managerial implications 266Summary 266Discussion questions 268
14 Quantitative data analysis 271
Introduction 271Getting the data ready for analysis 273
Coding and data entry 273Coding the responses 273
Data entry 275
Editing data 276Data transformation 277
Getting a feel for the data 278Frequencies 279
Bar charts and pie charts 280
Measures of central tendency and dispersion 282Measures of central tendency 282
Measures of dispersion 283
Relationships between variables 285Relationship between two nominal variables: χ2 test 285
Correlations 286
Excelsior enterprises: descriptive statistics part 1 287Testing the goodness of measures 289
Reliability 289Excelsior Enterprises: checking the reliability of the multi-item measures 290
Validity 292Excelsior enterprises: descriptive statistics part 2 293Summary 296Discussion questions 297
15 Quantitative data analysis: Hypothesis testing 300
Introduction 300Type I errors, type II errors, and statistical power 301Choosing the appropriate statistical technique 302
Testing a hypothesis about a single mean 302

contents xvii
Testing hypotheses about two related means 305Testing hypotheses about two unrelated means 309Testing hypotheses about several means 311Regression analysis 312
Standardized regression coefficients 315
Regression with dummy variables 315
Multicollinearity 316
Testing moderation using regression analysis: interaction effects 316
Other multivariate tests and analyses 319Discriminant analysis 319
Logistic regression 319
Conjoint analysis 320
Two-way ANOVA 322
MANOVA 322
Canonical correlation 322
Excelsior enterprises: hypothesis testing 323Overall interpretation and recommendations to the president 325
Data warehousing, data mining, and operations research 326Some software packages useful for data analysis 327Summary 328Discussion questions 329
16 Qualitative data analysis 332
Introduction 332Three important steps in qualitative data analysis 332
Data reduction 334Data display 347Drawing conclusions 347
Reliability and validity in qualitative research 348Some other methods of gathering and analyzing qualitative data 350
Content analysis 350Narrative analysis 350Analytic induction 350
Big data 351Summary 351Discussion questions 352
17 The research report 353
Introduction 353The written report 354
The purpose of the written report 354The audience for the written report 356

xviii contents
Characteristics of a well-written report 356Contents of the research report 357
The title and the title page 357The executive summary or abstract 357Table of contents 358List of tables, figures, and other materials 359Preface 359The authorization letter 360The introductory section 360The body of the report 360The final part of the report 361References 361Appendix 363
Oral presentation 363Deciding on the content 364Visual aids 364The presenter 365The presentation 365Handling questions 365
Summary 366Discussion questions 367Appendix: Examples 368Report 1: sample of a report involving a descriptive study 368Report 2: sample of a report offering alternative solutions and explaining
the pros and cons of each alternative 371Report 3: example of an abridged basic research report 373
A Final Note to Students 377Statistical Tables 379Glossary 389Bibliography 399Index 407

xix
ABOUT THE AUTHORS
Uma Sekaran was Professor Emerita of Management, Southern Illinois University at Carbondale (SIUC), Illinois.
She obtained her MBA degree from the University of Connecticut at Storrs, and her PhD from UCLA. She was
the Chair of the Department of Management and also the Director of University Women’s Professional
Advancement at SIUC when she retired from the University and moved to California to be closer to her family.
Professor Sekaran authored or co‐authored eight books, 12 book chapters, and more than 55 refereed journal
articles in the management area, and presented more than 70 papers at regional, national, and international
management conferences. She also won recognition for significant research contributions to cross‐cultural
research from US and international professional organizations. She received Meritorious Research Awards both
from the Academy of Management and SIUC, and was conferred the Best Teacher Award by the University.
Roger Bougie is Associate Professor at the TIAS School for Business and Society (Tilburg University, The
Netherlands), where he teaches executive courses in Business Research Methods. He has received a number of
teaching awards, including the Best Course Award for his course on Business Research Methods. Dr Bougie’s
main research interest is in emotions and their impact on consumer behavior, service quality, and satisfaction.
Dr Bougie authored or co‐authored numerous papers, books, book chapters, and cases in the area of Marketing
and Business Research Methods. Dr Bougie is ad hoc reviewer for the Journal of the Academy of Marketing
Science, the Journal of Business Research, the Journal of Marketing Research, and Marketing Letters.


xxi
PREFACE
I have used previous editions of this book in various research methods courses with great success. For many years
the book has helped thousands of my own students (undergraduate students, graduate students, and executive
students), as well as many more around the world, to carry out their research projects. The great strength of
Research Methods for Business is that students find it clear, informal, easy to use and unintimidating. I have tried
to maintain these strengths in this seventh edition.
CHANGES IN THE SEVENTH EDITION
The seventh edition of Research Methods for Business has been thoroughly revised.
● Chapter 3 (Defining and Refining the Problem), Chapter 4 (The Critical Literature Review), Chapter 6
(Elements of Research Design), Chapter 7 (Interviews), Chapter 9 (Administering Questionnaires), Chapters 14
and 15 (Quantitative Data Analysis), and Chapter 17 (The Research Report) have been substantially modified
and updated in this edition.
● Examples, exercises, and other pedagogical features have been revised and updated in all the chapters.
● The structure of the book has not changed, but the storyline has been greatly improved. As in previous editions,
the accessible and informal style of presenting information has been maintained and the focus on practical
skill building preserved.
● Chapter 2 introduces and discusses alternative approaches to research. In the new edition, subsequent chapters
follow up on this by reviewing a range of topics (such as research questions, research design, and measurement)
from various perspectives. This allows users of this book to recognize and develop their personal ideas on
research and how it should be done, to determine which kinds of research questions are important to them, and
what methods for collecting and analyzing data will give them the best answers to their research questions.
The book provides numerous examples to illustrate the concepts and points presented. Users will also note
the variety of examples from different areas of the world as well as different areas of business – human resources
management, strategic management, operations management, management control, marketing, finance, accounting,
and information management.
Most chapters in the book include managerial implications of the contents discussed, emphasizing the need
for managers to understand research. The ethical considerations involved in conducting research are also clearly
brought out. The dynamics of cross‐cultural research in terms of instrument development, surveys, and sam-
pling are discussed, which, in the context of today’s global economy, will be useful to students.
We expect that students and instructors alike will enjoy this edition. Students should become effective
researchers, helped by the requisite knowledge and skills acquired by the study of this book. Finally, it is hoped
that students will find research interesting, unintimidating, and of practical use.
HOW TO USE THIS SEVENTH EDITION
You can read this book in a variety of ways, depending on your reasons for using this book.
If the book is part of a Business Research Methods course, the order in which you read the chapters will be
prescribed by your instructor.

If you are reading the book because you are engaged in a project (a consultancy project, a research project,
or a dissertation) then the order in which your read the chapters is your own choice. However, we recommend
that you follow the structure of the book rather closely. This means that we advise you to start with reading the
first three chapters that introduce research, various approaches to what makes good research, and the develop-
ment of a problem statement and a research proposal. Based on the type of research questions and whether, as a
result of your research questions, your study is either qualitative or quantitative in nature you may decide to read
the book in the following way.
In the case of qualitative research:
4 The critical literature review
6 Research design
7, 8, and/or 9 Data collection methods
13 Sampling
16 Qualitative data analysis
17 The research report
In the case of quantitative research:
4 The critical literature review
5 Theoretical framework
6 Research design
9 Questionnaires
10 Experimental designs
11 and 12 Measurement and Scaling
13 Sampling
14 and 15 Quantitative data analysis
17 The research report
COMPANION WEBSITES
Lecturers and students have a dedicated companion website available at www.wiley.com/college/sekaran.
Lecturers will find a range of bespoke video material, developed by the author to provide extra explanation
on difficult topics; videos are signposted in the text. The lecturer website also houses additional case studies
related to each chapter, including accompanying cases for the three new chapters. There is also an extensive test
bank for lecturers, a comprehensive set of PowerPoint slides to accompany the new edition, and an instructor’s
manual, which offers an up‐to‐date and valuable additional teaching aid.
Students will find an online glossary and flashcards, which are useful for self‐study and revision. In addition,
the student website provides self‐test quizzes with over 250 questions for students to use while studying outside
the classroom.
xxii PREFACE

ACKNOWLEDGMENTS
Working on the seventh edition of Research Methods for Business has been a positive and rewarding experience.
Many people have contributed to this in many different ways. Thank you colleagues at Tilburg University and
the TIAS School for Business and Society for your feedback on earlier versions of this book. Thank you for
providing me with a pleasant, professional and inspiring work environment. Thank you dear students for the
lively and inspiring discussions we have had during the past twenty years; I have learned a lot from these discus-
sions. Thanks everybody at John Wiley & Sons, in particular Steve Hardman, for your support, your patience,
and your confidence. Thank you reviewers for your constructive and insightful comments on earlier drafts of
this book.
Roger Bougie
PREFACE xxiii


1
INTRODUCTION
Just close your eyes for a minute and utter the word research to yourself. What kinds of images does this word
conjure up for you? Do you visualize a lab with scientists at work with Bunsen burners and test tubes, or an
Einstein‐like character writing a dissertation on some complex subject such as ‘behavioral heterogeneity in eco-
nomic institutions’, or someone analyzing large amounts of scanner data to assess the impact of a price reduction
on sales? Most certainly, all these images do represent different aspects of research. However, research is not
necessarily characterized by Bunsen burners, Einstein‐like characters or Big Data. Research, a somewhat intimi-
dating term for some, is simply the process of finding solutions to a problem after a thorough study and analysis
of the situational factors. Along these lines, people (consumers, investors, managers) constantly engage them-
selves in exploring and examining issues – and hence are involved in some form of research activity‐ as they want
to change mobile phone providers, buy a new car, go to the movies, invest in a business startup, or increase
advertising expenditures in their role as a manager.
Introduction to research
C H A P T E R 1
LEARNING OBJECTIVES
After completing Chapter 1 you should be able to:
1. Describe and define business research.
2. Distinguish between applied and basic research, giving examples, and discussing why they fall
into one or the other of the two categories.
3. Explain why managers should know about research and discuss what managers should and
should not do in order to interact effectively with researchers.
4. Identify and fully discuss specific situations in which a manager would be better off using an
internal research team, and when an external research team would be more advisable, giving
reasons for the decisions.
5. Discuss what research means to you and describe how you, as a manager, might apply the
knowledge gained about research.
6. Demonstrate awareness of the role of ethics in business research.

2 research methods for business
Research, in some form or another, may help managers in organizations to make decisions at the workplace.
As we all know, sometimes they make good decisions and the problem gets solved; sometimes they make poor
decisions and the problem persists; and on occasions they make such colossal blunders that they get stuck in the
mire. The difference between making good decisions and committing blunders often lies in how we go about the
decision‐making process. In other words, good decision making fetches a “yes” answer to the following ques-
tions: Do we identify where exactly the problem lies? Do we correctly recognize the relevant factors in the situa-
tion needing investigation? Do we know what types of information are to be gathered and how? Do we know
how to make use of the information so collected and draw appropriate conclusions to make the right decisions?
And, finally, do we know how to implement the results of this process to solve the problem? This is the essence
of research and to be a successful manager it is important to know how to go about making the right decisions
by being knowledgeable about the various steps involved in finding solutions to problematic issues of interest to
the organization and/or its stakeholders. This is what this book is all about.
Business research
Business research can be described as a systematic and organized effort to investigate a specific problem encoun-
tered in the work setting, which needs a solution. It comprises a series of steps that are designed and executed with
the goal of finding answers to the issues that are of concern to the manager in the work environment. This means
that the first step in research is to know where the problem areas exist in the organization, and to identify as clearly
and specifically as possible the problems that need to be studied and resolved. Once the problem is clearly defined,
steps can be taken to determine the factors that are associated with the problem, gather information, analyze the
data, develop an explanation for the problem at hand and then solve it by taking the necessary corrective measures.
The entire process by which we attempt to solve problems is called research. Thus, research involves a series of
well‐thought‐out and carefully executed activities that enable the manager to know how organizational problems can
be solved, or at least considerably minimized. Research encompasses the processes of inquiry, investigation, exami-
nation, and experimentation. These processes have to be carried out systematically, diligently, critically, objectively,
and logically. The expected end result would be a discovery that helps the manager to deal with the problem situation.
Identifying the critical issues, gathering relevant information, analyzing the data in ways that help decision
making, and implementing the right course of action, are all facilitated by understanding business research.
After all, decision making is simply a process of choosing from among alternative solutions to resolve a problem
and research helps to generate viable alternatives for effective decision making. Knowledge of research thus ena-
bles you to undertake research yourself in order to solve the smaller and bigger problems that you will encounter
in your (future) job as a treasurer, controller, brand manager, product manager, marketing manager, IT auditor,
project manager, business analyst, or consultant. What’s more, it will help you to discriminate between good and
bad studies published in (professional) journals, to discriminate between good and bad studies conducted by
research agencies, to discriminate between good and bad research proposals of research agencies, and to interact
more effectively with researchers and consultants.
We can now define business research as an organized, systematic, data‐based, critical, objective, inquiry or
investigation into a specific problem, undertaken with the purpose of finding answers or solutions to it. In
essence, research provides the necessary information that guides managers to make informed decisions to suc-
cessfully deal with problems. The information provided could be the result of a careful analysis of primary
data gathered first‐hand or of secondary data that are already available (in the company, industry, archives,
etc.). These data can be quantitative (quantitative data are data in the form of numbers as generally gathered
through structured questions) or qualitative (qualitative data are data in the form of words) as generated from the
broad answers to questions in interviews, or from responses to open‐ended questions in a questionnaire, or
through observation, or from already available information gathered from various sources such as the Internet.

chapter introduction to research 3
The role of theory and information in research
We have just explained that research comes in many forms and shapes. There are different types of questions
research projects can address and there are many different approaches to collecting and analyzing different types
of data. What’s more, some research is aimed at building theory, whereas other research is designed to test a
theory or to describe what is going on, using an existing framework, instrument, or model. Indeed, in one form
or another, both theory and information play an important role in a research project.
The term ‘theory’ can mean a lot of different things, depending on whom you ask. Many people use the
word ‘theory’ to mean an idea or hunch that someone has, for instance about the optimal formation of a soccer
team, investment bankers’ salaries, or the Apollo program and the associated moon landings (‘the Apollo moon
landing didn’t happen’). For others, a theory is any concept, instrument, model, or framework that helps them to
think about or solve a problem, to describe a phenomenon, or to better understand a topic of interest, such as
competitive advantage, portfolio management, or the sociology of Canadian donut shops. To a scientist, a theory
explains a certain phenomenon, and the idea is that this explanation will hold in a wide range of settings. For
instance, expectancy theory proposes that people will choose how to behave depending on the outcomes they
expect as a result of their behavior. In other words, people decide what to do based on what they expect the out-
come to be. At work, for example, it might be that people work longer hours because they expect an increase in
pay. Like this, a theory may generate testable – and sooner or later, tested – predictions. A theory (in the formal,
scientific sense) may thus vary in the extent to which it has been conceptually developed and empirically tested.
We will have more to say about the role of information and theory in the research process in subsequent chapters.
Research and the manager
An experience common to all organizations is that the managers thereof encounter problems, big and small, on
a daily basis, which they have to solve by making the right decisions. In business, research is usually primarily
conducted to resolve problematic issues in, or interrelated among, the areas of accounting, finance, management,
and marketing. In accounting, budget control systems, practices, and procedures are frequently examined.
Inventory costing methods, accelerated depreciation, time‐series behavior of quarterly earnings, transfer pricing,
cash recovery rates, and taxation methods are some of the other areas that are researched. In finance, the opera-
tions of financial institutions, optimum financial ratios, mergers and acquisitions, leveraged buyouts, intercorpo-
rate financing, yields on mortgages, the behavior of the stock exchange, the influence of psychology on the
behavior of financial practitioners and the subsequent effect on markets, and the like, become the focus of inves-
tigation. Management research could encompass the study of employee attitudes and behaviors, human resources
management, the impact of changing demographics on management practices, production operations manage-
ment, strategy formulation, information systems, and the like. Marketing research could address issues pertain-
ing to consumer decision making, customer satisfaction and loyalty, market segmentation, creating a competitive
advantage, product image, advertising, sales promotion, marketing channel management, pricing, new product
development, and other marketing aspects.
Exhibit 1 gives an idea of some commonly researched topical areas in business.
Visit the companion website at www.wiley.com/college/sekaran for Author Video: Research and the manager.

4 research methods for business
EXHIBIT 1
SOME COMMONLY RESEARCHED AREAS IN BUSINESS
1. Employee behaviors such as performance, absenteeism, and turnover.
2. Employee attitudes such as job satisfaction, loyalty, and organizational commitment.
3. Supervisory performance, managerial leadership style, and performance appraisal systems.
4. Employee selection, recruitment, training, and retention.
5. Validation of performance appraisal systems.
6. Human resource management choices and organizational strategy.
7. Evaluation of assessment centers.
8. The dynamics of rating and rating errors in the judgment of human performance.
9. Strategy formulation and implementation.
10. Just‐in‐time systems, continuous‐improvement strategies, and production efficiencies.
11. Updating policies and procedures in keeping with latest government regulations and organizational
changes.
12. Organizational outcomes such as increased sales, market share, profits, growth, and effectiveness.
13. Consumer decision making.
14. Customer relationship management.
15. Consumer satisfaction, complaints, customer loyalty, and word‐of‐mouth communication.
16. Complaint handling.
17. Delivering and performing service.
18. Product life cycle, new product development, and product innovation.
19. Market segmentation, targeting, and positioning.
20. Product image, corporate image.
21. Cost of capital, valuation of firms, dividend policies, and investment decisions.
22. Risk assessment, exchange rate fluctuations, and foreign investment.
23. Tax implications of reorganization of firms or acquisition of companies.
24. Market efficiency.
25. Banking strategies.
26. Behavioral finance: overconfidence, bounded rationality, home‐bias.
27. Executive compensation.
28. Mergers and acquisitions.
29. Portfolio and asset management.
30. Financial reporting.
31. Cash flow accounting.
32. Accounting standards.
33. Outsourcing of accounting.
34. Sustainability reporting.

chapter introduction to research 5
Not only are the issues within any subarea related to many factors within that particular system, but they
must also be investigated in the context of the external environment facing the business. For example, economic,
political, demographic, technological, competitive, and other relevant global factors could impinge on some of
the dynamics related to the firm. These have to be scrutinized as well to assess their impact, if any, on the problem
being researched.
TYPES OF BUSINESS RESEARCH: APPLIED AND BASIC
Research can be undertaken for two different purposes. One is to solve a current problem faced by the manager
in the work setting, demanding a timely solution. For example, a particular product may not be selling well and
the manager might want to find the reasons for this in order to take corrective action. Such research is called
applied research. The other is to generate a body of knowledge by trying to comprehend how certain problems
that occur in organizations can be solved. This is called basic, fundamental, or pure research.
It is quite possible that some organizations may, at a later stage, apply the knowledge gained by the findings
of basic research to solve their own problems. For instance, a university professor may be interested in investigat-
ing the factors that contribute to absenteeism as a matter of mere academic interest. After gathering information
on this topic from several institutions and analyzing the data, the professor may identify factors such as inflexible
work hours, inadequate training of employees, and low morale as primarily influencing absenteeism. Later on, a
manager who encounters absenteeism of employees in his organization may use this information to determine if
these factors are relevant to that particular work setting.
35. The implications of social networks on the capital markets.
36. Corporate governance.
37. Development of effective cost accounting procedures.
38. Installation of effective management information systems.
39. Advanced manufacturing technologies and information systems.
40. Auditor behavior.
41. Approaches and techniques of auditing.
42. The use of technology in auditing.
43. Decision making in auditing.
44. Installation, adaptation, and updating of computer networks and software suitable for creating
effective information systems for organizations.
45. Installation of an effective data warehouse and data mining system for the organization.
46. The acceptance of new computer programs.
47. Tax audits.
48. Internal auditing.
49. Accounting fraud and auditor liability.
50. The quality of audit reports.

6 research methods for business
In sum, research done with the intention of applying the results of the findings to solve specific problems
currently being experienced in an organization is called applied research. Research done chiefly to make a
contribution to existing knowledge is called basic, fundamental, or pure research. The findings of such research
contribute to the building of knowledge in the various functional areas of business; they teach us something we
did not know before. Such knowledge, once generated, is usually later applied in organizational settings for prob-
lem solving.
Applied research
The following examples, following two situations cited in Businessweek and The New York Times, should provide
some idea of the scope of business research activities.
The two preceding examples illustrate the benefits of applied research.
EXAMPLE
1. Globally, colas account for more than 50% of all
sodas sold. The challenge for the $187 billion soft
drink industry is giving consumers in developed
markets the sugary taste they want without giving
them the mouthful of calories they don’t. Concerns
about obesity and health have led to nine years of
falling U.S. soda consumption. The soda giants can’t
rely on existing diet versions of their namesake
colas, as consumers are shying away from the artifi-
cial sweeteners they contain. Critics have blamed
the ingredients – rightly or not – for everything
from weight gain to cancer. Diet Coke is losing U.S.
sales at 7% a year, almost double the rate of decline
of American cola sales overall. So Coke and Pepsi
are turning to research to save their cola businesses,
which take in about two‐thirds of the industry’s U.S.
sales. “If you can crack the perfect sweetener, that
would be huge,” says Howard Telford, an analyst at
researcher Euromonitor International.
Source: Stanford, D. (2015, March 19). Scientists Are Racing to Build a
Better Diet Soda. Retrieved from http://www.bloomberg.com/news
/articles/2015‐03‐19/coke‐pepsi‐seek‐diet‐soda‐s‐perfect‐sweetener
2. In classical mythology, Aquila is the eagle carrying
Jupiter’s thunderbolts skyward. At Facebook, it is
the code name for a high‐flying drone, indicative of
the social networking company’s lofty ambitions.
The V‐shaped unmanned vehicle, which has about
the wingspan of a Boeing 767 but weighs less than a
small car, is the centerpiece of Facebook’s plans to
connect with the 5 billion or so people it has yet to
reach. Taking to the skies to beam Internet access
down from solar‐powered drones may seem like a
stretch for a tech company that sells ads to make
money. The business model at Facebook, which has
1.4 billion users, has more in common with NBC
than Boeing. But in a high‐stakes competition for
domination of the Internet, in which Google wields
high‐altitude balloons and high‐speed fiber net-
works, and Amazon has experimental delivery
drones and colossal data centers, Facebook is under
pressure to show that it, too, can pursue projects
that are more speculative than product. One of
those offbeat ideas, or so the thinking goes, could
turn out to be a winner. “The Amazons, Googles
and Facebooks are exploring completely new
things that will change the way we live,” said Ed
Lazowska, who holds the Bill and Melinda Gates
Chair in Computer Science and Engineering at the
University of Washington.
Source: Hardy, Q. & Goel, V. (2015, March 26). Drones Beaming Web
Access are in the Stars for Facebook. Retrieved from http://www.
nytimes.com/2015/03/26/technology/drones‐beaming‐web‐access‐
are‐in‐the‐stars‐for‐facebook.html
Faqih
Highlight
Faqih
Highlight
chapter introduction to research 7
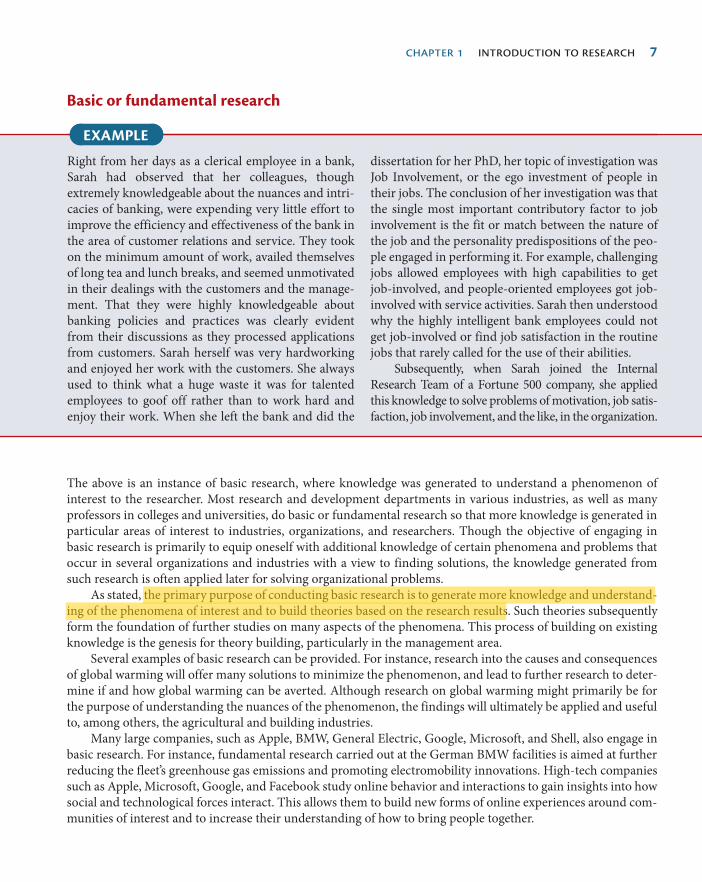
Basic or fundamental research
EXAMPLE
Right from her days as a clerical employee in a bank,
Sarah had observed that her colleagues, though
extremely knowledgeable about the nuances and intri-
cacies of banking, were expending very little effort to
improve the efficiency and effectiveness of the bank in
the area of customer relations and service. They took
on the minimum amount of work, availed themselves
of long tea and lunch breaks, and seemed unmotivated
in their dealings with the customers and the manage-
ment. That they were highly knowledgeable about
banking policies and practices was clearly evident
from their discussions as they processed applications
from customers. Sarah herself was very hardworking
and enjoyed her work with the customers. She always
used to think what a huge waste it was for talented
employees to goof off rather than to work hard and
enjoy their work. When she left the bank and did the
dissertation for her PhD, her topic of investigation was
Job Involvement, or the ego investment of people in
their jobs. The conclusion of her investigation was that
the single most important contributory factor to job
involvement is the fit or match between the nature of
the job and the personality predispositions of the peo-
ple engaged in performing it. For example, challenging
jobs allowed employees with high capabilities to get
job‐involved, and people‐oriented employees got job‐
involved with service activities. Sarah then understood
why the highly intelligent bank employees could not
get job‐involved or find job satisfaction in the routine
jobs that rarely called for the use of their abilities.
Subsequently, when Sarah joined the Internal
Research Team of a Fortune 500 company, she applied
this knowledge to solve problems of motivation, job satis-
faction, job involvement, and the like, in the organization.
The above is an instance of basic research, where knowledge was generated to understand a phenomenon of
interest to the researcher. Most research and development departments in various industries, as well as many
professors in colleges and universities, do basic or fundamental research so that more knowledge is generated in
particular areas of interest to industries, organizations, and researchers. Though the objective of engaging in
basic research is primarily to equip oneself with additional knowledge of certain phenomena and problems that
occur in several organizations and industries with a view to finding solutions, the knowledge generated from
such research is often applied later for solving organizational problems.
As stated, the primary purpose of conducting basic research is to generate more knowledge and understand-
ing of the phenomena of interest and to build theories based on the research results. Such theories subsequently
form the foundation of further studies on many aspects of the phenomena. This process of building on existing
knowledge is the genesis for theory building, particularly in the management area.
Several examples of basic research can be provided. For instance, research into the causes and consequences
of global warming will offer many solutions to minimize the phenomenon, and lead to further research to deter-
mine if and how global warming can be averted. Although research on global warming might primarily be for
the purpose of understanding the nuances of the phenomenon, the findings will ultimately be applied and useful
to, among others, the agricultural and building industries.
Many large companies, such as Apple, BMW, General Electric, Google, Microsoft, and Shell, also engage in
basic research. For instance, fundamental research carried out at the German BMW facilities is aimed at further
reducing the fleet’s greenhouse gas emissions and promoting electromobility innovations. High‐tech companies
such as Apple, Microsoft, Google, and Facebook study online behavior and interactions to gain insights into how
social and technological forces interact. This allows them to build new forms of online experiences around com-
munities of interest and to increase their understanding of how to bring people together.
Faqih
Highlight

8 research methods for business
University professors engage in basic research in an effort to understand and generate more knowledge about
various aspects of businesses, such as how to improve the effectiveness of information systems, integrate technology
into the overall strategic objectives of an organization, assess the impact of marketing action, increase the productiv-
ity of employees in service industries, monitor sexual harassment incidents at the workplace, increase the effective-
ness of small businesses, evaluate alternative inventory valuation methods, change the institutional structure of the
financial and capital markets, and the like. These findings later become useful for application in business situations.
As illustrated, the main distinction between applied and basic business research is that the former is specifi-
cally aimed at solving a currently experienced problem within a specific organization, whereas the latter has the
broader objective of generating knowledge and understanding of phenomena and problems that occur in various
organizational settings. Despite this distinction, both types of research may benefit from following the same steps
of systematic inquiry to arrive at solutions to problems. For this reason, both basic and applied research are often
carried out in a scientific manner (discussed in the next chapter) so that the findings or results generated by them
can be relied upon to effectively solve the problem investigated.
MANAGERS AND RESEARCH
Why managers need to know about research
Managers with knowledge of research have an advantage over those without. Though you yourself may not be
doing any major research as a manager, you will have to understand, predict, and control events that are dysfunc-
tional within the organization. For example, a newly developed product may not be “taking off,” or a financial
investment may not be “paying off ” as anticipated. Such disturbing phenomena have to be understood and
explained. Unless this is done, it will not be possible to predict the future of that product or the prospects of that
investment, and how future catastrophic outcomes can be controlled. A grasp of research methods enables man-
agers to understand, predict, and control their environment.
A thought that may cross your mind is that, because you will probably be bringing in researchers to solve
problems instead of doing the research yourself, there is no need to bother to study research. The reasons for its
importance become clear when one considers the consequences of failing to do so. With the ever‐increasing com-
plexity of modern organizations, and the uncertainty of the environment they face, the management of organiza-
tional systems now involves constant troubleshooting in the workplace. It would help if managers could sense,
spot, and deal with problems before they got out of hand. Knowledge of research and problem‐solving processes
helps managers to identify problem situations before they get out of control. Although minor problems can be
fixed by the manager, major problems warrant the hiring of outside researchers or consultants. The manager who
is knowledgeable about research can interact effectively with them. Knowledge about research processes, design,
and interpretation of data also helps managers to become discriminating recipients of the research findings pre-
sented, and to determine whether or not the recommended solutions are appropriate for implementation.
Another reason why professional managers today need to know about research methods is that they will
become more discriminating while sifting through the information disseminated in business journals. Some
journal articles are more scientific and objective than others. Even among the scientific articles, some are more
appropriate for application or adaptation to particular organizations and situations than others. This is a function
of the sampling design, the types of organizations studied, and other factors reported in the journal articles.
Unless the manager is able to grasp fully what the published empirical research really conveys, she or he is likely
to err in incorporating some of the suggestions such publications offer. By the same token, managers can handle
with success their own problems at considerable cost savings by studying the results of “good” (discussed in the
next chapter) published research that has addressed similar issues.

chapter introduction to research 9
There are several other reasons why professional managers should be knowledgeable about research and
research methods in business. First, such knowledge sharpens the sensitivity of managers to the myriad variables
operating in a situation and reminds them frequently of the multicausality and multifinality of phenomena, thus
avoiding inappropriate, simplistic notions of one variable “causing” another. Second, when managers understand
the research reports about their organizations handed to them by professionals, they are equipped to take intel-
ligent, educated, calculated risks with known probabilities attached to the success or failure of their decisions.
Research then becomes a useful decision‐making tool rather than generating a mass of incomprehensible statisti-
cal information. Third, if managers become knowledgeable about scientific investigations, vested interests inside
or outside the organization will not prevail. For instance, an internal research group within the organization will
not be able to distort information or manipulate the findings to their advantage if managers are aware of the
biases that can creep into research and know how data are analyzed and interpreted. As an example, an internal
research team might state that a particular unit to which it is partial (for whatever reason) has shown increased
profits and hence should be allocated more resources to buy sophisticated equipment to further enhance its
effectiveness. However, the increased profit could have been a one‐time windfall phenomenon due to external
environmental factors such as market conditions, bearing no relation whatever to the unit’s operating efficiency.
Thus, awareness of the different ways in which data may be camouflaged will help the manager to make the right
decision. Fourth, knowledge about research helps the manager to relate to and share pertinent information with
the researcher or consultant hired for problem solving.
In sum, being knowledgeable about research and research methods helps professional managers to:
1. Identify and effectively solve minor problems in the work setting.
2. Know how to discriminate good from bad research.
3. Appreciate and be constantly aware of the multiple influences and multiple effects of factors impinging
on a situation.
4. Take calculated risks in decision making, knowing full well the probabilities associated with the differ-
ent possible outcomes.
5. Prevent possible vested interests from exercising their influence in a situation.
6. Relate to hired researchers and consultants more effectively.
7. Combine experience with scientific knowledge while making decisions.
The manager and the consultant–researcher
Managers often need to engage a consultant to study some of the more complex, time‐consuming problems that
they encounter, as in the case of Facebook mentioned earlier. It is thus important to be knowledgeable about how
to effectively interact with the consultant (the terms researcher and consultant are used interchangeably), what
the manager–researcher relationship should be, and the advantages and disadvantages of internal versus external
consultants.
During their careers, it often becomes necessary for managers to deal with consultants. In such cases, the
manager must not only interact effectively with the research team, but must also explicitly delineate the roles for
the researchers and the management. The manager has to inform the researchers what types of information may
be provided to them and, more importantly, which of their records will not be made available to them. Such
records might include the personnel files of the employees, or certain trade secrets. Making these facts explicit at
the very beginning can save a lot of frustration for both parties. Managers who are very knowledgeable about
research can more easily foresee what information the researchers might require, and if certain documents
containing such information cannot be made available, they can inform the research team about this at the outset.

10 research methods for business
It is vexing for researchers to discover, at a late stage, that the company will not let them have certain information.
If they know the constraints right from the beginning, the researchers might be able to identify alternate ways of
tackling the problems and to design the research in such a way as to provide the needed answers.
Beyond specifying the roles and constraints, the manager should also make sure that there is congruence in
the value systems of management and the consultants. For example, the research team might very strongly believe
and recommend that reduction of the workforce and streamlining would be the ideal way to significantly cut
down operating costs. Management’s consistent philosophy, however, might be not to fire employees who are
experienced, loyal, and senior. Thus, there might be a clash of ideologies between management and the research
team. Research knowledge will help managers to identify and explicitly state, even at the outset, the values that
the organization holds dear, so that there are no surprises down the road. Clarification of the issue offers the
research team the opportunity to either accept the assignment and find alternative ways of dealing with the prob-
lem, or regret its inability to undertake the project. In either case, both the organization and the research team
will be better off having discussed their value orientations, thus avoiding potential frustration on both sides.
Exchange of information in a straightforward and forthright manner also helps to increase the rapport and
trust levels between the two parties, which in turn motivates the two sides to interact effectively. Under this setup,
researchers feel free to approach the management to seek assistance in making the research more purposeful. For
instance, the research team is likely to request that management inform the employees of the ensuing research
and its broad purpose to allay any fears they might entertain.
To summarize, while hiring researchers or consultants the manager should make sure that:
1. The roles and expectations of both parties are made explicit.
2. Relevant philosophies and value systems of the organization are clearly stated and constraints, if any,
are communicated.
3. A good rapport is established with the researchers, and between the researchers and the employees in
the organization, enabling the full cooperation of the latter.
INTERNAL VERSUS EXTERNAL CONSULTANTS/RESEARCHERS
Internal consultants/researchers
Some organizations have their own consulting or research department, which might be called the Management
Services Department, the Organization and Methods Department, R&D (research and development depart-
ment), or some other name. This department serves as the internal consultant to subunits of the organization
that face certain problems and seek help. Such a unit within the organization, if it exists, is useful in several ways,
and enlisting its help might be advantageous under some circumstances, but not others. The manager often has
to decide whether to use internal or external researchers. To reach a decision, the manager should be aware of the
strengths and weaknesses of both, and weigh the advantages and disadvantages of using either, based on the
needs of the situation. Some of the advantages and disadvantages of both internal and external teams are now
discussed.
Advantages of internal consultants/researchers
There are at least four advantages in engaging an internal team to do the research project:
1. The internal team stands a better chance of being readily accepted by the employees in the subunit of
the organization where research needs to be done.

chapter introduction to research 11
2. The team requires much less time to understand the structure, the philosophy and climate, and the
functioning and work systems of the organization.
3. They are available to implement their recommendations after the research findings have been accepted.
This is very important because any “bugs” in the implementation of the recommendations may be
removed with their help. They are also available to evaluate the effectiveness of the changes, and to
consider further changes if and when necessary.
4. The internal team might cost considerably less than an external team for the department enlisting help
in problem solving, because they will need less time to understand the system due to their continuous
involvement with various units of the organization. For problems of low complexity, the internal team
would be ideal.
Disadvantages of internal consultants/researchers
There are also certain disadvantages to engaging internal research teams for the purposes of problem solving.
The four most critical ones are:
1. In view of their long tenure as internal consultants, the internal team may quite possibly fall into a ste-
reotyped way of looking at the organization and its problems. This inhibits any fresh ideas and perspec-
tives that might be needed to correct the problem. This is definitely a handicap for situations in which
weighty issues and complex problems are to be investigated.
2. There is scope for certain powerful coalitions in the organization to influence the internal team to con-
ceal, distort, or misrepresent certain facts. In other words, certain vested interests could dominate,
especially in securing a sizable portion of the available scant resources.
3. There is also a possibility that even the most highly qualified internal research teams are not perceived
as “experts” by the staff and management, and hence their recommendations may not get the consid-
eration and attention they deserve.
4. Certain organizational biases of the internal research team might, in some instances, make the findings
less objective and consequently less scientific.
External consultants/researchers
The disadvantages of the internal research teams turn out to be the advantages of the external teams, and the
former’s advantages work out to be the disadvantages of the latter. However, the specific advantages and disad-
vantages of the external teams may be highlighted.
Advantages of external consultants/researchers
The advantages of the external team are:
1. The external team can draw on a wealth of experience from having worked with different types of
organizations that have had the same or similar types of problems. This wide range of experience ena-
bles them to think both divergently and convergently rather than hurry to an instant solution on the
basis of the apparent facts in the situation. They are able to ponder over several alternative ways of
looking at the problem because of their extensive problem‐solving experience in various other organi-
zational setups. Having viewed the situation from several possible angles and perspectives (divergently),
they can critically assess each of these, discard the less viable options and alternatives, and focus on
specific feasible solutions (think convergently).

12 research methods for business
2. The external teams, especially those from established research and consulting firms, might have more
knowledge of current sophisticated problem‐solving models through their periodic training programs,
which the teams within the organization may not have access to. Because knowledge obsolescence is a
real threat in the consulting area, external research institutions ensure that their members are conver-
sant with the latest innovations through periodic organized training programs. The extent to which
internal team members are kept abreast of the latest problem‐solving techniques may vary considerably
from one organization to another.
Disadvantages of external consultants/researchers
The major disadvantages in hiring an external research team are as follows:
1. The cost of hiring an external research team is usually high and is the main deterrent, unless the prob-
lems are critical.
2. In addition to the considerable time the external team takes to understand the organization being
researched, they seldom get a warm welcome, nor are readily accepted by employees. Departments and
individuals likely to be affected by the research study may perceive the study team as a threat and resist
them. Therefore, soliciting employees’ help and enlisting their cooperation in the study is a little more
difficult and time‐consuming for external researchers than for internal teams.
3. The external team also charges additional fees for their assistance in the implementation and evalua-
tion phases.
Keeping in mind these advantages and disadvantages of internal and external research teams, the manager
who desires research services has to weigh the pros and cons of engaging either before making a decision. If the
problem is a complex one, or if there are likely to be vested interests, or if the very existence of the organization
is at stake because of one or more serious problems, it would be advisable to engage external researchers despite
the increased costs involved. However, if the problems that arise are fairly simple, if time is of the essence in solv-
ing moderately complex problems, or if there is a system‐wide need to establish procedures and policies of a
fairly routine nature, the internal team would probably be the better option.
Knowledge of research methods and appreciation of the comparative advantages and disadvantages of exter-
nal and internal teams help managers to make decisions on how to approach problems and determine whether
internal or external researchers are the appropriate choice to investigate and solve the problem.
KNOWLEDGE ABOUT RESEARCH AND MANAGERIAL EFFECTIVENESS
As already mentioned, managers are responsible for the final outcome by making the right decisions at work.
This is greatly facilitated by research knowledge. Knowledge of research heightens the sensitivity of managers to
the innumerable internal and external factors operating in their work and organizational environment. It also
helps to facilitate effective interactions with consultants and comprehension of the nuances of the research process.
In today’s world, a multitude of instruments and theories, (big) data, and sophisticated technology is avail-
able to model and analyze a wide range of issues such as business processes, consumer behavior, investment
decisions, and the like. The recommendations of the external consultant who is proficient in research, and urges
the application of particular models, instruments, or statistical techniques in a particular situation may make no
sense to, and might create some misgivings in, the manager not acquainted with research. Even superficial
knowledge of research helps the manager to deal with the consultant/researcher in a mature and confident

chapter introduction to research 13
manner, so that dealing with “experts” does not result in discomfort. As the manager, you will be the one to make
the final decision on the implementation of the recommendations made by the research team. Remaining objec-
tive, focusing on problem solutions, fully understanding the recommendations made, and why and how they
have been arrived at, make for good managerial decision making. Although company traditions are to be
respected, there may be occasions where today’s rapidly changing turbulent environment demands the substitu-
tion or re‐adaptation of some of these traditions, based on research findings. Thus, knowledge of research greatly
enhances the decision‐making skills of the manager.
ETHICS AND BUSINESS RESEARCH
Ethics in business research refers to a code of conduct or expected societal norms of behavior while conducting
research. Ethical conduct applies to the organization and the members that sponsor the research, the researchers
who undertake the research, and the respondents who provide them with the necessary data. The observance of
ethics begins with the person instituting the research, who should do so in good faith, pay attention to what the
results indicate, and, surrendering the ego, pursue organizational rather than self‐interests. Ethical conduct
should also be reflected in the behavior of the researchers who conduct the investigation, the participants who
provide the data, the analysts who provide the results, and the entire research team that presents the interpreta-
tion of the results and suggests alternative solutions.
Thus, ethical behavior pervades each step of the research process – data collection, data analysis, reporting,
and dissemination of information on the Internet, if such an activity is undertaken. How the subjects are treated
and how confidential information is safeguarded are all guided by business ethics. We will highlight these as they
relate to different aspects of research in the relevant chapters of this book.
There are business journals such as the Journal of Business Ethics and the Business Ethics Quarterly that are
mainly devoted to the issue of ethics in business. The American Psychological Association has established certain
guidelines for conducting research, to ensure that organizational research is conducted in an ethical manner and
the interests of all concerned are safeguarded. As stated, we will discuss the role of ethics in the chapters that fol-
low, insofar as it is relevant to the various steps in the research process.
SUMMARY
● Learning objective 1: Describe and define business research.
Research is the process of finding solutions to a problem after a thorough study and analysis of the situational
factors. Business research is an organized, systematic, data-based, critical, objective, inquiry or investigation
into a specific problem, undertaken with the purpose of finding answers or solutions to it. In essence, business
research provides the necessary information that guides managers to make informed decisions to successfully
deal with problems. In one form or another, both theory and information play an important role in research.
● Learning Objective 2: Distinguish between applied and basic research, giving examples, and discussing
why they fall into one or the other of the two categories.
Research can be undertaken for different purposes. One is to solve a current problem faced by the manager
in the work setting, demanding a timely solution. Such research is called applied research. The other is to
generate a body of knowledge by trying to comprehend how certain problems that occur in organizations
can be solved. This is called basic, fundamental, or pure research. The findings of such research teach us

14 research methods for business
something we did not know before. Such knowledge, once generated, is usually later applied in organizational
settings for problem solving.
● Learning Objective 3: Explain why managers should know about research and discuss what managers
should and should not do in order to interact effectively with researchers.
Managers with knowledge of research have an advantage over those without. A grasp of research methods
enables managers to understand, predict, and control their environment and/or to effectively communicate
with external researchers or consultants. While hiring external researchers/consultants the manager should
ensure that the roles and expectations of both parties are made explicit; relevant philosophies and value
systems of the organization are clearly stated and constraints are communicated; and, a good rapport is
established with the researchers.
● Learning Objective 4: Identify and fully discuss specific situations in which a manager would be better
off using an internal research team, and when an external research team would be more advisable,
giving reasons for the decisions.
The manager often has to decide whether to use internal or external researchers. To reach a decision, the
manager should be aware of the strengths and weaknesses of both, and weigh the advantages and disadvan-
tages of using either, based on the specific needs of the situation.
● Learning Objective 5: Discuss what research means to you and describe how you, as a manager, might
apply the knowledge gained about research.
As the manager, you will be the one to make the final decision on the implementation of the recommenda-
tions made by the researcher or the research team. Remaining objective, focusing on problem solutions, fully
understanding the recommendations made, and why and how they have been arrived at, make for good
managerial decision making. Knowledge of research greatly enhances the decision-making skills of the manager.
● Learning Objective 6: Demonstrate awareness of the role of ethics in business research.
Ethics in business research refers to a code of conduct or expected societal norms of behavior while con-
ducting research. Ethical conduct applies to the organization and the members that sponsor the research,
the researchers who undertake the research, and the respondents who provide them with the necessary
data. Ethical behavior pervades each step of the research process. We will highlight these as they relate to
different aspects of research in the relevant chapters of this book.
DISCUSSION QUESTIONS
1. Describe a situation where you used research in order to inform thinking, decisions, and/or actions
in relation to a personal issue of interest such as buying a new mobile phone or going to the movies.
Provide information about the purpose of your research, the problem, the information you col-
lected, how you collected this information, the role of theory, and the solution to the problem.
2. Why should a manager know about research when the job entails managing people, products, events,
environments, and the like?

chapter introduction to research 15
3. For what specific purposes is basic research important?
4. When is applied research, as distinct from basic research, useful?
5. Why is it important to be adept in handling the manager–researcher relationship?
6. Explain, giving reasons, which is more important, applied or basic research.
7. Give two specific instances where an external research team would be useful and two other scenar-
ios when an internal research team would be deployed, with adequate explanations as to why each
scenario is justified for an external or internal team.
8. Describe a situation where research will help you as a manager to make a good decision.
9. Given the situations below:
a. discuss, with reasons, whether they fall into the category of applied or basic research;
b. for Scenario 1, explain, with reasons, who will conduct the research.
Scenario 1 To acquire or not to acquire: that is the question
Companies are very interested in acquiring other firms, even when the latter operate in totally unrelated
realms of business. For example, Coca‐Cola has announced that it wants to buy China Huiyuan Juice
Group in an effort to expand its activities in one of the world’s fastest‐growing beverage markets. Such
acquisitions are claimed to “work miracles.” However, given the volatility of the stock market and the
slowing down of business, many companies are not sure whether such acquisitions involve too much risk.
At the same time, they also wonder if they are missing out on a great business opportunity if they fail to
take such risks. Some research is needed here!
Scenario 2 Reasons for absenteeism
A university professor wanted to analyze in depth the reasons for absenteeism of employees in organizations.
Fortunately, a company within 20 miles of the campus employed her as a consultant to study that very issue.
Scenario 3 Effects of service recovery on customer satisfaction
A research scientist wants to investigate the question: What is the most effective way for an organization
to recover from a service failure? Her objective is to provide guidelines for establishing the proper “fit”
between service failure and service recovery that will generalize across a variety of service industries.
CASE
THE LAROCHE CANDY COMPANY
In 1864 Henricus Laroche started making high‐
quality chocolate in his kitchen in Ooigem, Belgium.
Henricus learned his trade at a famous chocolate
shop in Paris, and he and his wife began to make
chocolate in bars, wafers, and other shapes soon
after Henricus had returned to Belgium to start his
own business. The Belgian people loved Laroche’s
chocolate and the immediate success soon caused

16 research methods for business
him to increase his production facilities. Henricus
decided to build a chocolate factory in Kortrijk, a
nearby city in the Flemish province West Flanders.
With mass‐production, the company was able to
lower the per‐unit costs and to make chocolate,
once a luxury item, affordable to everybody. The
Laroche Candy Company flourished, expanded
its product lines, and acquired related companies
during the following decades. Within a century
the company had become Belgium’s leading candy‐
manufacturer, employing over 2500 people.
Today, The Laroche Candy Company is one
of the biggest manufacturers of chocolate and
non‐chocolate confectionery products in Europe.
Under the present leadership of Luc Laroche the
company has become truly innovative. What’s
more, the company has adopted a very proactive
approach to marketing planning and is therefore
a fierce competitor in an increasingly global mar-
ketplace. The number of products the company
produces and markets has increased dramatically;
at this moment there are more than 250 Laroche
Candy items distributed internationally in bulk,
bags, and boxes.
Luc Laroche, born in 1946, is the fifth generation
of his family to lead The Laroche Candy Company.
He is the great‐great‐grandson of company founder
Henricus Laroche and the current Chairman and
CEO of the company. But Luc is nearing retire-
ment. He has planned to stop working in two to
three years. Whereas stepping back from power is
a very difficult thing to do for a lot of people, it is
an easy thing to do for Luc: He is looking forward
to spending time with his grandchildren and to
driving his Harley‐Davidson across Europe. What’s
more, he has never found the time to play golf,
and he is planning to spend “three whole summers
learning it” if necessary. And yet, even though “let-
ting go” is not a problem for Luc, he still has his
worries about his imminent retirement.
As in most family businesses, Luc’s two chil-
dren spent their share of summers working for
the company. Luc’s oldest son Davy has repeatedly
worked for the accounting department whereas
Davy’s younger brother Robert has infrequently
worked in the field. However, they have never
shown a serious interest in the business. Davy, who
is 35, currently works as an associate professor of
management accounting at a reputable university in
Belgium. Robert, aged 32, lives in Paris and has been
working as a photographer for the past ten years.
About 12 years ago, Robert told his dad, “I know
you’d like me to come into the business, but I’ve got
my own path to travel.” Luc recalls responding that
he respects that and that he does not want Robert
to feel constrained; “I just want you to be happy,”
is what he told Robert on that particular occasion.
Ever since this conversation with Robert, Luc
has put his hopes on Davy. A few days ago, Luc
invited Davy to have dinner at the famous In de
Wulf restaurant in Dranouter, Belgium, to discuss
the future of The Laroche Candy Company. He
wants to talk about his retirement and a succession
plan for the company with Davy, who has serious
doubts about taking over the company. Davy knows
that for his dad the company is his life and, like his
dad, he wants the company to be successful in the
future; but he just does not know whether it is a
good idea to take over from his father. In an effort to
maintain a balanced perspective on the issue, Davy
has done some research on it. Hence, he has become
very familiar with statistics about the failure rate of
family transitions. These statistics have triggered
numerous concerns and fears about taking over the
company from his father.
Luc and Davy discuss the future of the
company during a memorable dinner in Dranouter.
Luc tells Davy that he wants his son to take over the
company, but Davy explains that he has qualms.
He brings up his doubts and fears and alternatives
such as going public, selling to a strategic acquirer
or investor, or selling to employees through an
employee stock ownership plan. Luc hardly lis-
tens to Davy’s concerns and strikes a blow for
family business.
“History is full of examples of spectacular
ascents of family business,” he said after the waiter
has refilled his glass for the fourth time in just

chapter introduction to research 17
over an hour, “the Rothschilds, the Murdochs, the
Waltons, and the Vanderbilts, to name only a few.
The Rothschilds, for instance, not only accumulated
the largest amount of private wealth the Western
world has ever seen, they also changed the course
of history by financing kings and monarchs. Did
you know that they supported Wellington’s armies,
which ultimately led to the defeat of Napoleon at
Waterloo? I bet you didn’t.”
Davy raised an eyebrow. “I didn’t. But what
I do know,” he replied, “is that only 50 years after
the death of Cornelius Vanderbilt, who created
a fortune in railroads and shipping, several of his
direct descendants were flat broke. Apparently the
Vanderbilts had both a talent for acquiring and
spending money in unmatched numbers. Seriously,
dad, I do believe that strong family values are
very important but I also feel that they may place
restraints on the development of the company. It is
commonly known that familism in Southern Italy
is one of the main reasons for the slower economic
development of the south relative to the north.”
Luc sighed and looked at his son. “So, what
does this all mean?”
“Well, I think that the key question is whether
family firms evolve as an efficient response to the
institutional and market environment, or whether
they are an outcome of cultural norms that might
be harmful for corporate decisions and economic
outcomes,” Davy replied with a gentle smile. “Don’t
you think so?”
“I . . . um . . . I guess I do.” Luc smiled back at
his son. “I am not sure that I understand what you
mean, but it sounds great. Let’s throw some money
at it and hire a consultant who knows something
about this. I’ll call McKinsey first thing tomorrow
morning. Cheers.”
“Cheers dad,” Davy echoed lifting his glass.
Two weeks later, Paul Thomas Anderson, a
senior McKinsey consultant, put forward the fol-
lowing problem statement in a meeting with Luc
Laroche: What are the implications of family con-
trol for the governance, financing, and overall
performance of The Laroche Candy Company?
CASE QUESTIONS
1. What is business research?
2. Why is the project that Paul Thomas Anderson is doing for The Laroche Candy Company a research
project?
3. Which steps will Paul take now that he has clearly defined the problem that needs attention?
4. Luc Laroche has decided to hire an external consultant to investigate the problem. Do you think that
this is a wise decision or would it have been better to ask his son Davy or an internal consultant to
do the research project?
5. What can (or should) Luc do to assist Paul to yield valuable research results?
6. How can basic or fundamental research help Paul to solve the specific problem of The Laroche
Candy Company?
7. Try to find relevant books, articles, and research reports relating to this issue. Use, among others,
electronic resources of your library and/or the Internet.

18
INTRODUCTION
Managers frequently face issues that call for critical decision making. Managerial decisions based on the results
of “good” research tend to be effective. In Chapter 1, we defined research as an organized, systematic, data‐
based, critical, objective inquiry into a specific problem that needs a solution. We also explained that both basic
and applied research are often carried out in a scientific way. It is therefore important to understand what the
term scientific means. Scientific research focuses on solving problems and pursues a step‐by‐step logical, organ-
ized, and rigorous method to identify the problems, gather data, analyze them, and draw valid conclusions from
them. Thus, scientific research is not based on hunches, experience, and intuition (though these may play a part
in final decision making), but is purposive and rigorous. Because of the rigorous way in which it is done, scien-
tific research enables all those who are interested in researching and knowing about the same or similar issues to
come up with comparable findings when the data are analyzed. Scientific research also helps researchers to state
their findings with accuracy and confidence. Furthermore, scientific investigation tends to be more objective
than subjective, and helps managers to highlight the most critical factors at the workplace that need specific
attention so as to avoid, minimize, or solve problems. Scientific investigation and managerial decision making
are integral aspects of effective problem solving. The term scientific research applies, therefore, to both basic and
applied research.
Do researchers always take a scientific approach to research? No. Sometimes, researchers have a different
perspective on what makes good research and how research should be done. We will have more to say about this
later in this chapter. At other times, the problem may be so simple that it does not call for elaborate research, and
past experience might offer the necessary solution. Finally, exigencies of time (where quick decisions are called for),
The scientific approach and alternative approaches to investigation
C H A P T E R 2
LEARNING OBJECTIVES
After completing Chapter 2 you should be able to:
1. Explain what is meant by scientific investigation, giving examples of both scientific and non-
scientific investigations.
2. Discuss the seven steps of the hypothetico-deductive method, using an example of your own.
3. Discuss alternative perspectives on what makes good research.
Faqih
Highlight
Faqih
Highlight
Faqih
Highlight
Faqih
Highlight

chapter the scientific approach and alternative approaches to investigation 19
unwillingness to expend the resources needed for doing good research, lack of knowledge, and other factors
might prompt businesses to try to solve problems based on hunches. However, the probability of making wrong
decisions in such cases is high. Even such business “gurus” as Richard Branson and Steve Jobs have confessed to
making big mistakes due to errors of judgment. BusinessWeek, Fortune, and the Wall Street Journal, among other
business periodicals and newspapers, feature articles from time to time about organizations that face difficulties
because of wrong decisions made on the basis of hunches and/or insufficient information. Many implemented
plans fail because not enough research has preceded their formulation.
THE HALLMARKS OF SCIENTIFIC RESEARCH
The hallmarks or main distinguishing characteristics of scientific research may be listed as follows:
1. Purposiveness.
2. Rigor.
3. Testability.
4. Replicability.
5. Precision and confidence.
6. Objectivity.
7. Generalizability.
8. Parsimony.
Each of these characteristics can be explained in the context of a concrete example. Let us consider the case
of a manager who is interested in investigating how employees’ commitment to the organization can be increased.
We shall examine how the eight hallmarks of science apply to this investigation so that it may be considered
“scientific.”
Purposiveness
The manager has started the research with a definite aim or purpose. The focus is on increasing the commitment
of employees to the organization, as this will be beneficial in many ways. An increase in employee commitment
will translate into lower turnover, less absenteeism, and probably increased performance levels, all of which will
definitely benefit the organization. The research thus has a purposive focus.
Rigor
A good theoretical base and a sound methodological design add rigor to a purposive study. Rigor connotes care-
fulness, scrupulousness, and the degree of exactitude in research investigations. In the case of our example, let us
say the manager of an organization asks 10 to 12 of its employees to indicate what would increase their level of
commitment to it. If, solely on the basis of their responses, the manager reaches several conclusions on how
employee commitment can be increased, the whole approach to the investigation is unscientific. It lacks rigor for
the following reasons:
1. The conclusions are incorrectly drawn because they are based on the responses of just a few employees
whose opinions may not be representative of those of the entire workforce.

20 research methods for business
2. The manner of framing and addressing the questions could have introduced bias or incorrectness in
the responses.
3. There might be many other important influences on organizational commitment that this small sample
of respondents did not or could not verbalize during the interviews, and the researcher has therefore
failed to include them.
Therefore, conclusions drawn from an investigation that lacks a good theoretical foundation, as evidenced
by reason 3, and methodological sophistication, as evident from 1 and 2 above, are unscientific. Rigorous research
involves a good theoretical base and a carefully thought‐out methodology. These factors enable the researcher to
collect the right kind of information from an appropriate sample with the minimum degree of bias, and facilitate
suitable analysis of the data gathered. The following chapters of this book address these theoretical and methodo-
logical issues. Rigor in research design also makes possible the achievement of the other six hallmarks of science
that we shall now discuss.
Testability
Testability is a property that applies to the hypotheses of a study. In Chapter 5, we will define a hypothesis as a
tentative, yet testable, statement, which predicts what you expect to find in your empirical data. Hypotheses are
derived from theory, which is based on the logical beliefs of the researcher and on (the results of) previous, sci-
entific research – we will have more to say about these matters in Chapter 5.
A scientific hypothesis must be testable. Not all hypotheses can be tested. Non‐testable hypotheses are often
vague statements, or they put forward something that cannot be tested experimentally. A famous example of a
hypothesis that is not testable is the hypothesis that God created the earth.
If, after talking to a random selection of employees of the organization and study of the previous research
done in the area of organizational commitment, the manager or researcher develops certain hypotheses on how
employee commitment can be enhanced, then these can be tested by applying certain statistical tests to the data
collected for the purpose. For instance, the researcher might hypothesize that those employees who perceive
greater opportunities for participation in decision making will have a higher level of commitment. This is a
hypothesis that can be tested when the data are collected. A correlation analysis will indicate whether the hypoth-
esis is substantiated or not. The use of several other tests, such as the chi‐square test and the t‐test, is discussed
in Chapters 14 and 15.
Scientific research thus lends itself to testing logically developed hypotheses to see whether or not the data
support the educated conjectures or hypotheses that are developed after a careful study of the problem situation.
Testability thus becomes another hallmark of scientific research.
Replicability
Let us suppose that the manager/researcher, based on the results of the study, concludes that participation in
decision making is one of the most important factors that influences the commitment of employees to the organ-
ization. We will place more faith and credence in these findings and conclusion if similar findings emerge on the
basis of data collected by others employing the same methods – that is, we have more faith in the findings of a
study if the findings are replicated in another study. Replication demonstrates that our hypotheses have not been
supported merely by chance, but are reflective of the true state of affairs in the population. The results of the tests
of hypotheses should be supported again and yet again when the same type of research is repeated in similar
circumstances. To the extent that this does happen (i.e., the results are replicated or repeated), we will gain con-
fidence in the scientific nature of our research.

chapter the scientific approach and alternative approaches to investigation 21
Replication is made possible by a detailed description of the design details of the study, such as the sampling
method and the data collection methods that were used. This information should create the possibility to repli-
cate the research. Replicability is the extent to which a re‐study is made possible by the provision of the design
details of the study in the research report. Replicability is another hallmark of scientific research.
Precision and confidence
In management research, we seldom have the luxury of being able to draw “definitive” conclusions on the basis
of the results of data analysis. This is because we are unable to study the universe of items, events, or population
we are interested in, and have to base our findings on a sample that we draw from the universe. In all probability,
the sample in question may not reflect the exact characteristics of the phenomenon we are trying to study (these
difficulties are discussed in greater detail in Chapter 13). Measurement errors and other problems are also bound
to introduce an element of bias or error in our findings. However, we would like to design the research in a man-
ner that ensures that our findings are as close to reality (i.e., the true state of affairs in the universe) as possible,
so that we can place reliance or confidence in the results.
Precision refers to the closeness of the findings to “reality” based on a sample. In other words, precision
reflects the degree of accuracy or exactitude of the results on the basis of the sample, to what really exists in the
universe. For example, if I estimated the number of production days lost during the year due to absenteeism at
between 30 and 40, as against the actual figure of 35, the precision of my estimation compares more favorably
than if I had indicated that the loss of production days was somewhere between 20 and 50. You may recall the
term confidence interval in statistics, which is what is referred to here as precision.
Confidence refers to the probability that our estimations are correct. That is, it is not merely enough to be
precise, but it is also important that we can confidently claim that 95% of the time our results will be true and
there is only a 5% chance of our being wrong. This is also known as the confidence level.
The narrower the limits within which we can estimate the range of our predictions (i.e., the more precise our
findings) and the greater the confidence we have in our research results, the more useful and scientific the find-
ings become. In social science research, a 95% confidence level – which implies that there is only a 5% probability
that the findings may not be correct – is accepted as conventional, and is usually referred to as a significance level
of 0.05 (p = 0.05). Thus, precision and confidence are important aspects of research, which are attained through
appropriate scientific sampling design. The greater the precision and confidence we aim at in our research, the
more scientific is the investigation and the more useful are the results. Both precision and confidence are dis-
cussed in detail in Chapter 13 on Sampling.
Objectivity
The conclusions drawn through the interpretation of the results of data analysis should be objective; that is, they
should be based on the facts of the findings derived from actual data, and not on our own subjective or emotional
values. For instance, if we had a hypothesis that stated that greater participation in decision making would
increase organizational commitment, and this was not supported by the results, it would make no sense if the
researcher continued to argue that increased opportunities for employee participation would still help! Such an
argument would be based not on the factual, data‐based research findings, but on the subjective opinion of the
researcher. If this was the researcher’s conviction all along, then there was no need to do the research in the
first place!
Much damage can be sustained by organizations that implement non‐data‐based or misleading conclu-
sions drawn from research. For example, if the hypothesis relating to organizational commitment in our previ-
ous example was not supported, considerable time and effort would be wasted in finding ways to create

22 research methods for business
opportunities for employee participation in decision making. We would only find out later that employees still
kept quitting, remained absent, and did not develop any sense of commitment to the organization. Likewise, if
research shows that increased pay is not going to increase the job satisfaction of employees, then implementing
a revised, increased pay system will only drag down the company financially without attaining the desired
objective. Such a futile exercise, then, is based on nonscientific interpretation and implementation of the
research results.
The more objective the interpretation of the data, the more scientific the research investigation becomes.
Though managers or researchers might start with some initial subjective values and beliefs, their interpretation
of the data should be stripped of personal values and bias. If managers attempt to do their own research, they
should be particularly sensitive to this aspect. Objectivity is thus another hallmark of scientific investigation.
Generalizability
Generalizability refers to the scope of applicability of the research findings in one organizational setting to other
settings. Obviously, the wider the range of applicability of the solutions generated by research, the more useful
the research is to the users. For instance, if a researcher’s findings that participation in decision making enhances
organizational commitment are found to be true in a variety of manufacturing, industrial, and service organiza-
tions, and not merely in the particular organization studied by the researcher, then the generalizability of the
findings to other organizational settings is enhanced. The more generalizable the research, the greater its useful-
ness and value. However, not many research findings can be generalized to all other settings, situations, or
organizations.
For wider generalizability, the research sampling design has to be logically developed and a number of other
details in the data‐collection methods need to be meticulously followed. However, a more elaborate sampling
design, which would doubtless increase the generalizability of the results, would also increase the costs of
research. Most applied research is generally confined to research within the particular organization where the
problem arises, and the results, at best, are generalizable only to other identical situations and settings. Though
such limited applicability does not necessarily decrease its scientific value (subject to proper research), its gener-
alizability is restricted.
Parsimony
Simplicity in explaining the phenomena or problems that occur, and in generating solutions for the problems, is
always preferred to complex research frameworks that consider an unmanageable number of factors. For instance,
if two or three specific variables in the work situation are identified, which when changed would raise the organi-
zational commitment of the employees by 45%, that would be more useful and valuable to the manager than if it
were recommended that he should change ten different variables to increase organizational commitment by 48%.
Such an unmanageable number of variables might well be totally beyond the manager’s control to change.
Therefore, the achievement of a meaningful and parsimonious, rather than an elaborate and cumbersome, model
for problem solution becomes a critical issue in research.
Economy in research models is achieved when we can build into our research framework a lesser number of
variables that explain the variance far more efficiently than a complex set of variables that only marginally add to
the variance explained. Parsimony can be introduced with a good understanding of the problem and the impor-
tant factors that influence it. Such a good conceptual theoretical model can be realized through unstructured and
structured interviews with the concerned people, and a thorough literature review of the previous research work
in the particular problem area.
In sum, scientific research encompasses the eight criteria just discussed. These are discussed in more detail
later in this book.

chapter the scientific approach and alternative approaches to investigation 23
THE HYPOTHETICODEDUCTIVE METHOD
Scientific research pursues a step‐by‐step, logical, organized, and rigorous method (a scientific method) to find
a solution to a problem. The scientific method was developed in the context of the natural sciences, where it has
been the foundation of many important discoveries. Although there have been numerous objections to this
method and to using it in social and business research (we will discuss some of these later in this chapter),
it is still the predominant approach for generating knowledge in natural, social, and business sciences. The
hypothetico‐deductive method, popularized by the Austrian philosopher Karl Popper, is a typical version of the
scientific method. The hypothetico‐deductive method provides a useful, systematic approach for generating
knowledge to solve basic and managerial problems. This systematic approach is discussed next.
The seven-step process in the hypothetico-deductive method
The hypothetico‐deductive method involves the seven steps listed and discussed next.
1. Identify a broad problem area.
2. Define the problem statement.
3. Develop hypotheses.
4. Determine measures.
5. Data collection.
6. Data analysis.
7. Interpretation of data.
Identify a broad problem area
A drop in sales, frequent production interruptions, incorrect accounting results, low‐yielding investments, dis-
interestedness of employees in their work, customer switching, and the like, could attract the attention of the
manager and catalyze the research project.
Define the problem statement
Scientific research starts with a definite aim or purpose. To find solutions for identified problems, a problem
statement that includes the general objective and research questions of the research should be developed.
Gathering initial information about the factors that are possibly related to the problem will help us to narrow the
broad problem area and to define the problem statement. Preliminary information gathering, discussed in greater
detail in Chapter 3, involves the seeking of information in depth, of what is observed (for instance, the observa-
tion that our company is losing customers). This could be done by a literature review (literature on customer
switching) or by talking to several people in the work setting, to clients (why do they switch?), or to other relevant
sources, thereby gathering information on what is happening and why. Through any of these methods, we get an
idea or a “feel” for what is transpiring in the situation. This allows us to develop a specific problem statement.
Develop hypotheses
In this step, variables are examined to ascertain their contribution or influence in explaining why the problem
occurs and how it can be solved. The network of associations identified among the variables is then theoretically
woven, together with justification as to why they might influence the problem. From a theorized network of

24 research methods for business
associations among the variables, certain hypotheses or educated conjectures can be generated. For instance, at
this point, we might hypothesize that specific factors such as overpricing, competition, inconvenience, and unre-
sponsive employees affect customer switching.
A scientific hypothesis must meet two requirements. The first criterion is that the hypothesis must be testable.
We have discussed the testability of hypotheses earlier in this chapter. The second criterion, and one of the central
tenets of the hypothetico‐deductive method, is that a hypothesis must also be falsifiable. That is, it must be possible
to disprove the hypothesis. According to Karl Popper, this is important because a hypothesis cannot be confirmed;
there is always a possibility that future research will show that it is false. Hence, failing to falsify (!) a hypothesis
does not prove that hypothesis: it remains provisional until it is disproved. Hence, the requirement of falsifiability
emphasizes the tentative nature of research findings: we can only “prove” our hypotheses until they are disproved.
The development of hypotheses and the process of theory formulation are discussed in greater detail in Chapter 5.
Determine measures
Unless the variables in the theoretical framework are measured in some way, we will not be able to test our
hypotheses. To test the hypothesis that unresponsive employees affect customer switching, we need to operation-
alize unresponsiveness and customer switching. Measurement of variables is discussed in Chapters 11 and 12.
Data collection
After we have determined how to measure our variables, data with respect to each variable in the hypothesis need
to be obtained. These data then form the basis for data analysis. Data collection is extensively discussed in
Chapters 7 to 12.
Data analysis
In the data analysis step, the data gathered are statistically analyzed to see if the hypotheses that were generated
have been supported. For instance, to see if unresponsiveness of employees affects customer switching, we might
want to do a correlational analysis to determine the relationship between these variables.
Hypotheses are tested through appropriate statistical analysis, as discussed in Chapter 15.
Interpretation of data
Now we must decide whether our hypotheses are supported or not by interpreting the meaning of the results of
the data analysis. For instance, if it was found from the data analysis that increased responsiveness of employees
was negatively related to customer switching (say, 0.3), then we can deduce that if customer retention is to be
increased, our employees have to be trained to be more responsive. Another inference from this data analysis is
that responsiveness of our employees accounts for (or explains) 9% of the variance in customer switching (0.32).
Based on these deductions, we are able to make recommendations on how the “customer switching” problem
may be solved (at least to some extent); we have to train our employees to be more flexible and communicative.
Note that even if the hypothesis on the effect of unresponsiveness on customer switching is not supported,
our research effort has still been worthwhile. Hypotheses that are not supported allow us to refine our theory by
thinking about why it is that they were not supported. We can then test our refined theory in future research.
In summary, there are seven steps involved in identifying and resolving a problematic issue. To make sure
that the seven steps of the hypothetico‐deductive method are properly understood, let us briefly review an exam-
ple in an organizational setting and the course of action taken in the seven steps.

chapter the scientific approach and alternative approaches to investigation 25
EXAMPLE
Application of the hypothetico-deductive method in organizations
The CIO Dilemma
Identifying the broad problem area
Sara Foster is the Information Technology Director of a
medium‐sized firm. She observes that the newly installed
Management Information System (MIS) is not being used
by middle managers as much as was originally expected.
Some middle managers have occasionally approached the
ICT helpdesk or some other expert for help, whereas oth-
ers make decisions without facts. Recognizing there is
surely a problem, Sara develops the following broad prob-
lem statement: “What should be done to increase the use
of the newly installed MIS by our middle managers?”
Defining the problem statement
Talking to some of the middle‐level managers, Sara finds
that many of them have very little idea as to what the MIS
is all about, what kinds of information it can provide, and
how to access it and utilize the information. Sara uses
Google Scholar to explore further information on the
lack of use of management information systems in
organizations. The search indicates that many middle‐
level managers – especially the old‐timers – are not open
to new ideas or ways of solving problems. Lack of knowl-
edge about what the MIS offers is also found to be
another main reason why some managers do not use it.
This information helps Sara to narrow the broad prob-
lem area and to refine the problem statement: “To what
extent do knowledge‐related factors and openness to
change affect the use of the MIS by middle managers?”
Hypothesizing
Sara develops a theory incorporating all the relevant
factors contributing to the use of the MIS by managers
in the organization. From such a theory, she generates
various hypotheses for testing, one among them being:
Knowledge of the usefulness of the MIS would help man-
agers to put it to greater use.
Development of measures and data collection
Sara then develops a short questionnaire measuring
the various factors theorized to influence the use of the
MIS by managers, such as the extent of knowledge of
what the MIS is, what kinds of information the MIS
provides, how to gain access to the information, and
the level of openness to change of managers, and,
finally, how often managers have used the MIS in the
preceding three months.
Data analysis
Sara then analyzes the data obtained through the ques-
tionnaire to see what factors prevent the managers
from using the system.
Interpretation
Based on the results, Sara deduces – or concludes –
that a lot of managers do not use the MIS because
they do not believe that using the system would
enhance their job performance. Other managers do
not use the system because they do not know how to
use it effectively. These deductions help Sara to take
necessary action to rectify the situation, which
includes, among other things, organizing seminars
for training managers on the use of the MIS and
illustrating the advantages of using the MIS to
the managers.

26 research methods for business
Review of the hypothetico-deductive method
The hypothetico‐deductive method involves the seven steps of identifying a broad problem area, defining the
problem statement, hypothesizing, determining measures, data collection, data analysis, and the interpretation
of the results. The scientific method uses deductive reasoning to test a theory (recall that, to a scientist, a theory
is an organized set of assumptions that generates testable predictions) about a topic of interest. In deductive rea-
soning, we work from the more general to the more specific. We start out with a general theory and then narrow
down that theory into specific hypotheses we can test. We narrow down even further when we collect specific
observations to test our hypotheses. Analysis of these specific observations ultimately allows us to confirm (or
refute) our original theory.
Inductive reasoning works in the opposite direction: it is a process where we observe specific phenomena
and on this basis arrive at general conclusions. Hence, in inductive reasoning, we work from the more specific to
the more general. The observation of a first, second, and third white swan (this is a very famous example) may
lead to the proposition that “all swans are white.” In this example, the repeated observation of a white swan has
led to the general conclusion that all swans are white. According to Karl Popper it is not possible to “prove” a
hypothesis by means of induction, because no amount of evidence assures us that contrary evidence will not be
found. Observing 3, 10, 100, or even 10 000 white swans does not justify the conclusion that “all swans are white”
because there is always a possibility that the next swan we observe will be black. Instead, Popper proposed that
(proper) science is accomplished by deduction.
However, despite Popper’s criticism on induction, both inductive and deductive processes are often used in
both fundamental and applied research. Indeed, many researchers have argued that theory generation (induc-
tion) and theory testing (deduction) are essential parts of the research process.
Induction and deduction are often used in a sequential manner. John Dewey describes this process as “the
double movement of reflective thought.” Induction takes place when a researcher observes something and asks,
“Why does this happen?” In answer to this question, the researcher may develop a provisional explanation – a
hypothesis. Deduction is subsequently used to test this hypothesis. The following example illustrates this process.
EXAMPLE
A manager may notice that frequent price promotions
of a product have a negative effect on product sales.
Based on this observation, the manager may wonder
why price promotions have a negative – instead of a
positive – effect on sales. Interviews with customers
indicate that frequent price promotions have a nega-
tive effect on sales because frequent price promotions
negatively affect the reputation or image of the product.
Based on these interviews, the manager develops a
new theory about why price promotions have a nega-
tive effect on sales – because frequent price promo-
tions have a negative effect on the reputation of the
product! Accordingly, the manager hypothesizes that
frequent price promotions negatively affect the reputa-
tion of the product and hence product sales. The man-
ager may verify this hypothesis by means of deduction.
This example shows that both inductive and deductive processes are applied in scientific investigations.
Although both deductive and inductive processes can be used in quantitative and qualitative research, deductive
processes are more often used in causal and quantitative studies, whereas inductive research processes are regu-
larly used in exploratory and qualitative studies.
In sum, theories based on deduction and induction help us to understand, explain, and/or predict business
phenomena. When research is designed to test some specific hypothesized outcomes (for instance, to see if

chapter the scientific approach and alternative approaches to investigation 27
controlling aversive noise in the environment increases the performance of individuals in solving mental puzzles),
the following steps ensue. The investigator begins with the theory that noise adversely affects mental problem solv-
ing. The hypothesis is then generated that if the noise is controlled, mental puzzles can be solved more quickly and
correctly. Based on this, a research project is designed to test the hypothesis. The results of the study help the
researcher to deduce or conclude that controlling the aversive noise does indeed help the participants to improve
their performance on mental puzzles. This method of starting with a theoretical framework, formulating hypoth-
eses, and logically deducing from the results of the study is known as (you probably recognized it already) the
hypothetico‐deductive method. Here is another example of the hypothetico‐deductive research process.
EXAMPLE
A sales manager might observe that customers are per-
haps not as pleased as they used to be. The manager
may not be certain that this is really the case but may
experience uneasiness among consumers and observe
that the number of customer complaints has increased
recently. This process of observation or sensing of the
phenomena around us is what gets most research –
whether applied or basic – started. The next step for
the manager is to determine whether there is a real
problem and, if so, how serious it is. This problem
identification calls for some preliminary data gather-
ing. The manager might talk casually to a few custom-
ers to find out how they feel about the products and
customer service. During the course of these conversa-
tions the manager might find that the customers like the
products but are upset because many of the items they
need are frequently out of stock, and they perceive the
salespersons as not being helpful. From discussions
with some of the salespersons, the manager might dis-
cover that the factory does not supply the goods on
time and promises new delivery dates that it fails, on
occasion, to keep. Salespersons might also indicate
that they try to please and retain the customers by
communicating the delivery dates given to them by
the factory.
Integration of the information obtained through
the informal and formal interviewing process helps the
manager to determine that a problem does exist and to
define the central question of the study as follows: “How
do delays affect customer satisfaction?” It also helps
the manager to formulate a theoretical framework of
all the factors contributing to the problem. In this case,
there is a network of connections among the following
factors: delays by the factory in delivering goods, the
notification of later delivery dates that are not kept, the
promises of the salespersons to the customers (in
hopes of retaining them) that cannot be fulfilled, all of
which contribute to customer dissatisfaction. From the
theoretical framework, which is a meaningful integra-
tion of all the information gathered, several hypotheses
can be generated and tested to determine if the data
support them. Concepts are then operationally defined
so that they can be measured. A research design is set
up to decide on, among other issues, how to collect fur-
ther data, analyze and interpret them, and finally, to
provide an answer to the problem. The process of
drawing from logical analysis an inference that pur-
ports to be conclusive is called deduction. Thus, the
building blocks of science provide the genesis for the
hypothetico‐deductive method of scientific research.
Some obstacles to conducting scientific research in the management area
In the management and behavioral areas, it is not always possible to conduct investigations that are 100% scien-
tific, in the sense that, unlike in the physical sciences, the results obtained will not be exact and error‐free. This is
primarily because of difficulties likely to be encountered in the measurement and collection of data in the subjec-
tive areas of feelings, emotions, attitudes, and perceptions. These problems occur whenever we attempt to measure
abstract and subjective constructs. Difficulties might also be encountered in obtaining a representative sample,

28 research methods for business
restricting the generalizability of the findings. Thus, it is not always possible to meet all the hallmarks of science in
full. Comparability, consistency, and wide generalizability are often difficult to obtain in research. Still, to the
extent that the research is designed to ensure purposiveness, rigor, and the maximum possible testability, replica-
bility, generalizability, objectivity, parsimony, and precision and confidence, we would have endeavored to engage
in scientific investigation. Several other possible limitations in research studies are discussed in subsequent chapters.
ALTERNATIVE APPROACHES TO RESEARCH
Following a scientific approach to research should help the researcher to get to the truth about the subject of the
research. But is there such a thing as the truth? Or is the truth subjective; something that we have only con-
structed in our minds? All research is based on beliefs about the world around us (the philosophical study of
what can be said to exist is called ontology) and what we can possibly discover by research. Different researchers
have different ideas about these issues.
The disagreement about the nature of knowledge or how we come to know (the appropriate name for these
matters is epistemology) has a long history and it is not restricted to research in business. Questions such as “What
exists?”, “What is knowledge?”, and “How do we acquire knowledge?” have fascinated philosophers and researchers
in many fields for over 2000 years. At this point, we will briefly discuss the most important perspectives for contem-
porary research in business. We will successively deal with positivism, constructionism, critical realism, and
pragmatism. Note that in order to make our point we will sometimes exaggerate the descriptions of these research
perspectives. For this reason, experts on these matters may sometimes disapprove on what we have to say.
Positivism
In a positivist view of the world, science and scientific research is seen as the way to get at the truth – indeed, posi-
tivists believe that there is an objective truth out there – to understand the world well enough so that we are able
to predict and control it. For a positivist, the world operates by laws of cause and effect that we can discern if we
use a scientific approach to research. Positivists are concerned with the rigor and replicability of their research,
the reliability of observations, and the generalizability of findings. They use deductive reasoning to put forward
theories that they can test by means of a fixed, predetermined research design and objective measures. The key
approach of positivist researchers is the experiment, which allows them to test cause‐and‐effect relationships
through manipulation and observation. Some positivists believe that the goal of research is to only describe phe-
nomena that one can directly observe and objectively measure. For them, knowledge of anything beyond that –
such as emotions, feelings, and thoughts – is impossible.
Constructionism
A completely different approach to research and how research should be done is constructionism. Constructionism
criticizes the positivist belief that there is an objective truth. Constructionists hold the opposite view, namely that
the world (as we know it!) is fundamentally mental or mentally constructed. For this reason, constructionists do
not search for the objective truth. Instead, they aim to understand the rules people use to make sense of the world by
Visit the companion website at www.wiley.com/college/sekaran for Author Video: Alternative approaches to research.

chapter the scientific approach and alternative approaches to investigation 29
investigating what happens in people’s minds. Constructionism thus emphasizes how people construct knowledge;
it studies the accounts people give of issues and topics and how people get to these accounts. Constructionists are
particularly interested in how people’s views of the world result from interactions with others and the context in
which they take place. The research methods of constructionist researchers are often qualitative in nature. Focus
groups and unstructured interviews allow them to collect rich data, oriented to the contextual uniqueness of the
world that is being studied. Indeed, constructionists are often more concerned with understanding a specific case
than with the generalization of their findings. This makes sense from the viewpoint of the constructionist; there
is no objective reality to generalize about.
Critical realism
Between these two opposed views on research and on how research should be done, there are many intermediary
viewpoints. One of these viewpoints is critical realism. Critical realism is a combination of the belief in an exter-
nal reality (an objective truth) with the rejection of the claim that this external reality can be objectively meas-
ured; observations (especially observations on phenomena that we cannot observe and measure directly, such as
satisfaction, motivation, culture) will always be subject to interpretation. The critical realist is thus critical of our
ability to understand the world with certainty. Where a positivist believes that the goal of research is to uncover
the truth, the critical realist believes that the goal of research is to progress toward this goal, even though it is
impossible to reach it. According to the critical realist viewpoint, measures of phenomena such as emotions, feel-
ings, and attitudes are often subjective in nature and the collection of data is, generally speaking, imperfect and
flawed. The critical realist also believes that researchers are inherently biased. They argue that we therefore need
to use triangulation across multiple flawed and erroneous methods, observations, and researchers to get a better
idea of what is happening around us.
Pragmatism
A final viewpoint on research that we will discuss here is pragmatism. Pragmatists do not take on a particular
position on what makes good research. They feel that research on both objective, observable phenomena and
subjective meanings can produce useful knowledge, depending on the research questions of the study. The focus
of pragmatism is on practical, applied research where different viewpoints on research and the subject under
study are helpful in solving a (business) problem. Pragmatism describes research as a process where concepts and
meanings (theory) are generalizations of our past actions and experiences, and of interactions we have had with
our environment. Pragmatists thus emphasize the socially constructed nature of research; different researchers
may have different ideas about, and explanations for, what is happening around us. For the pragmatist, these dif-
ferent perspectives, ideas, and theories help us to gain an understanding of the world; pragmatism thus endorses
eclecticism and pluralism. Another important feature of pragmatism is that it views the current truth as tenta-
tive and changing over time. In other words, research results should always be viewed as provisional truths.
Pragmatists stress the relationship between theory and practice. For a pragmatist, theory is derived from practice
(as we have just explained) and then applied back to practice to achieve intelligent practice. Along these lines,
pragmatists see theories and concepts as important tools for finding our way in the world that surrounds us. For
a pragmatist, the value of research lies in its practical relevance; the purpose of theory is to inform practice.
Conclusion
You may have asked yourself repeatedly, “Why do I need to know this?” One answer is that we believe that it is
important for you to know that there is more than one viewpoint on what makes good research. Knowledge of
epistemology may help you to relate to and understand the research of others and the choices that were made in
this research. Different researchers have different ideas about the nature of knowledge or on how we come to
Faqih
Highlight
Faqih
Highlight

30 research methods for business
know (indeed, the scientific approach to research is only one – albeit important – view on what “good” research is).
These different ideas translate into different approaches that are taken to research, into different research designs,
and into different choices regarding the research methods used.
Another answer to the question “Why do I need to know this?” is that you will probably have noticed that
you prefer one research perspective over the other perspectives. Understanding your personal ideas on research
and how it should be done allows you to determine which kinds of research questions are important to you and
what methods for collecting and analyzing data will give you the best answer to these questions. It will also help
you to make informed decisions during the research process, to have a clear understanding about what the find-
ings of your study (do and do not) mean, and to understand the type of conclusions that your research approach
allows you to draw. Like this, it helps you to put your research and research findings in perspective.
In sum, your viewpoint on the nature of knowledge and on how we come to know will have a strong influence
on the research questions you ask, your research design, and the research methods you will use. The rest of this
book is primarily concerned with the development of research questions, research design, and research methods,
and much less with the foregoing philosophical issues. However, it is important that every so often you consider
the philosophical underpinnings of your research questions, your research design, and your research methods.
This is important since the value of your research findings depends on how well they relate to the methods you
have used, the design you have chosen, the questions you have asked, and the research perspective you have taken.
SUMMARY
● Learning objective 1: Explain what is meant by scientific investigation, giving examples of both scien-
tific and non-scientific investigations.
Scientific research focuses on solving problems and pursues a step-by-step, logical, organized and rigorous
method to identify the problems, gather data, analyze them, and draw valid conclusions from them. The
hallmarks or main distinguishing characteristics of scientific research are purposiveness, rigor, testability,
replicability, precision and confidence, objectivity, generalizability, and parsimony.
● Learning objective 2: Discuss the seven steps of the hypothetico-deductive method, using an example
of your own.
The hypothetico-deductive method is a typical version of the scientific method. This method provides a
useful, systematic approach for generating knowledge to solve basic and managerial problems. The hypothetico-
deductive method involves seven steps: (1) identify a broad problem area; (2) define the problem statement;
(3) develop hypotheses; (4) determine measures; (5) collect data; (6) analyze data; and (7) interpret data.
The scientific method uses deductive reasoning to test a theory about a topic of interest.
● Learning objective 3: Discuss alternative perspectives on what makes good research.
All research is based on beliefs about the world around us and what we can possibly discover by research.
Different researchers have different ideas about these issues. Your viewpoint on the nature of knowledge and
on how we come to know things will have a strong influence on the research questions you ask, your research
design, and the research methods you will use.
In the rest of this book these matters are discussed in more detail.

chapter the scientific approach and alternative approaches to investigation 31
DISCUSSION QUESTIONS
1. Describe the hallmarks of scientific research.
2. What are the steps in hypothetico‐deductive research? Explain them, using your own example.
3. One hears the word research being mentioned by several groups such as research organizations, col-
lege and university professors, doctoral students, graduate assistants working for faculty, graduate
and undergraduate students doing their term papers, research departments in industries, newspa-
per reporters, journalists, lawyers, doctors, and many other professionals and nonprofessionals.
In the light of what you have learned in this chapter, which among the aforementioned groups of
people do you think may be doing “scientific” investigations in the areas of basic or applied
research? Why?
4. Explain the processes of deduction and induction, giving an example of each.
5. Discuss the following statement: “Good research is deductive in nature.”
6. Discuss the following statement: “The hallmarks of scientific research do not/cannot apply to
inductive research.”
7. If research in the management area cannot be 100% scientific, why bother to do it at all? Comment
on this question.
8. What is epistemology and why is it important to know about different perspectives on research and
how it should be done?
9. Discuss the most important differences between positivism and constructionism.
10. Is there a specific perspective on research that appeals to you? Why?
11. Some people think that you should choose a particular research perspective based on the research
questions of your study. Others feel that a particular research perspective “chooses” you. That is,
they believe that you will have a rather strong preference for one particular research perspective; in
turn, this will have an influence on the type of questions you ask. How do you feel about this
matter?
12. Critique the following research done in a service industry as to the extent to which it meets the
hallmarks of scientific investigation discussed in this chapter.
The Mobile Phone Company
The Mobile Phone Company has been named as the most complained‐about mobile phone company,
narrowly beating 3G, which has shot to the top of the table as the worst landline provider.
Visit the companion website at www.wiley.com/college/sekaran for Case Study: The
Pacific Futures Trading Company.

32 research methods for business
According to the latest figures from the regulator, Ofcom, the Mobile Phone Company was the most
complained‐about mobile provider – with 0.15 complaints per 1,000 – in the last three months of 2014.
It saw its complaint figures rise substantially in the last quarter of 2014. The company wanted to pinpoint
the specific problems and take corrective action.
Researchers were called in, and they spoke to a number of customers, noting the nature of the specific
problems they faced. Because the problem had to be attended to very quickly, they developed a theoretical
base, collected relevant detailed information from a sample of 100 customers, and analyzed the data. The
results promise to be fairly accurate with at least an 85% chance of success in problem solving. The
researchers will make recommendations to the company based on the results of data analysis.

33
INTRODUCTION
Earlier in this book we have described business research as a systematic and organized effort to investigate a
specific problem encountered in the work setting. Indeed, managers have to be alert and responsive to what is
going on, both within their organization and in its environment in order to take effective decisions and develop
effective courses of action. The origin of most research stems from the desire to get a grip on issues, concerns,
and conflicts within the company or in its environment. In other words, research typically begins with a problem.
THE BROAD PROBLEM AREA
A “problem” does not necessarily mean that something is seriously wrong with a current situation that needs to
be rectified immediately. A problem could also indicate an interest in an issue where finding the right answers
might help to improve an existing situation. Thus, it is fruitful to define a problem as any situation where a gap
exists between an actual and a desired ideal state. Box 3.1 provides examples of problems that the manager may
encounter in the work setting.
Defining and refining the problem
C H A P T E R 3
LEARNING OBJECTIVES
After completing Chapter 3 you should be able to:
1. Identify problem areas that are likely to be studied in organizations.
2. Narrow down a broad problem into a feasible topic for research using preliminary research.
3. Develop a good problem statement.
4. Develop a research proposal.
5. Be aware of the role of the manager in the early stages of the research process.
6. Be aware of the role of ethics in the early stages of the research process.

34 research methods for business
The foregoing problems provide us with enough information to embark on our research journey. However,
what these problems also have in common is that they still have to be transformed into a researchable topic for
investigation. Indeed, once we have identified the management problem, it needs to be narrowed down to a
researchable topic for study. Very often much work is needed to translate the broad problem into a feasible
research topic.
BOX 3.1
EXAMPLES OF PROBLEMS
1. Long and frequent delays lead to much frustration among airline passengers. Th ese feelings may
eventually lead to switching behavior, negative word‐of‐mouth communication, and customer
complaints.
2. Staff turnover is higher than anticipated.
3. Th e current instrument for the assessment of potential employees for management positions is
imperfect.
4. Minority group members in organizations are not advancing in their careers.
5. Th e newly installed information system is not being used by the managers for whom it was
primarily designed.
6. Th e introduction of fl exible work hours has created more problems than it has solved.
7. Young workers in the organization show low levels of commitment to the organization.
BOX 3 1
EXAMPLE
Problems versus symptoms of problems
It is very important that symptoms of problems are not
defined as the real problem. For instance, a manager
might have tried to decrease employee turnover (the
best people are leaving the organization) by increasing
wages, but with little success. Here the real problem
may be something else such as the low motivation of
employees who feel they do not have enough control
over their work. The high turnover rate may merely be
a symptom of the deep‐rooted motivational problem.
Under these conditions, in the long run, a higher sal-
ary will not affect employees ’ intentions to leave. Thus,
finding the “right” answer to the “wrong” problem
definition will not help. Hence, it should be recognized
that correct problem identification is extremely critical
for finding solutions to vexing issues.
Frequently, managers tend to describe the prob-
lem in terms of symptoms. Rather than accepting it as
such, the researcher needs to identify the problem
more accurately. One way of determining that the
problem, rather than the symptom, is being addressed
is a technique called “5 Whys” or “5 Times Why”. 5 Whys
is a fairly straightforward approach that will help you

chapter defining and refining the problem 35
“The introduction of flexible work hours has created more problems than it has solved” provides a nice starting
point for a research project, but it lacks the specificity and focus needed to investigate it. We need to transform
the broad problem into a feasible topic for research by a) making it more specific and precise and by b) setting
clear boundaries. Finally, we need to select a c) perspective from which we investigate the subject (Machi and
McEvoy, 2012).
to get to the root cause (the most basic cause) of a
problem (via preliminary research). Developed by the
Japanese industrialist Sakichi Toyada, the idea is to
keep asking “Why?” until the most basic cause is
arrived at.
Let’s go back to our example to illustrate this
approach.
My best employees are leaving the organization.
Why? Because they are not satisfied with their jobs.
Why? Because they do not find a challenge in their jobs.
Why? Because they do not have control over their work.
Why? Because they do not have a lot of influence over
planning, executing, and evaluating the work they
do.
Why? Because we have been reluctant to delegate.
Note that the number five is a general guideline
for the number of whys needed to get to the root cause
level, but asking “Why?” five times versus three, four,
or six times is not a strict requirement. What matters
is that we investigate recurring problems by address-
ing true causes and not symptoms of these causes.
EXAMPLE
Bringing clarity and focus to the problem
The “secret” to bringing clarity and focus to your prob-
lem is to isolate the key ideas in the first version of the
problem statement. A broad, first statement of the
problem often includes several words and/or phrases
that need definition. Check out the following problem
statement:
“Minority group members in organizations
are not advancing in their careers.”
To identify the key terms in your problem statement,
look for the subjects (careers), verbs (advancing), and
objects (minority group members) in your statement.
Definitions of key terms must be precise in order to iden-
tify the subject of the research and to gain access to rele-
vant academic literature. Precise definitions will allow
you to explore the literature. The literature review will
help you to refine your research objective(s) and research
questions and thus to develop a feasible topic for research.
The selection of a particular (academic) perspective on the problem will allow us to draw upon a rich body
of literature to help us to formulate a feasible problem statement, as exemplified by the following example.

36 research methods for business
We have just explained that we need to transform (read: narrow down) a broad management problem into a
feasible topic for research. Preliminary information gathering (or preliminary research) will help us to make the neces-
sary transformations. Figure 3.1 shows the three initial stages of the research process and illustrates how we get from a
broad management problem to a feasible topic for research. Note that this process is not linear; in the beginning of our
project we will have to move back and forth between preliminary research and (re)defining the problem (see Box 3.2).
Step 1 Step 2 Step 3
Identification of the
broad management
problem
Preliminary
research
Definition of the
research problem
F I G U R E 3 . 1
Three important first steps in the research process
BOX 3.2
DEFINING THE PROBLEM
In the early stages of the research process you will have to spend time alternating between preliminary
research (e.g., a fi rst review of the literature) and (re)defi ning the problem statement. Until you have
developed a fi rst tentative problem statement you cannot decide what information is useful. However,
the awareness and understanding of current work and viewpoints in the subject area may change your
perspective on what the problem is and encourage you to refi ne the problem statement; a more refi ned
problem statement may trigger the need to collect further information which may inspire you to reframe
the problem statement . . . and so on.
BOX 3 2
EXAMPLE
How the selection of an academic perspective will help us to narrow down our research
Consider the following problem: “ Long and frequent
delays lead to much frustration among airline passen-
gers. These feelings may eventually lead to switching
behavior, negative word-of-mouth communication,
and customer complaints .” Preliminary research on
this issue suggests that service waiting times are
typically controlled by two techniques: operations
management, to decrease actual, objective waiting
times (perspective 1) and management of percep-
tions, that will help service providers to manage the
customers' subjective waiting experience (perspec-
tive 2). The selection of a particular academic per-
spective on the problem (for instance, management
of perceptions in the foregoing example of long and
frequent delays) provides us with a vast body of
knowledge that will help us to shape our own think-
ing and spark valuable insights on the problem
under study.

chapter defining and refining the problem 37
PRELIMINARY RESEARCH
Once we have identified the broad problem area preliminary research should help the researcher to gain a better
understanding of the problem and to narrow the problem down to a researchable topic for study. Preliminary
research should help the researcher to find answers to questions such as: “What is the problem?”; “Why does the
problem exist?”; “Is the problem important?”; and “What are the benefits of solving the problem?” Although the
exact nature of the information needed for this purpose depends on the type of problem one is addressing, it may
be broadly classified under two headings:
1. Information on the organization and its environment – that is, the contextual factors.
2. Information on the topic of interest.
Nature of information to be gathered
Background information on the organization
Information gathered on relevant contextual factors will be useful in talking knowledgeably with managers and
other employees in the company and raising the appropriate issues related to the problem. Along these lines, an
understanding of these factors might be helpful in arriving at a precise problem formulation. Background infor-
mation might include, among other things, the contextual factors listed below, which may be obtained from
various sources.
1. The origin and history of the company – when it came into being, business it is in, rate of growth,
ownership and control, and so on.
2. Size in terms of employees, assets, or both.
3. Charter – purpose and ideology.
4. Location – regional, national, or other.
5. Resources – human and others.
6. Interdependent relationships with other institutions and the external environment.
7. Financial position during the previous five to ten years, and relevant financial data.
8. Information on structural factors (for instance, roles and positions in the organization and number of
employees at each job level, communication channels, control systems, workflow systems).
9. Information on the management philosophy.
Depending on the situation, the type of problem investigated, and the nature of some initial responses
received, certain aspects may have to be explored in greater depth than others.
The contextual information mentioned may be obtained through various primary and/or secondary
data collection methods, such as interviews and a review of company records and archives. Data gathered
through existing sources are called secondary data. Secondary data are data that have been collected by oth-
ers for another purpose than the purpose of the current study. Some secondary sources of data are statistical
bulletins, government publications, published or unpublished information available from either within or
outside the organization, company websites, and the Internet. The nature and the value of secondary data
should be carefully evaluated before it is used. Box 3.3 provides an overview of the key criteria for evaluating
secondary data.

38 research methods for business
The collection of secondary data is very often quite helpful in the early stages of the research process, but in
some cases information is best obtained by other methods such as interviewing people, observation, or by
administering questionnaires to individuals. Such data that the researcher gathers first hand for the specific pur-
pose of the study are called primary data. Four principal methods of primary data collection (interviews, obser-
vation, administering questionnaires, and experiments) are discussed in Chapters 7 to 10 .
Note that it is often beneficial to simultaneously gather primary and secondary data in the early stages of the
research process. On the one hand, secondary data can help you to focus (further) interviews more meaningfully
on relevant aspects pertaining to the problem; on the other hand, interviews may help you to search for relevant
information in secondary sources.
Information on the topic or subject area
The literature – the body of knowledge available to you as a researcher – may also help you to think about and/
or better understand the problem. A careful review of textbooks, journal articles, conference proceedings, and
other published and unpublished materials (see Chapter 4 for a detailed discussion on how to review the litera-
ture) ensures that you have a thorough awareness and understanding of current work and viewpoints on the
subject area. This helps you to structure your research on work already done and to develop the problem state-
ment with precision and clarity.
A first review of the literature also helps you to make an informed decision about your research approach, as
exemplified in Box 3.4 . In this example (of fundamental research) an exploratory research approach is used in
order to provide insight into events that typically instigate customer anger in service settings.
BOX 3.3
CRITERIA FOR EVALUATING SECONDARY DATA
Timeliness of the data. When were the data collected? It is important that the data are up‐to‐date.
Check the dates on all of your secondary data to make sure that you have the newest information
available.
Accuracy of the data. What was the purpose of (presenting) the data? Web pages are created with a
specifi c purpose in mind. Commercial organizations oft en post information online that might favor them
in some way or represent their own interests. Who collected the data? How were the data collected? What are
the author ’ s credentials on this subject? Th e accuracy of data can be impacted by who collected it and how
the data were collected. Are the data consistent with data from other sources? If specifi c information varies
from source to source, you need to fi nd out which information is more accurate.
Relevance of the data. Not all of the secondary data you fi nd will be relevant to your particular needs.
Data may be accurate and up‐to‐date but not applicable to your research objective(s) and research
questions.
Costs of the data. How much do the data cost? Do the benefi ts outweigh the costs? Are you better off
collecting other data? Are you better off using other (primary?) methods of data collection?
BOX 3 3

chapter defining and refining the problem 39
DEFINING THE PROBLEM STATEMENT
After gathering preliminary information, the researcher is in a position to narrow down the problem from its
original broad base and define the issues of concern more clearly. As we have explained earlier, it is critical that
the problem statement is unambiguous, specific, and focused, and that the problem is addressed from a specific
academic perspective. No amount of good research can find solutions to the situation if the critical issue or the
problem to be studied is not clearly pinpointed.
What makes a good problem statement?
BOX 3.4
INSPECTION OF THE LITERATURE ON THE ANTECEDENTS OF CUSTOMER ANGER
Customer anger has been found to lead to negative word‐of‐mouth communication and switching, above
and beyond customer dissatisfaction (Bougie, Pieters & Zeelenberg, 2003 ; Dubé & Maute, 1996; Nyer, 1997 ;
Taylor, 1994 ). Since it is also a common emotional response to failed services, it may have strong implica-
tions for the performance and profi tability of service fi rms. For these reasons it is critical that service fi rms
try to avoid customer anger.
To be able to avoid customer anger, service providers need to understand what events typically insti-
gate this emotion in customers. Surprisingly, to date, we do not know much about instigations of cus-
tomer anger. Although we know that core service failures (Dubé and Maute, 1996) and waiting for service
(Folkes, Koletsky & Graham, 1987 ; Taylor, 1994 ) give rise to anger, systematic research on the precipitating
events of this emotion in service settings is absent. Th erefore, this exploratory study investigates and cate-
gorizes events that typically instigate customer anger to fi ll this void. Th us it provides a conceptual model
of anger instigation in services and guidelines for service fi rms on how to avoid customer anger.
BOX 3 4
Visit the companion website at www.wiley.com/college/sekaran for Author Video: What
makes a good problem statement?
A good problem statement includes both a statement of the research objective(s) and the research question(s).
In chapter 2 we have explained that good research has a purposive focus. Whereas the purpose of fundamental
(or basic) research in business is related to expanding knowledge (of processes) of business and management in
general, the ultimate aim of applied research is often to change something in order to solve a specific problem
encountered in the work setting. For instance, a manager might be interested in determining the factors that
increase employee commitment to the organization , since an increase in employee commitment may translate into
lower staff turnover, less absenteeism, and increased performance levels, all of which will benefit the organiza-
tion. The purpose or objective of the study thus explains why the study is being done. The statement of the
research objective(s) should be brief, but nonetheless communicate clearly the focus of the project.

40 research methods for business
Once the purpose of the study has been identified, one is able to formulate the research question(s) of the
study. The inclusion of one or more research questions in the problem statement further clarifies the issue to be
resolved. The research question(s) specify what you want to learn about the topic. They guide and structure the
process of collecting and analyzing information to help you to attain the purpose of your study. In other words,
research questions are the translation of the problem of the organization into a specific need for information.
Box 3.5 provides an example of a problem statement. Note that both the research objective and the research ques-
tions of the study are detailed in this example.
BOX 3.5
EXAMPLE OF A PROBLEM STATEMENT
CAA Airlines carries out charter and regular fl ights to medium‐haul destinations – such as the
Mediterranean, North Africa and the Red Sea – and to long‐haul destinations such as the Caribbean.
Today, CAA ’ s fl eet consists of three (new) Boeing 737‐800s and four (outdated) Boeing 767‐300s. Because
the Boeing 767s are rather outdated they need more maintenance than the average airplane. Despite an
intensive maintenance program, these planes have a lot of technical problems. Consequently, the long‐haul
fl eet of CAA has needed to deal with a lot of delays recently. New long‐haul planes have been ordered, but
these planes will not be delivered before 2016. Th is means that more delays will inevitably occur. Th is may
translate into much frustration among airline passengers, to switching behavior, and to negative word‐of‐
mouth communication. Th ese feelings and behaviors of consumers may eventually have negative eff ects
on the performance and the profi tability of the fi rm.
Prior research has claimed that service waits can be controlled by two techniques: operations
management and management of perceptions. For CAA Airlines it is very diffi cult to obtain “zero defects”
(no delays). Hence, this project will focus on managing the perceptions of the wait experience: because
CAA Airlines cannot control the actual amount of delays and the duration, the company must focus
BOX 3 5
EXAMPLE
Examples of research objectives
● To find out what motivates consumers to buy a
product online.
● To study the effect of leadership style on employees ’
job satisfaction.
● To investigate the relationship between capital
structure and profitability of the firm.
● To establish success factors regarding the adoption
and use of information systems.
● To determine the optimal price for a product.
● To investigate the influence of the in‐store shopping
environment on impulse buying.
● To establish the determinants of employee
involve ment.
● To understand the causes of employee absence.

chapter defining and refining the problem 41
The foregoing problem statement addresses both the research objectives and the research questions of the
study. The research objective and the research questions are strongly related; it would have been impossible to
adequately detail the research questions if the research objective had been unclear, unspecified, or ambiguous.
What ’ s more, the research questions have been clarified to the extent that it is possible to relate them to existing
literature in the areas of waiting, service evaluations, and mood theory. Hence, the broad problem area has been
transformed into a researchable topic for study.
Box 3.6 summarizes the problem and the problem statement of the foregoing research project.
BOX 3.6
BUSINESS PROBLEM TRANSLATED INTO PROBLEM STATEMENT
Problem statement
Problem Research objective Research questions
Frequent and long delays may
translate into much frustration
among airline passengers, to
switching behavior, and to
negative word‐of‐mouth
communication. These feelings
and behaviors eventually have
negative effects on the
performance and the profitability
of the firm.
The purpose of this study
is twofold: (1) to identify
the factors that influence
the passengers ’ waiting
experience and (2) to
investigate the possible
impact of waiting on
customer satisfaction and
service evaluations.
1. What are the factors that affect the perceived
waiting experience of airline passengers and
to what extent do these factors affect the
perception of waiting times?
2. What are the affective consequences of
waiting and how does affect mediate the
relationship between waiting and service
evaluations?
3. How do situational variables (such as filled
time) influence customer reactions to the
waiting experience?
BOX 3 6
on managing the customers ’ perception of the waiting experience. Th e purpose of this study is twofold:
(1) to identify the factors that infl uence the passengers ’ waiting experience and (2) to investigate the
possible impact of waiting on customer satisfaction and service evaluations.
Th erefore, this project focuses on the following research questions:
1. What are the factors that aff ect the perceived waiting experience of airline passengers and to what
extent do these factors aff ect the perception of waiting times?
2. What are the aff ective consequences of waiting and how does aff ect mediate the relationship bet-
ween waiting and service evaluations?
3. How do situational variables (such as fi lled time) infl uence customer reactions to the waiting
experience?
Drawing from prior research in the areas of waiting, service evaluations, and mood theory, hypotheses
are generated regarding the relationships among a delay, the waiting experience, aff ect, and service evalua-
tions. Th e hypothesized relationships are tested in a fi eld setting involving delayed CAA airline passengers.

42 research methods for business
By now, it should be clear that a problem statement addresses both the “why” (the specific aim or purpose
of the study) and the “what” (the central research question or a set of research questions) of the research.
There are three key criteria to assess the quality of a problem statement: it should be relevant, feasible, and
interesting.
A problem statement is relevant if it is meaningful from a managerial perspective, an academic perspective,
or both. From a managerial perspective, research is relevant if it relates to (1) a problem that currently exists in
an organizational setting or (2) an area that a manager believes needs to be improved in the organization. From
an academic perspective, research is relevant if: (1) nothing is known about a topic, (2) much is known about the
topic, but the knowledge is scattered and not integrated, (3) much research on the topic is available, but the
results are (partly) contradictory, or (4) established relationships do not hold in certain situations. If you base
your research report on the “nothing is known” argument, you will have to prove that your claim is right. The
observation that much is known about a topic, but that the knowledge is scattered and not integrated also pro-
vides a good basis for a research report. Your task is, however, a difficult one, since it is expected that you will
present an integrated overview of the topic. A research project that aims to reconcile contradictory findings or to
establish boundary conditions is also a real challenge.
A good problem statement is relevant but also feasible. A problem statement is feasible if you are able to
answer the research questions within the restrictions of the research project. These restrictions are possibly
related to time and money, but also to the availability of respondents, the expertise of the researcher (a prob-
lem statement may be too difficult to answer), and the like. A frequent problem in terms of feasibility is that
the problem statement is too broad in scope. Indeed, it is important that you develop a narrowly defined
research question that can be investigated within a reasonable amount of time, and with a reasonable amount
of money and effort. For instance, the problem statement “How do consumers behave?” is far too general to
investigate.
A third characteristic of a good problem statement is that it is interesting to you. Research is a time‐consuming
process and you will go through many ups and downs before you present the final version of your research
report. It is therefore vital that you are genuinely interested in the problem statement you are trying to answer, so
that you can stay motivated throughout the entire research process.
EXAMPLE
Well-defined research questions
1. To what extent do the structure of the organization
and type of information systems installed account
for the variance in the perceived effectiveness of
managerial decision making?
2. To what extent has the new advertising campaign
been successful in creating the high‐quality,
customer‐centered corporate image that it was
intended to produce?
3. How has the new packaging affected the sales of
the product?
4. Has the new advertising message resulted in enhanced
recall?
5. How do price and quality rate on consumers’ eval-
uation of products?
6. Is the effect of participative budgeting on perfor-
mance moderated by control systems?
7. Does better automation lead to greater asset
investment per dollar of output?
8. Does expansion of international operations result
in an enhancement of the firm’s image and value?
9. What are the effects of downsizing on the long‐
range growth patterns of companies?
10. What are the specific factors to be considered in cre-
ating a data warehouse for a manufacturing company?

chapter defining and refining the problem 43
Basic types of questions: exploratory and descriptive
Visit the companion website at www.wiley.com/college/sekaran for Author Video:
Purpose of the study.
Earlier in this chapter, we explained that a problem statement includes both a statement of the research objective(s)
and the research questions. There are three basic types of questions that research projects can address: exploratory
and descriptive questions. We will now look at each of these in some detail.
Exploratory research questions
Exploratory research questions are typically developed when: a) not much is known about a particular phenome-
non; b) existing research results are unclear or suffer from serious limitations; c) the topic is highly complex; or
d) there is not enough theory available to guide the development of a theoretical framework (discussed in Chapter 5).
Exploratory research often relies on qualitative approaches to data gathering such as informal discussions (with
consumers, employees, managers), interviews, focus groups, and/or case studies (discussed in Chapter 6 and 7). As
a rule, exploratory research is flexible in nature. Indeed, the activities of the researcher in exploratory research are
quite similar to the activities of Inspector Lewis, Inspector Wallander, Sergeant Hunter, Detective Dee, or the South
Florida team of forensic investigators from “CSI Miami”, who use old‐fashioned police work, cutting‐edge scientific
methods, or both to solve murder crimes. Whereas the focus of the research is broad at first, it becomes increasingly
narrower as the research proceeds. The results of exploratory studies are typically not generalizable to the population.
The following is an example where exploratory research would be necessary.
EXAMPLE
The manager of a multinational corporation is curi-
ous to know if the work ethic values of employees
working in its subsidiary in Pennathur City are dif-
ferent from those of Americans. There is very little
information about Pennathur (except that it is a small
city in southern India), and since there is considera-
ble controversy about what work ethic values mean to
people in other cultures, the manager’s curiosity can
be satisfied only by an exploratory study, interview-
ing the employees in organizations in Pennathur.
Religion, political, economic, and social conditions,
upbringing, cultural values, and so on play a major
role in how people view their work in different parts
of the world. Here, since very little is known about
work ethic values in India, an exploratory study will
have to be undertaken.
Descriptive research questions
The objective of a descriptive study is to obtain data that describes the topic of interest. For instance, if we want
to know what percent of the population likes Coca‐Cola better than pepsi in a double‐blind test, we are interested
in describing consumers’ taste preferences. Descriptive studies are often designed to collect data that describe
characteristics of objects (such as persons, organizations, products, or brands), events, or situations. Descriptive
research is either quantitative or qualitative in nature. It may involve the collection of quantitative data such as
satisfaction ratings, production figures, sales figures, or demographic data, but it may also entail the collection of
qualitative information. For instance, qualitative data might be gathered to describe how consumers go through
a decision‐making process or to examine how managers resolve conflicts in organizations.

44 research methods for business
Sometimes the researcher is interested in associations among variables to describe populations, events, or
situations. For instance, a researcher might be interested in the relationship between job involvement and job
satisfaction, arousal‐seeking tendency and risk‐taking behavior, self‐confidence and the adoption of innovative
products, or goal clarity and job performance. Such studies are correlational in nature. Correlational studies
describe relationships between variables. While correlational studies can suggest that there is a relationship
between two variables, finding a correlation does not mean that one variable causes a change in another variable.
Descriptive studies may help the researcher to:
1. Understand the characteristics of a group in a given situation (for instance the profile of a specific
segment in a market).
2. Think systematically about aspects in a given situation (for instance, factors related to job satisfaction).
3. Offer ideas for further probing and research.
4. Help make certain (simple) decisions (such as decisions related to the use of specific communication chan-
nels depending on the customer profile, opening hours, cost reductions, staff employment, and the like).
Below are examples of situations warranting a descriptive study.
EXAMPLE
A bank manager wants to have a profile of the indi-
viduals who have loan payments outstanding for six
months and more. The profile will include details of
their average age, earnings, nature of occupation, full‐
time/part‐time employment status, and the like. This
might help him to elicit further information or decide
right away on the types of individuals who should be
made ineligible for loans in the future.
A CEO may be interested in having a description
of how companies in her industry have incorporated
corporate social responsibility into the business strat-
egy of the organization. Such information might allow
comparison later of the performance levels of specific
types of companies.
Causal research questions
Causal studies test whether or not one variable causes another variable to change. In a causal study, the researcher
is interested in delineating one or more factors that are causing a problem. Typical examples of causal research
questions are: “What is the effect of a reward system on productivity?” and “How does perceived value affect
consumer purchase intentions?” The intention of the researcher conducting a causal study is to be able to state
that variable X causes variable Y. So, when variable X is removed or altered in some way, problem Y is solved
(note that quite often, however, it is not just one variable that causes a problem in organizations). In Chapter 5,
we will explain that in order to establish a causal relationship, all four of the following conditions should be met:
1. The independent and the dependent variable should covary.
2. The independent variable (the presumed causal factor) should precede the dependent variable.
3. No other factor should be a possible cause of the change in the dependent variable.
4. A logical explanation (a theory) is needed and it must explain why the independent variable affects the
dependent variable.
Because of the time sequence condition, experimental designs, discussed in Chapter 6 and in more detail in
Chapter 10, are often used to establish causal relationships.
Examples of causal studies are given below.

chapter defining and refining the problem 45
EXAMPLE
A marketing manager wants to know if the sales of the company will increase if he increases the advertising
budget. Here, the manager would like to know the nature of the relationship that may be established between
advertising and sales by testing the hypothesis: “If advertising is increased, then sales will also go up.”
A prevalent theory is that the diversity of the workforce increases organizational effectiveness. A manager
wants to know if this relationship holds for her organization.
A manager wants to test the hypothesis that stress experienced in the job negatively affects the job satisfac-
tion of employees.
A researcher is interested in testing the hypothesis that women are more motivated for their jobs than men.
Researchers often aim to answer different types of research questions in a single project. For this reason it is
quite common to conduct exploratory research before moving to descriptive or causal studies in order to develop
a thorough understanding of the phenomenon under study. Indeed, the three types of research (exploratory,
descriptive, and causal) are often viewed as building blocks, where exploratory research lays the foundation for
descriptive research and causal research builds on descriptive research.
After you have defined the problem statement you are ready to start your research. First, however, you need
to communicate the problem statement and a number of other important aspects of the study – such as the scope
of the study, the procedures to be followed, the time frame, and the budget – to all the parties involved.
THE RESEARCH PROPOSAL
Before any research study is undertaken, there should be an agreement between the person who authorizes the
study and the researcher as to the problem to be investigated, the methodology to be used, the duration of the
study, and its cost. This ensures that there are no misunderstandings or frustrations later for either party. This is
usually accomplished through a research proposal, which the researcher submits and gets approved by the spon-
sor, who issues a letter of authorization to proceed with the study.
The research proposal drawn up by the investigator is the result of a planned, organized, and careful effort,
and basically contains the following:
1. A working title.
2. Background of the study.
BOX 3.6
THE POSITIVIST VIEW
Causal studies are at the heart of the scientifi c approach. For a positivist, the world operates by laws of
cause and eff ect that can be discerned if a scientifi c method to research is used. Exploratory research is
needed when there is not enough theory available to guide the development of a theoretical framework. In
such cases, exploratory research needs to be done to understand what is going on. Based on this prelimi-
nary work, we will be able to set up more rigorous (read: causal) designs for further investigation.
BOX 3 6

46 research methods for business
MODEL 3.1
Research proposal to study retention of new employees
Purpose of the study
To find a solution to the recurring problem of 40%
employee turnover within the first three years of their
recruitment, and more specifically to:
1. Draw up a profile of the employees who quit;
2. Assess if there are any special needs of the new
recruits that require to be met; and
3. Determine the reasons for employees leaving the
organization in the first three years.
Research question
How can small to medium‐sized firms increase the
organizational commitment of their employees?
Scope of the study
This research analyzes the problem of high turnover of
employees within small to medium‐sized firms.
Relevance of the study
The cost of employee turnover to firms has been esti-
mated to be up to 150% of the employees’ remunera-
tion package (Schlesinger & Heskett, 1991). There are
both direct and indirect costs involved. Direct costs
relate to leaving costs, replacement costs, and transi-
tion costs, while indirect costs relate to the loss of pro-
duction, reduced performance levels, unnecessary
overtime, and low morale. The results of this study
provide managers with the means to decrease the costs
of employee turnover.
The research design (i.e., details of the study)
Survey instruments. First, we will interview a small
number of employees who have joined the company in
the previous three years. Based on these exploratory
findings, we will administer a questionnaire to all of
the employees who have joined the company in the
past three years.
3. The problem statement:
a. The purpose of the study
b. Research questions.
4. The scope of the study.
5. The relevance of the study.
6. The research design, offering details on:
a. Type of study – exploratory and descriptive
b. Data collection methods
c. The sampling design
d. Data analysis.
7. Time frame of the study, including information on when the written report will be handed over to
the sponsors.
8. The budget, detailing the costs with reference to specific items of expenditure.
9. Selected bibliography.
Such a proposal containing the above features is presented to the manager, who might seek clarification on
some points, want the proposal to be modified in certain respects, or accept it in toto. A model of a simple
research proposal to study the frequent turnover of newly recruited employees is presented below.

chapter defining and refining the problem 47
Once the proposal is accepted, the researcher conducts the research, going through the appropriate steps
discussed in the research design process.
MANAGERIAL IMPLICATIONS
Managers sometimes look at the symptoms in problematic situations and treat them as if they are the real problems,
getting frustrated when their remedies do not work. Understanding the antecedents–problem–consequences sequence
and gathering the relevant information to get a real grasp of the problem go a long way towards pinpointing it.
Managers’ inputs help researchers to define the broad problem area and to narrow down the broad problem
into a feasible topic for research. Managers who realize that correct problem definition is critical to ultimate
problem solution do not begrudge the time spent in working closely with researchers, particularly at this stage.
A well‐developed research proposal allows managers to judge the relevance of the proposed study. However, to
make sure that the objectives of the study are actually being achieved, managers must stay involved throughout the
entire research process. Information exchange between the manager and the researcher during all the important
stages of the research process will definitely enhance the managerial relevance and the quality of the research effort.
ETHICAL ISSUES IN THE PRELIMINARY STAGES OF INVESTIGATION
Preliminary information is gathered by the researcher to narrow the broad problem area and to define a specific
problem statement. In many cases, the researcher interviews decision makers, managers, and other employees to gain
knowledge of the situation so as to better understand the problem. Once a problem is specified and a problem state-
ment is defined, the researcher needs to assess his or her research capabilities; if the researcher does not have the skills
Data collection. The interviews will be conducted
during office hours in the conference hall of the organ-
ization at a prearranged time convenient to the inter-
viewees. The questionnaire will be given to the
employees to be completed by them in their homes
and returned anonymously to the box set up for the
purpose by the specified date. They will all be reminded
two days before the due date to return their question-
naires, if not already done.
Time frame
The time frame necessary for completion of this
research project is approximately five months. During
these five months, periodic reports will be provided on
the progress being made.
Budget
The budget for this project is in Appendix A.1
Selected bibliography
Bateman, T. S. & Strasser, S. (1984) A longitudinal analysis
of the antecedents of organizational commitment. The
Academy of Management Journal, 27(1), 95–112.
Lachman, L. & Aranya, N. (1986) Evaluation of alternative
models of commitments and job attitudes of profession-
als. Journal of Occupational Behavior, 7, 227–243.
Meyer, J. & Allen, N. (1997) Commitment in the Workplace:
Theory, research and application. Thousand Oaks: Sage.
Meyer, J., Stanley, D., Herscovitch, L. & Topolnytsky, L.
(2002) Affective, continuance and normative commit-
ment: a meta‐analysis of antecedents, correlates and con-
sequences. Journal of Vocational Behavior, 63, 20–52.
Schlesinger, L. & Heskett, J. (1991) The service‐driven ser-
vice company. Harvard Business Review, 69, 71–81.
Vandenberghe, C., Bentein, K. & Stinglhamber, F. (2002)
Affective commitment to the organization, supervisor
and work group: antecedents and outcomes. Journal of
Vocational Behavior, 64, 47–71.
1Please note that Appendix A has not been included as Model 3.1 is
an example only.

48 research methods for business
SUMMARY
● Learning objective 1: Identify problem areas that are likely to be studied in organizations.
Research typically begins with a problem. A problem is any situation where a gap exists between an actual
and a desired ideal state. Examples of problems are provided in Box 3.1.
● Learning objective 2: Narrow down a broad problem into a feasible topic for research using prelimi-
nary research.
A broad problem area provides researchers with enough information to embark on their research journey.
However, a broad problem has to be transformed into a researchable topic for investigation by making it more
a) specific and precise and by b) setting clear boundaries. Finally, the researcher needs to select a c) perspective
or resources to carry out the project, he or she should decline the project. If the researcher decides to carry out the
project, it is necessary to inform all the employees – particularly those who will be interviewed for preliminary data
gathering through structured and unstructured interviews – of the proposed study (though it is not necessary to
acquaint them with the actual reasons for the study, because this might bias responses). The element of unpleasant
surprise will thus be eliminated for the employees. It is also necessary to assure employees that their responses will be
kept confidential by the interviewer/s and that individual responses will not be divulged to anyone in the organiza-
tion. These two steps make the employees comfortable with the research undertaken and ensure their cooperation.
Employees should not be forced to participate in the study. When employees are willing to participate in the study,
they have the right to be protected from physical or psychological harm. They also have a right to privacy and confi-
dentiality. Attempts to obtain information through deceptive means should be avoided at all costs.
EXAMPLE
Checklist for dealing with ethical considerations and dilemmas during the first stages of the research process
● Why is this research project worth doing?
● How does the organization benefit from this project?
● What impact, if any, does your research have on the
organization?
● Do you have the skills and resources to carry out
this research project?
● Have you informed all the employees of the research
project? Why not?
● Do you explain the purpose of your research to the
participants? Why not?
● Are participants given the opportunity to decline
participation?
● Are participants able to withdraw their consent at
any point? How?
● Does the research cause you to have access to sensi-
tive information? How will you ensure the confi-
dentiality of this information?
● How will you ensure individual respondents cannot
be identified from any research reports or papers
that are produced?
● Are there any possible negative effects (long or short
term) on your participants (including any physical
or psychological harm)?
● How will you report back from the research to your
participants?
● Where ethical dilemmas have arisen, what steps
have you taken to resolve these?

chapter defining and refining the problem 49
Visit the companion website at www.wiley.com/college/sekaran for Case Study:
CAP Airlines.
DISCUSSION QUESTIONS
1. Define “problem” and provide an example of a problem you have encountered in your daily life.
Discuss how you have used research to solve this problem.
2. Why do we still have to transform the following problem statement into a researchable topic for
investigation?
“The introduction of flexible work hours has created more problems than it has solved.”
3. Use the Internet to find more information about the “Five Times Why” approach. Discuss this
approach using an example provided on the Internet.
4. Describe the functions of preliminary data gathering.
from which the subject is investigated. Preliminary research should help the researcher to arrive at a specific
problem statement. Although the exact nature of the information needed for this purpose depends on the
type of problem one is addressing, it may be broadly classified under two headings: (1) information on the
organization and its environment – that is, the contextual factors, and (2) information on the topic of interest.
● Learning objective 3: Develop a good problem statement.
There are three key criteria to assess the quality of a problem statement: it should be relevant, feasible, and
interesting. A good problem statement includes both a statement of the research objective(s) and the
research question(s). The research objectives and the research questions are strongly related. There are three
basic types of questions that research projects can address: exploratory and descriptive questions.
● Learning objective 4: Develop a research proposal.
Before any research study is undertaken, there should be an agreement between the sponsor of the study
and the researcher as to the problem to be investigated, the methodology, the duration of the study, and its
cost. This is usually accomplished through a research proposal, which the researcher submits and has
approved by the sponsor, who issues a letter of authorization to proceed with the study.
● Learning objective 5: Be aware of the role of the manager in the early stages of the research process.
Managers must stay involved in a research project throughout the entire research process. This will enhance
the managerial relevance and the quality of the research effort.
● Learning objective 6: Be aware of the role of ethics in the early stages of the research process.
The checklist provided in this chapter will help the researcher to deal with ethical considerations and dilem-
mas during the first stages of the research process.
In Chapter 4 we will examine the next step in the research process: the critical literature review.

50 research methods for business
5. Why is it important to gather information on the background of the organization? Why is it impor-
tant to review the literature on your topic?
6. Should a researcher always obtain information on the structural aspects and job characteristics from
those interviewed? Give reasons for your answer with examples.
7. “The problem definition stage is perhaps more critical in the research process than the problem
solution stage.” Discuss this statement.
8. “The ‘secret’ to bringing clarity and focus to your problem is to isolate the key ideas in the first version
of the problem statement.” What are the subjects, verbs, and objects in the following statement?
“The newly installed information system is not being used by the managers for whom it was primarily
designed.”
9. Offer a clearly focused problem statement in the broad area of corporate culture, job satisfaction or
risk‐seeking behaviors of investors.
10. A typical example of a research questions is: “What is the effect of reward system on productivity?”
What is the problem here, according to the researcher?
And what is a possible solution to the problem, according to the same researcher?
11. Below is the gist of an article from Businessweek. After reading it:
a. identify the broad problem area; and
b. explain how you would proceed further.
Two years ago, Electronic Arts, the second‐largest U.S. video game company, ran on promises. Developers
pitching a feature for a big game had to produce a cool video to win approval from the bosses. They were
then left alone for months, until it was too late to fix any problems, says Ian Milham, one of the company’s
creative directors. He describes the philosophy as “make a trailer that promises a lot and then don’t show
anyone until it’s perfect.”
Often it wasn’t. Several of EA’s biggest 2013 releases, including entries in its SimCity and Battlefield fran-
chises, were so bug‐ridden on release that they crashed game servers and were essentially unplayable for
days or weeks before they were fixed. EA’s sports games have become Internet punch lines, thanks to
videos of glitches trapping digital athletes in anatomically impossible positions.
Burger, D. (2015, March 12) EA Tries Selling Video Games That Work. Retrieved from http://www.
bloomberg.com/news/articles/2015‐03‐12/electronic‐arts‐delays‐game‐releases‐to‐fix‐bugs‐for‐a‐change
12. Define the problem statement (the why and the what) in the following situation:
Employee loyalty
Companies benefit through employee loyalty. Crude downsizing in organizations during the recession
crushed the loyalty of millions. The economic benefits of loyalty embrace lower recruitment and training
costs, higher productivity of workers, customer satisfaction, and the boost to morale of fresh recruits. In
order that these benefits are not lost, some companies, while downsizing, try various gimmicks. Flex
leave, for instance, is one. This helps employees receive 20% of their salary, plus employer‐provided ben-
efits, while they take a 6‐ to 12‐month sabbatical, with a call option on their services. Others try alterna-
tives like more communication, hand holding, and the like.

51
INTRODUCTION
In Chapter 3, we explained that a first review of the academic literature will help you to narrow down the broad
problem and to develop a clear and specific problem statement. But mere definition of the problem does not solve
it. How, then, does one proceed further? One answer is by going through the entire process as shown in the research
process model in Figure 4.1. This figure illustrates that the next step, after you have developed a research proposal,
is the critical literature review. This step is designated step 4 and it is indicated by the shaded portion in the figure.
The aim of this chapter is to introduce you to the process of carrying out a literature review. The chapter
begins with a definition of the critical literature review, followed by a discussion of its functions. Then it will
explain that a critical literature review is a step‐by‐step process that involves the identification of published
and unpublished work from secondary data sources on the topic of interest, the evaluation of this work in rela-
tion to the problem, and the documentation of this work. Finally, this chapter will discuss two pitfalls you have
to be aware of when you document the literature review: misrepresenting others and plagiarism.
To be able to generate viable alternatives for effective decision making you have to become an expert on your
topic. A second review of the literature, or critical literature review, is therefore essential in most research pro-
jects. A literature review is “the selection of available documents (both published and unpublished) on the topic,
which contain information, ideas, data and evidence written from a particular standpoint to fulfill certain aims
or express certain views on the nature of the topic and how it is to be investigated, and the effective evaluation of
these documents in relation to the research being proposed” (Hart, 1998 , p. 13).
In general, a literature review ensures that:
1. The research effort is positioned relative to existing knowledge and builds on this knowledge.
2. You can look at a problem from a specific angle; it shapes your thinking and sparks useful insights on
the topic of your research.
The critical literature review
C H A P T E R 4
LEARNING OBJECTIVES
After completing Chapter 4 you should be able to:
1. Discuss the functions of a literature review.
2. Write a literature review on any given topic, documenting the references in the prescribed manner.
3. Discuss the ethical issues of documenting the literature review.
Faqih
Highlight

52 research methods for business
3. You do not run the risk of “reinventing the wheel”, that is, wasting effort on trying to rediscover some-
thing that is already known.
4. You are able to introduce relevant terminology and to define key terms used in your writing. This is
important because the same term may have different meanings, depending on the context in which it is
used. Definitions will also help you to give structure to your essay, article or report (see Box 4.1 for
an example).
5. You obtain useful insights of the research methods that others have used to provide an answer to similar
research questions. Knowledge of the research methods used by others allows you to replicate existing
research, which will help you to relate your research findings to the findings of others.
6. The research effort can be contextualized in a wider academic debate. In other words, it allows you to
relate your findings to the findings of others.
A critical review of the literature has helped Emma, George, and Jim (check Box 4.2) to become familiar
with relevant knowledge related to the problem that they aim to solve. The examples in Box 4.2 illustrate that
a critical review of the literature is vital in nearly all research projects, regardless of the type of study. Indeed,
1
OBSERVATIONBroad areaof research
interestidentified
3
PROBLEMDEFINITION
Researchproblem
delineated
5
DEDUCTION:THEORETICALFRAMEWORK
INDUCTION
Variablesclearly
identifiedand labeled
7
RESEARCHDESIGN
8
DATA COLLECTION,ANALYSIS, AND
INTERPRETATION
INDUCTIONResearch question
answered?
DEDUCTIONHypotheses
substantiated?Research question
answered?
12
ManagerialDecisionMaking
11
ReportPresentation
10
ReportWriting
Yes
Criticalliterature
review
2
PRELIMINARYDATA GATHERING
InterviewingLiterature survey
No
9a9b
4
DEDUCTION:GENERATION
OFHYPOTHESES
6
F I G U R E 4 . 1
The functions of the critical literature review

chapter the critical literature review 53
BOX 4.1
DEFINING WAITING FOR SERVICE
Waiting for service refers to the time between the point a customer is ready to receive a service and the
point the service starts (Taylor, 1994). A customer may have to wait before, during, or aft er a transaction.
In other words, there are three kinds of waits: pre‐process waits, in‐process waits, and post‐process waits
(Dubé‐Rioux, Schmitt & LeClerc 1988; Miller, Kahn & Luce, 2008). To make these diff erent kinds of waits
more concrete, imagine you are fl ying with an airline from point A to B. You may have to wait before you
can board the plane (a pre‐process wait ), because the plane cannot land (an in‐process wait ), and because
you cannot disembark immediately (a post‐process wait ).
Since the research questions of your study serve as the starting point for your critical review of the
literature, some of the functions of a critical literature review depend on the type of study and the specifi c
research approach that is taken, as illustrated by the examples in Box 4.2 .
BOX 4 1
BOX 4.2
SPECIFIC FUNCTIONS OF A LITERATURE REVIEW
Emma is involved in a descriptive study that aims to describe how a major player in the pharmaceutical
industry delivers valuable products to the market. A critical review of the literature should help her to
come up with a comprehensive overview of the relevant perspectives on value, a guiding defi nition of value
and an in‐depth overview of frameworks, instruments, and analytical tools (such as Michael Porter ’ s value
chain) that will help her to describe how the organization can create value and competitive advantage.
George ’ s fundamental research project is inductive and exploratory in nature. A review of the liter-
ature has helped him to develop a theoretical background, which provides an overview of the literature
pertinent to the specifi c topic he is studying. Relevant research fi ndings, methodological issues, and major
conclusions of earlier and more recent work are put forward, the logical continuity between earlier and
more recent work is clarifi ed, and controversial issues, when relevant, are addressed. George explains
that despite the valuable work of others, exploratory research is needed. He argues that although earlier
research fi ndings provide a wide variety of potential explanations for the problem under study, they are
oft en confl icting and industry‐specifi c, which limits the generalizability of these fi ndings.
Jim ’ s applied study is deductive in nature. A second review of the literature has allowed him to develop
a theoretical background. Th is has helped him to obtain a clear idea as to what variables (diff erent types of
variables are discussed in Chapter 5 ) will be important to consider in his theoretical framework, why they
are considered important, how they are related to each other, and how they should be measured to solve the
problem. A critical review of the literature has also helped him to provide arguments for the relationships
between the variables in his conceptual causal model and to develop hypotheses. Along these lines, a second
review of the literature provides Jim with a framework for his own work. It ensures that no important vari-
able that has in the past been found (repeatedly) to have an impact on the problem is ignored in the research
project. Indeed, if there are variables that are not identifi ed but infl uence the problem critically, then research
done without considering them is an exercise in futility. In such a case, the true reason for the problem will
remain unidentifi ed and the research project will not help the manager to solve the problem. To avoid such
possibilities Jim has delved into all the important research relating to the problem under study.
BOX 4 2

54 research methods for business
familiarity with the literature on your subject area is beneficial in exploratory, descriptive, and in causal
research. A literature review is helpful in both an academic (or fundamental) and a non‐academic (or applied)
context. In both cases, a good theoretical base will add rigor to the study. We have explained earlier that rigor-
ous research allows the researcher to collect the right kind of information with a minimum degree of bias, and
facilitates suitable analysis of the data gathered. This is obviously important in both fundamental and
applied research.
In sum, a critical review of the literature will spark many useful insights on your research topic; it will allow
you to work in an expert manner, to make informed decisions, and to benefit from existing knowledge in many
different ways. Let us now turn to how you can approach the literature review.
HOW TO APPROACH THE LITERATURE REVIEW
The first step of a literature review involves the identification of the various published and unpublished materials
that are available on the topic of interest, and gaining access to these.
Data sources
The quality of a literature review depends on a cautious selection and reading of books, academic and profes-
sional journals, reports, theses, conference proceedings, unpublished manuscripts, and the like. Academic books
and journals are, in general, the most useful sources of information. However, other sources such as professional
journals, reports, and even newspapers may also be valuable because they can provide you with specific, real‐
world information about markets, industries, or companies. Therefore, as a rule, you will need to use a combina-
tion of information resources. The precise combination of resources depends on the nature and the objectives of
your research project.
Textbooks
Textbooks are a useful source of theory in a specific area. An advantage of textbooks is that they can cover a
broad range of topics. What’s more, textbooks can cover a topic much more thoroughly than articles can.
Hence, textbooks offer a good starting point from which to find more detailed sources such as journal arti-
cles, theses, and unpublished manuscripts. A downside of textbooks is that they tend to be less up to date
than journals.
Journals
Both academic and professional journals are important sources of up‐to‐date information. Articles in academic
journals have generally been peer‐reviewed: this means that the articles have been subject to the scrutiny of
experts in the same field before being accepted for publication. Review articles (that may or may not contain a
meta‐analysis: a type of data analysis in which the results of several studies are combined and analyzed as if they
were the results of one large study) summarize previous research findings to inform the reader of the state of
existing research. Review articles are very useful because they provide an overview of all the important research
in a specific area. Research articles are reports of empirical research, describing one or a few related studies. The
conceptual background section of a research article provides a compact overview of relevant literature. Research
articles also provide a detailed description of the purpose of the study, the method(s) used, and the results of
the study.

chapter the critical literature review 55
Articles in professional journals are a valuable source of recent developments in the field and of facts and
figures. What’s more, they may provide you with a feel for the practical relevance of a problem.
Theses
PhD theses often contain an exhaustive review of the literature in a specific area. Most PhD theses include several
empirical chapters. These chapters often have the same structure and characteristics as academic journal articles.
Note that not every empirical chapter of a thesis is eventually published in an academic journal.
Conference proceedings
Conference proceedings can be useful in providing the latest research, or research that has not (yet) been pub-
lished. Conference proceedings are very up to date, and for this reason this information source is quite valuable
if you are working in a relatively new area or domain. Not every manuscript presented at a conference is eventu-
ally published in an academic journal; hence you must critically assess the quality of this information source.
Unpublished manuscripts
The APA defines an unpublished manuscript as any information source that is not “officially” released by an
individual, publishing house, or other company. Examples of unpublished manuscripts may include papers
accepted for publication but still “in press,” data from an unpublished study, letters, manuscripts in preparation,
and personal communications (including e‐mails). Unpublished manuscripts are often very up to date.
Reports
Government departments and corporations commission or carry out a large amount of research. Their published
findings provide a useful source of specific market, industry, or company information.
Newspapers
Newspapers provide up‐to‐date business information. They are a useful source of specific market, industry, or
company information. Note that opinions in newspapers are not always unbiased.
The Internet
The amount of information that can be found on the World Wide Web is enormous. You can search for (the
details of) books, journals and journal articles, and conference proceedings, as well as for specialized data
such as company publications and reports. The number of newspapers, magazines, and journals that is available
electronically is enormous.
Note that the Internet is unregulated and unmonitored. Moreover, developing an Internet page is easy and
cheap. For this reason, the Internet provides exceptional challenges in determining the usefulness and reliability
of information. A source that may help you to assess the quality of online information is Cooke (2001). You can
also find useful information on the Internet itself; several universities have developed useful guidelines to assess
the quality of information found online (check, for instance, http://www.lib.berkeley.edu/TeachingLib/Guides/
Internet/Evaluate.html).
Search engines such as Google and Yahoo! can help you to find relevant information. For instance, Google
Scholar, which can be accessed from the Google homepage, can help you to identify academic literature, such as
peer‐reviewed papers, theses, books, abstracts, and articles from academic publishers, universities, and other
scholarly organizations.

56 research methods for business
Searching for literature
Previously, one had to manually go through several bibliographical indexes that are compiled periodically,
listing the journals, books, and other sources in which published work in the area of interest could be found.
With modern technology, locating sources where the topics of interest have been published has become
much easier. Almost every library today has computer online systems to locate published infor mation.
Computerized databases provide a number of advantages. First, they save enormous amounts of time.
Second, they are comprehensive in their listing and review of references. Third, gaining access to them is
relatively inexpensive. For these reasons the researcher can focus on material most central to the research effort.
You will benefit from spending some time on becoming familiar with the online resources that your library
provides. Most libraries have the following electronic resources at their disposal:
● Electronic journals. Your library is probably subscribed to journals that are published or made available online.
Discover which journals are provided online by your library.
● Full‐text databases. Full‐text databases provide the full text of the article. Find out which full‐text databases are
provided by your library.
● Bibliographic databases. Bibliographic databases display only the bibliographic citations; that is, the name of
the author, the title of the article (or book), source of publication, year, volume, and page numbers. These
contain the same information as can be found in the Bibliographic Index books in libraries, which are periodi-
cally updated, and include articles published in periodicals, newspapers, books, and so on. Some useful indexes
are provided in the appendix to this chapter.
● Abstract databases. Abstract databases also provide an abstract or summary of articles. They do not provide
the full text of an article or manuscript.
Some of these databases are listed in the appendix at the end of this chapter. Some important research data-
bases available on the World Wide Web are also provided in the appendix. Databases include, among others,
listings of journal articles, books in print, census data, dissertation abstracts, conference papers, and newspaper
abstracts that are useful for business research.
Evaluating the literature
Accessing the online system and searching for literature in the area of interest will provide a comprehensive bib-
liography on the subject. Because the search for literature can sometimes provide as many as 100 or more results,
you will have to carefully select relevant books and articles.
A glance at the titles of the articles or books will indicate which of them may be pertinent and which others
are likely to be peripheral to the contemplated study. The abstract of an article usually provides an overview of
the study purpose, general research strategy, findings, and conclusions. A good abstract thus provides you with
enough information to help you to decide whether an article is relevant for your study. An article’s introduction
also provides an overview of the problem addressed by the research and specific research objectives. The introduction
often ends with a summary of the research questions that guide the study. The problem statement, research ques-
tions, and/or the research objectives give you a feel for what the researcher is studying and thus for the relevance
Visit the companion website at www.wiley.com/college/sekaran for Author Video:
Searching for literature.

chapter the critical literature review 57
of the article to your study. In a similar fashion, the table of contents and the first chapter of a book may help you
to assess the relevance of the book.
A good literature review needs to include references to the key studies in the field. For this reason, articles and
books that are often cited by others must be included in your literature review, even if these articles and books were
written 30 or even 40 years ago. Of course, more recent work should also be incorporated in your literature survey,
since recent work will build on a broader and more up‐to‐date stream of literature than older work.
To assess the quality of recent research (indeed, in this case you cannot use the number of citations as an
indicator of the quality of an article) you could ask the following questions:
● Is the main research question or problem statement presented in a clear and analytical way?
● Is the relevance of the research question made transparent?
● Does this study build directly upon previous research?
● Will the study make a contribution to the field?
● Is there a theory that guides the research?
● Is the theory described relevant and is it explained in an understandable, structured, and convincing manner?
● Are the methods used in the study explained in a clear manner (description of methods)?
● Is the choice of certain methods motivated in a convincing way (justification of methods)?
● Is the sample appropriate?
● Are the research design and/or the questionnaire appropriate for this study?
● Are the measures of the variables valid and reliable?
● Has the author used the appropriate quantitative and/or qualitative techniques?
● Do the conclusions result from the findings of the study?
● Do the conclusions give a clear answer to the main research question?
● Has the author considered the limitations of the study?
● Has the author presented the limitations in the article?
The quality of the journal that published an article can also be used as an indicator of the quality of an article.
Important questions in this respect are: “Is the journal peer‐reviewed; that is, do all articles have to undergo a
review process before they are published?” and “What is the impact factor of the journal?” The impact factor of
a journal can be viewed as the average number of citations in a year given to those papers in the journal that were
published during a given period (usually the two preceding years). Because important articles are cited more
often than articles that are not important, the impact factor of a journal is frequently used as a proxy for the
importance of that journal to its field.
In sum, some criteria for assessing the value of articles or books are: the relevance of the issues that are
addressed in the article or book, the importance of a book or article in terms of citations, the year of publication
of the article or book, and the overall quality of the article or book.
All the articles considered relevant to your study can be listed as references, using the appropriate referenc-
ing format, which is discussed in the appendix to this chapter.
Documenting the literature review
As stated earlier, the purpose of the literature review is to help the researcher to build on the work of others and
to make informed decisions during the various stages of the research project. A review of the literature identifies
and highlights relevant themes and documents significant findings, frameworks, and/or instruments from earlier

58 research methods for business
research that will serve as the foundation for the current project. Documenting the literature review is important
to convince the reader that the researcher is knowledgeable about the problem area and has done the preliminary
homework that is necessary to conduct the research.
A point to note is that the literature survey should bring together all relevant information in a cogent and logi-
cal manner instead of presenting all the studies in chronological order with bits and pieces of uncoordinated infor-
mation. A literature review is intended to synthesize (and not necessarily to summarize) relevant research on your
topic. To synthesize is to combine two or more elements to form a new whole. In your literature review, the elements
are the findings of the literature you select and read; the new whole is the conclusion you draw from these findings.
There are several accepted methods of citing references in the literature survey section and using quotations.
The Publication Manual of the American Psychological Association (2012) offers detailed information regarding
citations, quotations, references, and so on, and is one of the accepted styles of referencing in the management
area. Other formats include The Chicago Manual of Style (2010) and Turabian’s Manual for Writers (2013). As
stated earlier, details of the referencing style and quotations based on the APA Manual are offered in the appen-
dix at the end of this chapter.
To conclude, let us take a portion of a completed literature review and examine how the activity has helped
to (1) introduce the subject of study, (2) identify the problem statement, and (3) build on previous research to
offer the basis from which to get to the next steps of the theoretical framework and hypothesis development.
EXAMPLE
Organizational effectiveness
Organization theorists have defined organizational
effectiveness (OE) in various ways. OE has been
described in terms of objectives (Georgopolous &
Tannenbaum, 1957), goals (Etzioni, 1960), efficiency
(Katz & Kahn, 1966), resources acquisition (Yuchtman
& Seashore, 1967), employee satisfaction (Cummings,
1977), interdependence (Pfeffer, 1977), and organiza-
tional vitality (Colt, 1995). As Coulter (2002) remarked,
there is little consensus on how to conceptualize, meas-
ure, or explain OE. This should, however, not come as a
surprise to us since OE models are essentially value‐based
classifications of the construct (the values being those of
the researchers) and the potential number of models
that can be generated by researchers is virtually limit-
less. Researchers are now moving away from a single
model and are taking contingency approaches to con-
ceptualizing OE (Cameron, 1996; Wernerfelt, 1998;
Yetley, 2001). However, they are still limiting themselves
to examining the impact of the dominant constituencies
served and the organization’s life cycle on OE instead
of taking a broader, more dynamic approach (Dahl,
2001, p. 25).
From the above extract, several insights can be gained. The literature review (1) introduces the subject of
study (organizational effectiveness), (2) highlights the problem (that we do not have a good conceptual frame-
work for understanding what OE is), and (3) summarizes the work done so far on the topic in a manner that
convinces the reader that the researcher has indeed surveyed the work done in the area of OE and wants to con-
tribute to the understanding of the concept, taking off on the earlier contingency approaches in a more creative
way. The scholar has carefully paved the way for the next step, which is to develop a more viable and robust
model of organizational effectiveness. This model will be logically developed, integrating several streams of
research done in other areas (such as cross‐cultural management, sociology, etc.), which will be woven further
into the literature review. Once the scholar has explicated the framework as to what constitutes OE and what the
factors that influence it are, the next step is to develop testable hypotheses to see if the new model is indeed viable.

chapter the critical literature review 59
ETHICAL ISSUES
Earlier in this chapter we have explained that research involves building on the work of others. When you sum-
marize, add to, or challenge the work of others, there are two important pitfalls that you have to beware of:
1. Purposely misrepresenting the work of other authors – that is, their viewpoints, ideas, models, findings,
conclusions, interpretations, and so on.
2. Plagiarism – the use of another ’ s original words, arguments, or ideas as though they were your own,
even if this is done in good faith, out of carelessness, or out of ignorance.
Both purposely misrepresenting the work of others and plagiarism are considered to be fraud.
In today ’ s information age, copying and pasting information from online sources into your own research
paper has become very simple. This may create a temptation to copy (significant) portions of text into your work.
Your task is to resist this temptation. Plagiarism is a type of fraud that is taken very seriously in the academic
world, mainly because using the work of others as if it were your own does not convey much respect for the
efforts that other people have put into their work. Two other reasons to take plagiarism very seriously are pro-
vided by IJzermans and Van Schaaijk ( 2007 ). They point out that:
1. Plagiarism makes it is difficult for the reader to verify whether your claims about other authors and
sources are accurate.
2. You are participating in a scientific debate. You need to make your position in this debate clear by des-
ignating the authors whose work you are building on or whose ideas you are challenging.
There are many forms of plagiarism above and beyond copying and pasting text into your own work. Box 4.3
provides an overview of common forms of plagiarism. This overview may help you to avoid the pitfall of plagiarism.
Note that many universities use software such as Turnitin or Ephorus to detect plagiarism. To avoid
plagiarism you need to observe the rules for referencing sources, detailed in the appendix of this chapter. You
may also benefit from examining the plagiarism guidelines of your own university or from checking out the
integrity handbook of the Massachusetts Institute of Technology at the following URL: http://web.mit.edu/
academicintegrity/handbook/handbook.pdf
BOX 4.3
COMMON FORMS OF PLAGIARISM
Sources not cited
1. “Th e Ghost Writer”
Th e writer turns in another ’ s work, word‐for‐word, as his or her own.
2. “Th e Photocopy”
Th e writer copies signifi cant portions of text straight from a single source, without alteration.
3. “Th e Potluck Paper”
Th e writer tries to disguise plagiarism by copying from several diff erent sources, tweaking the
sentences to make them fi t together while retaining most of the original phrasing.
BOX 4 3

60 research methods for business
SUMMARY
● Learning objective 1: Discuss the functions of a literature review.
A literature review is the selection of available documents on a topic, which contain information, ideas, data
and evidence written from a particular standpoint to fulfill certain aims or express certain views on the
nature of the topic and how it is to be investigated, and the effective evaluation of these documents in rela-
tion to the research being proposed. A literature review ensures that the research effort is positioned relative
to existing knowledge and builds on this knowledge. A literature review has many other functions. Because
4. “Th e Poor Disguise”
Although the writer has retained the essential content of the source, he or she has altered the
paper ’ s appearance slightly by changing key words and phrases.
5. “Th e Labor of Laziness”
Th e writer takes the time to paraphrase most of the paper from other sources and make it all fi t
together, instead of spending the same eff ort on original work.
6. “Th e Self‐Stealer”
Th e writer “borrows” generously from his or her previous work, violating policies concerning the
expectation of originality adopted by most academic institutions.
Sources cited (but still plagiarized)
1. “Th e Forgotten Footnote”
Th e writer mentions an author ’ s name for a source, but neglects to include specifi c information on
the location of the material referenced. Th is oft en masks other forms of plagiarism by obscuring
source locations.
2. “Th e Misinformer”
Th e writer provides inaccurate information regarding the sources, making it impossible to fi nd them.
3. “Th e Too‐Perfect Paraphrase”
Th e writer properly cites a source, but neglects to put in quotation marks text that has been
copied word‐for‐word, or close to it. Although attributing the basic ideas to the source, the writer
is falsely claiming original presentation and interpretation of the information.
4. “Th e Resourceful Citer”
Th e writer properly cites all sources, paraphrasing and using quotations appropriately. Th e catch?
Th e paper contains almost no original work! It is sometimes diffi cult to spot this form of plagia-
rism because it looks like any other well‐researched document.
5. “Th e Perfect Crime”
Well, we all know it doesn ’ t exist. In this case, the writer properly quotes and cites sources in some
places, but goes on to paraphrase other arguments from those sources without citation. Th is way,
the writer tries to pass off the paraphrased material as his or her own analysis of the cited material.
Reprinted with permission from: What is Plagiarism? (n.d.), retrieved June 22, 2011, from http://
www.plagiarism.org/learning_center/what_is_plagiarism.html

chapter the critical literature review 61
Visit the companion website at www.wiley.com/college/sekaran for Case Study: The Literature Review.
DISCUSSION QUESTIONS
1. What is the purpose of a critical literature review?
2. “The exact purpose of a critical literature review depends on the research approach that is taken.”
Discuss this statement.
3. Provide at least two distinctive definitions of two of the following terms:
● Leadership
● Job satisfaction
● Organizational effectiveness
● Service quality
● Auditor liability
● Cash flow
the research questions of a study serve as the starting point for the literature review, some of these functions
depend on the type of research questions the researcher develops.
● Learning objective 2: Write a literature review on any given topic, documenting the references in the
prescribed manner.
The first step of a literature review involves the identification of the materials that are available on the topic
of interest, and gaining access to these. Searching for literature in the area of interest will provide a compre-
hensive bibliography on the subject. That is why the researcher will have to carefully select relevant material.
Some criteria for assessing the value of materials are: the relevance of the issues that are addressed, the
importance in terms of citations, the year of publication, and overall quality. Documenting the literature
review is important to convince the reader that the researcher is knowledgeable about the problem area and
has done the preliminary homework that is necessary to conduct the research.
● Learning objective 3: Discuss the ethical issues of documenting the literature review.
When researchers document their literature review, there are two important pitfalls that they have to beware of:
(1) purposely misrepresenting the work of other authors; and (2) plagiarism – the use of another’s original words,
arguments, or ideas as though they were your own, even if this is done in good faith, out of carelessness, or out
of ignorance. Both purposely misrepresenting the work of others and plagiarism are considered to be fraud.
The appendix to this chapter offers information on (1) online databases, (2) bibliographical indexes,
(3) the APA format for references, and (4) notes on referencing previous studies and quoting original sources in
the literature review section.

62 research methods for business
PRACTICE PROJECT
Do the project assigned below, following the step‐by‐step process outlined:
Compile a bibliography on any one of the following topics, or any other topic of interest to you, from
a business perspective: (a) service quality; (b) product development; (c) open‐market operations; (d) infor-
mation systems; (e) manufacturing technology; (f) assessment centers; (g) transfer pricing.
From this bibliography, select five to seven references that include books, academic journals, and
professional journals.
Based on these five to seven references, write a literature review using different forms of citation, as
described in the appendix.
4. How would you go about doing a literature review in the area of corporate social responsibility?
5. Find two or more sources with contrasting viewpoints on the same issue. Discuss the main differences
between these sources.
6. After studying and extracting information from all the relevant work done previously, how does the
researcher know which particular references, articles, and information should be given prominence
in the literature review?
7. Why is appropriate citation important? What are the consequences of not giving credit to the source
from which materials are extracted?

chapter the critical literature review 63
A P P E N D I X
SOME ONLINE RESOURCES USEFUL FOR BUSINESS RESEARCH
Online databases
Databases contain raw data stored in a variety of ways. Computerized databases can be purchased that deal with
statistical data, financial data, texts, and the like. Computer network links allow the sharing of these databases,
which are updated on a regular basis. Most university libraries have computerized databases pertaining to busi-
ness information that can be readily accessed. Some of the databases useful for business research are listed below:
1. ABI/INFORM Global and ABI/INFORM provide the capability to search most major business,
management, trade and industry, and scholarly journals from 1971 onward. The information search
can be made by keying in the name of the author, periodical title, article title, or company name. Full
texts from the journals and business periodicals are also available on CD‐ROM and electronic services.
2. The Business Periodicals Index (BPI) provides an index of business and management periodicals, and
is available online and on CD‐ROM.
3. Dow Jones Factiva products and services provide business news and information. The collection
of more than 14000 sources includes the Wall Street Journal, Financial Times, Dow Jones and
Reuters newswires, and the Associated Press, as well as Reuters Fundamentals, and D&B com-
pany profiles.
4. EconLit is a comprehensive index of journal articles, books, book reviews, collective volume articles,
working papers, and dissertations.
5. The International Bibliography of the Social Sciences (IBSS) is an online resource for social science
and interdisciplinary research. IBSS includes over 2.5 million bibliographic records relating to the four
core social science subjects of anthropology, economics, politics, and sociology.
6. PsycINFO is an abstract database of psychological literature from the 1800s to the present. PsycINFO
contains bibliographic citations, abstracts, cited references, and descriptive information of scholarly
publications in the behavioral and social sciences.
7. RePEc (Research Papers in Economics) is a collaborative effort of volunteers in 63 countries to enhance
the dissemination of research in economics. The heart of the project is a decentralized database of
working papers, journal articles, and software components.
8. SSRN (Social Science Research Network) is devoted to the rapid worldwide dissemination of social
science research and is composed of a number of specialized research networks in each of the
social sciences.
9. Web of Stories contains video archive of interviews with today’s greatest scientists, writers, filmmakers,
and craftspeople about their work. Once‐only registration required for a personalized view of
the website.
10. World Development Indicators (World Bank) is a database, produced by the World Bank, containing
statistical data from 1970 onwards on the economic and social development of 223 countries.
The following databases can also be accessed through the Internet: Business and Industry Database, Guide to
Dissertation Abstracts, Periodicals Abstract, Social Science Citation Index, STAT‐USA.

64 research methods for business
Note: A cumulated annotated index to articles on accounting and in business periodicals arranged by subject and
by author is also available. The Lexis‐Nexis Universe provides specific company and industry information includ-
ing company reports, stock information, industry trends, and the like.
On the Web
Some of the many websites useful for business research are provided below.
General
Bureau of Census: http://www.census.gov/
Business Information on the Internet: http://www.rba.co.uk/sources/. A selection of key business Information
Sites on the Internet, compiled by Karen Blakeman.
Business information on the Internet: http://www.crosscut.net/research/business.html. Using the Internet for
college research, maintained by Terry Dugas.
Business Researcher’s Interests: http://www.brint.com/interest.html
Businessweek Online: http://www.businessweek.com/. The journal Businessweek online from 1995 until now.
China & World Economy: http://www.iwep.org.cn/wec/
Company Annual Reports: http://www.annualreports.com
Corporate Information: http://www.corporateinformation.com/. Starting point to find corporate information
from around the world.
Economic Journals on the Web: http://www.oswego.edu/˜economic/journals.htm
Euromoney Publications: http://www.euromoney.com/. The journal Euromoney online from 1995 until now.
Registration required.
European Business Directory: http://www.europages.com/home‐en.html
Eurostat: http://ec.europa.eu/eurostat. Eurostat is the site of the Statistical Office of the European Community. It
provides direct access to the latest and most complete statistical information available on the European Union,
the EU members, the euro‐zone, and other countries.
Fortune: http://www.fortune.com/. Also contains the Fortune 500 List (500 American companies and 500 global
companies with financial data and their home pages).
Forbes Magazine: http://www.forbes.com/forbes/. The journal Forbes Magazine online from August 1997
until now.
FT.com. TotalSearch: http://news.ft.com/home/europe. FT.com’s TotalSearch gives you access to more than ten
million free newspaper and magazine articles alongside results gathered from leading online news sources.
TotalSearch also incorporates a definitive web guide in association with Business.com, a leader in business web-
site classification. You can search in the Financial Times, the Guardian, and Wall Street Journal from 1996 until
now, or you can refine your search for the Finanical Times only.
globalEDGE: http://globaledge.msu.edu/ibrd/ibrd.asp. A directory of international business resources
categorized by specific orientation and content. Each resource has been selected and reviewed by the
globalEDGE TM Team.
I.O.M.A.: www.ioma.com/ioma/direct.html. This site links to business resources that include financial manage-
ment, legal resources, small business, human resources, and Internet marketing.

chapter the critical literature review 65
Kompass: http://www.kompass.com/. Addresses and business information of 1.5 million companies
worldwide.
List of Economics Journals:
http://en.wikipedia.org/wiki/List_of_economics_journals
NASDAQ Stock Market: http://www.nasdaq.com
New York Stock Exchange: http://www.nyse.com
STAT‐USA: http://www.usa.gov/Topics/Reference‐Shelf/Data.shtml
Wall Street Executive Library: http://www.executivelibrary.com/. Business sites on newspapers, magazines,
government, financial markets, company and industry, law, marketing and advertising, statistics, etc.
Wall Street Journal: http://online.wsj.com/public/us
Accounting
ARN: http://www.ssrn.com/update/arn/. The Accounting Research Network (ARN) was founded to increase
communication among scholars and practitioners of accounting worldwide. ARN encourages the early distri-
bution of research results by publishing abstracts of top quality research papers in three journals: Auditing,
Litigation and Tax Abstracts, Financial Accounting Abstracts, and Managerial Accounting Abstracts. The journals
publish abstracts of articles dealing with empirical, experimental, and theoretical research in financial and
managerial accounting, auditing, and tax strategy. ARN is a division of the Social Science Research
Network (SSRN).
Accounting terminology guide: http://www.nysscpa.org/glossary
AuditNet: http://www.auditnet.org/. A global resource for auditors.
Internal Auditing World Wide Web (IAWWW): http://www.bitwise.net/iawww/. A warehouse of information
and knowledge pertaining to the internal auditing profession and functions across all associations, industries,
and countries.
Management
Academy of Management: http://www.aomonline.org
Harvard Business Review: https://hbr.org/
Society for Human Resource Management: www.shrm.org
Sloan Management Review: http://sloanreview.mit.edu/
Financial economics
Behavioral Finance: http://www.behaviouralfinance.net/
CNN financial network: http://money.cnn.com
The Financial Economic Network (FEN) is a division of the Social Science Research Network (SSRN):
http://www.ssrn.com/update/fen/
FINWeb: http://finweb.com/. FINWeb is a financial economics website managed by James R. Garven. The pri-
mary objective of FINWeb is to list Internet resources providing substantive information concerning economics
and finance‐related topics.

66 research methods for business
MFFAIS: http://www.mffais.com/. Mutual Fund Facts About Individual Stocks. A reference site that shows you
(among other things) which and how many mutual funds sold shares in a specific company. And the only one
that lists more than just the top ten fundholders of a company.
Morningstar, Inc. is a leading provider of independent investment research in North America, Europe, Australia,
and Asia: http://www.morningstar.com/
Standard & Poor’s Ratings Services provides market intelligence in the form of credit ratings, research:
http://www.standardandpoors.com/en_US/web/guest/home
Marketing
The Marketing Science Institute is a nonprofit, membership‐based organization dedicated to bridging the gap
between academic marketing theory and business practice: http://www.msi.org/
Links to academic marketing journals: http://www.sfu.ca/˜mvolker/biz/journal1.htm
KnowThis: http://www.knowthis.com/. Marketing virtual library, offering an objective and unbiased resource for
marketing basics, market research, Internet marketing, marketing plans, advertising, and much more.
BIBLIOGRAPHICAL DATABASES
The following indexes help in compiling a comprehensive bibliography on business topics.
1. Bibliographic Index. A cumulative bibliography of bibliographies – an index that lists, by subject,
sources of bibliographies.
2. Business Books in Print. This indexes, by author, title, and business subject, the books in print in the
areas of finance, business, and economics.
3. Business Periodicals Index. This is a cumulative subject index covering 270 business periodicals.
4. Management Information Guide. This offers bibliographic references in many business areas.
5. Human Resource Management Abstracts. This is an index of articles that deal with the management of
people and the subject area of organizational behavior.
6. Psychological Abstracts. This summarizes the literature in psychology, covering several hundred jour-
nals, reports, monographs, and other scientific documents.
7. Public Affairs Information Service Bulletin. This has a selective subject index of books, yearbooks,
directories, government documents, pamphlets, and over a thousand periodicals relating to national
and international economic and public affairs.
8. Work Related Abstracts. This contains abstracts of articles, dissertations, and books relating to labor,
personnel, and organizational behavior.
APA FORMAT FOR REFERENCING RELEVANT ARTICLES
A distinction has to be made between a bibliography and references. A bibliography is a listing of work that is
relevant to the main topic of research interest arranged in alphabetical order of the last names of the authors. A
reference list is a subset of the bibliography, which includes details of all the citations used in the literature review

chapter the critical literature review 67
and elsewhere in the paper, arranged, again, in alphabetical order of the last names of the authors. These citations
have the goals of crediting the authors and enabling the reader to find the works cited.
At least three modes of referencing are followed in business research. These are based on the format pro-
vided in the Publication Manual of the American Psychological Association (APA) (2012), the Chicago Manual of
Style (2010), and Turabian’s Manual for Writers (2013). Each of these manuals specifies, with examples, how
books, journals, newspapers, dissertations, and other materials are to be referenced in manuscripts. Since the
APA format is followed for referencing by many journals in the management area, we will use this below to
highlight the distinctions in how books, journals, newspaper articles, dissertations, and so on, are referenced.
In the following section we will discuss how these references should be cited in the literature review section. All
the citations mentioned in the research report will find a place in the References section at the end of the report.
Specimen format for citing different types of references (APA format)
Book by a single author
Leshin, C.B. (1997). Management on the World Wide Web. Englewood Cliffs, NJ: Prentice Hall.
Book by more than one author
Diener, E., Lucas, R., Schimmack, U., & Helliwell, J.F. (2009). Well‐being for public policy. New York: Oxford University Press.
Book review
Nichols, P. (1998). A new look at Home Services [Review of the book Providing Home Services to the Elderly by Girch, S.].
Family Review Bulletin, 45, 12–13.
Chapter in an edited book
Riley, T., & Brecht, M.L. (1998). The success of the mentoring process. In R. Williams (Ed.), Mentoring and career success,
pp. 129–150. New York: Wilson Press.
Conference proceedings publication
Sanderson, R., Albritton B., Schwemmer R., & Van de Sompel, H. (2011). Shared canvas: A collaborative model for medieval
manuscript layout dissemination. Proceedings of the Eleventh ACM/IEEE Joint Conference on Digital Libraries, pp. 175–184.
Ottawa, Ontario.
Doctoral dissertation
Hassan, M. (2014). The Lives of micro‐marketers: Why do some differentiate themselves from their competitors more than
others? Unpublished doctoral dissertation, University of Cambridge.
Edited book
Pennathur, A., Leong, F.T., & Schuster, K. (Eds.) (1998). Style and substance of thinking. New York: Publishers Paradise.
Edited book, digital, with DOI (Digital Object Identifier)1
Christiansen, S. (Ed.). (2007). Offenders’ memories of violent crimes. doi: 10.1002/7980470713082.
Journal article
Jeanquart, S., & Peluchette, J. (1997). Diversity in the workforce and management models. Journal of Social Work Studies,
43 (3), 72–85.
Deffenbacher, J.L., Oetting, E.R., Lynch, R.S., & Morris, C.D. (1996). The expression of anger and its consequences. Behavior
Research and Therapy, 34, 575–590.
Journal article in press
Van Herpen, E., Pieters, R., & Zeelenberg, M. (2009). When demand accelerates demand: Trailing the bandwagon, Journal of
Consumer Psychology.
Journal article with DOI
1A Digital Object Identifier is a unique alphanumeric string assigned by a registration agency (the International DOI Foundation) to identify
an object (such as an electronic document) and provide a persistent link to its location on the Internet. A publisher assigns a DOI when an
article is published and made available electronically.

68 research methods for business
López‐Vicente, M., Sunyer, J., Forns, J., Torrent, M., & Júlvez, J. (2014). Continuous Performance Test II outcomes in 11‐year‐
old children with early ADHD symptoms: A longitudinal study. Neuropsychology, 28, 202–211. http://dx.doi.org/10.1037/
neu0000048
More than one book by the same author in the same year
Roy, A. (1998a). Chaos theory. New York: Macmillan Publishing Enterprises.
Roy, A. (1998b). Classic chaos. San Francisco, CA: Jossey‐Bass.
Newspaper article, no authorQE faces challenge in Europe’s junk bond market (2015, March 27). Financial Times, p. 22.
Paper presentation at conference
Bajaj, L.S. (1996, March 13). Practical tips for efficient work management. Paper presented at the annual meeting of
Entrepreneurs, San Jose, CA.
Unpublished manuscript
Pringle, P.S. (1991). Training and development in the ’90s. Unpublished manuscript, Southern Illinois University,
Diamondale, IL.
Referencing non-print media
AppSkyscape. (2010). Skyscape Medical Resources (Version 1.9.11) [Mobile application software]. Retrieved from http://itunes.
apple.com/
Conference proceeding from the Internet
Balakrishnan, R. (2006, March 25–26). Why aren’t we using 3d user interfaces, and will we ever? Paper presented at the IEEE
Symposium on 3D User Interfaces. doi:10.1109/VR.2006.148
Dictionary
Motivation. (n.d.). In Merriam‐Webster’s online dictionary (12th ed.). Retrieved from http://www.merriam‐webster.com/
dictionary/motivation
E‐book
Diener, E., Lucas, R., Schimmack, U., & Helliwell, J.F. (2009). Well‐being for public policy (New York: Oxford University Press).
Retrieved from http://books.google.com
Electronic journal article
Campbell, A. (2007). Emotional intelligence, coping and psychological distress: A partial least squares approach to develop-
ing a predictive model. E‐Journal of Applied Psychology, 3 (2), 39–54. Retrieved from http://ojs.lib.swin.edu.au/index.php/
ejap/article/view/91/117
Message posted to online forum or discussion group
Davitz, J.R. (2009, February 21). How medieval and renaissance nobles were different from each other [Msg 131]. Message
posted to http://groups.yahoo.com/group/Medieval_Saints/message/131
Online document
Frier, S. (2015, March 19). Facebook shares hit record amid optimism for ads business. Retrieved from http://www.bloomberg.
com/news/articles/2015‐03‐19/facebook‐shares‐hit‐record‐amid‐optimism‐for‐ads‐business
Online document, no author identified, no date
GVU’s 18th WWW customer survey. (n.d.). Retrieved 2009, March 24, from http://www.bb.gotech.edu/gvu/user‐surveys/
survey‐2008‐10/
Podcast
Raz, G. (TED Radio Hour Host). (2015, February 27). Success (R) [Audio podcast]. Retrieved from http://podbay.fm/
show/523121474/e/1425015000?autostart=1
Report from private organization, available on organization’s website

chapter the critical literature review 69
Philips UK. (2009, March 23). U.S. Department of Energy honors Philips for significant advancement in LED lighting. Retrieved
March 2009, 24, from http://www.philips.co.uk/index.page
Streaming video (for instance from YouTube)
How2stats (2011, September 15). Cronbach’s Alpha ‐ SPSS (part 1) [Video file]. Retrieved from https://www.youtube.com/
watch?v=2gHvHm2SE5s
Tweet
TIAS (@TIASNews). “Cooperative banks make the financial system more stable, says Professor Hans Groeneveld”,
buff.ly/1BwXNhR. 13 March 2015, 19.24 p.m. Tweet.
Wikipedia
Game theory (n.d.). In Wikipedia. Retrieved 2015, November 6, from http://en.wikipedia.org/wiki/Game_theory
REFERENCING AND QUOTATION IN THE LITERATURE REVIEW SECTION
Cite all references in the body of the paper using the author–year method of citation; that is, the surname of the
author(s) and the year of publication are given in the appropriate places. Examples of this are as follows:
1. Todd (2015) found the more motivated students are . . .
2. More recent studies of transformational leadership (Hunt, 2014; Osborn, 2013) focus on . . .
3. In a follow‐up study from 2013, Green demonstrates . . .
As can be seen from the above, if the name of the author appears as part of the narrative as in the case of 1,
the year of publication alone has to be cited in parentheses. Note that in case 2, both the author and the year are
cited in parentheses, separated by a comma. If the year and the author are a part of the textual discussion as in 3
above, the use of parentheses is not warranted.
Note also the following:
1. Within the same paragraph, you need not include the year after the first citation so long as the study
cannot be confused with other studies cited in the article. An example of this is:
- Lindgren (2009, p. 24) defines satisfaction as “the customer’s fulfillment response. It is the judgment that
a . . . service . . . provides a pleasurable level of consumption‐related fulfillment.” Lindgren finds that . . .
2. When a work is authored by two individuals, always cite both names every time the reference occurs in
the text, as follows:
- As Tucker and Snell (2014) pointed out . . .
- As has been pointed out (Tucker & Snell, 2014), . . .
3. When a work has more than two authors but fewer than six authors, cite all authors the first time the
reference occurs, and subsequently include only the surname of the first author followed by “et al.” as
per the example below:
- Bougie, Pieters, and Zeelenberg (2003) found . . . (first citation) Bougie et al. (2003)
found . . . (subsequent citations)
4. When a work is authored by six or more individuals, cite only the surname of the first author followed
by et al. and the year for the first and subsequent citations. Join the names in a multiple‐author citation
in running text by the word and. In parenthetical material, in tables, and in the reference list, join the
names by an ampersand (&).

70 research methods for business
5. When a work has no author, cite in text the first two or three words of the article title. Use double quota-
tion marks around the title of the article. For example, while referring to the newspaper article cited
earlier, the text might read as follows:
- There are limits to how risky investors want to get (“QE faces challenge,” 2015), . . .
6. When a work’s author is designated as “Anonymous,” cite in text the word Anonymous followed by a
comma and the date: (Anonymous, 2014). In the reference list, an anonymous work is alphabetized by
the word Anonymous.
7. When the same author has several works published in the same year, cite them in the same order as they
occur in the reference list, with the in press citations coming last. For example:
- Research on Corporate Social Responsibility (Long, 1999, 2003, in press) indicates . . .
8. When more than one author has to be cited in the text, these should be in the alphabetical order of the
first author’s surname, and the citations should be separated by semicolons as per the illustration below:
- In the job design literature (Aldag & Brief, 2007; Alderfer, 2009; Beatty, 1982; Jeanquart, 1999), . . .
9. Personal communication through letters, memos, telephone conversations, and the like, should be cited in
the text only and not included in the reference list since these are not retrievable data. In the text, provide
the initials as well as the surname of the communicator together with the date, as in the following example:
- T. Peters (personal communication, June 15, 2013) feels . . .
In this section we have seen different modes of citation. We will next see how to include quotations from
others in the text.
Quotations in text
Quotations should be given exactly as they appear in the source. The original wording, punctuation, spelling, and
italics must be preserved even if they are erroneous. The citation of the source of a direct quotation should always
include the page number(s) as well as the reference.
Use double quotation marks for quotations in text. Use single quotation marks to identify the material that
was enclosed in double quotation marks in the original source. If you want to emphasize certain words in a quo-
tation, underline them and immediately after the underlined words, insert within brackets the words: italics
added. Use three ellipsis points (. . .) to indicate that you have omitted material from the original source. See the
example that follows below.
If the quotation is of more than 40 words, set it in a free‐standing style starting on a new line and indenting
the left margin a further five spaces. Type the entire quotation double spaced on the new margin, indenting the
first line of paragraphs five spaces from the new margin, as shown below.
For instance, Weiner (1998, p. 121) argues that:
Following the outcome of an event, there is initially a general positive or negative reaction (a “primitive”
emotion) based on the perceived success or failure of that outcome (the “primary” appraisal). (. . .) Following
the appraisal of the outcome, a causal ascription will be sought if that outcome was unexpected and/or
important. A different set of emotions is then generated by the chosen attributions.
If you intend publishing an article in which you have quoted extensively from a copyrighted work, it is
important that you seek written permission from the owner of the copyright. Make sure that you also footnote
the permission obtained with respect to the quoted material. Failure to do so may result in unpleasant conse-
quences, including legal action taken through copyright protection laws.

71
INTRODUCTION
After a critical review of the literature you may be ready to develop a theoretical framework. A theoretical frame-
work is the foundation of hypothetico‐deductive research as it is the basis of the hypotheses that you will develop.
Indeed, the development of a theoretical framework is crucial in deductive, theory‐testing, causal research (but
not in exploratory or descriptive research where one does not develop a theoretical framework to develop and
test hypotheses).
This chapter highlights the importance of theory development in deductive research and explains how the-
ory is developed. The chapter starts with a definition of a theoretical framework followed by a discussion on the
need for a theoretical framework. It explains that a theoretical framework involves the identification of a network
of relationships among variables considered important to the problem. Different types of variables on hypotheses
development are reviewed at the end of this chapter.
As you proceed through this chapter, in various places you are instructed to work through certain exercises.
Doing them at that time, before reading further, will help you in becoming adept at formulating theoretical
frameworks in a logical manner without getting confused.
Theoretical framework and hypothesis development
C H A P T E R 5
LEARNING OBJECTIVES
After completing Chapter 5, you should be able to:
1. Discuss the need for a theoretical framework in deductive research.
2. Describe four main types of variables and identify and label variables associated with any given
situation.
3. Develop a theoretical framework that includes all the relevant components.
4. Develop a set of hypotheses to be tested.
5. Demonstrate awareness of the role of the manager in the development of a theoretical
framework.

72 research methods for business
THE NEED FOR A THEORETICAL FRAMEWORK
A theoretical framework represents your beliefs on how certain phenomena (or variables or concepts) are related
to each other (a model) and an explanation of why you believe that these variables are associated with each other
(a theory). Both the model and the theory flow logically from the documentation of previous research in the prob-
lem area. Integrating your logical beliefs with published research, taking into consideration the boundaries and
constraints governing the situation, is pivotal in developing a scientific basis for investigating the research problem.
The process of building a theoretical framework includes:
1. Introducing definitions of the concepts or variables in your model.
2. Developing a conceptual model that provides a descriptive representation of your theory.
3. Coming up with a theory that provides an explanation for relationships between the variables in
your model.
From the theoretical framework, then, testable hypotheses can be developed to examine whether your
theory is valid or not. The hypothesized relationships can thereafter be tested through appropriate statistical
analyses. Hence, the entire deductive research project rests on the basis of the theoretical framework. Even if
testable hypotheses are not necessarily generated (as in some applied research projects), developing a good
theoretical framework is central to examining the problem under investigation.
Since a theoretical framework involves the identification of the network of relationships among the variables
considered important to the study of any given problem situation, it is essential to understand what a variable
means and what the different types of variables are.
VARIABLES
A variable is anything that can take on differing or varying values. The values can differ at various times for the
same object or person, or at the same time for different objects or persons. Examples of variables are production
units, absenteeism, and motivation.
EXAMPLE
Production units: One worker in the manufacturing
department may produce one widget per minute, a
second might produce two per minute, a third might
produce five per minute. It is also possible that the
same member might produce one widget the first min-
ute and five the next minute. In both cases, the number
of widgets produced has taken on different values, and
is therefore a variable.
Absenteeism: Today, three members in the sales
department may be absent; tomorrow, six members
may not show up for work; the day after, there may be
no one absent. The value can thus theoretically range
from “zero” to “all” being absent, on the absentee-
ism variable.
Motivation: The levels of motivation of members
to learn in the class or in a work team might take on
varying values ranging from “very low” to “very high.”
An individual’s motivation to learn from different
classes or in different work teams might also take on
differing values. Now, how one measures the level of
motivation is an entirely different matter. The factor
called motivation has to be reduced from its level of
abstraction and operationalized in such a way that it
becomes measurable. We will discuss this in Chapter 11.

chapter theoretical framework and hypothesis development 73
Four main types of variables are discussed in this chapter1:
1. The dependent variable (also known as the criterion variable).
2. The independent variable (also known as the predictor variable).
3. The moderating variable.
4. The mediating variable.
Each of these variables can be discrete (e.g., male/female) or continuous (e.g., the age of an individual).
Associated scale levels of variables are discussed in Chapter 12.
Dependent variable
The dependent variable is the variable of primary interest to the researcher. The researcher’s goal is to under-
stand and describe the dependent variable, or to explain its variability, or predict it. In other words, it is the main
variable that lends itself for investigation as a viable factor. Through the analysis of the dependent variable (i.e.,
finding what variables influence it), it is possible to find answers or solutions to the problem. For this purpose,
the researcher will be interested in quantifying and measuring the dependent variable, as well as the other vari-
ables that influence this variable.
EXAMPLE
A manager is concerned that the sales of a new product,
introduced after test marketing it, do not meet with his
expectations. The dependent variable here is “sales.” Since
the sales of the product can vary – they can be low, medium,
or high – it is a variable; since sales is the main focus of
interest to the manager, it is the dependent variable.
A basic researcher is interested in investigating
the debt‐to‐equity ratio of manufacturing companies
in southern Germany. Here, the dependent variable is
the ratio of debt to equity.
A vice president is concerned that the employees
are not loyal to the organization and, in fact, seem to
switch their loyalty to other institutions. The depend-
ent variable in this case is “organizational loyalty.”
Here again, there is variance found in the levels of
organizational loyalty of employees. The vice presi-
dent might want to know what accounts for the vari-
ance in the loyalty of organizational members with
a view to controlling it. If he finds that increased
pay levels would ensure their loyalty and retention,
he can then offer inducement to employees by way
of pay rises, which will help control the variability
in organizational loyalty and keep them in the
organization.
It is possible to have more than one dependent variable in a study. For example, there is always a tussle
between quality and volume of output, low‐cost production and customer satisfaction, and so on. In such cases,
the manager is interested to know the factors that influence all the dependent variables of interest and how some
of them might differ in regard to different dependent variables. These investigations may call for multivariate
statistical analyses.
Now do Exercise 5.1 and Exercise 5.2.
1Extraneous variables that confound cause‐and‐effect relationships are discussed in Chapter 10 on Experimental Designs.

74 research methods for business
Independent variable
It is generally conjectured that an independent variable is one that influences the dependent variable in either a
positive or negative way. That is, when the independent variable is present, the dependent variable is also present,
and with each unit of increase in the independent variable, there is an increase or decrease in the dependent
variable. In other words, the variance in the dependent variable is accounted for by the independent variable. To
establish that a change in the independent variable causes a change in the dependent variable, all four of the
following conditions should be met:
1. The independent and the dependent variable should covary: in other words, a change in the dependent
variable should be associated with a change in the independent variable.
2. The independent variable (the presumed causal factor) should precede the dependent variable. In other
words, there must be a time sequence in which the two occur: the cause must occur before the effect.
3. No other factor should be a possible cause of the change in the dependent variable. Hence, the researcher
should control for the effects of other variables.
4. A logical explanation (a theory) is needed and it must explain why the independent variable affects the
dependent variable.
Because of the time sequence condition, experimental designs, described in Chapter 10, are often used to
establish causal relationships.
EXERCISE 5.1
Research in behavioral finance has shown that overconfidence can cause investors to underreact to new
information.
What is the dependent variable in this case?
EXERCISE 5.2
A marketing manager believes that limiting the availability of a product increases product desirability.
What is the dependent variable here?
EXAMPLE
Research studies indicate that successful new prod-
uct development has an influence on the stock mar-
ket price of the company. That is, the more
successful the new product turns out to be, the
higher will be the stock market price of that firm.
Therefore, the “success of the new product” is the
independent variable, and “stock market price” the
dependent variable. The degree of perceived success
of the new product developed will explain the vari-
ance in the stock market price of the company. This
relationship and the labeling of the variables are
illustrated in Figure 5.1.

chapter theoretical framework and hypothesis development 75
Now do Exercise 5.3 and Exercise 5.4. List the variables in these two exercises individually, and label them
as dependent or independent, explaining why they are so labeled. Create diagrams to illustrate the relationships.
Cross‐cultural research indicates that managerial
values govern the power distance between superiors
and subordinates. Here, power distance (i.e., egalitar-
ian interactions between the boss and the employee,
versus the high‐power superior in limited interaction
with the low‐power subordinate) is the subject of inter-
est and hence the dependent variable. Managerial val-
ues that explain the variance in power distance
comprise the independent variable. This relationship
is illustrated in Figure 5.2.
New productsuccess
Stock marketprice
Independent variable Dependent variable
F I G U R E 5 . 1
Diagram of the relationship between the independent variable (new product success) and the dependent variable (stock market price)
Managerial values Power distance
Independent variable Dependent variable
F I G U R E 5 . 2
Diagram of the relationship between the independent variable (managerial values) and the dependent variable (power distance)
Visit the companion website at www.wiley.com/college/sekaran for Author Video: The
moderating variable.
The moderating variable is one that has a strong contingent effect on the independent variable–dependent vari-
able relationship. That is, the presence of a third variable (the moderating variable) modifies the original rela-
tionship between the independent and the dependent variables. This becomes clear through the following examples.
EXERCISE 5.3
An investor believes that more information increases the accuracy of his forecasts.
EXERCISE 5.4
A marketing manager believes that selecting physically attractive spokespersons and models to endorse
their products increases the persuasiveness of a message.
Moderating variable

76 research methods for business
EXAMPLE
It has been found that there is a relationship between
the availability of reference manuals that manufactur-
ing employees have access to and the product rejects.
That is, when workers follow the procedures laid down
in the manual, they are able to manufacture products
that are flawless. This relationship is illustrated in
Figure 5.3(a). Although this relationship can be said to
hold true generally for all workers, it is nevertheless
contingent on the inclination or urge of the employees
to look in the manual every time a new procedure is to
be adopted. In other words, only those who have the
interest and urge to refer to the manual every time a
new process is adopted will produce flawless products.
Others who do not consult the manual will not benefit
and will continue to produce defective products. This
influence of the attributes of the worker on the rela-
tionship between the independent and the dependent
variables can be illustrated as shown in Figure 5.3(b).
(b)
Availability ofreference manuals
# of rejects
Independent variable Dependent variable
Interest&
inclination
Moderating variable
(a)
Availability ofreference manuals
# of rejects
Independent variable Dependent variable
F I G U R E 5 . 3
(a) Diagram of the relationship between the independent variable (availability of reference manuals) and the dependent variable (rejects); (b) diagram of the relationship between the independent variable (availability of reference materials) and the dependent variable (rejects) as moderated by the moderating variable (interest and inclination)
As in the above case, whenever the relationship between the independent variable and the dependent vari-
able becomes contingent or dependent on another variable, we say that the third variable has a moderating effect
on the independent variable–dependent variable relationship. The variable that moderates the relationship is
known as the moderating variable.

chapter theoretical framework and hypothesis development 77
The distinction between an independent variable and a moderating variable
At times, confusion is likely to arise as to when a variable is to be treated as an independent variable and when it
becomes a moderating variable. For instance, there may be two situations as follows:
1. A research study indicates that the better the quality of the training programs in an organization and
the greater the growth needs of the employees (i.e., where the need to develop and grow on the job is
strong), the greater is their willingness to learn new ways of doing things.
2. Another research study indicates that the willingness of the employees to learn new ways of doing
things is not influenced by the quality of the training programs offered by the organizations to all
people without any distinction. Only those with high growth needs seem to have the yearning to learn
to do new things through specialized training.
In the above two situations, we have the same three variables. In the first case, the training programs and
growth need strength are the independent variables that influence employees’ willingness to learn, this latter
being the dependent variable. In the second case, however, the quality of the training program is the independent
variable, and while the dependent variable remains the same, growth need strength becomes a moderating vari-
able. In other words, only those with high growth needs show a greater willingness and adaptability to learn to
do new things when the quality of the training program is improved. Thus, the relationship between the inde-
pendent and dependent variables has now become contingent on the existence of a moderator.
EXAMPLE
Let us take another example of a moderating variable. A
prevalent theory is that the diversity of the workforce
(comprising people of different ethnic origins, races,
and nationalities) contributes more to organizational
effectiveness because each group brings its own special
expertise and skills to the workplace. This synergy can
be exploited, however, only if managers know how to
harness the special talents of the diverse work group;
otherwise they will remain untapped. In the above sce-
nario, organizational effectiveness is the dependent
variable, which is positively influenced by workforce
diversity – the independent variable. However, to har-
ness the potential, managers must know how to
encourage and coordinate the talents of the various
groups to make things work. If not, the synergy will not
be tapped. In other words, the effective utilization of
different talents, perspectives, and eclectic problem‐
solving capabilities for enhanced organizational effec-
tiveness is contingent on the skill of the managers in
acting as catalysts. This managerial expertise then
becomes the moderating variable. These relationships
can be depicted as in Figure 5.4.
Workforce diversityOrganizational
effectiveness
Independent variable Dependent variable
Managerialexpertise
Moderating variable
F I G U R E 5 . 4
Diagram of the relationship among the three variables: workforce diversity, organizational effectiveness, and managerial expertise

78 research methods for business
The above illustration makes it clear that even though the variables used are the same, the decision as to
whether to label them dependent, independent, or moderating depends on how they affect one another. The dif-
ferences between the effects of the independent and the moderating variables may be visually depicted as in
Figures 5.5(a) and 5.5(b). Note the steep incline of the top line and the relative flatness of the bottom line in
Figure 5.5(b).
Now do Exercise 5.5 and Exercise 5.6. List and label the variables in these two exercises and explain and
illustrate by means of diagrams the relationships among the variables.
Training programsGrowth needs
(a)
Wil
lin
gnes
s to
lear
n
Training programs
(b)
Effects for those lowin growth needs
Effects for those highin growth needs
Wil
lin
gnes
s to
lear
n
F I G U R E 5 . 5
(a) Illustration of the influence of independent variables on the dependent variable when no moderating variable operates in the situation; (b) illustration of the influence of independent variables on the dependent variable when a moderating variable is operating in the situation
EXERCISE 5.5
A manager finds that off‐the‐job classroom training has a great impact on the productivity of the employ-
ees in her department. However, she also observes that employees over 60 years of age do not seem to
derive much benefit and do not improve with such training.
EXERCISE 5.6
A manager of an insurance company finds that “fear appeals” in commercials are positively associated with
consumers’ behavioral intentions to insure their house. This effect is particularly strong for people with a
high inherent level of anxiety.

chapter theoretical framework and hypothesis development 79
Mediating variable
A mediating variable (or intervening variable) is one that surfaces between the time the independent variables
start operating to influence the dependent variable and the time their impact is felt on it. There is thus a temporal
quality or time dimension to the mediating variable. In other words, bringing a mediating variable into play helps
you to model a process. The mediating variable surfaces as a function of the independent variable(s) operating in
any situation, and helps to conceptualize and explain the influence of the independent variable(s) on the depend-
ent variable. The following example illustrates this point.
Visit the companion website at www.wiley.com/college/sekaran for Author Video: The
mediating variable.
EXAMPLE
In the previous example, where the independent vari-
able (workforce diversity) influences the dependent
variable (organizational effectiveness), the mediating
variable that surfaces as a function of the diversity in
the workforce is “creative synergy.” This creative syn-
ergy results from a multiethnic, multiracial, and multi-
national (i.e., diverse) workforce interacting and
bringing together their multifaceted expertise in prob-
lem solving. This helps us to understand how organi-
zational effectiveness can result from having diversity
in the workforce. Note that creative synergy, the
mediating variable, surfaces at time t2, as a function of
workforce diversity, which was in place at time t1, to
bring about organizational effectiveness in time t3. The
mediating variable of creative synergy helps us to con-
ceptualize and understand how workforce diversity
brings about organizational effectiveness. The dynam-
ics of these relationships are illustrated in Figure 5.6.
Workforcediversity
Creativesynergy
Organizationaleffectiveness
Independent variable
Time: t2 t3t1
Mediating variable Dependent variable
F I G U R E 5 . 6
Diagram of the relationship among the independent, mediating, and dependent variables
It would be interesting to see how the inclusion of the moderating variable, “managerial expertise” in the
foregoing example, would change the model or affect the relationships. The new set of relationships that would
emerge in the presence of the moderator is depicted in Figure 5.7. As can be seen, managerial expertise moder-
ates the relationship between workforce diversity and creative synergy. In other words, creative synergy will not

80 research methods for business
result from the multifaceted problem‐solving skills of the diverse workforce unless the manager is capable of
harnessing that synergy by creatively coordinating the different skills. If the manager lacks the expertise to per-
form this role, then no matter how many different problem‐solving skills the diverse workforce might have,
synergy will just not surface. Instead of functioning effectively, the organization might just remain static, or even
deteriorate.
It is now easy to see what the differences are among an independent variable, a mediating variable, and a
moderating variable. The independent variable helps to explain the variance in the dependent variable; the
mediating variable surfaces at time t2 as a function of the independent variable, which also helps us to concep-
tualize the relationship between the independent and dependent variables; and the moderating variable has a
contingent effect on the relationship between two variables. To put it differently, while the independent variable
explains the variance in the dependent variable, the mediating variable does not add to the variance already
explained by the independent variable, whereas the moderating variable has an interaction effect with the inde-
pendent variable in explaining the variance. That is, unless the moderating variable is present, the theorized
relationship between the other two variables considered will not hold.
Whether a variable is an independent variable, a dependent variable, a mediating variable, or a moderating
variable should be determined by a careful reading of the dynamics operating in any given situation. For instance,
a variable such as motivation to work could be a dependent variable, an independent variable, a mediating vari-
able, or a moderating variable, depending on the theoretical model that is being advanced.
Now do Exercise 5.7, Exercise 5.8, and Exercise 5.9.
EXERCISE 5.7
Make up three different situations in which motivation to work would be an independent variable, a
mediating variable, and a moderating variable.
Workforcediversity
Creativesynergy
Organizationaleffectiveness
Independent variable
Time: t2 t3t1
Mediating variable Dependent variable
Managerialexpertise
Moderating variable
F I G U R E 5 . 7
Diagram of the relationship among the independent, mediating, moderating, and dependent variables

chapter theoretical framework and hypothesis development 81
HOW THEORY IS GENERATED
Having examined the different kinds of variables that can operate in a situation and how the relationships among
these can be established, it is now possible to see how we can develop the theoretical framework for our research.
The theoretical framework is the foundation on which the entire deductive research project is based. It is a
logically developed, described, and elaborated network of associations among the variables deemed relevant to
the problem situation and identified through such processes as interviews, observations, and literature review.
Experience and intuition also guide the development of the theoretical framework.
It becomes evident at this stage that, to arrive at good solutions to the problem, one should first correctly
identify the problem, and then the variables that contribute to it. The importance of doing a thorough literature
review and conducting exploratory and inductive research now becomes clear. After identifying the appropriate
variables, the next step is to elaborate the network of associations among the variables, so that relevant hypoth-
eses can be developed and subsequently tested. Based on the results of hypothesis testing (which indicate whether
or not the hypotheses have been supported), the extent to which the problem can be solved becomes evident. The
theoretical framework is thus an important step in the research process.
The relationship between the literature review and the theoretical framework is that the former provides a
solid foundation for developing the latter. That is, the literature review identifies the variables that might be
important, as determined by previous research findings. This, in addition to other logical connections that can
be conceptualized, forms the basis for the theoretical model. The theoretical framework represents and elabo-
rates the relationships among the variables, explains the theory underlying these relations, and describes the
nature and direction of the relationships. Just as the literature review sets the stage for a good theoretical frame-
work, this in turn provides the logical base for developing testable hypotheses.
EXERCISE 5.8
Failure to follow accounting principles causes immense confusion, which in turn creates a number of prob-
lems for the organization. Those with vast experience in bookkeeping, however, are able to avert the prob-
lems by taking timely corrective action. List and label the variables in this situation, explain the relationships
among the variables, and illustrate these by means of diagrams.
EXERCISE 5.9
A store manager observes that the morale of employees in her supermarket is low. She thinks that if their
working conditions are improved, pay scales raised, and the vacation benefits made more attractive, the
morale will be boosted. She doubts, however, if an increase in pay scales would raise the morale of all employ-
ees. Her conjecture is that those who have supplemental incomes will just not be “turned on” by higher pay,
and only those without side incomes will be happy with increased pay, with a resultant boost in morale. List
and label the variables in this situation. Explain the relationships among the variables and illustrate them by
means of diagrams. What might be the problem statement or problem definition for the situation?

82 research methods for business
The components of the theoretical framework
A good theoretical framework identifies and defines the important variables in the situation that are relevant
to the problem and subsequently describes and explains the interconnections among these variables. The rela-
tionships among the independent variables, the dependent variable(s), and, if applicable, the moderating and
mediating variables are elaborated. Should there be any moderating variable(s), it is important to explain how
and what specific relationships they moderate. An explanation of why they operate as moderators should also
be offered. If there are any mediating variables, a discussion on how or why they are treated as mediating vari-
ables is necessary. Any interrelationships among the independent variables themselves, or among the depend-
ent variables themselves (in case there are two or more dependent variables), should also be clearly spelled out
and adequately explained. Note that a good theoretical framework is not necessarily a complex framework.
Earlier in this chapter, we have already explained that there are three basic features that should be incorpo-
rated in any theoretical framework:
1. The variables considered relevant to the study should be clearly defined.
2. A conceptual model that describes the relationships between the variables in the model should be given.
3. There should be a clear explanation of why we expect these relationships to exist.
It is not always easy to come up with generally agreed‐upon definitions of the relevant variables. More often
than not, there are many definitions available in the literature (for instance, there are literally dozens of definitions
of “brand image,” “customer satisfaction,” and “service quality” available in the marketing literature). Still, well‐
chosen guiding definitions of concepts are needed, because they will help you to provide an explanation for the
relationships between the variables in your model. What’s more, they will also serve as a basis for the operationali-
zation or measurement of your concepts in the data collection stage of the research process. Hence, you will have
to choose a useful definition from the literature (do not use dictionary definitions, they are usually too general). It
is also important that you explain why you have chosen a particular definition as your guiding definition.
A conceptual model helps you to structure your discussion of the literature. A conceptual model describes
your ideas about how the concepts (variables) in your model are related to each other. A schematic diagram of
the conceptual model helps the reader to visualize the theorized relationships between the variables in your
model and thus to obtain a quick idea about how you think that the management problem can be solved. Hence,
conceptual models are often expressed in this form. However, relationships between variables can also be ade-
quately expressed in words. Both a schematic diagram of the conceptual model and a description of the relation-
ships between the variables in words should be given, so that the reader can see and easily comprehend the
theorized relationships. This facilitates and stimulates discussion about the relationships between the variables in
your model. It is therefore important that your model is based on a sound theory.
A theory or a clear explanation for the relationships in your model is the last component of the theoretical
framework. A theory attempts to explain relationships between the variables in your model: an explanation
should be provided for all the important relationships that are theorized to exist among the variables. If the
nature and direction of the relationships can be theorized on the basis of the findings of previous research and/
or your own ideas on the subject, then there should also be an indication as to whether the relationships should
be positive or negative and linear or nonlinear. From the theoretical framework, then, testable hypotheses can be
developed to examine whether the theory formulated is valid or not.
Note that you do not necessarily have to “invent” a new theory every time you are undertaking a research
project. In an applied research context you apply existing theories to a specific context. This means that argu-
ments can be drawn from previous research. However, in a basic research context you will make some contribution
to existing theories and models. In such a case, it is not (always) possible to use existing theories or explanations
for relationships between variables. As a result, you will have to rely on your own insights and ideas.

chapter theoretical framework and hypothesis development 83
Now do Exercise 5.10.
EXERCISE 5.10
Avatars are virtual characters that can be used as representatives of a company that is using the Internet as a
distribution channel. For instance, avatars can be used as shopping assistants, website guides, or as identifi-
cation figures. A manager of an online company believes that avatar‐mediated communication will have a
positive effect on satisfaction with her company and on purchase intentions of consumers, because avatars
enhance the value of information provided on the website and increase the pleasure of the shopping experi-
ence. She also believes that the positive effect of the perceived information value on satisfaction with the
company and purchase intentions is stronger when customers are highly involved. Develop a theoretical
framework for this situation after stating what the problem definition of the researcher would be in this case.
HYPOTHESIS DEVELOPMENT
Once we have identified the important variables in a situation and established the relationships among them
through logical reasoning in the theoretical framework, we are in a position to test whether the relationships that
have been theorized do, in fact, hold true. By testing these relationships scientifically through appropriate statis-
tical analyses, or through negative case analysis in qualitative research (described later in the chapter), we are able
to obtain reliable information on what kinds of relationships exist among the variables operating in the problem
situation. The results of these tests offer us some clues as to what could be changed in the situation to solve the
problem. Formulating such testable statements is called hypothesis development.
Definition of a hypothesis
A hypothesis can be defined as a tentative, yet testable, statement, which predicts what you expect to find in your
empirical data. Hypotheses are derived from the theory on which your conceptual model is based and are often
relational in nature. Along these lines, hypotheses can be defined as logically conjectured relationships between
two or more variables expressed in the form of testable statements. By testing the hypotheses and confirming the
conjectured relationships, it is expected that solutions can be found to correct the problem encountered.
EXAMPLE
Several testable statements or hypotheses can be drawn
from the example depicted in Figure 5.4. One of them
might be:
Workforce diversity has a positive effect on
organizational effectiveness.
The above is a testable statement. By measuring
the extent of workforce diversity and organizational
effectiveness, we can statistically examine the relation-
ship between these two variables to see if there is a sig-
nificant (positive) correlation between the two. If we
do find this to be the case, then the hypothesis is
substantiated. If a significant correlation is not found,
then the hypothesis has not been substantiated. By
convention in the social sciences, to call a relationship
“statistically significant,” we should be confident that
95 times out of 100 the observed relationship will hold
true. There should be only a 5% chance that the rela-
tionship will not be detected.

84 research methods for business
Statement of hypotheses: formats
If–then statements
As already stated, a hypothesis can be defined as a testable statement of the relationship among variables. A
hypothesis can also test whether there are differences between two groups (or among several groups) with respect
to any variable or variables. To examine whether or not the conjectured relationships or differences exist, these
hypotheses can be set either as propositions or in the form of if–then statements. The two formats can be seen in
the following two examples.
Young women will be more likely to express dissatisfaction with their body weight, when they are more
frequently exposed to images of thin models in advertisements.
If young women are more frequently exposed to images of thin models in advertisements, then they
will be more likely to express dissatisfaction with their body weight.
Directional and nondirectional hypotheses
If, in stating the relationship between two variables or comparing two groups, terms such as positive, negative,
more than, less than, and the like are used, then these are directional hypotheses because the direction of the
relationship between the variables (positive/negative) is indicated, as in the first example below, or the nature
of the difference between two groups on a variable (more than/less than) is postulated, as in the second example.
The greater the stress experienced in the job, the lower the job satisfaction of employees.
Women are more motivated than men.
On the other hand, nondirectional hypotheses are those that do postulate a relationship or difference, but
offer no indication of the direction of these relationships or differences. In other words, though it may be conjec-
tured that there is a significant relationship between two variables, we may not be able to say whether the rela-
tionship is positive or negative, as in the first example below. Likewise, even if we can conjecture that there will
be differences between two groups on a particular variable, we may not be able to say which group will be more
and which less on that variable, as in the second example.
There is a relation between arousal‐seeking tendency and consumer preferences for complex product
designs.
There is a difference between the work ethic values of American and Asian employees.
Nondirectional hypotheses are formulated either because the relationships or differences have never been
explored, and hence there is no basis for indicating the direction, or because there have been conflicting findings
in previous research studies on the variables. In some studies a positive relationship might have been found,
while in others a negative relationship might have been traced. Hence, the current researcher might only be able
to hypothesize that there is a significant relationship, but the direction may not be clear. In such cases, the
hypotheses can be stated nondirectionally. Note that in the first example there is no clue as to whether

chapter theoretical framework and hypothesis development 85
arousal‐seeking tendency and preferences for complex product designs are positively or negatively correlated,
and in the second example we do not know whether the work ethic values are stronger in Americans or in Asians.
However, it would have been possible to state that arousal‐seeking tendency and preferences for complex product
designs are positively correlated, since previous research has indicated such a relationship. Whenever the direc-
tion of the relationship is known, it is better to develop directional hypotheses for reasons that will become clear
in our discussions in a later chapter.
Null and alternate hypotheses
The hypothetico‐deductive method requires that hypotheses are falsifiable: they must be written in such a way
that other researchers can show them to be false. For this reason, hypotheses are sometimes accompanied by null
hypotheses. A null hypothesis (H0) is a hypothesis set up to be rejected in order to support an alternate hypoth-
esis, labeled HA. When used, the null hypothesis is presumed true until statistical evidence, in the form of a
hypothesis test, indicates otherwise. For instance, the null hypothesis may state that advertising does not affect
sales, or that women and men buy equal amounts of shoes. In more general terms, the null hypothesis may state
that the correlation between two variables is equal to zero or that the difference in the means of two groups in the
population is equal to zero (or some other definite number). Typically, the null statement is expressed in terms of
there being no (significant) relationship between two variables or no (significant) difference between two groups.
The alternate hypothesis, which is the opposite of the null, is a statement expressing a relationship between two
variables or indicating differences between groups.
To explain further, in setting up the null hypothesis, we are stating that there is no difference between what
we might find in the population characteristics (i.e., the total group we are interested in knowing something
about) and the sample we are studying (i.e., a limited number representative of the total population or group that
we have chosen to study). Since we do not know the true state of affairs in the population, all we can do is to draw
inferences based on what we find in our sample. What we imply through the null hypothesis is that any differ-
ences found between two sample groups or any relationships found between two variables based on our sample
are simply due to random sampling fluctuations and not due to any “true” differences between the two popula-
tion groups (say, men and women), or relationships between two variables (say, sales and profits). The null
hypothesis is thus formulated so that it can be tested for possible rejection. If we reject the null hypothesis, then
all permissible alternate hypotheses relating to the particular relationship tested could be supported. It is the
theory that allows us to have faith in the alternate hypothesis that is generated in the particular research investi-
gation. This is one more reason why the theoretical framework should be grounded on sound, defendable logic
to start with. Otherwise, other researchers are likely to refute and postulate other defensible explanations through
different alternate hypotheses.
The null hypothesis in respect of group differences stated in the example “Women are more motivated than
men” would be:
HM W0
:
or
HM W0
0:
where H0 represents the null hypothesis, μ
M is the mean motivational level of the men, and μ
W is the mean
motivational level of the women.

86 research methods for business
The alternate for the above example would statistically be set as follows:
HA M W:
which is the same as
HA W M:
where HA represents the alternate hypothesis and μ
M and μ
W are the mean motivation levels of men and women,
respectively.
For the nondirectional hypothesis of mean group differences in work ethic values in the example “There is a
difference between the work ethic values of American and Asian employees,” the null hypothesis would be:
HAM AS0
:
or
HAM AS0
0:
where H0 represents the null hypothesis, μ
AM is the mean work ethic value of Americans and μ
AS is the mean work
ethic value of Asians.
The alternate hypothesis for the above example would statistically be set as:
HA AM AS:
where HA represents the alternate hypothesis and μ
AM and μ
AS are the mean work ethic values of Americans and
Asians, respectively.
The null hypothesis for the relationship between the two variables in the example “The greater the stress
experienced in the job, the lower the job satisfaction of employees,” would be H0: There is no relationship between
stress experienced on the job and the job satisfaction of employees. This would be statistically expressed by:
H0
0:
where ρ represents the correlation between stress and job satisfaction, which in this case is equal to 0 (i.e., no
correlation).
The alternate hypothesis for the above null, which has been expressed directionally, can be statistically
expressed as:
H The correlation is negative.A: 0
For the example “There is a relationship between age and job satisfaction,” which has been stated nondirec-
tionally, the null hypothesis would be statistically expressed as:
H0
0:

chapter theoretical framework and hypothesis development 87
whereas the alternate hypothesis would be expressed as:
HA: 0
Having formulated the null and alternate hypotheses, the appropriate statistical tests (t‐tests, F‐tests) can then
be applied, which indicate whether or not support has been found for the alternate hypothesis – that is, that there is
a significant difference between groups or that there is a significant relationship between variables, as hypothesized.
The steps to be followed in hypothesis testing are:
1. State the null and the alternate hypotheses.
2. Choose the appropriate statistical test depending on whether the data collected are parametric or
nonparametric.
3. Determine the level of significance desired (p = 0.05, or more, or less).
4. See if the output results from computer analysis indicate that the significance level is met. If, as in the
case of Pearson correlation analysis in Excel software, the significance level is not indicated in the print-
out, look up the critical values that define the regions of acceptance on the appropriate table (i.e., (t, F,
χ2) – see the statistical tables at the end of this book). This critical value demarcates the region of rejec-
tion from that of acceptance of the null hypothesis. When the resultant value is larger than the critical
value, the null hypothesis is rejected, and the alternate accepted. If the calculated value is less than the
critical value, the null is accepted and the alternate rejected.
Note that null hypotheses are rarely presented in research reports or journal articles.
Now do Exercise 5.11, Exercise 5.12, and Exercise 5.13.
EXERCISE 5.11
Create a diagram to illustrate the relationships between the relevant variables in Exercise 5.9 and develop
five different hypotheses.
EXERCISE 5.12
A production manager is concerned about the low output levels of his employees. The articles that he
has read on job performance frequently mention four variables as being important to job performance:
(1) skills required for the job, (2) rewards, (3) motivation, and (4) satisfaction. In several of the articles it
was also indicated that only if the rewards were (attractive) to the recipients did motivation, satisfaction,
and job performance increase, not otherwise. Given this situation:
1. Define the problem.
2. Create a diagram.
3. Develop at least six hypotheses.

88 research methods for business
EXERCISE 5.13
A recent study has investigated the effect of corporate social responsibility (CSR) on the market value of
the firm. This study developed and tested a conceptual framework, which posits that (1) customer satis-
faction mediates the relationship between CSR and the market value of the firm, and (2) two firm factors
(“innovativeness capability” and “product quality”) moderate the relationship between CSR and cus-
tomer satisfaction. For this situation, define the problem, draw a schematic diagram, and formulate the
hypotheses.
Hypothesis testing is strongly associated with designing experiments and the collection of quantitative data.
However, as exemplified by Box 5.1, hypotheses can also be tested with qualitative data.
BOX 5.1
HYPOTHESIS TESTING WITH QUALITATIVE RESEARCH: NEGATIVE CASE ANALYSIS
Hypotheses can also be tested with qualitative data. For example, let us say that, aft er extensive interviews,
a researcher has developed the theoretical framework that unethical practices by employees are a function
of their inability to discriminate between right and wrong, or due to a dire need for more money, or the
organization ’ s indiff erence to such practices. To test the hypothesis that these three factors are the primary
ones that infl uence unethical practices, the researcher should look for data to refute the hypothesis. When
even a single case does not support the hypothesis, the theory needs revision. Let us say that the researcher
fi nds one case where an individual is deliberately engaged in the unethical practice of accepting kickbacks
(despite the fact that he is knowledgeable enough to discriminate right from wrong, is not in need of
money, and knows that the organization will not be indiff erent to his behavior), simply because he wants to
“get back” at the system, which “will not listen to his advice.” Th is new discovery, through disconfi rmation
of the original hypothesis, known as the negative case method , enables the researcher to revise the theory
and the hypothesis until such time as the theory becomes robust.
BOX 5 1
We have thus far seen how a critical literature review is done, theoretical frameworks are formulated, and
hypotheses developed. Let us now illustrate this logical sequence through a small example where a researcher
wants to examine the organizational factors influencing women ’ s progress to top management positions. The
literature review and the number of variables are deliberately kept small, since the purpose is merely to illustrate
how a theoretical framework is developed from the literature review, and how hypotheses are developed based
on the theoretical framework.

chapter theoretical framework and hypothesis development 89
EXAMPLE
Literature review, theoretical framework, and hypothesis development
Introduction
“Fewer large companies are run by women than by
men named John, a sure indicator that the glass ceil-
ing remains firmly in place in corporate America”
(Wolfers, 2015). Despite the spectacular increase in
the number of managerial women during the last dec-
ades, the number of women in top management posi-
tions continues to be very small and static, suggesting
a glass‐ceiling effect that women still face (Lückerath‐
Rovers, 2013; Morrison, White & Vura, 1999; O’Neil,
Hopkins & Bilimoria, 2008; Van Velsor, 2000). Given
the demographics of the workplace, which projects
that more and more women will enter the workforce
in the future, it becomes important to examine the
factors that might facilitate the advancement of
women to top executive positions. This study is an
effort to identify the factors that currently impede
women’s advancement to the top in organizations.
A brief literature review
It is often declared that since women have only recently
embarked on careers and entered the managerial
ranks, it will take more time for them to rise to top
executive positions. However, many women in higher
middle‐management positions feel that there are at
least two major stumbling blocks to their advance-
ment: gender role stereotypes and inadequate access to
critical information (Daniel, 1998; Koenig et al., 2011;
Schein, 2007; Welch, 2001).
Gender stereotypes, or sex‐role stereotypes as
they are also known, are societal beliefs that men are
better suited for taking on leadership roles and posi-
tions of authority and power, whereas women are more
suited for taking on nurturing and helping roles
(DeArmond et al., 2006; Eagly, 1989; Kahn & Crosby,
1998; Smith, 1999). These beliefs influence the posi-
tions that are assigned to organizational members.
Whereas capable men are given line positions and
developed to take on higher responsibilities and execu-
tive roles in the course of time, capable women are
assigned to staff positions and dead‐end jobs. With lit-
tle exposure to management of budgets and opportu-
nities for significant decision making, women are
seldom groomed for top‐level positions.
Women are also excluded from the “old boys” net-
work because of their gender. Information exchange,
development of career strategies, clues regarding access
to resources, and such important information vital to
upward mobility are thus lost to women (The Chronicle,
2000). While many other factors impinge on women’s
upward mobility, the two variables of gender‐role ste-
reotypes and exclusion from critical information are
particularly detrimental to women’s advancement to
senior level positions.
Theoretical framework
The dependent variable of advancement of women to
top management positions is influenced by gender‐role
stereotyping and access to critical information. These
two variables are also interrelated as explained below.
Gender‐role stereotypes adversely impact on
women’s career progress. Since women are perceived
as ineffective leaders but good nurturers, they are
not assigned line positions in their early careers but
offered staff responsibilities. It is only in line posi-
tions that managers make significant decisions,
control budgets, and interact with top‐level execu-
tives who have an impact on their future careers.
These opportunities to learn, grow and develop on
the job, and gain visibility in the system help manag-
ers to advance to top‐level positions. However, since
women in staff positions do not gain these experi-
ences or have the visibility to be identified as key

90 research methods for business
people in the organization with the potential to be
successful top managers, their advancement to top‐
level positions is never considered by the system and
they are always overlooked. Thus, gender‐role stere-
otypes hinder the progress of women to the top.
Gender‐role stereotypes also hinder access to infor-
mation. If women are not considered to be decision
makers and leaders, but are perceived merely as support
personnel, they will not be apprised of critical informa-
tion essential for organizational advancement, since this
is not seen as relevant for them. Exclusion from the net-
works where men informally interact with one another
(golf courses, bars, and so on) precludes women from
gaining access to crucial information and resources vital
for their advancement. For example, many of the signifi-
cant organizational changes and current events are dis-
cussed informally among men outside the work setting.
Women are generally unaware of the most recent devel-
opments since they are not a part of the informal group
that interacts and exchanges information away from the
workplace. This definitely is a handicap. For example,
knowledge of an impending vacancy for an executive
position enables one to strategize to occupy that posi-
tion. One can become a key contender by procuring
critical information relevant to the position, get pre-
pared to present the appropriate credentials to the right
people at the right time, and thus pave the way for suc-
cess. Thus, access to critical information is important
for the progress of all, including women. When women
do not have the critical information that is shared in
informal networks, their chances of advancement to top
positions also get severely restricted.
The foregoing relationships are shown schemati-
cally in Figure 5.8.
Hypotheses
1. The greater the extent of gender‐role stereotyping in
organizations, the fewer will be the number of women
at the top.
2. The effect of gender‐role stereotyping on advance-
ment of women to the top is partially mediated by
access to information.
Independentvariable
Dependentvariable
Mediatingvariable
Access to informationAdvancement of
women to the topGender-rolestereotyping
F I G U R E 5 . 8
Schematic diagram of the example relating to women in managerial positions
MANAGERIAL IMPLICATIONS
Knowledge of how and for what purpose the theoretical framework is developed, and the hypotheses are gener-
ated, enables the manager to be an intelligent judge of the research report submitted by the consultant. At this
juncture, it becomes clear that once the problem is defined, a good grasp of the concepts “independent variable”
and “dependent variable” broadens the understanding of managers as to how multiple factors (the independent

chapter theoretical framework and hypothesis development 91
variables in the model) may provide possible solutions to the problem (the dependent variable in the model). An
understanding of the concept “moderating variable” may allow the manager to understand that some of the pro-
posed solutions may not solve the problem for everybody or in every situation. Likewise, knowledge of what
significance means, and why a given hypothesis is either accepted or rejected, helps the manager to persist in or
desist from following hunches, which, while making good sense, do not work. If such knowledge is absent, many
of the findings through research will not make much sense to the manager and decision making will bristle with
confusion.
SUMMARY
● Learning objective 1: Discuss the need for a theoretical framework in deductive research.
A theoretical framework represents a researcher’s beliefs on how certain phenomena (or variables or con-
cepts) are related to each other (a model) and an explanation of why he or she believes that these variables
are associated with each other (a theory). From a theoretical framework, testable hypotheses can be devel-
oped to examine whether a theory is valid or not. The entire deductive research project rests on the basis of
the theoretical framework.
● Learning objective 2: Describe four main types of variables and identify and label variables associated
with any given situation.
Since a theoretical framework involves the identification of a network of relationships among the variables
considered important to the study of any given problem situation, it is essential to understand what a vari-
able means and what the different types of variables are. A variable is anything that can take on differing or
varying values. Four main types of variables discussed in this chapter are: (1) the dependent variable; (2) the
independent variable; (3) the moderating variable; and (4) the mediating variable.
● Learning objective 3: Develop a theoretical framework that includes all the relevant components.
Three basic features that should be incorporated in any theoretical framework:
– The variables considered relevant to the study should be clearly defined.
– A conceptual model that describes the relationships between the variables in the model should be
given.
– There should be a clear explanation of why we expect these relationships to exist.
Just as the literature review sets the stage for a good theoretical framework, this in turn provides the logical
base for developing testable hypotheses.
● Learning objective 4: Develop a set of hypotheses to be tested.
Hypotheses are derived from the theory on which a conceptual model is based. They are often relational
in nature. Along these lines, hypotheses can be defined as logically conjectured relationships between
two or more variables expressed in the form of testable statements. By testing the hypotheses and con-
firming the conjectured relationships, it is expected that solutions can be found to correct the problem
encountered.

92 research methods for business
● Learning objective 5: Demonstrate awareness of the role of the manager in the development of a theo-
retical framework.
Knowledge of how and for what purpose the theoretical framework is developed and the hypotheses are
generated enables the manager to be an intelligent judge of the research report submitted by the
researcher.
In the next chapter we will examine a number of basic research design issues.
Visit the companion website at www.wiley.com/college/sekaran for Case Study: The
Social Network.
DISCUSSION QUESTIONS
1. “Because literature review is a time‐consuming exercise, a good, in‐depth interview should suffice
to develop a theoretical framework.” Discuss this statement.
2. “Good models are complex. What’s more, a good model should include both moderating and medi-
ating variables.” Discuss this statement.
3. “Academic researchers usually develop more complex and elaborate models than applied researchers.”
Discuss this statement.
4. “In an applied research context you do not need to explain the relationships between the variables in
your conceptual model.” Discuss this statement.
5. There is an advantage in stating the hypothesis both in the null and in the alternate; it adds clarity to
our thinking of what we are testing. Explain.
6. It is advantageous to develop a directional hypothesis whenever we are sure of the predicted direc-
tion. How will you justify this statement?
7. In recent decades, many service markets have been liberalized. For this reason, incumbent service
firms are facing new competitors and must address customer switching. You are discussing the
determinants of customer switching with a service firm manager. She believes that product qual-
ity, relationship quality, and switching costs are important determinants of customer switching.
You agree with the contention that product quality and relationship quality are important deter-
minants of switching. However, you believe that switching costs moderate the relationships
between product quality, relationship quality, and customer switching. Provide arguments for this
contention.

chapter theoretical framework and hypothesis development 93
8. For the following case:
a. Identify the problem.
b. Develop a diagram representing the conceptual model.
c. Develop the hypotheses.
Concerned about her current customer base, manager Andersen started to think of factors that might
affect the attractiveness of an auditing firm. Of course, the service quality provided and the fees charged
by the auditor seem two important factors. Next, she decides that the reputation of the auditing firm also
needs to be included in the framework as an independent variable. As illustrated by the dramatic effects
of recent auditing scandals, reputation seems especially important for large auditors (i.e., auditing firms
that are large in size). Finally, manager Andersen also thinks that the proximity of the auditing firm to
the customer is another variable to be included as an independent variable. Proximity very likely affects
the possibility for the client to personally meet with the auditors on a regular basis and she knows from
her own contact with customers that they perceive personal interactions as quite important.
9. Develop a conceptual model for the scenario below.
Incidence of smoking in movies has started to increase again, after having declined for several decades.
According to the National Cancer Institute, smoking is seen in at least three out of four contemporary
box‐office hits. What’s more, identifiable cigarette brands appeared in about one‐third of all movies in
2008. Exposure to smoking in movies is an important predictor of adolescent smoking initiation: smok-
ing in movies has been shown to affect adolescents’ intentions to start smoking. In turn, the intentions
to start smoking are determined by a more positive attitude toward smoking after seeing a film charac-
ter smoke. Recent research has revealed that the relationship between seeing a film character smoke and
the attitude toward smoking is stronger when a person’s identification with a film character increases.
These findings are consistent with social learning theory, which predicts that attitudes and behaviors
are modeled by observing the behaviors of others.
10. Develop a conceptual model for the following case.
Once given, bonuses are extraordinarily hard to take away without undermining employee morale. The
adverse effects of these cuts far outweigh the anticipated savings in dollars. Research has shown that
when the reason behind the cuts is explained to employees, morale does not drop.
11. Product placement is a form of advertising in which a company’s products and name are intention-
ally positioned in motion pictures, television programs, radio broadcasts, and the like. Product
placement can take many forms: verbal mentions in dialogue; actual use by a character; or visual
displays (for instance, a company logo on a vehicle or billboard). Develop a theoretical framework
on this issue, based on a review of the current literature. This framework should include:
a. a specification and definition of an appropriate dependent variable;
b. a conceptual model that describes the relationships between the dependent variable, at least one
independent variable, and either a moderating or a mediating variable;
c. a theory on why you would expect these relationships to exist;
d. an appropriate number of testable hypotheses.

94 research methods for business
PRACTICE PROJECT
For the topic you chose to work on for the project in Chapter 4, do the following:
● Go through the computer‐generated bibliography again.
● Define a problem statement that, in your opinion, would be most useful for researchers to investigate.
● Carry out a literature review that would seem to offer the greatest potential for developing a good
theoretical framework, using about five to seven references.
● Develop the theoretical framework incorporating its three basic features, as discussed in the chapter.
● Generate a set of testable hypotheses based on the theoretical framework.

95
INTRODUCTION
Up to now you have made a great effort to:
● develop a problem statement;
● develop a research proposal;
● conduct a critical review of the literature;
● document your literature review; and
● (in deductive research) develop a theoretical framework and hypotheses.
The next step is to design the research in such a way that the requisite data can be gathered and analyzed to
answer your research questions to be able to arrive at a solution for the problem that catalyzed the research project.
THE RESEARCH DESIGN
A research design is a blueprint or plan for the collection, measurement, and analysis of data, created to answer
your research questions.
The various issues involved in the research design and discussed in this chapter are shown comprehensively in
Figure 6.1. As may be seen, issues relating to decisions regarding the research strategy (for instance, experiments,
surveys, case studies), the extent to which the study is manipulated and controlled by the researcher (extent of
Elements of research design
C H A P T E R 6
LEARNING OBJECTIVES
After completing Chapter 6 you should be able to:
1. Explain what is meant by a research design.
2. Develop an appropriate research design for any given study.
3. Explain why a researcher might be constrained to settle for less than the “ideal” research design.
4. Demonstrate awareness of the role of the manager in the area of research design.

96 research methods for business
researcher interference), location (i.e., the study setting), the level at which the data will be analyzed (unit of analy-
sis), and temporal aspects (the time horizon) are integral to research design. These issues are discussed in this chapter.
As shown in Figure 6.1, each component of the research design offers several critical choice points. Obviously,
there is no single design that is superior in all circumstances. Instead, you will have to make choices and create a
design that is suitable for the job at hand. The quality of a research design depends on how carefully you choose
the appropriate design alternatives, taking into consideration the specific objectives, research questions, and
constraints of the project, such as access to data, time, and/or money.
In addition to the decisions above regarding the research design, choices have to be made as to the data collec-
tion method to be used, the type of sample (sampling design), how variables will be measured (measurement), and
how they will be analyzed to test the hypotheses (data analysis). These issues are discussed in subsequent chapters.
ELEMENTS OF RESEARCH DESIGN
Research strategies
A strategy is a plan for achieving a certain goal. A research strategy will help you to meet your research objective(s)
and to answer the research questions of your study. The choice for a particular research strategy will therefore
depend on the research objective(s) and (the type of) research questions of your study, but also on your view-
point on what makes good research and on practical aspects such as access to data sources and time constraints.
DATA
ANALYSIS
1. Feel for
data
2. Goodness of
data
3. Hypothesis
testing
DETAILS OF STUDY
PR
OB
LE
M S
TA
TE
ME
NT
Extent of researcher
interference
Minimal: Studying eventsas they normally occur
Manipulation and/orcontrol and/or simulation
Study setting
Contrived
Noncontrived
Unit of analysis(population to
be studied)
Individuals
Dyads
Groups
Organizations
Machines
etc.
Sampling
design
Probability/ nonprobability
Sample size (n)
Research strategies
Experiment
Survey research
Observation
Case studies
Grounded theory
Action research
Mixed methods
Data collection
method
Interviews
Observation
Questionnaires
Physical measurement
Unobtrusive
Measurement
and measures
Operational definition
Items (measure)
Scaling
Categorizing
Coding
MEASUREMENT
One-shot (cross-sectional)
Longitudinal
Time
horizon
F I G U R E 6 . 1
The research design

chapter elements of research design 97
In this section we will discuss the following research strategies: experiments, surveys, ethnography, case studies,
grounded theory, and action research.
Experiments
Experiments are usually associated with a hypothetico‐deductive approach to research. The purpose of an exper-
iment is to study causal relationships between variables. Experimental designs are less useful or appropriate for
answering exploratory and descriptive research questions.
In an experiment, the researcher manipulates the independent variable to study the effect of this manipulation
on the dependent variable. In other words, the researcher deliberately changes a certain variable (or certain varia-
bles), for instance “reward system”, to establish whether (and to what extent) this change will produce a change in
another variable, in this example “productivity”. The simplest experimental design is a two‐group, post‐test‐only,
randomized experiment, where one group gets a treatment, for instance “piece wages”. The other group (the com-
parison group, in this example the “hourly wages” group) does not get the treatment. Subjects (workers) are ran-
domly assigned to the groups and hence the researcher is able to determine whether the productivity of the two
groups is different after the treatment. Later on in this chapter, we will have more to say about the extent of researcher
interference with the study and the study setting. This will help us to make a distinction among field experiments
and lab experiments. Chapter 10 discusses lab experiments and field experiments, manipulation, controlling “nui-
sance” variables, factors affecting the validity of experiments, and various types of experiments in considerable detail.
Under the right circumstances, an experimental design is a very strong design to use. However, experimen-
tal designs are not always feasible in an applied research context where the researcher tries to solve a management
problem. For instance, we do not want (for obvious reasons) to assign customers to a low service quality treat-
ment to study the effect of service quality on customer retention or assign workers to highly stressful situations
to investigate the effect of work‐related stress on personal and professional relations. In such cases, we may opt
for an alternative research strategy to answer the research questions of their study.
Survey research
A survey is a system for collecting information from or about people to describe, compare, or explain their
knowledge, attitudes, and behavior (Fink, 2003). The survey strategy is very popular in business research, because
it allows the researcher to collect quantitative and qualitative data on many types of research questions. Indeed,
surveys are commonly used in exploratory and descriptive research to collect data about people, events, or
situations. For instance, in a business context, surveys are often taken on the subject of consumer decision
making, customer satisfaction, job satisfaction, the use of health services, management information systems, and
the like. A large number of such surveys are one‐time surveys. Other surveys are continuing, allowing the
researcher to observe changes over time. The questions in survey instruments are typically arranged into
self‐administered questionnaires that a respondent completes on his or her own, either on paper or via the
computer. Other survey instruments are interviews and structured observation. Interviews, observation, and
self‐administered questionnaires are discussed in subsequent chapters. Interviews are discussed in Chapter 7,
structured observation in Chapter 8, and self‐administered questionnaires in Chapter 9.
Ethnography
Ethnography is a research strategy that has its roots in anthropology. It is a strategy in which the researcher
“closely observes, records, and engages in the daily life of another culture [. . .] and then writes accounts of this
culture, emphasizing descriptive detail” (Markus & Fischer, 1986, p. 18). Ethnography involves immersion in the
particular culture of the social group that is being studied (such as, for instance, bankers in the City of London),

98 research methods for business
observing behavior, listening to what is said in conversations, and asking questions. It thus aims to generate an
understanding of the culture and behavior of a social group from an “insider’s point of view.”
Participant observation is closely related to ethnography. However, different people have different ideas about
the exact relationship between the two. Ethnography and participant observation are sometimes used interchange-
ably in the literature. For some, both ethnography and participant observation are research strategies that involve
spending long periods watching people and talking to them about what they are doing, thinking, and saying, with
the objective of generating an understanding of the social group under study (Delamont, 2004). For others,
ethnography is a more inclusive term, whereas participant observation is more specific and related to a particular
method of data collection. From this perspective, participant observation is a primary source of ethnographic
data. However, it is just one of a number of methods, and rarely the only method, used by a researcher to generate
an understanding of a culture or a social group. Along these lines, observation – observing behavior through a
long‐term engagement in the field setting where ethnography takes place – is regarded as one of several methods
for ethnographic research. Other methods, such as interviews and questionnaires, may also be used to collect data
in ethnographic research. We will have more to say about these various approaches to observation in Chapter 8.
Case studies
Case studies focus on collecting information about a specific object, event or activity, such as a particular business
unit or organization. In case studies, the case is the individual, the group, the organization, the event, or the situ-
ation the researcher is interested in. The idea behind a case study is that in order to obtain a clear picture of a
problem one must examine the real‐life situation from various angles and perspectives using multiple methods
of data collection. Along these lines, one may define a case study as a research strategy that involves an empirical
investigation of a particular contemporary phenomenon within its real‐life context using multiple methods of
data collection (Yin, 2009). It should be noted that case studies may provide both qualitative and quantitative
data for analysis and interpretation. As in experimental research, hypotheses can be developed in case studies as
well. However, if a particular hypothesis has not been substantiated in even a single other case study, no support
can be established for the alternate hypothesis developed.
Grounded theory
Grounded theory is a systematic set of procedures to develop an inductively derived theory from the data (Strauss &
Corbin, 1990). Important tools of grounded theory are theoretical sampling, coding, and constant comparison.
Theoretical sampling is “the process of data collection for generating theory whereby the analyst jointly collects,
codes, and analyzes the data and decides what data to collect next and where to find them, in order to develop
his theory as it emerges” (Glaser & Strauss, 1967, p. 45). In constant comparison you compare data (for instance,
an interview) to other data (for instance, another interview). After a theory has emerged from this process you
compare new data with your theory. If there is a bad fit between data (interviews), or between the data and your
theory, then the categories and theories have to be modified until your categories and your theory fit the data. In
constant comparison, discrepant and disconfirming cases play an important role in rendering categories and
(grounded) theory.
Action research
Action research is sometimes undertaken by consultants who want to initiate change processes in organiza-
tions. In other words, action research is a research strategy aimed at effecting planned changes. Here, the
researcher begins with a problem that is already identified, and gathers relevant data to provide a tentative
problem solution. This solution is then implemented, with the knowledge that there may be unintended

chapter elements of research design 99
consequences following such implementation. The effects are then evaluated, defined, and diagnosed, and
the research continues on an ongoing basis until the problem is fully resolved. Thus, action research is a
constantly evolving project with interplay among problem, solution, effects or consequences, and new solu-
tion. A sensible and realistic problem definition and creative ways of collecting data are critical to
action research.
Extent of researcher interference with the study
The extent of interference by the researcher has a direct bearing on whether the study undertaken is correlational
or causal. A correlational study (recall that a correlational study is descriptive in nature, see Chapter 3) is con-
ducted in a natural environment (for instance, a supermarket or the factory floor) with minimal interference by
the researcher with the normal flow of events. For example, if a researcher wants to study the factors influencing
training effectiveness (a correlational study), all that the individual has to do is delineate the relevant variables,
collect the relevant data, and analyze them to come up with the findings. Though there is some disruption to the
normal flow of work in the system as the researcher interviews employees and administers questionnaires in the
workplace, the researcher’s interference in the routine functioning of the system is minimal as compared to that
caused during causal studies and experimental designs.
In studies conducted to establish cause‐and‐effect relationships, the researcher tries to manipulate certain
variables so as to study the effects of such manipulation on the dependent variable of interest. In other words, the
researcher deliberately changes certain variables in the setting and interferes with the events as they normally
occur. As an example, a researcher might want to study the influence of lighting on worker performance; hence
he manipulates the lighting in the work situation to varying intensities. Here, there is considerable researcher
interference with the natural and normal setting. In other cases the researcher might even want to create an alto-
gether new artificial setting where the cause‐and‐effect relationships can be studied by manipulating certain
variables and tightly controlling certain others, as in a laboratory. Thus, there could be varying degrees of inter-
ference by the researcher in the manipulation and control of variables in the research study, either in the natural
setting or in an artificial lab setting.
Let us give examples of research with varying degrees of interference – minimal, moderate, and excessive.
EXAMPLE
Minimal interference
A hospital administrator wants to examine the relation-
ship between the perceived emotional support in the
system and the stresses experienced by the nursing staff.
In other words, she wants to do a correlational study.
Here, the administrator/researcher will collect data
from the nurses (perhaps through a questionnaire) to
indicate how much emotional support they get in the
hospital and to what extent they experience stress. (We
will learn in a later chapter how to measure these varia-
bles.) By correlating the two variables, the answer that is
being sought can be found. In this case, beyond admin-
istering a questionnaire to the nurses, the researcher has
not interfered with the normal activities in the hospital.
In other words, researcher interference has been minimal.
Moderate interference
The same researcher is now no longer content with find-
ing a correlation, but wants to firmly establish a causal
connection. That is, the researcher wants to demonstrate
that if the nurses had emotional support, this indeed
would cause them to experience less stress. If this can be

100 research methods for business
In summary, the extent of researcher interference is related to whether the research questions are correla-
tional or causal in nature and to the importance of establishing a causal relationship beyond any doubt what so ever.
Study setting: contrived and noncontrived
As we have just seen, business research can be done in the natural environment where events proceed normally
(i.e., in noncontrived settings) or in artificial, contrived settings. Exploratory and descriptive (correlational)
studies are invariably conducted in noncontrived settings, whereas most causal studies are done in contrived
lab settings.
established, then the nurses’ stress can definitely be
reduced by offering them emotional support. To test the
cause‐and‐effect relationship, the researcher will meas-
ure the stress currently experienced by the nurses in
three wards in the hospital, and then deliberately manip-
ulate the extent of emotional support given to the three
groups of nurses in the three wards for, perhaps, a week,
and measure the amount of stress at the end of that
period. For one group, the researcher will ensure that a
number of lab technicians and doctors help and comfort
the nurses when they face stressful events – for example,
when they care for patients suffering excruciating pain
and distress in the ward. Under a similar setup, for a
second group of nurses in another ward, the researcher
might arrange only a moderate amount of emotional
support, employing only the lab technicians and exclud-
ing doctors. The third ward might operate without any
emotional support. If the experimenter’s theory is cor-
rect, then the reduction in the stress levels before and
after the one‐week period should be greatest for the
nurses in the first ward, moderate for those in the second
ward, and nil for the nurses in the third ward. Here we
find that not only does the researcher collect data from
nurses on their experienced stress at two different points
in time, but she also “plays with” or manipulates the nor-
mal course of events by deliberately changing the amount
of emotional support received by the nurses in two
wards, while leaving things in the third ward unchanged.
Here, the researcher has interfered more than minimally.
Excessive interference
The above researcher, after conducting the previous
experiments, feels that the results may or may not be
valid since other external factors might have
influenced the stress levels experienced by the nurses.
For example, during that particular experimental
week, the nurses in one or more wards may not have
experienced high levels of stress because there were
no serious illnesses or deaths in the ward. Hence, the
emotional support received might not be related to
the level of stress experienced. The researcher might
now want to make sure that such extraneous factors
as might affect the cause‐and‐effect relationship are
controlled. So she might take three groups of medical
students, put them in different rooms, and confront
all of them with the same stressful task. For example,
she might ask them to describe in the minutest detail,
the procedures in performing surgery on a patient
who has not responded to chemotherapy and keep
bombarding them with more and more questions
even as they respond. Although all are exposed to the
same intensive questioning, one group might get help
from a doctor who voluntarily offers clarification and
help when students stumble. In the second group, a
doctor might be nearby, but might offer clarification
and help only if the group seeks it. In the third group,
there is no doctor present and no help is available. In
this case, not only is the support manipulated, but
even the setting in which this experiment is con-
ducted is artificial inasmuch as the researcher has
taken the subjects away from their normal environ-
ment and put them in a totally different setting. Here,
the researcher has intervened maximally with the
normal setting, the participants, and their duties. In
Chapter 10 we will see why such manipulations are
necessary to establish cause‐and‐effect relationships
beyond any doubt.

chapter elements of research design 101
Studies done in noncontrived settings are called field studies. Studies conducted to establish cause‐and‐effect
relationships using the same natural environment in which the subjects under study (employees, consumers,
managers, and the like) normally function are called field experiments. Here, as we have seen earlier,
the researcher does interfere with the natural occurrence of events inasmuch as the independent variable is
manipulated. For example, a manager wanting to know the effects of pay on performance should raise the salary
of employees in one unit, decrease the pay of employees in another unit, and leave the pay of the employees in
a third unit untouched. Here there is a tampering with, or manipulating of, the pay system to establish a cause‐
and‐effect relationship between pay and performance, but the study is still conducted in the natural setting and
hence is called a field experiment.
Experiments done to establish a cause‐and‐effect relationship beyond the possibility of the least doubt
require the creation of an artificial, contrived environment in which all the extraneous factors are strictly con-
trolled. Similar subjects are chosen carefully to respond to certain manipulated stimuli. These studies are referred
to as lab experiments. Let us give some further examples to understand the differences among a field study
(a noncontrived setting with minimal researcher interference), a field experiment (noncontrived setting but
with researcher interference to a moderate extent), and a lab experiment (a contrived setting with researcher
interference to an excessive degree).
EXAMPLE
Field study
A bank manager wants to analyze the relationship
between interest rates and bank deposit patterns of
clients. She tries to correlate the two by looking at
deposits into different kinds of accounts (such as savings,
certificates of deposit, golden passbooks, and interest‐
bearing checking accounts) as interest rates change.
This is a field study where the bank manager has
merely taken the balances in various types of account
and correlated them to the changes in interest rates.
Research here is done in a noncontrived setting with
no interference with the normal work routine.
Field experiment
The bank manager now wants to determine the cause‐
and‐effect relationship between the interest rate and
the inducement it offers to clients to save and deposit
money in the bank. She selects four branches within a
60‐mile radius for the experiment. For one week only,
she advertises the annual rate for new certificates of
deposit received during that week in the following
manner: the interest rate will be 9% in one branch, 8%
in another, and 10% in the third. In the fourth branch,
the interest rate remains unchanged at 5%. Within the
week, she will be able to determine the effects, if any, of
interest rates on deposit mobilization.
The above is a field experiment since nothing
but the interest rate is manipulated, with all activities
occurring in the normal and natural work environ-
ment. Hopefully, all four branches chosen will be more
or less compatible in size, number of depositors,
deposit patterns, and the like, so that the interest–savings
relationships are not influenced by some third factor.
But it is possible that some other factors might affect
the findings. For example, one of the areas may have
more retirees who may not have additional disposable
income to deposit, despite the attraction of a good
interest rate. The banker may not have been aware of
this fact while setting up the experiment.
Lab experiment
The banker in the previous example may now want to
establish the causal connection between interest rates
and savings, beyond a doubt. Because of this, she wants
to create an artificial environment and trace the true
cause‐and‐effect relationship. She recruits 40 students

102 research methods for business
Experimental designs are discussed more fully in Chapter 10. However, the above examples show us that
it is important to decide the various design details before conducting the research study, since one decision
criterion might have an impact on others. For example, if one wants to conduct an exploratory or a descriptive
study, then the necessity for the researcher to interfere with the normal course of events will be minimal.
However, if causal connections are to be established, experimental designs need to be set up either within
a setting where the events normally occur (a field experiment) or in an artificially created laboratory setting
(a lab experiment).
In summary, we have thus far made a distinction among (1) field studies, where various factors are examined
in the natural setting in which daily activities go on as normal with minimal researcher interference, (2) field
experiments, where cause‐and‐effect relationships are studied with some amount of researcher interference, but
still in the natural setting where events continue in the normal fashion, and (3) lab experiments, where the
researcher explores cause‐and‐effect relationships, not only exercising a high degree of control but also in an
artificial and deliberately created setting. In Chapter 10 we will see the advantages and disadvantages of using
contrived and noncontrived settings for establishing cause‐and‐effect relationships.
Unit of analysis: individuals, dyads, groups, organizations, cultures
The unit of analysis refers to the level of aggregation of the data collected during the subsequent data analysis
stage. If, for instance, the problem statement focuses on how to raise the motivational levels of employees in
general, then we are interested in individual employees in the organization and have to find out what we can do
to raise their motivation. Here the unit of analysis is the individual. We will be looking at the data gathered from
each individual and treating each employee’s response as an individual data source. If the researcher is interested
in studying two‐person interactions, then several two‐person groups, also known as dyads, will become the unit
of analysis. Analysis of husband–wife interactions in families and supervisor–subordinate relationships in the
workplace are good examples of dyads as the unit of analysis. However, if the problem statement is related to
group effectiveness, then the unit of analysis will be at the group level. In other words, even though we may
gather relevant data from all individuals comprising, say, six groups, we aggregate the individual data into group
data so as to see the differences among the six groups. If we are comparing different departments in the organiza-
tion, then the data analysis will be done at the departmental level – that is, the individuals in the department will
be treated as one unit – and comparisons made by treating the department as the unit of analysis.
who are all business majors in their final year of study
and are more or less of the same age. She splits them into
four groups and gives each one of them chips that count
for $1000, which they are told they might utilize to buy
their needs, or save for the future, or both. She offers
them, by way of incentive, interest on what they save but
manipulates the interest rates by offering a 6% interest
rate on savings for group 1, 8% for group 2, 9% for group
3, and keeps the interest at the low rate of 1% for group 4.
Here, the manager has created an artificial labora-
tory environment and has manipulated the interest
rates for savings. She has also chosen subjects with
similar backgrounds and exposure to financial matters
(business students). If the banker finds that the savings
by the four groups increase progressively, keeping in
step with the increasing rates of interest, she will be
able to establish a cause‐and‐effect relationship between
interest rates and the disposition to save.
In this lab experiment with the contrived setting,
the researcher interference has been maximal, inas-
much as the setting is different, the independent vari-
able has been manipulated, and most external nuisance
factors such as age and experience have been controlled.

chapter elements of research design 103
Our research question determines the appropriate unit of analysis. For example, if we wish to study group
decision‐making patterns, we will probably be examining such aspects as group size, group structure, cohesive-
ness, and the like, in trying to explain the variance in group decision making. Here, our main interest is not in
studying individual decision making but group decision making, and we will be studying the dynamics that oper-
ate in several different groups and the factors that influence group decision making. In such a case, the unit of
analysis will be groups.
As our research question addresses issues that move away from the individual to dyads, and to groups,
organizations, and even nations, so also does the unit of analysis shift from individuals to dyads, groups, organi-
zations, and nations. The characteristic of these “levels of analysis” is that the lower levels are subsumed within
the higher levels. Thus, if we study buying behavior, we have to collect data from, say, 60 individuals, and analyze
the data. If we want to study group dynamics, we may need to study, say, six or more groups, and then analyze the
data gathered by examining the patterns in each of the groups. If we want to study cultural differences among
nations, we will have to collect data from different countries and study the underlying patterns of culture in each
country. Some critical issues in cross‐cultural research are discussed in later chapters.
Individuals do not have the same characteristics as groups (e.g., structure, cohesiveness), and groups do
not have the same characteristics as individuals (e.g., IQ, stamina). There are variations in the perceptions,
attitudes, and behaviors of people in different cultures. Hence, the nature of the information gathered, as well
as the level at which data are aggregated for analysis, are integral to decisions made on the choice of the unit
of analysis.
It is necessary to decide on the unit of analysis even as we formulate the research question, since the data
collection methods, sample size, and even the variables included in the framework may sometimes be deter-
mined or guided by the level at which data are aggregated for analysis.
Let us examine some research scenarios that would call for different units of analysis.
EXAMPLE
Individuals as the unit of analysis
The Chief Financial Officer of a manufacturing com-
pany wants to know how many of the staff would be
interested in attending a three‐day seminar on making
appropriate investment decisions. For this purpose,
data will have to be collected from each individual staff
member and the unit of analysis is the individual.
Dyads as the unit of analysis
Having read about the benefits of mentoring, a human
resources manager wants to first identify the number
of employees in three departments of the organization
who are in mentoring relationships, and then find out
what the jointly perceived benefits (i.e., by both the
mentor and the one mentored) of such a relationship
are. Here, once the mentor and the mentored pairs are
identified, their joint perceptions can be obtained by
treating each pair as one unit. Hence, if the manager
wants data from a sample of 10 pairs, he will have to
deal with 20 individuals, a pair at a time. The informa-
tion obtained from each pair will be a data point for
subsequent analysis. Thus, the unit of analysis here
is the dyad.
Groups as the unit of analysis
A manager wants to see the patterns of usage of the
newly installed information system (IS) by the produc-
tion, sales, and operations personnel. Here, three
groups of personnel are involved and information on
the number of times the IS is used by each member in

104 research methods for business
It is now even easier to see why the unit of analysis should be given serious consideration even as the research
question is being formulated and the research design planned.
Time horizon: cross-sectional versus longitudinal studies
Cross-sectional studies
A study can be undertaken in which data are gathered just once, perhaps over a period of days or weeks or
months, in order to answer a research question. Such studies are called one‐shot or cross‐sectional studies (see
the following example).
The purpose of the studies in the two following examples was to collect data that would be pertinent to
finding the answer to a research question. Data collection at one point in time was sufficient. Both were cross‐
sectional designs.
each of the three groups, as well as other relevant issues,
will be collected and analyzed. The final results will
indicate the mean usage of the system per day or month
for each group. Here, the unit of analysis is the group.
Divisions as the unit of analysis
Procter & Gamble wants to see which of its various
divisions (soap, paper, oil, etc.) have made profits of
over 12% during the current year. Here, the profits
of each of the divisions will be examined and the
information aggregated across the various geographi-
cal units of the division. Hence, the unit of analysis
will be the division, at which level the data will be
aggregated.
Industry as the unit of analysis
An employment survey specialist wants to see the pro-
portion of the workforce employed by the health care,
utilities, transportation, and manufacturing industries.
In this case, the researcher has to aggregate the data
relating to each of the subunits comprised in each of the
industries and report the proportions of the workforce
employed at the industry level. The health care indus-
try, for instance, includes hospitals, nursing homes,
mobile units, small and large clinics, and other health
care providing facilities. The data from these subunits
will have to be aggregated to see how many employees
are employed by the health care industry. This will need
to be done for each of the other industries.
Countries as the unit of analysis
The Chief Financial Officer (CFO) of a multinational
corporation wants to know the profits made during the
past five years by each of the subsidiaries in England,
Germany, France, and Spain. It is possible that there are
many regional offices of these subsidiaries in each of
these countries. The profits of the various regional
centers for each country have to be aggregated and the
profits for each country for the past five years provided
to the CFO. In other words, the data will now have to be
aggregated at the country level. As can be easily seen,
the data collection and sampling processes become
more cumbersome at higher levels of units of analysis
(industry, country) than at the lower levels (individuals
and dyads). It is obvious that the unit of analysis has to
be clearly identified as dictated by the research ques-
tion. Sampling plan decisions will also be governed by
the unit of analysis. For example, if I compare two cul-
tures, for instance those of India and the United States
–where my unit of analysis is the country – my sample
size will be only two, despite the fact that I shall have to
gather data from several hundred individuals from a
variety of organizations in the different regions of each
country, incurring huge costs. However, if my unit of
analysis is individuals (as when studying the buying
patterns of customers in the southern part of the United
States), I may perhaps limit the collection of data to a
representative sample of a hundred individuals in that
region and conduct my study at a low cost!

chapter elements of research design 105
Longitudinal studies
In some cases, however, the researcher might want to study people or phenomena at more than one point in
time in order to answer the research question. For instance, the researcher might want to study employees’
behavior before and after a change in the top management, so as to know what effects the change accom-
plished. Here, because data are gathered at two different points in time, the study is not cross‐sectional or of
the one‐shot kind, but is carried longitudinally across a period of time. Such studies, as when data on the
dependent variable are gathered at two or more points in time to answer the research question, are called
longitudinal studies.
EXAMPLE
E.1 Data were collected from stock brokers between
April and June of last year to study their concerns in a
turbulent stock market. Data with respect to this par-
ticular research had not been collected before, nor will
they be collected again for this research.
E.2 A drug company wanting to invest in research for
a new obesity (reduction) pill conducted a survey among
obese people to see how many of them would be interested
in trying the new pill. This is a one‐shot or cross‐sectional
study to assess the likely demand for the new product.
EXAMPLE
E.1 A marketing manager is interested in tracing the
pattern of sales of a particular product in four different
regions of the country on a quarterly basis for the next
two years. Since data will be collected several times to
answer the same issue (tracing pattern of sales), the
study falls into the longitudinal category.
E.2 In 2002, Sturges, Guest, Conway and Davey pub-
lished the results of a two‐wave longitudinal study
investigating the relationship between career manage-
ment and organizational commitment among gradu-
ates in the first ten years at work. Data were collected at
two points in time 12 months apart. The results of this
study showed that high organizational commitment
predicts the practice of career management activities
by graduates to further their career within the organi-
zation. On the other hand, low commitment was
closely associated with behavior aimed at furthering
their career outside the organization. The results also
pointed out that graduates who manage their own
careers receive more career management help from
their employer. This suggests that there may be the
potential for employers to create a “virtuous circle” of
career management in which individual and organiza-
tional activities complement each other.
Longitudinal studies take more time and effort and cost more than cross‐sectional studies. However,
well‐planned longitudinal studies can, among other things, help to identify cause‐and‐effect relationships. For
example, one could study the sales volume of a product before and after an advertisement, and provided other
environmental changes have not impacted on the results, one could attribute the increase in the sales volume,
if any, to the advertisement. If there is no increase in sales, one could conclude that either the advertisement is
ineffective or it will take a longer time to take effect.
Experimental designs invariably are longitudinal studies, since data are collected both before and after a
manipulation. Field studies may also be longitudinal. For example, a study of the comparison data pertaining to
the reactions of managers in a company toward working women now and ten years later will be a longitudinal

106 research methods for business
field study. Most field studies conducted, however, are cross‐sectional in nature often because of the time, effort,
and costs involved in collecting data over several time periods. Longitudinal studies will certainly be necessary if
a manager wants to keep track of certain factors (e.g., sales, advertising effectiveness, etc.) over a period of time
to assess improvements, or to detect possible causal connections (sales promotions and actual sales data; fre-
quency of drug testing and reduction in drug usage, etc.). Though more expensive, longitudinal studies offer
some good insights.
MIXED METHODS
Earlier (in Chapter 3) we explained that qualitative studies are often carried out to better understand the nature
of a problem. Extensive interviews with many people might have to be undertaken to get a handle on the situa-
tion and understand the phenomenon. When the data reveal some pattern regarding the phenomenon of inter-
est, theories are developed and hypotheses formulated. Other methods, such as an experimental method, for
instance, are subsequently used to test these hypotheses. Along these lines, combinations of qualitative and quan-
titative methods are used in many studies.
Mixed methods research aims to answer research questions that cannot be answered by “qualitative” or
“quantitative” approaches alone. Mixed methods research focuses on collecting, analyzing, and mixing both
quantitative and qualitative data in a single study or series of studies. A mixed methods approach is increasingly
advocated within business research. The attractiveness of this approach is that it allows researchers to combine
inductive and deductive thinking, to use more than one research method to address the research problem, and
to solve this problem using different types of data. On the other hand, a mixed methods approach complicates
the research design and therefore requires clear presentation to allow the reader to sort out its different
components.
EXAMPLE
Henry Mintzberg interviewed managers to explore the
nature of managerial work. Based on the analysis of his
interview data, he formulated theories of managerial
roles, the nature and types of managerial activities, and
so on. These have been tested in different settings
through both interviews and questionnaire surveys.
Triangulation is a technique that is also often associated with using mixed methods. The idea behind trian-
gulation is that one can be more confident in a result if the use of different methods or sources leads to the same
results. Triangulation requires that research is addressed from multiple perspectives. Several kinds of triangula-
tion are possible:
● Method triangulation: using multiple methods of data collection and analysis.
● Data triangulation: collecting data from several sources and/or at different time periods.
● Researcher triangulation: multiple researchers collect and/or analyze the data.
● Theory triangulation: multiple theories and/or perspectives are used to interpret and explain the data.

chapter elements of research design 107
TRADEOFFS AND COMPROMISES
This concludes the discussions on the basic design issues regarding the research strategy, extent of researcher
interference, study setting, unit of analysis, and the time horizon. The researcher determines the appropriate
decisions to be made in the study design based on the research perspective of the investigator, the research
objective(s), research questions, the extent of rigor desired, and practical considerations. Sometimes, because
of the time and costs involved, a researcher might be constrained to settle for less than the “ideal” research
design. For instance, the researcher might have to conduct a cross‐sectional instead of a longitudinal study, do
a field study rather than an experimental design, choose a smaller rather than a larger sample size, and so on,
thus suboptimizing the research design decisions and settling for a lower level of scientific rigor because of
resource constraints. This trade‐off between rigor and practical considerations will be a deliberate and con-
scious decision made by the manager/researcher, and will have to be explicitly stated in the research report.
Compromises so made also account for why management studies are not entirely scientific, as discussed in
Chapter 2. Mixed methods research focuses on collecting, analyzing, and mixing both quantitative and qualita-
tive data in a single study or series of studies. As stated above, a mixed methods approach complicates the research
design and therefore requires clear presentation to allow the reader to sort out its different components.
Regardless of the complexity of the design, the researcher always has to be very clear about each aspect discussed
in this chapter before embarking on data collection.
Now do Exercises 6.1, 6.2, 6.3, and 6.4.
EXERCISE 6.1
A foreman thinks that the low efficiency of the machine tool operators is directly linked to the high level
of fumes emitted in the workshop. He would like to prove this to his supervisor through a research study.
1. Would this be a causal or a correlational study? Why?
2. Is this an exploratory, a descriptive, or a causal study? Why?
3. What kind of a study would this be: field study, lab experiment, or field experiment? Why?
4. What would be the unit of analysis? Why?
5. Would this be a cross‐sectional or a longitudinal study? Why?
EXERCISE 6.2
You want to examine how exposure to thin or heavy models in advertisements influences a person’s self‐
esteem. You believe that the effect of exposure to models in advertisements depends on the extremity of the
model’s thinness or heaviness. Discuss the design decisions that you as a researcher will make to investigate
this issue, giving reasons for your choices.

108 research methods for business
MANAGERIAL IMPLICATIONS
Knowledge about research design issues helps the manager to understand what the researcher is attempting
to do. The manager also understands why the reports sometimes indicate data analytic results based on small
sample sizes, when a lot of time has been spent in collecting data from several scores of individuals, as in the case
of studies involving groups, departments, or branch offices.
One of the important decisions a manager has to make before starting a study pertains to how rigorous the
study ought to be. Knowing that more rigorous research designs consume more resources, the manager is in a posi-
tion to weigh the gravity of the problem experienced and decide what kind of design will yield acceptable results in
an efficient manner. For example, the manager might decide that knowledge of which variables are associated with
employee performance is good enough to enhance performance results and there is no need to ferret out the cause.
Such a decision would result not only in economy in resources, but also cause the least disruption to the smooth
flow of work for employees and preclude the need for collecting data longitudinally. Knowledge of interconnections
among various aspects of the research design helps managers to call for the most effective study, after weighing the
nature and magnitude of the problem encountered, and the type of solution desired.
One of the main advantages in fully understanding the difference between causal and correlational studies
is that managers do not fall into the trap of making implicit causal assumptions when two variables are only
associated with each other. They realize that A could cause B, or B could cause A, or both A and B could covary
because of some third variable.
Knowledge of research design details also helps managers to study and intelligently comment on research
proposals and on research reports.
SUMMARY
● Learning objective 1: Explain what is meant by a research design.
A research design is a blueprint or plan for the collection, measurement, and analysis of data, created to answer
your research questions. Issues relating to decisions regarding the research strategy (for instance, experiments,
surveys, case studies), the extent of researcher interference, location (i.e., the study setting), the level at which
the data will be analyzed (unit of analysis), and temporal aspects (the time horizon) are integral to research design.
EXERCISE 6.4
You are interested in how person–organization fit relates to employees’ affective commitment and intention
to stay with an organization during the early stages of a strategic organizational change.
EXERCISE 6.3
You want to investigate the specific effects of specific emotions on customers’ behavioral responses to
failed service encounters across industries. Discuss the design decisions that you as a researcher will make
to investigate this issue, giving reasons for your choices.

chapter elements of research design 109
Visit the companion website at www.wiley.com/college/sekaran for Case Study: The
effect of calorie information on food consumption.
DISCUSSION QUESTIONS
1. What are the basic research design issues? Describe them in some detail.
2. Why is it important to consider basic design issues before conducting the study and even as early as
at the time of formulating the research question?
3. Is a field study totally out of the question if one is trying to establish cause‐and‐effect relationships?
4. “A field study is often more useful than a lab experiment.” Discuss this statement.
5. Why is the unit of analysis an integral part of the research design?
6. Discuss the interrelationships among the research questions of a study (exploratory, descriptive,
causal), study setting (noncontrived or contrived), researcher interference, research strategy, and
time horizon of study.
7. Below are three scenarios. Indicate how the researcher should proceed in each case; that is, determine
the following, giving reasons:
a. Type of research question (exploratory, descriptive, or causal).
b. The extent of researcher interference.
● Learning objective 2: Develop an appropriate research design for any given study.
Each component of the research design offers several critical choice points. There is no single design that
is superior in all circumstances. Instead, the researcher will have to make choices and create a design that is
suitable for the job at hand. The researcher determines the appropriate decisions to be made in the study
design based on the research perspective of the investigator, the research objective(s), research questions,
the extent of rigor desired, and practical considerations.
● Learning objective 3: Explain why a researcher might be constrained to settle for less than the “ideal”
research design.
Sometimes, because of the time and costs involved, a researcher might be constrained to settle for less than
the “ideal” research design. For instance, the researcher might have to conduct a field study rather than an
experimental design or choose a smaller rather than a larger sample size thus sub-optimizing the research
design decisions and settling for a lower level of scientific rigor because of resource constraints. This trade-
off between rigor and practical considerations should be a deliberate and conscious decision made by the
researcher.
● Learning objective 4: Demonstrate awareness of the role of the manager in the area of research design.
Knowledge about research design issues helps the manager to understand what the researcher is attempting
to do and to study and intelligently comment on research proposals and on research reports.

110 research methods for business
c. The study setting.
d. The research strategy.
e. The time horizon for the study.
f. The unit of analysis.
Scenario 1
A specific department within an organization has a high turnover rate; employees of this department
have a shorter average tenure than those of other departments in the company. Skilled workers are
leaving and the worker population contains a high percentage of novice workers. Ms Joyce Lynn has no
idea what is going on and wants to know more about what is happening.
Scenario 2
Mr Paul Hodge, the owner of several restaurants on the East Coast, is concerned about the wide differences
in their profit margins. He would like to try some incentive plans for increasing the efficiency levels of
those restaurants that lag behind. But before he actually does this, he would like to be assured that the
idea will work. He asks a researcher to help him on this issue.
Scenario 3
A manager is intrigued as to why some people seem to derive joy from work and get energized by it, while
others find it troublesome and frustrating.

111
INTRODUCTION
Having discussed a number of basic issues in research design in the previous chapter, we will now turn to primary
data collection methods – or ways in which data collected from original sources for the specific purpose of this
study can be gathered. Data collection methods are an integral part of research design, as shown in the shaded
portion of Figure 7.1.
The aim of this chapter is to introduce a commonly used method of primary data collection: interviewing.
Different types of interviews are discussed and ways in which to structure and carry out interviews are explained.
The chapter starts with an introduction to primary data collection methods.
PRIMARY DATA COLLECTION METHODS
Since business is largely a social phenomenon, much of the information needed to make decisions in the work
setting has to come from people – for instance from employees, consumers, managers, investors, and/or suppli-
ers. For this reason, interviews, observation, and questionnaires are very popular in business research; these
methods allow the researcher to collect a wide variety of different sorts of data from human respondents. We
discuss these methods in, respectively, Chapter 7, Chapter 8, and Chapter 9. After we have discussed these non‐
experimental approaches to the collection of primary data, we discuss experimental designs in Chapter 10. In this
way, our discussion on primary data collection methods is organized around four principal methods of primary
data collection.
INTERVIEWS
C H A P T E R 7
LEARNING OBJECTIVES
After completing Chapter 7, you should be able to:
1. Differentiate primary from secondary data collection methods.
2. Plan, design, and carry out a personal interview.
3. Plan, design, and carry out a group interview.
4. Discuss the advantages and disadvantages of interviewing.

112 research methods for business
A thorough knowledge of the most important methods will help you to evaluate alternative approaches
to primary data collection (check Box 7.1 for a further example). As you will understand, the primary data
collection decision – which involves the selection of the method(s) of obtaining the information needed – is
interrelated with the other steps in the research process. That is why your choice of method(s) will depend on the
objective(s) of the study, the research questions, and the research strategy. Facilities available, the degree of accu-
racy required, the type of data required, the time span of the study, the expertise of the reviewer, and other costs
and resources associated with and available for data gathering will also affect the choice of method(s). Problems
researched with the use of appropriate methods greatly enhance the value of the study.
DATA
ANALYSIS
1. Feel for
data
2. Goodness of
data
3. Hypothesis
testing
DETAILS OF STUDY
PR
OB
LE
M S
TA
TE
ME
NT
Extent of researcher
interference
Minimal: Studying eventsas they normally occur
Manipulation and/orcontrol and/or simulation
Sampling
design
Probability/ nonprobability
Sample size (n)
Measurement
and measures
Operational definition
Items (measure)
Scaling
Categorizing
Coding
MEASUREMENT
Time
horizon
One-shot (cross-sectional)
Longitudinal
Study setting
Contrived
Noncontrived
Unit of analysis(population to
be studied)
Individuals
Dyads
Groups
Organizations
Machines
etc.
Research strategies
Experiment
Survey research
Observation
Case studies
Grounded theory
Action research
Mixed methods
Data collection
method
Interviews
Observation
Questionnaires
Physical measurement
Unobtrusive
F I G U R E 7 . 1
Research design and how data collection methods fit in
BOX 7.1
UNOBTRUSIVE METHODS
Unobtrusive methods do not require the researcher to interact with the people he or she is studying.
Unobtrusive methods are sometimes used by researchers who seek to understand what people actually do ,
instead of what they say they do (as in interviews or in questionnaires). Internet clickstream data exem-
plify unobtrusive data. Nowadays, virtually every commercial website monitors traffi c to its site to collect
BOX 7 1

chapter interviews 113
INTERVIEWS
A widely used method of collecting data in business research is to interview respondents to obtain information
on an issue of interest. An interview is a guided, purposeful conversation between two or more people. There
are many different types of interviews. Individual or group interviews may be unstructured or structured, and
conducted face to face, by telephone, or online.
Unstructured and structured interviews will be discussed first. Some important factors to be borne in mind
while interviewing will then be detailed. Next, the advantages and disadvantages of face‐to‐face interviewing
and telephone interviews are considered and then, computer‐assisted interviews are described. A discussion on
group interviews concludes this chapter. Managerial implications and ethics in interviews and other types of
survey research are discussed in Chapter 9 after we have discussed interviews, observation, and administering
questionnaires in greater detail.
Unstructured and structured interviews
Unstructured interviews
Unstructured interviews are so labeled because the interviewer does not enter the interview setting with a
planned sequence of questions to be asked of the respondent. A possible objective of an unstructured interview
is to bring some preliminary issues to the surface so that the researcher can determine what factors need further
in‐depth investigation. In Chapter 3, in the discussion of the “broad problem area,” we saw several situations
where the manager might entertain a vague idea of certain changes taking place in the situation without knowing
what exactly they are. Such situations call for unstructured interviews with the people concerned.
data on its visitors. Based on the observed behavior of these visitors, it is possible to develop a thorough
understanding of the website’s customer base. This helps managers to predict likely future behavioral pat-
terns but also to anticipate customers’ responses to (future) marketing activities. Like this, clickstream data
provide managers with a valuable tool to shape their marketing efforts (cf. Park and Fader, 2004). Scanner
data (data on sales of consumer goods obtained by scanning bar codes of products in retail outlets) also
provide managers with detailed information about the effects of marketing activities (such as price pro-
motions) on sales (cf. Van Heerde, Gupta and Wittink, 2003). Other examples of unobtrusive methods
are the wear and tear of books in a library, which offers a good indication of their popularity, frequency of
use, or both; the number of different brands of soft drink cans found in trash bags, which offers a measure
of their consumption levels; signatures on checks exposed to ultraviolet rays, which can indicate forgery
and fraud; and actuarial records, which are good sources for collecting data on the births, marriages, and
deaths in a community. These unobtrusive sources of data and their use are important in research aimed
at understanding behavior.
Visit the companion website at www.wiley.com/college/sekaran for Author Video:
Interviewing.

114 research methods for business
Suppose that a manager is interested in solving a problem in the work setting. In order to understand the situation
in its totality, the researcher may interview employees at several levels. In the initial stages, only broad, open‐ended
questions should be asked, and the replies to them should inform the researcher of the perceptions of the individuals.
The type and nature of the questions asked of the individuals might vary according to the job level and type of work
done by them. For instance, top and middle‐level managers might be asked more direct questions about their percep-
tions of the problem and the situation. Employees at lower levels may have to be approached differently.
Clerical and other employees at lower hierarchical levels may be asked broad, open‐ended questions about
their jobs and the work environment during unstructured interviews. Supervisors may be asked broad questions
relating to their department, the employees under their supervision, and the organization. The following
question, for instance, may be put to them during the unstructured interview stage:
Tell me something about your unit and department, and perhaps even the organization as a whole,
in terms of work, employees, and whatever else you think is important.
Such a question might elicit an elaborate response from some people; others may just say that everything is
fine. Following the leads from the more vocal persons is easy, especially when the interviewer listens carefully to
the important messages that they might convey in a very casual manner while responding to a general, global
question. As managers and researchers, we should train ourselves to develop these listening skills and identify the
critical topics that are touched on. However, when some respondents give a monosyllabic, crisp, short reply that
is not informative, the interviewer will have to ask questions that call for details and cannot be answered in one
or two words. Such questions might be phrased like the one below:
I would like to know something about your job. Please describe to me in detail the things you do in
your job on a typical day, from eight in the morning to four in the afternoon.
Several questions might then be asked as a follow‐up to the answer. Some examples of such follow‐up
questions include:
Compared to other units in this organization, what are the strengths and weaknesses of your unit?
If you could have a problem solved in your unit, or a bottleneck eliminated, or something attended to
that blocks your effectiveness, what would that be?
If the respondent answers that everything is fine and she has no problems, the interviewer could say: “That
is great! Tell me what contributes to this effectiveness of your unit, because most other organizations usually experi-
ence several difficulties.” Such a questioning technique usually brings the respondent’s defenses down and makes
him or her more amenable to sharing information. Typical of the revised responses to the original question
would be something like, “Well, it is not that we never have a problem; sometimes there is delay in getting the jobs
done, crash jobs have some defective items, . . .” Encouraging the respondent to talk about both the good things
and those not‐so‐good in the unit can elicit a lot of information. Whereas some respondents do not need much
encouragement to speak, others do, and they have to be questioned broadly. Some respondents may show reluc-
tance to be interviewed, and subtly or overtly refuse to cooperate. The wishes of such people must be respected
and the interviewer should pleasantly terminate such interviews.
Employees at the shop‐floor level, and other nonmanagerial and nonsupervisory employees, might be asked
very broad questions relating to their jobs, work environment, satisfactions and dissatisfactions at the workplace,
and the like – for example:

chapter interviews 115
What do you like about working here?
If you were to tell me which aspects of your job you like and which you do not, what would they be?
Tell me something about the reward systems in this place.
If you were offered a similar job elsewhere, how willing would you be to take it and why?
If I were to seek employment here and request you to describe your unit to me as a newcomer, what
would you say?
After conducting a sufficient number of such unstructured interviews with employees at several levels and
studying the data obtained, the researcher would know the variables that needed greater focus and called for
more in‐depth information.
This sets the stage for the interviewer to conduct further structured interviews, for which the variables will
have been identified.
Structured interviews
Structured interviews are those conducted when it is known at the outset what information is needed.
The content of a structured interview can be prepared in advance, and usually consists of:
● an introduction: the interviewer introduces him‐ or herself, the purpose of the interview, assures confidential-
ity, asks permission to record the interview;
● a set of topics (usually questions) in a logical order: first “warm‐up” questions (which are easy to answer and
non‐threatening) and then the main questions covering the purpose of the interview;
● suggestions for probing questions (Box 7.2 ): follow‐up questions that are used when the first answer is unclear
or incomplete, the interviewer does not fully understand the answer, or in any other case where the interviewer
requires more specific or in‐depth information.
BOX 7.2
PROBING TACTICS
● Silence.
● Repeating the answer.
● “So what I hear you saying is . . .”
● “I ’ m not quite sure I understood . . . Could you . . .”
● “Could you please tell me more about . . .”
● “Could you give an example?”
● “Could you go over that again?”
● “Anything else?”
BOX 7 2

116 research methods for business
As the respondents express their views, the researcher notes them down. The same questions will be
asked of everybody in the same manner. Sometimes, however, based on the exigencies of the situation,
the experienced researcher might take a lead from a respondent’s answer and ask other relevant questions
not on the interview protocol. Through this process, new factors might be identified, resulting in a deeper
understanding. However, to be able to recognize a probable response, the interviewer must comprehend
the purpose and goal of each question. This is particularly important when a team of trained interviewers
conducts the survey.
Visual aids such as pictures, line drawings, cards, and other materials are also sometimes used in conducting
interviews. The appropriate visuals are shown to the interviewees, who then indicate their responses to the
questions posed. Marketing research, for example, benefits from such techniques in order to capture the likes and
dislikes of customers with regard to different types of packaging, forms of advertising, and so on. Visual aids,
including painting and drawing, are particularly useful when children are the focus of marketing research. Visual
aids also come in handy while endeavoring to elicit certain thoughts and ideas that are difficult to express or
awkward to articulate.
When a sufficient number of structured interviews has been conducted and adequate information obtained
to understand and describe the important factors operating in the situation, the researcher stops the interviews.
The information is then tabulated and the data analyzed. This helps the researcher to accomplish the task he set
out to achieve, such as describing the phenomena, or quantifying them, or identifying the specific problem and
evolving a theory of the factors that influence the problem, or finding answers to the research question. Much
qualitative research is done in this manner.
Review of unstructured and structured interviews
The main purpose of the unstructured interview is to explore and probe into the several factors in the situation
that might be central to the broad problem area. During this process it might become evident that the problem,
as identified by the client, is but a symptom of a more serious and deep‐rooted problem. Conducting unstruc-
tured interviews with many people could result in the identification of several critical factors in the situation.
These would then be pursued further during structured interviews for eliciting more in‐depth information on
them. This helps identify the critical problem as well as ways of solving it. In applied research, a tentative theory
of the factors contributing to the problem is often conceptualized on the basis of the information obtained from
unstructured and structured interviews.
Training interviewers
When several long interviews are to be conducted, it is often not feasible for one individual to conduct all the
interviews. A team of trained interviewers then becomes necessary. Interviewers have to be thoroughly briefed
about the research and trained in how to start an interview, how to proceed with the questions, how to motivate
respondents to answer, what to look for in the answers, and how to close an interview. They also need to be
instructed about taking notes and coding the interview responses. The tips for interviewing, discussed later,
should become a part of their repertoire for interviewing.
Good planning, proper training, offering clear guidelines to interviewers, and supervising their work all help
in profitably utilizing the interviewing technique as a viable data collection mechanism. Personal interviews
provide rich data when respondents spontaneously offer information, in the sense that their answers do not
typically fall within a constricted range of responses, as in a questionnaire. However, personal interviews are
expensive in terms of time, training costs, and resource consumption.

chapter interviews 117
Some tips to follow when interviewing
The information obtained during the interviews should be as free as possible of bias. Bias refers to errors or
inaccuracies in the data collected. Bias could be introduced by the interviewer, the interviewee, or the situation.
The interviewer could bias the data if proper trust and rapport are not established with the interviewee, or when
the responses are either misinterpreted or distorted, or when the interviewer unintentionally encourages or
discourages certain types of response through gestures and facial expressions.
Listening attentively to the interviewee, evincing keen interest in what the respondent has to say, exercising
tact in questioning, repeating and/or clarifying the questions posed, and paraphrasing some of the answers to
ensure their thorough understanding go a long way in keeping alive the interest of the respondent throughout
the interview. Recording the responses accurately is equally important.
Interviewees can bias the data when they do not come out with their true opinions but provide information
that they think is what the interviewer expects of them or would like to hear. Also, if they do not understand the
questions, they may feel diffident or hesitant to seek clarification. They may then answer questions without
knowing their importance, and thus introduce bias.
Some interviewees may be turned off because of personal likes and dislikes, or the dress of the interviewer,
or the manner in which the questions are put. They may, therefore, not provide truthful answers, but instead,
deliberately offer incorrect responses. Some respondents may also answer questions in a socially acceptable
manner rather than indicating their true sentiments.
Biases could be situational as well, in terms of (1) nonparticipants, (2) trust levels and rapport established,
and (3) the physical setting of the interview. Nonparticipation, either because of unwillingness or the inability
of the interviewee to participate in the study, can bias data inasmuch as the responses of the participants may
be different from those of the nonparticipants (which implies that a biased, rather than a representative, set of
responses is likely to result). Bias also occurs when different interviewers establish different levels of trust and
rapport with their interviewees, thus eliciting answers of varying degrees of openness. The actual setting in which
the interview is conducted might sometimes introduce bias. Some individuals, for instance, may not feel quite at
ease when interviewed at the workplace and therefore may not respond frankly and honestly.
In door‐to‐door or telephone interviews, when the respondent cannot be reached due to unavailability at
that time, callbacks and further contacts should be attempted so that the sample does not become biased
(discussed in Chapter 13 on Sampling). The interviewer can also reduce bias by being consistent with the
questioning mode as each person is interviewed, by not distorting or falsifying the information received, and by
not influencing the responses of the subjects in any manner.
The above biases can be minimized in several ways. The following strategies will be useful for the purpose.
Establishing credibility and rapport, and motivating individuals to respond
The projection of professionalism, enthusiasm, and confidence is important for the interviewer. For instance, a
manager hiring outside researchers to deal with a problem within an organization would be interested in assess-
ing their abilities and personality predispositions. Researchers must establish rapport with, and gain the confi-
dence and approval of, the hiring client before they can even start their work in the organization. Knowledge,
skills, ability, confidence, articulateness, and enthusiasm are therefore qualities a researcher must demonstrate in
order to establish credibility with the hiring organization and its members.
To obtain honest information from the respondents, the researcher/interviewer should be able to establish
rapport and trust with them. In other words, the researcher should be able to make the respondent sufficiently at
ease to give informative and truthful answers without fear of adverse consequences. To this end, the researcher

118 research methods for business
should state the purpose of the interview and assure complete confidentiality about the source of the responses.
Establishing rapport with the respondents may not be easy, especially when interviewing employees at lower
levels. They are likely to be suspicious of the intentions of the researchers; they may believe that the researchers
are on the management’s “side,” and therefore likely to propose a reduction in the labor force, an increase in the
workload, and so on. Thus, it is important to ensure that everyone concerned is aware of the researchers’ purpose
as being one of merely understanding the true state of affairs in the organization. The respondents must be
tactfully made to understand that the researchers do not intend to take sides; they are not there to harm the staff,
and will provide the results of research to the organization only in aggregates, without disclosing the identity of
the individuals. This should encourage the respondents to feel secure about responding.
The researcher can establish rapport by being pleasant, sincere, sensitive, and nonevaluative. Evincing a
genuine interest in the responses and allaying any anxieties, fears, suspicions, and tensions sensed in the situation
will help respondents to feel more comfortable with the researchers. If the respondent is told about the purpose
of the study and how he or she was chosen to be one of those interviewed, there should be better communication
between the parties. Researchers can motivate respondents to offer honest and truthful answers by explaining
to them that their contribution will indeed help, and that they themselves may stand to gain from such a survey,
in the sense that the quality of life at work for most of them may improve significantly.
Certain other strategies in how questions are posed also help participants to offer less biased responses.
These are discussed below.
The questioning technique
Funneling At the beginning of an unstructured interview, it is advisable to ask open‐ended questions to get a
broad idea and form some impressions about the situation. For example a question that could be asked would be:
What are some of your feelings about working for this organization?
From the responses to this broad question, further questions that are progressively more focused may be
asked as the researcher processes the interviewees’ responses and notes some possible key issues relevant to the
situation. This transition from broad to narrow themes is called the funneling technique.
Unbiased questions It is important to ask unbiased questions to ensure that you minimize bias in the
responses. For example, “Tell me how you experience your job” is a better question than, “Boy, the work you do
must be really boring; let me hear how you experience it.” The latter question is “loaded” in terms of the inter-
viewer’s own perceptions of the job. A loaded question might influence the types of answers received from the
respondent. Bias could also be introduced by emphasizing certain words, by tone and voice inflections, and
through inappropriate suggestions.
Clarifying issues To make sure that the researcher understands issues as the respondent intends to represent
them, it is advisable to restate or rephrase important information given by the respondent. For instance, if the
interviewee says, “There is an unfair promotion policy in this organization; seniority does not count at all – it is
the juniors who always get promoted,” the researcher might interject, “So you are saying that juniors always get
promoted over the heads of even capable seniors.” Rephrasing in this way clarifies the issue of whether or not the
respondent considers ability important. If certain things that are being said are not clear, the researcher should
seek clarification. For example, if the respondent happens to say, “The facilities here are really poor; we often have
to continue working even when we are dying of thirst,” the researcher might ask if there is no water fountain or
drinking water available in the building. The respondent’s reply to this might well indicate that there is a water
fountain across the hall, but the respondent would like one on his side of the work area as well.

chapter interviews 119
Helping the respondent to think through issues If the respondent is not able to verbalize her
perceptions, or replies, “I don’t know,” the researcher should ask the question in a simpler way or rephrase it.
For instance, if a respondent is unable to specify what aspects of the job he dislikes, the researcher might ask the
question in a simpler way. For example, the respondent might be asked which task he would prefer to do: serve a
customer or do some filing work. If the answer is “serve the customer,” the researcher might use another aspect of
the respondent’s job and ask the paired‐choice question again. In this way, the respondent can sort out which
aspects of the job he likes better than others.
Taking notes When conducting interviews, it is important that the researcher makes written notes as the
interviews are taking place, or as soon as the interview is terminated. The interviewer should not rely on
memory, because information recalled from memory is imprecise and often likely to be incorrect. Furthermore,
if more than one interview is scheduled for the day, the amount of information received increases, as do possible
sources of error in recalling from memory who said what. Information based solely on recall introduces bias
into the research.
The interviews can be recorded on tape if the respondent has no objection. However, taped interviews might
bias the respondents’ answers because they know that their voices are being recorded, and their anonymity is not
preserved in full. Hence, even if the respondents do not object to being taped, there could be some bias in their
responses. Before recording or videotaping interviews, one should be reasonably certain that such a method of
obtaining data is not likely to bias the information received. Any audio or videotaping should always be done
only after obtaining the respondent’s permission.
Review of tips to follow when interviewing
Establishing credibility as able researchers is important for the success of the research project. Researchers
need to establish rapport with the respondents and motivate them to give responses relatively free from bias
by allaying whatever suspicions, fears, anxieties, and concerns they may have about the research and
its consequences. This can be accomplished by being sincere, pleasant, and nonevaluative. While interview-
ing, the researcher has to ask broad questions initially and then narrow them down to specific areas, ask
questions in an unbiased way, offer clarification when needed, and help respondents to think through
difficult issues. The responses should be transcribed immediately and should not be trusted to memory and
later recall.
Having looked at unstructured and structured interviews and learned something about how to conduct the
interviews, we can now discuss face‐to‐face and telephone interviews.
Face-to-face and telephone interviews
Interviews can be conducted either face to face or over the telephone. They may also be computer‐assisted.
Although most unstructured interviews in business research are conducted face to face, structured inter-
views may be either face to face or through the medium of the telephone, depending on the level of com-
plexity of the issues involved, the likely duration of the interview, the convenience of both parties, and the
geographical area covered by the survey. Telephone interviews are best suited when information from a
large number of respondents spread over a wide geographic area is to be obtained quickly, and the likely
duration of each interview is, say, ten minutes or less. Many market surveys, for instance, are conducted
through structured telephone interviews. In addition, computer‐assisted telephone interviews (CATI)
are also possible, and easy to manage.
Face‐to‐face interviews and telephone interviews have other advantages and disadvantages. These will now
be briefly discussed.

120 research methods for business
Face-to-face interviews: advantages and disadvantages
The main advantage of face‐to‐face or direct interviews is that the researcher can adapt the questions as necessary,
clarify doubts, and ensure that the responses are properly understood, by repeating or rephrasing the questions.
The researcher can also pick up nonverbal cues from the respondent. Any discomfort, stress, or problem that the
respondent experiences can be detected through frowns, nervous tapping, and other body language unconsciously
exhibited by her. This would be impossible to detect in a telephone interview.
The main disadvantages of face‐to‐face interviews are the geographical limitations they may impose on the
surveys and the vast resources needed if such surveys need to be done nationally or internationally. The costs
of training interviewers to minimize interviewer bias (e.g., differences in questioning methods, interpretation of
responses) are also high. Another drawback is that respondents might feel uneasy about the anonymity of their
responses when they interact face to face with the interviewer.
Telephone interviews: advantages and disadvantages
The main advantage of telephone interviewing, from the researcher’s point of view, is that a number of different
people can be reached (if need be, across the country or even internationally) in a relatively short period of time.
From the respondents’ standpoint it eliminates any discomfort that some of them might feel in facing the inter-
viewer. It is also possible that most of them might feel less uncomfortable disclosing personal information over
the phone than face to face.
A main disadvantage of telephone interviewing is that the respondent could unilaterally terminate the interview
without warning or explanation, by hanging up the phone. Caller ID might further aggravate the situation. This is
understandable, given the numerous telemarketing calls people are bombarded with on a daily basis. To minimize
this type of nonresponse problem, it is advisable to call the interviewee ahead of time to request participation in the
survey, giving an approximate idea of how long the interview will last, and setting up a mutually convenient time.
Interviewees usually tend to appreciate this courtesy and are more likely to cooperate. It is a good policy not to
prolong the interview beyond the time originally stated. As mentioned earlier, another disadvantage of the telephone
interview is that the researcher will not be able to see the respondent to read the nonverbal communication.
Additional sources of bias in interview data
We have already discussed several sources of bias in data collection. Biased data will be obtained when respond-
ents are interviewed while they are extremely busy or are not in good humor. Responses to issues such as strikes,
layoffs, or the like could also be biased. The personality of the interviewer, the introductory sentence, inflection
of the voice, and such other aspects could introduce additional bias. Awareness of the many sources of bias will
enable interviewers to obtain relatively valid information.
Sampling biases, which include inability to contact persons whose telephone numbers have changed, could
also affect the quality of the research data. Likewise, people with unlisted numbers who are not contacted could
also bias the sample (discussed in Chapter 13), and, hence, the data obtained. With the introduction of caller ID,
it is possible for telephone interviews to be ridden with complexity.
Computer-assisted interviewing
With computer‐assisted interviews (CAI) questions are flashed onto the computer screen and interviewers can
enter the answers of the respondents directly into the computer. The accuracy of data collection is considerably
enhanced since the software can be programmed to flag the “offbase” or “out‐of‐range” responses. CAI software also
prevents interviewers from asking the wrong questions or in the wrong sequence since the questions are automati-
cally flashed to the respondent in an ordered sequence. This, to some extent, eliminates interviewer‐induced bias.

chapter interviews 121
CATI and CAPI
There are two types of computer‐assisted interview programs: CATI (computer‐assisted telephone interviewing)
and CAPI (computer‐assisted personal interviewing).
CATI, used in research organizations, is useful inasmuch as responses to surveys can be obtained from peo-
ple all over the world. The computer prompts the questions with the help of software and the respondent pro-
vides the answers. The computer selects the telephone number, dials, and places the responses in a file. The data
are analyzed later. Computerized, voice‐activated telephone interviews are also possible for short surveys. Data
can also be gathered during field surveys through handheld computers that record and analyze responses.
CAPI involves rather big investments in hardware and software. CAPI has an advantage in that it can be
self‐administered; that is, respondents can use their own computers to run the program by themselves once they
receive the software and enter their responses, thereby reducing errors in recording. However, not everyone is
comfortable using a personal computer and some may not have access to one.
The voice recording system assists CATI programs by recording interviewees’ responses. Courtesy, ethics,
and legal requirements require that the respondents’ permission to record be obtained before the voice capture
system (VCS) is activated. The VCS allows the computer to capture respondents’ answers, which are recorded
in a digital mode and stored in a data file. They can be played back later, for example, to listen to customers by
region, industry, or any combination of different sets of factors.
In sum, the advantages of computer‐assisted interviews can be stated simply as quick and more accurate
information gathering, plus faster and easier analysis of data. The field costs are low and automatic tabulation of
results is possible. It is more efficient in terms of costs and time, once the initial heavy investment in equipment
and software has been made. However, to be really cost‐effective, large surveys should be done frequently enough
to warrant the heavy front‐end investment and programming costs.
Software packages
Field notes taken by interviewers as they collect data generally have to be transcribed, hand‐coded, hand‐tabulated,
and so on – all of which are tedious and time consuming. In the present day there is a lot of software available
that may ease the interviewers’ job with regard to these activities.
Group interviews
Interviews may be conducted on an individual basis, but also on a group basis, where the interviewer puts open
questions to a group of participants. The term “focus group” is used for a particular type of group interview,
where the topic is clearly defined and there is a focus on facilitating discussion between participants.
Focus groups
Focus groups consist typically of eight to ten members with a moderator leading the discussions on a particular
topic, concept, or product. Members are generally chosen on the basis of their familiarity with the topic on which
information is sought. For example, women with children may compose a focus group to identify how organiza-
tions can help working mothers. Large organizations such as Coca‐Cola, Unilever, and Nike regularly convene
young men and women from around the world to tap them for ideas for a new product.
The focus sessions are aimed at obtaining respondents’ impressions, interpretations, and opinions, as
the members talk about the event, concept, product, or service. The moderator plays a vital role in steering the
discussions in a manner that draws out the information sought, and keeps the members on track.
Focus group discussions on a specific topic at a particular location and at a specified time provide the
opportunity for a flexible, free‐flowing format for the members. The unstructured and spontaneous

122 research methods for business
responses are expected to reflect the genuine opinions, ideas, and feelings of the members about the topic
under discussion. Focus groups are relatively inexpensive and can provide fairly dependable data within a
short time frame.
Role of the moderator The selection and role of the moderator are critical. The moderator introduces the
topic, observes, and takes notes and/or records the discussions. The moderator never becomes an integral part
of the discussions, but merely steers the group persuasively to obtain all the relevant information, and helps
the group members to get through any impasse that might occur. The moderator also ensures that all members
participate in the discussion and that no member dominates the group. Someone from the research team may
also observe the proceedings through a one‐way mirror, listening to the verbal statements and noticing the
nonverbal cues of the members.
The nature of data obtained through focus groups It should be noted that although data obtained
through these homogeneous group members are less expensive than those obtained through the various other
data collection methods, and also lend themselves to quick analysis, the content analysis of the data so obtained
provides only qualitative and not quantitative information. Also, since the members are not selected scientifi-
cally to reflect the opinions of the population at large (see Chapter 13 on Sampling for more details on this),
their opinions cannot be considered to be truly representative. However, when exploratory information is col-
lected as a basis for further scientific research, focus groups serve an important function. Consider, for example,
the value of focus groups in exploring the concept of “intellectual property.” When animated discussions take
place, there is a serendipitous flow of new ideas among the group members who discuss the nuances of each
thought process. Researchers are thereby helped to obtain valuable insights from the snowballing effects of the
discussions.
Videoconferencing If regional variations in responses are expected, several focus groups could be
formed, including trained moderators, at different locations. This process is easily facilitated through video-
conferencing. By zooming in on a particular member, the nonverbal cues and gestures of that individual can
be captured, as and when desired. This also obviates the need for an observer looking through a one‐way mirror.
With the great strides that have been made in technological advancement, videoconferencing as a means
of gathering information from different groups in distant locations has become rather common these days.
In sum, focus groups are used for:
1. Exploratory studies.
2. Making generalizations based on the information generated by them.
3. Conducting sample surveys.
Focus groups have been credited with enlightening investigators as to why certain products are not doing well,
why certain advertising strategies are effective, why specific management techniques do not work, and the like.
Expert panels
“Focus group research” is a generic term for any research that studies how groups of people talk about a clearly
defined issue. An expert panel is a group of people specifically convened by the researcher to elicit expert
knowledge and opinion about a certain issue. The criteria for qualification as an expert are many and varied, but
the expert panel usually comprises independent specialists, recognized in at least one of the fields addressed dur-
ing the panel sessions. Expert panels may thus bring together a wide variety of experts, including scientists,
policy makers, and community stakeholders.

chapter interviews 123
ADVANTAGES AND DISADVANTAGES OF INTERVIEWS
Interviews are one method of obtaining data; they can be either unstructured or structured, and can be con-
ducted face to face, over the telephone, or via the computer. Interviews may be conducted on an individual basis,
but also on a group basis. Unstructured interviews are usually conducted to obtain definite ideas about what is,
and is not, important and relevant to particular problem situations. Structured interviews give more in‐depth
information about specific variables of interest. To minimize bias in responses, the interviewer must establish
rapport with the respondents and ask unbiased questions. The face‐to‐face interview and that conducted over
the telephone have their advantages and disadvantages, and both have their uses in different circumstances.
Computer‐assisted interviewing, which entails heavy initial investment, is an asset for interviewing and for the
analysis of qualitative, spontaneous responses. Computer interactive interviews have become an increasingly
important mode of data collection in recent years.
The advantages and disadvantages of personal or face‐to‐face interviews and telephone interviews are
presented in Table 7.1.
T A B L E 7 . 1
Advantages and disadvantages of interviews
Mode of data collection Advantages Disadvantages
Personal or face‐to‐face
interviews
Can establish rapport and motivate
respondents.
Can clarify the questions, clear doubts,
add new questions.
Can read nonverbal cues.
Can use visual aids to clarify points.
Rich data can be obtained.
CAPI can be used and responses entered
in a portable computer.
Takes personal time.
Costs more when a wide geographic region
is covered.
Respondents may be concerned about
confidentiality of information given.
Interviewers need to be trained.
Can introduce interviewer bias.
Telephone interviews Less costly and speedier than personal
interviews.
Can reach a wide geographic area.
Greater anonymity than personal
interviews.
Can be done using CATI.
Nonverbal cues cannot be read.
Interviews will have to be kept short.
Obsolete telephone numbers could be
contacted, and unlisted ones omitted
from the sample.
Respondents can terminate the interview at
any time.
SUMMARY
● Learning objective 1: Differentiate primary from secondary data collection methods.
Data collection methods are an integral part of research design. Primary data collection methods involve
data collection from original sources for the specific purpose of the study. The discussion on primary data
collection methods is organized around four principal methods of primary data collection: interviews,
observation, administering questionnaires, and experiments. The primary data collection decision is inter-
related with the other steps in the research process.

124 research methods for business
● Learning objective 2: Plan, design, and carry out a personal interview.
A commonly used method of collecting data in business research is to interview respondents to obtain
information on an issue of interest. An interview is a guided, purposeful conversation between two or more
people. There are many different types of interviews. Individual interviews may be unstructured or struc-
tured, and conducted face to face, by telephone, or online.
● Learning objective 3: Plan, design, and carry out a group interview.
Interviews may be conducted on an individual basis, but also on a group basis, where the interviewer
asks open questions of a group of participants. The term “focus group” is used for a particular type of
group interview, where the topic is clearly defined and there is a focus on facilitating discussion between
participants. An expert panel is a group of people specifically convened by the researcher to elicit expert
knowledge and opinion about a certain issue.
● Learning objective 4: Discuss the advantages and disadvantages of interviewing.
Problems researched with the use of appropriate methods greatly enhance the value of the study. That is
why the choice of method(s) will depend on the objective(s) of the study, the research questions, and the
research strategy. Other factors, such as facilities available, the degree of accuracy required, the type of data
required, the time span of the study, the expertise of the reviewer, and costs will also affect the choice of
method(s). The advantages and disadvantages of interviews are discussed in the final part of this chapter.
In the next chapter, we discuss observation as a method of collecting data.
DISCUSSION QUESTIONS
1. Describe the different data sources, explaining their usefulness and disadvantages.
2. As a manager, you have invited a research team to come in, study, and offer suggestions on how to
improve the performance of your staff. What steps will you take to relieve staff apprehensions and
worries even before the research team sets foot in your department?
3. What is bias, and how can it be reduced during interviews?
4. Discuss the advantages and disadvantages of personal and telephone interviews.
5. What are projective techniques and how can they be used profitably?
6. How has the advancement in technology helped data gathering via interviewing?
Visit the companion website at www.wiley.com/college/sekaran for Case Study: Kyoto
Midtown Shopping Centre.

chapter interviews 125
Now do Exercises 7.1 and 7.2.
EXERCISE 7.1
First conduct an unstructured and later a structured interview, to learn about how people use and process
information to choose among alternative brands when they are looking for furniture, clothing, household
appliances, and the like. Select a specific product and ask people, for instance, about the product attributes
they consider, and how important these attributes are. Write up the results, and include the formats you
used for both stages of the research.
EXERCISE 7.2
Design an interview schedule to assess the “intellectual capital” as perceived by employees in an organization –
the dimensions and elements for which you developed earlier.

126
INTRODUCTION
Actions and behavior of employees, consumers, investors, and the like may play an important role in business
research. Researchers and managers might be interested in the way workers carry out their jobs, the impact of
new manufacturing techniques on employee activity, in how consumers watch commercials, use products, or
behave in waiting areas, or in how a merchant bank trades and operates. A useful and natural technique to collect
data on actions and behavior is observation. Observation involves going into “the field” – the factory, the super-
market, the waiting room, the office, or the trading room – watching what workers, consumers, or day traders
do, and describing, analyzing, and interpreting what one has seen.
Observational methods are best suited for research requiring non‐self‐report descriptive data; that is, when
behavior is to be examined without directly asking the respondents themselves. Observational data are rich and
uncontaminated by self‐report bias. However, observational methods are also time consuming and challenging
in a lot of other ways as you will learn in this chapter. Indeed, they are not without difficulties for the untrained
researcher.
This chapter starts with a definition of observation, followed by an overview of observational methods dis-
tinguished by four basic dimensions: control, group membership, structure, and concealment. Subsequently we
examine two important observational methods, participant observation and structured observation, in more
detail. Finally, we discuss advantages and disadvantages of observation.
Data collection methods: Observation
C H A P T E R 8
LEARNING OBJECTIVES
After completing Chapter 8 you should be able to:
1. Define observation and discuss how observation may help to solve business problems.
2. Demonstrate the ability to make an informed decision on an appropriate type of observational
method for a specific study.
3. Explain the issues related to participant observation and structured observation.
4. Discuss the advantages and disadvantages of observation.

chapter data collection methods: observation 127
DEFINITION AND PURPOSE OF OBSERVATION
Observation concerns the planned watching, recording, analysis, and interpretation of behavior, actions, or
events. Various approaches of observation have been used in business research. These may be distinguished by
four key dimensions that characterize the way observation is conducted: (1) control (are the observations con-
ducted in an artificial or in a natural setting?), (2) whether the observer is a member of the group that is observed
or not (participant versus nonparticipant observation), (3) structure (to what extent the observation is focused,
predetermined, systematic, and quantitative in nature), and (4) concealment of observation (are the members of
the social group under study told that they are being studied or not?). These key dimensions that distinguish
particular methods of observation are discussed next.
FOUR KEY DIMENSIONS THAT CHARACTERIZE THE TYPE OF OBSERVATION
Controlled versus uncontrolled observational studies
A distinction can be made between observation conducted in controlled (or artificial) versus uncontrolled (or
natural) settings. Observation is often conducted in a natural setting. However, observation is also a potential
method of data collection within an experimental, controlled research tradition.
An observational study is said to be high in control when the situation or setting is manipulated or contrived
by the researcher; the exposure of subjects (for instance, consumers, employees, or investors) to a certain situation
or condition (for instance a specific store layout, specific labor conditions, or a certain amount of time pressure)
allows the researcher to observe differences between individual behavioral reactions to the situation. Controlled
observation may be carried out in a laboratory (for instance, a simulated store environment or trading room) or
in the field (for instance, a store).
EXAMPLE
Examples of observation discussed in further detail later in this chapter
● Shadowing a Wall Street broker engaged in his
daily routine.
● Observing in‐store shopping behavior of consumers
via a camera.
● Sitting in the corner of an office to observe how a
merchant bank trader operates.
● Working in a plant to study factory life.
● Studying the approach skills of sales people disguised
as a shopper.
Visit the companion website at www.wiley.com/college/sekaran for Author Video:
Definition and purpose of observation.

128 research methods for business
Controlled observation occurs when observational research is carried out under carefully arranged condi-
tions. Uncontrolled observation is an observational technique that makes no attempt to control, manipulate, or
influence the situation. Events are running their natural course and the researcher observes these events without
interfering in the real‐life setting. An advantage of uncontrolled observation is that people can be observed in
their natural shopping or work environment. A major drawback of uncontrolled observation is, however, that it
is usually difficult to untangle the often complex situation since we do not control any factor in this. Accordingly,
it is very hard to distinguish the causes of events, actions, and behavior.
Participant versus nonparticipant observation
The researcher can play one of two roles while gathering observational data – that of a nonparticipant or a partici-
pant observer. In the case of nonparticipant observation, the researcher is never directly involved in the actions of
the actors, but observes them from outside the actors’ visual horizon, for instance via a one‐way mirror or a camera.
Participant observation is an approach that has frequently been used in case studies, ethnographic studies,
and grounded theory studies (see Chapter 6 for a discussion on the relationship between participant observation
and ethnography). In participant observation the researcher gathers data by participating in the daily life of the
group or organization under study.
Spradley (1980) has developed a typology to describe a continuum in the degree of participation of research-
ers. The lowest level of participant observation is passive participation. Passive participation allows the researcher
to collect the required data without becoming an integral part of the (organizational) system. For example, the
researcher might sit in the corner of an office and watch and record how a merchant bank trader spends her time.
Moderate participation occurs when the researcher does not actively participate and only occasionally interacts
with the social group under study. In new research settings, in which the researcher is not familiar with the activi-
ties, habits, and/or the jargon of the group, many researchers begin at the level of moderate participation until a
more active role is possible. Active participation is when the researcher actually engages in almost everything that
the group under study is doing as a means of trying to learn about their behavior. The researcher may also play
the role of the complete participant‐observer. In complete participant observation, the researcher becomes a
member of the social group under study. Complete participant observation involves “immersion” in the social
group under study. For instance, if a researcher wants to study group dynamics in work organizations, then she
may join the organization as an employee and observe the dynamics in groups while being a part of the work
organization and work groups. Like this, complete participant observation aims to generate an understanding of
a social group from an “insider’s point of view” (Hume & Mulcock, 1994).
Structured versus unstructured observational studies
As we have seen, observational studies can be of either the nonparticipant‐observer or the participant‐observer
type. Both of these, again, can be either structured or unstructured. Where the observer has a predetermined
set of categories of activities or phenomena planned to be studied, it is a structured observational study. Formats
for recording the observations can be specifically designed and tailored to each study to suit the goal of that
research. Structured observation is generally quantitative in nature.
EXAMPLE
A famous example of complete participant observation
in a business context is Beynon’s (1975) study. Beynon
spent much of 1967 in Ford’s Halewood plant to study
factory life and the experience of people who worked at
the assembly lines of the Ford Motor Company. Beynon
entered the Ford Motor Company and became a mem-
ber of the social group under study (workers within a
car assembly plant) to investigate “life on the line.”

chapter data collection methods: observation 129
Usually, matters that pertain to the feature of interest, such as the duration and frequency of an event (for
instance, how long does it take to get a meal at a fast‐food restaurant?), as well as certain activities that precede
and follow it, are recorded. Environmental conditions (for instance, labor conditions) and any changes in setting
are also noted, if considered relevant. Task‐relevant behaviors of the actors, their perceived emotions, verbal and
nonverbal communication, and the like, may also be recorded. Observations that are recorded in worksheets or
field notes are then systematically analyzed.
At the beginning of a study, it is also possible that the observer has no definite ideas of the particular aspects
that need focus. Observing events as they take place may also be a part of the plan as in many other forms of
exploratory and qualitative research. In such cases, the observer will record practically everything that is
observed. Such a study will be an unstructured observational study. Unstructured observational studies are
claimed to be the hallmark of qualitative research. Qualitative data analysis (Chapter 16) is used to analyze and
interpret what the researcher has seen.
Unstructured observation may eventually lead to a set of tentative hypotheses that are tested in subsequent
research that is deductive in nature. Hence, inductive discovery via observation can pave the way for subsequent
theory building and hypotheses testing.
Concealed versus unconcealed observation
Concealment of observation relates to whether the members of the social group under study are told that they
are being investigated. A primary advantage of concealed observation is that the research subjects are not influ-
enced by the awareness that they are being observed. Indeed, reactivity or the extent to which the observer affects
the situation under observation could be a major threat to the validity of the results of observational studies.
Unconcealed observation is more obtrusive, perhaps upsetting the authenticity of the behavior under study.
EXAMPLE
The Hawthorne studies
A famous example of subject responses to unconcealed
observation is the “Hawthorne effect.” In a relay assem-
bly line, many experiments were conducted that
increased lighting and the like, based on the original
hypothesis that these would account for increases in pro-
ductivity. However, as it turned out, the mere fact that
people were chosen for the study gave them a feeling of
importance that increased their productivity whether or
not lighting, heating, or other effects were improved,
thus the coining of the term the Hawthorne effect.
Concealed observation
To avoid reactivity, McClung, Grove & Hughes (1989)
used researchers disguised as shoppers to collect data
on the approach skills of salespeople. They decided to
employ concealed observation because unconcealed
observation could have an effect on the validity of their
observations.
Concealed observation has some serious ethical drawbacks. While less reactive, concealed observation
raises ethical concerns since it may violate the principles of informed consent, privacy, and confidentiality
(Burgess 1989; Lauder 2003). For this reason concealed observation may harm the subjects in several ways.
However, in some situations, for instance when a (marketing) researcher watches a service encounter between a

130 research methods for business
bus driver and a bus passenger, the researcher is likely to be less culpable than in other situations, for instance
when the researcher immerses herself in a certain social group such as a specific department within an organiza-
tion (cf. Grove and Fisk, 1992). Note that there are no strict rules for assessing the ethicality of concealed obser-
vational research. Instead, a careful, well‐judged assessment of the potential harmful consequences of concealed
observational research should be made by the researcher. Frederichs and Ludtke (1975, p. 12) provide an elegant
guideline for such an assessment: the research plan “should be able to justify itself to the members of the scientific
community as well as to those involved in the study.”
TWO IMPORTANT APPROACHES TO OBSERVATION
We have just briefly discussed the key dimensions that differentiate various approaches to observation. Two
important, distinct approaches to observation are participant observation and structured observation. The remain-
ing part of this chapter will discuss these two approaches in more detail.
Participant observation: introduction
Earlier in this chapter we have explained that the researcher can play one of two roles while gathering observa-
tional data: that of a nonparticipant or a participant observer. A key characteristic of participant observation is that
the researcher gathers data by participating in the daily life of the group or organization under study. This enables
the researcher to learn about the activities of the group under study in a natural setting from an insider’s point of
view through observing and participating in these activities. When Malinowski introduced this method in his
influential work Argonauts of the Western Pacific he argued that it puts the researcher in a position “to grasp the
native’s point of view, his relation to life, to realize his vision of his world” (Malinowksi, 1992, p. 25). Today, this is
still regarded as the key objective and one of the main strengths of participant observation. Since the time of
Malinowski, the method of participant observation has been thoroughly developed and refined. It is now common
to distinguish between two basic ways of conceiving of the method (Zahle, 2012). It may be narrowly identified as
participation in the way of life of the social group under study combined with observing what is going on. Or, it
may be labeled more broadly to involve not only participation and observation but also the use of other methods
such as interviews. In this chapter, we take on a more narrow view of participant observation; we look at partici-
pant observation as one of several qualitative research methods aiming to understand the nature of phenomena.
The participatory aspect of participant observation
Participant observation combines the processes of participation and observation. Nonetheless, participant obser-
vation should be distinguished from both pure observation and pure participation (Bernard, 1994). Pure obser-
vation seeks to remove the researcher from the observed actions and behavior; the researcher is never directly
involved in the actions and behavior of the group under study. Pure participation has been described as “going
native”; the researcher becomes so involved with the group under study that eventually every objectivity and
research interest is lost (Jorgensen, 1989; DeWalt & DeWalt, 2002). Within these two extremes, participant
observation has been successfully employed by many researchers engaged in business research.
A distinctive feature of participant observation is that the researcher participates in the social group under
study. As we have explained earlier in this chapter, the researcher may do so to different extents. The highest
degree of participation occurs with complete participation. In this case, the researcher lives or works with the
subjects under study and tends to assume a pre‐established role (for instance, the role of coworker). In complete
participation, the researcher may conceal that she is an observer, behaving as naturally as possible and seeking to

chapter data collection methods: observation 131
become an accepted member of the social group. This technique assures close intimacy with the subjects; the
researcher interacts with the subjects and also carries out their activities. A disadvantage of this method is that
complete participation may limit freedom of movement outside the adopted role: it is difficult to abandon the
role of complete participant as the research proceeds. What’s more, the methodological problem of “going native”
may result in a fading research perspective and an increased likelihood of biased research findings. Finally, there
are important ethical problems with concealed complete participation. Becoming a member of a social group and
deliberately deceiving the members of this group is regarded as unethical by many. For these reasons, complete
participation has become increasingly rare.
In many situations, observational studies are based on moderate participation. In the case of moderate par-
ticipation, the researcher assumes an intermediate position between being a complete insider (a complete par-
ticipant) and being a complete outsider (as in nonparticipation observational studies). In moderate participation,
the researcher observes the scene under study, maintaining a certain distance from it and never intervening.
Indeed, the role of the researcher is often the role of a passive witness or bystander. Another technique that is
sometimes used is “shadowing.” Shadowing implies that the researcher closely follows a subject (for instance, a
manager or a Wall Street broker) engaged in his or her daily routine.
In the case of active participation, the researcher is not satisfied with the role of the bystander. In this case,
the researcher does not conceal that she is an observer but explains the fact that she is an observer to the social
group under study right from the start. This allows the researcher to not only observe the everyday activities of
the subjects (workers, managers, consumers, brokers), but also to engage in those activities and thus to put them
into practice. The goal of active participation is not to become like the subjects, and to immerse in their activities,
but to carry out certain activities and hence to acquire a better understanding of their practices.
The observation aspect of participant observation
While participating, the researcher should observe and record, and at a later stage analyze behavior, actions,
interactions, events, and the like. Getting started with participant observation and becoming a part of a social
group is not without its difficulties. There are several issues that must be addressed. These include choosing a
“site” (a specific department, business unit, plant, supermarket, etc.), gaining permission, the selection of key
informants, and familiarizing oneself with the research setting (Bernard, 1994).
EXAMPLE
Typical examples of passive participation are observa-
tions conducted in service consumption settings, such
as in a lecture room, a theater, a waiting room, or a
theme park.
EXAMPLE
To what extent should I participate?
The extent to which the researcher participates depends
on a range of factors. For instance, it may be determined
by the research questions, ethical considerations, meth-
odological considerations, but also by more practical
factors such as by how much the researcher feels happy
about participating or by the extent to which either con-
textual factors or the members of the group under study
are willing to let the researcher participate.

132 research methods for business
In most observational studies, gaining access begins with obtaining permission to carry out research from
highly ranked people within the organization, preferably from top management. To gain permission to carry out
the study, it is important to carefully explain the purpose of the research. If the purpose of the research is under-
stood (and accepted) you will eventually get permission to carry out your research project. You may also benefit
from letters of introduction (for instance, from the sponsor of the study) that will ease entry.
Getting permission is only the first step in carrying out participant observation. Becoming an accepted
member of the social group under study is the next. Numerous ethnographers have noticed that some members
of the social group under study are more open and more likely to approach the researcher early in the fieldwork
than others (DeWalt & DeWalt, 2002).
Agar suggests that the researcher finds a well‐liked and respected person who can act as a sponsor. This
“sponsor” is a group member who is willing to introduce you to the group, to vouch for you, and to explain your
presence to the other group members.
An essential aspect of participant observation is establishing “rapport.” Establishing rapport involves estab-
lishing a trusting relationship with the social group under study, by showing respect, being truthful, and showing
commitment to the well‐being of the group or the individual members of the group, so that they feel secure in
sharing (sensitive) information with the researcher. Jorgensen (1989) has argued that the degree to which rapport
is established influences the degree to which the information that is collected in participant observation is accu-
rate and dependable. In a similar vein, rapport has been referred to as “the only basis on which really reliable
information can be obtained” (Villa Rojas, 1979, p. 59).
EXAMPLE
On “deviants” and “professional stranger handlers”
Agar suggests that the researcher be careful to accept
the first people she encounters as key informants, since
they are often either “deviants” or “professional stran-
ger handlers.” Deviants are “members who are on the
boundaries of the group in some low‐status position”
(Agar, 1996, p. 136). Association with deviants may
alienate the researcher from the rest of the group and
provide the researcher with a flawed view on the social
group under study. Professional stranger handlers are
persons who take it upon themselves to check out the
new person and what it is this person is after. “They
can [. . .] quickly improvise some information that sat-
isfies her without representing anything potentially
harmful to the group” (Agar, 1996, p. 135).
EXAMPLE
How do I establish rapport?
Rapport is built over time. Hanging out with the subjects
under study – that is, meeting and chatting with them to
develop relationships over an extended period of time –
is the process through which the researcher gains trust
and establishes rapport with participants (DeMunck &
Sobo, 1998). Establishing rapport involves active listen-
ing, reciprocity (giving back something to the subjects
under study), and confidentiality; the subjects must be
assured that they can share personal and sensitive infor-
mation without their identity being exposed to others.

chapter data collection methods: observation 133
What to observe
A potential problem with observational studies is getting overwhelmed by massive amounts of often discon-
nected data. For this reason, the researcher should try to keep a certain focus during the various stages of the
observation process. Generally speaking, the most important factor in determining what to observe is the aim or
purpose of the study. However, “[w]here to begin looking depends on the research question, but where to focus
or stop action cannot be determined ahead of time” (Merriam, 1988, p. 97). Werner and Schoepfle (1987) discern
three consecutive processes in observation that may provide an increasingly deep understanding of the setting
that is being studied: (1) descriptive observation, ( 2) focused observation, and (3) selective observation.
In descriptive observation, the researcher is open to everything that is going on; data are collected that
describe the setting, the subjects, and the events that are taking place.
The data collected during descriptive observation provide an initial story or narrative account which may
serve as a basis for the development of a set of concepts, a theory, or even a conceptual framework. The develop-
ment of concepts, theories, and conceptual frameworks is facilitated by a greater focus via focused and selective
observation. Focused observation emphasizes observation (often supported by interviews) in which the
researcher will concentrate on particular types of feelings, emotions, actions, activities, and/or events and look
for emerging themes. Finally, in selective observation the researcher focuses on different types of actions, activi-
ties, or events and look for regularities in them, while being open to variations from or exceptions to emerging
patterns (Emerson, Fretz & Shaw, 1995).
EXAMPLE
What to observe in the focused and selective observation stages
To help researchers decide on what to observe in the
focused and selective observation stages, DeWalt &
DeWalt (2002) suggest that they:
● observe events, actions, and behavior and look for a
story line;
● sort out the regular from the irregular activities;
● look for variation in the storyline;
● look for negative cases or exceptions; and,
● in case the observation is structured, develop a plan
for systematic observation, including an estimate of
how many observations will be enough.
EXAMPLE
What to observe in the descriptive observation stage
Spradley (1980) distinguishes the following dimen-
sions on which descriptive data might be collected:
● space layout of the physical setting such as the fac-
tory floor layout;
● objects physical elements such as office equipment,
machines, and power tools;
● actors relevant details of the persons involved;
● feelings, emotions, activities, actions, and goals of
the actors;
● events for instance meetings; and
● time or the time sequence of events, feelings, actions,
and the like.

134 research methods for business
The most important method of capturing data in participant observation is writing field notes. Notes taken to
capture data include records of what is observed, records of informal conversations with the subjects under study, and
journal notes that are kept on a daily basis. Most researchers write down words, phrases, or even whole sentences dur-
ing the course of the day or the event and write more expanded notes during quieter times. The quality of field notes
relies heavily on the level of detail and the accuracy of the description (Schensul, Schensul & LeCompte, 1999 ). The
documentation of observations should therefore be as accurate, complete, detailed, and objective as possible. How
much is actually written down during the course of the day or the event depends on the quality of the memory of the
researcher and the circumstances under which the researcher is working (DeWalt & DeWalt, 2002 ). Schensul, Schensul,
and Lecompte ( 1999 ) provide a range of characteristics of good field notes. These are summarized in Box 8.1 .
One should be aware of the fact that field notes are a construction of the researcher; it is the researcher who
decides what goes into the field notes, the level of detail to include, how much context to include, and so on. For
this reason field notes are often regarded as being simultaneously data and data analysis, or as the first step in the
process of data analysis (e.g., DeWalt & DeWalt, 2002 ).
To summarize, participant observation requires many skills, such as commitment, the ability to fit in, tact,
the ability to communicate with different members of the social group at their level, patience, the ability to
observe, the ability to separate the role of participant from that of observer, and so on. Therefore, before commit-
ting yourself to participant observation you need to be certain you have the time, resources, and skills required
to carry out and carry through this exceptionally challenging type of research.
We conclude our discussion of participant observation with some suggestions for conducting participant
observation adapted from DeWalt and DeWalt ( 2002 ), Merriam (1998), and Wolcott ( 2001 ). These suggestions
are specified in Box 8.2 .
Structured observation: introduction
Structured observation is focused in nature, as it looks selectively at predetermined phenomena. The focus of
structured observation is fragmented into small and manageable pieces of information (such as information on
behavior, actions, interactions, or events).
BOX 8.1
CHARACTERISTICS OF GOOD FIELD NOTES
Good fi eld notes:
● use exact quotes when possible;
● use pseudonyms to protect confi dentiality;
● describe activities in the order in which they occur;
● provide descriptions without inferring meaning;
● include relevant background information to situate the event;
● separate one ’ s own thoughts and assumptions from what one actually observes;
● record the date, time, place, and name of researcher on each set of notes.
Schensul, Schensul, and LeCompte ( 1999 ).
BOX 8 1

chapter data collection methods: observation 135
There are different levels of structure in structured observation. For instance, the researcher may have
decided on the observation categories in a rather precise and mutually exclusive way in advance (highly struc-
tured observation) or start with a detailed plan of what will be observed and how, but collect the data in a less
systematic or predetermined way (semi‐structured observation).
An example of the use of (nonexperimental) structured observation in marketing is the employment of
mystery shoppers – thoroughly trained researchers who accurately record employee behavior using checklists
and codes – to gather specific information on service performance. Service providers such as fast‐food chains use
this particular type of observation to monitor the quality of their service.
Structured observation can also be used to generate numerical data to test hypotheses, as the following
example illustrates.
BOX 8.2
SUGGESTIONS FOR CONDUCTING PARTICIPANT OBSERVATION
1. Be unobtrusive in your actions.
2. Become familiar with the setting before collecting other types of data.
3. Be tolerant of ambiguity: this includes being adaptive and fl exible.
4. Pay attention, and alternate between a wide (a view of the overall situation) and a narrow (focusing
on a single person, activity, or interaction) perspective.
5. Look at interactions in the setting: who talks to whom, who is respected, and how are decisions made.
6. Listen carefully to conversations, look for key words in conversations, and write these down to
prompt later recollection of the conversation.
7. Concentrate on the fi rst and last remarks of a conversation, as these are most easily remembered.
8. Being attentive for a long time is diffi cult; pay attention off and on. Capitalize on moments of attention.
9. Field work oft en involves more than observation. It may also involve (informal) interviews and
structured interviews, such as questionnaires.
10. Be determined and have faith in yourself.
Adapted from DeWalt and DeWalt ( 2002 ), Merriam (1998), and Wolcott ( 2001 ).
BOX 8 2
EXAMPLE
A master ’ s student of Tilburg University, Thomas Perks,
is currently engaged in a research project aimed at inves-
tigating the effect of GDA labels on the consumption of
candy bars. (A GDA label shows the number of calories
and grams of sugars, fat, saturates (saturated fat), and
salt per portion of food, and expresses these quantities
as a percentage of your Guideline Daily Amount.)
To be able to observe the effect of GDA labels on
the consumption of candy bars, Thomas is allegedly
waiting for his car at a car dealer. In fact, he is observing
the behavior of people who are waiting for their cars,
sitting at a large table. To test one of the hypotheses of
his study – GDA labels have a negative effect on the
consumption of candy bars – he has put two bowls
filled with candy bars on this table. In the experimental
condition, the candy bars in the bowls contain a GDA‐
label; in the control condition they do not contain
such a label.

136 research methods for business
The use of coding schemes in structured observation
The development of a coding scheme is a crucial aspect of structured observation. Coding schemes contain pre-
determined categories for recording what is observed. Such schemes come in many forms and shapes. Some of
them are very simple; they merely allow the researcher to note whether or not a particular event has taken place.
Other schemes are more complex; they include multiple categories, timescales, and the like. Note that the devel-
opment of an adequate coding scheme is never a straightforward task.
The type of coding scheme you will use depends on the information that you want to collect. Again, the
research questions of your study serve as the starting point, in this case for the development of a coding scheme.
Based on the research questions, sometimes refined via a pilot study, you define the important concepts (varia-
bles) in your study and develop a coding scheme that allows you to collect information on these concepts.
The following considerations should be taken into account with regard to the construction of a coding scheme.
● Focus. From the coding scheme it should be clear what is to be observed. For instance, Thomas’ coding scheme
should help him to establish which aspects of the setting (for instance, how many people are waiting for their
car) and which types of behavior (for instance, the subject is walking through the showroom of the car dealer,
the subject is eating a candy bar) are to be observed and recorded.
● Objective. The coding scheme and the categories should require little inference or interpretation from the
researcher. Clear guidelines and detailed definitions of categories should help the observer to objectively code
events, actions, and behavior.
● Ease of use. A good coding scheme is easy to use.
● Mutually exclusive and collectively exhaustive. Categories in a coding scheme should be mutually exclusive and
collectively exhaustive. Categories are mutually exclusive if none of the categories overlap one another. A cod-
ing scheme that is collectively exhaustive covers all possibilities (for instance, all the relevant events, actions,
and behavior) so that it is always possible to code.
Standard coding schemes may help you to develop your own coding scheme, allowing you to provide an
answer to your research questions. In some cases, frequency measures suffice to provide an answer to the research
questions. For instance, a researcher who is merely interested in how often a manager attends scheduled and
unscheduled meetings, answers telephone calls, or writes emails may simply wait for these activities to happen
and record the incidences on a simple checklist. However, many researchers are not only interested in how often
certain events take place, but also in the circumstances under which these events take place. In these cases, the
researcher is not only interested in the frequency of certain behavior, but also in the timing of certain behavior.
In order to minimize possible observer effects,
Thomas is keeping a low profile: he avoids eye contact
and he smiles politely when people are trying to start a
conversation. Nonetheless, he gets engaged in conver-
sations about the weather, computer problems, gas
prices, and so on every now and then. While Thomas is
waiting for his car (observing the behavior of the sub-
jects under study) he is working on his laptop (keeping
a detailed account of the behavior of the subjects).
Thomas is using a coding scheme that allows him
to collect data in a structured way. His coding scheme
contains predetermined categories that enable him to
systematically generate information on characteristics
of the subjects, events, and behavior of the subjects. The
categories are closely related to the variables (including
a range of confounding variables) in Thomas’ concep-
tual causal model.

chapter data collection methods: observation 137
Figure 8.1 illustrates various ways in which the researcher can code events: (a) a simple checklist pro-
vides information about how often a certain event has occurred; (b) a sequence record allows the researcher
to collect information on how often an event occurs and about the order in which the events occur; and,
finally, (c) a sequence record on a timescale adds a further level of detail, showing the time intervals between
the events.
Simple checklists and sequence records are often very useful to the researcher conducting structured obser-
vation. Sometimes, however, the researcher may need information about the duration of particular events. In
that case the researcher will also code the start and the finish of a certain activity or event.
You have probably noticed by now that structured observation is largely quantitative in nature. Indeed,
structured observation allows you to collect quantitative information that may be used to test the hypotheses of
your study. The specific instrument for collecting the necessary data is your coding scheme. It is therefore impor-
tant that your coding scheme is good; in other words, that it is valid and reliable. Validity indicates the extent to
which observations accurately record the behavior in which you are interested. Reliability refers to the consist-
ency of observations, usually whether two (or more) observers, or the same observer on separate occasions,
observing the same event attain the same results.
We have just discussed two important approaches to observation. Of course, there is much more to say about
both participant observation and structured observation. If you are interested in learning more about these
approaches you may benefit from a range of excellent books and research articles such as, for instance, Participant
Observation: A Guide for Fieldworkers by DeWalt and DeWalt (2002). We will now conclude this chapter on
observation by discussing advantages and disadvantages of observation.
ADVANTAGES AND DISADVANTAGES OF OBSERVATION
One of the main advantages of observation is its directness. Whereas interviews and questionnaires elicit verbal
responses about actions and behavior from the subjects (which merely allows behavior to be inferred from these
verbal responses), observation allows the researcher to gather behavioral data without asking questions. People can
be observed in their natural work environment or in the lab setting, and their activities and behaviors or other
items of interest can be noted, recorded, analyzed, and interpreted.
(a) Simple checklist
Event 1 2 3 4
//// // / ///
(b) Sequence record
Event 1 4 2 4 1 1 3 1 4 2 1
(c) Sequence record on timescale
0 5 10 15 20 25 30
4 2 4 1 11 3 1 4 2 1
F I G U R E 8 . 1
Alternative ways of coding events

138 research methods for business
Apart from the activities performed by the individuals under study, their movements, work habits, the
statements made and meetings conducted by them, other – environmental – factors such as layout, work‐flow
patterns, the closeness of the seating arrangement, and the like, can also be noted. In observational studies, it is
also relatively easy to discern situational factors such as the weather (hot, cold, rainy), the day of the week
( midweek as opposed to Monday or Friday), and other factors that might have a bearing on, for example, pro-
ductivity, the sales of a product, traffic patterns, absenteeism, and the like. These factors can be recorded and
meaningful patterns might emerge from this type of data. However, note that it is often very difficult to estab-
lish the specific effects of situational factors on behavior and actions of the subjects under study. As we explained
earlier in this chapter, it is often difficult to untangle the often complex situation. Accordingly, it is sometimes
very difficult to establish cause‐and‐effect relationships between situational factors and events, actions,
and behavior.
Another advantage of observation is that is possible to observe certain groups of individuals – for exam-
ple, very young children and extremely busy executives – from whom it may be otherwise difficult to obtain
information. Children can be observed as to their interests and attention span with various stimuli, such as
their involvement with different toys. Such observation would help toy manufacturers, child educators, day‐
care administrators, and others deeply involved in or responsible for children’s development, to design and
model ideas based on children’s interests, which are more easily observed than traced in any other manner.
The data obtained through observation of events as they normally occur are generally more reliable and free
from respondent bias.
Observation is not without challenges and difficulties. The following drawbacks of observational studies
have to be noted. Reactivity (the extent to which the observer affects the situation under study) could be a major
threat to the validity of the results of observational studies, because those who are observed may behave differ-
ently during the period of the study. Observational research may be particularly vulnerable to reactivity if the
observations are confined to a short period of time. In studies of longer duration, the subjects under study will
become more relaxed as the study progresses and tend to behave normally, as illustrated in the following passage,
provided by Malinowski, who carried out ethnographic field work in Omarkana Trobriand Islands:
It must be remembered that the natives saw me constantly every day, they ceased to be interested or
alarmed, or made self‐conscious by my presence, and I ceased to be a disturbing element in the tribal
life which I was to study, altering it by my very approach, as always happens to a newcomer to every
savage community. In fact, as they knew that I would thrust my nose into everything, even where a
well‐mannered native would not dream of intruding, they finished by regarding me as a part and
parcel of their life, a necessary evil or nuisance, mitigated by donations of tobacco.
Malinowski, 1992, pp. 7–8
Researchers doing observational studies often discount the data recorded in the first few days, especially if
they seem to be (very) different from what is observed later.
Data observed from the researcher’s point of view are likely to be prone to observer biases. For instance, a
possible problem in participant observation is that the research perspective fades or even disappears completely
because the role that the researcher has adopted in the group has taken over: the researcher has “gone native.”
This may lead to deficient, flawed, and biased accounts; there could be recording errors and errors in interpreting
activities, behaviors, events, and nonverbal cues.
Observation of the happenings day in and day out, over extended periods of time, could also afflict the
observer with ennui and could also introduce biases in the recording of the observations.
To minimize observer bias, observers are usually given training on how to observe and what to record. Good
observational studies would also establish interobserver reliability. This could also be established during the

chapter data collection methods: observation 139
training of the observers, when videotaped stimuli could be used to determine interobserver reliability. A simple
formula can be used for the purpose – dividing the number of agreements among the trainees by the number of
agreements and disagreements – thus establishing the reliability coefficient.
Observation is an obvious and appropriate technique to study actions and behavior. Though moods, feel-
ings, and attitudes can be guessed by observing facial expressions and other nonverbal behaviors, the cognitive
thought processes of individuals cannot be captured. In other words, it is very difficult to identify reasons behind
behavior of the subjects under study. Observation is therefore often used as a technique to collect data that com-
plement data obtained by other techniques such as interviews.
A practical problem of observation is that it is time consuming. Many forms of observation require the
observer to be physically present, often for prolonged periods of time. For instance, participant observation
entails the immersion of the researcher into the social group that is under study for many months and often even
years. For this reason, this method of collecting data is not only slow, but also tedious and expensive.
In the following chapter, we turn to another method of collecting data: namely, questionnaires.
SUMMARY
● Learning objective 1: Define observation and discuss how observation may help to solve business
problems.
Actions and behavior of people may play an important role in business research. A useful and natural tech-
nique to collect data on actions and behavior is observation. Observation concerns the planned watching,
recording, analysis, and interpretation of behavior, actions, or events.
● Learning objective 2: Demonstrate the ability to make an informed decision on an appropriate type of
observational method for a specific study.
Various approaches of observation may be distinguished by four key dimensions that characterize the way
observation is conducted: (1) control; (2) whether the observer is a member of the group that is observed or
not; (3) structure; and (4) concealment of observation.
● Learning objective 3: Explain the issues related to participant observation and structured observation.
Two important, distinct approaches to observation are participant observation and structured observation.
A key characteristic of participant observation is that the researcher gathers data by participating in the
daily life of the group or organization under study. Participant observation requires many skills, such as com-
mitment, the ability to fit in, tact, the ability to communicate with different members of the social group at
their level, patience, the ability to observe, the ability to separate the role of participant from that of observer,
and so on. Structured observation is focused in nature, as it looks selectively at predetermined phenomena.
The focus of structured observation is fragmented into small and manageable pieces of information. The
development of a coding scheme is a crucial aspect of structured observation. Coding schemes contain
predetermined categories for recording what is observed.
● Learning objective 4: Discuss the advantages and disadvantages of observation.
One of the main advantages of observation is its directness. Another advantage of observation is that it is possible
to observe certain groups of individuals from whom it may otherwise be difficult to obtain information. Drawbacks
of observational studies are reactivity, observer bias, and that it is time consuming, tedious and expensive.

140 research methods for business
Visit the companion website at www.wiley.com/college/sekaran for Case Study:
Performance Improvement Through Mystery Shopping.
DISCUSSION QUESTIONS
1. Describe the key purpose of observation.
2. Discuss four dimensions that distinguish various approaches to observation.
3. Under which circumstances would you prefer observation as a method to collect data over other
methods of data collection such as interviews and questionnaires?
4. How does participant observation differ from structured observation?
5. Discuss how ethnography and participant observation are related.
6. How does moderate participation differ from complete participation?
7. Although participant observation combines the processes of participation and observation it should
be distinguished from both pure observation and pure participation. Explain.
8. What is rapport and how is rapport established in participant observation?
9. Field notes are often regarded as being simultaneously data and data analysis. Why?
10. Is it possible to test hypotheses with structured observation? Why (not)?
11. How does a simple checklist differ from a sequence record on time‐scale?
12. “One of the main advantages of observation is its directness.” Discuss.
13. What is reactivity?
14. A disadvantage of observation is observer bias. Discuss at least two ways of minimizing observer
bias.
15. Discuss the ethics of concealed observation.
Now do Exercises 8.1, 8.2, and 8.3.
EXERCISE 8.1
You are investigating the service quality of restaurants. You are collecting primary data through inter-
views and observation. Your task is to go to a restaurant and collect descriptive observational data on
the following factors: space (layout of the physical setting), objects (physical elements such as equip-
ment, tables, chairs, and the like), actors (staff and clients), and interactions between staff members
and clients.

chapter data collection methods: observation 141
EXERCISE 8.3
Read all relevant information regarding Thomas Perks’ study. From this information, develop a coding
scheme to test the effect of GDA labels1 on the consumption of candy bars (chocolate bars). Do not forget
to include categories allowing you to collect data on relevant covariates.
1 GDA labels show the number of calories and grams of sugars, fat, saturates (saturated fats), and salt per portion of food, and
expresses these quantities as a percentage of your “Guideline Daily Amount.”
EXERCISE 8.2
Seek permission from a professor to sit in two sessions of his or her class, and do an unstructured,
nonparticipant‐observer study. Give your conclusions on the data, and include in the short report your
observation sheets and tabulations.

142
INTRODUCTION
In Chapter 7, we have already explained that in business research, three important data collection methods are
interviewing, observing people, and administering questionnaires. We have discussed interviewing in Chapter 7
and observation in Chapter 8. In this chapter, we will discuss questionnaires and questionnaire design.
A questionnaire is a preformulated written set of questions to which respondents record their answers, usually
within rather closely defined alternatives.
TYPES OF QUESTIONNAIRES
Administering questionnaires
C H A P T E R 9
LEARNING OBJECTIVES
After completing Chapter 9, you should be able to:
1. Compare and contrast different types of questionnaires.
2. Design questionnaires to tap different variables.
3. Discuss the issues related to cross-cultural research.
4. Discuss the advantages and disadvantages of various data collection methods in survey research.
5. Discuss the advantages of multisources and multimethods of data collection.
6. Demonstrate awareness of the role of the manager in primary data collection.
7. Demonstrate awareness of the role of ethics in primary data collection.
Visit the companion website at www.wiley.com/college/sekaran for Author Video:
Questionnaires.

chapter administering questionnaires 143
Questionnaires are generally designed to collect large numbers of quantitative data. They can be administered
personally, distributed electronically, or mailed to the respondents. Questionnaires are generally less expensive
and time consuming than interviews and observation, but they also introduce a much larger chance of non-
response and nonresponse error. An overview of the advantages and disadvantages of questionnaires (and other
methods of data collection) and a section on when to use each of these methods is provided later in this chapter.
Personally administered questionnaires
When the survey is confined to a local area a good way to collect data is to personally administer the questionnaires.
The main advantage of this is that the researcher or a member of the research team can collect all the completed
responses within a short period of time. Any doubts that the respondents might have on any question can be clari-
fied on the spot. The researcher also has the opportunity to introduce the research topic and motivate the respond-
ents to offer their frank answers. Administering questionnaires to large numbers of individuals at the same time is
less expensive and consumes less time than interviewing; equally, it does not require as much skill to administer a
questionnaire as it does to conduct interviews. Wherever possible, questionnaires are best administered personally
because of these advantages. A disadvantage of personally administered questionnaires is that the researcher may
introduce a bias by explaining questions differently to different people; participants may be in fact answering differ-
ent questions as compared to those to whom the questionnaire was mailed. What’s more, personally administered
questionnaires take time and a lot of effort. For this reason, electronic questionnaires are widely used these days.
Mail questionnaires
A mail questionnaire is a self‐administered (paper and pencil) questionnaire that is sent to respondents via the
mail. This method has long been the backbone of business research, but with the arrival of the Internet, mobile
phones, and social networks, mail questionnaires have become redundant or even obsolete. Instead, online ques-
tionnaires are posted on the Internet or sent via email.
Electronic and online questionnaires
The distribution of electronic or online questionnaires is easy and fast. All you have to do is to email the invita-
tions to complete a survey, post a link on a website or personal blog, or use social networks. Online question-
naires are usually created as “web forms” with a database to store the answers and statistical software to provide
statistical analysis. Until recently, conducting online surveys was a time‐consuming and tedious task requiring
familiarity with web authoring programs, HTML codes, and/or scripting programs. Today, survey development
software packages and online survey services make online survey research much easier and more accessible.
Online questionnaires are often used to gain a deeper understanding of consumers’ opinions and prefer-
ences. A big advantage of online survey research is that it makes the most of the ability of the Internet to provide
access to groups and individuals who would be difficult, if not impossible, to reach through other channels.
Virtual communities flourish online, and hundreds of thousands of people regularly participate in discussions
about almost every conceivable issue and interest (Wright, 2005). A second advantage of online questionnaires is
that a wide geographical area can be covered in the survey. A (link to the) questionnaire is sent to the respond-
ents, who can complete it at their convenience, in their homes, and at their own pace. The automatic processing
of the survey saves further costs, time, and energy.
However, there are also important disadvantages to online questionnaires. When conducting online research,
researchers often encounter problems with regard to sampling. For instance, self‐selection and extremely low response
rates make it difficult to establish the representativeness of the sample and to generalize the findings, because those
responding to the survey may not at all represent the population they are supposed to (see Box 9.1). Indeed, the return rates
of such questionnaires are typically low. A 30% response rate is considered acceptable, and in many cases even exceptional.

144 research methods for business
Posting invitations to participate in a survey on social networks, discussion groups, and chat rooms is often
perceived as rude or offensive. This is another drawback of online questionnaires. Many people consider this
type of posting to be “spam”, and the researcher may be flooded with emails from angry members of a virtual
community. Researchers sending email invitations to participate in a study may face similar issues. An unwanted
email is often considered an invasion of privacy and the invitation for the survey may be deleted, or the researcher
may receive email from participants complaining about it (Wright, 2005). A final disadvantage of electronic
questionnaires is that any doubts the respondents might have cannot be clarified.
The advantages and disadvantages of personally administered questionnaires, mail questionnaires, and
electronic questionnaires are presented in Table 9.1 .
T A B L E 9 . 1
Advantages and disadvantages of diff erent questionnaires
Mode of data collection Advantages Disadvantages
Personally administered
questionnaires
Can establish rapport and motivate
respondent.
Doubts can be clarified.
Less expensive when administered to groups
of respondents.
Almost 100% response rate ensured.
Anonymity of respondent is high.
Explanations may introduce a bias.
Take time and effort.
Mail questionnaires Anonymity is high.
Wide geographic regions can be reached.
Token gifts can be enclosed to seek compliance.
Respondent can take more time to respond
at convenience. Can be administered
electronically, if desired.
Response rate is almost always low. A
30% rate is quite acceptable.
Cannot clarify questions.
Follow‐up procedures for nonresponses
are necessary.
Electronic
questionnaires
Easy to administer.
Can reach globally.
Very inexpensive.
Fast delivery.
Respondents can answer at their
convenience like the mail questionnaire.
Automatic processing of answers.
Computer literacy is a must.
Sampling issues.
High non‐response.
Not always possible to generalize findings.
Respondent must be willing to
complete the survey.
People find invitations via email rude
and offensive; emails are deleted or
people complain.
BOX 9.1
HOW TO IMPROVE YOUR RESPONSE RATES
Some eff ective techniques can be employed for improving the rates of response. Sending follow‐up mails
and keeping the questionnaire brief usually help. Electronic questionnaires are also expected to meet with
a better response rate when respondents are notifi ed in advance about the forthcoming survey, and a
reputed research organization administers them with its own introductory cover letter. A small monetary
incentive is also an eff ective technique to increase response rates.
BOX 9 1

chapter administering questionnaires 145
The choice of using the questionnaire as a data gathering method might be restricted if the researcher has to
reach subjects with very little education. Adding pictures to the questionnaires, if feasible, might be of help in
such cases. For most business research, however, after the variables for the research have been identified and the
measures therefore found or developed, the questionnaire is a convenient data collection mechanism. Survey
research, case study research, and experimental designs often use questionnaires to measure the variables of
interest. Because questionnaires are in common use, it is necessary to know how to design them effectively. A set
of guidelines for questionnaire construction follows.
GUIDELINES FOR QUESTIONNAIRE DESIGN
Sound questionnaire design principles should focus on three areas. The first relates to the wording of the questions.
The second refers to the planning of issues with regard to how the variables will be categorized, scaled, and coded
after receipt of the responses. The third pertains to the general appearance of the questionnaire. All three are impor-
tant issues in questionnaire design because they can minimize bias in research. These issues are discussed below.
The important aspects are schematically depicted in Figure 9.1.
Datacollectionmethods
Principlesof wording
Content andpurpose ofquestion
Wordingand
language
Type andform of
questionsSequencing
Classification dataor
personal information
1
Observation
QuestionnaireQuestionnaireadministration
Testinggoodness of
data
Interview
2
3
Principlesof
measurement
Categorization
Coding
Scalesand
scaling
Reliability andvalidity
General“getup’’
Appearance of questionnaire
Length of questionnaire
Introduction to respondents
Instructions for completion
F I G U R E 9 . 1
Principles of questionnaire design

146 research methods for business
Principles of wording
The principles of wording refer to such factors as:
1. The appropriateness of the content of the questions.
2. How questions are worded and the level of sophistication of the language used.
3. The type and form of questions asked.
4. The sequencing of the questions.
5. The personal data sought from the respondents.
Each of these is explained below.
Content and purpose of the questions
The nature of the variable tapped – subjective feelings or objective facts – will determine what kinds of questions
are asked. If the variables tapped are of a subjective nature (e.g., satisfaction, involvement), where respondents’
beliefs, perceptions, and attitudes are to be measured, the questions should tap the dimensions and elements of
the concept. Where objective variables, such as age and educational levels of respondents, are tapped, a single
direct question – preferably one that has an ordinal scaled set of categories – is appropriate. Thus, the purpose of
each question should be carefully considered so that the variables are adequately measured and yet no superflu-
ous questions are asked.
Language and wording of the questionnaire
The language of the questionnaire should approximate the level of understanding of the respondents. The choice of
words will depend on their educational level, the usage of terms and idioms in the culture, and the frames of refer-
ence of the respondents. For instance, even when English is the spoken or official language in two cultures, certain
words may be alien to one culture. Terms such as “working here is a drag” and “she is a compulsive worker” may
not be interpreted the same way in different cultures. Some blue‐collar workers may not understand terminology
such as “organizational structure.” Thus, it is essential to word the questions in a way that can be understood by
the respondent. If some questions are either not understood or are interpreted differently by the respondent, the
researcher will obtain the wrong answers to the questions, and responses will thus be biased. Hence, the questions
asked, the language used, and the wording should be appropriate to tap respondents’ attitudes, perceptions,
and feelings.
Type and form of questions
The type of question refers to whether the question is open‐ended or closed. The form of the question refers to
whether it is positively or negatively worded.
Open-ended versus closed questions Open‐ended questions allow respondents to answer them in any
way they choose. An example of an open‐ended question is asking the respondent to state five things that are
interesting and challenging in the job. Another example is asking what the respondents like about their supervi-
sors or their work environment. A third example is to invite their comments on the investment portfolio of the firm.
A closed question, in contrast, asks the respondents to make choices among a set of alternatives given by the
researcher. For instance, instead of asking the respondent to state any five aspects of the job that she finds inter-
esting and challenging, the researcher might list 10 or 15 aspects that might seem interesting or challenging in

chapter administering questionnaires 147
jobs and ask the respondents to rank the first five among these in the order of their preference. All items in a
questionnaire using a nominal, ordinal, Likert, or ratio scale are considered closed.
Closed questions help the respondents to make quick decisions to choose among the several alternatives
before them. They also help the researcher to code the information easily for subsequent analysis. Care has to be
taken to ensure that the alternatives are mutually exclusive and collectively exhaustive. If there are overlapping
categories, or if all possible alternatives are not given (i.e., the categories are not exhaustive), the respondents
might get confused and the advantage of their being enabled to make a quick decision is thus lost.
Some respondents may find even well‐delineated categories in a closed question rather confining and might
avail themselves of the opportunity to make additional comments. This is the reason why many questionnaires
end with a final open‐ended question that invites respondents to comment on topics that might not have been
covered fully or adequately. The responses to such open‐ended questions have to be edited and categorized for
subsequent data analysis.
Positively and negatively worded questions Instead of phrasing all questions positively, it is advis-
able to include some negatively worded questions as well, so the tendency in respondents to mechanically
circle the points toward one end of the scale is minimized. For example, let us say that a set of six questions
is used to tap the variable “perceived success” on a five‐point scale, with 1 being “very low” and 5 being “very
high” on the scale. A respondent who is not particularly interested in completing the questionnaire is more
likely to stay involved and remain alert while answering the questions when positively and negatively worded
questions are interspersed in it. For instance, if the respondent has circled 5 for a positively worded question
such as, “I feel I have been able to accomplish a number of different things in my job,” he cannot circle number
5 again to the negatively worded question, “I do not feel I am very effective in my job.” The respondent is now
shaken out of any likely tendency to mechanically respond to one end of the scale. In case this does still
happen, the researcher has an opportunity to detect such bias. A good questionnaire should therefore include
both positively and negatively worded questions. The use of double negatives and excessive use of the words
“not” and “only” should be avoided in negatively worded questions because they tend to confuse respond-
ents. For instance, it is better to say “Coming to work is not great fun” than to say “Not coming to work is
greater fun than coming to work.” Likewise, it is better to say “The rich need no help” than to say “Only the rich
do not need help.”
Double-barreled questions A question that lends itself to different possible responses to its subparts is
called a double‐barreled question. Such questions should be avoided and two or more separate questions
asked instead. For example, the question “Do you think there is a good market for the product and that it will
sell well?” could bring a “yes” response to the first part (i.e., there is a good market for the product) and a “no”
response to the latter part (i.e., it will not sell well for various other reasons). In this case, it would be better to
ask two questions: (1) “Do you think there is a good market for the product?” and (2) “Do you think the product
will sell well?” The answers might be “yes” to both, “no” to both, “yes” to the first and “no” to the second, or
“yes” to the second and “no” to the first. If we combined the two questions and asked a double‐barreled ques-
tion, we would confuse the respondents and obtain ambiguous responses. Hence, double‐barreled questions
should be eliminated.
Ambiguous questions Even questions that are not double‐barreled might be ambiguously worded and
the respondent may not be sure what exactly they mean. An example of such a question is “To what extent
would you say you are happy?” Respondents might find it difficult to decide whether the question refers to
their state of feelings in the workplace, or at home, or in general. Thus, responses to ambiguous questions
have built‐in bias inasmuch as different respondents might interpret such items in the questionnaire differently.

148 research methods for business
The result is a mixed bag of ambiguous responses that do not accurately provide the correct answer to
the question.
Recall-dependent questions Some questions might require respondents to recall experiences from the
past that are hazy in their memory. Answers to such questions might have bias. For instance, if an employee who
has had 30 years’ service in the organization is asked to state when he first started working in a particular depart-
ment and for how long, he may not be able to give the correct answers and may be way off in his responses.
A better source for obtaining that information would be the personnel records.
Leading questions Questions should not be phrased in such a way that they lead the respondents to give
the responses that the researcher would like them to give. An example of such a question is: “Don’t you think that
in these days of escalating costs of living, employees should be given good pay rises?” By asking a leading question,
we are signaling and pressuring respondents to say “yes.” Tagging the question to rising living costs makes it dif-
ficult for most respondents (unless they are the top bosses in charge of budget and finances) to say, “No; not
unless their productivity increases too!” Another way of asking the question about pay rises to elicit less biased
responses would be: “To what extent do you agree that employees should be given higher pay rises?” If respondents
think that the employees do not deserve a higher pay rise at all, their response will be “Strongly Disagree”;
if they think that respondents should definitely be given a high pay rise, they will respond to the “Strongly Agree”
end of the scale, and the in‐between points will be chosen depending on the strength of their agreement or
disagreement. In this case, the question is not framed in a suggestive manner as in the previous instance.
Loaded questions Another type of bias in questions occurs when they are phrased in an emotionally charged
manner. An example of such a loaded question is asking employees: “To what extent do you think management is
likely to be vindictive if the union decides to go on strike?” The words “strike” and “vindictive” are emotionally charged
terms, polarizing management and unions. Hence, asking a question such as the above would elicit strongly emo-
tional and highly biased responses. If the purpose of the question is twofold – that is, to find (1) the extent to which
employees are in favor of a strike and (2) the extent to which they fear adverse reactions if they do go on strike – then
these are the two specific questions that need to be asked. It may turn out that the employees are not strongly in
favor of a strike and they also do not believe that management would retaliate if they did go on strike!
Social desirability Questions should not be worded such that they elicit socially desirable responses. For
instance, a question such as “Do you think that older people should be laid off?” would elicit a response of “no,”
mainly because society would frown on a person who said that elderly people should be fired even if they are
capable of performing their jobs satisfactorily. Hence, irrespective of the true feelings of the respondent, a socially
desirable answer would be provided. If the purpose of the question is to gauge the extent to which organizations
are seen as obligated to retain those above 65 years of age, a differently worded question with less pressure toward
social desirability would be: “There are advantages and disadvantages to retaining senior citizens in the workforce.
To what extent do you think companies should continue to keep the elderly on their payroll?”
Sometimes certain items that tap social desirability are deliberately introduced at various points in the ques-
tionnaire and an index of each individual’s social desirability tendency is calculated therefrom. This index is then
applied to all other responses given by the individual in order to adjust for social desirability bias (Crowne &
Marlowe, 1980; Edwards, 1957).
Length of questions Finally, simple, short questions are preferable to long ones. As a rule of thumb, a ques-
tion or a statement in the questionnaire should not exceed 20 words, or exceed one full line in print (Horst, 1968;
Oppenheim, 1986).

chapter administering questionnaires 149
Sequencing of questions
The sequence of questions in the questionnaire should be such that the respondent is led from questions of a general
nature to those that are more specific, and from questions that are relatively easy to answer to those that are progres-
sively more difficult. This funnel approach, as it is called (Festinger & Katz, 1966), facilitates the easy and smooth
progress of the respondent through the items in the questionnaire. The progression from general to specific questions
might mean that the respondent is first asked questions of a global nature that pertain to the issue, and then is asked
more incisive questions regarding the specific topic. Easy questions might relate to issues that do not involve much
thinking; the more difficult ones might call for more thought, judgment, and decision making in providing the answers.
In determining the sequence of questions, it is advisable not to place contiguously a positively worded and a
negatively worded question tapping the same element or dimension of a concept. For instance, placing two ques-
tions such as the following, one immediately after the other, is not only awkward but might also seem insulting
to the respondent.
I have opportunities to interact with my colleagues during work hours.
I have few opportunities to interact with my colleagues during work hours.
First, there is no need to ask the very same question in both a positive and a negative way. Second, if for some
reason this is deemed necessary (e.g., to check the consistency of the responses), the two questions should be
placed in different parts of the questionnaire, as far apart as possible.
The way questions are sequenced can also introduce certain biases, frequently referred to as ordering effects.
Though randomly placing the questions in the questionnaire reduces any systematic bias in the responses, it is
very rarely done, because of subsequent confusion while categorizing, coding, and analyzing the responses.
In sum, the language and wording of the questionnaire focus on such issues as the type and form of ques-
tions asked (i.e., open‐ended and closed questions, and positively and negatively worded questions), as well as
avoiding double‐barreled questions, ambiguous questions, leading questions, loaded questions, questions prone
to tap socially desirable answers, and those involving distant recall. Questions should also not be unduly long.
Using the funnel approach helps respondents to progress through the questionnaire with ease and comfort.
Classification data or personal information
Classification data, also known as personal information or demographic questions, elicit such information as
age, educational level, marital status, and income. Unless absolutely necessary, it is best not to ask for the name
of the respondent. If, however, the questionnaire has to be identified with the respondents for any reason, then
the questionnaire can be numbered and connected by the researcher to the respondent’s name, in a separately
maintained, private document. This procedure should be clearly explained to the respondent. The reason for
using the numerical system in questionnaires is to ensure the anonymity of the respondent.
Whether questions seeking personal information should appear at the beginning or at the end of the ques-
tionnaire is a matter of choice for the researcher. Some researchers ask for personal data at the end rather than
the beginning of the questionnaire (Oppenheim, 1986). Their reasoning may be that by the time the respondent
reaches the end of the questionnaire he or she has been convinced of the legitimacy and genuineness of the ques-
tions framed by the researcher and, hence, is more inclined and amenable to share personal information.
Researchers who prefer to elicit most of the personal information at the very beginning may opine that once
respondents have shared some of their personal history, they may have psychologically identified themselves
with the questionnaire, and may feel a commitment to respond. Thus, whether one asks for this information at
the beginning or at the end of the questionnaire is a matter of individual choice. However, questions seeking

150 research methods for business
details of income, or other highly sensitive information – if deemed necessary – are best placed at the very end
of the questionnaire. Even so, it is a wise policy to ask for such information by providing a range of response
options, rather than seeking exact figures. For example, the variables may be tapped as shown below:
Age Annual income
Under 20 Less than $20 000
20–30 $20 000–30 000
31–40 $30 001–40 000
41–50 $40 001–50 000
51–60 $50 001–70 000
Over 60 $70 001–90 000
Over $90 000
In surveys, it is advisable to gather certain demographic data such as age, sex, educational level, job level,
department, and number of years in the organization, even if the theoretical framework does not necessitate or
include these variables. Such data help to describe the sample characteristics in the report written after data
analysis. However, when there are only a few respondents in a department, then questions likely to reveal their
identity might render them futile, objectionable, and threatening to employees. For instance, if there is only one
female in a department, then she might refrain from responding to the question on gender, because it would
establish the source of the data; this apprehension is understandable.
To sum up, certain principles of wording need to be followed while designing a questionnaire. The questions
asked must be appropriate for tapping the variable. The language and wording used should be such that it is
meaningful to the employees. The form and type of questions should be geared to minimize respondent bias.
The sequencing of the questions should facilitate the smooth progress of the responses from start to finish. The
personal data should be gathered with due regard to the sensitivity of the respondents’ feelings, and with respect
for privacy.
Principles of measurement
Just as there are guidelines to be followed to ensure that the wording of the questionnaire is appropriate to mini-
mize bias, so also are there some principles of measurement to be followed to ensure that the data collected are
appropriate to test our hypotheses. These refer to the scales and scaling techniques used in measuring concepts,
as well as the assessment of reliability and validity of the measures used, which are all discussed in Chapter 12.
Appropriate scales have to be used depending on the type of data that need to be obtained. The different
scaling mechanisms that help us to anchor our scales appropriately should be properly used. Wherever possible,
the interval and ratio scales should be used in preference to nominal or ordinal scales. Once data are obtained,
the “goodness of data” should be assessed through tests of validity and reliability. Validity establishes how well
a technique, instrument, or process measures a particular concept, and reliability indicates how stably and con-
sistently the instrument taps the variable. Finally, the data have to be obtained in a manner that makes for easy
categorization and coding, both of which are discussed later.
General appearance or “getup” of the questionnaire
Not only is it important to address issues of wording and measurement in questionnaire design, but it is also
necessary to pay attention to how the questionnaire looks. An attractive and neat questionnaire with appropriate
introduction, instructions, and well‐arrayed set of questions and response alternatives will make it easier for the

chapter administering questionnaires 151
Organizing questions, giving instructions and guidance, and good alignment Organizing the
questions logically and neatly in appropriate sections and providing instructions on how to complete the items
in each section will help the respondents to answer them without difficulty. Questions should also be neatly
aligned in a way that allows the respondent to complete the task of reading and answering the questionnaire by
expending the least time and effort and without straining the eyes.
A specimen of the portion of a questionnaire incorporating the above points follows.
respondents to answer them. A good introduction, well‐organized instructions, and neat alignment of the questions
are all important. These elements are briefly discussed with examples.
A good introduction A proper introduction that clearly discloses the identity of the researcher and conveys
the purpose of the survey is absolutely necessary. It is also essential to establish some rapport with the respond-
ents and motivate them to respond to the questions in the questionnaire wholeheartedly and enthusiastically.
Assurance of confidentiality of the information provided by them will allow for less biased answers. The intro-
duction section should end on a courteous note, thanking the respondent for taking the time to respond to the
survey. The following is an example of an appropriate introduction.
EXAMPLE
Section Two: About Work Life
The questions below ask about how you experience
your work life. Think in terms of your everyday expe-
riences and accomplishments on the job and put the
most appropriate response number for you beside each
item, using the scale below.
EXAMPLE
Dear Participant Date
This questionnaire is designed to study aspects of life at work. The information you provide will help us better
understand the quality of our work life. Because you are the one who can give us a correct picture of how you
experience your work life, I request you to respond to the questions frankly and honestly.
Your response will be kept strictly confidential. Only members of the research team will have access to
the information you give. In order to ensure the utmost privacy, we have provided an identification number
for each participant. This number will be used by us only for follow‐up procedures. The numbers, names, and
the completed questionnaires will not be made available to anyone other than the research team. A summary
of the results will be mailed to you after the data are analyzed.
Thank you very much for your time and cooperation. I greatly appreciate the help of your organization and
yourself in furthering this research endeavor.
Cordially,
(Sd)
A. Professor, PhD

152 research methods for business
Personal data Demographic or personal data could be organized as in the example that follows. Note the
ordinal scaling of the age variable.
Strongly
Agree
1
Agree
2
Slightly
Agree
3
Neutral
4
Slightly
Disagree
5
Disagree
6
Strongly
Disagree
7
I do my work best when my job assignments are fairly difficult. __
When I have a choice, I try to work in a group instead of by myself. __
In my work assignments, I try to be my own boss. __
I seek an active role in the leadership of a group. __
I try very hard to improve on my past performance at work. __
I pay a good deal of attention to the feelings of others at work. __
I go my own way at work, regardless of the opinions of others. __
I avoid trying to influence those around me to see things my way. __
I take moderate risks, sticking my neck out to get ahead at work. __
I prefer to do my own work, letting others do theirs. __
I disregard rules and regulations that hamper my personal freedom. __
EXAMPLE
Section One: About Yourself
Please circle the numbers representing the most appropriate responses for you in respect of the following items.
1. Your age
1 Under 20
2 20–35
3 36–50
4 51–65
5 Over 65
2. Your highest completed level
of education
1 Elementary school
2 High school
3 College degree
4 Graduate degree
5 Other (specify)
3. Your gender
1 Female
2 Male
4. Your marital status
1 Married
2 Single
3 Widowed
4 Divorced or separated
5 Other (specify)
5. Number of preschool children
(under 5 years of age)
1 None
2 One
3 Two
4 Three or more
6. Age of the eldest child in your
care (years)
1 Under 5
2 5‐12
3 13–19
4 Over 19
5 Not applicable

chapter administering questionnaires 153
Information on income and other sensitive personal data Although demographic information can
be sought either at the beginning or at the end of the questionnaire, information of a very private and personal
nature such as income, state of health, and so on, if considered at all necessary for the survey, should be asked at
the end of the questionnaire, rather than the beginning. Also, such questions should be justified by explaining
how this information might contribute to knowledge and problem solving, so that respondents do not perceive
them to be of an intrusive or prying nature (see example below). Postponing such questions to the end will help
reduce respondent bias if the individual is vexed by the personal nature of the question.
7. Number of years
worked in the
organization
1 Less than 1
2 1–2
3 3–5
4 6–10
5 Over 10
8. Number of other organizations
worked for before joining this
organization
1 None
2 One
3 Two
4 Three
5 Four or more
9. Present work shift
1 First
2 Second
3 Third
10. Job status
1 Top management
2 Middle management
3 First‐level supervisor
4 Nonmanagerial
EXAMPLE
Because many people believe that income is a sig-
nificant factor in explaining the type of career deci-
sions individuals make, the following two questions
are very important for this research. Like all other
items in this questionnaire, the responses to these
two questions will be kept confidential. Please cir-
cle the most appropriate number that describes your
position.
Roughly, my total yearly income before
taxes and other deductions is:
Roughly, the total yearly income before taxes and
other deductions of my immediate family –
including my own job income, income from other
sources, and the income of my spouse – is:
1 Less than $36 000
2 $36 000–50 000
3 $50 001–70 000
4 $70 001–90 000
5 Over $90 000
1 Less than $36 000
2 $36 000–50 000
3 $50 001–70 000
4 $70 001–90 000
5 $90 001–120 000
6 $120 001–150 000
7 Over $150 000

154 research methods for business
Open-ended question at the end The questionnaire could include an open‐ended question at the end,
allowing respondents to comment on any aspect they choose. It should end with an expression of sincere thanks
to respondents. The last part of the questionnaire could look as follows.
EXAMPLE
The questions in the survey may not be all‐embracing
and comprehensive and may not therefore have
afforded you an opportunity to report some things you
may want to say about your job, the organization, or
yourself. Please make any additional comments needed
in the space provided.
How did you feel about completing this ques-
tionnaire? Check the face in the following dia-
gram that reflects your feelings.
Concluding the questionnaire The questionnaire should end on a courteous note, reminding the respond-
ent to check that all the items have been completed, as per the example below.
Review of questionnaire design
We have devoted a lot of attention to questionnaire design because questionnaires are the most common method
of collecting data. The principles of questionnaire design relate to how the questions are worded and measured,
and how the entire questionnaire is organized. To minimize respondent bias and measurement errors, all the
principles discussed have to be followed carefully.
Questionnaires are most useful as a data collection method, especially when large numbers of people are to
be reached in different geographical regions. They are a popular method of collecting data because researchers
can obtain information fairly easily, and the questionnaire responses are easily coded. When well‐validated
instruments are used, the findings of the study benefit the scientific community since the results can be repli-
cated and additions to the theory base made.
There are several ways of administering questionnaires. Questionnaires can be personally administered to
respondents, electronically distributed to respondents, a link can be posted on a website, a blog, or on your social
EXAMPLE
I sincerely appreciate your time and cooperation.
Please check to make sure that you have not skipped
any questions inadvertently, and then drop the ques-
tionnaire in the locked box, clearly marked for the pur-
pose, at the entrance of your department.
Thank you!

chapter administering questionnaires 155
network account, they can be inserted in magazines, periodicals, or newspapers, or mailed to respondents.
Software is also available to frame subsequent questions based on the subject’s response to the preceding ques-
tion. Companies’ websites can also elicit survey responses; for example, reactions to customer service, product
utility, and the like. Global research is now vastly facilitated by the Internet.
Pretesting of structured questions
Whether it is a structured interview where the questions are posed to the respondent in a predetermined order,
or a questionnaire that is used in a survey, it is important to pretest the instrument to ensure that the questions
are understood by the respondents (i.e., there is no ambiguity in the questions) and that there are no problems
with the wording or measurement. Pretesting involves the use of a small number of respondents to test the
appropriateness of the questions and their comprehension. This helps to rectify any inadequacies before admin-
istering the instrument orally or through a questionnaire to respondents, and thus reduces bias.
It would be good to debrief the results of the pretest and obtain additional information from the small group
of participants (who serve the role of a focus group) on their general reactions to the questionnaire and how they
felt about completing the instrument.
Electronic questionnaire and survey design
We have explained earlier in this chapter that online surveys are easily designed and administered. Electronic
survey design systems (for instance, InstantSurvey, Infopoll, SurveyGold, Statpac, SurveyMonkey, SurveyPro, The
Survey System), which facilitate the preparation and administration of questionnaires, are particularly useful for
online research. Such systems usually include a range of programs enabling the user to design sophisticated ques-
tionnaires, computerize the data collection process, check for syntactical or logical errors in the coding, and
analyze the data collected. More reliable data are likely to result since the respondent can go back and forth and
easily change a response, and various on‐ and off‐screen stimuli are provided to sustain respondents’ interest.
Even as the survey is in progress, descriptive summaries of the cumulative data can be obtained either on the
screen or in printed form. After data collection is complete, a data‐editing program identifies missing or out‐of‐
range data (e.g., a 6 in response to a question on a five‐point scale). The researcher can set the parameters to
either delete missing responses if there are too many of them, or compute the mean of other responses and sub-
stitute this figure for the missing response. Such systems also include data analytic programs such as ANOVA,
multiple regression, and others (discussed later in the book). Randomization of questions and the weighting of
respondents to ensure more representative results (in cases where the sample either overrepresents or underrep-
resents certain population groups – discussed in Chapter 13 on Sampling) are some of the attractive features of
survey design systems.
Electronic questionnaires are very popular at the moment, also because electronic nonresponse rates may
not be any lower than those for mail questionnaires. With the increased computer literacy, we can expect elec-
tronic questionnaire administration to keep on growing in the future.
INTERNATIONAL DIMENSIONS OF SURVEYS
We have so far discussed instrument development for eliciting responses from subjects within a country. With
the globalization of business operations, managers often need to compare the business effectiveness of their sub-
sidiaries in different countries. Researchers engaged in cross‐cultural research may attempt to trace the similari-
ties and differences in the behavioral and attitudinal responses of employees, consumers, or investors in different

156 research methods for business
cultures. When data are collected through questionnaires and occasionally through interviews, one should pay
attention to the measuring instruments and how data are collected, in addition to being sensitive to cultural dif-
ferences in the use of certain terms. Such research should be tailored to the different cultures, as discussed below.
Special issues in instrumentation for cross-cultural research
Certain special issues need to be addressed while designing instruments for collecting data from multiple coun-
tries. Since different languages are spoken in different countries, it is important to ensure that the translation of
the instrument to the local language matches accurately to the original language. For this purpose, the instru-
ment should be first translated by a local expert. Supposing a comparative survey is to be done between Japan and
the United States, and the researcher is a US national, then the instrument has first to be translated from English
to Japanese. Then, another bilinguist should translate it back to English. This back translation, as it is called,
ensures vocabulary equivalence (i.e., that the words used have the same meaning). Idiomatic equivalence could
also become an issue, where some idioms unique to one language just do not lend themselves for translation to
another language. Conceptual equivalence, where the meanings of certain words could differ in different cul-
tures, is yet another issue to which attention has to be paid. For instance, the meaning of the concept “love” may
differ in different cultures. All these issues can be taken care of through good back translation by persons who
are fluent with the relevant languages and are also knowledgeable about the customs and usages in the cultures
concerned.
The following examples culled from BusinessWeek show the pitfalls in cross‐cultural advertising and empha-
size the need for back translation of messages for idiomatic and conceptual equivalence. Not only is the meaning
lost in some advertisement messages by literally translating the English words into the native languages, but in
some cases they actually become offensive.
EXAMPLE
1. Pepsi’s “Come alive with the Pepsi generation” when
translated into Chinese means “Pepsi brings your
ancestors from the grave.”
2. Frank Perdue’s chicken slogan “It takes a strong man
to make a tender chicken” translates in Spanish to “It
takes an aroused man to make a chicken affectionate.”
3. When American Airlines wanted to advertise its
new leather first‐class seats to Mexico, its “Fly in
Leather” campaign would have literally translated
to “Fly Naked” in Spanish.
Issues in cross-cultural data collection
At least three issues are important for cross‐cultural data collection – response equivalence, timing of data
collection, and the status of the individual collecting the data. Response equivalence is ensured by adopting
uniform data collection procedures in the different cultures. Identical methods of introducing the study, the
researcher, task instructions, and closing remarks, in personally administered questionnaires, provide equiva-
lence in motivation, goal orientation, and response attitudes. Timing of data collected across cultures is also
critical for cross‐cultural comparison. Data collection should be completed within acceptable time frames in
the different countries – say within three to four months. If too much time elapses in collecting data in the
different countries, much might change during the time interval in any one country or all the countries.

chapter administering questionnaires 157
As pointed out as early as 1969 by Mitchell, in interview surveys, the egalitarian‐oriented interviewing style
used in the West may not be appropriate in societies that have well‐defined status and authority structures. Also,
when a foreigner comes to collect data, the responses might be biased for fear of portraying the country to a
“foreigner” in an “adverse light”. The researcher has to be sensitive to these cultural nuances while engaging in
cross‐cultural research. It is worth while collaborating with a local researcher while developing and administer-
ing the research instrument, particularly when the language and customs of the respondents are different from
those of the researcher.
REVIEW OF THE ADVANTAGES AND DISADVANTAGES OF DIFFERENT DATA COLLECTION METHODS AND WHEN TO USE EACH
Having discussed the various data collection methods, we will now briefly recount the advantages and disadvan-
tages of the three most commonly used methods – interviews, observation, and questionnaires – and examine
when each method can be most profitably used.
Face‐to‐face interviews provide rich data, offer the opportunity to establish rapport with the interviewees,
and help to explore and understand complex issues. Many ideas ordinarily difficult to articulate can also be
brought to the surface and discussed during such interviews. On the negative side, face‐to‐face interviews have
the potential for introducing interviewer bias and can be expensive if a large number of subjects are involved.
Where several interviewers become necessary, adequate training becomes a necessary first step. Face‐to‐face
interviews are best suited to the exploratory stages of research when the researcher is trying to get an overarching
view of the concepts or the situational factors.
Telephone interviews help to contact subjects dispersed over various geographic regions and obtain imme-
diate responses from them. They are, hence, an efficient way of collecting data when one has specific, struc-
tured questions to ask, needs the responses quickly, and has a sample spread over a wide area. On the negative
side, the interviewer cannot observe the nonverbal responses of the respondents, and the interviewee can
block the call.
Observational studies help us to comprehend complex issues through direct observation (either as a partici-
pant or a nonparticipant observer) and then, if possible, asking questions to seek clarification on certain issues.
The data obtained are rich and uncontaminated by self‐report bias. On the negative side, they are expensive,
since long periods of observation (usually encompassing several weeks or even months) are required, and
observer bias may well be present in the data. Because of the costs involved, very few observational studies are
done in business. Henry Mintzberg’s (1971) study of managerial work is one of the best‐known published works
that used an observational data collection method. Observational studies are best suited for research requiring
non‐self‐report descriptive data; that is, when behaviors are to be understood without directly asking the
respondents themselves. Observational studies can also capture marketing information such as the in‐store buy-
ing behavior of customers.
Personally administering questionnaires to groups of individuals helps to (1) establish rapport with the
respondents while introducing the survey, (2) provide clarification sought by the respondents on the spot, and
(3) collect the questionnaires immediately after they are completed. In that sense, there is a 100% response rate.
On the negative side, administering questionnaires personally is expensive, especially if the sample is widely
dispersed geographically. Personally administered questionnaires are best suited when data are collected from
subjects that are located in close proximity to one another and groups of respondents can be conveniently
assembled.

158 research methods for business
Electronic questionnaires are advantageous when responses to many questions have to be obtained from a
sample that is geographically dispersed, or it is difficult or not possible to conduct telephone interviews without
much expense. On the negative side, such questionnaires usually have a low response rate and one cannot be sure
if the data obtained are unbiased since the nonrespondents may be different from those who did respond. The
electronic questionnaire survey is best suited (and perhaps the only alternative open to the researcher) when
information is to be obtained on a substantial scale through structured questions, at a reasonable cost, from a
sample that is widely dispersed geographically.
MULTIMETHODS OF DATA COLLECTION
Because almost all data collection methods have some bias associated with them, collecting data through multi-
methods and from multiple sources lends rigor to research. For instance, if the responses collected through inter-
views, questionnaires, and observation are strongly correlated with one another, then we will have more confidence
about the goodness of the collected data. If the same question fetches discrepant answers in the questionnaire and
during the interview, then an air of uncertainty emerges and we will be inclined to discard both data as being biased.
Likewise, if data obtained from several sources bear a great degree of similarity, we will have stronger convic-
tion in the goodness of the data. For example, if an employee rates his performance as 4 on a five‐point scale, and
his supervisor gives him a similar rating, we may be inclined to consider him a better than average worker. On
the contrary, if he gives himself a 5 on the five‐point scale and his supervisor gives him a rating of 2, then we will
not know to what extent there is a bias and from which source. Therefore, high correlations among data obtained
on the same variable from different sources and through different data collection methods lend more credibility
to the research instrument and to the data obtained through these instruments. Good research entails collection
of data from multiple sources and through multiple data collection methods. Such research, though, is more
costly and time consuming.
EXAMPLE
The Delphi Technique
The Delphi Technique builds on the idea of using
expert panels (discussed in Chapter 7), but seeks to
combine expert panel discussions with other research
methods such as (email) questionnaires. A panel of
experts often answers questionnaires in two or more
rounds. In the first round they are asked to answer a
series of questions on the likelihood of a future sce-
nario or any other issue about which there is unsure or
incomplete knowledge. The contributions from all the
experts are then collected, summarized, and fed back
in the form of a second‐round questionnaire. After
reviewing the first‐round results, the experts assess the
same issue once more, taking the opinions of other
experts into account. This process goes on until it is
stopped by the researcher. The rationale behind this
iterative process is that eventually it may lead to a con-
sensus about the issue that is being investigated.
The identity of participants is usually not revealed,
even after the completion of the final report. This
should prevent some experts from dominating others,
allow experts to unreservedly express their opinions,
and encourage them to admit mistakes, if any, by revis-
ing their earlier judgments. The Delphi Technique has
been widely used for long‐run business forecasting.

chapter administering questionnaires 159
MANAGERIAL IMPLICATIONS
As a manager, you will perhaps engage consultants to do research and may not be collecting data yourself through
interviews, questionnaires, or observation. However, some basic knowledge of the characteristics and the advan-
tages and disadvantages of primary methods to data collection will help you to evaluate alternative approaches to
primary data collection and to understand why a consultant has opted for a certain method or for a combination
of methods. As the sponsor of research, you will be able to decide at what level of sophistication you want data to
be collected, based on the complexity and gravity of the situation. Your input will help researchers/consultants to
think about their topic list (in interviews), their coding scheme (in observation), or the content of their questions
(in questionnaires).
As a constant (participant-) observer of all that goes on around you at the workplace, you will be able to
understand the dynamics operating in the situation. Also, as a manager, you will be able to differentiate between
good and bad questions used in surveys, with sensitivity to cultural variations, not only in scaling but also in
developing the entire survey instrument, and in collecting data, as discussed in this chapter.
ETHICS IN DATA COLLECTION
Several ethical issues should be addressed while collecting primary data. As previously noted, these pertain
to those who sponsor the research, those who collect the data, and those who offer them. The sponsors
should ask for the study to be done to better the purpose of the organization, and not for any other
self‐serving reason. They should respect the confidentiality of the data obtained by the researcher, and not
ask for the individual or group responses to be disclosed to them, or ask to see the questionnaires. They
should have an open mind in accepting the results and recommendations in the report presented by the
researchers.
Ethics and the researcher
1. Treating the information given by the respondent as strictly confidential and guarding his or her pri-
vacy is one of the primary responsibilities of the researcher. If the vice president or some other top
executive wishes to take a look at the completed questionnaires, the obligatory need to preserve the
confidentiality of the documents should then be pointed out. They should be reminded that prior
understanding of this had already been reached with them before starting the survey.
Also, data for a subgroup of, say, less than ten individuals, should be dealt with tactfully to preserve
the confidentiality of the group members. The data can be combined with others, or treated in another
unidentifiable manner. It is difficult to sanitize reports to protect sources and still preserve the richness
of detail of the study. An acceptable alternative has to be found, since preserving confidentiality is the
fundamental goal.
2. Personal or seemingly intrusive information should not be solicited, and if it is absolutely neces-
sary for the project, it should be tapped with high sensitivity to the respondent, offering spe-
cific reasons.
3. Whatever the nature of the data collection method, the self‐esteem and self‐respect of the subjects
should never be violated.
4. No one should be forced to respond to the survey and if someone does not want to avail themselves of
the opportunity to participate, the individual’s desire should be respected. Informed consent of the

160 research methods for business
SUMMARY
● Learning objective 1: Compare and contrast different types of questionnaires.
Questionnaires are generally designed to collect large numbers of (quantitative) data. They can be adminis-
tered personally, mailed to the respondents, or distributed electronically. When the survey is limited to a
local area a good way to collect data is to personally administer the questionnaires. A mail questionnaire is
a self-administered (paper and pencil) questionnaire that is sent to respondents via the mail. This method
has long been the backbone of business research, but with the arrival of the Internet, mail questionnaires
have become redundant or obsolete. Instead, online questionnaires are posted on the Internet or sent
via email.
● Learning objective 2: Design questionnaires to tap different variables.
Sound questionnaire design principles should focus on three areas. The first concerns the wording of the
questions; the second refers to the planning of issues with regard to how the variables will be categorized,
scaled, and coded after the responses are received; and the third pertains to the general appearance of the
questionnaire. All three are important issues because they can minimize bias in research.
● Learning objective 3: Discuss the issues related to cross-cultural research.
With the globalization of business, managers are often interested in similarities and differences in behavioral
and attitudinal responses of people (employees, consumers, investors) in different cultures. Surveys should
be tailored to the specific needs and features of different cultures. At least three issues are important
for cross-cultural data collection – response equivalence, timing of data collection, and the status of the
individual collecting the data.
subjects should be the goal of the researcher. This holds true even when data are collected through
mechanical means, such as recording interviews, videotaping, and the like.
5. Nonparticipant observers should be as unintrusive as possible. In qualitative studies, personal values
could easily bias the data. It is necessary for the researcher to make explicit his or her assumptions,
expectations, and biases, so that informed decisions regarding the quality of the data can be made by
the manager.
6. Posting invitations to participate in a survey on social networks, discussion groups, and chat rooms is
often perceived as “spam”. Make sure that you are familiar with, and that you act in accordance with,
anti‐spam legislation and guidelines.
7. There should be absolutely no misrepresentation or distortion in reporting the data collected during
the study.
Ethical behavior of respondents
1. The subject, once having exercised the choice to participate in a study, should cooperate fully in the
tasks ahead, such as responding to a survey.
2. The respondent also has an obligation to be truthful and honest in the responses. Misrepresentation or
giving information, knowing it to be untrue, should be avoided.

chapter administering questionnaires 161
Visit the companion website at www.wiley.com/college/sekaran for Case Study: An
online shopping questionnaire.
DISCUSSION QUESTIONS
1. Discuss the advantages and disadvantages of personally administered questionnaires, mail ques-
tionnaires, and electronic questionnaires.
2. Explain the principles of wording, stating how these are important in questionnaire design, citing
examples not in the book.
3. How are multiple methods of data collection and from multiple sources related to the reliability and
validity of the measures?
4. “Every data collection method has its own built‐in biases. Therefore, resorting to multimethods of
data collection is only going to compound the biases.” How would you critique this statement?
5. “One way to deal with discrepancies found in the data obtained from multiple sources is to average
the figures and take the mean as the value of the variable.” What is your reaction to this?
6. How has the advancement in technology helped data gathering via questionnaires?
● Learning objective 4: Discuss the advantages and disadvantages of various data collection methods
in survey research.
Having discussed the primary data collection methods in survey research (interviews, observation, and
administering questionnaires), this chapter recounts the advantages and disadvantages of these methods
and examines when each method can be most profitably used.
● Learning objective 5: Discuss the advantages of multisources and multimethods of data collection.
Because almost all data collection methods have some bias associated with them, collecting data through
multimethods and from multiple sources lends rigor to research. If data obtained from several sources bear
a great degree of similarity, we will have stronger conviction of the goodness of the data.
● Learning objective 6: Demonstrate awareness of the role of the manager in primary data collection.
Managers often engage consultants to do research and may not be collecting data themselves through
interviews, questionnaires, or observation. However, some basic knowledge of the characteristics and the
advantages and disadvantages of primary methods of data collection will help them to evaluate alternative
approaches to primary data collection and/or to understand why a consultant has opted for a certain
method or for a combination of methods.
● Learning objective 7: Demonstrate awareness of the role of ethics in primary data collection.
Several ethical issues should be addressed while collecting primary data. These pertain to those who sponsor
the research, those who collect the data, and those who offer them.

162 research methods for business
Now do Exercises 9.1, 9.2, and 9.3.
EXERCISE 9.1
David Shen Liang is a business student engaged in a management project for Ocg Business Services (OBS),
a supplier of office equipment to a large group of (international) customers. OBS operates in the Business‐
to‐business market. David wants to test the following hypotheses:
1. Service quality has a positive effect on customer satisfaction.
2. Price perception has a negative effect on customer satisfaction.
For this purpose he has developed the following questionnaire:
- - - - - - - - - - - - - - - - - - - - - - - - - - - - - - - - - - - - - - - - - - - - - - - - - - - - - - - - - - - - - - - - - - - - - - - -
Dear Sir,
My name is David Shen Liang. I am a business student currently engaged in a management project for Ocg
Business Services (OBS). I am interested in how satisfied you – as a client of OBS – are about your relation-
ship with OBS. For this purpose I would like you to fill in the following questionnaire. It will take no more
than five minutes to fill in the questionnaire. Thank you so much for your time.
Kind regards,
David Shen Liang.
OBS is in an easily accessible location
Strongly disagree ‐1‐‐‐2‐‐‐3‐‐‐4‐‐‐5‐‐‐6‐‐‐7‐ Strongly agree
OBS has convenient opening hours
Strongly disagree ‐1‐‐‐2‐‐‐3‐‐‐4‐‐‐5‐‐‐6‐‐‐7‐ Strongly agree
OBS delivers fast service
Strongly disagree ‐1‐‐‐2‐‐‐3‐‐‐4‐‐‐5‐‐‐6‐‐‐7‐ Strongly agree
OBS informs you on the status of your order
Strongly disagree ‐1‐‐‐2‐‐‐3‐‐‐4‐‐‐5‐‐‐6‐‐‐7‐ Strongly agree
OBS provides its services on the agreed time
Strongly disagree ‐1‐‐‐2‐‐‐3‐‐‐4‐‐‐5‐‐‐6‐‐‐7‐ Strongly agree
OBS offers a range of products and services that fits your needs
Strongly disagree ‐1‐‐‐2‐‐‐3‐‐‐4‐‐‐5‐‐‐6‐‐‐7‐ Strongly agree
The end‐products of OBS are sound
Strongly disagree ‐1‐‐‐2‐‐‐3‐‐‐4‐‐‐5‐‐‐6‐‐‐7‐ Strongly agree
The facilities of OBS look well‐cared for
Strongly disagree ‐1‐‐‐2‐‐‐3‐‐‐4‐‐‐5‐‐‐6‐‐‐7‐ Strongly agree

chapter administering questionnaires 163
Employees of OBS are helpful and friendly
Strongly disagree ‐1‐‐‐2‐‐‐3‐‐‐4‐‐‐5‐‐‐6‐‐‐7‐ Strongly agree
Employees of OBS give good advice
Strongly disagree ‐1‐‐‐2‐‐‐3‐‐‐4‐‐‐5‐‐‐6‐‐‐7‐ Strongly agree
Employees of OBS respond to your requests promptly
Strongly disagree ‐1‐‐‐2‐‐‐3‐‐‐4‐‐‐5‐‐‐6‐‐‐7‐ Strongly agree
OBS is reliable
Strongly disagree ‐1‐‐‐2‐‐‐3‐‐‐4‐‐‐5‐‐‐6‐‐‐7‐ Strongly agree
When a problem occurs, OBS will help you adequately
Strongly disagree ‐1‐‐‐2‐‐‐3‐‐‐4‐‐‐5‐‐‐6‐‐‐7‐ Strongly agree
OBS is innovative
Strongly disagree ‐1‐‐‐2‐‐‐3‐‐‐4‐‐‐5‐‐‐6‐‐‐7‐ Strongly agree
OBS has your best interests at heart.
Strongly disagree ‐1‐‐‐2‐‐‐3‐‐‐4‐‐‐5‐‐‐6‐‐‐7‐ Strongly agree
OBS fully informs you about the products and services it provides within your organization and
about everything else you may want to learn from OBS or its employees
Strongly disagree ‐1‐‐‐2‐‐‐3‐‐‐4‐‐‐5‐‐‐6‐‐‐7‐ Strongly agree
The price of OBS products is:
Very Low ‐1‐‐‐2‐‐‐3‐‐‐4‐‐‐5‐‐‐6‐‐‐7‐ Very high
In general, how satisfied are you about the services you received?
Very satisfied ‐1‐‐‐2‐‐‐3‐‐‐4‐‐‐5‐‐‐6‐‐‐7‐ Very dissatisfied
Which services do you miss at Ocg Business Services?
When was your first contact with Ocg? ____________ ago.
Are the services of Ocg Business Services of added value to your organization?
[_] Yes, they are.
[_] Irrelevant, the services are not better or worse than those of other providers.
[_] No, I would prefer another provider.
General Questions
Age ___
Gender Male/Female

164 research methods for business
Position
□ Secretarial □ Management □ Administration
□ Facility □ Marketing/sales □ Project
□ Engineers □ Purchasing □ Other
This was the final question of this questionnaire.
Thank you very much for your cooperation!
- - - - - - - - - - - - - - - - - - - - - - - - - - - - - - - - - - - - - - - - - - - - - - - - - - - - - - - - - - - - - - - - - - - - - - - - - -
Comment on the foregoing questionnaire. Pay attention to:
– principles of wording;
– the classification data (personal information); and
– the general appearance or “getup” of the questionnaire.
EXERCISE 9.3
Design a questionnaire that you could use to assess the quality of your on‐campus dining facilities. Make
sure you can test the following hypotheses:
H1: There is a positive relationship between the service quality of the on‐campus dining facilities and
customer loyalty.
H2: The relationship between service quality and customer loyalty is mediated by customer satisfaction.
EXERCISE 9.2
A production manager wants to assess the reactions of the blue‐collar workers in his department (includ-
ing foremen) to the introduction of computer‐integrated manufacturing (CIM) systems. He is particularly
interested to know how they perceive the effects of CIM on:
1. Their future jobs.
2. Additional training that they will have to receive.
3. Future job advancement.
Design a questionnaire for the production manager.

165
INTRODUCTION
In Chapter 6, we examined basic research strategies. We distinguished experimental from non‐experimental
approaches and explained that experimental designs are typically used in deductive research where the researcher is
interested in establishing cause‐and‐effect relationships. In the last three chapters we discussed non‐experimental
approaches to primary data collection. In this chapter we look at experimental designs.
Consider the following three scenarios.
Experimental designs
C H A P T E R 1 0
LEARNING OBJECTIVES
After completing Chapter 10, you should be able to:
1. Describe lab experiments and discuss the internal and external validity of this type of
experiment.
2. Describe field experiments and discuss the internal and external validity of this type of
experiment.
3. Describe, discuss, and identify threats to internal and external validity and make a trade-off between
internal and external validity.
4. Describe the different types of experimental designs.
5. Discuss when and why simulation might be a good alternative to lab and field experiments.
6. Discuss the role of the manager in experimental designs.
7. Discuss the role of ethics in experimental designs.

166 research methods for business
EXAMPLE
Cause-and-effect relationship after randomization
Scenario A A manufacturer of luxury cars has decided to launch a global brand communications cam-
paign to reinforce the image of its cars. An 18‐month campaign is scheduled that will be
rolled out worldwide, with advertising in television, print, and electronic media. Under the
title “Bravura”, a renowned advertising agency developed three different campaign concepts.
To determine which of these concepts is most effective, the car manufacturer wants to test
their effects on the brand’s image. But how can the car manufacturer test the effectiveness
of these concepts?
Scenario B A study of absenteeism and the steps taken to curb it indicates that companies use the follow-
ing incentives to reduce it:
14% give bonus days;
39% offer cash;
39% present recognition awards;
4% award prizes; and
4% pursue other strategies.
Asked about their effectiveness,
22% of the companies said they were very effective;
66% said they were somewhat effective; and
12% said they were not at all effective.
What does the above information tell us? How do we know what kinds of incentives cause
people not to absent themselves? What particular incentive(s) did the 22% of companies that
found their strategies to be “very effective” offer? Is there a direct causal connection between
one or two specific incentives and absenteeism?
Scenario C The dagger effect of layoffs is that there is a sharp drop in the commitment of workers who
are retained, even though they might well understand the logic of the reduction in the
workforce.
Does layoff really cause employee commitment to drop off, or is something else operating
in this situation?
The answers to the questions raised in Scenarios A, B, and C might be found by using experimental designs
in researching the issues.
In Chapter 6 we touched on experimental designs. In this chapter, we will discuss lab experiments and field
experiments in detail. Experimental designs, as we know, are set up to examine possible cause‐and‐effect rela-
tionships among variables, in contrast to correlational studies, which examine the relationships among variables
without necessarily trying to establish if one variable causes another.

chapter experimental designs 167
We have already explained that in order to establish that a change in the independent variable causes a
change in the dependent variable: (1) the independent and the dependent variable should covary; (2) the inde-
pendent variable should precede the dependent variable; (3) no other factor should be a possible cause of the
change in the dependent variable; (4) a logical explanation is needed about why the independent variable affects
the dependent variable.
The third condition implies that to establish causal relationships between two variables in an organizational
setting, several variables that might covary with the dependent variable have to be controlled. This then allows
us to say that variable X, and variable X alone, causes the dependent variable Y. However, it is not always possible
to control all the covariates while manipulating the causal factor (the independent variable that is causing the
dependent variable) in organizational settings, where events flow or occur naturally and normally. It is, however,
possible to first isolate the effects of a variable in a tightly controlled artificial setting (the lab setting), and after
testing and establishing the cause‐and‐effect relationship under these tightly controlled conditions, see how gen-
eralizable such relationships are to the field setting.
Let us illustrate this with an example.
EXAMPLE
Suppose a manager believes that staffing the account-
ing department completely with personnel with M.Acc.
(Master of Accountancy) degrees will increase its pro-
ductivity. It is well nigh impossible to transfer all those
without the M.Acc. degree currently in the department
to other departments and recruit fresh M.Acc. degree
holders to take their place. Such a course of action is
bound to disrupt the work of the entire organization
inasmuch as many new people will have to be trained,
work will slow down, employees will get upset, and so
on. However, the hypothesis that possession of an
M.Acc. degree would cause increases in productivity
can be tested in an artificially created setting (i.e., not
at the regular workplace) in which an accounting job
can be given to three groups of people: those with an
M.Acc. degree, those without an M.Acc. degree, and a
mixed group of those with and without an M.Acc.
degree (as is the case in the present work setting). If the
first group performs exceedingly well, the second
group poorly, and the third group falls somewhere in
the middle, there will be evidence to indicate that the
M.Acc. degree qualification might indeed cause pro-
ductivity to rise. If such evidence is found, then
planned and systematic efforts can be initiated to grad-
ually transfer those without the M.Acc. degree in the
accounting department to other departments and
recruit others with this degree to this department. It is
then possible to see to what extent productivity does,
in fact, go up in the department because all the staff
members are M.Acc. degree holders.
As we saw earlier, experimental designs fall into two categories: experiments done in an artificial or con-
trived environment, known as lab experiments, and those done in the natural environment in which activities
regularly take place, known as field experiments.
THE LAB EXPERIMENT
As stated earlier, when a cause‐and‐effect relationship between an independent and a dependent variable of
interest is to be clearly established, then all other variables that might contaminate or confound the relationship
have to be tightly controlled. In other words, the possible effects of other variables on the dependent variable
have to be accounted for in some way, so that the actual causal effects of the investigated independent variable on

168 research methods for business
the dependent variable can be determined. It is also necessary to manipulate the independent variable so that the
extent of its causal effects can be established. The control and manipulation are best done in an artificial setting
(the laboratory), where the causal effects can be tested. When control and manipulation are introduced to estab-
lish cause‐and‐effect relationships in an artificial setting, we have laboratory experimental designs, also known
as lab experiments.
Because we use the terms control and manipulation, let us examine what these concepts mean.
Control
When we postulate cause‐and‐effect relationships between two variables X and Y, it is possible that some
other factor, say A, might also influence the dependent variable Y. In such a case, it will not be possible to
determine the extent to which Y occurred only because of X, since we do not know how much of the total vari-
ation in Y was caused by the presence of the other factor A. For instance, a Human Resource Development
manager might arrange special training for a set of newly recruited secretaries in creating web pages, to prove
to the VP (his boss) that such training causes them to function more effectively. However, some of the new
secretaries might function more effectively than others mainly or partly because they have had previous inter-
mittent experience with using the web. In this case, the manager cannot prove that the special training alone
caused greater effectiveness, since the previous intermittent web experience of some secretaries is a contami-
nating factor. If the true effect of the training on learning is to be assessed, then the learners’ previous experi-
ence has to be controlled. This might be done by not including in the experiment those who already have had
some experience with the web. This is what we mean when we say we have to control the contaminating fac-
tors, and we will later see how this is done.
Manipulation
To examine the causal effects of an independent variable on a dependent variable, certain manipulations
need to be tried. Manipulation simply means that we create different levels of the independent variable to
assess the impact on the dependent variable. For example, we may want to test the theory that depth of
knowledge of various manufacturing technologies is caused by rotating the employees on all the jobs on the
production line and in the design department, over a four‐week period. Then we can manipulate the inde-
pendent variable, “rotation of employees,” by rotating one group of production workers and exposing them
to all the systems during the four‐week period, rotating another group of workers only partially during the
four weeks (i.e., exposing them to only half of the manufacturing technologies), and leaving the third group
to continue to do what they are currently doing, without any special rotation. By measuring the depth of
knowledge of these groups both before and after the manipulation (also known as the treatment), it is pos-
sible to assess the extent to which the treatment caused the effect, after controlling the contaminating fac-
tors. If deep knowledge is indeed caused by rotation and exposure, the results will show that the third group
had the lowest increase in depth of knowledge, the second group had some significant increase, and the first
group had the greatest gains!
Let us look at another example of how causal relationships are established by manipulating the independ-
ent variable.
Visit the companion website at www.wiley.com/college/sekaran for Author Video:
Manipulation.

chapter experimental designs 169
In the above case the independent variable, lighting, has been manipulated by exposing different groups to
different degrees of changes in it. This manipulation of the independent variable is also known as the treatment,
and the results of the treatment are called treatment effects.
Let us illustrate how variable X can be both controlled and manipulated in the lab setting through
another example.
EXAMPLE
Let us say we want to test the effects of lighting on
worker production levels among sewing machine oper-
ators. To establish a cause‐and‐effect relationship, we
must first measure the production levels of all the opera-
tors over a 15‐day period with the usual amount of light
they work with – say 60 watt lamps. We might then want
to split the group of 60 operators into three groups of
20 members each, and while allowing one subgroup to
continue to work under the same conditions as before
(60 watt electric light bulbs), we might want to manipu-
late the intensity of the light for the other two subgroups,
by making one group work with 75 watt and the other
with 100 watt light bulbs. After the different groups have
worked with these varying degrees of light exposure for
15 days, each group’s total production for these 15 days
may be analyzed to see if the difference between the pre‐
experimental and the post‐experimental production
among the groups is directly related to the intensity of
the light to which they have been exposed. If our
hypothesis that better lighting increases the production
levels is correct, then the subgroup that did not have any
change in the lighting (called the control group), should
have no increase in production and the other two groups
should show increases, with those having the most light
(100 watts) showing greater increases than those who
had the 75 watt lighting.
EXAMPLE
Let us say an entrepreneur – the owner of a toy factory –
is rather disappointed with the number of imitation
Batman action figures produced by his workers, who are
paid wages at an hourly rate. He might wonder whether
paying them piece rates would increase their production
levels. However, before implementing the piece‐rate
system, he wants to make sure that switching over to the
new system would indeed achieve the objective.
In a case like this, the researcher might first want to
test the causal relationships in a lab setting, and if the
results are encouraging, conduct the experiment later in
a field setting. In designing the lab experiment, the
researcher should first think of possible factors affecting
the production level of the workers, and then try to con-
trol these. Other than piece rates, previous job experi-
ence might also influence the rate of production because
familiarity with the job makes it easy for people to
increase their productivity levels. In some cases, where
the jobs are very strenuous and require muscular
strength, gender differences may affect productivity.
Let us say that for the type of production job discussed
earlier, age, gender, and prior experience of the employ-
ees are the factors that influence the production levels of
the employees. The researcher needs to control these
three variables. Let us see how this can be done.
Suppose the researcher intends to set up four
groups of 15 people each for the lab experiment – one
to be used as the control group, and the other three
subjected to three different pay manipulations. Now,
the variables that may have an impact on the cause‐
and‐effect relationship can be controlled in two differ-
ent ways: either by matching the groups or through
randomization. These concepts are explained before
we proceed further.

170 research methods for business
Controlling the contaminating exogenous or “nuisance” variables
Matching groups
One way of controlling the contaminating or “nuisance” variables is to match the various groups by picking the
confounding characteristics and deliberately spreading them across groups. For instance, if there are 20 women
among the 60 members, then each group will be assigned five women, so that the effects of gender are distributed
across the four groups. Likewise, age and experience factors can be matched across the four groups, such that
each group has a similar mix of individuals in terms of gender, age, and experience. Because the suspected con-
taminating factors are matched across the groups, we can be confident in saying that variable X alone causes vari-
able Y (if, of course, that is the result of the study).
Randomization
Another way of controlling the contaminating variables is to assign the 60 members randomly (i.e., with no prede-
termination) to the four groups. That is, every member will have a known and equal chance of being assigned to any
of these four groups. For instance, we might throw the names of all the 60 members into a hat and draw their names.
The first 15 names drawn may be assigned to the first group, the second 15 to the second group, and so on, or the
first person drawn might be assigned to the first group, the second person drawn to the second group, and so on.
Thus, in randomization, the process by which individuals are drawn (i.e., everybody has a known and equal chance
of being drawn) and their assignment to any particular group (each individual could be assigned to any one of
the groups set up) are both random. By thus randomly assigning members to the groups we are distributing the
confounding variables among the groups equally. That is, the variables of age, sex, and previous experience – the
controlled variables – will have an equal probability of being distributed among the groups.
The process of randomization ideally ensures that each group is comparable to the others, and that all variables,
including the effects of age, sex, and previous experience, are controlled. In other words, each of the groups will have
some members who have more experience mingled with those who have less or no experience. All groups will
have members of different age and sex composition. Thus, randomization ensures that if these variables do indeed
have a contributory or confounding effect, we have controlled their confounding effects (along with those of other
unknown factors) by distributing them across groups. This is achieved because when we manipulate the independ-
ent variable of piece rates by having no piece rate system at all for one group (control) and having different piece
rates for the other three groups (experimental), we can determine the causal effects of the piece rates on production
levels. Any errors or biases caused by age, sex, and previous experience are now distributed equally among all four
groups. Any causal effects found will be over and above the effects of the confounding variables.
To make it clear, let us illustrate this with some actual figures, as in Table 10.1. Note that because the effects
of experience, sex, and age were controlled in all the four groups by randomly assigning the members to them,
T A B L E 1 0 . 1
Cause-and-effect relationship after randomization
Groups Treatment
Treatment effect (% increase in production
over pre‐piece rate system)
Experimental group 1 $1.00 per piece 10
Experimental group 2 $1.50 per piece 15
Experimental group 3 $2.00 per piece 20
Control group (no treatment) Old hourly rate 0

chapter experimental designs 171
and the control group had no increase in productivity, it can be reliably concluded from the result that the per-
centage increases in production are a result of the piece rate (treatment effects). In other words, piece rates are
the cause of the increase in the number of toys produced. We cannot now say that the cause‐and‐effect relation-
ship has been confounded by other “nuisance” variables, because they have been controlled through the process
of randomly assigning members to the groups. Here, we have high internal validity or confidence in the cause‐
and‐effect relationship.
Advantages of randomization The difference between matching and randomization is that in the
former case individuals are deliberately and consciously matched to control the differences among group
members, whereas in the latter case we expect that the process of randomization will distribute the inequal-
ities among the groups, based on the laws of normal distribution. Thus, we need not be particularly con-
cerned about any known or unknown confounding factors.
In sum, compared to randomization, matching might be less effective, since we may not know all the factors
that could possibly contaminate the cause‐and‐effect relationship in any given situation, and hence fail to match
some critical factors across all groups while conducting an experiment. Randomization, however, will take care
of this, since all the contaminating factors will be spread across all groups. Moreover, even if we know the
confounding variables, we may not be able to find a match for all such variables. For instance, if gender is a con-
founding variable, and if there are only two women in a four‐group experimental design, we will not be able
to match all the groups with respect to gender. Randomization solves these dilemmas as well. Thus, lab experi-
mental designs involve control of the contaminating variables through the process of either matching or rand-
omization, and the manipulation of the treatment.
Internal validity of lab experiments
Internal validity refers to the confidence we place in the cause‐and‐effect relationship. In other words, it
addresses the question, “To what extent does the research design permit us to say that the independent variable A
causes a change in the dependent variable B?” As Kidder and Judd (1986) note, in research with high internal
validity, we are relatively better able to argue that the relationship is causal, whereas in studies with low internal
validity, causality cannot be inferred at all. In lab experiments where cause‐and‐effect relationships are substanti-
ated, internal validity can be said to be high.
So far we have talked about establishing cause‐and‐effect relationships within the lab setting, which is an artifi-
cially created and controlled environment. You might yourself have been a subject taking part in one of the lab
experiments conducted by the psychology or other departments on campus at some time. You might not have been
specifically told what cause‐and‐effect relationships the experimenter was looking for, but you would have been told
what is called a “cover story.” That is, you would have been apprised in general terms of some reason for the study and
your role in it, without divulging its true purpose. After the end of the experiment you would also have been debriefed
and given a full explanation of the experiment, and any questions you might have had would have been answered.
This is how lab experiments are usually conducted: subjects are selected and assigned to different groups through
matching or randomization; they are moved to a lab setting; they are given some details of the study and a task to
perform; and some kind of questionnaire or other tests are administered both before and after the task is completed.
The results of these studies indicate the cause‐and‐effect relationship between the variables under investigation.
External validity or generalizability of lab experiments
To what extent are the results found in the lab setting transferable or generalizable to actual organizational or
field settings? In other words, if we do find a cause‐and‐effect relationship after conducting a lab experiment, can
we then confidently say that the same cause‐and‐effect relationship will also hold true in the organizational setting?

172 research methods for business
Consider the following situation. If, in a lab experimental design, the groups are given the simple production
task of screwing bolts and nuts onto a plastic frame, and the results indicate that the groups who were paid piece
rates were more productive than those who were paid hourly rates, to what extent can we then say that this would
be true of the sophisticated nature of the jobs performed in organizations? The tasks in organizational settings
are far more complex, and there might be several confounding variables that cannot be controlled – for example,
experience. Under such circumstances, we cannot be sure that the cause‐and‐effect relationship found in the lab
experiment is necessarily likely to hold true in the field setting. To test the causal relationships in the organiza-
tional setting, field experiments are carried out. These will now be briefly discussed.
THE FIELD EXPERIMENT
A field experiment, as the name implies, is an experiment done in the natural environment in which work
(or life) goes on as usual, but treatments are given to one or more groups. Thus, in the field experiment, even
though it may not be possible to control all the nuisance variables because members cannot be either randomly
assigned to groups, or matched, the treatment can still be manipulated. Control groups can also be set up in field
experiments. The experimental and control groups in the field experiment may be made up of the people work-
ing at several plants within a certain radius, or from the different shifts in the same plant, or in some other way.
If there are three different shifts in a production plant, for instance, and the effects of the piece‐rate system are to
be studied, one of the shifts can be used as the control group, and the two other shifts given two different treat-
ments or the same treatment – that is, different piece rates or the same piece rate. Any cause‐and‐effect relation-
ship found under these conditions will have wider generalizability to other similar production settings, even
though we may not be sure to what extent the piece rates alone were the cause of the increase in productivity,
because some of the other confounding variables could not be controlled.
EXTERNAL AND INTERNAL VALIDITY IN EXPERIMENTS
What we just discussed can be referred to as an issue of external validity versus internal validity. External validity
refers to the extent of generalizability of the results of a causal study to other settings, people, or events, and internal
validity refers to the degree of our confidence in the causal effects (i.e., that variable X causes variable Y). Field
experiments have more external validity (i.e., the results are more generalizable to other similar organizational set-
tings), but less internal validity (i.e., we cannot be certain of the extent to which variable X alone causes variable Y).
Note that in the lab experiment, the reverse is true: the internal validity is high but the external validity is rather low.
In other words, in lab experiments we can be sure that variable X causes variable Y because we have been able to
keep the other confounding exogenous variables under control, but we have so tightly controlled several variables
to establish the cause‐and‐effect relationship that we do not know to what extent the results of our study can be
generalized, if at all, to field settings. In other words, since the lab setting does not reflect the “real‐world” setting,
we do not know to what extent the lab findings validly represent the realities in the outside world.
Trade-off between internal and external validity
There is thus a trade‐off between internal validity and external validity. If we want high internal validity, we should
be willing to settle for lower external validity and vice versa. To ensure both types of validity, researchers usually
try first to test the causal relationships in a tightly controlled artificial or lab setting, and once the relationship has
been established, they try to test the causal relationship in a field experiment. Lab experimental designs in the

chapter experimental designs 173
management area have thus far been done to assess, among other things, gender differences in leadership styles
and managerial aptitudes. However, gender differences and other factors found in the lab settings are frequently
not found in field studies (Osborn & Vicars, 1976). These problems of external validity usually limit the use of
lab experiments in the management area. Field experiments are also infrequently undertaken because of the
resultant unintended consequences – personnel becoming suspicious, rivalries and jealousies being created
among departments, and the like.
Factors affecting the validity of experiments
Even the best designed lab studies may be influenced by factors that might affect the internal validity of the lab
experiment. That is, some confounding factors might still be present that could offer rival explanations as to what
is causing the dependent variable. These possible confounding factors pose a threat to internal validity. The seven
major threats to internal validity are the effects of history, maturation, (main) testing, selection, mortality, statis-
tical regression, and instrumentation, and these are explained below with examples. Two threats to external
validity are (interactive) testing and selection. These threats to the validity of experiments are discussed next.
History effects
Certain events or factors that have an impact on the independent variable–dependent variable relationship might
unexpectedly occur while the experiment is in progress, and this history of events would confound the cause‐and‐
effect relationship between the two variables, thus affecting the internal validity. For example, let us say that the
manager of a Dairy Products Division wants to test the effects of the “buy one, get one free” sales promotion on the
sale of the company‐owned brand of packaged cheese for a week. She carefully records the sales of the packaged
cheese during the previous two weeks to assess the effect of the promotion. However, on the very day that her sales
promotion goes into effect, the Dairy Farmers’ Association unexpectedly launches a multimedia advertisement on
the benefits of consuming dairy products, especially cheese. The sales of all dairy products, including cheese, go up
in all the stores, including the one where the experiment had been in progress. Here, because of an unexpected
advertisement, one cannot be sure how much of the increase in sales of the packaged cheese in question was due to
the sales promotion and how much to the advertisement by the Dairy Farmers’ Association! The effects of history
have reduced the internal validity or the faith that can be placed on the conclusion that the sales promotion caused
the increase in sales. The history effects in this case are illustrated in Figure 10.1.
Salespromotion
Sales
Independent variable
Time: t2 t3t1
Uncontrolled variable
Dairyfarmers’ advertisement
Dependent variable
F I G U R E 1 0 . 1
Illustration of history effects in experimental design

174 research methods for business
To give another example, let us say a bakery is studying the effects of adding to its bread a new ingredient
that is expected to enrich it and offer more nutritional value to children under 14 years of age within 30 days,
subject to a certain daily intake. At the start of the experiment the bakery takes a measure of the health of
30 children through some medical yardsticks. Thereafter, the children are given the prescribed intakes of bread
daily. Unfortunately, on day 20 of the experiment, a flu virus hits the city in epidemic proportions affecting most
of the children studied. This unforeseen and uncontrollable effect of history, flu, has contaminated the cause‐
and‐effect relationship study for the bakery.
Maturation effects
Cause‐and‐effect inferences can also be contaminated by the effects of the passage of time – another uncontrol-
lable variable. Such contamination effects are denoted maturation effects. The maturation effects are a function
of the processes – both biological and psychological – operating within the respondents as a result of the passage
of time. Examples of maturation processes include growing older, getting tired, feeling hungry, and getting bored.
In other words, there could be a maturation effect on the dependent variable purely because of the passage of
time. For instance, let us say that an R&D director contends that increases in the efficiency of workers will result
within three months’ time if advanced technology is introduced in the work setting. If, at the end of the three
months, increased efficiency is indeed found, it will be difficult to claim that the advanced technology (and it
alone) increased the efficiency of workers because, with the passage of time, employees will also have gained
experience, resulting in better job performance and therefore in improved efficiency. Thus, the internal validity
also gets reduced owing to the effects of maturation inasmuch as it is difficult to pinpoint how much of the
increase is attributable to the introduction of the enhanced technology alone. Figure 10.2 illustrates the matura-
tion effects in the above example.
Testing effects
Frequently, to test the effects of a treatment, subjects are given what is called a pretest. That is, first a measure of
the dependent variable is taken (the pretest), then the treatment is given, and after that a second measure of the
dependent variable is taken (the posttest). The difference between the posttest and the pretest scores is then
attributed to the treatment. However, the exposure of participants to the pretest may affect both the internal and
external validity of the findings. Indeed, the aforementioned process may lead to two types of testing effects.
Independent variable
Time: t2 t3t1
Maturation effects
Dependent variable
Enhanced technology Efficiency increases
Gaining experience anddoing the job faster
F I G U R E 1 0 . 2
Illustration of maturation effects on a cause-and-effect relationship

chapter experimental designs 175
A main testing effect occurs when the prior observation (the pretest) affects the later observation (the post-
test). Main testing effects typically occur because participants want to be consistent. Let us assume that we have
tested the effect of a television commercial (the treatment) on attitudes toward the brand using a pretest and a
posttest. Suppose that no significant difference in attitude toward the brand was found. This finding could lead
to the conclusion that the commercial was ineffective. However, an alternative explanation is that our partici-
pants tried to be consistent and answered the later questions so that their answers were similar to the answers
they gave the first time. The pretest may thus have affected the results of the experiment. Along these lines, main
testing effects are another threat to internal validity.
Interactive testing effects occur when the pretest affects the participant’s reaction to the treatment (the inde-
pendent variable). Again, let’s assume that we are testing the effect of a television commercial on attitude toward
the brand using a pretest and a posttest. It is possible that because of the pretest, the participants watch the televi-
sion commercial more closely than consumers that do not take part in the experiment. For this reason, any
effects that are found may not necessarily be generalizable to the population. Hence, interactive treatment effects
are a threat to the external validity of an experiment.
In sum, testing effects may affect both the internal and external validity of our findings. Main testing effects
threaten the internal validity, whereas interactive testing effects threaten the external validity.
Selection bias effects
Another threat to both the internal and external validity of our findings is the selection of participants. First, we
will discuss how selection may affect the external validity of our findings. Then, we will discuss how selection
may affect the internal validity.
In a lab setting, the types of participants selected for the experiment may be very different from the types of
employees recruited by organizations. For example, students in a university might be allotted a task that is
manipulated to study the effects on their performance. The findings from this experiment cannot be generalized,
however, to the real world of work, where the employees and the nature of the jobs are both quite different. Thus,
subject selection poses a threat to external validity.
The threat to internal validity comes from improper or unmatched selection of subjects for the experimental
and control groups. For example, if a lab experiment is set up to assess the impact of the working environment
on employees’ attitudes toward work, and if one of the experimental conditions is to have a group of subjects
work for about two hours in a room with a mildly unpleasant smell, an ethical researcher might disclose this
condition to prospective subjects, who may decline to participate in the study. However, some volunteers might
be lured through incentives (say, a payment of $70 for the two hours of participation in the study). The volunteers
so selected may be quite different from the others (inasmuch as they may come from an environment of depriva-
tion) and their responses to the treatment might be quite different. Such bias in the selection of the subjects
might contaminate the cause‐and‐effect relationships and pose a threat to internal validity as well. Hence, new-
comers, volunteers, and others who cannot be matched with the control groups pose a threat to internal validity
in certain types of experiment. For this reason, randomization or matching groups is highly recommended.
Mortality effects
Another confounding factor on the cause‐and‐effect relationship is the mortality or attrition of the members in
the experimental or control group, or both, as the experiment progresses. When the group composition changes
over time across the groups, comparison between the groups becomes difficult, because those who dropped out
of the experiment may confound the results. Again, we will not be able to say how much of the effect observed
arises from the treatment, and how much is attributable to the members who dropped out, since those who
stayed with the experiment may have reacted differently from those who dropped out. Let us see an example.

176 research methods for business
Statistical regression effects
The effects of statistical regression are brought about when the members chosen for the experimental group
have extreme scores on the dependent variable to begin with. For instance, if a manager wants to test whether
he can increase the “salesmanship” repertoire of the sales personnel through Dale Carnegie‐type programs, he
should not choose those with extremely low or extremely high abilities for the experiment. This is because we
know from the laws of probability that those with very low scores on a variable (in this case, current sales ability)
have a greater probability of showing improvement and scoring closer to the mean on the posttest after being
exposed to the treatment. This phenomenon of low scorers tending to score closer to the mean is known as
“regressing toward the mean” (statistical regression). Likewise, those with very high abilities also have a greater
tendency to regress toward the mean – they will score lower on the posttest than on the pretest. Thus, those who
are at either end of the continuum with respect to a variable will not “truly” reflect the cause‐and‐effect relation-
ship. The phenomenon of statistical regression is thus yet another threat to internal validity.
Instrumentation effects
Instrumentation effects are yet another source of threat to internal validity. These might arise because of a
change in the measuring instrument between pretest and posttest, and not because of the treatment’s differen-
tial impact at the end (Cook & Campbell, 1979a). For instance, an observer who is involved in observing a
particular pattern of behavior in respondents before a treatment might start concentrating on a different set of
behaviors after the treatment. The frame of measurement of behavior (in a sense, the measuring instrument)
has now changed and will not reflect the change in behavior that can be attributed to the treatment. This is also
true in the case of physical measuring instruments like the spring balance or other finely calibrated instru-
ments that might lose their accuracy due to a loss of tension with constant use, resulting in erroneous final
measurement.
In organizations, instrumentation effects in experimental designs are possible when the pretest is done by
the experimenter, treatments are given to the experimental groups, and the posttest on measures such as perfor-
mance is done by different managers. One manager might measure performance by the final units of output, a
second manager might take into account the number of rejects as well, and a third manager might also take into
EXAMPLE
A sales manager had heard glowing reports about
three different training programs that train salesper-
sons in effective sales strategies. All three were of six
weeks’ duration. The manager was curious to know
which one would offer the best results for the com-
pany. The first program took the trainees daily on field
trips and demonstrated effective and ineffective sales
strategies through practical experience. The second
program trained groups on the same strategies but
indoors in a classroom setting, with lectures, role play-
ing, and answering questions from the participants.
The third program used mathematical models and
simulations to increase sales effectiveness. The man-
ager chose eight trainees each for the three different
programs and sent them to training. By the end of the
fourth week, three trainees from the first group, one
from the second group, and two from the third group
had dropped out of the training programs for a variety
of reasons, including ill health, family exigencies,
transportation problems, and a car accident. This attri-
tion from the various groups made it impossible to
compare the effectiveness of the various programs.
Thus, mortality can also lower the internal validity of
an experiment.

chapter experimental designs 177
consideration the amount of resources expended in getting the job done! Here, there are at least three different
measuring instruments, if we treat each manager as a performance measuring instrument.
Thus, instrumentation effects also pose a threat to internal validity in experimental design.
Identifying threats to validity
Let us examine each of the possible seven threats to validity in the context of the following scenario.
EXAMPLE
An organizational consultant wanted to demonstrate
to the president of a company, through an experimen-
tal design, that the democratic style of leadership best
enhances the morale of employees. She set up three
experimental groups and one control group for the
purpose and assigned members to each of the groups
randomly. The three experimental groups were headed
by an autocratic leader, a democratic leader, and a
laissez‐faire leader, respectively.
The members in the three experimental groups
were administered a pretest. Since the control group
was not exposed to any treatment, they were not
given a pretest. As the experiment progressed, two
members in the democratic treatment group got quite
excited and started moving around to the other mem-
bers saying that the participative atmosphere was
“great” and “performance was bound to be high in
this group.” Two members from each of the autocratic
and laissez‐faire groups left after the first hour saying
they had to go and could no longer participate in the
experiment. After two hours of activities, a posttest
was administered to all the participants, including
the control group members, on the same lines as
the pretest.
1. History effects. The action of the two members in the participative group by way of unexpectedly mov-
ing around in an excited manner and remarking that participative leadership is “great” and the “perfor-
mance is bound to be high in this group” might have boosted the morale of all the members in the
group. It would be difficult to separate out how much of the increase in morale was due to the participa-
tive condition alone and how much to the sudden enthusiasm displayed by the two members.
2. Maturation effects. It is doubtful that maturation had any effect on morale in this situation, since the
passage of time, in itself, may not have anything much to do with increases or decreases in morale.
3. Testing effects. The pretests are likely to have sensitized the respondents to both the treatment and the
posttest. Thus, main and interactive testing effects exist. However, if all the groups had been given both
the pre‐ and the posttests, the main testing effects (but not the interactive testing effects!) across all
groups would have been taken care of (i.e., nullified) and the posttests of each of the experimental
groups could have been compared with that of the control group to detect the effects of the treatment.
Unfortunately, the control group was not given the pretest, and thus this group’s posttest scores were
not biased by the pretest – a phenomenon that could have occurred in the experimental groups. Hence,
it is incorrect, on the face of it, to compare the experimental groups’ scores with those of the control
group. Interactive testing poses a threat to the external validity of the findings.
4. Selection bias effects. Since members were randomly assigned to all groups, selection bias should not
have affected the internal validity of the findings. The external validity of the findings should also not
have been threatened by selection: there is no reason to assume that the participants selected for the
experiment are different from the other employees of the organization.

178 research methods for business
5. Mortality effects. Since members dropped out of two experimental groups, the effects of mortality could
affect internal validity.
6. Statistical regression effects. Though not specifically stated, we can assume that all the members partici-
pating in the experiment were selected randomly from a normally distributed population, in which
case the issue of statistical regression contaminating the experiment does not arise.
7. Instrumentation effects. Since the same questionnaire measured morale both before and after the treat-
ment for all members, there should not have been any instrumentation bias.
In effect, three of the seven threats to internal validity do apply in this case. The history, main testing, and
mortality effects are of concern and, therefore, the internal validity will not be high. Interactive testing effects
threaten the external validity of the findings.
EXAMPLE
Internal Validity in Case Studies
If there are several threats to internal validity even in a
tightly controlled lab experiment, it should be quite
clear why we cannot draw conclusions about causal
relationships from case studies that describe the events
that occurred during a particular time. Unless a well‐
designed experimental study, randomly assigning
members to experimental and control groups, and suc-
cessfully manipulating the treatment indicates possible
causal relationships, it is impossible to say which factor
causes another. For instance, there are several causes
attributed to “Slice,” the soft drink introduced by
PepsiCo Inc., not taking off after its initial success.
Among the reasons given are: (1) a cutback in adver-
tisements for Slice, (2) operating on the mistaken
premise that the juice content in Slice would appeal to
health‐conscious buyers, (3) PepsiCo’s attempts to
milk the brand too quickly, (4) several strategic errors
made by PepsiCo, (5) underestimation of the time
taken to build a brand, and the like. While all the above
could provide the basis for developing a theoretical
framework for explaining the variance in the sales of a
product such as Slice, conclusions about cause‐and‐
effect relationships cannot be determined from anec-
dotal events.
Review of factors affecting internal and external validity
Whereas internal validity raises questions about whether it is the treatment alone or some additional extraneous
factor that causes the effects, external validity raises issues about the generalizability of the findings to
other settings.
Interactive testing and selection effects may restrict the external validity of our findings. These threats to
external validity can be combated by creating experimental conditions that are as close as possible to the situa-
tions to which the results of the experiment are to be generalized.
At least seven contaminating factors exist that might affect the internal validity of experimental designs.
These are the effects of history, maturation, (main) testing, instrumentation, selection, statistical regression, and
mortality. It is, however, possible to reduce these biases by enhancing the level of sophistication of the experi-
mental design. Whereas some of the more sophisticated designs, discussed next, help to increase the internal
validity of the experimental results, they also become expensive and time consuming.
The different types of experimental design and the extent to which internal and external validity are met in
each are discussed next.

chapter experimental designs 179
TYPES OF EXPERIMENTAL DESIGN AND VALIDITY
Let us consider some of the commonly used experimental designs and determine the extent to which they guard
against the seven factors that could contaminate the internal validity of experimental results. The shorter the
time span of the experiments, the less the chances are of encountering history, maturation, and mortality effects.
Experiments lasting an hour or two do not usually meet with many of these problems. It is only when experi-
ments are spread over an extended period of, say, several months, that the possibility of encountering more of the
confounding factors increases.
Quasi-experimental designs
Some studies expose an experimental group to a treatment and measure its effects. Such an experimental design
is the weakest of all designs, and it does not measure the true cause‐and‐effect relationship. This is so because
there is no comparison between groups, nor any recording of the status of the dependent variable as it was prior
to the experimental treatment and how it changed after the treatment. In the absence of such control, the study
is of no scientific value in determining cause‐and‐effect relationships. Hence, such a design is referred to as a
quasi‐experimental design. The following three designs are quasi‐experimental designs.
Pretest and posttest experimental group design
An experimental group (without a control group) may be given a pretest, exposed to a treatment, and then given a
posttest to measure the effects of the treatment. This can be illustrated as in Table 10.2, where O refers to some process
of observation or measurement, X represents the exposure of a group to an experimental treatment, and the X and Os
in the row are applied to the same specific group. Here, the effects of the treatment can be obtained by measuring the
difference between the posttest and the pretest ( )O O2 1
. Note, however, that testing effects might contaminate both
the internal (main testing effects) and external (interactive testing effects) validity of the findings. If the experiment is
extended over a period of time, history, mortality, and maturation effects may also confound the results.
Posttests only with experimental and control groups
Some experimental designs are set up with an experimental and a control group, the former alone being exposed
to a treatment and not the latter. The effects of the treatment are studied by assessing the difference in the
outcomes – that is, the posttest scores of the experimental and control groups. This is illustrated in Table 10.3.
Here is a case where the testing effects have been avoided because there is no pretest, only a posttest. Care has to
be taken, however, to make sure that the two groups are matched for all the possible contaminating “nuisance”
variables. Otherwise, the true effects of the treatment cannot be determined by merely looking at the difference
in the posttest scores of the two groups. Randomization would take care of this problem.
Mortality (the dropping out of individuals from groups) is a problem for all experimental designs, including
this one. It can confound the results, and thus pose a threat to internal validity.
T A B L E 1 0 . 2
Pretest and posttest experimental group design
Group Pretest score Treatment Posttest score
Experimental group O1
X O2
Treatment effect ( )O O2 1

180 research methods for business
Time series design
A time series design (sometimes called an interrupted time series design) differs from the aforementioned
designs in that it collects data on the same variable at regular intervals (for instance weeks, months, or years).
A time series design thus allows the researcher to assess the impact of a treatment over time. Figure 10.3 visually
describes a time series design. It shows that a series of measurements on the dependent variable is taken before
and after the treatment is administered (either by the researcher or naturally).
Figure 10.4 depicts the results of a time series experiment testing the effect of price reduction (in week 4) on
sales. The horizontal scale (x‐axis) is divided into weeks, and the vertical scale (y‐axis) shows the values of sales
(the dependent variable) as they fluctuate over a period of nine weeks. Assuming that other factors, such as the
other marketing‐mix variables and the marketing mix of competitors, stay the same, the impact of the price cut
is the difference in sales before and after the change. From Figure 10.4 it is easy to see that there was an increase
in sales after the price of the product went down. The question is, however, whether the increase in sales,
depicted by the two horizontal lines in Figure 10.4, is significant. Bayesian moving average models (for instance,
F I G U R E 1 0 . 3
Time series design
0
20
40
60
80
100
120
140
160
1 2 3 4 5 6 7 8 9
Week
Sale
s
Significant difference?
F I G U R E 1 0 . 4
Effect of price cut in week 4
T A B L E 1 0 . 3
Posttest only with experimental and control groups
Group Treatment Outcome
Experimental group X O1
Control group O2
Treatment effect ( )O O1 2
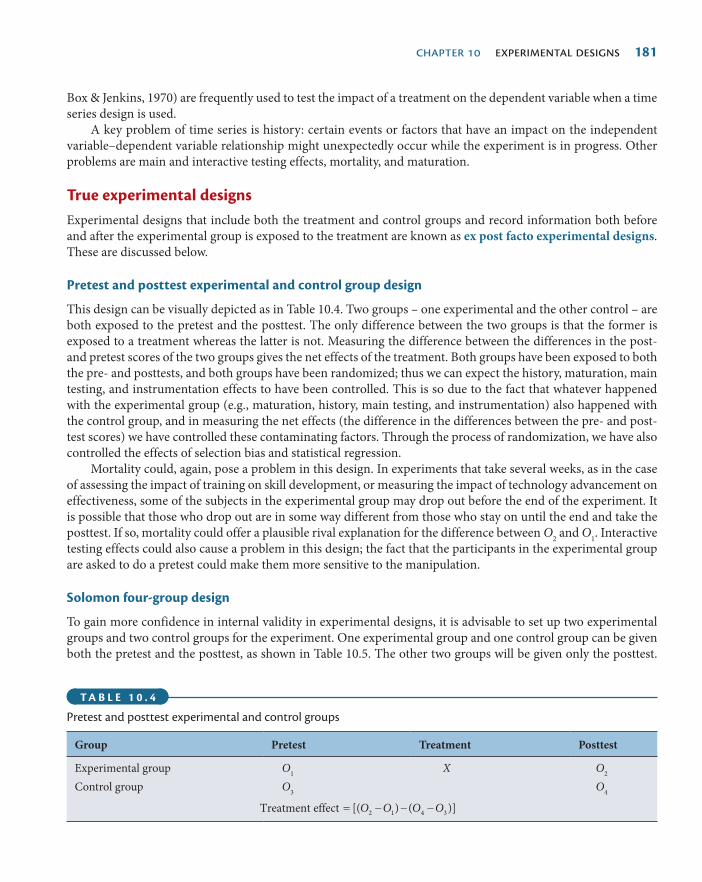
chapter experimental designs 181
Box & Jenkins, 1970) are frequently used to test the impact of a treatment on the dependent variable when a time
series design is used.
A key problem of time series is history: certain events or factors that have an impact on the independent
variable–dependent variable relationship might unexpectedly occur while the experiment is in progress. Other
problems are main and interactive testing effects, mortality, and maturation.
True experimental designs
Experimental designs that include both the treatment and control groups and record information both before
and after the experimental group is exposed to the treatment are known as ex post facto experimental designs.
These are discussed below.
Pretest and posttest experimental and control group design
This design can be visually depicted as in Table 10.4. Two groups – one experimental and the other control – are
both exposed to the pretest and the posttest. The only difference between the two groups is that the former is
exposed to a treatment whereas the latter is not. Measuring the difference between the differences in the post‐
and pretest scores of the two groups gives the net effects of the treatment. Both groups have been exposed to both
the pre‐ and posttests, and both groups have been randomized; thus we can expect the history, maturation, main
testing, and instrumentation effects to have been controlled. This is so due to the fact that whatever happened
with the experimental group (e.g., maturation, history, main testing, and instrumentation) also happened with
the control group, and in measuring the net effects (the difference in the differences between the pre‐ and post-
test scores) we have controlled these contaminating factors. Through the process of randomization, we have also
controlled the effects of selection bias and statistical regression.
Mortality could, again, pose a problem in this design. In experiments that take several weeks, as in the case
of assessing the impact of training on skill development, or measuring the impact of technology advancement on
effectiveness, some of the subjects in the experimental group may drop out before the end of the experiment. It
is possible that those who drop out are in some way different from those who stay on until the end and take the
posttest. If so, mortality could offer a plausible rival explanation for the difference between O2 and O
1. Interactive
testing effects could also cause a problem in this design; the fact that the participants in the experimental group
are asked to do a pretest could make them more sensitive to the manipulation.
Solomon four-group design
To gain more confidence in internal validity in experimental designs, it is advisable to set up two experimental
groups and two control groups for the experiment. One experimental group and one control group can be given
both the pretest and the posttest, as shown in Table 10.5. The other two groups will be given only the posttest.
T A B L E 1 0 . 4
Pretest and posttest experimental and control groups
Group Pretest Treatment Posttest
Experimental group O1
X O2
Control group O3
O4
Treatment effect [( ) ( )]O O O O2 1 4 3

182 research methods for business
Here, the effects of the treatment can be calculated in several different ways, as indicated below. To the extent that
we come up with almost the same results in each of the different calculations, we can attribute the effects to the
treatment. This increases the internal validity of the results of the experimental design. This design, known as the
Solomon four‐group design, is perhaps the most comprehensive and the one with the least number of problems
with internal validity.
Solomon four-group design and threats to validity The Solomon four‐group design, also known as
the four‐group six‐study design, is a highly sophisticated experimental design. This design controls for all the
threats to internal validity, except for mortality (which is a problem for all experimental designs) and also for
interactive testing effects. For this reason, the Solomon four‐group design is very useful when interactive testing
effects are expected.
Treatment effect (E) could be judged by:
E O O
E O O
E O O
E O O
E O O O O
( )
( )
( )
( )
[( ) ( )]
2 1
2 4
5 6
5 3
2 1 4 3
If all Es are similar, the cause‐and‐effect relationship is highly valid.
To be able to calculate the effect of the experimental treatment, an estimate of the prior measurements
is needed for Groups 3 and 4. The best estimate of this premeasure is the average of the two pretests; that is,
(O1 + O
3)/2. Together with the six pre‐ and posttest observations, the estimates of the premeasures can then be
used to generate estimations of the impact of the experimental treatment (E), interactive testing effects (I), and
the effects of uncontrolled variables (U). Estimates of these effects are made by comparing the before and after
measures of the four groups.
The following equations provide an overview of the potential impact of the experimental treatment (E),
interactive testing effects (I), and uncontrolled variables (U) for each group:
Group O O E I U
Group O O U
Group O O O
1:
2:
3:
( )
( )
[ / ( )]
2 1
4 3
5 1 31 2 E U
Group O O O U4: [ / ( )]6 1 3
1 2
T A B L E 1 0 . 5
Solomon four-group design
Group Pretest Treatment Posttest
1. Experimental O1
X O2
2. Control O3
O4
3. Experimental X O5
4. Control O6

chapter experimental designs 183
We can use these equations to estimate the effects of E, I, and U by comparing the pre‐ and posttests of the
groups. For instance, to estimate the effect of the experimental stimulus (E) the results of Groups 3 and 4 are used:
O O O O O O E U U E5 1 3 6 1 3
12
12
( ) ( )
To calculate the effect of I (the interactive testing effect) the results of Groups 1 and 3 are used:
( ) ( ) ( ) .( )O O O O O E I U E U I2 1 5 1 3
12
Thus we are able to control for interactive testing effects that threaten the external validity of our findings.
Let us now examine how the threats to internal validity are taken care of in the Solomon four‐group design.
It is important to note that subjects should be randomly selected and randomly assigned to groups. This
removes the statistical regression and selection biases. Group 2, the control group that was exposed to both the
pre‐ and posttest, helps us to see whether or not history, maturation, (main) testing, instrumentation, or regres-
sion threaten internal validity. Mortality (the loss of participants during the course of the experiment) is a poten-
tial problem for all experimental designs, even for this one.
Thus, the Solomon four‐group experimental design guarantees the maximum internal and external valid-
ity, ruling out many other rival hypotheses. Where establishing a cause‐and‐effect relationship is critical for
the survival of businesses (e.g., pharmaceutical companies, which often face lawsuits for questionable prod-
ucts) the Solomon four‐group design is eminently useful. However, because of the number of subjects that
need to be recruited, the care with which the study has to be designed, the time that needs to be devoted to the
experiment, and other reasons, the cost of conducting such an experiment is high. For this reason it is
rarely used.
Table 10.6 summarizes the threats to validity covered by the different experimental designs. If the subjects
have all been randomly assigned to the groups, then selection bias and statistical regression are eliminated in
all cases.
Double-blind studies
When extreme care and rigor are needed in experimental designs, as in the case of discovery of new medicines
that could have an impact on human lives, blind studies are conducted to avoid any bias that might creep in. For
example, pharmaceutical companies experimenting with the efficacy of newly developed drugs in the prototype
stage ensure that the subjects in the experimental and control groups are kept unaware of who is given the drug,
and who the placebo. Such studies are called blind studies.
T A B L E 1 0 . 6
Major threats to validity in different experimental designs when members are randomly selected and assigned
Types of experimental design Major threats to validity
1. Pretest and posttest with one experimental group only History, maturation, main testing, interactive
testing, mortality
2. Pretest and posttest with one experimental and one control group Interactive testing, mortality
3. Posttests only with one experimental and one control group Mortality
4. Solomon four‐group design Mortality

184 research methods for business
When Aviron tested and announced the Flu‐mist vaccine, neither the subjects nor the researchers who
administered the vaccine to them were aware of the “true” versus the “placebo” treatment. The entire process was
conducted by an outside testing agency, which alone knew who got what treatment. Since, in this case, both the
experimenter and the subjects are blinded, such studies are called double‐blind studies. Since there is no tam-
pering with the treatment in any way, such experimental studies are the least biased.
As mentioned previously, managers rarely undertake the study of cause‐and‐effect relationships in organiza-
tions using experimental designs because of the inconvenience and disruption they cause to the system.
Ex post facto designs
Cause‐and‐effect relationships are sometimes established through what is called the ex post facto experimental
design. Here, there is no manipulation of the independent variable in the lab or field setting, but subjects who
have already been exposed to a stimulus and those not so exposed are studied. For instance, training programs
might have been introduced in an organization two years earlier. Some might have already gone through the
training while others might not. To study the effects of training on work performance, performance data might
now be collected for both groups. Since the study does not immediately follow after the training, but much later,
it is an ex post facto design.
More advanced experimental designs such as the completely randomized design, randomized block design,
Latin square design, and the factorial design are described in the appendix to this chapter, for those students
interested in these.
SIMULATION
An alternative to lab and field experimentation currently being used in business research is simulation.
Simulation uses a model‐building technique to determine the effects of changes. Simulations are becoming
popular in business research. A simulation can be thought of as an experiment conducted in a specially cre-
ated setting that very closely represents the natural environment in which activities are usually carried out. In
that sense, the simulation lies somewhere between a lab and a field experiment, insofar as the environment is
artificially created but not too different from “reality.” Participants are exposed to real‐world experiences over
a period of time, lasting anywhere from several hours to several weeks, and they can be randomly assigned to
different treatment groups. If managerial behavior as a function of a specific treatment is to be studied, sub-
jects will be asked to operate in an environment very much like an office, with desks, chairs, cabinets, tele-
phones, and the like. Members will be randomly assigned the roles of directors, managers, clerks, and so on,
and specific stimuli will be presented to them. Thus, while the researcher retains control over the assignment
and manipulation, the subjects are left free to operate as in a real office. In essence, some factors will be built
into or incorporated in the simulated system and others left free to vary (participants’ behavior, within the
rules of the game). Data on the dependent variable can be obtained through observation, videotaping, audio
recording, interviews, or questionnaires.
Causal relationships can be tested since both manipulation and control are possible in simulations. Two
types of simulation can be made: one in which the nature and timing of simulated events are totally determined
by the researcher (called experimental simulation), and the other (called free simulation) where the course of
activities is at least partly governed by the reaction of the participants to the various stimuli as they interact
among themselves. Looking Glass, the free simulation developed by Lombardo, McCall, and DeVries (1983) to
study leadership styles, has been quite popular in the management area.

chapter experimental designs 185
Cause‐and‐effect relationships are better established in experimental simulations where the researcher
exercises greater control. In simulations involving several weeks, however, there may be a high rate of attrition of
members. Experimental and free simulations are both expensive, since creating real‐world conditions in an
artificial setting and collecting data over extended periods of time involve the deployment of many types of
resources. Simulations can be done in specially created settings using subjects, computers, and mathematical
models. Steufert, Pogash, and Piasecki (1988), who assessed managerial competence through a six‐hour
computer‐assisted simulation, are of the opinion that simulation technology may be the only viable method to
simultaneously study several types of executive style.
Computer‐based simulations are frequently used in the accounting and finance areas. For example, the
effectiveness of various analytic review procedures in detecting errors in account balances has been tested
through simulations (Knechel, 1986). In the finance area, risk management has been studied through simula-
tions. Simulations have also been used to understand the complex relationships in the financing of pension plans
and making important investment decisions (Perrier & Kalwarski, 1989). It is possible to vary several variables
(workforce demographics, inflation rates, etc.) singly or simultaneously in such models.
Prototypes of machines and instruments are often the result of simulated models. Simulation has also been
used by many companies to test the robustness and efficacy of various products. We are also familiar with flight
simulators, driving simulators, and even nuclear reactor simulators. Here, the visual patterns presented keep
changing in response to the reactions of the individual (the pilot, the driver, or the emergency handler) to the
previous stimulus presented, and not in any predetermined order. Entire business operations, from office layout
to profitability, can be simulated using different prospective scenarios. With increasing access to sophisticated
technology, and the advancement of mathematical models, simulation is becoming an important managerial
decision‐making tool. It is quite likely that we will see simulation being used as a managerial tool, to enhance
motivation, leadership, and the like, in the future. Simulation can also be applied as a problem‐solving manage-
rial tool in other behavioral and administrative areas. Programmed, computer‐based simulation models in
behavioral areas could serve managerial decision making very well indeed.
ETHICAL ISSUES IN EXPERIMENTAL DESIGN RESEARCH
It is appropriate at this juncture to briefly discuss a few of the many ethical issues involved in doing research, some
of which are particularly relevant to conducting lab experiments. The following practices are considered unethical:
● Putting pressure on individuals to participate in experiments through coercion, or applying social pressure.
● Giving menial tasks and asking demeaning questions that diminish participants’ self‐respect.
● Deceiving subjects by deliberately misleading them as to the true purpose of the research.
● Exposing participants to physical or mental stress.
● Not allowing subjects to withdraw from the research when they want to.
● Using the research results to disadvantage the participants, or for purposes not to their liking.
● Not explaining the procedures to be followed in the experiment.
● Exposing respondents to hazardous and unsafe environments.
● Not debriefing participants fully and accurately after the experiment is over.
● Not preserving the privacy and confidentiality of the information given by the participants.
● Withholding benefits from control groups.

186 research methods for business
The last item is somewhat controversial in terms of whether or not it should be an ethical dilemma, espe-
cially in organizational research. If three different incentives are offered for three experimental groups and none
is offered to the control group, it is a fact that the control group has participated in the experiment with absolutely
no benefit. Similarly, if four different experimental groups receive four different levels of training but the control
group does not, the other four groups have gained expertise that the control group has been denied. But should
this be deemed an ethical dilemma preventing experimental designs with control groups in organizational
research? Perhaps not, for at least three reasons. One is that several others in the system who did not participate
in the experiment did not benefit either. Second, even in the experimental groups, some would have benefited
more than others (depending on the extent to which the causal factor was manipulated). Finally, if a cause‐and‐
effect relationship is found, the system will, in all probability, implement the new‐found knowledge sooner or
later and everyone will ultimately stand to gain. The assumption that the control group did not benefit from
participating in the experiment may not be a sufficient reason not to use lab or field experiments.
Many universities have a “human subjects committee” to protect the right of individuals participating in any
type of research activity involving people. The basic function of these committees is to discharge the moral and
ethical responsibilities of the university system by studying the procedures outlined in the research proposals and
giving their stamp of approval to the study. The human subjects committee might require the investigators to
modify their procedures or inform the subjects fully, if occasion demands it.
MANAGERIAL IMPLICATIONS
Before using experimental designs in research studies, it is essential to consider whether they are necessary at all,
and if so, at what level of sophistication. This is because experimental designs call for special efforts and varying
degrees of interference with the natural flow of activities. Some questions that need to be addressed in making
these decisions are the following:
1. Is it really necessary to identify causal relationships, or would it suffice if the correlates that account for
the variance in the dependent variable were known?
2. If it is important to trace the causal relationships, which of the two, internal validity or external validity,
is needed more, or are both needed? If only internal validity is important, a carefully designed lab
experiment is the answer; if generalizability is the more important criterion, then a field experiment is
called for; if both are equally important, then a lab study should be first undertaken, followed by a field
experiment (if the results of the former warrant the latter).
3. Is cost an important factor in the study? If so, would a less rather than a more sophisticated experimen-
tal design do?
These decision points are illustrated in the chart in Figure 10.5.
Though some managers may not be interested in cause‐and‐effect relationships, a good knowledge of exper-
imental designs could foster some pilot studies to be undertaken to examine whether factors such as bonus sys-
tems, piece rates, rest pauses, and so on lead to positive outcomes such as better motivation, improved job
performance, and other favorable working conditions at the workplace. Marketing managers could use experi-
mental designs to study the effects on sales of advertisements, sales promotions, pricing, and the like. Awareness
of the usefulness of simulation as a research tool can also result in creative research endeavors in the management
area, as it currently does in the manufacturing side of businesses.

chapter experimental designs 187
Internal validity ismore important than
external validity.
Generalizability ismore important than
internal validity.
Both internal validityand external validity
are important.
Engage in alab experiment.
Engage in afield experiment.
First do a lab experiment,then, a field experiment.
Yes No
Engage in a simplerexperimental design.
Engage in a moresophisticated design.
Do not undertake anexperimental design study.
Are there costconstraints?
Is tracing causaleffects necessary?
Yes;and if
No
F I G U R E 1 0 . 5
Decision points for embarking on an experimental design
SUMMARY
● Learning objective 1: Describe lab experiments and discuss the internal and external validity of this
type of experiment.
When control and manipulation are introduced to establish cause-and-effect relationships in an
artificial setting, we have lab experiments. The goal of the researcher is to keep every variable con-
stant except for the independent variable. Manipulation means that we create different levels of
the independent variable to assess the impact on the dependent variable. One way of controlling for
contaminating variables is to match the various groups in an experiment. Another way of controlling
the contaminating variables is to assign participants randomly to groups. In lab experiments internal
validity can be said to be high. On the other hand, the external validity of lab experiments is typ-
ically low.

188 research methods for business
● Learning objective 2: Describe field experiments and discuss the internal and external validity of this
type of experiment.
A field experiment is an experiment done in the natural environment. In the field experiment, it is not pos-
sible to control all the nuisance variables. The treatment however can still be manipulated. Control groups
can also be set up in field experiments. Cause-and-effect relationships found under these conditions will
have a wider generalizability to other similar settings (the external validity is typically high; the internal valid-
ity of field experiments is low).
● Learning objective 3: Describe, discuss, and identify threats to internal and external validity and make
a trade-off between internal and external validity.
External validity refers to the extent of generalizability of the results of a causal study to other settings.
Internal validity refers to the degree of our confidence in the causal effects. Field experiments have more
external validity, but less internal validity. In lab experiments, the internal validity is high but the exter-
nal validity is low. There is thus a trade-off between internal validity and external validity. Even the best
designed lab studies may be influenced by factors affecting the internal validity. The seven major threats
to internal validity are the effects of history, maturation, (main) testing, selection, mortality, statistical
regression, and instrumentation. Two threats to external validity are (interactive) testing and selection.
● Learning objective 4: Describe the different types of experimental designs.
A quasi-experimental design is the weakest of all designs, and it does not measure the true cause-and-
effect relationship. Pretest and posttest experimental group designs, posttests only with experimental
and control groups, and time series designs are examples of quasi-experimental designs. True experimen-
tal designs that include both treatment and control groups and record information both before and after
the experimental group is exposed to the treatment are known as ex post facto experimental designs.
Pretest and posttest experimental and control group designs, Solomon four-group designs, and double
blind studies are examples of true experimental designs. In ex post facto experimental design there is no
manipulation of the independent variable in the lab or field setting, but subjects who have already been
exposed to a stimulus and those not so exposed are studied.
● Learning objective 5: Discuss when and why simulation might be a good alternative to lab and field
experiments.
An alternative to lab and field experimentation, simulation uses a model-building technique to determine
the effects of changes.
● Learning objective 6: Discuss the role of the manager in experimental designs.
Knowledge of experimental designs may help the manager to (engage a consultant to) establish cause-and-
effect relationships. Through the analysis of the cause-and effect relationships, it is possible to find answers
or solutions to a problem. Experiments may help managers to examine whether bonus systems lead to
more motivation, whether piece rates lead to higher productivity, or whether price cuts lead to more sales.
● Learning objective 7: Discuss the role of ethics in experimental designs.
Ethics in experiments refers to the correct rules of conduct necessary when carrying out experimental
research. Researchers have a duty to respect the rights and dignity of research participants. This means that
they should take certain rules of conduct into account.

chapter experimental designs 189
Visit the companion website at www.wiley.com/college/sekaran for Case Study: The
moderating effect of involvement in product placement effectiveness.
DISCUSSION QUESTIONS
1. What are the differences between causal and correlational studies?
2. In what ways do lab experiments differ from field experiments?
3. Define the terms control and manipulation. Describe a possible lab experiment where you would
need to control a variable. Include also a variable over which you would have no control but which
could affect your experiment.
4. Explain the possible ways in which you can control “nuisance” variables.
5. What is internal validity and what are the threats it stands exposed to?
6. Explain the concept of “trade‐off between internal validity and external validity.”
7. Explain how the selection of participants may affect both the internal and external validity of your
experiments.
8. Explain the difference between main and interactive testing effects. Why is this difference important?
9. History is a key problem in a time series design. Other problems are main and interactive testing
effects, mortality, and maturation. Explain.
10. Explain why mortality remains a problem even when a Solomon four‐group design is used.
11. “If a control group is a part of an experimental design, one need not worry about controlling other
exogenous variables.” Discuss this statement.
12. “The Solomon four‐group design is the answer to all our research questions pertaining to cause‐
and‐effect relationships because it guards against all the threats to internal validity.” Comment.
13. Below is an adapted note from BusinessWeek published some time ago. After reading it, apply what
you have learned in this chapter, and design a study after sketching the theoretical framework.
The vital role of self-esteem
Why do some people earn more than others? Economists focused on the importance of education, basic
skills, and work experience – what they called human capital – on increased productivity, and said these
were reflected in greater earning power. Researchers also found that self‐esteem was instrumental in
acquiring human capital.
14. Design a study to examine the following situation.
An organization would like to introduce one of two types of new manufacturing process to increase the
productivity of workers, and both involve heavy investment in expensive technology. The company wants
to test the efficacy of each process in one of its small plants.

190 research methods for business
A P P E N D I X
Further experimental designs
In this chapter we discussed different types of experimental design where groups were subjected to one or more
treatments and the effects of the manipulation measured. However, we may sometimes wish to assess the simul-
taneous effects of two or more variables on a dependent variable, and this calls for more complex designs. Among
the many advanced experimental designs available, we will examine here the completely randomized design, the
randomized block design, the Latin square design, and the factorial design.
It would be useful to understand some terms before describing the various designs. The term “factor” is
used to denote an independent variable – for example, price. The term “level” is used to denote various grada-
tions of the factor – for example, high price, medium price, low price – while making it clear as to what these
gradations signify (e.g., high price is anything over $2 per piece; medium is $1–2 per piece; low price is any-
thing less than $1 per piece). “Treatment” refers to the various levels of the factors. A “blocking factor” is a
preexisting variable in a given situation that might have an effect on the dependent variable in addition to the
treatment, the impact of which is important to assess. In effect, a blocking factor is an independent variable
that has an effect on the dependent variable, but which preexists in a given situation: for example, the number
of women and men in an organization; or teenagers, middle‐aged men, and senior citizens as customers of a
store; and so on.
The completely randomized design
Let us say that a bus transportation company manager wants to know the effects of fare reduction by 5, 7, and 10
cents on the average daily increase in the number of passengers using the bus as a means of transportation. He
may take 27 routes that the buses usually ply, and randomly assign nine routes for each of the treatments (i.e.,
reduction of fares by 5, 7, and 10 cents) for a two‐week period. His experimental design is shown in Table 10.7,
where the Os on the left indicate the number of passengers that used the bus for the two weeks preceding the
treatment; X1, X
2, and X
3 indicate the three different treatments (fare reductions of 5, 7, and 10 cents per mile),
and the Os on the right indicate the number of passengers that used the bus as a transportation mode during the
two weeks when the fares were reduced. The manager will be able to assess the impact of the three treatments by
deducting each of the three Os on the left from its corresponding O on the right. The results of this study will
provide the answer to the bus company manager’s question.
T A B L E 1 0 . 7
Illustration of a completely randomized design
Routes Number of passengers before Treatment Number of passengers after
Group 1 of nine routes O1
X1
O2
Group 2 of nine routes O3
X2
O4
Group 3 of nine routes O5
X3
O6

chapter experimental designs 191
Randomized block design
In the foregoing case, the bus company manager was interested only in the effects of different levels of price
reduction on the increase in the number of passengers in general. He may be more interested, however, in target-
ing the price reduction on the right routes or sectors. For example, it is likely that the reduction in fares will be
more welcome to senior citizens and residents of crowded urban areas where driving is stressful, than to car
owners living in the suburbs, who may not be equally appreciative of and sensitive to price reduction. Thus,
reductions in fares will probably attract more passengers if targeted at the right groups (i.e., the right blocking
factor – the residential areas). In this case, the bus company manager should first identify the routes that fall into
the three blocks – those in suburbs, crowded urban areas, or residential areas with retirees. Thus, the 27 routes
will get assigned to one or other of three blocks and will then be randomly assigned, within the blocks, to the
three treatments. The experimental design is shown in Table 10.8.
Through the above randomized block design, not only can the direct effect of each treatment (i.e., the main
effect of the level, which is the effect of each type of fare reduction) be assessed, but also the joint effects of price
and the residential area route (the interaction effect). For example, the general effect of a 5 cent reduction for all
routes will be known by the increase in passengers across all three residential areas, and the general effect of a
5 cent reduction on those in the suburbs alone will also be known by seeing the effects in the first cell. If the high-
est average daily number of increased passengers is 75 for a 7 cent decrease for the crowded urban area route,
followed by an increase of 30 for the retirees’ areas for the 10 cent decrease, and an increase of five passengers for
a 5 cent reduction for the suburbs, the bus company manager can work out a cost–benefit analysis and decide on
the course of action to be taken. Thus, the randomized block design is a more powerful technique, providing
more information for decision making. However, the cost of this experimental design will be higher.
Latin square design
Whereas the randomized block design helps the experimenter to minimize the effects of one nuisance variable
(variation among the rows) in evaluating the treatment effects, the Latin square design is very useful when two
nuisance blocking factors (i.e., variations across both the rows and the columns) are to be controlled. Each treat-
ment appears an equal number of times in any one ordinal position in each row. For instance, in studying the
effects of bus fare reduction on passengers, two nuisance factors could be: (1) the day of the week, (a) midweek
(Tuesday through Thursday), (b) weekend, (c) Monday and Friday; and (2) the (three) residential localities of the
passengers. A three by three Latin square design can be created in this case, to which will be randomly assigned
the three treatments (5, 7, and 10 cent fare reductions), such that each treatment occurs only once in each row
and column intersection. The Latin square design is shown in Table 10.9. After the experiment is carried out and
T A B L E 1 0 . 8
Illustration of a randomized block design
Blocking factor: residential areas
Fare reduction Suburbs Crowded urban areas Retirement areas
5c X1
X1
X1
7c X2
X2
X2
10c X3
X3
X3
Note that the Xs only indicate various levels of the blocking factor and the Os (the number of passengers before and after each treatment at
each level) are not shown, though these measures will be taken.

192 research methods for business
the net increase in passengers under each treatment calculated, the average treatment effects can be gauged. The
price reduction that offers the best advantage can also be assessed.
A problem with the Latin square design is that it presupposes the absence of interaction between the treat-
ments and blocking factors, which may not always be the case. We also need as many cells as there are treatments.
Furthermore, it is an uneconomical design compared to some others.
Factorial design
Thus far we have discussed experimental designs in the context of examining a cause‐and‐effect relationship between
one independent variable and the dependent variable. The factorial design enables us to test the effects of two or more
manipulations at the same time on the dependent variable. In other words, two treatments can be simultaneously
manipulated and their single and joint (known as main and interaction) effects assessed. For example, the manager of
the bus company might be interested in knowing passenger increases if he used three different types of buses (Luxury
Express, Standard Express, and Regular) and manipulated both the fare reduction and the type of vehicle used, simul-
taneously. Table 10.10 illustrates the 3 × 3 factorial design that would be used for the purpose.
T A B L E 1 0 . 9
Illustration of the Latin square design
Day of the week
Residential area Midweek Weekend Monday/Friday
Suburbs X1
X2
X3
Urban X2
X3
X1
Retirement X3
X1
X2
T A B L E 1 0 . 1 0
Illustration of a 3 × 3 factorial design
Bus fare reduction rates
Type of bus 5c 7c 10c
Luxury Express X1Y
1X
2Y
1X
3Y
1
Standard Express X2Y
2X
1Y
2X
3Y
2
Regular X3Y
3X
2Y
3X
1Y
3
Here, two factors are used with three levels in each. The above is completely randomized, since the fares are
randomly assigned to one of nine treatment combinations. A wealth of information can be obtained from this
design. For example, the bus company manager will know the increase in passengers for each fare reduction, for
each type of vehicle, and for the two in combination. Thus, the main effects of the two independent variables, as
well as the interactions among them, can be assessed. For this reason, the factorial design is more efficient than
several single‐factor randomized designs.
It is also statistically possible to control one or more variables through covariance analysis. For example, it
may be suspected that even after randomly assigning members to treatments, there is a further “nuisance” factor.
It is possible to statistically block such factors while analyzing the data.
Several other complex experimental designs are also available and are treated in books devoted to experi-
mental designs.

193
INTRODUCTION
Measurement of the variables is an integral part of research and an important aspect of research design (see shaded
portion in Figure 11.1). Unless the variables are measured in some way, we will not be able to find answers to our
research questions. Surveys and experimental designs, discussed in the previous chapters, often use questionnaires
to measure the variables of interest. In this chapter we will discuss how variables lend themselves to measurement.
HOW VARIABLES ARE MEASURED
To test the hypothesis that workforce diversity affects organizational effectiveness we have to measure workforce
diversity and organizational effectiveness. Measurement is the assignment of numbers or other symbols to charac-
teristics (or attributes) of objects according to a prespecified set of rules. Objects include persons, strategic business
units, companies, countries, bicycles, elephants, kitchen appliances, restaurants, shampoo, yogurt, and so on.
Examples of characteristics of objects are arousal‐seeking tendency, achievement motivation, organizational effec-
tiveness, shopping enjoyment, length, weight, ethnic diversity, service quality, conditioning effects, and taste. It is
important that you realize that you cannot measure objects (for instance, a company); you measure characteristics
or attributes of objects (for instance, the organizational effectiveness of a company). In a similar fashion, you can
measure the length (the attribute) of a person (the object), the weight of an elephant, the arousal‐seeking tendency
of stockbrokers, the shopping enjoyment of women, the service quality of a restaurant, the conditioning effects of
a shampoo, and the taste of a certain brand of yogurt. To be able to measure you need an object and attributes of
the object, but you also need a judge. A judge is someone who has the necessary knowledge and skills to assess “the
Measurement of variables: Operational definition
C H A P T E R 1 1
LEARNING OBJECTIVES
After completing Chapter 11, you should be able to:
1. Explain how variables are measured.
2. Explain when operationalization of variables is necessary.
3. Operationally define (or operationalize) abstract and subjective variables.

194 research methods for business
quality” of something, such as the taste of yogurt, the arousal‐seeking tendency of stockbrokers, or the communi-
cation skills of students. In many cases the object and the judge are the same person. For instance, if you want to
measure the gender (the attribute) of your employees (the objects), or the shopping enjoyment (the attribute) of
women (the objects), you can simply ask the objects (employees and women respectively) to provide you with the
necessary details via a self‐administered questionnaire. However, it is unlikely that the object has the necessary
knowledge and skills to act as a judge when you want to measure the taste (the attribute) of yogurt (the object), the
service quality of a restaurant, the communication skills of students, or even the managerial expertise of supervisors.
Now do Exercise 11.1.
Purpose of the
studyExtent of researcher
interferenceStudy setting
MEASUREMENT
DATA
ANALYSIS
1. Feel for
data
2. Goodness of
data
3. Hypothesis
testing
Measurement
and measures
Operational definition
Items (measure)
Scaling
Categorizing
Coding
DETAILS OF STUDY
Contrived
Noncontrived
Minimal: Studying eventsas they normally occur
Manipulation and/orcontrol and/or simulation
Exploration
Description
Hypothesis testing
PR
OB
LE
M S
TA
TE
ME
NT
Unit of analysis
(population to
be studied)
Sampling
design
Time
horizon
One-shot (cross-sectional)
Longitudinal
Probability/ nonprobability
Sample size (n)
Individuals
Dyads
Groups
Organizations
Machines
etc.
Research Strategies
Experiment
Survey research
Observation
Case studies
Grounded theory
Action research
Mixed methods
Data collection
method
Interviews
Observation
Questionnaires
Physical measurement
Unobtrusive
F I G U R E 1 1 . 1
Research design and where this chapter fits in
EXERCISE 11.1
Identify the object and the attribute. Give your informed opinion about who would be an adequate judge.
a. Price consciousness of car buyers.
b. Self‐esteem of dyslexic children.
c. Organizational commitment of school teachers.
d. Marketing orientation of companies.
e. Product quality of tablets (such as the Apple iPad and the Samsung Galaxy Tab).

chapter measurement of variables: operational definition 195
Attributes of objects that can be physically measured by some calibrated instruments pose no measurement
problems. For example, the length and width of a rectangular office table can be easily measured with a measur-
ing tape or a ruler. The same is true for measuring the office floor area and for measuring the weight of an ele-
phant (at least to some extent). Data representing several demographic characteristics of office personnel are also
easily obtained by asking employees simple, straightforward questions, such as: “How long have you been working
in this organization?” or “What is your marital status?”
The measurement of more abstract and subjective attributes is more difficult, however. For instance, it is
relatively difficult to measure the level of achievement motivation of office clerks, the shopping enjoyment of
women, or the need for cognition of students. Likewise, it is not straightforward to test hypotheses on the relation-
ship between workforce diversity, managerial expertise, and organizational effectiveness. The problem is that we
cannot simply ask questions like “How diverse is your company’s workforce?” or “How effective is your organiza-
tion?” because of the abstract nature of the variables “workforce diversity” and “organizational effectiveness.” Of
course, there are solutions to this problem. One of these solutions is discussed next. But let us, before we discuss
the solution, summarize the problem.
Certain variables lend themselves to easy measurement through the use of appropriate measuring instru-
ments; for example, physiological phenomena pertaining to human beings, such as blood pressure, pulse rates,
and body temperature, as well as certain physical attributes such as length and weight. But when we get into the
realm of people’s subjective feelings, attitudes, and perceptions, the measurement of these factors or variables
becomes more difficult. Accordingly, there are at least two types of variables: one lends itself to objective and
precise measurement; the other is more nebulous and does not lend itself to accurate measurement because of its
abstract and subjective nature.
OPERATIONAL DEFINITION OPERATIONALIZATION
Despite the lack of physical measuring devices to measure the more nebulous variables, there are ways of tapping
these types of variable. One technique is to reduce these abstract notions or concepts to observable behavior and/
or characteristics. In other words, the abstract notions are broken down into observable behavior or characteris-
tics. For instance, the concept of thirst is abstract; we cannot see it. However, we would expect a thirsty person to
drink plenty of fluids. In other words, the expected reaction of people to thirst is to drink fluids. If several people
say they are thirsty, then we may determine the thirst levels of each of these individuals by the measure of the
quantity of fluids that they drink to quench their thirst. We will thus be able to measure their levels of thirst, even
though the concept of thirst itself is abstract and nebulous. Reduction of abstract concepts to render them meas-
urable in a tangible way is called operationalizing the concepts.
Operationalizing is done by looking at the behavioral dimensions, facets, or properties denoted by the con-
cept. These are then translated into observable and measurable elements so as to develop an index of measure-
ment of the concept. Operationalizing a concept involves a series of steps. The first step is to come up with a
definition of the construct that you want to measure. Then, it is necessary to think about the content of the
measure; that is, an instrument (one or more items or questions) that actually measures the concept that one
wants to measure has to be developed. Subsequently, a response format (for instance, a seven‐point rating scale
Visit the companion website at www.wiley.com/college/sekaran for Author Video:
Operational definition (operationalization).

196 research methods for business
with end‐points anchored by “strongly disagree” and “strongly agree”) is needed, and, finally, the validity and
reliability of the measurement scale has to be assessed. The next chapter discusses steps 3 and 4. In this chapter
we will discuss step 2: the development of an adequate and representative set of items or questions.
Now do Exercise 11.2.
Operationalization: dimensions and elements
The examples of thirst and need for cognition illustrate how abstract concepts are operationalized by using
observable and measurable elements, such as the amount of drinks people use to quench their thirst, and the
extent to which people prefer complex to simple problems. You may have noticed that whereas only one item is
EXAMPLE
Operationalizing the concept “need for cognition”
We have just reduced the abstract concept thirst into
observable behavior by measuring the amount of
drinks people use to quench their thirst. Other abstract
concepts such as need for cognition (the tendency to
engage in and enjoy thinking (Cacioppo & Petty, 1982))
can be reduced to observable behavior and/or charac-
teristics in a similar way. For instance, we would expect
individuals with a high need for cognition to prefer
complex to simple problems, to find satisfaction in
deliberating hard and for long hours, and to enjoy tasks
that involve coming up with new solutions to problems
(examples taken from Cacioppo & Petty, 1982). We
may thus identify differences between individuals in
need of cognition by measuring to what extent people
prefer complex to simple problems, find satisfaction in
deliberating hard and for long hours, and enjoy tasks
that involve coming up with new solutions to problems.
In 1982, Cacioppo and Petty reported four studies
to develop and validate a measurement scale to assess
need for cognition. In a first study, a pool of 45 items
that appeared relevant to need for cognition was gen-
erated (based on prior research) and administered to
groups “known to differ in need for cognition.” The
results of this study revealed that the 45 items exhib-
ited a high degree of interrelatedness and thus sug-
gested that need for cognition is a unidimensional
construct (that is, it does not have more than one main
component or dimension; we will come back to this
issue further on in this chapter). This finding was rep-
licated in a second study. Two further studies (studies
three and four) were carried out to validate the find-
ings of the first two studies. The outcome of this vali-
dation process was a valid and reliable need for
cognition measure containing 34 items, such as “I
would prefer complex to simple problems,” “I find sat-
isfaction in deliberating hard and for long hours,” and
“I really enjoy tasks that involve coming up with new
solutions to problems.”
EXERCISE 11.2
a. Read the paper by Cacioppo and Petty (1982) and describe how the authors generated the pool of
45 scale items that appeared relevant to need for cognition.
b. Why do we need 34 items to measure “need for cognition”? Why do three or four items not suffice?

chapter measurement of variables: operational definition 197
needed to measure thirst (“how many drinks did you use to quench your thirst?”), 34 items are needed to measure
need for cognition. These 34 items are needed because if we used fewer than these 34 items, our measurement
scale would probably not represent the entire domain or universe of need for cognition; in other words, our
measure would probably not include an adequate and representative set of items (or elements). As a consequence,
our measure would not be valid. A valid measure of need for cognition thus contains 34 items even though need
for cognition is a unidimensional construct.
An example of a construct with more than one dimension is aggression. Aggression has at least two dimen-
sions: verbal aggression and physical aggression. That is, aggression might include behavior such as shouting and
swearing at a person (verbal aggression), but also throwing objects, hitting a wall, and physically hurting others
(physical aggression). A valid measurement scale of aggression would have to include items that measure verbal
aggression and items that measure physical aggression. A measurement scale that would only include items
measuring physical aggression would not be valid if our aim were to measure aggression. Likewise, a scale that
would only include items measuring verbal aggression would also not be a valid measure of aggression. Thus, a
valid measurement scale includes quantitatively measurable questions or items (or elements) that adequately
represent the domain or universe of the construct; if the construct has more than one domain or dimension, we
have to make sure that questions that adequately represent these domains or dimensions are included in
our measure.
Now do Exercise 11.3.
Operationalizing the (multidimensional) concept of achievement motivation
Suppose that we are interested in establishing a relationship between gender and achievement motivation. To test
this relationship we will have to measure both gender and achievement motivation. At this point, you will prob-
ably understand that whereas measuring gender will not cause any problems, measuring achievement motivation
probably will, because the latter construct is abstract and subjective in nature. For this reason we must infer
achievement motivation by measuring behavioral dimensions, facets, or characteristics we would expect to find
in people with high achievement motivation. Indeed, without measuring these dimensions, facets, or character-
istics we will not be able to arrive at bottom‐line statements about the relationship between gender and achieve-
ment motivation.
After we have defined the construct, the next step in the process of measuring abstract constructs such as
achievement motivation is to go through the literature to find out whether there are any existing measures of
the concept. Both scientific journals and “scale handbooks” are important sources of existing measures. As a
rule, empirical articles published in academic journals provide a detailed description of how specific constructs
were measured; information is often provided on what measures were used, when and how these measures were
developed, by whom, and for how long they have been in use. Scale handbooks are also a useful source of exist-
ing measurement scales. Scale handbooks, such as the Marketing Scales Handbook or the Handbook of
Organizational Measurement, provide an exhaustive overview of measurement scales that have appeared in the
academic literature. These handbooks help you to determine whether a measurement scale exists and, if more
than one measurement scale exists, to make a logical selection between available measures. The use of existing
EXERCISE 11.3
Try to come up with two unidimensional and two multidimensional abstract concepts. Explain why these
concepts have either one or more than one dimension.

198 research methods for business
measurement scales has several advantages. First, it saves you a lot of time and energy. Second, it allows you to
verify the findings of others and to build on the work of others (this is very important in scientific research but
impossible if you use measures that differ from those that our predecessors have used!). Hence, if you want to
measure something, see if it has been measured before and then use this measure (adapt it to your specific needs
whenever this is needed). Make sure that you document the use of existing measurement scales properly.
There are several measures of achievement motivation available from the literature (Amabile, Hill,
Hennessey & Tighe, 1994; Gordon, 1973; Heggestad & Kanfer, 1999; Super, 1970). But what if there were no
existing measures available? In such a case, we would have to develop a measure ourselves; this means that we
would have to break down the concept “achievement motivation” into observable behavior or characteristics, as
detailed next.
Dimensions and elements of achievement motivation
Let us try to operationalize “achievement motivation,” a concept of interest to educators, managers, and students
alike. What behavioral dimensions, facets, or characteristics would we expect to find in people with high achieve-
ment motivation? They would probably have the following five typical broad characteristics, which we will call
dimensions:
1. They would be driven by work; that is, they would be working almost round the clock in order to derive
the satisfaction of having “achieved and accomplished.”
2. Many of them would generally be in no mood to relax and direct their attention to anything other than
work‐related activity.
3. Because they want always to be achieving and accomplishing, they would prefer to work on their own
rather than with others.
4. With mind and heart set on accomplishment and achievement, they would rather engage in challeng-
ing jobs than easy, hum‐drum ones. However, they would not want to take on excessively challenging
jobs because the expectation and probability of accomplishment and achievement in such jobs would
not be very high.
EXAMPLE
Documenting the use of existing measurement scales
Service encounter dissatisfaction and anger were
measured with seven‐point, multi‐item rating scales
adapted from previous studies (Crosby & Stephens,
1987; Izard, 1977). These scales were introduced with
the following question: “How did you feel about your
service experience on this particular occasion?” A seven‐
point, multi‐item measurement scale adapted from
prior research (Nasr‐Bechwati & Morrin, 2003) was
used to measure the desire to get even with the service
provider. Scales measuring customers’ behavioral
intentions closely followed existing scales measuring
reactions to service failure. Intentions to engage in
negative word‐of‐mouth communication, complaint
filing (Zeithaml, Berry & Parasuraman, 1996), and
switching (Oliver, 1996) were assessed by having par-
ticipants indicate the degree to which they were
inclined to such behavior on a seven‐point rating scale,
anchored by “not at all” and “very much.”

chapter measurement of variables: operational definition 199
5. They would be yearning to know how they are progressing in their jobs as they go along. That is, they
would like to get frequent feedback in direct and subtle ways from their superiors, colleagues, and on
occasion even their subordinates, to know how they are progressing.
Thus, we would expect those with high achievement motivation to drive themselves hard at work, find it
difficult to relax, prefer to work alone, engage in challenging (but not too challenging) jobs, and seek feedback.
Although breaking the concept into these five dimensions has somewhat reduced its level of abstraction, we
have still not operationalized the concept into measurable elements of behavior. This could be done by exam-
ining each of the five dimensions and breaking each one down further into its elements, thus delineating the
actual patterns of behavior that would be exhibited. These should somehow be quantitatively measurable so
that we can distinguish those who have high motivation from those with less. Let us see how this can be done.
Elements of dimension 1 It is possible to describe the behavior of a person who is driven by work. Such
a person will (1) be at work all the time, (2) be reluctant to take time off from work, and (3) persevere even
in the face of some setbacks. These types of behavior lend themselves to measurement. For instance, we can
count the number of hours employees engage themselves in work‐related activities during work hours,
beyond working hours at the workplace, and at home, where they are likely to pursue their unfinished assign-
ments. Thus, the number of hours put in by them on their work is an index of the extent to which work
“drives” them.
Next, keeping track of how frequently people persevere with their job despite failures is a reflection of how
persevering they are in achieving their goals. A student who drops out of school due to failure to pass the first
exam can by no means be deemed to be a highly persevering, achievement‐oriented individual. However, a stu-
dent who, despite getting D grades on three quizzes, toils day and night unceasingly in order to understand and
master a course he considers difficult, is exhibiting perseverance and achievement‐oriented behavior.
Achievement‐motivated individuals do not usually want to give up on their tasks even when confronted by initial
failures. Perseverance urges them to continue. Hence, a measure of perseverance could be obtained by the num-
ber of setbacks people experience on the task and yet continue to work, undaunted by failures. For example, an
accountant might find that she is unable to balance the books. She spends an hour trying to detect the error, fails
to do so, gives up, and leaves the workplace. Another employee in the same position stays patiently on the job,
discovers the error, and balances the books, spending the entire evening in the process. In this case it is easy to
tell which of the two is the more persevering by merely observing them.
Finally, in order to measure reluctance to take time off, we need only know how frequently people take time
off from their jobs, and for what reasons. If an employee is found to have taken seven days off during the previous
six months to watch football games, attend an out‐of‐town circus, and visit friends, we can conclude that the
individual probably would not hesitate in taking time away from the job. However, if an individual has not been
absent even a single day during the past 15 months, and has not missed work even when slightly indisposed, it is
evident that he is too dedicated to work to take time off from the job.
Thus, if we can measure how many hours per week individuals spend on work‐related activities, how per-
severing they are in completing their daily tasks, and how frequently and for what reasons they take time off
from their jobs, we will have a measure of the extent to which employees are driven by work. This variable,
when thus measured, would place individuals on a continuum ranging from those who are least driven by work
to those whose very life is work. This, then, would give some indication of the extent of their achievement
motivation.
Figure 11.2 schematically outlines the dimensions (the several facets or main characteristics) and the ele-
ments (representative behaviors) for the concept of achievement motivation. Frequent reference to this figure
will help you follow the ensuing discussions.

200 research methods for business
Elements of dimension 2 The degree of unwillingness to relax can be measured by asking persons such
questions as:
1. How often do you think about work while you are away from the workplace?
2. What are your hobbies?
3. How do you spend your time when you are away from the workplace?
Those who are able to relax would indicate that they do not generally think about work or the workplace while
at home, that they spend time on hobbies, engage in leisure‐time activities, and spend their waking hours with
the family or in other social or cultural activities.
Thus, we can place employees on a continuum ranging from those who relax very well to those who relax
very little. This dimension also then becomes measurable.
Achievementmotivation
Impatience withineffectiveness
C
D3
Swears under one’sbreath when even
small mistakesoccur
E
Opts to doa challengingrather than aroutine job
E
Opts to takemoderate,rather than
overwhelmingchallenges
E
Does notlike to
work withslow or
inefficientpeople
E
Asks forfeedback
on how thejob has
been done
E
Is impatientfor immediate
feedback
E
Very reluctantto take time
off for anything
E
Thinks ofwork evenat home
E
Does not haveany hobbies
E
Perseveringdespite
setbacks
E
Constantlyworking
E
Seeks moderatechallenge
D4
Seeks feedback
D5
Unable to relax
D2
Driven by work
D1
F I G U R E 1 1 . 2
Dimensions (D) and elements (E) of the concept (C) “achievement motivation”

chapter measurement of variables: operational definition 201
Elements of dimension 3 Individuals with high achievement motivation have no patience with ineffective
people and are reluctant to work with others. Whereas achievement‐motivated persons in the organization may
rank very high on these behavioral predispositions, there may be others who are not highly achievement moti-
vated. The latter may not at all mind ineffectiveness in either themselves or others, and may be quite willing to
work with almost anybody. Thus, impatience with ineffectiveness can also be measured by observing behavior.
Elements of dimension 4 A measure of how excited people are at seeking challenging jobs can be had by
asking employees what kinds of jobs they prefer. A number of different job descriptions could be presented –
some jobs entailing stereotyped work of a routine nature, and others with gradations of challenge built into them.
Employee preferences for different types of jobs could then be placed on a continuum ranging from those who
prefer fairly routine jobs to those who prefer jobs with a progressive increase in challenge. Those opting for
medium degrees of challenge are likely to be more achievement motivated than those who opt for either lower or
higher degrees of challenge. Achievement‐oriented individuals tend to be realistic and choose jobs that are rea-
sonably challenging and within reach of accomplishment. Heedless and overconfident persons would perhaps
choose the highly challenging jobs where the success is slow in coming, oblivious to whether or not the end
results will be achieved. Those who are low in achievement motivation would perhaps choose the more routine
jobs. Thus, those seeking moderate challenges can also be identified.
Elements of dimension 5 Those who desire feedback seek it from their superiors, coworkers, and some-
times even from their subordinates. They want to know others ’ opinions on how well they are performing.
Feedback, both positive and negative, indicates to them how much they are achieving and accomplishing. If they
receive messages suggesting a need for improvement, they will act on them. Hence, they constantly seek feedback
from several sources. By keeping track of how often individuals seek feedback from others during a certain
period of time – say, over several months – employees can again be placed on a continuum ranging from those
who seek extensive feedback from all sources to those who never seek any feedback from anyone at any time.
Having thus operationalized the concept of achievement motivation by reducing its level of abstraction to
observable behaviors, it is possible to develop a good measure to tap the concept of achievement motivation. Its
usefulness is that others could use the same measure, thus ensuring replicability. It should, however, be recog-
nized that any operationalization is likely to, first, exclude some of the important dimensions and elements aris-
ing from failure to recognize or conceptualize them and, second, include certain irrelevant features, mistakenly
thought to be relevant.
Box 11.1 provides the (somewhat exaggerated) viewpoint of the positivist on the measurement of abstract
and subjective variables. For a pragmatist or a critical realist, operationalizing the concept, nevertheless, is the
BOX 11.1
THE POSITIVIST VIEW
You will recall that we earlier pointed out that business research cannot be 100% scientifi c because we oft en
do not have the “perfect” measuring instruments. Th at is why, for a positivist, the purpose of science is to
stick to what we can observe (and hence, what we can measure). Knowledge of anything beyond that is
impossible. Since we cannot directly observe achievement motivation, job satisfaction, and service quality,
these are not appropriate topics for a scientifi c study.
BOX 11 1

202 research methods for business
best way to measure it. Actually observing and counting the number of times individuals behave in particular
ways, even if practical, would be too laborious and time consuming. So, instead of actually observing the behav-
ior of individuals, we could ask them to report their own behavior patterns by asking them appropriate questions,
which they could respond to on some (rating) scale that we provide. In the following example we will look at the
type of questions that may be asked to tap achievement motivation.
The foregoing illustrates a possible way to measure variables relating to the subjective domain of people’s
attitudes, feelings, and perceptions by first operationalizing the concept. Operationalization consists of the
reduction of the concept from its level of abstraction, by breaking it into its dimensions and elements, as dis-
cussed. By tapping the behaviors associated with a concept, we can measure the variable. Of course, the questions
will ask for responses on some scale attached to them (such as “very little” to “very much”), which we will discuss
in the next chapter.
What operationalization is not
Just as it is important to understand what operationalization is, it is equally important to remember what it is not.
An operationalization does not describe the correlates of the concept. For example, success in performance can-
not be a dimension of achievement motivation, even though a motivated person is likely to meet with it in large
measure. Thus, achievement motivation and performance and/or success may be highly correlated, but we
EXAMPLE
Answers to the following questions from respondents
would be one way of tapping the level of achievement
motivation.
1. To what extent would you say you push yourself to
get the job done on time?
2. How difficult do you find it to continue to do your
work in the face of initial failure or discouraging results?
3. How often do you neglect personal matters because
you are preoccupied with your job?
4. How frequently do you think of your work when
you are at home?
5. To what extent do you engage yourself in hobbies?
6. How disappointed would you feel if you did not
reach the goals you had set for yourself?
7. How much do you concentrate on achieving
your goals?
8. How annoyed do you get when you make mistakes?
9. To what extent would you prefer to work with a
friendly but incompetent colleague, rather than a
difficult but competent one?
10. To what extent would you prefer to work by your-
self rather than with others?
11. To what extent would you prefer a job that is dif-
ficult but challenging, to one that is easy
and routine?
12. To what extent would you prefer to take on
extremely difficult assignments rather than mod-
erately challenging ones?
13. During the past three months, how often have you
sought feedback from your superiors on how well
you are performing your job?
14. How often have you tried to obtain feedback on
your performance from your coworkers during
the past three months?
15. How often during the past three months have you
checked with your subordinates that what you are
doing is not getting in the way of their efficient
performance?
16. To what extent would it frustrate you if people
did not give you feedback on how you are
progressing?

chapter measurement of variables: operational definition 203
cannot measure an individual’s level of motivation through success and performance. Performance and success
may have been made possible as a consequence of achievement motivation, but in and of themselves, the two are
not measures of it. To elaborate, a person with high achievement motivation might have failed for some reason,
perhaps beyond her control, to perform the job successfully. Thus, if we judge the achievement motivation of this
person with performance as the yardstick, we will have measured the wrong concept. Instead of measuring
achievement motivation – our variable of interest – we will have measured performance, another variable we did
not intend to measure nor were interested in.
Thus, it is clear that operationalizing a concept does not consist of delineating the reasons, antecedents,
consequences, or correlates of the concept. Rather, it describes its observable characteristics in order to be able to
measure the concept. It is important to remember this because if we either operationalize the concepts incor-
rectly or confuse them with other concepts, then we will not have valid measures. This means that we will not
have “good” data, and our research will not be scientific.
Review of operationalization
We have thus far examined how to operationally define concepts. Operationalizations are necessary to measure
abstract and subjective concepts such as feelings and attitudes. More objective variables such as age or educa-
tional level are easily measured through simple, straightforward questions and do not have to be operationalized.
We have pointed out that operationalization starts with a definition of the concept. The next step is to either find
or develop an adequate (set of) closed‐end question(s) that allow(s) you to measure the concept in a reliable and
valid way. Luckily, measures for many concepts that are relevant in business research have already been devel-
oped by researchers. While you review the literature in a given area, you might want to particularly note the refer-
ence that discusses the instrument used to tap the concept in the study, and read it. The article will tell you when
the measure was developed, by whom, and for how long it has been in use. If you cannot find or use an existing
measure, you have to develop your own measure. To be able to do this, you will need to become an expert in a
particular domain; this enables you to include the relevant dimensions and elements in your measure. Only a
well‐developed instrument, which has been operationalized with care, will be accepted and frequently used by
other researchers.
Now do Exercises 11.4, 11.5, and 11.6.
EXERCISE 11.4
Provide an operational definition of the concept of “service quality” and develop questions that would
measure service quality.
EXERCISE 11.5
Compare your service quality measure to the measure of Zeithaml, Berry, and Parasuraman (1996)
presented in the Journal of Retailing.
a. How does your measure differ from this measure in terms of dimensions and elements?
b. Would you prefer using your own measure or the measure of Zeithaml, Berry, and Parasuraman? Why?

204 research methods for business
INTERNATIONAL DIMENSIONS OF OPERATIONALIZATION
In conducting transnational research, it is important to remember that certain variables have different meanings
and connotations in different cultures. For instance, the term “love” is subject to several interpretations in differ-
ent cultures and has at least 20 different interpretations in some countries. Likewise, the concept “knowledge” is
equated with “jnana” in some Eastern cultures and construed as “realization of the Almighty.” Thus, it is wise for
researchers who hail from a country speaking a different language to recruit the help of local scholars to opera-
tionalize certain concepts while engaging in cross‐cultural research.
SUMMARY
● Learning objective 1: Explain how variables are measured.
To test hypotheses the researcher has to measure. Measurement is the assignment of numbers or other
symbols to characteristics (or attributes) of objects according to a prespecified set of rules. There are at least
two types of variables: one lends itself to objective and precise measurement; the other is more nebulous
and does not lend itself to accurate measurement because of its abstract and subjective nature.
● Learning objective 2: Explain when operationalization of variables is necessary.
Despite the lack of physical measuring devices to measure the more nebulous variables, there are ways of
tapping these types of variables. One technique is to reduce these abstract notions to observable behavior
and/or characteristics. This is called operationalizing the concepts. A valid measurement scale includes
quantitatively measurable questions or items (or elements) that adequately represent the domain or uni-
verse of the construct; if the construct has more than one domain or dimension, the researcher has to make
sure that questions that adequately represent these domains or dimensions are included in the measure. An
operationalization does not describe the correlates of the concept.
● Learning objective 3: Operationally define (or operationalize) abstract and subjective variables.
In conducting transnational research, it is important to remember that certain variables have different
meanings and connotations in different cultures.
EXERCISE 11.6
Find the paper “Consumer values orientation for materialism and its measurement: Scale development and
validation,” written by Marsha Richins and Scott Dawson.
a. Provide an overview of the dimensions and elements of Richins and Dawson’s materialism scale.
b. Use Bruner, Hensel, and James’ the Marketing Scales Handbook or your local (electronic) library to
find at least two other materialism scales. Compare the scales you have found with the Richins and
Dawson scale.

chapter measurement of variables: operational definition 205
Visit the companion website at www.wiley.com/college/sekaran for Case Study: The
Standard Asian Merchant Bank.
DISCUSSION QUESTIONS
1. Define measurement.
2. Explain why it is impossible to measure an object.
3. Provide (relevant) measurable attributes for the following objects:
a. a restaurant;
b. an investment banker;
c. a consumer;
d. a bicycle;
e. a pair of sunglasses;
f. a strategic business unit.
4. Why is it wrong to use correlates of a concept to measure that concept?
5. What is meant by operational definition, when is it necessary, and why is it necessary?
6. Operationalize the following:
a. customer loyalty;
b. price consciousness;
c. career success.
7. Is it useful to draw on existing measures to measure abstract and subjective constructs such as
customer loyalty? Why (not)?
8. “Since we cannot directly observe achievement motivation, job satisfaction, and service quality,
these are not appropriate topics for a scientific study.” Discuss this statement.

206
INTRODUCTION
In the previous chapter, we explained that measurement is the assignment of numbers or other symbols to char-
acteristics (or attributes) of objects according to a prespecified set of rules. Now that we have learned how to
operationally define (or operationalize) a concept (or variable), we need to assign numbers (or other symbols) to
it in some manner. Note that it is important that the rules for assigning numbers to characteristics of objects
should be standardized and applied in a consistent manner.
Numbers allow us to perform statistical analysis on the resulting data and (in deductive research) to test the
hypotheses that we have developed. What’s more, they facilitate the communication of our research results.
In this chapter we will examine the types of scales that can be applied to assign numbers to characteristics of
objects and subsequently see how we actually apply them. We will first discuss four different types of scales
(nominal, ordinal, interval, and ratio scales) and point out that the statistical analysis we can perform later on in
the research process is directly related to the type of scales we use. We will also discuss two main categories of
attitudinal scales (not to be confused with the four different types of scales, discussed first in this chapter) – the
rating scale and the ranking scale. Rating scales have several response categories and are used to elicit responses
with regard to the object, event, or person studied. Ranking scales, on the other hand, make comparisons
between or among objects, events, or persons and elicit the preferred choices and ranking among them.
Measurement: Scaling, reliability and validity
C H A P T E R 1 2
LEARNING OBJECTIVES
After completing Chapter 12, you should be able to:
1. Describe the characteristics and power of the four types of scales – nominal, ordinal, interval,
and ratio.
2. Describe and know how and when to use different forms of rating scales.
3. Describe and know how and when to use different forms of ranking scales.
4. Discuss international dimensions of scaling.
5. Describe validity and reliability and how they are established and assess the reliability and validity
of a scale.
6. Explain the difference between reflective and formative scales.

chapter measurement: scaling, reliability and validity 207
FOUR TYPES OF SCALES
Visit the companion website at www.wiley.com/college/sekaran for Author Video: The
four types of scales.
Measurement means gathering data in the form of numbers. To be able to assign numbers to attributes of objects
we need a scale. A scale is a tool or mechanism by which individuals are distinguished as to how they differ from
one another on the variables of interest to our study. Scaling involves the creation of a continuum on which our
objects are located.
Suppose that we want to measure consumer attitudes toward soft drink consumption. After we have devel-
oped one or more scale items or questions, the next step in measurement is to decide on a scale that allows us to
assign numbers to the attribute (attitude toward soft drink consumption) of our objects (consumers). This allows
us to subsequently classify our objects (consumers) in terms of how unfavorable or favorable they are toward
drinking a soft drink. One of the many options we have to classify consumers is a Likert scale. The Likert scale
is a scale designed to examine how strongly respondents agree with a statement (such as “I enjoy having a soft
drink”) on a five-point scale with the following anchors: 1 = Strongly Disagree, 2 = Disagree, 3 = Neither Agree
Nor Disagree, 4 = Agree, 5 = Strongly Agree (further on in this chapter we will thoroughly discuss a wide variety
of rating and ranking scales, including the Likert scale). Hence, the Likert scale allows us to distinguish consum-
ers in terms of how they differ from one another in their attitude toward soft drinks, each respondent being
assigned a number indicating a more or less unfavorable, neutral, or more or less favorable.
The million dollar question is: What is the meaning of the numbers 1, 2, 3, 4, and 5? Does the scale that we
have used allow us for instance to rank our objects (2 is more than 1)? Does it allow us to compare differences
between objects (in other words is the difference between 1 and 2 the same as the difference between 2 and 3?
And does it allow us to calculate certain statistics such as a mean (or average) and a standard deviation? The
answer is: it depends. It depends on the type of scale (that is, the basic scale type) that we have used.
There are four basic types of scales: nominal, ordinal, interval, and ratio. The degree of sophistication to
which the scales are fine-tuned increases progressively as we move from the nominal to the ratio scale. That is
why information on the variables can be obtained in greater detail when we employ an interval or a ratio scale
rather than using the other two scales. As the calibration or fine-tuning of the scale increases in sophistication,
so does the power of the scale. With more powerful scales, increasingly sophisticated data analyses can be per-
formed, which, in turn, means that more meaningful answers can be found to our research questions. However,
certain variables lend themselves with greater ease to more powerful scaling than others. Let us now examine
each of these four scales.
Nominal scale
A nominal scale is one that allows the researcher to assign subjects to certain categories or groups. For example,
with respect to the variable of gender, respondents can be grouped into two categories – male and female. These
two groups can be assigned code numbers 1 and 2. These numbers serve as simple and convenient category labels
with no intrinsic value, other than to assign respondents to one of two nonoverlapping, or mutually exclusive,
categories. Note that the categories are also collectively exhaustive. In other words, there is no third category into
which respondents would normally fall. Thus, nominal scales categorize individuals or objects into mutually
exclusive and collectively exhaustive groups. The information that can be generated from nominal scaling is the
calculation of the percentage (or frequency) of males and females in our sample of respondents. For example, if

208 research methods for business
we had interviewed 200 people, and assigned code number 1 to all male respondents and number 2 to all female
respondents, then computer analysis of the data at the end of the survey may show that 98 of the respondents are
men and 102 are women. This frequency distribution tells us that 49% of the survey’s respondents are men and
51% women. Other than this marginal information, such scaling tells us nothing more about the two groups.
Thus, the nominal scale gives some basic, categorical, gross information.
EXAMPLE
Let us take a look at another variable that lends itself to
nominal scaling – the nationality of individuals. We
could nominally scale this variable in the following
mutually exclusive and collectively exhaustive categories.
American Japanese
Australian Polish
Chinese Russian
German Swiss
Indian Zambian
Other
Note that every respondent has to fit into one of the
above 11 categories and that the scale allows computa-
tion of the numbers and percentages of respondents
that fit into them.
Now do Exercise 12.1.
EXERCISE 12.1
Suggest two variables that would be natural candidates for nominal scales, and set up mutually exclusive
and collectively exhaustive categories for each.
Ordinal scale
An ordinal scale not only categorizes the variables in such a way as to denote differences among the various
categories, it also rank-orders the categories in some meaningful way. With any variable for which the categories
are to be ordered according to some preference, the ordinal scale would be used. The preference would be ranked
(e.g., from best to worst; first to last) and numbered 1, 2, and so on. For example, respondents might be asked to
indicate their preferences by ranking the importance they attach to five distinct characteristics in a job that the
researcher might be interested in studying. Such a question might take the form shown in the following example.
The ordinal scale helps the researcher to determine the percentage of respondents who consider interac-
tion with others as most important, those who consider using a number of different skills as most important,
and so on. Such knowledge might help in designing jobs that are seen as most enriched by the majority of the
employees.
We can now see that the ordinal scale provides more information than the nominal scale. The ordinal scale
goes beyond differentiating the categories to providing information on how respondents distinguish them by
rank-ordering them. Note, however, that the ordinal scale does not give any indication of the magnitude of the
differences among the ranks. For instance, in the job characteristics example, the first-ranked job characteristic
might be only marginally preferred over the second-ranked characteristic, whereas the characteristic that is
ranked third might be preferred in a much larger degree than the one ranked fourth. Thus, in ordinal scaling,
even though differences in the ranking of objects, persons, or events investigated are clearly known, we do not
know their magnitude. This deficiency is overcome by interval scaling, which is discussed next.

chapter measurement: scaling, reliability and validity 209
Now do Exercise 12.2.
EXERCISE 12.2
Develop an ordinal scale for consumer preferences for different brands of cars.
EXAMPLE
Rank the following five characteristics in a job in terms
of how important they are for you. You should rank the
most important item as 1, the next in importance as 2, and
so on, until you have ranked each of them 1, 2, 3, 4, or 5.
Job characteristic Ranking of importance
The opportunity provided by the job to:
Interact with others —
Use a number of different skills. —
Complete a whole task from beginning to end. —
Serve others. —
Work independently. —
Interval scale
In an interval scale, or equal interval scale, numerically equal distances on the scale represent equal values in the
characteristics being measured. Whereas the nominal scale allows us only to qualitatively distinguish groups by cat-
egorizing them into mutually exclusive and collectively exhaustive sets, and the ordinal scale to rank-order the prefer-
ences, the interval scale allows us to compare differences between objects. The difference between any two values on
the scale is identical to the difference between any other two neighboring values of the scale. The clinical thermom-
eter is a good example of an interval-scaled instrument; it has an arbitrary origin and the magnitude of the difference
between 98.6 degrees (supposed to be the normal body temperature) and 99.6 degrees is the same as the magnitude
of the difference between 104 and 105 degrees. Note, however, that one may not be seriously concerned if one’s tem-
perature rises from 98.6 to 99.6, but one is likely to be so when the temperature goes up from 104 to 105 degrees!
The interval scale, then, taps the differences, the order, and the equality of the magnitude of the differences in
the variable. As such, it is a more powerful scale than the nominal and ordinal scales, and has for its measure of cen-
tral tendency the arithmetic mean. Its measures of dispersion are the range, the standard deviation, and the variance.
Ratio scale
The ratio scale overcomes the disadvantage of the arbitrary origin point of the interval scale, in that it has an absolute
(in contrast to an arbitrary) zero point, which is a meaningful measurement point. Thus, the ratio scale not only
measures the magnitude of the differences between points on the scale but also taps the proportions in the differ-
ences. It is the most powerful of the four scales because it has a unique zero origin (not an arbitrary origin) and sub-
sumes all the properties of the other three scales. The weighing balance is a good example of a ratio scale. It has an
absolute (and not arbitrary) zero origin calibrated on it, which allows us to calculate the ratio of the weights of two
individuals. For instance, a person weighing 250 pounds is twice as heavy as one who weighs 125 pounds. Note that
multiplying or dividing both of these numbers (250 and 125) by any given number will preserve the ratio of 2:1. The
measure of central tendency of the ratio scale may be either the arithmetic or the geometric mean and the measure

210 research methods for business
of dispersion may be either the standard deviation, or variance, or the coefficient of variation. Some examples of ratio
scales are those pertaining to actual age, income, and the number of organizations individuals have worked for.
Now do Exercise 12.3 and Exercise 12.4.
EXERCISE 12.3
Measure any three variables on an interval or a ratio scale.
EXERCISE 12.4
Mention one variable for each of the four scales in the context of a market survey, and explain how or why
it would fit into the scale.
The properties of the scales, as fine-tuning is increasingly achieved, are summarized in Table 12.1. We may also see
from the table how the power of the statistic increases as we move away from the nominal scale (where we group subjects
or items under some categories), to the ordinal scale (where we rank-order the categories), to the interval scale (where
we tap the magnitude of the differences), to the ratio scale (which allows us to measure the proportion of the differences).
You must have surmised by now that some variables, such as gender, can be measured only on the nominal
scale, while others, such as temperature, can be measured on an ordinal scale (hot/medium/low), or the interval
scale through a thermometer. Whenever it is possible to use a more powerful scale, it is wise to do so.
Ordinal or interval?
Likert scales (discussed later in this chapter) are a commonly used way of measuring opinions and attitudes.
They measure the extent to which participants agree or disagree with a given statement, and typically range
from 1 (strongly disagree) to 5 (strongly agree) with a neutral point in the middle (e.g. neither agree nor
disagree). Whether this scale is ordinal or interval in nature is a subject of much debate. Some people argue that
a Likert scale is ordinal in nature. They correctly point out that one cannot assume that all pairs of adjacent
T A B L E 1 2 . 1
Properties of the four scales
Highlights
Scale Difference Order Distance
Unique
origin
Measures of
central tendency Measures of dispersion
Some tests of
significance
Nominal Yes No No No Mode — χ2
Ordinal Yes Yes No No Median Semi-interquartile range Rank-order
correlations
Interval Yes Yes Yes No Arithmetic
mean
Standard deviation, variance,
coefficient of variation
t, F
Ratio Yes Yes Yes Yes Arithmetic or
geometric
mean
Standard deviation or
variance or coefficient of
variation
t, F
Note: The interval scale has 1 as an arbitrary starting point. The ratio scale has the natural origin 0, which is meaningful.

chapter measurement: scaling, reliability and validity 211
levels are equidistant (of the same distance). Nonetheless, Likert scales (and a few other scales, that is, the
semantic differential scale and the numerical scale – also discussed later on in this chapter) are generally treated
as if they were interval scales, because it allows researchers to calculate averages and standard deviations and to
apply other, more advanced statistical techniques (for instance, to test hypotheses).
An example of a Likert scale is provided next. How would you treat this scale?
EXAMPLE
Indicate the extent to which you agree with the follow-
ing statements as they relate to your job, by circling the
appropriate number against each, using the scale
given below.
Strongly
Disagree
Disagree
Neither Agree
Nor Disagree
Agree
Strongly
Agree
1 2 3 4 5
The following opportunities offered by the job are very important to me:
a. Interacting with others 1 2 3 4 5
b. Using a number of different skills 1 2 3 4 5
c. Completing a task from beginning to end 1 2 3 4 5
d. Serving others 1 2 3 4 5
e. Working independently 1 2 3 4 5
Now that we have looked at the four types of scales, let us see, through the following examples, when and
how they should be used.
EXAMPLE
Use of the nominal scale
The nominal scale is always used for obtaining
personal data such as gender or department in which
one works, where grouping of individuals or objects is
useful, as shown below.
1. Your gender 2. Your department
__ Male __ Production
__ Female __ Sales
__ Accounting
__ Finance
__ Personnel
__ R&D
__ Other (specify)
Use of the ordinal scale
The ordinal scale is used to rank the preferences or
usage of various brands of a product by individuals and
to rank-order individuals, objects, or events, as per the
examples below.
1. Rank the following personal computers with res-
pect to their usage in your office, assigning the
number 1 to the most used system, 2 to the next
most used, and so on. If a particular system is not
used at all in your office, put a 0 next to it.
__ Apple __ Hewlett-Packard
__ Compaq __ IBM
__ Comp USA __ Packard Bell
__ Dell Computer __ Sony
__ Gateway __ Toshiba
__ Other (Specify)

212 research methods for business
2. Rank the cities listed below in the order that you
consider suitable for opening a new plant. The city
considered the most suitable should be ranked 1,
the next 2, and so on.
__ Cincinnati __ Milwaukee
__ Detroit __ Pittsburgh
__ Des Moines __ St Louis
__ Houston
Use of the interval scale
The interval scale (note that a Likert scale – formally
an ordinal scale – is used in the following example) is
used when responses to various items that measure a
variable can be tapped on a five-point (or seven-point
or any other number of points) scale, which can there-
after be summed across the items. See the following
example of a Likert scale.
Using the scale below, please indicate your
response to each of the items that follow, by circling the
number that best describes your feeling.
Strongly Disagree Disagree
Neither Agree Nor Disagree Agree
Strongly Agree
1 2 3 4 5
1. My job offers me a chance to test myself and my abilities.
1 2 3 4 5
2. Mastering this job meant a lot to me. 1 2 3 4 5
3. Doing this job well is a reward in itself. 1 2 3 4 5
4. Considering the time spent on the job, I feel thoroughly familiar with my tasks and responsibilities.
1 2 3 4 5
Use of the ratio scale
Ratio scales are usually used in business research when
exact numbers on objective (as opposed to subjective)
factors are called for, as in the following questions:
1. How many other organizations did you work for
before joining this system? __
2. Please indicate the number of children you have in
each of the following categories:
__ below 3 years of age
__ between 3 and 6
__ over 6 years but under 12
__ 12 years and over
3. How many retail outlets do you operate? __
The responses to the questions could range from 0 to
any reasonable figure.
Review of scales
The four scales that can be applied to the measurement of variables are the nominal, ordinal, interval, and
ratio scales. The nominal scale highlights the differences by classifying objects or persons into groups, and

chapter measurement: scaling, reliability and validity 213
provides the least amount of information on the variable. The ordinal scale provides some additional
information by rank-ordering the categories of the nominal scale. The interval scale not only ranks, but also
provides us with information on the magnitude of the differences in the variable. The ratio scale indicates
not only the magnitude of the differences but also their proportion. Multiplication or division would preserve
these ratios. As we move from the nominal to the ratio scale, we obtain progressively increasing precision in
quantifying the data, and greater flexibility in using more powerful statistical tests. Hence, whenever possible
and appropriate, a more powerful rather than a less powerful scale should be used to measure the variables
of interest.
The specific scaling techniques commonly used in business research can be classified into rating scales
and the ranking scales. In rating scales each object is scaled independently of the other objects under study.
Ranking scales, on the other hand, make comparisons between or among objects and elicit the preferred
choices and ranking among them. Specific rating and ranking scales are discussed next.
RATING SCALES
The following rating scales are often used in business research:
● Dichotomous scale
● Category scale
● Semantic differential scale
● Numerical scale
● Itemized rating scale
● Likert scale
● Fixed or constant sum rating scale
● Stapel scale
● Graphic rating scale
● Consensus scale
Other scales, such as the Thurstone Equal Appearing Interval Scale, and the multidimensional scale, are less
frequently used. We will briefly describe each of the above attitudinal scales.
Dichotomous scale
The dichotomous scale is used to elicit a Yes or No answer, as in the example below. Note that a nominal scale is
used to elicit the response.
EXAMPLE
Do you own a car? Yes No

214 research methods for business
EXAMPLE
How pleased are you with your new estate agent?
Extremely Pleased 7 6 5 4 3 2 1 Extremely Displeased
Category scale
The category scale uses multiple items to elicit a single response, as per the following example. This also uses the
nominal scale.
EXAMPLE
Where in London do you reside?
__ East London
__ South London
__ West London
__ North London
__ Outskirts
Semantic differential scale
Several bipolar attributes are identified at the extremes of the scale, and respondents are asked to indicate their
attitudes, on what may be called a semantic space, toward a particular individual, object, or event on each of the
attributes. The bipolar adjectives used might employ such terms as Good–Bad; Strong–Weak; Hot–Cold. The
semantic differential scale is used to assess respondents’ attitudes toward a particular brand, advertisement,
object, or individual. The responses can be plotted to obtain a good idea of their perceptions. A semantic dif-
ferential scale is ordinal in nature. However, it is often treated as an interval scale. An example of the semantic
differential scale follows.
Numerical scale
The numerical scale is similar to the semantic differential scale, with the difference that numbers on a five-point
or seven-point scale are provided, with bipolar adjectives at both ends, as illustrated below. This scale is also often
treated as an interval scale, although it is formally ordinal in nature.
EXAMPLE
Responsive — — — — — — Unresponsive
Beautiful — — — — — — Ugly
Courageous — — — — — — Timid

chapter measurement: scaling, reliability and validity 215
Itemized rating scale
A five-point or seven-point scale with anchors, as needed, is provided for each item and the respondent states the
appropriate number on the side of each item, or circles the relevant number against each item, as per the exam-
ples that follow. The responses to the items are then summed. This uses an interval scale.
EXAMPLE
Respond to each item using the scale below, and indicate your response number on the line by each item.
1
Very Unlikely
2
Unlikely
3
Neither Unlikely
Nor Likely
4
Likely
5
Very Likely
1 I will be changing my job within the next 12 months. —
2 I will take on new assignments in the near future. —
3 It is possible that I will be out of this organization within the next 12 months.
—
Note that the above is a balanced rating scale with a neutral point.
Not at All
Interested
1
Somewhat
Interested
2
Moderately
Interested
3
Very Much
Interested
4
How would you rate your interest in changing current organizational policies?
1 2 3 4
This is an unbalanced rating scale which does not have a neutral point.
The itemized rating scale provides the flexibility to use as many points in the scale as considered necessary
(4, 5, 7, 9, or whatever), and it is also possible to use different anchors (e.g., Very Unimportant to Very Important;
Extremely Low to Extremely High). When a neutral point is provided, it is a balanced rating scale, and when it is
not, it is an unbalanced rating scale.
Research indicates that a five-point scale is just as good as any, and that an increase from five to seven or nine
points on a rating scale does not improve the reliability of the ratings (Elmore & Beggs, 1975).
The itemized rating scale is frequently used in business research, since it adapts itself to the number of points
the researcher wishes to use, as well as the nomenclature of the anchors, as is considered necessary to accom-
modate the needs of the researcher for tapping the variable.
Likert scale
The Likert scale is designed to examine how strongly subjects agree or disagree with statements on a five-point
scale with the following anchors:
Strongly Disagree Disagree Neither Agree nor Disagree Agree Strongly Agree
1 2 3 4 5

216 research methods for business
EXAMPLE
In choosing a toilet soap, indicate the importance you attach to each of the following five aspects by allotting
points for each to total 100 in all.
Fragrance —
Color —
Shape —
Size —
Texture of lather —
Total points 100
The responses over a number of items tapping a particular concept or variable can be analyzed item by item,
but it is also possible to calculate a total or summated score for each respondent by summing across items. The
summated approach is widely used, and therefore the Likert scale is also referred to as a summated scale.
In the following example, the scores on the second item have to be reversed before calculating the summated
score, because a high score on this item reflects an unfavorable attitude to work, whereas a high score on items 1
and 3 reflects a favorable attitude to work. This will lead to high total scores for respondents who have a favorable
attitude toward work and to low total scores for respondents who have an unfavorable attitude toward work.
EXAMPLE
Using the preceding Likert scale, state the extent to which you agree with each of the following statements:
My work is very interesting 1 2 3 4 5
I am not engrossed in my work all day 1 2 3 4 5
Life without my work would be dull 1 2 3 4 5
Whether a Likert scale is an ordinal or an interval scale is a subject of much debate. People who treat a Likert
scale as an ordinal scale argue that one cannot assume that all pairs of adjacent levels are equidistant. Nonetheless,
Likert scales are generally treated as interval scales.
Fixed or constant sum scale
The respondents are here asked to distribute a given number of points across various items as per the example
below. This is more in the nature of an ordinal scale.
Stapel scale
This scale simultaneously measures both the direction and intensity of the attitude toward the items under study.
The characteristic of interest to the study is placed at the center with a numerical scale ranging, say, from +3 to −3,
on either side of the item, as illustrated in the example below. This gives an idea of how close or distant the indi-
vidual response to the stimulus is. Since this does not have an absolute zero point, this is an interval scale.

chapter measurement: scaling, reliability and validity 217
EXAMPLE
State how you would rate your supervisor’s abilities with respect to each of the characteristics mentioned below,
by circling the appropriate number.
+3 +3 +3
+2 +2 +2
+1 +1 +1
Adopting modern technology Product innovation Interpersonal skills
−1 −1 −1
−2 −2 −2
−3 −3 −3
Graphic rating scale
A graphical representation helps the respondents to indicate on this scale their answers to a particular question
by placing a mark at the appropriate point on the line, as in the following example. This is an ordinal scale,
though the following example might make it look like an interval scale.
EXAMPLE
On a scale of 1 to 10, how would
you rate your supervisor?
– 10 Excellent
–
–
–
–
– 5 Adequate
–
–
–
– 1 Very bad
This scale is easy to respond to. The brief descriptions on the scale points are meant to serve as a guide in
locating the rating rather than representing discrete categories. The faces scale, which depicts faces ranging from
smiling to sad (illustrated in Chapter 9), is also a graphic rating scale used to obtain responses regarding people’s
feelings with respect to some aspect – say, how they feel about their jobs.

218 research methods for business
Consensus scale
Scales can also be developed by consensus, where a panel of judges selects certain items, which in its view meas-
ure the relevant concept. The items are chosen particularly based on their pertinence or relevance to the concept.
Such a consensus scale is developed after the selected items have been examined and tested for their validity and
reliability. One such consensus scale is the Thurstone Equal Appearing Interval Scale, where a concept is meas-
ured by a complex process followed by a panel of judges. Using a pile of cards containing several descriptions of
the concept, a panel of judges offers inputs to indicate how close or not the statements are to the concept under
study. The scale is then developed based on the consensus reached. However, this scale is rarely used for measur-
ing organizational concepts because of the time necessary to develop it.
Other scales
There are also some advanced scaling methods such as multidimensional scaling, where objects, people, or both,
are visually scaled, and a conjoint analysis is performed. This provides a visual image of the relationships in space
among the dimensions of a construct.
It should be noted that the Likert or some form of numerical scale is the one most frequently used to meas-
ure attitudes and behaviors in business research.
RANKING SCALES
As already mentioned, ranking scales are used to tap preferences between two or among more objects or items
(ordinal in nature). However, such ranking may not give definitive clues to some of the answers sought. For
instance, let us say there are four product lines and the manager seeks information that would help decide which
product line should get the most attention. Let us also assume that 35% of the respondents choose the first prod-
uct, 25% the second, and 20% choose each of products three and four as being of importance to them. The man-
ager cannot then conclude that the first product is the most preferred, since 65% of the respondents did not
choose that product! Alternative methods used are paired comparisons, forced choice, and the comparative scale,
which are discussed below.
Paired comparison
The paired comparison scale is used when, among a small number of objects, respondents are asked to choose
between two objects at a time. This helps to assess preferences. If, for instance, in the previous example, during
the paired comparisons, respondents consistently show a preference for product one over products two, three,
and four, the manager can reliably understand which product line demands his utmost attention. However, as the
number of objects to be compared increases, so does the number of paired comparisons. The number of paired
choices for n objects will be (n)(n − 1)/2. The greater the number of objects or stimuli, the greater the number of
paired comparisons presented to the respondents, and the greater the respondent fatigue. Hence, paired com-
parison is a good method if the number of stimuli presented is small.
Forced choice
The forced choice enables respondents to rank objects relative to one another, among the alternatives provided.
This is easier for the respondents, particularly if the number of choices to be ranked is limited in number.

chapter measurement: scaling, reliability and validity 219
EXAMPLE
Rank the following magazines that you would like to subscribe to in the order of preference, assigning 1 to the
most preferred choice and 5 to the least preferred.
Fortune —
Playboy —
Time —
People —
Prevention —
Comparative scale
The comparative scale provides a benchmark or a point of reference to assess attitudes toward the current object,
event, or situation under study. An example of the use of the comparative scale follows.
EXAMPLE
In a volatile financial environment, compared to stocks, how wise or useful is it to invest in Treasury bonds?
Please circle the appropriate response.
More useful About the same Less useful1 2 3 4 5
In sum, nominal data lend themselves to dichotomous or category scales; ordinal data to any one of the
ranking scales – paired comparison, forced choice, or comparative scales; and interval or interval-like data to the
other rating scales, as seen from the various examples above. The semantic differential and the numerical scales
are, strictly speaking, not interval scales, though they are often treated as such in data analysis.
Rating scales are used to measure most behavioral concepts. Ranking scales are used to make comparisons
or rank the variables that have been tapped on a nominal scale.
INTERNATIONAL DIMENSIONS OF SCALING
Apart from sensitivity to operational definition of concepts in other cultures, the issue of scaling also needs to
be addressed in cross-cultural research. Different cultures react differently to issues of scaling. For instance, a
five-point or a seven-point scale may make no difference in the United States, but could in the responses of
subjects in other countries (see Sekaran & Martin, 1982; Sekaran & Trafton, 1978). Barry (1969), for instance,
found that in some countries, a seven-point scale is more sensitive than a four-point scale in eliciting unbiased
responses.
Recent research has shown that people from different countries differ in both their tendency to use the
extremes of the rating scale (for instance 1 and 5 or 1 and 7) and to respond in a socially desirable way (De Jong,

220 research methods for business
2006). These findings illustrate that analyzing and interpreting data that are collected in multiple countries is an
extremely challenging undertaking.
GOODNESS OF MEASURES
Now that we have seen how to operationally define variables and apply different scaling techniques, it is important
to make sure that the instrument that we develop to measure a particular concept is indeed accurately measuring
the variable, and that, in fact, we are actually measuring the concept that we set out to measure. This ensures that
in operationally defining perceptual and attitudinal variables, we have not overlooked some important dimensions
and elements or included some irrelevant ones. The scales developed can often be imperfect, and errors are prone
to occur in the measurement of attitudinal variables. The use of better instruments will ensure more accuracy in
results, which in turn will enhance the scientific quality of the research. Hence, in some way, we need to assess the
“goodness” of the measures developed. That is, we need to be reasonably sure that the instruments we use in our
research do indeed measure the variables they are supposed to, and that they measure them accurately.
Let us now examine how we can ensure that the measures developed are reasonably good. First, an item
analysis of the responses to the questions tapping the variable is carried out, and then the reliability and validity
of the measures are established, as described below.
Item analysis
Item analysis is carried out to see if the items in the instrument belong there or not. Each item is examined for its
ability to discriminate between those subjects whose total scores are high and those with low scores. In item
analysis, the means between the high-score group and the low-score group are tested to detect significant differ-
ences through the t-values. The items with a high t-value (test which is able to identify the highly discriminating
items in the instrument) are then included in the instrument. Thereafter, tests for the reliability of the instrument
are carried out and the validity of the measure is established.
Very briefly, reliability is a test of how consistently a measuring instrument measures whatever concept it is
measuring. Validity is a test of how well an instrument that is developed measures the particular concept it is
intended to measure. In other words, validity is concerned with whether we measure the right concept, and reli-
ability with stability and consistency of measurement. Validity and reliability of the measure attest to the scien-
tific rigor that has gone into the research study. These two criteria will now be discussed. The various forms of
reliability and validity are depicted in Figure 12.1.
Validity
In Chapter 10 we examined the terms internal validity and external validity in the context of experimental
designs. That is, we will be concerned about the issue of the authenticity of the cause-and-effect relationships
(internal validity), and their generalizability to the external environment (external validity). For now, we are
going to examine the validity of the measuring instrument itself. That is, when we ask a set of questions (i.e.,
develop a measuring instrument) with the hope that we are tapping the concept, how can we be reasonably
certain that we are indeed measuring the concept we set out to measure and not something else? This can be
determined by applying certain validity tests.
Several types of validity test are used to test the goodness of measures and writers use different terms to
denote them. For the sake of clarity, we may group validity tests under three broad headings: content validity,
criterion-related validity, and construct validity.

chapter measurement: scaling, reliability and validity 221
Content validity
Content validity ensures that the measure includes an adequate and representative set of items that tap the con-
cept. The more the scale items represent the domain or universe of the concept being measured, the greater the
content validity. To put it differently, content validity is a function of how well the dimensions and elements of a
concept have been delineated.
A panel of judges can attest to the content validity of the instrument. Kidder and Judd (1986) cite the exam-
ple where a test designed to measure degrees of speech impairment can be considered as having validity if it is so
evaluated by a group of expert judges (i.e., professional speech therapists).
Face validity is considered by some a basic and minimum index of content validity. Face validity indicates
that the items that are intended to measure a concept, do, on the face of it, look like they measure the concept.
Some researchers do not see fit to treat face validity as a valid component of content validity.
Criterion-related validity
Criterion-related validity is established when the measure differentiates individuals on a criterion it is
expected to predict. This can be done by establishing concurrent validity or predictive validity, as
explained below.
Concurrent validity is established when the scale discriminates individuals who are known to be different;
that is, they should score differently on the instrument, as in the example that follows.
Goodnessof data
Reliability
Stability
Test–retest reliability
Parallel-form reliability
Interitem consistency reliability
Split-half reliability
Consistency
Validity(are we
measuringthe rightthing?)
Logical validity(content)
Criterion-relatedvalidity
Face validity Predictive Concurrent Convergent Discriminant
Congruent validity(construct)
F I G U R E 1 2 . 1
Testing goodness of measures: forms of reliability and validity
222 research methods for business
EXAMPLE
If an aptitude or ability test administered to employ-
ees at the time of recruitment is to differentiate indi-
viduals on the basis of their future job performance,
then those who score low on the test should be
poor performers and those with high scores good
performers.
EXAMPLE
If a measure of work ethic is developed and adminis-
tered to a group of welfare recipients, the scale should
differentiate those who are enthusiastic about accept-
ing a job and glad of an opportunity to be off welfare,
from those who do not want to work, even when
offered a job. Obviously, those with high work ethic
values do not want to be on welfare and yearn for
employment to be on their own. Those who are low on
work ethic values, on the other hand, might exploit the
opportunity to survive on welfare for as long as possi-
ble, deeming work to be drudgery. If both types of
individual have the same score on the work ethic scale,
then the test is not a measure of work ethic, but of
something else.
Predictive validity indicates the ability of the measuring instrument to differentiate among individuals with
reference to a future criterion.
Construct validity
Construct validity testifies to how well the results obtained from the use of the measure fit the theories around
which the test is designed. This is assessed through convergent and discriminant validity, which are explained below.
Convergent validity is established when the scores obtained with two different instruments measuring the
same concept are highly correlated.
Discriminant validity is established when, based on theory, two variables are predicted to be uncorrelated,
and the scores obtained by measuring them are indeed empirically found to be so. Validity can thus be estab-
lished in different ways. Published measures for various concepts usually report the kinds of validity that have
been established for the instrument, so that the user or reader can judge the “goodness” of the measure. Table 12.2
summarizes the kinds of validity discussed here.
Some of the ways in which the above forms of validity can be established are through the following:
1. Correlational analysis (as in the case of establishing concurrent and predictive validity or convergent
and discriminant validity).
2. Factor analysis, a multivariate technique that confirms the dimensions of the concept that have been
operationally defined, as well as indicating which of the items are most appropriate for each dimension
(establishing construct validity).
3. The multitrait, multimethod matrix of correlations derived from measuring concepts by different
forms and different methods, additionally establishing the robustness of the measure.
In sum, the goodness of measures is established through the different kinds of validity and reliability depicted in
Figure 12.1. The results of any research can only be as good as the measures that tap the concepts in the theoretical

chapter measurement: scaling, reliability and validity 223
framework. We need to use well-validated and reliable measures to ensure that our research is scientific. Fortunately,
measures have been developed for many important concepts in business research and their psychometric properties (i.e.,
the reliability and validity) established by the developers. Thus, researchers can use the instruments already reputed to
be “good,” rather than laboriously developing their own measures. When using these measures, however, researchers
should cite the source (i.e., the author and reference) so that the reader can seek more information if necessary.
It is not unusual for two or more equally good measures to be developed for the same concept. For example,
there are several different instruments for measuring the concept of “job satisfaction”. One of the most frequently
used scales for the purpose, however, is the Job Descriptive Index (JDI) developed by Smith, Kendall, and Hulin
(1969). When more than one scale exists for any variable, it is preferable to use the measure that has better reli-
ability and validity, and is also more frequently used.
At times, we may also have to adapt an established measure to suit the setting. For example, a scale that is used
to measure job performance, job characteristics, or job satisfaction in the manufacturing industry may have to be
modified slightly to suit a utility company or a health care organization. The work environment in each case is
different and the wordings in the instrument may have to be suitably adapted. However, in doing this, we are tam-
pering with an established scale, and it is advisable to test it for the adequacy of the validity and reliability afresh.
A sample of a few measures used to tap some frequently researched concepts in the management and mar-
keting areas is provided in the appendix to this chapter.
Finally, it is important to note that validity is a necessary but not sufficient condition of the test of goodness
of a measure. A measure should not only be valid but also reliable. A measure is reliable if it provides consistent
results. We will now discuss the concept of reliability.
Reliability
The reliability of a measure indicates the extent to which it is without bias (error free) and hence ensures consist-
ent measurement across time and across the various items in the instrument. In other words, the reliability of a
measure is an indication of the stability and consistency with which the instrument measures the concept and
helps to assess the “goodness” of a measure.
T A B L E 1 2 . 2
Types of validity
Validity Description
Content validity Does the measure adequately measure the concept?
Face validity Do “experts” validate that the instrument measures what its name suggests it measures?
Criterion-related validity Does the measure differentiate in a manner that helps to predict a criterion variable?
Concurrent validity Does the measure differentiate in a manner that helps to predict a criterion variable
currently?
Predictive validity Does the measure differentiate individuals in a manner that helps predict a future
criterion?
Construct validity Does the instrument tap the concept as theorized?
Convergent validity Do two instruments measuring the concept correlate highly?
Discriminant validity Does the measure have a low correlation with a variable that is supposed to be unrelated
to this variable?

224 research methods for business
Stability of measures
The ability of a measure to remain the same over time – despite uncontrollable testing conditions or the state of
the respondents themselves – is indicative of its stability and low vulnerability to changes in the situation. This
attests to its “goodness” because the concept is stably measured, no matter when it is done. Two tests of stability
are test–retest reliability and parallel-form reliability.
Test–retest reliability The reliability coefficient obtained by repetition of the same measure on a second
occasion is called the test–retest reliability. That is, when a questionnaire containing some items that are sup-
posed to measure a concept is administered to a set of respondents, now and again to the same respondents, say
several weeks to six months later, then the correlation between the scores obtained at the two different times
from one and the same set of respondents is called the test–retest coefficient. The higher it is, the better the test–
retest reliability and, consequently, the stability of the measure across time.
Parallel-form reliability When responses on two comparable sets of measures tapping the same construct
are highly correlated, we have parallel-form reliability. Both forms have similar items and the same response
format, the only changes being the wording and the order or sequence of the questions. What we try to establish
here is the error variability resulting from wording and ordering of the questions. If two such comparable forms
are highly correlated (say 8 and above), we may be fairly certain that the measures are reasonably reliable, with
minimal error variance caused by wording, ordering, or other factors.
Internal consistency of measures
The internal consistency of measures is indicative of the homogeneity of the items in the measure that taps
the construct. In other words, the items should “hang together as a set,” and be capable of independently
measuring the same concept so that the respondents attach the same overall meaning to each of the items.
This can be seen by examining whether the items and the subsets of items in the measuring instrument are
correlated highly. Consistency can be examined through the interitem consistency reliability and split-half
reliability tests.
Interitem consistency reliability The interitem consistency reliability is a test of the consistency of
respondents’ answers to all the items in a measure. To the degree that items are independent measures of the
same concept, they will be correlated with one another. The most popular test of interitem consistency relia-
bility is Cronbach’s coefficient alpha (Cronbach, 1946), which is used for multipoint-scaled items, and the
Kuder–Richardson formulas (Kuder & Richardson, 1937), used for dichotomous items. The higher the coef-
ficients, the better the measuring instrument.
Split-half reliability Split-half reliability reflects the correlations between two halves of an instrument. The
estimates will vary depending on how the items in the measure are split into two halves. Split-half reliabilities
may be higher than Cronbach’s alpha only in the circumstance of there being more than one underlying response
dimension tapped by the measure and when certain other conditions are met as well (for complete details, refer
to Campbell, 1976). Hence, in almost all cases, Cronbach’s alpha can be considered a perfectly adequate index of
the inter-item consistency reliability.

chapter measurement: scaling, reliability and validity 225
REFLECTIVE VERSUS FORMATIVE MEASUREMENT SCALES
At this moment, it is important to come back to the contention that the items of a multi-item measure should
hang together as a set and be capable of independently measuring the same concept (it may give you a headache
right now, but it most certainly will save you an even bigger headache in your future career as a researcher, so bear
with us). The fact is that the items that measure a concept should not always hang together: this is only true for
reflective, but not for formative, scales.
What is a reflective scale?
In a reflective scale, the items (all of them!) are expected to correlate. Unlike the items used in a formative scale,
discussed next, each item in a reflective scale is assumed to share a common basis (the underlying construct of
interest). Hence, an increase in the value of the construct will translate into an increase in the value for all the
items representing the construct. An example of a reflective scale is the Attitude Toward the Offer scale devel-
oped by Burton and Lichtenstein (1988). This is a six-item, nine-point summated ratings scale measuring a
person’s attitude about a certain product offered at a certain price. The scale is composed of five bipolar adjectives
(unfavorable–favorable; bad–good; harmful–beneficial; unattractive–attractive; poor–excellent) and one disa-
gree–agree item (introduced by the stem: “I like this deal”), measured on a nine-point graphic scale. Indeed, we
would expect that a more favorable attitude toward the offer would translate into an increase in the value of all
the six items representing attitude toward the offer. Hence, we would expect all the six items to correlate. Note
that the direction of “causality” is from the construct to the items.
What is a formative scale and why do the items of a formative scale not necessarily hang together?
A formative scale is used when a construct is viewed as an explanatory combination of its indicators (Fornell, 1987;
Fornell & Bookstein, 1982). Take the Job Description Index (Smith, Kendall & Hulin, 1969), a composite measure
purporting to evaluate job satisfaction. This measure includes five dimensions: type of work (18 items), opportu-
nities for promotion (9 items), satisfaction with supervision (18 items), coworkers (18 items), and pay (9 items).
The five dimensions are seen as the five defining characteristics of job satisfaction.
The five dimensions are translated into 72 observable and measureable elements such as “Good opportunity for
advancement”, “Regular promotions,” “Fairly good chance for promotion,” “Income adequate for normal expenses,”
“Highly paid,” and “Gives sense of accomplishment.” The idea is that we would expect the first three items (“Good
opportunity for advancement,” “Regular promotions,” and “Fairly good chance for promotion”) to be correlated
(after all, they all aim to measure one particular dimension of job satisfaction, i.e., “opportunities for promotion”).
However, these items do not necessarily correlate with the items that measure “Pay” (a second dimension), such as
“Income adequate for normal expenses” and “Highly paid,” because the dimension “Good opportunities for
advancement” is not necessarily related to the dimension “Pay.” Indeed, a first worker may have a very good salary
but no opportunities for promotion, a second worker may have very good opportunities for promotion but a very
poor salary, and a third worker may have a very good salary and very good opportunities for promotion.
Likewise, we would expect the items “Income adequate for normal expenses” and “Highly paid” to be cor-
related to each other (since both items measure pay), but we would not necessarily expect these items to correlate
with the item “Gives sense of accomplishment” (because this last item does not measure pay but another dimen-
sion of the Job Description Index).

226 research methods for business
SUMMARY
● Learning objective 1: Describe the characteristics and power of the four types of scales – nominal,
ordinal, interval, and ratio.
To be able to assign numbers to attributes of objects we need a scale. A scale is a tool or mechanism by
which individuals are distinguished as to how they differ from one another on the variables of interest to our
study. Scaling involves the creation of a continuum on which our objects are located. There are four basic
types of scales: nominal, ordinal, interval, and ratio. The degree of sophistication to which the scales are fine-
tuned increases progressively as we move from the nominal to the ratio scale.
● Learning objective 2: Describe and know how and when to use different forms of rating scales.
In rating scales each object is scaled independently of the other objects under study. The following rating
scales are often used in business research: dichotomous scale, category scale, semantic differential scale,
numerical scale, itemized rating scale, Likert scale, fixed or constant sum rating scale, Stapel scale, graphic
rating scale, and consensus scale. The Likert scale or some form of numerical scale is the one most frequently
used to measure attitudes and behaviors in business research.
● Learning objective 3: Describe and know how and when to use different forms of ranking scales.
Ranking scales are used to tap preferences between two or among more objects or items. The paired com-
parison scale is used when, among a small number of objects, respondents are asked to choose between two
objects at a time. The forced choice enables respondents to rank objects relative to one another, among the
alternatives provided. The comparative scale provides a benchmark or a point of reference to assess atti-
tudes toward the current object, event, or situation under study.
In summary, the Job Description Index includes five dimensions and 72 items. These 72 items are not neces-
sarily related to each other, because the five dimensions they represent do not necessarily hang together.
A scale that contains items that are not necessarily related is called a formative scale. We have already
explained that formative scales are used when a construct (such as job satisfaction) is viewed as an explanatory
combination of its indicators (promotions, pay, satisfaction with supervision, coworkers, and work); that is, when
a change in any one of the indicators (dimensions) is expected to change the score of the overall construct,
regardless of the value of the other indicators (dimensions). The Job Description Index is formative in nature,
since an increase in the value of one of its indicators, such as “opportunities for promotion,” is expected to trans-
late into a higher score for job satisfaction, regardless of the value of the other indicators. Thus, the Job Description
Index conceptualizes job satisfaction as the total weighted score across the 72 job satisfaction items, where each
item corresponds to a specific independent dimension of job satisfaction.
A good (that is, a valid) formative scale is one that represents the entire domain of the construct. This means
that a valid scale should represent all the relevant aspects of the construct of interest, even if these aspects do not
necessarily correlate.
While it makes sense to test the interitem consistency of reflective scales, it does not make sense to test the
interitem consistency of formative scales. The reason is that we do not expect the items in a formative scale to be
homogeneous; in other words, we do not expect all the items to correlate. For this reason, tests of the consistency
of respondents’ answers to the items of a formative measure do not tell us anything about the quality of our meas-
uring instrument. Note that there are other methods to assess the goodness of formative scales (see, for instance,
Jarvis, MacKenzie & Podsakoff, 2003).

chapter measurement: scaling, reliability and validity 227
● Learning objective 4: Discuss international dimensions of scaling.
Different cultures react differently to issues of scaling. What’s more, recent research has shown that people
from different countries differ in both their tendency to use the extremes of the rating scale (for instance 1
and 5 or 1 and 7) and to respond in a socially desirable way. These findings illustrate that analyzing and
interpreting data that are collected in multiple countries is a challenging task.
● Learning objective 5: Describe validity and reliability and how they are established and assess the reli-
ability and validity of a scale.
Reliability is a test of how consistently a measuring instrument measures whatever concept it is measuring.
Validity is a test of how well an instrument that is developed measures the particular concept it is intended
to measure. Several types of validity test are used to test the goodness of measures. Content validity ensures
that the measure includes an adequate and representative set of items that tap the concept. Criterion-
related validity is established when the measure differentiates individuals on a criterion it is expected to
predict. Construct validity testifies to how well the results obtained from the use of the measure fit the theo-
ries around which the test is designed. Two tests of stability are test–retest reliability and parallel-form reli-
ability. The internal consistency of measures is indicative of the homogeneity of the items in the measure
that taps the construct.
● Learning objective 6: Explain the difference between reflective and formative scales.
The items that measure a concept should not always hang together: this is only true for reflective, but not
for formative, scales. In a reflective scale, the items (all of them!) are expected to correlate. A formative scale
is used when a construct is viewed as an explanatory combination of its indicators.
Visit the companion website at www.wiley.com/college/sekaran for Case Study: The
Standard Asian Merchant Bank.
DISCUSSION QUESTIONS
1. Describe the four types of scales.
2. How is the interval scale more sophisticated than the nominal and ordinal scales?
3. Why is the ratio scale considered to be the most powerful of the four scales?
4. Briefly describe the difference between attitude rating scales and ranking scales and indicate when
the two are used.
5. Why is it important to establish the “goodness” of measures and how is this done?
6. Describe the difference between formative and reflective scales.
7. Explain why it does not make sense to assess the internal consistency of a formative scale.
8. “The job involvement measure described in the appendix is reflective in nature.” Comment on this
statement.

228 research methods for business
Now do Exercise 12.5 and Exercise 12.6.
EXERCISE 12.5
Develop and name the type of measuring instrument you would use to tap the following:
a. Which brands of toothpaste are consumed by how many individuals?
b. Among the three types of exams – multiple choice, essay type, and a mix of both – which is the one
preferred most by students?
c. To what extent do individuals agree with your definition of accounting principles?
d. How much people like an existing organizational policy.
e. The age of employees in an organization.
f. The number of employees in each of the 20 departments of a company.
EXERCISE 12.6
“The SERVQUAL-scale described in the appendix is formative in nature.” Comment on this statement.
Explain why it does not make sense to assess the interitem consistency of this scale.
9. Construct a semantic differential scale to assess the properties of a particular brand of coffee or tea.
10. Whenever possible, it is advisable to use instruments that have already been developed and repeat-
edly used in published studies, rather than developing our own instruments for our studies. Do you
agree? Discuss the reasons for your answer.
11. “A valid instrument is always reliable, but a reliable instrument may not always be valid.” Comment
on this statement.

chapter measurement: scaling, reliability and validity 229
A P P E N D I X
Examples of some measures
Some of the measures used in business research can be found in the Marketing Scales Handbook by Bruner,
Hensel and James. The latest volumes (5, 6 and 7) are the only ones available at this time. The earlier volumes in
the series are no longer being published but revised versions of their scale reviews are in the database. Volume 5
contains reviews of scales published in scholarly marketing articles between 2002 and 2005. Volume 6 has reviews
that were reported in articles from 2006 to 2009. Volume 7 is the newest book and covers 2010 and 2011. To be
included in these volumes, the scales had to be composed of three or more items, have empirical evidence of
their psychometric quality, and have been treated by their users as reflective measures rather than formative.
Other useful (but somewhat outdated) sources are the Handbook of Organizational Measurement by Price and
Mueller (1986) and the Michigan Organizational Assessment Package published by the Institute of Survey
Research in Ann Arbor, Michigan. Several measures can also be seen in Psychological Measurement Yearbooks
and in other published books. A sample of measures from the accounting, finance, management, and marketing
areas is provided in this appendix.
Measures from behavioral finance research
Below is a sample of scales used to measure variables related to behavioral finance research.
Information overload
Information Overload Measure (on a scale of 1 to 6, from strongly disagree to strongly agree)
1. There were too many different options to consider. _____
2. This decision required a great deal of thought. _____
3. This was a difficult decision. _____
4. I found this decision to be overwhelming. _____
5. It was difficult to comprehend all of the information available to me. _____
6. This task was stressful. _____
7. It was a relief to make a decision. _____
Source: Agnew, J. R. & Szykman, L. R. (2010) Asset allocation and information overload: The influence of
information display, asset choice, and investor experience. Journal of Behavioral Finance, 6(2), 57–70. Reproduced
with permission.

230 research methods for business
Orientation towards finance: interest in financial information
Interest in Financial Information Measure (on a scale of 1 to 5, from strongly disagree to strongly agree)
I never read the financial pages of my newspaper (reverse coding). _____
I try to keep track of general economic trends. _____
I am not attracted by the financial part of life (reverse coding). _____
I regularly look for interesting investment opportunities for my money. _____
I am interested in the evolution of currency rates. _____
Source: Loix, E., Pepermans, R., Mentens, C., Goedee, M. & Jegers (2005), M. Orientation toward finances:
Development of a measurement scale. Journal of Behavioral Finance, 6(4), 192–201. Reproduced with permission.
Measures from management accounting research
Below is a sample of scales used to measure variables related to management accounting research.
Formality of performance evaluation:
My superior does not explicitly document work
objectives in writing.
1 2 3 4 5 My superior explicitly documents work
objectives in writing.
When judging my performance, my superior
uses his/her personal judgment of my
performance.
1 2 3 4 5 When judging my performance, my superior
relies on objective information from the
information system.
My pay is based on my superior’s personal
judgment of my performance.
1 2 3 4 5 My pay is based on objective information from
the information system.
Source: Hartmann, F. & Slapničar, S. (2012) The perceived fairness of performance evaluation: The role of uncertainty. Management
Accounting Research, 23(1), 17–33. Reproduced with permission.
Organizational performance (measured on a scale of 1 to 5, from strongly disagree to strongly agree):
Your company performance on return on investment is better than your competitors. _____
Your company performance on gross margin is better than your competitors. _____
Your company performance on customer satisfaction is better than your competitors. _____
Your company performance on quality of product/service is better than your competitors. _____
Your company performance on employee productivity is better than your competitors. _____
Source: Lee, C. & Yang, H. (2011). Organization structure, competition and performance measurement systems and their joint effects on
performance. Management Accounting Research, 22(2), 84–104. Reproduced with permission.
Measures from management research
Below is a sample of scales used to measure variables related to management research.

chapter measurement: scaling, reliability and validity 231
Job involvement
Strongly
Disagree Disagree
Neither
Agree nor
Disagree Agree
Strongly
Agree
1. My job means a lot more to me than just
money.
1 2 3 4 5
2. The major satisfaction in my life comes from
my job.
1 2 3 4 5
3. I am really interested in my work. 1 2 3 4 5
4. I would probably keep working even if I didn’t
need the money.
1 2 3 4 5
5. The most important things that happen to me
involve my work.
1 2 3 4 5
6. I will stay overtime to finish a job, even if I am
not paid for it.
1 2 3 4 5
7. For me, the first few hours at work really fly by. 1 2 3 4 5
8. I actually enjoy performing the daily activities
that make up my job.
1 2 3 4 5
9. I look forward to coming to work each day. 1 2 3 4 5
Source: White, J. K. and Ruh, R. A. (1973) Effects of personal values on the relationship between participation and job attitudes. Administrative
Science Quarterly, 18(4), p. 509. Reproduced with permission.
Participation in decision making
Not at
all
Very
little Somewhat
To a moderate
extent
To a large
extent
1. In general, how much say or influence do you
have on how you perform your job?
1 2 3 4 5
2. To what extent are you able to decide how to do
your job?
1 2 3 4 5
3. In general, how much say or influence do you
have on what goes on in your work group?
1 2 3 4 5
4. In general, how much say or influence do you
have on decisions that affect your job?
1 2 3 4 5
5. My superiors are receptive and listen to my
ideas and suggestions.
1 2 3 4 5
Source: White, J. K. and Ruh, R. A. (1973) Effects of personal values on the relationship between participation and job attitudes. Administrative
Science Quarterly, 18(4), p. 509. Reproduced with permission.

232 research methods for business
Career salience
Strongly
Disagree Disagree Slightly Disagree Neutral Slightly Agree Agree Strongly Agree
1 2 3 4 5 6 7
1 My career choice is a good occupational decision for me. _____
2 My career enables me to make significant contributions
to society.
_____
3 The career I am in fits me and reflects my personality. _____
4 My education and training are not tailored for this career. _____
5 I don’t intend changing careers. _____
6 All the planning and thought I gave to pursuing this career are
a waste.
_____
7 My career is an integral part of my life. _____
Source: Sekaran, U. (1986) Dual-Career Families: Contemporary Organizational and Counseling Issues. San Francisco: Jossey-Bass. Reproduced
with permission.
Measures from marketing research
Below is a sample of some scales used to measure commonly researched concepts in marketing. Bruner and
Hensel have done extensive work since 1992 in documenting and detailing several scores of scales in marketing
research. For each scale examined, they have provided the following information:
1. Scale description
2. Scale origin
3. Samples in which the scale was used
4. Reliability of the scale
5. Validity of the scale
6. How the scale was administered
7. Major findings of the studies using the scale
The interested student should refer to the five volumes of Marketing Scales Handbook by G. C. Bruner
and P. J. Hensel (Volume 1 and 2); G. C. Bruner, P. J. Hensel, and K. E. James published by the American
Marketing Association (Volume 1, 2, and 3) and Thomson (Volume 4 and 5). The first volume covers scales
used in articles published in the 1980s, and volume two covers scales used in articles published from 1990
to 1993. The third volume covers the period from 1994 to 1997. The fourth volume covers marketing scales
that were reported in articles published from 1998 to 2001. The fifth volume covers the period from 2001
to 2005.

chapter measurement: scaling, reliability and validity 233
Complaint success likelihood
The likelihood of the complaint being successful (5-point scale with end-points labeled “very unlikely” and
“very likely”):
At the moment of the service failure, how likely was it that the service provider would. . .
. . .take appropriate action to take care of your problem if you reported the incident? _____
. . .solve your problem and give better service to you in the future if you reported the incident? _____
. . .be more careful in the future and everyone would benefit if you reported the incident. _____
Source: Bougie, R., Pieters, R. and Zeelenberg, M. (2003) Angry customers don’t come back, they get back: The experience and behavioral
implications of anger and dissatisfaction in services. Journal of the Academy of Marketing Science, 31, 377–393. Reproduced with permission.
SERVQUAL: A multidimensional scale to capture customer perceptions and expectations of service quality
Reliability items:
1. When XYZ Company promises to do something by a certain time, it does so.
2. When you have a problem, XYZ Company shows a sincere interest in solving it.
3. XYZ Company performs the service right the first time.
4. XYZ Company provides its services at the time it promises to do so.
5. XYZ Company keeps customers informed about when services will be performed.
Responsiveness items:
1. Employees in XYZ Company give you prompt service.
2. Employees in XYZ Company are always willing to help you.
3. Employees in XYZ Company are never too busy to respond to your request.
Assurance items:
1. The behavior of employees in XYZ Company instills confidence in you.
2. You feel safe in your transactions with XYZ Company.
3. Employees in XYZ Company are consistently courteous with you.
4. Employees in XYZ Company have the knowledge to answer your questions.
Empathy items:
1. XYZ Company gives you individual attention.
2. XYZ Company has employees who give you individual attention.
3. XYZ Company has your best interests at heart.
4. Employees of XYZ Company understand your specific needs.

234 research methods for business
Tangibles items:
1. XYZ Company has modern-looking equipment.
2. XYZ Company’s physical facilities are visually appealing.
3. XYZ Company’s employees appear neat.
4. Materials associated with the service (such as pamphlets or statements) are visually appealing at XYZ Company.
5. XYZ Company has convenient business hours.
Source: Parasuraman, A., Zeithaml, V. A. and Berry, L. L. (1988) SERVQUAL: A multi-item scale for measuring consumer perceptions of
service quality. Journal of Retailing 64(1) (Spring). Reproduced with permission.
Role ambiguity (salesperson)
Very False Very True
1 2 3 4 5 6 7
1. I feel certain about how much authority I have in my selling position. __
2. I have clearly planned goals for my selling job. __
3. I am sure I divide my time properly while performing my selling tasks. __
4. I know my responsibilities in my selling position. __
5. I know exactly what is expected of me in my selling position. __
6. I receive lucid explanations of what I have to do in my sales job. __
Source: Modified from Rizzo, J. R., House, R. J. and Lirtzman, S. L. (1970) Role conflict and role ambiguity in complex organizations.
Administrative Science Quarterly, 15, 156.

INTRODUCTION
Experimental designs and surveys are useful and powerful in finding answers to research questions through data
collection and subsequent analyses, but they can do more harm than good if the population is not correctly tar-
geted. That is, if data are not collected from the people, events, or objects that can provide the correct answers to
solve the problem, the research will be in vain. The process of selecting the right individuals, objects, or events as
representatives for the entire population is known as sampling, which we will examine in some detail in this
chapter (see shaded portion in Figure 13.1).
The reasons for using a sample, rather than collecting data from the entire population, are self‐evident. In
research investigations involving several hundreds and even thousands of elements, it would be practically
impossible to collect data from, or test, or examine, every element. Even if it were possible, it would be prohibitive
in terms of time, cost, and other human resources. Study of a sample rather than the entire population is also
sometimes likely to produce more reliable results. This is mostly because fatigue is reduced and fewer errors
Sampling
C H A P T E R 1 3
LEARNING OBJECTIVES
After completing Chapter 13, you should be able to:
1. Define sampling, sample, population, element, sampling unit, and subject.
2. Discuss statistical terms in sampling.
3. Describe and discuss the sampling process.
4. Compare and contrast specific probability sampling designs.
5. Compare and contrast specific nonprobability sampling designs.
6. Discuss precision and confidence and the trade-off between precision and confidence.
7. Discuss how hypotheses can be tested with sample data.
8. Discuss the factors to be taken into consideration for determining sample size and determine
the sample size for any given research project.
9. Discuss sampling in qualitative research.
10. Discuss the role of the manager in sampling.
235

236 research methods for business
therefore result in collecting data, especially when a large number of elements is involved. In a few cases, it would
also be impossible to use the entire population to gain knowledge about, or test, something. Consider, for
instance, the case of electric light bulbs. In testing the life of bulbs, if we were to burn every single bulb produced,
there would be none left to sell! This is known as destructive sampling.
POPULATION, ELEMENT, SAMPLE, SAMPLING UNIT, AND SUBJECT
In learning how representative data (i.e., as reflected in the universe) can be collected, a few terms, as described
below, have first to be understood.
Population
The population refers to the entire group of people, events, or things of interest that the researcher wishes to
investigate. It is the group of people, events, or things of interest for which the researcher wants to make infer-
ences (based on sample statistics). For instance, if the CEO of a computer firm wants to know the kinds of adver-
tising strategies adopted by computer firms in the Silicon Valley, then all computer firms situated there will be
the population. If an organizational consultant is interested in studying the effects of a four‐day work week on
the white‐collar workers in a telephone company in Ireland, then all white‐collar workers in that company will
make up the population. If regulators want to know how patients in nursing homes run by a company in France
Purpose of the
study
Extent of researcher
interferenceStudy setting
MEASUREMENT
DATA
ANALYSIS
1. Feel for
data
2. Goodness of
data
3. Hypothesis
testing
Measurement
and measures
Operational definition
Items (measure)
Scaling
Categorizing
Coding
DETAILS OF STUDY
Contrived
Noncontrived
Minimal: Studying eventsas they normally occur
Manipulation and/orcontrol and/or simulation
Exploration
Description
Hypothesis testing
PR
OB
LE
M S
TA
TE
ME
NT
Unit of analysis
(population to
be studied)
Sampling
design
Time
horizon
One-shot (cross-sectional)
Longitudinal
Probability/ nonprobability
Sample size (n)
Individuals
Dyads
Groups
Organizations
Machines
etc.
Research strategies
Experiment
Survey research
Observation
Case studies
Grounded theory
Action research
Mixed methods
Data collection
method
Interviews
Observation
Questionnaires
Physical measurement
Unobtrusive
F I G U R E 1 3 . 1
The research process and where this chapter fits in

chapter sampling 237
are cared for, then all the patients in all the nursing homes run by them will form the population. If, however, the
regulators are interested only in one particular nursing home run by that company, then only the patients in that
specific nursing home will form the population.
Element
An element is a single member of the population. If 1000 blue‐collar workers in a particular organization happen
to be the population of interest to a researcher, each blue‐collar worker therein is an element. If 500 pieces of
machinery are to be approved after inspecting a few, there will be 500 elements in this population. Incidentally,
the census is a count of all elements in the human population.
Sample
A sample is a subset of the population. It comprises some members selected from it. In other words, some, but
not all, elements of the population form the sample. If 200 members are drawn from a population of 1000 blue‐
collar workers, these 200 members form the sample for the study. That is, from a study of these 200 members,
the researcher will draw conclusions about the entire population of 1000 blue‐collar workers. Likewise, if there
are 145 in‐patients in a hospital and 40 of them are to be surveyed by the hospital administrator to assess their
level of satisfaction with the treatment received, then these 40 members will be the sample.
A sample is thus a subgroup or subset of the population. By studying the sample, the researcher should be
able to draw conclusions that are generalizable to the population of interest.
Sampling unit
The sampling unit is the element or set of elements that is available for selection in some stage of the sampling
process. Examples of sampling units in a multistage sample are city blocks, households, and individuals within
the households.
Subject
A subject is a single member of the sample, just as an element is a single member of the population. If 200 mem-
bers from the total population of 1000 blue‐collar workers form the sample for the study, then each blue‐collar
worker in the sample is a subject. As another example, if a sample of 50 machines from a total of 500 machines is
to be inspected, then every one of the 50 machines is a subject, just as every single machine in the total popula-
tion of 500 machines is an element.
SAMPLE DATA AND POPULATION VALUES
When we sample, the sampling units (employees, consumers, and the like) provide us with responses. For instance,
a consumer responding to a survey question may give a response of “3”. When we examine the responses that we
get for our entire sample, we make use of statistics. In Chapter 14 we will explain that there is a wide variety of
statistics we can use, such as the mean, the median, or the mode. The reason we sample, however, is that we are
interested in the characteristics of the population we sample from. If we study the entire population and calculate
the mean or the standard deviation, then we don’t refer to this as a statistic. Instead, we call it a parameter of the
population.

238 research methods for business
Parameters
The characteristics of the population such as μ (the population mean), σ (the population standard deviation),
and σ2 (the population variance) are referred to as its parameters. The central tendencies, the dispersions, and
other statistics in the sample of interest to the research are treated as approximations of the central tendencies,
dispersions, and other parameters of the population. As such, all conclusions drawn about the sample under
study are generalized to the population. In other words, the sample statistics – X (the sample mean), S (the
standard deviation), and S2 (the variation in the sample) – are used as estimates of the population parameters μ,
σ, and σ2. Figure 13.2 shows the relationship between the sample and the population.
Representativeness of Samples
The need to choose the right sample for a research investigation cannot be overemphasized. We know that rarely
will the sample be an exact replica of the population from which it is drawn. For instance, very few sample means
(X) are likely to be exactly equal to the population means (μ). Nor is the standard deviation of the sample (S) likely
to be the same as the standard deviation of the population (σ). However, if we choose the sample in a scientific way,
we can be reasonably sure that the sample statistic (e.g., X, S, or S2) is fairly close to the population parameter (i.e.,
μ, σ, or σ2). To put it differently, it is possible to choose the sample in such a way that it is representative of the popu-
lation. There is always a slight probability, however, that sample values might fall outside the population parameters.
Normality of Distributions
Attributes or characteristics of the population are generally normally distributed. For instance, when attributes
such as height and weight are considered, most people will be clustered around the mean, leaving only a small
number at the extremes who are either very tall or very short, very heavy or very light, and so on, as indicated in
Figure 13.3. If we are to estimate the population characteristics from those represented in a sample with reason-
able accuracy, the sample has to be chosen so that the distribution of the characteristics of interest follows the
same pattern of normal distribution in the sample as it does in the population. From the central limit theorem, we
know that the sampling distribution of the sample mean is normally distributed. As the sample size n increases,
the means of the random samples taken from practically any population approach a normal distribution with
Sample
Statistics
(X, S, S2)
Parameters
Population
Estimate
F I G U R E 1 3 . 2
The relationship between sample and population
Visit the companion website at www.wiley.com/college/sekaran for Author Video:
Representativeness of samples.

chapter sampling 239
mean μ and standard deviation σ. In sum, irrespective of whether or not the attributes of the population are
normally distributed, if we take a sufficiently large number of samples and choose them with care, we will have a
sampling distribution of the means that has normality. This is the reason why two important issues in sampling
are the sample size (n) and the sampling design, as discussed later.
When the properties of the population are not overrepresented or underrepresented in the sample, we have a
representative sample. When a sample consists of elements in the population that have extremely high values on the
variable we are studying, the sample mean X will be far higher than the population mean μ. If, in contrast, the sample
subjects consist of elements in the population with extremely low values on the variable of interest, the sample mean
will be much lower than the true population mean μ. If our sampling design and sample size are right, however, the
sample mean X will be within close range of the true population mean μ. Thus, through appropriate sampling design,
we can ensure that the sample subjects are not chosen from the extremes, but are truly representative of the properties
of the population. The more representative of the population the sample is, the more generalizable are the findings of
the research. Recall that generalizability is one of the hallmarks of scientific research, as we saw in Chapter 2.
While, in view of our concern about generalizability, we may be particular about choosing representative
samples for most research, some cases may not call for such regard to generalizability. For instance, at the explor-
atory stages of fact finding, we may be interested only in “getting a handle” on the situation, and therefore limit
the interview to only the most conveniently available people. The same is true when time is of the essence, and
urgency in getting information overrides a high level of accuracy in terms of priority. For instance, a film agency
might want to find out quickly the impact on the viewers of a newly released film shown the previous evening.
The interviewer might question the first 20 people leaving the theater after seeing the film and obtain their reac-
tions. On the basis of their replies, she may form an opinion as to the likely success of the film. As another exam-
ple, a restaurant manager might want to find the reactions of customers to a new item added to the menu to
determine whether or not it has been a popular and worth while addition. For this purpose, the first 15 people
who chose the special item might be interviewed, and their reactions obtained. In such cases, having instant
information may be more gainful than obtaining the most representative facts. It should, however, be noted that
the results of such convenient samples are not reliable and can never be generalized to the population.
THE SAMPLING PROCESS
Sampling is the process of selecting a sufficient number of the right elements from the population, so that a study
of the sample and an understanding of its properties or characteristics make it possible for us to generalize such
properties or characteristics to the population elements. The major steps in sampling include:
𝜇Low High
F I G U R E 1 3 . 3
Normal distribution in a population

240 research methods for business
1. Define the population.
2. Determine the sample frame.
3. Determine the sampling design.
4. Determine the appropriate sample size.
5. Execute the sampling process.
Defining the population
Sampling begins with precisely defining the target population. The target population must be defined in terms of
elements, geographical boundaries, and time. For instance, for a banker interested in saving habits of blue‐collar
workers in the mining industry in the United States, the target population might be all blue‐collar workers in that
industry throughout the country. For an advertising agency interested in reading habits of elderly people, the
target population might be the German population aged 50 and over. These examples illustrate that the research
objective and the scope of the study play a crucial role in defining the target population.
Determining the sample frame
The sampling frame is a (physical) representation of all the elements in the population from which the sample
is drawn. The payroll of an organization would serve as the sampling frame if its members are to be studied.
Likewise, the university registry containing a listing of all students, faculty, administrators, and support staff in
the university during a particular academic year or semester could serve as the sampling frame for a study of the
university population. A roster of class students could be the sampling frame for the study of students in a class.
The telephone directory is also frequently used as a sampling frame for some types of study, even though it has
an inherent bias inasmuch as some numbers are unlisted and certain others may have become obsolete.
Although the sampling frame is useful in providing a listing of each element in the population, it may not
always be a current, up‐to‐date document. For instance, the names of members who have recently left the
organization or dropped out of the university, as well as members who have only recently joined the organiza-
tion or the university may not appear in the organization's payroll or the university registers on a given day. The
most recently installed or disconnected telephones will not, likewise, be included in the current telephone
directory. Hence, though the sampling frame may be available in many cases, it may not always be entirely cor-
rect or complete. When the sampling frame does not exactly match the population coverage error occurs. In
some cases, the researcher might recognize this problem and not be too concerned about it, because the dis-
crepancy between the target population and the sampling frame is small enough to ignore. However, in most
cases, the researcher should deal with this error by either redefining the target population in terms of the sam-
pling frame, screening the respondents with respect to important characteristics to ensure that they meet the
criteria for the target population, or adjusting the collected data by a weighting scheme to counterbalance the
coverage error.
Determining the sampling design
There are two major types of sampling design: probability and nonprobability sampling. In probability sampling,
the elements in the population have some known, nonzero chance or probability of being selected as sample
subjects. In nonprobability sampling, the elements do not have a known or predetermined chance of being
selected as subjects. Probability sampling designs are used when the representativeness of the sample is of impor-
tance in the interests of wider generalizability. When time or other factors, rather than generalizability, become
critical, nonprobability sampling is generally used. Each of these two major designs has different sampling

chapter sampling 241
strategies. Depending on the extent of generalizability desired, the demands of time and other resources, and the
purpose of the study, different types of probability and nonprobability sampling design are chosen.
The choice of the sampling procedure is a very important one. Therefore, this chapter will elaborately discuss
the different types of sampling designs, bearing in mind the following points in the determination of the choice:
● What is the relevant target population of focus to the study?
● What exactly are the parameters we are interested in investigating?
● What kind of a sampling frame is available?
● What costs are attached to the sampling design?
● How much time is available to collect the data from the sample?
Determining the sample size
Is a sample size of 40 large enough? Or do you need a sample size of 75, 180, 384, or 500? Is a large sample better
than a small sample; that is, is it more representative? The decision about how large the sample size should be can
be a very difficult one. We can summarize the factors affecting decisions on sample size as:
1. The research objective.
2. The extent of precision desired (the confidence interval).
3. The acceptable risk in predicting that level of precision (confidence level).
4. The amount of variability in the population itself.
5. The cost and time constraints.
6. In some cases, the size of the population itself.
Thus, how large your sample should be is a function of these six factors. We will have more to say about
sample size later on in this chapter, after we have discussed sampling designs.
Executing the sampling process
The following two examples illustrate how, in the final stage of the sampling process, decisions with respect to the
target population, the sampling frame, the sample technique, and the sample size have to be implemented.
EXAMPLE
A satisfaction survey was conducted for a computer
retailer in New Zealand. The objective of this survey
was to improve internal operations and thus to retain
more customers. The survey was transactional in
nature; service satisfaction and several related variables
were measured following a service encounter (i.e., a
visit to the retailer). Hence, customer feedback was
obtained while the service experience was still fresh. To
obtain a representative sample of customers of the
computer retailer (the target population), every tenth
person, leaving one out of ten randomly selected stores,
in randomly selected cities, in randomly selected
regions, was approached during a one‐week period (the
sampling technique). Trained interviewers that were
sent out with standardized questionnaires approached
732 customers leaving the stores (the sample size).
A young researcher was investigating the anteced-
ents of salesperson performance. To examine his
hypotheses, data were collected from chief sales exe-
cutives in the United Kingdom (the target population)

242 research methods for business
PROBABILITY SAMPLING
When elements in the population have a known, nonzero chance of being chosen as subjects in the sample, we
resort to a probability sampling design. Probability sampling can be either unrestricted (simple random sampling)
or restricted (complex probability sampling) in nature.
Unrestricted or simple random sampling
In the unrestricted probability sampling design, more commonly known as simple random sampling , every
element in the population has a known and equal chance of being selected as a subject. Let us say there are 1000
elements in the population, and we need a sample of 100. Suppose we were to drop pieces of paper in a hat, each
bearing the name of one of the elements, and draw 100 of those from the hat with our eyes closed. We know that
BOX 13.1
NONRESPONSE AND NONRESPONSE ERROR
A failure to obtain information from a number of subjects included in the sample (nonresponse) may lead
to nonresponse error. Nonresponse error exists to the extent that those who did respond to your survey
are diff erent from those who did not on (one of the) characteristics of interest in your study. Two important
sources of nonresponse are not‐at‐homes and refusals. An eff ective way to reduce the incidence of not‐
at‐homes is to call back at another time, preferably at a diff erent time of day. Th e rate of refusals depends,
among other things, on the length of the survey, the data collection method, and the patronage of the
research. Hence, a decrease in survey length, in the data collection method (personal interviews instead of
mail questionnaires), and the auspices of the research oft en improve the overall return rate. Personalized
cover letters, a small incentive for participating in the study, and an advance notice that the survey is tak-
ing place may also help you to increase the response rate. Nonetheless, it is almost impossible to entirely
avoid nonresponse in surveys. In these cases you may have to turn to methods to deal with nonresponse
error, such as generalizing the results to the respondents only or statistical adjustment (weighting the data
by observable variables).
BOX 13 1
via mail questionnaires. The sample was initially drawn
from a published business register ( the sampling frame ),
but supplemented with respondent recommendations
and other additions, in a judgment sampling methodol-
ogy . Before distributing the questionnaires, the young
researcher called each selected company to obtain the
name of the chief sales executive, who was contacted
and asked to participate in the study. The questionnaires
were subsequently distributed to chief sales executives
of 450 companies ( the sample size ). To enhance the
response rate, pre‐addressed and stamped envelopes
were provided, anonymity was assured, and a summary
of the research findings as an incentive to the partici-
pants was offered. Several follow‐up procedures, such
as telephone calls and new mailings, were planned in
order to receive as many responses as possible.

chapter sampling 243
the first piece drawn will have a 1/1000 chance of being drawn, the next one a 1/999 chance of being drawn, and
so on. In other words, we know that the probability of any one of them being chosen is 1 in the number of the
population, and we also know that each single element in the hat has the same or equal probability of being
chosen. We certainly know that computers can generate random numbers and one does not have to go through
the tedious process of pulling out names from a hat!
When we thus draw the elements from the population, it is most likely that the distribution patterns of the
characteristics we are interested in investigating in the population are also likewise distributed in the subjects we
draw for our sample. This sampling design, known as simple random sampling, has the least bias and offers the
most generalizability. However, this sampling process could become cumbersome and expensive; in addition, an
entirely updated listing of the population may not always be available. For these and other reasons, other prob-
ability sampling designs are often chosen instead.
Restricted or complex probability sampling
As an alternative to the simple random sampling design, several complex probability sampling (restricted
probability) designs can be used. These probability sampling procedures offer a viable, and sometimes more
efficient, alternative to the unrestricted design we just discussed. Efficiency is improved in that more information
can be obtained for a given sample size using some of the complex probability sampling procedures than the
simple random sampling design. The five most common complex probability sampling designs – systematic
sampling, stratified random sampling, cluster sampling, area sampling, and double sampling – will now be
discussed.
Systematic sampling
The systematic sampling design involves drawing every nth element in the population starting with a randomly
chosen element between 1 and n. The procedure is exemplified below.
EXAMPLE
If we wanted a sample of 35 households from a total
population of 260 houses in a particular locality, then
we could sample every seventh house starting from a
random number from 1 to 7. Let us say that the ran-
dom number was 7, then houses numbered 7, 14, 21, 28,
and so on, would be sampled until the 35 houses were
selected. The one problem to be borne in mind in the
systematic sampling design is the probability of a sys-
tematic bias creeping into the sample. In the above
example, for instance, let us say that every seventh
house happened to be a corner house. If the focus of
the research study conducted by the construction
industry was to control “noise pollution” experienced
by residents through the use of appropriate filtering
materials, then the residents of corner houses may not
be exposed to as much noise as the houses that are in
between. Information on noise levels gathered from
corner house dwellers might therefore bias the research-
er's data. The likelihood of drawing incorrect con-
clusions from such data is thus high. In view of the
scope for such systematic bias, the researcher must
consider the plans carefully and make sure that the sys-
tematic sampling design is appropriate for the study,
before deciding on it. For market surveys, consumer
attitude surveys, and the like, the systematic sampling
design is often used, and the telephone directory
frequently serves as the sampling frame for this
sampling design.

244 research methods for business
Stratified random sampling
While sampling helps to estimate population parameters, there may be identifiable subgroups of elements within
the population that may be expected to have different parameters on a variable of interest to the researcher. For
example, to the human resources management director interested in assessing the extent of training that the
employees in the system feel they need, the entire organization will form the population for study. But the extent,
quality, and intensity of training desired by middle‐level managers, lower‐level managers, first‐line supervisors,
computer analysts, clerical workers, and so on will be different for each group. Knowledge of the kinds of differ-
ences in needs that exist for the different groups will help the director to develop useful and meaningful training
programs for each group in the organization. Data will therefore have to be collected in a manner that will help
the assessment of needs at each subgroup level in the population. The unit of analysis then will be at the group
level and the stratified random sampling process will come in handy.
Stratified random sampling, as its name implies, involves a process of stratification or segregation, followed
by random selection of subjects from each stratum. The population is first divided into mutually exclusive groups
that are relevant, appropriate, and meaningful in the context of the study. For instance, if the president of a com-
pany is concerned about low motivational levels or high absenteeism rates among the employees, it makes sense
to stratify the population of organizational members according to their job levels. When the data are collected
and the analysis is done, we may find that, contrary to expectations, it is the middle‐level managers that are not
motivated. This information will help the president to focus on action at the right level and devise better methods
to motivate this group. Tracing the differences in the parameters of the subgroups within a population would not
be possible without the stratified random sampling procedure. If either the simple random sampling or the sys-
tematic sampling procedure were used in a case like this, then the high motivation at some job levels and the low
motivation at other levels would cancel each other out, thus masking the real problems that exist at a particular
level or levels.
Stratification also helps when research questions such as the following are to be answered:
1. Are the machinists more accident prone than clerical workers?
2. Are Hispanics more loyal to the organization than Native Americans?
Stratifying customers on the basis of life stages, income levels, and the like to study buying patterns and
stratifying companies according to size, industry, profits, and so forth to study stock market reactions are com-
mon examples of the use of stratification as a sampling design technique.
Stratification is an efficient research sampling design; that is, it provides more information with a given
sample size. Stratification should follow the lines appropriate to the research question. If we are studying con-
sumer preferences for a product, stratification of the population could be by geographical area, market segment,
consumers' age, consumers' gender, or various combinations of these. If an organization contemplates budget
cuts, the effects of these cuts on employee attitudes can be studied with stratification by department, function, or
region. Stratification ensures homogeneity within each stratum (i.e., very few differences or dispersions on the
variable of interest within each stratum), but heterogeneity (variability) between strata. In other words, there will
be more between‐group differences than within‐group differences.
Proportionate and disproportionate stratified random sampling Once the population has been
stratified in some meaningful way, a sample of members from each stratum can be drawn using either a simple
random sampling or a systematic sampling procedure. The subjects drawn from each stratum can be either
proportionate or disproportionate to the number of elements in the stratum. For instance, if an organization

chapter sampling 245
employs 10 top managers, 30 middle managers, 50 lower‐level managers, 100 supervisors, 500 clerks, and 20
secretaries, and a stratified sample of about 140 people is needed for some specific survey, the researcher might
decide to include in the sample 20% of members from each stratum. That is, members represented in the sam-
ple from each stratum will be proportionate to the total number of elements in the respective strata. This would
mean that two from the top, six from the middle, and ten from the lower levels of management would be
included in the sample. In addition, 20 supervisors, 100 clerks, and four secretaries would be represented in the
sample, as shown in the third column of Table 13.1. This type of sampling is called a proportionate stratified
random sampling design.
In situations like the one above, researchers might sometimes be concerned that information from only two
members at the top and six from the middle levels would not truly reflect how all members at those levels would
respond. Therefore, a researcher might decide, instead, to use a disproportionate stratified random sampling
procedure. The number of subjects from each stratum would now be altered, while keeping the sample size
unchanged. Such a sampling design is illustrated in the far right‐hand column in Table 13.1. The idea here is that
the 60 clerks might be considered adequate to represent the population of 500 clerks; seven out of ten managers
at the top level might also be considered representative of the top managers, and likewise 15 out of the 30 manag-
ers at the middle level. This redistribution of the numbers in the strata might be considered more appropriate and
representative for the study than the previous proportionate sampling design.
Disproportionate sampling decisions are made either when some stratum or strata are too small or too large,
or when there is more variability suspected within a particular stratum. As an example, the educational levels
among supervisors, which may be considered to influence perceptions, may range from elementary school to
master's degrees. Here, more people will be sampled at the supervisory level. Disproportionate sampling is also
sometimes done when it is easier, simpler, and less expensive to collect data from one or more strata than
from others.
In summary, stratified random sampling involves stratifying the elements along meaningful levels and
taking proportionate or disproportionate samples from the strata. This sampling design is more efficient than
the simple random sampling design because, for the same sample size, each important segment of the popula-
tion is better represented, and more valuable and differentiated information is obtained with respect to
each group.
T A B L E 1 3 . 1
Proportionate and disproportionate stratified random sampling
Number of subjects in the sample
Job level Number of elements
Proportionate sampling
(20% of the elements) Disproportionate sampling
Top management 10 2 7
Middle‐level management 30 6 15
Lower‐level management 50 10 20
Supervisors 100 20 30
Clerks 500 100 60
Secretaries 20 4 10
Total 710 142 142

246 research methods for business
Cluster sampling
Cluster samples are samples gathered in groups or chunks of elements that, ideally, are natural aggregates of ele-
ments in the population. In cluster sampling, the target population is first divided into clusters. Then, a random
sample of clusters is drawn and for each selected cluster either all the elements or a sample of elements are
included in the sample. Cluster samples offer more heterogeneity within groups and more homogeneity among
groups – the reverse of what we find in stratified random sampling, where there is homogeneity within each
group and heterogeneity across groups.
A specific type of cluster sampling is area sampling. In this case, clusters consist of geographic areas such as
counties, city blocks, or particular boundaries within a locality. If you wanted to survey the residents of a city, you
would get a city map, take a sample of city blocks and select respondents within each city block. Sampling the
needs of consumers before opening a 24‐hour convenience store in a particular part of town would involve area
sampling. Location plans for retail stores, advertisements focused specifically on local populations, and TV and
radio programs beamed at specific areas could all use an area sampling design to gather information on the inter-
ests, attitudes, predispositions, and behaviors of the local area people.
Area sampling is less expensive than most other probability sampling designs, and it is not dependent
on a sampling frame. A city map showing the blocks of the city is adequate information to allow a researcher
to take a sample of the blocks and obtain data from the residents therein. Indeed, the key motivation for
cluster sampling is cost reduction. The unit costs of cluster sampling are much lower than those of other
probability sampling designs of simple or stratified random sampling or systematic sampling. However, clus-
ter sampling exposes itself to greater bias and is the least generalizable of all the probability sampling designs,
because most naturally occurring clusters in the organizational context do not contain heterogeneous ele-
ments. In other words, the conditions of intracluster heterogeneity and intercluster homogeneity are
often not met.
For these reasons, the cluster sampling technique is not very common in organizational research.
Moreover, for marketing research activities, naturally occurring clusters, such as clusters of residents, buyers,
students, or shops, do not have much heterogeneity among the elements. As stated earlier, there is more intra-
cluster homogeneity than heterogeneity in such clusters. Hence, cluster sampling, though less costly, does not
offer much efficiency in terms of precision or confidence in the results. However, cluster sampling offers con-
venience. For example, it is easier to inspect an assortment of units packed inside, say, four boxes (i.e., all the
elements in the four clusters) than to open 30 boxes in a shipment in order to inspect a few units from each
at random.
Single-stage and multistage cluster sampling We have thus far discussed single‐stage cluster sam-
pling, which involves the division of the population into convenient clusters, randomly choosing the required
number of clusters as sample subjects, and investigating all the elements in each of the randomly chosen
clusters. Cluster sampling can also be done in several stages and is then known as multistage cluster sam-
pling. For instance, if we were to do a national survey of the average monthly bank deposits, cluster sampling
would first be used to select the urban, semi‐urban, and rural geographical locations for study. At the next
stage, particular areas in each of these locations would be chosen. At the third stage, banks within each area
would be chosen. In other words, multistage cluster sampling involves a probability sampling of the primary
sampling units; from each of these primary units, a probability sample of the secondary sampling units is
then drawn; a third level of probability sampling is done from each of these secondary units, and so on, until
we have reached the final stage of breakdown for the sample units, when we sample every member in
those units.

chapter sampling 247
Double sampling
This plan is resorted to when further information is needed from a subset of the group from which some infor-
mation has already been collected for the same study. A sampling design where initially a sample is used in a
study to collect some preliminary information of interest, and later a subsample of this primary sample is used to
examine the matter in more detail, is called double sampling. For example, a structured interview might indicate
that a subgroup of the respondents has more insight into the problems of the organization. These respondents
might be interviewed again and asked additional questions. This research adopts a double sampling procedure.
Review of probability sampling designs
There are two basic probability sampling plans: the unrestricted or simple random sampling, and the restricted
or complex probability sampling plans. In the simple random sampling design, every element in the population
has a known and equal chance of being selected as a subject. The complex probability plan consists of five dif-
ferent sampling designs. Of these five, the cluster sampling design is probably the least expensive as well as the
least dependable, but is used when no list of the population elements is available. The stratified random sam-
pling design is probably the most efficient, in the sense that for the same number of sample subjects, it offers
precise and detailed information. The systematic sampling design has the built‐in hazard of possible systematic
bias. Area sampling is a popular form of cluster sampling, and double sampling is resorted to when information
in addition to that already obtained by using a primary sample has to be collected using a subgroup of the sample.
NONPROBABILITY SAMPLING
In nonprobability sampling designs, the elements in the population do not have any probabilities attached to their
being chosen as sample subjects. This means that the findings from the study of the sample cannot be confidently
generalized to the population. As stated earlier, however, researchers may, at times, be less concerned about gener-
alizability than obtaining some preliminary information in a quick and inexpensive way. They might then resort to
nonprobability sampling. Sometimes nonprobability sampling is the only way to obtain data, as discussed later.
Some of the nonprobability sampling plans are more dependable than others and could offer some impor-
tant leads to potentially useful information with regard to the population. Nonprobability sampling designs,
which fit into the broad categories of convenience sampling and purposive sampling, are discussed next.
Convenience sampling
As its name implies, convenience sampling refers to the collection of information from members of the popula-
tion who are conveniently available to provide it. One would expect the “Pepsi Challenge” contest to have been
administered on a convenience sampling basis. Such a contest, with the purpose of determining whether people
prefer one product to another, might be held at a shopping mall visited by many shoppers. Those inclined to take
the test might form the sample for the study of how many people prefer Pepsi over Coke or product X to product Y.
Such a sample is a convenience sample.
Consider another example. A convenience sample of five officers who attended a competitor's showcase
demonstration at the county fair the previous evening offered the vice president of the company information on
the “new” products of the competitor and their pricing strategies, which helped the VP to formulate some ideas
on the next steps to be taken by the company.
Convenience sampling is most often used during the exploratory phase of a research project and is perhaps
the best way of getting some basic information quickly and efficiently.

248 research methods for business
Purposive sampling
Instead of obtaining information from those who are most readily or conveniently available, it might some-
times become necessary to obtain information from specific target groups. The sampling here is confined to
specific types of people who can provide the desired information, either because they are the only ones who
have it, or they conform to some criteria set by the researcher. This type of sampling design is called purposive
sampling, and the two major types of purposive sampling – judgment sampling and quota sampling – will
now be explained.
Judgment sampling
Judgment sampling involves the choice of subjects who are most advantageously placed or in the best position
to provide the information required. For instance, if a researcher wants to find out what it takes for women
managers to make it to the top, the only people who can give first‐hand information are the women who have
risen to the positions of presidents, vice presidents, and important top‐level executives in work organizations.
They could reasonably be expected to have expert knowledge by virtue of having gone through the experiences
and processes themselves, and might perhaps be able to provide good data or information to the researcher.
Thus, the judgment sampling design is used when a limited number or category of people have the informa-
tion that is sought. In such cases, any type of probability sampling across a cross‐section of the entire population
is purposeless and not useful.
Judgment sampling may curtail the generalizability of the findings, due to the fact that we are using a sample of
experts who are conveniently available to us. However, it is the only viable sampling method for obtaining the type of
information that is required from very specific pockets of people who alone possess the needed facts and can give the
information sought. In organizational settings, and particularly for market research, opinion leaders who are very
knowledgeable are included in the sample. Enlightened opinions, views, and knowledge constitute a rich data source.
Judgment sampling calls for special efforts to locate and gain access to the individuals who do have the req-
uisite information. As already stated, this sampling design may be the only useful one for answering certain types
of research question.
Quota sampling
Quota sampling, a second type of purposive sampling, ensures that certain groups are adequately represented in
the study through the assignment of a quota. Generally, the quota fixed for each subgroup is based on the total
numbers of each group in the population. However, since this is a nonprobability sampling plan, the results are
not generalizable to the population.
Quota sampling can be considered a form of proportionate stratified sampling, in which a predetermined
proportion of people are sampled from different groups, but on a convenience basis. For instance, it may be
surmised that the work attitude of blue‐collar workers in an organization is quite different from that of white‐
collar workers. If there are 60% blue‐collar workers and 40% white‐collar workers in this organization, and if
a total of 30 people are to be interviewed to find the answer to the research question, then a quota of 18 blue‐
collar workers and 12 white‐collar workers will form the sample, because these numbers represent 60% and
40% of the sample size. The first 18 conveniently available blue‐collar workers and 12 white‐collar workers will
be sampled according to this quota. Needless to say, the sample may not be totally representative of the popu-
lation; hence the generalizability of the findings will be restricted. However, the convenience it offers in terms
of effort, cost, and time makes quota sampling attractive for some research efforts. Quota sampling also
becomes a necessity when a subset of the population is underrepresented in the organization – for example,
minority groups, foremen, and so on. In other words, quota sampling ensures that all the subgroups in the

chapter sampling 249
population are adequately represented in the sample. Quota samples are basically stratified samples from
which subjects are selected nonrandomly.
In a workplace (and society) that is becoming increasingly heterogeneous because of the changing demo-
graphics, quota sampling can be expected to be used more frequently in the future. For example, quota sampling
can be used to gain some idea of the buying predispositions of various ethnic groups, to get a feel of how
employees from different nationalities perceive the organizational culture, and so on.
Although quota sampling is not generalizable like stratified random sampling, it does offer some informa-
tion, based on which further investigation, if necessary, can proceed. That is, it is possible that the first stage of
research will use the nonprobability design of quota sampling, and once some useful information has been
obtained, a probability design will follow. The converse is also entirely possible. A probability sampling design
might indicate new areas for research, and nonprobability sampling designs might be used to explore their
feasibility.
Review of nonprobability sampling designs
There are two main types of nonprobability sampling design: convenience sampling and purposive sam-
pling. Convenience sampling is the least reliable of all sampling designs in terms of generalizability,
but sometimes it may be the only viable alternative when quick and timely information is needed, or for
exploratory research purposes. Purposive sampling plans fall into two categories: judgment and quota sam-
pling designs. Judgment sampling, though restricted in generalizability, may sometimes be the best sam-
pling design choice, especially when there is a limited population that can supply the information needed.
Quota sampling is often used on considerations of cost and time and the need to adequately represent
minority elements in the population. Although the generalizability of all nonprobability sampling designs
is very restricted, they have certain advantages and are sometimes the only viable alternative for the
researcher.
Table 13.2 summarizes the probability and nonprobability sampling designs discussed thus far, and their
advantages and disadvantages. Figure 13.4 offers some decision choice points as to which design might be useful
for specific research goals.
T A B L E 1 3 . 2
Probability and nonprobability sampling designs
Sampling design Description Advantages Disadvantages
Probability sampling
1. Simple random
sampling
All elements in the population
are considered and each
element has an equal chance
of being chosen as the
subject.
High generalizability of
findings.
Not as efficient as
stratified sampling.
2. Systematic
sampling
Every nth element in the
population is chosen starting
from a random point in the
sampling frame.
Easy to use if sampling
frame is available.
Systematic biases are
possible.

250 research methods for business
Sampling design Description Advantages Disadvantages
3. Stratified random
sampling (Str.R.S.)
Proportionate
Str.R.S.
Disproportionate
Str.R.S.
Population is first divided into
meaningful segments;
thereafter subjects are
drawn in proportion to
their original numbers in
the population.
Based on criteria other than
their original population
numbers.
Most efficient among all
probability designs.
All groups are adequately
sampled and
comparisons among
groups are possible.
Stratification must be
meaningful. More
time consuming
than simple
random sampling
or systematic
sampling.
Sampling frame for
each stratum is
essential.
4. Cluster sampling Groups that have heterogeneous
members are first identified;
then some are chosen at
random; all the members in
each of the randomly
chosen groups are studied.
In geographic clusters,
costs of data collection
are low.
The least reliable and
efficient among all
probability
sampling designs
since subsets of
clusters are more
homogeneous than
heterogeneous.
5. Area sampling Cluster sampling within a
particular area or locality.
Cost‐effective. Useful for
decisions relating to a
particular location.
Takes time to collect
data from an area.
6. Double sampling The same sample or a subset of
the sample is studied twice.
Offers more detailed
information on the
topic of study.
Original biases, if any,
will be carried over.
Individuals may
not be happy
responding a
second time.
Nonprobability sampling
7. Convenience
sampling
The most easily accessible
members are chosen as
subjects.
Quick, convenient, less
expensive.
Not generalizable
at all.
8. Judgment sampling Subjects selected on the basis of
their expertise in the subject
investigated.
Sometimes, the only
meaningful way to
investigate.
Generalizability is
questionable;
not generalizable
to entire
population.
9. Quota sampling Subjects are conveniently
chosen from targeted
groups according to some
predetermined number or
quota.
Very useful where
minority participation
in a study is critical.
Not easily
generalizable.

chapter sampling 251
Is REPRESENTATIVENESSof sample critical for the study?
NoYes
Choose one ofthe PROBABILITYsampling designs.
If purpose ofstudy mainly is for:
Generalizability. Assessingdifferential
parameters insubgroups ofpopulation.
Collectinginformationin a localized
area.
Gathering moreinformation from
a subset ofthe sample.
To obtain quick,even if unreliable,
information.
To obtain informa-tion relevant to andavailable only with
certain groups.
Choosesimple
randomsampling.
Choosesystematicsampling.
Choosecluster
samplingif not
enough $.
Choose areasampling.
Choose doublesampling.
Chooseconvenience
sampling.
All subgroupshave equal number
of elements?
Looking forinformation that
only a few "experts"can provide?
Need responsesof special interestminority groups?
If purpose ofstudy mainly is:
Choose one ofthe NONPROBABILITY
sampling designs.
NoYesChoosequota
sampling.
Choosejudgmentsampling.
Chooseproportionate
stratified randomsampling.
Choosedisproportionatestratified random
sampling.
F I G U R E 1 3 . 4
Choice points in sampling design

252 research methods for business
INTERMEZZO: EXAMPLES OF WHEN CERTAIN SAMPLING DESIGNS WOULD BE APPROPRIATE
Simple random sampling
This sampling design is best when the generalizability of the findings to the whole population is the main
objective of the study. Consider the following two examples.
It has to be noted that in some cases, where cost is a primary consideration (i.e., resources are limited),
and the number of elements in the population is very large and/or geographically dispersed, the simple
random sampling design may not be the most desirable, because it could become quite expensive. Thus,
both the criticality of generalizability and considerations of cost come into play in the choice of this sam-
pling design.
Stratified random sampling
This sampling design, which is the most efficient, is a good choice when differentiated information is needed
regarding various strata within the population, which are known to differ in their parameters. See the examples
on the following page.
EXAMPLE
The human resources director of a company with 82
people on its payroll has been asked by the vice presi-
dent to consider formulating an implementable flex-
time policy. The director feels that such a policy is not
necessary since everyone seems happy with the 9‐to‐
5 hours, and no one has complained. Formulating such
a policy now, in the opinion of the director, runs the
risk of creating domestic problems for the staff and
scheduling problems for the company. She wants, how-
ever, to resort to a simple random sampling procedure
to do an initial survey, and, with the results, convince
the VP that there is no need for flextime, and urge him
to drop the matter. Since simple random sampling
offers the greatest generalizability of the results to the
entire population, and the VP needs to be convinced, it
is important to resort to this sampling design.
The regional director of sales operations of a medium‐
sized company, which has 20 retail stores in each of
its four geographical regions of operation, wants to
know what types of sales gimmicks worked best for
the company overall during the past year. This is to
help formulate some general policies for the company
as a whole and prioritize sales promotion strategies
for the coming year. Instead of studying each of the
80 stores, some dependable (i.e., representative and
generalizable) information can be had, based on the
study of a few stores drawn through a simple random
sampling procedure. That is, each one of the 80 stores
would have an equal chance of being included in the
sample, and the results of the study would be the
most generalizable. A simple random sampling
procedure is recommended in this case since the pol-
icy is to be formulated for the company as a whole.
This implies that the most representative infor mation
has to be obtained that can be generalized to the
entire company. This is best accomplished through
this design.

chapter sampling 253
Systematic sampling
If the sampling frame is large, and a listing of the elements is conveniently available in one place (as in the
telephone directory, company payroll, chamber of commerce listings, etc.), then a systematic sampling
procedure will offer the advantages of ease and quickness in developing the sample, as illustrated by the
following example.
EXAMPLE
The director of human resources of a manufacturing
firm wants to offer stress management seminars to the
personnel who experience high levels of stress. He con-
jectures that three groups are most prone to stress: the
workmen who constantly handle dangerous chemicals,
the foremen who are held responsible for production
quotas, and the counselors who, day in and day out, lis-
ten to the problems of the employees, internalize them,
and offer them counsel, with no idea of how much they
have really helped the clients. To get a feel for the expe-
rienced level of stress within each of the three groups
and the rest of the firm, the director might stratify the
sample into four distinct categories: (1) the workmen
handling the dangerous chemicals, (2) the foremen, (3)
the counselors, and (4) all the rest. He might then
choose a disproportionate random sampling procedure
(since group (3) can be expected to be very small, and
groups (2) and (1) are much smaller than group (4)).
This is the only sampling design that would allow
the designing of stress management seminars in a
meaningful way, targeted at the right groups.
If, in the earlier example, the regional director had
wanted to know which sales promotion gimmick
offered the best results for each of the geographical
areas, so that different sales promotion strategies
(according to regional preferences) could be devel-
oped, then the 80 stores would first be stratified on the
basis of the geographical region, and then a represent-
ative sample of stores would be drawn from each of the
geographical regions (strata) through a simple random
sampling procedure. In this case, since each of the
regions has 20 stores, a proportionate stratified ran-
dom sampling process (say, five stores from each
region) would be appropriate. If, however, the north-
ern region had only three stores, the southern had 15,
and the eastern and western regions had 24 and 38
stores, respectively, then a disproportionate stratified
random sampling procedure would be the right choice,
with all three stores in the northern region being stud-
ied, because of the small number of elements in that
population. If the sample size was retained at 20, then
the north, south, east, and west regions would proba-
bly have samples respectively of three, four, five and
eight. It is interesting to note that sometimes when
stratified random sampling might seem logical, it
might not really be necessary. For example, when test‐
marketing results show that Cubans, Puerto Ricans,
and Mexicans perceive and consume a particular
product the same way, there is no need to segment the
market and study each of the three groups using a
stratified sampling procedure.
EXAMPLE
An administrator wants to assess the reactions of
employees to a new and improved health benefits
scheme that requires a modest increase in the premi-
ums to be paid by the employees for their families. The
administrator can assess the enthusiasm for the new
scheme by using a systematic sampling design. The
company's records will provide the sampling frame,
and every nth employee can be sampled. A stratified
plan is not called for here since the policy is for the
entire company.

254 research methods for business
Area sampling
Area sampling is best suited when the goal of the research is confined to a particular locality or area, as per the
example below.
Cluster sampling
This sampling design is most useful when a heterogeneous group is to be studied at one time. Two examples are
offered below.
BOX 13.2
NOTE
Systematic sampling is inadvisable where systematic bias can be anticipated to be present. For example,
systematic sampling from the personnel directory of a company (especially when it has an equal number of
employees in each department), which lists the names of the individuals department‐wise, with the head
of the department listed fi rst, and the secretary listed next, has inherent bias. Th e possibility of systematic
bias creeping into the data cannot be ruled out in this case, since the selection process may end up pick-
ing each of the heads of the department or the departmental secretaries as the sample subjects. Th e results
from such a sample will clearly be biased and not generalizable, despite the use of a probability sampling
procedure. Systematic sampling will have to be scrupulously avoided in cases where known systematic
biases are possible.
BOX 13 2
EXAMPLE
A human resources director is interested in knowing
why staff resign. Cluster sampling will be useful in this
case for conducting exit interviews of all members
completing their final papers in the human resources
department on the same day (cluster), before resign-
ing. The clusters chosen for interview will be based on
a simple random sampling of the various clusters of
personnel resigning on different days. The interviews
will help to understand the reasons for turnover of a
heterogeneous group of individuals (i.e., from various
departments), and the study can be conducted at
a low cost.
A financial analyst wishes to study the lending prac-
tices of banks in the Netherlands. All the banks in each
city will form a cluster. By randomly sampling the clus-
ters, the analyst will be able to draw conclusions on the
lending practices.
EXAMPLE
A telephone company wants to install a public tele-
phone outlet in a locality where crime is most rampant,
so that victims can have access to a telephone. Studying
the crime statistics and interviewing the residents in a
particular area will help to choose the right location
for installation of the phone.

chapter sampling 255
Convenience sampling
This nonprobability design, which is not generalizable at all, is used at times to obtain some “quick” information
to get a “feel” for the phenomenon or variables of interest. See the example below.
Double sampling
This design provides added information at minimal additional expenditure. See the example below.
BOX 13.3
NOTE
Convenience sampling should be resorted to in the interests of expediency, with the full knowledge that
the results are not generalizable at all.
BOX 13 3
EXAMPLE
In the previous exit interview example, some individu-
als (i.e., a subset of the original cluster sample) might
have indicated that they were resigning because of
philo sophical differences with the company's policies.
The researcher might want to do an in‐depth interview
with these individuals to obtain further information
regarding the nature of the policies disliked, the actual
philosophical differences, and why these particular
issues were central to the individuals' value systems.
Such additional detailed information from the target
group through the double sampling design could help
the company to look for ways of retaining employees
in the future.
EXAMPLE
The accounts executive has established a new account-
ing system that maximally utilizes computer technol-
ogy. Before making further changes, he would like to
get a feel for how the accounting clerks react to the
new system without making it seem that he has doubts
about its acceptability. He may then “casually” talk to
the first five accounting personnel that walk into his
office, trying to gauge their reactions.
Judgment sampling: one type of purposive sampling
A judgment sampling design is used where the collection of “specialized informed inputs” on the topic area
researched is vital, and the use of any other sampling design would not offer opportunities to obtain the special-
ized information, as per the example that follows.
EXAMPLE
A pharmaceutical company wants to trace the effects
of a new drug on patients with specific health problems
(muscular dystrophy, sickle cell anemia, rheumatoid
arthritis, etc.). It then contacts such individuals and,
with a group of voluntarily consenting patients, tests
the drug. This is a judgment sample because data are
collected from appropriate special groups.

256 research methods for business
In effect, as can be seen from the discussions on sampling designs thus far, decisions on which design to use
depend on many factors, including the following:
1. Extent of prior knowledge in the area of research undertaken.
2. The main objective of the study – generalizability, efficiency, knowing more about subgroups within a
population, obtaining some quick (even if unreliable) information, etc.
3. Cost considerations – is exactitude and generalizability worth the extra investment of time, cost, and
other resources in resorting to a more, rather than less, sophisticated sampling design? Even if it is, is
suboptimization because of cost or time constraints called for? (See also Figure 13.4 .)
The advantages and disadvantages of the different probability and nonprobability sampling designs are
listed in Table 13.2 .
In sum, choosing the appropriate sampling plan is one of the more important research design decisions the
researcher has to make. The choice of a specific design will depend broadly on the goal of research, the charac-
teristics of the population, and considerations of cost.
Quota sampling: a second type of purposive sampling
This sampling design allows for the inclusion of all groups in the system researched. Thus, groups who are small
in number are not neglected, as per the example below.
BOX 13.4
NOTE
Th e last group in the above example should also be included in the sample since there is a possibility that
they may perceive this as a facility that favors only the parents of kindergarten children, and therefore
resent the idea. It is easy to see that resorting to quota sampling would be important in a case such as this.
BOX 13 4
EXAMPLE
A company is considering operating an on‐site kinder-
garten facility. But before taking further steps, it wants
to get the reactions of four groups to the idea: (1)
employees who are parents of kindergarten‐age chil-
dren, and where both are working outside of the home,
(2) employees who are parents of kindergarten‐age
children, but where one of them is not working outside
of the home, (3) single parents with kindergarten‐
age children, and (4) all those without children of
kindergarten age. If the four groups are expected to
represent 60%, 7%, 23%, and 10%, respectively, in the
population of 420 employees in the company, then a
quota sampling will be appropriate to represent the
four groups.

chapter sampling 257
ISSUES OF PRECISION AND CONFIDENCE IN DETERMINING SAMPLE SIZE
Having discussed the various probability and nonprobability sampling designs, we now need to focus attention
on the second aspect of the sampling design issue – the sample size. Suppose we select 30 people from a popula-
tion of 3000 through a simple random sampling procedure. Will we be able to generalize our findings to the
population with confidence, since we have chosen a probability design that has the most generalizability? What
is the sample size required to make reasonably precise generalizations with confidence? What do precision and
confidence mean? These issues will be considered now.
A reliable and valid sample should enable us to generalize the findings from the sample to the population
under investigation. In other words, the sample statistics should be reliable estimates and reflect the population
parameters as closely as possible within a narrow margin of error. No sample statistic (X, for instance) is going to
be exactly the same as the population parameter ( μ), no matter how sophisticated the probability sampling design
is. Remember that the very reason for a probability design is to increase the probability that the sample statistics
will be as close as possible to the population parameters. Though the point estimate X may not accurately reflect
the population mean, μ, an interval estimate can be made within which μ will lie, with probabilities attached –
that is, at particular confidence levels. The issues of confidence interval and confidence level are addressed in the
following discussions on precision and confidence.
Precision
Precision refers to how close our estimate is to the true population characteristic. Usually, we estimate the popu-
lation parameter to fall within a range, based on the sample estimate. For example, let us say that from a study of
a simple random sample of 50 of the total 300 employees in a workshop, we find that the average daily production
rate per person is 50 pieces of a particular product ( )X 50 . We might then (by doing certain calculations, as we
shall see later) be able to say that the true average daily production of the product (μ) lies anywhere between 40
and 60 for the population of employees in the workshop. In saying this, we offer an interval estimate, within
which we expect the true population mean production to be ( )50 10 . The narrower this interval, the greater
the precision. For instance, if we are able to estimate that the population mean will fall anywhere between 45 and
55 pieces of production ( )50 5 rather than 40 and 60 ( )50 10 , then we have more precision. That is, we
now estimate the mean to lie within a narrower range, which in turn means that we estimate with greater exacti-
tude or precision.
Precision is a function of the range of variability in the sampling distribution of the sample mean. That is, if
we take a number of different samples from a population, and take the mean of each of these, we will usually find
that they are all different, are normally distributed, and have a dispersion associated with them. The smaller this
dispersion or variability, the greater the probability that the sample mean will be closer to the population mean.
We need not necessarily take several different samples to estimate this variability. Even if we take only one sample
of 30 subjects from the population, we will still be able to estimate the variability of the sampling distribution of
the sample mean. This variability is called the standard error, denoted by SX. The standard error is calculated by
the following formula:
S
S
nX
where S is the standard deviation of the sample, n is the sample size, and SX indicates the standard error or the
extent of precision offered by the sample.
Note that the standard error varies inversely with the square root of the sample size. Hence, if we want to
reduce the standard error given a particular standard deviation in the sample, we need to increase the sample size.

258 research methods for business
Another noteworthy point is that the smaller the variation in the population, the smaller the standard error,
which in turn implies that the sample size need not be large. Thus, low variability in the population requires a
smaller sample size.
In sum, the closer we want our sample results to reflect the population characteristics, the greater the preci-
sion we should aim at. The greater the precision required, the larger the sample size needed, especially when the
variability in the population itself is large.
Confidence
Whereas precision denotes how close we estimate the population parameter based on the sample statistic, confi-
dence denotes how certain we are that our estimates will really hold true for the population. In the previous
example of production rate, we know we are more precise when we estimate the true mean production (μ) to fall
somewhere between 45 and 55 pieces than somewhere between 40 and 60. However, we may have more confi-
dence in the latter estimation than in the former. After all, anyone can say with 100% certainty or confidence that
the mean production (μ) will fall anywhere between zero and infinity! Other things being equal, the narrower the
range, the lower the confidence. In other words, there is a trade‐off between precision and confidence for any
given sample size, as we shall see later in this chapter.
In essence, confidence reflects the level of certainty with which we can state that our estimates of the popula-
tion parameters, based on our sample statistics, will hold true. The level of confidence can range from 0 to 100%.
A 95% confidence is the conventionally accepted level for most business research, most commonly expressed by
denoting the significance level as p ≤ 0.05. In other words, we say that at least 95 times out of 100 our estimate
will reflect the true population characteristic.
Sample Data, Precision, and Confidence in Estimation
Precision and confidence are important issues in sampling because when we use sample data to draw inferences
about the population, we hope to be fairly “on target,” and have some idea of the extent of possible error. Because
a point estimate provides no measure of possible error, we do an interval estimation to ensure a relatively accurate
estimation of the population parameter. Statistics that have the same distribution as the sampling distribution of
the mean are used in this procedure, usually a z or a t statistic.
For example, we may want to estimate the mean dollar value of purchases made by customers when they
shop at department stores. From a sample of 64 customers sampled through a systematic sampling design proce-
dure, we may find that the sample mean X 105, and the sample standard deviation S X10. , the sample mean,
is a point estimate of μ, the population mean. We could construct a confidence interval around X to estimate the
range within which μ will fall. The standard error SX and the percentage or level of confidence we require will
determine the width of the interval, which can be represented by the following formula, where K is the t statistic
for the level of confidence desired.
X KS
We already know that:
S
S
nX
Here,
S
X
10
641 25.

chapter sampling 259
From the table of critical values for t in any statistics book (see Table II, columns 5, 6, and 8, in the statistical
tables given toward the end of this book), we know that:
For a 90% confidence level, the K value is 1.645.
For a 95% confidence level, the K value is 1.96.
For a 99% confidence level, the K value is 2.576.
If we desire a 90% confidence level in the above case, then 105 1 645 1 25. ( . ) (i.e., 105 2 056. ). μ thus
falls between 102.944 and 107.056. These results indicate that using a sample size of 64, we could state with 90%
confidence that the true population mean value of purchases for all customers would fall between $102.94 and
$107.06. If we now want to be 99% confident of our results without increasing the sample size, we necessarily
have to sacrifice precision, as may be seen from the following calculation: 105 2 576 1 25. ( . ). The value of μ
now falls between 101.78 and 108.22. In other words, the width of the interval has increased and we are now less
precise in estimating the population mean, though we are a lot more confident about our estimation. It is not
difficult to see that if we want to maintain our original precision while increasing the confidence, or maintain the
confidence level while increasing precision, or we want to increase both the confidence and the precision, we
need a larger sample size.
In sum, the sample size, n, is a function of:
1. the variability in the population;
2. precision or accuracy needed;
3. confidence level desired; and
4. type of sampling plan used – for example, simple random sampling versus stratified random sampling.
Trade-Off Between Confidence and Precision
We have noted that if we want more precision, or more confidence, or both, the sample size needs to be increased –
unless, of course, there is very little variability in the population itself. However, if the sample size (n) cannot be
increased, for whatever reason – say, we cannot afford the costs of increased sampling – then, with the same n,
the only way to maintain the same level of precision is to forsake the confidence with which we can predict our
estimates. That is, we reduce the confidence level or the certainty of our estimate. This trade‐off between preci-
sion and confidence is illustrated in Figures 13.5 (a) and (b). Figure 13.5 (a) indicates that 50% of the time the
true mean will fall within the narrow range indicated in the figure, the 0.25 in each tail representing the 25%
nonconfidence, or the probability of making errors, in our estimation on either side. Figure 13.5 (b) indicates that
X
(a)
.50
.25.25
X
(b)
.99
.005 .005
F I G U R E 1 3 . 5
Illustration of the trade-off between precision and confidence. (a) More precision but less confidence; (b) more confidence but less precision.

260 research methods for business
99% of the time we expect the true mean μ to fall within the much wider range indicated in the figure and there
is only a 0.005% chance that we are making an error in this estimation. That is, in Figure 13.5 (a), we have more
precision but less confidence (our confidence level is only 50%). In Figure 13.5 (b), we have high confidence
(99%), but then we are far from being precise – that is, our estimate falls within a broad interval range.
It thus becomes necessary for researchers to consider at least four aspects while making decisions on the
sample size needed to do the research:
1. How much precision is really needed in estimating the population characteristics of interest – that is,
what is the margin of allowable error?
2. How much confidence is really needed – that is, how much chance can we take of making errors in
estimating the population parameters?
3. To what extent is there variability in the population on the characteristics investigated?
4. What is the cost–benefit analysis of increasing the sample size?
SAMPLE DATA AND HYPOTHESIS TESTING
So far we have discussed sample data as a means of estimating the population parameters, but sample data can
also be used to test hypotheses about population values rather than simply to estimate population values. The
procedure for this testing incorporates the same information as in interval estimation, but the goals behind the
two methods are somewhat different.
Referring to the earlier example of the average dollar value purchases of customers in a department store,
instead of trying to estimate the average purchase value of the store's customers with a certain degree of accuracy,
let us say that we now wish to determine whether or not customers expend the same average amount in pur-
chases in Department Store A as in Department Store B. From Chapter 5, we know that we should first set the
null hypothesis, which will state that there is no difference in the dollar values expended by customers shopping
at the two different stores. This is expressed as:
HA B0
0:
The alternate hypothesis of differences will be stated nondirectionally (since we have no idea whether
customers buy more at Store A or Store B) as:
HA A B
: 0
If we take a sample of 20 customers from each of the two stores and find that the mean dollar value purchases
of customers in Store A is 105 with a standard deviation of 10, and the corresponding figures for Store B are 100
and 15, respectively, we see that:
X XA B
105 100 5
whereas our null hypothesis had postulated no difference (difference = 0). Should we then conclude that our
alternate hypothesis is to be accepted? We cannot say! To determine this we must first find the probability or
likelihood of the two group means having a difference of 5 in the context of the null hypothesis or a difference of 0.
This can be done by converting the difference in the sample means to a t statistic and seeing what the probability

chapter sampling 261
is of finding a t of that value. The t distribution has known probabilities attached to it (see Table II (t distribution)
in the statistical tables given toward the end of the book). Looking at the t distribution table, we find that, with
two samples of 20 each (the degrees of freedom become n n1 2
2 38), for the t value to be significant at the
0.05 level, the critical value should be around 2.021 (see t distribution table column 6 against v40). We need to
use the two‐tailed test since we do not know whether the difference between Store A and Store B will be positive
or negative. For even a 90% probability, it should be at least 1.684 (see the number to the left of 2.021). The t
statistic can be calculated for testing our hypothesis as follows:
tX X
S
Sn s n s
n n n n
X X
X X
( ) ( )
( )
1 2 1 2
1 1
2
2 2
2
1 2 1
1 2
1 2 2
1 1
2
( ) ( )
( ) (
20 10 20 15
20 20 2
1
20
1
20
2 2
tX X
A B A B)
4.136
We already know that
X XA B
the difference in the means of the two stores5 ( )
and
A Bfrom our null hypothesis0 ( )
Then
t
5 0
4 1361 209
..
This t value of 1.209 is way below the value of 2.021 (for 40 degrees of freedom for a two‐population t‐test,
the closest to the actual 38 degrees of freedom [( ) ])20 20 2 required for the conventional 95% probability, and
even for the 90% probability, which requires a value of 1.684. We can thus say that the difference of 5 that we
found between the two stores is not significantly different from 0. The conclusion, then, is that there is no signifi-
cant difference between how much customers buy (dollars expended) at Department Store A and Department
Store B. We will thus accept the null hypothesis and reject the alternative.
Sample data can thus be used not only for estimating the population parameters, but also for testing hypoth-
eses about population values, population correlations, and so forth, as we will see more fully in Chapter 15.
THE SAMPLE SIZE
Both sampling design and the sample size are important to establish the representativeness of the sample for
generalizability. If the appropriate sampling design is not used, a large sample size will not, in itself, allow the
findings to be generalized to the population. Likewise, unless the sample size is adequate for the desired level of

262 research methods for business
The sample size indicated above is 188. However, let us say that this bank has a total clientele of only 185.
This means we cannot sample 188 clients. We can, in this case, apply a correction formula and see what sample
size would be needed to have the same level of precision and confidence given the fact that we have a total of only
185 clients. The correction formula is as follows:
SS
n
N n
NX 1
where N is the total number of elements in the population, n is the sample size to be estimated, SX is the standard
error of the estimate of the mean, and S is the standard deviation of the sample mean.
Applying the correction formula, we find that:
255 103500 185
184
94
.n
n
n
We would now sample 94 of the total 185 clients.
precision and confidence, no sampling design, however sophisticated, will be useful to the researcher in meeting
the objectives of the study. Hence, sampling decisions should consider both the sampling design and the
sample size.
Determining the Sample Size
Now that we are aware of the fact that the sample size is governed by the extent of precision and confidence
desired, how do we determine the sample size required for our research? The procedure can be illustrated through
an example.
EXAMPLE
Suppose a manager wants to be 95% confident that the
expected monthly withdrawals in a bank will be within
a confidence interval of $500. Let us say that a study
of a sample of clients indicates that the average with-
drawals made by them have a standard deviation of
$3500. What would be the sample size needed in
this case?
We noted earlier that the population mean can be
estimated by using the formula:
X KSX
Since the confidence level needed here is 95%, the
applicable K value is 1.96 (t table). The interval estimate
of ±$500 will have to encompass a dispersion of
(1.96 × standard error). That is,
500 1 96. S XX
We already know that:
SS
n
n
n
X
255 103500
188
.

chapter sampling 263
To understand the impact of precision and/or confidence on the sample size, let us try changing the confi-
dence level required in the bank withdrawal example, which needed a sample size of 188 for a confidence level of
95%. Let us say that the bank manager now wants to be 99% sure that the expected monthly withdrawals will be
within the interval of $500. What will be the sample size now needed?
SX will now be:
500
2 576194 099
194 0993500
325
..
.n
n
The sample has now to be increased 1.73 times (from 188 to 325) to increase the confidence level from
95% to 99%!
Try calculating the sample size if the precision has to be narrowed down from $500 to $300 for a 95% and a 99%
confidence level! Your answers should show the sample sizes needed as 523 and 902, respectively. These results
dramatically highlight the costs of increased precision, confidence, or both. It is hence a good idea to think through
how much precision and confidence one really needs, before determining the sample size for the research project.
So far we have discussed sample size in the context of precision and confidence with respect to one variable
only. However, in research, the theoretical framework has several variables of interest, and the question arises as
to how one should come up with a sample size when all the factors are taken into account. Krejcie and Morgan
(1970) greatly simplified the size decision by providing a table that ensures a good decision model. Table 13.3
provides that generalized scientific guideline for sample size decisions. The interested student is advised to read
Krejcie and Morgan (1970) as well as Cohen (1969) for decisions on sample size.
T A B L E 1 3 . 3
Sample size for a given population size
N S N S N S
10 10 220 140 1200 291
15 14 230 144 1300 297
20 19 240 148 1400 302
25 24 250 152 1500 306
30 28 260 155 1600 310
35 32 270 159 1700 313
40 36 280 162 1800 317
45 40 290 165 1900 320
50 44 300 169 2000 322
55 48 320 175 2200 327
60 52 340 180 2400 331
65 56 360 186 2600 335
70 59 380 191 2800 338
75 63 400 196 3000 341
80 66 420 201 3500 346

N S N S N S
85 70 440 205 4000 351
90 73 460 210 4500 354
95 76 480 214 5000 357
100 80 500 217 6000 361
110 86 550 226 7000 364
120 92 600 234 8000 367
130 97 650 242 9000 368
140 103 700 248 10 000 370
150 108 750 254 15 000 375
160 113 800 260 20 000 377
170 118 850 265 30 000 379
180 123 900 269 40 000 380
190 127 950 274 50 000 381
200 132 1000 278 75 000 382
210 136 1100 285 1 000000 384
Sample size and Type II errors
Too large a sample size, (say, over 500) could become a problem inasmuch as we would then be prone to commit-
ting Type II errors. That is, we would accept the findings of our research, when in fact we should reject them. In
other words, with too large a sample size, even weak relationships (say a correlation of 0.10 between two varia-
bles) might reach significance levels, and we would be inclined to believe that these significant relationships
found in the sample were indeed true of the population, when in reality they may not be. Thus, neither too large
nor too small sample sizes help research projects.
Statistical and practical significance
Another point to consider, even with the appropriate sample size, is whether statistical significance is more rel-
evant than practical significance. For instance, a correlation of 0.25 may be statistically significant, but since this
explains only about 6% of the variance (0.252), how meaningful is it in terms of practical utility?
Rules of thumb
Roscoe (1975) proposes the following rules of thumb for determining sample size:
1. Sample sizes larger than 30 and less than 500 are appropriate for most research.
2. Where samples are to be broken into subsamples (males/females, juniors/seniors, etc.), a minimum
sample size of 30 for each category is necessary.
3. In multivariate research (including multiple regression analyses), the sample size should be several
times (preferably ten times or more) as large as the number of variables in the study.
4. For simple experimental research with tight experimental controls (matched pairs, etc.), successful
research is possible with samples as small as 10 to 20 in size.
264 research methods for business

SAMPLING AS RELATED TO QUALITATIVE STUDIES
Sampling for qualitative research is as important as sampling for quantitative research. Qualitative sampling begins
with precisely defining the target population . As a sampling technique, qualitative research generally uses nonprob-
ability sampling as it does not aim to draw statistical inference. Purposive sampling is one technique that is often
employed in qualitative investigation: subjects are selected on the basis of expertise in the subject that is being
investigated. It is important that the subjects are chosen in such a way that they reflect the diversity of the population.
One form of purposive sampling is theoretical sampling , introduced by Glaser and Strauss ( 1967 ) in their
work on grounded theory. The term grounded theory expresses the idea that theory will emerge from data
through an iterative process that involves repeated sampling, collection of data, and analysis of data until
Efficiency In Sampling
Efficiency in sampling is attained when, for a given level of precision (standard error), the sample size could be
reduced, or for a given sample size ( n ), the level of precision could be increased. Some probability sampling
designs are more efficient than others. The simple random sampling procedure is not always the most efficient
plan to adopt; some other probability sampling designs are often more efficient. A stratified random sampling
plan is often the most efficient, and a disproportionate stratified random sampling design has been shown to be
more efficient than a proportionate sampling design in many cases. Cluster sampling is less efficient than simple
random sampling because there is generally more homogeneity among the subjects in the clusters than is found
in the elements in the population. Multistage cluster sampling is more efficient than single‐stage cluster sampling
when there is more heterogeneity found in the earlier stages. There is often a trade‐off between time and cost
efficiencies (as achieved in nonprobability sampling designs) and precision efficiencies (as achieved in many
probability sampling plans). The choice of a sampling plan thus depends on the objectives of the research, as well
as on the extent and nature of efficiency desired.
BOX 13.5
SAMPLING ISSUES IN ONLINE RESEARCH
When conducting online surveys, researchers oft en encounter problems with respect to sampling (Wright,
2005). Establishing a sampling frame when researching an online community presents a real challenge.
Unlike membership‐based organizations, many online communities, such as community bulletin boards
and chat rooms, do not typically provide participant email addresses. Membership is based on common
interests and little information is required when registering to use these communities, if registration is
required at all (Andrews, Nonnecke, and Preece, 2003; Couper, 2000). Due to the lack of an adequate
sampling frame , many online survey invitations are published in the form of a link on websites or in other
media, which leads to non‐probability samples and in many cases to sample selection bias. Self‐selection
bias is a major limitation of online survey research. In any given online community, there are individ-
uals who are more likely than others to complete an online survey. Th e tendency of some individuals to
respond to an invitation to participate in an online survey, while others ignore it, may lead to a systematic
bias. Finally, the response rates of online surveys are generally very low. Th ese sampling issues in online
research oft en hinder researchers ’ ability to generalize their fi ndings.
BOX 13 5
chapter sampling 265

MANAGERIAL IMPLICATIONS
Awareness of sampling designs and sample size helps managers to understand why a particular method of sam-
pling is used by researchers. It also facilitates understanding of the cost implications of different designs, and the
trade‐off between precision and confidence vis‐à‐vis the costs. This enables managers to understand the risk they
take in implementing changes based on the results of the research study. While reading research reports or jour-
nal articles, this knowledge also helps managers to assess the generalizability of the findings and analyze the
implications of trying out the recommendations made therein in their own system.
“ theoretical saturation” is reached. Theoretical saturation is reached when no new information about the subject
emerges in repeated cases. Theoretical sampling may or may not begin with purposive sampling, but the sam-
pling of additional subjects is directed by the emerging theoretical framework. According to Glaser, theoretical
sampling takes place when “the analyst jointly collects, codes, and analyzes his data and decides what data to
collect next and where to find them, in order to develop his theory as it emerges” (1978, p. 36).
Because it is impossible to predict when theoretical saturation is reached, you cannot determine how many
subjects will need to be sampled at the beginning of your study. Instead, the general rule in qualitative research
is that you continue to sample until you are not getting any new information or are no longer gaining new
insights. Note that the sample size will, therefore, at least partly, depend on the heterogeneity of the population.
SUMMARY
● Learning objective 1: Define sampling, sample, population, element, sampling unit, and subject.
In learning how representative data can be collected, a few terms have to be understood. The population
refers to the entire group of people, events, or things of interest that the researcher wishes to investigate. An
element is a single member of the population. A sample is a subset of the population. The sampling unit is
the element or set of elements that is available for selection in some stage of the sampling process. A subject
is a single member of the sample, just as an element is a single member of the population.
● Learning objective 2: Discuss statistical terms in sampling.
Sampling units provide the researcher with responses . When researchers examine the responses they get for
their entire sample, they make use of statistics. The characteristics of the population are referred to as its
parameters. When the properties of the population are not overrepresented or underrepresented in the
sample, we have a representative sample.
BOX 13.6
SAMPLING IN CROSSCULTURAL RESEARCH
Just as in instrument development and data collection, while engaging in cross‐cultural research one has
to be sensitive to the issue of selecting matched samples in the diff erent countries. Th e nature and types of
organizations studied, whether subjects are from rural or urban areas, and the types of sampling design
used, should all be similar in the diff erent countries to enable true comparisons.
BOX 13 6
266 research methods for business

● Learning objective 3: Describe and discuss the sampling process.
Sampling is the process of selecting a sufficient number of the right elements from the population, so that a
study of the sample and an understanding of its properties make it possible for the researcher to generalize
such properties to the population elements. The major steps in sampling include: (1) defining the popula-
tion; (2) determining the sample frame; (3) determining the sampling design; (4) determining the appropri-
ate sample size; and (5) executing the sampling process.
● Learning objective 4: Compare and contrast specific probability sampling designs.
In probability sampling, elements in the population have a known, nonzero chance of being chosen as sub-
jects in the sample. Probability sampling can be either unrestricted (simple random sampling) or restricted
(complex probability sampling) in nature.
● Learning objective 5: Compare and contrast specific nonprobability sampling designs.
In nonprobability sampling designs, the elements in the population do not have any probabilities attached
to their being chosen as sample subjects. This means that the findings from the study of the sample cannot
be confidently generalized to the population. There are two main types of nonprobability sampling design:
convenience sampling and purposive sampling.
● Learning objective 6: Discuss precision and confidence and the trade-off between precision and
confidence.
A reliable and valid sample enables the researcher to generalize the findings from the sample to the popula-
tion under study. That is why sample statistics should be reliable estimates and reflect the population
parameters as closely as possible. Precision and confidence are important issues in sampling because sample
data are used to draw inferences about the population; one hopes to be pretty “on target.” Precision and
confidence are related to sample size: if one wants to maintain the original precision while increasing the
confidence, or maintain the confidence level while increasing precision, or one wants to increase both the
confidence and the precision, one needs a larger sample size.
● Learning objective 7: Discuss how hypotheses can be tested with sample data.
Sample data can thus be used not only for estimating the population parameters, but also for testing
hypotheses. We will have more to say about this in Chapter 15.
● Learning objective 8: Discuss the factors to be taken into consideration for determining sample size
and determine the sample size for any given research project.
It is a good idea to think through how much precision and confidence one really needs, before determining
the sample size for the research project. Too large a sample size could become a problem inasmuch as we
would then be prone to committing Type II errors. Efficiency in sampling is attained when, for a given level
of precision (standard error), the sample size could be reduced, or for a given sample size (n), the level of
precision could be increased.
● Learning objective 9: Discuss sampling in qualitative research.
Qualitative sampling begins with precisely defining the target population. Qualitative research generally uses
nonprobability sampling as it does not aim to draw statistical inference. Purposive sampling is one technique
that is often employed in qualitative research. It is important that the subjects are chosen in such a way that
chapter sampling 267

Visit the companion website at www.wiley.com/college/sekaran for Case Study: Banks
start image repair over financial crisis.
DISCUSSION QUESTIONS
1. Identify the relevant population for the following research foci, and suggest the appropriate sam-
pling design to investigate the issues, explaining why they are appropriate. Wherever necessary,
identify the sampling frame as well.
a. A company wants to investigate the initial reactions of heavy soft‐drink users to a new “all natu-
ral” soft drink.
b. A hospital administrator wants to find out if the single parents working in the hospital have a
higher rate of absenteeism than parents who are not single.
c. A researcher would like to assess the extent of pilferage in the materials storage warehouses of
manufacturing firms.
d. The director of human resources wants to investigate the relationship between drug abuse and
dysfunctional behavior of blue‐collar workers in a particular plant.
e. A marketer wants to generate some ideas on how women differ from men in acquiring product
knowledge about cars.
2. a. Explain why cluster sampling is a probability sampling design.
b. What are the advantages and disadvantages of cluster sampling?
c. Describe a situation where you would consider the use of cluster sampling.
they reflect the diversity of the population. One form of purposive sampling is theoretical sampling. Because
it is impossible to predict when theoretical saturation is reached, it is impossible to determine how many
subjects will need to be sampled at the beginning of one’s study.
● Learning objective 10: Discuss the role of the manager in sampling.
Awareness of sampling designs and sample size decisions helps managers to understand why particular
methods of sampling are used by researchers. In the next two chapters, we will see how the data gathered
from a sample of respondents in the population are analyzed to test the hypotheses generated and find
answers to the research questions. It facilitates understanding of the cost implications of different designs,
and the trade-off between precision and confidence in relation to the costs. It enables managers to under-
stand the risk they take in implementing changes based on the results of a research study. Finally, it helps
managers to assess the generalizability of the findings of a study.
268 research methods for business

Now do Exercises 13.1, 13.2, 13.3, 13.4, 13.5, and 13.6.
For the situations presented in Exercises 13.1 to Exercise 13.6 below, indicate what would be the relevant
population and the most appropriate sampling design. Make sure you discuss the reasons for your answers.
3. a. Explain what precision and confidence are and how they influence sample size.
b. Discuss what is meant by the statement: “There is a trade‐off between precision and confidence
under certain conditions.”
4. The use of a convenience sample used in organizational research is correct because all members
share the same organizational stimuli and go through almost the same kinds of experience in their
organizational life. Comment.
5. “Use of a sample of 5000 is not necessarily better than one of 500.” How would you react to this
statement?
6. Nonprobability sampling designs ought to be preferred to probability sampling designs in some
cases. Explain with an example.
7. Because there seems to be a trade‐off between accuracy and confidence for any given sample size,
accuracy should always be considered more important than precision. Explain with reasons why you
do or do not agree.
8. Overgeneralizations give rise to much confusion and other problems for researchers who try to
replicate the findings. Explain what is meant by this.
9. Double sampling is probably the least used of all sampling designs in organizational research. Do
you agree? Provide reasons for your answer.
10. Why do you think the sampling design should feature in a research proposal?
EXERCISE 13.1
A medical inspector wants to estimate the overall average monthly occupancy rates of the cancer wards in
80 different hospitals that are evenly located in the northwestern, southeastern, central, and southern
suburbs of New York City.
EXERCISE 13.2
A magazine article suggested that “Consumers aged 35 to 44 will soon be the nation's biggest spenders, so
advertisers must learn how to appeal to this over‐the‐thrill crowd.” If this suggestion appeals to an apparel
manufacturer, what should the sampling design be to assess the tastes of this group?
chapter sampling 269

EXERCISE 13.3
The McArthur Co. produces special vacuum cleaners for conveniently cleaning the inside of cars. About a
thousand of these, with stamped serial numbers, are produced every month and stored serially in a stock-
room. Once a month an inspector does a quality control check on 50 of these. When he certifies them as to
quality, the units are released from the stockroom for sale. The production and sales managers, however, are
not satisfied with the quality control check since, quite often, many of the units sold are returned by custom-
ers because of various types of defect. What would be the most useful sampling plan to test the 50 units?
EXERCISE 13.4
A consultant had administered a questionnaire to some 285 employees using a simple random sampling
procedure. As she looked at the responses, she suspected that two questions might not have been clear to
the respondents. She would like to know if her suspicion is well‐founded.
EXERCISE 13.6
T‐Mobile is a mobile network operator headquartered in Bonn, Germany. The company has enlisted your
help as a consultant to develop and test a model on the determinants of subscriber churn in the German
mobile telephone market. Develop a sampling plan and pay specific attention to the following aspects.
Define the target population. Discuss in as much detail as possible the sampling frame and the sampling
design that you would use. Give reasons for your choice.
EXERCISE 13.5
The executive board of a relatively small university located in Europe wants to determine the attitude of
their students toward various aspects of the university. The university, founded in 1928, is a fully accred-
ited government‐financed university with 11 000 students. The university specializes in the social sci-
ences and humanities and has five faculties, six service departments, eight research centers, and two
graduate schools. The executive board has asked you to come up with a sampling plan. Develop a sam-
pling plan and pay attention to the following aspects: target population, the sampling frame, the sample
technique, and the sample size.
270 research methods for business

C H A P T E R 1 4
Quantitative data analysis
INTRODUCTION
After quantitative data have been collected from a representative sample of the population, the next step is to
analyze them to answer our research questions. However, before we can start analyzing the data, some prelimi-
nary steps need to be completed. These help to ensure that the data are accurate, complete, and suitable for fur-
ther analysis. This chapter addresses these preliminary steps in detail. Subsequently, general guidelines are
provided for calculating and displaying basic descriptive statistics.
The easiest way to illustrate data analysis is through a case. We will therefore introduce the Excelsior
Enterprises case first.
LEARNING OBJECTIVES
After completing Chapter 14 you should be able to:
1. Demonstrate the ability to get data ready for quantitative analysis.
2. Describe the various processes by which one can get a feel for the data in a study.
3. Describe the means by which the reliability and validity of measures can be assessed.
EXAMPLE
Excelsior Enterprises is a medium‐sized company,
manufacturing and selling instruments and supplies
needed by the health care industry, including blood
pressure instruments, surgical instruments, dental
accessories, and so on. The company, with a total of
360 employees working three shifts, is doing reasona-
bly well but could do far better if it did not experience
employee turnover at almost all levels and in all depart-
ments. The president of the company called in a
research team to study the situation and to make rec-
ommendations on the turnover problem.
Since access to those who had left the company
would be difficult, the research team suggested to
the president that they talk to the current employees
and, based on their input and a literature survey, try
to get at the factors influencing employees’ inten-
tions to stay with, or leave, the company. Since past
research has shown that intention to leave (ITL) is
271

an excellent predictor of actual turnover, the presi-
dent concurred.
The team first conducted an unstructured inter-
view with about 50 employees at various levels and
from different departments. Their broad statement
was: “We are here to find out how you experience your
work life. Tell us whatever you consider is important
for you in your job, as issues relate to your work, the
environment, the organization, supervision, and what-
ever else you think is relevant. If we get a good handle
on the issues involved, we may be able to make appro-
priate recommendations to management to enhance
the quality of your work life. We would just like to talk
to you now, and administer a questionnaire later.”
Each interview typically lasted about 45 minutes,
and notes on the responses were written down by the
team members. When the responses were tabulated, it
became clear that the issues most frequently brought up
by the respondents, in one form or another, related to
three main areas: the job (employees said the jobs were
dull or too complex; there was lack of freedom to do the
job as one wanted to, etc.), perceived inequities (remarks
such as “I put much more in my work than I get out of it”);
and burnout (comments such as “there is so much work
to be done that by the end of the day we are physically and
emotionally exhausted”; “we feel the frequent need to
take time off because of exhaustion”; etc.).
A literature survey confirmed that these variables
were good predictors of intention to leave and subse-
quent turnover. In addition, job satisfaction was also
found to be an important predictor of intention to leave.
A theoretical framework was developed based on the
interviews and the literature survey, and four hypothe-
ses (stated later) were developed.
Next, a questionnaire was designed incorporating
well‐validated and reliable measures for job enrichment,
perceived equity, burnout, job satisfaction, and intention
to leave. Perceived equity was measured by five survey
items: (1) “I invest more in my work than I get out of it”;
(2) “I exert myself too much considering what I get back
in return”; (3) “For the efforts I put into the organization,
I get much in return” (reversed); (4) “If I take into account
my dedication, the company ought to give me better
training”; and (5) “In general, the benefits I receive from
the organization outweigh the effort I put in it” (reversed).
Job enrichment was measured on a four‐item Likert
scale: (1) “The job is quite simple and repetitive”
(reversed); (2) “The job requires me to use a number of
complex or higher‐level skills”; (3) “The job requires a lot
of cooperative work with other people”; and (4) “The job
itself is not very significant or important in the broader
scheme of things” (reversed). Participants responded to
these items on a five‐point scale, ranging from “I disa-
gree completely” (1) to “I agree completely” (5). Burnout
was measured with The Burnout Measure Short Version
(BMS). The BMS includes ten items that measure levels
of physical, emotional, and mental exhaustion of the
individual. Respondents are asked to rate the frequency
with which they experience each of the items appearing
in the questionnaire (e.g., being tired or helpless) on a
scale ranging from 1 (“never”) to 5 (“always”). Job satis-
faction was measured by a single‐item rating of “satisfac-
tion with your current job,” using a five‐point “not at
all–very much” scale. Intention to leave was measured
using two survey items: “With what level of certainty do
you intend to leave this organization within the next year
for another type of job?” (item 1) “for a similar type of
job?” (item 2). Participants indicated on a four‐point rat-
ing scale their level of certainty. Demographic variables
such as age, education, gender, tenure, department, and
work shift were also included in the questionnaire.
The questionnaire was administered personally to
174 employees who were chosen on a disproportionate
stratified random sampling basis. The responses were
entered into the computer. Thereafter, the data were
submitted for analysis to test the following hypotheses,
which were formulated by the researchers:
H1: Job enrichment has a negative effect on inten-
tion to leave.
H2: Perceived equity has a negative effect on inten-
tion to leave.
H3: Burnout has a positive effect on intention to leave.
H4: Job satisfaction mediates the relationship between
job enrichment, perceived equity, and burnout on
intention to leave.
272 research methods for business272 research methods for business

It may be pertinent to point out here that the four hypotheses derived from the theoretical framework are
particularly relevant for finding answers to the turnover issue. The results of testing the hypotheses will certainly
offer insights into how much of the variance in intention to leave can be explained by the independent variables,
and what corrective action, if any, needs to be taken.
GETTING THE DATA READY FOR ANALYSIS
After data are obtained through questionnaires, they need to be coded, keyed in, and edited. That is, a cat-
egorization scheme has to be set up before the data can be typed in. Then, outliers, inconsistencies, and
blank responses, if any, have to be handled in some way. Each of these stages of data preparation is dis-
cussed below.
Coding and data entry
The first step in data preparation is data coding. Data coding involves assigning a number to the partici-
pants’ responses so they can be entered into a database. In Chapter 9, we discussed the convenience of
electronic surveys for collecting questionnaire data; such surveys facilitate the entry of the responses
directly into the computer without manual keying in of the data. However, if, for whatever reason, this can-
not be done, then it is perhaps a good idea to use a coding sheet first to transcribe the data from the ques-
tionnaire and then key in the data. This method, in contrast to flipping through each questionnaire for each
item, avoids confusion, especially when there are many questions and a large number of question-
naires as well.
Coding the responses
In the Excelsior Enterprises questionnaire, we have 22 items measuring perceived equity, job enrichment, burn-
out, job satisfaction, and intention to leave, and six demographic variables, as shown in Figure 14.1, a sample
questionnaire.
The responses of this particular employee (participant #1 in the data file) to the first 22 questions can be
coded by using the actual number circled by the respondent (1, 2, 3, 1, 4, 5, 1, 3, 3, etc.). Coding the demographic
variables is somewhat less obvious. For instance, tenure is a special case, because it is a two‐category variable. It
is possible to use a coding approach that assigns a 1 = part‐time and a 2 = full‐time. However, using 0 = part‐time
and 1 = full‐time (this is called dummy coding) is by far the most popular and recommended approach because
it makes our lives easier in the data analysis stage. Hence, we code tenure (full‐time) with 1 for participant #1.
Work shift (third shift) can be coded 3, department (production) 2, and age 54. Gender can be coded 0 (male)
Finally, education (less than high school) can be coded 1.
At this stage you should also think about how you want to code nonresponses. Some researchers leave non-
responses blank, others assign a “9,” a “99” or a “.” All the approaches are fine, as long as you code all the nonre-
sponses in the same way.
Human errors can occur while coding. At least 10% of the coded questionnaires should therefore be
checked for coding accuracy. Their selection may follow a systematic sampling procedure. That is, every nth
form coded could be verified for accuracy. If many errors are found in the sample, all items may have to
be checked.
chapter quantitative data analysis 273

F I G U R E 1 4 . 1
Sample questionnaire
2
3
5
3
3
4
1
1
2
2
2
2
2
3
1
1
3
5
21
1
1
274 research methods for business

Data entry
After responses have been coded, they can be entered into a database. Raw data can be entered through any soft-
ware program. For instance, the SPSS Data Editor, which looks like a spreadsheet and is shown in Figure 14.2,
can enter, edit, and view the contents of the data file.
Each row of the editor represents a case or observation (in this case a participant of our study – 174 in the
Excelsior Enterprises study), and each column represents a variable (here variables are defined as the different items
of information that you collect for your cases; there are thus 28 variables in the Excelsior Enterprises questionnaire).
It is important to always use the first column for identification purposes; assign a number to every question-
naire, write this number on the first page of the questionnaire, and enter this number in the first column of your
F I G U R E 1 4 . 1
(Continued)
F I G U R E 1 4 . 2
The SPSS Data Editor
chapter quantitative data analysis 275

data file. This allows you to compare the data in the data file with the answers of the participants, even after you
have rearranged your data file.
Then, start entering the participants’ responses into the data file.
Editing data
After the data are keyed in, they need to be edited. For instance, the blank responses, if any, have to be handled in
some way, and inconsistent data have to be checked and followed up. Data editing deals with detecting and correct-
ing illogical, inconsistent, or illegal data and omissions in the information returned by the participants of the study.
An example of an illogical response is an outlier response. An outlier is an observation that is substantially
different from the other observations. An outlier is not always an error even though data errors (entry errors) are
a likely source of outliers. Because outliers have a large impact on the research results they should be investigated
carefully to make sure that they are correct. You can check the dispersion of nominal and/or ordinal variables by
obtaining minimum and maximum values and frequency tables. This will quickly reveal the most obvious outliers.
For interval and ratio data, visual aids (such as a scatterplot or a boxplot) are good methods to check for outliers.
Inconsistent responses are responses that are not in harmony with other information. For instance, a partici-
pant in our study might have answered the perceived equity statements as in Figure 14.3. Note that all the answers
of this employee indicate that the participant finds that the benefits she receives from the organization balance
the efforts she puts into her job, except for the answer to the third statement. From the other four responses we
might infer that the participant in all probability feels that, for the efforts she puts into the organization, she does
get much in return and has made a mistake in responding to this particular statement. The response to this state-
ment could then be edited by the researcher.
It is, however, possible that the respondent deliberately indicated that she does not get much in return for the
efforts she puts into the organization. If such were to be the case, we would be introducing a bias by editing the
data. Hence, great care has to be taken in dealing with inconsistent responses such as these. Whenever possible,
it is desirable to follow up with the respondent to get the correct data, even though this is an expensive solution.
Illegal codes are values that are not specified in the coding instructions. For example, a code of “6” in ques-
tion 1 (I invest more in my work than I get out of it) would be an illegal code. The best way to check for illegal
codes is to have the computer produce a frequency distribution and check it for illegal codes.
Not all respondents answer every item in the questionnaire. Omissions may occur because respondents did
not understand the question, did not know the answer, or were not willing to answer the question.
If a substantial number of questions – say, 25% of the items in the questionnaire – have been left unan-
swered, it may be a good idea to throw out the questionnaire and not include it in the data set for analysis.
In this event, it is important to mention the number of returned but unused responses due to excessive
missing data in the final report submitted to the sponsor of the study. If, however, only two or three items
1
1
1
2
5
F I G U R E 1 4 . 3
Example of a possible inconsistent answer
276 research methods for business

are left blank in a questionnaire with, say, 30 or more items, we need to decide how these blank responses
are to be handled.
One way to handle a blank response is to ignore it when the analyses are done. This approach is possible in
all statistical programs and is the default option in most of them. A disadvantage of this approach is that, of
course, it will reduce the sample size, sometimes even to an inappropriate size, whenever that particular variable
is involved in the analyses. Moreover, if the missing data are not missing completely at random, this method may
bias the results of your study. For this reason, ignoring the blank responses is best suited to instances in which we
have gathered a large amount of data, the number of missing data is relatively small, and relationships are so
strong that they are not affected by the missing data (Hair, Anderson, Tatham & Black, 1995).
An alternative solution would be to look at the participant’s pattern of responses to other questions and,
from these answers, deduce a logical answer to the question for the missing response. A second alternative solu-
tion would be to assign to the item the mean value of the responses of all those who have responded to that
particular item. In fact, there are many ways of handling blank responses (see Hair et al., 1995), each of them
having its own particular advantages and disadvantages.
Note that if many of the respondents have answered “don’t know” to a particular item or items, further inves-
tigation may well be worth while. The question might not have been clear or, for some reason, participants could
have been reluctant or unable to answer the question.
Data transformation
Data transformation, a variation of data coding, is the process of changing the original numerical representation of
a quantitative value to another value. Data are typically changed to avoid problems in the next stage of the data analy-
sis process. For example, economists often use a logarithmic transformation so that the data are more evenly distrib-
uted. If, for instance, income data, which are often unevenly distributed, are reduced to their logarithmic value, the
high incomes are brought closer to the lower end of the scale and provide a distribution closer to a normal curve.
Another type of data transformation is reverse scoring. Take, for instance, the perceived inequity measure of
the Excelsior Enterprises case. Perceived inequity is measured by five survey items: (1) “I invest more in my work
than I get out of it”; (2) “I exert myself too much considering what I get back in return”; (3) “For the efforts I put
into the organization, I get much in return” (reversed); (4) “If I take into account my dedication, the organization
ought to give me a better practical training”; and (5) “In general, the benefits I receive from the organization
outweigh the effort I put in” (reversed). For the first, second, and fourth items, a score indicating high agreement
would be negative, but for the third and fifth questions, a score indicating high agreement would be positive. To
maintain consistency in the meaning of a response, the first, second, and fourth items have to be reverse scored
(note that we are measuring equity and not inequity). In this case, a 5 (“I completely agree”) would be trans-
formed to a 1 (“I completely disagree”), a 4 to a 2, and so forth.
Data transformation is also necessary when several questions have been used to measure a single concept.
In such cases, scores on the original questions have to be combined into a single score (but only after we have
established that the interitem consistency is satisfactory (see Testing goodness of data, later on in this chapter).
For instance, because five items have been used to measure the concept “perceived equity”, a new “perceived
equity” score has to be calculated from the scores on the five individual items (but only after items 1, 2, and 4
have been reverse coded). This involves calculating the summed score (per case/participant) and then divid-
ing it by the number of items (five in this case). For example, our employee #1 has circled, respectively, 1, 2,
3, 1, and 4 on the five participation in decision‐making questions; his (employee #1 is a man) scores on the
items, once items 1, 2, and 4 have been reverse coded, are 5, 4, 3, 5, and 4. The combined score on perceived
equity would be 5 4 3 5 4 21 5 4 2/ . ). This combined score is included in a new column in SPSS. It is
easy to compute the new variables, using the Compute dialog box, which opens when the Transform icon is
chosen (Figure 14.4).
chapter quantitative data analysis 277

Note that it is useful to set up a scheme for categorizing the responses such that the several items measuring
a concept are all grouped together. If the questions measuring a concept are not contiguous but scattered over
various parts of the questionnaire, care has to be taken to include all the items without any omission or wrong
inclusion.
GETTING A FEEL FOR THE DATA
We can acquire a feel for the data by obtaining a visual summary or by checking the central tendency and the
dispersion of a variable. We can also get to know our data by examining the relation between two variables. In
Chapter 12, we explained that different statistical operations on variables are possible, depending on the level at
which a variable is measured. Table 14.1 summarizes the relationship between scale type, data analysis, and
methods of obtaining a visual summary for variables.
Table 14.1 shows that, depending on the scale of our measures, the mode, median, or mean, and the semi‐
interquartile range, standard deviation, or variance will give us a good idea of how the participants in our study
have reacted to the items in the questionnaire. These statistics can be easily obtained, and will indicate whether
the responses range satisfactorily over the scale. If the response to each individual item in a scale does not have a
good spread (range) and shows very little variability, then the researcher may suspect that the particular question
was probably not properly worded. Biases, if any, may also be detected if the respondents have tended to respond
similarly to all items – that is, they have stuck to only certain points on the scale. Remember that if there is no
variability in the data, then no variance can be explained! Getting a feel for the data is thus the necessary first step
in all data analysis. Based on this initial feel, further detailed analyses may be undertaken to test the goodness
of the data.
F I G U R E 1 4 . 4
Transforming data with SPSS
278 research methods for business

Researchers go to great lengths to obtain the central tendency, the range, the dispersion, and other statistics
for every single item measuring the dependent and independent variables, especially when the measures for a
concept are newly developed.
Descriptive statistics for a single variable are provided by frequencies, measures of central tendency, and
dispersion. These are now described.
Frequencies
Frequencies simply refer to the number of times various subcategories of a certain phenomenon occur, from
which the percentage and the cumulative percentage of their occurrence can be easily calculated.
Excelsior Enterprises: frequencies The frequencies for the number of individuals in the various
departments for the Excelsior Enterprises sample are shown in Output 14.1. It may be seen therefrom that
the greatest number of individuals in the sample came from the production department (28.1%), followed
by the sales department (25.3%). Only three individuals (1.7%) came from public relations, and five indi-
viduals each from the finance, maintenance, and accounting departments (2.9% from each). The low num-
bers in the sample in some of the departments are a function of the total population (very few members) in
those departments.
T A B L E 1 4 . 1
Scale type, data analysis, and methods of obtaining a visual summary for variables
Scale Examples
Measures
of central
tendency . . .
for a single
variable
Measures of
dispersion . . .
for a single
variable
Visual
summary . . .
for a single
variable
Measure of
relation . . .
between
variables
Visual
summary of
relation . . .
between
variables
Nominal Social security
number,
gender
Mode — Bar chart, pie
chart
Contingency
table
(Cross‐tab)
Stacked bars,
Clustered
bars
Ordinal Satisfaction rating
on a 5‐point
scale (1 = not
satisfied at all;
5 = extremely
satisfied)
Median Semi‐interquartile
range
Bar chart, pie
chart
Contingency
table
(Cross‐tab)
Stacked bars,
Clustered
bars
Interval Arithmetic
mean
Minimum, maximum,
standard deviation,
variance, coefficient
of variation
Histogram,
scatterplot,
box‐and‐
whisker plot
Correlations Scatterplots
Ratio Age, Sales Arithmetic or
geometric
mean
Minimum, maximum,
standard deviation,
variance, coefficient
of variation
Histogram,
scatterplot,
box‐and‐
whisker plot
Correlations Scatterplots
chapter quantitative data analysis 279

From the frequencies obtained for the other variables (results not shown here) it was found that 79.9% of the
respondents were men and 20.1% women; about 62% worked the first shift, 20% the second shift, and 18% the
third shift. About 16% of the respondents worked part time and 84% full time. About 8% had less than a high
school diploma, 39% a high school diploma, 32% a college degree, 20% a master ’ s degree, and 1% had doc-
toral degrees.
We thus have a profile of the employees in this organization, which is useful for describing the sample in
the “methods” section of the written report (see Chapter 17 ). Other instances where frequency distributions
would be useful are when: (1) a marketing manager wants to know how many units (and what proportions or
percentages) of each brand of coffee are sold in a particular region during a given period; (2) a tax consultant
wishes to keep count of the number of times different sizes of firms (small, medium, large) are audited by the
IRS; and (3) the financial analyst wants to keep track of the number of times the shares of manufacturing,
industrial, and utility companies lose or gain more than ten points on the New York Stock Exchange over a
six‐month period.
Bar charts and pie charts
Frequencies can also be visually displayed as bar charts, histograms, or pie charts. Bar charts, histograms, and pie
charts help us to understand our data.
Excelsior Enterprises: bar chart Figure 14.5 provides a graphic representation of the results listed in the
table in Output 14.1 .
Frequency distributions, bar charts, histograms, and pie charts provide a great deal of basic information
about the data. Measures of central tendency and dispersion will help us to further understand our data. These
are discussed next.
OUTPUT 14.1
FREQUENCIES
From the menus, choose:
Analyze
Descriptive Statistics
Frequencies
[Select the relevant variables]
Choose needed:
Statistics . . .
Charts . . .
Format [for the order in which the results are to be displayed]
OUTPUT 14 1
280 research methods for business

OUTPUT: RESPONDENT’S DEPARTMENT
Frequency Percent Valid percent Cumulative percent
Marketing 13 7.5 7.5 7.5
Production 49 28.1 28.1 35.6
Sales 44 25.3 25.3 60.9
Finance 5 2.9 2.9 63.8
Servicing 34 19.5 19.5 83.3
Maintenance 5 2.9 2.9 86.2
Personnel 16 9.2 9.2 95.4
Public Relations 3 1.7 1.7 97.1
Accounting 5 2.9 2.9 100.0
Total 174 100.0 100.0 100.0
(Continued)
chapter quantitative data analysis 281
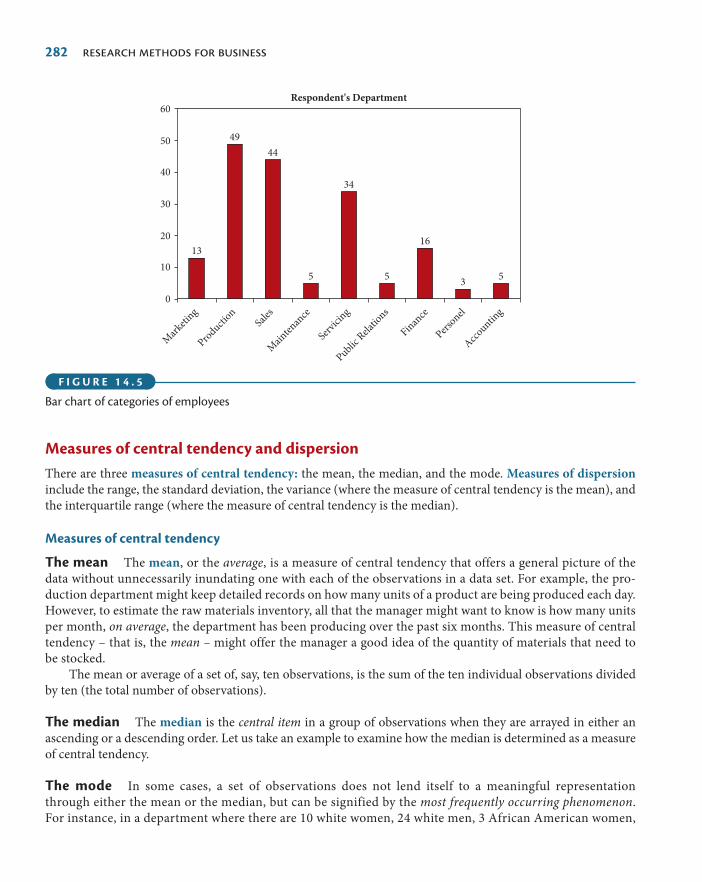
Measures of central tendency and dispersion
There are three measures of central tendency: the mean, the median, and the mode. Measures of dispersion
include the range, the standard deviation, the variance (where the measure of central tendency is the mean), and
the interquartile range (where the measure of central tendency is the median).
Measures of central tendency
The mean The mean, or the average, is a measure of central tendency that offers a general picture of the
data without unnecessarily inundating one with each of the observations in a data set. For example, the pro-
duction department might keep detailed records on how many units of a product are being produced each day.
However, to estimate the raw materials inventory, all that the manager might want to know is how many units
per month, on average, the department has been producing over the past six months. This measure of central
tendency – that is, the mean – might offer the manager a good idea of the quantity of materials that need to
be stocked.
The mean or average of a set of, say, ten observations, is the sum of the ten individual observations divided
by ten (the total number of observations).
The median The median is the central item in a group of observations when they are arrayed in either an
ascending or a descending order. Let us take an example to examine how the median is determined as a measure
of central tendency.
The mode In some cases, a set of observations does not lend itself to a meaningful representation
through either the mean or the median, but can be signified by the most frequently occurring phenomenon.
For instance, in a department where there are 10 white women, 24 white men, 3 African American women,
Respondent's Department
13
49
44
5
34
5
16
35
0
10
20
30
40
50
60
Mar
ketin
g
Product
ion
Sale
s
Mai
ntenan
ce
Serv
icin
g
Public R
elat
ions
Finan
ce
Perso
nel
Acc
ounting
F I G U R E 1 4 . 5
Bar chart of categories of employees
282 research methods for business

and 2 Asian women, the most frequently occurring group – the mode – is the white men. Neither a mean
nor a median is calculable or applicable in this case. There is also no way of indicating any measure
of dispersion.
We have illustrated how the mean, median, and the mode can be useful measures of central tendency, based
on the type of data we have. We will now examine dispersion.
Measures of dispersion
Apart from knowing that the measure of central tendency is the mean, median, or mode (depending on
the type of available data), one would also like to know about the variability that exists in a set of obser-
vations. Like the measure of central tendency, the measure of dispersion is also unique to nominal and
interval data.
Two sets of data might have the same mean, but the dispersions could be different. For example, if Company
A sold 30, 40, and 50 units of a product during the months of April, May, and June, respectively, and Company B
sold 10, 40, and 70 units during the same period, the average units sold per month by both companies is the
same – 40 units – but the variability or the dispersion in the latter company is larger.
The three measurements of dispersion connected with the mean are the range, the variance, and the stand-
ard deviation, which are explained below.
Range Range refers to the extreme values in a set of observations. The range is between 30 and 50 for Company A
(a dispersion of 20 units), while the range is between 10 and 70 units (a dispersion of 60 units) for Company B. Another
more useful measure of dispersion is the variance.
Variance The variance is calculated by subtracting the mean from each of the observations in the data set,
taking the square of this difference, and dividing the total of these by the number of observations. In the above
example, the variance for each of the two companies is:
Variance for Company A
Var
( ) ( ) ( ).
30 40 40 40 50 40
366 7
2 2 2
iiance for Company B( ) ( ) ( )10 40 40 40 70 40
3600
2 2 2
As we can see, the variance is much larger in Company B than Company A. This makes it more difficult for
the manager of Company B to estimate how many goods to stock than it is for the manager of Company A. Thus,
variance gives an indication of how dispersed the data in a data set are.
EXAMPLE
Let’s say the annual salaries of nine employees in a
department are as follows: $65 000, $30 000, $25 000,
$64 000, $35 000, $63 000, $32 000, $60 000, and $61
000. The mean salary here works out to be about $48
333, but the median is $60 000. That is, when arrayed in
ascending order, the figures will be as follows: $25 000,
$30 000, $32 000, $35 000, $60 000, $61 000, $63 000,
$64 000, $65 000, and the figure in the middle is $60 000.
If there is an even number of employees, then the
median will be the average of the middle two salaries.
chapter quantitative data analysis 283

Standard deviation The standard deviation, which is another measure of dispersion for interval and
ratio scaled data, offers an index of the spread of a distribution or the variability in the data. It is a very
commonly used measure of dispersion, and is simply the square root of the variance. In the case of the
above two companies, the standard deviation for Companies A and B would be √66.7 and √600 or 8.167 and
24.495, respectively.
The mean and standard deviation are the most common descriptive statistics for interval and ratio scaled
data. The standard deviation, in conjunction with the mean, is a very useful tool because of the following statisti-
cal rules, in a normal distribution:
1. Practically all observations fall within three standard deviations of the average or the mean.
2. More than 90% of the observations are within two standard deviations of the mean.
3. More than half of the observations are within one standard deviation of the mean.
Other measures of dispersion When the median is the measure of central tendency, percentiles,
deciles, and quartiles become meaningful. Just as the median divides the total realm of observations
into two equal halves, the quartile divides it into four equal parts, the decile into ten, and the percentile
into 100 equal parts. The percentile is useful when huge masses of data, such as the GRE or GMAT scores,
are handled. When the area of observations is divided into 100 equal parts, there are 99 percentile points.
Any given score has a probability of 0.01 that it will fall in any one of those points. If John’s score is in the
16th percentile, it indicates that 84% of those who took the exam scored better than he did, while 15%
did worse.
Oftentimes we are interested in knowing where we stand in comparison to others – are we in the middle, in
the upper 10 or 25%, or in the lower 20 or 25%, or where? For instance, if in a company‐administered test,
Mr Chou scores 78 out of a total of 100 points, he may be unhappy if he is in the bottom 10% among his
colleagues (the test‐takers), but may be reasonably pleased if he is in the top 10%, despite the fact that his score
remains the same. His standing in relation to the others can be determined by the central tendency median and
the percentile he falls in.
The measure of dispersion for the median, the interquartile range, consists of the middle 50% of
the observations (i.e., observations excluding the bottom and top 25% quartiles). The interquartile range
is very useful when comparisons are to be made among several groups. For instance, telephone companies
can compare long‐distance charges of customers in several areas by taking samples of customer bills
from each of the cities to be compared. By plotting the first and third quartiles and comparing the median
and the spread, they can get a good idea of where billings tend to be highest, to what extent customers
vary in the frequency of use of long‐distance calls, and so on. This is done by creating a box‐and‐whisker
plot for each area. The box‐and‐whisker plot is a graphic device that portrays central tendency, percen-
tiles, and variability. A box is drawn, extending from the first to the third quartile, and lines are drawn
from either side of the box to the extreme scores, as shown in Figure 14.6(a). Figure 14.6(b) has the median
represented by a dot within each box. Side‐by‐side comparisons of the various plots clearly indicate the
highest value, the range, and the spread for each area or city. For a fuller discussion on this, refer to
Salvia (1990).
In sum, we have illustrated how the mean, median, and the mode can be useful measures of central ten-
dency, depending on the type of available data. Likewise, we have shown how the standard deviation (and vari-
ance, which is the square of standard deviation), and the interquartile range are useful measures of dispersion.
Obviously, there is no measure of dispersion associated with the mode.
284 research methods for business

Relationships between variables
In a research project that includes several variables, beyond knowing the descriptive statistics of the variables, we
would often like to know how one variable is related to another. That is, we would like to see the nature, direction,
and significance of the bivariate relationships of the variables used in the study (i.e., the relationship between any
two variables among the variables tapped in the study).
Nonparametric tests are available to assess the relationship between variables measured on a nominal or an
ordinal scale. Spearman’s rank correlation and Kendall’s rank correlation are used to examine relationships between
two ordinal variables. A correlation matrix is used to examine relationships between interval and/or ratio variables.
Relationship between two nominal variables: χ2 test
We might sometimes want to know if there is a relationship between two nominal variables or whether they are
independent of each other. As examples: (1) Is viewing a television advertisement of a product (yes/no) related to
buying that product by individuals (buy/don’t buy)? (2) Is the type of job done by individuals (white‐collar job/
blue‐collar job) a function of the color of their skin (white/nonwhite)? Such comparisons are possible by organ-
izing data by groups or categories and seeing if there are any statistically significant relationships. For example, we
might collect data from a sample of 55 individuals whose color of skin and nature of jobs, culled from a frequency
count, might be illustrated as in Table 14.2 in a two‐by‐two contingency table. Just by looking at Table 14.2, a
Los Angeles
San Diego
San Francisco
2X(1) Q1 Q2 Q3 X(n) 4 6 8 10 12
(b)(a)
14 16 18 20 22 24 26
F I G U R E 1 4 . 6
(a) Box-and-whisker plot; (b) comparison of telephone bills in three cities
T A B L E 1 4 . 2
Contingency table of skin color and job type
Skin color White collar Blue collar Total
White 30 5 35
Nonwhite 2 18 20
Total 32 23 55
chapter quantitative data analysis 285

clear pattern seems to emerge that those who are white hold white‐collar jobs. Only a few of the nonwhites hold
white‐collar jobs. Thus, there does seem to be a relationship between the color of the skin and the type of job
handled; the two do not seem to be independent. This can be statistically confirmed by the chi‐square ( 2) test –
a nonparametric test – which indicates whether or not the observed pattern is due to chance. As we know,
nonparametric tests are used when normality of distributions cannot be assumed as in nominal or ordinal data.
The 2 test compares the expected frequency (based on probability) and the observed frequency, and the 2
statistic is obtained by the formula:
22( )Oi Ei
Ei
where 2 is the chi‐square statistic; Oi is the observed frequency of the ith cell; and Ei is the expected frequency.
The 2 statistic with its level of significance can be obtained for any set of nominal data through computer analysis.
Thus, in testing for differences in relationships among nominally scaled variables, the 2 (chi‐square) statis-
tic comes in handy. The null hypothesis would be set to state that there is no significant relationship between two
variables (color of skin and nature of the job, in the above example), and the alternate hypothesis would state that
there is a significant relationship.
The chi‐square statistic is associated with the degrees of freedom (df), which denote whether or not a signifi-
cant relationship exists between two nominal variables. The number of degrees of freedom is one less than the
number of cells in the columns and rows. If there are four cells (two in a column and two in a row), then the
number of degrees of freedom would be 1: [( ) ( )]2 1 2 1 . The chi‐square statistic for various df is provided in
Table III in the statistical tables toward the end of the book.
The 2 statistic can also be used for multiple levels of two nominal variables. For instance, one might be
interested to know if four groups of employees – production, sales, marketing, and R&D personnel – react to a
policy in four different ways (i.e., with no interest at all, with mild interest, moderate interest, and intense inter-
est). Here, the 2 value for the test of independence is generated by cross‐tabulating the data in 16 cells – that is,
classifying the data in terms of the four groups of employees and the four categories of interest. The degrees of
freedom here will be 9: [( ) ( )]4 1 4 1 .
The 2 test of significance thus helps us to see whether or not two nominal variables are related. Besides the 2 test, other tests, such as the Fisher exact probability test and the Cochran Q test are used to determine the rela-
tionship between two nominally scaled variables.
Correlations
A Pearson correlation matrix will indicate the direction, strength, and significance of the bivariate relation-
ships among all the variables that were measured at an interval or ratio level. The correlation is derived by
assessing the variations in one variable as another variable also varies. For the sake of simplicity, let us say
we have collected data on two variables – price and sales – for two different products. The volume of sales
at every price level can be plotted for each product, as shown in the scatter diagrams in Figure 14.7(a)
and 14.7(b).
Figure 14.7 (b) indicates a discernible pattern of how the two factors vary simultaneously (the trend of the
scatter is that of a downward straight line), whereas Figure 14.7 (a) does not. Looking at the scatter diagram in
Figure 14.7 (b), it would seem there is a direct negative correlation between price and sales for this product. That
is, as the price increases, sales of the product drop consistently. Figure 14.7 (a) suggests no interpretable pattern
for the other product.
286 research methods for business

A correlation coefficient that indicates the strength and direction of the relationship can be computed by
applying a formula that takes into consideration the two sets of figures – in this case, different sales volumes at
different prices.
Theoretically, there could be a perfect positive correlation between two variables, which is represented
by 1.0 (plus 1), or a perfect negative correlation which would be −1.0 (minus 1). However, neither of these
will be found in reality when assessing correlations between any two variables expected to be different from
each other.
While the correlation could range between −1.0 and +1.0, we need to know if any correlation found between
two variables is significant or not (i.e., if it has occurred solely by chance or if there is a high probability of its
actual existence). As we know, a significance of p 0 05. is the generally accepted conventional level in social sci-
ence research. This indicates that 95 times out of 100, we can be sure that there is a true or significant correlation
between the two variables, and there is only a 5% chance that the relationship does not truly exist. If there is a
correlation of 0.56 (denoted as r 0 56. ) between two variables A and B, with p 0 01. , then we know that there is
a positive relationship between the two variables and the probability of this not being true is 1% or less. That is,
over 99% of the time we would expect this correlation to exist. The correlation of 0.56 also indicates that the vari-
ables explain the variance in one another to the extent of 31.4% (0.562).
We do not know which variable causes which, but we do know that the two variables are associated with each
other. Thus, a hypothesis that postulates a significant positive (or negative) relationship between two variables
can be tested by examining the correlation between the two.
The Pearson correlation coefficient is appropriate for interval‐ and ratio‐scaled variables, and the Spearman
Rank or the Kendall’s tau coefficients are appropriate when variables are measured on an ordinal scale. Any
bivariate correlation can be obtained by clicking the relevant menu, identifying the variables, and seeking the
appropriate parametric or nonparametric statistics.
EXCELSIOR ENTERPRISES: DESCRIPTIVE STATISTICS PART 1
Descriptive statistics such as maximum, minimum, means, standard deviations, and variance were obtained for
the interval‐scaled items of the Excelsior Enterprises study. The procedure is shown in Output 14.2.
Sale
s
Price
(a)
Sale
s
Price
(b)
F I G U R E 1 4 . 7
(a) Scatter diagram with no discernible pattern; (b) scatter diagram indicating a downward or negative slope
chapter quantitative data analysis 287

OUTPUT 14.2
DESCRIPTIVE STATISTICS: CENTRAL TENDENCIES AND DISPERSIONS
From the menus, choose:
Analyze
Descriptive Statistics
Descriptives
[Select the variables]
Statistics . . .
[Choose the relevant statistics needed]
Output
pe1 pe2 pe3 pe4 pe5 jobchar1 jobchar2 jobchar3 jobchar4 burnout1 burnout2
N valid 174 174 174 171 171 172 173 173 173 171 171
N missing 0 0 0 3 3 2 1 1 1 3 3
Mean 2.385 2.270 2.523 2.491 2.552 3.526 3.428 3.549 3.462 2.468 2.444
Std deviation 1.023 0.980 1.126 0.916 0.999 1.097 1.035 1.097 1.081 1.238 1.041
Variance 1.047 0.961 1.268 0.840 0.997 1.204 1.072 1.203 1.169 1.533 1.084
Minimum 1 1 1 1 1 1 1 1 1 1 1
Maximum 5 5 5 5 5 6 5 5 5 5 5
OUTPUT 14 2
288 research methods for business

The results presented in the table in Output 14.2 indicate that:
● there are missing observations for every item except for the items pe1, pe2, pe3, burnout10, itl1, and itl2;
● there are illegal codes for items jobchar1 (a 6 has been entered in at least one cell), burnout3 (again, a 6 has
been entered in at least one cell), and itl2 (a 5 has been entered in at least one cell);
● the responses to each individual item have a good spread.
Appropriate actions were taken to correct the illegal entries. A further inspection of the missing data revealed
that every participant answered either all or the vast majority of the questions. Therefore, no questionnaires were
thrown out. Missing data will be ignored during subsequent analyses.
From here, we can proceed with further detailed analyses to test the goodness of our data.
TESTING THE GOODNESS OF MEASURES
The reliability and validity of the measures can now be tested.
Reliability
As discussed in Chapter 12, the reliability of a measure is established by testing for both consistency and
stability. Consistency indicates how well the items measuring a concept hang together as a set. Cronbach’s alpha
is a reliability coefficient that indicates how well the items in a set are positively correlated to one another.
Cronbach’s alpha is computed in terms of the average intercorrelations among the items measuring the concept.
The closer Cronbach’s alpha is to 1, the higher the internal consistency reliability.
burnout3 burnout4 burnout5 burnout6 burnout7 burnout8 burnout9 burnout10 job sat itl1 itl2
N valid 171 171 173 173 173 173 173 174 173 174 174
N missing 3 3 1 1 1 1 1 0 1 0 0
Mean 2.462 2.532 2.734 2.665 2.584 2.688 2.798 2.270 2.931 2.569 2.615
Std deviation 1.144 1.356 1.028 1.064 1.146 1.129 0.988 1.021 1.169 0.828 0.903
Variance 1.309 1.356 1.057 1.131 1.314 1.274 0.976 1.042 1.367 0.686 0.816
Minimum 1 1 1 1 1 1 1 1 1 1 1
Maximum 6 5 5 5 5 5 5 4 5 4 5
Visit the companion website at www.wiley.com/college/sekaran for Author Video:
Reliability.
chapter quantitative data analysis 289

Another measure of consistency reliability used in specific situations is the split‐half reliability coefficient.
Since this reflects the correlations between two halves of a set of items, the coefficients obtained will vary depend-
ing on how the scale is split. Sometimes split‐half reliability is obtained to test for consistency when more than one
scale, dimension, or factor, is assessed. The items across each of the dimensions or factors are split, based on some
predetermined logic (Campbell, 1976). In almost every case, Cronbach’s alpha is an adequate test of internal con-
sistency reliability. You will see later in this chapter how Cronbach’s alpha is obtained through computer analysis.
As discussed in Chapter 12, the stability of a measure can be assessed through parallel form reliability and
test–retest reliability. When a high correlation between two similar forms of a measure (see Chapter 12) is
obtained, parallel form reliability is established. Test–retest reliability can be established by computing the cor-
relation between the same tests administered at two different time periods.
Excelsior Enterprises: checking the reliability of the multi-item measures
Because perceived equity, burnout, job enrichment, and intention to leave were measured with multi‐item scales,
the consistency of the respondents’ answers to the scale items has to be tested for each measure. In Chapter 12,
we explained that Cronbach’s alpha is a popular test of inter‐item consistency. Table 14.3 provides an overview of
Cronbach’s alpha for the four variables. This table shows that the alphas were all well above 0.60.
In general, reliabilities less than 0.60 are considered to be poor, those in the 0.70 range, acceptable, and those
over 0.80 good. Thus, the internal consistency reliability of the measures used in this study can be considered to
be acceptable for the intention to leave measure and good for the other measures.
It is important to note that all the negatively worded items in the questionnaire should first be reversed
before the items are submitted for reliability tests. Unless all the items measuring a variable are in the same direc-
tion, the reliabilities obtained will be incorrect.
A sample of the result obtained for the Cronbach’s alpha test for job enrichment, together with instructions
on how it is obtained, is shown in Output 14.3.
The reliability of the job enrichment measure is presented in the first table in Output 14.3. The second table
provides an overview of the alphas if we take one of the items out of the measure. For instance, it is shown that if
the first item (Jobchar1) is taken out, Cronbach’s alpha of the new three‐item measure will be 0.777. This means
that the alpha will go down if we take item 1 out of our measure. Likewise, if we take out item 2, our alpha will go
down and become 0.788. Note that even if our alpha would increase if we would take out one of the items, we
would not take it out for two reasons. First, our alpha is above 0.7 so we do not have to take any remedial actions.
Second, if we would take one of the items out, the validity of our measure would probably decrease. The items (all
of them) were included in the original measure for a reason!
T A B L E 1 4 . 3
Reliability of the Excelsior Enterprises measures
Variable Number of items Cronbach’s alpha
Perceived equity 5 0.882
Job enrichment 4 0.844
Burnout 10 0.813
Intention to leave 2 0.749
290 research methods for business

OUTPUT 14.3
RELIABILITY ANALYSIS
From the menus, choose:
Analyze
Scale
Reliability Analysis . . .
[Select the variables constituting the scale]
Choose Model Alpha [this is the default option]
Click on Statistics .
Select Scale if item deleted under Descriptives
Output
Reliability statistics
Cronbach ’ s alpha Number of items
0.844 4
OUTPUT 14 3
chapter quantitative data analysis 291

If, however, our Cronbach’s alpha was too low (under 0.60) then we could use this table to find out which of
the items would have to be removed from our measure to increase the inter‐item consistency. Note that, usually,
taking out an item, although improving the reliability of our measure, affects the validity of our measure in a
negative way.
Now that we have established that the inter‐item consistency is satisfactory for perceived equity, job enrich-
ment, burnout, and intention to leave, the scores on the original questions can be combined into a single score.
For instance, a new “perceived equity” score can be calculated from the scores on the five individual “perceived
equity” items (but only after items 1, 2, and 4 have been reverse coded). Likewise, a new “job enrichment” score
can be calculated from the scores on the four individual “job enrichment” items, and so on. We have already
explained that this involves calculating the summed score (per case/participant) and then dividing it by the num-
ber of items.
Validity
Factorial validity can be established by submitting the data for factor analysis. The results of factor analysis (a
multivariate technique) will confirm whether or not the theorized dimensions emerge. Recall from Chapter 11
that measures are developed by first delineating the dimensions so as to operationalize the concept. Factor analy-
sis reveals whether the dimensions are indeed tapped by the items in the measure, as theorized. Criterion‐
related validity can be established by testing for the power of the measure to differentiate individuals who are
known to be different (refer to discussions regarding concurrent and predictive validity in Chapter 12).
Convergent validity can be established when there is a high degree of correlation between two different sources
responding to the same measure (e.g., both supervisors and subordinates respond similarly to a perceived reward
system measure administered to them). Discriminant validity can be established when two distinctly different
concepts are not correlated to each other (e.g., courage and honesty; leadership and motivation; attitudes and
behavior). Convergent and discriminant validity can be established through the multitrait multimethod matrix,
a full discussion of which is beyond the scope of this book. The student interested in knowing more about factor
analysis and the multitrait multimethod matrix can refer to books on those subjects. When well‐validated meas-
ures are used, there is no need, of course, to establish their validity again for each study. The reliability of the
items can, however, be tested.
Item‐total statistics
Scale mean if
item deleted
Scale variance if
item deleted
Corrected item‐total
variation
Cronbach’s alpha if
item deleted
Jobchar1 10,4393 7,143 ,735 ,777
Jobchar2 10,5318 7,483 ,714 ,788
Jobchar3 10,4104 7,639 ,620 ,828
Jobchar4 10,4971 7,554 ,652 ,814
292 research methods for business

EXCELSIOR ENTERPRISES: DESCRIPTIVE STATISTICS PART 2
Once the new scores for perceived equity, job enrichment, burnout, and intention to leave have been calculated,
we are ready to further analyze the data. Descriptive statistics such as maximum, minimum, means, standard
deviations, and variance can now be obtained for the multi‐item, interval‐scaled independent and dependent
variables. What’s more, a correlation matrix can also be obtained to examine how the variables in our model are
related to each other.
This will help us to answer important questions such as:
● How big is the problem? In other words, to what extent are the employees of Excelsior Enterprises inclined to
leave? What is the average inclination to leave?
● What is the nature of the problem? Compare, for instance, the histograms provided in Figure 14.8. The average
ITL is the same in both cases. However, the graphs show us that in the first hypothetical histogram ITL is
"fairly normally" distributed.1 In the second hypothetical histogram, the distribution is clearly not normal. In
fact, it looks bimodal (with two peaks indicative of two modes). The first distribution suggests that most of the
respondents are neither bent on leaving nor staying. The bimodal distribution, on the other hand, suggests
that one group of employees is not inclined to leave at all, whereas another group is determined to leave the
organization.2
,00 1,00
60
50
40
30
Fre
quen
cy
Fre
quen
cy
20
10
0
60
40
20
02,00
ITL
Histogram Histogram
3,00 4,00 5,00 ,00 1,00 2,00ITL
3,00 4,00 5,00
Mean = 2,57Std. Dev. = ,952N = 174
Mean = 2,56Std. Dev. = 1,31N = 174
F I G U R E 1 4 . 8
Two hypothetical histograms of “intention to leave”
1Note that there are objective tests to decide whether or not a distribution is normal, for instance the Kolmogorov‐Smirnov test and the
Shapiro‐Wilk test.2“Normally distributed data” is one of the assumptions of parametric data; this assumption is unmistakably violated in the second histogram.
An excellent discussion on the assumptions of parametric data and on what to do if the assumptions are violated is provided by Andy Field
in his book Discovering Statistics Using SPSS (Field, 2009).
chapter quantitative data analysis 293

Descriptive statistics will also help us to answer the following questions:
● Are the employees satisfied with their jobs?
● What are the employees’ perceptions on job enrichment?
● How many employees have which degrees of burnout?
● Is there much variance in the extent to which employees perceive the relationship with the company as
equitable?
● What are the relationships between perceived equity, burnout, job enrichment, job satisfaction, and inten-
tion to leave?
The answers to these questions will help us (together with the results of our hypotheses tests) to make
informed decisions on how we can best solve the problem.
Descriptive statistics such as maximum, minimum, means, standard deviations, and variance were obtained
for the interval‐scaled independent and dependent variables in the Excelsior Enterprises study. The results are
shown in Table 14.4. It may be mentioned that all variables except ITL were tapped on a five‐point scale. ITL was
measured on a four‐point scale.
From the results, it may be seen that the mean of 2.59 on a four‐point scale for ITL indicates that Excelsior
Enterprises has a problem with regard to turnover. The minimum of 1 reveals that there are some employees who
do not intend to leave at all, and the maximum of 4 reveals that some are seriously considering leaving. Job sat-
isfaction is about average (2.91 on a five‐point scale). The mean on perceived equity is rather low (2.44 on a
five‐point scale), as is the mean on experienced burnout (2.57). Finally, the job is perceived as somewhat enriched
(3.49). Table 14.4 also points out that the variance for all the variables is rather high, indicating that participants’
answers are not always very close to the mean on all the variables.
Table 14.5 provides a more detailed account of employees’ intentions to leave. This table shows that a large
group of employees seriously considers leaving Excelsior Enterprises! Testing our hypotheses will improve our
understanding of why employees consider leaving Excelsior Enterprises and will provide us with useful tools to
reduce employees’ intentions to leave the company.
The Pearson correlation matrix obtained for the five interval‐scaled variables is shown in Table 14.6. From
the results, we see that the intention to leave is, as would be expected, significantly negatively correlated to job
satisfaction, perceived equity, and job enrichment. That is, the intention to leave is low if job satisfaction and
equitable treatment are experienced, and the job is enriched. However, when individuals experience burnout
(physical and emotional exhaustion), their intention to leave does not increase (this relationship is not significant;
T A B L E 1 4 . 4
Descriptive statistics for independent and dependent variables
N Minimum Maximum Mean Std deviation Variance
ITL 174 1.00 4.00 2.589 0.769 0.592
Job satisfaction 173 1.00 5.00 2.931 1.169 1.367
Perceived equity 174 1.00 4.60 2.444 0.883 0.694
Burnout 174 1.20 4.60 2.566 0.681 0.463
Jobchar 173 1.00 5.00 3.491 0.888 0.789
294 research methods for business
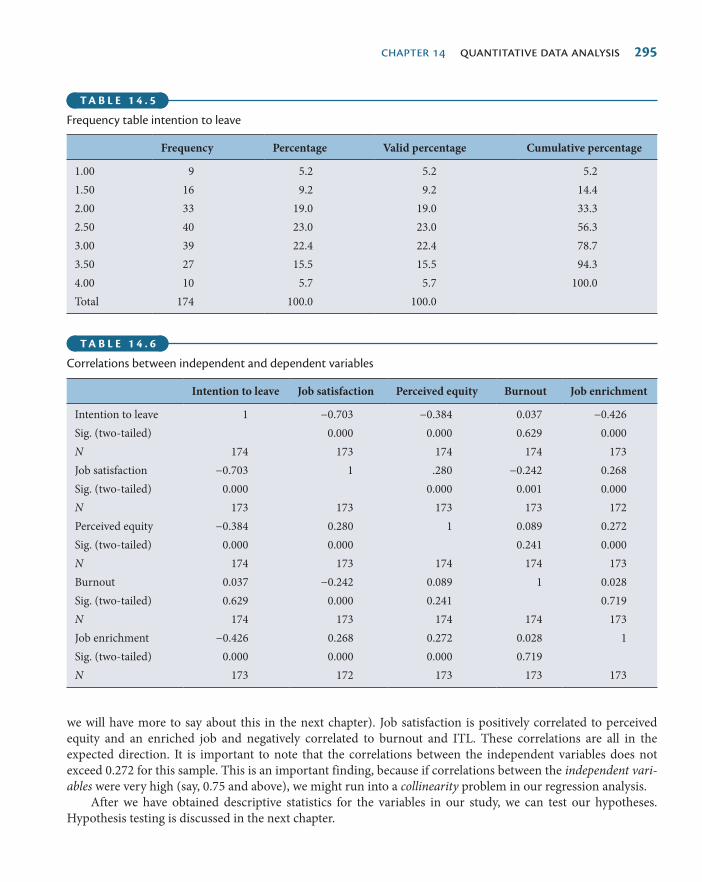
we will have more to say about this in the next chapter). Job satisfaction is positively correlated to perceived
equity and an enriched job and negatively correlated to burnout and ITL. These correlations are all in the
expected direction. It is important to note that the correlations between the independent variables does not
exceed 0.272 for this sample. This is an important finding, because if correlations between the independent vari-
ables were very high (say, 0.75 and above), we might run into a collinearity problem in our regression analysis.
After we have obtained descriptive statistics for the variables in our study, we can test our hypotheses.
Hypothesis testing is discussed in the next chapter.
T A B L E 1 4 . 5
Frequency table intention to leave
Frequency Percentage Valid percentage Cumulative percentage
1.00 9 5.2 5.2 5.2
1.50 16 9.2 9.2 14.4
2.00 33 19.0 19.0 33.3
2.50 40 23.0 23.0 56.3
3.00 39 22.4 22.4 78.7
3.50 27 15.5 15.5 94.3
4.00 10 5.7 5.7 100.0
Total 174 100.0 100.0
T A B L E 1 4 . 6
Correlations between independent and dependent variables
Intention to leave Job satisfaction Perceived equity Burnout Job enrichment
Intention to leave 1 −0.703 −0.384 0.037 −0.426
Sig. (two‐tailed) 0.000 0.000 0.629 0.000
N 174 173 174 174 173
Job satisfaction −0.703 1 .280 −0.242 0.268
Sig. (two‐tailed) 0.000 0.000 0.001 0.000
N 173 173 173 173 172
Perceived equity −0.384 0.280 1 0.089 0.272
Sig. (two‐tailed) 0.000 0.000 0.241 0.000
N 174 173 174 174 173
Burnout 0.037 −0.242 0.089 1 0.028
Sig. (two‐tailed) 0.629 0.000 0.241 0.719
N 174 173 174 174 173
Job enrichment −0.426 0.268 0.272 0.028 1
Sig. (two‐tailed) 0.000 0.000 0.000 0.719
N 173 172 173 173 173
chapter quantitative data analysis 295

SUMMARY
● Learning objective 1: Demonstrate the ability to get data ready for quantitative analysis.
After quantitative data have been collected, the next step is to analyze them to answer the research ques-
tions. However, before the data can be analyzed, they need to be coded, keyed in, and edited. A categoriza-
tion scheme has to be set up before the data can be typed in. Then, outliers, inconsistencies, and blank
responses, if any, have to be handled in some way. Data transformation, the next step, is a variation of data
coding; it is the process of changing the original numerical representation of a quantitative value to another
value. Data are typically changed to avoid problems in the next stage of the data analysis process. Data trans-
formation is also necessary when several questions have been used to measure a single concept.
● Learning objective 2: Describe the various processes by which one can get a feel for the data in a study.
The researcher can acquire a feel for the data by obtaining a visual summary or by checking the central ten-
dency and the dispersion of a variable. One can also get to know the data by examining the relation between
two variables.
● Learning objective 3: Describe the means by which the reliability and validity of measures can
be assessed.
The reliability of a measure is established by testing for both consistency and stability. Consistency indicates
how well the items measuring a concept hang together as a set. Cronbach’s alpha is a reliability coefficient
that indicates how well the items in a set are correlated to one another. Another measure of consistency
reliability used in specific situations is the split-half reliability coefficient. Factorial validity can be established
by submitting the data for factor analysis. Criterion-related validity can be established by testing for the
power of the measure to differentiate individuals who are known to be different. Convergent validity can be
established when there is a high degree of correlation between two different sources responding to the same
measure. Discriminant validity can be established when two distinctly different concepts are not correlated
to each other.
Visit the companion website at www.wiley.com/college/sekaran for Case Study: The
Doughnut Dilemma.
296 research methods for business

DISCUSSION QUESTIONS
1. What activities are involved in getting the data ready for analysis?
2. What does coding the data involve?
3. Data editing deals with detecting and correcting illogical, inconsistent, or illegal data in the informa-
tion returned by the participants of the study. Explain the difference between illogical, inconsistent,
and illegal data.
4. How would you deal with missing data?
5. What is reverse scoring and when is reverse scoring necessary?
6. There are three measures of central tendency: the mean, the median, and the mode. Measures of dis-
persion include the range, the standard deviation, and the variance (where the measure of central
tendency is the mean), and the interquartile range (where the measure of central tendency is the
median). Describe these measures and explain which of these measures you would use to provide an
overview of (a) nominal, (b) ordinal, and (c) interval data?
7. A researcher wants to provide an overview of the gender of the respondents in his sample. The gender
is measured like this: What is your gender? □ Male □ Female. What is the best way to provide an
overview of the gender of the respondents?
8. Consider the following reliability analysis for the variable customer differentiation. What could you
conclude from it?
Reliability analysis-scale (alpha)
Item‐total statistics
Scale Scale Corrected
Mean if item deleted
Variance if item deleted
Item‐total correlation
Alpha if item deleted
CUSDIF1 10.0405 5.4733 0.2437 0.7454
CUSDIF2 9.7432 5.0176 0.5047 0.3293
CUSDIF3 9.6486 5.3754 0.4849 0.3722
Reliability coefficients
N of Cases = 111.0 N of Items = 3
Alpha = 0.5878
chapter quantitative data analysis 297

EXERCISE 14.4
The following data are available:
Respondent Age Exam mark Paper mark Sex Year in college IQ
1 21 87 83 M 2 80
2 19 83 80 M 1 100
3 23 85 86 M 4 98
4 21 81 75 F 1 76
5 21 81 75 F 3 82
6 20 67 68 F 3 99
7 26 75 88 F 2 120
8 24 92 78 F 4 115
9 26 78 92 M 4 126
10 30 89 95 F 3 129
11 21 72 80 F 1 86
12 19 81 65 M 2 80
13 17 75 77 M 1 70
14 19 76 85 F 1 99
15 35 80 83 F 3 99
16 27 75 60 F 2 60
17 21 85 80 M 3 89
18 27 79 75 M 4 70
19 21 90 93 F 3 140
20 22 97 95 M 3 165
21 21 90 82 M 2 115
22 19 87 86 F 3 119
23 32 95 90 M 2 120
24 19 68 57 F 3 89
Note: Maximum exam mark = 100, Maximum paper mark = 100, Sex: M = male, F = female, Year in college: 1 = Freshman;
2 = Sophomore; 3 = Junior; 4 = Senior.
1. Data handling
a. Enter the data in SPSS. Save the file to your USB flashdrive. Name the file “resmethassignment1.”
b. Provide appropriate variable labels, value labels, and scaling indications to the variables.
2. Descriptives
a. Use Analyze, Descriptive statistics, Descriptives to summarize metric variables.
b. Use Analyze, Descriptive statistics, Frequencies to summarize nonmetric variables.
298 research methods for business

c. Create a pie‐chart for Year in college.
d. Create a histogram for IQ and include the normal distribution.
e. Make a scatter plot with IQ on the x‐axis and exam grade on the y‐axis. What do you conclude?
f. Recode the sex variable such that it is 1 for females and 0 for males.
g. Make a scatter plot with sex on the x‐axis and IQ on the y‐axis. What do you conclude?
h. Compute the mean IQ for males and for females. Conclusion?
i. Create a new dummy variable, IQdum, which is 1 if the IQ is larger than or equal to 100, and 0
otherwise.
chapter quantitative data analysis 299

INTRODUCTION
In Chapter 5 we discussed the steps to be followed in hypothesis development and testing. These steps are:
1. State the null and the alternate hypotheses.
2. Determine the level of significance desired (p 0 05. , or more, or less).
3. Choose the appropriate statistical test depending on the type of scales that have been used (nominal,
ordinal, interval, or ratio).
4. See if the output results from computer analysis indicate that the significance level is met. When the
resultant value is larger than the critical value, the null hypothesis is rejected, and the alternate accepted.
If the calculated value is less than the critical value, the null hypothesis is accepted and the alternate
hypothesis rejected.
In this chapter we will discuss hypothesis testing. First, we will pay attention to type I errors, type II errors,
and statistical power. Then, we will discuss various univariate and bivariate statistical tests that can be used to test
hypotheses. Finally, we will come back to the Excelsior Enterprises case and test the hypotheses that were
developed in the previous chapter.
Quantitative data analysis: Hypothesis testing
C H A P T E R 1 5
LEARNING OBJECTIVES
After completing Chapter 15, you should be able to:
1. Discuss type I errors, type II errors, and statistical power.
2. Test hypotheses using the appropriate statistical technique.
3. Describe data warehousing, data mining, and operations research.
4. Describe useful software packages for quantitative data analysis.
300

TYPE I ERRORS, TYPE II ERRORS, AND STATISTICAL POWER
In Chapter 5 we explained that the hypothetico‐deductive method requires hypotheses to be falsifiable. For this
reason, null hypotheses are developed. These null hypotheses (H0) are thus set up to be rejected in order to sup-
port the alternate hypothesis, termed HA.
The null hypothesis is presumed true until statistical evidence, in the form of a hypothesis test, indicates
otherwise. The required statistical evidence is provided by inferential statistics, such as regression analysis or
MANOVA. Inferential statistics help us to draw conclusions (or to make inferences) about the population
from a sample.
The purpose of hypothesis testing is to determine accurately if the null hypothesis can be rejected in favor of
the alternate hypothesis. Based on the sample data the researcher can reject the null hypothesis (and therefore
accept the alternate hypothesis) with a certain degree of confidence: there is always a risk that the inference that is
drawn about the population is incorrect.
There are two kinds of errors (or two ways in which a conclusion can be incorrect), classified as type I errors
and type II errors. A type I error, also referred to as alpha (α), is the probability of rejecting the null hypothesis
when it is actually true. In the Excelsior Enterprises example introduced in Chapter 14, a type I error would occur
if we concluded, based on the data, that burnout affects intention to leave when, in fact, it does not. The probabil-
ity of type I error, also known as the significance level, is determined by the researcher. Typical significance levels
in business research are 5% (<0.05) and 1% (<0.01).
A type II error, also referred to as beta (β), is the probability of failing to reject the null hypothesis given that
the alternate hypothesis is actually true; e.g., concluding, based on the data, that burnout does not affect intention
to leave when, in fact, it does. The probability of type II error is inversely related to the probability of type I error:
the smaller the risk of one of these types of error, the higher the risk of the other type of error.
A third important concept in hypothesis testing is statistical power (1 − β). Statistical power, or just power,
is the probability of correctly rejecting the null hypothesis. In other words, power is the probability that statistical
significance will be indicated if it is present.
Statistical power depends on:
1. Alpha (α): the statistical significance criterion used in the test. If alpha moves closer to zero (for
instance, if alpha moves from 5% to 1%), then the probability of finding an effect when there is an effect
decreases. This implies that the lower the α (i.e., the closer α moves to zero) the lower the power; the
higher the alpha, the higher the power.
2. Effect size: the effect size is the size of a difference or the strength of a relationship in the population: a
large difference (or a strong relationship) in the population is more likely to be found than a small dif-
ference (similarity, relationship).
3. The size of the sample: at a given level of alpha, increased sample sizes produce more power, because
increased sample sizes lead to more accurate parameter estimates. Thus, increased sample sizes lead to
a higher probability of finding what we were looking for. However, increasing the sample size can also
lead to too much power, because even very small effects will be found to be statistically significant.
Along these lines, there are four interrelated components that affect the inferences you might draw from a
statistical test in a research project: the power of the test, the alpha, the effect size, and the sample size. Given the
values for any three of these components, it is thus possible to calculate the value of the fourth. Generally, it is
recommended to establish the power, the alpha, and the required precision (effect size) of a test first, and then,
based on the values of these components, determine an appropriate sample size.
chapter quantitative data analysis: hypothesis testing 301

CHOOSING THE APPROPRIATE STATISTICAL TECHNIQUE
BOX 15.1
Th e focus of business research is usually on type I error. However, power (e.g., to determine an appropriate
sample size) and, in some situations, type II error (e.g., if you are testing the eff ect of a new drug) must also
be given serious consideration.
BOX 15 1
Visit the companion website at www.wiley.com/college/sekaran for Author Video:
Choosing the appropriate statistical technique .
After you have selected an acceptable level of statistical significance to test your hypotheses, the next step is to
decide on the appropriate method to test the hypotheses. The choice of the appropriate statistical technique
largely depends on the number of (independent and dependent) variables you are examining and the scale of
measurement (metric or nonmetric) of your variable(s). Other aspects that play a role are whether the assump-
tions of parametric tests are met and the size of your sample.
Univariate statistical techniques are used when you want to examine two‐variable relationships. For instance,
if you want to examine the effect of gender on the number of candy bars that students eat per week, univariate
statistics are appropriate. If, on the other hand, you are interested in the relationships between many variables,
such as in the Excelsior Enterprises case, multivariate statistical techniques are required. The appropriate univariate
or multivariate test largely depends on the measurement scale you have used, as Figure 15.1 illustrates.
Chi‐square analysis was discussed in the previous chapter. This chapter will discuss the other techniques
listed in Figure 15.1 . Note that some techniques are discussed more elaborately than others. A detailed discussion
of all these techniques is beyond the scope of this book.
Testing a hypothesis about a single mean
The one sample t ‐test is used to test the hypothesis that the mean of the population from which a sample is drawn
is equal to a comparison standard. Assume that you have read that the average student studies 32 hours a week.
From what you have observed so far, you think that students from your university (the population from which
your sample will be drawn) study more. Therefore, you ask 20 class mates how long they study in an average
week. The average study time per week turns out to be 36.2 hours, 4 hours and 12 minutes more than the study
time of students in general. The question is: is this a coincidence?
In the above example, the sample of students from your university differs from the typical student. What you
want to know, however, is whether your fellow students come from a different population than the rest of the
students. In other words, did you select a group of motivated students by chance? Or is there a “true” difference
between students from your university and students in general?
In this example the null hypothesis is:
H 0 : Th e number of study hours of students from our university is equal to the number of study hours of students
in general.
302 research methods for business

The alternate hypothesis is:
H1: The number of study hours of students from our university differs from the number of study hours of students
in general.
The way to decide whether there is a significant difference between students from your university and stu-
dents in general depends on three aspects: the value of the sample mean (36.2 hours); the value of the comparison
standard (32 hours); and the degree of uncertainty concerning how well the sample mean represents the popula-
tion mean (the standard error of the sample mean).
Univariate techniques:
Testing a hypothesis on a single mean:
Metric data: One sample t-test
Nonmetric data: Chi-square
Testing hypotheses about two related means
Independent samples
Metric data: Independent samples t-test
Nonmetric data: Chi-square
Mann−Whitney U -test
Related samples
Metric data Paired samples t-test
Nonmetric data: Chi-square
Wilcoxon
McNemar
Testing hypotheses about several means
Metric data: One-way analysis of variance
Nonmetric data: Chi-square
Multivariate techniques:
One metric dependent variable
Analysis of variance and covariance
Multiple regression analysis
Conjoint analysis
One nonmetric dependent variable
Discriminant analysis
Logistic regression
More than one metric dependent variable
Multivariate analysis of variance
Canonical correlation
F I G U R E 1 5 . 1
Overview of univariate and multivariate statistical techniques
chapter quantitative data analysis: hypothesis testing 303

Along these lines, the following formula is used to compute the t‐value:
tX
s nn 1
/
Assume that the observed standard deviation is 8. Hence, the t‐statistic becomes:
t36 2 32
8 202 438
.
/.
BOX 15.2
HOW DOES THIS WORK IN SPSS ?
Under the Analyze menu, choose Compare Means, then One‐Sample T Test. Move the dependent variable into
the “Test Variable(s)” box. Type in the value you wish to compare your sample to in the box called “Test Value.”
BOX 15 2
304 research methods for business

Having calculated the t‐statistic, we can now compare the t‐value with a standard table of t‐values with
n 1 degrees of freedom to determine whether the t‐statistic reaches the threshold of statistical significance.
When the t‐statistic is larger than the appropriate table value, the null hypothesis (no significant difference)
is rejected.
Our t‐statistic (2.438) is larger than the appropriate table value (1.729). This means that the difference
between 36.2 and 32 is statistically significant. The null hypothesis must thus be rejected: there is a significant
difference in study time between students from our university and students in general.
Testing hypotheses about two related means
We can also do a (paired samples) t-test to examine the differences in the same group before and after a treat-
ment. For example, would a group of employees perform better after undergoing training than they did before?
BOX 15.3
HOW DOES THIS WORK IN SPSS ?
Under the Analyze menu, choose Compare Means, then Paired‐Samples T Test. Move each of the two var-
iables whose means you want to compare to the “Paired Variables” list.
BOX 15 3
chapter quantitative data analysis: hypothesis testing 305

In this case, there would be two observations for each employee, one before the training and one after the train-
ing. We would use a paired samples t‐test to test the null hypothesis that the average of the differences between
the before and after measure is zero.
EXAMPLE
A university professor was interested in the effect of
her teaching program on the performance of her stu-
dents. For this reason, ten students were given a math
test in the first week of the semester and their scores
were recorded. Subsequently, the students were given
an equivalent test during the last week of the semester.
The professor now wants to know whether the stu-
dents’ math scores have increased.
Table 15.1 depicts the scores of students on the
math test in the first and in the last week of the semester.
To find out if there is a significant difference in
math scores we need a test statistic. The test statistic is
the average difference/sdifference
/√n.
In this example we get: 22.5/13.79412/√10.
Having calculated the t‐statistic, we can now com-
pare the t‐value with a standard table of t‐values with
n 1 degrees of freedom to determine whether the t‐
statistic reaches the threshold of statistical significance.
Again, when the t‐statistic is larger than the appropri-
ate table value, the null hypothesis (no significant dif-
ference) is rejected.
Our t‐statistic is larger than the appropriate table
value (1.83). This means that the difference between
70 and 57.5 is statistically significant. The null hypoth-
esis must thus be rejected: there is a significant increase
in math score.
T A B L E 1 5 . 1
Math scores of ten students in the first and last week of the semester
Math scores
Student Score first week Score last week Difference
1 55 75 +20
2 65 80 +15
3 70 75 +5
4 55 60 +5
5 40 45 +5
6 60 55 −5
7 80 75 −5
8 35 70 +35
9 55 75 +20
10 60 90 +30
Average score 57.5 70 22.5
306 research methods for business

BOX 15.4
HOW DOES THIS WORK IN SPSS ?
Under the Analyze menu, choose Nonparametric Tests, then Related Samples. Choose ‘Automatically
compare observed data to hypothesized’ as the objective of your analysis, ‘Wilcoxon matched-pair signed-
rank (2 samples)’, under ‘Settings’ and move the variables you want to compare into the ‘Test Fields’ box.
BOX 15 4
chapter quantitative data analysis: hypothesis testing 307
The Wilcoxon signed‐rank test is a nonparametric test for examining significant differences between two
related samples or repeated measurements on a single sample. It is used as an alternative to a paired samples t‐test
when the population cannot be assumed to be normally distributed.
McNemar ’ s test is a nonparametric method used on nominal data. It assesses the significance of the differ-
ence between two dependent samples when the variable of interest is dichotomous. It is used primarily in before−
after studies to test for an experimental effect.
In the following example, a researcher wants to determine whether the use of a new training method (called
CARE) has an effect on the performance of athletes. Counts of individual athletes are given in Table 15.2 . The
performance (average/good) before the treatment (the new training method) is given in the columns (244 ath-
letes delivered an average performance before they trained with the CARE method, whereas 134 athletes deliv-
ered a good performance before they adopted this method). You can find the performance after the treatment
(average/good) in the rows (190 athletes delivered an average performance after using the new training method,
while the number of athletes that delivered a good performance increased to 188).

The cells of Table 15.2 can be represented by the letters a, b, c, and d. The totals across rows and columns are
marginal totals (a + b, c + d, a + c, and b + d). The grand total is represented by n, as shown in Table 15.3.
McNemar’s test is a rather straightforward technique to test marginal homogeneity. Marginal homogeneity
refers to equality (or the lack of a significant difference) between one or more of the marginal row totals and the
corresponding marginal column totals. In this example, marginal homogeneity implies that the row totals are
equal to the corresponding column totals, or
a b a c
c d b d
Marginal homogeneity would mean there was no effect of the treatment. In this case it would mean that the
new training method would not affect the performance of athletes.
The McNemar test uses the χ2 distribution, based on the formula: (| | ) /( )b c b c1 2 . χ2 is a statistic with 1
degree of freedom [(# rows − 1) × (# columns −1)]. The marginal frequencies are not homogeneous if the χ2
result is significant at p 0 05. .
The χ2 value in this example is:
(| | ) )/( ) / .78 132 1 78 132 53 210 13 3762 2
The table of the distribution of chi‐square, with 1 degree of freedom, reveals that the difference between
samples is significant at the 0.05 level: the critical value of chi‐square is 3.841. Since 13.376 computed for the
example above exceeds this value, the difference between samples is significant. Hence, we can conclude that the
new training method has a positive effect on the performance of athletes.
T A B L E 1 5 . 2
Performance of athletes before and after new training method
Before
average good totals
average 112 78 190
After good 132 56 188
totals 244 134 378
T A B L E 1 5 . 3
A more abstract representation of Table 15.2
Before
average good totals
average a b a + b
After good c d c + d
totals a + c b + d n
308 research methods for business

Note that if b and/or c are small ( b + c 20) then χ 2 is not approximated by the chi‐square distribution.
Instead a sign test should be used.
Testing hypotheses about two unrelated means
There are many instances when we are interested to know whether two groups are different from each other on
a particular interval‐scaled or ratio‐scaled variable of interest. For example, would men and women press their
case for the introduction of flextime at the workplace to the same extent, or would their needs be different?
Do MBAs perform better in organizational settings than business students with only a bachelor ’ s degree? Do
individuals in urban areas have a different investment pattern for their savings than those in semi‐urban
areas? Do CPAs perform better than non‐CPAs in accounting tasks? To find answers to such questions, an
BOX 15.5
HOW DOES THIS WORK IN SPSS ?
Under the Analyze menu, choose Nonparametric Tests, then Related Samples. Choose ‘Automatically
compare observed data to hypothesized’ as the objective of your analysis, ‘McNedmar’s test (2 samples)’,
under ‘Settings’ and move the variables you want to compare into the ‘Test Fields’ box.
BOX 15 5
chapter quantitative data analysis: hypothesis testing 309

independent samples t ‐test is carried out to see if there are any significant differences in the means for two
groups in the variable of interest. That is, a nominal variable that is split into two subgroups (e.g., smokers and
nonsmokers; employees in the marketing department and those in the accounting department; younger and
older employees) is tested to see if there is a significant mean difference between the two split groups on a
dependent variable, which is measured on an interval or ratio scale (for instance, extent of wellbeing; pay; or
comprehension level).
BOX 15.6
HOW DOES THIS WORK IN SPSS ?
Under the Analyze menu, choose Compare Means, then Independent Samples T Test. Move the dependent
variable into the “Test Variable(s)” box. Move the independent variable (i.e., the variable whose values
defi ne the two groups) into the “Grouping Variable” box. Click “Defi ne Groups” and specify how the
groups are defi ned (for instance 0 and 1 or 1 and 2).
BOX 15 6
310 research methods for business

Testing hypotheses about several means
Whereas the (independent samples) t‐ test indicates whether or not there is a significant mean difference in a
dependent variable between two groups, an analysis of variance ( ANOVA ) helps to examine the significant
mean differences among more than two groups on an interval or ratio‐scaled dependent variable. For example,
is there a significant difference in the amount of sales by the following four groups of salespersons: those who
are sent to training schools; those who are given on‐the‐job training during field trips; those who have been
tutored by the sales manager; and those who have had none of the above? Or is the rate of promotion signifi-
cantly different for those who have assigned mentors, choose their own mentors, and have no mentors in the
organizational system?
BOX 15.7
HOW DOES THIS WORK IN SPSS ?
Under the Analyze menu, choose Compare Means, then One‐Way ANOVA. Move the dependent vari-
able into the “Dependent List”. Move the Independent variable (i.e., the variable whose values defi ne the
groups) into the “Factor” box. Click OK.
BOX 15 7
chapter quantitative data analysis: hypothesis testing 311

The results of ANOVA show whether or not the means of the various groups are significantly different from
one another, as indicated by the F statistic. The F statistic shows whether two sample variances differ from each
other or are from the same population. The F distribution is a probability distribution of sample variances
and the family of distributions changes with changes in the sample size. Details of the F statistic may be seen in
Table IV in the statistical tables toward the end of the book.
When significant mean differences among the groups are indicated by the F statistic, there is no way of know-
ing from the ANOVA results alone where they lie; that is, whether the significant difference is between Groups A
and B, or between B and C, or A and C, and so on. It is therefore unwise to use multiple t‐tests, taking two groups
at a time, because the greater the number of t‐tests done, the lower the confidence we can place on results. For
example, three t‐tests done simultaneously decrease the confidence level from 95% to 86% (0.95)3. However, sev-
eral tests, such as Scheffe’s test, Duncan Multiple Range test, Tukey’s test, and Student−Newman−Keul’s test are
available and can be used, as appropriate, to detect where exactly the mean differences lie.
Regression analysis
Simple regression analysis is used in a situation where one independent variable is hypothesized to affect one
dependent variable. For instance, assume that we propose that the propensity to buy a product depends only on
the perceived quality of that product.1 In this case we would have to gather information on perceived quality and
propensity to buy a product. We could then plot the data to obtain some first ideas on the relationship between
these variables.
From Figure 15.2 we can see that there is a linear relationship between perceived quality and propensity to
buy the product. We can model this linear relationship by a least squares function.
5,00
4,00
3,00
2,00
1,00
1,00 2,00 3,00 4,00
Perceived Quality
Pro
pen
sity
to
Bu
y
5,00
F I G U R E 1 5 . 2
Scatter plot of perceived quality versus propensity to buy
1In reality, any effort to model the effect of perceived quality on propensity to buy a product without careful attention to other factors that
affect propensity to buy would cause a serious statistical problem (“omitted variables bias”).
312 research methods for business

A simple linear regression equation represents a straight line. Indeed, to summarize the relationship between
perceived quality and propensity to buy, we can draw a straight line through the data points, as in Figure 15.3.
We can also express this relationship in an equation:
Y Xi i i0 1 1
The parameters 0 and
1 are called regression coefficients. They are the intercept (
0) and the slope (
1) of
the straight line relating propensity to buy (Y) to perceived quality (X1). The slope can be interpreted as the num-
ber of units by which propensity to buy would increase if perceived quality increased by a unit. The error term
denotes the error in prediction or the difference between the estimated propensity to buy and the actual propen-
sity to buy.
In this example the intercept (0) was not significant whereas the slope (
1) was. The unstandardized regres-
sion coefficient 1 was 0.832. Recall that the unstandardized regression coefficient represents the amount of
change in the dependent variable (propensity to buy in this case) for a one‐unit change in the independent vari-
able (perceived quality). Hence, the regression coefficient 1 indicates that the propensity to buy increases by
0.832 (on a five‐point scale) for a one unit change in perceived quality. In other words, the propensity to buy for
consumer A, who appraises perceived quality with a 4 (on a five‐point scale) is estimated to be 0.832 units higher
(on a five‐point scale) than the propensity to buy for consumer B, who appraised perceived quality with a 3 (on
a five‐point scale).
The coefficient of determination, R2, provides information about the goodness of fit of the regression model:
it is a statistical measure of how well the regression line approximates the real data points. R2 is the percentage of
variance in the dependent variable that is explained by the variation in the independent variable. If R2 is 1, the
regression model using perceived quality perfectly predicts propensity to buy. In other words, the regression
model fits the data perfectly. On the other hand, if R2 is 0, none of the variation in propensity to buy can be attrib-
uted to the independent variable, perceived quality. In this case, the R2 for the model is 0.519. This means that
almost 52% of the variation in propensity to buy is explained by variation in perceived quality.
5,00
4,00
3,00
2,00
1,00
1,00 2,00 3,00 4,00
Perceived Quality
Pro
pen
sity
to
Bu
y
5,00
R Sq Liner = 0,519
F I G U R E 1 5 . 3
Regression of propensity to buy on perceived quality
chapter quantitative data analysis: hypothesis testing 313

The basic idea of multiple regression analysis is similar to that of simple regression analysis. Only in this
case, we use more than one independent variable to explain variance in the dependent variable. Multiple regres-
sion analysis is a multivariate technique that is used very often in business research. The starting point of multi-
ple regression analysis is, of course, the conceptual model (and the hypotheses derived from that model) that the
researcher has developed in an earlier stage of the research process.
Multiple regression analysis provides a means of objectively assessing the degree and the character of the
relationship between the independent variables and the dependent variable: the regression coefficients indicate
the relative importance of each of the independent variables in the prediction of the dependent variable. For
example, suppose that a researcher believes that the variance in performance can be explained by four independ-
ent variables, A, B, C, and D (say, pay, task difficulty, supervisory support, and organizational culture). When
these variables are jointly regressed against the dependent variable in an effort to explain the variance in it, the
sizes of the individual regression coefficients indicate how much an increase of one unit in the independent vari-
able would affect the dependent variable, assuming that all the other independent variables remain unchanged.
What ’ s more, the individual correlations between the independent variables and the dependent variable collapse
BOX 15.8
HOW DOES THIS WORK IN SPSS ?
Under the Analyze menu, choose Regression, then Linear. Move the dependent variable into the
“Dependent” box. Move the independent variables into the “Independent(s)” list and click OK.
BOX 15 8
314 research methods for business

into what is called a multiple r or multiple correlation coefficient. The square of multiple r , R‐square, or R2 as it
is commonly known, is the amount of variance explained in the dependent variable by the predictors.
Standardized regression coefficients
Standardized regression coefficients (or beta coefficients) are the estimates resulting from a multiple regres-
sion analysis performed on variables that have been standardized (a process whereby the variables are trans-
formed into variables with a mean of 0 and a standard deviation of 1). This is usually done to allow the researcher
to compare the relative effects of independent variables on the dependent variable, when the independent vari-
ables are measured in different units of measurement (e.g., income measured in dollars and household size
measured in number of individuals).
Regression with dummy variables
A dummy variable is a variable that has two or more distinct levels, which are coded 0 or 1. Dummy variables
allow us to use nominal or ordinal variables as independent variables to explain, understand, or predict the
dependent variable.
Suppose that we are interested in the relationship between work shift and job satisfaction. In this case, the
variable “work shift,” which has three categories (see the Excelsior Enterprises case), would have to be coded in
terms of two dummy variables, since one of the three categories should serve as the reference category. This
might be done as shown in Table 15.4. Note that the third shift serves as the reference category.
Next, the dummy variables D1 and D
2 have to be included in a regression model. This would look like this:
Y D Di i i i i0 1 1 2 2
In this example workers from the third shift have been selected as the reference category. For this reason, this
category has not been included in the regression equation. For workers in the third shift, D1 and D
2 assume a
value of 0, and the regression equation thus becomes:
Yi i0
For workers in the first shift the equation becomes:
Y Di i i0 1 1
T A B L E 1 5 . 4
Recoding work shift into dummy codes
Work shift Original code Dummy D1
Dummy D2
First shift 1 1 0
Second shift 2 0 1
Third shift 3 0 0
chapter quantitative data analysis: hypothesis testing 315

The coefficient 1 is the difference in predicted job satisfaction for workers in the first shift, as compared to
workers in the third shift. The coefficient 2 has the same interpretation. Note that any of the three shifts could
have been used as a reference category.
Now do Exercises 15.1 and 15.2.
EXERCISE 15.2
Use the data of the Excelsior Enterprises case to estimate the effect of work shift on job satisfaction.
EXERCISE 15.1
Provide the equation for workers in the second shift.
Multicollinearity
Multicollinearity is an often encountered statistical phenomenon in which two or more independent variables
in a multiple regression model are highly correlated. In its most severe case (if the correlation between two inde-
pendent variables is equal to 1 or −1) multicollinearity makes the estimation of the regression coefficients impos-
sible. In all other cases it makes the estimates of the regression coefficients unreliable.
The simplest and most obvious way to detect multicollinearity is to check the correlation matrix for the inde-
pendent variables. The presence of high correlations (most people consider correlations of 0.70 and above high) is
a first sign of sizeable multicollinearity. However, when multicollinearity is the result of complex relationships
among several independent variables, it may not be revealed by this approach. More common measures for identi-
fying multicollinearity are therefore the tolerance value and the variance inflation factor (VIF – the inverse of the
tolerance value). Box 15.9 explains how you can produce tolerance and VIF values using SPSS. These measures
indicate the degree to which one independent variable is explained by the other independent variables. A common
cutoff value is a tolerance value of 0.10, which corresponds to a VIF of 10.
Note that multicollinearity is not a serious problem if the purpose of the study is to predict or forecast future
values of the dependent variable, because even though the estimations of the regression coefficients may be
unstable, multicollinearity does not affect the reliability of the forecast. However, if the objective of the study is
to reliably estimate the individual regression coefficients, multicollinearity is a problem. In this case, we may use
one or more of the following methods to reduce it:
● Reduce the set of independent variables to a set that are not collinear (but note that this may lead to omitted
variable bias, which is also a serious problem).
● Use more sophisticated ways to analyze the data, such as ridge regression.
● Create a new variable that is a composite of the highly correlated variables.
Testing moderation using regression analysis: interaction effects
Earlier in this book we described a moderating variable as a variable that modifies the original relationship
between an independent variable and the dependent variable. This means that the effect of one variable (X1) on
316 research methods for business

Y depends on the value of another variable, the moderating variable ( X2). Such interactions are included as the
product of two variables in a regression model.
Suppose that we have developed the following hypothesis:
H 1 : Th e students ’ judgment of the university ’ s library is aff ected by the students ’ judgment of the computers in
the library .
Now suppose that we also believe that, even though this relationship will hold for all students, it will be
nonetheless contingent on laptop ownership. That is, we believe that the relationship between the judgment of
computers in the library and the judgment of the library is affected by laptop ownership (indeed laptop owner-
ship is a dummy variable ). Therefore, we hypothesize that:
H 2 : Th e relationship between the judgment of the library and judgment of computers in the library is moderated
by laptop ownership .
BOX 15.9
HOW DOES THIS WORK IN SPSS ?
Under the Analyze menu, choose Regression, then Linear. Move the dependent variable into the
“Dependent” box. Move the independent variables into the “Independent(s)” list. Select “Statistics”
by clicking the button on the right‐hand side. Select “Collinearity diagnostics” and click continue.
Th en click OK.
BOX 15 9
chapter quantitative data analysis: hypothesis testing 317

The relationship between the judgment of the library and judgment of computers in the library can be mod-
eled as follows:
Y Xi i i0 1 1 (1)
We have also hypothesized that the effect of X1 on Y depends on X
2. This can be modeled as follows:
1 0 1 2X
i (2)
Adding the second equation into the first one leads to the following model:
Y X X Xi i i i i0 0 1 1 1 2 (3)
This last model states that the slope of the relationship between the independent variable (judgment of com-
puters in the library: X1) and the dependent variable (judgment of the library: Y) varies according to the level of
the moderating variable (laptop possession: X2). In other words, the relationship between the independent and
the dependent variable is a function of variable X2.
Although this model allows us to test moderation, the following model is better (because it also helps us to
account for differences in starting level between laptop owners and students who do not own a laptop):
Y X X X Xi i i i i i0 0 1 1 1 2 2 2 (4)
Because model (4) includes a direct effect of X2 on Y , it allows us to differentiate between pure moderation
and quasi moderation (compare Sharma, Durand & Gur‐Arie, 1981), as explained next.
If 1
0 and 2
0, X2 is not a moderator but simply an independent predictor variable. If
10, X
2 is a
moderator. Model (4) allows us to differentiate between pure moderators and quasi moderators as follows: if
10 and
20, X
2 is a pure moderator. That is, X
2 moderates the relationship between X
1 and Y , but it has no
direct effect on Y . In other words, in this case the effect of judgment of computers in the library on judgment of
the library is different for the two groups (the line representing this relationship has a different slope); the start-
ing level is the same however (there are no differences in the intercept). If 1
0 and 2
0, X2 is a quasi modera-
tor. That is, X2 moderates the relationship between X
1 and Y , but it also has a direct effect on Y (different slope
and different intercept).
Suppose that data analysis leads to the following model:
Y X X X Xi i i i i
4 3 0 4 0 01 0 21 2 1 2
. . . . ( ) (5)
where 0
0, 0
0, 1
0, and 2
0.
Based on the results we can conclude that: (1) the judgment of computers in the library has a positive effect
on the judgment of the library and (2) that this effect is moderated by laptop possession: if a student has no laptop
X Xi i2 2
0 0 the marginal effect is 0.4; if the student has a laptop X Xi i2 2
1 1 the marginal effect is 0.2.
Thus, laptop possession has a negative moderating effect.
Now do Exercises 15.3, 15.4, and 15.5.
318 research methods for business

The previous example shows that dummy variables can be used to allow the effect of one independent vari-
able on the dependent variable to change depending on the value of the dummy variable. It is, of course, also
possible to include metric variables as moderators in a model. In such cases, the procedure to test moderation is
exactly the same as in the previous example.
In this section, we have explained how moderation can be tested with regression analysis. Note that it is also
possible to test mediation with regression analysis. We will explain this later on in this chapter using the Excelsior
Enterprises data.
Other multivariate tests and analyses
We will now briefly describe five other multivariate techniques: discriminant analysis, logistic regression, con-
joint analysis, multivariate analysis of variance (MANOVA), and canonical correlations.
Discriminant analysis
Discriminant analysis (Box 15.10) helps to identify the independent variables that discriminate a nominally
scaled dependent variable of interest – say, those who are high on a variable from those who are low on it. The
linear combination of independent variables indicates the discriminating function showing the large difference
that exists in the two group means. In other words, the independent variables measured on an interval or ratio
scale discriminate the groups of interest to the study.
Logistic regression
Logistic regression (Box 15.11) is also used when the dependent variable is nonmetric. However, when the
dependent variable has only two groups, logistic regression is often preferred because it does not face the strict
assumptions that discriminant analysis faces and because it is very similar to regression analysis. Although
EXERCISE 15.5
Provide a logical explanation for the negative moderating effect of laptop possession.
EXERCISE 15.3
Why could it be important to differentiate between quasi moderators and pure moderators?
EXERCISE 15.4
Is laptop possession a pure moderator or a quasi moderator? Explain.
chapter quantitative data analysis: hypothesis testing 319

regression analysis and logistic regression analysis are very different from a statistical point of view, they are very
much alike from a practical viewpoint. Both methods produce prediction equations and in both cases the regres-
sion coefficients measure the predictive capability of the independent variables. Thus, logistic regression allows
the researcher to predict a discrete outcome, such as “will purchase the product/will not purchase the product,”
from a set of variables that may be continuous, discrete, or dichotomous.
Conjoint analysis
Conjoint analysis is a statistical technique that is used in many fields including marketing, product manage-
ment, and operations research. Conjoint analysis requires participants to make a series of trade‐offs. In market-
ing, conjoint analysis is used to understand how consumers develop preferences for products or services. Conjoint
analysis is built on the idea that consumers evaluate the value of a product or service by combining the value that
is provided by each attribute. An attribute is a general feature of a product or service, such as price, product qual-
ity, or delivery speed. Each attribute has specific levels. For instance, for the attribute “price,” levels might be €249,
BOX 15.10
HOW DOES THIS WORK IN SPSS ?
Under the Analyze menu, choose Classify, then Discriminant. Move the dependent variable into the
“Grouping” box. Move the independent variables into the “Independent(s)” list and click OK.
BOX 15 10
320 research methods for business

BOX 15.11
HOW DOES THIS WORK IN SPSS ?
Under the Analyze menu, choose Regression, then Binary Logistic. Move the dependent variable into the
“Dependent” box. Move the independent variables into the “Covariate(s)” list and click OK.
BOX 15 11
€279, and €319. Along these lines, we might describe a mobile phone using the attributes “memory,” “battery life,”
“camera,” and “price”. A specific mobile phone would be described as follows: memory, 12 GB; battery life,
24 hours; camera 8 megapixels; and price €249.
Conjoint analysis takes these attribute and level descriptions of products and services and uses them by ask-
ing participants to make a series of choices between different products. For instance:
Would you choose phone X or phone Y ?
Phone X Phone Y
Memory 12 GB 16 GB
Battery life 24 hours 12 hours
Camera 8 megapixels 16 megapixels
Price €249 €319
chapter quantitative data analysis: hypothesis testing 321

By asking for enough choices, it is possible to establish how important each of the levels is relative to the
others; this is known as the utility of the level. Conjoint analysis is traditionally carried out with some form of
multiple regression analysis. More recently, the use of hierarchical Bayesian analysis has become widespread to
develop models of individual consumer decision‐making behavior.
Two-way ANOVA
Two‐way ANOVA can be used to examine the effect of two nonmetric independent variables on a single metric
dependent variable. Note that, in this context, an independent variable is often referred to as a factor and this is
why a design that aims to examine the effect of two nonmetric independent variables on a single metric depend-
ent variable is often called a factorial design. The factorial design is very popular in the social sciences. Two‐way
ANOVA enables us to examine main effects (the effects of the independent variables on the dependent variable)
but also interaction effects that exist between the independent variables (or factors). An interaction effect exists
when the effect of one independent variable (or one factor) on the dependent variable depends on the level of the
other independent variable (factor).
MANOVA
MANOVA is similar to ANOVA, with the difference that ANOVA tests the mean differences of more than two
groups on one dependent variable, whereas MANOVA tests mean differences among groups across several depend-
ent variables simultaneously, by using sums of squares and cross‐product matrices. Just as multiple t‐tests would
bias the results (as explained earlier), multiple ANOVA tests, using one dependent variable at a time, would also
bias the results, since the dependent variables are likely to be interrelated. MANOVA circumvents this bias by
simultaneously testing all the dependent variables, cancelling out the effects of any intercorrelations among them.
In MANOVA tests (Box 15.12), the independent variable is measured on a nominal scale and the dependent
variables on an interval or ratio scale.
The null hypothesis tested by MANOVA is:
H0 1 2 3:
n
The alternate hypothesis is:
HA:
1 2 3 n
Canonical correlation
Canonical correlation examines the relationship between two or more dependent variables and several inde-
pendent variables; for example, the correlation between a set of job behaviors (such as engrossment in work,
timely completion of work, and number of absences) and their influence on a set of performance factors (such as
quality of work, the output, and rate of rejects). The focus here is on delineating the job behavior profiles associ-
ated with performance that result in high‐quality production.
In sum, several univariate, bivariate, and multivariate techniques are available to analyze sample data. Using
these techniques allows us to generalize the results obtained from the sample to the population at large. It is, of
course, very important to use the correct statistical technique to test the hypotheses of your study. We have
explained earlier in this chapter that the choice of the appropriate statistical technique depends on the number
of variables you are examining, on the scale of measurement of your variable(s), on whether the assumptions of
parametric tests are met, and on the size of your sample.
322 research methods for business

EXCELSIOR ENTERPRISES: HYPOTHESIS TESTING
The following hypotheses were generated for this study, as stated earlier:
H 1 : Job enrichment has a negative effect on intention to leave.
H 2 : Perceived equity has a negative effect on intention to leave.
H 3 : Burnout has a positive effect on intention to leave.
H 4 : J ob satisfaction mediates the relationship between job enrichment, perceived equity, and burnout on inten-
tion to leave.
These hypotheses call for the use of mediated regression analysis (all the variables are measured at an inter-
val level). The results of these tests and their interpretation are discussed below.
BOX 15.12
HOW DOES THIS WORK IN SPSS ?
Under the Analyze menu, choose General Linear Model, then Multivariate. Move the dependent variables
into the “Dependent” box. Move the independent variables into the “Fixed Factor(s)” list. Select any of the
dialog boxes by clicking the buttons on the right‐hand side.
BOX 15 12
chapter quantitative data analysis: hypothesis testing 323

To test the hypothesis that job satisfaction mediates the effect of perceived justice, burnout, and job enrich-
ment on employees’ intentions to leave three regression models were estimated, following Baron and Kenny
(1986): model 1, regressing job satisfaction on perceived justice, burnout, and job enrichment; model 2, regress-
ing intention to leave on perceived justice, burnout, and job enrichment; and model 3, regressing employees’
intentions to leave on perceived justice, burnout, job enrichment, and job satisfaction. Separate coefficients for
each equation were estimated and tested. To establish mediation the following conditions must hold: perceived
justice, burnout, and job enrichment must affect job satisfaction in model 1; perceived justice, burnout, and job
enrichment must be shown to have an impact on employees’ intention to leave in model 2; and job satisfaction
must affect employees’ intention to leave in model 3 (while controlling for perceived justice, burnout, and job
enrichment). If these conditions all hold in the predicted direction, then the effect of perceived justice, burnout,
and job enrichment must be less in model 3 than in model 2. Perfect mediation holds if perceived justice, burn-
out, and job enrichment have no effect on intention to leave (in other words, the effect of these variables on
intention to leave is no longer significant) when the effect of job satisfaction is controlled for (model 3); partial
mediation is established if perceived justice, burnout, and job enrichment still affect intention to leave in model 3.
The R‐square of the first regression model (model 1) was 0.172 and the model was statistically significant. In
this model perceived equity, burnout and job enrichment were all significant predictors of job satisfaction. The
R‐square of the second regression model (model 2) was 0.264 and this model was also statistically significant.
Model 2, as depicted in Table 15.5 indicated that perceived equity and job enrichment affected employees’ inten-
tion to leave, whereas burnout did not.
T A B L E 1 5 . 5
Mediation analysis
Step 1 model, with job satisfaction as the dependent variable
Coefficient p‐value
Constant 2.329 0.000
Perceived equity 0.343 0.001
Burnout −0.454 0.000
Job enrichment 0.269 0.005
Model fit = 0.172
Step 2 model, with intention to leave (ITL) as the dependent variable
Coefficient p‐value
Constant 4.094 0.000
Perceived equity −0.270 0.000
Burnout 0.075 0.315
Job enrichment −0.299 0.000
Model fit = 0.264
Step 3 model, including job satisfaction as an independent variable and with ITL as the dependent variable
Coefficient p‐value
Constant 5.019 0.000
Perceived equity −0.131 0.009
Burnout −0.103 0.089
Job enrichment −0.187 0.000
Job satisfaction −0.408 0.000
Model fit = 0.577
Note: Parameters are unstandardized regression weights, with significance levels of t‐values. Two‐sided tests. N = 174.
324 research methods for business

The R‐square of the last model (model 3) was 0.577 and again the model was statistically significant. In this
model, job satisfaction was a significant predictor of intention to leave. Perceived equity and job enrichment were
significant predictors of intention to leave when job satisfaction was controlled for. The effect of perceived equity
and job enrichment on intention to leave was less in the third model than in the second model. Thus, all condi-
tions for partial mediation were met for perceived equity and job enrichment.
Follow‐up analyses were performed to test for the indirect effect of perceived equity and job enrichment on
intention to leave via job satisfaction. Baron and Kenny ( 1986 ) provide an approximate significance test for the
indirect effect of perceived justices and burnout on employees ’ intentions. The path from, respectively, perceived
equity and job enrichment to job satisfaction is denoted a and its standard error sa; the path from job satisfaction
to intention to leave is denoted b and its standard error sb. The product ab is the estimate of the indirect effect of
perceived equity and job enrichment on employees ’ intentions to leave. The standard error of ab is:
SE b s a s s sab a b a b
2 2 2 2 2 2
The ratio ab SEab
/ can be interpreted as a z statistic. Indirect effects of perceived equity (−3.246, p 0 01. )
and burnout (−2.743, p 0 01. ) were both significant.
BOX 15.13
RESEARCH REALITY
A method of testing mediation and moderation that is becoming more and more popular is bootstrapping
(Bullock, Green & Ha, 2010 ; Preacher, Rucker & Hayes, 2007 ; Shrout & Bolger, 2002 ). Bootstrapping is a
statistical method based on building a sampling distribution for a statistic by resampling from the data at
hand. A big advantage of bootstrapping is that no assumptions about the shape of the sampling distribu-
tion of the statistic are necessary when conducting inferential tests. Two soft ware packages that are oft en
used to bootstrap are Mplus and AMOS.
BOX 15 13
Overall interpretation and recommendations to the president
From the results of the hypothesis tests, it is clear that perceived equity and job enrichment affect employees ’
intentions to leave through job satisfaction. From the descriptive results, we have already seen that the mean on
perceived equity is rather low (2.44 on a five‐point scale). The mean of job enrichment is clearly higher (3.49 on
a five‐point scale), but it is still below the standards of the company. Hence, if retention of employees is a top
priority for the president, it is important to formulate policies and practices that help to enhance equity percep-
tions and to redesign jobs in such a way that they are more challenging to the employees . Whatever is done to
improve employees ’ perceptions of equity and to enrich the jobs of employees will improve job satisfaction and
thus help employees to think less about leaving and induce them to stay.
The president would therefore be well advised to rectify inequities in the system, if they really exist, or to
clear misperceptions of inequities if this is actually the case.
To enrich jobs of employees, the president may want to keep the following goals in mind:
● Reduce repetitive work.
● Increase the employee ’ s feelings of recognition and achievement.
chapter quantitative data analysis: hypothesis testing 325

● Provide opportunities for employee advancement (promotions into jobs requiring more skills).
● Provide opportunities for employee growth (an increase in skills and knowledge without a job promotion).
The fact that only 57.7% of the variance in “intention to leave” was explained by the four independent vari-
ables considered in this study still leaves more than 40% unexplained. In other words, there are other additional
variables that are important in explaining ITL that have not been considered in this study. Further research might
be necessary to explain more of the variance in ITL, if the president wishes to pursue the matter further.
Now do Exercises 15.6, 15.7, and 15.8.
EXERCISE 15.6
Discuss: what do the unstandardized coefficients and their p‐values in the first model imply? In other words,
what happens to job satisfaction if perceived justice, burnout, and job enrichment change by one unit?
EXERCISE 15.7
Provide the tolerance values and the variance inflation factors for all the independent variables in model 1.
Discuss: do we have a multicollinearity problem?
EXERCISE 15.8
Does work shift moderate the relationship between job satisfaction and intention to leave for Excelsior
Enterprises employees?
We have now seen how different hypotheses can be tested by applying the appropriate statistical tests in data
analysis. Based on the interpretation of the results, the research report is then written, making necessary recom-
mendations and discussing the pros and cons of each, together with cost−benefit analysis.
DATA WAREHOUSING, DATA MINING, AND OPERATIONS RESEARCH
Data warehousing and data mining are aspects of information systems. Most companies are now aware of the
benefits of creating a data warehouse that serves as the central repository of all data collected from disparate
sources, including those pertaining to the company’s finance, manufacturing, sales, and the like. The data ware-
house is usually built from data collected through the different departments of the enterprise and can be accessed
through various online analytical processing (OLAP) tools to support decision making. Data warehousing can
be described as the process of extracting, transferring, and integrating data spread across multiple external data-
bases and even operating systems, with a view to facilitating analysis and decision making.
Complementary to the functions of data warehousing, many companies resort to data mining as a strategic
tool for reaching new levels of business intelligence. Using algorithms to analyze data in a meaningful way, data
326 research methods for business

mining more effectively leverages the data warehouse by identifying hidden relations and patterns in the data
stored in it. For instance, data mining makes it possible to trace retail sales patterns by ZIP code and the time of
day of the purchases, so that optimal stocking of items becomes possible. Such “mined” data pertaining to the
vital areas of the organization can be easily accessed and used for different purposes. For example, staffing for
different times of the day can be planned, as can the number of check‐out counters that need to be kept open in
retail stores, to ensure efficiency as well as effectiveness. We can see that data mining helps to clarify the underly-
ing patterns in different business activities, which in turn facilitates decision making.
Operations research (OR) or management science (MS) is another sophisticated tool used to simplify and
thus clarify certain types of complex problem that lend themselves to quantification. OR uses higher mathemat-
ics and statistics to identify, analyze, and ultimately solve intricate problems of great complexity faced by the
manager. It provides an additional tool to the manager by using quantification to supplement personal judgment.
Areas of problem solving that easily lend themselves to OR include those relating to inventory, queuing, sequenc-
ing, routing, and search and replacement. OR helps to minimize costs and increase efficiency by resorting to
decision trees, linear programming, network analysis, and mathematical models.
Other information systems such as management information systems (MIS), decision support systems, execu-
tive information systems, and expert systems are good decision‐making aids, but not necessarily involved with
data collection and analyses in the strict sense.
In sum, a good information system collects, mines, and provides a wide range of pertinent information relat-
ing to aspects of both the external and internal environments of the organization. By using the wide variety of
tools and techniques available for solving problems of differing magnitude, executives, managers, and others
entrusted with responsibility for results at various levels of the organization can find solutions to various con-
cerns merely by securing access to the data available in the system and analyzing them.
It should be ensured that the data in the information system are error‐free and are frequently updated. After
all, decision making can only be as good as the data made available to managers.
SOME SOFTWARE PACKAGES USEFUL FOR DATA ANALYSIS
There is a wide variety of analytical software that may help you to analyze your data. Based on your specific
needs, your research problem, and/or your conceptual model, you might consider the following software packages:
● LISREL: from Scientific Software International;
● MATLAB®: from the MathWorks, Inc.;
● Mplus: developed by Linda and Bengt Muthén;
● Qualtrics: a private research software company;
● SAS/STAT: from SAS Institute;
● SPSS: from SPSS Inc.;
● SPSS AMOS: from SPSS Inc.;
● Stata: from Stata Corporation.
LISREL is designed to estimate and test structural equation models. Structural equation models are complex,
statistical models of linear relationships among latent (unobserved) variables and manifest (observed) variables.
You can also use LISREL to carry out exploratory factor analysis and confirmatory factor analysis.
MATLAB is a computer program that was originally designed to simplify the implementation of numerical
linear algebra routines. It is used to implement numerical algorithms for a wide range of applications.
chapter quantitative data analysis: hypothesis testing 327

Mplus is a statistical modeling program that offers researchers a wide choice of models, estimators, and
algorithms. Mplus allows the analysis of a wide variety of data such as cross‐sectional and longitudinal data,
single‐level and multilevel data, and data that come from different populations with either observed or unobserved
heterogeneity. In addition, Mplus has extensive capabilities for Monte Carlo simulation studies.
Qualtrics was founded in 2002. The program allows users to do many kinds of online data collection and data
analysis, employee evaluations, website feedback, marketing research, and customer satisfaction and loyalty research.
SAS is an integrated system of software products, capable of performing a broad range of statistical analyses
such as descriptive statistics, multivariate techniques, and time series analyses. Because of its capabilities, it is
used in many disciplines, including medical sciences, biological sciences, social sciences, and education.
SPSS (Statistical Package for the Social Sciences) is a data management and analysis program designed to do
statistical data analysis, including descriptive statistics such as plots, frequencies, charts, and lists, as well as
sophisticated inferential and multivariate statistical procedures like analysis of variance (ANOVA), factor analy-
sis, cluster analysis, and categorical data analysis.
SPSS AMOS is designed to estimate and test structural equation models.
Stata is a general purpose statistical software package that supports various statistical and econometric
methods, graphics, and enhanced features for data manipulation, programming, and matrix manipulation.
SUMMARY
● Learning objective 1: Discuss type I errors, type II errors, and statistical power.
The null hypothesis is presumed true until statistical evidence, in the form of a hypothesis test, indicates
otherwise. The required statistical evidence is provided by inferential statistics. There are two kinds of errors
(two ways in which a conclusion can be incorrect), classified as type I errors and type II errors. A type I error,
also referred to as alpha (α), is the probability of rejecting the null hypothesis when it is actually true. A type
II error, also referred to as beta (β), is the probability of failing to reject the null hypothesis given that the
alternate hypothesis is actually true. A third important concept in hypothesis testing is statistical power (1 – β).
Statistical power is the probability of correctly rejecting the null hypothesis. In other words, power is the
probability that statistical significance will be indicated if it is present.
● Learning objective 2: Test hypotheses using the appropriate statistical technique.
After the researcher has selected an acceptable level of statistical significance to test the hypotheses, the next
step is to decide on the appropriate method to test them. The choice of the appropriate statistical technique
largely depends on the number of (independent and dependent) variables and the scale of measurement
(metric or nonmetric) of these variables. Other aspects that play a role are whether the assumptions of para-
metric tests are met and the size of the sample.
● Learning objective 3: Describe data warehousing, data mining, and operations research.
A good information system collects, mines, and provides a wide range of information relating to aspects of
both the external and internal environments of the organization. By using tools and techniques available for
solving problems of differing magnitude, organizations may find solutions to various concerns merely by
securing access to the data available in the system and analyzing them.
● Learning objective 4: Describe useful software packages for quantitative data analysis.
There is a wide variety of analytical software that may help researchers to analyze their data. Based on one’s
specific needs, the research problem, and/or the conceptual model, one might consider software packages
such as LISREL, MATLAB, Qualtrics, or SPSS, to name a few.
328 research methods for business

Now do Exercises 15.9, 15.10, and 15.11.
EXERCISE 15.9
Open the file “resmethassignment1” (you created this file doing the exercise from the previous chapter).
Answer the following questions.
a. Is the exam grade significantly larger than 75?
b. Are there significant differences in the exam grade for men and women?
c. Is there a significant difference between the exam grade and the paper grade?
d. Are there significant differences in the paper grade for the four year groups?
e. Is the sample representative for the IQ level, for which it is known that 50% of the population has
an IQ below 100, and 50% has an IQ of 100 or higher?
f. Obtain a correlation matrix for all relevant variables and discuss the results.
g. Do a multiple regression analysis to explain the variance in paper grades using the independent
variables of age, sex (dummy coded), and IQ, and interpret the results.
Visit the companion website at www.wiley.com/college/sekaran for Case Study:
Perceptions of Organizational Attractiveness.
DISCUSSION QUESTIONS
1. What kinds of biases do you think could be minimized or avoided during the data analysis stage of
research?
2. When we collect data on the effects of treatment in experimental designs, which statistical test is
most appropriate to test the treatment effects?
3. A tax consultant wonders whether he should be more selective about the class of clients he serves so
as to maximize his income. He usually deals with four categories of clients: the very rich, rich, upper
middle class, and middle class. He has records of each and every client served, the taxes paid by them,
and how much he has charged them. Since many particulars in respect of the clients vary (number of
dependants, business deductibles, etc.), irrespective of the category they belong to, he would like an
appropriate analysis to be done to see which among the four categories of clientele he should choose
to continue to serve in the future. What kind of analysis should be done in this case and why?
4. What is bootstrapping and why do you think that this method is becoming more and more popular
as a method of testing for moderation and mediation?
chapter quantitative data analysis: hypothesis testing 329

EXERCISE 15.10
Tables 15.A to 15.D below summarize the results of data analyses of research conducted in a sales organiza-
tion that operates in 50 different cities of the country and employs a total sales force of about 500. The
number of salespersons sampled for the study was 150.
a. Interpret the information contained in each of the tables in as much detail as possible.
b. Summarize the results for the CEO of the company.
c. Make recommendations based on your interpretation of the results.
T A B L E 1 5 . A
Means, standard deviations, minimum, and maximum
Variable Mean Std. deviation Minimum Maximum
Sales (in 1000s of $) 75.1 8.6 45.2 97.3
No of salespersons 25 6 5 50
Population (in 100s) 5.1 0.8 2.78 7.12
Per capita income (in 1000s of $) 20.3 20.1 10.1 75.9
Advertising (in 1000s of $) 10.3 5.2 6.1 15.7
T A B L E 1 5 . B
Correlations among the variables
Sales Salespersons Population Income Ad. expenditure
Sales 1.0
No. of salespersons 0.76 1.0
Population 0.62 0.06 1.0
Income 0.56 0.21 0.11 1.0
Ad. expenditure 0.68 0.16 0.36 0.23 1.0
All figures above 0.15 are significant at p .
All figures above 0.35 are significant at p
T A B L E 1 5 . C
Results of one-way ANOVA: sales by level of education
Source of variation Sums of squares df Mean squares F Significance of F
Between groups 50.7 4 12.7 3.6 0.01
Within groups 501.8 145 3.5
Total 552.5 150
330 research methods for business

T A B L E 1 5 . D
Results of regression analysis
Multiple R 0.65924
R‐square 0.43459
Adjusted R‐square 0.35225
Standard error 0.41173
df (5.144)
F 5.278
Sig. 0.000
Variable Beta t Sig. t
Training of salespersons 0.28 2.768 0.0092
No. of salespersons 0.34 3.55 0.00001
Population 0.09 0.97 0.467
Per capita income 0.12 1.200 0.089
Advertisement 0.47 4.54 0.00001
EXERCISE 15.11
Visit David Kenny’s website (http://davidakenny.net/cm/mediate.htm) and search for a link to SPSS and
SAS macros that can be downloaded for tests of indirect effects.
chapter quantitative data analysis: hypothesis testing 331

INTRODUCTION
Qualitative data are data in the form of words. Examples of qualitative data are interview notes, transcripts of
focus groups, answers to open‐ended questions, transcriptions of video recordings, accounts of experiences with
a product on the Internet, news articles, and the like. Qualitative data can come from a wide variety of primary
sources and/or secondary sources, such as individuals, focus groups, company records, government publications,
and the Internet. The analysis of qualitative data is aimed at making valid inferences from the often overwhelm-
ing amount of collected data.
THREE IMPORTANT STEPS IN QUALITATIVE DATA ANALYSIS
The analysis of qualitative data is not easy. The problem is that, in comparison with quantitative data analysis,
there are relatively few well‐established and commonly accepted rules and guidelines for analyzing qualitative
data. Over the years, however, some general approaches for the analysis of qualitative data have been developed.
The approach discussed in this chapter is largely based on work of Miles and Huberman (1994). According to
Qualitative data analysis
C H A P T E R 1 6
LEARNING OBJECTIVES
After completing Chapter 16 you should be able to:
1. Discuss three important steps in qualitative data analysis: data reduction, data display, and draw-
ing conclusions.
2. Discuss how reliability and validity have a different meaning in qualitative research in compari-
son to quantitative research and explain how reliability and validity are achieved in qualitative
research.
3. Compare and contrast content analysis, narrative analysis, and analytic induction.
4. Describe the characteristics of big data and explain why big data holds many promises for organi-
zations and managers.
332

them, there are generally three steps in qualitative data analysis: data reduction, data display, and the drawing of
conclusions.
The first step in qualitative data analysis is concerned with data reduction. Data reduction refers to the
process of selecting, coding, and categorizing the data. Data display refers to ways of presenting the data. A selec-
tion of quotes, a matrix, a graph, or a chart illustrating patterns in the data may help the researcher (and eventu-
ally the reader) to understand the data. In this way, data displays may help you to draw conclusions based on
patterns in the reduced set of data.
Having identified these general stages, it should be noted that qualitative data analysis is not a step‐by‐step,
linear process but rather a continuous and iterative process. For instance, data coding may help you simultane-
ously to develop ideas on how the data may be displayed, as well as to draw some preliminary conclusions. In
turn, preliminary conclusions may feed back into the way the raw data are coded, categorized, and displayed.
This chapter will discuss the three important steps in qualitative data analysis – data reduction, data display,
and drawing and verifying conclusions – in some detail. To illustrate these steps in qualitative data analysis, we
will introduce a case. We will use the case, by means of boxes throughout the chapter, to illustrate key parts of the
qualitative research process.
EXAMPLE
Qualitative research may involve the repeated sampling,
collection, and analysis of data. As a result, qualitative
data analysis may already start after some of the data
have been collected.
BOX 16.1
THE INTERNET AS A SOURCE OF TEXTUAL INFORMATION
Earlier in this book we explained that you can search the Internet for books, journals articles, conference
proceedings, company publications, and the like. However, the Internet is more than a mere source of
documents; it is also a rich source of textual information for qualitative research. For instance, there are
many social networks on the Internet structured around products and services such as computer games,
mobile telephones, movies, books, and music. Th rough an analysis of these social networks researchers
may learn a lot about the needs of consumers, about the amount of time consumers spend in group com-
munication, or about the social network that underlies the virtual community. In this way, social networks
on the Internet may provide researchers and marketing and business strategists with valuable, strategic
information.
Th e possibilities for qualitative research on the Internet are unlimited, as the following example illus-
trates. In an eff ort to fi nd out what motivates consumers to construct protest websites , Ward and Ostrom
( 2006 ) examined and analyzed protest websites. A content analysis revealed that consumers construct
complaint websites to demonstrate their power, to infl uence others, and to gain revenge on the orga-
nization that betrayed them. Th is example illustrates how the Internet can be a valuable source of rich,
authentic qualitative information. With increasing usage of the Internet, it will undoubtedly become even
more important as a source of qualitative and quantitative information.
BOX 16 1
chapter qualitative data analysis 333

Data reduction
Qualitative data collection produces large amounts of data. The first step in data analysis is therefore the reduc-
tion of data through coding and categorization. Coding is the analytic process through which the qualitative data
that you have gathered are reduced, rearranged, and integrated to form theory. The purpose of coding is to help
you to draw meaningful conclusions about the data. Codes are labels given to units of text which are later grouped
and turned into categories. Coding is often an iterative process; you may have to return to your data repeatedly
to increase your understanding of the data (i.e., to be able to recognize patterns in the data, to discover connec-
tions between the data, and to organize the data into coherent categories).
Visit the companion website at www.wiley.com/college/sekaran for Author Video: Data
reduction.
CASE
INSTIGATIONS OF CUSTOMER ANGER
INTRODUCTION
Suppose that you are in a fashion shop and that you
have just found a clothing item that you like. You
go to the counter to pay for the item. At the counter
you find a shop assistant who is talking to a friend
on her mobile phone. You have to wait. You wait for
a couple of minutes, but the shop assistant is in no
hurry to finish the call.
This event may make you angry. Waiting for ser-
vice is a common cause of anger: the longer the delay,
the angrier customers tend to be (Taylor, 1994).
RESEARCH OBJECTIVE
Prior research in marketing has applied appraisal
theory to understand why anger is experienced in
such situations (e.g., Folkes, Koletsky & Graham, 1987;
Nyer, 1997; Taylor, 1994). Appraisal refers to the pro-
cess of judging the significance of an event for personal
well‐being. The basic premise of appraisal theory is
that emotions are related to the interpretations that
people have about events: people may differ in the
specific appraisals that are elicited by a particular event
(for instance, waiting for service), but the same pat-
terns of appraisal give rise to the same emotions. Most
appraisal theories see appraisals as being a cause of
emotions (Parrott, 2001). Along these lines, appraisal
theory has been used to understand why anger is
experienced in service settings.
Although appraisal theory provides useful
insights into the role of cognition in emotional service
encounters, recent research suggests that, although
they are clearly associated with anger, none of the
aforementioned appraisals is a necessary or sufficient
condition for anger to arise (Kuppens, VanMechelen,
Smits & DeBoeck, 2003; Smith & Ellsworth, 1987).
What’s more, for the specific purpose of avoiding
customer anger, appraisal theory is too abstract to
be diagnostic for services management. That is, ser-
vice firm management may benefit more from a
classification of incidents that are considered to be
unfair (for instance, waiting for service and core
service failures), than from the finding that unfair
events are generally associated with customer anger.
In other words, to be able to avoid customer
anger, it is crucial that service firm management
knows what specific precipitating events typically
elicit this emotion in customers. After all, it is easier
to manage such events than the appraisals that may
or may not be associated with these particular events.
334 research methods for business

Therefore, this study investigates events that
typically instigate customer anger in services. This
study builds on a rich tradition of research in psy-
chology that has specified typical instigations of
anger in everyday life. In addition, it builds on
research in marketing that has identified and classi-
fied service failures, retail failures, and behaviors of
service firms that cause customers to switch services
(Bitner, Booms & Tetreault, 1990; Keaveney, 1995;
Kelley, Hoffman & Davis, 1993).
METHOD
Procedure. Following related research in marketing,
the critical incident technique (CIT) was used to
identify critical behaviors of service providers that
instigate customer anger (e.g., Bitner, Booms &
Tetreault, 1990; Keaveney, 1995; Kelley, Hoffman &
Davis, 1993; Mangold, Miller & Brockway, 1999).
Critical incidents were collected by 30 trained
research assistants, who were instructed to collect 30
critical incidents each. In order to obtain a sample
representative of customers of service organizations,
they were instructed to collect data from a wide
variety of people. Participants were asked to record
their critical incidents on a standardized form in
the presence of the interviewer. This has several
advantages, such as availability of the interviewer to
answer questions and to provide explanations.
Questionnaire. Participants were asked to record
their answers on a standardized questionnaire, which
was modeled after previous applications of CIT in
services (e.g., Keaveney, 1995; Kelley, Hoffman &
Davis, 1993). The questionnaire began by asking
participants to indicate which of 30 different services
they had purchased during the previous six‐month
period. Next, participants were asked to recall the
last negative incident with a service provider that
made them feel angry. They were asked to describe
the incident in detail by means of open‐ended ques-
tions. The open‐ended questions were “What service
are you thinking about?”, “Please tell us, in your own
words, what happened. Why did you get angry?”,
and “Try to tell us exactly what happened: where you
were, what happened, what the service provider did,
how you felt, what you said, and so forth.”
Sample. Critical incidents were defined as events,
combinations of events, or series of events between
a customer and a service provider that caused
customer anger. The interviewers collected 859 inci-
dents. The participants (452 males, 407 females) rep-
resented a cross‐section of the population. Their ages
ranged between 16 and 87 with a mean age of 37.4.
Approximately 2% of the participants had less than a
completed high school education, whereas 45.1% had
at least a bachelor's degree. The reported incidents
covered more than 40 different service businesses,
including banking and insurance, personal transpor-
tation (by airplane, bus, ferry, taxi, or train), hospitals,
physicians, and dentists, repair and utility services,
(local) government and the police, (virtual) stores,
education and child care, entertainment, hospitality,
restaurants, telecommunication companies, health
clubs, contracting firms, hairdressers, real‐estate
agents, driving schools, rental companies, and travel
agencies. On average, the negative events that partici-
pants reported had happened 18 weeks earlier.
Coding begins with selecting the coding unit. Indeed, qualitative data can be analyzed at many levels. Examples
of coding units include words, sentences, paragraphs, and themes. The smallest unit that is generally used is the word.
A larger, and often more useful, unit of content analysis is the theme: “a single assertion about a subject”
(Kassarjian, 1977, p. 12). When you are using the theme as a coding unit, you are primarily looking for the expression
of an idea (Minichiello, Aroni, Timewell & Alexander, 1990). Thus, you might assign a code to a text unit of any size,
as long as that unit of text represents a single theme or issue. Consider, for instance, the following critical incident:
After the meal I asked for the check. The waitress nodded and I expected to get the check. After three
cigarettes there was still no check. I looked around and saw that the waitress was having a lively
conversation with the bartender.
chapter qualitative data analysis 335

This critical incident contains two themes:
1. The waitress does not provide service at the time she promises to: “The waitress nodded and I expected
to get the check. After three cigarettes there was still no check.”
2. The waitress pays little attention to the customer: she is not late because she is very busy; instead of
bringing the check, she is engaged in a lively conversation with the bartender.
Accordingly, the aforementioned critical incident was coded as: “delivery promises” (that were broken) and
“personal attention” (that was not provided).
This example illustrates how the codes “delivery promises” and “personal attention” help to reduce the data
to a more manageable amount. Note that proper coding not only involves reducing the data but also making sure
that no relevant data are eliminated. Hence, it is important that the codes “delivery promises” and “personal
attention” capture the meaning of the coded unit of text.
Categorization is the process of organizing, arranging, and classifying coding units. Codes and categories
can be developed both inductively and deductively. In situations where there is no theory available, you must
generate codes and categories inductively from the data. In its extreme form, this is what has been called
grounded theory (see Chapter 6 ).
In many situations, however, you will have a preliminary theory on which you can base your codes and cat-
egories. In these situations you can construct an initial list of codes and categories from the theory, and, if neces-
sary, change or refine these during the research process as new codes and categories emerge inductively (Miles &
Huberman, 1994 ). The benefit of the adoption of existing codes and categories is that you are able to build on
and/or expand prevailing knowledge.
BOX 16.2
DATA ANALYSIS
Unit of analysis Since the term “critical incident” can refer to either the overall story of a participant or to
discrete behaviors contained within this story, the fi rst step in data analysis is to determine the appropriate
unit of analysis (Kassarjian, 1977 ). In this study, critical behavior was chosen as the unit of analysis. For
this reason, 600 critical incidents were coded into 886 critical behaviors. For instance, a critical incident
in which a service provider does not provide prompt service and treats a customer in a rude manner was
coded as containing two critical behaviors (“unresponsiveness” and “insulting behavior”).
BOX 16 2
BOX 16.3
DATA ANALYSIS
Categorization Qualitative data analysis was used to examine the data (Kassarjian, 1977 ). As a fi rst step,
two judges coded critical incidents into critical behaviors. Next, (sub)categories were developed based on
these critical behaviors. Two judges (A and B) independently developed mutually exclusive and exhaustive
categories and subcategories for responses 1 to 400 (587 critical behaviors). Two other trained judges (C
and D) independently sorted the critical behaviors into the categories provided by judges A and B. Finally,
a fi ft h, independent judge (E) carried out a fi nal sort.
BOX 16 3
336 research methods for business

As you begin to organize your data into categories and subcategories you will begin to notice patterns and
relationships between the data. Note that your list of categories and subcategories may change during the process
of analyzing the data. For instance, new categories may have to be identified, definitions of categories may have
to be changed, and categories may have to be broken into subcategories. This is all part of the iterative process of
qualitative data analysis.
Sometimes you may want to capture the number of times a particular theme or event occurs, or how many
respondents bring up certain themes or events. Quantification of your qualitative data may provide you with a
rough idea about the (relative) importance of the categories and subcategories.
BOX 16.4
RESULTS
Categories Participants reported a wide range of critical behaviors that made them angry. Some of these
behaviors were closely related to the outcome of the service process (e.g., “My suitcase was heavily dam-
aged”). Other behaviors were related to service delivery (e.g., “For three days in a row I tried to make an
appointment [. . .] via the telephone. Th e line was always busy”) or interpersonal relationships (e.g., “She
did not stir a fi nger. She was defi nitely not intending to help me”). Finally, customers got angry because of
inadequate responses to service failures (e.g., “He did not even apologize” or “He refused to give me back
my money”). Th ese four specifi c behavior types represent the four overarching categories of events that
instigate customer anger.
Two of these categories were further separated into, respectively, three categories representing service
delivery or procedural failures (“unreliability,” “inaccessibility,” and “company policies”) and two categories
representing interpersonal relationships or interactional failures (“insensitive behavior” and “impolite
behavior”). Th e main reason for this was that the categories “procedural failures” and “interactional fail-
ures” would otherwise be too heterogeneous with respect to their composition and, more importantly,
with respect to ways of avoiding or dealing with these failures. For instance, avoiding anger in response
to unreliability (not performing in accordance with agreements) will most likely call for a diff erent – and
maybe even opposite – approach than avoiding anger in response to company policies (performing in
accordance with company rules and procedures), even though these failures are both procedural; that is,
related to service delivery.
BOX 16 4
BOX 16.5
Table 16.1 indicates that “price agreements that were broken” (category “unreliability”, subcategory
“pricing”) was mentioned 12 times as a cause of anger. Hence, broken price agreements represent 1.35%
of the total number of critical behaviors (886) and 2% of the total number of the reported critical inci-
dents (600). Th e sixth column indicates that nine participants mentioned broken price agreements
as the sole cause of their anger, whereas three participants mentioned at least one additional critical
behavior (column 7).
BOX 16 5
chapter qualitative data analysis 337

TA
BL
E 1
6.1
Inst
igat
ion
s o
f an
ger
in s
ervi
ce c
on
sum
pti
on
set
tin
gs
(Su
b)c
ateg
ory
(Su
b)c
ateg
ory
def
init
ion
No
. of
beh
avio
rs
No
. of
beh
avio
rs
in %
of
beh
avio
rs
No
. of
beh
avio
rs
in %
of
inci
den
ts
No
. of
beh
avio
rs
in
sin
gle
‐
fact
or
inci
den
ts
No
. of
beh
avio
rs
in
mu
lti‐
fact
or
inci
den
tsE
xam
ple
(s)
Pro
ced
ura
l fa
ilu
res
Un
reli
abil
ity
Serv
ice
firm
doe
s n
ot
perf
orm
th
e se
rvic
e
dep
end
ably
.
156
17.6
1 26
.00
73
83
Del
iver
y p
rom
ises
Serv
ice
pro
vid
er d
oes
no
t p
rovi
de
serv
ices
at
the
tim
e
it p
rom
ises
to
do
so.
104
11.7
417
.33
4262
Wai
t fo
r ap
po
intm
ent
wit
h
den
tist
, ph
ysic
ian
, or
hai
rdre
sser
, or
on
a p
lan
e,
trai
n, o
r ta
xi.
Serv
ice
pro
visi
on
Serv
ice
pro
vid
er d
oes
no
t p
rovi
de
the
serv
ice
that
was
agre
ed u
po
n.
40
4.52
6.67
2218
Cli
ent
rece
ives
dif
fere
nt
car
than
agre
ed u
pon
wit
h c
ar r
enta
l
com
pan
y or
dif
fere
nt
apar
tmen
t th
an a
gree
d u
pon
wit
h t
rave
l age
nt.
Bic
ycle
rep
aire
rs, c
ar m
ech
anic
s, o
r
buil
din
g co
ntr
acto
rs c
arry
ou
t
dif
fere
nt
wor
k th
an a
gree
d
up
on o
r w
ork
that
was
no
t
agre
ed u
pon
wit
h t
hei
r cl
ien
ts.
Pri
cin
gP
rice
agr
eem
ents
are
bro
ken
.
12
1.35
2.00
9
3
“Aft
er a
par
ty w
e ca
lled
a c
ab.
We
wer
e w
ith
a p
arty
of
five
.
A v
an w
ou
ld t
ake
us
ho
me
for
a fi
xed
, lo
w p
rice
.
Ho
wev
er, u
po
n a
rriv
al, t
he
dri
ver
ask
ed t
he
regu
lar
clo
ck p
rice
.”
338

Inac
cess
ibil
ity
Cu
stom
ers
expe
rien
ce
dif
ficu
ltie
s w
ith
enga
gin
g in
th
e
serv
ice
proc
ess .
47
5.
30
7.83
17
30
Co
mm
un
icat
ive
inac
cess
ibil
ity
Inac
cess
ibil
ity
via
tele
ph
on
e, f
ax,
e‐m
ail,
and
/or
the
Inte
rnet
.
26
2.93
4.33
9
17“F
or
thre
e d
ays
in a
ro
w I
tri
ed
to m
ake
an a
pp
oin
tmen
t w
ith
my
ph
ysic
ian
via
th
e
tele
ph
on
e. T
he
lin
e w
as
alw
ays
bu
sy.”
Ph
ysic
al
inac
cess
ibil
ity
of
serv
ice
elem
ents
Cu
sto
mer
s ex
per
ien
ce
dif
ficu
ltie
s w
ith
acce
ssin
g a
cert
ain
elem
ent
or
par
t o
f
the
serv
ice.
12
1.35
2.00
4
8
Ch
eck
‐in
co
un
ter
of
an a
irli
ne
com
pan
y, c
ash
‐po
int
of
a
sup
erm
arke
t, s
ervi
ce d
esk
of
a h
oli
day
res
ort
, or
bag
gage
clai
m a
t an
air
po
rt.
Ph
ysic
al
inac
cess
ibil
ity
of
serv
ice
pro
vid
er
Dif
ficu
lt p
hys
ical
acce
ssib
ilit
y o
f
serv
ice
pro
vid
er
bec
ause
of
inco
nve
nie
nt
loca
tio
ns
or
op
enin
g h
ou
rs.
91.
021.
50
4
5“I
t w
as t
hre
e o
'clo
ck o
n a
Satu
rday
aft
ern
oo
n a
nd
th
e
dry
cle
aner
was
alr
ead
y
clo
sed
.”
Com
pan
y po
lici
es
Serv
ice
prov
ider
’ s ru
les
and
pro
cedu
res
or
the
exec
uti
on o
f
rule
s an
d p
roce
dure
s
by s
ervi
ce s
taff
is
perc
eive
d t
o be
un
fair
.
76
8.
57
12.6
7 45
31
Ru
les
and
pro
ced
ure
s
Inef
fici
ent,
ill
‐tim
ed,
and
un
clea
r ru
les
and
pro
ced
ure
s.
66
7.45
11.0
038
28“I
t tu
rned
ou
t th
at t
he
[Cys
tic
Fib
rosi
s] f
ou
nd
atio
n u
sed
un
fair
pro
ced
ure
s fo
r
assi
gnin
g fa
mil
ies
wit
h c
ysti
c
fib
rosi
s to
vac
atio
ns.
Fo
r
exam
ple
, so
me
fam
ilie
s w
ere
invi
ted
fo
r ye
ars
in a
ro
w e
ven
tho
ugh
th
is is
no
t al
low
ed.”
(con
tin
ued
)
339

(Su
b)c
ateg
ory
(Su
b)c
ateg
ory
def
init
ion
No
. of
beh
avio
rs
No
. of
beh
avio
rs
in %
of
beh
avio
rs
No
. of
beh
avio
rs
in %
of
inci
den
ts
No
. of
beh
avio
rs
in
sin
gle
‐
fact
or
inci
den
ts
No
. of
beh
avio
rs
in
mu
lti‐
fact
or
inci
den
tsE
xam
ple
(s)
“On
ly t
wo
day
s b
efo
re o
ur
wed
din
g m
y w
ife
was
ord
ered
to
lea
ve t
he
cou
ntr
y b
y th
e im
mig
rati
on
off
ice.
”
“I w
ent
to t
he
loca
l
adm
inis
trat
ion
to
rep
ort
a
chan
ge o
f ad
dre
ss. A
t th
e
sam
e ti
me
I w
ante
d t
o a
pp
ly
for
a p
ark
ing
lice
nse
. In
th
at
case
yo
u m
ust
dra
w a
nu
mb
er f
or
the
chan
ge o
f
add
ress
fir
st a
nd
late
r o
n
you
mu
st d
raw
a s
eco
nd
nu
mb
er f
or
the
par
kin
g
lice
nse
. I g
ot
angr
y an
d a
sked
wh
y o
n e
arth
th
at w
as
nec
essa
ry.”
Infl
exib
le s
ervi
ce
staf
f
Serv
ice
staf
f d
oes
no
t
adap
t ru
les
and
pro
ced
ure
s to
refl
ect
ind
ivid
ual
circ
um
stan
ces
of
cust
om
er.
10
1.12
1.67
7
3
“It
was
an
exc
epti
on
ally
ho
t d
ay.
Th
e se
con
d‐c
lass
com
par
tmen
ts o
f th
e tr
ain
wer
e o
verc
row
ded
. To
avo
id
the
bad
atm
osp
her
e I
wen
t to
a fi
rst‐
clas
s co
mp
artm
ent.
Wh
en t
he
guar
d c
ame
he
sen
t
us
away
. At
that
mo
men
t I
flew
in
to a
rag
e.”
TA
BL
E 1
6.1
(Co
nti
nu
ed)
340

Inte
ract
ion
al f
ailu
res
Impo
lite
beh
avio
r Se
rvic
e pr
ovid
er
beh
aves
ru
del
y .
84
9.
48
14.0
0 46
38
Insu
ltin
g b
ehav
ior
Serv
ice
pro
vid
er i
s
beh
avin
g
off
ensi
vely
.
32
3.61
5.33
1517
“Th
e p
hys
icia
n w
as g
etti
ng
flu
id
ou
t o
f m
y k
nee
. Th
is w
as
rath
er p
ain
ful,
so I
to
ld h
im
that
it h
urt
. He
dir
ectl
y
sto
pp
ed e
ven
th
ou
gh t
her
e
was
so
me
flu
id le
ft. W
hen
I as
ked
him
wh
y h
e h
ad
sto
pp
ed h
e sa
id ‘b
ecau
se
you
are
su
ch a
mo
aner
’.
Th
at ’ s
no
way
to
tre
at
peo
ple
.”
No
t ta
kin
g cl
ien
t
seri
ou
sly
Serv
ice
pro
vid
er d
oes
no
t ta
ke c
lien
t
seri
ou
sly.
28
3.16
4.67
1513
“Fo
r so
me
tim
e I
was
hea
rin
g
stra
nge
no
ises
wh
en I
was
dri
vin
g m
y ca
r. A
gain
an
d
agai
n t
hey
[ga
rage
] fo
bb
ed
me
off
wit
h ‘Y
es, d
ear
. . .’
an
d
‘Yes
, lo
ve .
. .’ E
ven
tual
ly
they
had
to
rep
lace
th
e
engi
ne.
”
Dis
ho
nes
tySe
rvic
e p
rovi
der
tri
es
to e
arn
mo
ney
in
an i
mp
rop
er
man
ner
.
16
1.81
2.67
10
6“A
fter
we
wen
t to
th
e th
eate
r, w
e
too
k a
cab
. Th
e d
rive
r m
ade
a
hu
ge d
eto
ur.
I w
as m
ad
bec
ause
th
is w
as a
pla
in r
ip‐o
ff.”
“I w
as r
efu
sed
acc
ess
to t
he
bar
bec
ause
of
my
race
, eve
n
tho
ugh
I w
as i
mm
acu
late
ly
dre
ssed
. Th
ey li
tera
lly
told
me
that
th
ey d
id n
ot
care
fo
r
my
kin
d o
f p
eop
le.”
Dis
crim
inat
ion
Per
son
or
gro
up
is
trea
ted
un
fair
ly,
usu
ally
bec
ause
of
pre
jud
ice
abo
ut
race
, eth
nic
gro
up
,
age
gro
up
, or
gen
der
.
80.
901.
33
6
2
(con
tin
ued
)
341

(Su
b)c
ateg
ory
(Su
b)c
ateg
ory
def
init
ion
No
. of
beh
avio
rs
No
. of
beh
avio
rs
in %
of
beh
avio
rs
No
. of
beh
avio
rs
in %
of
inci
den
ts
No
. of
beh
avio
rs
in
sin
gle
‐
fact
or
inci
den
ts
No
. of
beh
avio
rs
in
mu
lti‐
fact
or
inci
den
tsE
xam
ple
(s)
Inse
nsi
tive
beh
avio
r Se
rvic
e pr
ovid
er d
oes n
ot
mak
e an
effo
rt to
appr
ecia
te th
e
cust
omer
's ne
eds a
nd/
or p
ays l
ittle
att
entio
n
to c
ust
omer
s or
thei
r
belo
ngin
gs .
195
22.0
1 32
.50
76
119
Un
resp
on
sive
nes
sU
nre
spo
nsi
ve s
taff
do
es n
ot
pro
vid
e
pro
mp
t se
rvic
e to
cust
om
ers
or
do
es
no
t re
spo
nd
to
cust
om
ers'
req
ues
ts a
t al
l.
80
9.03
13.3
333
47“I
wen
t to
a c
ash
des
k [o
f a
dru
gsto
re]
but
the
sale
sper
son
wal
ked
aw
ay. A
t an
oth
er c
ash
des
k tw
o p
erso
ns
wer
e
hel
pin
g on
e cl
ien
t. O
ne
of
them
loo
ked
at
me
but
did
no
t
show
an
y in
ten
tion
to
hel
p
me.
It
too
k fo
reve
r b
efor
e I
was
fin
ally
ser
ved
.”
“I a
sked
a g
irl t
o h
elp
me
fin
d
the
righ
t si
ze [
clo
thes
] fo
r m
y
gran
dso
n. S
he
did
no
t st
ir a
fin
ger.
Sh
e w
as d
efin
itel
y n
ot
inte
nd
ing
to h
elp
me.
”
Inco
mp
lete
/
inco
rrec
t
info
rmat
ion
Serv
ice
pro
vid
er
wit
hh
old
s
info
rmat
ion
fro
m
clie
nt
or
pro
vid
es
inco
mp
lete
,
imp
reci
se, o
r
inco
rrec
t
info
rmat
ion
.
61
6.88
10.1
721
40“O
ur
pla
ne
was
no
t th
ere.
I g
ot
mad
bec
ause
th
ey d
id n
ot
tell
us
wh
y n
ot
or
wh
at t
o d
o.”
TA
BL
E 1
6.1
(Co
nti
nu
ed)
342

Inac
cura
cy w
ith
per
son
al d
ata
Serv
ice
pro
vid
er
han
dle
s p
erso
nal
info
rmat
ion
of
clie
nt
rath
er
care
less
ly.
16
1.81
2.67
5
11“I
was
lo
ok
ing
fo
r a
sum
mer
job
an
d s
ign
ed u
p a
t an
emp
loy
men
t ag
ency
. W
hen
I as
ked
th
em a
bo
ut
the
stat
e o
f af
fair
s a
cou
ple
of
wee
ks
late
r, I
fo
un
d o
ut
that
I h
ad n
ot
bee
n s
ign
ed
up
yet
. T
hey
to
ld m
e th
at
they
had
lo
st m
y
app
lica
tio
n f
orm
.”
Per
son
al a
tten
tio
nSe
rvic
e p
rovi
der
pay
s
litt
le a
tten
tio
n t
o
the
cust
om
er.
15
1.69
2.50
8
7
“Aft
er t
he
mea
l I a
sked
fo
r th
e
chec
k. T
he
wai
tres
s n
od
ded
and
I e
xpec
ted
to
get
th
e
chec
k. A
fter
th
ree
ciga
rett
es
ther
e w
as s
till
no
ch
eck
. I
loo
ked
aro
un
d a
nd
saw
th
at
the
wai
tres
s w
as h
avin
g a
live
ly c
on
vers
atio
n w
ith
th
e
bar
ten
der
.”
Imp
erso
nal
trea
tmen
t
Serv
ice
pro
vid
er d
oes
no
t p
rovi
de
tail
or‐
mad
e so
luti
on
s.
91.
021.
50
3
6“I
go
t an
gry
bec
ause
sh
e
[hai
rdre
sser
] d
id n
ot
cut
my
hai
r th
e w
ay I
had
ask
ed h
er
to .
. .”
“Th
e m
ort
gage
co
un
selo
r w
as
very
do
min
ant
du
rin
g th
e
con
vers
atio
n. M
y o
wn
po
int
of
view
was
no
t su
ffic
ien
tly
add
ress
ed.”
Inco
nve
nie
nce
Cu
sto
mer
en
ds
up
in
inco
nve
nie
nt
or
un
com
fort
able
situ
atio
n, o
ften
lead
ing
to p
hys
ical
dis
tres
s.
80.
901.
332
6“A
fter
lan
din
g [a
irp
lan
e], w
e h
ad
to s
tay
in o
ur
seat
s fo
r 1.
5
ho
urs
. It
was
ver
y
un
com
fort
able
”.
(con
tin
ued
)
343

(Su
b)c
ateg
ory
(Su
b)c
ateg
ory
def
init
ion
No
. of
beh
avio
rs
No
. of
beh
avio
rs
in %
of
beh
avio
rs
No
. of
beh
avio
rs
in %
of
inci
den
ts
No
. of
beh
avio
rs
in
sin
gle
‐
fact
or
inci
den
ts
No
. of
beh
avio
rs
in
mu
lti‐
fact
or
inci
den
tsE
xam
ple
(s)
Pri
vacy
mat
ters
Serv
ice
pro
vid
er
inva
des
or
dis
rega
rds
a
per
son
's p
riva
cy.
30.
340.
50
2
1“T
he
wel
fare
wo
rker
left
th
e
do
or
op
en d
uri
ng
ou
r p
riva
te
con
vers
atio
n.”
Irre
spo
nsi
ble
beh
avio
r
Serv
ice
staf
f b
ehav
es
irre
spo
nsi
bly
.
30.
340.
50
2
1“T
he
sch
oo
ltea
cher
let
my
very
you
ng
chil
dre
n w
alk
to
thei
r h
om
es o
n t
hei
r o
wn
wh
en I
was
a li
ttle
late
to
pic
k
them
up
.”
Ou
tcom
e fa
ilu
res
Qu
alit
y of
cor
e se
rvic
e
itse
lf .
191
21.5
6 31
.84
76
115
Serv
ice
mis
take
sSm
all o
r b
ig m
ista
kes
,
wh
ich
may
cau
se
dam
age
to t
he
cust
om
er o
r
bel
on
gin
gs o
f th
e
cust
om
er.
115
12.9
818
.50
4768
“Th
e w
aitr
ess
bro
ugh
t th
e w
ron
g
mea
l.”
“Th
e p
hys
icia
n p
resc
rib
ed t
he
wro
ng
med
icin
e.”
“As
a co
nse
qu
ence
of
the
op
erat
ion
I w
ill n
ot
be
able
to
ever
wal
k a
gain
.”
“My
suit
case
was
hea
vily
dam
aged
.”
TA
BL
E 1
6.1
(Co
nti
nu
ed)
344

Def
ecti
ve t
angi
ble
sIn
op
erat
ive,
bro
ken
,
bad
ly p
rep
ared
, or
un
sati
sfac
tory
tan
gib
les.
35
3.95
5.83
6
29“M
y ca
sh c
ard
was
no
t w
ork
ing.
”
“Aft
er t
hre
e w
eek
s th
e co
ffee
mac
hin
e [b
ou
ght
in s
ho
p]
bro
ke d
ow
n.”
“Th
e fo
od
was
co
ld.”
“We
bo
ok
ed a
ver
y ex
pen
sive
ho
lid
ay. H
ow
ever
, th
e h
ote
l
was
an
old
, dir
ty, r
un
‐do
wn
slu
m, w
ith
ho
les
in t
he
carp
etin
g. T
he
swim
min
g
po
ol
was
un
pai
nte
d a
nd
95
cen
tim
eter
s d
eep
. Th
e
din
ing
roo
m l
oo
ked
lik
e a
stab
le.”
Bil
lin
g er
rors
Cu
sto
mer
s ar
e
mis
char
ged
fo
r
serv
ices
.
25
2.82
4.17
1015
Hig
h p
rice
sSe
rvic
e p
rovi
der
's
pri
ces
are
con
sid
ered
to
be
too
hig
h r
elat
ive
to
an i
nte
rnal
refe
ren
ce p
rice
or
rela
tive
to
pri
ces
of
com
pet
ito
rs.
16
1.81
2.67
13
3“I
ord
ered
tw
o d
rin
ks
at t
he
bar
.
I h
ad t
o p
ay €
12. T
hat
is
real
ly a
n a
bsu
rd p
rice
!”
“Th
e p
rice
of
the
DV
D‐p
laye
r
was
€12
50. A
t an
oth
er s
tore
it
was
on
ly €
900.
”
Inad
equ
ate
resp
onse
s to
serv
ice
fail
ure
s
137
15.4
6 22
.83
10
127
(con
tin
ued
)
345

(Su
b)c
ateg
ory
(Su
b)c
ateg
ory
def
init
ion
No
. of
beh
avio
rs
No
. of
beh
avio
rs
in %
of
beh
avio
rs
No
. of
beh
avio
rs
in %
of
inci
den
ts
No
. of
beh
avio
rs
in
sin
gle
‐
fact
or
inci
den
ts
No
. of
beh
avio
rs
in
mu
lti‐
fact
or
inci
den
tsE
xam
ple
(s)
Inte
ract
ion
al
un
fair
nes
s
Serv
ice
emp
loye
es'
inte
rper
son
al
beh
avio
r d
uri
ng
the
serv
ice
reco
very
.
80
9.03
13.3
3
476
“He
[wai
ter]
did
no
t ev
en
apo
logi
ze.”
Ou
tco
me
un
fair
nes
sT
he
ou
tco
me
of
the
serv
ice
reco
very
.
37
4.17
6.17
5
32“I
did
no
t re
ceiv
e th
e n
ewsp
aper
.
I ca
lled
th
em o
n t
he
ph
on
e
and
th
ey p
rom
ised
th
at I
wo
uld
rec
eive
th
e n
ewsp
aper
that
sam
e d
ay. N
oth
ing
hap
pen
ed.”
“He
[hai
rdre
sser
] re
fuse
d t
o g
ive
me
bac
k m
y m
on
ey.”
Pro
ced
ura
l
un
fair
nes
s
Th
e p
erce
ived
fai
rnes
s
of
the
serv
ice
reco
very
pro
cess
.
20
2.26
3.33
1
19“R
ecen
tly
I b
ou
ght
a h
ou
se.
Aft
er m
ovi
ng
in I
no
tice
d
that
th
e b
ath
roo
m t
ap w
as
def
ecti
ve. T
he
con
trac
tor
adm
itte
d t
hat
it w
as t
he
firm
's r
esp
on
sib
ilit
y.
Ho
wev
er, i
t to
ok
fo
reve
r
bef
ore
th
ey t
oo
k a
ctio
n. O
nly
afte
r th
e ch
ief
exec
uti
ve o
f
the
com
pan
y in
terv
ened
did
they
co
ver
the
exp
ense
s.”
TA
BL
E 1
6.1
(Co
nti
nu
ed)
346

chapter qualitative data analysis 347
Data display
According to Miles and Huberman ( 1994 ), data display is the second major activity that you should go through
when analyzing your qualitative data. Data display involves taking your reduced data and displaying them in an
organized, condensed manner. Along these lines, charts, matrices, diagrams, graphs, frequently mentioned
phrases, and/or drawings may help you to organize the data and to discover patterns and relationships in the data
so that the drawing of conclusions is eventually facilitated.
In our example, a matrix was considered to be the appropriate display to bring together the qualitative
data. The selected data display technique may depend on researcher preference, the type of data set, and the
purpose of the display. A matrix is, by and large, descriptive in nature, as the aforementioned example illus-
trates. Other displays, such as networks or diagrams, allow you to present causal relationships between
concepts in your data.
Drawing conclusions
Conclusion drawing is the “final” analytical activity in the process of qualitative data analysis. It is the essence of
data analysis; it is at this point where you answer your research questions by determining what identified themes
stand for, by thinking about explanations for observed patterns and relationships, or by making contrasts and
comparisons.
BOX 16.6
DATA ANALYSIS
In our study into events that typically elicit customer anger in service consumption settings, we devel-
oped a matrix to organize and arrange the qualitative data. Th is allowed us to extract higher order
themes from the data: we were able to combine the 28 subcategories into seven categories and four
“super‐categories.” Th e seven categories were “unreliability,” “inaccessibility,” and “company policies”
(procedural failures); “insensitive behaviour” and “impolite behavior” (interactional failures); “out-
come failures”; and “inadequate responses to service failures.” Th ese categories and subcategories are
defi ned in the second column of Table 16.1 . Th e eighth column provides typical examples of critical
behavior per subcategory.
Table 16.1 illustrates how data display organizes qualitative information in a way that helps you to
draw conclusions. Categories and corresponding subcategories of events that typically instigate anger
are presented in column 1 and defined in column 2. Column 3 provides information on how many
times specific themes were mentioned by the participants. Column 4 provides information about
how many times a specific theme was mentioned as a percentage of the total number of themes (885).
Column 5 contains the percentage of participants that mentioned a specific category or subcategory.
Columns 6 and 7 provide an overview of the distribution of incidents over one‐ or multifactor inci-
dents. Column 8 provides (verbatim) examples of critical behaviors, attitudes, and manners of service
providers.
BOX 16 6

RELIABILITY AND VALIDITY IN QUALITATIVE RESEARCH
It is important that the conclusions that you have drawn are verified in one way or another. That is, you must
make sure that the conclusions that you derive from your qualitative data are plausible, reliable, and valid.
Reliability and validity have a slightly different meaning in qualitative research in comparison to quantitative
research. Reliability in qualitative data analysis includes category and interjudge reliability. Category reliability
“depends on the analyst's ability to formulate categories and present to competent judges definitions of the cat-
egories so they will agree on which items of a certain population belong in a category and which do not”
(Kassarjian, 1977 , p. 14). Thus, category reliability relates to the extent to which judges are able to use category
definitions to classify the qualitative data. Well‐defined categories will lead to higher category reliability and
BOX 16.7
DISCUSSION
Th e identifi cation of precipitating events of anger is critical to understanding this emotion. What's more,
for service fi rm management, it is important to understand what critical behaviors from their side typi-
cally elicit anger in customers. For this reason, this exploratory study investigated precipitating events of
customer anger in services.
Th e results of this study provide an adequate, unambiguous representation of precipitating events of
customer anger and expand existing (appraisal) theories of antecedents of customer anger. Specifi cally, seven
event categories were found to instigate anger, including unreliability, inaccessibility, and company policies
(the procedural failures), insensitive behavior and impolite behavior (the interactional failures), outcome
failures, and inadequate responses to service failures. Each of these events was found to be a suffi cient cause
of customer anger. However, the compound incidents that were reported by the participants in this study sug-
gest that critical behaviors of service providers may also interact in their eff ects on customer anger.
Th e foregoing fi ndings imply certain extensions to service marketing research. Researchers have pre-
viously examined the eff ects of core service failures and waiting for service on anger. However, this study
shows that the antecedents of anger are not limited to these two factors. For service fi rm management,
the seven categories suggest areas in which managers might take action to prevent customer anger. For
example, the fi nding that inaccessibility of services causes customers to get angry suggests that service
providers may benefi t from being easily accessible for consumers. Th e fi nding that customer anger may
be caused by insensitivity and impoliteness of service staff implies that hiring the right people, adequate
training of service employees, and fi nding ways to motivate service staff to adequately perform services
also reduces customer anger.
Th e present results partly converge with prior studies that have categorized dissatisfying experiences
with service fi rm employees (Bitner, Booms & Tetreault, 1990 ) and retail failures (Kelley, Hoff man &
Davis, 1993 ). Besides these similarities, there are important diff erences with the aforementioned studies as
well. For instance, incidents reported by the participants of this study include diffi culties with engaging in
the service process and unfair rules and procedures (company policies). Th ese behaviors, which account
for more than 20% of the reported anger‐provoking incidents, did not come forward as unfavorable behav-
iors of service providers in earlier research. Th is shows how the classifi cation scheme developed here builds
on and extends earlier models of service and retail failures.
BOX 16 7
348 research methods for business

chapter qualitative data analysis 349
eventually to higher interjudge reliability (Kassarjian, 1977 ), as discussed next. However, categories that are
defined in a very broad manner will also lead to higher category reliability. This can lead to the oversimplification
of categories, which reduces the relevance of the research findings. For instance, McKellar ( 1949 ) in an attempt
to classify instigations of anger distinguished between need situations and personality instigations . Need situa-
tions were defined as “any interference with the pursuit of a personal goal,” such as missing a bus. Personality
situations included the imposition of physical or mental pain or the violation of personal values, status, and pos-
session. This classification, which focuses on whether an anger‐provoking event can be classified as a personality
situation or a need situation, will undoubtedly lead to high category and interjudge reliability, but it seems to be
too broad to be relevant to service firm management trying to avoid customer anger. Therefore, Kassarjian
( 1977 ) suggests that the researcher must find a balance between category reliability and the relevance of catego-
ries. Interjudge reliability can be defined as a degree of consistency between coders processing the same data
(Kassarjian, 1977 ). A commonly used measure of interjudge reliability is the percentage of coding agreements
out of the total number of coding decisions. As a general guideline, agreement rates at or above 80% are consid-
ered to be satisfactory.
Earlier in this book, validity was defined as the extent to which an instrument measures what it purports to
measure. In this context, however, validity has a different meaning. It refers to the extent to which the research
results (1) accurately represent the collected data (internal validity) and (2) can be generalized or transferred to
other contexts or settings (external validity). Two methods that have been developed to achieve validity in quali-
tative research are:
● Supporting generalizations by counts of events. This can address common concerns about the reporting of
qualitative data: that anecdotes supporting the researcher's theory have been selected, or that too much atten-
tion has been paid to a small number of events, at the expense of more common ones.
● Ensuring representativeness of cases and the inclusion of deviant cases (cases that may contradict your the-
ory). The selection of deviant cases provides a strong test of your theory.
Triangulation, discussed in Chapter 6 , is a technique that is also often associated with reliability and validity
in qualitative research. Finally, you can also enhance the validity of your research by providing an in‐depth
description of the research project. Anyone who wishes to transfer the results to another context is then respon-
sible for judging how valid such a transfer is.
BOX 16.8
RELIABILITY AND VALIDITY
A rigorous classifi cation system should be “intersubjectively unambiguous” (Hunt, 1983 ), as measured by
interjudge reliability. Th e interjudge reliability averaged 0.84, and no individual coeffi cients were lower
than 0.80. Th e content validity of a critical incident classifi cation scheme is regarded as satisfactory if
themes in the confi rmation sample are fully represented by the categories and subcategories developed in
the classifi cation sample. In order to determine whether the sample size was appropriate, two confi rmation
samples (hold‐out samples from the original 859 samples) of 100 new incidents (299 critical behaviors)
were sorted into the classifi cation scheme with an eye to developing new categories. No new categories
emerged, indicating that the set of analyzed critical incidents forms an adequate representation of the pre-
cipitating events of anger in services.
BOX 16 8

SOME OTHER METHODS OF GATHERING AND ANALYZING QUALITATIVE DATA
Content analysis
Content analysis is an observational research method that is used to systematically evaluate the symbolic con-
tents of all forms of recorded communications (Kolbe & Burnett, 1991). Content analysis can be used to analyze
newspapers, websites, advertisements, recordings of interviews, and the like. The method of content analysis
enables the researcher to analyze (large amounts of) textual information and systematically identify its proper-
ties, such as the presence of certain words, concepts, characters, themes, or sentences. To conduct a content
analysis on a text, the text is coded into categories and then analyzed using conceptual analysis or rela-
tional analysis.
Conceptual analysis establishes the existence and frequency of concepts (such as words, themes, or char-
acters) in a text. Conceptual analysis analyzes and interprets text by coding the text into manageable content
categories. Relational analysis builds on conceptual analysis by examining the relationships among concepts
in a text.
The results of conceptual or relational analysis are used to make inferences about the messages within the
text, the effects of environmental variables on message content, the effects of messages on the receiver, and so on.
Along these lines, content analysis has been used to analyze press coverage of election campaigns, to assess the
effects of the content of advertisements on consumer behavior, and to provide a systematic overview of tools that
online media use to encourage interactive communication processes.
Narrative analysis
A narrative is a story or “an account involving the narration of a series of events in a plotted sequence which
unfolds in time” (Denzin, 2000). Narrative analysis is an approach that aims to elicit and scrutinize the stories
we tell about ourselves and their implications for our lives. Narrative data are often collected via interviews.
These interviews are designed to encourage the participant to describe a certain incident in the context of his or
her life history. In this way, narrative analysis differs from other qualitative research methods; it is focused on a
process or temporal order, for instance by eliciting information about the antecedents and consequences of a
certain incident in order to relate this incident to other incidents. Narrative analysis has thus been used to study
impulsive buying (Rook, 1987), customers' responses to advertisements (Mick & Buhl, 1992), and relationships
between service providers and consumers (Stern, Thomson & Arnould, 1998).
Analytic induction
Another (more general) strategy of qualitative data analysis is analytic induction. Analytic induction is an
approach to qualitative data analysis in which universal explanations of phenomena are sought by the collection
of (qualitative) data until no cases that are inconsistent with a hypothetical explanation of a phenomenon are
found. Analytic induction starts with a (rough) definition of a problem (“why do people use marijuana” is a
famous example), continues with a hypothetical explanation of the problem (e.g., “people use marijuana for
pleasure”), and then proceeds with the examination of cases (e.g., the collection of data via in‐depth interviews).
If a case is inconsistent with the researcher's hypothesis (e.g., “I use marijuana for health reasons”), the researcher
either redefines the hypothesis or excludes the “deviant” case that does not confirm the hypothesis. Analytic
induction involves inductive – rather than deductive – reasoning, allowing for the modification of a hypothetical
explanation for phenomena throughout the process of doing research.
350 research methods for business

chapter qualitative data analysis 351
BIG DATA
Now that we have discussed data analysis, it is time to say a few words about big data. “Big data” is a popular term
nowadays that is commonly used to describe the exponential growth and availability of data from digital sources
inside and outside the organization. The term originally related to the volume of data that could not be processed and
analyzed (efficiently) by traditional methods and tools. The original definition of big data focused on structured data,
but most researchers and practitioners have come to realize that a lot of information resides in massive, unstructured
or semi‐structured data, such as texts (think weblogs, Twitter, and Facebook), images, clickstreams, and/or videos.
New technologies have the ability to measure, record, and combine such data and that is why big data has great poten-
tial for making fast advances in many academic disciplines and improving decision making in organizations.
The main characteristics of big data are its volume, its variety and its velocity, where volume refers to the
amount of data, variety refers to the many different types of data, and velocity refers to the pace at which data
become available from business processes, social networks, mobile devices, and the like. Occasionally, additional
“V”s are put forward, most notably veracity, which refers to the biases, noise and abnormality that are often present
in big data.
Big data holds many promises for organizations and managers. However, it also provides them with new
challenges and dilemmas, for instance with regard to how big data should be managed, processed, and analyzed.
That is why many organizations find it difficult to successfully exploit the value in big data.
SUMMARY
● Learning objective 1: Discuss three important steps in qualitative data analysis: data reduction, data
display, and drawing conclusions.
Qualitative data are data in the form of words. There are generally three steps in qualitative data analysis:
data reduction, data display, and the drawing of conclusions. Data reduction refers to the process of select-
ing, coding, and categorizing the data. Data display refers to ways of presenting the data. Data displays may
help the researcher to draw conclusions based on patterns in the reduced set of data.
● Learning objective 2: Discuss how reliability and validity have a different meaning in qualitative
research in comparison to quantitative research and explain how reliability and validity are achieved
in qualitative research.
Reliability and validity have a slightly different meaning in qualitative research in comparison to quantitative
research. Reliability in qualitative data analysis includes category and interjudge reliability. Category reliability
relates to the extent to which judges are able to use category definitions to classify the qualitative data.
Interjudge reliability can be defined as a degree of consistency between coders processing the same data. Two
methods that have been developed to achieve validity in qualitative research are (1) supporting generaliza-
tions by counts of events, and (2) ensuring representativeness of cases and the inclusion of deviant cases.
Triangulation is a technique that is also often associated with reliability and validity in qualitative research.
● Learning objective 3: Compare and contrast content analysis, narrative analysis, and analytic induction.
Content analysis is an observational research method that enables the researcher to analyze textual informa-
tion and systematically identify its properties, such as the presence of certain words, concepts, characters,
themes, or sentences. Narrative analysis is an approach that aims to elicit and scrutinize the stories we tell

about ourselves and their implications for our lives. Narrative data are often collected via interviews. Analytic
induction is an approach to qualitative data analysis in which universal explanations of phenomena are
sought by the collection of (qualitative) data until no cases that are inconsistent with a hypothetical expla-
nation of a phenomenon are found.
● Learning objective 4: Describe the characteristics of big data and explain why big data holds many
promises for organizations and managers.
New technologies have the ability to measure, record, and combine large amounts of data that reside in
massive, unstructured or semi-structured data, such as texts, images, clickstreams, and/or videos. That is
why big data has great potential for making fast advances in many academic disciplines and improving deci-
sion making in organizations. The main characteristics of big data are its volume, its variety and its velocity.
Occasionally, additional “V”s are put forward, most notably veracity.
Visit the companion website at www.wiley.com/college/sekaran for Case study: The
Prevalence of Anger in Service Consumption Settings.
DISCUSSION QUESTIONS
1. What is qualitative data? How do qualitative data differ from quantitative data?
2. Describe the main steps in qualitative data analysis.
3. Define reliability and validity in the context of qualitative research.
4. How can you assess the reliability and validity of qualitative research?
5. What is grounded theory?
6. How does narrative analysis differ from content analysis?
7. Why is analytic induction inductive (rather than deductive) in nature?
352 research methods for business

353
INTRODUCTION
The key purpose of any research report is to offer a clear description of what has been done in the various stages
of the research process. Hence, a research report may possibly include information on the formulation of the
problem statement, a critical review of the literature, the development of a theoretical framework, the collection
of data, the analysis of the data, and the interpretation of the results.
When researchers describe what has been done in the research, they should keep the hallmarks of
scientific research in mind. For instance, the researcher started the research with a definite aim or purpose.
It is imperative to inform the reader about the specific aim or purpose of the research project as soon as
possible; that is, in the introductory section of the research report. The researcher should also keep the
criterion of replicability in mind; a research report is well written when a colleague researcher is able to
replicate the research after reading the report. It is also important that the results of the study and the rec-
ommendations for solving the problem are objectively and effectively communicated to the sponsor, so that
the suggestions made are accepted and implemented. Otherwise, all the effort hitherto expended on the
investigation would have been in vain. Writing the report concisely, convincingly, and with clarity is perhaps as
important as conducting a rigorous research study. Indeed, a well‐thought‐out written report and oral presenta-
tion are critical.
The exact contents and organization of both modes of communication – the written report and the oral
presentation – depend on the purpose of the research study, and the audience to which it is targeted. The relevant
aspects of the written report and oral presentation are discussed in this chapter.
The research report
C H A P T E R 1 7
LEARNING OBJECTIVES
After completing Chapter 17 you should be able to:
1. Describe the characteristics of a well-written research report that is tailored to the needs of a
specific audience.
2. Write a thorough and complete research report.
3. Describe the characteristics of a good oral presentation and deliver a good oral presentation.

354 research methods for business
THE WRITTEN REPORT
The written report starts with a description of the management problem and the research objective. This allows
the reader to quickly become familiar with “the why” of the research project. The written report should also allow
the reader to weigh the facts and arguments presented therein, to examine the results of the study, to reflect on
the conclusions and recommendations, and eventually to implement the acceptable recommendations presented
in the report, with a view to closing the gap between the existing state of affairs and the desired state. To achieve
its goal, the written report has to focus on the issues discussed below.
The purpose of the written report
Research reports can have different purposes and hence the form of the written report will vary according to the
situation. It is important to identify the purpose of the report, so that it can be tailored accordingly. If the purpose
is simply to offer details on some specific areas of interest requested by a manager, the report can be very
narrowly focused and provide the desired information to the manager in a brief format, as in the example below.
A different form of report will be prescribed in some cases, where a manager asks for several alternative solutions
or recommendations to rectify a problem in a given situation. Here the researcher provides the requested
information and the manager chooses from among the alternatives and makes the final decision. In this case, a
more detailed report surveying past studies, the methodology used for the present study, different perspectives
generated from interviews and current data analyses, and alternative solutions based on the conclusions drawn
therefrom will have to be provided. How each alternative helps to improve the problem situation will also have
to be discussed. The advantage and disadvantages of each of the proposed solutions, together with a cost–benefit
analysis in terms of dollars and/or other resources, will also have to be presented to help the manager make the
decision. A situation like that in the third example would warrant this kind of a report. Such a report can also be
found in Report 2 of the appendix to this chapter.
Yet another type of report might require the researcher to identify the problem and provide the final
solution as well. That is, the researcher might be called in to study a situation, determine the nature of the
problem, and offer a report of the findings and recommendations. Such a report has to be very comprehensive,
following the format of a full‐fledged study, as detailed later in this chapter. A fourth kind of research report
is the very scholarly publication presenting the findings of a basic study that one usually finds published in
academic journals.
EXAMPLE
A simple descriptive report
If a study is undertaken to understand, in detail, certain
factors of interest in a given situation (variations in
production levels, composition of employees, and
the like), then a report describing the phenomena of
interest, in the manner desired, is all that is called for.
For instance, let us say a human resources manager
wants to know how many employees have been recruited
during the past 18 months in the organization, their
gender composition, educational level, and the average
proportion of days that these individuals have absented
themselves since recruitment. A simple report giving
the desired information would suffice.
In this report, a statement of the purpose of the
study will be first given (e.g., “It was desired that a profile

chapter the research report 355
EXAMPLE
A situation where a comprehensive report, offering alternative solutions, is needed
The president of a tire company wants several recom-
mendations to be made on planning for the future
growth of the company, taking into consideration the
manufacturing, marketing, accounting, and financial
perspectives. In this case, only a broad objective is
stated: corporate growth. There may currently be
several impediments that retard growth. One has to
carefully examine the situation to determine the obsta-
cles to expansion and how these may be overcome
through strategic planning from production, marketing,
management, financial, and accounting perspectives.
Identification of the problems or impediments in the
situation would call for intensive interviews, literature
review, industry analysis, formulation of a theoretical
perspective, generation of several hypotheses to come
up with different alternative solutions, data gathering,
data analysis, and then exploration of alternative ways
of attaining corporate growth through different strate-
gies. To enable the president to evaluate the alternatives
proposed, the pros and cons of implementing each of
the alternative solutions, and a statement of the costs
and benefits attached to each, would follow.
This report will be more elaborate than the previ-
ous one, detailing each of the steps in the study, empha-
sizing the results of data analysis, and furnishing a
strong basis for the various recommendations. The
alternatives generated and the pros and cons of each in
a report such as this are likely to follow the format of
Report 2 in the appendix. Report 3 in the appendix
relates to basic research on an issue that was examined
by a researcher.
As we can see, the contents and format of a report
will depend on the purpose of the study and the needs
of the sponsors to whom it is submitted.
of the employees recruited during the past 18 months in
the company, and an idea of their rate of absenteeism be
provided. This report offers those details”). The methods
or procedures adopted to collect the data will then be
given (e.g., “The payroll of the company and the personal
files of the employees were examined”). Finally, a narra-
tion of the actual results, reinforced by visual tabular
and graphical forms of representation of the data, will
be provided. Frequency distributions, cross‐tabulations,
and other data will be presented in a tabular form, and
illustrations will include bar charts (for gender), pie
charts (to indicate the proportions of individuals at
various educational levels), and so on. This section will
summarize the data and may look as follows:
A total of 27 employees were recruited during
the past 18 months, of whom 45% are women
and 55% are men. Twenty percent have a
master’s degree, 68% a bachelor’s degree,
and 12% a high school diploma. The aver-
age proportion of days that these employees
remained absent during the past 18 months
is six.
These details provide the information required
by the manager. It may, however, be a good idea to
provide a further gender‐wise breakdown of the mean
proportion of days of absence of the employees in an
appendix, even though this information might not
have been specifically requested. If considered relevant,
a similar breakdown can also be furnished for people
at different job levels.
A short simple report of the type discussed above
is provided in Report 1 in the appendix to this chapter.

356 research methods for business
The audience for the written report
The organization of a report, its length, focus on details, data presentation, and illustrations will, in part, be a
function of the audience for whom it is intended. The letter of transmittal of the report will clearly indicate to
whom the report is being sent. An executive summary placed at the beginning will offer (busy) executives just
the right amount of vital details – usually in less than one page. This will help the managers to quickly grasp the
essentials of the study and its findings, and turn to the pages that offer more detailed information on aspects that
are of special interest to them.
Some managers are distracted by data presented in the form of tables and feel more comfortable with
graphs and charts, while others want to see “facts and figures.” Both tables and figures are visual forms
of representation and need to be presented in reports. Which of these are to be prominently highlighted in
the report and which relegated to an appendix is a function of the awareness of the idiosyncracies of the
ultimate user of the report. If a report is to be handled by different executives, with different orientations,
it should be packaged such that they know where to find the information that meets their preferred mode
of information processing. The length, organization, and presentation modes of the report will, among
other things, depend at least in part on the target audience. Some businesses might also prescribe their own
format for report writing. In all cases, a good report is a function of the audience for whom it is intended
and its exact purpose. As we have seen, some reports may have to be long and detailed, and others brief
and specific.
Sometimes, the findings of a study may be unpalatable to the executive (e.g., the organizational policies are
outdated and the system is very bureaucratic), or may reflect poorly on management, tending to make them react
defensively (e.g., the system has an ineffective top‐down approach). In such cases, tact should be exercised in
presenting the conclusions without compromising on the actual findings. That is, while there is no need to
suppress the unpleasant findings, they can be presented in a nonjudgmental, non‐fault‐finding or finger‐pointing
manner, using objective data and facts that forcefully lead to, and convince the managers of the correctness of,
the conclusions drawn. If this is not done, the report will be read defensively, the recommendations will not be
accepted, and the problem will remain unsolved.
Characteristics of a well-written report
Despite the fact that report writing is a function of the purpose of the study and the type of audience to which it
is presented, and accordingly has to be tailored to meet both, certain basic features are integral to all written
reports. Clarity, conciseness, coherence, the right emphasis on important aspects, meaningful organization of
paragraphs, smooth transition from one topic to the next, apt choice of words, and specificity are all important
features of a good report. The report should, to the extent possible, be free of technical or statistical jargon unless
it happens to be of a technical or statistical nature. Care should also be taken to eliminate grammatical and
spelling errors.
Any assumptions made by the researcher should be clearly stated in the report, and facts, rather than opin-
ions, provided. The report should be organized in a manner that enhances the meaningful and smooth flow of
materials, as the reader progresses through it. Indeed, every reader loves to read a well‐built “story.” The balance
between the academic standpoint and the writing of a good story is not always easy to find though; some trial
and error is often needed.
The importance of the appearance of the report and its readability cannot be overemphasized. Appropriate
headings and subheadings help organize the report in a logical manner and allow the reader to follow the transi-
tions easily. A double‐spaced, typed report with wide margins on all sides enables the reader to make notes/
comments while perusing the contents.

chapter the research report 357
CONTENTS OF THE RESEARCH REPORT
A research report has a title page, an executive summary (in the case of applied research) or an abstract (in the
case of basic research), a preface, a table of contents, and sometimes a copy of the authorization to conduct
the study.
All reports should have an introductory section detailing the problem studied, the purpose of the study and
the research questions, giving some background of what it relates to and setting the stage for what the reader
should expect in the rest of the report. The body of the report should contain a conceptual background, details
regarding the framework of the study and hypotheses (in case of deductive research), the sampling design, data
collection methods, analysis of data, and the results obtained. The final part of the report should present the
findings and draw conclusions. If recommendations have been called for, they will be included, with a cost–
benefit analysis provided with respect to each. Such information clarifies the net advantages of implementing
each of the recommendations. The details provided in the report should be such as to convince the reader of the
thoroughness of the study, and induce confidence in accepting the results and the recommendations made. Every
professional report should also point out the limitations of the study (e.g., in sampling, data collection, and the
like). A list of references cited in the report should then follow.
Appendices, if any, should be attached to the report. A report on the factors influencing the upward mobility
of women in accounting firms can be found in Report 3 of the appendix to this chapter. We will now discuss the
different parts of the report.
The title and the title page
The title of your research report (together with the abstract or management summary) permits potential readers
to obtain a first idea of your study and to decide whether they want to read your report in its entirety. For this
reason you may decide to come up with a descriptive title that accurately reflects the contents of your research or
that indicates the methodology used in the research. Examples of descriptive titles are: “The Impact of Venture
Capital Investments on Public Firm Stock Performance”; “Compulsive Buying: An Exploration into Self‐Esteem
and Money Attitudes”; and “How Advertising Really Works: A Meta‐Analysis.” Hence, a descriptive title may
inform potential readers about the contents of the research, the method that was used, the results of the research
report, and the like.
A good title also grabs attention and entices people to read the research report in its entirety. References
to well‐known (literary) quotes, proverbs, or popular movie and song titles are only some of the possibilities
you have to stand out. “Scents and sensibility: When do (in) congruent ambient scents influence product evalu-
ations?” is an excellent example of a title that is both informative and persuasive. Indeed, do not be afraid to use
a subtitle. If you have a catchy title, but feel it does not provide enough information, use it to clarify the contents
of your research.
In addition to the title of the project, the title page will also indicate further relevant information. Note that
it is important that you are familiar with your institution’s rules and recommendations about what should be
included here. You may need to enter your name, your student number, the name of your institution, depart-
ment, sponsors, supervisor(s), the date of your final report, and so on.
The executive summary or abstract
An executive summary or abstract of your research report is placed on the page immediately following the
title page. The executive summary is a brief account of the entire research study. It provides an overview,
and highlights the following important information related to it: the problem statement, sampling design, data

358 research methods for business
collection methods used, results of data analysis, conclusions, and recommendations, with suggestions for
their implementation.
The executive summary is probably the first part of your research report that is read by the sponsors of
your study. They will use it to get an initial idea about (the results) of your study. The executive summary will be
brief – and is usually restricted to one page or less in length.
An example of a management summary of a study of customer satisfaction with the website of a Dutch
investment bank follows.
EXAMPLE
Management Summary
The aim of this study was to determine the variables
that drive website user satisfaction in the Dutch invest-
ment banking industry. The results of this study aim to
help Peeters & Co.’s Structured Products (SP) desk to
improve the quality of its website. The following prob-
lem statement was formulated:
“What elements are of importance in driving
website user satisfaction in the Dutch invest-
ment banking industry and how can the results
of this study be used to ensure users spend
more time on the website of the SP desk and
use it as their main information source?”
Based on a literature review and exploratory
interviews, a conceptual model of website user satisfac-
tion was constructed. The conceptual model includes
website user satisfaction and its expected (hypothe-
sized) antecedents: information quality, system quality,
interactivity, and system design quality. To examine
the effect of the independent variables on website
user satisfaction, an online survey was used. The
results of this survey showed that the current level
of user satisfaction with the website of the SP desk is
below Peeters & Co.’s standards. Furthermore, the
results showed that the variables information quality,
system quality, interactivity, and system design quality
all have a linear and positive influence on website user
satisfaction.
Based on the results of this study, it is recom-
mended that the SP desk improves the information
quality and interactivity of its website. Information
quality can be improved by including more relevant
content on the website and by making the information
on the website more transparent, objective, and up to
date. Interactivity can be improved by improving cus-
tomer support and by including customization options
and financial tools on the website.
Table of contents
The logic of the structure of your research report becomes evident not only through an apt choice of words in the
titles of the sections, but also as a result of the arrangement of the different components of the work. For the
reader, the table of contents serves as a guide through your research report. The table of contents usually lists
the important headings and subheadings in the report with page references. A separate list of tables and figures
should also be listed in the table of contents. Your institution may have guidelines or recommendations about the
form the contents pages should take. An example of the guidelines of the TIAS School for Business and Society
is provided next.

chapter the research report 359
List of tables, figures, and other materials
If the research report contains charts, figures, maps, tables, photographs, or other types of material, each series
of these should be listed separately in an appropriate list on the page or pages immediately following the table of
contents. Each such list should appear on a separate page. In format, such lists should follow the general style
of the table of contents.
The number of the item is given at the left‐hand margin of the page under the appropriate column head-
ings entitled, “Charts,” “Figures,” “Maps,” “Tables,” or “Photographs.” This is followed by the title of the item,
given exactly as it appears in the text of the research report. The number of the page on which the item appears
in the body of the research report is given flush with the right‐hand margin of the page. Tables, figures, etc.,
should be numbered according to their chapter and position in the chapter. Thus Figure 2.10 is the tenth
figure in chapter two.
Preface
The preface is used primarily to mention matters of background necessary for an understanding of the subject
that do not logically fit into the text. Items such as the following may also be mentioned here unless they are
more extensively considered in the body of the research report: why the report has been written (e.g.,
Management Project Report for . . .), reason for the selection of the subject, difficulties encountered along the
way, etc. It is customary to include a brief expression of the author’s appreciation of help and guidance received
in the research. Note that the preface is not the same as an introduction, which is a part of the main body of
the research report.
EXAMPLE
TIAS School for Business and Society guidelines for the table of contents
The table of contents contains the headings and sub-
headings of the chapters and sections of your research
project, with the numbers of the pages on which these
chapters and sections begin. The outer cover page and
management summary are not entered in the table of
contents and therefore the first item to be listed is
the preface.
The minimum content of the table of contents
should be the preface, each chapter or main division
title, each appendix and the bibliography. All headings
should correspond exactly in wording, arrangement,
punctuation, and capitalisation with the headings as
they appear in the body of the dissertation.
A main heading or chapter title is given entirely in
capitals and begins at the left‐hand margin of the page.
Main subheadings should be indented and typed in
upper and lower case. Subordinate subheadings should
also be indented. Chapters, sections of chapters, and
subsections, etc., are numbered using Arabic numerals
in a decimal sequence. Thus the third subsection of the
second section of chapter three is numbered 3.2.3.
The number of the page on which the division
begins in the text of the management project is given in
the table of contents in Arabic numerals flush with the
right‐hand margin of the page. Double‐spacing is used
except for overrun lines, which are single‐spaced.

360 research methods for business
The authorization letter
A copy of the letter of authorization from the sponsor of the study approving the investigation and detailing its
scope is sometimes attached at the beginning of the research report. The authorization letter makes clear to the
reader that the goals of the study have the full blessing of the organization.
The introductory section
The layout of the first chapter is more or less standard. This chapter could contain, in the following order:
1. Introduction (§1.1).
2. Reason for the research (description of the problem)(§1.2).
3. Research objective and research questions (§1.3).
4. The scope of the study (§1.4).
5. Research method (approach) (§1.5).
6. Managerial relevance (§1.6).
7. Structure and division of chapters in the research report (§1.7).
The introductory section starts with a short introduction providing background information on why and
how the study was initiated. The introduction is followed by a section describing the objective of the research
project, and a section providing the research questions. Brief (!) descriptions of the scope of the study, the
research method, and the managerial relevance of the study are also provided in the introductory section.
The last section offers an overview of the structure and division of chapters in the research report.
The body of the report
The central part of a research report usually has two large sections: a theoretical part and an empirical part. The
theoretical part contains an in‐depth exploration and a clear explication of the relevant literature. The exact
nature of this part depends on the type of study you have done (exploratory, descriptive, or causal – see
Chapter 4, Box 4.2 for an example). It documents the relevant instruments provided in earlier research that
may help you to describe what you aim to describe (when your research is descriptive in nature) or relevant
findings from earlier research (when your research is exploratory or causal in nature) and should be selective,
goal oriented, thorough, and critical – a literature review is more than just a summary of the literature! The
literature review can be concluded with a theoretical framework and a number of hypotheses, which will be
tested in the empirical part of your study (if your research is deductive and causal in nature). Avoid elabora-
tions that will ultimately not contribute to a better understanding of the problem and/or solutions to
the problem.
The design details – such as sampling and data collection methods, as well as the time horizon, the field
setting, and the unit of analysis – and the results of the study are described in the empirical part of the research
report. The information provided here should enable the reader to replicate the research. In the case of experi-
ments, the empirical part should therefore at the very least contain the components “participants,” “material,” and
“method.” In the case of survey research you should include the components “participants,” “method,” and, if
relevant, “material.”
The “participants” section clarifies who took part in the research, the number of participants, and how and
why participants were selected. The section “material” describes the instruments (such as stimuli and measure-
ment scales) that were used and their functions. The description should be detailed enough to allow another

chapter the research report 361
researcher to replicate your research at a later stage. Stimuli can, for example, be a series of product packages that
you showed your participants during an experiment. This part also informs the reader about the measurement
scales that were used in the research. If an existing measurement scale (to measure a construct from your conceptual model) is used, the source of the material should be mentioned. Self‐developed measurement scales
should be tested for validity and internal consistency. For existing and previously published scales, a mention of
a coefficient of internal consistence usually suffices (e.g., Cronbach’s alpha). The “method” section provides a
step‐by‐step description of the execution of the research. Again, it is important that the full course of the research
that was followed by the participants is given in enough detail to allow another person to carry out an exact
replication of the research.
In the “results” part of the research report the data are presented that were uncovered through your empiri-
cal research and subsequent data analysis. In this part you do not come forward with an explanation for the
results yet, or the implications that follow from the results; this information should be offered in the final part of
the report. At this place you provide a well‐organized and understandable overview of the results of your study,
using the appropriate procedures for statistical analysis. The specific form in which you present your results
depends on the type of research. It is customary in descriptive statistics always to process information in tables
or graphs (e.g., means, standard deviations, number of subjects per cell, and so on) and to include statistical
tests in the text. A few of the various ways in which data can be pictorially presented in written reports and oral
presentations are illustrated in Figure 17.1.
Note that all relevant results should be reported: that is, also those that contradict your hypotheses. However,
avoid an overflow of numbers and figures in your text. Only include the most relevant statistical data; incorporate
the rest of the results in the appendices.
The final part of the report
The aim of this part of the research report is to interpret the results of the research with regard to the research
questions. This is a very important aspect of the research report. Readers (managers) often skip the method sec-
tion and move straight to the conclusions of the research. For this reason, the discussion should stand on its own,
and should form a whole with a beginning and an ending. Include the following aspects in your discussion:
1. The main findings of your research.
2. The (managerial) implications of these findings (vis‐à‐vis your research questions).
3. Recommendations for implementation and a cost–benefit analysis of these recommendations.
4. The limitations of your study and suggestions for future research following up on your research project.
References
Immediately after the final part of the research report, starting on a fresh page, a list of the references cited in the
literature review and in other places in the report will be given. The format of the references has been discussed
and illustrated in the appendix to Chapter 4. Footnotes, if any in the text, are referenced either separately at the
end of the report, or at the bottom of the page where the footnote occurs.
Visit the companion website at www.wiley.com/college/sekaran for Author Video: The
final part of the report.

362 research methods for business
F I G U R E 1 7 . 1
Pictorial representation of data
Others Production
Sales
Radar Chart of Staff
Marketing
Males
Personnel
40
20
0
200
180
160
140
120
80
60
100
Females
3%9%
MalesFemales
37%
11%
Doughnut Chart of Staff
13%
4%
22%
8%
SalesProductionMarketingPersonnelOthers
40%
53%
Sale
s
Pro
du
ctio
n
Mar
ket
ing
Per
son
nel
Males
Females
Oth
ers
Department
Column Chart of Staff
Staff
0
20
40
60
80
100
120
140
160
180
200
0 50 100 150 200
Staff
Bar Chart of Staff
Dep
artm
ent
Sales
Production
Marketing
Personnel
Others
MalesFemales

chapter the research report 363
Appendix
The appendix, which comes last, is the appropriate place for the organization chart, newspaper clippings or other
materials that substantiate the text of the report, detailed verbatim narration of interviews with members, and
whatever else might help the reader follow the text. It should also contain a copy of the questionnaire adminis-
tered to the respondents. If there are several appendices, they should be referenced as Appendix A, Appendix B,
and so on, and appropriately labeled.
The above will make clear that the table of contents (mentioned earlier), following the title page and the
letter of transmittal, will look somewhat as indicated below, with some possible variations.
EXAMPLE
Table of contents
Preface
● Introduction to your research report
– Introduction
– Problem statement
– Research objective(s)
– Research questions
– The scope of the study
– Research method
– Managerial relevance
– Structure of the research report
● Theoretical framework
● Research design
● Results
● Conclusions
● Recommendations
● Limitations of study and suggestions for further
research
● References
● Appendices
ORAL PRESENTATION
Usually organizations (and instructors in classes) require about a 20‐minute oral presentation of the research
project, followed by a question‐and‐answer session. The oral presentation calls for considerable planning.
Imagine a study that spanned several months having to be presented in 20 minutes to a live audience! Those who
have not read the report at all, or at best only superficially, have to be convinced that the recommendations made
therein will indeed prove to be beneficial to the organization. All this will have to be effectively accomplished in
the matter of a few minutes.
The challenge is to present the important aspects of the study so as to hold the interest of the audience, while
still providing detailed information, which may drive many to ennui. Different stimuli (charts, short movies,
pictorial and tabular depiction, etc.) have to be creatively provided to the audience to sustain their interest
throughout the presentation. To make all this possible, time and effort have to be expended in crafting, planning,
organizing, and rehearsing the presentation.
Check out the information provided on the TEDx Speaker Guide (www.ted.com) or review the “TEDx
Illustrated Guide for Speakers” document (http://storage.ted.com/tedx/manuals/IllustratedTEDxSpeakerGuide.
pdf) for some guiding principles on how to draft and deliver a compelling talk.

364 research methods for business
Slides are often helpful for the audience – even though they are not necessary for every talk. Images, photos,
graphs and infographics help you to sustain the interest of your audience. They also help you to discuss and
explain the research project coherently, without reading from prepared notes.
Factors irrelevant to the written report, such as dress, mannerisms, gestures, voice modulation, and the like,
take on added importance in oral presentations. Speaking audibly, clearly, without distracting mannerisms, and
at the right speed for the audience to comprehend is vital for holding their attention. Varying the length of the
sentences, establishing eye contact, tone variations, voice modulation, and the rate of flow of information make
all the difference to audience receptivity. That is why it is very important that you rehearse. The contents of
the presentation, timing, and the style of delivery should be practiced in detail. Keep rehearsing until you feel
comfortable about your presentation.
Deciding on the content
Because a lot of material has to be covered in, perhaps, a 20‐minute presentation, it becomes necessary to decide
on the points to focus on and the importance to be given to each. Remembering that the listener absorbs only a
small proportion of all that he or she has heard, it is important to determine what the presenter would like the
listener to walk away with, and then organize the presentation accordingly.
Obviously, the problem investigated, the results found, the conclusions drawn, the recommendations made,
and the ways in which they can be implemented are of vital interest to organizational members, and need to be empha-
sized during the presentation. The design aspects of the study, details of the sample, data collection methods,
details of data analysis, and the like, can be mentioned in passing to be picked up at the question‐and‐answer
session by interested members.
However, depending on the type of audience, it may become necessary to put more stress on the data
analytic aspects. For example, if the presentation is being made to a group of statisticians in the company, or
in a research methods class, the data analyses and results will receive more time than if the project is being pre-
sented to a group of managers whose main interest lies in the solution to the problem and implementation of the
recommendations. Thus, the time and attention devoted to the various components of the study will require
adjustment, depending on the audience.
Visual aids
Graphs, charts, and tables help to drive home the points one wishes to make much faster and more effectively,
true to the adage that a picture is worth a thousand words. Visual aids provide a captivating sensory stimulus that
sustains the attention of the audience. Slides, flip charts, and handout materials also help the audience to easily
follow the points of the speaker’s focus. The selection of specific visual modes of presentation will depend, among
other things, on the size of the room, the availability of a good screen for projection, and the cost constraints of
developing sophisticated visuals. Visuals that present side‐by‐side comparisons of the existing and would‐be
state of affairs via graphs or pie charts drive home the points made much more forcefully than elaborate and
laborious verbal explanations.
Integrated multimedia presentations using PowerPoint, Prezi, and other visuals are quite common in this
technological age. When planning a presentation using PowerPoint or Prezi, it is important to ensure before the
presentation starts that the related equipment is properly hooked up and tested so that the presentation can go
smoothly without interruptions.

chapter the research report 365
The presenter
An effective presentation is also a function of how “unstressed” the presenter is. The speaker should establish
eye contact with the audience, speak audibly and understandably, and be sensitive to the nonverbal reactions
of the audience. Strict adherence to the time frame and concentration on the points of interest to the audience
are critical aspects of presentation. A display of extreme nervousness throughout the presentation, stumbling
for words, fumbling with the notes or audiovisuals, speaking inaudibly and/or with distracting mannerisms,
straying away from the main focus of the study, and exceeding the time limit all detract from effectiveness.
One should also not minimize the importance of the impression created on the audience by dress, posture,
bearing, and the confidence with which one carries oneself. Such simple things as covering the materials on
the visuals until they need to be exhibited, and voice modulation, help to focus the attention of the audience
on the discussion.
The presentation
The opening remarks set the stage for riveting the attention of the audience. Certain aspects such as the problem
investigated, the findings, the conclusions drawn, the recommendations made and their implementation are, as
previously mentioned, important aspects of the presentation. The speaker should drive home these points at least
three times – once in the beginning, again when each of these areas is covered, and finally, while summarizing
and bringing the presentation to a conclusion.
Handling questions
Concentrated and continuous research on the research topic over a considerable period of time indisputably
makes the presenter more knowledgeable about the project than anyone else in the audience. Hence, it is not
difficult to handle questions from the members with confidence and poise. It is important to be nondefensive
when questions are posed that seemingly find fault with some aspect of the research. Openness to suggestions
also helps, as the audience might, at times, come up with some excellent ideas or recommendations that the
researcher might not have thought of. Such ideas must always be acknowledged graciously. If a question or a
suggestion from a member in the audience happens to be flawed, it is best addressed in a nonjudgmen-
tal fashion.
The question‐and‐answer session, when handled well, leaves the audience with a sense of involvement and
satisfaction. Questioning should be encouraged and responded to with care. This interactive question‐and‐
answer session offers an exciting experience both to the audience and to the presenter.
As may be readily seen, a 20‐minute presentation and a short question‐and‐answer session thereafter do call
for substantial planning, anticipation of audience concerns, psychological preparedness, and good impression
management skills.
Reporting has to be done in an honest and straightforward manner. It is unethical to fail to report findings
that are unpalatable to the sponsors or that reflect poorly on management. As suggested earlier, it is possible to
be tactful in presenting such findings without withholding or distorting information to please the sponsors.
Internal researchers, in particular, will have to find ways of presenting unpopular information in a tactful man-
ner. It is also important to state the limitations of the study – and practically every study has some limitation – so
that the audience is not misled.

366 research methods for business
SUMMARY
● Learning objective 1: Describe the characteristics of a well-written research report that is tailored
to the needs of a specific audience.
The written report should allow the reader to weigh the facts and arguments presented therein, to examine
the results of the study, to reflect on the conclusions and recommendations, and to implement the recom-
mendations presented, with a view to solving the problem that catalyzed the research project. Despite the
fact that report writing is a function of the purpose of the study and the type of audience to which it is
presented, and accordingly has to be tailored to meet both, certain basic features are integral to all written
reports. Clarity, conciseness, coherence, and the right emphasis on important aspects are examples of
characteristics of a well-written research report.
● Learning objective 2: Write a thorough and complete research report.
The exact content and organization of the written report depends on the purpose of the research study, and
the audience to which it is targeted. In general, a research report has a title page, an executive summary or
an abstract, a preface, a table of contents, and (sometimes) a copy of the authorization to conduct the study.
The introductory section details the problem studied, the purpose of the study and the research questions,
giving some background of what it relates to and setting the stage for what the reader should expect in the
rest of the report. The body of the report contains a conceptual background, the theoretical framework of
the study and hypotheses, if any, the sampling design, data collection methods, analysis of data, and the
results obtained. The final part of the report should present the findings, conclusions, and recommenda-
tions (for further research). A list of references cited in the report should then follow. Appendices should be
attached to the report.
● Learning objective 3: Describe the characteristics of a good oral presentation and deliver a good oral
presentation.
Usually organizations require about a 20-minute oral presentation of the research project, followed by a
question-and-answer session. The oral presentation calls for considerable planning: time and effort have to
be expended in crafting, planning, organizing, and rehearsing the presentation. Because a lot of material has
to be covered, it becomes necessary to decide on the points to focus on and the importance to be given to
each. The problem investigated, the results found, the conclusions drawn, the recommendations made, and
the ways in which they can be implemented are of vital interest to organizational members, and need to be
emphasized during the presentation.
Visit the companion website at www.wiley.com/college/sekaran for Case Study: The
Jupiter Consumer Electronics Chain.

chapter the research report 367
EXERCISE 17.1
Critique Report 3 in the appendix. Discuss it in terms of good and bad research, suggesting how the study
could have been improved, what aspects of it are good, and how scientific it is.
DISCUSSION QUESTIONS
1. Discuss the purpose and contents of the executive summary.
2. What are the similarities and differences between basic and applied research reports?
3. How have technological advancements helped in writing and presenting research reports?
4. Why is it necessary to specify the limitations of the study in the research report?
5. What aspects of a class research project would be stressed by you in the written report and in the
oral presentation?
Now do Exercises 17.1 and 17.2.
EXERCISE 17.2
Give a title to and write the introductory section of any study you might like to conduct.

368 research methods for business
A P P E N D I X
Examples
REPORT 1: SAMPLE OF A REPORT INVOLVING A DESCRIPTIVE STUDY
Sekras Company
TO: Mr L. Raiburn, Chairman
Strategic Planning Committee
FR: Joanne Williams
Public Relations Officer
RE: Report requested by Mr Raiburn
Attached is the report requested by Mr Raiburn. If any further information or clarification is needed, please
let me know.
Encl: Report
Report for the strategic planning committee
Introduction
Vice President Raiburn, Chairman of the Strategic Planning Committee, requested two pieces of information:
1. The sales figures of the top five retailers in the country.
2. Customers’ ideas of what improvements can be made to Sekras to enhance their satisfaction.
For this purpose, he desired that a quick survey of the company’s customers be done to elicit
their opinions.
Method used for obtaining the requisite information
Figures of sales of the top five retailers in the country were obtained from BusinessWeek, which periodically
publishes many kinds of industry statistics.
To obtain customers’ inputs on improvements that could be made by the company, a short questionnaire
(specimen in Appendix A) was mailed to 300 of our credit card customers – 100 who had most frequently used
the card in the last 18 months, 100 who most infrequently used it during the same period, and 100 average
users. Questionnaires in three different colors were sent to the three groups. Respondents were offered a

chapter the research report 369
complimentary magnet for responses received within a week. The questionnaire asked for responses to three
questions:
1. What are some of the things you like best about shopping at Sekras?
2. What are some of the things that you dislike and would like to see improved at Sekras? Please explain
in as much detail as possible.
3. What are your specific suggestions for making improvements to enhance the quality of our service to
customers like you?
Findings
Sales figures of the top five retailers Information regarding sales of the top five retailers in 2000 and 2003
is provided in Table 17.1.
As can be seen, Wal‐Mart and Home Depot retained their top positions in 2003. Kroger (a supermarket chain
with 2532 grocery stores in 32 states) which was not among the top five in 2000, occupied the third place in 2003,
whereas Costco (an international chain of membership warehouses, primarily under the “Costco Wholesale” name)
occupied the fourth place. Target (the company’s stores offer men’s and women’s clothing, home furnishings, electronic
products, sports products, toys, and entertainment products) retained the fifth position in 2003. Sears, Roebuck and
Kmart did not find a place among the top five retailers during 2003. It may be observed that even though Wal‐Mart
increased its sales by about 1.33 times during the three‐year period, its share among the top five did not increase.
Customer suggestions for improvements Of the 300 surveys sent out, 225 were received, a 75% response
rate. Of the 100 most frequent users of our credit card to whom questionnaires were sent, 80 responded; among
the most infrequent users, 60 responded; and among the average users, 85 responded.
About 75% of the respondents were women. The majority of the customers were between the ages of
35 and 55 (62%).
The responses to the three open‐ended questions were analyzed. The information needed by the Committee
on the suggested improvements is tabulated (see Table 17.2). Responses to the other two questions on features
T A B L E 1 7 . 1
Comparative sales figures of the five top retail companies during 2000 and 2003
Top retailers in 2000 Top retailers in 2003
Company
Sales in
billions of $
Share among
top five Company
Sales
in billions of $
Share among
top five
Wal‐Mart Stores 191.33 54.7% Wal‐Mart Stores 256.0 53.4%
Home Depot 45.74 13.1% Home Depot 73.10 15.2%
Sears, Roebuck 40.94 11.7% Kroger 56.40 11.8%
Kmart 36.50 10.3% Costco 47.15 9.8%
Target 35.51 10.2% Target 46.80 9.8%
Source: Businessweek

370 research methods for business
liked by the customers, and their specific suggestions for improvement, are provided in the two tables in the
appendix. The following are suggestions received from one or two respondents only:
1. Have more water fountains on each floor.
2. The pushcarts could be lighter, so they will be less difficult to push.
3. More seats for resting after long hours of shopping would help.
4. Prices of luxury items are too high.
From looking at Table 17.2, it can be seen that the most dissatisfaction stems from (1) out‐of‐stock small appli-
ances, and (2) inability to locate store assistants who could guide customers in locating what they need (44% each).
The need for child care services is expressed by 38% of the customers. Twenty percent also indicate that the cafeteria
should cater to tastes for international spicy type of foods. The next two important items pertain to the temperature
(18%) and billing mistakes (16%). Some customers (16%) also wish the store was open 24 hours.
The rest of the suggestions were offered by less than 10% of the customers and, hence, can perhaps be
attended to later.
T A B L E 1 7 . 2
Suggested areas for improvement
Features
Frequent
users no.
Medium
users no.
Infrequent
users no.
Total
no. %
1. Small appliances such as mixers, blenders are
often not in stock. This is irritating.
30 48 22 100 44
2. The cafeteria serves only bland, uninteresting
food. How about some spicy international
food?
26 14 5 45 20
3. Often, we are unable to locate where the items
we want are!
3 6 14 23 10
4. It would be nice if you could have a child care
service so we can shop without distractions.
28 32 25 85 38
5. It is often difficult to locate an assistant who
can help us with answers to our questions.
29 49 22 100 44
6. I wish it were a 24‐hour store. 17 13 7 37 16
7. Sometimes, there is a mistake in billing. We
have to make some telephone calls before
charges are corrected. This is a waste of
our time.
4 12 14 20 16
8. Allocate some floor space for kids to play
video games.
2 — 4 6 2
9. Import more Eastern apparel like the kimono,
sarees, sarongs.
— 8 4 12 5
10. Regulate the temperature better; often, it
is too cold or too hot.
15 12 17 44 18

chapter the research report 371
A note of caution is in order at this juncture. We are not sure how representative our sample is. We thought
that a mix of high, average, and infrequent users of our credit card would provide us with some useful insights.
If a more detailed study obtaining information from a sample of all the customers who come to the store is
considered necessary, we will initiate it quickly. In the meantime, we are also interviewing a few of the customers
who shop here daily. If we find anything of significance from these interviews, we will inform you.
Improvements indicated by these suggestions
Based on the current sample of customers who have responded to our survey, the following improvements and
actions seem called for:
1. Small appliances need to be adequately stocked (44% complained about this). An effective reorder
inventory system has to be developed for this department to minimize customer dissatisfaction and
avoid loss of sales for lack of sufficient stock. The research team can help in this, if requested.
2. Customers seem to need help to locate store items and would appreciate help from store assistants
(44% expressed this need). If providing assistance is a primary concern, it would be a good idea to
have liveried store personnel with badges to indicate they are there to assist customers. During idle
hours, if any (when there are no customers seeking help), these individuals can be deployed as shelf
organizers.
3. Need for child care has been expressed by more than a third of our customers (38%). It would be a good
idea to earmark a portion of the front of the building for parents to drop off their children while
shopping. The children will have to be supervised by a trained child care professional recruited by
the organization. An assistant could be recruited later if needed. From the cost–benefit analysis in
Exhibit 7, it may be seen that this additional expenditure will pay off multifold in sales revenue, and at
the same time, create a fund of goodwill for the company.
4. Adding to the variety of foods served in the cafeteria (a need expressed by 20%) is at once a simple and
a complex matter. We need further ideas and details as to what types of food need to be added. This
information can be obtained through a short survey, if Mr Raiburn so desires.
5. Billing errors should not occur (16% indicated this). The billing department should be warned
that such mistakes should be avoided and should not recur. Performance assessment should be tied to
such mistakes.
6. Regulation of temperature (16% identified this) is easy. This, in fact, could be immediately attended to
by the engineering department personnel.
I hope this report contains all the information sought by Mr Raiburn. As stated earlier, if the non‐credit card
customers also have to be sampled, this can be easily arranged.
REPORT 2: SAMPLE OF A REPORT OFFERING ALTERNATIVE SOLUTIONS AND EXPLAINING THE PROS AND CONS OF EACH ALTERNATIVE
TO: Mr Charles Orient, CEO, Lunard Manufacturing Company
FR: Alex Ventura, Senior Researcher, Beam Research Team
RE: Suggestions on alternative ways of cutting costs in anticipation of recession.

372 research methods for business
Enclosed is the report requested by Mr Orient. If any additional Information or clarification is needed, please
let me know.
Encl: Report
Report on alternative ways of handling recessionary times without massive layoffs
Introduction
The Beam Research Team was asked to suggest alternative ways of tiding over the anticipated recession of the
next several months, when a slowdown of the economy is expected. A recent article in BusinessWeek entitled
“Hunkering Down in a Hurry” indicated that executives in a large number of companies are slashing costs mostly
through layoffs and restructuring. Mr Orient wanted the Beam Research Team to suggest other alternatives
besides layoffs.
This report provides five alternatives citing the advantages and disadvantages of each.
Method used for developing the alternatives
The team studied the economic indicators and the published industry analyses, read the Federal Reserve Board
Chairman’s speeches, examined the many ways in which companies cut costs during nonrecessionary periods
as well as recessions, and, based on these, suggests the following five alternatives.
Alternatives suggested:
1. A moratorium on all capital expenditure.
2. Hiring freeze.
3. Recovery of bad debts through sustained efforts.
4. Trimming of operating expenditure with substantial reduction in travel and entertainment expenditure.
5. Discontinuance of the manufacture of low‐profit‐margin products.
Advantages and disadvantages of each of the above
Itemized details of the cost–benefit analysis for each of the above suggestions are furnished in the appendix.
We give only the net benefits for each alternative here.
Moratorium on all capital expenditure It makes good sense to desist from all capital expenditure since
manufacture of most of the items will slow down during recession. Except for parts for existing machines, there
is no need to buy capital equipment, and all proposals in this regard should be shelved.
This strategy will cut down expenditure to the extent of 7 to 10% of revenue. See appendix for full details.
A reserve fund can be created to catch up with future orders when the economy returns to normal.
Hiring freeze The annual increase in the strength of staff during the past four years has been about 15%.
With a slowdown of the economy, a hiring freeze in all branch offices will save over $10 million annually.
This might initially result in some extra workload for the staff and cause some job dissatisfaction, but
once they get used to it, and the impact of the actual recession hits them, employees will be thankful for the
job they have. It will be a good idea to explain in advance the reasons for the hiring freeze to the employees so
that they understand the motive behind the company’s policy, and appreciate having been informed.

chapter the research report 373
Recovery of bad debts through aggressive efforts Bad debts of the company have been on the increase
over the past three years, and no intensive efforts to recover them seem to have been made hitherto.
We suggest that collection agents who have successfully recovered bad debts for other companies be hired
immediately. Such agents may have to be paid more than other collection agents, but the extra cost will be well
worth it. About a billion dollars can be collected within a few weeks of their being on the job, and this will help
the financial cash flow of the company.
Trimming of operating expenditure Several operating expenses can be cut down – the travel expenses of
managers in particular – as shown in Exhibit 4 of the appendix. Videoconferencing costs much less and is quicker,
and should be encouraged for most of the meetings and negotiations. This alone will result in savings of more
than $175000 per month.
Another way of considerably curtailing expenditure is to restrict entertainment expenses only for such purposes
and to such managers as actively promote the business of the company or are essential for public relations.
These changes will have a negative impact on morale, but managers understand the economic situation, and
will adjust to the new system once the initial mental resistance wears off.
Eliminating the manufacture of low-margin products The team found from a detailed study of the
company records of manufacturing, sales, and profits figures for the various products that all the items listed in
Exhibit 5 of the appendix have very low profit margins. It is evident from the data provided that considerable
time and effort are expended in manufacturing and selling these items.
It will be useful to phase out the manufacture of these items and divert the resources to the high‐profit items
suggested in Exhibit 6. From the cost–benefit analysis in Exhibit 7, it may be seen that several billions can be
saved through this strategy.
It is possible to put into effect all of the five alternatives above and handle the onslaught of the recession
with confidence.
REPORT 3: EXAMPLE OF AN ABRIDGED BASIC RESEARCH REPORT
Factors affecting the upward mobility of women in public accounting
Introduction
A substantial number of women have entered the public accounting profession in the past 15 years or so. However,
less than 4% of the partners in the big eight accounting firms are women, indicating a lack of upward mobility
for women in the accounting profession. Against the backdrop of the fact that the women students perform
significantly better during their academic training than their male counterparts, it is unfortunate that their intel-
lectual ability and knowledge remain underutilized during their professional careers. The recent costly litigation
and discrimination suits filed make it imperative for us to study the factors that affect the upward mobility of
women and examine how the situation can be rectified.
A brief literature review
Studies of male and female accounting majors indicate that the percentage of women accounting students has
increased severalfold since 1977 (Kurian, 1998). Based on the analysis of longitudinal data collected over a
15‐year period, Mulcher, Turner, and Williams (2000) found that female students’ grades in senior accounting

374 research methods for business
courses were significantly higher than those of the male students. This higher level of academic performance has
been theorized as being due to the higher need and desire that women have to achieve and overcome stereotypes
(Messing, 2000), having higher career aspirations (Tinsley et al., 1999), or having a higher aptitude for account-
ing (Jones & Alexander, 2001; Riley, 2001). Empirical studies by Fraser, Lytle, and Stolle (1998) and Johnson and
Meyer (1999), however, found no significant differences in personality predispositions or behavioral traits among
male and female accounting majors.
Several surveys of women accountants in the country pinpoint three major factors that hinder women’s
career progress in the public accounting field (see, for instance, Kaufman, 1986; Larson, 1999; Walkup & Fenman,
2001). They are: (1) the long hours of work demanded by the profession (a factor that conflicts with family
demands); (2) failure to be entrusted with responsible assignments; and (3) discrimination. In sum, the lack
of upward mobility seems to be due to factors over which the organization has some control.
Research question
Do long work hours, failure to be handed greater responsibilities, and discrimination account for the lack of upward
mobility of women in public accounting?
Theoretical framework
The variance in the dependent variable, upward mobility, can be explained by the three independent variables:
long hours of work, not handling greater responsibilities, and discrimination. As women are expected to, and do
indeed, take on responsibility for household work and childrearing, they are not able to work beyond regular
work hours at the workplace. This creates the wrong impression among higher‐ups in the organization that
women are less committed to their work. Because of this perception, they are not entrusted with significant
responsibilities. This further hinders their progress as they are not afforded exposure to the intricacies of account-
ing practices as much as men. Hence, women are overlooked at the time of promotion.
Deliberate discriminatory practices due to sex‐role stereotypes, as evidenced in the well‐known case of
Hopkins vs. Price Waterhouse & Co., also arrest women’s progress. If women are not valued for their potential
and are expected to conform to sex‐typed behavior (which confines them to inconspicuous roles), their chances
of moving up the career ladder are significantly reduced.
Thus, the three independent variables considered here would significantly explain the variance in the
upward mobility of women in public accounting. The impracticability of putting in long hours of work, lack of
opportunities to handle greater responsibilities, and sex‐role stereotyping all negatively impact upward mobility.
Hypotheses
If women spend more hours on the job after regular work hours, they will be given greater responsibilities.
If women are entrusted with higher levels of responsibility, they will have more opportunities to move up in
the organization.
If women are not expected to conform to stereotypical behavior, their chances for upward mobility
will increase.
All three independent variables will significantly explain the variance in women CPAs’ upward mobility.
Method section
Study design In this cross‐sectional correlational field study, data on the three independent variables and the
dependent variable were collected from women CPAs in several public accounting organizations in the country
through mail questionnaires.

chapter the research report 375
Population and sample The population for the study comprised all women CPAs in the country. A systematic
sampling procedure was first used to select 30 cities from the various regions of the country, from which a sample
of accounting firms would be drawn. Then, through a simple random sampling procedure, five CPA firms
from each of the cities were chosen for the study. Data were collected from all the women in each of the firms so
chosen. The total sample size was 300 and responses were received from 264 women CPAs, for an 88% response
rate for the mail questionnaires, which is pretty good. The unit of analysis was the individuals who responded to
the survey.
All respondents had, as expected, the CPA degree. Their ages ranged from 28 to 66. About 60% of the
women were over 45 years of age. The average number of children in the house below the age of 13 was two. The
average number of years of work in the organization was 15, and the average number of organizations worked
for was two. The average number of hours spent daily at home on office‐related matters was 1.4.
Variables and measures All demographic variables such as age, number of years in the organization, number
of other organizations in which the individual had worked, number of hours spent at home on office‐related
matters, and number of children in the house and their ages, were tapped by direct single questions.
Upward mobility. This dependent variable indicates the extent to which individuals are expected to progress
in their career during the succeeding three to ten years. Hall (1986) developed four items to measure this varia-
ble, a sample item being: “I see myself being promoted to the next level quite easily.” The measure is reported to
have convergent and discriminant validity, and Cronbach’s alpha for the four items for this sample was 0.86.
Sex‐role stereotyping. This independent variable was measured using Hall and Humphreys’ (1972) eight‐item
measure. An example item is: “Men in this organization do not consider women’s place to be primarily in the
home.” Cronbach’s alpha for the measure for this sample was 0.82.
Responsibilities assigned. This was tapped by three items from Sonnenfield and McGrath (1983), which asked
respondents to indicate their levels of assigned responsibility to (a) make important decisions, (b) handle large
accounts, and (c) account for the annual profits of the firm. Cronbach’s alpha for the three items was 0.71 for
this sample.
Data collection method Questionnaires were mailed to 300 women CPAs in the United States. After two
reminders, 264 completed questionnaires were received within a period of six weeks. The high return rate of 88%
can be attributed to the shortness of the questionnaire and perhaps the motivation of the women CPAs to respond
to a topic close to their heart.
Questionnaires were not electronically administered for various reasons, including the advantage it afforded
to the busy respondents to reply without switching on the computer.
Data analysis and results After determining the reliabilities (Cronbach’s alpha) for the measures for this
sample, frequency distributions for the demographic variables were obtained. These may be seen in Exhibit 1.
Then a Pearson correlation matrix was obtained for the four independent and dependent variables. This may be
seen in Exhibit 2. It is to be noted that no correlation exceeded 0.6.
Each hypothesis was then tested. The correlation matrix provided the answer to the first three hypotheses.
The first hypothesis stated that the number of hours put in beyond work hours on office‐related matters would
be positively correlated to the responsibilities assigned. The correlation of 0.56 (p < 0.001) between the number
of hours spent on office work beyond regular work hours and the entrusted responsibilities substantiates this
hypothesis.
The second hypothesis stated that if women were given higher responsibilities, their upward mobility would
improve. The positive correlation of 0.59 (p < 0.001) between the two variables substantiates this hypothesis.
That is, the greater the entrusted responsibilities, the higher are the perceived chances of being promoted.

376 research methods for business
The third hypothesis indicated that sex‐role stereotyping would be negatively correlated to upward mobility.
The correlation of –0.54 (p < 0.001) substantiates this hypothesis as well. That is, the greater the expected
conformity to stereotyped behavior, the less the chances of upward mobility.
To test the fourth hypothesis that the number of hours spent beyond regular work hours on job‐related
matters, assignment of higher responsibilities, and expectations of conformity with stereotyped behavior will
significantly explain the variance in perceived upward mobility, the three independent variables were regressed
against the dependent variable. The results, which are shown in Exhibit 3, indicate that this hypothesis is also
substantiated. That is, the R2 value of 0.43 at a significance level of p < 0.001, with df (3.238), confirms that 43%
of the variance in upward mobility is significantly explained by the three independent variables.
Discussion of results The results of this study confirm that the variables considered in the theoretical
framework are important. By focusing solely on the number of hours worked, ignoring the quality of work done,
the organization is perhaps not harnessing the full potential and encouraging the development of the talents of
the women CPAs adequately. It seems worth while to remedy this situation.
It would be useful if the top executives were to assign progressively higher levels of responsibility to women.
This would utilize their abilities fully and, in turn, enhance the effectiveness of the firm. If executives are helped
to modify their mental attitudes and sex‐role expectations, they should tend to expect less stereotypical behavior
and encourage the upward mobility of women CPAs. Knowing women bring a different kind of perspective to
organizational matters (Smith, 1999; Vernon, 2001), it is quite possible that having them as partners of the firm
will enhance the organizational effectiveness as well.
Recommendations It is recommended that a system be set up to assess the value of the contributions of
each individual in discharging his or her duties, and use that, rather than the number of hours of work put in, as
a yardstick for promotion.
Second, women CPAs should be given progressively more responsibility after they have served three to five
years in the system. Assigning a mentor to train them will facilitate smooth functioning of the firm.
Third, a short seminar should be organized for executives to sensitize them to the adverse effects of sex‐role
stereotyping at the workplace. This will help them to beneficially utilize the talents of women CPAs. If viewed as
professionals with career goals and aspirations, rather than in stereotyped ways, women CPAs will be enabled to
handle more responsibilities and advance in the system. The organization also stands to benefit from their
contributions.
In conclusion, it would be worth while for public accounting firms to modify their mental orientations
toward, and expectations of, women CPAs. It is a national waste if their potential is not fully tapped and utilized.

377
A FINAL NOTE TO STUDENTS
If you have enjoyed learning about research and built up a repertoire of research skills, you are prepared and
ready for your professional life. Earlier in the book we have explained how research helps managers to get a grip
on issues, concerns, and conflicts within the company or in its environment, to take effective decisions and to
develop effective courses of action. As you must have realized from these and other discussions in this book,
research is an integral part of organizational reality that helps businesses to continuously improve and grow
progressively.
Though you may not have become an expert researcher after one semester of coursework, and perhaps a
research project, we are sure you would have gained an intelligent appreciation of, and an adequate depth of
knowledge for, business research – great assets in dealing effectively with consultants. The ability to discriminate
between the good and the not‐so‐good research will also be invaluable to you in sifting through the materials you
will undoubtedly read in the practitioner and academic journals in your professional life as managers. And, more
important, as you get deluged by all the information from various sources, including the Internet, newspapers,
talk shows, and the like, you will be better able to evaluate the validity of the messages and judge them for
what they truly represent. You are thus armed to handle the information overload that one faces in today’s
information age.
If you have satisfactorily met the chapter objectives, you can be confident that you have taken a giant step
toward becoming even more effective as a manager.
Research is the excitement of exploring avenues for problem solving, and as a manager you will find the
research knowledge and skills you have now acquired to be extremely useful. Research, when applied with good
common sense, yields the desired results.
We wish you success in your personal, academic, and professional careers!
—Uma Sekaran and Roger Bougie


379
STATISTICAL TABLES
Table I
Cumulative Normal Probabilities
z F(z) z F(z) z F(z)
0.00 0.5000000 0.30 0.6179114 0.60 0.7257469
0.01 0.5039894 0.31 0.6217195 0.61 0.7290691
0.02 0.5079783 0.32 0.6255158 0.62 0.7323711
0.03 0.5119665 0.33 0.6293000 0.63 0.7356527
0.04 0.5159534 0.34 0.6330717 0.64 0.7389137
0.05 0.5199388 0.35 0.6368307 0.65 0.7421539
0.06 0.5239222 0.36 0.6405764 0.66 0.7453731
0.07 0.5279032 0.37 0.6443088 0.67 0.7485711
0.08 0.5318814 0.38 0.6480273 0.68 0.7517478
0.09 0.5358564 0.39 0.6517317 0.69 0.7549029
0.10 0.5398278 0.40 0.6554217 0.70 0.7580363
0.11 0.5437953 0.41 0.6590970 0.71 0.7611479
0.12 0.5477584 0.42 0.6627573 0.72 0.7642375
0.13 0.5517168 0.43 0.6664022 0.73 0.7673049
0.14 0.5556700 0.44 0.6700314 0.74 0.7703500
0.15 0.5596177 0.45 0.6736448 0.75 0.7733726
0.16 0.5635595 0.46 0.6772419 0.76 0.7763727
0.17 0.5674949 0.47 0.6808225 0.77 0.7793501
0.18 0.5714237 0.48 0.6843863 0.78 0.7823046
0.19 0.5753454 0.49 0.6879331 0.79 0.7852361
0.20 0.5792597 0.50 0.6914625 0.80 0.7881446
0.21 0.5831662 0.51 0.6949743 0.81 0.7910299
0.22 0.5870604 0.52 0.6984682 0.82 0.7938919
0.23 0.5909541 0.53 0.7019440 0.83 0.7967306
0.24 0.5948349 0.54 0.7054015 0.84 0.7995458
0.25 0.5987063 0.55 0.7088403 0.85 0.8023375
0.26 0.6025681 0.56 0.7122603 0.86 0.8051055
0.27 0.6064199 0.57 0.7156612 0.87 0.8078498
0.28 0.6102612 0.58 0.7190427 0.88 0.8105703
0.29 0.6140919 0.59 0.7224047 0.89 0.8132671
(continued )

380 statistical tables
z F(z) z F(z) z F(z)
0.90 0.8159399 1.37 0.9146565 1.84 0.9671159
0.91 0.8185887 1.38 0.9162067 1.85 0.9678432
0.92 0.8212136 1.39 0.9177356 1.86 0.9685572
0.93 0.8238145 1.40 0.9192433 1.87 0.9692581
0.94 0.8263912 1.41 0.9207302 1.88 0.9699460
0.95 0.8289439 1.42 0.9221962 1.89 0.9706210
0.96 0.8314724 1.43 0.9236415 1.90 0.9712834
0.97 0.8339768 1.44 0.9250663 1.91 0.9719334
0.98 0.8364569 1.45 0.9264707 1.92 0.9725711
0.99 0.8389129 1.46 0.9278550 1.93 0.9731966
1.00 0.8413447 1.47 0.9292191 1.94 0.9738102
1.01 0.8437524 1.48 0.9305634 1.95 0.9744119
1.02 0.8461358 1.49 0.9318879 1.96 0.9750021
1.03 0.8484950 1.50 0.9331928 1.97 0.9755808
1.04 0.8508300 1.51 0.9344783 1.98 0.9761482
1.05 0.8531409 1.52 0.9357445 1.99 0.9767045
1.06 0.8554277 1.53 0.9369916 2.00 0.9772499
1.07 0.8576903 1.54 0.9382198 2.01 0.9777844
1.08 0.8599289 1.55 0.9394292 2.02 0.9783083
1.09 0.8621434 1.56 0.9406201 2.03 0.9788217
1.10 0.8643339 1.57 0.9417924 2.04 0.9793248
1.11 0.8665005 1.58 0.9429466 2.05 0.9798178
1.12 0.8686431 1.59 0.9440826 2.06 0.9803007
1.13 0.8707619 1.60 0.9452007 2.07 0.9807738
1.14 0.8728568 1.61 0.9463011 2.08 0.9812372
1.15 0.8749281 1.62 0.9473839 2.09 0.9816911
1.16 0.8769756 1.63 0.9484493 2.10 0.9821356
1.17 0.8789995 1.64 0.9494974 2.11 0.9825708
1.18 0.8809999 1.65 0.9505285 2.12 0.9829970
1.19 0.8829768 1.66 0.9515428 2.13 0.9834142
1.20 0.8849303 1.67 0.9525403 2.14 0.9838226
1.21 0.8868606 1.68 0.9535213 2.15 0.9842224
1.22 0.8887676 1.69 0.9544860 2.16 0.9846137
1.23 0.8906514 1.70 0.9554345 2.17 0.9849966
1.24 0.8925123 1.71 0.9563671 2.18 0.9853713
1.25 0.8943502 1.72 0.9572838 2.19 0.9857379
1.26 0.8961653 1.73 0.9581849 2.20 0.9860966
1.27 0.8979577 1.74 0.9590705 2.21 0.9864474
1.28 0.8997274 1.75 0.9599408 2.22 0.9867906
1.29 0.9014747 1.76 0.9607961 2.23 0.9871263
1.30 0.9031995 1.77 0.9616364 2.24 0.9874545
1.31 0.9049021 1.78 0.9624620 2.25 0.9877755
1.32 0.9065825 1.79 0.9632730 2.26 0.9880894
1.33 0.9082409 1.80 0.9640697 2.27 0.9883962
1.34 0.9098773 1.81 0.9648521 2.28 0.9886962
1.35 0.9114920 1.82 0.9656205 2.29 0.9889893
1.36 0.9130850 1.83 0.9663750 2.30 0.9892759
Table I (Continued)

statistical tables 381
z F(z) z F(z) z F(z)
2.31 0.9895559 2.45 0.9928572 2.59 0.9952012
2.32 0.9898296 2.46 0.9930531 2.60 0.9953388
2.33 0.9900969 2.47 0.9932443 2.70 0.9965330
2.34 0.9903581 2.48 0 9934309 2.80 0.9974449
2.35 0.9906133 2.49 0.9936128 2.90 0.9981342
2.36 0.9908625 2.50 0.9937903 3.00 0.9986501
2.37 0.9911060 2.51 0.9939634 3.20 0.9993129
2.38 0.9913437 2.52 0.9941323 3.40 0.9996631
2.39 0.9915758 2.53 0.9942969 3.60 0.9998409
2.40 0.9918025 2.54 0.9944574 3.80 0.9999277
2.41 0.9920237 2.55 0.9946139 4.00 0.9999683
2.42 0.9922397 2.56 0.9947664 4.50 0.9999966
2.43 0.9924506 2.57 0.9949151 5.00 0.9999997
2.44 0.9926564 2.58 0.9950600 5.50 0.9999999
This table is condensed from Table 1 of the Biometrika Tables for Statisticians, Vol. 1 (1st ed.), edited by
E. S. Pearson and H. O. Hartley. Reproduced with the kind permission of E. S. Pearson and the trustees of
Biometrika.
Table I (Continued)

382 statistical tables
Table II
Upper Percentage Points of the t Distribution
Q = 0.4 0.25 0.1 0.05 0.025 0.01 0.005 0.001
υ 2Q = 0.8 0.5 0.2 0.1 0.05 0.02 0.01 0.002
1 0.325 1.000 3.078 6.314 12.706 31.821 63.657 318.31
2 0.289 0.816 1.886 2.920 4.303 6.965 9.925 22.326
3 0.277 0.765 1.638 2.353 3.182 4.541 5.841 10.213
4 0.271 0.741 1.533 2.132 2.776 3.747 4.604 7.173
5 0.267 0.727 1.476 2.015 2.571 3.365 4.032 5.893
6 0.265 0.718 1.440 1.943 2.447 3.143 3.707 5.208
7 0.263 0.711 1.415 1.895 2.365 2.998 3.499 4.785
8 0.262 0.706 1.397 1.860 2.306 2.896 3.355 4.501
9 0.261 0.703 1.383 1.833 2.262 2.821 3.250 4.297
10 0.260 0.700 1.372 1.812 2.228 2.764 3.169 4.144
11 0.260 0.697 1.363 1.796 2.201 2.718 3.106 4.025
12 0.259 0.695 1.356 1.782 2.179 2.681 3.055 3.930
13 0.259 0.694 1.350 1.771 2.160 2.650 3.012 3.852
14 0.258 0.692 1.345 1.761 2.145 2.624 2.977 3.787
15 0.258 0.691 1.341 1.753 2.131 2.602 2.947 3.733
16 0.258 0.690 1.337 1.746 2.120 2.583 2.921 3.686
l7 0.257 0.689 1.333 1.740 2.110 2.567 2.898 3.646
18 0.257 0.688 1.330 1.734 2.101 2.552 2.878 3.610
19 0.257 0.688 1.328 1.729 2.093 2.539 2.861 3.579
20 0.257 0.687 1.325 1.725 2.086 2.528 2.845 3.552
21 0.257 0.686 1.323 1.721 2.080 2.518 2.831 3.527
22 0.256 0.686 1.321 1.717 2.074 2.508 2.819 3.505
23 0.256 0.685 1.319 1.714 2.069 2.500 2.807 3.485
24 0.256 0.685 1.318 1.711 2.064 2.492 2.797 3.467
25 0.256 0.684 1.316 1.708 2.060 2.485 2.787 3.450
26 0.256 0.684 1.315 1.706 2.056 2.479 2.779 3.435
27 0.256 0.684 1.314 1.703 2.052 2.473 2.771 3.421
28 0.256 0.683 1.313 1.701 2.048 2.467 2.763 3.408
29 0.256 0.683 1.311 1.699 2.045 2.462 2.756 3.396
30 0.256 0.683 1.310 1.697 2.042 2.457 2.750 3.385
40 0.255 0.681 1.303 1.684 2.021 2.423 2.704 3.307
60 0.254 0.679 1.296 1.671 2.000 2.390 2.660 3.232
120 0.254 0.677 1.289 1.658 1.980 2.358 2.617 3.160
∞ 0.253 0.674 1.282 1.645 1.960 2.326 2.576 3.090
This table is condensed from Table 12 of the Biometrika Tablesfor Statisticians, Vol. 1 (1st ed.), edited by
E. S. Pearson and H. O. Hartley. Reproduced with the kind permission of E. S. Pearson and the trustees of
Biometrika.

statistical tables 383
Table III
Upper Percentage Points of the χ2 Distribution
Q
υ 0.995 0.990 0.975 0.950 0.900 0.750 0.500
1 392704.10–10 157088.10–9 982069.10–9 393214.10–8 0.0157908 0.1015308 0.454937
2 0.0100251 0.0201007 0.0506356 0.102587 0.210720 0.575364 1.38629
3 0.0717212 0.114832 0.215795 0.351846 0.584375 1.212534 2.36597
4 0.206990 0.297110 0.484419 0.710721 1.063623 1.92255 3.35670
5 0.411740 0.554300 0.831211 1.145476 1.61031 2.67460 4.35146
6 0.675727 0.872085 1.237347 1.63539 2.20413 3.45460 5.34812
7 0.989265 1.239043 1.68987 2.16735 2.83311 4.25485 6.34581
8 1.344419 1.646482 2.17973 2.73264 3.48954 5.07064 7.34412
9 1.734926 2.087912 2.70039 3.32511 4.16816 5.89883 8.34283
10 2.15585 2.55821 3.24697 3.94030 4.86518 6.73720 9.34182
11 2.60321 3.05347 3.81575 4.57481 5.57779 7.58412 10.3410
12 3.07382 3.57056 4.40379 5.22603 6.30380 8.43842 11.3403
13 3.56503 4.10691 5.00874 5.89186 7.04150 9.29906 12.3398
14 4.07468 4.66043 5.62872 6.57063 7.78953 10.1653 13.3393
15 4.60094 5.22935 6.26214 7.26094 8.54675 11.0365 14.3389
16 5.14224 5.81221 6.90766 7.96164 9.31223 11.9122 15.3385
17 5.69724 6.40776 7.56418 8.67176 10.0852 12.7919 16.3381
18 6.26481 7.01491 8.23075 9.39046 10.8649 13.6753 17.3379
19 6.84398 7.63273 8.90655 10.1170 11.6509 14.5620 18.3376
20 7.43386 8.26040 9.59083 10.8508 12.4426 15.4518 19.3374
21 8.03366 8.89720 10.28293 11.5913 13.2396 16.3444 20.3372
22 8.64272 9.54249 10.9823 12.3380 14.0415 17.2396 21.3370
23 9.26042 10.19567 11.6885 13.0905 14.8479 18.1373 22.3369
24 9.88623 10.8564 12.4011 13.8484 15.6587 19.0372 23.3367
25 10.5197 11.5240 13.1197 14.6114 16.4734 19.9393 24.3366
26 11.1603 12.1981 13.8439 15.3791 17.2919 20.8434 25.3364
27 11.8076 12.8786 14.5733 16.1513 18.1138 21.7494 26.3363
28 12.4613 13.5648 15.3079 16.9279 18.9392 22.6572 27.3363
29 13.1211 14.2565 16.0471 17.7083 19.7677 23.5666 28.3362
30 13.7867 14.9535 16.7908 18.4926 20.5992 24.4776 29.3360
40 20.7065 22.1643 24.4331 26.5093 29.0505 33.6603 39.3354
50 27.9907 29.7067 32.3574 34.7642 37.6886 42.9421 49.3349
60 35.5346 37.4848 40.4817 43.1879 46.4589 52.2938 59.3347
70 43.2752 45.4418 48.7576 51.7393 55.3290 61.6983 69.3344
80 51.1720 53.5400 57.1532 60.3915 64.2778 71.1445 79.3343
90 59.1963 61.7541 65.6466 69.1260 73.2912 80.6247 89.3342
100 67.3276 70.0648 74.2219 77.9295 82.3581 90.1332 99.3341
ZQ
−2.5758 −2.3263 −1.9600 −1.6449 −1.2816 −0.6745 0.0000
(continued )

384 statistical tables
Q
υ 0.250 0.100 0.050 0.025 0.010 0.005 0.001
1 1.32330 2.70554 3.84146 5.02389 6.63490 7.87944 10.828
2 2.77259 4.60517 5.99147 7.37776 9.21034 10.5966 13.816
3 4.10835 6.25139 7.81473 9.34840 11.3449 12.8381 16.266
4 5.38527 7.77944 9.48773 11.1433 13.2767 14.8602 18.467
5 6.62568 9.23635 11.0705 12.8325 15.0863 16.7496 20.515
6 7.84080 10.6446 12.5916 14.4494 16.8119 18.5476 22.458
7 9.03715 12.0170 14.0671 16.0128 18.4753 20.2777 24.322
8 10.2188 13.3616 15.5073 17.5346 20.0902 21.9550 26.125
9 11.3887 14.6837 16.9190 19.0228 21.6660 23.5893 27.877
10 12.5489 15.9871 18.3070 20.4831 23.2093 25.1882 29.588
11 13.7007 17.2750 19.6751 21.9200 24.7250 26.7569 31.264
12 14.8454 18.5494 21.0261 23.3367 26.2170 28.2995 32.909
13 15.9839 19.8119 22.3621 24.7356 27.6883 29.8194 34.528
14 17.1170 21.0642 23.6848 26.1190 29.1413 31.3193 36.123
15 18.2451 22.3072 24.9958 27.4884 30.5779 32.8013 37.697
16 19.3688 23.5418 26.2962 28.8454 31.9999 34.2672 39.252
17 20.4887 24.7690 27.5871 30.1910 33.4087 35.7185 40.790
18 21.6049 25.9894 28.8693 31.5264 34.8053 37.1564 42.312
19 22.71578 27.2036 30.1435 32.8523 36.1908 38.5822 43.820
20 23.8277 28.4120 31.4104 34.1696 37.5662 39.9968 45.315
21 24.9348 29.6151 32.6705 35.4789 38.9321 41.4010 46.797
22 26.0393 30.8133 33.9244 36.7807 40.2894 42.7956 48.268
23 27.1413 32.0069 35.1725 38.0757 41.6384 44.1813 49.728
24 28.2412 33.1963 36.4151 39.3641 42.9798 45.5585 51.179
25 29.3389 34.3816 37.6525 40.6465 44.3141 46.9278 52.620
26 30.4345 35.5631 38.8852 41.9232 45.6417 48.2899 54.052
27 31.5284 36.7412 40.1133 43.1944 46.9630 49.6449 55.476
28 32.6205 37.9159 41.3372 44.4607 48.2782 50.9933 56.892
29 33.7109 39.0875 42.5569 45.7222 49.5879 52.3356 58.302
30 34.7998 40.2560 43.7729 46.9792 50.8922 53.6720 59.703
40 45.6160 51.8050 55.7585 59.3417 63.6907 66.7659 73.402
50 56.3336 63.1671 67.5048 71.4202 76.1539 79.4900 86.661
60 66.9814 74.3970 79.0819 83.2976 88.3794 91.9517 99.607
70 77.5766 85.5271 90.5312 95.0231 100.425 104.215 112.317
80 88.1303 96.5782 101.879 106.629 112.329 116.321 124.839
90 98.6499 107.565 113.145 118.136 124.116 128.299 137.208
100 109.141 118.498 124.342 129.561 135.807 140.169 149.449
zQ
+0.6745 +1.2816 +1.6449 +1.9600 +2.3263 +2.5758 +3.0902
This table is taken from Table 8 of the Biometrika Tables for Statisticians, Vol. 1 (1st ed), edited by E. S.Pearson
and H. O. Hartley. Reproduced with the kind permission of E. S. Pearson and the trustees of Biometrika.
Table III (Continued)

statistical tables 385Ta
ble
IV
Perc
enta
ge P
oin
ts o
f th
e F
Dis
trib
uti
on
: Up
per
5%
Po
ints
υ 1
υ 21
23
45
67
89
10
12
15
20
24
30
40
60
12
0∞
11
61
.41
99
.52
15
.72
24
.62
30
.22
34
.02
36
.82
38
.92
40
.52
41
.92
43
.92
45
.92
48
.02
49
.12
50
.12
51
.12
52
.22
53
.32
43
.3
21
8.5
11
9.0
01
9.1
61
9.2
51
9.3
01
9.3
31
9.3
51
9.3
71
9.3
81
9.4
01
9.4
11
9.4
31
9.4
51
9.4
51
9.4
61
9.4
71
9.4
81
9.4
91
9.5
0
31
0.1
39
.55
9.2
89
.12
9.0
18
.94
8.8
98
.85
8.8
18
.79
8.7
48
.70
8.6
68
.64
8.6
28
.59
8.5
78
.55
8.5
3
47
.71
6.9
46
.59
6.3
96
.26
6.1
66
.09
6.0
46
.00
5.9
65
.91
5.8
65
.80
5.7
75
.75
5.7
25
.69
5.6
65
.63
56
.61
5.7
95
.41
5.1
95
.05
4.9
54
.88
4.8
24
.77
4.7
44
.68
4.6
24
.56
4.5
34
.50
4.4
64
.43
4.4
04
.36
65
.99
5.1
44
.76
4.5
34
.39
4.2
84
.21
4.1
54
.10
4.0
64
.00
3.9
43
.87
3.8
43
.81
3.7
73
.74
3.7
03
.67
75
.59
4.7
44
.35
4.1
23
.97
3.8
73
.79
3.7
33
.68
3.6
43
.57
3.5
13
.44
3.4
13
.38
3.3
43
.30
3.2
73
.23
85
.32
4.4
64
.07
3.8
43
.69
3.5
83
.50
3.4
43
.39
3.3
53
.28
3.2
23
.15
3.1
23
.08
3.0
43
.01
2.9
72
.93
95
.12
4.2
63
.86
3.6
33
.48
3.3
73
.29
3.2
33
.18
3.1
43
.07
3.0
12
.94
2.9
02
.86
2.8
32
.79
2.7
52
.71
10
4.9
64
.10
3.7
13
.48
3.3
33
.22
3.1
43
.07
3.0
22
.98
2.9
12
.85
2.7
72
.74
2.7
02
.66
2.6
22
.58
2.5
4
11
4.8
43
.98
3.5
93
.36
3.2
03
.09
3.0
12
.95
2.9
02
.85
2.7
92
.72
2.6
52
.61
2.5
72
.53
2.4
92
.45
2.4
0
12
4.7
53
.89
3.4
93
.26
3.1
13
.00
2.9
12
.85
2.8
02
.75
2.6
92
.62
2.5
42
.51
2.4
72
.43
2.3
82
.34
2.3
0
13
4.6
73
.81
3.4
13
.18
3.0
32
.92
2.8
32
.77
2.7
12
.67
2.6
02
.53
2.4
62
.42
2.3
82
.34
2.3
02
.25
2.2
1
14
4.6
03
.74
3.3
43
.11
2.9
62
.85
2.7
62
.70
2.6
52
.60
2.5
32
.46
2.3
92
.35
2.3
12
.27
2.2
22
.18
2.1
3
15
4.5
43
.68
3.2
93
.06
2.9
02
.79
2.7
12
.64
2.5
92
.54
2.4
82
.40
2.3
32
.29
2.2
52
.20
2.1
62
.11
2.0
7
16
4.4
93
.63
3.2
43
.01
2.8
52
.74
2.6
62
.59
2.5
42
.49
2.4
22
.35
2.2
82
.24
2.1
92
.15
2.1
12
.06
2.0
1
17
4.4
53
.59
3.2
02
.96
2.8
12
.70
2.6
12
.55
2.4
92
.45
2.3
82
.31
2.2
32
.19
2.1
52
.10
2.0
62
.01
1.9
6
18
4.4
13
.55
3.1
62
.93
2.7
72
.66
2.5
82
.31
2.4
62
.41
2.3
42
.27
2.1
92
.15
2.1
12
.06
2.0
21
.97
1.9
2
19
4.3
83
.52
3.1
32
.90
2.7
42
.63
2.5
42
.48
2.4
22
.38
2.3
12
.23
2.1
62
.11
2.0
72
.03
1.9
81
.93
1.8
8
20
4.3
53
.49
3.1
02
.87
2.7
12
.60
2.5
12
.45
2.3
92
.35
2.2
82
.20
2.1
22
.08
2.0
41
.99
1.9
31
.90
1.8
4
21
4.3
23
.47
3.0
72
.84
2.6
82
.57
2.4
92
.42
2.3
72
.32
2.2
52
.18
2.1
02
.05
2.0
11
.96
1.9
21
.87
1.8
1
22
4.3
03
.44
3.0
52
.82
2.6
62
.55
2.4
62
.40
2.3
42
.30
2.2
32
.15
2.0
72
.03
1.9
81
.94
1.8
91
.84
1.7
8
23
4.2
83
.42
3.0
32
.80
2.6
42
.53
2.4
42
.37
2.3
22
.27
2.2
02
.13
2.0
52
.01
1.9
61
.91
1.8
61
.81
1.7
6
24
4.2
63
.40
3.0
12
.78
2.6
22
.51
2.4
22
.36
2.3
02
.25
2.1
82
.11
2.0
31
.98
1.9
41
.89
1.8
41
.79
1.7
3
25
4.2
43
.39
2.9
92
.76
2.6
02
.49
2.4
02
.34
2.2
82
.24
2.1
62
.09
2.0
11
.96
1.9
21
.87
1.8
21
.77
1.7
1
26
4.2
33
.37
2.9
82
.74
2.5
92
.47
2.3
92
.32
2.2
72
.22
2.1
52
.07
1.9
91
.95
1.9
01
.83
1.8
01
.75
1.6
9
27
4.2
13
.35
2.9
62
.73
2.5
72
.46
2.3
72
.31
2.2
52
.20
2.1
32
.06
1.9
71
.93
1.8
81
.84
1.7
91
.73
1.6
7
28
4.2
03
.34
2.9
32
.71
2.5
62
.45
2.3
62
.29
2.2
42
.19
2.1
22
.04
1.9
61
.91
1.8
71
.82
1.7
71
.71
1.6
5
29
4.1
83
.33
2.9
32
.70
2.5
52
.43
2.3
52
.28
2.2
22
.18
2.1
02
.03
1.9
41
.90
1.8
51
.81
1.7
51
.70
1.6
4
30
4.1
73
.32
2.9
22
.69
2.5
32
.42
2.3
32
.27
2.2
12
.16
2.0
92
.01
1.9
31
.89
1.8
41
.79
1.7
41
.68
1.6
2
40
4.0
83
.23
2.8
42
.61
2.4
52
.34
2.2
52
.18
2.1
22
.08
2.0
01
.92
1.8
41
.79
1.7
41
.69
1.6
41
.58
1.3
1
60
4.0
03
.15
2.7
62
.53
2.3
72
.25
2.1
72
.10
2.0
31
.99
1.9
21
.84
1.7
51
.70
1.6
51
.59
1.5
31
.47
1.3
9
12
03
.92
3.0
72
.68
2.4
52
.29
2.1
72
.09
2.0
21
.96
1.9
11
.83
1.7
51
.66
1.6
11
.55
1.3
01
.43
1.3
51
.25
∞3
.84
3.0
02
.60
2.3
72
.21
2.1
02
.01
1.9
41
.88
1.8
31
.75
1.6
71
.57
1.5
21
.46
1.3
91
.32
1.2
21
.00
(con
tin
ued
)

386 statistical tablesTa
ble
IV
(c
on
tin
ued
)
Up
per
2.5
% P
oin
ts
υ 1
υ 21
23
45
67
89
10
12
15
20
24
30
40
60
12
0∞
16
47
.87
99
.58
64
.28
99
.69
21
.89
37
.19
48
.29
6.6
79
3.3
39
68
.69
76
.79
84
.99
93
.19
97
.21
00
11
00
61
01
01
01
41
01
8
23
8.5
13
9.0
03
9.1
73
9.2
53
9.3
03
9.3
33
9.3
63
9.3
73
9.3
93
9.4
03
9.4
13
9.4
33
9.4
53
9.4
63
9.4
63
9.4
73
9.4
83
9.4
93
9.5
0
31
7.4
41
6.0
41
5.4
41
5.1
01
4.8
81
4.7
31
4.6
21
4.5
41
4.4
71
4.4
21
4.3
41
4.2
51
4.1
71
4.1
21
4.0
81
4.0
41
3.9
91
3.9
51
3.9
0
41
2.2
21
0.6
59
.98
9.6
09
.36
9.2
09
.07
8.9
88
.90
8.8
48
.75
8.6
68
.56
8.5
18
.46
8.4
18
.36
8.3
18
.26
51
0.0
18
.43
7.7
67
.39
7.1
56
.98
6.8
56
.76
6.6
86
.62
6.5
26
.43
6.3
36
.28
6.2
36
.18
6.1
26
.07
6.0
2
68
.81
7.2
66
.60
6.2
35
.99
5.8
25
.70
5.6
05
.52
5.4
65
.37
5.2
75
.17
5.1
25
.07
5.0
14
.96
4.9
04
.85
78
.07
6.5
45
.89
5.5
25
.29
5.2
14
.99
4.9
04
.82
4.7
64
.67
4.5
74
.47
4.4
24
.36
4.3
14
.25
4.2
04
.14
87
.57
6.0
65
.42
5.0
54
.82
4.6
54
.53
4.4
34
.36
4.3
04
.20
4.1
04
.00
3.9
53
.89
3.8
43
.78
3.7
33
.67
97
.21
5.7
15
.08
4.7
24
.48
4.3
24
.20
4.1
04
.03
3.9
63
.87
3.7
73
.67
3.6
13
.56
3.5
13
.45
3.3
93
.33
10
6.9
45
.46
4.8
34
.47
4.2
44
.07
3.9
53
.85
3.7
83
.72
3.6
23
.52
3.4
23
.37
3.3
13
.26
3.2
03
.14
3.0
8
11
6.7
25
.26
4.6
34
.28
4.0
43
.88
3.7
63
.66
3.5
93
.53
3.4
33
.33
3.2
33
.17
3.1
23
.06
3.0
02
.94
2.8
8
12
6.5
55
.10
4.4
74
.12
3.8
93
.73
3.6
13
.51
3.4
43
.37
3.2
83
.18
3.0
73
.02
2.9
62
.91
2.8
52
.79
2.7
2
13
6.4
14
.97
4.3
54
.00
3.7
73
.60
3.4
83
.39
3.3
13
.25
3.1
53
.05
2.9
52
.89
2.8
42
.78
2.7
22
.66
2.6
0
14
6.3
04
.86
4.2
43
.89
3.6
63
.50
3.3
83
.29
3.2
13
.15
3.0
52
.95
2.8
42
.79
2.7
32
.67
2.6
12
.55
2.4
9
15
6.2
04
.77
4.1
53
.80
3.5
83
.41
3.2
93
.20
3.1
23
.06
2.9
62
.86
2.7
62
.70
2.6
42
.59
2.5
22
.46
2.4
0
16
6.1
24
.69
4.0
83
.73
3.5
03
.34
3.2
23
.12
3.0
52
.99
2.8
92
.79
2.6
82
.63
2.5
72
.51
2.4
52
.38
2.3
2
17
6.0
44
.62
4.0
13
.66
3.4
43
.28
3.1
63
.06
2.9
82
.92
2.8
22
.72
2.6
22
.56
2.5
02
.44
2.3
82
.32
2.2
5
18
5.9
84
.56
3.9
53
.61
3.3
83
.22
3.1
03
.01
2.9
32
.87
2.7
72
.67
2.5
62
.50
2.4
42
.38
2.3
22
.26
2.1
9
19
5.9
24
.51
3.9
03
.56
3.3
33
.17
3.0
52
.96
2.8
82
.82
2.7
22
.62
2.5
12
.45
2.3
92
.33
2.2
72
.20
2.1
3
20
5.8
74
.46
3.8
63
.51
3.2
93
.13
3.0
12
.91
2.8
42
.77
2.6
82
.57
2.4
62
.41
2.3
52
.29
2.2
22
.16
2.1
9
21
5.8
34
.42
3.8
23
.48
3.2
53
.09
2.9
72
.87
2.8
02
.73
2.6
42
.53
2.4
22
.37
2.3
12
.25
2.1
82
.11
2.0
4
22
5.7
94
.38
3.7
83
.44
3.2
23
.05
2.9
32
.84
2.7
62
.70
2.6
02
.50
2.3
92
.33
2.2
72
.21
2.1
42
.08
2.0
0
23
5.7
54
.35
3.7
53
.41
3.1
83
.02
2.9
02
.81
2.7
32
.67
2.5
72
.47
2.3
62
.30
2.2
42
.18
2.1
12
.04
1.9
7
24
5.7
24
.32
3.7
23
.38
3.1
52
.99
2.8
72
.78
2.7
02
.64
2.5
42
.44
2.3
32
.27
2.2
12
.15
2.0
82
.01
1.9
4
25
5.6
94
.29
3.6
93
.35
3.1
32
.97
2.8
52
.75
2.6
82
.61
2.5
12
.41
2.3
02
.24
2.1
82
.12
2.0
51
.98
1.9
1
26
5.6
64
.27
3.6
73
.33
3.1
02
.94
2.8
22
.73
2.6
52
.59
2.4
92
.39
2.2
82
.22
2.1
62
.09
2.0
31
.95
1.8
8
27
5.6
34
.24
3.6
53
.31
3.0
82
.92
2.8
02
.71
2.6
32
.57
2.4
72
.36
2.2
52
.19
2.1
32
.07
2.0
01
.93
1.8
5
28
5.6
14
.22
3.6
33
.29
3.0
62
.90
2.7
82
.69
2.6
12
.55
2.4
52
.34
2.2
32
.17
2.1
12
.05
1.9
81
.91
1.8
3
29
5.5
94
.20
3.6
13
.27
3.0
42
.88
2.7
62
.67
2.5
92
.53
2.4
32
.32
2.2
12
.15
2.0
92
.03
1.9
61
.89
1.8
1
30
5.5
74
.18
3.5
93
.25
3.0
32
.87
2.7
52
.65
2.5
72
.51
2.4
12
.31
2.2
02
.14
2.0
72
.01
1.9
41
.87
1.7
9
40
5.4
24
.05
3.4
63
.13
2.9
02
.74
2.6
22
.53
2.4
52
.39
2.2
92
.18
2.0
72
.01
1.9
41
.88
1.8
01
.72
1.6
4
60
5.2
93
.93
3.3
43
.01
2.7
92
.63
2.5
12
.41
2.3
32
.27
2.1
72
.06
1.9
41
.88
1.8
21
.74
1.6
71
.58
1.4
8
12
05
.15
3.8
03
.23
2.8
92
.67
2.5
22
.39
2.3
02
.22
2.1
62
.05
1.9
41
.82
1.7
61
.69
1.6
11
.53
1.4
31
.31
∞5
.02
3.6
93
.12
2.7
92
.57
2.4
12
.29
2.1
92
.11
2.0
51
.94
1.8
31
.71
1.6
41
.57
1.4
81
.39
1.2
71
.00
(con
tin
ued
)

statistical tables 387U
pp
er 1
% P
oin
ts
υ 1
υ 21
23
45
67
89
10
12
15
20
24
30
40
60
12
0∞
14
05
24
99
9.5
54
03
56
25
57
64
58
59
59
28
59
82
60
22
60
56
61
06
61
57
62
09
62
35
62
61
62
87
63
13
63
39
63
66
29
8.5
09
9.0
09
9.1
79
9.2
59
9.3
09
9.3
39
9.3
69
9.3
79
9.3
99
9.4
09
9.4
29
9.4
39
9.4
59
9.4
69
9.4
79
9.4
79
9.4
89
9.4
99
9.5
0
33
4.1
23
0.8
22
9.4
62
8.1
72
8.2
42
7.9
12
7.6
72
7.4
92
7.3
52
2.2
32
7.0
52
6.8
72
6.6
92
6.6
02
6.5
02
6.4
12
6.3
22
6.2
22
6.1
3
42
1.2
01
8.0
01
6.6
91
5.9
81
5.5
21
5.2
11
4.9
81
4.8
01
4.6
61
4.5
51
4.3
71
4.2
01
4.0
21
3.9
31
3.8
41
3.7
51
3.6
51
3.5
61
3.4
6
51
6.2
61
3.2
71
2.0
61
1.3
91
0.9
71
0.6
71
0.4
61
0.2
91
0.1
61
0.0
59
.89
9.7
29
.05
9.4
79
.38
9.2
99
.20
9.1
19
.06
61
3.7
51
0.9
29
.78
9.1
58
.75
8.4
78
.26
8.1
07
.98
7.8
77
.72
7.5
67
.40
7.3
17
.23
7.1
47
.06
6.9
76
.88
71
2.2
59
.55
8.4
57
.85
7.4
67
.19
6.9
96
.84
6.7
26
.62
6.4
76
.31
6.6
16
.07
5.9
95
.91
5.8
25
.74
5.6
5
81
1.2
68
.65
7.5
97
.01
6.6
36
.37
6.1
86
.03
5.9
15
.81
5.6
75
.52
5.3
65
.28
5.2
05
.12
5.0
34
.95
4.8
6
91
0.5
68
.02
6.9
96
.42
6.0
65
.80
5.6
15
.47
5.3
55
.26
5.1
14
.96
4.8
14
.73
4.6
54
.57
4.4
84
.40
4.3
1
10
10
.04
7.5
66
.55
5.9
95
.64
5.3
95
.20
5.0
64
.94
4.8
54
.71
4.5
64
.41
4.3
34
.25
4.1
74
.08
4.0
03
.91
11
9.6
57
.21
6.2
25
.67
5.3
25
.07
4.8
94
.74
4.6
34
.54
4.4
04
.25
4.1
04
.02
3.9
43
.86
3.7
83
.69
3.6
0
12
9.3
36
.93
5.9
55
.41
5.0
64
.82
4.6
44
.50
4.3
94
.30
4.1
64
.01
3.8
63
.78
3.7
03
.62
3.5
43
.45
3.3
6
13
9.0
76
.70
5.7
45
.21
4.8
64
.62
4.4
44
.30
4.1
94
.10
3.9
63
.82
3.6
63
.59
3.5
13
.43
3.3
43
.25
3.1
7
14
8.8
66
.51
5.5
65
.04
4.6
94
.46
4.2
84
.14
4.0
33
.94
1.8
03
.66
3.5
13
.43
3.3
53
.27
3.1
83
.09
3.0
0
15
8.6
86
.36
5.4
24
.89
4.5
64
.32
4.1
44
.00
3.8
93
.80
3.6
73
.52
3.3
73
.29
3.2
13
.13
3.0
52
.96
2.8
7
16
8.5
36
.23
5.2
94
.77
4.4
44
.20
4.0
33
.89
3.7
83
.69
3.5
53
.41
3.2
63
.18
3.1
03
.02
2.9
32
.84
2.7
5
17
8.4
06
.11
5.1
84
.67
4.3
44
.10
3.9
33
.79
3.6
83
.59
3.4
63
.31
3.1
63
.08
3.0
02
.92
2.8
32
.75
2.6
5
18
8.2
96
.01
5.0
94
.58
4.2
54
.01
3.8
43
.71
3.6
03
.51
3.3
73
.23
3.0
83
.00
2.9
22
.84
2.7
52
.66
2.5
7
19
8.1
85
.93
5.0
14
.50
4.1
73
.94
3.7
73
.63
3.5
23
.43
3.3
03
.15
3.0
02
.92
2.8
42
.76
2.6
72
.58
2.4
9
20
8.1
05
.85
4.9
44
.43
4.1
03
.87
3.7
03
.56
3.4
63
.37
3.2
33
.09
2.9
42
.86
2.7
82
.69
2.6
12
.52
2.4
2
21
8.0
25
.78
4.8
74
.37
4.0
43
.81
3.6
43
.51
3.4
03
.31
3.1
73
.03
2.8
82
.80
2.7
22
.64
2.5
52
.46
2.3
6
22
7.9
55
.72
4.8
24
.31
3.9
93
.76
3.5
93
.45
3.3
53
.26
3.1
22
.98
2.8
32
.75
2.6
72
.58
2.5
02
.40
2.3
1
23
7.8
85
.66
4.7
64
.26
3.9
43
.71
3.5
43
.41
3.3
03
.21
3.0
72
.93
2.7
82
.70
2.6
22
.54
2.4
52
.35
2.2
6
24
7.8
25
.61
4.7
24
.22
3.9
03
.67
3.5
03
.36
3.2
63
.17
3.0
32
.89
2.7
42
.66
2.5
82
.49
2.4
02
.31
2.2
1
25
7.7
75
.57
4.6
84
.18
3.8
53
.63
3.4
63
.32
1.2
23
.13
2.9
92
.85
2.7
02
.62
2.5
42
.45
2.3
62
.27
2.1
7
26
7.7
25
.53
4.6
44
.60
3.8
23
.59
3.4
23
.29
3.1
83
.09
2.9
62
.81
2.6
62
.58
2.5
02
.42
2.3
32
.23
2.1
3
27
7.6
85
.49
4.6
04
.11
3.7
83
.56
3.3
93
.26
3.1
53
.06
2.9
32
.78
2.6
32
.55
2.4
72
.38
2.2
92
.20
2.1
0
28
7.6
45
.45
4.5
74
.07
3.7
53
.53
3.3
63
.23
3.1
23
.03
2.9
02
.75
2.6
02
.52
2.4
42
.35
2.2
62
.17
2.0
6
29
7.6
05
.42
4.5
44
.04
3.7
33
.50
3.3
33
.20
3.0
93
.00
2.8
72
.73
2.5
72
.49
2.4
12
.33
2.2
32
.14
2.0
3
30
7.5
65
.39
4.5
14
.02
3.7
03
.47
3.3
03
.17
3.0
72
.98
2.8
42
.70
2.5
52
.47
2.3
92
.30
2.2
12
.11
2.0
1
40
7.3
15
.18
4.3
13
.83
3.5
13
.29
3.1
22
.99
2.8
92
.80
2.6
62
.52
2.3
72
.29
2.2
02
.11
2.0
21
.92
1.8
0
60
7.0
84
.98
4.1
33
.65
3.3
43
.12
2.9
52
.82
2.7
22
.63
2.5
02
.35
2.2
02
.12
2.0
31
.94
1.8
41
.73
1.6
0
120
6.8
54
.79
3.9
53
.48
3.1
72
.96
2.7
92
.66
2.5
62
.47
2.3
42
.19
2.0
31
.95
1.8
61
.76
1.6
61
.53
1.3
8
∞6
.63
4.6
13
.78
3.3
23
.02
2.8
02
.64
2.5
12
.41
2.3
22
.18
2.0
41
.88
1.7
91
.70
1.5
91
.47
1.3
21
.00
Th
is t
able
is
abri
dge
d f
rom
Tab
le 1
8 o
f th
e B
iom
etri
ka T
able
s fo
r St
atis
tici
ans,
Vo
l. 1
(ls
t ed
.), e
dit
ed b
y t.
S. P
ears
on
an
d H
. O. H
artl
ey R
epro
du
ced
wit
h t
he
kin
d p
erm
issi
on
of
E S
. Pea
rso
n a
nd
th
e tr
ust
ees
of
Bio
met
rika
.


389
GLOSSARY
A
Action research: A research strategy aimed at initiating
change processes, with an incremental focus, for narrowing
the gap between the desired and actual states.
Alternate hypothesis: An educated conjecture that sets
the parameters one expects to find. The alternate hypothesis
is tested to see whether or not the null is to be rejected.
Ambiguous questions: Questions that are not clearly
worded and are likely to be interpreted by respondents in
different ways.
ANOVA: Stands for analysis of variance, which tests for
significant mean differences in variables among multiple
groups.
Applied research: Research conducted in a particular
setting with the specific objective of solving an existing prob-
lem in the situation.
Area sampling: Cluster sampling within a specified area or
region; a probability sampling design.
B
Basic research: Research conducted to generate knowledge
and understanding of phenomena (in the work setting)
that adds to the existing body of knowledge (about organiza-
tions and management theory).
Bias: Any error that creeps into the data. Biases can be
introduced by the researcher, the respondent, the measuring
instrument, the sample, and so on.
Bibliography: A listing of books, articles, and other relevant
materials, alphabetized according to the last name of the
authors, referencing the titles of their works, and indicating
where they can be located.
Big data: Term commonly used to describe the exponential
growth and availability of data from digital sources inside
and outside the organization.
C
Canonical correlation: A statistical technique that exam-
ines the relationship between two or more dependent vari-
ables and several independent variables.
Case study: Focuses on collecting information about a spe-
cific object, event or activity, such as a particular business
unit or organization.
Categorization: The process of organizing, arranging, and
classifying coding units (in qualitative data analysis).
Category (in qualitative data analysis): A group of coding
units that share some commonality.
Category reliability: The extent to which judges are able to
use category definitions to classify qualitative data.
Category scale: A scale that uses multiple items to seek a
single response.
Causal study: A research study conducted to establish
cause‐and‐effect relationships among variables.
Chi‐square test: A nonparametric test that establishes the
independence or otherwise between two nominal variables.
Classification data: Personal information or demographic
details of the respondents such as age, marital status, and
educational level.
Closed questions: Questions with a clearly delineated set of
alternatives that confine the respondents’ choice to one of
them.
Cluster sampling: A probability sampling design in which
the sample comprises groups or chunks of elements with
intragroup heterogeneity and intergroup homogeneity.
Coding: The analytic process through which the qualitative
data that you have gathered are reduced, rearranged, and
integrated to form theory (compare Data coding).
Coding scheme: Contains predetermined categories for
recording what is observed. Such schemes come in many
forms and shapes.
Comparative scale: A scale that provides a benchmark or
point of reference to assess attitudes, opinions, and the like.
Complex probability sampling: Several probability sam-
pling designs (such as systematic and stratified random),
which offer an alternative to the cumbersome, simple ran-
dom sampling design.
Computer‐assisted telephone interviews (CATI): Interviews
in which questions are prompted onto a PC monitor that is
networked into the telephone system, to which respondents
provide their answers.

390 glossary
Concealed observation: Members of a social group under
study are not told that they are being observed.
Concealment of observation: Relates to whether the mem-
bers of the social group under study are told that they are
being observed.
Conceptual analysis: Establishes the existence and frequency
of concepts (such as words, themes, or characters) in a text.
Concurrent validity: Relates to criterion‐related validity,
which is established at the same time the test is administered.
Confidence: The probability estimate of how much reliance
can be placed on the findings; the usual accepted level of
confidence in social science research is 95%.
Conjoint analysis: A multivariate statistical technique used to
determine the relative importance respondents attach to attrib-
utes and the utilities they attach to specific levels of attributes.
Consensus scale: A scale developed through consensus or
the unanimous agreement of a panel of judges as to the items
that measure a concept.
Constant sum rating scale: A scale where the respondents
distribute a fixed number of points across several items.
Construct validity: Testifies to how well the results obtained
from the use of the measure fit the theories around which the
test was designed.
Constructionism: An approach to research that is based on
the idea that the world as we know it is fundamentally men-
tal or mentally constructed. Constructionists aim to under-
stand the rules people use to make sense of the world by
investigating what happens in people’s minds.
Content analysis: An observational research method that is
used to systematically evaluate the symbolic contents of all
forms of recorded communication.
Content validity: Establishes the representative sampling of
a whole set of items that measures a concept, and reflects
how well the dimensions and elements thereof are
delineated.
Contextual factors: Factors relating to the organization
under study such as the background and environment of the
organization, including its origin and purpose, size, resources,
financial standing, and the like.
Contrived setting: An artificially created or “lab” environ-
ment in which research is conducted.
Control group: The group that is not exposed to any treat-
ment in an experiment.
Controlled observation: Controlled observation occurs
when observational research is carried out under carefully
arranged conditions.
Convenience sampling: A nonprobability sampling design
in which information or data for the research are gathered
from members of the population conveniently accessible to
the researcher.
Convergent validity: That which is established when the
scores obtained by two different instruments measuring the
same concept, or by measuring the concept by two different
methods, are highly correlated.
Correlation matrix: A correlation matrix is used to exam-
ine relationships between interval and/or ratio variables.
Correlational study: A research study conducted to iden-
tify the important factors associated with the variables of
interest.
Criterion‐related validity: That which is established when
the measure differentiates individuals on a criterion that it is
expected to predict.
Criterion variable: The variable of primary interest to the
study, also known as the dependent variable.
Critical literature review: A step‐by‐step process that
involves the identification of published and unpublished
work from secondary data sources on the topic of interest,
the evaluation of this work in relation to the problem, and
the documentation of this work.
Critical realism: A school of thought combining the belief
in an external reality (an objective truth) with the rejection
of the claim that this external reality can be objectively meas-
ured. The critical realist is critical of our ability to under-
stand the world with certainty.
Cross‐sectional study: A research study for which data
are gathered just once (stretched though it may be over a
period of days, weeks, or months) to answer the research
question.
D
Data coding: In quantitative research data coding involves
assigning a number to the participants’ responses so they can
be entered into a database.
Data display: Taking the reduced qualitative data and dis-
playing them in an organized, condensed manner.
Data editing: Data editing deals with detecting and correct-
ing illogical, inconsistent, or illegal data and omissions in the
information returned by the participants of the study.
Data mining: Helps to trace patterns and relationships in
the data stored in the data warehouse.
Data reduction: Breaking down data into manageable
pieces.

glossary 391
Data transformation: The process of changing the original
numerical representation of a quantitative value to another
value.
Data warehouse: A central repository of all information
gathered by the company.
Deductive reasoning: The application of a general theory
to a specific case.
Delphi technique: A forecasting method that uses a cau-
tiously selected panel of experts in a systematic, interactive
manner.
Dependent variable: See Criterion variable.
Descriptive statistics: Statistics such as frequencies, the
mean, and the standard deviation, which provide descriptive
information about a set of data.
Descriptive study: A research study that describes the vari-
ables in a situation of interest to the researcher.
Dichotomous scale: Scale used to elicit a Yes/No response,
or an answer to two different aspects of a concept.
Directional hypothesis: An educated conjecture as to the
direction of the relationship, or differences among variables,
which could be positive or negative, or more or less,
respectively.
Discriminant analysis: A statistical technique that helps to
identify the independent variables that discriminate a nomi-
nally scaled dependent variable of interest.
Discriminant validity: That which is established when two
variables are theorized to be uncorrelated, and the scores
obtained by measuring them are indeed empirically found to
be so.
Disproportionate stratified random sampling: A proba-
bility sampling design that involves a procedure in which the
number of sample subjects chosen from various strata is not
directly proportionate to the total number of elements in the
respective strata.
Double‐barreled question: Refers to the improper framing
of a question that should be posed as two or more separate
questions, so that the respondent can give clear and unam-
biguous answers.
Double‐blind study: A study where neither the experi-
menter nor the subjects are aware as to who is given the real
treatment and who the placebo.
Double sampling: A probability sampling design that
involves the process of collecting information from a set of
subjects twice – such as using a sample to collect preliminary
information, and later using a subsample of the primary
sample for more information.
Dummy variable: A variable that has two or more distinct
levels, which are coded 0 or 1.
E
Efficiency in sampling: Attained when the sampling design
chosen either results in a cost reduction to the researcher or
offers a greater degree of accuracy in terms of the sample
size.
Electronic questionnaire: Online questionnaire adminis-
tered when a microcomputer is hooked up to computer
networks.
Element: A single member of the population.
Epistemology: Theory about the nature of knowledge or
how we come to know.
Ethics: Code of conduct or expected societal norms of
behavior.
Ethnography: A research process in which the anthropolo-
gist closely observes, records, and engages in the daily life of
another culture and then writes accounts of this culture,
emphasizing descriptive detail.
Exogenous variable: A variable that exerts an influence on
the cause‐and‐effect relationship between two variables in
some way, and needs to be controlled.
Experimental design: A study design in which the
researcher might create an artificial setting, control some
variables, and manipulate the independent variable to estab-
lish cause‐and‐effect relationships.
Experimental group: The group exposed to a treatment in
an experimental design.
Expert panel: A group of people specifically convened by
the researcher to elicit expert knowledge and opinion about
a certain issue.
Exploratory research: A research study where very little
knowledge or information is available on the subject under
investigation.
Ex post facto experimental design: Studying subjects who
have already been exposed to a stimulus and comparing them
to those not so exposed, so as to establish cause‐and‐effect
relationships (in contrast to establishing cause‐and‐effect
relationships by manipulating an independent variable in a
lab or a field setting).
External consultants: Research experts outside the organiza-
tion who are hired to study specific problems to find solutions.
External validity: The extent of generalizability of the
results of a causal study to other field settings.

392 glossary
F
Faces scale: A particular representation of the graphic scale,
depicting faces with expressions that range from smiling to sad.
Face‐to‐face interview: Information gathering when both
the interviewer and interviewee meet in person.
Face validity: An aspect of validity examining whether the
item on the scale, on the face of it, reads as if it indeed meas-
ures what it is supposed to measure.
Factorial validity: That which indicates, through the use of
factor analytic techniques, whether a test is a pure measure of
some specific factor or dimension.
Field experiment: An experiment done to detect cause‐
and‐effect relationships in the natural environment in which
events normally occur.
Field study: A study conducted in the natural setting with a
minimal amount of researcher interference in the flow of
events in the situation.
Fixed rating scale: See Constant sum rating scale.
Focus group: A group consisting of eight to ten members
randomly chosen, who discuss a product or any given topic
for about two hours with a moderator present, so that their
opinions can serve as the basis for further research.
Forced choice: Elicits the ranking of objects relative to one
another.
Formative scale: Used when a construct is viewed as an
explanatory combination of its indicators.
Frequencies: The number of times various subcategories of
a phenomenon occur, from which the percentage and cumu-
lative percentage of any occurrence can be calculated.
Fundamental research: See Basic research.
Funneling technique: The questioning technique that con-
sists of initially asking general and broad questions, and grad-
ually narrowing the focus thereafter to more specific themes.
G
Generalizability: The applicability of research findings in
one setting to others.
Going native: The researcher/observer becomes so involved
with the group under study that eventually every objectivity
and research interest is lost.
Goodness of measures: Attests to the reliability and validity
of measures.
Graphic rating scale: A scale that graphically illustrates the
responses that can be provided, rather than specifying any
discrete response categories.
Grounded theory: A systematic set of procedures to
develop an inductively derived theory from the data.
H
History effects: A threat to the internal validity of the
experimental results, when events unexpectedly occur while
the experiment is in progress and contaminate the cause‐
and‐effect relationship.
Hypothesis: A tentative, yet testable, statement that predicts
what you expect to find in your empirical data.
Hypothetico‐deductive method: A seven‐step research
process of identifying a broad problem area, defining the
problem statement, developing hypotheses, determining
measures, data collection, data analysis, and the interpreta-
tion of data.
I
Independent samples t‐test: Test that is done to see if there
are significant differences in the means for two groups in the
variable of interest.
Independent variable: A variable that influences the
dependent or criterion variable and accounts for (or explains)
its variance.
Inductive reasoning: A process where we observe specific
phenomena and on this basis arrive at general conclusions.
Inferential statistics: Statistics that help to establish rela-
tionships among variables and draw conclusions therefrom.
Instrumentation effects: The threat to internal validity in
experimental designs caused by changes in the measuring
instrument between the pretest and the posttest.
Inter item consistency reliability: A test of the consistency
of responses to all the items in a measure to establish that
they hang together as a set.
Interjudge reliability: The degree of consistency between
coders processing the same (qualitative) data.
Internal consistency: Homogeneity of the items in the
measure that tap a construct.
Internal consultants: Research experts within the organiza-
tion who investigate and find solutions to problems.
Internal validity of experiments: Attests to the confidence
that can be placed in the cause‐and‐effect relationship found
in experimental designs.
Interval scale: A multipoint scale that taps the differences,
the order, and the equality of the magnitude of the differ-
ences in the responses.

glossary 393
Intervening variable: A variable that surfaces as a function
of the independent variable, and helps in conceptualizing
and explaining the influence of the independent variable on
the dependent variable.
Interview: A data collection method in which the researcher
asks for information verbally from the respondents.
Itemized rating scale: A scale that offers several categories
of response, out of which the respondent picks the one most
relevant for answering the question.
J
Judgment sampling: A purposive, nonprobability sampling
design in which the sample subject is chosen on the basis of
the individual’s ability to provide the type of special informa-
tion needed by the researcher.
L
Lab experiment: An experimental design set up in an artifi-
cially contrived setting where controls and manipulations are
introduced to establish cause‐and‐effect relationships among
variables of interest to the researcher.
Leading questions: Questions phrased in such a manner as
to lead the respondent to give the answers that the researcher
would like to obtain.
Likert scale: An interval scale that specifically uses the five
anchors of Strongly Disagree, Disagree, Neither Disagree nor
Agree, Agree, and Strongly Agree.
Literature review: A step‐by‐step process that involves the
identification of published and unpublished work from
secondary data sources on the topic of interest, the evalua-
tion of this work in relation to the problem, and the docu-
mentation of this work.
Loaded questions: Questions that elicit highly biased
emotional responses from subjects.
Logistic regression: A specific form of regression analysis
in which the dependent variable is a nonmetric, dichoto-
mous variable.
Longitudinal study: A research study for which data are
gathered at several points in time to answer a research
question.
M
Manipulation: How the researcher exposes the subjects to
the independent variable to determine cause‐and‐effect rela-
tionships in experimental designs.
MANOVA: A statistical technique that is similar to ANOVA,
with the difference that ANOVA tests the mean differences
of more than two groups on one dependent variable, whereas
MANOVA tests mean differences among groups across sev-
eral dependent variables simultaneously, by using sums of
squares and cross‐product matrices.
Match groups: A method of controlling known contaminat-
ing factors in experimental studies, by deliberately spreading
them equally across the experimental and control groups, so
as not to confound the cause‐and‐effect relationship.
Maturation effects: A threat to internal validity that is a func-
tion of the biological, psychological, and other processes tak-
ing place in the respondents as a result of the passage of time.
McNemar’s test: A nonparametric method used on nomi-
nal data. It assesses the significance of the difference between
two dependent samples when the variable of interest is
dichotomous.
Mean: The average of a set of figures.
Measure of central tendency: Descriptive statistics of a
data set such as the mean, median, or mode.
Measure of dispersion: The variability in a set of observa-
tions, represented by the range, variance, standard deviation,
and the interquartile range.
Measurement: The assignment of numbers or other sym-
bols to characteristics (or attributes) of objects according
to a prespecified set of rules.
Median: The central item in a group of observations
arranged in an ascending or descending order.
Mediating variable: A variable that surfaces as a function of
the independent variable, and helps in conceptualizing and
explaining the influence of the independent variable on the
dependent variable.
Mode: The most frequently occurring number in a data set.
Moderating variable: A variable on which the relationship
between two other variables is contingent. That is, if the
moderating variable is present, the theorized relation-
ship between the two variables will hold good, but not
otherwise.
Mortality: The loss of research subjects during the course
of the experiment, which confounds the cause‐and‐effect
relationship.
Multicollinearity: A statistical phenomenon in which two
or more independent variables in a multiple regression
model are highly correlated.
Multiple regression analysis: A statistical technique to pre-
dict the variance in the dependent variable by regressing the
independent variables against it.

394 glossary
Multistage cluster sampling: A probability sampling design
that is a stratified sampling of clusters.
N
Narrative analysis: A qualitative approach that aims to
elicit and scrutinize the stories we tell about ourselves and
their implications for our lives.
Nominal scale: A scale that categorizes individuals or
objects into mutually exclusive and collectively exhaustive
groups, and offers basic, categorical information on the vari-
able of interest.
Noncontrived setting: Research conducted in the natural
environment where activities take place in the normal man-
ner (i.e., the field setting).
Nondirectional hypothesis: An educated conjecture of a
relationship between two variables, the directionality of
which cannot be guessed.
Nonparametric test: A hypothesis test that does not require
certain assumptions about the population’s distribution,
such as that the population follows a normal distribution.
Nonparticipant observation: The researcher is never
directly involved in the actions of the actors, but observes
them from outside the actors’ visual horizon, for instance via
a one‐way mirror or a camera.
Nonprobability sampling: A sampling design in which the
elements in the population do not have a known or predeter-
mined chance of being selected as sample subjects.
Nonresponse error: Exists to the extent that those who did
respond to your survey are different from those who did not on
(one of the) characteristics of interest in your study. Two impor-
tant sources of non‐response are not‐at‐homes and refusals.
Nuisance variable: A variable that contaminates the cause‐
and‐effect relationship.
Null hypothesis: The conjecture that postulates no differ-
ences or no relationship between or among variables.
Numerical scale: A scale with bipolar attributes with five
points or seven points indicated on the scale.
O
Objectivity: Interpretation of the results on the basis of the
results of data analysis, as opposed to subjective or emotional
interpretations.
Observation: The planned watching, recording, analysis,
and interpretation of behavior, actions, or events.
One sample t‐test: A test that is used to test the hypothesis
that the mean of the population from which a sample is
drawn is equal to a comparison standard.
One‐shot study: See Cross‐sectional study.
Ontology: The philosophical study of what can be said to exist.
Open‐ended questions: Questions that the respondent can
answer in a free‐flowing format without restricting the range
of choices to a set of specific alternatives suggested by the
researcher.
Operationalizing: Reduction of abstract concepts to render
them measurable in a tangible way.
Operations research: A quantitative approach taken to ana-
lyze and solve problems of complexity.
Ordinal scale: A scale that not only categorizes the qualita-
tive differences in the variable of interest, but also allows for
the rank‐ordering of these categories in a meaningful way.
Outlier: An observation that is substantially different from
the other observations.
P
Paired comparisons: Respondents choose between two
objects at a time, with the process repeated with a small
number of objects.
Paired samples t‐test: Test that examines the differences in
the same group before and after a treatment.
Parallel‐form reliability: That form of reliability which is
established when responses to two comparable sets of meas-
ures tapping the same construct are highly correlated.
Parametric test: A hypothesis test that assumes that your
data follow a specific distribution.
Parsimony: Efficient explanation of the variance in the
dependent variable of interest through the use of a smaller,
rather than a larger number of independent variables.
Participant observation: In participant observation the
researcher gathers data by participating in the daily life of
the group or organization under study.
Population: The entire group of people, events, or things
that the researcher desires to investigate.
Positivism: A school of thought employing deductive laws
and quantitative methods to get at the truth. For a positivist,
the world operates by laws of cause and effect that one can
discern if one uses a scientific approach to research.
Posttest: A test given to the subjects to measure the depend-
ent variable after exposing them to a treatment.

glossary 395
Pragmatism: A viewpoint on research that does not take
on a particular position on what makes good research.
Pragmatists feel that research on both objective, observa-
ble phenomena and subjective meanings can produce
useful knowledge, depending on the research questions of
the study.
Precision: The degree of closeness of the estimated sample
characteristics to the population parameters, determined by
the extent of the variability of the sampling distribution of
the sample mean.
Predictive validity: The ability of the measure to differentiate
among individuals as to a criterion predicted for the future.
Predictor variable: See Independent variable.
Pretest: A test given to subjects to measure the dependent
variable before exposing them to a treatment.
Pretesting survey questions: Test of the understandabil-
ity and appropriateness of the questions planned to be
included in a regular survey, using a small number of
respondents.
Primary data: Data collected first‐hand for subsequent
analysis to find solutions to the problem researched.
Probability sampling: The sampling design in which the
elements of the population have some known chance or
probability of being selected as sample subjects.
Problem definition: A definition of the difference between
the actual and desired situation.
Problem statement: A problem statement includes both a
statement of the research objective(s) and the research
question(s).
Proportionate stratified random sampling: A probability
sampling design in which the number of sample subjects
drawn from each stratum is proportionate to the total
number of elements in the respective strata.
Pure observation: Seeks to remove the researcher from the
observed actions and behavior; the researcher is never
directly involved in the actions and behavior of the group
under study.
Pure participation: The researcher becomes so involved
with the group under study that eventually every objectivity
and research interest is lost.
Pure research: See Basic research.
Purposiveness in research: The situation in which
research is focused on solving a well‐identified and defined
problem, rather than aimlessly looking for answers to vague
questions.
Purposive sampling: A nonprobability sampling design
in which the required information is gathered from special
or specific targets or groups of people on some rational
basis.
Q
Qualitative data: Data that are not immediately quantifia-
ble unless they are coded and categorized in some way.
Questionnaire: A preformulated written set of questions to
which the respondent records the answers, usually within
rather closely delineated alternatives.
Quota sampling: A form of purposive sampling in which a
predetermined proportion of people from different sub-
groups is sampled.
R
Randomization: The process of controlling the nuisance
variables by randomly assigning members among the vari-
ous experimental and control groups, so that the con-
founding variables are randomly distributed across all
groups.
Range: The spread in a set of numbers indicated by the
difference in the two extreme values in the observations.
Ranking scale: Scale used to tap preferences between two or
among more objects or items.
Rapport: A trusting relationship with the social group
under study, by showing respect, being truthful, and
showing commitment to the well-being of the group
or the individual members of the group, so that they
feel secure in sharing (sensitive) information with the
researcher
Rating scale: Scale with several response categories that
evaluate an object on a scale.
Ratio scale: A scale that has an absolute zero origin, and
hence indicates not only the magnitude, but also the propor-
tion, of the differences.
Reactivity: The extent to which the observer affects the
situation under observation.
Recall‐dependent question: Question that elicits from the
respondents information that involves recall of experiences
from the past that may be hazy in their memory.
Reference list: A list that includes details of all the citations
used in the literature review and elsewhere in the paper or
report.

396 glossary
Reflective scale: Each item in a reflective scale is assumed to
share a common basis (the underlying construct of interest).
Regression analysis: Used in a situation where one or more
metric independent variable(s) is (are) hypothesized to affect
a metric dependent variable.
Relational analysis: Builds on conceptual analysis by exam-
ining the relationships among concepts in a text.
Reliability: Attests to the consistency and stability of the
measuring instrument.
Replicability: The extent to which a re‐study is made pos-
sible by the provision of the design details of the study in the
research report.
Representativeness of the sample: The extent to which the
sample that is selected possesses the same characteristics as
the population from which it is drawn.
Research: An organized, systematic, critical, scientific
inquiry or investigation into a specific problem, undertaken
with the objective of finding answers or solutions thereto.
Research design: A blueprint or plan for the collection,
measurement, and analysis of data, created to answer your
research questions.
Research objective: The purpose or objective of the study
explains why the study is being done. Providing a solution to
a problem encountered in the work setting is the purpose of
the study in most applied research.
Research proposal: A document that sets out the purpose
of the study and the research design details of the investiga-
tion to be carried out by the researcher.
Research question(s): Specify what you want to learn about
the topic. They guide and structure the process of collecting
and analyzing information to help you to attain the purpose
of your study. In other words, research questions are the
translation of the problem of the organization into a specific
need for information.
Researcher interference: The extent to which the person
conducting the research interferes with the normal course of
work at the study site.
Restricted probability designs: See Complex probability
sampling.
Rigor: The theoretical and methodological precision adhered
to in conducting research.
S
Sample: A subset or subgroup of the population.
Sample size: The actual number of subjects chosen as a
sample to represent the population characteristics.
Sampling: The process of selecting items from the popula-
tion so that the sample characteristics can be generalized to
the population. Sampling involves both design choice and
sample size decisions.
Sampling frame: A (physical) representation of all the
elements in the population from which the sample is drawn.
Sampling unit: The element or set of elements that is avail-
able for selection in some stage of the sampling process.
Scale: A tool or mechanism by which individuals, events, or
objects are distinguished on the variables of interest in some
meaningful way.
Scientific investigation: A step‐by‐step, logical, organized,
and rigorous effort to solve problems.
Secondary data: Data that already exist and do not have to
be collected by the researcher.
Selection effects: The threat to internal validity that is a
function of improper or unmatched selection of subjects
for the experimental and control groups.
Semantic differential scale: Usually a seven‐point scale
with bipolar attributes indicated at its extremes.
Sequence record: A sequence record allows the researcher
conducting an observational study to collect information on
how often an event occurs.
Simple checklist: Checklist used in structured observation
that provides information about how often a certain event
has occurred.
Simple random sampling: A probability sampling design
in which every single element in the population has a known
and equal chance of being selected as a subject.
Simulation: A model‐building technique for assessing the
possible effects of changes that might be introduced in a
system.
Social desirability: The respondents’ need to give socially
or culturally acceptable responses to the questions posed by
the researcher even if they are not true.
Solomon four‐group design: The experimental design that
sets up two experimental groups and two control groups,
subjecting one experimental group and one control group to
both the pretest and the posttest, and the other experimental
group and control group to only the posttest.
Split‐half reliability: The correlation coefficient between
one half of the items measuring a concept and the other
half.
Stability of a measure: The ability of the measure to repeat
the same results over time with low vulnerability to changes
in the situation.

glossary 397
Standard deviation: A measure of dispersion for paramet-
ric data; the square root of the variance.
Standardized regression coefficients (or beta coeffi-
cients): The estimates resulting from a multiple regression
analysis performed on variables that have been standardized
(a process whereby the variables are transformed into varia-
bles with a mean of 0 and a standard deviation of 1).
Stapel scale: A scale that measures both the direction and
intensity of the attributes of a concept.
Statistical power (1 – β): The probability of correctly reject-
ing the null hypothesis.
Statistical regression: The threat to internal validity that
results when various groups in the study have been selected
on the basis of their extreme (very high or very low) scores
on some important variables.
Stratified random sampling: A probability sampling design
that first divides the population into meaningful, nonover-
lapping subsets, and then randomly chooses the subjects
from each subset.
Structured interviews: Interviews conducted by the
researcher with a predetermined list of questions to be asked
of the interviewee.
Structured observation: Form of observation where the
observer has a predetermined set of categories of activities or
phenomena planned to be studied.
Subject: A single member of the sample.
Survey: A system for collecting information from or about
people to describe, compare, or explain their knowledge,
attitudes, and behavior.
Systematic sampling: A probability sampling design that
involves choosing every nth element in the population for
the sample.
T
Telephone interview: The information‐gathering method
by which the interviewer asks the interviewee over the tele-
phone, rather than face to face, for information needed for
the research.
Test–retest reliability: A way of establishing the stability of
the measuring instrument by correlating the scores obtained
through its administration to the same set of respondents at
two different points in time.
Testability: The ability to subject the data collected to
appropriate statistical tests, in order to substantiate or reject
the hypotheses developed for the research study.
Testing effects: The distorting effects on the experimen-
tal results (the posttest scores) caused by the prior sensiti-
zation of the respondents to the instrument through the
pretest.
Theoretical framework: A logically developed, described,
and explained network of associations among variables of
interest to the research study.
Treatment: The manipulation of the independent variable
in experimental designs so as to determine its effects on a
dependent variable of interest to the researcher.
Two‐way ANOVA: A statistical technique that can be used
to examine the effect of two nonmetric independent varia-
bles on a single metric dependent variable.
Type I error (α): The probability of rejecting the null
hypothesis when it is actually true.
Type II error (β): The probability of failing to reject the null
hypothesis given that the alternative hypothesis is actually
true.
U
Unbalanced rating scale: An even‐numbered scale that has
no neutral point.
Unbiased questions: Questions posed in accordance with
the principles of wording and measurement, and the right
questioning technique, so as to elicit the least biased
responses.
Unconcealed observation: Members of a social group
under study are told that they are being observed.
Uncontrolled observation: An observational technique
that makes no attempt to control, manipulate, or influence
the situation.
Unit of analysis: The level of aggregation of the data col-
lected during data analysis.
Unobtrusive methods: Methods that do not require the
researcher to interact with the people he or she is studying.
Unrestricted probability sampling: See Simple random
sampling.
Unstructured interviews: Interviews conducted with the
primary purpose of identifying some important issues rele-
vant to the problem situation, without prior preparation of a
planned or predetermined sequence of questions.
Unstructured observation: Form of observation that is
used when the observer has no definite ideas of the particu-
lar aspects that need focus.

398 glossary
V
Validity: Evidence that the instrument, technique, or pro-
cess used to measure a concept does indeed measure the
intended concept.
Variable: Anything that can take on differing or varying
values.
Variance: Indicates the dispersion of a variable in the data
set, and is obtained by subtracting the mean from each of the
observations, squaring the results, summing them, and
dividing the total by the number of observations.
W
Wilcoxon signed‐rank test: A nonparametric test used to
examine differences between two related samples or repeated
measurements on a single sample. It is used as an alternative
to a paired samples t‐test when the population cannot be
assumed to be normally distributed.

399
BIBLIOGRAPHY
Abbott, C. C. (1966) Basic Research in Finance: Needs and
Prospects. Charlottesville, VA: University Press.
Abdel‐khalik, A. R. & Ajinkya, B. B. (1979) Empirical Research
in Accounting: A Methodological Viewpoint. Sarasota, FL:
American Accounting Association.
Agar, M. (1996) The Professional Stranger: An Informal
Introduction to Ethnography, 2nd ed. New York: Academic
Press.
Amabile, T. M., Hill, K. G., Hennessey, B. A. & Tighe, E. M.
(1994) The work preference inventory: Assessing intrin-
sic and extrinsic motivational orientations. Journal of
Personality and Social Psychology, 66, 950–967.
American Psychological Association (2009) Publication
Manual of the American Psychological Association, 6th ed.
Washington, DC.
Andrews, D., Nonnecke, B. & Preece, J. (2003) Electronic
survey methodology: A case study in reaching hard-to-
involve Internet users. International Journal of Human–
Computer Interaction, 16 (2), 185–210.
Angell, R. C. & Freedman, R. (1966) The use of documents,
records, census materials, and indices. In L. Festinger &
D. Katz (Eds.), Research Methods in the Behavioral
Sciences. New York: Holt, Rinehart and Winston.
Baker, R. L. & Schutz, R. E. (Eds.) (1972) Instructional
Product Research. New York: Van Nostrand.
Balsley, H. L. & Clover, V. T. (1988) Research for Business
Decisions. Business Research Methods, 4th ed. Columbus,
OH: Publishing Horizons.
Baron, R. M. & Kenny, D. A. (1986) The moderator–mediator
variable distinction in social psychological research: con-
ceptual, strategic, and statistical considerations. Journal of
Personality and Social Psychology, 51, 1173–1182.
Barry, H. (1969) Cross‐cultural research with matched pairs
of societies. Journal of Social Psychology, 79, 25–33.
Bending, A. W. (1954) Transmitted information and the
length of rating scales. Journal of Experimental Psychology,
47, 303–308.
Bentley, T. J. & Forkner, I. H. (1983) Making Information
Systems Work for You: How to Make Better Decisions using
Computer‐generated Information. Englewood Cliffs, NJ:
Prentice Hall.
Bernard, R. H. (1994) Research Methods in Anthropology:
Qualitative and Quantitative Approaches, 2nd ed. Walnut
Creek, CA: AltaMira Press.
Beynon, H. (1975) Working for Ford. London: EP Publishing.
Billings, R. S. & Wroten, S. P. (1978) Use of path analysis in
industrial/organizational psychology: Criticisms and sug-
gestions. Journal of Applied Psychology, 63(6), 677–688.
Bitner, M. J., Booms, B. H. & Tetreault, M. S. (1990) The
service encounter – diagnosing favorable and unfavora-
ble incidents. Journal of Marketing, 54, 71–84.
Blank, G. (1989). Finding the right statistic with statistical
navigator. PC Magazine, March 14, p. 97.
Boot, J. C. G. & Cox, E. B. (1970) Statistical Analysis for
Managerial Decisions. New York: McGraw‐Hill.
Bordens, K. S. & Abbott, B. B. (1988) Research Design and
Methods: A Process Approach. Mountain View, CA: Mayfield
Publishing.
Bougie, R., Pieters, R. & Zeelenberg, M. (2003) Angry custom-
ers don’t come back, they get back: The experience and
behavioral implications of anger and dissatisfaction in
services. Journal of the Academy of Marketing Science,
31, 377–393.
Box, G. & Jenkins, G. (1970) Time Series Analysis: Forecasting
and Control. San Francisco: Holden‐Day.
Brown, L. D. & Vasarhelyi, M. A. (1985) Accounting Research
Directory: The Database of Accounting Literature. New
York: Markus Wiener Publishing.
Bruner II, G. C., Hensel, P. J. & James, K. E. (2005) Marketing
Scales Handbook. Chicago: Thomson South‐Western Co.
Bullock, J. G., Green, D. P. & Ha, S. E. (2010) Yes, but what’s
the mechanism? (Don’t expect an easy answer). Journal of
Personality and Social Psychology, 98 (April), 550–558.
Burger, D. (2015, March 12). EA Tries Selling Video Games
That Work. Retrieved from http://www.bloomberg.com/
news/articles/2015-03-12/electronic-arts-delays-game-
releases-to-fix-bugs-for-a-change
Burgess, R (Ed.) (1989) The Ethics of Educational Research.
Lewes: Falmer Press.
Burton, S. & Lichtenstein, D. R. (1988) The effect of ad
claims and ad context on attitude toward the advertise-
ment. Journal of Advertising, 17, 3–11.
Cacioppo, J. T. & Petty, R. E. (1982) The need for cognition.
Journal of Personality and Social Psychology, 42, 116–131.
Campbell, A. A. & Katona, G. (1966) The sample survey: A
technique for social science research. In L. Festinger & D.
Katz (Eds.), Research Methods in the Behavioral Sciences.
New York: Holt, Rinehart and Winston.

400 bibliography
Campbell, D. T. (1976) Psychometric theory. In M. D.
Dunnette (Ed.), Handbook of Industrial and Organizational
Psychology. Chicago: Rand McNally.
Campbell, D. T. & Fiske, D. W. (1959) Convergent and discri-
minant validation by the multitrait‐multimethod matrix.
Psychological Bulletin, 56, 81–105.
Campbell, D. T. & Stanley, J. C. (1966) Experimental and
Quasi‐experimental Designs for Research. Chicago: Rand
McNally.
Cannell, C. F. & Kahn, R. L. (1966) The collection of data by
interviewing. In L. Festinger & D. Katz (Eds.), Research
Methods in the Behavioral Sciences. New York: Holt, Rinehart
and Winston.
Carlsmith, M., Ellsworth, P. C. & Aronson, E. (1976)
Methods of Research in Social Psychology. Reading, MA:
Addison‐Wesley.
Cattell, R. B. (1966) The screen test for the number of factors.
Multivariate Behavioral Research, 1, 245–276.
Chein, L. (1959) An introduction to sampling. In C. Selltiz,
M. Jahoda, M. Deutsch, & S. W. Cook (Eds.), Research
Methods in Social Relations. New York: Holt, Rinehart
and Winston.
Chicago Manual of Style, 16th ed. (2010) Chicago: University
of Chicago Press.
Churchill, G. A. (1987) Marketing Research: Methodological
Foundations. Chicago: Dryden Press.
Clark, D. & Bank, D. (1998) Microsoft and Sony agree to
work together to link consumer‐electronic devices. Wall
Street Journal, April 8, p. B6.
Cohen, J. (1969) Statistical Power Analysis for the Behavioral
Sciences. New York: Academic Press.
Cohen, J. (1990) Things I have learned (so far). American
Psychologist, 1304–1312.
Cook, T. D. & Campbell, D. T. (1979a) Quasi‐experimentation:
Design and Analysis Issues for Field Settings. Boston:
Houghton‐Mifflin.
Cook, T. D. & Campbell, D. T. (1979b) Four kinds of validity.
In R. T. Mowday & R. M. Steers (Eds.), Research in
Organizations: Issues and Controversies. Santa Monica,
CA: Goodyear Publishing.
Cooke, A. (2001) A Guide to Finding Quality Information on
the Internet: Selection and Evaluation Strategies, 2nd ed.
London: Library Association.
Coombs, C. H. (1966) Theory and methods of social meas-
urement. In L. Festinger & D. Katz (Eds.), Research
Methods in the Behavioral Sciences. New York: Holt,
Rinehart and Winston.
Cortada, J. W. (1996) Information Technology as Business
History: Issues in the History and Management of Computers.
Westport, CT: Greenwood Press.
Coulter, M. K. (2002) Strategic Management in Action.
Englewood Cliffs, NJ: Prentice Hall.
Couper, M. P. (2000) Web-based surveys: A review of issues
and approaches. Public Opinion Quarterly, 64 (4), 464–494.
Cronbach, L. J. (1946) Response sets and test validating.
Educational and Psychological Measurement, 6, 475–494.
Cronbach, L. J. (1990) Essentials of Psychological Testing,
5th ed. New York: Harper & Row.
Cronin, M. J. (1998a) Business secrets of the billion‐dollar
website. Fortune, February 2, p. 142.
Cronin, M. J. (1998b) Ford’s Intranet success. Fortune, March
30, p. 158.
Crosby, L. A. & Stephens N. (1987) Effects of relationship
marketing on satisfaction, retention, and prices in the
life insurance industry. Journal of Marketing Research,
24, 404–411.
Crowne, D. P. & Marlowe, D. (1980) The Approval Motive:
Studies in Evaluative Dependence. Westport, CT: Greenwood
Press.
Cummings, L. L. (1977) Emergence of the instrumental
organization. In P. S. Goodman & J. M. Pennings (Eds.),
New Perspectives on Organizational Effectiveness. San
Francisco, CA: Jossey‐Bass, pp. 56–62.
Davies, G. R. & Yoder, D. (1937) Business Statistics. New
York: John Wiley & Sons, Inc.
Davis, D. & Cosenza, R. M. (1988) Business Research for
Decision Making, 2nd ed. Boston: PWS‐Kent Publishing.
DeArmond, S., Tye, M., Chen, P. Y., Krauss, A., Rogers, D. A.
& Sintek, E. (2006) Age and gender stereotypes: New
challenges in a changing workplace and workforce.
Journal of Applied Social Psychology, 36, 2184–2214.
DeJong, M. (2006) Response bias in international marketing
research, Doctoral Dissertation, Tilburg University.
Delamont, S. (2004) Ethnography and participant observa-
tion. In C. Seale, G. Gobo & J. Gubrium (Eds.) Qualitative
Research Practices, pp. 217–229. London: Sage.
DeMunck, V. C. & Sobo, E. J. (Eds.) (1998) Using Methods in
the Field: A Practical Introduction and Casebook. Walnut
Creek, CA: AltaMira Press.
Denzin, N. K. (2000) The practices and politics of interpreta-
tion. In N. K. Denzin & Y. S. Lincoln (Eds.), Handbook of
Qualitative Research, 2nd ed. Thousand Oaks, CA: Sage.
DeWalt, K. M. & DeWalt, B. R. (2002) Participant Observation:
A Guide for Fieldworkers. Walnut Creek, CA: AltaMira Press.
Drenkow, G. (1987) Data acquisition software that adapts to
your needs. Research and Development, April, 84–87.
Dubé, L. & Maute, M. (1996) The antecedents of brand
switching, brand loyalty and verbal responses to service
failure. Advances in Services Marketing and Management,
5, 127–151.

bibliography 401
Dubé‐Rioux, L., Schmitt, B. H. & LeClerc, F. (1988)
Consumers’ reactions to waiting: When delays affect the
perception of service quality. In T. Snull (Ed.), Advances
in Consumer Research, Volume 16(1).
Edwards, A. L. (1957) Manual for the Edwards Personal
Preference Schedule. New York: Psychological Corporation.
Elmore, P. E. & Beggs, D. L. (1975) Salience of concepts and
commitment to extreme judgements in response pattern
of teachers. Education, 95(4), 325–334.
Emerson, R., Fretz, R. & Shaw, L. (1995) Writing Ethnographic
Fieldnotes. Chicago: University of Chicago Press.
Emory, C. W. (1985) Business Research Methods, 3rd ed.
Homewood, IL: Richard D. Irwin.
Etzioni, A. (1960) Interpersonal and structural factors in the
study of mental hospitals. Psychiatry, 23, 13–22.
Ferris, K. R. (1988) Behavioral Accounting Research: A
Critical Analysis. Columbus, OH: Century VII Publishing.
Festinger, L. (1966) Laboratory experiments. In L. Festinger
& D. Katz (Eds.), Research Methods in the Behavioral
Sciences. New York: Holt, Rinehart and Winston.
Festinger, L. & Katz, D. (1966) Research Methods in the
Behavioral Sciences. New York: Holt, Rinehart and Winston.
Fiedler, F. (1967) A Theory of Leadership Effectiveness. New
York: McGraw‐Hill.
Field, A. (2009) Discovering Statistics Using SPSS. Sage
Publications.
Fink, A. (2003) The Survey Kit, 2nd ed. Thousand Oaks, CA:
Sage.
Fishbein, M. (1967) Readings in Attitude Theory and
Measurement. New York: John Wiley.
Folkes, V. S., Koletsky, S. & Graham, J. L. (1987) A field study
of causal inferences and consumer reaction: The view
from the airport. Journal of Consumer Research, 13,
534–539.
Fornell, C. (1987) A second generation of multivariate
analysis: Classification of methods and implications for
marketing research. In M. Houston (Ed.), Review of
Marketing. Chicago, IL: American Marketing Association.
Fornell, C. & Bookstein, F. L. (1982) Two structural equation
models: LISREL and PLS applied to consumer exit‐voice
theory. Journal of Marketing Research, 19, 440–452.
Frederichs, J. & Ludtke, H. (1975) Participant Observation:
Theory and Practice. Lexington, MA: Lexington Books.
French, J. R. P. (1966) Experiments in field settings. In L.
Festinger & D. Katz (Eds.), Research Methods in the
Behavioral Sciences. New York: Holt, Rinehart and Winston.
Garten, J. E. (1998) Why the global economy is here to stay.
Business Week, March 23, p. 21.
Gaski, J. F. & Etzel, M. J. (1986) The index of consumer senti-
ment toward marketing. Journal of Marketing, 50, 71–81.
Georgopolous, B. S. & Tannenbaum, A. S. (1957) The study
of organizational effectiveness. American Sociological
Review, 22, 534–540.
Glaser, B. (1978) Theoretical Sensitivity. Mill Valley, CA:
Sociology Press.
Glaser, B. G. & Strauss, A. L. (1967) The Discovery of
Grounded Theory. Chicago: Aldine.
Gordon, R. A. (1973) An explicit estimation of the prevalence
of commitment to a training school, to age 18, by race and
by sex. Journal of the American Statistical Association, 68,
547–553.
Gorsuch, R. L. (1974) Factor Analysis. Philadelphia: Saunders.
Gorsuch, R. L. (1983) Factor Analysis, 2nd ed. Philadelphia:
Saunders.
Green, P. E., Kedia, P. K. & Nikhil, R. S. (1985) Electronic
Questionnaire Design and Analysis with CAPPA. Palo
Alto, CA: The Scientific Press.
Grove, S. J. & Fisk, R. P. (1992) Observational data collection
methods for services marketing: An overview. Journal of
the Academy of Marketing Science, 20(3), 217–224.
Hair, J. F., Jr., Anderson, R. E., Tatham, R. L. & Black, W. C.
(1995) Multi‐variate Data Analysis. Englewood Cliffs, NJ:
Prentice Hall.
Hardy, Q. & Goel, V. (2015, March 26). Drones Beaming Web
Access are in the Stars for Facebook. Retrieved from http://
www.nytimes.com/2015/03/26/technology/drones-beaming-
web-access-are-in-the-stars-for-facebook.html
Harnett, D. L. & Horrell, J. F. (1998) Data, Statistics, and Decision
Models with Excel. New York: John Wiley & Sons, Inc.
Hart, C. (1998) Doing a Literature Review. London: Sage.
Heerde, H. van, Leeflang P. S. H. & Wittink, D. R. (2004)
Decomposing the sales promotion bump with store data.
Marketing Science, 23, 317–334.
Heggestad, E. D. & Kanfer, R. (1999) Individual differences in
trait motivation: Development of the motivational trait
questionnaire. Poster presented at the Annual Meetings of
the Society of Industrial and Organizational Psychology,
Atlanta, Georgia, April.
Hoel, P. G. & Jessen, R. J. (1971) Basic Statistics for Business
and Economics. New York: John Wiley.
Horst, P. (1968) Personality: Measurement of Dimensions. San
Francisco: Jossey‐Bass.
Hume, L. & Mulcock J. (Eds) (1994) Anthropologists in the
Field: Cases in Participant Observation. New York: Columbia
University Press.
Hunt, S. D. (1983) Marketing Theory: The Philosophy of
Marketing Science. Homewood, IL: Richard D. Irwin.
IJzermans, M. G. & Van Schaaijk, G. A. F. M. (2007) Oefening
baart kunst. Onderzoeken, argumenteren en presenteren
voor juristen. Den Haag: Boom Juridische uitgevers.

402 bibliography
Izard, C. E. (1977) Human Emotions. New York: Plenum.
Jarvis, C. B., MacKenzie, S. B. & Podsakoff, P. M. (2003) A
critical review of construct indicators and measurement
model misspecification in marketing and consumer
research. Journal of Consumer Research, 30(2), 199–218.
Jorgensen, D. L. (1989) Participant Observation: Methodology
for Human Studies. Newbury, CA: Sage.
Kanuk, L. & Berenson, C. (1975) Mail surveys and response
rates: A literature review. Journal of Marketing Research,
12, 440–453.
Kaplan, A. (1979) The Conduct of Inquiry: Methodology for
Behavioral Science. New York: Harper & Row.
Kassarjian, H. H. (1977) Content‐analysis in consumer
research. Journal of Consumer Research, 4, 8–18.
Katz, D. (1966) Research Methods in the Behavioral Sciences.
New York: Holt, Rinehart and Winston.
Katz, D. & Kahn, R. L. (1966) Organizations and the System
Concept: The Social Psychology of Organizations. John
Wiley & Sons, Inc. Reprinted in Shafritz, J. & Ott, J. S.
(2001) Classics of Organization Theory. Fort Worth:
Harcourt College Publishers.
Keaveney, S. M. (1995) Customer Switching Behavior in
Service Industries – an Exploratory Study. Journal of
Marketing, 59, 71–82.
Kelley, S. W., Hoffman, K. D. & Davis, M. A. (1993) A typol-
ogy of retail failures and recoveries. Journal of Retailing,
69, 429–452.
Kelly, F. J., Beggs, D. L., McNeil, K. A., Eichelberger, T. &
Lyon, J. (1969) Research Design in the Behavioral Sciences:
Multiple Regression Approach. Carbondale, IL: Southern
Illinois University Press.
Kerlinger, R. N. (1986) Foundations of Behavioral Research,
3rd ed. New York: Holt, Rinehart and Winston.
Kidder, L. H. & Judd, C. H. (1986) Research Methods in Social
Relations. New York: Holt, Rinehart and Winston.
Kilmer, B. & Harnett, D. L. (1998) KADDSTAT: Statistical
Analysis Plug‐in to Microsoft Excel. New York: John Wiley.
Kirby, C. (2001) Snail mail’s loss could be e‐mail’s gain. San
Francisco Chronicle, October 23, p. B1.
Kirk, R. E. (1982) Experimental Design: Procedures for the
Behavioral Sciences. Belmont, CA: Brooks/Cole.
Kish, L. (1965) Survey Sampling. New York: John Wiley.
Kish, L. (1966) Selection of the sample. In L. Festinger &
D. Katz (Eds.), Research Methods in the Behavioral
Sciences. New York: Holt, Rinehart and Winston.
Knechel, W. R. (1986) A simulation study of the relative
effectiveness of alternative analytical review procedures.
Decision Sciences, 17(3), 376–394.
Kolbe, R. H. & Burnett, M. S. (1991) Content analysis
research: an examination of applications with directives
for improving research reliability and objectivity. Journal
of Consumer Research, 18, 243–250.
Kornhauser, A. & Sheatsley, P. B. (1959) Questionnaire con-
struction and interview procedure. In C. Sellitz, M.
Jahoda, M. Deutsch & S. W. Cook (Eds.), Research
Methods in Social Relations. New York: Holt, Rinehart
and Winston.
Krejcie, R. & Morgan, D. (1970) Determining sample size for
research activities. Educational and Psychological Measurement,
30, 607–610.
Kuder, G. F. & Richardson, M. W. (1937) The theory of the
estimation of test reliability. Psychometrika, 2, 151–160.
Kuppens, P., VanMechelen, I., Smits, D. J. M. & DeBoeck, P.
(2003) The appraisal basis of anger: Specificity, neces-
sity, and sufficiency of components. Emotion, 3(3),
254–269.
Labaw, P. (1980) Advanced Questionnaire Design. Cambridge,
MA: Abt Books.
Lauder, M. A. (2003) Covert participant observation of a
deviant community: Justifying the use of deception.
Journal of Contemporary Religion, 18(2), 185–196.
Lazarsfeld, P. F. (1935) The art of asking why. National
Marketing Research, 1, 26–38.
Leedy, P. D. (1985) Practical Research: Planning and Design,
3rd ed. New York: Macmillan Publishing.
Leshin, C. B. (1997) Management on the World Wide Web.
Englewood Cliffs, NJ: Prentice Hall.
Likert, R. (1932) A technique for the measurement of atti-
tudes. Archives of Psychology, No. 140.
Lombardo, M. L., McCall, M. & DeVries, D. L. (1983) Looking
Glass. Glenview, IL: Scott Foresman, Co.
Lückerath-Rovers, M. (2013) Women on boards and company
performance. Journal of Management and Governance,
17 (2), 491–509.
Luconi, F. L., Malone, T. W. & Scott Morton, M. S. (1986)
Expert systems: The next challenge for managers. Sloan
Management Review, 27(4), 3–14.
Luftman, J. N. (1996) Competing in the Information Age:
Strategic Alignment in Practice. New York: Oxford
University Press.
Machi, L. E. & McEvoy, B. T. (2009) The Literature Review:
Six Steps to Success. Thousand Oaks: Corwin Sage.
Malinowski, B. (1992) Argonauts of the Western Pacific.
New York: Dutton (First Published 1922).
Mangold, W. G., Miller, F. & Brockway, G. R. (1999) Word‐
of‐mouth communication in the service marketplace.
Journal of Services Marketing, 13, 73–89.
Marascuilo, L. A. & McSweeney, M. (1977) Nonparametric
and Distribution‐free Methods for the Social Sciences.
Monterey, CA: Brooks/Cole.

bibliography 403
Marcus, G. E. & Fischer, M. M. J. (1986) Anthropology as
Cultural Critique. An Experimental Moment in the Human
Sciences. Chicago: University of Chicago Press.
Martin, M. H. (1998) Smart managing: Best practices,
careers, and ideas. Fortune, February 2, p. 149.
McClave, J. T. & Benson, P. G. (1988) Statistics for Business and
Economics, 4th ed. San Francisco: Dellen Publishing Co.
McClung, J., Grove S. J., & Hughes, M. A. (1989) An investi-
gation of the impact and situation as determinants of cus-
tomers’ approach skills in retailing. In P. Bloom et al.
(Eds.), Proceedings: Summer Conference of the American
Marketing Association. Chicago. 92.
McKellar, P. (1949) The emotion of anger in the expression of
human aggressiveness. British Journal of Psychology, 39,
148–155.
McNeil, K. A., Kelly, F. J. & McNeil, J. T. (1975) Testing
Research Hypotheses using Multiple Linear Regression.
Carbondale, IL: Southern Illinois University Press.
Meltzer, M. E. (1981) Information: The Ultimate Management
Resource. New York: Amacom.
Merriam, S. B. (1988). Case Study Research in Education: A
Qualitative Approach. San Francisco: Jossey‐Bass Publishers.
Merton, R. K. & Kendall, P. L. (1955) The focused interview.
In P. F. Lazarsfeld & M. Rosenberg (Eds.), The Language
of Social Research. New York: The Free Press.
Mick, D. & Buhl, C. (1992) A meaning‐based model of
advertising experiences. Journal of Consumer Research,
19, 317–338.
Miles, M. B. & Huberman, A. M. (1994) Qualitative Data
Analysis, 2nd ed. Thousand Oaks, CA: Sage.
Miller, E. G., Kahn, B., & Luce M. F. (2008) Consumer wait
management strategies for negative service events: A coping
approach. Journal of Consumer Research, 34(5), 635–648.
Minichiello, V., Aroni, R., Timewell, E. & Alexander, L. (1990)
In‐depth Interviewing: Researching People. Melbourne:
Longman Cheshire.
Mintzberg, H. (1971) Managerial work: Analysis from obser-
vation. Management Science, 18, 23, 97–110.
Mitchell, R. E. (1969) Survey materials collected in developing
countries: Sampling, measurement, and interviewing obsta-
cles to intra‐ and international comparisons. In J. Bod-
dewyn (Ed.), Comparative Management and Marketing,
pp. 232–252. Glenview, IL: Scott, Foresman & Co.
Mittal, B. & Lassar, W. M. (1996) The role of personalization
in service encounters. Journal of Retailing, 72, 95–109.
Muehling, D. D. (1987) An investigation of factors underly-
ing attitude toward advertising in general. Journal of
Advertising, 16(1), 32–40.
Murdick, P. G. & Cooper, D. R. (1982) Business Research:
Concepts and Guides. Columbus, OH: Grid Publishing.
Namboodiri, N. K., Carter, L. F. & Blalock, H. M. (1975)
Applied Multivariate Analysis and Experimental Designs.
New York: McGraw‐Hill.
Nasr‐Bechwati, N. & Morrin, M. (2003) Outraged consum-
ers: Getting even at the expense of getting a good deal.
Journal of Consumer Psychology, 13, 440–453.
Norusis, M. J. (1998) SPSS 8.0 Guide to Data Analysis.
Englewood Cliffs, NJ: Prentice Hall.
Nyer, P. U. (1997) A study of the relationships between cog-
nitive appraisals and consumption emotions. Journal of
the Academy of Marketing Science, 25, 296–304.
Oliver, R. L. (1996) Satisfaction: A Behavioral Perspective on
the Consumer. New York: McGraw‐Hill.
O’Neil, D., Hopkins, M. M. & Bilimoria, D. (2008) Women’s
careers at the start of the 21st century: Patterns and para-
doxes. Journal of Business Ethics, 80, 727–743.
Oppenheim, A. N. (1986) Questionnaire Design and Attitude
Measurement. Gower Publishing.
Osborn, R. N. & Vicars, W. M. (1976) Sex stereotypes: An
artifact in leader behavior and subordinate satisfaction
analysis? Academy of Management Journal, 19, 439–449.
Park, Y. -H. & Fader P. S. (2004) Modeling browsing behavior
at multiple web sites. Marketing Science, 23, 280–303.
Parrott, W. G. (2001) Emotions in Social Psychology: Essential
Readings. Philadelphia: Psychology Press.
Payne, S. L. (1951) The Art of Asking Questions. Princeton,
NJ: Princeton University Press.
Peak, H. (1966) Problems of objective observation. In
L. Festinger & D. Katz (Eds.), Research Methods in the
Behavioral Sciences. New York: Holt, Rinehart and
Winston.
Pedhazur, E. J. (1982) Multiple Regression in Behavioral
Research: Explanation and Prediction, 2nd ed. New York:
CBS College Publishing.
Pelosi, M. K., Sandifer, T. M. & Letkowski, J. J. (1998) Doing
Statistics with Excel™ 97: Software Instruction and Exercise
Activity Supplement. New York: John Wiley & Sons, Inc.
Perrier, C. & Kalwarski, G. (1989) Stimulating Simulations:
Technique shows relationship between risk, funding.
Pensions and Investment Age, October 30, 41–43.
Pfeffer, J. (1977) The ambiguity of leadership. The Academy
of Management Review, 2.
Popper, K. R. (2002a) The Logic of Scientific Discovery.
London: Routledge.
Popper, K. R. (2002b) Conjectures and Refutations. London:
Routledge.
Preacher, K. J., Rucker, D. D. & Hayes, A. F. (2007) Addressing
moderated mediated hypotheses: Theory, methods, and
prescriptions. Multivariate Behavioral Research, 42,
185–227.

404 bibliography
Price, J. (1997) Handbook of Organizational Measurement.
International Journal of Manpower, 18(4/5/6), 301–558.
Price, J. L. & Mueller, C. W. (1986) Handbook of Organizational
Measurement. Marshfield, MA: Pitman.
Rao, C. R. (1973) Linear Statistical Inference and its Applications,
2nd ed. New York: John Wiley.
Resta, P. A. (1972) The Research Report. New York: American
Book Co.
Richins, M. L. & Dawson, S. (1992) Consumer values orien-
tation for materialism and its measurement: Scale devel-
opment and validation. Journal of Consumer Research, 19,
303–316.
Riley, M. W. & Nelson, E. E. (1974) Sociological Observation:
A Strategy for New Social Knowledge. New York: Basic
Books.
Rizzo, J. R., House, R. J. & Lirtzman, S. L. (1970) Role conflict
and role ambiguity in complex organizations. Administrative
Science Quarterly, 15, 150–163.
Rook, D. W. (1987) The buying impulse. Journal of Consumer
Research, 14(2), 189–199.
Roscoe, J. T. (1975) Fundamental Research Statistics for the
Behavioral Sciences, 2nd ed. New York: Holt, Rinehart
and Winston.
Runkel, P. J. & McGrath, J. E. (1972) Research on Human
Behavior: A Systematic Guide to Method. New York: Holt,
Rinehart and Winston.
Salvia, A. A. (1990) Introduction to Statistics. Philadelphia,
PA: Saunders.
Schein, V. E. (2007) Women in management: Reflections
and projections. Women in Management Review, 22(1),
6–18.
Schensul, S. L., Schensul, J. J. & LeCompte, M. D. (1999)
Essential Ethnographic Methods: Observations, Interviews,
and Questionnaires (Book 2 in Ethnographer’s Toolkit).
Walnut Creek, CA: AltaMira Press.
Schmitt, N. W. & Klimoski, R. J. (1991) Research Methods in
Human Resources Management. Cincinnati, OH: South‐
Western Publishing.
Sekaran, U. (1983) Methodological and theoretical issues
and advancements in cross‐cultural research. Journal of
International Business, Fall, 61–73.
Sekaran, U. (1986) Dual‐career Families: Contemporary
Organizational and Counseling Issues. San Francisco:
Jossey‐Bass.
Sekaran, U. & Martin, H. J. (1982) An examination of the
psychometric properties of some commonly researched
individual differences, job, and organizational variables
in two cultures. Journal of International Business Studies,
Spring/Summer, 51–66.
Sekaran, U. & Trafton, R. S. (1978) The dimensionality of
jobs: Back to square one. Twenty‐fourth Midwest Academy
of Management Proceedings, pp. 249–262.
Selltiz, C., Jahoda, M., Deutsch, M. & Cook, S. W. (1959)
Research Methods in Social Relations, rev. ed. New York:
Holt, Rinehart, and Winston.
Selltiz, C., Wrightsman, L. S. & Cook, S. W. (1981) Research
Methods in Social Relations, 4th ed. New York: Holt,
Rinehart and Winston.
Shapira, Z. (1995) Risk Taking: A Managerial Perspective.
New York: Russell Sage Foundation.
Sharma, S., Durand, R. M. & Gur‐Arie, O. (1981) Identification
and analysis of moderator variables. Journal of Marketing
Research, 18, 291–300.
Shrout, P. E. & Bolger, N. (2002) Mediation in experimental
and nonexperimental studies: New procedures and rec-
ommendations. Psychological Methods, 7(4), 422–445.
Shurter, R. L., Williamson, J. P. & Broehl, W. G., Jr. (1965)
Business Research and Report Writing. New York:
McGraw‐Hill.
Smith, C. A. & Ellsworth, P. C. (1987) Patterns of appraisals
and emotions related to taking an exam. Journal of
Personality and Social Psychology, 52, 475–488.
Smith, C. B. (1981) A Guide to Business Research: Developing,
Conducting, and Writing Research Projects. Chicago, IL:
Nelson‐Hall.
Smith, P. C., Kendall, L. & Hulin, C. (1969) The Measurement
of Satisfaction in Work and Retirement. Chicago: Rand
McNally.
Spradley, J. P. (1980) Participant Observation. New York:
Holt, Rinehart and Winston.
Stanford, D. (2015, March 19). Scientists are Racing to Build a
Better Diet Soda. Retrieved from http://www.bloomberg.
com/news/articles/2015-03-19/coke-pepsi-seek-diet-soda-s-
perfect-sweetener
Stern, B. B., Thompson, C. J. & Arnould, E. J. (1998) Narrative
analysis of a marketing relationship: The consumer’s per-
spective. Psychology and Marketing, 15(3), 195–214.
Stern, N. B. & Stern, R. A. (1996) Computing in the
Information Age, 2nd ed. New York: John Wiley & Sons,
Inc.
Steufert, S., Pogash, R. & Piasecki, M. (1988) Simulation‐
based assessment of managerial competence: Reliability
and validity. Personnel Psychology, 41(3), 537–557.
Stone, E. (1978) Research Methods in Organizational
Behavior. Santa Monica, CA: Goodyear Publishing.
Strauss, A. & Corbin, J. (1990) Basics of Qualitative
Research: Grounded Theory Procedures and Techniques.
Sage Publications.

bibliography 405
Sturges, J., Guest, D., Conway, N. & Davey, K. M. (2002) A
longitudinal study of the relationship between career man-
agement and organizational commitment among gradu-
ates in the first ten years at work. Journal of Organizational
Behavior, 23, 731–748. http://doi: 10.1002/job.164
Super, D. E. (1970) Work Values Inventory Manual. Boston,
MA: Houghton Mifflin Co.
Taylor, S. (1994) Waiting for service – the relationship
between delays and evaluations of service. Journal of
Marketing, 58, 56–69.
Tomaski, E. A. (1970) The Computer Revolution: The Executive
and the New Information Technology. New York: Macmillan.
Turabian, K. L. (2007) A Manual for Writers of Term Papers,
Theses, and Dissertations, 7th ed. Chicago: University of
Chicago Press.
Turban, E., McLean, E. & Wetherbe, J. (1998) Informational
Technology for Management: Making Connections
for Strategic Advantage. New York: John Wiley &
Sons, Inc.
University of Chicago (2010) The Chicago Manual of Style,
16th ed. Chicago: University of Chicago Press.
Villa Rojas, A. (1979) Fieldwork in the Mayan region of
Mexico. In G. Foster, T. Scudder, E. Colson & R. Kemper
(Eds.), Long‐Term Field Research in Social Anthropology,
pp. 45–64. New York: Academic Press.
Ward, J. C. & Ostrom, A. L. (2006) Complaining to the masses:
The role of protest framing in customer‐created complaint
web sites. Journal of Consumer Research, 33, 220–230.
Webb, E. J., Campbell, D. T., Schwartz, P. D. & Sechrest,
L. (1966) Unobtrusive Measures: Non‐reactive Research in
the Social Sciences. Chicago, IL: Rand McNally.
Werner, O. & Schoepfle, M. G. (1987) Systematic Fieldwork.
Volume 1: Foundations of Ethnography and Interviewing.
Newbury Park, CA: Sage Publications.
Wetherbe, J. C. (1983) Computer‐based Information Systems.
Englewood Cliffs, NJ: Prentice Hall.
What is Plagiarism? (n.d.) Retrieved June 22, 2011, from
http://www.plagiarism.org/learning_center/what_is_
plagiarism.html
White, J. K. & Ruh, R. A. (1973) Effects of personal values on
the relationship between participation and job attitudes.
Administrative Science Quarterly, 18(4), 506–514.
Wildstrom, S. H. (1998) Web sites made simpler. Business
Week, January 26.
Williams, C. T. & Wolfe, G. K. (1979) Elements of Research: A
Guide for Writers. Sherman Oaks, CA: Alfred Publishing.
Wolcott, H. (2001) Writing Up Qualitative Research, 2nd ed.
London: Sage.
Wolfers, J. (2015, March 2). Fewer Women Run Big Companies
Than Men Named John. Retrieved from http://www.nytimes.
com/2015/03/03/upshot/fewer‐women‐run‐big‐companies‐
than‐men‐named‐john.html?_r=0&abt=0002&abg=1
Wright, K. B. (2005) Researching internet‐based populations:
Advantages and disadvantages of online survey research,
online questionnaire authoring software packages, and
web survey services. Journal of Computer‐Mediated
Communica tion, http://doi: 10.1111/j.1083‐6101.2005.
tb00259.x
Yin, R. (2009) Case Study Research: Design and Methods, 4th
ed. Thousand Oaks, CA: Sage Publications.
Yuchtman, E. & Seashore, S. E. (1967) A system resource
approach to organizational effectiveness. American Socio-
logical Review, 32, 891–903.
Zahle, J. (2012) Practical knowledge and participant obser-
vation. Inquiry: An Interdisciplinary Journal of Philosophy,
55, 50–65.
Zeithaml, V. A., Berry, L. L. & Parasuraman, A. (1996) The
behavioral consequences of service quality. Journal of
Retailing, 60, 31–46.
Zetterberg, H. (1955) On axiomatic theories in sociology. In
P. F. Lazarsfeld & M. Rosenberg (Eds.), The Language of
Social Research. New York: The Free Press.


407
INDEX
ABI/INFORM, online database 63
Abstract attributes, measurement issues 195
Abstract databases 56
Abstract (executive summary) of a report 357–8
Accounting resources 65
Achievement motivation concept, operationalizing
197–201
Action research 98–9
Active participation 128, 131
Alpha (α)/type I errors 301
Alternate hypothesis 85–7
Alternative solutions, research report offering 354,
355, 371–3
Ambiguous questions 147–8
American Psychological Association (APA), format
for referencing articles 66–9
AMOS 325, 327, 328
Analysis of variance (ANOVA) 311–12
two-way ANOVA 322
Analytic induction 350
APA format for referencing articles 66–9
Applied research 5–6
Area sampling 246
example of use 254
pros and cons 250
Attitude Toward the Offer scale 225
Attitudinal measures see Scales
Attributes of objects, measurement of 192–4
Audience for research report 356
Authorization letter, research report 360
Back translation, cross-cultural research 156
Background information, preliminary research
37–8
Balanced rating scale 215
Bar charts 280–2, 362
Basic research 7–8
Behavioral finance research measures 229–30
Beta coefficients 315
Beta (β)/type II errors 301–2
Bias 117
interviews 117–20
minimizing 117–19, 150, 158
observer 138–9
questionnaires 146–9, 150, 153, 154, 155, 157
in selection of participants 175, 177
self-selection, online surveys 265
systematic 243, 247, 249, 254, 265
Bibliographical databases 66
Bibliography versus references 66–7
Big data 351
Blank responses, dealing with 273, 276–7
Body of research report 360–1
Bootstrapping 325
Box-and-whisker plot 284, 285
Broad problem area, identifying 33–6
Business Periodicals Index (BPI) 63
Business research, defined 2
Canonical correlation 322–3
CAPI (computer-assisted personal interviewing) 121
Case study research method 98
internal validity 178
Categories and subcategories 337
Categorization of data 336–46
Category reliability 348–9
Category scale 214
CATI (computer-assisted telephone interviews)
119, 121
Causal (cause-and-effect) studies 44–5, 97
longitudinal studies 105
researcher interference 99–102
see also Experimental designs
Central tendency measures 279, 282–3, 288
Chi-square (χ2) distribution 308
Chi-square (χ2) statistic 285–6
Chicago Manual of Style 58, 67
Chronbach’s alpha 224, 375
reliability analysis 289–92
Citations, APA format 66–8

Classification data 149–50
example questions 152–3
Closed questions 146–7
Cluster sampling 246
example of use 254
pros and cons 250
Coding of responses
qualitative data analysis 333, 334, 335–6
quantitative data analysis 273–5
Coding schemes, structured observation 136–7
Column charts 362
Comparative scale 219
Comparative surveys 156
Completely randomized design 190–1
Complex probability sampling 243–7
area sampling 246
cluster sampling 246
double sampling 247
pros and cons 249–50
stratified random sampling 244–5
systematic sampling 243
when to choose 251
Computer-assisted interviews (CAI) 120–1
Computer-assisted personal interviewing (CAPI) 121
Computer-assisted telephone interviews (CATI)
119, 121
Computer-based simulations 185
Concealed observation 129–30
Concepts, operationalizing 196
Conceptual analysis 350
Conceptual equivalence, instrument translation 156
Conclusion of questionnaire 154
Conclusion of research report 361
Conclusion drawing (discussion) 347–8
Concurrent validity 221–2, 223
Conference proceedings 55
Confidence 21, 258
and estimation of sample size 258–9
and sample size determination 262–3
trade-off with precision 259–60
Confidentiality 47, 151, 159
Conjoint analysis 320–2
Consensus scale 218
Consistency reliability 224, 289–90
case study 290–2
Constant sum rating scale 216
Construct validity 222, 223
Constructionism 28–9
Consultants/researchers 9–13
external 11–12
internal 10–11
and managers 9–10
Content analysis 350
Content validity 221, 223
Contextual factors, preliminary research 37–8
Contingency tables 279, 285–6
Contrived study setting 100
lab experiments 101–2
Control group 169
Control group designs 181
Control groups, field experiments 172
Control, lab experiments 168
Controlled observation 127–8
Controlled variable 170
Convenience sampling 247, 249
example of use 255
pros and cons 250
Convergent validity 222, 223, 292
Correlation matrix 285
Correlational analysis 286–7
case study 293–5
Correlational (descriptive) studies 43–4
noncontrived settings 100–1, 102
researcher interference 99–100
Countries as the unit of analysis 104
Credibility of interviewer 117–18
Criterion (dependent) variable 73–4
Criterion-related validity 221, 223, 292
Critical incidents, qualitative data analysis 335–6, 349
customer anger case study 334–5, 337–46
Critical realism 29
Cross-cultural research
data collection issues 156–7
operationalization issues 204
rating scale issues 219–20
sampling in 266
translation problems 156
Cross-sectional studies 104–5
Customer service anger study
documenting existing measurement scales 198
literature review 38–9
qualitative data analysis 334–5, 336–46
408 index

index 409
Data analysis 24
getting a feel for the data 278–87
goodness of data, testing 289–92
hypothesis testing 300–31
qualitative 332–52
quantitative 271–99
Data categorization 336–46
Data coding 273–5
qualitative data 333, 334, 335–6
Data collection methods
cross-cultural issues 156–7
ethical issues 159–60
interviews 113–23
multimethods 158
observation 126–41
primary 111–12
pros and cons of different 157–8
questionnaires 142–55
unobtrusive 112–13
Data display, qualitative data analysis 333, 347
example 338–46
Data editing 276–7
Data entry 275
Data interpretation 24
example 25
objectivity of 21–2
Data mining 326–7
Data preparation (prior to analysis) 273–8
Data presentation, pictorial 362
Data reduction 333, 334–46
Data sources 54–5
Data transformation 277–8
Data warehousing 326
Databases
of abstracts 56
bibliographic 56, 66
electronic 56
full-text 56
online 63
Decile 284
Deductive reasoning 26
positivists 28
Degrees of freedom (df) 286
Delphi technique 158
Demographic data, questionnaires 149–50, 152–3
Departments/divisions as the unit of analysis 102, 104
Dependent variable 73–4
Descriptive (correlational) studies 43–4, 53
noncontrived settings 100–1, 102
researcher interference 99–100
Descriptive observation 133
Descriptive statistics 278–85, 293–5
bar charts and pie charts 280–3
central tendency measures 282–3
dispersion measures 283–5
frequencies 279–80
Deviant cases 349, 350
“Deviants”, observational studies 132
Dichotomous scale 213
Dimensions, operationalization 196–203
Directional hypotheses 84–5
Discriminant analysis 319
Discriminant validity 222, 223, 292
Dispersion measures 279, 283–5, 288
Disproportionate stratified random sampling
244–5, 250
deciding when to choose 251
example cases 253, 272
Distributions, normality of 238–9
Divisions as the unit of analysis 104
Documentation of literature review 57–8
Double-barreled questions 147
Double-blind studies 183–4
Double sampling 247
example of use 255
pros and cons 250
Doughnut charts 362
Dow Jones Factiva, online database 63
Dummy coding 273
Dummy variables 315, 319
Dyads as the unit of analysis 102, 103
Econlit, online database 63
Editing of data 276–7
Effect size 301
Efficiency in sampling 265
Electronic questionnaires 143–5, 155, 158
Electronic resources 56
Electronic survey design 155
Elements
operationalization 196–203
sampling 237

410 index
Epistemology 28, 29–30
Equal interval scale 209
Errors 21
coverage 240
human, during coding 273
nonresponse 242
standard 257–8, 325
type I and type II 301–2
Estimation of sample data, precision and confidence
in 258–9
Ethical issues 13
concealed observation 129–30
early stages of research process 47
experimental design research 185–6
literature review 59–60
primary data collection 159–60
Ethnography 97–8
Event coding, structured observation 136–7
Ex post facto experimental designs 184
Excelsior Enterprises case study 271–2
descriptive statistics 287–9, 293–5
hypothesis testing 323–6
reliability testing 290–2
Excessive researcher interference 100
Executive summary, reports 357–8
Exogenous variables 170–1
Experimental designs 165–92
completely randomized design 190–1
decision points for 187
ethical issues in research 185–6
ex post facto designs 184
factorial design 192
field experiments 172
lab experiments 167–72
Latin square design 191–2
managerial implications 186
quasi designs 179–81
randomized block design 191
simulation 184–5
true designs 181–4
types of design 179–84
validity issues 172–8
Experimental simulations 184, 185
Experiments 97
Expert panels 122–3
Delphi technique 158
Exploratory studies 43, 100–1, 102
External consultants/researchers 11–12
External validity
defined 172
generalizability of lab experiments 171–2
interactive testing as threat to 175, 177, 178
selection bias effects as threat to 175, 177, 178
trade-off with internal 172–3
F statistic 311–12
Face-to-face interviews 119–20, 123, 157
Face validity 221, 223
Faces scale 154, 217
Factor analysis 222, 292, 327, 328
Factorial design 192, 322
Factorial validity 292
Falsifiability, hypothesis criterion 24, 85, 301
Feel for data 278–87
Field experiments 97, 101, 102, 167
external validity 172
unintended consequences 173
Field notes 134
Field studies 101, 102, 105–6
Figures and tables list, research report 359
Final part of research report 361
Financial and economic resources 65–6
Fixed (rating) scale 216
Focus groups 121–2
Focused observation 133
Forced choice ranking scale 218–19
Formative scale 225–6
Free simulations 184, 185
Frequencies 279–82
charts and histograms 280–2, 293
measures 136, 207–8
observed and expected 286
Frequency distributions 208, 280
Full-text databases 56
Fundamental research 7–8
Funneling, interview technique 118
Generalizability 22
lab experiments 171–2
qualitative research 349
sample data and population values 238, 239
and sample size 257

index 411
simple random sampling 243, 249, 252
see also External validity
“Going native (pure participation)” 130, 131
Goodness of fit 313
Goodness of measures 220–4, 289–92
item analysis 220
reliability 223–4, 289–92
validity 220–3, 292
Graphic rating scale 217
Grounded theory 98, 265–6, 336
Group interviews 121–3
Group matching 170
Groups as the unit of analysis 102, 103–4
Hawthorne studies 129
Histograms 279, 280, 293
History effects 173–4, 177
Human error 273
Hypothesis definition 84
Hypothesis development 23–4, 83–91
definition of hypothesis 84
directional and nondirectional hypotheses
84–5
example of 91
null and alternate hypotheses 85–8
statement of hypotheses 84
Hypothesis testing 300–31
data warehousing and data mining 326–7
Excelsior Enterprises case study 323–6
negative case method 89
operations research (OR) 327
sample data and 260–1
software packages 327–8
statistical power 301
statistical techniques 302–23
steps to follow 87–8
type I and type II errors 301–2
Hypothetico-deductive method 23–8
Idiomatic equivalence, translation issues 156
If-then statements 84
Illegal codes 276, 289
Illogical responses 276
Inconsistent responses 276
Independent samples t‐test 310
Independent variable 74–5
manipulation of 168–9
versus moderating variable 77–8
Indexes, bibliographical 66
Individuals as the unit of analysis 102–3, 104
Inductive reasoning 26
analytic induction 350
Industry as the unit of analysis 104
Inferential statistics 301
Information overload, measure for 229
Information systems 327
Instrumentation effects 176–7, 178
Interaction effects, regression analysing 316–18
Interactive testing effects
controlling for, Solomon four-group design 182–3
threat to external validity 175, 177, 178
Interference by researcher 99–100
Interitem consistency reliability 224
Interjudge reliability 349
Internal consistency of measures 224, 289–90
Internal consultants/researchers 10–11
Internal validity
case studies 178
defined 172
history effects 173–4
instrumentation effects 176–7
lab experiments 171
main testing effects 175
maturation effects 174
mortality effects 175–6
statistical regression effects 176
threat identification 177–8
trade-off with external 172–3
International Bibliography of the Social Sciences
(IBSS) 63
International dimensions of operationalization 204
International dimensions of scaling 219–20
Internet
clickstream data 112–13
information source, literature review 55–6
online questionnaires 143–4, 154–5
qualitative information 333
websites for business research 64–6
Interquartile range 284
Interval scales 209, 213
itemized rating scale 215
properties 210

412 index
Stapel scale 216–17
use of 212
visual summary for variables 279
Intervening (mediating) variable 79–80
Interviewer bias, minimizing 117–19
Interviewer training 116
Interviewing techniques 117–19
Interviews
advantages and disadvantages 123
computer-assisted 120–1
face-to-face 119–20
primary data collection 111–13
structured 115–16
taped 119
techniques 117–19
telephone 119–20
unstructured 113–15
Introductory section
example 89
questionnaire design 151
research report 360
Item analysis 220
Itemized rating scale 215
Journals 54–5, 56
Judgment sampling 248
example of use 255
pros and cons 250
Kendall’s tau 287
Knowledge about research 12–13
Lab experiments 101–2, 167–72
control of contaminating factors 168
control of nuisance variables 170–1
external validity of 171–2
internal validity of 171
manipulation of independent variable 168–9
Latin square design 191–2
Leading questions 148
Letter of authorization, research report 360
Likert scale 207, 215–16
ordinal versus interval debate 210–11
Linear regression 312–13
LISREL 327
Literature review 51–62
bibliographic databases 66
documenting the review 57–8
ethical issues 59–60
evaluation of literature 56–7
example of 90
literature search 56
online resources 63–6
referencing format 66–8
sources of data 54–5
specific functions of 53
to understand the problem 38–9
written report 360, 373–4
Loaded questions 118, 148
Logistic regression 319–20
Longitudinal studies 105–6
Mail questionnaires 143
Main testing effect 175
Management accounting research methods 230
Management information systems (MIS), case
example 25
Management research measures 230–2
Management resources 65
Managerial implications
experimental design 186
problem definition 47
questionnaire administration 159
research design 108
sampling 266
theoretical framework 91
theoretical framework development 91
Managers 3
and consultant-researchers 9–10
importance of research knowledge for 8–9
knowledge of research 8–9, 12–13
Manipulation, lab experiments 168–9
MANOVA (multivariate analysis of variance) 322
Manual for Writers (Turabian) 58, 67
Marginal homogeneity 308
Marketing research measures 232
Marketing resources 66
Matching groups 170
MATLAB 327
Maturation effects 174, 177
McNemar’s test 307–9
Interval scales (Continued)

index 413
Mean 279, 282
Measurement
meaning of 206, 207
scaling 206–20
variables, operational definition 193–204
Measures of central tendency and dispersion 282–5
Measures, examples of 229–34
Median 279, 282
Mediated regression analysis 323–5
Mediating variable 79–81
Method section, research report 374–6
Minimal researcher interference 99
Missing data 276–7, 289
Mixed research methods 106
Mode 279, 282–3
Moderate researcher interference 99–100
Moderating variable 75–7
contingent effect 80
interaction effects 316–18
and theoretical framework 83
versus independent variable 77–8
Moderation testing 316–18
Moderator, focus groups 122
Mortality effects 175–6, 178, 179
Motivation of respondents 117–18
Mplus 325, 327, 328
Multi-item measures, checking reliability of 290–2
Multicollinearity 316
Multiple regression analysis 314–15
multicollinearity 316
Multistage cluster sampling 246
efficiency of 265
Multivariate analysis of variance (MANOVA) 322
Multivariate statistical techniques 302, 303, 319–23
canonical correlation 322–3
conjoint analysis 320–2
discriminant analysis 319
logistic regression 319–20
MANOVA 322
multiple regression analysis 314–15
two-way ANOVA 322
Narrative analysis 350
Nations as the unit of analysis 103, 104
Negative case analysis 89
Negatively worded questions 147
Newspapers, source of data 55
Nominal scale 207–8
properties of 210
use of 211
visual summary 279
Nominal variables 310
relationship between two 285–6
Non-print media, referencing 68–9
Noncontrived study setting 100
field experiments 101
Nondirectional hypotheses 85
Nonparametric statistics
chi‐square (χ2) test 285–6
McNemar’s test 307–9
Wilcoxon signed‐rank test 307
Nonparticipant observation 128
Nonprobability sampling 240, 247–9
convenience 247
judgment 248
pros and cons 250
purposive 248–9
quota 248–9
when to choose 251
Nonresponse errors 242
Nonresponses, coding of 273
Normal distribution 238–9
Note-taking
field notes 134
when interviewing 119
Nuisance variables, controlling 170–1
Null hypotheses 85–8
and sample data 260–1
type I and type II errors 301
Numerical scale 214
see Objectives of research see Research objective(s)
Objectivity 21–2
Objects, measurable attributes of 192–4
Observation 126–41
concealed versus unconcealed 129–30
controlled versus uncontrolled 127–8
definition and purpose 127
examples of 127
participant 130–4
participant versus nonparticipant 128
pros and cons 137–9, 157

414 index
structured 134–7
structured versus unstructured 128–9
Observer bias 138–9
Omissions in questionnaire items 276
One sample t‐test 302–5
One-shot studies 104–5
One-way ANOVA 311–12
Online databases 63–4
Online documents, referencing format for 68–9
Online questionnaires 143–4
Online research 143–4
improving response rates 144
sampling issues 265
Online surveys 143, 265
Ontology 28
Open-ended questions 146, 154
Operationalization (operational definition) 195–204
international dimensions 204
Operations research (OR) 327
Oral presentation 363–5
deciding content 364
handling questions 365
presentation 365
presenter 365
visual aids 364
Ordinal scale 208–9
and Likert scales 210–11
use of 211–12
visual summary 279
Outliers 276
Paired comparison ranking scale 218
Paired samples t-test 305–6
Parallel-form reliability 224, 290
Parameters, population 238
Parametric tests, when to use 322
Parsimony 22
Partial mediation 324, 325
Participant observation 128–34
knowing what to observe 133
note taking 134
observation aspect of 131–2
participatory aspect 130–1
suggestions for conducting 135
Passive participation 128
Pearson correlation matrix 286–7, 294–5
Percentile 284
Perfect mediation 324
Permission for research, gaining 132
Personal data, questionnaires 149–50, 152–3
Physical attributes, measurement of 195
Pictorial data presentation 362
Pie charts 280, 282
Plagiarism 59–60
Population 236–7
defining 240
link to sample data 237–8
mean 238–9, 257, 258, 259, 262
unit of analysis 102–4
Positively worded questions 147
Positivism 28, 45
Posttest 174
quasi experimental designs 179–80
statistical regression 176
testing effects 174, 175, 177
true experimental designs 181–3
Power, statistical 301
Pragmatism 29
Precision 21, 257–8
and estimation 258–9
impact on sample size 262–3
and sampling efficiency 265
trade-off with confidence 259–60
Predictive validity 222, 223
Predictor (independent) variable 74–5
Preface, research report 359
Preliminary research 37–9
Presentation of research report 363–5
Pretest 174
instrumentation effects 176
quasi-experimental designs 179
testing effects 174–5, 177
true experimental designs 181–3
Pretesting of survey questions 155
Primary data 2, 38 see Primary data collection
methods see Experimental designs; Interviews;
Observation; Questionnaires
Probability sampling 240, 242–7
area 246
cluster 246
double 247
Observation (Continued)

index 415
pros and cons 249–50
restricted/complex 243–7
review 247
stratified random 244–5
systematic 243
unrestricted/simple random 242–3
when to choose 251
Problem area, identifying 23, 33–6
Problem statement, defining 23, 39–44
“Professional stranger handlers” 132
Proportionate stratified random sampling 244–5, 250
deciding when to choose 251
example cases 253
quota sampling as form of 248
Proposal of research, drawing up 46–7
Protest websites 333
Prototypes, simulation 185
PsycINFO, online database 63
Pure (basic) research 7–8
Pure moderators 318
Pure observation 130
Pure participation 130
Purposive sampling 248–9, 265
Purposiveness in research 19
Qualitative data analysis 332–52
analytic induction 350
content analysis 350
data display 333, 347
data reduction 333, 334–46
drawing conclusions 347–8
narrative analysis 350
reliability and validity 348–9
three important steps in 332–48
“V”s of big data 351
Qualitative data, defined 2, 332
Qualitative studies/research
methods for achieving validity in 349
and sampling 265–6
Qualtrics 327, 328
Quantitative data 2
Quantitative data analysis 271–3
acquiring a feel for the data 278–87
central tendency measures 279, 282–3
coding and data entry 273–5
data preparation 273–8
descriptive statistics 279–85, 293–5
dispersion measures 279, 283–5, 288
editing data 276–7
hypothesis testing 300–31
relationships between variables 285–7
reliability 289–92
transformation of data 277–8
validity 292
visual summary 279, 282
Quartile 284
Quasi-experimental designs 179–81
Quasi moderators 318
Question-and-answer session, oral presentation 365
Questionnaire design 145–55
electronic 155
international issues 155–7
pretesting of structured questions 155
principles 145
principles of measurement 150–4
principles of wording 146–50
review 154–5
Questionnaire types 142–5
electronic/online 143–4
mail 143
personally administered 143
pros and cons 144, 157–8
Questionnaires
defined 142
example 151–4
general appearance 150–1
language and wording of 146
type and form of questions 146–50
Questions
ambiguous 147–8
closed 146–7
content and purpose 146
demographic 149–50
double-barreled 147
leading 148
length of 148
loaded 148
negatively-worded 147
open-ended 146
positively-worded 147
recall-dependent 148
sequencing of 149

416 index
and social desirability 148
unbiased 118
see also Research question(s)
Quota sampling 248–9
example of use 256
pros and cons 250
Quotations, citation of 70
R-square (R2), coefficient of determination 313, 315,
324, 325
Radar charts 362
Random sampling see Simple random sampling;
Stratified random sampling
Randomization 170–1
advantages 171
cause-and-effect relationship after 166, 170–1
completely randomized design 190
factorial design 192
randomized block design 191
Range 283
Rank-ordering of categories (ordinal scale) 208–9,
211–12, 213
Ranking scales 218–19
Rapport, establishing 118, 132
Rating scales 213–18
balanced 215
category 214
consensus 218
constant sum 216
dichotomous 213
fixed 216
graphic 217
itemized 215
Likert 215–16
numerical 214
semantic differential 214
Stapel 216–17
unbalanced 215
Ratio scale 209–10, 279, 310
use of 212
Reactivity 129, 138
concealed observation avoiding 129
Reasoning
deductive 26, 28
inductive 26
Recall-dependent questions 148
Recommendations
based on interpretation of results 24, 325–6
implementation of, manager’s decision 12–13
and internal consultants 11
research report 357, 361, 376
References section in research report 361
Reference list 66–7
Referencing
APA format 66–9
literature review 69–70
Reflective scale 225, 226
“Regressing toward the mean” 176
Regression analysis 312–19
with dummy variables 315–16
moderation testing 316–17
multicollinearity 316
testing moderation using 316–18
Regression coefficients
standardized 315
unstandardized 313
Relational analysis 350
Relationships between variables 285–7
Reliability 137, 221, 223–4, 289–92
interitem consistency 224
multi-item measures, case study 290–2
parallel-form 224, 290
split-half 224, 290
test-retest 224, 290
RePEc (Research Papers in Economics) 63
Rephrasing, questioning technique 118
Replicability 20–1
Report writing see Written report
Reports, data source 55
Representativeness of sample 238, 239
see also Probability sampling
Research 1–2
applied and basic 5–8
business 2
commonly researched areas 3–5
and ethics 13
internal versus external consultants 10–13
and managers 3, 8–10
role of theory and information 3
Research approaches 18–19
alternative 28–30
characteristics of scientific 19–22
hypothetico-deductive method 23–8
Questions (Continued)

index 417
Research design 95–6
contrived and noncontrived study setting
100–2
interference of researcher in study 99–100
managerial implications 108
mixed methods 106
research strategies 96–9
time horizon 104–6
trade-offs and compromises 107
unit of analysis 102–4
Research knowledge, enhancing managerial
effectiveness 12–13
Research objective(s) 39–41
customer anger case study 39, 334–5
examples of 40
Research proposal 45–7
Research question(s) 39–41, 374
and coding scheme development 136
causal 44–5
descriptive 43–4
examples of 42
exploratory 43
and literature review 53, 56–7
Research reports 353–67
examples 368–76
oral presentation 363–5
written report 354–63
Research strategies 96–9
action research 98–9
case studies 98
ethnography 97–8
experiments 97
grounded theory 98
surveys 97
Researcher interference 99–100
Researchers/consultants 9–13
Response coding 273–5
Response rates, improving 144
Restricted probability sampling 243–7
Reverse scoring 277 see Review of the literature see
Literature review
Rigor 19–20
Sample
defined 237
link to population values 237–8
Sample data
hypothesis testing with 260–1
making population estimates with 258–9
Sample frame 240
Sample size 261–5
confidence and precision issues 257–60
deciding 241
determination of 262–3
and efficiency in sampling 265
and generalizability 261–2
for given population size 263–4
and normality of distributions 238–9
rules of thumb 264
statistical and practical significance 264
and Type II errors 264
Sampling
in cross-cultural research 266
managerial role 266
in qualitative research 265–6
Sampling design 242–56
appropriateness of certain designs 252–6
choice of 240–1, 251
nonprobability 247–50
probability 242–7
and sample size 261–5
Sampling frame 240
and online research 265
systematic sampling 253
Sampling process 239–42
dealing with nonresponses 242
executing 241–2
Sampling unit 237
SAS/STAT 327, 328
Scales 207–13
formative 225–6
international dimensions 219–20
interval 209
nominal 207–8
ordinal 208–9
ranking 218–19
rating 213–18
ratio 209–10
reflective 225
reliability 223–4
validity 220–3
Scanner data, product sales 113
Scatterplots 279, 287, 312–13
Scientific investigation 18

418 index
Scientific research 18–28
hypothetico‐deductive method 23–8
main characteristics of 19–22
obstacles to conducting 27–8
Secondary data 2, 37–8
see also Literature review
Selection bias effects 175, 177
Selective observation 133
Self-selection bias, online surveys 265
Semantic differential scale 214
Semi-interquartile range 210, 279
Sensitive data, questionnaires 150, 153
Sequence record 137
Setting of study 100–2
Significance levels 21, 258, 264, 301
Simple checklist 137
Simple random sampling 242–3
efficiency of 265
example of use 252
pros and cons 249
Simple regression analysis 312–13
Simulation 184–5
Single-stage cluster sampling 246
Social desirability 148
Software packages
data analysis 327–8
field notes/interviewing 121
plagiarism detection 59
survey design 143, 155
Solomon four-group design 181–3
Spearman’s rank correlation 285, 287
Split‐half reliability 224, 290
“sponsor”, participant observation 132
SPSS AMOS 327, 328
SPSS (Statistical Package for the Social Sciences)
327, 328
Square of multiple r (R-square) 315, 324, 325
SSRN (Social Science Research Network) 63
Stability of measures 224, 290
Standard deviation 238–9
defined 284
precision and confidence 257–8
and sample size 262–3
Standard error 257–8, 325
Standardized regression coefficients 315
Stapel scale 216–17
Stata 327, 328
Statement of hypotheses 84
Statistical power (1 – β) 301
Statistical regression effects 176, 178
Statistical significance criterion 301
Statistical techniques for hypothesis testing 302–23
about a single mean 302–5
about several means 311–12
about two related means 305–9
about two unrelated means 309–10
other multivariate tests and analyses 319–23
regression analysis 312–19
Stratified random sampling 244
example of use 252–3
proportionate and disproportionate 244–5
pros and cons 250
Structured interviews 115–16
face-to-face and telephone interviews 119–20, 123
Structured observation 128–9, 134–6
use of coding schemes in 136–7
Structured questions, pretesting of 155
Study setting 100–2
Subject area, gathering information on 38–9
Subject, defined 237
Summated scale see Likert scale
Surveys 97
electronic/online 120–1, 143
ethical issues 159–60
international dimensions 155–7
software design systems 155
telephone 120
Systematic bias 243, 247, 249, 254, 265
Systematic sampling 243
example of use 253–4
pros and cons 249
when to choose 251
T distribution 261
T-statistic 304, 305
T-test
independent samples 310
one sample 302–5
paired samples 305–6
T-value 304, 305, 306
Table of contents, research report 358–9
example 363

index 419
Target population, defining 240
Telephone directory, sampling frame
240, 243, 253
Telephone interviews 119
computer-assisted 119, 121
pros and cons 120, 123, 157
Test-retest reliability 224, 290
Testability, hypothesis criterion 20, 24
Testable statement, hypothesis definition 83–4
Testing effects 174–5, 177
Textbooks, data source 54
Theoretical framework 71–2
components of 82–3
examples of 90–1, 374
identifying the problem 81
link to literature review 81
Theoretical sampling, grounded theory 98, 265–6
Theoretical saturation 266
Theory, defined 3
Theses, literature reviews 55
Thurstone Equal Appearing Interval Scale 218
Time horizon of study 104–6
Time series design 180–1
Title of research report 357
Tolerance value 316
Trade-offs
confidence and precision 259–60
internal and external validity 172–3
research design choice 107
Training of interviewers 116
Transformation of data 277–8
Translation issues, cross-cultural research 156
Treatment, experimental designs 169
Triangulation 106, 349
True experimental designs 181–4
Two-way ANOVA 322
Type I errors 301–2
Type II errors 301
and sample size 264
Unbalanced rating scale 215
Unbiased questions 118
Unconcealed observation 129
Uncontrolled observation 127–8
Uncontrolled variables 173, 182–3
Unit of analysis 102–4
Univariate statistical techniques 302, 303
chi-square analysis 285–6
independent samples t‐test 310
McNemar’s test 307–9
one sample t‐test 302–5
one-way ANOVA 311–12
paired samples t-test 305–6
Wilcoxon signed‐rank test 307
Unobtrusive data collection methods 112–13
Unpublished manuscripts 55
Unrestricted probability sampling 242–3
Unstructured interviews 113–15, 116, 123
Unstructured observation 128–9
“V”s of big data 351
Validity 137, 220–1, 292, 349
concurrent 221–2, 223
construct 222, 223
content 221, 223
convergent 222, 223, 292
criterion-related 221, 223, 292
discriminant 222, 223, 292
face 221, 223
factorial 292
predictive 222, 223
threats to 177–8
and types of experimental design 179–84
see also External validity; Internal validity
Variables
contaminating 170–1
dependent 73–4
discrete 73
dummy 315, 319
exogenous 170–1
independent 74–5
measurement of 193–5
mediating 79–80
moderating 75–8
nuisance 170–1
operationalization of 195–204
relationships between 285–7
research report 375
uncontrolled 173, 182–3
Variance, calculation of 283
Variance inflation factor (VIF) 316
Videoconferencing 122, 373

420 index
Visual aids
for interviews 116
report presentation 364
Vocabulary equivalence, back translation ensuring
156
Voice capture system (VCS) 121
Waiting for service, defining 53
Web of Stories 63
Websites for business research 64–6
Wilcoxon signed‐rank test 307
World Development Indicators (World Bank) 63
Written report 354–64
abridged basic report example 373–6
appendix 363
audience for 356
authorization letter 360
basic features of good 356
body of report 360–1
comprehensive report examples 355, 371–3
contents 357–64
descriptive report examples 354–5, 368–71
executive summary 357–8
final section/conclusion 361
introductory section 360
list of tables and figures 359
pictorial data presentation 362
preface 359
purpose of 354
references 361
table of contents 363
title and title page 357

WILEY END USER LICENSE AGREEMENTGo to www.wiley.com/go/eula to access Wiley’s ebook EULA.