205/b introduction to social research methods
356
THIKA INSTITUTE OF BUSINESS STUDIES P.O. BOX 321 – 01000 THIKA WEBSITE: www.tibs.ac.ke E-MAIL: [email protected] TEL. No: 0715 067 272 1410 - 205/B INTRODUCTION TO SOCIAL RESEARCH METHODS
-
Upload
khangminh22 -
Category
Documents
-
view
1 -
download
0
Transcript of 205/b introduction to social research methods

THIKA INSTITUTE OF BUSINESS STUDIES P.O. BOX 321 – 01000 THIKA
WEBSITE: www.tibs.ac.ke E-MAIL: [email protected] TEL. No: 0715 067 272
1410 - 205/B
INTRODUCTION TO SOCIAL RESEARCH
METHODS

INTRODUCTION TO SOCIAL RESEARCH METHODS
1 | THIKA INSTITUTE OF BUSINESS STUDIES 0715 067 272 www.tibs.ac.ke [email protected]
INTRODUCTION TO SOCIAL RESEARCH METHODS
INTRODUCTION
Social research methods enable social development workers to identify, diagnose and facilitate
initiation of intervention programmes in order to solve social problems and to meet social
development needs.
The study of social research methods is therefore aimed at providing the social development
work trainees with the knowledge, skills and attitudes that they will need in sampling, collecting,
analyzing, presenting and interpreting data related to their day to day work.
GENERAL OBJECTIVES
At the end of this subject, the trainee should be able to:
a) Understand and explain the importance of research in social development work;
b) Understand basic concepts, and use various research methods in social development
work;
c) Identify and explain various issues related to social research;
d) Evaluate social development programmes;
e) Use research methods in identifying and diagnosing social problems and needs and
conduct limited research.
SUBJECT SUMMARY
a) Nature and scope of social research
b) Research methods, concepts and issues
c) Research procedures
CONTENT
1.0 NATURE AND SCOPE OF SOCIAL RESEARCH
A. SPECIFIC OBJECTIVES
At the end of this topic, the trainee should be able to:
a) Explain the meaning of social research in relation to social development work;

INTRODUCTION TO SOCIAL RESEARCH METHODS
2 | THIKA INSTITUTE OF BUSINESS STUDIES 0715 067 272 www.tibs.ac.ke [email protected]
b) Identify and explain the major components of social research;
c) Explain the importance of social research methods
B. TOPIC OUTLINE
a) Definition of social research
b) Major components of social research
i. Objectives (problem statement)
ii. Literature review
iii. Theoretical framework
iv. Methodology
v. Data presentation and analysis
vi. Conclusion and recommendations
c) Uses of research in social development work
i. Identification of social needs and problems
ii. Diagnosis of social needs and problems
iii. Collection of data for planning development projects
iv. Impact assessment of social development services
C. LEARNING AND INSTRUCTIONAL METHODOLOGY
a) Reading relevant materials
b) Audio visual aids
c) Lectures
d) Discussions
e) Role play
f) Projects
D. ASSESSMENT
a) Tests
b) Assignments
c) Presentation
d) Observation

INTRODUCTION TO SOCIAL RESEARCH METHODS
3 | THIKA INSTITUTE OF BUSINESS STUDIES 0715 067 272 www.tibs.ac.ke [email protected]
2.0 RESEARCH METHODS, CONCEPTS AND ISSUES
A. SPECIFIC OBJECTIVES
At the end of this topic, the trainee should be able to:
a) Understand and identify basic concepts in research;
b) Read and interpret research materials;
c) Use case studies, surveys and experiments in analyzing social situations;
d) Explain application and limitation of research methods and concepts;
e) Evaluate development programmes.
B. TOPIC OUTLINE
a) Basic concepts of research
i. Variables
ii. Indicators/measurements
iii. Reliability
iv. Validity
v. Probability
vi. Hypothesis
vii. Relationships
b) Research methods, application and limitations
i. Case studies
ii. Surveys
iii. Experiments
c) Evaluation
i. Definition of evaluation
ii. Importance of evaluation
iii. Design of evaluation
iv. Types of evaluation
v. Utilization of evaluation
C. LEARNING AND INSTRUCTIONAL METHODOLOGY
a) Lectures

INTRODUCTION TO SOCIAL RESEARCH METHODS
4 | THIKA INSTITUTE OF BUSINESS STUDIES 0715 067 272 www.tibs.ac.ke [email protected]
b) Discussions
c) Tutorials
d) Experiments
e) Role playing
f) Reading of relevant materials
D. ASSESSMENT
a) Tests
b) Essays
c) Assignments
d) Presentations
e) Projects
f) Observation
3.0 PROCEDURE OF UNDERTAKING RESEARCH
A. SPECIFIC OBJECTIVES
At the end of this topic, the trainee should be able to;
a) Identify social problems;
b) Prepare a problem statement;
c) Justify the stated problems;
d) Set objectives of the research;
e) Identify relevant literature and theories
f) Undertake research.
B. TOPIC OUTLINE
a) Problem identification
i. Problem conceptualization
ii. Problem statement and justification
iii. Literature review and theoretical perspectives
iv. Objectives of the research
v. Study design

INTRODUCTION TO SOCIAL RESEARCH METHODS
5 | THIKA INSTITUTE OF BUSINESS STUDIES 0715 067 272 www.tibs.ac.ke [email protected]
b) Sampling and sampling procedure
i. Population identification
ii. Definition of sample
iii. Types of samples
iv. Basic sampling procedures
c) Data collection methods
i. Simple observation
ii. Participant observation
iii. Questionnaires
iv. Interviews
v. Secondary data content analysis
vi. Quasi-experiment
d) Data analysis methods
i. Classification of data for analysis
ii. Frequencies
iii. Ratios/proportions
iv. Rates
v. Averages
vi. Graphs
vii. Tables
viii. Interpretation
ix. Inferences
x. Deductions
xi. Coding
e) Presentation of research
i. Order and sequence
ii. Publishing
iii. Distribution
C. LEARNING AND INSTRUCTIONAL METHODOLOGY
a) Lectures
b) Discussions
c) Field work

INTRODUCTION TO SOCIAL RESEARCH METHODS
6 | THIKA INSTITUTE OF BUSINESS STUDIES 0715 067 272 www.tibs.ac.ke [email protected]
d) Tutorials
D. ASSESSMENT
a) Tests
b) Essays
c) Assignments
d) Observation
e) Presentation
Contents INTRODUCTION TO SOCIAL RESEARCH METHODS ....................................................................................... 0
INTRODUCTION ......................................................................................................................................... 1
GENERAL OBJECTIVES ............................................................................................................................... 1
SUBJECT SUMMARY .................................................................................................................................. 1
CONTENT ................................................................................................................................................... 1
1.0 NATURE AND SCOPE OF SOCIAL RESEARCH .................................................................................... 1
2.0 RESEARCH METHODS, CONCEPTS AND ISSUES ............................................................................... 3
3.0 PROCEDURE OF UNDERTAKING RESEARCH .................................................................................... 4
CHAPTER ONE ............................................................................................................................................. 11
NATURE AND SCOPE OF SOCIAL RESEARCH ............................................................................................... 11
INTRODUCTION ....................................................................................................................................... 11
DEFINITION OF RESEARCH ...................................................................................................................... 11
PURPOSE OF RESEARCH .......................................................................................................................... 12
SOCIAL SCIENCE RESEARCH ..................................................................................................................... 13
Characteristics of Social Research ....................................................................................................... 14

INTRODUCTION TO SOCIAL RESEARCH METHODS
7 | THIKA INSTITUTE OF BUSINESS STUDIES 0715 067 272 www.tibs.ac.ke [email protected]
Nature of Social Science Research ...................................................................................................... 16
Objectivity in Social Research ............................................................................................................. 17
MEANING AND ESSENTIALS OF SCIENTIFIC METHOD ......................................................................... 18
QUALITIES OF A GOOD RESEARCH ...................................................................................................... 20
TYPES OF RESEARCH ........................................................................................................................... 21
THE MAJOR COMPONENTS OF SOCIAL RESEARCH ................................................................................. 26
PROBLEM STATEMENT ........................................................................................................................ 26
OBJECTIVES ......................................................................................................................................... 27
Objectives should: ............................................................................................................................... 28
LITERATURE REVIEW ........................................................................................................................... 29
Structure: ........................................................................................................................................... 35
Examples:........................................................................................................................................... 35
THEORETICAL FRAMEWORK ............................................................................................................... 35
METHODOLOGY .................................................................................................................................. 38
DATA PRESENTATION AND ANALYSIS ................................................................................................. 39
DATA PRESENTATION AND ANALYSIS ................................................................................................. 40
CONCLUSION AND RECOMMENDATIONS ........................................................................................... 41
USES OF RESEARCH IN SOCIAL WORK: .................................................................................................... 42
CHAPTER TWO ............................................................................................................................................ 46
RESEARCH METHODS, CONCEPTS AND ISSUES ........................................................................................... 46
DEFINITION OF KEY TERMS IN RESEARCH ............................................................................................... 46
1. VARIABLE ......................................................................................................................................... 46
2. HYPOTHESIS .................................................................................................................................... 48

INTRODUCTION TO SOCIAL RESEARCH METHODS
8 | THIKA INSTITUTE OF BUSINESS STUDIES 0715 067 272 www.tibs.ac.ke [email protected]
3. MEASUREMENT .............................................................................................................................. 52
4. VALIDITY .......................................................................................................................................... 57
Validity ................................................................................................................................................... 57
5. RELIABILITY ...................................................................................................................................... 58
6. RELATIONSHIP ................................................................................................................................. 60
7. POPULATION ................................................................................................................................... 60
8. SAMPLE ........................................................................................................................................... 61
9. SAMPLING ....................................................................................................................................... 61
10. DATA ............................................................................................................................................. 62
11. STATISTICS ..................................................................................................................................... 62
RESEARCH METHODS, APPLICATION AND LIMITATIONS ........................................................................ 63
1. CASE STUDY ..................................................................................................................................... 63
2. SURVEYS .......................................................................................................................................... 65
3. EXPERIMENTAL RESEARCH .............................................................................................................. 69
EVALUATION RESEARCH ......................................................................................................................... 73
Definition of Evaluation ...................................................................................................................... 73
Some of the most common evaluation (research) questions: ............................................................ 74
Importance of Evaluation .................................................................................................................... 75
TYPES OF EVALUATION ....................................................................................................................... 75
CHAPTER THREE .......................................................................................................................................... 82
PROCEDURES OF UNDERTAKING RESEARCH .............................................................................................. 82
INTRODUCTION ....................................................................................................................................... 82
STEP 1: SELECTION AND DEFINING RESEARCH PROBLEM ...................................................................... 83

INTRODUCTION TO SOCIAL RESEARCH METHODS
9 | THIKA INSTITUTE OF BUSINESS STUDIES 0715 067 272 www.tibs.ac.ke [email protected]
Meaning of Research Problem ............................................................................................................ 83
Problem Identification and Formulation ............................................................................................ 83
Sources of Research Problems ............................................................................................................ 84
Factors to Consider When Selecting a Research Problem .................................................................. 85
Criteria of Good Research Problems ................................................................................................... 86
What to Avoid While Selecting Problem ............................................................................................. 87
STEP 2: REVIEW OF LITERATURE ............................................................................................................. 87
STEP 3: HYPOTHESIS FORMULATION ...................................................................................................... 88
STEP 4: RESEARCH DESIGN ...................................................................................................................... 89
STEP 5: DATA COLLECTION ...................................................................................................................... 92
Meaning of Data ................................................................................................................................. 92
Types of Data ...................................................................................................................................... 92
Importance of Data Collection ............................................................................................................ 93
SOURCES OF DATA COLLECTION ......................................................................................................... 93
b. Secondary Sources .......................................................................................................................... 94
DATA COLLECTION METHODS ............................................................................................................. 95
Focus group discussions II ................................................................................................................ 108
SAMPLING AND SAMPLING PROCEDURE .......................................................................................... 110
Characteristics of Good Sampling ..................................................................................................... 112
Benefits of Sampling ......................................................................................................................... 112
Limitations of Sampling ..................................................................................................................... 113
TYPES OF SAMPLING ......................................................................................................................... 113
TYPES OF SAMPLING ......................................................................................................................... 113

INTRODUCTION TO SOCIAL RESEARCH METHODS
10 | THIKA INSTITUTE OF BUSINESS STUDIES 0715 067 272 www.tibs.ac.ke [email protected]
TYPES OF SAMPLING ......................................................................................................................... 113
When to Use Non-Probability Sampling ........................................................................................... 123
STEP 6: DATA PRESENTATION AND ANALYSIS ...................................................................................... 125
Meaning of Data Presentation: ......................................................................................................... 126
1. TEXTUAL PRESENTATION .............................................................................................................. 126
2. TABULAR PRESENTATION .............................................................................................................. 128
Grouped Frequency Distribution Table ............................................................................................ 140
Cumulative Frequency Table ............................................................................................................ 141
Relative Frequency Distribution Table ............................................................................................. 148
3. GRAPHICAL PRESENTATION .......................................................................................................... 150
TYPES OF SAMPLING ......................................................................................................................... 113
TYPES OF SAMPLING ......................................................................................................................... 113
TYPES OF SAMPLING ......................................................................................................................... 113
TYPES OF SAMPLING ......................................................................................................................... 113
TYPES OF SAMPLING ......................................................................................................................... 113
TYPES OF SAMPLING ......................................................................................................................... 113

INTRODUCTION TO SOCIAL RESEARCH METHODS
11 | THIKA INSTITUTE OF BUSINESS STUDIES 0715 067 272 www.tibs.ac.ke [email protected]
CHAPTER ONE
NATURE AND SCOPE OF SOCIAL RESEARCH
INTRODUCTION
The unique characteristic of human mind is the curiosity to know about the universe.
Innumerable questions arise in our mind about our environment, planet and the universe. Most of
these questions starting with what, why, how and soon. For example, what are stars? , why day
and night alternate? How is rain formed and why the mode of life and activities of human beings
vary from place to place? Whenever such questions arise we seek answer to them or we try to
find out solutions to them. Seeking answers to questions and finding solutions to the problems
have been the basis of human progress. A systematic search for an answer to a question or a
solution to a problem is called research.
DEFINITION OF RESEARCH
The term research consist of two words,’ Re’+’Search’. “Re” means again and again and
“Search” means to find out something.
Research is a process of which a person observes the phenomena again and again and collects the
data and on the basis of data he draws some conclusions.
It is simply the process of arriving at dependable solution to a problem through the planned and
systematic collection, analysis and interpretation of a data. Research is the most important
process for advancing knowledge for promoting progress and to enable man to relate more
effectively to his environment to accomplish his purpose and to solve his conflicts. Although it is
not the only way, it is one of the most effective ways of solving problems.
Therefore, Research seeks to find out explanations to unexplained phenomena to clarify the
doubtful propositions and to correct the misconceived facts. It simply means a search for facts,
answer to questions and solutions to problems.
The search for facts may be made through either:
(a) arbitrary (unscientific) method or
(b) scientific method.
Arbitrary method of seeking answer to questions is based on imagination, blind belief or
impression. It is vague and inaccurate.

INTRODUCTION TO SOCIAL RESEARCH METHODS
12 | THIKA INSTITUTE OF BUSINESS STUDIES 0715 067 272 www.tibs.ac.ke [email protected]
Scientific method is a systematic rational approach to seeking fact. It is objective, precise and
arrives at conclusions on the basis of verifiable evidences. Hence research is systematic and
logical study of an issue problem or phenomenon through scientific method. Following
definitions may reveal the proper meaning of the concept of research.
Different Definitions of Research:
a) According to Black and Champion, “scientific research consist of obtaining information
through empirical observation that can be used for systematic development of logically related
propositions attempting to establish casual relations among variable”.
b) Emory defines research as “any organized inquiry designed and carried out to provide
information for solving a problem”.
c) Kerlinger defines research as a” systematic, controlled, empirical and critical investigation
of hypothetical relations among natural phenomena”.
d) L.V. Redman and A.V.H. Morry have defined “systematic effort to gain new knowledge we
call research”.
e) C.C. Crawford : “Research is simply a systematic and refined technique of thinking,
employing specialized tools, instruments & procedures in order to obtain a more adequate
solution of a problem than would be possible under ordinary means.”
It starts with a problem, collects data or facts, analyses these critically based decisions actual
evidence. It evolves original work instead of mere exercise of personal opinion. It is quantitative,
seeking to know not only what but much and measurement is therefore a central feature of it.
f) Webster Dictionary : “A careful inquiry or examination in seeking facts or principles,
diligent investigation in order to ascertain something.”
g) Francis Bacon: “Research is a power of suspending judgement with patience of meditating
with pleasures of asserting with caution, of correcting with readiness of arranging thought
with scrupulous plan.
PURPOSE OF RESEARCH
The purposes or objectives of research are varied. They are,
Research extends knowledge of human beings social life and environment.
Research reveals the mysteries of nature.

INTRODUCTION TO SOCIAL RESEARCH METHODS
13 | THIKA INSTITUTE OF BUSINESS STUDIES 0715 067 272 www.tibs.ac.ke [email protected]
Research establishes generalizations and general laws and contributes to theory building
in various fields of knowledge.
Research verifies and tests existing facts and theory.
Research helps us to improve our knowledge and ability to handle situation.
General laws developed through research may enable us to make reliable predictions of
events.
Research aims to analyze inter-relationship between variables and to derive causal
explanations, which help us to better understanding of the world in which we live.
Research aims to finding solutions to the problem, e.g.:- socio-economic problems, health
problems, organizational and human relational problems and so on…
Research also aims at developing new tools, concepts and theories for better
understanding to unknown phenomena.
Research helps national planning board to focus our national development. It enables the
planners to evaluate alternative strategies, on-going programs and evaluation etc.,
Research provides functional data for rational decision making and formulation of
strategies and policies.
SOCIAL SCIENCE RESEARCH
Meaning and Scope:
Sciences are broadly divided in to natural (physical) sciences and social sciences. Social sciences
include various disciplines dealing with human life, human behavior and institutions. E.g.
Anthropology, History, Economics, Education, Commerce, Demography etc,.
Social sciences are not exact science like physical sciences. It deals with human beings. Human
nature and mans environment are so complex, that it is more difficult to comprehend and predict
human behavior than the physical phenomena. It is difficult see the underlying uniformities in
the diversity of complex human behavior.
Redman Peter says that social research is “systematised effort to gain new knowledge.”
Stephenson is of the view that “social research is manipulation of things, concepts or symbols for
the purpose of generalising to extend correct and ‘verifying knowledge, whether that knowledge
aids in the construction of a theory or in the practice of an art.”
Another definition of social research has been given by F.A. Ogg: “Research may or may not
come to success; it may or may not add anything to what is already known. It is sufficient that its
objectives be new knowledge or at least a new mode or orientation of knowledge.”

INTRODUCTION TO SOCIAL RESEARCH METHODS
14 | THIKA INSTITUTE OF BUSINESS STUDIES 0715 067 272 www.tibs.ac.ke [email protected]
Clifford Moody has said about research that “It comprises defining and redefining problems;
formulating hypotheses or suggested solutions; collecting, analyzing and evaluating data; making
deductions and making conclusions; and at last carefully testing the conclusions to determine
whether they fit the formulated hypothesis.”
In Webster’s International Dictionary, Research has been defined as “a careful and critical
enquiry or examination in seeking facts or principles, diligent investigation in order to ascertain
something.” Social research in other words discovers new facts and verifies the old ones. It does
not aim at finding the ultimate truths but helps in understanding and classifying the behaviour of
individuals in society.
According to P.V. Young, we may define social research as “the systematic method of
discovering new facts and verifying old facts. Their sequences inter relationship, causal
explanations and the natural laws govern them”. From the above definition we can identify the
following,
Characteristics of Social Research
Social research deals with social phenomena. It studies human behavior and their
feelings.
Social research is carried on both for discovering new facts and verification of the old
ones.
Social research tries to establish casual connection between various human activities.
Social research deals with the social phenomena
It studies behaviour of human beings-as members of society, and their feeling, responses,
attitudes under different circumstances.
Social research is carried on both for discovering new facts and verification of the old ones
The object of every science of course, is the discovery of new facts, new relationship, and new
laws governing the phenomena. But constant verification of the old concepts is also needed,
especially in case of dynamic sciences. Verification is needed because of two reasons. Firstly,
there may be an improvement in the technique of research and it is necessary to test the old
concepts by this improved technique. Secondly, the phenomena under study might have
undergone a change and it may be required to test the validity of old concepts in the changed
circumstances.
In Social sciences a lot of research is being carried on for both purposes and has resulted in the
discovery of new facts as well as modification of old concepts.

INTRODUCTION TO SOCIAL RESEARCH METHODS
15 | THIKA INSTITUTE OF BUSINESS STUDIES 0715 067 272 www.tibs.ac.ke [email protected]
Social research tries to establish causal connection between various human activities
It is really very interesting to note whether various complex human activities, are being
performed only at random without any sequence, law or system behind them.
At the first causal look at varied human behaviour attitudes, moods and temperaments, the
presence of any system may appear to be an impossibility, but a close and patient study of
different cases, their scientific analysis and comparison and logical interpretation is bound to
disclose the truth, that most of them are not merely haphazard -as they appear but motivated by
definite rules perfect system and universal laws. The main purpose of social research is therefore,
to discover these laws, so that they may be used in the guided growth of human society.
In this way it will be observed that every definition focusses on the point namely that social
research aims at adding to knowledge of human beings about the problems which face the
society.
It involves the application of scientific method for understanding and analyzing of social life
inorder to correct and verify the existing knowledge as a system. The main idea behind social
research is to discover new inter relations, new knowledge, new facts and also to verify old ones.
Human behavior may be involved by certain values and laws. The main purpose of social
research is to discover those laws which can be proper guidelines for studying human contact
and behavior.
Characteristics II
• It is directed towards the solution of problems. The ultimate goal is to discover cause-and-
effect relationship between social problems.
• It emphasis the development of generalizations, principles or theories that will be helpful in
predicting future occurrences.
• It is based upon observable experience or empirical evidence.
• It demands accurate observations and description. Researchers may choose from a variety or
non- qualitative description of their observations.
• It involves gathering new data from primary sources or using existence data for new purpose.
• Although social research activities may at time be somewhat random and unsystematic, it is
more often characterized by carefully designed procedure that applies rigorous analysis.

INTRODUCTION TO SOCIAL RESEARCH METHODS
16 | THIKA INSTITUTE OF BUSINESS STUDIES 0715 067 272 www.tibs.ac.ke [email protected]
• It requires expertise. The researcher knows what is already known about the problem and how
others have investigated.
• It strives to the objective and logical applying every possible test to validate the procedure
employed, data collected and conclusion reached.
• It involves the guests for answer to unsolved problems.
• It is characterized by patient and unhurried activity. Researcher must expect disappointment
and discouragement as they pursue the answer to difficult question.
• It is carefully recorded and reported. Each important term is defined, limiting factors are
recognized, procedures are described in detail, reference are carefully documented, results are
objectively recorded and conclusions are presented with scholarly caution and restraint.
• It is interdisciplinary in nature
• It sometimes requires courage.
Nature of Social Science Research
In contrast to the physical science the social science lack the power of exact prediction; this is
attributed to the “erratic”, idiosynoration and irregular nature of human behavior. Social scientist
point out that the low predictable potential in social science is due to our limited knowledge of
relevant variables operative in the group like customs, traditions etc,. The cause and effect are
difficult to be segregated clearly. The present state of development of social science is far behind
physical science. Merton advises to social scientist against their despair; it is possible to develop
border applicability.
Objectives of Social Research
The major objectives of social research are listed as follows:-
a. To discover new facts and verifying or testing old facts.
b. To understand the human behavior and its interaction with the environment.
c. To acquire knowledge about social phenomena, events, issue, problems etc. ™
d. To identify functional relationship existing in the social phenomena. ™
e. To find out the natural laws that regulates or directs social phenomena. ™
f. To standardize the society concept, e.g. culture, struggle, generation gap, social distance
etc. ™
g. To formulate solution to social problems.

INTRODUCTION TO SOCIAL RESEARCH METHODS
17 | THIKA INSTITUTE OF BUSINESS STUDIES 0715 067 272 www.tibs.ac.ke [email protected]
h. To maintain social organization, remove social tension, misconception, etc ™ To develop
social revival plan.
Objectivity in Social Research
The question of objectivity has been central to the methodological debates of the social sciences
from the beginning. It means the willingness and ability to examine evidence dispassionately. It
is the first condition of research. Objectivity means basing conclusion on facts without any bias
and value judgement. The conclusion should be independent of one’s personal beliefs, likes
dislikes and hopes. Both the data and the inference drawn from their analysis must be free from
bias and prejudices. But modern feminist researchers and critical social researchers argued
research is a moral-political activity that requires the researcher to commit to a value position.
Value freedom is a myth.
Factors Affecting Objectivity
It is very difficult to achieve objectivity in social science research. This difficulty arises out of
the adverse influences of
a. personal prejudices and bias,
b. value judgement,
c. ethical dilemma and
d. complexity of social phenomena.
a. Personal Prejudices and Biases
Prejudices and biases are like fantasies to believe what is comforting to believe. It makes to
believe something without considering evidence.
b. Value related problem arises
Value related problem arises from the social context with in which research occurs. A
researcher’s attitudes towards socio-economic issues are influenced by his values.
c. Personal preconceptions
Personal preconceptions of research create not only a distorting effect on the data but are also
highly insidious. Research failed to examination objectivity.
d. Ethical dilemmas

INTRODUCTION TO SOCIAL RESEARCH METHODS
18 | THIKA INSTITUTE OF BUSINESS STUDIES 0715 067 272 www.tibs.ac.ke [email protected]
Research relation with other aspect of research creates ethical problems. E.g. Relation with
sponsors, relation with source data, relation with research subject etc,.
Limits of Objectivity in Social Sciences
Objectivity in social science research has certain limitations, they are:
a) Social scientist is part of human society and their judgements are subjective and coloured by
researchers own experience.
b) The subject matter of social science research is too complex. All propositions are limited
particular social groups and contexts. Thus objectivity in a major issue in social science research.
c) All members of the society have different values, social researcher will unconsciously
influenced by their values.
d) Social scientist fails to achieve objectivity because the respondents are human beings have
certain human problems. e.g. refusal of respondent, improper understanding, reluctance etc,. All
these problems cause biases and invalidate the research findings and conclusions.
MEANING AND ESSENTIALS OF SCIENTIFIC METHOD
Scientific method is a way in which one can test opinion, impressions or guess by examining
available evidences fore and against them. So it is controlling lot of things and establishing stable
belief.
Essentials of scientific method are,
Scientific method aims at discovering facts.
It is itself corrective in nature.
It is itself based on systematic doubts.
Scientific theories are abstract in nature.
Basis of Scientific Method
Following are the major basis of scientific method,
(a) Reliance on empirical evidence:-
Scientific method involves a systematic process. The answer to a question is not decided by
intuition or imagination.

INTRODUCTION TO SOCIAL RESEARCH METHODS
19 | THIKA INSTITUTE OF BUSINESS STUDIES 0715 067 272 www.tibs.ac.ke [email protected]
Relevant data are collected through observation and experimentation. The validity and the
reliability of data are checked carefully and the data are analyzed thoroughly using appropriate
methods of analyses.
(b) Use of concepts:-
We use concepts to deal with real facts. Concepts are logical constructs or abstractions created
from sense impressions. They are the symbols representing the meaning that we hold.
(c) Commitment to objectivity:-
Objectivity is the hallmark of the scientific method. It means forming a judgment upon facts
unbiased by personal impressions. The conclusion should not vary from person to person. It
should be same for all persons.
(d) Ethical neutrality.
Science does not pass normative judgment on facts. It does not say they are good or bad. Science
aims nothing but making true and adequate statements about its object.
(e) Generalization.
Scientist tries to find out the commonality of a series of event. They aim at discovering the
uniformity. Assumed a discovered uniformity a logical class and it’s observed pattern, a
descriptive generalization is formulated.
(f) Verifiability.
The findings of a research should be verifiable. Scientist must make know to others, how he
arrived at his conclusion. He should thus expose his own methods and conclusions to critical
scrutiny. When others test his conclusion under the same conditions, then it is accepted as
correct.
(g) Logical reasoning process.
The scientist method involves the logical process of reasoning. This reasoning process is used for
drawing inference from the finding of a study or for arriving at conclusion. This logical
reasoning process consists of induction and deduction.
Induction: One of the methods of logical reasoning process. The inductive method
consists of studying several individual cases drawing a generalization. It involves two

INTRODUCTION TO SOCIAL RESEARCH METHODS
20 | THIKA INSTITUTE OF BUSINESS STUDIES 0715 067 272 www.tibs.ac.ke [email protected]
processes-observation and generalization. Conclusion from induction method is subjected
to further conformation based on more evidence
Deduction: deduction is reasoning from the general to the particular. This reasoning
establishes a logical relationship between a major premise. A minor premise and a
conclusion. A major premise is a previously established generalization or assumption. A
minor premise is a particular case related to the major premise. The logical relationship
of these premise lead to conclusion.
E.g. major premise: - All men are mortal
Minor premise: - A is a man
Conclusion: - A is mortal.
The logical process of both induction and deduction are useful in research studies. Both are
inseparable parts of a system of reasoning. Both processes are often used simultaneously.
Difficulties in the Use of Scientific Methods in Social Science Research
Some theorists argue that scientific method is more applicable to physical or natural sciences:
and it can not applicable to social sciences. The following are the major difficulties.
a. Human behavior is different.
b. It s very difficult to categorize.
c. When human behavior is studied and analyses by another human, there may be personal
problems.
d. Psychological nature of human behavior can not be measurable.
e. Human behavior is not uniformed and predictable. Uncertainty is existing.
f. Difference in choice and decision.
QUALITIES OF A GOOD RESEARCH
1. Must be controlled
In research, many factors interferes with the findings. Controlling means minimizing the effects
of other factors which can affect the variables under study. This can largely be achieved in
physical sciences but it is difficult to achieve in social sciences.
2. Must be vigorous

INTRODUCTION TO SOCIAL RESEARCH METHODS
21 | THIKA INSTITUTE OF BUSINESS STUDIES 0715 067 272 www.tibs.ac.ke [email protected]
Research must ensure that procedure followed to find answers to the questions are relevant,
appropriate, justified and diligently followed.
3. Must be systematic
Procedure adopted to undertake research must follow a certain logical sequence. Research should
never be taken in an haphazard manner. These stages/steps in research must be followed in a
documented manner.
4. Verifiable
Research findings can be in such a way that can be confirmed by further testing’s. If the study is
replicated under similar circumstances one should expect to obtain similar results.
Research should not be unique to local situations but rather should be replicable. Any difference
in findings must be explained logically by use of data, instruments or methods.
5. Empirical
Any conclusions drawn from research must be based upon hard evidence gathered from
information collected from real life experience or observation.
6. Critical
The process adopted and the findings obtained must be able to withstand critical scrutiny.
The process of investigation therefore must be free from concealments or other draw backs
emanating from the procedure used in collecting the information.
7. Objective
One should not be influenced by their own background, philosophy, experience and
environment.
8. Logical
Research must follow the path of reason. This path of reason has few characterstics.
TYPES OF RESEARCH
Research can be classified from four perspectives:
1. Application of research study
2. Objectives in undertaking the research

INTRODUCTION TO SOCIAL RESEARCH METHODS
22 | THIKA INSTITUTE OF BUSINESS STUDIES 0715 067 272 www.tibs.ac.ke [email protected]
3. Inquiry mode employed
4. Type of information sought
1. BASED ON APPLICATION:
From the point of view of application, there are two broad categories of research: -
a. Pure Research
b. Applied research
a. Pure Research
Also known as basic research. It involves developments and testing of theories and hypothesis
that are intellectually challenging for the researches but may not have a practical application at
the time or in the future.
The knowledge produced through pure research is sought in order to add to the existing body of
research methods.
Basic/pure research produces results/ findings which provide empirical knowledge for the sake
knowledge.
Rarely would basic research be expected to provide practical use of solution.
Pure research deals with abstract/theoretical situations. The primary focus for basic research is
to:
i. Generate knowledge and enhance the use of critical thinking. ‘
ii. To solve theoretical dilemma
iii. To establish the existence of certain phenomena in community or nations.
b. Applied/Action Reseach
Def.
Process consisting of:
a. Problem identification
b. Considering of action or alternatives
c. Action taking
d. Evaluation of consequences

INTRODUCTION TO SOCIAL RESEARCH METHODS
23 | THIKA INSTITUTE OF BUSINESS STUDIES 0715 067 272 www.tibs.ac.ke [email protected]
Applied research is also known as Action Research. It focuses on activities in order to obtain
information to answer operational problems.
Applied research is done to solve specific, practical questions; for policy formulation,
administration and understanding of a phenomenon. It can be exploratory, but is usually
descriptive. It is almost always done on the basis of basic research. Applied research can be
carried out by academic or industrial institutions. Often, an academic institution such as a
university will have a specific applied research program funded by an industrial partner
interested in that program.
Some feasibility studies fit into the definition of action research.
In economics and business, actions research is preferred to pure results.
Differences between Basic and Applied research
DIFFERENCES BASIC RESEARCH APPLIED RESEARCH
Purpose Its purpose is to add human
knowledge.
Its purpose is to answer
practical question
Nature Knowledge or findings is
fundamental and generalizable.
It is applied and more specific
Time Scale Flexible time scale. It results in
universal principles relating to the
process and its relationship to
outcomes.
Tight time scale.
Outcomes Theoretical Practical
Ability to solve problem It doesn’t solve immediate
problem in hand.
It has immediate application.
2. BASED ON OBJECTIVES:
From the viewpoint of objectives, a research can be classified as;
a. Descriptive
b. Correlational
c. Explanatory
d. Exploratory

INTRODUCTION TO SOCIAL RESEARCH METHODS
24 | THIKA INSTITUTE OF BUSINESS STUDIES 0715 067 272 www.tibs.ac.ke [email protected]
a. Descriptive Research
Descriptive research attempts to describe systematically a situation, problem, phenomenon,
service or programme, or provides information as fully and carefully as possible about , say,
living condition of a community, or describes attitudes towards an issue.
It normally deals with observation and documentation of behaviors, trends or characteristics of
individuals or group. Researchers normally summarize these characteristics without modifying
or manipulating.
b. Correlational Research
Correlational research attempts to discover or establish the existence of a relationship/
interdependence between two or more two or more variables and to explore their implications for
cause and effect.
This approach also requires no manipulation or intervention on the part of researches other than
that which is required to administer the instruments necessary to collect the desired data.
For example relationship between price and sales are usually key in advertising and promotion.
c. Explanatory research
Explanatory research tries to clarify how there is a relationship between two or more aspects of a
phenomenon or situation. It tries to explain why things happen the way they do for example why
house rent reduce with increase in noise or air pollution.
d. Exploratory research
Exploratory research is also known as pilot studies or feasibility studies. In this type, one
investigates the possibility of undertaking more comprehensive or elaborate study in future. It is
undertaken to explore an area where little is known or to investigate the possibilities of
undertaking a particular research study (feasibility study / pilot study).
Pilot studies are important where the main study would cost large sums of money, would take a
very long time to establish results, or would cover a very large area and thus call for a large
group of researches.

INTRODUCTION TO SOCIAL RESEARCH METHODS
25 | THIKA INSTITUTE OF BUSINESS STUDIES 0715 067 272 www.tibs.ac.ke [email protected]
In practice most studies are a combination of the first three categories.
3. BASED ON INQUIRY MODE:
From the process adopted to find answer to research questions – the two approaches are:
a. Structured approach
b. Unstructured approach
a. Structured Approach:
The structured approach to inquiry is usually classified as quantitative research. Here everything
that forms the research process- objectives, design, sample, and the questions that you plan to ask
of respondents- is predetermined.
It is more appropriate to determine the extent of a problem, issue or phenomenon by quantifying
the variation. e.g. how many people have a particular problem? How many people hold a
particular attitude?
b. Unstructured Approach:
The unstructured approach to inquiry is usually classified as qualitative research. This approach
allows flexibility in all aspects of the research process.
4. BASED ON TYPE OF INFORMATION SOUGHT
a. Qualitative Research
This is the study of the quality of relationships activities or situations.
The emphasis is on the holistic description iec describing all the goes on in a particular activity
or situation rather than comparing the effect of a particular treatment.
Characteristics of qualitative research
- Research is a key instrument in qualitative research ie what he puts down after
observation normally forms that basis of analysis in this research.
- It a naturalistic inquiry ie real life situations are documented in their natural set up in
other words the experimental laboratory is a real world.
- Quantitative data is collected in the form of words or pictures rather numbers.

INTRODUCTION TO SOCIAL RESEARCH METHODS
26 | THIKA INSTITUTE OF BUSINESS STUDIES 0715 067 272 www.tibs.ac.ke [email protected]
- It’s concerned with both the process of research as well as the product. Ie the way the
information is collected is important just as important as final results.
- It tends to analyses the date inductively in a local situation is analyzed and a
generalization made.
b. Quantitative Research
Based on measurement of quality or amount. Research is said to be quantities if:
- The objective is to quantify the variation in a situation or phenomenon.
- It the information is gathered using predominantly quantitative variables.
- If the analysis is geared towards ascertaining the magnitude of the situation.
Unlike qualitative research where preference is given to holistic description of complex
phenomenon, quantitative research breaks down the complex phenomena into specific parts for
analysis and quantitative research, there is a willingness to manipulate aspects, situations or
conditions in studying complex phenomena.
THE MAJOR COMPONENTS OF SOCIAL RESEARCH
i. Problem Statement
ii. Objectives
iii. Literature Review
iv. Theoretical Framework
v. Methodology
vi. Data Presentation and Analysis
vii. Conclusion and Recommendations
PROBLEM STATEMENT
The problem statement illustrates what’s wrong, what’s missing, what we don’t know or need to
know better, and what needs to be done. This should be
synthesized in a paragraph or two, followed by your research purpose and a statement of your
research objectives.
Writing a persuasive problem statement means setting the stage for why your research
objectives, or the questions you are investigating, are important.
Writing a persuasive problem statement means engaging your audience
(i.e. your reviewers) so that they want to learn more about your proposed research.

INTRODUCTION TO SOCIAL RESEARCH METHODS
27 | THIKA INSTITUTE OF BUSINESS STUDIES 0715 067 272 www.tibs.ac.ke [email protected]
The problem statement should be the very first paragraph (or two) of your proposal (i.e.,the
Detailed Description section).
Written as a single paragraph, a problem statement consists of:
i) a broad sentence or two introducing your research topic,
ii) a thesis sentence or two that captures to the position you want to prove, the significance of the
knowledge gap, or the importance of the topic at hand (i.e.,
identify that your research is important) and
iii) a sentence or three that briefly overviews your main bodies of evidence (i.e., establish why
your research is important).
The purpose of your problem statement is to:
1. Introduce the reader to the importance of the topic being studied,
2. Orient the reader to the significance of your study and the research objectives or questions to
follow,
3. Answer the “so what?” question so that reviewers know why they should care about this
problem and your research, and
4. Place the problem into a particular context that defines the parameters of what you will be
investigating.
OBJECTIVES
What are research objectives?
The objectives of a research project summarize what is to be achieved by the study. These
objectives should be closely related to the research problem.
The general objective of a study states what researchers expect to achieve by the study in general
terms. It is possible (and advisable) to break down a general objective into smaller, logically
connected parts. These are normally referred to as specific objectives. Specific objectives should
systematically address the various research questions. They should specify what you will do in
your study, where and for what purpose.
Research objectives (or questions) serve to narrow the purpose statement and are linked directly
to the research findings. Research objectives (or questions) are the specific things you will
achieve(or questions you will answer) in your research in order to accomplish your overall
purpose
Why should research objectives be developed?
The formulation of objectives will help you to:

INTRODUCTION TO SOCIAL RESEARCH METHODS
28 | THIKA INSTITUTE OF BUSINESS STUDIES 0715 067 272 www.tibs.ac.ke [email protected]
Focus the study (narrowing it down to essentials); Avoid the collection of data which are not strictly necessary for understanding and solving the
problem you have identified; Organize the study in clearly defined parts or phases.
Properly formulated, specific objectives will facilitate the development of your research
methodology and will help to orient the collection, analysis, interpretation and utilization of data.
How should you state your objectives?
Objectives should:
Be concise and brief.
Be interrelated; the aim is what you want to achieve, and the objective describes how you
are going to achieve that aim.
Be realistic about what you can accomplish in the duration of the project and the other
commitments you have
Cover the different aspects of the problem and its contributing factors in a coherent way
and in a logical sequence;
Are clearly phrased in operational terms, specifying exactly what
you are going to do, where, and for what purpose;
Are realistic considering local conditions; and
Use action verbs that are specific enough to be evaluated.
Some effective verbs used to construct research objectives:
Knowledge: relate, define, describe, identify, indicate
Application: apply, demonstrate, measure, illustrate
Analysis: appraise, analyze, identify, deduce, measure
Comprehension: assess, compare, classify, predict, understand
Evaluation: determine, measure, project, evaluate, determine, compare
Synthesis: construct, create, compose, develop, integrate, formulate
Avoid the use of vague non-action verbs such as: to appreciate, to understand, or to study.
At the conclusion of your project you will need to assess whether or not you have met your
objectives and if not, why not. However, you may not always meet your aims in full, since your
research may reveal that your questions were inappropriate, that there are intervening variables
you could not account for or that the circumstances of the study have changed, etc. Whatever the
case, your conclusion will still have to reflect on how well the research design, which was guided
by your objectives has contributed to addressing your aims.

INTRODUCTION TO SOCIAL RESEARCH METHODS
29 | THIKA INSTITUTE OF BUSINESS STUDIES 0715 067 272 www.tibs.ac.ke [email protected]
LITERATURE REVIEW
Meaning of Literature Review
A literature review is an account of what has been published on a topic by accredited scholars
and researchers. Occasionally you will be asked to write one as a separate assignment, but more
often it is part of the introduction to an essay, research report, or thesis. In writing the literature
review, your purpose is to convey to your reader what knowledge and ideas have been established
on a topic, and what their strengths and weaknesses are. As a piece of writing, the literature
review must be defined by a guiding concept (e.g., your research objective, the problem or issue
you are discussing, or your argumentative thesis). It is not just a descriptive list of the material
available, or a set of summaries
A literature review discusses published information in a particular subject area, and sometimes
information in a particular subject area within a certain time period.
A literature review is an evaluative report of information found in the literature related to your
selected area of study. The review should describe, summarise, evaluate and clarify this
literature. It should give a theoretical base for the research and help you (the author) determine
the nature of your research. Works which are irrelevant should be discarded and those which are
peripheral should be looked at critically.
A literature review uses as its database reports of primary or original scholarship, and does not
report new primary scholarship itself. The primary reports used in the literature may be verbal,
but in the vast majority of cases reports are written documents. The types of scholarship may be
empirical, theoretical, critical/analytic or methodological in nature. Second, a literature review
seeks to describe, summarise, evaluate, clarify and/or integrate the content of primary reports.
A literature review is more than the search for information, and goes beyond being a descriptive
annotated bibliography. All works included in the review must be read, evaluated and analysed.
Relationships between the literature must also be identified and articulated, in relation to your
field of research.
It is important to think of knowledge in a given field as consisting of three layers. First, there are
the primary studies that researchers conduct and publish. Second are the reviews of those studies
that summarize and offer new interpretations built from and often extending beyond the primary
studies. Third, there are the perceptions, conclusions, opinion, and interpretations that are shared
informally that become part of the lore of field.
In composing a literature review, it is important to note that it is often this third layer of
knowledge that is cited as "true" even though it often has only a loose relationship to the primary

INTRODUCTION TO SOCIAL RESEARCH METHODS
30 | THIKA INSTITUTE OF BUSINESS STUDIES 0715 067 272 www.tibs.ac.ke [email protected]
studies and secondary literature reviews. Given this, while literature reviews are designed to
provide an overview and synthesis of pertinent sources you have explored, there are a number of
approaches you could adopt depending upon the type of analysis underpinning your study.
TYPES OF LITERATURE REVIEWS
a. Argumentative Review
This form examines literature selectively in order to support or refute an argument, deeply
imbedded assumption, or philosophical problem already established in the literature. The
purpose is to develop a body of literature that establishes a contrarian viewpoint. Given the
value-laden nature of some social science research [e.g., educational reform; immigration
control], argumentative approaches to analyzing the literature can be a legitimate and important
form of discourse. However, note that they can also introduce problems of bias when they are
used to make summary claims of the sort found in systematic reviews [see below].
b. Integrative Review
Considered a form of research that reviews, critiques, and synthesizes representative literature on
a topic in an integrated way such that new frameworks and perspectives on the topic are
generated. The body of literature includes all studies that address related or identical hypotheses
or research problems. A well-done integrative review meets the same standards as primary
research in regard to clarity, rigor, and replication. This is the most common form of review in
the social sciences.
c. Historical Review
Few things rest in isolation from historical precedent. Historical literature reviews focus on
examining research throughout a period of time, often starting with the first time an issue,
concept, theory, phenomena emerged in the literature, then tracing its evolution within the
scholarship of a discipline. The purpose is to place research in a historical context to show
familiarity with state-of-the-art developments and to identify the likely directions for future
research.
d. Methodical Review
A review does not always focus on what someone said [findings], but how they came about
saying what they say [method of analysis]. Reviewing methods of analysis provides a framework
of understanding at different levels [i.e. those of theory, substantive fields, research approaches,
and data collection and analysis techniques], how researchers draw upon a wide variety of
knowledge ranging from the conceptual level to practical documents for use in fieldwork in the
areas of ontological and epistemological consideration, quantitative and qualitative integration,

INTRODUCTION TO SOCIAL RESEARCH METHODS
31 | THIKA INSTITUTE OF BUSINESS STUDIES 0715 067 272 www.tibs.ac.ke [email protected]
sampling, interviewing, data collection, and data analysis. This approach helps highlight ethical
issues which you should be aware of and consider as you go through your own study.
e. Systematic Review
This form consists of an overview of existing evidence pertinent to a clearly formulated research
question, which uses pre-specified and standardized methods to identify and critically appraise
relevant research, and to collect, report, and analyze data from the studies that are included in the
review. The goal is to deliberately document, critically evaluate, and summarize scientifically all
of the research about a clearly defined research problem. Typically it focuses on a very specific
empirical question, often posed in a cause-and-effect form, such as "To what extent does A
contribute to B?" This type of literature review is primarily applied to examining prior research
studies in clinical medicine and allied health fields, but it is increasingly being used in the social
sciences.
f. Theoretical Review
The purpose of this form is to examine the corpus of theory that has accumulated in regard to an
issue, concept, theory, phenomena. The theoretical literature review helps to establish what
theories already exist, the relationships between them, to what degree the existing theories have
been investigated, and to develop new hypotheses to be tested. Often this form is used to help
establish a lack of appropriate theories or reveal that current theories are inadequate for
explaining new or emerging research problems. The unit of analysis can focus on a theoretical
concept or a whole theory or framework.
PURPOSE OF LITERATURE REVIEW
To provide a context for the research
To justify the research
To ensure the research hasn't been done before (or if it is repeated, that it is marked as a
"replication study")
To show where the research fits into the existing body of knowledge
To illustrate how the subject has been studied previously
To highlight flaws in previous research
To outline gaps in previous research
To show that the work is adding to the understanding and knowledge of the field
To help refine, refocus or even change the topic
To sharpen and deepen the theoretical framework of the research.
To familiarize the researcher with the latest developments in the area of research.
To identify gaps in knowledge, as well as weaknesses in previous studies.
To discover connections, contradictions or other relations between different research
results by comparing various investigations.

INTRODUCTION TO SOCIAL RESEARCH METHODS
32 | THIKA INSTITUTE OF BUSINESS STUDIES 0715 067 272 www.tibs.ac.ke [email protected]
To identify variables that must be considered in the research.
To study the definitions used in previous works as well as the characteristics of the
populations investigated, with the aim of adopting them for the new research.
To study the advantages and disadvantages of the research methods used by others, in
order to adopt or improve on them in one's own research.
IMPORTANCE OF LITERATURE REVIEW
The following are the main importance of literature review:
(a) Improve your Research Methodology
Literature review helps you to acquire methodologies used by other researchers to find and solve research
questions similar to the ones you are investigating. It will explain the procedures other researchers used
and methods similar to the ones you are proposing. It will give you an idea whether the methods other
researchers used worked for them and what are the problems they faced. By doing a review of literature,
you will become aware of pitfalls and problems and could strategise well to select a methodology that you
feel will suit your research work better.
(b) Focus on Research Problem
Review of literature could help you shape your research problem because the process of reviewing the
literature helps you to understand the subject area better and thus helps you to conceptualise your research
problem clearly and precisely. In addition, it also helps to understand the relationship between your
research problem and body of knowledge in your research area.
(c) Cater to Knowledge Base for Research Area
One of the most important objectives of literature review is to ensure that you read widely around the
subject area in which you intend to conduct research study. It is fundamental that you know what others
are doing in your field of interest or the similar topic you have been working on as well as understanding
theories that have been put forward and gaps that exist in the particular field. M.Sc and PhD candidates
are expected to be experts in their area of study, therefore a thorough review of literature helps to fulfil
this expectation.
(d) Contextualising Research Findings
Obtaining answers for your research questions is easy. The difficulties lies in how you examine your
research findings in the existing body of knowledge. How do you answer your research questions
compared to what other researchers concluded? What is the new knowledge contribution from your
research work? How are your findings distinguished from those of other researchers? To answer these
questions, you need to go back to the review of literature. It is important to put your findings in the
context of what is already known and understood in your field of research.

INTRODUCTION TO SOCIAL RESEARCH METHODS
33 | THIKA INSTITUTE OF BUSINESS STUDIES 0715 067 272 www.tibs.ac.ke [email protected]
(e) Ensure Novelty in your Work
By doing a review of literature, you do not run the risk of „reinventing the wheel,‰ meaning that wasting
efforts on trying to rediscover something that is already known or published in the research arena.
Therefore, through literature review, you could ensure novelty and new contribution in your research
work.
CITATION
Meaning of Citation
A "citation" is the way you tell your readers that certain material in your work came from
another source. It also gives your readers the information necessary to find that source again,
including:
information about the author
the title of the work
the name and location of the company that published your copy of the source
the date your copy was published
the page numbers of the material you
When do I need to cite?
Whenever you borrow words or ideas, you need to acknowledge their source. The following
situations almost always require citation:
whenever you use quotes
whenever you paraphrase
whenever you use an idea that someone else has already expressed
whenever you make specific reference to the work of another
whenever someone else's work has been critical in developing your own ideas.
METHOD OF CITATION
Include an in-text citation when you refer to, summarize, paraphrase, or quote from another
source. For every in-text citation in your paper, there must be a corresponding entry in your
reference list.
APA in-text citation style uses the author's last name and the year of publication, for example:
(Field, 2005). For direct quotations, include the page number as well, for example: (Field, 2005,
p. 14).

INTRODUCTION TO SOCIAL RESEARCH METHODS
34 | THIKA INSTITUTE OF BUSINESS STUDIES 0715 067 272 www.tibs.ac.ke [email protected]
In-text Citation
APA citation basics
When using APA format, follow the author-date method of in-text citation. This means that the
author's last name and the year of publication for the source should appear in the text, for
example, (Jones, 1998), and a complete reference should appear in the reference list at the end of
the paper.
Short quotations
If you are directly quoting from a work, you will need to include the author, year of publication,
and page number for the reference (preceded by "p."). Introduce the quotation with a signal
phrase that includes the author's last name followed by the date of publication in parentheses.
According to Jones (1998), "Students often had difficulty using APA style, especially when it
was their first time" (p. 199).
Jones (1998) found "students often had difficulty using APA style" (p. 199); what implications
does this have for teachers?
If the author is not named in a signal phrase, place the author's last name, the year of publication,
and the page number in parentheses after the quotation.
She stated, "Students often had difficulty using APA style" (Jones, 1998, p. 199), but she did not
offer an explanation as to why.
Long Quotations
Place direct quotations that are 40 words or longer in a free-standing block of typewritten lines
and omit quotation marks. Start the quotation on a new line, indented 1/2 inch from the left
margin, i.e., in the same place you would begin a new paragraph. Type the entire quotation on
the new margin, and indent the first line of any subsequent paragraph within the quotation 1/2
inch from the new margin. Maintain double-spacing throughout. The parenthetical citation
should come after the closing punctuation mark.
Jones's (1998) study found the following:
Students often had difficulty using APA style, especially when it was their first time citing sources. This
difficulty could be attributed to the fact that many students failed to purchase a style manual or to ask
their teacher for help. (p. 199)

INTRODUCTION TO SOCIAL RESEARCH METHODS
35 | THIKA INSTITUTE OF BUSINESS STUDIES 0715 067 272 www.tibs.ac.ke [email protected]
Summary or Paraphrase
If you are paraphrasing an idea from another work, you only have to make reference to the
author and year of publication in your in-text reference, but APA guidelines encourage you to
also provide the page number (although it is not required.)
According to Jones (1998), APA style is a difficult citation format for first-time learners.
APA style is a difficult citation format for first-time learners (Jones, 1998, p. 199).
Reference
Structure:
Last, F. M. (Year Published) Book. City, State: Publisher.
Examples:
James, H. (1937). The ambassadors. New York, NY: Scribner.
Rowling, J.K. (2001). Harry Potter and the socerer's stone. London: Bloomsburg Children's.
THEORETICAL FRAMEWORK
Meaning of Theoretical Framework
The term “theoretical framework” comprises two words, “theory” and “framework”. It is
therefore appropriate to start by giving definitions of what a theory is and what a framework is.
A theory, according to Kerlinger (1986:9), is “a set of interrelated constructs, definitions, and
propositions that present a systematic view of phenomena by specifying relations among
variables with the purpose of explaining and predicting phenomena”.
A framework is “a set of ideas that you use when you are forming your decisions and
judgements” (MacMillan English dictionary, 2002:561).
According to Kerlinger (1986), a theory can be used to successfully make predictions and this
predictive power of the theory can help guide researchers to ask appropriate research questions.
On the other hand, a framework provides structure within which the relationships between
variables of a phenomenon are explained.

INTRODUCTION TO SOCIAL RESEARCH METHODS
36 | THIKA INSTITUTE OF BUSINESS STUDIES 0715 067 272 www.tibs.ac.ke [email protected]
Abd-El-Khalick & Akerson (2007) point out the difficulty of identifying an exact definition of a
theoretical framework in the field of (science) education. Nevertheless, LeCompte and Preissle
(1993) define a theoretical framework as a collection of interrelated concepts that can be used
to direct research with the purpose of predicting and explaining the results of the research.
Simply put, a theoretical framework is used to provide the rationale for conducting the research
(Caliendo & Kyle, 1996; Radhakrishna, Yoder & Ewing, 2007).
In social research, theoretical frameworks have a number of roles, which improve the quality of
research (Caliendo & Kyle, 1996).
According to various authors, theoretical frameworks:
Theories are formulated to explain, predict, and understand phenomena and, in many cases, to
challenge and extend existing knowledge within the limits of critical bounding assumptions. The
theoretical framework is the structure that can hold or support a theory of a research study. The
theoretical framework introduces and describes the theory that explains why the research
problem under study exists.
Eisenhart defined a theoretical framework as “a structure that guides research by relying on a
formal theory...constructed by using an established, coherent explanation of certain
phenomena and relationships” (1991, p. 205). Thus, the theoretical framework consists of the
selected theory (or theories) that undergirds your thinking with regards to how you understand
and plan to research your topic, as well as the concepts and definitions from that theory that are
relevant to your topic. Lovitts (2005) empirically defines criteria for applying or developing
theory to the dissertation that must be appropriate, logically interpreted, well understood, and
align with the question at hand.
ROLE OF THEORETICAL FRAMEWORK IN RESEARCH
The theoretical framework strengthens the study in the following ways:
1. An explicit statement of theoretical assumptions permits the reader to evaluate them
critically.
2. The theoretical framework connects the researcher to existing knowledge. Guided by a
relevant theory, you are given a basis for your hypotheses and choice of research
methods.

INTRODUCTION TO SOCIAL RESEARCH METHODS
37 | THIKA INSTITUTE OF BUSINESS STUDIES 0715 067 272 www.tibs.ac.ke [email protected]
3. Articulating the theoretical assumptions of a research study forces you to address
questions of why and how. It permits you to intellectually transition from simply
describing a phenomenon you have observed to generalizing about various aspects of that
phenomenon.
4. Having a theory helps you identify the limits to those generalizations. A theoretical
framework specifies which key variables influence a phenomenon of interest and
highlights the need to examine how those key variables might differ and under what
circumstances.
5. Guide the choice of research design (LeCompte & Preissle, 1993).
6. Guide the researcher toward appropriate data collection methods (Miller, 2007).
7. Connect the researcher to existing literature (Smyth, 2004;Herek, 1995).
8. Provide assumptions that guide the research (Miller, 2007).
9. Help the researcher to choose appropriate questions for the study (Miller,2007).
10. Convince the reader of the relevance of the research question (LeCompte & Preissle,
1993; Mishra & Koehler,2006).
11. Assist the researcher to make predictions of the outcomes and to interpret and analyse the
results of research based on the existing literature. The results can be used “to test and
critically appraise a theory” (Abd-El Khalick & Akerson, 2007:.189).
Examples of Theories
The following list details a sampling of commonly used theories across disciplines.
• Transformational/relational theories
• Transactional/management theories
• Servant leadership/moral theories
• Trait theories
• Situational theories
• Behavioral theories
• Systems theory
• Developmental theory
• Cognitive theory
• Sense of community theory
• Feminist Theory
• Self-efficacy theory
• Functionalist theory
• Relational theory
• Marxist Theory
• Gender theory
• Change theory
• Social Exchange Theory
Symbolic Interactionism Theory

INTRODUCTION TO SOCIAL RESEARCH METHODS
38 | THIKA INSTITUTE OF BUSINESS STUDIES 0715 067 272 www.tibs.ac.ke [email protected]
METHODOLOGY
The methodology section of a research paper answers two main questions: How was the data
collected or generated? And, how was it analyzed? The writing should be direct and precise and
always written in the past tense.
Research methodology is the specific procedures or techniques used to identify, select, process,
and analyze information about a topic. In a research paper, the methodology section allows the
reader to critically evaluate a study’s overall validity and reliability. The methodology section
answers two main questions: How was the data collected or generated? How was it analyzed?
You must explain how you obtained and analyzed your results for the following reasons:
Readers need to know how the data was obtained because the method you chose affects
the results and, by extension, how you interpreted their significance.
Methodology is crucial for any branch of scholarship because an unreliable method
produces unreliable results and, as a consequence, undermines the value of your
interpretations of the findings.
In most cases, there are a variety of different methods you can choose to investigate a
research problem. The methodology section of your paper should clearly articulate the
reasons why you chose a particular procedure or technique.
The reader wants to know that the data was collected or generated in a way that is
consistent with accepted practice in the field of study. For example, if you are using a
multiple choice questionnaire, readers need to know that it offered your respondents a
reasonable range of answers to choose from.
The method must be appropriate to fulfilling the overall aims of the study. For example,
you need to ensure that you have a large enough sample size to be able to generalize and
make recommendations based upon the findings.
The methodology should discuss the problems that were anticipated and the steps you
took to prevent them from occurring. For any problems that do arise, you must describe
the ways in which they were minimized or why these problems do not impact in any
meaningful way your interpretation of the findings.
In the social and behavioral sciences, it is important to always provide sufficient
information to allow other researchers to adopt or replicate your methodology. This
information is particularly important when a new method has been developed or an
innovative use of an existing method is utilized.

INTRODUCTION TO SOCIAL RESEARCH METHODS
39 | THIKA INSTITUTE OF BUSINESS STUDIES 0715 067 272 www.tibs.ac.ke [email protected]
DATA PRESENTATION AND ANALYSIS
Meaning of Data Analysis:
Data analysis is the process of developing answers to questions through the examination and
interpretation of data.
Analysis and presentation of data Analysis of data Analysis means categorizing, ordering, manipulating,
and summarizing of data to obtain answers to research questions. The purpose of analysis is to reduce
data to intelligible and interpretable form so that the relations of research problems can be studied and
tested.
Methods of Data Analysis
a. Descriptive analysis:
It limits generalization to the particular group of individuals observed. No conclusions are extended
beyond this group and any similarity to those outside the group cannot be assumed. The data describes
one group and that group only. It provides valuable information about the nature of particular group of
individuals.
b. Inferential analysis:
It is also called logical or statistical analysis. It is probably based. It always involves the process of
sampling and the selection of a small group that is assumed to be related to the population from which it
is drawn. The small group is called the sample and the large group is the population.
Why is Data Analyzed?
The purpose of analysing data is to obtain usable and useful information. The analysis,
irrespective of whether the data is qualitative or quantitative, may:
• describe and summarise the data
• identify relationships between variables
• compare variables
• identify the difference between variables
• forecast outcomes

INTRODUCTION TO SOCIAL RESEARCH METHODS
40 | THIKA INSTITUTE OF BUSINESS STUDIES 0715 067 272 www.tibs.ac.ke [email protected]
DATA PRESENTATION AND ANALYSIS
Data analysis is the process of systematically searching and arranging collected data in a form
that enhance understanding.
Its also the process of searching for relationships and ends only after the data has been
interpreted. Data analysis inevitably involves the use and manipulation of variables. A variable is
any characteristics contrasted with a constant ie a value that never changes
Before data can be analyzed it must be put in some kind of order. Raw data are rarely useful in
decision making. Researchers generate information by analyzing data after its collection. Data
analysis usually involves reducing accumulated data to a manageable size, developing
summaries, looking for patterns and applying statistical techniques. Further, researchers must
interprete these findings in light of the research questions or determine if the results are
consistent with their hypothesis and theories.
One of the most common ways to order data is by preparing frequency distribution. Frequency
distribution is simply a ranking of items along with the frequency. When such statistical data is
presented in a graph the display is known as a frequency polygon. There are times that it may be
necessary to group the data and have the frequency to represent the groups rather than the
individual item.
Meaning of Data Presentation:
Data presentation refers to the organization of data in tables, graphs or charts, so that logical and
statistical conclusions can be derived from the collected measurements.
The presentation of data is the basic organization and classification of the data for analysis. After
data collection is completed, the data will be in the raw form. It is necessary to arrange the data
so that it makes some sense to researchers as well to the readers. Different types of data require
different methods of summary and presentation. Data are presented in charts, graphs and tables.
Data may be presented in 3 methods:
i. Textual
ii. Tabular
iii. Graphical

INTRODUCTION TO SOCIAL RESEARCH METHODS
41 | THIKA INSTITUTE OF BUSINESS STUDIES 0715 067 272 www.tibs.ac.ke [email protected]
CONCLUSION AND RECOMMENDATIONS
There are usually a few ideas about corrective actions. In academic research, the
recommendations are often further study suggestions that broaden or test understanding of the
subject area. In applied research the recommendations will usually be for managerial action
rather than research action.
Conclusions are logical deductions based on the data in the findings section. It usually includes a
summary of the findings. It usually ends with a statement which will lead to the
Recommendations. The conclusion is intended to help the reader understand why your research
should matter to them after they have finished reading the paper. A conclusion is not merely a
summary of the main topics covered or a re-statement of your research problem, but a synthesis
of key points and, if applicable, where you recommend new areas for future research. For most
essays, one well-developed paragraph is sufficient for a conclusion, although in some cases, a
two or three paragraph conclusion may be required.
A well-written conclusion provides you with important opportunities to demonstrate to the reader
your understanding of the research problem. These include:
1. Presenting the last word on the issues you raised in your paper. Just as the
introduction gives a first impression to your reader, the conclusion offers a chance to
leave a lasting impression. Do this, for example, by highlighting key findings in your
analysis or result section or by noting important or unexpected implications applied to
practice.
2. Summarizing your thoughts and conveying the larger significance of your study.
The conclusion is an opportunity to succinctly answer [or in some cases, to re-
emphasize] the "So What?" question by placing the study within the context of how your
research advances past research about the topic.
3. Identifying how a gap in the literature has been addressed. The conclusion can be
where you describe how a previously identified gap in the literature [described in your
literature review section] has been filled by your research.
4. Demonstrating the importance of your ideas. Don't be shy. The conclusion offers you
the opportunity to elaborate on the impact and significance of your findings.
5. Introducing possible new or expanded ways of thinking about the research problem.
This does not refer to introducing new information [which should be avoided], but to
offer new insight and creative approaches for framing or contextualizing the research
problem based on the results of your study.
Purpose of Conclusion
The purpose of a conclusion can be:

INTRODUCTION TO SOCIAL RESEARCH METHODS
42 | THIKA INSTITUTE OF BUSINESS STUDIES 0715 067 272 www.tibs.ac.ke [email protected]
To make a connection between the paper’s completely argued or explained findings and
another related, sometimes larger, context (like another discipline).
To offer a policy or plan that could benefit from your work.
To set up future work by suggesting ideas for further research or questions to explore.
To recast, or further explain, the thesis or purpose statement in a way that benefits from the
improved understanding provided in the paper.
Recommendations
Recommendations are often included with a report’s conclusion, although they serve different
purposes. Whereas a conclusion offers you the opportunity to summarize or review your report’s
main ideas, recommendations suggest actions to be taken in response to the findings of a report.
You can regard recommendations as a prompt to action for your readers. As you have seen from
your planning, your report structure should lead up to the recommendations and provide
justification for them. Just as a proposal grows from your project’s goals and objectives, a report
should actually grow backwards from your recommendations. Having your recommendations
accepted then becomes part of your purpose.
What makes a good recommendation? Effective recommendations:
describe a suggested course of action to be taken to solve a particular problem;
are written as action statements without justification;
are stated in clear, specific language;
should be expressed in order of importance;
are based on the case built up in the body of the report; are written in parallel structure.
USES OF RESEARCH IN SOCIAL WORK:
In concrete developmental parlance the major possibilities of utilizing social science
research may be identified as under:
(a) Development planning
Development planning, or for that matter any planning, requires a store of reliable, factual
knowledge on the basis of which a blue-print may be designed and the difficulties in its
implementation anticipated and guarded against.

INTRODUCTION TO SOCIAL RESEARCH METHODS
43 | THIKA INSTITUTE OF BUSINESS STUDIES 0715 067 272 www.tibs.ac.ke [email protected]
Any effort at development planning is bound to fail of it is based on fictitious assumptions of
planners in relation to what the clients of planning need, what their problems are, what they want
remedied, and what kind of system they want as an emergent product of planning.
Systematic research can give us the required data base for planning and designing developmental
schemes and programmes.
Social research may afford valuable background data to be capitalized by development planners
for assessing the existing state of affairs; particularly the magnitude, complexity and
ramifications of the problem they are expected to grapple with.
The observed and hidden dimensions of the problem thrown up by such studying may be
expected to proffer certain measure of foresight to planners to deal with the problem effectively.
Social research has a crucial role to play in guiding social planning. Adequate social planning
depends for its success on a systematic knowledge above the social resources and liabilities, of
the people and their culture; of their similarities and differences, of organizations and operative
controls, of their needs, hopes, aspirations and problems.
(b) Testing Assumptions
Social research exercise may provide a basis for testing the validity of certain assumptions that
our planners are prone to make in laying down their short-term and long-term goals. These
researches conceivably, may help the planner to anticipate the consequences and cost of
alternative strategies which may be pressed into operation for achieving the settled goals.
(c) Avoidance of failure
Social science researches may bring into sharp focus the varied influences and factors that
contribute to the failure of certain projects. Hence the policy planners may stand forewarned
about these.
(d) Increased Public Awareness
If social science research finding becomes a part of public knowledge, a general awareness
about the situation and challenges, as also, the desired policy to meet them squarely may result.
This would prepare people for accepting a particular policy and for exerting popular pressure for
reformulation of amending current policies, or rejecting of modifying them. Let us now consider
the utility of social research, especially, for a developing country like ours.
(e) Greater Control of Man’s Environment

INTRODUCTION TO SOCIAL RESEARCH METHODS
44 | THIKA INSTITUTE OF BUSINESS STUDIES 0715 067 272 www.tibs.ac.ke [email protected]
Since knowledge is a particular kind of power, social research, by affording firsthand knowledge
about the organization and working of society and its institutions, gives us a greater power of
control over the social phenomena and action. Thus, social research may be visualized as having
practical implications for formal and informal types of leadership, patterns on influence and
reform in different spheres of society.
(f) Increased Understanding
Social research dispels the thrust of outworn assumptions, superstitions and stereotypes. Social
research thus, may be expected at-least to afford a more solid basis for people to hold whatever
opinions they do.
(g) Resolution of Social problems
Our society has innumerable problems such as poverty, unemployment, economic inequality,
social tension etc,. The nature and dimensions of such problems have to be diagnosed and
analyzed. An analysis of problems leads to an identification of appropriate remedial actions.
Social researchers analyse the problem basis for effective remedial measure. Social researchers
analyse the problem in the ‘total context’ (this is desirable) and as such are in a better position to
identify social structural anomalies and ambivalences that get reflected in the form of these
problems and hence, structural changes would be necessitated.
The ‘remedies’ suggested by research are thus deep going. They hit where they must. Many of
the laymen reformer’s ‘remedies’ create other new problem or ‘side effect.’ Scientific social
research provides sound guidelines for appropriate measures of welfare of reform. It is no
accident that a large portion of legislation and reformative measures own its origin to reports of
social surveys.
(i) Assessment of Impact of Social Projects
Social research helps in identifying both the desired and undesired effects of strategies
implemented to solve social problems.
j) Discovery of facts and their interpretation
Social research provides answer to questions of what, when, how and why of man, social life and
institutions. Discover of facts and their inter relationship help us to discard distortions and
contribute to our understanding of social reality.
k) Systematization of knowledge

INTRODUCTION TO SOCIAL RESEARCH METHODS
45 | THIKA INSTITUTE OF BUSINESS STUDIES 0715 067 272 www.tibs.ac.ke [email protected]
The facts discovered through research are systematized and the body of knowledge is developed.
It contributes to the growth of theory building.
l) Prediction
Social research aims at finding an order among social fact and their casual relations. This affords
a sound basis for prediction in several cases.
m) Social welfare
It is obvious that social research has direct implications for social welfare. By virtue of the
deeper understanding of the casual relationships of various social ‘maladies’, social research
provides a secure basis for effective remedial measure.
Social research can identify the causes of social evils and problems. It can thus help in taking
appropriate remedial actions. It also provides guideline for social welfare.
n) Basis for funding
Most funding agencies anchor their funding on findings of the research done. The funding
agencies are likely to invest where there is guarantee that thre is a need and that the funds will be
spent well for the benefit of the community.

INTRODUCTION TO SOCIAL RESEARCH METHODS
46 | THIKA INSTITUTE OF BUSINESS STUDIES 0715 067 272 www.tibs.ac.ke [email protected]
CHAPTER TWO
RESEARCH METHODS, CONCEPTS AND ISSUES
DEFINITION OF KEY TERMS IN RESEARCH
1. VARIABLE
A variable is a characteristic that increases or decreases over time or takes different values in
different situations.
TYPES OF VARIABLES:
a. Independent variable
Independent variable is a variable that a researcher manipulates in order to determine its change
or its influence on another variable (predictor variable), because it will predict the amount of
variation that occurs in another variable. It is a variable which influences the dependent variable
in either a positive way or a negative way.
b. Dependent Variables
The dependent variable attempts to indicate the total influence arising from the total effect
arising from the independent variable. A dependent variable therefore varies as a function of the
independent variable. In other words, it is the variable which is expected to change as a result of
the presence or absence or magnitude of the independent variable. For example, does a
participative leadership style (independent variable) influence job satisfaction or performance
(dependent variables )?
c. Extraneous variables
A basic problem in research is that there are many possible independent variables that could have
an effect on the dependent variables. Once researchers have decided which variables to study,
they must be concerned about the influence or effect of other variables that exist. Such variables
are usually called extraneous variables. The task is to control these extraneous variables either to
eliminate or minimize their effect.

INTRODUCTION TO SOCIAL RESEARCH METHODS
47 | THIKA INSTITUTE OF BUSINESS STUDIES 0715 067 272 www.tibs.ac.ke [email protected]
Extraneous variables are independent variables that have not been controlled.
One way of controlling extraneous variables is to hold then constant.
d. Qualitative variables
These are variables that can be placed in distinct categories according to some characteristics or
attribute. For examples if variables are classified according to gender then gender is qualitative.
Other examples of qualitative variables are religious preference and geographical locations.
e. Quantitative variables
These are numerical and can be ordered or ranked. For example the number of years a firm has
been operating in quantitative. Quantitative variables can also be divided into discrete and
continuous.
f. Discrete variables
These variables are said to be countable and are assigned whole numbers such as 0,1,2,3 i.e they
have no decimal point e.g. number of children in a family, number of students in a
classroom, the number of small and medium businesses within municipality.
g. Continuous variables
Continuous variables by comparison, can assume all values in an internal between any two
specific points. They are obtained by measuring e.g. Temperature, the rate of growth of business
is an example of a continuous variable.
h. Moderate variable
A moderator variable is a special type of independent variable. It is secondary independent
variable that has been selected for study in order to determine if it affects or modifies the basic
relationship between the primary independent variable and the dependent variable. Thus if an

INTRODUCTION TO SOCIAL RESEARCH METHODS
48 | THIKA INSTITUTE OF BUSINESS STUDIES 0715 067 272 www.tibs.ac.ke [email protected]
experimentor thinks that the relationship between variables X and Y might be altered in some
way by a third variable Z then Z could be inclined in the study as a moderator variable.
2. HYPOTHESIS
The word hypothesis is a compound of two words ‘hypo’ and ‘thesis’ where ‘hypo’ means under and
‘thesis ’ means reason or rational view. Thus, hypothesis is a below reasoned view. It is a view, which is
not fully reasoned. In social research and other research, hypothesis is used to mean a statement about the
relationship, which helps to be investigated.
Hypothesis is defined as the tentative prediction of outcome of the results. A hypothesis states the
research expectation concerning the relationships between the variable in the research problem. It is the
most specific statement to the problem and it states what the researcher thinks would be the outcome of
the researcher to be undertaken.
According to F.N. Kerlinger, “Hypothesis is the most powerful tool man has invented to achieve
dependable knowledge ”
Once the problem to be answer is defined, the researcher formulates theory. Theory formulation leads to
hypothesis formulation. Data collection and analysis revolve around the hypothesis, when hypothesis
comes to be true, it originates theory. Hypothesis is an educated guess about a problem’s solution. It
shows the relation between two or more variables, which need to be investigated for the truth. Non-
hypothesis can be defined as logically conjectured relationship between two or more variables in testable
statements. Hypothesis is always presented in declarative sentence form. They can be general or specific.
According to G.A. Lundberg: - “A hypothesis is a tentative generalization the validity of which remains
to be tested. It may be any hunch, imaginative idea or intuition whatsoever, which becomes the basis of
action or investigation.”
According to W. Goode and P.K. Hatt: - “A hypothesis is a proposition, which can be put to test to
determine its validity. It may seem contrary to, or in accordance with common sense.”
Examples of Hypotheses “Family planning can reduce the growth of population.”
“There is no relationship between working condition and job satisfaction of workers.”

INTRODUCTION TO SOCIAL RESEARCH METHODS
49 | THIKA INSTITUTE OF BUSINESS STUDIES 0715 067 272 www.tibs.ac.ke [email protected]
TYPES OF HYPOTHESES
a. Null Hypothesis
It is a statement that states no relationship or difference exists between the independent and the
dependent variables. Analysts usually test to determine whether there has been no change in the
population of interest or whether a real difference exits. Any relationship in this case or difference
between the two is merely due to chances or some error. The null hypothesis is usually denoted as( Ho;).
Examples
There is no relationship between vacation benefits and employees job satisfaction.
There is no significant difference in performance between learners who participate in class
discussion and those who do not.
b. Alternative non-directional Hypothesis
It is a statement that states that a relationship or difference exists between the stipulated variables but the
researcher does not know the nature of such a relationship or difference. These types of hypothesis do
indicate a relationship or difference but do not indicate the direction of these relationships. From this
hypothesis, it is not possible to say whether the relationship is positive or negative.
Example: there is a relationship between vacation benefits and employees job satisfaction.
c. Alternative Directional Hypothesis
It is a statement that states that a relationship or a difference between the stipulated variables and goes
further to specify the nature of the relationship or difference between the variables.
This means that the relationship may be stated as being less than, greater than, increase, decrease etc. they
are denoted as (H1) e.g the higher the vacation benefits, the higher the job satisfaction among employees.
Formulation of hypothesis
There are 2 methods:

INTRODUCTION TO SOCIAL RESEARCH METHODS
50 | THIKA INSTITUTE OF BUSINESS STUDIES 0715 067 272 www.tibs.ac.ke [email protected]
1.™ Deductive method /approach/logic: The deductive method is one in which the researcher develops
hypothesis from theory and design a research strategy to test them. There, hypothesis formulation is
preceded by theory formulation. A clear theoretical portion is developed prior to data collection.
2.™ Inductive method/approach/logic: The inductive method is in which the researcher develops
hypothesis from specific observation. Here, the researcher first collects data and then develops theory as a
result of data analysis. It is based on the principle of developing theory after the data have been collected.
The two approaches are closely interlinked. Theory and research go side by side. They have never ending
interaction. The deductive approach owes more to positivism and the inductive approach to interpretive.
However, such labeling is potentially misleading and of no practical value.
Differences between Deductive and Inductive method
DIFFERENCE DEDUCTIVE METHOD INDUCTIVE METHOD
Precedence It moves from theory to data.
It develops hypothesis from
theory.
It constructs theory or
principle from specific
observation. It moves from
data to theory.
Data It collects quantative data. It collects qualitative data
Flexibility It is a highly structured
approach.
It is a more flexible structured
approach to permit changes of
research emphasis as the
research progresses.
Generalization It has necessity to collect
samples of sufficient size in
order to generalize
conclusions.
It has less concern with the
need to generalize.
Others • It has need to explain casual
relationship between
variables.
• It is application or controls
to ensure validity of data.
• It is the operationalization of
concepts to ensure clarity of
definition.
• It gains an understanding of
meanings of human attach to
events.
• It is a realization that the
researcher is a part of the
research process.
• It is a close understanding of
the research context

INTRODUCTION TO SOCIAL RESEARCH METHODS
51 | THIKA INSTITUTE OF BUSINESS STUDIES 0715 067 272 www.tibs.ac.ke [email protected]
Good hypothesis should have the following characteristics
i) They must state clearly and briefly the expected relationships between variables.
ii) They must have both the independent and dependent variables.
iii) They must be based on a sound rationale derived from theory or from previous research or
professional experience.
iv) They must be consistent with generally accepted traits of common sense
v) They must be testable. A hypothesis is not testable if it calls for techniques that are not available
with the present state of the art. A hypothesis is also un-
vi) testable if it calls for an explanation that defies known physical or Psychological laws.
vii) They should be testable within a reasonable period.
viii) Variables tested in the hypothesis must be consistent with the purpose, statement and objective of
the study.
ix) Good hypothesis must be simple and as precise as possible.
Functions of Hypothesis
Purpose of having a hypothesis in research (functions)
1. Hypothesis provides directions; they bridge the gap between the problem and evidence needed for
its solution.
2. Hypothesis ensures collection of the evidence necessary to answer the question posed in the
statement of the problem.
3. Hypothesis permits the researcher to understand the problem with greater clarity and use the data
collected to find solutions to the problem.
4. Hypothesis form the framework for the ultimate conclusions of a study, researcher always bases
their conclusions on the results of tests of their hypothesis.
5. Hypothesis enables the investigation to assess the information collected from the stand point of
both relevance and organization.
Therefore, the most important role of hypothesis is to guide the direction of the study. A frequent problem
in research is the proliferation of interesting information. Unless the researcher curbs the urge to include

INTRODUCTION TO SOCIAL RESEARCH METHODS
52 | THIKA INSTITUTE OF BUSINESS STUDIES 0715 067 272 www.tibs.ac.ke [email protected]
additional element, a study can be diluted by trivial concerns that do not answer the basic questions
posed. The virtue of the hypothesis is that, if taken seriously, it limits what shall be studied and what shall
not. It identifies facts that are relevant and those that are not; in so doing, it suggests which form of
research design is likely to be more appropriate. A final role of the hypothesis is to provide a framework
for organizing the conclusions that result.
3. MEASUREMENT
Measurement is the process observing and recording the observations that are collected as part of
a research effort. Measurement involves assigning scores to individuals so that they represent some
characteristic of the individuals. Measurement is the process of assigning numbers to objects or
observation.
While it is easy to assign numbers in respect of properties of some object, it is relatively difficult
in respect to others. For example, measuring such things, as intelligence, love, hate is much less
obvious and requires much closer attention than measuring physical properties like, length,
height or width. While we can expect high accuracy in measuring physical properties like the
height of a person, we would be less confident about the accuracy of the measurements we use
for abstract concepts like motivation to work.
In social sciences, the researchers measure indicators of concepts. As we said earlier, abstract
concepts such as motivation, love or hate cannot be observed directly; researchers must infer
their presence by measuring their empirical, observable indicators. For instance motivation can
be measures by some identifiable behaviour like, being punctual or being ready to take more
responsibility.
Therefore, we can say that indicators are specified by operational definitions. After a researcher
observes the indicators, they substitute numerals or numbers for the value of the indicator and
perform quantitative analyses.
LEVELS OF MEASUREMENTS (MEASUREMENT SCALES)
There are typically four levels of measurement that are defined:
a. Nominal
b. Ordinal
c. Interval
d. Ratio

INTRODUCTION TO SOCIAL RESEARCH METHODS
53 | THIKA INSTITUTE OF BUSINESS STUDIES 0715 067 272 www.tibs.ac.ke [email protected]
a. Nominal Scale
In nominal measurement the numerical values just "name" the attribute uniquely. No ordering of
the cases is implied. Nominal scales are used for labelling variables, without any quantitative
value. A nominal scale is simply a system of assigning symbols to events in order to label them.
The numbers assigned to an object is only a symbol. Nominal scales could simply be called
labels.
Nominal scales are the lowest level of measurement.
Examples
i. We can use numbers “1” and “2” to represent male and female respectively.
ii. Assign the following on Marital Status
-Single
-Married
-Widowed
As a rule, we should the categories should be exhaustive (that is, with no case that include all
cases of that type) and mutually exclusive (that no case can be classified as belonging to more
than one category). The numbers are just convenient labels for the particular class of events and
as such have no quantitative value.
Nominal scale is the least powerful level of measurement. It does not indicate order or distance
relationship and has no arithmetic origin. It simply describes differences between things by
assigning them to categories. The scale wastes all the information that may have about varying
degrees of the variable.
The main statistics used for nominal scale are the mode, measures of qualitative variation and
appropriate measures of association.
Chi-square test is the most common test of statistical significance.
Fore measures of correlation, the contingency coefficient can be worked out.
b. Ordinal Scale
In ordinal measurement the attributes can be rank-ordered. Here, distances between attributes do
not have any meaning. The intervals between the ranks are not intended to be equal
This is a level of measurement that shows the relative importance of variables in order of
magnitude, size and preferences. Ordinal scale emphasizes order, which is expressed in degree of

INTRODUCTION TO SOCIAL RESEARCH METHODS
54 | THIKA INSTITUTE OF BUSINESS STUDIES 0715 067 272 www.tibs.ac.ke [email protected]
quality. The typical relations are, “ higher”, “ greater”, “More desired” and so on. In most cases,
ordinal scales indicate rank order.
Example 1
Value Potential Hazard
10 Extra ordinary
9 Outstanding
8 Far-reaching
7 High
6 Noteworthy
5 Intermediate
4 Moderate
3 Minor
2 Low
1 Insignificant
Example 2
Ordinal scales are also used for questions that rate the quality of something (for example, very
good, good, fair, and poor, etc.) and agreements (for example, Strongly agree, Agree, Disagree,
etc.).
Q.4. How do you rate the following?
a. Service: Very Poor, Poor, OK, Good, Very Good
b. Cleanliness: Very Poor, Poor, OK, Good, Very Good
c. Parking: Very Poor, Poor, OK, Good, Very Good
d. Quality of food: Very Poor, Poor, OK, Good, Very Good
e. Choice of food: Very Poor, Poor, OK, Good, Very Good
Example 3
How often have you felt like not coming to class? (Tick one)
Every day
Once a week

INTRODUCTION TO SOCIAL RESEARCH METHODS
55 | THIKA INSTITUTE OF BUSINESS STUDIES 0715 067 272 www.tibs.ac.ke [email protected]
Sometimes
Never
For example, on a survey you might code Educational Attainment as 0=less than high school;
1=some high school.; 2=high school degree; 3=some college; 4=college degree; 5=post college.
In this measure, higher numbers mean more education. But is distance from 0 to 1 same as 3 to
4? Of course not. The interval between values is not interpretable in an ordinal measure.
c. Interval Scale
In interval measurement the distance between attributes does have meaning. Numerical values
are assigned along an interval scale with equal intervals, but there is no zero point where the trait
being measured does not exist. the difference between a score of 12 and 16 would be the same as
the difference between a score of 40 and 42 hence, in contrast to ordinal data, the differences
between the categories are identical.
An interval scale processes all the characteristics of an ordinal scale. An interval scale processes
all the characteristics of an ordinal scale with one additional feature; the distances between the
points on this scale are equal. For example the distance between a score of 70 and 80 is the same
as the score between 80 and 90.
This level of measurement is used where particular data and information collected has
quantifiable magnitude such as population size, weight and distances, which are measured
against an established criteria or standard. Examples of such measurements include year
calendar, temperature, time, and test scores.
Interval scales provide more powerful measurement than ordinal scales for interval scale also
incorporates the concept of equality of interval. As such more powerful statistical measures can
be used with interval scales.
For example, when we measure temperature (in Fahrenheit), the distance from 30-40 is same as
distance from 70-80. The interval between values is interpretable. Because of this, it makes sense
to compute an average of an interval variable, where it doesn't make sense to do so for ordinal
scales. But note that in interval measurement ratios don't make any sense - 80 degrees is not
twice as hot as 40 degrees (although the attribute value is twice as large).
d. Ratio Scale
Finally, in ratio measurement there is always an absolute zero that is meaningful. This means
that you can construct a meaningful fraction (or ratio) with a ratio variable.

INTRODUCTION TO SOCIAL RESEARCH METHODS
56 | THIKA INSTITUTE OF BUSINESS STUDIES 0715 067 272 www.tibs.ac.ke [email protected]
Ratio data are a subset of interval data, and the scale is again interval, but there is an absolute
zero that represents some meaning,
Example, scores on an achievement test. If an employee undertakes a class -related test and
scores zero, this would indicate a complete lack of knowledge or ability in this subject!
they tell us about the order, they tell us the exact value between units, AND they also have an
absolute zerowhich allows for a wide range of both descriptive and inferential statistics to be
applied
Weight is a ratio variable. In applied social research most "count" variables are ratio, for
example, the number of clients in past six months. Why? Because you can have zero clients and
because it is meaningful to say that "...we had twice as many clients in the past six months as we
did in the previous six months."
It's important to recognize that there is a hierarchy implied in the level of measurement idea. At
lower levels of measurement, assumptions tend to be less restrictive and data analyses tend to be
less sensitive. At each level up the hierarchy, the current level includes all of the qualities of the
one below it and adds something new. In general, it is desirable to have a higher level of
measurement (e.g., interval or ratio) rather than a lower one (nominal or ordinal).
MEASUREMENT ERRORS
Any good scientific study should be precise and unambiguous. However, some errors can occur
in the process of measurements. There are four main sources of measurement errors. They are:
• Respondent: The respondents can be a source of measurement errors. This may occur if the
respondent is reluctant to express strong negative feelings or it is just possible that he may have
very little knowledge but may not admit his ignorance on the subject of study. Other respondent
related errors may occur due to fatigue, boredom, anxiety etc. and may limit the ability of the
respondent to respond accurately and fully.
• Situation: Situational factors may also come in the way of correct measurement. Any condition
that places a strain on interview can have serious effects on the interviewer-respondent rapport.
For example, if someone else is present during the interview, the respondent may feel shy to give
all the information they may want to give.
• Measurer: The interviewer can be a source of error if they distort responses by rewording or
reordering the questions. The interviewer‘s behaviour, style, or looks may encourage or
discourage certain replies from the respondents. The sources may relate to incorrect coding,
faulty tabulation and/ or statistical calculations, or careless mechanical processing.

INTRODUCTION TO SOCIAL RESEARCH METHODS
57 | THIKA INSTITUTE OF BUSINESS STUDIES 0715 067 272 www.tibs.ac.ke [email protected]
• Instruments: Defective measuring instruments may cause measurement errors. For example
when a person uses complex words beyond the comprehension of the respondents, ambiguous
meanings, poor printing, inadequate space for replies, response choice omissions and so on.
It is therefore important for the researcher to ensure that they meet all the problems listed above.
4. VALIDITY
It is concerned with measurement of quality of data. It ensures measuring what is expected to
measure. It is the characteristics used to describe a test which measures what it claims to
measure.
According to F.N. Kerlinger: - “The commonest definition of validity is epitomized by the
question: Are we measuring what we think we are measuring.”
According to J.W. Best and J.V. Kahn: - “Validity is that of gathering instrument or procedure
that enables to measure what it is supposed to measure”
Validity II
Validity
In research we try that every information we collect to be accurate. This implies that what we
use to obtain that information must also be accurate. For instance, if you want information on
the “effect of malaria on health” it would be accurate if we obtain such information from a health
inspector rather than from a butcher. This concept of accuracy is what is called validity.
Validity refers to the extent to which a test or an instrument measure what we actually wish to
measure. A researcher cannot for instance get the right information about the students who are
dull or intelligent by measuring the size of their heads. In this case the study would not be valid.
If the study used some kind of intelligence tests to identify intelligent or dull students, then our
study would be valid; i.e. true, accurate, correct and meaningful. Validity in research may imply
accuracy of research tool (instrument), validity of research procedure (technique), and validity of
the research findings (report).
BASIS OF VALIDATION:
a. Logical validation:

INTRODUCTION TO SOCIAL RESEARCH METHODS
58 | THIKA INSTITUTE OF BUSINESS STUDIES 0715 067 272 www.tibs.ac.ke [email protected]
This refers simply to a type of theoretical, intuitive, or common sense analysis. This type of
validation is derived from the careful definition of the continuum of a scale and the selection
items to be measured. It is a component of content of validation.
b. Jury opinion:
It refers to the personal judgment of experts to the field. The behavior scientist’s ordinary
element to measure content validity by such jury opinions. That is, several content experts may
be as judge whether the items being used instrument and representative of the field be
investigated . The result of this procedure reflects the ‘conformed’ judgments of experts in the
content field.
c. Known groups:
Closely related to jury opinion approach for assessing content validation is a method involving
known groups. With this approach, validation comes from the known attitudes and other
characteristics of antiethical groups and not from specific expertise.
d. Independent criteria:
One of the validity measurement include considering independent criterion. The research
attempts to develop or obtain an independent criterion against which the measurement results be
matched. Criterion validity can be assessed by correlating the set of scaling result under study
with other set, developed from another instrument is administered at the same time. When one
predicts success or failure of student from academic aptitude measures, the researcher is
concerned with criteria – related validity.
5. RELIABILITY
It refers to the degree of consistency that the instrument/ procedure demonstrate whatever it is
measured does so consistently and accurately. It is the consistency and accuracy of scores
obtained by the same variable when retested with the identical or equivalent test. Synchronous
for reliability are: dependability, stability, predictability, accuracy. A reliable man, e.g. man
whose behavior is consistent , dependable and predictable –what he will do tomorrow and next
week will be consistent with what he / she does today he has done last week.
According to Best and Kahn: “A test is reliable to the extent that it measures whatever is
measuring consistently”.

INTRODUCTION TO SOCIAL RESEARCH METHODS
59 | THIKA INSTITUTE OF BUSINESS STUDIES 0715 067 272 www.tibs.ac.ke [email protected]
According to Boyd and Others: “Reliability is the characteristics of research methodology
which allow it to be repeated again and again by the same and by different researchers”.
Reliability II
A measuring instrument is reliable if it provides consistent measurement over time. Reliability is
also considered as the level of internal consistency or stability of a measuring instrument. The
instrument is considered to be reliable to the extent that its measurements are free from non
systematic (random) error.
Reliability is necessary but not sufficient condition of validity. That is, a test or instrument must
be reliable for it to be valid but a test instrument can be reliable but not valid. The relationship
between validity and reliability can be simply illustrated by the weighing scale. If the scale
measures your weight correctly then it is both reliable and valid. If it constantly overweighs you
by six pounds, then the scale is reliable but not valid. If the scale measures erratically from time
to time, then it is not valid and not reliable.
METHODS OF MEASUREMENT OF RELIABILITY
a. Test-retest method:
It involves repeated measurement using the same instrument under as nearly equivalent
conditions as possible. The results of the two administrations are then compared and the degree
of correspondence is determined. The greater the difference, the lower the reliability and vice
versa. This method examines the stability of response.
b. Alternative form method:
It involves using two equivalent forms of measuring instruments to the single subject. The result
of the two instruments is compared on item-by -item basis and the degree of similarity is
determined. The scores on a test are highly correlated with scores on an alternative from of test.
The greater the difference lowers the reliability and vice versa.
c. Split-half method:
It involves dividing the total number of items into two groups: odd number and even number
item. Scores on the odd number items are then correlated with the scores on the even numbered

INTRODUCTION TO SOCIAL RESEARCH METHODS
60 | THIKA INSTITUTE OF BUSINESS STUDIES 0715 067 272 www.tibs.ac.ke [email protected]
items. Or, the scores on the half of the test can be correlated with scores on the second half of the
test. The greater the difference the lower the reliability and vice versa.
6. RELATIONSHIP
A relationship refers to the correspondence between two variables. When we talk about types of
relationships, we can mean that in at least two ways: the nature of the relationship or the pattern
of it.
It is very important to understand relationship between variables to draw the right conclusion
from a statistical analysis. The relationship between variables determines how the right
conclusions are reached. Without an understanding of this, you can fall into many pitfalls that
accompany statistical analysis and infer wrong results from your data.
Two variables can be associated in one of three ways: unrelated, linear, or nonlinear.
1. Unrelated variables have no systematic relationship; changes in one variable simply are not related to the changes in
the other variable.
2. Linear relationships between variables can generally be represented and explained by a straight line on a scatter plot.
a. There are two types of linear relationships: positive and negative
i. Positive relationship: Two variables move, or change, in the same direction.
ii. Negative relationship: Two variables move in opposite directions.
3. Nonlinear relationships between variables can be represented and explained by a line on a scatter plot that is not straight,
but curved in some way.
7. POPULATION
A research population is a collection of individuals or objects known to have similar
characteristics. It is a large collection of individuals or objects that is the main focus of research.
It is for the benefit of the population that research is done. However due to the large size of
populations, researchers cannot test every individual in the population because it is too expensive
and time consuming.
Two types of population:

INTRODUCTION TO SOCIAL RESEARCH METHODS
61 | THIKA INSTITUTE OF BUSINESS STUDIES 0715 067 272 www.tibs.ac.ke [email protected]
Target population – this is the ENTIRE group of individuals or objects to which
researchers are interested in generalizing the conclusions.
Accessible population – this is the population that the researcher can apply their
conclusions.
8. SAMPLE
Meaning and Definition
For studying a social problem, it is difficult to study whole universe of the problem under study.
In such a case, sampling has become commonplace idea.
A sample is a small proportion of a population selected for observation and analysis. It is a
collection of items or elements from a population. It is a subset of the population that the
researcher studies and generalizes the findings to the entire population.
By observing the characteristics of sample, one can make certain inference about the
characteristics of the population from it is drawn; the act so involved is called sampling.
The main function of a sample is to allow researchers to conduct the study to individuals from
the population so that the results of their study can be used to derive conclusions that will apply
to the entire population.
9. SAMPLING
Sampling is the process of selecting units (eg people, organizations) from a population of interest
so that by studying the sample we may fairly generalize the results back to the population.
Sampling can be defined as the selection of some part of an aggregate or totality, the bases of
which a judgment or inference about the aggregate or totality is made. It is the process of
obtaining information about an entire population by examining a part of it.
According to F.N. Kerlinger: “Sampling is taking any portion of a population or universe as
representative of the population.”
According to Y.D. Keskar: “Sampling is the generalization in terms of the whole group
through the facts assembled relate to only part of it.”
Sampling terms/Concepts:

INTRODUCTION TO SOCIAL RESEARCH METHODS
62 | THIKA INSTITUTE OF BUSINESS STUDIES 0715 067 272 www.tibs.ac.ke [email protected]
1. Element: It is unit about which information is sought. E.g. individuals, products, stores,
companies etc.
2. Population: It is also called universe. It is the aggregate of all elements defined prior to the
selection of sample. Population can be finite or infinite.
3. Sampling unit: It is the element available for selection at some stage of the sampling process.
E.g. female 18-50 yrs.
4. Sampling frame: It is the list of all sampling units available for selection from the population.
A frame must a class list, list of registered voters, list of students and so on.
5. Sample size: It states how many to be surveyed. e.g. should 50 or 60 students be interviewed?
Sampling techniques:
Probability Sampling Non-probability Sampling
Simple random
Complex random
Systematic
Cluster
Stratified
Multi-stage
Convenience
Purposive
Judgment
Quota
Snowball
10. DATA
Data is defined as the facts presented to the researcher from the study’s environment.
Two types of data:
Primary data – facts collected by the researcher himself
Secondary data – facts collected by another party other than the researcher
11. STATISTICS
Statistics is the study of the collection, analysis, interpretation, presentation and organization of
data.
There are two main methodologies used in data analysis:

INTRODUCTION TO SOCIAL RESEARCH METHODS
63 | THIKA INSTITUTE OF BUSINESS STUDIES 0715 067 272 www.tibs.ac.ke [email protected]
Descriptive statistics – it summarizes data from a sample using indexes such as the
mean and standard deviation.
Inferential statistics – they draw conclusions from data that are subject to random
variation.
RESEARCH METHODS, APPLICATION AND LIMITATIONS
In scientific research the emphasis is on obtaining evidence to support or refute proposed facts or
principles. There are many methods that fit this definition. Let us now look at the various
methods of research:
1. CASE STUDY
A case study refers to specific unit of analysis for the study. Case study research refers to an in-depth,
detailed study of an individual or a small group of individuals. Case study is the method of exploring and
analyzing the life of social unit, be that unit a person, a family, institution, culture, group or even entire
community. They are commonly used to collect in-depth data in a natural setting where the researcher
has little or no control over the events and there is a real life context. Often times, the goal of a case study
is provide information that may research in the formation of a hypothesis for future research.
Example: For example, case studies may be used to study psychological problems such as the
development of a child raised by a single, deaf parent or the effects on a child who had been isolated,
abused and neglected until the age of 12 years old.
A case study involves intensive study of a relative small number of situations. It views a social unit as a
whole. . Case study research is not used to determine cause and effect, nor is it used to discover
generalizable truths or make predictions. Rather, the emphasis in case study research is placed on
exploration and description of a phenomenon.
It places more emphasis on the full analysis of limited number of events or conditions another behavior. It
is a longitudinal approach so in development over a period of time the case study processes deeply and
analyses interactions between the factors that explain present status or that influences change or growth.
The purpose is to understand life cycle or an important part of life cycle of the unit.
Such studies are typically qualitative in nature, resulting in a narrative description of behavior or
experience.

INTRODUCTION TO SOCIAL RESEARCH METHODS
64 | THIKA INSTITUTE OF BUSINESS STUDIES 0715 067 272 www.tibs.ac.ke [email protected]
Characteristics of Case Study
i. Case studies are in depth investigations of a given social unit resulting in a complete well
organized picture of that unit.
ii. It is a study of a unit as a whole. The unit may be a person, a family, a social group, an institution,
a community or situation.
iii. It examines a small number of units across a large number of variables and conditions.
iv. It is able to combine both objective and subjective data to achieve an in-depth understanding.
v. A generalization drawn from a single case cannot be applied to case in given population.
vi. It is a longitudinal approach. It shows a development over a period of time.
vii. It deals with both what and why of the subject. It describes the complex behavior pattern of a
unit.
viii. It identifies three factors:
a) Features which are common to all cases in a general group.
b) Features which are not common to all cases but are common to certain subgroups.
c) Features which are unique to specific cases.
Types of Case Studies
There are several types of case study methods. The method selected depends upon the nature of
the question being asked and the goals of the researcher. Following is a list of the different types
of case studies:
a. Illustrative – This type of method is used to “illustrate” or describe an event or situation
in such a way that people can become more familiar with the topic in question and
perhaps become acquainted with the terminology associated with the topic.
b. Exploratory – This method is a condensed case study and the purpose is to gather basic,
initial data that could be used to identify a particular question for a larger study. This
study is not designed to produce detailed data from which any conclusions could be
drawn. It is simply exploratory in nature.
c. Cumulative – The cumulative method is designed to pull together information for
several events/situations and aggregate it in such a way that it allows for greater
generalization. It has the advantage of saving time and money by not creating new and
repetitive studies.
d. Critical Instance – These studies are used to examine situations of unique interest or to
challenge a universal or generalized belief. Such studies are not to create new
generalizations. Rather, several situations or events may be examined to raise questions
or challenge previously held assertions.
Strength/Merits of Case Study
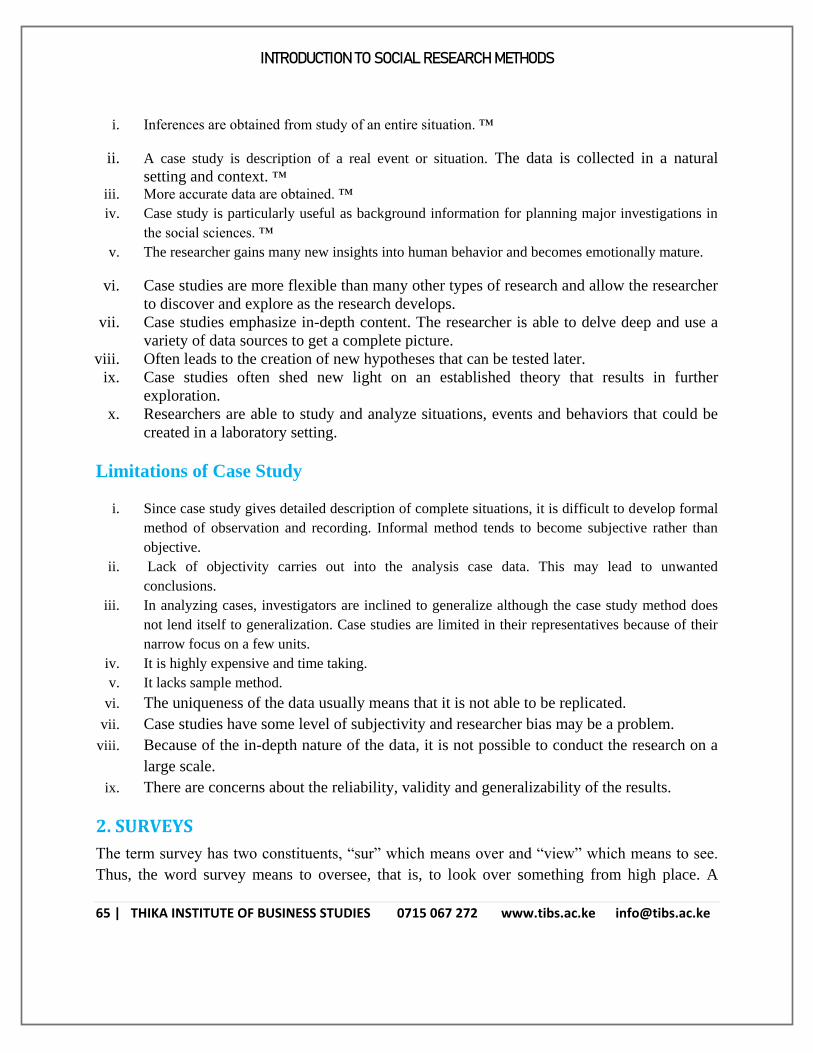
INTRODUCTION TO SOCIAL RESEARCH METHODS
65 | THIKA INSTITUTE OF BUSINESS STUDIES 0715 067 272 www.tibs.ac.ke [email protected]
i. Inferences are obtained from study of an entire situation. ™
ii. A case study is description of a real event or situation. The data is collected in a natural
setting and context. ™ iii. More accurate data are obtained. ™
iv. Case study is particularly useful as background information for planning major investigations in
the social sciences. ™
v. The researcher gains many new insights into human behavior and becomes emotionally mature.
vi. Case studies are more flexible than many other types of research and allow the researcher
to discover and explore as the research develops.
vii. Case studies emphasize in-depth content. The researcher is able to delve deep and use a
variety of data sources to get a complete picture.
viii. Often leads to the creation of new hypotheses that can be tested later.
ix. Case studies often shed new light on an established theory that results in further
exploration.
x. Researchers are able to study and analyze situations, events and behaviors that could be
created in a laboratory setting.
Limitations of Case Study
i. Since case study gives detailed description of complete situations, it is difficult to develop formal
method of observation and recording. Informal method tends to become subjective rather than
objective.
ii. Lack of objectivity carries out into the analysis case data. This may lead to unwanted
conclusions.
iii. In analyzing cases, investigators are inclined to generalize although the case study method does
not lend itself to generalization. Case studies are limited in their representatives because of their
narrow focus on a few units.
iv. It is highly expensive and time taking.
v. It lacks sample method.
vi. The uniqueness of the data usually means that it is not able to be replicated.
vii. Case studies have some level of subjectivity and researcher bias may be a problem.
viii. Because of the in-depth nature of the data, it is not possible to conduct the research on a
large scale.
ix. There are concerns about the reliability, validity and generalizability of the results.
2. SURVEYS
The term survey has two constituents, “sur” which means over and “view” which means to see.
Thus, the word survey means to oversee, that is, to look over something from high place. A

INTRODUCTION TO SOCIAL RESEARCH METHODS
66 | THIKA INSTITUTE OF BUSINESS STUDIES 0715 067 272 www.tibs.ac.ke [email protected]
survey is a data collection method based on the study of a given population. It is a systematic
gathering of information from the people for the purpose of understanding or predicting some
aspect of their behavior. The respondents are contacted by the research person personally,
telephonically or through mail. The questions to be asked in a survey are predetermined.
This is a type of research used to obtain data that can help determine specific characteristics of a
group. A descriptive survey involves asking questions (often in the form of a questionnaire) to a
large group of individuals either by mail, by telephone or in person. When answers to a set of
question are solicited in person, the data collection method is called an interview.
The survey method gathers data from a relatively large number of cases at a particular time. It is
not concerned with character of individuals. It is concerned with generalized statistics that results
when data are abstract from a number of individual cases. It is essentially cross sectional.
National population census is an example of survey. Survey data are expressed in numbers or
percentages.
3 Major Characteristics of a Survey
i. Information is collected from a group of people, in order to describe some aspect or
character of the entire population of which that group is a part.
ii. The main data collection method is asking questions. Answer to those questions
constitute the data of the study and an analysis of the data and interpretation of the same
presents the findings of the research.
iii. Information is collected from a sample rather than every member of the population.
Where the entire populations surveyed its called a census and not a survey
TYPES OF SURVEYS
a. Census survey: It covers the survey of entire population. It is very expensive and time
and effort consuming. But it provides diverse range of data.
b. Sample survey: It covers the study of a sample group only. A part of the population or
unit. It is less expensive and less time and effort consuming.
c. Regular survey: It is conducted after regular intervals. Generally, the government uses
it to obtain data about economics problems etc.

INTRODUCTION TO SOCIAL RESEARCH METHODS
67 | THIKA INSTITUTE OF BUSINESS STUDIES 0715 067 272 www.tibs.ac.ke [email protected]
d. Ad Hoc survey: It is conducted for certain purpose and is undertaken once for all.
Mostly, it is conducted for testing hypothesis, getting missing or new information.
e. Primary survey: It is conducted in order to acquire directly the relevant facts and
information. It is more reliable than secondary survey.
f. Secondary survey: It is conducted after the primary survey has been completed.
g. Official survey: It is conducted by government to serve general or specific information
for formulating plans and policies.
h. Non official survey: It is conducted by non-government persons or agency.
i. First survey: It is conducted in area for the first time.
j. Repetitive survey: It is conducted subsequent to first survey. It is made for second or
third time and so on.
k. Open survey: It is also called public survey. The repetitive survey is publicly available.
It is of general importance.
l. Confidential survey: The result of the survey is not made public. Information is not
revealed to the common people.
m. Social survey: It is conducted to collect facts about the social aspects of a community’s
position and activities.
n. Public opinion: It is conduced to know the views of the people in any subjects like
legalized abortion, open prostitution, homosexual activities etc.
Advantages of Surveys
- It has the potential to provide greater information from a large sample of individuals.
- Surveys provide a high level of general capability in representing a large population. Due
to the usual huge number of people who answers survey, the data being gathered possess
a better description of the relative characteristics of the general population
- Quickly reaches a geographically dispersed population.
- If structured random sampling is used, you might be able to make accurate population
estimates
- Can be administered remotely via online, mobile devices, mail, email, kiosk, or
telephone.

INTRODUCTION TO SOCIAL RESEARCH METHODS
68 | THIKA INSTITUTE OF BUSINESS STUDIES 0715 067 272 www.tibs.ac.ke [email protected]
- Conducted remotely can reduce or prevent geographical dependence
- Numerous questions can be asked about a subject, giving extensive flexibility in data
analysis
- A broad range of data can be collected (e.g., attitudes, opinions, beliefs, values, behavior,
factual).
- Standardized surveys are relatively free from several types of errors
- As questions in the survey should undergo careful scrutiny and standardization, they
provide uniform definitions to all the subjects who are to answer the questionnaires.
- Surveys are ideal for scientific research studies because they provide all the participants with
a standardized stimulus. With such high reliability obtained, the researcher’s own biases are
eliminated.
Difficulties in Surveys
Respondents may not feel encouraged to provide accurate, honest answers
Respondents may not feel comfortable providing answers that present themselves in a
unfavorable manner.
Respondents may not be fully aware of their reasons for any given answer because of
lack of memory on the subject, or even boredom.
Surveys with closed-ended questions may have a lower validity rate than other question
types.
Data errors due to question non-responses may exist. The number of respondents who
choose to respond to a survey question may be different from those who chose not to
respond, thus creating bias.
Survey question answer options could lead to unclear data because certain answer options
may be interpreted differently by respondents. For example, the answer option
“somewhat agree” may represent different things to different subjects, and have its own
meaning to each individual respondent. ‘Yes’ or ‘no’ answer options can also be
problematic. Respondents may answer “no” if the option “only once” is not available.
Surveys are good at getting shallow data from a large number of people, but not good at
getting deep data
Customized surveys can run the risk of containing certain types of errors
Getting respondents to answer questions honestly and thoughfully. Getting sufficient
numbers of the questionnaires completed and returned so that meaningful analysis can be
made.
Doing a survey research study is easy, but doing a well-planned, valid survey study takes
a lot of work
Ensuring that the questions to be answered are not misleading or ambiguous by trying to
make questions clear researchers unfortunately ask leading questions giving very little
true reflectin of the respondent answer. At times the question become too simplicit and
annoying.

INTRODUCTION TO SOCIAL RESEARCH METHODS
69 | THIKA INSTITUTE OF BUSINESS STUDIES 0715 067 272 www.tibs.ac.ke [email protected]
3. EXPERIMENTAL RESEARCH
It is a systematic and scientific approach to research in which the researcher manipulates one or
more variables, and controls and measures any change in other variables. It is research where the
researcher actively influences something to observe the consequences.
The researcher has two groups: the experimental group and the control group. The researcher
actually establishes different treatments and then studies their effects. The results of this type are
likely to lead to the clear-cut interpretations. The researcher will administer some treatment to
the experimental group while denying the control group, and then he/she sees the effect.
Unlike a descriptive study, an experiment is a study in which a treatment, procedure, or program
is intentionally introduced and a result or outcome is observed.
The American Heritage Dictionary of the English Language defines an experiment as “A test
under controlled conditions that is made to demonstrate a known truth, to examine the validity of
a hypothesis, or to determine the efficacy of something previously untried.”
True experiments have four elements:
i) Manipulation
ii) Control
iii) Random assignment ,
iv) Random selection .
The most important of these elements are manipulation and control. Manipulation means that
something is purposefully changed by the researcher in the environment.
Control is used to prevent outside factors from influencing the study outcome. When something
is manipulated and controlled and then the outcome happens, it makes us more confident that the
manipulation “caused” the outcome. In addition, experiments involve highly controlled and
systematic procedures in an effort to minimize error and bias which also increases our
confidence that the manipulation “caused” the outcome.
Another key element of a true experiment is random assignment. Random assignment means that
if there are groups or treatments in the experiment, participants are assigned to these groups or
treatments, or randomly (like the flip of a coin). This means that no matter who the participant is,
he/she has an equal chance of getting into all of the groups or treatments in an experiment. This
process helps to ensure that the groups or treatments are similar at the beginning of the study so
that there is more confidence that the manipulation (group or treatment) “caused” the outcome.

INTRODUCTION TO SOCIAL RESEARCH METHODS
70 | THIKA INSTITUTE OF BUSINESS STUDIES 0715 067 272 www.tibs.ac.ke [email protected]
Benefits and Advantages of Experimental Research:
Experimental research is the most appropriate way for drawing causal conclusions,
regarding interventions or treatments and establishing whether or not one or more factors
causes a change in an outcome. This is largely due to the emphasis in controlling
extraneous variables. If other variables are controlled, the researcher can say with
confidence that manipulation independent variable caused a changed in the dependent
variable.
It is a basic, straightforward, efficient type of research that can be applied across a variety
of disciplines.
Experimental research designs are repeatable and therefore, results can be checked and
verified.
Due to the controlled environment of experimental research, better results are often
achieved.
In the case of laboratory research, conditions not found in a natural setting can be created
in an experimental setting that allows for greater control of extraneous variables.
Conditions that may take longer to occur in a natural environment may occur more
quickly in an experimental setting.
There are many variations of experimental research and the researcher can tailor the
experiment while still maintaining the validity of the design.
It provides researchers with a high level of control.
By being able to isolate specific variables, it becomes possible to determine if a potential
outcome is viable. Each variable can be controlled on its own or in different
combinations to study what possible outcomes are available for a product, theory, or idea
as well. This provides a tremendous advantage in an ability to find accurate results.
There is no limit to the subject matter or industry involved.
Experimental research is not limited to a specific industry or type of idea. It can be used
in a wide variety of situations. Teachers might use experimental research to determine if
a new method of teaching or a new curriculum is better than an older system.
Pharmaceutical companies use experimental research to determine the viability of a new
product.
Experimental research provides conclusions that are specific.
Because experimental research provides such a high level of control, it can produce
results that are specific and relevant with consistency. It is possible to determine success
or failure, making it possible to understand the validity of a product, theory, or idea in a
much shorter amount of time compared to other verification methods. You know the
outcome of the research because you bring the variable to its conclusion.
The results of experimental research can be duplicated.
Experimental research is straightforward, basic form of research that allows for its
duplication when the same variables are controlled by others. This helps to promote the
validity of a concept for products, ideas, and theories. This allows anyone to be able to

INTRODUCTION TO SOCIAL RESEARCH METHODS
71 | THIKA INSTITUTE OF BUSINESS STUDIES 0715 067 272 www.tibs.ac.ke [email protected]
check and verify published results, which often allows for better results to be achieved,
because the exact steps can produce the exact results.
Natural settings can be replicated with faster speeds.
When conducting research within a laboratory environment, it becomes possible to
replicate conditions that could take a long time so that the variables can be tested
appropriately. This allows researchers to have a greater control of the extraneous
variables which may exist as well, limiting the unpredictability of nature as each variable
is being carefully studied.
Experimental research allows cause and effect to be determined.
The manipulation of variables allows for researchers to be able to look at various cause-
and-effect relationships that a product, theory, or idea can produce. It is a process which
allows researchers to dig deeper into what is possible, showing how the various variable
relationships can provide specific benefits. In return, a greater understanding of the
specifics within the research can be understood, even if an understanding of why that
relationship is present isn’t presented to the researcher.
It can be combined with other research methods.
This allows experimental research to be able to provide the scientific rigor that may be
needed for the results to stand on their own. It provides the possibility of determining
what may be best for a specific demographic or population while also offering a better
transference than anecdotal research can typically provide.
Limitations and Disadvantages of Experimental Research:
Experimental research can create artificial situations that do not always represent real-life
situations. This is largely due to fact that all other variables are tightly controlled which
may not create a fully realistic situation.
Because the situations are very controlled and do not often represent real life, the
reactions of the test subjects may not be true indicators of their behaviors in a non-
experimental environment.
Human error also plays a key role in the validity of the project as discussed in previous
modules.
It may not be really possible to control all extraneous variables. The health, mood, and
life experiences of the test subjects may influence their reactions and those variables may
not even be known to the researcher.
The research must adhere to ethical standards in order to be valid. These will be
discussed in the next module of this series.
Experimental research designs help to ensure internal validity but sometimes at the
expense of external validity. When this happens, the results may not be generalizable to
the larger population.
If an experimental study is conducted in its natural environment, such as a hospital or
community, it may not be possible to control the extraneous variables.

INTRODUCTION TO SOCIAL RESEARCH METHODS
72 | THIKA INSTITUTE OF BUSINESS STUDIES 0715 067 272 www.tibs.ac.ke [email protected]
Experimental research is a powerful tool for determining or verifying causation, but it
typically cannot specify “why” the outcome occurred.
Results are highly subjective due to the possibility of human error.
Because experimental research requires specific levels of variable control, it is at a high
risk of experiencing human error at some point during the research. Any error, whether it
is systemic or random, can reveal information about the other variables and that would
eliminate the validity of the experiment and research being conducted.
Experimental research can create situations that are not realistic.
The variables of a product, theory, or idea are under such tight controls that the data
being produced can be corrupted or inaccurate, but still seem like it is authentic. This can
work in two negative ways for the researcher. First, the variables can be controlled in
such a way that it skews the data toward a favorable or desired result. Secondly, the data
can be corrupted to seem like it is positive, but because the real-life environment is so
different from the controlled environment, the positive results could never be achieved
outside of the experimental research.
It is a time-consuming process.
For it to be done properly, experimental research must isolate each variable and conduct
testing on it. Then combinations of variables must also be considered. This process can
be lengthy and require a large amount of financial and personnel resources. Those costs
may never be offset by consumer sales if the product or idea never makes it to market. If
what is being tested is a theory, it can lead to a false sense of validity that may change
how others approach their own research.
There may be ethical or practical problems with variable control.
It might seem like a good idea to test new pharmaceuticals on animals before humans to
see if they will work, but what happens if the animal dies because of the experimental
research? Or what about human trials that fail and cause injury or death? Experimental
research might be effective, but sometimes the approach has ethical or practical
complications that cannot be ignored. Sometimes there are variables that cannot be
manipulated as it should be so that results can be obtained.
Experimental research does not provide an actual explanation.
Experimental research is an opportunity to answer a Yes or No question. It will either
show you that it will work or it will not work as intended. One could argue that partial
results could be achieved, but that would still fit into the “No” category because the
desired results were not fully achieved. The answer is nice to have, but there is no
explanation as to how you got to that answer. Experimental research is unable to answer
the question of “Why” when looking at outcomes.
Extraneous variables cannot always be controlled.
Although laboratory settings can control extraneous variables, natural environments
provide certain challenges. Some studies need to be completed in a natural setting to be
accurate. It may not always be possible to control the extraneous variables because of the
unpredictability of Mother Nature. Even if the variables are controlled, the outcome may

INTRODUCTION TO SOCIAL RESEARCH METHODS
73 | THIKA INSTITUTE OF BUSINESS STUDIES 0715 067 272 www.tibs.ac.ke [email protected]
ensure internal validity, but do so at the expense of external validity. Either way,
applying the results to the general population can be quite challenging in either scenario.
Participants can be influenced by their current situation.
Human error isn’t just confined to the researchers. Participants in an experimental
research study can also be influenced by extraneous variables. There could be something
in the environment, such an allergy, that creates a distraction. In a conversation with a
researcher, there may be a physical attraction that changes the responses of the
participant. Even internal triggers, such as a fear of enclosed spaces, could influence the
results that are obtained. It is also very common for participants to “go along” with what
they think a researcher wants to see instead of providing an honest response.
Manipulating variables isn’t necessarily an objective standpoint.
For research to be effective, it must be objective. Being able to manipulate variables
reduces that objectivity. Although there are benefits to observing the consequences of
such manipulation, those benefits may not provide realistic results that can be used in the
future. Taking a sample is reflective of that sample and the results may not translate over
to the general population.
Human responses in experimental research can be difficult to measure.
There are many pressures that can be placed on people, from political to personal, and
everything in-between. Different life experiences can cause people to react to the same
situation in different ways. Not only does this mean that groups may not be comparable
in experimental research, but it also makes it difficult to measure the human responses
that are obtained or observed.
EVALUATION RESEARCH
Definition of Evaluation
If you evaluate something or someone, you consider them in order to make a judgment about
them, for example about how good or bad they are.
Synonyms: assess, rate, value, judge
Gay defines evaluation research as the systematic process of collecting and analyzing data in
order to make decisions. Evaluation research is therefore a process of determining whether the
intended results were realized.
Evaluation research is used to determine the impact of a social intervention. A social
intervention is an action taken within a social context designed to produce an intended result.
Evaluation research thus analyzes the impact of a particular program on a certain social
problem the program is trying to solve.
In general, evaluation, both in theory and practice, covers the following criteria:

INTRODUCTION TO SOCIAL RESEARCH METHODS
74 | THIKA INSTITUTE OF BUSINESS STUDIES 0715 067 272 www.tibs.ac.ke [email protected]
• Relevance: The extent to which the objectives of an intervention are consistent with the
organization’s goals and strategies, beneficiaries’ requirements, country needs and global
priorities. Retrospectively, the question of relevance often becomes a question as to whether the
objectives of an intervention or its design are still appropriate given changed circumstances.
• Efficiency: A measure of how economically inputs are converted to results.
• Effectiveness: The extent to which the intervention’s objectives were achieved, or are
expected to be achieved, taking into account their relative importance. In this context, cost-
effectiveness assesses whether the costs of an activity can be justified by the outcomes and
impacts. At the design stage, the purpose is normally to identify the lowest cost alternative that
will achieve specified objectives. At the monitoring and evaluation stage, the purpose is to
analyse what outcomes have been achieved, at what cost.
• Impact: The primary and secondary, positive and negative, intended and unintended long-
term effects of an intervention.
• Sustainability: The continuation of benefits from an activity after major assistance has been
completed.
Some of the most common evaluation (research) questions:
Does a particular program or intervention – whether an instructional or motivational
program, improving access and opportunities, or a policy change – cause a particular
change in participants’ or others’ behavior, in physical or social conditions, health or
development outcomes, or other indicators of success?
What component(s) and element(s) of the program or intervention were responsible for
the change?
What are the unintended effects of an intervention, and how did they influence the
outcomes?
If you try a new method or activity, what happens?
Will the program that worked in another context, or the one that you read about in a
professional journal, work in your community, or with your population, or with your
issue?
If you want reliable answers to evaluation questions like these, you have to ask them in a way
that will show you whether you actually got results, and whether those results were in fact due to
your actions or the circumstances you created, or to other factors. In other words, you have to

INTRODUCTION TO SOCIAL RESEARCH METHODS
75 | THIKA INSTITUTE OF BUSINESS STUDIES 0715 067 272 www.tibs.ac.ke [email protected]
create a design for your research – or evaluation – to give you clear answers to your questions.
We’ll discuss how to do that later in the section.
Importance of Evaluation
Evaluating is for a number of reasons, including:
helping to ensure that objectives are met
identifying successes
identifying problems and weakness so they can be rectified
providing information to aid further development
providing evidence of the benefits and impacts of a project
contributing to securing funding for further development
identifying staff training and development needs
gaining the support of institutional managers
guiding future plans
providing information for stakeholders
developing guidelines which may be useful for other s
TYPES OF EVALUATION
a. Formative Evaluation
(also known as ‘evaluability assessment’)
A formative evaluation (sometimes referred to as internal) is a method for judging the worth of a
program while the program activities are forming (in progress).
Formative evaluation is used before program design or implementation. It generates data on the
need for the program and develops the baseline for subsequent monitoring. It also identifies areas
of improvement and can give insights on what the program’s priorities should be. This helps
project managers determine their areas of concern and focus, and increases awareness of your
program among the target population prior to launch.
When:
New program development
Program expansion
What:

INTRODUCTION TO SOCIAL RESEARCH METHODS
76 | THIKA INSTITUTE OF BUSINESS STUDIES 0715 067 272 www.tibs.ac.ke [email protected]
The need for your project among the potential beneficiaries
The current baseline of relevant indicators, which can help show impact later
Why:
Helps make early improvements to the program
Allows project managers to refine or improve the program
How:
Conduct sample surveys and focus group discussions among the target population focused on
whether they are likely to need, understand, and accept program elements.
Questions to ask:
Is there a need for the program?
What can do to improve it?
b. Process Evaluation
(also known as ‘program monitoring’)
Process evaluation occurs once program implementation has begun, and it measures how
effective your program’s procedures are. The data it generates is useful in identifying
inefficiencies and streamlining processes, and portrays the program’s status to external parties.
When:
When program implementation begins
During operation of an existing program
What:
Whether program goals and strategies are working as they should
Whether the program is reaching its target population, and what they think about it
Why:
Provides an opportunity to avoid problems by spotting them early
Allows program administrators to determine how well the program is working
How:

INTRODUCTION TO SOCIAL RESEARCH METHODS
77 | THIKA INSTITUTE OF BUSINESS STUDIES 0715 067 272 www.tibs.ac.ke [email protected]
Conduct a review of internal reports and a survey of program managers and a sample of the
target population. The aim should be to measure the number of participants, how long they have
to wait to receive benefits, and what their experience has been.
Questions to ask:
Who is being reached by the program?
How the program is being implemented and what are the gaps? Is it meeting targets?
c. Outcome Evaluation
(also known as ‘objective-based evaluation’)
Outcome evaluation is conventionally used during program implementation. It generates data on
the program’s outcomes and to what degree those outcomes are attributable to the program itself.
It is useful in measuring how effective your program has been and helps make it more effective
in terms of delivering the intended benefits.
When:
After the program has run for some time period
At an appropriate time to measure outcomes against set targets – usually benchmarked
time periods
What:
How much the program has affected the target population
Clearly establish the degree of benefit provided by the program
Why:
Helps program administrators tell whether a program is meeting its objectives
Insights from outcome-focused feedback can help increase effectiveness
How:
A randomized controlled trial, comparing the status of beneficiaries before and during the
program or comparing beneficiaries to similar people outside of the program. This can be done
through a survey or a focus group discussion.
Questions to ask:

INTRODUCTION TO SOCIAL RESEARCH METHODS
78 | THIKA INSTITUTE OF BUSINESS STUDIES 0715 067 272 www.tibs.ac.ke [email protected]
Did participants report the desired change after the implementation of the program?
What are the short or long-term results reported by participants?
d. Impact Evaluation
Impact evaluation studies the entire program from beginning to end (or at whatever stage the
program is at), and looks to quantify whether or not it has been successful. Focused on the long-
term impact, impact evaluation is useful for measuring sustained changes brought about by the
program or making policy changes or modifications to the program.
When:
At the end of the program
At pre-selected intervals in the program
What:
Assesses the change in the target population’s well-being
Accounts for what would have happened if there had been no program
Why:
To show proof of impact by comparing beneficiaries with control groups
Provides insights to help in making policy and funding decisions
How:
A macroscopic review of the program, coupled with an extensive survey of program participants,
to determine the effort involved and the impact achieved. Insights from program officers and
suggestions from program participants are also useful, and a control group of non-participants for
comparison is helpful.
Questions to ask:
What changes in program participants’ lives are attributable to your program?
What would those not participating in the program have missed out on?
e. Summative Evaluation
A summative evaluation (sometimes referred to as external) is a method of judging the worth of a
program at the end of the program activities (summation). The focus is on the outcome.

INTRODUCTION TO SOCIAL RESEARCH METHODS
79 | THIKA INSTITUTE OF BUSINESS STUDIES 0715 067 272 www.tibs.ac.ke [email protected]
Summative evaluation is conducted after the program’s completion or at the end of a program
cycle. It generates data about how well the project delivered benefits to the target population. It
is useful for program administrators to justify the project, show what they have achieved, and
lobby for project continuation or expansion.
When:
At the end of a program
At the end of a program cycle
What:
How effectively the program made the desired change happen
How the program changed the lives of program participants
Why:
Provides data to justify continuing the program
Generates insights into the effectiveness and efficiency of the program
How:
Conduct a review of internal reports and a survey for program managers and target populations.
The aim should be to measure the change that the project has brought about and compare the
change to the costs.
Questions to ask:
Should the program continue to be funded?
Should the program be expanded? If so, where? What factors worked in its favor and
what worked against it?
Evaluation
Type Definition Uses Examples
Formative
Evaluates a program
during development
in order to make early
improvements
Helps to refine or
improve program
When starting a
new program
To assist in the
early phases of
program
development
How well is
the program
being
delivered?
What
strategies can
we use to
improve this

INTRODUCTION TO SOCIAL RESEARCH METHODS
80 | THIKA INSTITUTE OF BUSINESS STUDIES 0715 067 272 www.tibs.ac.ke [email protected]
program?
Summative
Provides information
on program
effectiveness
Conducted after the
completion of the
program design
To help decide
whether to
continue or end a
program
To help
determine
whether a
program should
be expanded to
other locations
Should this
program
continue to be
funded?
Should we
expand these
services to all
other after-
school
programs in
the
community?
Process
Determines if specific
program strategies
were implemented as
planned
Focuses on program
implementation
To
determine why
an established
program has
changed over
time
To address
inefficiencies in
program delivery
of services
To accurately
portray to
outside parties
program
operations (e.g.,
for replication
elsewhere)
Did your
program meet
its goals for
recruitment of
program
participants?
Did
participants
receive the
specified
number of
service hours?
Outcomes
Focuses on the
changes in
comprehension,
attitudes, behaviors,
and practices that
result from programs
activities
Can include both short
To decide
whether
program/activity
affect
participants
outcomes
To establish and
measure clear
Did your
participants
report the
desired
changes after
completing a
program
cycle?
What are the

INTRODUCTION TO SOCIAL RESEARCH METHODS
81 | THIKA INSTITUTE OF BUSINESS STUDIES 0715 067 272 www.tibs.ac.ke [email protected]
and long term results benefits of the
program
short or long
term results
observed
among (or
reported by)
participants?
Impact
Focuses on long term,
sustained changes as a
result of the program
activities, both
positive/negative and
intended/unintended
To influence
policy
To see impact in
longitudinal
studies with
comparison
groups
What changes
in your
program
participants’
behaviors are
attributable to
your
program?
What effects
would program
participants
miss out on
without this
program?

INTRODUCTION TO SOCIAL RESEARCH METHODS
82 | THIKA INSTITUTE OF BUSINESS STUDIES 0715 067 272 www.tibs.ac.ke [email protected]
CHAPTER THREE
PROCEDURES OF UNDERTAKING RESEARCH
INTRODUCTION
Writers usually treat the research task on a sequential process involving several clearly defined
steps. Variations are suggested for different situations, but there is much similarity among the
sequences proposed. No one claims that research requires completion of each step before going
to the next. Recycling, circumventing and skipping occur. Some steps are begun out of
sequence, some are carried out simultaneously and some may be omitted. Despite these
variations the idea of a sequence is useful for developing a project and for keeping the project
orderly as it unfolds.
The scientific research process requires a sequence of steps. The following steps are undertaken
in a sociological investigation:
Summary of Steps
(Adapted from Anthony Giddens, Sociology. 1996)
1. DEFINE THE PROBLEM: Select a topic for research information
2. REVIEW THE LITERATURE: Familiarize yourself with existing research
3. FORMULATE a HYPOTHESIS: What do you intend to test? What is the relationship
between the variables?
4. SELECT A RESEARCH DESIGN: Choose one or more research methods: experiment,
survey, observation, use of existing sources, etc
5. CARRY OUT THE RESEARCH: Collect your data
6. INTERPRET YOUR RESULTS: Work out the implications of the data collected
7. REPORT THE RESEARCH FINDINGS: What is their significance? How do they relate to
previous findings?

INTRODUCTION TO SOCIAL RESEARCH METHODS
83 | THIKA INSTITUTE OF BUSINESS STUDIES 0715 067 272 www.tibs.ac.ke [email protected]
STEP 1: SELECTION AND DEFINING RESEARCH PROBLEM
Meaning of Research Problem
According to Mugenda and Mugenda( 2003) a research problem is a question or concern that can
be answered through the collection of data. We can also say a research problem is a question of
interest.
Problem Identification and Formulation
By definition, research problem is a difficulty which a researcher experiences in the context of
either theoretical or practical situation and wants to obtain a solution for the same.
Research problem is anything that a person finds unsatisfactory or unsetting a difficulty of
some sort, a state of affairs that needs to be changed or anything that is not working as well as
it might.
A research problem may be defined as an issue that exist in literature, theory or practice that
leads to a need of a research study.
Formulating a research problem is the first and most important step of the research. If the
identification of the final destination where one wants to go even before he starts the journey.
First it involves identifying the broad area or interest for example small scale business
enterprises, marketing of a particular commodity or personal performance in an industry.
Secondly the researcher narrows down from the general problem to a specific problem forming
the basis of the research study.
If a research problem is clearly and specifically formulated, the other processes or stages in the
process of research would be easier to achieve or to carry out.
Data analysis and style of writing of final report would greatly be influenced by the way in
which one formulates the research problem.
The research for a problem may take either of the two forms below:

INTRODUCTION TO SOCIAL RESEARCH METHODS
84 | THIKA INSTITUTE OF BUSINESS STUDIES 0715 067 272 www.tibs.ac.ke [email protected]
An attempt to fill the gaps or deficiency in past literature in terms of topics, methods and
implications.
A practical situation requiring investigation.
Sources of Research Problems
a. Personal experience: there could be important sources of a research problem.
Experience usually leads to a clear conceptualizing of the problem.
b. Deduction from theories: Deductive explanation arrives at specific conclusion on
the basis of generalization. There are many theories or general principles whose
applicability to specific educational problems is not known until tested. Such theories can
be found in politics personality or economics e.g the theory of demand or the price
theory.
c. Literature review: A review of related literature such as text books, articles, journals
on the broad problem area can give the researcher a good background of basic
information and an insight into various issues that can be studied.
d. Consultation with experts in this discipline: For example you may consult a
marketer to give you those problems in marketing.
e. Previous research study: Previous research studies especially in the area of interest
usually indicate areas of further research. A review of such studies usually provides the
researchers with the opportunity to be able to build up the previous research.
f. Replication: This involves carrying out a research project that had been done
previously. In this case, the problem and the procedure of the research are identical to the
study that was previously done. Replication is therefore done to find out whether findings
hold.
g. The media: issues which are frequently reported in this media can also form the basis
of a research problem. Such issues are usually discussed in public forums and are
important to the majority of the people.

INTRODUCTION TO SOCIAL RESEARCH METHODS
85 | THIKA INSTITUTE OF BUSINESS STUDIES 0715 067 272 www.tibs.ac.ke [email protected]
Factors to Consider When Selecting a Research Problem
The research problem should be formulated in view of some important variables.
a. Financial resources at one’s disposal
A research problem should be formulated in such a way that the objectives of the research can be
achieved with the given resources available. Poor formulation of a research problem which does
not take into consideration/ cognizance the financial situation may lead to non completion of the
research or inconclusive findings
One should make sure that the financial resources give room for readjsutmetn or changes as the
research progresses
b. Knowledge in the field of study
One should not formulate o research problem which goes for above his/her majesty of the area
Its important to identify any gap in one’s knowledge of the study before formulating the
problem.
d. Interests
Select a topic or an area of research that is interesting or stimulating to you. Given that research
involves hardwork has unforeseen problem and is time consuming a topic that is not interesting
ot the researcher may lead ot incomplete research study
e. Magnitude of the problem
Ensure that the research process covered in your research can be undertaken in the given time
and is manageable in view of knowledge already present. It may be necessary to narrow the topic
down or even to change it to a case study rather than studying the entire field or scope of
research area
f. Measurement of the Problem
Concepts used in study should be clear about the indicators to be used, tools and instruments of
measurements
E.g. Scale 1-10,1-3-slight 4-6 corrupt, 7-10 very corrupt
g. Level of Expertise
Pick an area of research that has basic information, or if information is lacking there is adequate
expertise or experts who can help you build up the stock of knowledge needed to solve the
research problem.

INTRODUCTION TO SOCIAL RESEARCH METHODS
86 | THIKA INSTITUTE OF BUSINESS STUDIES 0715 067 272 www.tibs.ac.ke [email protected]
i. Available of data
Research problem formulation should be restricted where data is available or can be generated
j. Ethical issues
Avoid controversial topics
Avoid research topics which would require deception or concealment of facts
General
Choose area that is not overdone
Don’t choose a topic that is too narrow or too vague
Criteria of Good Research Problems
In formulating research problems, it is possible that the problems that may be important to some
people may not be so to others. It is also possible that some problems are easy to understand and
investigate than others.
In order to ensure that your research problem is appropriate, it should have the basic qualities.
These are:-
i. It should be researchable and verifiable. It should be one which can be investigated
through collection and analysis of data.
ii. It must have the theoretical or practical significance. This means that it should contribute
to the improvement educational process.
iii. It should be clear. The problem should be stated clearly and concisely.
iv. It should be ethical. That is, it should not involve psychological damage to the people
being investigated. It generates a number of more specific research questions.
v. Sufficient research should be available or can be obtained to address it.
vi. It must be that you can adequately investigate that research with your skills and available
time and other resources.

INTRODUCTION TO SOCIAL RESEARCH METHODS
87 | THIKA INSTITUTE OF BUSINESS STUDIES 0715 067 272 www.tibs.ac.ke [email protected]
What to Avoid While Selecting Problem
(i) Subject which is overdone should not be normally chosen, for it will be a difficult task to
throw any new light in such a case.
(ii) Controversial subject should not become the choice of an average researcher.
(iii) Too narrow or too vague problems should be avoided.
(iv) The subject selected for research should be familiar and feasible so that the related research
material or sources of research are within one’s reach. Even then it is quite difficult to supply
definitive ideas concerning how a researcher should obtain ideas for his research. For this
purpose, a researcher should contact an expert or a professor in the University who is already
engaged in research. He may as well read articles published in current literature available on the
subject and may think how the techniques and ideas discussed therein might be applied to the
solution of other problems. He may discuss with others what he has in mind concerning a
problem. In this way he should make all possible efforts in selecting a problem.
(v) The importance of the subject, the qualifications and the training of a researcher, the costs
involved, the time factor are few other criteria that must also be considered in selecting a
problem. In other words, before the final selection of a problem is done, a researcher must ask
himself the following questions:
(a) Whether he is well equipped in terms of his background to carry out the research?
(b) Whether the study falls within the budget he can afford?
(c) Whether the necessary cooperation can be obtained from those who must participate
in research as subjects?
If the answers to all these questions are in the affirmative, one may become sure so far as the
practicability of the study is concerned.
(vi) The selection of a problem must be preceded by a preliminary study. This may not be
necessary when the problem requires the conduct of a research closely similar to one that has
already been done. But when the field of inquiry is relatively new and does not have available a
set of well developed techniques, a brief feasibility study must always be undertaken.
STEP 2: REVIEW OF LITERATURE
This step involves familiarizing or orienting yourself with the concepts, theories and the works
already done pertaining to the topic identified. Relevant available literature on the topic chosen

INTRODUCTION TO SOCIAL RESEARCH METHODS
88 | THIKA INSTITUTE OF BUSINESS STUDIES 0715 067 272 www.tibs.ac.ke [email protected]
should be reviewed; we should also check out what works have already been done by others,
what gaps are remaining, what questions remain unanswered, etc.
Research work normally proceeds by reviewing earlier works on a specific research problem one
has identified. The researcher will need to review past works on the question he or she is raising
(Dooley, 1995). The traditionally dominant source for literature review has been libraries and
documentation centers where books and various references are found in card catalogued manner.
Nowadays, most libraries maintain a computerized filing system, whereby references are made
available via electronic online methods. Searching literature has become very easy, thus, with the
computerization of library sources; one can easily access them if Internet connection is available
(Rosnow and Rosenthal, 1996)
Literature review is necessitated by the fact that a researcher is probably not the first person to
develop an interest in a particular problem; and hence, he or she need to spend some time in the
library reviewing what theories and methods others have used to the topic in the past and what
findings are there (Macionis, 1997).
According to Marshal and Rossman (1989: 35), review of literature has the following four
purposes:
i. First, it demonstrates the underlying assumptions behind the general research question….
ii. Second, it demonstrates that the researcher is thoroughly knowledgeable about related
research and the intellectual traditions that surround and support the study.
iii. Third, it shows that the researcher has identified some gaps in previous research and that
the proposed study will fill a demonstrated need.
iv. And finally, the review refines and redefines the research questions and related tentative
hypotheses by embedding those questions in larger empirical traditions.
STEP 3: HYPOTHESIS FORMULATION
Hypothesis is a statement that can be proved to be correct or incorrect. Hypothesis formulation
involves identifying basic research objectives and determining research questions. This should be
tested empirically.
We put some guiding assumptions to the research in this step. We ask some basic research
questions.

INTRODUCTION TO SOCIAL RESEARCH METHODS
89 | THIKA INSTITUTE OF BUSINESS STUDIES 0715 067 272 www.tibs.ac.ke [email protected]
However, we may note that this may not be always the case. The type of research may determine
whether hypothesizing is needed or not. For example, in exploratory studies hypothesizing may
not be needed.
STEP 4: RESEARCH DESIGN
When particular research area has been defined, research problem is defined, and the related
literature in the area has been reviewed, the next step is to construct the research design. It is
fundamental to the success of any scientific research. Decisions with regards to what, where,
when, how much, by what means concerning an enquiry or a research design are taken. A
research design expresses both the structure of the research problem and the plan of investigation
used to obtain empirical evidence on relations.
Research design means an overall framework or plan for the activities to be undertaken during
the course of a research study. It involves decisions regarding what, where, when, how much
and by what means concerning a research study. It constitutes a blue print for the collection,
measurement and analysis of data. It serves as a framework for the study , guiding the collection
and analysis of data, research instrument to be utilized and the sampling plan to be followed.
There are many definitions of research design, but no definition imparts the full range of
important aspects.
Kerlinger N F (1986) defines a research design as the plan and structure of investigation so
conceived on to obtain answer to research questions and to control variance.
Phillips S B (1971) noted that the research design constitutes the blueprint for the collection,
measurement, and analysis of data. It aids the scientist in the allocation of his limited resources
by posing crucial choices. The two definitions differ in detail, but together they give the
essentials of research design
According to Kinner and Taylor: “ A research design is the basic plan which guides the data
collection and analysis phase of the research project. It is the framework which specifies the
type of information to be collected, the source of data and the data collection procedure.”
The design provides answers for such questions as:.

INTRODUCTION TO SOCIAL RESEARCH METHODS
90 | THIKA INSTITUTE OF BUSINESS STUDIES 0715 067 272 www.tibs.ac.ke [email protected]
i. Methods and techniques to be utilized for gathering information from the population to
be researched.
ii. What kind of sampling will be used?
iii. Approach to be utilized in processing and analyzing data.
Elements of Research Design
1. Problem: A problem is an interrogative sentence or statement that asks what relation exists
between two or more variables. The answer is what is being bought in the research. Research
design is based on the research problem.
2. Methodology: It deals with a choice of research design methods of measurement and types of
analysis. All of these must be congruent. They must fit together. Methodology should be
appropriate to the research problem.
3. Data gathering: To implement general plan of research, methods of data collection must be
used. There is always mutual inter plan of the problem and method. Problems dictate methods to
a considerable extent. It can use internal or external sources. The tools can be questionnaire,
observation, interview, etc.
4. Report writing: It involves preparation and presentation of the research report. A report is a
presentation of the research findings directed to a specific audience to accomplish specific
objective.
Purposes of research design:
To provide answer to research question: Research design is invented to enable the
researcher to answer research questions as , objective, accurately and economically as
possible.
To control variance: It enables the investigator to gather and analyze his data in certain
ways, It is a control mechanism.
Types of Research Design:
1. Descriptive Research Design: ™
Descriptive research design is designed to describe something. It simply portrays an accurate
profile of organizations, events, situation or any phenomena. It describes conditions or
relationship that exists, opinion that are held, process that are going on, effects that are evidence

INTRODUCTION TO SOCIAL RESEARCH METHODS
91 | THIKA INSTITUTE OF BUSINESS STUDIES 0715 067 272 www.tibs.ac.ke [email protected]
or trends that are developing. It is the fact finding operation design to search for information.
Investigators collect, classify and correlate data to describe that exists. But it does not answer
why phenomena behave as they do.
Descriptive research is appropriate in the following conditions:
• Portraying the characteristics of social or any phenomena and determining the frequency of
occurrence.
• Determining the degree of to which variables are associated.
Purposes of Descriptive Research
To collect detailed factual information that describes existing phenomena.
To identify problems or justify current conditions and practice.
To make comparisons and evaluations.
To determine what others are doing with similar problems or situations and benefit from
their experience in making future plans and decisions.
2. Exploratory Research Design:
It is designed to explore ideas and insights in order to obtain a proper definition of problems at
hand. It is appropriate for the early stage of decision making process. It is designed to obtain a
preliminary investigation of the situation with a minimum expenditure of time and cost.
Purpose of exploratory research
• To identify problems and opportunities.
• To develop a more precise formulation of a vaguely identified problems or opportunity.
• To gain perspective regarding the breadth of variables operating in a situations.
• To establish priorities regarding the potential significance of various problems or opportunities
• To identify and formulate alternative courses of action.
• To gather information on the problems associated with doing conclusive research.
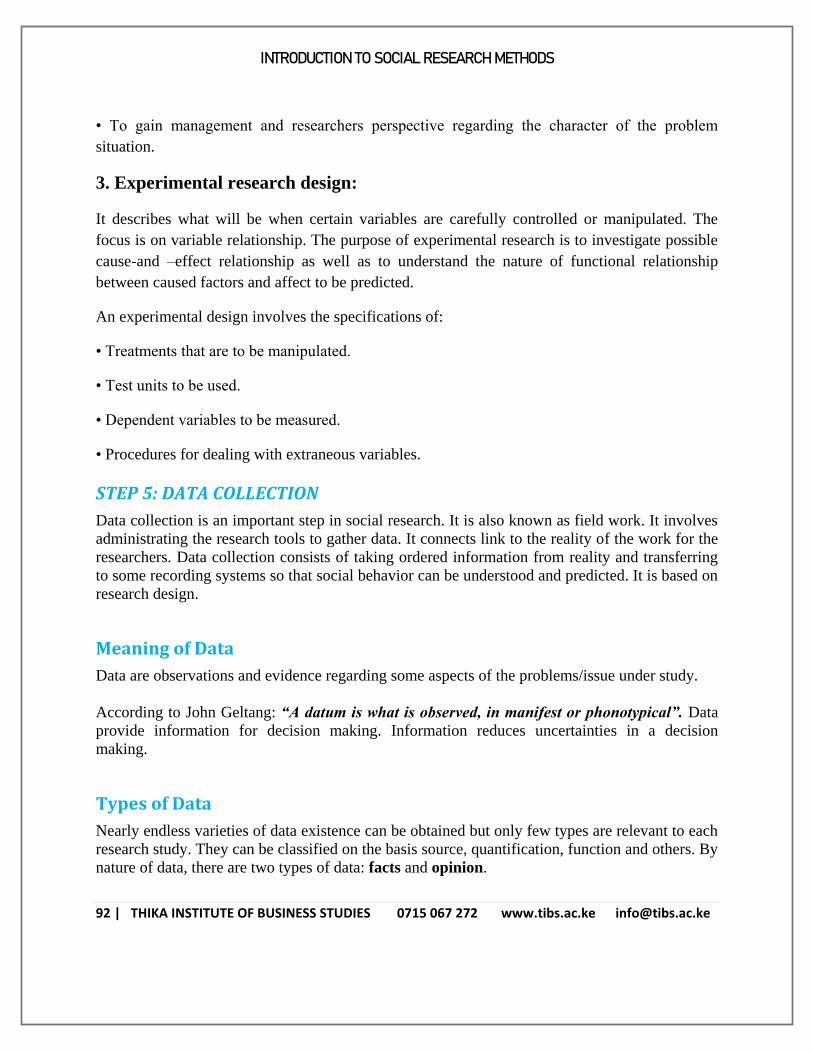
INTRODUCTION TO SOCIAL RESEARCH METHODS
92 | THIKA INSTITUTE OF BUSINESS STUDIES 0715 067 272 www.tibs.ac.ke [email protected]
• To gain management and researchers perspective regarding the character of the problem
situation.
3. Experimental research design:
It describes what will be when certain variables are carefully controlled or manipulated. The
focus is on variable relationship. The purpose of experimental research is to investigate possible
cause-and –effect relationship as well as to understand the nature of functional relationship
between caused factors and affect to be predicted.
An experimental design involves the specifications of:
• Treatments that are to be manipulated.
• Test units to be used.
• Dependent variables to be measured.
• Procedures for dealing with extraneous variables.
STEP 5: DATA COLLECTION
Data collection is an important step in social research. It is also known as field work. It involves
administrating the research tools to gather data. It connects link to the reality of the work for the
researchers. Data collection consists of taking ordered information from reality and transferring
to some recording systems so that social behavior can be understood and predicted. It is based on
research design.
Meaning of Data
Data are observations and evidence regarding some aspects of the problems/issue under study.
According to John Geltang: “A datum is what is observed, in manifest or phonotypical”. Data
provide information for decision making. Information reduces uncertainties in a decision
making.
Types of Data
Nearly endless varieties of data existence can be obtained but only few types are relevant to each
research study. They can be classified on the basis source, quantification, function and others. By
nature of data, there are two types of data: facts and opinion.

INTRODUCTION TO SOCIAL RESEARCH METHODS
93 | THIKA INSTITUTE OF BUSINESS STUDIES 0715 067 272 www.tibs.ac.ke [email protected]
Facts: Facts describes tangible things. They measure anything that actually exists or can exist.
Facts then described as things done or a piece of information having objectives reality. Facts can
be intangible as long as they can really be determined.
Examples of facts:
• The distance between Nairobi and Mombasa is 342 km
• We have 8 planets The information presented in the above example give us the accurate picture
of the distance and the number of planets respectively. However, the data based on estimates or
on samples may not be reliable facts.
Opinion: Opinions are how people perceive something. They are what people believe about
something and what whose beliefs signify. They are the results of people attitudes, intensions,
knowledge and motives. These all reflects people perception about matter. It can be an attitude or
image. Attitudes are mental sets or predispositions to some manner. An image is what something
is like.
Examples of opinion: “I believe there is life on Mars.”
Importance of Data Collection
• Data collection completely fulfills the data requirements of a research project. It is the
connecting link for the researchers to the world of reality.
• It provides the sources of comparative data by which data can be interpreted and evaluated
against each other. Based on the data collection, data are presented and analyzed.
• It suggests the type and method of data for meeting the information needed. Several data
collection methods are used to collect several types of data.
• It serves as a source of future reference and evidence because they are used to prepare written
records. They can now provide lots of material for the subsequent research.
• It helps to takes ordered information from reality and transferring into some recording system
so that it can be later examined and analyzed. It is from that pattern that social behavior can be
predicted.
SOURCES OF DATA COLLECTION
Data may be collected from several sources. It is not easy to list them in details. Researchers use
these sources according to their data needs. However, the general classification of data collection
sources can be presented under two groups:
a. Primary Sources
It provides primary data. Primary data are first hand, original data collected by the researchers
for the research project by hand. They are collected for meeting the specific objectives of the

INTRODUCTION TO SOCIAL RESEARCH METHODS
94 | THIKA INSTITUTE OF BUSINESS STUDIES 0715 067 272 www.tibs.ac.ke [email protected]
study. They can be obtained from families, representatives, organization, etc. interviews,
questionnaire, observation are the major tools for collecting data from primary sources.
Advantages of Primary Data:
Advantages of primary data are as follows:
• The primary data are original and relevant to the topic of the research study so the
degree of accuracy is very high.
• Primary data is that it can be collected from a number of ways like interviews, telephone
surveys, focus groups etc. It can be also collected across the national borders through emails and
posts. It can include a large population and wide geographical coverage.
• Moreover, primary data is current and it can better give a realistic view to the researcher about
the topic under consideration.
• Reliability of primary data is very high because these are collected by the concerned and
reliable party.
Disadvantages of Primary Data:
Following are the disadvantages of primary data:
• For collection of primary data where interview is to be conducted the coverage is limited and
for wider coverage a more number of researchers are required.
• A lot of time and efforts are required for data collection. By the time the data collected,
analysed and report is ready the problem of the research becomes very serious or out dated. So
the purpose of the research may be defeated.
• It has design problems like how to design the surveys. The questions must be simple to
understand and respond.
• Some respondents do not give timely responses. Sometimes, the respondents may give fake,
socially acceptable and sweet answers and try to cover up the realities.
• With more people, time and efforts involvement the cost of the data collection goes
high. The importance of the research may go down.
• In some primary data collection methods there is no control over the data collection.
Incomplete questionnaire always give a negative impact on research.
• Trained persons are required for data collection. In experienced person in data collection may
give inadequate data of the research.
b. Secondary Sources
It provides secondary data. Secondary data are already gathered by others. They are attained
indirectly. The researcher doesn’t obtain them directly. They are collected by some other
researchers before and have been processed at least once.

INTRODUCTION TO SOCIAL RESEARCH METHODS
95 | THIKA INSTITUTE OF BUSINESS STUDIES 0715 067 272 www.tibs.ac.ke [email protected]
Types of Secondary Data
a. Internal secondary data: They are available from in-house source. The source like
within the organization. Sources of such data include representative’s report, shipment records,
accounting data etc.
b. External secondary data: They are available from the sources outside the organization.
Such sources include published report, library, computer, data books, etc.
Advantages of Secondary Data:
• The primary advantage of secondary data is that it is cheaper and faster to access.
• Secondly, it provides a way to access the work of the best scholars all over the world.
• Thirdly, secondary data gives a frame of mind to the researcher that in which direction he/she
should go for the specific research.
• Fourthly secondary data save time, efforts and money and add to the value of the
research study.
Disadvantages of Secondary Data:
Following are the disadvantage of secondary data:
• The data collected by the third party may not be a reliable party so the reliability and
accuracy of data go down.
• Data collected in one location may not be suitable for the other one due variable
environmental factor.
• With the passage of time the data becomes obsolete and very old
• Secondary data collected can distort the results of the research. For using secondary
data a special care is required to amend or modify for use.
• Secondary data can also raise issues of authenticity and copyright.
DATA COLLECTION METHODS
Any research is only as good as the data that drives it, so choosing the right technique of data
collection can make all the difference. The following are some of the methods of data collection:
1. INTERVIEW
It is a technique of primary data collection. It is an oral method in which one person asks another
person questions designed to obtain answer pertinent to the research problem. It is most

INTRODUCTION TO SOCIAL RESEARCH METHODS
96 | THIKA INSTITUTE OF BUSINESS STUDIES 0715 067 272 www.tibs.ac.ke [email protected]
commonly used direct method in the study of human behavior. The interview is a face to face
interpersonal role situation in which one person asks another person being interviewed. The
respondent question designed to obtain answer pertinent to the purpose of the research problem.
The interview may be regarded as a systematic method by which one person enters more or less
imaginatively with the inner life of another who is generally a comparative stranger to him. The
purpose of interview is to find out what’s in or on someone else’s mind.
According to Kerlinger “The interview is a face to face interpersonal role situation in which
one person, the interviewer, asks a person being interviewed, the respondent, questions
designed to obtain answers pertinent to the purpose of the research problem.”
Research Interview Schedule
Interviewing itself is an art. But planning and writing an interview schedule is even more or so.
The research interview schedule is a guideline which the interviewer follows indicating which
question should be asked. As interviewer asks the question, s/he records the response. A good
interviewer will let the respondent do most of talking.
Formats of Research Interview Schedule
There are three formats of interview schedule providing 3 kinds of information. They are:
i. Fixed – alternative item interview It offers the respondents a choice among two or more alternatives. The responses are limited to
stated alternatives. These items are called or full questions. The commonest kind of fixed –
alternative items is dichotomous. If asks for yes-no, agree-disagree, and other two alternative
items often a third alternative don’t know or undecided is added.
ii. Open-end item Open-end item is an interview schedule that lists only the main question. It permits the
respondent to answer the question in the way s/he likes. The contents of the schedule are dictated
by the research problems. They impose no other restriction on the contents and the manner of
respondents answer. Open-end questions are more flexible. They have possibilities of depth.
Misunderstanding can be clear up through poling.
Example: Do you have any contacts with any members of the faculty outside of class? If
yes, how often is that?
iii. Scale item A scale is set of verbal items to each of which an individual responds by expressing degree of
agreement or disagreement or some other mode or response. Scale items have fixed alternatives
and place the responding individual at some point on the scale.

INTRODUCTION TO SOCIAL RESEARCH METHODS
97 | THIKA INSTITUTE OF BUSINESS STUDIES 0715 067 272 www.tibs.ac.ke [email protected]
Example: How do you rate your college library in relation to your needs? 1. Terrible 2.
Unsatisfaction 3. Satisfaction 4. Very good 5. Excellent
Types of Interview
i. Structured or Standardized Interview It this interview, the questions, their sequence and their wordings are fixed. The same question is
asked to everybody in the same manner. in general, the interviewer doesn’t have flexibility to
change the question, their format or order. Sometimes an interviewer may be allowed some
liberty in asking question but relatively little. That liberty is specified in advance. Standardized
interviews are interview schedule that have been carefully prepared to obtained information
pertinent to the research problem.
ii. Unstructured or Unstandardized Interview In the interview, the sequence and wording of question are not fixed. The interviewer doesn’t
follow pre-planed list of the question. The interviewer writes the response of the interview
during the interview or after interview is completed. It is more flexible and open. Ordinary no
schedule is used. They don’t mean that unstructured interview is casual. The interviewer will
have a tentative list of question to be covered during the interview.
iii. Semi-structured or focused interview
The investigator attempt to focus the discussion on the actual effects of a given experience to
which the respondents have been exposed.
The situation is analyzed prior to the interview. An interview guide specifying topics relating
to the research hypothesis is used. Interview is focused on the subjective experiences of the
respondent.
iv. Clinical interview
It is concerned with broad underling feelings or motivations or with the course of the
individual’s life experiences. The ‘personal history’ interview used in social case work, prison
administration, psychiatric clinics and in individuals life history research is the most common
type of clinical interview
v. Depth interview

INTRODUCTION TO SOCIAL RESEARCH METHODS
98 | THIKA INSTITUTE OF BUSINESS STUDIES 0715 067 272 www.tibs.ac.ke [email protected]
This is an intensive and searching interview aiming at studying the respondent’s opinion,
emotions or convictions on the basis of an interview guide.
This deliberately aims to elicit unconscious as well as extremely personal feelings and
emotions
vi. Group interview
It is a method of collecting primary data in which a number of individuals with a common
interest interact with each other
vii. Telephone interviews
It is a non-personal method of data collection.
It may be used as a major method or supplementary method.
Advantages of Interviews:
quick method
more flexible as interviewer can explain questions not understood by the respondent
allows greater sample control
response rate tends to be higher than mail
Low cost (assuming relatively few)
Respondents define what is important
Rapid data collection
Possible to explore issues in depth
Opportunity to clarify responses through probes
Sources of leads to other data sources and other key informants
Drawbacks of Interviews:
Cost per respondent higher
Some people may not want to discuss personal Qs with interviewer
Interviewer’s manner of speaking may affect the respondent’s answers
Different interviewers may interpret and record response in a variety of ways
under time pressure, data may be entered without actually interviewing
Can be time consuming to set up interviews with busy informants

INTRODUCTION TO SOCIAL RESEARCH METHODS
99 | THIKA INSTITUTE OF BUSINESS STUDIES 0715 067 272 www.tibs.ac.ke [email protected]
Requires skilled and/or trained interviewers
Accuracy (generalizability) limited and difficult to specify
Produces limited quantitative data
May be difficult to analyze and summarize findings
2. QUESTIONNAIRE
A questionnaire is a format list of questions designed to gather respondent from respondent on a
given topic. It is a formalized schedule for data collection. It is used when fractional information
is designed. When opinion rather than facts are desired, opinionnaire or attitude scale is used.
Questionnaire is a term used for almost any kind of instrument that has questions or items to
which individuals respond. A questionnaire is a list of questions to number of persons for them
to answer. It secures standardized results that can be tabulated created statistically.
Types of Questionnaire
a. Open or open-ended question: It calls for free response in the respondent’s own words.
It requires the respondents to provide their own answer to the question. No alternative answer is
given.
b. Close or close-ended question: It is also called restricted questionnaire. It offers the
respondent choice among two or more alternatives. Answer to each question is predetermined
and included in the question form. The respondents mark yes or no or write a short response or
check an item form the list of suggest response.
Types of close- questionnaire Dichotomous questionnaire: It offers only two alternatives; positive and negative. The
response would be yes or no; agree or disagree; and so on. It is also known as two way
questionnaire.
Multi chotomous questionnaire: It is also called multiple choice questionnaires.
FORMULATION OF A QUESTIONNAIRE
The success of a questionnaire depends upon the skills and insights with which the lists of
questions are formulated along with the type of questions used. The following considerations in
mind while formulating questionnaire.

INTRODUCTION TO SOCIAL RESEARCH METHODS
100 | THIKA INSTITUTE OF BUSINESS STUDIES 0715 067 272 www.tibs.ac.ke [email protected]
a. Appeal
The appeal should be short, clear and direct establishing the genuineness of the research and its
utility for all concerned.
b. Instruction for Filling up the Questionnaire
The questionnaire must carry a list of instructions for filling it up and dispatching it.
c. Form of the Questionnaire
The outlook and appearance of the questionnaire should be attractive. It must be printed in an
appealing style on high quality paper.
d. Clarity of Questions
The best method is to ensure that our questionnaire does not have any misleading or confusing
questionnaire. It should first be tried on a selected group of individuals and suitable
modifications should be made in questions in the light of the experience with the selected group.
e. Sequence of Questions
The order of framing questions is also important. The sequence must be logical and arouse
interest in the questions. The disorderly sequence of the questions disturbs the mind of the
respondent and he may fail to answer the questions, adequately.
f. General Form
So far as the general form of a questionnaire is concerned, it can either be structured or
unstructured questionnaire. Structured questionnaire are those questionnaires in which there are
definite, concrete and pre-determined questions. The questionnaire which do not have definite,
concrete and pre0determind questions are termed as unstructured questionnaire. In this type, the
researcher/ interviewer is provided with a general guide on the type of information to be
obtained.
g. Question Formulation and Wording
In general, all questions should meet the following standards
(i) should be easily understood;
(ii) should be simple that is, should convey only one thought at a time;

INTRODUCTION TO SOCIAL RESEARCH METHODS
101 | THIKA INSTITUTE OF BUSINESS STUDIES 0715 067 272 www.tibs.ac.ke [email protected]
(iii) should be concrete and should conform as much as possible to the respondents way of
thinking.
Construction of Questionnaire
The process of drafting a questionnaire should have the following aspects:
i) Information required: The first step in the formulation of a questionnaire is to decide in
advance what type of information is needed for the study.
ii) Type of questionnaire to be used: Questionnaires may be categorized according to structure
and directness. Structure refers to the degree to which the questions and responses are formal and
standardized.
iii) First draft: Before finalizing the questionnaire the researcher should prepare a preliminary
draft of the questionnaire based on the aim and objectives of the study. The researcher can
check .revise and prepare the final draft of the questionnaire based on pre-testing result of the
questionnaire. Revising questions: the researcher should revise the questionnaire before the final
edition. This will help the researcher to understand unforeseen problems related to wording,
format, sequence etc
iv) Editing of questionnaire: Researcher must pay proper care and attention to the editing of the
questionnaire. Simple words, which are familiar to all respondents should be employed. Words
with ambiguous meanings, danger words, words with emotional connotations should be avoided.
v) Explaining the procedure for its use: the researcher should give or specify the procedure or
instructions for its use. If the instrument is meant for mail survey, instructions regarding the
mode of answering should be specified at the top of the first page. The anonymity should be
assured.
vi) Pre-testing of questionnaire: Pretest is a try out of the questionnaire to see how it works and
whether changes are necessary before the start of full scale study. It provides a means of catching
and solving unforeseen problems in the administration of the questionnaire, such as the wording,
sequence of questions or even length. It may also indicate the need for additional questions or the
elimination of others. Pretests are best done by personal interview even if the survey is to be
handled by mail or telephone.
vii) Final draft of the questionnaire: After pretesting the questionnaire if any mistakes are
found, they must be corrected and the draft revised. In fact, there is no final word about the

INTRODUCTION TO SOCIAL RESEARCH METHODS
102 | THIKA INSTITUTE OF BUSINESS STUDIES 0715 067 272 www.tibs.ac.ke [email protected]
construction of a questionnaire. Improvements can always be thought of and the lacunae existing
in the questionnaire would be coming to light as the work is progressing.
Various Methods/ Techniques for Getting the Response
There are several methods to get the responses through a questionnaire. They can be listed as:
a. Self addressed envelope
b. Incentives/schemes/prizes
c. Reminders
d. Using mediator
e. Sufficient interval
f. Retention
g. Good and interest creating questions
CHARACTERISTICS OF GOOD QUESTIONS
Good questions should:
1. Be simple and clear
2. Be suitable to respondent’s intelligence level
3. Be relevant
4. Be indirect
5. Have serial order
6. Have classifiability
7. Have verifiable questions
8. Have ambiguous questions
9. Be answerable in few words
TYPES OF QUESTIONS
The different types of questions are framed by the social scientist in order to elicit different types
of information on various aspects of a problem. The two most common types of questions
generally used in the research instruments:
a. Open ended questions,
b. Closed ended questions
a. Open-ended questions

INTRODUCTION TO SOCIAL RESEARCH METHODS
103 | THIKA INSTITUTE OF BUSINESS STUDIES 0715 067 272 www.tibs.ac.ke [email protected]
The respondent in asked to provide his or her own answer to the questions eg. (‘What do you feel
is the most important issue facing Kenya today?) and provided with a space to write in the
answer (or be asked to report in verbally to an interviewer)
b. Closed-ended Questions
The respondents are asked to select an answer from among a list provided by the researcher.
Closed-ended questions are very popular because they provide a greater conformity of responses
and are more easily processed. Open-ended responses must be coded before they can be
processed for computer analysis. This coding process often requires that the researcher interpret
the meaning of responses, opening the possibility of misunderstanding and researcher bias.
There is also a danger that some respondents will give answers that are essentially irrelevant to
the researcher’s intent. Closed-ended questions can often be transferred directly into computer
format.
The chief shortcoming of closed-ended questions lies in the researcher’s structuring of responses.
In asking about ‘the most important issue facing Kenya, for example, your check-list of issues
might omit certain issues that respondents would have said were important.
In the construction of closed-ended questions, the response categories provided should be
exhaustive. (They should include all the possible responses that might be expected) – (Please
specify …………). Second, the answer categories must be mutually exclusive : (In some cases
you may wish to solicit multiple answers, but these may create difficulties in data processing and
analysis later on).
Advantages of Questionnaire
i. It is versatile. Almost every problem of social research can be approached from the
questionnaire stand point. Every social problem involves people. Therefore, ideas relative
to the problem and solution can be obtained by asking these people about the problem
ii. Many people can be studied only by questioning. Knowledge, opinions, motivation, and
intentions are usually not open to observation. Similarly, it is not feasible to observe
personnel activities such as burning teeth. So, it is feasible.
iii. Questioning is usually faster and efficient than observation. Some events that take place
over a time period would require lengthy observation, but a question on this behavior can
be answered in a few seconds.
iv. It is cheaper then observing. The researcher has not to stand time to observe the behavior
of the respondent. A decrease in time usually lead to decrease in cost.
v. The person administrating the questionnaire has an opportunity to establish report,
explain the purpose of the study and explain the meaning of items that may not be clear.

INTRODUCTION TO SOCIAL RESEARCH METHODS
104 | THIKA INSTITUTE OF BUSINESS STUDIES 0715 067 272 www.tibs.ac.ke [email protected]
vi. Facilitates the study of larger population
vii. Early receipt of information is possible
viii. Provides valid information
ix. It is self-administrative
Disadvantages of Questionnaire
i. Respondents would be unwilling to provide information. Questions about income or very
personnel subject frequently meet refusal by respondent. The show little or no interest to
the question.
ii. Despite a willingness to cooperate, many people are unable to give accurate information
of questions.
iii. There can be influence on questioning process. Often respondent attempt to give answers
that they think will please the researchers.
iv. Filling out lengthy questions take a great deal of time and money.
v. It cannot be used in illiterate person.
vi. Incomplete responses are possible
vii. There is a possibility of wrong answer
viii. Useless in depth problem
ix. Uniform questions are not applicable to other people of different ethnicity, culture etc.
3. OBSERVATION
It is a method of gathering primary data physically or mechanically recording events or aspect of
the phenomenon under investigation. It involves recording of the respondents’ behavior. It is the
process of recognizing noting people, objects and occurrence of events rather than asking for
information. It can supplement the information collected through questionnaire and interview.
Observation is the process of recognizing and recording behavior of people, objects and events.
Observation is systematic and deliberate study through eye, of spontaneous occurrence at the
time they occur. Example: instead of asking consumer what brand they buy or what television
program they watch, the researcher arrange to observe what product are brought and what
program they watch.
Observation is one of the cheaper and more effective techniques of data collection. Observation,
in simple terms, is defined as watching the things with some purpose in view. However, in
research activity the term has a wider meaning than simple watching.
Observation, is a systematic and deliberate study through eye of spontaneous occurrence at the
time, they occur.

INTRODUCTION TO SOCIAL RESEARCH METHODS
105 | THIKA INSTITUTE OF BUSINESS STUDIES 0715 067 272 www.tibs.ac.ke [email protected]
Observation may serve a variety of research purposes, it may be used to explore the given area of
subject matter or to gain insight in to the research problem and provide a basis for development
of hypotheses.
Observation may also be used as the primary technique of data collection in descriptive studies
and also in the experimental studies designed for testing casual hypotheses. Observation many
times is a perception.
Observation has mainly three components-Sensation, attention and perception. The accuracy of
observation depends on knowledge and experience. Generally, the intellectual, physical and
moral conditions are very important in observation.
Characteristics of Good Observations
i. Observation should be carefully planned, systematic and perceptive. Observers should
know what they are looking for and what is irrelevant in a situation.
ii. It should focus on wholeness of what is observed. Observers should not only be alert to
significant details, they should also know that the whole is often greater than the sum of
its parts. It should be objective and bias-free. Observers should strive to eliminate their
influence what see and report.
iii. It should separate the facts from the interpretation of facts. Observers observe the facts
and make their interpretation at a later time.
iv. It should be checked and verified whenever possible by repetition or by comparison with
those of other competent observers.
v. It should be carefully and expertly recorded. Observers use appropriate instruments to
systematize, qualify and preserve the result of their observations.
vi. Observations are collected in such a way that they are valid and reliable.
Aids in Observation Process
In order to make the process of observation effective and reduce the faults of the observer, a
researcher may use a range of tools for systematising and recording data. Diaries, field notes,
maps, check lists, cameras, audio, video tape recorders, maps ,analogy, checklist, sociometric
scales, mechanical devices are the major tools adopted by the researcher to make the observation
process as accurate as possible.
TYPES OF OBSERVATION
Observation, which is the most classical method of scientific enquiry, may take many forms.
With reference to investigators role, it may be classified into

INTRODUCTION TO SOCIAL RESEARCH METHODS
106 | THIKA INSTITUTE OF BUSINESS STUDIES 0715 067 272 www.tibs.ac.ke [email protected]
a. Participant Observation:
In this observation, the observer is a part of the phenomenon or group which is observed and he
acts as both an observer and a participant. The persons who are observed group should not be
aware of the researcher’s purpose. Then only their behaviour will be natural. The observer can
understand the emotional reactions of the observe group, and get a deeper insight of their
experiences.
b. Non-Participant Observation:
In this type of observation, the researcher does not actually participate in the activities of the
group to be studied.There is no emotional involvement on the part of the observer.Observer
would be simply present in the group to note down the behaviour of the respondents.
c. Controlled Observation:
This type of observation is found quite useful in either in the laboratory orin the field.This
involves standardization of the fields like psychology and sociology.Controlled observation is
carried out observational techniques and exercise of maximum control over extrinsic and
intrinsic variables
d. Uncontrolled Observation:
If the observation takes place in the natural settings, it may be termed as uncontrolled
observation. The main aim of this observation is get spontaneous picture of life. This does not
involve control over any extrinsic or intrinsic variables.
e. Direct Observation:
In this type of observation, the event or the behaviour of the person is observed as it occurs. This
method is flexible and allows the observer to see and record subtle aspects of events and
behaviour as they occur.
f. Indirect Observation;
This does not involve the physical presence of the observer , and the recording is done by
mechanical, photographic or electronic devices. This method is less flexible than direct
observation. In other words, the behaviour of the person is not observed, rather its effects are
observed.

INTRODUCTION TO SOCIAL RESEARCH METHODS
107 | THIKA INSTITUTE OF BUSINESS STUDIES 0715 067 272 www.tibs.ac.ke [email protected]
Advantages of Observation Method
a. It is the most direct means of studying a wide variety of phenomena based on actual and first-
hand experience.
b. It enables the observer to code and record behavior at the time of its occurrence.
c. The behavior of human beings can be best studied.
d. It is the basis for formulating hypothesis.
e. Data collected under this method is more accurate and reliable, as it is based on the first hand
perception of the eyes.
f. Can collect sensitive data
g. Accuracy of measuring overt behaviours
h. Useful in studies of cross-cultural differences
Disadvantages of Observation Method
a. Appropriate only for frequently occurring behaviours
b. Unable to assess opinions or attitudes causing behaviours
c. May be expensive
d. It is time consuming
4. FOCUS GROUP INTERVIEWING
It is rapidly becoming one of the major research tool to understand people’s thoughts and
feelings. It is usually conducted by inviting six to ten people to gather for a few hours with a
trained moderator to talk about a product, service or organization.
The meeting is held in a pleasant place, and refreshments are served to create a relaxed
environment. The moderator needs objectivity, knowledge of the subject and industry, and some
understanding of group and consumer behaviour.
The moderator starts with a broad question before moving to more specific issues, encouraging
open and easy discussion to bring out true feelings and thoughts. At the same time, the
interviewer focuses the discussion, hence the name focus group interviewing.
-often held to help determine the subject areas on which questions should be asked in a later,
large-scale, structured-direct interview Comments are recorded through note taking or
videotaped and studied later to understand consumer’ buying process.
This method is especially suited for managers of hotels and restaurants, who have easy access to
their customers. e.g. Some hotel managers often invite a group of hotel guests from a particular
market segment to have a free breakfast with them. Managers get the chance to meet the guests

INTRODUCTION TO SOCIAL RESEARCH METHODS
108 | THIKA INSTITUTE OF BUSINESS STUDIES 0715 067 272 www.tibs.ac.ke [email protected]
and discuss what they like about the hotel and what the hotel could do to make their stay more
enjoyable and comfortable. The guests appreciate this recognition and the manager gets valuable
information. Restaurant managers use the same approach by holding discussion meetings over
lunch or dinner.
Focus group discussions II
Focus group discussions (FGDs) are unstructured interviews with small group of people who
interact with each other and a focus group leader (researcher). They make use of group
dynamics to stimulate discussions, gain insights and generate ideas on a given topic of study.
FGDs are used to investigate what people think, how they think and why they think in that way
on a given subject. It is a useful technique for exploring cultural values, beliefs and practices.
This method is appropriate for action research where participants are required to play an active
role in the research process and in decision making.
Factors to consider in focus group discussions:-
Group composition is important and researcher should decide whether the topic is
suitable for single sex groups, particular age group or a combination of both.
A focus group should have 5-10 participants and a group leader (researcher).
The number of focus groups to constitute depends on the depth of the topic and the
geographical area being covered.
You need an unstructured guide with appropriate topics to stimulate discussion and a
field note book or recording information.
A comfortable non-threatening environment where participants feel free to express
themselves.
Discussions should last one to two hours.
Advantages of Focus Group Discussions
The focus group discussions:-

INTRODUCTION TO SOCIAL RESEARCH METHODS
109 | THIKA INSTITUTE OF BUSINESS STUDIES 0715 067 272 www.tibs.ac.ke [email protected]
Allow more complex issues to be probed in a group setting
Less threatening than one to one interviews.
Useful for understanding public opinion on a given subject.
Low cost
Rapid data collection
Participants define what is important
Some opportunity to explore issues in depth
Opportunity to clarify responses through probes
Disadvantages of Focus Group Discussions
Focus group discussions consume a lot of time.
Limited sampling methods are used such as purposive or convenience samples.
Data is difficult to collect and analyze.
Requires a skilled group discussion leader in group dynamics.
Can be time consuming to assemble groups
Produces limited quantitative data
Requires trained facilitators
Less control over process than key informant interviews
Difficult to collect sensitive information
Accuracy (generalizability) limited and difficult to specify
May be difficult to analyze and summarize findings
5. SECONDARY DATA/CONTENT ANALYSIS
Content analysis serves the purpose in qualitative research to enable you to study human
behavior indirectly through how people choose to communicate.
Content analysis is a systematic, quantitative process of analyzing communication messages by
determining the frequency of message characteristics. It consists of examining existing data in
texts. Content analysis is a research method used to determine the presence of certain words or
concepts within texts or sets of texts. Researchers quantify and analyze the presence, meanings
and relationships of such words and concepts, then make inferences about the messages within
the texts, the writer(s), the audience, and even the culture and time of which these are a part.
Texts can be defined broadly as books, book chapters, essays, interviews, discussions, newspaper
headlines and articles, historical documents, speeches, conversations, advertising, theater,
informal conversation, the form of databases, meeting minutes, reports, attendance logs, financial
records, newsletters, or really any occurrence of communicative language.etc.

INTRODUCTION TO SOCIAL RESEARCH METHODS
110 | THIKA INSTITUTE OF BUSINESS STUDIES 0715 067 272 www.tibs.ac.ke [email protected]
This can be an inexpensive way to gather information but may be an incomplete data source
Advantages of Content Analysis
Unobtrusive-Content analysis does not disturb the field or a people group normally
Replication-Since the documents are permanent, it is possible to replicate a study
Simplicity-Compared to other forms of research, content analysis is highly practical to
complete
looks directly at communication via texts or transcripts, and hence gets at the central
aspect of social interaction
can allow for both quantitative and qualitative operations
can provides valuable historical/cultural insights over time through analysis of texts
allows a closeness to text which can alternate between specific categories and
relationships and also statistically analyzes the coded form of the text
can be used to interpret texts for purposes such as the development of expert systems
(since knowledge and rules can both be coded in terms of explicit statements about the
relationships among concepts)
is an unobtrusive means of analyzing interactions
provides insight into complex models of human thought and language use
when done well, is considered as a relatively “exact” research method (based on hard
facts, as opposed to Discourse Analysis).
Disadvantages of Content Analysis
Limited data-Content analysis is limited to recorded content. This leaves out other forms
of information
can be extremely time consuming
is subject to increased error, particularly when relational analysis is used to attain a
higher level of interpretation
is often devoid of theoretical base, or attempts too liberally to draw meaningful
inferences about the relationships and impacts implied in a study
is inherently reductive, particularly when dealing with complex texts
tends too often to simply consist of word counts
often disregards the context that produced the text, as well as the state of things after the
text is produced
can be difficult to automate or computerize
SAMPLING AND SAMPLING PROCEDURE
Introduction

INTRODUCTION TO SOCIAL RESEARCH METHODS
111 | THIKA INSTITUTE OF BUSINESS STUDIES 0715 067 272 www.tibs.ac.ke [email protected]
When a researcher wants to know something about a certain group of people, they usually find a
few members of the group and study them. After they have finished studying the individuals they
usually come up with conclusions about a larger group.
Typically, generalizations are not based on data collected from all the observations, all the
respondents, or all the events that are defined by the research problem. Instead, researchers use a
relatively small number of cases (a sample) as the bases for making inferences about all the
cases (a population), Nachmias, 1996 pp178. One of the most important steps in the research
process is to select the sample of individuals who will participate as part of the study.
Meaning and Definition of Sample & Sampling
Definition of the term “sample” A sample is a group in a research study on which information is
obtained. A population is the group to which the results of the study are intended to apply. It is a
collection of items or elements from a population. By observing the characteristics of sample,
one can make certain inference about the characteristics of the population from it is drawn. In
almost all research investigations, the sample is smaller than the population, since the researchers
rarely have access to all the members of the population.
Sampling refers to the process of selecting these individuals. Sampling can be defined as the
selection of some part of an aggregate or totality, the bases of which a judgment or inference
about the aggregate or totality is made. It is the process of obtaining information about an entire
population by examining a part of it.
Sampling
For studying a social problem, it is difficult to study whole universe of the problem under study.
In such a case, sampling has become commonplace idea. A sampling is a small proportion of a
population selected for observation and analysis.; the act so involved is called sampling.
According to F.N. Kerlinger: “Sampling is taking any portion of a population or universe as
representative of the population.”
According to Y.D. Keskar: “Sampling is the generalization in terms of the whole group
through the facts assembled relate to only part of it.” Virtually every research study uses
sampling method of some kind to generalize about population. It is deliberate rather than
haphazard.

INTRODUCTION TO SOCIAL RESEARCH METHODS
112 | THIKA INSTITUTE OF BUSINESS STUDIES 0715 067 272 www.tibs.ac.ke [email protected]
Sampling terms/Concepts:
1. Element: It is unit about which information is sought. E.g. individuals, products, stores,
companies etc.
2. Population: It is also called universe. It is the aggregate of all elements defined prior to the
selection of sample. Population can be finite or infinite.
3. Sampling unit: It is the element available for selection at some stage of the sampling process.
E.g. female 18-50 yrs.
4. Sampling frame: It is the list of all sampling units available for selection from the population.
A frame must a class list, list of registered voters, list of students and so on.
5. Sample size: It states how many to be surveyed. e.g. should 50 or 60 students be interviewed?
Characteristics of Good Sampling
i. A sample should be representative of the whole population.
ii. A sample should be independent i.e. interchangeability of units. Each unit should be free
to include in the sample.
iii. The size of the sample should be adequate to generalize conclusions to the whole
population.
iv. A sample should be free from prejudice and bias.
v. A sample should be in coeternity with the objective of the study.
vi. The units included in the sample should be homogenous.
vii. Sampling should result in small sampling error.
viii. Sampling should be economy in terms of time, cost and effort.
ix. Sampling should have scientific base.
Benefits of Sampling
i. Sample saves money. It is less expensive.
ii. Sampling saves time because observing the characteristics of the sample takes lesser time
than that of observing the whole population.

INTRODUCTION TO SOCIAL RESEARCH METHODS
113 | THIKA INSTITUTE OF BUSINESS STUDIES 0715 067 272 www.tibs.ac.ke [email protected]
iii. Sampling may be more accurate .It enables more accurate measurements for a sample
study because it is generally conducted by a trained and experienced investigator.
iv. Sampling remains only choice when the population contains infinitely many members.
v. A sample is better in the event that the study result in the destruction or contamination of
the element sampled.
vi. More coverage is possible with efficient management.
vii. It becomes easy to establish report with the information. It facilitates collection of
information from them.
viii. The process of sampling makes it possible to draw valid inferences or generalization on
the basis of large observation of variables within a relatively small proportion of the
population.
ix. More intense study is possible.
x. It increases administrative convenience.
Limitations of Sampling
i. Due to human involvement, there could be human bias and subjectivity in the sample
itself. It could lead to wrong and misleading result.
ii. Its phenomena are complex in nature, the selection or sample becomes more difficult. It
is difficult to pick two similar situations, institutions or individuals for sample picking.
iii. If the sample units are not homogenous, the sample technique will become more
hazardous and unscientific.
iv. The sampling technique becomes scientific only when it is done by specialized
investigator.
v. There is difficult in selecting representative.
vi. There is difficult in sticking to samples.
vii. When the characteristics to be measured occur in rare conditions, sampling will not give
statistically reliable information about it.
TYPES OF SAMPLING
There are two types:
i. Probability sampling
ii. Non probability sampling

INTRODUCTION TO SOCIAL RESEARCH METHODS
114 | THIKA INSTITUTE OF BUSINESS STUDIES 0715 067 272 www.tibs.ac.ke [email protected]
PROBABILITY SAMPLING
This provides a scientific technique of drawing samples from the population according to the
laws of chance in which each unit in the universe has some definite pre-assigned probability of
being selected in the sample. The selection of the sample based on the theory of probability is
also known as random selection and sometimes the probability sampling is also called Random
Sampling.
According to Simpson and Kafka, "Random samples are characterized by the way in which
they are selected. Randomness is not used in the sense of haphazard or hit or miss".
When using probability sampling technique, the sampling units are selected according to some
probability laws. Some of these laws are that:
• Each sample unit has an equal chance of being selected.
• Sampling units have varying probability of being selected.
• Probability of selection of a unit is proportional to the sample size.
With a probabilistic sample, we know the odds or probability that we have represented the
population well. We are able to estimate confidence intervals for the statistic.
Types of Probability Sampling
Some of the important types of probability sampling techniques include;
a. Simple Random Sampling
b. Stratified Random Sampling /Stratified Sampling
c. Systematic Random Sampling / Systematic Sampling
d. Cluster Sampling
e. Multi stage Sampling

INTRODUCTION TO SOCIAL RESEARCH METHODS
115 | THIKA INSTITUTE OF BUSINESS STUDIES 0715 067 272 www.tibs.ac.ke [email protected]
a. Simple Random Sampling
In statistics, a simple random sample is a group of subjects (a sample) chosen from a larger
group (a population). Each subject from the population is chosen randomly and entirely by
chance, such that each subject has the same probability (or chance) of being chosen at any stage
during the sampling process.
This type of sampling best suits situations where not much information is available about the
population and data collection can be efficiently conducted on randomly distributed items. A
simple random sample gives each member of the population an equal chance of being chosen. It
is not a haphazard sample as some people think! One way of achieving a simple random sample
is to number each element in the sampling frame (e.g. give everyone on the Electoral register a
number) and then use random numbers to select the required sample.
Random numbers can be obtained using your calculator, a spreadsheet, and printed tables of
random numbers, or by the more traditional methods of drawing slips of paper from a hat,
tossing coins or rolling dice.
For example: Random selection of 20 students from class of 50 students. Each student has equal
chance of getting selected. Here probability of selection is 1/50
Single Random Sampling
b. Stratified Random Sampling Technique

INTRODUCTION TO SOCIAL RESEARCH METHODS
116 | THIKA INSTITUTE OF BUSINESS STUDIES 0715 067 272 www.tibs.ac.ke [email protected]
This is also referred to as proportional random sampling. It is used when we have to select
sample from a heterogeneous population. It involves dividing your population into homogeneous
subgroups (known as strata) and then taking a simple random sample in each subgroup.
When surveys are being conducted, due to the population not being homogeneous, different
problems are experienced in different parts of the population. To increase efficiency, it becomes
important to treat homogenous parts of the population as populations in their own rights. Each
homogenous part of the population is referred to as a stratum.
This technique divides the elements of the population into small subgroups (strata) based on the
similarity in such a way that the elements within the group are homogeneous and heterogeneous
among the other subgroups formed. And then the elements are randomly selected from each of
these strata. We need to have prior information about the population to create subgroups
Example: If a researcher has to select 300 students from a college for study, he has to first
stratify the student population into two strata; their sex-male and female or in a similar way.
Stratified Sampling
c. Systematic Random Sampling or Systematic Sampling
Here the selection of elements is systematic and not random except the first element. Elements of
a sample are chosen at regular intervals of population. It consists of the selection of each nth
term from a list. All the elements are put together in a sequence first where each element has the
equal chance of being selected.
Sampling of this type is known as systematic sampling. An element of randomness is usually
introduced into this kind of sampling by using random numbers to pick up the unit with which to
start. This procedure is useful when sampling frame is available in the form of a list. In such a
design the selection process starts by picking some random point in the list and then every nth
element is selected until the desired number is secured.

INTRODUCTION TO SOCIAL RESEARCH METHODS
117 | THIKA INSTITUTE OF BUSINESS STUDIES 0715 067 272 www.tibs.ac.ke [email protected]
It is used when population size is large and when it become very tiresome to use table of random
number to select a sample.
In some instances the most practical way of sampling is to select every 15th name on a list, every
10th house on one side of a street and so on.
Example
Suppose your dissertation topic is A Study into the Impact Leadership Style on Employee
Motivation in ABC Company and you have chosen semi-structured in-depth interview as
primary data collection method. ABC Company has 200 operational level employees who could
be potentially interviewed. You identified your sample size as 24 subjects, i.e. you will interview
12 employees.
You will have to do the following:
1. Label each employee with a unique number.
2. Calculate the sampling fraction.
Sampling fraction = Actual Sample Size/Total Population = 24/200 = 3/25.
This sampling fraction can be narrowed down to 1/8. Accordingly, every 8th member of the
sampling frame needs to be selected to participate in the study.
3. Choose the first sample randomly. Suppose you randomly seleced the sample #47 as the
starting point for selecting samples. Accordingly, your sample group will comprise of ABC
Company employees under the following numbers: #47; #55; #63; #71; #79; #87; #95; #103;
#111; #119; #127; #135; #143; #151; #159; #167; #175; #183; #191; #199; #7; #15; #23; #31.
Example 2:
For a sample of size n, we divide our population of size N into subgroups of k elements.
We select our first element randomly from the first subgroup of k elements.
To select other elements of sample, perform following:
We know number of elements in each group is k i.e N/n

INTRODUCTION TO SOCIAL RESEARCH METHODS
118 | THIKA INSTITUTE OF BUSINESS STUDIES 0715 067 272 www.tibs.ac.ke [email protected]
So if our first element is n1 then
Second element is n1+k i.e n2
Third element n2+k i.e n3 and so on..
Taking an example of N=20, n=5
No of elements in each of the subgroups is N/n i.e 20/5 =4= k
Now, randomly select first element from the first subgroup.
If we select n1= 3
n2 = n1+k = 3+4 = 7
n3 = n2+k = 7+4 = 11
Systematic Clustering
d. Cluster Sampling Technique
This is a form of random sampling where the entire population is divided into groups, or clusters
and a random sample of these clusters are selected. All observations in the selected clusters may
be included in the sample or simple random sampling techniques may be used to pick out the
individuals to be included from each cluster.
When all units of the selected cluster are interviewed, this is referred to as "one-stage cluster
sampling". If the subjects to be interviewed are selected randomly within the selected clusters, it
is called "two-stage cluster sampling" (Caswell F 1989). Cluster sampling is a form of random
sampling where the units sampled are chosen in clusters.
If you were to study Kenya, most probably you will cluster the country into the eight provinces
and then draw samples from each province using simple random. At the end of the day all the
geographical parts of Kenya will be represented in the study.

INTRODUCTION TO SOCIAL RESEARCH METHODS
119 | THIKA INSTITUTE OF BUSINESS STUDIES 0715 067 272 www.tibs.ac.ke [email protected]
This method of sampling is particularly useful where it is difficult to know the exact numbers of
individuals in a population, for example, in developing countries where official statistics are
sparse. It is also applicable where the population is too large to carry out simple random or
stratified sampling and is commonly used in geography and biology where; the survey area is
covered with a grid of squares, A random sample of the squares is then used for a complete
investigation either by counting some physical or manmade features in Geography or microbes,
plant species etc in Biology. The results are then generalized to the rest of the grids.
Cluster sampling can be done in following ways:
· Single Stage Cluster Sampling
Entire cluster is selected randomly for sampling.
Single Stage Cluster Sampling
· Two Stage Cluster Sampling
Here first we randomly select clusters and then from those selected clusters we randomly select
elements for sampling

INTRODUCTION TO SOCIAL RESEARCH METHODS
120 | THIKA INSTITUTE OF BUSINESS STUDIES 0715 067 272 www.tibs.ac.ke [email protected]
Two Stage Cluster Sampling
e. Multi-Stage Sampling
It is the combination of one or more methods described above.
Population is divided into multiple clusters and then these clusters are further divided and
grouped into various sub groups (strata) based on similarity. One or more clusters can be
randomly selected from each stratum. This process continues until the cluster can’t be divided
anymore. For example country can be divided into states, cities, urban and rural and all the areas
with similar characteristics can be merged together to form a strata.
Multi-Stage Sampling

INTRODUCTION TO SOCIAL RESEARCH METHODS
121 | THIKA INSTITUTE OF BUSINESS STUDIES 0715 067 272 www.tibs.ac.ke [email protected]
Advantages of Probability Sampling:
1. Unbiased estimates: This sampling technique is unbiased and has significant precision, it
gives a certain level of objectivity to the investigator/researcher.
2. Relative Efficiency: It gives quantitatively more relative efficiency in results as compared
to non-probability sampling.
3. Less Universe Knowledge is required: Comparatively lesser knowledge of the universal
sample is required. Basically two things are required to be know 1. unique way of
identifying each element and 2. total number of universal elements.
4. It is Fair: every item in the population has equal chance of selection
5. Easy: Easy data analysis and error calculation.
Disadvantages of Probability Sampling:
1. Less Efficient: Other sampling techniques are more efficient than probability sampling.
2. Non-Utilisation of additional knowledge: It doesn't take into consideration additional
knowledge of the population.
3. Complex and Time consuming: This method is time consuming and complicated,
particularly for market research in which budget constraints and limitations of time exists
4. High Level of skills: Very high level of skill and experience is required.
5. High costs: It is relatively more costly that non-probability sampling.
Advantages of a Simple Random Sampling Technique: • It is ideal for statistical purposes.
• It is free of classification error.
• It requires minimum advance knowledge of the population
Disadvantages of a Simple Random Sampling Technique • It is hard to achieve in practice
• It requires an accurate list of the whole population
• It is expensive to conduct as those sampled may be scattered over a wide area.
• The selected sample is not necessarily representative of the larger population.
Advantages of Stratified Sampling Technique It assures the researcher of representation not only for the overall population, but also key
subgroups of the population, especially small minority groups.
• When we use the same sampling fraction within strata, we are conducting proportionate
stratified random sampling.

INTRODUCTION TO SOCIAL RESEARCH METHODS
122 | THIKA INSTITUTE OF BUSINESS STUDIES 0715 067 272 www.tibs.ac.ke [email protected]
• When we use different sampling fractions in the strata, we call this disproportionate stratified
random sampling.
•Stratified random sampling will generally have more statistical precision than simple random
sampling. This will only be true if the strata or groups are homogeneous. If they are, we expect
that the variability within-groups is lower than the variability for the population as a whole.
•Administrative convenience - in this case we have field officers dealing with different parts of
the population independently.
Disadvantages Stratified Sampling Technique: The following are the disadvantages of stratified random sample.
• It can be difficult to select relevant stratification variables
• It is not useful when there are no homogeneous subgroups
• It can be expensive
• It requires accurate information about the population, or introduces bias.
• It looks randomly within specific sub headings.
Advantages of Cluster Sampling Technique • It helps to reduced field costs as a result of saving of travelling time and distance covered
It is applicable where no complete list of units is available (special lists only need be formed for
clusters)
Disadvantages of Cluster Sampling Technique • Units close to each other may be very similar and so less likely to represent the whole
population
• It results in a larger sampling error than simple random sampling
• Clusters may not be representative of whole population but may be too alike
• Analysis of data is more complicated than for simple random sampling.
NON-PROBABILITY SAMPLING
Non-probability sampling is a sampling technique where the samples are gathered in a process
that does not give all the individuals in the population equal chances of being selected.
In contrast with probability sampling, non-probability sample is not a product of a randomized
selection processes. Subjects in a non-probability sample are usually selected on the basis of
their accessibility or by the personal convenience, purposive personal judgment of the researcher.
Most researchers are bounded by time, money and workforce and because of these limitations, it
is almost impossible to randomly sample the entire population and it is often necessary to
employ another sampling technique, the non-probability sampling technique.

INTRODUCTION TO SOCIAL RESEARCH METHODS
123 | THIKA INSTITUTE OF BUSINESS STUDIES 0715 067 272 www.tibs.ac.ke [email protected]
When to Use Non-Probability Sampling
This type of sampling can be used when demonstrating that a particular trait exists in the
population.
It can also be used when the researcher aims to do a qualitative, pilot or exploratory
study.
It can be used when randomization is impossible like when the population is almost
limitless.
It can be used when the research does not aim to generate results that will be used to
create generalizations pertaining to the entire population.
It is also useful when the researcher has limited budget, time and workforce.
This technique can also be used in an initial study which will be carried out again using a
randomized, probability sampling.
Types of Non-Probability Sampling
The various type of non probability sampling is as follows.
a. Convenience sampling: -
It refers to samples selection on the basis of convenience of the researcher. A sample is chosen
purely for expedience because it is cheap to find. The sample then would not necessarily be a
representative one. Commonly used convenient samples are friends, relatives, family members,
associations etc.
b. Purposive/Judgment Sampling:
It refers to the sample selected on the basis of what some experts think particular sampling units
or elements will contribute to answering particular questions at hand. It is an expert judgment
based sampling .Using this method , specialists in the subject matter of the survey choose what
they believe to be the best sample for that particular study. It is moderately used in practice.
Example: - A group of sales manager might select sample of grocery stores in city that they
regard as representative in some sense.
c. Quota sampling:
Quota sampling derives its name from the practice assigning quotes or proportions of kind of
people to interviewers. It involves three steps; Selection of control characteristics (sex, age,
education, etc.) and determination of the proportion of the universe having equal set of
characteristics. Allocation of the sample among cells (how large a sample should be taken from
each cell) Selection of the sample item. Example: An interviewer may be instructed to conduct

INTRODUCTION TO SOCIAL RESEARCH METHODS
124 | THIKA INSTITUTE OF BUSINESS STUDIES 0715 067 272 www.tibs.ac.ke [email protected]
the interviews with people 30 years old and half with people under 30 years. Here, the control
characteristic is the age of respondents.
d. Sequential Sampling:
In fixed-size sampling the number of items is decided upon in advance whereas in sequential
sampling, the number of items is not presented. In sequential sampling one usually …….
measurements .On only a single unit or the population or a group of population units at a time.
The measurement or each group is cumulated with those of previously measured groups. The
data are analyzed as they are assembled and sample size is not predetermined. The mathematics
underlying sequential samplings are more complex and time consuming.
e. Snowball Sampling:
It refers to a procedure in which initial respondents are selected randomly but where additional
respondents are then obtained from referral or by other information provided by the initial
respondents. One uses this method where respondents are difficult to identify and are best
located through referral network. The “snowball” gather subjects as it rolls along. It is widely
used to study drug culture, teenage gang activities, community relations etc. Its purpose is to
estimate various characteristics that are rare in the total population.
Advantages of Non-Probability Sampling:
1. True Universe Picture: Relevant sections of the universal sample can be selected in the
proportions they appear in the universe.
2. Economical: Geographical concentration can be achieved thus reducing cost
3. Quick: Use and quick method in certain situations
4. Specific case type: This can be the only technique available for some special cases such
as illegal drug users.
5. Specific members of population: Helpful if the researchers are interested in specific
members of the population and not the entire population.
6. Pilot study: Helpful for exploratory research like a pilot/initial study, attempting to
determine whether the problem really exists or not.
Disadvantages of Non-Probability Sampling:
1. Details needed: Detailed information of the universe is needed.
2. Errors: Errors can occur easily
3. Subjective nature: The subjective nature of this technique prevents making inferences to
the entire population

INTRODUCTION TO SOCIAL RESEARCH METHODS
125 | THIKA INSTITUTE OF BUSINESS STUDIES 0715 067 272 www.tibs.ac.ke [email protected]
4. Selection Bias: Validity and credibility are questionable.
5. Reliability: The reliability of the resulting estimates cannot be evaluated which results in
lack of confidence of the researcher.
DIFFERENCE BETWEEN PROBABILITY AND NON-PROBABILITY SAMPLING
Basis for
Comparison Probability Sampling Non-Probability Sampling
Meaning
Probability sampling is a sampling
technique, in which the subjects of the
population get an equal opportunity to
be selected as a representative sample.
Nonprobability sampling is a method
of sampling wherein, it is not known
that which individual from the
population will be selected as a
sample.
Alternately
known as Random sampling Non-random sampling
Basis of
selection Randomly Arbitrarily
Opportunity of
selection Fixed and known Not specified and unknown
Research Conclusive Exploratory
Result Unbiased Biased
Method Objective Subjective
Inferences Statistical Analytical
Hypothesis Tested Generated
STEP 6: DATA PRESENTATION AND ANALYSIS
Data analysis is the process of systematically searching and arranging collected data in a form
that enhance understanding.
Its also the process of searching for relationships and ends only after the data has been
interpreted. Data analysis inevitably involves the use and manipulation of variables. A variable is
any characteristics contrasted with a constant ie a value that never changes
Before data can be analyzed it must be put in some kind of order. Raw data are rarely useful in
decision making. Researchers generate information by analyzing data after its collection. Data
analysis usually involves reducing accumulated data to a manageable size, developing

INTRODUCTION TO SOCIAL RESEARCH METHODS
126 | THIKA INSTITUTE OF BUSINESS STUDIES 0715 067 272 www.tibs.ac.ke [email protected]
summaries, looking for patterns and applying statistical techniques. Further, researchers must
interprete these findings in light of the research questions or determine if the results are
consistent with their hypothesis and theories.
One of the most common ways to order data is by preparing frequency distribution. Frequency
distribution is simply a ranking of items along with the frequency. When such statistical data is
presented in a graph the display is known as a frequency polygon. There are times that it may be
necessary to group the data and have the frequency to represent the groups rather than the
individual item.
Meaning of Data Presentation:
Data presentation refers to the organization of data in tables, graphs or charts, so that logical and
statistical conclusions can be derived from the collected measurements.
The presentation of data is the basic organization and classification of the data for analysis. After
data collection is completed, the data will be in the raw form. It is necessary to arrange the data
so that it makes some sense to researchers as well to the readers. Different types of data require
different methods of summary and presentation. Data are presented in charts, graphs and tables.
Data may be presented in 3 methods:
1. Textual
2. Tabular
3. Graphical
1. TEXTUAL PRESENTATION
What is Textual Presentation of Data?
Textual presentation data refers to data presented in written, paragraph form. All the data is
presented in the form of texts, phrases, or paragraphs. It involves enumerating important
characteristics, emphasizing significant figures and identifying important features of data.
This is commonly used when the data is not very large.
This kind of representation is useful when we are looking to supplement qualitative statements
with some data. For this purpose, the data should not be voluminously represented in tables or
diagrams. It just has to be a statement that serves as a fitting evidence to our qualitative evidence
and helps the reader to get an idea of the scale of a phenomenon.
Example:

INTRODUCTION TO SOCIAL RESEARCH METHODS
127 | THIKA INSTITUTE OF BUSINESS STUDIES 0715 067 272 www.tibs.ac.ke [email protected]
Following is an example of textual presentation.
In 1999, out of a total of five thousand workers of a factory, four thousand and two hundred were members of a Trade Union. The number of female workers was twenty per cent of the total workers out of which thirty per cent were members of the
Trade Union.
In 2000, the number of workers belonging to the trade union was increased by twenty per cent as compared to 1999 of which four thousand and two hundred were male.
The number of workers not belonging to trade union was nine hundred and fifty of which four hundred and fifty were females. The merit of this mode of presentation lies in its simplicity and even a layman can present data by this method.
The observations with exact magnitude can be presented with the help of textual presentation. Furthermore, this type of presentation can be taken as the first step towards the other methods of presentation.
The textual representation of data simply requires some intensive reading. This is because the
quantitative statement just serves as an evidence of the qualitative statements and one has to go
through the entire text before concluding anything.
Further, if the data under consideration is large then the text matter increases substantially. As a
result, the reading process becomes more intensive, time-consuming and cumbersome.
Textual presentation, however, is not preferred by a statistician simply because, it is dull,
monotonous and comparison between different observations is not possible in this method.
For manifold classification, this method cannot be recommended and tabulation is usually
preferred.
Now, let us see, how the same data can be represented using tabular representation.
Status of the workers of the factory on the basis of their trade union
membership for 1999 and 2000.

INTRODUCTION TO SOCIAL RESEARCH METHODS
128 | THIKA INSTITUTE OF BUSINESS STUDIES 0715 067 272 www.tibs.ac.ke [email protected]
Source :
Here, we have to write the source through which we got the above data.
Footnote :
TU, M, F and T stand for trade union, male, female and total respectively.
2. TABULAR PRESENTATION
Method of presenting data using the statistical table. It is a systematic organization of the data in
columns and rows.
Parts of a Statistical Table
A statistical table has at least four major parts and some other minor parts.
(1) Table Number
(2) The Title
(3) The Box Head (column captions)
(4) The Stub (row captions)
(5) The Body
(6) Prefatory Notes
(7) Foot Notes
(8) Source Notes
The general sketch of table indicating its necessary parts is shown below:

INTRODUCTION TO SOCIAL RESEARCH METHODS
129 | THIKA INSTITUTE OF BUSINESS STUDIES 0715 067 272 www.tibs.ac.ke [email protected]
1) Table Number
When there are many tables, then these tables should be numbered in a logical sequence
2) The Title
The title is the main heading written at the top of the table. It must explain the contents of the
table and throw light on the table, as whole different parts of the heading can be separated by
commas. There are no full stops in the little.
The title must tell as simply as possible what is in the table. It should answer the questions:
- Who? White females with breast cancer, black males with lung cancer.
- What are the data? Counts, percentage distributions, rates.
- Where are the data from? One hospital, or the entire population covered by your registry.
- 'When? A particular year, time period.
3) The Box Head (column captions)
The vertical heading and subheading of the column are called columns captions. The spaces
where these column headings are written is called the box head. Only the first letter of the box
head is in capital letters and the remaining words must be written in lowercase.
The boxhead contains the cap- tions or column headings. The heading of each column should
contain as few words as possible, yet explain exactly what the data in the columns represent.

INTRODUCTION TO SOCIAL RESEARCH METHODS
130 | THIKA INSTITUTE OF BUSINESS STUDIES 0715 067 272 www.tibs.ac.ke [email protected]
4) The Stub (row captions)
The horizontal headings and sub heading of the row are called row captions and the space where
these rows headings are written is called the stub. The row captions are known as the stub. Items
in the stub should be grouped to facilitate interpretation of the data. For example, group ages into
10-year age- groups.
5) The Body
This is the main part of the table which contains the numerical information classified with
respect to row and column captions. Each item in a body is known as a ‘cell’.
6) Prefatory Notes
A statement given below the title and enclosed in brackets usually describes the units of
measurement and is called the prefatory notes.
7) Foot Notes
Footnotes are rarely used. In effect, they supplement the title of a table if required.
This refers to any statement or note inserted. These appear immediately below the body of the
table providing additional explanation. Anything in a table which cannot be understood by the
reader from the title, boxhead, or stub should be explained by footnotes. The footnotes contain
information on missing numbers, preliminary or revised numbers, or explanations for any
unusual numbers. Definitions, abbreviations, and/or qualifications for captions or cell names, and
all pertinent information should be footnoted. A footnote usually applies to a specific cell(s)
within the table and a symbol, such as,` or '#', is used to key the cell to the footnote. If several
footnotes are required, it is better to use small letters rather than numbers. Footnote numbers
might be confused with the numbers within the table.
8) Source
When using data obtained from a secondary source, this source has to be mentioned below the
footnote. The source notes are given at the end of the table indicating the source the information
has been taken from. It includes the information about compiling agency, publication, etc.
Construction of Data Tables
There are many ways for construction of a good table. However, some basic ideas are:

INTRODUCTION TO SOCIAL RESEARCH METHODS
131 | THIKA INSTITUTE OF BUSINESS STUDIES 0715 067 272 www.tibs.ac.ke [email protected]
The title should be in accordance with the objective of study: The title of a table
should provide a quick insight into the table.
Comparison: If there might arise a need to compare any two rows or columns then these
might be kept close to each other.
Alternative location of stubs: If the rows in a data table are lengthy, then the stubs can
be placed on the right-hand side of the table.
Headings: Headings should be written in a singular form. For example, ‘good’ must be
used instead of ‘goods’.
Footnote: A footnote should be given only if needed.
Size of columns: Size of columns must be uniform and symmetrical.
Use of abbreviations: Headings and sub-headings should be free of abbreviations.
Units: There should be a clear specification of units above the columns.
The Advantages of Tabular Presentation
Ease of representation: A large amount of data can be easily confined in a data table.
Evidently, it is the simplest form of data presentation.
Ease of analysis: Data tables are frequently used for statistical analysis like calculation
of central tendency, dispersion etc.
Helps in comparison: In a data table, the rows and columns which are required to be
compared can be placed next to each other. To point out, this facilitates comparison as it
becomes easy to compare each value.
Economical: Construction of a data table is fairly easy and presents the data in a manner
which is really easy on the eyes of a reader. Moreover, it saves time as well as space.
Frequency Distribution Tables
A statistical data may consists of a list of numbers related to a research. Among those numbers,
few may be repeated twice and even more than twice. The number which tells us how many
times a particular data appears is called the frequency of that particular number or the variable in
which that number is assigned. The frequencies of variables in a data are to be listed in a table.
This table is known as frequency distribution table and the list is referred as frequency
distribution.
A frequency distribution is a tabular summary of data showing the frequency (or number) of
items in each of several non-overlapping classes. It is as an orderly arrangement of data
classified according to the magnitude of the observations.
When the data are grouped into classes of appropriate size indicating the number of observations
in each class we get a frequency distribution.

INTRODUCTION TO SOCIAL RESEARCH METHODS
132 | THIKA INSTITUTE OF BUSINESS STUDIES 0715 067 272 www.tibs.ac.ke [email protected]
The objective is to provide insights about the data that cannot be quickly obtained by looking
only at the original data. By forming frequency distribution, we can summarize the data
effectively. It is a method of presenting the data in a summarized form. Frequency distribution is
also known as Frequency Table.
In a frequency table you keep count of the number of times a data item occurs by
keeping a tally.
Example 1
Suppose you kept a record of the maths marks obtained by learners in a test in
Grade 9. The test is out of a 10 marks and you have drawn a frequency table to show
the marks.
A tally of the marks is shown in the table below:
Mark Tally Frequency
1 /
2 ///
3 ////
4 //// /
5 //// ////
6 //// ////
/
7 //// ////
////
8 //// ////
//// ///
Complete the
frequency
table – fill in
the frequency
column and
the totals.

INTRODUCTION TO SOCIAL RESEARCH METHODS
133 | THIKA INSTITUTE OF BUSINESS STUDIES 0715 067 272 www.tibs.ac.ke [email protected]
9 //// ////
10 ////
Total
Example 1:
Example 2
Example 3

INTRODUCTION TO SOCIAL RESEARCH METHODS
134 | THIKA INSTITUTE OF BUSINESS STUDIES 0715 067 272 www.tibs.ac.ke [email protected]
Example 4
Uses of Frequency Distribution:
Frequency distribution helps us:
1. To analyze the data.

INTRODUCTION TO SOCIAL RESEARCH METHODS
135 | THIKA INSTITUTE OF BUSINESS STUDIES 0715 067 272 www.tibs.ac.ke [email protected]
2. To estimate the frequencies of the population on the basis of the ample.
3. To facilitate the computation of various statistical measures.
Components of a Frequency Distribution Table
Frequency distribution table (also known as frequency table) consists of various components.
a. Classes: A large number of observations varying in a wide range are usually classified in
several groups according to the size of their values. Each of these groups is defined by an
interval called class interval. The class interval between 10 and 20 is defined as 10-20.
b. Class limits: The smallest and largest possible values in each class of a frequency
distribution table are known as class limits. For the class 10-20, the class limits are 10 and 20. 10
is called the lower class limit and 20 is called the upper class limit.
c. Class limit: Class limit is the midmost value of the class interval. It is also known as the
mid value.
d. Mid value of each class = (lower limit + Upper limit)/2.
If the class is 0-10, lower limit is 0 and upper limit is 10. So the mid value is
(0+10)2 = 10/2 = 5.
e. Magnitude of a class interval: The difference between the upper and lower limit of a
class is called the magnitude of a class interval.
f. Class frequency: The number of observation falling within a class interval is called class
frequency of that class interval.
Constructing a Frequency Distribution
A frequency distribution table is one way to organize data so that it makes more sense. The data
so distributed is called frequency distribution and the tabular form is called frequency
distribution table. Let us see with the help of example how to construct distribution table.
The frequency distribution table lists all the marks and also show how many times (frequency)
they occurred.

INTRODUCTION TO SOCIAL RESEARCH METHODS
136 | THIKA INSTITUTE OF BUSINESS STUDIES 0715 067 272 www.tibs.ac.ke [email protected]
Example 1
The marks awarded for an assignment set for a Year 8 class of 20 students were as follows:
6 7 5 7 7 8 7 6 9 7
4 10 6 8 8 9 5 6 4 8
Present this information in a frequency table.
Example 2
The following data show the survey results of the number of children in families.
Data:
3, 5, 2, 4, 3, 1, 4, 1, 2, 5, 3, 6, 4, 3, 5, 4, 4.
Create a frequency table for this data.
Solution
No of children Tally Frequency
1 l l 2
2 l l 2
3 l l l l 4
4 l l l l 5
5 l l l 3
6 l 1
Total 17
TYPES OF FREQUENCY DISTRIBUTION
There are many types of frequency distributions:

INTRODUCTION TO SOCIAL RESEARCH METHODS
137 | THIKA INSTITUTE OF BUSINESS STUDIES 0715 067 272 www.tibs.ac.ke [email protected]
a. Ungrouped frequency distribution
b. Grouped frequency distribution
c. Cumulative frequency distribution
d. Relative frequency distribution
e. Relative cumulative frequency distribution
a. Ungrouped Frequency Distribution
A frequency distribution with an interval width of 1 is referred to an ungrouped frequency
distribution. Ungroped frequency distribution is an arrangement of the observed values in
ascending order. The ungrouped frequency distribution are those data, which are not arranged in
groups. They are known as individual series. When the ungrouped data are grouped, we get the
grouped frequency distribution.
For Example: A teacher gave a test to a class of 26 students. The maximum mark is 5. The marks obtained by the pupils are: 3 2 3 3 4 3 1 2 5
1 5 4 2 1 1 3 3 4
1 2 1 4 5 4 2 2
Such data as above is called ungrouped (or raw) data.
We may arrange the marks in ascending or descending order. The data so represented is called an
array.
1 1 1 1 1 1 1 2 2 2 2 2
3 3 3 3 3 3 4 4 4 4 4 4 5 5
The difference between the greatest and the smallest number is called range of the data. Thus for
the above data, the range is 5 - 1 which equals 4 marks.
Example 2
Problem 1. Create an Ungrouped Frequency Distribution table with the data from the survey,
accomplished among the students of university, which answered the question of how many
books they read per year. The answers are presented below:

INTRODUCTION TO SOCIAL RESEARCH METHODS
138 | THIKA INSTITUTE OF BUSINESS STUDIES 0715 067 272 www.tibs.ac.ke [email protected]
7 3 0 9 8 5 4 4 5 6 6 3 3 4 5 1 0 3
Solution:
The next steps were accomplished:
1. First column where all different answers were placed from higher to lower value was
created;
2. Second column, where quantity of same answers in the survey was put for each score,
was created;
3. Third column was obtained by dividing values of the second column on the number of
answers;
4. Fourth column was obtained by multiplying the values from the third column by 100%;
5. The values for the fifth column were obtained starting from the lowest score (0), for
which Cf=f, and for other scores Cf was obtained as the sum of Cf for the previous score
and the f from the second column for current score.
6. Cp for the sixth column was calculated as a ratio of Cf and N;
7. the last column was obtained by multiplying the sixth column on 100%.
See results of calculations in the table below.
X f fr % Cf Cp C%
9 1 1/18=0,06 6 18=N 18/18=1 100
8 1 0,06 6 17 17/18=0,94 94
7 1 0,05 5 16 0,88 88
6 2 0,11 11 15 0,83 83
5 3 0,16 16 13 0,72 72
4 3 0,17 17 10 0,56 56
3 4 0,22 22 7 0,39 39
2 0 0 0 3 0,17 17
1 1 0,06 6 3 0,17 17
0 2 0,11 11 2 0,11 11
N=18 Σ=1 Σ%=100
Problem 2
Create an Ungrouped Frequency Distribution table with the data from the survey concerning the
age of the people, which attend the gym. The results of a survey are presented below.
25 30 27 32 22 25 27 24 25 26 26 23 23 24 25 21 20 30

INTRODUCTION TO SOCIAL RESEARCH METHODS
139 | THIKA INSTITUTE OF BUSINESS STUDIES 0715 067 272 www.tibs.ac.ke [email protected]
31 25 30 32 21 21 24 25 26 28 30 29 32 19 20 21 25 25
Solution
The same steps as for the previous problem were accomplished. Results are performed in the
Ungrouped Frequency Distribution table below.
X f fr % Cf Cp C%
19 1 0,028 2,8 36=N 1 100
20 2 0,056 5,6 35 0,972 97,2
21 4 0,111 11,1 33 0,917 91,7
22 1 0,028 2,8 29 0,806 80,6
23 2 0,056 5,6 28 0,778 77,8
24 3 0,083 8,3 26 0,722 72,2
25 8 0,222 22,2 23 0,639 63,9
26 3 0,083 8,3 15 0,417 41,7
27 2 0,056 5,6 12 0,333 33,3
28 1 0,028 2,8 10 0,278 27,8
29 1 0,028 2,8 9 0,25 25
30 4 0,111 11,1 8 0,222 22,2
31 1 0,028 2,8 4 0,111 11,1
32 3 0,081 8,1 3 0,083 8,3
N=36 Σ=1 Σ%=100
b. Grouped Frequency Distribution
A grouped frequency distribution is an ordered listed of a variable X,, into groups in one column
with a listing in a second column, the frequency column. A grouped frequency distribution is an
arrangement class intervals and corresponding frequencies in a table.
Guidelines for Classes
1. Lower limit of first class must be multiple of 5
2. The number of classes should be between 5 and 20
3. Classes are shown in the first column and frequencies in the second column.
4. The class width should be an odd number. This will guarantee that the class midpoints are
integers instead of decimals.
5. The classes must be mutually exclusive. This means that no data value can fall into two
different classes
6. The classes must be all inclusive or exhaustive. This means that all data values must be
included.

INTRODUCTION TO SOCIAL RESEARCH METHODS
140 | THIKA INSTITUTE OF BUSINESS STUDIES 0715 067 272 www.tibs.ac.ke [email protected]
7. The classes must be continuous. There are no gaps in a frequency distribution. Classes
that have no values in them must be included (unless it's the first or last class which are
dropped).
8. The classes must be equal in width. The exception here is the first or last class. It is
possible to have an "below ..." or "... and above" class. This is often used with ages.
Grouped Frequency Distribution Table
Inclusive type of frequency distribution can be converted into exclusive type as in Table (b)
c. Cumulative Frequency Distribution
Cumulative frequency is defined as a running total of frequencies. In cumulative frequency
distribution, the frequencies are shown in the cumulative manner. The cumulative frequency for
each class interval is the frequency for that class interval added to the preceding cumulative total.
Cumulative frequency can also defined as the sum of all previous frequencies up to the current
point.
The cumulative frequency is important when analyzing data, where the value of the cumulative
frequency indicates the number of elements in the data set that lie below the current value. The
cumulative frequency is also useful when representing data using diagrams like histograms.

INTRODUCTION TO SOCIAL RESEARCH METHODS
141 | THIKA INSTITUTE OF BUSINESS STUDIES 0715 067 272 www.tibs.ac.ke [email protected]
Cumulative Frequency Table
The cumulative frequency is usually observed by constructing a cumulative frequency table. The
cumulative frequency table takes the form as in the example below.
Example 1
Note that another column labelled cumulative frequency has been added to the table.

INTRODUCTION TO SOCIAL RESEARCH METHODS
142 | THIKA INSTITUTE OF BUSINESS STUDIES 0715 067 272 www.tibs.ac.ke [email protected]
Mark Frequency Cumulative
frequency This tells you that
1 1 1 1 learner scored 1 mark
2 3 3 + 1 = 4 4 learners scored marks of 2 or less
3 4 4 + 4 = 8 8 learners scored marks of 3 or less
4 6 6 + 8 = 14 14 learners scored marks of 4 or less
5 9 9 + 14 = 23 23 learners scored marks of 5 or less
6 11 11 + 23 = ………
7 15 15 + …….…..= ……..
8 18 18 + 49 = 67
9 10 10 + ….…….=………
10 5 5 + .……..=……….
Total 82
Note:
The final total in the cumulative frequency column is the same as the total number of learners. This helps you check that your working is correct.
The frequency tells you how many learners scored a certain mark The cumulative frequency tells you how many learners scored that mark or less.
e.g.
1) From the frequency column you know that 18 learners scored 8 marks. From the cumulative frequency column you can see that 67 learners scored a mark
of 8 or less
2) You can also see that 8 learners got 3 marks or less than 3 marks.
Therefore, you can say that 82 – 8 = 74 learners got more than 3 marks.

INTRODUCTION TO SOCIAL RESEARCH METHODS
143 | THIKA INSTITUTE OF BUSINESS STUDIES 0715 067 272 www.tibs.ac.ke [email protected]
Activity
a) Complete the cumulative frequency table above. b) How many learners scored 6 marks or less?
c) How many learners scored more than 6 marks? d) How many learners scored 9 marks or less?
Example 1
The set of data below shows the ages of participants in a certain summer camp. Draw a
cumulative frequency table for the data.
Age (Years) Frequency
10 3
11 18
12 13
13 12
14 7
15 27
Solution:
The cumulative frequency at a certain point is found by adding the frequency at the present point
to the cumulative frequency of the previous point.
The cumulative frequency for the first data point is the same as its frequency since there is no
cumulative frequency before it.
Age (years) Frequency Cumulative Frequency
10 3 3
11 18 3+18 = 21
12 13 21+13 = 34
13 12 34+12 = 46
14 7 46+7 = 53
15 27 53+27 = 80

INTRODUCTION TO SOCIAL RESEARCH METHODS
144 | THIKA INSTITUTE OF BUSINESS STUDIES 0715 067 272 www.tibs.ac.ke [email protected]
Example 3
2) The table below shows the number of pets owned by the 26 learners in Grade 5.
Number of pets 0 1 2 3 4 5
frequency 8 6 6 3 2 1
Cumulative frequency
a) Complete the table.
b) With a partner discuss i) How many learners had 3 pets or fewer than 3 pets ii) How many learners had more than 3 pets iii) How many learners had 4 pets or less than 4 pets
A CUMULATIVE FREQUENCY TABLE WITH GROUPED DATA
a) Grouped discrete data. Discrete data is data that has a certain exact value (often whole numbers) and
is often collected by counting.
e.g. A set of data collected about shoe sizes would be discrete data.
Discrete data can be shown by points on a number line.
Suppose you kept a record of the marks of a maths exam of the 140 learners
in Grade 10. The exam is out of 100 and you have grouped the marks and
recorded the data in a frequency table shown below:
Mark Frequency Cumulative frequency This tells you that
1 - 10 0 0 0 learners scored between 1 and 10
marks
11 - 20 2 2 + 0 = 2 2 learners scored 20 marks or less
21 - 30 6 6 + 2 = 8 8 learners scored 30 marks or less
31 – 40 7 7 + 8 = 15 15 learners scored 40 marks or less
41 - 50 14 14 + 15 = …..

INTRODUCTION TO SOCIAL RESEARCH METHODS
145 | THIKA INSTITUTE OF BUSINESS STUDIES 0715 067 272 www.tibs.ac.ke [email protected]
51 - 60 20
61 - 70 35
71 - 80 29
81 - 90 16
91 - 100 11
Total 140
Note:
The frequency tells you how many learners scored between certain marks
The cumulative frequency tells you how many learners scored the upper limit or
less than the upper limit of the group.
e.g.
From the cumulative frequency column you can see that 15 learners scored a mark
of 40 or less. Therefore, you can say that 140 – 15 = 125 learners scored more
than 40 marks (i.e. they scored 41 or more marks).
b) Grouped continuous data Continuous data can be any value within a certain range (not exact values) and is
found by measuring. For example, a set of data relating to the length of people’s
feet would be continuous data.
Continuous data can be shown by a continuous number line.
Suppose you measured the heights of all the learners in Grade 1.
The data is shown in the following frequency table. A cumulative frequency
column has been added to the frequency table.
Height, h cm Frequency Cumulative
frequency This tells you that
90 < h 95 5 5 5 learners had a height of 95 cm
or less
95 < h 100 9 9 + 5 = 14 14 learners had a height of 100cm
or less than 100cm

INTRODUCTION TO SOCIAL RESEARCH METHODS
146 | THIKA INSTITUTE OF BUSINESS STUDIES 0715 067 272 www.tibs.ac.ke [email protected]
100 < h 105 17 17 + 14 = 31 31 learners had a height of 105
cm or less than 105 cm
105 < h 110 28 28 + 31 = …….
110 < h 115 21
115 < h 120 10
Total 90
Note:
The frequency for each group tells you how many learners are between the limits
of a particular group height
The cumulative frequency for each group tells you how many learners are less
than or equal to the upper boundary of the group.
e.g.
1. From the frequency column you know that 17 learners are between 100 and 105
cm tall (100 < h 105).
From the cumulative frequency column you can see that 31 learners are 105 cm or
less than 105 cm tall
2. From the cumulative frequency column you know that 14 learners are 100 cm or
less than 100 cm. Therefore, you can also tell that 90 – 14 = 76 learners are taller
than 100 cm.
Activity
a) Complete the cumulative frequency table on the previous page b) How many learners were between 105 cm and 110 cm in height? c) How many learners were 110 cm or less than 110 cm in height?
d) How many learners were greater than 110 cm in height?
Example
2) The table shows the marks for a maths exam in Grade 10

INTRODUCTION TO SOCIAL RESEARCH METHODS
147 | THIKA INSTITUTE OF BUSINESS STUDIES 0715 067 272 www.tibs.ac.ke [email protected]
% Number of
learners
Cumulative
frequency
0 < x 10 0
10 < x 20 2
20 < x 30 6
30 < x 40 7
40 < x 50 14
50 < x 60 20
60 < x 70 35
70 < x 80 29
80 < x 90 16
90 < x 100 11
Total = 140
a) What do you notice that is different in this cumulative frequency table compared to the one on page 4?
b) Complete the table by filling in the cumulative frequency column.
c) Your HOD tells you that any learner that got 40% or less must re-write the exam. How many learners must re-write the exam.
d) If a learner scored more than 80% he/she achieved an A symbol. Discuss how you can work out how many learners got As.
e) How would you be able to find out the number of learners who scored 80% or
higher than 80%?

INTRODUCTION TO SOCIAL RESEARCH METHODS
148 | THIKA INSTITUTE OF BUSINESS STUDIES 0715 067 272 www.tibs.ac.ke [email protected]
d. Relative Frequency Distribution
A relative frequency distribution is a distribution in which relative frequencies are recorded
against each class interval. Relative frequency of a class is the frequency obtained by dividing
frequency by the total frequency. Relative frequency is the proportion of the total frequency that
is in any given class interval in the frequency distribution.
Relative Frequency Distribution Table
If the frequency of the frequency distribution table is changed into relative frequency then
frequency distribution table is called as relative frequency distribution table. For a data set
consisting of n values. If f is the frequency of a particular value then the ratio 'fn' is called its
relative frequency.
Solved Example
Question: Find the relative frequency from the data given below:
Class interval Frequency
20-24 10
25-29 12
30-34 8
35-39 20
40-44 11
45-49 4
50-54 5
Solution:
Relative frequency distribution table for the given data.
Here n = 70
Class
Interval
Frequency
(f)
Relative Cumulative
Frequency(fn)
20 – 24 10 10 / 70 = 0.143
25 - 29 12 12 / 70 = 0.171
30 - 34 8 8 / 70 = 0.114

INTRODUCTION TO SOCIAL RESEARCH METHODS
149 | THIKA INSTITUTE OF BUSINESS STUDIES 0715 067 272 www.tibs.ac.ke [email protected]
35 - 39 20 20 / 70 = 0.286
40 - 44 11 11 / 70 = 0.157
45 – 49 4 4 / 7 0 = 0.057
50 – 54 5 5 / 70 = 0.071
TOTAL n = 70
e. Cumulative Relative Frequency Distribution
Cumulative relative frequency distribution is one type of frequency distribution. The relative
cumulative frequency is the cumulative frequency divided by the total frequency.
Cumulative relative frequency is the accumulation of the previous relative frequencies. To find
the cumulative relative frequencies, add all the previous relative frequencies to the relative
frequency for the current row.
Table 1.9 Frequency Table of Student Work Hours w/ Relative and Cumulative Relative Frequency
DATA
VALUE FREQUENCY
RELATIVE
FREQUENCY
CUMULATIVE RELATIVE
FREQUENCY
2 3
0.15
3 5
0.15+0.25=0.40
4 3
0.40+0.15=0.55
5 6
0.55+0.30=0.85
6 2
0.85+0.10=0.95
7 1
0.95+0.05=1.00
The last entry of the cumulative relative frequency column is one, indicating that one hundred
percent of the data has been accumulated.
The following table represents the heights, in inches, of a sample of 100 male semiprofessional
soccer players.

INTRODUCTION TO SOCIAL RESEARCH METHODS
150 | THIKA INSTITUTE OF BUSINESS STUDIES 0715 067 272 www.tibs.ac.ke [email protected]
Table 1.10 Frequency Table of Soccer Player Height
HEIGHT
(INCHES) FREQUENCY
RELATIVE
FREQUENCY
CUMULATIVE RELATIVE
FREQUENCY
59.95 - 61.95 5
0.05
61.95 - 63.95 3
0.05+0.03=0.08
63.95 - 65.95 15
0.08+0.15=0.23
65.95 - 67.95 40
0.23+0.40=0.63
67.95 - 69.95 17
0.63+0.17=0.80
69.95 - 71.95 12
0.80+0.12=0.92
71.95 - 73.95 7
0.92+0.07=0.99
73.95 - 75.95 1
0.99+0.01=1.00
Total = 100 Total = 1.00
3. GRAPHICAL PRESENTATION
There are tedious and lengthy calculations in statistics. It is easier to draw graphs for such
problems and calculate the results from it. The graph makes large data quite simpler to work
with. The graph is pictorial representation of the numerical data. Graphs are a very effective
visual tool because they have the capacity to present the information quickly as well as easily.
That is the main reason why the graphs are commonly used by different media and also in
business.
Data can be understood better when it is presented as a graph rather than as a table because the
graphs have the ability to reveal a trend or comparison. In the world of statistics, graphs give us
the relationship between different variables or show the value spread of a given variable or
phenomenon.

INTRODUCTION TO SOCIAL RESEARCH METHODS
151 | THIKA INSTITUTE OF BUSINESS STUDIES 0715 067 272 www.tibs.ac.ke [email protected]
A graph is the best medium for presenting data for quick visualization of relationships between
various factors. Graphs effectively emphasize the main points in an analysis and clarify
relationships which might other- wise remain elusive.
Parts of a Graph
a. Title: The title must tell as simply as possible what the graph shows. It should answer the
same questions as the title for a table.
- Who? White females with breast cancer; black males with lung cancer.
- What are the data? Counts; percentage distributions; rates.
- Where are the data from? One hospital; the entire state.
- When? A particular year; a time period.
b. Legend or key: When several variables are included on the same graph, it is necessary to
identify each by using a key or legend. The legend should be placed in a clear space on the face
of the graph and each line iden- tified on the graph as in the example below.
White males ..........
Black males ---------
White females ----------------
Black females —.—.—.—.
c. Scale captions: Scale captions are placed on both axes to identify the scale values clearly.
It is essential that both the subject and the units used be identified. The caption for the horizontal
scale is generally centred under the X-axis. The caption for the vertical axis is placed either at the
top left of the Y-axis or along the Y-axis, whichever is the easier to read.
d. Footnotes: If the title, scale labels, and leg- end cannot explain everything in the graph,
then footnotes should be used as in tables.
e. Source: The exact reference to the source should be given just as for tables.
TYPES OF GRAPHS AND THEIR USES
There are different kinds of graphical charts based on statistics as follows:
1. Bar Graphs
2. Line graphs
3. Pie charts

INTRODUCTION TO SOCIAL RESEARCH METHODS
152 | THIKA INSTITUTE OF BUSINESS STUDIES 0715 067 272 www.tibs.ac.ke [email protected]
4. Histogram
5. Frequency polygon
6. Frequency curve
7. Cumulative frequency or ogives
8. Z – Chart (Zee Chart)
9. Scatter plot
10. Stem and plot
Let us study the graphs and their uses in detail.
1. Bar Graph
Bar graph is drawn on an x-y graph and it has labelled horizontal or vertical bars that show
different values. A bar graph is one method of comparing data by using solid bars to represent
unique quantities. The size, length and color of the bars represent different values.
Bar graph is very useful for non continuous, non-numerical data (e.g. place, colour, and species)
so the bars do not touch).
Bar Graphs are appropriate for data that are non-numerical and discrete for at least one variable,
i.e. they are grouped into separate categories. There are no dependent or independent variables.
Data are collected for discontinuous, non-numerical categories.
Multiple sets of data can be displayed side-by-side for direct comparison (e.g. Males and
females of the same age group).
It helps in comparing or contrasting the size of the different categories of the data provided.
Bar graphs are commonly used for frequencies, proportions and percentages of nominal and
ordinal data. They are easy to construct and can be readily interpreted.
The bars may be either horizontal or vertical and may be filled in with stripes, cross- hatching, or
shading to make them stand out.
Because the bars represent magnitudes by their lengths, a zero line must be shown and the
arithmetic scale must be used.
In a simple bar graph, the spaces between the bars are usually about half of the width of each bar.
Example
Lets take an example of the bar diagram and compare the pass percentage of a school during the

INTRODUCTION TO SOCIAL RESEARCH METHODS
153 | THIKA INSTITUTE OF BUSINESS STUDIES 0715 067 272 www.tibs.ac.ke [email protected]
years 2000, 2001 and 2002.
2. Line Graphs
A line graph is a diagram that shows a line joining several points, or a line that shows the
relationship between the points.
Line graphs are used to display continuous data.
You can only use line graphs when the variable plotted along the x-axis is continuous -for
example, time, temperature or distance.
A line graph can be taken as xy plane, where there will be an independent variable and a
dependent variable and it specifies how the two variables are related to each other and vary with
respect to one another. Mostly, the independent variable is taken on the x-axis while the
dependent variable on the y-axis.
Line graphs can be useful in predicting future events when they show trends over time. They are
most useful for showing trends, and for identifying whether two variables are related to one
another.
An example of Trend data: How does temperature vary from month to month?
An example of a Correlation: On average, how much sleep do people get, based on their age?
Solved Example
Question: The table given below shows the weights of a set of people –
Month Weight (kg)

INTRODUCTION TO SOCIAL RESEARCH METHODS
154 | THIKA INSTITUTE OF BUSINESS STUDIES 0715 067 272 www.tibs.ac.ke [email protected]
1 38
3 41
5 43
7 49
9 51
11 54
Solution:
The data as per given in the table above has been summarized in the form of a line graph below.
3. Pie Charts
A pie chart can be taken as a circular graph which is divided into different disjoint pieces, each
displaying the size of some related information. The highlight of this graph is that it represents a
whole and each part represents a percentage of the whole. Hence, pie charts are best used with
respect to categorical data which helps one understand what percentage each of these category
constitutes. It also has a good visual treat and the percentage value of each section is instantly
known.
When producing a pie chart it is important that these are constructed accurately. The 'pie' is
divided with regard to the angles at the centre of the circle. There are 360° in total. These must
be divided in proportion to the data.

INTRODUCTION TO SOCIAL RESEARCH METHODS
155 | THIKA INSTITUTE OF BUSINESS STUDIES 0715 067 272 www.tibs.ac.ke [email protected]
Example.
A sample of 30 students were asked how many brothers and sisters they had. Results were as
follows:
Use the steps listed below to produce a pie chart to display this data.
Step 1:
Put the data into a table and convert the actual numbers into degrees.
Complete the following table:
No. of
siblings
No. of
students Conversion No. of degrees
0 4
1 12
2 8
3 3
4 2
more 1
30
To convert the number of students into degrees:
Result for class x 360
Total in sample
The number of degrees should always be rounded to a whole number.

INTRODUCTION TO SOCIAL RESEARCH METHODS
156 | THIKA INSTITUTE OF BUSINESS STUDIES 0715 067 272 www.tibs.ac.ke [email protected]
The total number of degrees must always equal 360° (check, especially if you have had to round any
of the answers).
You now know how to divide the degrees at the centre of the 'pie'.
Step2:
Draw the circle, using compasses.
Always mark your page with a dot first and then use this as the centre of you circle. It can be very
difficult to find the centre after the circle has been drawn.
Step3:
Draw a line from the centre to the top of the circle. This will be your starting point for
plotting your results.
Step4:
Mark the first portion of the 'pie'.
Put the protractor on the line, with + at centre of circle and 0 towards its edge.
Follow the protractor numbers round from 0 to 48° and mark. Draw a line at this point from the
centre of the circle to the edge.

INTRODUCTION TO SOCIAL RESEARCH METHODS
157 | THIKA INSTITUTE OF BUSINESS STUDIES 0715 067 272 www.tibs.ac.ke [email protected]
Step5:
Repeat this for each of the other results.
Put the protractor on the new line you have just drawn (at 48°), again with + at centre of circle and
0 towards the edge of the circle.
Follow the protractor numbers round from 0 to 144° and mark. Draw a line at this point from the
centre of the circle to the edge.
Continue with the other results. Take care to always move your protractor to the new line you have
just drawn.
Step6:
Add colour, an informative title and key.
Your pie chart should look something like this:
Solved Example
Question: The following table shows the expenses of a nuclear family for a month for some day
to day items:
Expense Money (Ksh)
Mortgage 400
Food 120
Dress 80
TOTAL 600

INTRODUCTION TO SOCIAL RESEARCH METHODS
158 | THIKA INSTITUTE OF BUSINESS STUDIES 0715 067 272 www.tibs.ac.ke [email protected]
Solution:
The total monthly expenditure=
Ksh 400 + Ksh 120 + Ksh 80 = Ksh 600
To draw a pie chart, first lets form a pie chart using the relevant formula.
Subject Ratio
Mortgage 400/600 x 360 = 240
Food 120/600 x 360 = 72
Dress 80/600 x 360 = 48
It can be seen that the total of the ratios equals 240 + 72 + 48 = 360
So we get pie diagram:
4. Histogram
Histogram is the most accurate graph that represents a frequency distribution. In the histogram
the scores are spread uniformly over the entire class interval. The class intervals are plotted on
the x-axis and the frequencies on the y-axis. Each interval is represented by a separate rectangle.
The area of each rectangle is proportional to the number of measures within the class- interval.
The entire histogram is proportional to the statistical data set.
Lets consider a data table and lets try to draw a histogram of it.

INTRODUCTION TO SOCIAL RESEARCH METHODS
159 | THIKA INSTITUTE OF BUSINESS STUDIES 0715 067 272 www.tibs.ac.ke [email protected]
Class interval frequency
0-10 1
10-20 3
20-30 6
30-40 4
40-50 2
To plot this take the class limits on the x-axis and the frequency on the y-axis. On the x-axis, the
scale can be 10 units whereas on the y-axis the scale can be 1 unit. Hence, we get
Histogram II
Example 1: In a batch of 400 students, the height of students is given in the following table.
Represent it through a frequency polygon.

INTRODUCTION TO SOCIAL RESEARCH METHODS
160 | THIKA INSTITUTE OF BUSINESS STUDIES 0715 067 272 www.tibs.ac.ke [email protected]
Solution: Following steps are to be followed to construct a histogram from the given data:
The heights are represented on the horizontal axes on a suitable scale as shown.
The number of students is represented on the vertical axes on a suitable scale as shown.
Now rectangular bars of widths equal to the class- size and the length of the bars
corresponding to a frequency of the class interval is drawn.
ABCDEF represents the given data graphically in form of frequency polygon as:
Frequency polygons can also be drawn independently without drawing histograms. For this, the
midpoints of the class intervals known as class marks are used to plot the points.
Example 3
This frequency table shows Grade 12 maths exam marks
% Number of
learners
0 < x 10 0
10 < x 20 2
20 < x 30 6
30 < x 40 7
40 < x 50 14
50 < x 60 20

INTRODUCTION TO SOCIAL RESEARCH METHODS
161 | THIKA INSTITUTE OF BUSINESS STUDIES 0715 067 272 www.tibs.ac.ke [email protected]
60 < x 70 35
70 < x 80 29
80 < x 90 6
90 < x 100 1
total 120
This data can be represented by drawing a histogram.
Maths Marks in Grade 12
0
5
10
15
20
25
30
35
40
5 15 25 35 45 55 65 75 85 95 105
Marks as a %
Fre
qu
en
cy
Histogram Analysis
In this course, we will confine our analysis of histograms to answering the following six
questions.
What is the maximum value?
What is the minimum value?
How many peaks does the histogram have and where are they located?
What is the general shape of the histogram?
Does the histogram have any gaps? If so, where are they located?
Does the histogram have any extreme values? If so, where are they located?
A peak is a bar that is taller than the neighboring bars. If two or more adjacent bars have the
same height but are taller than the neighboring bars, they form a single peak or plateau. A gap is

INTRODUCTION TO SOCIAL RESEARCH METHODS
162 | THIKA INSTITUTE OF BUSINESS STUDIES 0715 067 272 www.tibs.ac.ke [email protected]
a class or classes having frequency zero, but with non-zero frequency classes on both sides.
Extreme values are data values which are separated from other data values by a gap at least two
classes wide.
In this class, you must always provide the answers to the above questions in paragraph form. The
order of the questions is unimportant, but you should try to answer each question for each
histogram you are analyzing. The following five examples are intended to give a general idea of
how to do this.
Example 1
This histogram has a maximum value of 3 and a minimum value of zero. It has one peak between
0.5 and 1.0, and one gap between 2.0 and 2.5. There are no extreme values. The histogram is
skewed right.
Example 2

INTRODUCTION TO SOCIAL RESEARCH METHODS
163 | THIKA INSTITUTE OF BUSINESS STUDIES 0715 067 272 www.tibs.ac.ke [email protected]
The above histogram is skewed left. It has two peaks, between -36 and -26 and between -6 and 4.
There are no gaps or extreme values. The minimum value is -36 and the maximum is 14.
Example 3
The histogram above is skewed right. It has a large gap between 4.72 and 5.36. The value
between 5.36 and 5.68 is extreme. The maximum value is 5.68 and the minimum is 3.76.
Example 4

INTRODUCTION TO SOCIAL RESEARCH METHODS
164 | THIKA INSTITUTE OF BUSINESS STUDIES 0715 067 272 www.tibs.ac.ke [email protected]
The histogram of male pulse rates is bell-shaped with one peak between 64 and 70. The
minimum value is 46 and the maximum value is 82. There are no gaps or extreme values.
Example 5

INTRODUCTION TO SOCIAL RESEARCH METHODS
165 | THIKA INSTITUTE OF BUSINESS STUDIES 0715 067 272 www.tibs.ac.ke [email protected]
The histogram of earthquake depths is uniform in shape. It has two peaks, a plateau between 2
and 12, and another peak between 17 and 22. There are no gaps or extreme values.
5. Frequency Polygon
The frequency polygon has most of the properties of a histogram, with an extra feature. Here the
mid point of each class of the x-axis is marked. Then the midpoints and the frequencies are taken
as the plotting point. These points are connected using line segments. We also complete the
graph, that is, it's closed by joining to the x-axis. Frequency polygon gives a less accurate
representation of the distribution, than a histogram, as it represents the frequency of each class
by a single point not by the whole class interval.
Lets consider a data table and lets try to draw an ogive of it.
This frequency table shows Grade 12 maths exam marks
% Number of
learners
0 < x 10 0
10 < x 20 2
20 < x 30 6
30 < x 40 7
40 < x 50 14
50 < x 60 20
60 < x 70 35
70 < x 80 29
80 < x 90 6
90 < x 100 1
total 120
This data can be represented by drawing a histogram.

INTRODUCTION TO SOCIAL RESEARCH METHODS
166 | THIKA INSTITUTE OF BUSINESS STUDIES 0715 067 272 www.tibs.ac.ke [email protected]
Maths Marks in Grade 12
0
5
10
15
20
25
30
35
40
5 15 25 35 45 55 65 75 85 95 105
Marks as a %
Fre
qu
en
cy
This same information can be represented in a frequency polygon by joining the
midpoints of the bars of the histogram like this
Maths Marks in Grade 12
0
5
10
15
20
25
30
35
40
5 15 25 35 45 55 65 75 85 95 105
Marks as a %
Fre
qu
en
cy

INTRODUCTION TO SOCIAL RESEARCH METHODS
167 | THIKA INSTITUTE OF BUSINESS STUDIES 0715 067 272 www.tibs.ac.ke [email protected]
and then erasing the bars like this:
Maths Marks in Grade 12
0
5
10
15
20
25
30
35
40
0 10 20 30 40 50 60 70 80 90 100 110
Marks as a %
Fre
qu
en
cy
Notice: the graph begins and ends where the frequency is zero
A frequency polygon is a line graph of the data. It is a useful way of representing the
data as it gives another way of reading frequency. Frequency polygons are often used
to compare different frequency distributions. You may have seen line graphs in the
newspaper that are actually frequency polygons.
Solved Example
Question: Draw a frequency polygon graph by using data given below:
Class interval frequency
0-10 1
10-20 3
20-30 6
30-40 4

INTRODUCTION TO SOCIAL RESEARCH METHODS
168 | THIKA INSTITUTE OF BUSINESS STUDIES 0715 067 272 www.tibs.ac.ke [email protected]
40-50 2
Solution:
Step 1:
First we need the mid point of the class interval.
Class Interval Midpoint Frequency
0-10 5 1
10-20 14 3
20-30 25 6
30-40 35 4
40-50 45 2
Step 2:
The frequency polygon obtained is
Frequency Polygon II
A frequency polygon shows a frequency distribution emphasizing the overall pattern in the data.
It is constructed from a histogram. The frequency polygon is a polygon - a closed two-

INTRODUCTION TO SOCIAL RESEARCH METHODS
169 | THIKA INSTITUTE OF BUSINESS STUDIES 0715 067 272 www.tibs.ac.ke [email protected]
dimensional figure of straight line segments - joining the mid points of the top of the bars of a
histogram. The first point is on the x-axis (y = 0) and is placed in the middle of the interval
which precedes the first bar of the histogram. The last point is located on the x axis in the middle
of the interval immediately following the last bar of the histogram. The important issue is that,
by joining the mid point of each bar and the x-axis at each end, the surface under the frequency
polygon is exactly the same as the surface of the histogram. Therefore the principle of the
histogram is respected. The same surface represents the same amount of data (cases).
Frequency polygons represent a simple way to show data of several histograms on the same
graphic.

INTRODUCTION TO SOCIAL RESEARCH METHODS
170 | THIKA INSTITUTE OF BUSINESS STUDIES 0715 067 272 www.tibs.ac.ke [email protected]
6. Frequency Curve
The frequency polygon consists of sharp turns, and ups and downs which are not in conformity
with actual conditions. To remove these sharp features of a polygon, it becomes necessary to
smooth it. No definite rule for smoothing the polygon can be laid down. It should be understood
very clearly that the curve does not, in any way, sharply deviate from the polygon. In order to
draw a satisfactory frequency curve, first of all, we need to draw a frequency histogram, then the
frequency polygon and ultimately the frequency curve.
Frequency curve is obtained by joining the points of frequency polygon by freehand smoothed
curve. Unlike frequency polygon where the points are joined by straight lines, we make use of
freehand joining of those points in order to get a smoothed frequency curve. It is used to remove
the ruggedness of a polygon and to present it in a good form or shape. The curve begins and ends
at the base line as in the case of a polygon. Area under the curve must remain almost the same as
in the case of a polygon

INTRODUCTION TO SOCIAL RESEARCH METHODS
171 | THIKA INSTITUTE OF BUSINESS STUDIES 0715 067 272 www.tibs.ac.ke [email protected]
7. Cumulative Frequency Curve (Ogive)
Pronounced ‘Oh-jiv’
The word ogive is used to describe various smooth curved surfaces.
In ballistics and aerodynamics, an ogive is a pointed, curved surface used to form the
approximately streamlined nose of a bullet, shell, missile or aircraft.The ogive nose cone is
probably one of the most common shapes used in rocketry. It exhibits very good drag
characteristics.
In architecture an ogive is an arch with a pointed apex. It is formed by the intersection of
two S curves usually confined to decoration. An ogive or ogival arch is a pointed, "Gothic"
arch, drawn with compasses or with arcs of an ellipse
http://www.geocities.com/rocketguy_101/ogive/OgiveNoseCones.htm
http://www.pitt.edu/~medart/menuglossary/ogee.htm

INTRODUCTION TO SOCIAL RESEARCH METHODS
172 | THIKA INSTITUTE OF BUSINESS STUDIES 0715 067 272 www.tibs.ac.ke [email protected]
In woodworking, an ogive is a type of curve in which a piece of wood can be shaped.
In glaciology, ogives are bands of light and dark ice on the surface of a glacier.
Ogives is also a set of pieces for the piano by the composer Erik Satie.
In statistics, an ogive is the curve of a cumulative distribution function which forms an S
shape. The ogive is also called a cumulative frequency curve.
Cumulative frequencies of a distribution can also be charted on a graph. The curve that results by
plotting these is called the Cumulative Frequency Curve or an Ogive. Cumulative frequency
curve is a graph plotting cumulative frequencies on the y-axis and class scores on the x-axis.
Representing cumulative frequency data on a graph is the most efficient way to understand the
data and derive results.
The difference between frequency curve and an ogive is that in the later we plot the cumulative
frequency on the y-axis rather than plotting the individual frequencies. The advantage of an
ogive is that it enables median, quartiles, etc to be studied from the graph.
The value of median and other partition values can be located from the ogives. The technique of
drawing frequency curves and cumulative frequency curves is more or less the same. The only
difference is that in case of simple frequency curves the frequency is plotted against the mid
point of a class interval whereas in case of a cumulative frequency curve it is plotted at the upper
or lower limit of a class interval depending upon the manner in which the series has been
cumulated.

INTRODUCTION TO SOCIAL RESEARCH METHODS
173 | THIKA INSTITUTE OF BUSINESS STUDIES 0715 067 272 www.tibs.ac.ke [email protected]
Types of Cumulative Frequency Curves
Since the cumulative frequencies can either be ‘less than’ or ‘more than’ type, there are two type
of ogives called ‘less than’ type and ‘more than’ type ogive
There are two types of Cumulative Frequency Curves (or Ogives):
1. Less than type Cumulative Frequency Curve
2. More than type Cumulative Frequency Curve
1. Less Than Type Cumulative Frequency Curve
The less than cumulative frequencies are in ascending order. Here we use the upper limit of the
class intervals to plot the curve.
How to plot a Less than type Ogive:
1. In the graph, put the upper limit on the x-axis
2. Mark the cumulative frequency on the y-axis.
3. Plot the points (x,y) using upper limits (x) and their corresponding Cumulative frequency
(y)
4. Join the points by a smooth freehand curve. It looks like an elongated S.
2. More Than/Greater Than Type Cumulative Frequency Curve
The cumulative frequencies in this type are in the descending order. The cumulative frequency of
each class is plotted against the lower limit of the class interval and then various points are
joined by freehand.

INTRODUCTION TO SOCIAL RESEARCH METHODS
174 | THIKA INSTITUTE OF BUSINESS STUDIES 0715 067 272 www.tibs.ac.ke [email protected]
How to plot a More than type Ogive:
1. In the graph, put the lower limit on the x-axis
2. Mark the cumulative frequency on the y-axis.
3. Plot the points (x,y) using lower limits (x) and their corresponding Cumulative frequency
(y)
4. Join the points by a smooth freehand curve. It looks like an upside down S.
NOTE: Cumulative Graphs can also be used to calculate the Median of given data. If you draw
both the curves on the same graph, the point at which they intersect, the corresponding value on
the x-axis, represents the Median of the given data set.
Solved Example 1
Question: Consider a data table and lets try to draw a ogive of it.
Class interval frequency
0-10 1
10-20 3
20-30 6
30-40 4
40-50 2
Solution:
Step 1:
From the table given, lets make the cumulative frequency table for both less than and greater
than ogive.
Less than ogive
Upper limit Cumulative frequency
10 1
20 1 + 3 = 4
30 4 + 6 = 10
40 10 + 4 = 14
50 14 + 2 = 16
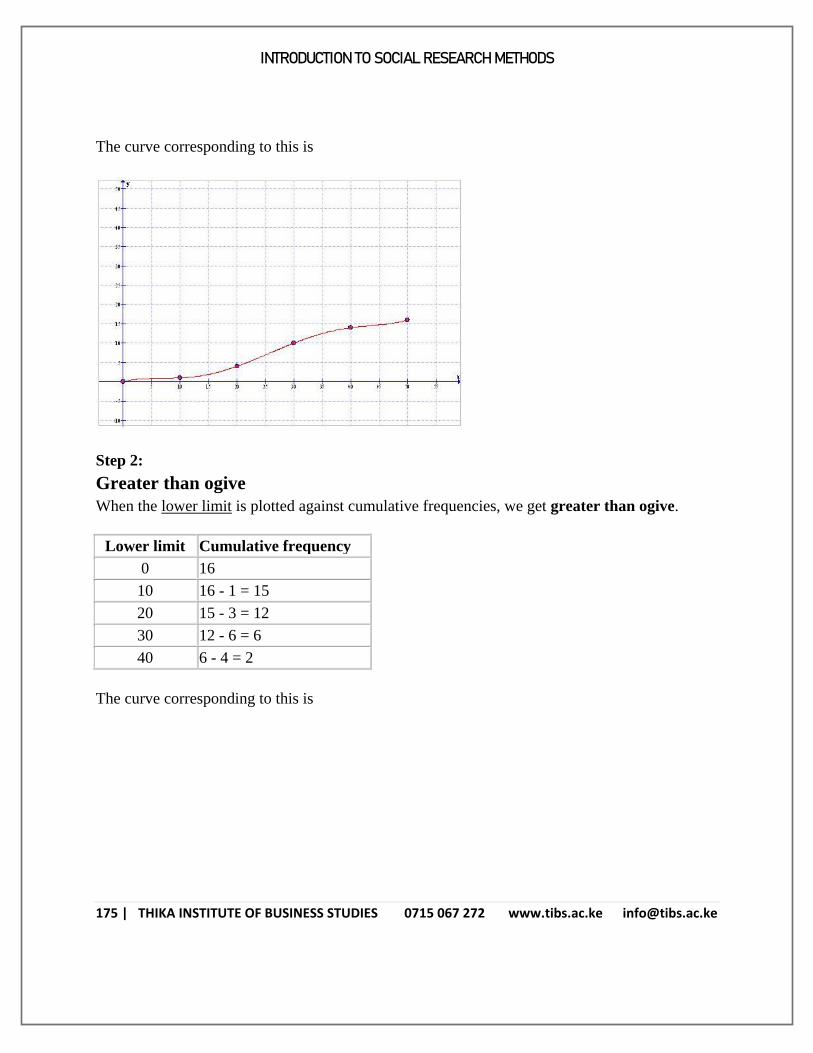
INTRODUCTION TO SOCIAL RESEARCH METHODS
175 | THIKA INSTITUTE OF BUSINESS STUDIES 0715 067 272 www.tibs.ac.ke [email protected]
The curve corresponding to this is
Step 2:
Greater than ogive
When the lower limit is plotted against cumulative frequencies, we get greater than ogive.
Lower limit Cumulative frequency
0 16
10 16 - 1 = 15
20 15 - 3 = 12
30 12 - 6 = 6
40 6 - 4 = 2
The curve corresponding to this is

INTRODUCTION TO SOCIAL RESEARCH METHODS
176 | THIKA INSTITUTE OF BUSINESS STUDIES 0715 067 272 www.tibs.ac.ke [email protected]
Example 2
Example: Marks obtained by the students of a class in statistics test are :
Marks 0 – 10 10 – 20 20 – 30 30 – 40 40 – 50 Number of students
4 8 18 15 5
Draw ‘less than’ and ‘more than’ ogives.
Solutions.
First, the ‘less than and ‘more than’ cumulative frequencies will be calculated and the ogives will
be drawn on the basis of these cumulative frequencies.
Calculation Of Cumulative Frequencies
Marks Frequency ‘Less than’ Cumulative Frequency
‘More than’ Cumulative Frequency
0 – 10 10 – 20 20 – 30 30 – 40 40 – 50
4 8 18 15 5
4 12 30 45 50
50 46 38 20 5
The Two Ogives Are Shown In Below Figure

INTRODUCTION TO SOCIAL RESEARCH METHODS
177 | THIKA INSTITUTE OF BUSINESS STUDIES 0715 067 272 www.tibs.ac.ke [email protected]
Example 3
Marks Frequency
(No. of Students)
Cumulative Frequency
0 – 5 2 2
5 – 10 10 12
10 – 15 5 17
15 – 20 5 22

INTRODUCTION TO SOCIAL RESEARCH METHODS
178 | THIKA INSTITUTE OF BUSINESS STUDIES 0715 067 272 www.tibs.ac.ke [email protected]
Example 4
Q: From the given Less than frequency curve, calculate the frequency between 600 and 1000
Sol: By observing the graph, we can see that corresponding values for class intervals between the
frequency
600 – 1000 = 16 – 10 = 6
Hence the frequency between said class intervals is 6.
DRAWING AN OGIVE OF UNGROUPED DISCRETE DATA.
The following activity will take you through how to draw a cumulative frequency curve for
ungrouped discrete data
Activity 3
The cumulative frequency table of the Grade 9 maths test given on page 2 is shown below. You
are going to draw a cumulative frequency curve to show the information. To do so you need
ordered pairs to plot on the Cartesian plane. The first element of the ordered pair is the mark
and the second element of the ordered pair is the cumulative frequency value associated with
that mark.
1) Complete the table
Mark Frequency Cumulative
frequency Points
0 0 0 (0 ; 0)

INTRODUCTION TO SOCIAL RESEARCH METHODS
179 | THIKA INSTITUTE OF BUSINESS STUDIES 0715 067 272 www.tibs.ac.ke [email protected]
1 1 1 (1 ; 1)
2 3 4 (2 ; 4)
3 4 8 (3 ; 8)
4 6 14
5 9 23
6 11 34
7 15 49
8 18 67
9 10 77
10 5 82
Total 82
2) Plot the points from the frequency table on to the grid below. Join the points with a smooth
line.
Grade 9 Maths Test
0
10
20
30
40
50
60
70
80
90
0 1 2 3 4 5 6 7 8 9 10
Mark
Cu
mu
lati
ve
Fre
qu
en
cy
Note:
If you join the points with a smooth line you get a cumulative frequency curve.

INTRODUCTION TO SOCIAL RESEARCH METHODS
180 | THIKA INSTITUTE OF BUSINESS STUDIES 0715 067 272 www.tibs.ac.ke [email protected]
The graph starts on the horizontal axis – i.e. where the cumulative frequency is zero. i.e start
the curve at (0 ; 0)
The shape of the curve is a leaning S shape. If you get any other shape you have made a
mistake.
2) DRAWING AN OGIVE OF GROUPED CONTINUOUS DATA
For a cumulative frequency curve of continuous data,
the first element of the ordered pair is the upper limit of the interval.
the second element is the value of the cumulative frequency.
The cumulative frequency table of the heights of the learners in Grade 1 given on page 5 is
shown below:
Height, h cm Frequency Cumulative
frequency Points
85 < h ≤ 90 0 0 (90 ; 0)
90 < h 95 5 5 (95 ; 5)
95 < h 100 9 14 (100 ; 14)
100 < h 105 17 31
105 < h 110 28 59
110 < h 115 21 80
115 < h 120 10 90
Total = 90
The graph looks like this:
heights of learners in grade 1
05
101520253035404550556065707580859095
90 100 110 120
height (cm)
cu
mu
lativ
e fre
qu
en
cy
Fill in the
rest of the
points

INTRODUCTION TO SOCIAL RESEARCH METHODS
181 | THIKA INSTITUTE OF BUSINESS STUDIES 0715 067 272 www.tibs.ac.ke [email protected]
The frequency curve allows you to read off the numbers of learners who are less than a certain
height. If you wanted to know how many learners were 102 cm or were shorter than 102 cm you
can read up from 102 cm on the horizontal axis and find that there are about 20 learners who are
shorter than or equal to 102cm - see arrows on graph.
Note:
The graph starts at the point where the cumulative frequency is zero (at the lower end of the
first group. So you plot the point (90 ; 0) ).
When you join the points on the graph you are assuming that the items are evenly spread
throughout the groups. Data items are not necessarily evenly spread on a graph so any
reading from a frequency curve is an estimate, not an exact reading.
Always draw lines on the graph to show where you took the readings
Activity 4
1) Use the graph on the previous page:
a) Estimate how many learners were 110 cm or less in height. Draw lines on the graph to
show where your answer came from.
b) Does this correspond to the number on the cumulative frequency table?
c) How many learners were more than 110 cm in height?
2) Forty Five Grade 10 learners were asked to estimate how long they thought one minute is.
They indicated when they thought one minute was up, and their partner recorded the length
of time, correct to the nearest second. Their estimates are given below:
53 47 77 63 59 54 62 65 71 77 42 58 67 51 72
57 73 48 61 46 51 50 63 68 54 50 65 53 56 69
44 56 77 58 55 79 56 58 67 52 48 70 49 71 73
a) Use the following table to work out the frequency.

INTRODUCTION TO SOCIAL RESEARCH METHODS
182 | THIKA INSTITUTE OF BUSINESS STUDIES 0715 067 272 www.tibs.ac.ke [email protected]
Time, x,
(in seconds) Tallies Frequency
Cumulative
frequency Points
40 < x ≤ 45
45 < x ≤ 50
50 < x ≤ 55
55 < x ≤ 60
60 < x ≤ 65
65 < x ≤ 70
70 < x ≤ 75
75 < x ≤ 80
a) On the squared paper on the next page construct a frequency polygon to illustrate the
above data.
b) Complete the cumulative frequency column and find the points that have to be plotted.
c) Construct an ogive to show the data.
d) Use the ogive to answer the following two questions:
i) How many estimates were 60 seconds or less?
ii) How many estimates were more than 60 seconds?
e) Write down 3 things that will help you remember the differences between a frequency
polygon and a cumulative frequency curve
Summary of the Ogive
The cumulative frequency curve has links to the 5 number summary and the box-and-whisker
plot. Look at the following diagram that shows this:
0
10
20
30
40
50
60
70
80
90
10
0
data items
cumulative
frequency
Lower quartile
Median
Upper quartile
Minimum
value Maximum
value

INTRODUCTION TO SOCIAL RESEARCH METHODS
183 | THIKA INSTITUTE OF BUSINESS STUDIES 0715 067 272 www.tibs.ac.ke [email protected]
8. Z – Chart (Zee Chart)
One of the problems with charting information is where your objective is to explain a complex
situation with a minimum number of charts or graphs. Showing progress over time of a small
project or a whole business can result in many different charts to show various viewpoints. The
Z-chart is a combination chart that shows three perspectives in a single diagram. It reduces at
least three different charts into one simple chart.
Meaning: A diagram charting values over a period (frequently one year) and showing
simultaneously 3 time series. It is often used in industry and constructed by plotting on it three
series:
1. monthly, figures for each of the 12 months ( or weekly, or daily data), Current line: It
shows the variation for each period
2. the cumulative total dating from the beginning of the current year to the end of each
month, (The total for the previous 12 months to the end of each month) Cumulative line:
and
3. the moving annual total. For this you need the figures for the year before the year for
which you are drawing the chart. Moving total:
It normally takes a Z shape, hence its title and is of use in clarifying the trends present in the
data displayed

INTRODUCTION TO SOCIAL RESEARCH METHODS
184 | THIKA INSTITUTE OF BUSINESS STUDIES 0715 067 272 www.tibs.ac.ke [email protected]
How the Z Chart Works
When reviewing progress of a project or business, there are three time scales you can look at.
In the short term, you will want to know 'How did we do this month (/week/etc.)?'.
In the intermediate term, it is interesting to connect these two, to see how short-term
achievement is building up to longer-term goals.
In the longer term, the rate of growth or decline may be of significant interest.
Z-chart: How to do it
1. Gather data on a regular basis for a given activity. This may be the sales per month, words
written by an author per week or calls handled by a customer response centre per day.
2. Identify the major review period to be considered. When you are gathering data on a monthly
cycle, then this is likely to be 12 months. If your minor review period is one day, then the major
review period is more likely to be something like one month or four weeks.
3. For each minor review period (one month in the examples here), build the longer-term view by
totalling the data for the past major review period (12 months in the examples here).

INTRODUCTION TO SOCIAL RESEARCH METHODS
185 | THIKA INSTITUTE OF BUSINESS STUDIES 0715 067 272 www.tibs.ac.ke [email protected]
Note that the rolling total for 12 months ago will require data from 12 months previous to that.
Thus the longer-term view really does look back over a longer period.
4. For the current review (month, in the example here), sum the previous values over the past
major review period (12 months here).
5. Build the Z-chart, as in the diagram above.
The table below shows how these measurements can all be put into a simple table. You can use
a spreadsheet to automatically build the third and fourth column and also to subsequently build
the final Z-chart.
Example 1: The sales figures for a company for the years 2004 and 2005 are
2004 Sales 2005 Sales
January 7 8
February 7 8
March 8 8
April 7 9
May 9 8
June 8 8
July 8 7
August 7 8
September 6 9
October 7 6
November 8 9
December 8 9
Total 90 97
We first find the cumulative monthly sales (Col CMS) and the annual moving totals (Col AMT)
2004 Sales 2005 Sales Cumulative
Monthly Sales
(CMS)
Annual Moving Totals
(AMT)
January 7 8 8 (8+0) 91 (90+1)
February 7 8 16 (8+8) 92 (91+1)
March 8 8 24 (16+8) 92 (92+0)
April 7 9 33 (24+9) 94 (92+2)
May 9 8 41 (33+8) 93 (94-1)

INTRODUCTION TO SOCIAL RESEARCH METHODS
186 | THIKA INSTITUTE OF BUSINESS STUDIES 0715 067 272 www.tibs.ac.ke [email protected]
June 8 8 49 (41+8) 93 (93+0)
July 8 7 56 (49+7) 92 (93-1)
August 7 8 64 (56+8) 93 (92+1)
September 6 9 73 (64+9) 96 (93+3)
October 7 6 79 (73+6) 95 (96-1)
November 8 9 88 (79+9) 96 (95+1)
December 8 9 97 (88+9) 97 (96+1)
Total 90 97
We now put in the 2005 Sale, the CMS and the AMT figures on the same graph. The 12
months are on the X axis and the figures on the Y axis
Example 2 & 3

INTRODUCTION TO SOCIAL RESEARCH METHODS
187 | THIKA INSTITUTE OF BUSINESS STUDIES 0715 067 272 www.tibs.ac.ke [email protected]
Graph 2
3,880 = (9+20+229+201+211+205+237+290+327+351+428+891+481)
4,598 = 3,880 + (738 – 20)
5,811 = 4,598 + (1442 -229)
Graph 3
13,425 = 13,035 +390
13,357 = 13,425 + (670-738)
Example 4
The ZYZ Company – Sales for This Year and Last
MONTH LAST YEAR’S
SALES
‘000
THIS YEAR’S
SALES
‘000
CUMULATIVE
FOR THIS YEAR
‘000
MOVING
ANNUAL TOTAL
‘000

INTRODUCTION TO SOCIAL RESEARCH METHODS
188 | THIKA INSTITUTE OF BUSINESS STUDIES 0715 067 272 www.tibs.ac.ke [email protected]
JAN 430 450 450 6,830
6810 +(450-430)
FEB 365 340 790 6,805
6830 +(340-365)
MAR 365 400 1,190 6,840
6805 +(400-365)
APR 680 680 1,870 6,840
6840 + (680 -680)
MAY 560 610 2,480 6,890
6840+(610 – 560)
JUN 800 760 3,240 6,850
6890+(760-800)
JUL 630 700 3,940 6,920
6850+(700-630)
AUG 760 800 4,740 6,960
6920+(800-760)
SEP 540 570 5,310 6,990
6960+(570-540)
OCT 635 590 5,900 6,945
6990+(590-635)
NOV 630 620 6,520 6,935
6945+(620-630)
DEC 415 430 6,950 6,950
6935+(430-415)
TOTAL 6,810 6,950
Example 5

INTRODUCTION TO SOCIAL RESEARCH METHODS
189 | THIKA INSTITUTE OF BUSINESS STUDIES 0715 067 272 www.tibs.ac.ke [email protected]
This month Total since
March
(Cumulative
Total)
Rolling 12
month total
(Moving
Total)
March 5 5 46
April 2 7 45
May 5 12 47
June 12 22 46
July 3 25 48
August 5 30 47
September 7 37 49
October 2 39 50
November 4 43 51
December 2 45 50
January 7 52 58
February 3 55 55
***Solution
THIS
MONTH
TOTAL SINCE
JANUARY
(CUMULATIVE
TOTAL)
ROLLING 12
MONTH TOTAL
(MOVING TOTAL)
JANUARY 5 5 46 = 46 + (5-5)
FEBRUARY 3 2 7 45 = (2-x)
MARCH 3 5 12 47
APRIL 11 12 22 46
MAY 1 3 25 48
JUNE 4 5 30 47
JULY 5 7 37 49
AUGUST 1 2 39 50
SEPTEMBER 3 4 43 51
OCTOBER 1 2 45 50
NOVEMBER 7 52 58
DECEMBER 3 55
TOTAL 46 57

INTRODUCTION TO SOCIAL RESEARCH METHODS
190 | THIKA INSTITUTE OF BUSINESS STUDIES 0715 067 272 www.tibs.ac.ke [email protected]
9. Scatter Plot
What is a Scatter Plot?
Also called: Scatter Graph, Scatter Diagram, X–Y Graph, Correlation Plots
Scatter plots are similar to line graphs in that they use horizontal and vertical axes to plot data
points. However, they have a very specific purpose. Scatter plots show how much one variable is
affected by another. The relationship between two variables is called their correlation .
A scatter plot is a two-dimensional data visualization that uses dots to represent the values
obtained for two different variables - one plotted along the x-axis and the other plotted along the
y-axis, to look for a relationship between them. If the variables are correlated, the points will fall
along a line or curve.
The closer the data points come when plotted to making a straight line, the higher the correlation
between the two variables, or the stronger the relationship. (The better the correlation, the tighter
the points will hug the line)
If the data points make a straight line going from the origin out to high x- and y-values, then the
variables are said to have a positive correlation . If the line goes from a high-value on the y-axis
down to a high-value on the x-axis, the variables have a negative correlation .
Various types of correlation can be interpreted through the patterns displayed on Scatter plots.
These are:
a. Positive (values increase together),

INTRODUCTION TO SOCIAL RESEARCH METHODS
191 | THIKA INSTITUTE OF BUSINESS STUDIES 0715 067 272 www.tibs.ac.ke [email protected]
b. Negative (one value decreases as the other increases),
c. Null (no correlation),

INTRODUCTION TO SOCIAL RESEARCH METHODS
192 | THIKA INSTITUTE OF BUSINESS STUDIES 0715 067 272 www.tibs.ac.ke [email protected]
d. Linear,

INTRODUCTION TO SOCIAL RESEARCH METHODS
193 | THIKA INSTITUTE OF BUSINESS STUDIES 0715 067 272 www.tibs.ac.ke [email protected]
e. Exponential and
f. U-shaped.

INTRODUCTION TO SOCIAL RESEARCH METHODS
194 | THIKA INSTITUTE OF BUSINESS STUDIES 0715 067 272 www.tibs.ac.ke [email protected]

INTRODUCTION TO SOCIAL RESEARCH METHODS
195 | THIKA INSTITUTE OF BUSINESS STUDIES 0715 067 272 www.tibs.ac.ke [email protected]
The strength of the correlation can be determined by how closely packed the points are to each
other on the graph. Points that end up far outside the general cluster of points are known as
outliers.
For example this scatter plot shows the height and weight of a fictitious set of children.
Each dot represents one child with his or her height measured along the x-axis and weight
measured along the y-axis.
In the height and weight example, the chart wasn’t just a simple log of the height and weight of a
set of children, but it also visualized the relationship between height and weight - namely that
weight increases as height increases. Notice that the relationship isn’t perfect, some taller
children weight less than some shorter children, but the general trend is pretty strong and we can
see that weight is correlated with height.
Common Extensions of Scatter Plots
Line of Best Fit
Several advanced visualization tools allow for more complex visualizations.
Often scatter plots will include a trendline to help make the relationship more clear, as we do in
the following graph.
We can also draw a "Line of Best Fit" (also called a "Trend Line") on our scatter plot:
Try to have the line as close as possible to all points, and as many points above the line as
below.

INTRODUCTION TO SOCIAL RESEARCH METHODS
196 | THIKA INSTITUTE OF BUSINESS STUDIES 0715 067 272 www.tibs.ac.ke [email protected]
Additionally, the size, shape or color of the dot could represents a third (or even fourth variable).
For example, this chart shows the height and weight data but adds in the information of the
gender of the child as the color of the dot.
C. Good and Bad Scatter Diagrams
Figure 1: GOOD Scatter Diagram

INTRODUCTION TO SOCIAL RESEARCH METHODS
197 | THIKA INSTITUTE OF BUSINESS STUDIES 0715 067 272 www.tibs.ac.ke [email protected]
This is a GOOD scatter diagram. It has a title and both axes are labeled. Both scales extend only
as far as the data values and not much farther. Notice that the regression line goes through the
middle of the points. Three points are above the regression line and three points are below it,
while two points just touch the regression line.
Figure 2: BAD Scatter Diagram
This is a BAD scatter diagram. Notice that there are no data values to the left of 90 on the
horizontal axis, and yet the horizontal scale goes all the way down to zero. As a result, most of
the left side of the chart is empty and all the data values are squeezed against the right side of the
chart.
Figure 3: BAD Scatter Diagram

INTRODUCTION TO SOCIAL RESEARCH METHODS
198 | THIKA INSTITUTE OF BUSINESS STUDIES 0715 067 272 www.tibs.ac.ke [email protected]
This is a BAD scatter diagram. Notice that there are no data values below 250 on the vertical
axis, and yet the vertical scale goes all the way down to zero. As a result, most of the bottom part
of the chart is empty and all the data values are pushed up against the top of the graph.
Figure 4: BAD Scatter Diagram
This is a BAD scatter diagram. While both scales are restricted, they still go a lot farther than
they need to. As a result, the data is forced into a very small area of the chart and there is a lot of
blank space around it. There is no need for the horizontal axis to go below 95 or above 110.
There is no need for the vertical axis to go below 250 or above 280. The smaller the range of
data on each axis is, the more the chart becomes focused on the data. See how the data points
take up most of the graph in Figure 1 above.
Figure 5: BAD Scatter Diagram

INTRODUCTION TO SOCIAL RESEARCH METHODS
199 | THIKA INSTITUTE OF BUSINESS STUDIES 0715 067 272 www.tibs.ac.ke [email protected]
This is a BAD scatter diagram. The vertical axis has been extended to show the line, but since
the line is nowhere near the data, this is not the regression line. Usually when this happens, it
means the x and y variables have been switched somewhere in the process of finding the
regression line. Always set up the scatter diagram first. Then if the regression line is nowhere
near the data, that means you made a mistake in computing the regression line. One thing to try if
this happens is switching x and y values.
Solved Example 1
Question: Consider the table that gives the data which shows the relation between height and
size of shoes for a set of people. Using the data plot a graph.
Height(in inches) Shoe size
60 3
61 3
62 4
63 4
64 5
65 5
66 6
67 6
68 7

INTRODUCTION TO SOCIAL RESEARCH METHODS
200 | THIKA INSTITUTE OF BUSINESS STUDIES 0715 067 272 www.tibs.ac.ke [email protected]
Solution:
Using the data given in above table we can plot the graph
Each data point denoted by a small circle in the graph represents the shoe size at a particular
height on two variables. Note that these data are not random, but rather seem to show a general
tendency for the scores on x-axis to increase as the hours of y axis increase.
Example 2:
The local ice cream shop keeps track of how much ice cream they sell versus the noon
temperature on that day. Here are their figures for the last 12 days:
Ice Cream Sales vs Temperature
Temperature °C Ice Cream Sales
14.2° $215
16.4° $325
11.9° $185
15.2° $332
18.5° $406

INTRODUCTION TO SOCIAL RESEARCH METHODS
201 | THIKA INSTITUTE OF BUSINESS STUDIES 0715 067 272 www.tibs.ac.ke [email protected]
22.1° $522
19.4° $412
25.1° $614
23.4° $544
18.1° $421
22.6° $445
17.2° $408
And here is the same data as a Scatter Plot:
It is now easy to see that warmer weather leads to more sales, but the relationship is not
perfect.
Example 3
Example 4, 5, 6 & 7

INTRODUCTION TO SOCIAL RESEARCH METHODS
202 | THIKA INSTITUTE OF BUSINESS STUDIES 0715 067 272 www.tibs.ac.ke [email protected]
10. Stem and Leaf Plot
Also known as Stem Plot.
A Stem and Leaf Plot is a special table where each data value is split into a "stem" (the first
digit or digits) and a "leaf" (usually the last digit).
The "stem" values are listed down in a vertical column, and the "leaf" values go right (or left)
from the stem values. Between them is a vertical line dividing them.
The "stem" is used to group the scores and each "leaf" shows the individual scores within each
group.
It is a descriptive technique which gives more emphases on the data provided. It concludes more
about the shape of a set of data and provides better view about each of the data. The data is
arranged by “place value”.
Steps in Constructing a Stem and Leaf Plot
In general the following steps have to be followed while forming a stem and leaf plot.
1. First the numbers has to be arranged in ascending order that is from smaller to bigger number.
2. The digits at large place form the stem and the ones at the smallest place forms the leaf

INTRODUCTION TO SOCIAL RESEARCH METHODS
203 | THIKA INSTITUTE OF BUSINESS STUDIES 0715 067 272 www.tibs.ac.ke [email protected]
3. The leaf is placed to the right of the stem separated by a division or line.
4. For each stem digit, there may be a different or same leaf digit, so it can be placed horizontally
in the same row where the stem is kept.
5. Create a legend or key for the figure drawn
Example:
"32" is split into "3" (stem) and "2" (leaf).
More Examples:
Stem "1" Leaf "5" means 15
Stem "1" Leaf "6" means 16
Stem "2" Leaf "1" means 21
Etc
Solved Example 1
Question: Consider the following set of numbers
12, 16, 32, 56, 24, 37, 92, 86, 54, 11, 96, 75, 38, 97, 57, 43, 61, 83, 93, 47, 99, 87.
Draw a stem and leaf plot representing the data.
Solution:
Step 1:
First the numbers has to be arranged in ascending order that is from smaller to bigger number
11, 12, 16, 24, 32, 37, 38, 43, 47, 54, 56, 57, 61, 75, 83, 86, 89, 92, 93, 96, 97, 99.
Step 2:
The digits at large place form the stem and the ones at the smallest place forms the leaf.
Stem will contain the tens digit, as the numbers are between 11 and 99. So place them vertically
in order from smaller to bigger. Here, there is no need to repeat the digit.

INTRODUCTION TO SOCIAL RESEARCH METHODS
204 | THIKA INSTITUTE OF BUSINESS STUDIES 0715 067 272 www.tibs.ac.ke [email protected]
Step 3:
Working from left to right, place the unit digits, in the leave place in front of the corresponding
row.
Here there is 11, 12, 16
So we write
Step 4:
In the same way, the whole numbers are plotted.
Step 5:

INTRODUCTION TO SOCIAL RESEARCH METHODS
205 | THIKA INSTITUTE OF BUSINESS STUDIES 0715 067 272 www.tibs.ac.ke [email protected]
At last, remember to create a legend (key) for the figure drawn. It will help in reading the values
of the number in the plot.
=> Legend
2|4 is 24
5|7 is 57
Hence the diagram is formed.
Example 2
Here is a set of data on showing the test scores on the last science quiz.
56, 78, 82, 82, 90, 94, 93, 67, 67, 69, 74, 77, 92, 88, 81, 83, 84, 77, 72
Step 1: In order to create a stem and leaf plot, we need to first organize the data into groups. In
this situation, we will group the tests by decades.
56
67, 67, 69
72, 74, 77, 77, 78
81, 82, 82, 83, 84, 88
90, 92, 93, 94
Step 2: Create the plot with the stems as the tens and the leaves as the ones.

INTRODUCTION TO SOCIAL RESEARCH METHODS
206 | THIKA INSTITUTE OF BUSINESS STUDIES 0715 067 272 www.tibs.ac.ke [email protected]
The stems will be 5, 6, 7, 8 and 9
Now we are ready to add the ones place from each of the values in the list we made.
Step 3: Add a key to the bottom of the stem and leaf plot.
=> Legend
5|6 is 56
6|7 is 67
Hence the diagram is formed.
Reading a Stem and Leaf Plot
The Stem and Leaf Plot is an interesting way to showcase data.
Check out the example showing ages at a birthday party.

INTRODUCTION TO SOCIAL RESEARCH METHODS
207 | THIKA INSTITUTE OF BUSINESS STUDIES 0715 067 272 www.tibs.ac.ke [email protected]
When reading a stem and leaf plot, you will want to start with the key. It will guide you on how
to read the other values.
The key on this plot shows that the stem is the tens place and the leaf is the ones place.
Now we can see that the oldest person at the party is 66 years old.

INTRODUCTION TO SOCIAL RESEARCH METHODS
208 | THIKA INSTITUTE OF BUSINESS STUDIES 0715 067 272 www.tibs.ac.ke [email protected]
We can also see that the youngest person at the party was 01, or 1 year old.
Stem and leaf plots are similar to horizontal bar graph, but the actual numbers are used instead of
bars.
Looking across the rows, we can see that there are 9 people in their 30s and 4 people in their 40s.
With the numbers ordered on the leaf side of the plot, we can also see that there are 4 children
that are 4 years old. This represents the mode because it is the age that appears the most.

INTRODUCTION TO SOCIAL RESEARCH METHODS
209 | THIKA INSTITUTE OF BUSINESS STUDIES 0715 067 272 www.tibs.ac.ke [email protected]
We can also easily get the median by finding the middle of the leaves. i.e 28
Here we can see that the median is 28 years old. So half the guests are younger than 28 and half
are older than 28.
Stem and leaf plots are a great way to visually see what age groups are at the party. What is even
better, is that after you get the quick visual, you have the actual values in the plot to work with as
well.
A stem and leaf plot can quickly be turned into a histogram as well to show the data using
bars.
Recall that a histogram shows the data in intervals. The intervals would be of size ten.

INTRODUCTION TO SOCIAL RESEARCH METHODS
210 | THIKA INSTITUTE OF BUSINESS STUDIES 0715 067 272 www.tibs.ac.ke [email protected]
Example 3
Example 4

INTRODUCTION TO SOCIAL RESEARCH METHODS
211 | THIKA INSTITUTE OF BUSINESS STUDIES 0715 067 272 www.tibs.ac.ke [email protected]
Example 5
Example 6

INTRODUCTION TO SOCIAL RESEARCH METHODS
212 | THIKA INSTITUTE OF BUSINESS STUDIES 0715 067 272 www.tibs.ac.ke [email protected]
For the above stem and leaf plot, what is the median value?
Answer
The total number of values recorded in the stem and leaf plot is the number of leaves = 19
The median is the middle value or 10th value.
The values written out in full are:
11, 12, 15, 17, 20, 21, 23, 24, 28, 32, 39, 43, 43, 45, 46, 48, 50, 51, 56
Therefore the 10th or median value is 32
Example 7
What is the range for the above stem and leaf plot?
Answer
The largest value recorded in the stem and leaf plot is 56.
The smallest value recorded in the stem and leaf plot is 11.
The range is the difference between the largest value and the smallest value

INTRODUCTION TO SOCIAL RESEARCH METHODS
213 | THIKA INSTITUTE OF BUSINESS STUDIES 0715 067 272 www.tibs.ac.ke [email protected]
= 56 - 11
= 45
Example 8
What is the range for the above stem and leaf plot?
Answer
The largest value recorded in the stem and leaf plot is 98.
The smallest value recorded in the stem and leaf plot is 12.
The range is the difference between the largest value and the smallest value
= 98 - 12
= 86
Example 9
What is the mode for the above stem and leaf plot?
The mode is the most frequently occurring number, which is 54.
(54 occurs three times.)

INTRODUCTION TO SOCIAL RESEARCH METHODS
214 | THIKA INSTITUTE OF BUSINESS STUDIES 0715 067 272 www.tibs.ac.ke [email protected]
Example 10
For the above stem and leaf plot, what is the mean value?
(You may use a calculator)
Answer
The total number of values recorded in the stem and leaf plot is the number of leaves = 19
The values written out in full are:
11, 12, 15, 17, 20, 21, 23, 24, 28, 32, 39, 43, 43, 45, 46, 48, 50, 51, 56
So the mean
= (11 + 12 + 15 + 17 + 20 + 21 + 23 + 24 + 28 + 32 + 39 + 43 + 43 + 45 + 46 + 48 + 50 + 51 +
56) ÷ 19
= 624 ÷ 19
= 32.8 correct to 1 decimal place
(Note that this is not the same as the mean of the stems plus the mean of the leaves)
Example 11

INTRODUCTION TO SOCIAL RESEARCH METHODS
215 | THIKA INSTITUTE OF BUSINESS STUDIES 0715 067 272 www.tibs.ac.ke [email protected]
What is the mean for the above stem and leaf plot?
(You may use a calculator)
Answer
The total number of values recorded in the stem and leaf plot is the number of leaves = 25
The values written out in full are:
12, 13, 20, 21, 25, 25, 28, 34, 36, 39, 53, 54, 54, 54, 56, 62, 65, 66, 66, 67, 68, 80, 83, 85, 98
So the mean
= (12 + 13 + 20 + 21 + 25 + 25 + 28 + 34 + 36 + 39 + 53 + 54 + 54 + 54 + 56 + 62 + 65 + 66 +
66 + 67 + 68 + 80 + 83 + 85 + 98) ÷ 25
= 1,264 ÷ 25
= 50.56
(Note that this is not the same as the mean of the stems plus the mean of the leaves)

INTRODUCTION TO SOCIAL RESEARCH METHODS
216 | THIKA INSTITUTE OF BUSINESS STUDIES 0715 067 272 www.tibs.ac.ke [email protected]
DATA ANALYSIS
MEASURES OF CENTRAL TENDENCY
A measure of central tendency (also referred to as measures of centre or central location) is
a summary measure that attempts to describe a whole set of data with a single value that
represents the middle or centre of its distribution.
There are three main measures of central tendency:
1. the Mean ,
2. the Median, and
3. the Mode.
Each of these measures describes a different indication of the typical or central value in the
distribution.
1. THE MEAN
The mean is the sum of the value of each observation in a dataset divided by the number of
observations. This is also known as the arithmetic average.
Also known as the average. The mean is found by adding up all of the given data and dividing
by the number of data entries.
For Ungrouped Data this can be represented by the formula:
n
xxxxxMean n
...)( 321

INTRODUCTION TO SOCIAL RESEARCH METHODS
217 | THIKA INSTITUTE OF BUSINESS STUDIES 0715 067 272 www.tibs.ac.ke [email protected]
Example 1:
The grade 10 math class recently had a mathematics test and the grades were as follows:
78
66
82 464 / 6 = 77.3
89
75 Hence, 77.3 is the mean average of the class.
+ 74
464
Example 2
Consider this dataset showing the retirement age of 11 people, in whole years:
54, 54, 54, 55, 56, 57, 57, 58, 58, 60, 60
The mean is calculated by adding together all the values
(54+54+54+55+56+57+57+58+58+60+60 = 623) and dividing by the number of observations
(11) which equals 56.6 years.
Advantage of the Mean: - The mean can be used for both continuous and discrete numeric data.
Limitations of the Mean: - The mean cannot be calculated for categorical data, as the values cannot be summed.
As the mean includes every value in the distribution the mean is influenced by outliers and
skewed distributions.

INTRODUCTION TO SOCIAL RESEARCH METHODS
218 | THIKA INSTITUTE OF BUSINESS STUDIES 0715 067 272 www.tibs.ac.ke [email protected]
What else do we need to know about the mean?
The population mean is indicated by the Greek symbol µ (pronounced ‘mu’). When the mean is
calculated on a distribution from a sample it is indicated by the symbol x̅ (pronounced X-bar).
2. THE MEDIAN
The median is the middle value in distribution when the values are arranged in ascending
or descending order.
The median divides the distribution in half (there are 50% of observations on either side of the
median value).
To find the median, first you arrange the numbers in order from lowest to highest, then you find
the middle number by crossing off the numbers until you reach the middle.
If there is an even number of items of data, there will be two numbers in the middle. The median
is the number that is half way between these two numbers.
If there are a lot of items of data, add 1 to the number of items of data and then divide by 2 to
find which item of data will be the median. This works when it is an odd number but when it is
an even number you will get a decimal answer such as 7.5. The median will be halfway between
the 7th and 8th items.
Formula
To calculate Median
Example 1
7 babies weigh the following amounts:
2.5 kg, 3.1 kg, 3.4 kg, 3.5 kg, 3.5 kg, 4 kg, 4.1 kg
Find the median weight of the babies.

INTRODUCTION TO SOCIAL RESEARCH METHODS
219 | THIKA INSTITUTE OF BUSINESS STUDIES 0715 067 272 www.tibs.ac.ke [email protected]
The numbers are already in order. Find the median amount by finding the middle number.
Cross off the first and last item of data (the items in bold):
2.5 kg, 3.1 kg, 3.4 kg, 3.5 kg, 3.5 kg, 4 kg, 4.1 kg
Repeat until you reach the middle:
3.1 kg, 3.4 kg, 3.5 kg, 3.5 kg, 4 kg
3.4 kg, 3.5 kg, 3.5 kg
3.5 kg
The median weight of these babies is 3.5 kg.
Another method is to find which item of data is the median.
Example 2
There are 7 numbers, so adding 1 to 7 then dividing by 2 gives: , so the median
value is the 4th number in the list:
2.5 kg, 3.1 kg, 3.4 kg, 3.5 kg, 3.5 kg, 4 kg, 4.1 kg
The median weight of these babies is 3.5 kg.
Notice that this is the median value as, in ascending order, there are 3 values before it and 3
values after that central value.
Example 3 If another baby was born that weighed 3 kg then the list would be like this:
2.5 kg, 3 kg, 3.1 kg, 3.4 kg, 3.5 kg, 3.5 kg, 4 kg, 4.1 kg
Now there are 2 items of data in the middle, so the median is half way between 3.4 kg and 3.5
kg, which is 3.45 kg. Again, an alternative method would be to add 1 to 8 then divide by 2,
giving: , so the median values are the 4th and 5th numbers in the list.
The median weight of these 8 babies is 3.45 kg.

INTRODUCTION TO SOCIAL RESEARCH METHODS
220 | THIKA INSTITUTE OF BUSINESS STUDIES 0715 067 272 www.tibs.ac.ke [email protected]
Example 4
Let us consider an odd set of data
14, 4, 6, 51, 7, 25, 81, 3, 9, 68, 73
Step 1: Rearrange the given set of numbers in the ascending order.
3, 4, 6, 7, 9, 14, 25, 51, 68, 73, 81
n(number of data) = 11
Step 2: Middle most value is the median for the given set of data.
x = (n + 1) / 2
= (11 + 1) / 2
= 12/2
x = 6
Step 3: 6th value is the median for the group of data. Here 6th value is 14. So, 14 is the median
for the given set of data.
Example 5 Find the median of the following data:
7, 9, 3, 4, 11, 1, 8, 6, 1, 4
Step 1: Organize the data, or arrange the numbers from smallest to largest.
1, 1, 3, 4, 4, 6, 7, 8, 9, 11
Step 2: Since the number of data values is even, the median will be the mean value of the
numbers found before and after the position.
Step 3: The number found before the 5.5 position is 4 and the number found after the 5.5
position is 6. Now, you need to find the mean value.
1, 1, 3, 4, 4, 6, 7, 8, 9, 11

INTRODUCTION TO SOCIAL RESEARCH METHODS
221 | THIKA INSTITUTE OF BUSINESS STUDIES 0715 067 272 www.tibs.ac.ke [email protected]
Example 6
Looking at the retirement age distribution (which has 11 observations), the median is the middle
value, which is 57 years:
54, 54, 54, 55, 56, 57, 57, 58, 58, 60, 60
Example 7
Find the median of the following set of data:
66, 74, 75, 78, 82, 89
In the above example we have two numbers, there is no middle number. To find the median, we
therefore take the two middle numbers and find the average, (or mean ).
75 + 78 = 153
153 / 2 = 76.5
Hence, the middle number is 76.5.
Example 8
In the following distribution, 52, 54, 54, 54, 55, 56, 57, 57, 58, 58, 60, 60
The two middle values are 56 and 57, therefore the median equals 56.5 years:
Advantage of the Median: The median is less affected by outliers and skewed data than the mean, and is usually the
preferred measure of central tendency when the distribution is not symmetrical.
Limitation of the Median: The median cannot be identified for categorical nominal data, as it cannot be logically ordered.
3. THE MODE
The mode is the most commonly occurring value in a distribution.
If a data set has only one value that occurs most often, the set is called unimodal.
A data set that has two values that occur with the same greatest frequency is referred to as
bimodal.
When a set of data has more than two values that occur with the same greatest frequency, the
set is called multimodal.

INTRODUCTION TO SOCIAL RESEARCH METHODS
222 | THIKA INSTITUTE OF BUSINESS STUDIES 0715 067 272 www.tibs.ac.ke [email protected]
Example 1
Consider this dataset showing the retirement age of 11 people, in whole years:
54, 54, 54, 55, 56, 57, 57, 58, 58, 60, 60
The most commonly occurring value is 54, therefore the mode of this distribution is 54 years.
Example 2
Find the mode of the following data:
78 56 68 92 84 76 74 56 68 66 78 72 66
65 53 61 62 78 84 61 90 87 77 62 88 81
The mode is 78.
Example 3
Find the Mode of the following data set.
Solution
Mode = 3 and 15
Example 4
Remember that the mode can be determined for qualitative data as well as quantitative data, but
the mean and the median can only be determined for quantitative data.
Problem: You begin to observe to the color of clothing your employees wear. Your goal is to
find out what color is worn most frequently so that you can offer company shirts to your
employees.
Monday: Red, Blue, Black, Pink, Green, and Blue
Tuesday: Green, Blue, Pink, White, Blue, and Blue
Wednesday: Orange, White, White, Blue, Blue, and Red
Thursday: Brown, Black, Brown, Blue, White, and Blue
Friday: Blue, Black, Blue, Red, Red, and Pink

INTRODUCTION TO SOCIAL RESEARCH METHODS
223 | THIKA INSTITUTE OF BUSINESS STUDIES 0715 067 272 www.tibs.ac.ke [email protected]
What is the mode of the colors above?
Answer: The color blue was worn 11 times during the week. All other colors were worn with
much less frequency in comparison to the color blue.
Advantage of the Mode:
The mode has an advantage over the median and the mean as it can be found for both numerical
and categorical (non-numerical) data.
Limitations of the Mode:
The are some limitations to using the mode. In some distributions, the mode may not reflect the
centre of the distribution very well. When the distribution of retirement age is ordered from
lowest to highest value, it is easy to see that the centre of the distribution is 57 years, but the
mode is lower, at 54 years.
54, 54, 54, 55, 56, 57, 57, 58, 58, 60, 60
It is also possible for there to be more than one mode for the same distribution of data, (bi-modal,
or multi-modal). The presence of more than one mode can limit the ability of the mode in
describing the centre or typical value of the distribution because a single value to describe the
centre cannot be identified.
In some cases, particularly where the data are continuous, the distribution may have no mode at
all (i.e. if all values are different).
In cases such as these, it may be better to consider using the median or mean, or group the data in
to appropriate intervals, and find the modal class.
Worked Example
21 people were timed in a sprint race, to the nearest second: Calculate the mean,
median and mode
59, 65, 61, 62, 53, 55, 60, 70, 64, 56, 58, 58, 62, 62, 68, 65, 56, 59, 68, 61, 67
1. Mean:

INTRODUCTION TO SOCIAL RESEARCH METHODS
224 | THIKA INSTITUTE OF BUSINESS STUDIES 0715 067 272 www.tibs.ac.ke [email protected]
To find the Mean we add up all the numbers, then divides by how many numbers:
Mean = 59+65+61+62+53+55+60+70+64+56+58+58+62+62+68+65+56+59+68+61+67/21
= 61.38095...
2. Median:
To find the Median we place the numbers in value order and find the middle number.
In this case the median is the 11th number:
53, 55, 56, 56, 58, 58, 59, 59, 60, 61, 61, 62, 62, 62, 64, 65, 65, 67, 68, 68, 70
Median = 61
3. Mode
To find the Mode, or modal value, we place the numbers in value order then count how many of
each number. The Mode is the number which appears most often (there can be more than one
mode):
53, 55, 56, 56, 58, 58, 59, 59, 60, 61, 61, 62, 62, 62, 64, 65, 65, 67, 68, 68, 70
62 appears three times, more often than the other values, so Mode = 62
ESTIMATING CENTRAL TENDENCY FROM
GROUPED DATA
1. Estimating the Mean from Grouped Data
From a grouped frequency table, we can’t get the true mean but can only estimate. Since
we don’t have the full information therefore we use the mid points of the class intervals.
We can estimate the Mean by using the midpoints.

INTRODUCTION TO SOCIAL RESEARCH METHODS
225 | THIKA INSTITUTE OF BUSINESS STUDIES 0715 067 272 www.tibs.ac.ke [email protected]
In order to calculate the mean of grouped data, you need to:
Find the mid-point of each interval ( ix )
Multiply the frequency of each interval by its mid-point ( ii xf . )
Find the sum of all the products ii xf .
Find the sum of all the frequencies
Divide the sum of the products ii xf . by the sum of the frequencies.
Mean =
i
ii
f
xfx
.
Mean of Grouped Data
where
i = the number of classes
f = class frequency
M = class midpoint
N = total frequencies (total number of data values)
Example 1
21 people were timed in a sprint race, to the nearest second. Create a frequency
distribution table and calculate the mean, median and the mode of the data.
We make a Grouped Frequency Table as follows:
Seconds Frequency
51 - 55 2
56 - 60 7
61 - 65 8
66 - 70 4

INTRODUCTION TO SOCIAL RESEARCH METHODS
226 | THIKA INSTITUTE OF BUSINESS STUDIES 0715 067 272 www.tibs.ac.ke [email protected]
The midpoints are in the middle of each class: 53, 58, 63 and 68
Think about the 7 runners in the group 56 - 60: all we know is that they ran somewhere between
56 and 60 seconds:
Maybe all seven of them did 56 seconds,
Maybe all seven of them did 60 seconds,
But it is more likely that there is a spread of numbers: some at 56, some at 57, etc
So we take an average and assume that all seven of them took 58 seconds.
So all we have left is:
Seconds Frequency
51 - 55 2
56 - 60 7
61 - 65 8
66 - 70 4
The groups (51-55, 56-60, etc), also called class intervals, are of width 5
Let's now make the table using midpoints:
Seconds Midpoint Frequency
51 - 55 53 2
56 - 60 58 7
61 - 65 63 8
66 - 70 68 4

INTRODUCTION TO SOCIAL RESEARCH METHODS
227 | THIKA INSTITUTE OF BUSINESS STUDIES 0715 067 272 www.tibs.ac.ke [email protected]
Our thinking is: "2 people took 53 sec, 7 people took 58 sec, 8 people took 63 sec and 4 took 68
sec". In other words we imagine the data looks like this:
53, 53, 58, 58, 58, 58, 58, 58, 58, 63, 63, 63, 63, 63, 63, 63, 63, 68, 68, 68, 68
Then we add them all up and divide by 21. The quick way to do it is to multiply each midpoint
by each frequency:
Class Midpoint
x
Frequency
f
Midpoint ×
Frequency
fx
51-55 53 2 106
56-60 58 7 406
61-65 63 8 504
66-70 68 4 272
Totals: 21 1288
And then our estimate of the mean time to complete the race is:
Estimated Mean = 1288/21 = 61.333...
Very close to the exact answer we got earlier.
Example 2
The table below gives data on the heights, in cm, of 51 children.
a. Estimate the mean height.
To estimate the mean, the mid-point of each interval should be used.

INTRODUCTION TO SOCIAL RESEARCH METHODS
228 | THIKA INSTITUTE OF BUSINESS STUDIES 0715 067 272 www.tibs.ac.ke [email protected]
Mean = 821551
= 161 (to the nearest cm)
Example 3
The ages of students in a small primary school were recorded in the table below.
(a) Estimate the mean.
To estimate the mean, we must use the mid-point of each interval; so, for example for '5 – 6',
which really means
5 ≤ age < 7
the mid-point is taken as 6.
Mean = 874107
= 8.2 (to 1 decimal place)
Example 4

INTRODUCTION TO SOCIAL RESEARCH METHODS
229 | THIKA INSTITUTE OF BUSINESS STUDIES 0715 067 272 www.tibs.ac.ke [email protected]
The number of days that students were missing from school due to sickness in one year was
recorded.
(a) Estimate the mean.
The estimate is made by assuming that all the values in a class interval are equal to the midpoint
of the class interval.
Mean = 395/40
= 9.875 days
Example 5
The table shows the distribution of scores or 40 students on a Mathematics test.
(a) Estimate the mean score obtained on the test.

INTRODUCTION TO SOCIAL RESEARCH METHODS
230 | THIKA INSTITUTE OF BUSINESS STUDIES 0715 067 272 www.tibs.ac.ke [email protected]
Mean = (11 × 4 + 14 × 6 + 17 × 13 + 20 × 9 + 23 × 8) ÷ 40
= (44 + 84 + 221 +180 + 184) ÷ 40
= 71340
= 17.825
Example 6
This grouped frequency table gives the number of ‘salmon cod’ caught by a fisherman on 25
fishing trips.
Number of
salmon codFrequency f
20–24 1
25–29 2
30–34 4
35–39 4
40–44 6
45–49 8
Use the above frequency distribution table to calculate the mean number of ‘salmon cod’ caught
by the fisherman on his 25 fishing trips.
Solution
Number of
salmon cod
Class
centre (x )
Frequency
ffx
20–24 22 1 22
25–29 27 2 54
30–34 32 4 128
35–39 37 4 148
40–44 42 6 252
45–49 47 8 376
25f 980fx

INTRODUCTION TO SOCIAL RESEARCH METHODS
231 | THIKA INSTITUTE OF BUSINESS STUDIES 0715 067 272 www.tibs.ac.ke [email protected]
2.39
25
980
f
fxx
Example 7
In Tim's office, there are 25 employees. Each employee travels to work every morning in his or
her own car. The distribution of the driving times (in minutes) from home to work for the
employees is shown in the table below.
Driving Times (minutes)
0 to less than 10
10 to less than 20
20 to less than 30
30 to less than 40
40 to less than 50
Number of Employees
3
10
6
4
2
Calculate the mean of the driving times.
Step 1: Determine the midpoint for each interval.
For 0 to less than 10, the midpoint is 5.
For 10 to less than 20, the midpoint is 15.
For 20 to less than 30, the midpoint is 25.
For 30 to less than 40, the midpoint is 35.
For 40 to less than 50, the midpoint is 45.
Step 2: Multiply each midpoint by the frequency for the class.
For 0 to less than 10, (5)(3) = 15

INTRODUCTION TO SOCIAL RESEARCH METHODS
232 | THIKA INSTITUTE OF BUSINESS STUDIES 0715 067 272 www.tibs.ac.ke [email protected]
For 10 to less than 20, (15)(10) = 150
For 20 to less than 30, (25)(6) = 150
For 30 to less than 40, (35)(4) = 140
For 40 to less than 50, (45)(2) = 90
Step 3: Add the results from Step 2 and divide the sum by 25.
15 + 150 + 150 + 140 + 90 = 545
Each teacher spends a mean time of 21.8 minutes driving from home to school each morning.
To better represent the problem and its solution, a table can be drawn as follows:
Driving Times (minutes) Number of Teachers f Midpoint Of Class m Product mf 0 to less than 10 3 5 15
10 to less than 20 10 15 150
20 to less than 30 6 25 150
30 to less than 40 4 35 140
40 to less than 50 2 45 90
25 545
For the population, N=25 and ∑mf=545, so using the formula μ=∑mf/N, the mean would
again be μ=545/25=21.8.
Example 8
In the previous example, suppose the distribution of driving times were broken down into
smaller intervals as shown:
Driving Times (minutes) Number of Teachers
0 to less than 5 2
5 to less than 10 1
10 to less than 15 4
15 to less than 20 6

INTRODUCTION TO SOCIAL RESEARCH METHODS
233 | THIKA INSTITUTE OF BUSINESS STUDIES 0715 067 272 www.tibs.ac.ke [email protected]
20 to less than 25 3
25 to less than 30 3
30 to less than 35 1
35 to less than 40 3
40 to less than 45 1
45 to less than 50 1
Calculate the mean of the driving times.
First create the table below:
Driving Times (minutes) Number of Teachers f Midpoint Of Class m Product mf 0 to less than 5 2 3 6.0
5 to less than 10 1 8 8.0
10 to less than 15 4 13 52.0
15 to less than 20 6 18 108.0
20 to less than 25 3 23 69.0
25 to less than 30 3 28 84.0
30 to less than 35 1 33 33
35 to less than 40 3 38 114.0
40 to less than 45 1 43 43.0
45 to less than 50 1 48 48.0
25 565.0
Now the mean can be calculated as shown:
μμμμ=∑mf/N
= 6.0+8.0+52.0+108.0+69.0+84.0+33.0+114.0+43.0+48.0/25
= 565.0/25
= 22.60
This time, the mean time spent by each teacher driving from home to school is 22.60 minutes.
Thus, the mean for grouped data can change based on the size of the intervals.
Example 9
The ages of 100 singers of a 360-member choir are shown in the table below:

INTRODUCTION TO SOCIAL RESEARCH METHODS
234 | THIKA INSTITUTE OF BUSINESS STUDIES 0715 067 272 www.tibs.ac.ke [email protected]
Ages of Members (years) Number of Members
20 to less than 25 12
25 to less than 30 14
30 to less than 35 10
35 to less than 40 8
40 to less than 45 20
45 to less than 50 6
50 to less than 55 5
55 to less than 60 4
60 to less than 65 11
65 to less than 70 10
Calculate the mean of the ages.
First create the table below:
Ages of Members (years) Number of Members f Midpoint Of Class m Product mf 20 to less than 25 12 22.5 270.0
25 to less than 30 14 27.5 385.0
30 to less than 35 10 32.5 325.0
35 to less than 40 8 37.5 300.0
40 to less than 45 20 42.5 850.0
45 to less than 50 6 47.5 285.0
50 to less than 55 5 52.5 262.5
55 to less than 60 4 57.5 230.0
60 to less than 65 11 62.5 687.5
65 to less than 70 10 67.5 675.0
Since the ages represent a sample, the mean can be calculated as shown:
x¯¯¯x¯¯¯x¯¯¯x¯¯¯=∑mfn=270.0+385.0+325.0+300.0+850.0+285.0+262.5+230.0+687.5+
675.0100=4,270.0100=42.7
The mean age of the 100 members of the choir is 42.7 years.
Example 10
The following set of raw data shows the lengths, in millimeters, measured to the nearest mm, of 40 leaves
taken from plants of a certain species. This is the table of frequency distribution. Calculate the mean.

INTRODUCTION TO SOCIAL RESEARCH METHODS
235 | THIKA INSTITUTE OF BUSINESS STUDIES 0715 067 272 www.tibs.ac.ke [email protected]
Lengths (mm) Frequency ( if )
25 – 29 2
30 – 34 4
35 – 39 7
40 – 44 10
45 – 49 8
50 – 54 6
55 – 59 3
Solution
Lengths (mm) Frequency ( if ) Mid-point ( ix ) ii xf .
25 – 29 2
30 – 34 4
35 – 39 7
40 – 44 10
45 – 49 8
50 – 54 6
55 – 59 3
if ii xf .
i
ii
f
xfx
.
ESTIMATING THE MEAN FROM A HISTOGRAM
For each histogram bar, we start by multiplying the central x-value to the corresponding bar
height. Each of these products corresponds to the sum of all values falling within each bar.
Summing all products gives us the total sum of all values, and dividing it by the number of
observations yields the mean.
Example 1

INTRODUCTION TO SOCIAL RESEARCH METHODS
236 | THIKA INSTITUTE OF BUSINESS STUDIES 0715 067 272 www.tibs.ac.ke [email protected]
Solution for finding mean :
Example 2

INTRODUCTION TO SOCIAL RESEARCH METHODS
237 | THIKA INSTITUTE OF BUSINESS STUDIES 0715 067 272 www.tibs.ac.ke [email protected]
2. ESTIMATING THE MEDIAN FROM GROUPED DATA
For grouped data, the median is obtained by finding the size of the N/2 value. N is the size of the
frequencies and can be even or odd.
Example 1
Find the median for the following set of data.

INTRODUCTION TO SOCIAL RESEARCH METHODS
238 | THIKA INSTITUTE OF BUSINESS STUDIES 0715 067 272 www.tibs.ac.ke [email protected]
Median for Frequency Distribution
For the grouped frequency distribution of a discrete variable or a continuous variable the
calculation of the median involves identifying the median class, i.e. the class containing the
median. This can be done by calculating the less than type cumulative frequencies. It should be
recalled that less than type cumulative frequencies correspond to the upper class boundaries of
the respective classes. First we calculate and find out the less than type cumulative frequency
just greater or equal to . Let that less than type cumulative frequency be denoted by . Now,
we find out the class boundary corresponding to which the less than type cumulative frequency is
equal to . Let us denote that class boundary by . The median class will be that class for
which the upper class boundary is .Now, that we know the median class, the median can be
calculated using the following formula:
Median or

INTRODUCTION TO SOCIAL RESEARCH METHODS
239 | THIKA INSTITUTE OF BUSINESS STUDIES 0715 067 272 www.tibs.ac.ke [email protected]
where, is the lower class boundary of the median class,
is the total frequency,
is the less than type cumulative frequency corresponding to ,
is the frequency of the median class
and is the class width of the median class.
For a frequency distribution this handy formula does the calculation:
On the other hand, to calculate the median from a histogram you have to apply the following
classical formula:
Lm+[N2−Fm−1fm]⋅c
where Lm is the lower limit of the median bar,
N is the total number of observations,

INTRODUCTION TO SOCIAL RESEARCH METHODS
240 | THIKA INSTITUTE OF BUSINESS STUDIES 0715 067 272 www.tibs.ac.ke [email protected]
Fm−1 is the cumulative frequency of the bar preceding the median bar (i.e. the total number of
observations in all bars below the median bar),
f is the frequency of the median bar, and c is the median bar width.
This formula substantially arises from a linear interpolation, which assumes that data are
uniformly distributed within the median class.
To understand this formula, it can be noted that the fraction N/2−Fm−1fm is the proportion of
observations in the median bar that are below the median. Under the assumption that
observations are uniformly distributed within the median bar, multiplying this proportion by the
median bar width c yields the fraction of median bar width corresponding to the position of the
median. Adding this result to Lm finally provides the median.
Example 1
This grouped frequency table gives the number of ‘salmon cod’ caught by a fisherman on 25
fishing trips.
Number of
salmon codFrequency f
20–24 1
25–29 2
30–34 4
35–39 4
40–44 6
45–49 8
Add a cumulative frequency column to the table, then use this to determine the median class.
Solution

INTRODUCTION TO SOCIAL RESEARCH METHODS
241 | THIKA INSTITUTE OF BUSINESS STUDIES 0715 067 272 www.tibs.ac.ke [email protected]
Number of
salmon codFrequency f
Cumulative
frequency
20–24 1 1
25–29 2 3
30–34 4 7
35–39 4 11
40–44 6 17
45–49 8 25
44. 40 is class Median
score13th
scoreth 2
1 25 Median
Example 2:
The following distribution represents the number of minutes spent per week by a group
of teenagers in going to the movies. Find the median number of minutes spent per by the
teenagers in going to the movies.
Number of minutes per week Number of teenagers
0-99 26
100-199 32
200-299 65
300-399 75
400-499 60
500-599 42
Solution:
Let us convert the class intervals given, to class boundaries and construct the less than type
cumulative frequency distribution.
Number of
minutes per week
Class Boundaries Number of
teenagers
(Frequency)
Cumulative
Frequency
(less than type)
0-99 0-99.5 26 26
100-199 99.5-199.5 32 58

INTRODUCTION TO SOCIAL RESEARCH METHODS
242 | THIKA INSTITUTE OF BUSINESS STUDIES 0715 067 272 www.tibs.ac.ke [email protected]
200-299 199.5-299.5 65 123
300-399 299.5-399.5 75 198
400-499 399.5-499.5 60 258
500-599 499.5-599.5 42 300
Here,
Here, the cumulative frequency just greater than or equal to 150 is 198.
and
is the less than type cumulative frequency corresponding to the class boundary 399.5
the median class is the class for which upper class boundary is
In other words, 299.5-399.5 is the median class, i.e. the class containing the median value.
using the formula for median we have,
Median or
where, (lower class boundary of the median class),
(total frequency),
( less than type cumulative frequency corresponding to ),
(frequency of the median class),
and (class width of the median class).
or, Median (

INTRODUCTION TO SOCIAL RESEARCH METHODS
243 | THIKA INSTITUTE OF BUSINESS STUDIES 0715 067 272 www.tibs.ac.ke [email protected]
Example 3
In a work study investigation, the times taken by 20 men in a firm to do a particular job were
tabulated as follows: Find the median.
Solution

INTRODUCTION TO SOCIAL RESEARCH METHODS
244 | THIKA INSTITUTE OF BUSINESS STUDIES 0715 067 272 www.tibs.ac.ke [email protected]
Example 4
Let's look at our data again:
21 people were timed in a sprint race, to the nearest second. Create a frequency
distribution table and calculate the mean, median and the mode of the data.
Seconds Frequency
51 - 55 2
56 - 60 7
61 - 65 8
66 - 70 4
The median is the middle value, which in our case is the 11th one, which is in the 61 - 65 group:
We can say "the median group is 61 - 65"
But if we want an estimated Median value we need to look more closely at the 61 - 65 group.

INTRODUCTION TO SOCIAL RESEARCH METHODS
245 | THIKA INSTITUTE OF BUSINESS STUDIES 0715 067 272 www.tibs.ac.ke [email protected]
We call it "61 - 65", but it really includes values from 60.5 up to (but not including) 65.5.
Why? Well, the values are in whole seconds, so a real time of 60.5 is measured as 61. Likewise
65.4 is measured as 65.
At 60.5 we already have 9 runners, and by the next boundary at 65.5 we have 17 runners. By
drawing a straight line in between we can pick out where the median frequency of n/2 runners is:
Class Midpoint
x
Frequency
f
Cumulative
frequency
51-55 53 2 2
56-60 58 7 9
61-65 63 8 17
66-70 68 4 21
21
For our example:
L = 60.5
N = 21
F = 2 + 7 = 9
fm = 8
c = 5
Estimated Median= 60.5 + (21/2) – 9/ 8 × 5
= 60.5 + 0.9375

INTRODUCTION TO SOCIAL RESEARCH METHODS
246 | THIKA INSTITUTE OF BUSINESS STUDIES 0715 067 272 www.tibs.ac.ke [email protected]
= 61.4375
Example 5
FINDING MEDIAN GRAPHICALLY
The median value of a series may be determinded through the graphic presentation of data in the
form of Ogives following the following steps:
Step 1: Draw the cumulative frequency curve.
Step 2: The median is the datum corresponding to the middle value of the cumulative
frequency.
The median can be got in in 3 ways corresponding to the types of ogives:
1. Presenting the data graphically in the form of 'less than' ogive or
2. Presenting the data graphically in the form of 'more than' ogive .
3. Presenting the data graphically and simultaneously in the form of 'less than' and 'more
than' ogives. The two ogives are drawn together.

INTRODUCTION TO SOCIAL RESEARCH METHODS
247 | THIKA INSTITUTE OF BUSINESS STUDIES 0715 067 272 www.tibs.ac.ke [email protected]
1. Less than Ogive approach
Use the data tabulated below to draw an ogive and find the mean from the ogive:
Marks Conversion into
exclusive series No. of students Cumulative Frequency
(x) (f) (C.M) 410 - 419 409.5 - 419.5 14 14 420 - 429 419.5 - 429.5 20 34 430 - 439 429.5 - 439.5 42 76 440 - 449 439.5 - 449.5 54 130 450 - 459 449.5 - 459.5 45 175 460 - 469 459.5 - 469.5 18 193 470 - 479 469.5 - 479.5 7 200
Steps involved in calculating median using less than Ogive approach -
1. Convert the series into a 'less than ' cumulative frequency distribution as shown above .
2. Let N be the total number of students who's data is given. N will also be the cumulative
frequency of the last interval. Find the (N/2)th item(student) and mark it on the y-axis. In this case
the (N/2)th item (student) is 200/2 = 100th student.
3. Draw a perpendicular from 100 to the right to cut the Ogive curve at point A.
4.From point A where the Ogive curve is cut, draw a perpendicular on the x-axis. The point at
which it touches the x-axis will be the median value of the series as shown in the graph.
Solution
Marks Less Than
Cumulative Frequency (C.M)
Less than 419.5 14
Less than 429.5 34
Less than 439.5 76
Less than 449.5 130
Less than 459.5 175
Less than 469.5 193
Less than 479.5 200

INTRODUCTION TO SOCIAL RESEARCH METHODS
248 | THIKA INSTITUTE OF BUSINESS STUDIES 0715 067 272 www.tibs.ac.ke [email protected]
Example 2
Let's look at our data again:
21 people were timed in a sprint race, to the nearest second. Create a frequency
distribution table and calculate the mean, median and the mode of the data.

INTRODUCTION TO SOCIAL RESEARCH METHODS
249 | THIKA INSTITUTE OF BUSINESS STUDIES 0715 067 272 www.tibs.ac.ke [email protected]
2. More than Ogive approach
Steps involved in calculating median using more than Ogive approach - 1. Convert the series into a 'more than ' cumulative frequency distribution as shown above .
2. Let N be the total number of students who's data is given.N will also be the cumulative
frequency of the last interval.Find the (N/2)th item(student) and mark it on the y-axis.In this case
the (N/2)th item (student) is 200/2 = 100th student.
3. Draw a perpendicular from 100 to the right to cut the Ogive curve at point A.
4.From point A where the Ogive curve is cut, draw a perpendicular on the x-axis. The point at
which it touches the x-axis will be the median value of the series as shown in the graph.
Solution
Marks More Than
Cumulative Frequency (C.M)
More than 409.5 200
More than 419.5 186
More than 429.5 166
More than 439.5 124
More than 449.5 70
More than 459.5 25
More than 469.5 7
More than 479.5 0

INTRODUCTION TO SOCIAL RESEARCH METHODS
250 | THIKA INSTITUTE OF BUSINESS STUDIES 0715 067 272 www.tibs.ac.ke [email protected]
3. Less than and more than Ogive approach
Another way of graphical determination of median is through simultaneous graphic presentation
of both the less than and more than Ogives.
1.Mark the point A where the
Ogive curves cut each other.
2.Draw a perpendicular from
A on the x-axis. The
corresponding value on the x-
axis would be the median
value.

INTRODUCTION TO SOCIAL RESEARCH METHODS
251 | THIKA INSTITUTE OF BUSINESS STUDIES 0715 067 272 www.tibs.ac.ke [email protected]
Example 3
Determine the median graphically from the data given below :
Wages No. of workers.
(Kshs)
20- 40 4
40-60 6
60-80 10
80-100 16
100-120 12
120-140 7
140-160 3
Total 58
We shall use the second method of locating the Median by drawing two ogives (one 'less than’
and the other 'more than’).
In the 'less than' o give the upper limit of the first class-interval (20—40) would be the starting
point and in the 'more than' ogive the lower limit of this class-interval or 20 would be the first
value of the variable.
From the point of intersection of the two o gives we will draw a perpendicular on the x-axis and
the point where it touches the x-axis would be the value of the Median.
Wages
less than
(Kshs)
No. of workers. Wages
more than
(Kshs)
No. of
workers.
40 4 20 58
60 10 40 54
80 20 60 48
100 36 80 38
120 48 100 22
140 55 120 10
160 58 140 3
160 0

INTRODUCTION TO SOCIAL RESEARCH METHODS
252 | THIKA INSTITUTE OF BUSINESS STUDIES 0715 067 272 www.tibs.ac.ke [email protected]
Locating Median Graphically
Wages in Shillings
The value of the median comes to Kshs 91.25
Example 4
The cumulative frequency curve for maths marks of a class is given below, find the median
mark.
Solution
a) Median =
b) Median =
c) Total frequency
= 40
The rank of median
= 40/2 =
From the cumulative
polygon, 0
5
10
15
20
25
30
35
40
frequ
ency
9.5 19.5 29.5 39.5 49.5 59.5 69.5 79.5 89.5 99.5
Cumulative Frequency Curve for marks in maths
Marks

INTRODUCTION TO SOCIAL RESEARCH METHODS
253 | THIKA INSTITUTE OF BUSINESS STUDIES 0715 067 272 www.tibs.ac.ke [email protected]
median =
Example 5
The provisional figures on the population by age group in Kenya as at 2018 are tabulated below.
Draw a cumulative frequency curve and determine the median age for the population.
Age group 0 9 10 19 20 29 49 50 59 60 69 > 70
Population
(‘000)
676 885 1208 677 503 499
Solution
Age group x
Population ('000)
cumulative population (‘000 000)
x < 10 676 0.676
10 ≦ x < 20 885 1.561
20 ≦ x < 30 1000
30 ≦ x < 40 1267
40 ≦ x < 50 1208
50 ≦ x < 60 677
60 ≦ x < 70 503
70 < x 499
The rank of median = 6.715/2 =
The median age =
Example 6
Draw an ogive for the following frequency distribution. Use your ogive to estimate:
Class
Interval
0 - 9 10 -
19
20 -
29
30 -
39
40 -
49
50 -
59
60 -
69
70 -
79
80 -
89
90 -
99
Frequency 5 9 16 22 26 18 11 6 4 3
0
1.0
2.
0
3.0
4.
0
5.0
6.
0
7.
0
8.
0
Po
pu
lation
(‘00
0 0
00
)
Less than Cumulative frequency polygon for population
10 20 30 40 50 60 70 70+
Age group

INTRODUCTION TO SOCIAL RESEARCH METHODS
254 | THIKA INSTITUTE OF BUSINESS STUDIES 0715 067 272 www.tibs.ac.ke [email protected]
(I) The Median,
(2) The number of students who obtained more than 75% marks.
(use a graph paper to solve this question).
Marks No. OfÂ
Students
Cumulative
Frequency
0 − 9 5 5
10 − 19 9 14
20 − 29 16 30
30 − 39 22
52
40 − 49 26 78
50 − 59 18 96
60 − 69 11 107
70 − 79 6 113
80 − 89 4 117
90 − 99 3 120
N = 120
Consider
Hence the median class is 40− 49
Example 7
In a public collection towards supporting orphans, 1000 people contributed sums of money
varying from Kshs. 1 to Kshs. 100 ( in units of Kshs 1). The following table gives the frequency
distribution of contribution:
Using a suitable scale, draw on graph paper an ogive (cumulative frequency graph)and use it to
answer the following:
Contribution 1-10 11-20 21-30 31-40 41-50 51-60 61-70 71-80 81-90 91-

INTRODUCTION TO SOCIAL RESEARCH METHODS
255 | THIKA INSTITUTE OF BUSINESS STUDIES 0715 067 272 www.tibs.ac.ke [email protected]
100
No. of
people
30 60 80 170 200 180 140 70 40 30
(1) Estimate the median.
(2) If it is agreed to allow only those who contributed Kshs. 45 or more to attend the unveiling
ceremony, what percentage would attend?
No. of people Contribution (in Rs) Cumulative
Frequency
0.5− 10.5 30 30
10.5− 20.5 60 90
20.5 − 30.5 80 170
30.5− 40.5 170 340
40.5− 50.5 200 Median Class
540
50.5 − 60.5 180 720
60.5 − 70.5 140 860
70.5− 80.5 70 930
80.5 − 90.5 40 970
90.5 − 100.5 30 1000
N = 1000

INTRODUCTION TO SOCIAL RESEARCH METHODS
256 | THIKA INSTITUTE OF BUSINESS STUDIES 0715 067 272 www.tibs.ac.ke [email protected]
(i) Median is 48 (Approx)
(ii) From 45 on x-axis draw a perpendicular line such that it intersects the curve drawn.
From the point of intersection of the curve and the line draw another line parallel to x-
axis.
It meets the y-axis at the point (0, 450)
Which means 550 members can attend the unveiling ceremony which amounts to
55%.
THE MEDIAN AND QUARTILES FROM AN OGIVE
If you divide the marks of 82 learners into four groups containing the same number of marks, the
divisions might look like this:

INTRODUCTION TO SOCIAL RESEARCH METHODS
257 | THIKA INSTITUTE OF BUSINESS STUDIES 0715 067 272 www.tibs.ac.ke [email protected]
We work out the position of Q1, M and Q3 is as follows:
There are 82 data items. 82 ÷ 2 = 41. So the median lies between the 41st and
42nd item and is the average of the 41st and 42nd item..
There are 41data items to the left of the median. 41 ÷ 2 = 20 ½, so Q1 is the
score of the 21st item.
This means that we have
20 terms Q1 20 terms M 20 terms Q3 20 terms
To find Q3 we can go: 82 – 20 = 62. So Q3 is the score of the 62nd item
These values can also be found in the cumulative frequency table by counting the data items like
this:
Mark Frequency Cumulative frequency
1 1 1
2 3 4
3 4 8
4 6 14
5 9 23 The 41st and 42nd
learners are in
here.
Median = 7
The 21st learner is in
here.
Q 1= 5
Scores of learners
1 - 20
Scores of
learners 22 - 41
Scores of learners
42 - 61
Scores of learners
63 - 82
5 8
Median is the average score of 41st
and 42nd learners’ scores
Lower quartile is the score
of the 21st learner Upper quartile is the score of
the 62nd learner
7

INTRODUCTION TO SOCIAL RESEARCH METHODS
258 | THIKA INSTITUTE OF BUSINESS STUDIES 0715 067 272 www.tibs.ac.ke [email protected]
6 11 34
7 15 49
8 18 67
9 10 77
10 5 82
Total = 82
NB:
1. The median and quartiles are the marks, not the frequencies
2. This method of finding the median can be used both for discrete and continuous data.
The 62nd learner is in
here.
Q 3 = 8

INTRODUCTION TO SOCIAL RESEARCH METHODS
259 | THIKA INSTITUTE OF BUSINESS STUDIES 0715 067 272 www.tibs.ac.ke [email protected]
A cumulative frequency graph shows data in order from the smallest to the largest. The ogive of
the data in the frequency table on the previous looks like this:
Grade 10 maths marks
0246
8101214161820
2224262830323436
38404244464850
5254565860626466
68707274767880
82848688
1 2 3 4 5 6 7 8 9 10
marks
cu
mu
lati
ve
fre
qu
nc
y
Median is the
41½ th value
Q 1 is the 21st
value
Estimate of the median
is read here.
Median 7
Estimate of the lower
quartile is read here.
Q1 5
Q 3 is the 62nd
value
Estimate of the
upper quartile is
read here.
Q3 8

INTRODUCTION TO SOCIAL RESEARCH METHODS
260 | THIKA INSTITUTE OF BUSINESS STUDIES 0715 067 272 www.tibs.ac.ke [email protected]
NB: Each point on the cumulative frequency curve gives an estimate of a value in a particular
position in the whole data set.
Median, Quartiles and Percentiles (Grouped Data)
In these lessons, we will learn how to obtain the median, quartiles and percentiles from the
cumulative frequency graph of the distribution (grouped data).
Example 1:
The following cumulative frequency graph shows the distribution of marks scored by a class of
32 students in a test.

INTRODUCTION TO SOCIAL RESEARCH METHODS
261 | THIKA INSTITUTE OF BUSINESS STUDIES 0715 067 272 www.tibs.ac.ke [email protected]
Use the graph to estimate
a) the median mark b) the upper quartile
c) the lower quartile d) the interquartile range
Solution:
a) Median corresponds to the 50th percentile i.e. 50% of the total frequency.
50% of the total frequency =
From the graph, 20 on the vertical axis corresponds to 44 on the horizontal axis. The median
mark is 44.
b) The upper quartile corresponds to the 75th percentile i.e. 75% of the total frequency.
75% of the total frequency =
From the graph, 30 on the vertical axis corresponds to 52 on the horizontal axis. The upper
quartile is 52.
c) The lower quartile corresponds to the 25th percentile i.e. 25% of the total frequency.
25% of the total frequency =
From the graph, 10 on the vertical axis corresponds to 36 on the horizontal axis. The lower
quartile is 36.
d) The interquartile range = upper quartile – lower quartile
= 52 – 36 = 16
Example 2 The number of goals scored by a team is shown below:
5, 4, 4, 7, 5, 9, 12, 14, 16, 16.
(a) Find the lower quartile.
(b) Find the upper quartile.

INTRODUCTION TO SOCIAL RESEARCH METHODS
262 | THIKA INSTITUTE OF BUSINESS STUDIES 0715 067 272 www.tibs.ac.ke [email protected]
(c) Find the interquartile range.
Solution
4, 4, 5, 5, 7, 9, 12, 14, 16, 16
LQ median UQ
(a) Lower quartile = 5
(b) Upper quartile = 14
(c) Interquartile range = 14 5 = 9
PERCENTILES
The median and the quartiles divide a data set into 4 equal parts – the same number of items in
each part.
Two other measures are sometimes used when describing a data set:
Deciles: They divide the data set into 10 equal parts
Percentiles : They divide the data set into 100 equal parts
It follows then that
The median is the 50th percentile. This means 50% of the data items are below the median
Q1 = 25th percentile. This means 25% of the data items are below Q1
Q 3 = 75th percentile. This means 75% of the data items are below Q3
Similarly
The 33rd percentile means that 1/3 of the data items are below this value,
The 10th percentile is the value that separates the bottom 10% of values in a data set from the
rest and the 90th percentile is the value that is 90% of the way through the data set.
Percentiles should only be used with large sets of data.
Where you don’t have exactly 100 pieces of data, you have to find the percentage of the total in
order to find a particular percentile.

INTRODUCTION TO SOCIAL RESEARCH METHODS
263 | THIKA INSTITUTE OF BUSINESS STUDIES 0715 067 272 www.tibs.ac.ke [email protected]
Example
The 16th percentile of the data on the previous page is found like this:
16% of 82 = 13,12
On vertical axis find 13 then read across to curve and then down to horizontal axis
16th percentile 4
This means 16% of the class scored 4 marks or less.
The next activity gives you more practice on using the ogive to find quartiles and percentiles.
Activity a) Use the ogive on page 15 to find an estimate of the:
i) 10th percentile of the data
ii) 90th percentile
b) Write a sentence that interprets these two values
c) Complete the following sentence”
50% of the class got …………….or less out of 10 for the test.
2) Which percentile is the same as the
a) Median b) Lower quartile c) Upper quartile
3) The maths marks of 100 learners are shown in the frequency table
marks frequency Cumulative
frequency Points
0-10 1 1 (10 ; 1)
11-20 2 3
21-30 13
31-40 24
41-50 32
51-60 16
61-70 11
71-80 1 100

INTRODUCTION TO SOCIAL RESEARCH METHODS
264 | THIKA INSTITUTE OF BUSINESS STUDIES 0715 067 272 www.tibs.ac.ke [email protected]
a) Complete the table.
b) Plot the points on the grid on the next page to form a cumulative frequency curve.
c) Calculate the median
d) On the graph show where you might read the estimate of the median.
e) Find the lower quartile and the upper quartile from the frequency table.
f) Use arrows on the curve to show where to estimate the upper and lower quartiles from the
ogive. Do your values agree?
g) Find the10th percentile. Use arrows on the curve to show where to take the readings.
h) Find the 60th percentile. Use arrows on the curve to show where to take the readings.
Summary of the Ogive
The cumulative frequency curve has links to the 5 number summary and the box-and-whisker
plot. Look at the following diagram that shows this:
0
10
20
30
40
50
60
70
80
90
10
0
data items
cumulative
frequency
Lower quartile
Median
Upper quartile
Minimum
value Maximum
value

INTRODUCTION TO SOCIAL RESEARCH METHODS
265 | THIKA INSTITUTE OF BUSINESS STUDIES 0715 067 272 www.tibs.ac.ke [email protected]
Estimating the Median from a Histogram
The construction of histograms entails grouping data together into classes for better visual
presentation. This grouping loses some of the original information, specifically the values of data
are replaced by ranges within which the values lie. It is not possible to find the mean or median
of the data which provided a histogram, but a ``best'' estimate for the mean or median can be
calculated, and bounds on where the mean or median can be are obtainable. The ``best'' estimates
are obtained by assuming that the data is uniformly spread within each class.
Example: Consider a histogram which has 10 data in the class with class mark 100, 12 data in the
class with class mark 125, 20 data in the class with class mark 150, 8 data in the class with class
mark 175, and 5 data in the class with class mark 200. What can you say about the mean and
median of the data?
The ``best'' estimate for the mean is obtained by assuming the data is uniformly spread within
each interval; for purposes of calculating the mean, this is equivalent to assuming that all the data
lie on the class marks. In this example the ``best'' estimate for the mean is
=
10 ×100 + 12 ×125 + 20 ×150 + 8 ×175 + 5 ×200
55
= 143
7
11
.
In order to get bounds on the mean, it is necessary to know the class boundaries, which are
halfway between the class marks. Adding or subtracting (25/2) = 12.5 from the class marks
provides the class boundaries 87.5, 112.5, 137.5, etc. The least possible mean would occur if all
of the data in each class were at the lower class boundary. In this example the least possible
mean is
= (10 ×87.5 + 12 ×112.5 + 20 ×137.5 + 8 ×162.5 + 5 ×187.5)/55 = 131+(3/22).

INTRODUCTION TO SOCIAL RESEARCH METHODS
266 | THIKA INSTITUTE OF BUSINESS STUDIES 0715 067 272 www.tibs.ac.ke [email protected]
Similarly, the greatest possible value for the mean is 156+(3/22).
The median is the middle value; uniformly spread data will provide that the area of the histogram
on each side of the median will be equal.
The total area of this histogram is 10 ×25 + 12 ×25 + 20 ×25 + 8 ×25 + 5 ×25 = 55 ×25 = 1375.
Of this sum, 250 comes from the first class, 300 comes from the second class, hence (1375/2) -
550 = 137.5 is needed from the third class to account for half the area.
The area 137.5 is obtained from the third class by going (137.5/20) = 6.875 into it.
The ``best'' estimate for the median is 144.375, which provides equal area in the histogram on
either side of it. Since there are 55 data, the median is the value of the 28th in rank order. This
datum will lie in the third class, which contains the 23rd through 42nd data. It is possible that all
(most) of the data in the third class would be at the bottom or top of that class, hence the actual

INTRODUCTION TO SOCIAL RESEARCH METHODS
267 | THIKA INSTITUTE OF BUSINESS STUDIES 0715 067 272 www.tibs.ac.ke [email protected]
value of the median can be anywhere in the range 137.5 to 162.5.
Example 2

INTRODUCTION TO SOCIAL RESEARCH METHODS
268 | THIKA INSTITUTE OF BUSINESS STUDIES 0715 067 272 www.tibs.ac.ke [email protected]

INTRODUCTION TO SOCIAL RESEARCH METHODS
269 | THIKA INSTITUTE OF BUSINESS STUDIES 0715 067 272 www.tibs.ac.ke [email protected]
3. ESTIMATING THE MODE FROM GROUPED DATA
In order to calculate the mode of grouped data, you need to:
Find the modal class. The modal class is the class interval that has the largest frequency.
Find the lower class boundary of the modal class ( Lb )
Find the difference of frequency between the modal class to its upper class ( a ). 0r d1
Find the difference of frequency between the modal class to its lower class ( b ). Or d2
Add the Lb to products ba
a
by C , then add it to A .
We can estimate the Mode using the following formula:
Mode = Cba
aLbMo Mo .
Or

INTRODUCTION TO SOCIAL RESEARCH METHODS
270 | THIKA INSTITUTE OF BUSINESS STUDIES 0715 067 272 www.tibs.ac.ke [email protected]
Formula II
The mode can also be calculated using the formula below:
where:
L is the lower class limit of the modal class
f1 is the frequency of the modal class
f0 is the frequency of the class before the modal class in the frequency table
f2 is the frequency of the class after the modal class in the frequency table
h is the class interval of the modal class
Example 1
Again, looking at our data:
Seconds
Frequency
51 - 55 2
56 - 60 7
61 - 65 8
66 - 70 4
We can easily find the modal group (the group with the highest frequency), which is 61 - 65
We can say "the modal group is 61 - 65"
But the actual Mode may not even be in that group! Or there may be more than one mode.
Without the raw data we don't really know.
Example 2
Class Midpoint
x
Frequency
f
51-55 53 2
56-60 58 7
61-65 63 8

INTRODUCTION TO SOCIAL RESEARCH METHODS
271 | THIKA INSTITUTE OF BUSINESS STUDIES 0715 067 272 www.tibs.ac.ke [email protected]
66-70 68 4
Totals: 21
In this example:
L = 60.5
fm-1 = 7
fm = 8
fm+1 = 4
w = 5
Estimated Mode= 60.5 + 8 – 7 / (8 − 7) + (8 − 4) × 5
= 60.5 + (1/5) × 5
= 61.5
Example 3
Calculating mode using the formula below:
where
L is the lower class limit of the modal class
f1 is the frequency of the modal class
f0 is the frequency of the class before the modal class in the frequency table
f2 is the frequency of the class after the modal class in the frequency table
h is the class interval of the modal class

INTRODUCTION TO SOCIAL RESEARCH METHODS
272 | THIKA INSTITUTE OF BUSINESS STUDIES 0715 067 272 www.tibs.ac.ke [email protected]
Example 4
Find the modal class and the actual mode of the data set below
Number Frequency
1 - 3 7
4 - 6 6
7 - 9 4
10 - 12 9
13 - 15 2
16 - 18 8
19 - 21 1
22 - 24 2
25 - 27 3
28 - 30 2
Solution
Modal class = 10 - 12
where
L = 10
f1 = 9
f0 = 4
f2 = 2
h = 3
therefore,
Solving the above using the order of operations:

INTRODUCTION TO SOCIAL RESEARCH METHODS
273 | THIKA INSTITUTE OF BUSINESS STUDIES 0715 067 272 www.tibs.ac.ke [email protected]
Example 5
The weight , in kg, of 50 boys were recorded as shown in the table below:
Weight ( x kg) Number of boys
4540 x 4
5045 x 5
5550 x 10
6055 x 14
6560 x 8
7065 x 6
7570 x 3
Find the Mode.
Finding Mode Graphically
The following steps must be followed to find the mode graphically.
1. Represent the given data in the form of a Histogram. The height of the rectangles in the
histogram is marked by the frequencies of the class interval as shown in the graph.
Identify the highest rectangle. This corresponds to the modal class of the series.
2. Join the top corners of the modal rectangle with the immediately next corners of the
adjacent rectangles. The two lines must be cutting each other. This might be difficult to
visualise so look at the graph given below.
3. Let the point where the joining lines cut each other be 'A'. Draw a perpendicular line from
point A onto the x-axis. The point 'P' where the perpendicular will meet the x-axis will
give the mode.

INTRODUCTION TO SOCIAL RESEARCH METHODS
274 | THIKA INSTITUTE OF BUSINESS STUDIES 0715 067 272 www.tibs.ac.ke [email protected]
By histogram
-
-
-
-
-
2
4
6
8
10
24.5 29.5 34.5 39.5 44.5 49.5 54.5 59.5
Lengths (mm)
Frequency
A B P
C D
E
F
CE = …… - …… = ……
DF = …… - …… = ……
AP : PB = CE : DF
AP : PB = …… : …….
AP : AB = …… : (…. + .…)
AP : …… = …… : …….
AP =
AP = …….
Mo = 39.5 + AP
Mo = 39.5 + …… = ……

INTRODUCTION TO SOCIAL RESEARCH METHODS
275 | THIKA INSTITUTE OF BUSINESS STUDIES 0715 067 272 www.tibs.ac.ke [email protected]
Example 1
Example 2
Marks
inclusive series
Conversions into
exclusive series
No. of students
(frequency)
(x) (f)
10-19 9.5-19.5 10
20-29 19.5-29.5 12
30-39 29.5-39.5 18
40-49 39.5-49.5 30
50-59 49.5-59.5 16
60-69 59.5-69.5 6
70-79 69.5-79.5 8
The Histogram

INTRODUCTION TO SOCIAL RESEARCH METHODS
276 | THIKA INSTITUTE OF BUSINESS STUDIES 0715 067 272 www.tibs.ac.ke [email protected]
In this case the value of point P turns out to be 44.12

INTRODUCTION TO SOCIAL RESEARCH METHODS
277 | THIKA INSTITUTE OF BUSINESS STUDIES 0715 067 272 www.tibs.ac.ke [email protected]
EXERCISES
C 1.A financial analyst has randomly selected 200 companies from those traded on the NYSE.
At the end of each trading day, the analyst records the closing price for each of
the 200 companies. These 200 measurements are an example of __________.
E A. an ogive
Term B. grouped data
C. raw data
D. a stem and leaf plot
C 2. If data are grouped into intervals and the number of items in each group is listed,
this could be called a _______.
E A. ogive
Term B. histogram
C. frequency distribution
D. stem and leaf plot
C 3. A graphical representation of a frequency distribution is called a _______.
E A. stem and leaf plot
Term B. ogive
C. histogram
D. pie chart
A 4. The width of a class interval in a frequency distribution will be approximately
equal to the range divided by _______.
M A. the number of class intervals
Term B. the highest number in the data set
C. the lowest number in the data set
D. the midpoint of the middle class
D 5. If the individual class frequency is divided by the total frequency, the result is the
_______.
M A. midpoint frequency
Term B. cumulative frequency
C. stem and leaf plot
D. relative frequency

INTRODUCTION TO SOCIAL RESEARCH METHODS
278 | THIKA INSTITUTE OF BUSINESS STUDIES 0715 067 272 www.tibs.ac.ke [email protected]
A 6. A cumulative frequency polygon is also called _______.
E A. an ogive
Term B. a histogram
C. a frequency polygon
D. a stem and leaf plot
B 7. A histogram can be described as _______.
E A. a graphical depiction of an ogive
Term B. a vertical bar chart
C. a vertical stem and leaf plot
D. a three dimensional pie chart
C 8. The number of class intervals in a frequency distribution is usually between
_______.
E A. 3 and 5
Term B. 7 and 9
C. 5 and 15
D. 1 and 25
B 9. One advantage of a stem and leaf plot over a frequency distribution is that
_______.
E A. it contains more class intervals
Term B. the values of the original data are retained
C. the class midpoints are used as the stem
D. the class midpoints are used as the leaf
B 10. One rule that must always be followed in constructing frequency distributions is
that _______.
E A. the number of classes must be less than 10
Term B. each data point can only fall into one class
C. the width of each class is equal to the range
D. the number of intervals must be an odd number
A 11. One rule that must always be followed in constructing frequency distributions is
that _______.

INTRODUCTION TO SOCIAL RESEARCH METHODS
279 | THIKA INSTITUTE OF BUSINESS STUDIES 0715 067 272 www.tibs.ac.ke [email protected]
E A. adjacent classes must not overlap
Term B. the midpoint of each class must be a whole number
C. the width of each class is equal to the range
D. the number of intervals must be an odd number
D 12. Which of the following is best to show the percentage of a total budget that is
spent on each category of items?
E A. histogram
Term B. ogive
C. stem and leaf chart
D. pie chart
B 13. A cumulative frequency distribution would provide _______.
E A. a graph of a frequency distribution
Term B. a running total of the frequencies in the classes
C. the proportion of the total frequencies which fall into each class
D. a very cloudy picture of the frequencies
B 14. What is the midpoint of the class interval 10 - under 12?
E A. 22
Calc B. 11
C. 10.5
D. 11.5
C 15. What is the midpoint of the class interval 20 - under 25?
E A. 47
Calc B. 20
C. 22.5
D. 23
B 16. What is the midpoint of the class interval 6 - under 9?
E A. 15
Calc B. 7.5
C. 3
D. 1.5
C 17. Consider the following frequency distribution:

INTRODUCTION TO SOCIAL RESEARCH METHODS
280 | THIKA INSTITUTE OF BUSINESS STUDIES 0715 067 272 www.tibs.ac.ke [email protected]
Class Interval Frequency
10-under 20 15
20-under 30 25
30-under 40 10
What is the midpoint of the first class?
E A. 10
Calc B. 20
C. 15
D. none of the above
B 18. Consider the following frequency distribution:
Class Interval Frequency
10-under 20 15
20-under 30 25
30-under 40 10
What is the relative frequency of the first class?
E A. 0.15
Calc B. 0.30
C. 0.10
D. none of the above
B 19. Consider the following frequency distribution:
Class Interval Frequency
10-under 20 15
20-under 30 25
30-under 40 10
What is the cumulative frequency of the second class interval?
E A. 25
Calc B. 40
C. 15
D. 50
C 20. Consider the following frequency distribution:
Class Interval Frequency
10-under 20 15
20-under 30 25
30-under 40 10
What is the approximate range of this data?
E A. 10

INTRODUCTION TO SOCIAL RESEARCH METHODS
281 | THIKA INSTITUTE OF BUSINESS STUDIES 0715 067 272 www.tibs.ac.ke [email protected]
Calc B. 20
C. 30
D. 40
D 21. The number of phone calls arriving at a switchboard each hour has been recorded,
and the following frequency distribution has been developed.
Class Interval Frequency
20-under 40 30
40-under 60 45
60-under 80 80
80-under 100 45
What is the midpoint of the last class?
E A. 80
Calc B. 100
C. 95
D. 90
C 22. The number of phone calls arriving at a switchboard each hour has been recorded,
and the following frequency distribution has been developed.
Class Interval Frequency
20-under 40 30
40-under 60 45
60-under 80 80
80-under 100 45
What is the relative frequency of the second class?
E A. 0.45
Calc B. 0.90
C. 0.225
D. 0.75
C 23. The number of phone calls arriving at a switchboard each hour has been recorded,
and the following frequency distribution has been developed.
Class Interval Frequency
20-under 40 30
40-under 60 45
60-under 80 80
80-under 100 45
What is the cumulative frequency of the third class?
E A. 80

INTRODUCTION TO SOCIAL RESEARCH METHODS
282 | THIKA INSTITUTE OF BUSINESS STUDIES 0715 067 272 www.tibs.ac.ke [email protected]
Calc B. 0.40
C. 155
D. 75
A 24.The number of phone calls arriving at a switchboard each hour has been recorded, and the
following frequency distribution has been developed.
Class Interval Frequency
20-under 40 30
40-under 60 45
60-under 80 80
80-under 100 45
What is the approximate range of the number of phone calls arriving each hour?
E A. 80
Calc B. 200
C. 20
D. 100
C 25. Consider the following stem and leaf plot:
Stem Leaf
1 0, 2, 5, 7
2 2, 3, 4, 4
3 0, 4, 6, 6, 9
4 5, 8, 8, 9
5 2, 7, 8
Suppose that a frequency distribution was developed from this, and there were 5
classes (10-under 20, 20-under 30, etc.). What would the frequency be for class
30-under 40?
M A. 3
Calc B. 4
C. 5
D. 9
C 26. Consider the following stem and leaf plot:
Stem Leaf
1 0, 2, 5, 7
2 2, 3, 4, 8
3 0, 4, 6, 6, 9
4 5, 8, 8, 9
5 2, 7, 8

INTRODUCTION TO SOCIAL RESEARCH METHODS
283 | THIKA INSTITUTE OF BUSINESS STUDIES 0715 067 272 www.tibs.ac.ke [email protected]
Suppose that a frequency distribution was developed from this, and there were 5
classes (10-under 20, 20-under 30, etc.). What would be the relative frequency of
the class 20-under 30?
M A. 0.4
Calc B. 0.25
C. 0.20
D. 4
B 27. Consider the following stem and leaf plot:
Stem Leaf
1 0, 2, 5, 7
2 2, 3, 4, 8
3 0, 4, 6, 6, 9
4 5, 8, 8, 9
5 2, 7, 8
Suppose that a frequency distribution was developed from this, and there were 5
classes (10-under 20, 20-under 30, etc.). What was the highest number in the data
set?
M A. 50
App B. 58
C. 59
D. 100
B 28. Consider the following stem and leaf plot:
Stem Leaf
1 0, 2, 5, 7
2 2, 3, 4, 8
3 0, 4, 6, 6, 9
4 5, 8, 8, 9
5 2, 7, 8
Suppose that a frequency distribution was developed from this, and there were 5
classes (10-under 20, 20-under 30, etc.). What was the lowest number in the data
set?
M A. 0
App B. 10
C. 7
D. 2
B 29. Consider the following stem and leaf plot:

INTRODUCTION TO SOCIAL RESEARCH METHODS
284 | THIKA INSTITUTE OF BUSINESS STUDIES 0715 067 272 www.tibs.ac.ke [email protected]
Stem Leaf
1 0, 2, 5, 7
2 2, 3, 4, 8
3 0, 4, 6, 6, 9
4 5, 8, 8, 9
5 2, 7, 8
Suppose that a frequency distribution was developed from this, and there were 5
classes (10-under 20, 20-under 30, etc.). Most of the numbers in the 40-under 50
class are _______.
M A. close to 40
App B. close to 50
C. equal to 45
D. between 41 and 44
C 30. Consider the following stem and leaf plot:
Stem Leaf
1 0, 2, 5, 7
2 2, 3, 4, 8
3 0, 4, 6, 6, 9
4 5, 8, 8, 9
5 2, 7, 8
Suppose that a frequency distribution was developed from this, and there were 5
classes (10-under 20, 20-under 30, etc.). What is the cumulative frequency for the
30-under 40 class interval?
M A. 5
App B. 9
C. 13
D. 14
C 31. Cumulative frequencies are usually represented graphically by _______.
E A. histograms
Term B. pie charts
C. ogives
D. frequency polygons
B 32. An instructor has decided to graphically represent the grades on a test. The
instructor uses a plus/minus grading system (i.e. she gives grades of A-, B+, etc.).
Which of the following would provide the most information for the students?

INTRODUCTION TO SOCIAL RESEARCH METHODS
285 | THIKA INSTITUTE OF BUSINESS STUDIES 0715 067 272 www.tibs.ac.ke [email protected]
M A. a histogram
App B. a stem and leaf plot
C. a cumulative frequency distribution
D. a frequency distribution
B 33. The following represent the ages of students in a class:
19, 23, 21, 19, 19, 20, 22, 31, 21, 20
If a stem and leaf plot were to be developed from this, how many stems would
there be?
M A. 2
App B. 3
C. 4
D. 10
B 34. The difference between the highest number and the lowest number in a set of data
is called the _______.
E A. difference
Term B. range
C. polygonal frequency
D. relative frequency
C 35. A person has decided to construct a frequency distribution for a set of data
containing 60 numbers. The lowest number is 23 and the highest number is 68. If
5 classes are used, the class width should be approximately _______.
E A. 4
Calc B. 12
C. 9
D. 5
B 36. A person has decided to construct a frequency distribution for a set of data
containing 60 numbers. The lowest number is 23 and the highest number is 68. If
7 classes are used, the class width should be approximately _______.
E A. 6
Calc B. 7
C. 9
D. 11
D 37. A frequency distribution was developed. The lower endpoint of the first class is
9.30, and the midpoint is 9.35. What is the upper endpoint of this class?

INTRODUCTION TO SOCIAL RESEARCH METHODS
286 | THIKA INSTITUTE OF BUSINESS STUDIES 0715 067 272 www.tibs.ac.ke [email protected]
E A. 9.50
Calc B. 9.60
C. 9.70
D. 9.40
C 38. The cumulative frequency for a class is 27. The cumulative frequency for the
next (non-empty) class will be _______.
E A. less than 27
App B. equal to 27
C. greater than 27
D. 27 minus the next class frequency
B 39. Which of the following would be most helpful if you wished to construct a pie
chart?
E A. a frequency distribution
App B. a relative frequency distribution
C. a cumulative frequency distribution
D. an ogive
B 40. A person has constructed a frequency distribution for the grades on a test. This
person is not sure how to do this, and thus only 7 classes were developed, and
each class width was set at 10 units. If the lowest possible score is 0 and the
highest possible score is 100, which of the following is true?
M A. all numbers between 0 and 100 belong to one of these classes
App B. some number might not fit into any of these classes
C. some of these classes would have to overlap
D. there are too many classes
A 41. In a histogram, the highest bar represents the class with _______.
E A. the highest frequency
App B. the lowest frequency
C. the highest cumulative frequency
D. the lowest relative frequency
C 42. The following class intervals for a frequency distribution were developed to
provide information regarding the starting salaries for students graduating from a
particular school:

INTRODUCTION TO SOCIAL RESEARCH METHODS
287 | THIKA INSTITUTE OF BUSINESS STUDIES 0715 067 272 www.tibs.ac.ke [email protected]
Salary Number of Graduates
($1,000s)
18-under 21 -
21-under 25 -
24-under 27 -
29-under 30 -
Before data was collected, someone questioned the validity of this arrangement.
Which of the following represents a problem with this set of intervals?
M A. there are too many intervals
App B. the class widths are too small
C. some numbers between 18,000 and 30,000 would fall into two different
intervals
D. the first and the second interval overlap
C 43. The following class intervals for a frequency distribution were developed to
provide information regarding the starting salaries for students graduating from a
particular school:
Salary Number of Graduates
($1,000s)
18-under 21 -
21-under 25 -
24-under 27 -
29-under 30 -
Before data was collected, someone questioned the validity of this arrangement.
Which of the following represents a problem with this set of intervals?
M A. there are too many intervals
App B. the class widths are too small
C. some numbers between 18,000 and 30,000 would not fall into any of these
intervals
D. the first and the second interval overlap
D 44. The following class intervals for a frequency distribution were developed to
provide information regarding the starting salaries for students graduating from a
particular school:
Salary Number of Graduates
($1,000s)
18-under 21 -
21-under 25 -
24-under 27 -
29-under 30 -

INTRODUCTION TO SOCIAL RESEARCH METHODS
288 | THIKA INSTITUTE OF BUSINESS STUDIES 0715 067 272 www.tibs.ac.ke [email protected]
Before data was collected, someone questioned the validity of this arrangement.
Which of the following represents a problem with this set of intervals?
M A. there are too many intervals
App B. the class widths are too small
C. the class widths are too large
D. the second and the third interval overlap
D 45. Abel Alonzo, Director of Human Resources, is exploring employee absenteeism
at the Harrison Haulers Plant during the last operating year. A review of all
personnel records indicated that absences ranged from zero to twenty-nine days
per employee. The following class intervals were proposed for a frequency
distribution of absences.
Absences Number of Employees
(days)
0-under 5 -
5-under 10 -
10-under 15 -
15-under 20 -
20-under 25 -
25-under 30 -
Which of the following represents a problem with this set of intervals?
M A. there are too few intervals
BApp B. some numbers between 0 and 29 would not fall into any interval
C. the first and second interval overlap
D. none of the above (These intervals are okay.)
B 46. Abel Alonzo, Director of Human Resources, is exploring employee absenteeism
at the Harrison Haulers Plant during the last operating year. A review of all
personnel records indicated that absences ranged from zero to twenty-nine days
per employee. The following class intervals were proposed for a frequency
distribution of absences.
Absences Number of Employees
(days)
0-under 5 -
5-under 10 -
10-under 15 -
20-under 25 -
25-under 30 -
Which of the following represents a problem with this set of intervals?

INTRODUCTION TO SOCIAL RESEARCH METHODS
289 | THIKA INSTITUTE OF BUSINESS STUDIES 0715 067 272 www.tibs.ac.ke [email protected]
M A. there are too few intervals
BApp B. some numbers between 0 and 29, inclusively, would not fall into any interval
C. the first and second interval overlap
D. there are too many intervals
A 47. Abel Alonzo, Director of Human Resources, is exploring employee absenteeism
at the Harrison Haulers Plant during the last operating year. A review of all
personnel records indicated that absences ranged from zero to twenty-nine days
per employee. The following class intervals were proposed for a frequency
distribution of absences.
Absences Number of Employees
(days)
0-under 10 -
10-under 20 -
20-under 30 -
Which of the following represents a problem with this set of intervals?
E A. there are too few intervals
BApp B. some numbers between 0 and 29 would not fall into any interval
C. the first and second interval overlap
D. there are too many intervals
A 48. Consider the relative frequency distribution given below:
Class Interval Relative Frequency
20-under 40 0.2
40-under 60 0.3
60-under 80 0.4
80-under 100 0.1
There were 60 numbers in the data set. How many numbers were in the interval
20-under 40?
E A. 12
Calc B. 20
C. 40
D. 10
C 49. Consider the relative frequency distribution given below:
Class Interval Relative Frequency
20-under 40 0.2
40-under 60 0.3

INTRODUCTION TO SOCIAL RESEARCH METHODS
290 | THIKA INSTITUTE OF BUSINESS STUDIES 0715 067 272 www.tibs.ac.ke [email protected]
60-under 80 0.4
80-under 100 0.1
There were 60 numbers in the data set. How many numbers were in the interval
40-under 60?
E A. 30
Calc B. 50
C. 18
D. 12
D 50. Consider the relative frequency distribution given below:
Class Interval Relative Frequency
20-under 40 0.2
40-under 60 0.3
60-under 80 0.4
80-under 100 0.1
There were 60 numbers in the data set. How many of the number were less than
80?
E A. 90
Calc B. 80
C. 0.9
D. 54
B 51. Consider the following frequency distribution:
Class Interval Frequency
100-under 200 25
200-under 300 45
300-under 400 30
What is the midpoint of the first class?
E A. 100
Calc B. 150
C. 25
D. 250
A 52. Consider the following frequency distribution:
Class Interval Frequency
100-under 200 25
200-under 300 45
300-under 400 30
What is the relative frequency of the second class interval?

INTRODUCTION TO SOCIAL RESEARCH METHODS
291 | THIKA INSTITUTE OF BUSINESS STUDIES 0715 067 272 www.tibs.ac.ke [email protected]
E A. 0.45
Calc B. 0.70
C. 0.30
D. 0.33
C 53. Consider the following frequency distribution:
Class Interval Frequency
100-under 200 25
200-under 300 45
300-under 400 30
What is the cumulative frequency of the second class interval?
E A. 25
Calc B. 45
C. 70
D. 250
C 54. Consider the following frequency distribution:
Class Interval Frequency
100-under 200 25
200-under 300 45
300-under 400 30
What is the approximate range of the data?
E A. 100
Calc B. 25
C. 300
D. 400
B 55. Consider the following frequency distribution:
Class Interval Frequency
100-under 200 25
200-under 300 45
300-under 400 30
What is the midpoint of the last class interval?
E A. 15
Calc B. 350
C. 300
D. 200

INTRODUCTION TO SOCIAL RESEARCH METHODS
292 | THIKA INSTITUTE OF BUSINESS STUDIES 0715 067 272 www.tibs.ac.ke [email protected]
B 56. Pinky Bauer, Chief Financial Officer of Harrison Haulers, Inc., suspects
irregularities in the payroll system, and orders an inspection of "each and every
payroll voucher issued since January 1, 1993." Each payroll voucher was
inspected and the following frequency distribution was compiled.
Errors Per Voucher Number of Vouchers
0-under 2 500
2-under 4 400
4-under 6 300
6-under 8 200
8-under 10 100
The relative frequency of the first class interval is _________.
E A. 0.50
BCalc B. 0.33
C. 0.40
D. 0.27
C 57. Pinky Bauer, Chief Financial Officer of Harrison Haulers, Inc., suspects
irregularities in the payroll system, and orders an inspection of "each and every
payroll voucher issued since January 1, 1993." Each payroll voucher was
inspected and the following frequency distribution was compiled.
Errors Per Voucher Number of Vouchers
0-under 2 500
2-under 4 400
4-under 6 300
6-under 8 200
8-under 10 100
The cumulative frequency of the second class interval is _________.
E A. 1,500
BCalc B. 500
C. 900
D. 1,000
D 58. Pinky Bauer, Chief Financial Officer of Harrison Haulers, Inc., suspects
irregularities in the payroll system, and orders an inspection of "each and every
payroll voucher issued since January 1, 1993." Each payroll voucher was
inspected and the following frequency distribution was compiled.
Errors Per Voucher Number of Vouchers
0-under 2 500
2-under 4 400
4-under 6 300

INTRODUCTION TO SOCIAL RESEARCH METHODS
293 | THIKA INSTITUTE OF BUSINESS STUDIES 0715 067 272 www.tibs.ac.ke [email protected]
6-under 8 200
8-under 10 100
The approximate range of the data is _________.
E A. 1,500
BCalc B. 2
C. 400
D. 10
59. The following data represent the fire in the week for 4 cities. Choose the correct
frequency distribution to organize the data
Class
Limit
Frequency
4-7 2
7-10 3
10-13 6
15-18 8
Class
Limit
Frequency
4-7 2
8-11 5
12-15 9
16-19 2
Class
Limit
Frequency
4-7 2
8-11 3
12-16 6
17-21 8
Class
Limit
Frequency
4-7 2
7-10 3
10-13 1
13-16 5
60. What are the boundaries of 49.005 ounces ?
a) 49-50 ounces
b) 48.505-49.505 ounces
c) 49.0045-49.0055 ounces
d) 48.955-49.055 ounces
61. The class width for the class limit 28-33 is
a) 5
b) 6
c) 33
d) 28

INTRODUCTION TO SOCIAL RESEARCH METHODS
294 | THIKA INSTITUTE OF BUSINESS STUDIES 0715 067 272 www.tibs.ac.ke [email protected]
62. The following table shows the frequency distribution of temperature (in degree
centigrade) of 30 countries :
Use the above table to answer questions(4-6)
63. The number of countries with temperature less than 44.5 is
a) 8
b) 10
c) 3
d) 23
64. The percentage of values in second class is :
a) 33.33
b) 16.67
c) 0.1667
d) 0.2667
C 66. Pinky Bauer, Chief Financial Officer of Harrison Haulers, Inc., suspects
irregularities in the payroll system, and orders an inspection of "each and every payroll voucher
issued since January 1, 1993." Each payroll voucher was inspected and the following frequency
distribution was compiled.
Errors Per Voucher Number of Vouchers
0-under 2 500
2-under 4 400
4-under 6 300
6-under 8 200
8-under 10 100
The midpoint of the first class interval is _________.
E A. 500
BCalc B. 2
C. 1.5
D. 1
Class
Limit
Frequency
30-34 10
35-39 5
40-44 8
45-49 7
65. The midpoint in the first class is:
a) 32
b) 32.5
c) 37
d) 64

INTRODUCTION TO SOCIAL RESEARCH METHODS
295 | THIKA INSTITUTE OF BUSINESS STUDIES 0715 067 272 www.tibs.ac.ke [email protected]
D 67. The staffs of the accounting and the quality control departments rated their
respective supervisor's leadership style as either (1) authoritarian or (2)
participatory. Sixty-eight percent of the accounting staff rated their supervisor
"authoritarian," and thirty-two percent rated him "participatory." Forty percent of
the quality control staff rated their supervisor "authoritarian," and sixty percent
rated her "participatory." The best graphic depiction of these data would be two
___________________.
E A. histograms
BApp B. frequency polygons
C. ogives
D. pie charts
B 68. Jessica Salas, president of Salas Products, is reviewing the warranty policy for her
company's new model of automobile batteries. Accelerated life tests were
performed on a sample of 100 batteries, and the following relative frequency
distribution was compiled.
Battery Life Relative Frequency
(months)
40-under 50 0.05
50-under 60 0.10
60-under 70 0.25
70-under 80 0.50
80-under 100 0.10
The number of batteries in 40-under 50 interval was _________.
E A. 45
BCalc B. 5
C. 10
D. 15
A 69. Jessica Salas, president of Salas Products, is reviewing the warranty policy for her
company's new model of automobile batteries. Accelerated life tests were
performed on a sample of 100 batteries, and the following relative frequency
distribution was compiled.
Battery Life Relative Frequency
(months)
40-under 50 0.05
50-under 60 0.10
60-under 70 0.25
70-under 80 0.50
80-under 100 0.10

INTRODUCTION TO SOCIAL RESEARCH METHODS
296 | THIKA INSTITUTE OF BUSINESS STUDIES 0715 067 272 www.tibs.ac.ke [email protected]
The number of batteries in 60-under 70 interval was _________.
E A. 25
BCalc B. 65
C. 40
D. 60
D 70. Jessica Salas, president of Salas Products, is reviewing the warranty policy for her
company's new model of automobile batteries. Accelerated life tests were
performed on a sample of 100 batteries, and the following relative frequency
distribution was compiled.
Battery Life Relative Frequency
(months)
40-under 50 0.05
50-under 60 0.10
60-under 70 0.25
70-under 80 0.50
80-under 100 0.10
The number of batteries which lasted less than 60 months was _________.
M A. 10
BCalc B. 55
C. 5
D. 15
C 71. Chili Robinson, Director of Quality Control, is concerned about the variability in
a drilling process. The process should produce 1" holes in aluminum castings. A
sample of ninety castings are drilled and inspected. Data collected from
measuring the ninety holes were compiled to form the following frequency
distribution.
Hole Diameter Number of Holes
(inches)
0.85-under 0.90 10
0.90-under 0.95 20
0.95-under 1.00 30
1.00-under 1.05 20
1.05-under 1.10 10
The percentage of holes under 1" in diameter was _____________.
E A. 33%
BCalc B. 60%
C. 67%

INTRODUCTION TO SOCIAL RESEARCH METHODS
297 | THIKA INSTITUTE OF BUSINESS STUDIES 0715 067 272 www.tibs.ac.ke [email protected]
D. 50%
B 72. Chili Robinson, Director of Quality Control, is concerned about the variability in
a drilling process. The process should produce 1" holes in aluminum castings. A
sample of ninety castings are drilled and inspected. Data collected from
measuring the ninety holes were compiled to form the following frequency
distribution.
Hole Diameter Number of Holes
(inches)
0.85-under 0.90 10
0.90-under 0.95 20
0.95-under 1.00 30
1.00-under 1.05 20
1.05-under 1.10 10
The number of holes under 1" in diameter was _____________.
M A. 20
BCalc B. 60
C. 25
D. 30
B 73. Chili Robinson, Director of Quality Control, is concerned about the variability in
a drilling process. The process should produce 1" holes in aluminum castings. A
sample of ninety castings are drilled and inspected. Data collected from
measuring the ninety holes were compiled to form the following frequency
distribution.
Hole Diameter Number of Holes
(inches)
0.85-under 0.90 10
0.90-under 0.95 20
0.95-under 1.00 30
1.00-under 1.05 20
1.05-under 1.10 10
The midpoint of the third class interval is _____________.
E A. 1.025
BCalc B. 25
C. 35
D. 0.975

INTRODUCTION TO SOCIAL RESEARCH METHODS
298 | THIKA INSTITUTE OF BUSINESS STUDIES 0715 067 272 www.tibs.ac.ke [email protected]
C 74. The U.S. PC market is very competitive. In 1998 unit-shipment market shares
were: Dell 13.4%; Compaq 15.0%; Gateway 8.2%; Hewlett-Packard 8.4%; IBM
8.9%; and others 46.1%.
The best graphic depiction of these data would be ___________________.
E A. a histogram
BApp B. a frequency polygon
C. a pie chart
D. an ogive
75. What graph should be used to show the relationship between the parts and the whole ?
a) Histogram
b) Pie graph
c) Pareto graph
d) Ogives
76. Data collected over period of time can be graphed using ………..graph
a) Pareto graph
b) Pie graph
c) Time serious
d) Curve
77. Choose the correct stem and leaf plot which represent the following data
16 10 11 30 35 33 35 44 47
a) 1 0 1 6
2 0
3 0 3 5 5
4 4 7
b) 1 0 1 6
3 0 3 5 5
4 4 7
c) 1 0 1 6
2
3 0 3 5 5

INTRODUCTION TO SOCIAL RESEARCH METHODS
299 | THIKA INSTITUTE OF BUSINESS STUDIES 0715 067 272 www.tibs.ac.ke [email protected]
4 4 7
d) 1 0 1 6
3 0 3 5
4 4 7
78. Percentages can be used in which type of graph…
a) Histogram
b) Pareto chart
c) Pie graph
d) Ogive
79. A researcher wishes to represent the percentage of students in the department of statistics
using a pie graph. If the percentage of statistical department students is 25%, then their
corresponding degree of the angle on the pie graph is .........
a) 300
b) 1080
c) 900
d) 1800
80. In a stem and leaf plot, the stem part for the data value 347 is .........
a. 34
b. 7
c. 47
d. 3
81. A department store wants to construct a pie graph to represent the marital status ( الحالة
of its employees. There were 30 married , 10 divorced, 20 singles and 5 (االجتماعية
widows. How many degrees will be needed to represent the divorced( المطلقات)
employees?
a) 41.6⁰
b) 10⁰
c) 55.38⁰
d) 15.4⁰
82. When data are collected from January to December in year 2011 , then they can be
represented by
a) Histogram

INTRODUCTION TO SOCIAL RESEARCH METHODS
300 | THIKA INSTITUTE OF BUSINESS STUDIES 0715 067 272 www.tibs.ac.ke [email protected]
b) Pie graph
c) Time series
d) Pareto chart
83. The heights of vertical bars in the histogram represent the ……..
a) Class width
b) Sample size
c) Frequencies of classes
d) Number of classes
B 84. The U.S. PC market is very competitive. In 1998 unit-shipment market shares
were: Dell 13.4%; Compaq 15.0%; Gateway 8.2%; Hewlett-Packard 8.4%; IBM
8.9%; and others 46.1%. In 1999 unit-shipment market shares were: Dell 17.1%;
Compaq 15.3%; Gateway 9.3%; Hewlett-Packard 8.2%; IBM 7.6%; and others
42.5%.
The best graphic depiction of these data would be ___________________.
E A. a pie chart
BApp B. two pie charts
C. a histogram
D. two histograms
A 85. The Worlwide PC market is very competitive. In 1998 unit-shipment market
shares were: Dell 8.2%; Compaq 13.4%; Gateway 3.8%; Hewlett-Packard 5.9%;
IBM 8.4%; and others 60.3%.
The best graphic depiction of these data would be ___________________.
E A. a pie chart
BApp B. a histogram
C. a frequency polygon
D. an ogive
D 86. The Worlwide PC market is very competitive. In 1998 unit-shipment market
shares were: Dell 8.2%; Compaq 13.4%; Gateway 3.8%; Hewlett-Packard 5.9%;
IBM 8.4%; and others 60.3%. In 1999 unit-shipment market shares were: Dell
10.8%; Compaq 12.8%; Gateway 4.3%; Hewlett-Packard 6.2%; IBM 7.6%; and
others 58.3%.
The best graphic depiction of these data would be ___________________.
E A. a histogram

INTRODUCTION TO SOCIAL RESEARCH METHODS
301 | THIKA INSTITUTE OF BUSINESS STUDIES 0715 067 272 www.tibs.ac.ke [email protected]
BApp B. two histograms
C. a pie chart
D. two pie charts
87. Use the following graph to answer the question (a-b)
a. The graph has ………peak
a) four
b) One
c) Three
d) Two
b. Type of graphs is:
a) Frequency polygon
b) Ogive
c) Cumulative frequency
d) Curve
88. Other name for ogive is:
a) Histogram
b) Frequency Polygon
c) Cumulative frequency graph
d) Pareto Chart
89. From the ogive below, answer (a-b)

INTRODUCTION TO SOCIAL RESEARCH METHODS
302 | THIKA INSTITUTE OF BUSINESS STUDIES 0715 067 272 www.tibs.ac.ke [email protected]
a. Approximately what is the total number of observations?
a) 222
b) 50
c) 8
d) 134.5
b. How many records high temperature are less than 109.5?
a) 50
b) 40
c) 28
d) 10
90. Using the histogram shown here, do the following :
a. How many values less than 33.5 ?
a) 0
b) 14
c) 10
d) 16
b. How many classes in the above chart ?
a) 7

INTRODUCTION TO SOCIAL RESEARCH METHODS
303 | THIKA INSTITUTE OF BUSINESS STUDIES 0715 067 272 www.tibs.ac.ke [email protected]
b) 6
c) 12
d) 4
c. The class width is ….
a) 4 b) 3 c)5 d)2
91. Liz Chapa manages a portfolio of 250 common stocks. Her staff compiled the following
frequency distribution of dividends received (in $/share) during the previous year.
Dividends Number of Stocks
($/share)
$0-under $0.50 25
0.50-under 1.00 50
1.00-under 1.50 100
1.50-under 2.00 50
2.00-under 2.50 25
Construct a histogram of the dividend frequency distribution on the following
grid.
E
BCalc
92. Liz Chapa manages a portfolio of 250 common stocks. Her staff compiled the following
frequency distribution of dividends received (in $/share) during the previous year.
Dividends Number of Stocks
($/share)
$0-under $0.50 25
0.50-under 1.00 50
1.00-under 1.50 100
1.50-under 2.00 50
2.00-under 2.50 25
Construct a frequency polygon of the dividend frequency distribution on the
following grid.
E
BCalc
93. Liz Chapa manages a portfolio of 250 common stocks. Her staff compiled the
following frequency distribution of dividends received (in $/share) during the
previous year.
Dividends ($/share) Number of Stocks
$0-under $0.50 25
0.50-under 1.00 50
1.00-under 1.50 100

INTRODUCTION TO SOCIAL RESEARCH METHODS
304 | THIKA INSTITUTE OF BUSINESS STUDIES 0715 067 272 www.tibs.ac.ke [email protected]
1.50-under 2.00 50
2.00-under 2.50 25
Construct a cumulative frequency ogive on the following grid.
E
BCalc
94. Chili Robinson, Director of Quality Control, is concerned about the variability in
a drilling process. The process should produce 1" holes in aluminum castings. A
sample of ninety castings are drilled and inspected. Data collected from
measuring the ninety holes were compiled to form the following frequency
distribution.
Hole Diameter (inches) Number of Holes
0.85-under 0.90 10
0.90-under 0.95 20
0.95-under 1.00 30
1.00-under 1.05 20
1.05-under 1.10 10
Construct a histogram on the following grid.
E
BCalc
95. Chili Robinson, Director of Quality Control, is concerned about the variability in
a drilling process. The process should produce 1" holes in aluminum castings. A
sample of ninety castings are drilled and inspected. Measurements from the
ninety holes were compiled to form the following frequency distribution.
Hole Diameter (inches) Number of Holes
0.85-under 0.90 10
0.90-under 0.95 20
0.95-under 1.00 30
1.00-under 1.05 20
1.05-under 1.10 10
Construct a frequency polygon on the following grid.
E
BCalc
96. Chili Robinson, Director of Quality Control, is concerned about the variability in
a drilling process. The process should produce 1" holes in aluminum castings. A
sample of ninety castings are drilled and inspected. Measurements from the
ninety holes were compiled to form the following frequency distribution.

INTRODUCTION TO SOCIAL RESEARCH METHODS
305 | THIKA INSTITUTE OF BUSINESS STUDIES 0715 067 272 www.tibs.ac.ke [email protected]
Hole Diameter (inches) Number of Holes
0.85-under 0.90 10
0.90-under 0.95 20
0.95-under 1.00 30
1.00-under 1.05 20
1.05-under 1.10 10
Construct a cumulative frequency ogive on the following grid.
E
BCalc
B 97. Each day, the office staff at Oasis Quick Shop prepares a frequency distribution
and an ogive of sales transactions by dollar value of the transactions. Saturday's
cumulative frequency ogive follows.
The total number of sales transactions on Saturday was _____________.
E A. 200
BCalc B. 500
C. 300
D. 100
D 98. Each day, the office staff at Oasis Quick Shop prepares a frequency distribution
and an ogive of sales transactions by dollar value of the transactions. Saturday's
cumulative frequency ogive follows.

INTRODUCTION TO SOCIAL RESEARCH METHODS
306 | THIKA INSTITUTE OF BUSINESS STUDIES 0715 067 272 www.tibs.ac.ke [email protected]
The percentage of sales transactions on Saturday that were under $100 each was
_____________.
M A. 100
BCalc B. 10
C. 80
D. 20
C 99. Each day, the office staff at Oasis Quick Shop prepares a frequency distribution
and an ogive of sales transactions by dollar value of the transactions. Saturday's
cumulative frequency ogive follows.
The percentage of sales transactions on Saturday that were at least $100 each was
_____________.
M A. 100
BCalc B. 10
C. 80
D. 20

INTRODUCTION TO SOCIAL RESEARCH METHODS
307 | THIKA INSTITUTE OF BUSINESS STUDIES 0715 067 272 www.tibs.ac.ke [email protected]
C 100. Each day, the office staff at Oasis Quick Shop prepares a frequency distribution
and an ogive of sales transactions by dollar value of the transactions. Saturday's
cumulative frequency ogive follows.
The percentage of sales transactions on Saturday that were between $100 and
$150 was _____________.
M A. 20%
BCalc B. 40%
C. 60%
D. 80%
D 101. Each day, the office staff at Oasis Quick Shop prepares a frequency distribution
and a histogram of sales transactions by dollar value of the transactions. Friday's
histogram follows.
On Tuesday, the approximate number of sales transactions in the 125-under 150
category was _____________.
E A. 50
BCalc B. 100
C. 150
D. 200

INTRODUCTION TO SOCIAL RESEARCH METHODS
308 | THIKA INSTITUTE OF BUSINESS STUDIES 0715 067 272 www.tibs.ac.ke [email protected]
C 102. Each day, the office staff at Oasis Quick Shop prepares a frequency distribution
and a histogram of sales transactions by dollar value of the transactions. Friday's
histogram follows.
On Tuesday, the approximate number of sales transactions between $100 and
$150 was _____________.
E A. 100
BCalc B. 200
C. 300
D. 400
D 103. The staff of Mr. Wayne Wertz, VP of Operations at Portland Peoples Bank,
prepared a cumulative frequency ogive of waiting time for walk-in customers.
The total number of walk-in customers included in the study was _________.
E A. 100
BCalc B. 250
C. 300
D. 450

INTRODUCTION TO SOCIAL RESEARCH METHODS
309 | THIKA INSTITUTE OF BUSINESS STUDIES 0715 067 272 www.tibs.ac.ke [email protected]
A 104. The staff of Mr. Wayne Wertz, VP of Operations at Portland Peoples Bank,
prepared a cumulative frequency ogive of waiting time for walk-in customers.
The percentage of walk-in customers waiting one minute or less was _________.
E A. 22%
BCalc B. 11%
C. 67%
D. 10%
B 105. The staff of Mr. Wayne Wertz, VP of Operations at Portland Peoples Bank,
prepared a cumulative frequency ogive of waiting time for walk-in customers.
The percentage of walk-in customers waiting more than 6 minutes was ______.
E A. 22%
BCalc B. 11%
C. 67%
D. 10%
C 106. The staff of Mr. Wayne Wertz, VP of Operations at Portland Peoples Bank,
prepared a cumulative frequency ogive of waiting time for walk-in customers.

INTRODUCTION TO SOCIAL RESEARCH METHODS
310 | THIKA INSTITUTE OF BUSINESS STUDIES 0715 067 272 www.tibs.ac.ke [email protected]
The percentage of walk-in customers waiting between 1 and 6 minutes was ___.
M A. 22%
BCalc B. 11%
C. 67%
D. 10%
D 107. The staff of Mr. Wayne Wertz, VP of Operations at Portland Peoples Bank,
prepared a frequency histogram of waiting time for walk-in customers.
Approximately _____ walk-in customers waited less than 2 minutes.
E A. 20
BCalc B. 30
C. 100
D. 180
B 108. The staff of Mr. Wayne Wertz, VP of Operations at Portland Peoples Bank,
prepared a frequency histogram of waiting time for walk-in customers.

INTRODUCTION TO SOCIAL RESEARCH METHODS
311 | THIKA INSTITUTE OF BUSINESS STUDIES 0715 067 272 www.tibs.ac.ke [email protected]
Approximately ____ walk-in customers waited at least 7 minutes.
E A. 20
BCalc B. 30
C. 100
D. 180
B 109. The staff of Ms. Tamara Hill, VP of Technical Analysis at Blue Sky Brokerage,
prepared a cumulative percentage ogive of market capitalization of the 937
corporations listed on the American Stock Exchange in January 2000.
The median market capitalization of the corporations was _________
($1,000,000).

INTRODUCTION TO SOCIAL RESEARCH METHODS
312 | THIKA INSTITUTE OF BUSINESS STUDIES 0715 067 272 www.tibs.ac.ke [email protected]
E A. 200
BCalc B. 26
C. 12
D. 60
C 110. The staff of Ms. Tamara Hill, VP of Technical Analysis at Blue Sky Brokerage,
prepared a cumulative percentage ogive of market capitalization of the 937
corporations listed on the American Stock Exchange in January 2000.
The percentage of corporations with capitalization of $50,000,000 or less was
_________.
E A. 38
BCalc B. 26
C. 62
D. 43
A 111. The staff of Ms. Tamara Hill, VP of Technical Analysis at Blue Sky Brokerage,
prepared a cumulative percentage ogive of market capitalization of the 937
corporations listed on the American Stock Exchange in January 2000.

INTRODUCTION TO SOCIAL RESEARCH METHODS
313 | THIKA INSTITUTE OF BUSINESS STUDIES 0715 067 272 www.tibs.ac.ke [email protected]
The percentage of corporations with capitalization exceeding $50,000,000 was
_________.
E A. 38
BCalc B. 26
C. 62
D. 43
B 112. The staff of Ms. Tamara Hill, VP of Technical Analysis at Blue Sky Brokerage,
prepared a cumulative percentage ogive of market capitalization of the 937
corporations listed on the American Stock Exchange in January 2000.
The percentage of corporations with capitalization of $150,000,000 or less was
_________.
E A. 38
BCalc B. 85
C. 62
D. 15

INTRODUCTION TO SOCIAL RESEARCH METHODS
314 | THIKA INSTITUTE OF BUSINESS STUDIES 0715 067 272 www.tibs.ac.ke [email protected]
D 113. The staff of Ms. Tamara Hill, VP of Technical Analysis at Blue Sky Brokerage,
prepared a cumulative percentage ogive of market capitalization of the 937
corporations listed on the American Stock Exchange in January 2000.
The percentage of corporations with capitalization exceeding $150,000,000 was
_________.
E A. 38
BCalc B. 85
C. 62
D. 15
B 114. The staff of Ms. Tamara Hill, VP of Technical Analysis at Blue Sky Brokerage,
prepared a frequency histogram of market capitalization of the 937 corporations
listed on the American Stock Exchange in January 2000.
AMEX Listed Securities
0
200
400
600
800
$100 $200 $300 $400 $500
Market Capitalization
($1,000,000)
Num
ber
of Is
su
es

INTRODUCTION TO SOCIAL RESEARCH METHODS
315 | THIKA INSTITUTE OF BUSINESS STUDIES 0715 067 272 www.tibs.ac.ke [email protected]
Approximately ________ corporations had capitalization exceeding
$200,000,000.
E A. 50
BCalc B. 100
C. 700
D. 800
D 115. The staff of Ms. Tamara Hill, VP of Technical Analysis at Blue Sky Brokerage,
prepared a frequency histogram of market capitalization of the 937 corporations
listed on the American Stock Exchange in January 2000.
Approximately ________ corporations had capitalizations of $200,000,000 or
less.
E A. 50
BCalc B. 100
C. 700
D. 800
B 116. Destiny Houston needs to prepared several graphics for a report on competition
and growth of Internet advertising. Which Excel feature is most useful for this
task?
E A. Solver
Term B. Chart Wizard
C. Data Analysis
D. Pivot Table
117. The following data show the survey results of the number of children in families.
AMEX Listed Securities
0
200
400
600
800
$100 $200 $300 $400 $500
Market Capitalization
($1,000,000)
Num
ber
of Is
su
es

INTRODUCTION TO SOCIAL RESEARCH METHODS
316 | THIKA INSTITUTE OF BUSINESS STUDIES 0715 067 272 www.tibs.ac.ke [email protected]
Data: 3, 5, 2, 4, 3, 1, 4, 1, 2, 5, 3, 6, 4, 3, 5, 4, 4.
Create a frequency table for this data.
Solution
No of children Tally Frequency
1 l l 2
2 l l 2
3 l l l l 4
4 l l l l 5
5 l l l 3
6 l 1
Total 17
118. Using the frequency table above to find:
a. the mean number of children per family
b. the median number of children per family
c. the modal number of children per family
Solution
a. 17
)61()53()45()34()22()12(
47.3
17
59
b. 1, 1, 2, 2, 3, 3, 3, 3, 4, 4, 4, 4, 4, 5, 5, 5, 6,
Median = 4
c. Mode = 4
119. A shoe company surveyed the shoe size purchased by women over a period of time.

INTRODUCTION TO SOCIAL RESEARCH METHODS
317 | THIKA INSTITUTE OF BUSINESS STUDIES 0715 067 272 www.tibs.ac.ke [email protected]
The results were as follows:
8, 5, 6, 5, 8, 6, 7, 9, 5, 7, 6, 8, 8, 6, 9, 7, and 8.
(a) Calculate the mean of this data
(b) Find the modal value.
(c) Find the median value.
(d) Which of these values would be of the most use to the company? Why?
Solution
a.
94.6
17
118
17
87968867597685658
The mean shoe size is 7.
b. The mode is 8
c. 5, 5, 5, 6, 6, 6, 6, 7, 7, 7, 8, 8, 8, 8, 8, 9, 9,
i. The median value is 7.
d. The mode would probably be of the most value because this is the shoe size that they sell
the most.
120. Tom has been earning some extra pocket money by washing cars.
In each hour block he has managed to wash 4 cars, 5 cars, 3 cars, 4 cars and 4 cars.
The mean number of cars that he has been able to wash is therefore 4 cars per hour.
In order to increase his mean to 5 cars per hour, how many cars does Tom need to wash in the
next hour? Is this likely?
Solution

INTRODUCTION TO SOCIAL RESEARCH METHODS
318 | THIKA INSTITUTE OF BUSINESS STUDIES 0715 067 272 www.tibs.ac.ke [email protected]
10
3020
56
20
56
44354
x
x
x
x
Tom needs to wash 10 cars in his next hour.
No, this is not very likely.
121. Use the data in columns 1 and 3 below to compute means, medians and modes only.
Solution:
Class x (midpoint) f F fx
0 – 10 5 122 122 610
10 – 20 15 180 302 2700
20 – 30 25 256 558 6400
30 – 40 35 350 908 12250
40 – 50 45 311 1219 13995
50 – 60 55 278 1497 15290
60 – 70 65 250 1747 16250
70 – 80 75 211 1958 15825
80 – 90 85 180 2138 15300
90 – 100 95 175 2313 16625
100 – 110 105 143 2456 15015
110 – 120 115 120 2576 13800
120 – 130 125 106 2682 13250
130 – 140 135 99 2781 13365
140 – 150 145 97 2878 14065
150 – 160 155 75 2953 11625
Total 2953 196365
(i) So 2953 nf , 196385 fx , so that 4968.662953
196365
n
fxx .
(ii) For the median, 5.p , where p is the proportion below the median.
1477129535.15.1 nnpposition . If we compare this with the cumulative frequency

INTRODUCTION TO SOCIAL RESEARCH METHODS
319 | THIKA INSTITUTE OF BUSINESS STUDIES 0715 067 272 www.tibs.ac.ke [email protected]
column, 1477 is above 1219 and below 1497, so the median group is 50 - 60. We then use the
formula wf
FNLw
f
FpNLx
pp
ppp
5.1 to find the median. For the group that we have
chosen, ,50pL ,1219F 278pf and 10w . So the median is
26.59109263.05010
278
121929535.501
px .
(iii) The mode is 35, the midpoint of the largest group (the class with the highest frequency), 30
to 40.
122. 1. A salesman keeps a record of the number of shops he visits each day.
Shops visited 0 – 9 10 – 19 20 – 29 30 – 39 40 – 49
Frequency 3 8 24 60 21
(a) Estimate the mean number of shops visited.
(b) Estimate the median.
(c) What is the mode?
123. The weights of a number of students were recorded in kg.
Weight (kg)
30 ≤ w < 35 35 ≤ w < 40 40 ≤ w < 45 45 ≤ w < 50 50 ≤ w < 55
Frequency 10 11 15 7 4
(a) Estimate the mean weight.
(b) Estimate the median.
(c) What is the modal class?
124 . The distances that students in a year group travelled to school is recorded.
Distance (km)
0 ≤ d < 0.5 0.5 ≤ d < 1.0 1.0 ≤ d < 1.5 1.5 ≤ d < 2.0
Frequency 30 22 19 8
(a) Does the modal class contain the median?
(b) Estimate the median, mode and the mean.
(c) Which is the larger, the median or the mean?
The is the larger.
125. The ages of the people at a youth camp are summarised in the table below.

INTRODUCTION TO SOCIAL RESEARCH METHODS
320 | THIKA INSTITUTE OF BUSINESS STUDIES 0715 067 272 www.tibs.ac.ke [email protected]
Age (years) 6 – 8 9 – 11 12 – 14 15 – 17
Frequency 8 22 29 5
Estimate the mean, median and mode ages.
126. The lengths of a number of leaves collected for a project are recorded.
Length (cm) 2 – 5 6 – 10 11 – 15 16 – 25
Frequency 8 20 42 12
Estimate:
(a) the mean
(b) the median length of a leaf.
127. (a) A teacher notes the number of correct answers given by a class on a multiple-choice test.
Correct answers
1 – 10
11 – 20
21 – 30
31 – 40
41 – 50
Frequency 2 8 15 11 3
(i) Estimate the mean.
(ii) Estimate the median.
(iii) Estimate the mode.
(b) Another class took the same test. Their results are given below.
Correct answers 1 – 10 11 – 20 21 – 30 31 – 40 41 – 50
Frequency 3 14 20 2 1
(i) Estimate the mean.
(ii) Estimate the median.
(iii) Estimate the mode.
(c) How do the results for the two classes compare?
The second class have a mean but range.
128. In an experiment, 50 people were asked to estimate the length of a rod to the nearest
centimetre. The results were recorded.
Length (cm) 20 21 22 23 24 25 26 27 28 29
Frequency 0 4 6 7 9 10 7 5 2 0

INTRODUCTION TO SOCIAL RESEARCH METHODS
321 | THIKA INSTITUTE OF BUSINESS STUDIES 0715 067 272 www.tibs.ac.ke [email protected]
(a) Find the value of the median.
(b) Calculate the mean length.
(c) Calculate the modal length.
129. A sample of college students was asked how much they spent monthly on a cell phone plan
(to the nearest shilling).
Monthly Cell Phone Plan Cost (Ksh) Number of Students
10 - 20 8
20 - 30 16
30 - 40 21
40 - 50 11
50 - 60 4
Calculate the mean, median and mode.
130. The following data represent the difference in scores between the winning and losing teams
in a sample of 15 football games from 2004-2005.
Point Difference Number of Bowl Games
1 - 5 8
6 - 10 0
11 - 15 2
16 - 20 3
21 - 25 1
26 - 30 0
31 - 35 1
Calculate the mean, median and mode.
131. The following table represents the distribution of the annual number of days over 30
degrees Celcius for Nairobi for a sample of 80 months from 1919 to 2018.
Days Above 100 Degrees Number of Years
0 - 10 25
10 – 20 33
20 – 30 14
30 – 40 5
40 – 50 2
50 - 60 1
Calculate the mean, median and mode.

INTRODUCTION TO SOCIAL RESEARCH METHODS
322 | THIKA INSTITUTE OF BUSINESS STUDIES 0715 067 272 www.tibs.ac.ke [email protected]
132. The following table shows the distribution of the number of hours worked each week (on
average) for a sample of 100 casual workers.
Hours Worked per Week Number of Students
0 – 10 24
10 – 20 14
20 – 30 39
30 – 40 18
40 - 50 5
Calculate the mean, median and mode.
133. The following data represents the age distribution of a sample of 100 people covered by
health insurance.
Age Number
25 - 34 23
35 - 44 29
45 - 54 28
55 - 64 20
Calculate the mean, median and mode.
134. The following data represent the high temperature distribution in degrees Fahrenheit for a
sample of 40 days from the month of August in Mombasa.
Temperature Days
60 - 69 3
70 - 79 15
80 - 89 17
90 - 99 5
Calculate the mean, median and mode.
135. The following data represent the annual rainfall distribution in Kiambu, for a sample of 25
years from 1993 to 2018.
Rainfall (inches) Number of Years
20 - 24 1
25 - 29 3
30 - 34 5
35 - 39 8
40 - 44 5
45 - 49 2

INTRODUCTION TO SOCIAL RESEARCH METHODS
323 | THIKA INSTITUTE OF BUSINESS STUDIES 0715 067 272 www.tibs.ac.ke [email protected]
50 - 54 0
55 - 59 1
Calculate the mean, median and mode.
136. The following data represent the age distribution of a sample of 70 women having
multiple-delivery births in 2002.
Age Number
15 - 19 1
20 - 24 5
25 - 29 16
30 - 34 28
35 - 39 17
40 - 44 3
Calculate the mean, median and mode.
137. Obtain the median for the following frequency distribution of house rent for a sample of 30
families in a certain locality:
Rent (Rs.) Number of Families
1800-2000 4
2000-2200 7
2200-2400 10
2400-2600 5
2600-2800 2
2800-3000 2
138. Frequency distribution of I.Q. of 309 6-year old children is given below:
Class Intervals Frequency
40-49 1
50-59 2
60-69 3
70-79 5
80-89 17
90-99 65
100-109 69
110-119 79
120-129 37

INTRODUCTION TO SOCIAL RESEARCH METHODS
324 | THIKA INSTITUTE OF BUSINESS STUDIES 0715 067 272 www.tibs.ac.ke [email protected]
130-139 19
140-149 7
150-159 3
160-169 2
Find the median I.Q. of these children.
139. Draw an ogive for the following frequency distribution. Use your ogive to estimate:
0 - 9 10 -
19
20 -
29
30 -
39
40 -
49
50 -
59
60 -
69
70 -
79
80 -
89
90 -
99
5 9 16 22 26 18 11 6 4 3
(I) The Median,
(2) The number of students who obtained more than 75% marks.
(use square paper to solve this question).
Solution
Marks No. OfÂ
Students
Cumulative
Frequency
0 − 9 5 5
10 − 19 9 14
20 − 29 16 30
30 − 39 22
52
40 − 49 26 78
50 − 59 18 96
60 − 69 11 107
70 − 79 6 113
80 − 89 4 117
90 − 99 3 120
N = 120

INTRODUCTION TO SOCIAL RESEARCH METHODS
325 | THIKA INSTITUTE OF BUSINESS STUDIES 0715 067 272 www.tibs.ac.ke [email protected]
Consider
Hence the median class is 40− 49
140. In a public collection towards supporting orphans, 1000 people contributed sums of
money varying from Kshs. 1 to Kshs. 100 ( in units of Kshs 1). The following table gives the
frequency distribution of contribution:
Using a suitable scale, draw on graph paper an ogive (cumulative frequency graph)and use it to
answer the following:
Contribution 1-10 11-20 21-30 31-40 41-50 51-60 61-70 71-80 81-90 91-
100
No. of
people
30 60 80 170 200 180 140 70 40 30
(1) Estimate the median.
(2) If it is agreed to allow only those who contributed Kshs. 45 or more to attend the unveiling
ceremony, what percentage would attend?
Solution
No. of people Contribution (in Rs) Cumulative
Frequency
0.5− 10.5 30 30
10.5− 20.5 60 90
20.5 − 30.5 80 170
30.5− 40.5 170 340
40.5− 50.5 200 Median Class
540
50.5 − 60.5 180 720
60.5 − 70.5 140 860
70.5− 80.5 70 930
80.5 − 90.5 40 970
90.5 − 100.5 30 1000
N = 1000

INTRODUCTION TO SOCIAL RESEARCH METHODS
326 | THIKA INSTITUTE OF BUSINESS STUDIES 0715 067 272 www.tibs.ac.ke [email protected]
(i) Median is 48 (Approx)
(ii) From 45 on x-axis draw a perpendicular line such that it intersects the curve drawn.
From the point of intersection of the curve and the line draw another line parallel to x-
axis.
It meets the y-axis at the point (0, 450)
Which means 550 members can attend the unveiling ceremony which amounts to
55%.

INTRODUCTION TO SOCIAL RESEARCH METHODS
327 | THIKA INSTITUTE OF BUSINESS STUDIES 0715 067 272 www.tibs.ac.ke [email protected]
141. The cumulative frequency curve for maths marks of a class is given below, find the median
mark.
Solution
d) Median =
e) Median =
f) Total frequency
= 40
The rank of median
= 40/2 =
From the cumulative
polygon,
median =
142. The provisional figures on the population by age group in Kenya as at 2018 are tabulated
below. Draw a cumulative frequency curve and determine the median age for the population.
Age group 0 9 10 19 20 29 49 50 59 60 69 > 70
Population
(‘000)
676 885 1208 677 503 499
0
5
10
15
20
25
30
35
40
frequ
ency
9.5 19.5 29.5 39.5 49.5 59.5 69.5 79.5 89.5 99.5
Cumulative Frequency Curve for marks in maths
Marks

INTRODUCTION TO SOCIAL RESEARCH METHODS
328 | THIKA INSTITUTE OF BUSINESS STUDIES 0715 067 272 www.tibs.ac.ke [email protected]
Solution
Age group
x
Populatio
n ('000)
cumulative
population
(‘000 000)
x < 10 676 0.676
10 ≦ x <
20
885 1.561
20 ≦ x <
30
1000
30 ≦ x <
40
1267
40 ≦ x <
50
1208
50 ≦ x <
60
677
60 ≦ x <
70
503
70 < x 499
The rank of median = 6.715/2 =
The median age =
143. The length of 40 insects of a certain species were measured correct to the nearest
millimeter. The frequency distribution is given below:
Lengths
(mm)
Frequency
( if )
a. Construct a cumulative frequency table for the given
data.
b. Draw a cumulative frequency curve for the data.
c. Estimate from the curve
(i) the number of insects that were less than 43.5 mm
long,
(ii) the percentage of insects that were of length 37.5
mm or more,
(iii)the value of k, if 75% of the insects were less than k
25 – 29 2
30 – 34 4
35 – 39 7
0
1.0
2.
0
3.0
4.
0
5.0
6.
0
7.
0
8.
0
Po
pu
lation
(‘00
0 0
00
)
Less than Cumulative frequency polygon for population
10 20 30 40 50 60 70 70+
Age group

INTRODUCTION TO SOCIAL RESEARCH METHODS
329 | THIKA INSTITUTE OF BUSINESS STUDIES 0715 067 272 www.tibs.ac.ke [email protected]
40 – 44 10 mm long.
45 – 49 8
50 – 54 6
55 – 59 3
Solution
a. The cumulative frequency table is constructed below. The table shows the cumulative
frequency distribution of the length of 40 insects.
Lengths
(mm)
Upper class
boundaries
Frequency
( if )
Length less
than
Cumulative
frequency
25 – 29 2
30 – 34 4
35 – 39 7
40 – 44 10
45 – 49 8
50 – 54 6
55 – 59 3
b. The cumulative frequency curve is drawn by plotting the cumulative frequencies against
the upper class boundaries, i.e. plotting the points corresponding to the ordered pairs
(29.5 , 1), ( ……, ……) , ( ……, ……) , ( ……, ……) , ( ……, ……) , ( ……, ……) , (
……, ……) .
c. To estimate
(i) the number of insects that were less than 43.5 mm long, locate the length 43.5 mm
on the horizontal axis. Draw a vertical line to meet the curve followed by a
horizontal line to meet the vertical axis or cumulative frequency axis as shown in
the diagram. From the graph, the number of insects that were less than 43.5 mm
long is …….
(ii) the percentage of insects that were of length 37.5 mm or more, find 37.5 on the
horizontal axis and draw a vertical line to meet the curve and then draw a horizontal

INTRODUCTION TO SOCIAL RESEARCH METHODS
330 | THIKA INSTITUTE OF BUSINESS STUDIES 0715 067 272 www.tibs.ac.ke [email protected]
line to meet the vertical axis. From the graph, …… insects were less than 37.5 mm
long.
the number of insects that were of length 37.5 mm or more = …… - …… = ……
The percentage of insects that were of length 37.5 mm or more is
%%100
(iii) the value of k, if 75% of the insects were less than k mm long.
75% of …… =
…… insects were less than k mm long.
From …… on the vertical axis, draw a horizontal line to meet the curve followed by
a vertical line to meet the horizontal axis. From the graph, …… insects were less
than …… mm long.
k = ……
144. The mass of 300 apples were measured. The table gives the cumulative frequency
distribution of the masses.
a. Draw a cumulative frequency curve.
b. Estimate from the curve
1. the number of apples having masses 98 g or less,
2. the value of m given that 20% of the apples had masses more than m g.
c. Taking class interval 7060 x , 8070 x , 9080 x , 9590 x , … , construct
a frequency distribution and draw a histogram.
Mass ( x g) Number of apples
60x 0
70x 8
80x 19
90x 57
100x 89
110x 141
120x 216

INTRODUCTION TO SOCIAL RESEARCH METHODS
331 | THIKA INSTITUTE OF BUSINESS STUDIES 0715 067 272 www.tibs.ac.ke [email protected]
130x 266
140x 290
150x 300
Solution
a. The graph shows the cumulative frequency curve.
b. Estimate from the curve
(i) From the curve, we estimate that 120 apples have masses …… g or less.
(ii) 20% of …… =
…… apples have masses more than m g, i.e. …… - …… = …… apples have
masses m g or less. From the curve, …… apples have masses …… g or less.
m = ……
c. The frequency distribution is constructed as shown in the following table:
Mass ( x g) Cumulative
frequency
Mass ( x g) Frequency Frequency
density
70x 8 7060 x 8 8.0108
80x 19
90x 57
100x 89
110x 141
120x 216
130x 266
140x 290
150x 300
The histogram
145. The speeds of 100 motor vehicles passing a certain point in a busy street are recorded. The
cumulative are frequency curve shows the speed, u km/h and the number of vehicles, whose
speeds are less than u km/h. (As an example, 74 vehicles have speeds less than 53 km/h). Use the
curve to estimate
a. the number of vehicles whose speeds are less than 34 km/h,

INTRODUCTION TO SOCIAL RESEARCH METHODS
332 | THIKA INSTITUTE OF BUSINESS STUDIES 0715 067 272 www.tibs.ac.ke [email protected]
b. the fraction of the total number of vehicles whose speeds are greater than or equal to 59
km/h,
c. the value of v, if 40% of the vehicles have a speed less than v km/h.
146. The results of a music examination taken by 160 pupils are shown in the cumulative
frequency table below:
Mark < 10 < 20 < 30 < 40 < 50 < 60 < 70 < 80
Number of pupils 0 8 21 55 103 135 150 160
a. Using a horizontal scale of 2 cm to represent 10 marks and a vertical scale of 1 cm to
represent 10 pupils, draw a cumulative frequency curve for the results.
b. Use your graph to estimate
(i) the number of pupils who scored less than 45 marks,
(ii) the fraction of the total number of pupils who failed the music examination
given that 34 is the lowest mark to pass the examination,
(iii) the value of x if 22.5% of the pupils obtained at least x marks in the music
examination.
147. 500 earthworms were collected from a sample of soil. Their lengths were recorded and the
results are given in the following table:
Length (mm) Number of worms
2010 x 10
3020 x 20
4030 x 50
5040 x 90
6050 x 150
7060 x 100
8070 x 50
9080 x 20
10090 x 10
a. Copy and complete the following cumulative frequency table:
Lengths (mm) Number of worms
10 0
20 10

INTRODUCTION TO SOCIAL RESEARCH METHODS
333 | THIKA INSTITUTE OF BUSINESS STUDIES 0715 067 272 www.tibs.ac.ke [email protected]
30
40
50
60
70
80
90
100 500
b. Draw a cumulative frequency curve to represent the results by using 2 cm to represent
100 worms on the vertical axis and taking values of the cumulative frequency from 0
to 500. On the horizontal axis, take values of the length from 10 mm to 100 mm and
use a scale if 1 cm to represent 10 mm.
c. Use your graph to estimate
(i) the number of earthworms whose lengths are less than or equal to 58 mm,
(ii) the percentage of earthworms whose lengths are greater than 76 mm,
(iii) the value of x if 18% of the earthworms are of length x mm or less.
148. The lengths of 600 leaves from a tree are measured. The following table gives the
cumulative frequency distribution of these lengths:
Length ( x mm) 20x 25x 30x 35x 40x 45x 50x
Number of leaves 0 20 80 260 500 580 600
a. Draw a cumulative frequency to represent these results using the following scales:
On the horizontal axis, take values of the length from 20 mm to 50 mm and use a
scale of 2 cm to represent 5 mm.
On the vertical axis, take values of the cumulative frequency from 0 to 600 and use a
scale of 2 cm to represent 100 leaves.
b. Use your graph to estimate
i. the number of leaves whose lengths are less than or equal to 41.5 mm,
ii. the percentage of leaves whose lengths are greater than 33 mm.
c. Copy and complete the following frequency distribution table:
Length ( x Number of worms

INTRODUCTION TO SOCIAL RESEARCH METHODS
334 | THIKA INSTITUTE OF BUSINESS STUDIES 0715 067 272 www.tibs.ac.ke [email protected]
mm)
2520 x 20
3025 x 60
3530 x
4035 x
4540 x
5045 x
d. Draw a histogram to represent the frequency distribution in ©.
149. The table below shows the amount of milk ( in kg) obtained from each of the 70 cows of a
dairy farm on a particular day:
Amount of milk ( x kg) Number of cows
40 x 7
64 x 11
86 x 17
108 x 20
1210 x 10
150. A factory has a census of its workers. There are 50 workers in total. The following list
shows their ages:
34, 28, 22, 36, 27, 18, 52, 39, 42, 29, 35, 31, 27, 22, 37, 34, 19, 20, 57, 49, 50, 37, 46, 25, 17, 37,
42, 53, 41, 51, 35, 24, 33, 41, 53, 60, 18, 44, 38, 41, 48, 27, 39, 19, 30, 61, 54, 48, 26, 18.
(a) Make a table grouping the data into classes from 10 to 19,
20 to 29, 30 to 39, 40 to 49 etc. Find the modal and median classes.
(b) Make a table grouping the data into classes from 15 to 19,
20 to 24, 25 to 29, 30 to 34, 35 to 39 etc. Find the modal and median classes.
(c) Calculate the mean age of workers
(d) Calculate the median
(e) Calculate the mode

INTRODUCTION TO SOCIAL RESEARCH METHODS
335 | THIKA INSTITUTE OF BUSINESS STUDIES 0715 067 272 www.tibs.ac.ke [email protected]
Solution
(a) Age Tally Number of
workers
10-19 //// / 6
20-29 //// //// / 11
30-39 //// //// //// 14
40-49 //// //// 10
50-59 //// // 7
60-69 // 2
The modal class is 30-39 years old.
There are 50 workers. So the median will be the 25th and 26th workers. Count up from the
tally chart. The 25th and 26th workers are both in the 30-39 class.
So, the median class is also 30-39 years old.
(b) Age Tally Number of
workers
15-19 //// / 6
20-24 //// 4
25-29 //// // 7
30-34 //// 5
35-39 //// //// 9
40-44 //// / 6
45-49 //// 4
(Check the total:
6+11+14+10+7=2=50,
this is correct)
(Check the total:
6+4+7+5+9+6+4+6+1+2=50t
his is correct)

INTRODUCTION TO SOCIAL RESEARCH METHODS
336 | THIKA INSTITUTE OF BUSINESS STUDIES 0715 067 272 www.tibs.ac.ke [email protected]
50-54 //// / 6
55-59 / 1
60-64 // 2
The modal class is now 35-39 years old.
The 24th and 25th workers are both in the 35-39 class.
So, the median class is also 35-39.
151. The data shows the marks given to a class of mathematics students in a test.
34, 12, 45, 23, 12, 18, 26, 41, 48, 23, 47, 11, 7, 15, 31, 28, 6, 43, 27, 38, 32, 21, 29, 45, 15,
9, 20, 37, 43, 27, 30, 17, 14, 26, 34, 24, 18, 16, 35, 32, 27, 14, 30, 22, 31, 40, 17, 24, 37, 13
Copy the tally chart below.
Complete the tally. Cross off each number in the list as you use it.
Mark 1-10 11-20 21-30 31-40 41-50
Tally
Total
Check that the totals add up to 50 students.
Write down the modal class.
152. The data shows the ages of 20 workers in an office.
23, 35, 21, 20, 28, 32, 19, 39, 20, 18,
37, 29, 19, 25, 34, 26, 24, 31, 22, 30.
(a) Make a tally chart with classes for 16-20, 21-25, 26-30, 31-35 and 36-40.

INTRODUCTION TO SOCIAL RESEARCH METHODS
337 | THIKA INSTITUTE OF BUSINESS STUDIES 0715 067 272 www.tibs.ac.ke [email protected]
(b) Check that the total adds up to 20.
(c) Write the data in order and find the median.
(d) Which class is it in ? (This is the median class).
(e) Write down the modal class.
153. A scientist measures the weights of 20 tomatoes (in grammes) in an experiment. These are
the results:
121, 187, 143, 219, 191, 146, 203, 142, 172, 234, 163, 194, 241, 150, 125, 219, 162, 210,
120, 236.
(a) Make a table for this data using classes from 120-149, 150-179, 180-209, 210-229
and 230-259.
(b) Find the modal class.
(c) Find the median class.
154. A machine measures the length of a part in a tractor engine. The measurements (in
millimetres) are to the nearest 01 mm.
111, 113, 107, 112, 116, 109, 106, 113, 112, 105,
104, 112, 111, 116, 106, 113, 109, 112, 110, 114.
(a) Make a table for classes 101-105, 106-110 etc.
(b) What is the modal class ?
(c) What is the median class ?
155. The following table shows the distribution of marks of some students who took part in
science quiz.
Marks Tally Lower class Upper class Frequency

INTRODUCTION TO SOCIAL RESEARCH METHODS
338 | THIKA INSTITUTE OF BUSINESS STUDIES 0715 067 272 www.tibs.ac.ke [email protected]
boundary boundary
56 – 60 //// //
61 – 65 //// //
66 – 70 ////
71 – 75 //// ////
76 – 80 ////
81 – 85 ////
86 – 90 //
91 – 95 ///
96 – 100 ///
d. Copy and complete the table
e. Calculate the mean and the mode.
156. The length, in mm, of 48 rubber tree leaves are given below.
137 152 127 147 141 157 132 153 166 147 136 134
146 142 162 169 149 135 166 157 141 146 147 148
163 133 148 150 136 127 162 152 143 138 142 153
145 154 144 126 139 126 158 147 136 144 159 161
Copy and complete the following table:
Lengths ( x mm) Tally Frequency
130125 x
135130 x
140135 x
145140 x

INTRODUCTION TO SOCIAL RESEARCH METHODS
339 | THIKA INSTITUTE OF BUSINESS STUDIES 0715 067 272 www.tibs.ac.ke [email protected]
150145 x
155150 x
160155 x
165160 x
170165 x
a. Calculate the mean and the mode.
b. Use the histogram in exercise 4) to calculate the mode.
157.The waiting times, x minutes, for 60 patients at a certain clinic are as follows:
25 12 53 8 26 5 19 73 67 18 87 42
6 21 14 19 12 15 13 36 36 16 72 36
13 37 11 51 39 32 30 47 6 22 68 25
98 23 45 22 7 9 26 35 27 48 58 56
29 20 32 62 80 41 58 17 54 15 14 74
a. Using the frequency table in exercise 4), calculate the mean.
b. Using the histogram in exercise 4), calculate the mode.
158.
The weights, in kg, of 80 members of a
sports club were measured and recorded
as shown in the table.
e. Calculate the mean. f. Calculate the mode.
Weight ( x kg) Number of members
5040 x 7
6050 x 10
7060 x 14
8070 x 27
9080 x 12
10090 x 6

INTRODUCTION TO SOCIAL RESEARCH METHODS
340 | THIKA INSTITUTE OF BUSINESS STUDIES 0715 067 272 www.tibs.ac.ke [email protected]
110100 x 4
159. In an examination taken by 400 students, the scores were as shown in the
following distribution table:
Marks Frequency Find :
The mode
The mean
The median
1 – 10 8
11 – 20 14
21 – 30 32
31 – 40 56
41 – 50 102
51 – 60 80
61 – 70 54
71 – 80 30
81 – 90 16
91 – 100 8
160. Find the mean of each of the following sets of data. Correct the answer to 2 decimal places
if necessary. (Qn.1 – 4)
1. 14 , 16 , 10 , 11 , 13 , 14
2. 62 , 47 , 97 , 36 , 42 , 15
3. 1 , –1 , –2 , 0 , 2 , 1
4. 1.5 , –1.5 , –2.5 , 3.5 , –2.5 , –1.5
161. Find the mean of each of the following sets of data
Data 1 2 3 4
Frequency 8 7 10 5
162. Data 10 12 15 17 20 23
Frequency 3 5 10 15 15 12
163. Find the mean of each of the following sets of data. Correct the answer to 2 decimal places
if necessary.
Data 11 – 15 16 – 20 21 – 25 26 – 30 31 – 35
Frequency 6 8 11 9 6
Data 26 – 30 31 – 35 36 – 40 41 – 45 46 – 50

INTRODUCTION TO SOCIAL RESEARCH METHODS
341 | THIKA INSTITUTE OF BUSINESS STUDIES 0715 067 272 www.tibs.ac.ke [email protected]
Frequency 30 40 65 45 20
Data 11 – 20 21 – 30 31 – 40 41 – 50 51 – 60
Frequency 5 14 17 8 6
Data 101 – 110 111 – 120 121 – 130 131 – 140 141 – 150
Frequency 40 55 75 65 45
164. Find the median of each of the following sets of data.
16 , 16 , 17 , 18 , 19 , 20 , 20 , 22
51 , 52 , 52 , 53 , 55 , 57 , 63
26 , 21 , 22 , 22 , 24 , 19 , 20
34 , 30 , 31 , 32 , 30 , 28 , 28 , 30
Data 3 5 7 9 10
Frequency 2 3 6 4 5
Data 15 17 20 27 32
Frequency 6 9 10 11 9
165. The following cumulative frequency polygon shows the scores of 40 students in a Chinese
test.
Scores of 40 students in a Chinese test
Score
Find the median score. (Correct the answer to the nearest integer.)
Cumulative
frequency

INTRODUCTION TO SOCIAL RESEARCH METHODS
342 | THIKA INSTITUTE OF BUSINESS STUDIES 0715 067 272 www.tibs.ac.ke [email protected]
166. The following cumulative frequency polygon shows the heights of 50 students.
Heights of 50 students
Find the median height. (Correct the answer to the nearest integer.)
167. Find the mode of each of the following sets of data.
1. 6 , 7 , 6 , 8 , 8 , 8 , 9 , 7 , 8 , 9
2. 36 , 37 , 39 , 37 , 36 , 37 , 38 , 37 , 36 , 40
3. 184 , 160 , 164 , 164 , 165 , 186 , 146 , 164
4. 241 , 246 , 247 , 248 , 249 , 240 , 246 , 242 , 245 , 247 , 247
168. Find the mode of the following set of data.
Data 21 22 28 29 31
Frequency 1 5 8 4 2
169. The following table shows the ages of 40 students.
Age 14 15 16 17 18
Frequency 9 17 6 4 4
12.5

INTRODUCTION TO SOCIAL RESEARCH METHODS
343 | THIKA INSTITUTE OF BUSINESS STUDIES 0715 067 272 www.tibs.ac.ke [email protected]
Find the mode of ages of the students.
170. Find the modal class in each of the following distribution.
1. Data 1 – 5 6 – 10 11 – 15 16 – 20 21 – 25
Frequency 3 9 15 6 2
Modal class: ______________________
2. Data 51 – 60 61 – 70 71 – 80 81 – 90 91 – 100
Frequency 7 12 11 8 2
Modal class: ______________________
3. Data 11 – 20 21 – 30 31 – 40 41 – 50 51 – 60
Frequency 6 14 17 8 5
Modal class: ______________________
4. Data 121 – 130 131 – 140 141 – 150 151 – 160 161 – 170
Frequency 4 9 14 16 8
Modal class: ______________________
5. Data 2 – 4 5 – 7 8 – 10 11 – 13 14 – 16
Frequency 10 7 5 6 2
Modal class: ______________________

INTRODUCTION TO SOCIAL RESEARCH METHODS
344 | THIKA INSTITUTE OF BUSINESS STUDIES 0715 067 272 www.tibs.ac.ke [email protected]
REPORT WRITING No matter what quality is of the research undertaken, much of the acceptance of the results
depends on the way a they are communicated to the relevant audiences. This act of
communicating is called report writing. It is the final step in the research process.
A report is simply a statement or description of theirs that have already occurred. It is
culmination of the research findings to a specific audience to accomplish given purpose. This
presentation can be written or given orally or both. It is concise and clear communication of
findings of the research work.
According to Kinner and Taylor- “A research report can be defined as the presentation of the
research findings directed to a specific audience to accomplish specific purposes. “ Its
objective is to tell readers the problems investigated, method used to solve the problem, result of
the investigation and conclusion inferred from the result. It is to report what was done, why it is
done, outcome of the doing and researchers’ conclusion.
Writing the report is the last, and for many, the most difficult step of the research process. The
report informs the world what you have done, what you have discovered and what conclusions
you have drawn from your findings. The report should be written in an academic style. Language
should be formal and not journalistic.
Report writing is the last step in the research process. After data have been collected, analyzed
and interpreted, the researcher has to prepare a report of the findings of the study. It may be seen
unscientific and even unfair, but a poor report or presentation can destroy a study.
Role of the Research Report
The main role of the research report is to communicate the findings of the research project. The
project should answer the questions raised in the statement of objectives of the study. The
researcher should be clearly aware of the purpose of the research when preparing the report. A
research project can bring out a lot of information but much of this information may not be
relevant to the problem initially defined. Only information that is likely to be useful to the
decision maker in decision making should be included in the report. The researcher will need to
use his own judgement in deciding what information should be omitted.
For the report to be of maximum use to the decision maker, it must be objective. The researcher
should therefore have the courage to present and defend their results as long as they are
convinced that they are valid. They should also clearly indicate any limitations of the study.

INTRODUCTION TO SOCIAL RESEARCH METHODS
345 | THIKA INSTITUTE OF BUSINESS STUDIES 0715 067 272 www.tibs.ac.ke [email protected]
Research Report Criteria
The main criteria by which research reports are evaluated are communication with the reader.
The report is prepared for a specific purpose and for a specific type of audience. It should
therefore communicate effectively with the intended audience.
The report should be written with due consideration for the readers, their level of interest in the
subject, understanding of technical terms and what they will make of the report.
In order to tailor the report to meet the needs of the readers, the researcher should understand the
readers’ preferences. One may find that different readers have different preferences and this may
at times bring conflicts. Some readers may want to have the basic information only while others
prefer to have the technical details clearly brought out in the report. One way to reconcile these
conflicting interests is to prepare a basic report with a minimum detail and to have appendices
that give the technical details. Again, in some cases, the researcher may indicate that certainly
details have been omitted but are available upon request.
Another point to consider regarding the report’s ability to communicate with the intended reader
is whether the reader has to keep referring to the dictionary as this may seriously interfere with
the flow of information and thus affect communication.
Writing Criteria
A report should satisfy the following criteria to improve its chances of communicating
effectively with the reader:
a. Completeness
b. Accuracy
c. Clarity
d. Conciseness
Let us now discuss how each of these criteria enhances communication.
a) Completeness; A report should provide all the information that readers need in a language
they understand. This means that the writer should continually ask himself whether all the issues
in the research objectives have been addressed.
The report should not be too long as to include findings that are not relevant to the study. Yet, it
should not be too short as to omit necessary definitions and explanations.
The abilities and interests of readers should be considered in determining completeness.

INTRODUCTION TO SOCIAL RESEARCH METHODS
346 | THIKA INSTITUTE OF BUSINESS STUDIES 0715 067 272 www.tibs.ac.ke [email protected]
b) Accuracy; The preceding steps in the research process provide the basic input for the report.
This means that the data generated at the data collection and analysis steps should be accurate in
order for the report to be accurate.
c) Clarity; Writing clearly is not easy. Clarity is achieved by clear logical thinking and
precision of expression. The way the report is organised may contribute to clarity or affect it
negatively. Some principles of writing clearly are:
i. Use short and simple sentences.
ii. Use simple words which the reader is familiar with.
iii. Ensure that words and phrases express exactly what the writer means to say.
iv. Avoid grammatical errors.
v. Use uniform style and format. It may help to write a first draft and then have another
person review it before preparing the final report.
d) Conciseness; The criteria of completeness should not be complemented by conciseness. The
writer should be concise in his writing and selective with regard to what to include in the report.
The report should be brief and to the point – this means that the report should not include
everything that has been found but only what is relevant to the study.
The writing style should render itself to conciseness. The findings should be expressed
completely and clearly in the fewest words possible.
REPORT FORMAT
The organization of the report influences its ability to meet all the criteria of report writing.
There is no format that is appropriate for all reports. A report should use a format that best fits
the needs of its readers. The following format may be used for most types of reports.
Generally, research report should have the following major parts:
1. Preliminary pages;
2. Main body of the report and
3. Conclusion (Discussions and Recommendation)
Preliminary pages
This part serves to provide a guide to the reader. It has the following components:

INTRODUCTION TO SOCIAL RESEARCH METHODS
347 | THIKA INSTITUTE OF BUSINESS STUDIES 0715 067 272 www.tibs.ac.ke [email protected]
i. Title page – This is written on page (i), which is usually unnumbered. It contains the title
of the study, which must be precise, short, and points out the problem clearly. The author,
degree sought (if any) and month/year submission must also be indicated.
THE IMPACT OF LAND CLASHES ON KENYAS ECONOMY
BY
KAMAU JOSEPH MWANGI
INDEX NUMBER:
COURSE CODE: 1410
CENTRE NAME: THIKA INSTITUTE OF BUSINESS STUDIES – HIGHWAY CAMPUS
A RESEARCH PROJECT SUBMITTED IN PARTIAL FULFILLMENT OF THE
REQUIREMENTS FOR THE AWARD OF DIPLOMA/CERTIFICATE IN SOCIAL
WORK/COMMUNITY DEVELOPMENT TO THE KENYA NATIONAL
EXAMINATIONS COUNCIL
NOVEMBER 2020

INTRODUCTION TO SOCIAL RESEARCH METHODS
348 | THIKA INSTITUTE OF BUSINESS STUDIES 0715 067 272 www.tibs.ac.ke [email protected]
ii. Declaration – This is the page (ii) and it spells out the author’s oath; a confirmation that
this is the author’s work. It should be signed by the author
Example: I, M.M Mutua, declare that this is my original work and has not been
presented to any college/university for examination
iii. Acknowledgement – On page (iii), the researcher expresses his gratitude to all who have
assisted one way or other. This may include the ministry of education, lecturers,
supervisors, statistician, relatives, friends and many others.
iv. Table of contents – This may be on page (iv) but if acknowledgement long and overlaps
into other pages then table of contents will be found on the page after acknowledgements.
It indicates where the various topics can be found.
v. List of tables (if any) – This consists of any tables that have been used to display data
and the pages where they are found.
vi. List of figures (if any) – This consists of any diagram, map or graph that you might have
used to illustrate your point and the pages where they are found.
vii. Abstract – This is quite important because it is a summary of the report (usually not
more than 500 words). The abstract must clearly point out the problem, subjects,
instruments, procedures, basic results and major conclusion. Make it one page.
Main body of the Report
This part is also similar to the proposal. The language should, however, be the past tense. Its
major parts include:
Chapter 1: Introduction

INTRODUCTION TO SOCIAL RESEARCH METHODS
349 | THIKA INSTITUTE OF BUSINESS STUDIES 0715 067 272 www.tibs.ac.ke [email protected]
The introduction provides the foundation for the understanding of the problem under
investigation. The introductory chapter contains the following elements under investigation.
Background of the Study: It provides essential information from the broad to specific
about the problem being researched on. This section should provide brief background to
the problem indicating how the need for the study arose. This is followed by the research
problem, research question hypothesis and of the study. Other subsections in the section
are limitations and assumptions of the study and definition of the terms used.
Statement of the problem: It spells out in clear and very specific terms what the
researcher set out to investigate.
Purpose of the study: This spells out what the study did.
Objectives: these are specific indicators of what the study did.
Significance of the study: This part spells out why the study was conducted and what it
should do or benefit from it.
Delimitation and Limitation/Scope: This indicates the boundaries of the study in terms
of geography and content.
Chapter 2: Review of literature
General review: these attempts to bring out other researches, which are directly or
generally related to the present study. This should be based on the variables studied. This
literature review focuses on prior research studies that are relevant to the current study. It
is advisable to start with a review of the research in the broad area.
Chapter 3: Methods of Investigation (Methodology)
In this section, you should describe exactly how you carried out the study. You should describe
the sample and how it was selected. This involves a description of the demographic

INTRODUCTION TO SOCIAL RESEARCH METHODS
350 | THIKA INSTITUTE OF BUSINESS STUDIES 0715 067 272 www.tibs.ac.ke [email protected]
characteristics of the subjects e.g. sex, age, education, socio-economic status, etc and the
institutions from which you obtained the subjects. This should be followed by a description
which describes the instruments used in the study. The data collection subsection describes the
techniques you used to obtain data. The final subsection, data analysis, describes the statistical
and qualitative techniques you used to analyze data.
This states where, by whom and how the study was conducted. The major components include:
Research design – This specifies how data was collected; for example, the research
methods used.
Target population -
Sampling techniques and sample size – These are participants who are being studied.
The researcher explains mode of selection, the number, location and other demographic
explains mode of selection, the number, location and other demographic characteristics
like sex, age, socio-economic status and others.
Research Instruments – These are any tools used to collect data, for example, radio,
questionnaires, interviews and so on. The researcher explains them in their nature,
whether they are standardized or were constructed by the researcher. Contingencies like
the reliability and validity are spelt out (where applicable).
Data collection Procedure – This spells out actual steps taken to collect data, for
example, whether it was experimental, who collected the data, problems met, etc.
Data Analyses – This points out how the researcher treated the data, what statistical
technique was used to make sense in the data.
Limitations – These are statements of which could not be controlled by the researcher.
They can be put at the end of chapter four.
Delimitations – These are statements showing the extent to which the study can be
generalized to others.
All these were briefly mentioned in the proposal, but must be explicitly clear in the report.

INTRODUCTION TO SOCIAL RESEARCH METHODS
351 | THIKA INSTITUTE OF BUSINESS STUDIES 0715 067 272 www.tibs.ac.ke [email protected]
Chapter 4: Findings and Discussions (Results)
In this section, the findings of your study and the statistical tests are described. Normally, the
results involving descriptive statistics are presented first, followed by the results of inferential
statistical tests. Tables, charts and graphs should be used to present the data and the patterns and
trends explained.
Chapter 5: Conclusions and Recommendations or Implications
The researcher now interprets the findings. He explains why findings are in that manner; the
findings are linked with other researches to review whether or not they agree. Other factors,
which were unable to be controlled, are specified. Advice, recommendations and proposals are
articulates. Data on each research questions or hypothesis should be interpreted and evaluated.
You should tell the reader what the results mean and how they should be interpreted. The main
conclusion and recommendations are based on the findings of the study.
In some cases the researcher may prefer to separate chapter 5 into two such that discussion is
alone as chapter 5 and; summary, conclusion and recommendations.
Appendix
The purpose of the appendix is to provide a place for material which is not absolutely essential to
the body of the report. This material is typically more specialized and complex or too detailed
than presented in the main report and it is design to serve the needs of the technically oriented
readers. The appendix typically contains the following materials:
copies of data collection forms:
details of sampling plan;
tables not included in findings;
questionnaires,
interview schedule,
maps,
letters of enquiry,

INTRODUCTION TO SOCIAL RESEARCH METHODS
352 | THIKA INSTITUTE OF BUSINESS STUDIES 0715 067 272 www.tibs.ac.ke [email protected]
photographs
bibliography.
References/Bibliography
They include all the reference materials the researcher used in the study. A bibliography is a list
of published works. However, by common use both published and unpublished materials are
listed in bibliography. It is added at the end of research report. It is always arranged
alphabetically.
The referencing technique to be used is the American Psychological Association (APA).
Follow the order of: Author, Year, Title, Place, Publisher
Rules for preparing bibliography
a. For a book with one author
Kotler, P (1998). Marketing management: Analysis, planning, implementation and control. New
Delhi: PHI
Note:
Use surname of the author first followed by middle name or two initials. Use the name of
institutions or agency if there is no author name.
Place the parenthesis immediately after the name to enter the year of publication. ¾
Name the books in italic if computer printed, and use underline if it is typed.
Give the place of publication and name of publisher.
In case of two or more works by the same author, the author’s name is not to be
repeated; a short horizontal line followed by a period should take the place of author’s
name
If there are two or more works by one author, arrange them chronologically, most recent
last.
Use double space between the entries. The second line of an entry should be single
spaced. ™
b. For a book with two authors

INTRODUCTION TO SOCIAL RESEARCH METHODS
353 | THIKA INSTITUTE OF BUSINESS STUDIES 0715 067 272 www.tibs.ac.ke [email protected]
Kotler, P and Armstrong (2005), Principles of Marketing , New Delhi
c. For an edited book
Blois, Keith (Ed.) (2000). The oxford text book of marketing, New York: Oxford University
Press Line.
d. For a corporate or institutional author
Nepal Red Cross(1991). Fire representative training manual. Kathmandu: NRC
e. For a newspaper article
The Rising Nepal. April 15, 1997. P3. Col4
METHODS OF REPORT WRITING
Write a good research report is a very demanding task. Here are some hints on writing style:
Use the active voice.
Use simple sentence structure.
Use pronouns and abbreviations sparingly. Every abbreviation used should be explained
to the reader.
Write the report in the past tense and in the third person point of view, e.g. the researcher
collected data by means of ---
It is quite clear to you now that research is a scientific and systematic investigation into a
problem. Therefore, your report should reflect the following characteristics:
It should be creative, clear and concise.

INTRODUCTION TO SOCIAL RESEARCH METHODS
354 | THIKA INSTITUTE OF BUSINESS STUDIES 0715 067 272 www.tibs.ac.ke [email protected]
It should be written in simple language
There should be no exhortation; you should describe and explain issue rather than
convince readers.
Avoid personal pronouns like, I, we, me. Use such phrases like the researcher or the
author or the investigator believes ….
When citing any researcher, only the last name should be used, for example, “Opolot
(181) proposed …” but not “prof. J. A. Opolot proposed ….”
Abbreviations should not be used except after reference has been spelt out with the
abbreviation following in parenthesis, for example the Chief Chemical Officer (CCO).
However, well known abbreviations may be used, for example, 1Q, UNO.
Statistical formulae or computations should not be presented in the report.
Writing is not an easy task and, therefore do not hurry in writing your report but think
critically.
Typing should only be on one side of the sheet, clean and black ink, double spacing,
leaving margins of about 30 mm (I in) at the top, bottom, right and left of every page, and
number all pages except page (i).
Quotations of three lines or less should be included in the text and enclosed within
quotation marks “…”. If they are more than three lines, set them off the text and indent
them.
This is how a research is written and the findings communicated to others. In case you are not
yet sure, then go to the Library or Departments and borrow some research report or dissertations
and read through. This will enable you to develop more insight into what to do.

INTRODUCTION TO SOCIAL RESEARCH METHODS
355 | THIKA INSTITUTE OF BUSINESS STUDIES 0715 067 272 www.tibs.ac.ke [email protected]