PARC '1 - World Bank Documents
86
& PARC '1 S fm 2 03 K IL- World Bank Discussion Papers Poverty Reduction in East Asia The Silent Revolution Fnda Johansen Public Disclosure Authorized Public Disclosure Authorized Public Disclosure Authorized Public Disclosure Authorized
-
Upload
khangminh22 -
Category
Documents
-
view
0 -
download
0
Transcript of PARC '1 - World Bank Documents

& PARC '1
S fm
2 03 K IL- World Bank Discussion Papers
PovertyReductionin East Asia
The Silent Revolution
Fnda Johansen
Pub
lic D
iscl
osur
e A
utho
rized
Pub
lic D
iscl
osur
e A
utho
rized
Pub
lic D
iscl
osur
e A
utho
rized
Pub
lic D
iscl
osur
e A
utho
rized

Recent World Bank Discussion Papers
No. 143 Chiina: Industrial Policiefor an Etonomy in Transition. lnderjit Singh
No. 144 Reforming Prices: The Experience of China, flungary, and Polnd. Anand R2ajaram
No. 145 Developing Mongolia. Shahid Yusufand Shahidj2ved Burki
No. 146 Sino-Japanese Economic Relationships: Trade, Direct Investmenr, and Future Strategy. Shuichi Ono
No. 147 Thc Effeas ofEconomic Policies on African Agriculture: From Past fMlann to FSture u lope. William K. Jaeger
No. 148 n,e S&aoral Foundations of Chlina's Development. Shahidjaved Burki and Shahid Yusuf. cditors
No. 149 7he Consulting Profession in Developing Countries: A Strategyfor Development. Sycd S. Kim uniand Warren C. Baum
No. 150 Successful Rural Finance Institutions. Jacob Yaron
No. 151 Transport Development in Southern China. ClcH G. Harri. editor. and Peter Cook and Edward Holand.principal contributors
No. 152 T7he Urban Environment and Population Relocation. Michael M. Ccrnca
No. 153 Fundinyg Medanismsfor Higher Education: Financingfor Stability, Efficiency, and Responsiveness. Douglas Albrechcand Adrian Zidcrman
No. 154 Eamings, Oaupational Choice, and Mobility in Segmented Labor Markets of India. Shahidur R. Khandker
No. 155 M1anaging External Debt in Developing Countries: Proceedings of aJoint Seminar.Jeddah, Mfay 1990. Thomas M.Klein. editor
No. 156 Developing Agricultural Extensionfor Women Farmers. Katrine A. Saito and Daphne Spurhng
No. 157 Awakening the AMarker: Vie: Nam's Economir Transition. D. M. Lcipzigcr
No. 158 Wage Poicy durintg de Transition to a M arket Eonomy: Poland 1990-91. Fabrizio Corieli and Ana Revenga. editors
No. 159 Intcrnational Trade and the En vironenr. Pa cnick Low. editor
No. 1611 International Migfrationt and Intemational Trade. Sharon Stmnton Russell and Michael S. Tetelbaum
No. 161 Civil Service Reformr and the World Bank. Barbara Nunberg andJohn Nellis
No. 162 Rural Enterprise Development in Chrina, 1986-90. AnEhonvJ. Ody
No. 163 The Balance between Public and Private SecrAaivities in the Delivery of Livestock S&rices. Dina L. Umali, GershonFeder. and Comelis dc Haan
No. 164 How Do National Policies Affect Long-run Growth?: A Research Agenda. William Easterly. Robert King. RossLcvine. and Sergio Rebelo
No. 165 Fisheies Development, Fisheries Management, and Externalities. Richard S. Johnston
No. 166 The Building Blocks of Particpation: Testing Bottom-up Planning. Michael M. Cemea
No. 167 Seed System Development: The Appropriate Roles of die Private and Public Sectors. Steven Jaffec andJitcndra Srivastava
No. 168 Environmental M-fanagement and Urban Vulnerability. Alcin Kreimcr and Mohan Munasinghe. editors
No. 169 Comnmon Property Resources: A Missing Dimension of Developmntt Strategies. N. S. Jodha
No. 170 A Chinese Province as a Reform Experiment: Tze Case of Hainan. Paul M. Cadario, Kazuko Ogawa. and Yin-Kann Wen
No. 171 Issuesfor Infrastruaure Management in the 1990s. Arturo Israel
No. 172 Japanese National Railuays Privarization Study: 7he Experience ofJapan and Lessonsfor Developing Countries.Koichiro Fukui
(Continued on the inside back cover.)

PovertyReductionin East Asia

East Asia and Pacific Region Series
aiW R gEd*V M*mwmxntd Rod Rd.ioom. Rangpul Aprwab. Disdn Paper No. 178.
Ozia's Refwr H Ferto Da Peter Haold Di on Pap No. 18D.
Km= Idi.asviald &y: Ladas ofthe Ru nd Dawusfor de Fuwr. DAny ML Lezger nd Peter A. Peti.Discunion Paper No. 197.

SWM
2 03 *1 World Bank Discussion Papers
PovertyReductionin East Asia
The Silent Revolution
Frda Johansen
The Word BankWainon, D.C.

Copynght 0 1993The International Bank for Rcconstnsctionand Development/THE WORLD BANK1818 H Stret, N.W.Washington. D.C. 20433, U.S.A
All fights reservedManufictured in the United States of AmericaFirst printingjuly 1993
Discussion Papers present results of country analysis or research that is circulated to encourage discussionand comment within the development community. To prsent thcse results aith the least possible deay. thetypescript ofthis paper has not been prepared in accordance with the procedCus appropriat to formalprnted texts, and thc Wodd Bank accepts no responsibility for errors
The findings, interpretatiors, and conclusions axpressed in this paper are enIrely those of the author(s) andshould not be attibuted in any manner to the Wodd Bank, to its aliated organizations, or to members ofits Board of Ewcutive Dirwcors or the counties they represent. The World Bank does not guarntee theaccuracy of the data included in this publication and ac-cpts no responsiblity whasoever for anyconsequence of their use. Any maps that accompany the text have becn prepard solely for the convenienmcof readers; the designations and presentation of materil in them do not imply the expression of any opinionwhatsoever on the part of the World Bank, its affiliates, or its Board or member countries concering thelegal status of any country, temitory, city, or area or ofthc audorities thereofor concening th deliitationof its boundaics or its national affiiation.
The material in this publication is copyrighted. Requests for pemission to reprduce portions of i shouldbe sent to the Office of the Publisher at the address shown in the copyright notice above. Ihe World Bankncourages disserination of its worc and wil nomaly give permission promptly and, when the
reproduction is for noncommercial purposes, without asking a fee. Pemission to copy portions fDr clsroomuse is ranted through the Copyright Clearace Center, 7 Congrss Street, Sabnm, M2ssachusetts 01970, U.SA
The complete backlist of publications from the Wold Bank is shown in the ann ndex of PaUatoes,whih contains an alphabetical tiLde list (with fidi ordenng iformatin) and indexs of subjects, authors andcountnes and regions. The latest edition is avadable fice of charge fom thc Distribution Unit, Office of thePublisher, The World Bank, 1818 H Street, N.W., Washington. D.C. 20433. U.SA., or fiom Publications,The World Bank, 66, avenue dIena, 75116 Paris, France
ISSN: 0259-210X
Frida Johansen is an economist in the Inef2structum Operations Division ofthe World Bank's East Asiaand Pacific Regional Office. Country Department IIL
library of Congress Cataloging-in-Publicatio= Data
Jobansen, Frida.Povery reduction in East Asia: the silent revolution / Frida
Johansep. cm. - (World Bank discussion papers, ISSN 0259-210X;
203)Inludes bibliographical referaeces (p.ISBN 04213-2489-61. Poverty-East Asia 2. Poverty-Asia, Soutestern. 3. East
Asia-Social conditions. 4. Asia, SoutheaSe-Social conditions.5. Soci indicators-East Asia. 6. Socal indicators-Asia,Southatern L Tide. IL Series.HC460.529P65 1993362.58'095-dc2O 93-24676
CIP

V
FOREWORD
Overcoming poverty is the overarching goal of economic development, and East Asia is on theright path. Accompanying the rapid economic growth in the region were less talked about, but equallyimpressive reductions in absolute poverty and improvements in social conditions. The incidence ofabsolute poverty is estimated to have declined from a third of the population in 1970, to a fifth in 1980and about a tenth in 1990. Because of the sensitivity to the chosen poverty line, however, the precisemagnitudes of poverty ought to be less the focus of attention than the trends and country differences.
The regional trends derived in this report are based on equivalent pover; lines across countries.Most World Bank reports are country focused and do not allow straightforward comparisons acrosscounties. Data pertain to different years, and official poverty lines allow different levels of consumption.This report reviews social progress in East Asia that was faster than in other developing regions. It alsolooks into the congruence of poverty and social indicator data, pointing out shortcomings of some of theindicators in revealing poverty. Fmally, the report summarizes the policies adopted by a nunber of thegovernments in the region. Rapid and broad-based economic growth, as well as public expenditureseffectively channeled to social development, contrnbuted to the remarkable reduction in poverty.
Poverty has been reduced substantially, but there is-no room for complacency. An etmated 180million people remain poor in East Asia-about equal the number of poor in Sub-saharan Africa. Andthe poverty that remains is the more intractable kind, found in pockets thus far bypassed by the generalgrowth and social programs that have raised others out of poverty. Further progress depends onsustaining reforms for broad-based growth and on strenening the capacity to implement effectiveprograms for overcoming poverty. East Asia's track record is reason to believe thatthese chaUenges wilbe met.
Gautam KayiVice PresidentEast Asia and Pacific RegionJune 1993

vi
Acknowledgements
I am grateful to Vinod Thomas for suggesting this paper be written and helping it progressthrough various stages. Comments by Bank colleagues are also gratefully acinowledged. KaliKondury prepared the data base in Annex 3. Bruce Ross Larson provided editorial assistance. JaeShin Yang patiently prepared the successive draft.

vii
Table of Contents
EXECUTIVE SUMMARY ......................................... ix
POVERTY REDUCTIONS IN THE 1970s AND 1980s ....................... 1
PROGRESS IN SOCIAL CONDITIONS ................................ 5
POVERTY CHARACTERISTICS .................................... 12
THE POVERTY REDUCTION PROCESS . .............................. 14
Graphs:
- Reduction in Absolute Poverty, 1970-90 ............................. xi
- Social Indicators - Illustrative Estimates for 1980 and 1990 ................. xiv
Table:
- Estimated Absolute Poverty, 1970-90: Selected East Asian Countries ........... 4
Boxes:
1. Social Indicators .......................................... 6
2. Shortcomings in Data as Indicators of Poverty ........................ 11
3. Addressing Poverty: General Lessons from East Asia ................... 24

viii
Aunex1. WHO ARE THE POOR? ................................ 25Poverty Lines and Crs Country Poverty Comparability
Annex 2. POVERTY CHARACTERISTICS ........................... 35China, Indonesia, the Phflippines
Annex 3. TABLES ............................................ 41
Poverty number estmates:1. AbsolutePovertyinEastAsia, 1970-90 ........................ 42
Regiona distributional within countries:2. China, 1990 ...................................... 433. Indonesia, 1990 ....................................... 444. Philippines, 1990 ....................................... 455. Thailand, 198090 ...................................... 466. Viet Nam, 1990 ....................................... 477. Papua New Guinea, 1980-90 . ............................... 48
Social indicators by country:S. Food, 1970-90 ...................................... 499. Safe Drinking Water and Sanitation, 1980-90 ..................... 5010. Health, 1970-90 ....................................... 5111. Education, 1970-90 . .................................... 5212. Total and Urban Popuations, 1970-90 ....... .................. 5313. Income Distribution, 1970s, 1980 ............................ 5414. Country Rankdngs by Social Indicators, 1990 ..................... 5615. Imovement in Social Indicators, 1990:1980 ..................... 57
Public expenditre en health and education, 1 y country:16. Health and Family Planning Public Expenditure, 1989 ............... 5817. Health per Capita Spend'ng, 1980s ........................... 5918. Education Public Expenditure, 1980 90 ......................... 6019. Indicative Public Financing of Health Services and Primary Education .61
20. Projected Population Increases, 1990-2000 .62
21. Official Development Assistance: Disbursements, 1990 .63
BlBLIGRAPY. .64

ix
Executive Summary
Accompanying the much-publicized rapid economic growth in East Asian developing countriesin the 1980s were equally impressive reductions in absolute poverty and improvements in socialconditions. The incidence of absolute poverty in East Asian developing countries went from a third ofthe population in 1970, to a fifth in 1980, and to a tenth in 1990. Probably unmatched, such povertyreduction is less talked about-a silent revolution.
The prospects for reducing poverty further in the 1990s are good, but it will not necessarily beeasy. The poverty that remains is the more intractable, the more difficult to eradicate in pockets bypassedthus far by general growth and social programs. To cover unmet basic needs, the funding requirementsare relatively small, a few percentage points of GNP. It is the capacity to implement poverty reductionprograms, wuether broad-based or targeted, that may prove to be the major constraint. Moreover, careneeds to be taken to avoid reversals of past gains, as economic adjustment programs continue in the 1990sand growth perhaps becomes more difficult to sustain at the past high rates. Many people not consideredabsolutely poor hover just over the poverty line and could easily fall below. But population growth iscontinuing to slow down, easing pressures on resources. There thus is reason for optimism-cautiousoptimism.
Over the past years, the Bank has prepared reports on poverty for six East Asian countries.! Tereports do not allow straightforward cross-country comparisons or aggregates: data pertain to differentyears and official poverty lines allow different levels of consumption. The purpose of this report is toshed light on the basic facts on poverty in the East Asian developing countries-past progress in abatingpoverty, and how many poor remain in the 1990s, based on a common definition of absolute poverty.Any poverty line is somewhat arbitrary, but in order to permit comparisons this report uses an equivalentabsolute poverty line for the six countries-including some 2150 calories per day, 90% from grains, andnon-food necessities. It then adjusts data as necessary to obtain estimates for 1970, 1980, and 1990-rural, urban and total-recognizing that the numbers for 1990 are often uprojections". It also estimatesthe absolute poverty gap, in terms of GNP. The number of poor in the smaller countries of Indochinawas estimated without ad-hoc poverty data. The report also reviews the evolution of social indicators andlooks into the congruence of poverty and social indicator data. The report touches on the policies adoptedby the governments. However, this report is not an analysis of the determinants of poverty reduction,and as such, it does not advocate any particular combination or sequence of policies and programs.
1 Philippines (1988, 1992); Indonesia (1990, 1992); Korea (1991); Thailand (1990); ialaysia (1991); China(1992). (TIse reorts ae for official use only.)

x
Absolute Poverty
From 400 million in 1970, the number of absolute poor in East Asia is estimated to have fallento 300 million in 1980, and to 180 million in 1990, reductions all the more remarkable as the East Asianpopulation grew by some 425 million persons over the two decades. Not only were 220 million poorlifted out of poverty, but another 425 million people were added above poverty standards. East Asia'spoverty reduction to a tenth of the population today is in sharp contrast to other regions. In 1990 theabsolute poor remained at around half the popul. ;on in South Asia and Africa and a fourth ir. LatinAmerica (WDR 1992).
Poverty was and remains predominantly a rural problem: with almost 90% of East Asia's poorin rural areas today, even though most of the reduction in the number of poor took place in rural areas.Cities more than doubled their populations in the past two decades as they absorbed rural emigrants whowould otherwise have added a third to the rural population. They nevertheless managed to reduce theirnumber of poor slightly from about 25 to 20 million.
The two most populous countries, China and Indonesia, made the most progress. Since 1970,China has lifted an estimated 175 million out of poverty and added some 300 million more people abovethe poverty line. It virtually elininated poverty in urban areas. In its rural areas, China started with 275million absolute poor in 1970, or one person in every three. Progress accelerated in the late 1970s andcontinued at a high pace until the mid-1980s, such that only one person in 10 has been poor since then.But with China's population of more than a billion, that still left 100 million poor in 1990, more than halfthe East Asian total. Indonesia lifted over 40 million out of poverty and added 60 million above thepoverty line. Indonesia started the 1970s with more than half its people in poverty, some 70 million, butby 1990 the incidence came down to 15% and the number of poor, to about 27 million, 15% of EastAsia's poor.
Korea and Malaysia, having accomplished considerable progress by 1970, reached out to themarginal poor, many of them bypassed by overall economic growth. They ended the 1980s with fewerhan 5% of their people in poverty, only slightly more than 1% of East Asia's poor.

xi
Reduction in Absolute Poverty, 1970-90
Million Poor300 -
1970
250 - EJ1 1980
~~~~~~~~~~~~~~~~~logo
200-
100-
0
China Indonesia Korea Malaysia Philippines ThailandO of Pop. 33 28 10 69 29 15 23 10 6 IS 9 2 36 30 21 26 17 16
3ndochlnu 6l Indochina %_Korea i%
Thai land 2%
Indonesia 1pa 180 Million in 1990300 Million in 1980
400 Million in 1970
Source: Estimates based on country dam; some figures for 1990 are projections, Annex table 1.
xii
By conrast, Thailad and the Philippines was able to shrink the numbe of poor in the lastdecade-Thailand despite rapid economic growth, and the Philippines without much economic growth.Through the 1980s Thailand had some 9 million absolute poor, and the Philippines 13 million-togetherabout 12% of East Asia's poor in 1990. But the Philippines reduced the incidence of absolute povertyby about a third in the 1980s, to 20% of the population. Thailand's incidence was about 16% in the1980s. This represented a substantial reduction from the previous decade, but it was as high asIndonesias, even though Thailand's average GNP per capita was 2.5 times higher.
The countries of Indochina-Myanmar, Laos, Viet Nam, and Canbodia-are estmated Oessreliably) to have some 25 million poor, or 15% of East Asia's total. Viet Nam would have the mos,around 15 million. Some evidence points to a poverty reduction over the 1980s, but insufficient dataprecluded estimates.
Poverq in East Asia has become more and more localized, increasing widt the remoteness frommain cities. Remote areas tend to be resource-poor, unable to sustain dense agricultral populations, andafflicted by scarce water. The poor were generally younger families, with more children and higherdependency ratios than the nonpoor-extacting a basic living from small fams, often too small forsubsistence, and from seasonal, informal off-farm jobs. They tended to have less formal education andoften were ethnic minorities. The simple fact that poor have more children made childrenoverrepresented among the poor. Even though women tend to receive less education than men and lesshealth care than desirable, they were not overrepresented among poor, based on income.
Social Indicators
Social indicators-reflecting improvements more for the many in lower and middle-incomebrackets than for the few in high-income brackets-are a broader gauge of progress than absolute poverty.In East Asia, social conditions greatly improved, even in the countnes where economic growth faltered.Actual data for recent years are often missing, but some broad generalizations are possible for the 1980s:
* Average per capita food intakes increased by more than 10%-both in calories and in themore costly and mntritive proteins.
* Life expectancy at birth increased in all countries, by three to four years, to an average of63 years.
* Infant mortality declined substantially, falling by almost one-third.
* Ihe use of contaceptives became widespread, and the age at childbearing increased,

reducing fertility rates. But death rates fell faster than fertility rates, so the populationcontinued to increase but at a slower pace, 2.1% a year.
* The average illiteracy rate was reduced by a third, with the percentage of adults consideredliterate increasing by some 16%. Most East Asian countries achieved the objective ofuniversal primary education, with full enrolment at least in lower grades.
* The share of the population in cities rose from a fourth to a third, absorbing two-thirds ofthe population increase in the decade and easing pressures on rural economies.
* The proportion of people served with safe drinking water and sanitation increased.
* The increases in GNPs per capita were even more outstanding, almost doubling in Chinaand Korea, and rising by two-thirds in Thailand, half in Indonesia, and two-fifths inMalaysia. But in the Philippines growth was elusive, with GNP per capita (and foodintakes) decreasing.
Korea and Malaysia ranked first and second in virtually all social indicators, as well as in GNPper capita in 1990. China ranked third in social indicators though seventh in income, even with someof the best economic growth in the 1980s. (Correcting China's GNP undervaluation in US doLarsresolves the oddity in its rank.) Thailand was fourth in social indicators. The Philippines managed tolift its social indicators somewhat even though its GNP per capita slipped over the decade. Indonesiashowed great improvements-but having started at a lower level, it also ended lower. Indochinesecountries remained worst off by almost all accounts.
Indeed, a rapid convergence of social indicators toward a plateau was apparent in the East Asiandeveloping countries. That is, after a certain level of social indicators is reached still at a relatively lowincome, social indicators do not inprove much fiurther (as in a logistic curve) while incomes continue togrow. This was apparent even though incomes were still at a relatively low level in most countries.However, the various social indicators did not improve in a given sequence across countries, and someindicators even seemed contradictory within countries, particularly in those at intermediate stages ofprogress.
Simple individual measures have shortcomings in revealing poverty, both across countries andwithin countries: the average GNP per capita is silent on income distribution patterns and on the provisionof public goods that give the poor a high proportion of their utility'. GNPs per capia in US doilarsoverstate poverty in countries at lower GNP levels. Absolute poverty data, too, are silent on the extenof poverty above the absolute level and on the related social vulnerability, and on the distbution ofpoverty below the line.

xiv
Social IndicatorsIllustrative Estimates for 1980 and 1990 0 199O
0 1990100
Wantn 80 Moraity 60 _Q i)Ratlso 40 _ %0 IV,] live bu*x) 20F
01
70 0
Population [0_Share 30 _ I
(%) r0) E J ,
30
10
90 _LieaMCY 0
M% 50- 0
30
Daily 2.8 0calorie 2.6- intake 2.4 (OW) .2.2
80
Expectancy LAt Birth 60
so 8~
GNP per 6h 0
(19 2 F,O2 zi ~~~~~~Ir I
Z 0~~~
Low bic.nof del oiisy ofj) fdipe pudam

xv
Factors Behind the Improvements
Increased public provision of basic services, targeted interventions, and broad-based economic
growth all helped in reducing poverty and improving social indicators. Broad-based growth involves
investments in people, the development of agriculture and exports-all of which raise the contribution of
labor. Increased public spending on such services as water and sanitation, health services, family
planning programs, and primary education no doubt mattered, but so did the efficiency of spending. In
most countries, the rapid expansion of public family planning programs can be credited (among other
factors) with lowering fertility rates. Universal primary education, a policy objective for a long time in
all East Asian countries, was achieved at least at the lower grades. Safe water and sanitation services
were greatly expanded-as one of the best preventive public investments. Nevertheless, water and
sanitation thwarted by the high initial costs of provision, remained the least provided services. And
despite the overall increases, public expenditure on services remained low in relation to GNP. Public
spending on health and primary education programs in the 1980s ranged from 2% of GNP in the
Philippines and China to 2.5% in Korea, to slightly more than 3% in Indonesia and Thailand, and to
about 5% in Malaysia. Public spending on water and sanitation was generally less than 1% of GNP.
Providing universal coverage in some basic social services can have higher returns than targeting
of more specific assistance to the poor. Basic social services can be to some extent self-targeting-they
are often considered inferior and better off people seek privately provided services-and the more complex
delivery organization is avoided. A good rationale exists even for subsidized provision of some services
that have high social returns but lower private returns.
The East Asian experience shows that while the provision of food and basic social services is
essential, broad-based economic growth is crucial to poverty reduction. Investments in people increase
average incomes per capita, facilitates the employment and financing of services for the poor, and lessens
the need for subsidized services (WDR 1991). It is thus the best antidote to poverty. Helping the poor
become productive and increase their incomes has high returns for society-helping economic growth.
As poverty receded, a combination of economic growth and targeted interventions became even more
effective in reducing poverty further.
The Poverty Challenge in the 1990s
Despite past progress, East Asia still had some 180 million absolute poor, close to the estimated
numbers of poor in Subsaharan Africa. Much remains to be improved in social conditions. The
proportion of the populations served with safe drinking water and sanitation increased, but so did the

Xvi
number of people without access. Life expectancy lengthened, but it was still only 50 years in somecountries. Infant mortality decreased, but it was still 6% or more in a few countries. Universal primary
school enrolment was generally achieved, but completion rates and quality were still highly variable. Andthe gaps were generally larger, the lower income the country. Further reducing the number of poor inthe 1990s is likely to be more difficult than it was in the 1980s because most of the poor are in resource-poor areas with less productive land. And as economies liberalize firther and reduce subsidies evenmore, care will be needed to avoid worsening the rural terms of trade and reversing past povertyreductions.
The poverty gap, measured as the financial shortfall in the incomes of the poor, may beequivalent to 1% of GNP in China, 2.5% in Indonesia, and 1.5% in the Philippines for a given year.
It is in the poorer Indochina countries that the additional provision of basic services and food may
translate to between 5% and 10% of GNP. The poverty gap is of course not the same as the expenditureneeded in any year to overcome poverty nor an adequate reflection of what it takes to sustain poverq
reduction. Direct costs can be substantially less than total costs: delivery costs and imperfect targetingmay add substantially to any specific poverty program. In most areas, however, efficiency gains maybe achievable through budgetary reallocations and better use of existing budgets. And the private sectorcould do more as a service provider and through greater cost recovery. Alternative lower cost ways of
achieving the same goal may also be found. Carefil ranking of programs will be required-but cleanwater and sanitation, family planning services, food supplements to the neediest warrat increasedfinancing. Still, implementation constraints may be more binding than fimding. Ihey loom large at all
stages of expanded programs-planning, organization, construction, management, ma ce, cost-
recovery, and targeting where needed. Even low receptivity by potential beneficiaries may have to be
overcome. And such constraints will most likely postpone the reaching of coverage objectives beyond
the year 2000.

POVERTY RDUCONS N TE 1970s AND 1980s
The much-publicized rapid economic growth in East Asian developing countries in the 1970s and1980s was accompanied by much less talked about but equally impressive reductions in poverty. Mmprogress is even more remarkable in light of the large growth in population-more th 40% -in 1970-90.The absolute poor-defined as those at or below an income that allows only subsistence levels in food andnonfood necessities (the absolute poverty line)-were only some 10% of the East Asia developing coutrypopulation by 1990, compared with about 50% in South Asia and Africa and 25% in Lain America
This section reportsprogress in six countries-Korea, Malaysia, China, Indonesia, the Philippines,Thailand-that in 1990 compsed more than 90% of the East Asian population. Povety trends in theother East Asian counties are not well lkown, but adding data for the remainin 10% of the populationwould liklcy not change the average trends a great deal. Ihe Indochinese countries-Myamnar, Las,Vqiet Nam and Cambodia-had 7% of the East Asian population in 1990. Ihey also had the lowest GNPsper capita and higher incidences of poverq than the other countries. The other Ea.-.Asia countries-Mongoia, Papua New Glzinea, and the Pacific Islands-had much smailer populations and fewer poor.
The definition of poty lines is importan small changes in their coverage, particuady in thecomposition of fbods-grains against the much cosdier and more mnu ve nongran foods-ven whinthe sme caloric level, resut in large changes in the monetary povery lines and, oeondingy, in thenmber of people with incomes below them and considered poor, given the income disutio data (seeAnnex 1). There are well-known limitations to the use of any poverty line, which are not revisited here.Tbis means that any poverty estimates are ilustatve of trends rather dt precise measures.
An equ poverty line (equivalent in tms of consmption of food and no-food necessities)has been used for dte six countries to allow comparisons and tbe derivaion of regional agegates andtrends. This is, official poverty lines are used for China, nonesia, Koea and Mlaysia; official subsienlines are used for the Philippines; and only for Thailand the lines used are slightly lower than the officialones. The official poverty lines in the Philippines and Thaland include a higher-cost food, and result inmuch larger in of "poverty". So, those countries' official estimztes also exceed the estimatesderived for this comparison. The absolute poverty line used in this report allows for 2,150 calories per dayper person, 90% of the calories derived from grains, the lowest-cost source of calories in East Asia. TIisdiet cemposition is that included in the official poverty lines in China, but other food choices are possiblewithin the same budget, depending on relative prices and astes in each country. The nonfood share isslighdy variable across countries, partly reflecdng different food/nonfood price ratios. It is highr in urbanareas than nrual areas -except in Chia, where the food share is a uniform 63%. TIe share of the nonfoodbudget in official poverty lines was retained because inadequate data limited potental adjustments.

2
Absolute poverty has decreased dramatically in East Asia. The proportion fell from more than
a third of the population in 1970, to a fifth in 1980, and to an estimated tenth in 1990. The incidence
in rural areas decreased even more, from 40% in 1970, to some 27% in 1980, and to less than half this
level-12%-by 1990. The poverty incidence in urban areas went from some 13 to 5% in 1990; the urbanincidence was always much smaller than the rural incidence, only a third in 1970 and a somewhat higher
proportion, almost one-half, in 1990. The rural poor made up as much as 93% of the poor in 1970, the
proportion gradually decreasing to 87% in 1990.
Although from 1970 to 1990 the size of the population increased by 40%, the number of poor
decreased by 60%. The pace of improvement accelerated in the 1980s. After a reductien of about one-
fourth in the 1970s, the number of poor decreased further by almost half in the 1980s. The cities more
than doubled their populations between 1970 and 1990-absorbing rural emigrants who otherwise would
have added one-third to the rural population-yet managed also to reduce slightly their number of absolute
poor. The cities did, however, end with a larger proportion of the poor, some 13% in 1990, than they
had started with in 1970, some 7%. Most nf the reduction in the number of poor was in rural areas, but
poverty remained essentially a nrual problem.
Given the large East Asian population, absolute numbers are perhaps more impressive than
percentages. The absolute poor in the six countries numbered some 380 million in 1970, 290 million in
1980, and some 150 million in 1990. Of these, the urban poor were some 25 million throughout the1970s, down to some 20 million by 1990. The reductions are even more remarkable, given the East
Asian population growth of the two decades-not orly were 230 million poor lifted out of poverty, but
another 425 million people were added above the poverty line (see table overleaf).
Among the East Asian countries, China has made the most impressive progress in poverty
reduction, perhaps ever. From 275 million absolute poor in 1970, or one of every three people, progress
started to accelerate in the late 1970s and continued at a high pace until the mid-1980s, that resulted in
only one of every ten-100 million-being poor by 1990. Sinca 1970, China has lifted 175 million out
of poverty and added 300 million more people above the poverty line. Poverty was virually avoided in
urban areas. But China alone made up more than half of East Asia's poor in 1990 (when the estimated
25 million poor in Indochinese countries are inctuded); it is the country with the most weight in setting
East Asia's trend.
Indonesia's performance is second only to China's in recent decades. Indonesia started the 1970s
with more than half its population in absolute poverty-some 70 million-and after steady progress, by
1990 the poverty incidence was only some 15% and the number of poor, 27 million, despite a larger
percentage increase in population than China's. Indonesia lifted 43 million out of poverty and added 60

3
million more people above the poverty line, but it still has almost 15% of East Asia's poor. Indonesia'surban population tripled in the two decades, accommodating large numbers of rural migrants-makingrural poverty less widespread but still predominant.'
Korea and Malaysia, with much smaller populations dtan in China or Indonesia, had already madegreat strides against absolute poverty by 1970, so that their progress over the past two decades may seemless impressive. But it probably was as difficult because they reached the marginal poor normally bypassedby overall economic growth: in 1990, less than 5% of the populations of Korea and Malaysia remained inabsolute poverty. Mfalaysia was able to make progress across edtic groups, reducing the poverty incidencemost for the Malays, the poorest group, and almost eradicating poverty among the Chinese. Malaysiastarted 1970 with some 18% absolute poor, or 2 million people, and by 1990 had only some 2%, or400,000 people in absolute poverty, and poverty was mainly a rural problem. Korea reduced its povertyincidence from 236 to 5%, from 7 million to 2 million in the two decades. Its urban population grew
eedingly fast, from 30 to 72% of the population; at the same time, the percentage of the poor living incities went from 16 tD 80%. By 1990 Korea was the only East Asia country where more poor lived incities thn in rural areas. The poverty incidence was similar in both countyside and cities.
Thailand had some 16% poverty incidence in 1990, similar to Indonesia's but baving shown muchless progrss-a 40% reduction-since 1970. Thailand had the slowest urbanization in East Asia; theincidence of urban poor halved to less than 4% while the rural incidence was reduced by only about a third.Through the two decades the rural areas had some 94% of the poor, similar to the distribution in China,which also had a slow urbanizaton process. The total number of poor remained at about 9 million, withonly a tmporry decrease around 1980. By 1990, Thailand had 5% of the East Asian poor.
Like Thailand, the Philippines had reduced its absolute poverty incidence by only some 40% since1970. It started with a rate similar to China's in 1970, but it had a rate more than twice China's in 1990,and the worst among the six countries: 21%. The number of poor was more or less stagnant at around13 million over the two decades, when population growth was high. The rural incidence remained morethan twice the urban-and more than 75% of the poor lived in rural areas. By 1990 the Philippinesaccounted for 7% of East Asia's absolute poor.2
1 According to the govnment estimate, the urban poverty incidence is lager than the mral one in 1990 (17against 14%). A more recent estime, bsed an 99 srvey data, fmds the rual poverty incidence to exceed theuba one. Both estim rsult in the sam toal number of poor. The official distribution is used in the summarytable.
2 The philippines Ilustra ow severly the poverty line defiition affcts the related incidence. Th official
lines result in very high poverty incidences. 64% of rund popuations and 45% of urban popuations with an average55%, vemas 27, 11, and 21%, respcivy, at the -Absolute- line.

4
Table 1: Esimated Absolute Poverty, 1970-90: Selecwed East Asian Countries
PePUjado Number ofAboiw Pow lacde ofpovuay1970 1990 leu 1970 1910 1990 Deera I970 1930 1990
1970-90mu- Miieu Milieu _eaeN
ToWt 136 1134 292 275 220 I10 175 33 23 9Rwa 636 134 148 267 211 9S 172 39 11Ud1b 150 300 IS0 U 9 5 3 5 2S Poor lRuml Anns 97 96 96
hdo.mh ToW 115 178 63 70 42 27 43 60 29 isRural 96 123 27 56 33 18 38 53 23 14Uib. 19 55 36 14 9 9 5 73 29 17S Poor m umal Ars a2 s0 66
mo- Total 32 43 11 7 4 2 5 23 10 5Rwa 22 12 -10 6 1.5 OA 5.6 23 9 4-. 10 31 21 1 2.5 1.6 -0.6 16 10 5% PowinRuzlurAnna . 4 37 20
Maa Tou I i 56 7 2 1 0.4 1.6 i3 9 2:m11 8 10 2 1.7 0.9 0.3 1.4 21 4Urban 3 a 5 0.3 0.1 0.1 0.2 10 I
Poor in Rual Areas as as as
hmlpplu Toald 37 62 25 13 14 13W 0 35 30 21 oRurl 25 35 10 11 11 10 1 42 35 7U1b 12 27 IS 2 3 3 -1 20 1 11S PeIn. RuIra Ana I5 75 71
Thilmd Tol 36 56 20 9.5 7.9 9.0 0.5 26 17 16 oRual 31 43 12 9.0 7.4 * 0.5 30 19 20Ugbs 5 13 8 0.5 0.5 0.5 0.0 9 5 4S Peoria Rora Ar 94 94 94
Six Cbs0riu TOl 1067 1491 424 377 289 152 225 (-60S) 35 23 10Pual Su 1057 1I9 351 26 132 219 (-625) 40 27 12
Uba 199 434 235 26 24 20 6 (-23S) 13 9 5S Por: Rual Ares 93 92 17S UM 19 29 55
Note: Excpt for Cdoa.- etcs for 190 m prajectisa. Mlue clidme am based official prmcar t,ine fr GIn a. Jdraa uams andbl maId. ;officia subsistence line. for het Phlpeand lines Mel lower lba de afficadl one. oThiLad Abaola povedy line low, 215D cadoiapeddWy. 905 fim rins, and norood basi needs or otber baskets coot de
ao Bned 1U iM i dUco ad dinlmii dpouy and 1990 populatio catmSooe: EiimmeL

5
PROGRESS IN SOCIAL CONDMONS
Social Indicators
Despite well-known data deficiencies, social indicators are a good complement to povertymeasures based on poverty lines. nhey reflect standards of middle and lower income people-people inhigh brackets are few. Just as absolute poverty was much reduced, social indicators (see box 1) weremuch improved even in countries were economic growth faltered (see Annex tables for details).
Progress in food sufficiency in East Asia has been remarkable. During each of the past twodecades, the average country intake of calories per day per person increased by some 150 to slightly morethan 2500 calories in 1990. Weighting by the size of populations, the average increase is more than 200calories. And not only did caloric intake increase, but diets were diversified, further improving thenmtritional value. In East Asia the average country protein consumption was some 60 grams per day percapita in 1990, almost 5% more than 10 years earlier and 13% more than in 1970.
It can be said that there was much prgress in providing safe water and sanitation-and thatprogress fell short of the coverage objectives. In all countries, the proportions of populations servedincreased despite the large population increases, but the number of people witiout access also increased.The low coverage-less than 50% in most countries-reflected a high percentage of deaths estimated tobe due to waterborne diseases, compared with only 5% in industrial countries. The percentage wouldhave been even higher were it not for the widespread boiling of water for drinking, at a high cost.Provision of safe drinking water and sanitation seems to have progressed less than that of otier services.
In all countries of the region, people are living longer. After an average five year extension inthe 1970s, in the 1980s life expectancy at birth increased further by four years, to 63. The lifeexpectancy increase was relatively uniform across countries-three years in the more advanced, and fouryears in those behind. Substantial disparities across countries-up to 20 years-remained in 1990. In thelower life expectancy countries, the difference in favor of women-biologically stronger and expected tolive longer-was also low, three years or less. The small diffence may be due to higher rates ofmaternal mortality. Infant mortality rates have declined substantially in all East Asian countries.Unweighted country averages decreased from 9.6% in 1970 to 7.7% in 1980 and to 5.3% by 1990.Ibere remained wide variations across countries.
Population growth continued to slow down in East Asia. The use of contives becamewidespread in most countries. Contraceptive efficiency also rose. China achieved the potential

6
Box 1 SOCMAL INDICATORS
Food intake. Food is the most basic of neods The saple in East Asia is rice, among te lowes cost sourcesof calories but ric and more broadly grains, lack some essential mineals, vitmins and nutients (teir lackleads to increased incidence of diseases such as anemia, beriberi and blindness, especially among youngmothers and children). Potemns provide for such other needs and dteir consumpon levels are good indicatorsof nutritional values.
Safe drinking water and sanitation. In a vicious cire, poor saitation in dense huim settements quicklycontaminates surfce wats with human excreau and colifirs wats become unsuitable for driing. Thecosts in infant morlity are well known; the costs of high adult morbidity are probably higher: dysentey,gunea and hook worm infections, skin and eye ftions reduce prductvity if not causing periodic totaldisability. To the cost of lost productive pential hbs to be added the coat of care, alo, watebon disesreduce the ability to absorb nutrients, lessning dte uwefnew of foods conumed. Wtr contmination alsoreduces fish supplies, the main nd cheapest source of protein for may people. Because of their importace,the 1980s was declared the inte_ntiond decade of clea wate and sanitation.
Ife expectancy and infant morality rates. Longer lives reflect better standards of living. IMR arenormally inversely related to life eqpctanies and positively elated with fertlity rates.
Population growth A lower population gmwth rate facilitates a higher hua resource development withina given global economic growth, by makcing more avaable per capita. It is hardly possble to both have ahigh popuation grwth rat and a fast impovement in living standads2
Liteacy. It is well known dtatducatio increases potential productvity and incomes, and dtat the noreeducated women choose lower fertility rates.
Urbanization. Although urbaniation may not be thought of as a 'socia inicator off-hand, it is includedher as one because urbani=aion avoids pressues on agicultual nd ad the relad lower rual productivity,and alows ownomies of aggom , scope and scae to benefit reideS in the growing citie iuleed,urbanimzation is consisently higher i higher incme countiea.
GNP per capita and income distribution. Wie GNP needs no explanon, its shortomngs as an indicatorof poverty are mntioned in box 2. Income distribution da help determine the welfare of the lower incomehouseholds.
'Systemati data on saf drinling water and sanitio ar scant, and not readily comparable across countries or overtime, bcaus the denions ar vaible. 'Access to saf drnkng waW can mean just 2 irs per day from a publicwat pump, or many more ern fim a house connectn 'Acrn to sani'e cover th wholc rnge from a smiplepit laine to a tilt conncted to a centrl sewer system. ha t is, a low access rate ca mean hat de tah standardsare high and not necessary tht W avalityiss tan another county with wer tare and higher
2 In a sensc the poor man and trich man of today my becoumingsimil amot ofrsour vcrafewgenerations: if the rich has two children and four grnddildr and ech ha a income of S2000, his third genamtionconsumes 58000; if the poor ha four cbilr and 16 gmadchidrn, and each ha a low income evel of SS0, the towalconsumption of his third gneration also becomes $8000 per year.

7
contracepting rate; with more than 300 million women, or some 75% of East Asian women inreproductive age, their high contracepting prevalence is very important in capping the Asian population.Some opposite extremes still existed, with less than 10% of women contracepting with modern methods.With a substantial increase in contraceptive use, fertility rates declined over the 1980s. Delayingchildbearing also had an effect on reducing fertility rates.
Even so, the East Asia population increased by an overall 2.1% a year during the decade, asdeath rates decreased faster than fertility rates. At the end of the decade, population growth rates werehighly diverse. The group of countries with low growth now had a growth in the past that was higherthan in the current high growth countries, mainly because they reduced crude death rates more rapidly.In addition, the crude birth rate began falling rapidly in the early 1970s in today's low population growthcountries, while the decline started only in the early 1980s in today's high population growth group ofcountries (Sanderson 1992).
Great strides were made in improving literacy in the 1980s. The average country adult illiteracyrate was reduced by one-third. The complementary measure, the percentage of adults considered literate,increased by some 16%. But illiteracy rates in 1990 were commonly twice as high for adult women asfor men, and as for the other indicators, large disparities remained across countries. Most East Asiancountries achieved universal primary education. Enrolment ratios of girls came close to those of boys.But while enrolments were high, completion rates varied, as did the quality of education.
The population in urban centers grew from 19% in 1970 to 26% in 1980 to 34% in 1990. Ofa total population increase of 480 million, cities absorbed 245 million, having expanded at almost 4% ayear, about twice the overall population growth rate. Korea, the highest income country, increased itsurbanization gap with other East Asian countries. 'he lower income countries, despite urban growth,still ended with only around a fifth of their population in towns and cities.
GNPs per capita also grew steadily in the major countries. Some 75% of East Asia's 1990population enjoyed GNPs per capita twice their 1980 levels, 15% had increases of around 50%, and theremaining 10% of the population, mainly in the Indochina countries and the Philippines, were bypassedby economic growth. The range of GNP per capita across countries thus widened-the highest havingbecome US$5,400 and the lowest remaining at US$150-200 in 1990. In the 1980s income distributionwithin countries also varied-with the lowest Gini coefficient being 0.29, and the highest, 0.48, with thecoefficients normally lower in rural areas.
Social indicators did not improve in a given sequence across countries. Linkages are complex.Some indicators even seem contradictory in their movements within countries. A lower-than-average

S
caloric consumption may not be accompanied by lower than average life expectancy. For exanple, life
expectancy increased in the Thilippines while food intake is estimated to have stagnated. And in Laos
food inDtakes were relatively high, but life expectancy remained short and infafit mortality, very high.
Food differentials were perhaps compensated by differentials in literacy and access to clean water and
sanitation.
Nevertheless, as far as pattems in social indicators are concerned, there seems to be a rapid
convergence toward a plateau. After a certain level has been reached at a relatively low income, social
indicators do not improve much further, while incomes continue to do so. And yet, same of the highestranked countries by social indicators still had some of the highest improvements in the 1980s. Korea
caught up in reducing infant mortality; Malaysia caught up in reducing infant mortality and illiteracy
rates. The spread in social indicators was much narrower than the spread in GNP per capita across
countries.3
Ranking of counies according to social indicators, though limited by poor data, is illustrative of
expected as well as surprising patterns. The 1990 country rankdng was the same whether by GNP per
capita or by most social indicators or by poverty incidence for the top two counties (Korea and Malaysia),
even though, some indicators in Malaysia (adult literacy) trailed surprisingly behind. The bottom countries
(Indochina) would also seem to rank at the bottom by all indicators. But the raning differed for theintermdiate countries. For example, Thailand mnked third by GNP per capita but fourth by most socialindicators and fifth by poverty incidence. The Philippines ranked fourth by GNP per capita, but fifth by
m.os social indicators and sixth by poverty incidence. Indonesia rankd fifth by GNP per capita and by
most indicators, but fourth by poverty incidence. China ranked sixth by GNP per capita but third by most
social indicators and poverty incidence, and some indicators were as good as the top country's. However,
China's gap in GNP per capita with the immediately higher ranked contries was smail, when expressed
in purchasing power dollars, so that the ranking variance is not significant.'
3 Ingam (1992) did a regression analysis based on data for 100 countries from 1960 to 1985, as available.The data showed strong convergence across the sample for four social indicators: lif expectancy, caloric intake,prniuy erolmohent raios, and urbaniztion; socal spending as a peraonge of GNP also showed convergence, butslower. That is, a given increse in per capita GDP in low income developing countries is generally associated withgreat iprovements in sociLl idiat m is a similar incse in higher income countries.
4 Cinaes GNP per capita in US dollars370 in 1990_is udad and disort CoMparisons. For instanceif official growth rates in real terms are applied to the 1970 GNP per capita figure in US dollus published in 1972ad the reut adjusted to 1990 prices, the 1990 GNP per capita thus obWined is five times the official value, ndis viruy te same as the GNP per capita estimate in purchasing parity dollars for 1990-1950. However, China'sranig doesn't cnge with the corection.

9
Country raoning by improvement over the 1980s also differed depending on whether GNP percapita, social indicators, or poverty incidence was considered. Improvement in one indicator was not
paralleled by similar levels of improvement in the others, some of which even moved in the opposite
direcdon. China had the largest increase in GNP per capita (it doubled) and reduction in poverty incidence
(to a third), but not the best overall social indicator improvement. Thailand's GNP per capita increased
by more than one half, but poverty incidence did not decrease much.
Ovemll, poverty reduction, by poverty lines, exceeded the improvement in most social indicators
over the 1980s. The inverse might have been expected: that the middle and low income groups in each
country would improve relatively more than the absolute poor. This may still have been the case, but it
is disguised in averages. Incomes above the poverty line are highly heterogeneous and probably improved
at different rates. Moreover, poverty improvements would have been less if poverty were defined by more
generous standards. The Philippines, by the common standard in this report, had some 20% of itspopulation in absolute poverty folHowing a reduction in the incidence over the 1980s. By a previously used
official standard, some 55% were poor, following no improvement in the incidence over the 1980s. Alarge group of people, while not considered absolute poor according to the poverty ine in this report, hover
just above it-for instance, those lifted out of hard core poverty who may not have inmproved their
conditions much beyond-and enter in a more broadly defined category of poor.
Shortcomings of Data
Each statistic on its own-GNP per capita, social indicators or absolute poverty data-has
shortcomings in revealing poverty (see box 2).
In particular for East Asia, average GNP per capita figtues do not inform on several important
facets. First, GNP per capita in US dollars does not reflect the GNP per capita in purchasing parity dollars
which were close for China, Indonesia, and the Philippines (rather than widely apart, as in US dollars).
Further, household incomes are generally only a fraction of GNPs (about 0.6 in the Philippines and 0.5
in China and in Thailand). Tbird, the GNP per capita figures do not tell about the nature of incomc
distributio. Thailand had a Gini coefficient of about 0.48, and the Philippines, 0.46. Korea's Gini
coefficient was 0.34 in 1988. China and Indonesia had Gini coefficients of about 0.29 and 0.32, and
poverty incidences cendy lower than their GNPs per capita might imply.' Thus, middle income
countries may still have significant poverty; indeed the various East Asian countries' ranking by GNP per
s For instance, the lowest quintile people had bigher incomes in Indonesia than in the Philippines (US$250vs 200) despitc Phlpps igher average GNP per capita (US$730 vs 570 equvalent in 1990).

10
capita did not neesrily reflct e rafing by poverty Incidence (it nerdhel reflected dbe raWnn bytotal numbers of absolute poor-but onry coincidentally, becaus of hc size of their populadom, andcoincideoce are not good rules). That is, while a very low GNP per capita is a good indicator of poverty,measures to GNP per capita-suh as income distribution, social indicators and specificpoverW data compiled on a homogeneous bas-could improve poverty identification and thereby,allocations of developmt aid and recommendadons for social policies.
Also, within counties, regional price and inconme differences are lrge and shoud be takn inloaccount For a same 'bundle of goods, the related monety cost poverty lines sowed great variancewithin countries. In the Phlippines urban-ral poverty lines difrered more than rura lines cro regions.In Thailand the urban tD nira poverty line rado averaged 1.5:1; the Northeast's averge urban income percapita was 3 times the rural one, and this was less than half the rural income in the sout.'
6 HiEgh uban wage ae oft= used to prclm superior urba productvity but this ior the high coaof living in citie Rea ubmn-r bor c d producivities coveg.

11
Box 2 SHORTCOMINGS IN DATA AS INDICATORS OF POVERTY
A variety of problems with data and measement affect the analysis and usefulne of intemationalcompaisons of poverty d socidal condition; the estimates shoudd therfore be considered illustrative. Someof the common difficulties are mentioned below:
. GNPs per capita in US dollas ovestat poverty in countries at the lower GNP lovel. GNPs per capita inpurchasing panty dollars compress the css country income npge by inc ing the lower GNPs per capitain relative terms, reflecting the relatively lower cos of necessities.
. Average GNPs per capita are silent on income distribution patens; but the nmore evenly distributedincomes are, the lower poverty incidences could be expected to be at any given GNP per capita level.However, Gini coefficients, or income distribution studies more geneally, arm derived fom nominal incomesand overstate income varances in real terms. Tbe higher nominal incomes nonnally occur in cities, whereprices are also much higher than in rural areas. Normaly, the more remote a region, the lower the monetaryincomes (a produce- exporting region gets a local fob price bused on the price at the capital minus trasportand trade margns). Real income variances are considerably more compressed within countries just as theyare across countries when expressed in purchasing parity values.
. GNPs per capita are also silent on the provision of public goods from which the poor derive a highproportion of their utility. GNPs per capita ae deived frm natinal accounts and exceed incomes asderived frm household surveys, by vaiable but large margs that paly reflect the provision of freeschooling, health services, roads, even firwood. Ihe higher the iocome:GNP per capita ratio, the lower theprovision of public goods could be expected to be.
. Household income or expenditue dat are equally silent on the utility derived by the poor from free publicgoods.
. Social indicatos while they reflect public goods, are silent on the chaactrstics by incom group.
* Absolute poverty data are silent on the extent of poverty that exists above the absolute level and relatedsocial vulnerability.
. Poverty lines are often defined at differet welfare levels in each country. This is adequat for internalpolicy objectives but misleading for cross country co i A similr level of the 'subsistence' lineallows poverty to be compared acr countries. This requires defining the food contet on a caoric cunprotein basis, rather thn calories alone, as protins provide essmtial nutrients but are muh more expensive;even small differences in protein content imply large diffecs in the manetauy value of the poverty lineand given income distnbution patterns, results in equally large changes in the number of people consideredpoor. Tlere is also a need to improve the definition of non-food necessities that ought to be included in astandard poverty line. A given poverty line is likely to have different US dollar vales ross comtris, andin domestic curenc across regions within a country i most countries the official line is a locationallyweighted average).
. Poverty incidence is not necearily a good indicaor of where the poor ae witin a coumtry. Highincidences may coincide with low population density - and imply few poor, snd viceversL What mattersis the number of poor.
. Headcounts, the rnubes of poor, have to be complemented by indicators of the depth of poverty belowthe line (the poverty gp).

12
POVERTY CHARACTER1STICS
Not only was the number of poor greatly reduced but the remaining poverty gap-the shortfadlin incomes of the poor to the poverty line and in the provision of social services-was also quite smalin all but the poorest East Asian countries by the end of the 1980s, and poverty had become relativelylocalized. (Annex 2 refers)
The absolute poverq gap was 22% in China-i.e. incomes of the poor fell short of the povertyline by an average 22%-large in relative terms; the average rural net income was, however, just abouttwice the rural poverty line, reflecting many people not much better off than the absolute poor. InIndonesia the gap averaged 15% in 1987, smaller than the Chinese gap in percentage but equivalent indollars. The poverty gap in food and services in terms of the 1990 GNPs for the countries with the mostpoor was estimated at 1% in China, 2.5% in ndonesia, and 1.5% in the Pailippines. t is in the poorercountries that the gap was more daunting: the 1990 food bacldog may be equivalent to more than 2.5%of GNP, up to 10% of GNP for the additional provision of both basic services and food-he indicativenature of the figures cannot be overemphasized.
But the gaps only represent direct costs; the fmancial costs of closing the gaps are higher.Service delivery costs and imperfect targeting would add substantially to the cost of any poverty reductiosprogram, as some of the less-needy are likely to draw on resources as well as the absolute poor.Furthermore, unit costs are more likely to rise than not, as the rural poor may be increasingly difficultto reach. On the other hand, some economies of scale or efficiency achievable in cities may offset costs.In general, public expenditures for programs may be contained through better selection. Provision ofadequate drnking water and sewerage facilities, and control of pollution can benefit the poor reladvelymore than the rich if only because the poor are less able to compensate for inadequate public investmentsin these areas. Investments can also be targeted to disadvantaged areas. Providing universal coverageof some basic services may be one of the better ways to reduce povety, and it avoids the difficulties oftargetig ivolved in special assistance programs. Reaching more women and girls would have highpayoffs. In most countries, some budgetary reallocations could enhance social returns. It is also possiblethat increased private sector fiacing of some services previously provided free could release publicresources for programs for the poor.
And fiancing the deficits of the absolute poor may be less of a problem than the inadequatecapacity to carry out programs. Implementation constraints loom large at all stages-planning,organzation, construction, management, maintenance, cost recovery, targeting where needed. Even lowreceptivity by beneficiaries may have to be overcome. Every country requires collection of more data

13
to identify better the poor and their most pressing needs. And such constraints will inevitably slow downprogress. Moreover, some poverty will always remain, as it does even in the better off counries.
Poverty had become relatively localized. China's poor were highly oDncentrated on small blocksof land behind the coastal belt. Five provinces along the middle range of the Yellow river, in the centerof China and with 15% of the land area, comprised 33% (33 million) of China's poor in 1990. Thesouthwest, at the beginning of the Yangtze river, had another 15% of the land and 30% of the poor.Furthermore, two provinces within these blocks-of a total 29 provinces-housed 20% of China's poor.The two blocks accounted for no less than 33 % of East Asia's poor. The healdL and educational statusof the poor was extremnely low, and ethnic minorities were overrepresenbed.
In Indonesia, the densely populated island of Java was residence for 55% (15 million) of the poor.Sumatra was a distant second with 4 million poor, and by compaison, all the other islands had few poorpeople. The regional ratios of poverty lines to GDPs per capita showed large variations; average GDPsper capita per region revealed little about the distribution of poverty.
There were also strong regional poverty disparities in Thailand, with the incidence of povertyincreasing with distance from Bangkok. In 1990 the Bangkok area, which accounts for almost 75% ofThailand's industrial production, was estimated to have 15% of the population and only 2% of the poor.The GDP per capita was ten times higher in the Bangkok area than in the poorest region, the Northeast(though incomes per capita according to household surveys, varied only 2:1). Some 75% of the poorwere in the rural Northeast and North regions, lacking local off-faum income eaming oppories forthe dry season, a lack that spurred widespread seasonal migration to the metropolitan region or abroad.
' It may be difficult to reduce absolute poverty below a 5% inidence. This ae wasaeady achieved inKoR and Maysia in 1990. En the United States in 1990. the poverty incidence was 13.5% bsod an csh incomat a povrty line of $6930, equiv t to 32% of the average GNP per capita. Adding non-chbenefitB the povertyicidence was 11.4%X Pavaty has been rising since 1973, when the incidence was 11.3%; the poverty gap mseas well. Just as in fte Asian coumtries, the poor in tie United Staes were mme lily to lack heath insurance, toave inadequat des, substadard housig (that neverdtless absorbe mor ton half te income), and power
shools, and chidren were ovemepresented (more than 21% of dem poor) as were norities (some 33% of blwcwee poor) (1990 Ce dat). At an absolute poverty line imia to dht ud her of some 20% of GNP percapita, povrty incidence probably was close to 5% in the United Sats as wel.

14
THE POVERTY REDUCTION PROCESS
The East Asian experence provides evidence that while provision of food and basic socialservices is essential, broad-based economic growth not only increases average incomes per capita but alsolifts the poor above the poverq line. How? It facilitates employment and the financing of services forthe poor-and lessens the need for subsidized social services. Helping the poor becorne productive andincrease their incomes has high returns for society. And this in turn helps economic growth-a win-winpolicy.
Progress in the Past
The fastest economic growth in the 1980s (averaging 8.5%) and the nost spectacular povertyreductions (declining from about a third in 1980 to barely 10% by 1985 and beyond) were in China.Two rapidly industrializing countries-Korea and Malaysia-had GNP growth rates averaging 6% to 89%over the 1980s, and in parallel the incidence of poverty was more than halved, to less than 5%. InIndonesia, as economic growth averaged 6%, households below the poverty line decreased by one third(to 15%) in the six years between 1984 and 1990. There are counterexamples. In the Philippines,following a decade of only 2% GNP average growth that was outpaced by population growth, the absolutepoverty incidence nevertheless decreased by one third. And in Thailand, a rapid economic growth of7.5% a year over the 1980s was not broad-based but was instead concetrated in the modern sector inand around the capital. It thus reduced poverty, concentrated in the rural north, relatively little.
How did the remarkable progress come about? There has been a progression in the policymeasures adopted-and in their sophistication-as the successful countries moved up the income per capitaladder and reduced the incidence of poverty.
In 1970 the average GNP per capita was only S109 2nd S230 (in 1990 prices) in China andIndonesia, and one dtird and two thirds of the populatons, respectively, were living at or belowsubsistence levels. By 1990, GNPs had more than trebled in China and almost trebled in Indonesia2 andwhile stil low (S370 and $575) income was equitably distributed so that absolute poverty was down toone fourth of the 1970 incidence, at some 10% and 15%. This was achieved despite population increasesof a third in China and a half in Indonesia.
Number denved by deducting ra growth fiom 1990 GNP per capita csma.

IS
As more than tiree quarters of the populations lived in rural ar, the govements of both Chinaand Indonesia pursued broad-based agricultnal development poliies eady on. Food production, inparticular rice, was promoted with the objective of achieving food self sufficiency. People had or weregiven access to land; a key ingredient of success was brnging the greei revolution to farmers throughproviding irrigation, improved seeds and other inputs. Access to credit ad the provision of subsidiesfurther facilitated production; initial controls applied to prices and trading but wer gradually liberalized.Food production per capita increased by 30% in the l98s. In parallel, public infastructure such asroads was developed; public works, many carried out with labor intesve methods, had importantemployment effects. Education and health services were greatly increased. China also emphasized amilyplanning early to reduce population growth and achieved a rate of only 1.5% over the 1980s. The resultwas a considerable increase in the productivity and incomes of the rural poor. The urbanization process,to some extent unintended, that accompanied rural development greatly helped economic growth andpovwey reduction. Half the total population increase from 1970 to 1990 setded in cities and towns; urbanpopulations doubled. Rural populations increased much less, by almost oneotird in indonesia and aboutone fifth in China; the rural increase in China would have been smaller but for the adopted policy ofrestrictng rural emigration. In both countries the resulting eonomic grwth was high and widespread.
China virtually avoided urban poverty. lhe goverment effectivly limited urban poverty througha system of full employment, price controls and subsidies on basic foods, and access to subsidizedhousing, education and health care; the goverment also restricted urban immigration. There washowever an increasing number of unauthorized urban residents who, lily, were poor as they did notenjoy job security nor the attendant benefits; they were registered by their official nral residences.
Despite the impressive early progress, China witnse unimproved poverty levels in rural areassince 1985. The absence of a meaningful agricultural growth in upland, poor areas was a keydeterminant Rural enterprises, an important source of employment in general, developed slowly inpoorer areas, and their wages and profits were lower than in the rest of the country. A rapid increasein the size of the labor force worsened rural unemployment. Also, since the mid-80s in rural areas, foodprices increased and affected negatively the poor who are net buyers of food whie public social and reliefservices were curtailed-fiscal decentralization passed an increasing shae of srvice costs to localgovernments, that poor local governments were unable tD support
General growdt, that lifts out of poverty those dosely under the line, failed to make inroads intothe deeper poverty pockets. Targeted programs, therefore, were needed in addition to genera growthpolicies. As the Chinese government was commited to reducing poverty, it had disaster reliefprograms,including the distnribuon of gram; there were special programs to impwve the educaton and health ofthe poor. A Food for Work program assisted with the building of roads, ddnking water systems,

16
irrigation works and other construction in poor areas. Subsidized loans were offered for developmentof poor areas. A special agency was established in 1986 to coordinate the many poverty alleviationinitiatives.
Malaysia achieved China's poverty incidence levels in 1980 and Indonesia's in 1970; its policiesand trends over the last decades are relevant for these two countries in the 1990s. Much as in China andIndonesia, Malaysia's population was predominantly rural (two-thirds in 1970) and the goverment alsoadopted broad-based, agricultural growth policies, including land development schemes and temporarysubsidies. During the 1980s food production doubled, allowing 50% more per capita. Poverty alleviationand economic growth were recognized as being interdependent and therefore investment in educion,health care and rural infrastructure were given priority. As rural Malays were the poorest, programsaddressed ethnic imbalances in income distribution and access to modern sector jobs. In the 1980s thegovernment continued to pursue general growth but also focused on the more difficult objectives ofincreasing productivity, on grouping smallholders and shifting employment out of agriculture. In the mid-1980s it further introduced structural reforms to increase market orientation of the economy and tofacilitate transition to higher industrial sophistication and capital deepening. Urbanization deepened aswell and by 1990 almost half the population was urban. Absolute poverty was reduced from a fifth toa tenth over the 1970s, and was almost eradicated by 1990; average GNPs per capita increased from$1000 to $2274 in 1990 prices over the period.
And to some extent, for Malaysia in the 1990s, Korea's policies and trends of the 1980s arerelevant as Korea has progressed the most among East Asia's developing countries, having reached a$5530 per capita GNP in 1990 and the lowest population growth rate, close to replacement level. Three-fourths of the population now lives in urban areas, a share close to that of developed countries. By 1980illiteracy was estimated at only 7%. Beginning with a drastic land reform, urbanization and expansionof labor intensive manufactures led to sharp and equitably spread increases in wage incomes. But by themid-8Qs, upheaval in labor markets and a new emphasis on domestic consumption appeared, with labortrying to capture productivity gains in the mostly unionized wage settlements. The success by labor ledto sizeable difficulties in some export oriented manufacturing sectors, the disappearance of the previouslylarge current account surplus, and it also seemingly led to a greater disparity in income and wealthdistribution. Much of the wealth is in the capital city. To redress disparities, the government is fbcusig
on more sophisticated tax reforms (reviewing tax incidence by income bracket, simplification of taxschedules, and reliance on indirect taxation), on housing markets, and on identifying beneficiary groupsfrom public expenditure.

17
Economic growth has been elusive in the Philippines. During the 1980s GNPs per capita declind
to $730, a level only a third higher than in 1970. And this in spite of the Philippines having reached alower illiteracy rate than the more growth successful Malaysia, and the same urbanization rate, by 1990.What was different? Probably different macroeconomic policies could have prompted both higher and
more equitable growth. Agricuture-manufacturing terms of trade remained unfavorable; terms evenworsened temporarily with the economic adjustnents the government undertook statng in 1983, without
protecting incomes of the poor. The intended agrarian reform did not have the impact on poverty
reduction that was envisaged pardy because of poor implementation. The lack of concessionality to
former beneficiaries in the price of land, as prwvided for in the law, was an obstacle to major
redistributive effects from land reform. Even though total food production increased by 10%, food
production per capita declined. But more than half the population continued to live in nrua areas by
1990, only slightly less than the two-thirds that lived in rural areas in 1970. Assets remained unequaly
distnrbuted. The economic stagnation of the 1980s made progress on the poverty front even moredifficult. Population growth-25 million or two-thirds in two decades-outpaced economic growth.
Nevertheless the poverty incidence is estimated to have been reduced from almost a third in 1970 to afifth by 1990. 9 of 12 regions experienced reductions in poverty incidences during 1985-88. Social
expenditure programs were protected through the adjustments in the 1980s and allocations were biased
to poorer areas; it is estimated that public transfers-education, health, infrastrcture-increased the net
income of the lowest decile people by more than a third, and doubled incomes for the lowest quintile.
Numerous NGOs emerged and have assisted in taclding aspects other than incomes. Those who escaped
poverty did so through higher levels of education and vocational training, jobs in the formal sector, lower
dependency ratios in the household and farmers, by diversifying into higher value crops.
Despite high economic growth of some 7.6% p.a., the incidence of absolute poverty is estimated
to not have declined in ThailMand over the 1980s. In the early 1980s, temporariy adverse conditions to
agncult-climaic and terms of trade-affected the 80% rural population; not surprisingly, the rural
areas comprise more than 90% of the poor. Food production increased little. Cities did not absorb as
many rural poor as in other East Asian countries. Furthermore, economic growth was concentrated in
Bangkok, spurred in the industrial and service sectors that benefitted mostly a relatively small share of
the population. Indeed, Banglok has been able to keep its poverty incidence below 5%. However,
provision of social services was improved in general. Reducing poverty is now a government priority.
The 1992-96 Plan outlines the means envisaged: to reduce the population grwth rate, to expand
productive employment opportunities, and foremost, to accelerate land reform for improved land
ownership and broad-based growth.

18
Provision of Social Services
The 1980s improvements in social indicators were no doubt helped by public provision of servicessuch as water and sanitation, health services, including family planning programs, and primary education.It is known that basic public services can be self targeting to the poor and have a redistributive ffect,as better off people view them as inferior and tend to opt for privately provided services.9 There is arationale for free public provision of some services. It may ease reaching the poorer populationsparticuiLarly in rural areas, and the social returns, which are high, exceed private returns of some services,such as sanitation.
Adequate and comparable measure of public expenditures on social services are hard to come by.Available data suggest, however, that the public expenditure on social services was relatively low,between 3% and 6% of GNPs in East Asian countries in the 199s. Generaly governments spend lessthm 1% of GNP on the provision of water and sanitation; from 0.6% to 3.5% on health services; andbetween 1% and 3% of GNPs on primary education.'0 While the corrlation between the 1990 rankingof social indicators and public spending in terms of percentage of GNP on social services is not clear,it improves when spending is expressed in US dollars per capita. The efficiency in spending was surelya very varable factor.
Public expenditures on health are estimated to have varied widely across countries, from some3.5% of GNP to some 0.6%. Reflecting the higher share of public financing in Malaysia (75%) and inPapua New Guinea (90%), public health expenditures there amounted to 2.7% and 3.4% of GNPrespectively in the mid-1980s. In the other countries, the share was at or below 1% of GNP. As shareof government spending, health absorbed between 10% (PNG) and 2% (Korea). The public cost of healthservices per capita varied even more, from more than US$30 to less dtm US$5 equivalent. The costsper user were, of course, higher (ee Annex tables for details).
Government financing of family planning programs also vaned widely across countries. In themid-8Os it was a relatively low proportion of GNPs, the highest was close to 0.1%, in China andIndonesia; in Korea and Malaysia it amounted to only 0.02% of GNP and most countries were closer tothis lower end. In the Philippines family planning services amounted to 15% of public expenditure onhealth services; in China it was some 8% and less in the other coumftries. Allocations within family
9 Jamner et aL, Distributionampac of Social Sector Expenditu in Malyse (192).
10 Publi ex penkditue data preted here e extracted from te dws by Grffin (1990) on healt, bySanderon and Tan (1992) on poplti including family planing dat and by Miat nd Ton (199).) educatd

19
planning expenditures also varied widely: in the late 1980s the provision of contraceptive supplies
absorbed 80% in Malaysia and Thailand while only 63% in Indonesia.
Universal primary education, having been a policy objective for a long time in all the East Asia
countries, had reasonable overall funding. Governments spent from slighdy more than 1% to 3% of
GNPs on primary education in the mid-1980s. At the lower end were the Philippines and China,
countries that however had high enrolment ratios; at the higher expenditure end was Papua New Guinea,
country that had about the lowest enrolment ratio; and in between, with some 2% of GNP, were
Indonesia, Korea, Malaysia and Thailand. Prixr ry education absorbed the larger share of total public
spending on education in some countries: this was the case in Indonesia, Korea, the Philippines and Viet
Nam, where it was close to 60%. In China, Malaysia and Papua New Guinea it was below 45%. The
cost per pupil varied across countries as much as the cost of health services did per capita, normally
increasing with income levels across countries.
Challenge for the 1990s
AUl East Asian governments are committed to easing the plight of the poor. Most countries could
benefit from collecting more data to better identify the poor and their most pressing needs-and from
substantial istution-buildingto design and implement programs to improve assistance delivery. There
may be a case for some redirecting of aid allocations towards solving more poverty specific problems.
During the 1990s the East Asia population is expected to increase by almost 20% and the populations in
cities, by more than 50% and mostly in the lower income brackets. But, even such high growth entails
an expected slowdown in population growth, that in principle should ease the demands on public financing
for basic services.
The provision of safe drinking water and sanitation has been thwarted so far by the high cost
Providing some 250 million underprovided people could require billions of dollars but is a priority as
population growth adds pressure on sparse and unreliable basic services. The potential exists for
increased efficiency, lower cost, and increased cost recovery, but achieving these objectives has been
elusive. Water and sanitation programs have been built on the assumption that people are too poor to
pay and, so, the limited public resources must be spread by providing basic needs levels of service to all.
But the stretched resources result in low levels and low reliability of service. Often as much as half the
water put into a system is unaccounted for due to leakages. Agencies are frequendy recovering less dtan
a tenth of their costs from users. Users are paying a high cost, though not to the agencies: they boil
water to make it safe to drink, spend time in lines for fetching water and carrying it, pay vendors if
necessary. It has been estimated that some poor spend up to a tenth of their income on water. Relatively

20
higher levels of service can be provided for small premiums over the cost of a lower level of service.Yard taps, for instance, are not much more expensive than public taps, and cost recovery would be better.Different agencies and methods of operation need to be established, including involving more the privatesector as a service provider. The adoption of already available technological innovations and pricing andmanagerial improvements could lead to universal coverage at current investnent ratios.
Demographic trends imply changing rather than lessened demand on health services. Over the1990s, the elderly population will still be a small share of the population. The more immediatechallenges concem health services for children and women. In the 1980s, the population of childrenbelow age five increased much more than is projected for the 1990s. This would slow down giowth indemand for basic health services for young children, in quantitative terms, but may prompt demand forbetter quality services. Organizational changes would help. There could be some diversion of publicresources out of curative services into preventive services, such as control of communicable diseases, andgreater dependence on the private sector to deliver care holds promise to improve the operationalefficiency of the health systems and free up budget resources where the private sector is well developed.Imposing user fees on the more expensive curative srvices would be warranted, although, because ofthe incidence of poverty, any fee strategy would also require careful targeting of subsidies to the poor(ran, 1992).
Sustaining the quality improvements in family programs achieved in the 1980s-in terms ofavailability, accessibility, trained personnel-is a challenge because the number of women in childbearingage continues to grow. The barriers to further fertility rate declines differ across settings. In some,inadequate family planning services and other supply-side bottlenecks is the chief limiting factor. Inothers, it is a weak demand for small families. Careful assessment of the barriers is essential todetermining the appropriate balance of emphasis between enhancing supply of services and strengtheningdemand for small families. In the poorer countries, though, family programs face a double burden,because both the delivery of services and the demand for them are weak. Where the private sector isrelatively well developed, there may be scope for an expanded private sector role. There is also scopefor some cost recovery in public family planning services. Overall, this should increase the availabilityof and not reduce the demand for services, as higher income groups are willing to pay and more fundingcould then be directed to the needy. The alternative of heavily subsidized services could attract moreusers but reduce the viability of private providers and endanger abundant provision in the longer run.
Progress towards lower fertility requires a broad set of interventions beyond simply supplyingcntraceptives services, particularly expansion of broad based education and preventive health careservices.
All but the poorest countries will be able to provide universal run education if related public

21
expenditure shares continue at their current levels, but reallocations among expenditure categories maybe needed. Significant changes in the age structures of Asian populations are expected, with obviousimplications for education planning and funding. The countries fall into three broad groups in primaryeducation development. In the first group, enrolment at grade 1 is still incomplete and substantialincreases in the size of the school age population is envisaged, as in Papua New Guinea and in Cambodia.These countries face a double burden, but may be able to achieve universal primary schooling withouthaving to increase total expenditures on education-by switching resources from the higher educationsystem and introducing fees at that level. In the second group, first grade entry is widespread, and theprimary school age population is not expected to grow much. But drop-out rates and quality of educationneed improvement, as is the case in Indonesia. A third group of countries, Thailand and Korea, face theprospect of shrinking primary school age populations by as much as 12%. The savings could be usedto upgrade the quality of education, if rigidities in the systemn can be overcome. (Tan 1992).
Ego availability is not expected to be a problem in East Asia, at least during the 1990s.Production could continue to increase in line with needs, especially if irrigation is expanded wherejustified into poorer regions. But food's affordability will remain a problem for some of the poor.Providing for their basic unmet food would cost almost surprisingly little in 'direct' costs. However,any loss in incomes of people just hovering over the poverty lines would add substanta numbers to therans of the absolute poor below them, and further increase costs.
Some features of programs in China, Indonesia and the Philippines are mentioned below.
In ChLna further reducing the number of poor in the 1990s is more difficult than in the 1980s asnow the majority of the poor are concentrated in resource poor areas with lower land productivity andaccessibility that general economic growth may not reach. However, driven by fertility trends of the1960s and 70s, the growth of the labor force is projected to decline from more than 3% in the l980s toless than 1.5% in the 90s. The reduction in urban labor force growth will be stronger; urban areas, inparticular the small and medium sized cities and towns, are therefore expecced to be able to absorbsurp!s rural workers. Rural underemployment could be significantly reduced. Two key initiativesintroduced in the five year plan that started in 1991, are extension of assistance to the poor living in themost difficult environments and the integration of various programs into comprehensive local interventionpackages.
Reforms in the education system and coverage to further develop human capital of the poor, inparticular girls, are crucial. Redistributing more fiscal resources to backward areas is necessary. Easinggradually restrictions on migration is an option tied to complementary reforms in housing and socialsecurity systems, liked with labor policy reforms. The state enterprise sector, the main urban employer,

22
needs tc reduce its wage supports and increase productivity considerably for efficient labor absorptionby cities, while avoiding creating urban poverty. During the early 1990s period of economic adjustnenttowards liberalization, care is needed to avoid a temporary worsening of poverty.
To reduce rural poverty at the lowest cost, targeting expanded programs to geographical areaswith high numbers of poor would be a suitable broad-based approach. The four provinces in theSouthwest alone house about 30% of China's poor, and two provinces on the Yellow river, Henan andHebei, comprise another 20%, even though the poverty incidence there is generally less than 15%. Onthe other hand, Gansu and Shaanxi comprise less, 10%, of China's poer, but the poor constitute up to30% of their populations and their poverty seems to be somewhat deeper than in other provinces if judgedby average income levels. Selecting to help provinces or districts with high poverty incidences wouldalso be a good approach. Geographical emphasis may need to be complemented with better individualtargeting of some types of assistance given that poverty incidences are relatively low.
In Indonesia. the government is also committed to continued poverty reduction, and has plans onvarious fronts-institutional, funding, reform-to achieve the objectives. The focus is on improving accessto economic infrastructure and services by the poor and especially in outlying provinces. Priorities arehealth, family planning, nutrition, safe water, and education. Increased community participation isenvisaged in the design and delivery of poverty reduction programs, to make them more cost-effective.As in China, in Indonesia public expenditure management is a tool to reorient allocations to servicesneeded by the poor and to promote cost-effectiveness in their delivery. Building up institutions to handlethe tasks is one of the challenges. Another challenge is to identify better the poor that have to bereached.
It is clear that concentrating poverty reduction efforts in lava, a small area coriLiining more thanhalf of Indonesia's poor, should be a priority. Reaching the poor there would be easier; they are not asremote as in the outer islands and economies of agglomeration if not of scale should be achievable inpoverty reduction programs. However, careful targeting of special programs would be needed if benefitsare to reach the poor effectively, as the poverty incidence is relatively low. Th:s calls for datadisaggregated below provincial level; starting in 1993 district level poverty indicators *-il be estimatedthrough an increased survey effort for this purpose.
In the PhirigDines, the government's agenda encompasses poverty alleviation as a central theme.Improving the trend is a challenge: given the population momentum, a high growth rate is needed to keepunderemployment from increasing. The emphasis is now on advancing the land reforms; increasing off-faim, non-seasonal rural employment; improving domestic terms of trade; upgrading and expandingneglected infrastructure; a recovery of private investment levels. Improved capacity to deliver programs

23
in education, health and family planning, and in parallel, renewed targeted interventions are envisagedto reduce poverty. Above all, measures to renew the overall growth process-sound macroeconomicmanagement-are essential.
Regional programs could be developed to reduce poverty. Th:- %;enter islands would seem to havepriority in broad progrms. With up to 30% of their populations at or below absolute poverty and 40%of the absolute poor in the Philippines-5 million people-, they are also the least urbanized. They hadthe lowestpopulationgrowth over the 1980s, at 1% p.a., suggestingoutmigration, despite some economicprogress. Region 4 (Tagalog) with some 1.8 million absolute poor and a rapidly growing population alsoseems a priority area for intervention. To assist the needy, as in the other countries, special programswith individual targeting mechanisms may be warranted.

24
Box 3 ADDRESSING POVERTY: GENERAL LESSONS FROM EAST ASIA
Broad-based economic guwth. The impressive reduction in poverty indenc in East Asia is due mosty toconsistnt and relatively rapid, broad-based and efficient growth; countries with high economic growth havereduced poverty incidence the most by lifting the poor from under the poverty line. Sound macroeconomic
_ru t designed to foster sustained grwth was essential for poverty alleviation; agricultue was thegrowth focus in arly stages when most of the poor lived in rural areas. Improving the business-eablingfrmework, and liberaizing markets and prices, provided powerfid incentives to private sector-led growthand employment opportnities also for the poor outside agriculture.
Pfrovsion of social services. Provision of services such as health care, have a direct impact on the poor-prmvided nutrition levels are adequate. Reduced morbidity can greatly increase productivity and the capacityto learn, and incomes. Education not only allows the poor to participate in modern sectors at better wages,but iitracy rtes and popuation growth rates tend to move in the sam direction, and shrinking populationgrwth rtes is a priority in many countries. Safe water and sanitation are essential to reduce morbidity andincrease productive potential-sanitation is also essential for the environment. Such social services tend to beself-trgeting to the poor.
Targeted interventions. A tureted approach of investments and programs designed to reach povertypockets is an effective complement to an overall growth stategy; it also inproves the cost-efectiveness ofpublic expenditue. Compaing indicators from vanous countries may be a first step to identify areas mostout of line, and better delivery means for more effective interventions can usually also be found:
• Pragrams for women and girls, who tend to be a high proportion of the absolute poor, have high retrns.
_ hotecting public expenditure on programs for the poor has prioray in times of adjustment, when thepoor are likely to suffer the most. It is also cost effective as not doing it involves much higher costs later, toredress the damage done. Even new programs, such as for food supply, may be needed at suchi tines.
. Regional targeting may prove useful when poverty in a region is very wiesped, but becomes lessefficient as the poverty incidence is reduced.
Frovision of physical inf The poor denve a large share of their incomes from publicinfiastucture. Cities alleviate rral poverty by absorbing efficiently larW rral emigrations, and make theprovision of urban infrasucue (drinking wter, electricity) as valuable as that of ural infstnicue (roads,irrigation for insce) for reducing poverty.
Idenifyng the poor better. While estimates of incidence and number of poor are available, targetingrequimes a better knowledge of the poor and of their priority needs.

25
Annex 1
WHO ARE THE POOR?Poverty Lines and Cross Country Poverty Comparability
People who are at or below established poverty lines, defined to cover subsistence food and non-food needs, are considered to be poor according to current convention. But "subsistence" is variuslydefined across countries, and even a small change in the definition can result in large variations in thenumber of people dassified as poor. For cross country comparisons of poverty, standard definitions aredesirable. This annex illustrates through the examples of four countries with a majority of East Asian'spoor, how important the definition of poverty lines is in determining the extent of absolute poverty.
Based on late 1980s household surveys and income distribution data,' r China, Indonesia, thePhilippines and Thailand, this annex first reviews official poverty line definitions; then establishes thedifference between the official lines and equivalent poverty lines across countries (in terms of food andnon-food necessities), one line at a low expenditure level enabling subsistence and another somewhathigher line allowing more diversified diets, based on caloric and other nutrient contents. Both a standardcalorie level and the percentage derived from grains, and a standard non-food percentage, provideequivalent poventy lines across countries-even such common measures are relative as needs vary withclimate, extent of physical work, preferences, etc. The caloric/grain content-food costs predominate inpoverty lines-was standardized but the non-food hare in official poverty lines was retained, as no datawere available to improve equivalencies. Poverty incidences at eacn poverty line are esdmated; indeed,changes in the line level change considerably the related number of poor.
-he analysis also confirms that there are no good shortcuts to define a representative poverty lineacross countries: a simple standard calorie level may not provide equivalent lines becae the level ofesseWtial but more costly nutrients involved may vary; neither would a standard US dollar line, partlybecause average exchange rates do not reflect relative costs of basic necessities, that tend to be lower thelower the income level of the country. As purchasing power dollars partly correct this bias, a standardline in purchasing power parity dollars is a better yardstick, even more so if a line is defined for eachincome country group. And, subsistence budgets seem to be a relatively stable proportion of averageGNPs per capita for rural and urban areas-about 20%, the lowest quintile incomes. Poverty lines arehigher in urban areas, though not in real terms. Summary graphs at end of Annex illustrate thedifferences in lines and incidences for the four countries reviewed.'
I This annex does not deal with other difliukies involved in defining povety lines: price diffrnrals require lines be setby location; fily size differentiab also mater -an additional child requires an income addition lower thn the average fimilymember incom- so that incomes of equivalent adults or of houwholds rather tan indiiduals my be better xdicators forpoverty, especially if amily size varies by locaton. Consunmpton may be a belter indirthan mcoms whn the poor havesavmng/dissving possibilities. And scing lines is only a first step; then the number of people under them has to bc estmatd,their location and depti of needs identified. Usually two poverty lines are set one adopted by each goverment for its ownalleviaton tags and dth tcnd. to incr with overal icome lvels, and one to define absolut poverty, et at the localsub-stencelovcL

26
Official poverty lines
While it is accepted that absolute poverty lines should reflect subsistence levels, the definition ofsubsistence levels varies across countries. Poverty lines are set by each government at a level thatrepresents the expenditure necessary to buy what is considered to be subsistence food and non-foodrequirements, in urban and rural areas of that country, reflecting goods available and their prices.Poverty lines normally increase with average income levels, as governments of better off countries expectsomewhat higher standards even for their poorest people and thus, poverty lines are set with povertyalleviation objectives and policies in mind.
The caloric intake considered a minimum for subsistence is relatively standard, in the range of2000-2150 calories per day; much more variable is the caloric proportion assumed to be derived fromgrains. Grains are the lowest cost source of calories. However, grains don't provide all the requirednutrients and need to be complemented by other foods; a more diversified diet is more healthy as itprovides proteins, vitamins, minerals and other elements, but is also much more expensive.
How expensive the step is to upgrade a basic grain diet to a more diversified one can beillustrated by the relative costs per calorie from grains and from other foods bought by the poor. Riceis the staple grain in East Asia; the composition of foods other than rice is quike varied across countriesand even across regions witiin a couiay, reflecting food availability, prices and preferences. The non-grain/grain calorie cost ratio is about 8:1 in Thailand and 7:1 in the Philippines, in both rural and urbanareas. The ratio is also 7:1 in China at official prices but 5:1 at market prices for grain That is, thepoor are willing to pay up to 8 times more for a calorie that also diversifies their diets, when they canafford it.
China, a low income country, has adopted poverty lines that refiect the lowest food cost, byassuming that 90% of the caloric intake is obtained from grains-the 10% other foods is to provideessential nutients missing in grains-and a 2150 daily caloric requirem per average person with suchdiets (while rice is the staple diet coarse gains cost less and are included to various degrees in povertybaskets). The low cost diet entails each person eating slighdy more than half a kilo of rice (or equivalentgrains) per day. Indonesia's poverty line provides 2100 calories per day. Both Philippines and Thailand,low-middle income countries, consider some 2000 calories as the daily requirement, with grains providingon average 66% of the calories in the Philippines, and some 70% for urban poor and 77% for rural poorin Thailand. Slightly lower caloric i aes a compensated by more proteins in more diversified diets,and preferred compared to those of China. While the diffierence in calories from foods other than grainsin basic diets across countries may seem small, it makes an impressive difference in the expenditurerequired to buy the food basket.
The non-food subsistence requirements, fbr clothing, sheter and some other expenditures, arenormally expressed as a percentage of the subsistence food expenditure. The foodfttal expenditure ratiois itself a reflection of the degree of poverty-the higher dLe ratio, the deeper the poverty. Averagefood/expenditure ratios are lowest in the Philippines and highest in Indonesia.
The differences in food baskets, and cven more in total baskets, included in official poverty linessuggest that the -poor-, spending at levels around the poverty lines, are better off in the Philippines andThailand, than the *poor- in China and Indonesia. That is, the "poore from official statistics are far froman homogeneous group across counties and as a result, the poverty incidence and trends based on suchdifferent definitions are hardly comparable.

27
TABLE 1 - OFFICIAL POVERTY INE CHARACTERISTICS
Chins I ia Phili Thailanduni uba nE Rdu MEd Elba Mal gd
Official linescalories per day 2150 2150 2100 2100 2000 2000 1978 1978% fromgrains 90% 90% 81% 81% 66% 66% 77% 69%food, % of expenditure 63% 63% 95% 85% S7% 48% 689% 54%
21aumktlta/
ratio cost per calorie, 7.3 4.9 6.8 2.3 2.3 7.0 7.0 8.5 7.8non-grain/grain
Soucc Developed firm daft in World Bank repots.a! Plan pnces are lowcr dtan maket price for a n rur aas.
Equivalent poverty fines
Poverty lines for China and Indonesia reflecting the more diversified diets of the Philippines andThailand (2000 calories and 66% from grains), are estimated to be at least 57% and 20% higher thantheir official lines, respectively. Convrsely, poverty lines based on 2150 calories per day and 90%derived from grains in the Philippines and Thailand are between 30% and 45% lower than their officiallines based on more divesfied diets. The ratios of food to total expenditures were assumed unchangedfrom official lines. If in addition to the above changes, in the Phflippines the high 43% share of non-foodexpenditures in the rural basket is lowered to 37% as in China, the rural poverty line decreases by noless than 50% and becomes equivalent to the 'subsistence3 line defined by the goverment as oouveringneeds in foods only. And in Indonesia, increasing the low non-food shares compensates the costreduction from increasing calories from grains from 81 tO 90%, so that the official line is also the lowline.
TABLE 2 - CHANGE FROM OFFICIAL TO EQUIVALENT LINES a/
Chins Iondmsis ,PbdRie Thailand
Increase to higher line 80% 57% 57% 13% 11%
Decrease to lower line -7% -5% -43% 45% -31% -42%+ 63% foodinsteadof57% -519%+ lower fiood shae 0% 0%
Sourp: Developed from dam iD Word Bank rpot.a/ Tbe higher cost lie based on Philippines and Thaland, 2000 calies and 66% fom grins;
the lower line based on China, 2150 calorieand 90% firom gains.Food/ion-food eniture rtios uncbanged fiom official lines, cecpt a noted.
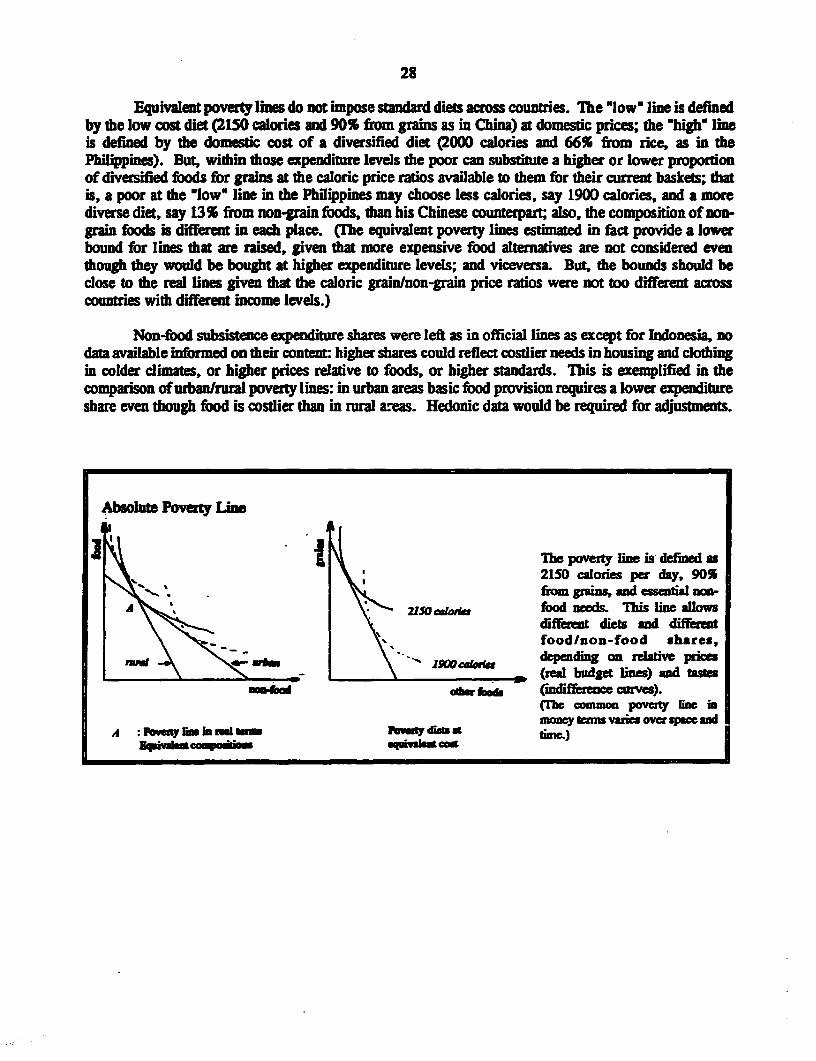
28
Equivalent poverty lines do not impose standard diets across countries. The 'low' line is definedby the low cost diet (2150 calories and 90% from grains as in China) at domestic prices; the 'high lineis defined by the domestic cost of a diversified diet (2000 calories and 66% from rice, as in thePhilippines). But, within those expenditure levels the poor can substitute a higher or lower proportionof diversified foods for grains at the caloric price ratios available to them for their current baskets; thatis, a poor at the low" line in the Philippines may choose less calories, say 1900 calories, and a morediverse diet, say 13% from non-grain foods, than his Chinese counterpart; also, the composition of non-grain foods is different in each place. (The equivalent poverty lines estimated in fact provide a lowerbound for lines that are raised, given that more expensive food alternatives are not considered eventhough they would be bought at higher expenditure levels; and viceversa. But, the bounds shoud beclose to the real lines given that the caloric grain/non-grain price ratios were not too different acrosscountries with different income levels.)
Non-food subsistence expenditure shares were left as in official lines as except for Indonesia, nodata available informed on their content: higher shares could reflect costlier needs in housing and dotLingin colder climates, or higher prices relative to foods, or higher standards. Ihis is exemplified in thecomparison of urbannrural poverty lines: in urban areas basic food provision requires a lower expenditureshare even though food is costlier than in rural areas. Hedonic data would be required for adjustments.
Absolute Poverty Lim
(I The~~~~~~~~~~~~~~~~l poverty line is definedun2150 calories per day, 90SfiX gain, an essential non-
A \- 2150 calda food needs. This hIe alkwsdifferent diets and diffen
\ >>-_ 3i foodfuon-food shares,PU1WI W \ - -- lSVXca1IoseI depending n relative pc
\W X ,_\, (red budget flnes) and tson4bo G&W etoor (nxiffe cm-e -w).
(Thc common poverty linc mmoney trm vua over space and
A i:wtty 11in U rind kq ftvutiy diets ) tic- _~~~ 6 * Os

29
Poverty Incdence
Estimates of poverty incidence at the official and standardized poverty lines are shown belowfor 1990. Tle esimated incidences at the non-official poverty lines are more tentative dan the officialones, but nevertheless they allow improved poverty comparisons across countries.
TABLE 3 - POVERTY INCIDENCE, 1990
Cho na Indonesia Phibmi= Thnind
RI=n muu
Atofficial lines 11% 13% 1% 14% 17% 64% 45% 29% 7%
Atlowline 11% 13% 1% 14% at 17% aI 27% 11% 20% t 4% t19% b/
At highline 36%9 35% e 4% e 23% 22% S4% o 45% 29% 7%
Soure: Developed from data in World Baz& repons.Low line : includes low cost diet (215D calorn, 90% fiom grains).High line: includes higher cost diet (2000 calories. 66% from grins).c: simate from income distibution datat Tenative; needs verfication with becr income distribution data.
at lower food sharcs.b* 63% instead of 57% food in poverty line
Even small differences in poverty line levels make a great difference in the rdated povertyincidence. With generally skewed distributions of income a great proportion of the populaons is in thelower deciles of income; large nmnbers of people are just above a low poverty line, but below a higherone. The Philippines illustrates how severely the poverty line definition affects the related incidence.The official lines result in very high povaerq incidences: 64% of rural populations and 45% of urbanpopulations. The government also estimated that 27% of the rural populations would be below a lineexcluding non-food costs from their basket; this line also represents the standardized poverty line. f fooditems were 63% instead of 57% as in the official poverty line in rural areas, the povery incidence woulddecrease from 64% to some 54%; and if both the higher food share and the lower quality diet applied,then the incidence would be some 19%. In China, passing from the lower povty line to the higher oneabout trebles the poverty incidence. In Indonesia, newly suggested lines increase the rural incidence andlower the urban incidence, reverting the rank to the usual pattr-the percentage of poor is geneallyhigher in nrual areas.
Contrary to expecations. given its relatively high average income per capita in the group of fourcountries, the Philippines fares worst in terms of poverq incidence, at viruly all poverty lines. Alsocontrary to expectations, given its low official average income per capita, at the lower poverty line, Chinafares best among the four countries. This reflects China's relatively even distributionof income, but also,undervatuation of incomes per capita in dollar terms.

30
The level of the poverty line also has an effect on how difficult it is to reduce the povertyincidence defined by it. Lifting people out of levels below bare subsistence to just above, throughprovision of the lowest cost food (90% grains, in East Asia), is much lower cost and thus easier than thesubsequent improvement by which the poor start having more diversified diets. The countries whoseofficial poverty line is low are likely to show better poverty reduction trends than others.
Numbers of poor
The poverty incidences estimated above, given the 1990 population estimates, result in numbersof poor shown below:
TABLE 4 - MLrXON POOR, 1990
China Indonesi PhiliunM ThailandRI If a Riag UIkn IQ £Rul Uzba Io d RVIn UM-60 MoM
At officil poverty lin 95 5 100 18 9 27 22 12 34 12 1 13
Atstandardized low line 95 5 100 18 9 27 a/ 9 b/ 3 12 8.5 .5 9
Atstandardized high line 300 12 312 28 12 40 a 19 12 31 12 1 13
Low line include low coat diet (2150 calories, 90% from grins).High lne: incle higher comt dict (2000 calorie, 66% fiom gnins).a/ Lowering food are in official line.hi1 Without lowering non-fod share in ofcald line.
Despite relatively low porverty incidence, but due to the size of the population, of 1.1 billion in1990. China has between 100 million poor-at the low/official poverty line-and more than 300 millionpoor at the higher poverty line. Depending on the poverty line, Indonesia's poor range from 27 mIlionto some 40 million; Philippines', from 12 million to 34 million, and Thailand's, from 9 million to 13million. It is noteworthy that poverty is mainly a rural problem.
The numbers show how misleading it is to compare official estimates across countries. At officialpoverty lines China has 100 million poor and the Philippines, 34 million. At the sundardized lowpoverty line, China's 100 million compare to only some 12 million in the Philippines, while at thestandardized high poverty line, China's poor nmber three times as much, 300 milion, while Philippines'number some 31 million.
Poverty nE in dola
The above analysis of poverty lines was based on equivalent baskets of goods consumed by thevery poor and the poor, in domestic prices. While the official poverty lines vary widely across coumtries,standardized poverty lines provide equivalent baskets and dtus, their costs could be expected tD be quitesimilar across countries, when expressed in a common crrency. If so, adopting one line in a givencurrency would facilitate cross couny poverty comparisons. This is tested below.

31
Official and standardized poverty lines were conveted into 1990 equivalent US dollars, at officialexchange rates, and into purchasing power parity dollars (ICPS):
TABLE 5 - POVERTY LiNES IN 1990 DOLLARS
China Jdoneis Philijgj Thailandnnl un . l Ui ai , u rua urban
-------------- (in 1990 USS at official exchange rats) -------------
Official line 53 58 62 80 125 248 364 182 272
Standardizd low line 53 58 62 80 125 128 bl 200 126 158141
Standarlized high lne 95 91 97 90 138 220 b/ 364 182 272248
Avenge GNP per capita 370 570 730 1430
…(in--- ------------ - ( 1990 ICP$) ---------------------
ICPSIUSS 5.3 4.1 3.2 3.2
Official line 280 307 329 320 512 787 1110 582 870
Standadized low ine 280 307 329 320 512 410 b) 640 403 506451
Standadhzd higb line 504 482 514 369 566 704 b/ 1100 582 870787
Avenge GNP per capita 1950 2350 2320 4610
Lon line: iwludes low coat dietHigh lne: incudes higher cost dieta/ With .63 instad of .57 food hare in cqxndire baskeL
ConDtary to expectations, the standardized pover lines are not relativly dose when expressedin US dollars; the differences are too large (up to a factor of 3) to permit the use of a single line in USdollars across countries. China requires the lowest expenditure in dollars to meet the needs even of themore costy diet, under US$100. Phiippines has the highest official poverty lines, at USS 248 and 364in rural and urban areas; but even the Philippines" standardized poverty lines remain the highest. Thedifferences in dollar values imply that basic goods consumed by the poor have relatively lower prices thantradables. And, the lower income the country, or the region within a country, the lower the prices fornecessities.
When the poverty lies are expressed in purchasig power parity dollars, diffces persistalthough the ranges become narrower. It is well lnown that parity dollars compress the range of incomesper capita across countries, increasing the lower incomes, better reflecting wage and standard of living

32
differentials. Indeed, the conversion rate of US dollars into purchasing parity dollars is highest for theyuan-China has the lowest income-among the countries considered. Expressed in parity dollars, theChinese poverty line is closer to the others, but still the lowest, and Philippines" remain the highest.Lines remain apart. However, the lower rural poverty lines are close in Indonesia, and China (aboutICPS300) and in Philippines and Thailand (about ICPS400). A parity dollar value may be used as awelfare yardstick across countries; one poverty line for countries within each GNP per capita bracket-e.g. ICPS370 or $1 per day for subsistence in rural areas in low-middle income countries-may give moreaccurate proxies; this is the line used in World Development Reports.
Poverty GnelGNP per calpits ratios
At first thought the ratios of standardized poverty lines to GNPs per capita could be expected tobe highest in the lowest income countries. However, even absolute poverty lines increase with incomelevels; if so, the poor in low income countries are probably not (much) worse off than poor in higherincome countries, and a given ratio of poverty line to average GNP per capita could perhaps be appliedto GNPs per capita across countries to define equivalent poverty lines, in welfare terms. This is testedbelow.
A caveat must be made, though: GNPs per capita obtained from national accounts are higher thanincomes obtained from household surveys, with the difference being variable over time in the samecountry, and across countries. The discrepancy is high: in China, the household surveys show an incomelevel only about half the GNP per capita level, even though it is also known that the GNP figuresunderestimate services somewhat. The income:gnp ratio is also about 0.5 in Thailand, and about 0.6 inthe Philippines.
For 1990, the official poverty lines as ratios of the GNPs per capita are quite irariable. The ratiosare highest in the Philippines and lowest in Thailand; excluding Thiand, the low poverty lins rangefrom .14 to .27 of GNPs per capita. The ratios in China could have been expected to be higher, giventhe highly even income distrbution in the country; poverty line ratios to average incomes derived notfrom national accounts but from income surveys are indeed twice as high.
TABLE 6 - POVERTY LBIESIGNPs PER CAP1TA RATIOS, 1990
China Indonesia a/ Pniliunins bailadnual urban rurd ura nagl whiM mrsl whi
plan market
Aveag GNP per capita 370$ 570$ 730$ 1430Slow lineaverage income .14 .16 .17 .14 .22 .151.19 .27 .08 .11high lineavmg income .26 .25 .26 .16 .26 .27/.34 .50 .13 .19
Rumliurbn GNP per capita bl 260$ 635S 485$ 800S 515$ 1085$ UaLlow lineaage .20 .23 .10 .16 .16 .211.27 .18high linverage .37 .36 .15 .19 .19 .381.48 .34
Low line: including low cost diet (2150 calories. 90% from gains)High line: inluding a higher cost dirt 2000 calories, 66% from grins)./ Witbout increing prices of non-rice foods from official low csdmaze. bt Baed on income distibution dat.

33
To the extent that urban poverty lines and GNPs per capita are highez (in nominal terms) than therural ones, it is also useful to relate the poverty limes to the respective rural/urban GNPs per capit Thiscomparison shows the rural poor requiring a higher proportion of the ural average income forsubsistence, and the urban poor requiring a lower proportion of the urban average income for subsistence,than resulted from the comparison with average GNPs per capita. Ratios in rural and urban areas areclose, as could be expected, in Indonesia and the Philippines, but not in China, where official prices andrestricted labor migration favor urban populations. The urban ratio tends to be lower. A areasonable'yardstick for East Asian countries could be that subsistence expenditures are about 20% of average urbanand rural GNPs per capita.
Urban vs. rural poverty
Invariably poverty lines are higher in urban areas than in mral ones. Non-food items are the mcause for this differential, reflecting the higher cost of living in cities, for housing, transport, etc.; foodsconsuLmed by the poor have relatively small urban/rural price differentials, generaly not more than 15%,in part due to transport and trade cost margins. Food is priced lower in rural areas; the rural poor aremostly subsistence farmers with some surplus exported to urban areas and litle imports. Indonesia hasthe highest urban/rural poverty line ratio, of 1.6, and China, the lowest, at less than 1.2, given thesubsidies afforded urban dwellers for housing, transportation and other services. The ratios are dose to1.5 in the Philippines and to 1.3 in Thailand (at low lines). Ihat is, in the Philippines, an urban poorneeds to earn/spend 50% more than a rural poor just to be as well (or poorly) off.
TABLE 7 - URBAN/RURAL POVERTY L1NE RATIOS, 1990
China Indonesia Philpi ibh nd
Low line ratios 1.17/1.07 1.6 1.6 1.3High line ratios 1.02 1.4 1.6 1.5
Souce: From previous Table 6.
The rurallurban poverty line ratios could be used as price deflators to establish real purchasingpowers of low level incomes in cities, and dispel the notion that urban dwellers are better off, or moreproductive, than rural ones, that is based on mistaking higher nominal incomes for higher real incomes.
The urban/rural cost ratios are also a reminder that contrary to appearances, it is not easier tolift the lower (nominal) rural incomes than it is to lift the higher (nominal) urban ones, because they areequivalent in real terms.

Poverty by Two Definitions
EqhNainI Po lyL . US $ In dn E lven Line. No. Of P Af P leipr L ne.. 10400 so 340~~~~~~~~~~~~~~~~~~~~~~~~~U4 (mulUon)
300
At standatdi; d Soo~~~~~~~~~~~~~~~~~~~~~~~~~~~~~~~~~~6
Al ~ ~ ~ 1! Rotffild 40¢a I t UD IelOU
200
Wth~ ~~~o cort lino 210clro90 img
20~~~~~~~~~~~~~~~6
400~~~~~~~~~~~~~~~~~~~~~~~~~~~~~~~~~~~~~~~~0 I100~ ~ ~ ~ ~ ~ ~ ~ ~ ~~~~~~~~~~~~~~~~~~~~~0800 i~~~~~~~~~~~~~~~~~~~~~~~~~~~~~~~~~~~~~so
a 0~~~~~~~~~~~~~~~~~~~~~~~~~~~~~~~~0
low tins 500 16~~~~~~~~~~~~~~~~a 00000 - 29~~~~~~~~~~~~~~~~~~~~~~~~~~~~~~~00
100 flISW to 60~~~~~~~~~~~~~~~~~~~~~~~~~~~o
Hlwhcoa0line3 20000calon 66%from rsinsw

35
Annex 2
POVERTY CHARACTERISTICSChina, Indonesia, the Philippines
The poverty gap-the shortfall of incomes of the poor from the poverty line-tends to be largerin rural areas, even though the poverty lines there are lower (in nominal terms). Poverty tends toincrease with the remoteness of areas from the main cities. Often inhabited by ethnic minorities, remoteareas tend to be resource poor, afflicted by water scarcity and difficult access, and unable to sustain denseagricultural populations. This annex describes some characteristics and location of the poor in 1990within the countries with the largest numbers - China, Indonesia, the Philippines. The data were derivedfrom statistical yearbooks, summaries of household surveys, Bank reports and other publications. Thelimitation of available data ought to be fully recognized, and measures considered illustrative of the broadpicture.
China
The rural poverty line was Y275 ($53 equivalent) on average-although it ranged from 244 to284, depending on the province-somewhat less than half the average rural net income of some Y630($120). The rural poor consumed about 63% of their incomes on food, or $33, while the average sharewas 55%, or $65, twice as much in absolute terms. The poverty line of the urban poor-Y320-was onlyslightlyhigher than that of the rural poor. The government subsidizes urban residents-services includinghousing, transportatinn, education take only 10% of household expenditures. The urban poverty line wasless than half the income of the lowest urban decile, at Y782; the average urban income was Y1,280, fourtimes the poverty line. The poverty gap averaged some 22%-the incomes of the poor were, on average,22% below the poverty line 1990. The gap was equivalent to $11.50 per poor per year, and for theentire population-given the 12% poverty incidence-it was only 0.3%, US$1 per capita. Thisnevertheless added to about $1.1 billion, not a negligible amount.
If better standards were sought, in line with the official poverty line in the Philippines, the lineincreases to $83 from $53 equivalent and the number of poor trebles, to 300 million. The gap wouldbecome 50% for the absolute poor (instead of the current 22% estimate) and 25% for the 200 millionpoor between the two poverty lines; the average gap would be 33%, or some $27 and the total gap wouldthus be some $8 billion or almost 2.5% of GNP.
There were wide disparities in rural poverty incidence across regions. Although the poor haveland-use rights, the land allotted may not enable subsistence levels of crop production. Poverty wasrestricted to resource-poor areas, that also generally have more difficult access, and its incidence tendedto increase further inland from the Pacific coast. The coastal provinces had virtually eradicated poverty,with less than 5% poor, and provinces westward along the Yangtze River had done almost as well, withless than 6%. The upper range of the Yangtze River, China's southwest, had close to 15% poor, themost affected province in the region being Yunnan, with an 18% incidence. The north and west had thehighest poverty incidence, averaging some 20%, bui within it Shanxi, closer to the coast, had only 15%while Gansu, farther west, had as much as 30%, the worst rate in China. (No data are available onTibet.)

36
Incidence is not always a good indicator of where the poor are. In China where the incidenceis high, population density tends to be lower. The Northwest comprises half of China's land area, butonly slightly more than 10% of its people. The density is even lower in the two westermmost provinceswith more than a fourth of the land area and little more than 1 % of the population. Thus, despite thehigh incidence of poverty in the Northwest, the poor there numbered only 20 million-a fifth of the pooron half the land.
The largest numbers of poor tended to be concentrated in the higher-density provinces just westof the coastal provinces. The province with the highest number of poor was in the center, Henan, withmore than 11 million, or 15% of the provincial population. Henan and four other provinces-also alongthe middle range of the Yellow River-form a 'poverty block' with 33% of China's poor on some 15%of the land, and with poverty incidences increasing westward from 7 to 20%. Sichuan, adjoining theformer block to the southwest, had the second-largest number of poor, with more than 10 million, buta relatively low incidence of around 11%. The three southernmost provinces, south of Sichuan, had atleast 5 million poor each, at an 18% incidence, making the southwest home to almost 30% of China'spoor, on about 15% of the land. Sichuan and Henan alone, with close to the average incidence ofpoverty, accounted for a fifth of China's poor. Outside these blocks, only Gansu in the Northwest, withChina's highest incidence, had more than 5 million poor. Other provinces had much smaller numbersof poor: the Coastal provinces combined, with almost a third of China's population, had only some 10million poor, 10% of the total.
Poverty was not strictly found in ethnic minorities' provinces, but minorities represented a highlydisproportionate share of the poor. Only 6% of China's population are considered minorities, or non-Han. The Han predominate in the richer coastal provinces between Beijing and Shanghai, and theirhinterland, totaling 11 provinces; minorities are recognized in the other 19 provinces, where they rangefrom 10 to 97% of the population, on average 45%. The southwest, the poorest region, entirelycomprises minority peoples' provinces, and in the northwest, the poorer provinces are also 'minority'.On the other hand, the poorest province in the center, Henan, is not a minority one, and provinces in thesouth, with about the lowest poverty incidences, are minority peoples' provinces.
The incidence of poverty was positively correlated-but not strictly-with other indicators ofpoverty, such as illiteracy rates and population growth rates, at the provincial level. In the southwest,its incidence was about half the adult illiteracy rate-while in the northwest it was about two-thirds-withboth regions showing the same average illiteracy rate of 28%. In the northeast, poverty incidence aboutequaled that of illiteracy, at 12 to 14%. Wide variance may exist within provinces that would requiremore disaggregated data, at least at county level, for poverty and illiteracy correlations to show. Theeducational status of China's absol-ite poor was extremely low. In some minority areas, more than halfthe children, and a much higher proportion of gtrls, did not attend school. The cities had the lowestilliteracy rates. The lowest population growth rates in the 1980s, at 1% or less per year, were found inlow-poverty-incidence provinces (1.1% in Guandong, 2.3% in Zhejiang) and high-incidence provinces(18% in HeilongJiang). Thehighestpopulation growth rate, 2.4%, was in a northwestprovince that alsohad an 18% poverty incidence. The ubiquitous success in family planning, and restrictions on migration,may have contributed to this pattern.
The health status of the absolute poor was extremely low. In poor households some 50% ofchildren were mildly malnourished, and as many as 90% of poor children suffered from chronichelminthic infection, compared with 60 to 80%, on average. Incidence of infectious and endemicdiseases, including tuberculosis and iodine deficiency disorders, was concentrated in poor and remote

37
areas, as was the higher incidence of fluorosis and diarrhea. Infant and maternal mortality in poorcounties was at least 50% higher than the national average.
Differential economic growth in the 1980s contributed to shape the uneven poverty incidencesby 1990. The lowest economic growth, at 3% per year, was in Gansu, the province with the highestpoverty incidence in 1990 (30%). Provinces with growth in excess of 8% a year ended with less than4% poor. But other provinces with more than 6% growth a year nevertheless ended with more than 14%poor, having started lower.
Meeting the challenge of better health and education for the poor require an estimated annualincremental funding of Y2 billion ($380 million) or less, if it could be partially defrayed throughefficiency gains in planned expenditure on education during the 1990s. But even at full cost, theincremental funding would represent only about 0.5% of current govermment expenditure. This couldenable universal six-year primary education for 15 million poor children, and reducing by one-third thehigher morbidity and mortality rates in the poorer areas. Greater central government funding would beneeded, despite the move to decentralization; currently social services rely primarily on local finance, thatfalls short of needs in the poorer areas.
The greatest bacldog is in the provision of water and sanitation. By 1991 only about half theurban populationc, some 150 million, had water supply systems; in the 1990s, as they did in the 198Os,cities may add another 150 million to their populations: 300 million persons would need to be provided-nith water and sewerage capacity in the 1990s. In rural areas some 200 million people use untreatedsurface water or water with excessive fluor or salt; proper sanitation is almost totally lacking. Thescarcity of safe water and sanitation is deeper in the poorer regions. The capital cost for the requiredwater and sanitation provision could well exceed $5 billion equivalent in each of the rural and urbanareas. Coverage could almost be universal by the year 2000 with an annual incremental expenditure of$1.3 billion equivalent, some 0.5% of GNP. However, users should be able to repay the cost throughfees. Such public work programs could also be a source for employment.
Indonesia
the poverty gap-the weighted percentage by which local incomes of the poor fell below localpoverty lines-averaged about 15%, in 1990. The gap was equivalent to some $12-$15 on average perabsolute poor. The gap for the 27 million poor totaled $336 million, about 0.4% of GNP, or some $2per capita. The total direct cost of basic needs in food, shelter, public services (water and sanitation,health services, improved primary education) could add to some 2.5 % of GDP. But an analysis showedthere was scope to increase efficiency of public expenditure by reallocations to more efficiently targetedprograms, and by charging different prices to the poor and the non-poor.
The regional poverty gaps tended to correlate with poverty incidence. The ratio of regionalpoverty lines to regional GDPs per capita showed great variance. In East Tenggara, a poor province,the ratio of the rural poverty line to average GDP per capita was more than 0.6. In a region having alower poverty incidence, South Sulawesi with 10% poor, the ratio was 0.3. However, the ratio was notnecessarily higher where the incidence of poverty was higher, this pointing to differential pans ofincome distribution across regions (and that the levels of local average GDPs per capita are not goodindicators of poverty just as they are not good indicators across countries). Gini coefficients variedbetween 0.2 and 0.3 in rural areas, but between 0.2 and 0.4 in urban areas. There was also great

38
variance in poverty lines, reflecting different price levels, both across regions and between urban andrural lines in the same region.
Java, with 60% of Indonesia's population, had 55% of the poor, or 15 million. By comparison,all the other islands had small numbers of poor. To the northwest of Java, Sumatra had 5 million withan incidence of about 13%; to the east of Java, the Tenggaras had less than 2 million poor but nearly thehighest incidence, of 24%. The much larger island to the north of Java, Kalimantan, also had fewer than2 million poor and incidence of about 25%. East of Kalimantan, Sulawesi's poor numbered about 1.5million, with incidences varying between 11 and 17%. The easternmost islands, Timor and Irian Jaya,had the highest poverty incidence, almost 30%, but because of their low populations, the poor wererelatively few, less than a million.
The rural poverty incidence is higher, the less urbanized the island. Java is the most urbanizedisland; fewer than half its inhabitants are "rural". With little available land per capita in central andeastern Java-60% of the farms are only 0.5 hectare or less-the rural poverty incidence was aboutIndonesia's average, but with large disparities. The poorest districts were uplands-particularly thelimestone hills-fishing villages, and areas most removed from urban centers. The low-lying, irrigatedrice villages were relatively better-off. In the least-urbanized eastern islands-Tenggaras, Timor, Maluku,Irian Jaya-70% or more of the population was considered rural and poverty claimed 30 to 40% of them.Sumatra's rural population is 66% of the total, and had a poverty incidence of 13%. Kalimantan's is60%, and with some 25% poor. The incidence of rural poverty was three times that of urban povertyin Maluku.
The incidence of poverty was lower in the regions with oil-based economies, mainly Aceh andRiau in Sumatra and East Kalimantan. The incidence was less than 8%, as it was in Jakarta, much lowerthan Indonesia's average of 15%. These regions attracted migrants and thus had a population growthsomewhat higher than average. Java, not directly dependent on oil, had the highest growth in its averageGDP per capita, but it is not clear that the benefits of growth were evenly distributed.
As in China, poverty was not necessarily correlated with other characteristics that could beexpected to show correlation. The poor had larger families, more children, and higher dependency ratiosthan others. Neither age nor gender of the head of the household were good indicators of poverty.Although educational level was a good indicator of poverty, statistics of illiteracy by region are notrevealing; no more than 20% of the rural poor in any region were reported to be illiterate, with theIndonesian average being only 12%. The low illiteracy rate may result more from low standards requiredto qualify as liteiate than from extended achievement.
Water has become scarce in Indonesia, particularly Java, and needs to be carefilly managed foragriculture and household uses. In addition to being scarce, it is generally quite polluted; rarely is rawwater safe to drink without boiling. Nevertheless, according to a survey in 1988, in rural areas some70% of households drew water from open wells or rivers and didn't have even a latrine. In urban areas,water availability for the poor had become critical-in large cities only 30% of the populations wereserved by a municipal water supply system-; formal sanitation facilities were lacking for almost one-thirdor poor households. During the second half of the 1980s safe water supply was made available to 7million consumers in urban areas, barely keeping pace with population growth. The allocation requiredin development plans for provision of safe drinking water is estimated to amount to some 0.5% of GDPover the 1990s; this expenditure level would not achieve universal coverage, but implementation capacityis expected to be a constraint. Universal coverage by the year 2000, could it be physically implemented,

39
could require twice as much. Expanded sanitation and sewerage systems would likely cost as much asthe planned water provision. Public agencies along commercial lines as well as private companies needto be developed to handle the sector expansion. Both water supply and sanitation would have wide-ranging health, social and environmental benefits, and would benefit particularly women in rural areas.
It has been estimatad that Indonesia could usefully double the public expenditure for health, thatwould require some 0.5% of its GDP. There were large differentials in the quality of services used bythe poor and by the non-poor; the availability of drugs and trained medical staff could be much improved,and prices lowered, in poorer areas. A change in pricing policy to lower private costs in the use ofpublic services could significantly increase utilization rates by the poor. It has been estimated that publicspending on health centers and subcenters increased the consumption of the poor by less than 1% each,and some of that funding could be reallocated. Indonesia had 10 million (20%) potential contraceptiveusers; the supply of contraceptives should increase in order to achieve a higher coverage particularlyamong poorer women, but almost no incremental cost may be necessary given that there is scope andsteps are being taken to increase the targeting of public services to populations that could not readily bereached by the private sector, particularly in rural areas.
While the objective of universal primary education has been achieved, quality is variable andleaves much scope for improvement. Public spending on primary education was found to increaseconsumption of the poor by 10%. But the inability to pay the costs of schooling increased primary schooldropout rates among the poor. Financial assistance for textbooks and other private expenses wouldimprove attendance of poor children; the cost could be borne through reallocations from higher educationbudgets-that increases consumption of the poor by less than 1 %-but given that primary education alreadyabsorbs a relatively high share, education as whole may need increased public funding.
Philippines
The absolute poverty line was some $145 equivalent in rural areas, 28% of the estimated ruralaverage GNP per capita or 20% of the national GNP per capita, in 1990. No data were available on thepoverty gap.
Poverty was mainly a rural problem: 67% of the absolute poor were in rural areas. They weremostly dependent on agriculture employing almost 50% of the labor but generating only 25% of GDPat low productivity. Some 15% of the farmers had only about half an hectare (and the average for thesmaller farms making up half the farms was only 1.2 hectares, adding to a mere 16% of the total farmarea). Scarce land made nonfarm activities, particularly seasonal jobs, more important to generate incomein the poorer households. The poore- families had higher dependency ratios (4.5, compared with 2.5 forhigher income fimilies) as they tended to be younger and still be rearing children. Women did not seemto be at a disadvantage in general. They had reasonably equal access to education, employmentopportunities, and services. The poverty in the Philippines was thus quite similar to Indonesia's andChina's.
While poverty was widespread, regional differences existed. The lowest incidence-17% onaverage-was in the northern, main island that comprises Manila. The highest incidence was in the centerislands (Bicol and Visayas, with rates between 26% and 32%). The southernmost islands showedintermediate incidences (Mindanaos, with 17% to 27%). The highest concentration of poor, 1.8 million,was in Tagalog, a smaller island south of the main one. Each of the regions in the center islands had in

40
excess of I million poor, while other regions had less than I million poor each. At the official povertylines, the number of people considered poor more than doubled in the northern island to 12 million, andin the southern islands to 8 million. It almost trebled in the center regions, to some 12 million.
The center islands had in parallel to the higher poverty incidences, among the lower poverty lines.At first glance, it should be easier at lower poverty lines to have incomes exceeding them; but, bydefinition, the line is not lower in real terms, only in nominal ones. This possibly reflected farmgateprices lower in the center islands than in the other islands: farmers there were likely to be mostlysubsistence frmers, importing little and exporting little. The center islands probably had the highesttransport and trade costs for imports and exports, depressing farmgate prices (and food prices), incomes,and the demand for imnports. Indeed, despite their low prices, food made up the highest shares of thepoverty lines in these center islands. Conversely, regions neighboring Manila (region 1) had higher-than-average (nominal) poverty thresholds, but an average incidence of poverty.
The Philippines had greater urban/rural poverty line disparides than disparities across regions.Manila's poverty threshold was 57% higher than the national average; the cost of subsistence food was30% higher in cities than in rural areas, and the cost of nonfood needs, 80% higher. Reflecting suchrelative prices, food accounted for only 48% of the budget share in urban areas, but 57% in rural areas.Between 1985 and 1988, the incidence of poverty increased near Manila-but either less or not at all lesselsewhere. This may have been due pardy to having food prices increasing less than nonfood prices.Income differential were higher in cities than in rural areas (Gini coefficients were 0.49 vs 0.40respectively in 1988).

41
Annex 3
Tables
Cavea Most social indicato and some povera estimates for 1990 are projectons. Allsocal data are illu ve ra than exact estimates More detailed qualiicatonscan be found in the World Dvelopment Repots.

Poverty Number Estimates:1. Absolute Poverty in East Asia, 1970-90
Room 1 1970 1980 1990 1,970 IMt LI1990 1_190
EaAaIa 3S 23 10 400 300 1I0 100Rua 40 27 12 375 275 160 S7Utsb 13 9 5 2S 25 20 13
Chin 33 28 10 27S 220 100 SSIndomeal 60 29 IS 70 42 27 ISKoma 23 10 5 7 4 2 1Mdayda is 9 2 2 1 0.4 -
PhIlippnes 35 30 21 13 14 13 7Thailand 26 17 16 9.5 S 9 SIndochina - - 20 - - 2S 14
Source: EMImatea, baed on country data with Intoepolations ad extropolatdos.

Regional Distributional Characteristics within Countries:2. CHINA, 1990
POPULATION (uilioo_ RURAL POVERTY bRa! Two= S 1910, P ctore% IcIdence (I) | MIitli Poor pci Capiu fliboate boreReglos Toal Rural Rural Nda. ine P. Lie Yua over age 135 P C
10.56 4.39 40.4 0.2 0.1 0.01 - 0.00 1261.11 11.03 2.0 3.97Tial 1.64 3.99 45.1 0.4 0.4 0.02 - 0.02 1069.04 13.72 1.6 7.39Hobel 61.59 51.97 *4.4 13.0 11.7 *.76 - 6.0U 591.2l 21.91 1.7 4.46Neca 56.49 74.51 56.2 16.5 15.2 12.31 - 11.34 432.01 2290 1.7 4.6USlmade 54.93 72.02 54.3 6.3 5.9 4.90 - 4.25 644.70 23.0U 1.5 4.11
39.67 23.09 538.2 5.0 7.1 1.35 - 1.64 no.35 13.56 I3 4.21'4 ZUlu 24.53 15.31 61.7 12.2 10.7 1.37 - 1.64 717.34 14.30 1.2 S."
Hell.jlaq * 35.43 39." 54.3 13.3 17.9 3.65 - 3.57 670.78 15.05 1.0 3.79
NMCI Ma 21.63 14.37 66.4 23.5 20.3 3.31 - 2.99 607.15 21.53 1.4 3."Saxl 28.39 22.69 73.3 17.4 14.8 3.95 - 3.36 559.67 16.49 1.6 4.29S5aa 33.16 26.66 30-4 20.3 18.4 5.41 - 4.91 459.72 25.32 1.5 5.45NidgSi J 4.70 3.39 711 13.9 13.4 0.64 - 0.62 534.19 32.19 2.4 501cun ' 22.55 19.22 55.2 34.2 30.4 6.57 - 5.34 M9." 39.80 1. 2.39Qiqi a 4.48 3.14 70.1 23.7 21.1 0.74 - 0.61 513.96 40.55 1.7XI*p 15.29 10.79 70.6 13.7 17.6 2.02 - 1.90 622.45 19.34 1.3 4.34
- ----- 3 13.37 4.67 34.9 0.0 0.0 0.00 - 0.00 1664.65 13.41 13 4.30lang. 67.67 S4.11 30.0 3.4 3.6 1.64 - I."5 U3.71 22.59 .3 6.40flejaq* 41.A 34.36 S2.4 20 2.3 0.6 - 0-79 1044.58 23.19 0.9 9.90
A" 56.75 43.39 33.3 7.7 3.3 3.73 - 4.02 517.01 34." 31 4.41laqxl 38.10 31.11 11.7 5.0 6.4 1.56 - 3.99 597.61 23.35 1.5 5.57Hfblu ' 5439 43.92 *0.6 6.0 7.0 2.3 - 3.07 60206 22.1I 1.5 *.46HN a 61.2S 52.07 3.0 6.2 7.7 3.23 - 4.01 545.69 17.11 13 3.57
30.37 240 31.7 3L3 2.1 0.45 - 0.52 764.41 22.5 1.3 *.50Guaagda' *63.46 48.91 77.1 0.9 1.1 0.44 - 0.54 9:5.71 15.23 1.0 6.5Hdalaan' 6.63 5.26 79.3 3.3 3.3 0.17 - 0.20 653.43 21.34
Ouinl * 42.61 36.57 35.3 15.4 18.1 5.63 - 6.62 499.76 16.47 1.9 4.48Skihua 103.04 91.16 *4.4 11.2 11.2 10.23 - 10.21 505.15 21.36 0.9 3.56oaiaou 32.6 28.35 56.3 17.3 17.4 5.05 - 4.93 435.14 36.42 1.6 4.00YVm ' 37.31 32.23 56.5 19.0 18.3 6.13 - 5.91 439.75 37.54 1.6 5.U3
SOW": Be. a iU SI I YVaOe 3991 aW daff ealsaeMA*: blad .e*peilsa

Regional Distributional Characteristics within Countries:3. INDONESIA, 1990
I .o .el inpow I _ anM R .c. 1990I I 19 99 a El mu S-
13.31Cm Tea Runt I Runt Runt U" Tal IRw 1 1Am TOWl I Ru UAm wied vieoiPqdsh<m TM. ws o *m4u!D.ILL l*w 3.3 -. - - 7.3 7. -- A. 0.6 - fl 2.094 2.09 2.41 2.7 2.7 -W. la. 35.4 2s.7 4.9 10.2 3.9 13.9 2.4 2.4 4.3 174 253 713 654 2.57 to0 69 11.5C. lava 22.5 21.4 75.1 15.3 22.0 17.5 3.3 1.4 4.9 147 224 "6I so 5.1 5.9 SA 10.5D.L l.Jaka 2.9 1.6 6.l 116 19.2 15.5 0.2 02 0.4 351 232 539 539 057 .5 3.7 6.1IL lava 325 24.2 74.5 12.1 21.9 14.1 2.9 1.9 4.3 145 253 751 753 1.66 4.5 4.6 32.4
Mcd 3.4 2.9 65.3 14.3 1.7 15.9 0.4 0.1 0.5 201 237 2.22 7n5 2.n 4.3 2. 16.7M. Saam 10.3 4.3 ".0 1s.0 14.4 13.5 0.9 0.5 1.4 377 261 92 n 435.00 4.1 4.5 LW. Satw 4.0 2.3 u.5 te.o 11.2 11.0 0.5 0.1 0.6 204 305 740 740 23.00 2.2 3.2 13.2Rl1 5.3 2.2 46.7 16.0 3.3 13.7 0.4 0.1 0.5 240 294 4.076 334 4.31 -1.3 2.6 12.11m4 2.0 1.e w0.0 6 561 323 5. is a.a. son" 6.3 4.5 71.4 14.0 23.6 14.3 0.6 0.4 1.0 134 312 1.194 27 3.09 1.9 2.3 0.7
BDubI 1.2 1.0 83.3 6 626 431 4.3 43 11.3tapsq 6.0 5.3 U.3 12.3 15.1 13.1 0.7 0.1 0.5 151 232 402 402 2.65 4.1 4.1 32.6
alkI 2.3 2.1 75.0 9.3 16.6 11.2 0.2 0.1 0.3 172 310 932 on 1.18 7.3 7.3 10.3W. Nwa Taa 2.4 2.3 n2.4 21.3 32.2 23.2 0.6 0.2 0.3 152 245 332 332 2.15 3.5 3.S 19.4•l Nu Tmuan 2.3 2.9 37.9 24. 18.0 24.1 0.7 0.1 0.3 145 25 314 314 1.79 2.7 2.7 19.0• Ti. 0.7 0.7 100.0 335 335 3.02 4.6 4.6 52.4
W. Kaltmaaiam 3.2 2.6 31.3 23.9 22.4 27.6 0.3 0.1 0.9 213 295 736 736 2.43 I. 5.6 336C, Kathmm 1.4 1.2 35.7 12013 1.013 3.65 3.3 2.3 14.5S. KaUscU 2.6 1.9 73.1 21.9 19.2 21.2 0.4 0.1 0.5 236 314 312 799 2.32 3.3 4.5 9.3L amu1m 1.9 1.0 52.6 4.959 2.114 4.42 -1.A 6. 34
N4. Iealawual 2.5 2.0 20.0 tE.0 3.0 14.9 0.3 0.3 0.4 176 253 515 55 1.60 2.3 23 3.C. Mawaul 1.7 1.4 A.4 511 511 27 2.9 2.9 14.0S. bRaved 7.0 5.4 77.3 8.7 17.3 30.3 0.5 0.3 0.7 133 256 538 5S 1.42 4.5 4.5 14.3SB. Sutaweud 1.4 1.1 7A. 5m m7 36.6 3.3 3.3 Ito
__ _ _" 11_ _ _ 111111U^lm 1.9 1.5 78.9 755 743 2.7 1 6.0 14.3a y 1ay 1.1 ".1 1054 66 3.4 -2.5 2.4 17.3
Sauces hiada 3sf.! 01to. 599M.a 3WULt

Regional Distributional Characteristics within Countries:4. PHILIPPINES, 1990
Populatlan (mu, Ian) J Poveit Poety Lie (US$) [9tlh, p.a. COA 19S0 PopulaionLX IncIdence(S) a/ MU_o Poor bI (mim)Region Tobl Rural Rural Rural Urban Total Rural Urbn Total Rural Urban Aver Popultin Total
~~~~~~~~~~~~~~~~~~~~~~~~~~~. . ..... .......
Region I [locos 3.6 2.2 62.3 20.0 18.2 19.6 0.4 0.3 0.7 162 182 166 2.1 2.9Region 2 Cagmyan 2.3 1.3 76.6 17.5 23.6 18.4 0.3 0.1 0.4 147 195 156 1.9 1.9Region 3 Luzon 6.2 2.5 39.9 10,6 9.3 10.2 0.3 0.4 0.6 147 207 171 2.6 4.8RaegIo4 Tagalog 6.3 4.1 49.0 25.7 14.0 21.7 1.0 0.7 I.o 151 202 163 3.2 6.1
Regb S 8kol 3.9 2.7 68.9 32.8 26.6 31.S 0.9 0.3 1.2 13S 190 14S 1.0 3SRegion 6 W. Vianyu 5.4 3.5 64.3 28.3 18.2 2S.9 1.0 GA lA ISO IS7 I15 1.9 4,5Region7 C. VIamyu 4.6 2.7 S9.7 34.4 13.2 27.6 0.9 0.2 1.2 127 148 130 1.9 3.3Regloi B.EVlaya 3.1 2.1 69.0 33.9 22.0 31.2 0.7 0.3 1.0 140 152 142 1.0 2.8
Resga 9 W. Mlndmsa 3.2 2.2 69.4 23.9 17.S 22.8 0.5 0.2 0.7 134 163 138 2.5 LSRagla 10 N. MIdaa 3.5 1.9 53.5 30.1 18.9 27.2 0.6 0.3 0.9 147 I8 154 23 2.3RegIo 11 S. Mamo 4.5 2.4 52.7 29.4 14.6 24.0 0.7 0.4 1.0 159 197 167 3.2 3.3Regio 12 C. Mldmn 3.2 2.4 73.5 16.2 19.8 16.3 0.4 0.2 O.S 137 202 ISO 34 2.3
Souna: PhQippie StSlea ym*oa& 1991, (or poplato aatica.1990 Cmnaus, fo, usbaiaa rats.Povety Ddueula Wachin Grop, Draft 1992, for paout inuldeu.
ai 193 Ildmme at ubsMdaeevdW.bl World daa eadla bi ed on lb 1988 Iede and 1990 populion daa.

Regional Distributional Characteristics within Countries:5. THAILAND, 1980-90
Population ('000) Poverty Incidence % s/ Poor ('000) 1987 Population % b/ w/Adequate wiComplete 1987
Drinking Primary PARRoglon 1990 % 1980 1989 1990 S Water Schod %
Metro Bangkok 8,766 IS 3.9 3.4 298 2North 11,056 19 21.5 23.2 2,565 19 55 57 1.25North Ead 19,836 35 35.9 37.5 7,439 SS 4S 62 1. ISCentrl 2,876 5 13.6 16.0 460 3 77 62 1.02Eat 3.703 12 1,137 9 60 57Wed 3,314 12 69 62South 7,068 12 20.4 21.S 1,S20 11 51 5Io4 0.73
MunIIpal¢pItes 10,246 7.5 6.7 686Villages 27.3 29.4Sanitay DLitrics I 1 13.5 1 _
Source: Thailand Statlstical Yeabook; Thailand: A Frmework for Development of the Northeat Region.e/ World Bank daff estimates, basd on the officil poverty line, that Is somewhat higher than the standardized absolute line; with interpolation
for 1980 and extrapolation for 1990.b/ For villages only.

Regional Distributional Characteristics within Countries:6. VIET NAM, 1990
XPopuladon L| S thaA I 800 calorcudayylcapta Meao Lntake GDP per capia f198N. S p.a. Oro*wh Infant Moatta|Regn El mIii n | Incidence (%) Million Poor |cWaoru/peno/day USS P__ I Ras (%)
Nothen MounIns 10.4 12 1.2 2107 124 2.9 4.5Red River Delta (tadl. HFon) 13.9 27 3.8 1878 ISS 2.3 3.7Nozh Cea*dl Coast 8.8 30 2.6 I8S0 89 2.2 4.6SouthCenuuCO.M 6.8 30 2.0 1861 146 2.0 4.8Cenrl Higands 2.6 IS 0.4 2059 96 S.8 5.6North-HAst Southland (Ho Chi Mlnh) 8.0 27 2.2 1924 504 2.S 3.4Mekog Rlver Dlta 14.4 2S 3.6 1891 236 1.9 4.4
Souee: Poratlo Ceaua, 1979 ai 1989. Extapolain for 1990.Natioal Inaltkt of Nuwion, Guwu Nutit Survey, 1987-89.

Regional Distributional Characteristics within Countries:7. PAPUA NEW GUINEA, 1980-90
1990 Population Health Education loo=% Anual Life Ldu Molty % MCH % Popuati % Pray Pa Cap" Pe Capi % Forma
Toal Growth S sBxpeano Rmw (p 1000) Coverge bl w/ no Scdoing d Earolm Rato (Kin) Growth dl EuOwme dPmvio a1 ('000) 1910190 Ui 1910 110 194 9190 195 I93 S 1910
Nat'ICp CaIDigct 193.2 4.47 100 S6.7 3S 18 36 75 2115 172 0 45NorthSoloaa 125.5 3.40 16 59.6 33 66 50 73 1973 218 20tKNOWBrDitain 184.4 3.25 12 S2.3 57 90 5S 76 770 114 IS-We*e 10W.7 3.25 IS 47.7 U3 94 71 77 673 329 6Hew lrad 57.2 2.78 9 52.7 62 94 59 K6 534 141 ISCoaSol 140.6 1.84 S SO.3 59 63 68 79 S28 17 U tO
Wad Now Brkal 127.S 3.61 13 51.3 60 85 Sl 7S 483 60 I5Motob 363.S 1.57 2S 50.9 62 66 51 61 473 54 12Mnus 32.3 2.32 Is 51.6 5S 79 51 84 416 55 13NodsOro 96.8 2.23 14 49.2 67 77 61 67 413 161 tO
Madq 270.3 2.47 14 S0.7 62 73 sO 5S 387 110 IWes HO Ilha)s 291.1 0.91 7 5S.9 l1 83 89 S0 337 70 17 IfBadlSepik 248.3 1.12 11 49.3 94 67 II 72 320 96 5
1eh HISWo1mis 299.6 0.79 9 53.1 55 95 91 63 290 5s 5Maw Bay 157.3 2.06 7 57.1 50 66 64 73 210 i5 5Sq. 238.4 3.71 2 47.1 91 91 94 51 267 70 3
Chimbu 133.8 0.30 3 50.2 87 SS 93 60 264 *6 3SauI0hevHW& 302.7 2.49 3 43.1 116 91 94 51 256 90 4Wed Sik 13#.2 1.69 9 42.1 104 56 84 59 2SS SS Saulf 63.1 0.60 I1 47.3 71 *9 71 67 196 29 6
ua: Nbmal KIa VM 196 OWNH): *1 Coua, _LWNPOvha km hysiim ih Now N ew a, 116 to1IM Tuag*d M.L. raduAu^ir Winkbu 1a NMe 97ioMa*laa Csw for Dswlpuo UmWas. AMU.
a hfudstelaMappdw S an NW e am abed, £96.
Ss ft atemIeAAny wimuns PApati

Social Indicators by Country:8. Food, 1970-90
Daiy per Capit Intake of Food Production Index */
Coun_y 1970 1980 1989 1970 1987-89 1988-90
Cambodia 2332 1746 2166 52 41 S 163 203China 1982 2331 2639 47 SS 63 132 149lndovsIa 2061 2397 2730 43 Sl 60 128 IS3Korea (Rep. of) 2439 2828 2852 61 77 77 97 1O0Lao PDR 2256 2418 2630 61 65 70 121 ISIMalaysia 2SIS 2716 2774 S0 S8 SS 2SS 196Moolla 2337 2475 U79 95 92 aS S9 114Myanmu 2070 2343 2440 53 60 64 101 122Papua Newo eub 2192 2307 2403 42 47 49 101 102PhilIppIs 1839 2421 2375 45 54 53 86 109Thailand 2213 2300 2316 49 48 49 I05 124Vie Nam 2167 2045 2233 Sl 46 51 119 145
Source: ANDRUX, Worl Devdopmnt Report 992 snd World Rsources, 1992-93.*/ 1979-81 - 100* Uaw*ed.

Social Indicators by Country:9. Safe Drinking Water and Sanitation, 1980-90
(Percent population with access) Safe Driiiking Water Sanitation Services
Urban Rural Total Urban RuralCountry 1980 1990 1980 1990 1980 1990 1980 1988 1980 1988
Cambodia - 20 - 12 - 12.8 - - - -China - 68 - 87 - 71.3. - 100 - 95Indonesla 35 65 19 32 - 41.6 29 40 21 45Korea (Rep. of) 86 100 61 76 - 93.0 100 99 100 100Lao PDR 21 47 12 25 - 28.3 11 - 3 6Malayla 90 96 49 76 - 78.4 100 - 55 75Mongolia - 78 ./ - 50 a/ - - - 100 - 43Myanmar 38 43 15 29 - 32.S 38 35 is 27Papua New Guinea 55 94 10 20 - 32.8 - - - -Phillppines 65 93 43 72 - 81.0 81 98 67 85 oThailand 65 67 63 76 a/ - 70.0 64 84 41Vict Nam - 33 32 47 - 35.6 - 48 55 S5
Source: WHO.a/ 1988 data.* Unwelghted.

Social Indicators by Country:10. Health, 1970-90
Life Expectancy Infant Mortality Rate Population Contraceptive Acces to Health Services bl(years) (per 1,000) Growth p.a. (%) Prevalence (%) al Pcrcent of i
Country 1970 1980 1990 1970 1980 1990 1980S 1986 Rural Urban Total
Cambodia 42 39 51 161 201 117 3 - 50 80 53China 62 67 70 69 41 29 1 74 _ _ -Indonesia 47 55 62 118 99 61 c/ 2 48 - - 80Korea (Rep. on) 60 67 70 51 32 17 1 70 86 97 93Lao PDR 40 45 50 146 127 103 3 - - - 67Malaysia 62 67 70 45 30 16 3 51 _ Mongolia 53 58 63 102 82 62 3 - _ 100 -Myanmar 51 57 62 104 84 64 2 5 11 100 33Papua New Guinca 47 51 55 115 78 57 2 4 - -Philippines 57 61 64 66 52 41 3 45 - - -Thailand 58 62 66 73 44 27 2 66 80 85 70 LAViet Nam 55 63 67 104 57 42 2 38 75 100 80
Source: ANDREX and UNICEF.a/ Contraceptive uscrs among married women aged 15-49.b/ Acces within an hour by local transport.cl 80 Is the more recent estimate.* Unweighted.

Social Indicators by Country:11. Education, 1970-90
Adult Illiteracy (M) _ Primary SchoolCompletion Rate Enrollntw (% of age group) School Age Children Pupa Teacber
ToWl Female (%) Total Female (minio) RaidoCountry 1970 1980 1990 1990 Mi 80 1965 1980 1989 1965 1980 1939 1990 1965 1989
Cambodia - - 65 78 40 77 - 82 S6 - - 1.4 48 -China - 31 27 38 68 89 117 135 - 106 128 120.0 30 22Indonesia - 33 23 32 60 72 98 118 65 91 115 21.6 41 23Kore (Rep. o) 12 7 4 7 97 101 107 108 99 105 109 3.4 62 36Lao PDR - 56 - - - 40 96 111 30 88 98 0.9 37 28Malaysia 42 40 22 30 97 90 92 96 84 91 96 2.7 29 21Moolia - 7 5 - 95 98 105 98 97 102 100 - 32 -Mymnmur - 34 19 28 - 71 84 103 65 81 100 6.2 53 43 1Papu Newn utlul - 68 48 62 67 44 62 73 35 54 67 0.7 19 32Philippis 17 17 10 11 66 113 110 111 111 108 110 8.2 31 33Thaiand 21 12 7 10 s0 78 97 86 74 - - 5.9 35 ISViet Nau - 13 12 16 64 - 116 - - 109 - 10.0 - _
Source: World Dedopmat Rapat 1992 and Popuidton [aUm in Asia, 1992. Plean eo coves in WDR 1992, page 210.* UnwelaJxd.

Social Indicators by Country:12. Total and Urban Populations, 1970-90
Total Population Urban PopulationMilion % growth p.a. Miion Share of totl (O % growth p.a.
Ccuntry 1970 1980 1990 1970s 199N 1970 1980 1990 1970 1980 1990 1970r 1980k
Cambodia 7 7 8 -0.3 2.6 0.8 0.7 1.0 11.7 10.3 12.0 -2.1 3.8Chin 818 981 1134 1.8 1.5 143.0 195.4 294.8 17.5 19.2 26.0 2.6 4.2lndoneda ItS 148 178 2.4 1.8 20.0 33.5 56.3 17.1 22.2 30.5 5.1 S.IKorea (Rcp. o) 32 38 43 1.8 1.1 13.0 21.7 30.8 40.7 S6.9 72.0 5.3 3.5Lao PDR 3 3 4 1.6 2.6 0.3 0.4 0.8 9.6 13.4 18.6 S.1 6.1Mulaymia I 1 14 18 2.4 2.6 2.9 4.8 7.7 27.0 34.7 43.0 S.0 4.9Mongolia 1 2 2 2.6 2.8 0.6 0.8 1.1 45.1 51.3 S2.0 3.9 2.9Myanm" 27 34 42 2.2 2.1 6.2 8.1 10.3 22.8 24.0 24.8 2.8 2.4Papua Now GuIn 2 3 4 2.4 2.5 0.2 0.4 0.6 9.8 13.1 IS.8 5.3 4.SPhiippIues 38 48 61 2.S 2.4 12.4 18.1 26.6 33.0 37.4 42.6 3.8 3.8 tAThaIlad 36 47 56 2.7 1.8 4.8 8.1 12.6 13.3 17.3 22.6 5.4 4.6Vic NCDI 43 54 66 2.3 2.1 7.8 10.4 14.6 18.3 19.3 21.9 2.9 3.4
Sources: WDR; ANDREX: United Natio 1991.

Social Indicators by Country:13. Income Distribution, 1970s, 1980sPercentage share of household income, by percentile group of households
[- 1990 GNPL________________I |Lowest Second Third Fourth Highest Olni per capitaCountry | Year 20% 20% 20% 20% 20% coeff ICPS
East AsiaChina (se table overlean 0.29 1950Indonesia 1976 6.6 7.8 12.6 23.6 49.4
1987 8.8 12.4 16.0 21.5 41.3 0.32 2350Philippines 1970 5.2 9.0 12.8 19.0 54.0 0.49
1985 5.5 9.7 14.8 22.0 48.0 0.46 2320Malaysia 1973 3.5 7.7 12.4 20.3 56.1
1987 4.6 9.3 13.9 21.2 51.2 5900Korea 1976 5.7 11.2 15.4 22.4 45.3
1980 a/ 5.1 11.0 15.9 22.6 45.4 0.39 t1988 a/ 7.4 12.3 16.3 21.8 42.2 0.34 7190
Thailand 1975 5.6 9.6 13.9 21.1 49.8 0.48 4610..................... ..........
~~~ . .~~~~............'9 r
OECD countrimJapan 1969 7.9 13.1 16.8 21.2 41.0
1979 8.7 13.2 17.5 23.1 37.5 16950Netherlmnds 1967 6.5 11.6 16.4 22.7 42.9
1981 8.3 14.1 18.2 23.2 36.2 14600Sweden 1972 6.6 13.1 18.5 24.8 37.0
1981 8.0 13.2 17.4 24.5 36.9 16000Germany 1973 6.5 10.3 15.0 22.0 46.2
1978 .9 12.5 17.0 23.1 39.51984 6.8 12.7 17.8 24.1 38.7 16290
UK 1973 6.3 12.6 18.4 23.9 38.81979 5.8 11.5 17.0 24.8 39.7 14960
US 1972 4.5 10.7 17.3 24.7 42.81980 5.3 11.9 17.9 25.0 39.91985 4.7 11.0 17.4 25.0 41.9 21360
MINE ....... _":'.l- :1:11194Source: WDR 1992.a/ Economic Planning Board.

Note: FPor indkative purpos only, applying tho Income distribution patterns to average UNPa per capita resultin th following GNP per capita distribution:
Lowest Second Third Fourth HighestiCountry | 20% 20% 20% 20% 20% Average |
US$/ICP$ per capitaIndonesia 250/1022 353/1444 455/1161 613/2507 117714814 570/2330Philippines 2001635 35411126 501717 103/2553 175VS571 73012320Malaysia 534/1335 1079/2691 161V4030 2459/6148 5939141414 2320/5900Korea 1993n657 332/4417 4401/5153 5886/7828 11394115154 5400/7190
China, Income Distribution, 1981-90
Rural a/ UrbanIncome In Percent Populatlon Income in Percent Population1990 Yuan 1981 1990 1990 Yuan 1981 1990
<200 5% 4% <700 25% 9%200-300 16% 10% 700-840 20% 6%300-400 24% 15% 840-1200 40% 26%>400 56% 71% 1200-1440 10% 19%
>1440 5% 40%Poverty llne Poverty linein 1990 Yuan: 320Y 275Y in 1990 Yuan: 350Y 320Y
Source: Income distribution in current prices from SSB converted to constant 1990 prices.a/ From Cluangxl province.

Social Indicators by Country:14. Country Rankings by Social Indicators, 1990
by Life by Infant by Ciuorla by by Mult by PovwuICounY IBEiPenCY Modality per Capia Urbdankaion Lieracy Growth I
Kore (Rep. of) 70 1.7 2S52 72.0 96 1.2Mdaysit 70 1.6 2774 43.0 73 2.6ChIba 70 2.9 2639 26.0 73 1.3Th aiad 66 2.7 2316 22.6 93 l.SMogolua 63 6.2 2479 S2.0 94 2.7PhilIppis 64 4.1 237S 42.6 90 2.6lndonms 62 6.1 2730 30.5 77 2.0Vie Nam 67 4.2 2233 21.9 88 2.2Myanmar 62 6.4 2440 24.8 81 2.1Papua Now Oubne 55 5.7 2403 15.8 52 2.3Lao PDR S0 10.3 2630 18.6 (50) 2.6Cambodia Si 11.7 2166 12.0 35 2.6
Index numbers compared to top ranidng country. a/
Kore (Rep.of) 100 94 100 100 100 100Malaysia too 1 97 60 81 46Cblna IOD SS 93 36 76 99Thaiand a9 S9 81 31 97 67Mongolia 90 27 87 72 93 44PhDippInes 87 39 83 S9 94 46Lndoneia 338 26 96 42 80 77Vie Namn 90 38 78 30 85 55Myanmar 87 2S 86 34 34 57Papua Now ulnes 79 28 34 22 54 52Lao PDR 70 i6 92 26 (S0) 46Cambodia 71 - 76 17 73 46
Source: UN, World Bank.A/ Por each socl Indkator, the bed value (the lowed, for infant mordity and for population growth;
the hinhed, for others) b equated to 100, and odhrs are convere proportooately.() Tenblivo.

Social Indicators by Country:15. Improvement in Social Indicators, 1990:1980
UrbanLifo Infant Calories Populaton Adult ONP per Poverty
Country Expectancy Mortaity per Capita Share Literacy Capita icidence
Cambodia - - 1.05 1.20 - - -Chin 1.04 0.70 1.13 1.33 1.06 1.98 0.36Indoneia 1.13 0.61 1.14 1.37 1.15 1.46 0.52Korea (Rep. of) 1.04 O.S3 1.01 1.27 1.03 1.95 0.50Lao PDR 1.11 0.81 1.09 1.39 - -
Malaysia 1.04 0.53 1.02 1.24 1.30 1.40 0.22Mongolia - - 1.04 1.30 1.02 -
Myanmar 1.09 0.76 1.04 1.03 1.22 -
Papua New Guinea 1.08 0.73 1.04 1.20 1.62 1.02PhillippInes 1.05 0.79 a/ 0.98 1.14 1.08 0.96 0.70Thaiand 1.06 0.61 1.01 1.31 1.06 1.66 0.94Viet Nam 1.06 0.74 1.09 1.13 1.01 _
Source: Derived from oter Annex tables.a/ Receat data suggest no improvemaent.* Unweighted.

Public Expenditure on Health and Education, by Country:
16. Health and Family Planning Public Expenditure, 1989
Health Family Planning%of % of tou US$per of f
US$ pet government % of ipWendg contracopdg public health % of % externa coiitaceptlvcowtubp capita expendfturo GNP on heath a/ woman bi expenditure byNP funded cC rly
ChIna 2.9 4.2 0.8 70 1.1 8.0 0.07 5.8 to0I1do.ealh 4.5 3.P 0.9 38 6.3 19.6 0.13 45.8 soKorea (Rtep. of) 29.7 2.2 0.6 12 4.4 2.2 0.02 4.1 62LAo PDR 3.0 4.9 2.0 - - - - - -
?daylsa 55.4 6.2 2.7 77 6.3 1.5 0.02 5.5 56Myanmar 4.4 6.8 1.1 34 - - - - -
Papua New Uuia 30.1 10.0 3.4 90 _ - - - -
PhilIpplaes 4A 3.3 0.6 27 2.2 14.5 d/ 0.03 dl 44.0 70Thailand 13.6 6.1 1.1 30 2.4 4.1 0.03 17.3 83 A
Viet Nam 0.8 3.3 0.7 35 1.3 5.4 0.05 16.6 60
Sources: UN Population Division; Woeld Bank BESD database; Population Isucs in Asia, 1992.a/ From Health Sector Financing In Asia, years 1985-87.b/ Own appoximto estimate, from family planning expenditure, women In target age-group, percentage contracepting (1986) and government share of contaceptive supc/ Total public spending on family planning progrms includes external financing channeled through the government but not through NGOs.d/ 1988.* Unweighted.

Public Expenditure on Health and Education, by Country:17. Health per Capita Spending, 1980s(in US$)
Bygovernment most recont By % by govinmentmiCaunt y 1980 i year govetnment Private Insurance Total Toid Contra Olher
Cambodia - - - - - - - - -China 2.52 1987 2.13 3.42 5.49 11.04 19.3 0.8 18.5Indonesia 3.70 1986 3.90 6.20 0.32 10.42 37.4 31.0 6.4Korea (Rep. co 8.62 1986 17.87 97.16 32.63 148.30 12.1 4.9 7.2Lao PDR - - - - - - - - -Malaysia 36.84 1983 44.97 13.49 0.04 58.51 76.8 72.7 4.1Mongolia - - - - - - - - -
Myanmar _ - - - - - 34.0 - -Papua Now Guinea 12.22 1986 23.68 2.37 0.12 26.18 90.5 39.1 51.4Philippines 3.73 1985 3.76 9.77 0.56 14.09 26.7 22.8 3.9 AThaiiand 6.37 198S 9.94 22.66 0.20 32.79 30.3 30.3 0.0Viet Nam - - - - - - - -
Source: Hoalth Sector Financing in Asia, 1990.

Public Expenditure on Health and Education, by Country:18. Education Public Expenditure, 1980-90
t E~~~~rducation Pnimuy Eductin %ofCelr US$pe Sof l of Nb. SpmlWng Unit OperuIng Eq*Mlau USS
. Oov't Expenditume %ofGoNP Capta GNP anoEducatos Coa lu% f puPpIlCoumfsy 191"0 1990 1980 1990 1990 19 19S GNP p copis 1915
China 13.0 - 2.8 - 1.3 40.6 6.7 22Indo_aa 8.4 - 1.7 9.7 2.2 61.1 12.6 66Koea (RP. 01) 17.9 19.6 3.4 3.1 167.4 1.9 S7.1 16.5 321Lao PDR - - - - - - - - _MAaysa 15.9 - 3.8 - - 2.2 37.4 14.1 271MonlaS _ _ _ _ _ _ _ _-Mynmar - 16.8 - - - - - - _Papua New Guls. 17.7 15.3 6.3 4.4 37.8 3.1 44.8 29.0 200PhIliin 14.2 16.9 I.8 3.3 24.1 1.2 64.0 5.8 33Thaiand 19.3 20.1 3.6 3.0 42.6 2.1 so.I IS.5 124Vid Nam - 17.2 - 2.0 2.3 - _ _
Source: Educatib in Asa, 1992.* Unw.ge4hd.

Public Expenditure on Health and Education, by Country:19. Indicative Public Financing of Health Services and Primary Educadon
Health Ramiy Educatias US$
Couny I (1939) Planninga/ (1985) Total | pita
I- --_- -- %ofGNP-----------
Chin 0 .8 0.07 1.3 2.1 8indoeaa 0.9 0.18 2.2 3.1 ISKorea (Rep. o) 0.6 0.01 1.9 2.S 135Lao PDR 2.0 - - - -MalAySIa 2.7 0.04 2.2 4.9 114MyamW 1.1 - - - -PauNow Oule 3.4 - 3.1 6.5 SSPhillppin 0.6 0.09 1.2 1.8 13Thaid 1.1 0.0S 2.1 3.2 45ViNnam 0.7 0.04 _- -
Soue: Dtived from othr Amn tablea.a/ udd in H h.

20. Projected Increases, 1990-2000(%)
-County - -ulatlon Women School age ICOUA!!2 I PopuIatkm aged 15-49 chgdren UrbanizatonI
Cambodia 25 10 13 -China 14 11 31 61IndonesIa 17 24 2 S3Korea (Rcp. o) 9 9 -8 23LaoPDR S0 30 53 75Malaysia 22 27 14 47Mongolia SO - - -
Myanmar 21 28 20 41Papua New ulneA 2S 27 30 67PhilIppina 21 30 -2 42Thailand 14 22 -8 48Vet Nam 24 34 14 53
Sources: United Nations 1991; WDR.* Unweighted.

21. Official Development Assistance: Disbursements, 1990
Per Capita Total GNP Per CapitaICounty USS USS MiUlon % of GNP USS
Cambodia 4.9 42 - _China 1.8 2,076 0.6 370Indonesla 9.7 1,724 1.6 570Korea (Rep. of) 1.2 52 0.0 5,400Lao PDR 36.6 152 17.5 200Malaysia 26.3 469 1.1 2,320Mongolia _ _ Mynmr 4.1 170 0.8 _Papua New Guina 96.1 376 11.4 860Philippines 20.8 1,277 2.9 730Thaiand 14.4 805 1.0 1,420Viet Nam 2.9 190 2.1 -
Source: World Developmeat Report IM.

64
BIBLIOGRAPHY
China Goverment, 1991 Stadistcal Yearbook, Beijing: State Statistical Bureau of the People'sRepublic of China.
Griffin, Charles C. (1990) Health Sector Financing in Asia. Intemal Discussion Paper 68,Washington D.C.: World Bank.
Hakim, Guillermo (1991) Economic Recovey and Poverty Alleviation: The Case of the Phili2ines1985-1988, Processed, Washington D.C.: World Bank.
Hammer, Jeffrey, Ijaz Nabi, and James A. Cercone (1992) Distributional Imnact of Social ScExpenditures in Malaysia. 1973 to 1989, World Bank Conference on Public Expenditures andthe Poor: Incidence and Targeting, Washington D.C.: World Bank.
Indonesia Government, 1989 Statistical Yearbook, Jakarta.
Ingram, Gregory (1992) Social Indicators and Productiviq Convervence in Developing Countries.Working Paper Series # WPS 894, Washington D.C.: World Bank.
Mingat, Alain, and Jee-Peng Tan (1992) Education in Asia: A Comparative Study of Cost andEinancing. World Bank Regional and Sectoral Studies, Washington D.C.: World Bank.
Philippines Govermnent, 1991 PhilipDine Statistical Yearbook Manila: National StaisticalCoordination Board.
Philippines Government (1992) Working Paper on Povery Determination. Preliminary Version,Processed, Mamila: National Statistical Coordination Board (NSCB), Technical WorkingGroup (TWG).
Sanderson, Warren, and Jee-Peng Tan (1992) Population Issues in Asia: Context. Policies andProM=, Processed, Washington D.C.: World Bank.
Ihailand Government, 1989 Statistical Yearbook. Bangkok: National Statistical Office.
United Nations Development Programme (UNDP) (1990) Human Development Report 1990 NewYork: Oxford University Press.
World Bank (1980) Thailand: Income Growth and Poverty Alleviation Washington D.C.: WorldBank Country Study.
World Bank (1990) Indonesia: Segy for a Sustained Reduction in Poverty Washington D.C.:World Bank Country Study.
World Bank (1991) World Development Report 1991: The Challenge of Develo nent Washigton,D.C.: Oxford University Press for the World Bank.
World Bank (1992) World Devonment Report 1992: Development and the Environment.Wash_igton, D.C.: Oxford University Press for the World Bank.
Wodd Resources Instiue (1992) World Resources. 199293. New York: Oxford University Press.

Distributors of World Bank PublicationsARGENTINA The Middle Eat Obum KENYA SOUTH AFRCA. OTSWANACarla HIdtcSRL 41,Sl,nfrStrAt A Md kloolSkvla%J Ltd. Forsya ilbeCGlu Grum Cairo Quaran Hous. M tuianga Steet Oxifd UniiSty PimRorbd 165M4th Floc-c 453/465 PO Boa 4524S SaurrnIdAn1333 Bunas Aim FINLAND Nairob PO DoX 1141
Akalernmna Klrjatcuppa CapeTown5000AUSTRALIA. PAPUA NEW GUINEA, P.O. BSo 128 KOREA. REIIUUC OFFIJI SOLOMON ISLANDS. SF40101 Helmnkd 10 Pan Keam Bek Cor,patmn For radhcytku a.s:VANUATU. AND WESTERN SAMOA PO. aoX 101. Kwanwvbamun Inotrattanal Subshipthmn SavteDA. Boaks & jounal FRANCE Saul P.o. Box41b¶645 WhiSehore Red World Bank PuhbirAeona CragitltMicanm 3312 66 avenued-Iha MALAYISA johmnnmau2,124Vktrla 75116 Pam Unlusity of Mlay. Caopwdtlw
Booakhop, Limitd SPAINAUSTIUA GERMANY ROP lax 1127.I" PantiBPnr Mundl,-PornaeLUw S.A.CeldG an CI. UNO-Verla 59700 Kuaxb Lumpur Castilo37Crabenm3 Pappesdorer AJlIe55 2001 MadfldA-1012 Wien D-SIOO BanP I MEWICO
INICIEC LixwU InteuwadanalAEDOSB-ANCLADESH HONC KONC. MACAO Aprtldo Potsftl -84160 CrnnatdeCent39lMiacr IndueteDevelopment Asa 200 LWd. 14060Tlalpn.MiCo Dr. 03009 Ilmctona
Aslaance Scatty ObIIDAS) 4648 Wyndarm SbtusHourw S. RoDI 16 WInning Cent. NEIHERLANDS SRI LANKA AND THE MALDIVESDhanmandi It/Arm 2nd Floor De Lrdeboom/InOu-Pubbfftim Las Hrowa BoomhpDhaka 19 Central Hong Kong ROL Box 20 P.O. BOX 244
740AEH Hakberqen IW. Sir Chittampalla A.Bxrandiefq I.,DIA CardinWrMwstha156.NurAhm dSarSk Allied Publishe Pnwxte Ltd. N;3'ZEALAND CnlombzoChittagong40W 751 Mount Road EBSCO NZ Lid
Madras -6C 002 PrIvate Mal Bag99914 SWEDEN76. D.A. Avenue Nr Mxrat For sik remK..-a 9100Bq ho alms: Auiland Fnmfidubakioentag2e
IS 1.1. Hmed ia Ma;u Rigwxppmn 12. BaOm 1156BELGIUM Batlhd Estat NIGERIA S-103IC SeduiolnJan De Lanqa Bobaf - 4G0 035 Uasy P LirmitrdAv. du Roi 202 Thmb Crowns Buddlog lJ-ho Farhmhyw.adeurr1060 Bnrds 13/14 AM Ali Road Ptr,le Mail BagSUS Wwenerlpn.WaiamsAB
New Deh -110 002 bnride P. O. B" 13LSCANADA S-1712 SoIr&La Diffiutur 17 Cluttranran Avenue NOCRWAYCF.P5. 150111rueAspire Cakut - 70 072 Nare tnfommation Catw SWrFlELANDBouche"Ulk,Qubec Boak Depaxnat F rte14BSE6 Jayedeva Hosl Building PO. Box 612S Etarsad l.rlnnePayot
5th Main Road, Canidhsagsr N460 Oslo 6 1. rLed. ourCHILE Bangslose-S60 00 03410 IOM sneInverti lCr SA. PAK1STANAmescoeVpucio Norte l65 3-5-1129 Kaciguda MixBaloakAgencY Forinba*uties areSanSga Cro-s Road 6SShahraho(ad-,Azmn Ltbraui. Payot
H4yd erubad -5SW0027 P0.QBo No. 729 Savior doAboasaishbCHINA Lahmw b540W Case poa_e3312Chib Rmandl & tcanomie Parduan Rle. 2nd Roar Cm IOnsmrn
Pub lHin H .Ner mhaimol Bgu. Niassgpurs PERU8. Da Fo S Dan;g IW Ahmndabad - 310009 Edilrta Denlle SA TANZAIABel11d Apartdo3824 Oxdrrd Univetty PIe
Pearls HOUse LEMme P.O.1kn So2COLOMUIA I1AAshokMar;s Mxakna RoadInfocel Lads- Lucknow -726001 PHILIPPIICS Dar "SaSemnAparmdeomo3l70f Isnetiodn Boak CentwBrog DCE Cntal Bazaar Road Suit 17203 Otyazu 10 THAILAmu
60 Eajaj Napr Condonuntum Tower 1 Canl DepmantStareCOTS DIVOIRE Jagpur440010 Aysl Aveme Corner H.V. data 306 Silom RoadCentr dEC;tlon atde Diffusior Extension BSmogik
Afrlcats(CEDA) INDONESIA Mahatt&Mebo Manisa043.P.541 Pt Indir Liunied TRINIDAD & TOBACG ANTICUAAbidjan 04 PL6u la-bn Sorabudur it POLAND BARWDA. BARBADOS.
P.O Box 161 Inttional PubaW Or Suwe DOMaCA. GRENADA. GUYANA,CYRUS jekara IM20 UL Ptekna 31/37 JAMAlCA.MON2aRUAT. ST.Car of Appled Ranrsc 00477 Warwa ITS & NEVlS ST. LuaA.CypsuasCG IRELAND ST. VINCENT & GRENADINES6 DtoemStt Sgoad GovennotSupplinAgency ForWSUinjIIkn Systimo Studio UnItP.Q B1=2006 4-5 Haurte Road 'SJiocuna 89 WattSb wat
owat Dub>in 2 ULOkmna3 Curue02-916WArmawa Trinidad.West India
DEN WARK ISRAELSamfundaLiteatur Yoznot Litare Ltd. PORTUCAL TJRKEY&osenuAtl* 11 P.O. BoxS6SS Livanria Portugl IrltDK-1970 Fued.iltgC Tt Aviv61560 Ra DoCarna 70-74 Narleliz Sok. No. 1S
1200 Lbon CagAgisuDOMINMCAN REPUBIUC ITALY LstnbulEdits TaLEr C porAU Lies COsmlionaS Oi SPA SAUDI ARABIA. QATARRfluracita lIsabelsCaGtilk1309 Via Ducs 01 Calabria. ll JurdirsooakStre UNIrED3WGDOMApfrdodeCorrae2i90Z-1 Casella Patsl.m52 P.Q Ox3196 kianIoLtd.Santo Domd 50125 FIrm Ripuiah 11471 P. Box:3
AltosH. p.1 c;=rCEGCPT,ARAB RElPBLICOF JAPAN SINCAPOREZTA1WAK EnglandAl Aham Eaern Book Sece MYAhMAB.ABRUNEIAl GalSm t Hango 3-Chome. Bunkyo-ki 113 Wof_umaian P:bhIct1mw VENEJEIACats Tokyo P da Lid Llbred dd Eta
GCide Whd hBul Aptd W3741, KaJna Pwddng dk Caie 1060-ASingapor 1334

Recent World Bank Discussion Papers (ion? icnrd)
Nil. 173 i71. !.icmw.rt.Lk Srator 1c II-strri lEurope (Catc'f O acdcr'lil l citU l)jlaa IrtnI rcfc I . ( iIIl C I 1% LIC 1 l.i.iia Iarclt t Slii lilt ir \': .11
VeCiI .-cnd Karti lrnrok%
NrJ. 174 . Orve llvIo nenr Fccina.e Iftiir ' -1fon .A I 'n/tic. ar rc.g -1 ci.ii na I.iotli Y.cr.i
No. 175 Ritran.' .t 1 Alanai-ainccr and AI mr.a! Itint I Bulndu/n en d II 1f.-li ain Salr N.adarap hli SIl.cn air an g.ar.cl 0.1
T rn nn VetiIul. A nice Mo-'' gc. ju! Mlctic Iv. iVn
No. M. I T ,. .anIdcic'afc S8itip R c'/.. l r. I .-I /a11,1n n/..al......ti.. ... j- .Rnm I: unul r/hly I)mI n.f I . L itua
Nt . 77 1 litR ft rgid.ai lic-llr ro n lr. Is idnan.iI .S !At1-7iprn ci ll i.l.t .1 C *tdi /.WI * n Slt 1. .h..."....... I1kOa )t (I eaid I;I I aiimt
N i. 173 C:hicnai. R414a1c1c1nar l4Irntrfgtac'.itni- I. ReLm,! .Loc.n I t1.IIIg.ma I Agarw.iLh
I-1) Nj.\ipopr 'I rJ1r d. '.rc.!I Strud.yc l : .cr bily / . ' .A .q l/. 1H.i 1 th -0u! 1* IM I ) :01'ia,la.1
NtI I-Nc;11 icil c.a*, u.j;'n;c lnvprmnt r to I).r I cter I Larrld!
Nt 181i8i u;n.Ai . II)SAl .'n . 11n 1 r.- 1.111, .% Te.ill) I r.lica.arrced Di.a........A.R. .w1)1.iill-. inI I'Fil .1/i 11a1 A d.cAL ilc .. i dir i1 'rid hank -1 nt.i. li.t.1I
Ije.c- ul-itt IA ndiii rtv .1lt1 A I -ldwa.rul I:dIcatmecdoirl
.4 I 82 1'.I ali,a1'i ikohl,ai .cR aIdtilatr}- I.el .i,/ l l I.ucLt c mra ( :er .il 1:u I- lr. liCetcI.II I IAISI a t 'It I' %SI
Nti. 1 83 Mmci ip.nor; 1 )lea m ory Drrholitprraind /cr i l' rl an i Mite.: rkl 1 )irrtl i leant a .ot I i lii u v.ti 1 ; :m11.111 .ctcr .11t ad A lirct t
WillumLl. vditorU
NJo. 184 .-jCndeuiltnral Rrejanhuin 11 4Sooiinl .:Ifiita: .1 limdlikii¶'Ik for .IAitiarc. Andrcw Sprtirliag. TcC.k Y. I'CC. ( ;.dIS-1 1M
M/imantanga. atid Chlristoplher Nkwa.nvanu
N'. I 85 Ah.Irzyim ixpcndi rcyE!l mtIac/Io iri Sy'rq'.tMindic anRr.rr.fir I. 11. 'ut -l:dEt-Deepn;aiIt ll 11R(;.I ji- ml' . L d v lilt
Valernacu Kallalb
Nti- 1 8 Effietcictact!.n Snb.l'waiiia', rcI Polln.uff'on A I'trilifrnc lctr (:.a. Sri. dccS .di)ecimiii AtiLder f.1l Aid WVl 1.11tiA2 1. .cW ash
Nio. 1 S7 lre .Stare ll/ l/dull! Gompri y: bnuc' and Op14ru -io. Anjaic Kumaar
N... 1.8S lndgcrttain 1 arrc ii handait d the Iinvronniimcn:. Shcltlna H. )Davi. editoir
Noi. IS'1J Poverty., lPioliraioct. .and ir/Ic l:cwir.incmerit StephIcni 1). Miak
No. 1, 13 I' Natral G;a! in h)Drrc!opnt (GtfIni rs: hi'as.i czf11 / i hi- B 1j 1 it is, ' !iht acEn ccrnrrt Joihcin I lonicr
Noa. 191 AppdrOpnriarc ctoIam Oi'ii"Ocmt l u ia (Jpam El/ain.liy. SadtIq AliticI
Noi. 1')2 lTeilccncnicnii-atioi,s: I U rld MBank IExpcrener alit! Srrauigy. lIjirca Wdleatmu antd others
NO. 193 hie,/inltiic Syrnc Sr151c SrsategicL h;lr li:alw Iccan.1ceal .Mth.Iltj,'ci'lct. Hydcl M. Dav.ive.. Ala Hahitii. .Hh tm LdtidE rdtua i ldalro
No. 194 Soc-ial Gainsifrio / Fcnair Eidriiarion: A CGrou,-.\a.ztntal Study. K. Suhbharao .and Laura Itaaev
No. 195 7ilwatrd/ -i Snstarinahl! l)ccvclopctcni. 77ec RiO tik bJrtcro ilStwiy. Editcd by Alcirac Krciiier. Thcrcz.a L.obo. IBr.az
Mcntc?cs. M hilaci Muiasiciglic. :mid 1 ot nald Pa'rkcr
NM. 196 E1astern L•nro:cc in lVanisiriace: I:r.omn RK es.01on to (;yrou.ith I' Pwreding t /1 o ;a Ciiflrrtvcc-e tnii ri/ic A.Iairiainotltit Ajrt a-
Adjimir ni. (Jaspc'rt3oird by ! hy IFMe .2h.c: au1a .locuerary In:dcc,, antid die lar/ i .1/tck ELtited En- Mario I. IlejeCr.Guillermo A. Calvo, Fabrizio Coricelli. cind Alan H4. Gcib
No. 197 Korean Induistial Pohl,: l:afeis. o'rhc PI.r'a amli DirrnicLs f3r icc Futuirr Danni M. Leipzigeracid PeterA I'ctn
No. 19$ ILEmrrccqti, lgh- Val/tic Fiod Gonrmodirics: Siteeess Sto:ariersacn Dcicclipine Coinurie. Stev-ai NA -atThe witl the
assstaiticc of Peter Gordon
No. 199 Borrourr Ouaieusihip ofAd4jstncect ProWracs arid :1lw Political Frontonv oy Refonn. Johic H. olilmsorn and Sulainian S. Wasty
No. 20X) Siidat b14strnani Corisrcuaorio in tile Sabld: Opriocrsfor hqnpoair! Curvn: h'raLtricas. Bermard Abeill andJcan-Marie Lanmran

The World Bank
Headquarten European Office Tokyo Offlice1818 H Szrect, N.W. 66. avenue d'ikna Kokusai Building HWashington, D.C. 20433. U.S.A. 75116 Paris. Francc I -I Marunouchi 3-chomc
Chiyoda-ku. Tokyo 100.JapanTclphonc: (202) 477-1234 Tciphonc: (1) 40.69.30.00Facsimic: (202) 477-6391 Facsimidc: (1) 40.69.30.66 Telephonc: (3) 3214-5001Tcicx: wui 64145WoEIUDUANK Telex: 640651 Facsimile: (3)3214-3657
kcA 248423 WORUJBK Tccx: 26838Cabic Addrcss: INTHAFRAID
WASHINGTONDC
ISBN 0-8213-2489-6