Absence of peripheral blood mononuclear cells priming in hemodialysis patients
Upload
independentCategory
view
3download
0
Kidney International, Vol. 56 (1999), pp. 306–317
Parathyroid function as a determinant of the response tocalcitriol treatment in the hemodialysis patient
MARIANO RODRIGUEZ, FRANCISCO CARAVACA, ELVIRA FERNANDEZ, MARIA J. BORREGO,VICTOR LORENZO, JUAN CUBERO, ALEJANDRO MARTIN-MALO, ANGELS BETRIU,ALEJANDRO JIMENEZ, ARMANDO TORRES, and ARNOLD J. FELSENFELD
Nephrology Services from the Hospital Universitario Reina Sofia, Cordoba, Hospital Infanta Cristina, Badajoz,Hospital Universitario Arnau de Vilanova, Lleida, and Hospital Universitario, Tenerife, and Department of Medicine,University of Lleida, Lleida, Spain; and Departments of Medicine, West Los Angeles VA Medical Center andUCLA, Los Angeles, California, USA
nificance but was positive (r 5 0.34, P 5 0.09). After CTRParathyroid function as a determinant of the response totreatment, serum calcium increased in both groups, and despitecalcitriol treatment in the hemodialysis patient.marked differences in basal PTH (Rs, 197 6 25 vs. NRs, 969 6Background. Bolus calcitriol (CTR) is used for the treat-85 pg/ml), an inverse correlation between ionized calcium andment of secondary hyperparathyroidism in dialysis patients.basal/maximal PTH was present in both groups (Rs, r 5 20.61,Although CTR treatment reduces parathyroid hormone (PTH)
levels in many dialysis patients, a significant number fail to P 5 0.001, and NRs, r 5 20.60, P 5 0.001).respond. Conclusions. (a) Dynamic testing of parathyroid function
Methods. To learn whether or not an analysis of parathyroid provided insights into the pathophysiology of PTH secretionfunction could further illuminate the response to CTR, a PTH- in hemodialysis patients. (b) The magnitude of hyperparathy-calcium curve was performed before and after at least two roidism was the most important predictor of the response tomonths of CTR treatment in 50 hemodialysis patients with a CTR. (c) Before CTR treatment, PTH was sensitive to calciumpredialysis intact PTH of greater than 300 pg/ml. in Rs, and serum calcium was PTH driven in NRs, and (d)
Results. For the entire group (N 5 50), CTR treatment re- after the CTR-induced increase in serum calcium, calcium sup-sulted in a 24% reduction in predialysis (basal) PTH from pressed basal PTH relative to maximal PTH in both groups.773 6 54 to 583 6 71 pg/ml (P , 0.001), whereas ionizedcalcium increased from 1.10 6 0.02 to 1.22 6 0.02 mm (P ,0.001); however, maximal and minimal PTH did not change
Since 1984, when bolus intravenous calcitriol (CTR)from pre-CTR values. Based on whether or not the basal PTHdecreased by 40% or more during CTR treatment, patients was first introduced as a treatment for renal hyperpara-were divided into responders (Rs, N 5 25) and nonresponders thyroidism [1], several studies have shown that bolus oral(NRs, N 5 25). Before CTR, the NR group was characterized
and intravenous CTR have similar efficacy in decreasingby a greater basal (959 6 80 vs. 586 6 51 pg/ml, P , 0.001)parathyroid hormone (PTH) levels in dialysis patientsand maximal (1899 6 170 vs. 1172 6 108 pg/ml, P , 0.001)
PTH and serum phosphorus (6.14 6 0.25 vs. 5.14 6 0.34 mg/ [2, 3]. However, even though treatment with CTR re-dl, P , 0.01). Logistical regression analysis showed that the duces PTH levels in many dialysis patients, a significantpre-CTR basal PTH was the most important predictor of the number of patients fail to respond to CTR treatmentpost-CTR basal PTH, and a pre-CTR basal PTH of 750 pg/
[2, 4, 5]. These failures have been ascribed to intrinsicml represented a 50% probability of a response. Basal PTHcorrelated with the ionized calcium in the NR group (r 5 0.59, factors associated with large, hyperplastic parathyroidP 5 0.002) but not in the R group (r 5 0.06, P 5 NS). In the glands such as nodular hyperplasia [6–8] and a decreaseR group, an inverse correlation was present between ionized in vitamin D receptor density [8, 9], and extrinsic factorscalcium and the basal/maximal PTH ratio, an indicator of
such as the failure to control the serum phosphoruswhether calcium is suppressing basal PTH secretion relative[2, 10, 11].to the maximal secretory capacity (maximal PTH) r 5 20.55,
P 5 0.004; in the NR group, this correlation approached sig- The PTH-calcium curve has been used to evaluate theeffectiveness of CTR treatment in several studies [2, 10,12–15]. Dynamic testing of parathyroid function providesKey words: calcium, hyperparathyroidism, parathyroid hormone, dial-
ysis. information on the maximal PTH response to hypocal-cemia and maximal PTH suppression during hypercalce-
Received for publication September 9, 1998mia, and these should be less affected by changes inand in revised form January 15, 1999
Accepted for publication March 1, 1999 serum calcium than the predialysis PTH. Thus, an analy-sis of these two parameters should provide a greater 1999 by the International Society of Nephrology
306

Rodriguez et al: Parathyroid function and calcitriol 307
understanding of the PTH response to CTR than only (Lleida). All patients were treated with CTR for at least2 months, and the mean duration was 3.07 months.the predialysis PTH level. In addition, other parameters
obtained during dynamic testing of parathyroid function Among the four hemodialysis units, the magnitude ofhyperparathyroidism and the serum calcium values weresuch as the set point of calcium and the ratio of basal
to maximal PTH, the latter reflecting the effect of serum similar in the Badajoz, Tenerife, and Cordoba hemodial-ysis units. When these groups were combined and com-calcium on basal PTH secretion relative to maximal
PTH, may help in understanding the pathophysiology of pared with the Lleida patients, the basal PTH (705 653 vs. 1078 6 143 pg/ml, P , 0.01) and the maximalPTH secretion in the hemodialysis patient.
This study was performed in 50 hemodialysis patients PTH (1414 6 105 vs. 2088 6 362 pg/ml, P 5 0.02), aswell as the serum calcium concentration (1.08 6 0.02 vs.in whom the PTH-calcium curve was obtained before
and after treatment with bolus CTR. The goals of this 1.21 6 0.04 mm, P 5 0.001), were greater in the Lleidapatients.study in hemodialysis patients with secondary hyper-
parathyroidism were to determine whether or not (a) an During CTR treatment, the dialysate calcium concen-tration was maintained at 2.5 mEq/liter. All patients wereanalysis of parathyroid function would aid in understand
the response to CTR treatment and whether (b) the dialyzed for 12 to 14 hours per week and had Kt/V valuesgreater than 1.2. In the four hemodialysis units, the dialy-predialysis serum calcium level affected PTH secretion
differently in responders (Rs) and nonresponders (NRs) sate bicarbonate concentration was 35 or 36 mEq/liter,and the dialysate magnesium concentration ranged fromboth before and after CTR treatment.1 to 1.5 mEq/liter. The serum aluminum concentrationwas monitored during the study and was less than 35 mg/
METHODSliter in all patients.
Fifty hemodialysis patients from four hemodialysis As has been described previously [10, 17, 18], to deter-units in Spain were studied before and after treatment mine maximal PTH secretion and suppression, low (1with CTR. These hemodialysis units were in Badajoz mEq/liter) and high (4 mEq/liter) calcium hemodialyzes(N 5 19), Tenerife (N 5 9), Lleida (N 5 9), and Cordoba were performed on separate days within one week. These(N 5 13), and the study was approved by the Human studies were performed immediately before and afterStudies Committee at the four hospitals. Although some CTR treatment. Before CTR treatment, three patientspatients were included in previous reports [16, 17], this did not have high calcium studies, and two of these samestudy differs because the detailed analysis of parathyroid patients did not have high calcium studies after CTRfunction provides information on the pathophysiology treatment. From the data obtained during dialysis-of the PTH response to CTR treatment. The mean age induced hypocalcemia and hypercalcemia, the followingof the patients was 53 6 2 years, and the female/male criteria were applied: (a) Basal PTH was the predialysisdistribution was 32 and 18, respectively. The duration of PTH level. (b) Maximal PTH was the highest PTH levelhemodialysis at entry was 83 6 8 months and was not observed in response to hypocalcemia and which an addi-different among the four hemodialysis units. The primary tional reduction of the serum calcium did not furtherphosphate binder was calcium carbonate; in seven pa- increase PTH; the maximal PTH level was achieved intients, aluminum hydroxide was added when serum phos- all patients. (c) Minimal PTH was the lowest PTH levelphorus was not adequately controlled with calcium car- during suppression by hypercalcemia and which a furtherbonate. Patients had never received CTR or had not increase in the serum calcium did not result in any addi-received CTR for at least three months before study tional decrease in PTH; the minimal PTH level wasentry. achieved in all patients. (d) The basal serum calcium was
The criteria for receiving CTR were a basal (predial- the serum ionized calcium concentration at the basalysis) PTH level of more than 300 pg/ml. In two hemodial- PTH. (e) The ratio of basal to maximal PTH was theysis units (Badajoz and Tenerife), patients were ran- basal PTH divided by the maximal PTH; this fractiondomly assigned to receive either twice or three times was multiplied by 100, and in normal volunteers, it is 20weekly bolus oral or intravenous CTR. In the other two to 25% [19]. By correcting the actual PTH for the overallhemodialysis units, the patients entering the study re- capacity to produce PTH (maximal PTH), a measure ofceived twice or three times weekly bolus intravenous the relative degree of PTH stimulation is obtained. WhenCTR. Of the 50 patients enrolled in the study, 38 patients the basal calcium is low, the basal to maximal PTH ratioreceived intravenous CTR, and 12 patients received oral should be high, indicating that the parathyroid gland isCTR. PTH values were similar in patients who received using more of its overall capacity to correct the loworal and intravenous CTR (775 6 115 vs. 772 6 63 pg/ calcium. Conversely, a high basal calcium should be ac-ml, respectively). The mean weekly CTR dose was 4.03 6 companied by a decrease in the basal to maximal PTH0.14 mg, and the respective weekly CTR doses were 3.13 ratio. For an inverse correlation to be present between
calcium and the basal/maximal PTH, an increasing cal-mg (Badajoz), 4 mg (Tenerife and Cordoba), and 6 mg

Rodriguez et al: Parathyroid function and calcitriol308
Table 1. Parameters of the parathyroid hormone (PTH)-calciumcium must decrease basal PTH relative to maximal PTH.curve and serum phosphorus pre- and post-calcitriol treatment
However, for an inverse correlation to be present, it is in all patients and in responders and non-responders tocalcitriol treatmentnot necessary for basal PTH to decrease because maxi-
mal PTH could be increasing as basal PTH remains rela- All patients Responder Non-responder(N 5 50) (N 5 25) (N 5 25)tively constant. (e) The set point of calcium was defined
Ionized calcium mmas we have done previously [10, 13, 18] as the serumPre 1.1060.02 1.1060.02 1.10 60.02calcium concentration at which maximal PTH secretionPost 1.2260.22b 1.2760.03c 1.1760.02c,e
was reduced by 50%. The set point of calcium was also Phosphorus mg/dlPre 5.6460.22 5.1460.34 6.14 60.25bdefined by the method of Brown in which the set pointPost 6.5560.25b 5.8460.33d 7.2660.45c,e
is the midrange of the PTH-calcium curve [20]. Basal PTH pg/mlPre 773654 586651 959 680aThe patients were divided into Rs and NRs based onPost 583671b 197626a 969685a
whether the predialysis (basal) PTH value decreased byMaximal PTH pg/ml
40% or more in response to CTR treatment. This value Pre 15356112 11726108 1899 6170e
Post 13006187 599670c 20016312ewas selected because it represented the median for theMinimal PTH pg/mltotal group of 50 patients and also was the mean CTR- Pre 261630 206632 314 650
Post 238633 127619c 344654einduced decrease in PTH observed in a recent prospec-Basal/maximal PTH %tive study [2]. Because bolus oral and intravenous CTR
Pre 5262 5263 52 62have been reported to induce a similar reduction in PTH Post 4463c 3363c 5463e
Set point (50%) mm[2, 3] and, more importantly, because the results of aPre 1.1060.01 1.1060.01 1.11 60.03
chi-square analysis in this study showed that the response Post 1.1760.01b 1.1760.02c 1.1860.02c
Set point (mid-range) mmto CTR was not different between patients receivingPre 1.0860.01 1.0860.02 1.08 60.03bolus oral and intravenous CTR, the 50 patients were Post 1.1360.01b 1.1360.02c 1.1360.02c
analyzed as a single group.Data are mean 6 se.
Intact PTH was measured with an IRMA assay (Al- a Basal PTH post-calcitriol different by definitionb P , 0.001, c P , 0.01, d P , 0.05 pre- vs. post-calcitriollegro; Nichols Institute, San Juan Capistrano, CA, USA); e P , 0.01, f P , 0.05, responder vs. non-responder
normal values are 10 to 65 pg/ml. During the low- andhigh-calcium studies, serum-ionized calcium was mea-sured with a selective electrode in freshly obtained sam-
RESULTSples. At all other times, serum calcium as well as serumphosphorus was measured with standard laboratory tech- As shown in Table 1, CTR treatment resulted in in-
creases in the serum calcium and phosphorus and theniques.set point. CTR treatment also resulted in decreases in
Statistics the basal PTH and the basal/maximal PTH ratio. Maxi-mal and minimal PTH did not change during CTR treat-For comparisons between two groups before and afterment.CTR treatment, the unpaired or paired Student’s t-test
The patients were divided into R and NR groups basedwas used. The association between two variables wason whether or not basal PTH decreased by 40% or moreassessed by Pearson’s linear correlation. One-way analy-during CTR treatment. The respective changes in basalsis of variance was used for the comparison of three orPTH with CTR treatment were 2389 6 35 (R) versus
more groups, and the Duncan test was the post hoc test10 6 54 (NR) pg/ml; these were different by definition
used for intergroup comparison when the analysis of of the two groups. For the R (N 5 25) and NR (N 5variance (ANOVA) was significant. Chi-square analysis 25) groups, the mean age, duration of dialysis, and sexwas performed to determine whether the response to distribution were not different (56 6 3 vs. 49 6 3 years,CTR was different in patients receiving bolus oral or 70 6 12 vs. 96 6 11 months, and 7 male/18 female vs.intravenous CTR. Stepwise multiple regression analysis 11 male/14 female patients, respectively). Furthermore,was performed to determine which parameters best pre- the mean weekly CTR dose was not different betweendicted the basal PTH before and after CTR treatment. the R and NR groups (4.21 6 0.17 vs. 3.85 6 0.23 mg).Similarly, stepwise logistic regression analysis was per- As shown in Table 1, the pre-CTR values for the serumformed to predict which pre-CTR parameter best pre- calcium, basal/maximal PTH ratio, and set point weredicted a response to CTR defined as a treatment-induced not different for the R and NR groups. However, serum40 or 20% decrease in basal PTH. Results are shown as phosphorus, basal PTH, and maximal PTH were greater,the mean 6 se, and a P value of less than 0.05 was and minimal PTH tended to be greater (P 5 0.07) in
the NR group.considered significant.

Rodriguez et al: Parathyroid function and calcitriol 309
The maximal PTH correlated with the serum calcium inboth the R (P 5 0.02) and NR (P 5 0.05) groups. Thebasal/maximal PTH ratio was inversely correlated withthe serum calcium in the R group (P 5 0.004); conversely,in the NR group, the correlation was positive and tendedto approach significance (P 5 0.09). Finally, the minimalPTH correlated with the serum calcium in both the R(P , 0.001) and NR (P 5 0.02) groups.
The post-CTR treatment values for the R and NRgroups are shown in Table 1. In addition to the defineddifference for basal PTH, both maximal PTH and mini-mal PTH were less (P , 0.001) after CTR treatment in
Fig. 1. Logistic regression model to predict response to calcitriol treat- the R group. In the same group, serum phosphorus wasment. Stepwise logistic regression analysis showed that the precalcitriol
less (P , 0.01), and serum calcium was greater (P ,basal parathyroid hormone (PTH) level was the most important pre-dictor of the probability of a 40% reduction in basal PTH during 0.01). Associated with the greater serum calcium was acalcitriol treatment. Using the previously mentioned model, a 50% lower basal/maximal PTH ratio (P , 0.001). It shouldprobability of a response (40% reduction in basal PTH) was observed
also be noted that in the R group, the decrease in basalat a precalcitriol basal PTH value of 750 pg/ml. At a basal PTH of 1200pg/ml, the probability of a response to calcitriol was less than 20%, and PTH was greater (P , 0.01) than that for maximal PTHat a basal PTH of 400 pg/ml, the probability of a response approached and minimal PTH; moreover, the decrease in maximal80%.
PTH was greater (P , 0.05) than minimal PTH. Respec-tive values for basal, maximal, and minimal PTH withthe post-CTR value as a percentage of the pre-CTRvalue were 32 6 3, 51 6 3, and 64 6 6%, respectively.Stepwise logistic regression was performed to deter-
mine which parameters available before CTR treatment The change in the basal/maximal PTH ratio and inbasal, maximal, and minimal PTH values and thebest predicted a response to CTR. Pre-CTR calcium,
phosphorus, and PTH values (independent variables) rightward shift of the PTH-calcium curve produced byCTR treatment are shown in Figure 3. The basal/maxi-were used in the logistic matrix to predict a 40 or 20%
post-CTR decrease in basal PTH (dependent variable). mal PTH ratio that reflects the relative degree of para-thyroid gland sensitivity to the serum calcium decreasedFor a 40% decrease in basal PTH, the only significant
predictor was the pre-CTR basal PTH (P 5 0.013, odds in the R group from 52 6 3 to 33 6 3% (P , 0.001)after CTR treatment as the serum calcium concentrationratio 0.9965 for each 1 pg/ml decrease in basal PTH,
95% CI, 0.994 to 0.9986). The use of pre-CTR minimal increased (Fig. 3A). Conversely, in the NR group, thebasal/maximal PTH ratio did not change despite the in-or maximal PTH values instead of basal PTH did not
improve the predictive power. The probability of a re- crease in serum calcium and a similar shift to the rightof the PTH-calcium curve (Fig. 3B). The magnitude ofsponse to CTR based on pre-CTR basal PTH values is
shown for the model in Figure 1. A 50% probability of the absolute reduction in PTH in the R group (Fig. 3C)and the lack of a change in the NR group (Fig. 3D) cana response (40% reduction in basal PTH) was observed
at a pre-CTR basal PTH value of 750 pg/ml. At a basal be appreciated in the PTH-calcium curves shown in thesefigures.PTH of 1200 pg/ml, the probability of a response to CTR
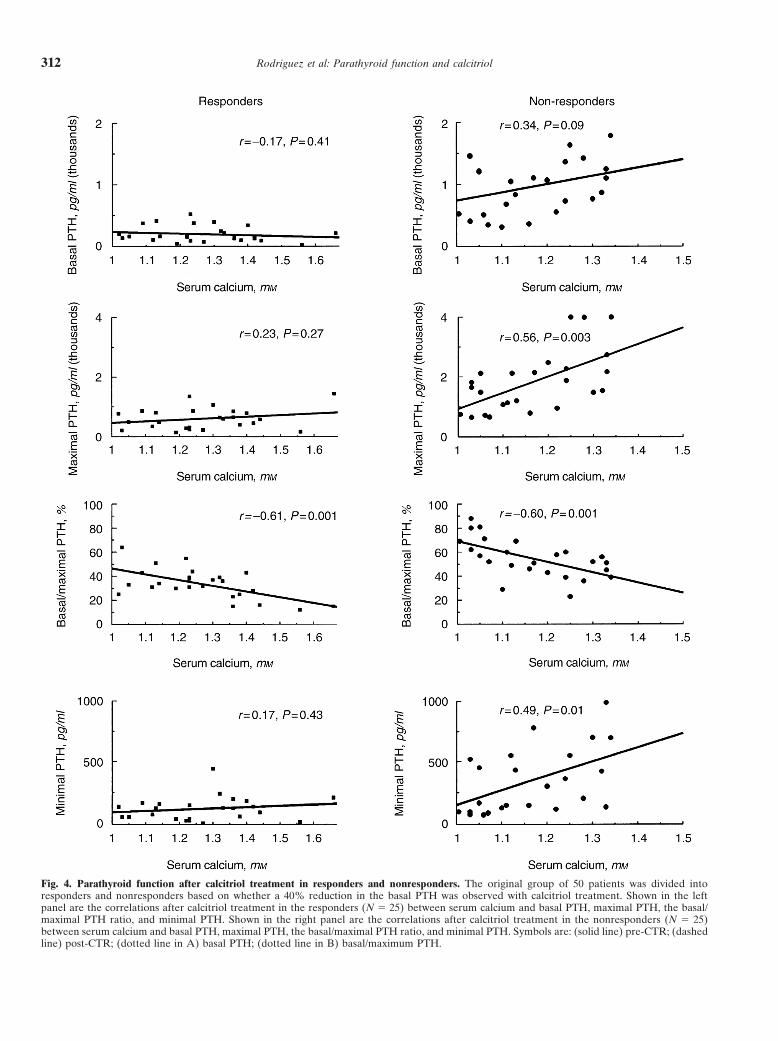
was less than 20%, and at a basal PTH of 400 pg/ml, the The post-CTR correlations between serum calciumand the PTH parameters are shown for the R and NRprobability of a response approached 80%. For a 20%
decrease in basal PTH, the only significant predictor groups in Figure 4. For the R group in which significantreductions in basal, maximal, and minimal PTH werewas the pre-CTR basal PTH level (P 5 0.02, odds ratio
0.9982). observed as a result of CTR treatment, the previouslysignificant pre-CTR correlations between calcium andBefore the CTR treatment, the predialysis serum cal-
cium concentration was highly correlated with the set maximal and minimal PTH were no longer present. Thecorrelation between serum calcium and basal PTH waspoint (50% and mid range) in the Rs [r 5 0.76, P ,
0.001 (50%) and r 5 0.70, P , 0.001 (mid range)] and essentially flat, as it was before CTR treatment. An in-verse correlation was again present between serum cal-NRs [r 5 0.88, P , 0.001 (50%) and r 5 0.86, P , 0.001
(mid range)] groups. By contrast, as shown in Figure 2, cium and basal/maximal PTH (r 5 20.61, P 5 0.001).Moreover, even though a marked post-CTR reductionseveral differences were observed between the R and
NR groups for the correlations between serum calcium in basal and maximal PTH was observed in the R group,the combining of the pre- and post-CTR groups showedand the different PTH parameters. A significant correla-
tion was present between serum calcium and basal PTH that the inverse correlation between serum calcium andbasal/maximal PTH ratio represented a continuum within the NR group (P 5 0.002) but not in the R group.

Rodriguez et al: Parathyroid function and calcitriol310
Fig. 2. Parathyroid function before calcitriol treatment in responders and nonresponders. The original group of 50 patients was divided intoresponders and nonresponders based on whether a 40% reduction in the basal PTH was observed with calcitriol treatment. Shown in the leftpanel are the correlations before calcitriol treatment in the responders (N 5 25) between serum calcium and basal PTH, maximal PTH, the basal/maximal PTH ratio, and minimal PTH. Shown in the right panel are the correlations before calcitriol treatment in the nonresponders (N 5 25)between serum calcium and basal PTH, maximal PTH, the basal/maximal PTH ratio, and minimal PTH.
Rodriguez et al: Parathyroid function and calcitriol 311
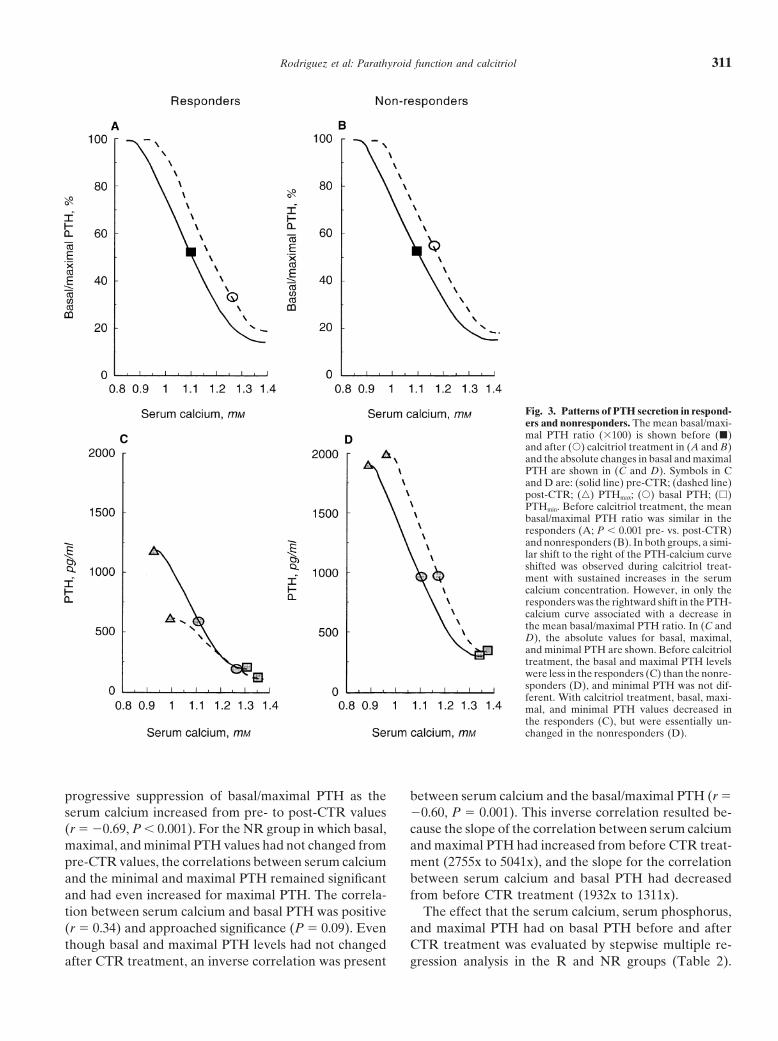
Fig. 3. Patterns of PTH secretion in respond-ers and nonresponders. The mean basal/maxi-mal PTH ratio (3100) is shown before (j)and after (s) calcitriol treatment in (A and B)and the absolute changes in basal and maximalPTH are shown in (C and D). Symbols in Cand D are: (solid line) pre-CTR; (dashed line)post-CTR; (n) PTHmax; (s) basal PTH; (h)PTHmin. Before calcitriol treatment, the meanbasal/maximal PTH ratio was similar in theresponders (A; P , 0.001 pre- vs. post-CTR)and nonresponders (B). In both groups, a simi-lar shift to the right of the PTH-calcium curveshifted was observed during calcitriol treat-ment with sustained increases in the serumcalcium concentration. However, in only theresponders was the rightward shift in the PTH-calcium curve associated with a decrease inthe mean basal/maximal PTH ratio. In (C andD), the absolute values for basal, maximal,and minimal PTH are shown. Before calcitrioltreatment, the basal and maximal PTH levelswere less in the responders (C) than the nonre-sponders (D), and minimal PTH was not dif-ferent. With calcitriol treatment, basal, maxi-mal, and minimal PTH values decreased inthe responders (C), but were essentially un-changed in the nonresponders (D).
progressive suppression of basal/maximal PTH as the between serum calcium and the basal/maximal PTH (r 5
20.60, P 5 0.001). This inverse correlation resulted be-serum calcium increased from pre- to post-CTR values(r 5 20.69, P , 0.001). For the NR group in which basal, cause the slope of the correlation between serum calcium
and maximal PTH had increased from before CTR treat-maximal, and minimal PTH values had not changed frompre-CTR values, the correlations between serum calcium ment (2755x to 5041x), and the slope for the correlation
between serum calcium and basal PTH had decreasedand the minimal and maximal PTH remained significantand had even increased for maximal PTH. The correla- from before CTR treatment (1932x to 1311x).
The effect that the serum calcium, serum phosphorus,tion between serum calcium and basal PTH was positive(r 5 0.34) and approached significance (P 5 0.09). Even and maximal PTH had on basal PTH before and after
CTR treatment was evaluated by stepwise multiple re-though basal and maximal PTH levels had not changedafter CTR treatment, an inverse correlation was present gression analysis in the R and NR groups (Table 2).
Rodriguez et al: Parathyroid function and calcitriol312
Fig. 4. Parathyroid function after calcitriol treatment in responders and nonresponders. The original group of 50 patients was divided intoresponders and nonresponders based on whether a 40% reduction in the basal PTH was observed with calcitriol treatment. Shown in the leftpanel are the correlations after calcitriol treatment in the responders (N 5 25) between serum calcium and basal PTH, maximal PTH, the basal/maximal PTH ratio, and minimal PTH. Shown in the right panel are the correlations after calcitriol treatment in the nonresponders (N 5 25)between serum calcium and basal PTH, maximal PTH, the basal/maximal PTH ratio, and minimal PTH. Symbols are: (solid line) pre-CTR; (dashedline) post-CTR; (dotted line in A) basal PTH; (dotted line in B) basal/maximum PTH.

Rodriguez et al: Parathyroid function and calcitriol 313
Table 2. Stepwise multiple regression analysis before and after sult in any differences in ionized calcium, basal/maximalcalcitriol (CTR) treatment with basal parathyroid hormone (PTH)
PTH, basal PTH, and maximal PTH values. Thus, atas the dependent variable and serum calcium and maximal PTHas the independent variables least based on absolute post-CTR values, differences in
serum phosphorus did not seem to be responsible forS-Estb R2 addc t value P valuedifferences between the R and NR groups. However, as
Responder group, pre-CTRa
shown in Table 3, when the effect of serum phosphorusYes Pre-CTR basal calcium 20.38 0.113 22.9 50.007Yes Pre-CTR maximal PTH 0.95 0.707 7.3 ,0.001 on the CTR-induced decrease in basal and maximal PTHNo Pre-CTR phosphorus 0.002 0.3 50.73 was evaluated, phosphorus appeared to have an effect.R2 5 0.71
Although the delta ionized calcium was greater in theNon-responder group, pre-CTRYes Pre-CTR basal calcium 0.31 0.08 2.8 50.01 R than the NR group, intragroup differences in serumYes Pre-CTR maximal PTH 0.71 0.432 6.5 ,0.001 phosphorus did not result in differences in calcium. AsNo Pre-CTR phosphorus 0.001 0.3 50.80
expected, the decrease in basal and maximal PTH wasR2 5 0.78Responder group, post-CTR greater in the R group. However, the results also suggest
Yes Post-CTR basal calcium 20.33 0.095 22.8 50.01 that in each group, phosphorus appeared to have anYes Post-CTR maximal PTH 0.86 0.698 7.5 ,0.001
independent effect. In the NR group, despite no differ-Yes Post-CTR phosphorus 0.14 0.018 1.2 50.24R2 5 0.73 ence in ionized calcium and delta ionized calcium, the
Non-responder group, post-CTR decrease in basal PTH was greater when the phosphorusNo Post-CTR basal calcium 0.011 0.8 50.44
was less than 6 mg/dl. The decrease in maximal PTHYes Post-CTR maximal PTH 0.77 0.587 5.7 ,0.001No Post-CTR phosphorus 0.009 0.7 50.49 also tended to be greater for the absolute (P 5 0.06)R2 5 0.59 and percentage (P 5 0.07) decrease in maximal PTH.a Indicates that the variable is in the equation In the R group, the subgroup with the lower phosphorusb The standardized regression coefficient
also seemed to have a better response. The percentagec The amount that would be added to or removed from R2 if this variable wereincluded in or removed from the model decrease in basal and maximal PTH was greater when
serum phosphorus was less than 6 mg/dl.
DISCUSSIONBefore CTR treatment in the R group, with basal PTHIn this study, PTH-calcium curves were performedas the dependent variable and basal calcium, phospho-
before and after CTR treatment in 50 hemodialysis pa-rus, and maximal PTH as independent variables, thetients. We evaluated whether information obtained fromserum calcium had a strong negative effect (P , 0.01),the PTH-calcium curve helped to understand the patho-and the maximal PTH had a strong positive effect (P ,physiology of PTH secretion in renal hyperparathyroid-0.001) on the basal PTH. The remarkable finding in theism and in the response to CTR treatment. The separa-NR group was that the effect of serum calcium was nottion of patients into R and NR groups resulted in distinctnegative but positive (P 5 0.01). The maximal PTH haddifferences between the two groups that were recogniz-a strong positive effect (P , 0.001) on the basal PTH.able before CTR treatment. Although an acute changeAfter CTR treatment in the R group, even with thein serum calcium produced reciprocal changes in PTHincrease in serum calcium and the reduction in all PTHsecretion during dynamic testing in both the R and NRparameters, the effect of serum calcium remained nega-groups, there was a remarkable difference in control oftive (P 5 0.01) and that of maximal PTH remainedPTH secretion between the R and NR groups duringstrongly positive (P , 0.001). After CTR treatment insustained changes in the predialysis serum calcium. Inthe NR group during which the serum calcium had in-the R group, a higher serum calcium resulted in a lowercreased but maximal PTH did not decrease, the effectbasal PTH relative to the maximal secretory capacityof serum calcium was no longer positive, and the effect(maximal PTH). Conversely, in the NR group, as theof maximal PTH remained strongly positive (P , 0.001).serum calcium increased, basal PTH increased evenBecause serum phosphorus was greater in the NR thanmore than maximal PTH, suggesting that basal PTHthe R group, it could have contributed to the failure tosecretion was poorly controlled by the prevailing serumrespond to CTR either by a direct effect on PTH secre-calcium concentration. Finally, as was shown in previoustion or by acting to minimize the increase in serum cal-studies [17, 18, 21, 22], CTR treatment in both the Rcium. To determine the effect of phosphorus, the R andand NR groups induced a sustained increase in serumNR groups were subdivided based on a post-CTR serumcalcium with a rightward shift of the PTH-calcium curve.phosphorus of 6 mg/dl (Table 3). Although basal PTH
Besides differences in the magnitude of hyperparathy-was different by definition, other differences were pres-roidism, the two groups were also characterized by differ-ent. Ionized calcium was greater, and the basal/maximalences in the PTH response to sustained changes in serumPTH ratio and maximal PTH were less in the R group.
Intragroup separation by serum phosphorus did not re- calcium. In the R group, the inverse correlation between

Rodriguez et al: Parathyroid function and calcitriol314
Table 3. Effect of serum phosphorus on the response to calcitriol treatment in responder and non-responder groups
Responder Non-responder
Phosphorus Phosphorus Phosphorus Phosphorus,6 mg/dl .6 mg/dl ,6 mg/dl .6 mg/dl(N 5 15) (N 5 10) (N 5 6) (N 5 19)
Post-CTRIonized calcium mm 1.2960.05 1.24 60.03 1.1560.04a 1.1760.03Phosphoruse mg/dl 4.6860.16 7.57 60.32 5.6260.16a 7.7860.37Basal/maximal PTH % 3163 37 64 4965a 5765b
Basal PTHf pg/ml 167625 241 654 8546138 10056103Maximal PTH pg/ml 577686 632 6122 17406241a 20846405b
Minimal PTH pg/ml 122619 125 642 4186113a 319662b
Difference between pre- and post-CTRD Ionized calcium mm 0.1560.04 0.17 60.04 0.0360.03a 0.0860.02b
D Phosphorus mg/dl 0.4160.35 1.12 60.44 0.0860.48 1.45 60.28c
D Basal PTHf pg/ml 2418644 2347657 22526104 92651bc
D Basal PTHf % 27263 26165c 22266a 1065bc
D Maximal PTH pg/ml 2658661 24446106 23826150a 2556298bd
D Maximal PTH % 25564 24165c 21865a 8613bd
Data are mean 6 sd.a P , 0.05 vs. Responder (Phosphorus , 6 mg/dl)b P , 0.05 vs. Responder (Phosphorus . 6 mg/dl)c P # 0.05 vs. Phosphorus , 6 mg/dl – same groupd P 5 0.06 or 0.07 vs. Phosphorus , 6 mg/dl – same groupe Phosphorus different between the two subgroups of Responders and Non-responders based on the definition of the subgroupsf Basal PTH different between the Responders and Non-responders based on the definition of the groups
basal/maximal PTH and serum calcium suggested that decreased more than the maximal secretory capacity(maximal PTH).sustained increases in serum calcium inhibited basal PTH
secretion relative to the maximal secretory capacity As schematically drawn for the R group in Figure 5,we suggest that changes in serum calcium can move the(maximal PTH). The result of the stepwise multiple re-
gression also supported this interpretation. Conversely, PTH-calcium curve in two directions, either primarilyvertically or horizontally. Acute changes in serum cal-in the NR group, a direct correlation was present be-
tween basal PTH and the serum calcium. Moreover, as cium produced rapid responses in PTH secretion in ac-cordance with the traditional concepts of the primarilythe serum calcium increased, basal PTH secretion tended
to increase even more than the maximal secretory capac- vertically oriented sigmoidal PTH-calcium relationship.However, as shown in Figure 3 and in previous studiesity (maximal PTH). Finally, stepwise multiple regression
also showed that the effect of calcium was positive. Thus, [17, 18, 21, 22], sustained changes in serum calcium shiftthe PTH-calcium curve horizontally in the direction ofbefore CTR treatment, a sustained increase in the serum
calcium seemed to inhibit basal PTH secretion in the R the change in serum calcium. In such shifts of the PTH-calcium curve in which new steady-state conditions pre-but not in the NR group. Furthermore, in the NR group,
the situation may be analogous to primary hyperparathy- vail, a leftward shift increases and a rightward shift de-creases the basal/maximal PTH ratio. This shift of theroidism in which it is considered that PTH is driving the
serum calcium, even though an acute calcium infusion serum calcium to a new steady state results in calciumhaving an effect on basal PTH secretion, but to a consid-rapidly decreases PTH secretion [23–27].
Calcitriol treatment together with the increases in se- erably lesser extent than that produced by acute changesin serum calcium.rum calcium markedly reduced basal, maximal, and mini-
mal PTH values in the R group. The inverse relationship As has been shown in previous in vitro [28–30] and invivo [31] studies, an elevated phosphorus could directlybetween basal/maximal PTH and the serum calcium was
maintained post-CTR treatment and suggests that in the affect PTH secretion. After CTR treatment in both the Rand NR groups, basal PTH values were only marginallyR group, calcium continued to inhibit basal PTH secre-
tion. The results of the stepwise multiple regression also lower in patients with serum phosphorus values of lessthan 6 mg/dl. However, when factored for serum phos-serve to support this conclusion. In the NR group, CTR
treatment did not change the basal, maximal, and mini- phorus and shown as the decrease from pre-CTR values,the decrease in basal PTH was greater in both the Rmal PTH. Nonetheless, an inverse correlation, which was
not present before CTR treatment, was observed be- and NR groups in the patients with the lower serumphosphorus. This effect of phosphorus was observedtween the basal/maximal PTH and serum calcium. Thus,
as the serum calcium increased, basal PTH secretion even though the absolute and delta serum calcium values

Rodriguez et al: Parathyroid function and calcitriol 315
only one factor of which the most important seems tobe the magnitude of hyperparathyroidism.
Although our study was solely a clinical study, thedistinct differences in parathyroid function and the re-sponse to CTR between the R and NR groups suggestthe likelihood of differences in parathyroid gland size[32] and pathology between the two groups. It is knownthat the most severe hyperparathyroidism in dialysis pa-tients is associated with nodular hyperplasia of the para-thyroid gland [6, 7, 33–35]. As compared with diffusehyperplasia, nodular hyperplasia is characterized by agreater parathyroid gland mass [7, 33–35], a moremarked decrease in vitamin D receptor density [8], agreater parathyroid cell proliferative capacity [36], thedevelopment of recurrent hyperparathyroidism afterparathyroidectomy [7, 36–39], an abnormal release ofPTH [40, 41], and the suggestion that parathyroid cellsfrom areas of nodular hyperplasia may be monoclonalin origin [42, 43]. In this study, it would be expectedthat in the NR group, especially in those patients withhypercalcemia and marked elevations in basal and maxi-mal PTH levels before CTR treatment, nodular hyper-plasia would be the predominant pathologic lesion.
In conclusion, this study shows that (a) even beforeCTR treatment, distinct differences in parathyroid func-tion were present between the eventual Rs and NRs.(b) Dynamic testing of parathyroid function provided aphysiologic framework that helped to understand theresponse of hemodialysis patients to CTR treatment. (c)Fig. 5. Schematic representation of changes in parathyroid function
before and after calcitriol treatment in responders. A schematic repre- The magnitude of hyperparathyroidism was the mostsentation of the changes in the PTH-calcium curve is shown before
important predictor of the response to CTR. (d) In NRs(solid line) and after (dashed line) calcitriol treatment in the respondergroup with PTH in (A) in absolute values and (B) as a percentage of to CTR, serum calcium was PTH driven. (e) In Rs tomaximal PTH. The figure is drawn to show that in both (A and B), the CTR, basal PTH secretion was sensitive to serum cal-PTH-calcium curve moves both vertically at various serum calcium
cium. (f ) The basal/maximal PTH ratio functioned as anconcentrations in the classic sigmoidal PTH in response to acute changesin serum calcium and horizontally in the direction of sustained changes indicator of parathyroid gland responsiveness to calcium,in the serum calcium. As shown in (A), as the serum calcium increased and (g) an elevated serum phosphorus had an adversebefore calcitriol treatment, basal PTH remained constant even though
effect on the response to CTR.maximal PTH increased, and as a result, (B) the basal/maximal PTHratio decreased as the serum calcium increased. After calcitriol treat-ment (A), both basal and maximal PTH markedly decreased markedlyin absolute values, and serum calcium increased from precalcitriol levels.
ACKNOWLEDGMENTSDespite these marked reductions in basal and maximal PTH, basal PTHvalues remained constant over a wide range of serum calcium values.
This work was in part supported by grants #PB93-0720 and #PM95-However, as shown in (B), an inverse correlation was present between0184 from the Direccion General Ensenanza Superior, a grant fromcalcium and the basal/maximal PTH, and more remarkably, despite thethe Fundacion Reina Sofıa-Cajasur, a grant from the Baxter Extramu-marked differences in basal and maximal PTH before and after calcitriolral Grant Program, and a grant from Paeria of Lleida.treatment, the precalcitriol and postcalcitriol correlation between cal-
cium and basal/maximal PTH appeared to be a continuum.Reprint requests to Dr. Mariano Rodriguez, Unidad de Investigacion,
Hospital Reina Sofia, Avda Menendez Pidal, s/n, 14004 Cordoba, Spain.E-mail: [email protected]
were not different for the intragroup differences in serum REFERENCESphosphorus in the R and NR groups. Thus, independent 1. Slatopolsky E, Weerts C, Thielan J, Horst R, Harter H, Martinof an increase in serum calcium, an elevated serum phos- KJ: Marked suppression of secondary hyperparathyroidism by in-
travenous administration of 1, 25-dihydroxy-cholecalciferol in ure-phorus had an adverse effect on the PTH response tomic patients. J Clin Invest 74:2136–2143, 1984CTR. However, it must be emphasized that in the re- 2. Quarles LD, Yohay DA, Carroll BA, Spritzer CE, Minda SA,Lobaugh BL: Prospective trial of pulse oral versus intravenoussponse to CTR treatment, the effect of phosphorus is

Rodriguez et al: Parathyroid function and calcitriol316
calcitriol treatment of hyperparathyroidism in ESRD. Kidney Int of the entire PTH-calcium curve to sustained changes in the serumcalcium in haemodialysis patients. Nephrol Dial Transplant 12:505–45:1710–1721, 1994
3. Levine BS, Song M: Pharmacokinetics and efficacy of pulse oral 513, 199722. Brossard J, Roy L, Lepage R, Gascon-Barre M, D’Amour P:versus intravenous calcitriol in hemodialysis patients. J Am Soc
Nephrol 7:488–496, 1996 Intravenous 1, 25(OH)2D therapy increases the intact parathyroidhormone secretion set point in hemodialyzed patients. Miner Elec-4. Gallieni M, Brancaccio D, Padovese P, Rolla D, Bedani P,
Colantonio G, Bronzieri C, Bagni B, Tarolo G: Low-dose intra- trolyte Metab 23:25–32, 199723. Broadus AE, Deftos LJ, Bartter FC: Effects of the intravenousvenous calcitriol treatment of secondary hyperparathyroidism in
hemodialysis patients. Kidney Int 42:1191–1198, 1992 administration of calcium on nephrogenous cyclic AMP. J ClinEndocrinol Metab 46:477–487, 19785. Kitaoka M, Fukagawa M, Ogata E, Kurokawa K: Reduction of
functioning parathyroid cell mass by ethanol injection in chronic 24. Lips P, Netelenbos JC, van Doorn L, Hackeng WHL, Lips CJM:Stimulation and suppression of intact parathyroid hormone (PTHdialysis patients. Kidney Int 46:1110–1117, 1994
6. Mendes V, Jorgetti V, Nemeth J, Lavergne A, Lecharpentier 1–84) in normal subjects and hyperparathyroid patients. Clin Endo-crinol (Oxf) 35:35–40, 1991Y, Dubost C, Cournot-Witmer C, Bourdon R, Bourdeau A,
Zingraff J, Drueke T: Secondary hyperparathyroidism in chronic 25. Sorensen HA, Schwarz P, McNair P, Hyldstrup L, TransbolI: Calcium clamp technique: Suppression of serum intact PTH byhaemodialysis patients: A clinico-pathological study. Proc Eur Dial
Transplant Assoc 20:731–738, 1983 induced hypercalcemia in normal men and primary hyperparathy-roidism. Scand J Clin Lab Invest 52:457–462, 19927. Gagne ER, Urena P, Leite-Silva S, Zingraff J, Chevalier A,
Sarfati E, Dubost C, Drueke TB: Short and long-term efficacy 26. Brossard JH, Whittom S, Lepage R, D’Amour P: Carboxyltermi-nal fragments of parathyroid hormone are not preferentially se-of total parathyroidectomy with immediate autografting compared
with subtotal parathyroidectomy in hemodialysis patients. J Am creted in primary hyperparathyroidism as they are in other causesof hypercalcemia. J Clin Endocrinol Metab 77:413–419, 1993Soc Nephrol 3:1008–1017, 1992
8. Fukuda N, Tanaka H, Tominaga Y, Fukagawa M, Kurokawa 27. Goodman WG, Veldhuis JD, Belin TR, Van Herle AJ, JuppnerH, Salusky IB: Calcium-sensing by parathyroid glands in second-K, Seino Y: Decreased 1, 25-dihydroxyvitamin D3 receptor density
is associated with a more severe form of parathyroid hyperplasia ary hyperparathyroidism. J Clin Endocrinol Metab 83:2765–2772,1998in chronic uremic patients. J Clin Invest 92:1436–1443, 1993
9. Patel SR, Ke HQ, Hsu CH: Regulation of calcitriol receptor and 28. Almaden Y, Canalejo A, Hernandez A, Ballesteros E, Garcia-Narvarro S, Torres A, Rodriguez M: Direct effect of phosphorusits mRNA in normal and renal failure rats. Kidney Int 45:1020–
1027, 1994 on parathyroid hormone secretion from whole rat parathyroidglands in vitro. J Bone Miner Res 11:970–976, 199610. Rodriguez M, Felsenfeld AJ, Williams C, Pederson JA, Llach
F: The effect of long-term intravenous calcitriol administration on 29. Slatopolsky E, Finch J, Denda M, Ritter C, Zhang M, DussoA, McDonald PN, Brown AJ: Phosphorus restriction preventsparathyroid function in hemodialysis patients. J Am Soc Nephrol
2:1014–1020, 1991 parathyroid gland growth. J Clin Invest 97:2534–2540, 199630. Nielsen PK, Feldt-Rasmussen U, Olgaard K: A direct effect in11. Brancaccio D, Gallieni M, Cozzolino M: Treatment of hyper-
parathyroidism: Why is it crucial to control serum phosphate? vitro of phosphate on PTH release from bovine parathyroid tissueslices but not from dispersed parathyroid cells. Nephrol Dial Trans-Nephrol Dial Transplant 11:420–423, 1996
12. Delmez JA, Tindira C, Grooms P, Dusso A, Windus DW, Slato- plant 11:1762–1768, 199631. de Francisco ALM, Cobo MA, Setien MA, Rodrigo E, Fresnedopolsky E: Parathyroid hormone suppression by intravenous 1,25-
dihydroxyvitamin D. J Clin Invest 83:1349–1355, 1989 GF, Unzueta MT, Amado JA, Ruiz JC, Arias M, RodriguezM: Effect of serum phosphate on parathyroid hormone secretion13. Dunlay R, Rodriguez M, Felsenfeld A, Llach F: Direct inhibi-
tory effect of calcitriol on parathyroid function (sigmoidal curve) during hemodialysis. Kidney Int 54:2140–2145, 199832. Fukagawa M, Kitaoka M, Yi H, Fukuda N, Matsumoto T, Ogatain dialysis patients. Kidney Int 36:1093–1098, 1989
14. Malberti F, Surian M, Cosci P: Effect of chronic intravenous E, Kurokawa K: Serial evaluation of parathyroid size by ultraso-nography is another useful marker for the long-term prognosiscalcitriol on parathyroid function and set point of calcium in dialysis
patients with refractory secondary hyperparathyroidism. Nephrol of calcitriol pulse therapy in chronic dialysis patients. Nephron68:221–228, 1994Dial Transplant 7:822–828, 1992
15. Ramirez JA, Goodman WG, Belin TR, Gales B, Segre GV, 33. Diethelm AG, Adams PL, Murad TM, Daniel WW, WhelchelJD, Rutsky EA, Rostand SG: Treatment of secondary hyperpara-Salusky IB: Calcitriol therapy and calcium-regulated PTH secre-
tion in patients with secondary hyperparathyroidism. Am J Physiol thyroidism in patients with chronic renal failure by total parathy-roidectomy and parathyroid autograft. Ann Surg 193:777–793, 1981267:E961–E967, 1994
16. Caravaca F, Cubero JJ, Jimenez F, Lopez JM, Aparicio A, Cid 34. Krause MW, Hedinger CE: Pathologic study of parathyroidglands in tertiary hyperparathyroidism. Hum Pathol 16:772–784,MC, Pizarro JL, Liso J, Santos I: Effect of the mode of calcitriol
administration of PTH-ionized calcium relationship in uraemic 198535. Tominaga Y, Tanaka Y, Sato K, Nagasaka T, Takagi H: Histopa-patients with secondary hyperparathyroidism. Nephrol Dial Trans-
plant 10:665–670, 1995 thology, pathophysiology, and indications for surgical treatmentof renal hyperparathyroidism. Semin Surg Oncol 13:78–86, 199717. Rodriguez M, Caravaca F, Fernandez E, Borrego MJ, Lorenzo
V, Cubero J, Martin-Malo A, Betriu A, Rodriguez AP, Felsen- 36. Tominaga Y, Tanaka Y, Sato K, Numano M, Uchida K, FalkmerU, Grimelius L, Johansson H, Takagi H: Recurrent renal hyper-feld AJ: Evidence for both abnormal set point of calcium and
adaptation to serum calcium in hemodialysis patients with hyper- parathyroidism and DNA analysis of autografted parathyroid tis-sue. World J Surg 16:595–603, 1992parathyroidism. J Bone Miner Res 12:347–355, 1997
18. Pahl M, Jara A, Bover J, Rodriguez M, Felsenfeld AJ: The 37. Wallfelt C, Larsson R, Gylfe E, Ljunghall S, Rastad J, Aker-strom G: Secretory disturbance in hyperplastic parathyroid nod-set point of calcium and the reduction of parathyroid hormone in
hemodialysis patients. Kidney Int 49:226–231, 1996 ules of uremic hyperparathyroidism: Implication for parathyroidautotransplantation. World J Surg 12:431–438, 198819. Brent GA, Leboff MS, Seely EW, Conlin PR, Brown EM: Rela-
tionship between the concentration and rate of change of calcium 38. Tanaka Y, Seo H, Tominaga Y, Funahashi H, Matsui N, TakagiH: Factors related to the recurrent hyperfunction of autograftsand serum intact parathyroid hormone levels in normal humans.
J Clin Endocrinol Metab 67:944–950, 1988 after total parathyroidectomy in patients with severe secondaryhyperparathyroidism. Surg Today 23:220–227, 199320. Brown EM: Four-parameter model of the sigmoidal relationship
between parathyroid hormone release and extracellular calcium 39. Tominaga Y, Numano M, Tanaka Y, Kazuhara K, Takagi H:Surgical treatment of renal hyperparathyroidism. Semin Surg On-concentration in normal and abnormal parathyroid tissue. J Clin
Endocrinol Metab 56:572–581, 1983 col 13:87–96, 199740. Wallfelt C, Gylfe E, Larsson R, Ljunghall S, Rastad J, Aker-21. Borrego MJ, Felsenfeld AJ, Martin-Malo A, Almaden Y, Con-
cepcion MT, Aljama P, Rodriguez M: Evidence for adaptation strom G: Relationship between external and cytoplasmic calcium

Rodriguez et al: Parathyroid function and calcitriol 317
concentrations, parathyroid hormone release and weight of para- 42. Arnold A, Brown MF, Urena P, Gaz RD, Sarfati E, DruekeTB: Monoclonality of parathyroid tumors in chronic renal failurethyroid glands in human hyperparathyroidism. J Endocrinol 116:
457–464, 1988 and in primary parathyroid hyperplasia. J Clin Invest 95:2047–2053,199541. Rudberg C, Grimelius L, Johansson H, Ljunghall S, Odselius
R, Pertoft H, Rastad J, Wide L, Akerstrom G: Alteration in 43. Tominaga Y, Kohara S, Namii Y, Nagasaka T, Haba T, UchidaK, Numano M, Tanaka Y, Takagi H: Clonal analysis of nodulardensity, morphology, and parathyroid hormone release of dis-
persed parathyroid cells from patients with hyperparathyroidism. parathyroid hyperplasia in renal hyperparathyroidism. World JSurg 20:744–752, 1996Acta Pathol Microbiol Immunol Scand 94:253–261, 1986
Copyright © 2022 FDOKUMEN