Objectives and Design of the Hemodialysis Fistula Maturation Study
Upload
independentCategory
view
0download
0
Research ArticleNutritional Markers and Body Composition inHemodialysis Patients
Rodolfo Valtuille,1 Maria Elisa Casos,1 Elmer Andres Fernandez,2
Adrian Guinsburg,3 and Cristina Marelli3
1FME Burzaco, 2289 Espora Avenue, Burzaco, B1852FZD Buenos Aires, Argentina2Universidad Catolica de Cordoba, 3555 Armada Argentina Avenue, X5016DHK Cordoba, Argentina3FMC Argentina, 707 Arenales Street, C1061AAA Buenos Aires, Argentina
Correspondence should be addressed to Rodolfo Valtuille; [email protected]
Received 3 September 2014; Revised 13 December 2014; Accepted 14 December 2014
Academic Editor: Giuseppe Biondi-Zoccai
Copyright © 2015 Rodolfo Valtuille et al. This is an open access article distributed under the Creative Commons AttributionLicense, which permits unrestricted use, distribution, and reproduction in any medium, provided the original work is properlycited.
The aims of this study were to analyse body composition, to detect the presence of undernutrition, and to establish a relationshipbetween undernutrition and the biological markers routinely used as indicators of nutritional status in hemodialysis (HD) patients(pts). We used a body composition monitor (BCM) that expresses body weight in terms of lean tissue mass (LTM) and fat tissuemass (FTM) independent of hydration status. From nine HD units, 934 pts were included. Undernutrition was defined as havinga lean tissue index (LTI = LTM/height2) below the 10th percentile of a reference population. Biochemical markers and parametersdelivered by BCM were used to compare low LTI and normal LTI groups. Undernutrition prevalence was 58.8% of the populationstudied. Low LTI pts were older, were significantly more frequently overhydrated, and had been on HD for a longer period of timethan the normal LTI group. FTI (FTI = FTM/ height2) was significantly higher in low LTI pts and increased according to BMI. LTIwas not influenced by different BMI levels. Albumin and C-reactive protein correlated inversely (𝑟 = −0.28). However neither ofthem was statistically different when considering undernourished and normal LTI pts. Our BCM study was able to show a highprevalence of undernutrition, as expressed by low LTI. In our study, BMI and other common markers, such as albumin, failed topredict malnutrition as determined by BCM.
1. Introduction
Many studies have reported the presence of malnutritionin a large fraction of hemodialysis (HD) patients (pts).The majority of these studies revealed that protein energywasting was associated with increased morbidity, mortality,and impaired quality of life [1]. Several markers, such aslow BMI (weight/height2), low serum albumin (Alb), lowserum cholesterol (Chol), and elevated C-reactive protein(CRP) either as isolated metrics or incorporated as part of ascore, have been previously associated with undernutrition inpopulations of HD pts [1].
The aims of this study were to analyse body composition(BC), to detect the presence of undernutrition, and to estab-lish a relationship between undernutrition and the biologicalmarkers routinely used as indicators of nutritional status inHD patients from several HD units of Argentina.
We used a portable device (a body composition monitor(BCMFresenius)) that expresses body weight in terms of leantissue mass (LTM) and fat tissue mass (FTM) independent ofhydration status.
The BCM model has recently been validated in multi-centre studies against the respective gold standards both inhealthy subjects and in HD pts [2–5].
The BCM Fresenius device uses an easy and noninvasivemethod that incorporates a novel three-compartment (3C)body composition model and involves bioimpedance spec-troscopy (BIS), a technique that measures the impedance ofbody tissues over wide frequency ranges.
The BCM was first validated against gold standardsto determine total body water (TBW), extracellular water(ECW), and intracellular water (ICW) [5] and then on thebasis that in healthy subjects a given mass of tissue could
Hindawi Publishing CorporationInternational Scholarly Research NoticesVolume 2015, Article ID 695263, 7 pageshttp://dx.doi.org/10.1155/2015/695263
2 International Scholarly Research Notices
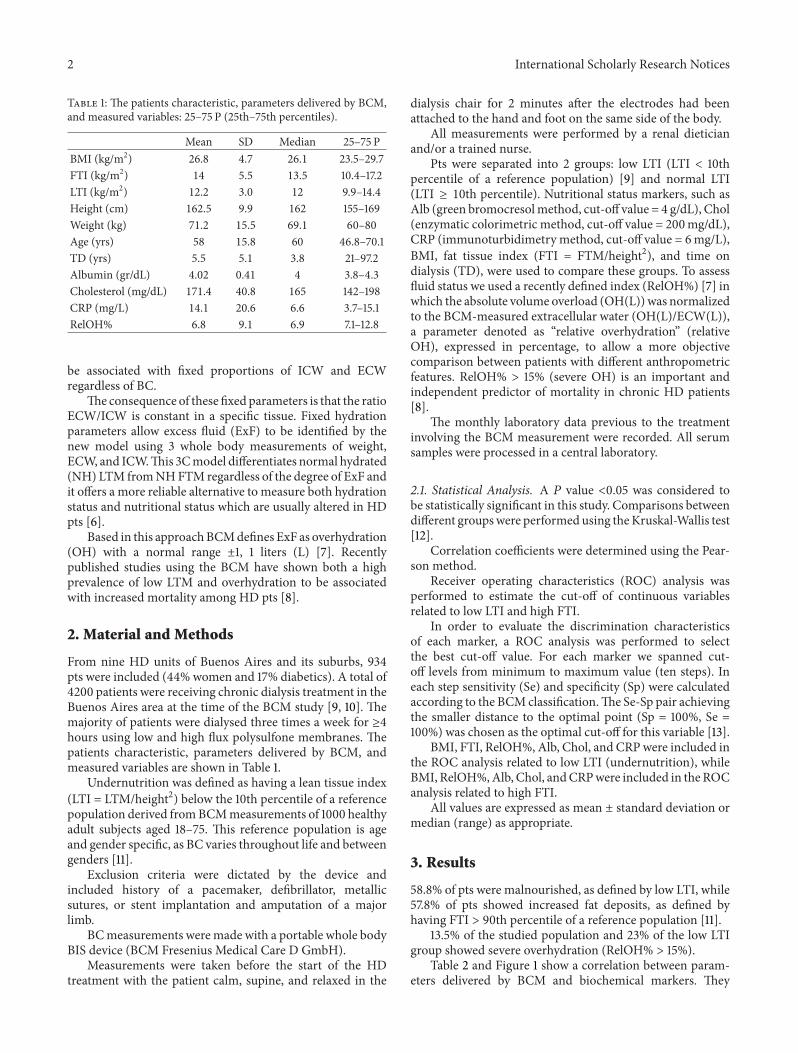
Table 1: The patients characteristic, parameters delivered by BCM,and measured variables: 25–75 P (25th–75th percentiles).
Mean SD Median 25–75 PBMI (kg/m2) 26.8 4.7 26.1 23.5–29.7FTI (kg/m2) 14 5.5 13.5 10.4–17.2LTI (kg/m2) 12.2 3.0 12 9.9–14.4Height (cm) 162.5 9.9 162 155–169Weight (kg) 71.2 15.5 69.1 60–80Age (yrs) 58 15.8 60 46.8–70.1TD (yrs) 5.5 5.1 3.8 21–97.2Albumin (gr/dL) 4.02 0.41 4 3.8–4.3Cholesterol (mg/dL) 171.4 40.8 165 142–198CRP (mg/L) 14.1 20.6 6.6 3.7–15.1RelOH% 6.8 9.1 6.9 7.1–12.8
be associated with fixed proportions of ICW and ECWregardless of BC.
The consequence of these fixed parameters is that the ratioECW/ICW is constant in a specific tissue. Fixed hydrationparameters allow excess fluid (ExF) to be identified by thenew model using 3 whole body measurements of weight,ECW, and ICW.This 3Cmodel differentiates normal hydrated(NH) LTM fromNHFTMregardless of the degree of ExF andit offers a more reliable alternative to measure both hydrationstatus and nutritional status which are usually altered in HDpts [6].
Based in this approachBCMdefines ExF as overhydration(OH) with a normal range ±1, 1 liters (L) [7]. Recentlypublished studies using the BCM have shown both a highprevalence of low LTM and overhydration to be associatedwith increased mortality among HD pts [8].
2. Material and Methods
From nine HD units of Buenos Aires and its suburbs, 934pts were included (44% women and 17% diabetics). A total of4200 patients were receiving chronic dialysis treatment in theBuenos Aires area at the time of the BCM study [9, 10]. Themajority of patients were dialysed three times a week for ≥4hours using low and high flux polysulfone membranes. Thepatients characteristic, parameters delivered by BCM, andmeasured variables are shown in Table 1.
Undernutrition was defined as having a lean tissue index(LTI = LTM/height2) below the 10th percentile of a referencepopulation derived fromBCMmeasurements of 1000 healthyadult subjects aged 18–75. This reference population is ageand gender specific, as BC varies throughout life and betweengenders [11].
Exclusion criteria were dictated by the device andincluded history of a pacemaker, defibrillator, metallicsutures, or stent implantation and amputation of a majorlimb.
BCmeasurements weremade with a portable whole bodyBIS device (BCM Fresenius Medical Care D GmbH).
Measurements were taken before the start of the HDtreatment with the patient calm, supine, and relaxed in the
dialysis chair for 2 minutes after the electrodes had beenattached to the hand and foot on the same side of the body.
All measurements were performed by a renal dieticianand/or a trained nurse.
Pts were separated into 2 groups: low LTI (LTI < 10thpercentile of a reference population) [9] and normal LTI(LTI ≥ 10th percentile). Nutritional status markers, such asAlb (green bromocresolmethod, cut-off value = 4 g/dL), Chol(enzymatic colorimetric method, cut-off value = 200mg/dL),CRP (immunoturbidimetry method, cut-off value = 6mg/L),BMI, fat tissue index (FTI = FTM/height2), and time ondialysis (TD), were used to compare these groups. To assessfluid status we used a recently defined index (RelOH%) [7] inwhich the absolute volume overload (OH(L)) was normalizedto the BCM-measured extracellular water (OH(L)/ECW(L)),a parameter denoted as “relative overhydration” (relativeOH), expressed in percentage, to allow a more objectivecomparison between patients with different anthropometricfeatures. RelOH% > 15% (severe OH) is an important andindependent predictor of mortality in chronic HD patients[8].
The monthly laboratory data previous to the treatmentinvolving the BCM measurement were recorded. All serumsamples were processed in a central laboratory.
2.1. Statistical Analysis. A 𝑃 value <0.05 was considered tobe statistically significant in this study. Comparisons betweendifferent groupswere performed using theKruskal-Wallis test[12].
Correlation coefficients were determined using the Pear-son method.
Receiver operating characteristics (ROC) analysis wasperformed to estimate the cut-off of continuous variablesrelated to low LTI and high FTI.
In order to evaluate the discrimination characteristicsof each marker, a ROC analysis was performed to selectthe best cut-off value. For each marker we spanned cut-off levels from minimum to maximum value (ten steps). Ineach step sensitivity (Se) and specificity (Sp) were calculatedaccording to the BCM classification.The Se-Sp pair achievingthe smaller distance to the optimal point (Sp = 100%, Se =100%) was chosen as the optimal cut-off for this variable [13].
BMI, FTI, RelOH%, Alb, Chol, and CRPwere included inthe ROC analysis related to low LTI (undernutrition), whileBMI, RelOH%,Alb, Chol, andCRPwere included in theROCanalysis related to high FTI.
All values are expressed as mean ± standard deviation ormedian (range) as appropriate.
3. Results
58.8% of pts were malnourished, as defined by low LTI, while57.8% of pts showed increased fat deposits, as defined byhaving FTI > 90th percentile of a reference population [11].
13.5% of the studied population and 23% of the low LTIgroup showed severe overhydration (RelOH% > 15%).
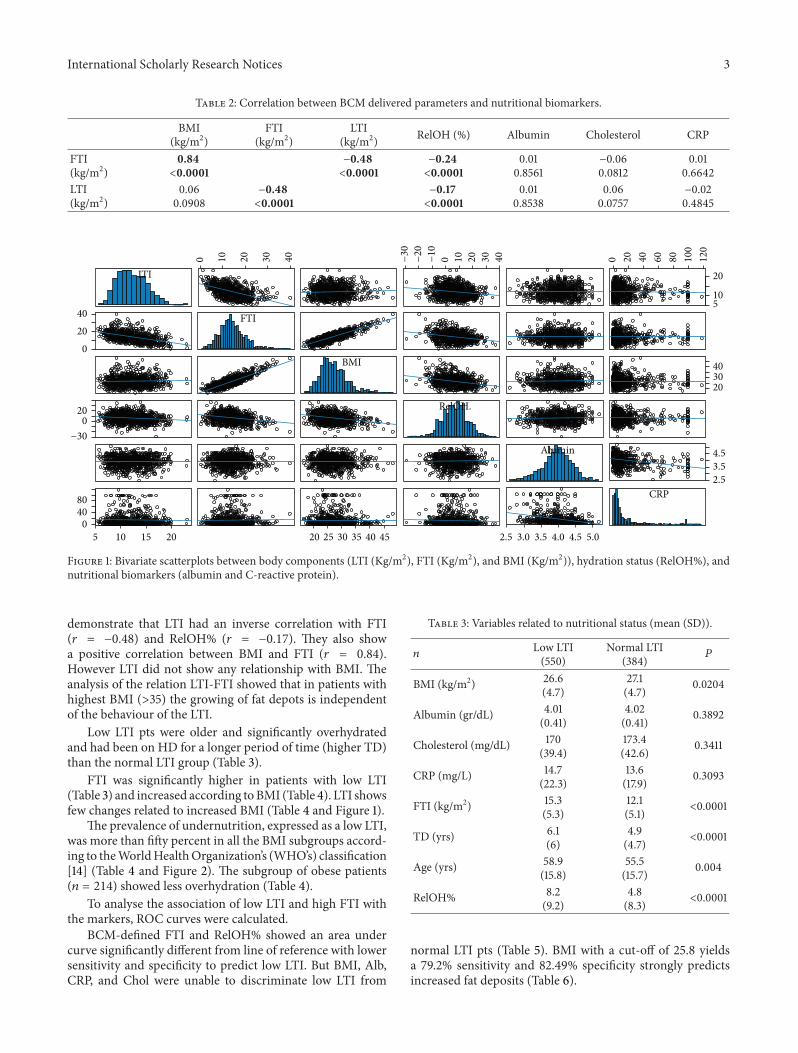
Table 2 and Figure 1 show a correlation between param-eters delivered by BCM and biochemical markers. They
International Scholarly Research Notices 3
Table 2: Correlation between BCM delivered parameters and nutritional biomarkers.
BMI(kg/m2)
FTI(kg/m2)
LTI(kg/m2) RelOH (%) Albumin Cholesterol CRP
FTI(kg/m2)
0.84<0.0001
−0.48<0.0001
−0.24<0.0001
0.010.8561
−0.060.0812
0.010.6642
LTI(kg/m2)
0.060.0908
−0.48<0.0001
−0.17<0.0001
0.010.8538
0.060.0757
−0.020.4845
LTI
−20
−30
−10 0 2010 4030
02040 FTI
BMI
−300
20 RelOH.
Albumin
5 10 15 200
4080
20 25 30 35 40 45
CRP
0 20 40 60 80 100
120
510
20
203040
2.53.54.5
3.02.5 3.5 4.0 4.5 5.0
0 10 20 30 40
Figure 1: Bivariate scatterplots between body components (LTI (Kg/m2), FTI (Kg/m2), and BMI (Kg/m2)), hydration status (RelOH%), andnutritional biomarkers (albumin and C-reactive protein).
demonstrate that LTI had an inverse correlation with FTI(𝑟 = −0.48) and RelOH% (𝑟 = −0.17). They also showa positive correlation between BMI and FTI (𝑟 = 0.84).However LTI did not show any relationship with BMI. Theanalysis of the relation LTI-FTI showed that in patients withhighest BMI (>35) the growing of fat depots is independentof the behaviour of the LTI.
Low LTI pts were older and significantly overhydratedand had been on HD for a longer period of time (higher TD)than the normal LTI group (Table 3).
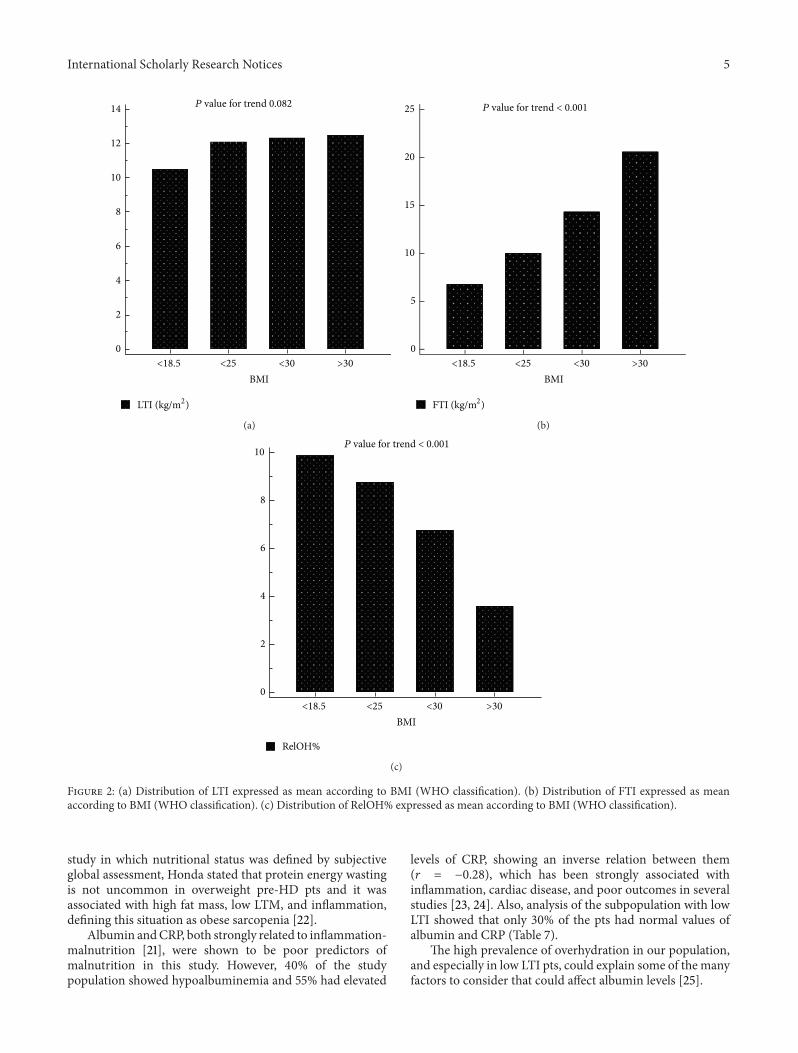
FTI was significantly higher in patients with low LTI(Table 3) and increased according toBMI (Table 4). LTI showsfew changes related to increased BMI (Table 4 and Figure 1).
The prevalence of undernutrition, expressed as a low LTI,was more than fifty percent in all the BMI subgroups accord-ing to theWorldHealthOrganization’s (WHO’s) classification[14] (Table 4 and Figure 2). The subgroup of obese patients(𝑛 = 214) showed less overhydration (Table 4).
To analyse the association of low LTI and high FTI withthe markers, ROC curves were calculated.
BCM-defined FTI and RelOH% showed an area undercurve significantly different from line of reference with lowersensitivity and specificity to predict low LTI. But BMI, Alb,CRP, and Chol were unable to discriminate low LTI from
Table 3: Variables related to nutritional status (mean (SD)).
𝑛Low LTI(550)
Normal LTI(384) 𝑃
BMI (kg/m2) 26.6(4.7)
27.1(4.7) 0.0204
Albumin (gr/dL) 4.01(0.41)
4.02(0.41) 0.3892
Cholesterol (mg/dL) 170(39.4)
173.4(42.6) 0.3411
CRP (mg/L) 14.7(22.3)
13.6(17.9) 0.3093
FTI (kg/m2) 15.3(5.3)
12.1(5.1) <0.0001
TD (yrs) 6.1(6)
4.9(4.7) <0.0001
Age (yrs) 58.9(15.8)
55.5(15.7) 0.004
RelOH% 8.2(9.2)
4.8(8.3) <0.0001
normal LTI pts (Table 5). BMI with a cut-off of 25.8 yieldsa 79.2% sensitivity and 82.49% specificity strongly predictsincreased fat deposits (Table 6).
4 International Scholarly Research Notices
Table 4: Distribution of LTI and FTI and overhydration (RelOH%)expressed as mean (SD) according to BMI (WHO classification).
BMI (𝑛) <18.5(11)
18.5–24.9(354)
25–29.9(355)
≥30(214)
𝑃 value fortrend
FTI(kg/m2)
6.75(1.94)
9.97(3.34)
14.32(3.31)
20.52(4.79) <0.001
LTI(kg/m2)
10.5(1.95)
12.08(2.96)
12.32(3.03)
12.48(3.15) 0.082
RelOH% 9.81(11.11)
8.73(8.87)
6.74(8.77)
3.57(8.87) <0.001
Table 5: Area under the curve and cut-off values from ROC curvesof BMI, albumin, cholesterol, CRP, FTI, and RelOH% as predictorsof low LTI.
Cut-off AUC Sensitivity(%)
Specificity(%)
BMI (kg/m2) 26.1 0.543 54 55.73
Albumin (g/dL) 3.7 0.516 24.39 81.50
Cholesterol (mg/dL) 183 0.517 66.23 40.27
CRP (mg/L) 7.55 0.519 57.44 48.36
FTI (kg/m2)∗∗ 13.9 0.677 56.18 68.75
RelOH%∗∗ 7.94 0.611 53.27 63.28
∗∗Significantly different from AUC 0.5 𝑃 < 0.001.
Alb and CRP correlated inversely (𝑟 = −0.28). Howeverneither of them was statistically different when consideringundernourished and normal LTI pts (see Table 2 and Fig-ure 1).
Table 7 shows the distribution of nutritional markersin the low LTI subpopulation (𝑛 = 550): 167 pts (30.36%)included in this group had normal (N) values of Alb (≥4 g/dL)and CRP (≤6mg/L); 151 pts (27.45%) showed N values ofAlb and increased values of CRP (>6mg/L); 144 pts (26.18%)had lower values of Alb (<4 g/dL) and increased values ofCRP (>6mg/L) and 88 pts (16%) had lower values of Alband normal values of CRP. The prevalence of high FTI wasuniformly distributed in this subpopulation.
4. Discussion
Our BCM study was able to show a high prevalence ofundernutrition, as expressed by low LTI, and was the firstapplication of this BCM device in Argentina.
These findings are consistent with several other studies.Among these studies, the prevalence of undernutrition dif-fered according to the method used to define nutritionalstatus [1].
In the French national cooperative study [15], whichincluded 7123 pts, nutritional status was determined by BMI,normalized protein catabolic rate, laboratory values, andLTM calculated from the creatinine generation rate. Thisstudy showed undernutrition in 20–36% of the studied pop-ulation, according to nutritional parameters. A remarkableaspect of this study was the high prevalence (62%) of reducedLTM similar to our findings of around 60% of low LTI pts in
Table 6: Area under the curve and cut-off values from ROC curvesof BMI, albumin, cholesterol, CRP, and RelOH% as predictors ofhigh FTI.
Cut-off AUC Sensitivity(%)
Specificity(%)
BMI (kg/m2)∗∗ 25.8 0.894 79.81 82.49
Albumin (g/dL) 4.39 0.52 22.77 82.32
Cholesterol (mg/dL) 134 0.507 18.7 84.49
CRP (mg/L) 3.98 0.504 29.75 74.47
RelOH%∗∗ 6.36 0.595 55.93 61.17
∗∗Significantly different from AUC 0.5 𝑃 < 0.001.
Table 7: Distribution of nutritional markers in patients with lowLTI.
Alb NC-RP N
Alb NC-RP ↑
Alb ↓C-RP ↑
Alb ↓C-RP N
𝑛 167 151 144 88
High FTI (%) 69 69 66 63
Alb: N ≥ 4 g%; ↓ < 4 g%. C-RP: N ≤ 6mg/L; ↑ > 6mg/L.
a BCM approach. Other technologies, like DXA (dual X-rayabsorptiometry) and BIA (bioelectrical impedance analysis),used for this purpose showed a high prevalence of low LTM[1].Woodrow found a significantly lower LTMmeasuredwithDXA and BIA in pts with advanced chronic renal failure,peritoneal dialysis, and HD compared with a healthy group[16].
The low-LTI population showed significantly longertimes in HD in this study. Chertow et al. [17] described thattime on dialysis was associated with impaired nutritionalstatus and increased mortality risk.
Older HD pts may be a greater risk for undernutritionthan their younger counterparts [18]. In our study low LTIpts were significantly older than the normal LTI group. Thiswas a relevant finding because the BCM device defines lowLTI after comparing the measurement with a reference rangederived from healthy controls according to gender and age[11].
The ability of BCM to differentiate lean tissue from fatmass allowed us to describe a strong association betweenFTI and BMI as well as low LTI and high FTI. Using DXAtechnology, Leinig et al. [19] reported strong and significantcorrelation between BMI and fat mass in a study of a smallnumber of CKD stage 3–5, peritoneal, and HD pts. Torun etal. [20] arrived to similar conclusions in a BIA analysis.
In healthy adults, BMI is dependent on muscle and fatmass [14]. In our study, BMI clearly expressed the changesin the fat deposits but failed to show lean mass status. Thissituation was confirmed by the ROC curves and by thehigh prevalence of undernutrition in patients with BMI ≥23 kg/m2, a value commonly recommended as predictor ofbetter survival in HD populations [1, 21].
Despite being an observational study of an unselectedpopulation, the conclusion was that increased fat deposits,especially those related to low LTM, are a characteristic pat-tern of body composition for this population. In aDXA-based
International Scholarly Research Notices 5
0
2
4
6
8
10
12
14
BMI<18.5 <25 <30 >30
P value for trend 0.082
LTI (kg/m2)
(a)
0
5
10
15
20
25
BMI<18.5 <25 <30 >30
P value for trend < 0.001
FTI (kg/m2)
(b)
0
2
4
6
8
10
BMI<18.5 <25 <30 >30
RelOH%
P value for trend < 0.001
(c)
Figure 2: (a) Distribution of LTI expressed as mean according to BMI (WHO classification). (b) Distribution of FTI expressed as meanaccording to BMI (WHO classification). (c) Distribution of RelOH% expressed as mean according to BMI (WHO classification).
study in which nutritional status was defined by subjectiveglobal assessment, Honda stated that protein energy wastingis not uncommon in overweight pre-HD pts and it wasassociated with high fat mass, low LTM, and inflammation,defining this situation as obese sarcopenia [22].
Albumin andCRP, both strongly related to inflammation-malnutrition [21], were shown to be poor predictors ofmalnutrition in this study. However, 40% of the studypopulation showed hypoalbuminemia and 55% had elevated
levels of CRP, showing an inverse relation between them(𝑟 = −0.28), which has been strongly associated withinflammation, cardiac disease, and poor outcomes in severalstudies [23, 24]. Also, analysis of the subpopulation with lowLTI showed that only 30% of the pts had normal values ofalbumin and CRP (Table 7).
The high prevalence of overhydration in our population,and especially in low LTI pts, could explain some of the manyfactors to consider that could affect albumin levels [25].
6 International Scholarly Research Notices
Recently, a study using BCM technology to define hydra-tion status showed that hyperhydration is an independentpredictor of mortality [8].
Another interesting finding in our population was theinverse relation of LTI-FTI and overhydration (RelOH%);in our study, pts with higher BMI (defined as overweightand obese according WHO) showed less overhydration andhigher fat mass (Table 4) findings that could match classicaltheory of reverse epidemiology [26]. In our study lean massdid not change significantly with higher BMI. Some studies[27] showed that a survival advantage of higher fat massappeared to be superior to that of lean body mass.
Even though we did not include clinical outcomes inour study, the high prevalence of undernutrition and fluidoverload could have a strong impact in outcome and clinicalpractice.
A recently published study of a Slovakian populationshowed that low LTI was a strong independent predictorof mortality where intervention (nutritional supplements)might improve nutrition and reduce the mortality risk [28].
Also these findings may explain the multifactorial aeti-ology of undernutrition in this HD population related to lowprotein intake [15], inflammation [23], overhydration [8], lowphysical activity [29], and ageing [18].
Metallic endovascular devices, pacemakers, or amputa-tions are exclusion criteria for BCM study in an HD popula-tion in which cardiovascular burden is quite frequent thoughit could result in a potential bias. Therefore, early detectionof muscle mass loss and overhydration in pts with CKDstages 3–5 with BIS approach could help to change history ofthe disease. Szu-Chun Hung showed a higher prevalence ofvolume overload, undernutrition, and inflammation in CKDstage 3–5 pts diabetics as well as diabetics [30].
Implementation of BCM technology as a bed-side clinicaltool in HD pts was easy and noninvasive and should beconsidered for helping the health team in his decisionmaking.
5. Conclusions
In our study, BMI and other common markers, such asalbumin, failed to predict malnutrition as determined byBCM.
Trend analysis based on repetitive BCM measurements(evaluating intraindividual variability) should be consideredas an earlier marker of undernutrition in HD pts in whichtraditional anthropometrics, somatic proteins, and inflam-mation biomarkers showed a high variability.
Future BCM-based studies in our country that includea follow-up of the cohort may be able to show the truesignificance of the high prevalence of increased fat depositswith and without low LTI and hydration status in thispopulation.
Conflict of Interests
The authors declare that there is no conflict of interestsregarding the publication of this paper.
Acknowledgments
Special thanks are to dialysis centres involved in thisstudy: FME Avellaneda, FME Burzaco, FME Caballito, FMECEMIC, FME Ciudad Evita, FME Ciudadela, FME Florida,FME Lomas, and FMEMansilla. The authors appreciated thelanguage support of Stella Paolin and Dr. Lucas Valtuille.
References
[1] D. Fouque, M. Vennegoor, P. T. Wee et al., “EBPG guidelineon nutrition,” Nephrology Dialysis Transplantation, vol. 22,supplement 2, pp. ii45–ii87, 2007.
[2] P. Wabel, P. Chamney, U. Moissl, and T. Jirka, “Importance ofwhole-body bioimpedance spectroscopy for themanagement offluid balance,” Blood Purification, vol. 27, no. 1, pp. 75–80, 2009.
[3] P. Wabel, P. W. Chamney, U. Moissl et al., “Reproducibility ofbioimpedance spectroscopy (BIS) for the assessment of bodycomposition and dry weight,” Journal of the American Societyof Nephrology, vol. 18, p. 255A, 2007.
[4] U. Moissl, P. Wabel, P. W. Chamney et al., “Validation of abioimpedance spectroscopy method for the assessment of fatfree mass,” NDT Plus, supplement 2, p. ii215, 2008.
[5] U.M.Moissl, P.Wabel, P.W. Chamney et al., “Body fluid volumedetermination via body composition spectroscopy in health anddisease,” Physiological Measurement, vol. 27, article 921, 2006.
[6] P. W. Chamney, P. Wabel, U. M. Moissl et al., “A whole-bodymodel to distinguish excess fluid from the hydration of majorbody tissues,” The American Journal of Clinical Nutrition, vol.85, no. 1, pp. 80–89, 2007.
[7] P. Wabel, U. Moissl, P. Chamney et al., “Towards improvedcardiovascular management: the necessity of combining bloodpressure and fluid overload,” Nephrology Dialysis Transplanta-tion, vol. 23, no. 9, pp. 2965–2971, 2008.
[8] V.Wizemann, P.Wabel, P. Chamney et al., “Themortality risk ofoverhydration in haemodialysis patients,” Nephrology DialysisTransplantation, vol. 24, no. 5, pp. 1574–1579, 2009.
[9] http://www.cucaiba.gba.gov.ar/.[10] http://www.incucai.gov.ar/.[11] http://www.bcm-fresenius.com/23.htm.[12] D.G.Altman,Practical Statistics forMedical Research, Chapman
& Hall, London, UK, 1991.[13] E. A. Fernandez, R. Valtuille, J. M. R. Presedo, and P. Willshaw,
“Comparison of different methods for hemodialysis evaluationby means of ROC curves: from artificial intelligence to currentmethods,” Clinical Nephrology, vol. 64, no. 3, pp. 205–213, 2005.
[14] WHO Expert Consultation, “Appropriate body-mass index forAsian populations and its implications for policy and interven-tion strategies,”TheLancet, vol. 363, no. 9403, pp. 157–163, 2004.
[15] M. Aparicio, N. Cano, P. Chauveau et al., “Nutritional status ofhaemodialysis patients: a French national cooperative study,”Nephrology Dialysis Transplantation, vol. 14, no. 7, pp. 1679–1686, 1999.
[16] G. Woodrow, B. Oldroyd, J. H. Turney, L. Tompkins, A. M.Brownjohn, and M. A. Smith, “Whole body and regional bodycomposition in patients with chronic renal failure,” NephrologyDialysis Transplantation, vol. 11, no. 8, pp. 1613–1618, 1996.
[17] G. M. Chertow, K. L. Johansen, N. Lew, J. M. Lazarus, andE. G. Lowrie, “Vintage, nutritional status, and survival inhemodialysis patients,” Kidney International, vol. 57, no. 3, pp.1176–1181, 2000.
International Scholarly Research Notices 7
[18] J. D. Burrowes, D. B. Cockram, J. T. Dwyer et al., “Cross-sectional relationship between dietary protein and energyintake, nutritional status, functional status, and comorbidity inolder versus younger hemodialysis patients,” Journal of RenalNutrition, vol. 12, no. 2, pp. 87–95, 2002.
[19] C. Leinig, R. Pecoits-Filho, M. M. Nascimento, S. Goncalves,M. C. Riella, and C. Martins, “Association between body massindex and body fat in chronic kidney disease stages 3 to 5,hemodialysis, and peritoneal dialysis patients,” Journal of RenalNutrition, vol. 18, no. 5, pp. 424–429, 2008.
[20] D. Torun, H. Micozkadioglu, N. Torun et al., “Increased bodymass index is not a reliable marker of good nutrition inhemodialysis patients,”Renal Failure, vol. 29, no. 4, pp. 487–493,2007.
[21] D. Fouque, K. Kalantar-Zadeh, J. Kopple et al., “A proposednomenclature and diagnostic criteria for protein-energy wast-ing in acute and chronic kidney disease,” Kidney International,vol. 73, no. 4, pp. 391–398, 2008.
[22] H. Honda, A. R. Qureshi, J. Axelsson et al., “Obese sarcopeniain patients with end-stage renal disease is associated withinflammation and increased mortality,” The American Journalof Clinical Nutrition, vol. 86, no. 3, pp. 633–638, 2007.
[23] G. A. Kaysen, “Biological basis of hypoalbuminemia in ESRD,”Journal of the American Society of Nephrology, vol. 9, no. 12, pp.2368–2376, 1998, Review.
[24] W. E. Mitch, “Malnutrition: a frequent misdiagnosis forhemodialysis patients,”The Journal of Clinical Investigation, vol.110, no. 4, pp. 437–439, 2002.
[25] C. H. Jones, H. Akbani, D. C. Croft, and D. P. Worth, “Therelationship between serum albumin and hydration status inhemodialysis patients,” Journal of Renal Nutrition, vol. 12, no.4, pp. 209–212, 2002.
[26] K. Kalantar-Zadeh, K. C. Abbott, A. K. Salahudeen, R. D.Kilpatrick, and T. B. Horwich, “Survival advantages of obesityin dialysis patients,”The American Journal of Clinical Nutrition,vol. 81, no. 3, pp. 543–554, 2005.
[27] N. Noori, C. P. Kovesdy, R. Dukkipati et al., “Survival pre-dictability of lean and fat mass in men and women undergoingmaintenance hemodialysis,” The American Journal of ClinicalNutrition, vol. 92, no. 5, pp. 1060–1070, 2010.
[28] J. Rosenberger, V. Kissova, M. Majernikova, Z. Straussova, andJ. Boldizsar, “Body compositionmonitor assessingmalnutritionin the hemodialysis population independently predicts mortal-ity,” Journal of Renal Nutrition, vol. 24, no. 3, pp. 172–176, 2014.
[29] J. T. Dwyer, B. Larive, J. Leung et al., “Nutritional status affectsquality of life in Hemodialysis (HEMO) Study patients atbaseline,” Journal of Renal Nutrition, vol. 12, no. 4, pp. 213–223,2002.
[30] S.-C. Hung, K.-L. Kuo, C.-H. Peng et al., “Volume overloadcorrelates with cardiovascular risk factors in patients withchronic kidney disease,” Kidney International, vol. 85, no. 3, pp.703–709, 2014.

Submit your manuscripts athttp://www.hindawi.com
Stem CellsInternational
Hindawi Publishing Corporationhttp://www.hindawi.com Volume 2014
Hindawi Publishing Corporationhttp://www.hindawi.com Volume 2014
MEDIATORSINFLAMMATION
of
Hindawi Publishing Corporationhttp://www.hindawi.com Volume 2014
Behavioural Neurology
EndocrinologyInternational Journal of
Hindawi Publishing Corporationhttp://www.hindawi.com Volume 2014
Hindawi Publishing Corporationhttp://www.hindawi.com Volume 2014
Disease Markers
Hindawi Publishing Corporationhttp://www.hindawi.com Volume 2014
BioMed Research International
OncologyJournal of
Hindawi Publishing Corporationhttp://www.hindawi.com Volume 2014
Hindawi Publishing Corporationhttp://www.hindawi.com Volume 2014
Oxidative Medicine and Cellular Longevity
Hindawi Publishing Corporationhttp://www.hindawi.com Volume 2014
PPAR Research
The Scientific World JournalHindawi Publishing Corporation http://www.hindawi.com Volume 2014
Immunology ResearchHindawi Publishing Corporationhttp://www.hindawi.com Volume 2014
Journal of
ObesityJournal of
Hindawi Publishing Corporationhttp://www.hindawi.com Volume 2014
Hindawi Publishing Corporationhttp://www.hindawi.com Volume 2014
Computational and Mathematical Methods in Medicine
OphthalmologyJournal of
Hindawi Publishing Corporationhttp://www.hindawi.com Volume 2014
Diabetes ResearchJournal of
Hindawi Publishing Corporationhttp://www.hindawi.com Volume 2014
Hindawi Publishing Corporationhttp://www.hindawi.com Volume 2014
Research and TreatmentAIDS
Hindawi Publishing Corporationhttp://www.hindawi.com Volume 2014
Gastroenterology Research and Practice
Hindawi Publishing Corporationhttp://www.hindawi.com Volume 2014
Parkinson’s Disease
Evidence-Based Complementary and Alternative Medicine
Volume 2014Hindawi Publishing Corporationhttp://www.hindawi.com
Copyright © 2022 FDOKUMEN