Paragon Automation User Guide - Juniper Networks
791
Paragon Automaon User Guide Published 2022-01-14 RELEASE 21.1
-
Upload
khangminh22 -
Category
Documents
-
view
2 -
download
0
Transcript of Paragon Automation User Guide - Juniper Networks

Paragon Automation User Guide
Published
2022-01-14
RELEASE
21.1
Juniper Networks, Inc.1133 Innovation WaySunnyvale, California 94089USA408-745-2000www.juniper.net
Juniper Networks, the Juniper Networks logo, Juniper, and Junos are registered trademarks of Juniper Networks, Inc.in the United States and other countries. All other trademarks, service marks, registered marks, or registered servicemarks are the property of their respective owners.
Juniper Networks assumes no responsibility for any inaccuracies in this document. Juniper Networks reserves the rightto change, modify, transfer, or otherwise revise this publication without notice.
Paragon Automation User Guide21.1Copyright © 2022 Juniper Networks, Inc. All rights reserved.
The information in this document is current as of the date on the title page.
YEAR 2000 NOTICE
Juniper Networks hardware and software products are Year 2000 compliant. Junos OS has no known time-relatedlimitations through the year 2038. However, the NTP application is known to have some difficulty in the year 2036.
END USER LICENSE AGREEMENT
The Juniper Networks product that is the subject of this technical documentation consists of (or is intended for usewith) Juniper Networks software. Use of such software is subject to the terms and conditions of the End User LicenseAgreement ("EULA") posted at https://support.juniper.net/support/eula/. By downloading, installing or using suchsoftware, you agree to the terms and conditions of that EULA.
ii
Table of Contents
About This Guide | xvi
1 Introduction
Overview | 2
About the Paragon Automation User Guide | 2
Paragon Automation Overview | 3
Paragon Pathfinder Overview | 5
Paragon Insights Overview | 8
Paragon Planner Overview | 13
Paragon Automation GUI Overview | 15
Paragon Automation GUI Menu Overview | 24
Access the Paragon Automation GUI | 31
Single Sign-On Overview | 31
Access the Paragon Automation GUI | 32
About the Dashboard Page | 34
Change Your Password | 41
Reset Your Password | 41
Reset User Password | 42
Access the Paragon Planner Desktop Application | 44
Access Paragon Planner Desktop Application | 44
Configure SMTP, LDAP, and Portal Settings | 46
Configure SMTP Settings | 46
About LDAP Authentication | 48
Configure LDAP Settings | 49
Configure Portal Settings | 51
iii
Manage Users | 53
Users Overview | 53
About the Users Page | 54
Add Users | 58
Edit and Delete Users | 60
Edit Users | 60
Delete Users | 60
Manage Roles | 62
Roles Overview | 62
About the Roles Page | 63
Add Roles | 65
Edit, Clone, and Delete Roles | 67
Edit a Role | 67
Clone a Role | 68
Delete a Role | 68
Manage User Groups | 70
User Groups Overview | 70
About the User Groups Page | 71
Add User Groups | 73
Edit and Delete User Groups | 75
Edit User Groups | 75
Delete User Groups | 75
Identity Providers | 77
About the Identity Providers Page | 77
Add Identity Providers | 80
Edit and Delete Identity Providers | 82
Edit Identity Providers | 83
Delete Identity Providers | 83
2 Integration With Anuta ATOM
iv
Introduction | 86
Integration with Anuta ATOM Overview | 86
Register Paragon Automation with Keycloak | 90
Add Anuta ATOM as an Identity Provider | 92
Add Anuta ATOM as an External EMS Application | 94
3 Manage Devices and Network
Devices | 98
Devices Overview | 98
Zero-Touch Provisioning Overview | 100
Add Devices Overview | 103
About the Device Page | 105
Supported Devices and OS Versions | 111
Add Devices | 119
Discover Devices | 119
Add New Devices | 121
Upgrade the Device Image | 123
View Device Statistics and Inventory information | 124
View Device Statistics | 125
View Device Inventory | 127
View and Manage Device Configuration | 132
Edit Devices | 135
Delete Devices | 140
Device Groups | 141
About the Device Groups Page | 141
Add a Device Group | 143
Edit a Device Group | 148
Filter a Device Group | 149
v
Delete a Device Group | 150
Commit or Roll Back Configuration Changes in Paragon Insights | 151
Device Images | 154
Image Upgrade Workflow | 154
About the Images Page | 156
Upload an Image | 158
Stage an Image | 159
Deploy an Image | 160
Delete Images | 162
Network | 163
Assign Names to Admin Group Bits | 163
Modify Pathfinder Settings From the Pathfinder CLI | 164
Access the Pathfinder CLI | 165
Modify Pathfinder Configuration Settings | 169
Modify Pathfinder Settings From the GUI | 172
Network Groups | 216
About the Network Groups Page | 216
Add a Network Group | 218
Edit a Network Group | 220
Topology Filter | 221
About the Topology Filter Page | 221
Add a Topology Filter Rule | 224
Edit a Topology Filter Rule | 225
Delete a Topology Filter Rule | 226
4 Manage Device Templates and Configuration Templates
Configuration Templates | 228
Configuration Templates Overview | 228
vi

Configuration Templates Workflow | 230
About the Configuration Templates Page | 231
Add Configuration Templates | 234
Preview and Render a Configuration Template | 241
Assign Configuration Templates to a Device Template | 242
Deploy a Configuration Template to a Device | 243
Edit, Clone, and Delete a Configuration Template | 245
Edit a Configuration Template | 245
Clone a Configuration Template | 246
Delete a Configuration Template | 246
Device Templates | 248
Device Templates Overview | 248
About the Device Templates Page | 249
Edit Configuration Templates Assigned to a Device Template | 252
Edit, Clone, and Delete Device Templates | 253
Edit a Device Template | 254
Clone a Device Template | 254
Delete Device Templates | 255
5 Manage Playbook, Rules, and Graphs
Playbooks | 257
About Playbooks | 257
Add a Predefined Playbook | 258
Create a New Playbook Using the Paragon Insights GUI | 259
Edit a Playbook | 260
Clone a Playbook | 261
Manage Playbook Instances | 262
View Information About Playbook Instances | 262
Create a Playbook Instance | 264
Manually Pause or Play a Playbook Instance | 266
vii
Create a Schedule to Automatically Play/Pause a Playbook Instance | 267
Rules | 270
Understand Paragon Insights Topics | 270
Rules Overview | 271
About the Rules Page | 288
Add a Predefined Rule | 289
Manage Rules | 290
Configure a Custom Rule in Paragon Insights GUI | 292
Create a New Rule Using the Paragon Insights GUI | 292
Rule Filtering | 294
Sensors | 296
Fields | 297
Vectors | 300
Variables | 302
Functions | 303
Triggers | 305
Rule Properties | 307
Configure Paragon Insights Notification for LSP Gray Failures | 308
Configure Multiple Sensors per Device | 310
Understand Sensor Precedence | 312
Configure Sensor Precedence | 314
Graphs | 317
Graphs Overview | 317
Manage the Graphs Page | 331
6 Manage Sensor Settings and Data Summarization Profiles
Sensor Settings | 337
Sensors Overview | 338
Native GPB | 339
NetFlow | 340
viii

sFlow | 341
OpenConfig | 342
gNMI-Encoded OpenConfig RPC | 343
Device Configuration for OpenConfig | 344
Syslog | 346
iAgent (CLI/NETCONF) | 348
Define PyEZ Table/View | 350
Gather Output from Device | 351
Generate JSON for Use in Paragon Insights Database | 352
SNMP | 353
About the Sensor Settings Page | 354
Configure Netflow Settings | 355
Use Pre-defined NetFlow Templates | 355
Create Custom NetFlow Templates | 356
Clone an Existing NetFlow Template | 357
Configure Flow Source IP Address | 357
Configure Flow Ports | 359
Configure a Rule Using Flow Sensor | 359
About Frequency Profiles | 367
Configure, Edit and Delete Frequency Profiles | 368
Apply a Frequency Profile | 370
Configure Offset Time | 371
Offset Used in Formulae | 372
Offset Used in Reference | 373
Offset Used in Vectors | 374
Offset Used in Trigger Term | 376
Offset Used in Frequency Profile Applied to a Rule | 377
Configure Native GPB Ingest | 380
Configure sFlow Settings | 382
Configure Devices to Send sFlow Packets | 382
Configure sFlow Ingest | 384
Configure sFlow in Devices and Device Groups | 389
ix
Configure a Rule Using sFlow | 392
Configure SNMP Ingest | 392
Configure SNMP Trap and Inform Notifications | 396
Tasks You can Perform | 396
Find the Engine ID | 398
Configure Trap Notifications | 398
Configure Inform Notifications | 403
Configure Port for Inform Notifications | 404
Configure a Rule for SNMP Notification | 405
Configure System Log Ingest | 407
Device Configuration | 408
Configure Syslog Pattern | 408
Add Patterns to a Pattern Set | 412
Configure Header Pattern | 412
Edit a Header Pattern | 414
Clone a Syslog Pattern | 415
Clone a Pattern Set | 416
Configure Multiple Source IP Addresses for a Device | 417
System Log Optional Configurations | 417
Configure Syslog Ports | 417
Configure Syslog Time Zone | 418
Configure Host Name Aliases for a Device | 418
Configure a Rule Using Syslog | 419
About the Sensor Diagnostics Page | 424
Use the Self Test Tool | 426
Use the Reachability Test | 428
Use the Ingest Test Tool | 429
Use the No-Data Tool | 430
Paragon Insights Tagging Overview | 431
Types of Tagging | 439
x
Add a Tagging Profile | 447
Apply a Tagging Profile | 452
Understand User-Defined Actions and Functions | 453
Modify User-Defined Action and Function Engines | 455
Data Summarization Profiles | 459
About the Data Summarization Page | 459
Add a Raw Data Summarization Profile | 461
Add a Data Rollup Summarization Profile | 463
Apply Data Summarization Profiles | 466
7 Configure Your Network
Topology | 470
Interactive Map Features Overview | 470
About the Topology Page | 485
Left Widget Options on Topology Page | 488
Group Nodes | 490
Ungroup Nodes | 491
Automatically Group Nodes | 492
Manage Map Layouts | 493
Network Information Table | 495
Network Information Table Overview | 496
About the Node Tab | 499
Add a Node | 503
Edit Node Parameters | 506
Delete a Node | 508
About the Link Tab | 509
Add a Link | 512
xi
Edit Link Parameters | 515
Delete a Link | 516
About the Tunnel Tab | 517
Configure Routers to Send JTI Telemetry Data and RPM Statistics to the Data Collector | 521
Understand How Pathfinder Handles LSPs | 524
Add a Single LSP | 528
Add Diverse LSPs | 540
Add Multiple LSPs | 550
Edit and Delete LSPs | 559
Edit LSPs | 559
Delete LSPs | 560
About the Interface Tab | 560
About the Container LSP Tab | 561
Add a Container LSP | 562
Edit Container LSP Parameters | 568
About the Maintenance Tab | 569
Add a Maintenance Event | 570
Edit a Maintenance Event | 572
Simulate a Maintenance Event | 574
Delete a Maintenance Event | 575
About the P2MP Groups Tab | 575
Add a P2MP Group | 584
Edit P2MP Group Parameters | 591
About the SRLG/Facility Tab | 592
Add an SRLG/Facility | 593
Edit SRLG/Facility Parameters | 594
xii
Tunnels | 595
Understand LSP Delegation and Undelegation | 595
Add and Remove LSP Delegation | 596
Add LSP Delegation | 597
Remove LSP Delegation | 598
About the Bandwidth Calendar Page | 599
About the Path Optimization Page | 601
8 Monitoring
Monitor Network Health | 605
About the Network Health Page | 605
Activate Time Inspector View | 617
Manage Alarms and Alerts | 618
Alerts and Alarms Overview | 618
About the Alarms Page | 619
About the Alerts Page | 622
Monitor Jobs | 625
About the Jobs Page | 625
Viewing Job Details | 627
Monitor Reports | 628
About the Reports Page | 628
Network Reports Overview | 635
View Network Reports | 636
Inventory Reports Overview | 638
View Inventory Reports | 640
Maintenance Reports Overview | 651
View Maintenance Reports | 653
Analytics | 667
xiii
Collect Analytics Data Overview | 667
View Analytics Data | 673
| 691
9 Administration
Manage E-mail Templates | 693
E-mail Templates Overview | 693
About the E-mail Templates Page | 694
Edit an E-mail Template | 695
Manage Audit Logs | 697
Audit Logs Overview | 697
About the Audit Logs Page | 698
Export Audit Logs | 699
Configure External EMS | 701
About the External EMS Page | 701
Add an External EMS | 703
Edit and Delete an External EMS | 705
Edit an External EMS | 705
Delete an External EMS | 705
Manage Ingest Settings | 707
About the Ingest Settings Page | 707
Add Alert Blackouts | 711
About Alert Notifications | 713
Configure a Notification Profile | 713
Enable Alert Notifications for Device Groups and Network Groups | 719
Configure Report Settings | 720
Create a Scheduler Profile | 722
Configure a Retention Policy | 723
xiv
Configure Destination Settings | 725
Time Series Database (TSDB) Overview | 726
Manage TSDB Settings | 730
Backup and Restore the TSDB | 732
Manage Task Scheduler | 735
About the Task Scheduler Page | 735
Add a Bandwidth Sizing Task | 739
Add a Container Normalization Task | 742
Add a Device Collection Task | 745
Add a Network Archive Task | 751
Add a Network Maintenance Task | 755
Add a Network Cleanup Task | 758
Edit and Delete Tasks | 762
Edit Tasks | 762
Delete Tasks | 762
Manage Security Settings | 764
About the Security Settings Page | 764
Configure Security Profiles for SSL Authentication | 766
License Management | 768
Paragon Insights Licensing Overview | 768
About the License Management Page | 768
View, Add, or Delete Paragon Insights Licenses | 771
xv

About This Guide
Use this guide to understand the features and tasks that you can configure and perform from theParagon Automation GUI . This guide provides feature overviews and procedures that help youunderstand the features and perform Paragon Automation configuration tasks.
xvi
1PART
Introduction
Overview | 2
Access the Paragon Automation GUI | 31
Access the Paragon Planner Desktop Application | 44
Configure SMTP, LDAP, and Portal Settings | 46
Manage Users | 53
Manage Roles | 62
Manage User Groups | 70
Identity Providers | 77
CHAPTER 1
Overview
IN THIS CHAPTER
About the Paragon Automation User Guide | 2
Paragon Automation Overview | 3
Paragon Pathfinder Overview | 5
Paragon Insights Overview | 8
Paragon Planner Overview | 13
Paragon Automation GUI Overview | 15
Paragon Automation GUI Menu Overview | 24
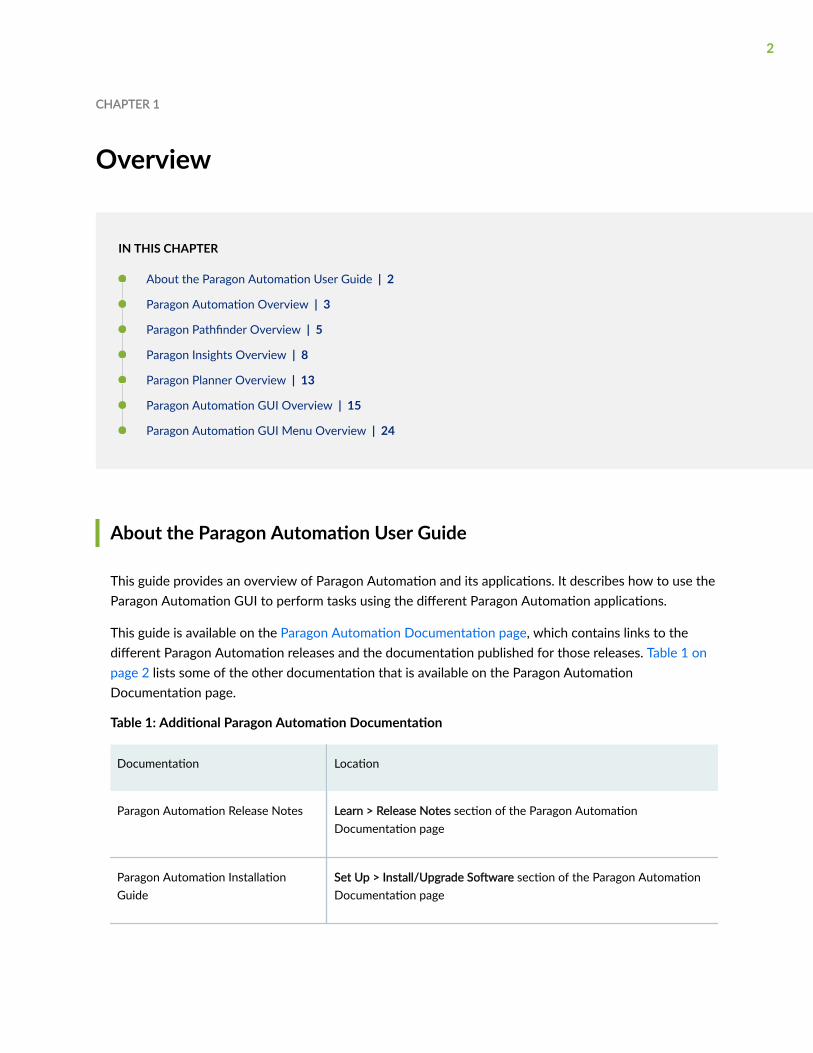
About the Paragon Automation User Guide
This guide provides an overview of Paragon Automation and its applications. It describes how to use theParagon Automation GUI to perform tasks using the different Paragon Automation applications.
This guide is available on the Paragon Automation Documentation page, which contains links to thedifferent Paragon Automation releases and the documentation published for those releases. Table 1 onpage 2 lists some of the other documentation that is available on the Paragon AutomationDocumentation page.
Table 1: Additional Paragon Automation Documentation
Documentation Location
Paragon Automation Release Notes Learn > Release Notes section of the Paragon AutomationDocumentation page
Paragon Automation InstallationGuide
Set Up > Install/Upgrade Software section of the Paragon AutomationDocumentation page
2

Table 1: Additional Paragon Automation Documentation (Continued)
Documentation Location
Paragon Planner Desktop ApplicationUser Guide
How To > User Guides section of the Paragon AutomationDocumentation page
Paragon Planner User Guide How To > User Guides section of the Paragon AutomationDocumentation page
NOTE: Paragon Active Assurance is not yet integrated with the Paragon Automation suite ofapplications. So, you can access the documentation from the Paragon Active Assurance technicaldocumentation page.
RELATED DOCUMENTATION
Paragon Automation Overview | 3
Paragon Automation Overview
IN THIS SECTION
Key Use Cases | 4
Benefits of Paragon Automation | 5
As networks have become pervasive and more important in our daily lives, the stakes for ensuring a highquality of service and operational experience have increased. In addition, networks have expanded inscale, making them extremely difficult to manage manually. Because human errors are the cause of manynetwork outages, an increase in scale means that there's a greater likelihood of human errors.
To improve the operational and service experience, it is essential for network operators to have fewernetwork errors, faster resolution times, and better visibility into and control of their networks. Theseoutcomes can be achieved only by using automation.
3
Juniper’s Paragon Automation is a modular portfolio of cloud-native software applications that helpoperators to simplify their network operations by eliminating manual tasks, processes, and workflowsthat are often repetitive and prone to human error. Paragon Automation delivers closed-loopautomation to translate business intent into service performance across the entire service deliverylifecycle. Paragon Automation builds on Juniper's existing automation portfolio to meet the mostpressing challenges of current and next-generation networks and services.
The Paragon Automation portfolio includes the following products:
• Paragon Pathfinder (formerly NorthStar Controller): Design, provision, and optimize segment routing(SR) and MPLS path flows. See "Paragon Pathfinder Overview" on page 5.
• Paragon Planner (formerly NorthStar Planner): Plan, model, and verify services before deployingthem, and forecast the impact of network changes such as latency, traffic flows, and new traffic, andthe impact of new services. See "Paragon Planner Overview" on page 13.
• Paragon Active Assurance (formerly Netrounds): Actively test and assure services across physical,hybrid, and virtual networks. Paragon Active Assurance utilizes synthetic traffic to verify applicationand service performance at the time of service delivery and throughout the life of the service. Seethe Paragon Active Assurance technical documentation page.
NOTE: Currently, Paragon Active Assurance features are not accessible from the ParagonAutomation GUI because Paragon Active Assurance is not yet integrated with the ParagonAutomation suite of applications.
• Paragon Insights (formerly HealthBot): Diagnose network health and services health by usingstreaming telemetry and machine learning (ML) analytics, which provide actionable insights intonetwork behavior to help identify and resolve issues quickly. See "Paragon Insights Overview" onpage 8.
• Anuta Networks ATOM: Provides multi-vendor provisioning, orchestration, and workflowautomation for networks and services to eliminate costly errors while increasing operational speed,accuracy, and quality. See the Anuta ATOM Resource Center page.
Key Use Cases
• Automated service provisioning and monitoring: Service deployment with automated servicemonitoring.
• Software-defined networking (SDN) IP transport management: Automated management of IPtransport using an SDN controller.
• Zero-touch testing: Automatically verify service quality prior to onboarding customers.
4

• Automated root cause analysis: Spot a service quality problem, and root cause and remediate theproblem.
• Anomaly detection: Understand network anomalies and assess impact.
• Coordinated maintenance: Fix issues without traffic impact.
Benefits of Paragon Automation
• Shorten time-to-revenue for new infrastructure and services by leveraging the power of automation.
• Assure service experience throughout the service lifecycle by using active testing, monitoring,predictive analytics, and closed-loop remediation.
• Minimize risk associated with upgrades, changes, and new deployments. Reduce failed servicedelivery rates, mean-time-to-repair (MTTR), and SLA penalties, resulting in higher service uptime,better quality of service, and increased customer satisfaction & retention.
• Obtain OPEX savings and higher workforce efficiency, and increase network utilization byautomating device and service deployment, management, and compliance by using workflowautomation, for greater network visibility and repeatable, best-in-class service delivery.
RELATED DOCUMENTATION
Paragon Automation GUI Overview | 15
Paragon Pathfinder Overview
IN THIS SECTION
Key Features | 6
Key Use Cases | 7
Benefits of Paragon Pathfinder | 8
As more content and applications are migrated to the cloud and as new services are delivered over thenetwork, network operators are expanding their networks to meet the increase in bandwidth demand.This expansion and the growing number of features in the network are increasing the complexity of
5
traffic management. Therefore, network operators need to find a way to manage this complexity and todeliver increased speed and agility in their networks.
The high bandwidth demand and the increase in the number of latency-sensitive applications alsomeans that network operators must meet stringent service-level agreements (SLAs). Further, to ensurethat they reduce costs (CapEx and OpEx) and maximize revenue, network operators must run theirnetworks hotter and more efficiently to make greater use of network bandwidth, potentially eliminatingthe need for redundant paths. Network operators must also design, implement, and operate theirnetworks to make the networks operationally efficient. To achieve these outcomes, network operatorsare using automation.
Software-defined networking (SDN) controllers help network operators to visualize, monitor, andautomate their network by using closed-loop automation. In addition, segment routing (SR) simplifiestraffic management of IP-MPLS networks while integrating application awareness into the networkcontrol plane, thus providing the best possible application quality of experience (AppQoE) withoutincreasing network complexity.
Juniper's Paragon Pathfinder (formerly NorthStar Controller) is a standards-based, stateful SDN andsegment routing controller, which enables granular visibility and control of IP-MPLS and SR traffic flowsin large service provider, cloud provider, and enterprise networks. Paragon Pathfinder collects topologyand performance statistics, and provides network operators with a view of the network through real-time topology view and events, traffic and latency graphs, and traffic reports.
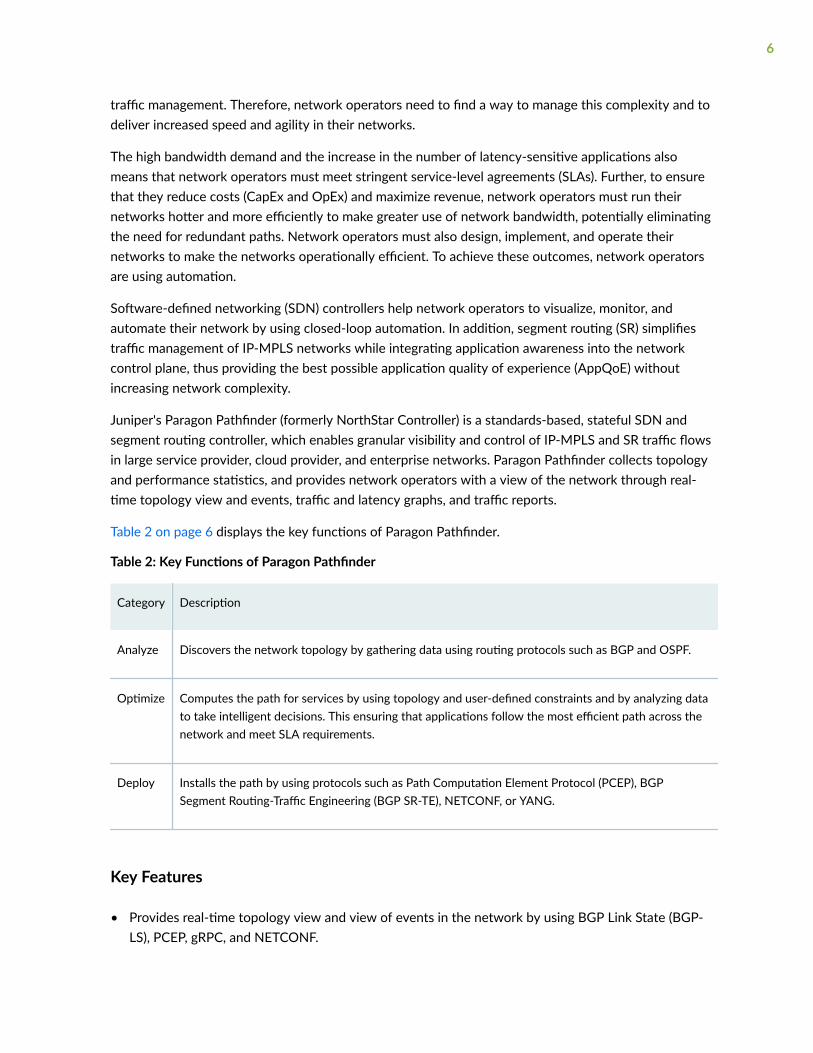
Table 2 on page 6 displays the key functions of Paragon Pathfinder.
Table 2: Key Functions of Paragon Pathfinder
Category Description
Analyze Discovers the network topology by gathering data using routing protocols such as BGP and OSPF.
Optimize Computes the path for services by using topology and user-defined constraints and by analyzing datato take intelligent decisions. This ensuring that applications follow the most efficient path across thenetwork and meet SLA requirements.
Deploy Installs the path by using protocols such as Path Computation Element Protocol (PCEP), BGPSegment Routing-Traffic Engineering (BGP SR-TE), NETCONF, or YANG.
Key Features
• Provides real-time topology view and view of events in the network by using BGP Link State (BGP-LS), PCEP, gRPC, and NETCONF.
6

• Enables centralized discovery and provisioning, monitoring, and management of label-switched paths(LSPs).
• Enables complex, inter-domain path computation by using sophisticated algorithms.
• Facilitates the archival of network data, which can then be used for network planning (by usingParagon Planner).
• Integrates with Paragon Insights to monitor and manage device and network health.
• Provides open southbound (for example, PCEP, BGP-LS, NETCONF) and northbound interfaces (forexample, REST, YANG)
Key Use Cases
• Visualization: Visualize and monitor MPLS networks running RSVP-Traffic Engineering (RSVP-TE),LDP, or SR-TE.
• Path diversity: Use traffic engineering to achieve a diverse path through the network. For example, ifyou have a critical service and want to guarantee SLAs on that service, you can specify a diverse paththrough the network. This ensures that if one path fails, the traffic can move to a different path asquickly as possible.
• Rerouting LSPs based on different criteria:
• End-to-end utilization threshold violation: Paragon Pathfinder tracks the threshold for eachinterface. If the thresholds are violated (compared to user-defined global threshold values), theLSPs are rerouted based on priority, bandwidth, and so on.
• Delay threshold violation: Paragon Pathfinder collects the measured delay and reroutes LSPs thatare transiting on links that violate a configured maximum delay.
• Packet loss threshold violation: Paragon Pathfinder collects packet loss data and compares it withthe user-defined global threshold values. Any link that violates the packet loss threshold is placedin maintenance mode for an hour, and LSPs that transit the link are rerouted based on priority,bandwidth, and so on.
• Node maintenance: If a user puts a node in maintenance (thereby triggering a maintenance event),Paragon Pathfinder excludes all nodes placed under maintenance from path computations, andautomatically reroutes the affected LSPs.
• Bandwidth calendaring: Schedule future bandwidth needs.
7
Benefits of Paragon Pathfinder
• Provides better service experience by enabling network operators to monitor their networks for real-time topology and bandwidth changes, and optimizes network services to deliver high-qualitycustomer experience.
• Simplifies the operational experience because network operators can see an overview of their entireMPLS or segment routed networks and then drill down to view the detailed state of a path, link, ornode.
• Enables the network to operate more autonomously by enabling MPLS and segment-routednetworks to self-learn changes in topology, bandwidth usage, and traffic patterns and then to takeappropriate action to maintain SLAs.
RELATED DOCUMENTATION
Paragon Planner Overview | 13
Paragon Insights Overview
IN THIS SECTION
Main Components of Paragon Insights | 9
Closed-Loop Automation | 11
Benefits of Paragon Insights | 12
Paragon Insights is a highly automated and programmable device-level diagnostics and network analyticstool that provides consistent and coherent operational intelligence across network deployments.Paragon Insights integrates multiple data collection methods (such as Junos Telemetry Interface (JTI),NETCONF, system log [syslog], and SNMP), to aggregate and correlate large volumes of time-sensitivetelemetry data, thereby providing a multidimensional and predictive view of the network. Additionally,Paragon Insights translates troubleshooting, maintenance, and real-time analytics into an intuitive userexperience to give network operators actionable insights into the health of individual devices and of theoverall network.
8

Main Components of Paragon Insights
Paragon Insights consists of two main components:
• Health Monitoring, which enables you to view an abstracted, hierarchical representation of deviceand network-level health, and define the health parameters of key network elements throughcustomizable key performance indicators (KPIs), rules, and playbooks.
A playbook is a collection of rules. You can create a playbook and apply the playbook to a devicegroup or a network group. For more information on rules and playbooks, see Paragon Insights Rulesand Playbooks.
• Root Cause Analysis (RCA), which helps you find the root cause of a device or network-level issuewhen Paragon Insights detects a problem with a network element.
Paragon Insights Health Monitoring
The Challenge
With increasing data traffic generated by cloud-native applications and emerging technologies, serviceproviders and enterprises need a network analytics solution to analyze volumes of telemetry data, offerinsights into overall network health, and produce actionable intelligence. Although telemetry-basedtechniques have existed for years, the growing number of protocols, data formats, and KPIs from diversenetworking devices has made data analysis complex and costly. Traditional CLI-based interfaces requirespecialized skills to extract business value from telemetry data, creating a barrier to entry for networkanalytics.
How Paragon Insights Health Monitoring Helps
By aggregating and correlating raw telemetry data from multiple sources, the Paragon Insights HealthMonitoring component provides a multidimensional view of network health that reports current status,as well as projected threats to the network infrastructure and its workloads.
Health status determination is tightly integrated with the Paragon Insights RCA component, which canmake use of system log data received from the network and its devices. Health Monitoring providesstatus indicators that alert you when a network resource is currently operating outside a user-definedperformance policy. Health Monitoring does a risk analysis using historical trends and predicts whether aresource may become unhealthy in the future. Health Monitoring not only offers a fully customizableview of the current health of network elements, but also automatically initiates remedial actions basedon predefined service level agreements (SLAs).
Defining the health of a network element, such as broadband network gateway (BNG), provider edge(PE), core, and leaf-spine, is highly contextual. Each element plays a different role in a network, withunique KPIs to monitor. Given that there is no single definition for network health across all use cases,Paragon Insights provides a highly customizable framework to allow you to define your own healthprofiles.
9

Paragon Insights Root Cause Analysis
The Challenge
For some network issues, it can be challenging for network operators to figure out what caused anetworking device to stop working properly. In such cases, an operator must call on a specialist (withknowledge built from years of experience) to troubleshoot the problem and find the root cause.
How Paragon Insights RCA Helps
The Paragon Insights RCA component simplifies the process of finding the root cause of a network issue.RCA captures the troubleshooting knowledge of specialists and has a knowledge base in the form ofParagon Insights rules. These rules are evaluated either on demand by a specific trigger or periodically inthe background to ascertain the health of a networking component (such as routing protocol, system,interface, or chassis) on the device.
To illustrate the benefits of Paragon Insights RCA, let’s consider the problem of OSPF flapping. Figure 1on page 10 highlights the workflow sequence involved in debugging OSPF flapping. A networkoperator troubleshooting this issue would need to perform manual debugging steps for each tile (step)of the workflow sequence in order to find the root cause of the OSPF flapping. On the other hand, theRCA component troubleshoots the issue automatically by using an RCA bot. The RCA bot tracks all ofthe telemetry data collected by Paragon Insights and translates the information into graphical statusindicators (displayed in the Paragon Insights web GUI) that correlate to different parts of the workflowsequence shown in Figure 1 on page 10.
Figure 1: High-level workflow to debug OSPF flapping
When you configure Paragon Insights, each tile of the workflow sequence (shown in Figure 1 on page10) can be defined by one or more rules. For example, the RPD-OSPF tile could be defined as two ruleconditions: one to check if "hello-transmitted" counters are incrementing and the other to check if
10

"hello-received" counters are incrementing. Based on these user-defined rules, Insights provides statusindicators, alarm notifications, and an alarm management tool to inform and alert you of specificnetwork conditions that could lead to OSPF flapping.
By isolating a problem area in the workflow, RCA proactively guides you in determining the appropriatecorrective action to take to fix a pending issue or avoid a potential one.
Closed-Loop Automation
Paragon Insights offers closed-loop automation. The automation workflow can be divided into sevenmain steps (see Figure 2 on page 12):
1. Define—The user defines the health parameters of key network elements through customizable keyperformance indicators (KPIs), rules, and playbooks, by using the tools provided by Paragon Insights.
2. Collect—Paragon Insights collects rule-based telemetry data from multiple devices using thecollection methods specified for the different network devices.
3. Store—Paragon Insights stores time-sensitive telemetry data in a time-series database (TSDB). Thisallows users to query, perform operations on, and write new data back to the database, days, or evenweeks after the initial storage.
4. Analyze—Paragon Insights analyzes telemetry data based on the specified KPIs, rules, and playbooks.
5. Visualize—Paragon Insights provides multiple ways for you to visualize the aggregated telemetry datathrough its web-based GUI to gain actionable and predictive insights into the health of your devicesand the overall network.
6. Notify—Paragon Insights notifies you through the GUI and notification alarms when problems inindividual devices or in the network are detected.
11

7. Act—Paragon Insights performs user-defined actions to help resolve and proactively prevent networkproblems.
Figure 2: Paragon Insights Closed-Loop Automation Workflow
Benefits of Paragon Insights
• Customization—Provides a framework to define and customize health profiles, allowing trulyactionable insights for the specific device or network being monitored.
• Automation—Automates root cause analysis and log file analysis, streamlines diagnostic workflows,and provides self-healing and remediation capabilities.
• Greater network visibility—Provides advanced multidimensional analytics across network elements,giving you a clearer understanding of network behavior to establish operational benchmarks, improveresource planning, and minimize service downtime.
• Intuitive GUI—Offers an intuitive web-based GUI for policy management and easy data consumption.
• Open integration—Lowers the barrier of entry for telemetry and analytics by providing open sourcedata pipelines, notification capabilities, and third-party device support.
12

• Multiple data collection methods—Includes support for JTI, OpenConfig, NETCONF, CLI, Syslog,NetFlow, and SNMP.
RELATED DOCUMENTATION
Paragon Insights Getting Started Guide
Paragon Planner Overview
IN THIS SECTION
Key Features and Use Cases | 13
Benefits of Paragon Planner | 14
Network automation has become increasingly important to operators who want to improve theiroperational and service experience. Network operators can apply automation across the entire networklife cycle: from planning and designing, to implementing and operating, and optimizing the network. Inaddition, by using feedback from the different steps in the lifecycle, operators can achieve closed loopnetwork automation.
The first step in realizing closed loop network automation is the accurate planning and designing of thenetwork. Juniper’s Paragon Automation suite of applications includes Paragon Planner, which helpsoperators to plan and design their network.
Paragon Planner is a network modeling tool that enables offline visualization of network resources andprovides detailed architectural planning of production networks. Network operators can use ParagonPlanner to visualize and map services to resources, and forecast the impact of network changes (such aslatency, additional traffic, shifts in traffic flows, and new capacity) on transport services. Paragon Planneralso enables operators to simulate network changes and other traffic scenarios without affecting theproduction network, and assess the network for potential failure scenarios.
Key Features and Use Cases
The key features of and use cases for Paragon Planner include the following:
• Automatically construct network topologies by using data snapshots of live networks (obtained fromParagon Pathfinder) or source data from stored network configuration files and other sources.
13

• Perform capacity planning to determine whether there is sufficient capacity or if more capacityshould be added, and which links can be pruned without compromising resiliency.
• Analyze traffic loads to determine accurate link utilization for failure simulation.
• Validate network changes (in a safe, virtual environment) before deployment.
• Run what-if scenarios to anticipate the impact of any network change.
• Create and model VPNs, simulate VPN routing, and generate VPN traffic.
• Simulate multicast flows based on user-defined multicast groups and demands.
• Design and simulate MPLS traffic engineering (MPLS-TE) and label-switched path (LSP) routing.
• Assess network resiliency against different failure scenarios and analyze how traffic is rerouted andits effect on network links.
• Ensure service-level agreement (SLA) compliance by modeling class of service (CoS) classes andpolicies and queuing schemes. (You can define application flows based on CoS to enable themodeling of voice over IP (VoIP) or video on demand (VOD) traffic.)
• Model and analyze BGP routing.
• Hardware inventory.
• Network integrity checks.
Benefits of Paragon Planner
• Lower CapEx and OpEx (hardware and maintenance costs) by using Planner's tariff-based design,MPLS LSP, and segment routing traffic engineering (SR-TE) features for effective utilization of thenetwork, and superior design optimization.
• Quickly diagnose performance problems by using flow analysis, bottleneck detection and analysis,peak utilization analysis, and multicast simulation features.
• Optimize plans for future network growth (to meet business needs) by using capacity planning anddata forecasting.
• Avoid problems and mitigate risk by assessing the network using Planner’s resiliency analysis, fibercut analysis, and so on.
• Validate new services, equipment, and technologies before they are rolled out.
14
RELATED DOCUMENTATION
Paragon Pathfinder Overview | 5
Access Paragon Planner Desktop Application | 44
Paragon Automation GUI Overview
IN THIS SECTION
Menu Bar and Banner | 15
Commonly Used Icons | 20
Add or Remove Favorite Pages | 22
The Paragon Automation GUI provides an easy to use, single pane of glass experience that allows usersto access and use the different Paragon Automation applications.
After you log in successfully to the Paragon Automation GUI, the first page that you encounter is theDashboard page, as shown in Figure 3 on page 19. The Dashboard page displays multiple widgets (alsoknown as dashlets) that you can customize. For more information, see "About the Dashboard Page" onpage 34.
In the rest of this topic, we’ll discuss some commonly used elements and features of the ParagonAutomation GUI.
Menu Bar and Banner
The two elements of the Paragon Automation GUI that you’ll use frequently are as follows:
• Menu bar: The menu bar, which is available at the left-side of the Paragon Automation GUI, isminimized by default. You can mouse over or click inside the menu bar to expand the menu. A sampleof the expanded menu is shown in Figure 3 on page 19.
You can expand the high-level menu items and navigate to the different pages in the ParagonAutomation GUI. For more information about the different menu entries and how they map to thedifferent Paragon Automation applications, see "Paragon Automation GUI Menu Overview" on page24.
15

• Banner: The banner, which is displayed at the top of the page (see Figure 3 on page 19) containsseveral icons that you’re likely to use regularly. The icons and their functions are explained in Table 3on page 16.
Table 3: Icons on the Paragon Automation Banner
Description Function
NOTE: See Figure 3 on page 19 for the banner icons described in this table.
Menu bar toggle Clicking the menu bar toggle icon (the icon with threehorizontal bars) in the top left of the ParagonAutomation banner toggles the visibility of the ParagonAutomation menu, which means that the menu isdisplayed if it was previously hidden and the menu ishidden if it was previously displayed.
In-progress and scheduled jobs To quickly view the jobs that are running or that arescheduled, mouse over the clock icon, which opens awidget that contains two tabs: In-Progress andScheduled.
The number of jobs that are in progress and scheduledare shown in parentheses in the title of the tab, andeach tab lists the in-progress and scheduled jobs.
You can view all the jobs by clicking the See all jobshyperlink, which takes you to the Jobs page.
16
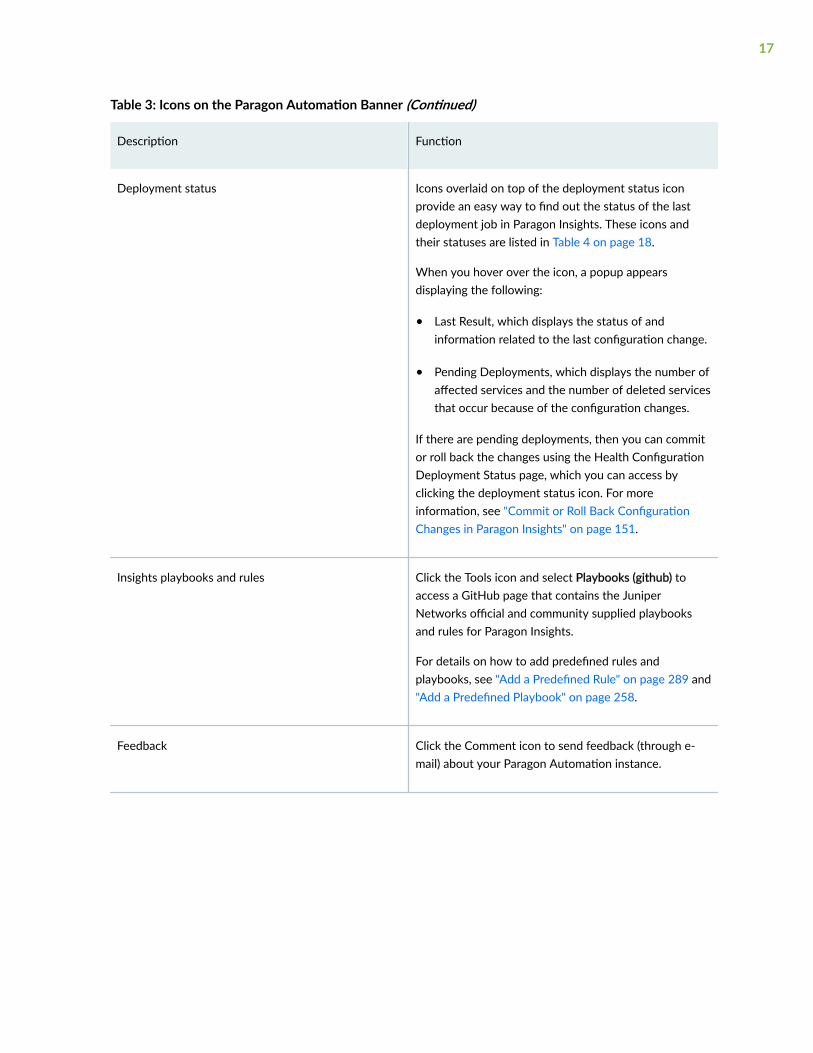
Table 3: Icons on the Paragon Automation Banner (Continued)
Description Function
Deployment status Icons overlaid on top of the deployment status iconprovide an easy way to find out the status of the lastdeployment job in Paragon Insights. These icons andtheir statuses are listed in Table 4 on page 18.
When you hover over the icon, a popup appearsdisplaying the following:
• Last Result, which displays the status of andinformation related to the last configuration change.
• Pending Deployments, which displays the number ofaffected services and the number of deleted servicesthat occur because of the configuration changes.
If there are pending deployments, then you can commitor roll back the changes using the Health ConfigurationDeployment Status page, which you can access byclicking the deployment status icon. For moreinformation, see "Commit or Roll Back ConfigurationChanges in Paragon Insights" on page 151.
Insights playbooks and rules Click the Tools icon and select Playbooks (github) toaccess a GitHub page that contains the JuniperNetworks official and community supplied playbooksand rules for Paragon Insights.
For details on how to add predefined rules andplaybooks, see "Add a Predefined Rule" on page 289 and"Add a Predefined Playbook" on page 258.
Feedback Click the Comment icon to send feedback (through e-mail) about your Paragon Automation instance.
17

Table 3: Icons on the Paragon Automation Banner (Continued)
Description Function
User menu Click the user (profile) icon to access the user menu. Youcan do the following:
• Change your password: Click Change Password toopen the Change Password dialog and modify yourpassword. See "Change Your Password" on page41.
• Log out of Paragon Automation: Click Logout to logout of the Paragon Automation GUI.
You are taken to the Paragon Automation login page.
Help menu Click the Help (?) icon to access the help menu, whichprovides links to the Paragon Automationdocumentation:
• Documentation: Clicking this link opens the ParagonAutomation technical documentation page (in yourbrowser).
• Release Notes: Clicking this link opens the ParagonAutomation Release Notes page (in your browser).
• About: Clicking this link opens the About panelwithin the Paragon Automation application.
Table 4: Icons Indicating Last Deployment Status
Description of Icon Meaning
Check mark (√) in a green circle at the top-right of theDeployment status icon.
Last configuration change was successful.
Cross (×) in a red circle at the top-right of theDeployment status icon.
Last configuration change was unsuccessful.
18

Table 4: Icons Indicating Last Deployment Status (Continued)
Description of Icon Meaning
Exclamation point (!) in an orange circle at the top-rightof the Deployment status icon.
Last configuration change is in progress or the status isunknown.
No icon at the top-right of the Deployment status icon. There is no last configuration change.
Bouncing, blue downward arrow (↓) on theDeployment Status icon.
One or more deployments are pending.
Figure 3: Sample Dashboard Page Showing Menu and Banner
1— Menu toggle icon 6— Feedback icon
2— Expanded menu bar 7— Icon to access Insights playbooks and rules
3— Banner 8— User (profile) icon
4— Icon for viewing in-progress and scheduled jobs 9— Help (?) icon
5— Icon for viewing deployment status (ParagonInsights)
19
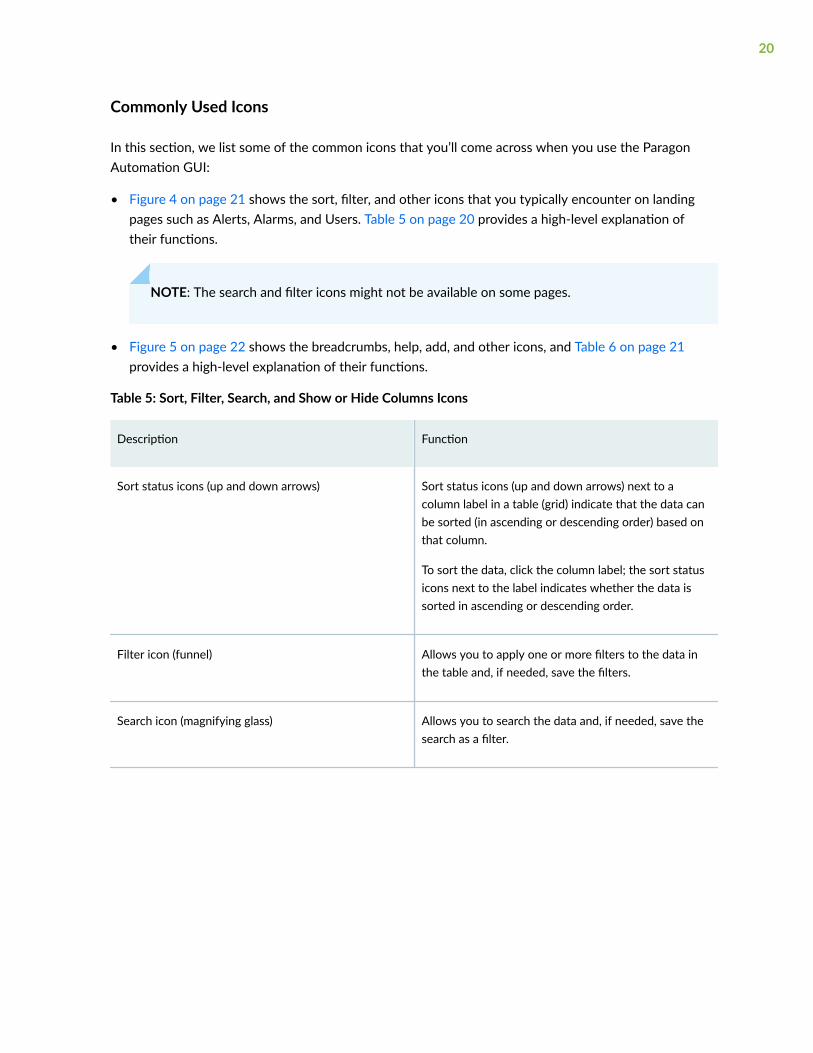
Commonly Used Icons
In this section, we list some of the common icons that you’ll come across when you use the ParagonAutomation GUI:
• Figure 4 on page 21 shows the sort, filter, and other icons that you typically encounter on landingpages such as Alerts, Alarms, and Users. Table 5 on page 20 provides a high-level explanation oftheir functions.
NOTE: The search and filter icons might not be available on some pages.
• Figure 5 on page 22 shows the breadcrumbs, help, add, and other icons, and Table 6 on page 21provides a high-level explanation of their functions.
Table 5: Sort, Filter, Search, and Show or Hide Columns Icons
Description Function
Sort status icons (up and down arrows) Sort status icons (up and down arrows) next to acolumn label in a table (grid) indicate that the data canbe sorted (in ascending or descending order) based onthat column.
To sort the data, click the column label; the sort statusicons next to the label indicates whether the data issorted in ascending or descending order.
Filter icon (funnel) Allows you to apply one or more filters to the data inthe table and, if needed, save the filters.
Search icon (magnifying glass) Allows you to search the data and, if needed, save thesearch as a filter.
20

Table 5: Sort, Filter, Search, and Show or Hide Columns Icons (Continued)
Description Function
Show or hide columns icon (three vertical dots orellipses)
Allows you to pick the columns that you wantdisplayed on the page or reset the preferences to thedefault.
Figure 4: Sample Alerts Page Showing Sort, Filter, and Other Icons
1— Sort status icons 3— Search icon
2— Filter icon 4— Show or Hide columns icon
Table 6: Breadcrumbs, Help, and Other Icons
Name Description
NOTE: Access to the add, modify, and delete capabilities depends on the role that you are assigned as a user. Formore information, see "Roles Overview" on page 62.
Breadcrumbs Provides an alternate way to navigate and access the ParagonAutomation menu items.
21

Table 6: Breadcrumbs, Help, and Other Icons (Continued)
Name Description
Help icon (?) Mouse over the help icon to get high-level information about thepage that you’re viewing.
Add icon (+) Enables you to add objects; for example, add users or roles.
Modify icon (pencil) Enables you to modify existing objects.
Delete icon (trash can) Enables you to delete existing objects.
Figure 5: Sample Users Page Showing Breadcrumbs, Help, and Other Icons
1— Breadcrumbs 4— Edit or Modify icon
2— Help icon 5— Delete icon
3— Add icon
Add or Remove Favorite Pages
The Favorites feature in the Paragon Automation GUI allows you to mark pages that you frequently useor visit as favorites, so that you can access such pages easily. Figure 6 on page 23 shows a sample pagewith existing favorites.
22
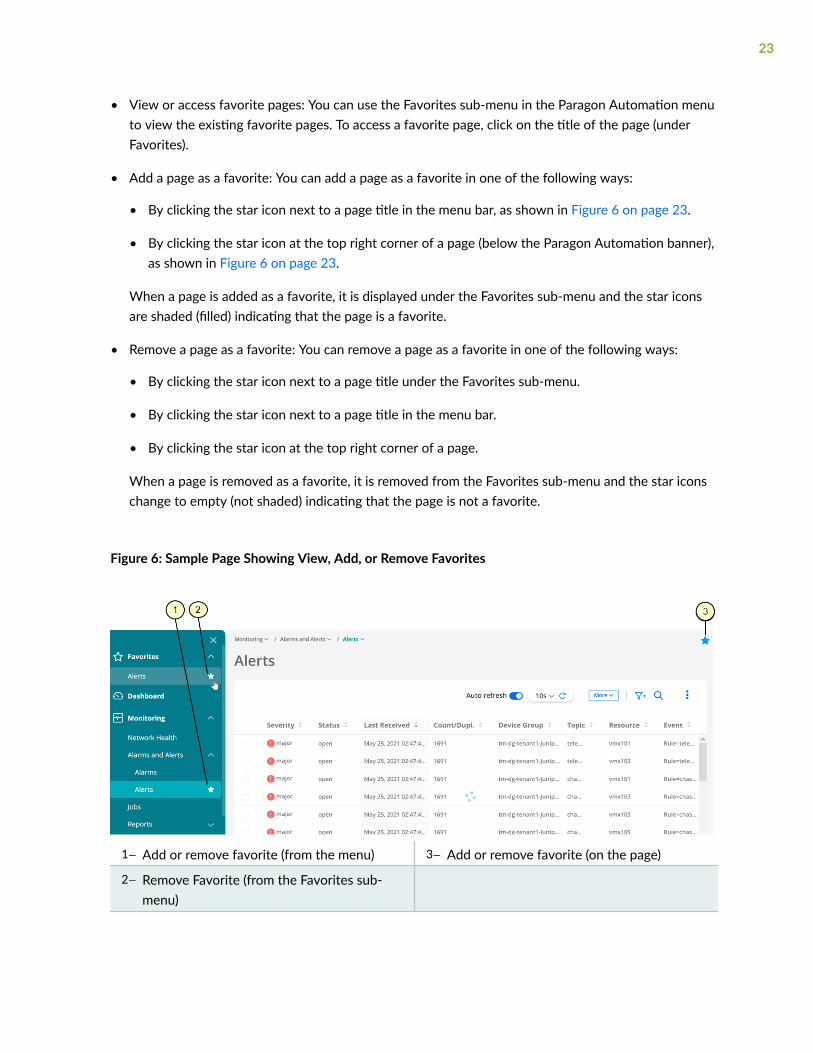
• View or access favorite pages: You can use the Favorites sub-menu in the Paragon Automation menuto view the existing favorite pages. To access a favorite page, click on the title of the page (underFavorites).
• Add a page as a favorite: You can add a page as a favorite in one of the following ways:
• By clicking the star icon next to a page title in the menu bar, as shown in Figure 6 on page 23.
• By clicking the star icon at the top right corner of a page (below the Paragon Automation banner),as shown in Figure 6 on page 23.
When a page is added as a favorite, it is displayed under the Favorites sub-menu and the star iconsare shaded (filled) indicating that the page is a favorite.
• Remove a page as a favorite: You can remove a page as a favorite in one of the following ways:
• By clicking the star icon next to a page title under the Favorites sub-menu.
• By clicking the star icon next to a page title in the menu bar.
• By clicking the star icon at the top right corner of a page.
When a page is removed as a favorite, it is removed from the Favorites sub-menu and the star iconschange to empty (not shaded) indicating that the page is not a favorite.
Figure 6: Sample Page Showing View, Add, or Remove Favorites
1— Add or remove favorite (from the menu) 3— Add or remove favorite (on the page)
2— Remove Favorite (from the Favorites sub-menu)
23

RELATED DOCUMENTATION
Access the Paragon Automation GUI | 32
Paragon Automation GUI Menu Overview
IN THIS SECTION
Monitoring Sub-Menu | 25
Network Sub-Menu | 27
Planning Sub-Menu | 28
Configuration Sub-Menu | 28
Administration Sub-Menu | 29
The Paragon Automation GUI menu enables you to access the different Paragon Automationapplications and perform tasks related to those applications. In addition, you can perform tasks that arecommon to the different Paragon Automation applications. The tasks that you can perform is based onthe roles and access privileges (capabilities) that you’re assigned as a Paragon Automation user. For moreinformation, see "Roles Overview" on page 62.
NOTE: Currently, Paragon Active Assurance features are not accessible from the ParagonAutomation GUI, because Paragon Active Assurance is not yet integrated with the ParagonAutomation suite of applications.
Table 7 on page 24 shows the top-level menu items (sub-menus) in the Paragon Automation GUI.
Table 7: Paragon Automation Main Menu
Sub-Menu Description
Favorites Displays the pages that are marked as favorites. See "Paragon Automation GUI Overview" onpage 15.
24

Table 7: Paragon Automation Main Menu (Continued)
Sub-Menu Description
Dashboard Access a user-configurable dashboard that you can customize with available widgets (alsoknown as dashlets). See "About the Dashboard Page" on page 34.
Monitoring Access various monitoring tasks, such as network health, alarms and alerts, jobs, and differenttypes of reports. See Table 8 on page 26.
Network Access tasks related to Paragon Pathfinder, such as network topology, label-switched path (LSP)delegation, and path optimization. See Table 9 on page 28.
Planning Access the Paragon Planner GUI and the egress peering engineering (EPE) planner. See Table 10on page 28.
Configuration Access tasks related to configuration, such as adding and discovering devices, device andnetwork groups, templates, playbooks and rules. See Table 11 on page 28.
Administration Access tasks related to administration, such as managing users and roles, authentication, andlicenses. See Table 12 on page 30.
ATOM Access the Anuta ATOM application. See "Integration with Anuta ATOM Overview" on page86.
NOTE: The Paragon Automation suite contains a built-in element management system (EMS)that provides functionality which is used by one or more Paragon Automation applications.Therefore, in the sections that follow, for the menu items used to access these features, theapplicable application is listed as EMS.
Monitoring Sub-Menu
Table 8 on page 26 displays the menu entries in the Monitoring sub-menu and the applications towhich each menu entry is applicable.
25

Table 8: Monitoring Sub-Menu Entries
Sub-Menu Entry and Applicable Applications Description
Network Health (Insights) See "About the Network Health Page" on page 605.
Alarms and Alerts > Alarms (Insights) See "About the Alarms Page" on page 619.
Alarms and Alerts > Alerts (Insights) See "About the Alerts Page" on page 622.
Graphs (Insights) See "Manage the Graphs Page" on page 331.
Jobs (EMS) See "About the Jobs Page" on page 625.
Reports > Health Reports (Insights) See "About the Reports Page" on page 628.
Reports > Network > Integrity Check (Pathfinder) See "View Network Reports" on page 636.
Reports > Network > LSP Discrepancy (Pathfinder)
Reports > Inventory > Devices (Pathfinder) See "View Inventory Reports" on page 640.
Reports > Inventory > Device Parts (Pathfinder)
Reports > Inventory > Line Cards (Pathfinder)
Reports > Inventory > Line Cards Usage (Pathfinder)
Reports > Inventory > Miscellaneous Parts (Pathfinder)
Reports > Inventory > Physical Interfaces (Pathfinder)
Reports > Inventory > Transceivers (Pathfinder)
26

Table 8: Monitoring Sub-Menu Entries (Continued)
Sub-Menu Entry and Applicable Applications Description
Reports > Maintenance > Link Oversubscription(Pathfinder)
See "View Maintenance Reports" on page 653.
Reports > Maintenance > Link Utilization Changes(Pathfinder)
Reports > Maintenance > LSP Path Changes (Pathfinder)
Reports > Maintenance > Maintenance Simulation(Pathfinder)
Reports > Maintenance > Path Delay (Pathfinder)
Reports > Maintenance > Peak Interface Utilization(Pathfinder)
Reports > Maintenance > Peak Link Utilization (Pathfinder)
Reports > Maintenance > Peak Simulation Summary(Pathfinder)
Reports > Maintenance > Peak Tunnel Failure (Pathfinder)
Network Sub-Menu
Table 9 on page 28 displays the menu entries in the Network sub-menu and the applications to whicheach menu entry is applicable.
27

Table 9: Network Sub-Menu Entries
Sub-Menu Entry and Applicable Applications Description
Topology (Pathfinder) See "About the Topology Page" on page 485.
Tunnels > Configure LSP Delegation (Pathfinder) See "Add and Remove LSP Delegation" on page 596.
Bandwidth Calendar (Pathfinder) See "About the Bandwidth Calendar Page" on page 599.
Path Optimization (Pathfinder) See "About the Path Optimization Page" on page 601.
Planning Sub-Menu
Table 10 on page 28 displays the menu entries in the Planning sub-menu and the applications to whicheach menu entry is applicable.
Table 10: Planning Sub-Menu Entries
Sub-Menu Entry and Applicable Applications Description
Paragon Planner See "Access Paragon Planner Desktop Application" on page 44.
Configuration Sub-Menu
Table 11 on page 28 displays the menu entries in the Configuration sub-menu and the applications towhich each menu entry is applicable.
Table 11: Configuration Sub-Menu Entries
Sub-Menu Entry and ApplicableApplications
Description
Devices (EMS) See "About the Device Page" on page 105.
Device Groups (Insights) See "About the Device Groups Page" on page 141.
28
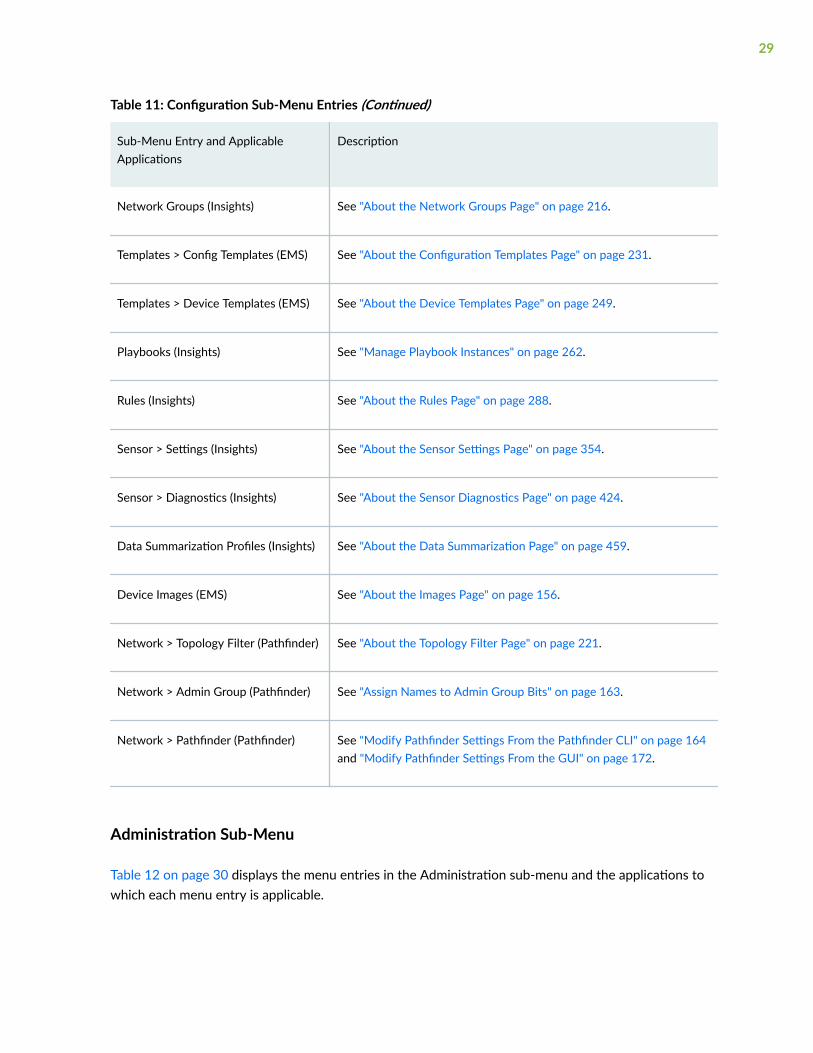
Table 11: Configuration Sub-Menu Entries (Continued)
Sub-Menu Entry and ApplicableApplications
Description
Network Groups (Insights) See "About the Network Groups Page" on page 216.
Templates > Config Templates (EMS) See "About the Configuration Templates Page" on page 231.
Templates > Device Templates (EMS) See "About the Device Templates Page" on page 249.
Playbooks (Insights) See "Manage Playbook Instances" on page 262.
Rules (Insights) See "About the Rules Page" on page 288.
Sensor > Settings (Insights) See "About the Sensor Settings Page" on page 354.
Sensor > Diagnostics (Insights) See "About the Sensor Diagnostics Page" on page 424.
Data Summarization Profiles (Insights) See "About the Data Summarization Page" on page 459.
Device Images (EMS) See "About the Images Page" on page 156.
Network > Topology Filter (Pathfinder) See "About the Topology Filter Page" on page 221.
Network > Admin Group (Pathfinder) See "Assign Names to Admin Group Bits" on page 163.
Network > Pathfinder (Pathfinder) See "Modify Pathfinder Settings From the Pathfinder CLI" on page 164and "Modify Pathfinder Settings From the GUI" on page 172.
Administration Sub-Menu
Table 12 on page 30 displays the menu entries in the Administration sub-menu and the applications towhich each menu entry is applicable.
29

Table 12: Administration Sub-Menu Entries
Sub-Menu Entry and Applicable Applications Description
User Management > User (EMS) See "About the Users Page" on page 54.
User Management > Role (EMS) See "About the Roles Page" on page 63.
User Management > User Groups (EMS) See "About the User Groups Page" on page 71.
Authentication > Portal Settings (EMS) See "Configure Portal Settings" on page 51.
Authentication > SMTP Settings (EMS) See "Configure SMTP Settings" on page 46.
Authentication > LDAP Settings (EMS) See "Configure LDAP Settings" on page 49.
Authentication > Email Templates (EMS) See "About the E-mail Templates Page" on page 694.
Authentication > Identity Providers (EMS) See "About the Identity Providers Page" on page 77.
Audit Logs (EMS) See "About the Audit Logs Page" on page 698.
External EMS (EMS) See "About the External EMS Page" on page 701.
Ingest Settings (Insights) See "About the Ingest Settings Page" on page 707.
Task Scheduler (Pathfinder) See "About the Task Scheduler Page" on page 735.
Security (Insights) See "About the Security Settings Page" on page 764.
License Management (EMS) See "About the License Management Page" on page 768.
30

CHAPTER 2
Access the Paragon Automation GUI
IN THIS CHAPTER
Single Sign-On Overview | 31
Access the Paragon Automation GUI | 32
About the Dashboard Page | 34
Change Your Password | 41
Reset Your Password | 41
Reset User Password | 42
Single Sign-On Overview
Paragon Automation allows single sign-on of users to allow users to access Paragon Automationresources by using credentials of a third-party account such as Anuta or Google.
NOTE: Paragon Automation Release 21.1 supports single sign-on only for Anuta and Googleaccounts.
When you log in to Paragon Automation by using the credentials of an identity provider account, theauthentication is provided by the identity provider and authorization by Paragon Automation.
To allow single sign-on in Paragon Automation:
1. Add the identity provider to Paragon Automation; see "Add Identity Providers" on page 80.
2. If default roles are not assigned for users logging in by using the identity provider account credentialswhile adding the identity provider, add the default roles; see "Edit and Delete Identity Providers" onpage 82.
You can also define individual users who can log in by using single sign-on and assign specific roles tothem; see "Add Users" on page 58.
31
If you have roles defined as part of identity provider and also as an individual user, you are assignedprivileges based on the roles assigned to you as an individual user.
After you create an identity provider, Paragon Automation displays Log in with <identity provider-name> on the log in page. Users having an account with the identity provider can log in to ParagonAutomation by using their credentials of their identity provider account.
RELATED DOCUMENTATION
About the Identity Providers Page | 77
Add Anuta ATOM as an Identity Provider | 92
Integration with Anuta ATOM Overview | 86
Access the Paragon Automation GUI
Before you access the GUI, activate your account. .
1. Click the Set your password link in the activation mail.
The Set Password page appears.
2. In the Password field, enter your password.
The password should be between 6 to 20 characters and must be a combination of uppercase letters,lowercase letters, numbers, and special characters.
3. In the Confirm Password field, enter the password again for confirmation. .
4. Click OK.
An e-mail with the subject Paragon Account Password Changed is sent to you.
Your account is now activated. You can access the Paragon Automation GUI by using the URL and theusername present in the activation mail and the password you set.
After an account is created for a user in Paragon Automation, an activation e-mail with a subjectParagon Account Created is sent to the user if SMTP is configured on Paragon Automation. Theactivation e-mail contains the URL to access the Paragon Automation GUI, the username and the Setyour password link to set your password. Your user account is activated only after you click the Set yourpassword link and set your password.
32

If SMTP is not configured, you will be intimated about the URL to access Paragon Automation, yourusername and password, either verbally or through an e-mail by the system administrator who managesthe Paragon Automation installation.
To access the Paragon Automation GUI:
1. Click the URL of the Paragon Automation installation.
The Paragon Automation Login page appears.
2. Enter your username and password.
On successful authentication, the Dashboard page appears. The navigation menu on the left-handside of every page allows you to access different objects and perform different tasks easily. The top-level menu items in the navigation menu are listed in Table 13 on page 33.
Table 13 on page 33 lists the top level menu items in the Paragon Automation GUI.
Table 13: Paragon Automation GUI Menu
Menu Description
Favorites Lists the pages that you marked as favorite. You do not have any listings when you log into Paragon Automation for the first time.
Dashboard Displays a variety of status and statistics information related to the network as widgets.These widgets are displayed in a carousel, that you can arrange.
Monitoring View network health report, alerts and alarms, scheduled jobs, jobs that are initiated andcompleted, inventory reports, reports about link utilization changes, peak interfaceutilization and many more reports.
Network View and manage the network topology, and perform tasks such as configuring tunnels,optimizing paths, and many more tasks.
Planning Access the Paragon Planner desktop application to simulate your network.
Configuration Configure devices, device groups, network groups, configuration templates, devicetemplates, playbooks for analytics, upload device images, and many more objects.
Administration Perform administration tasks such as configuring security, SMTP settings, LDAP settings,managing users, roles, user groups, licenses, and many more tasks.
33

Table 13: Paragon Automation GUI Menu (Continued)
Menu Description
ATOM Access the Anuta ATOM GUI.
RELATED DOCUMENTATION
Paragon Automation Overview | 3
Paragon Automation GUI Overview | 15
Paragon Automation GUI Menu Overview | 24
About the Dashboard Page
IN THIS SECTION
Tasks You Can Perform | 35
Field Descriptions | 36
To access the dashboard, select Dashboard.
Use the Dashboard page to view a variety of status and statistics information related to the network.This information is displayed in a carousel as widgets that you can arrange according to your preference.
Table 14 on page 34 describes the meaning of the severity level colors displayed on the widgets.
Table 14: Meaning of the Severity Level Colors
Color Definition
Green Healthy—The overall health of the device, device group, or network group is normal. Noproblems have been detected.
34

Table 14: Meaning of the Severity Level Colors (Continued)
Color Definition
Yellow Warning—There might be a problem with the health of the device, device group, or networkgroup. A minor problem has been detected. Further investigation is required.
Red Risk—The health of the device, device group, or network group is severely compromised. Amajor problem has been detected.
Gray No Data—No data is available for the device, device group, or network group.
Tasks You Can Perform
• Show or hide the carousel—Click the cluster of nine blue dots on the top-center part of the page todisplay the carousel that contains the available widgets. To hide the carousel, click the up arrow onthe carousel.
• View widgets in the carousel—From the list at the top left of the carousel, select the category ofwidgets that you want to view. The default is All Widgets.
The widgets that belong to the selected category are displayed in the carousel.
• Search for a widget in the carousel—Click the search icon (magnifying glass) at the top-left corner ofthe carousel, enter the search text, and press Enter.
The widgets, relevant to your search text, are displayed in the carousel.
• Create your own dashboard—Click the add (+) icon to the right of My Dashboard to create your owndashboard.
A new tab appears next to My Dashboard.
Then, drag the widgets (that you want to add to your dashboard) from the carousel and drop them inthis tab. The dashboard automatically adjusts the placement of the widgets to dynamically fit on yourbrowser window without changing their order. You can press and hold the top portion of the widgetand move it to a new location on the tab.
• Update information on specific widgets or all widgets—Click the refresh icon (circular arrow) on thetop of a widget to refresh this specific widget or click the refresh icon on the top-right corner of thedashboard to refresh all widgets in the dashboard.
35
At the bottom of each widget, you can see the date (in MM:DD:YYYY format) and time (inHH:MM:SS AM/PM 12-hour format) at which the widget was last updated.
• Rename a dashboard—Double-click on the title bar of the dashboard, specify a name, and pressEnter.
• Delete a dashboard or widget—Click the delete icon (X) in the title bar of the dashboard to removethe dashboard from the Dashboard page or click X on the top of a widget to remove the widget fromthe Dashboard page, and confirm the delete operation. The dashboard or widget, and its customsettings (if any) are deleted.
Field Descriptions
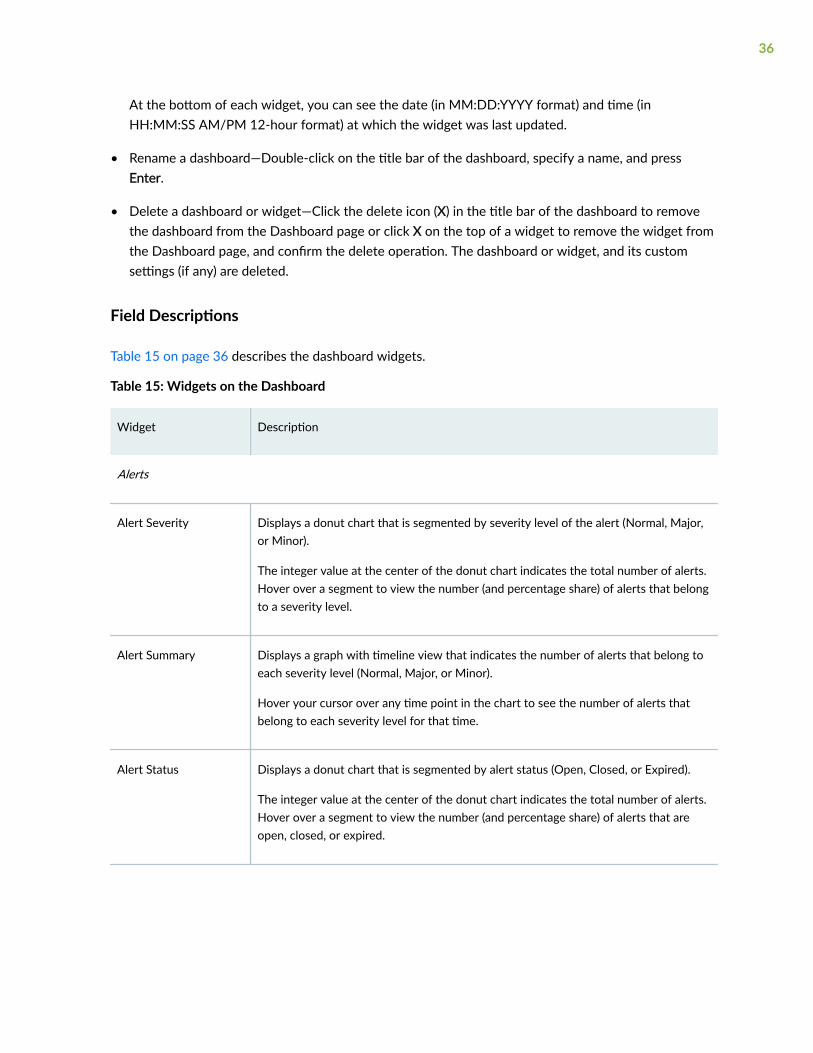
Table 15 on page 36 describes the dashboard widgets.
Table 15: Widgets on the Dashboard
Widget Description
Alerts
Alert Severity Displays a donut chart that is segmented by severity level of the alert (Normal, Major,or Minor).
The integer value at the center of the donut chart indicates the total number of alerts.Hover over a segment to view the number (and percentage share) of alerts that belongto a severity level.
Alert Summary Displays a graph with timeline view that indicates the number of alerts that belong toeach severity level (Normal, Major, or Minor).
Hover your cursor over any time point in the chart to see the number of alerts thatbelong to each severity level for that time.
Alert Status Displays a donut chart that is segmented by alert status (Open, Closed, or Expired).
The integer value at the center of the donut chart indicates the total number of alerts.Hover over a segment to view the number (and percentage share) of alerts that areopen, closed, or expired.
36

Table 15: Widgets on the Dashboard (Continued)
Widget Description
Alarms By Type Displays a bar graph that indicates the number of major and minor alarms, per alarmtype.
From the View list at the top-right corner of the widget, select the period for whichyou want to view the alarms. You can choose to view alarms for the past hour, pastday, past week, and past month.
To see more details of the alarms (such as the severity level and time at which thealarm was raised), click the More Details link at the bottom-right corner of the widget.You are taken to the Alarms page (Monitoring > Alarms).
Historical Alarms Displays a graph with timeline view that indicates the number of major and minoralarms for the selected period.
From the View list at the top-right corner of the widget, select the period for whichyou want to view the alarms. You can choose to view alarms for the past hour, pastday, past week, past month, and past year.
To see more details of the alarms (such as the severity level and time at which thealarm was raised), click the More Details link at the bottom-right corner of the widget.You are taken to the Alarms page (Monitoring > Alarms).
Devices
Device Count ByVendor
Displays a donut chart that is segmented by vendor.
The integer value at the center of the donut chart indicates the total number ofdevices in the network. Hover over a segment to view the number (and percentageshare) of devices belonging to a particular vendor.
Top 10 Traffic - Devices Displays a bar graph that indicates the top 10 devices (in descending order) with thehighest measured traffic values, in terms of the bandwidth usage.
Top 10 Traffic -Interfaces
Displays a bar graph that indicates the top 10 interfaces (in descending order) with thehighest measured traffic values, in terms of the bandwidth usage.
Top 10 Delay -Interfaces
Displays a bar graph that indicates the top 10 interfaces (in descending order) with thehighest measured delay.
37

Table 15: Widgets on the Dashboard (Continued)
Widget Description
Devices Displays a table that lists all the devices in the network and their details (status, host IPaddress, and the number of device groups that each device belong to).
If you click a device name, you are taken to the Devices page (Configuration >Devices), where you can perform various actions on the device. If you click a devicegroup value, you are taken to the Device Group Configuration page (Configuration >Device Group) where you can perform various actions on the device group.
Status
Device Status Displays a donut chart that is segmented by the health status of devices (Healthy,Warning, Risk, or No Data).
The integer value at the center of the donut chart indicates the total number ofdevices in the network. Hover over a segment to view the number (and percentageshare) of devices with a particular health status.
Device Group Health Displays a donut chart that is segmented by device groups.
The integer value at the center of the donut chart indicates the total number ofdevices in device groups. Each segment on the donut chart represents a device group,while the color of each segment represents the health status (Healthy, Warning, Risk,or No Data) of the device group. Hover over a segment to view the number (andpercentage share) of devices in a device group with a particular health status.
Network Health Displays a donut chart that is segmented by network groups.
The integer value at the center of the donut chart indicates the total number ofnetworks in the network group. Each segment on the donut chart represents anetwork group, while the color of each segment represents the health status (Healthy,Warning, Risk, or No Data) of the network group. Hover over a segment to view thenumber (and percentage share) of devices with a particular health status.
38

Table 15: Widgets on the Dashboard (Continued)
Widget Description
Device Groups Displays separate panels for each device group.
Each panel displays:
• The number of devices in a device group.
Click the down arrow beside the device count to see the list of devices.
• The number of playbooks to which the device group is applied.
Click the down arrow beside the playbook count to see the list of playbooks.
• A donut chart that is segmented by the health status for the device group.
The integer value at the center of the donut chart indicates the total number ofdevices in the device group. Hover over a segment to view the number (andpercentage share) of devices that belong to a particular health status.
To add a device group to the widget, click the Add New Device Group link thatappears on the empty panel in the widget. You are taken to the Device GroupConfiguration page (Configuration > Device Group), where you can add a devicegroup.
Network Groups Displays a table with the health status for each network group.
Click a network name to view the network properties (such as the number ofplaybooks and instances for the network) on the Network Configuration page(Configuration > Network Groups).
LSPs
Top LSP Sources Displays a table that lists the top 10 routers that have LSPs originating there, and thenumber of originating LSPs, based on LSP count.
Top LSP Destinations Displays a table that lists the top 10 routers that have LSPs terminating there, and thenumber of terminating LSPs, based on LSP count.
LSP Summary Displays a bar graph that indicates the number of primary, standby, and secondaryLSPs that are Up (or Active) and Down.
39
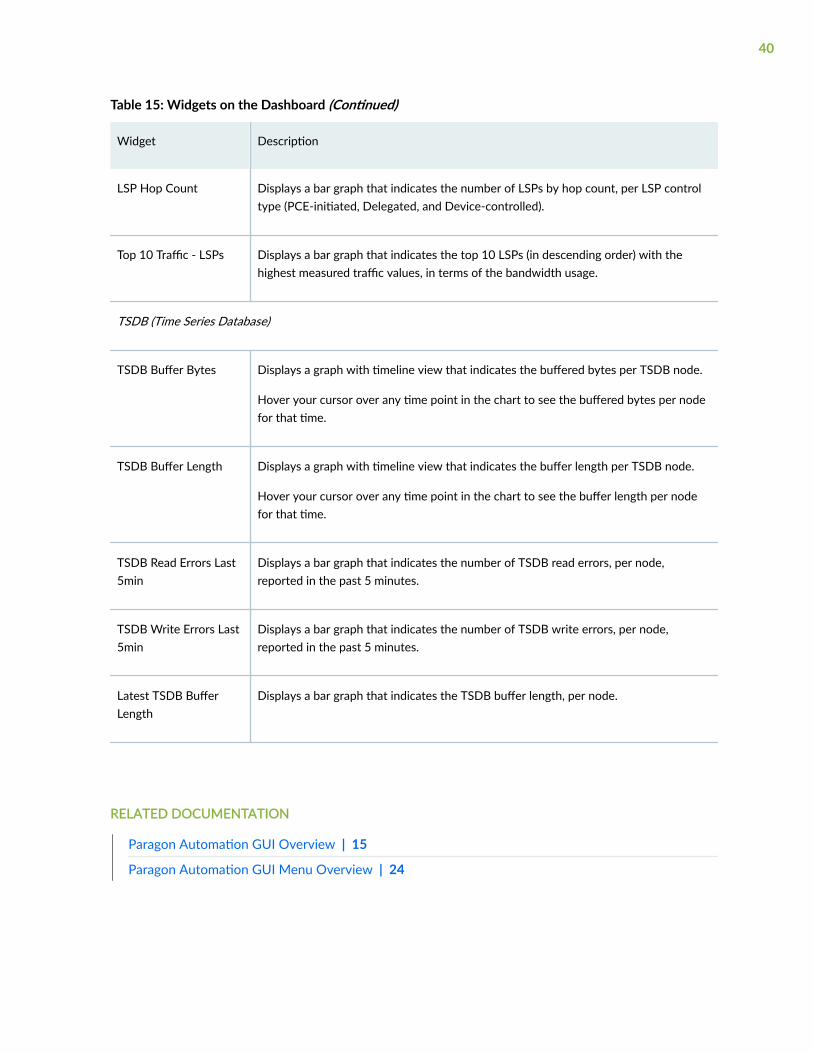
Table 15: Widgets on the Dashboard (Continued)
Widget Description
LSP Hop Count Displays a bar graph that indicates the number of LSPs by hop count, per LSP controltype (PCE-initiated, Delegated, and Device-controlled).
Top 10 Traffic - LSPs Displays a bar graph that indicates the top 10 LSPs (in descending order) with thehighest measured traffic values, in terms of the bandwidth usage.
TSDB (Time Series Database)
TSDB Buffer Bytes Displays a graph with timeline view that indicates the buffered bytes per TSDB node.
Hover your cursor over any time point in the chart to see the buffered bytes per nodefor that time.
TSDB Buffer Length Displays a graph with timeline view that indicates the buffer length per TSDB node.
Hover your cursor over any time point in the chart to see the buffer length per nodefor that time.
TSDB Read Errors Last5min
Displays a bar graph that indicates the number of TSDB read errors, per node,reported in the past 5 minutes.
TSDB Write Errors Last5min
Displays a bar graph that indicates the number of TSDB write errors, per node,reported in the past 5 minutes.
Latest TSDB BufferLength
Displays a bar graph that indicates the TSDB buffer length, per node.
RELATED DOCUMENTATION
Paragon Automation GUI Overview | 15
Paragon Automation GUI Menu Overview | 24
40
Change Your Password
Your password expires 180 days after it is assigned to you. After your password expires, you will not beable to log in to Paragon Automation. So, you must change your password before it expires.
To change your password:
1. Log in to the Paragon Automation GUI.
2. On the top-right corner, on the banner of the Paragon Automation GUI, click the user icon and selectChange Password.
The Change Password page appears.
3. In the Current Password field, enter your current password.
4. In the New Password field, enter a new password or select the Use a Securely Generated Passwordoption that appears when you click in the field.
The password should be between 6 to 20 characters and must be a combination of uppercase letters,lowercase letters, numbers, and special characters.
A password strength indicator indicates the strength of your new password. A long green lineindicates a strong password where as a short red line indicates a weak password. We recommendthat you provide a strong password.
5. In the Confirm Password field, enter the new password again for confirmation.
If you selected the Use a Securely Generated Password option for entering new password, theConfirm Password field is auto-populated.
6. Click OK.
A message indicating that the password is changed appears. Use your new password to log in toParagon Automation the next time.
RELATED DOCUMENTATION
Paragon Automation GUI Overview | 15
Paragon Automation GUI Menu Overview | 24
Reset Your Password
Sometimes you may forget your password. In such a case, you can use the Forgot Password option toreset your old password and obtain a new password.
41

NOTE: You cannot reset passwords for predefined users such as sp-admin or sp-operator. Youmust contact your system administrator to obtain or reset passwords for predefined users.
To reset your password:
1. On the Login page of Paragon Automation, in the Username field, enter your username in [email protected] format.
2. Click the Forgot Password link that appears below the Log In button.
A message appears stating that a mail is sent with a link to reset your password to your e-mail id.
3. Open the mail and click the Reset Your Password link.
The Reset Password page appears.
4. In the New Password field, enter a new password.
The password should be between 6 to 20 characters and must be a combination of uppercase letters,lowercase letters, numbers, and special characters.
A password strength indicator indicates the strength of your new password. A long green lineindicates a strong password where as a short red line indicates a weak password. We recommendthat you provide a strong password.
5. In the Confirm Password field, enter the new password again for confirmation.
6. Click OK to reset your password.
A message indicating that your password is reset appears.
You can now log in to Paragon Automation with your new password.
RELATED DOCUMENTATION
Paragon Automation GUI Overview | 15
Paragon Automation GUI Menu Overview | 24
Reset User Password
In Paragon Automation, the default username and password are set as admin and Admin123!,respectively.
The admin user does not require an e-mail address to access the Paragon Automation GUI. If the initialpassword set by an admin user is lost, it can be recovered by a system administrator who has access tothe physical server or virtual machine where Paragon Automation is installed.
42
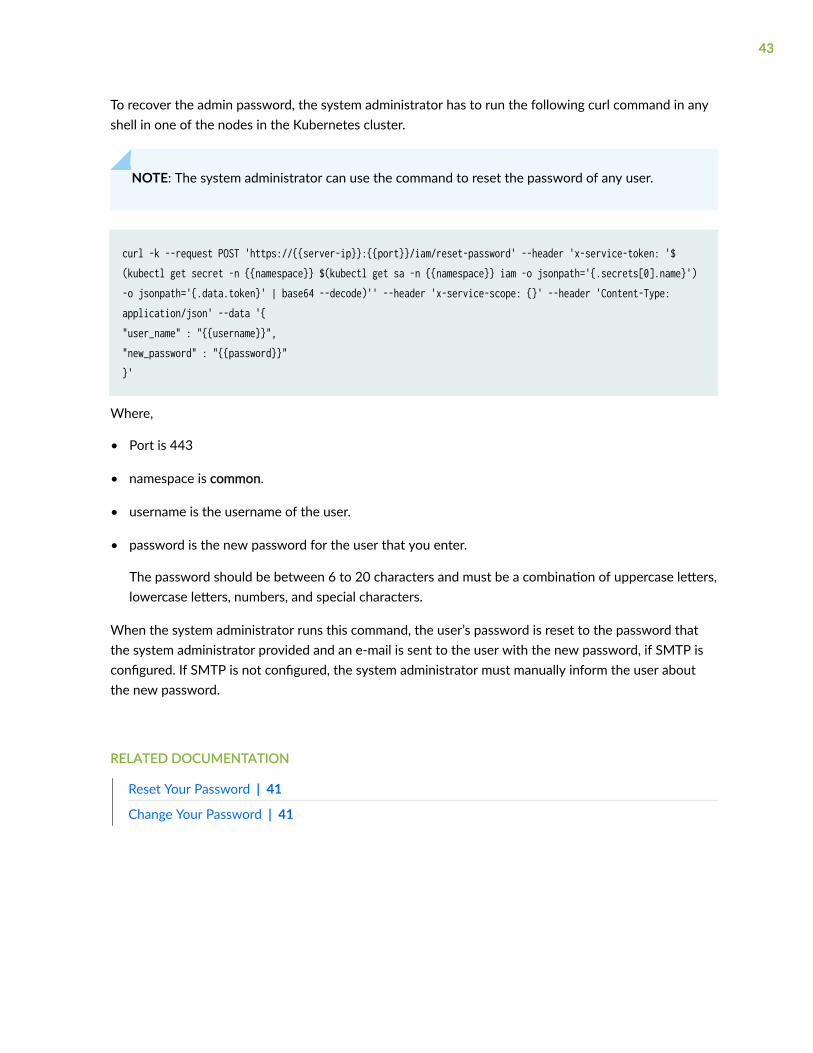
To recover the admin password, the system administrator has to run the following curl command in anyshell in one of the nodes in the Kubernetes cluster.
NOTE: The system administrator can use the command to reset the password of any user.
curl -k --request POST 'https://{{server-ip}}:{{port}}/iam/reset-password' --header 'x-service-token: '$(kubectl get secret -n {{namespace}} $(kubectl get sa -n {{namespace}} iam -o jsonpath='{.secrets[0].name}') -o jsonpath='{.data.token}' | base64 --decode)'' --header 'x-service-scope: {}' --header 'Content-Type: application/json' --data '{ "user_name" : "{{username}}", "new_password" : "{{password}}" }'
Where,
• Port is 443
• namespace is common.
• username is the username of the user.
• password is the new password for the user that you enter.
The password should be between 6 to 20 characters and must be a combination of uppercase letters,lowercase letters, numbers, and special characters.
When the system administrator runs this command, the user’s password is reset to the password thatthe system administrator provided and an e-mail is sent to the user with the new password, if SMTP isconfigured. If SMTP is not configured, the system administrator must manually inform the user aboutthe new password.
RELATED DOCUMENTATION
Reset Your Password | 41
Change Your Password | 41
43
CHAPTER 3
Access the Paragon Planner Desktop Application
IN THIS CHAPTER
Access Paragon Planner Desktop Application | 44
Access Paragon Planner Desktop Application
The Paragon Planner desktop application helps you simulate the effect of changes in a network withoutaffecting the actual network. You can access the Paragon Planner desktop application by using the JavaNetwork Launch Protocol (JNLP) file, which you can download from the Paragon Planner web UI. JNLPfiles are used to launch applications hosted on a web server or a remote computer.
NOTE: To run the JNLP file, you must have Java Runtime Environment installed on yourcomputer.
To download and launch the Paragon Planner desktop application:
1. From the Paragon Automation web UI, select Planning > Paragon Planner Desktop.
2. In the Paragon Planner Desktop page that is displayed, enter the memory to be allocated and clickOK. The default value is 512 MB.
3. Click Save File when prompted.
A Java Network Launch Protocol (JNLP) file is downloaded to your computer.
4. Double-click the JNLP file to launch Paragon Planner desktop application.
5. Log in using the credentials for Paragon Planner.
Paragon Planner desktop application main window opens. For information about how to use ParagonPlanner desktop application, see Paragon Planner Desktop Application User Guide
44

RELATED DOCUMENTATION
Key Paragon Planner Features
Main Window Overview
45
CHAPTER 4
Configure SMTP, LDAP, and Portal Settings
IN THIS CHAPTER
Configure SMTP Settings | 46
About LDAP Authentication | 48
Configure LDAP Settings | 49
Configure Portal Settings | 51
Configure SMTP Settings
You must configure SMTP in Paragon Automation so that the Paragon Automation users can be notifiedwhen their account is created, activated, locked, or when password is changed for their account.
To configure SMTP settings:
1. Click Administration > Authentication > SMTP Settings in the left navigation bar.
The SMTP Settings page appears.
2. Configure SMTP settings referring to Table 16 on page 46.
3. Click Save.
The SMTP settings are saved.
Table 16 on page 46 lists the fields on the SMTP Settings page.
Table 16: SMTP Settings
Field Description
SMTP Server
Server Address Enter the hostname for the SMTP server.
46
Table 16: SMTP Settings (Continued)
Field Description
TLS Click to enable or disable Transport Layer Security (TLS) protocol. If you enable TLS,the e-mail messages are transmitted over an encrypted channel.
Port Number Enter the port number for the SMTP server. Check with your e-mail serviceprovider for the SMTP port number. By default, the port number is set to 587 whenTLS is enabled and to 25 when TLS is disabled. However, you can modify the portnumber.
SMTP Authentication
SMTP Authentication Enable (default) this option if the e-mail server requires authentication before an e-mail can be sent.
The Username and Password fields are displayed when you enable this option.
Disable this option if you want to configure an unauthenticated e-mail server.
The From Name and From Email Address fields are displayed when you disable thisoption.
From Name Enter the name to be displayed in the From field in the e-mail sent to a user.
From Email Address Enter the e-mail address from which Paragon Automation should send e-mails tousers. The name can contain only alphanumeric characters and hyphen (-); 35characters long.
User Name Configure the username for logging in to the SMTP server.
Password Enter the password that you want to use for authentication.
The password should be between 8 to 20 characters and must be a combination ofuppercase letters, lowercase letters, numbers, and special characters.
Confirm Password Reenter the password for confirmation.
From Name Enter a name. This name will appear as the sender’s name in the e-mails sent tousers from Paragon Automation. ;
47
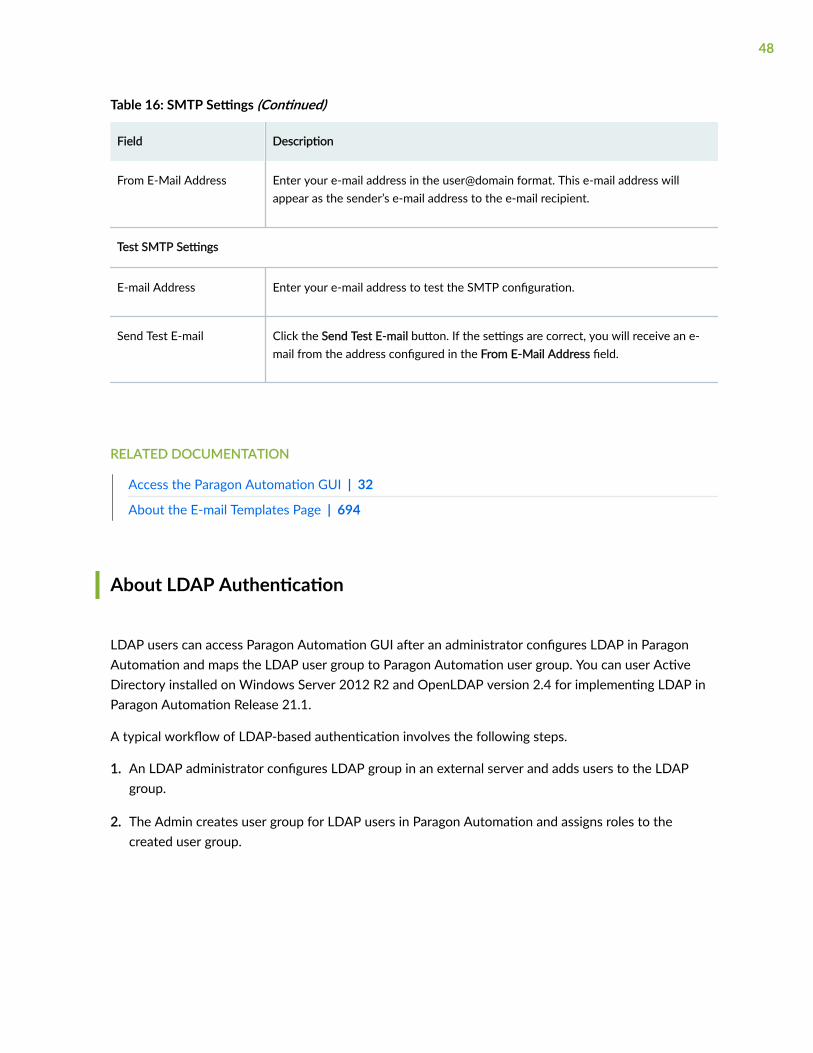
Table 16: SMTP Settings (Continued)
Field Description
From E-Mail Address Enter your e-mail address in the user@domain format. This e-mail address willappear as the sender’s e-mail address to the e-mail recipient.
Test SMTP Settings
E-mail Address Enter your e-mail address to test the SMTP configuration.
Send Test E-mail Click the Send Test E-mail button. If the settings are correct, you will receive an e-mail from the address configured in the From E-Mail Address field.
RELATED DOCUMENTATION
Access the Paragon Automation GUI | 32
About the E-mail Templates Page | 694
About LDAP Authentication
LDAP users can access Paragon Automation GUI after an administrator configures LDAP in ParagonAutomation and maps the LDAP user group to Paragon Automation user group. You can user ActiveDirectory installed on Windows Server 2012 R2 and OpenLDAP version 2.4 for implementing LDAP inParagon Automation Release 21.1.
A typical workflow of LDAP-based authentication involves the following steps.
1. An LDAP administrator configures LDAP group in an external server and adds users to the LDAPgroup.
2. The Admin creates user group for LDAP users in Paragon Automation and assigns roles to thecreated user group.
48

NOTE: The Mapping Provider Group attribute should have the same value in ParagonAutomation and the LDAP server.
See "Add User Groups" on page 73.
3. The admin configures LDAP settings in Paragon Automation. and maps the Paragon Automation usergroup to the LDAP user group; see "Configure LDAP Settings" on page 49.
When an LDAP user logs in to Paragon Automation, the LDAP server authenticates the user andParagon Automation enforces access control on the LDAP user based on roles assigned for the LDAPuser’s user group.
RELATED DOCUMENTATION
User Groups Overview | 70
Configure LDAP Settings
To configure LDAP settings in Paragon Automation:
1. Click Administration > Authentication > LDAP Settings in the left navigation menu.
The LDAP Settings page appears.
2. Configure LDAP by referring to Table 17 on page 49.
3. Click Save.
LDAP is configured in Paragon Automation.
Table 17 on page 49 describes the attributes in the LDAP configuration settings.
Table 17: LDAP Configuration Settings
Attributes Description
LDAP Server
Server Address Enter the LDAP server url.
For example, ldap.example.net.
49

Table 17: LDAP Configuration Settings (Continued)
Attributes Description
SSL Click to enable or disable SSL for communication between Paragon Automation and theLDAP server.
SSL Certificate If you enable SSL, enter or browse for the SSL certificate.
Port Number Enter the port number for connecting with the LDAP server.
The default port number if SSL is enabled is 636 and without SSL is 389.
Click Test Connection to test the connection with the LDAP server. The server addressand port number are configured correctly if you receive a message indicating that theconnection with the LDAP server is successful.
LDAP Authentication
AuthenticationMethod
The authentication method for the LDAP server. It is set to Simple and cannot be edited.
Base Domain Name Enter the domain name that constitutes the search base for querying the LDAP server.
For example: dc=mycompany, dc=net/com.
Bind Domain Name Enter the user name configured for LDAP authentication.
For example: [email protected].
Bind Password Enter the password for LDAP authentication.
Click the Test Authentication button to test LDAP authentication settings. The LDAPsettings are correct if you receive a message indicating that the LDAP settings issuccessfully authenticated.
User Options (Optional)
User Attribute Specify the username attribute used for comparing user entries in the LDAP server. Thedefault is sAMAccountName.
50

Table 17: LDAP Configuration Settings (Continued)
Attributes Description
User Filter Specify the attribute to filter data retrieved from LDAP.
The default value is objectClass=person.
RELATED DOCUMENTATION
User Groups Overview | 70
Configure Portal Settings
IN THIS SECTION
What's Next | 0
After Paragon Automation is installed or upgraded, a user with the SP administrator role must configurethe Paragon Automation portal URL in the Paragon Automation GUI. The portal URL is used as follows:
• Paragon Automation includes the portal URL in the e-mail that is sent to a user when the user’saccount needs to be activated.
• If you want to allow single sign-on (SSO) of Anuta ATOM users into Paragon Automation, you mustuse the portal URL when you register Paragon Automation with Keycloak.
NOTE: Whenever the URL to access Paragon Automation is changed, you must update theParagon Automation portal URL in the Portal Settings. This ensures that:
• The activation e-mails sent to new users contain the correct link to access the ParagonAutomation GUI.
51
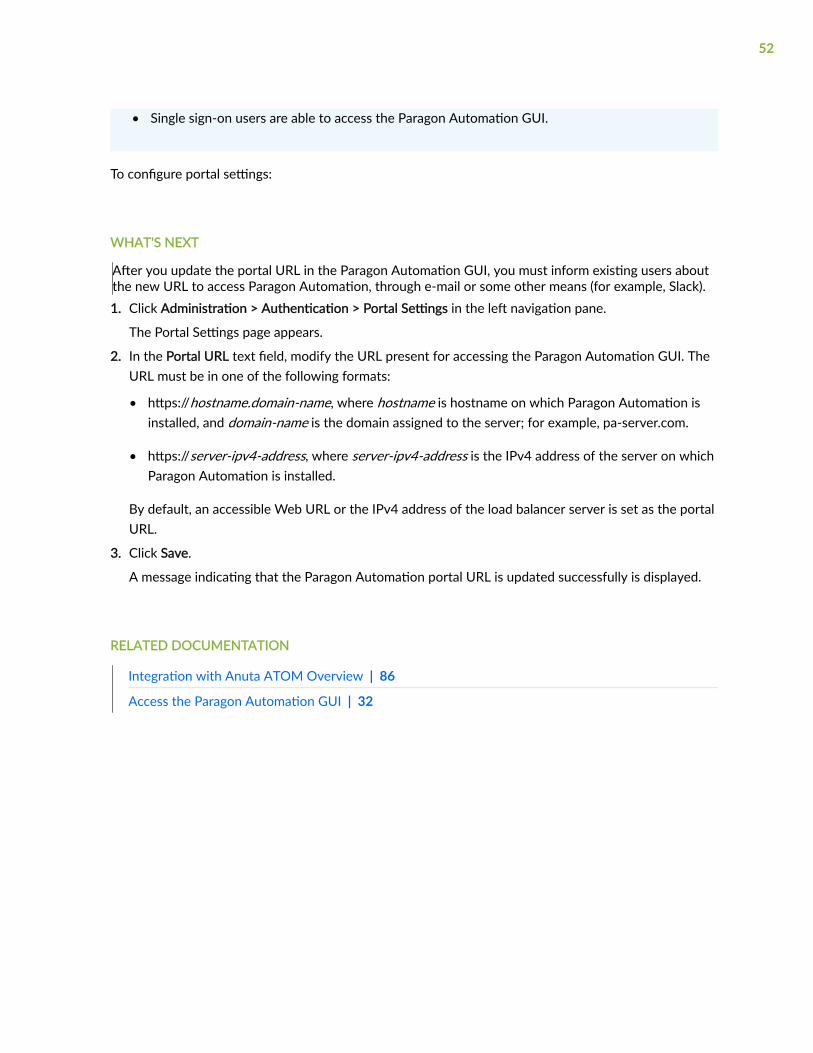
• Single sign-on users are able to access the Paragon Automation GUI.
To configure portal settings:
WHAT'S NEXT
After you update the portal URL in the Paragon Automation GUI, you must inform existing users aboutthe new URL to access Paragon Automation, through e-mail or some other means (for example, Slack).1. Click Administration > Authentication > Portal Settings in the left navigation pane.
The Portal Settings page appears.
2. In the Portal URL text field, modify the URL present for accessing the Paragon Automation GUI. TheURL must be in one of the following formats:
• https://hostname.domain-name, where hostname is hostname on which Paragon Automation isinstalled, and domain-name is the domain assigned to the server; for example, pa-server.com.
• https://server-ipv4-address, where server-ipv4-address is the IPv4 address of the server on whichParagon Automation is installed.
By default, an accessible Web URL or the IPv4 address of the load balancer server is set as the portalURL.
3. Click Save.
A message indicating that the Paragon Automation portal URL is updated successfully is displayed.
RELATED DOCUMENTATION
Integration with Anuta ATOM Overview | 86
Access the Paragon Automation GUI | 32
52

CHAPTER 5
Manage Users
IN THIS CHAPTER
Users Overview | 53
About the Users Page | 54
Add Users | 58
Edit and Delete Users | 60
Users Overview
Paragon Automation allows its users authentication and role-based access control (RBAC) to itsresources and services; that is, you are allowed access only to resources and actions that are defined inthe roles assigned to you. For example, if you are assigned the sp-operator role, you can only viewdetails of objects, such as devices, alarms, alerts, device templates, configuration templates, and otherobjects. You do not have the permission to create, add, modify, or delete objects.
The use of access controls allows the assignment of different access privileges to different users.
Paragon Automation provides the following default users and permissions:
• sp-admin: Users with the SP Admin role have full access to the Paragon Automation GUI and APIcapabilities. They can add users, create custom roles and user groups.
• sp-operator: Users with the SP operator role have read-only access to the Paragon Automation GUI.
NOTE: The other default roles provided are tenant-admin, tenant-operator, opco-admin, opco-operator. However, these roles are not supported in Paragon Automation Release 21.1.
RELATED DOCUMENTATION
Roles Overview | 62
53
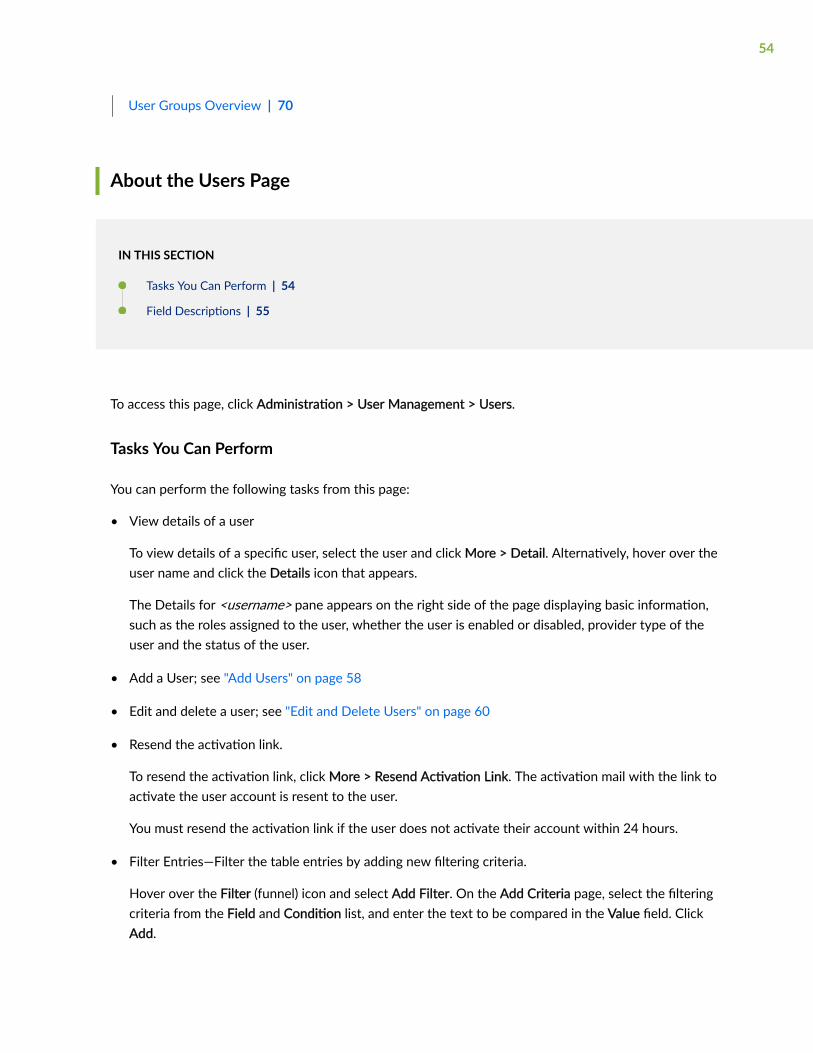
User Groups Overview | 70
About the Users Page
IN THIS SECTION
Tasks You Can Perform | 54
Field Descriptions | 55
To access this page, click Administration > User Management > Users.
Tasks You Can Perform
You can perform the following tasks from this page:
• View details of a user
To view details of a specific user, select the user and click More > Detail. Alternatively, hover over theuser name and click the Details icon that appears.
The Details for <username> pane appears on the right side of the page displaying basic information,such as the roles assigned to the user, whether the user is enabled or disabled, provider type of theuser and the status of the user.
• Add a User; see "Add Users" on page 58
• Edit and delete a user; see "Edit and Delete Users" on page 60
• Resend the activation link.
To resend the activation link, click More > Resend Activation Link. The activation mail with the link toactivate the user account is resent to the user.
You must resend the activation link if the user does not activate their account within 24 hours.
• Filter Entries—Filter the table entries by adding new filtering criteria.
Hover over the Filter (funnel) icon and select Add Filter. On the Add Criteria page, select the filteringcriteria from the Field and Condition list, and enter the text to be compared in the Value field. ClickAdd.
54
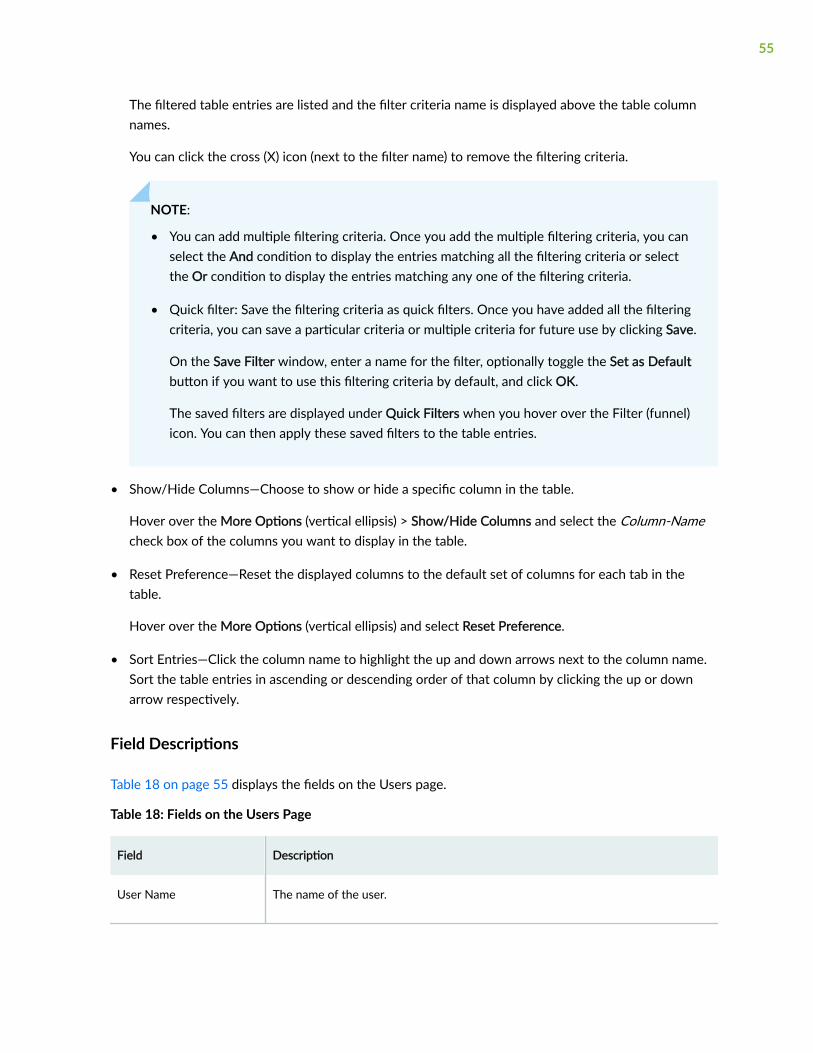
The filtered table entries are listed and the filter criteria name is displayed above the table columnnames.
You can click the cross (X) icon (next to the filter name) to remove the filtering criteria.
NOTE:
• You can add multiple filtering criteria. Once you add the multiple filtering criteria, you canselect the And condition to display the entries matching all the filtering criteria or selectthe Or condition to display the entries matching any one of the filtering criteria.
• Quick filter: Save the filtering criteria as quick filters. Once you have added all the filteringcriteria, you can save a particular criteria or multiple criteria for future use by clicking Save.
On the Save Filter window, enter a name for the filter, optionally toggle the Set as Defaultbutton if you want to use this filtering criteria by default, and click OK.
The saved filters are displayed under Quick Filters when you hover over the Filter (funnel)icon. You can then apply these saved filters to the table entries.
• Show/Hide Columns—Choose to show or hide a specific column in the table.
Hover over the More Options (vertical ellipsis) > Show/Hide Columns and select the Column-Namecheck box of the columns you want to display in the table.
• Reset Preference—Reset the displayed columns to the default set of columns for each tab in thetable.
Hover over the More Options (vertical ellipsis) and select Reset Preference.
• Sort Entries—Click the column name to highlight the up and down arrows next to the column name.Sort the table entries in ascending or descending order of that column by clicking the up or downarrow respectively.
Field Descriptions
Table 18 on page 55 displays the fields on the Users page.
Table 18: Fields on the Users Page
Field Description
User Name The name of the user.
55

Table 18: Fields on the Users Page (Continued)
Field Description
Roles The roles assigned to the user.
By default, this column lists only one role assigned to the user. When a user isassigned more than one role, a +<integer> icon (for example: +2) appears to theright of the role. The integer indicates the number of additional roles assigned tothe user. Click on the integer to view the additional roles.
State Indicates whether the user can log in to Paragon Automation (enabled) or cannotlog in to Paragon Automation (disabled).
Provider Type Indicates who is the provider for authentication and authorization.
• Local—The authentication and authorization is done within Paragon Automationor by using an LDAP server.
• OpenID Connect-A third-party, such as Google or Anuta ATOM, authenticatesand authorizes the user.
56

Table 18: Fields on the Users Page (Continued)
Field Description
Status Indicates a user’s account status.
• Activation_pending: The user account is not activated and therefore the usercannot log in to Paragon Automation.
The user must click the activate mail that they received after their account wascreated and change their password to activate their account.
• Active: The user account is active. The user can log in to Paragon Automation.:
• Invite_Expired The invite mail that is sent by Paragon Automation, after the useraccount was created has expired. The activate mail is valid only for 24 hrs.
To activate the user account, the user must contact the administrator to resenda new activation mail.
• InActive: The user has not logged into Paragon Automation for 180 days.
To reactivate the user account, the user must contact the administrator toresend the activation mail.
• Locked: The user account is locked.
A user account is locked if the user enters an incorrect password for more than5 times. To unlock, the user must contact the administrator or use the click theForgot Password link.
• PasswordExpiry: The user password has expired. The password expires 180days after it is assigned.
If your password has expired, the user must click the Forgot Password link onthe Login page or contact their administrator.
RELATED DOCUMENTATION
Add Roles | 65
User Groups Overview | 70
Single Sign-On Overview | 31
57

Add Users
Before you add a user, confirm that the URL to access the Paragon Automation GUI is configured in thePortal Settings page, because this URL is sent in the activation e-mail. For more information, see"Configure Portal Settings" on page 51.
An administrator or a user with the privilege to add users can add the following types of users toParagon Automation:
• Local users, where the user is authenticated and authorized by Paragon Automation.
• Lightweight Directory Access Protocol (LDAP) users, where the user is authenticated in the LDAPserver, but authorized by Paragon Automation.
• Third-party users, where the user is authenticated by OpenID Connect or Google and authorized byParagon Automation.
To add a user:
1. Select Administration > User Management > Users.
The Users page appears.
2. Click the Add (+) icon.
The Add User page appears.
3. Complete the configuration as described in Table 19 on page 59.
NOTE: Fields marked with an asterisk (*) are mandatory.
4. Click OK.
A confirmation message indicating that the user account is added appears and the user account islisted on the Users page.
After the user is added, if SMTP is configured, Paragon Automation sends the user an activation e-mail which contains the link to activate the user’s account. By default, the activation link expires after24 hours. If the user does not click the activation link and set a password within 24 hours, theaccount is not activated. To activate the account, you should resend the activation link by clickingMore > Resend Activation Link.
58
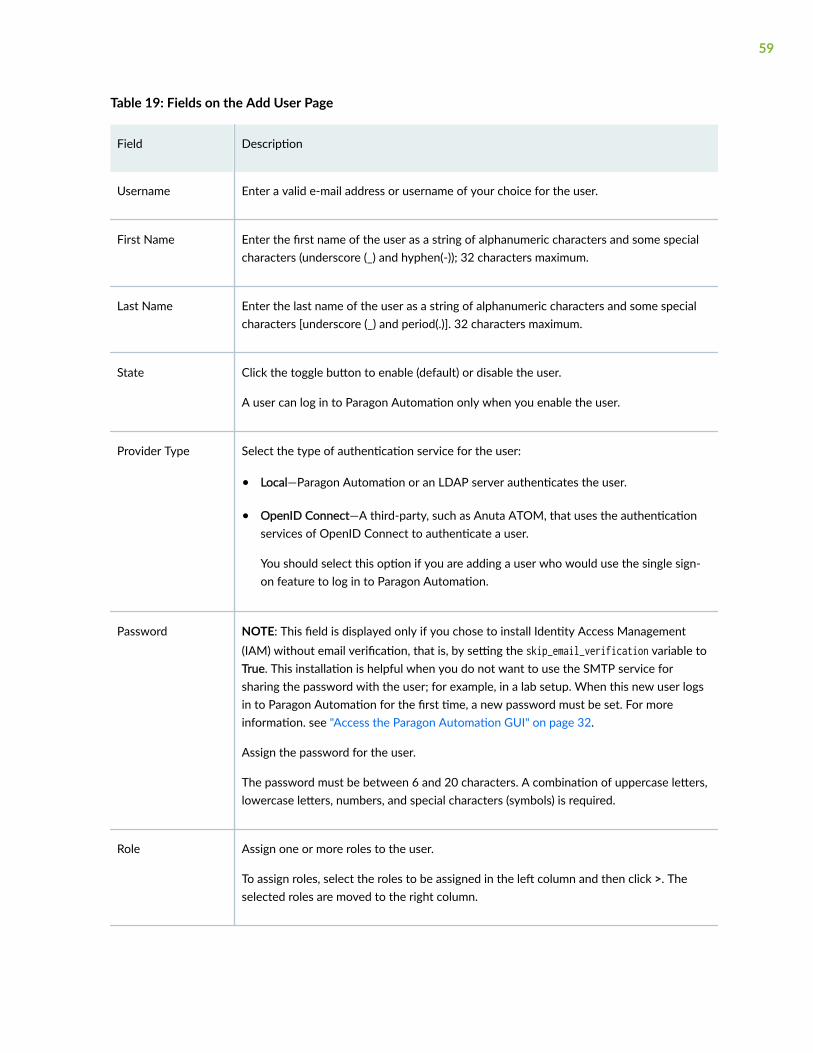
Table 19: Fields on the Add User Page
Field Description
Username Enter a valid e-mail address or username of your choice for the user.
First Name Enter the first name of the user as a string of alphanumeric characters and some specialcharacters (underscore (_) and hyphen(-)); 32 characters maximum.
Last Name Enter the last name of the user as a string of alphanumeric characters and some specialcharacters [underscore (_) and period(.)]. 32 characters maximum.
State Click the toggle button to enable (default) or disable the user.
A user can log in to Paragon Automation only when you enable the user.
Provider Type Select the type of authentication service for the user:
• Local—Paragon Automation or an LDAP server authenticates the user.
• OpenID Connect—A third-party, such as Anuta ATOM, that uses the authenticationservices of OpenID Connect to authenticate a user.
You should select this option if you are adding a user who would use the single sign-on feature to log in to Paragon Automation.
Password NOTE: This field is displayed only if you chose to install Identity Access Management(IAM) without email verification, that is, by setting the skip_email_verification variable toTrue. This installation is helpful when you do not want to use the SMTP service forsharing the password with the user; for example, in a lab setup. When this new user logsin to Paragon Automation for the first time, a new password must be set. For moreinformation. see "Access the Paragon Automation GUI" on page 32.
Assign the password for the user.
The password must be between 6 and 20 characters. A combination of uppercase letters,lowercase letters, numbers, and special characters (symbols) is required.
Role Assign one or more roles to the user.
To assign roles, select the roles to be assigned in the left column and then click >. Theselected roles are moved to the right column.
59

RELATED DOCUMENTATION
Single Sign-On Overview | 31
About the Identity Providers Page | 77
Edit and Delete Users
IN THIS SECTION
Edit Users | 60
Delete Users | 60
Edit Users
To edit or delete a user account, you should be an administrator or a user with the permissions to editand delete users.
To modify the information about a user:
1. Click Administration > User Management > User.
The Users page appears.
2. Select the user that you want to modify and click the Edit (pencil) icon.
The Edit User page appears.
3. Modify the parameters by following the guidelines provided in Table 19 on page 59.
4. Click OK to save the changes.
If you click OK, a confirmation message indicating that the user account is modified appears and theupdated information about the user appears on the Users page.
Delete Users
To delete a user account from Paragon Automation:
1. Click Administration > User Management > User.
The Users page appears.
2. Select the user that you want to delete and click the Delete (trashcan) icon.
An message appears, asking you to confirm the delete operation.
3. Click Yes to delete the users.
60
A confirmation message indicating that the selected user account is deleted from ParagonAutomation appears and the user account is removed from the Users page.
RELATED DOCUMENTATION
Users Overview | 53
User Groups Overview | 70
61

CHAPTER 6
Manage Roles
IN THIS CHAPTER
Roles Overview | 62
About the Roles Page | 63
Add Roles | 65
Edit, Clone, and Delete Roles | 67
Roles Overview
IN THIS SECTION
Types of Roles | 62
Access Privileges | 63
A role is a function assigned to a user that defines the tasks that the user can perform within ParagonAutomation. Each user can be assigned one or more roles depending on the tasks that the user isexpected to perform. User roles enable you to classify users based on the privileges assigned to them toperform tasks.
Types of Roles
Paragon automation provides the following two types of roles:
• Predefined roles—System-defined roles with a set of predefined access privileges. Predefined rolesare created while installing Paragon Automation.
• Custom roles—User-defined roles with a set of access privileges. Custom roles can be created by thesp-admin or a user with the privilege to create users.
62

Access Privileges
User roles define the access privileges or permissions and actions to access objects (dashboard, devicetemplates, devices, and so on) in Paragon Automation. For example, a user role can contain permissionsto read device configurations and delete alarms and alerts objects.
Paragon Automation provides the following privileges:
• Read
• Create
• Update
• Delete
• Other actions; (for example, stage and deploy for the image objects).
RELATED DOCUMENTATION
Users Overview | 53
Add Users | 58
About the Roles Page
IN THIS SECTION
Tasks You Can Perform | 63
Field Descriptions | 65
To access this page, click Administration > User Management > Roles.
Tasks You Can Perform
You can perform the following tasks from this page:
• View details of a role
63

To view details of a specific role, select the role and click More > Detail. Alternatively, hover over therole name and click the Details icon that appears.
The Details for <rolename> pane appears on the right side of the page displaying basic information,such as the roles scope and a link to the Preview Roles page. The Preview Roles page lists the accessprivileges assigned to the role.
• Create a custom role; see "Add Roles" on page 65.
• Edit, clone, or delete a role; see "Edit, Clone, and Delete Roles" on page 67.
• Filter Entries—Filter the table entries by adding new filtering criteria.
Hover over the Filter (funnel) icon and select Add Filter. On the Add Criteria page, select the filteringcriteria from the Field and Condition list, and enter the text to be compared in the Value field. ClickAdd.
The filtered table entries are listed and the filter criteria name is displayed above the table columnnames.
You can click the cross (X) icon (next to the filter name) to remove the filtering criteria.
NOTE:
• You can add multiple filtering criteria. Once you add the multiple filtering criteria, you canselect the And condition to display the entries matching all the filtering criteria or selectthe Or condition to display the entries matching any one of the filtering criteria.
• Quick filter: Save the filtering criteria as quick filters. Once you have added all the filteringcriteria, you can save a particular criteria or multiple criteria for future use by clicking Save.
On the Save Filter window, enter a name for the filter, optionally toggle the Set as Defaultbutton if you want to use this filtering criteria by default, and click OK.
The saved filters are displayed under Quick Filters when you hover over the Filter (funnel)icon. You can then apply these saved filters to the table entries.
• Show/Hide Columns—Choose to show or hide a specific column in the table.
Hover over the More Options (vertical ellipsis) > Show/Hide Columns and select the Column-Namecheck box of the columns you want to display in the table.
• Reset Preference—Reset the displayed columns to the default set of columns for each tab in thetable.
Hover over the More Options (vertical ellipsis) and select Reset Preference.
64

• Sort Entries—Click the column name to highlight the up and down arrows next to the column name.Sort the table entries in ascending or descending order of that column by clicking the up or downarrow respectively.
Field Descriptions
Table 20 on page 65 describes the fields on the Roles page.
Table 20: Fields on the Roles Page
Field Description
Role Name The name of the role.
Role Scope The scope of the role—Service Provider, Operating Company, and Tenant.
NOTE: Operating Company and tenant scopes are not supported in this release.
Role Type The type of role—pre-canned and custom.
Created By The user who created the role. System indicates that the roles are predefined.
RELATED DOCUMENTATION
Users Overview | 53
User Groups Overview | 70
Add Roles
To add a role, you should be an administrator or a user with the privilege to add roles.
To add a role:
1. Select Administration > User Management > Roles.
The Roles page appears.
2. Click the Add (+) icon to add a new role.
The Add Role page appears.
65
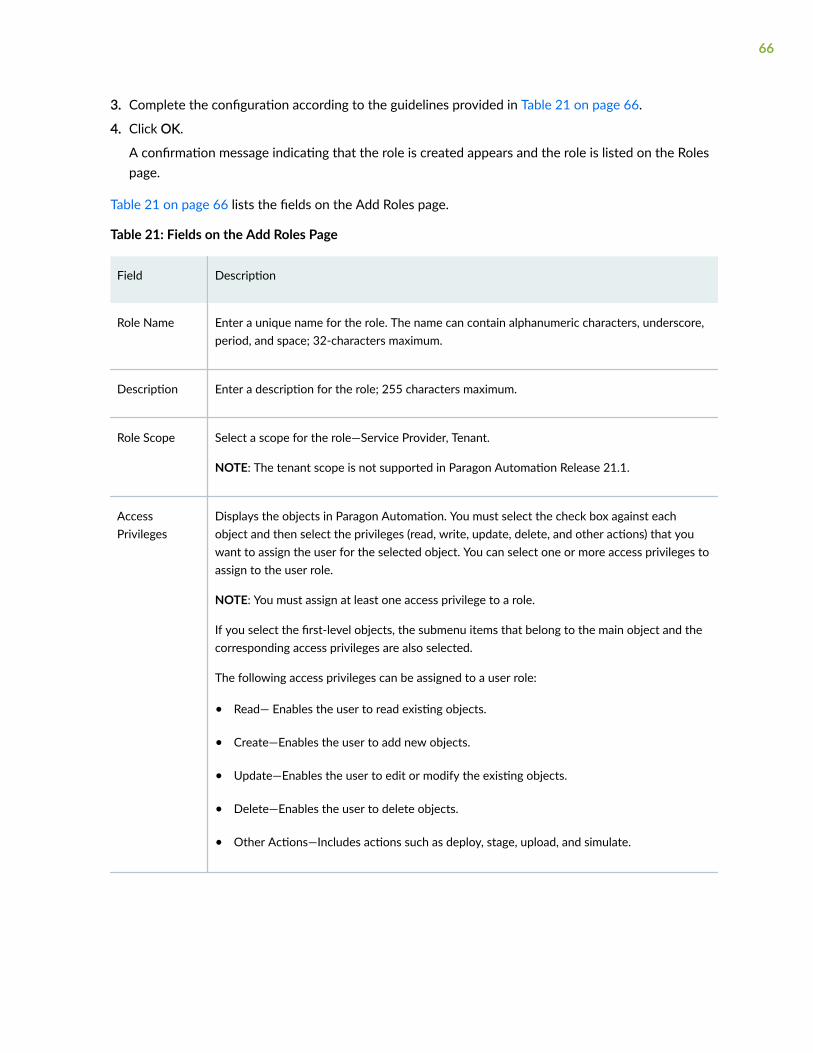
3. Complete the configuration according to the guidelines provided in Table 21 on page 66.
4. Click OK.
A confirmation message indicating that the role is created appears and the role is listed on the Rolespage.
Table 21 on page 66 lists the fields on the Add Roles page.
Table 21: Fields on the Add Roles Page
Field Description
Role Name Enter a unique name for the role. The name can contain alphanumeric characters, underscore,period, and space; 32-characters maximum.
Description Enter a description for the role; 255 characters maximum.
Role Scope Select a scope for the role—Service Provider, Tenant.
NOTE: The tenant scope is not supported in Paragon Automation Release 21.1.
AccessPrivileges
Displays the objects in Paragon Automation. You must select the check box against eachobject and then select the privileges (read, write, update, delete, and other actions) that youwant to assign the user for the selected object. You can select one or more access privileges toassign to the user role.
NOTE: You must assign at least one access privilege to a role.
If you select the first-level objects, the submenu items that belong to the main object and thecorresponding access privileges are also selected.
The following access privileges can be assigned to a user role:
• Read— Enables the user to read existing objects.
• Create—Enables the user to add new objects.
• Update—Enables the user to edit or modify the existing objects.
• Delete—Enables the user to delete objects.
• Other Actions—Includes actions such as deploy, stage, upload, and simulate.
66
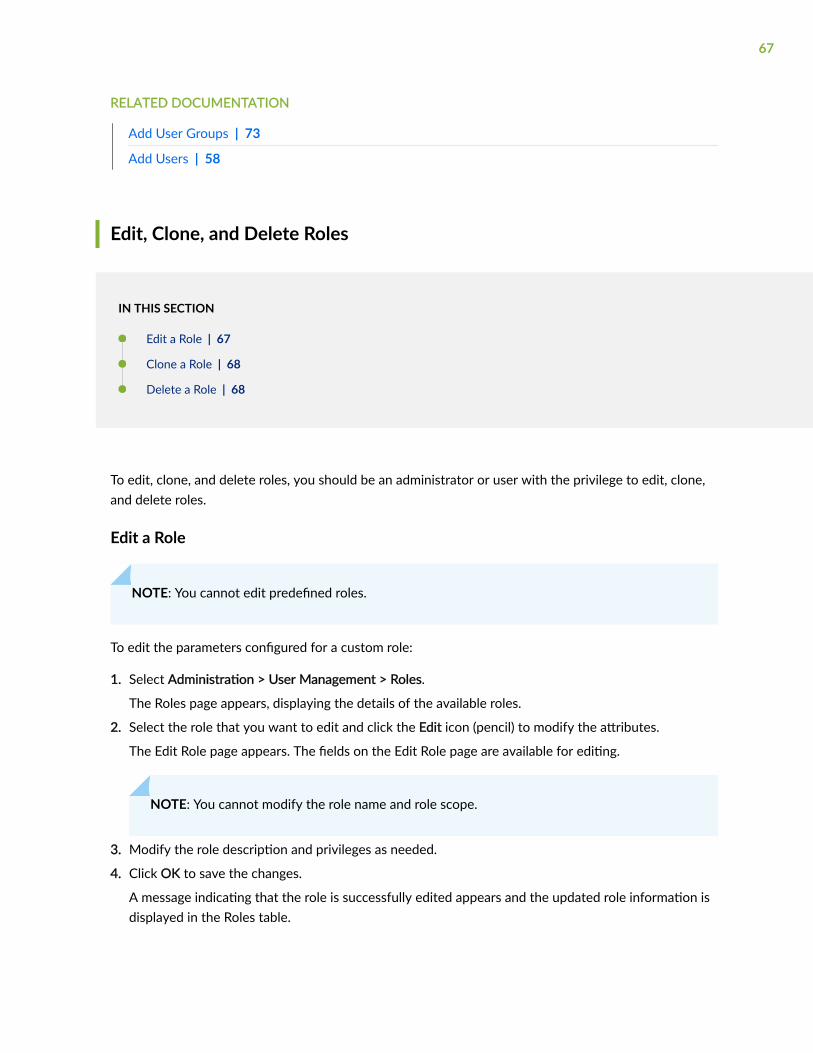
RELATED DOCUMENTATION
Add User Groups | 73
Add Users | 58
Edit, Clone, and Delete Roles
IN THIS SECTION
Edit a Role | 67
Clone a Role | 68
Delete a Role | 68
To edit, clone, and delete roles, you should be an administrator or user with the privilege to edit, clone,and delete roles.
Edit a Role
NOTE: You cannot edit predefined roles.
To edit the parameters configured for a custom role:
1. Select Administration > User Management > Roles.
The Roles page appears, displaying the details of the available roles.
2. Select the role that you want to edit and click the Edit icon (pencil) to modify the attributes.
The Edit Role page appears. The fields on the Edit Role page are available for editing.
NOTE: You cannot modify the role name and role scope.
3. Modify the role description and privileges as needed.
4. Click OK to save the changes.
A message indicating that the role is successfully edited appears and the updated role information isdisplayed in the Roles table.
67
Clone a Role
You can clone a role (both custom and predefined) when you want to quickly create a copy of an existingrole and modify its access privileges.
To clone a role:
1. Select Administration > User Management > Roles.
The Roles page appears, displaying the details of the available roles.
2. Select the role that you want to clone and then click the Clone button at the top-right corner of thepage.
The Clone Role Role-Name page appears.
3. Specify an appropriate name for the cloned role.
The name can contain alphanumeric characters, underscore, period, and space; 32-charactersmaximum.
4. Click OK to save your changes.
A clone of the role is created and listed on the Roles page.
5. Select the new cloned role and click the Edit icon (pencil) to modify the parameters.
The Edit Role page appears.
6. Select the objects, and modify the access privileges of the role, as needed.
NOTE: You cannot modify the role name and role scope.
7. Click OK to save your changes.
A confirmation message appears, indicating the status of the edit operation.
Delete a Role
You cannot delete a predefined role or if it is assigned to a user.
To delete a role:
1. Select Administration > User Management > Roles.
The Roles page appears, displaying the details of the available roles.
2. Select a role that you want to delete and then click the Delete (trashcan) icon.
A message appears, asking you to confirm the delete operation.
3. Click Yes to delete the selected role.
A confirmation message appears, indicating that the selected role is deleted and the role is no longerlisted on the Roles page.
68

RELATED DOCUMENTATION
Roles Overview | 62
Add Users | 58
Add User Groups | 73
69
CHAPTER 7
Manage User Groups
IN THIS CHAPTER
User Groups Overview | 70
About the User Groups Page | 71
Add User Groups | 73
Edit and Delete User Groups | 75
User Groups Overview
A user group contains a group of users that have the same access privileges assigned to them. A usergroup helps in grouping users based on their roles and assigning privileges to them easily. You can createuser groups that are local to Paragon Automation or create user groups based on user groups present inan LDAP server.
NOTE: Before you create user groups based on user groups in the LDAP server, ensure that youhave configured LDAP settings in Paragon Automation; see "Configure LDAP Settings" on page49 for details.
If you are adding a user group based on a user group in the LDAP server, you must enter the LDAP usergroup name in the Mapping Provider Group field See "Add User Groups" on page 73 for adding a usergroup to Paragon Automation.
RELATED DOCUMENTATION
About LDAP Authentication | 48
Users Overview | 53
70

About the User Groups Page
IN THIS SECTION
Tasks You Can Perform | 71
Field Descriptions | 72
To access this page, click Administration > User Management > User Groups.
Tasks You Can Perform
You can perform the following tasks from this page:
• View details of a user group
To view details of a user group, click the details icon that appears when you hover over the usergroup. Alternatively, select the user group and click the More > Detail icon. The details is displayed inthe Details of <device group-name> pane that appears on the right side of the Device Groups page.
• Add a user group; see "Add User Groups" on page 73.
• Edit and delete a user group; see "Edit and Delete User Groups" on page 75.
• Filter Entries—Filter the table entries by adding new filtering criteria.
Hover over the Filter (funnel) icon and select Add Filter. On the Add Criteria page, select the filteringcriteria from the Field and Condition list, and enter the text to be compared in the Value field. ClickAdd.
The filtered table entries are listed and the filter criteria name is displayed above the table columnnames.
You can click the cross (X) icon (next to the filter name) to remove the filtering criteria.
NOTE:
• You can add multiple filtering criteria. Once you add the multiple filtering criteria, you canselect the And condition to display the entries matching all the filtering criteria or selectthe Or condition to display the entries matching any one of the filtering criteria.
71
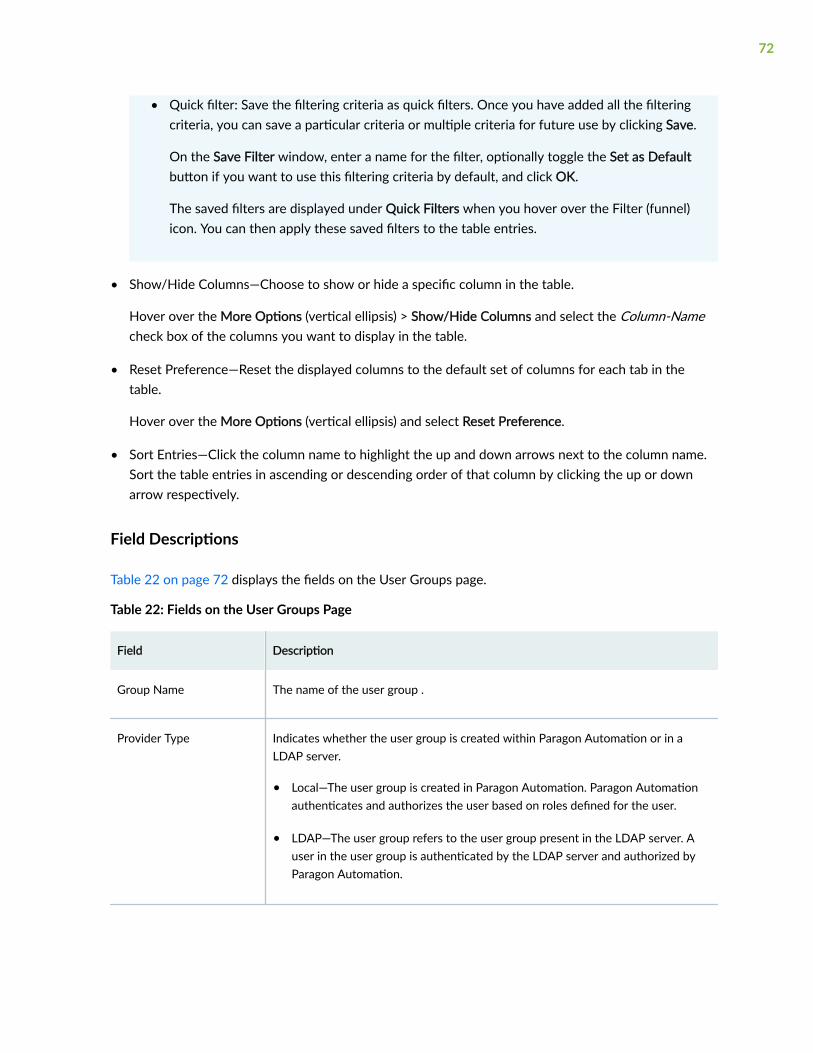
• Quick filter: Save the filtering criteria as quick filters. Once you have added all the filteringcriteria, you can save a particular criteria or multiple criteria for future use by clicking Save.
On the Save Filter window, enter a name for the filter, optionally toggle the Set as Defaultbutton if you want to use this filtering criteria by default, and click OK.
The saved filters are displayed under Quick Filters when you hover over the Filter (funnel)icon. You can then apply these saved filters to the table entries.
• Show/Hide Columns—Choose to show or hide a specific column in the table.
Hover over the More Options (vertical ellipsis) > Show/Hide Columns and select the Column-Namecheck box of the columns you want to display in the table.
• Reset Preference—Reset the displayed columns to the default set of columns for each tab in thetable.
Hover over the More Options (vertical ellipsis) and select Reset Preference.
• Sort Entries—Click the column name to highlight the up and down arrows next to the column name.Sort the table entries in ascending or descending order of that column by clicking the up or downarrow respectively.
Field Descriptions
Table 22 on page 72 displays the fields on the User Groups page.
Table 22: Fields on the User Groups Page
Field Description
Group Name The name of the user group .
Provider Type Indicates whether the user group is created within Paragon Automation or in aLDAP server.
• Local—The user group is created in Paragon Automation. Paragon Automationauthenticates and authorizes the user based on roles defined for the user.
• LDAP—The user group refers to the user group present in the LDAP server. Auser in the user group is authenticated by the LDAP server and authorized byParagon Automation.
72

Table 22: Fields on the User Groups Page (Continued)
Field Description
Users The users in the user group.
By default, this column lists only one user assigned to the user group. When a usergroup is assigned more than one user, a +<integer> icon (for example: +2) appearsto the right of the user name. The integer indicates the number of additional usersassigned to the user group. Click on the integer to view the additional users.
Roles Roles assigned to the user group.
By default, this column lists only one role assigned to the user group. When a useris assigned more than one role, a +<integer> icon (for example: +2) appears to theright of the role. The integer indicates the number of additional roles assigned tothe user group. Click on the integer to view the additional roles.
RELATED DOCUMENTATION
About LDAP Authentication | 48
User Groups Overview | 70
Roles Overview | 62
Add User Groups
To add a user group:
1. Click Administration > User Management > User Group.
The User Groups page appears.
2. Click the Add (plus) icon.
The Create User Group page appears.
3. Configure values by following the guidelines provided in Table 23 on page 74.
4. Click OK to save the changes.
A confirmation message indicating that the user group is successfully created appears and the usergroup is listed on the User Groups page.
Table 23 on page 74 displays the fields on the Add User Groups page.
73
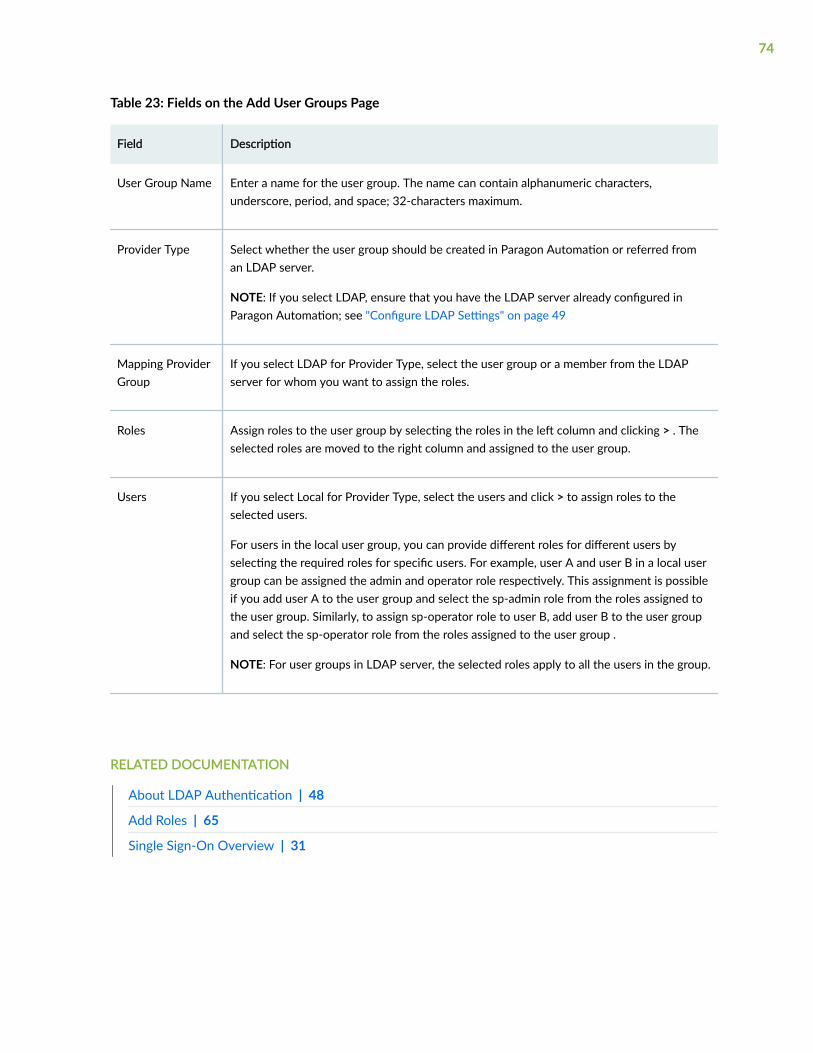
Table 23: Fields on the Add User Groups Page
Field Description
User Group Name Enter a name for the user group. The name can contain alphanumeric characters,underscore, period, and space; 32-characters maximum.
Provider Type Select whether the user group should be created in Paragon Automation or referred froman LDAP server.
NOTE: If you select LDAP, ensure that you have the LDAP server already configured inParagon Automation; see "Configure LDAP Settings" on page 49
Mapping ProviderGroup
If you select LDAP for Provider Type, select the user group or a member from the LDAPserver for whom you want to assign the roles.
Roles Assign roles to the user group by selecting the roles in the left column and clicking > . Theselected roles are moved to the right column and assigned to the user group.
Users If you select Local for Provider Type, select the users and click > to assign roles to theselected users.
For users in the local user group, you can provide different roles for different users byselecting the required roles for specific users. For example, user A and user B in a local usergroup can be assigned the admin and operator role respectively. This assignment is possibleif you add user A to the user group and select the sp-admin role from the roles assigned tothe user group. Similarly, to assign sp-operator role to user B, add user B to the user groupand select the sp-operator role from the roles assigned to the user group .
NOTE: For user groups in LDAP server, the selected roles apply to all the users in the group.
RELATED DOCUMENTATION
About LDAP Authentication | 48
Add Roles | 65
Single Sign-On Overview | 31
74
Edit and Delete User Groups
IN THIS SECTION
Edit User Groups | 75
Delete User Groups | 75
Edit User Groups
To edit a user group, you should be an administrator or a user with the permissions to edit user groups.
NOTE: You cannot edit the name and the provider type of the user group.
To edit the information about a user group:
1. Click Administration > User Management > User Group.
The User Groups page appears.
2. Select the user that you want to modify and click the Edit (pencil) icon.
The Edit User page appears.
3. Update the users and roles assigned to the user group.
4. Click OK to save the changes.
A confirmation message indicating that the user group is modified appears and the updatedinformation about the user group appears on the User Groups page.
Delete User Groups
To delete a user group, you should be an administrator or a user with the permissions to edit and deleteuser groups.
To delete a user group from Paragon Automation:
1. Click Administration > User Management > User Group.
The User groups page appears.
2. Select the user groups that you want to delete and click the Delete (trashcan) icon.
An message appears, asking you to confirm the delete operation.
3. Click Yes to delete the selected user group.
75
A confirmation message indicating that the selected user group is deleted from Paragon Automationis displayed and the user group is removed from the User Groups page.
RELATED DOCUMENTATION
User Groups Overview | 70
About LDAP Authentication | 48
76
CHAPTER 8
Identity Providers
IN THIS CHAPTER
About the Identity Providers Page | 77
Add Identity Providers | 80
Edit and Delete Identity Providers | 82
About the Identity Providers Page
IN THIS SECTION
Tasks You Can Perform | 77
Field Descriptions | 79
An identity provider enables you to log in to multiple applications by using the same username andpassword.
Paragon Automation Release 21.1 allows you to use OpenID Connect and Google to provide theauthentication services; that is, you can use the username and password of your Anuta ATOM, whichuses the OpenID Connect authentication services, or your Google account to log in to ParagonAutomation.
To access this page, click Administration > Authentication > Identity Providers on the left navigationmenu.
Tasks You Can Perform
You can perform the following tasks from this page:
• View details of an identity provider.
77
To view details of an identity provider, click the details icon that appears when you hover over theidentity provider. Alternatively, select the identity provider and click More > Detail. The details isdisplayed in the Details for <identity-provider> pane that appears on the right side of the IdentityProviders page.
• Add an identity provider; see "Add Identity Providers" on page 80.
• Edit and Delete an identity provider; see "Edit and Delete Identity Providers" on page 82.
• Add custom roles to authorize single sign-on (SSO) users.
You can define custom roles and assign them to users logging into Paragon Automation by using theirAnuta ATOM or Google credentials. For information about adding custom roles to SSO users, see"Edit and Delete Identity Providers" on page 82.
• Filter Entries—Filter the table entries by adding new filtering criteria.
Hover over the Filter (funnel) icon and select Add Filter. On the Add Criteria page, select the filteringcriteria from the Field and Condition list, and enter the text to be compared in the Value field. ClickAdd.
The filtered table entries are listed and the filter criteria name is displayed above the table columnnames.
You can click the cross (X) icon (next to the filter name) to remove the filtering criteria.
NOTE:
• You can add multiple filtering criteria. Once you add the multiple filtering criteria, you canselect the And condition to display the entries matching all the filtering criteria or selectthe Or condition to display the entries matching any one of the filtering criteria.
• Quick filter: Save the filtering criteria as quick filters. Once you have added all the filteringcriteria, you can save a particular criteria or multiple criteria for future use by clicking Save.
On the Save Filter window, enter a name for the filter, optionally toggle the Set as Defaultbutton if you want to use this filtering criteria by default, and click OK.
The saved filters are displayed under Quick Filters when you hover over the Filter (funnel)icon. You can then apply these saved filters to the table entries.
• Show/Hide Columns—Choose to show or hide a specific column in the table.
Hover over the More Options (vertical ellipsis) > Show/Hide Columns and select the Column-Namecheck box of the columns you want to display in the table.
78
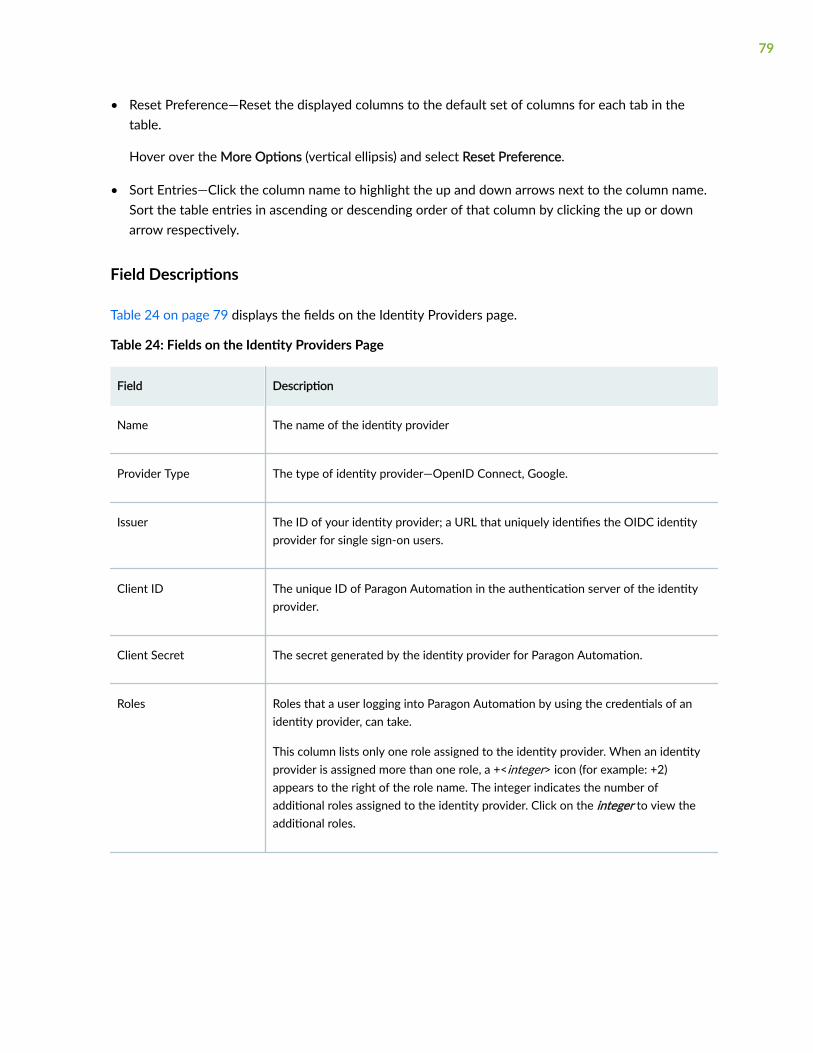
• Reset Preference—Reset the displayed columns to the default set of columns for each tab in thetable.
Hover over the More Options (vertical ellipsis) and select Reset Preference.
• Sort Entries—Click the column name to highlight the up and down arrows next to the column name.Sort the table entries in ascending or descending order of that column by clicking the up or downarrow respectively.
Field Descriptions
Table 24 on page 79 displays the fields on the Identity Providers page.
Table 24: Fields on the Identity Providers Page
Field Description
Name The name of the identity provider
Provider Type The type of identity provider—OpenID Connect, Google.
Issuer The ID of your identity provider; a URL that uniquely identifies the OIDC identityprovider for single sign-on users.
Client ID The unique ID of Paragon Automation in the authentication server of the identityprovider.
Client Secret The secret generated by the identity provider for Paragon Automation.
Roles Roles that a user logging into Paragon Automation by using the credentials of anidentity provider, can take.
This column lists only one role assigned to the identity provider. When an identityprovider is assigned more than one role, a +<integer> icon (for example: +2)appears to the right of the role name. The integer indicates the number ofadditional roles assigned to the identity provider. Click on the integer to view theadditional roles.
79

Table 24: Fields on the Identity Providers Page (Continued)
Field Description
Status Indicates whether the identity provider is enabled or disabled.
• Enable: Users can log in to Paragon Automation by using the credentials of theidentity provider account.
• Disable: Users cannot use the credentials of the identity provider account to login to Paragon Automation.
RELATED DOCUMENTATION
Single Sign-On Overview | 31
Integration with Anuta ATOM Overview | 86
Add Identity Providers
Before you add an identity provider, you must register Paragon Automation with the identity provider.While registering, you must provide the URL where you would be hosting Paragon Automation; see"Configure Portal Settings" on page 51.
To add an identity provider to Paragon Automation, you will need the following information from theidentity provider:
• The link to the authentication server of the identity provider (known as issuer).
• Client ID and Client secret.
The client ID and client secret details are provided by the identity provider when you register withthem.
Paragon Automation Release 21.1 allows you to add OpenID Connect (Anuta ATOM) and Google asidentity providers.
To add an identity provider:
1. Select Administration > Authentication > Identity Providers on the left navigation menu.
80

The Identity Providers page appears. If there are no identity providers added, the Identity Providerspage has the Add Identity Provider button to add an identity provider. If an identity provider isalready added, the page lists the details of the identity provider in tabular format.
2. Click Add Identity Provider if adding an identity provider for the first time or else, click the Add (+)icon.
The Create Identity Provider page appears.
3. Enter values as described in Table 25 on page 81.
NOTE: Fields marked with * are mandatory.
4. Click OK.
A confirmation message appears indicating that the identity provider is added successfully and theidentity provider is listed on the Identity Providers page.
Table 25 on page 81 displays the fields on the Add Identity Providers page.
Table 25: Fields on the Add Identity Providers Page
Field Description
Type Select the type of identity provider—OpenID Connect or Google.
To add Anuta ATOM as your identity provider, use OpenID Connect.
Name Enter a name for the identity provider.
The name can be a string of alphanumeric characters and some special characters (hyphenand underscore); 32 characters maximum.
Issuer Enter the URL that uniquely identifies your OIDC identity provider. You can get this URL fromOIDC well know configuration endpoint.
For example: https://sso server address.com/.well-known/openid-configuration
NOTE: For Anuta ATOM, enter https://<ATOM-MasterIP>/auth/realms/system.
Status Click to enable (default) or disable allowing users to log in by using credentials of the identityprovider account.
81

Table 25: Fields on the Add Identity Providers Page (Continued)
Field Description
Client ID A unique ID for Paragon Automation in the identity provider. This information is provided bythe identity provider.
NOTE: For Anuta ATOM, the client ID is derived from ATOM Keycloak UI.
Client Secret A secret generated for authenticating requests from Paragon Automation. This is generatedby the identity provider.
NOTE: For Anuta ATOM, the client secret is derived from ATOM Keycloak UI.
AuthorizedRedirect URI
A valid URI pattern, a browser can redirect to after a successful login or logout from ParagonAutomation.
The value is https://portal Ip address/oidc/redirect/callback; where, portal ip address is the IPaddress to access the Paragon Automation GUI.
You cannot edit this field.
Roles Assign roles that a user, logging by using the credentials of the identity provider, can take.
RELATED DOCUMENTATION
Single Sign-On Overview | 31
Register Paragon Automation with Keycloak | 90
Roles Overview | 62
Edit and Delete Identity Providers
IN THIS SECTION
Edit Identity Providers | 83
Delete Identity Providers | 83
82

Edit Identity Providers
To edit an identity provider, you should be an administrator or a user with privileges to edit an identityprovider. You can edit the following parameters of an identity provider:
• Issuer
• Client ID
• Client Secret
• Role assignment
You can edit the roles assigned for single sign on users.
To edit an identity provider:
1. Select Administration > Authentication > Identity Providers on the left navigation menu.
The Identity Providers page appears.
2. Select the identity provider that you want to edit and click the Edit (pencil) icon.
The Edit Identity Providers page appears.
3. Edit the fields by referring toTable 25 on page 81.
4. Click OK.
A confirmation message appears indicating that the identity provider information is successfullyedited and the updated information of the identity provider is listed on the Identity Providers page.
Delete Identity Providers
To delete an identity provider, you should be an administrator or a user with privileges to delete anidentity provider.
To delete an identity provider:
1. Select Administration > Authentication > Identity Providers on the left navigation menu.
The Identity Providers page appears.
2. Select the identity provider that you want to delete and click the Delete (trashcan) icon.
A confirmation message appears.
3. Click OK.
A message indicating that the identity provider is successfully deleted appears and the identityprovider is no longer listed on the Identity Providers page.
RELATED DOCUMENTATION
Single Sign-On Overview | 31
83

Integration with Anuta ATOM Overview | 86
84

2PART
Integration With Anuta ATOM
Introduction | 86

CHAPTER 9
Introduction
IN THIS CHAPTER
Integration with Anuta ATOM Overview | 86
Register Paragon Automation with Keycloak | 90
Add Anuta ATOM as an Identity Provider | 92
Add Anuta ATOM as an External EMS Application | 94
Integration with Anuta ATOM Overview
IN THIS SECTION
ATOM-Paragon Automation Integration Workflow | 87
How ATOM Works with Paragon Automation Components | 87
Accessing ATOM from Paragon Automation | 89
Benefits | 89
Paragon Automation can integrate with an external application that has EMS capabilities to leverage itsfunctionality to provide an improved WAN automation solution. Paragon Automation Release 21.1integrates with Anuta Networks ATOM platform to provide automated WAN assurance for L3VPNservices.
Anuta ATOM (hereafter ATOM) is a highly scalable cloud-native platform for orchestrating andmonitoring network services. ATOM delivers stateful service provisioning and workflow managementfor stateless services, along with configuration compliance and device life-cycle management.
Paragon Automation together with ATOM provides automation solutions across the entire life cycle of anetwork service—plan, design, implement, operate, and optimize.
86
ATOM-Paragon Automation Integration Workflow
To integrate ATOM with Paragon Automation:
• Configure the Paragon Automation portal IP address in Paragon Automation.
To configure the Paragon Automation portal IP address, navigate to Administration > Authentication> Portal Settings. Enter the IPv4 address for accessing the Paragon Automation GUI in theAuthentication Settings page that appears and click Save.
• Register Paragon Automation with Keycloak so that ATOM can be added as an external EMSapplication and identity provider in Paragon Automation; see "Register Paragon Automation withKeycloak" on page 90.
• Add ATOM as an identity provider in Paragon Automation; see "Add Anuta ATOM as an IdentityProvider " on page 92.
This allows single sign-on of ATOM users in to Paragon Automation. During the single sign-on byusing ATOM credentials, ATOM handles user authentication while Paragon Automation handlesauthorization.
• Add ATOM as an external EMS application in Paragon Automation; see "Add Anuta ATOM as anExternal EMS Application" on page 94.
This helps in integrating ATOM with the EMS, Paragon Pathfinder, and Paragon Insights componentsof Paragon Automation.
How ATOM Works with Paragon Automation Components
When ATOM is added as an external EMS component in Paragon Automation:
• The device model connector service retrieves the devices discovered by ATOM and synchronizes thedevice configuration in its database. You can view the devices discovered by both ATOM andParagon Automation on the Devices page of Paragon Automation.
87
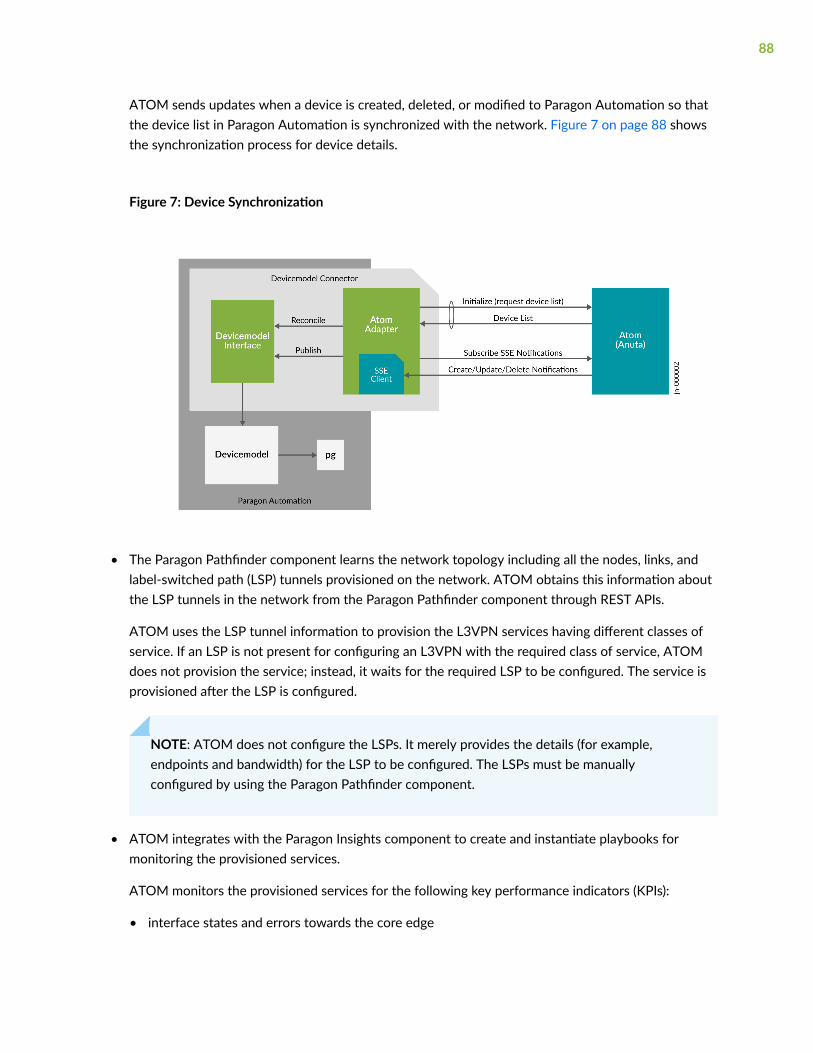
ATOM sends updates when a device is created, deleted, or modified to Paragon Automation so thatthe device list in Paragon Automation is synchronized with the network. Figure 7 on page 88 showsthe synchronization process for device details.
Figure 7: Device Synchronization
• The Paragon Pathfinder component learns the network topology including all the nodes, links, andlabel-switched path (LSP) tunnels provisioned on the network. ATOM obtains this information aboutthe LSP tunnels in the network from the Paragon Pathfinder component through REST APIs.
ATOM uses the LSP tunnel information to provision the L3VPN services having different classes ofservice. If an LSP is not present for configuring an L3VPN with the required class of service, ATOMdoes not provision the service; instead, it waits for the required LSP to be configured. The service isprovisioned after the LSP is configured.
NOTE: ATOM does not configure the LSPs. It merely provides the details (for example,endpoints and bandwidth) for the LSP to be configured. The LSPs must be manuallyconfigured by using the Paragon Pathfinder component.
• ATOM integrates with the Paragon Insights component to create and instantiate playbooks formonitoring the provisioned services.
ATOM monitors the provisioned services for the following key performance indicators (KPIs):
• interface states and errors towards the core edge
88

• interface states and errors towards the customer edge
• VPN state
• BGP protocol errors
For each service that is provisioned, ATOM creates a playbook instance for monitoring the serviceand adds the devices on which the service is provisioned to the playbook. Paragon Insights isconfigured to send notifications through Microsoft Teams, Slack, or e-mail when the constraints, suchas bandwidth and latency, for the service are not met.
Accessing ATOM from Paragon Automation
When ATOM is added as an identity provider in Paragon Automation, an ATOM user can use the singlesign-on feature of Paragon Automation to sign in to Paragon Automation by using their ATOMcredentials.
After logging in to Paragon Automation, an ATOM user can log in to ATOM by clicking the ATOM linkon the left navigation bar. The user is taken to the ATOM portal, where the user can log in by using theirATOM credentials.
Benefits
Integrating Paragon Automation with ATOM provides the following benefits:
• The integration of ATOM with Paragon Automation leverages the traffic engineering (TE) features ofParagon Pathfinder to enable VPN to LSP steering.
• The L3VPN workflows present in ATOM helps in setting up L3 VPNs quickly without errors.
• ATOM configures the L3VPN monitoring playbooks to automate L3VPN assurance.
• The closed-loop automation capabilities of ATOM along with automation capabilities of ParagonPathfinder and Paragon Insights provide network operators with increased service assurance andoperational efficiency.
RELATED DOCUMENTATION
Configure Portal Settings | 51
89

Register Paragon Automation with Keycloak
IN THIS SECTION
What's Next | 0
NOTE: Ensure that you have the following information before registering Paragon Automation asa client with Keycloak:
• ATOM Keycloak IPv4 address
• Paragon Automation portal IPv4 address
• IPv4 address of the ATOM primary node
• Credentials to log in to the ATOM primary node
Anuta ATOM (hereafter ATOM) uses Keycloak for authenticating users. Therefore, to enable ATOMusers to use single sign-on to log in to Paragon Automation GUI, you must register Paragon Automationas a client in Keycloak.
To register Paragon Automation with Keycloak:
WHAT'S NEXT
Add ATOM as an identity provider and as an external EMS in Paragon Automation. For moreinformation, see "Add Anuta ATOM as an Identity Provider " | 92 and "Add Anuta ATOM as anExternal EMS Application" | 94.1. Log in to the ATOM Keycloak UI as an admin user by entering the following URL in your browser:
https://app.atom-keycloak-ipv4-address.nip.io:32443/ngui/login
2. If the System realm is not already added in Keycloak, add it.
3. Add atom and paragon-automation as clients under the System realm.
NOTE: For information on how to add realms and clients in Keycloak, refer to the ATOMAPI documentation.
4. In the left navigation menu, select System > Clients.
90

The Clients page appears.
5. Click atom.
The atom page appears.
6. On the Settings tab, configure the following parameters:
• Valid Redirect URIs: Enter the following values:
• https://paragon-automation-portal-ipv4-address/oidc/redirect/callback
NOTE: You can also obtain the value for the Valid Redirect Uniform ResourceIndicator (URI) from the Authorized Redirect URI field on the Add Identity Providerspage (Administration > Authentication > Identity Providers > Add Identity Providers)of the Paragon Automation GUI.
• https://paragon-automation-portal-ipv4-address
• https://atom-primary-ipv4-address:32443/*
• Ensure that the following parameters are turned ON:
• Enabled
• Direct Access Grants Enabled
• Service Accounts Enabled
• Authorization Enabled
7. Click Save.
8. Go back to the Clients page.
9. Click paragon-automation.
The paragon-automation page appears.
10. Configure the following parameters:
• On the Settings tab, ensure that Enabled is turned ON.
• On the Credentials tab:
• For Client Authenticator, select Client Id and Secret.
The client secret is displayed in the Secret field. Copy this value because you will need itwhen you add ATOM as an identity provider in Paragon Automation.
• For Valid Redirect URI, enter the following values:
• https://paragon-automation-portal-ipv4-address/oidc/redirect/callback
91
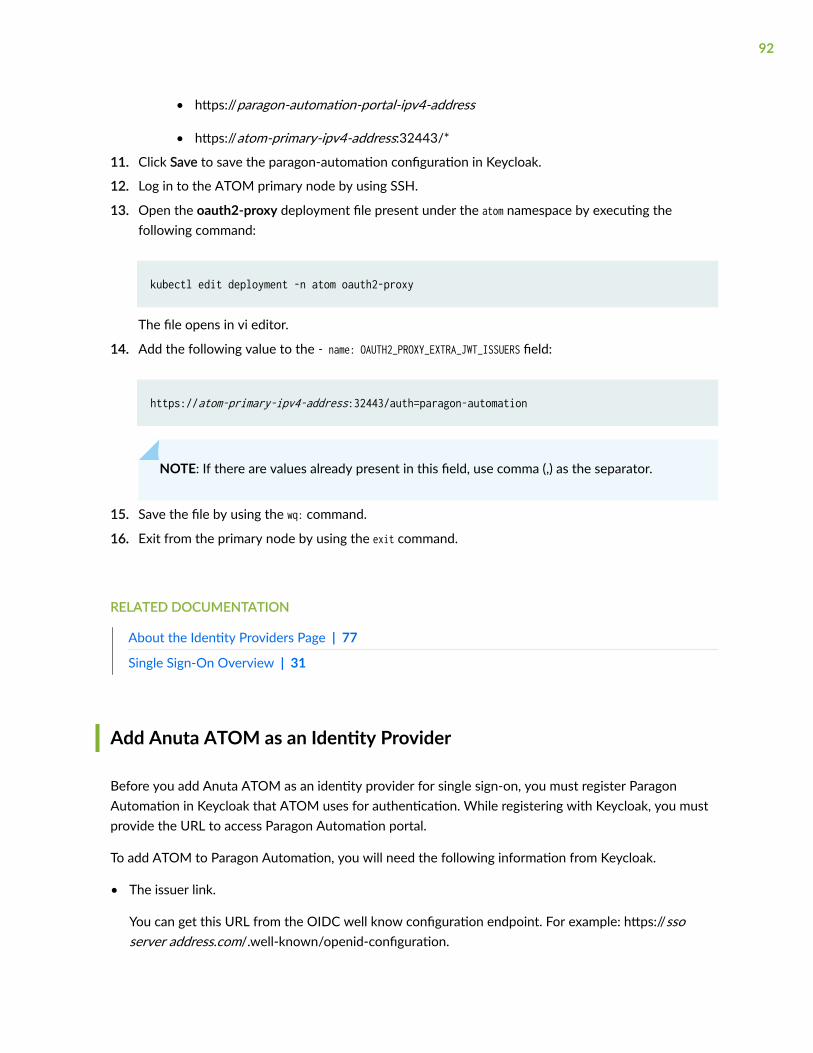
• https://paragon-automation-portal-ipv4-address
• https://atom-primary-ipv4-address:32443/*
11. Click Save to save the paragon-automation configuration in Keycloak.
12. Log in to the ATOM primary node by using SSH.
13. Open the oauth2-proxy deployment file present under the atom namespace by executing thefollowing command:
kubectl edit deployment -n atom oauth2-proxy
The file opens in vi editor.
14. Add the following value to the - name: OAUTH2_PROXY_EXTRA_JWT_ISSUERS field:
https://atom-primary-ipv4-address:32443/auth=paragon-automation
NOTE: If there are values already present in this field, use comma (,) as the separator.
15. Save the file by using the wq: command.
16. Exit from the primary node by using the exit command.
RELATED DOCUMENTATION
About the Identity Providers Page | 77
Single Sign-On Overview | 31
Add Anuta ATOM as an Identity Provider
Before you add Anuta ATOM as an identity provider for single sign-on, you must register ParagonAutomation in Keycloak that ATOM uses for authentication. While registering with Keycloak, you mustprovide the URL to access Paragon Automation portal.
To add ATOM to Paragon Automation, you will need the following information from Keycloak.
• The issuer link.
You can get this URL from the OIDC well know configuration endpoint. For example: https://ssoserver address.com/.well-known/openid-configuration.
92
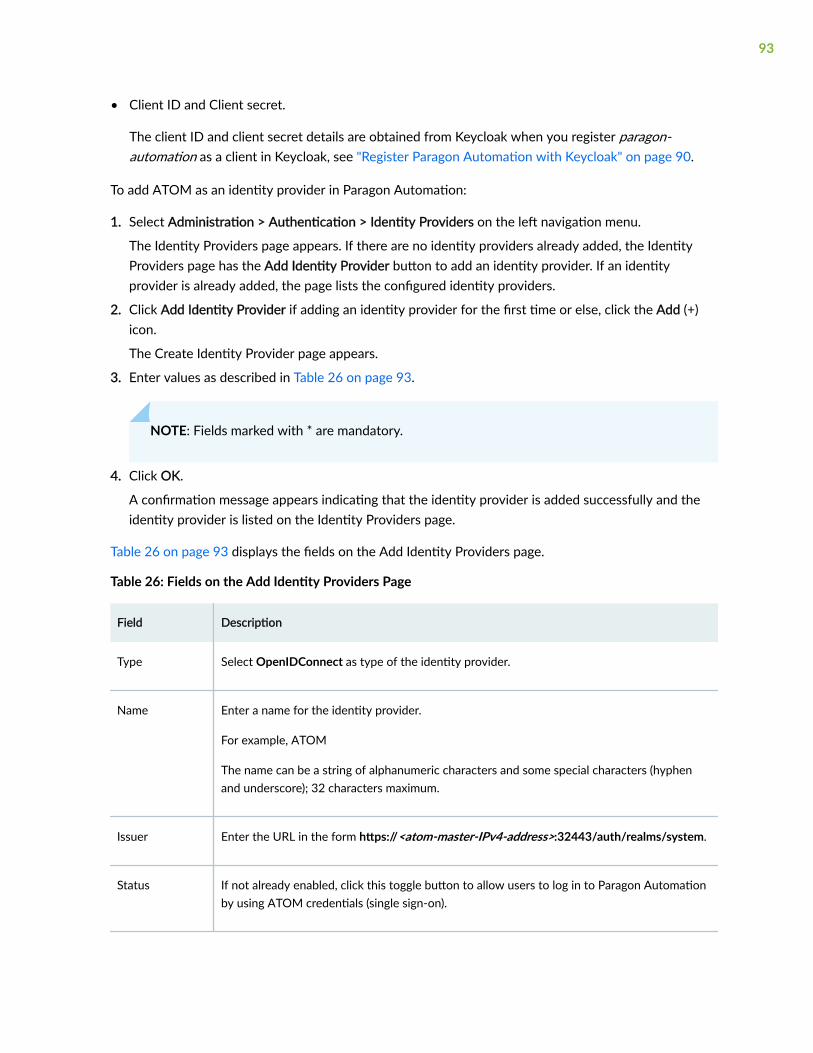
• Client ID and Client secret.
The client ID and client secret details are obtained from Keycloak when you register paragon-automation as a client in Keycloak, see "Register Paragon Automation with Keycloak" on page 90.
To add ATOM as an identity provider in Paragon Automation:
1. Select Administration > Authentication > Identity Providers on the left navigation menu.
The Identity Providers page appears. If there are no identity providers already added, the IdentityProviders page has the Add Identity Provider button to add an identity provider. If an identityprovider is already added, the page lists the configured identity providers.
2. Click Add Identity Provider if adding an identity provider for the first time or else, click the Add (+)icon.
The Create Identity Provider page appears.
3. Enter values as described in Table 26 on page 93.
NOTE: Fields marked with * are mandatory.
4. Click OK.
A confirmation message appears indicating that the identity provider is added successfully and theidentity provider is listed on the Identity Providers page.
Table 26 on page 93 displays the fields on the Add Identity Providers page.
Table 26: Fields on the Add Identity Providers Page
Field Description
Type Select OpenIDConnect as type of the identity provider.
Name Enter a name for the identity provider.
For example, ATOM
The name can be a string of alphanumeric characters and some special characters (hyphenand underscore); 32 characters maximum.
Issuer Enter the URL in the form https://<atom-master-IPv4-address>:32443/auth/realms/system.
Status If not already enabled, click this toggle button to allow users to log in to Paragon Automationby using ATOM credentials (single sign-on).
93
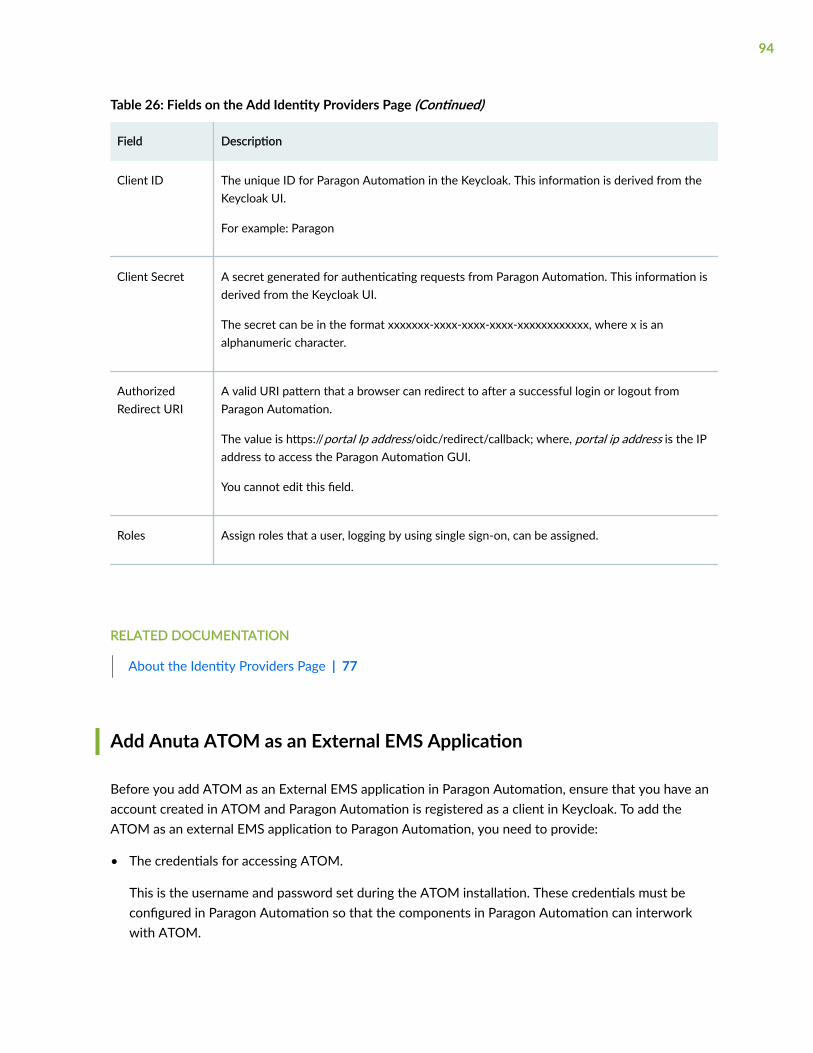
Table 26: Fields on the Add Identity Providers Page (Continued)
Field Description
Client ID The unique ID for Paragon Automation in the Keycloak. This information is derived from theKeycloak UI.
For example: Paragon
Client Secret A secret generated for authenticating requests from Paragon Automation. This information isderived from the Keycloak UI.
The secret can be in the format xxxxxxx-xxxx-xxxx-xxxx-xxxxxxxxxxxx, where x is analphanumeric character.
AuthorizedRedirect URI
A valid URI pattern that a browser can redirect to after a successful login or logout fromParagon Automation.
The value is https://portal Ip address/oidc/redirect/callback; where, portal ip address is the IPaddress to access the Paragon Automation GUI.
You cannot edit this field.
Roles Assign roles that a user, logging by using single sign-on, can be assigned.
RELATED DOCUMENTATION
About the Identity Providers Page | 77
Add Anuta ATOM as an External EMS Application
Before you add ATOM as an External EMS application in Paragon Automation, ensure that you have anaccount created in ATOM and Paragon Automation is registered as a client in Keycloak. To add theATOM as an external EMS application to Paragon Automation, you need to provide:
• The credentials for accessing ATOM.
This is the username and password set during the ATOM installation. These credentials must beconfigured in Paragon Automation so that the components in Paragon Automation can interworkwith ATOM.
94
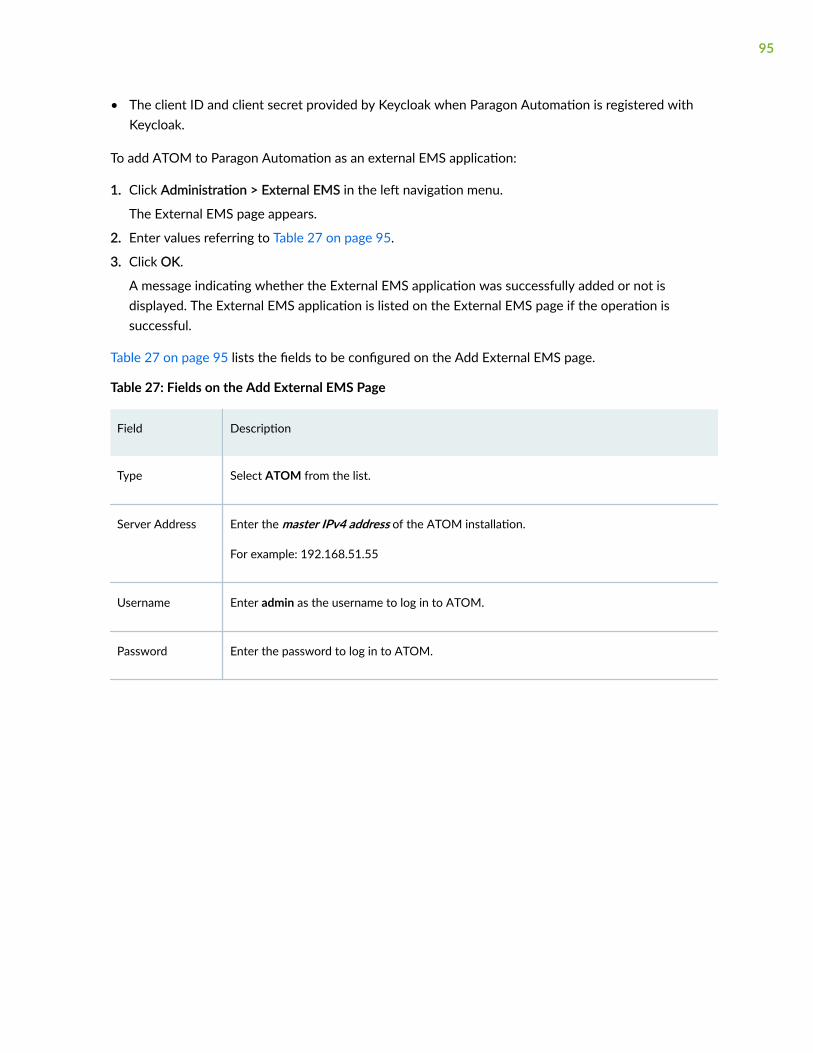
• The client ID and client secret provided by Keycloak when Paragon Automation is registered withKeycloak.
To add ATOM to Paragon Automation as an external EMS application:
1. Click Administration > External EMS in the left navigation menu.
The External EMS page appears.
2. Enter values referring to Table 27 on page 95.
3. Click OK.
A message indicating whether the External EMS application was successfully added or not isdisplayed. The External EMS application is listed on the External EMS page if the operation issuccessful.
Table 27 on page 95 lists the fields to be configured on the Add External EMS page.
Table 27: Fields on the Add External EMS Page
Field Description
Type Select ATOM from the list.
Server Address Enter the master IPv4 address of the ATOM installation.
For example: 192.168.51.55
Username Enter admin as the username to log in to ATOM.
Password Enter the password to log in to ATOM.
95
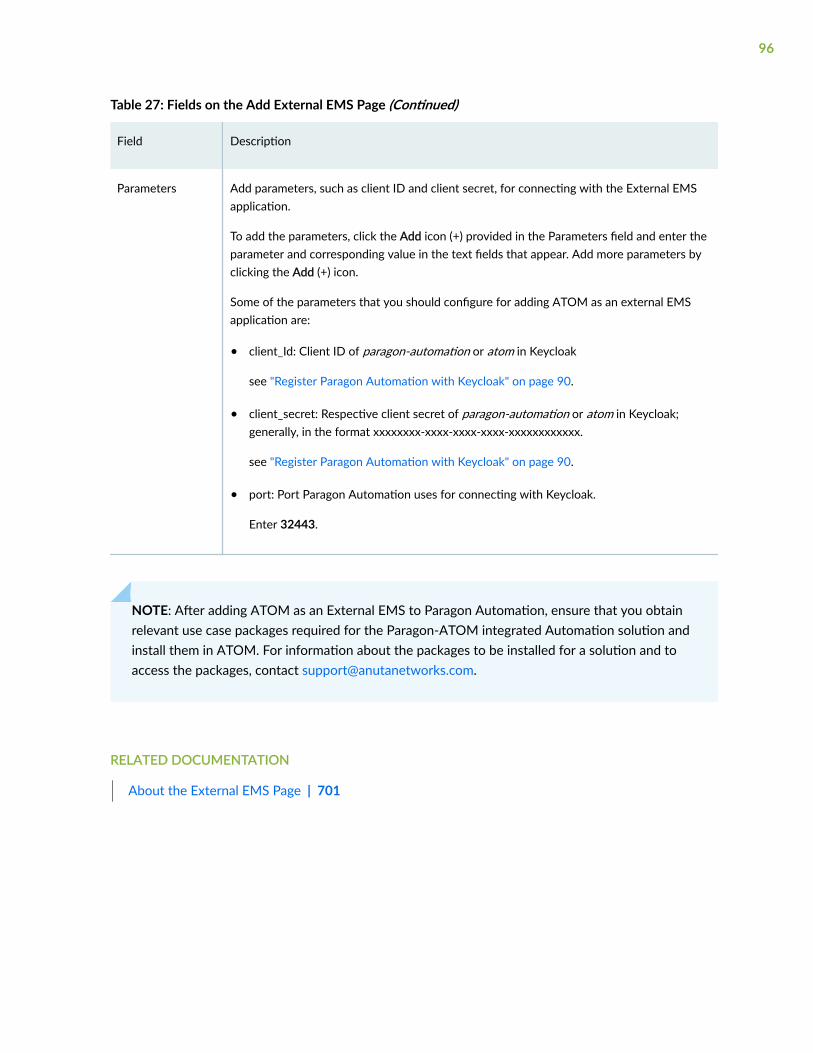
Table 27: Fields on the Add External EMS Page (Continued)
Field Description
Parameters Add parameters, such as client ID and client secret, for connecting with the External EMSapplication.
To add the parameters, click the Add icon (+) provided in the Parameters field and enter theparameter and corresponding value in the text fields that appear. Add more parameters byclicking the Add (+) icon.
Some of the parameters that you should configure for adding ATOM as an external EMSapplication are:
• client_Id: Client ID of paragon-automation or atom in Keycloak
see "Register Paragon Automation with Keycloak" on page 90.
• client_secret: Respective client secret of paragon-automation or atom in Keycloak;generally, in the format xxxxxxxx-xxxx-xxxx-xxxx-xxxxxxxxxxxx.
see "Register Paragon Automation with Keycloak" on page 90.
• port: Port Paragon Automation uses for connecting with Keycloak.
Enter 32443.
NOTE: After adding ATOM as an External EMS to Paragon Automation, ensure that you obtainrelevant use case packages required for the Paragon-ATOM integrated Automation solution andinstall them in ATOM. For information about the packages to be installed for a solution and toaccess the packages, contact [email protected].
RELATED DOCUMENTATION
About the External EMS Page | 701
96

3PART
Manage Devices and Network
Devices | 98
Device Groups | 141
Device Images | 154
Network | 163
Network Groups | 216
Topology Filter | 221
CHAPTER 10
Devices
IN THIS CHAPTER
Devices Overview | 98
Zero-Touch Provisioning Overview | 100
Add Devices Overview | 103
About the Device Page | 105
Supported Devices and OS Versions | 111
Add Devices | 119
Upgrade the Device Image | 123
View Device Statistics and Inventory information | 124
View and Manage Device Configuration | 132
Edit Devices | 135
Delete Devices | 140
Devices Overview
The Devices page in Paragon Automation helps you manage the devices in your network. ParagonAutomation supports zero-touch provisioning (ZTP) which you can use to provision the devices whileonboarding the device. For information on ZTP, see "Zero-Touch Provisioning Overview" on page 100.
You can use Paragon Automation to manage both Juniper Networks devices and third-party devices(only Cisco IOS XR is supported in Paragon Automation Release 21.1). A managed device in ParagonAutomation refers to devices that the EMS component of Paragon Automation can discover in anetwork, and therefore can configure and monitor the device. An unmanaged device refers to a devicethat the Element Management System (EMS) component of Paragon Automation does not manage andtherefore cannot configure or monitor.
Paragon Automation Release 21.1 supports Juniper Networks devices and Cisco IOS XR devices. Table28 on page 99 lists the tasks that you can perform on the Juniper Networks and Cisco IOS-XR devicesin this release,
98
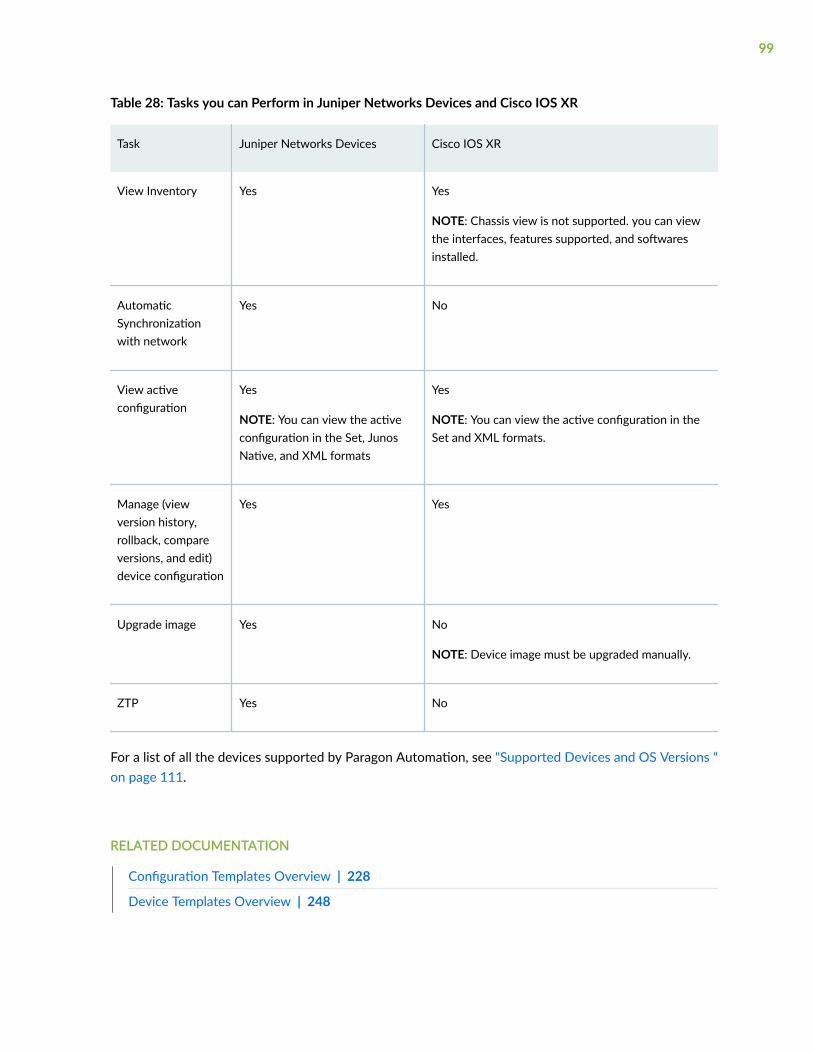
Table 28: Tasks you can Perform in Juniper Networks Devices and Cisco IOS XR
Task Juniper Networks Devices Cisco IOS XR
View Inventory Yes Yes
NOTE: Chassis view is not supported. you can viewthe interfaces, features supported, and softwaresinstalled.
AutomaticSynchronizationwith network
Yes No
View activeconfiguration
Yes
NOTE: You can view the activeconfiguration in the Set, JunosNative, and XML formats
Yes
NOTE: You can view the active configuration in theSet and XML formats.
Manage (viewversion history,rollback, compareversions, and edit)device configuration
Yes Yes
Upgrade image Yes No
NOTE: Device image must be upgraded manually.
ZTP Yes No
For a list of all the devices supported by Paragon Automation, see "Supported Devices and OS Versions "on page 111.
RELATED DOCUMENTATION
Configuration Templates Overview | 228
Device Templates Overview | 248
99
Zero-Touch Provisioning Overview
IN THIS SECTION
Benefits | 102
Zero Touch Provisioning (ZTP) enables you to configure and manage devices automatically, reducing themanual intervention required for adding devices to a network. The ZTP solution uses DHCP protocol toprovision devices that are on the same subnet as Paragon Automation and also on a different subnet.
NOTE:
• In Paragon Automation Release 21.1, you can only add the MX Series and QFX Series devicesby using ZTP.
• For ZTP, the image loaded on the device should be Junos OS Release 21.1 or later. The Imageshould be added through the image upgrade workflow; see "Deploy an Image" on page 160.
ZTP for onboarding a device involves the following steps:
1. Provide inputs such as available IP addresses (range) to be leased, corresponding gatewayinformation and device details like root password, serial number to onboard the devices.
2. A job is created and the job lists the progress of ZTP.
3. A DHCP server, configured in Paragon Automation, leases an available IP address to the devicerequesting for an IP address.
4. The device uses the IP address received from the DHCP server to connect with Paragon Automation.
5. The bootstrapping configuration and software images, required for ZTP, served through the internalHTTP server of Paragon Automation, are installed on the device.
Once the bootstrap configuration is installed on the device, the device establishes a NetConf sessionwith Paragon Automaton for syncing of inventory, configurations, configuration template, andconfiguration version.
6. The ZTP progress is updated in the database.
100

To perform ZTP on devices that are present on a subnet that is different from the subnet in whichParagon Automation is installed, you must configure a relay. as shown in Figure 8 on page 101.
Figure 8: Layer 3 Topology for ZTP
The relay can be an MX Series device or a Linux-based or CentOS-based Virtual Machine (VM). Forinformation about using an MX Series device as a DHCP relay, see DHCP Relay Agent.
To configure DHCP relay in a Linux-based or CentOS-based VM.
1. Log in to the VM.
2. Check if the DHCP relay is already installed or not by executing the ~]# yum list installed | grep dhcpcommand.
If DHCP relay is already installed, the output of the command should list the DHCP image versioninstalled on the VM. For example:
~]# yum list installed | grep dhcpdhcp.x86_64 12:4.2.5-83.el7.centos.1 @updates dhcp-common.x86_64 12:4.2.5-83.el7.centos.1 @updates dhcp-libs.x86_64 12:4.2.5-83.el7.centos.1 @updates
3. If DHCP is not installed, Install the DHCP relay package on the VM.
root@device yum install dhcp
101
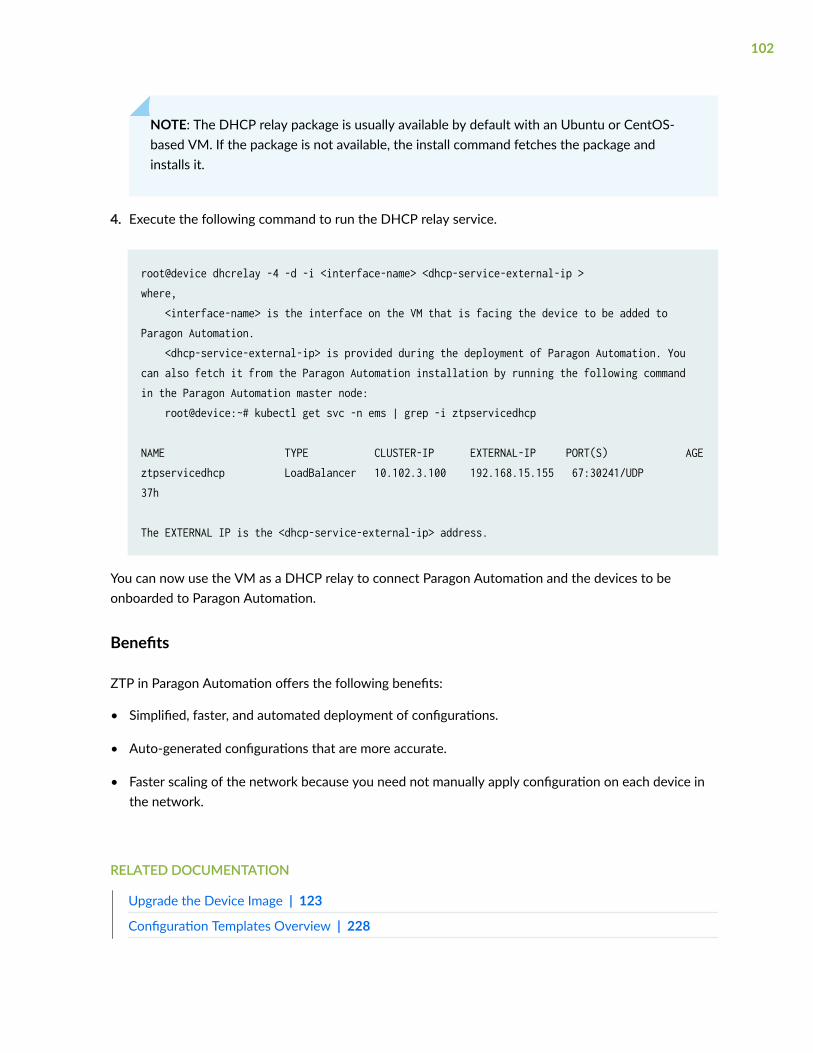
NOTE: The DHCP relay package is usually available by default with an Ubuntu or CentOS-based VM. If the package is not available, the install command fetches the package andinstalls it.
4. Execute the following command to run the DHCP relay service.
root@device dhcrelay -4 -d -i <interface-name> <dhcp-service-external-ip > where, <interface-name> is the interface on the VM that is facing the device to be added to Paragon Automation. <dhcp-service-external-ip> is provided during the deployment of Paragon Automation. You can also fetch it from the Paragon Automation installation by running the following command in the Paragon Automation master node: root@device:~# kubectl get svc -n ems | grep -i ztpservicedhcp
NAME TYPE CLUSTER-IP EXTERNAL-IP PORT(S) AGEztpservicedhcp LoadBalancer 10.102.3.100 192.168.15.155 67:30241/UDP 37h The EXTERNAL IP is the <dhcp-service-external-ip> address.
You can now use the VM as a DHCP relay to connect Paragon Automation and the devices to beonboarded to Paragon Automation.
Benefits
ZTP in Paragon Automation offers the following benefits:
• Simplified, faster, and automated deployment of configurations.
• Auto-generated configurations that are more accurate.
• Faster scaling of the network because you need not manually apply configuration on each device inthe network.
RELATED DOCUMENTATION
Upgrade the Device Image | 123
Configuration Templates Overview | 228
102
Device Templates Overview | 248
Add Devices Overview
You use the Add Device option to discover and synchronize all devices connected to your network.Paragon Automation classifies devices as managed and unmanaged.
• A managed device is a device that the EMS component of Paragon Automation discovers andtherefore, can configure and monitor; for example, Juniper Networks SRX Series devices, vSRXdevices, MX Series devices, Cisco-IOS XR devices.
For a complete list of managed devices, see "Supported Devices and OS Versions " on page 111
• An unmanaged device is a device that the EMS component of Paragon automation cannot discoverand therefore, cannot configure and monitor, for example, third-party devices (other than Cisco IOSXR).
Paragon Automation lists the hostname and IP address of the unmanaged devices on the Devicespage.
To discover a device, you must provide the IP addresses, hostnames, and IP subnets to be discoveredand the credentials to connect to the devices.
NOTE:
• Netconf over ssh should be enabled on Cisco IOS XR devices and you should have theprivilege to manage Netconf on the devices.
• For devices with dual Routing Engines, Chassis Cluster, or Virtual Chassis, enter the Virtual IPaddress (VIP) or the IP address of the primary device
• The values that you enter to specify the targets, and credentials are persistent from onediscovery operation to the next, so you do not have to reenter information that is the samefrom one operation to the next
You can add devices in a network to Paragon Automation in one of the following ways:
• Discover the devices already present in a network by providing the device credentials.
You can use this option to discover devices that are already present in your network. You candiscover the devices by providing a list of IPv4 addresses, subnet addresses, IP ranges or hostnames.
You can also use a CSV file to provide the targets to discover the existing devices in a network.
103
See "Discover Devices" on page 119 for more information about discovering devices.
• Add devices manually by specifying their details such as serial number and device model and the rootpassword.
You can use this option to add a specific set of devices; for example, add a set of new EX Seriesdevices. When you add a new device, the device is automatically provisioned by zero-touchprovisioning (ZTP). For details on ZTP, see "Zero-Touch Provisioning Overview" on page 100
You can also use a CSV file to specify the details of the devices to be added.
See "Add New Devices" on page 121 for more information about adding new devices.
When you add a device, Paragon Automation executes the following tasks:
1. Paragon establishes connection with the devices based on the specified device targets.
2. Deploys the default configuration templates included in the device template associated with thedevice-family to which the device belongs.
3. Deploys telemetry configuration for monitoring.
4. Captures and stores the device inventory data.
5. Captures and stores the device configuration.
6. Applies any additional configuration template, for example for configuring BGP, if the configurationtemplate is assigned for the device.
7. Synchronizes the device configuration in the database.
8. Pins the configuration.
The time required to complete the discovery process or adding the devices depends on multiple factorssuch as the number of devices you are discovering, the size of configuration and inventory data on thedevices, the network bandwidth available between Paragon Automation and the devices, and so forth.
After your devices are successfully discovered or added, you can view them on the Devices page(Configuration > Devices) of Paragon Automation.
• For managed devices, after the discovery, the Management Status should display “Up” and the SyncStatus “In Sync”, which indicates that Paragon Automation has established a session with the devicesand that the configuration and inventory data in Paragon Automation is in sync with the data on thedevices.
• For unmanaged devices, the Management Status should display as “Unmanaged” and the Sync Status“Unknown”, which indicates that Paragon Automation has added the device details to its database.
104

RELATED DOCUMENTATION
Upgrade the Device Image | 123
View Device Statistics and Inventory information | 124
View and Manage Device Configuration | 132
About the Device Page
IN THIS SECTION
Tasks You Can Perform | 105
Field Descriptions | 108
The Devices page in Paragon Automation helps you manage the devices in your network. To access theDevices page, click Configuration > Devices.
Tasks You Can Perform
Users with the SP Administrator role can perform the following tasks from this page, while users withthe SP Operator role have read only capabilities.
• View the list of devices managed by Paragon Automation, and their details.
To view details of a specific device, select the device and click More > Detail. Alternatively, hoverover the device name and click the Details icon that appears.
The Device Details pane appears on the right side of the page, displaying basic information, such asdevice name, device family, OS version, management status, and synchronization status of thedevice. Click the close (x) icon to close the page.
• Add new devices or discover devices existing in the network topology; see "Add Devices" on page119.
• View details of a device’s inventory.
To view details of a device’s inventory, click the device link or select the device and click More > ViewInventory. The Device-Name page appears, displaying the details on the Inventory tab of the Devicespage.
105

• Synchronize the device inventory details with the network
NOTE:
• Juniper Networks devices are automatically synchronized with the network whenever achange in inventory, such as change in configuration, interface link or admin status, or FRUinsertion or deletion, is detected in the system logs.
• Cisco IOS-XR devices must be manually synchronized for the inventory updates to bereflected in Paragon Automation.
To synchronize the device inventory details of a device, select the device and click More >Resynchronize With Network. A job is triggered to synchronize the device inventory stored indatabase with the network.
Use this option to:Synchronize the inventory of a device when its Sync Status is Unknown or Out-of-Sync.
• View the current configuration used by the device (active configuration)
To view the active configuration of a device, select the device and click More > View ActiveConfiguration. The Active Configuration for Device-Name page appears, displaying the configurationin the Set, Junos Native, and XML formats for Juniper Networks devices and in the Set and XMLformats for CISCO-IOS XR devices.
• View the different configuration versions used on a device
To view the different configuration versions used on a device, select a device and click More >Configuration Versions. The Configuration Versions for Device-Name page appears, displaying thecurrent configuration and the version history of the different configurations used on the device.
On the Configuration Versions for Device-Name page, you can perform the following tasks:
• Compare two versions of a configuration—Select the configurations to be compared and clickCompare, The Compare Configuration page appears, displaying the configurations side-by-side foryou to view and compare.
• Rollback to a previous configuration—Select the configuration that you want to rollback to andclick Rollback. The device configuration is rolled back to the selected configuration version.
• Pin or unpin a device configuration—Select the configuration and click the Pin icon. The deviceconfiguration is pinned and a small pin icon appears next to the configuration.
106

Paragon Automation archives only ten configurations. When the next configuration is to bearchived, the oldest configuration is deleted. When you pin a configuration, the pinnedconfiguration is not deleted, but the next oldest configuration is deleted.
To unpin a configuration, select the configuration and click the Unpin icon. The configuration isunpinned and the small pin icon, present next to the configuration, is removed.
• Add a description for a configuration version—Select the configuration version and click the Editicon. The Add Description page appears, where you can enter the description in the Descriptiontext box.
• Reboot a device
To reboot one or more devices, select the devices and click More > Reboot. A confirmation messageappears. Click Yes. A message indicating that the reboot has started is displayed along with the jobID. Click the job ID to view the progress of the reboot job in the Jobs page (Monitoring > Jobs).
NOTE: Reboot may affect traffic flowing through the device. For the impact of reboot on adevice, refer to the respective device documentation.
• Upgrade images on one or more devices; see "Upgrade the Device Image" on page 123.
• Export general details of all devices to a CSV file
To export details of all devices to a CSV file, click More > Export as CSV. A comma-separated values(CSV) file is generated that you can download to your local system.
The CSV file includes information about the device name, platform, OS version, synchronizationstate, IP address, family to which the device belongs, management status, serial number, and theunique identifier of the device.
• Edit parameters configured for devices; see "Edit Devices" on page 135.
• Delete devices from Paragon Automation; see "Delete Devices" on page 140
• Filter Entries—Filter the table entries by adding new filtering criteria.
Hover over the Filter (funnel) icon and select Add Filter. On the Add Criteria page, select the filteringcriteria from the Field and Condition list, and enter the text to be compared in the Value field. ClickAdd.
The filtered table entries are listed and the filter criteria name is displayed above the table columnnames.
You can click the cross (X) icon (next to the filter name) to remove the filtering criteria.
107
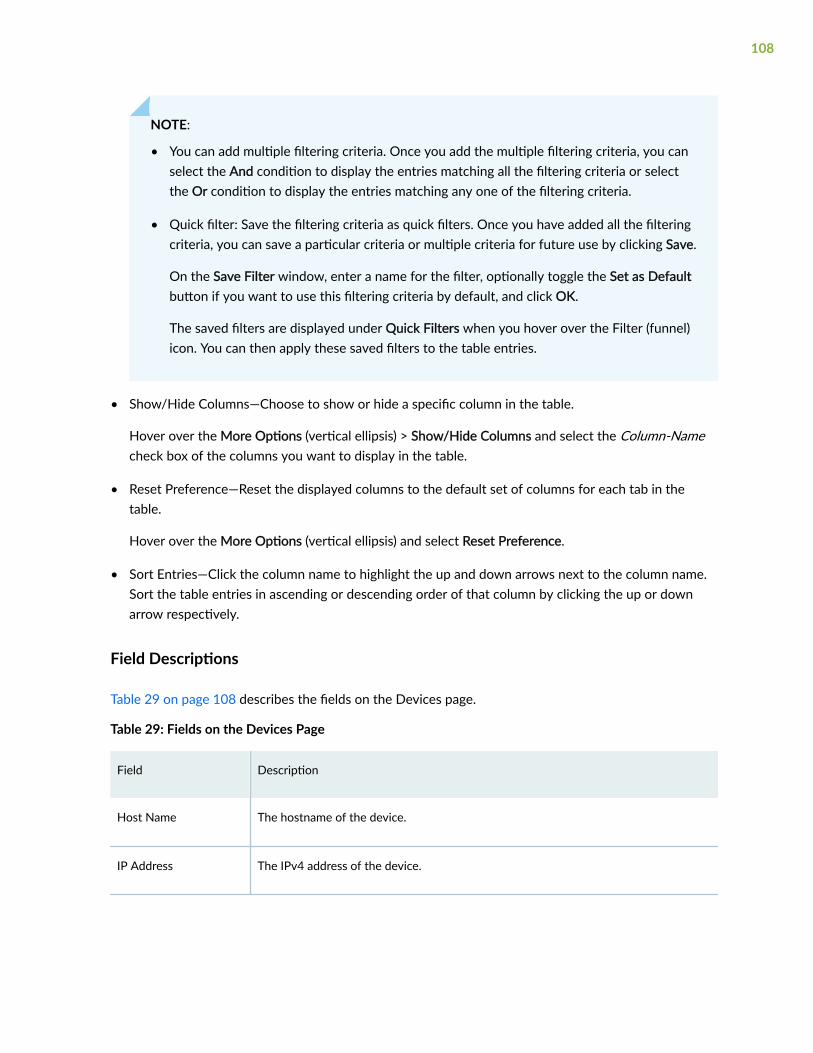
NOTE:
• You can add multiple filtering criteria. Once you add the multiple filtering criteria, you canselect the And condition to display the entries matching all the filtering criteria or selectthe Or condition to display the entries matching any one of the filtering criteria.
• Quick filter: Save the filtering criteria as quick filters. Once you have added all the filteringcriteria, you can save a particular criteria or multiple criteria for future use by clicking Save.
On the Save Filter window, enter a name for the filter, optionally toggle the Set as Defaultbutton if you want to use this filtering criteria by default, and click OK.
The saved filters are displayed under Quick Filters when you hover over the Filter (funnel)icon. You can then apply these saved filters to the table entries.
• Show/Hide Columns—Choose to show or hide a specific column in the table.
Hover over the More Options (vertical ellipsis) > Show/Hide Columns and select the Column-Namecheck box of the columns you want to display in the table.
• Reset Preference—Reset the displayed columns to the default set of columns for each tab in thetable.
Hover over the More Options (vertical ellipsis) and select Reset Preference.
• Sort Entries—Click the column name to highlight the up and down arrows next to the column name.Sort the table entries in ascending or descending order of that column by clicking the up or downarrow respectively.
Field Descriptions
Table 29 on page 108 describes the fields on the Devices page.
Table 29: Fields on the Devices Page
Field Description
Host Name The hostname of the device.
IP Address The IPv4 address of the device.
108

Table 29: Fields on the Devices Page (Continued)
Field Description
Platform The device model.
For example, MX960, SRX3500.
Vendor The name of the device vendor.
Family The device family to which the device belongs.
For example, Juniper-MX, Juniper-SRX
Management IP The management IP address (IPv4) of the device, which is used for managementaccess.
OS Version The version of OS that is currently installed on the device.
Serial Number The serial number of the device.
109
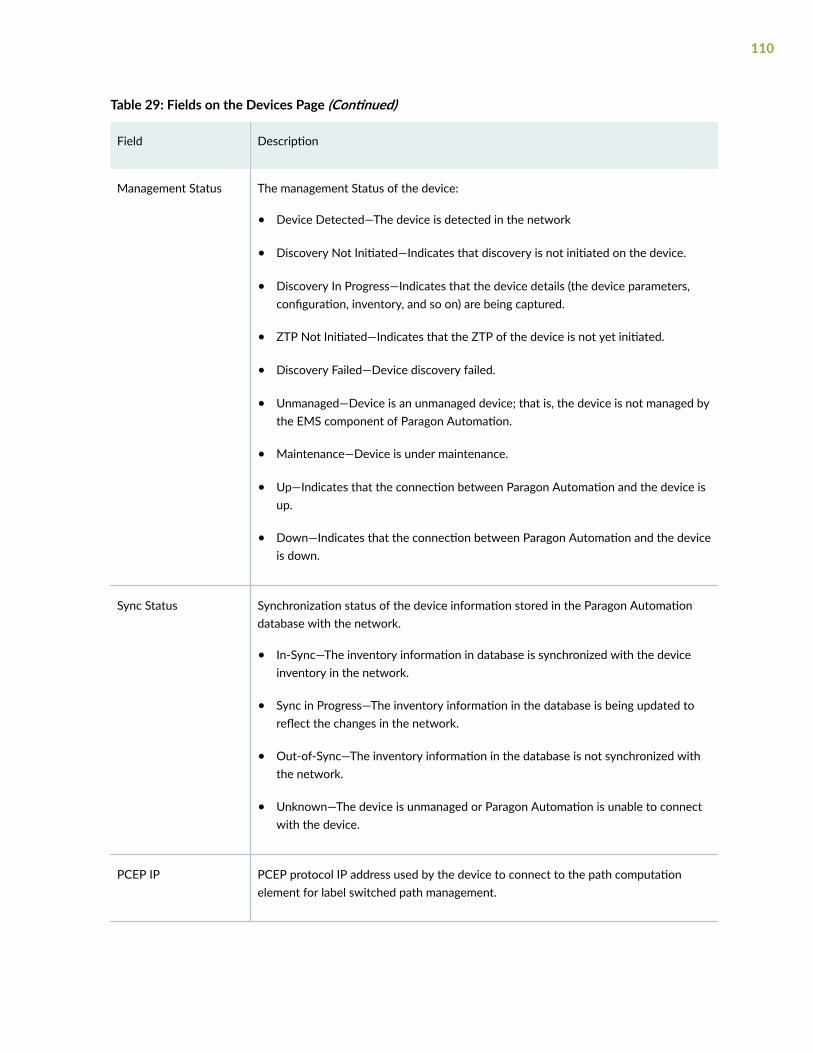
Table 29: Fields on the Devices Page (Continued)
Field Description
Management Status The management Status of the device:
• Device Detected—The device is detected in the network
• Discovery Not Initiated—Indicates that discovery is not initiated on the device.
• Discovery In Progress—Indicates that the device details (the device parameters,configuration, inventory, and so on) are being captured.
• ZTP Not Initiated—Indicates that the ZTP of the device is not yet initiated.
• Discovery Failed—Device discovery failed.
• Unmanaged—Device is an unmanaged device; that is, the device is not managed bythe EMS component of Paragon Automation.
• Maintenance—Device is under maintenance.
• Up—Indicates that the connection between Paragon Automation and the device isup.
• Down—Indicates that the connection between Paragon Automation and the deviceis down.
Sync Status Synchronization status of the device information stored in the Paragon Automationdatabase with the network.
• In-Sync—The inventory information in database is synchronized with the deviceinventory in the network.
• Sync in Progress—The inventory information in the database is being updated toreflect the changes in the network.
• Out-of-Sync—The inventory information in the database is not synchronized withthe network.
• Unknown—The device is unmanaged or Paragon Automation is unable to connectwith the device.
PCEP IP PCEP protocol IP address used by the device to connect to the path computationelement for label switched path management.
110
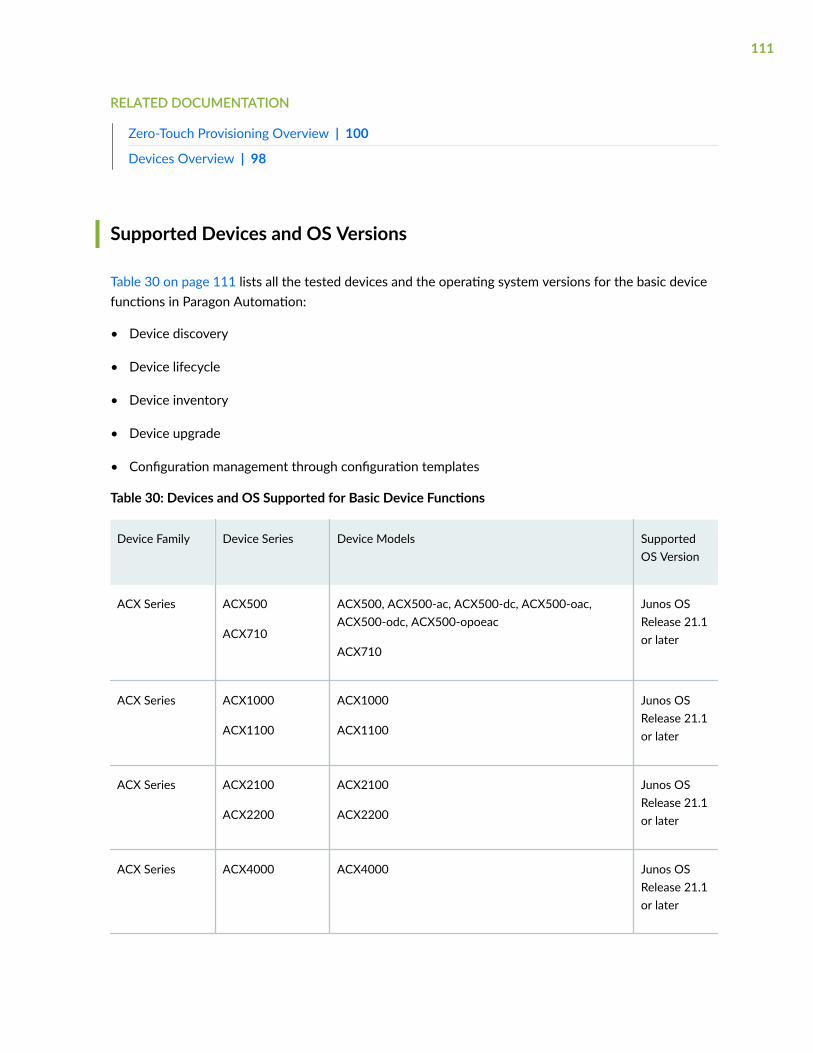
RELATED DOCUMENTATION
Zero-Touch Provisioning Overview | 100
Devices Overview | 98
Supported Devices and OS Versions
Table 30 on page 111 lists all the tested devices and the operating system versions for the basic devicefunctions in Paragon Automation:
• Device discovery
• Device lifecycle
• Device inventory
• Device upgrade
• Configuration management through configuration templates
Table 30: Devices and OS Supported for Basic Device Functions
Device Family Device Series Device Models SupportedOS Version
ACX Series ACX500
ACX710
ACX500, ACX500-ac, ACX500-dc, ACX500-oac,ACX500-odc, ACX500-opoeac
ACX710
Junos OSRelease 21.1or later
ACX Series ACX1000
ACX1100
ACX1000
ACX1100
Junos OSRelease 21.1or later
ACX Series ACX2100
ACX2200
ACX2100
ACX2200
Junos OSRelease 21.1or later
ACX Series ACX4000 ACX4000 Junos OSRelease 21.1or later
111
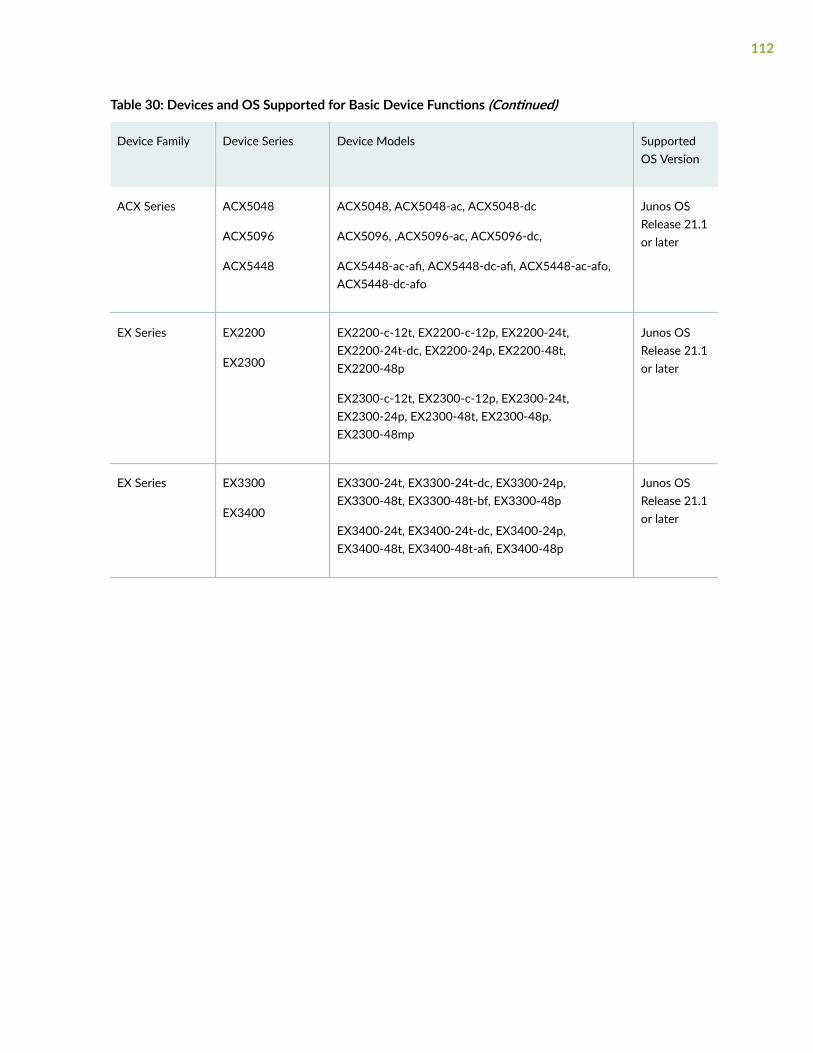
Table 30: Devices and OS Supported for Basic Device Functions (Continued)
Device Family Device Series Device Models SupportedOS Version
ACX Series ACX5048
ACX5096
ACX5448
ACX5048, ACX5048-ac, ACX5048-dc
ACX5096, ,ACX5096-ac, ACX5096-dc,
ACX5448-ac-afi, ACX5448-dc-afi, ACX5448-ac-afo,ACX5448-dc-afo
Junos OSRelease 21.1or later
EX Series EX2200
EX2300
EX2200-c-12t, EX2200-c-12p, EX2200-24t,EX2200-24t-dc, EX2200-24p, EX2200-48t,EX2200-48p
EX2300-c-12t, EX2300-c-12p, EX2300-24t,EX2300-24p, EX2300-48t, EX2300-48p,EX2300-48mp
Junos OSRelease 21.1or later
EX Series EX3300
EX3400
EX3300-24t, EX3300-24t-dc, EX3300-24p,EX3300-48t, EX3300-48t-bf, EX3300-48p
EX3400-24t, EX3400-24t-dc, EX3400-24p,EX3400-48t, EX3400-48t-afi, EX3400-48p
Junos OSRelease 21.1or later
112
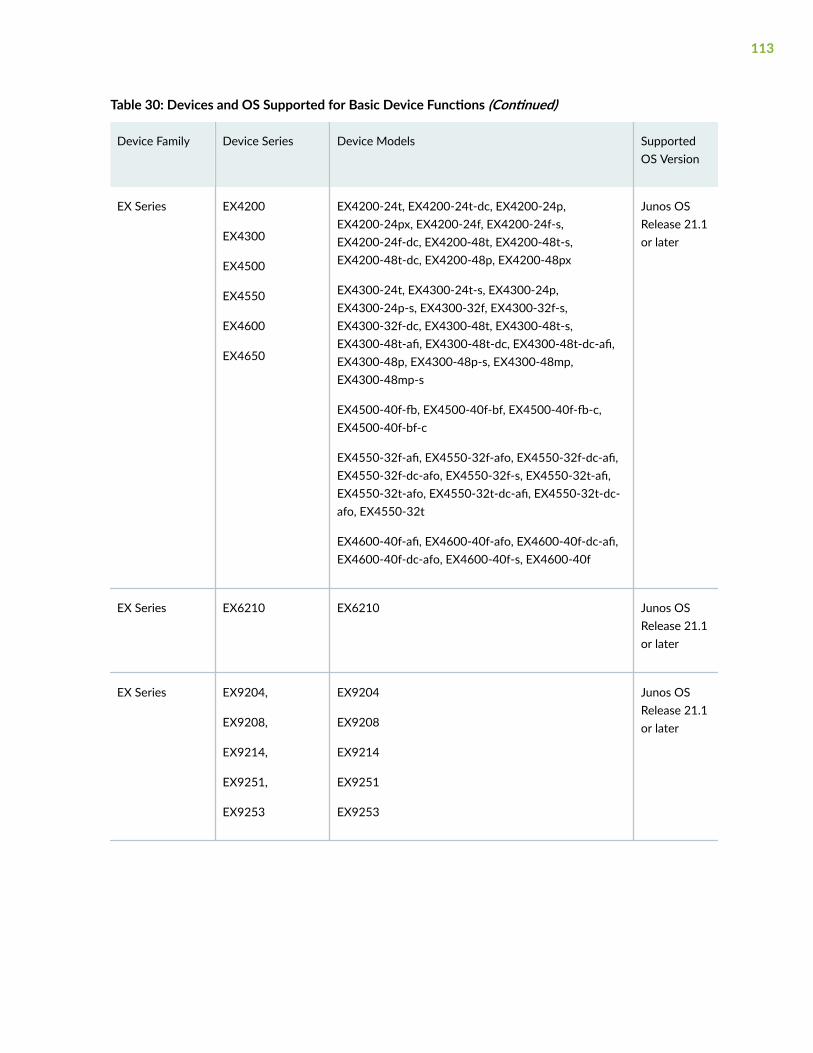
Table 30: Devices and OS Supported for Basic Device Functions (Continued)
Device Family Device Series Device Models SupportedOS Version
EX Series EX4200
EX4300
EX4500
EX4550
EX4600
EX4650
EX4200-24t, EX4200-24t-dc, EX4200-24p,EX4200-24px, EX4200-24f, EX4200-24f-s,EX4200-24f-dc, EX4200-48t, EX4200-48t-s,EX4200-48t-dc, EX4200-48p, EX4200-48px
EX4300-24t, EX4300-24t-s, EX4300-24p,EX4300-24p-s, EX4300-32f, EX4300-32f-s,EX4300-32f-dc, EX4300-48t, EX4300-48t-s,EX4300-48t-afi, EX4300-48t-dc, EX4300-48t-dc-afi,EX4300-48p, EX4300-48p-s, EX4300-48mp,EX4300-48mp-s
EX4500-40f-fb, EX4500-40f-bf, EX4500-40f-fb-c,EX4500-40f-bf-c
EX4550-32f-afi, EX4550-32f-afo, EX4550-32f-dc-afi,EX4550-32f-dc-afo, EX4550-32f-s, EX4550-32t-afi,EX4550-32t-afo, EX4550-32t-dc-afi, EX4550-32t-dc-afo, EX4550-32t
EX4600-40f-afi, EX4600-40f-afo, EX4600-40f-dc-afi,EX4600-40f-dc-afo, EX4600-40f-s, EX4600-40f
Junos OSRelease 21.1or later
EX Series EX6210 EX6210 Junos OSRelease 21.1or later
EX Series EX9204,
EX9208,
EX9214,
EX9251,
EX9253
EX9204
EX9208
EX9214
EX9251
EX9253
Junos OSRelease 21.1or later
113
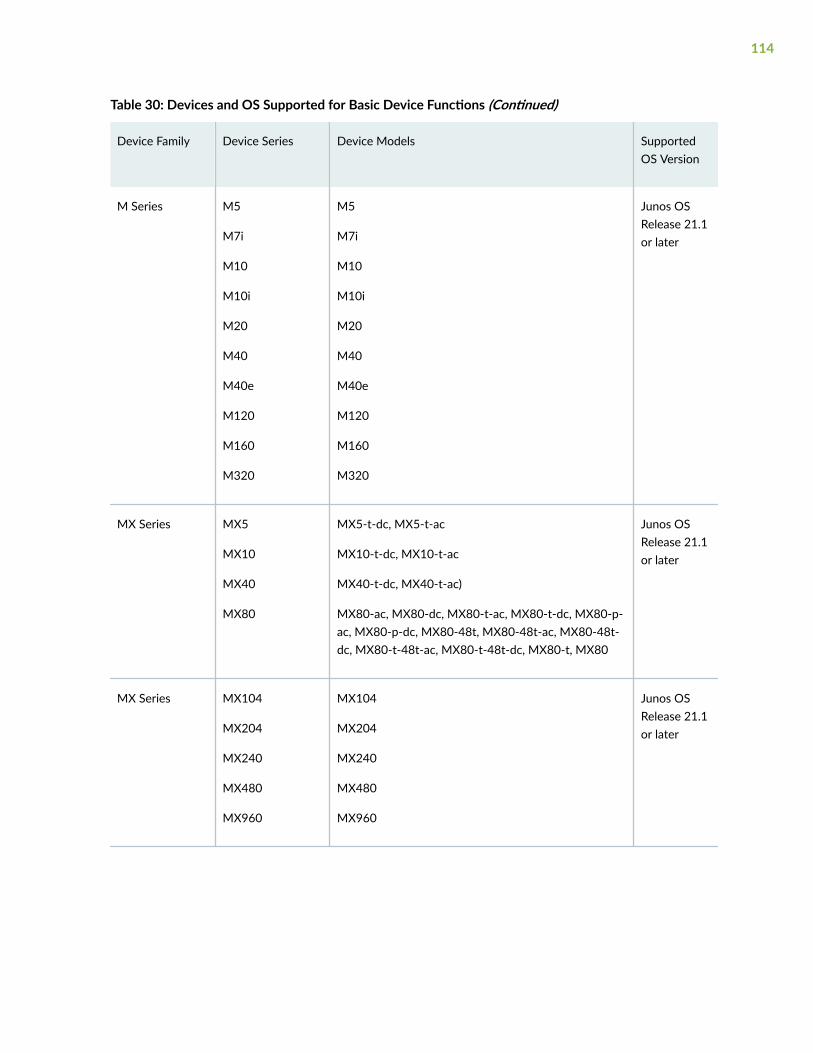
Table 30: Devices and OS Supported for Basic Device Functions (Continued)
Device Family Device Series Device Models SupportedOS Version
M Series M5
M7i
M10
M10i
M20
M40
M40e
M120
M160
M320
M5
M7i
M10
M10i
M20
M40
M40e
M120
M160
M320
Junos OSRelease 21.1or later
MX Series MX5
MX10
MX40
MX80
MX5-t-dc, MX5-t-ac
MX10-t-dc, MX10-t-ac
MX40-t-dc, MX40-t-ac)
MX80-ac, MX80-dc, MX80-t-ac, MX80-t-dc, MX80-p-ac, MX80-p-dc, MX80-48t, MX80-48t-ac, MX80-48t-dc, MX80-t-48t-ac, MX80-t-48t-dc, MX80-t, MX80
Junos OSRelease 21.1or later
MX Series MX104
MX204
MX240
MX480
MX960
MX104
MX204
MX240
MX480
MX960
Junos OSRelease 21.1or later
114
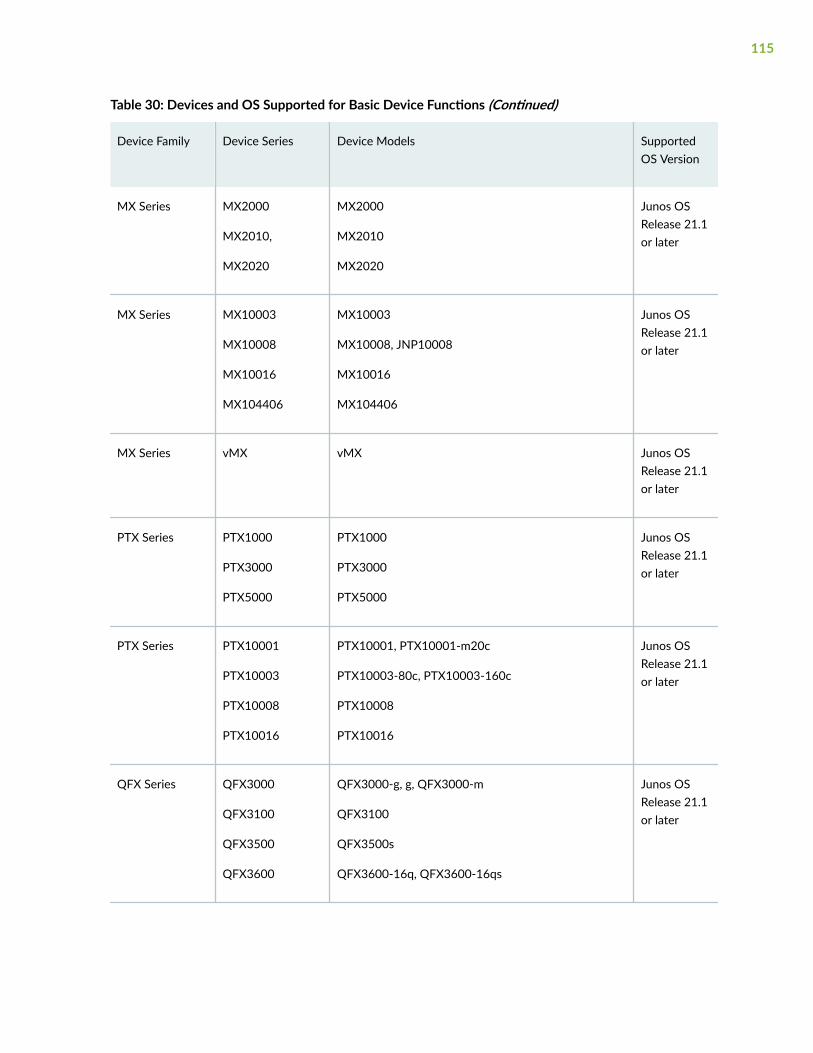
Table 30: Devices and OS Supported for Basic Device Functions (Continued)
Device Family Device Series Device Models SupportedOS Version
MX Series MX2000
MX2010,
MX2020
MX2000
MX2010
MX2020
Junos OSRelease 21.1or later
MX Series MX10003
MX10008
MX10016
MX104406
MX10003
MX10008, JNP10008
MX10016
MX104406
Junos OSRelease 21.1or later
MX Series vMX vMX Junos OSRelease 21.1or later
PTX Series PTX1000
PTX3000
PTX5000
PTX1000
PTX3000
PTX5000
Junos OSRelease 21.1or later
PTX Series PTX10001
PTX10003
PTX10008
PTX10016
PTX10001, PTX10001-m20c
PTX10003-80c, PTX10003-160c
PTX10008
PTX10016
Junos OSRelease 21.1or later
QFX Series QFX3000
QFX3100
QFX3500
QFX3600
QFX3000-g, g, QFX3000-m
QFX3100
QFX3500s
QFX3600-16q, QFX3600-16qs
Junos OSRelease 21.1or later
115
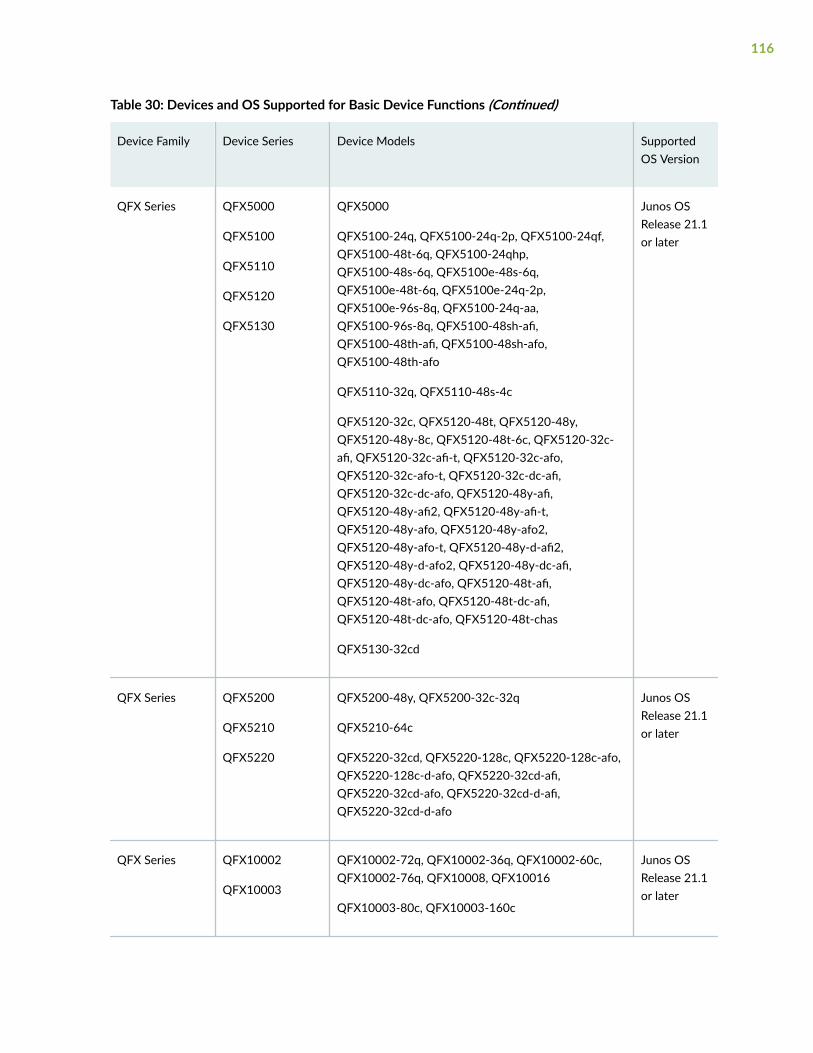
Table 30: Devices and OS Supported for Basic Device Functions (Continued)
Device Family Device Series Device Models SupportedOS Version
QFX Series QFX5000
QFX5100
QFX5110
QFX5120
QFX5130
QFX5000
QFX5100-24q, QFX5100-24q-2p, QFX5100-24qf,QFX5100-48t-6q, QFX5100-24qhp,QFX5100-48s-6q, QFX5100e-48s-6q,QFX5100e-48t-6q, QFX5100e-24q-2p,QFX5100e-96s-8q, QFX5100-24q-aa,QFX5100-96s-8q, QFX5100-48sh-afi,QFX5100-48th-afi, QFX5100-48sh-afo,QFX5100-48th-afo
QFX5110-32q, QFX5110-48s-4c
QFX5120-32c, QFX5120-48t, QFX5120-48y,QFX5120-48y-8c, QFX5120-48t-6c, QFX5120-32c-afi, QFX5120-32c-afi-t, QFX5120-32c-afo,QFX5120-32c-afo-t, QFX5120-32c-dc-afi,QFX5120-32c-dc-afo, QFX5120-48y-afi,QFX5120-48y-afi2, QFX5120-48y-afi-t,QFX5120-48y-afo, QFX5120-48y-afo2,QFX5120-48y-afo-t, QFX5120-48y-d-afi2,QFX5120-48y-d-afo2, QFX5120-48y-dc-afi,QFX5120-48y-dc-afo, QFX5120-48t-afi,QFX5120-48t-afo, QFX5120-48t-dc-afi,QFX5120-48t-dc-afo, QFX5120-48t-chas
QFX5130-32cd
Junos OSRelease 21.1or later
QFX Series QFX5200
QFX5210
QFX5220
QFX5200-48y, QFX5200-32c-32q
QFX5210-64c
QFX5220-32cd, QFX5220-128c, QFX5220-128c-afo,QFX5220-128c-d-afo, QFX5220-32cd-afi,QFX5220-32cd-afo, QFX5220-32cd-d-afi,QFX5220-32cd-d-afo
Junos OSRelease 21.1or later
QFX Series QFX10002
QFX10003
QFX10002-72q, QFX10002-36q, QFX10002-60c,QFX10002-76q, QFX10008, QFX10016
QFX10003-80c, QFX10003-160c
Junos OSRelease 21.1or later
116
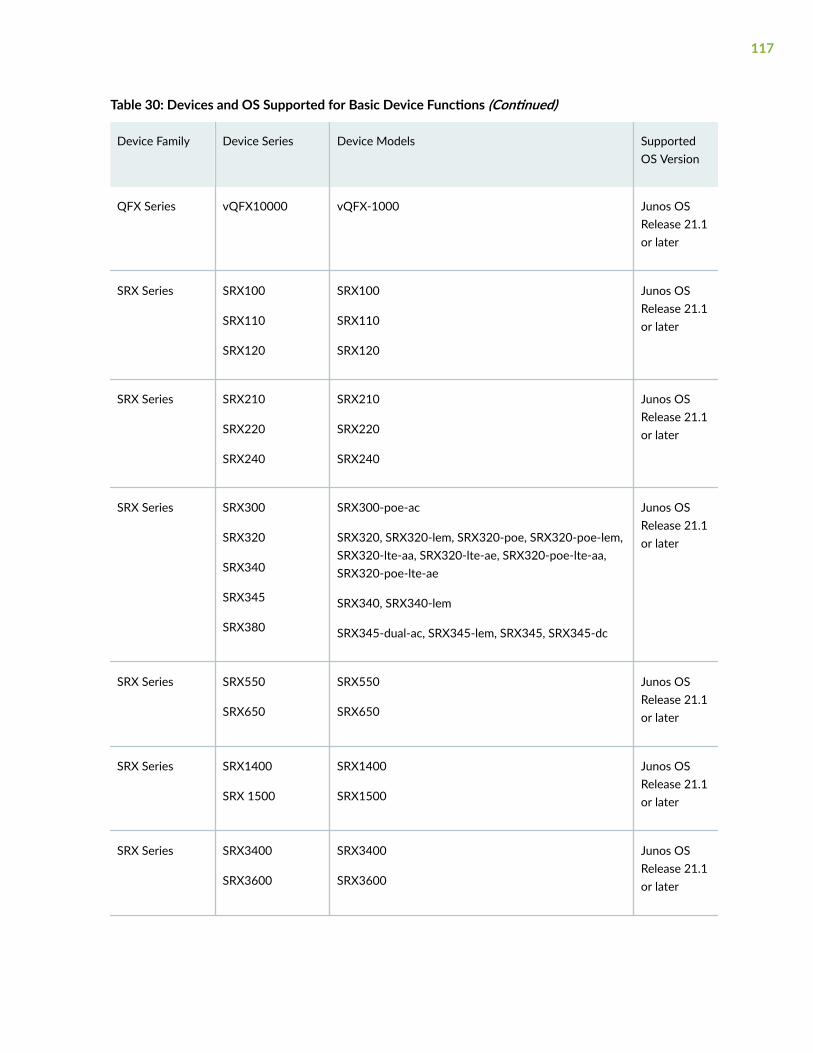
Table 30: Devices and OS Supported for Basic Device Functions (Continued)
Device Family Device Series Device Models SupportedOS Version
QFX Series vQFX10000 vQFX-1000 Junos OSRelease 21.1or later
SRX Series SRX100
SRX110
SRX120
SRX100
SRX110
SRX120
Junos OSRelease 21.1or later
SRX Series SRX210
SRX220
SRX240
SRX210
SRX220
SRX240
Junos OSRelease 21.1or later
SRX Series SRX300
SRX320
SRX340
SRX345
SRX380
SRX300-poe-ac
SRX320, SRX320-lem, SRX320-poe, SRX320-poe-lem,SRX320-lte-aa, SRX320-lte-ae, SRX320-poe-lte-aa,SRX320-poe-lte-ae
SRX340, SRX340-lem
SRX345-dual-ac, SRX345-lem, SRX345, SRX345-dc
Junos OSRelease 21.1or later
SRX Series SRX550
SRX650
SRX550
SRX650
Junos OSRelease 21.1or later
SRX Series SRX1400
SRX 1500
SRX1400
SRX1500
Junos OSRelease 21.1or later
SRX Series SRX3400
SRX3600
SRX3400
SRX3600
Junos OSRelease 21.1or later
117
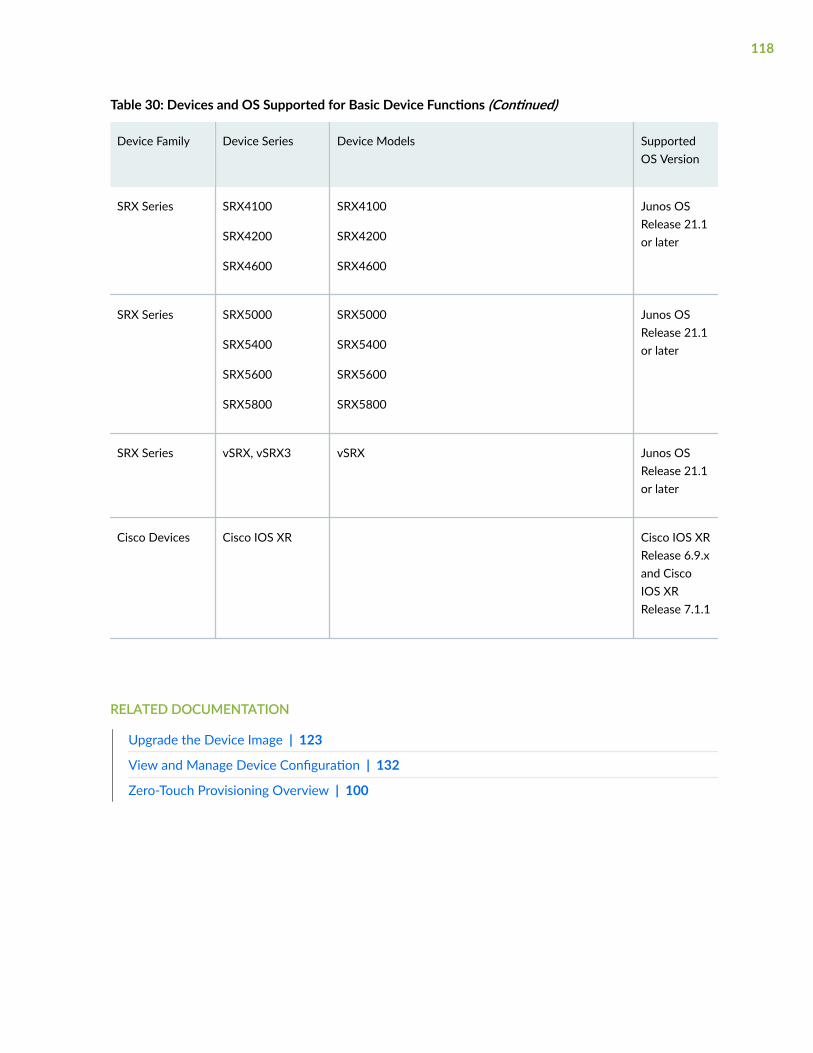
Table 30: Devices and OS Supported for Basic Device Functions (Continued)
Device Family Device Series Device Models SupportedOS Version
SRX Series SRX4100
SRX4200
SRX4600
SRX4100
SRX4200
SRX4600
Junos OSRelease 21.1or later
SRX Series SRX5000
SRX5400
SRX5600
SRX5800
SRX5000
SRX5400
SRX5600
SRX5800
Junos OSRelease 21.1or later
SRX Series vSRX, vSRX3 vSRX Junos OSRelease 21.1or later
Cisco Devices Cisco IOS XR Cisco IOS XRRelease 6.9.xand CiscoIOS XRRelease 7.1.1
RELATED DOCUMENTATION
Upgrade the Device Image | 123
View and Manage Device Configuration | 132
Zero-Touch Provisioning Overview | 100
118

Add Devices
IN THIS SECTION
Discover Devices | 119
Add New Devices | 121
An administrator or a user with add device privileges can add devices to Paragon Automation.
Discover Devices
Before you start discovering devices, ensure that:
• The device is configured with a management IP address that is reachable from Paragon Automation.
• A user with the privileges of an administrator is created and enabled on the device.
To discover one or more devices:
1. On the left navigation menu, click Configuration > Devices.
The Devices page appears.
2. Click the Add icon (+).
The Add Devices page appears.
3. On the Add Devices page, click Discover Devices.
4. You can choose to either specify the details of devices manually, or import the details from a comma-separated values (CSV) file on your local computer.
Do one of the following:
• To specify the details manually, Click Enter Manually. This is the default option.
Complete the configuration according to the guidelines specified in Table 31 on page 120.
NOTE: Fields marked with an asterisk (*) are mandatory.
• To import the device details by using a CSV file:
a. Click Import From File.
119

b. (Optional) Click Download Sample CSV file to download a sample CSV template(DiscoverDeviceSample.csv) and use it to specify the details of the devices to be discovered.
c. Save the file on your local system.
d. Click Browse to navigate to the folder and select the CSV file from your local file system.
e. Click Open to upload the CSV file.
The Targets and Credentials section on the Add Devices page displays the details that areautomatically populated from the CSV file.
5. (Optional) Click the Add icon (+) to add the details of another set of devices to be discovered.
To delete one or more sets of devices and their credentials, select the corresponding Targets andCredentials section and click the Delete icon (trashcan).
6. Click OK to save your changes.
A confirmation message appears, indicating that a job is triggered to discover the devices
7. (Optional) You can click the job link in the confirmation message to view the status of the job on thejobs page (Monitoring > Jobs).
After the job completes successfully, the discovered devices are listed on the Devices page.
Table 31: Fields on the Add Devices Page - Discover Devices
Field Description
Managed Status Click this toggle button to discover managed (default) or unmanaged devices.
• When you enable this option, only Juniper Networks devices and Cisco IOS XRdevices in your network are discovered.
• When you disable this option, device discovery is not triggered. However, all thedetails of the device is retrieved from the path computation element (PCE) andstored in the database. The Devices page displays the hostname and the IPaddress of the unmanaged devices.
Hostname / IP Targets Enter the hostname or IPv4 addresses of the devices to be discovered. You canspecify a combination of individual IPv4 addresses, a subnet (for example,10.0.0.1/24) or a range of IPv4 addresses (for example, 10.0.0.1 - 10.0.0.20).
When you specify a subnet or a range of IPv4 addresses, all the devices that havethe IPv4 addresses within that subnet or range are discovered.
Add targets fromtopology to this list
Click this link to add the details of unmanaged devices that are discovered by thepath computation element in a network, to the database.
120
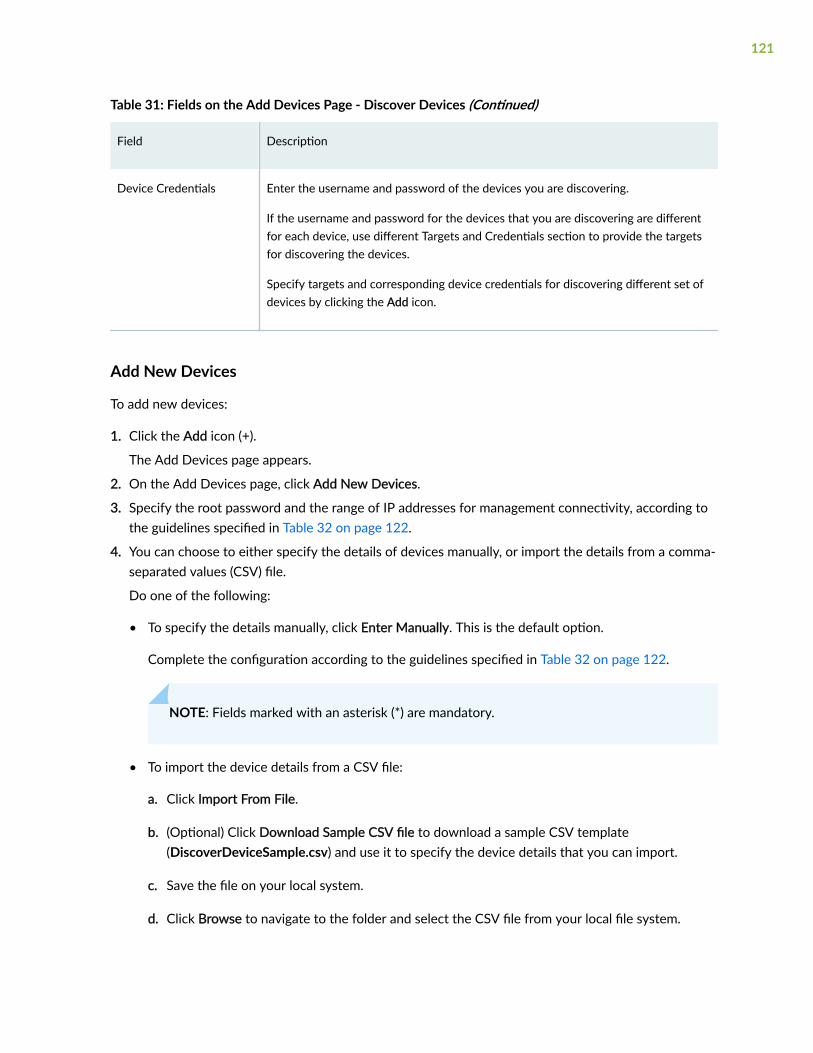
Table 31: Fields on the Add Devices Page - Discover Devices (Continued)
Field Description
Device Credentials Enter the username and password of the devices you are discovering.
If the username and password for the devices that you are discovering are differentfor each device, use different Targets and Credentials section to provide the targetsfor discovering the devices.
Specify targets and corresponding device credentials for discovering different set ofdevices by clicking the Add icon.
Add New Devices
To add new devices:
1. Click the Add icon (+).
The Add Devices page appears.
2. On the Add Devices page, click Add New Devices.
3. Specify the root password and the range of IP addresses for management connectivity, according tothe guidelines specified in Table 32 on page 122.
4. You can choose to either specify the details of devices manually, or import the details from a comma-separated values (CSV) file.
Do one of the following:
• To specify the details manually, click Enter Manually. This is the default option.
Complete the configuration according to the guidelines specified in Table 32 on page 122.
NOTE: Fields marked with an asterisk (*) are mandatory.
• To import the device details from a CSV file:
a. Click Import From File.
b. (Optional) Click Download Sample CSV file to download a sample CSV template(DiscoverDeviceSample.csv) and use it to specify the device details that you can import.
c. Save the file on your local system.
d. Click Browse to navigate to the folder and select the CSV file from your local file system.
121

e. Click Open.
The Device Model section on this page displays the details that are automatically populatedfrom the CSV file.
5. (Optional) Click the Add icon (+) to add the details of another set of devices to be added.
To delete one or more sets of devices and their credentials, select the corresponding section and clickthe Delete icon.
6. Click OK to save your changes.
A confirmation message appears, indicating that a job is triggered to discover the devices
7. (Optional) You can click the job link in the confirmation message to view the status of the job on thejobs page (Monitoring > Jobs).
After the job completes successfully, the devices are listed on the Devices page.
Table 32: Fields on the Add Devices Page-Add New Devices
Field Description
Management Connectivity
Root Password Click to enable or disable the toggle button.
• When you enable this toggle button, the root password, that you set, is assignedto all the new devices being added.
Follow the Junos OS password rules for the device model being added to set thepassword; the password is usually 6 to 128 characters long, and contains mixedcase letters combined with numbers and/or symbols.
• When you disable, you must assign the password to each device separately.
IP / Subnet/ Gateway Enter the range of addresses that can be configured on the devices being added.These IP addresses are added to a DHCP server and then assigned to the devices.
Device Models
Click the Add icon (+) to add more device models for discovery.
Device Family Select the device family that you want to add from the list; for example, Juniper-ACX.
122
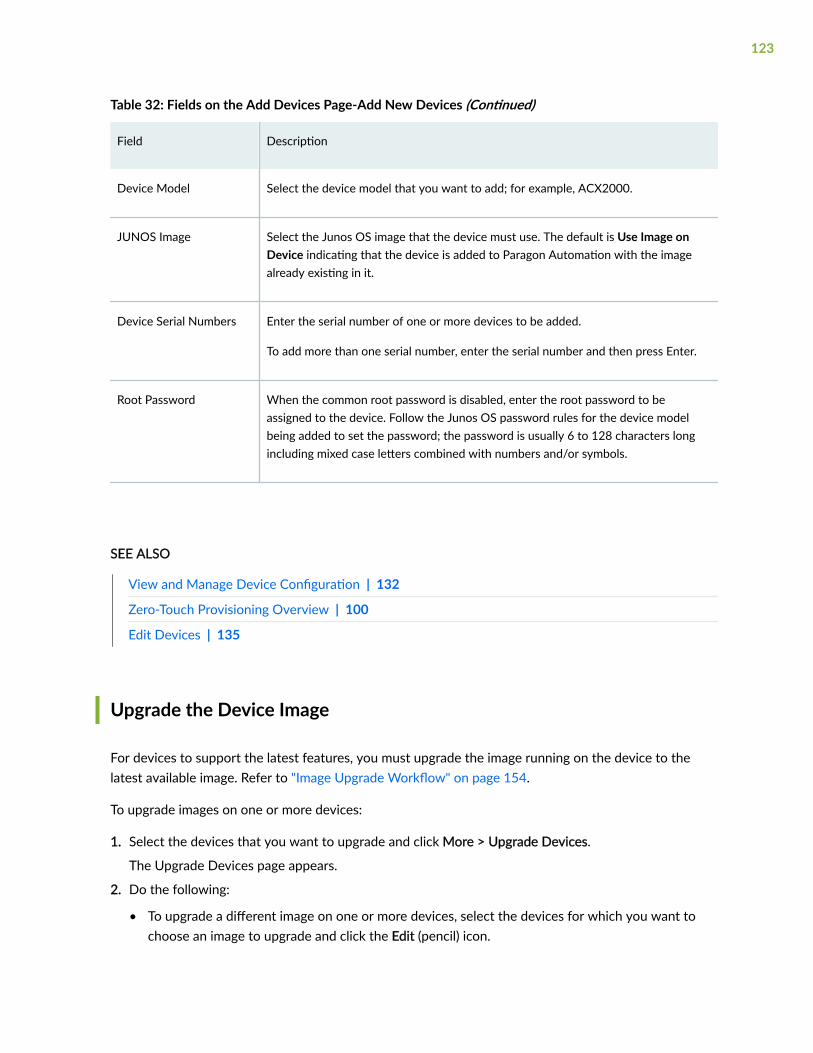
Table 32: Fields on the Add Devices Page-Add New Devices (Continued)
Field Description
Device Model Select the device model that you want to add; for example, ACX2000.
JUNOS Image Select the Junos OS image that the device must use. The default is Use Image onDevice indicating that the device is added to Paragon Automation with the imagealready existing in it.
Device Serial Numbers Enter the serial number of one or more devices to be added.
To add more than one serial number, enter the serial number and then press Enter.
Root Password When the common root password is disabled, enter the root password to beassigned to the device. Follow the Junos OS password rules for the device modelbeing added to set the password; the password is usually 6 to 128 characters longincluding mixed case letters combined with numbers and/or symbols.
SEE ALSO
View and Manage Device Configuration | 132
Zero-Touch Provisioning Overview | 100
Edit Devices | 135
Upgrade the Device Image
For devices to support the latest features, you must upgrade the image running on the device to thelatest available image. Refer to "Image Upgrade Workflow" on page 154.
To upgrade images on one or more devices:
1. Select the devices that you want to upgrade and click More > Upgrade Devices.
The Upgrade Devices page appears.
2. Do the following:
• To upgrade a different image on one or more devices, select the devices for which you want tochoose an image to upgrade and click the Edit (pencil) icon.
123

The Selected Image field for each device lists the images that you can choose to upgrade.
• To upgrade the same image on two or more devices, select the devices and click Bulk SelectImage. Select the image that you want to upgrade in the Select Image page that is displayed.
3. For each device, select the image that you want to upgrade from the list.
4. In Upgrade Devices, click:
• Run Now to upgrade the image immediately.
• Schedule Later and select the date and time to schedule the upgrade.
5. Click OK.
A job is created to upgrade the image. You can view the progress of the job by clicking the job ID thatappears on the top of the page or by navigating to the Jobs page (Monitoring > Jobs).
RELATED DOCUMENTATION
Stage an Image | 159
Deploy an Image | 160
View Device Statistics and Inventory information
IN THIS SECTION
View Device Statistics | 125
View Device Inventory | 127
You can use the Device-Name page to view statistics, inventory and the configuration templatesassigned to the device.
To access this page:
1. Select Configuration > Devices.
The Device page appears.
2. Click a device in the Device Name column of the Devices list.
The Device-Name appears displaying the Overview, Inventory, and Configuration Template tabs.
124

View Device Statistics
To view the device statistics, click the Overview tab on the Device-Name page to view informationabout the device. The overview tab displays the Chassis View and the widgets listed in Table 34 on page126.
You can view the following information on the Overview tab of the <device-name> page:
• The Chassis View, present at the top of the Overview tab, displays the device ports as icons. Hoverover the ports icon to view the details, such as input and output bandwidth, port mode, negotiatedspeed, input and output errors, and admin status of the port.
For a Virtual Chassis, Chassis Cluster, or dual Routing Engine, the member devices are listed on theleft side of the chassis view. Clicking the member devices displays the ports of the member device.
NOTE: You cannot view the chassis view for a Cisco-IOS XR device.
At the top of the Chassis view, system meters are provided to display data about functioning of thedevice components such as CPU, memory, storage and fan. If data is not collected for the systemmeters (for example, due to issue with telemetry manager service), dummy data is displayed.
Table 33 on page 125 lists the system meters present on the top right-corner of the Chassis View.
Table 33: Widgets on the Overview Tab
System Meter Description
CPU Displays the percentage of CPU utilized and that is idle in the device
Memory Memory (in %) utilized in the device.
Storage Storage space (in %) allocated to the logical partitions of the device (/, /var, and /temp)
NOTE: The data displayed for storage is dummy data for all devices.
Fan Details of fans present in the device.
Temperature Temperature of the FPCs in the device.
125
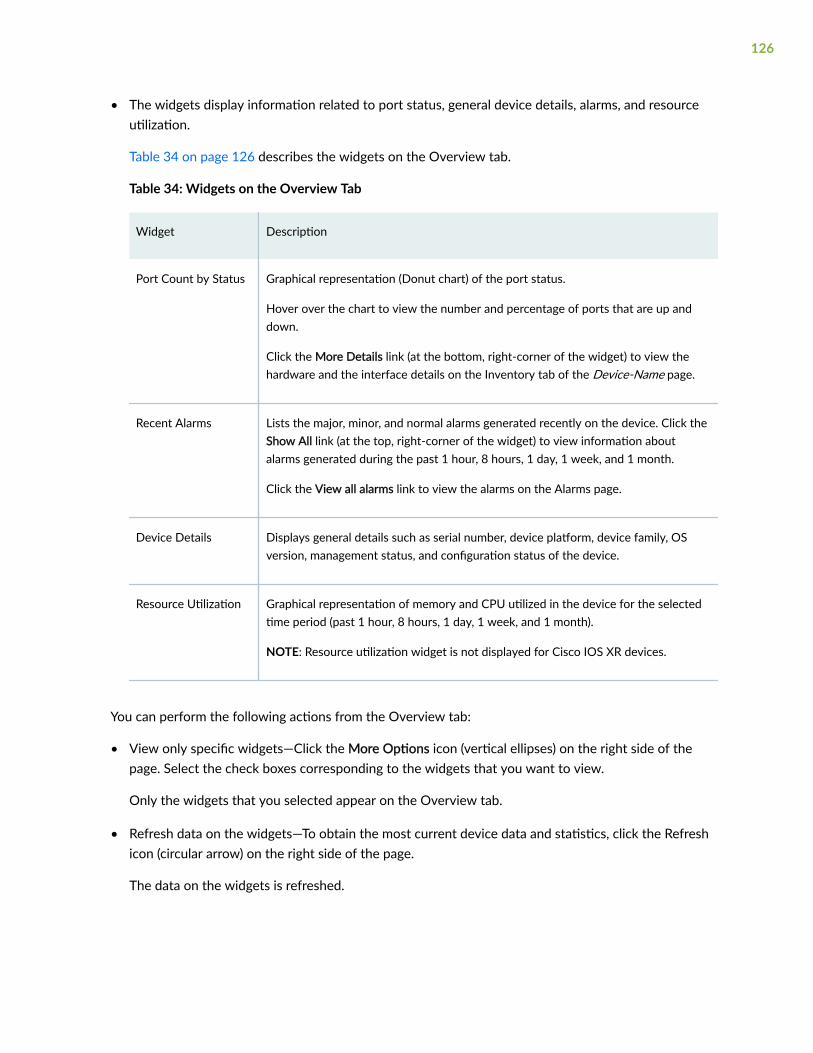
• The widgets display information related to port status, general device details, alarms, and resourceutilization.
Table 34 on page 126 describes the widgets on the Overview tab.
Table 34: Widgets on the Overview Tab
Widget Description
Port Count by Status Graphical representation (Donut chart) of the port status.
Hover over the chart to view the number and percentage of ports that are up anddown.
Click the More Details link (at the bottom, right-corner of the widget) to view thehardware and the interface details on the Inventory tab of the Device-Name page.
Recent Alarms Lists the major, minor, and normal alarms generated recently on the device. Click theShow All link (at the top, right-corner of the widget) to view information aboutalarms generated during the past 1 hour, 8 hours, 1 day, 1 week, and 1 month.
Click the View all alarms link to view the alarms on the Alarms page.
Device Details Displays general details such as serial number, device platform, device family, OSversion, management status, and configuration status of the device.
Resource Utilization Graphical representation of memory and CPU utilized in the device for the selectedtime period (past 1 hour, 8 hours, 1 day, 1 week, and 1 month).
NOTE: Resource utilization widget is not displayed for Cisco IOS XR devices.
You can perform the following actions from the Overview tab:
• View only specific widgets—Click the More Options icon (vertical ellipses) on the right side of thepage. Select the check boxes corresponding to the widgets that you want to view.
Only the widgets that you selected appear on the Overview tab.
• Refresh data on the widgets—To obtain the most current device data and statistics, click the Refreshicon (circular arrow) on the right side of the page.
The data on the widgets is refreshed.
126

View Device Inventory
To view inventory of a device, click the Inventory tab on the <Device-Name> page. A device inventorycomprises hardware components (Chassis, FPC, PIC, and Interfaces) and software components (Licenses,Features, and Software).
Paragon Automation displays the inventory of a device containing data retrieved from the device duringdiscovery and resynchronization operations. This inventory includes the number of available slots,power supplies, chassis cards, fans, part numbers, and so on. Sorting is disabled on the Chassis tab topreserve the natural slot order of the devices.
Paragon Automation displays the inventory information for primary and the member devices for dualRouting Engines, Chassis Clusters, and Virtual Chassis.
NOTE:
• For Juniper Networks devices, the inventory is synchronized whenever a change in thecomponents is indicated in the device syslog.
• For Cisco-IOS XR devices, you must manually synchronize to retrieve the latest inventoryinformation.
The inventory tab displays the following information:
• Chassis—View the hierarchical list of all the hardware components present on the chassis, and theassociated physical interfaces and logical interfaces. Table 35 on page 128 describes the fieldsdisplayed on the Chassis tab.
• Interfaces—View details of the interfaces present on the chassis, line card, FPC, and MICs. Table 36on page 129 describes the fields displayed on this tab.
You can perform the following functions on this tab:
• Change the administration status of an interface by selecting the interface and clicking More >Change Admin Status.
A message indicating the change in the admin status is initiated is displayed along with the job ID.Click the link job ID link to view the progress of the job on the Jobs page (Monitoring > Jobs). Theadmin status is changed after the job completes successfully.
• View the following details of an interface, as widgets, by clicking on the interface link:
• General details, such as the port name, IP address, admin status, link status, and so on of theinterface.
127

• Bandwidth consumed by the interface for the previous 1 hour, 8 hours, 1 day, 1 week, and 1month.
• Errors that occurred on the interface during the previous 1 hour, 8 hours, 1 day, 1 week, and 1month.
• Licenses—View details (such as the license version, validity type, and start and end dates) of thelicenses installed on the device. Table 37 on page 130 describes the fields on this tab.
NOTE: You cannot view the License information for Cisco IOS XR devices.
• Features—View details (such as feature name, validity type, and licenses) of the features that areconfigured on the device. Table 38 on page 131 describes the fields on this tab.
• Software—View details (such as software name, version, and state) of the software installed on thedevice. Table 39 on page 132 describes the fields on this tab.
• On all the tabs, click the Show or Hide Columns icon and select the check boxes corresponding tothe columns that you want to view.
If you want to revert to the default column selections, click Reset Preferences. The selections thatyou previously made are cleared, and the default columns are displayed.
Table 35 on page 128 describes the fields on the Chassis tab.
Table 35: Fields on the Chassis Tab
Field Description
Module Name of the hardware component (chassis, FPC, MIC, midplane, and so on).
Type Type of the hardware component—Chassis, line card, CPU, backplane, and so on.
Version Version of the hardware component.
Part Number Part number of the hardware component. Built-in indicates that the PIC is a part of theparent component and does not have a part number.
Serial number Serial number of the hardware component.
128
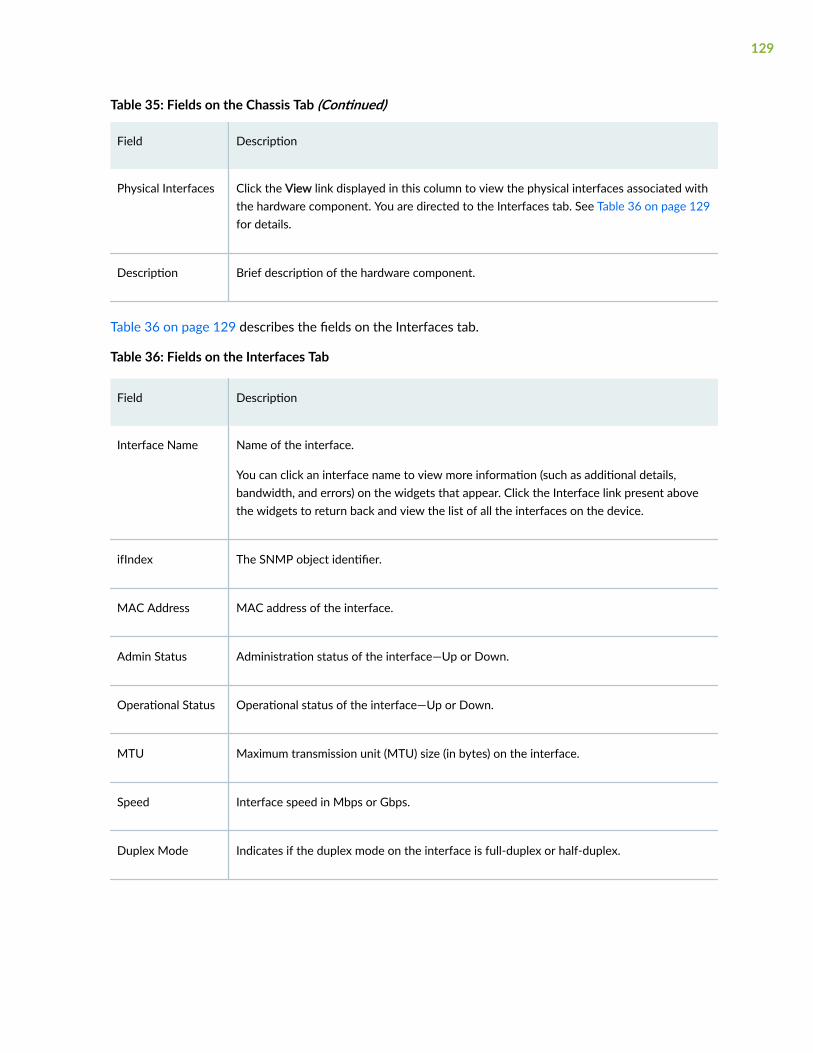
Table 35: Fields on the Chassis Tab (Continued)
Field Description
Physical Interfaces Click the View link displayed in this column to view the physical interfaces associated withthe hardware component. You are directed to the Interfaces tab. See Table 36 on page 129for details.
Description Brief description of the hardware component.
Table 36 on page 129 describes the fields on the Interfaces tab.
Table 36: Fields on the Interfaces Tab
Field Description
Interface Name Name of the interface.
You can click an interface name to view more information (such as additional details,bandwidth, and errors) on the widgets that appear. Click the Interface link present abovethe widgets to return back and view the list of all the interfaces on the device.
ifIndex The SNMP object identifier.
MAC Address MAC address of the interface.
Admin Status Administration status of the interface—Up or Down.
Operational Status Operational status of the interface—Up or Down.
MTU Maximum transmission unit (MTU) size (in bytes) on the interface.
Speed Interface speed in Mbps or Gbps.
Duplex Mode Indicates if the duplex mode on the interface is full-duplex or half-duplex.
129

Table 36: Fields on the Interfaces Tab (Continued)
Field Description
Link Type Type of link provided by the interface.
Example: Ethernet, Fast Ethernet
Line card The line card number in which the interface is present.
Logical Interfaces Number of logical interfaces associated with the physical interface.
Click the number displayed in the column to view the logical interfaces and their details.The details are displayed on the Logical Interfaces page.
Table 37 on page 130 describes the fields on the Licenses tab.
Table 37: Fields on the Licenses Tab
Field Description
License Name Name of the license.
Version Version of the license.
State State of the license:
• Valid: The installed license key is valid.
• Invalid: The installed license key is invalid.
• Expired: The license key is expired.
Validity Type Validity type of the license:
• Databased: License expires on end date.
• Permanent: License never expires.
• Countdown: License expires when time remaining is zero
• Trial: License expires at the end of the trial period.
130
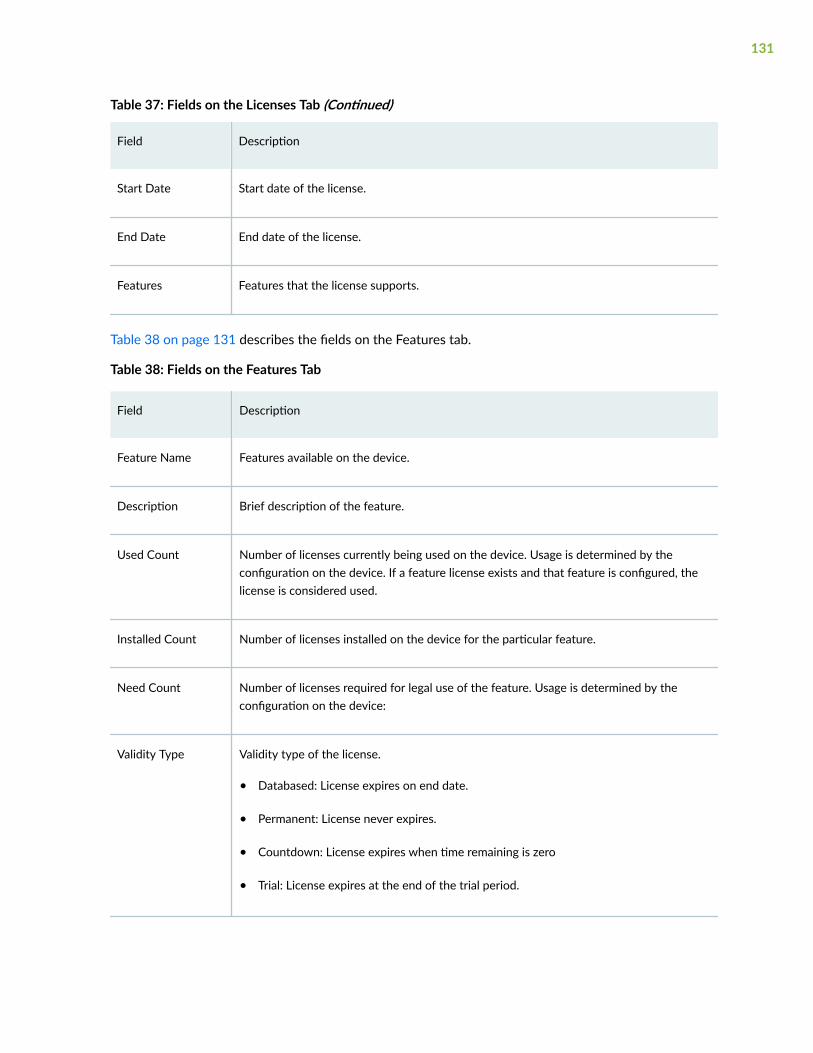
Table 37: Fields on the Licenses Tab (Continued)
Field Description
Start Date Start date of the license.
End Date End date of the license.
Features Features that the license supports.
Table 38 on page 131 describes the fields on the Features tab.
Table 38: Fields on the Features Tab
Field Description
Feature Name Features available on the device.
Description Brief description of the feature.
Used Count Number of licenses currently being used on the device. Usage is determined by theconfiguration on the device. If a feature license exists and that feature is configured, thelicense is considered used.
Installed Count Number of licenses installed on the device for the particular feature.
Need Count Number of licenses required for legal use of the feature. Usage is determined by theconfiguration on the device:
Validity Type Validity type of the license.
• Databased: License expires on end date.
• Permanent: License never expires.
• Countdown: License expires when time remaining is zero
• Trial: License expires at the end of the trial period.
131
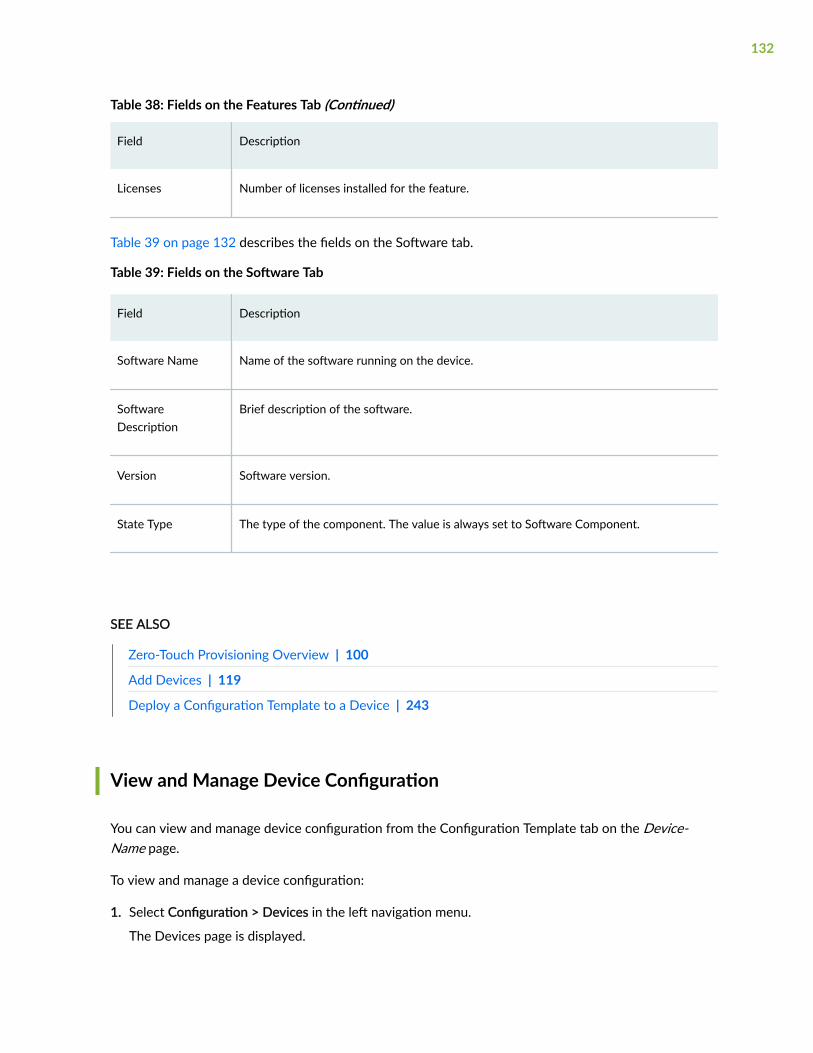
Table 38: Fields on the Features Tab (Continued)
Field Description
Licenses Number of licenses installed for the feature.
Table 39 on page 132 describes the fields on the Software tab.
Table 39: Fields on the Software Tab
Field Description
Software Name Name of the software running on the device.
SoftwareDescription
Brief description of the software.
Version Software version.
State Type The type of the component. The value is always set to Software Component.
SEE ALSO
Zero-Touch Provisioning Overview | 100
Add Devices | 119
Deploy a Configuration Template to a Device | 243
View and Manage Device Configuration
You can view and manage device configuration from the Configuration Template tab on the Device-Name page.
To view and manage a device configuration:
1. Select Configuration > Devices in the left navigation menu.
The Devices page is displayed.
132
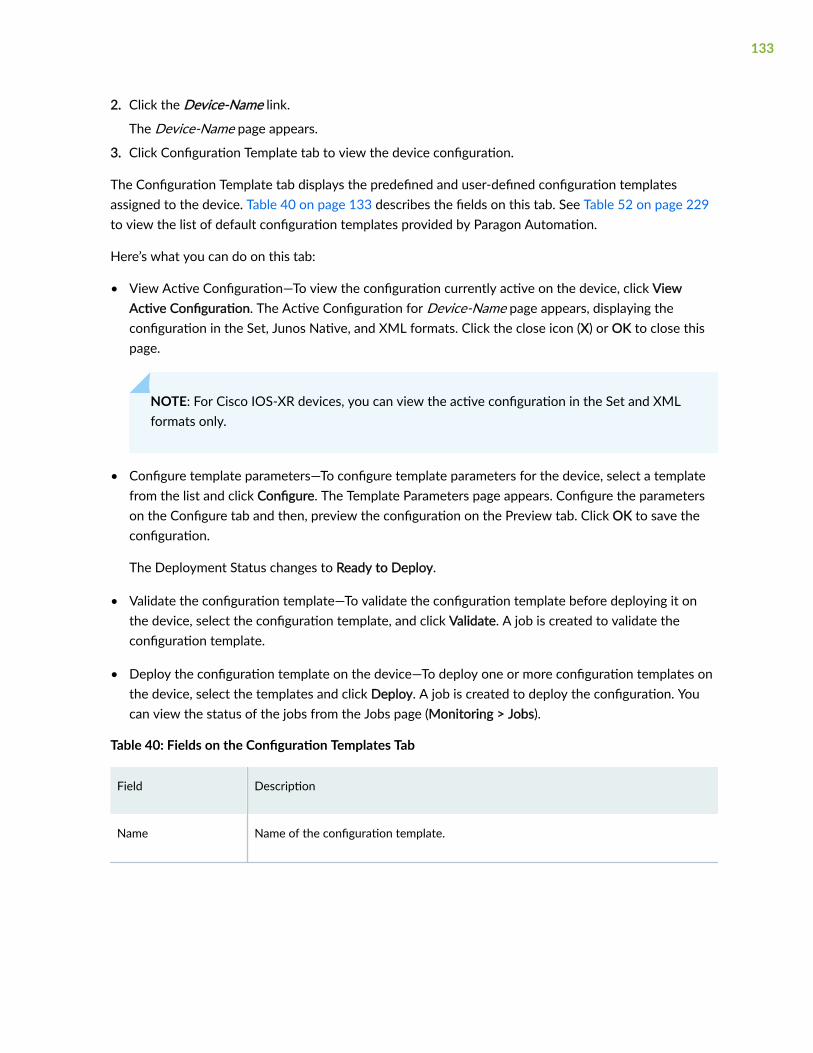
2. Click the Device-Name link.
The Device-Name page appears.
3. Click Configuration Template tab to view the device configuration.
The Configuration Template tab displays the predefined and user-defined configuration templatesassigned to the device. Table 40 on page 133 describes the fields on this tab. See Table 52 on page 229to view the list of default configuration templates provided by Paragon Automation.
Here’s what you can do on this tab:
• View Active Configuration—To view the configuration currently active on the device, click ViewActive Configuration. The Active Configuration for Device-Name page appears, displaying theconfiguration in the Set, Junos Native, and XML formats. Click the close icon (X) or OK to close thispage.
NOTE: For Cisco IOS-XR devices, you can view the active configuration in the Set and XMLformats only.
• Configure template parameters—To configure template parameters for the device, select a templatefrom the list and click Configure. The Template Parameters page appears. Configure the parameterson the Configure tab and then, preview the configuration on the Preview tab. Click OK to save theconfiguration.
The Deployment Status changes to Ready to Deploy.
• Validate the configuration template—To validate the configuration template before deploying it onthe device, select the configuration template, and click Validate. A job is created to validate theconfiguration template.
• Deploy the configuration template on the device—To deploy one or more configuration templates onthe device, select the templates and click Deploy. A job is created to deploy the configuration. Youcan view the status of the jobs from the Jobs page (Monitoring > Jobs).
Table 40: Fields on the Configuration Templates Tab
Field Description
Name Name of the configuration template.
133

Table 40: Fields on the Configuration Templates Tab (Continued)
Field Description
Deployment Status Deployment status of the configuration template.
• No Configuration—Indicates that either the configuration template is not applied tothe device or the configuration template does not have any values assigned to theparameters.
• Deployed—Indicates that the configuration template is deployed on the device
• Ready to Deploy—Indicates that the configuration template is configured on thesystem and is ready to be pushed on to the device
• Deployment-In-Progress—Indicates that the configuration template is currentlygetting deployed on the device.
• Deployment Failed—Indicates that the configuration template push failed on thedevice (due to some errors or conflicting configuration)
Deployment Date Date and time at which the configuration template was deployed on the device in theMonth DD, YYYY hh:mm:ss AM/PM format.
Description Description of the configuration template.
Validation Indicates whether the validation of the configuration template was successful or not.
RELATED DOCUMENTATION
Deploy a Configuration Template to a Device | 243
Zero-Touch Provisioning Overview | 100
Upgrade the Device Image | 123
134

Edit Devices
You must be an administrator or a user with edit device privileges to edit a device. You edit the deviceparameters to update the Paragon Automation database with values of parameters that are not capturedduring device discovery or synchronization.
You cannot edit general information, such as the device name, IP address, OS version running on thedevice, the family the device belongs to, the device vendor, the device model, or the device serialnumber. You can, however, edit the device group to which the device belongs and the protocolparameters on the device.
To edit a device configuration in the database:
1. On the navigation menu, select Configuration > Devices.
2. Select the device that you want to edit and click the Edit icon (pencil).
The Edit <device-name> page appears.
3. Edit the parameter values by referring to Table 41 on page 135.
4. Click OK.
A message indicating that the device parameters are successfully updated is displayed and you arereturned to the Devices page.
Table 41: Editable Fields on the Edit Devices Page
Field Description
Device Group The device group to which the device belongs. By default, all the device discoveredin a topology are assigned to the Controller group, A device must be assigned to thecontroller group if you want to manage label-switched paths on the device.
NOTE: This field is not applicable for Paragon Automation Release 21.1.
Authentication
Authentication Method Displays the authentication method—Credential-Based.
Username Enter the username to access the device.
Password Enter the password to access the device.
135
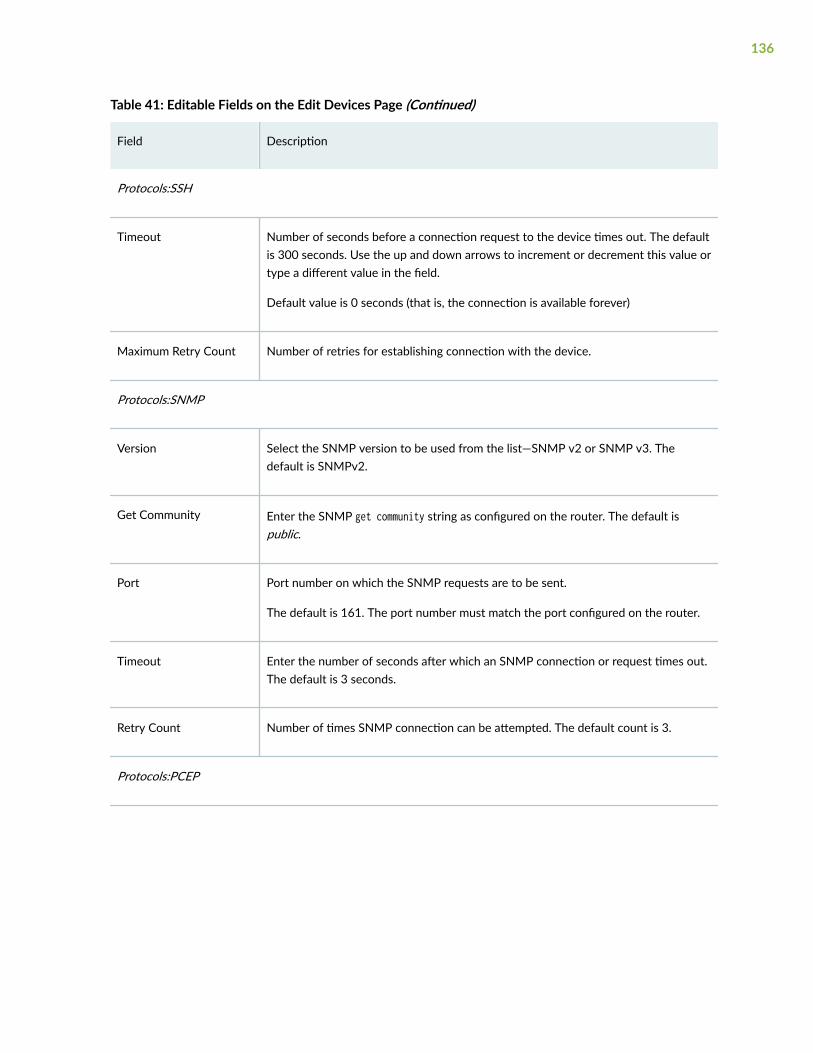
Table 41: Editable Fields on the Edit Devices Page (Continued)
Field Description
Protocols:SSH
Timeout Number of seconds before a connection request to the device times out. The defaultis 300 seconds. Use the up and down arrows to increment or decrement this value ortype a different value in the field.
Default value is 0 seconds (that is, the connection is available forever)
Maximum Retry Count Number of retries for establishing connection with the device.
Protocols:SNMP
Version Select the SNMP version to be used from the list—SNMP v2 or SNMP v3. Thedefault is SNMPv2.
Get Community Enter the SNMP get community string as configured on the router. The default ispublic.
Port Port number on which the SNMP requests are to be sent.
The default is 161. The port number must match the port configured on the router.
Timeout Enter the number of seconds after which an SNMP connection or request times out.The default is 3 seconds.
Retry Count Number of times SNMP connection can be attempted. The default count is 3.
Protocols:PCEP
136
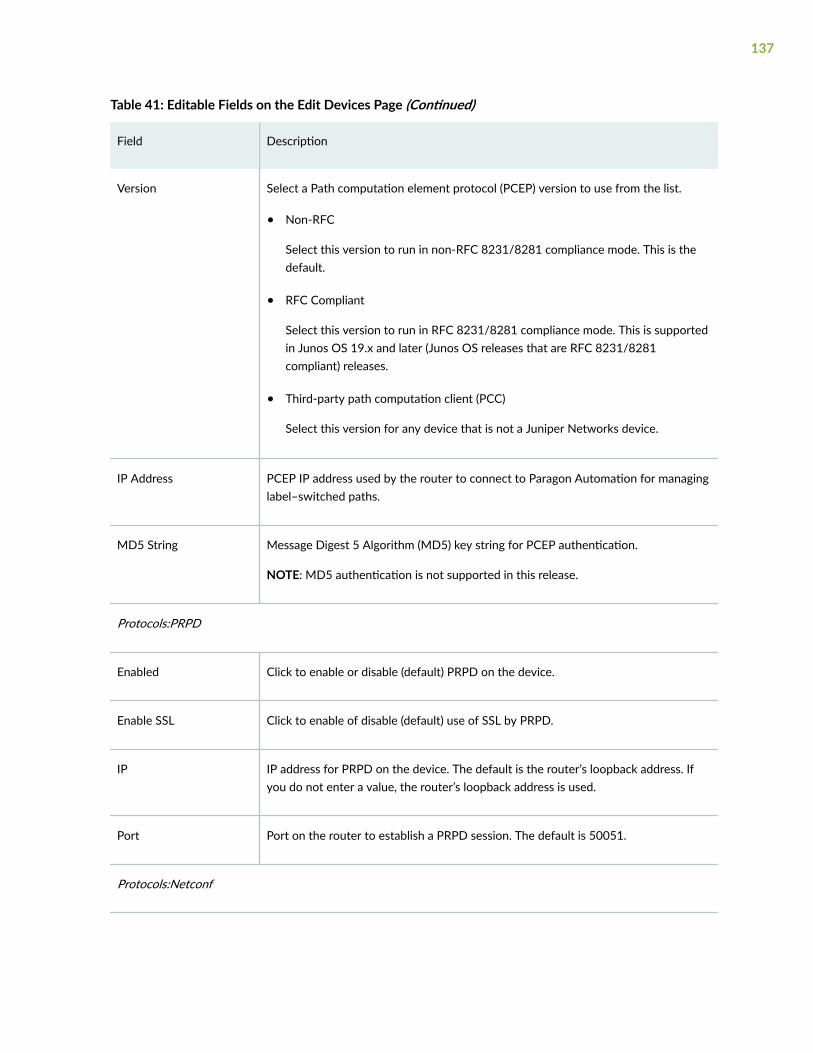
Table 41: Editable Fields on the Edit Devices Page (Continued)
Field Description
Version Select a Path computation element protocol (PCEP) version to use from the list.
• Non-RFC
Select this version to run in non-RFC 8231/8281 compliance mode. This is thedefault.
• RFC Compliant
Select this version to run in RFC 8231/8281 compliance mode. This is supportedin Junos OS 19.x and later (Junos OS releases that are RFC 8231/8281compliant) releases.
• Third-party path computation client (PCC)
Select this version for any device that is not a Juniper Networks device.
IP Address PCEP IP address used by the router to connect to Paragon Automation for managinglabel–switched paths.
MD5 String Message Digest 5 Algorithm (MD5) key string for PCEP authentication.
NOTE: MD5 authentication is not supported in this release.
Protocols:PRPD
Enabled Click to enable or disable (default) PRPD on the device.
Enable SSL Click to enable of disable (default) use of SSL by PRPD.
IP IP address for PRPD on the device. The default is the router’s loopback address. Ifyou do not enter a value, the router’s loopback address is used.
Port Port on the router to establish a PRPD session. The default is 50051.
Protocols:Netconf
137

Table 41: Editable Fields on the Edit Devices Page (Continued)
Field Description
Enabled Click to enable or disable Netconf on the device.
Bulk Commit Click to enable or disable NetConf bulk commit on the device.
If this option is enabled, you can provision multiple LSPs in a single commit insteadof multiple commits on the same router. when you provision multiple LSPs on thesame route.
This option should be enabled for P2MP-TE.
Retry Count Enter the number of times a connection can be attempted on the device. The defaultis 3.
A value of 0 means an unlimited number of retries; connection attempts never stop.
iAgent/Netconf Port Enter the port number for Netconf on the device. This port should not be used forany other service.
The default port number is 830 for Juniper Networks devices and 22 for otherdevices.
Device ID Details
System ID to use for JTI Unique system identifier required for JTI native sensors. Junos devices use thefollowing format: <host_name>:<jti_ip_address> System ID to use for JTI
When a device has dual routing engines (REs), it might send different system IDsdepending on which RE is primary. You can use a regular expression to match bothsystem IDs.
Management IP Enter the management IP address of the device
Flow Source IPs Enter one or more IP addresses that the device uses to send NetFlow data to theParagon Insights component of Paragon Automation. Separate the IP addresses witha comma.
138
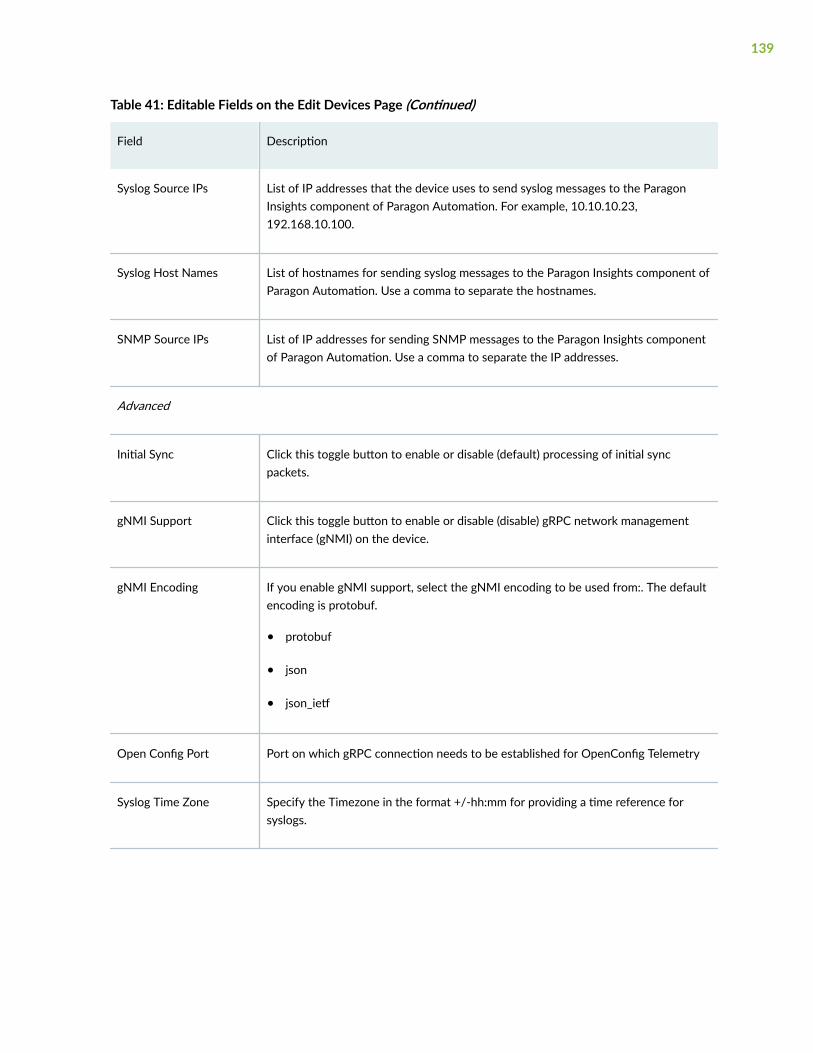
Table 41: Editable Fields on the Edit Devices Page (Continued)
Field Description
Syslog Source IPs List of IP addresses that the device uses to send syslog messages to the ParagonInsights component of Paragon Automation. For example, 10.10.10.23,192.168.10.100.
Syslog Host Names List of hostnames for sending syslog messages to the Paragon Insights component ofParagon Automation. Use a comma to separate the hostnames.
SNMP Source IPs List of IP addresses for sending SNMP messages to the Paragon Insights componentof Paragon Automation. Use a comma to separate the IP addresses.
Advanced
Initial Sync Click this toggle button to enable or disable (default) processing of initial syncpackets.
gNMI Support Click this toggle button to enable or disable (disable) gRPC network managementinterface (gNMI) on the device.
gNMI Encoding If you enable gNMI support, select the gNMI encoding to be used from:. The defaultencoding is protobuf.
• protobuf
• json
• json_ietf
Open Config Port Port on which gRPC connection needs to be established for OpenConfig Telemetry
Syslog Time Zone Specify the Timezone in the format +/-hh:mm for providing a time reference forsyslogs.
139
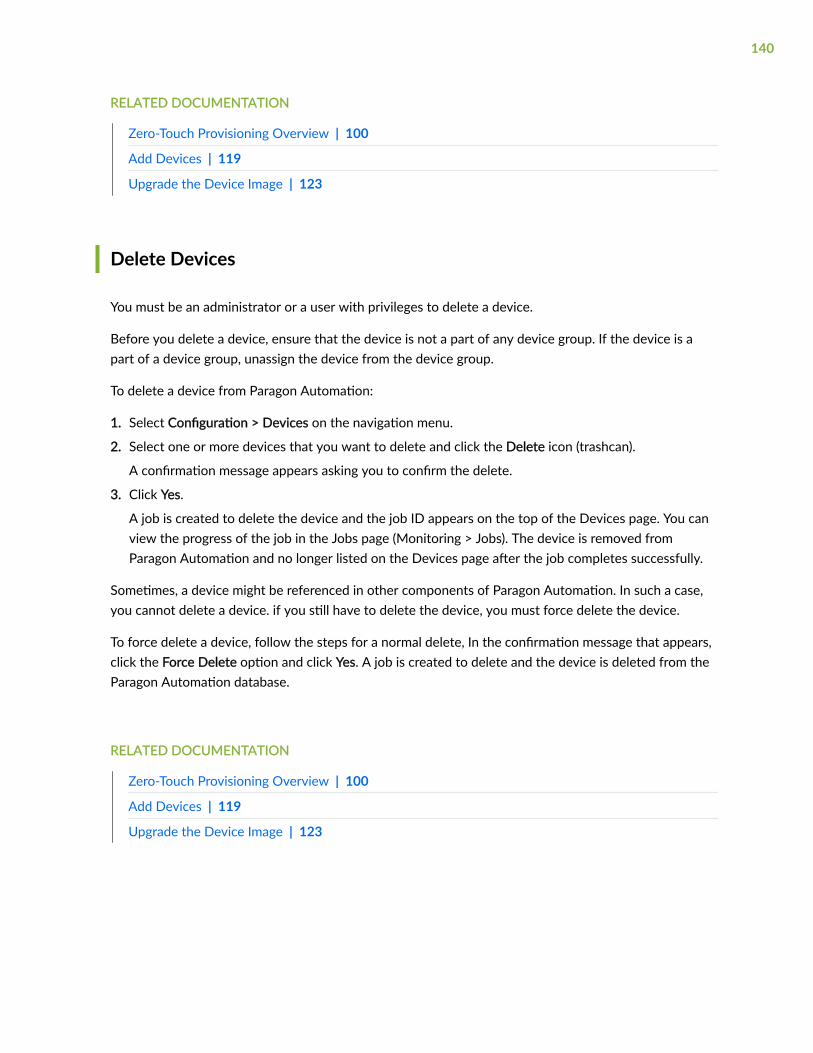
RELATED DOCUMENTATION
Zero-Touch Provisioning Overview | 100
Add Devices | 119
Upgrade the Device Image | 123
Delete Devices
You must be an administrator or a user with privileges to delete a device.
Before you delete a device, ensure that the device is not a part of any device group. If the device is apart of a device group, unassign the device from the device group.
To delete a device from Paragon Automation:
1. Select Configuration > Devices on the navigation menu.
2. Select one or more devices that you want to delete and click the Delete icon (trashcan).
A confirmation message appears asking you to confirm the delete.
3. Click Yes.
A job is created to delete the device and the job ID appears on the top of the Devices page. You canview the progress of the job in the Jobs page (Monitoring > Jobs). The device is removed fromParagon Automation and no longer listed on the Devices page after the job completes successfully.
Sometimes, a device might be referenced in other components of Paragon Automation. In such a case,you cannot delete a device. if you still have to delete the device, you must force delete the device.
To force delete a device, follow the steps for a normal delete, In the confirmation message that appears,click the Force Delete option and click Yes. A job is created to delete and the device is deleted from theParagon Automation database.
RELATED DOCUMENTATION
Zero-Touch Provisioning Overview | 100
Add Devices | 119
Upgrade the Device Image | 123
140
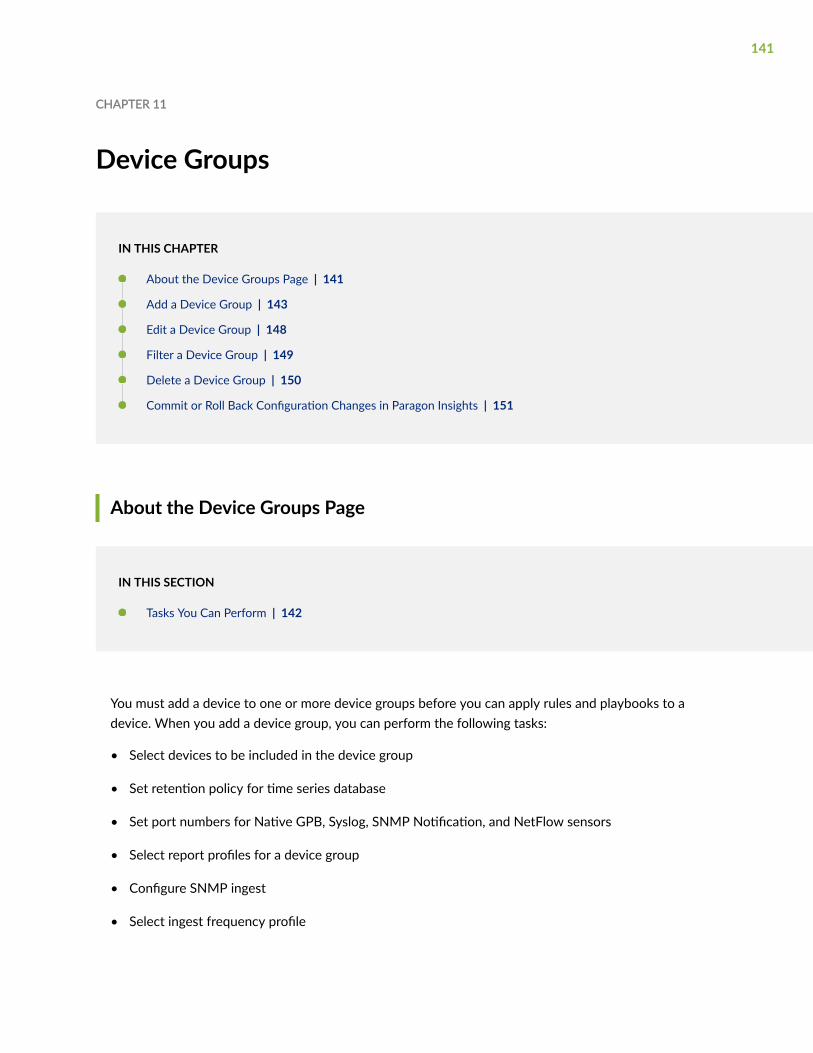
CHAPTER 11
Device Groups
IN THIS CHAPTER
About the Device Groups Page | 141
Add a Device Group | 143
Edit a Device Group | 148
Filter a Device Group | 149
Delete a Device Group | 150
Commit or Roll Back Configuration Changes in Paragon Insights | 151
About the Device Groups Page
IN THIS SECTION
Tasks You Can Perform | 142
You must add a device to one or more device groups before you can apply rules and playbooks to adevice. When you add a device group, you can perform the following tasks:
• Select devices to be included in the device group
• Set retention policy for time series database
• Set port numbers for Native GPB, Syslog, SNMP Notification, and NetFlow sensors
• Select report profiles for a device group
• Configure SNMP ingest
• Select ingest frequency profile
141
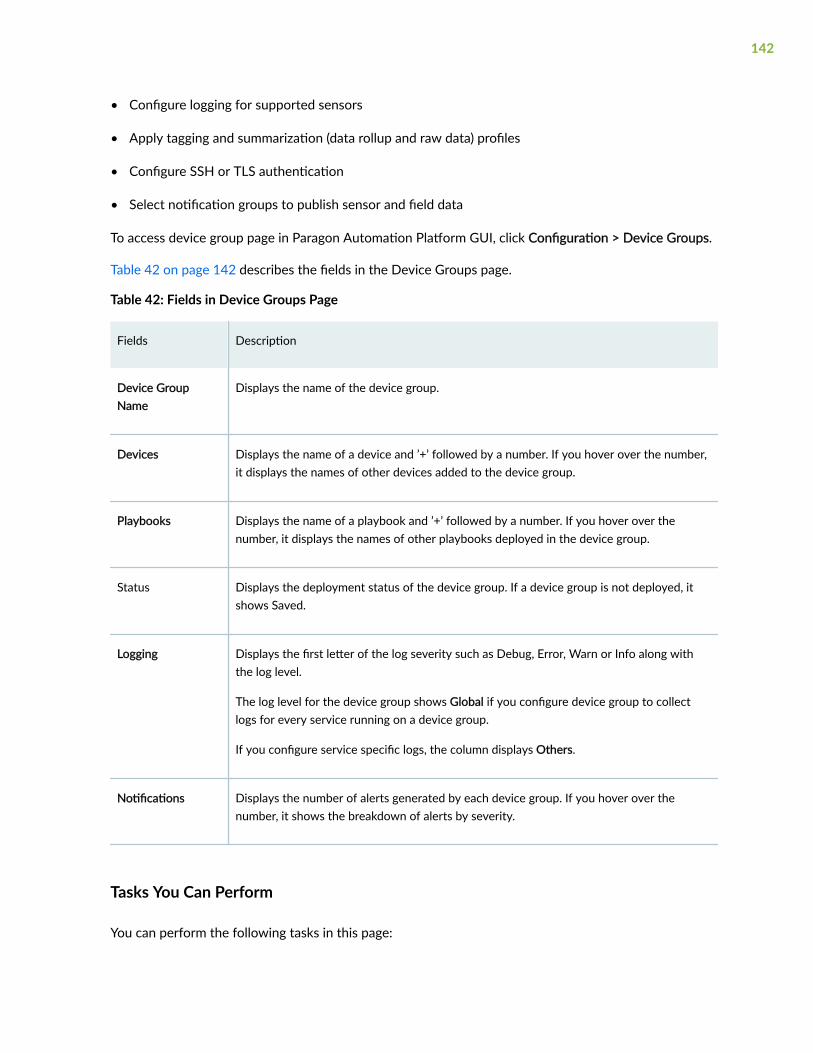
• Configure logging for supported sensors
• Apply tagging and summarization (data rollup and raw data) profiles
• Configure SSH or TLS authentication
• Select notification groups to publish sensor and field data
To access device group page in Paragon Automation Platform GUI, click Configuration > Device Groups.
Table 42 on page 142 describes the fields in the Device Groups page.
Table 42: Fields in Device Groups Page
Fields Description
Device GroupName
Displays the name of the device group.
Devices Displays the name of a device and ’+’ followed by a number. If you hover over the number,it displays the names of other devices added to the device group.
Playbooks Displays the name of a playbook and ’+’ followed by a number. If you hover over thenumber, it displays the names of other playbooks deployed in the device group.
Status Displays the deployment status of the device group. If a device group is not deployed, itshows Saved.
Logging Displays the first letter of the log severity such as Debug, Error, Warn or Info along withthe log level.
The log level for the device group shows Global if you configure device group to collectlogs for every service running on a device group.
If you configure service specific logs, the column displays Others.
Notifications Displays the number of alerts generated by each device group. If you hover over thenumber, it shows the breakdown of alerts by severity.
Tasks You Can Perform
You can perform the following tasks in this page:
142
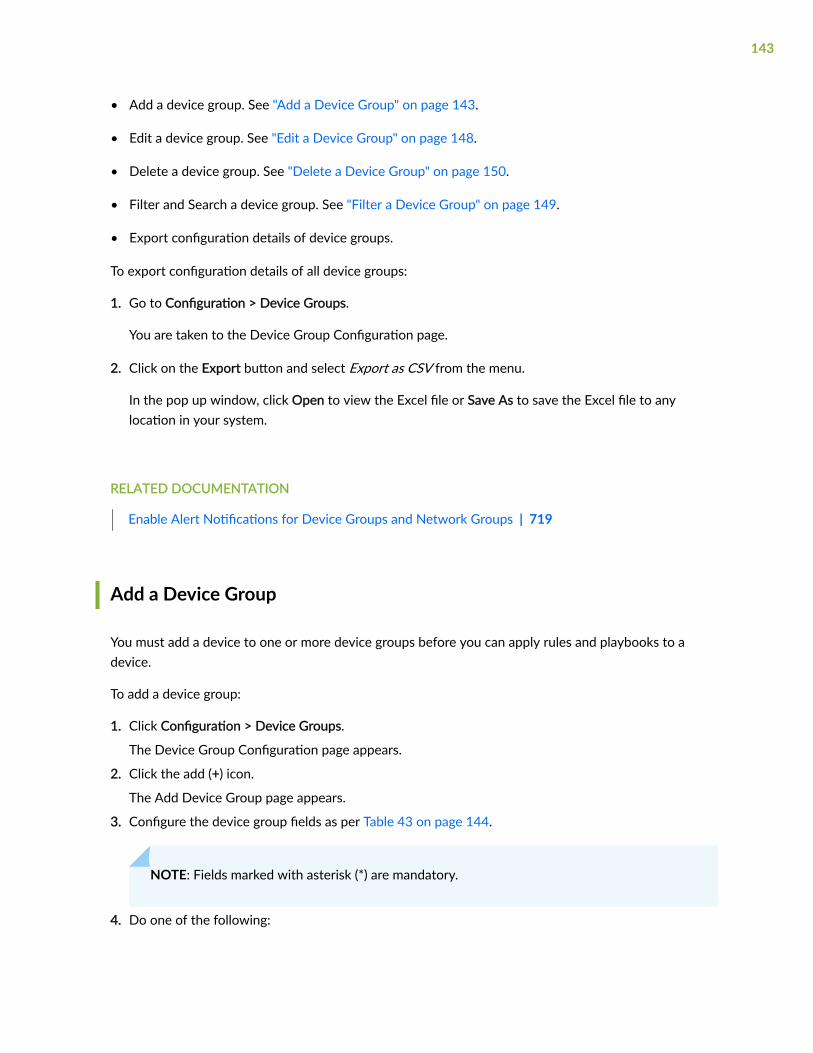
• Add a device group. See "Add a Device Group" on page 143.
• Edit a device group. See "Edit a Device Group" on page 148.
• Delete a device group. See "Delete a Device Group" on page 150.
• Filter and Search a device group. See "Filter a Device Group" on page 149.
• Export configuration details of device groups.
To export configuration details of all device groups:
1. Go to Configuration > Device Groups.
You are taken to the Device Group Configuration page.
2. Click on the Export button and select Export as CSV from the menu.
In the pop up window, click Open to view the Excel file or Save As to save the Excel file to anylocation in your system.
RELATED DOCUMENTATION
Enable Alert Notifications for Device Groups and Network Groups | 719
Add a Device Group
You must add a device to one or more device groups before you can apply rules and playbooks to adevice.
To add a device group:
1. Click Configuration > Device Groups.
The Device Group Configuration page appears.
2. Click the add (+) icon.
The Add Device Group page appears.
3. Configure the device group fields as per Table 43 on page 144.
NOTE: Fields marked with asterisk (*) are mandatory.
4. Do one of the following:
143

• Click Save to save the configuration. Selecting this option does not deploy the new device groupconfiguration.
NOTE: You can click the Health Configuration Deployment Status icon on the top-rightcorner to commit, deploy, or rollback the configuration settings. For more information, see"Commit or Roll Back Configuration Changes in Paragon Insights" on page 151.
A confirmation message appears stating that the device group is successfully created. The newdevice group is added to the Device Group page.
• Click Save and Deploy to save and immediately deploy the device group configuration.
A confirmation message appears that device group is successfully created and deployed.
Table 43: Fields on Add Device Group Page
Field Description
General
Name Enter a name for the device group.
Description Enter a description for the device group.
Devices Select one or more devices to add to the device group.
Advanced
Flow Ingest Deploy Nodes Select one or more nodes from the existing nodes list to specify which nodesmust receive the NetFlow traffic if your installation is a multi-node installationusing Kubernetes.
Ingest Frequency Profiles Select one or more profiles from the list that should override the rules or sensorfrequency settings.
Reports Select one or more health report profiles from the list to generate reports for thedevice group. Reports include alarm statistics, device health data, and device-specific information (such as hardware and software specifications).
144
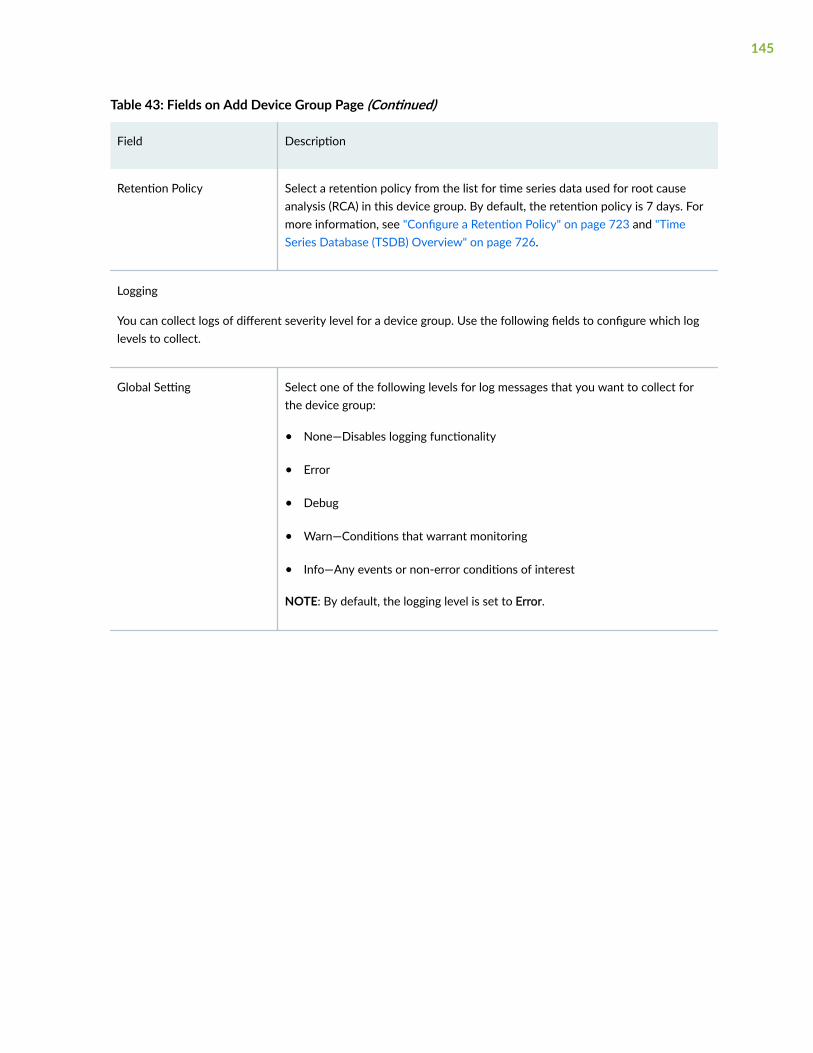
Table 43: Fields on Add Device Group Page (Continued)
Field Description
Retention Policy Select a retention policy from the list for time series data used for root causeanalysis (RCA) in this device group. By default, the retention policy is 7 days. Formore information, see "Configure a Retention Policy" on page 723 and "TimeSeries Database (TSDB) Overview" on page 726.
Logging
You can collect logs of different severity level for a device group. Use the following fields to configure which loglevels to collect.
Global Setting Select one of the following levels for log messages that you want to collect forthe device group:
• None—Disables logging functionality
• Error
• Debug
• Warn—Conditions that warrant monitoring
• Info—Any events or non-error conditions of interest
NOTE: By default, the logging level is set to Error.
145

Table 43: Fields on Add Device Group Page (Continued)
Field Description
Service Logging Overrides Select the log level for any of the following services that you want to configuredifferently from the Global Log Level setting:
• Open Config
• iAgent
• Native GPB
• Netflow
• SNMP
• SNMP Notification
• Syslog
• Reports Generation
• Non-Sensor rules
• Trigger Evaluation
• ML Model Builder
NOTE: The log level that you select here for a specific service takes precedenceover the Global Log Level setting.
Notifications • You can use the Notifications feature to organize, track, and manage KPIevent alarm notifications received from devices in the device group.
• To receive alarm notifications for KPI events that have occurred on yourdevices, you must first configure the notification delivery method for eachKPI event severity level (Major, Minor, and Normal).
Select the delivery method from the respective lists.
Ports
146
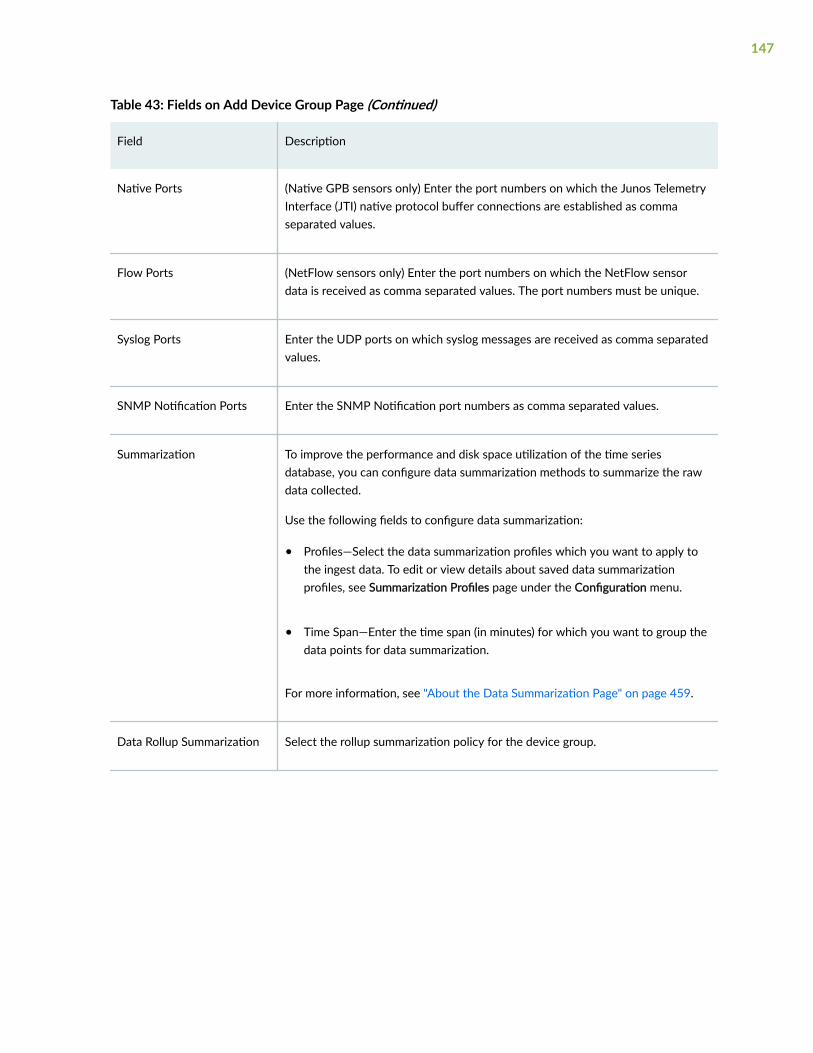
Table 43: Fields on Add Device Group Page (Continued)
Field Description
Native Ports (Native GPB sensors only) Enter the port numbers on which the Junos TelemetryInterface (JTI) native protocol buffer connections are established as commaseparated values.
Flow Ports (NetFlow sensors only) Enter the port numbers on which the NetFlow sensordata is received as comma separated values. The port numbers must be unique.
Syslog Ports Enter the UDP ports on which syslog messages are received as comma separatedvalues.
SNMP Notification Ports Enter the SNMP Notification port numbers as comma separated values.
Summarization To improve the performance and disk space utilization of the time seriesdatabase, you can configure data summarization methods to summarize the rawdata collected.
Use the following fields to configure data summarization:
• Profiles—Select the data summarization profiles which you want to apply tothe ingest data. To edit or view details about saved data summarizationprofiles, see Summarization Profiles page under the Configuration menu.
• Time Span—Enter the time span (in minutes) for which you want to group thedata points for data summarization.
For more information, see "About the Data Summarization Page" on page 459.
Data Rollup Summarization Select the rollup summarization policy for the device group.
147
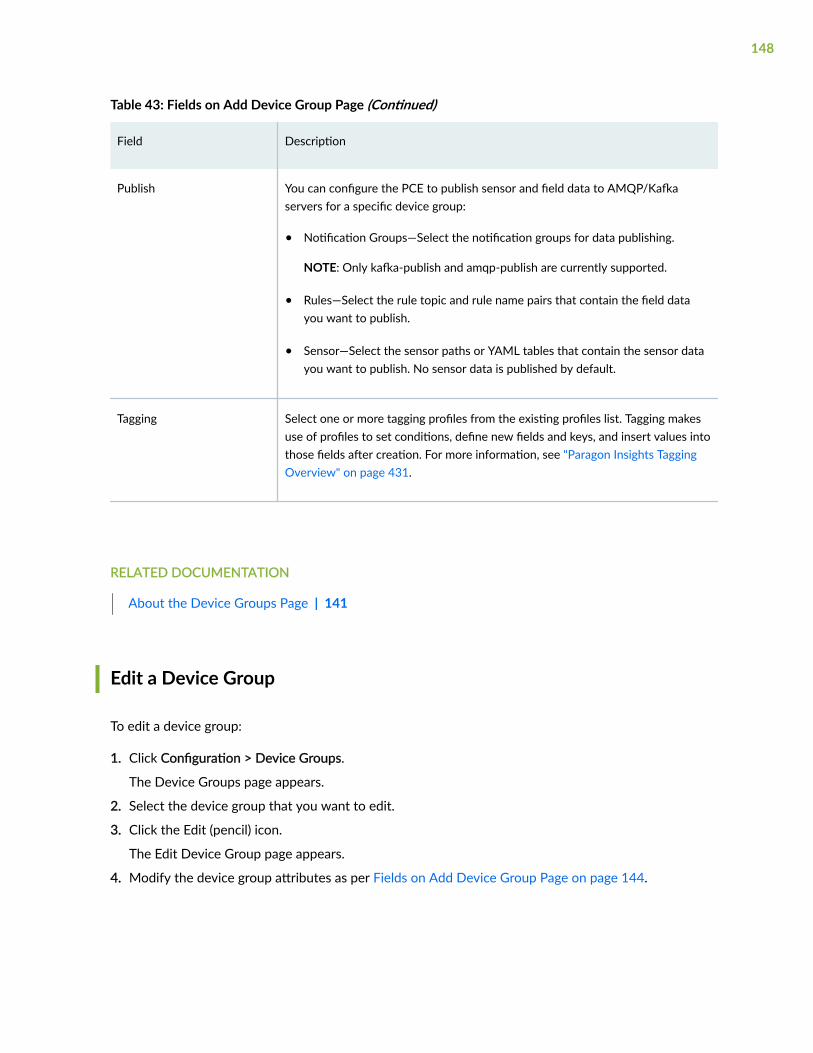
Table 43: Fields on Add Device Group Page (Continued)
Field Description
Publish You can configure the PCE to publish sensor and field data to AMQP/Kafkaservers for a specific device group:
• Notification Groups—Select the notification groups for data publishing.
NOTE: Only kafka-publish and amqp-publish are currently supported.
• Rules—Select the rule topic and rule name pairs that contain the field datayou want to publish.
• Sensor—Select the sensor paths or YAML tables that contain the sensor datayou want to publish. No sensor data is published by default.
Tagging Select one or more tagging profiles from the existing profiles list. Tagging makesuse of profiles to set conditions, define new fields and keys, and insert values intothose fields after creation. For more information, see "Paragon Insights TaggingOverview" on page 431.
RELATED DOCUMENTATION
About the Device Groups Page | 141
Edit a Device Group
To edit a device group:
1. Click Configuration > Device Groups.
The Device Groups page appears.
2. Select the device group that you want to edit.
3. Click the Edit (pencil) icon.
The Edit Device Group page appears.
4. Modify the device group attributes as per Fields on Add Device Group Page on page 144.
148

NOTE: You cannot edit the Device Group Name field.
5. Do one the following:
• Click Save to save the configuration. Selecting this option does not deploy the updated devicegroup configuration.
A confirmation message appears stating that the device group is successfully edited.
NOTE: You can click the Health Configuration Deployment Status icon on the top-rightcorner to commit, deploy, or rollback the configuration settings. For more information, see"Commit or Roll Back Configuration Changes in Paragon Insights" on page 151.
• Click Save and Deploy to save and immediately deploy the updated device group configuration.
RELATED DOCUMENTATION
About the Device Groups Page | 141
Add a Device Group | 143
Filter a Device Group
In the Device Group Configuration page, you can filter and search for a device group. You can alsosearch for a device group by clicking on the search button (magnifying glass icon) and entering the nameof a device group. The page displays the device group you entered in the search field.
To apply filter:
1. Go to Configuration > Device Group configuration.
You are taken to the Device Group Configuration page.
2. Click on the filter button (funnel icon) and click on the Add Filter button.
The Add Criteria window pops up.
3. Select a device, a device group, a playbook and so on from the drop-down menu of the Field box.
4. Select a condition from Includes, =, and != from the drop-down menu of Condition box.
5. Enter the name of a device, device group, status (Deployed or Saved) in the Value box.
The results of your search is displayed on the Device Group Configuration page.
6. (Optional) Click on the + button at the side of the existing filter to add new filters.
149
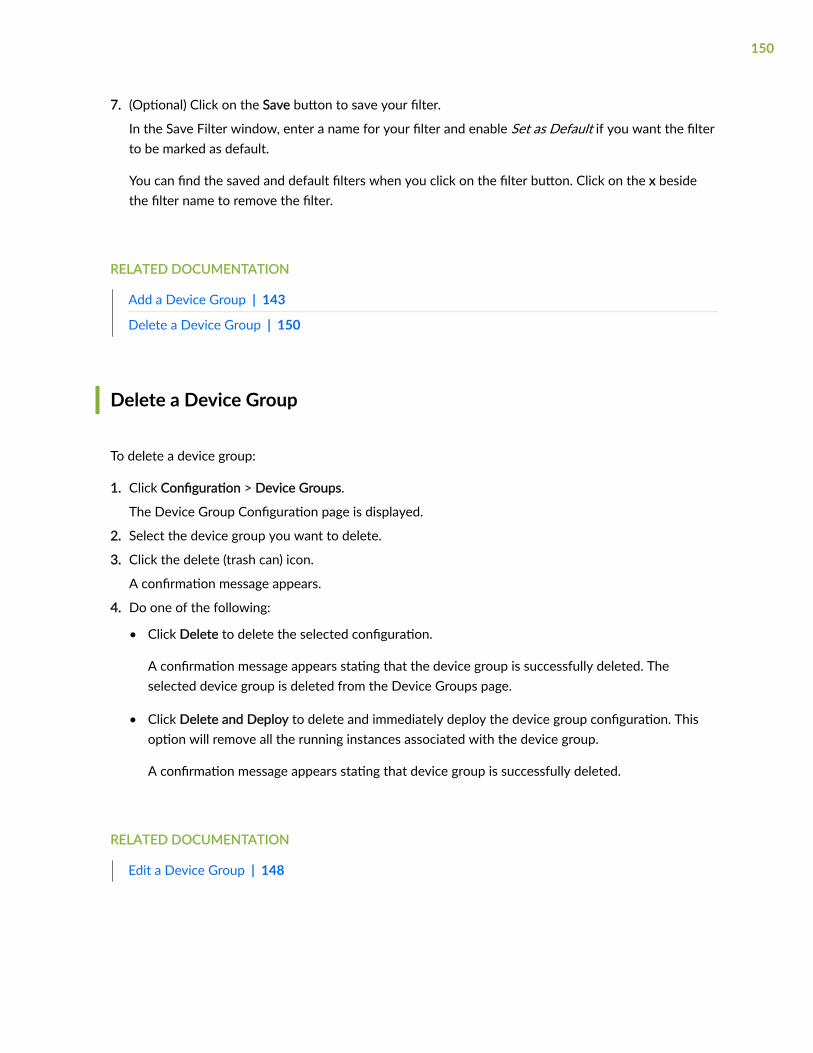
7. (Optional) Click on the Save button to save your filter.
In the Save Filter window, enter a name for your filter and enable Set as Default if you want the filterto be marked as default.
You can find the saved and default filters when you click on the filter button. Click on the x besidethe filter name to remove the filter.
RELATED DOCUMENTATION
Add a Device Group | 143
Delete a Device Group | 150
Delete a Device Group
To delete a device group:
1. Click Configuration > Device Groups.
The Device Group Configuration page is displayed.
2. Select the device group you want to delete.
3. Click the delete (trash can) icon.
A confirmation message appears.
4. Do one of the following:
• Click Delete to delete the selected configuration.
A confirmation message appears stating that the device group is successfully deleted. Theselected device group is deleted from the Device Groups page.
• Click Delete and Deploy to delete and immediately deploy the device group configuration. Thisoption will remove all the running instances associated with the device group.
A confirmation message appears stating that device group is successfully deleted.
RELATED DOCUMENTATION
Edit a Device Group | 148
150

Commit or Roll Back Configuration Changes in Paragon Insights
In Paragon Insights, when you make changes to the configuration, you can perform the followingoperations:
• Save
• Save and Deploy
• Delete
• Delete and Deploy
These operations and their effect on the Paragon Insights ingest services are explained in Table 44 onpage 151.
For changes that were not already deployed, you can either commit or roll back the changes, which youcan do using the Health Configuration Deployment Status page; the procedure is provided below Table44 on page 151.
Table 44: Operations After Changing the Configuration in Paragon Insights
Operation Explanation Effect on Ingest Services
Save Saves the changes to the database, but doesn'tapply the changes to the ingest services.
No effect until the changes arecommitted.
Delete Deletes the changes from the database. butdoesn't apply the changes to the ingest services.
Save and Deploy Saves the changes to the database and applies thechanges to the ingest services.
The ingest services starts processingthe data based on the changesconfigured.
Delete andDeploy
Deletes the changes from the database andapplies the changes to the ingest services.
NOTE: Users might do the Save or Delete operations if they have multiple configuration stepsand want to stack the configuration steps, so that they can later commit the changes at one go.
To commit or roll back configuration changes in Paragon Insights:
151

1. On the Paragon Automation banner, click the deployment status icon.
The Health Configuration Deployment Status page appears displaying:
• The status of the last deployment.
• The list of device groups and network groups for which pending changes have not beencommitted.
• The list of device groups and network groups for which pending deletions have not beencommitted.
2. You can do one of the following:
• Commit any changes that are pending deployment:
a. Click Commit.
Paragon Insights triggers the commit operation and the configuration changes are applied tothe ingest services. Depending on the number of configuration changes and number of devicegroups and network groups affected, applying the configuration changes to the ingest servicesmight take between a few seconds or a few minutes to complete.
After the operation completes, a confirmation message is displayed. Paragon Insights startsrunning the associated playbooks and starts ingesting the data.
b. Go to Step 3.
• Roll back any changes that are pending deployment:
a. Click Rollback to roll back any changes that are pending deployment. (The roll back operationdiscards the pending configuration changes that were previously saved in the database.)
Paragon Insights triggers the roll back operation and the configuration changes are rolled backalmost immediately. After the rollback is complete, a confirmation message is displayed.
b. Go to Step 3.
NOTE: After the roll back or commit operation is completed, the status of the last deploymentin the Health Configuration Deployment Status page displays the last operation that wascompleted.
3. Click Close to exit the page.
You are returned to the previous page from which you accessed the Health ConfigurationDeployment Status page.
152

RELATED DOCUMENTATION
Add a Device Group | 143
Add a Network Group | 218
153
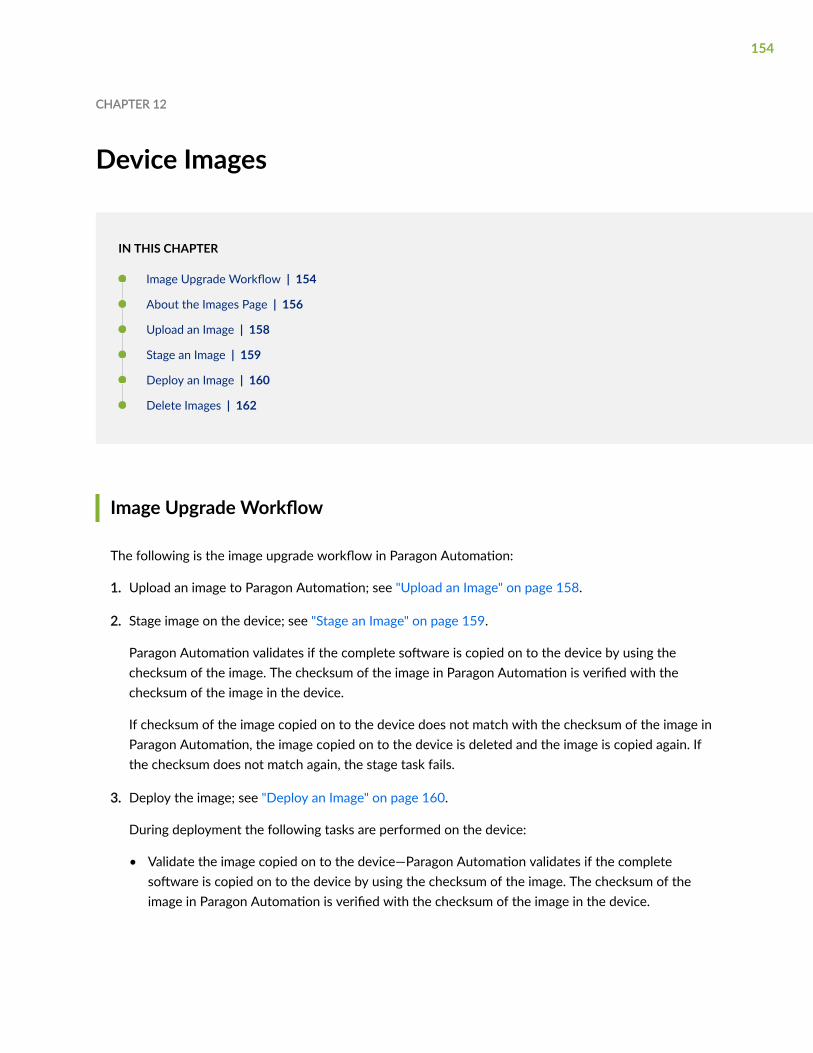
CHAPTER 12
Device Images
IN THIS CHAPTER
Image Upgrade Workflow | 154
About the Images Page | 156
Upload an Image | 158
Stage an Image | 159
Deploy an Image | 160
Delete Images | 162
Image Upgrade Workflow
The following is the image upgrade workflow in Paragon Automation:
1. Upload an image to Paragon Automation; see "Upload an Image" on page 158.
2. Stage image on the device; see "Stage an Image" on page 159.
Paragon Automation validates if the complete software is copied on to the device by using thechecksum of the image. The checksum of the image in Paragon Automation is verified with thechecksum of the image in the device.
If checksum of the image copied on to the device does not match with the checksum of the image inParagon Automation, the image copied on to the device is deleted and the image is copied again. Ifthe checksum does not match again, the stage task fails.
3. Deploy the image; see "Deploy an Image" on page 160.
During deployment the following tasks are performed on the device:
• Validate the image copied on to the device—Paragon Automation validates if the completesoftware is copied on to the device by using the checksum of the image. The checksum of theimage in Paragon Automation is verified with the checksum of the image in the device.
154
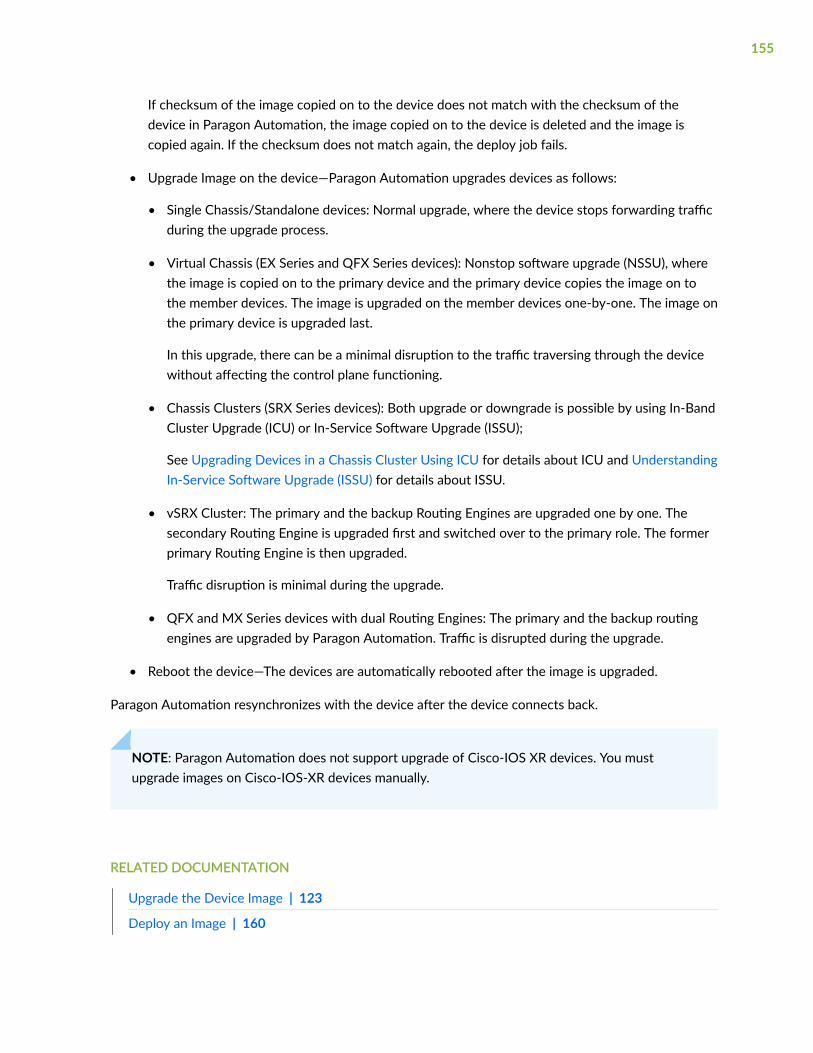
If checksum of the image copied on to the device does not match with the checksum of thedevice in Paragon Automation, the image copied on to the device is deleted and the image iscopied again. If the checksum does not match again, the deploy job fails.
• Upgrade Image on the device—Paragon Automation upgrades devices as follows:
• Single Chassis/Standalone devices: Normal upgrade, where the device stops forwarding trafficduring the upgrade process.
• Virtual Chassis (EX Series and QFX Series devices): Nonstop software upgrade (NSSU), wherethe image is copied on to the primary device and the primary device copies the image on tothe member devices. The image is upgraded on the member devices one-by-one. The image onthe primary device is upgraded last.
In this upgrade, there can be a minimal disruption to the traffic traversing through the devicewithout affecting the control plane functioning.
• Chassis Clusters (SRX Series devices): Both upgrade or downgrade is possible by using In-BandCluster Upgrade (ICU) or In-Service Software Upgrade (ISSU);
See Upgrading Devices in a Chassis Cluster Using ICU for details about ICU and UnderstandingIn-Service Software Upgrade (ISSU) for details about ISSU.
• vSRX Cluster: The primary and the backup Routing Engines are upgraded one by one. Thesecondary Routing Engine is upgraded first and switched over to the primary role. The formerprimary Routing Engine is then upgraded.
Traffic disruption is minimal during the upgrade.
• QFX and MX Series devices with dual Routing Engines: The primary and the backup routingengines are upgraded by Paragon Automation. Traffic is disrupted during the upgrade.
• Reboot the device—The devices are automatically rebooted after the image is upgraded.
Paragon Automation resynchronizes with the device after the device connects back.
NOTE: Paragon Automation does not support upgrade of Cisco-IOS XR devices. You mustupgrade images on Cisco-IOS-XR devices manually.
RELATED DOCUMENTATION
Upgrade the Device Image | 123
Deploy an Image | 160
155
About the Images Page
IN THIS SECTION
Tasks You Can Perform | 156
Field Descriptions | 157
Paragon Automation helps you to manage (add, stage, deploy, and delete) the entire lifecycle of imagesof all managed network devices. A device image is a software installation package that you use toupgrade or downgrade the operating system running on a network device.
Paragon Automation can manage Junos OS images running on the following devices:
• ACX Series
• EX Series (both single and Virtual Chassis; mixed-mode Virtual Chassis supported)
• MX Series
• PTX Series
• QFX Series (both single and virtual chassis)
• SRX Series (both standalone and chassis clusters)
• vSRX
To access this page, click Configuration > Device Images.
Tasks You Can Perform
You can perform the following tasks from this page:
• Upload an image; see "Upload an Image" on page 158.
• Stage an image; see "Stage an Image" on page 159.
• Deploy an image; see "Deploy an Image" on page 160.
• Delete images; see "Delete Images" on page 162.
• Filter Entries—Filter the table entries by adding new filtering criteria.
156
Hover over the Filter (funnel) icon and select Add Filter. On the Add Criteria page, select the filteringcriteria from the Field and Condition list, and enter the text to be compared in the Value field. ClickAdd.
The filtered table entries are listed and the filter criteria name is displayed above the table columnnames.
You can click the cross (X) icon (next to the filter name) to remove the filtering criteria.
NOTE:
• You can add multiple filtering criteria. Once you add the multiple filtering criteria, you canselect the And condition to display the entries matching all the filtering criteria or selectthe Or condition to display the entries matching any one of the filtering criteria.
• Quick filter: Save the filtering criteria as quick filters. Once you have added all the filteringcriteria, you can save a particular criteria or multiple criteria for future use by clicking Save.
On the Save Filter window, enter a name for the filter, optionally toggle the Set as Defaultbutton if you want to use this filtering criteria by default, and click OK.
The saved filters are displayed under Quick Filters when you hover over the Filter (funnel)icon. You can then apply these saved filters to the table entries.
• Show/Hide Columns—Choose to show or hide a specific column in the table.
Hover over the More Options (vertical ellipsis) > Show/Hide Columns and select the Column-Namecheck box of the columns you want to display in the table.
• Reset Preference—Reset the displayed columns to the default set of columns for each tab in thetable.
Hover over the More Options (vertical ellipsis) and select Reset Preference.
• Sort Entries—Click the column name to highlight the up and down arrows next to the column name.Sort the table entries in ascending or descending order of that column by clicking the up or downarrow respectively.
Field Descriptions
Table 45 on page 158 displays the fields on the Images page.
157
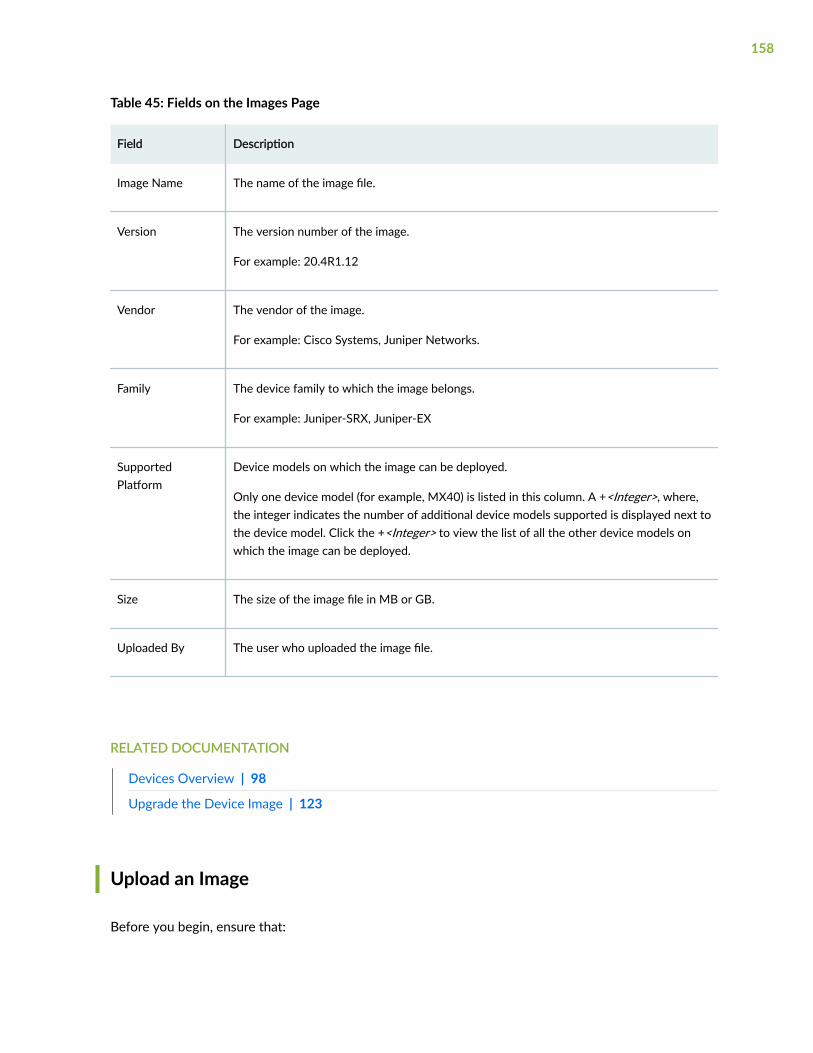
Table 45: Fields on the Images Page
Field Description
Image Name The name of the image file.
Version The version number of the image.
For example: 20.4R1.12
Vendor The vendor of the image.
For example: Cisco Systems, Juniper Networks.
Family The device family to which the image belongs.
For example: Juniper-SRX, Juniper-EX
SupportedPlatform
Device models on which the image can be deployed.
Only one device model (for example, MX40) is listed in this column. A +<Integer>, where,the integer indicates the number of additional device models supported is displayed next tothe device model. Click the +<Integer> to view the list of all the other device models onwhich the image can be deployed.
Size The size of the image file in MB or GB.
Uploaded By The user who uploaded the image file.
RELATED DOCUMENTATION
Devices Overview | 98
Upgrade the Device Image | 123
Upload an Image
Before you begin, ensure that:
158
• You are able to access the image.
• You have the permission to upload the device image.
You upload images of devices to Paragon Automation so that you can manage the lifecycle of the imageon a device. When you need to upgrade or downgrade the image running on a device, you can stage anddeploy the required image on the device by using Paragon Automation.
To upload an image:
1. Click Configuration > Device Images in the left navigation menu.
The Images page appears.
2. Click the Add (+) icon.
The Upload Image page appears.
3. Do one of the following:
• To upload the image from your local system, click Browse under Upload from computer, and selectthe image file saved on your computer in the explorer that opens.
NOTE: When you try to upload a large image from your local system, the image uploadmight fail if there are firewall or issues in connecting with the network. In such scenarios,we recommend that you use the option to upload an image from the external server.
• To upload the image from an external server, enter the URL in the Image URL field; for example,you can provide the URL from the Juniper Networks Software Download page to download animage.
4. Click OK.
The image is copied to Paragon Automation server and listed on the Images page.
RELATED DOCUMENTATION
Upgrade the Device Image | 123
Stage an Image
You need to stage or copy an image on to a device before upgrading the software running on the device.The Stage option is useful if you are using a low-bandwidth connection. On low bandwidth connections,manually staging an image prior to deploying the image helps prevent the image deployment from timing
159

out because of a slow connection. On high-bandwidth connections, you can choose to stage the imagealong with the image deployment.
When you stage an image, the checksum of the image in Paragon Automation is verified with thechecksum of the image in the device. If checksum of the image on the device does not match with thechecksum in Paragon Automation, the image copied on to the device is deleted and the image is copiedagain.
To stage an image, you must be an administrator or a user with the privilege to stage an image.
To stage an image:
1. Click Configuration > Device Images in the left navigation menu.
The images page appears.
2. Select the image that you want to stage and click the Stage button. You can stage an image onto asingle device or multiple devices at the same time.
The Stage Image page appears.
3. Under Select Devices, select one or more devices onto which the image needs to be staged.
4. In the Stage Image field, click:
• Run Now to stage the image immediately.
• Schedule Later to stage the image later and specify the date and time when you want the imageto be staged.
5. Click OK.
If you selected Run Now, a job is initiated immediately to stage the image. If you selected ScheduleLater, a job is initiated at the scheduled date and time to stage the image. You can monitor theprogress of the job in the Jobs page (Monitor > Jobs).
RELATED DOCUMENTATION
Upgrade the Device Image | 123
Image Upgrade Workflow | 154
Deploy an Image
To deploy an image, you should be an administrator or a user with the privilege to deploy images ondevices. You can deploy an image on a single device or multiple devices at the same time.
160

NOTE:
• Upgrade of Junos Continuity software packages (JAM packages) is not supported.
• When you deploy an image on a device, the device goes into the maintenance state. In themaintenance state:
• Other actions that impact the device such as, rebooting the device or deployingconfiguration templates is not possible.
• Traffic flowing through an SRX Chassis Cluster or an EX Series or QFX Series VirtualChassis is not disrupted.
• Traffic flowing through a standalone device is disrupted.
NOTE: You can also upgrade images from the Devices page; see "Upgrade the Device Image" onpage 123.
To deploy an image onto a device:
1. Click Configuration > Device Images on the left navigation menu.
The images page appears.
2. Select the device image to be deployed on the device and click the Deploy button.
The Deploy Images page appears. In the Deploy Images page, you can view whether the image isstaged on a device or not. If the image is not staged already, the image is copied on to the device andthen deployed and this results in a longer deployment time.
3. Under Select Devices, select one or more devices onto which the device image needs to be deployed.
4. In the Deploy Image field, select a time to run the deployment:
• Click Run Now to deploy the image immediately.
• Click Schedule Later to deploy the image later and specify the date and time when you want theimage to be deployed.
5. Click OK.
If you selected Run Now, a job is initiated immediately to deploy the image. If you selected ScheduleLater, a job is initiated at the scheduled date and time to deploy the image. You can monitor theprogress of the job in the Jobs page (Monitor > Jobs).
161

RELATED DOCUMENTATION
Upgrade the Device Image | 123
Image Upgrade Workflow | 154
Delete Images
You can delete one or more device images from the Images page when you no longer need to managethem.
To delete an image, you should be an administrator or a user with the privilege to delete an image. If youdelete an image while the image is being staged or deployed, the job initiated to stage or deploy theimage fails.
To delete an image:
1. Click Configuration > Device Images on the left navigation menu.
The images page appears.
2. Select one or more images that you want to delete and click the Delete icon (trashcan).
A confirmation message appears.
3. Click Yes to delete the images.
The selected images are deleted and the images are no longer listed on the Images page.
RELATED DOCUMENTATION
Upload an Image | 158
Upgrade the Device Image | 123
Image Upgrade Workflow | 154
162
CHAPTER 13
Network
IN THIS CHAPTER
Assign Names to Admin Group Bits | 163
Modify Pathfinder Settings From the Pathfinder CLI | 164
Modify Pathfinder Settings From the GUI | 172
Assign Names to Admin Group Bits
Admin groups, also known as link coloring or resource class assignment, are manually assigned attributesthat describe the “color” of links, such that links with the same color conceptually belong to the sameclass. The path computation element (PCE) automatically discovers admin group bits associated with alink or label-switched path (LSP).
You can use the Admin Group page to assign a meaningful name to the admin group bits (0 through 31).
For example, you might want to map an admin group to a network region, such as San Francisco or NewYork, where each region is given its own bit name. Or, you can map each admin group to a color so thatyou can easily differentiate the different traffic routes in the topology map.
NOTE: You can access this page only if you have the permission to perform tasks (create, read,update, delete) in the Network page (Configuration > Network).
To assign names to admin group bits:
1. Select Configuration > Network > Admin Group.
The Admin Group page appears.
2. Specify a meaningful name for one or more corresponding admin group bits (0 through 31).
If you don’t specify a name, the default naming (bit0, bit1, and so on) is used.
3. Click Save Changes.
A confirmation message appears on the top of the page indicating that the changes have been savedsuccessfully.
163
In the Link tab of the network information table, the admin group bit names appear in the AdminGroup AZ and Admin Group ZA columns. In the Tunnel tab, the admin group bit names appear in theAdmin Group Include All, Admin Group Include Any, and Admin Group Exclude columns.
4. (Optional) To see the admin group names on the topology map, right-click the blank space in thetopology map and select Link Label > TE Admin Group A::Z from the list. The named (colored) linksthen appear in the topology map.
RELATED DOCUMENTATION
About the Tunnel Tab | 517
About the Link Tab | 509
Modify Pathfinder Settings From the Pathfinder CLI
IN THIS SECTION
Access the Pathfinder CLI | 165
Modify Pathfinder Configuration Settings | 169
The component-specific Pathfinder settings previously maintained in the northstar.cfg file aremaintained in an internal cache and can be modified by using the Pathfinder CLI. The Pathfinder CLI isvery similar to the Junos OS CLI.
NOTE: Certain bootstrap and infrastructure configuration settings continue to be maintained inthe northstar.cfg file.
If you are not already familiar with the Junos OS CLI, see Junos OS CLI User Guide which covers:
• Accessing operational and configuration command modes, and switching between modes.
• The concept of command hierarchies.
• Navigation among hierarchy levels.
164

• Getting help on command syntax including how to display all possible completions for a partialcommand.
• Helpful keyboard sequences including command completion shortcuts.
• Committing or backing out of configuration changes.
You can also modify the Pathfinder settings from the GUI. See "Modify Pathfinder Settings From theGUI" on page 172.
Access the Pathfinder CLI
To access the Pathfinder CLI:
1. After you successfully install Paragon Pathfinder, log in to the Pathfinder master server.
2. Launch the Pathfinder CLI:
[root@ns]# kubectl exec -it ns-cmgd-<pod-name> -n northstar -c ns-cmgd -- cli
<pod-name> is the name of the pod where the Containerized Management Daemon (cMGD) isinstalled.
To get the cMGD pod name in the cluster, run the following command:
[root@ns]# kubectl get pods -n northstar | grep ns-cmgd
3. The > prompt indicates you are in operational mode. In this mode, you can display the Pathfinderconfiguration, but you cannot change it. For example:
root@ns> show configuration northstar
config-server { health-monitor { heartbeat-interval 5s; poll-interval 10m; history-ttl 2d; heartbeat-holdown-timer 15s; }}path-computation-server { health-monitor { heartbeat-interval 5s; poll-interval 10m;
165

history-ttl 2d; heartbeat-holdown-timer 15s; }}netconfd { in-memory-datastore { reconnect-delay 1000; reconnect-retries 10000; }}programmable-rpd-client { health-monitor { heartbeat-interval 5s; poll-interval 10m; history-ttl 2d; heartbeat-holdown-timer 15s; } enable-top-prefix-filter; publish-top-prefix-only;}
root@ns1>
4. Use the edit (or configure) command to enter configuration mode (prompt changes to #):
root@ns> editEntering configuration modeUsers currently editing the configuration: root terminal pts/1 (pid 246) on since 2020-08-25 17:26:47 UTC, idle 1d 23:54 [edit] root terminal pts/2 (pid 262) on since 2020-08-26 23:05:31 UTC, idle 17:13:12 [edit]
[edit]root@ns1#
[edit] indicates the top of the command hierarchy.
166
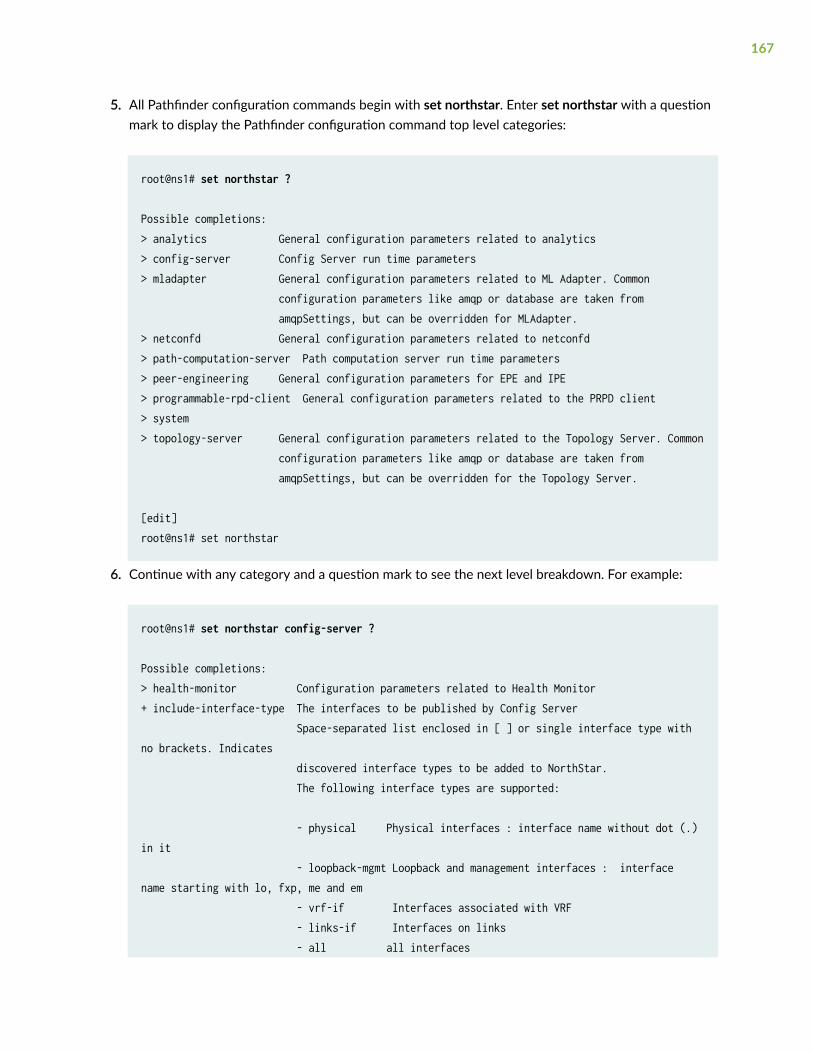
5. All Pathfinder configuration commands begin with set northstar. Enter set northstar with a questionmark to display the Pathfinder configuration command top level categories:
root@ns1# set northstar ?
Possible completions:> analytics General configuration parameters related to analytics> config-server Config Server run time parameters> mladapter General configuration parameters related to ML Adapter. Common configuration parameters like amqp or database are taken from amqpSettings, but can be overridden for MLAdapter.> netconfd General configuration parameters related to netconfd> path-computation-server Path computation server run time parameters> peer-engineering General configuration parameters for EPE and IPE> programmable-rpd-client General configuration parameters related to the PRPD client> system> topology-server General configuration parameters related to the Topology Server. Common configuration parameters like amqp or database are taken from amqpSettings, but can be overridden for the Topology Server.
[edit]root@ns1# set northstar
6. Continue with any category and a question mark to see the next level breakdown. For example:
root@ns1# set northstar config-server ?
Possible completions:> health-monitor Configuration parameters related to Health Monitor+ include-interface-type The interfaces to be published by Config Server Space-separated list enclosed in [ ] or single interface type with no brackets. Indicates discovered interface types to be added to NorthStar. The following interface types are supported:
- physical Physical interfaces : interface name without dot (.) in it - loopback-mgmt Loopback and management interfaces : interface name starting with lo, fxp, me and em - vrf-if Interfaces associated with VRF - links-if Interfaces on links - all all interfaces
167
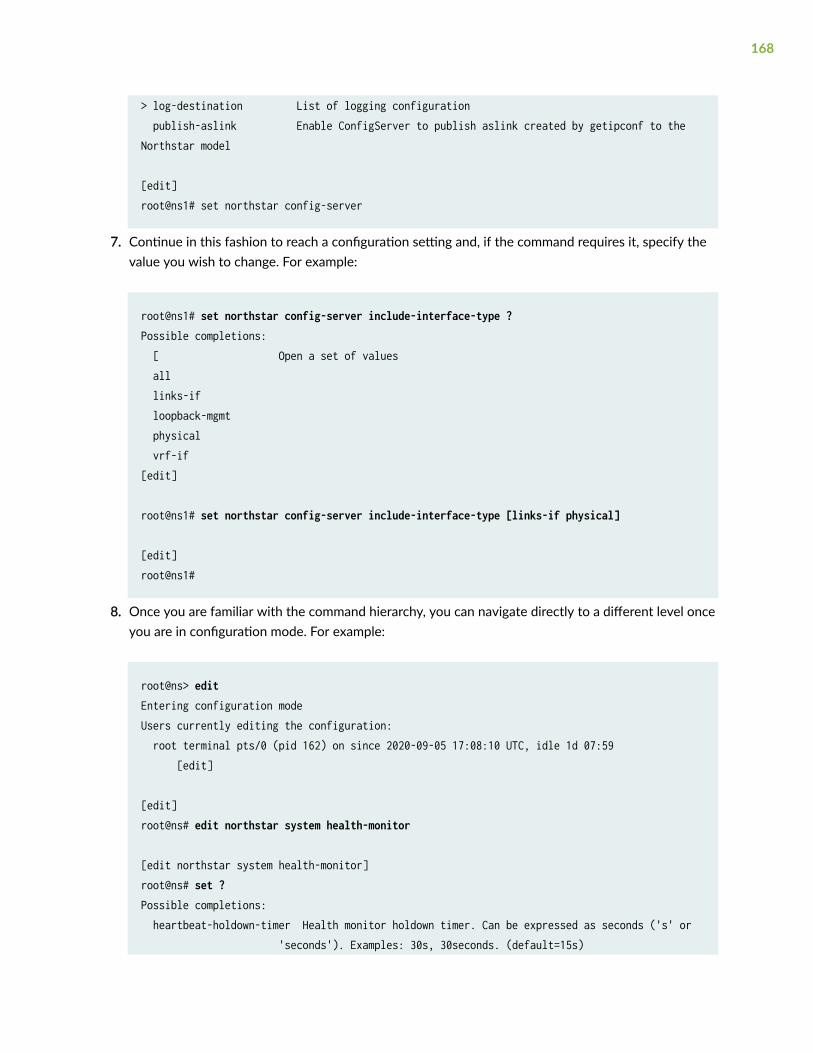
> log-destination List of logging configuration publish-aslink Enable ConfigServer to publish aslink created by getipconf to the Northstar model
[edit]root@ns1# set northstar config-server
7. Continue in this fashion to reach a configuration setting and, if the command requires it, specify thevalue you wish to change. For example:
root@ns1# set northstar config-server include-interface-type ?Possible completions: [ Open a set of values all links-if loopback-mgmt physical vrf-if[edit]
root@ns1# set northstar config-server include-interface-type [links-if physical]
[edit]root@ns1#
8. Once you are familiar with the command hierarchy, you can navigate directly to a different level onceyou are in configuration mode. For example:
root@ns> editEntering configuration modeUsers currently editing the configuration: root terminal pts/0 (pid 162) on since 2020-09-05 17:08:10 UTC, idle 1d 07:59 [edit]
[edit]root@ns# edit northstar system health-monitor
[edit northstar system health-monitor]root@ns# set ?Possible completions: heartbeat-holdown-timer Health monitor holdown timer. Can be expressed as seconds ('s' or 'seconds'). Examples: 30s, 30seconds. (default=15s)
168

heartbeat-interval Health monitoring heartbeat interval. Can be expressed as seconds ('s' or 'seconds'). Examples: 10s, 10seconds. (0 or -ve value = disabled, default=5s) history-ttl Health monitor history retention. Can be expressed as days ('d' or 'days'). Examples: 7d, 7days. (default=2d) poll-interval Health monitor poll interval. Can be expressed as minutes ('m' or 'minutes'). Examples: 4m, 4minutes. (default=10m)
[edit northstar system health-monitor]
Modify Pathfinder Configuration Settings
Table 46 on page 169 lists the Pathfinder configuration settings most likely to require modification. It isnot a complete listing of all the available settings.
NOTE: The following configuration settings are not supported in Paragon Automation Release21.1. We strongly recommend that you do not modify these settings:
• Analytics
• Health Monitor
• Peer Engineering
• Some Topology Server settings: element-state-mask, element-type-mask, use-safe-mode,do-not-use-davinci-device-model
Table 46: Frequently-used Pathfinder Configuration Settings
Setting Command Description
port
(NETCONF)
set northstar netconf-connection-controller device-connection-poolnetconf port
Change the default port for NETCONFfrom 830. In some installations, port 22 ispreferred.
exec-pace-rate
(EPE)
set northstar peer-engineering egressapplication exec-pace-rate
Set the maximum rate (in calls per second)at which the egress peer engineering(EPE) Planner executes Pathfinder RESTAPI calls that change the network.
169
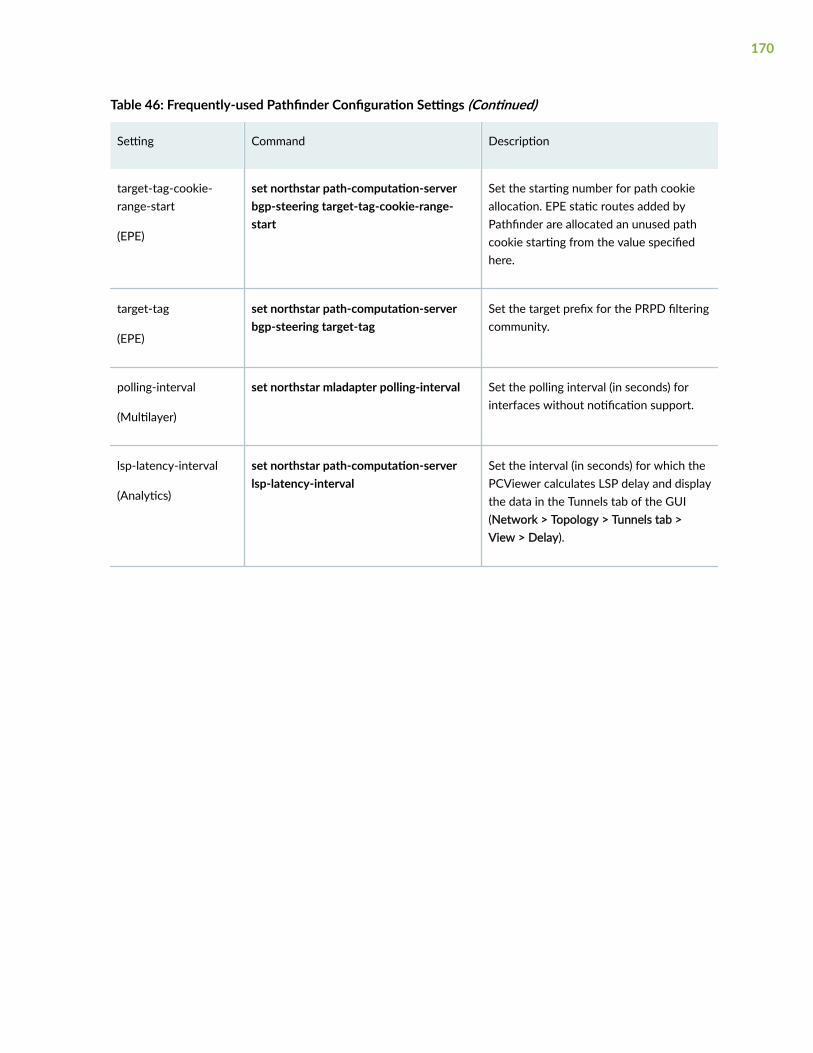
Table 46: Frequently-used Pathfinder Configuration Settings (Continued)
Setting Command Description
target-tag-cookie-range-start
(EPE)
set northstar path-computation-serverbgp-steering target-tag-cookie-range-start
Set the starting number for path cookieallocation. EPE static routes added byPathfinder are allocated an unused pathcookie starting from the value specifiedhere.
target-tag
(EPE)
set northstar path-computation-serverbgp-steering target-tag
Set the target prefix for the PRPD filteringcommunity.
polling-interval
(Multilayer)
set northstar mladapter polling-interval Set the polling interval (in seconds) forinterfaces without notification support.
lsp-latency-interval
(Analytics)
set northstar path-computation-serverlsp-latency-interval
Set the interval (in seconds) for which thePCViewer calculates LSP delay and displaythe data in the Tunnels tab of the GUI(Network > Topology > Tunnels tab >View > Delay).
170

Table 46: Frequently-used Pathfinder Configuration Settings (Continued)
Setting Command Description
include-interface-type
(all tasks related tointerfaces)
set northstar config-server include-interface-type
Set interface types that can be discoveredon devices and that are to be used fortraffic collection.
The supported interface types are:
• physical: Physical interfaces, expressedas the interface name without a dot (.)in it.
• loopback-mgmt: Loopback andmanagement interfaces expressed asthe interface name starting with lo,fxp, me, or em.
• vrf-if: Interfaces associated with aVRF.
• links-if: Interfaces on links.
• all: All interfaces.
NOTE: configServer publishes to allcomponents only the interface types thatyou specify. The GUI and data collectiononly receive information about interfacesrepresenting those interface types.
If you modify this setting by clearinginterface types that are alreadyrepresented by interfaces in thePathfinder model, those existinginterfaces remain in the model.
RELATED DOCUMENTATION
Paragon Pathfinder Overview | 5
171

Modify Pathfinder Settings From the GUI
In addition to modifying the settings from the CLI, you can also modify the component-specificPathfinder settings by using the Paragon Automation GUI.
NOTE: The Peer Engineering configuration settings are not supported in Paragon AutomationRelease 21.1. Although you can modify these settings from the GUI, the changes will not takeeffect.
To modify the settings from the GUI:
1. Select Configuration > Network > Pathfinder.
The Pathfinder page is displayed.
2. Select a component that you want to modify.
The component-specific settings appear on the right side of the page.
3. Modify the settings as needed. Table 47 on page 172 describes the settings that you can modify.
NOTE: Fields marked with an asterisk (*) on the GUI are mandatory.
4. Click Save Changes.
The changes are saved and a confirmation message is displayed.
The modified settings are displayed on the Pathfinder page.
Table 47: Pathfinder Settings
Setting Description
Advanced
172

Table 47: Pathfinder Settings (Continued)
Setting Description
Sync Network Model Click Sync to refresh the synchronization of the network model. You can use thisoption if the network model audit has unresolved discrepancies or if theinformation displayed for the model is out of sync.
When you sync the network model, this is what happens behind the scenes:
1. Information associated with the network model (nodes, links, LSPs, interfaces,SRLGs, and user-defined parameters) remains intact. Nothing is purged from thedatabase.
NOTE: Device profiles are not affected.
2. The network model is repopulated with live data learned from topologyacquisition.
Table 48 on page 212 describes the effects on various elements in the networkwhen you reset or synchronize the model.
173

Table 47: Pathfinder Settings (Continued)
Setting Description
Reset Network Model WARNING: The Reset Network Model operation is typically appropriate for alab rather than a production environment. We strongly recommend that youperform this action only under JTAC supervision.
There are two circumstances under which you must reset the network model inorder to keep the model in sync with the actual network:
• The node ISO network entity title (NET) address changes—This can happenwhen configuration changes are made to support IS-IS.
• The routing device’s IP address (router ID) changes—The router ID is used byBGP and OSPF to identify the routing device from which a packet originated.The router ID is usually the IP address of the local routing device. If a router IDhas not been configured for the device, the IP address of the first interface (ofthe device) that comes online is used, which is usually the loopback interface.Otherwise, the first hardware interface with an IP address is used.
If either of these addresses changes, and you do not perform the ResetNetwork Model operation, the network model in the Pathfinder databasebecomes out of sync with the live network.
When you reset the network model, this is what happens behind the scenes:
1. Information associated with the network model (nodes, links, LSPs, interfaces,SRLGs, and user-defined parameters) is purged from the database (so, werecommend that you do not reset the network model unless it is absolutelyrequired, and that you perform this action only under JTAC supervision).
NOTE: Device profiles are not affected.
2. The network model is repopulated with live data learned from topologyacquisition.
Table 48 on page 212 describes the effects on various elements in the networkwhen you reset or synchronize the model.
Config Server
174
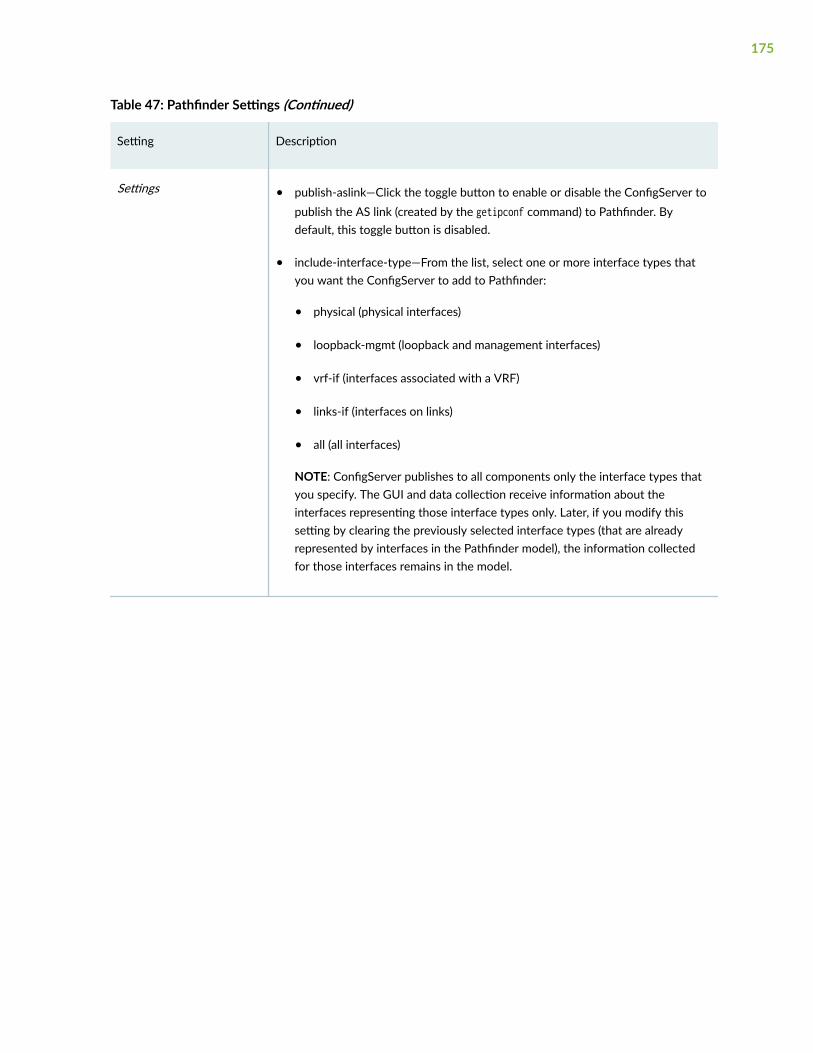
Table 47: Pathfinder Settings (Continued)
Setting Description
Settings • publish-aslink—Click the toggle button to enable or disable the ConfigServer topublish the AS link (created by the getipconf command) to Pathfinder. Bydefault, this toggle button is disabled.
• include-interface-type—From the list, select one or more interface types thatyou want the ConfigServer to add to Pathfinder:
• physical (physical interfaces)
• loopback-mgmt (loopback and management interfaces)
• vrf-if (interfaces associated with a VRF)
• links-if (interfaces on links)
• all (all interfaces)
NOTE: ConfigServer publishes to all components only the interface types thatyou specify. The GUI and data collection receive information about theinterfaces representing those interface types only. Later, if you modify thissetting by clearing the previously selected interface types (that are alreadyrepresented by interfaces in the Pathfinder model), the information collectedfor those interfaces remains in the model.
175

Table 47: Pathfinder Settings (Continued)
Setting Description
Log Destination • name—Displays the name for the log destination settings.
• level—From the list, select the severity level of the log messages. The availableoptions are:
• emergency—The system is unusable.
• alert—Immediate action is needed.
• critical—Critical condition exists.
• error—Error condition.
• warning—Warning condition (this is the default value).
• notice—Normal but significant condition.
• info—Information message.
• debug—Debug message.
• trace—Trace message.
• – (none)—No severity level.
Device Profile Adapter
Settings redis-poll-interval—Specify the frequency (in seconds) with which the device profileadapter polls the Redis service for the Redis status.
Enter 0 or a negative value to disable this setting.
Example: 10s or 10seconds
Default: 5s
176
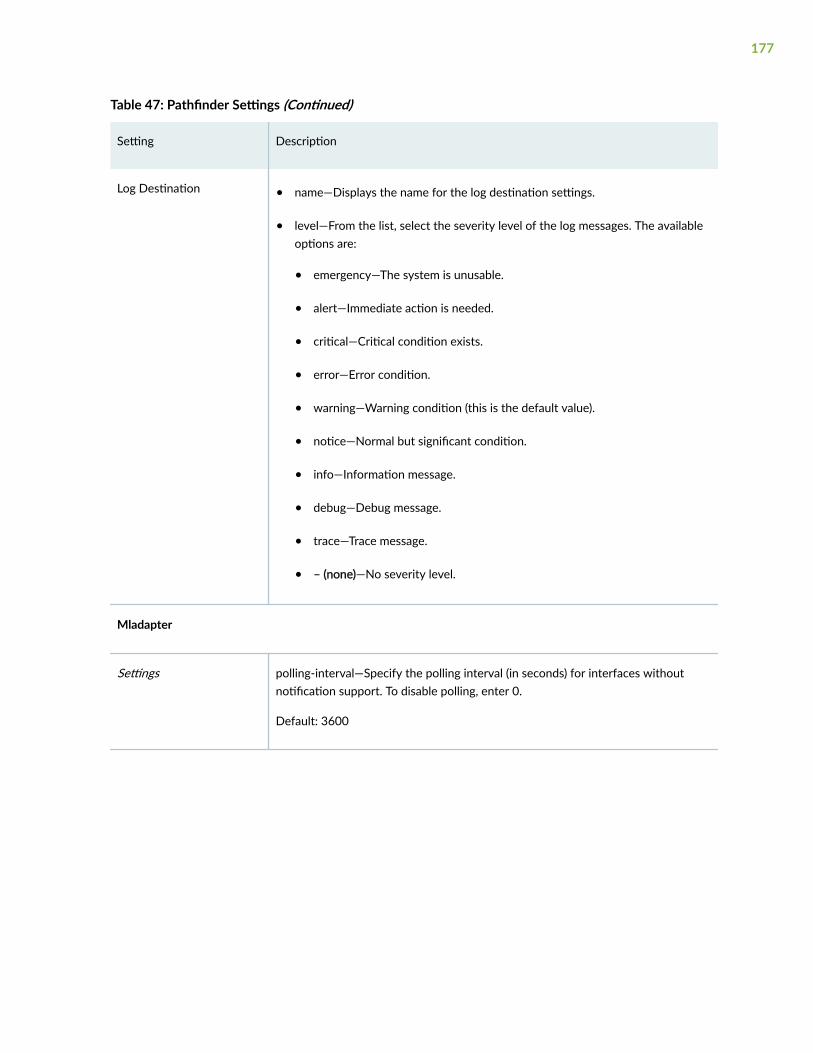
Table 47: Pathfinder Settings (Continued)
Setting Description
Log Destination • name—Displays the name for the log destination settings.
• level—From the list, select the severity level of the log messages. The availableoptions are:
• emergency—The system is unusable.
• alert—Immediate action is needed.
• critical—Critical condition exists.
• error—Error condition.
• warning—Warning condition (this is the default value).
• notice—Normal but significant condition.
• info—Information message.
• debug—Debug message.
• trace—Trace message.
• – (none)—No severity level.
Mladapter
Settings polling-interval—Specify the polling interval (in seconds) for interfaces withoutnotification support. To disable polling, enter 0.
Default: 3600
177

Table 47: Pathfinder Settings (Continued)
Setting Description
Log Destination • name—Displays the name for the log destination settings.
• level—From the list, select the severity level of the log messages. The availableoptions are:
• emergency—The system is unusable.
• alert—Immediate action is needed.
• critical—Critical condition exists.
• error—Error condition.
• warning—Warning condition (this is the default value).
• notice—Normal but significant condition.
• info—Information message.
• debug—Debug message.
• trace—Trace message.
• – (none)—No severity level.
Netconf Connection Controller
178
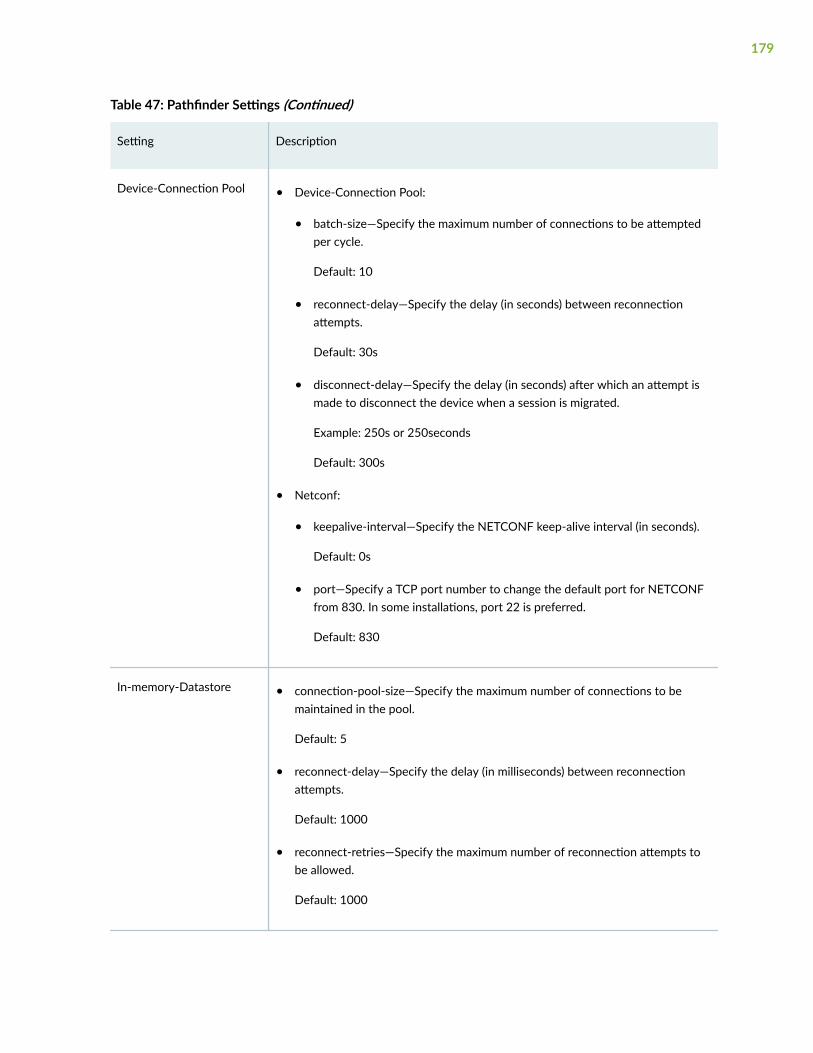
Table 47: Pathfinder Settings (Continued)
Setting Description
Device-Connection Pool • Device-Connection Pool:
• batch-size—Specify the maximum number of connections to be attemptedper cycle.
Default: 10
• reconnect-delay—Specify the delay (in seconds) between reconnectionattempts.
Default: 30s
• disconnect-delay—Specify the delay (in seconds) after which an attempt ismade to disconnect the device when a session is migrated.
Example: 250s or 250seconds
Default: 300s
• Netconf:
• keepalive-interval—Specify the NETCONF keep-alive interval (in seconds).
Default: 0s
• port—Specify a TCP port number to change the default port for NETCONFfrom 830. In some installations, port 22 is preferred.
Default: 830
In-memory-Datastore • connection-pool-size—Specify the maximum number of connections to bemaintained in the pool.
Default: 5
• reconnect-delay—Specify the delay (in milliseconds) between reconnectionattempts.
Default: 1000
• reconnect-retries—Specify the maximum number of reconnection attempts tobe allowed.
Default: 1000
179
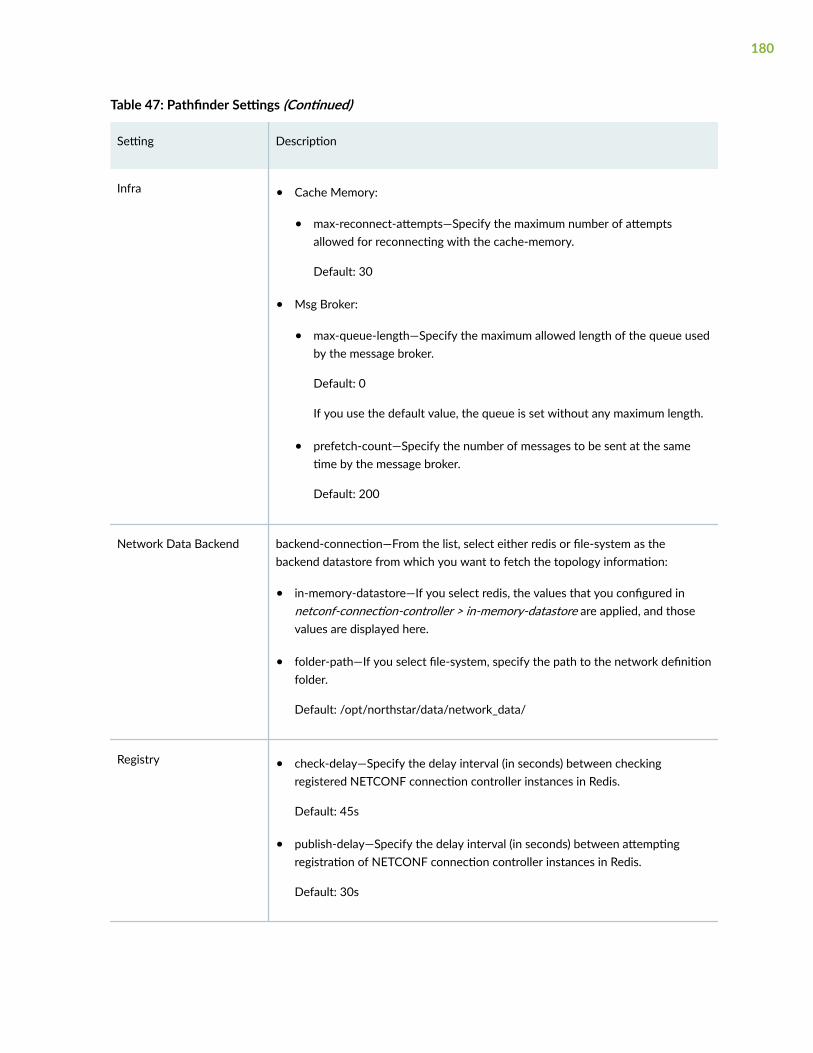
Table 47: Pathfinder Settings (Continued)
Setting Description
Infra • Cache Memory:
• max-reconnect-attempts—Specify the maximum number of attemptsallowed for reconnecting with the cache-memory.
Default: 30
• Msg Broker:
• max-queue-length—Specify the maximum allowed length of the queue usedby the message broker.
Default: 0
If you use the default value, the queue is set without any maximum length.
• prefetch-count—Specify the number of messages to be sent at the sametime by the message broker.
Default: 200
Network Data Backend backend-connection—From the list, select either redis or file-system as thebackend datastore from which you want to fetch the topology information:
• in-memory-datastore—If you select redis, the values that you configured innetconf-connection-controller > in-memory-datastore are applied, and thosevalues are displayed here.
• folder-path—If you select file-system, specify the path to the network definitionfolder.
Default: /opt/northstar/data/network_data/
Registry • check-delay—Specify the delay interval (in seconds) between checkingregistered NETCONF connection controller instances in Redis.
Default: 45s
• publish-delay—Specify the delay interval (in seconds) between attemptingregistration of NETCONF connection controller instances in Redis.
Default: 30s
180
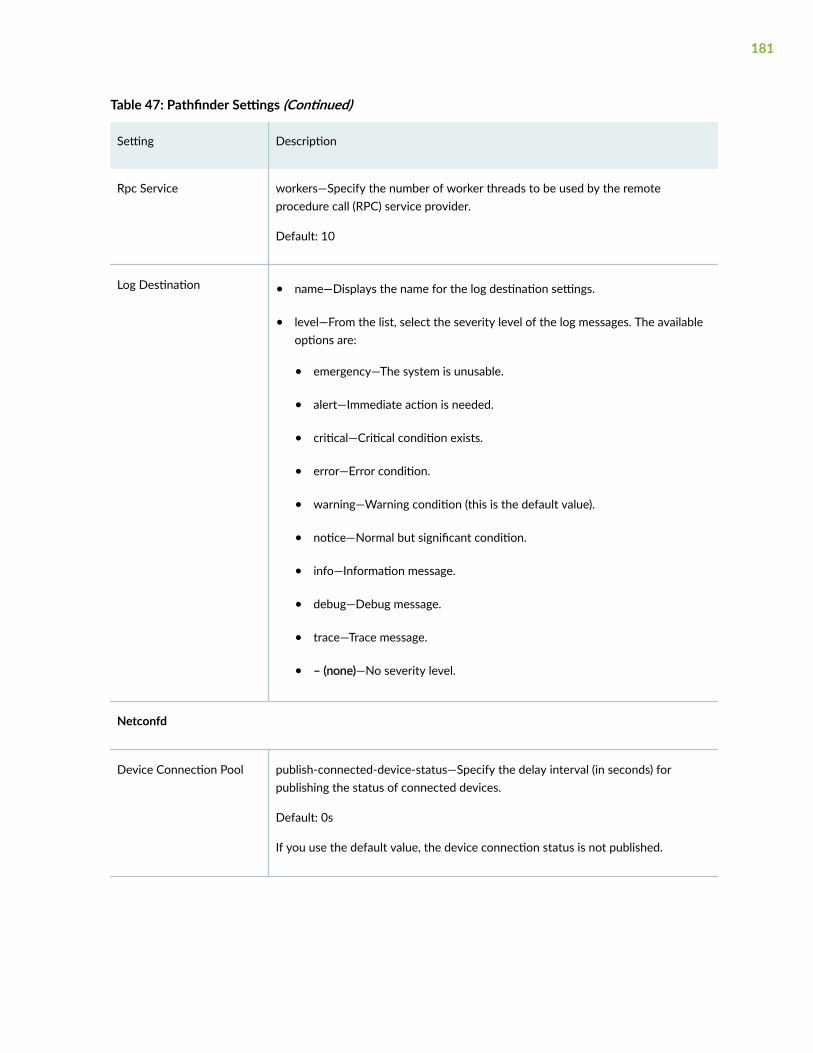
Table 47: Pathfinder Settings (Continued)
Setting Description
Rpc Service workers—Specify the number of worker threads to be used by the remoteprocedure call (RPC) service provider.
Default: 10
Log Destination • name—Displays the name for the log destination settings.
• level—From the list, select the severity level of the log messages. The availableoptions are:
• emergency—The system is unusable.
• alert—Immediate action is needed.
• critical—Critical condition exists.
• error—Error condition.
• warning—Warning condition (this is the default value).
• notice—Normal but significant condition.
• info—Information message.
• debug—Debug message.
• trace—Trace message.
• – (none)—No severity level.
Netconfd
Device Connection Pool publish-connected-device-status—Specify the delay interval (in seconds) forpublishing the status of connected devices.
Default: 0s
If you use the default value, the device connection status is not published.
181
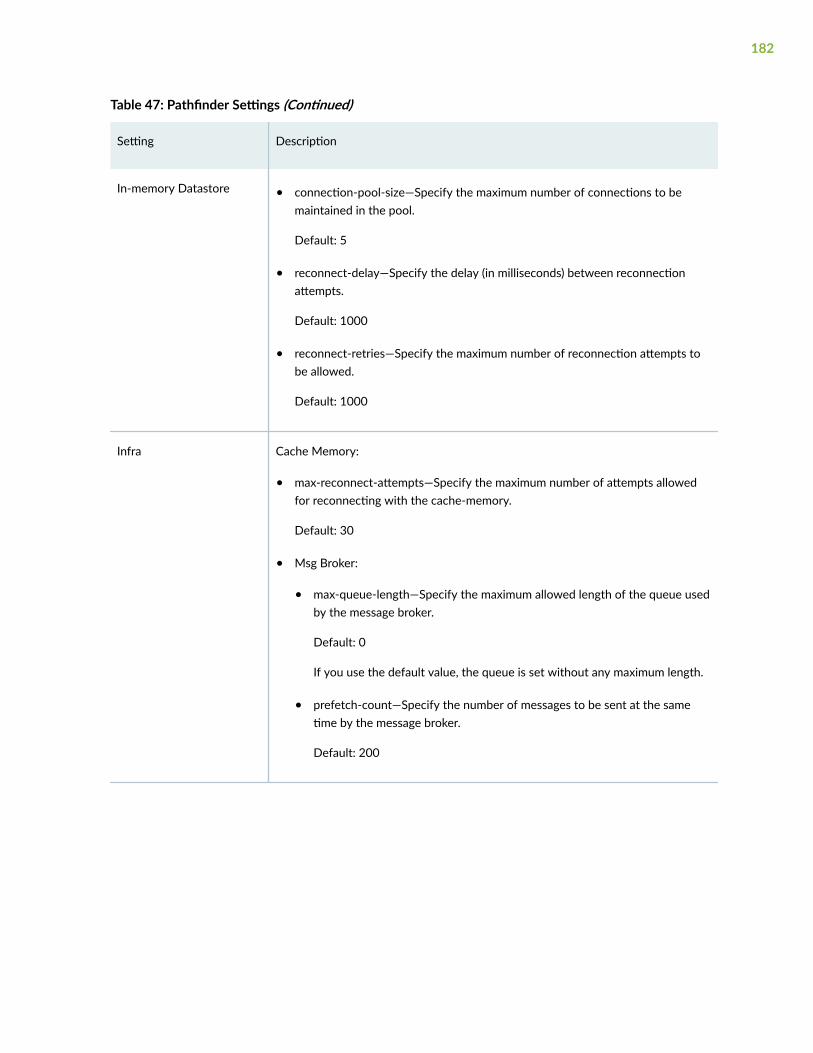
Table 47: Pathfinder Settings (Continued)
Setting Description
In-memory Datastore • connection-pool-size—Specify the maximum number of connections to bemaintained in the pool.
Default: 5
• reconnect-delay—Specify the delay (in milliseconds) between reconnectionattempts.
Default: 1000
• reconnect-retries—Specify the maximum number of reconnection attempts tobe allowed.
Default: 1000
Infra Cache Memory:
• max-reconnect-attempts—Specify the maximum number of attempts allowedfor reconnecting with the cache-memory.
Default: 30
• Msg Broker:
• max-queue-length—Specify the maximum allowed length of the queue usedby the message broker.
Default: 0
If you use the default value, the queue is set without any maximum length.
• prefetch-count—Specify the number of messages to be sent at the sametime by the message broker.
Default: 200
182

Table 47: Pathfinder Settings (Continued)
Setting Description
Network Data Backend backend-connection—From the list, select either redis or file-system as thebackend datastore from which you want to fetch the topology information:
• in-memory-datastore—If you select redis, the values that you configured innetconf-connection-controller > in-memory-datastore are applied, and thosevalues are displayed in this field.
• folder-path—If you select file-system, specify the path to the network definitionfolder.
Default: /opt/northstar/data/network_data/
Proxy workers—Specify the number of worker threads to be used by the proxy serviceprovider.
Default: 10
Registry check-delay—Specify the delay (in seconds) between checking registeredNETCONF connection controller instances in Redis.
Default: 45s
183
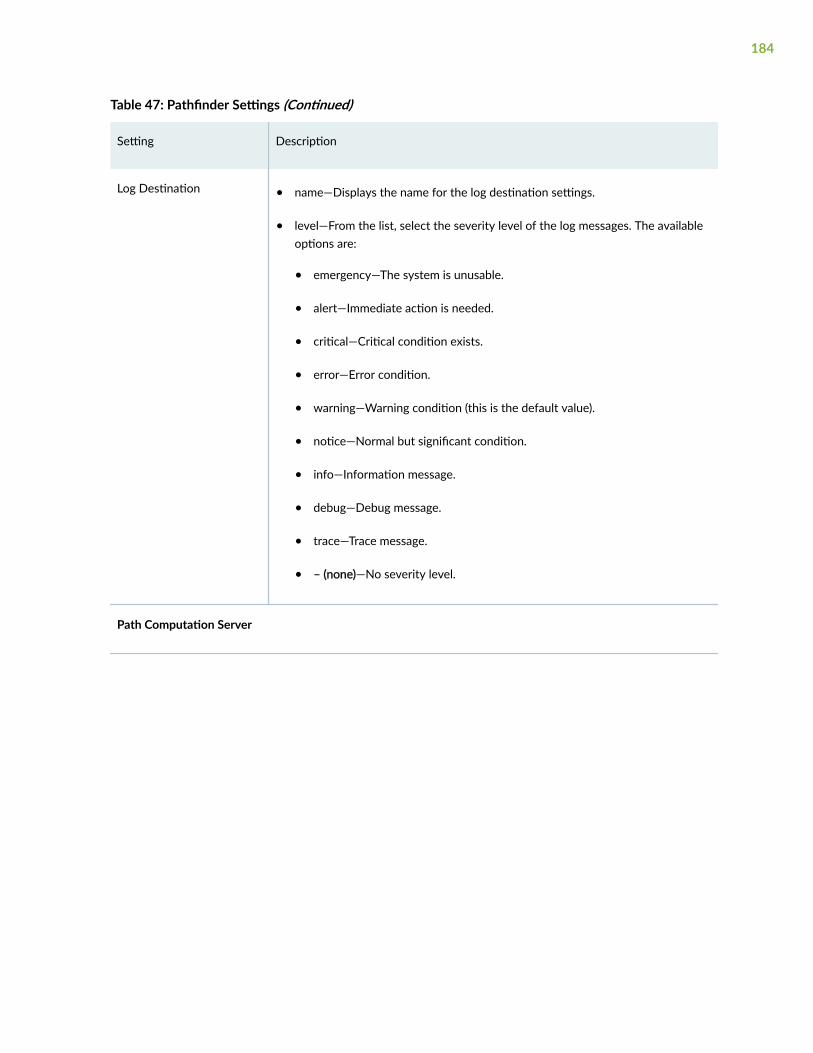
Table 47: Pathfinder Settings (Continued)
Setting Description
Log Destination • name—Displays the name for the log destination settings.
• level—From the list, select the severity level of the log messages. The availableoptions are:
• emergency—The system is unusable.
• alert—Immediate action is needed.
• critical—Critical condition exists.
• error—Error condition.
• warning—Warning condition (this is the default value).
• notice—Normal but significant condition.
• info—Information message.
• debug—Debug message.
• trace—Trace message.
• – (none)—No severity level.
Path Computation Server
184

Table 47: Pathfinder Settings (Continued)
Setting Description
Settings • ignore-rro-check—Click the toggle button to enable or disable the PathComputation Server (PCS) to ignore explicit route objects (ERO) and recordroute objects (RRO) during LSP initial node consolidation. By default, this togglebutton is disabled.
• northstar-vpn—Click the toggle button to enable or disable Pathfinder VPNfeatures in the PCS. By default, this toggle button is disabled.
• lsp-latency-interval—Specify the frequency (in seconds) at which the PCViewercalculates LSP delay and display the data in the Tunnel tab of the GUI (Network> Topology > Tunnels tab > View > Delay).
• license-check-interval—Specify the interval for the PCS to check for the license(npatpw) file.
Default: 3600s
• route-over-logical-SRLink—Click the toggle button to enable or disable the PCSto calculate a route over a logical segment routed (SR) link. By default, thistoggle button is disabled.
• SRLG-provisioning—Click the toggle button to enable or disable theprovisioning of shared risk link groups (SRLG). By default, this toggle button isdisabled.
• provisioning-include-lsp-metric—Click the toggle button to enable or disablethe PCS to include the LSP metric when provisioning the LSP. By default, thistoggle button is disabled.
• disable-ecmp-tree-calculation—Click the toggle button to enable or disable thecalculation of equal-cost multi-paths (ECMP). If you enable this toggle button,ECMP calculation is disabled. By default, this toggle button is disabled.
• disable-node-sid-calculation—Click the toggle button to enable or disable nodesegment ID (SID) calculation. By default, this toggle button is disabled. If youenable this toggle button, node segment SID calculation is disabled.
• lsp-provision-queue-size—Specify the size for the LSP provisioning queue.
Default: 50
185

Table 47: Pathfinder Settings (Continued)
Setting Description
• pcep-speaker-id—Specify the PCEP speaker ID to be used for P2MP flowmapping.
Default: northstar
• zero-bandwidth-signalling—Click the toggle button to enable or disable thezero-bandwidth signaling feature. By default, this toggle button is disabled.
• ecmp-placement-method—Specify one of the following options as the ECMPplacement method. After considering link metrics, if there are multiple ECMPsavailable, Pathfinder selects a path based on the value you specify here. If youdon't specify a value, the first random path is selected for all the LSPs.
Random—Pathfinder randomly selects one of the ECMP paths.
Least Fill—Pathfinder selects the path with the maximum available bandwidth.
Most Fill—Pathfinder selects the path with the minimum available bandwidth.
• monitor-mode—Click the toggle button to enable or disable the monitor modein the PCS. By default, this toggle button is disabled.
If you enable monitor mode, the PCS doesn't send LSP provisioning orders tothe PCC. You use this option when you want to monitor the topology but don’twant the LSPs provisioned. If you disable monitor mode, the PCS sends LSPprovisioning orders to the PCC.
186
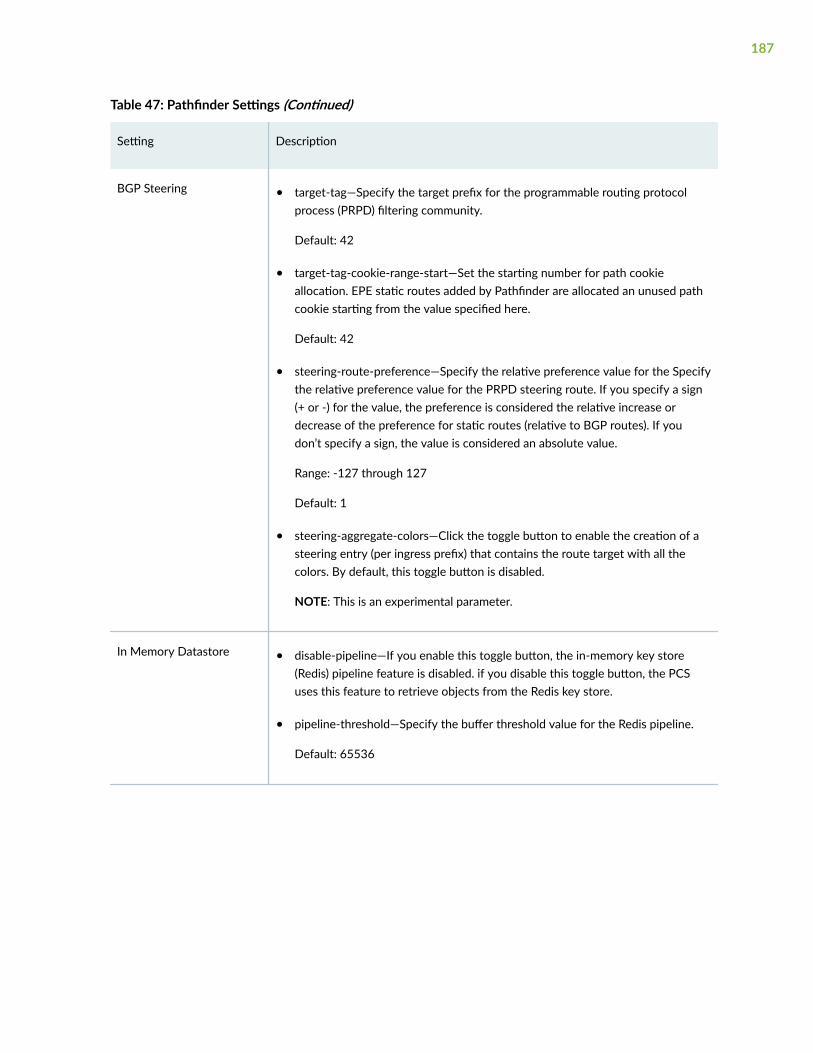
Table 47: Pathfinder Settings (Continued)
Setting Description
BGP Steering • target-tag—Specify the target prefix for the programmable routing protocolprocess (PRPD) filtering community.
Default: 42
• target-tag-cookie-range-start—Set the starting number for path cookieallocation. EPE static routes added by Pathfinder are allocated an unused pathcookie starting from the value specified here.
Default: 42
• steering-route-preference—Specify the relative preference value for the Specifythe relative preference value for the PRPD steering route. If you specify a sign(+ or -) for the value, the preference is considered the relative increase ordecrease of the preference for static routes (relative to BGP routes). If youdon’t specify a sign, the value is considered an absolute value.
Range: -127 through 127
Default: 1
• steering-aggregate-colors—Click the toggle button to enable the creation of asteering entry (per ingress prefix) that contains the route target with all thecolors. By default, this toggle button is disabled.
NOTE: This is an experimental parameter.
In Memory Datastore • disable-pipeline—If you enable this toggle button, the in-memory key store(Redis) pipeline feature is disabled. if you disable this toggle button, the PCSuses this feature to retrieve objects from the Redis key store.
• pipeline-threshold—Specify the buffer threshold value for the Redis pipeline.
Default: 65536
187
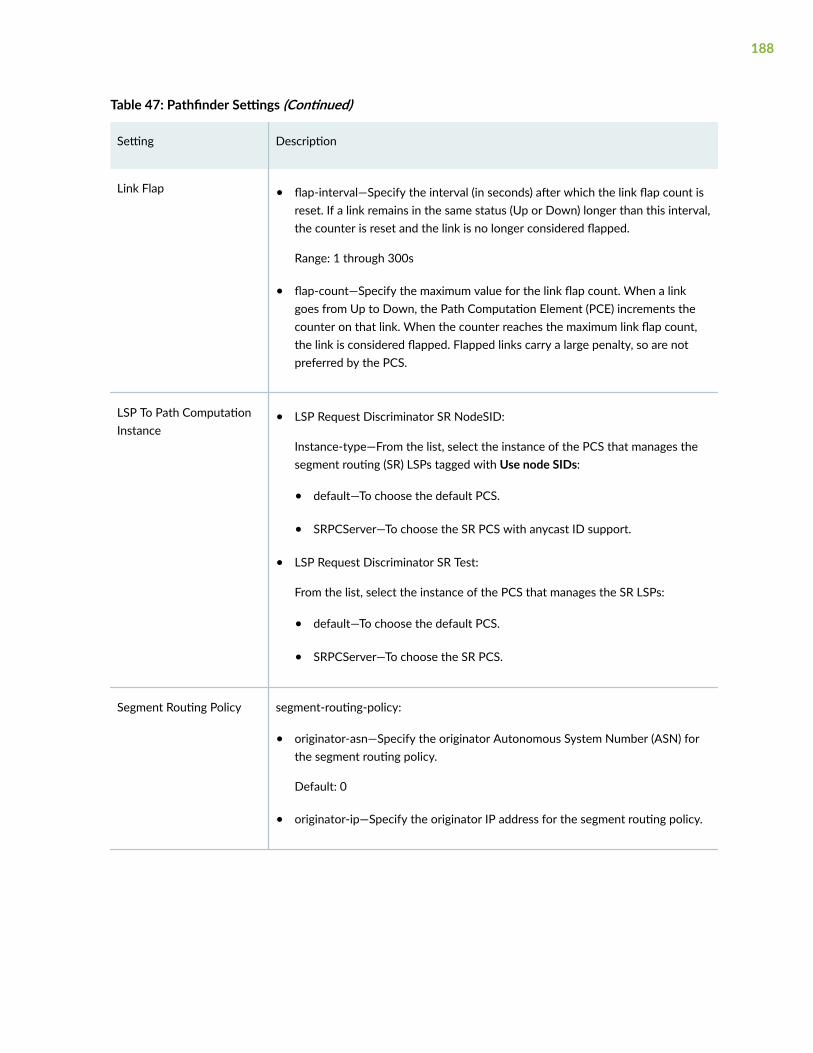
Table 47: Pathfinder Settings (Continued)
Setting Description
Link Flap • flap-interval—Specify the interval (in seconds) after which the link flap count isreset. If a link remains in the same status (Up or Down) longer than this interval,the counter is reset and the link is no longer considered flapped.
Range: 1 through 300s
• flap-count—Specify the maximum value for the link flap count. When a linkgoes from Up to Down, the Path Computation Element (PCE) increments thecounter on that link. When the counter reaches the maximum link flap count,the link is considered flapped. Flapped links carry a large penalty, so are notpreferred by the PCS.
LSP To Path ComputationInstance
• LSP Request Discriminator SR NodeSID:
Instance-type—From the list, select the instance of the PCS that manages thesegment routing (SR) LSPs tagged with Use node SIDs:
• default—To choose the default PCS.
• SRPCServer—To choose the SR PCS with anycast ID support.
• LSP Request Discriminator SR Test:
From the list, select the instance of the PCS that manages the SR LSPs:
• default—To choose the default PCS.
• SRPCServer—To choose the SR PCS.
Segment Routing Policy segment-routing-policy:
• originator-asn—Specify the originator Autonomous System Number (ASN) forthe segment routing policy.
Default: 0
• originator-ip—Specify the originator IP address for the segment routing policy.
188
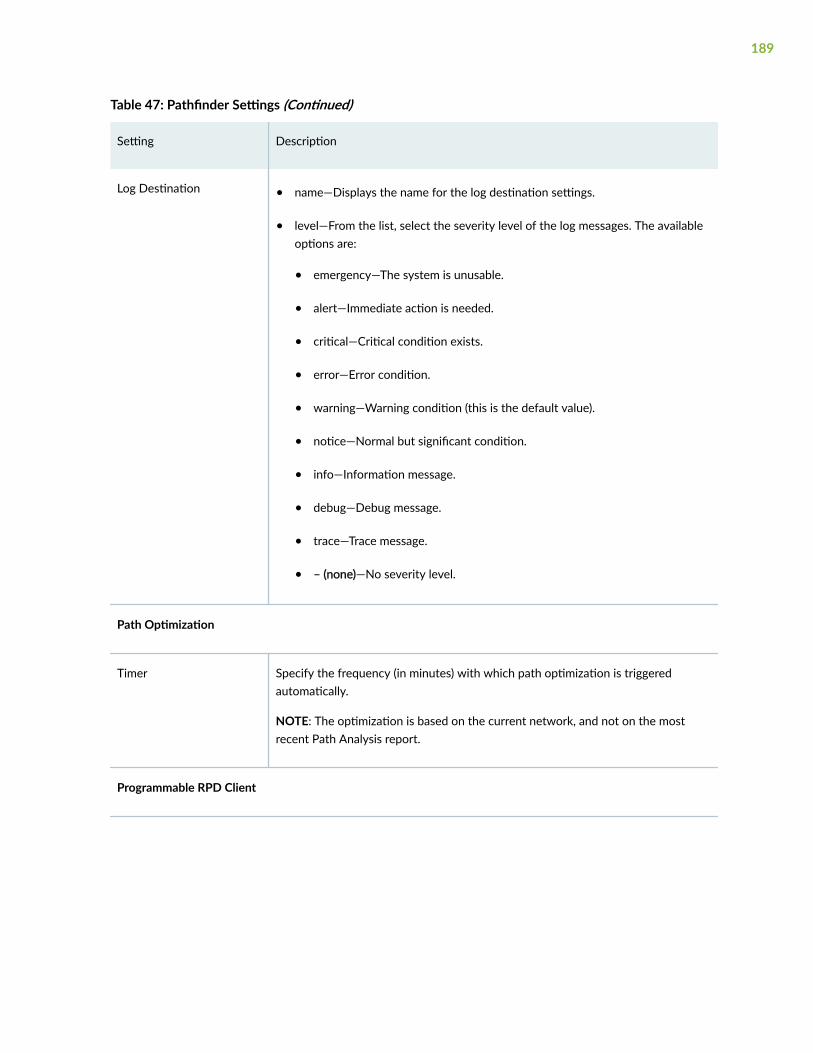
Table 47: Pathfinder Settings (Continued)
Setting Description
Log Destination • name—Displays the name for the log destination settings.
• level—From the list, select the severity level of the log messages. The availableoptions are:
• emergency—The system is unusable.
• alert—Immediate action is needed.
• critical—Critical condition exists.
• error—Error condition.
• warning—Warning condition (this is the default value).
• notice—Normal but significant condition.
• info—Information message.
• debug—Debug message.
• trace—Trace message.
• – (none)—No severity level.
Path Optimization
Timer Specify the frequency (in minutes) with which path optimization is triggeredautomatically.
NOTE: The optimization is based on the current network, and not on the mostrecent Path Analysis report.
Programmable RPD Client
189

Table 47: Pathfinder Settings (Continued)
Setting Description
Settings • retry-interval—Specify the frequency (in seconds) with which the connection tothe programmable routing protocol process (PRPD) client is retried after afailure.
Example: 60s or 60seconds
Default: 30s
• top-prefix-filter—Specify whether you want the BGP monitor routes to includeonly the top prefix routes. This setting will not filter out the already-learnedroutes until the connection to the router is reset.
Log Destination • name—Specify a unique name for the log destination settings.
• level—From the list, select the severity level of the log messages. The availableoptions are:
• emergency—The system is unusable.
• alert—Immediate action is needed.
• critical—Critical condition exists.
• error—Error condition.
• warning—Warning condition (this is the default value).
• notice—Normal but significant condition.
• info—Information message.
• debug—Debug message.
• trace—Trace message.
• – (none)—No severity level.
System
190
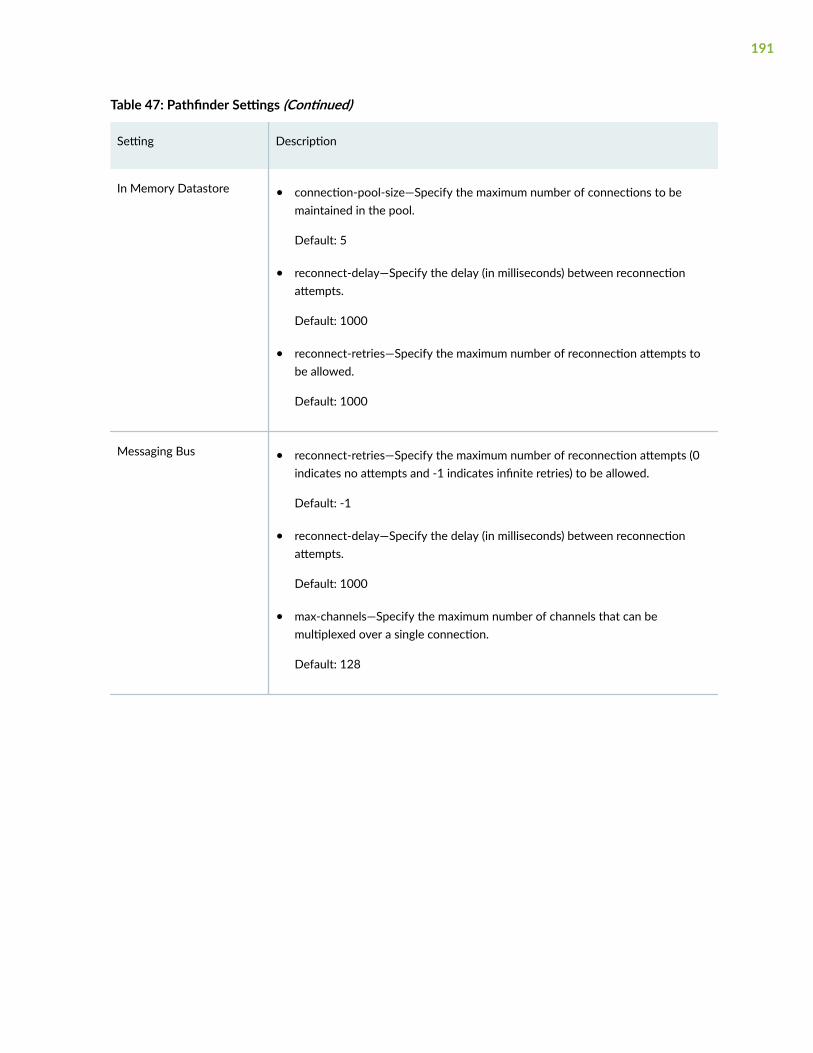
Table 47: Pathfinder Settings (Continued)
Setting Description
In Memory Datastore • connection-pool-size—Specify the maximum number of connections to bemaintained in the pool.
Default: 5
• reconnect-delay—Specify the delay (in milliseconds) between reconnectionattempts.
Default: 1000
• reconnect-retries—Specify the maximum number of reconnection attempts tobe allowed.
Default: 1000
Messaging Bus • reconnect-retries—Specify the maximum number of reconnection attempts (0indicates no attempts and -1 indicates infinite retries) to be allowed.
Default: -1
• reconnect-delay—Specify the delay (in milliseconds) between reconnectionattempts.
Default: 1000
• max-channels—Specify the maximum number of channels that can bemultiplexed over a single connection.
Default: 128
191
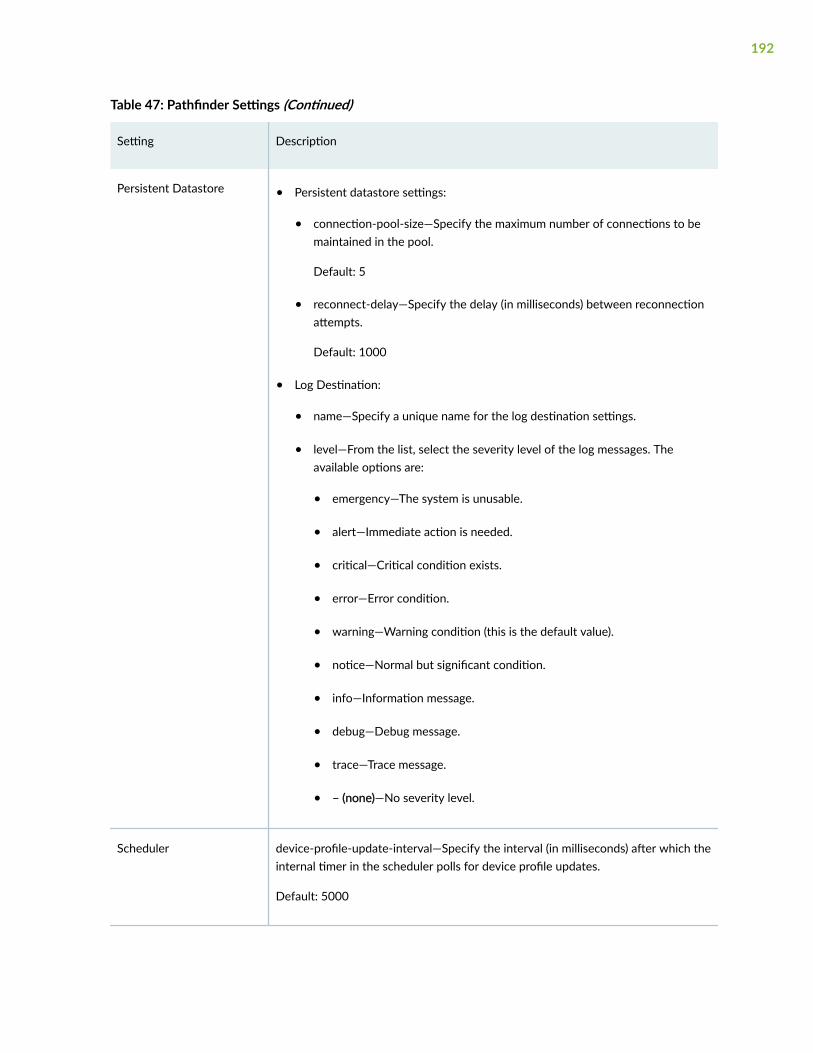
Table 47: Pathfinder Settings (Continued)
Setting Description
Persistent Datastore • Persistent datastore settings:
• connection-pool-size—Specify the maximum number of connections to bemaintained in the pool.
Default: 5
• reconnect-delay—Specify the delay (in milliseconds) between reconnectionattempts.
Default: 1000
• Log Destination:
• name—Specify a unique name for the log destination settings.
• level—From the list, select the severity level of the log messages. Theavailable options are:
• emergency—The system is unusable.
• alert—Immediate action is needed.
• critical—Critical condition exists.
• error—Error condition.
• warning—Warning condition (this is the default value).
• notice—Normal but significant condition.
• info—Information message.
• debug—Debug message.
• trace—Trace message.
• – (none)—No severity level.
Scheduler device-profile-update-interval—Specify the interval (in milliseconds) after which theinternal timer in the scheduler polls for device profile updates.
Default: 5000
192
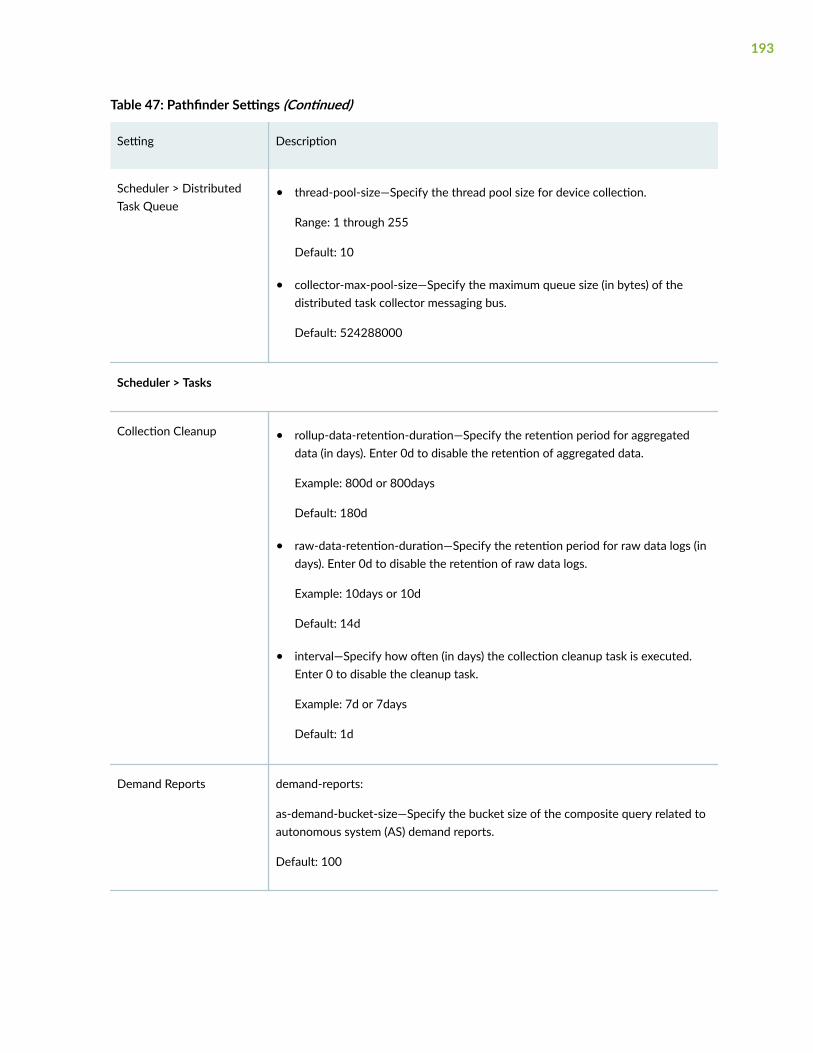
Table 47: Pathfinder Settings (Continued)
Setting Description
Scheduler > DistributedTask Queue
• thread-pool-size—Specify the thread pool size for device collection.
Range: 1 through 255
Default: 10
• collector-max-pool-size—Specify the maximum queue size (in bytes) of thedistributed task collector messaging bus.
Default: 524288000
Scheduler > Tasks
Collection Cleanup • rollup-data-retention-duration—Specify the retention period for aggregateddata (in days). Enter 0d to disable the retention of aggregated data.
Example: 800d or 800days
Default: 180d
• raw-data-retention-duration—Specify the retention period for raw data logs (indays). Enter 0d to disable the retention of raw data logs.
Example: 10days or 10d
Default: 14d
• interval—Specify how often (in days) the collection cleanup task is executed.Enter 0 to disable the cleanup task.
Example: 7d or 7days
Default: 1d
Demand Reports demand-reports:
as-demand-bucket-size—Specify the bucket size of the composite query related toautonomous system (AS) demand reports.
Default: 100
193

Table 47: Pathfinder Settings (Continued)
Setting Description
Device Collection • data-path—Specify the path to the parent directory for the device collectiontask.
Default: /opt/northstar/data
• timeout—Specify the time (in seconds) after which the device collection tasktimes out.
Example: 3000s or 3000seconds
Default: 1800s
• enable-update-device-profile—Click the toggle button to enable updating thedevice profiles as part of the device collection task. By default, this togglebutton is disabled.
• purge-cutoff—Specify the purge cut-off period (in days). The device collectiontask deletes all files that are older than the specified cut-off value.
Example: 10d or 10days
Default: 7d
File Transfer • interval—Specify the interval (in seconds) at which the system transfers filesfrom the active node to other cluster nodes.
Example: 3000s or 3000seconds
Default: 3600s
• paths—Specify one or more complete directory paths for transferring files fromthe active node to other cluster nodes.
194

Table 47: Pathfinder Settings (Continued)
Setting Description
Rollup • interval—Specify how often the ESRollup system task is run (in hours). TheESRollup system task executes the esrollup.py script to aggregate the previoushour’s data. The ESRollup task is called from the Pathfinder server. You canview (but not modify) the rollup task on the Task Scheduler page(Administration > Task Scheduler).
Example: 3h or 3hours
Default: 1h
NOTE: We recommend that you do not change this default value except todisable aggregation. If you want to disable data aggregation, set the value to0h.
• max-worker-process—Specify the maximum number of worker processes thatcan be used for the ESRollup system task.
Default: 4 or equivalent to the number of CPUs (whichever value is smaller)
• bulk-insert-record-count—Specify the maximum number of records in bulk,which can be inserted to the PostgreSQL database.
Default: 5000
195
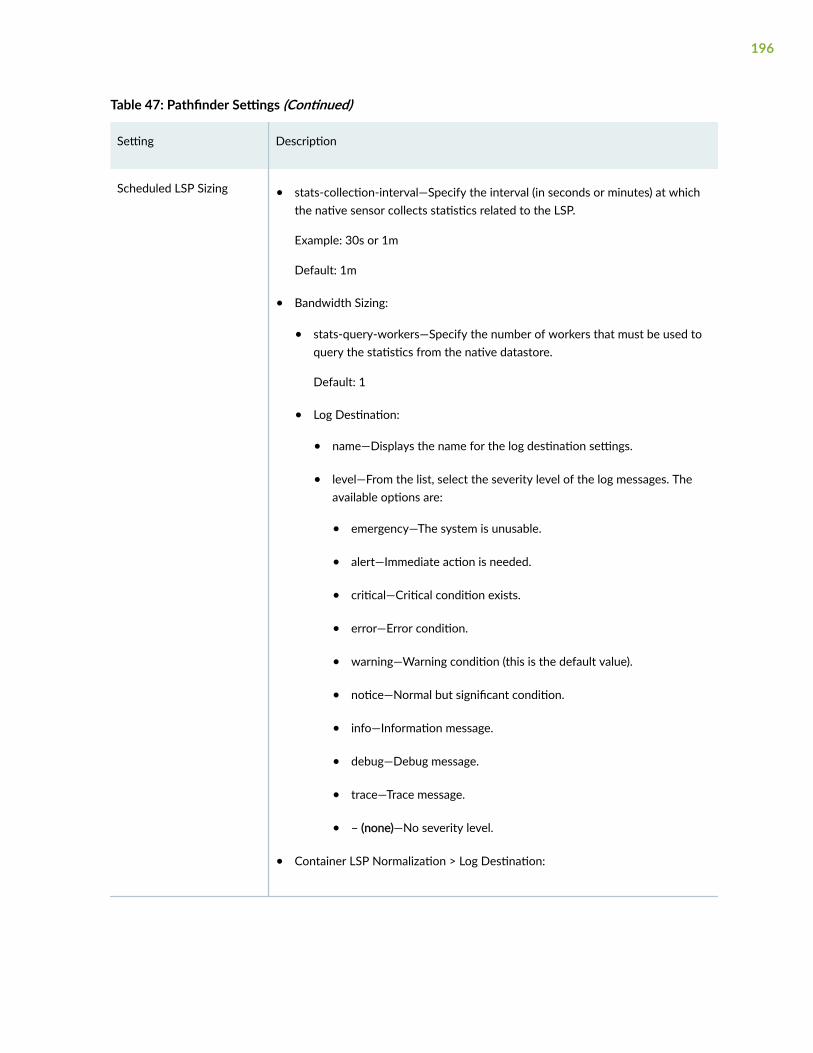
Table 47: Pathfinder Settings (Continued)
Setting Description
Scheduled LSP Sizing • stats-collection-interval—Specify the interval (in seconds or minutes) at whichthe native sensor collects statistics related to the LSP.
Example: 30s or 1m
Default: 1m
• Bandwidth Sizing:
• stats-query-workers—Specify the number of workers that must be used toquery the statistics from the native datastore.
Default: 1
• Log Destination:
• name—Displays the name for the log destination settings.
• level—From the list, select the severity level of the log messages. Theavailable options are:
• emergency—The system is unusable.
• alert—Immediate action is needed.
• critical—Critical condition exists.
• error—Error condition.
• warning—Warning condition (this is the default value).
• notice—Normal but significant condition.
• info—Information message.
• debug—Debug message.
• trace—Trace message.
• – (none)—No severity level.
• Container LSP Normalization > Log Destination:
196
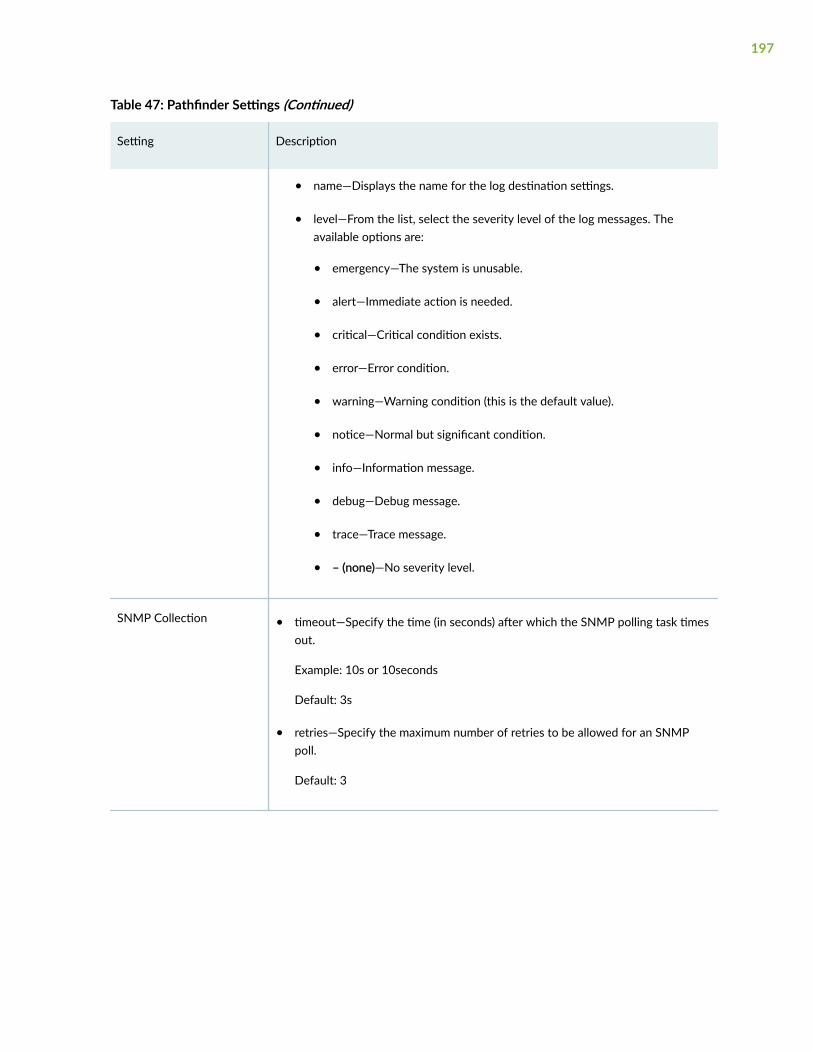
Table 47: Pathfinder Settings (Continued)
Setting Description
• name—Displays the name for the log destination settings.
• level—From the list, select the severity level of the log messages. Theavailable options are:
• emergency—The system is unusable.
• alert—Immediate action is needed.
• critical—Critical condition exists.
• error—Error condition.
• warning—Warning condition (this is the default value).
• notice—Normal but significant condition.
• info—Information message.
• debug—Debug message.
• trace—Trace message.
• – (none)—No severity level.
SNMP Collection • timeout—Specify the time (in seconds) after which the SNMP polling task timesout.
Example: 10s or 10seconds
Default: 3s
• retries—Specify the maximum number of retries to be allowed for an SNMPpoll.
Default: 3
197

Table 47: Pathfinder Settings (Continued)
Setting Description
Log Destination • name—Specify a unique name for the log destination settings.
• level—From the list, select the severity level of the log messages. The availableoptions are:
• emergency—The system is unusable.
• alert—Immediate action is needed.
• critical—Critical condition exists.
• error—Error condition.
• warning—Warning condition (this is the default value).
• notice—Normal but significant condition.
• info—Information message.
• debug—Debug message.
• trace—Trace message.
• – (none)—No severity level.
Topology Filter
Data Persistence • persistent-storage-init-wait—Specify the wait time (in seconds) for thepersistent storage connection to be established before exiting with aninitialization failure.
Default: 45s
• file-store-path—Specify the default data output directory for file stores.
Default: /opt/northstar/data
198

Table 47: Pathfinder Settings (Continued)
Setting Description
Messaging Bus • reconnect-retries—Specify the number of reconnection attempts (0 indicatesno attempts and -1 indicates infinite retries) to be allowed.
Default: -1
• reconnect-delay—Specify the delay (in milliseconds) between reconnectionattempts.
Default: 1000
• max-channels—Specify the maximum number of channels that can bemultiplexed over a single connection.
Default: 128
199

Table 47: Pathfinder Settings (Continued)
Setting Description
Persistent Datastore • Persistent datastore settings:
• connection-pool-size—Specify the maximum number of connections to bemaintained in the pool.
Default: 5
• reconnect-delay—Specify the delay (in milliseconds) between reconnectionattempts.
Default: 5000
• Log Destination:
• name—Specify a unique name for the log destination settings.
• level—From the list, select the severity level of the log messages. Theavailable options are:
• emergency—The system is unusable.
• alert—Immediate action is needed.
• critical—Critical condition exists.
• error—Error condition.
• warning—Warning condition (this is the default value).
• notice—Normal but significant condition.
• info—Information message.
• debug—Debug message.
• trace—Trace message.
• – (none)—No severity level.
200

Table 47: Pathfinder Settings (Continued)
Setting Description
Log Destination • name—Displays the name for the log destination settings.
• level—From the list, select the severity level of the log messages. The availableoptions are:
• emergency—The system is unusable.
• alert—Immediate action is needed.
• critical—Critical condition exists.
• error—Error condition.
• warning—Warning condition (this is the default value).
• notice—Normal but significant condition.
• info—Information message.
• debug—Debug message.
• trace—Trace message.
• – (none)—No severity level.
Topology Server
201

Table 47: Pathfinder Settings (Continued)
Setting Description
Application • use-live-rsvp-bw-over-configured—Click the toggle button to enable or disablethe usage of live RSVP bandwidth (obtained from the live network) instead ofthe RSVP bandwidth that you configured.
By default, this toggle button is disabled.
• use-nokia-path-workaround—Click the toggle button to append a double colon(::) to the device name and routing path name strings for Nokia devices.
By default, this toggle button is disabled.
• use-unnumbered-interface-workaround—Click the toggle button to enable ordisable the usage of interface index (IfIndex) to correlate link events forunnumbered interfaces.
If you enable this toggle button, usage of IfIndex is disabled. By default, thistoggle button is disabled.
• use-prefix-link-matching—Click the toggle button to enable or disable the usageof prefixes to correlate bidirectional links events.
By default, this toggle button is disabled.
• do-not-publish-rest-updates—Click the toggle button to allow or prevent thetopology server from publishing object updates to the REST server.
If you enable this toggle button, the topology server doesn’t publish objectupdates to the REST server. By default, this toggle button is disabled.
• do-not-suppress-beacon-message—Click the toggle button to allow or suppress(prevent) beacon messages from being written to log files.
If you enable this toggle button, the suppression of beacon messages isdisabled. By default, this toggle button is disabled.
• no-netconf-pathname-allocation—Click the toggle button to allow or preventthe topology server from checking the path names allocated to LSPs configuredthrough NETCONF.
If you enable this toggle button, the topology server doesn't check for pathnames and also doesn't set the path name for the planned LSP. By default, thistoggle button is disabled.
202
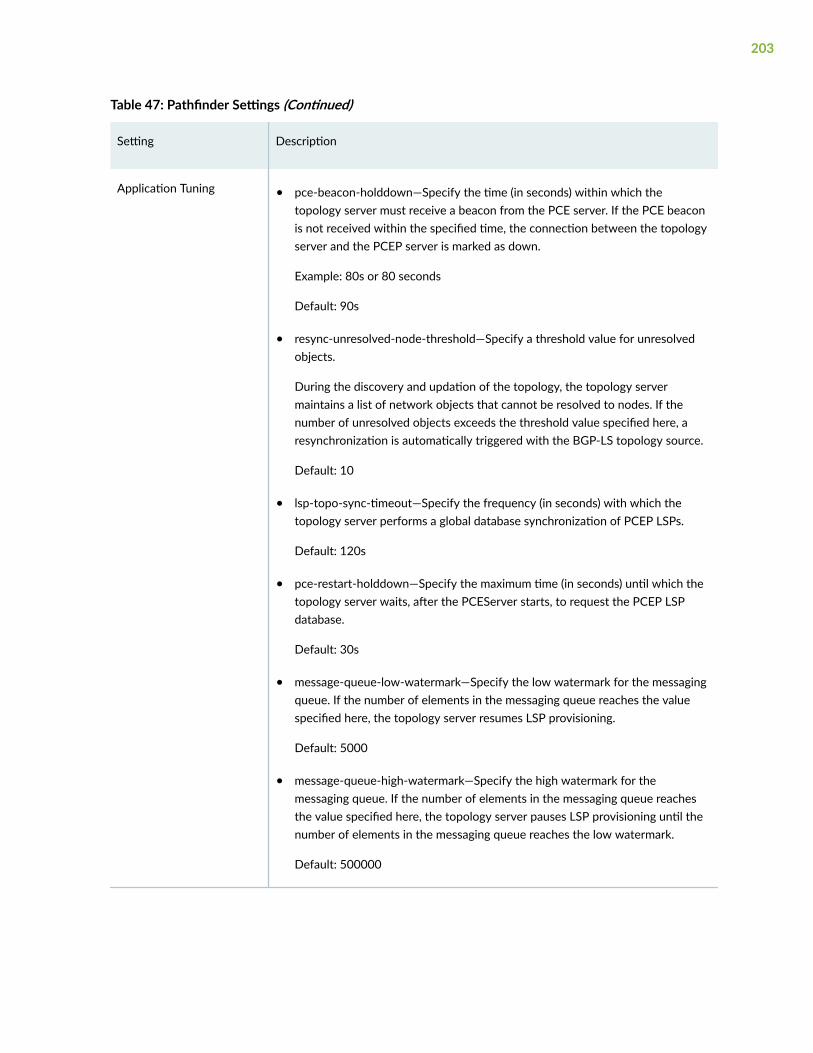
Table 47: Pathfinder Settings (Continued)
Setting Description
Application Tuning • pce-beacon-holddown—Specify the time (in seconds) within which thetopology server must receive a beacon from the PCE server. If the PCE beaconis not received within the specified time, the connection between the topologyserver and the PCEP server is marked as down.
Example: 80s or 80 seconds
Default: 90s
• resync-unresolved-node-threshold—Specify a threshold value for unresolvedobjects.
During the discovery and updation of the topology, the topology servermaintains a list of network objects that cannot be resolved to nodes. If thenumber of unresolved objects exceeds the threshold value specified here, aresynchronization is automatically triggered with the BGP-LS topology source.
Default: 10
• lsp-topo-sync-timeout—Specify the frequency (in seconds) with which thetopology server performs a global database synchronization of PCEP LSPs.
Default: 120s
• pce-restart-holddown—Specify the maximum time (in seconds) until which thetopology server waits, after the PCEServer starts, to request the PCEP LSPdatabase.
Default: 30s
• message-queue-low-watermark—Specify the low watermark for the messagingqueue. If the number of elements in the messaging queue reaches the valuespecified here, the topology server resumes LSP provisioning.
Default: 5000
• message-queue-high-watermark—Specify the high watermark for themessaging queue. If the number of elements in the messaging queue reachesthe value specified here, the topology server pauses LSP provisioning until thenumber of elements in the messaging queue reaches the low watermark.
Default: 500000
203
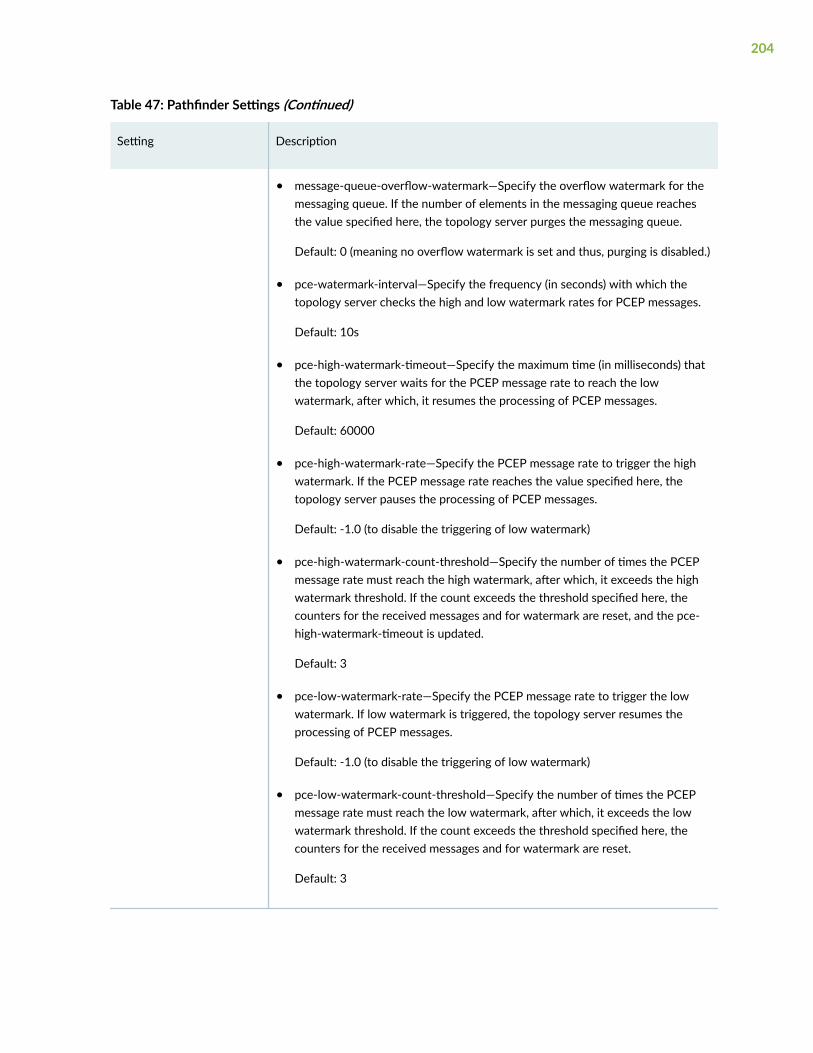
Table 47: Pathfinder Settings (Continued)
Setting Description
• message-queue-overflow-watermark—Specify the overflow watermark for themessaging queue. If the number of elements in the messaging queue reachesthe value specified here, the topology server purges the messaging queue.
Default: 0 (meaning no overflow watermark is set and thus, purging is disabled.)
• pce-watermark-interval—Specify the frequency (in seconds) with which thetopology server checks the high and low watermark rates for PCEP messages.
Default: 10s
• pce-high-watermark-timeout—Specify the maximum time (in milliseconds) thatthe topology server waits for the PCEP message rate to reach the lowwatermark, after which, it resumes the processing of PCEP messages.
Default: 60000
• pce-high-watermark-rate—Specify the PCEP message rate to trigger the highwatermark. If the PCEP message rate reaches the value specified here, thetopology server pauses the processing of PCEP messages.
Default: -1.0 (to disable the triggering of low watermark)
• pce-high-watermark-count-threshold—Specify the number of times the PCEPmessage rate must reach the high watermark, after which, it exceeds the highwatermark threshold. If the count exceeds the threshold specified here, thecounters for the received messages and for watermark are reset, and the pce-high-watermark-timeout is updated.
Default: 3
• pce-low-watermark-rate—Specify the PCEP message rate to trigger the lowwatermark. If low watermark is triggered, the topology server resumes theprocessing of PCEP messages.
Default: -1.0 (to disable the triggering of low watermark)
• pce-low-watermark-count-threshold—Specify the number of times the PCEPmessage rate must reach the low watermark, after which, it exceeds the lowwatermark threshold. If the count exceeds the threshold specified here, thecounters for the received messages and for watermark are reset.
Default: 3
204

Table 47: Pathfinder Settings (Continued)
Setting Description
Data Persistence • persistent-storage-init-wait—Specify the maximum time (in seconds) untilwhich the topology server waits for the persistent storage connection to beestablished. If the wait time exceeds the specified value, the topology serverexits the topology server application with an initialization failure.
Example: 10s or 10seconds
Default: 45s
• network-snapshot-store-path—Specify the output directory in which you wantto save a snapshot of the network topology.
Default: /opt/northstar/data/network_archive/NorthStar
• file-store-path—Specify the default data output directory for file stores.
Default: /opt/northstar/data
• debug-file-store-path—Specify the default data output directory for debugoutput files.
Default: /opt/northstar/data
• network-snapshot-store-interval—Specify the maximum time (in seconds) untilwhich the network topology snapshot must be stored in the PostgreSQLdatabase.
Example: 3000s or 3000seconds
Default: 3600s
• persist-lsp-topology-object—Click the toggle button to enable or disable thepersistence of the LSP topology object in the PostgreSQL database.
By default, this toggle button is disabled.
• do-not-persist-pcep-lsp-events—Click the toggle button to enable or disablethe persistence of PCEP LSP events in the PostgreSQL database.
If you enable this toggle button, PCEP LSP events are not stored in thePostgreSQL database. By default, this toggle button is disabled.
• persist-pcep-pcc-node-events—Click the toggle button to enable or disable thepersistence of PCEP node events in the PostgreSQL database.
205

Table 47: Pathfinder Settings (Continued)
Setting Description
By default, this toggle button is disabled.
• do-not-persist-topology-advertisements—Click the toggle button to enable ordisable the persistence of BGP-LS advertisements in the PostgreSQL database.
If you enable this toggle button, BGP-LS advertisements are not stored in thePostgreSQL database. By default, this toggle button is disabled.
• do-not-persist-provision-requests—Click the toggle button to enable or disablethe persistence of provisioning requests (in JSON format) in the PostgreSQLdatabase.
If you enable this toggle button, provisioning requests are not stored in thePostgreSQL database. By default, this toggle button is disabled.
• do-not-persist-lsp-events—Click the toggle button to disable the persistence ofLSP events (event description and object data) in the PostgreSQL database.
If you enable this toggle button, LSP events are not stored in the PostgreSQLdatabase. By default, this toggle button is disabled.
• do-not-persist-node-events—Click the toggle button to enable or disable thepersistence of node events (event description and object data) in thePostgreSQL database.
If you enable this toggle button, node events are not stored in the PostgreSQLdatabase. By default, this toggle button is disabled.
• do-not-persist-link-events—Click the toggle button to enable or disable thepersistence of link events (event description and object data) in the PostgreSQLdatabase.
If you enable this toggle button, link events are not stored in the PostgreSQLdatabase. By default, this toggle button is disabled.
• do-not-persist-lsps—Click the toggle button to enable or disable thepersistence of LSP data in the PostgreSQL database.
If you enable this toggle button, LSP data is not stored in the PostgreSQLdatabase. By default, this toggle button is disabled.
NOTE: We recommend that you do not disable the persistence of LSP data(that is, we recommend that you do not enable the toggle button).
206

Table 47: Pathfinder Settings (Continued)
Setting Description
• persist-topology-snapshot—Click the toggle button to enable or disable thepersistence of the topology snapshot in the PostgreSQL database.
By default, this toggle button is disabled.
• persist-demand-events—Click the toggle button to enable or disable thepersistence of demand events in the PostgreSQL database.
By default, this toggle button is disabled.
NOTE: To enable the persistence of demand events, persistence of LSP eventsis required.
• persist-topology-objects-to-file—Click the toggle button to enable or disablesaving the BGP Monitoring Protocol (BMP) events to a file in binary format.
By default, this toggle button is disabled.
In-memory Datastore in-memory-datastore:
• connection-pool-size—Specify the maximum number of connections to bemaintained in the pool.
Default: 5
• reconnect-delay—Specify the delay (in milliseconds) between reconnectionattempts.
Default: 1000
• reconnect-retries—Specify the maximum number of datastore reconnectionattempts to be allowed.
Default: 1000
207
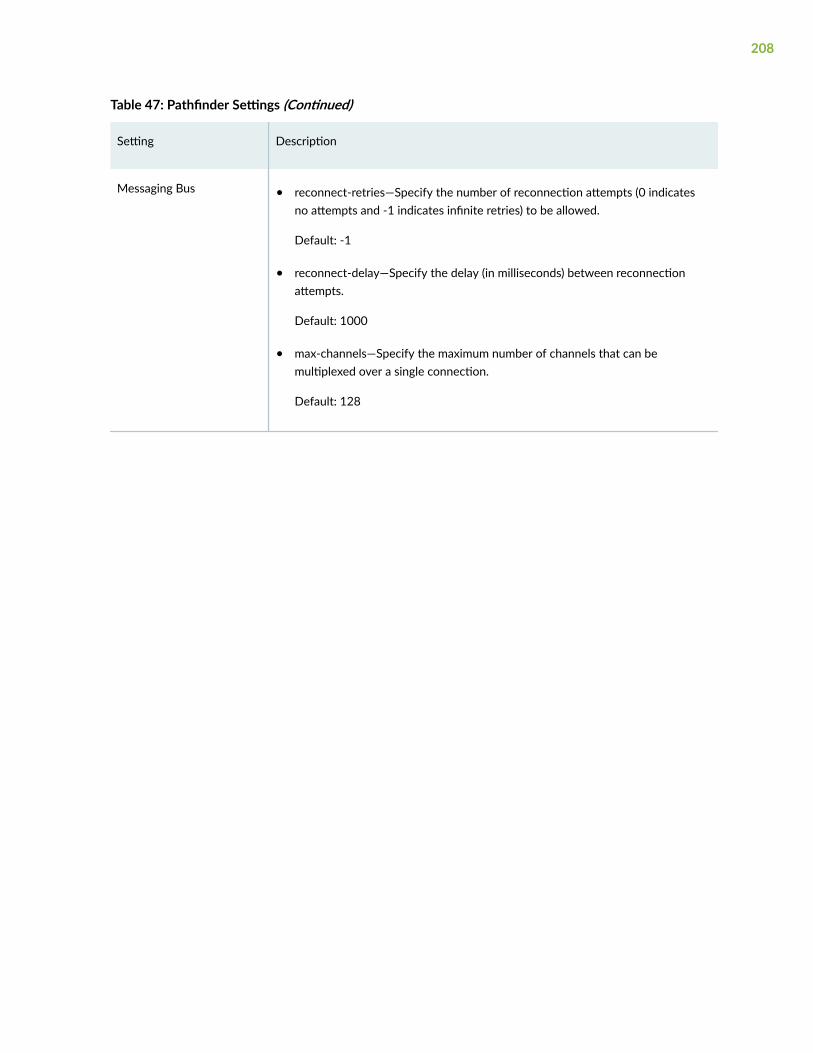
Table 47: Pathfinder Settings (Continued)
Setting Description
Messaging Bus • reconnect-retries—Specify the number of reconnection attempts (0 indicatesno attempts and -1 indicates infinite retries) to be allowed.
Default: -1
• reconnect-delay—Specify the delay (in milliseconds) between reconnectionattempts.
Default: 1000
• max-channels—Specify the maximum number of channels that can bemultiplexed over a single connection.
Default: 128
208

Table 47: Pathfinder Settings (Continued)
Setting Description
Persistent Datastore • Persistent datastore settings:
• connection-pool-size—Specify the maximum number of connections to bemaintained in the pool.
Default: 5
• reconnect-delay—Specify the delay (in milliseconds) between reconnectionattempts.
Default: 5000
• Log Destination:
• name—Specify a unique name for the log destination settings.
• level—From the list, select the severity level of the log messages. Theavailable options are:
• emergency—The system is unusable.
• alert—Immediate action is needed.
• critical—Critical condition exists.
• error—Error condition.
• warning—Warning condition (this is the default value).
• notice—Normal but significant condition.
• info—Information message.
• debug—Debug message.
• trace—Trace message.
• – (none)—No severity level.
209

Table 47: Pathfinder Settings (Continued)
Setting Description
Topology Acquisition • retry-before-exit-count—Specify the number of times the topology serverrequests a topology refresh (after it connects to a BMP topology source) toobtain the topology that contains the links. If the topology server doesn’treceive the topology even after the specified refresh requests, it exits thetopology server application.
Default: 0 (meaning infinite retries)
• retry-delay—Specify the maximum time (in seconds) that the topology serverwaits before requesting a topology refresh again (after it connects to a BMPtopology source).
Example: 30s or 30seconds
Default: 5s
• reconnection-count—Specify the number of times the topology server tries toreconnect to the BGP-LS topology source before exiting the topology serverapplication.
Default: 0 (meaning infinite retries)
• reconnection-delay—Specify the maximum time (in seconds) that the topologyserver waits before attempting to reconnect to the BGP-LS topology source.
Example: 30s or 30seconds
Default: 5s
• refresh-holddown—Specify the maximum time (in seconds) that the topologyserver waits to request for a topology refresh after it connects to a BMPtopology source but doesn’t receive the topology.
Example: 100s or 100seconds
Default: 300s
• eor-timeout—: Specify the maximum time (in seconds) that the topology serverwaits to receive the topology from the BGP-LS topology source. After thecomplete topology is sent, the topology source sends an end-of-RoutingInformation Base (end-of-RIB or EOR) message that indicates the completion oftopology update. If the topology server doesn’t receive this EOR message
210
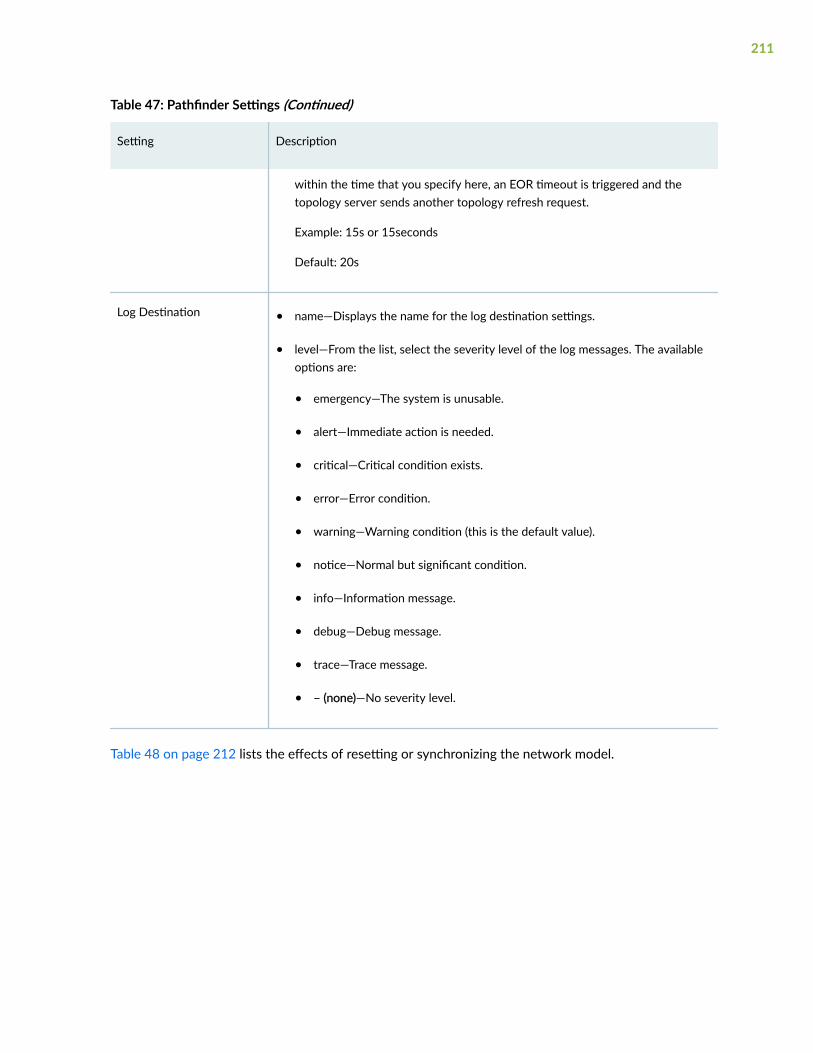
Table 47: Pathfinder Settings (Continued)
Setting Description
within the time that you specify here, an EOR timeout is triggered and thetopology server sends another topology refresh request.
Example: 15s or 15seconds
Default: 20s
Log Destination • name—Displays the name for the log destination settings.
• level—From the list, select the severity level of the log messages. The availableoptions are:
• emergency—The system is unusable.
• alert—Immediate action is needed.
• critical—Critical condition exists.
• error—Error condition.
• warning—Warning condition (this is the default value).
• notice—Normal but significant condition.
• info—Information message.
• debug—Debug message.
• trace—Trace message.
• – (none)—No severity level.
Table 48 on page 212 lists the effects of resetting or synchronizing the network model.
211
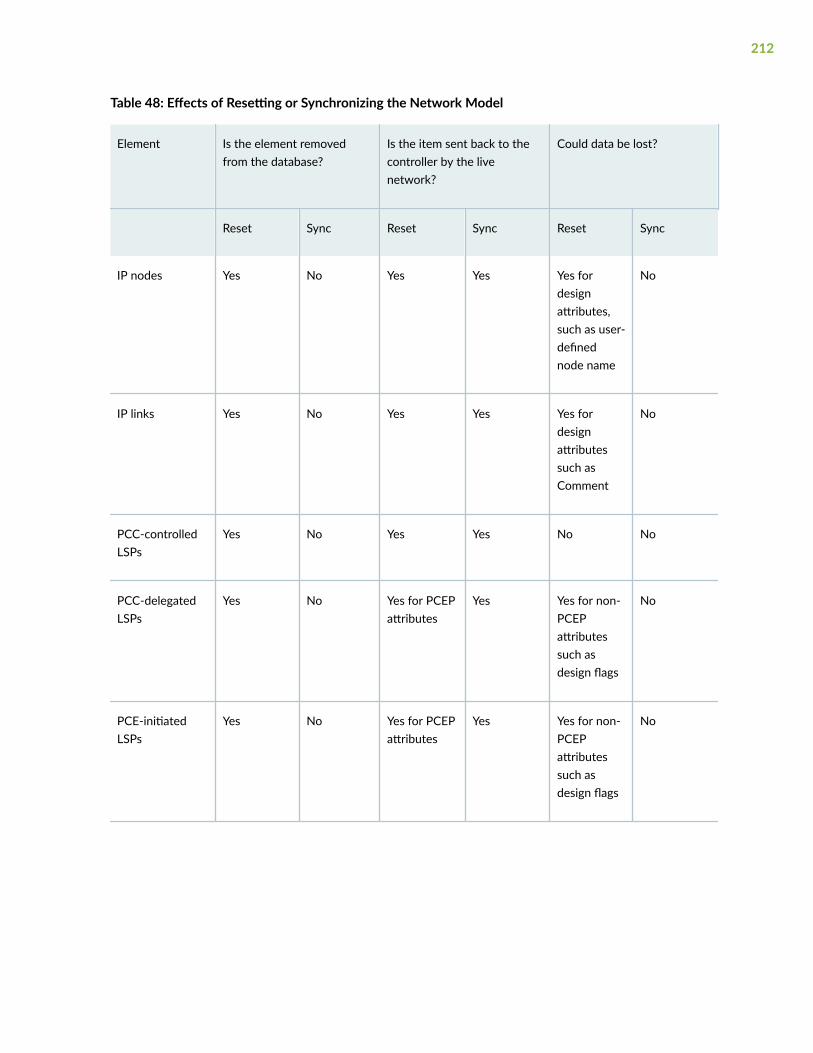
Table 48: Effects of Resetting or Synchronizing the Network Model
Element Is the element removedfrom the database?
Is the item sent back to thecontroller by the livenetwork?
Could data be lost?
Reset Sync Reset Sync Reset Sync
IP nodes Yes No Yes Yes Yes fordesignattributes,such as user-definednode name
No
IP links Yes No Yes Yes Yes fordesignattributessuch asComment
No
PCC-controlledLSPs
Yes No Yes Yes No No
PCC-delegatedLSPs
Yes No Yes for PCEPattributes
Yes Yes for non-PCEPattributessuch asdesign flags
No
PCE-initiatedLSPs
Yes No Yes for PCEPattributes
Yes Yes for non-PCEPattributessuch asdesign flags
No
212
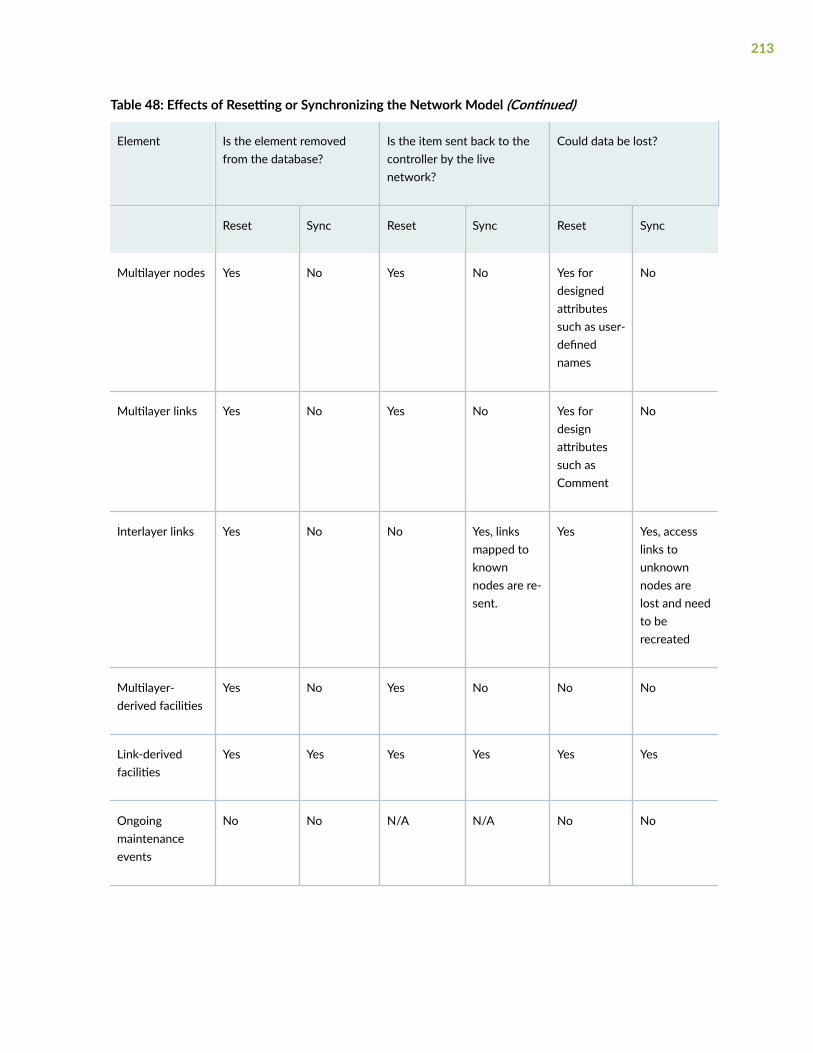
Table 48: Effects of Resetting or Synchronizing the Network Model (Continued)
Element Is the element removedfrom the database?
Is the item sent back to thecontroller by the livenetwork?
Could data be lost?
Reset Sync Reset Sync Reset Sync
Multilayer nodes Yes No Yes No Yes fordesignedattributessuch as user-definednames
No
Multilayer links Yes No Yes No Yes fordesignattributessuch asComment
No
Interlayer links Yes No No Yes, linksmapped toknownnodes are re-sent.
Yes Yes, accesslinks tounknownnodes arelost and needto berecreated
Multilayer-derived facilities
Yes No Yes No No No
Link-derivedfacilities
Yes Yes Yes Yes Yes Yes
Ongoingmaintenanceevents
No No N/A N/A No No
213

Table 48: Effects of Resetting or Synchronizing the Network Model (Continued)
Element Is the element removedfrom the database?
Is the item sent back to thecontroller by the livenetwork?
Could data be lost?
Reset Sync Reset Sync Reset Sync
Futuremaintenanceevents
Yes No N/A N/A Yes No
Ongoingscheduled LSPs
No No N/A N/A Yes(scheduledLSP is neverterminated)
No
Future scheduledLSPs
Yes No N/A N/A Yes No
Device profiles No No N/A N/A No No
Router latitudeand longitude
No No N/A N/A No No
Router grouping No No N/A N/A No No
Users table No No N/A N/A No No
Saved maplayout
No No N/A N/A No No
Events No No N/A N/A No No
Scheduled pathoptimization
No No N/A N/A No No
It’s worth stressing again that Reset Network Model is a drastic action that wipes out both the networkdata model and all the information you have manually provided through the Add or Modify functions in
214

the network information table (user model data). We strongly recommend that you perform this actiononly if JTAC instructs you to do so.
RELATED DOCUMENTATION
Paragon Pathfinder Overview | 5
215

CHAPTER 14
Network Groups
IN THIS CHAPTER
About the Network Groups Page | 216
Add a Network Group | 218
Edit a Network Group | 220
About the Network Groups Page
IN THIS SECTION
Tasks You Can Perform | 217
To access network group page in Paragon Automation Platform GUI, click Configuration > NetworkGroups.
Network groups allow you to correlate health status data between multiple devices across the network.For example, you can create a network group that monitors the ping times between two or more devicesand notifies you if the ping times are too high.
Table 49 on page 216 describes the fields in the Network Groups page.
Table 49: Fields in Network Groups Page
Fields Description
Network Name Displays the name of the network group.
216

Table 49: Fields in Network Groups Page (Continued)
Fields Description
Description Displays the description you give when adding the network group.
Playbooks Displays the number of playbooks applied to the network group.
Instances Displays the number of playbook instances applied to the network group.
Logging Displays the first letter of the log severity such as Debug, Error, Warn or Info along with the loglevel.
The log level for the device group shows Global if you configure device group to collect logs forevery service running on a device group.
If you configure service specific logs, the column displays Others.
Tasks You Can Perform
You can perform the following tasks in this page:
• Add a network group. See "Add a Network Group" on page 218.
• Edit a network group. See "Edit a Network Group" on page 220.
• Export details of all network groups or of a particular network group.
To export configuration details of all network groups:
1. Go to Configuration > Network Groups.
You are taken to the Network Configuration page.
2. Click on the Export button (at the top right corner) and select Export as CSV from the menu.
In the pop up window, click Open to view the Excel file or Save As to save the Excel file to anylocation in your system.
RELATED DOCUMENTATION
Enable Alert Notifications for Device Groups and Network Groups | 719
217
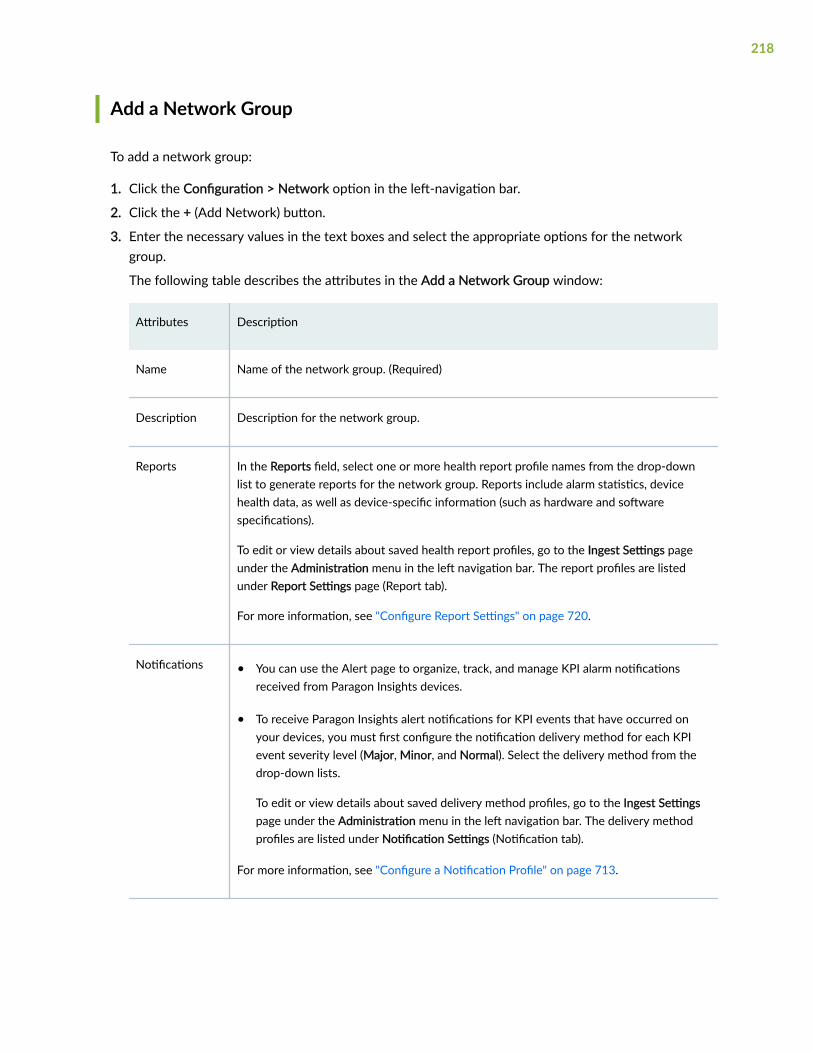
Add a Network Group
To add a network group:
1. Click the Configuration > Network option in the left-navigation bar.
2. Click the + (Add Network) button.
3. Enter the necessary values in the text boxes and select the appropriate options for the networkgroup.
The following table describes the attributes in the Add a Network Group window:
Attributes Description
Name Name of the network group. (Required)
Description Description for the network group.
Reports In the Reports field, select one or more health report profile names from the drop-downlist to generate reports for the network group. Reports include alarm statistics, devicehealth data, as well as device-specific information (such as hardware and softwarespecifications).
To edit or view details about saved health report profiles, go to the Ingest Settings pageunder the Administration menu in the left navigation bar. The report profiles are listedunder Report Settings page (Report tab).
For more information, see "Configure Report Settings" on page 720.
Notifications • You can use the Alert page to organize, track, and manage KPI alarm notificationsreceived from Paragon Insights devices.
• To receive Paragon Insights alert notifications for KPI events that have occurred onyour devices, you must first configure the notification delivery method for each KPIevent severity level (Major, Minor, and Normal). Select the delivery method from thedrop-down lists.
To edit or view details about saved delivery method profiles, go to the Ingest Settingspage under the Administration menu in the left navigation bar. The delivery methodprofiles are listed under Notification Settings (Notification tab).
For more information, see "Configure a Notification Profile" on page 713.
218
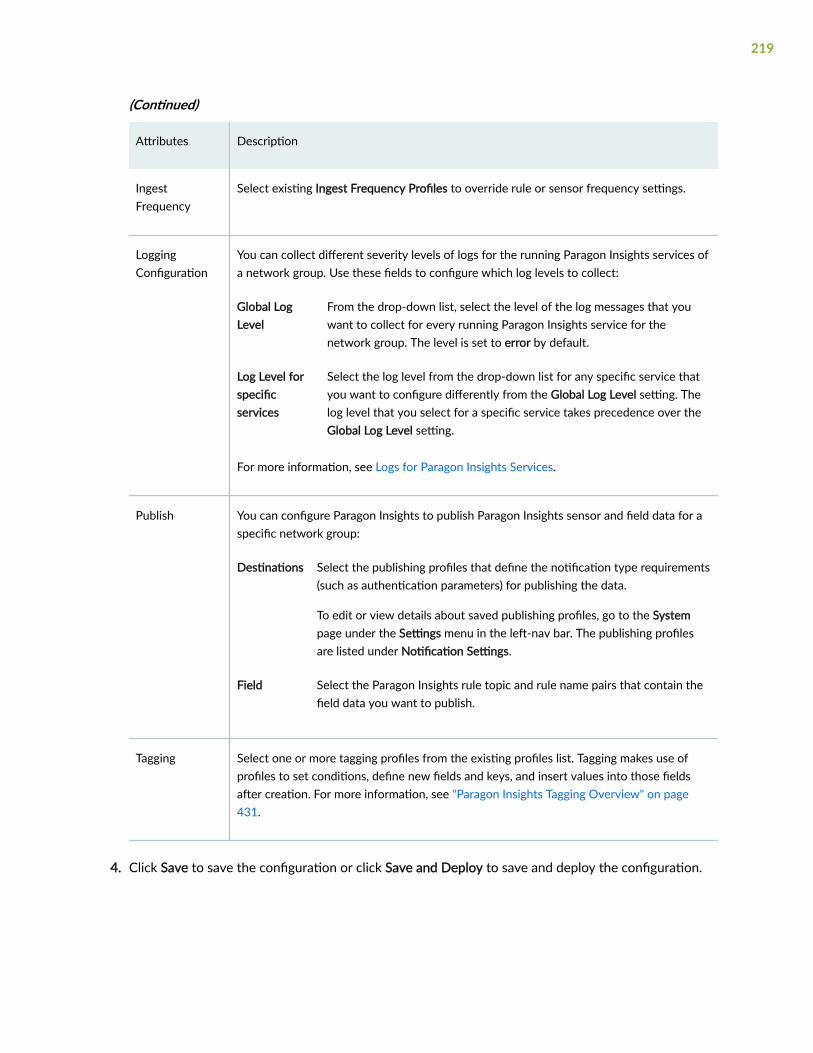
(Continued)
Attributes Description
IngestFrequency
Select existing Ingest Frequency Profiles to override rule or sensor frequency settings.
LoggingConfiguration
You can collect different severity levels of logs for the running Paragon Insights services ofa network group. Use these fields to configure which log levels to collect:
Global LogLevel
From the drop-down list, select the level of the log messages that youwant to collect for every running Paragon Insights service for thenetwork group. The level is set to error by default.
Log Level forspecificservices
Select the log level from the drop-down list for any specific service thatyou want to configure differently from the Global Log Level setting. Thelog level that you select for a specific service takes precedence over theGlobal Log Level setting.
For more information, see Logs for Paragon Insights Services.
Publish You can configure Paragon Insights to publish Paragon Insights sensor and field data for aspecific network group:
Destinations Select the publishing profiles that define the notification type requirements(such as authentication parameters) for publishing the data.
To edit or view details about saved publishing profiles, go to the Systempage under the Settings menu in the left-nav bar. The publishing profilesare listed under Notification Settings.
Field Select the Paragon Insights rule topic and rule name pairs that contain thefield data you want to publish.
Tagging Select one or more tagging profiles from the existing profiles list. Tagging makes use ofprofiles to set conditions, define new fields and keys, and insert values into those fieldsafter creation. For more information, see "Paragon Insights Tagging Overview" on page431.
4. Click Save to save the configuration or click Save and Deploy to save and deploy the configuration.
219

RELATED DOCUMENTATION
Edit a Network Group | 220
Edit a Network Group
To edit a network group:
1. Click the Configuration > Network Groups option in the left navigation bar.
2. Click anywhere on the line that contains the group name in the table under NETWORK LIST.
3. Click on the Edit Network (Pencil) icon.
4. Modify the attributes, as needed.
See "Add a Network Group" on page 218 for a description of each attribute.
5. Click Save to save the configuration or click Save and Deploy to save and deploy the configuration. .
6. (Optional) A network can be deleted by clicking the Delete Network (Trash Can) icon.
RELATED DOCUMENTATION
About the Network Groups Page | 216
220
CHAPTER 15
Topology Filter
IN THIS CHAPTER
About the Topology Filter Page | 221
Add a Topology Filter Rule | 224
Edit a Topology Filter Rule | 225
Delete a Topology Filter Rule | 226
About the Topology Filter Page
IN THIS SECTION
Enable the Topology Filter Service | 222
Tasks You Can Perform | 223
Field Descriptions | 223
To access this page, click Configuration > Network > Topology Filter.
The topology filter service allows you to limit the nodes appearing in your topology map to a subset ofthe nodes in your network. This capability is important when your network contains more nodes thanyour license covers and you want to control which nodes are recognized. You might also want to filterout nodes that are not important for traffic engineering management such as aggregation layer nodes orroute reflectors.
The topology filter is available only in installations utilizing BMP for the topology acquisition method.The topology filter is added to the BMP messaging pipeline between the BMP monitor and the topologyserver.
221
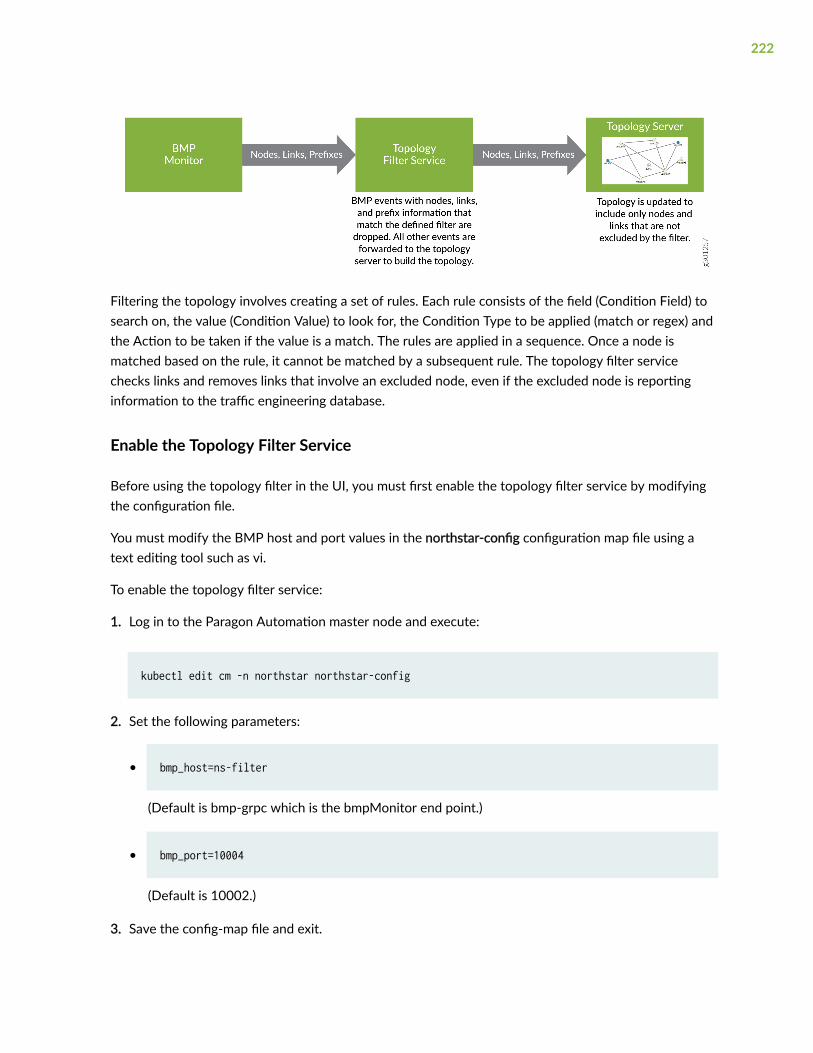
Filtering the topology involves creating a set of rules. Each rule consists of the field (Condition Field) tosearch on, the value (Condition Value) to look for, the Condition Type to be applied (match or regex) andthe Action to be taken if the value is a match. The rules are applied in a sequence. Once a node ismatched based on the rule, it cannot be matched by a subsequent rule. The topology filter servicechecks links and removes links that involve an excluded node, even if the excluded node is reportinginformation to the traffic engineering database.
Enable the Topology Filter Service
Before using the topology filter in the UI, you must first enable the topology filter service by modifyingthe configuration file.
You must modify the BMP host and port values in the northstar-config configuration map file using atext editing tool such as vi.
To enable the topology filter service:
1. Log in to the Paragon Automation master node and execute:
kubectl edit cm -n northstar northstar-config
2. Set the following parameters:
• bmp_host=ns-filter
(Default is bmp-grpc which is the bmpMonitor end point.)
• bmp_port=10004
(Default is 10002.)
3. Save the config-map file and exit.
222

All the pods using this config-map are restarted automatically.
NOTE: You can check the status of all services by executing:
kubectl -n northstar get pods
Tasks You Can Perform
You can perform the following tasks from this page:
• Add a topology filter rule. See "Add a Topology Filter Rule" on page 224.
• Edit the existing topology filter rule. See "Edit a Topology Filter Rule" on page 225.
• Delete an existing topology filter rule. See "Delete a Topology Filter Rule" on page 226.
• From the More list, you can:
• View detailed information about the topology filter rule by clicking the details icon that appearswhen you hover over the filter rule or select More > View Details. A Result of Applied Filters pageappears on the right displaying the filter rule details.
• Export all the topology filter rules to a CSV file by clicking More > Export Rules.
• Show/Hide Columns: Choose to show or hide a specific column in the Filter Rules table.
Hover over the More Options (vertical ellipses) > Show/Hide Columns and select the Column-Namecheck box of the column you want to display in the table.
Field Descriptions
Table 50: Fields on Topology Filter Page
Field Description
Condition Field Field (hostname, router-id, or sys-id) selected as the condition while adding a filter rule.
Condition Type Type of match using text or regex (regular expression).
Condition Value Text to be matched.
223
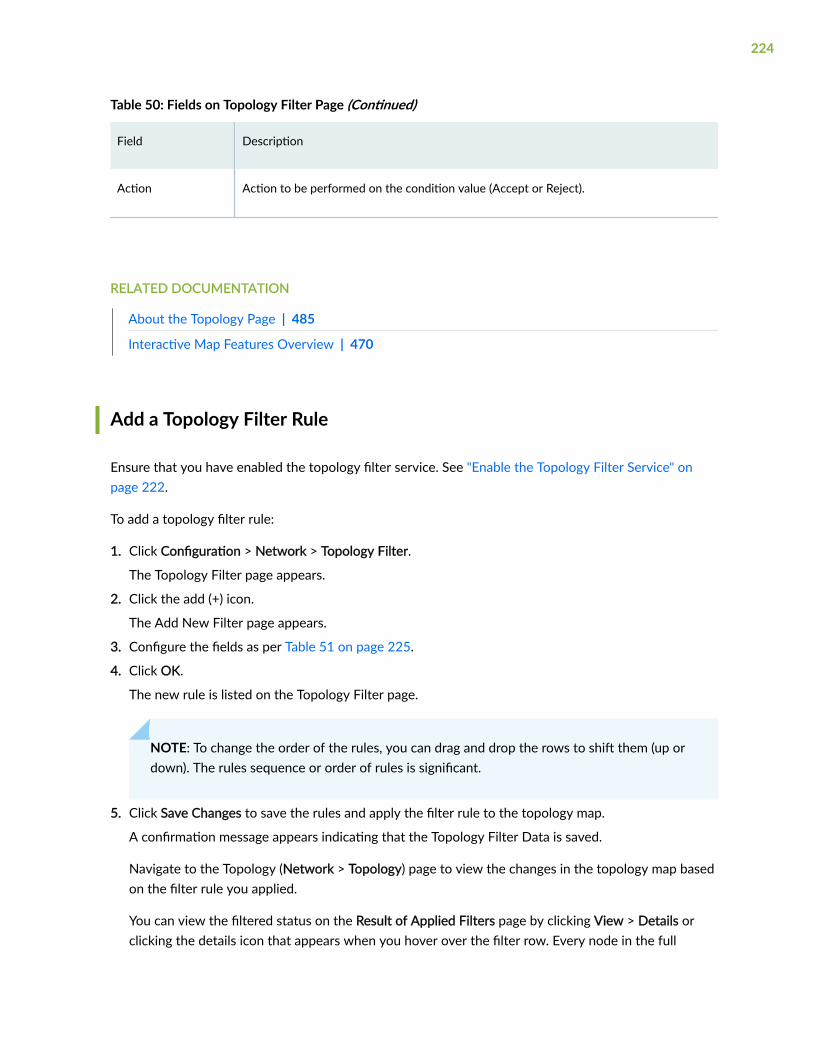
Table 50: Fields on Topology Filter Page (Continued)
Field Description
Action Action to be performed on the condition value (Accept or Reject).
RELATED DOCUMENTATION
About the Topology Page | 485
Interactive Map Features Overview | 470
Add a Topology Filter Rule
Ensure that you have enabled the topology filter service. See "Enable the Topology Filter Service" onpage 222.
To add a topology filter rule:
1. Click Configuration > Network > Topology Filter.
The Topology Filter page appears.
2. Click the add (+) icon.
The Add New Filter page appears.
3. Configure the fields as per Table 51 on page 225.
4. Click OK.
The new rule is listed on the Topology Filter page.
NOTE: To change the order of the rules, you can drag and drop the rows to shift them (up ordown). The rules sequence or order of rules is significant.
5. Click Save Changes to save the rules and apply the filter rule to the topology map.
A confirmation message appears indicating that the Topology Filter Data is saved.
Navigate to the Topology (Network > Topology) page to view the changes in the topology map basedon the filter rule you applied.
You can view the filtered status on the Result of Applied Filters page by clicking View > Details orclicking the details icon that appears when you hover over the filter row. Every node in the full
224
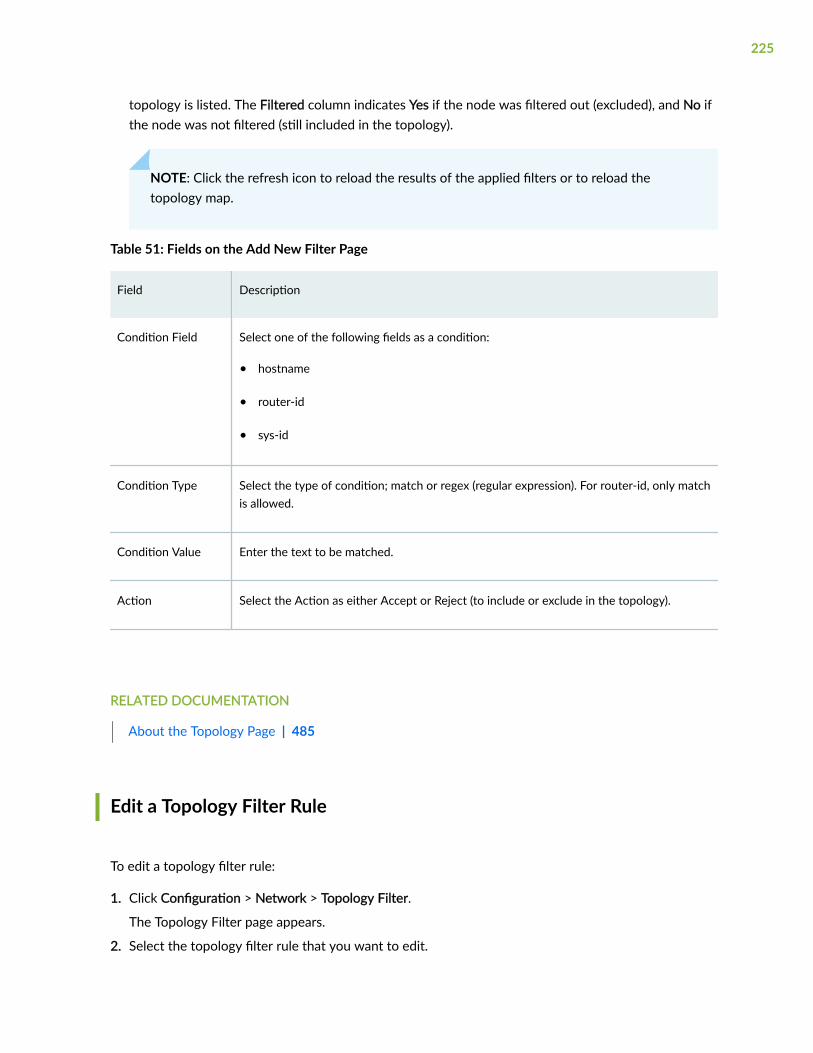
topology is listed. The Filtered column indicates Yes if the node was filtered out (excluded), and No ifthe node was not filtered (still included in the topology).
NOTE: Click the refresh icon to reload the results of the applied filters or to reload thetopology map.
Table 51: Fields on the Add New Filter Page
Field Description
Condition Field Select one of the following fields as a condition:
• hostname
• router-id
• sys-id
Condition Type Select the type of condition; match or regex (regular expression). For router-id, only matchis allowed.
Condition Value Enter the text to be matched.
Action Select the Action as either Accept or Reject (to include or exclude in the topology).
RELATED DOCUMENTATION
About the Topology Page | 485
Edit a Topology Filter Rule
To edit a topology filter rule:
1. Click Configuration > Network > Topology Filter.
The Topology Filter page appears.
2. Select the topology filter rule that you want to edit.
225
3. Click the edit (pencil) icon.
The Edit Filter Rule page appears.
4. Configure the fields as per Fields on the Add New Filter Page on page 225.
NOTE: If you select multiple rules for modification, you can edit only the Action field (Acceptor Reject). If you select a single rule, you can edit all the fields.
5. Click OK.
The edited topology filter rule is displayed on the Topology Filter page.
Navigate to the Topology (Network > Topology) page to view the changes in the topology map basedon the filter rule you applied.
RELATED DOCUMENTATION
About the Topology Filter Page | 221
Delete a Topology Filter Rule
To delete a topology filter rule:
1. Click Configuration > Network > Topology Filter.
The Topology Filter page appears.
2. Select the topology filter rule that you want to delete.
NOTE: You can delete multiple filter rules at a time.
3. Click the delete (trash can) icon.
A confirmation dialog box appears.
4. Click Yes.
The topology filter rule is removed from the Topology Filter page.
226

4PART
Manage Device Templates andConfiguration Templates
Configuration Templates | 228
Device Templates | 248
CHAPTER 16
Configuration Templates
IN THIS CHAPTER
Configuration Templates Overview | 228
Configuration Templates Workflow | 230
About the Configuration Templates Page | 231
Add Configuration Templates | 234
Preview and Render a Configuration Template | 241
Assign Configuration Templates to a Device Template | 242
Deploy a Configuration Template to a Device | 243
Edit, Clone, and Delete a Configuration Template | 245
Configuration Templates Overview
IN THIS SECTION
Benefits | 230
Paragon Automation provides configuration templates to provision opaque configurations, both duringonboarding and throughout the device lifecycle, for Juniper Networks and other third-party devices. Byusing configuration templates, you can deploy customized configurations on devices that are managedby Paragon Automation.
A configuration template can be used as follows:
• Globally—You can define the configuration (for example, SNMP Configuration) to be applied to all thedevices managed by Paragon Automation.
228

• Device-specific—You can define a configuration that is specific to a device; for example, BGPconfiguration
By default, Paragon Automation provides some predefined configuration templates. See Table 52 onpage 229 for the list of the predefined configuration templates You can also create your own templatesby cloning an existing template and modifying its settings. Templates can be added by administrators orusers with privilege to add configuration templates. Some of the predefined templates are pre-assignedto specific device templates for enabling configurations that are required during onboarding of a device;for example, username and password.
Table 52 on page 229 lists the predefined configuration templates available in Paragon Automation.
Table 52: Predefined Configuration Templates in Paragon Automation
Name Description
AE_DEVICE_COUNT Configure the aggregated Ethernet interfaces on a device.
BANNER Configure the banner that appears when you log in to a device.
DNS Configure Domain Name System (DNS) server settings on a device.
DOMAIN_NAME Configure the domain name on a device.
HOSTNAME Configure the host name on a device.
LLDP Enable and configure Link Layer Discovery Protocol (LLDP) on all interfaces of a device.
LOCAL_USER Configure a local user on a device.
NETCONF Configure NETCONF on a device.
NTP Configure Network Time Protocol (NTP) settings on a device.
SNMP Configure basic SNMP version 2 (SNMPv2) parameters on a device.
SSH Configure SSH parameters on a device.
229

Table 52: Predefined Configuration Templates in Paragon Automation (Continued)
Name Description
SYSLOG Configure system log settings on a device.
You can deploy a configuration template as follows:
• Deploy the configuration template directly on a device; see "Deploy a Configuration Template to aDevice" on page 243
• Assign the configuration template to a device template so that the configuration is deployed on adevice during zero-touch provisioning (ZTP) and device discovery; see "Assign ConfigurationTemplates to a Device Template" on page 242.
Benefits
Configuration templates provide a mechanism to create customized configurations and push theconfigurations to one or more devices. This helps you to deploy configurations beyond the standardconfiguration templates provided in Paragon Automation.
RELATED DOCUMENTATION
Devices Overview | 98
Device Templates Overview | 248
View and Manage Device Configuration | 132
Configuration Templates Workflow
The high-level workflow for configuration templates is as follows:
1. You can use a pre-existing template (skip to step 2) or create a new template using one of thefollowing methods:
• Clone an existing configuration template and modify the cloned template. For more information,see "Edit, Clone, and Delete a Configuration Template" on page 245.
• Add a configuration template by specifying the template configuration and logic. For moreinformation, see "Add Configuration Templates" on page 234.
230
2. (Optional) We recommend that you preview and validate the configuration template before assigningthe configuration template to a device template or deploying the configuration template directly on adevice. For more information, see "Preview and Render a Configuration Template" on page 241.
3. You can assign a configuration template to a device template from the Device Templates page. Thisenables you to deploy additional configuration on the device during zero touch provisioning (ZTP) orduring device discovery. and after the device is onboarded. For more information, see "Deploy aConfiguration Template to a Device" on page 243.
4. You can deploy a configuration template directly on one or more devices that were previouslyactivated, which enables you to deploy templates that were added after a device was activated or todeploy additional configuration to devices. You can deploy configuration templates to devices fromthe Configuration TemplatesFor more information, see "Assign Configuration Templates to a DeviceTemplate" on page 242.
RELATED DOCUMENTATION
Edit Configuration Templates Assigned to a Device Template | 252
View and Manage Device Configuration | 132
About the Configuration Templates Page
IN THIS SECTION
Tasks You Can Perform | 231
Field Descriptions | 233
To access this page, click Configuration > Templates > Config Templates in the left navigation menu.
Tasks You Can Perform
You can perform the following tasks from this page:
• View details of a configuration template. Select a configuration template and click More > Details orhover over the configuration template and click the Detailed View icon. The Details of <Template-Name> pane appears on the right side of the page displaying the configuration template details.
231

• Add a configuration template; see "Add Configuration Templates" on page 234.
• Preview a configuration template; see "Preview and Render a Configuration Template" on page 241.
• Deploy a configuration template on one or more devices; see "Deploy a Configuration Template to aDevice" on page 243.
• Assign a configuration template to a device template; see "Assign Configuration Templates to aDevice Template" on page 242.
• Clone, edit, or delete a configuration template; see "Edit, Clone, and Delete a ConfigurationTemplate" on page 245.
• Filter Entries—Filter the table entries by adding new filtering criteria.
Hover over the Filter (funnel) icon and select Add Filter. On the Add Criteria page, select the filteringcriteria from the Field and Condition list, and enter the text to be compared in the Value field. ClickAdd.
The filtered table entries are listed and the filter criteria name is displayed above the table columnnames.
You can click the cross (X) icon (next to the filter name) to remove the filtering criteria.
NOTE:
• You can add multiple filtering criteria. Once you add the multiple filtering criteria, you canselect the And condition to display the entries matching all the filtering criteria or selectthe Or condition to display the entries matching any one of the filtering criteria.
• Quick filter: Save the filtering criteria as quick filters. Once you have added all the filteringcriteria, you can save a particular criteria or multiple criteria for future use by clicking Save.
On the Save Filter window, enter a name for the filter, optionally toggle the Set as Defaultbutton if you want to use this filtering criteria by default, and click OK.
The saved filters are displayed under Quick Filters when you hover over the Filter (funnel)icon. You can then apply these saved filters to the table entries.
• Show/Hide Columns—Choose to show or hide a specific column in the table.
Hover over the More Options (vertical ellipsis) > Show/Hide Columns and select the Column-Namecheck box of the columns you want to display in the table.
• Reset Preference—Reset the displayed columns to the default set of columns for each tab in thetable.
232

Hover over the More Options (vertical ellipsis) and select Reset Preference.
• Sort Entries—Click the column name to highlight the up and down arrows next to the column name.Sort the table entries in ascending or descending order of that column by clicking the up or downarrow respectively.
Field Descriptions
Table 53 on page 233 displays the fields on the Configuration Templates page.
Table 53: Fields on the Configuration Templates Page
Field Description
Name The name of the configuration template.
Format The format in which the configuration template is defined—CLI or XML.
Family The device family for which the configuration template is applicable:
• Cisco IOS-XR
• Juniper-ACX
• Juniper-EX
• Juniper-MX
• Juniper-PTX
• Juniper-QFX
• Juniper-SRX
• Juniper-ANY
Description A description of the configuration template.
Last Updated The date and time when the configuration template was last updated, in the MonthDD, YYYY HH:MM:SS format.
233
Table 53: Fields on the Configuration Templates Page (Continued)
Field Description
Created by The user who created the configuration template. System indicates that thetemplate is a predefined template.
RELATED DOCUMENTATION
Devices Overview | 98
Device Templates Overview | 248
Add Configuration Templates
IN THIS SECTION
What's Next | 0
To add a configuration template, you should either be a user with administrative privileges or have theprivilege to add configuration templates.
NOTE:
• Before you add the configuration template, ensure that you have the device configurationready.
• We recommend that you use a working device configuration to add the configurationtemplate.
To add a configuration template:
WHAT'S NEXT
234
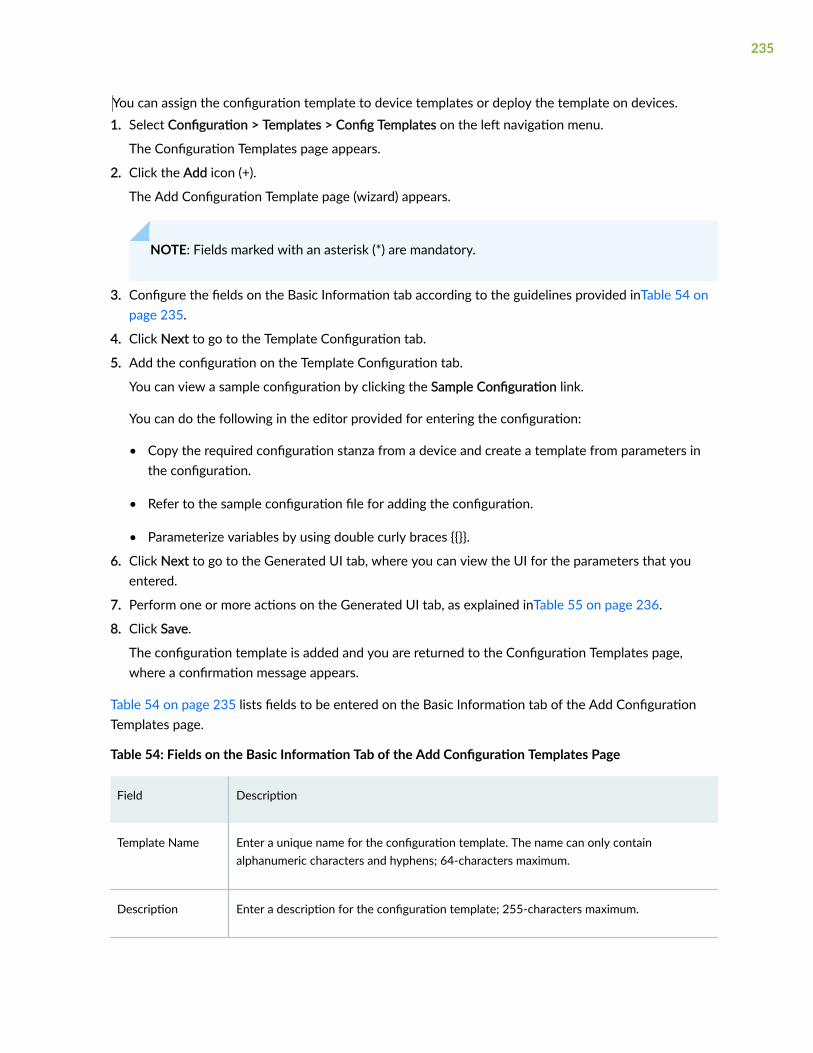
You can assign the configuration template to device templates or deploy the template on devices.1. Select Configuration > Templates > Config Templates on the left navigation menu.
The Configuration Templates page appears.
2. Click the Add icon (+).
The Add Configuration Template page (wizard) appears.
NOTE: Fields marked with an asterisk (*) are mandatory.
3. Configure the fields on the Basic Information tab according to the guidelines provided inTable 54 onpage 235.
4. Click Next to go to the Template Configuration tab.
5. Add the configuration on the Template Configuration tab.
You can view a sample configuration by clicking the Sample Configuration link.
You can do the following in the editor provided for entering the configuration:
• Copy the required configuration stanza from a device and create a template from parameters inthe configuration.
• Refer to the sample configuration file for adding the configuration.
• Parameterize variables by using double curly braces {{}}.
6. Click Next to go to the Generated UI tab, where you can view the UI for the parameters that youentered.
7. Perform one or more actions on the Generated UI tab, as explained inTable 55 on page 236.
8. Click Save.
The configuration template is added and you are returned to the Configuration Templates page,where a confirmation message appears.
Table 54 on page 235 lists fields to be entered on the Basic Information tab of the Add ConfigurationTemplates page.
Table 54: Fields on the Basic Information Tab of the Add Configuration Templates Page
Field Description
Template Name Enter a unique name for the configuration template. The name can only containalphanumeric characters and hyphens; 64-characters maximum.
Description Enter a description for the configuration template; 255-characters maximum.
235

Table 54: Fields on the Basic Information Tab of the Add Configuration Templates Page (Continued)
Field Description
ConfigurationFormat
Select the output format for the configuration template:
• CLI (default)
• XML
Device Family Select a device family for which you are adding the template.
• Cisco-IOS-XR
• Juniper-ACX
• Juniper-ANY (the configuration can be pushed to any Juniper Networks’ devices)
• Juniper-EX
• Juniper-MX
• Juniper-PTX
• Juniper-QFX
• Juniper-SRX
Table 55 on page 236 lists the actions that you can perform on the Generated UI tab of the AddConfiguration Templates page.
Table 55: Generated UI Actions (Add Configuration Template Page)
Action Description
Reorder the UI Drag and drop individual fields, grids, or sections to change the order in which theparameters appear on the UI.
236

Table 55: Generated UI Actions (Add Configuration Template Page) (Continued)
Action Description
Modify the settingsfor a field, section,or grid
To modify the settings for a field, section, or grid:
1. Click the Settings (gear) icon next to the field, section, or grid.
The Form Settings pane appears on the right side of the page, displaying the BasicSettings and Advanced Settings tabs.
2. Modify the fields on these tabs, as needed. See Table 56 on page 238 for anexplanation of the fields on these tabs.
3. Click Save Settings for each field to save your changes.
The modifications that you made are displayed on the UI.
Reset thegenerated UI
Click Undo all Edits to discard the changes that you made and undo the changes made onthe UI.
Previewconfiguration
Preview the configuration defined in the configuration template.
To preview a configuration template:
1. Click Preview Configuration.
The Preview Configuration page appears, displaying the configuration that wasrendered based on the values that you entered.
2. Check if the configuration was rendered correctly.
• If the configuration was not rendered correctly, click the close (X) icon to go backand make modifications as needed.
• If the configuration was rendered correctly, click OK.
You are returned to the Generated UI page.
Table 56 on page 238 lists the fields on the Form Settings pane.
237

Table 56: Form Settings (Add Configuration Template Page)
Setting Guideline
Basic Settings Tab Fields populated in this tab are based on the input type that you select.
Input Type Select the input type for the parameter in the configuration template:
• Text (default): If the input value for the parameter is a string of characters.
• Number: If the input value for the parameter is a number.
• Email: If the input value for the parameter is an e-mail address.
• IPv4: If the input value for the parameter is an IPv4 address.
• IPv4 Prefix: If the input value for the parameter is an IPv4 prefix.
• IPv6: If the input value for the parameter is an IPv6 address.
• IPv6 Prefix: If the input value for the parameter is an IPv6 prefix.
• Toggle Button (Boolean): If the input value for the parameter is a boolean value (trueor false).
• Dropdown: If the input value for the parameter is selected from a list.
• Password: If the input value for the parameter is a password.
The value that you enter is masked (default).
(Optional) Click the Show Password (eye) icon to unmask the password.
• Confirm Password: If the input value for the parameter is to confirm the password.
If you select this option, a Confirm Password field appears on the UI. The value thatyou enter is masked (default).
(Optional) Click the Show Password (eye) icon to unmask the password.
Label Enter the label that you want displayed (on the UI) for the parameter.
Default Value Specify a default value for the parameter.
238
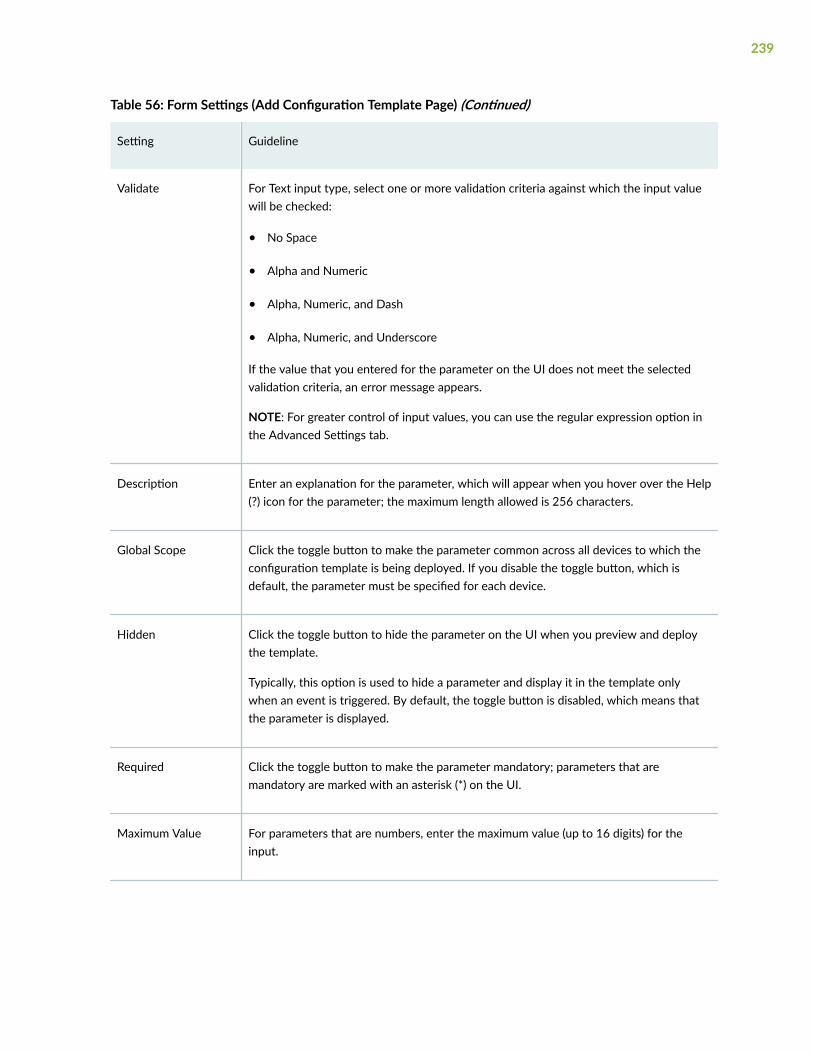
Table 56: Form Settings (Add Configuration Template Page) (Continued)
Setting Guideline
Validate For Text input type, select one or more validation criteria against which the input valuewill be checked:
• No Space
• Alpha and Numeric
• Alpha, Numeric, and Dash
• Alpha, Numeric, and Underscore
If the value that you entered for the parameter on the UI does not meet the selectedvalidation criteria, an error message appears.
NOTE: For greater control of input values, you can use the regular expression option inthe Advanced Settings tab.
Description Enter an explanation for the parameter, which will appear when you hover over the Help(?) icon for the parameter; the maximum length allowed is 256 characters.
Global Scope Click the toggle button to make the parameter common across all devices to which theconfiguration template is being deployed. If you disable the toggle button, which isdefault, the parameter must be specified for each device.
Hidden Click the toggle button to hide the parameter on the UI when you preview and deploythe template.
Typically, this option is used to hide a parameter and display it in the template onlywhen an event is triggered. By default, the toggle button is disabled, which means thatthe parameter is displayed.
Required Click the toggle button to make the parameter mandatory; parameters that aremandatory are marked with an asterisk (*) on the UI.
Maximum Value For parameters that are numbers, enter the maximum value (up to 16 digits) for theinput.
239
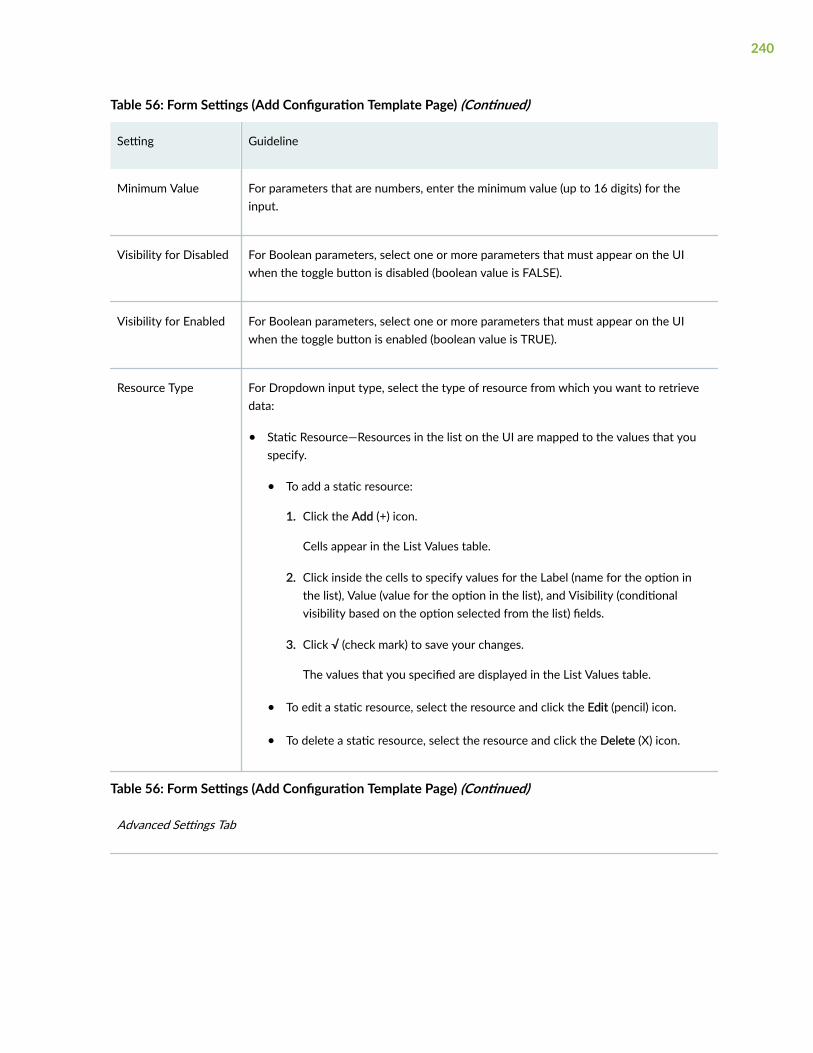
Table 56: Form Settings (Add Configuration Template Page) (Continued)
Setting Guideline
Minimum Value For parameters that are numbers, enter the minimum value (up to 16 digits) for theinput.
Visibility for Disabled For Boolean parameters, select one or more parameters that must appear on the UIwhen the toggle button is disabled (boolean value is FALSE).
Visibility for Enabled For Boolean parameters, select one or more parameters that must appear on the UIwhen the toggle button is enabled (boolean value is TRUE).
Resource Type For Dropdown input type, select the type of resource from which you want to retrievedata:
• Static Resource—Resources in the list on the UI are mapped to the values that youspecify.
• To add a static resource:
1. Click the Add (+) icon.
Cells appear in the List Values table.
2. Click inside the cells to specify values for the Label (name for the option inthe list), Value (value for the option in the list), and Visibility (conditionalvisibility based on the option selected from the list) fields.
3. Click √ (check mark) to save your changes.
The values that you specified are displayed in the List Values table.
• To edit a static resource, select the resource and click the Edit (pencil) icon.
• To delete a static resource, select the resource and click the Delete (X) icon.
Table 56: Form Settings (Add Configuration Template Page) (Continued)
Advanced Settings Tab
240
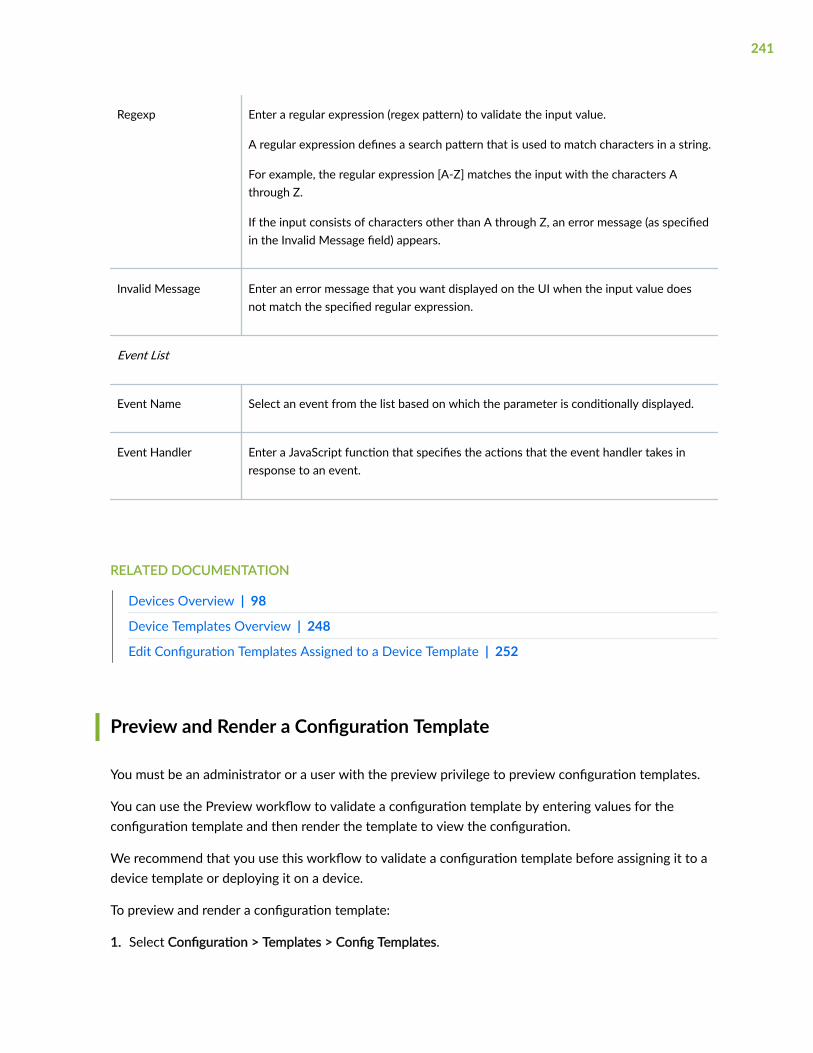
Regexp Enter a regular expression (regex pattern) to validate the input value.
A regular expression defines a search pattern that is used to match characters in a string.
For example, the regular expression [A-Z] matches the input with the characters Athrough Z.
If the input consists of characters other than A through Z, an error message (as specifiedin the Invalid Message field) appears.
Invalid Message Enter an error message that you want displayed on the UI when the input value doesnot match the specified regular expression.
Event List
Event Name Select an event from the list based on which the parameter is conditionally displayed.
Event Handler Enter a JavaScript function that specifies the actions that the event handler takes inresponse to an event.
RELATED DOCUMENTATION
Devices Overview | 98
Device Templates Overview | 248
Edit Configuration Templates Assigned to a Device Template | 252
Preview and Render a Configuration Template
You must be an administrator or a user with the preview privilege to preview configuration templates.
You can use the Preview workflow to validate a configuration template by entering values for theconfiguration template and then render the template to view the configuration.
We recommend that you use this workflow to validate a configuration template before assigning it to adevice template or deploying it on a device.
To preview and render a configuration template:
1. Select Configuration > Templates > Config Templates.
241
The Configuration Templates page appears.
2. Select the configuration template that you want to preview and click Preview.
The Template Preview for Template-Name page appears.
3. In the CONFIGURE tab, specify values for the parameters as needed.
NOTE: Fields marked with an asterisk (*) are mandatory.
4. After you have entered the necessary parameters, click PREVIEW.
The PREVIEW tab renders the configuration based on the values that you specified.
5. Check if the configuration was rendered correctly.
If the configuration was not rendered correctly, you can modify the configuration template asneeded. See "Edit, Clone, and Delete a Configuration Template" on page 245.
6. Click Close.
You are returned to the Configuration Templates page. You can assign the configuration template toone or more device templates or deploy on a device.
RELATED DOCUMENTATION
Deploy a Configuration Template to a Device | 243
Configuration Templates Overview | 228
Device Templates Overview | 248
Assign Configuration Templates to a Device Template
To assign a configuration template to a device template, you must be an administrator or a user with theprivilege to assign configuration template to a device template
To assign a configuration template to one or more device templates:
1. Select Configuration > Templates > Config Templates.
The Configuration Templates page appears.
2. Select the configuration template that you want to assign and select More > Assign to DeviceTemplate.
The Assign To Device Templates page appears. This page lists the device templates to which you canassign the configuration template.
242

3. Click the Set Initial Configuration to configure initial values for the parameters defined in theconfiguration template. These values are configured on the device when you assign the devicetemplate to the device during device activation.
The Initial Configuration page appears.
4. Assign initial values for the parameters and click OK.
NOTE: Fields marked with an asterisk (*) are mandatory.
You are returned to the Assign to Device Templates page.
5. In the Assign to Device Templates page, under Device Templates, select one or more devicetemplates to which you want to assign the configuration template.
6. Click OK.
You are returned to the Configuration Templates page and a popup appears indicating whether theassignment is successful or has failed. If the assignment failed, you can retry the assignment orcontact Juniper Networks support.
If the assignment is successful, you can navigate to the Device Templates page (Configuration >Templates > Device Templates) where you can view the configuration templates assigned to a devicetemplate; see "Edit Configuration Templates Assigned to a Device Template" on page 252.
RELATED DOCUMENTATION
Configuration Templates Overview | 228
Configuration Templates Workflow | 230
Deploy a Configuration Template to a Device
You can deploy a configuration template directly on one or more devices that were previously activated.This enables you to add configurations to devices after a device was activated or to deploy additionalconfiguration to the device.
To deploy a configuration template on a device, you must either be an administrator or a user with theprivilege to deploy configuration on devices.
To deploy a configuration template to one or more devices:
1. Select Configuration > Templates > Config Templates.
The Configuration Templates page appears.
243
2. Select the configuration template that you want deploy and click Deploy to Devices.
The list of devices to which the configuration template can be assigned appear in the ConfigurationTemplates page.
3. Do one of the following:
• If you have not set values for the parameters in the configuration template, click Set Parameters.
The Template Parameters page appears.
a. In the Configure tab, assign values for the parameters.
b. Click Preview to view and render the configuration.
If the configuration is fine, click OK or change the configuration in the Preview tab if you wantto change the configuration.
On clicking OK, a message indicating that the configuration is successful appears and youreturn to the Devices list.
c. (Optional) Click Validate to validate the configuration on the device.
A message indicating that a job is created for the validation appears. You can view the statusof the validation from the Monitor > Jobs page.
• If the values are set for the configuration template, then click Validate to validate theconfiguration on the device.
A message appears indicating that a job is created for the validation. You can view the status ofthe validation from the Monitor > Jobs page.
4. Click Deploy.
The Deploy page appears.
5. Do one of the following:
• Click Deploy Now to deploy the configuration on the selected devices immediately.
• Click Deploy Later to deploy the configuration later.
If you choose to deploy the configuration later, you must enter the date (in MM/DD/YYYYformat) and time (in HH:MM:SS 24-hour or AM/PM format) that you want the deployment tooccur.
6. Click OK.
The settings that you entered are saved and you are returned to the Configuration Templates page. Aconfirmation message appears indicating that a job is created. For each device, a separate task istriggered in the job to deploy the configuration.
You can view the status of the jobs from the Jobs page (Monitor > Jobs).
244
RELATED DOCUMENTATION
Configuration Templates Workflow | 230
Add Configuration Templates | 234
View and Manage Device Configuration | 132
Edit, Clone, and Delete a Configuration Template
IN THIS SECTION
Edit a Configuration Template | 245
Clone a Configuration Template | 246
Delete a Configuration Template | 246
You should be an administrator or a user with edit, clone, and delete privileges to edit, clone, and deleteconfiguration templates.
Edit a Configuration Template
To edit a Configuration Template:
1. Select Configuration > Templates > Config Templates.
The Configuration Templates page appears.
2. Select the configuration template that you want to modify and click the Edit (pencil) icon.
The Edit Configuration Template page appears. The fields on this page are same as the fields that youconfigure in the Add Configuration Template workflow.
3. Modify the fields as needed.
Refer "Add Configuration Templates" on page 234for an explanation of the fields.
NOTE: Fields marked with an asterisk (*) are mandatory.
4. Click OK.
The modifications are saved and you are returned to the Configuration Templates page, where aconfirmation message is displayed. If the configuration template was previously deployed on a device
245

or assigned to a device template, then you must redeploy the configuration template for the changesto take effect.
Clone a Configuration Template
To clone a configuration template:
1. Select Configuration > Templates > Config Templates.
The Configuration Templates page appears.
2. Select the configuration template that you want to clone and click Clone.
The Clone Configuration Template page appears.
3. In the Template Name field, enter a unique template name that can only contain alphanumericcharacters and hyphens up to a maximum of 64 characters.
4. Click OK.
You are returned to the Configuration Templates page and a confirmation message appears at the topof the page indicating the status of the clone operation.
After a template is cloned successfully, you can modify the template if needed. See the precedingsection for details.
Delete a Configuration Template
NOTE:
• You cannot delete predefined configuration templates.
• You can delete a configuration template only if the following conditions hold good:
• You added (created) the template.
• The template is not assigned to a device template.
• The template is not deployed on a device.
1. Select Configuration > Templates > Config Templates.
The Configuration Templates page appears.
2. Select the configuration template that you want to delete and click the Delete (X) icon.
You are asked to confirm the delete operation.
3. Click Yes.
You are returned to the Configuration Templates page and a popup appears indicating whether thedeletion was successful or not.
246

SEE ALSO
Configuration Templates Workflow | 230
Edit, Clone, and Delete a Configuration Template | 245
247
CHAPTER 17
Device Templates
IN THIS CHAPTER
Device Templates Overview | 248
About the Device Templates Page | 249
Edit Configuration Templates Assigned to a Device Template | 252
Edit, Clone, and Delete Device Templates | 253
Device Templates Overview
IN THIS SECTION
Predefined Device Templates | 248
Paragon Automation provides device templates that contain configurations for a device. Thisconfiguration is applied while onboarding or discovering a device.
Paragon Automation provides several default device templates for Juniper Networks devices. You caneither use the default device template provided with Paragon Automation if the template suits yourrequirements or if you have specific requirements, you can customize the default device template tomeet your requirements.
Predefined Device Templates
Table 57 on page 249 lists the predefined device templates provided with Paragon Automation.
248

Table 57: Predefined Device Templates
Template Name Description
juniper-ex-default-device-template
Default device template for Juniper Networks EX Series devices.
juniper-mx-default-device-template Default de
Default device template for Juniper Networks MX Series devices.
juniper-qfx-default-device-templa
Default device template for Juniper Networks QFX Series devices.
RELATED DOCUMENTATION
Zero-Touch Provisioning Overview | 100
Supported Devices and OS Versions | 111
Configuration Templates Overview | 228
About the Device Templates Page
IN THIS SECTION
Tasks You Can Perform | 249
Field Descriptions | 251
To access this page, click Configuration > Templates > Device Templates. Use this page to view details ofthe device templates and manage them.
Tasks You Can Perform
You can perform the following tasks from this page:
249
• View details of a device template.
To view details of a device template, select the device template and click the Details button. TheDetails for Device Template pane appears on the right side of the Device Templates page, displayingdetails such as the device family to which the template is applicable, description, number ofconfiguration templates assigned, and date and time the device template was last updated. Click theClose icon (X) to close the pane.
• Edit the configuration templates assigned to a device template; see "Edit Configuration TemplatesAssigned to a Device Template" on page 252.
• Edit, clone, and delete a device template; see "Edit, Clone, and Delete Device Templates" on page253.
• Filter Entries—Filter the table entries by adding new filtering criteria.
Hover over the Filter (funnel) icon and select Add Filter. On the Add Criteria page, select the filteringcriteria from the Field and Condition list, and enter the text to be compared in the Value field. ClickAdd.
The filtered table entries are listed and the filter criteria name is displayed above the table columnnames.
You can click the cross (X) icon (next to the filter name) to remove the filtering criteria.
NOTE:
• You can add multiple filtering criteria. Once you add the multiple filtering criteria, you canselect the And condition to display the entries matching all the filtering criteria or selectthe Or condition to display the entries matching any one of the filtering criteria.
• Quick filter: Save the filtering criteria as quick filters. Once you have added all the filteringcriteria, you can save a particular criteria or multiple criteria for future use by clicking Save.
On the Save Filter window, enter a name for the filter, optionally toggle the Set as Defaultbutton if you want to use this filtering criteria by default, and click OK.
The saved filters are displayed under Quick Filters when you hover over the Filter (funnel)icon. You can then apply these saved filters to the table entries.
• Show/Hide Columns—Choose to show or hide a specific column in the table.
Hover over the More Options (vertical ellipsis) > Show/Hide Columns and select the Column-Namecheck box of the columns you want to display in the table.
250

• Reset Preference—Reset the displayed columns to the default set of columns for each tab in thetable.
Hover over the More Options (vertical ellipsis) and select Reset Preference.
• Sort Entries—Click the column name to highlight the up and down arrows next to the column name.Sort the table entries in ascending or descending order of that column by clicking the up or downarrow respectively.
Field Descriptions
Table 58 on page 251 displays the fields on the Device Templates page.
Table 58: Fields on the Device Templates Page
Field Description
Name The name of the device template.
Description A brief description of the device template.
Family The device family to which the device template can be applied; for example,Juniper-EX, Juniper-MX, and Juniper-QFX
Default Indicates whether the device template is the default template.
• True indicates that the device template is the default device template for thedevice family.
• False indicates that the device template is not the default device template forthe device family.
The default device template for a device family is applied to the devices of thatfamily during device onboarding or discovery.
Last Updated Date and time when the device template was last updated, in the Month DD, YYYYHH:MM:SS AM/PM format.
Created By The user who added the device template to Paragon Automation.
251

RELATED DOCUMENTATION
Zero-Touch Provisioning Overview | 100
Supported Devices and OS Versions | 111
Add Devices Overview | 103
Edit Configuration Templates Assigned to a Device Template
An administrator or a user with permissions to edit device templates only can edit the configurationtemplates assigned to a device template.
While editing configuration templates assigned to a device template, you can do the following tasks:
• Set initial values for one or more configuration templates. The values that you set initially areassigned to the device during the device discovery or device onboarding.
• Assign one or more configuration templates.
• Remove one or more assigned configuration templates.
To edit a configuration templates assigned to a device template:
1. Select Configuration > Templates > Device Templates on the left navigation menu.
The Device Templates page appears.
2. Click on the device template for which you want to edit assigned configuration templates.
The Configuration Templates page appears.
3. Do one of the following:
• To set initial configuration values:
a. Select a configuration template and click Set initial Configuration.
The Initial Configuration page appears.
b. Set the initial values for the parameters in the configuration template and click OK.
Initial values are assigned to the configuration template.
• To add configuration templates to a device template:
a. Click the Add (+) icon.
The Add New Configuration Template page appears listing the available configurationtemplates in the Templates list.
b. From the Templates list, select the templates to be added, one at a time, and click OK.
252

A confirmation message appears indicating that the configuration template is added to thedevice template and you are returned to the Configuration Templates page.
• To remove one or more configuration templates assigned to the device template:
a. Select the configuration templates that you want to remove and click the Delete (trashcan)icon.
A confirmation message appears.
b. Click Yes to confirm.
The selected configuration templates are removed from the device template.
Click OK.
The configuration template assignment in the device template is modified and you are returned tothe Device Templates page.
RELATED DOCUMENTATION
Configuration Templates Workflow | 230
Assign Configuration Templates to a Device Template | 242
Zero-Touch Provisioning Overview | 100
Edit, Clone, and Delete Device Templates
IN THIS SECTION
Edit a Device Template | 254
Clone a Device Template | 254
Delete Device Templates | 255
To edit, clone, or delete a device template, you must be an administrator or have permissions to edit,clone, and delete device templates.
253
Edit a Device Template
You can edit only the following parameters of a device template:
• Description
• Enable or disable the template as the default template
To edit a device template:
1. Select Configuration > Templates > Device Templates on the left navigation menu.
The Device Templates page appears.
2. Select the device template that you want to edit and click the Edit (pencil) icon.
The Edit Device Template page appears.
3. Do the following: and enable or disable the template as the default template.
• Edit the description in the Description field.
The description can be a set of alphanumeric characters and some special characters [hyphen (-),underscore (_), and period (.)]. There is no limit on the number of characters used.
• Click the Mark as Default toggle button to enable or disable using the device template as thedefault template for the device family.
NOTE: You can have one default device template per device family.
4. Click OK.
A confirmation message appears indicating that the device template is successfully updated and theupdates appear on the Device Templates page.
Clone a Device Template
Cloning a device template is useful when you want to create a device template that is similar to anexisting one but with small differences.
To clone a device template:
1. Select Configuration > Templates > Device Templates on the left navigation menu.
The Device Templates page appears.
2. Select the device template that you want to clone and click the Clone button.
The Clone Device Template page appears.
3. Do the following:
254

• In the Name field, edit the name of the device template. The name can be a set of alphanumericcharacters, some special characters [hyphen (-), underscore (_), period (.) and space]. There is nolimit on the number of characters used.
• In the Description field, edit the description of the device template. There is no restriction on thedescription you provide.
• Click the Mark as Default toggle button to enable or disable setting the device template as thedefault device template.
NOTE: You can have only one default device template per device family. If you set thecloned device template as the default for the device family, the default tag on the earlierdevice template is removed.
4. Click OK.
A message appears indicating that the device template is cloned successfully and listed on the DeviceTemplates page.
Delete Device Templates
To delete a device template:
1. Select Configuration > Templates > Device Templates.
The Device Templates page appears.
2. Select the device template that you want to delete and click the Delete button.
A confirmation message appears.
3. Click Yes to delete the device template.
The device template is deleted and no longer listed on the Device Templates page.
SEE ALSO
Device Templates Overview | 248
Zero-Touch Provisioning Overview | 100
255

5PART
Manage Playbook, Rules, and Graphs
Playbooks | 257
Rules | 270
Graphs | 317
CHAPTER 18
Playbooks
IN THIS CHAPTER
About Playbooks | 257
Add a Predefined Playbook | 258
Create a New Playbook Using the Paragon Insights GUI | 259
Edit a Playbook | 260
Clone a Playbook | 261
Manage Playbook Instances | 262
About Playbooks
In order to fully understand any given problem or situation on a network, it is often necessary to look ata number of different system components, topics, or key performance indicators (KPIs). Paragon Insightsoperates on playbooks, which are collections of rules for addressing a specific use case. Playbooks arethe Paragon Insights element that gets applied, or run, on your device groups or network groups.
Paragon Insights comes with a set of pre-defined Playbooks. For example, the system-KPI playbookmonitors the health of system parameters such as system-cpu-load-average, storage, system-memory,process-memory, etc. It then notifies the operator or takes corrective action in case any of the KPIscross pre-set thresholds. Following is a sample list of Juniper-supplied Playbooks.
• bgp-session-stats
• route-summary-playbook
• lldp-playbook
• interface-kpis-playbook
• system-kpis-playbook
• linecard-kpis-playbook
• chassis-kpis-playbook
257

You can create a playbook and include any rules you want in it. You apply these playbooks to devicegroups. By default, all rules contained in a Playbook are applied to all of the devices in the device group.There is currently no way to change this behavior.
If your playbook definition includes network rules, then the playbook becomes a network playbook andcan only be applied to network groups. You must not add device group rules and network rules in asingle playbook.
To access the Playbooks page in the Paragon Automation Platform GUI, go to Configuration >Playbooks.
You can perform the following tasks in Playbooks page.
• Add a Pre-Defined Playbook. See "Add a Predefined Playbook" on page 258.
• Create a New Playbook Using the Paragon Automation GUI. See "Create a New Playbook Using theParagon Insights GUI" on page 259.
• Edit a Playbook. See "Edit a Playbook" on page 260.
• Clone a Playbook. See "Clone a Playbook" on page 261.
• Manage Playbook Instances. See "Manage Playbook Instances" on page 262.
RELATED DOCUMENTATION
Rules Overview | 271
Add a Predefined Playbook
To add a predefined playbook to Paragon Insights:
1. In a browser, go to https://github.com/Juniper/healthbot-rules and download the predefinedplaybook file to your computer.
2. In the Paragon Insights GUI, click the Configuration > Playbooks icon in the Paragon Automationmenu.
3. Click the upload playbook button (↑ Upload Playbook).
4. Click the Choose Files button.
5. Navigate to the playbook file and click Open.
The extension of playbook files must be .playbook.
6. Select one of the following options:
258

Upload Upload the file and add the playbook but do not deploy the updated configuration. You canuse this option when, for example, you are making several changes and want to deploy allyour updates at the same time.
Upload &Deploy
Upload the file, add the playbook, and immediately deploy the configuration.
RELATED DOCUMENTATION
Manage Playbook Instances | 262
Create a New Playbook Using the Paragon Insights GUI | 259
Create a New Playbook Using the Paragon Insights GUI
Paragon Insights operates on playbooks, which are a collection of rules for solving a specific customeruse case. For example, the system-kpi-playbook monitors the health of system parameters such assystem-cpu-load-average, storage, system-memory, process-memory, etc. and notifies the operator ortakes corrective action in case any of the KPIs cross pre-set thresholds. Any single rule can be a part of0, 1, or more playbooks. The playbook is the element that gets deployed on device groups. Rules thatare not included in any playbook will not be deployed to any device.
NOTE: Click the Name, Running, Paused, or Synopsiscolumn headers in the Playbooks table toorganize the data in ascending or descending order.
To create a new playbook using the Paragon Insights GUI:
1. Click the Configuration > Playbooks icon in the left navigation bar.
2. Click the create playbook button (+ Create Playbook).
A new window appears with 4 fields: Name, Synopsis, Description, and Rules. We describe the use ofeach field below.
3. Enter a name for the playbook in the Name field.
4. Enter a short description for the playbook in the Synopsis field.
This text appears in the Synopsis column of the table on the Playbooks page.
5. (Optional) Enter a description of each of the rules that make up this playbook in the Description field.
This text can only be seen if you click on the playbook name on the Playbooks page.
259

6. From the rules drop-down list, select the rules that make up this playbook.
7. Select one of the following options:
Save Save and add the playbook but do not deploy the updated configuration. You can use thisoption when, for example, you are making several changes and want to deploy all yourupdates at the same time.
Save & Deploy Immediately deploy the configuration and save and add the playbook.
RELATED DOCUMENTATION
Add a Predefined Playbook | 258
Clone a Playbook | 261
Edit a Playbook
To edit a playbook:
1. Click the Configuration > Playbooks icon in the left-nav bar.
2. Click the name of the playbook.
3. Modify the necessary text boxes.
4. Click Save to only save the configuration.
Click Save and Deploy to save and deploy the configuration immediately.
(Optional) You can delete a playbook by clicking the trash can icon in the Delete column.
NOTE: You cannot edit or delete a system defined (Juniper provided) playbook.
When you update a playbook, the new changes in the playbook are not applied to the existing instancesof the playbook. For example, a playbook instance that is associated to a device group will not beupdated when the playbook is edited or updated. You must delete the existing playbook instance andcreate a new one for updates to be applied.
260

RELATED DOCUMENTATION
Manage Playbook Instances | 262
Clone a Playbook
You can clone an existing playbook and modify configurations.
Follow these steps to clone a playbook by using the Paragon Insights UI.
1. Click Configuration>Playbooks in the left-nav bar.
The Playbooks page is displayed.
2. Click the Clone icon as show in Figure 9 on page 261.
Figure 9: Clone a Playbook
The Clone Playbook: <name of playbook> page is displayed.
You can now edit Name, Synopsis, and Description sections. You can also add new rules or removeexisting rules from the Rules drop-down list.
3. Click Save to save configurations and confirm cloning the playbook.
Alternatively, click Save & Deploy to save configurations, confirm cloning the playbook, and deploythe newly cloned playbook.
261
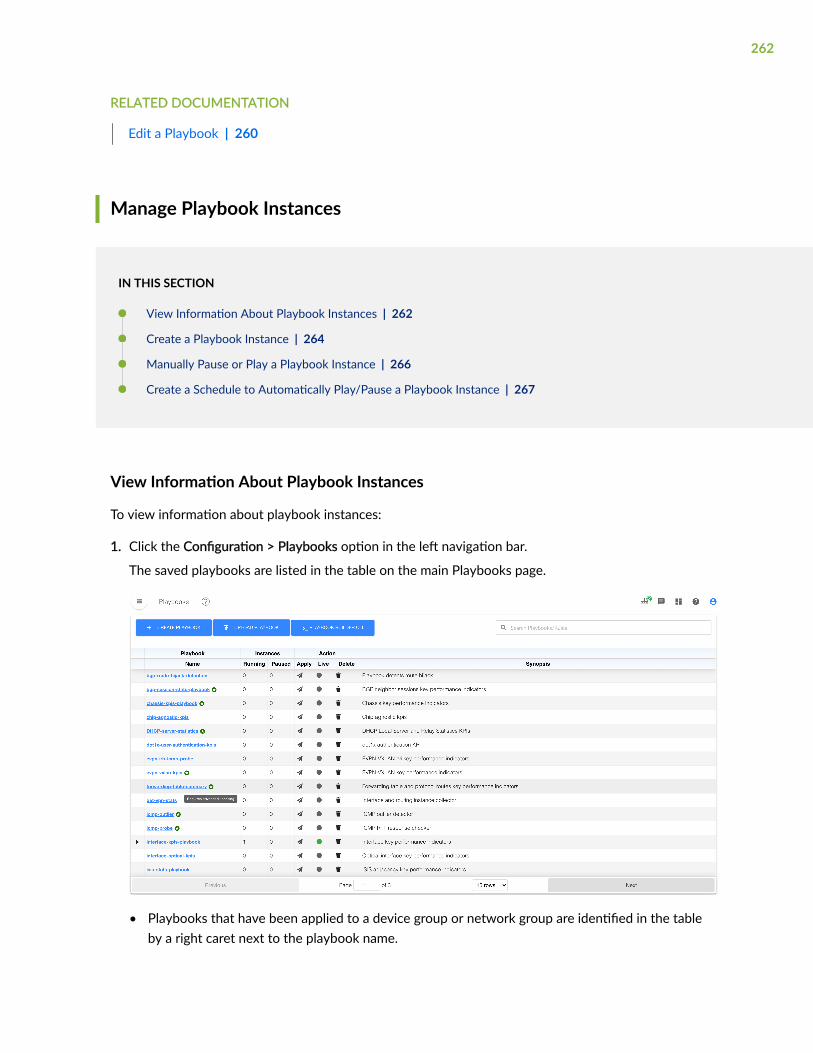
RELATED DOCUMENTATION
Edit a Playbook | 260
Manage Playbook Instances
IN THIS SECTION
View Information About Playbook Instances | 262
Create a Playbook Instance | 264
Manually Pause or Play a Playbook Instance | 266
Create a Schedule to Automatically Play/Pause a Playbook Instance | 267
View Information About Playbook Instances
To view information about playbook instances:
1. Click the Configuration > Playbooks option in the left navigation bar.
The saved playbooks are listed in the table on the main Playbooks page.
• Playbooks that have been applied to a device group or network group are identified in the tableby a right caret next to the playbook name.
262
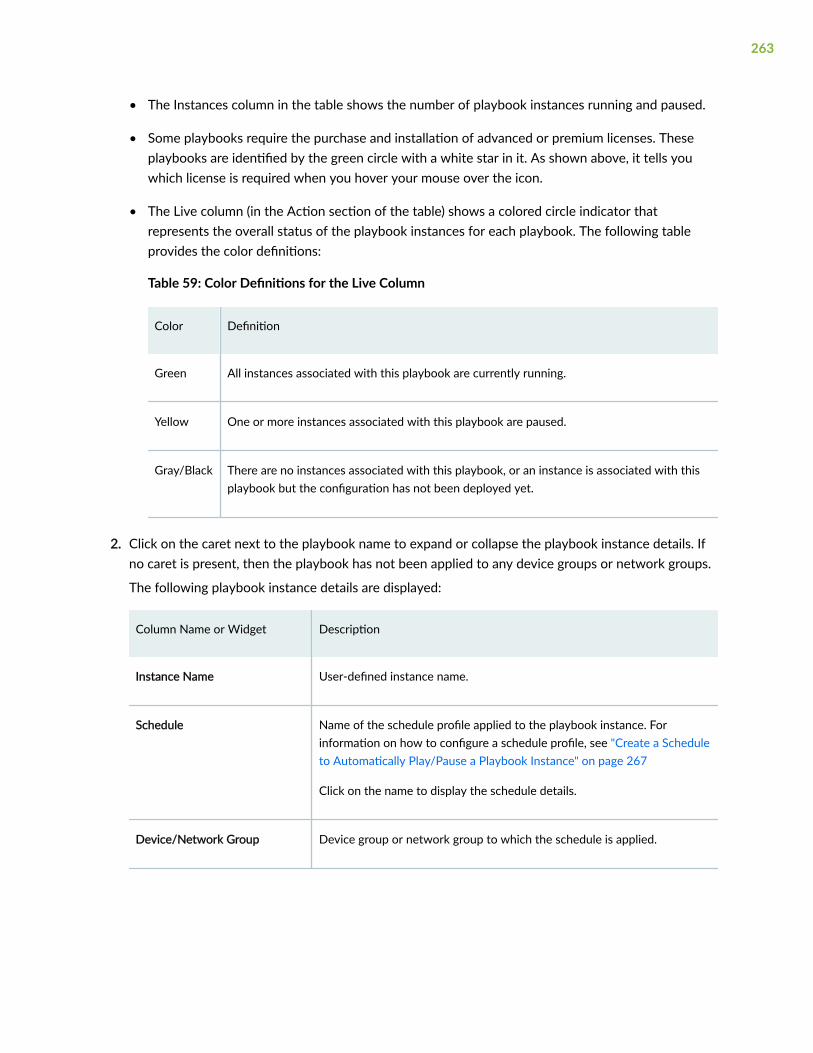
• The Instances column in the table shows the number of playbook instances running and paused.
• Some playbooks require the purchase and installation of advanced or premium licenses. Theseplaybooks are identified by the green circle with a white star in it. As shown above, it tells youwhich license is required when you hover your mouse over the icon.
• The Live column (in the Action section of the table) shows a colored circle indicator thatrepresents the overall status of the playbook instances for each playbook. The following tableprovides the color definitions:
Table 59: Color Definitions for the Live Column
Color Definition
Green All instances associated with this playbook are currently running.
Yellow One or more instances associated with this playbook are paused.
Gray/Black There are no instances associated with this playbook, or an instance is associated with thisplaybook but the configuration has not been deployed yet.
2. Click on the caret next to the playbook name to expand or collapse the playbook instance details. Ifno caret is present, then the playbook has not been applied to any device groups or network groups.
The following playbook instance details are displayed:
Column Name or Widget Description
Instance Name User-defined instance name.
Schedule Name of the schedule profile applied to the playbook instance. Forinformation on how to configure a schedule profile, see "Create a Scheduleto Automatically Play/Pause a Playbook Instance" on page 267
Click on the name to display the schedule details.
Device/Network Group Device group or network group to which the schedule is applied.
263

(Continued)
Column Name or Widget Description
No. of devices Number of devices on which this playbook instance is deployed. This isapplicable for device group instances only, not for network groupinstances.
Status Current status of the playbook instance. Status can be either Running orPaused. The Status column also indicates whether the action wasperformed automatically or manually.
Note: If the status of a playbook instance is Running (automatic), you canmanually pause the schedule for this instance using the Pause Schedulebutton. In this case, the status will change to Paused (manual). To resumerunning the schedule for this instance, you must manually run the instanceusing the Play Schedule button. In this case, the status will change back toRunning (automatic), and the play and pause actions associated with theschedule will resume.
Started/Paused at Date and time when the playbook instance was last started or paused. Thedate reflects local browser time zone.
Next Action This column applies only to playbook instances associated with a schedule.It indicates whether the playbook instance is scheduled to automaticallypause or play in the future. This column is blank if no schedule isassociated with the playbook instance or if the status of the instance isPaused (manual).
Play/Pause button Pauses or plays a playbook instance or the schedule for a playbookinstance.
The Play/Pause button toggles between the two states. For moreinformation, see "Manually Pause or Play a Playbook Instance" on page266.
Trash can icon Deletes the playbook instance.
Create a Playbook Instance
To create a playbook instance for a device group:
264
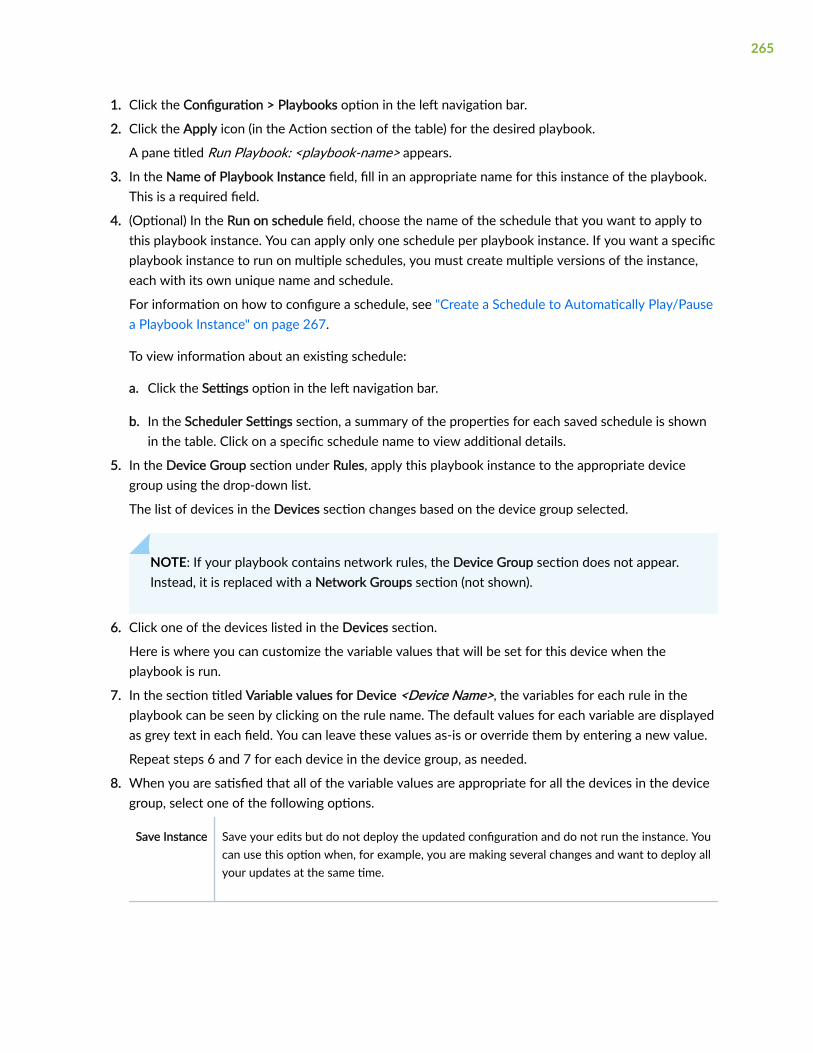
1. Click the Configuration > Playbooks option in the left navigation bar.
2. Click the Apply icon (in the Action section of the table) for the desired playbook.
A pane titled Run Playbook: <playbook-name> appears.
3. In the Name of Playbook Instance field, fill in an appropriate name for this instance of the playbook.This is a required field.
4. (Optional) In the Run on schedule field, choose the name of the schedule that you want to apply tothis playbook instance. You can apply only one schedule per playbook instance. If you want a specificplaybook instance to run on multiple schedules, you must create multiple versions of the instance,each with its own unique name and schedule.
For information on how to configure a schedule, see "Create a Schedule to Automatically Play/Pausea Playbook Instance" on page 267.
To view information about an existing schedule:
a. Click the Settings option in the left navigation bar.
b. In the Scheduler Settings section, a summary of the properties for each saved schedule is shownin the table. Click on a specific schedule name to view additional details.
5. In the Device Group section under Rules, apply this playbook instance to the appropriate devicegroup using the drop-down list.
The list of devices in the Devices section changes based on the device group selected.
NOTE: If your playbook contains network rules, the Device Group section does not appear.Instead, it is replaced with a Network Groups section (not shown).
6. Click one of the devices listed in the Devices section.
Here is where you can customize the variable values that will be set for this device when theplaybook is run.
7. In the section titled Variable values for Device <Device Name>, the variables for each rule in theplaybook can be seen by clicking on the rule name. The default values for each variable are displayedas grey text in each field. You can leave these values as-is or override them by entering a new value.
Repeat steps 6 and 7 for each device in the device group, as needed.
8. When you are satisfied that all of the variable values are appropriate for all the devices in the devicegroup, select one of the following options.
Save Instance Save your edits but do not deploy the updated configuration and do not run the instance. Youcan use this option when, for example, you are making several changes and want to deploy allyour updates at the same time.
265
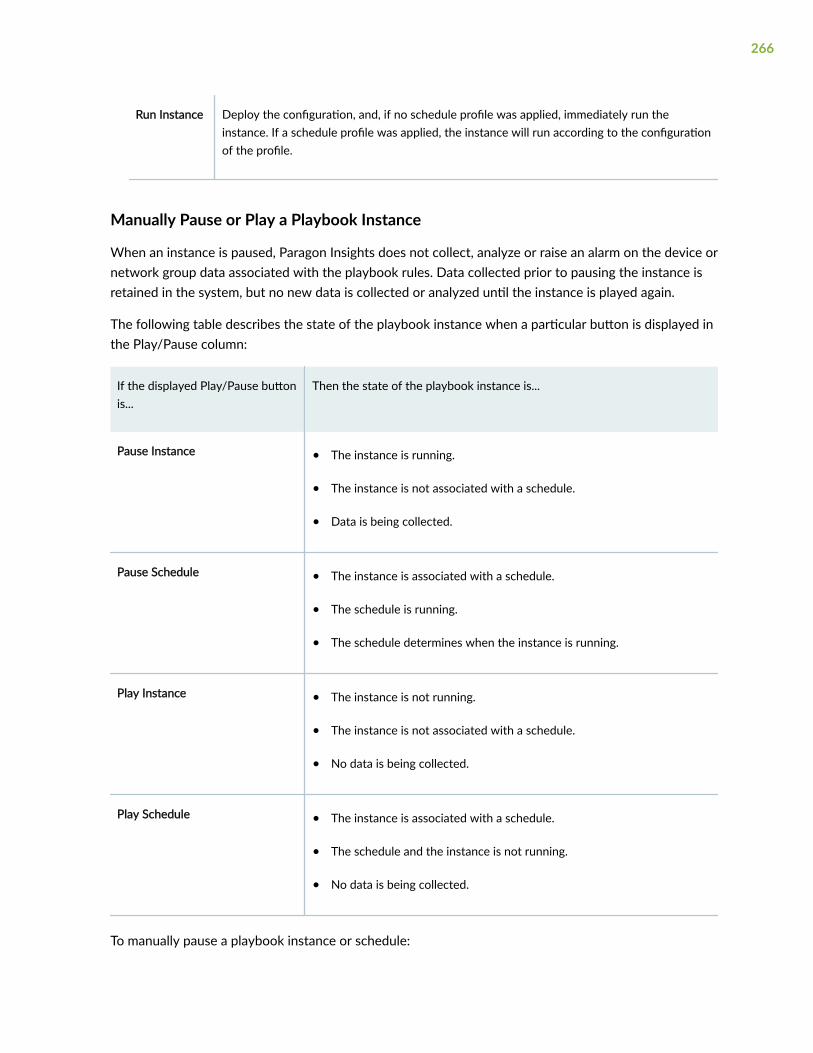
Run Instance Deploy the configuration, and, if no schedule profile was applied, immediately run theinstance. If a schedule profile was applied, the instance will run according to the configurationof the profile.
Manually Pause or Play a Playbook Instance
When an instance is paused, Paragon Insights does not collect, analyze or raise an alarm on the device ornetwork group data associated with the playbook rules. Data collected prior to pausing the instance isretained in the system, but no new data is collected or analyzed until the instance is played again.
The following table describes the state of the playbook instance when a particular button is displayed inthe Play/Pause column:
If the displayed Play/Pause buttonis...
Then the state of the playbook instance is...
Pause Instance • The instance is running.
• The instance is not associated with a schedule.
• Data is being collected.
Pause Schedule • The instance is associated with a schedule.
• The schedule is running.
• The schedule determines when the instance is running.
Play Instance • The instance is not running.
• The instance is not associated with a schedule.
• No data is being collected.
Play Schedule • The instance is associated with a schedule.
• The schedule and the instance is not running.
• No data is being collected.
To manually pause a playbook instance or schedule:
266
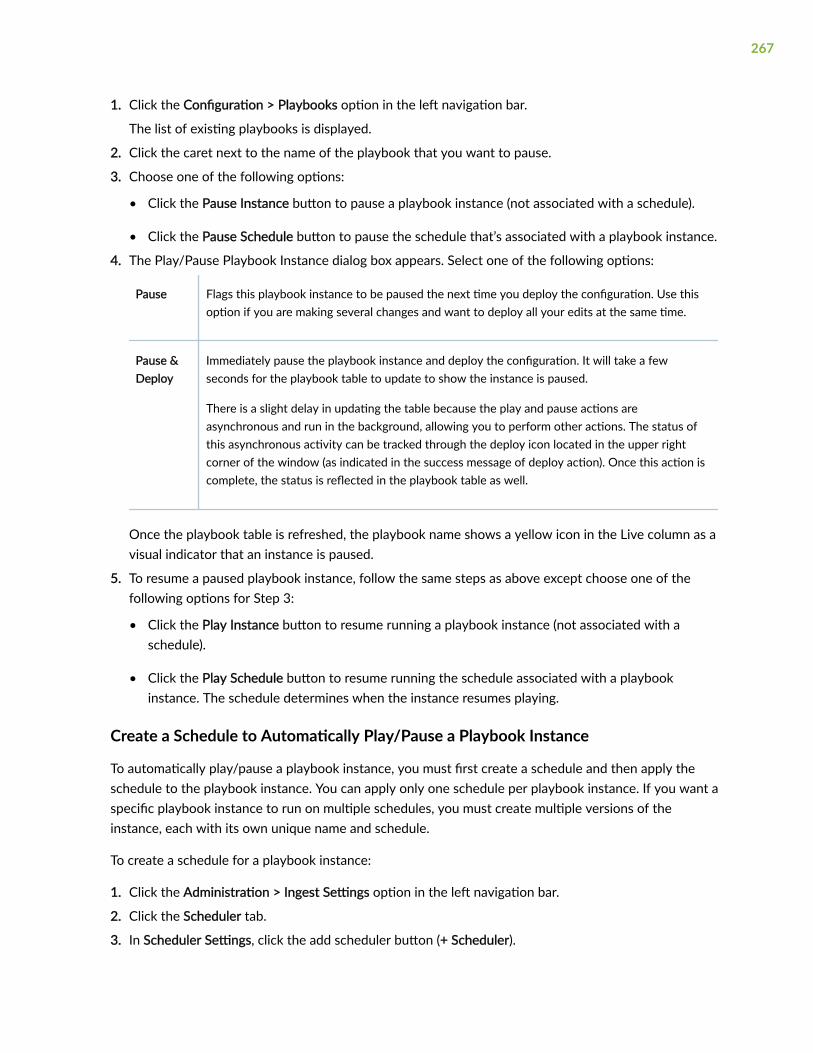
1. Click the Configuration > Playbooks option in the left navigation bar.
The list of existing playbooks is displayed.
2. Click the caret next to the name of the playbook that you want to pause.
3. Choose one of the following options:
• Click the Pause Instance button to pause a playbook instance (not associated with a schedule).
• Click the Pause Schedule button to pause the schedule that’s associated with a playbook instance.
4. The Play/Pause Playbook Instance dialog box appears. Select one of the following options:
Pause Flags this playbook instance to be paused the next time you deploy the configuration. Use thisoption if you are making several changes and want to deploy all your edits at the same time.
Pause &Deploy
Immediately pause the playbook instance and deploy the configuration. It will take a fewseconds for the playbook table to update to show the instance is paused.
There is a slight delay in updating the table because the play and pause actions areasynchronous and run in the background, allowing you to perform other actions. The status ofthis asynchronous activity can be tracked through the deploy icon located in the upper rightcorner of the window (as indicated in the success message of deploy action). Once this action iscomplete, the status is reflected in the playbook table as well.
Once the playbook table is refreshed, the playbook name shows a yellow icon in the Live column as avisual indicator that an instance is paused.
5. To resume a paused playbook instance, follow the same steps as above except choose one of thefollowing options for Step 3:
• Click the Play Instance button to resume running a playbook instance (not associated with aschedule).
• Click the Play Schedule button to resume running the schedule associated with a playbookinstance. The schedule determines when the instance resumes playing.
Create a Schedule to Automatically Play/Pause a Playbook Instance
To automatically play/pause a playbook instance, you must first create a schedule and then apply theschedule to the playbook instance. You can apply only one schedule per playbook instance. If you want aspecific playbook instance to run on multiple schedules, you must create multiple versions of theinstance, each with its own unique name and schedule.
To create a schedule for a playbook instance:
1. Click the Administration > Ingest Settings option in the left navigation bar.
2. Click the Scheduler tab.
3. In Scheduler Settings, click the add scheduler button (+ Scheduler).
267
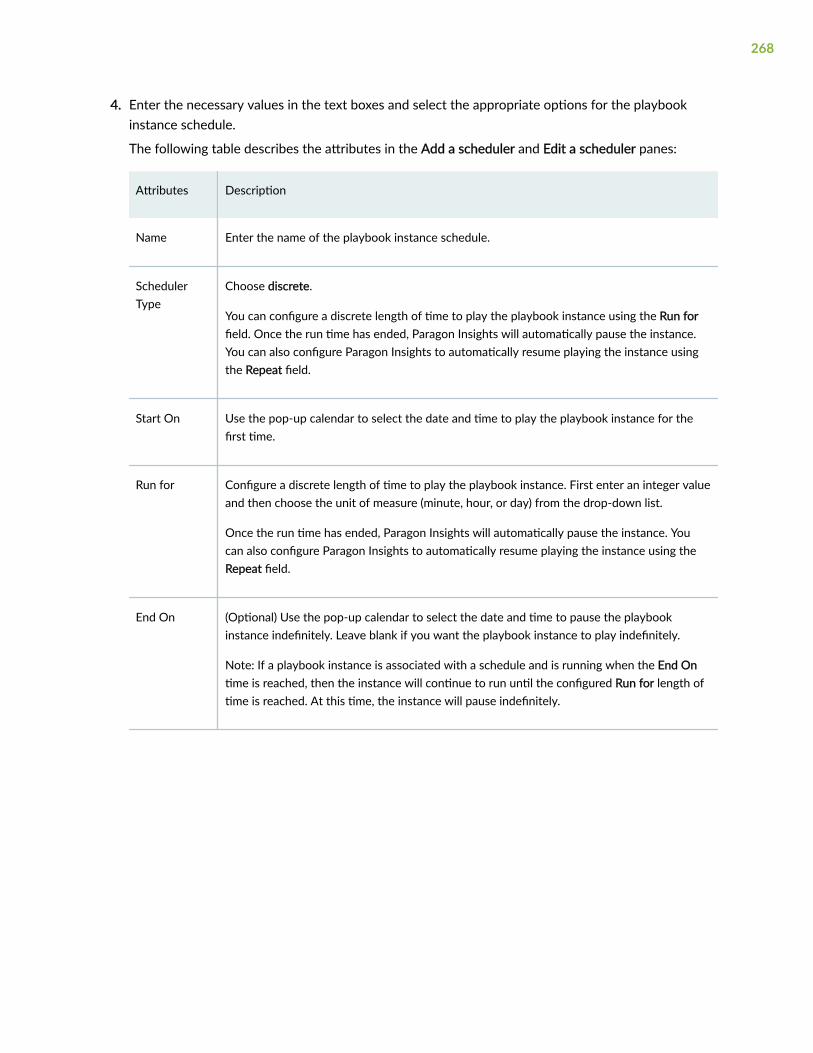
4. Enter the necessary values in the text boxes and select the appropriate options for the playbookinstance schedule.
The following table describes the attributes in the Add a scheduler and Edit a scheduler panes:
Attributes Description
Name Enter the name of the playbook instance schedule.
SchedulerType
Choose discrete.
You can configure a discrete length of time to play the playbook instance using the Run forfield. Once the run time has ended, Paragon Insights will automatically pause the instance.You can also configure Paragon Insights to automatically resume playing the instance usingthe Repeat field.
Start On Use the pop-up calendar to select the date and time to play the playbook instance for thefirst time.
Run for Configure a discrete length of time to play the playbook instance. First enter an integer valueand then choose the unit of measure (minute, hour, or day) from the drop-down list.
Once the run time has ended, Paragon Insights will automatically pause the instance. Youcan also configure Paragon Insights to automatically resume playing the instance using theRepeat field.
End On (Optional) Use the pop-up calendar to select the date and time to pause the playbookinstance indefinitely. Leave blank if you want the playbook instance to play indefinitely.
Note: If a playbook instance is associated with a schedule and is running when the End Ontime is reached, then the instance will continue to run until the configured Run for length oftime is reached. At this time, the instance will pause indefinitely.
268

(Continued)
Attributes Description
Repeat Configure the Run for field before configuring the Repeat field. The Repeat interval must belarger than the configured Run for length of time.
In the drop-down list, choose one of the following:
• The frequency (every day, week, month, or year) at which you want the playbookinstance to play.
• The Never option if you want the playbook to play only once.
• The Custom option to specify a custom frequency at which you want the playbookinstance to play. Use the Repeat Every field to configure the custom frequency.
Repeat Every (Optional) If you chose the Custom option for the Repeat field, enter the custom frequencyat which you want the playbook instance to play. First enter an integer value and thenchoose the unit of measure (minute, hour, or day) from the drop-down list.
5. Click Save to save the configuration or click Save and Deploy to save and deploy the configuration.
6. Now you’re ready to apply the schedule to a playbook instance. See "Create a Playbook Instance" onpage 264 for more information.
RELATED DOCUMENTATION
About the Rules Page | 288
269

CHAPTER 19
Rules
IN THIS CHAPTER
Understand Paragon Insights Topics | 270
Rules Overview | 271
About the Rules Page | 288
Add a Predefined Rule | 289
Manage Rules | 290
Configure a Custom Rule in Paragon Insights GUI | 292
Configure Paragon Insights Notification for LSP Gray Failures | 308
Configure Multiple Sensors per Device | 310
Understand Sensor Precedence | 312
Configure Sensor Precedence | 314
Understand Paragon Insights Topics
Network devices are made up of a number of components and systems from CPUs and memory tointerfaces and protocol stacks and more. In Paragon Insights, topics are the construct used to addressthose different device components. The Topics block is used to create name spaces that define whatneeds to be modeled. The Topics block consists of Rules blocks which in turn consist of the Fieldsblocks, Functions blocks, Triggers blocks, etc. See "Rules Overview" on page 271. Each rule created inParagon Automation Platform must be included in a Topic. Juniper has curated a number of thesesystem components into a list of Topics:
• chassis
• class-of-service
• external
• firewall
• interfaces
270

• kernel
• linecard
• logical-systems
• protocol
• routing-options
• security
• service
• system
Any pre-defined rules provided by Juniper fit within one of these topics with the exception of external,The external topic is reserved for user-created rules. You can create sub-topics underneath any of theallowed topic names by appending .<sub-topic> to them. For example, kernel.tcpip,
In the Paragon Automation GUI, when you create a new rule, the Topic field is automatically populatedwith the external topic name.
RELATED DOCUMENTATION
Add a Predefined Rule | 289
Configure a Custom Rule in Paragon Insights GUI | 292
Rules Overview
IN THIS SECTION
Rules | 275
Sensors | 280
Fields | 280
Vectors | 283
Variables | 284
Functions | 284
Triggers | 284
271
Tagging | 288
Rule Properties | 288
A rule is a package of components, or blocks, needed to extract specific information from the networkor from a Junos device. Rules conform to a specifically tailored domain specific language (DSL) foranalytics applications. The DSL is designed to allow rules to capture:
• The minimum set of input data that the rule needs to be able to operate
• The fields of interest from the configured sensors
• The reporting or polling frequency
• The set of triggers that operate on the collected data
• The conditions or evaluations needed for triggers to kick in
• The actions or notifications that need to be performed when a trigger kicks in
272

The structure of a rule looks like this:
273
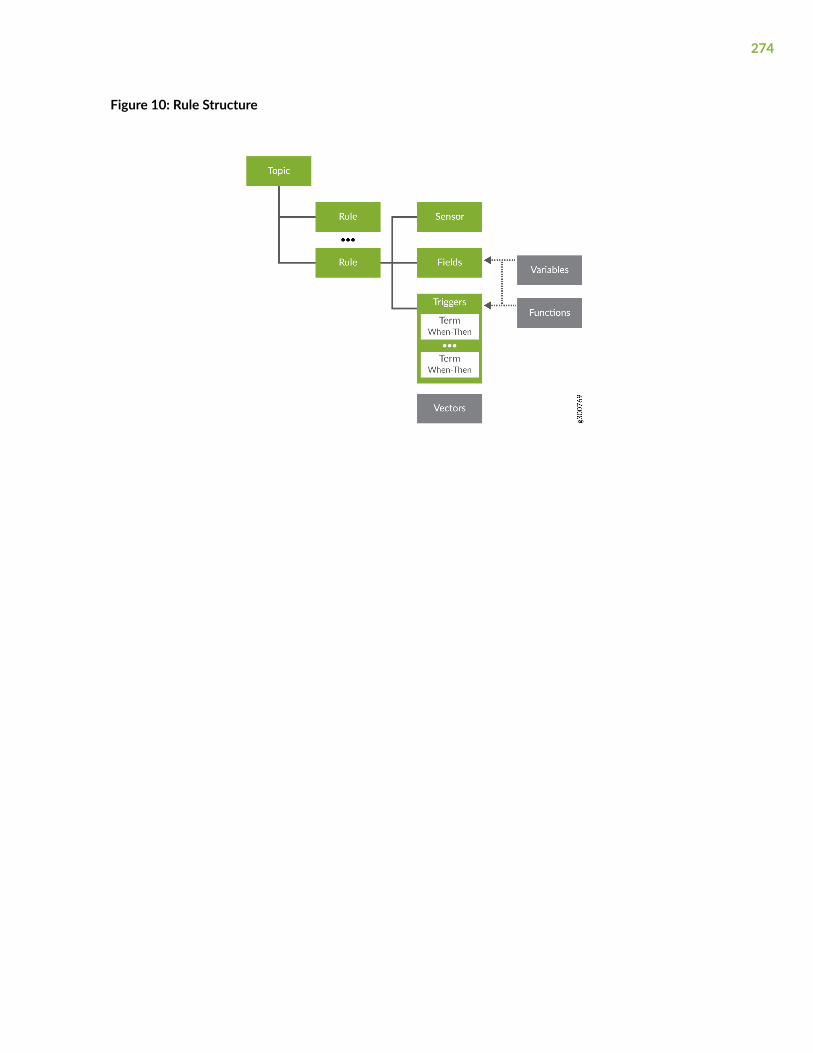
Figure 10: Rule Structure
274

To keep rules organized, Paragon Insights organizes them into topics. Topics can be very general, likesystem, or they can be more granular, like protocol.bgp. Each topic contains one or more rules. To knowmore about topics, see
The details around rules are presented in the following sections.
Rules
Rules are meant to be free of any hard coding. Think of threshold values; If a threshold is hard coded,there is no easy way to customize it for a different customer or device that has different requirements.Therefore, rules are defined using parameterization to set the default values. This allows the parametersto be left at default or be customized by the operator at the time of deployment. Customization can bedone at the device group or individual device level while applying the Playbook in which the individualrules are contained.
Rules that are device-centric are called device rules. Device components such as chassis, system, linecards, and interfaces are all addressed as Topics in the rule definition. Generally, device rules make useof sensors on the devices.
Rules that span multiple devices are called network rules. Network rules:
• Must have a rule-frequency configured
• Must not contain sensors
• Cannot be mixed with device rules in a playbook
To deploy either type of rule, include the rule in a playbook and then apply the playbook to a devicegroup or network group.
NOTE: Paragon Insights comes with a set of pre-defined rules.
Not all of the blocks that make up a rule are required for every rule. Whether or not a specific block isrequired in a rule definition depends on what sort of information you are trying to get to. Additionally,some rule components are not valid for network rules. Table 60 on page 276 lists the components of arule and provides a brief description of each one.
275
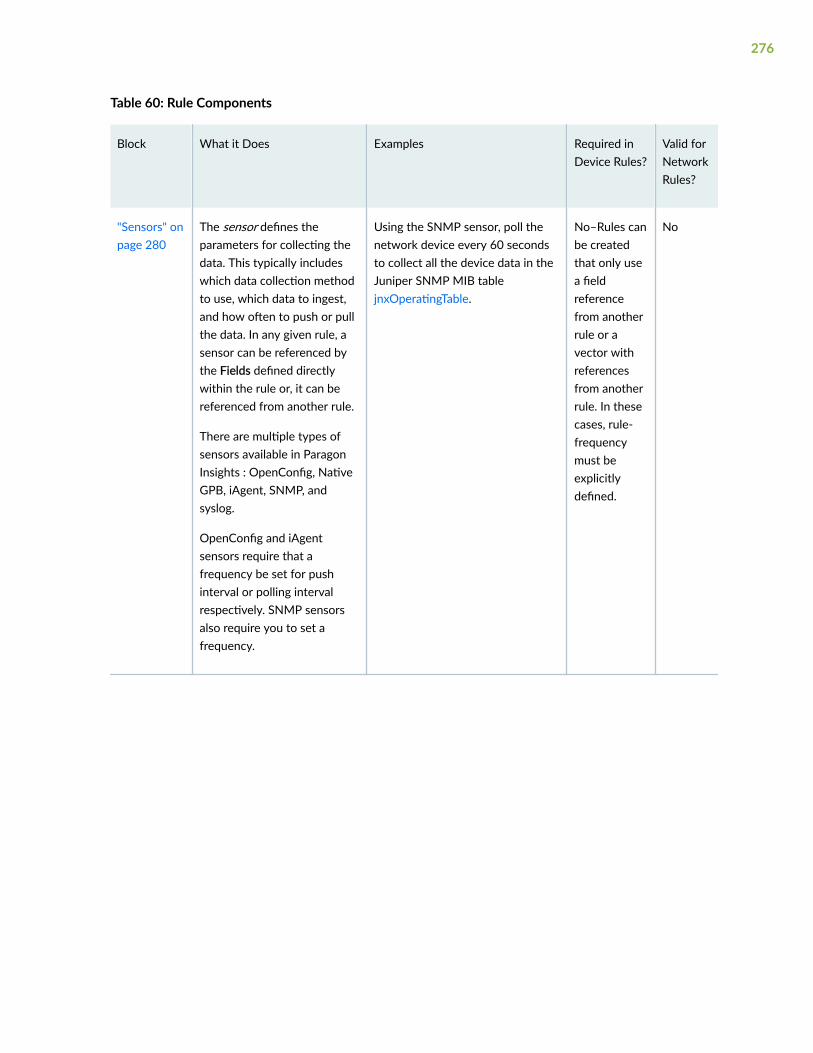
Table 60: Rule Components
Block What it Does Examples Required inDevice Rules?
Valid forNetworkRules?
"Sensors" onpage 280
The sensor defines theparameters for collecting thedata. This typically includeswhich data collection methodto use, which data to ingest,and how often to push or pullthe data. In any given rule, asensor can be referenced bythe Fields defined directlywithin the rule or, it can bereferenced from another rule.
There are multiple types ofsensors available in ParagonInsights : OpenConfig, NativeGPB, iAgent, SNMP, andsyslog.
OpenConfig and iAgentsensors require that afrequency be set for pushinterval or polling intervalrespectively. SNMP sensorsalso require you to set afrequency.
Using the SNMP sensor, poll thenetwork device every 60 secondsto collect all the device data in theJuniper SNMP MIB tablejnxOperatingTable.
No–Rules canbe createdthat only usea fieldreferencefrom anotherrule or avector withreferencesfrom anotherrule. In thesecases, rule-frequencymust beexplicitlydefined.
No
276

Table 60: Rule Components (Continued)
Block What it Does Examples Required inDevice Rules?
Valid forNetworkRules?
"Fields" onpage 280
The fields provide a way tofilter or manipulate sensordata, allowing you to identifyand isolate the specific piecesof information. Fields can alsoact as placeholder values, likea static threshold value, tohelp the system perform dataanalysis.
The source for the Fieldsblock can be a pointer to asensor, a reference to a fielddefined in another rule, aconstant, or a formula. Thefield can be a string, integer orfloating point. The defaultfield type is string.
Extract, isolate, and store thejnxOperating15MinLoadAvg (CPU15-minute average utilization)value from the SNMP tablespecified above in the sensor.
Yes-Fieldscontain thedata onwhich thetriggersoperate.Regular fieldsand key-fieldscan be addedto rules basedonconditionaltaggingprofiles. Seethe "Tagging"on page 288sectionbelow.
Yes
"Vectors" onpage 283
The Vectors block allowshandling of lists, creating sets,and comparing elementsamongst different sets. Avector is used to hold multiplevalues from one or morefields.Vectors allow you toleverage existing elements toavoid the need to repeatedlyconfigure the same elementsacross multiple rules.
A rule with a configured sensor,plus a vector to a second sensorfrom another rule; a rule with nosensors, and vectors to fields fromother rules.
No Yes
277

Table 60: Rule Components (Continued)
Block What it Does Examples Required inDevice Rules?
Valid forNetworkRules?
"Variables"on page 284
The Variables block allowsyou to pass values into rules.Invariant rule definitions areachieved through mustache-style templating like{{<placeholder-variable> }}.The placeholder-variablevalue is set in the rule bydefault or can be user-definedat deployment time.
The string “ge-0/0/0”, used withina field collecting status for allinterfaces, to filter the data downto just the one interface; aninteger, such as “80”, referenced ina field to use as a static thresholdvalue.
No No
"Functions"on page 284
The Functions block allowsyou to extend fields, triggers,and actions by creatingprototype methods in externalfiles written in languages likepython. The functions blockincludes details on the filepath, method to be accessed,and any arguments, includingargument description andwhether it is mandatory.
A rule that monitors input andoutput packet counts, using afunction to compare the countvalues; a rule that monitors systemstorage, invoking a function tocleanup temp and log files ifstorage utilization goes above adefined threshold
No No
278

Table 60: Rule Components (Continued)
Block What it Does Examples Required inDevice Rules?
Valid forNetworkRules?
"Triggers" onpage 284
Triggers periodically bringtogether the fields with otherelements to compare data anddetermine current devicestatus.
The Triggers block operateson fields and are defined byone or more Terms. A triggerTerm includes one ormore ’when-then’ statements,which contain the parametersthat define how device statusis visualized on the healthpages. When the conditionsof a Term are met, then theaction defined in the Term istaken.
By default, triggers areevaluated every 10 seconds,unless explicitly configured fora different frequency.
By default, all triggers definedin a rule are evaluated inparallel.
Every 90 seconds, check the CPU15min average utilization value,and if it goes above a definedthreshold, set the device’s status tored on the device health page anddisplay a message showing thecurrent value.
Optional–Triggersenable rulesto takeaction.
Yes
"RuleProperties"on page 288
The Rule Properties blockallows you to specifymetadata for a ParagonInsights rule, such ashardware dependencies,software dependencies, andversion history.
Configuration to set the minimumsupported release version forbackward compatibility for alldevices in the MX series of routers.
No Yes
279

Sensors
When defining a sensor, you must specify information such as sensor name, sensor type and datacollection frequency. As mentioned in Table 60 on page 276, sensors can be one of the following:
• OpenConfig For information on OpenConfig JTI sensors, see the Junos Telemetry Interface UserGuide.
• Native GPB For information on Native GPB JTI sensors, see the Junos Telemetry Interface UserGuide.
• iAgent The iAgent sensors use NETCONF and YAML-based PyEZ tables and views to fetch thenecessary data. Both structured (XML) and unstructured (VTY commands and CLI output)data are supported. For information on Junos PyEZ, see the Junos PyEz Documentation.
• SNMP Simple Network Management Protocol.
• syslog system log
• BYOI Bring your own ingest – Allows you to define your own ingest types.
• Flow NetFlow traffic flow analysis protocol
• sFlow sFlow packet sampling protocol
When different rules have the same sensor defined, only one subscription is made per sensor. A key,consisting of sensor-path for OpenConfig and Native GPB sensors, and the tuple of file and table foriAgent sensors is used to identify the associated rule.
When multiple sensors with the same sensor-path key have different frequencies defined, the lowestfrequency is chosen for the sensor subscription.
Fields
There are four types of field sources, as listed in Table 60 on page 276. Table 61 on page 281 describesthe four field ingest types in more detail.
280
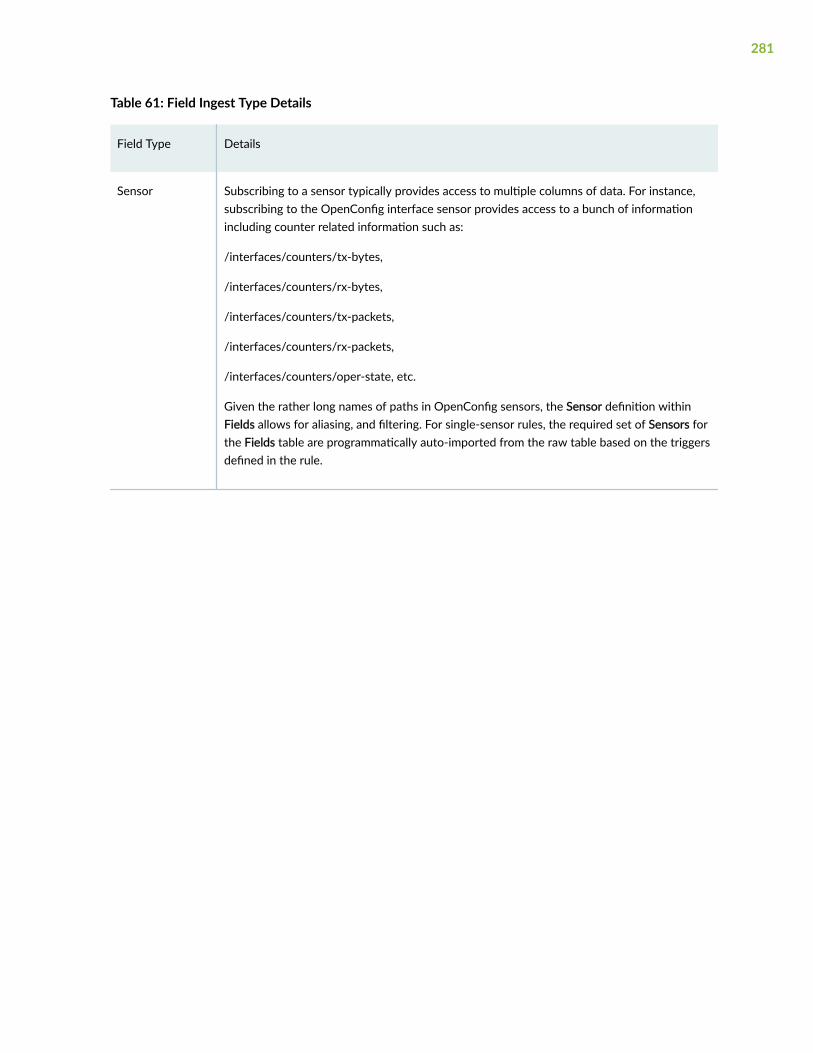
Table 61: Field Ingest Type Details
Field Type Details
Sensor Subscribing to a sensor typically provides access to multiple columns of data. For instance,subscribing to the OpenConfig interface sensor provides access to a bunch of informationincluding counter related information such as:
/interfaces/counters/tx-bytes,
/interfaces/counters/rx-bytes,
/interfaces/counters/tx-packets,
/interfaces/counters/rx-packets,
/interfaces/counters/oper-state, etc.
Given the rather long names of paths in OpenConfig sensors, the Sensor definition withinFields allows for aliasing, and filtering. For single-sensor rules, the required set of Sensors forthe Fields table are programmatically auto-imported from the raw table based on the triggersdefined in the rule.
281

Table 61: Field Ingest Type Details (Continued)
Field Type Details
Reference Triggers can only operate on Fields defined within that rule. In some cases, a Field mightneed to reference another Field or Trigger output defined in another Rule. This is achieved byreferencing the other field or trigger and applying additional filters. The referenced field ortrigger is treated as a stream notification to the referencing field. References aren’tsupported within the same rule.
References can also take a time-range option which picks the value, if available, from thetime-range provided. Field references must always be unambiguous, so proper attentionmust be given to filtering the result to get just one value. If a reference receives multiple datapoints, or values, only the latest one is used. For example, if you are referencing a the valuescontained in a field over the last 3 minutes, you might end up with 6 values in that field overthat time-range. Paragon Insights only uses the latest value in a situation like this.
The syntax for reference is:
/device-group[device-group-name=<device-group>]\/device[device-name=<device>]/topic[topic-name=<topic>]\/rule[rule-name=<rule>]/field[<field-name>=<field-value>\ AND|OR ...]/<field-name>
NOTE: The device-group and device components in above path are applicable only fornetwork rules.
For example, the pre-defined rule protocol.l3vpn/check-l3vpn-ospf-state has a field to checkthe interface status using the following reference path:
/device-group[device-group-name={{pe-device-group}}]/device[device-id={{pe-device-name}}]/topic[topic-name='protocol.l3vpn']/rule[rule-name=get-interface-details]/field[sub-interface-index='{{pe-ifl-number}}' and interface-name='{{pe-interface-name}}']/link-state
Constant A field defined as a constant is a fixed value which cannot be altered during the course ofexecution. Paragon Insights Constant types can be strings, integers, and doubles.
282

Table 61: Field Ingest Type Details (Continued)
Field Type Details
Formula Raw sensor fields are the starting point for defining triggers. However, Triggers often workon derived fields defined through formulas by applying mathematical transformations.
Formulas can be pre-defined or user-defined (UDF). Pre-defined formulas include: Min, Max,Mean, Sum, Count, Rate of Change, Elapsed Time, Standard Deviation, Microburst, DynamicThreshold, Anomaly Detection, Outlier Detection, and Predict.
Some pre-defined formulas can operate on time ranges in order to work with historical data.If a time range is not specified, then the formula works on current data, specified as now.
Vectors
Vectors are useful in helping to gather multiple elements into a single rule. For example, using a vectoryou could gather all of the interface error fields. The syntax for Vector is:
vector <vector-name>{ path [$field-1 $field-2 .. $field-n]; filter <list of specific element(s) to filter out from vector>; append <list of specific element(s) to be added to vector>;}
$field-n can be field of type reference.
The fields used in defining vectors can be direct references to fields defined in other rules:
vector <vector-name>{ path [/device-group[device-group-name=<device-group>]\/device[device-name=<device>]/topic[topic-name=<topic>]\/rule[rule-name=<rule>]/field[<field-name>=<field-value>\ AND|OR ...]/<field-name> ...]; filter <list of specific element(s) to filter out from vector>; append <list of specific element(s) to be added to vector>;}
This syntax allows for optional filtering through the <field-name>=<field-value> portion of theconstruct. Vectors can also take a time-range option that picks the values from the time-range provided.When multiple values are returned over the given time-range, they are all selected as an array.
283

The following pre-defined formulas are supported on vectors:
• unique @vector1–Returns the unique set of elements from vector1
• @vector1 and @vector2–Returns the intersection of unique elements in vector1 and vector2.
• @vector1 or @vector2–Returns the total set of unique elements in the two vectors.
• @vector1 unless @vector2–Returns the unique set of elements in vector-1, but not in vector-2
Variables
Variables are defined during rule creation on the Variables page. This part of variable definition createsthe default value that gets used if no specific value is set in the device group or on the device duringdeployment. For example, the check-interface-status rule has one variable called interface_name. The valueset on the Variables page is a regular expression (regex), .*, that means all interfaces.
If applied as-is, the check-interface-status rule would provide interface status information about all theinterfaces on all of the devices in the device group. While applying a playbook that contains this rule,you could override the default value at the device group or device level. This allows you flexibility whenapplying rules. The order of precedence is device value overrides device group value and device groupvalue overrides the default value set in the rule.
BEST PRACTICE: It is highly recommended to supply default values for variables defined indevice rules. All Juniper-supplied rules follow this recommendation. Default values must not beset for variables defined in network rules.
Functions
Functions are defined during rule creation on the Functions tab. Defining a function here allows it to beused in Formulas associated with Fields and in the When and Then sections of Triggers. Functions usedin the when clause of a trigger are known as user-defined functions. These must return true or false.Functions used in the then clause of a trigger are known as user-defined actions.
Triggers
Triggers play a pivotal role in Paragon Insights rule definitions. They are the part of the rule thatdetermines if and when any action is taken based on changes in available sensor data. Triggers areconstructed in a when-this, then-that manner. As mentioned earlier, trigger actions are based on Terms.A Term is built with when clauses that watch for updates in field values and then clauses that initiatesome action based on what changed. Multiple Terms can be created within a single trigger.
284
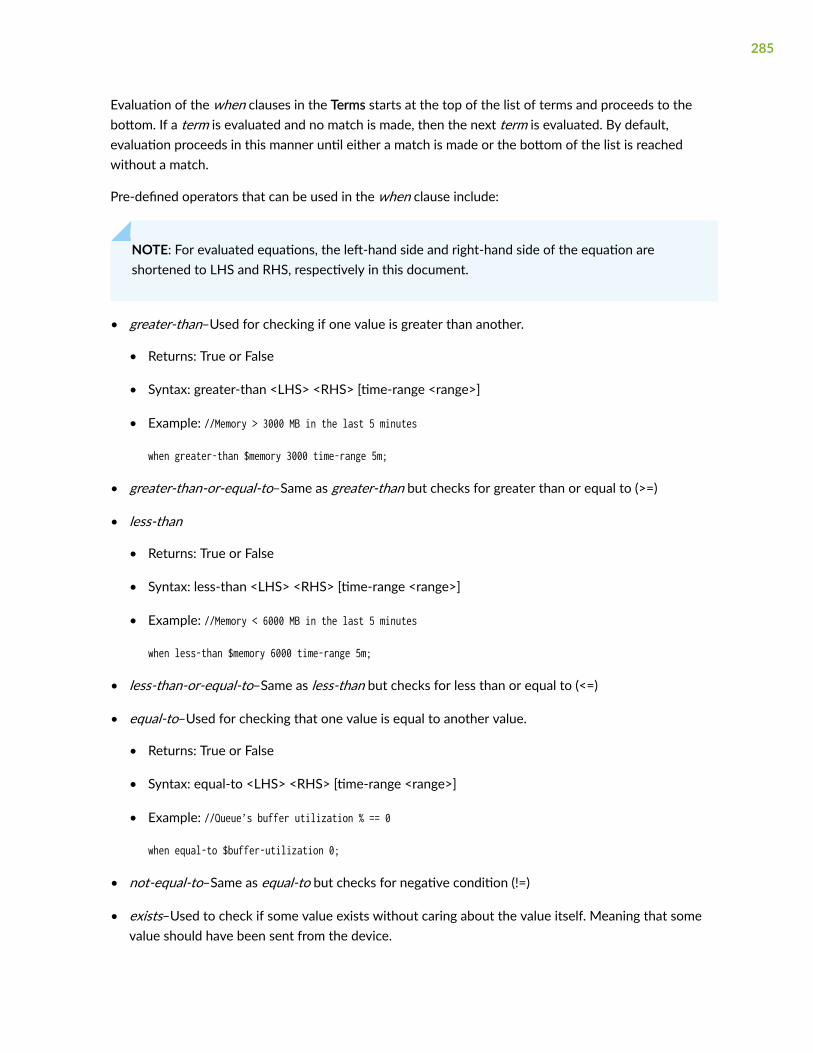
Evaluation of the when clauses in the Terms starts at the top of the list of terms and proceeds to thebottom. If a term is evaluated and no match is made, then the next term is evaluated. By default,evaluation proceeds in this manner until either a match is made or the bottom of the list is reachedwithout a match.
Pre-defined operators that can be used in the when clause include:
NOTE: For evaluated equations, the left-hand side and right-hand side of the equation areshortened to LHS and RHS, respectively in this document.
• greater-than–Used for checking if one value is greater than another.
• Returns: True or False
• Syntax: greater-than <LHS> <RHS> [time-range <range>]
• Example: //Memory > 3000 MB in the last 5 minutes
when greater-than $memory 3000 time-range 5m;
• greater-than-or-equal-to–Same as greater-than but checks for greater than or equal to (>=)
• less-than
• Returns: True or False
• Syntax: less-than <LHS> <RHS> [time-range <range>]
• Example: //Memory < 6000 MB in the last 5 minutes
when less-than $memory 6000 time-range 5m;
• less-than-or-equal-to–Same as less-than but checks for less than or equal to (<=)
• equal-to–Used for checking that one value is equal to another value.
• Returns: True or False
• Syntax: equal-to <LHS> <RHS> [time-range <range>]
• Example: //Queue’s buffer utilization % == 0
when equal-to $buffer-utilization 0;
• not-equal-to–Same as equal-to but checks for negative condition (!=)
• exists–Used to check if some value exists without caring about the value itself. Meaning that somevalue should have been sent from the device.
285
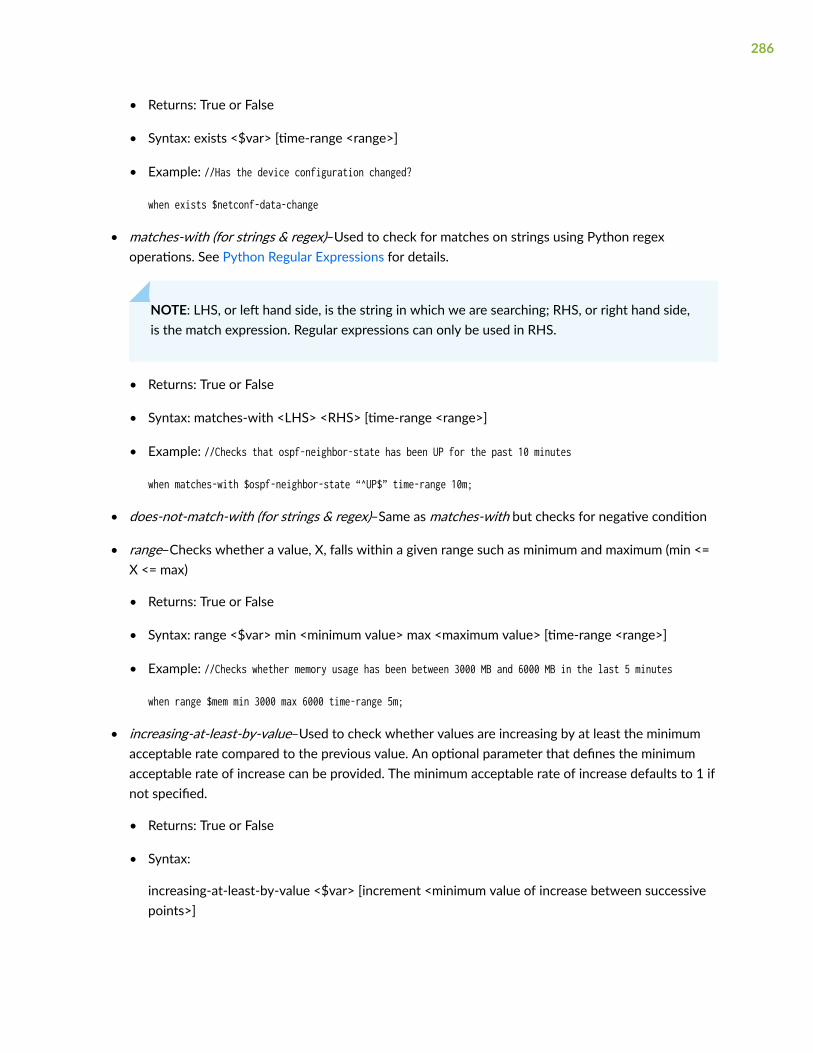
• Returns: True or False
• Syntax: exists <$var> [time-range <range>]
• Example: //Has the device configuration changed?
when exists $netconf-data-change
• matches-with (for strings & regex)–Used to check for matches on strings using Python regexoperations. See Python Regular Expressions for details.
NOTE: LHS, or left hand side, is the string in which we are searching; RHS, or right hand side,is the match expression. Regular expressions can only be used in RHS.
• Returns: True or False
• Syntax: matches-with <LHS> <RHS> [time-range <range>]
• Example: //Checks that ospf-neighbor-state has been UP for the past 10 minutes
when matches-with $ospf-neighbor-state “^UP$” time-range 10m;
• does-not-match-with (for strings & regex)–Same as matches-with but checks for negative condition
• range–Checks whether a value, X, falls within a given range such as minimum and maximum (min <=X <= max)
• Returns: True or False
• Syntax: range <$var> min <minimum value> max <maximum value> [time-range <range>]
• Example: //Checks whether memory usage has been between 3000 MB and 6000 MB in the last 5 minutes
when range $mem min 3000 max 6000 time-range 5m;
• increasing-at-least-by-value–Used to check whether values are increasing by at least the minimumacceptable rate compared to the previous value. An optional parameter that defines the minimumacceptable rate of increase can be provided. The minimum acceptable rate of increase defaults to 1 ifnot specified.
• Returns: True or False
• Syntax:
increasing-at-least-by-value <$var> [increment <minimum value of increase between successivepoints>]
286

increasing-at-least-by-value <$var> [increment <minimum value of increase between successivepoints>] time-range <range>
• Example: Checks that the ospf-tx-hello has been increasing steadily over the past 5 minutes.
when increasing-at-least-by-value $ospf-tx-hello increment 10 time-range 5m;
• increasing-at-most-by-value–Used to check whether values are increasing by no more than themaximum acceptable rate compared to the previous value. An optional parameter that defines themaximum acceptable rate of increase can be provided. The maximum acceptable rate of increasedefaults to 1 if not specified.
• Returns: True or False
• Syntax:
increasing-at-most-by-value <$var> [increment <maximum value of increase between successivepoints>]
increasing-at-most-by-value <$var> [increment <maximum value of increase between successivepoints>] time-range <range>
• Example: Checks that the error rate has not increased by more than 5 in the past 5 minutes.
when increasing-at-most-by-value $error-count increment 5 time-range 5m;
• increasing-at-least-by-rate–Used for checking that rate of increase between successive values is atleast given rate. Mandatory parameters include the value and time-unit, which together signify theminimum acceptable rate of increase.
• Returns: True or False
• Syntax:
This syntax compares current value against previous value ensuring that it increases at least byvalue rate.
increasing-at-least-by-rate <$var> value <minimum value of increase between successive points>per <second|minute|hour|day|week|month|year> [time-range <range>]
This syntax compares current value against previous value ensuring that it increases at least bypercentage rate
increasing-at-least-by-rate <$var> percentage <percentage> per <second|minute|hour|day|week|month|year> [time-range <range>]
• Example: Checks that the ospf-tx-hello has been increasing strictly over the past five minutes.
when increasing-at-least-by-rate $ospf-tx-hello value 1 per second time-range 5m;
287

• increasing-at-most-by-rate–Similar to increasing-at-least-by-rate, except that this checks fordecreasing rates.
Using these operators in the when clause, creates a function known as a user-defined condition. Thesefunctions should always return true or false.
If evaluation of a term results in a match, then the action specified in the Then clause is taken. Bydefault, processing of terms stops at this point. You can alter this flow by enabling the Evaluate nextterm button at the bottom of the Then clause. This causes Paragon Insights to continue term processingto create more complex decision-making capabilities like when-this and this, then that.
The following is a list of pre-defined actions available for use in the Then section:
• next
• status
Tagging
Tagging allows you to insert fields, values, and keys into a Paragon Insights rule when certain conditionsare met. See "Paragon Insights Tagging Overview" on page 431 for more information.
Rule Properties
The Rule Properties block allows you to specify metadata for a Paragon Insights rule, such as hardwaredependencies, software dependencies, and version history. This data can be used for informationalpurposes or to verify whether or not a device is compatible with a Paragon Insights rule.
RELATED DOCUMENTATION
Understand Sensor Precedence | 312
Understand Paragon Insights Topics | 270
About the Rules Page
Paragon Insight’s primary function is collecting and reacting to telemetry data from network devices. Arule contains all the details and instructions to define how to collect and handle the telemetry data.
Insights ships with a set of default rules, which can be seen on the Configuration > Rules page of theGUI, as well as in GitHub in the Paragon Insights rules repository. You can also create your own rules.
288
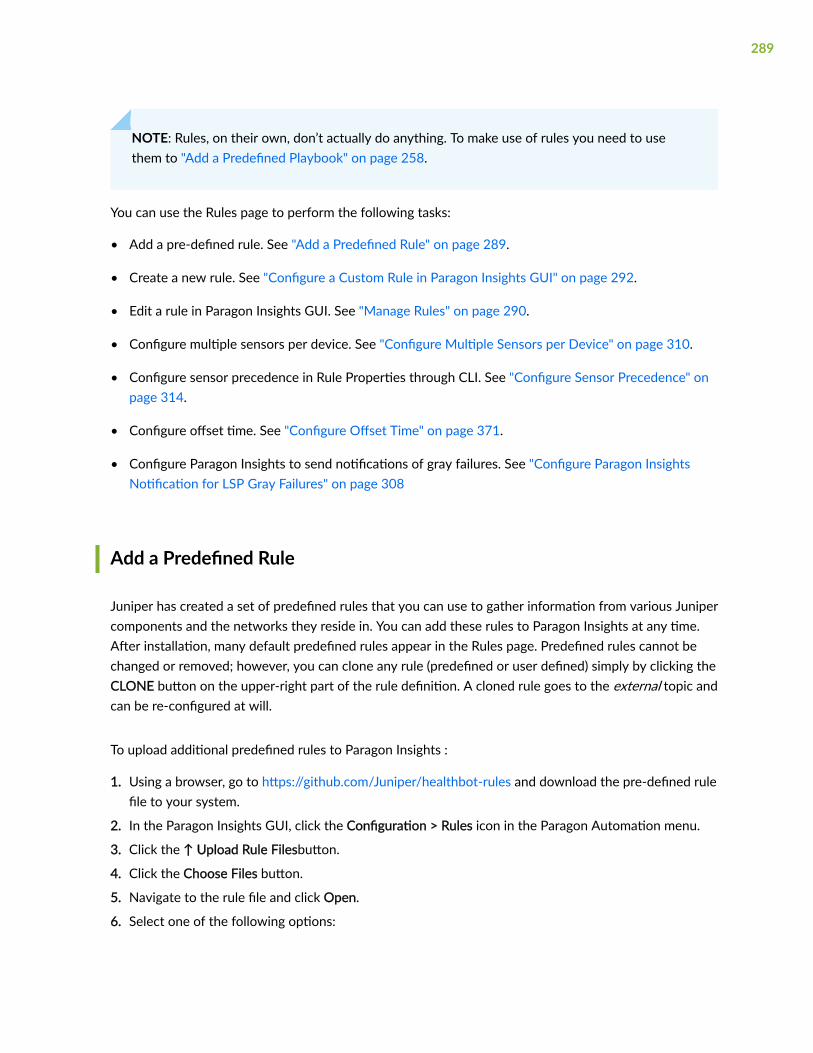
NOTE: Rules, on their own, don’t actually do anything. To make use of rules you need to usethem to "Add a Predefined Playbook" on page 258.
You can use the Rules page to perform the following tasks:
• Add a pre-defined rule. See "Add a Predefined Rule" on page 289.
• Create a new rule. See "Configure a Custom Rule in Paragon Insights GUI" on page 292.
• Edit a rule in Paragon Insights GUI. See "Manage Rules" on page 290.
• Configure multiple sensors per device. See "Configure Multiple Sensors per Device" on page 310.
• Configure sensor precedence in Rule Properties through CLI. See "Configure Sensor Precedence" onpage 314.
• Configure offset time. See "Configure Offset Time" on page 371.
• Configure Paragon Insights to send notifications of gray failures. See "Configure Paragon InsightsNotification for LSP Gray Failures" on page 308
Add a Predefined Rule
Juniper has created a set of predefined rules that you can use to gather information from various Junipercomponents and the networks they reside in. You can add these rules to Paragon Insights at any time.After installation, many default predefined rules appear in the Rules page. Predefined rules cannot bechanged or removed; however, you can clone any rule (predefined or user defined) simply by clicking theCLONE button on the upper-right part of the rule definition. A cloned rule goes to the external topic andcan be re-configured at will.
To upload additional predefined rules to Paragon Insights :
1. Using a browser, go to https://github.com/Juniper/healthbot-rules and download the pre-defined rulefile to your system.
2. In the Paragon Insights GUI, click the Configuration > Rules icon in the Paragon Automation menu.
3. Click the ↑ Upload Rule Filesbutton.
4. Click the Choose Files button.
5. Navigate to the rule file and click Open.
6. Select one of the following options:
289

Upload Upload the file and save the rule within the defined topic area but do not deploy theupdated configuration. You can use this option when, for example, you are making severalchanges and want to deploy all your updates at the same time.
Upload &Deploy
Upload the file, save the rule within the defined topic area, and immediately deploy theconfiguration.
RELATED DOCUMENTATION
Manage Rules | 290
Manage Rules
In the Rules page, you can edit, clone, delete, search, or download rule configurations.
1. Click Configuration > Rules in the Paragon Automation menu.
The Rules page appears.
2. Click the name of the rule (listed under a topic) in the left side of the Rules page.
For example, interface.statistics/check-interface-status.
3. You can perform the following tasks:
• (Optional) Filter — You can filter rules by rule name, topic name, and type of sensor used in rules.You can also filter rules by criteria defined in Rule Properties tab such as Paragon Insights version,operating system supported in devices to which rules are applied, and product name (deviceseries) such as MX, QFX, EX, or PTX.
• Edit a rule — Modify the necessary fields in Sensors tab, Fields tab, Trigger tab, and so on.
After you edit a rule, you can Save or Save & Deploy the rule configuration.
• Save — Save your configuration changes but do not deploy the updated configuration. You canuse this option when, for example, you are making several changes and want to deploy all yourupdates at the same time later.
If you choose only to save the changes, you can either commit or roll back the changes later.For more information, see "Commit or Roll Back Configuration Changes in Paragon Insights" onpage 151.
290

• Save & Deploy — Save the rule configuration in the GUI and deploy the configuration on yourproduction environment. The ingest starts collecting telemetry data based on theconfiguration changes.
• (Optional) Clone a rule — Click Clone to create a copy of the rule configuration.
You can rename and edit the configuration details of the cloned rule. A cloned rule appears in theexternal topic.
• (Optional) Delete a rule — Click Delete located to the right of the rule name. A deletionconfirmation message appears where you can Delete or Delete & Deploy a rule configuration.
If you delete a rule using Delete, the rule configuration is removed in Paragon AutomationPlatform only during next deployment. Until then, the application continues to collect sensor databased on the fields defined in the deleted rule. You can also rollback your deletion, if you usedDelete. For more information, see "Commit or Roll Back Configuration Changes in ParagonInsights" on page 151.
If you delete a rule using Delete & Deploy, the rule configuration is removed from ParagonAutomation and you cannot rollback the change.
NOTE: Before you delete a rule, ensure that you remove the rule in Playbook instance(s)where you added the rule.
• (Optional) Download a rule configuration — Click Download located to the right of the rule name.You can open or save the rule configuration tarball in the pop up window.
You must have pre-installed an application to open or extract tar files to open the ruleconfiguration files.
To save the configuration tarball, select Save File in the download pop up window, navigate to alocation on your local system, and click Save. You can optionally rename the file before saving it inyour system.
RELATED DOCUMENTATION
Add a Predefined Rule | 289
291

Configure a Custom Rule in Paragon Insights GUI
IN THIS SECTION
Create a New Rule Using the Paragon Insights GUI | 292
Rule Filtering | 294
Sensors | 296
Fields | 297
Vectors | 300
Variables | 302
Functions | 303
Triggers | 305
Rule Properties | 307
Create a New Rule Using the Paragon Insights GUI
To create a new rule using the Paragon Insights GUI, you’ll first fill out general descriptive informationabout the rule and then navigate through several rule definition blocks in the Rules page to provide thespecific configuration for the Paragon Insights rule.
To start creating a new Paragon Insights rule:
1. Click the Configuration > Rules icon in the left-navigation bar. A list of Paragon Insights rulesorganized by Paragon Insights topic is displayed along the left side of the Rules page.
2. Click the add rule button (+ Add Rule).
3. Enter general descriptive information about the rule using the following input parameters:
292
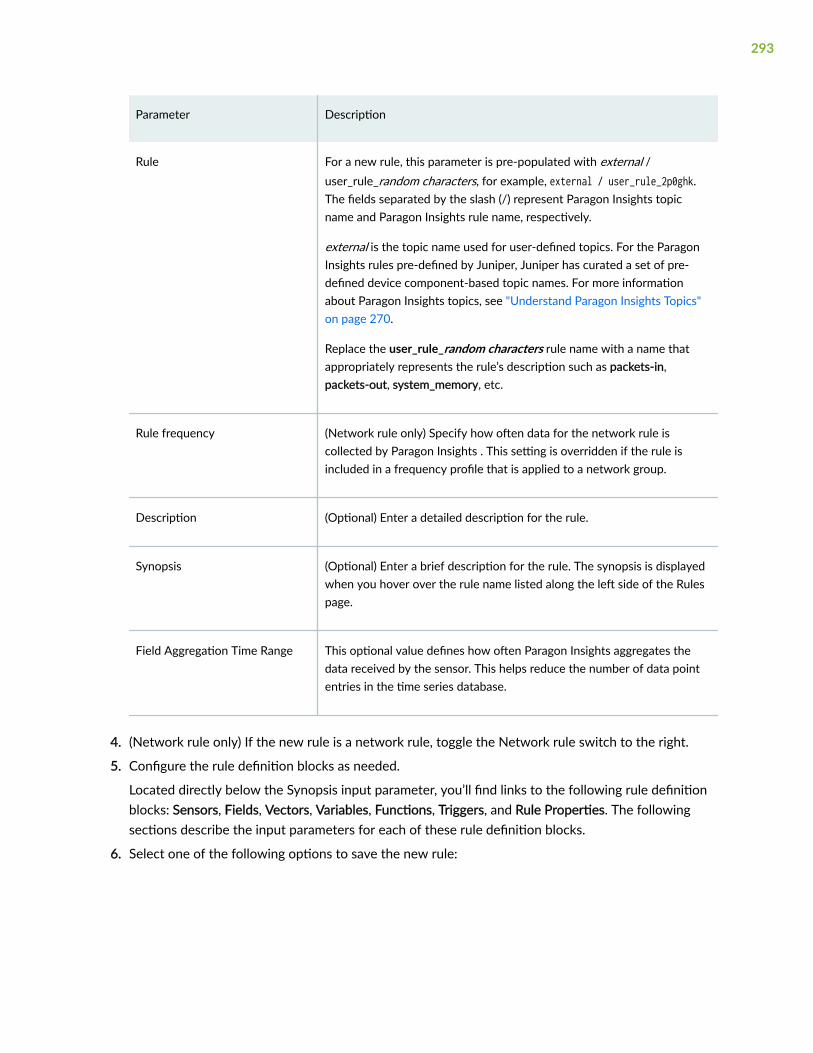
Parameter Description
Rule For a new rule, this parameter is pre-populated with external /user_rule_random characters, for example, external / user_rule_2p0ghk.The fields separated by the slash (/) represent Paragon Insights topicname and Paragon Insights rule name, respectively.
external is the topic name used for user-defined topics. For the ParagonInsights rules pre-defined by Juniper, Juniper has curated a set of pre-defined device component-based topic names. For more informationabout Paragon Insights topics, see "Understand Paragon Insights Topics"on page 270.
Replace the user_rule_random characters rule name with a name thatappropriately represents the rule’s description such as packets-in,packets-out, system_memory, etc.
Rule frequency (Network rule only) Specify how often data for the network rule iscollected by Paragon Insights . This setting is overridden if the rule isincluded in a frequency profile that is applied to a network group.
Description (Optional) Enter a detailed description for the rule.
Synopsis (Optional) Enter a brief description for the rule. The synopsis is displayedwhen you hover over the rule name listed along the left side of the Rulespage.
Field Aggregation Time Range This optional value defines how often Paragon Insights aggregates thedata received by the sensor. This helps reduce the number of data pointentries in the time series database.
4. (Network rule only) If the new rule is a network rule, toggle the Network rule switch to the right.
5. Configure the rule definition blocks as needed.
Located directly below the Synopsis input parameter, you’ll find links to the following rule definitionblocks: Sensors, Fields, Vectors, Variables, Functions, Triggers, and Rule Properties. The followingsections describe the input parameters for each of these rule definition blocks.
6. Select one of the following options to save the new rule:
293
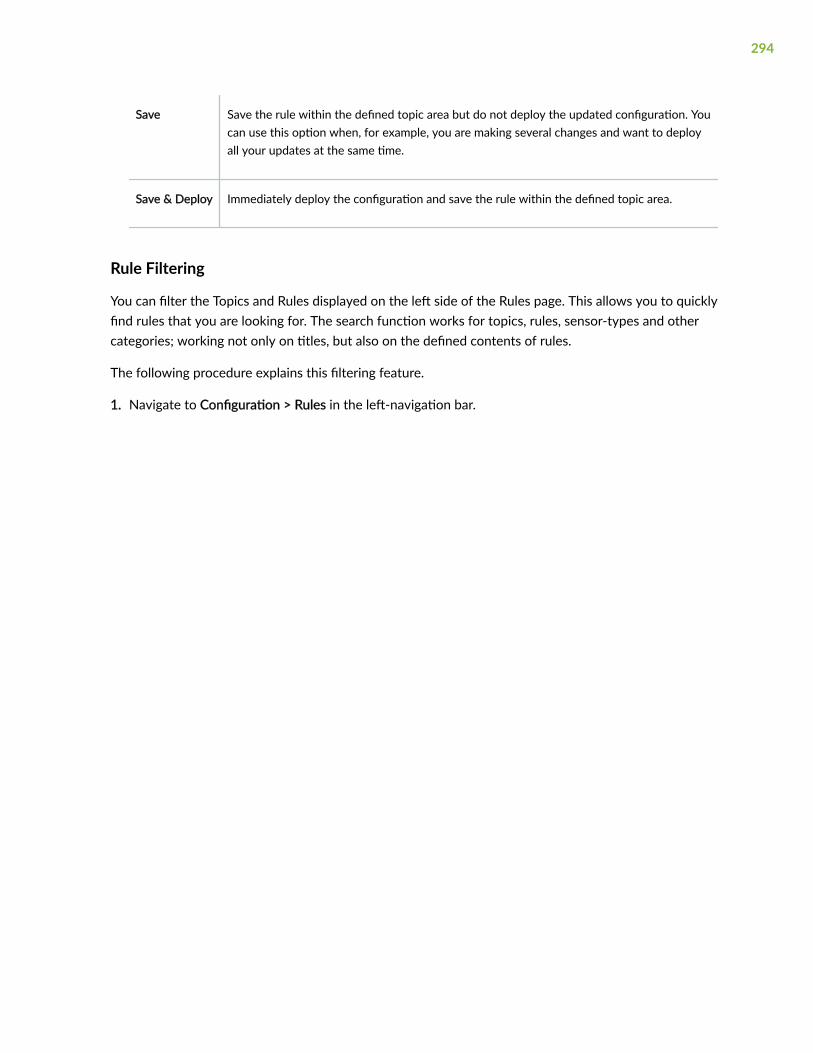
Save Save the rule within the defined topic area but do not deploy the updated configuration. Youcan use this option when, for example, you are making several changes and want to deployall your updates at the same time.
Save & Deploy Immediately deploy the configuration and save the rule within the defined topic area.
Rule Filtering
You can filter the Topics and Rules displayed on the left side of the Rules page. This allows you to quicklyfind rules that you are looking for. The search function works for topics, rules, sensor-types and othercategories; working not only on titles, but also on the defined contents of rules.
The following procedure explains this filtering feature.
1. Navigate to Configuration > Rules in the left-navigation bar.
294

The Rules page is displayed. To the left of the rule definition area is a new section as shown in Figure11 on page 295 below.
Figure 11: Rule Filtering
2. From the pull-down menu, select the type of search you want to perform.
3. In the search field, begin entering your search text.
The topic list below shrinks to display only topics and rules that match your search criteria.
295
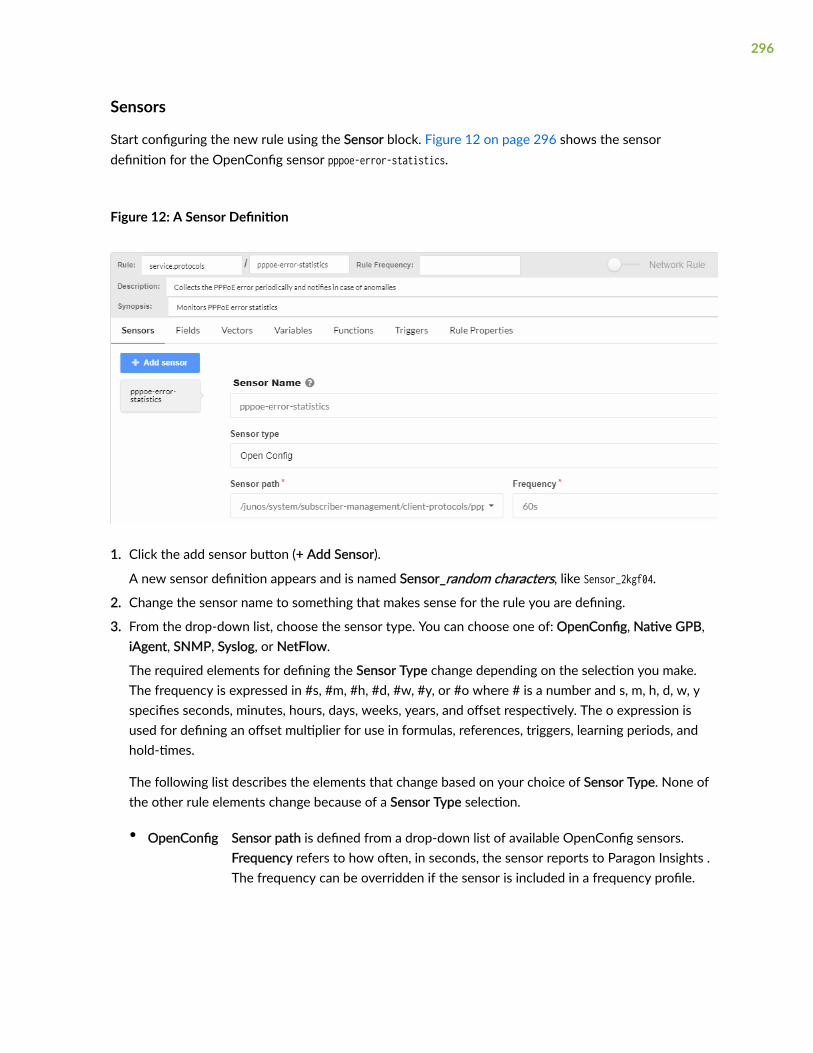
Sensors
Start configuring the new rule using the Sensor block. Figure 12 on page 296 shows the sensordefinition for the OpenConfig sensor pppoe-error-statistics.
Figure 12: A Sensor Definition
1. Click the add sensor button (+ Add Sensor).
A new sensor definition appears and is named Sensor_random characters, like Sensor_2kgf04.
2. Change the sensor name to something that makes sense for the rule you are defining.
3. From the drop-down list, choose the sensor type. You can choose one of: OpenConfig, Native GPB,iAgent, SNMP, Syslog, or NetFlow.
The required elements for defining the Sensor Type change depending on the selection you make.The frequency is expressed in #s, #m, #h, #d, #w, #y, or #o where # is a number and s, m, h, d, w, yspecifies seconds, minutes, hours, days, weeks, years, and offset respectively. The o expression isused for defining an offset multiplier for use in formulas, references, triggers, learning periods, andhold-times.
The following list describes the elements that change based on your choice of Sensor Type. None ofthe other rule elements change because of a Sensor Type selection.
• OpenConfig Sensor path is defined from a drop-down list of available OpenConfig sensors.Frequency refers to how often, in seconds, the sensor reports to Paragon Insights .The frequency can be overridden if the sensor is included in a frequency profile.
296
• Native GPB Sensor path refers to the path for a Native GPB sensor. Port refers to the GPB portover which the sensor communicates with Paragon Insights .
• iAgent File is the name of a YAML-formatted file that defines the NETCONF-accessible sensor.Table is defined from a drop-down list of available PyEZ tables and views in the YAMLfile. Frequency refers to how often the sensor is polled by Paragon Insights and can beoverridden by including the sensor in a frequency profile.
Based on the table you’ve selected, input fields for a target or dynamic arguments mightalso be provided. For these additional fields, you can do one of the following:
• Leave the input field blank. No default value will be applied.
• Enter a fixed value that will remain constant.
• Enter a variable name enclosed in double curly/flower brackets (for example, {{test-variable}}) The variable name must belong to a variable that was previously defined inthe Paragon Insights rule, and the variable’s Type option must be set to SensorArgument.
• SNMP Table is defined from a drop-down list of available SNMP tables. Frequency refers to howoften, in seconds, Paragon Insights polls the device for data and can be overridden byincluding the sensor in a frequency profile.
• Syslog Pattern set is a user-configured element that includes one or more patterns (youconfigure a pattern for each event you want to monitor). The Maximum hold period isused in advanced cases and refers to the maximum time that the system will wait whencorrelating events using multiple patterns within a pattern set.
NOTE: The syslog sensor requires some pre-configuration. See Syslog Ingest for moredetails.
• Flow Template Name is a Juniper-supplied built-in list of NetFlow v9 and IPFIX templates.
Fields
A sensor will generally carry information such as all information about interfaces on the device, chassisrelated information, system process and memory related information, and so on. After you configuresensors, you must mention Fields that process sensor information for a particular need. For example,
297

you can define fields to capture administrative or operational status of an interface or set traffic countthreshold.
To add a field:
1. Click the Fields link.
The screen updates and shows the defined field objects, if any, as shown in Figure 13 on page 298
Figure 13: The Fields Block
298
2. Click the add field button (+ Add Field).
3. Replace the random field name with a name that make sense for the rule you are defining, such asinterface-name, configured-threshold, etc.
4. (Optional) Add descriptive text for the new field.
5. Set the appropriate Field type. The options for field type are: string, integer, and float. String is thedefault field type.
6. (Optional) Toggle the Add to rule key switch.
The add rule to key switch tells Paragon Insights that this field should be indexed and searchable. Forexample, when you enable this switch, the field name will be listed on the Devices page under theKeys column.
7. Select the appropriate ingest type (Field source) from the pull-down menu.
The following list shows the options available for the Ingest type (Field source) menu.
• Sensor–Use this or another sensor definition.
• Path-Follow this Open Config or Netconf path within the sensor definition to gather specificdata like the names of the interfaces. For iAgent sensors the Path refers to the path defined inthe YAML file.
• Where–Filter the available data to gather information about a specific element within, like aspecific interface. This field can reference the Variables defined elsewhere within the rule.When referencing variables, use moustache notation, enclosed in slashes, such as:{{interface_name}}.
• Zero suppression-For some sensors associated with devices running Junos OS, such as JunosTelemetry Interface Open Config and native GPB sensors, no field data is sent from the sensorwhen the data’s value is zero. Enable the zero suppression switch to set the field data value tozero whenever no field data is sent from the sensor.
• Data if missing-Specify a value as the default data value whenever no data is sent from thesensor. The format of the specified value should match the defined field type (string, integer,or float). If the zero suppression switch is also enabled, then the specified data-if-missing valueis ignored, and the default sensor data value is set to zero.
• Reference–A reference to a field or trigger value from another rule.
• Data if missing-Specify a value as the default data value whenever no reference data isfetched. The format of the specified value should match the defined field type (string, integer,or float).
• Constant–Use a constant when referring to a Variable defined within the rule, whose valuedoesn’t change, such as IO_Drops_Threshold A constant can also be a string or numeric value thatdoes not change and is not a reference to a variable.
299
• Constant value–Use moustache notation to reference the variable like this:{{IO_Drops_Threshold}}.
• Formula–Select the desired mathematical formula from the Formula pull-down menu.
8. (Optional) Set the Field aggregation time-range. Located above the Fields tab with the general ruleparameters, this periodic aggregation setting helps to reduce the number of data points entered inthe database. For example, if the sensor settings specify that Paragon Insights ingests data every 10seconds, you could configure this setting to aggregate and record the relevant field data, say, every60 seconds. Note that when using this setting, any field-specific time ranges must use the samevalue.
NOTE: You can add fields and keys to rules based on whether the incoming data meets user-defined conditions defined in tagging profiles. Tagging profiles are defined in Paragon Insightsunder Administration > Ingest Settings on the left navigation bar. SeeParagon Insights Tagging fordetails.
Vectors
(Optional) Now that you have a sensor and fields defined for your rule, you can define vectors.
A vector is used when a single field has multiple values or when you receive a value from another field.
The syntax of a vector is:
vector <vector-name>{ path [$field-1 $field-2 .. $field-n]; filter <list of specific element(s) to filter out from vector>; append <list of specific element(s) to be added to vector>;}
300
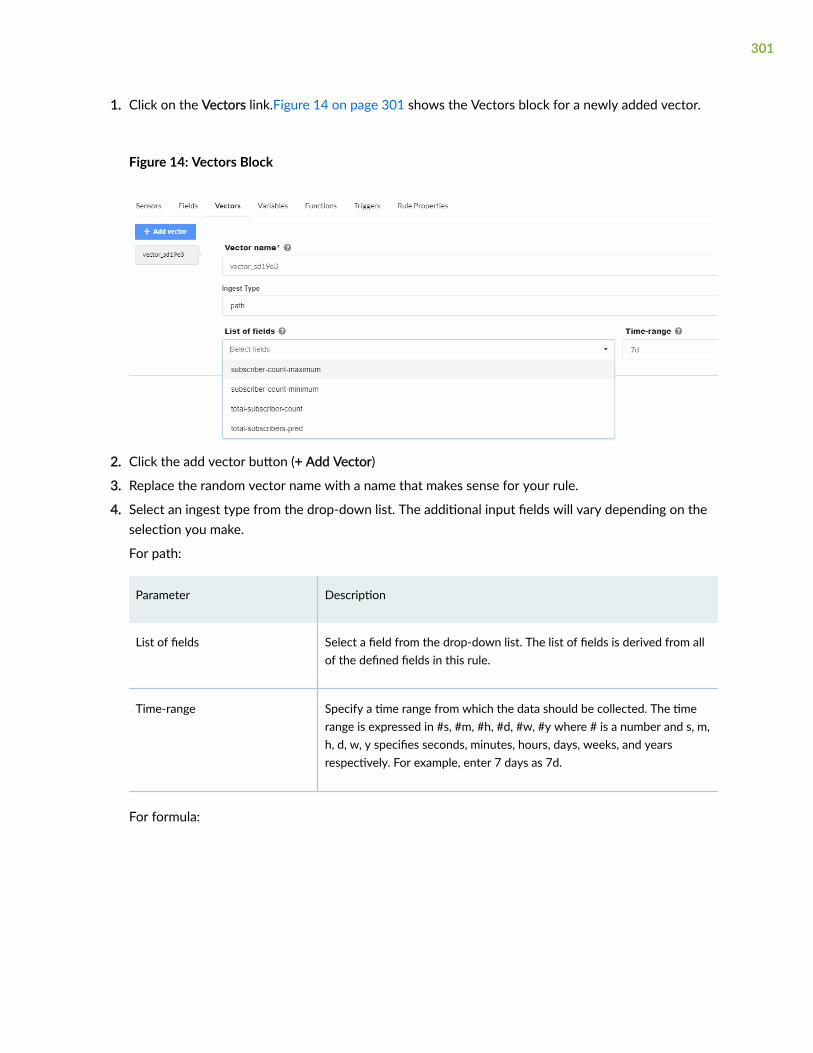
1. Click on the Vectors link.Figure 14 on page 301 shows the Vectors block for a newly added vector.
Figure 14: Vectors Block
2. Click the add vector button (+ Add Vector)
3. Replace the random vector name with a name that makes sense for your rule.
4. Select an ingest type from the drop-down list. The additional input fields will vary depending on theselection you make.
For path:
Parameter Description
List of fields Select a field from the drop-down list. The list of fields is derived from allof the defined fields in this rule.
Time-range Specify a time range from which the data should be collected. The timerange is expressed in #s, #m, #h, #d, #w, #y where # is a number and s, m,h, d, w, y specifies seconds, minutes, hours, days, weeks, and yearsrespectively. For example, enter 7 days as 7d.
For formula:
301
Parameter Description
Vector name (Unique formula type only) Select a vector name from the drop-down list.The list of vectors is derived from all of the defined vectors in this rule.
Formula Type Select a formula type from the drop-down list:
unique Creates a vector with unique elements from another vector.
and Compares two vectors and returns a vector with elementscommon to both vectors.
or Compares two vectors and returns a vector with elements fromboth vectors.
unless Compares two vectors and returns a vector with elements fromthe left vector but not the right vector.
Left vector Select a vector name from the drop-down list. The list of vectors isderived from all of the defined vectors in this rule.
Right vector Select a vector name from the drop-down list. The list of vectors isderived from all of the defined vectors in this rule.
Variables
(Optional) The Variables block is where you define the parts of the sensor that you are interested in. Forexample, a rule that monitors interface throughput needs to have a way to identify specific interfaces
302
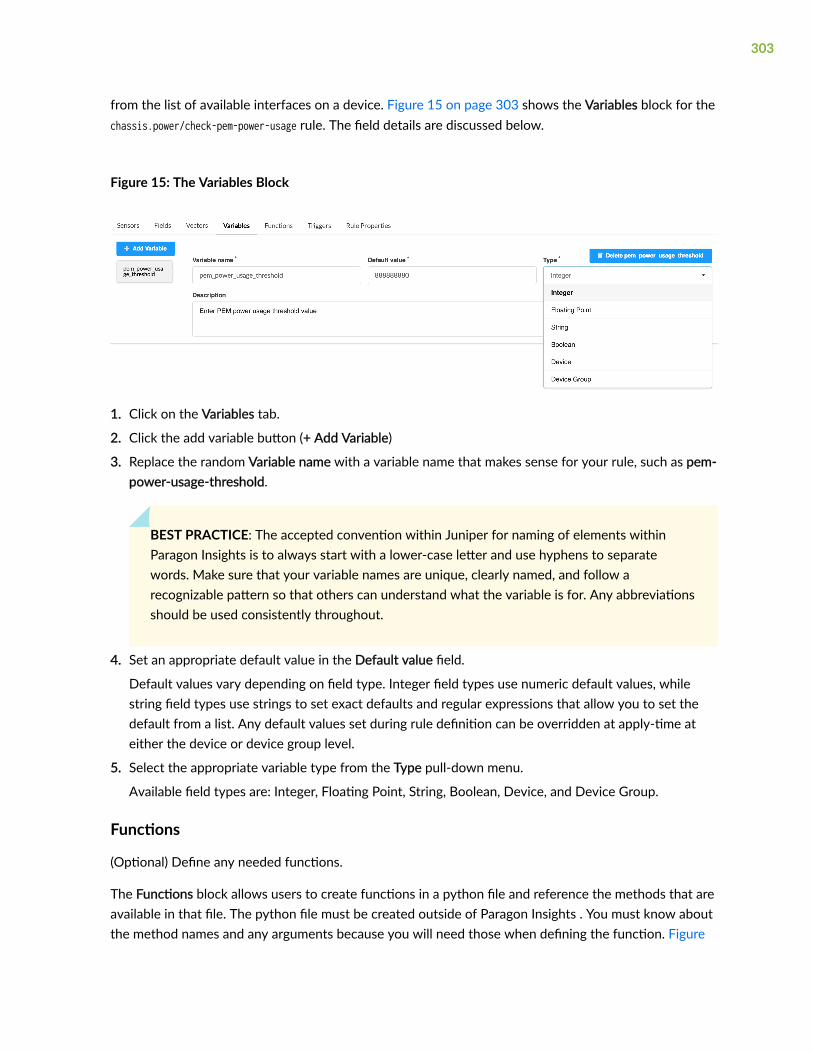
from the list of available interfaces on a device. Figure 15 on page 303 shows the Variables block for thechassis.power/check-pem-power-usage rule. The field details are discussed below.
Figure 15: The Variables Block
1. Click on the Variables tab.
2. Click the add variable button (+ Add Variable)
3. Replace the random Variable name with a variable name that makes sense for your rule, such as pem-power-usage-threshold.
BEST PRACTICE: The accepted convention within Juniper for naming of elements withinParagon Insights is to always start with a lower-case letter and use hyphens to separatewords. Make sure that your variable names are unique, clearly named, and follow arecognizable pattern so that others can understand what the variable is for. Any abbreviationsshould be used consistently throughout.
4. Set an appropriate default value in the Default value field.
Default values vary depending on field type. Integer field types use numeric default values, whilestring field types use strings to set exact defaults and regular expressions that allow you to set thedefault from a list. Any default values set during rule definition can be overridden at apply-time ateither the device or device group level.
5. Select the appropriate variable type from the Type pull-down menu.
Available field types are: Integer, Floating Point, String, Boolean, Device, and Device Group.
Functions
(Optional) Define any needed functions.
The Functions block allows users to create functions in a python file and reference the methods that areavailable in that file. The python file must be created outside of Paragon Insights . You must know aboutthe method names and any arguments because you will need those when defining the function. Figure
303
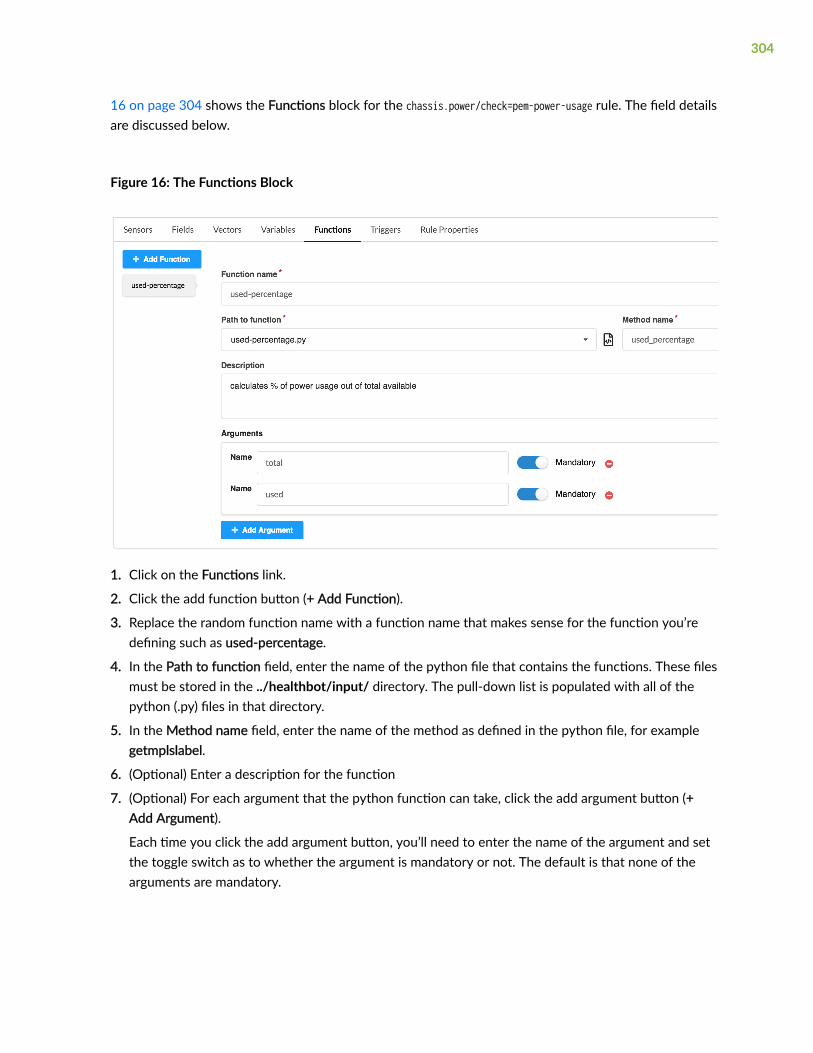
16 on page 304 shows the Functions block for the chassis.power/check=pem-power-usage rule. The field detailsare discussed below.
Figure 16: The Functions Block
1. Click on the Functions link.
2. Click the add function button (+ Add Function).
3. Replace the random function name with a function name that makes sense for the function you’redefining such as used-percentage.
4. In the Path to function field, enter the name of the python file that contains the functions. These filesmust be stored in the ../healthbot/input/ directory. The pull-down list is populated with all of thepython (.py) files in that directory.
5. In the Method name field, enter the name of the method as defined in the python file, for examplegetmplslabel.
6. (Optional) Enter a description for the function
7. (Optional) For each argument that the python function can take, click the add argument button (+Add Argument).
Each time you click the add argument button, you’ll need to enter the name of the argument and setthe toggle switch as to whether the argument is mandatory or not. The default is that none of thearguments are mandatory.
304

Triggers
A required element of rule definition that you’ll need to set is the trigger element. Figure 17 on page305 shows the Triggers block for the system.memory/check-system-memory rule. The field details are discussedbelow.
Figure 17: The Triggers Block
Setting up triggers involves creating terms that are used to set policy. If the terms within a trigger arematched, then some action is taken. Terms can evaluate the fields, functions, variables, etc that aredefined within the rule against each other or in search of specific values. Terms are evaluated in orderfrom the top of the term list to the bottom. If no match is found, then the next term (if any) is evaluateduntil a match is found or until the bottom of the term stack is reached.
1. Click on the Triggers link.
2. Click on the add trigger button (+ Add Trigger).
3. Replace the random trigger name with one that makes sense for the trigger you are defining, such asfoo-link-operation-state. We recommend using a name that is very unique to the rule and trigger toavoid having the same trigger name across two or more rules.
4. (Optional) Enter a value in the Frequency field. This value tells Paragon Insights how often the fielddata and triggers should be queried and evaluated. If no entry is made here, then the sensor
305

frequency is applied for this value. The frequency entered here can be entered as a multiple or, anoffset, of the sensor frequency such as 2o. For example, if the sensor frequency is 10s and the triggerfrequency is 2o, then the trigger frequency would be 20s (2*10s).
5. Click the add term button (+ Add Term).
The Term area will expand and show an add condition button, (+ Add Condition) in the When sectionand Color and Message fields in the Then section.
6. To define a condition that the term will evaluate, click the + Add Condition button.
The When section expands to show Left operand, Operator, and Time range fields.
NOTE: Setting a condition is not required. If you want to guarantee that a Term takes aspecific action, don’t set a condition. This could be useful, for example, at the bottom of aterm stack if you want some indication that none of the terms in your trigger matched.
7. Select values from the pull-down menus for each of these fields.
Depending on which Operator is chosen, a new field, Right operand may appear in between theOperator and Time range fields.
The left and right operand pull-down menus are populated with the fields and variables defined inthe rule. The operator field determines what kind of comparison is done. The time range field allowsthe trigger to evaluate things such as if there were any dropped packets in the last minute.
8. (Optional) Set values for the Color and Message fields of the Then section.
These fields are the action fields. If a match is made in the condition set within the same term, thenwhatever action you define here is taken. A color value of green, yellow, or red can be set. A messagecan also be set and is not dependent on whether any color is set.
If color or message are set, a toggle button labeled Evaluate next term appears at the bottom of theThen section. The default value for this button is off (not active).
NOTE: If no match is made in the When section of a term, the Then section is ignored. If thishappens, the next term down, if any, is evaluated.
If a match is made in the When section, then the actions in the Then section, if any, are takenand processing of terms stops unless the Evaluate next term button is set to on (active).
Setting the Evaluate next term button allows you to have Paragon Insights make morecomplex evaluations like ’if one condition and another condition are both true, then take thisaction’.
306
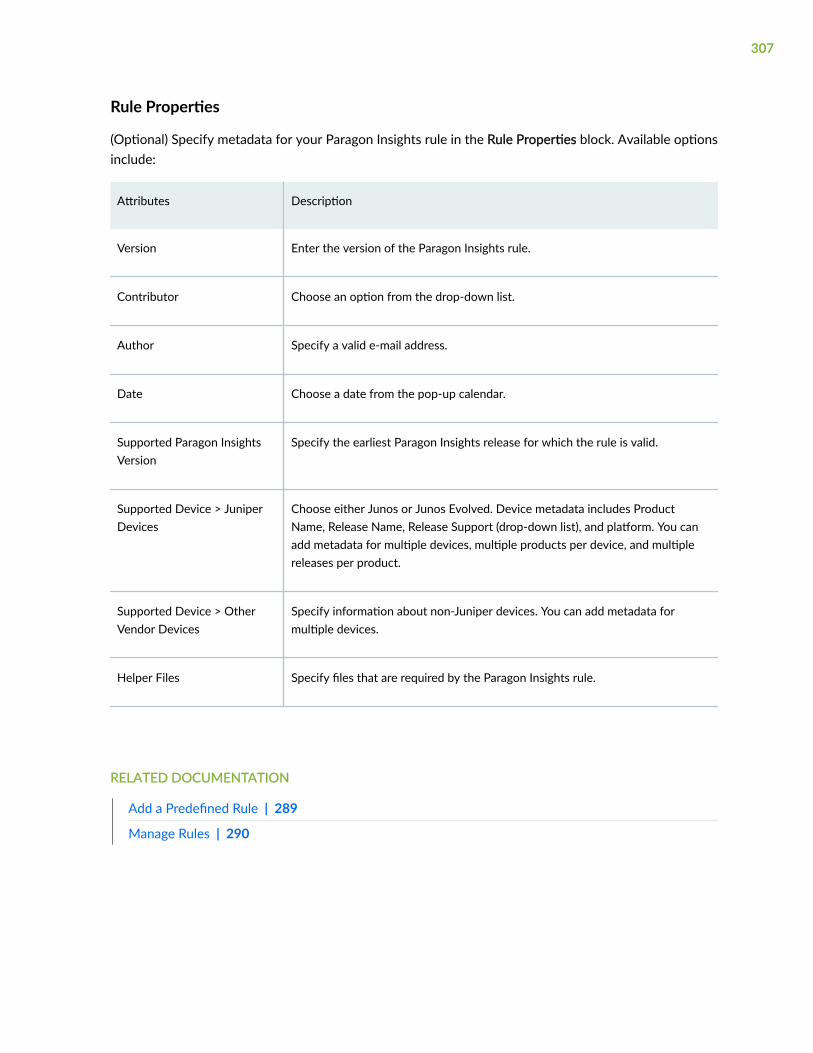
Rule Properties
(Optional) Specify metadata for your Paragon Insights rule in the Rule Properties block. Available optionsinclude:
Attributes Description
Version Enter the version of the Paragon Insights rule.
Contributor Choose an option from the drop-down list.
Author Specify a valid e-mail address.
Date Choose a date from the pop-up calendar.
Supported Paragon InsightsVersion
Specify the earliest Paragon Insights release for which the rule is valid.
Supported Device > JuniperDevices
Choose either Junos or Junos Evolved. Device metadata includes ProductName, Release Name, Release Support (drop-down list), and platform. You canadd metadata for multiple devices, multiple products per device, and multiplereleases per product.
Supported Device > OtherVendor Devices
Specify information about non-Juniper devices. You can add metadata formultiple devices.
Helper Files Specify files that are required by the Paragon Insights rule.
RELATED DOCUMENTATION
Add a Predefined Rule | 289
Manage Rules | 290
307
Configure Paragon Insights Notification for LSP Gray Failures
Paragon Insights can notify Paragon Pathfinder if there are gray failures in Label Switched Paths (LSPs)or nodes connecting the LSPs in an MPLS network. Gray failures or short-lived failures are mainlycaused by interface-related issues such as link flaps, traffic exceeding bandwidth thresholds, link orinterface errors, network delay, or packet loss and node-related issues such as routing daemon CPUutilization exceeding threshold, routing protocol issues, memory leaks, chassis temperature risingbeyond a set threshold, or line card failures. When an LSP consists of a faulty link due to a gray failure,Paragon Insights can be configured to notify Paragon Pathfinder which marks the link or node formaintenance and removes the maintenance mode status when the cause of gray failure is resolved.
Before you begin to configure functions, you must have completed configuring the interface.statistics/check-interface-flaps rule. The interface.statistics/check-interface-flaps rule periodically collects link flapcounts and notifies Paragon Pathfinder when the link flap counts exceeds a pre-defined threshold.
The following checklist ensures that you have configured the interface.statistics/check-interface-flapsrule in Rules page:
• Selected sensor and configured sensor frequency in interface.statistics/check-interface-flaps rule inSensor tab.
• Added a field to take flap count from sensor in Fields tab.
• Added a field to set flap threshold in Fields tab.
• Added a field to capture interface name in Fields tab.
• Added a Term to check if link flaps are increasing compared to threshold value for a given time rangein Triggers tab.
• Added a Term to check if link is stable in Triggers tab.
Paragon Insights has a number of pre-defined rules that collect interface statistics such as flap count,administrative state of the interface, neighbor interface states, and so on. Let us take the example ofhow you can configure a function in Paragon Insights that sends Paragon Pathfinder a maintenancemode alert when flap count increases consistently.
After you configure the interface.statistics/check-interface-flaps rule, you can configure functions togenerate or remove link maintenance mode in the Functions tab of the rule. The Python function catalognotify_pathfinder.py has pre-defined functions for generating and removing maintenance modes. Youcan make a reference to these functions and set arguments (parameters).
To add a link maintenance function:
1. Go to Configuration > Rules in the left navigation bar.
The Rules page appears.
308
2. Search for interface in the search box of Rules page.
This brings up all pre-defined rules related to interfaces. Check for interface.statistics/check-interface-flaps and click on the rule.
3. Click the Functions tab.
4. Click the Add Function button.
5. Enter a name for the function such as generate_maintenance.
6. Enter the description of the function in the Description field.
7. In the Path to Function field, enter notify_pathfinder.py.
8. In the Method Name field, enter generate_link_maintenance.
You can click the script icon near the field to open the catalog of functions available innotify_pathfinder.py. This shows a set of python functions with arguments (parameters). You mustdefine the arguments mentioned in the function you choose.
9. Click the Add Arguments button to enter all the arguments specified in thegenerate_link_maintenance function that is listed in the notify_pathfinder.py catalog.
If you enable the Mandatory button, you must enter a value for the argument when you call thefunction.
10. Click Save and Deploy.
In the Triggers tab, you can call the function name you added and enter the value for the arguments(function parameters).
To call the generate maintenance mode function for link flaps in a trigger:
1. Click Triggers tab.
2. In the link_flaps trigger, click on the Term you configured to check if link flaps exceed the thresholdlimit in a given time.
3. Under the Then statement of the Term, click the Add Function button.
4. Select the function name you configured to generate maintenance link from the drop-down menu.
All the arguments (function parameters) you entered in the Functions tab appear here.
5. Enter $ followed by argument name in the value field for each argument. You can also select asuitable input from the drop-down menu. For example, $interface-name for the argument ifd_name,$mnt_time for argument mnt_time, and so on.
6. Click Save and Deploy.
You can follow the same instructions to add remove_link_maintenance function in Functions tab anddefine argument values for that function under the Term in Triggers tab that checks if an interface isstable.
309
The four main functions that enable Insights to trigger notifications are generate_link_maintenance andremove_link_maintenance for any interface related issues and generate_node_maintenance andremove_node_maintenance for any node related issues.
To check nodes or interfaces that are under maintenance, navigate to Network > Topology in the leftnavigation bar. Click ellipse (...) in the panel with node, link and tunnel tabs. Select Maintenance in thedrop-down menu. The Maintenances page displays details of links and nodes kept under maintenance.
RELATED DOCUMENTATION
About the Topology Page | 485
Configure Multiple Sensors per Device
Sp-admins or users with create access privilege must note the following guidelines when configuringmultiple sensors:
• When adding multiple sensors to rules, you must ensure that there are no overlapping data orkeysets received from the sensors applied to a device. Overlapping keysets can result in duplicatedata points, overwriting of data points, and inaccurate evaluation of data. To avoid this, you can usefilter expressions such as the where statement in Fields.
• When you add multiple sensors in a rule in Paragon Insights GUI, you must set a common value forall sensors in the following fields:
• Frequency field in Sensors tab (sensor frequency)
• Field aggregation time-range field in Rules page.
• Frequency field in Triggers tab.
• Time range field used in triggers, formula, and reference.
For example, when multiple sensors are added in a rule, all sensors applied to a device must have thesame value for sensor frequency, irrespective of the type of sensors. If a rule has iAgent andOpenConfig sensors, the Frequency value in both sensors must be the same. This holds true for allthe fields listed above.
NOTE: We recommend you use offset values if you cannot match the time range values ondifferent sensors. For more information, see Frequency Profiles and Offset Time.
310
However, the frequency you set in a frequency profile will override the frequency values set inmultiple sensors in a rule.
• A Rule with multiple sensors is applied on all devices added in a particular device group. It is assumedthat the devices in a device group support the types of sensors used in Paragon Insights rules.
Sometimes, not all devices in a device group can support the same type of sensor. For example, thedevice group DG1 has an MX2020 router with OpenConfig package installed and another MX2020router configured without the OpenConfig package. The first MX2020 router would supportOpenConfig sensor whereas, the second MX2020 router would not support the same sensor.
To avoid such scenarios, you must ensure that all devices in the same device group support the typesof sensors used to collect information.
To add multiple sensors in a rule:
1. Navigate to Configuration > Rules > Add Rule.
Rules page appears.
2. Enter the Paragon Insights topic and rule name, rule description, synopsis, and optionally, the fieldaggregation time-range and rule frequency. For more information on these fields in Rules page, seeParagon Insights Rules and Playbooks.
3. Click Add Sensor button in Sensors tab and fill in the necessary details based on the type of sensoryou choose.
Repeat step 3 to add as many sensors as you need for your use case.
4. Configure fields for the sensors in the Fields tab.
5. Configure sensors in Rule Properties tab to set multiple sensors active.
You must enter all the sensors, earlier configured in the rule, under the supported-devices hierarchyin Rule Properties. For example, if you configured sensors s1, s2, and s3 in a rule, the Rule Propertiesconfiguration must also include the same sensors:
rule-properties { version 1; contributor juniper; supported-healthbot-version 4.0.0; supported-devices { sensors [s1 s2 s3];
You can also write a new rule and upload it to the Paragon Insights GUI.
The rule must follow the curly brackets format ( { ) and indentation for hierarchical structure.Terminating or leaf statements in the configuration hierarchy are displayed with a trailing semicolon(;) to define configuration details, such as supported version, sensors, and other configurationstatements.
311

6. Click Save & Deploy to apply the new sensors in your network or click Save to save theconfigurations of the new sensors and deploy them later.
RELATED DOCUMENTATION
Configure Sensor Precedence | 314
Understand Sensor Precedence | 312
Understand Sensor Precedence
Paragon Insights allows you to add multiple sensors per rule that can be applied to all the devices in adevice group. In earlier releases, you could add only one sensor per rule. Each sensor generates data in afield table. If you add the different sensors in multiple rules, it results in as many field tables as thenumber of rules. When you add multiple types of sensors (such as OpenConfig or Native GPB) in asingle rule in Paragon Insights, data from the sensors is consolidated in a single field table that is simplerto export or to visualize. The GUI for multiple sensor will be implemented in subsequent releases.
The following scenarios illustrate use cases for multiple sensors in a rule:
• In Paragon Pathfinder, there can be different native sensors that provide non-overlapping counterdetails for Segment Routing (SR) and Resource Reservation Protocol (RSVP) label switched paths(LSP). If the field table needs to be combined for the data collected from the LSPs, multiple sensorscan be made active for a device in the same rule.
• If you want to get data for ge interface using iAgent sensor and for fe interface using Native GPBsensor, then you could use multiple active sensor for a device. You need to ensure non-overlappingdata in this case by using Field filtering expression to filter by the interface name. Instead ofinterfaces, an sp-admin or a user with create access privilege can consider any other keyperformance indicators too.
Paragon Insights also supports a feature that can be used with multiple sensors, called sensorprecedence.
To make data collection from a sensor effective, devices in a device group must support a particularsensor as an ingest method. Select devices in a device group running an older version of operatingsystem, devices from different vendors in a device group, or different products from the same vendor(such as EX, MX, and PTX routers from Juniper) are all scenarios that can cause challenges whileapplying a sensor to a device group. In such cases, you need to set a different sensor that is compatiblewith specific devices in a device group.
Paragon Insights enables you to set sensor precedence so that you can configure different sensors ineach hierarchy of Rule Properties such as vendor name, operating system, product name, platform, and
312

release version. This makes it possible to apply suitable sensors on multi-vendor devices in aheterogeneous device group. You can configure sensor precedence only through Paragon Insights CLI.The GUI for multiple sensor will be implemented in subsequent releases.
Figure 18 on page 313 illustrates two rules each with multiple sensors. It is assumed that RuleProperties is configured for sensor precedence.
Figure 18: Representation of Sensor Precedence in Rules
Let us suppose Sensor1 in Rule 1 is OpenConfig and Sensor4 in Rule 2 is iAgent and Device1 runs Junosoperating system (OS). If OpenConfig and iAgent were set as default sensors for Junos OS hierarchy inRule Properties then, Device1 would receive data from Sensor1 and Sensor4 when the Playbook isdeployed for the device group.
RELATED DOCUMENTATION
Configure Multiple Sensors per Device | 310
Configure Sensor Precedence | 314
313
Configure Sensor Precedence
IN THIS SECTION
Configure Sensor Precedence | 316
In Paragon Automation Platform, the following fields in device configuration, required for sensorprecedence, are extracted using Element Management System (EMS):
• Vendor name: Paragon Insights supports multiple vendors that include Juniper Networks, CiscoSystems, Arista Networks, and PaloAlto Networks.
• Operating system: Name of the operating system supported by vendors such as Junos, IOS XR, andso on.
• Product: Name of the family of products (devices) offered by a vendor. For example, MX routers, ACXrouters, PTX routers from Juniper Networks.
• Platform: Particular member device in a series of products. For example, MX2020, ACX5400 and soon.
• Release or version: release version of the OS selected.
The configuration of above fields in the device hierarchy must match the sensor precedence specified inthe Rule Properties. For example, if you include platform MX2020 in device configuration, the sensorprecedence hierarchy must also include MX2020.
The following is a sample configuration of setting sensor precedence in Rule Properties:
rule-properties { version 1; contributor juniper; supported-healthbot-version 4.0.0; supported-devices { sensors interfaces-iagent; juniper { sensors interfaces-iagent; operating-system junos { products EX { sensors interfaces-iagent; platforms EX9200 {
314

sensors interfaces-iagent; releases 17.3R1 { sensors interfaces-iagent; release-support min-supported-release; } } platforms EX9100 { sensors interfaces-oc; } } products MX { sensors interfaces-oc; } products PTX { sensors interfaces-oc; } products QFX { sensors interfaces-oc; } } } other-vendor cisco { vendor-name cisco; sensors interfaces-oc; } } }
Sensor precedence mandates changes to the current hierarchy of configuration in Rule Properties. Thehierarchy of the following elements has changed in Paragon Insights. The old hierarchy of the listedelements in Rule Properties is deprecated.
• Releases: The old statement hierarchy defined releases under product, and platform as a leaf statementunder Releases. This hierarchy is deprecated.
products MX { releases 15.2R1 { ### Deprecated release-support min-supported-release; ### Deprecated platform All; ### Deprecated } }
315

• Operating system: The old statement hierarchy defined operating system as a leaf statement forother vendors. This order is deprecated.
other-vendor cisco { vendor-name cisco; operating-system nexus; ### Deprecated sensors [ s1 s2 ]; // Default sensors for cisco vendor operating-systems nxos { sensors [ s1 s2 ]; // Default sensors for cisco vendor with NX OS products NEXUS { sensors [ s1 s2 ]; // Default sensors for cisco vendor with NX OS and for the specified product platforms 7000 { sensors [ s1 s2 ]; // Default sensors for cisco vendor with NX OS and for the specified product and platform releases 15.8 { release-support only-on-this-release; sensors [ s1 s2 ]; // Sensors for cisco vendor with NX OS and for the product, platform and version } } }
Configure Sensor Precedence
RELATED DOCUMENTATION
Understand Sensor Precedence | 312
Configure Multiple Sensors per Device | 310
316

CHAPTER 20
Graphs
IN THIS CHAPTER
Graphs Overview | 317
Manage the Graphs Page | 331
Graphs Overview
IN THIS SECTION
Use Cases | 319
Paragon Automation Platform offers three types of graph that include time series graphs, histograms,and heatmaps.
Time series graphs are the kind you are used to, showing the data in a ’2D’ format where the x-axisindicates time while the y-axis indicates the value. Time series graphs are useful for real-timemonitoring, and also to show historical patterns or trends. This graph type does not provide insight intowhether a given value is ’good’ or ’bad’, it simply reports ’the latest value’.
Histograms work quite differently. Rather than show a continuous stream of data based on when eachvalue occurred, histograms aggregate the data to show the distribution of the values over time. Thisresults in a graph that shows ’how many instances of each value’. Histograms also show data in a ’2D’format, however in this case the x-axis indicates the value while the y-axis indicates the number ofinstances of the given value.
Heatmaps bring together the elements above and provide a ’3D’ view to help determine the deviationsin the data. Like a time series graph, the x-axis indicates time, while the y-axis indicates the value. Thenthe ’how many’ aspect of a histogram is added in. Finally, the third dimension—color—is added. It iscommon to think of the colors as showing heath, i.e., red means ’bad, yellow means ’OK’, and greenmeans ’good’. However, this is not correct; the color adds context. For each column, the bars indicate the
317

various values that occurred. The color then indicates how often the values occurred relative to theneighboring values. Within each vertical set of bars, the values that occurred more frequently showas ’hotter’ with orange and red, while those values that occurred less frequently show as shades ofgreen.
To help illustrate these graph types, consider the graphs shown below.
All three graphs are showing the same data—the running 1-minute average of CPU utilization on adevice over the last 24 hours. However, the way they visualize the data varies:
• The time series graph provides the typical view; each minute it adds the latest data point to the endof the line graph. Time moves forward along the x-axis from left to right, and the data values areindicated on the y-axis. What this graph doesn’t show is how often each data point has occurred.
318

• The histogram groups together the values to show how many of each data point there are. Noticethe tallest bar is the one between 30 and 40, which means the most common 1-minute CPU averagevalue is in the 30-40% range. And how many times did this range of values occur? Based on the y-axis, there have been over 350 instances of values in this range. The next most frequently occurringvalues are in the 40-50% range (almost 300 occurrences), while the 0-10% range has almost nooccurrences, suggesting this CPU is rarely idle. What this graph doesn’t show is how many of eachdata point occurred within a given time range.
• The heatmap makes use of elements from the other two graph types. Each small bar indicates thatsome number of instances occurred within the value range shown in the y-axis, at the given timeshow in the x-axis. The color indicates which value ranges, for each given time, occurred more thanothers. To illustrate this, notice the vertical set of bars towards the right of the graph, at 18:00. In thisexample (at this zoom level), each column of vertical bars represents 12 minutes, and each small barrepresents a bucket of 15 values. So the first (lowest) bar indicates that within this time range therewere some values in the 0-14 range. The bar above indicates that within this time range there weresome values in the 15-29 range, and so on. The color then indicates which bars have more valuesthan others. In this example, the third bar is red indicating that for those 12 minutes most of thevalues fell into the 30-44 range (in this example the count is 21). By contrast, the first bar is the mostgreen indicating that for those 12 minutes the least number of values fell into the 0-14 range (in thisexample the count is 1). This ’heat’ information is also supported by the histogram; the mostfrequently occurring values were those in the 30-40 range, which indeed is the ’hotter’ range in theheatmap.
Use Cases
How do I monitor interface flaps for a single interface?
1. Playbook used: interface-kpis-playbook
2. Graph configuration
319

The example shows configuration for vMX1 device in a canvas titled Test-canvas3. The query sectiontakes interface flap count (flaps) as field input and computes mean for flaps in ge-0/0/3 interface.The time series graph in the configuration is captured over 3 hours.
• In the Query section, the FROM fields take your input for device-group name, device name, andrule, respectively.
• The SELECT fields contain inputs for a KPI key based on the rule you set earlier. If the rule youselected is interface.statistics/check-interface-flaps, the SELECT field could show options for flapcount, flap threshold, and so on.
• The Aggregation field describes data aggregation computation to be performed on the KPI fielddata (flap counts in this example) such as mean, median, sum, and so on.
• The Transformation field (optional) describes computations performed on subsequent values in asingle field. For example, rate of change, elapsed time, differences, and so on.
• The WHERE section allows you to set a condition to filter the field data. You must enter a leftoperand, a right operand and a conditional operand such as equal to, matches with, greater than,less than, and so on. The left operand can be either a key or a field name.
320

In the example configuration, the condition defined checks if the interface-name is equal toge-0/0/3.
• The GROUP BY section allows you to group the filtered data by a time interval you specify andhandle output value in cases where no field data is available. You can choose group by timeinterval from the drop-down menu.
If you set the time interval in GROUP BY field as $_interval, then Grafana sets the time intervalfor data aggregation based on the number of points received in TSDB.
• In the Visualization section, you can enter the y-axis minimum and maximum values, y-axis labeland choose unit such as bytes, kilobytes, and so on.
In the example configuration, this section is not configured.
3. Graph panel
The graph shows interface flaps for ge/0/0/3 interface in device vMX1.
How do I monitor interface flaps for all ’ge’ interfaces on a device in a single graph?
1. Playbook used: interface-kpis-playbook
2. Graph configuration
321

The example shows configuration for vMX1 device in a canvas titled Test-canvas3. The query sectiontakes interface flap count (flaps) as field input and computes mean for flaps in all ge interfaces. Thetime series graph in the configuration is captured over 3 hours.
• In the Query section, the FROM fields take your input for device-group name, device name, andrule, respectively.
• The SELECT fields contain inputs for a KPI key based on the rule you set earlier. If the rule youselected is interface.statistics/check-interface-flaps, the SELECT field could show options for flapcount, flap threshold, and so on.
• The Aggregation field describes data aggregation computation to be performed on the KPI fielddata (flap counts in this example) such as mean, median, sum, and so on.
• The Transformation field (optional) describes computations performed on subsequent values in asingle field. For example, rate of change, elapsed time, differences, and so on.
• The WHERE section allows you to set a condition to filter the field data. You must enter a leftoperand, a right operand and a conditional operand such as equal to, matches with, greater than,less than, and so on. The left operand can be either a key or a field name.
In the example configuration, the condition defined checks if the interface-name matches with ge.
322

• The GROUP BY section allows you to group the filtered data by a time interval you specify andhandle output value in cases where no field data is available. You can choose group by timeinterval from the drop-down menu.
If you set the time interval in GROUP BY field as $_interval, then Grafana sets the time intervalfor data aggregation based on the number of points received in TSDB.
• In the Visualization section, you can enter the y-axis minimum and maximum values, y-axis labeland choose unit such as bytes, kilobytes, and so on.
In the example configuration, this section is not configured.
3. Graph panel
The graph shows flap counts of three ge interfaces — ge-0/0/0, ge0/0/1, and ge-0/0/2 in the vMX1device.
How do I monitor system memory usage for all devices in a device group in a single graph?
1. Playbook used: system-kpis-playbook
2. Graph configuration
323
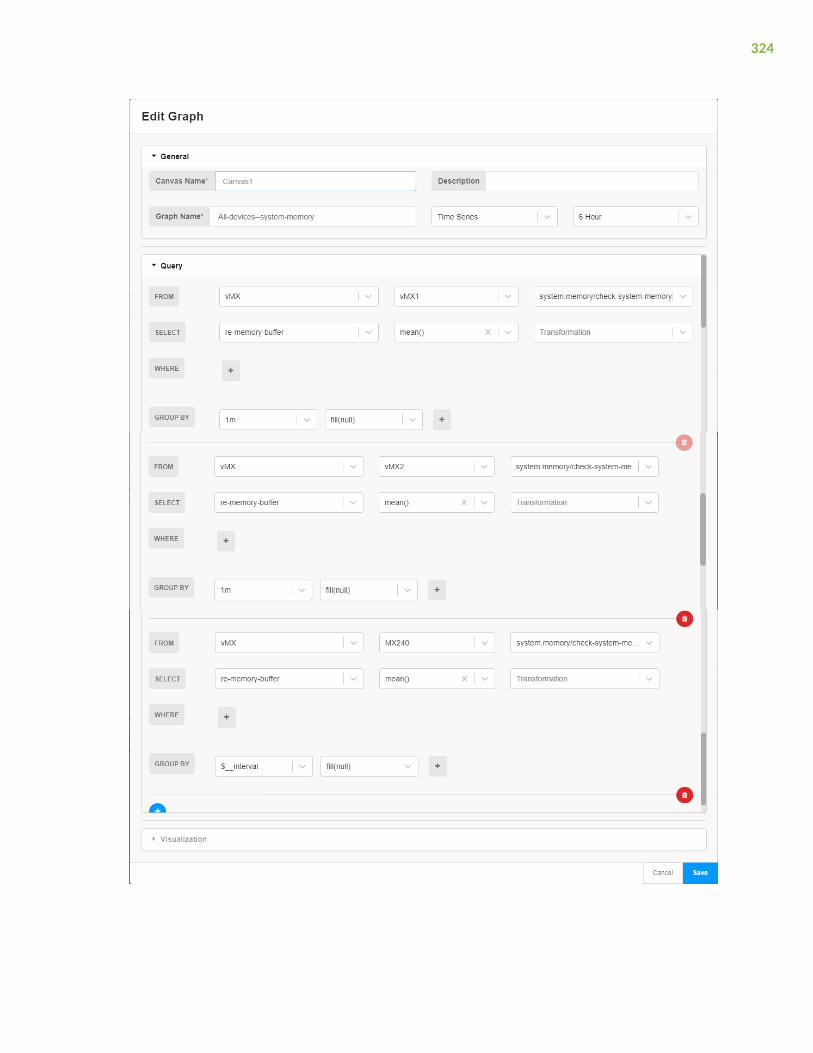
324
The example configuration shows query section configured for three devices — vMX1, vMX2, andMX240 — in a single canvas titled Canvas1. The query section takes routing engine’s system memorybuffer (re-memory-buffer) as field input, computes mean for a time interval set by the user orGrafana. The example configuration is set for the time series graph captured over 6 hours.
• In the Query section, the FROM fields take your input for device-group name, device name, andrule, respectively.
• The SELECT fields contain inputs for a KPI key based on the rule you set earlier. If the rule youselected is system.memory/check-system-memory, the SELECT field could show options for systemmemory buffer value, system memory high threshold, system memory low threshold, and so on.
• The Aggregation field describes data aggregation computation to be performed on the KPI fielddata (system memory buffer in this example) such as mean, median, sum, and so on.
• The Transformation field (optional) describes computations performed on subsequent values in asingle field. For example, rate of change, elapsed time, differences, and so on.
• The WHERE section allows you to set a condition to filter the field data. You must enter a leftoperand, a right operand and a conditional operand such as equal to, matches with, greater than,less than, and so on. The left operand can be either a key or a field name.
In this example, no conditions are set in the WHERE section.
• The GROUP BY section allows you to group the filtered data by a time interval you specify andhandle output value in cases where no field data is available. You can choose group by timeinterval from the drop-down menu.
If you set the time interval in GROUP BY field as $_interval, then Grafana sets the time intervalfor data aggregation based on the number of points received in TSDB.
In the example configuration, the group_by interval is set at 1 minute for vMX1 and vMX2 deviceswhereas, Grafana would decide the time interval to group by aggregated data for MX240 device.
• In the Visualization section, you can enter the y-axis minimum and maximum values, y-axis labeland choose unit such as bytes, kilobytes, and so on.
In the example configuration, this section is not configured.
3. Graph panel
325

The graph shows mean system memory buffer values aggregated per minute for vMX1 and vMX2,and for an unknown time interval for MX240 device.
How do I monitor RE CPU usage for multiple devices in a single graph?
1. Playbook used: system-kpis-playbook
2. Graph configuration
326

327

The example configuration shows query section and visualization section configured for threedevices — vMX1, vMX2, and MX240 — in a single canvas titled Canvas1. The query section takesrouting engine’s CPU utilization (re-cpu-utilization) as field input, computes mean every minute forthe three devices, and visualizes the mean CPU utilization per minute as percentage. The exampleconfiguration is set for the time series graph captured over 6 hours.
• In the Query section, the FROM fields take your input for device-group name, device name, andrule, respectively.
• The SELECT fields contain inputs for a KPI key based on the rule you set earlier. If the rule youselected is system.cpu/check-system-cpu, the SELECT field could show options for CPU utilizationvalue, CPU utilization high threshold, CPU utilization low threshold, and so on.
• The Aggregation field describes data aggregation computation to be performed on the KPI fielddata (CPU utilization in this example) such as mean, median, sum, and so on.
• The Transformation field (optional) describes computations performed on subsequent values in asingle field. For example, rate of change, elapsed time, differences, and so on.
• The WHERE section allows you to set a condition to filter the field data. You must enter a leftoperand, a right operand and a conditional operand such as equal to, matches with, greater than,less than, and so on. The left operand can be either a key or a field name.
In this example, no conditions are set in the WHERE section.
• The GROUP BY section allows you to group the filtered data by a time interval you specify andhandle output value in cases where no field data is available. You can choose group by timeinterval from the drop-down menu.
If you set the time interval in GROUP BY field as $_interval, then Grafana sets the time intervalfor data aggregation based on the number of points received in TSDB.
In the example configuration, the group_by interval is set at 1 minute for vMX1, vMX2, andMX240 devices.
• In the Visualization section, you can enter the y-axis minimum and maximum values, y-axis labeland choose unit such as bytes, kilobytes, and so on.
In the example configuration, the y-axis range for mean CPU utilization per minute is set on ascale of 0 to 100 percentage.
3. Graph panel
328

The graph displays mean CPU utilization in percentage for vMX1, vMX2, and MX240 devices.
How do I monitor RE CPU usage for multiple devices side-by-side?
1. Playbook used: system-kpis-playbook
2. Graph configuration
329

The example shows separate configuration for two devices — vMX1 and MX240 — in a single canvastitled Canvas1. The query section takes routing engine’s CPU utilization (re-cpu-utilization) as fieldinput, computes mean every minute for the three devices. The example configurations are set for thetime series graph captured over 6 hours.
• In the Query section, the FROM fields take your input for device-group name, device name, andrule, respectively.
• The SELECT fields contain inputs for a KPI key based on the rule you set earlier. If the rule youselected is system.cpu/check-system-cpu, the SELECT field could show options for CPU utilizationvalue, CPU utilization high threshold, CPU utilization low threshold, and so on.
• The Aggregation field describes data aggregation computation to be performed on the KPI fielddata (CPU utilization in this example) such as mean, median, sum, and so on.
• The Transformation field (optional) describes computations performed on subsequent values in asingle field. For example, rate of change, elapsed time, differences, and so on.
• The WHERE section allows you to set a condition to filter the field data. You must enter a leftoperand, a right operand and a conditional operand such as equal to, matches with, greater than,less than, and so on. The left operand can be either a key or a field name.
330

In this example, no conditions are set in the WHERE section.
• The GROUP BY section allows you to group the filtered data by a time interval you specify andhandle output value in cases where no field data is available. You can choose group by timeinterval from the drop-down menu.
If you set the time interval in GROUP BY field as $_interval, then Grafana sets the time intervalfor data aggregation based on the number of points received in TSDB.
• In the Visualization section, you can enter the y-axis minimum and maximum values, y-axis labeland choose unit such as bytes, kilobytes, and so on.
In the example configurations, this section is not configured.
3. Graph panel
The canvas titled Canvas1 has two graphs (because of separate configuration) for the vMX1 andMX240 devices side-by-side.
RELATED DOCUMENTATION
Manage the Graphs Page | 331
Manage the Graphs Page
IN THIS SECTION
Add a Graph | 332
Edit or Delete Graphs | 335
You can use graphs to monitor the status and health of your network devices. Graphs allow you tovisualize data collected by Paragon Insights from a device, showing the results of rule processing. Access
331
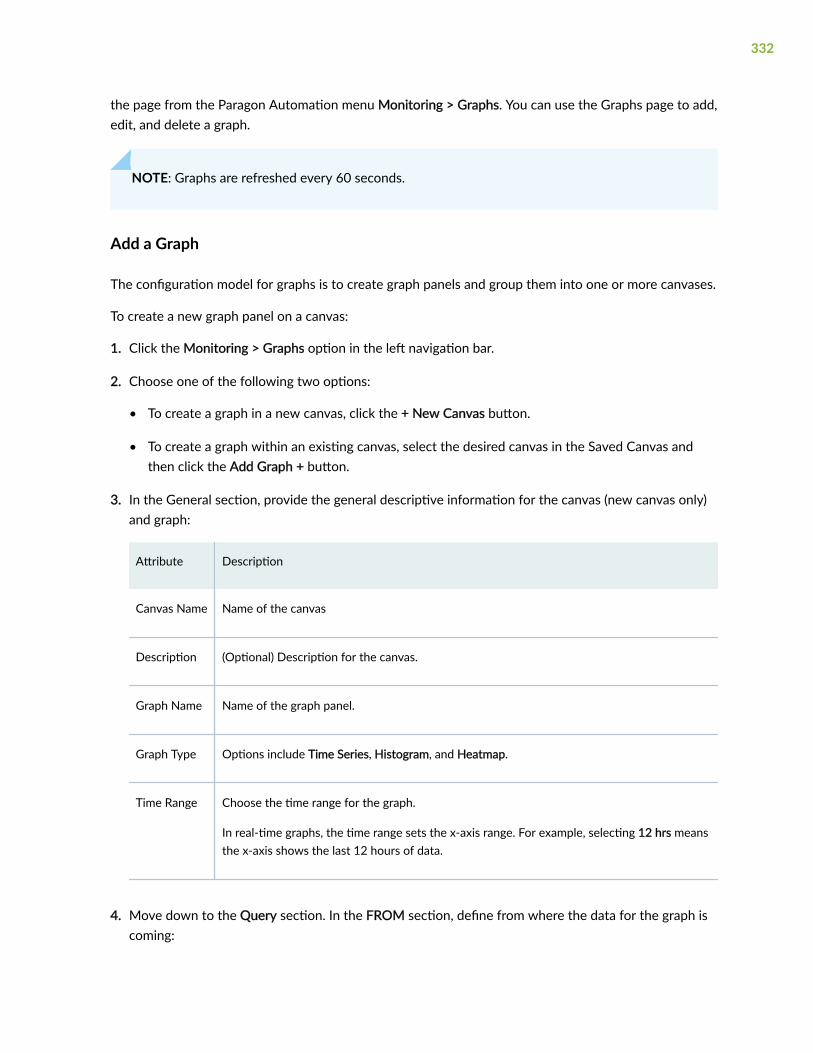
the page from the Paragon Automation menu Monitoring > Graphs. You can use the Graphs page to add,edit, and delete a graph.
NOTE: Graphs are refreshed every 60 seconds.
Add a Graph
The configuration model for graphs is to create graph panels and group them into one or more canvases.
To create a new graph panel on a canvas:
1. Click the Monitoring > Graphs option in the left navigation bar.
2. Choose one of the following two options:
• To create a graph in a new canvas, click the + New Canvas button.
• To create a graph within an existing canvas, select the desired canvas in the Saved Canvas andthen click the Add Graph + button.
3. In the General section, provide the general descriptive information for the canvas (new canvas only)and graph:
Attribute Description
Canvas Name Name of the canvas
Description (Optional) Description for the canvas.
Graph Name Name of the graph panel.
Graph Type Options include Time Series, Histogram, and Heatmap.
Time Range Choose the time range for the graph.
In real-time graphs, the time range sets the x-axis range. For example, selecting 12 hrs meansthe x-axis shows the last 12 hours of data.
4. Move down to the Query section. In the FROM section, define from where the data for the graph iscoming:
332

Attribute Description
Group Choose the device group or network group.
Device Choose a device from the group.
Topic / Rule Choose the Paragon Insights topic/rule name.
5. In the SELECT section, select the data field and apply aggregation and transformation types to thedata:
Attribute Description
Field Choose a field name.
This list is derived based on the fields defined in the selected topic/rule.
Aggregation (Optional) In the drop-down list, choose a data aggregation type.
Transformation (Optional) In the drop-down list, choose a data transformation type.
6. In the WHERE section, filter data based on field and KPI key:
Attribute Description
Tag Key / Field (Optional) Choose a key or field. A key is an index field such as interface name.
This list is derived based on the keys and fields defined in the selected topic/rule.
You can set a maximum of two tags with WHERE conditions. You can use the AND optionto satisfy both conditions and use OR option to satisfy either of the conditions you define.
Condition Choose the conditional for the WHERE statement such as greater than, less than, matcheswith, equal to, and so on.
The condition is used to check the right operand input against the left operand value.
333
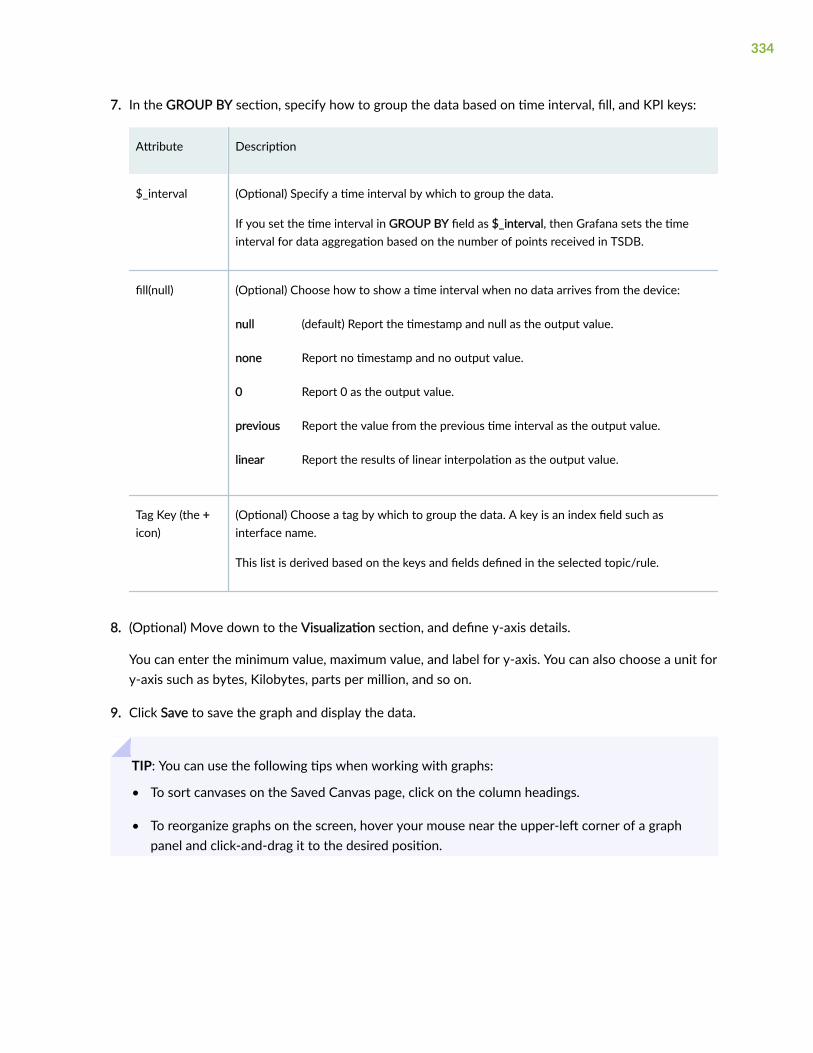
7. In the GROUP BY section, specify how to group the data based on time interval, fill, and KPI keys:
Attribute Description
$_interval (Optional) Specify a time interval by which to group the data.
If you set the time interval in GROUP BY field as $_interval, then Grafana sets the timeinterval for data aggregation based on the number of points received in TSDB.
fill(null) (Optional) Choose how to show a time interval when no data arrives from the device:
null (default) Report the timestamp and null as the output value.
none Report no timestamp and no output value.
0 Report 0 as the output value.
previous Report the value from the previous time interval as the output value.
linear Report the results of linear interpolation as the output value.
Tag Key (the +icon)
(Optional) Choose a tag by which to group the data. A key is an index field such asinterface name.
This list is derived based on the keys and fields defined in the selected topic/rule.
8. (Optional) Move down to the Visualization section, and define y-axis details.
You can enter the minimum value, maximum value, and label for y-axis. You can also choose a unit fory-axis such as bytes, Kilobytes, parts per million, and so on.
9. Click Save to save the graph and display the data.
TIP: You can use the following tips when working with graphs:
• To sort canvases on the Saved Canvas page, click on the column headings.
• To reorganize graphs on the screen, hover your mouse near the upper-left corner of a graphpanel and click-and-drag it to the desired position.
334

• To resize a graph, hover your mouse over the lower-right corner of the graph panel and click-and-drag it to the desired size.
• To change the color of graph elements, click the color bar for the desired line item under thegraph.
• To zoom in on a graph, click and drag across the desired section of the graph; to zoom out,double-click on the graph.
• To isolate an element on the graph, click its related line item under the graph; to view allelements again, click the same line item.
Edit or Delete Graphs
In the Graph canvas, you can edit or delete a graph or delete a canvas.
• To edit a graph, click the pencil icon located in the top right corner of the graph itself.
• To delete a graph, click the trash can icon located in the top right corner of the graph itself.
• To delete a canvas, click the trash can icon located in the top right corner of the canvas.
RELATED DOCUMENTATION
Graphs Overview | 317
335

6PART
Manage Sensor Settings and DataSummarization Profiles
Sensor Settings | 337
Data Summarization Profiles | 459

CHAPTER 21
Sensor Settings
IN THIS CHAPTER
Sensors Overview | 338
About the Sensor Settings Page | 354
Configure Netflow Settings | 355
Configure a Rule Using Flow Sensor | 359
About Frequency Profiles | 367
Configure, Edit and Delete Frequency Profiles | 368
Apply a Frequency Profile | 370
Configure Offset Time | 371
Configure Native GPB Ingest | 380
Configure sFlow Settings | 382
Configure SNMP Ingest | 392
Configure SNMP Trap and Inform Notifications | 396
Configure System Log Ingest | 407
System Log Optional Configurations | 417
Configure a Rule Using Syslog | 419
About the Sensor Diagnostics Page | 424
Use the Self Test Tool | 426
Use the Reachability Test | 428
Use the Ingest Test Tool | 429
Use the No-Data Tool | 430
Paragon Insights Tagging Overview | 431
Types of Tagging | 439
Add a Tagging Profile | 447
Apply a Tagging Profile | 452
Understand User-Defined Actions and Functions | 453
Modify User-Defined Action and Function Engines | 455
337

Sensors Overview
IN THIS SECTION
Native GPB | 339
NetFlow | 340
sFlow | 341
OpenConfig | 342
Syslog | 346
iAgent (CLI/NETCONF) | 348
SNMP | 353
Paragon Insights accepts data from a variety of Juniper and third-party devices and from various typesof telemetry sensors that include traditional network management protocols like syslog and SNMP.Paragon Insights supports push and pull models of data collection. In the push model, your devices pushtelemetry data to Paragon Insights through trap notifications, for instance. In the pull mode, ParagonInsights periodically polls your devices for data. This guide describes each of the supported ingestmethods, with examples, sorted by whether they fall into the push or pull model. Along with eachdescription, we provide the required Junos OS version and device configurations needed to enable thespecific ingest type.
As the number of objects in the network, and the metrics they generate, have grown, gatheringoperational statistics for monitoring the health of a network has become an ever-increasing challenge.Traditional ’pull’ data-gathering models, like SNMP and the CLI, require additional processing toperiodically poll the network element, and can directly limit scaling.
The ’push’ model overcomes these limits by delivering data asynchronously, which eliminates polling.With this model, the Paragon Insights server can make a single request to a network device to streamperiodic updates. As a result, the ’push’ model is highly scalable and can support the monitoring ofthousands of objects in a network. Junos devices support this model in the form of the Junos TelemetryInterface (JTI).
Paragon Insights currently supports five push-model sensors:
• "Native GPB" on page 339
• "NetFlow" on page 340
• "sFlow" on page 341
338
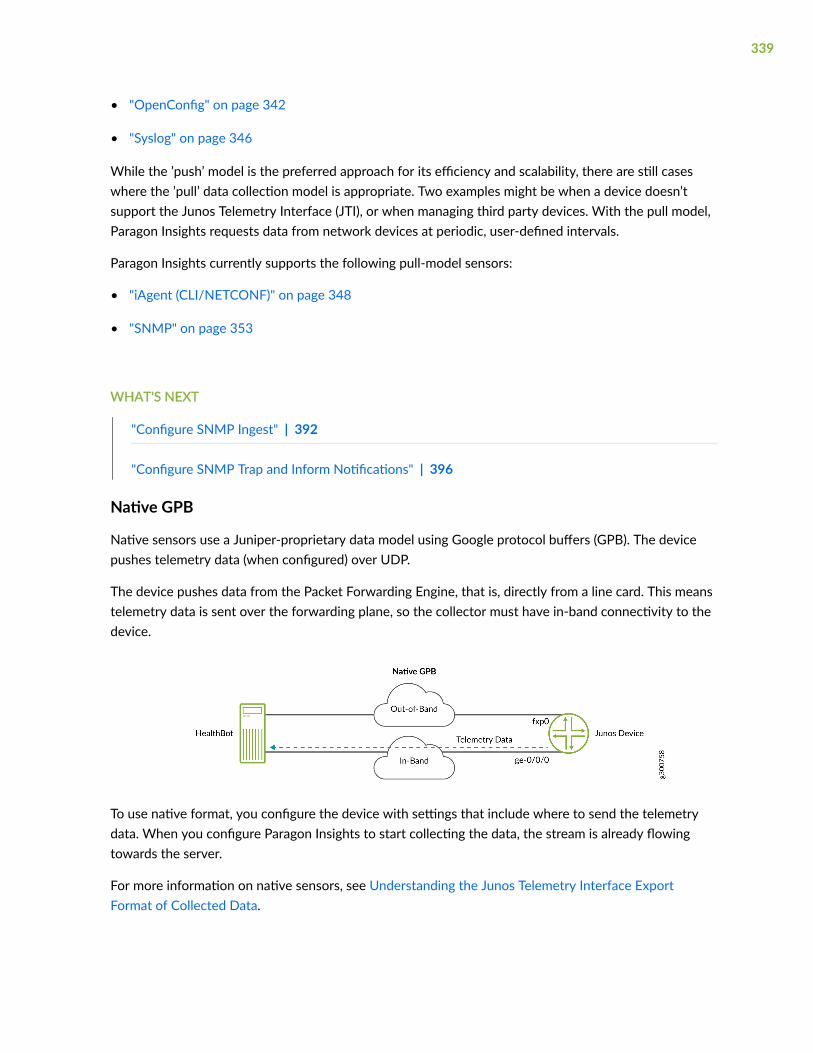
• "OpenConfig" on page 342
• "Syslog" on page 346
While the ’push’ model is the preferred approach for its efficiency and scalability, there are still caseswhere the ’pull’ data collection model is appropriate. Two examples might be when a device doesn’tsupport the Junos Telemetry Interface (JTI), or when managing third party devices. With the pull model,Paragon Insights requests data from network devices at periodic, user-defined intervals.
Paragon Insights currently supports the following pull-model sensors:
• "iAgent (CLI/NETCONF)" on page 348
• "SNMP" on page 353
WHAT'S NEXT
"Configure SNMP Ingest" | 392
"Configure SNMP Trap and Inform Notifications" | 396
Native GPB
Native sensors use a Juniper-proprietary data model using Google protocol buffers (GPB). The devicepushes telemetry data (when configured) over UDP.
The device pushes data from the Packet Forwarding Engine, that is, directly from a line card. This meanstelemetry data is sent over the forwarding plane, so the collector must have in-band connectivity to thedevice.
To use native format, you configure the device with settings that include where to send the telemetrydata. When you configure Paragon Insights to start collecting the data, the stream is already flowingtowards the server.
For more information on native sensors, see Understanding the Junos Telemetry Interface ExportFormat of Collected Data.
339
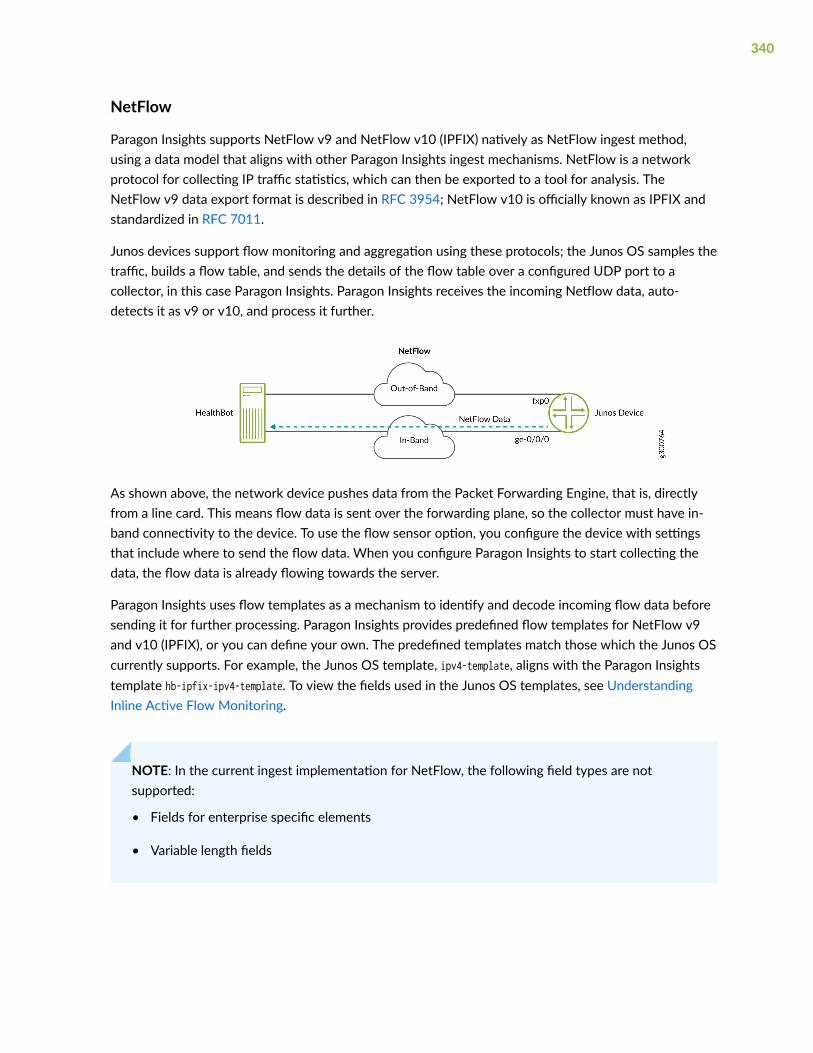
NetFlow
Paragon Insights supports NetFlow v9 and NetFlow v10 (IPFIX) natively as NetFlow ingest method,using a data model that aligns with other Paragon Insights ingest mechanisms. NetFlow is a networkprotocol for collecting IP traffic statistics, which can then be exported to a tool for analysis. TheNetFlow v9 data export format is described in RFC 3954; NetFlow v10 is officially known as IPFIX andstandardized in RFC 7011.
Junos devices support flow monitoring and aggregation using these protocols; the Junos OS samples thetraffic, builds a flow table, and sends the details of the flow table over a configured UDP port to acollector, in this case Paragon Insights. Paragon Insights receives the incoming Netflow data, auto-detects it as v9 or v10, and process it further.
As shown above, the network device pushes data from the Packet Forwarding Engine, that is, directlyfrom a line card. This means flow data is sent over the forwarding plane, so the collector must have in-band connectivity to the device. To use the flow sensor option, you configure the device with settingsthat include where to send the flow data. When you configure Paragon Insights to start collecting thedata, the flow data is already flowing towards the server.
Paragon Insights uses flow templates as a mechanism to identify and decode incoming flow data beforesending it for further processing. Paragon Insights provides predefined flow templates for NetFlow v9and v10 (IPFIX), or you can define your own. The predefined templates match those which the Junos OScurrently supports. For example, the Junos OS template, ipv4-template, aligns with the Paragon Insightstemplate hb-ipfix-ipv4-template. To view the fields used in the Junos OS templates, see UnderstandingInline Active Flow Monitoring.
NOTE: In the current ingest implementation for NetFlow, the following field types are notsupported:
• Fields for enterprise specific elements
• Variable length fields
340
WARNING: For NetFlow ingest, ensure that there is no source NAT in the networkpath(s) between the device and Paragon Insights. If the network path contains sourceNAT, then the received device information is not accurate.
A typical workflow includes adding a NetFlow configured device in Paragon Insights, configuringNetFlow templates, configuring a rule with Flow sensor, and deploying a playbook with the rule to adevice group.
• Configure devices to use NetFlow in Paragon Insights. See "Edit Devices" on page 135.
• Add the device to a device group. See "Add a Device Group" on page 143.
• Define NetFlow ingest settings. See "Configure Netflow Settings" on page 355.
• Use pre-defined NetFlow templates or
• Create your own NetFlow template
• Clone an existing NetFlow template
• Configure a rule that uses a flow sensor. See "Configure a Rule Using Flow Sensor" on page 359.
• Add the rule to a playbook. "Create a New Playbook Using the Paragon Insights GUI" on page 259
• Deploy the playbook. "Manage Playbook Instances" on page 262.
• Monitor the device for NetFlow traffic
With the playbook applied, you can begin to monitor the devices.
1. Click Monitoring > Network Health in the left navigation bar and click on the Device Group tab.
2. Select the device group to which you applied the playbook from the Device Group pull-down menu.
3. Select one of more of the devices to monitor.
4. In the Tile View, the external tile contains the parameters from the rule you configured earlier.
sFlow
Paragon Insights supports sFlow (v5) natively as another flow-based ingest method.
sFlow is a statistical sampling-based technology for high-speed switched or routed networks. You canconfigure sFlow to continuously monitor traffic at wire speed on all interfaces simultaneously if youwant.
sFlow provides or helps with:
341
• Detailed and quantitative traffic measurements at gigabit speeds
• Insight into forwarding decisions
• Troubleshooting for network issues
• Congestion control
• Security and audit trail analysis
• Route profiling
Everything that sFlow does above, it does without impact to forwarding or network performance. Formore information on sFlow, see: RFC 3176, InMon Corporation's sFlow: A Method for Monitoring Trafficin Switched and Routed Networks.
As a statistical sampling protocol, Juniper’s sFlow agent samples the traffic and counters on networkinterfaces, creates sFlow datagrams and forwards them to external sFlow collectors. Paragon Insights isone such collector.
To know how to configure sFlow packets in Paragon Insights, go to "Configure sFlow Settings" on page382.
OpenConfig
IN THIS SECTION
gNMI-Encoded OpenConfig RPC | 343
Device Configuration for OpenConfig | 344
To use OpenConfig format, you configure the device as a gRPC server. With Paragon Insights acting asthe client, you define which sensors you want it to subscribe to, and it makes subscription requeststowards the device.
Data streamed through gRPC is formatted in OpenConfig key/value pairs in protocol buffer (GPB)encoded messages. Keys are strings that correspond to the path of the system resources in theOpenConfig schema for the device being monitored; values correspond to integers or strings thatidentify the operational state of the system resource, such as interface counters. OpenConfig RPCmessages can be transferred in bulk, such as providing multiple interface counters in one message,thereby increasing efficiency of the message transfer.
For more information on OpenConfig sensors, see Understanding OpenConfig and gRPC on JunosTelemetry Interface.
342

gNMI-Encoded OpenConfig RPC
gNMI-encoded OpenConfig works much like OpenConfig RPC in that you must set the network deviceup as an OpenConfig server to which Paragon Insights makes subscription requests. However, gNMIsupports more subscription types than Paragon Insights currently supports. Currently, Paragon Insightsonly supports gNMI STREAM subscriptions in the SAMPLE mode. STREAM subscriptions are long-livedsubscriptions that continue, indefinitely, to transmit updates relating to the set of paths configuredwithin the subscription. SAMPLE mode STREAM subscriptions must include a sample_interval.
The messages returned to the client through gNMI are encoded by the device in protobuf, JSON, orJSON-IETF format and cannot be sent in bulk. This, in part, makes gNMI-encoded messaging lessefficient than gRPC-encoded messaging.
WARNING:
• For JSON or JSON-IETF, it is assumed that the device returns gNMI updates as onlyleaf values encoded in JSON, rather than returning an entire hierarchy or sub-hierarchy as a JSON object.
• Numbers encoded in JSON or JSON-IETF are decoded by Paragon Insights as eitherfloat64, int64, or string, according to RFC 7159 and RFC 7951. If your OpenConfigrules contain fields that are of a different type, we recommend that you change thefield types accordingly.
Junos OS and Cisco devices can be managed by Paragon Insights using gNMI-encoded OpenConfig. If adevice does not support gNMI in general, or the STREAM subscription in SAMPLE mode, or does notsupport an OpenConfig request, it returns one of the following errors:
• Unimplemented
• Unavailable
• InvalidArgument
In the case of a Junos OS or Cisco device, the error causes the connection to fall back to OpenConfigRPC. In the case of a third-party device, the connection simply fails due to the error.
gNMI-encoded OpenConfig can be enabled at the device or device-group level. If enabled at the device-group level, then all devices added to the group use gNMI by default. If enabled (or not enabled) at thedevice level, then the device level setting takes precedence over the device-group level setting.
NOTE: During the initial connection gNMI devices attempt to perform an initial sync with theclient. The device sends a continuous stream of data until the device and the collector (Paragon
343
Insights) are in sync. After initial sync, the device begins normal streaming operations based onthe configured reporting rate. Because of the processing load this creates, Paragon Insights hasthis feature disabled by default. It can be enabled at the device-group or device level if needed.
For more information about gNMI, see: gRPC Network Management Interface (gNMI).
Device Configuration for OpenConfig
OpenConfig requires:
• Junos OS Version: 16.1 or later
• The OpenConfig sensor requires that the Junos device have the OpenConfig and network agentpackages installed. These packages are built into Junos OS Releases 18.2X75, 18.3, and later. Forreleases between 16.1 and 18.2X75 or 18.2, you must install the OpenConfig and Network Agentpackages.
Before you install the Network Agent package:
• Install Junos OS Release 16.1R3 or later.
• Install the OpenConfig for Junos OS module. Using a Web browser, navigate to the All JunosPlatforms software download URL on the Juniper Networks webpage: https://www.juniper.net/support/downloads/. From the Network Management tab, scroll down toselect OpenConfig. Select the Software tab. Select the OpenConfig Package (Junos withupgraded FreeBSD). For more information, see Installing the OpenConfig Package.
• Install Secure Sockets Layer (SSL) certificates of authentication on your Juniper Networksdevice.
NOTE: Only server-based SSL authentication is supported. Client-based authenticationis not supported.
An example of a valid Network Agent package name is:
network-agent-x86-32-16.1R4.12-C1.1.tgz
NOTE: Each version of the Network Agent package is supported on a single release ofJunos OS only. The Junos OS version supported is identified by the Junos OS releasenumber included in the Network Agent package name.
344

Use the 32-bit Network Agent package for both 32-bit and 64-bit versions of Junos OS or JunosOS Evolved.
To download and install the Network Agent package:
1. Navigate to the All Junos Platforms software download URL on the Juniper Networkswebpage: https://www.juniper.net/support/downloads/.
2. Select the name of the Junos OS platform for the software that you want to download.
3. Select the release number (the number of the software version that you want to download)from the Release drop-down list to the right of the Download Software page.
4. Select the Software tab.
5. Navigate to the Tools section of the Software tab and select the Junos Network Agent packagefor the release.
6. Log in to the Juniper Networks authentication system using the username (generally your e-mail address) and password supplied by a Juniper Networks representative.
7. Download the software to a local host.
8. Copy the software to Juniper Networks device or to your internal software distribution site.
9. Install the new network-agent package on the device by issuing the request system software addpackage-name from the operational mode:
For example:
user@host > request system software add network-agent-x86-32-16.1R3.16-C1.0.tgz
NOTE: The command uses the validate option by default. This option validates thesoftware package against the current configuration as a prerequisite to adding thesoftware package to ensure that the device reboots successfully. This is the defaultbehavior when the software package being added is a different release.
To verify whether you have the OpenConfig and Network Agent packages installed, enter thefollowing command:
user@host> show version | match "Junos:|openconfig|na telemetry" Junos: 19.2R1.8
345
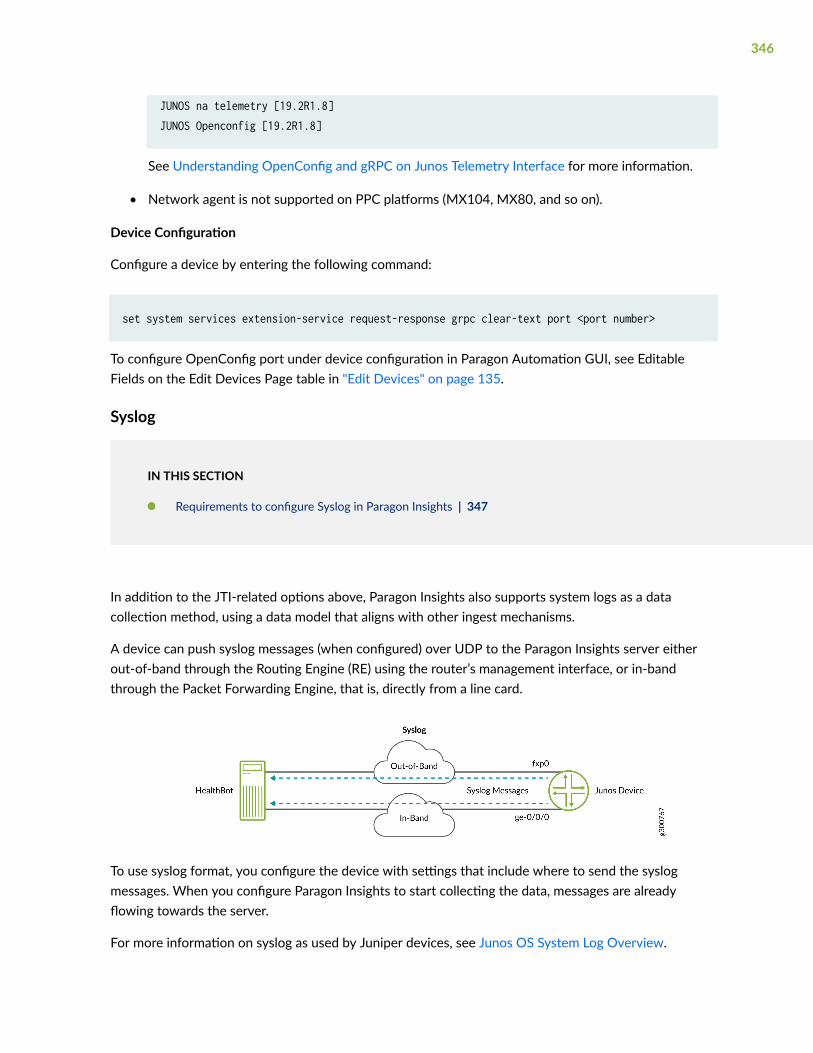
JUNOS na telemetry [19.2R1.8]JUNOS Openconfig [19.2R1.8]
See Understanding OpenConfig and gRPC on Junos Telemetry Interface for more information.
• Network agent is not supported on PPC platforms (MX104, MX80, and so on).
Device Configuration
Configure a device by entering the following command:
set system services extension-service request-response grpc clear-text port <port number>
To configure OpenConfig port under device configuration in Paragon Automation GUI, see EditableFields on the Edit Devices Page table in "Edit Devices" on page 135.
Syslog
IN THIS SECTION
Requirements to configure Syslog in Paragon Insights | 347
In addition to the JTI-related options above, Paragon Insights also supports system logs as a datacollection method, using a data model that aligns with other ingest mechanisms.
A device can push syslog messages (when configured) over UDP to the Paragon Insights server eitherout-of-band through the Routing Engine (RE) using the router’s management interface, or in-bandthrough the Packet Forwarding Engine, that is, directly from a line card.
To use syslog format, you configure the device with settings that include where to send the syslogmessages. When you configure Paragon Insights to start collecting the data, messages are alreadyflowing towards the server.
For more information on syslog as used by Juniper devices, see Junos OS System Log Overview.
346
A syslog message consists of a header, structured data in key-value format within square brackets, andthe log message. The header consists of the following information:
• Log priority
• Version number of Syslog protocol specification on header format.
Currently, this number is 1.
• Timestamp of when the message was generated in the format of "Mmm dd hh:mm:ss".
• Hostname identifies the device that sent the syslog message.
• Application name
• Application process ID
• Message ID
Requirements to configure Syslog in Paragon Insights
Syslog ingest requires some setup before you can use it as a sensor in a rule:
• Pattern - A pattern identifies some syslog event; you create a pattern for each event you want tomonitor. You can configure patterns for both structured and unstructured events.
• Pattern set - With the patterns configured, you then group them into a pattern set, which you thenreference when defining the syslog sensor settings within a rule.
Before you configure Patterns and Pattern Set for Syslog ingest, note that the following fields arecommon in syslog messages. Paragon Insights extracts these fields and includes them automatically inthe raw table, enabling you to make use of them directly when creating a rule, and avoiding the need toconfigure patterns.
To illustrate use of these values, consider the following example syslog messages:
Structured - <30>1 2019-11-22T03:17:53.605-08:00 R1 mib2d 28633 SNMP_TRAP_LINK_DOWN [[email protected] snmp-interface-index="545" admin-status="up(1)" operational-status="down(2)" interface-name="ge-1/0/0.16"] ifIndex 545,ifAdminStatus up(1), ifOperStatus down(2), ifName ge-1/0/0.16
Equivalent unstructured - <30>Nov 22 03:17:53 R1 mib2d[28633]: SNMP_TRAP_LINK_DOWN: ifIndex 545, ifAdminStatusup(1), ifOperStatus down(2), ifName ge-1/0/0.16
System-generated fields:
• "__log_priority__" - Priority of syslog message
• In the examples, <30> denotes the priority
347
• “__log_timestamp__" - Timestamp in epcoh in the syslog message
• In the structured example, 2019-11-22T03:17:53.605-08:00 is converted to epoch with -08:00indicating the time zone
• In the unstructured example, the time zone from the configuration will be used to calculate epoch
• "__log_host__" - Host name in the syslog message
• In the examples, R1 denotes the host name
• "__log_application_name__” - Application name in the syslog message
• In the examples, mib2d is the application name
• "__log_application_process_id__” - Application process ID in the syslog message
• In the examples, 28633 is the ID
• "__log_message_payload__" - Payload in the message
• Structured example - “SNMP_TRAP_LINK_DOWN [[email protected] snmp-interface-index="545" admin-status="up(1)" operational-status="down(2)" interface-name="ge-1/0/0.16"] ifIndex 545, ifAdminStatus up(1),ifOperStatus down(2), ifName ge-1/0/0.16”
• Unstructured example - “SNMP_TRAP_LINK_DOWN: ifIndex 545, ifAdminStatus up(1), ifOperStatus down(2),ifName ge-1/0/0.16”
• "Event-id" - Denotes the event ID configured in the pattern
• In the examples, SNMP_TRAP_LINK_DOWN is the event ID
NOTE: Be sure not to define any new fields using a name already defined above.
To know how to configure Syslog ingest, see "Configure System Log Ingest" on page 407.
iAgent (CLI/NETCONF)
IN THIS SECTION
Define PyEZ Table/View | 350
Gather Output from Device | 351
Generate JSON for Use in Paragon Insights Database | 352
348
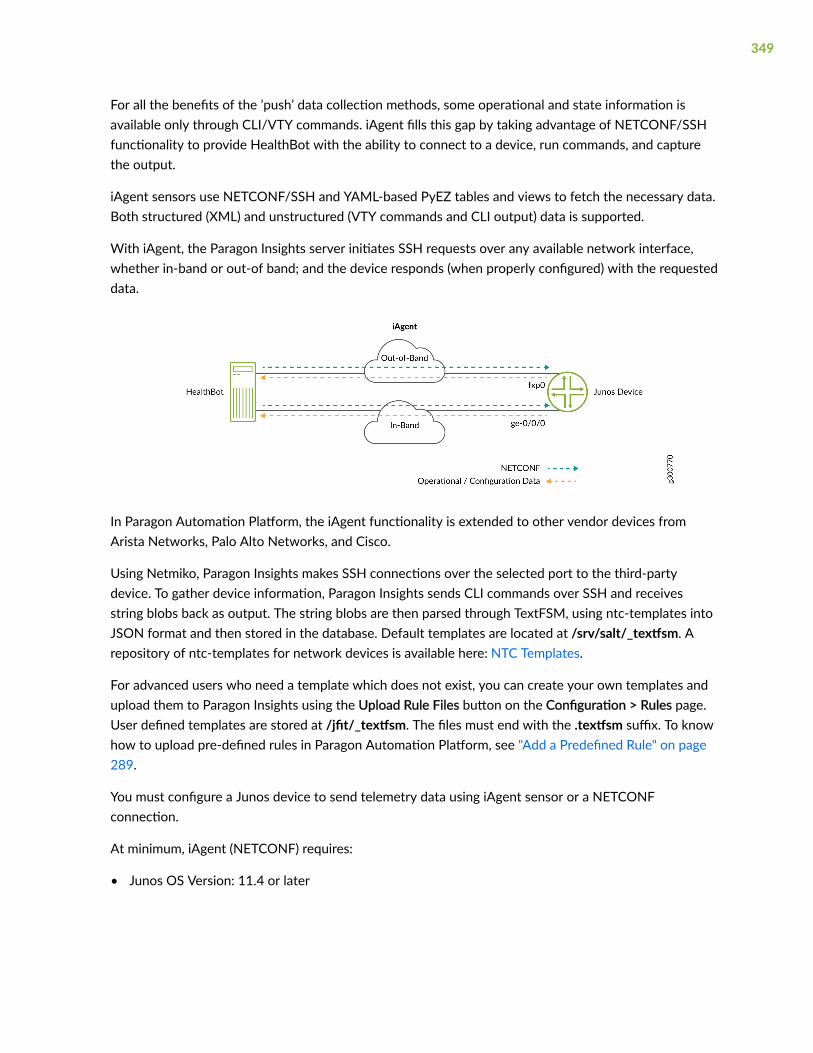
For all the benefits of the ’push’ data collection methods, some operational and state information isavailable only through CLI/VTY commands. iAgent fills this gap by taking advantage of NETCONF/SSHfunctionality to provide HealthBot with the ability to connect to a device, run commands, and capturethe output.
iAgent sensors use NETCONF/SSH and YAML-based PyEZ tables and views to fetch the necessary data.Both structured (XML) and unstructured (VTY commands and CLI output) data is supported.
With iAgent, the Paragon Insights server initiates SSH requests over any available network interface,whether in-band or out-of band; and the device responds (when properly configured) with the requesteddata.
In Paragon Automation Platform, the iAgent functionality is extended to other vendor devices fromArista Networks, Palo Alto Networks, and Cisco.
Using Netmiko, Paragon Insights makes SSH connections over the selected port to the third-partydevice. To gather device information, Paragon Insights sends CLI commands over SSH and receivesstring blobs back as output. The string blobs are then parsed through TextFSM, using ntc-templates intoJSON format and then stored in the database. Default templates are located at /srv/salt/_textfsm. Arepository of ntc-templates for network devices is available here: NTC Templates.
For advanced users who need a template which does not exist, you can create your own templates andupload them to Paragon Insights using the Upload Rule Files button on the Configuration > Rules page.User defined templates are stored at /jfit/_textfsm. The files must end with the .textfsm suffix. To knowhow to upload pre-defined rules in Paragon Automation Platform, see "Add a Predefined Rule" on page289.
You must configure a Junos device to send telemetry data using iAgent sensor or a NETCONFconnection.
At minimum, iAgent (NETCONF) requires:
• Junos OS Version: 11.4 or later
349
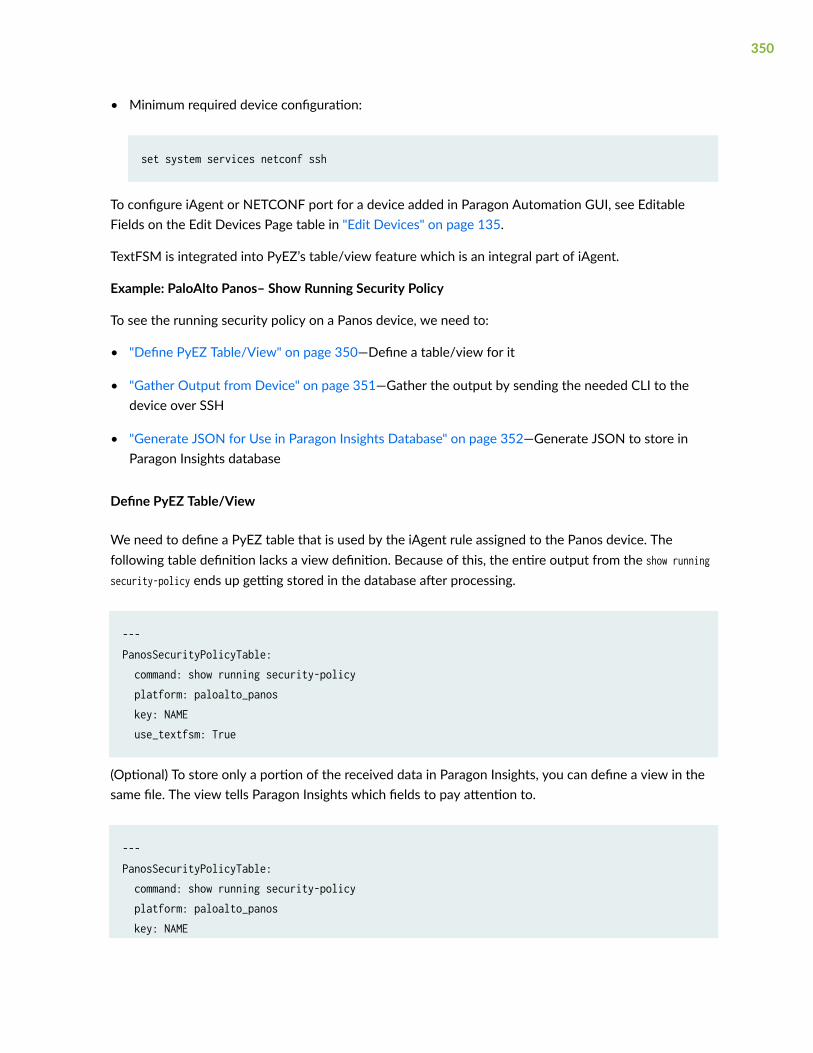
• Minimum required device configuration:
set system services netconf ssh
To configure iAgent or NETCONF port for a device added in Paragon Automation GUI, see EditableFields on the Edit Devices Page table in "Edit Devices" on page 135.
TextFSM is integrated into PyEZ’s table/view feature which is an integral part of iAgent.
Example: PaloAlto Panos– Show Running Security Policy
To see the running security policy on a Panos device, we need to:
• "Define PyEZ Table/View" on page 350—Define a table/view for it
• "Gather Output from Device" on page 351—Gather the output by sending the needed CLI to thedevice over SSH
• "Generate JSON for Use in Paragon Insights Database" on page 352—Generate JSON to store inParagon Insights database
Define PyEZ Table/View
We need to define a PyEZ table that is used by the iAgent rule assigned to the Panos device. Thefollowing table definition lacks a view definition. Because of this, the entire output from the show runningsecurity-policy ends up getting stored in the database after processing.
---PanosSecurityPolicyTable: command: show running security-policy platform: paloalto_panos key: NAME use_textfsm: True
(Optional) To store only a portion of the received data in Paragon Insights, you can define a view in thesame file. The view tells Paragon Insights which fields to pay attention to.
---PanosSecurityPolicyTable: command: show running security-policy platform: paloalto_panos key: NAME
350

use_textfsm: True view: TrafficAndActionView
TrafficAndActionView: fields: source: SOURCE destination: DESTINATION application_service: APPLICATION_SERVICE action: ACTION
Gather Output from Device
Using an iAgent rule that references the PyEZ table (or table/view) defined above, Paragon Insightssends the command show running security-policy to the device which produces the following output:
"intrazone-default; index: 1" { from any; source any; source-region none; to any; destination any; destination-region none; category any; application/service 0:any/any/any/any; action allow; icmp-unreachable: no terminal yes; type intrazone;}
"interzone-default; index: 2" { from any; source any; source-region none; to any; destination any; destination-region none; category any; application/service 0:any/any/any/any; action deny;
351
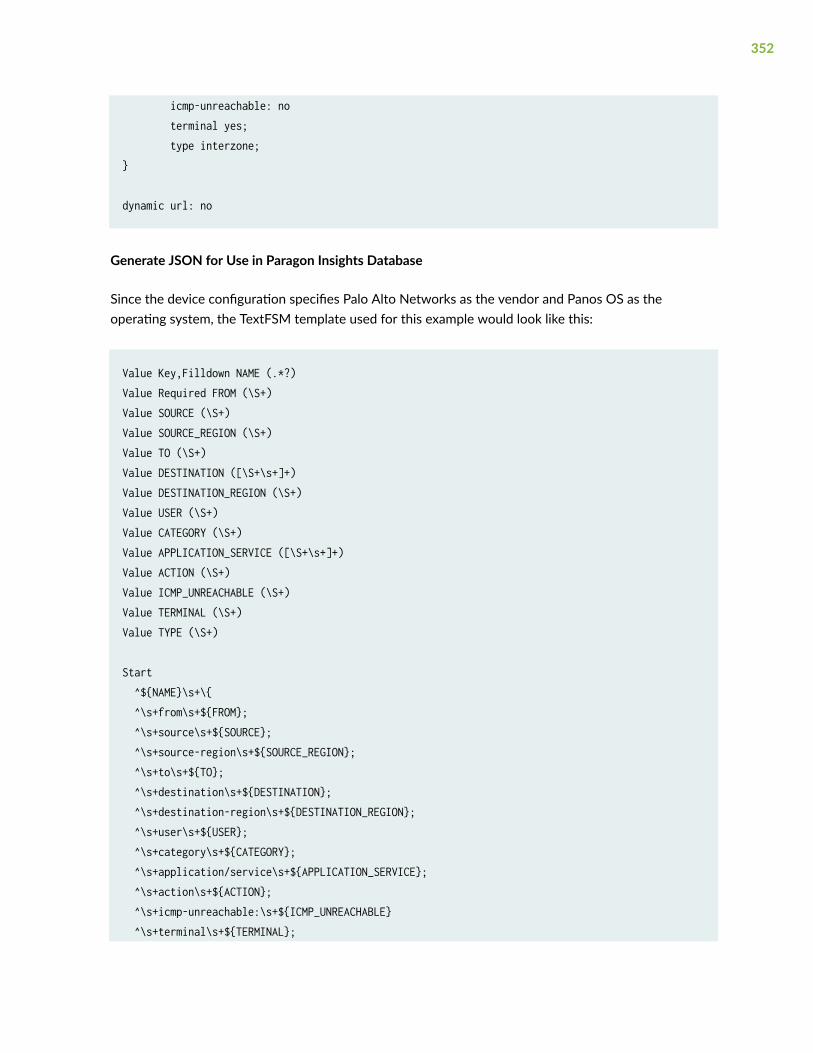
icmp-unreachable: no terminal yes; type interzone;}
dynamic url: no
Generate JSON for Use in Paragon Insights Database
Since the device configuration specifies Palo Alto Networks as the vendor and Panos OS as theoperating system, the TextFSM template used for this example would look like this:
Value Key,Filldown NAME (.*?)Value Required FROM (\S+)Value SOURCE (\S+)Value SOURCE_REGION (\S+)Value TO (\S+)Value DESTINATION ([\S+\s+]+)Value DESTINATION_REGION (\S+)Value USER (\S+)Value CATEGORY (\S+)Value APPLICATION_SERVICE ([\S+\s+]+)Value ACTION (\S+)Value ICMP_UNREACHABLE (\S+)Value TERMINAL (\S+)Value TYPE (\S+)
Start ^${NAME}\s+\{ ^\s+from\s+${FROM}; ^\s+source\s+${SOURCE}; ^\s+source-region\s+${SOURCE_REGION}; ^\s+to\s+${TO}; ^\s+destination\s+${DESTINATION}; ^\s+destination-region\s+${DESTINATION_REGION}; ^\s+user\s+${USER}; ^\s+category\s+${CATEGORY}; ^\s+application/service\s+${APPLICATION_SERVICE}; ^\s+action\s+${ACTION}; ^\s+icmp-unreachable:\s+${ICMP_UNREACHABLE} ^\s+terminal\s+${TERMINAL};
352

^\s+type\s+${TYPE}; ^} -> Record
When the template above is used by Paragon Insights to parse the output shown previously, theresulting JSON looks like:
{'"interzone-default; index: 2"': {'ACTION': 'deny', 'APPLICATION_SERVICE': '0:any/any/any/any', 'CATEGORY': 'any', 'DESTINATION': 'any', 'DESTINATION_REGION': 'none', 'FROM': 'any', 'ICMP_UNREACHABLE': 'no', 'SOURCE': 'any', 'SOURCE_REGION': 'none', 'TERMINAL': 'yes', 'TO': 'any', 'TYPE': 'interzone', 'USER': ''}, '"intrazone-default; index: 1"': {'ACTION': 'allow', 'APPLICATION_SERVICE': '0:any/any/any/any', 'CATEGORY': 'any', 'DESTINATION': 'any', 'DESTINATION_REGION': 'none', 'FROM': 'any', 'ICMP_UNREACHABLE': 'no', 'SOURCE': 'any', 'SOURCE_REGION': 'none', 'TERMINAL': 'yes', 'TO': 'any', 'TYPE': 'intrazone', 'USER': ''}}
SNMP
SNMP is a widely known and accepted network management protocol that many network devicemanufacturers, including Juniper Networks, provide for use with their devices. It is a polling typeprotocol where network devices that are properly configured make configuration, diagnostic, and eventinformation available to collectors, which must also be properly configured and authenticated. Thecollectors poll devices by sending specifically structured requests, called get requests, to retrieve data.
353
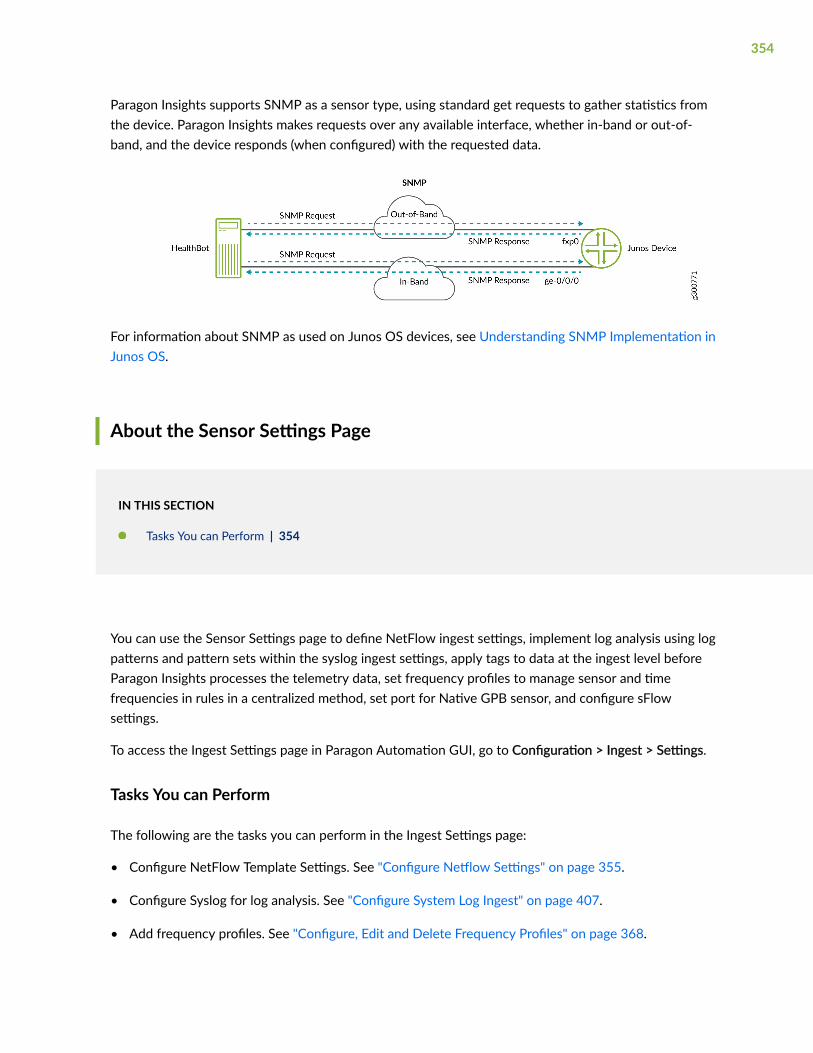
Paragon Insights supports SNMP as a sensor type, using standard get requests to gather statistics fromthe device. Paragon Insights makes requests over any available interface, whether in-band or out-of-band, and the device responds (when configured) with the requested data.
For information about SNMP as used on Junos OS devices, see Understanding SNMP Implementation inJunos OS.
About the Sensor Settings Page
IN THIS SECTION
Tasks You can Perform | 354
You can use the Sensor Settings page to define NetFlow ingest settings, implement log analysis using logpatterns and pattern sets within the syslog ingest settings, apply tags to data at the ingest level beforeParagon Insights processes the telemetry data, set frequency profiles to manage sensor and timefrequencies in rules in a centralized method, set port for Native GPB sensor, and configure sFlowsettings.
To access the Ingest Settings page in Paragon Automation GUI, go to Configuration > Ingest > Settings.
Tasks You can Perform
The following are the tasks you can perform in the Ingest Settings page:
• Configure NetFlow Template Settings. See "Configure Netflow Settings" on page 355.
• Configure Syslog for log analysis. See "Configure System Log Ingest" on page 407.
• Add frequency profiles. See "Configure, Edit and Delete Frequency Profiles" on page 368.
354
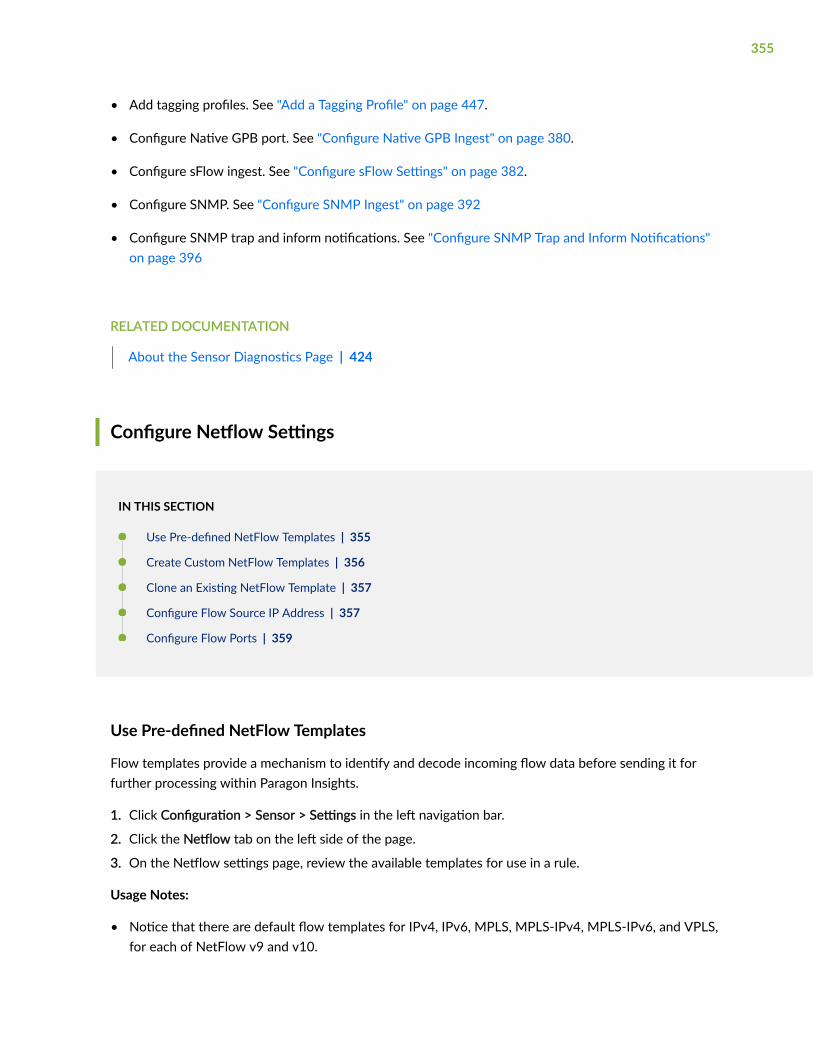
• Add tagging profiles. See "Add a Tagging Profile" on page 447.
• Configure Native GPB port. See "Configure Native GPB Ingest" on page 380.
• Configure sFlow ingest. See "Configure sFlow Settings" on page 382.
• Configure SNMP. See "Configure SNMP Ingest" on page 392
• Configure SNMP trap and inform notifications. See "Configure SNMP Trap and Inform Notifications"on page 396
RELATED DOCUMENTATION
About the Sensor Diagnostics Page | 424
Configure Netflow Settings
IN THIS SECTION
Use Pre-defined NetFlow Templates | 355
Create Custom NetFlow Templates | 356
Clone an Existing NetFlow Template | 357
Configure Flow Source IP Address | 357
Configure Flow Ports | 359
Use Pre-defined NetFlow Templates
Flow templates provide a mechanism to identify and decode incoming flow data before sending it forfurther processing within Paragon Insights.
1. Click Configuration > Sensor > Settings in the left navigation bar.
2. Click the Netflow tab on the left side of the page.
3. On the Netflow settings page, review the available templates for use in a rule.
Usage Notes:
• Notice that there are default flow templates for IPv4, IPv6, MPLS, MPLS-IPv4, MPLS-IPv6, and VPLS,for each of NetFlow v9 and v10.
355
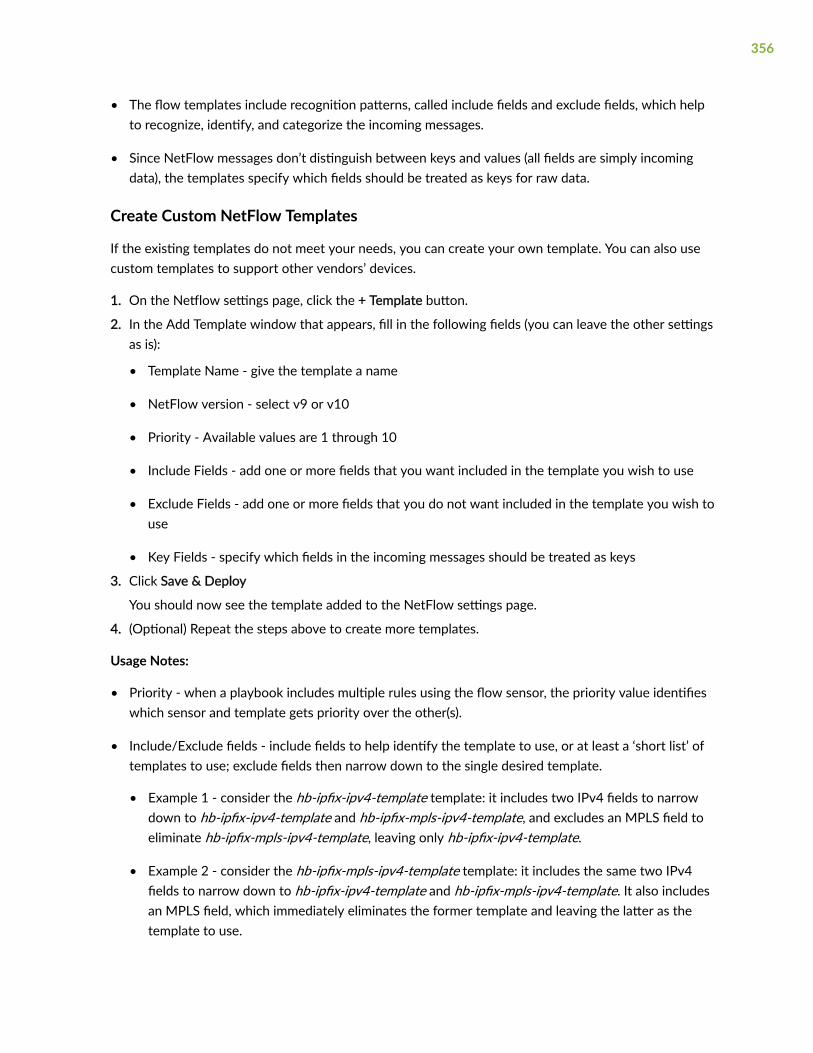
• The flow templates include recognition patterns, called include fields and exclude fields, which helpto recognize, identify, and categorize the incoming messages.
• Since NetFlow messages don’t distinguish between keys and values (all fields are simply incomingdata), the templates specify which fields should be treated as keys for raw data.
Create Custom NetFlow Templates
If the existing templates do not meet your needs, you can create your own template. You can also usecustom templates to support other vendors’ devices.
1. On the Netflow settings page, click the + Template button.
2. In the Add Template window that appears, fill in the following fields (you can leave the other settingsas is):
• Template Name - give the template a name
• NetFlow version - select v9 or v10
• Priority - Available values are 1 through 10
• Include Fields - add one or more fields that you want included in the template you wish to use
• Exclude Fields - add one or more fields that you do not want included in the template you wish touse
• Key Fields - specify which fields in the incoming messages should be treated as keys
3. Click Save & Deploy
You should now see the template added to the NetFlow settings page.
4. (Optional) Repeat the steps above to create more templates.
Usage Notes:
• Priority - when a playbook includes multiple rules using the flow sensor, the priority value identifieswhich sensor and template gets priority over the other(s).
• Include/Exclude fields - include fields to help identify the template to use, or at least a ‘short list’ oftemplates to use; exclude fields then narrow down to the single desired template.
• Example 1 - consider the hb-ipfix-ipv4-template template: it includes two IPv4 fields to narrowdown to hb-ipfix-ipv4-template and hb-ipfix-mpls-ipv4-template, and excludes an MPLS field toeliminate hb-ipfix-mpls-ipv4-template, leaving only hb-ipfix-ipv4-template.
• Example 2 - consider the hb-ipfix-mpls-ipv4-template template: it includes the same two IPv4fields to narrow down to hb-ipfix-ipv4-template and hb-ipfix-mpls-ipv4-template. It also includesan MPLS field, which immediately eliminates the former template and leaving the latter as thetemplate to use.
356

Clone an Existing NetFlow Template
To clone an existing NetFlow template:
1. Click Configuration > Sensor > Settings from the left navigation pane.
The Ingest Settings page is displayed.
2. Click the NetFlow tab to view the Flow Settings page.
3. To clone a particular template, click Clone icon as shown in Figure 19 on page 357.
Figure 19: Clone a NetFlow Template
The Clone Template: <name of template> page is displayed.
From the Clone Template: <name of template> page, you can
• Edit the Template Name, Description, and Priority sections.
• Choose between Netflow v9 or Netflow v10 versions.
• Add or exclude fields from the Include Fields, Exclude Fields, and Key Field drop-down lists.
4. After you have made the necessary edits, click Save to save the modifications and to clone thetemplate.
Alternatively, click Save & Deploy to save modifications, clone the template, and deploy thetemplate.
Configure Flow Source IP Address
The raw flow data that Paragon Insights receives is in binary format and unreadable. In order to makethis data usable, Paragon Insights processes the incoming flow data as follows:
357
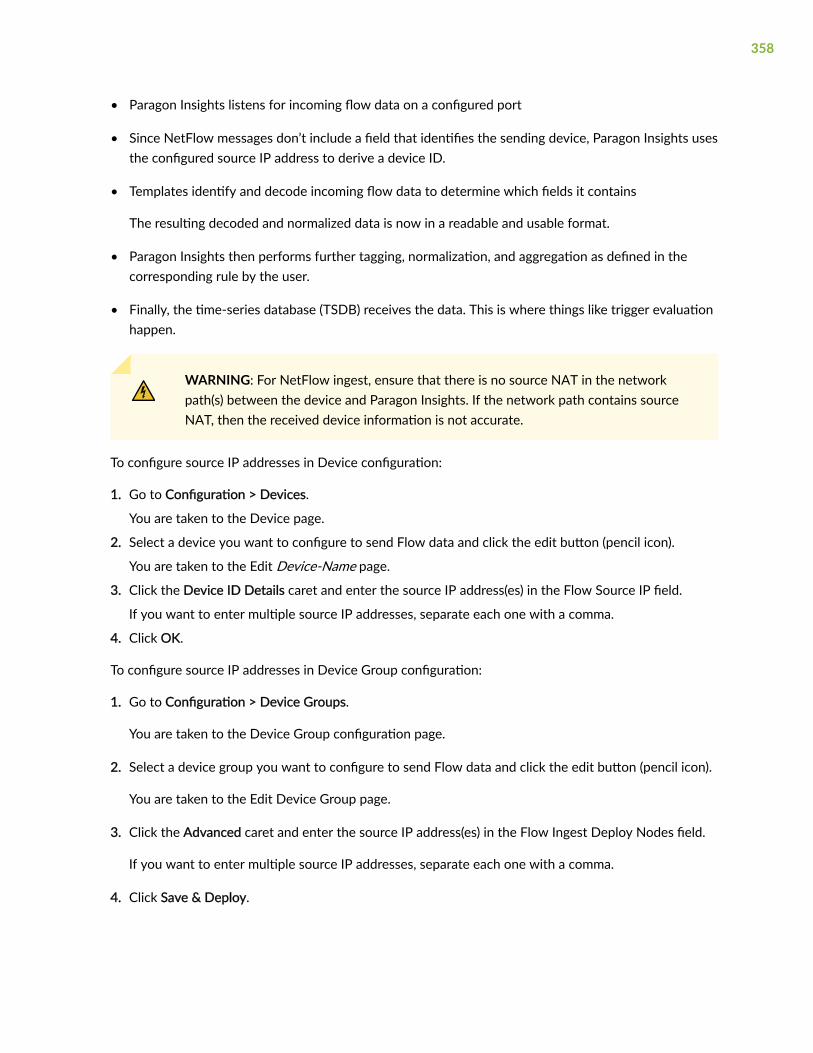
• Paragon Insights listens for incoming flow data on a configured port
• Since NetFlow messages don’t include a field that identifies the sending device, Paragon Insights usesthe configured source IP address to derive a device ID.
• Templates identify and decode incoming flow data to determine which fields it contains
The resulting decoded and normalized data is now in a readable and usable format.
• Paragon Insights then performs further tagging, normalization, and aggregation as defined in thecorresponding rule by the user.
• Finally, the time-series database (TSDB) receives the data. This is where things like trigger evaluationhappen.
WARNING: For NetFlow ingest, ensure that there is no source NAT in the networkpath(s) between the device and Paragon Insights. If the network path contains sourceNAT, then the received device information is not accurate.
To configure source IP addresses in Device configuration:
1. Go to Configuration > Devices.
You are taken to the Device page.
2. Select a device you want to configure to send Flow data and click the edit button (pencil icon).
You are taken to the Edit Device-Name page.
3. Click the Device ID Details caret and enter the source IP address(es) in the Flow Source IP field.
If you want to enter multiple source IP addresses, separate each one with a comma.
4. Click OK.
To configure source IP addresses in Device Group configuration:
1. Go to Configuration > Device Groups.
You are taken to the Device Group configuration page.
2. Select a device group you want to configure to send Flow data and click the edit button (pencil icon).
You are taken to the Edit Device Group page.
3. Click the Advanced caret and enter the source IP address(es) in the Flow Ingest Deploy Nodes field.
If you want to enter multiple source IP addresses, separate each one with a comma.
4. Click Save & Deploy.
358
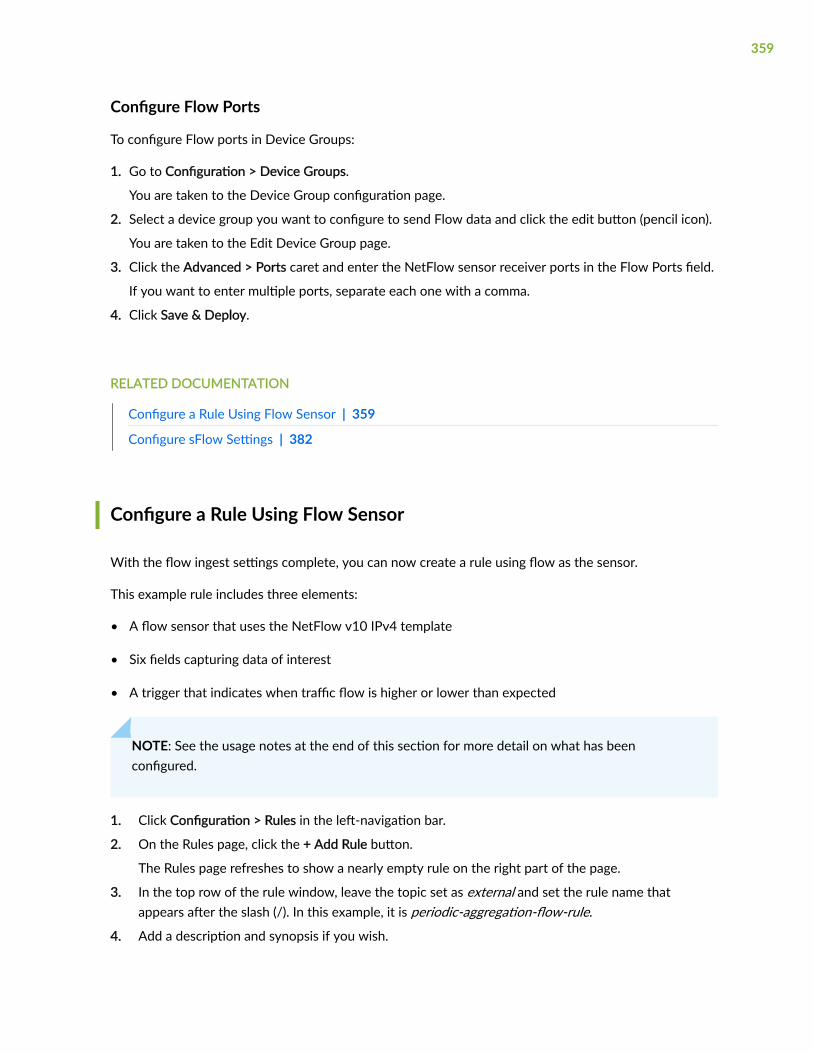
Configure Flow Ports
To configure Flow ports in Device Groups:
1. Go to Configuration > Device Groups.
You are taken to the Device Group configuration page.
2. Select a device group you want to configure to send Flow data and click the edit button (pencil icon).
You are taken to the Edit Device Group page.
3. Click the Advanced > Ports caret and enter the NetFlow sensor receiver ports in the Flow Ports field.
If you want to enter multiple ports, separate each one with a comma.
4. Click Save & Deploy.
RELATED DOCUMENTATION
Configure a Rule Using Flow Sensor | 359
Configure sFlow Settings | 382
Configure a Rule Using Flow Sensor
With the flow ingest settings complete, you can now create a rule using flow as the sensor.
This example rule includes three elements:
• A flow sensor that uses the NetFlow v10 IPv4 template
• Six fields capturing data of interest
• A trigger that indicates when traffic flow is higher or lower than expected
NOTE: See the usage notes at the end of this section for more detail on what has beenconfigured.
1. Click Configuration > Rules in the left-navigation bar.
2. On the Rules page, click the + Add Rule button.
The Rules page refreshes to show a nearly empty rule on the right part of the page.
3. In the top row of the rule window, leave the topic set as external and set the rule name thatappears after the slash (/). In this example, it is periodic-aggregation-flow-rule.
4. Add a description and synopsis if you wish.
359
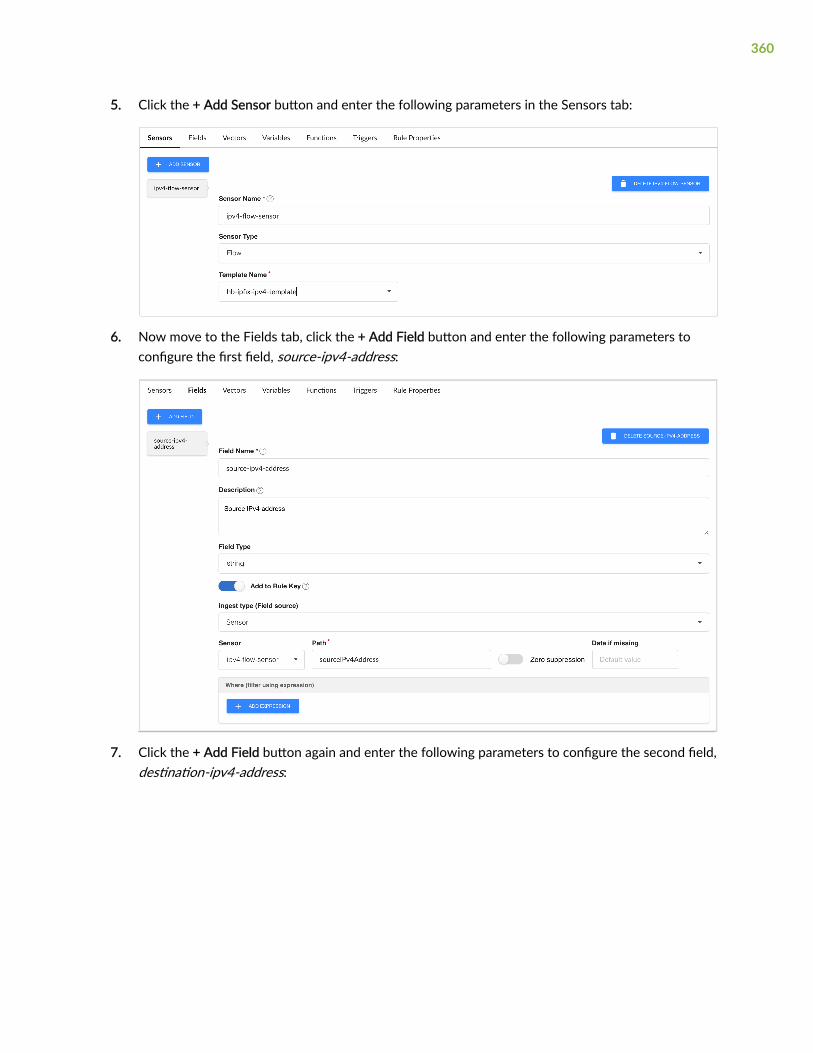
5. Click the + Add Sensor button and enter the following parameters in the Sensors tab:
6. Now move to the Fields tab, click the + Add Field button and enter the following parameters toconfigure the first field, source-ipv4-address:
7. Click the + Add Field button again and enter the following parameters to configure the second field,destination-ipv4-address:
360

8. Click the + Add Field button again and enter the following parameters to configure the third field,sensor-traffic-count:
9. Click the + Add Field button again and enter the following parameters to configure the fourth field,total-traffic-count:
361

10. Click the + Add Field button again and enter the following parameters to configure the fifth field,traffic-count-maximum:
11. Click the + Add Field button once more and enter the following parameters to configure the sixthfield, traffic-count-minimum:
362

12. As the last step for the fields configuration, set the field aggregation time-range value to 10s:
13. Now move to the Variables tab, click the + ADD VARIABLE button and create the traffic-count-maxand traffic-count-min variables that are the constants for the traffic-count-maximum and traffic-count-minimum fields, respectively.
NOTE: Only the definition for the traffic-count-max is shown graphically. Choose anappropriate Default Value when configuring both traffic-count-max and traffic-count-minvariables. The value shown above is for testing purposes only and may not be appropriatefor your network.
14. Now move to the Triggers tab, click the + Add trigger button and enter the following parameters toconfigure a trigger called traffic-measurement-trigger:
363
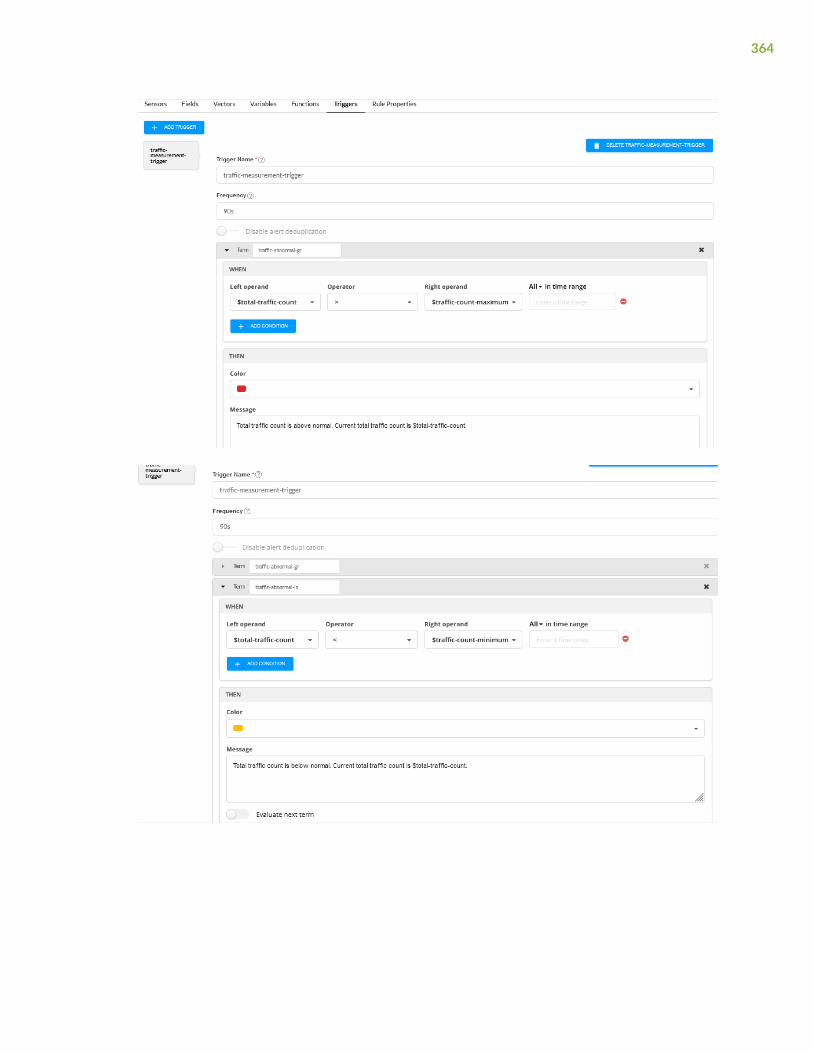
364

15. At the upper right of the window, click the Save & Deploy button.
Usage Notes:
• Sensor Tab:
• The sensor name ipv4-flow-sensor is user-defined
• The sensor type is flow
• The sensor uses the predefined template hb-ipfix-ipv4-template
• Variables Tab:
• The variables traffic-count-max and traffic-count-min are statically configured integers. In thiscase the values represent Bytes per second
• These values are referenced in fields traffic-count-maximum and traffic-count-minimum andprovide a reference point to compare against the total-traffic-count field
• Fields Tab:
• Six fields are defined; some fields are used in the trigger settings while one field is referencedwithin another field
• The field names are user-defined fields (UDF)
• Fields source-ipv4-address, destination-ipv4-address, and sensor-traffic-count are extractinginformation from the flow sensor input
365
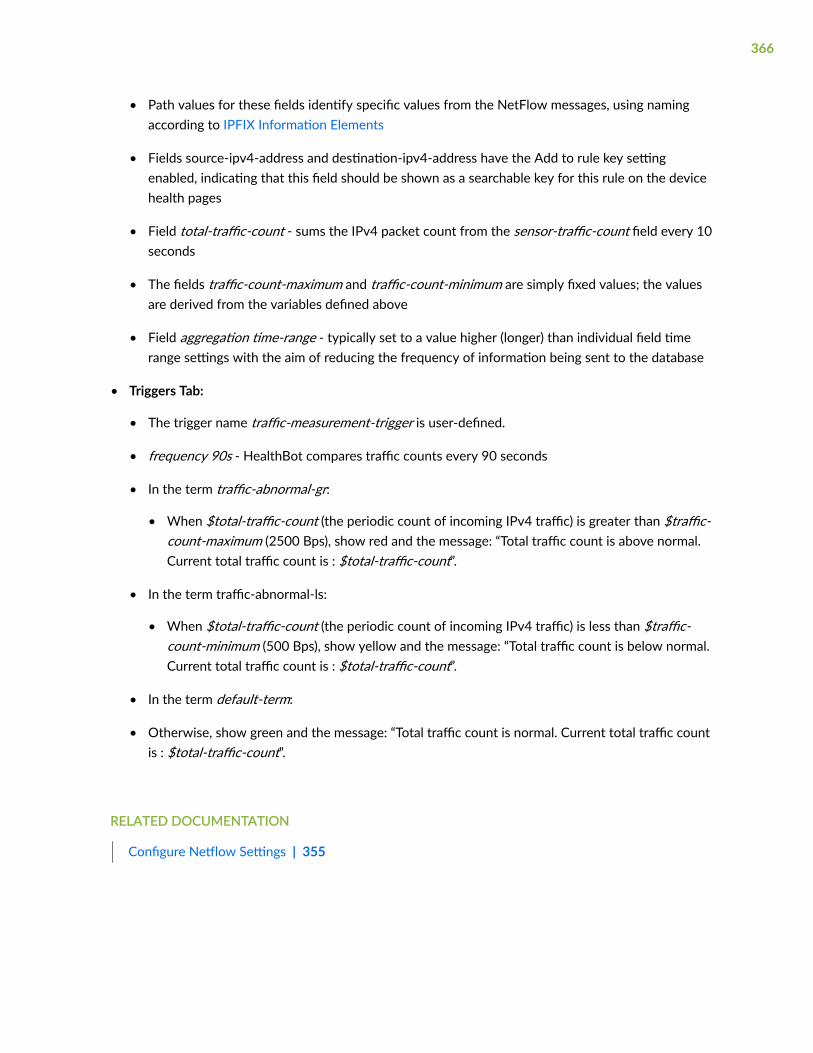
• Path values for these fields identify specific values from the NetFlow messages, using namingaccording to IPFIX Information Elements
• Fields source-ipv4-address and destination-ipv4-address have the Add to rule key settingenabled, indicating that this field should be shown as a searchable key for this rule on the devicehealth pages
• Field total-traffic-count - sums the IPv4 packet count from the sensor-traffic-count field every 10seconds
• The fields traffic-count-maximum and traffic-count-minimum are simply fixed values; the valuesare derived from the variables defined above
• Field aggregation time-range - typically set to a value higher (longer) than individual field timerange settings with the aim of reducing the frequency of information being sent to the database
• Triggers Tab:
• The trigger name traffic-measurement-trigger is user-defined.
• frequency 90s - HealthBot compares traffic counts every 90 seconds
• In the term traffic-abnormal-gr:
• When $total-traffic-count (the periodic count of incoming IPv4 traffic) is greater than $traffic-count-maximum (2500 Bps), show red and the message: “Total traffic count is above normal.Current total traffic count is : $total-traffic-count”.
• In the term traffic-abnormal-ls:
• When $total-traffic-count (the periodic count of incoming IPv4 traffic) is less than $traffic-count-minimum (500 Bps), show yellow and the message: “Total traffic count is below normal.Current total traffic count is : $total-traffic-count”.
• In the term default-term:
• Otherwise, show green and the message: “Total traffic count is normal. Current total traffic countis : $total-traffic-count”.
RELATED DOCUMENTATION
Configure Netflow Settings | 355
366
About Frequency Profiles
IN THIS SECTION
Tasks You Can Perform | 368
Frequency profiles are a central location in which sensor and rule time frequencies can be managed. Tounderstand frequency profiles, consider the following.
When defining rules in Paragon Insights you can:
• Define multiple rules that use the same sensor
• Define different sensor frequencies for each of the rules
• Apply all of these rules to the same device group/devices
This creates complexity in rule application and frequency adjustments within the individual rules:
• A key, consisting of sensor-path for OpenConfig and Native GPB sensors, or the tuple of file andtable for iAgent sensors is used to identify the specific rules.
• Paragon Insights takes the minimum defined frequency for that sensor from the applied rules anduses it to subscribe to, or fetch, data from the devices.
• This make it hard to identify what the data rate should be for that sensor. To do that, you would haveto go through the all the applied rules.
• A change in the sensor frequency of an applied rule might not take effect as intended.
To address these complexities, Paragon Insights needed a common place from which to control thesefrequencies. Frequency profiles can be created that allow you to manage sensor and rule frequenciesfrom a single location and then apply the profiles in various locations in Paragon Insights. Application ofthese profiles allows for persistent and repeatable behavior in regard to frequencies for rules, sensors,triggers, formulas, references, learning periods, and hold times.
A sensor profile consists of a profile name and two optional sections: the sensors section and the non-sensors section. In each section, an entry consists of a sensor or rule name and a frequency. Frequencyprofiles are applied to device groups or network groups.
367

Tasks You Can Perform
To access the page from where you can create frequency profiles, go to Configuration > Sensor >Settings. You can perform the following tasks:
• Configure frequency profile. For more information, see "Configure, Edit and Delete FrequencyProfiles" on page 368.
• Apply a frequency profile. For more information, see "Apply a Frequency Profile" on page 370.
RELATED DOCUMENTATION
Configure Offset Time | 371
Configure, Edit and Delete Frequency Profiles
Frequency profiles are configured and managed in the Paragon Insights GUI. In the GUI, they aremanaged by navigating to the Configuration > Sensor > Settings page and selecting the FrequencyProfile tab from the left side of the page.
NOTE: While the sections of the frequency profile are both optional, at least one section mustbe filled out per frequency profile if you want the applied profile to be able to do anything.
To configure a frequency profile:
1. Click the + FREQUENCY PROFILE button
The Add Frequency Profile window appears.
2. Give the profile a name such as Profile1
If you configured rules with sensors, follow steps 3 through 5. If you configured rules withoutsensors, follow steps 6 through 8.
3. Click the + ADD SENSORS button.
4. In the Sensor Name field, enter the sensor name as per the following guidelines:
• OpenConfig Sensors: Enter the OpenConfig path for the desired sensor, such as /components or /interfaces.
• iAgent Sensors: Enter the table name used in the sensor definition, such as ChassisAlarmTable orREutilizationTable
368
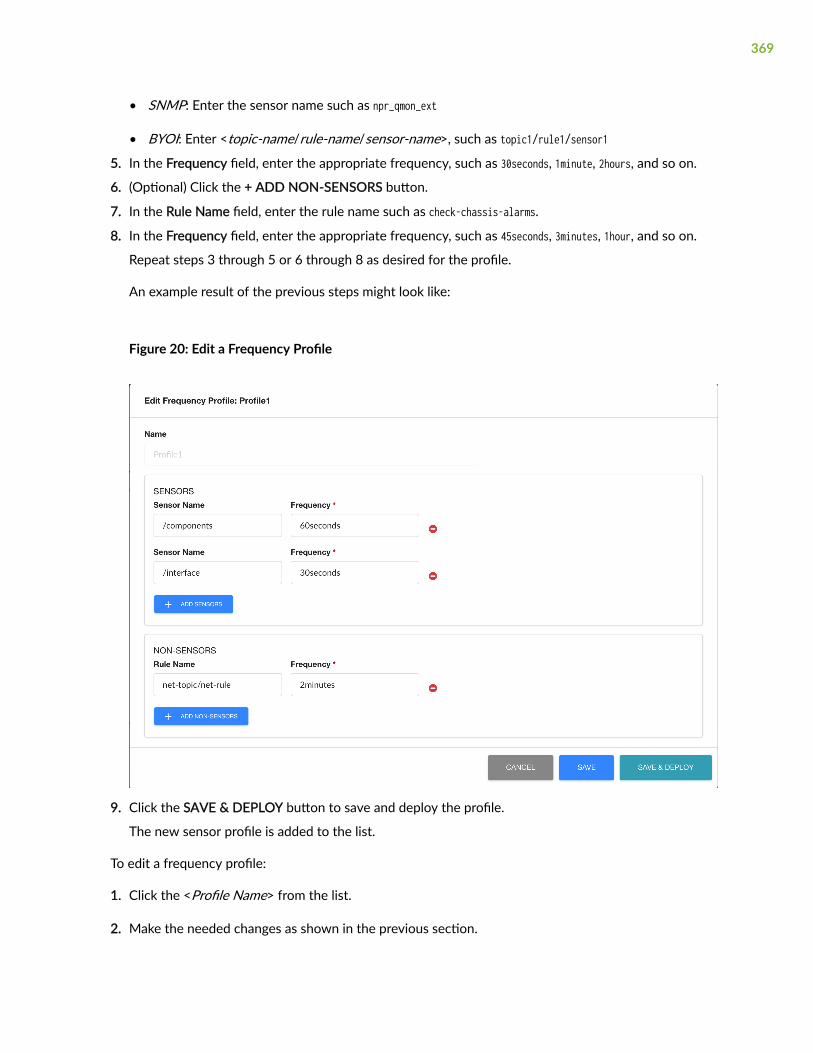
• SNMP: Enter the sensor name such as npr_qmon_ext
• BYOI: Enter <topic-name/rule-name/sensor-name>, such as topic1/rule1/sensor1
5. In the Frequency field, enter the appropriate frequency, such as 30seconds, 1minute, 2hours, and so on.
6. (Optional) Click the + ADD NON-SENSORS button.
7. In the Rule Name field, enter the rule name such as check-chassis-alarms.
8. In the Frequency field, enter the appropriate frequency, such as 45seconds, 3minutes, 1hour, and so on.
Repeat steps 3 through 5 or 6 through 8 as desired for the profile.
An example result of the previous steps might look like:
Figure 20: Edit a Frequency Profile
9. Click the SAVE & DEPLOY button to save and deploy the profile.
The new sensor profile is added to the list.
To edit a frequency profile:
1. Click the <Profile Name> from the list.
2. Make the needed changes as shown in the previous section.
369

3. Click the SAVE button to save the profile for later deployment or the SAVE & DEPLOY button tosave and deploy immediately.
To delete an existing frequency profile:
1. Click the trash can icon to the right of the profile name.
2. Click the DELETE button to delete the profile but not deploy the change or the DELETE & DEPLOYbutton to delete and deploy immediately.
Usage Notes:
• Profile Entries–Multiple entries can be configured in each section as shown in Figure 20 on page 369.
• Override–Sensor or rule frequency defined within an applied frequency profile overrides thosedefined within the individual rule or sensor.
• Order of Precedence–If a sensor or rule is defined in multiple frequency profiles, each with differentfrequency settings, the minimum frequency value for the sensor or rule is used.
RELATED DOCUMENTATION
About Frequency Profiles | 367
Apply a Frequency Profile | 370
Apply a Frequency Profile
Frequency profiles are applied to Paragon Insights device groups or network groups. When you create oredit a device or network group, you apply frequency profiles by selecting them in the Advanced sectionof the Edit Device Group page. The following steps describe how you can apply frequency profiles on anexisting device group. You can also follow the same steps while creating a device group.
To apply a frequency profile on a device group:
1. Go to Configuration > Device Groups.
In the Device Group Configuration page, select a device group.
2. Click on the pencil icon to edit the selected device group.
3. Click on Advanced and select a frequency profile from the drop-down menu in the Ingest FrequencyProfiles field.
4. Click Save to only save the changes and Save and Deploy to deploy the frequency profile for therules applied on the device group.
370
BEST PRACTICE: It is strongly recommended that you only apply frequency profiles to rules thatmake use of the Offset Time Unit feature.
The following steps describe how you can apply frequency profiles on an existing network group. Youcan also follow the same steps while creating a network group.
To apply a frequency profile on a network group:
1. Go to Configuration > Network Group.
In the Network Configuration page, select a network group.
2. Click on the pencil icon to edit the selected device group.
The Edit Network page appears.
3. Select a frequency profile from the drop-down menu in the Ingest Frequency Profiles field.
4. Click Save to only save the changes and Save and Deploy to deploy the frequency profile for therules applied on the device group.
RELATED DOCUMENTATION
Configure Offset Time | 371
Configure a Custom Rule in Paragon Insights GUI | 292
Configure Offset Time
IN THIS SECTION
Offset Used in Formulae | 372
Offset Used in Reference | 373
Offset Used in Vectors | 374
Offset Used in Trigger Term | 376
Offset Used in Frequency Profile Applied to a Rule | 377
371

The Paragon Insights offset time unit is used in conjunction with the "About Frequency Profiles" on page367to automatically manage time range calculations in various places within Paragon Insights rules. Tounderstand the Paragon Insights offset function, consider the following scenario:
In Paragon Insights, you can define a rule which
• Uses a sensor to gather data with a frequency of 10 seconds
• Has a field that calculates the mean every 60 seconds
If you later decide to increase the frequency of the sensor to 60 seconds, then calculating the meanevery 60 seconds would not make any sense. The result is that you would have to manually update thefield calculation any time up want to change the sensor frequency.
You can set the time range for the mean calculation to a value of 6o, or 6offset, rather than 60s, or 60seconds. Using an offset time value rather than a static time value tells Paragon Insights to automaticallymultiply the sensor frequency by the numeric value of the offset. Thus, any change to sensor frequencywill automatically be included in the time range calculation for a formula.
An offset time unit can be used in place of standard time units in the following time range locations:
• Formulae
• References
• Vectors
• Trigger Frequency
• Trigger Term
Offset Used in Formulae
In this example, we are creating a rule, Rule1, with a sensor, Sensor1. The sensor frequency is set to 10seconds.
372

In Figure 21 on page 373 below, you can see the Fields block definition for Rule1 with the Sensors blockdefinition framed in green. The formula, formula1, has a Time range value of 2o
Figure 21: Offset in a Formula
Usage Notes for Offset Used in Formulas
• An offset value applied to the time range of a formula multiplies the rule, sensor, or trigger frequencyof that rule.
• The result of this example is that the time range for the Max formula is now 2 times the Sensor1frequency of 10 seconds, or 20 seconds (2 * 10s = 20s).
• If a frequency profile of 30 seconds is applied to the rule used in the example, then the resultingtime-range would be 60 seconds (2 * 30s = 60s).
• Offset time can be applied to the following formulas: latest, count, min, max, sum, mean, on-change,and stdev.
Offset Used in Reference
In this example, there are two rules in play, but only one is shown. The unseen rule, Rule1, is in the topicrouting-engines and is named routing-engines (routing-engines/routing-engines). Rule1 has a frequencyof 20 seconds. Rule1 is referenced .
373

Rule2, shown in Figure 22 on page 374, is a network rule which has a reference field named ref1. Thefield, ref1, references back to Rule1 through the Reference XPath Expression with a Time Range settingof 3offset.
Figure 22: Offset Time Used in Reference Field
Usage Notes for Offset Used in References
• Offset values used in references multiply the frequency of the referenced rule by the offset value. Inthis case, the 20 second frequency of Rule1 is multiplied by 3, resulting in a 60 second time-range (3* 20s = 60s).
• If a frequency profile of 60 seconds (60s) was applied to Rule1, the time range for the referencewould increase to 180 seconds (3 * 60s = 180s).
Offset Used in Vectors
In this example, there are 3 rules at play. Rules Rule1 and Rule2 are not shown but are referenced by thevector.
Rule1 is in topic line-cards and is named line-cards (line-cards/line-cards) and has a frequency of 20seconds (20s).
374

Rule2 is in topic routing-engines and is named routing-engines (routing-engines/routing-engines) andhas a frequency of 30 seconds (30s).
In Rule3 below, we have defined a vector, vector1 that consists of 2 path references and 1 field. Thevector has a Time Range defined as 3offset. Figure 23 on page 375 shows the vector block definition inthe Paragon Insights GUI.
Figure 23: Offset Time Used in Vector Block
Usage Notes for Offset Used in Vectors
• An offset value defined in the time range of a vector multiplies the sensor or rule frequency of thereferenced rule or sensor. If a field from the same rule is used as the reference, then the frequency ofthe rule containing the vector is used.
• When multiple references or fields are defined for a vector and offset time is used, the offset value isapplied to each path independently. So, for this example in which our offset value is 3 (3offset):
• The path reference to Rule1: “/device-group[device-group-name='Core4']/device[device-id='R1']/topic[topic-name='line-cards']/rule[rule-name='line-cards']/memory” which has afrequency of 20 seconds, would result in a time range of 60 seconds for the vector (3 * 20s =60s).
• The path reference to Rule2: “/device-group[device-group-name='Core4']/device[device-id='R1']/topic[topic-name='routing-engines']/rule[rule-name='routing-engines']/field[slot='0']/ref1” which has a frequency of 30 seconds, would result in a time range of 90 seconds for thevector (3 * 30s = 90s).
375

NOTE: There are no spaces or line breaks in the path references. They are added to thisdocument only to enhance readability.
• The field reference to formula1: Since formula1 is a normal field used within the vector block, the rulefrequency of the current rule is used as a basis. So, the time range for formula1 is 30 seconds (3 *10s = 30s).
• If a frequency profile of 60 seconds is applied to Rule1 (line-cards/line-cards), then the time range forthat path in the vector would be 180 seconds (3 * 60s = 180s).
• If a frequency profile of 120 seconds is applied to Rule2 (routing-engines/routing-engines), then thetime range for that path in the vector would be 360 seconds (3 * 120s = 360s).
• The time range for the field reference, formula1, would remain the same as before at 30 secondsunless a change is made to Rule3 or a frequency profile with a different time is applied to Rule3.
Offset Used in Trigger Term
In this example, we have one rule, Rule1. Figure 24 on page 377 below shows the trigger blockdefinition with the sensor block definition overlaid with a green border.
The rule, Rule1, has a sensor frequency of 10 seconds (10s) applied.
The trigger itself, Trigger1, has an offset frequency of 2 (2o) applied.
376
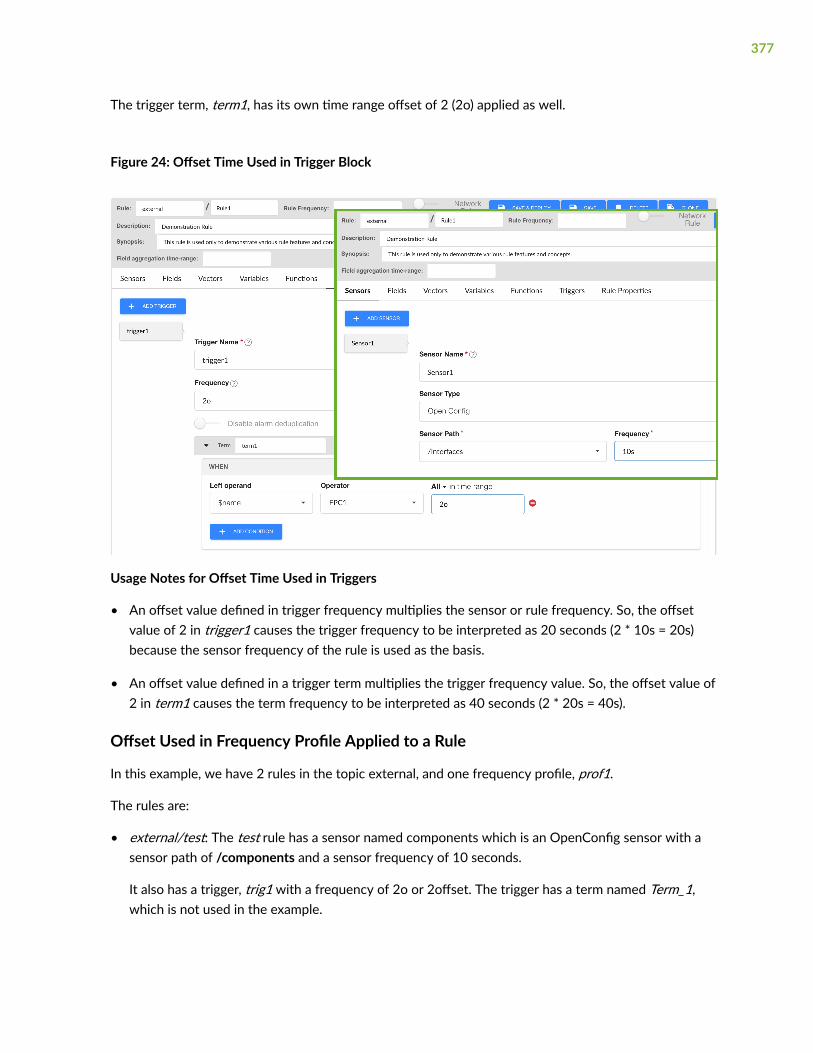
The trigger term, term1, has its own time range offset of 2 (2o) applied as well.
Figure 24: Offset Time Used in Trigger Block
Usage Notes for Offset Time Used in Triggers
• An offset value defined in trigger frequency multiplies the sensor or rule frequency. So, the offsetvalue of 2 in trigger1 causes the trigger frequency to be interpreted as 20 seconds (2 * 10s = 20s)because the sensor frequency of the rule is used as the basis.
• An offset value defined in a trigger term multiplies the trigger frequency value. So, the offset value of2 in term1 causes the term frequency to be interpreted as 40 seconds (2 * 20s = 40s).
Offset Used in Frequency Profile Applied to a Rule
In this example, we have 2 rules in the topic external, and one frequency profile, prof1.
The rules are:
• external/test: The test rule has a sensor named components which is an OpenConfig sensor with asensor path of /components and a sensor frequency of 10 seconds.
It also has a trigger, trig1 with a frequency of 2o or 2offset. The trigger has a term named Term_1,which is not used in the example.
377

• external/ref: The ref rule is a non-sensor rule, which means that the rule uses a reference field,trigger_reference, to reference the sensor defined in another rule; in this case external/test.
378

And the frequency profile is:
• prof1: The prof1 profile sets the frequency for the /components sensor at 30 seconds.
379
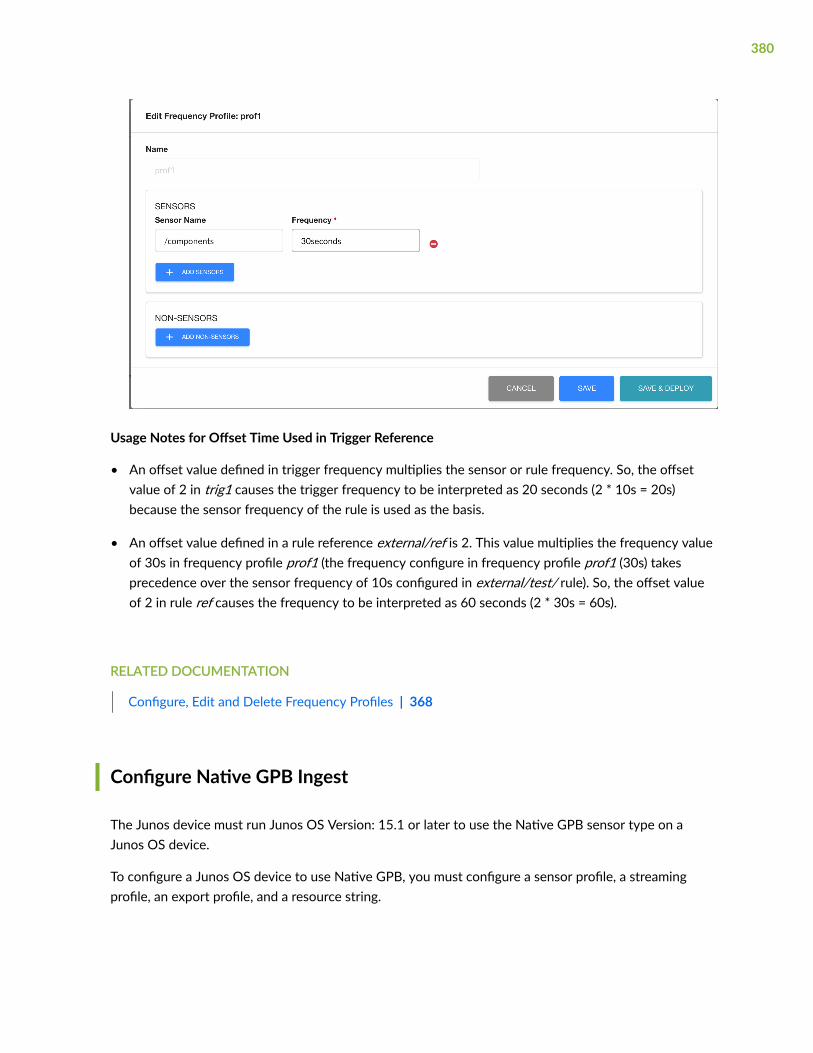
Usage Notes for Offset Time Used in Trigger Reference
• An offset value defined in trigger frequency multiplies the sensor or rule frequency. So, the offsetvalue of 2 in trig1 causes the trigger frequency to be interpreted as 20 seconds (2 * 10s = 20s)because the sensor frequency of the rule is used as the basis.
• An offset value defined in a rule reference external/ref is 2. This value multiplies the frequency valueof 30s in frequency profile prof1 (the frequency configure in frequency profile prof1 (30s) takesprecedence over the sensor frequency of 10s configured in external/test/ rule). So, the offset valueof 2 in rule ref causes the frequency to be interpreted as 60 seconds (2 * 30s = 60s).
RELATED DOCUMENTATION
Configure, Edit and Delete Frequency Profiles | 368
Configure Native GPB Ingest
The Junos device must run Junos OS Version: 15.1 or later to use the Native GPB sensor type on aJunos OS device.
To configure a Junos OS device to use Native GPB, you must configure a sensor profile, a streamingprofile, an export profile, and a resource string.
380

• Streaming profile — The profile associated with the server that collects exported data streamed by amonitored system resource. You can configure more than one streaming server. To collect data, youmust associate a configured server with one or more configured sensors.
To configure the server that collects data, you must also configure a destination IP address and adestination port on the Junos device. The same port must be configured at the remote end, in theParagon Automation Platform.
• Export profile — An export profile defines the parameters of the export process of data generatedthrough the sensor. You can associate multiple sensor profiles with an export profile but each sensorprofile can be associated with only one export profile.
• Sensor profile — A sensor profile defines the parameters of the system resource through resourcestrings (such as /junos/services/ldp/label-switched-path/transit/usage/) that is monitored.
See Configuring a Junos Telemetry Interface Sensor for more information on configuring the individualprofile.
The following is sample configurations of streaming server profile, export profile, and sensor profiles.
##Streaming Server Profileset services analytics streaming-server COLLECTOR-1 remote-address <virtual-IP-address-Insights-Services>set services analytics streaming-server COLLECTOR-1 remote-port 22000 ##Export Profileset services analytics export-profile EXP-PROF-1 local-address <local-router-IP>set services analytics export-profile EXP-PROF-1 local-port 22001set services analytics export-profile EXP-PROF-1 reporting-rate 30set services analytics export-profile EXP-PROF-1 format gpbset services analytics export-profile EXP-PROF-1 transport udp##Sensor Profileset services analytics sensor SENSOR-1 server-name COLLECTOR-1set services analytics sensor SENSOR-1 export-name EXP-PROF-1set services analytics sensor SENSOR-1 resource <resource> # example /junos/system/linecard/interface/
NOTE: The virtual IP address for Insights Services (configured during Paragon AutomationPlatform installation) is used for Native GPB, Syslog, and SNMP ingest configurations.
To configure streaming server port in Paragon Insights GUI:
1. Go to Configuration > Sensor > Settings.
381
2. Select Native gpb tab on the menu
3. Enter the port number. The port number must be the same as the remote-port configured in thestreaming server profile.
4. Click Save & Deploy to enable the sensor to collect data in your network.
RELATED DOCUMENTATION
Sensors Overview | 338
Configure sFlow Settings
IN THIS SECTION
Configure Devices to Send sFlow Packets | 382
Configure sFlow Ingest | 384
Configure sFlow in Devices and Device Groups | 389
Configure a Rule Using sFlow | 392
This section describes the configuration of sFlow ingest and device or device group configuration tostream sFlow packets in Paragon Insights.
Configure Devices to Send sFlow Packets
When you configure a device to send sFlow to a collector, you simply set an source IP address (IPaddress of the collector), sample-rate, polling interval, UDP port, and interface to capture from. There isno opportunity to filter or choose what data gets sent from the device side.
NOTE: The IP address of collector is the virtual IP address of Paragon Insights services you setwhile installing Paragon Automation Platform.
382
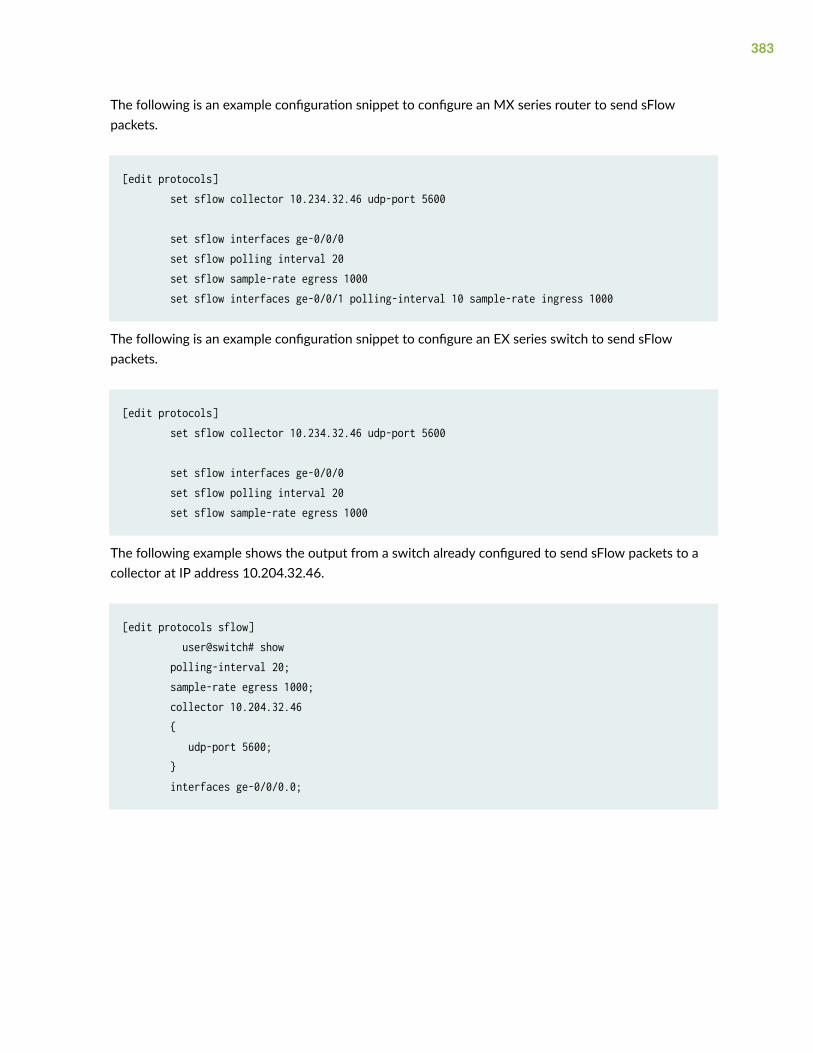
The following is an example configuration snippet to configure an MX series router to send sFlowpackets.
[edit protocols] set sflow collector 10.234.32.46 udp-port 5600 set sflow interfaces ge-0/0/0 set sflow polling interval 20 set sflow sample-rate egress 1000 set sflow interfaces ge-0/0/1 polling-interval 10 sample-rate ingress 1000
The following is an example configuration snippet to configure an EX series switch to send sFlowpackets.
[edit protocols] set sflow collector 10.234.32.46 udp-port 5600 set sflow interfaces ge-0/0/0 set sflow polling interval 20 set sflow sample-rate egress 1000
The following example shows the output from a switch already configured to send sFlow packets to acollector at IP address 10.204.32.46.
[edit protocols sflow] user@switch# show polling-interval 20; sample-rate egress 1000; collector 10.204.32.46 { udp-port 5600; } interfaces ge-0/0/0.0;
383
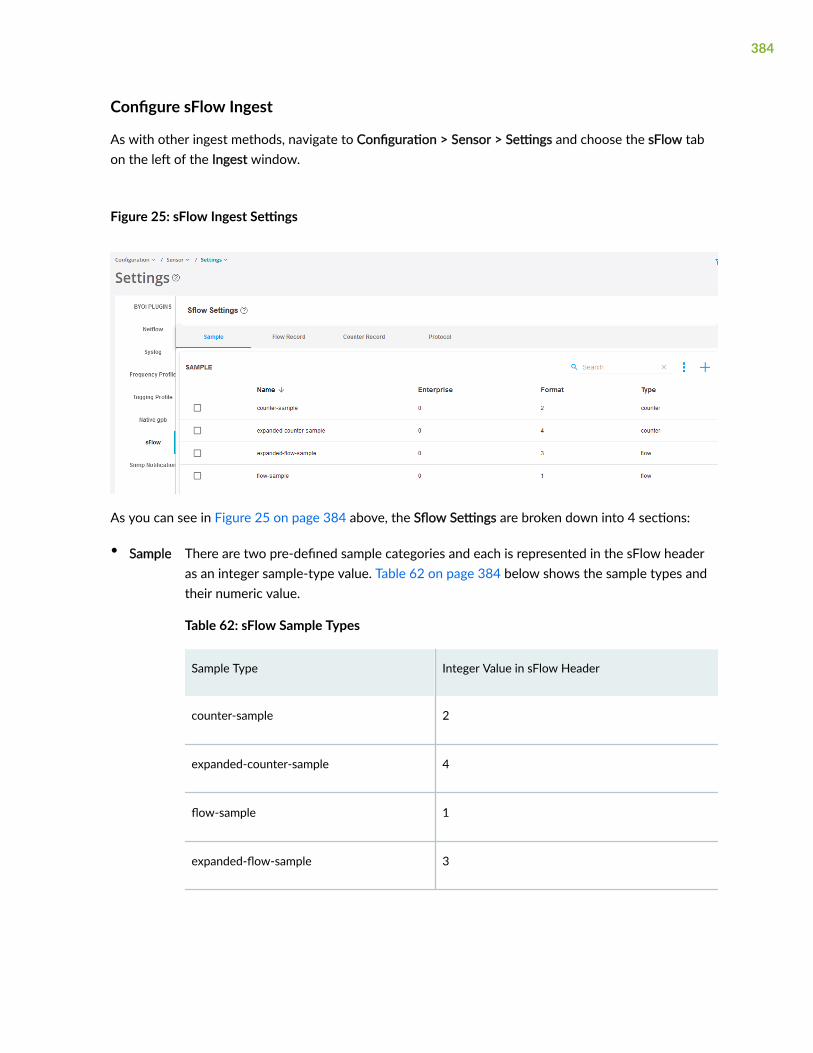
Configure sFlow Ingest
As with other ingest methods, navigate to Configuration > Sensor > Settings and choose the sFlow tabon the left of the Ingest window.
Figure 25: sFlow Ingest Settings
As you can see in Figure 25 on page 384 above, the Sflow Settings are broken down into 4 sections:
• Sample There are two pre-defined sample categories and each is represented in the sFlow headeras an integer sample-type value. Table 62 on page 384 below shows the sample types andtheir numeric value.
Table 62: sFlow Sample Types
Sample Type Integer Value in sFlow Header
counter-sample 2
expanded-counter-sample 4
flow-sample 1
expanded-flow-sample 3
384

NOTE: The difference between the expanded sensor types and the non-expandedsample types is the size of the data fields. The field names and types are the same,but the field sizes are larger in the expanded sample types.
Packet definitions for these sample types can be found here: sFlow Samples
Table 63 on page 385 shows the other fields contained in an sFlow sample header (bysample type) along with the field type.
Table 63: sFlow Packet Header Fields
field type/sizein bits
counter-sample flow-sample
integer/32 sampleSequenceNumber sampleSequenceNumber
integer/8 sourceIDType
• 0 = SNMP interface index
• 1 = VLAN ID(smonVlanDataSource)
• 2 = Physical entity(entPhysicalEntry)
sourceIDType
• 0 = SNMP interface index
• 1 = VLAN ID (smonVlanDataSource)
• 2 = Physical entity (entPhysicalEntry)
integer/24 sourceIDValue sourceIDValue
integer/32 n (the number of sampled recordscontained in the Counter sample)
sampleSamplingRate
integer/32 - samplePool (number of packets that couldhave been sampled)
integer/32 - sampleDroppedPackets (number of packetsdropped due to lack of resources)
385

Table 63: sFlow Packet Header Fields (Continued)
field type/sizein bits
counter-sample flow-sample
integer/8 - sampleInputInterfaceFormat (inputinterface type)
integer/32 - sampleInputInterfaceValue (input interface(SNMP interface index)
integer/1 sampleOutputInterfaceFormat (outputinterface type)
integer/33 - sampleOutputInterfaceValue (SNMPinterface index)
integer/32 - n (the number of flow records)
data counter records flow records
• FlowRecord
The Flow Record tab provides the tools needed to define the different types of flow thatmight be seen in an sFlow capture. Paragon Insights ships with 16 types of pre-definedflow records, each of which have a format number and a sensor path for use in definingsFlow rules, shown in Table 64 on page 386 below. There are several fields in each typeof flow record. These can be seen by selecting the desired record type from the list andclicking the edit (pencil) button.
Table 64: Flow Record Types
Record Type Format Number Sensor Path Value
raw packet headers 1 /sflow-v5/flow-sample/raw-packet-header
Ethernet frame data 2 /sflow-v5/flow-sample/ethernet-frame-data
386
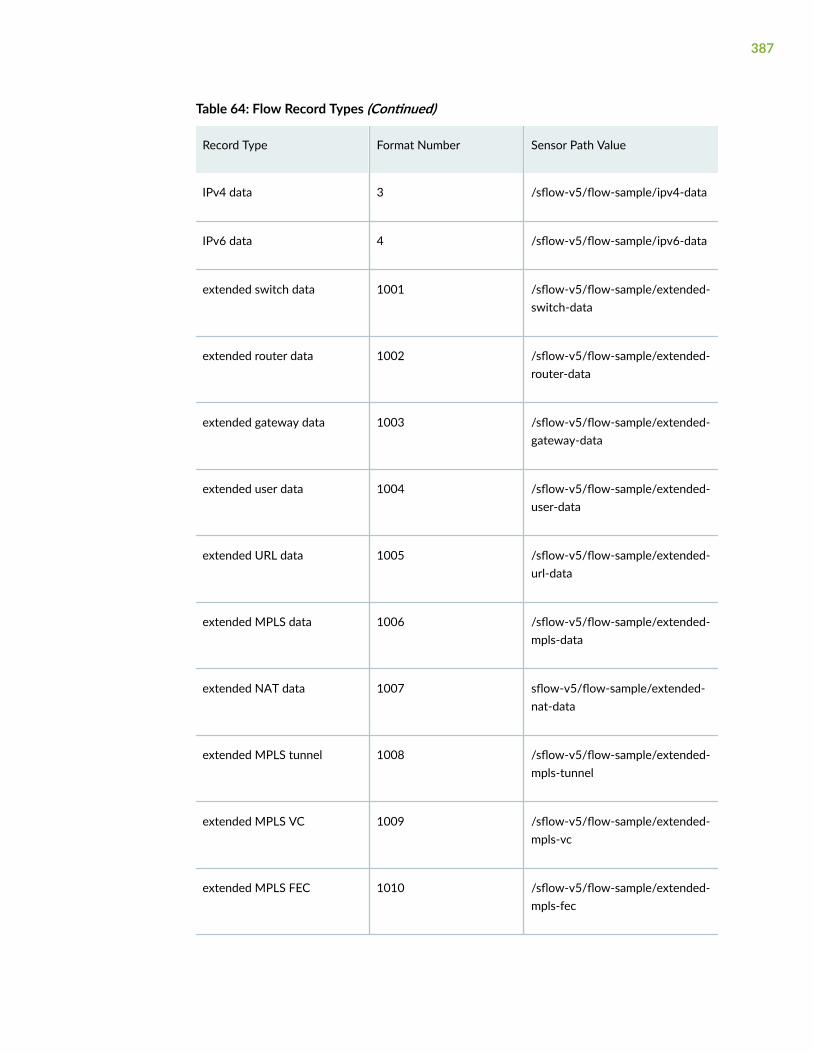
Table 64: Flow Record Types (Continued)
Record Type Format Number Sensor Path Value
IPv4 data 3 /sflow-v5/flow-sample/ipv4-data
IPv6 data 4 /sflow-v5/flow-sample/ipv6-data
extended switch data 1001 /sflow-v5/flow-sample/extended-switch-data
extended router data 1002 /sflow-v5/flow-sample/extended-router-data
extended gateway data 1003 /sflow-v5/flow-sample/extended-gateway-data
extended user data 1004 /sflow-v5/flow-sample/extended-user-data
extended URL data 1005 /sflow-v5/flow-sample/extended-url-data
extended MPLS data 1006 /sflow-v5/flow-sample/extended-mpls-data
extended NAT data 1007 sflow-v5/flow-sample/extended-nat-data
extended MPLS tunnel 1008 /sflow-v5/flow-sample/extended-mpls-tunnel
extended MPLS VC 1009 /sflow-v5/flow-sample/extended-mpls-vc
extended MPLS FEC 1010 /sflow-v5/flow-sample/extended-mpls-fec
387
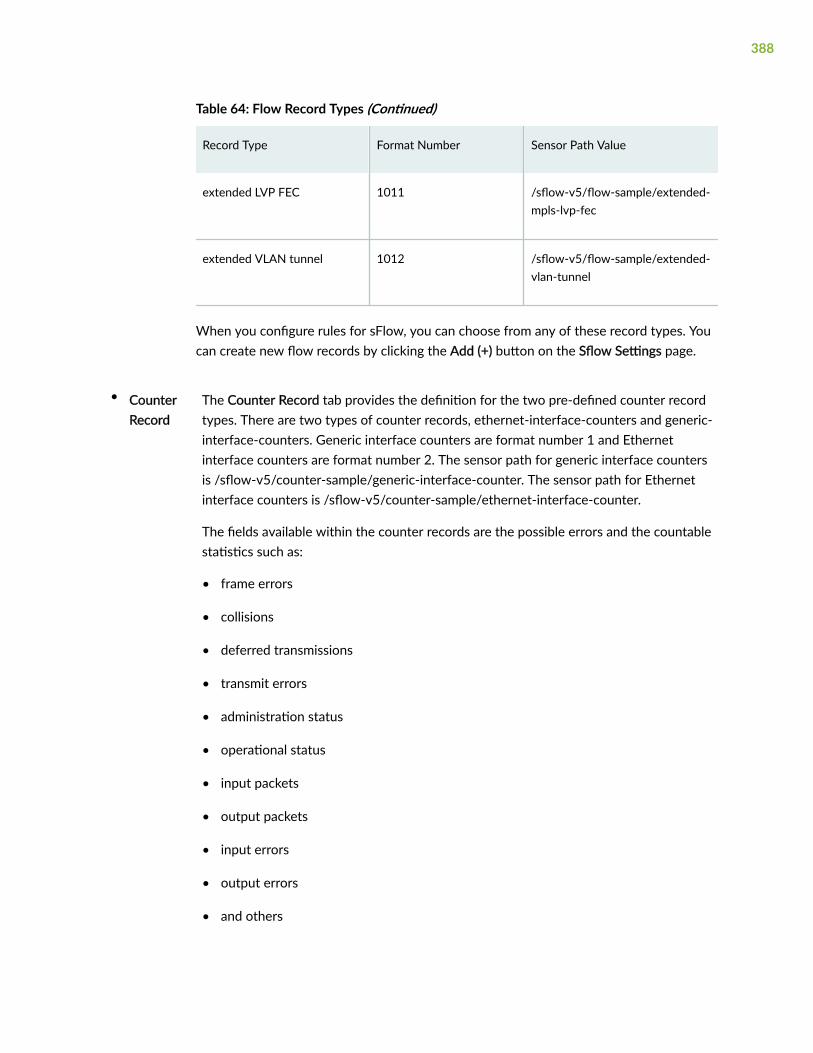
Table 64: Flow Record Types (Continued)
Record Type Format Number Sensor Path Value
extended LVP FEC 1011 /sflow-v5/flow-sample/extended-mpls-lvp-fec
extended VLAN tunnel 1012 /sflow-v5/flow-sample/extended-vlan-tunnel
When you configure rules for sFlow, you can choose from any of these record types. Youcan create new flow records by clicking the Add (+) button on the Sflow Settings page.
• CounterRecord
The Counter Record tab provides the definition for the two pre-defined counter recordtypes. There are two types of counter records, ethernet-interface-counters and generic-interface-counters. Generic interface counters are format number 1 and Ethernetinterface counters are format number 2. The sensor path for generic interface countersis /sflow-v5/counter-sample/generic-interface-counter. The sensor path for Ethernetinterface counters is /sflow-v5/counter-sample/ethernet-interface-counter.
The fields available within the counter records are the possible errors and the countablestatistics such as:
• frame errors
• collisions
• deferred transmissions
• transmit errors
• administration status
• operational status
• input packets
• output packets
• input errors
• output errors
• and others
388

You can use either the generic interface counter or Ethernet interface counter in rules that youdefine. The counter sensors can be defined to pick even single fields from either of the availablecounters. You can create additional counter record types by clicking the Add (+) on the Sflow Settingspage (Counter Record tab).
• Protocol The Protocol tab provides a means to define which protocol the sFlow captures containand allow for the decoding of many network protocols. The fields that are contained ineach protocol entry are the same fields as would be seen in a frame or packet of that type.For example, an Ethernet frame would have a destination MAC address, a source MACaddress, and an ethernet-next-header-type field. The fields defined in any protocol youwant to decode must appear in the protocol definition in the same order as they wouldappear in the packet or frame.
The number column that appears is the IANA protocol number assigned to that protocol.For example, the tcp protocol is protocol number 6.
NOTE: On the Sample, Flow Record, and Counter Record tabs, there is an Enterprise column.This column is for the use of vendor-specific or custom decoding details. For example, a FoundryACL-based flow sample has the enterprise value 1991, Format 1, includes additional fieldsspecifically for that Foundry flow.In most instances, the Enterprise value is 0.
Configure sFlow in Devices and Device Groups
To process sFlow packets, Paragon Insights depends on rule configuration. It also requires that youenable sFlow in the device group and device definition. This section describes sFlow enablement, andrule and sensor configuration options for sFlow.
First, to enable sFlow, you must enter at least one IP address in the device definition under Flow SourceIPs, and enter at least one port number in the device group definition under sFlow Ports. Figure 26 on
389

page 390 below is a composite image that shows the device definition overlaid with the device groupdefinition. The appropriate sections of each window are highlighted in red.
Figure 26: Enable sFlow Composite Image
The devices in the group send their sFlow packets to Paragon Insights over the configured UDP portfrom the configured IP address(es). The port number(s) used in these definitions must be unique acrossthe entire Paragon Insights installation.
NOTE:
390
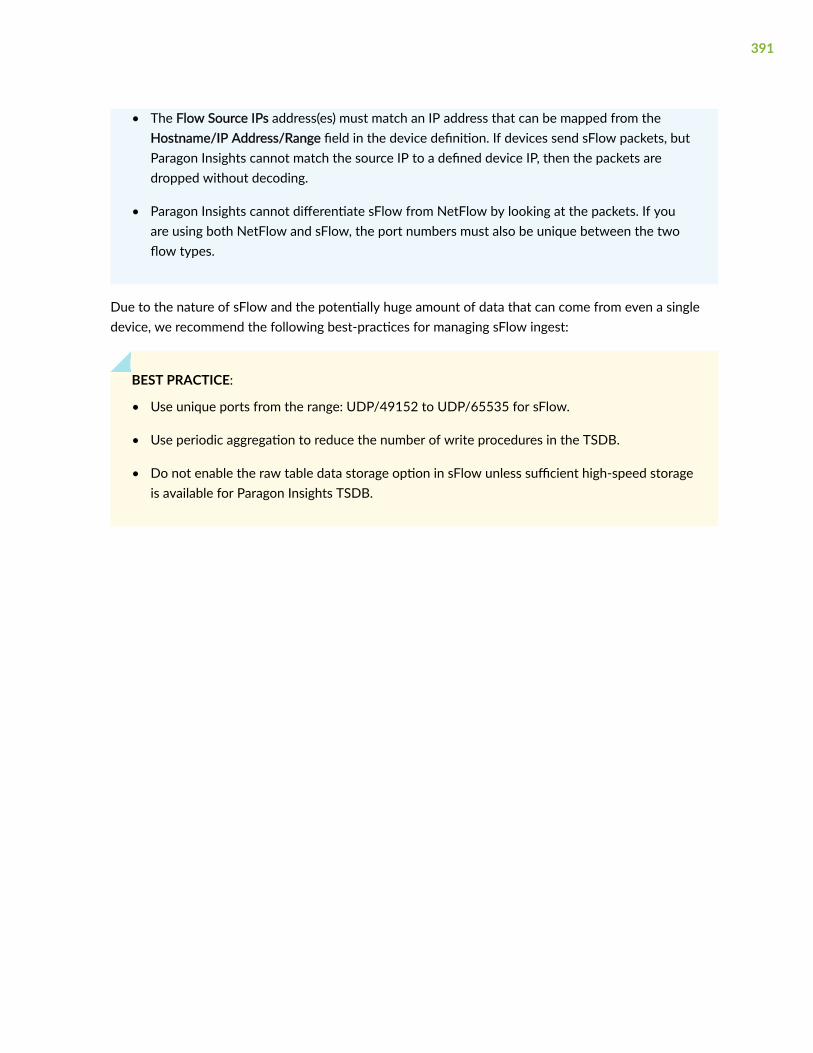
• The Flow Source IPs address(es) must match an IP address that can be mapped from theHostname/IP Address/Range field in the device definition. If devices send sFlow packets, butParagon Insights cannot match the source IP to a defined device IP, then the packets aredropped without decoding.
• Paragon Insights cannot differentiate sFlow from NetFlow by looking at the packets. If youare using both NetFlow and sFlow, the port numbers must also be unique between the twoflow types.
Due to the nature of sFlow and the potentially huge amount of data that can come from even a singledevice, we recommend the following best-practices for managing sFlow ingest:
BEST PRACTICE:
• Use unique ports from the range: UDP/49152 to UDP/65535 for sFlow.
• Use periodic aggregation to reduce the number of write procedures in the TSDB.
• Do not enable the raw table data storage option in sFlow unless sufficient high-speed storageis available for Paragon Insights TSDB.
391

Configure a Rule Using sFlow
As with other rule definitions, sFlow rules are made up of sensors, fields, vectors, and so on. An sFlowsensor has a Sensor Name, a Sensor Type of sFlow, and an sFlow Path as shown in Figure 27 on page392.
Figure 27: sFlow Sensor Definition
The sensor path serves a big role in sensor definition. Paragon Insights uses the sensor path to definenot only the sFlow flow type, but the sample type, record type, protocol, and other custom pathelements if needed.
RELATED DOCUMENTATION
Configure Netflow Settings | 355
Configure SNMP Ingest
Paragon Insights supports three methods of collecting telemetry data using SNMP. The ingest, alsoknown as request-response, is a pull mode method in which Paragon Insights requests for telemetrydata from the devices. The trap and inform notifications are push mode methods in which the devicesnotify Paragon Insights about key performance indicator events that prevents the devices fromfunctioning as expected.
392

Paragon Insights supports SNMPv3 alongside the current SNMPv2c as an ingest method. Users with sp-admin role can select any version of SNMP in the Paragon Insights GUI.
SNMPv3 ingest provides you with an option to set authentication and privacy credentials to leveragethe following features:
• Authentication — Identifies and verifies the origin of an SNMPv3 message.
• Privacy — Prevents packet analyzers from snooping the content of messages by encrypting them.
• Integrity — Ensures that the content of SNMP messages is not altered while in transit withoutauthorization.
Table 65 on page 393 lists the supported authentication and privacy algorithms in SNMPv3 protocol.
Table 65: Authentication and Privacy Algorithms
Feature Algorithm
Supported authentication algorithms MD5
SHA-1
Supported privacy algorithms DES
3DES
AES
In Paragon Insights, SNMPv3 ingest can be set at the device level. The configuration of SNMPv3 andSNMPv2c is mutually exclusive.
NOTE: If a device is not configured for SNMP ingest, Paragon Insights uses SNMP v2c withSNMP Community set to public as the default settings.
NOTE: In Paragon Insights, the SNMPv2c and SNMPv3 ingest and trap configurations share thesame workflow.
To configure SNMP ingest at the device level:
1. Click the Configuration > Device option in the left navigation bar.
2. Select a device by clicking on the checkbox and click the edit device button (pencil icon).
393
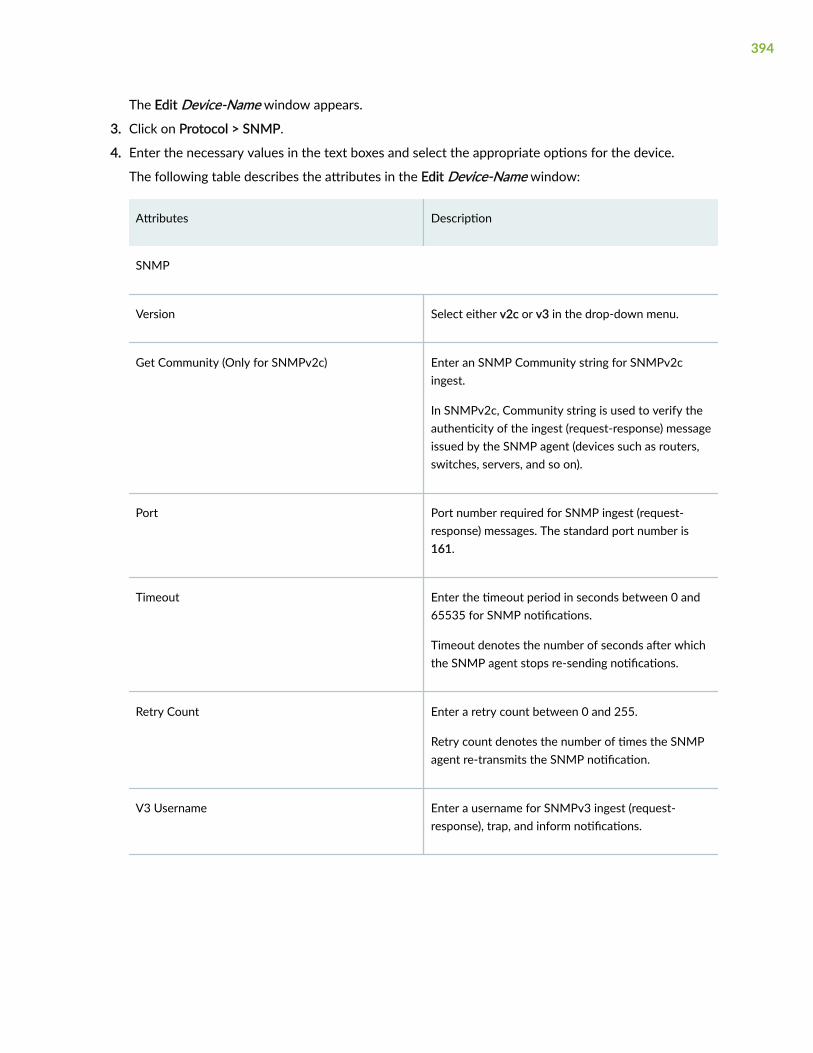
The Edit Device-Name window appears.
3. Click on Protocol > SNMP.
4. Enter the necessary values in the text boxes and select the appropriate options for the device.
The following table describes the attributes in the Edit Device-Name window:
Attributes Description
SNMP
Version Select either v2c or v3 in the drop-down menu.
Get Community (Only for SNMPv2c) Enter an SNMP Community string for SNMPv2cingest.
In SNMPv2c, Community string is used to verify theauthenticity of the ingest (request-response) messageissued by the SNMP agent (devices such as routers,switches, servers, and so on).
Port Port number required for SNMP ingest (request-response) messages. The standard port number is161.
Timeout Enter the timeout period in seconds between 0 and65535 for SNMP notifications.
Timeout denotes the number of seconds after whichthe SNMP agent stops re-sending notifications.
Retry Count Enter a retry count between 0 and 255.
Retry count denotes the number of times the SNMPagent re-transmits the SNMP notification.
V3 Username Enter a username for SNMPv3 ingest (request-response), trap, and inform notifications.
394
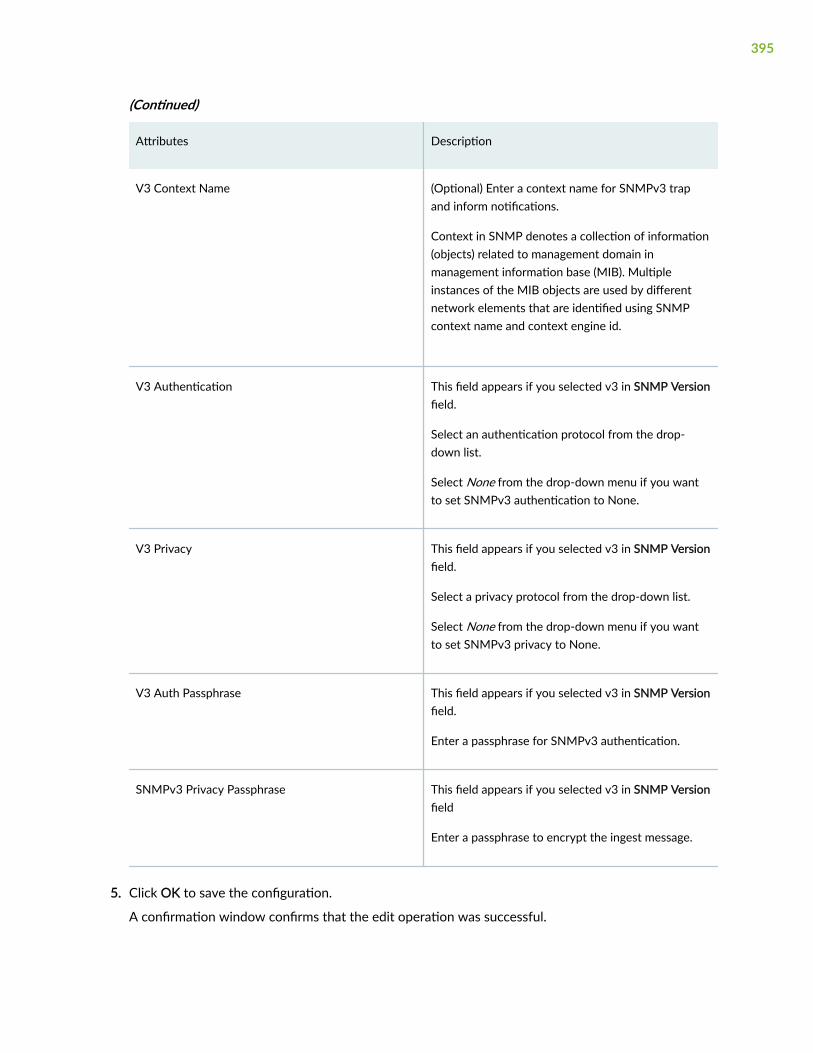
(Continued)
Attributes Description
V3 Context Name (Optional) Enter a context name for SNMPv3 trapand inform notifications.
Context in SNMP denotes a collection of information(objects) related to management domain inmanagement information base (MIB). Multipleinstances of the MIB objects are used by differentnetwork elements that are identified using SNMPcontext name and context engine id.
V3 Authentication This field appears if you selected v3 in SNMP Versionfield.
Select an authentication protocol from the drop-down list.
Select None from the drop-down menu if you wantto set SNMPv3 authentication to None.
V3 Privacy This field appears if you selected v3 in SNMP Versionfield.
Select a privacy protocol from the drop-down list.
Select None from the drop-down menu if you wantto set SNMPv3 privacy to None.
V3 Auth Passphrase This field appears if you selected v3 in SNMP Versionfield.
Enter a passphrase for SNMPv3 authentication.
SNMPv3 Privacy Passphrase This field appears if you selected v3 in SNMP Versionfield
Enter a passphrase to encrypt the ingest message.
5. Click OK to save the configuration.
A confirmation window confirms that the edit operation was successful.
395
RELATED DOCUMENTATION
About the Sensor Settings Page | 354
Configure SNMP Trap and Inform Notifications
IN THIS SECTION
Tasks You can Perform | 396
Find the Engine ID | 398
Configure Trap Notifications | 398
Configure Inform Notifications | 403
Configure Port for Inform Notifications | 404
Configure a Rule for SNMP Notification | 405
Paragon Insights supports inform and trap notifications that are sent by devices in the network for faultmanagement. Traps and informs are notifications about change of state in network that are sentbetween the SNMP manager (Paragon Insights) and the SNMP agents (devices), on which ParagonInsights performs trigger evaluations. Paragon Insights processes traps and informs from the configureddevice only if a playbook containing an SNMP-notification rule is running for the specified device. In allother cases, the trap or inform message is dropped by the SNMP Manager.
The following sections describe relevant terms, configuration of traps and informs through CLI, portconfiguration, and accessing status of SNMP traps through CLI.
NOTE: SNMP trap notifications are supported by SNMPv2c and SNMPv3. SNMP informmessages are supported only when you use SNMPv3 protocol.
Tasks You can Perform
Before you delve into SNMP trap and inform configurations, the following glossary can familiarize youwith important concepts in SNMPv3 protocol.
Authoritativeagent
In SNMPv3 transactions between two entities (agent and manager), the flow ofsending notification is controlled through authentication and privacy that are unique
396

features in SNMPv3.Authentication identifies and verifies the source of an SNMPv3message. The privacy feature prevents packet analyzers from snooping the content ofmessages by encrypting them. The entity that controls the notification flow is knownas authoritative agent. In SNMPv3, the non-authoritative entity must know the<Engine ID> of the authoritative agent for a successful communication.
Traps or trapmessages
A trap is an unacknowledged notification sent from an SNMP agent to the SNMPmanager. In trap messages, SNMP agent is the authoritative agent. The administratormust configure the SNMP v3 <user> (distinct from the local IAM users) and <ContextEngine ID> on the device that sends out the trap messages. For traps, the <ContextEngine ID> is set to the Engine ID that uniquely identifies the SNMP agent.
Informs orinformmessages
An inform is also a notification sent from an SNMP agent to the SNMP manager. Ininform messages, SNMP manager is the authoritative agent. The configuration is doneon the device that needs to send inform messages, with the details of the remoteauthoritative agent, SNMP manager (Paragon Insights). The administrator mustconfigure the <user> found in the remote SNMP manager.
Engine ID <Engine ID> is a hexadecimal generated for a given agent that uniquely identifies theSNMP agent and needs to be unique across a given administrative domain. It alsomust be persistent across reboots or upgrades.
Security EngineID
It is a security parameter in the SNMP communication between the agent and themanager. It is usually set to the <Engine ID> of the authoritative agent involved. Atrap message has two parts: a header and a trap Protocol Data Unit (PDU). The headercontains the <Security Engine ID> and a <username> set in the trap configuration.When an agent sends a trap, these parameters in the trap header are checked againstthe details stored in the USM table. The trap is further processed only when there is amatch.
In inform notifications, the <Security Engine ID> is set to Paragon Insight’s Engine ID.
Context EngineID
<Context Engine ID> is part of a trap PDU. It uniquely identifies a device which hassent the original trap message. <Context Engine ID> and <Security Engine ID> areidentical is most cases.
USM Table SNMP managers receiving the traps needs to maintain the USM table (User-basedSecurity Model) which has <Security Engine ID> and <username> as the key to verifythe source of the trap messages.
The following sections detail how to:
• "Find the Engine ID" on page 398
• "Configure Trap Notifications" on page 398
397

• "Configure Inform Notifications" on page 403
• "Configure a Rule for SNMP Notification " on page 405
• "Configure Port for Inform Notifications" on page 404
Find the Engine ID
Depending on if you configure devices to send trap or inform notifications, you need to first find the<Engine ID> of either the SNMP agent. You can refer to the sample commands below to find the engineid in Junos devices.
NOTE: The CLI command to find <Engine ID> varies from vendor-to-vendor.
To find the <Engine ID> of SNMP agents (devices) that are Junos-based platforms, enter the followingcommand in CLI.
show snmp v3 engine-id
You will receive a HEX output as the device <Engine ID>.
Configure Trap Notifications
You can configure a device to send trap notifications using SNMPv2c and SNMPv3.
The source IP address needs to be unique across all the devices as it uniquely identifies the device. Thesource IP address can only be configured for devices.
NOTE: In Paragon Insights, the SNMPv2c and SNMPv3 ingest and trap configurations share thesame workflow.
To configure SNMP trap notifications at the device level:
1. Click the Configuration > Device option in the left navigation bar.
2. Select a device by clicking on the checkbox and click the edit device button (pencil icon).
The Edit Device-Name window appears.
3. Click on Protocol > SNMP.
4. Enter the necessary values in the text boxes and select the appropriate options for the device.
The following table describes the attributes in the Edit Device-Name window:
398
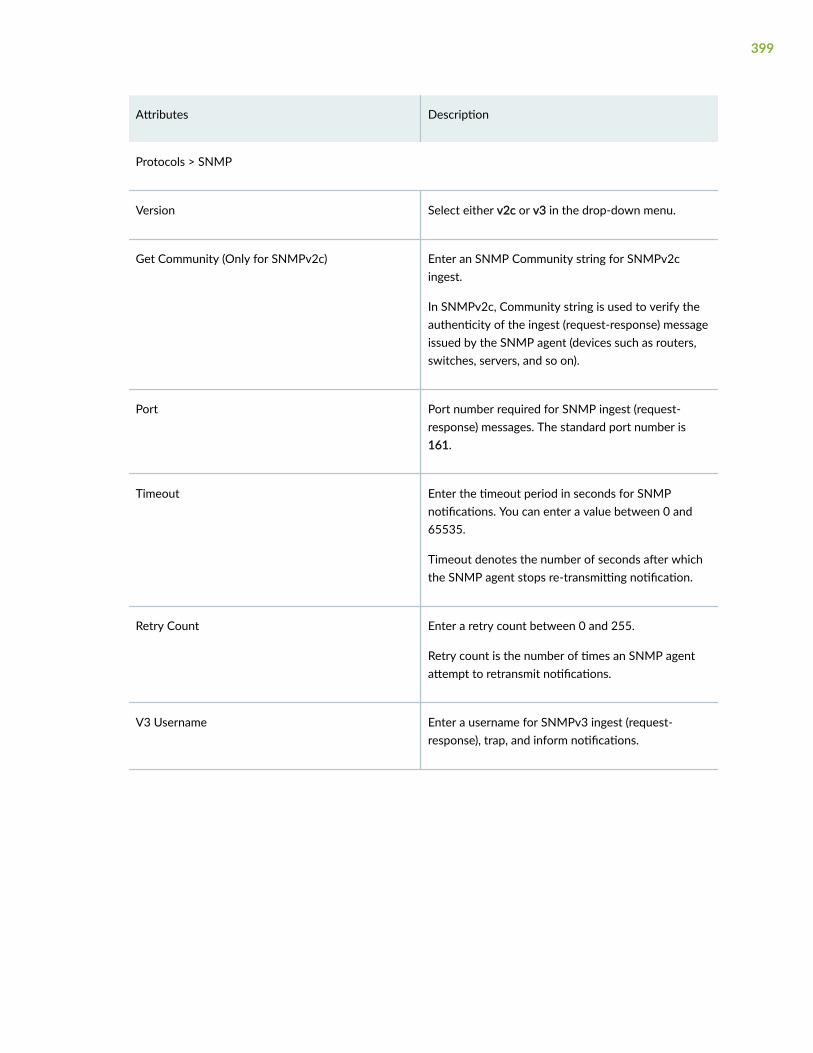
Attributes Description
Protocols > SNMP
Version Select either v2c or v3 in the drop-down menu.
Get Community (Only for SNMPv2c) Enter an SNMP Community string for SNMPv2cingest.
In SNMPv2c, Community string is used to verify theauthenticity of the ingest (request-response) messageissued by the SNMP agent (devices such as routers,switches, servers, and so on).
Port Port number required for SNMP ingest (request-response) messages. The standard port number is161.
Timeout Enter the timeout period in seconds for SNMPnotifications. You can enter a value between 0 and65535.
Timeout denotes the number of seconds after whichthe SNMP agent stops re-transmitting notification.
Retry Count Enter a retry count between 0 and 255.
Retry count is the number of times an SNMP agentattempt to retransmit notifications.
V3 Username Enter a username for SNMPv3 ingest (request-response), trap, and inform notifications.
399

(Continued)
Attributes Description
V3 Context Name (Optional) Enter a context name for SNMPv3 trap andinform notifications.
Context in SNMP denotes a collection of information(objects) related to management domain inmanagement information base (MIB). Multipleinstances of the MIB objects are used by differentnetwork elements that are identified using SNMPcontext name and context engine id.
V3 Authentication This field appears if you selected v3 in SNMP Versionfield.
Select an authentication protocol from the drop-downlist.
Select None from the drop-down menu if you want toset SNMPv3 authentication to None.
V3 Privacy This field appears if you selected v3 in SNMP Versionfield.
Select a privacy protocol from the drop-down list.
Select None from the drop-down menu if you want toset SNMPv3 privacy to None.
V3 Context Engine This field appears if you selected v3 in SNMP Versionfield.
The Engine ID must be set to engine-id of the SNMPagent.
V3 Auth Passphrase This field appears if you selected v3 in SNMP Versionfield.
Enter a passphrase for SNMPv3 authentication.
400

(Continued)
Attributes Description
SNMPv3 Privacy Passphrase This field appears if you selected v3 in SNMP Versionfield
Enter a passphrase to encrypt the ingest message.
Device ID Details
SNMP Source IPs Enter IP address(es) of source device. If there aremultiple IP addresses associated with a device,separate them with a comma.
The source IP address is used to identify the sender(SNMP agent) of trap and inform notifications.
If you configured virtual IP address for SNMP trapreceiver during installation, you can enter the virtualIP address here.
5. Click OK to save the configuration.
A confirmation window confirms that the edit operation was successful.
You can configure notification port number for traps and inform notifications and logs for snmpnotification in device groups.
1. Click the Configuration > Device Groups option in the left-navigation bar.
2. Select a device group and click on the edit button (pencil icon).
The Edit Device Group page appears.
3. Click Advanced > Ports to configure notification ports for traps and informs.
4. Click Advanced > Logging > Service Logging Overrides to configure SNMP logs.
The following table describes the attributes in the Add a Device Group window:
401

Table 66: Table 2: Add Device Group Page Details
Attributes Description
Name Name of the device group. (Required)
Description Description for the device group.
Devices Add devices to the device group from the drop-down list. (Required)
In Paragon Insights, you can add more than 50 devices per device group. However, theactual scale of the number of devices you can add depends on the available systemresources.
For example, consider that you want to create a device group of 120 devices. In releasesearlier than Release 4.0.0, it is recommended that you create three device groups of 50,50, and 20 devices respectively. With Paragon Insights, you just create one device group.
Logging Configuration
SNMPNotification
Paragon Insights supports collecting log data for SNMP notification. You can collectdifferent severity levels of logs for snmp-notification service in a device group.
Use these fields to configure which log levels to collect:
Global SettingLog Level
From the drop-down list, select the level of the log messages that youwant to collect for every running Paragon Insights service for thedevice group. The level is set to None by default.
ServicesLoggingOverrides
Select the log level from the drop-down list for any specific service thatyou want to configure differently from the Global Setting log level. Thelog level that you select for a specific service takes precedence over theGlobal Setting log configuration.
Ports
SNMPNotificationPorts
Enter port number(s) separated by comma if there are multiple ports. Paragon Insightslistens on these ports for trap and inform notifications.
402
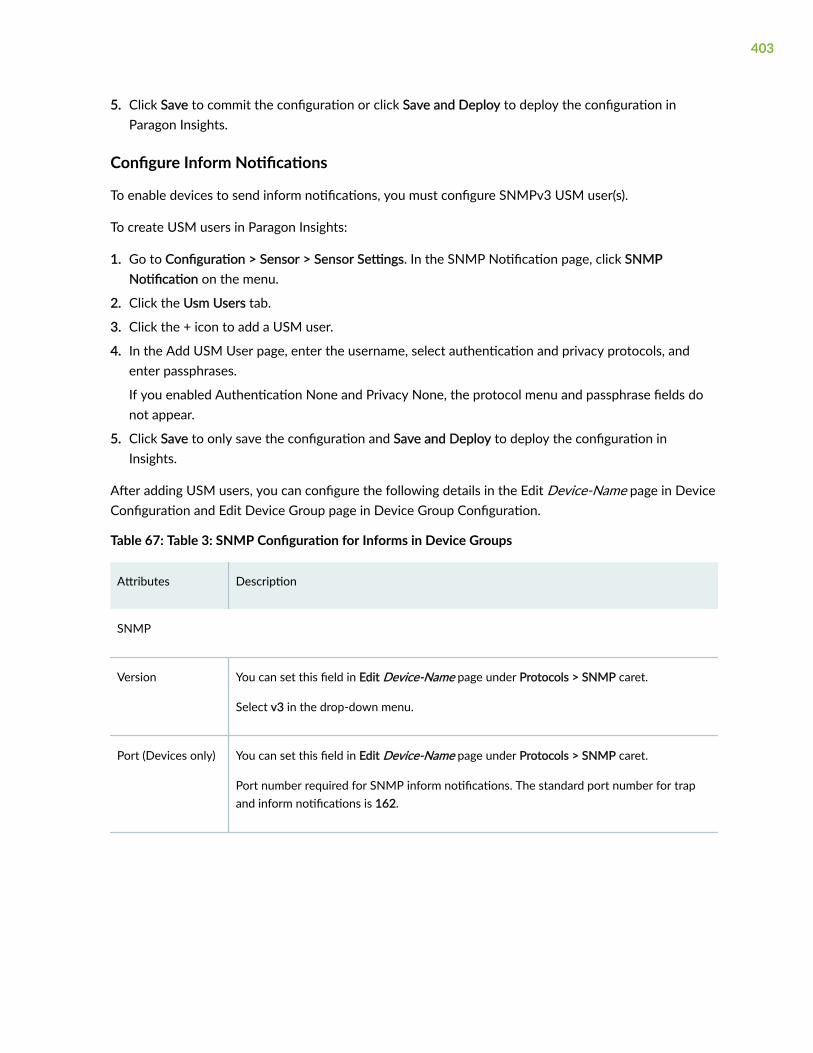
5. Click Save to commit the configuration or click Save and Deploy to deploy the configuration inParagon Insights.
Configure Inform Notifications
To enable devices to send inform notifications, you must configure SNMPv3 USM user(s).
To create USM users in Paragon Insights:
1. Go to Configuration > Sensor > Sensor Settings. In the SNMP Notification page, click SNMPNotification on the menu.
2. Click the Usm Users tab.
3. Click the + icon to add a USM user.
4. In the Add USM User page, enter the username, select authentication and privacy protocols, andenter passphrases.
If you enabled Authentication None and Privacy None, the protocol menu and passphrase fields donot appear.
5. Click Save to only save the configuration and Save and Deploy to deploy the configuration inInsights.
After adding USM users, you can configure the following details in the Edit Device-Name page in DeviceConfiguration and Edit Device Group page in Device Group Configuration.
Table 67: Table 3: SNMP Configuration for Informs in Device Groups
Attributes Description
SNMP
Version You can set this field in Edit Device-Name page under Protocols > SNMP caret.
Select v3 in the drop-down menu.
Port (Devices only) You can set this field in Edit Device-Name page under Protocols > SNMP caret.
Port number required for SNMP inform notifications. The standard port number for trapand inform notifications is 162.
403

Table 67: Table 3: SNMP Configuration for Informs in Device Groups (Continued)
Attributes Description
Notification Ports(Device Groupsonly)
You can set this field in Edit Device Group page under Advanced > Ports > SNMPNotification Ports field.
Enter notification ports separated by comma.
Paragon Insights listens on these notification ports for traps and inform notificationmessages from device groups.
Context Engine ID(Devices only)
You can set this field in Edit Device-Name page under Protocols > SNMP caret.
This field appears if you selected v3 in Version field.
The Engine ID must be set to engine-id of the SNMP agent.
Source IP Address(Devices only)
You can set this field in Edit Device-Name page under Device Details ID > SNMP SourceIPs caret.
This field appears if you selected v3 in SNMP Version field.
Enter the source IP address of the device. This field is optional.
If you use NAT or an SNMP Proxy, the virtual IP address you configure for the SNMPProxy must be set as the source IP address.
To set virtual IP address for SNMP Proxy, go to Settings > Deployment in the leftnavigation bar. In the Loadbalancer page, enter the virtual IP address and click Save andDeploy button.
Configure Port for Inform Notifications
By default, Paragon Insights listens for traps and informs in the standard SNMP trap port 162. This canbe changed if needed either at the global level which is applicable to all device groups or at the devicegroup level applicable to a specific device group.
Port configured under ingest will apply to all device groups. Trap and Inform messages received throughany other port are discarded.
To configure port number at the ingest level:
1. Go to Configuration > Sensor > Settings in the left navigation bar.
2. Select SNMP Notification from the left menu in the Settings page.
3. In the Port tab, enter the port number.
404

4. Click Save to only save the configuration and Save and Deploy to deploy the configuration in ParagonInsights.
Port configured under device group will apply to only a specific device group. Traps and informs receivedthrough any other port are discarded. To configure port numbers at the device group level, see Table 66on page 402.
Configure a Rule for SNMP Notification
Once the device is configured to send traps or inform notification, you must configure a rule on thedevice with SNMP trap so that, Paragon Insights can process traps from the device. In device groups,you can apply a playbook instance that has the snmp-notification rule. When you configure SNMPnotification in any rule, you must select the MIB name you want to monitor. Go to Juniper MIB Explorerto browse MIB files for Junos devices and Cisco MIB Locator to browse MIB files for Cisco devices.
The following example shows how you can configure a rule with SNMP notification to send alerts if aninterface comes up for the chassis.interfaces/ topic.
NOTE: It is assumed that you have configured the device or device group for SNMP trapnotification. See "Configure Trap Notifications" on page 398 to configure SNMP trapnotifications in devices or device groups.
To configure a rule under topic chassis.interfaces/:
1. Go to Configuration > Rules.
2. Click the Add Rules button in the Rules page.
Enter the rule name in the topic/rule-name format in the Rule field and description in the Descriptionfield. For example, chassis.interfaces/linkup.
3. Click Add Sensor button in Sensors tab.
4. Enter a name in the Sensor Name field and select SNMP Notification from the drop-down menu inSensor Type.
5. Enter notification name in MIB-Name::Notification Name format.
For example, IF-MIB::linkDown.
6. Click Add Field button in the Fields tab.
The fields for SNMP Notification rule can be derived by any of the following methods:
• Variables (varbinds) for the given trap name.
The variables of the trap name can be defined as fields. The following steps use the exampleIfAdminStatus as varbind and IF-MIB:linkDown as the snmp-notification.
a. Enter IfAdminStatus in the Field Name.
405

b. Select Integer as Field Type.
The Field Type you enter in the GUI must be same as the type defined in the MIB File.
c. Select Sensor as Ingest Type (field source).
The Ingest Type (field source) must be set to sensor.
d. Select the sensor name from the drop-down menu under Sensor.
The sensor name is the name you entered for the snmp-notification sensor.
e. Enter IfAdminStatus as sensor path.
The Path must be set the to the variable (varbind) name defined in the MIB file.
To add a second field for IfOperStatus as variable (varbind) for a given snmp-notification, followthe steps described here but change the field name and sensor path to IfOperStatus.
• Notification name as a field name.
The snmp notification name itself can be defined as field name to know which SNMP notificationtype is received. Some examples of SNMP Notification types are coldStart, warmStart,authenticationFailed, linkUp, and linkDown.
The following steps use the example IfAdminStatus as varbind and IF-MIB:linkDown as the snmp-notification.
a. Enter desired-name in the Field Name.
b. Enter string as Field Type.
The field type must be set to string.
c. Select Sensor as Ingest Type (field soruce).
The Ingest Type (field source) must be set to sensor.
d. Select the sensor name from the drop-down menu under Sensor.
The sensor name is the name you entered for the snmp-notification sensor.
e. Enter _notification_name as sensor path.
The Path must be set to ’_notification_name’. _notification_name is a special path defined inParagon Insights to get the notification name from the sensor data.
7. Click Save to commit the rule or Save & Deploy to deploy the rule in Paragon Insights.
You can see the new topic name and rule in the list of existing rules.
406

You can also configure triggers or functions based on the fields you add. See how to create a newrule in GUI as explained in Paragon Insights Rules and Playbooks.
You must include this rule in a playbook and apply the playbook instance on a device or device group.
To check the new SNMP notifications sent by device groups, log into Paragon Insights server as a rootuser and type the following command.
healthbot cli --device-group healthbot -s influxdb
You can track new entries sent by SNMP trap notifications to the Paragon Insights server for the fields(for example, IfAdminStatus) you configured.
RELATED DOCUMENTATION
Configure SNMP Ingest | 392
Configure System Log Ingest
IN THIS SECTION
Device Configuration | 408
Configure Syslog Pattern | 408
Add Patterns to a Pattern Set | 412
Configure Header Pattern | 412
Edit a Header Pattern | 414
Clone a Syslog Pattern | 415
Clone a Pattern Set | 416
Configure Multiple Source IP Addresses for a Device | 417
To be able to apply system log (syslog) ingest in a rule, you must first configure a device to send syslogdata, configure syslog ingest by adding pattern and applying patterns to patter sets, and configure syslogheader. You can refer this section to also clone pattern configurations and edit header configurations.
407

WHAT'S NEXT
When you configure syslog settings in Paragon Insights, you can opt to configure port, time zone fordevices, and so on. For more information on optional configurations, see "System Log OptionalConfigurations" | 417.
Device Configuration
Configure your network device(s) to send syslog data to Paragon Insights. The example deviceconfiguration from the previous section is repeated here:
set system syslog host 10.10.10.1 any any set system syslog host 10.10.10.1 allow-duplicates set system syslog host 10.10.10.1 structured-data
## 10.10.10.1 = Load balancer IP address
Configure Syslog Pattern
A pattern is a configuration to monitor some syslog event; you create a pattern for each event you wantto monitor. This example uses patterns to monitor four syslog events (two structured and twounstructured).
NOTE: See the usage notes at the end of this section for more detail on what has beenconfigured.
To configure Syslog pattern in GUI:
1. Click Configuration > Sensor > Settings in the left navigation bar.
2. Select the Syslog tab on the Settings page.
3. On the Syslog Settings page, click the + Add Pattern button.
4. In the pop-up window that appears, enter the following parameters for the first pattern, namedsnmp-if-link-down:
408
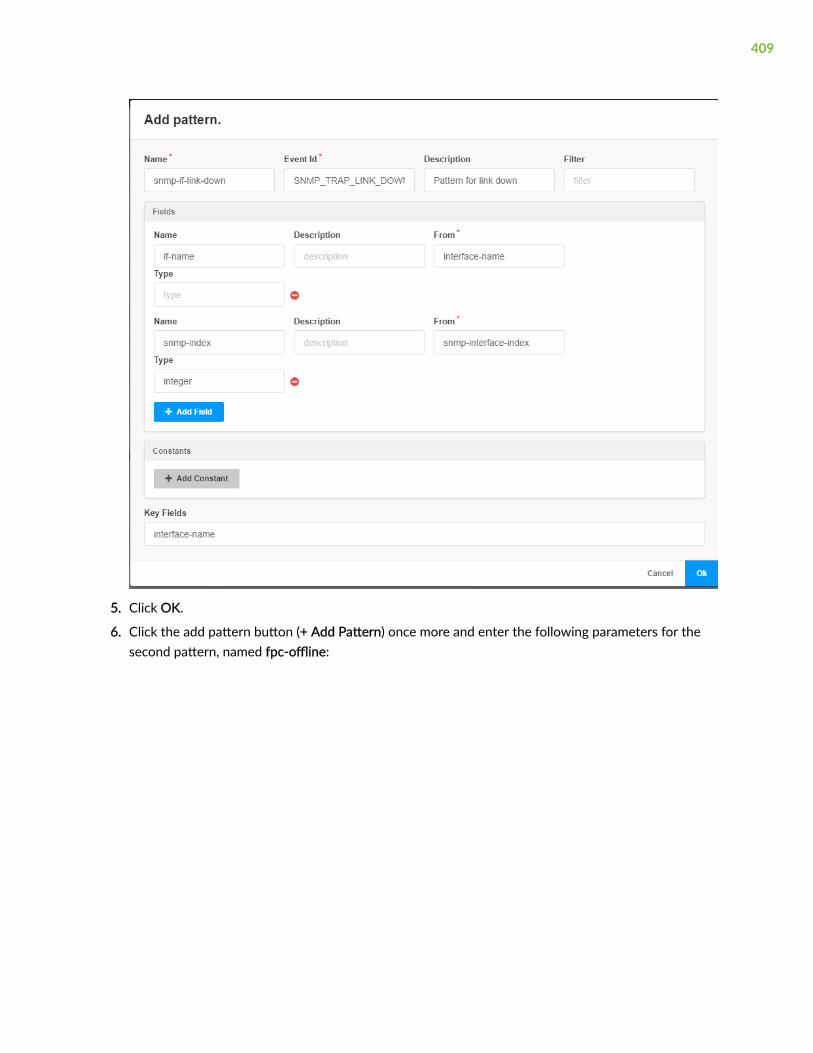
5. Click OK.
6. Click the add pattern button (+ Add Pattern) once more and enter the following parameters for thesecond pattern, named fpc-offline:
409

NOTE: The full value entered in the Filter field is fpc%{NUMBER:fpc} Marking ports %{WORD:port-status}
7. Click Save & Deploy. On the Syslog Settings page you should see the two patterns you just created.
Usage notes for the patterns
For structured syslog:
• The event ID (SNMP_TRAP_LINK_DOWN) references the event name found within the syslogmessages.
• Fields are optional for structured syslog messages; if you don’t configure fields, the attribute namesfrom the message will be treated as field names.
• In this example, however we have user-defined fields:
• The field names (if-name, snmp-index) are user-defined.
• The field interface-name value is an attribute from the syslog message, for example, ge-0/3/1.0;this field is renamed as if-name
• The field snmp-interface-index value is an attribute from the syslog message, for example,ifIndex 539; this field is renamed as snmp-index.
• The field snmp-interface-index here is defined as an integer; by default the fields extractedfrom a syslog message are of type string, however type integer changes this to treat the valueas an integer
410

• The constant section is optional, in this example, we have user-defined constants.
• The constant name ifOperStatus is user-defined; in this case it has the integer value of '2'
• Filter configuration is optional for a structured syslog, though you can do so if desired; if used, thefilter-generated fields will override the fields included in the syslog message.
• The key fields section is optional; by default the hostname and event ID will be the keys used byParagon Insights; add additional key fields here; in this example, we have key-fields, namelyinterface-name, where the name and value are extracted from the syslog message’s attribute-valuepair
For unstructured syslog:
• The event ID is user defined. In this case, it is PSEUDO_FPC_DOWN
• For example, neither the unstructured syslog Nov 22 02:27:05 R1 fpc1 Marking ports down nor itsstructured counterpart <166>1 2019-11-22T02:38:23.132-08:00 R1 - - - - fpc1 Marking ports down includesan event ID.
• A filter must be used to derive fields (unlike proper structured syslog); this example uses fpc%{NUMBER:fpc} Marking ports %{WORD:port-status}, where fpc becomes the field name and NUMBER denotesthe syntax used to extract the characters out of that particular portion of the message, for example“2”.
• An example of a syslog message that matches the grok filter is “fpc2 Marking ports down”.
• Constant fpc-status - has a string value of ‘online’.
Regarding filters:
• By default in a pattern, field and constant values are a string; to treat it as an integer or float, definethe pattern’s field type as integer or float.
• For unstructured patterns, you must configure a filter as the messages are sent essentially as plaintext and don’t include field info on their own.
• Filters should always be written to match the portion of message after the event ID; this allows thefilter to parse a syslog message irrespective of whether it arrives in unstructured or structuredformat.
• For example, the filter fpc%{NUMBER:fpc} Marking ports %{WORD:port-status} matches both versions of thefollowing syslog message:
• Structured: <166>1 2019-11-22T02:38:23.132-08:00 R1 - - - - fpc1 Marking ports down
• Unstructured: Nov 22 02:27:05 R1 fpc1 Marking ports down
411

Add Patterns to a Pattern Set
With the patterns configured, group them into a pattern set.
1. On the Syslog Settings page, scroll down and click the add pattern set button (+ Add Pattern Set).
2. In the pop-up window that appears, enter the following parameters:
3. Click Save & Deploy. On the Syslog Settings page you should see the pattern set you just created.
Configure Header Pattern
In Paragon Insights, you can configure the pattern for parsing the header portion of a syslog message.With this release, unstructured syslog messages of non-Juniper devices are supported. In earlierreleases, you can only parse the payload portion of either a structured syslog message as specified inRFC 5424 standard, or a Juniper device’s unstructured syslog message.
In general, it is assumed that any unstructured syslog message matches the Juniper syslog messagepattern. For example, you do not have to configure a Juniper header pattern as this pattern is inbuiltwith Paragon Insights. However, in case of a non-Juniper device’s unstructured syslog message that doesnot match with the inbuilt pattern, a first match is made with one of the user-configured headerpatterns. Following a successful match, the fields are extracted. When there is no match, the incomingsyslog message is dropped.
To configure a header pattern:
1. Navigate to Configuration > Sensor > Settings in the left navigation bar.
The Ingest Settings page is displayed.
2. Click Syslog to view the Syslog Settings page.
3. Click the Header Pattern tab.
The Header Pattern section of the Syslog Setting page is displayed. You can add a new headerpattern and edit or delete an existing header pattern from this page.
4. Click + to add a new header.
The Add Header Pattern page is displayed.
5. Enter the following information in the Add Header Pattern page.
a. Enter a name for the header pattern in the Name field.
412
b. Enter a description for the header pattern in the Description field.
For example, you can provide a one-line description of why you are creating this header pattern.
c. Enter the filter or regular expression (regex) for the header patter in the Filter field.
NOTE: You can use regex101.com to edit, validate, and modify the filter pattern you wantto add to the header pattern.
An example of a filter pattern is (.*):([A-Z][a-z]{2} \d{1,2} \d{1,2}:\d{1,2}:\d{1,2}\.\d*)\s:\s([a-z]*)\[(\d*)\]:\s*(.*)\s*.
d. log-host, log-timestamp, and log-message-payload of the Fields section are mandatory fields thatdetermine the position of the header.
In the Fields section,
i. Click log-host, and enter the following information.
• Enter a name for the log host in the Name field.
log-host is the default name.
• Enter a description for log-host in the Description field.
The default description is Position of host name.
• Enter the capture group value with prefix $ in the From field.
The capture group determines from which position in the header the log-host starts.
ii. Click log-timestamp, and enter the following information.
• Enter a name for the log timestamp in the Name field.
log-timestamp is the default name.
• Enter a description for log-timestamp in the Description field.
The default description is Position of time stamp.
• Enter the capture group value with prefix $ in the From field.
The capture group determines from which position in the header the log-timestampstarts.
413
NOTE: Ensure that timestamp format follows this sample timestamp format: “Jan _215:04:05 2006”. Otherwise parsing of syslog messages will lead to an undefinedbehavior.
iii. Click log-message-payload, and enter the following information.
• Enter a name for the log message payload in the Name field.
log-message-payload is the default name.
• Enter a description for log-message-payload in the Description field.
The default description is Position of payload.
• Enter the capture group value with prefix $ in the From field.
The capture group determines from which position in the header the log-message-payload starts.
iv. (Optional) Click Add Field to add a new field.
• Enter a name for the new field in the Name field.
• Enter a description for the new field in the Description field.
• Enter the capture group value with prefix $ in the From field.
The capture group determines from which position in the header the new field starts.
You can add one or more than one fields by clicking Add Field.
6. Enter the name(s) of key fields in the Key Fields field.
7. Click Save to save configuration, or click Save & Deploy to save and immediately deploy theconfiguration.
Alternatively, to cancel the configuration, click Cancel.
Edit a Header Pattern
To edit an already configured header pattern:
1. Navigate to Configuration > Sensor > Settings in the left navigation bar.
The Ingest Settings page is displayed.
2. Click Syslog to view the Syslog Settings page.
3. Click the Header Pattern tab.
The Header Pattern section of the Syslog Setting page is displayed.
414

4. Select the header pattern you want to edit by selecting the check box next to the name of the headerpattern, and click the Edit Header Pattern icon.
The Edit <Header Name> page is displayed.
5. After you have edited the required fields, click Save to save configuration.
You can also click Save & Deploy to save and immediately deploy the edited configuration.
Clone a Syslog Pattern
To clone an existing Syslog pattern:
1. Click Configuration > Sensor > Settings in the left-navigation bar.
The Ingest Settings page is displayed.
2. Click the Syslog tab to view the Syslog Settings page.
3. Click the Pattern tab in the Syslog Settings page to view existing syslog patterns.
4. To clone a pattern, click the Clone icon as show in Figure 28 on page 415.
Figure 28: Clone a Syslog Pattern
The Clone Pattern: <name of syslog pattern> page is displayed.
From the Clone Pattern: <name of syslog pattern> page, you can
• Edit existing fields
• Add new fields or constants
• Add or remove key fields
415

5. Click Save to save configuration and clone the syslog pattern.
Alternatively, click Save & Deploy to save configuration, clone syslog pattern, and deploy the pattern.
Clone a Pattern Set
To clone an existing Syslog pattern set:
1. Click Configuration > Sensor > Settings in the left navigation bar.
The Ingest Settings page is displayed.
2. Click the Syslog tab to view the Syslog Settings page.
3. Click the Pattern-Set tab in the Syslog Settings page to view existing syslog pattern sets.
4. To clone a pattern set, click the Clone icon as show in Figure 29 on page 416.
Figure 29: Clone a Syslog Pattern Set
The Clone Pattern-set: <name of pattern-set> page is displayed.
From the Clone Pattern-set: <name of pattern-set> page, you can
• Edit the name and description fields
• Add or remove patterns from the Patterns field.
5. Click Save to save configuration and clone the syslog pattern set.
Alternatively, click Save & Deploy to save configuration, clone syslog pattern set, and deploy thepattern set.
416
Configure Multiple Source IP Addresses for a Device
You can add additional source IP addresses for devices that send syslog messages using a differentsource IP address than the one originally configured in the Paragon Insights GUI.
To support additional source IP addresses:
1. Go to the Configuration > Devices page and click on the name of a device.
2. Click the Edit (Pencil) icon.
The Edit Device-Name page appears.
3. Click Device ID Details and enter the IP address(es) in the Syslog Source IPs field.
RELATED DOCUMENTATION
Sensors Overview | 338
System Log Optional Configurations
IN THIS SECTION
Configure Syslog Ports | 417
Configure Syslog Time Zone | 418
Configure Host Name Aliases for a Device | 418
Configure Syslog Ports
By default, Paragon Insights listens for system log (syslog) messages from all device groups on UDP port514. You can change the system-level syslog port, as well as configure one or more ports per devicegroup. The more specific device group setting takes precedence over the system level setting.
To change the system-level syslog port:
1. Click Configuration > Sensor > Settings in the left navigation bar.
2. Select the Syslog tab on the left side of the page.
3. On the Syslog Settings page, edit the port number.
4. Click Save & Deploy.
417
To configure a syslog port for a device group:
1. Go to the Configuration > Device Group page and click on the name of a device group.
2. Click the Edit (Pencil) icon.
3. In the Edit Device Group window, click Advanced > Ports caret.
4. Enter the port(s) in the Syslog Ports field.
5. Click Save & Deploy.
Configure Syslog Time Zone
When a device exports structured syslog messages, time zone information is included within themessage. However, unstructured syslog messages do not include time zone information. By default,Paragon Insights uses GMT as the time zone for a device. In these cases, you can assign a time zone to adevice or device group within Paragon Insights.
To configure a device’s time zone at the device level:
1. Go to the Configuration > Devices and click on the name of a device in the Device page.
2. Click the Edit (Pencil) icon.
The Edit Device-Name page appears.
3. Click Advanced drop-down menu and enter a value in the Syslog Time Zone field in the format +/-hh:mm. For example, -05:00.
Configure Host Name Aliases for a Device
When a device has more than one host name, such as a device with dual REs, syslog messages can arriveat the Paragon Insights server with a host name that is not the device’s main host name. In these cases,you can add host name aliases for that device.
NOTE: If you add a device in Paragon Insights using its IP address, you must also add the hostname that will appear in the syslog messages.
To configure additional hostname aliases:
1. Go to the Configuration > Device page and click on the name of a device.
2. Click the Edit (Pencil) icon.
The Edit Device-Name page appears.
3. Click Device ID Details and enter the host name(s) in the Syslog Host Names field.
418
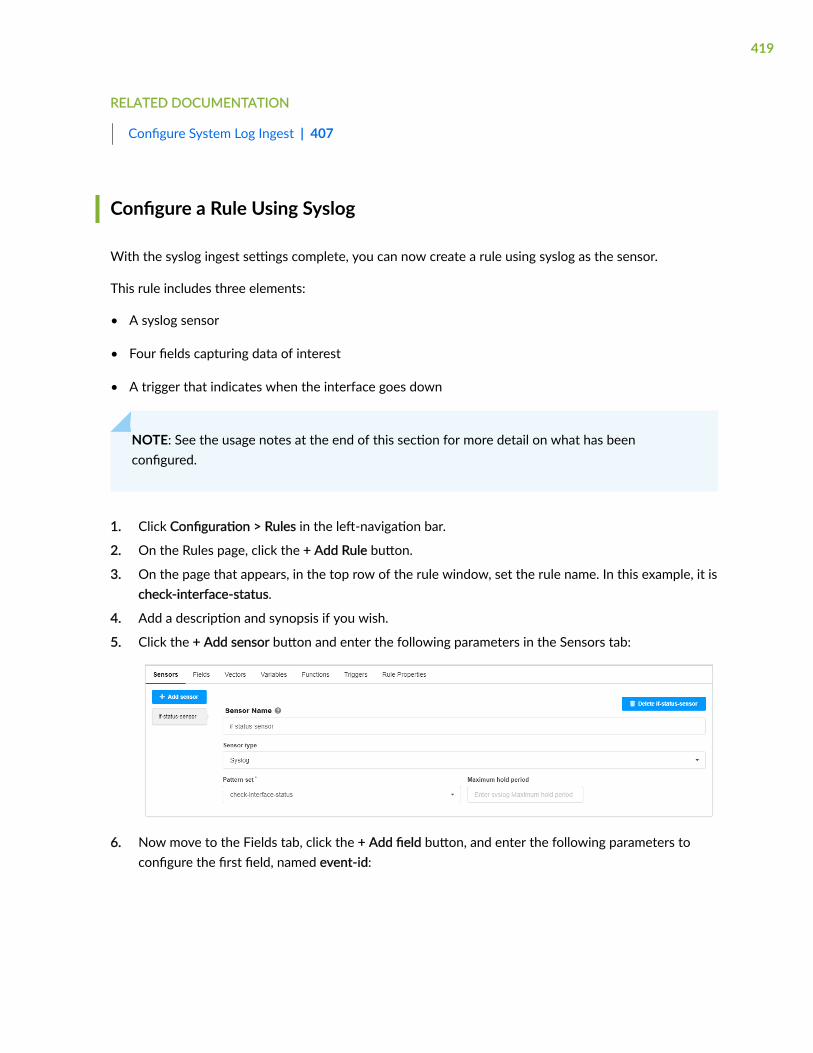
RELATED DOCUMENTATION
Configure System Log Ingest | 407
Configure a Rule Using Syslog
With the syslog ingest settings complete, you can now create a rule using syslog as the sensor.
This rule includes three elements:
• A syslog sensor
• Four fields capturing data of interest
• A trigger that indicates when the interface goes down
NOTE: See the usage notes at the end of this section for more detail on what has beenconfigured.
1. Click Configuration > Rules in the left-navigation bar.
2. On the Rules page, click the + Add Rule button.
3. On the page that appears, in the top row of the rule window, set the rule name. In this example, it ischeck-interface-status.
4. Add a description and synopsis if you wish.
5. Click the + Add sensor button and enter the following parameters in the Sensors tab:
6. Now move to the Fields tab, click the + Add field button, and enter the following parameters toconfigure the first field, named event-id:
419
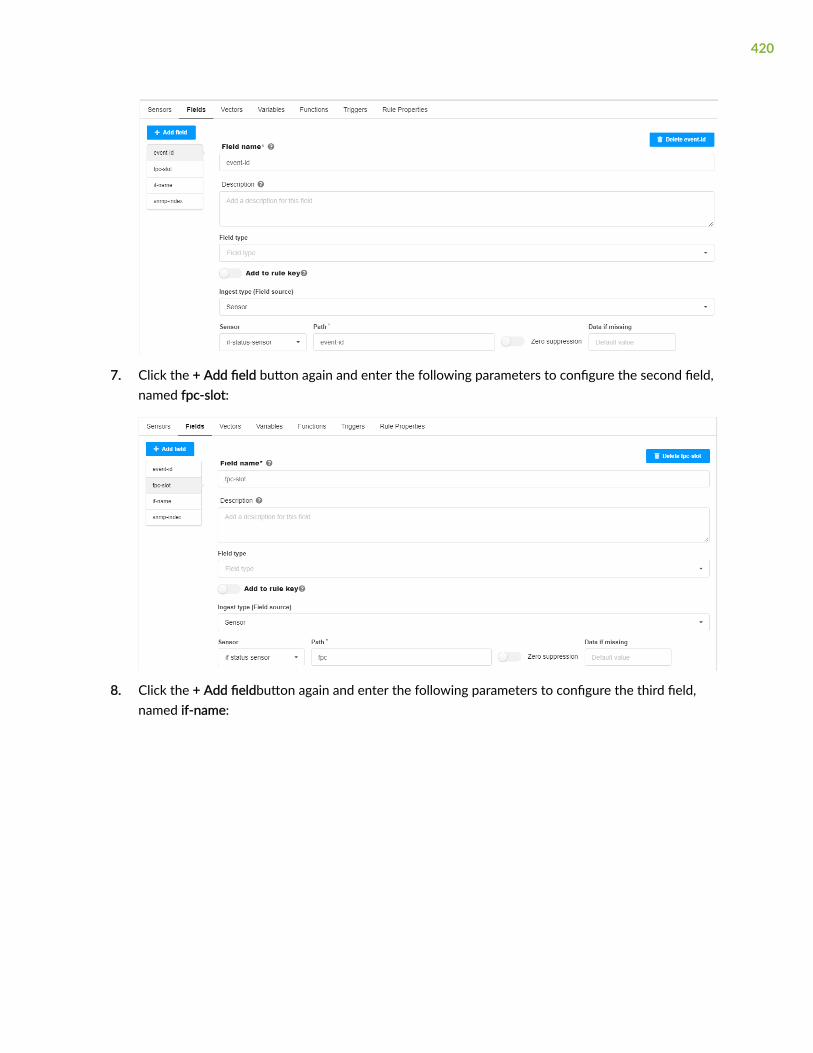
7. Click the + Add field button again and enter the following parameters to configure the second field,named fpc-slot:
8. Click the + Add fieldbutton again and enter the following parameters to configure the third field,named if-name:
420

9. Click the + Add field button once more and enter the following parameters to configure the fourthfield, named snmp-index:
10. Now move to the Triggers tab, click the + Add trigger button, and enter the following parameters toconfigure a trigger named link-down:
421

11. At the upper right of the window, click the + Save & Deploy button.
Usage Notes for the rule
• Sensor tab
422
• The sensor name if-status-sensor is user-defined.
• The sensor type is syslog.
• Pattern set check-interface-status - it is assumed that the pattern set is configured earlier.
• If not set, the Maximum hold period defaults to 1s.
• Fields tab
• Four fields are defined; although the patterns are capturing more than four fields of data, thisexample defines four fields of interest here; these fields are used in the trigger settings.
• The field names (event-id, fpc-slot, if-name, snmp-index) are user-defined.
• path event-id - default field created by syslog ingest in the raw table; references the field from thepattern configuration.
• path fpc - references the value from the filter used in the unstructured pattern configuration.
• path if-name - refers to the interface name field from the pattern configuration. See "ConfigureSystem Log Ingest" on page 407.
• Data if missing all interfaces - if the if-name value is not included in the syslog message, usethe string value “all interfaces”.
• path snmp-index - references the field from the pattern configuration.
• Triggers tab
• The trigger name link-down is user-defined.
• frequency 2s - Paragon Insights checks for link-down syslog messages every 2 seconds
• term is-link-down - when $event-id is like SNMP_TRAP_LINK_DOWN, in any syslog message inthe last 300 seconds, make red and show the message Link down for $if-name(snmp-id: $snmp-index).
• $event-id - $ indicates to reference the rule field event-id.
• Link down for $if-name(snmp-id: $snmp-index) - for example, “Link down for ge-2/0/0 of FPC2”.
• $if-name - references the field value, i.e., the name of the interface in the syslog message.
• term is-fpc-down - when $event-id is like PSEUDO_FPC_DOWN, in any syslog message in thelast 300 seconds, make red and show the message Link down for $if-name of FPC$fpc-slot.
• $event-id - $ indicates to reference the rule field event-id.
423

• $if-name - “all interfaces”.
• Link down for $if-name of FPC$fpc-slot - for example, “Link down for all interfaces of FPC 2”.
RELATED DOCUMENTATION
Configure System Log Ingest | 407
System Log Optional Configurations | 417
About the Sensor Diagnostics Page
Paragon Insights supports four verification and troubleshooting features:
• Paragon Insights Self Test — To know how to run the test, see "Use the Self Test Tool" on page 426.
• Device Reachability Test — To know how to run the test, see "Use the Reachability Test" on page 428.
• Ingest Connectivity Test — To know how to run the test, see "Use the Ingest Test Tool" on page 429.
• Debug No-Data — To know how to run the test, see "Use the No-Data Tool" on page 430
ParagonInsights SelfTest
The self-test tool validates the core functionality of Paragon Insights. To perform theself test, the tool performs a typical set of tasks:
• Adds a simulated device to Paragon Insights
• Creates a device group, and adds the device
• Creates a rule
• Creates and deploys a playbook
• Streams data from the simulated device
• Displays ongoing status in the dashboard
The self-test instance essentially acts as a fully working setup, running entirely withinthe Paragon Insights system. When testing is complete, the tool provides a report. Inaddition to validating the Paragon Insights installation, the self-test feature alsoprovides:
424

• An easy way to do a quick demo - the self test instance provides a simulated deviceconnected to Paragon Insights, so you can demo Paragon Insights with no need toadd a real device or apply playbooks.
• A good way for new users to get started - the self test auto-configures a simulateddevice connected to Paragon Insights, thereby eliminating the complexity of addingdevices, applying playbooks, and so on.
• A ‘running reference’ - if there is an issue with real devices, you can use a self-testinstance to help determine where the issue is; if the self-test instance is OK thenthe problem is not with the Paragon Insights system.
DeviceReachabilityTest
Earlier, you would need to get through the entire setup procedure - add the device,setup a device group, apply playbooks, monitor devices - at which point the healthpages would indicate “no data” indicating that the setup did not work correctly. But,“no data” does not indicate whether the problem is a reachability issue or datastreaming issue.
In Paragon Insights, the device reachability tool can verify connectivity to a device. Thetool performs tests using ping and SSH. Paragon Insights uses the device’s IP addressor host name, based on what was configured when adding the device.
IngestConnectivityTest
The ingest connectivity tool can verify ingest methods where Paragon Insights initiatesthe connection, such as OpenConfig, iAgent, and SNMP. Paragon Insights does not testUDP-based ingest methods, such as syslog and Native GPB, as the UDP parameters arecommon to a device group and not specific to a device. This tool provides multiplebenefits such as:
• Helps to identify when there might be missing configuration on the network deviceside.
• Helps you choose appropriate playbooks and rules that use sensors compatible withthe supported ingest methods.
• Helps to identify ingest connectivity issues early on, rather than troubleshoot the“no-data” issue described in the previous section.
Paragon Insights validates each supported ingest method in its own way:
• OpenConfig: Establishes a gRPC connection with the device using its IP/host name,gRPC port, and credentials
• iAgent: Establishes a NETCONF session with the device using its IP/host name,NETCONF port, and credentials
425

• SNMP: Executes a simple SNMP GET command; expects to get a reply from thedevice
Debug No-Data
The debug no-data tool helps to determine why a device or rule is showing a status of“no-data”. The tool takes a sequential, step-by-step approach to determine at whichstage incoming data is getting dropped or blocked, as follows:
• Paragon Insights Services — Verify that all common and device group-relatedservices are up and running
• Device Reachability — Test connectivity to device using ping and SSH
• Ingest Connectivity — Verify that the configured ingest session is established
• Raw Data Streaming — Verify whether the ingest is receiving any raw data from thedevices
• Field Processing — Within rules, verify that the fields working properly, and that thefield information is populated in the database
• Trigger Processing — Within rules, verify that the trigger settings working asintended, and status information is populated in the database
• API Verification — Check for API timeouts that might be affecting the GUI
RELATED DOCUMENTATION
Sensors Overview | 338
Use the Self Test Tool
You can refer to the following usage notes to get a better understanding of the features in the self-testtool.
• Currently this feature supports simulating devices to stream data for OpenConfig telemetry andiAgent (NETCONF).
• You can retain the self-test instance to act as a ‘running reference’, as noted above.
• The color coding for the test results is as follows:
• Green = pass
426
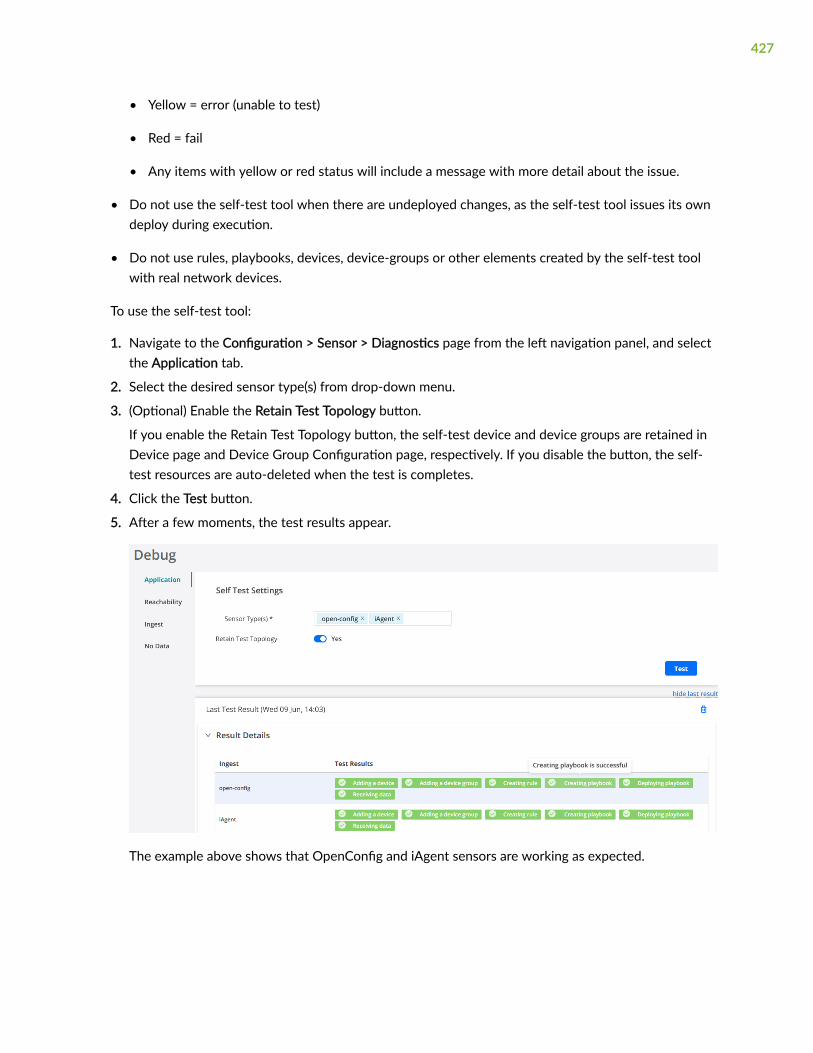
• Yellow = error (unable to test)
• Red = fail
• Any items with yellow or red status will include a message with more detail about the issue.
• Do not use the self-test tool when there are undeployed changes, as the self-test tool issues its owndeploy during execution.
• Do not use rules, playbooks, devices, device-groups or other elements created by the self-test toolwith real network devices.
To use the self-test tool:
1. Navigate to the Configuration > Sensor > Diagnostics page from the left navigation panel, and selectthe Application tab.
2. Select the desired sensor type(s) from drop-down menu.
3. (Optional) Enable the Retain Test Topology button.
If you enable the Retain Test Topology button, the self-test device and device groups are retained inDevice page and Device Group Configuration page, respectively. If you disable the button, the self-test resources are auto-deleted when the test is completes.
4. Click the Test button.
5. After a few moments, the test results appear.
The example above shows that OpenConfig and iAgent sensors are working as expected.
427
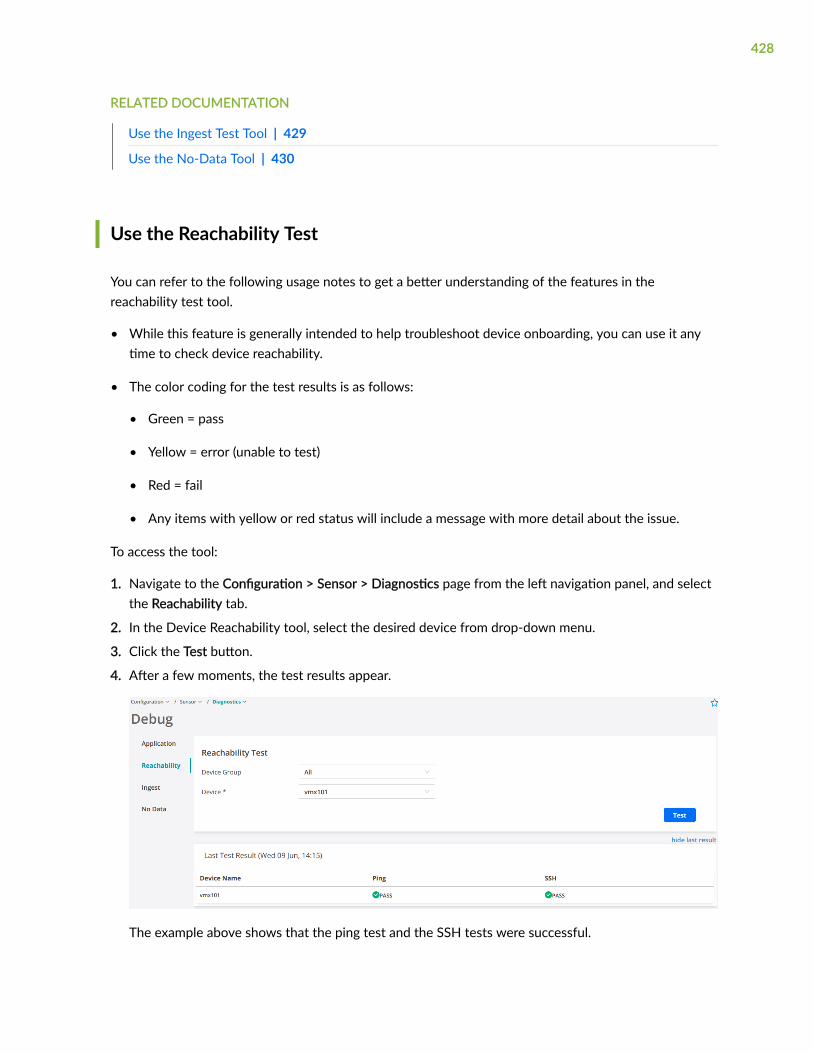
RELATED DOCUMENTATION
Use the Ingest Test Tool | 429
Use the No-Data Tool | 430
Use the Reachability Test
You can refer to the following usage notes to get a better understanding of the features in thereachability test tool.
• While this feature is generally intended to help troubleshoot device onboarding, you can use it anytime to check device reachability.
• The color coding for the test results is as follows:
• Green = pass
• Yellow = error (unable to test)
• Red = fail
• Any items with yellow or red status will include a message with more detail about the issue.
To access the tool:
1. Navigate to the Configuration > Sensor > Diagnostics page from the left navigation panel, and selectthe Reachability tab.
2. In the Device Reachability tool, select the desired device from drop-down menu.
3. Click the Test button.
4. After a few moments, the test results appear.
The example above shows that the ping test and the SSH tests were successful.
428
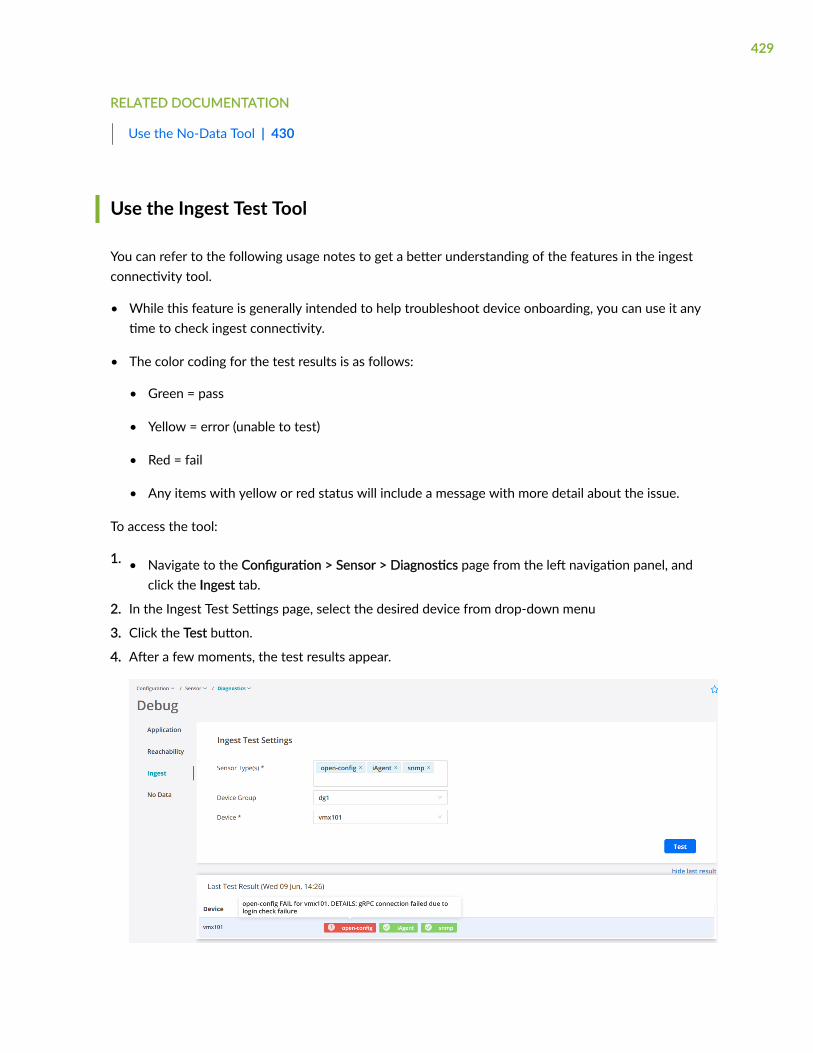
RELATED DOCUMENTATION
Use the No-Data Tool | 430
Use the Ingest Test Tool
You can refer to the following usage notes to get a better understanding of the features in the ingestconnectivity tool.
• While this feature is generally intended to help troubleshoot device onboarding, you can use it anytime to check ingest connectivity.
• The color coding for the test results is as follows:
• Green = pass
• Yellow = error (unable to test)
• Red = fail
• Any items with yellow or red status will include a message with more detail about the issue.
To access the tool:
1. • Navigate to the Configuration > Sensor > Diagnostics page from the left navigation panel, andclick the Ingest tab.
2. In the Ingest Test Settings page, select the desired device from drop-down menu
3. Click the Test button.
4. After a few moments, the test results appear.
429

The example above shows that iAgent and SNMP ingests are working well but gRPC connection fromOpenConfig ingest failed due to login check errors.
RELATED DOCUMENTATION
Use the Self Test Tool | 426
Use the No-Data Tool
You can refer to the following usage notes to get a better understanding of the features in the no-datatool.
• The tool runs through the entire sequence of checks, regardless of any issues along the way.
• The test results provide root cause information and advise where to focus your troubleshootingefforts.
• While this feature is generally intended to debug a device when it is marked as no-data, you can useit any time to verify that deployed rules are receiving data.
• This tool does not support rules using a syslog sensor, as the sensor data is event driven and notperiodic.
• The color coding for the test results is as follows:
• Green = pass
• Yellow = error (unable to test)
• Red = fail
• Any items with yellow or red status will include a message with more detail about the issue.
To access the tool:
1. • On any topic in network health page, click a “no data” tile.
430

• Or, navigate to the Configuration > Sensor > Diagnostics page from the left navigation panel, andselect the No Data tab.
2. In the No Data Settings page, select the desired device group, device, topic, and one or more rulesfrom the drop-down menu.
Only device, device group, and topic name are mandatory criteria. Rules are optional.
3. Click the Test button.
4. After a few moments, the test results appear.
The example above shows that all criteria are working as expected.
RELATED DOCUMENTATION
About the Network Health Page | 605
Paragon Insights Tagging Overview
IN THIS SECTION
Tagging Profile Terminology | 432
How do Tagging Profiles Work? | 436
Caveats | 438
431
You can use the Paragon Automation graphical user interface (GUI) to create tagging profiles. You canconfigure a tagging profile to insert fields, values, and keys into a Paragon Insights rule. You can also setconditions that are checked against values stored in the times series database (TSDB) or Redis database.
Paragon Insights supports the following types of tagging:
• Static Tagging
In static tagging, the tagging profile is applied to values stored in the time series data base (TSDB).These values do not vary a lot with time. In static tagging, you can avoid using When statements, andyou can add Then statements individually to a row of the TSDB. You can add tags to all rows since noconditions are present.
• Dynamic Tagging
In dynamic tagging, conditions used in Paragon Insights tagging are checked against values that arestored in Redis database. This database acts like a cache memory that stores dynamic data. Dynamicdata is real-time data that is stored in Redis database.
For more information on tagging, see "Types of Tagging" on page 439.
Tagging Profile Terminology
The following list describes the tagging profile terminologies:
Policy
A policy is the top-level element in a tagging profile. You can add multiple policies within a single taggingprofile. Multiple policies that exist within a tagging profile can have their own rules and terms.
Usage Notes:
• Defining multiple policies within a single profile allows you to define terms for each rule in one profilerather than having to create one profile for each rule.
Rules
A rule is any defined Paragon Insights rule. The rule element type in a tagging profile is a list element.You can apply a specific policy profile to the rule(s) ([rule1, rule2]) included within the tagging profile.
Usage Notes:
You can describe the topic-name/rule-name requirement for the rules element in the following ways:
• To name specific rules within a tagging profile, use the form: topic-name/rule-name.
432
For example, protocol.bgp/check-bgp-advertised-routes. Navigate to Configuration>Rules to viewconfigured rules.
• Use an asterisk (*) with no other value or brackets to match all rules.
• Use python-based fnmatch patterns to select all rules within a specific topic. For example, line-cards/*.
For more information, see fnmatch — Unix filename pattern matching.
Terms
The term section of the tagging profile is where the match conditions are set and examined, and actionsbased on those matches are set and carried out. Set the conditions for a match in a when statement. Setthe actions to be carried out upon completing a match in one or more then statements.
Usage Notes:
• Each term can contain a when statement but it is not mandatory.
• Each term must contain at least one then statement.
• Multiple terms can be set within a single policy.
• Terms are processed sequentially from top to bottom until a match is found. If a match is found,processing stops after completing the statements found in the then section. Other terms, if present,are not processed unless the next flag is enabled within the matched term. If the matched term hasthe next flag enabled, then subsequent terms are processed in order.
When Statements
When statements define the match conditions that you specify. When statements ultimately resolve tobe true or false. You can define a term without a when statement. This equates to a default termwherein the match is assumed true and the subsequent then statement is carried out. Conversely,multiple conditions can be checked within one when statement.
If one or more of the conditions set forth in a when statement are not met, the statement is false andthe term has failed to match; processing moves to the next term, if present.
Usage Notes:
When statements perform boolean operations on the received data to determine if it matches thecriteria you set. The supported operations are:
• Numeric Operations:
• equal-to
433
• not-equal-to
• greater-than
• greater-than-or-equal-to
• less-than
• less-than-or-equal-to
• String Operations:
• matches-with
• does-not-match-with
• Time Operations:
• matches-with-scheduler
NOTE: The matches-with-scheduler option requires that a discreet scheduler be configured in theAdministration > Ingest Settings > Scheduler page. The name of the scheduler can then beused in the matches-with-scheduler when statement
• Go Language Expressions:
• eval <simple-go-expression>
For example: eval a + b <= c.
Then Statements
Then statements implement the tagging instructions that you provide. This is done only after there is acomplete match of the conditions set forth in a when statement contained in the same term. Each termdefined must have at least one then statement. Each then statement must have one or more than oneaction(s) defined; the actions available in then statements are:
add-field
Adds a normal field to the rule(s) listed in the rule section.
Multiple fields can be added within a then statement. The add-field action requires that youalso define the kind of field you are adding with the field-type parameter:
• string
• integer
434
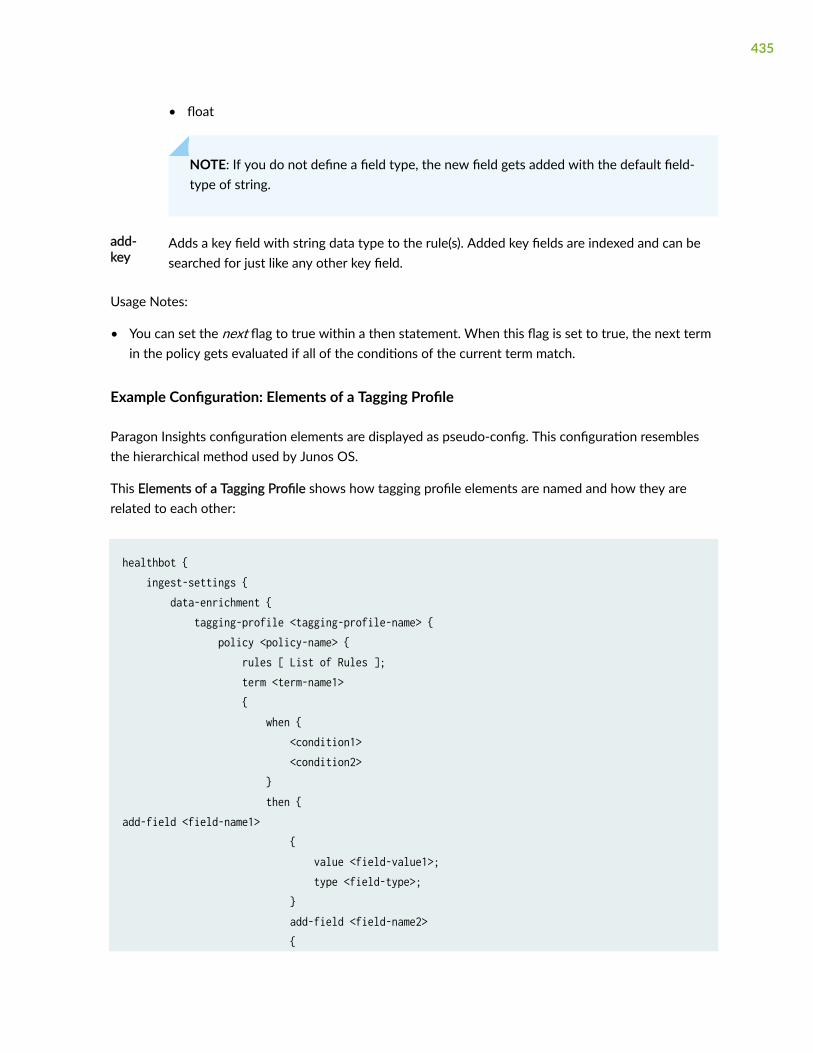
• float
NOTE: If you do not define a field type, the new field gets added with the default field-type of string.
add-key
Adds a key field with string data type to the rule(s). Added key fields are indexed and can besearched for just like any other key field.
Usage Notes:
• You can set the next flag to true within a then statement. When this flag is set to true, the next termin the policy gets evaluated if all of the conditions of the current term match.
Example Configuration: Elements of a Tagging Profile
Paragon Insights configuration elements are displayed as pseudo-config. This configuration resemblesthe hierarchical method used by Junos OS.
This Elements of a Tagging Profile shows how tagging profile elements are named and how they arerelated to each other:
healthbot { ingest-settings { data-enrichment { tagging-profile <tagging-profile-name> { policy <policy-name> { rules [ List of Rules ]; term <term-name1> { when { <condition1> <condition2> } then {add-field <field-name1> { value <field-value1>; type <field-type>; } add-field <field-name2> {
435
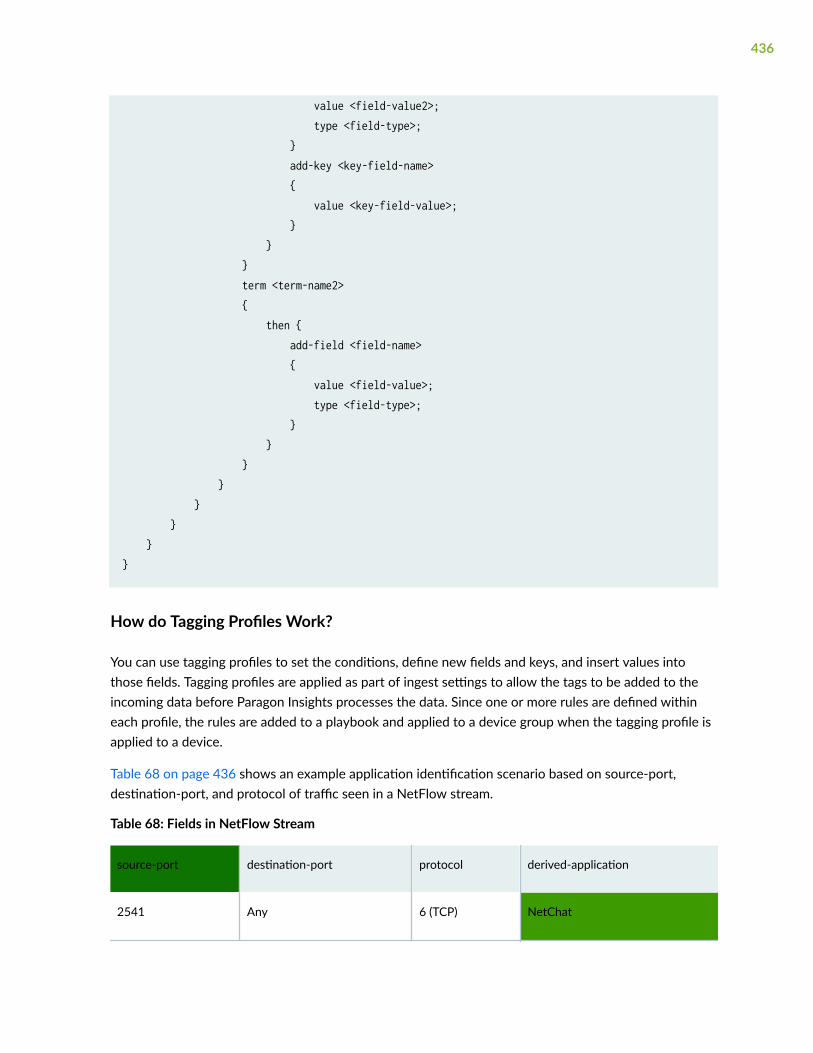
value <field-value2>; type <field-type>; } add-key <key-field-name> { value <key-field-value>; } } } term <term-name2> { then { add-field <field-name> { value <field-value>; type <field-type>; } } } } } } }}
How do Tagging Profiles Work?
You can use tagging profiles to set the conditions, define new fields and keys, and insert values intothose fields. Tagging profiles are applied as part of ingest settings to allow the tags to be added to theincoming data before Paragon Insights processes the data. Since one or more rules are defined withineach profile, the rules are added to a playbook and applied to a device group when the tagging profile isapplied to a device.
Table 68 on page 436 shows an example application identification scenario based on source-port,destination-port, and protocol of traffic seen in a NetFlow stream.
Table 68: Fields in NetFlow Stream
source-port destination-port protocol derived-application
2541 Any 6 (TCP) NetChat
436
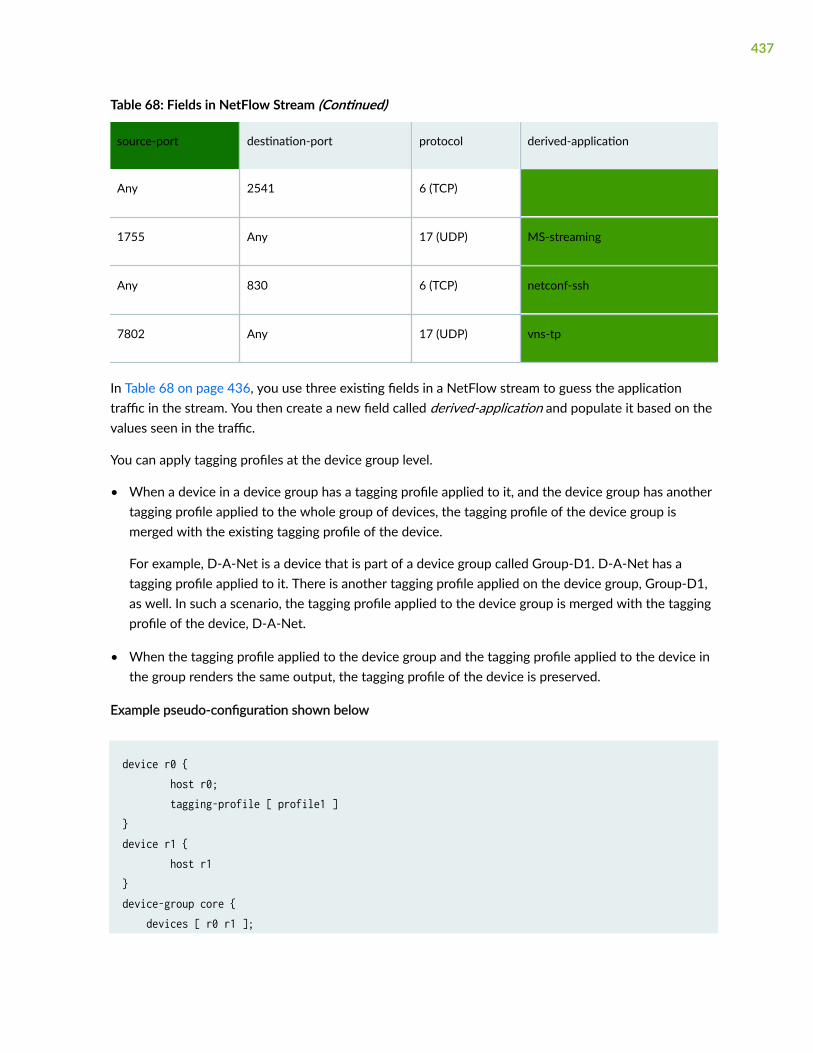
Table 68: Fields in NetFlow Stream (Continued)
source-port destination-port protocol derived-application
Any 2541 6 (TCP)
1755 Any 17 (UDP) MS-streaming
Any 830 6 (TCP) netconf-ssh
7802 Any 17 (UDP) vns-tp
In Table 68 on page 436, you use three existing fields in a NetFlow stream to guess the applicationtraffic in the stream. You then create a new field called derived-application and populate it based on thevalues seen in the traffic.
You can apply tagging profiles at the device group level.
• When a device in a device group has a tagging profile applied to it, and the device group has anothertagging profile applied to the whole group of devices, the tagging profile of the device group ismerged with the existing tagging profile of the device.
For example, D-A-Net is a device that is part of a device group called Group-D1. D-A-Net has atagging profile applied to it. There is another tagging profile applied on the device group, Group-D1,as well. In such a scenario, the tagging profile applied to the device group is merged with the taggingprofile of the device, D-A-Net.
• When the tagging profile applied to the device group and the tagging profile applied to the device inthe group renders the same output, the tagging profile of the device is preserved.
Example pseudo-configuration shown below
device r0 { host r0; tagging-profile [ profile1 ]}device r1 { host r1}device-group core { devices [ r0 r1 ];
437
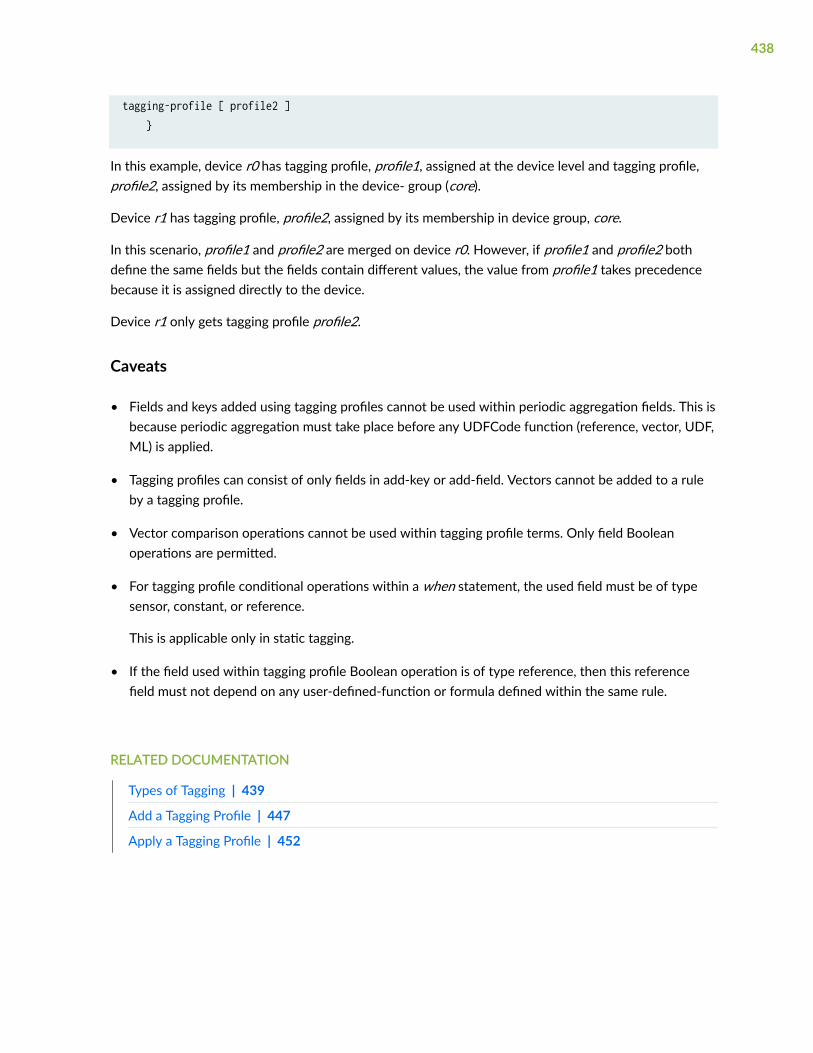
tagging-profile [ profile2 ] }
In this example, device r0 has tagging profile, profile1, assigned at the device level and tagging profile,profile2, assigned by its membership in the device- group (core).
Device r1 has tagging profile, profile2, assigned by its membership in device group, core.
In this scenario, profile1 and profile2 are merged on device r0. However, if profile1 and profile2 bothdefine the same fields but the fields contain different values, the value from profile1 takes precedencebecause it is assigned directly to the device.
Device r1 only gets tagging profile profile2.
Caveats
• Fields and keys added using tagging profiles cannot be used within periodic aggregation fields. This isbecause periodic aggregation must take place before any UDFCode function (reference, vector, UDF,ML) is applied.
• Tagging profiles can consist of only fields in add-key or add-field. Vectors cannot be added to a ruleby a tagging profile.
• Vector comparison operations cannot be used within tagging profile terms. Only field Booleanoperations are permitted.
• For tagging profile conditional operations within a when statement, the used field must be of typesensor, constant, or reference.
This is applicable only in static tagging.
• If the field used within tagging profile Boolean operation is of type reference, then this referencefield must not depend on any user-defined-function or formula defined within the same rule.
RELATED DOCUMENTATION
Types of Tagging | 439
Add a Tagging Profile | 447
Apply a Tagging Profile | 452
438

Types of Tagging
IN THIS SECTION
Static Tagging | 439
Dynamic Tagging | 442
Paragon Insights supports static tagging and dynamic tagging.
Static Tagging
In static tagging, the tagging profile is applied to values stored in the time series data base (TSDB). Thesevalues do not vary a lot with time. In static tagging, you can avoid using When statements, and you canadd Then statements to a tagging profile.
Sample Static Tagging Configuration
healthbot { ingest-settings { data-enrichment { tagging-profile profile { policy policy1 { rules *; term term1 { then { add-key "tenant-id" { value tenant1; } } } } } } }}
439
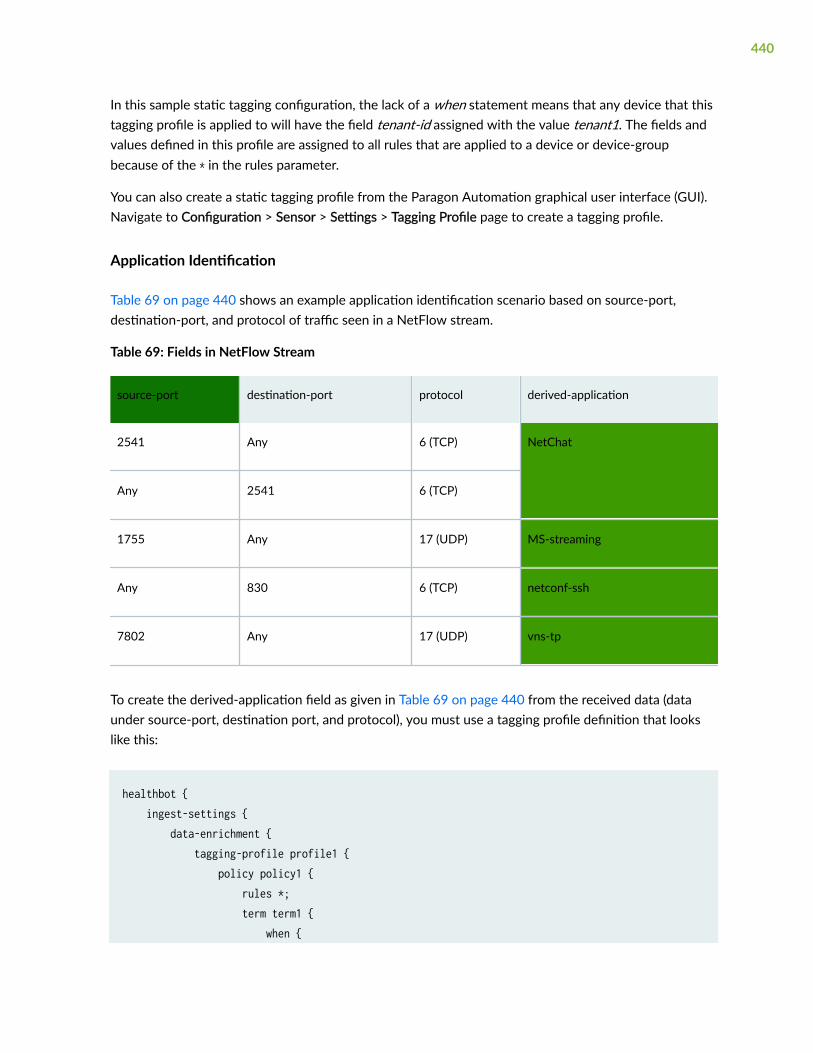
In this sample static tagging configuration, the lack of a when statement means that any device that thistagging profile is applied to will have the field tenant-id assigned with the value tenant1. The fields andvalues defined in this profile are assigned to all rules that are applied to a device or device-groupbecause of the * in the rules parameter.
You can also create a static tagging profile from the Paragon Automation graphical user interface (GUI).Navigate to Configuration > Sensor > Settings > Tagging Profile page to create a tagging profile.
Application Identification
Table 69 on page 440 shows an example application identification scenario based on source-port,destination-port, and protocol of traffic seen in a NetFlow stream.
Table 69: Fields in NetFlow Stream
source-port destination-port protocol derived-application
2541 Any 6 (TCP) NetChat
Any 2541 6 (TCP)
1755 Any 17 (UDP) MS-streaming
Any 830 6 (TCP) netconf-ssh
7802 Any 17 (UDP) vns-tp
To create the derived-application field as given in Table 69 on page 440 from the received data (dataunder source-port, destination port, and protocol), you must use a tagging profile definition that lookslike this:
healthbot { ingest-settings { data-enrichment { tagging-profile profile1 { policy policy1 { rules *; term term1 { when {
440
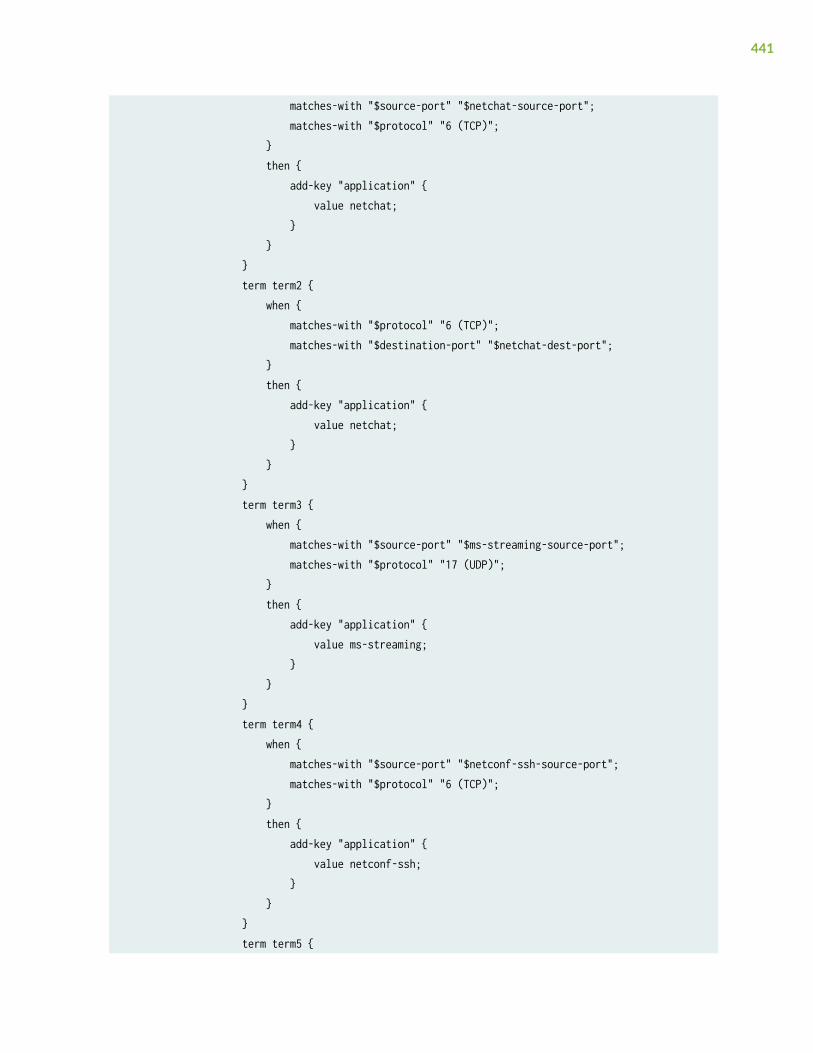
matches-with "$source-port" "$netchat-source-port"; matches-with "$protocol" "6 (TCP)"; } then { add-key "application" { value netchat; } } } term term2 { when { matches-with "$protocol" "6 (TCP)"; matches-with "$destination-port" "$netchat-dest-port"; } then { add-key "application" { value netchat; } } } term term3 { when { matches-with "$source-port" "$ms-streaming-source-port"; matches-with "$protocol" "17 (UDP)"; } then { add-key "application" { value ms-streaming; } } } term term4 { when { matches-with "$source-port" "$netconf-ssh-source-port"; matches-with "$protocol" "6 (TCP)"; } then { add-key "application" { value netconf-ssh; } } } term term5 {
441
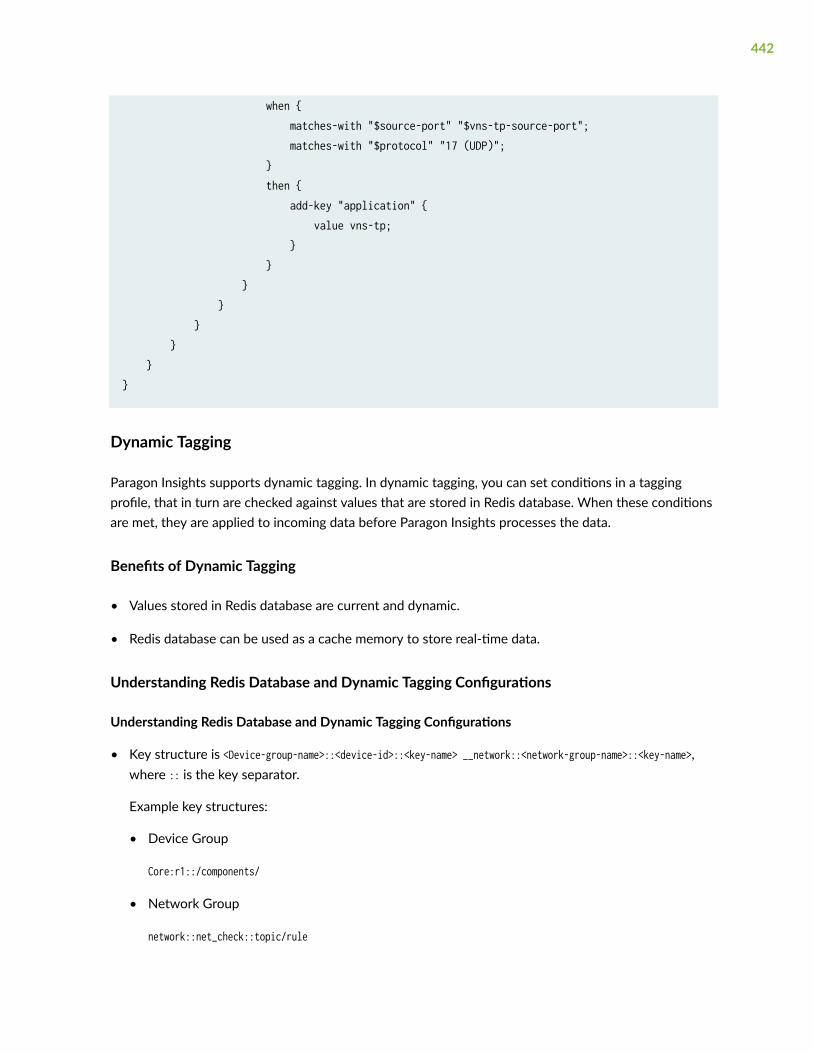
when { matches-with "$source-port" "$vns-tp-source-port"; matches-with "$protocol" "17 (UDP)"; } then { add-key "application" { value vns-tp; } } } } } } }}
Dynamic Tagging
Paragon Insights supports dynamic tagging. In dynamic tagging, you can set conditions in a taggingprofile, that in turn are checked against values that are stored in Redis database. When these conditionsare met, they are applied to incoming data before Paragon Insights processes the data.
Benefits of Dynamic Tagging
• Values stored in Redis database are current and dynamic.
• Redis database can be used as a cache memory to store real-time data.
Understanding Redis Database and Dynamic Tagging Configurations
Understanding Redis Database and Dynamic Tagging Configurations
• Key structure is <Device-group-name>::<device-id>::<key-name> __network::<network-group-name>::<key-name>,where :: is the key separator.
Example key structures:
• Device Group
Core:r1::/components/
• Network Group
network::net_check::topic/rule
442

• Values are stored in JSON string format <json dump as string> in Redis. However, values are provided instring, integer, and float formats.
Example value formats:
• Core:r1::/components/= value1
• Core:r1::/components/='{“key1”: value1, “key2”: value2}’
• Core:r1::/components/='{“key1”: {“key2”: value1, “key3”: value2}’
• Core:r1::/components/='{“key1”: {“key2”: ‘[list of values]’, “key3”: value1}’
• • Sample tagging-profile configurations using when statement.
"when" : { "matches-with" : [ { "left-operand" : "$field1", "right-operand" : “/interfaces/.key1”, “in-memory”: true } ]}
• Use a . operator between interfaces.
In the following example, key3 interface is nested within key2 interface in the right operand.
"when" : { "matches-with" : [ { "left-operand" : "$field1", "right-operand" : “/interfaces/.key2.key3”, } ]}
443
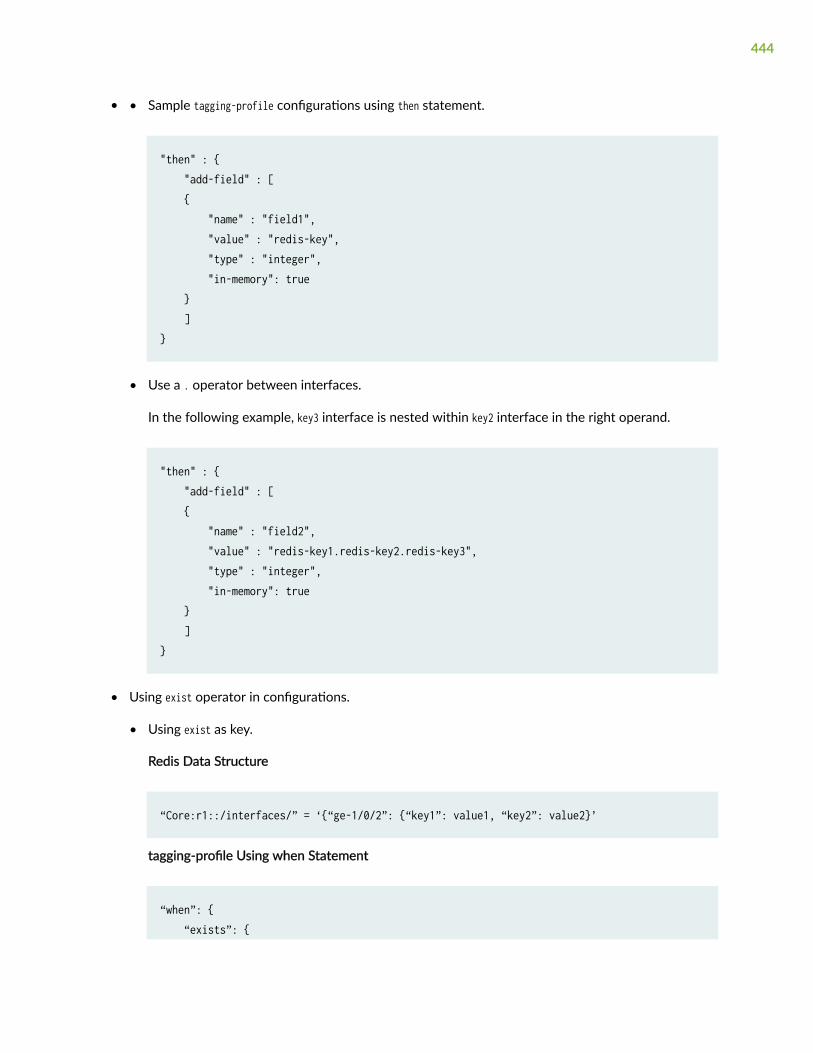
• • Sample tagging-profile configurations using then statement.
"then" : { "add-field" : [ { "name" : "field1", "value" : "redis-key", "type" : "integer", "in-memory": true } ]}
• Use a . operator between interfaces.
In the following example, key3 interface is nested within key2 interface in the right operand.
"then" : { "add-field" : [ { "name" : "field2", "value" : "redis-key1.redis-key2.redis-key3", "type" : "integer", "in-memory": true } ]}
• Using exist operator in configurations.
• Using exist as key.
Redis Data Structure
“Core:r1::/interfaces/” = ‘{“ge-1/0/2”: {“key1”: value1, “key2”: value2}’
tagging-profile Using when Statement
“when”: { “exists”: {
444

“field”: “$interface-name”, “path”: “/interfaces/”, “in-memory”: true }“then”: { do-something.. }
• Using exist as value in list.
Redis Data Structure
“Core:r1::/interfaces/” = ‘{“key1”: {“key2”: [‘ge-1/0/2’, ‘ge-1/0/3’], “key3”: value1}}
tagging-profile Using when Statement
“when”: { “exists”: { “field”: “$interface-name”, “path”: “/interfaces/.key1.key2” , “in-memory”: true }},“then”: { “add-field”: [ “name”: “field1”, “value”: “/interfaces/.key1.key3”, “in-memory”: true ]}
• Using $ in then statements.
When you use $<field-name> within a Redis key, $<field-name> is replaced with a value from the alreadyprocessed database value.
As an example, consider that ge-1/0/2 is present within Redis key.
Redis Data Structure
“Core:r1::/interfaces/” = ‘{“ge-1/0/2”: {“key1”: value1, “key2”: value2}, “ge-1/0/3”: {“key1”: value1, “key2”: value2}’
445

Example tagging -profile
“when”: { “exists”: [{ “field”: “$interface-name”, “path”: “/interfaces/”, “in-memory”: true } ], “greater-than”: [{ “left-operand”: “30”, “right-operand”: “/interfaces/.$interface-name.key1” , “in-memory”: true }]},“then”: { “add-field”: [ “name”: “interface-meta-data”, “value”: “/interfaces/.$interface-name.key2”, “in-memory”: true ]}
In this scenario, the tagging-profile checks if $interface-name is present in the Redis database, and if key1value for the given interface name is greater than 30. If the statement is true, the tagging-profilefetches key2 value from name field. In this example tagging profile, the name value is interface-meta-data.
• To enable dynamic tagging, set in-memory value to true.
By default in-memory value is set to false.
“when”: {“exists”: {“field”: “$interface-name”, “path”: “/interfaces/.key1.key2” , “in-memory”: true}}“then”: {
446

“add-field”: [“name”: “interface-meta-data”, “value”: “/interfaces/.$interface-name.key2”, “in-memory”: true]}
RELATED DOCUMENTATION
Paragon Insights Tagging Overview | 431
Add a Tagging Profile | 447
Apply a Tagging Profile | 452
Add a Tagging Profile
You can use the Paragon Automation graphical user interface (GUI) to add static tagging and dynamictagging profiles.
For more information on tagging, see "Paragon Insights Tagging Overview" on page 431.
Adding a Static Tagging Profile
To add a static tagging profile:
1. Navigate to Configuration > Sensor > Settings.
The Settings page is displayed.
2. Click the Tagging Profile tab and then click (+) icon to add a tagging profile.
The Add Tagging Profile page is displayed.
3. Enter the following information in the Add Tagging Profile page:
a. Enter a name for the tagging profile in the Name text box.
The maximum length is 64 characters.
Regex pattern: “[a-zA-Z][a-zA-Z0-9_-]*”
b. Click Add Policy under Policies to define a policy for this tagging profile.
You can define one or more policies.
The New Policy section is displayed.
i. Enter a name for the new policy in the Policy Name text box.
447

The maximum length is 64 characters.
Regex pattern: “[a-zA-Z][a-zA-Z0-9_-]*”
ii. Enter a rule that you want to apply to this tagging profile. The rule can contain an fnmatchexpression.
You can apply one or more than one rule to a profile. A rule is any defined Paragon Insightsrule.
c. Click Add Term under Terms to define a list of conditions.
The Term: New Term drop-down list is added.
Click the Term: New Term drop-down list to configure the following text boxes.
i. Enter a name for the match condition in the Term Name text box.
ii. Configure When and Then statements.
You can define tagging instructions in a Then statement. After the conditions that you set in aWhen statement are met, the Then statement is implemented. However, When statements are notmandatory in static tagging. A static tagging profile can be configured with just a Thenstatement.
To configure a Then statement:
1. Click Add Keys to add a key to the rules listed.
The Name and Value text boxes are displayed.
• Enter a name for the key in the Name text box.
The maximum length is 64 characters.
Regex pattern: “[a-zA-Z][a-zA-Z0-9_-]*”
This name is added as the key field for all rules configured within the tagging profilerules section.
• Enter a value that you want to associate to the key, in the Valuetext box.
2. Click Add Field to add a field to the rules listed.
The Name and Value text boxes, and the Type drop-down list are displayed.
• Enter the name in the Name text box.
• Enter a value in the Value text box.
• Select the field type from the Type drop-down list.
448

String type is selected by default.
3. Set the Evaluate next term flag to True to evaluate conditions in the next term. Evaluatenext term only if the first condition is satisfied.
By default, the Evaluate next term flag is set to False.
4. Click Save to only save the configuration.
Click Save & Deploy to save and deploy the configuration immediately.
Adding a Dynamic Tagging Profile
To configure a dynamic tagging profile with Redis:
1. Navigate to Configuration > Sensor > Settings.
The Settings page is displayed.
2. Click the Tagging Profile tab and then click (+) icon to add a tagging profile.
The Add Tagging Profile page is displayed.
3. Enter the following information in the Add Tagging Profile page.
a. Enter a name for the tagging profile in the Name text box.
The maximum length is 64 characters.
Regex pattern: “[a-zA-Z][a-zA-Z0-9_-]*”
b. Click Add Policy under Policies to define a policy for this tagging profile.
You can define one or more policies.
The New Policy section is displayed.
i. Enter a name for the new policy in the Policy Name text box.
The maximum length is 64 characters.
Regex pattern: “[a-zA-Z][a-zA-Z0-9_-]*”
ii. Enter a rule that you want to apply to this tagging profile. The rule can contain an fnmatchexpression.
You can apply one or more rules to a profile. A rule is any defined Paragon Insights rule.
c. Click Add Term under Terms to define a list of conditions.
The Term: New Term drop-down is added.
Click the Term: New Term drop-down list to configure the following fields:
449
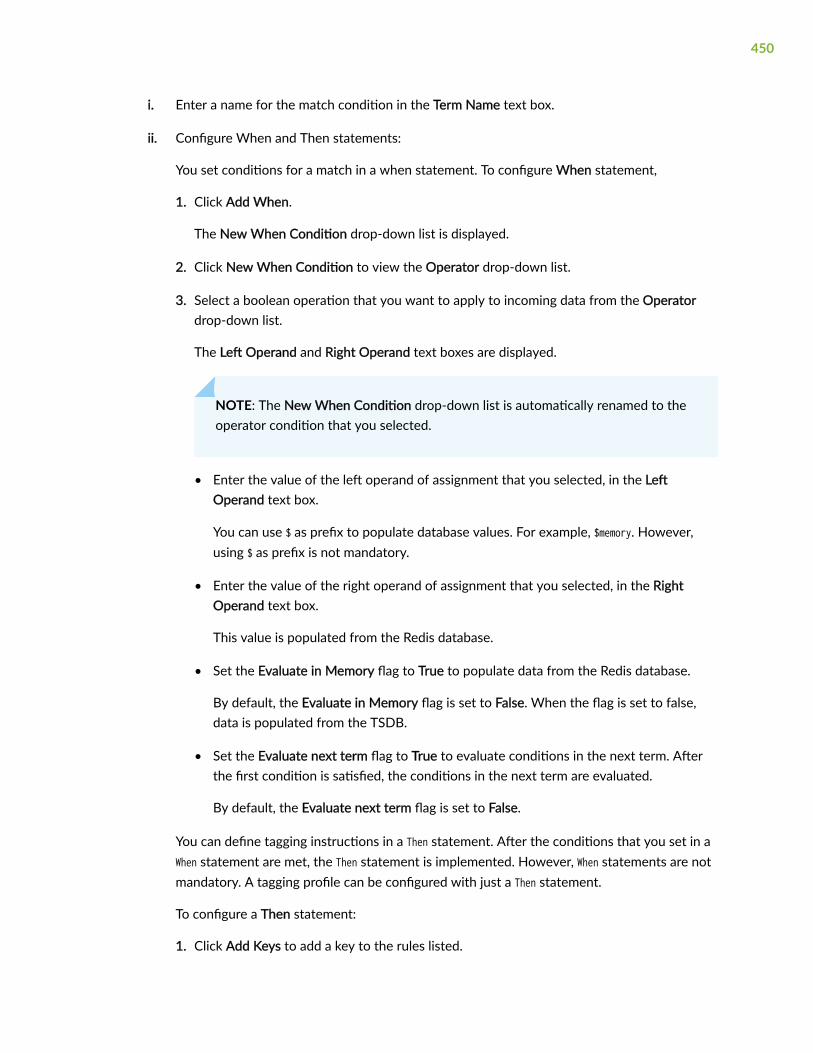
i. Enter a name for the match condition in the Term Name text box.
ii. Configure When and Then statements:
You set conditions for a match in a when statement. To configure When statement,
1. Click Add When.
The New When Condition drop-down list is displayed.
2. Click New When Condition to view the Operator drop-down list.
3. Select a boolean operation that you want to apply to incoming data from the Operatordrop-down list.
The Left Operand and Right Operand text boxes are displayed.
NOTE: The New When Condition drop-down list is automatically renamed to theoperator condition that you selected.
• Enter the value of the left operand of assignment that you selected, in the LeftOperand text box.
You can use $ as prefix to populate database values. For example, $memory. However,using $ as prefix is not mandatory.
• Enter the value of the right operand of assignment that you selected, in the RightOperand text box.
This value is populated from the Redis database.
• Set the Evaluate in Memory flag to True to populate data from the Redis database.
By default, the Evaluate in Memory flag is set to False. When the flag is set to false,data is populated from the TSDB.
• Set the Evaluate next term flag to True to evaluate conditions in the next term. Afterthe first condition is satisfied, the conditions in the next term are evaluated.
By default, the Evaluate next term flag is set to False.
You can define tagging instructions in a Then statement. After the conditions that you set in aWhen statement are met, the Then statement is implemented. However, When statements are notmandatory. A tagging profile can be configured with just a Then statement.
To configure a Then statement:
1. Click Add Keys to add a key to the rules listed.
450
The Name and Value text boxes are displayed.
• Enter a name for the key in the Name text box.
The maximum length is 64 characters.
Regex pattern: “[a-zA-Z][a-zA-Z0-9_-]*”
This name will be added as key field for all rules configured within the tagging profilerules section.
• Enter a value that you want to associate with the key, in the Value text box.
2. Click Add Field to add a text box to the rules listed.
The Name and Value text boxes, and the Type drop-down list are displayed.
• Enter the name in the Name text box.
• Enter a value in the Value text box.
• Select the field type from the Type drop-down list.
String type is selected by default.
3. Set the Evaluate in Memory flag to True to populate data from the Redis database.
By default, the Evaluate in Memory flag is set to False.
4. Set the Evaluate next term flag to True to evaluate conditions in the next term. The nextterm is evaluated only if the first condition is satisfied.
By default, the Evaluate next term flag is set to False.
4. Click Save to only save the configuration.
Click Save & Deploy to save and deploy the configuration immediately.
RELATED DOCUMENTATION
Paragon Insights Tagging Overview | 431
Types of Tagging | 439
Apply a Tagging Profile | 452
451
Apply a Tagging Profile
You can configure a tagging profile to insert fields, values, and keys into a Paragon Insights rule. You canalso set conditions that are checked against values stored in the times series database (TSDB) or Redisdatabase. For more information on configuring a tagging profile, see "Add a Tagging Profile" on page 447.
After you have created a tagging profile from the Paragon Automation graphical user interface (GUI),you can apply a tagging profile to:
• a new device group
• an existing device group
Follow these steps to apply a tagging profile.
To apply a tagging profile to a new device group:
1. Navigate to Configuration > Device Groups.
The Device Group Configuration page is displayed.
2. Click (+) icon to add a new device group.
The Add Device Group page is displayed.
3. Enter the following information in the Add Device Group page.
To create a new device group:
a. Enter a name for the device group in the Name text box.
b. Enter a description for the device group in the Description text box.
c. Select the devices from the Devices drop-down list that you want to add to the device group.
d. Click the Tagging Profiles section and select the tagging profile you want to apply to the device,from the Profiles drop-down list
e. Click Save to only save the configuration.
Click Save & Deploy to save and deploy the configuration immediately.
For more information on adding a device group, see "Add a Device Group" on page 143.
To apply a tagging profile to an existing device group:
1. Navigate to Configuration > Device Groups.
The Device Group Configuration page is displayed.
2. Select the check box next to the name of the device group and click the Edit device group icon.
The Edit Device Group page is displayed.
452

3. Click the Advanced > Tagging Profiles section to view the Profiles drop-down list.
4. Select the tagging profile you want to apply to the device group, from the Profiles drop-down list.
5. Click Save to only save the configuration.
Click Save & Deploy to save and immediately deploy the configuration.
For more information on adding a device group, see "Add a Device Group" on page 143.
RELATED DOCUMENTATION
Paragon Insights Tagging Overview | 431
Types of Tagging | 439
Add a Tagging Profile | 447
Understand User-Defined Actions and Functions
When creating rules, Paragon Insights includes the ability to run user-defined actions (UDAs) as part of atrigger. UDAs are essentially Python scripts that can be configured to be triggered by a Paragon Insightsrule. For example, you might configure a rule with a trigger that reacts to some critical interface goingdown by sending an SMS. You can write the logic to send the SMS in a UDA python script.
Paragon Insights also includes the ability to run user-defined functions (UDFs). Also created as Pythonscripts, UDFs provide the ability to process incoming telemetry data from a device and store theprocessed value in the time-series database for that device/device-group. For example, the device maybe sending FPC temperature in Celsius but you want to process it to be stored as Fahrenheit values inthe database.
The processing of UDF fields is handled by microservices called UDF farm unless, you declare globalvariables in Python scripts. This approach allows for Paragon Insights to process multiple data pointsfrom multiple devices and fields at the same time (parallel processing). The result is a 4 to 5 timesincrease in processing performance for UDA/UDF.
Global Variables in Python Scripts
TAND executes Python scripts that use global variables. Global variables retain a value across multipleUDFs.
453

The following is an example function to calculate cumulative sum and store the value in global variablesum.
sum = 0 def cumulative_sum (a, b): global sum sum = sum + a + b return sum
When you use global variables in Python scripts, the UDFs are processed by TAND instead of UDFfarms.
As an alternative to global variables, you can use the Python construct **kwargs to capture values thatmust be retained across different functions. When Paragon Insights calls a function (defined in a UDF), itsends topic name, rule name, device group, point time, and device ID that are captured using theconstruct **kwargs. In case of UDAs, Paragon Insights sends topic name and rule name while executingthe Python script.
Along with infrastructure values, Paragon Insights also sends a parameter called hb_store in **kwargs thatfetches the last computed value for a variable.
To illustrate how hb_store works in the cumulative addition example:
def sum(a, b, **kwargs): if ’sum’ not in kwargs[hb_store]: kwargs[hb_store][’sum’] = 0 #if ’sum’ is not present in kwargs, declare the initial ’sum’ value as 0.
kwargs[hb_store][’sum’] = kwargs[hb_store][’sum’] + a + b #Store cumulative addition value in ’sum’
return kwargs[hb_store][’sum’]
Each time a function with the above code is called, it performs addition of last stored value in ’sum’ withthe value of a and value of b. The new value of addition operation is displayed and stored in ’sum’.
RELATED DOCUMENTATION
Add a Predefined Rule | 289
454

Modify User-Defined Action and Function Engines
The following section describes how you can modify the UDA/UDF engine in Paragon Insightscommand line interface (CLI). This feature is supported in standalone Paragon Insights versions 2.1.0 andlater and not supported in Paragon Automation Platform 21.1.
You can modify the UDA or UDF engine using the Paragon Insights CLI, as shown below.
user@HB-server:~$ healthbot modify-uda-engine --helpusage: healthbot modify-uda-engine [-h] (-s SCRIPT | --rollback) [--simulate]
optional arguments: -h, --help show this help message and exit -s SCRIPT, --script SCRIPT Run script in UDA engine --rollback, -r Rollback UDA engine to original state --simulate Run script in simulated UDA engine and show output
user@HB-server:~$ healthbot modify-udf-engine --helpusage: healthbot modify-udf-engine [-h] (-s SCRIPT | --rollback) [--simulate] [--service SERVICE]optional arguments: -h, --help show this help message and exit -s SCRIPT, --script SCRIPT Run script in UDF engine --rollback, -r Rollback UDF engine to original state --simulate Run script in simulated UDF engine and show output --service SERVICE Modify specific service UDF
The commands have three main options:
• Simulate—test a script (and view its output) in the simulated UDA/UDF engine environment withoutaffecting the running Paragon Insights system
• Modify—modify the actual UDA/UDF engine using a script
• Rollback—revert to the original version of the UDA/UDF engine
Usage Notes
• The bash script will run in a container running Ubuntu OS Release 16.04 or 18.04; write the scriptaccordingly.
455
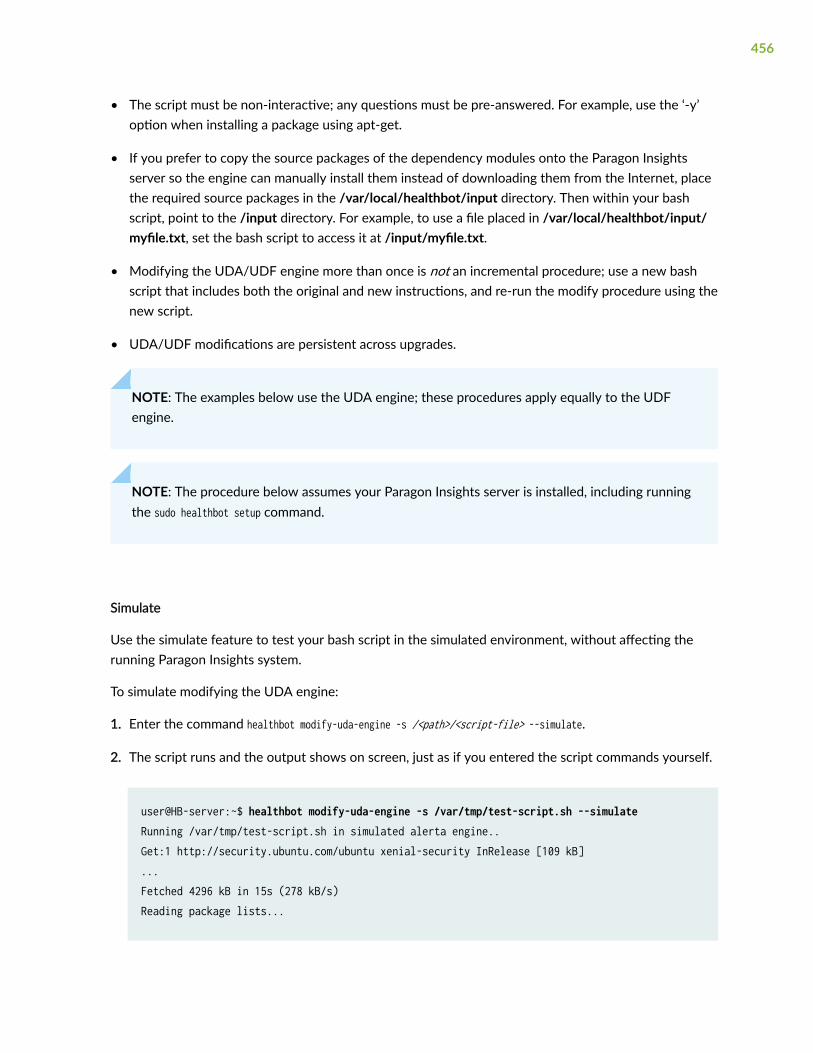
• The script must be non-interactive; any questions must be pre-answered. For example, use the ‘-y’option when installing a package using apt-get.
• If you prefer to copy the source packages of the dependency modules onto the Paragon Insightsserver so the engine can manually install them instead of downloading them from the Internet, placethe required source packages in the /var/local/healthbot/input directory. Then within your bashscript, point to the /input directory. For example, to use a file placed in /var/local/healthbot/input/myfile.txt, set the bash script to access it at /input/myfile.txt.
• Modifying the UDA/UDF engine more than once is not an incremental procedure; use a new bashscript that includes both the original and new instructions, and re-run the modify procedure using thenew script.
• UDA/UDF modifications are persistent across upgrades.
NOTE: The examples below use the UDA engine; these procedures apply equally to the UDFengine.
NOTE: The procedure below assumes your Paragon Insights server is installed, including runningthe sudo healthbot setup command.
Simulate
Use the simulate feature to test your bash script in the simulated environment, without affecting therunning Paragon Insights system.
To simulate modifying the UDA engine:
1. Enter the command healthbot modify-uda-engine -s /<path>/<script-file> --simulate.
2. The script runs and the output shows on screen, just as if you entered the script commands yourself.
user@HB-server:~$ healthbot modify-uda-engine -s /var/tmp/test-script.sh --simulateRunning /var/tmp/test-script.sh in simulated alerta engine..Get:1 http://security.ubuntu.com/ubuntu xenial-security InRelease [109 kB]...Fetched 4296 kB in 15s (278 kB/s)Reading package lists...
456
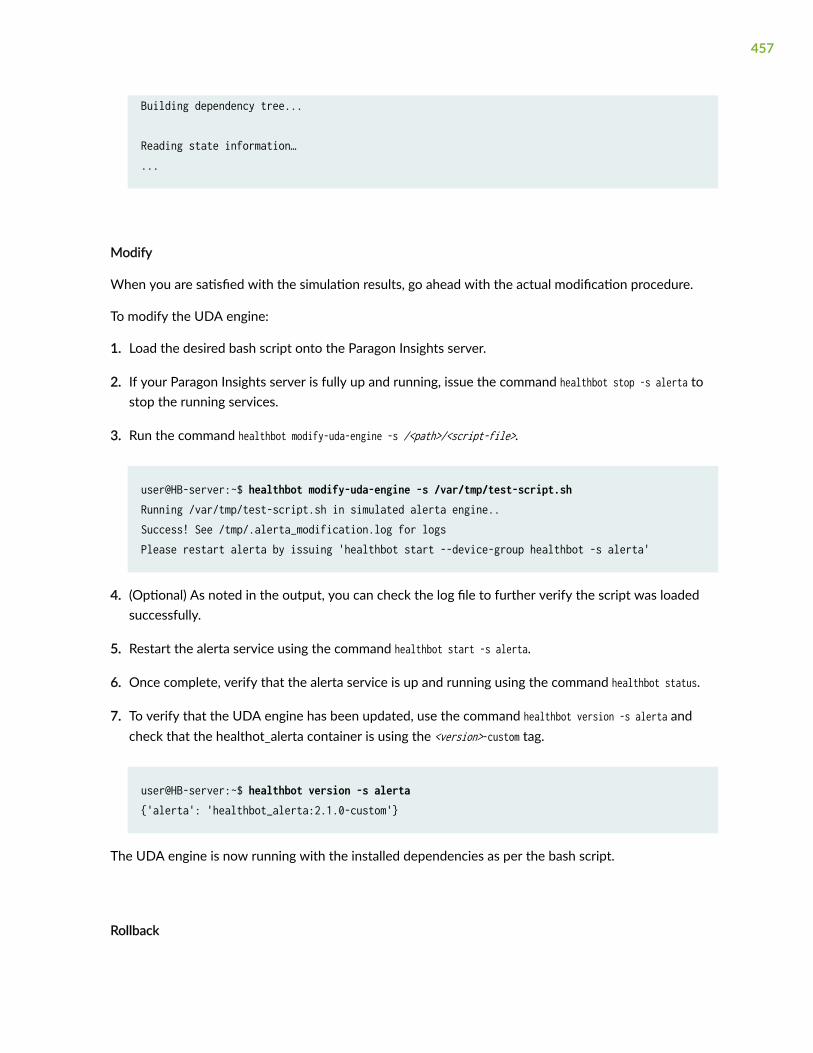
Building dependency tree...
Reading state information…...
Modify
When you are satisfied with the simulation results, go ahead with the actual modification procedure.
To modify the UDA engine:
1. Load the desired bash script onto the Paragon Insights server.
2. If your Paragon Insights server is fully up and running, issue the command healthbot stop -s alerta tostop the running services.
3. Run the command healthbot modify-uda-engine -s /<path>/<script-file>.
user@HB-server:~$ healthbot modify-uda-engine -s /var/tmp/test-script.shRunning /var/tmp/test-script.sh in simulated alerta engine..Success! See /tmp/.alerta_modification.log for logsPlease restart alerta by issuing 'healthbot start --device-group healthbot -s alerta'
4. (Optional) As noted in the output, you can check the log file to further verify the script was loadedsuccessfully.
5. Restart the alerta service using the command healthbot start -s alerta.
6. Once complete, verify that the alerta service is up and running using the command healthbot status.
7. To verify that the UDA engine has been updated, use the command healthbot version -s alerta andcheck that the healthot_alerta container is using the <version>-custom tag.
user@HB-server:~$ healthbot version -s alerta{'alerta': 'healthbot_alerta:2.1.0-custom'}
The UDA engine is now running with the installed dependencies as per the bash script.
Rollback
457
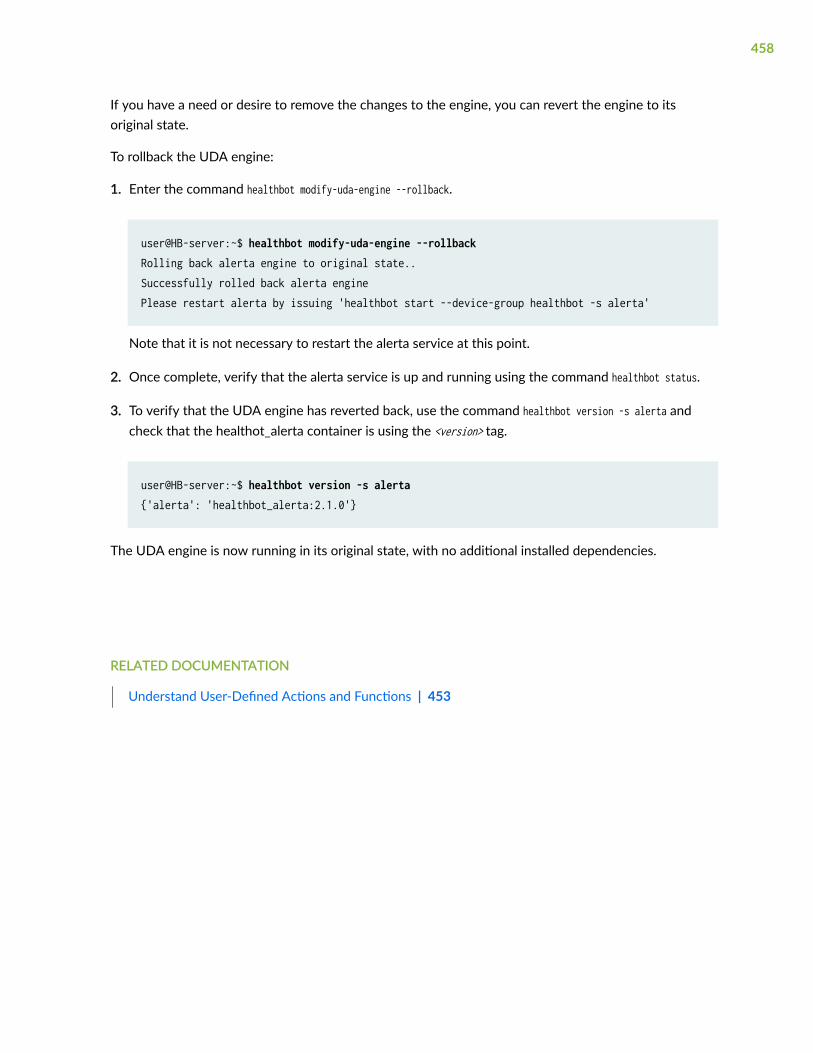
If you have a need or desire to remove the changes to the engine, you can revert the engine to itsoriginal state.
To rollback the UDA engine:
1. Enter the command healthbot modify-uda-engine --rollback.
user@HB-server:~$ healthbot modify-uda-engine --rollbackRolling back alerta engine to original state..Successfully rolled back alerta enginePlease restart alerta by issuing 'healthbot start --device-group healthbot -s alerta'
Note that it is not necessary to restart the alerta service at this point.
2. Once complete, verify that the alerta service is up and running using the command healthbot status.
3. To verify that the UDA engine has reverted back, use the command healthbot version -s alerta andcheck that the healthot_alerta container is using the <version> tag.
user@HB-server:~$ healthbot version -s alerta{'alerta': 'healthbot_alerta:2.1.0'}
The UDA engine is now running in its original state, with no additional installed dependencies.
RELATED DOCUMENTATION
Understand User-Defined Actions and Functions | 453
458

CHAPTER 22
Data Summarization Profiles
IN THIS CHAPTER
About the Data Summarization Page | 459
Add a Raw Data Summarization Profile | 461
Add a Data Rollup Summarization Profile | 463
Apply Data Summarization Profiles | 466
About the Data Summarization Page
Paragon Insights provide a way to store raw data using summarization profiles to reduce the disk spaceand improve performance of time series database (TSDB).
Paragon Insights collects data from devices by using push or pull data collection ingest methods. You cancreate rules or use the available pre-defined rules to determine how and when data is collected. Thetelemetry data can be summarized as a function of time or when a change occurs.
For time-based data summarization, the raw data points are grouped together into user-defined timespans, and each group of data points is summarized into one data point using aggregate functions.
Paragon Insights also supports data rollup summarization. Data rollup summarization helps you tosummarize field-level data. Field-level data is processed data that provides information on networkdevices and its components, and is stored in fields in the TSDB. A field is a single piece of informationthat forms a record in a database. In TSDB, multiple fields of processed data make a record. Data rollupsummarization enables efficient data storage and also ensures retaining of data for a longer duration.
Table 70 on page 460 provides a list of the supported data summarization algorithms and a descriptionof their output:
459

Table 70: Descriptions of the Data Summarization Algorithms
Algorithm Description of output
Latest Value of the last data point collected within the time span.
Count Total number of data points collected within the time span.
Mean Average value of the data points collected within the time span.
Min Minimum value of the data points collected within the time span.
Max Maximum value of the data points within the time span.
On-change Value of the data point whenever the value is different from the previous data point (occursindependently from the user-defined time span).
Stddev Standard deviation of the data points collected within the time span.
Sum Sum of the data points collected within the time span.
If no summarization algorithm is associated with the data, the following algorithms are used by default:
Data type Data summarization algorithm
Float, integer, unsigned Mean
Boolean, string On-change
You can use data summarization profiles to apply specific summarization algorithms to raw data andfield-level data collected by Paragon Insights for a specific device group:
These topics provide instructions on how to create a data summarization profile.
• Creating a Raw Data Summarization Profile. See "Add a Raw Data Summarization Profile" on page461.
460
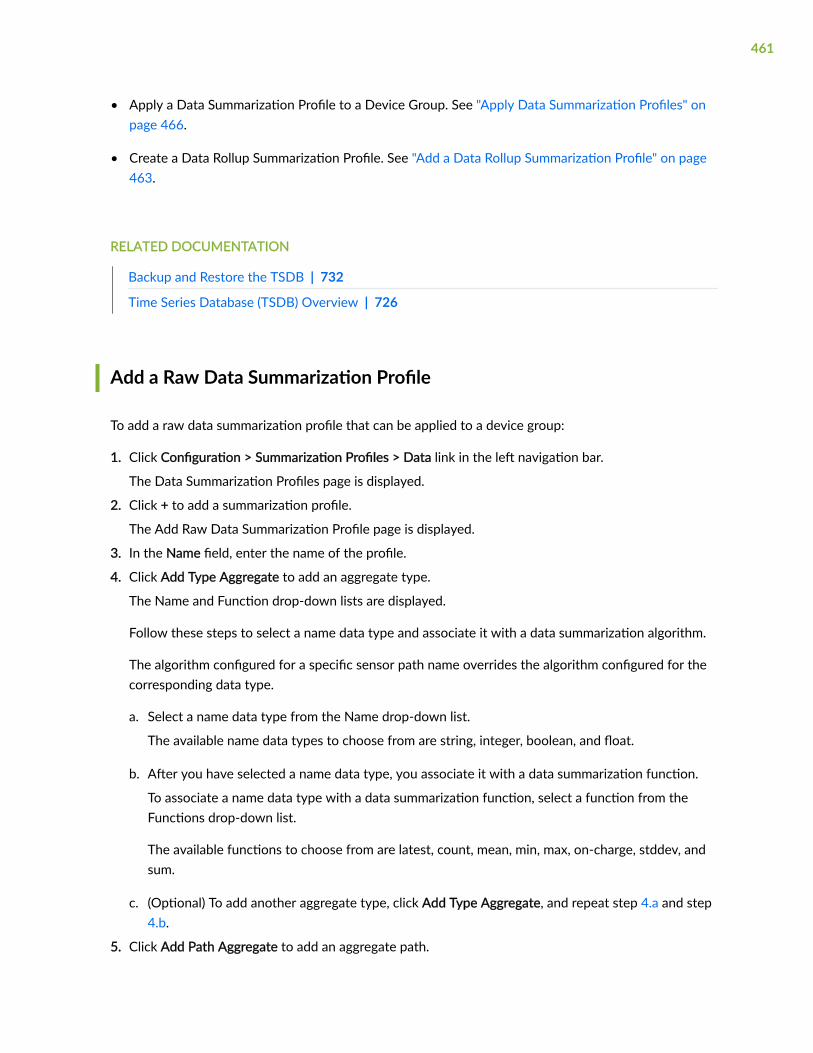
• Apply a Data Summarization Profile to a Device Group. See "Apply Data Summarization Profiles" onpage 466.
• Create a Data Rollup Summarization Profile. See "Add a Data Rollup Summarization Profile" on page463.
RELATED DOCUMENTATION
Backup and Restore the TSDB | 732
Time Series Database (TSDB) Overview | 726
Add a Raw Data Summarization Profile
To add a raw data summarization profile that can be applied to a device group:
1. Click Configuration > Summarization Profiles > Data link in the left navigation bar.
The Data Summarization Profiles page is displayed.
2. Click + to add a summarization profile.
The Add Raw Data Summarization Profile page is displayed.
3. In the Name field, enter the name of the profile.
4. Click Add Type Aggregate to add an aggregate type.
The Name and Function drop-down lists are displayed.
Follow these steps to select a name data type and associate it with a data summarization algorithm.
The algorithm configured for a specific sensor path name overrides the algorithm configured for thecorresponding data type.
a. Select a name data type from the Name drop-down list.
The available name data types to choose from are string, integer, boolean, and float.
b. After you have selected a name data type, you associate it with a data summarization function.
To associate a name data type with a data summarization function, select a function from theFunctions drop-down list.
The available functions to choose from are latest, count, mean, min, max, on-charge, stddev, andsum.
c. (Optional) To add another aggregate type, click Add Type Aggregate, and repeat step 4.a and step4.b.
5. Click Add Path Aggregate to add an aggregate path.
461
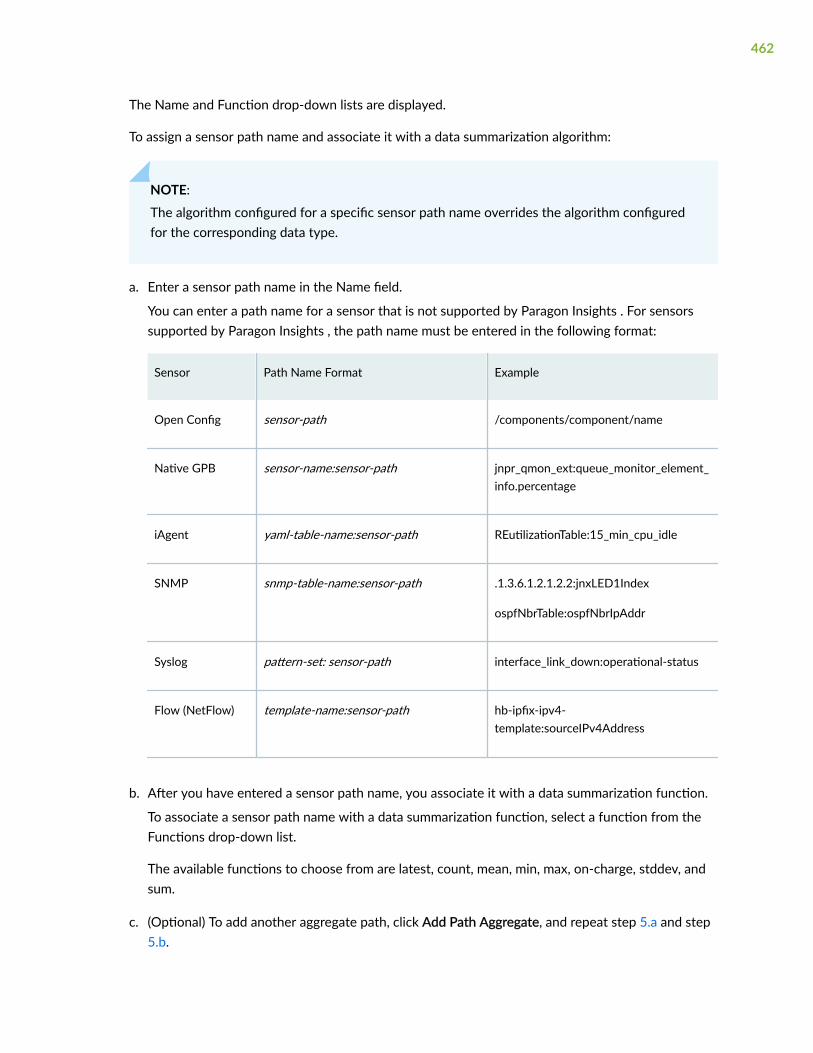
The Name and Function drop-down lists are displayed.
To assign a sensor path name and associate it with a data summarization algorithm:
NOTE:
The algorithm configured for a specific sensor path name overrides the algorithm configuredfor the corresponding data type.
a. Enter a sensor path name in the Name field.
You can enter a path name for a sensor that is not supported by Paragon Insights . For sensorssupported by Paragon Insights , the path name must be entered in the following format:
Sensor Path Name Format Example
Open Config sensor-path /components/component/name
Native GPB sensor-name:sensor-path jnpr_qmon_ext:queue_monitor_element_info.percentage
iAgent yaml-table-name:sensor-path REutilizationTable:15_min_cpu_idle
SNMP snmp-table-name:sensor-path .1.3.6.1.2.1.2.2:jnxLED1Index
ospfNbrTable:ospfNbrIpAddr
Syslog pattern-set: sensor-path interface_link_down:operational-status
Flow (NetFlow) template-name:sensor-path hb-ipfix-ipv4-template:sourceIPv4Address
b. After you have entered a sensor path name, you associate it with a data summarization function.
To associate a sensor path name with a data summarization function, select a function from theFunctions drop-down list.
The available functions to choose from are latest, count, mean, min, max, on-charge, stddev, andsum.
c. (Optional) To add another aggregate path, click Add Path Aggregate, and repeat step 5.a and step5.b.
462
6. Click Save to save the configuration or click Save and Deploy to save and deploy the configuration.
7. You can now apply the raw data summarization profile that you added to a specific device group. Formore information, see "Apply Data Summarization Profiles" on page 466.
RELATED DOCUMENTATION
Add a Data Rollup Summarization Profile | 463
Add a Data Rollup Summarization Profile
Data summarization refers to the process of creating a concise version of raw data and field data. Datacan be summarized as a function of time or when a change occurs. You can add a rollup summarizationprofile to summarize processed data that is stored in fields in the TSDB.
You can add a data rollup summarization profile to apply to a device group from the:
• Paragon Automation GUI
• MGD Command Line Interface
To add a data rollup summarization profile:
1. Click Configuration > Summarization > Data Roll Up link in the left navigation bar.
The Data Rollup Summarization Profiles page is displayed.
2. Click (+) icon to add a summarization profile.
The Add Data Rollup Summarization Profile page is displayed.
3. Enter the name of the profile in the Name text box.
4. Click Add Rule to add a rule for the device profile.
The Name and Apply on Existing Data drop-down lists are displayed.
Follow these steps to select a rule, to apply the rule to the profile, and to apply the rule to existingdata.
a. Select a rule to apply to the profile from the Name drop-down list.
b. To apply the rule that you selected to existing data, select True from the Apply on Existing Datadrop-down list.
The default value is False.
c. Click Add Field to associate a default field to an aggregate function.
To associate a default field to an aggregate function:
463
i. Select a default field from the Name drop-down list to which you want to apply an aggregatefunction.
ii. Select one or more aggregate functions from the Aggregate Function drop-down list that youwant to apply to a default field.
d. (Optional) To add another rule to the profile, click Add Rule, and repeat steps 4.a through step 4.c.
5. Click Add Data Rollup Order to define how multiple rollup orders are configured, retained, andexecuted.
The Name and Retention Policy drop-down lists, and the Rollup Interval text box are displayed.
To define a data rollup order:
a. Enter a name to identify the data rollup order in the Name text box.
The maximum length is 64 characters.
Regex pattern: “[a-zA-Z][a-zA-Z0-9_-]*”
b. Enter a value in the Rollup Interval text box to define an interval in which data is summarized.
Regex pattern: “[1-9][0-9]*[mhdw]”, where m is minutes, h is hours, d is days, and w is weeks.
Minimum value is 30m. Maximum value is 52w.
c. Select the retention policy for the rollup order from the Retention Policy drop-down list.
A retention policy defines how long you want to retain the new data.
Selecting a retention policy is optional. If you do not select a retention policy, the device groupretention policy is considered by default.
d. (Optional) To define another data rollup order, click Add Data Rollup Order, and repeat step 5.athrough step 5.c.
6. Click Save to only save the configuration.
Click Save and Deploy to save and deploy the configuration immediately.
7. You can now apply the data rollup summarization profile that you add to a specific device group. Formore information, see "Apply Data Summarization Profiles" on page 466.
464

Figure 30 on page 465 is an example configuration of how you can configure a data rollupsummarization profile from the CLI.
Figure 30: Example CLI Configuration of Creating a Data Rollup Summarization Profile
RELATED DOCUMENTATION
Backup and Restore the TSDB | 732
465
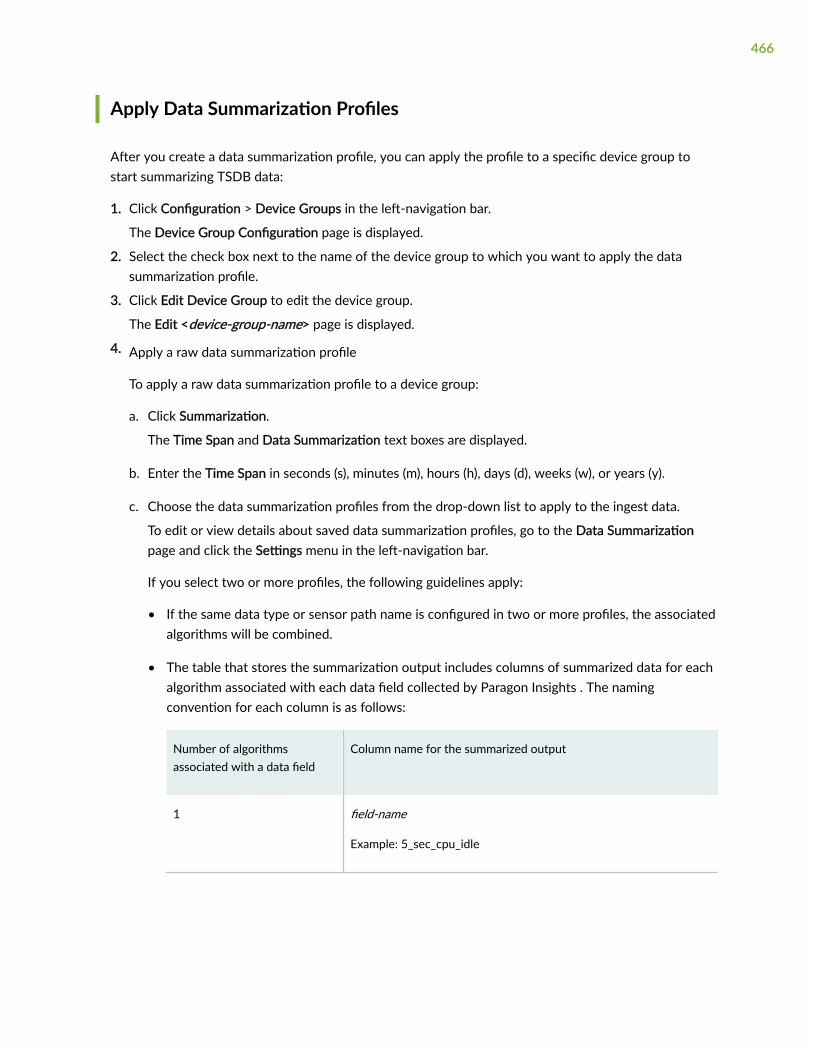
Apply Data Summarization Profiles
After you create a data summarization profile, you can apply the profile to a specific device group tostart summarizing TSDB data:
1. Click Configuration > Device Groups in the left-navigation bar.
The Device Group Configuration page is displayed.
2. Select the check box next to the name of the device group to which you want to apply the datasummarization profile.
3. Click Edit Device Group to edit the device group.
The Edit <device-group-name> page is displayed.
4. Apply a raw data summarization profile
To apply a raw data summarization profile to a device group:
a. Click Summarization.
The Time Span and Data Summarization text boxes are displayed.
b. Enter the Time Span in seconds (s), minutes (m), hours (h), days (d), weeks (w), or years (y).
c. Choose the data summarization profiles from the drop-down list to apply to the ingest data.
To edit or view details about saved data summarization profiles, go to the Data Summarizationpage and click the Settings menu in the left-navigation bar.
If you select two or more profiles, the following guidelines apply:
• If the same data type or sensor path name is configured in two or more profiles, the associatedalgorithms will be combined.
• The table that stores the summarization output includes columns of summarized data for eachalgorithm associated with each data field collected by Paragon Insights . The namingconvention for each column is as follows:
Number of algorithmsassociated with a data field
Column name for the summarized output
1 field-name
Example: 5_sec_cpu_idle
466
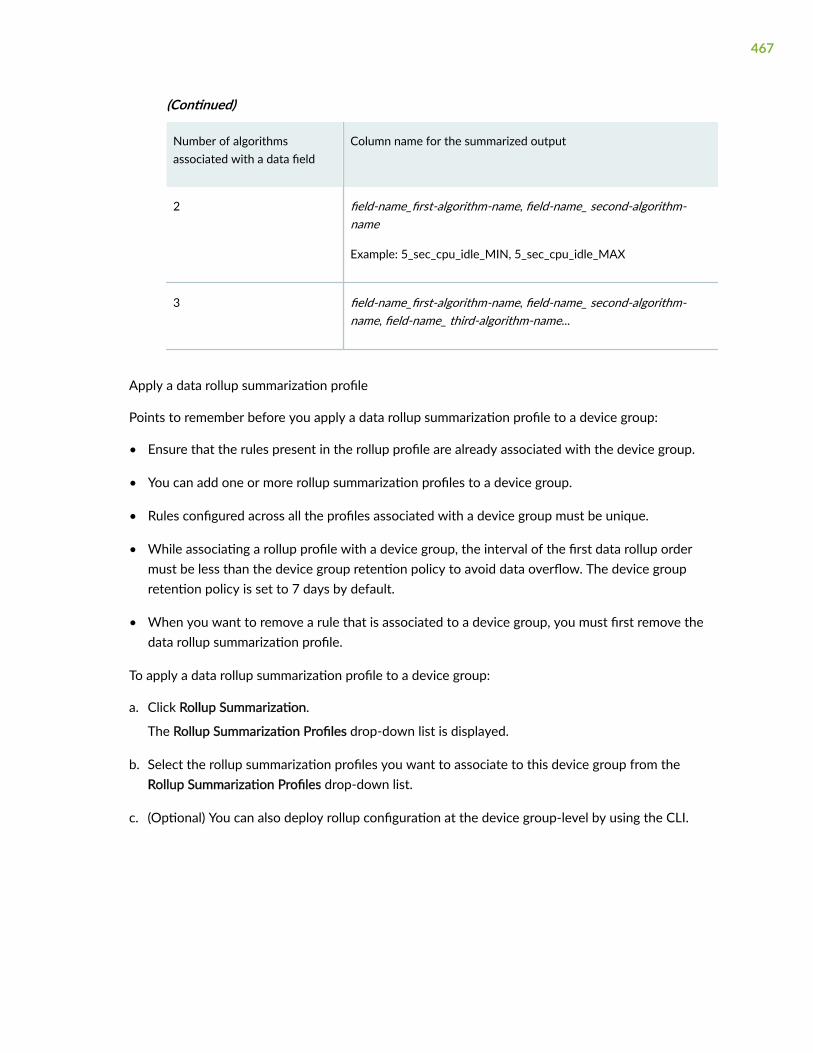
(Continued)
Number of algorithmsassociated with a data field
Column name for the summarized output
2 field-name_first-algorithm-name, field-name_ second-algorithm-name
Example: 5_sec_cpu_idle_MIN, 5_sec_cpu_idle_MAX
3 field-name_first-algorithm-name, field-name_ second-algorithm-name, field-name_ third-algorithm-name...
Apply a data rollup summarization profile
Points to remember before you apply a data rollup summarization profile to a device group:
• Ensure that the rules present in the rollup profile are already associated with the device group.
• You can add one or more rollup summarization profiles to a device group.
• Rules configured across all the profiles associated with a device group must be unique.
• While associating a rollup profile with a device group, the interval of the first data rollup ordermust be less than the device group retention policy to avoid data overflow. The device groupretention policy is set to 7 days by default.
• When you want to remove a rule that is associated to a device group, you must first remove thedata rollup summarization profile.
To apply a data rollup summarization profile to a device group:
a. Click Rollup Summarization.
The Rollup Summarization Profiles drop-down list is displayed.
b. Select the rollup summarization profiles you want to associate to this device group from theRollup Summarization Profiles drop-down list.
c. (Optional) You can also deploy rollup configuration at the device group-level by using the CLI.
467
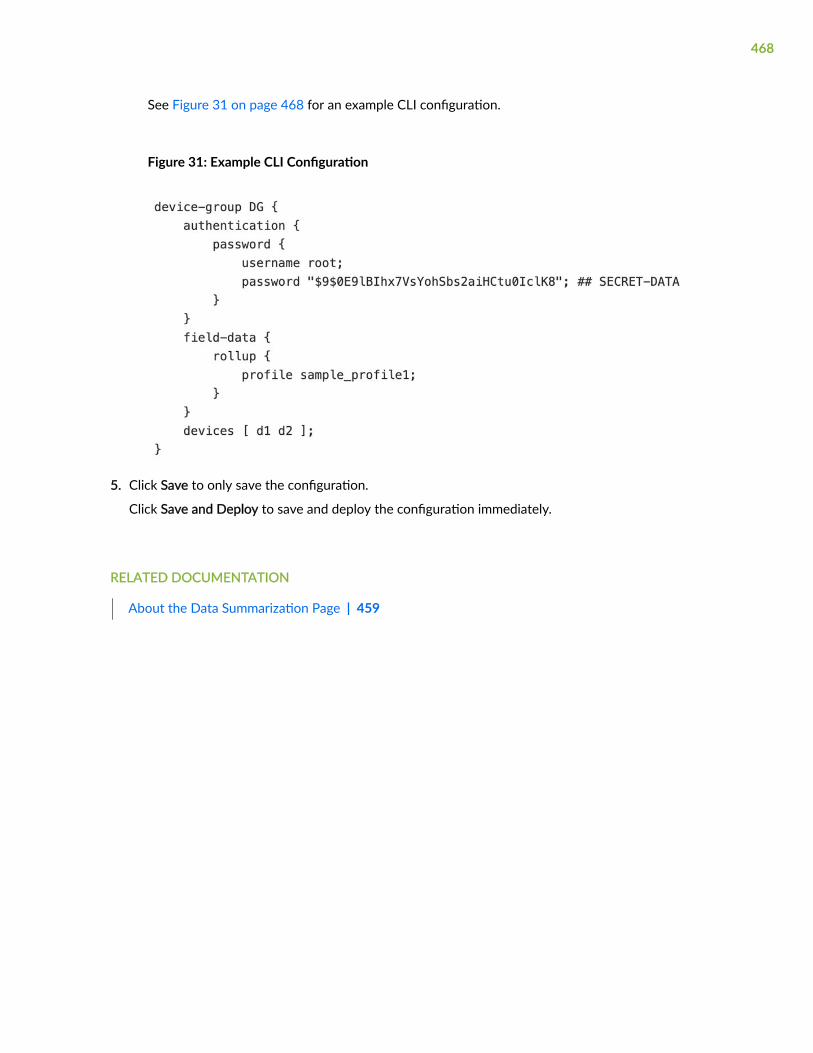
See Figure 31 on page 468 for an example CLI configuration.
Figure 31: Example CLI Configuration
5. Click Save to only save the configuration.
Click Save and Deploy to save and deploy the configuration immediately.
RELATED DOCUMENTATION
About the Data Summarization Page | 459
468
7PART
Configure Your Network
Topology | 470
Network Information Table | 495
Tunnels | 595

CHAPTER 23
Topology
IN THIS CHAPTER
Interactive Map Features Overview | 470
About the Topology Page | 485
Left Widget Options on Topology Page | 488
Group Nodes | 490
Ungroup Nodes | 491
Automatically Group Nodes | 492
Manage Map Layouts | 493
Interactive Map Features Overview
IN THIS SECTION
Right-Click Functions | 471
Topology Settings Pane | 478
The topology map is interactive which means you can use features within the map to customize the mapand the network information table. The map uses a geographic coordinate reference system. Somefeatures enabled by that system include:
• Constrained zooming: Controller performs coordinate checking so the view is constrained to thecoordinates on the earth.
• World wrapping/map wrapping: Scrolling the map in one direction is like spinning a globe. Forexample, this enables representation of links across an ocean.
470
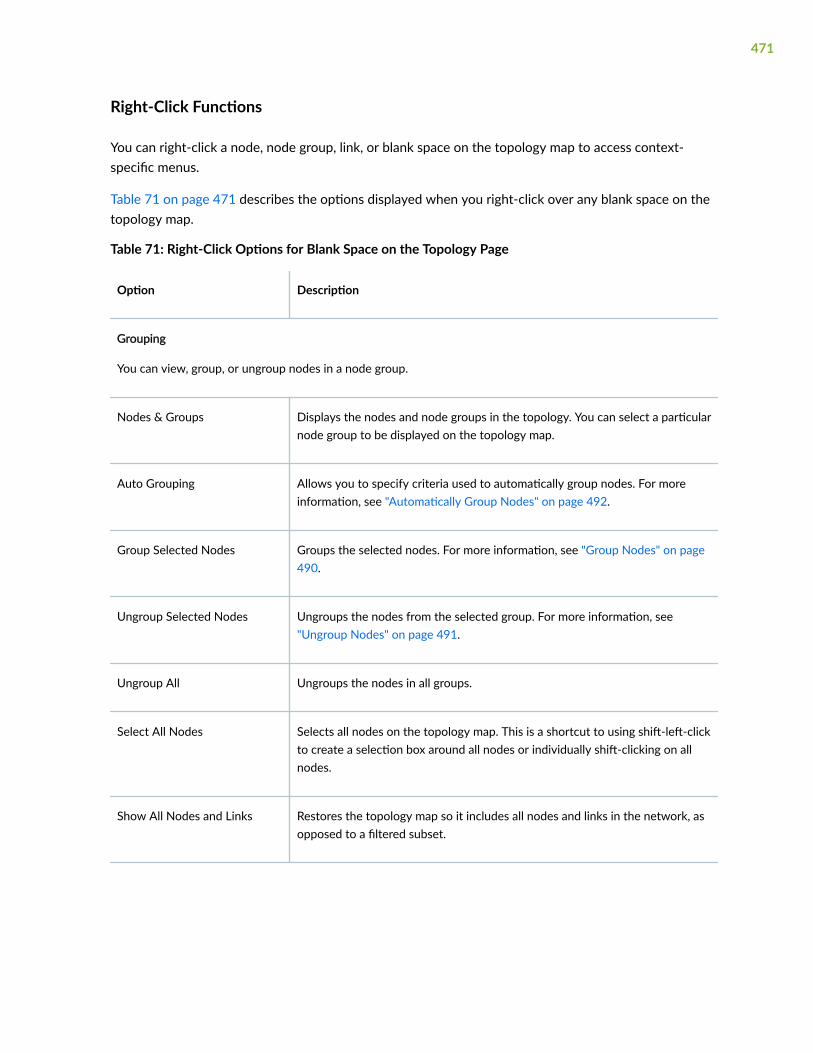
Right-Click Functions
You can right-click a node, node group, link, or blank space on the topology map to access context-specific menus.
Table 71 on page 471 describes the options displayed when you right-click over any blank space on thetopology map.
Table 71: Right-Click Options for Blank Space on the Topology Page
Option Description
Grouping
You can view, group, or ungroup nodes in a node group.
Nodes & Groups Displays the nodes and node groups in the topology. You can select a particularnode group to be displayed on the topology map.
Auto Grouping Allows you to specify criteria used to automatically group nodes. For moreinformation, see "Automatically Group Nodes" on page 492.
Group Selected Nodes Groups the selected nodes. For more information, see "Group Nodes" on page490.
Ungroup Selected Nodes Ungroups the nodes from the selected group. For more information, see"Ungroup Nodes" on page 491.
Ungroup All Ungroups the nodes in all groups.
Select All Nodes Selects all nodes on the topology map. This is a shortcut to using shift-left-clickto create a selection box around all nodes or individually shift-clicking on allnodes.
Show All Nodes and Links Restores the topology map so it includes all nodes and links in the network, asopposed to a filtered subset.
471
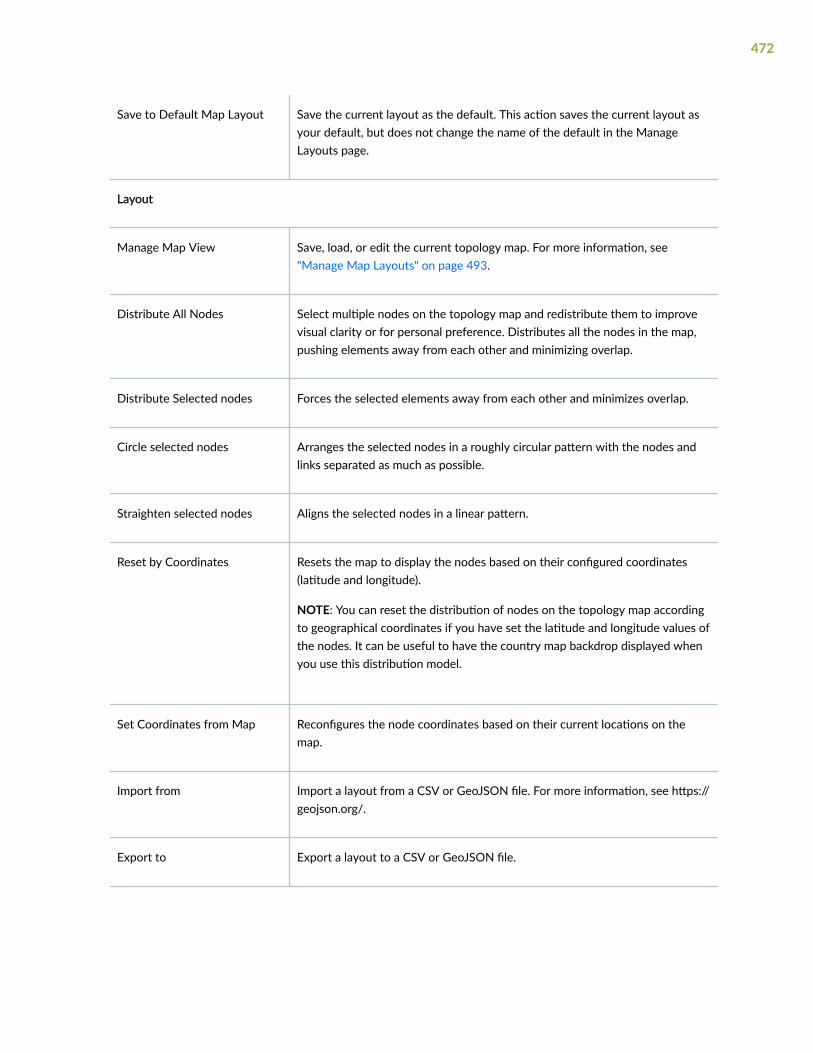
Save to Default Map Layout Save the current layout as the default. This action saves the current layout asyour default, but does not change the name of the default in the ManageLayouts page.
Layout
Manage Map View Save, load, or edit the current topology map. For more information, see"Manage Map Layouts" on page 493.
Distribute All Nodes Select multiple nodes on the topology map and redistribute them to improvevisual clarity or for personal preference. Distributes all the nodes in the map,pushing elements away from each other and minimizing overlap.
Distribute Selected nodes Forces the selected elements away from each other and minimizes overlap.
Circle selected nodes Arranges the selected nodes in a roughly circular pattern with the nodes andlinks separated as much as possible.
Straighten selected nodes Aligns the selected nodes in a linear pattern.
Reset by Coordinates Resets the map to display the nodes based on their configured coordinates(latitude and longitude).
NOTE: You can reset the distribution of nodes on the topology map accordingto geographical coordinates if you have set the latitude and longitude values ofthe nodes. It can be useful to have the country map backdrop displayed whenyou use this distribution model.
Set Coordinates from Map Reconfigures the node coordinates based on their current locations on themap.
Import from Import a layout from a CSV or GeoJSON file. For more information, see https://geojson.org/.
Export to Export a layout to a CSV or GeoJSON file.
472
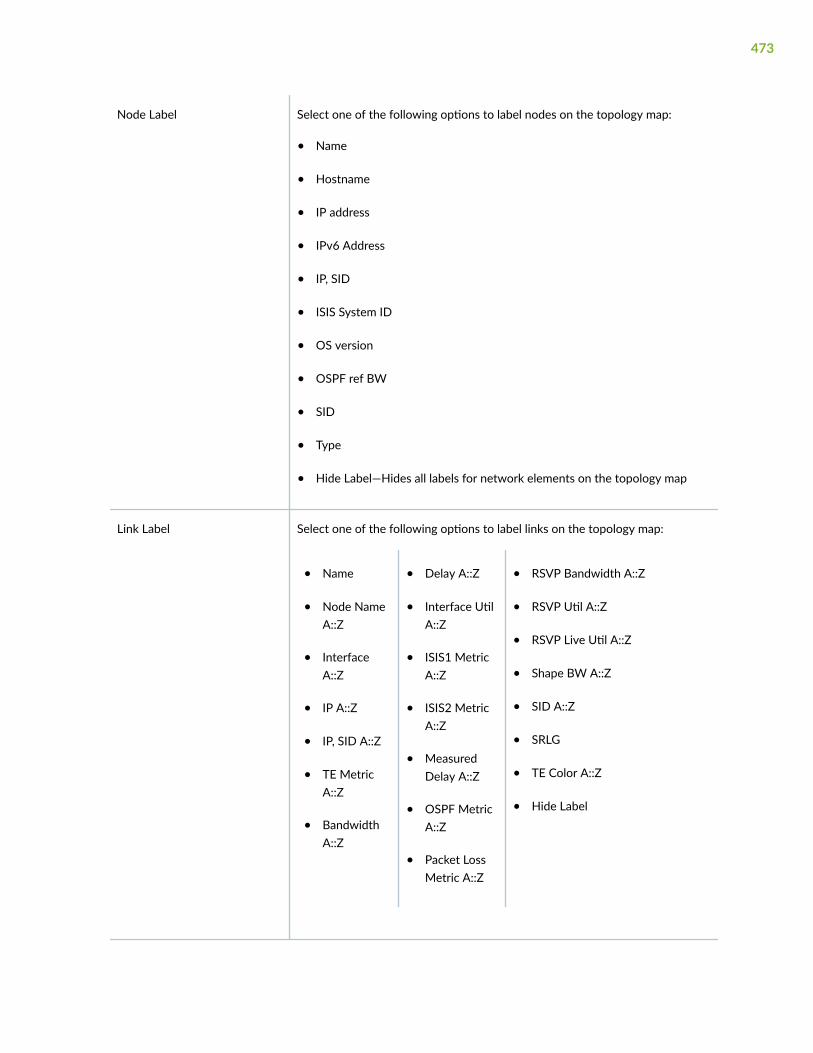
Node Label Select one of the following options to label nodes on the topology map:
• Name
• Hostname
• IP address
• IPv6 Address
• IP, SID
• ISIS System ID
• OS version
• OSPF ref BW
• SID
• Type
• Hide Label—Hides all labels for network elements on the topology map
Link Label Select one of the following options to label links on the topology map:
• Name
• Node NameA::Z
• InterfaceA::Z
• IP A::Z
• IP, SID A::Z
• TE MetricA::Z
• BandwidthA::Z
• Delay A::Z
• Interface UtilA::Z
• ISIS1 MetricA::Z
• ISIS2 MetricA::Z
• MeasuredDelay A::Z
• OSPF MetricA::Z
• Packet LossMetric A::Z
• RSVP Bandwidth A::Z
• RSVP Util A::Z
• RSVP Live Util A::Z
• Shape BW A::Z
• SID A::Z
• SRLG
• TE Color A::Z
• Hide Label
473

Favorites
Add Selected Nodes toFavorites
Select nodes on the topology map and designate them as favorites.
Remove Selected Nodes fromFavorites
Removes nodes selected on the topology map from the Favorites tab.
Clear Favorites Clears all the existing favorite nodes.
Highlight Favorites Highlights only the favorite nodes on the topology map.
Show only Favorites Displays only favorite nodes on the topology map.
Hide Favorites Hides all the favorite nodes on the topology map.
Subview Filters the network elements on the topology map based on Node Type,Autonomous System (AS) number, OSPF Area, ISIS Area, Layer, or AdminGroup. For more information on these options, see Table 72 on page 476.
474

Timeline Lists activities and status checkpoints with the most recent activity first.
You can use the search box at the top of the Timeline drawer to highlightspecific events. You can use the up and down arrows to move to the next orprevious event (search result), or click the Top arrow (at the bottom-rightcorner of the drawer) to move back to the topmost event in the timeline.
You can also refresh the timeline events by clicking the refresh button at thebottom-left corner of the page.
You can assess the stability of the MPLS network by tracking changes in thenumber of LSP Up and Down events over time. You can then analyze whetherthe occurrence of specific other events affects the number of LSP Up andDown events.
The following event types are included in the Timeline:
Event types related to nodes:
• PCEP session goes Down
• PCEP session goes Up
• PCEP session becomes ACTIVE
Event types related to links:
• Link goes Up
• Link goes Down
Event types related to LSPs:
• Change in the number of LSPs that are Up
• Change in the number of LSPs that are Down
• Change in the number of LSPs that are being provisioned
Even types related to Controller:
• Path optimization start and end times
• Maintenance events start and end times
475
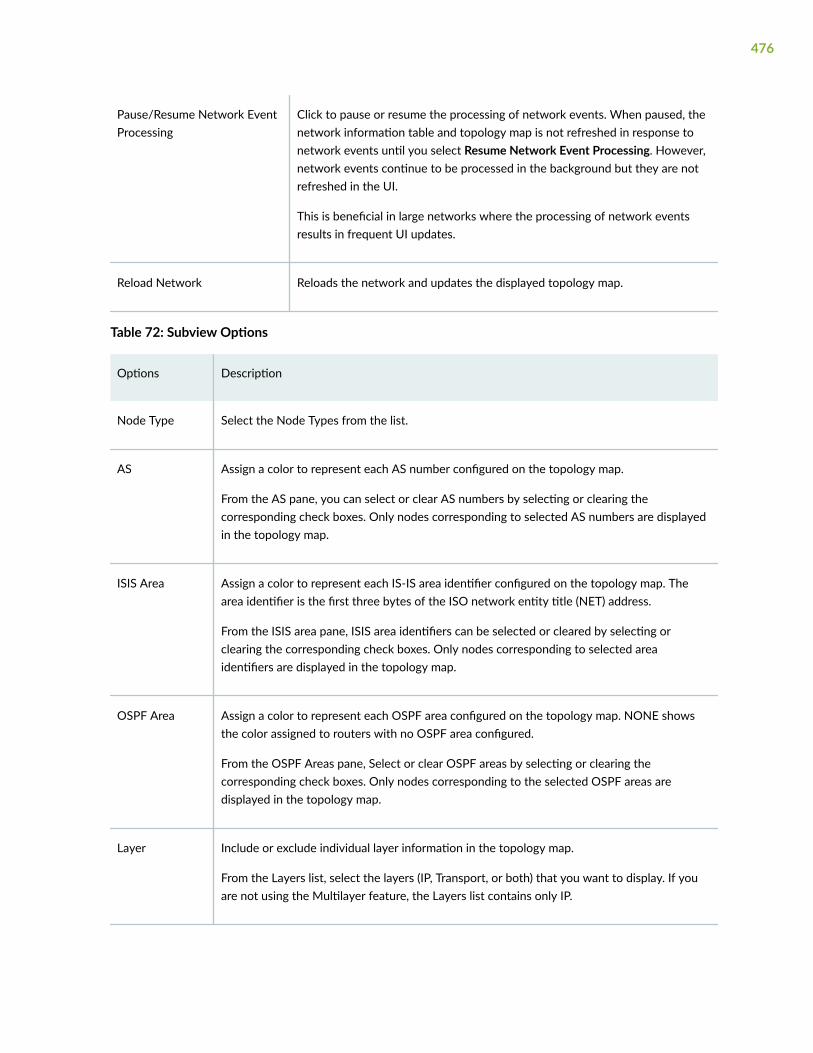
Pause/Resume Network EventProcessing
Click to pause or resume the processing of network events. When paused, thenetwork information table and topology map is not refreshed in response tonetwork events until you select Resume Network Event Processing. However,network events continue to be processed in the background but they are notrefreshed in the UI.
This is beneficial in large networks where the processing of network eventsresults in frequent UI updates.
Reload Network Reloads the network and updates the displayed topology map.
Table 72: Subview Options
Options Description
Node Type Select the Node Types from the list.
AS Assign a color to represent each AS number configured on the topology map.
From the AS pane, you can select or clear AS numbers by selecting or clearing thecorresponding check boxes. Only nodes corresponding to selected AS numbers are displayedin the topology map.
ISIS Area Assign a color to represent each IS-IS area identifier configured on the topology map. Thearea identifier is the first three bytes of the ISO network entity title (NET) address.
From the ISIS area pane, ISIS area identifiers can be selected or cleared by selecting orclearing the corresponding check boxes. Only nodes corresponding to selected areaidentifiers are displayed in the topology map.
OSPF Area Assign a color to represent each OSPF area configured on the topology map. NONE showsthe color assigned to routers with no OSPF area configured.
From the OSPF Areas pane, Select or clear OSPF areas by selecting or clearing thecorresponding check boxes. Only nodes corresponding to the selected OSPF areas aredisplayed in the topology map.
Layer Include or exclude individual layer information in the topology map.
From the Layers list, select the layers (IP, Transport, or both) that you want to display. If youare not using the Multilayer feature, the Layers list contains only IP.
476
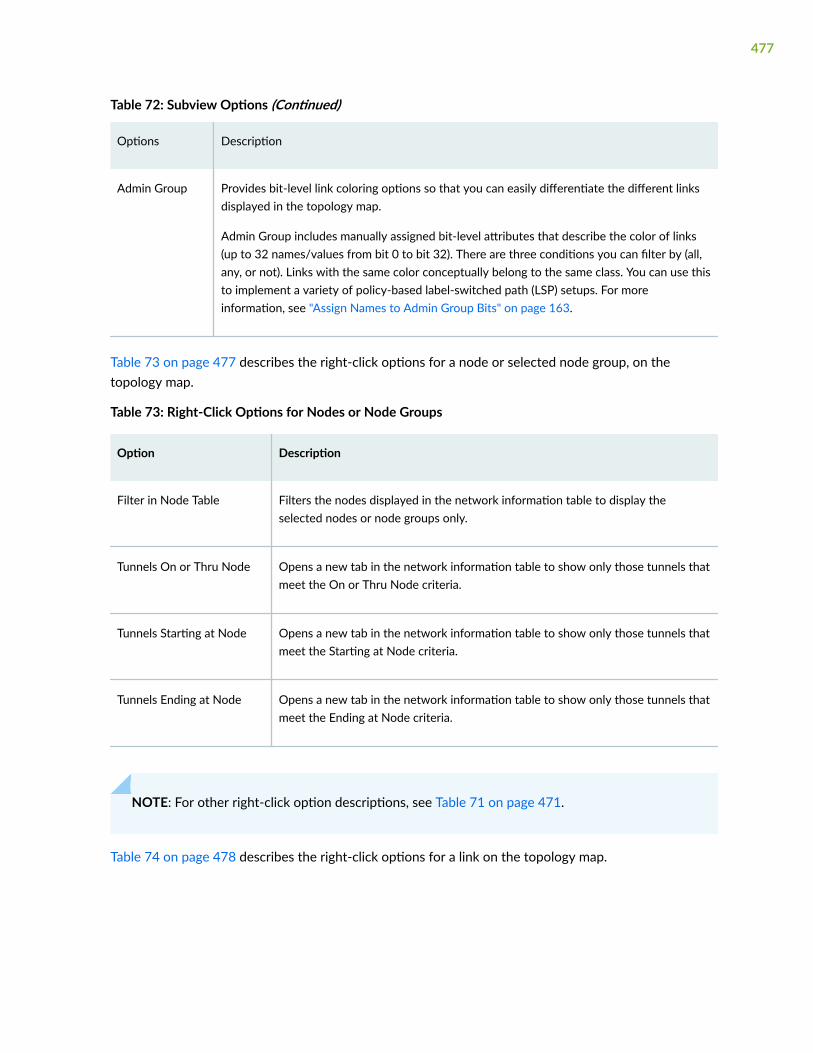
Table 72: Subview Options (Continued)
Options Description
Admin Group Provides bit-level link coloring options so that you can easily differentiate the different linksdisplayed in the topology map.
Admin Group includes manually assigned bit-level attributes that describe the color of links(up to 32 names/values from bit 0 to bit 32). There are three conditions you can filter by (all,any, or not). Links with the same color conceptually belong to the same class. You can use thisto implement a variety of policy-based label-switched path (LSP) setups. For moreinformation, see "Assign Names to Admin Group Bits" on page 163.
Table 73 on page 477 describes the right-click options for a node or selected node group, on thetopology map.
Table 73: Right-Click Options for Nodes or Node Groups
Option Description
Filter in Node Table Filters the nodes displayed in the network information table to display theselected nodes or node groups only.
Tunnels On or Thru Node Opens a new tab in the network information table to show only those tunnels thatmeet the On or Thru Node criteria.
Tunnels Starting at Node Opens a new tab in the network information table to show only those tunnels thatmeet the Starting at Node criteria.
Tunnels Ending at Node Opens a new tab in the network information table to show only those tunnels thatmeet the Ending at Node criteria.
NOTE: For other right-click option descriptions, see Table 71 on page 471.
Table 74 on page 478 describes the right-click options for a link on the topology map.
477

Table 74: Right-Click Options for Links
Option Function
Filter in Link Table Filters the tunnels displayed in the network information table to display only theselected link.
Tunnels On or Thru Link Opens a new tab in the network information table to show only those tunnels thatmeet the On or Thru Link criteria.
NOTE: For other right-click option descriptions, see Table 71 on page 471.
Topology Settings Pane
You can access the Topology Settings by clicking the Settings icon in the Topology menu bar located atthe upper right corner of the Topology Page.
Table 75 on page 478 describes the tabs on the topology settings pane.
Table 75: Topology Settings Options
Tab Description
Nodes You can do the following:
• Change the labels of all nodes on the topology map by selecting an option from the Labellist.
• Once you select a label, click the toggle button to show:
• Background shadow of node labels
• Pseudo node label
• Only favorite node labels
• Isolated nodes
• Overload bit marker
478
Table 75: Topology Settings Options (Continued)
Tab Description
Links You can do the following:
• Change the labels of all links on the topology map by selecting an option from the Labellist.
• Click the toggle button to:
• Show or hide link down markers
• Draw down links as a dashed line
• Draw a link line width in proportion to the interface speed
• Draw parallel links as a curve: Toggle the button to draw parallel links between twonodes as a curve, so that the parallel links are not overlapped and appear separately (ascurves) on the topology map. If the parallel links between two nodes are drawn asstraight lines, they would overlap on the topology map (as a bundle).
• Show utilization max instead of Average within bundle: Toggle this button to displaythe maximum utilization value (in red) instead of average utilization value forparallel links. For example, if there are two parallel links between two nodes, onelink has 10% utilization and the other has 20% utilization, and you want to draw thelink as a straight line between the nodes, you can choose which utilization valueshould be displayed: 15% (average) or 20% (maximum) value.
• Show Count of the bundle: Toggle the button to display (in green) how many linksare present between the two nodes.
• Wrap links as great arcs: Distinguishes links that would have to wrap around the worldmap
An example is shown in Figure 32 on page 480.
479

Table 75: Topology Settings Options (Continued)
Tab Description
Figure 32: Wrap Links as Great Arcs Example
• Hide Partially Visible links: Hides any link whose end nodes are outside the visible area.This is useful for focusing on a subset of a large network.
NOTE: The topology map does not display node or link labels over a certain quantity, even ifthe Topology Settings call for labels to be displayed. This improves performance whenredrawing a large number of graphic elements.
480

Table 75: Topology Settings Options (Continued)
Tab Description
Tunnels You can do the following:
• Click the toggle button to draw a path as a curve which might improve networkvisualization.
Figure 33 on page 481 shows both curved and straight lines for the same path.
Figure 33: Curved and Straight Line Path Depiction
• Click the toggle button to draw path through layers if the network includes transportlayers.
481
Table 75: Topology Settings Options (Continued)
Tab Description
General You can do the following:
• Click the toggle button to:
• Enable animation while calculating the topology layout.
• Show or hide maintenance marker: Displays a red M over any link that is a part of anactive maintenance event.
• Show or hide zoom slider: A vertical slider is displayed on the topology menu bar on thetop right corner of the topology window.
• Enable or disable to zoom to selected node: With this option enabled, when you clickthe node entry in the network information table (Node tab), the topology automaticallycenters the view on that selected node.
• Select a Label Size: Select one of the following as the font size for node and link labels:
• 8
• 10
• 12
• 14
• 16
• 18
• 20
• Apply Opacity effects: Move this slider to select the percent opacity for unhighlightedtopology map elements. Figure 34 on page 483 shows 100% and 20% opacity forcomparison.
482

Table 75: Topology Settings Options (Continued)
Tab Description
Figure 34: Opacity Effects: Example
483
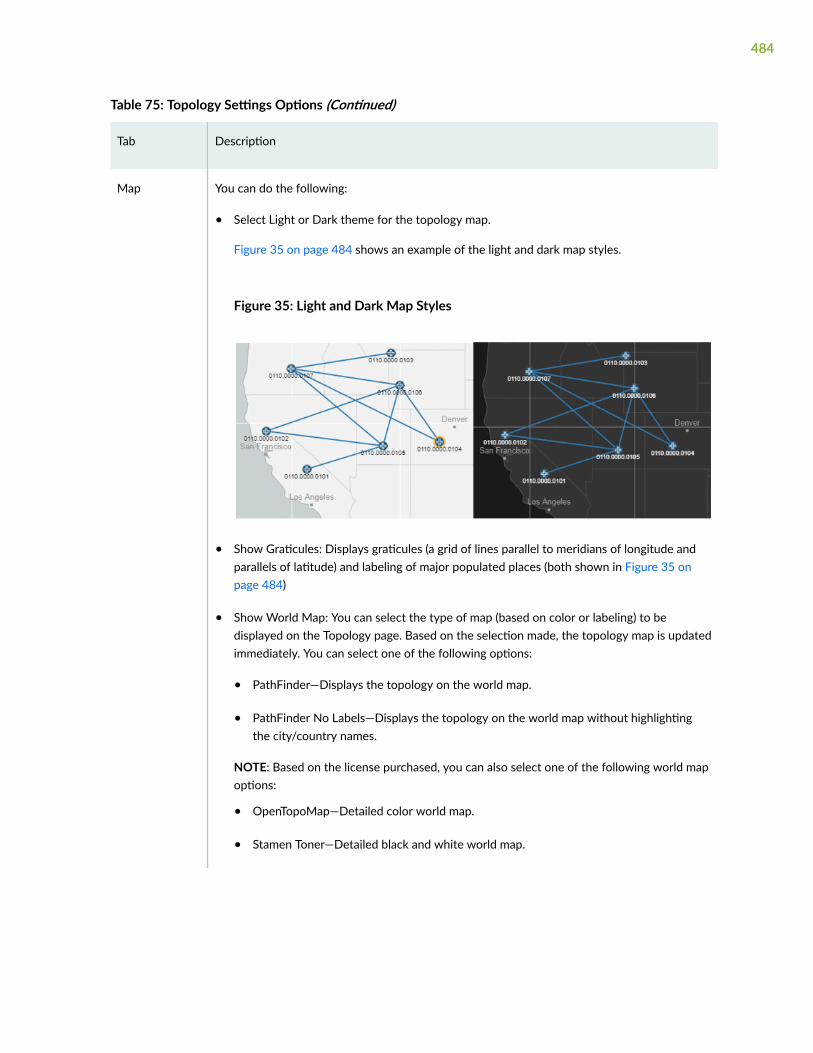
Table 75: Topology Settings Options (Continued)
Tab Description
Map You can do the following:
• Select Light or Dark theme for the topology map.
Figure 35 on page 484 shows an example of the light and dark map styles.
Figure 35: Light and Dark Map Styles
• Show Graticules: Displays graticules (a grid of lines parallel to meridians of longitude andparallels of latitude) and labeling of major populated places (both shown in Figure 35 onpage 484)
• Show World Map: You can select the type of map (based on color or labeling) to bedisplayed on the Topology page. Based on the selection made, the topology map is updatedimmediately. You can select one of the following options:
• PathFinder—Displays the topology on the world map.
• PathFinder No Labels—Displays the topology on the world map without highlightingthe city/country names.
NOTE: Based on the license purchased, you can also select one of the following world mapoptions:
• OpenTopoMap—Detailed color world map.
• Stamen Toner—Detailed black and white world map.
484

Table 75: Topology Settings Options (Continued)
Tab Description
• Stamen Toner-lite—Detailed world map with a white background.
• Stamen Toner no labels—World map with white background without highlighting thecity/country names.
• Even if you deselect Show World Map, the topology still is displayed according to thegeographical coordinates (in terms of displaying the topology within the field of view).
RELATED DOCUMENTATION
About the Topology Page | 485
About the Topology Page
IN THIS SECTION
Navigation on the Topology Page | 487
The Topology (Network > Topology) page is the main work area for the live network you load into thesystem. You can configure various network elements in your topology such as nodes, links, and tunnelsfrom the network information table.
485

Figure 36 on page 486 shows the all the components on the Topology page.
Figure 36: Topology Page
The Topology page consists of the following:
• Left Widget— Movable list of network metrics and performance data. You can hover over the MoreOptions (horizontal ellipsis) icon to display network metrics or performance submenu. Your selectionsare reflected in the topology map where applicable. You can expand or collapse the left widget byclicking the arrow icon. You can drag-and-drop this widget to position it anywhere on the screen. Formore information, see "Left Widget Options on Topology Page" on page 488.
• Interactive Topology Map—Use the topology map to access network element information and furthercustomize the map display. You can click the legend on the bottom right corner to configure the colorto be displayed for specific network elements like links. On the Legend Settings pane, you can clickon the color to customize it and move the sliders to customize the colors for specific link utilization(%) intervals. For more information, see "Interactive Map Features Overview" on page 470.
NOTE: Topology map is refreshed whenever there are network events such as link down orup, or new node discovery. To reload the topology map, click the Refresh icon at the bottomleft corner of the network information table.
• Network Information Table— Displays detailed information about network nodes, links, tunnels,interfaces, anycast groups, container LSPs, maintenance events, P2MP groups, and SRLG/Facilitywithin different tabs. For more information, see "Network Information Table Overview" on page 496.
486
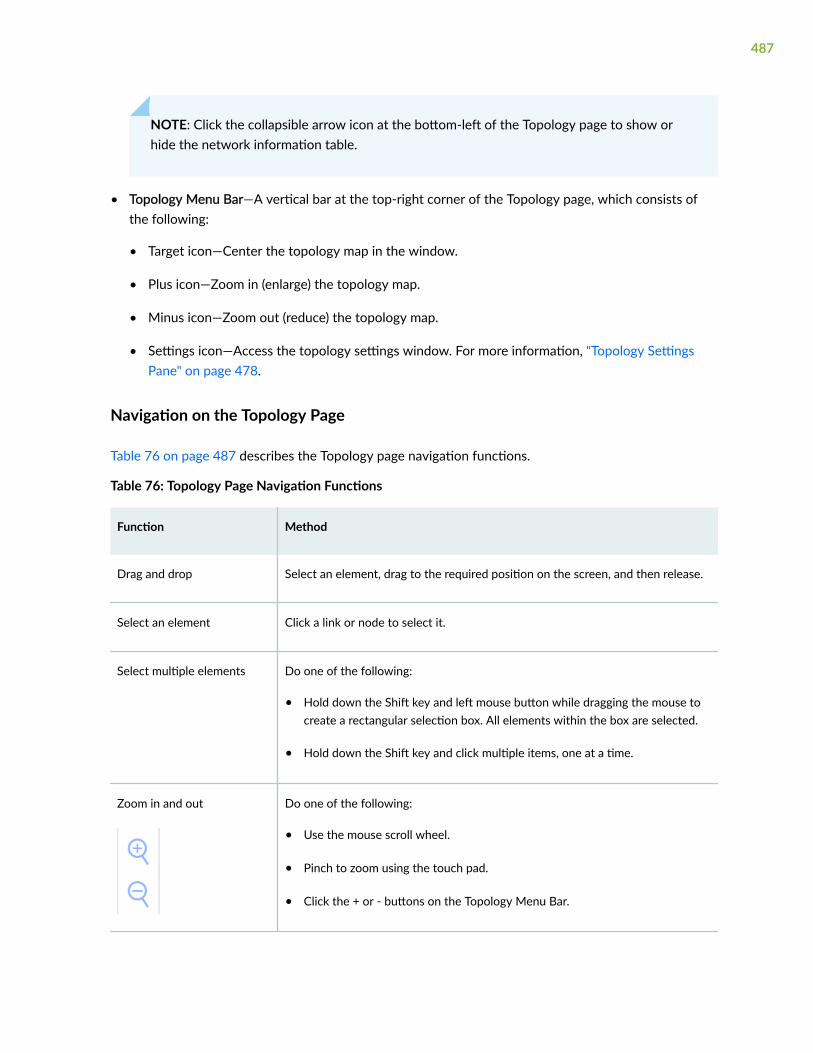
NOTE: Click the collapsible arrow icon at the bottom-left of the Topology page to show orhide the network information table.
• Topology Menu Bar—A vertical bar at the top-right corner of the Topology page, which consists ofthe following:
• Target icon—Center the topology map in the window.
• Plus icon—Zoom in (enlarge) the topology map.
• Minus icon—Zoom out (reduce) the topology map.
• Settings icon—Access the topology settings window. For more information, "Topology SettingsPane" on page 478.
Navigation on the Topology Page
Table 76 on page 487 describes the Topology page navigation functions.
Table 76: Topology Page Navigation Functions
Function Method
Drag and drop Select an element, drag to the required position on the screen, and then release.
Select an element Click a link or node to select it.
Select multiple elements Do one of the following:
• Hold down the Shift key and left mouse button while dragging the mouse tocreate a rectangular selection box. All elements within the box are selected.
• Hold down the Shift key and click multiple items, one at a time.
Zoom in and out Do one of the following:
• Use the mouse scroll wheel.
• Pinch to zoom using the touch pad.
• Click the + or - buttons on the Topology Menu Bar.
487

Table 76: Topology Page Navigation Functions (Continued)
Function Method
Zoom to fit Click the target icon on the Topology Menu Bar to resize and center the topologymap to fit the visible area of the Topology page.
Right-click to accessfunctions
Right-click the blank part of the topology map or on a map element to accesscontext menus.
Hover Hover over a network element in the topology map to display the element nameor ID.
Collapse/expand pane When a left, right, up, or down slider appears at the margin of a pane, you canclick it to collapse or expand the pane.
Pin Click the pin icon on the top right of the page or widget to fix it at any place onthe screen.
Resize panes Click and drag any of the pane margins to resize the panes in a display.
RELATED DOCUMENTATION
Network Information Table Overview | 496
Left Widget Options on Topology Page
The left widget menu allows you to filter the data displayed on the topology map. The left widgetdisplays Metrics when you first log in to the web user interface. Hover over the More Options(horizontal ellipsis) to view the other left widget options.
488
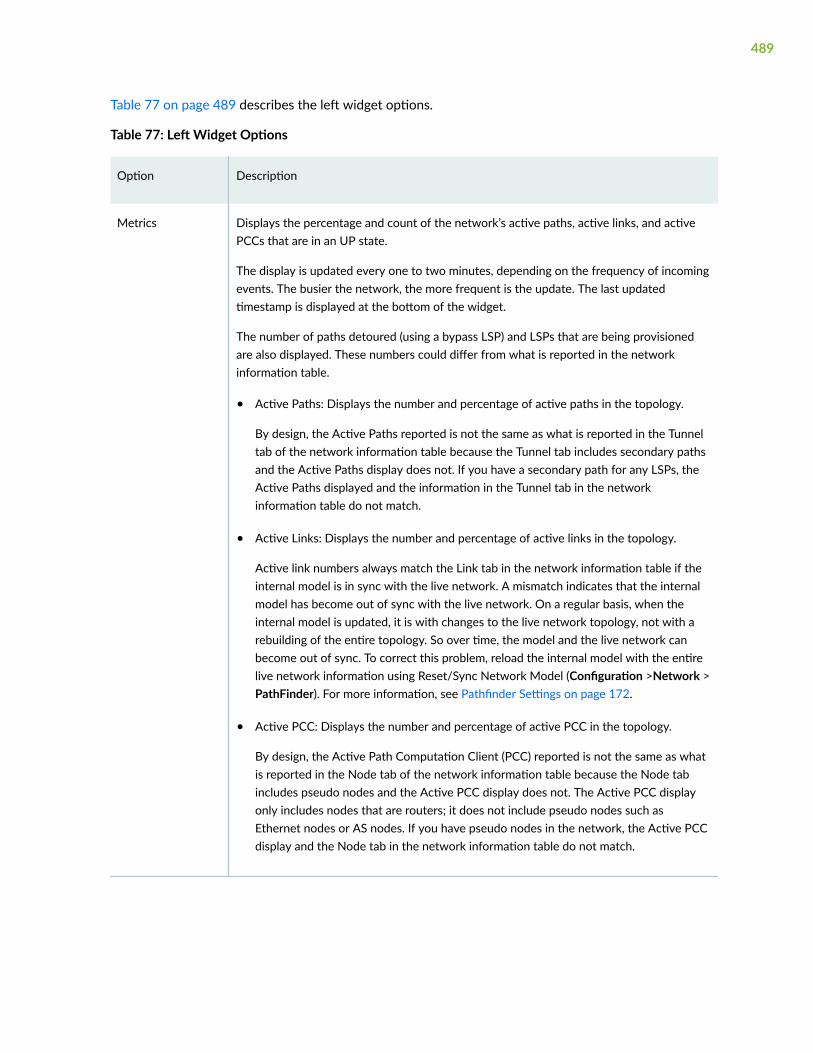
Table 77 on page 489 describes the left widget options.
Table 77: Left Widget Options
Option Description
Metrics Displays the percentage and count of the network’s active paths, active links, and activePCCs that are in an UP state.
The display is updated every one to two minutes, depending on the frequency of incomingevents. The busier the network, the more frequent is the update. The last updatedtimestamp is displayed at the bottom of the widget.
The number of paths detoured (using a bypass LSP) and LSPs that are being provisionedare also displayed. These numbers could differ from what is reported in the networkinformation table.
• Active Paths: Displays the number and percentage of active paths in the topology.
By design, the Active Paths reported is not the same as what is reported in the Tunneltab of the network information table because the Tunnel tab includes secondary pathsand the Active Paths display does not. If you have a secondary path for any LSPs, theActive Paths displayed and the information in the Tunnel tab in the networkinformation table do not match.
• Active Links: Displays the number and percentage of active links in the topology.
Active link numbers always match the Link tab in the network information table if theinternal model is in sync with the live network. A mismatch indicates that the internalmodel has become out of sync with the live network. On a regular basis, when theinternal model is updated, it is with changes to the live network topology, not with arebuilding of the entire topology. So over time, the model and the live network canbecome out of sync. To correct this problem, reload the internal model with the entirelive network information using Reset/Sync Network Model (Configuration >Network >PathFinder). For more information, see Pathfinder Settings on page 172.
• Active PCC: Displays the number and percentage of active PCC in the topology.
By design, the Active Path Computation Client (PCC) reported is not the same as whatis reported in the Node tab of the network information table because the Node tabincludes pseudo nodes and the Active PCC display does not. The Active PCC displayonly includes nodes that are routers; it does not include pseudo nodes such asEthernet nodes or AS nodes. If you have pseudo nodes in the network, the Active PCCdisplay and the Node tab in the network information table do not match.
489
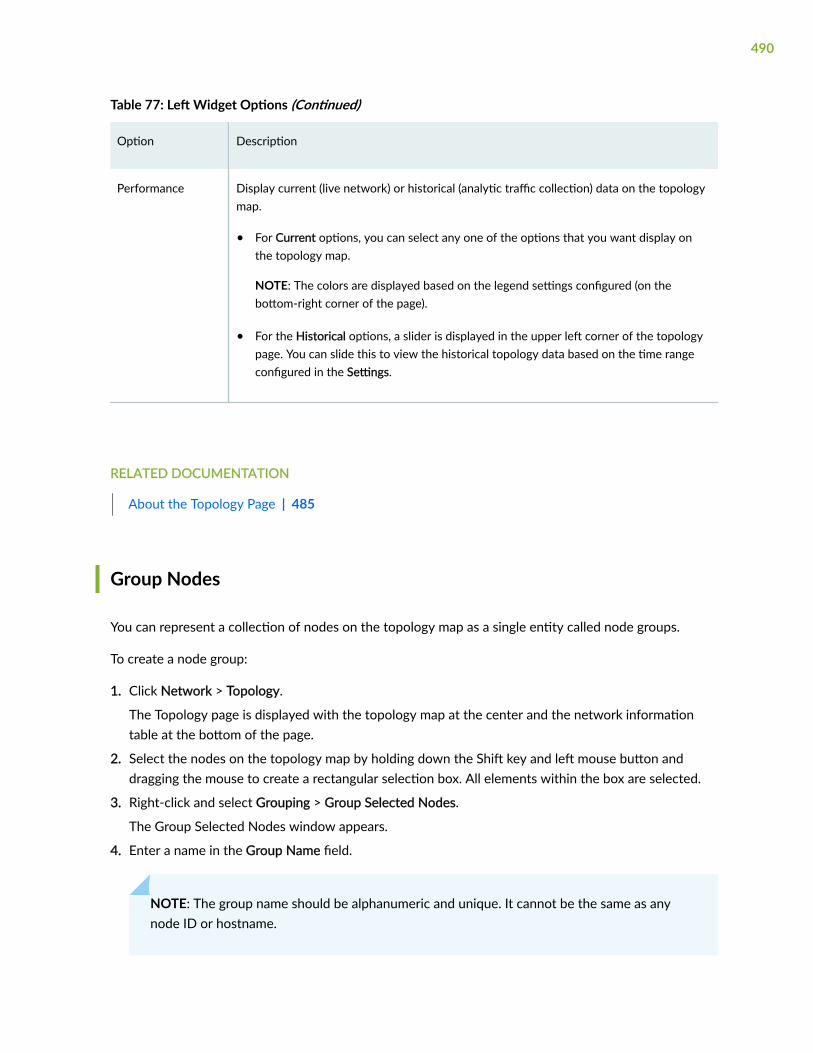
Table 77: Left Widget Options (Continued)
Option Description
Performance Display current (live network) or historical (analytic traffic collection) data on the topologymap.
• For Current options, you can select any one of the options that you want display onthe topology map.
NOTE: The colors are displayed based on the legend settings configured (on thebottom-right corner of the page).
• For the Historical options, a slider is displayed in the upper left corner of the topologypage. You can slide this to view the historical topology data based on the time rangeconfigured in the Settings.
RELATED DOCUMENTATION
About the Topology Page | 485
Group Nodes
You can represent a collection of nodes on the topology map as a single entity called node groups.
To create a node group:
1. Click Network > Topology.
The Topology page is displayed with the topology map at the center and the network informationtable at the bottom of the page.
2. Select the nodes on the topology map by holding down the Shift key and left mouse button anddragging the mouse to create a rectangular selection box. All elements within the box are selected.
3. Right-click and select Grouping > Group Selected Nodes.
The Group Selected Nodes window appears.
4. Enter a name in the Group Name field.
NOTE: The group name should be alphanumeric and unique. It cannot be the same as anynode ID or hostname.
490

5. Click OK.
The selected nodes are grouped and displayed as a single entity on the topology with a new NodeGroup icon highlighted in yellow.
The new group name is displayed in the Grouping > Nodes & Groups page when you right-clickanywhere on the screen.
On the Nodes & Groups page, you can control how the group is displayed in the topology map. Youcan uncheck the Group Name checkbox to hide the node group on the topology map. When youexpand a group in the Nodes & Groups list, the nodes are displayed individually on the map. Whenyou collapse a group in the Nodes & Groups list, only the group name appears on the topology maprepresented by an icon.
NOTE: You can also double-click the Group Node icon to view the nodes separately on thetopology map.
RELATED DOCUMENTATION
Interactive Map Features Overview | 470
Ungroup Nodes
Nodes that are part of a node group are displayed as a single entity (node group icon) on the topologymap. To view these nodes as discrete entities on the topology map, you can ungroup the nodes from thenode group.
To ungroup nodes from an existing node group:
1. Click Network > Topology.
The Topology page is displayed with the topology map at the center and the network informationtable at the bottom of the page.
2. Right-click on the node group and select Grouping > Ungroup Selected Nodes. Alternatively, you candouble-click the node group icon (highlighted in yellow) to ungroup the nodes on the topology map.
The nodes within the node group are ungrouped and are visible as separate nodes on the topologymap. The node group is removed from the Nodes & Groups page (right-click anywhere on theTopology map and select Grouping > Nodes & Groups).
491

RELATED DOCUMENTATION
About the Topology Page | 485
Automatically Group Nodes
Auto Grouping option enables you to use multiple rules in sequence to group nodes.
To auto group nodes:
1. Click Network > Topology.
The Topology page is displayed with the topology map at the center and the network informationtable at the bottom of the page.
2. Select the nodes on the topology map by holding down the Shift key and left mouse button anddragging the mouse to create a rectangular selection box. All elements within the box are selected.
3. Right-click and select Grouping > Auto Grouping.
Auto grouping pane is displayed on the right.
4. Hover over the Add list and select a rule type from one of the following:
• City
• Country
• AS
• ISIS Area
• OSPF Area
• Site
• Regular Expression: Add a more specific rule by using regular expressions to group nodes byHostname, IP address, or Type. You can find the first match for any case-sensitive expression.
NOTE:
• You can create one rule for each rule type.
• The Edit (pencil icon) function is only available for Regular Expression rules.
• You can change the order of the rules by clicking on a rule by selecting Up or Down fromthe Move list to reposition the rule in the list.
492
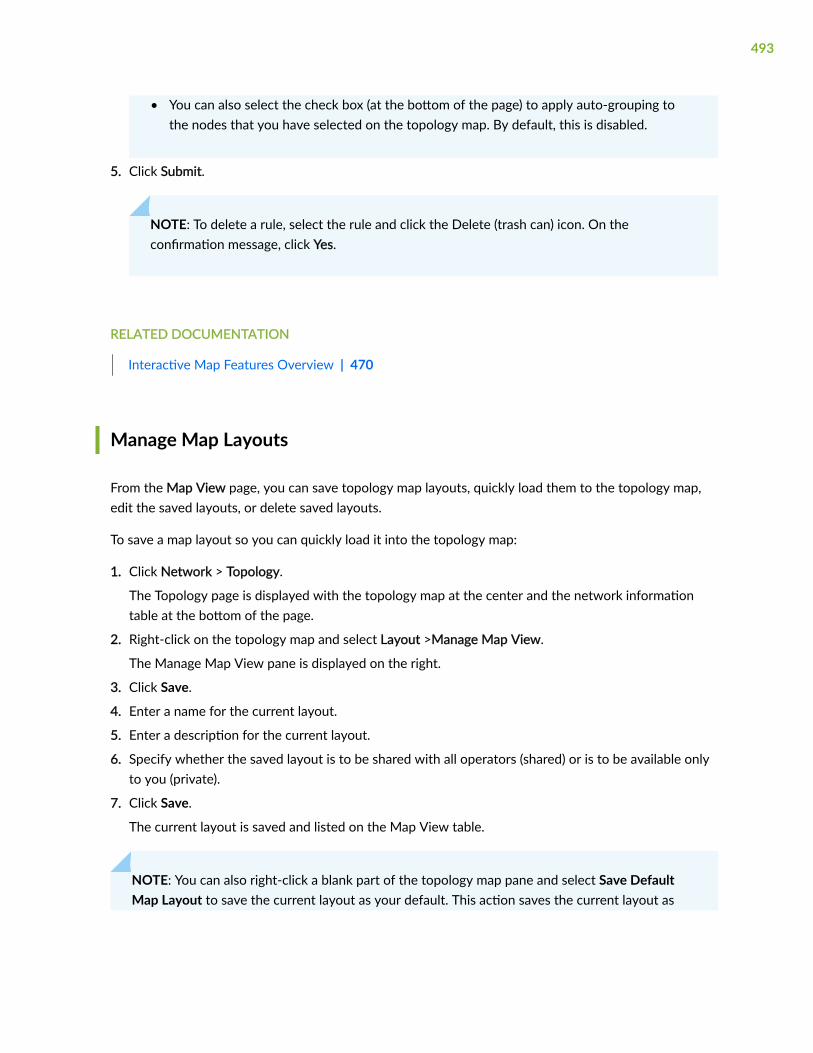
• You can also select the check box (at the bottom of the page) to apply auto-grouping tothe nodes that you have selected on the topology map. By default, this is disabled.
5. Click Submit.
NOTE: To delete a rule, select the rule and click the Delete (trash can) icon. On theconfirmation message, click Yes.
RELATED DOCUMENTATION
Interactive Map Features Overview | 470
Manage Map Layouts
From the Map View page, you can save topology map layouts, quickly load them to the topology map,edit the saved layouts, or delete saved layouts.
To save a map layout so you can quickly load it into the topology map:
1. Click Network > Topology.
The Topology page is displayed with the topology map at the center and the network informationtable at the bottom of the page.
2. Right-click on the topology map and select Layout >Manage Map View.
The Manage Map View pane is displayed on the right.
3. Click Save.
4. Enter a name for the current layout.
5. Enter a description for the current layout.
6. Specify whether the saved layout is to be shared with all operators (shared) or is to be available onlyto you (private).
7. Click Save.
The current layout is saved and listed on the Map View table.
NOTE: You can also right-click a blank part of the topology map pane and select Save DefaultMap Layout to save the current layout as your default. This action saves the current layout as
493
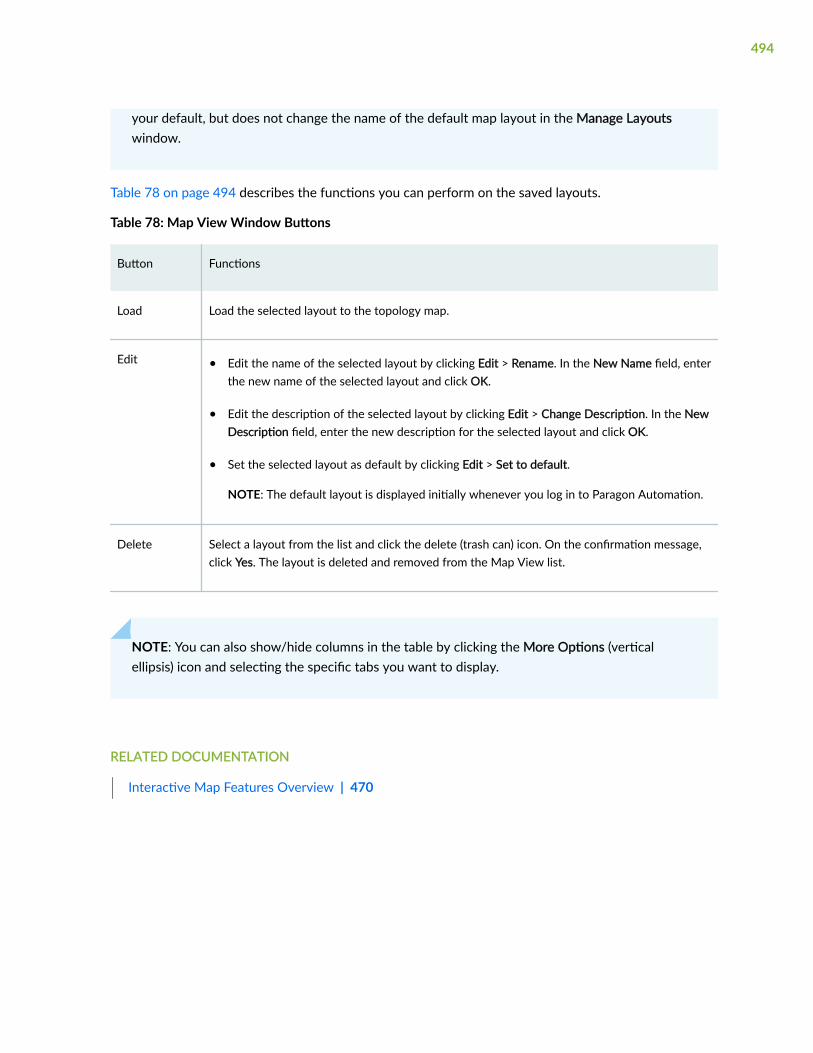
your default, but does not change the name of the default map layout in the Manage Layoutswindow.
Table 78 on page 494 describes the functions you can perform on the saved layouts.
Table 78: Map View Window Buttons
Button Functions
Load Load the selected layout to the topology map.
Edit • Edit the name of the selected layout by clicking Edit > Rename. In the New Name field, enterthe new name of the selected layout and click OK.
• Edit the description of the selected layout by clicking Edit > Change Description. In the NewDescription field, enter the new description for the selected layout and click OK.
• Set the selected layout as default by clicking Edit > Set to default.
NOTE: The default layout is displayed initially whenever you log in to Paragon Automation.
Delete Select a layout from the list and click the delete (trash can) icon. On the confirmation message,click Yes. The layout is deleted and removed from the Map View list.
NOTE: You can also show/hide columns in the table by clicking the More Options (verticalellipsis) icon and selecting the specific tabs you want to display.
RELATED DOCUMENTATION
Interactive Map Features Overview | 470
494

CHAPTER 24
Network Information Table
IN THIS CHAPTER
Network Information Table Overview | 496
About the Node Tab | 499
Add a Node | 503
Edit Node Parameters | 506
Delete a Node | 508
About the Link Tab | 509
Add a Link | 512
Edit Link Parameters | 515
Delete a Link | 516
About the Tunnel Tab | 517
Configure Routers to Send JTI Telemetry Data and RPM Statistics to the Data Collector | 521
Understand How Pathfinder Handles LSPs | 524
Add a Single LSP | 528
Add Diverse LSPs | 540
Add Multiple LSPs | 550
Edit and Delete LSPs | 559
About the Interface Tab | 560
About the Container LSP Tab | 561
Add a Container LSP | 562
Edit Container LSP Parameters | 568
About the Maintenance Tab | 569
Add a Maintenance Event | 570
Edit a Maintenance Event | 572
Simulate a Maintenance Event | 574
Delete a Maintenance Event | 575
About the P2MP Groups Tab | 575
495
Add a P2MP Group | 584
Edit P2MP Group Parameters | 591
About the SRLG/Facility Tab | 592
Add an SRLG/Facility | 593
Edit SRLG/Facility Parameters | 594
Network Information Table Overview
IN THIS SECTION
Tasks You Can Perform | 498
The Network Information Table at the bottom of the Topology page displays detailed networkinformation based on one of the following tabs selected:
• Node—View node information and add, edit, or delete nodes in the network.
• Link—View link information and add, edit, or delete links in the network.
• Tunnel—View tunnel information and provision, edit, or delete tunnels in the network.
• Interface—View information about various interfaces (such as IPv4, MAC, and VRF) in the network.
• Anycast Group—View information about different anycast groups in the network. You can view theanycast group Prefix Address, State (valid or not), SR (segment routing) information such as flags andindex, and the Members of the anycast group.
Segment Routing is a forwarding architecture which instructs a router on what to do with certainpackets. There are multiple types of SIDs supported such as node SIDs, prefix SIDs, Adjacency SIDs,Binding SIDs along with Anycast SIDs.
Anycast SIDs are a type of prefix SID that represents a group. It is present in multiple devices, andthe network can reach any of the members on the group based on IGP shortest path or potentiallyany other constraint defined. Anycast SID have multiple use cases, for example, they can be used as
496
transit SIDs (loose hops) on a SR-TE policy, or used as destination (representing a service, orrepresenting border gateways on a multi-domain network).
For LSPs using anycast group as intermediate hop, the intermediate hop will be a set of nodes.Within an anycast group, all the routers advertise the same prefix with the same SID value, whichfacilitates load balancing.
• Container LSP—View container LSP information and add, edit, or delete container LSPs and their sub-LSPs.
• Maintenance—View information about existing maintenance events and add, edit, simulate, or deletethese events.
• P2MP Group—View information about P2MP group and their sub-LSPs, and add, edit, or deletethem.
• SRLG/Facility—View information about shared risk link group (SRLG)/Facilities and add, edit, ordelete them.
• Topology Group—View information about topology groups in the network.
A topology group, also referred to as a topology slice, is a subset of nodes and links in the network.You must configure the network elements (nodes and links) to group them as a topology group. Toconfigure network elements, you must edit the Slices parameter for the node or link. For moreinformation, see "Edit Node Parameters" on page 506 and "Edit Link Parameters" on page 515. Allthe network elements tagged with the same topology slice IDs form a topology group and are listedunder this tab. Topology groups can be used as a constraint to restrict LSP (tunnel) routing on asubset of the topology. For more information, see "Add a Single LSP" on page 528.
When you select a topology group in the network information table, it is highlighted in yellow on thetopology map.
NOTE: You can only delete a topology group from this tab. A topology group can be deletedonly if there are no nodes or links present within that topology group.
The Node, Link, and Tunnel tabs are displayed by default. To view other tabs, you can hover over theMore Options (horizontal ellipsis icon next to the Tunnel tab) and select the required tab name.
NOTE: You can show or hide the network information table by clicking the collapsible arrow icon.
497
Tasks You Can Perform
You can perform the following tasks:
• Related to nodes, see "About the Node Tab" on page 499.
• Related to links, see "About the Link Tab" on page 509.
• Related to tunnels, see "About the Tunnel Tab" on page 517.
• Related to interfaces, see "About the Interface Tab" on page 560.
• Related to container LSPs, see "About the Container LSP Tab" on page 561.
• Related to maintenance events, see "About the Maintenance Tab" on page 569.
• Related to P2MP groups, see "About the P2MP Groups Tab" on page 575.
• Related to SRLG/Facility, see "About the SRLG/Facility Tab" on page 592.
• Filter Entries—Filter the table entries by adding new filtering criteria.
Hover over the Filter (funnel) icon and select Add Filter. On the Add Criteria page, select the filteringcriteria from the Field and Condition list, and enter the text to be compared in the Value field. ClickAdd.
The filtered table entries are listed and the filter criteria name is displayed above the table columnnames.
You can click the cross (X) icon (next to the filter name) to remove the filtering criteria.
NOTE:
• You can add multiple filtering criteria. Once you add the multiple filtering criteria, you canselect the And condition to display the entries matching all the filtering criteria or selectthe Or condition to display the entries matching any one of the filtering criteria.
• Quick filter: Save the filtering criteria as quick filters. Once you have added all the filteringcriteria, you can save a particular criteria or multiple criteria for future use by clicking Save.
On the Save Filter window, enter a name for the filter, optionally toggle the Set as Defaultbutton if you want to use this filtering criteria by default, and click OK.
The saved filters are displayed under Quick Filters when you hover over the Filter (funnel)icon. You can then apply these saved filters to the table entries.
• Show/Hide Columns—Choose to show or hide a specific column in the table.
498

Hover over the More Options (vertical ellipsis) > Show/Hide Columns and select the Column-Namecheck box of the columns you want to display in the table.
• Reset Preference—Reset the displayed columns to the default set of columns for each tab in thetable.
Hover over the More Options (vertical ellipsis) and select Reset Preference.
• Sort Entries—Click the column name to highlight the up and down arrows next to the column name.Sort the table entries in ascending or descending order of that column by clicking the up or downarrow respectively.
NOTE: The network information table is not refreshed by itself. If there is a network event, asmall yellow indicator next to Refresh icon at the bottom-left of the table is displayed. You mustrefresh the table explicitly.
RELATED DOCUMENTATION
About the Topology Page | 485
About the Node Tab
IN THIS SECTION
Tasks You Can Perform | 499
You can view detailed information, add, edit, or delete nodes from the Node tab of the networkinformation table on the Topology (Network > Topology) page.
Tasks You Can Perform
You can perform the following tasks on the Node tab:
• Add a Node. See "Add a Node" on page 503.
499
• Edit Node Properties. See "Edit Node Parameters" on page 506.
• Delete a Node. See "Delete a Node" on page 508.
• From the View list, you can view:
• Config—View the configuration of the selected device in the network.
• Node Traffic—View a graphical representation of node traffic (in bps) based on the selected timerange (for previous 3 hours, 1 day, 1 week, or Custom time range). A Node Traffic pop-up isdisplayed which you can pin anywhere on the screen.
• Device Detail—Displays device details (overview, alarms, and alerts), inventory details (chassis,interfaces, licenses, and software), and the configuration template. For more information, see"View Device Statistics and Inventory information" on page 124.
• Device Health—Displays the device health information in a table and tile view on the NetworkHealth page. For more information, see "About the Network Health Page" on page 605.
• From the Diagnostics list, you can run CLI commands on the routers in the network without manuallylogging into the routers. You can select the routers, select the commands, specify various commandparameters, execute the commands, and view/save the results. This is a unified way to manage pingand traceroute results, and is a useful tool for troubleshooting. Juniper, Cisco, Alcatel, and Huaweicommand sets are provided by default, and you can add other vendor command sets as needed.
• Ping/Traceroute—On the Ping or Traceroute window, Default and Custom tabs are displayed.
On the Default Tab:
• Click the From list and select one or more nodes from which ping or traceroute must beinitiated.
• Click the To list and select the one or more nodes as destination.
• (Optional) You can click the Use Management IP Address check box. If you don’t opt to use themanagement IP address, the loopback address is used.
• (Optional) You can use the Advanced Options to customize the ping or traceroute command.See Table 79 on page 501.
NOTE: We recommend that you do not use the Advanced Options if you are runningping or traceroute for a large number of devices as these actions would be significantlyslower.
500
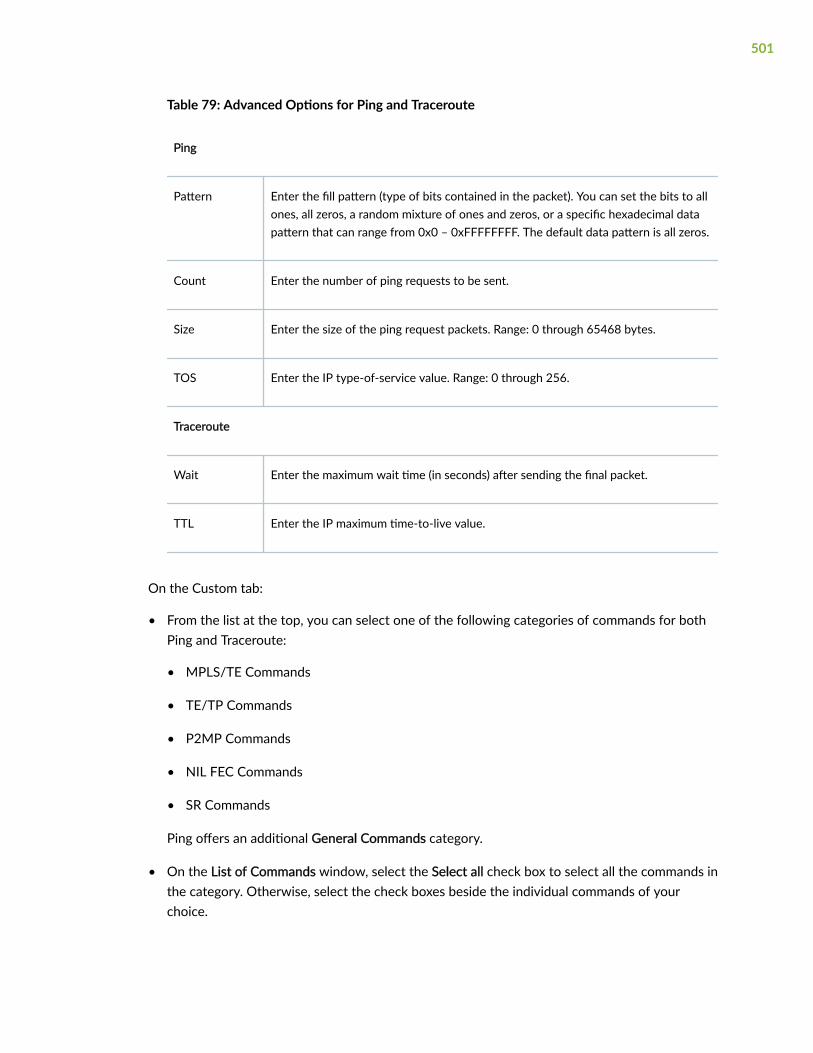
Table 79: Advanced Options for Ping and Traceroute
Ping
Pattern Enter the fill pattern (type of bits contained in the packet). You can set the bits to allones, all zeros, a random mixture of ones and zeros, or a specific hexadecimal datapattern that can range from 0x0 – 0xFFFFFFFF. The default data pattern is all zeros.
Count Enter the number of ping requests to be sent.
Size Enter the size of the ping request packets. Range: 0 through 65468 bytes.
TOS Enter the IP type-of-service value. Range: 0 through 256.
Traceroute
Wait Enter the maximum wait time (in seconds) after sending the final packet.
TTL Enter the IP maximum time-to-live value.
On the Custom tab:
• From the list at the top, you can select one of the following categories of commands for bothPing and Traceroute:
• MPLS/TE Commands
• TE/TP Commands
• P2MP Commands
• NIL FEC Commands
• SR Commands
Ping offers an additional General Commands category.
• On the List of Commands window, select the Select all check box to select all the commands inthe category. Otherwise, select the check boxes beside the individual commands of yourchoice.
501
• Once you select a command that requires a value for variable parameters, a field for eachparameter is displayed under the Selected Commands section at the bottom of the page. Enterthe appropriate values.
• Click Submit to execute the command(s).
The Diagnostics window displays the new commands along with status and results. When atraceroute command is successfully completed, the path is highlighted in the topology map.
• Run CLI—On the Run CLI window, select a command category from the list and enter theappropriate parameter values. Click Submit to execute the command.
NOTE: Make all your command selections first, and then enter the parameter valuesbecause the Selected Commands section of the page refreshes when you add commandsand clears any parameter information already entered.
The Diagnostics window displays the new commands along with status and results. If youselected multiple nodes, each command you specified is run on each node and all the resultsdisplayed as the Results on the Diagnostics window.
NOTE: The selected nodes must be of the same vendor because only one CLI commandset is used. If you want to run CLI on nodes of different vendors, run them separately.
• Download node information—Click Download to download detailed information about all theexisting nodes in the topology in CSV format.
• From More List, you can:
• View details about the node by clicking the Details icon when you hover over the node name orclick More > Show Detail. A moveable pop-up with traffic (for previous 3 hours, 1 day, 1 week, orCustom time range) and node details is displayed which you can pin anywhere on the screen.
• Filter selected node on the Topology Map. Only the selected node is displayed.
• Zoom in to the selected node on the Topology Map.
• Request NETCONF reconnect—If the NETCONF status of the node is Down, you can request fora reconnect. A confirmation message appears stating that the NETCONF reconnect request issubmitted successfully. If the reconnect is successful, the status is changed to Up.
• Run Device collection for the selected node. The device collection task is added to the TaskScheduler where you can view the summary, status, and history of tasks. For more information,see "Add a Device Collection Task" on page 745.
502

• Force Delete—Delete one or more nodes from the topology. Force delete is used to delete nodesthat are not completely withdrawn. When the TopoServer has not received the complete nodewithdrawal message from the network for the node, the node withdrawal is consideredincomplete. This can cause the network model (maintained by TopoServer) to be out-of-sync. Youcan fix this sync issue by force deleting the node and then syncing the network model again.
CAUTION: Force delete a node only in extraordinary circumstances, such astroubleshooting, because force deleting a node that's working normally might causeParagon Automation to be out-of-sync with the live network.
To force delete a node:
1. Select one or more nodes from the Node tab of the network information table and click More> Force Delete. Alternatively, right-click on the selected nodes and select Force Delete.
A confirmation message appears.
2. Click Yes.
The node is deleted from the table and the topology map. After the node is deleted,synchronize the network model. For more information, see "Modify Pathfinder Settings Fromthe GUI" on page 172.
RELATED DOCUMENTATION
About the Topology Page | 485
Group Nodes | 490
Add a Node
You can add customer edge (CE) nodes and sites (multiple CE nodes in one location). CE nodes and sitesare used when configuring P2MP tree design with diverse PE-CE links. This type of tree design allowsdiverse tree calculation to be performed all the way to the intended traffic endpoints(the CE nodes/sites), even though the P2MP trees need to terminate on the PEs connecting to the sites.
To add a new node to your network:
1. Click Network > Topology.
The Topology page is displayed with the topology map at the center and the network informationtable at the bottom of the page.
503
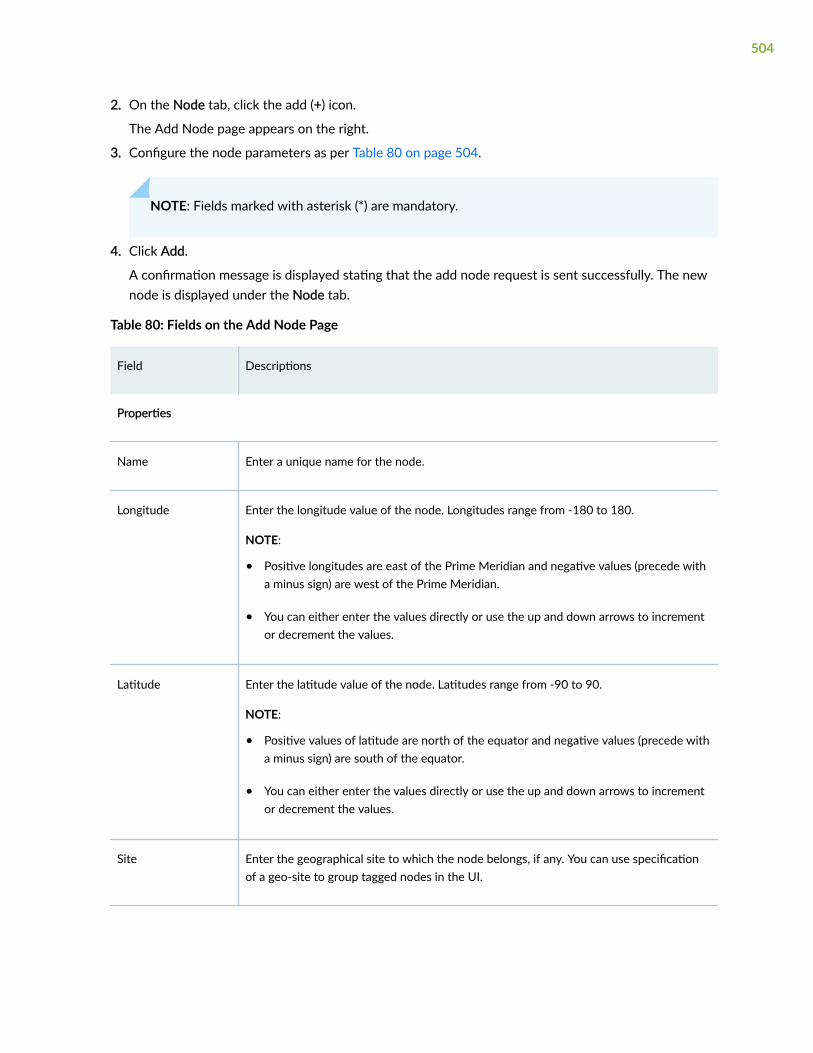
2. On the Node tab, click the add (+) icon.
The Add Node page appears on the right.
3. Configure the node parameters as per Table 80 on page 504.
NOTE: Fields marked with asterisk (*) are mandatory.
4. Click Add.
A confirmation message is displayed stating that the add node request is sent successfully. The newnode is displayed under the Node tab.
Table 80: Fields on the Add Node Page
Field Descriptions
Properties
Name Enter a unique name for the node.
Longitude Enter the longitude value of the node. Longitudes range from -180 to 180.
NOTE:
• Positive longitudes are east of the Prime Meridian and negative values (precede witha minus sign) are west of the Prime Meridian.
• You can either enter the values directly or use the up and down arrows to incrementor decrement the values.
Latitude Enter the latitude value of the node. Latitudes range from -90 to 90.
NOTE:
• Positive values of latitude are north of the equator and negative values (precede witha minus sign) are south of the equator.
• You can either enter the values directly or use the up and down arrows to incrementor decrement the values.
Site Enter the geographical site to which the node belongs, if any. You can use specificationof a geo-site to group tagged nodes in the UI.
504
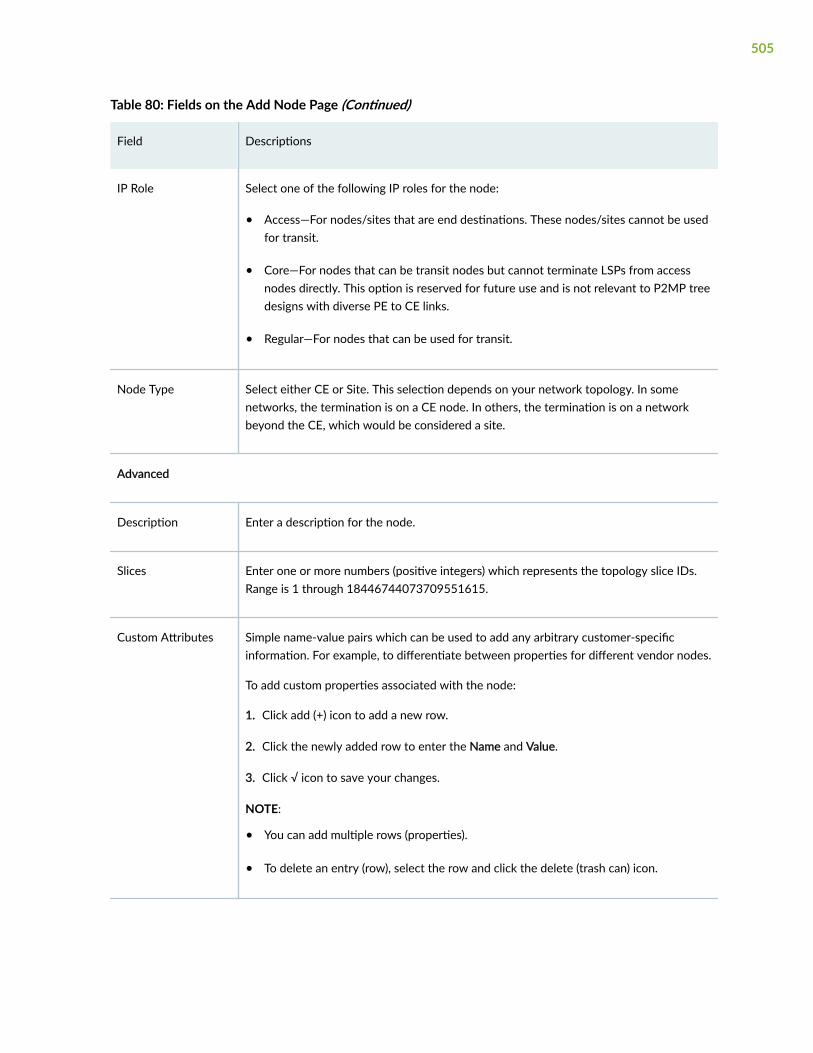
Table 80: Fields on the Add Node Page (Continued)
Field Descriptions
IP Role Select one of the following IP roles for the node:
• Access—For nodes/sites that are end destinations. These nodes/sites cannot be usedfor transit.
• Core—For nodes that can be transit nodes but cannot terminate LSPs from accessnodes directly. This option is reserved for future use and is not relevant to P2MP treedesigns with diverse PE to CE links.
• Regular—For nodes that can be used for transit.
Node Type Select either CE or Site. This selection depends on your network topology. In somenetworks, the termination is on a CE node. In others, the termination is on a networkbeyond the CE, which would be considered a site.
Advanced
Description Enter a description for the node.
Slices Enter one or more numbers (positive integers) which represents the topology slice IDs.Range is 1 through 18446744073709551615.
Custom Attributes Simple name-value pairs which can be used to add any arbitrary customer-specificinformation. For example, to differentiate between properties for different vendor nodes.
To add custom properties associated with the node:
1. Click add (+) icon to add a new row.
2. Click the newly added row to enter the Name and Value.
3. Click √ icon to save your changes.
NOTE:
• You can add multiple rows (properties).
• To delete an entry (row), select the row and click the delete (trash can) icon.
505
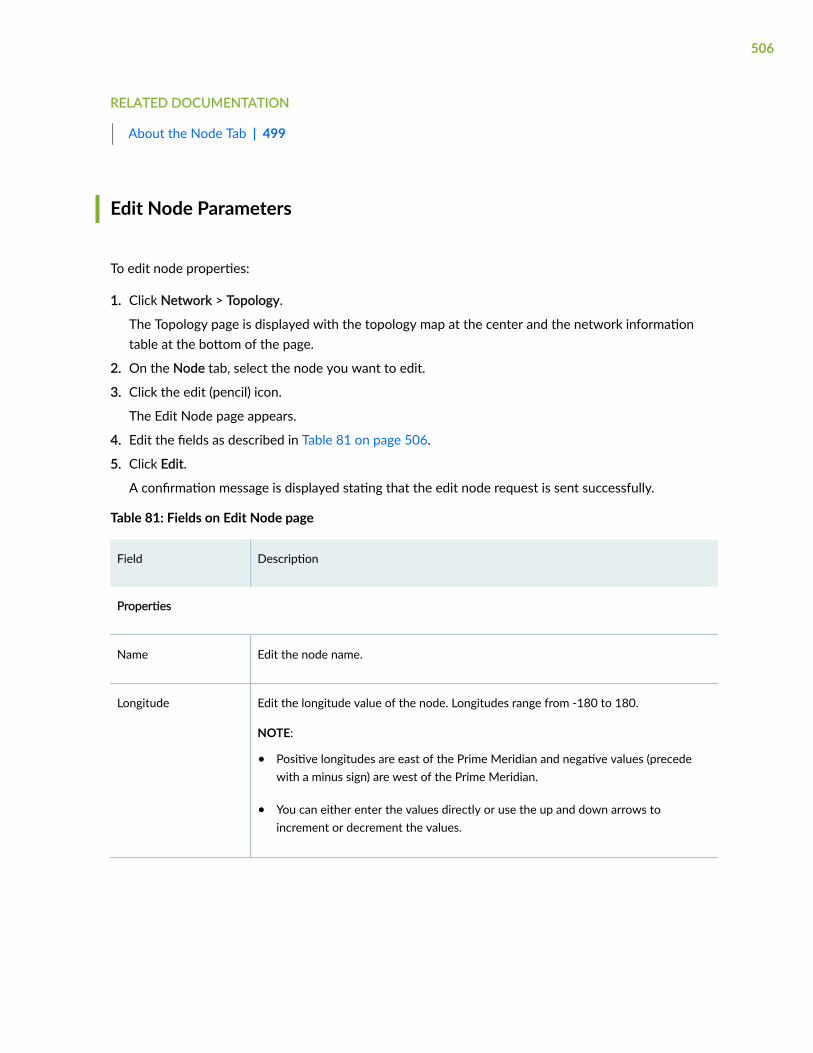
RELATED DOCUMENTATION
About the Node Tab | 499
Edit Node Parameters
To edit node properties:
1. Click Network > Topology.
The Topology page is displayed with the topology map at the center and the network informationtable at the bottom of the page.
2. On the Node tab, select the node you want to edit.
3. Click the edit (pencil) icon.
The Edit Node page appears.
4. Edit the fields as described in Table 81 on page 506.
5. Click Edit.
A confirmation message is displayed stating that the edit node request is sent successfully.
Table 81: Fields on Edit Node page
Field Description
Properties
Name Edit the node name.
Longitude Edit the longitude value of the node. Longitudes range from -180 to 180.
NOTE:
• Positive longitudes are east of the Prime Meridian and negative values (precedewith a minus sign) are west of the Prime Meridian.
• You can either enter the values directly or use the up and down arrows toincrement or decrement the values.
506

Table 81: Fields on Edit Node page (Continued)
Field Description
Latitude Edit the latitude value of the node. Latitudes range from -90 to 90.
NOTE:
• Positive values of latitude are north of the equator and negative values (precedewith a minus sign) are south of the equator.
• You can either enter the values directly or use the up and down arrows toincrement or decrement the values.
Site Edit the geographical site name to which the node belongs, if any.
Support SecondaryPath
Toggle the button to enable or disable support for a secondary path.
NOTE: This field is enabled by default.
Allow any SID at FirstHop
Toggle the button to allow SID at first hop. When disabled, the first hop is anadjacency SID, even if the LSP is configured to use a node SID as the first hop. Ifenabled, the ingress node supports any SID as the first hop of the SR LSP. In this case,a node SID can be used as the first hop. This is supported on PCC devices runningJunos OS Release 18.3 or later, and requires the configuration of set protocol source-packet-routing inherit-label-nexthops.
Advanced
Description Edit the description for the node.
Slices Edit the topology slice IDs (positive integer value). Range is 1 through18446744073709551615.
Custom Attributes Edit the custom properties associated with the node.
507
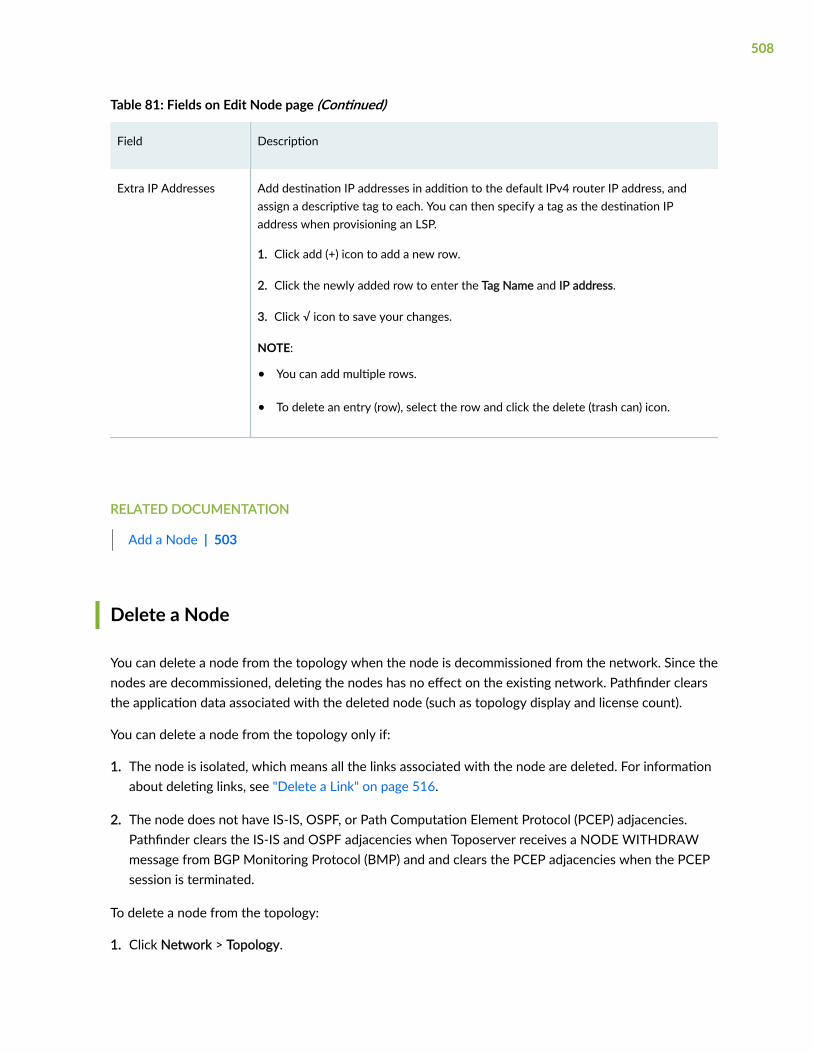
Table 81: Fields on Edit Node page (Continued)
Field Description
Extra IP Addresses Add destination IP addresses in addition to the default IPv4 router IP address, andassign a descriptive tag to each. You can then specify a tag as the destination IPaddress when provisioning an LSP.
1. Click add (+) icon to add a new row.
2. Click the newly added row to enter the Tag Name and IP address.
3. Click √ icon to save your changes.
NOTE:
• You can add multiple rows.
• To delete an entry (row), select the row and click the delete (trash can) icon.
RELATED DOCUMENTATION
Add a Node | 503
Delete a Node
You can delete a node from the topology when the node is decommissioned from the network. Since thenodes are decommissioned, deleting the nodes has no effect on the existing network. Pathfinder clearsthe application data associated with the deleted node (such as topology display and license count).
You can delete a node from the topology only if:
1. The node is isolated, which means all the links associated with the node are deleted. For informationabout deleting links, see "Delete a Link" on page 516.
2. The node does not have IS-IS, OSPF, or Path Computation Element Protocol (PCEP) adjacencies.Pathfinder clears the IS-IS and OSPF adjacencies when Toposerver receives a NODE WITHDRAWmessage from BGP Monitoring Protocol (BMP) and and clears the PCEP adjacencies when the PCEPsession is terminated.
To delete a node from the topology:
1. Click Network > Topology.
508
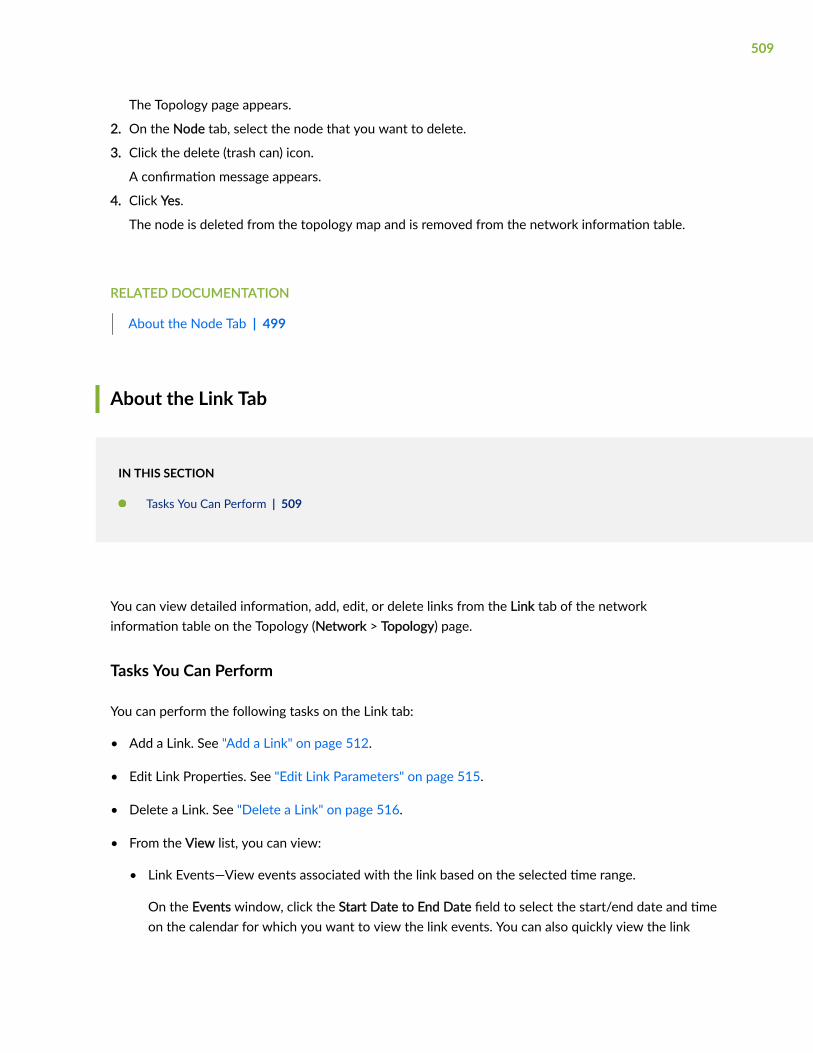
The Topology page appears.
2. On the Node tab, select the node that you want to delete.
3. Click the delete (trash can) icon.
A confirmation message appears.
4. Click Yes.
The node is deleted from the topology map and is removed from the network information table.
RELATED DOCUMENTATION
About the Node Tab | 499
About the Link Tab
IN THIS SECTION
Tasks You Can Perform | 509
You can view detailed information, add, edit, or delete links from the Link tab of the networkinformation table on the Topology (Network > Topology) page.
Tasks You Can Perform
You can perform the following tasks on the Link tab:
• Add a Link. See "Add a Link" on page 512.
• Edit Link Properties. See "Edit Link Parameters" on page 515.
• Delete a Link. See "Delete a Link" on page 516.
• From the View list, you can view:
• Link Events—View events associated with the link based on the selected time range.
On the Events window, click the Start Date to End Date field to select the start/end date and timeon the calendar for which you want to view the link events. You can also quickly view the link
509

events that occurred Today, Past 1h (one hour), Past 1d (one day), and Past Wk (week) byselecting the respective buttons at the bottom of the calendar.
NOTE: You can also enter the date and time manually.
The time series bar chart shows the hourly aggregated Status Up or Down counts. The Up orDown event is sent by the server to the client based on the date-time range configured.
The detailed events are displayed in the table at the bottom on the page. For example, you canview the link Action (add, remove, update, state change, or query) and the link Status (up, down,planned, or unknown).
You can also export all the events data to a CSV file by clicking Download.
NOTE: You can also:
• Show/Hide Columns—Choose to show or hide a specific column in the table.
Hover over the More Options (vertical ellipsis) > Show/Hide Columns and select theColumn-Name check box of the columns you want to display in the table.
• Reset Preference—Reset the displayed columns to the default set of columns in thetable.
Hover over the More Options (vertical ellipsis) and select Reset Preference.
• Interface Traffic—View a graphical representation of the link traffic (in bps) for interface A and Zbased on the time range selected from the Period list. A Link Traffic pop-up appears, which youcan pin anywhere on the screen using the pin icon. From the Period list, you can select an optionto view the traffic data for Previous 3 Hours, 1 day, 1 Week, or Custom time ranges.
• Interface Delay—View a graphical representation of the link delay (in milliseconds) for interface Aand Z based on the time range selected from the Period list. A Link Delay pop-up appears, whichyou can pin anywhere on the screen using the pin icon. From the Period list, you can select anoption to view the delay data for Previous 3 Hours, 1 day, 1 Week, or Custom time ranges.
• From the Diagnostics list, you can:
• Show Interface—Runs the show interfaces CLI command for each interface associated with thelink. Interface related information is displayed on the Diagnostics window. You can view thestatus, type, node for which the command is run (From), description, and time of last execution,for each associated interface. Once the commands are run, you can view detailed executiondetails under the Result tab.
510
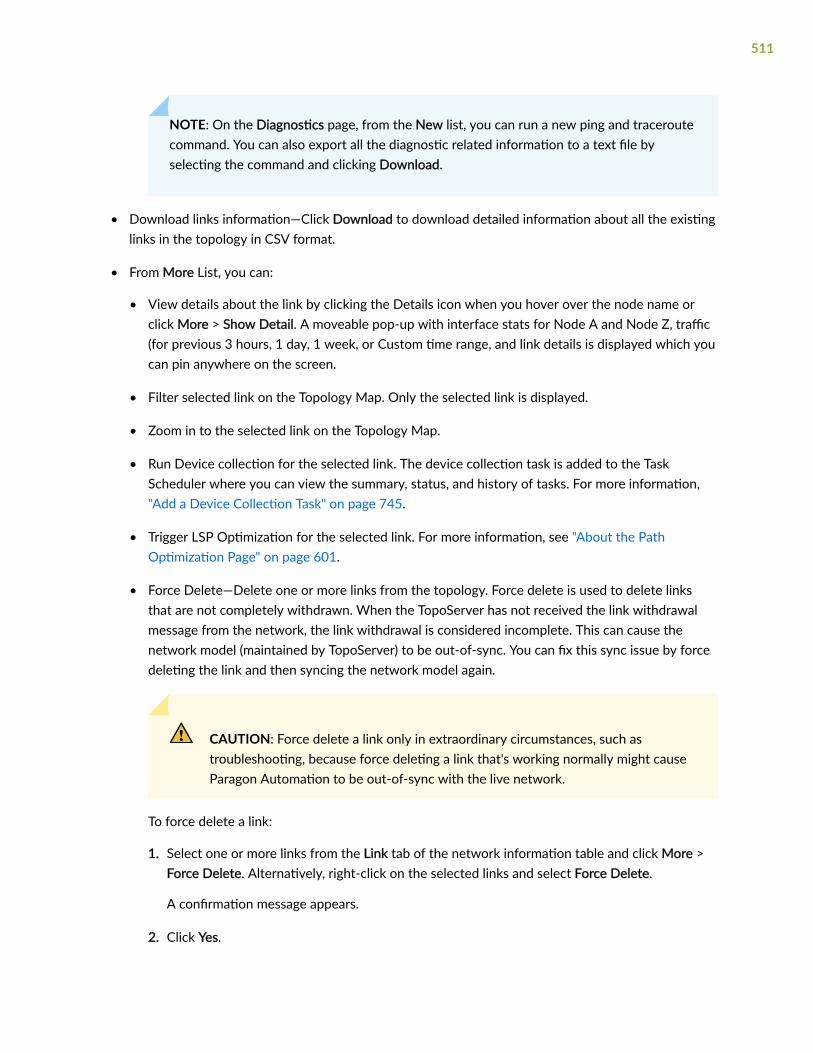
NOTE: On the Diagnostics page, from the New list, you can run a new ping and traceroutecommand. You can also export all the diagnostic related information to a text file byselecting the command and clicking Download.
• Download links information—Click Download to download detailed information about all the existinglinks in the topology in CSV format.
• From More List, you can:
• View details about the link by clicking the Details icon when you hover over the node name orclick More > Show Detail. A moveable pop-up with interface stats for Node A and Node Z, traffic(for previous 3 hours, 1 day, 1 week, or Custom time range, and link details is displayed which youcan pin anywhere on the screen.
• Filter selected link on the Topology Map. Only the selected link is displayed.
• Zoom in to the selected link on the Topology Map.
• Run Device collection for the selected link. The device collection task is added to the TaskScheduler where you can view the summary, status, and history of tasks. For more information,"Add a Device Collection Task" on page 745.
• Trigger LSP Optimization for the selected link. For more information, see "About the PathOptimization Page" on page 601.
• Force Delete—Delete one or more links from the topology. Force delete is used to delete linksthat are not completely withdrawn. When the TopoServer has not received the link withdrawalmessage from the network, the link withdrawal is considered incomplete. This can cause thenetwork model (maintained by TopoServer) to be out-of-sync. You can fix this sync issue by forcedeleting the link and then syncing the network model again.
CAUTION: Force delete a link only in extraordinary circumstances, such astroubleshooting, because force deleting a link that's working normally might causeParagon Automation to be out-of-sync with the live network.
To force delete a link:
1. Select one or more links from the Link tab of the network information table and click More >Force Delete. Alternatively, right-click on the selected links and select Force Delete.
A confirmation message appears.
2. Click Yes.
511
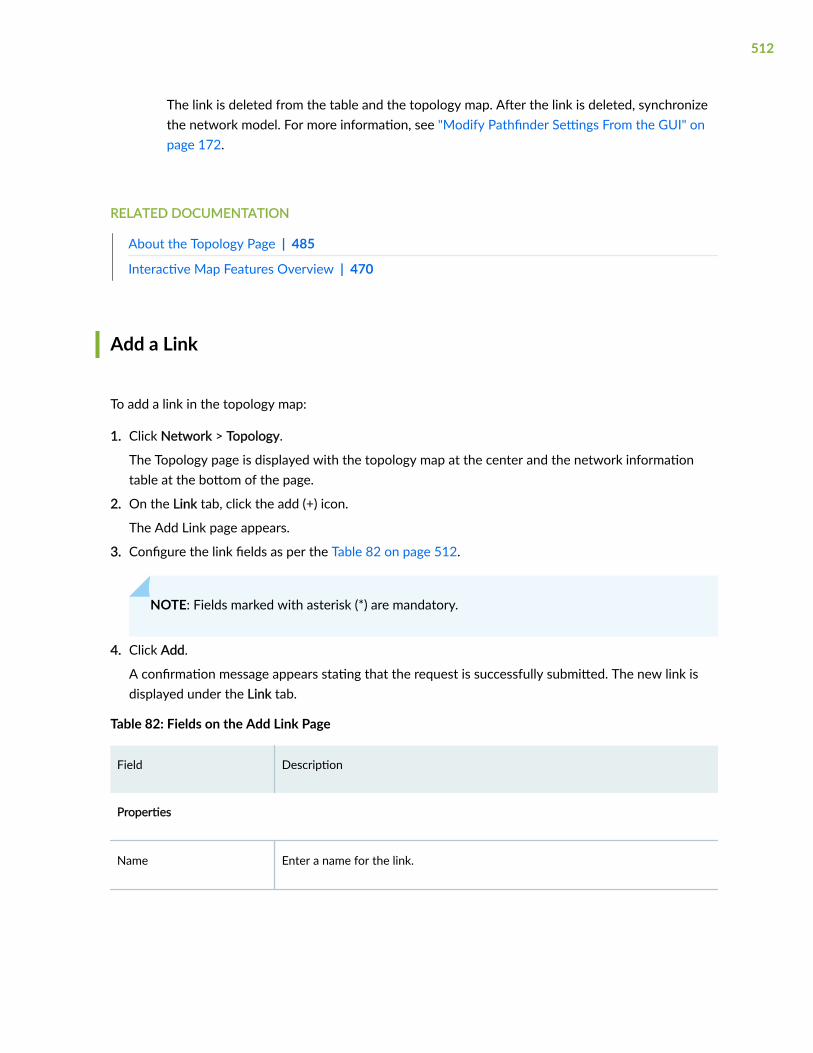
The link is deleted from the table and the topology map. After the link is deleted, synchronizethe network model. For more information, see "Modify Pathfinder Settings From the GUI" onpage 172.
RELATED DOCUMENTATION
About the Topology Page | 485
Interactive Map Features Overview | 470
Add a Link
To add a link in the topology map:
1. Click Network > Topology.
The Topology page is displayed with the topology map at the center and the network informationtable at the bottom of the page.
2. On the Link tab, click the add (+) icon.
The Add Link page appears.
3. Configure the link fields as per the Table 82 on page 512.
NOTE: Fields marked with asterisk (*) are mandatory.
4. Click Add.
A confirmation message appears stating that the request is successfully submitted. The new link isdisplayed under the Link tab.
Table 82: Fields on the Add Link Page
Field Description
Properties
Name Enter a name for the link.
512

Table 82: Fields on the Add Link Page (Continued)
Field Description
Node A Click the Node A list and select the name of the ingress (source) node from thelist.
Node Z Click the Node Z list and select the name of the egress (destination) node fromthe list.
IP A Enter the IPv4 address of Node A.
IP Z Enter the IPv4 address of Node Z.
Bandwidth AZ and ZA Enter the bandwidth (in bps) for each direction (Node A to Z and from Z to A). Youmust enter a number immediately followed by K (Kbps), M (Mbps), or G (Gbps).For example, 10M signifying 10 Megabits per second.
NOTE: If you enter a value without units, bps is applied.
ISIS Off/On Toggle the button to enable or disable ISIS protocol.
• Enter ISIS area level (L1, L2, or L1L2) metric. For more information on ISISarea, see Understanding IS-IS Areas to Divide an Autonomous System intoSmaller Groups.
• Enter the ISIS TE metric. Range: 1 through 16,777,215. Default: Value of theIGP metric.
RSVP Off/On Toggle the button to enable or disable the RSVP protocol. Enter the RSVPbandwidth for each direction AZ (Node A to Z) and ZA (from Z to A).
Constraints
Admin Group AZ and ZA Select the bit-level link coloring from the list for A to Z and Z to A links.
513
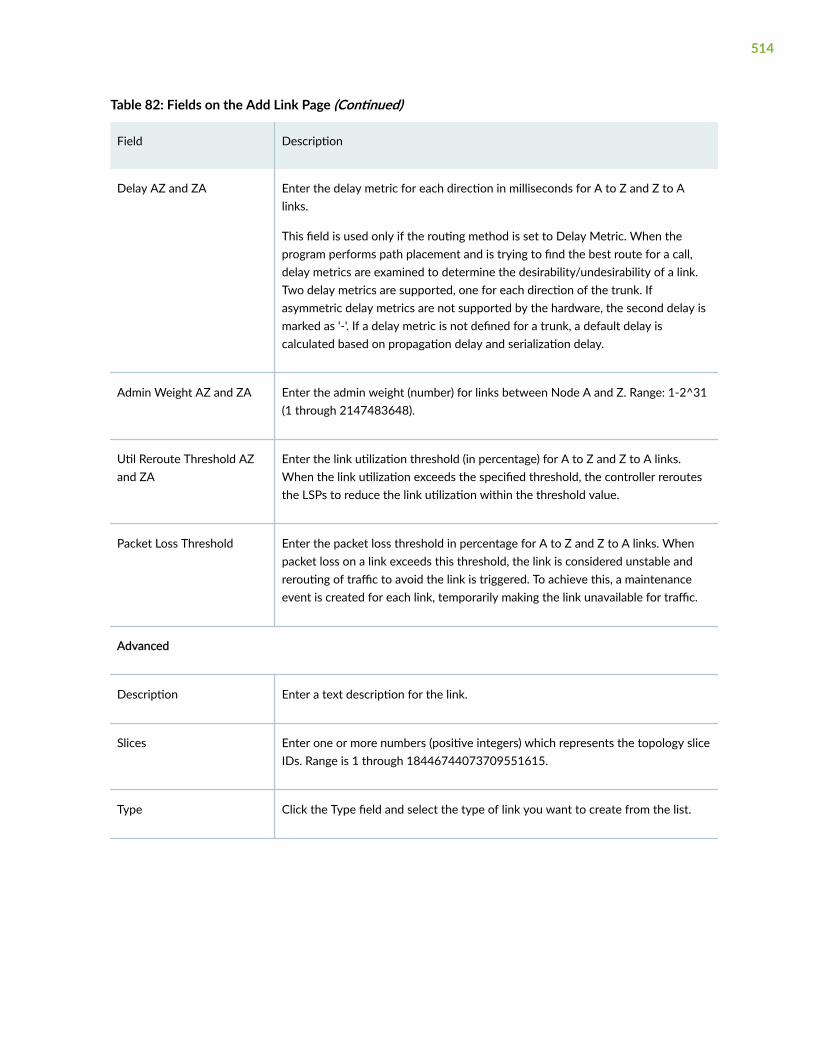
Table 82: Fields on the Add Link Page (Continued)
Field Description
Delay AZ and ZA Enter the delay metric for each direction in milliseconds for A to Z and Z to Alinks.
This field is used only if the routing method is set to Delay Metric. When theprogram performs path placement and is trying to find the best route for a call,delay metrics are examined to determine the desirability/undesirability of a link.Two delay metrics are supported, one for each direction of the trunk. Ifasymmetric delay metrics are not supported by the hardware, the second delay ismarked as '-'. If a delay metric is not defined for a trunk, a default delay iscalculated based on propagation delay and serialization delay.
Admin Weight AZ and ZA Enter the admin weight (number) for links between Node A and Z. Range: 1-2^31(1 through 2147483648).
Util Reroute Threshold AZand ZA
Enter the link utilization threshold (in percentage) for A to Z and Z to A links.When the link utilization exceeds the specified threshold, the controller reroutesthe LSPs to reduce the link utilization within the threshold value.
Packet Loss Threshold Enter the packet loss threshold in percentage for A to Z and Z to A links. Whenpacket loss on a link exceeds this threshold, the link is considered unstable andrerouting of traffic to avoid the link is triggered. To achieve this, a maintenanceevent is created for each link, temporarily making the link unavailable for traffic.
Advanced
Description Enter a text description for the link.
Slices Enter one or more numbers (positive integers) which represents the topology sliceIDs. Range is 1 through 18446744073709551615.
Type Click the Type field and select the type of link you want to create from the list.
514

Table 82: Fields on the Add Link Page (Continued)
Field Description
Protected Link Toggle this button to enable protected link status for this link. By default, this isdisabled.
PCE supports preferred protected links routing constraint for packet LSPs. Whenthis constraint is selected, PCE computes the path that maximizes the number ofprotected links, and therefore offers the best overall protection.
Custom Attributes Node Aand Node Z
Simple name-value pairs which can be used to add any arbitrary customer-specificinformation. For example, to differentiate between properties for different vendornodes.
To add custom properties associated with the node:
1. Click add (+) icon to add a new row.
2. Click the newly added row to enter the Name and Value.
3. Click √ icon to save your changes.
NOTE:
• You can add multiple rows (properties).
• To delete an entry (row), select the row and click the delete (trash can) icon.
RELATED DOCUMENTATION
About the Link Tab | 509
Edit Link Parameters
To edit an existing link in the topology:
1. Click Network > Topology.
The Topology page is displayed with the topology map at the center and the network informationtable at the bottom of the page.
2. On the Link tab, select the link that you want to edit.
515
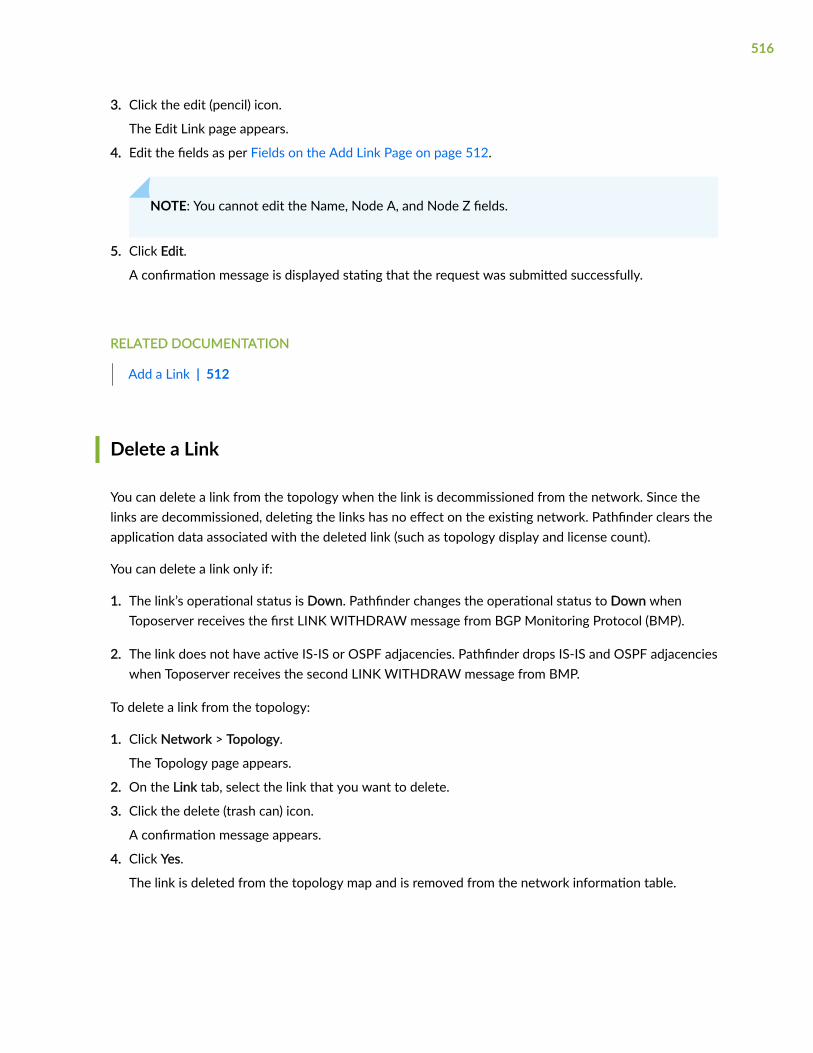
3. Click the edit (pencil) icon.
The Edit Link page appears.
4. Edit the fields as per Fields on the Add Link Page on page 512.
NOTE: You cannot edit the Name, Node A, and Node Z fields.
5. Click Edit.
A confirmation message is displayed stating that the request was submitted successfully.
RELATED DOCUMENTATION
Add a Link | 512
Delete a Link
You can delete a link from the topology when the link is decommissioned from the network. Since thelinks are decommissioned, deleting the links has no effect on the existing network. Pathfinder clears theapplication data associated with the deleted link (such as topology display and license count).
You can delete a link only if:
1. The link’s operational status is Down. Pathfinder changes the operational status to Down whenToposerver receives the first LINK WITHDRAW message from BGP Monitoring Protocol (BMP).
2. The link does not have active IS-IS or OSPF adjacencies. Pathfinder drops IS-IS and OSPF adjacencieswhen Toposerver receives the second LINK WITHDRAW message from BMP.
To delete a link from the topology:
1. Click Network > Topology.
The Topology page appears.
2. On the Link tab, select the link that you want to delete.
3. Click the delete (trash can) icon.
A confirmation message appears.
4. Click Yes.
The link is deleted from the topology map and is removed from the network information table.
516

RELATED DOCUMENTATION
About the Link Tab | 509
About the Tunnel Tab
IN THIS SECTION
Tasks You Can Perform | 517
Use the Tunnel tab to view and manage tunnels (label-switched paths or LSPs).
To access this tab, select Network > Topology.
The Topology page appears, with the topology map at the center and the network information table atthe bottom of the page. This table displays various tabs, including the Tunnel tab.
Tasks You Can Perform
• From the Provisioning list, you can perform the following tasks:
• Add an LSP—See "Add a Single LSP" on page 528.
• Add diverse LSPs—See "Add Diverse LSPs" on page 540.
• Add multiple LSPs—See "Add Multiple LSPs" on page 550.
• Manually reprovision LSPs—Select one or more LSPs for which provisioning has failed or the pathisn’t the expected path, and click Reprovision. The LSPs are reprovisioned and a confirmationmessage appears on the top of the page.
NOTE: You can reprovision only PCE-inititated and PCC-delegated LSPs.
• Return delegation of LSPs to the PCC—Select one or more LSPs (Control Type: Delegated) thatwere previously delegated to the PCE and click Return Delegation to PCC. Control of the selectedLSPs is temporarily returned to the PCC for a period of time based on the router’s timerstatement, and a confirmation message appears on the top of the page. The Control Type for theselected LSPs changes to Device Controlled.
517

• Set current path as explicit path—When creating the LSP, if you’ve configured the routing pathtype for one or more secondary or standby LSPs as Dynamic or Preferred and now want toconfigure this path as a strict explicit path, select the LSP, and click Set current path as explicitpath. A confirmation message appears on the top of the page and the routing path type is set toRequired. When you set the routing path type as Required, the PCE considers this path as explicit.If the required path is not viable and available, the LSP is down and the PCE doesn’t compute analternate path.
• Optimize LSPs—Select one or more LSPs for which you want to optimize the path, and clickTrigger LSP optimization. The paths are optimized and a confirmation message appears on the topof the page.
NOTE: You can optimize only PCE-inititated and PCC-delegated LSPs.
• From the View list, you can perform the following tasks:
• View events for LSPs—To view historical events (such as actions performed on the LSP andbandwidth changes) for an LSP for a specific time range, select the LSP and click Events. In theEvents page that appears, choose the start date and end date from the calendar that is displayed.Click the Select Time link at the bottom-right corner of the calendar to select the time for whichyou want to retrieve the events. Alternatively, you can select one of the shortcuts at the bottom-left corner of the calendar to view the events for the current day, past hour, past day, or pastweek.
Then, click OK. The events for the LSP are displayed in the Events table for the selected timerange.
A graph with timeline view, which indicates the bandwidth spikes for a time period, is alsodisplayed. You can drag the slider on the graph to select a custom time range. The events for theselected time range are displayed in the Events table.
To download the displayed data to your local system as a comma-separated values (CSV) file, clickDownload.
NOTE: The events displayed on the Events page are restricted to external communicationto and from the Path Computation Element (PCE). Most of the communications internal tothe PCE are captured only in the log files.
• View LSP traffic—To view an LSP’s traffic and bandwidth in graphical form, select the LSP and clickLSP Traffic. In the Tunnel Traffic page that appears, select the period for which you want to viewthe data. You can view data for the previous 3 hours, the previous day, the previous week, orchoose from a custom time range by specifying the start and end dates and times.
518

• View LSP delay—At any given time, the PCE is aware of the paths of all LSPs in the network.Periodically, the PCE uses the reported link delays to compute the end-to-end LSP delay as thesimple sum of all link delays in the LSP path. To view LSP delay in graphical form, select the LSPand click LSP Delay. In the Tunnel Delay page that appears, select the period for which you wantto view the data. You can view data for the previous 3 hours, the previous day, the previous week,or choose from a custom time range by specifying the start and end dates and times.
NOTE: To view LSP delay, you must first:
• Set the interval (in seconds) for the PCS to calculate LSP latency.
You can specify the interval in the lsp-latency-interval field in the Path ComputationServer section of the Pathfinder page (Configuration > Network > Pathfinder) on theGUI or by using the CLI (set northstar path-computation-server lsp-latency-interval).
• Configure routers to send JTI telemetry data and real-time performance monitoring(RPM) statistics to measure link delay. See "Configure Routers to Send JTI TelemetryData and RPM Statistics to the Data Collector" on page 521 for details.
• From the Diagnostics list, you can perform the following tasks:
• Run CLI commands—Select Show Tunnels, Run MPLS Ping, or Run MPLS Traceroute. TheDiagnostics page appears, displaying the list of CLI commands that are running or that havecompleted. The Status column indicates whether running the command was successful or not.Select one or more rows in the table to display the results in the Results tab (in the lower part ofthe page).
From the Diagnostics page, you can:
• Initiate a new ping or traceroute command—From the New list, select either Ping orTraceroute.
Based on what you select, the Ping or Traceroute page appears. The Default tab and Customtab are similar for Ping and Traceroute.
On the Default tab, you can:
• Select the ingress and egress nodes from the From list and To list.
• Choose to enable the Use Management IP address toggle button if the nodes havemanagement IP addresses specified for out-of-band use.
• Choose to enable the Advance Options toggle button to configure advanced parameters.For ping request packets, you can configure hexadecimal pattern, count, size, and IPv4type-of-service (tos). For traceroute, you can configure the maximum time (in seconds) to
519

wait for a response to the traceroute request after sending the final packet, and themaximum time-to-live value.
On the Custom tab, you can:
• Select the category of commands from the list at the top of the tab. The commands specificto the selected category appear in the List of Commands section.
The options for both Ping and Traceroute include:
• General Commands (only for Ping)
• RSVP LSP Commands
• P2MP Commands
• SR LSP Commands
• From the list of commands displayed, select the Select All check box to select all thecommands in the category. Otherwise, select the check boxes beside the commandvariations of your choice.
• If you select one or more commands from the list, the Selected Commands section appears.For commands that require the specification of variable parameters, a space for eachparameter is displayed. Enter the appropriate value.
• Click Submit to execute the commands. The Diagnostics page displays the new commandsalong with the status and results. When a traceroute command is successfully completed,the path is highlighted in the topology map.
• Download details of all the LSPs—To view detailed information on all the LSPs displayed in thenetwork information table, click Download. You can choose to open the comma-separated values(CSV) file with Excel or other applications, or save the file to your local system.
• From the More list, you can perform the following tasks:
• View details of the LSP—Select an LSP and click Show Detail. The Tunnel <Tunnel-Name> pageappears, displaying the details (on the Details tab) and traffic on the LSP for the time period thatyou selected (on the Traffic tab).
• Provision secondary or standby LSPs—If you want to provide an alternate route in case theprimary route fails, you can add additional secondary or standby LSPs for an LSP. Select the LSPand click Provision Secondary/Standby.
The Add Tunnel page appears, where you can create a secondary or standby LSP for the selectedLSP. After the secondary or standby LSP that you created is provisioned, you can see it in thenetwork information table and in the topology map.
520
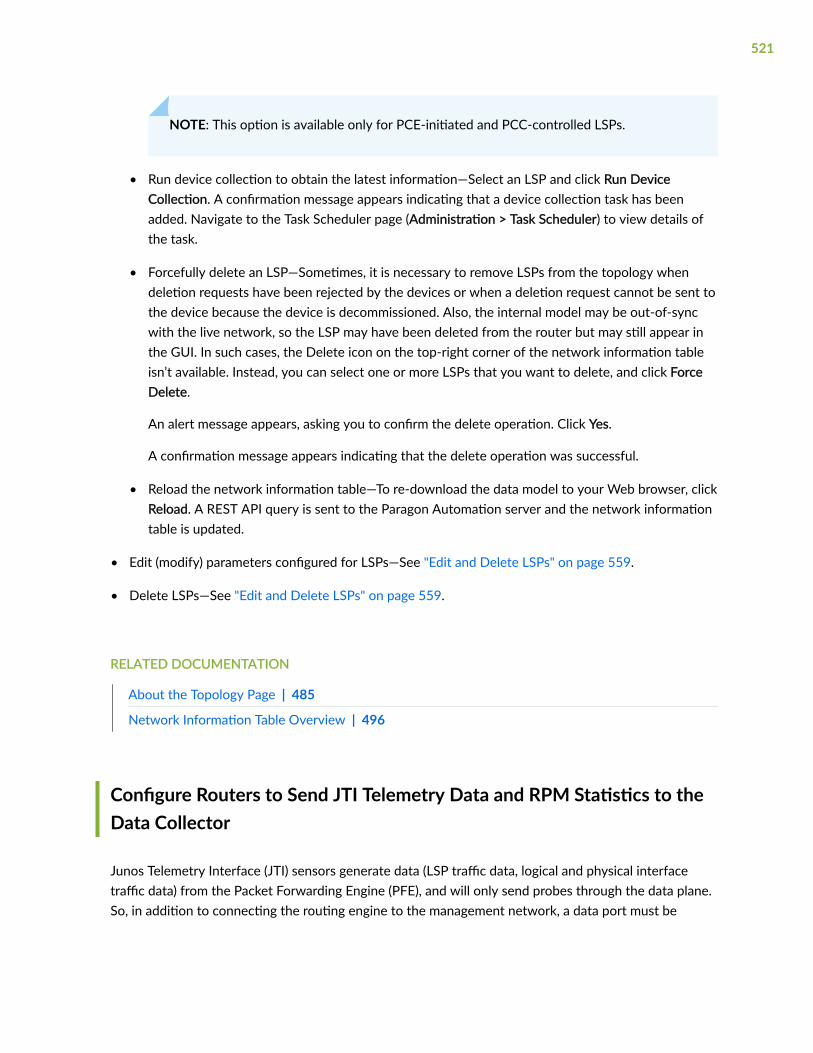
NOTE: This option is available only for PCE-initiated and PCC-controlled LSPs.
• Run device collection to obtain the latest information—Select an LSP and click Run DeviceCollection. A confirmation message appears indicating that a device collection task has beenadded. Navigate to the Task Scheduler page (Administration > Task Scheduler) to view details ofthe task.
• Forcefully delete an LSP—Sometimes, it is necessary to remove LSPs from the topology whendeletion requests have been rejected by the devices or when a deletion request cannot be sent tothe device because the device is decommissioned. Also, the internal model may be out-of-syncwith the live network, so the LSP may have been deleted from the router but may still appear inthe GUI. In such cases, the Delete icon on the top-right corner of the network information tableisn’t available. Instead, you can select one or more LSPs that you want to delete, and click ForceDelete.
An alert message appears, asking you to confirm the delete operation. Click Yes.
A confirmation message appears indicating that the delete operation was successful.
• Reload the network information table—To re-download the data model to your Web browser, clickReload. A REST API query is sent to the Paragon Automation server and the network informationtable is updated.
• Edit (modify) parameters configured for LSPs—See "Edit and Delete LSPs" on page 559.
• Delete LSPs—See "Edit and Delete LSPs" on page 559.
RELATED DOCUMENTATION
About the Topology Page | 485
Network Information Table Overview | 496
Configure Routers to Send JTI Telemetry Data and RPM Statistics to theData Collector
Junos Telemetry Interface (JTI) sensors generate data (LSP traffic data, logical and physical interfacetraffic data) from the Packet Forwarding Engine (PFE), and will only send probes through the data plane.So, in addition to connecting the routing engine to the management network, a data port must be
521

connected to the collector on one of your devices. The rest of the devices in the network can use thatinterface to reach the collector.
NOTE: You must use Junos OS Release 15.1F6 or later for the analytics feature.
To configure the routers, use the following procedure:
1. Configure the devices for telemetry data. On each device, the following configuration is required. Thedevice needs to be set to enhanced-ip mode, which might require a full reboot.
NOTE: Use default remote-port 4000 and set the remote-address to the Paragon Insightsvirtual IP address.
set chassis network-services enhanced-ipset services analytics streaming-server ns remote-address 192.168.10.100set services analytics streaming-server ns remote-port 4000set services analytics export-profile ns local-address 11.0.0.10set services analytics export-profile ns reporting-rate 2set services analytics export-profile ns format gpbset services analytics export-profile ns transport udpset services analytics sensor ifd server-name nsset services analytics sensor ifd export-name nsset services analytics sensor ifd resource /junos/system/linecard/interface/set services analytics sensor ifl server-name nsset services analytics sensor ifl export-name nsset services analytics sensor ifl resource /junos/system/linecard/interface/logical/usage/set services analytics sensor lsp server-name nsset services analytics sensor lsp export-name nsset services analytics sensor lsp resource /junos/services/label-switched-path/usage/set services analytics sensor sr-te-color server-name nsset services analytics sensor sr-te-color export-name nsset services analytics sensor sr-te-color resource /junos/services/segment-routing/traffic-engineering/ingress/usage/set services analytics sensor sid server-name nsset services analytics sensor sid export-name nsset services analytics sensor sid resource /junos/services/segment-routing/sid/usage/set services analytics sensor sr-te-tunnels server-name nsset services analytics sensor sr-te-tunnels export-name nsset services analytics sensor sr-te-tunnels resource /junos/services/segment-routing/traffic-
522

engineering/tunnel/ingress/usage/set protocols mpls sensor-based-statsset protocols source-packet-routing telemetry statistics
In this configuration, the remote address is the IP address of the collector (reachable though a dataport). The local address should be the loopback, or router-id, whichever is configured on the deviceprofile to identify the device.
2. Bandwidth sizing and container LSPs are supported for SR-TE LSPs. Junos OS release 19.2R1 or lateris required for this functionality. There is additional configuration required on the router to enablecollection of segment routing data. For example:
set groups jvision services analytics sensor sr-te-tunnels server-name nsset groups jvision services analytics sensor sr-te-tunnels export-name nsset groups jvision services analytics sensor sr-te-tunnels resource /junos/services/segment-routing/traffic-engineering/tunnel/ingress/usage/
3. Real-time performance monitoring (RPM) enables you to monitor network performance in real timeand to assess and analyze network efficiency. To achieve this, RPM exchanges a set of probes withother IP hosts in the network for monitoring and network tracking purposes.
You must configure RPM probes to measure the interface delays.
The following example shows the configuration of probes out of interface ge-0/1/1.0 to the remoteaddress 10.101.105.2. This remote address should be the IP address of the node at the other end ofthe link.
NOTE: The test name must match the interface being measured (test ge-0/1/1.0, in thisexample).
set services rpm probe northstar-ifl test ge-0/1/1.0 target address 10.101.105.2set services rpm probe northstar-ifl test ge-0/1/1.0 probe-count 11set services rpm probe northstar-ifl test ge-0/1/1.0 probe-interval 5set services rpm probe northstar-ifl test ge-0/1/1.0 test-interval 60set services rpm probe northstar-ifl test ge-0/1/1.0 source-address 10.101.105.1set services rpm probe northstar-ifl test ge-0/1/1.0 moving-average-size 12set services rpm probe northstar-ifl test ge-0/1/1.0 traps test-completionset services rpm probe northstar-ifl test ge-0/1/1.0 hardware-timestampset services rpm probe northstar-ifl test ge-0/1/1.0 probe-type icmp-ping-timestamp
523
RELATED DOCUMENTATION
About the Tunnel Tab | 517
Understand How Pathfinder Handles LSPs
IN THIS SECTION
LSP Control Types | 524
LSP Path Types | 525
Protocols to Provision and Manage LSPs | 526
LSP Routing Methods | 527
Routing Path Types | 527
Deletion of LSPs | 527
In Paragon Pathfinder, the Path Computation Element (PCE) computes paths in the network and appliescomputational constraints. The PCE uses the Path Computation Element Protocol (PCEP) or NETCONFto learn about label-switched paths (LSPs) in the discovered network topology. All LSPs and theirattributes can be viewed in the network information table on the Topology page of the ParagonAutomation GUI.
In the rest of this topic, we explain the different parameters that define how Pathfinder handles LSPs.
LSP Control Types
The LSP’s control type determines whether the Path Computation Client (PCC, which is the router) orthe PCE maintains the operational and configuration states of the LSP.
The PCE supports the following control types for LSPs:
• PCC-controlled LSPs (also known as device-controlled LSPs)—You can configure such LSPs on therouter either from the GUI (by selecting NETCONF as the provisioning method) or from the CLI. TheLSPs are managed by the router, which maintains both the operational state and configuration stateof the LSPs. The LSPs are part of the router’s configuration file.
• PCC-delegated LSPs—You cannot configure such LSPs directly from the GUI or from the CLI. Youmust first configure a PCC-controlled LSP from the GUI or from the CLI, and then delegate it to thePCE for management from the Configure LSP Delegation page (Network > Tunnels > Configure LSP
524
Delegation) on the GUI or from the CLI. The router maintains both the operational state andconfiguration state of the LSPs, and the LSPs are part of the router’s configuration file.
If Pathfinder is down or the LSP is not working as expected, you can delegate the LSP back to thePCC, in which case, the LSP is reclassified as PCC-controlled.
• PCE-initiated LSPs—You can configure such LSPs either from the GUI (by selecting PCEP as theprovisioning method) or from the CLI. The PCE manages the LSPs and only the operational state ismaintained in the router. The LSPs are not part of the router’s configuration file.
NOTE: Although Pathfinder typically creates PCE-initiated LSPs, in the following cases, thePCE discovers such LSPs from the router:
• When a PCE-initiated LSP is created by an external controller other than Pathfinder, thePCE then discovers the LSP from the router.
• When you reset the topology in the GUI, the PCE re-learns the LSPs from the router.
LSP Path Types
Pathfinder supports the discovery, control, and creation of primary and protection LSPs. Primary LSPsprovide the primary (preferred) route for traffic flows, while protection LSPs provide an alternate route ifthe primary route fails.
Protection LSPs are of two types: standby LSPs and secondary LSPs. The tunnel ID, source node,destination node, and IP address of a secondary or standby LSP are identical to that of the primary LSP.However, secondary and standby LSPs have the following differences:
• A secondary LSP is not signaled until the primary LSP fails.
• A standby LSP is signaled regardless of the status of the primary LSP.
When you configure a protection LSP from the GUI, you must have a primary LSP of the same controltype (PCC-controlled, PCC-delegated, or PCE-initiated) available before you configure a protection LSP.
NOTE: By default, a protection LSP uses the bandwidth, setup priority, and hold priority valuesof the primary LSP. However, each protection LSP can be configured to use values different fromthe primary LSP.
525
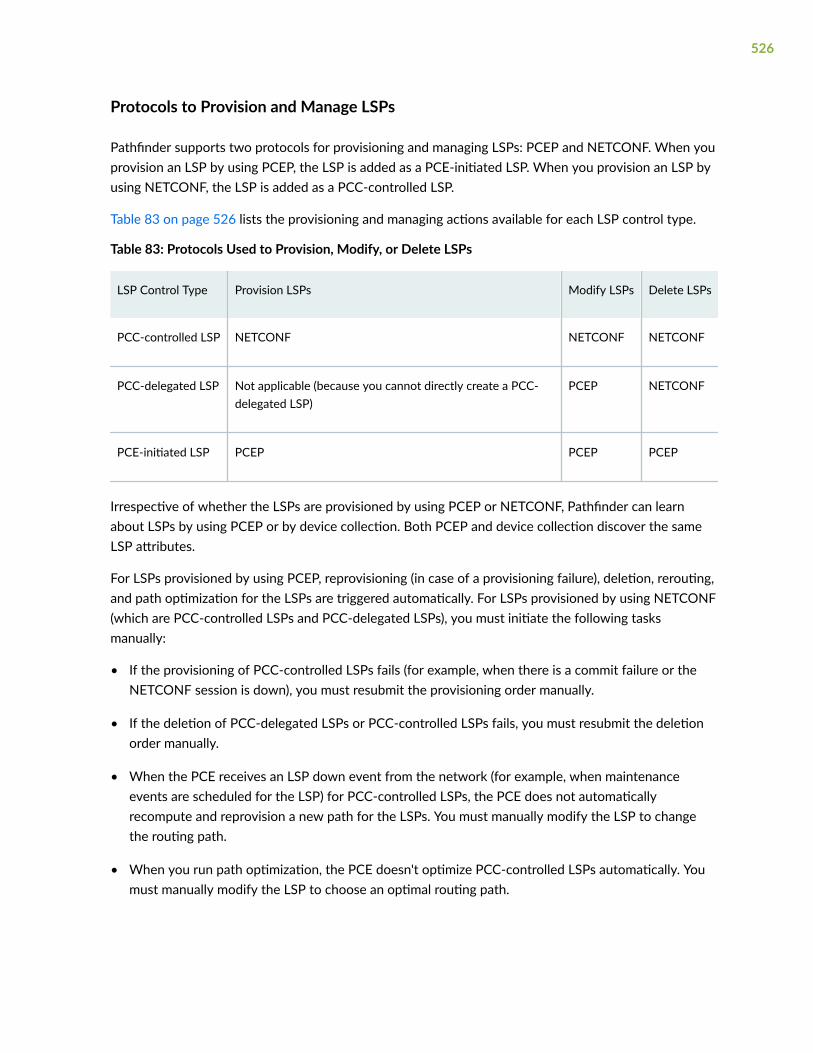
Protocols to Provision and Manage LSPs
Pathfinder supports two protocols for provisioning and managing LSPs: PCEP and NETCONF. When youprovision an LSP by using PCEP, the LSP is added as a PCE-initiated LSP. When you provision an LSP byusing NETCONF, the LSP is added as a PCC-controlled LSP.
Table 83 on page 526 lists the provisioning and managing actions available for each LSP control type.
Table 83: Protocols Used to Provision, Modify, or Delete LSPs
LSP Control Type Provision LSPs Modify LSPs Delete LSPs
PCC-controlled LSP NETCONF NETCONF NETCONF
PCC-delegated LSP Not applicable (because you cannot directly create a PCC-delegated LSP)
PCEP NETCONF
PCE-initiated LSP PCEP PCEP PCEP
Irrespective of whether the LSPs are provisioned by using PCEP or NETCONF, Pathfinder can learnabout LSPs by using PCEP or by device collection. Both PCEP and device collection discover the sameLSP attributes.
For LSPs provisioned by using PCEP, reprovisioning (in case of a provisioning failure), deletion, rerouting,and path optimization for the LSPs are triggered automatically. For LSPs provisioned by using NETCONF(which are PCC-controlled LSPs and PCC-delegated LSPs), you must initiate the following tasksmanually:
• If the provisioning of PCC-controlled LSPs fails (for example, when there is a commit failure or theNETCONF session is down), you must resubmit the provisioning order manually.
• If the deletion of PCC-delegated LSPs or PCC-controlled LSPs fails, you must resubmit the deletionorder manually.
• When the PCE receives an LSP down event from the network (for example, when maintenanceevents are scheduled for the LSP) for PCC-controlled LSPs, the PCE does not automaticallyrecompute and reprovision a new path for the LSPs. You must manually modify the LSP to changethe routing path.
• When you run path optimization, the PCE doesn't optimize PCC-controlled LSPs automatically. Youmust manually modify the LSP to choose an optimal routing path.
526
LSP Routing Methods
When you create an LSP, you can choose one of the following routing methods to specify whether thePCE should compute and provision the path or not:
• routeByDevice routing method—The LSP is provisioned with no explicit path, so the router computesthe path.
• Other routing methods (default, delay, adminWeight, constant, distance, IS-IS, OSPF)—For routingmethods other than routeByDevice, the PCE computes and provisions the path.
Routing Path Types
When you add an LSP, you can choose one of the following routing path types to specify how the PCEshould compute the path:
• Dynamic—The PCE computes the path without imposing any path restrictions.
• Required—The PCE uses the path that you specified. If the specified path is not viable and available,the LSP status changes to Down and the PCE does not perform the computation to look for analternate path.
• Preferred—The PCE uses the path that you specified, as long as it is viable and available. If not, thePCE computes an alternate path.
Deletion of LSPs
When an LSP is deleted from the router (and, thereby, from the network), it is automatically deletedfrom Pathfinder, unless it was previously modified by a user (either from the GUI or by using REST APIs).Any LSP that is modified by a user has a Persist state associated with it. Therefore, LSPs with Persiststate must be deleted manually from the GUI or by using REST APIs. See "Edit and Delete LSPs" on page559.
RELATED DOCUMENTATION
Add a Single LSP | 528
Add Diverse LSPs | 540
Add Multiple LSPs | 550
527

Add a Single LSP
You can provision LSPs by using either the Path Computation Element Protocol (PCEP) or the NetworkConfiguration Protocol (NETCONF). Whether provisioned by using PCEP or NETCONF, LSPs can belearned by using PCEP or device collection. If learned by using device collection, the PCE requiresperiodic device collection to learn about LSPs and other updates to the network. To learn about how toschedule a device collection task, see "Add a Device Collection Task" on page 745.
NOTE: For IOS-XR devices, you must first run device collection before provisioning LSPs by usingNETCONF.
Once you create device collection tasks, the PCE discovers LSPs provisioned by using NETCONF. UnlikePCEP, the PCE with NETCONF supports logical nodes.
For more information about managing logical nodes, see Considerations When Using Logical Nodes laterin this topic.
To provision a single LSP:
1. Select Network > Topology.
The Topology page is displayed with the topology map at the center and the network informationtable at the bottom of the page.
2. In the Tunnel tab, select Provisioning > Single LSP.
The Add Tunnel page appears.
3. Complete the configuration on each tab according to the guidelines in Table 84 on page 529.
NOTE: Fields marked with an asterisk (*) are mandatory.
4. (Optional) From any tab, you can click Preview Path at the bottom of the page to see the path drawnon the topology map.
5. Click Add to add the LSP.
A confirmation message appears on the top of the page, indicating that an add tunnel request wassuccessfully created. The request is automatically approved and deployed on the devices. The LSPthen appears in the Tunnel tab of the network information table (in the Topology page).
528

Table 84: Fields on the Add Tunnel Page
Field Description
Properties
ProvisioningMethod
From the list, select one of the following methods to be used to provision the LSP:
• NETCONF (default)—The LSP is statically provisioned and the associated configurationstatements appear in the router configuration file. Upon provisioning, this LSP is added asa device-controlled LSP.
• PCEP (Path Computation Element Protocol)—The LSP is initiated by the path computationelement (PCE) and the associated configuration statements do not appear in the routerconfiguration file. Upon provisioning, this LSP is added as a PCE-initated LSP.
NOTE:
• For IOS-XR routers, NETCONF-based LSP provisioning has the same capabilities as PCEP-based LSP provisioning.
• When provisioning LSPs by using NETCONF one at a time, the provisioning order may besent before the response to a previous provisioning order is received—which means, thesecond order may not have the correct bandwidth allocation information and the PCE maynot be able to provide ECMP. We recommend provisioning multiple LSPs via NETCONF inone operation (bulk provisioning) in order to avoid this issue.
Provision Type From the list, select the type of LSP that you want to provision (RSVP or SR (segmentrouting)).
Name For a primary LSP, specify a unique name for the LSP.
For a secondary or standby LSP, specify the same name as the primary LSP that is associatedwith the secondary or standby LSP.
You can use any number of alphanumeric characters, hyphens, and underscores.
NOTE: If you are creating multiple parallel LSPs that will share the same design parameters,the name you specify here is used as the base for the automatic naming of those LSPs. Seethe Count and Delimiter fields in the Advanced tab for more information.
Node A From the list, select the node that you want to use as the ingress node.
Node Z From the list, select the node that you want to use as the egress node.
529
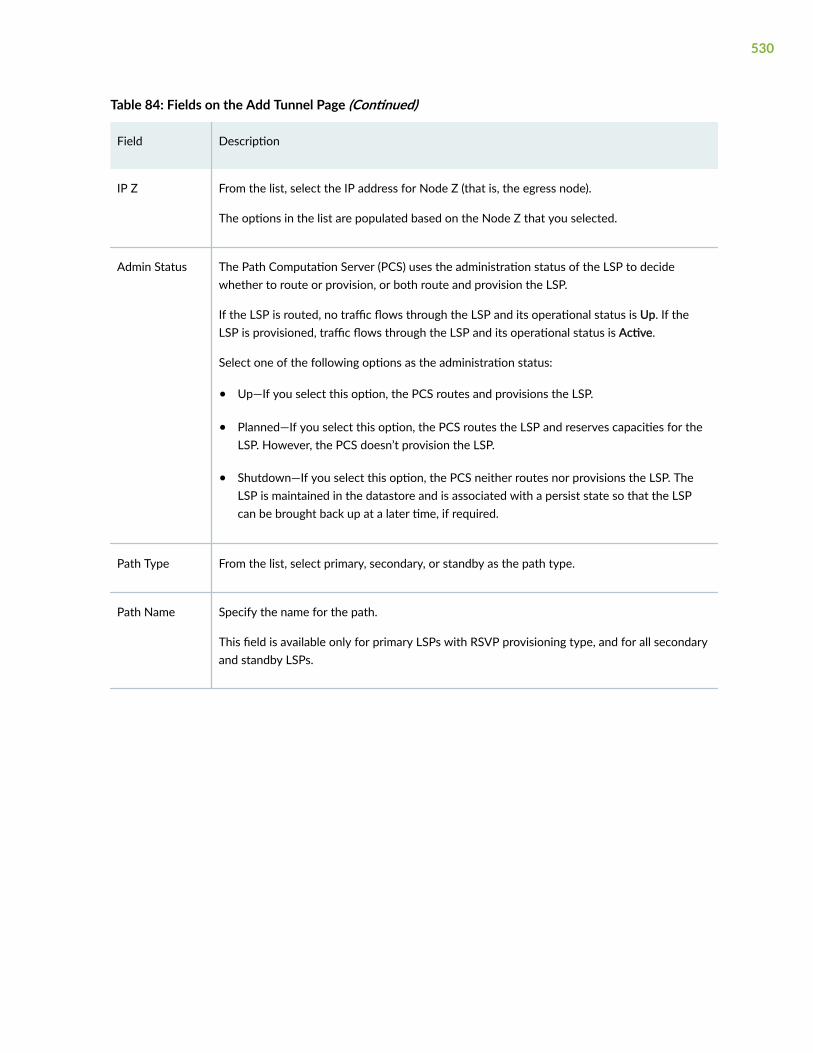
Table 84: Fields on the Add Tunnel Page (Continued)
Field Description
IP Z From the list, select the IP address for Node Z (that is, the egress node).
The options in the list are populated based on the Node Z that you selected.
Admin Status The Path Computation Server (PCS) uses the administration status of the LSP to decidewhether to route or provision, or both route and provision the LSP.
If the LSP is routed, no traffic flows through the LSP and its operational status is Up. If theLSP is provisioned, traffic flows through the LSP and its operational status is Active.
Select one of the following options as the administration status:
• Up—If you select this option, the PCS routes and provisions the LSP.
• Planned—If you select this option, the PCS routes the LSP and reserves capacities for theLSP. However, the PCS doesn’t provision the LSP.
• Shutdown—If you select this option, the PCS neither routes nor provisions the LSP. TheLSP is maintained in the datastore and is associated with a persist state so that the LSPcan be brought back up at a later time, if required.
Path Type From the list, select primary, secondary, or standby as the path type.
Path Name Specify the name for the path.
This field is available only for primary LSPs with RSVP provisioning type, and for all secondaryand standby LSPs.
530
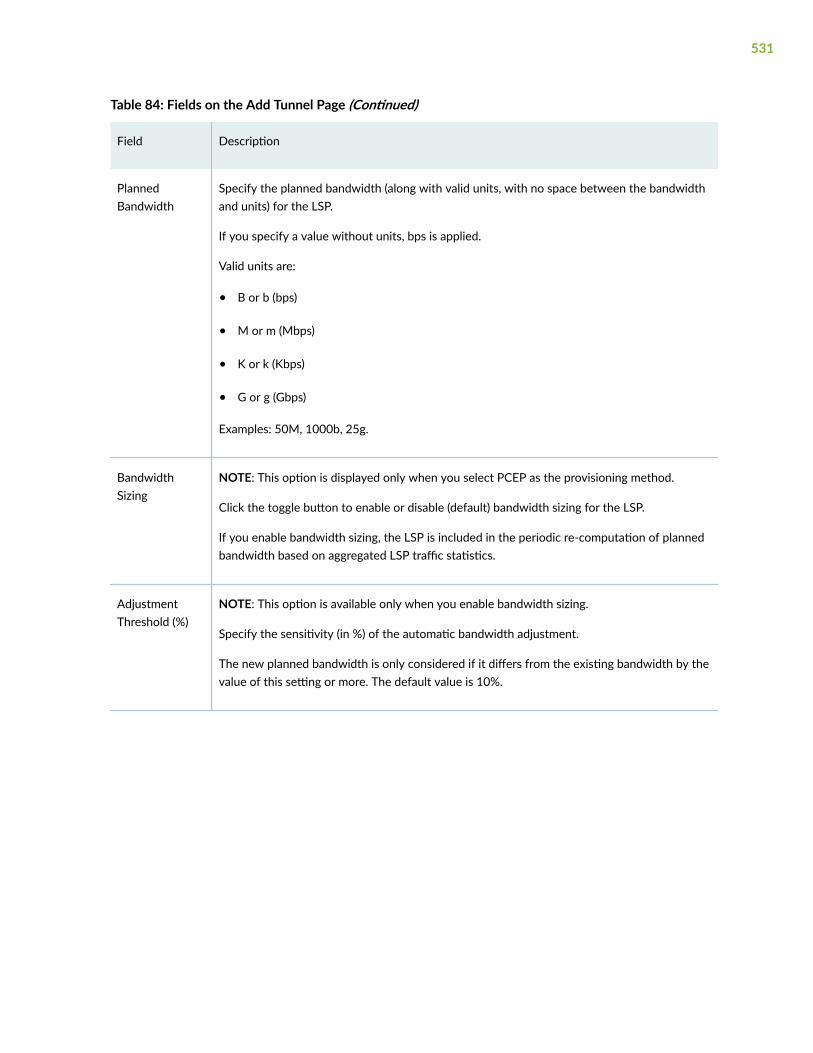
Table 84: Fields on the Add Tunnel Page (Continued)
Field Description
PlannedBandwidth
Specify the planned bandwidth (along with valid units, with no space between the bandwidthand units) for the LSP.
If you specify a value without units, bps is applied.
Valid units are:
• B or b (bps)
• M or m (Mbps)
• K or k (Kbps)
• G or g (Gbps)
Examples: 50M, 1000b, 25g.
BandwidthSizing
NOTE: This option is displayed only when you select PCEP as the provisioning method.
Click the toggle button to enable or disable (default) bandwidth sizing for the LSP.
If you enable bandwidth sizing, the LSP is included in the periodic re-computation of plannedbandwidth based on aggregated LSP traffic statistics.
AdjustmentThreshold (%)
NOTE: This option is available only when you enable bandwidth sizing.
Specify the sensitivity (in %) of the automatic bandwidth adjustment.
The new planned bandwidth is only considered if it differs from the existing bandwidth by thevalue of this setting or more. The default value is 10%.
531

Table 84: Fields on the Add Tunnel Page (Continued)
Field Description
MinimumBandwidth
NOTE: This option is available only when you enable bandwidth sizing.
Specify the minimum planned bandwidth (along with valid units, with no space between thebandwidth and units) for the LSP. If you specify a value without units, bps is applied.
If the new planned bandwidth is less than the minimum setting, the PCE signals the LSP withthe minimum bandwidth. However, if the new planned bandwidth falls in between themaximum and minimum settings, The PCE signals the LSP with the new planned bandwidth.
The valid units are:
• B or b (bps)
• M or m (Mbps)
• K or k (Kbps)
• G or g (Gbps)
Examples: 50M, 1000b, 25g.
MaximumBandwidth
NOTE: This option is available only when you enable bandwidth sizing.
Specify the maximum planned bandwidth (along with valid units, with no space between thebandwidth and units) for the LSP. If you specify a value without units, bps is applied.
If the new planned bandwidth is greater than the maximum setting, the PCE signals the LSPwith the maximum bandwidth. However, if the new planned bandwidth falls in between themaximum and minimum settings, the PCE signals the LSP with the new planned bandwidth.
The valid units are:
• B or b (bps)
• M or m (Mbps)
• K or k (Kbps)
• G or g (Gbps)
Examples: 50M, 1000b, 25g.
532

Table 84: Fields on the Add Tunnel Page (Continued)
Field Description
MinimumVariationThreshold
NOTE: This option is available only when you enable bandwidth sizing.
Specify the sensitivity of the automatic bandwidth adjustment when the new plannedbandwidth is compared to the current planned bandwidth.
Default: Zero.
The new planned bandwidth is only considered if the difference is greater than or equal to thevalue of this setting. Because it is not a percentage, this can be used to prevent smallfluctuations from triggering unnecessary bandwidth changes.
If both the adjustment threshold and the minimum variation threshold are greater than zero,both settings are taken into consideration. In that case, the new planned bandwidth isconsidered if the percentage difference is greater than or equal to the adjustment threshold,and, the actual difference is greater than or equal to the minimum variation.
ColorCommunity
NOTE: This field is available only for SR LSPs.
Assign a color for the SR LSP that can be used to map traffic on the LSP.
Use PenultimateHop as SignalingAddress
NOTE: This field is available only for SR LSPs.
Click the toggle button to enable the PCS to use the penultimate hop as the signaling addressfor Egress Peer Engineering (EPE).
If you haven’t specified a color community, the setting applies to all traffic. If you’ve specifieda color community, the setting applies to traffic in that color community.
Setup Specify the setup priority for the tunnel traffic.
Priority levels range from 0 (highest priority) through 7 (lowest priority). The default is 7,which is the standard MPLS LSP definition in Junos OS.
Based on the setup priority, the PCE determines whether a new LSP can be established, bypreempting an existing LSP. The existing LSP can be preempted if the setup priority of thenew LSP is higher than that of the existing LSP and the preemption releases enoughbandwidth for the new LSP.
533
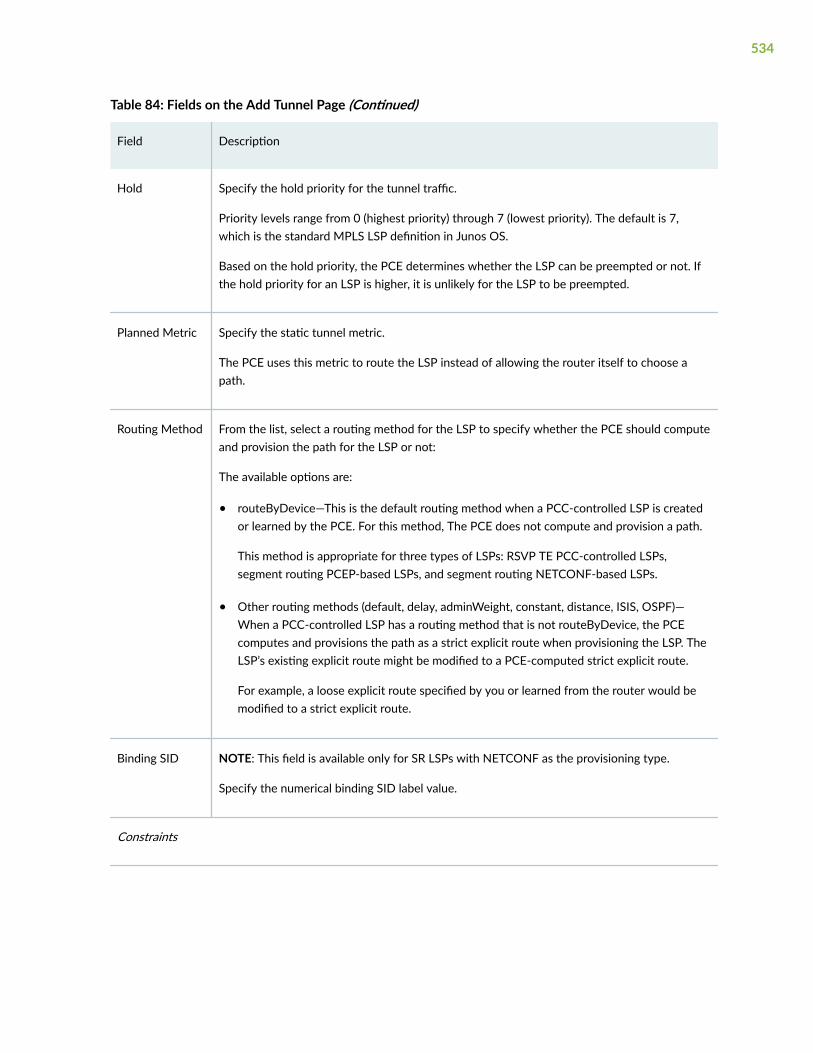
Table 84: Fields on the Add Tunnel Page (Continued)
Field Description
Hold Specify the hold priority for the tunnel traffic.
Priority levels range from 0 (highest priority) through 7 (lowest priority). The default is 7,which is the standard MPLS LSP definition in Junos OS.
Based on the hold priority, the PCE determines whether the LSP can be preempted or not. Ifthe hold priority for an LSP is higher, it is unlikely for the LSP to be preempted.
Planned Metric Specify the static tunnel metric.
The PCE uses this metric to route the LSP instead of allowing the router itself to choose apath.
Routing Method From the list, select a routing method for the LSP to specify whether the PCE should computeand provision the path for the LSP or not:
The available options are:
• routeByDevice—This is the default routing method when a PCC-controlled LSP is createdor learned by the PCE. For this method, The PCE does not compute and provision a path.
This method is appropriate for three types of LSPs: RSVP TE PCC-controlled LSPs,segment routing PCEP-based LSPs, and segment routing NETCONF-based LSPs.
• Other routing methods (default, delay, adminWeight, constant, distance, ISIS, OSPF)—When a PCC-controlled LSP has a routing method that is not routeByDevice, the PCEcomputes and provisions the path as a strict explicit route when provisioning the LSP. TheLSP’s existing explicit route might be modified to a PCE-computed strict explicit route.
For example, a loose explicit route specified by you or learned from the router would bemodified to a strict explicit route.
Binding SID NOTE: This field is available only for SR LSPs with NETCONF as the provisioning type.
Specify the numerical binding SID label value.
Constraints
534

Table 84: Fields on the Add Tunnel Page (Continued)
Field Description
Admin GroupInclude All
From the list, select one or more admin group bits for the LSP to traverse links that include allof the admin groups specified in this field. The maximum selections allowed is 32.
The admin group bits are mapped to meaningful names, such as colors (configured from theConfiguration > Network > Admin Group page), so that you can easily differentiate thedifferent traffic routes in the display and also use coloring constraints to influence the path ofthe LSP.
Admin GroupInclude Any
From the list, select one or more admin group bits for the LSP to traverse links that include atleast one of the admin groups specified in this field. The maximum selections allowed is 32.
Admin GroupExclude
From the list, select one or more admin group bits for the LSP to traverse links that do notinclude any of the admin groups specified in this field. The maximum selections allowed is 32.
Maximum Delay Specify the maximum delay (in milliseconds) for the LSP, which is used as a constraint for LSPrerouting.
Maximum Hop Specify an integer value for the maximum number of hops that the LSP can traverse.
Maximum Cost Specify an integer value for the maximum cost to be associated with the LSP.
Advanced
Count Specify the number of parallel LSPs to be created between two endpoints.
These LSPs share the same design parameters as specified in the Constraints tab.
NOTE: Creating parallel LSPs in this manner is different from provisioning multiple LSPs(Provisioning > Multiple LSPs) where you configure Design parameters separately for eachLSP.
535

Table 84: Fields on the Add Tunnel Page (Continued)
Field Description
Delimiter NOTE: This field is available only when the count value is greater than 1.
Specify a delimiter value, which can consist of alphanumeric characters and special charactersexcept space, comma (,), and semicolon (;).
This value is used in the automatic naming of parallel LSPs that share the same designparameters. The PCE names the LSPs using the name you enter in the Properties tab andappends the delimiter value plus a unique numerical value beginning with 1
Example: myLSP_1, myLSP_2, and so on.
Description Specify a comment or description for the LSP for your reference.
Symmetric PairGroup
Specify a unique name for the symmetric pair group. You can use any number of alphanumericand special characters.
LSPs with the same group name (as specified in this field) are considered part of a symmetricpair group.
You create a symmetric pair group so that the LSP from the ingress node to the egress nodefollows the same path as the LSP from the egress node to the ingress node. When there aretwo tunnels with the same end nodes but in opposite directions, the path routing uses thesame set of links. For example, suppose Tunnel1 source to destination is NodeA to NodeZ,and Tunnel2 source to destination is NodeZ to NodeA. Selecting Tunnel1-Tunnel2 as asymmetric pair group places both tunnels along the same set of links. Tunnels in the samegroup are paired based on the source and destination node.
CreateSymmetric Pair
NOTE: This option is displayed only when you specify a symmetric pair group.
Click the toggle button to enable the creation of a symmetric pair.
This option allows you to create the symmetric pair in the same operation as creating the LSP.
Diversity Group Specify the name of a group of tunnels to which this tunnel belongs, and for which diversepaths are desired.
536

Table 84: Fields on the Add Tunnel Page (Continued)
Field Description
Diversity Level From the list, select the level of diversity for the LSP:
• Default—No diversity level will be applied.
• Site—Two paths don’t intersect at any given site (aside from the source and destination).Site diversity is the strongest as it includes SRLG and link diversity.
• SRLG (Shared Risk Link Group)—Two paths don't intersect at any of the group’s links ornodes (aside from the source and destination). SRLG diversity includes link diversity.
• Link—Two paths don’t intersect at any given link. Link diversity is the weakest.
Slice Include All Specify one or more topology slice IDs (numbers) for the LSP to traverse links that include allof the slice IDs specified in this field.
Slice IncludeAny
Specify one or more topology slice IDs (numbers) for the LSP to traverse links that include atleast one of the slice IDs specified in this field.
Slice Exclude Specify one or more topology slice IDs (numbers) for the LSP to traverse links that do notinclude any of the slice IDs specified in this field.
Route onProtected IPLink
Click to enable the toggle button if you want the route to use protected IP links as much apossible.
CustomAttributes
Click the Add icon (+) to specify provisioning properties not directly supported by the GUI.
For example, you cannot specify a hop-limit when you provision an LSP. However, you canadd hop-limit as a custom attribute.
At the edit > protocols > mpls > label-switched-path hierarchy level in the NETCONFtemplate file, you must add the statements needed to provision with the property you areadding. If the property is present with the defined value, then the provisioning statement isexecuted.
Path
537
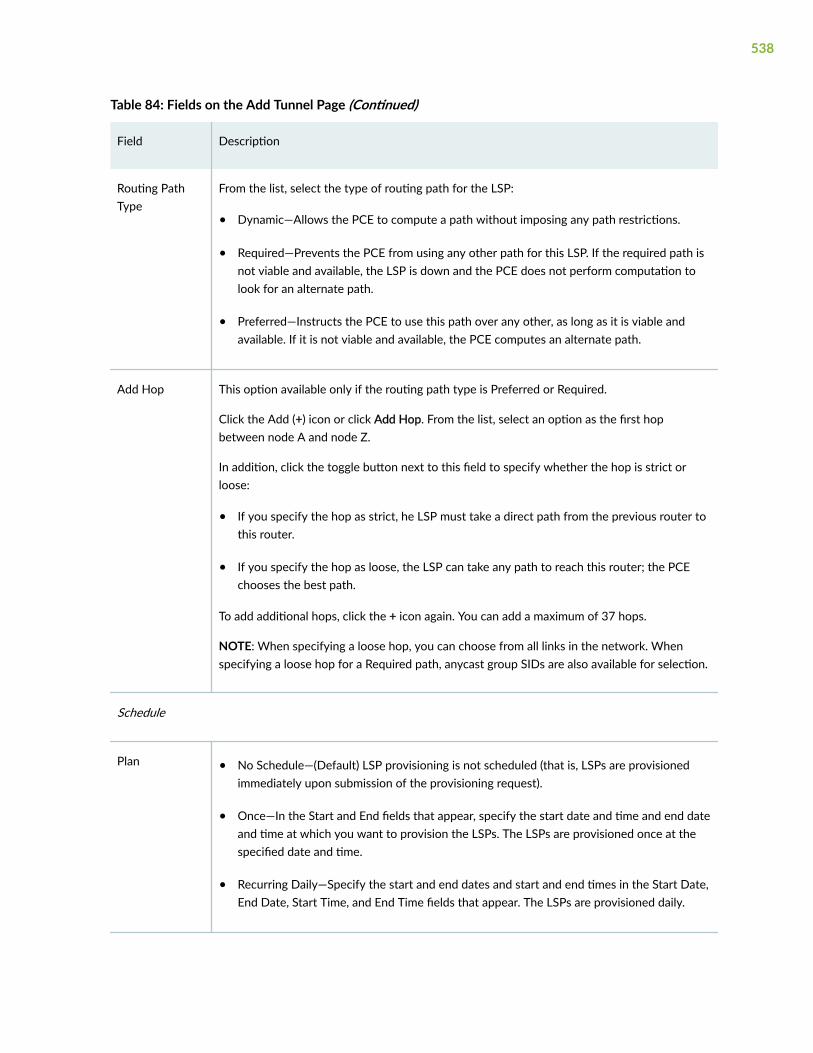
Table 84: Fields on the Add Tunnel Page (Continued)
Field Description
Routing PathType
From the list, select the type of routing path for the LSP:
• Dynamic—Allows the PCE to compute a path without imposing any path restrictions.
• Required—Prevents the PCE from using any other path for this LSP. If the required path isnot viable and available, the LSP is down and the PCE does not perform computation tolook for an alternate path.
• Preferred—Instructs the PCE to use this path over any other, as long as it is viable andavailable. If it is not viable and available, the PCE computes an alternate path.
Add Hop This option available only if the routing path type is Preferred or Required.
Click the Add (+) icon or click Add Hop. From the list, select an option as the first hopbetween node A and node Z.
In addition, click the toggle button next to this field to specify whether the hop is strict orloose:
• If you specify the hop as strict, he LSP must take a direct path from the previous router tothis router.
• If you specify the hop as loose, the LSP can take any path to reach this router; the PCEchooses the best path.
To add additional hops, click the + icon again. You can add a maximum of 37 hops.
NOTE: When specifying a loose hop, you can choose from all links in the network. Whenspecifying a loose hop for a Required path, anycast group SIDs are also available for selection.
Schedule
Plan • No Schedule—(Default) LSP provisioning is not scheduled (that is, LSPs are provisionedimmediately upon submission of the provisioning request).
• Once—In the Start and End fields that appear, specify the start date and time and end dateand time at which you want to provision the LSPs. The LSPs are provisioned once at thespecified date and time.
• Recurring Daily—Specify the start and end dates and start and end times in the Start Date,End Date, Start Time, and End Time fields that appear. The LSPs are provisioned daily.
538

Considerations When Using Logical Nodes
You can add and provision LSPs that incorporate logical nodes. In Junos OS, PCEP is not supported forlogical nodes, but the PCE can still import logical node information using device collection. When adevice collection task is run, the PCE uses the Junos OS show configuration command on each router toobtain both physical and logical node information. The logical node information must then be correlatedwith the physical node information, before provisioning LSPs that use logical nodes.
To provision an LSP that uses logical nodes:
1. On the Topology page (Network > Topology), click the Node tab in the network information table andconfirm that the PCEP Status is Up for all the physical nodes. For logical nodes, the PCEP Status isblank because LSPs originating from a logical system cannot be discovered directly by PCEP.
2. Enable NETCONF for the physical nodes (if not already done):
a. Select Configuration > Devices.
The Device page appears.
b. Select a device and click the Edit icon.
The Edit Device-Name page appears.
c. In the Protocols section, select NETCONF and click the toggle button to enable NETCONF for theselected device.
d. Click Save.
NETCONF is now enabled for the selected device.
Repeat the procedure to enable NETCONF for multiple devices.
e. On the Topology page, click the Node tab in the network information table and confirm that theNETCONF Status is Up for these devices.
3. Create and run a device collection task to obtain the latest information.
NOTE: Run device collection before you attempt to create LSPs that incorporate logical nodesbecause otherwise, the logical nodes are not available as selections for Nodes A and Z in theAdd Tunnel page (Network > Topology > Tunnel tab > Provisioning).
To create a device collection task:
a. Select Settings > Network > Task Scheduler.
The Task Scheduler page appears.
539
b. Click Add.
The Create New Task page (wizard) appears.
c. Configure the fields on each step of the wizard, as required.
If you use the Selective Devices option, select only the physical devices. See "Add a DeviceCollection Task" on page 745 for more information.
d. Click Submit.
The details of the task that you created are displayed on the Task Scheduler page. The devicecollection data is sent to the PCS for routing and is reflected in the Topology view.
When the device collection task is run, the PCE uses the Junos OS show configuration command oneach physical router to obtain both physical and logical node information. This allows the PCE tocorrelate each logical node to its corresponding physical node. You can confirm this correlation fromthe Node tab in the network information table (Network > Topology).
4. (Optional) Add the Physical Hostname and Physical Host IP columns to the Node tab. For a logicalnode, the hostname and IP address in these columns tell you which physical node correlates with thelogical node.
5. Provision LSPs:
Now that the logical nodes are in the device list and they are correlated to the correct physical nodes,you can create LSPs that incorporate logical nodes. You do this using the same procedure as LSPsusing only physical nodes, except that the provisioning method must be specified as NETCONF.
6. Run the device collection task periodically to keep the logical node information updated. There areno real time updates for logical nodes.
RELATED DOCUMENTATION
About the Tunnel Tab | 517
Edit and Delete LSPs | 559
Add Diverse LSPs
When creating a route between two sites, you might not want to rely on a single LSP to send trafficfrom one site to another. By creating a second LSP (routing path) between the two sites, you can protectyour network against failures and balance the network load.
540
NOTE:
• If the PCE is unable to achieve the diversity level you request, it still creates the diverse LSPpair, using a diversity level as close as possible to the level you requested.
• By default, the PCE does not reroute a diverse LSP pair when there is a network outage. Fordiverse LSPs to be rerouted, you can use the Path Optimization feature (Network > Topology> Path Optimization) and schedule path optimization to occur at regular intervals.
• When provisioning diverse LSPs, the PCE might return an error if the value you specified inthe Site field on the Edit Node page (Network > Topology > Node tab > Edit icon) containsspecial characters. Hence, we recommend using alphanumeric characters only.
To add diverse LSPs:
1. Select Network > Topology.
The Topology page is displayed with the topology map at the center and the network informationtable at the bottom of the page.
2. In the Tunnel tab, select Provisioning > Diverse LSPs.
The Add Diverse Tunnels page appears.
3. Complete the configuration on each tab of the Add Diverse Tunnels page according to the guidelinesin Table 85 on page 541.
NOTE: Fields marked with an asterisk (*) are mandatory.
4. (Optional) Click Preview Paths at the bottom of the page to see the paths drawn on the topologymap.
5. Click Add to add the LSPs.
A confirmation message appears on the top of the page, indicating that an add tunnel request wassuccessfully created. The LSPs are automatically approved and deployed on the devices.The LSPsthen appear in the Tunnel tab of the network information table (in the Topology page).
Table 85: Fields on the Add Diverse Tunnels Page
Field Description
Properties
541
Table 85: Fields on the Add Diverse Tunnels Page (Continued)
Field Description
Provisioning Method From the list, select one of the following methods to be used to provision the LSP:
• NETCONF (default)—The LSPs are statically provisioned and the associatedconfiguration statements appear in the router configuration file. Upon provisioning,these LSPs are added as device-controlled LSPs.
• PCEP (Path Computation Element Protocol)—The LSPs are initiated by the pathcomputation element (PCE) and the associated configuration statements do notappear in the router configuration file. Upon provisioning, these LSPs are added asPCE-initated LSPs.
NOTE: For IOS-XR routers, NETCONF-based LSP provisioning has the samecapabilities as PCEP-based LSP provisioning.
Provisioning Type From the list, select the type of LSP that you want to provision (RSVP or SR (segmentrouting)).
Diversity Group Specify the name of a group of tunnels to which this tunnel belongs, and for whichdiverse paths are desired.
Diversity Level From the list, select the level of diversity for the LSP:
• Default—No diversity level is applied.
• Site—Two paths don’t intersect at any given site (aside from the source anddestination). Site diversity is the strongest as it includes SRLG and link diversity.
• SRLG (Shared Risk Link Group)—Two paths don't intersect at any of the group’s linksor nodes (aside from the source and destination). SRLG diversity includes linkdiversity.
• Link—Two paths don’t intersect at any given link. Link diversity is the weakest.
Tunnel 1
NOTE: The same fields are available for Tunnel 2. Use the same guidelines to configure the fields for Tunnel 2.
Name Specify a unique name for the first LSP. You can use any number of alphanumericcharacters, hyphens, and underscores.
542
Table 85: Fields on the Add Diverse Tunnels Page (Continued)
Field Description
Node A From the list, select the node that you want to use as the ingress node.
Node Z From the list, select the node that you want to use as the egress node.
IP Z From the list, select the IP address for Node Z (that is, the egress node).
The options in the list are populated based on the Node Z that you selected.
Admin Status The PCS uses the administration status of the LSP to decide whether to route orprovision, or both route and provision the LSP.
If the LSP is routed, no traffic flows through the LSP and its operational status is Up. Ifthe LSP is provisioned, traffic flows through the LSP and its operational status is Active.
Select one of the following options as the administration status:
• Up—If you select this option, the PCS routes and provisions the LSP.
• Planned—If you select this option, the PCS routes the LSP and reserves capacitiesfor the LSP. However, the PCS doesn’t provision the LSP.
• Shutdown—If you select this option, the PCS neither routes nor provisions the LSP.The LSP is maintained in the datastore and is associated with a persist state so thatthe LSP can be brought back up at a later time, if required.
Planned Bandwidth Specify the planned bandwidth (along with valid units, with no space between thebandwidth and units) for the LSP.
If you specify a value without units, bps is applied.
The valid units are:
• B or b (bps)
• M or m (Mbps)
• K or k (Kbps)
• G or g (Gbps)
Examples: 50M, 1000b, 25g.
543
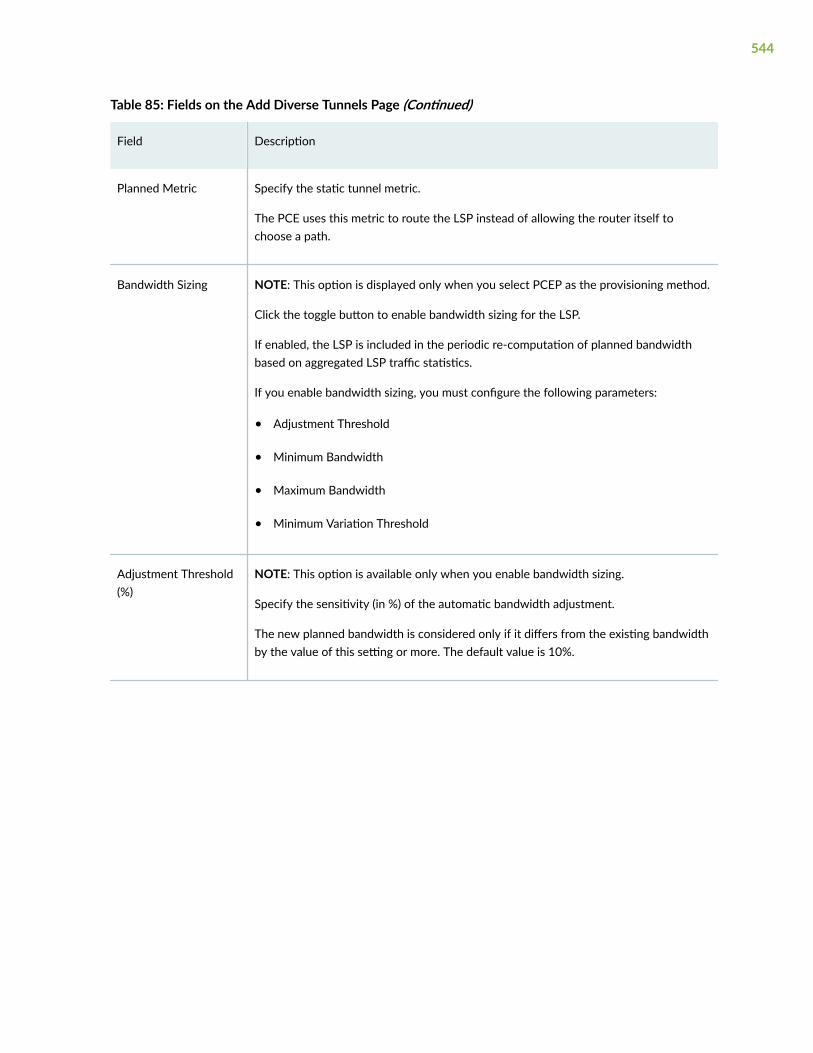
Table 85: Fields on the Add Diverse Tunnels Page (Continued)
Field Description
Planned Metric Specify the static tunnel metric.
The PCE uses this metric to route the LSP instead of allowing the router itself tochoose a path.
Bandwidth Sizing NOTE: This option is displayed only when you select PCEP as the provisioning method.
Click the toggle button to enable bandwidth sizing for the LSP.
If enabled, the LSP is included in the periodic re-computation of planned bandwidthbased on aggregated LSP traffic statistics.
If you enable bandwidth sizing, you must configure the following parameters:
• Adjustment Threshold
• Minimum Bandwidth
• Maximum Bandwidth
• Minimum Variation Threshold
Adjustment Threshold(%)
NOTE: This option is available only when you enable bandwidth sizing.
Specify the sensitivity (in %) of the automatic bandwidth adjustment.
The new planned bandwidth is considered only if it differs from the existing bandwidthby the value of this setting or more. The default value is 10%.
544

Table 85: Fields on the Add Diverse Tunnels Page (Continued)
Field Description
Minimum Bandwidth NOTE: This option is available only when you enable bandwidth sizing.
Specify the minimum planned bandwidth (along with valid units, with no spacebetween the bandwidth and units) for the LSP. If you specify a value without units, bpsis applied.
If the new planned bandwidth is less than the minimum setting, the PCE signals theLSP with the minimum bandwidth. However, if the new planned bandwidth falls inbetween the maximum and minimum settings, the PCE signals the LSP with the newplanned bandwidth.
The valid units are:
• B or b (bps)
• M or m (Mbps)
• K or k (Kbps)
• G or g (Gbps)
Examples: 50M, 1000b, 25g.
545
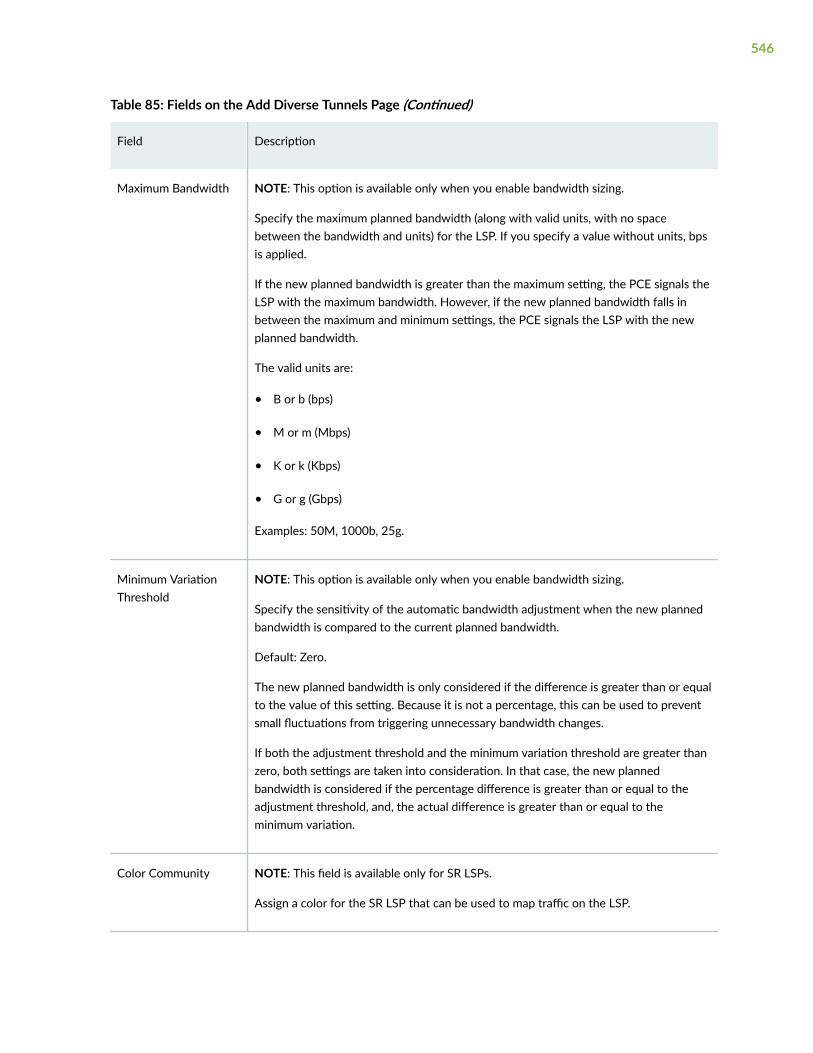
Table 85: Fields on the Add Diverse Tunnels Page (Continued)
Field Description
Maximum Bandwidth NOTE: This option is available only when you enable bandwidth sizing.
Specify the maximum planned bandwidth (along with valid units, with no spacebetween the bandwidth and units) for the LSP. If you specify a value without units, bpsis applied.
If the new planned bandwidth is greater than the maximum setting, the PCE signals theLSP with the maximum bandwidth. However, if the new planned bandwidth falls inbetween the maximum and minimum settings, the PCE signals the LSP with the newplanned bandwidth.
The valid units are:
• B or b (bps)
• M or m (Mbps)
• K or k (Kbps)
• G or g (Gbps)
Examples: 50M, 1000b, 25g.
Minimum VariationThreshold
NOTE: This option is available only when you enable bandwidth sizing.
Specify the sensitivity of the automatic bandwidth adjustment when the new plannedbandwidth is compared to the current planned bandwidth.
Default: Zero.
The new planned bandwidth is only considered if the difference is greater than or equalto the value of this setting. Because it is not a percentage, this can be used to preventsmall fluctuations from triggering unnecessary bandwidth changes.
If both the adjustment threshold and the minimum variation threshold are greater thanzero, both settings are taken into consideration. In that case, the new plannedbandwidth is considered if the percentage difference is greater than or equal to theadjustment threshold, and, the actual difference is greater than or equal to theminimum variation.
Color Community NOTE: This field is available only for SR LSPs.
Assign a color for the SR LSP that can be used to map traffic on the LSP.
546
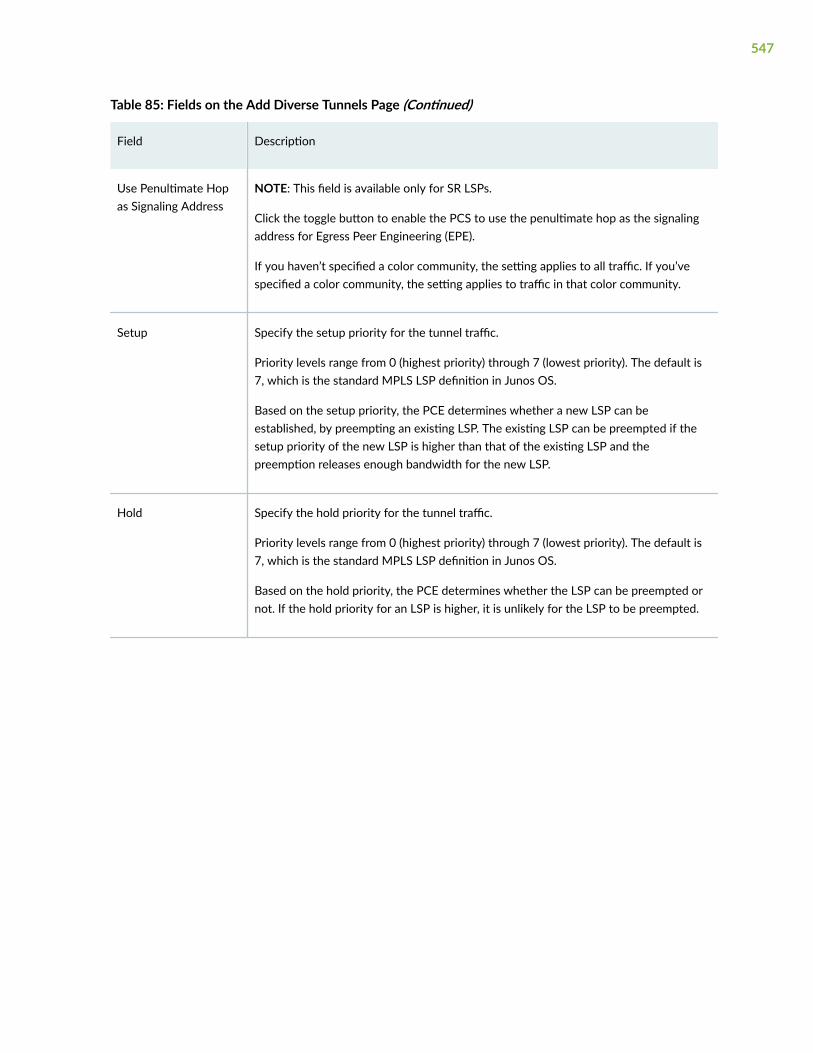
Table 85: Fields on the Add Diverse Tunnels Page (Continued)
Field Description
Use Penultimate Hopas Signaling Address
NOTE: This field is available only for SR LSPs.
Click the toggle button to enable the PCS to use the penultimate hop as the signalingaddress for Egress Peer Engineering (EPE).
If you haven’t specified a color community, the setting applies to all traffic. If you’vespecified a color community, the setting applies to traffic in that color community.
Setup Specify the setup priority for the tunnel traffic.
Priority levels range from 0 (highest priority) through 7 (lowest priority). The default is7, which is the standard MPLS LSP definition in Junos OS.
Based on the setup priority, the PCE determines whether a new LSP can beestablished, by preempting an existing LSP. The existing LSP can be preempted if thesetup priority of the new LSP is higher than that of the existing LSP and thepreemption releases enough bandwidth for the new LSP.
Hold Specify the hold priority for the tunnel traffic.
Priority levels range from 0 (highest priority) through 7 (lowest priority). The default is7, which is the standard MPLS LSP definition in Junos OS.
Based on the hold priority, the PCE determines whether the LSP can be preempted ornot. If the hold priority for an LSP is higher, it is unlikely for the LSP to be preempted.
547

Table 85: Fields on the Add Diverse Tunnels Page (Continued)
Field Description
Routing Method From the list, select a routing method for the LSP to specify whether the PCE shouldcompute and provision the path for the LSP, or not :
The available options are:
• routeByDevice—This is the default routing method when a PCC-controlled LSP iscreated or learned by the PCE. For this method, the PCE does not compute andprovision a path.
This method is appropriate for three types of LSPs: RSVP TE PCC-controlled LSPs,segment routing PCEP-based LSPs, and segment routing NETCONF-based LSPs.
• Other routing methods (default, delay, adminWeight, constant, distance, ISIS, OSPF)—When a PCC-controlled LSP has a routing method that is not routeByDevice, thePCE computes and provisions the path as a strict explicit route when provisioningthe LSP. The LSP’s existing explicit route might be modified to a the PCE-computedstrict explicit route. For example, a loose explicit route specified by you or learnedfrom the router would be modified to a strict explicit route.
Constraints
NOTE: The same fields are available for Tunnel 2. Use the same guidelines to configure the fields for Tunnel 2.
Tunnel 1
Admin Group IncludeAll
From the list, select one or more admin group bits for the LSP to traverse links thatinclude all of the admin groups specified in this field. You can select a maximum of 32admin group bits.
The admin group bits are mapped to meaningful names, such as colors (configured inthe Configuration > Network > Admin Group page), so that you can easily differentiatethe different traffic routes in the display and also use coloring constraints to influencethe path of the LSP.
Admin Group IncludeAny
From the list, select one or more admin group bits for the LSP to traverse links thatinclude at least one of the admin groups specified in this field. The maximum selectionsallowed is 32.
548
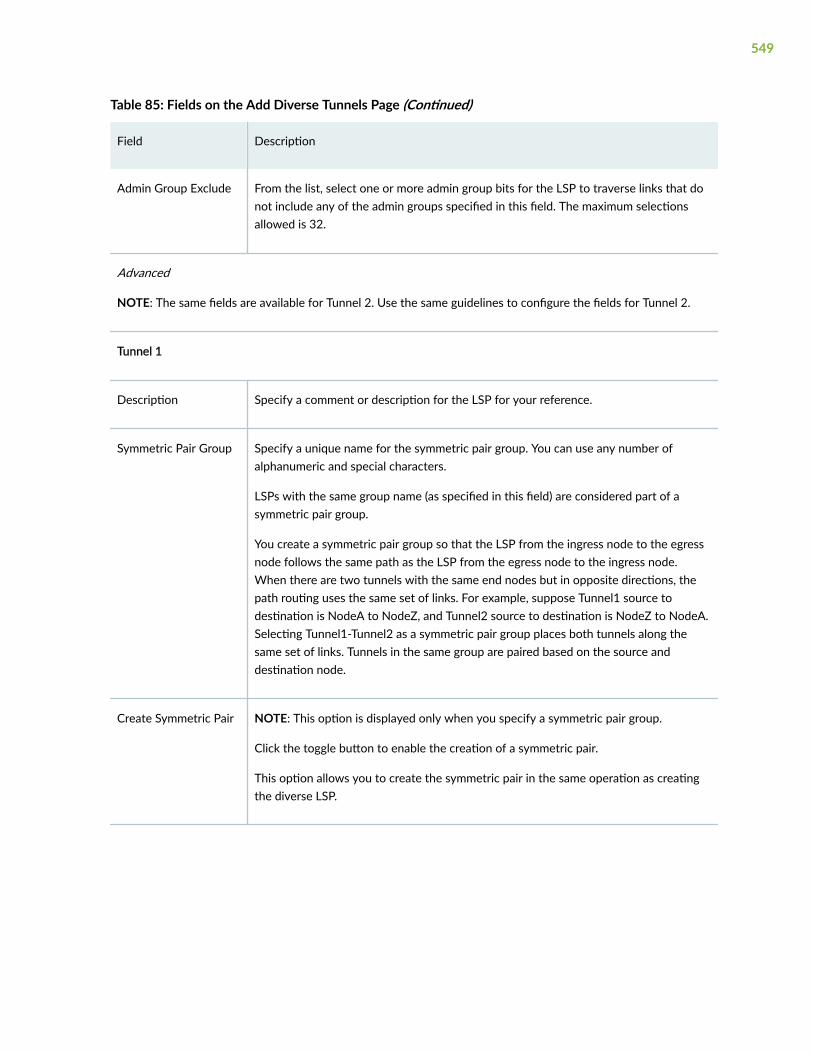
Table 85: Fields on the Add Diverse Tunnels Page (Continued)
Field Description
Admin Group Exclude From the list, select one or more admin group bits for the LSP to traverse links that donot include any of the admin groups specified in this field. The maximum selectionsallowed is 32.
Advanced
NOTE: The same fields are available for Tunnel 2. Use the same guidelines to configure the fields for Tunnel 2.
Tunnel 1
Description Specify a comment or description for the LSP for your reference.
Symmetric Pair Group Specify a unique name for the symmetric pair group. You can use any number ofalphanumeric and special characters.
LSPs with the same group name (as specified in this field) are considered part of asymmetric pair group.
You create a symmetric pair group so that the LSP from the ingress node to the egressnode follows the same path as the LSP from the egress node to the ingress node.When there are two tunnels with the same end nodes but in opposite directions, thepath routing uses the same set of links. For example, suppose Tunnel1 source todestination is NodeA to NodeZ, and Tunnel2 source to destination is NodeZ to NodeA.Selecting Tunnel1-Tunnel2 as a symmetric pair group places both tunnels along thesame set of links. Tunnels in the same group are paired based on the source anddestination node.
Create Symmetric Pair NOTE: This option is displayed only when you specify a symmetric pair group.
Click the toggle button to enable the creation of a symmetric pair.
This option allows you to create the symmetric pair in the same operation as creatingthe diverse LSP.
549
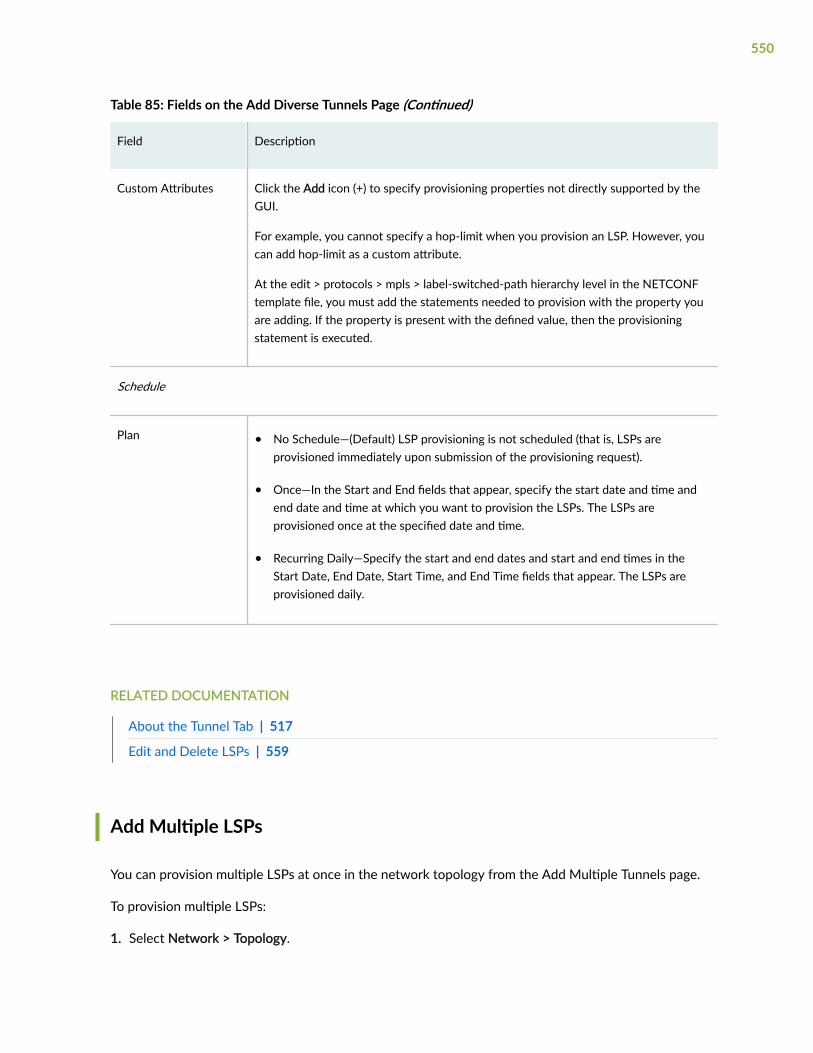
Table 85: Fields on the Add Diverse Tunnels Page (Continued)
Field Description
Custom Attributes Click the Add icon (+) to specify provisioning properties not directly supported by theGUI.
For example, you cannot specify a hop-limit when you provision an LSP. However, youcan add hop-limit as a custom attribute.
At the edit > protocols > mpls > label-switched-path hierarchy level in the NETCONFtemplate file, you must add the statements needed to provision with the property youare adding. If the property is present with the defined value, then the provisioningstatement is executed.
Schedule
Plan • No Schedule—(Default) LSP provisioning is not scheduled (that is, LSPs areprovisioned immediately upon submission of the provisioning request).
• Once—In the Start and End fields that appear, specify the start date and time andend date and time at which you want to provision the LSPs. The LSPs areprovisioned once at the specified date and time.
• Recurring Daily—Specify the start and end dates and start and end times in theStart Date, End Date, Start Time, and End Time fields that appear. The LSPs areprovisioned daily.
RELATED DOCUMENTATION
About the Tunnel Tab | 517
Edit and Delete LSPs | 559
Add Multiple LSPs
You can provision multiple LSPs at once in the network topology from the Add Multiple Tunnels page.
To provision multiple LSPs:
1. Select Network > Topology.
550

The Topology page is displayed with the topology map at the center and the network informationtable at the bottom of the page.
2. In the Tunnel tab, select Provisioning > Multiple LSPs.
The Add Multiple Tunnels page appears.
3. Complete the configuration on each tab according to the guidelines in Table 86 on page 551.
NOTE: Fields marked with an asterisk (*) are mandatory.
4. Click Add to add the LSPs.
A confirmation message appears on the top of the page, indicating that an add tunnel request wassuccessfully created. The LSPs are automatically approved and deployed on the devices.The LSPsthen appear in the Tunnel tab of the network information table (in the Topology page).
Table 86: Fields on the Add Multiple Tunnels Page
Field Description
Properties
ProvisioningMethod
From the list, select one of the following methods to be used to provision the LSP:
• NETCONF (default)—The LSPs are statically provisioned and the associated configurationstatements appear in the router configuration file. Upon provisioning, these LSPs are addedas PCC-controlled LSPs or device-controlled LSPs.
• PCEP (Path Computation Element Protocol)—The LSPs are initiated by the pathcomputation element (PCE) and the associated configuration statements do not appear inthe router configuration file. Upon provisioning, these LSPs are added as PCE-initatedLSPs.
NOTE:
• For IOS-XR routers, NETCONF-based LSP provisioning has the same capabilities as PCEP-based LSP provisioning.
ProvisioningType
From the list, select the type of LSP that you want to provision (RSVP or SR (segment routing)).
ID Prefix Specify a prefix to be applied to the names of all the LSPs that are created.
Default: PCE.
551
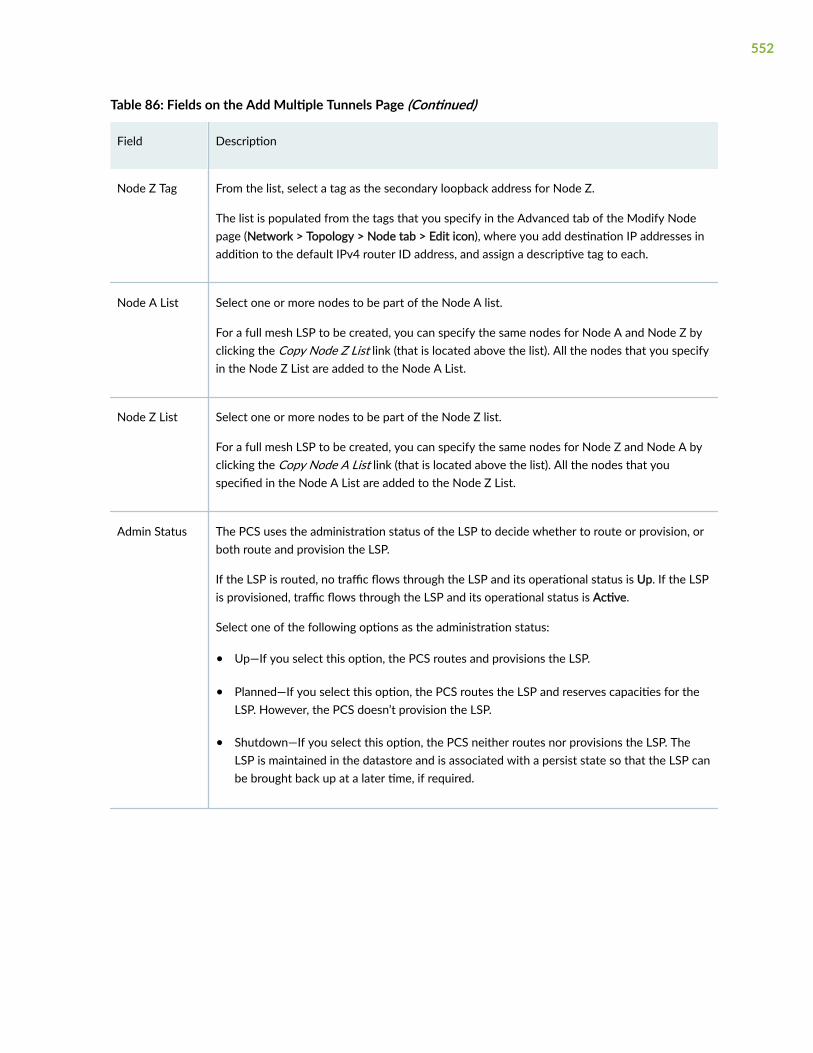
Table 86: Fields on the Add Multiple Tunnels Page (Continued)
Field Description
Node Z Tag From the list, select a tag as the secondary loopback address for Node Z.
The list is populated from the tags that you specify in the Advanced tab of the Modify Nodepage (Network > Topology > Node tab > Edit icon), where you add destination IP addresses inaddition to the default IPv4 router ID address, and assign a descriptive tag to each.
Node A List Select one or more nodes to be part of the Node A list.
For a full mesh LSP to be created, you can specify the same nodes for Node A and Node Z byclicking the Copy Node Z List link (that is located above the list). All the nodes that you specifyin the Node Z List are added to the Node A List.
Node Z List Select one or more nodes to be part of the Node Z list.
For a full mesh LSP to be created, you can specify the same nodes for Node Z and Node A byclicking the Copy Node A List link (that is located above the list). All the nodes that youspecified in the Node A List are added to the Node Z List.
Admin Status The PCS uses the administration status of the LSP to decide whether to route or provision, orboth route and provision the LSP.
If the LSP is routed, no traffic flows through the LSP and its operational status is Up. If the LSPis provisioned, traffic flows through the LSP and its operational status is Active.
Select one of the following options as the administration status:
• Up—If you select this option, the PCS routes and provisions the LSP.
• Planned—If you select this option, the PCS routes the LSP and reserves capacities for theLSP. However, the PCS doesn’t provision the LSP.
• Shutdown—If you select this option, the PCS neither routes nor provisions the LSP. TheLSP is maintained in the datastore and is associated with a persist state so that the LSP canbe brought back up at a later time, if required.
552

Table 86: Fields on the Add Multiple Tunnels Page (Continued)
Field Description
PlannedBandwidth
Specify the planned bandwidth (along with valid units, with no space between the bandwidthand units) for the LSP. If you specify a value without units, bps is applied.
Valid units are:
• B or b (bps)
• M or m (Mbps)
• K or k (Kbps)
• G or g (Gbps)
Examples: 50M, 1000b, 25g.
BandwidthSizing
NOTE: This option is displayed only when you select PCEP as the provisioning method.
Click the toggle button to enable bandwidth sizing for the LSP.
If enabled, the LSP is included in the periodic re-computation of planned bandwidth based onaggregated LSP traffic statistics.
If you enable bandwidth sizing, you must configure the following parameters:
• Adjustment Threshold
• Minimum Bandwidth
• Maximum Bandwidth
• Minimum Variation Threshold
AdjustmentThreshold (%)
NOTE: This option is available only when you enable bandwidth sizing.
Specify the sensitivity (in %) of the automatic bandwidth adjustment.
The new planned bandwidth is considered only if it differs from the existing bandwidth by thevalue of this setting or more. The default value is 10%.
553
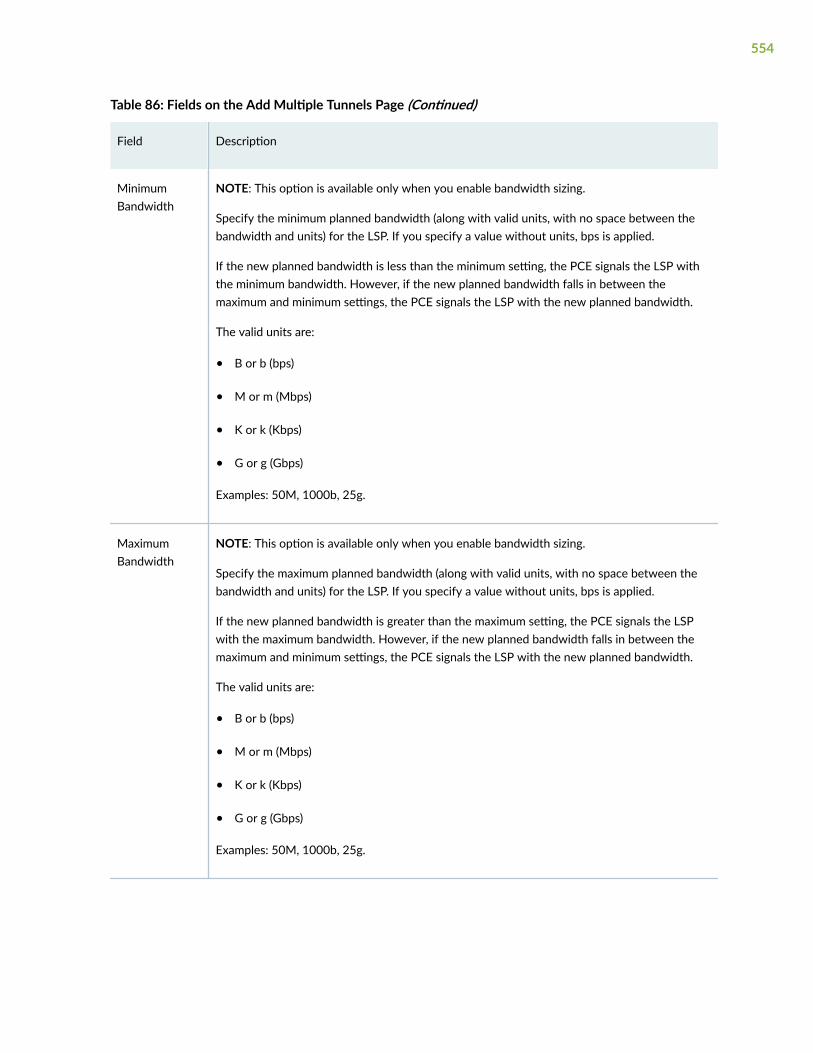
Table 86: Fields on the Add Multiple Tunnels Page (Continued)
Field Description
MinimumBandwidth
NOTE: This option is available only when you enable bandwidth sizing.
Specify the minimum planned bandwidth (along with valid units, with no space between thebandwidth and units) for the LSP. If you specify a value without units, bps is applied.
If the new planned bandwidth is less than the minimum setting, the PCE signals the LSP withthe minimum bandwidth. However, if the new planned bandwidth falls in between themaximum and minimum settings, the PCE signals the LSP with the new planned bandwidth.
The valid units are:
• B or b (bps)
• M or m (Mbps)
• K or k (Kbps)
• G or g (Gbps)
Examples: 50M, 1000b, 25g.
MaximumBandwidth
NOTE: This option is available only when you enable bandwidth sizing.
Specify the maximum planned bandwidth (along with valid units, with no space between thebandwidth and units) for the LSP. If you specify a value without units, bps is applied.
If the new planned bandwidth is greater than the maximum setting, the PCE signals the LSPwith the maximum bandwidth. However, if the new planned bandwidth falls in between themaximum and minimum settings, the PCE signals the LSP with the new planned bandwidth.
The valid units are:
• B or b (bps)
• M or m (Mbps)
• K or k (Kbps)
• G or g (Gbps)
Examples: 50M, 1000b, 25g.
554
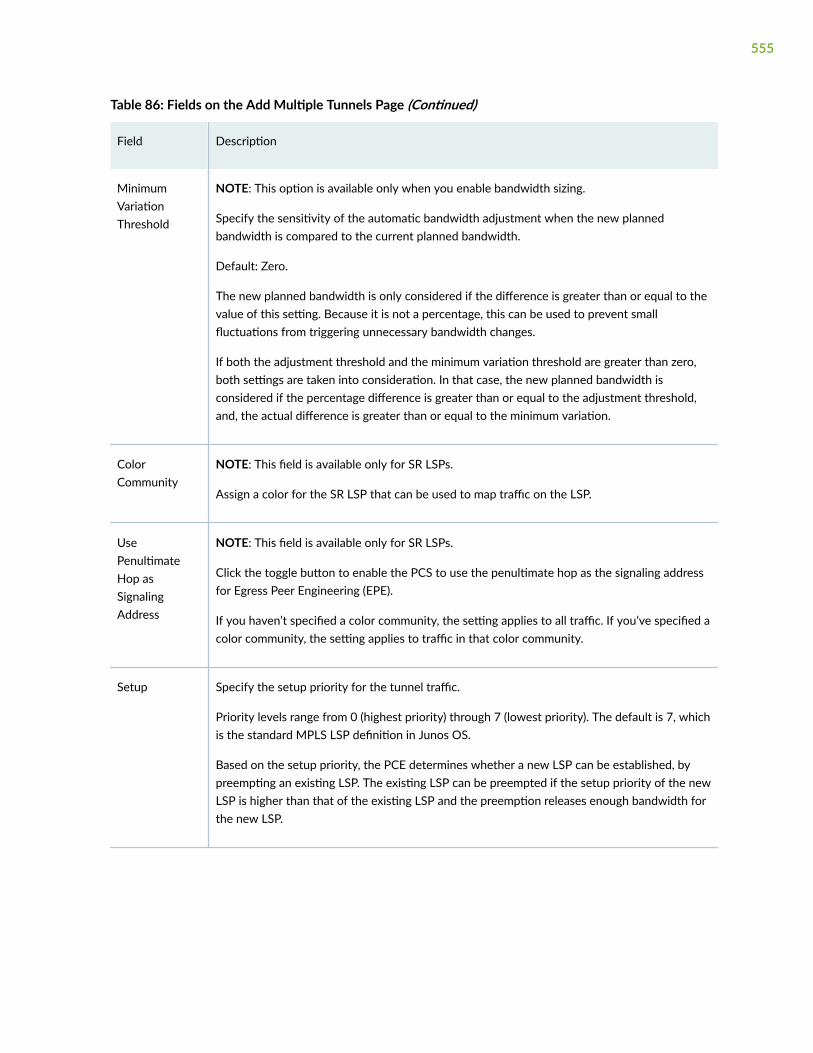
Table 86: Fields on the Add Multiple Tunnels Page (Continued)
Field Description
MinimumVariationThreshold
NOTE: This option is available only when you enable bandwidth sizing.
Specify the sensitivity of the automatic bandwidth adjustment when the new plannedbandwidth is compared to the current planned bandwidth.
Default: Zero.
The new planned bandwidth is only considered if the difference is greater than or equal to thevalue of this setting. Because it is not a percentage, this can be used to prevent smallfluctuations from triggering unnecessary bandwidth changes.
If both the adjustment threshold and the minimum variation threshold are greater than zero,both settings are taken into consideration. In that case, the new planned bandwidth isconsidered if the percentage difference is greater than or equal to the adjustment threshold,and, the actual difference is greater than or equal to the minimum variation.
ColorCommunity
NOTE: This field is available only for SR LSPs.
Assign a color for the SR LSP that can be used to map traffic on the LSP.
UsePenultimateHop asSignalingAddress
NOTE: This field is available only for SR LSPs.
Click the toggle button to enable the PCS to use the penultimate hop as the signaling addressfor Egress Peer Engineering (EPE).
If you haven’t specified a color community, the setting applies to all traffic. If you’ve specified acolor community, the setting applies to traffic in that color community.
Setup Specify the setup priority for the tunnel traffic.
Priority levels range from 0 (highest priority) through 7 (lowest priority). The default is 7, whichis the standard MPLS LSP definition in Junos OS.
Based on the setup priority, the PCE determines whether a new LSP can be established, bypreempting an existing LSP. The existing LSP can be preempted if the setup priority of the newLSP is higher than that of the existing LSP and the preemption releases enough bandwidth forthe new LSP.
555

Table 86: Fields on the Add Multiple Tunnels Page (Continued)
Field Description
Hold Specify the hold priority for the tunnel traffic.
Priority levels range from 0 (highest priority) through 7 (lowest priority). The default is 7, whichis the standard MPLS LSP definition in Junos OS.
Based on the hold priority, the PCE determines whether the LSP can be preempted or not. Ifthe hold priority for an LSP is higher, it is unlikely for the LSP to be preempted.
Planned Metric Specify the static tunnel metric.
The PCE uses this metric to route the LSP instead of allowing the router itself to choose apath.
RoutingMethod
From the list, select a routing method for the LSP to specify whether the PCE should computeand provision the path for the LSP, or not:
The available options are:
• routeByDevice—This is the default routing method when a PCC-controlled LSP is createdor learned by the PCE. For this method, the PCE does not compute and provision a path.
This method is appropriate for three types of LSPs: RSVP TE PCC-controlled LSPs,Segment routing PCEP-based LSPs, and Segment routing NETCONF-based LSPs.
• Other routing methods (default, delay, adminWeight, constant, distance, ISIS, OSPF)—When a PCC-controlled LSP has a routing method that is not routeByDevice, the PCEcomputes and provisions the path as a strict explicit route when provisioning the LSP. TheLSP’s existing explicit route might be modified to a PCE-computed strict explicit route. Forexample, a loose explicit route specified by you or learned from the router would bemodified to a strict explicit route.
Constraints
Admin GroupInclude All
From the list, select one or more admin group bits for the LSP to traverse links that include allof the admin groups specified in this field. You can select a maximum of 32 admin group bits.
The admin group bits are mapped to meaningful names (such as colors) on the Admin Grouppage (Configuration > Network > Admin Group). This enables you to easily differentiate thedifferent traffic routes in the display and also use coloring constraints to influence the path ofthe LSP.
556
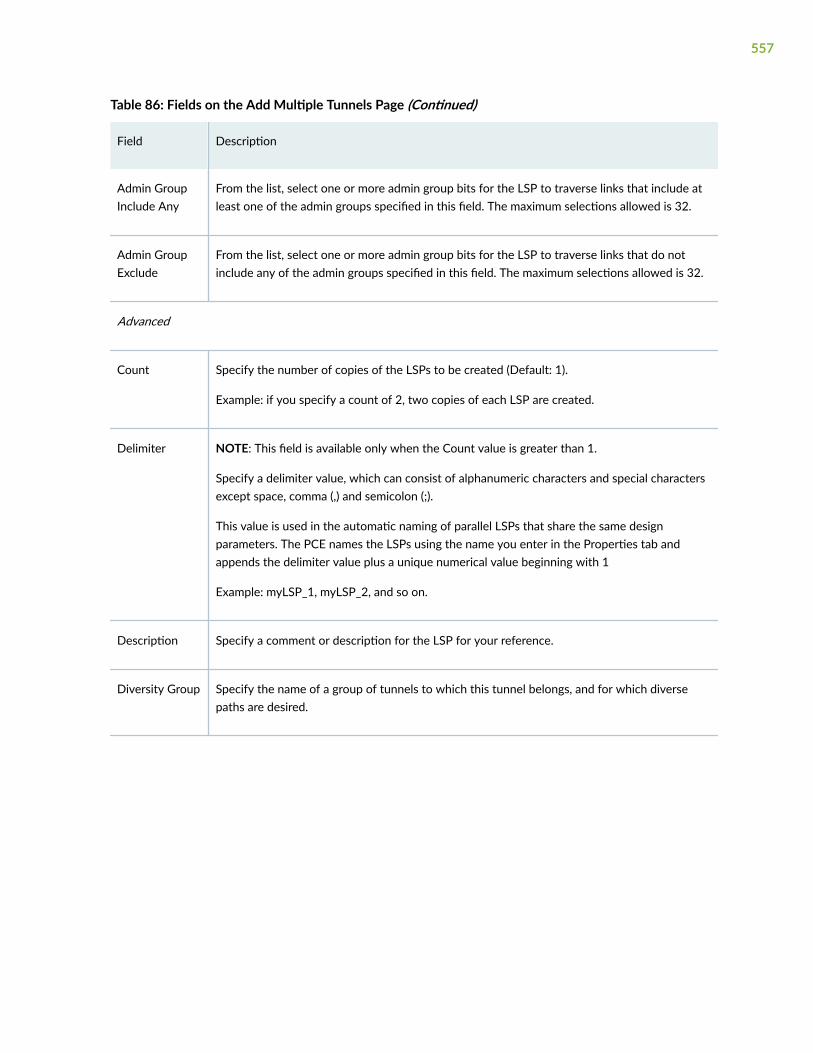
Table 86: Fields on the Add Multiple Tunnels Page (Continued)
Field Description
Admin GroupInclude Any
From the list, select one or more admin group bits for the LSP to traverse links that include atleast one of the admin groups specified in this field. The maximum selections allowed is 32.
Admin GroupExclude
From the list, select one or more admin group bits for the LSP to traverse links that do notinclude any of the admin groups specified in this field. The maximum selections allowed is 32.
Advanced
Count Specify the number of copies of the LSPs to be created (Default: 1).
Example: if you specify a count of 2, two copies of each LSP are created.
Delimiter NOTE: This field is available only when the Count value is greater than 1.
Specify a delimiter value, which can consist of alphanumeric characters and special charactersexcept space, comma (,) and semicolon (;).
This value is used in the automatic naming of parallel LSPs that share the same designparameters. The PCE names the LSPs using the name you enter in the Properties tab andappends the delimiter value plus a unique numerical value beginning with 1
Example: myLSP_1, myLSP_2, and so on.
Description Specify a comment or description for the LSP for your reference.
Diversity Group Specify the name of a group of tunnels to which this tunnel belongs, and for which diversepaths are desired.
557

Table 86: Fields on the Add Multiple Tunnels Page (Continued)
Field Description
Diversity Level From the list, select the level of diversity for the LSP:
• Default—No diversity level is applied.
• Site—Two paths don’t intersect at any given site (aside from the source and destination).Site diversity is the strongest as it includes SRLG and link diversity.
• SRLG (Shared Risk Link Group)—Two paths don't intersect at any of the group’s links ornodes (aside from the source and destination). SRLG diversity includes link diversity.
• Link—Two paths don’t intersect at any given link. Link diversity is the weakest.
CustomAttributes
Click the Add icon (+) to specify provisioning properties not directly supported by the GUI.
For example, you cannot specify a hop-limit when you provision an LSP. However, you can addhop-limit as a custom attribute.
At the edit > protocols > mpls > label-switched-path hierarchy level in the NETCONF templatefile, you must add the statements needed to provision with the property you are adding. If theproperty is present with the defined value, then the provisioning statement is executed.
Schedule
Plan Select one of the following plans to schedule LSP provisioning:
NOTE: The time zone is the server time zone.
• No Schedule—(Default) LSP provisioning is not scheduled (that is, LSPs are provisionedimmediately upon submission of the provisioning request).
• Once—In the Start and End fields that appear, specify the start date and time and end dateand time at which you want to provision the LSPs. The LSPs are provisioned once at thespecified date and time.
• Recurring Daily—Specify the start and end dates and start and end times in the Start Date,End Date, Start Time, and End Time fields that appear. The LSPs are provisioned daily.
558
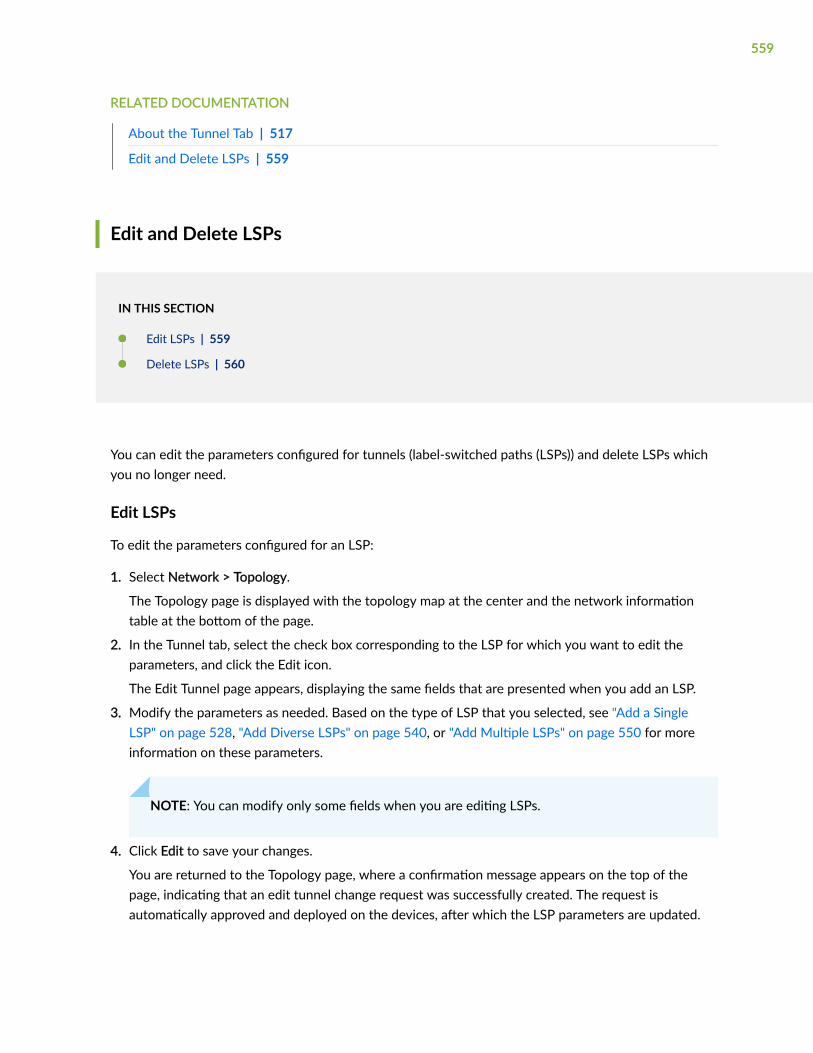
RELATED DOCUMENTATION
About the Tunnel Tab | 517
Edit and Delete LSPs | 559
Edit and Delete LSPs
IN THIS SECTION
Edit LSPs | 559
Delete LSPs | 560
You can edit the parameters configured for tunnels (label-switched paths (LSPs)) and delete LSPs whichyou no longer need.
Edit LSPs
To edit the parameters configured for an LSP:
1. Select Network > Topology.
The Topology page is displayed with the topology map at the center and the network informationtable at the bottom of the page.
2. In the Tunnel tab, select the check box corresponding to the LSP for which you want to edit theparameters, and click the Edit icon.
The Edit Tunnel page appears, displaying the same fields that are presented when you add an LSP.
3. Modify the parameters as needed. Based on the type of LSP that you selected, see "Add a SingleLSP" on page 528, "Add Diverse LSPs" on page 540, or "Add Multiple LSPs" on page 550 for moreinformation on these parameters.
NOTE: You can modify only some fields when you are editing LSPs.
4. Click Edit to save your changes.
You are returned to the Topology page, where a confirmation message appears on the top of thepage, indicating that an edit tunnel change request was successfully created. The request isautomatically approved and deployed on the devices, after which the LSP parameters are updated.
559
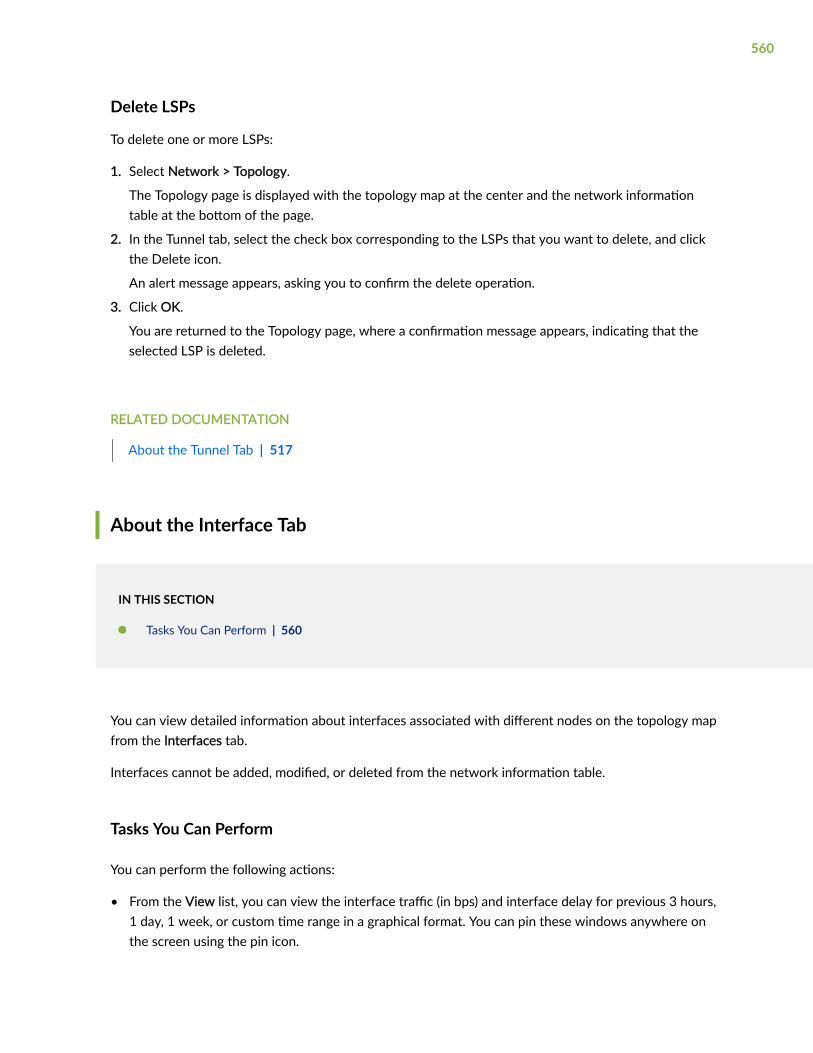
Delete LSPs
To delete one or more LSPs:
1. Select Network > Topology.
The Topology page is displayed with the topology map at the center and the network informationtable at the bottom of the page.
2. In the Tunnel tab, select the check box corresponding to the LSPs that you want to delete, and clickthe Delete icon.
An alert message appears, asking you to confirm the delete operation.
3. Click OK.
You are returned to the Topology page, where a confirmation message appears, indicating that theselected LSP is deleted.
RELATED DOCUMENTATION
About the Tunnel Tab | 517
About the Interface Tab
IN THIS SECTION
Tasks You Can Perform | 560
You can view detailed information about interfaces associated with different nodes on the topology mapfrom the Interfaces tab.
Interfaces cannot be added, modified, or deleted from the network information table.
Tasks You Can Perform
You can perform the following actions:
• From the View list, you can view the interface traffic (in bps) and interface delay for previous 3 hours,1 day, 1 week, or custom time range in a graphical format. You can pin these windows anywhere onthe screen using the pin icon.
560

• From the Diagnostics list, you can:
• Show Interface—Runs the show interfaces CLI command for each interface associated with thelink. Interface related information is displayed on the Diagnostics window. You can view thestatus, type, node for which the command is run (From), description, and time of last execution foreach associated interface. Once the commands are run, you can view detailed execution detailsunder the Result tab.
NOTE: From the New list, you can run a new ping and traceroute command. You can alsodownload all the diagnostic related information as a text file by clicking Download.
• Download node information—Click Download to download detailed information about all theexisting interfaces in the topology in CSV format.
• From the More List, you can:
• View detailed information about the interface by clicking Show Detail or click the Details icondisplayed next to the interface name when you hover over it. A pop-up appears displaying thetraffic and protocol details about the selected interface.
• Reload the network—When there is a large number of interfaces, you can click Reload to clear theinterface back end cache and reload the data (table entries) from the database.
About the Container LSP Tab
IN THIS SECTION
Tasks You Can Perform | 562
A container LSP is a logical grouping of sub-LSPs that share the properties defined in the container.Container LSPs provide automatic adding or removing of sub-LSPs in the network based on trafficstatistics. This mitigates the difficulty of finding a single path large enough to accommodate a largebandwidth reservation. Using container LSPs involves:
• Adding a container LSP from the network information table (Container LSP tab) on the Topologypage.
561
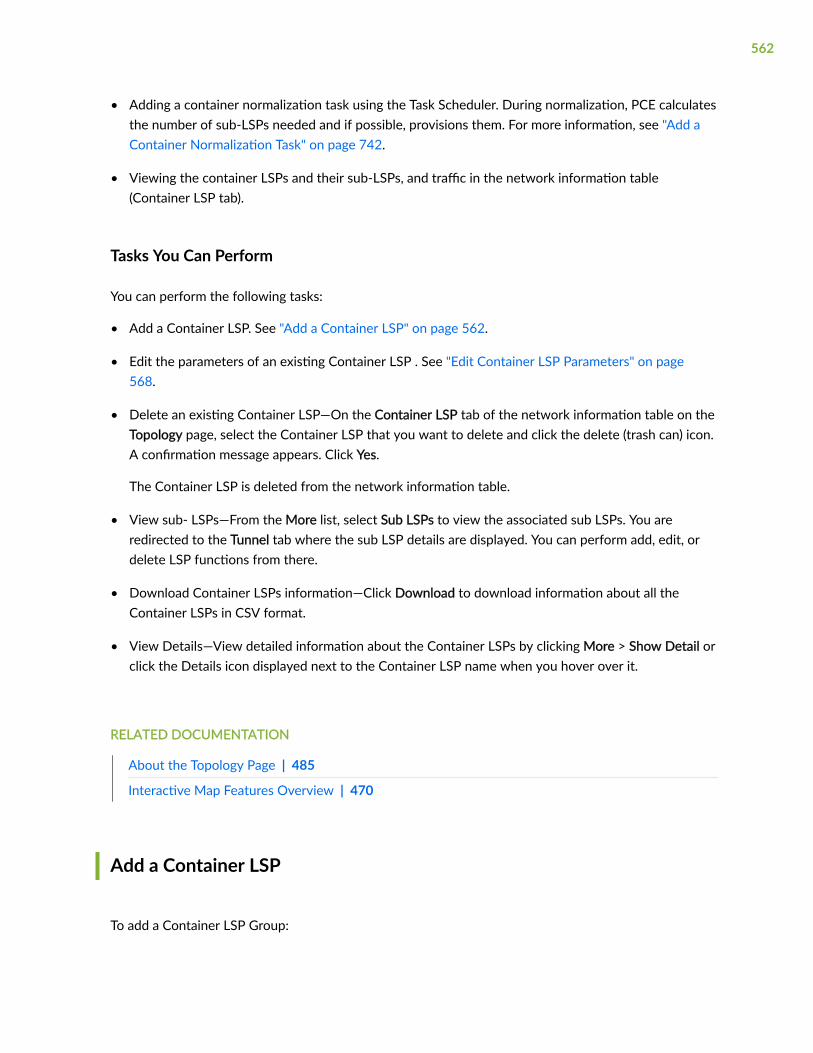
• Adding a container normalization task using the Task Scheduler. During normalization, PCE calculatesthe number of sub-LSPs needed and if possible, provisions them. For more information, see "Add aContainer Normalization Task" on page 742.
• Viewing the container LSPs and their sub-LSPs, and traffic in the network information table(Container LSP tab).
Tasks You Can Perform
You can perform the following tasks:
• Add a Container LSP. See "Add a Container LSP" on page 562.
• Edit the parameters of an existing Container LSP . See "Edit Container LSP Parameters" on page568.
• Delete an existing Container LSP—On the Container LSP tab of the network information table on theTopology page, select the Container LSP that you want to delete and click the delete (trash can) icon.A confirmation message appears. Click Yes.
The Container LSP is deleted from the network information table.
• View sub- LSPs—From the More list, select Sub LSPs to view the associated sub LSPs. You areredirected to the Tunnel tab where the sub LSP details are displayed. You can perform add, edit, ordelete LSP functions from there.
• Download Container LSPs information—Click Download to download information about all theContainer LSPs in CSV format.
• View Details—View detailed information about the Container LSPs by clicking More > Show Detail orclick the Details icon displayed next to the Container LSP name when you hover over it.
RELATED DOCUMENTATION
About the Topology Page | 485
Interactive Map Features Overview | 470
Add a Container LSP
To add a Container LSP Group:
562
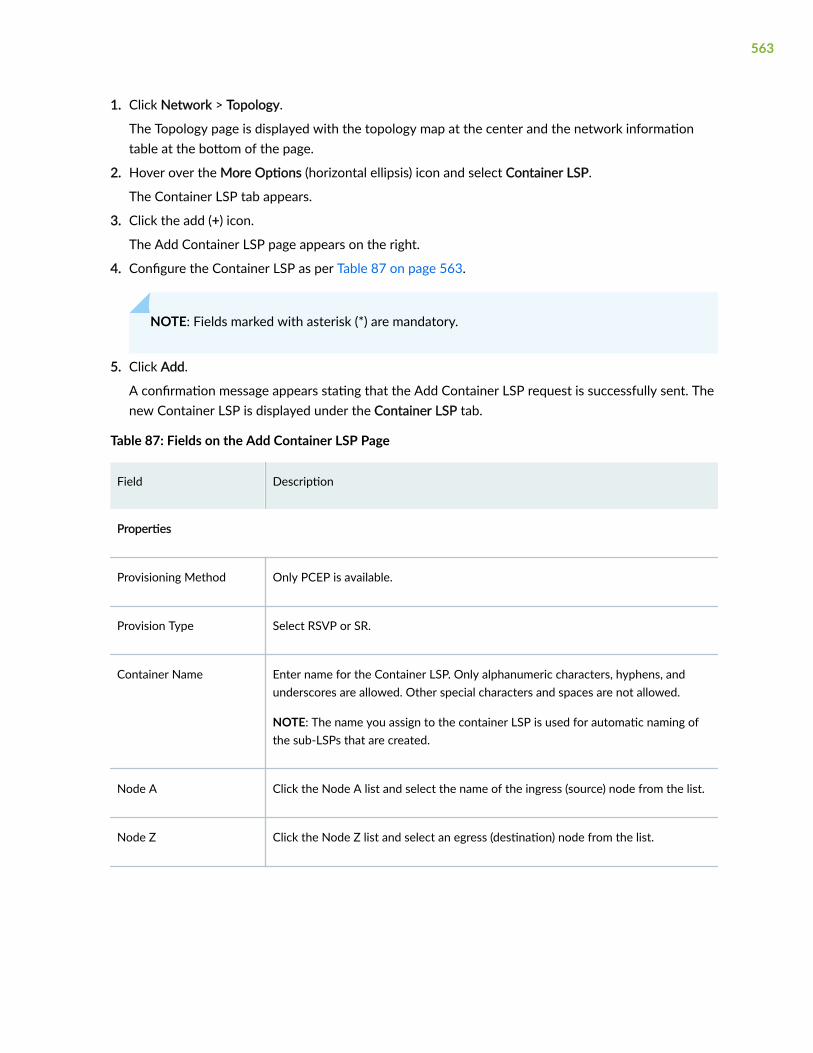
1. Click Network > Topology.
The Topology page is displayed with the topology map at the center and the network informationtable at the bottom of the page.
2. Hover over the More Options (horizontal ellipsis) icon and select Container LSP.
The Container LSP tab appears.
3. Click the add (+) icon.
The Add Container LSP page appears on the right.
4. Configure the Container LSP as per Table 87 on page 563.
NOTE: Fields marked with asterisk (*) are mandatory.
5. Click Add.
A confirmation message appears stating that the Add Container LSP request is successfully sent. Thenew Container LSP is displayed under the Container LSP tab.
Table 87: Fields on the Add Container LSP Page
Field Description
Properties
Provisioning Method Only PCEP is available.
Provision Type Select RSVP or SR.
Container Name Enter name for the Container LSP. Only alphanumeric characters, hyphens, andunderscores are allowed. Other special characters and spaces are not allowed.
NOTE: The name you assign to the container LSP is used for automatic naming ofthe sub-LSPs that are created.
Node A Click the Node A list and select the name of the ingress (source) node from the list.
Node Z Click the Node Z list and select an egress (destination) node from the list.
563

Table 87: Fields on the Add Container LSP Page (Continued)
Field Description
Merging Bandwidth Enter merging bandwidth value.
Aggregate bandwidth thresholds are used to trigger merging of sub-LSPs duringnormalization. When the aggregate bandwidth usage falls below the mergingbandwidth (the lower threshold), the number of sub-LSPs during normalization isreduced.
Splitting Bandwidth Enter splitting bandwidth value.
Aggregate bandwidth thresholds are used to trigger splitting of sub-LSPs duringnormalization. When the aggregate bandwidth usage rises above the splittingbandwidth (the upper threshold), sub-LSPs are added during normalization.
Minimum and MaximumLSP Count
Enter the minimum and maximum number of sub-LSPs that can be created in thecontainer LSP. Range is 1 through 6.
Minimum and MaximumLSP Bandwidth
Enter the minimum and maximum bandwidth that can be signaled for the sub-LSPsduring normalization or initialization, immediately followed by units (no space inbetween). Valid units are:
• B or b (bps)
• M or m (Mbps)
• K or k (Kbps)
• G or g (Gbps)
For example, 50M, 1000b, 25g.
If you enter a value without units, bps is applied.
Planned Metric Enter the metric value for static tunnel or use the up and down arrows to incrementor decrement the value. For more information, see Basic LSP Configuration in MPLSApplications User Guide.
Setup Enter the RSVP setup priority for the tunnel traffic. Priority levels range from 0(highest priority) through 7 (lowest priority). The default is 7, which is the standardMPLS LSP definition in Junos OS.
564

Table 87: Fields on the Add Container LSP Page (Continued)
Field Description
Hold Enter the RSVP hold priority for the tunnel traffic. Priority levels range from 0(highest priority) through 7 (lowest priority). The default is 7, which is the standardMPLS LSP definition in Junos OS.
Routing Method Select a routing method from the following:
• Admin Weight
• Constant
• Default
NOTE: Do not change the routing method for PCEP-provisioned sub-LSPs; theyshould always have a routing method of “default”.
• Delay
• Distance
• ISIS
• OSPF
• Route by Device
565
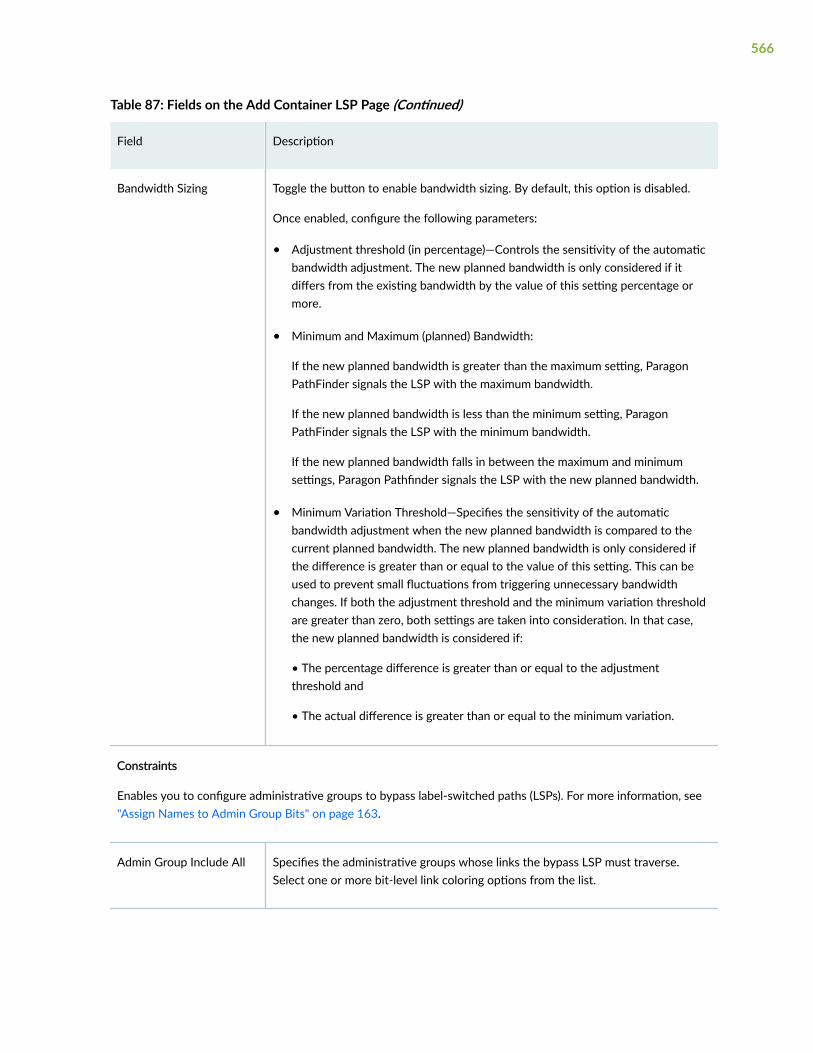
Table 87: Fields on the Add Container LSP Page (Continued)
Field Description
Bandwidth Sizing Toggle the button to enable bandwidth sizing. By default, this option is disabled.
Once enabled, configure the following parameters:
• Adjustment threshold (in percentage)—Controls the sensitivity of the automaticbandwidth adjustment. The new planned bandwidth is only considered if itdiffers from the existing bandwidth by the value of this setting percentage ormore.
• Minimum and Maximum (planned) Bandwidth:
If the new planned bandwidth is greater than the maximum setting, ParagonPathFinder signals the LSP with the maximum bandwidth.
If the new planned bandwidth is less than the minimum setting, ParagonPathFinder signals the LSP with the minimum bandwidth.
If the new planned bandwidth falls in between the maximum and minimumsettings, Paragon Pathfinder signals the LSP with the new planned bandwidth.
• Minimum Variation Threshold—Specifies the sensitivity of the automaticbandwidth adjustment when the new planned bandwidth is compared to thecurrent planned bandwidth. The new planned bandwidth is only considered ifthe difference is greater than or equal to the value of this setting. This can beused to prevent small fluctuations from triggering unnecessary bandwidthchanges. If both the adjustment threshold and the minimum variation thresholdare greater than zero, both settings are taken into consideration. In that case,the new planned bandwidth is considered if:
• The percentage difference is greater than or equal to the adjustmentthreshold and
• The actual difference is greater than or equal to the minimum variation.
Constraints
Enables you to configure administrative groups to bypass label-switched paths (LSPs). For more information, see"Assign Names to Admin Group Bits" on page 163.
Admin Group Include All Specifies the administrative groups whose links the bypass LSP must traverse.Select one or more bit-level link coloring options from the list.
566
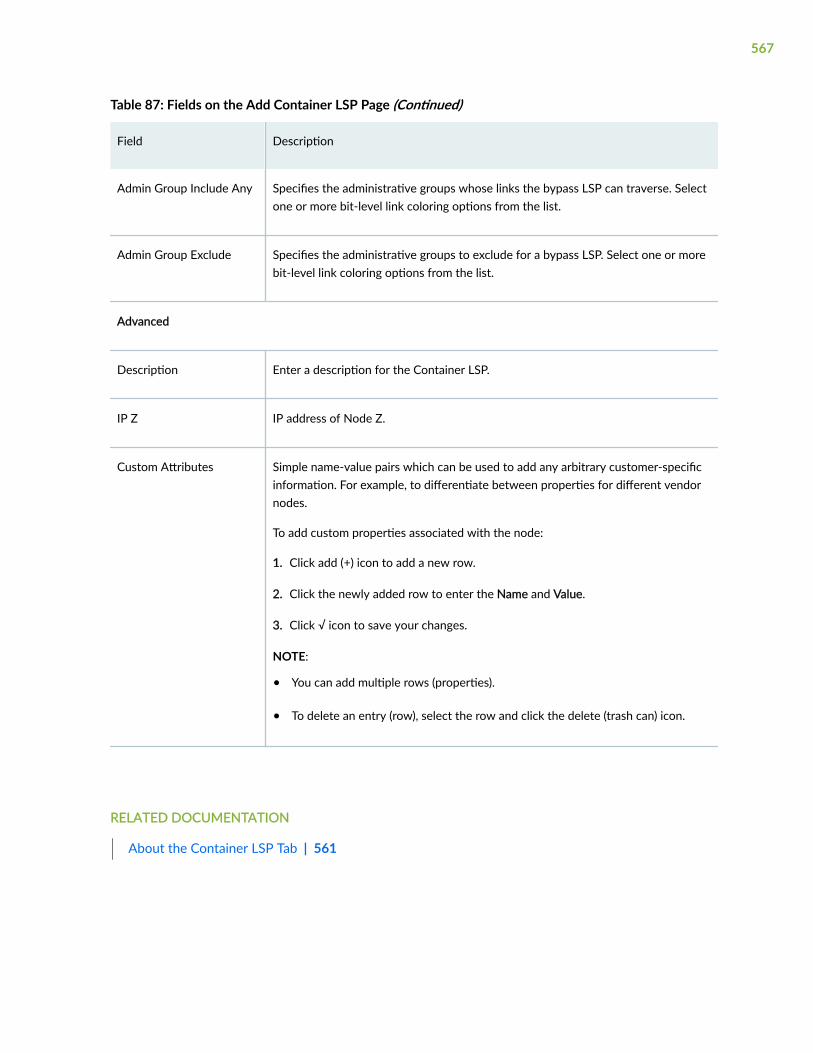
Table 87: Fields on the Add Container LSP Page (Continued)
Field Description
Admin Group Include Any Specifies the administrative groups whose links the bypass LSP can traverse. Selectone or more bit-level link coloring options from the list.
Admin Group Exclude Specifies the administrative groups to exclude for a bypass LSP. Select one or morebit-level link coloring options from the list.
Advanced
Description Enter a description for the Container LSP.
IP Z IP address of Node Z.
Custom Attributes Simple name-value pairs which can be used to add any arbitrary customer-specificinformation. For example, to differentiate between properties for different vendornodes.
To add custom properties associated with the node:
1. Click add (+) icon to add a new row.
2. Click the newly added row to enter the Name and Value.
3. Click √ icon to save your changes.
NOTE:
• You can add multiple rows (properties).
• To delete an entry (row), select the row and click the delete (trash can) icon.
RELATED DOCUMENTATION
About the Container LSP Tab | 561
567

Edit Container LSP Parameters
To edit the parameters of a container LSP:
1. Click Network > Topology.
The Topology page is displayed with the topology map at the center and the network informationtable at the bottom of the page.
2. Hover over the More Options (horizontal ellipsis) icon and select Container LSP.
The Container LSP tab appears.
3. Select the container LSP you want to edit and click the edit (pencil) icon.
The Edit Container LSP page appears on the right.
4. Configure the container LSP as per Fields on the Add Container LSP Page on page 563.
NOTE: You cannot edit the following fields:
On the Properties tab,
• Provisioning Method
• Provision Type
• Container Name
• Node A
• Node Z
• On the Advanced tab, IP Z.
5. Click Edit.
A confirmation message appears stating that the Edit Container LSP request is successfully sent.
RELATED DOCUMENTATION
Add a Container LSP | 562
568
About the Maintenance Tab
IN THIS SECTION
Tasks You Can Perform | 569
You can use the Maintenance tab in the network information table to schedule maintenance events fornetwork elements, so that you can perform updates or other configuration tasks. Maintenance eventsare planned downtimes which occur at specific future date and time. During a scheduled maintenanceevent, the selected elements are considered logically down, and the system reroutes the LSPs aroundthose elements. After the maintenance event is completed, by default, all LSPs that were affected by theevent are reoptimized.
NOTE: Paragon Pathfinder only attempts to reoptimize PCE-initiated and PCC-delegated LSPs(not PCC-controlled LSPs).
Tasks You Can Perform
You can perform the following tasks:
• Add a maintenance event. See "Add a Maintenance Event" on page 570.
• Edit an existing maintenance event. See "Edit a Maintenance Event" on page 572.
• Delete a maintenance event. See "Delete a Maintenance Event" on page 575.
• Simulate a maintenance event. See "Simulate a Maintenance Event" on page 574.
• View health of a device in maintenance—Select the maintenance event and click Device Health.Select the device for which you want to view the health information. You are redirected to theNetwork Health page, which displays the device health information in a table and tile view. For moreinformation, see "About the Network Health Page" on page 605.
• Download maintenance event information—Click Download to download information about allplanned maintenance events in CSV format.
569

• View Details—View detailed information about the existing maintenance events by clicking More>Show Detail or click the Details icon displayed next to the maintenance event name when youhover over it.
RELATED DOCUMENTATION
About the Topology Page | 485
Interactive Map Features Overview | 470
Add a Maintenance Event
To add a maintenance event:
1. Click Network > Topology.
The Topology page is displayed with the topology map at the center and the network informationtable at the bottom of the page.
2. Hover over the More Options (horizontal ellipsis) icon and select Maintenance.
The Maintenance tab appears.
3. Click the add (+) icon.
The Add Maintenance page appears on the right.
4. Configure the maintenance event as per Table 88 on page 571.
NOTE: Fields marked with asterisk (*) are mandatory.
5. Click Add.
A confirmation message appears stating that the add maintenance request is sent successfully. Thenew maintenance event is displayed under the Maintenance tab.
NOTE: When an element (node, link, or SRLG) is undergoing maintenance, it appears on thetopology map with a red M (for maintenance).
570
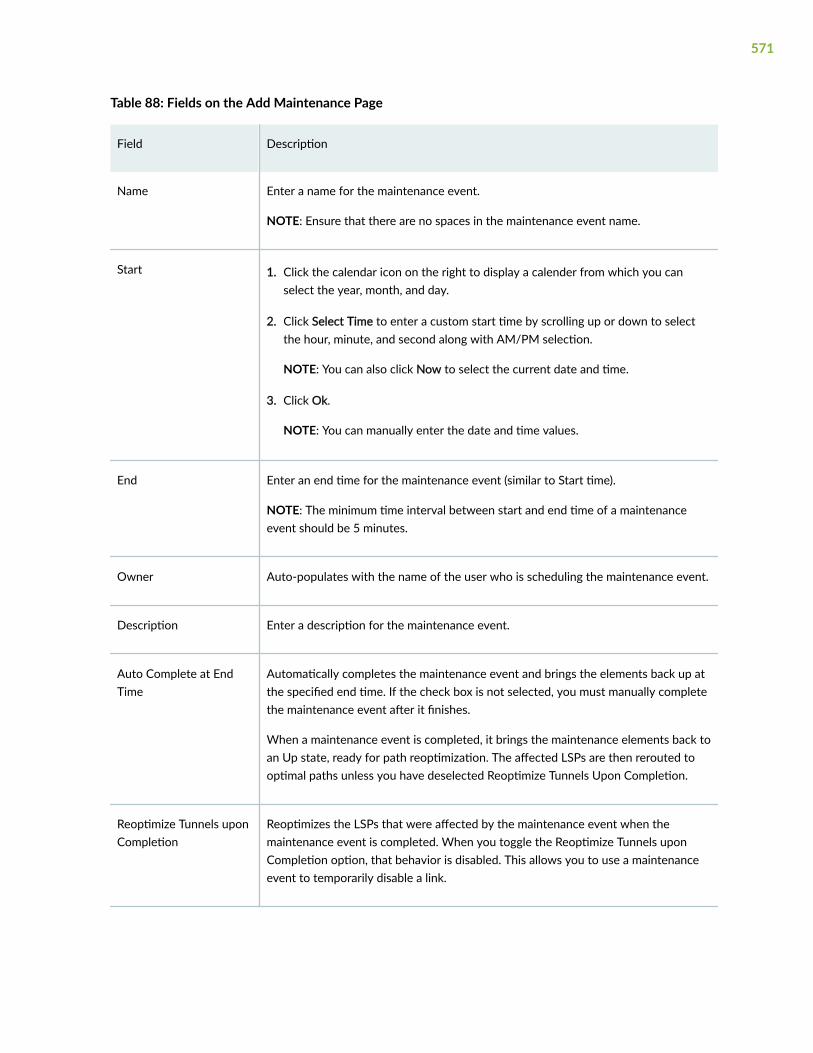
Table 88: Fields on the Add Maintenance Page
Field Description
Name Enter a name for the maintenance event.
NOTE: Ensure that there are no spaces in the maintenance event name.
Start 1. Click the calendar icon on the right to display a calender from which you canselect the year, month, and day.
2. Click Select Time to enter a custom start time by scrolling up or down to selectthe hour, minute, and second along with AM/PM selection.
NOTE: You can also click Now to select the current date and time.
3. Click Ok.
NOTE: You can manually enter the date and time values.
End Enter an end time for the maintenance event (similar to Start time).
NOTE: The minimum time interval between start and end time of a maintenanceevent should be 5 minutes.
Owner Auto-populates with the name of the user who is scheduling the maintenance event.
Description Enter a description for the maintenance event.
Auto Complete at EndTime
Automatically completes the maintenance event and brings the elements back up atthe specified end time. If the check box is not selected, you must manually completethe maintenance event after it finishes.
When a maintenance event is completed, it brings the maintenance elements back toan Up state, ready for path reoptimization. The affected LSPs are then rerouted tooptimal paths unless you have deselected Reoptimize Tunnels Upon Completion.
Reoptimize Tunnels uponCompletion
Reoptimizes the LSPs that were affected by the maintenance event when themaintenance event is completed. When you toggle the Reoptimize Tunnels uponCompletion option, that behavior is disabled. This allows you to use a maintenanceevent to temporarily disable a link.
571
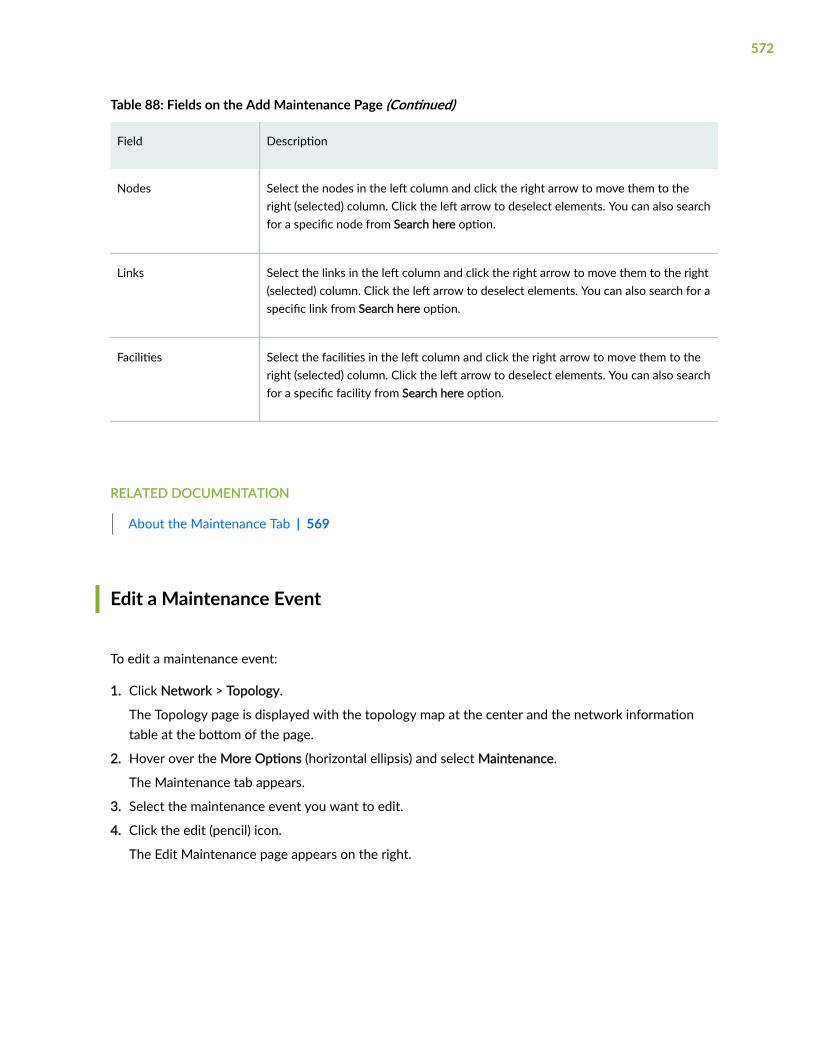
Table 88: Fields on the Add Maintenance Page (Continued)
Field Description
Nodes Select the nodes in the left column and click the right arrow to move them to theright (selected) column. Click the left arrow to deselect elements. You can also searchfor a specific node from Search here option.
Links Select the links in the left column and click the right arrow to move them to the right(selected) column. Click the left arrow to deselect elements. You can also search for aspecific link from Search here option.
Facilities Select the facilities in the left column and click the right arrow to move them to theright (selected) column. Click the left arrow to deselect elements. You can also searchfor a specific facility from Search here option.
RELATED DOCUMENTATION
About the Maintenance Tab | 569
Edit a Maintenance Event
To edit a maintenance event:
1. Click Network > Topology.
The Topology page is displayed with the topology map at the center and the network informationtable at the bottom of the page.
2. Hover over the More Options (horizontal ellipsis) and select Maintenance.
The Maintenance tab appears.
3. Select the maintenance event you want to edit.
4. Click the edit (pencil) icon.
The Edit Maintenance page appears on the right.
572
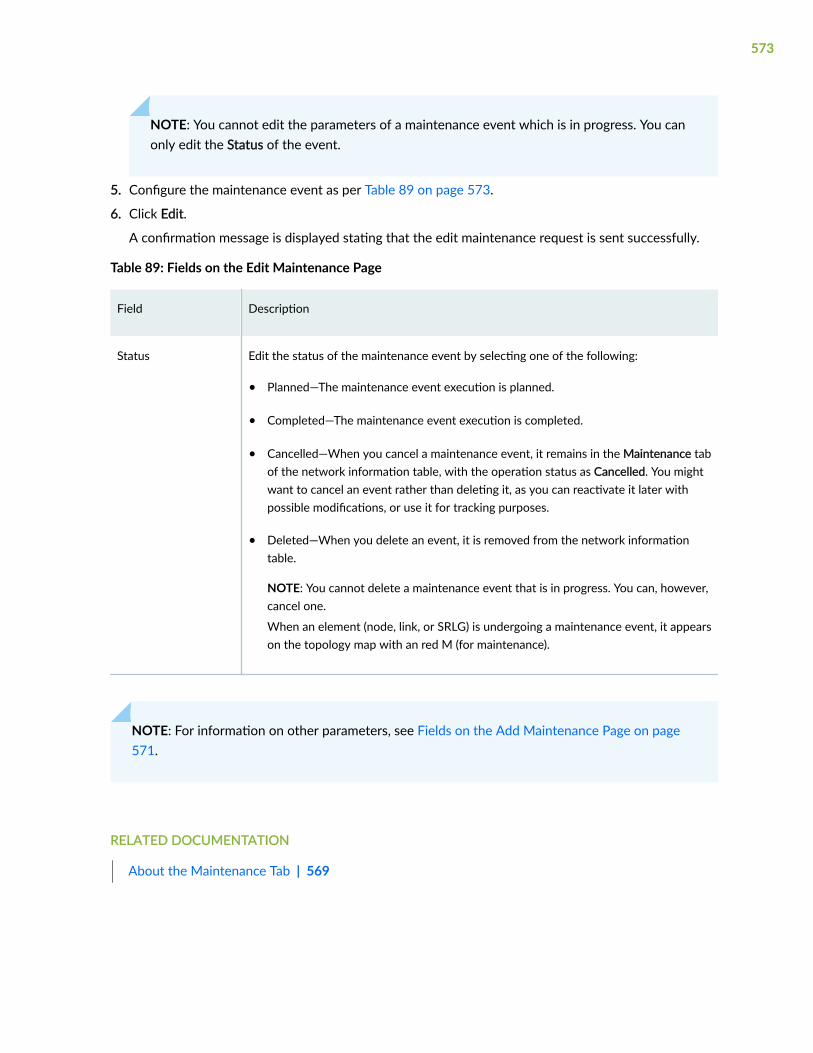
NOTE: You cannot edit the parameters of a maintenance event which is in progress. You canonly edit the Status of the event.
5. Configure the maintenance event as per Table 89 on page 573.
6. Click Edit.
A confirmation message is displayed stating that the edit maintenance request is sent successfully.
Table 89: Fields on the Edit Maintenance Page
Field Description
Status Edit the status of the maintenance event by selecting one of the following:
• Planned—The maintenance event execution is planned.
• Completed—The maintenance event execution is completed.
• Cancelled—When you cancel a maintenance event, it remains in the Maintenance tabof the network information table, with the operation status as Cancelled. You mightwant to cancel an event rather than deleting it, as you can reactivate it later withpossible modifications, or use it for tracking purposes.
• Deleted—When you delete an event, it is removed from the network informationtable.
NOTE: You cannot delete a maintenance event that is in progress. You can, however,cancel one.
When an element (node, link, or SRLG) is undergoing a maintenance event, it appearson the topology map with an red M (for maintenance).
NOTE: For information on other parameters, see Fields on the Add Maintenance Page on page571.
RELATED DOCUMENTATION
About the Maintenance Tab | 569
573

Simulate a Maintenance Event
You can run scheduled maintenance event simulations for different failure scenarios to test theresilience of your network. Network simulation is based on the current network state for the selectedmaintenance events at the time the simulation is initiated. This simulation workflow can not simulate amaintenance event for a future network state or simulate elements from other concurrent maintenanceevents. You can run network simulations based on elements selected for a maintenance event, with theoption to include exhaustive failure testing.
To simulate a maintenance event:
1. Click Network > Topology.
The Topology page is displayed with the topology map at the center and the network informationtable at the bottom of the page.
2. Hover over the More Options (horizontal ellipsis) icon and select Maintenance.
The Maintenance tab appears.
3. Select the maintenance event you want to simulate.
4. Select Simulate.
The Simulate Maintenance page appears. Exhaustive Failure simulation options are displayed alongwith the nodes, links, and facilities associated with the maintenance event.
5. (Optional)—Select Nodes, Links, or Facilities check box if you want to run an Exhaustive FailureSimulation on those network elements.
If you do not perform an exhaustive failure simulation (all check boxes under Exhaustive FailureSimulation are unchecked), all the nodes, links, and facilities selected for the maintenance event failconcurrently (at the same time). For example, if Nodes are selected under the Exhaustive FailureSimulation option, the simulation will still fail all the maintenance event elements concurrently, butfails each of the other nodes in the topology, one at a time. If you select multiple element types forexhaustive failure simulation, all possible combinations involving those elements are tested. Thesubsequent report reflects peak values based on the worst performing combination.
6. Click Simulate to perform the failure simulation and generate reports.
A confirmation message appears stating that the simulation is complete and the generated reportsare available in the Reports (Monitoring > Reports > Maintenance) section.
RELATED DOCUMENTATION
About the Maintenance Tab | 569
574

Delete a Maintenance Event
To delete a maintenance event:
1. Click Network > Topology.
The topology map is displayed with network information table at the bottom of the page.
2. On the Maintenance tab, select the maintenance event you want to delete.
3. Click the Delete (trash can) icon.
A confirmation message appears.
4. Click Yes.
The maintenance event is deleted and removed from the network information table. The topologymap is updated.
NOTE: You cannot delete a maintenance event when its Status is In progress. You must editthe maintenance event status by canceling or completing the event before you can delete it.For more information on event status, see Fields on the Edit Maintenance Page on page 573.
About the P2MP Groups Tab
IN THIS SECTION
PCEP-Provisioned P2MP Groups with Service Mapping | 576
Required Router Configuration | 576
Automatic Rerouting Around Points of Failure | 578
P2MP Tree Design with Diverse PE to CE Links | 579
Tasks You Can Perform | 583
You can use the P2MP Groups tab in the network information table on the Topology (Network >Topology) page to view, configure, and manage the point-to-multipoint group (P2MP) in your network.
P2MP groups, or trees, can be provisioned to help conserve bandwidth. Bandwidth is replicated atbranch points. P2MP groups support NETCONF and PCEP provisioning methods. PCEP provisioningoffers an advantage of real-time reporting. For PCEP-provisioned P2MP groups, Paragon Pathfinder also
575
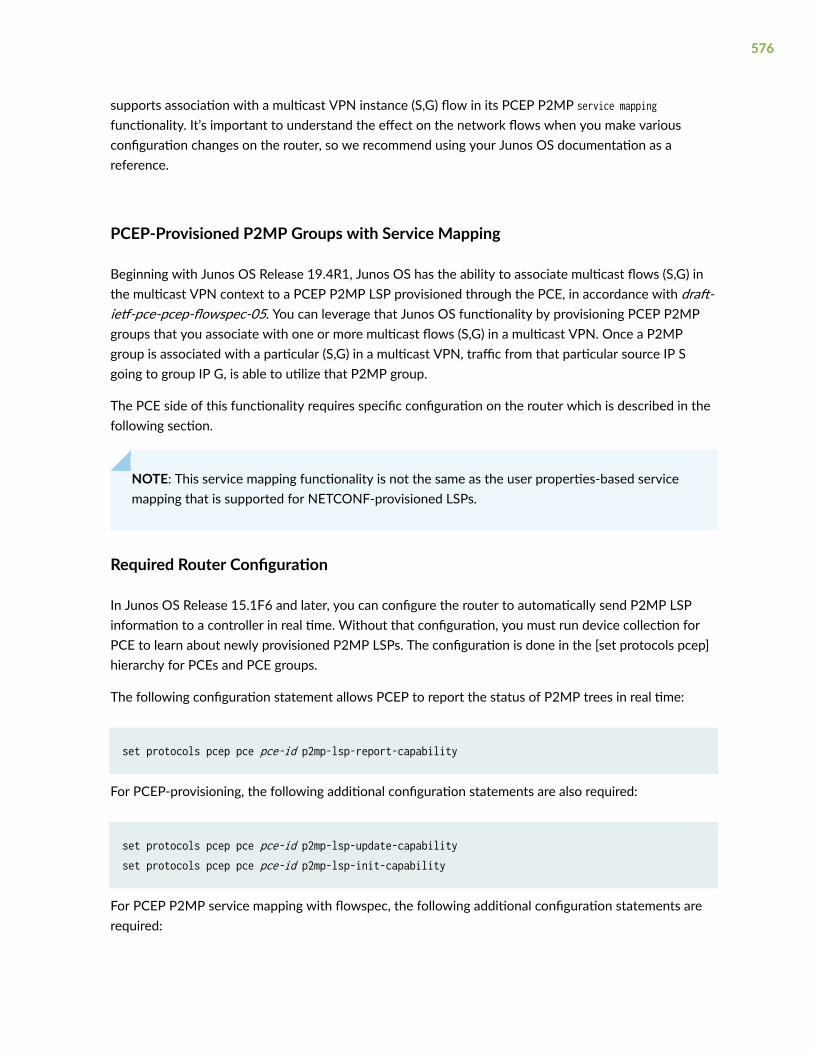
supports association with a multicast VPN instance (S,G) flow in its PCEP P2MP service mappingfunctionality. It’s important to understand the effect on the network flows when you make variousconfiguration changes on the router, so we recommend using your Junos OS documentation as areference.
PCEP-Provisioned P2MP Groups with Service Mapping
Beginning with Junos OS Release 19.4R1, Junos OS has the ability to associate multicast flows (S,G) inthe multicast VPN context to a PCEP P2MP LSP provisioned through the PCE, in accordance with draft-ietf-pce-pcep-flowspec-05. You can leverage that Junos OS functionality by provisioning PCEP P2MPgroups that you associate with one or more multicast flows (S,G) in a multicast VPN. Once a P2MPgroup is associated with a particular (S,G) in a multicast VPN, traffic from that particular source IP Sgoing to group IP G, is able to utilize that P2MP group.
The PCE side of this functionality requires specific configuration on the router which is described in thefollowing section.
NOTE: This service mapping functionality is not the same as the user properties-based servicemapping that is supported for NETCONF-provisioned LSPs.
Required Router Configuration
In Junos OS Release 15.1F6 and later, you can configure the router to automatically send P2MP LSPinformation to a controller in real time. Without that configuration, you must run device collection forPCE to learn about newly provisioned P2MP LSPs. The configuration is done in the [set protocols pcep]hierarchy for PCEs and PCE groups.
The following configuration statement allows PCEP to report the status of P2MP trees in real time:
set protocols pcep pce pce-id p2mp-lsp-report-capability
For PCEP-provisioning, the following additional configuration statements are also required:
set protocols pcep pce pce-id p2mp-lsp-update-capabilityset protocols pcep pce pce-id p2mp-lsp-init-capability
For PCEP P2MP service mapping with flowspec, the following additional configuration statements arerequired:
576
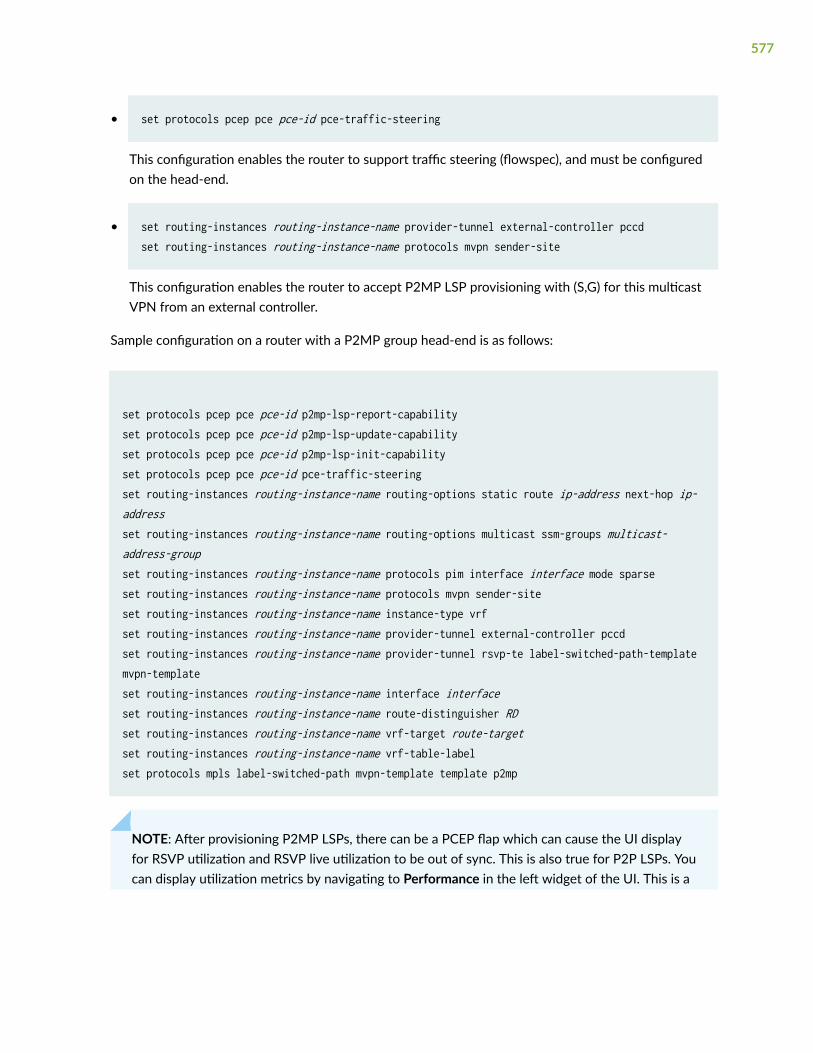
• set protocols pcep pce pce-id pce-traffic-steering
This configuration enables the router to support traffic steering (flowspec), and must be configuredon the head-end.
• set routing-instances routing-instance-name provider-tunnel external-controller pccdset routing-instances routing-instance-name protocols mvpn sender-site
This configuration enables the router to accept P2MP LSP provisioning with (S,G) for this multicastVPN from an external controller.
Sample configuration on a router with a P2MP group head-end is as follows:
set protocols pcep pce pce-id p2mp-lsp-report-capabilityset protocols pcep pce pce-id p2mp-lsp-update-capabilityset protocols pcep pce pce-id p2mp-lsp-init-capabilityset protocols pcep pce pce-id pce-traffic-steeringset routing-instances routing-instance-name routing-options static route ip-address next-hop ip-addressset routing-instances routing-instance-name routing-options multicast ssm-groups multicast-address-groupset routing-instances routing-instance-name protocols pim interface interface mode sparseset routing-instances routing-instance-name protocols mvpn sender-siteset routing-instances routing-instance-name instance-type vrfset routing-instances routing-instance-name provider-tunnel external-controller pccdset routing-instances routing-instance-name provider-tunnel rsvp-te label-switched-path-template mvpn-templateset routing-instances routing-instance-name interface interfaceset routing-instances routing-instance-name route-distinguisher RDset routing-instances routing-instance-name vrf-target route-targetset routing-instances routing-instance-name vrf-table-labelset protocols mpls label-switched-path mvpn-template template p2mp
NOTE: After provisioning P2MP LSPs, there can be a PCEP flap which can cause the UI displayfor RSVP utilization and RSVP live utilization to be out of sync. This is also true for P2P LSPs. Youcan display utilization metrics by navigating to Performance in the left widget of the UI. This is a
577

UI display issue only. The next live update from the network or the next manual sync using SyncNetwork Model (Configuration > Network > Pathfinder) corrects the UI display.
Useful Junos OS show commands
Table 90 on page 578 describes the Junos OS commands to view detailed information about P2MPgroups and their associated sub-LSPs.
Table 90: Junos OS show commands for P2MP Groups
Junos OS Command Description
show mpls lsp p2mp ingress extensive Displays information on each sub-LSP that belongs to theP2MP group.
show path-computation-client lsp Displays information about LSPs, including their status andtype.
show rsvp session p2mp ingress statisticsDisplays whether the selective tunnel is taking precedenceover the original inclusive dynamic provider tunnel as expected.
show mvpn c-multicast instance-name mvpn-instance-name display-tunnel-name
Displays which P2MP group is mapped to which (S,G) within amulticast VPN.
show path-computation-client traffic-steering Displays all P2MP groups with flowspec ID, state, and (S,G)prefix.
Automatic Rerouting Around Points of Failure
For PCEP-provisioned P2MP groups only (including those with flow-mapping information), sub-LSPs aredynamically rerouted around points of failure along the path of the tree. You might not see the OpStatus in the network information table change during the reroute as it happens very quickly. Thetopology map displays a red F on any failed link or node, and you can see how the path is reroutedaround those markers.
578

P2MP Tree Design with Diverse PE to CE Links
Paragon Pathfinder can calculate diverse P2MP tree designs all the way to a customer edge (CE) node orsite. Although the path computation extends to the intended endpoints, CE nodes or sites, the sub-LSPsactually terminate on the provider edge (PE) nodes. This ensures that the selection of tail nodes bestsatisfies the diversity constraints. When the diverse P2MP trees are computed, Paragon Pathfinderconsiders the shared risk groups and affinity constraints in the PE-CE links.
Figure 37 on page 579 shows an example topology with P2MP tree design. Two data sources arelocated at PE nodes (PE1 and PE2). The receiving nodes are located in sites A, B, C, and D with each sitehaving two CE nodes.
Figure 37: P2MP Tree Design with Diverse PE to CE Links Example Topology
Calculating pairs of diverse P2MP LSPs that terminate in the same nodes or sites enables the two datasources to distribute redundant data streams to the CE nodes or sites.
579
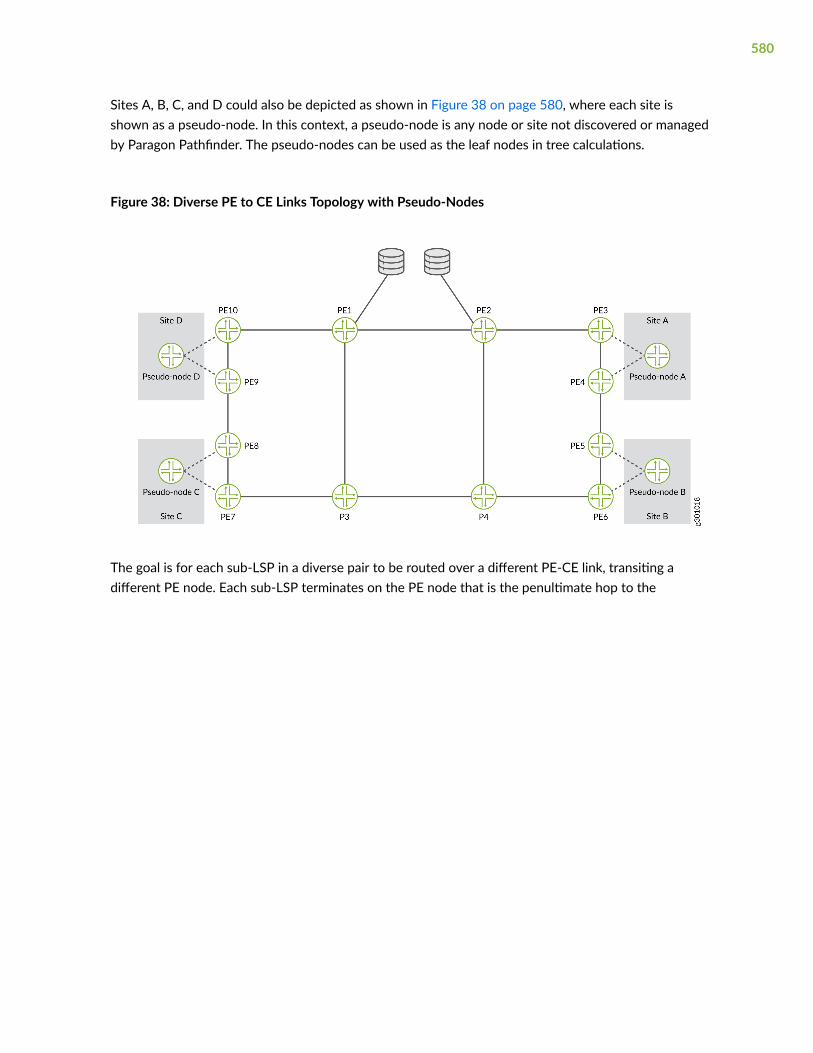
Sites A, B, C, and D could also be depicted as shown in Figure 38 on page 580, where each site isshown as a pseudo-node. In this context, a pseudo-node is any node or site not discovered or managedby Paragon Pathfinder. The pseudo-nodes can be used as the leaf nodes in tree calculations.
Figure 38: Diverse PE to CE Links Topology with Pseudo-Nodes
The goal is for each sub-LSP in a diverse pair to be routed over a different PE-CE link, transiting adifferent PE node. Each sub-LSP terminates on the PE node that is the penultimate hop to the
580

destination. An example is shown in Figure 39 on page 581. The redundant data streams arerepresented by the two colored paths.
Figure 39: Diverse PE to CE Links Topology with Redundant Data Streams
You can request a tree design with diverse PE to CE links through the REST API. When the tree iscreated, the Explicit Route Object (ERO) of the route, which is the list of LSRs specified by IP addressesthrough which the path must pass, is always strict. This is in contrast to a single P2MP group in which aloose path to the address can be specified. The result is that if a link goes down in a diverse P2MP tree,the signaling address remains the same and the operational status of the tunnel remains down. If the linkcomes back up, the tunnel is restored. You can also delete the tunnel or schedule a new one.
The Path Computation Server (PCS) follows a set of rules when routing LSPs to CE nodes or sites:
• The links connecting to the CE nodes or sites might not have protocols enabled since they do notneed to support LSPs. But the PCS must still consider those links for path placement.
• The PCS will never use a pseudo-node marked as an Access node as a transit node. Access nodes areend destination nodes.
• LSPs to CE nodes or sites must be signaled to their penultimate hop, the final PE in the path.
• The ERO pushed to the devices must be trimmed so it does not include the pseudo-node addressesor the PE-CE link identifiers.
581

NOTE: Paragon Pathfinder cannot discover CE nodes and sites, so you must add them and theirassociated links to the topology, using either the UI or the REST API. For more information onadding nodes using the Paragon Automation UI, see "Add a Node" on page 503 and "Add a Link"on page 512.
Figure 40 on page 582 shows a sample topology with some CE nodes that are configured as Regularand others that are configured as Access. For example, nodes CE_A1 and CE_B1 are Regular nodesbecause they need to be used for transit to the alpha and beta sites respectively. CE_D1 and CE_D2 areexamples of Access nodes that represent end points, and are not used for transit purposes. In additionto creating the nodes, you must also add links between the CE nodes/sites and the PE nodes in thetopology. As the nodes are pseudo-nodes, the links connecting them are pseudo-links. As pseudo-links,their status will remain Unknown in the Status column of the Link tab in the network information table.
Figure 40: Sample Topology with Access and Regular Pseudo-Nodes
582
NOTE:
• Hybrid diverse P2MP groups (destination designation includes both PEs and CEs) is notsupported.
• You cannot provision diverse P2MP trees using the Paragon Pathfinder UI. It must be donethrough the REST API.
• Diverse P2MP with flow mapping is not supported. The workaround for this limitation is tocreate a diverse tree using the REST API and then assign mapping to individual P2MP groupsusing either the UI or the REST API.
Tasks You Can Perform
You can perform the following tasks:
• Add a P2MP Group. See "Add a P2MP Group" on page 584.
• Edit a P2MP Group. See "Edit P2MP Group Parameters" on page 591.
• Delete a P2MP Group—On the P2MP Group tab of the network information table on the Topologypage, select the P2MP group you want to delete and click the delete (trash can) icon. A confirmationmessage appears. Click Yes. The P2MP group is deleted from the network information table.
Alternatively, you can use the Tunnel tab of the network information table to delete all the sub-LSPsin the P2MP group, which also deletes the group itself.
NOTE: When you delete a P2MP group, all sub-LSPs that are part of that group are alsodeleted. If you delete a P2MP group with associated multicast flows (S,G) in a multicast VPNcontext, the flows are also deleted.
• View Sub-LSPs— From the More list, you can view Sub-LSPs associated with the P2MP group. Whenyou click the Sub-LSPs option, you are redirected to the Tunnel tab where detailed information aboutthe sub-LSPs is displayed. You can perform several tasks such as add, edit, or delete LSPs from theTunnel tab. For more information, see "About the Tunnel Tab" on page 517.
• Download P2MP Groups information—Click Download to export (download) information about allthe P2MP groups in CSV format.
• View detailed information about the P2MP group by clicking More > Show Detail or click the Detailsicon which appears next to the P2MP group name when you hover over it. A pop-up appears
583

displaying the P2MP tree, flows associated with the group, and link/LSP details that are a part of theselected P2MP group.
RELATED DOCUMENTATION
About the Topology Page | 485
Interactive Map Features Overview | 470
Add a P2MP Group
To add a P2MP Group:
1. Click Network > Topology.
The Topology page is displayed with the topology map at the center and the network informationtable at the bottom of the page.
2. Hover over the More Options (horizontal ellipsis) icon and select P2MP Group.
The P2MP Group tab appears.
3. Click the add (+) icon.
The Add P2MP Group page appears on the right.
4. Configure the P2MP group as per Table 91 on page 584.
NOTE: Fields marked with asterisk (*) are mandatory.
5. Click Add.
A confirmation message appears stating that the Add P2MP request is successfully sent. The newP2MP group is displayed under the P2MP Groups tab.
Table 91: Fields on the Add P2MP Group Page
Field Description
Properties
ProvisioningMethod
Select PCEP or NETCONF. The default is NETCONF.
584

Table 91: Fields on the Add P2MP Group Page (Continued)
Field Description
Provision Type The default is RSVP, which is the only option supported for P2MP groups.
P2MP GroupName
Enter a user-defined name for the P2MP group. Only alphanumeric characters, hyphens,and underscores are allowed. Other special characters and spaces are not allowed.
Node A Click the Node A field and select the name of the ingress (source) node from the list.
Node Z List Click the Node Z field and select one or more egress (destination) nodes from the list.
PlannedBandwidth
Enter the planned bandwidth value. You must enter a number immediately followed by K(Kbps), M (Mbps), or G (Gbps). For example, 10M signifying 10 megabits per second.
NOTE: If you enter a value without units, bps is applied.
Planned Metric Enter the metric value for static tunnel. Use the up and down arrows to increment ordecrement the value. For more information, see Basic LSP Configuration in MPLSApplications User Guide.
Setup Enter the RSVP setup priority for the tunnel traffic. Priority levels range from 0 (highestpriority) through 7 (lowest priority). The default is 7, which is the standard MPLS LSPdefinition in Junos OS.
Hold Enter the RSVP hold priority for the tunnel traffic. Priority levels range from 0 (highestpriority) through 7 (lowest priority). The default is 7, which is the standard MPLS LSPdefinition in Junos OS.
585
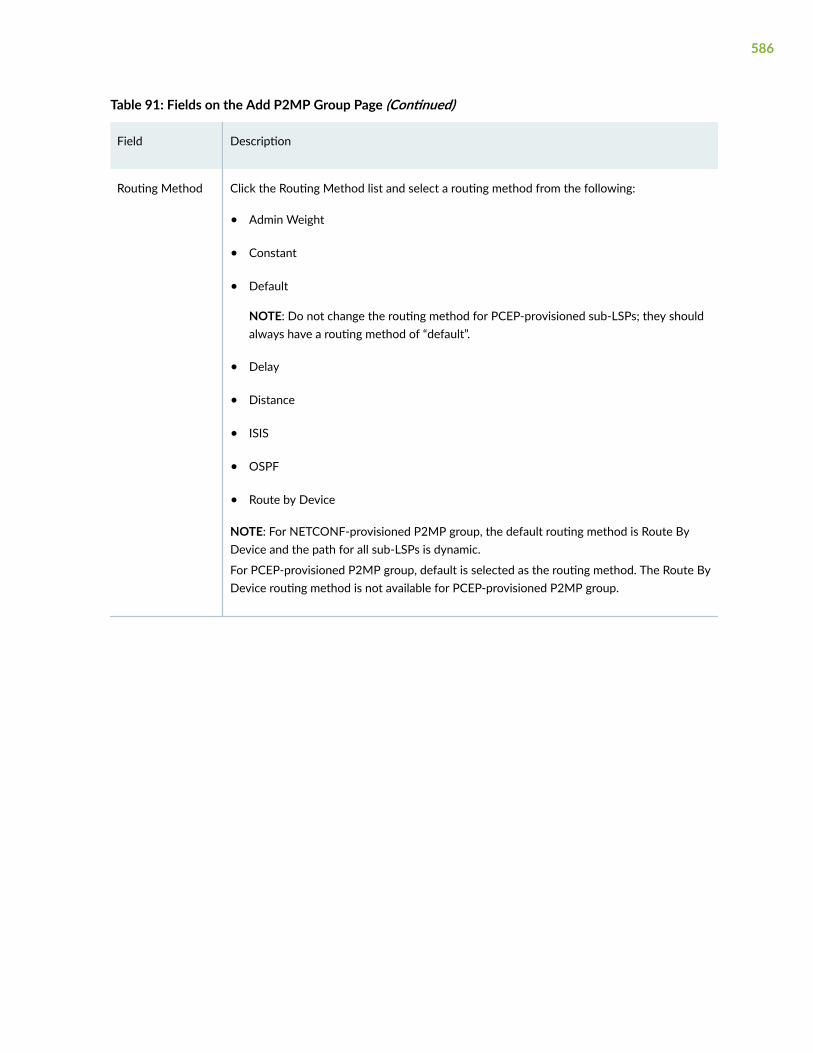
Table 91: Fields on the Add P2MP Group Page (Continued)
Field Description
Routing Method Click the Routing Method list and select a routing method from the following:
• Admin Weight
• Constant
• Default
NOTE: Do not change the routing method for PCEP-provisioned sub-LSPs; they shouldalways have a routing method of “default”.
• Delay
• Distance
• ISIS
• OSPF
• Route by Device
NOTE: For NETCONF-provisioned P2MP group, the default routing method is Route ByDevice and the path for all sub-LSPs is dynamic.
For PCEP-provisioned P2MP group, default is selected as the routing method. The Route ByDevice routing method is not available for PCEP-provisioned P2MP group.
586

Table 91: Fields on the Add P2MP Group Page (Continued)
Field Description
Bandwidth Sizing Toggle the button to enable bandwidth sizing. By default, this option is disabled.
NOTE: You cannot enable Bandwidth Sizing if the provisioning method is NETCONF.
Once enabled, configure the following parameters:
• Adjustment threshold (in percentage): Controls the sensitivity of the automaticbandwidth adjustment. The new planned bandwidth is only considered if it differs fromthe existing bandwidth by the value of this setting or more.
• Minimum and Maximum (planned) Bandwidth:
If the new planned bandwidth is greater than the maximum setting, PathFinder signalsthe LSP with the maximum bandwidth.
If the new planned bandwidth is less than the minimum setting, PathFinder signals theLSP with the minimum bandwidth.
If the new planned bandwidth value is in between the maximum and minimum settings,Pathfinder signals the LSP with the new planned bandwidth.
• Minimum Variation Threshold: Specifies the sensitivity of the automatic bandwidthadjustment when the new planned bandwidth is compared to the current plannedbandwidth. The new planned bandwidth is only considered if the difference is greaterthan or equal to the value of this setting. This can be used to prevent small fluctuationsfrom triggering unnecessary bandwidth changes. If both the adjustment threshold andthe minimum variation threshold are greater than zero, both settings are taken intoconsideration. In that case, the new planned bandwidth is considered if:
• The percentage difference is greater than or equal to the adjustment threshold and
• The actual difference is greater than or equal to the minimum variation.
Constraints
Enables you to configure administrative groups (link coloring) for bypass LSPs. For more information, see "AssignNames to Admin Group Bits" on page 163.
Admin GroupInclude All
Specifies the administrative groups whose links the bypass LSP must traverse. Select one ormore bit-level link coloring options from the list.
587

Table 91: Fields on the Add P2MP Group Page (Continued)
Field Description
Admin GroupInclude Any
Specifies the administrative groups whose links the bypass LSP can traverse. Select one ormore bit-level link coloring options from the list.
Admin GroupExclude
Specifies the administrative groups to exclude for a bypass LSP. Select one or more bit-levellink coloring options from the list.
Advanced
Description Enter a description for the P2MP Group.
Diversity Group Enter the name of a group of tunnels to which this tunnel belongs, and for which diversepaths is required.
Diversity Level Select one of the following values for diversity level:
• Default (no diversity)
• Link
• Shared Risk Link Group (SRLG)
• Site
Site diversity is the strongest—it includes SRLG and link diversity. SRLG diversity includeslink diversity. Link diversity is the weakest.
588

Table 91: Fields on the Add P2MP Group Page (Continued)
Field Description
Custom Attributes Simple name-value pairs which can be used to add any arbitrary customer-specificinformation. For example, to differentiate between properties for different vendor nodes.
To add custom properties associated with the node:
1. Click add (+) icon to add a new row.
2. Click the newly added row to enter the Name and Value.
3. Click the √ icon to save your changes.
NOTE:
• You can add multiple rows (properties).
• To delete an entry (row), select the row and click the delete (trash can) icon.
Service
NOTE: This tab is available only when the provisioning method selected is PCEP. When provisioning method isNETCONF, this tab is unavailable (greyed out).
VPN Identifier Select one of the following:
• MVPN instance: Select the multicast VPN instance as configured on the router.
• Route Distinguisher (RD): Populates automatically when you select the multicast VPNinstance, if the information is available. If the field does not automatically populate, youcan:
• Obtain the RD from the head-end router configuration.
• Run device collection for the head-end router from the Node tab of the networkinformation table. Right-click the head-end router and select More > Run DeviceCollection. Once the collection completes, the RD field should auto-populate.
589
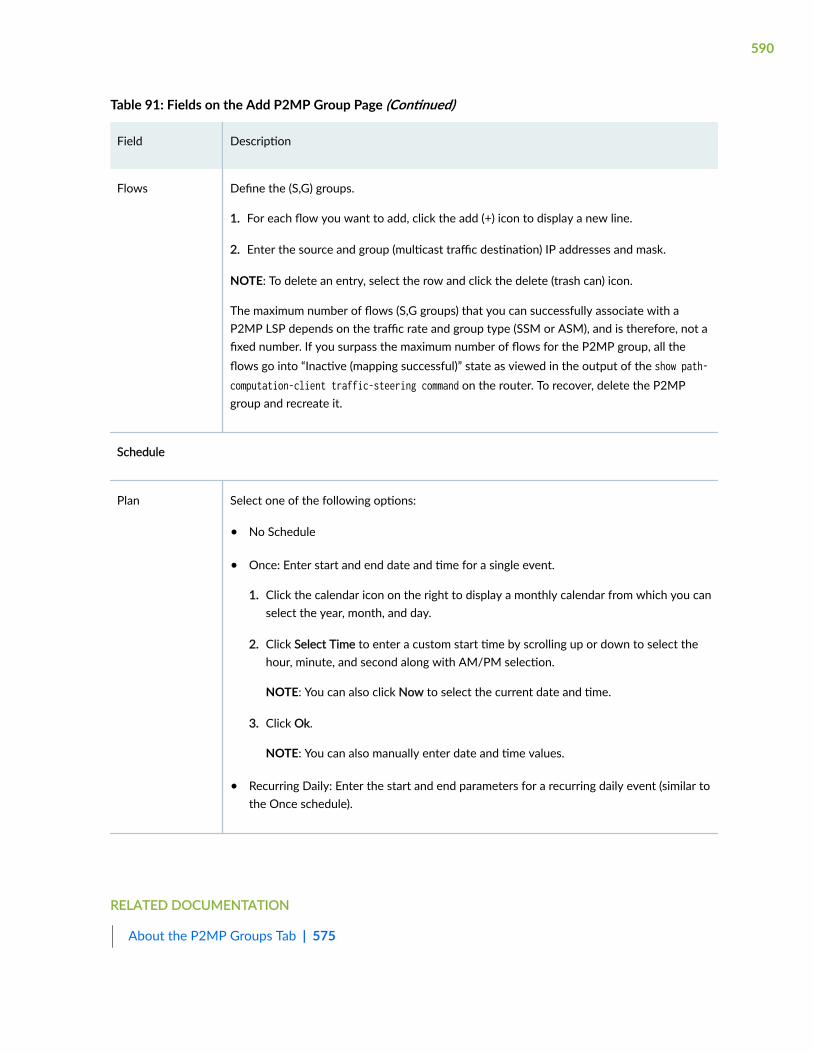
Table 91: Fields on the Add P2MP Group Page (Continued)
Field Description
Flows Define the (S,G) groups.
1. For each flow you want to add, click the add (+) icon to display a new line.
2. Enter the source and group (multicast traffic destination) IP addresses and mask.
NOTE: To delete an entry, select the row and click the delete (trash can) icon.
The maximum number of flows (S,G groups) that you can successfully associate with aP2MP LSP depends on the traffic rate and group type (SSM or ASM), and is therefore, not afixed number. If you surpass the maximum number of flows for the P2MP group, all theflows go into “Inactive (mapping successful)” state as viewed in the output of the show path-computation-client traffic-steering command on the router. To recover, delete the P2MPgroup and recreate it.
Schedule
Plan Select one of the following options:
• No Schedule
• Once: Enter start and end date and time for a single event.
1. Click the calendar icon on the right to display a monthly calendar from which you canselect the year, month, and day.
2. Click Select Time to enter a custom start time by scrolling up or down to select thehour, minute, and second along with AM/PM selection.
NOTE: You can also click Now to select the current date and time.
3. Click Ok.
NOTE: You can also manually enter date and time values.
• Recurring Daily: Enter the start and end parameters for a recurring daily event (similar tothe Once schedule).
RELATED DOCUMENTATION
About the P2MP Groups Tab | 575
590

Edit P2MP Group Parameters
To edit the parameters of a P2MP group:
1. Click Network > Topology.
The Topology page is displayed with the topology map at the center and the network informationtable at the bottom of the page.
2. Hover over the More Options (horizontal ellipsis) icon and select P2MP Group.
The P2MP Group tab appears.
3. Select the P2MP group that you want to edit and click the edit (pencil) icon.
The Edit P2MP Group page appears on the right.
4. Configure the P2MP group parameters as per Fields on the Add P2MP Group Page on page 584.
NOTE:
• You cannot edit the Provisioning Method, Provision Type, P2MP Group Name, and Node Afield values.
• The Service tab is only displayed if you are modifying a PCEP-provisioned P2MP groupwith service mapping.
5. Click Edit.
A confirmation message appears stating that the edit P2MP Group request is successfully sent.
NOTE: If the sub-LSPs tab in the network information table fails to update after modifying P2MPgroup or sub-LSP attributes, you can close the sub-LSPs tab and reopen it to refresh the display.You can also use the refresh button at the bottom of the table that turns orange when promptingyou for a refresh. When you click the refresh button, the Web UI client retrieves the latest P2MPsub-LSP status from the server.
RELATED DOCUMENTATION
About the P2MP Groups Tab | 575
591
About the SRLG/Facility Tab
IN THIS SECTION
Tasks You Can Perform | 592
Shared Link Risk Group (SRLG) information can be received from BGP-LS or Transport controller,whenever a path optimization occurs or whenever some event triggers rerouting. The information fromthese sources is merged and displayed on the UI. You can add, edit, and delete user-defined SRLGs fromthe SRLG/Facility tab of the network information table on the Topology (Network> Topology) page.
Transport SRLG information is considered whenever a path optimization occurs or whenever someevent triggers rerouting. By default, Paragon Automation associates transport SRLGs to IP links based oninformation received from the transport controller. Connecting to more than one transport controllerintroduces the possibility of overlapping SRLG ranges, which might not be acceptable. The configurationof transport controller profiles allows for the specification of an additional TSRLGprefix (a prefix extension)for each transport controller to prevent unintentional overlap. Preventing unintentional SRLG rangeoverlap requires vigilance when you have transport controller ranges and you also manually assignSRLGs to IP links.
Tasks You Can Perform
You can perform the following tasks:
• Add an SRLG/Facility. See "Add an SRLG/Facility" on page 593.
• Edit existing SRLG/Facility parameters. See "Edit SRLG/Facility Parameters" on page 594.
• Delete an existing SRLG/Facility—On the SRLG/Facility tab of the network information table in theTopology page, select the facility that you want to delete and click the delete (trash can) icon. Aconfirmation message appears. Click Yes. The facility is deleted from the network information table.
• View details about the SRLG/Facility by clicking the details icon when you hover over the SRLG/facility name or click More > Show Detail.
RELATED DOCUMENTATION
About the Topology Page | 485
592

Interactive Map Features Overview | 470
Add an SRLG/Facility
To add an SRLG/Facility:
1. Click Network > Topology.
The Topology page is displayed with the topology map at the center and the network informationtable at the bottom of the page.
2. Hover over the More Options (horizontal ellipsis) and select SRLG/Facility.
The SRLG/Facility tab appears.
3. Click the add (+) icon.
The Add Facility page appears.
4. Configure the fields as per Table 92 on page 593.
NOTE: Fields marked with asterisk (*) are mandatory.
5. Click Add.
A confirmation message appears stating that the add facility request has been successfully sent.
Table 92: Fields on the Add Facility Page
Field Description
Name Enter a name for the SRLG/Facility.
Nodes Select the nodes in the left column and click the right arrow to move them to the right(selected) column. Click the left arrow to deselect elements. You can also search for aspecific node from Search here field.
Links Select the links in the left column and click the right arrow to move them to the right(selected) column. Click the left arrow to deselect elements. You can also search for aspecific link from Search here field.
593

RELATED DOCUMENTATION
About the SRLG/Facility Tab | 592
Edit SRLG/Facility Parameters
To edit the parameters of an SRLG/Facility:
1. Click Network > Topology.
The Topology page is displayed with the topology map at the center and the network informationtable at the bottom of the page.
2. Hover over the More Options (horizontal ellipsis) icon and select SRLG/Facility.
The SRLG/Facility tab appears.
3. Select the facility you want to edit and click the edit (pencil) icon.
The Edit Facility page appears.
4. Configure the fields as per Fields on the Add Facility Page on page 593.
5. Click Edit.
A confirmation message appears stating that the edit facility request is successfully sent.
RELATED DOCUMENTATION
About the SRLG/Facility Tab | 592
594
CHAPTER 25
Tunnels
IN THIS CHAPTER
Understand LSP Delegation and Undelegation | 595
Add and Remove LSP Delegation | 596
About the Bandwidth Calendar Page | 599
About the Path Optimization Page | 601
Understand LSP Delegation and Undelegation
IN THIS SECTION
Understand the Behavior of Delegated and Undelegated LSPs | 596
In Paragon Pathfinder, the Path Computation Element (PCE) computes paths in the network and appliescomputational constraints.
You can delegate the management of Path Computation Client-controlled LSPs (PCC-controlled LSPs) tothe PCE either by using the Paragon Automation GUI (from the Configure LSP Delegation page[Network > Tunnels > Configure LSP Delegation]) or the Junos OS CLI. After delegation, such LSPs aremanaged by the PCE and are classified as PCC-delegated LSPs.
When LSPs are managed by the PCE, you can reprovision LSPs (directly from the GUI) for whichprovisioning has failed or for which the path isn’t the expected path. In addition, you can also enableoptimization to re-establish an optimal set of paths for the network. Pathfinder does not supportreprovisioning and optimization for PCC-controlled LSPs.
You can also delegate the LSPs back to the PCC (also known as undelegating the LSPs from the PCE),after which the LSPs are managed by the PCC and are re-classified as PCC-controlled LSPs. This is usefulif Pathfinder is down or if the LSPs are not working as expected.
595

For the procedure to delegate and undelegate LSPs from the Paragon Automation GUI, see "Add andRemove LSP Delegation" on page 596.
Understand the Behavior of Delegated and Undelegated LSPs
In both standalone (where the Paragon Automation components run on a single primary node) and highavailability (HA) cluster configurations (where the Paragon Automation components run on multipleprimary nodes), whenever a Path Computation Element Protocol (PCEP) session on a PCC goes down, allthe LSPs that originated from that PCC are removed from the Pathfinder database, except those LSPswith parameters configured from the GUI.
For PCC-controlled LSPs, all the configuration changes made to the LSP attributes from the router (thatis, the PCC) are stored only in the router’s configuration file. When you delegate such LSPs to the PCEand change the LSP attributes from the GUI, the changes are stored only in the Pathfinder database. ThePCE communicates the changes to the PCC by using PCEP.
You can still make changes to the LSP attributes from the router and these changes are stored in therouter’s configuration file, but the changes do not take effect as long as the LSPs remain delegated tothe PCE.
The configuration changes made from the PCC take effect automatically only after the LSPs areundelegated from the PCE, which means that the control of the LSPs is returned to the PCC. Afterundelegation, the PCE obtains the LSP state from the PCEP report messages. If you change the LSPattributes from the router and the PCE isn’t available at this time, the PCE obtains the latest LSP stateafter it becomes available. Therefore, if you delegate such LSPs to the PCE, the LSPs carry the lateststate.
RELATED DOCUMENTATION
Understand How Pathfinder Handles LSPs | 524
Add and Remove LSP Delegation
IN THIS SECTION
Add LSP Delegation | 597
Remove LSP Delegation | 598
596
You can use the Configure LSP Delegation page (Network > Tunnels > Configure LSP Delegation) todelegate the management of Path Computation Client-controlled label-switched paths (PCC-controlledLSPs) to the Path Computation Element (PCE). After delegation, these LSPs are managed by the PCE andare classified as PCC-delegated LSPs. You can also return the control of these LSPs to the PCC byremoving the delegation, and these LSPs are then re-classified as PCC-controlled LSPs.
Add LSP Delegation
To delegate one or more LSPs to the PCE:
NOTE: For LSPs that were manually created by using the CLI of IOS-XR devices, you must rundevice collection before doing any LSP delegation. See "Add a Device Collection Task" on page745.
1. From the Add Delegation tab, select the LSPs that you want to delegate to the PCE.
To select all the available LSPs for delegation, click the check-box beside the Name column.
2. Click Delegate LSP.
A confirmation message appears on the top of the page indicating that the LSP delegation wasrequested.
The lsp-external-controller pccd statement is added to the router configuration and the LSPs aredelegated to the PCE.
The Control Type column in the Tunnel tab (Topology > Tunnel) of the network information tabledisplays Delegated for the selected LSPs.
NOTE:
• If there is a failure along the path, the PCE reroutes the delegated LSPs (RSVP LSPs and SRLSPs with a single primary path) around the failed network element.
• When the PCE doesn’t find a path for the delegated SR LSP, the PCE sends a PCEPmessage to the PCC with an empty explicit route object (ERO). The PCC then sets theLSP's operational status as Down and sends a PCEP message to the PCE indicating thatthe LSP's operational status is Down. Later, when the PCE computes a path for the LSP,the PCE sends a PCEP message to the PCC, with the ERO. The PCC then provisions theERO and sends a PCEP message to the PCE indicating that the LSP's operational status isnow Up.
597
For delegated RSVP LSPs, if the PCE sends a PCEP message to the PCC with an emptyERO (when the following statement is configured on the PCC), the PCC tears down theexisting path and the operational status of the RSVP LSP changes to Down.
set protocols pcep pce pce1 pcupdate-empty-ero-action tear-down-path
The empty ERO feature for delegated SR LSPs and delegated RSVP LSPs is supported onlyfor Juniper Networks PCC devices and this feature has not been tested with other PCCdevices. For delegated SR LSPs, this feature is supported only on Juniper Networks PCCdevices running Junos OS Release 20.4R1 or later.
Remove LSP Delegation
NOTE: Undelegating LSPs from the PCE is not the same as the temporary removal you achievewhen you right-click a tunnel in the Tunnel tab of the network information table and selectReturn Delegation to PCC. In that case, control is temporarily returned to the PCC for a period oftime based on the router’s timer statement.
To undelegate one or more LSPs from the PCE:
1. From the Remove Delegation tab, select the LSPs that you want to undelegate.
To select all the available LSPs for undelegation, click the check-box beside the Name column.
2. Click Undelegate LSP.
A confirmation message appears on the top of the page indicating that the LSP delegation changewas requested.
The delegation statement is removed from the router configuration and the control of these LSPs isreturned to the PCC.
The Control Type column in the Tunnel tab (Topology > Tunnel) of the network information tabledisplays Device Controlled for the selected LSPs.
RELATED DOCUMENTATION
About the Tunnel Tab | 517
598

About the Bandwidth Calendar Page
IN THIS SECTION
Tasks you Can Perform | 599
Field Descriptions | 600
To access this page, select Network > Bandwidth Calendar.
Use the Bandwidth Calendar page to view a calendar that displays the LSPs scheduled for provisioning.You can also view the LSP details, provisioning schedule, and bandwidth allocated for the LSPs.
Tasks you Can Perform
• View the details of scheduled LSPs—On the calendar that is displayed on the left side of the page,the following views are supported:
• Month view (default)—The Month view displays the number of LSPs scheduled to be provisionedon a particular day of the month on the top of that day in the calendar.
• Year view—The Year view displays the number of LSPs scheduled to be provisioned in a particularmonth of the year on the top of that month in the calendar.
Click the day (in Month view) or month (in Year view) to view the details of these LSPs in theScheduled LSPs table on the right side of the page.
You can also click Show All on the top-right corner of the table to view all the scheduled LSPs.
NOTE: The Scheduled LSPs table is empty until one or more LSPs are scheduled forprovisioning.
• Show or hide columns displayed in the Scheduled LSPs table—Click the Vertical Ellipsis icon at thetop right corner of the page and select the columns that you want displayed in the Scheduled LSPstable.
Only the columns that you selected are displayed.
• Update the list of scheduled LSPs—Click the Refresh icon (circular arrow) at the bottom of theScheduled LSPs table to refresh (update) the list of scheduled LSPs.
599
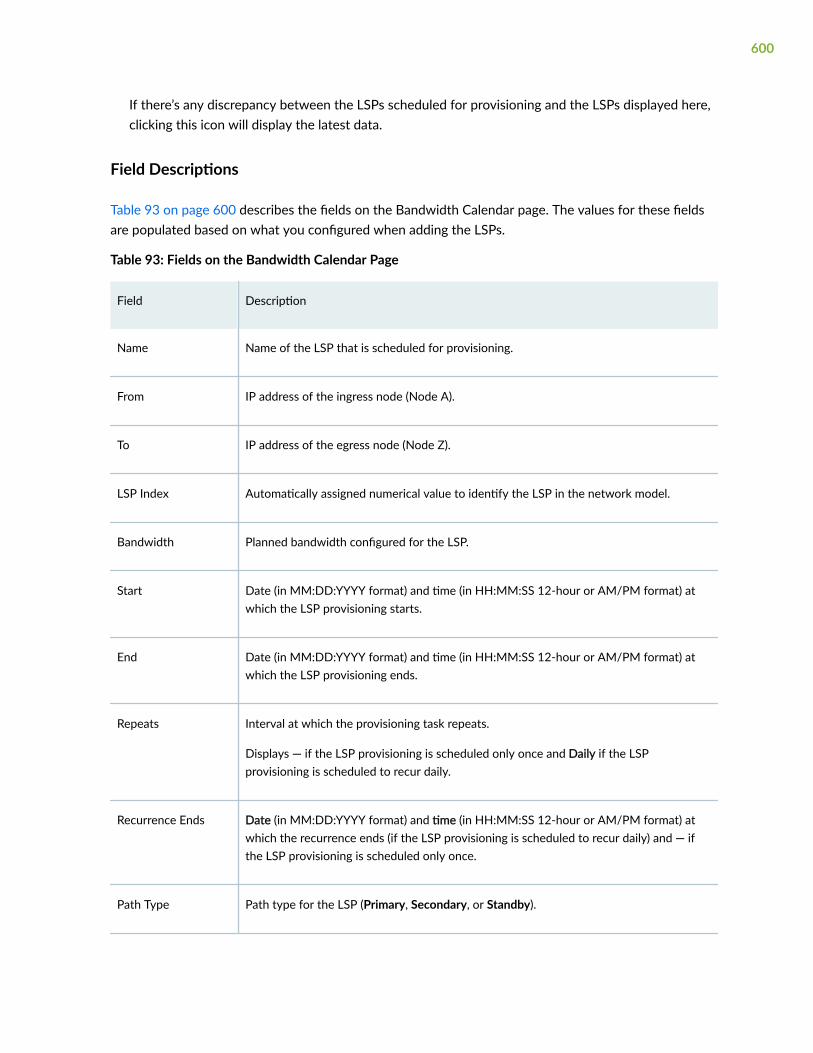
If there’s any discrepancy between the LSPs scheduled for provisioning and the LSPs displayed here,clicking this icon will display the latest data.
Field Descriptions
Table 93 on page 600 describes the fields on the Bandwidth Calendar page. The values for these fieldsare populated based on what you configured when adding the LSPs.
Table 93: Fields on the Bandwidth Calendar Page
Field Description
Name Name of the LSP that is scheduled for provisioning.
From IP address of the ingress node (Node A).
To IP address of the egress node (Node Z).
LSP Index Automatically assigned numerical value to identify the LSP in the network model.
Bandwidth Planned bandwidth configured for the LSP.
Start Date (in MM:DD:YYYY format) and time (in HH:MM:SS 12-hour or AM/PM format) atwhich the LSP provisioning starts.
End Date (in MM:DD:YYYY format) and time (in HH:MM:SS 12-hour or AM/PM format) atwhich the LSP provisioning ends.
Repeats Interval at which the provisioning task repeats.
Displays — if the LSP provisioning is scheduled only once and Daily if the LSPprovisioning is scheduled to recur daily.
Recurrence Ends Date (in MM:DD:YYYY format) and time (in HH:MM:SS 12-hour or AM/PM format) atwhich the recurrence ends (if the LSP provisioning is scheduled to recur daily) and — ifthe LSP provisioning is scheduled only once.
Path Type Path type for the LSP (Primary, Secondary, or Standby).
600

Table 93: Fields on the Bandwidth Calendar Page (Continued)
Field Description
Control Type Delegated (for PCC-delegated LSPs), PCC (for PCC-controlled LSPs), PCE-initiated (forPCE-initiated LSPs), and Transport (for transport LSPs).
Provisioning Type Provisioning type for the LSP (RSVP or SR (which indicates segment routing)).
Operational Status Operational status (Up, Down, or Active) of the LSP.
Last Status Last status message received from the PCS when processing the LSP.
RELATED DOCUMENTATION
Add a Single LSP | 528
Add Diverse LSPs | 540
Add Multiple LSPs | 550
About the Path Optimization Page
IN THIS SECTION
Tasks You Can Perform | 602
To access this page, select Network > Path Optimization.
You can use the Path Optimization page to run path analysis and generate a report to help youdetermine whether optimization should be done. Based on the analysis, you can choose to optimizepaths on demand from this page or set a timer to trigger the optimization automatically at regularintervals from the Pathfinder page (Configuration > Network > Pathfinder).
601
NOTE: Path analysis and optimization are applicable only to Path Computation Element-initiatedLSPs (PCE-initiated LSPs) and Path Computation Client-delegated LSPs (PCC-delegated LSPs)because the PCE doesn’t attempt to optimize PCC-controlled LSPs.
Tasks You Can Perform
• Analyze the network—You can analyze the network for optimization opportunities. The Path Analysisreport is generated automatically after path analysis and you can use this report to determinewhether optimization should be done.
To trigger path analysis, click Analyze in the top-right corner of the Path Analysis table.
All the PCE-initiated and PCC-delegated LSPs in the network are analyzed automatically foroptimization opportunities, and the Path Analysis report is generated.
This report lists the LSPs that are currently not in an optimized path, suggests what the optimizedpaths should be, and provides data about what could be gained (in terms of the number of hops,admin weight, and so on) if the LSPs were to be optimized.
• Optimize paths in the network—Optimization enables the Path Computation Element (PCE) to re-establish an optimal set of paths for a network by finding the optimal placement of LSPs using thecurrent set of nodes and links in the network.
To trigger path optimization, click Optimize in the top-right corner of the Path Analysis table.
An alert message appears asking you to confirm the operation.
If you click Yes, the PCE sends a provisioning order to the network to optimize all PCE-initiated andPCC-delegated LSPs. In case of provisioning delays or recent changes in the network, low priorityLSPs or low bandwidth LSPs may be temporarily unrouted. The PCE will attempt to reprovision theseunrouted LSPs until it finds a path.
After optimization is complete, the following reports are generated:
• Path Optimization—Lists the optimized LSPs and their details (such as the path name andoptimized path).
• LSP Path Changes—Lists changes (in terms of delay, number of hops, path cost, and so on) to theLSPs as a result of optimization.
• RSVP Link Changes—Lists changes in link RSVP bandwidth reservation (in terms of bandwidth,utilization, and so on) for the LSPs as a result of optimization.
602
NOTE: The optimization is based on the current network conditions, not on the conditions ineffect the last time the analysis was done.
• View the most recent reports—You can view the most-recently generated Path Analysis, PathOptimization, LSP Path Changes, and RSVP Link Changes reports.
To view these reports, click Reports in the top-right corner of the Path Analysis table and select thetype of report that you want to view.
The selected report is displayed on the Path Optimization page.
• Show or hide columns that contain information about the reports—Click the vertical ellipsis icon onthe top-right corner of a report and select the check boxes corresponding to the columns that youwant to view in the report. Only the selected columns are displayed in the report.
RELATED DOCUMENTATION
About the Tunnel Tab | 517
603
8PART
Monitoring
Monitor Network Health | 605
Manage Alarms and Alerts | 618
Monitor Jobs | 625
Monitor Reports | 628
Analytics | 667
| 691
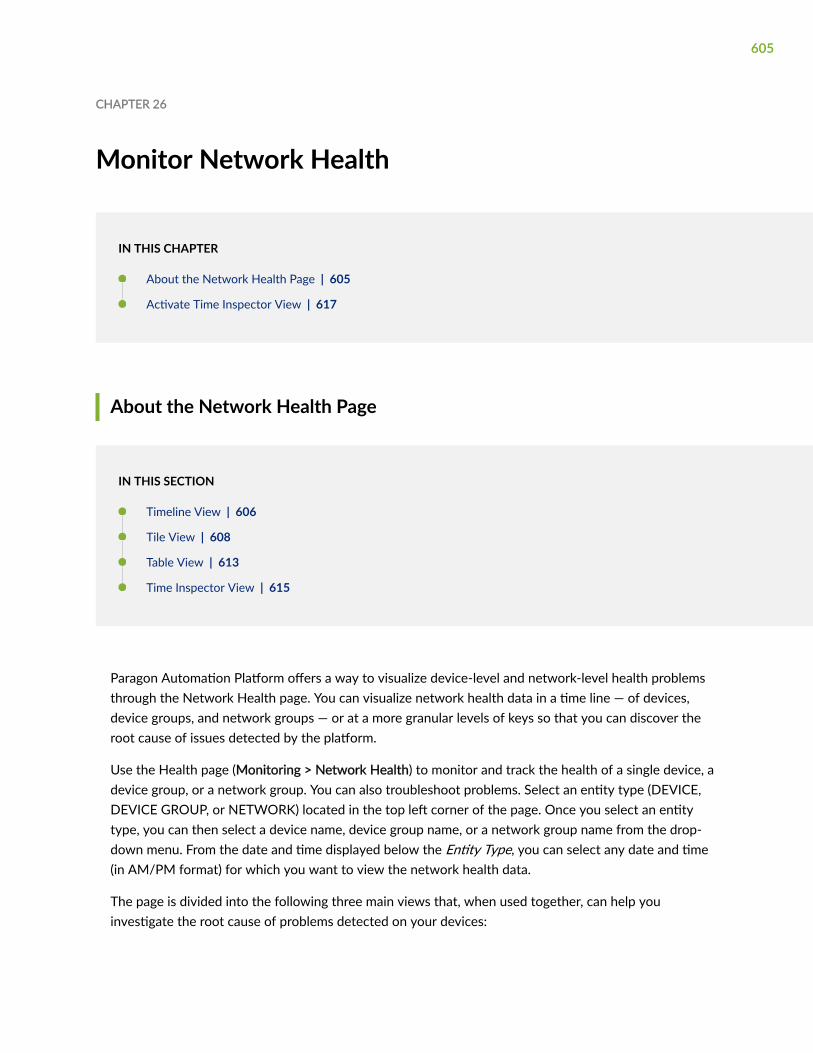
CHAPTER 26
Monitor Network Health
IN THIS CHAPTER
About the Network Health Page | 605
Activate Time Inspector View | 617
About the Network Health Page
IN THIS SECTION
Timeline View | 606
Tile View | 608
Table View | 613
Time Inspector View | 615
Paragon Automation Platform offers a way to visualize device-level and network-level health problemsthrough the Network Health page. You can visualize network health data in a time line — of devices,device groups, and network groups — or at a more granular levels of keys so that you can discover theroot cause of issues detected by the platform.
Use the Health page (Monitoring > Network Health) to monitor and track the health of a single device, adevice group, or a network group. You can also troubleshoot problems. Select an entity type (DEVICE,DEVICE GROUP, or NETWORK) located in the top left corner of the page. Once you select an entitytype, you can then select a device name, device group name, or a network group name from the drop-down menu. From the date and time displayed below the Entity Type, you can select any date and time(in AM/PM format) for which you want to view the network health data.
The page is divided into the following three main views that, when used together, can help youinvestigate the root cause of problems detected on your devices:
605

• "Timeline View" on page 606
• "Tile View" on page 608
• "Table View" on page 613
You can navigate to the "Time Inspector View" on page 615 from the Table View, if you chose devicegroup as the entity type and selected multiple devices.
Timeline View
In timeline view, you can monitor real-time and past occurrences of KPI events flagged with a minor ormajor severity level health status. The general characteristics and behaviors of the time line include (seeFigure 41 on page 607):
• Clicking on the right caret next to the Timeline View heading expands or collapses the time line.
• Each dot or line in the time line represents the health status of a unique KPI event (also known as aParagon Insights rule trigger) for a pre-defined KPI key with which Paragon Insights has detected aminor or major severity level issue. The name of each event is displayed (per device) directly to theleft of its associated health status dot or line.
• The health status dot or line for each unique KPI event in the time line can consist of severaldifferent KPI keys. Use tile view and table view to see the health status information for the KPI keys.
• Only minor or major severity level KPI events are displayed in the time line. Yellow represents aminor event and red represents a major one.
• A KPI event that occurs once (at only one point in time) and does not recur continuously over time isrepresented as a dot.
• A KPI event that occurs continuously over time is represented as a horizontal line.
• Time line data is by default displayed for a two-hour customizable time range. However, you canenlarge the time line graph (shorten the time range covered) by clicking on the Zoom in button andshrink the time line graph (extend the time interval covered) using the Zoom out button at the topright corner of the graph.
• The red vertical line on the time line represents the current time.
• The blue vertical line on the time line represents the user-defined point of time for which to displaydata. If you double click on any other time point in the time line graph, the blue line shifts to thelocation where you clicked and the graph displays two hours before and after the current position ofthe blue vertical line.
606
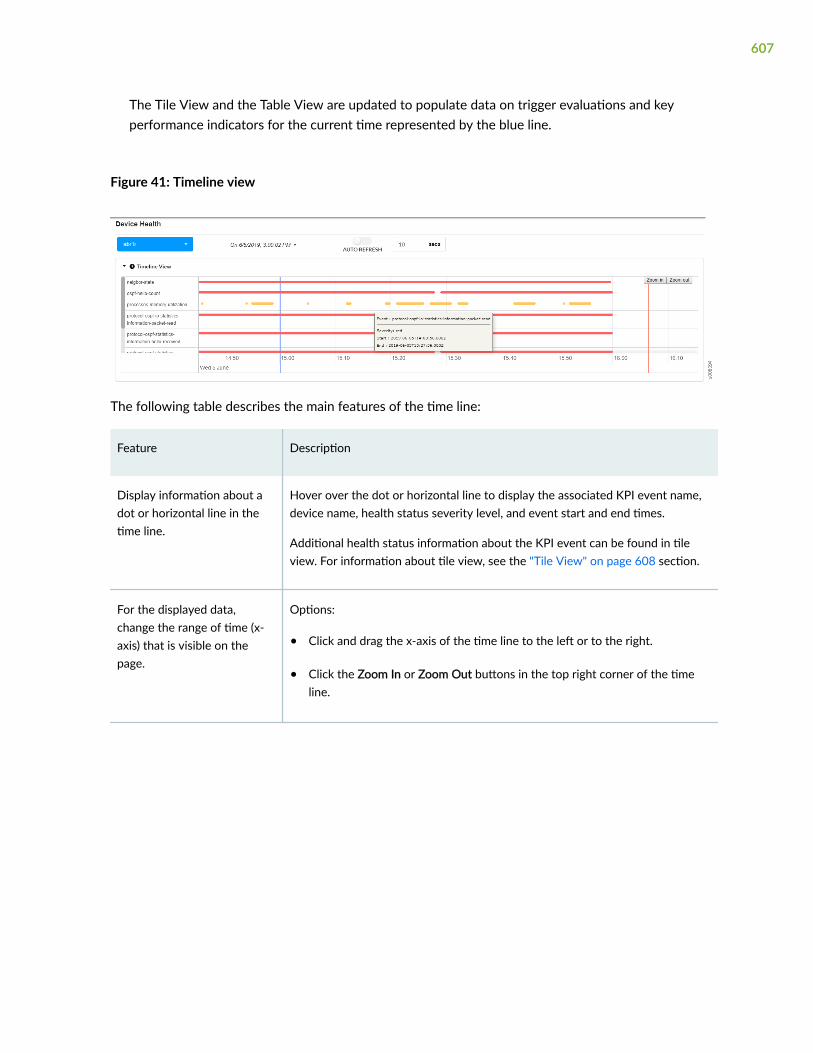
The Tile View and the Table View are updated to populate data on trigger evaluations and keyperformance indicators for the current time represented by the blue line.
Figure 41: Timeline view
The following table describes the main features of the time line:
Feature Description
Display information about adot or horizontal line in thetime line.
Hover over the dot or horizontal line to display the associated KPI event name,device name, health status severity level, and event start and end times.
Additional health status information about the KPI event can be found in tileview. For information about tile view, see the "Tile View" on page 608 section.
For the displayed data,change the range of time (x-axis) that is visible on thepage.
Options:
• Click and drag the x-axis of the time line to the left or to the right.
• Click the Zoom In or Zoom Out buttons in the top right corner of the timeline.
607

(Continued)
Feature Description
Choose a different two-hourtime range of data to display.
Use the blue vertical line to customize the time range of data to display. Optionsfor enabling the blue vertical line:
• Click inside the time line grid at the particular point in time you want todisplay data.
• In the date/time drop-down menu (located above the time line), select theparticular point in time you want to display data.
Data is generally displayed for 1 hour before and 1 hour after the blue line.Hover over the blue line to display the exact point in time that it represents.Drag the blue line left or right to adjust the time.
NOTE: Auto-refresh is disabled whenever you enable the blue line. Re-enablingauto-refresh disables the blue line and resets the time line to display the mostrecent two-hour time range of data.
Freeze the time line (disableauto-refresh).
Toggle the auto-refresh switch to the left.
Unfreeze the time line (enableauto-refresh).
Toggle the auto-refresh switch to the right.
Tile View
The tile view uses colored tiles to allow you to monitor and troubleshoot the health of a device. The tilesare organized first by topic and by unique KPI key (see Figure 43 on page 611) for the device or for thedevices you selected in a device group or network group. By default, the tile view data corresponds tothe most recent data collected. To customize the point in time for which data is displayed in tile view,select a particular point in time from the date/time drop-down menu (located above the time line) or
608

enable the blue vertical line in timeline view. For information about how to enable the blue vertical line,see the "Timeline View" on page 606 section.
609
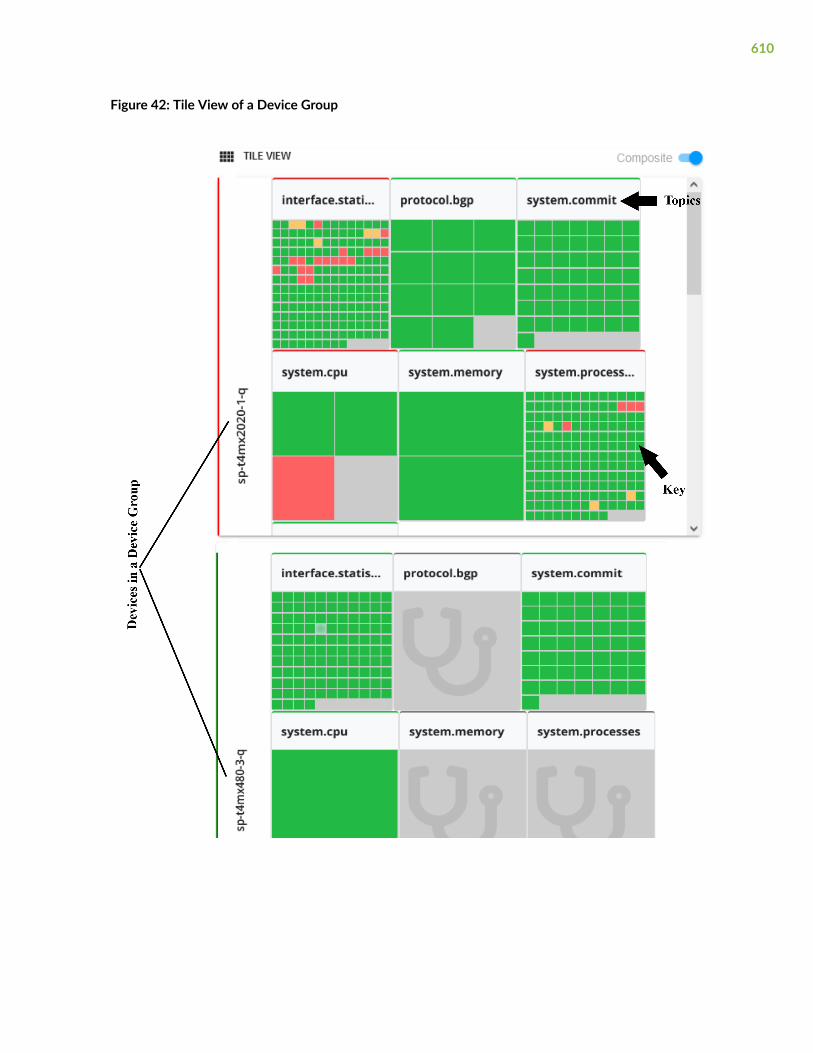
Figure 42: Tile View of a Device Group
610

Figure 43: Tile View of a Device
611

The following table describes the meaning of the severity level colors displayed by the status tiles:
Color Definition
Green The overall health of the KPI key is normal. No problems have been detected.
Yellow There might be a problem with the health of a KPI key. A minor problem has beendetected. Further investigation is required.
Red The health of a KPI key is severe. A major problem has been detected.
Gray No data is available.
The following table describes the main features of the tile view:
Feature Description
Display information abouta status tile.
Options:
• Hover over a status tile to display the name of the key, KPIs associated with thekey, and the status messages associated with the KPIs.
• Click on a status tile. Information about the status tile is displayed in table view.For information about table view, see the "Table View" on page 613 section.
Note: If the number of KPI keys exceeds 220, the keys are automatically aggregatedand grouped.
Display information intable view about thestatus tiles associatedwith a single topic.
Click on a topic name in tile view. For information about table view, see the "TableView" on page 613 section.
Composite Toggle When active, users can click on specific keys within the tile groups. This allows youto pass multiple KPIs to the Time Inspector View.
612
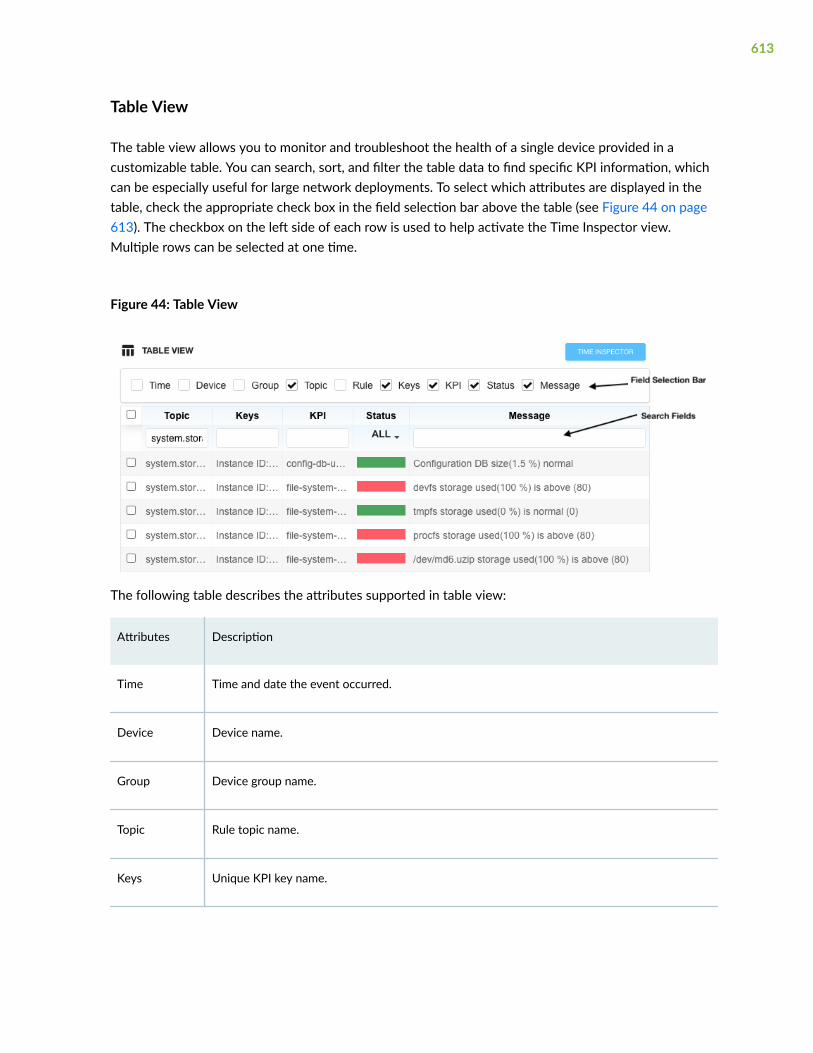
Table View
The table view allows you to monitor and troubleshoot the health of a single device provided in acustomizable table. You can search, sort, and filter the table data to find specific KPI information, whichcan be especially useful for large network deployments. To select which attributes are displayed in thetable, check the appropriate check box in the field selection bar above the table (see Figure 44 on page613). The checkbox on the left side of each row is used to help activate the Time Inspector view.Multiple rows can be selected at one time.
Figure 44: Table View
The following table describes the attributes supported in table view:
Attributes Description
Time Time and date the event occurred.
Device Device name.
Group Device group name.
Topic Rule topic name.
Keys Unique KPI key name.
613
(Continued)
Attributes Description
KPI Key Performance Indicator (KPI) name associated with an event.
Status Health status color. Each color represents a different severity level.
Message Health status message.
The following table describes the meaning of the severity level colors displayed by the Status column:
Color Definition
Green The overall health of the KPI key is normal. No problems have been detected.
Yellow There might be a problem with the health of a KPI key. A minor problem has beendetected. Further investigation is required.
Red The health of a KPI key is severe. A major problem has been detected.
The following table describes the main features of the table view:
Feature Description
Sort the data by ascending ordescending order based on a specificdata type.
Click on the name of the data type at the top of the column by whichyou want to sort.
Filter the data in the table based on akeyword.
Enter the keyword in the text box under the name of a data type at thetop of the table (see Figure 44 on page 613).
614

(Continued)
Feature Description
Navigate to a different page of thetable.
Options:
• At the bottom of the table, click the Previous or Next buttons.
• At the bottom of the table, select the page number using the up/down arrows (or by manually entering the number) and then pressEnter.
If the data in a cell is truncated, viewall of the data in a cell.
Options:
• Hover over the cell.
• Resize the column width of the cell by dragging the right side of thetitle cell of the column to the right.
Row selection checkbox Make this row’s data available for Time Inspector view.
Time Inspector View
Time Inspector is a composite view that is available only when the entity type DEVICE GROUP isselected. It can be accessed by clicking the TIME INSPECTOR button located below the Timeline Viewpull-down menu.
This view allows you to drill down into field-level data for specific triggers over a time line.
When the Health page is first accessed, the TIME INSPECTOR button is disabled. For more informationon activating the TIME INSPECTOR button, see "Activate Time Inspector View" on page 617.
The Composite toggle switch at the upper right of the TILE VIEW is used along with Time InspectorView. The Composite toggle switch allows you to select data from more than one topic to be shown inthe Table View and, thus, the Time Inspector View. This can be useful when topics must be combined tofind root cause for an issue. For example, system memory usage could combine with output queueusage to create a performance issue in an overloaded system. In certain cases, such as for keys thatrepresent interface statistics on bandwidth utilization, a single tile could represent more than one key.
615

Figure 45 on page 616 below shows a time inspector window created from the system.storage usagetopic for a specific device.
Figure 45: Time Inspector Window
As you can see, the Time Inspector window has a mini time line at the top, a topic-based line chartbelow, and a chart selector section at the bottom. This particular chart was created as a composite(indicated by the merging blue arrow) of a file-system-utilization in the check-storage rule of thesystem.storage topic.
Note that there are 3 fields in the check-storage rule: used-percentage, low-threshold, and high-threshold. Since the chart was created as a composite (fields charted together) there are three lines onthe displayed chart. If the “chart fields separately” button (diverging arrows) were clicked instead, youwould see 3 single-line charts showing the same data.
616

The more rules you select with the TABLE VIEW check boxes, the more charts you can create in theTime Inspector view.
RELATED DOCUMENTATION
Activate Time Inspector View | 617
Activate Time Inspector View
To activate the button and make the view available, you must:
1. Select the Entity Type DEVICE GROUP in the top section of the Health page.
2. Select at least one device from the Devices pull-down menu.
3. Have valid data in at least one device component topic in TILE VIEW.
NOTE: Topics showing “no data” will not work for enabling the Time Inspector view.
4. Have data appearing in the TABLE VIEW section. You can achieve this by clicking the devicecomponent topic header in TILE VIEW.
5. Select the checkbox to the left of at least one of the rows in TABLE VIEW.
When clicked, the TIME INSPECTOR button opens a pop-up window above the Health page.
RELATED DOCUMENTATION
About the Network Health Page | 605
617
CHAPTER 27
Manage Alarms and Alerts
IN THIS CHAPTER
Alerts and Alarms Overview | 618
About the Alarms Page | 619
About the Alerts Page | 622
Alerts and Alarms Overview
An alarm indicates conditions on a device that might prevent the device from operating normally. Alarmconditions for a device are predefined and are raised based on the fault monitoring and performancemonitoring (FMPM) being performed on the device. For example, conditions such as hardware issues,drop in throughput and latency of data, temperature variations, and capacity optimization issuesautomatically trigger an alarm. You can view the alarms raised on the devices on the Alarms page.
You can view alarms raised on both Juniper Networks and Cisco IOS-XR devices. On Juniper Networksdevices, you can view alarms for the following conditions:
• Interface down
• Chassis alarms
• High output utilization
• High input utilization
• High CPU utilization
• High memory utilization
• High storage utilization
• Fan failure
• High temperature
618
For Cisco IOS XR devices running IOS XR Release 7.1.5 and later, you can view alarms defined in theOpenConfig alarm model.
The lifecycle of an alarm includes the following steps:
• Raise—An alarm is raised when conditions defined in the telemetry manager are met. ParagonAutomation stores the alarms and you can view them on the Alarms page.
• Update—A user views and acknowledges the alarm, and takes the steps required to remediate theconditions in the device that raised the alarm.
• Clear—The alarm is cleared after the conditions that raised the alarm are normalized.
Besides viewing the alarms details on the Alarms page, you can view alarm statistics on the ParagonAutomation dashboard. Paragon Automation dashboard displays the severity of the different alarmtypes and the alarms history for the previous one hour, one day, one week, one month, and one year.
About the Alarms Page
In Paragon Automation Platform, alarms on device groups are generated automatically by the TelemetryManager as part of device discovery.
You can use the Alarm Manager feature to filter, track, and manage alarm notifications received fromdevices. Alarms alert you to conditions that might prevent the device from operating normally. Systemalarm conditions are preset. To access the Alarms page, go to Monitoring > Alarms and Alerts > Alarms.
In the Alarms page, you can perform the following tasks:
• Assign an alarm — You can assign an alarm to a user. Select an alarm and click the Assigned button.The Assign window appears. In the drop-down menu, select a user to whom you want to assign thealarm notifications. Click OK.
• Acknowledge the status of an alarm — When a user wants to mark an issue raised by an alarm asseen, you can update the Acknowledged status of the issue. Acknowledging an alarm does not clearthe alarm from the page. Select an alarm and click the Acknowledge button. The Acknowledgewindow appears. You can optionally enter an acknowledgment message and click OK.
• Filter alarms.
To filter alarms:
1. Click the filter (funnel icon) button.
2. In the drop-down menu, click Add Filter.
619
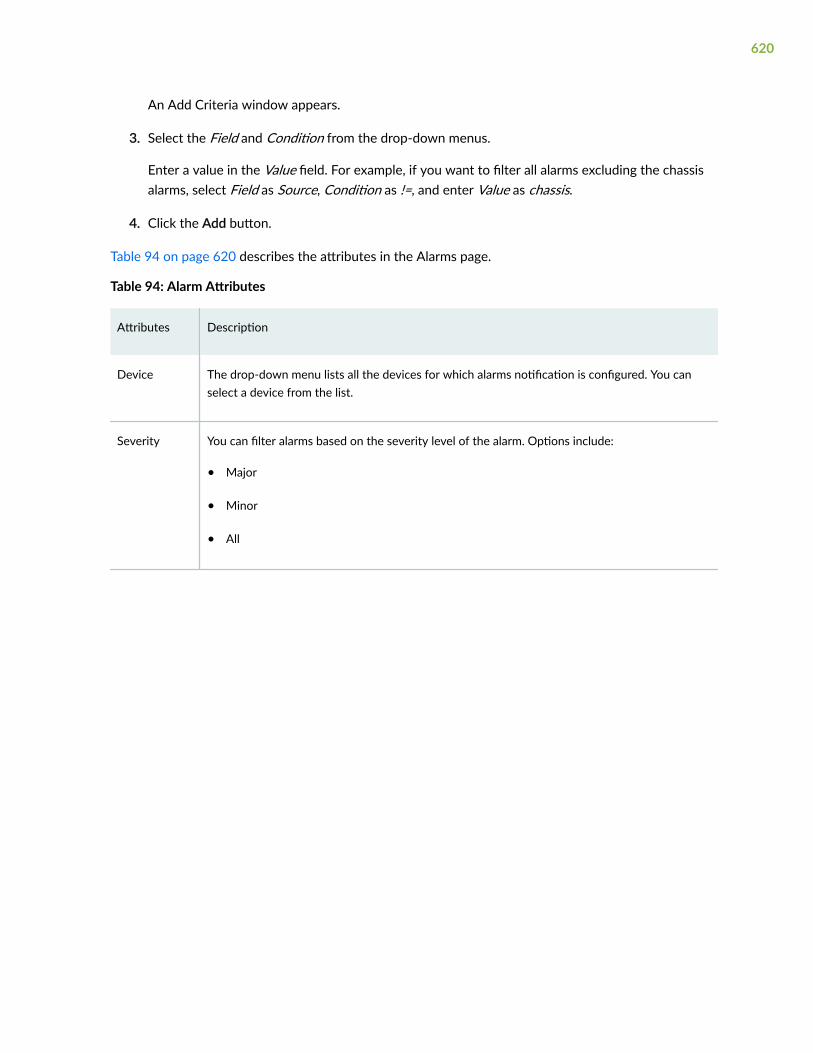
An Add Criteria window appears.
3. Select the Field and Condition from the drop-down menus.
Enter a value in the Value field. For example, if you want to filter all alarms excluding the chassisalarms, select Field as Source, Condition as !=, and enter Value as chassis.
4. Click the Add button.
Table 94 on page 620 describes the attributes in the Alarms page.
Table 94: Alarm Attributes
Attributes Description
Device The drop-down menu lists all the devices for which alarms notification is configured. You canselect a device from the list.
Severity You can filter alarms based on the severity level of the alarm. Options include:
• Major
• Minor
• All
620
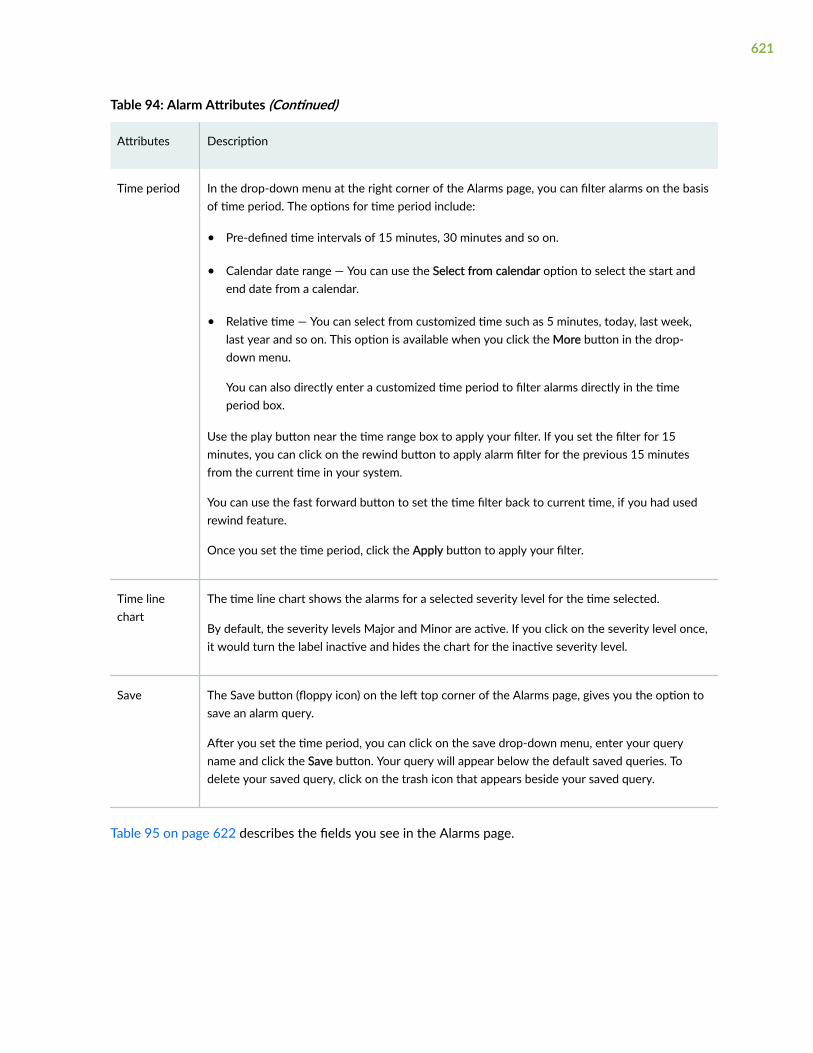
Table 94: Alarm Attributes (Continued)
Attributes Description
Time period In the drop-down menu at the right corner of the Alarms page, you can filter alarms on the basisof time period. The options for time period include:
• Pre-defined time intervals of 15 minutes, 30 minutes and so on.
• Calendar date range — You can use the Select from calendar option to select the start andend date from a calendar.
• Relative time — You can select from customized time such as 5 minutes, today, last week,last year and so on. This option is available when you click the More button in the drop-down menu.
You can also directly enter a customized time period to filter alarms directly in the timeperiod box.
Use the play button near the time range box to apply your filter. If you set the filter for 15minutes, you can click on the rewind button to apply alarm filter for the previous 15 minutesfrom the current time in your system.
You can use the fast forward button to set the time filter back to current time, if you had usedrewind feature.
Once you set the time period, click the Apply button to apply your filter.
Time linechart
The time line chart shows the alarms for a selected severity level for the time selected.
By default, the severity levels Major and Minor are active. If you click on the severity level once,it would turn the label inactive and hides the chart for the inactive severity level.
Save The Save button (floppy icon) on the left top corner of the Alarms page, gives you the option tosave an alarm query.
After you set the time period, you can click on the save drop-down menu, enter your queryname and click the Save button. Your query will appear below the default saved queries. Todelete your saved query, click on the trash icon that appears beside your saved query.
Table 95 on page 622 describes the fields you see in the Alarms page.
621

Table 95: Fields on the Alarms page
Field Description
Severity Displays an icon representing the severity level — Minor or Major.
Time Raised Displays the date and time when the alarm was raised in Paragon Insights.
Time Updated Displays the date and time when the alarm was acknowledged or assigned.
Device Displays the name of the device affected by the alarm.
Source Displays the source of alarm such as an interface or system alarm.
Description Displays details about the alarm in the source. For example, operational status of an interface isdown.
Type Displays the nature of the alarm at the source. For example, a state change (in the interface).
Acknowledged Displays yes if an alarm is acknowledged.
RELATED DOCUMENTATION
About the Alerts Page | 622
About the Alerts Page
You can use the Alerts page to organize, track, and manage KPI event alert notifications received fromParagon Insights devices. Paragon Automation Platform does not track alerts by default; it is populatedbased on which device groups or network groups are configured to send the notifications.
To access Alerts page, go to Monitoring > Alarms and Alerts > Alerts. Note that Paragon AutomationPlatform consolidates duplicate alerts into one table entry and provides a count of the number ofduplicate alarms it has received.
622

In the Alerts page, you can enable Auto Refresh and enter the time interval (for example, 10s) afterwhich the alerts page must refresh (or update) the listed data. You can also search alerts using the searchicon and filter alerts.
To filter alerts:
1. Click the filter (funnel icon) button.
2. In the drop-down menu, click Add Filter.
An Add Criteria window appears.
3. Select the Field and Condition from the drop-down menus.
Enter a value in the Value field. For example, if you want to filter all alarms excluding the chassisalarms, select Field as Source, Condition as !=, and enter Value as chassis.
4. Click the Add button.
The following table describes the alert page attributes.
Table 96: Fields in Alerts Page
Attributes Description
Severity Severity level of the alarm. Options include:
• Major
• Minor
• Normal
Status Management status of the alarm entry. Options are Open, Active, Shelved, Closed, and Ack. Thestatuses available in the Status pull-down menu in the top row of the table only include statusesof alarms visible in the table and those allowed by the status filter above the table.
Last Received Time the alarm was last received.
Dupl. Duplicate count. Number of times an alarm with the same event, resource, environment, andseverity has been triggered.
Topic Device component topic name.
623
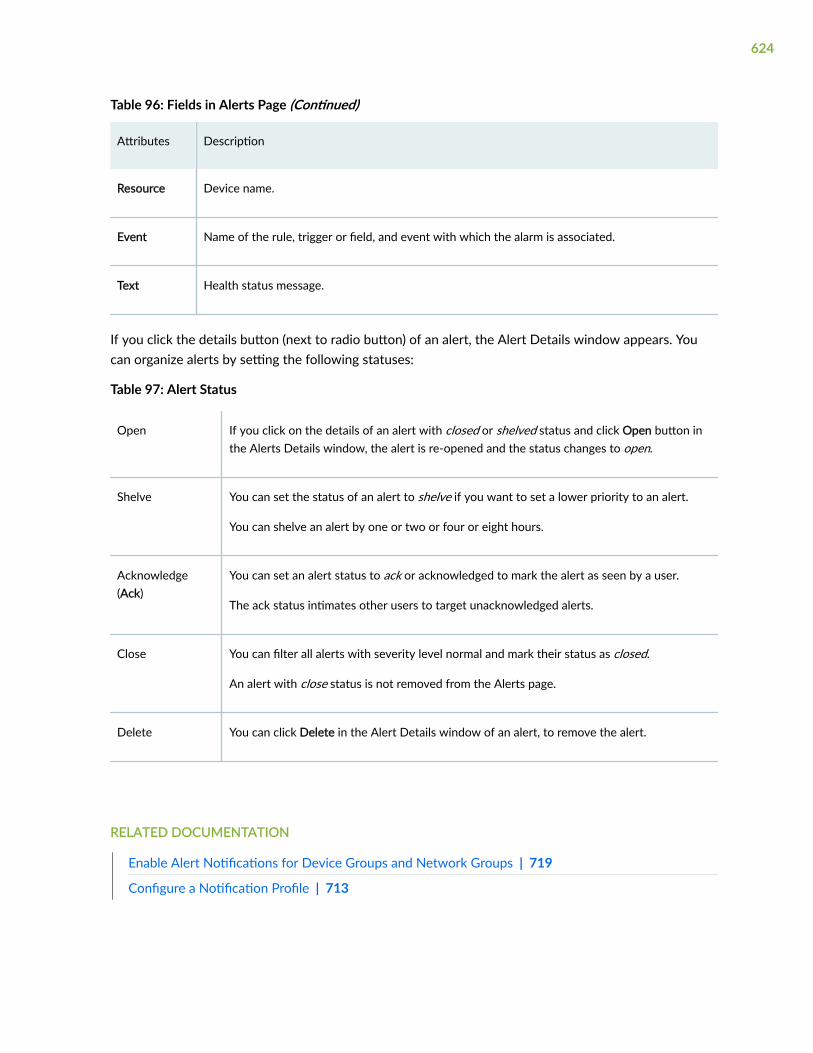
Table 96: Fields in Alerts Page (Continued)
Attributes Description
Resource Device name.
Event Name of the rule, trigger or field, and event with which the alarm is associated.
Text Health status message.
If you click the details button (next to radio button) of an alert, the Alert Details window appears. Youcan organize alerts by setting the following statuses:
Table 97: Alert Status
Open If you click on the details of an alert with closed or shelved status and click Open button inthe Alerts Details window, the alert is re-opened and the status changes to open.
Shelve You can set the status of an alert to shelve if you want to set a lower priority to an alert.
You can shelve an alert by one or two or four or eight hours.
Acknowledge(Ack)
You can set an alert status to ack or acknowledged to mark the alert as seen by a user.
The ack status intimates other users to target unacknowledged alerts.
Close You can filter all alerts with severity level normal and mark their status as closed.
An alert with close status is not removed from the Alerts page.
Delete You can click Delete in the Alert Details window of an alert, to remove the alert.
RELATED DOCUMENTATION
Enable Alert Notifications for Device Groups and Network Groups | 719
Configure a Notification Profile | 713
624

CHAPTER 28
Monitor Jobs
IN THIS CHAPTER
About the Jobs Page | 625
Viewing Job Details | 627
About the Jobs Page
IN THIS SECTION
Tasks You Can Perform | 625
Field Descriptions | 626
Field Descriptions | 626
To access this page, click Monitoring > Jobs.
Use this page to view the list of all jobs and the jobs that are scheduled to be executed. You can viewgeneral information about the jobs and the overall progress and status of the jobs.
Tasks You Can Perform
You can perform the following tasks from this page:
• View details about a job. See "Viewing Job Details" on page 627 .
• Sort and filter Jobs:
• Click a column name to sort the jobs based on the column name.
625
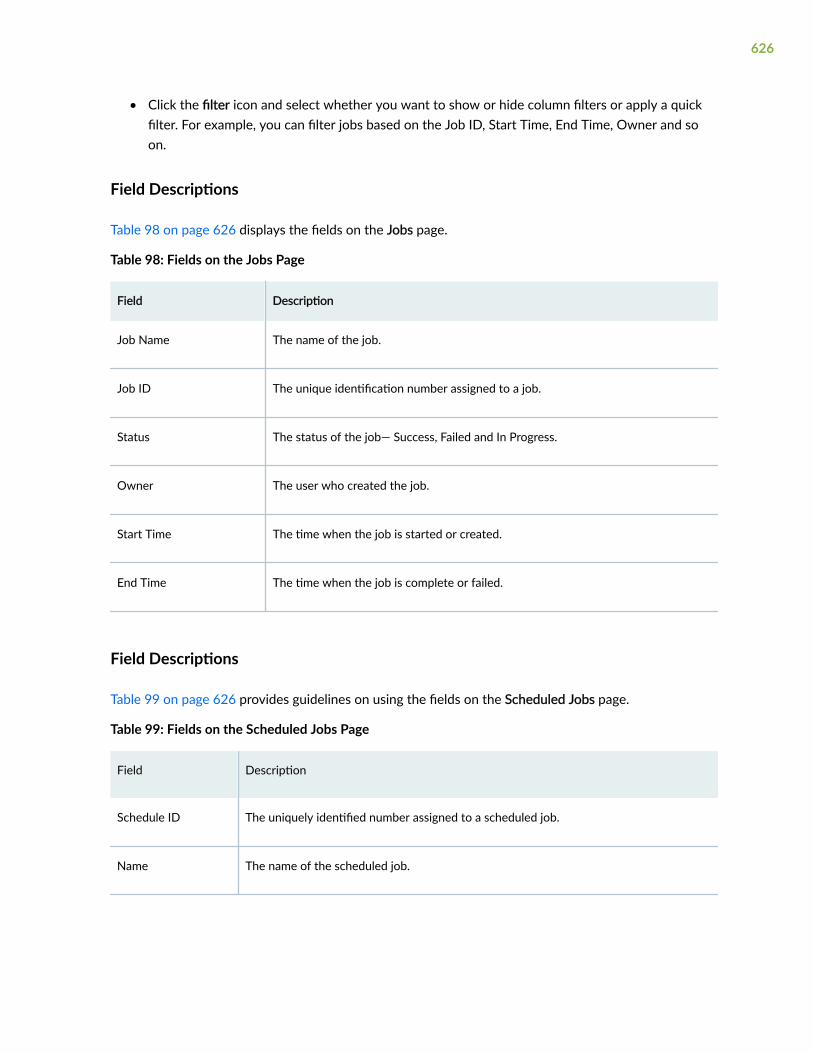
• Click the filter icon and select whether you want to show or hide column filters or apply a quickfilter. For example, you can filter jobs based on the Job ID, Start Time, End Time, Owner and soon.
Field Descriptions
Table 98 on page 626 displays the fields on the Jobs page.
Table 98: Fields on the Jobs Page
Field Description
Job Name The name of the job.
Job ID The unique identification number assigned to a job.
Status The status of the job— Success, Failed and In Progress.
Owner The user who created the job.
Start Time The time when the job is started or created.
End Time The time when the job is complete or failed.
Field Descriptions
Table 99 on page 626 provides guidelines on using the fields on the Scheduled Jobs page.
Table 99: Fields on the Scheduled Jobs Page
Field Description
Schedule ID The uniquely identified number assigned to a scheduled job.
Name The name of the scheduled job.
626

Table 99: Fields on the Scheduled Jobs Page (Continued)
Field Description
Status Defines the current status of scheduled job. The valid values are Scheduled, Success andFailed.
Owner View the name of the owner who scheduled the job.
Next Run Time View the time when the job is scheduled to run next.
Viewing Job Details
To view job details, select a job on the Jobs page and click More>Detail. The Details for Job-Name pageappears. This page has the following two tabs:
• The Details tab displays the details associated with the job such as Job Name, Status, Start Time, EndTime, Owner and Job ID. See About the Jobs Page for a description of each of the fields on this page.
• The Tasks tab displays the number of tasks associated with the job. A green check mark (success ) ora red cross mark (failed) is displayed next to each task indicating the status of the task. Click to list allsub-tasks associated with the task. You can hover on the icon to see the status message and elapsedtime information of the task.
Schedule Job will only list those jobs with current status Scheduled or Failed. Once job is scheduled,job status changes to Success , and it won’t be listed in Schedule Job page.
To quickly view the jobs that are running or that are scheduled, mouse over the clock icon, which opensa widget that contains two tabs: In-Progress and Scheduled. The number of jobs that are in progress andscheduled are shown in parentheses in the title of the tab, and each tab lists the in-progress andscheduled jobs. You can view all the jobs by clicking the See all jobs hyperlink, which takes you to theJobs page.
627

CHAPTER 29
Monitor Reports
IN THIS CHAPTER
About the Reports Page | 628
Network Reports Overview | 635
View Network Reports | 636
Inventory Reports Overview | 638
View Inventory Reports | 640
Maintenance Reports Overview | 651
View Maintenance Reports | 653
About the Reports Page
IN THIS SECTION
Use Health Reports | 629
Generate Diff Reports | 632
You can view health reports generated for device groups and network groups in Reports page. Thesereports include alarm statistics, device or network health data, as well as device-specific information(such as hardware and software specifications). To view this page, go to Monitoring > Reports > HealthReports. The reports are displayed with the latest appearing on top and the page auto refreshes at therefresh rate you configure in the Reports page.
The reports displayed in this page are configured through report profiles, schedule profiles, anddestination profiles in the Report Settings page. The report profiles can be scheduled to be published formultiple device groups or you can publish reports for a particular device group by selecting reportprofiles in a device group configuration.
628

Use Health Reports
To view and manage health reports for a device group or network group:
1. If the report’s notification parameters are set to use e-mail, check the e-mail box of the specifiedaccount for the report and open the attachment.
2. If the report’s notification parameters are set to save to the server’s disk, select the Monitoring >Reports > Health Reports page from the left navigation bar. The reports are organized by the dateand time at which they were generated. The most recent report is listed at the top of the table.
3. Find the report you wish to download. To help find the desired report:
• Click the column headings to sort based on that column.
• Search within a column using the text box under the column heading.
• Use the bottom of the page to view more rows or change pages.
629

4. Click on the name of the report to download it to your system.
630

Figure 46: Sample Report
631

Generate Diff Reports
When you generate two or more reports, you can compare any two reports in a diff report that showsthe changes.
To generate a Diff report:
1. Go to Monitoring > Reports > Health Reports.
2. Click on the check boxes of two reports and click Diff Report.
632

The diff report pops up in a new browser tab. Ensure that pop-ups are not blocked in your browser.
633
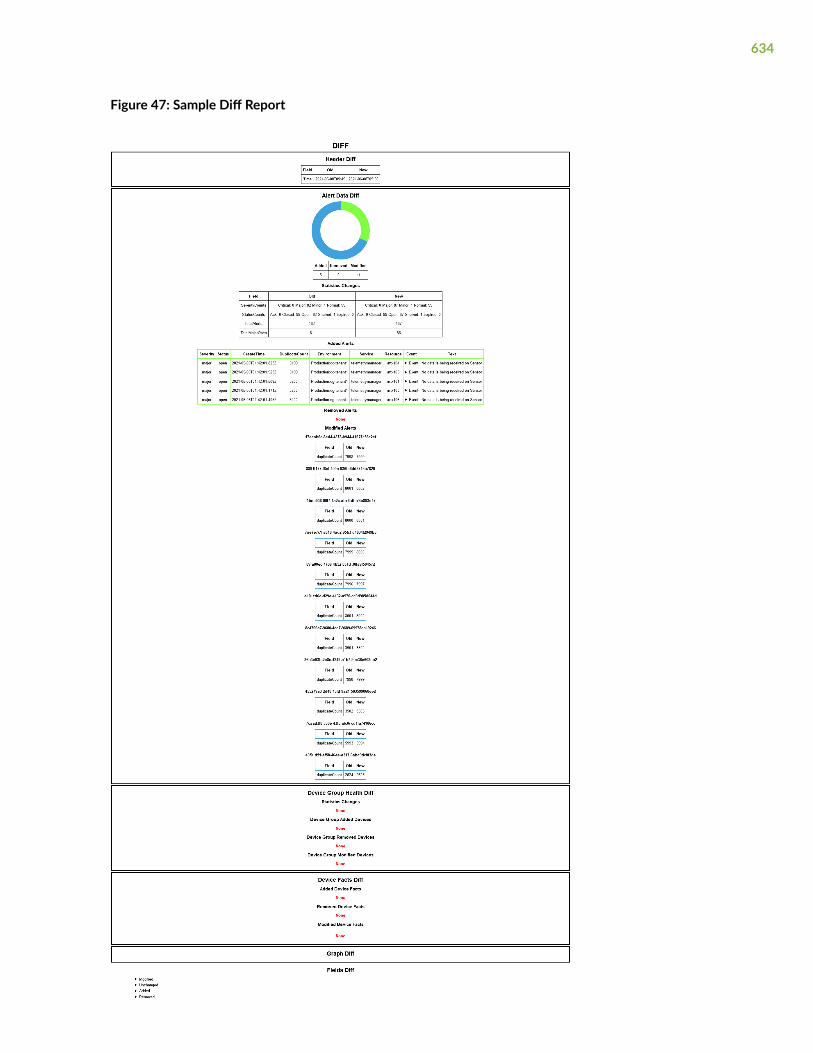
Figure 47: Sample Diff Report
634
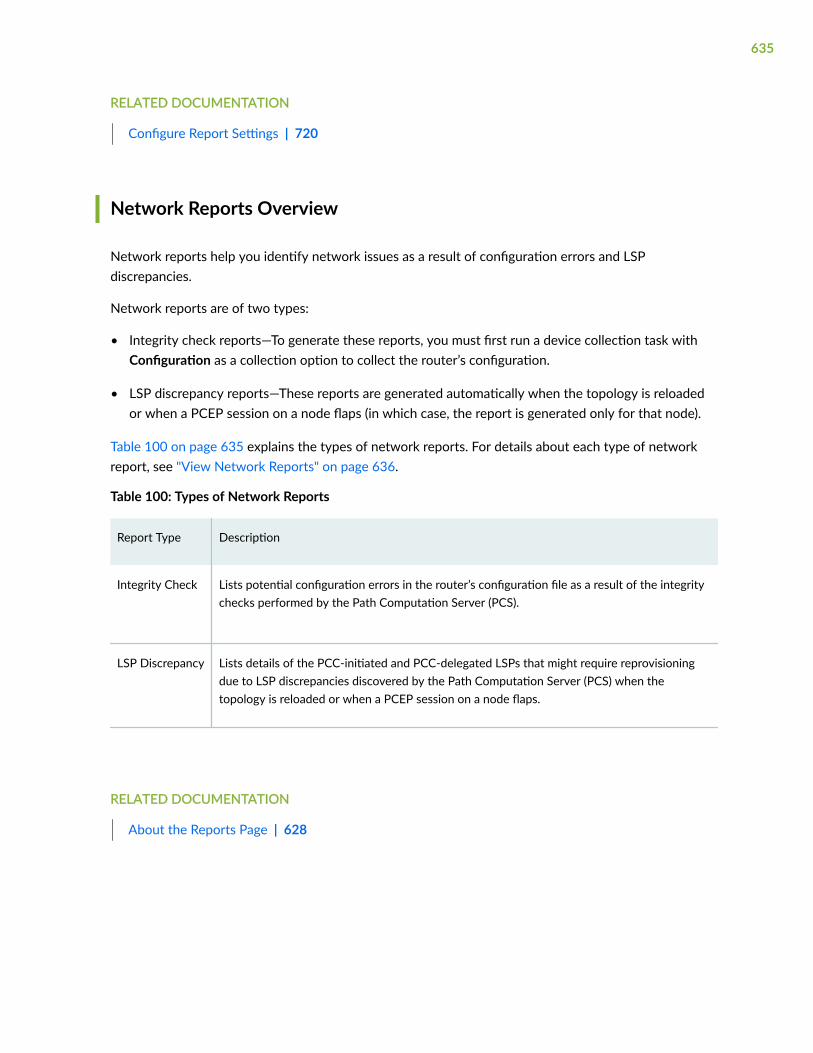
RELATED DOCUMENTATION
Configure Report Settings | 720
Network Reports Overview
Network reports help you identify network issues as a result of configuration errors and LSPdiscrepancies.
Network reports are of two types:
• Integrity check reports—To generate these reports, you must first run a device collection task withConfiguration as a collection option to collect the router’s configuration.
• LSP discrepancy reports—These reports are generated automatically when the topology is reloadedor when a PCEP session on a node flaps (in which case, the report is generated only for that node).
Table 100 on page 635 explains the types of network reports. For details about each type of networkreport, see "View Network Reports" on page 636.
Table 100: Types of Network Reports
Report Type Description
Integrity Check Lists potential configuration errors in the router’s configuration file as a result of the integritychecks performed by the Path Computation Server (PCS).
LSP Discrepancy Lists details of the PCC-initiated and PCC-delegated LSPs that might require reprovisioningdue to LSP discrepancies discovered by the Path Computation Server (PCS) when thetopology is reloaded or when a PCEP session on a node flaps.
RELATED DOCUMENTATION
About the Reports Page | 628
635

View Network Reports
Paragon Automation enables you to generate and view Network reports that help you identify networkissues. For information on the types of Network reports and how to generate them, see "NetworkReports Overview" on page 635.
To access the page for a specific network report, select Monitoring > Reports > Network > Report-Name.
You can perform the following actions on this page:
• View the following Network reports:
• Integrity Check reports, see Table 101 on page 636.
• LSP Discrepancy reports, see Table 102 on page 638.
• Download a report—Hover over the Download button on the top-right corner of the report andselect either CSV or JSON to download the report as a comma-separated values file (CSV) orJavaScript Object Notation (JSON) file, respectively.
• View router configuration files—Select an item in the Integrity Check report and hover over the Morebutton on the top-right corner of the report to select Show Config. Alternatively, hover over an itemand click the details icon that appears.
The Configuration pane appears on the right side of the page, displaying the configuration for theselected item.
• Show or hide columns in a report—Click the vertical ellipsis icon at the top right corner of the reportand select the columns that you want displayed in the report.
Only the columns that you selected are displayed.
Table 101 on page 636 explains the fields displayed in the Integrity Check reports.
Table 101: Integrity Check Reports
Field Description
Category Category to which the integrity check belongs.
Example: IS-IS, Tunnel, RSVP
636

Table 101: Integrity Check Reports (Continued)
Field Description
Message Description of the error.
This column may also contain references to specific configuration files or host names when morethan one configuration file is involved.
Detail Details of the entity in which the error was detected.
Severity Severity level (High, Medium, Low, and Warning) of the error:
• High—Indicates a severe problem that may cause major issues in the network.
• Medium—Indicates that the problem is not severe but should be fixed to prevent issues in thenetwork.
• Low—Indicates that the problem is not severe but should be fixed to prevent issues in thenetwork. An error with Medium severity level has higher priority over an error with Lowseverity level.
• Warning—Indicates a potential problem in the network and must be examined.
Error Source Device in which the error was detected.
Source File File in which the error was detected.
Displays a configuration file name, or a description when more than one configuration file isinvolved.
Line Number Line in the configuration file where the error was detected.
Line Content Content of the line in the configuration file where the error was detected.
Msg ID Index value assigned to the error for identification.
NOTE: This field is reserved for future use.
Table 102 on page 638 explains the fields displayed in the LSP Discrepancy reports.
637
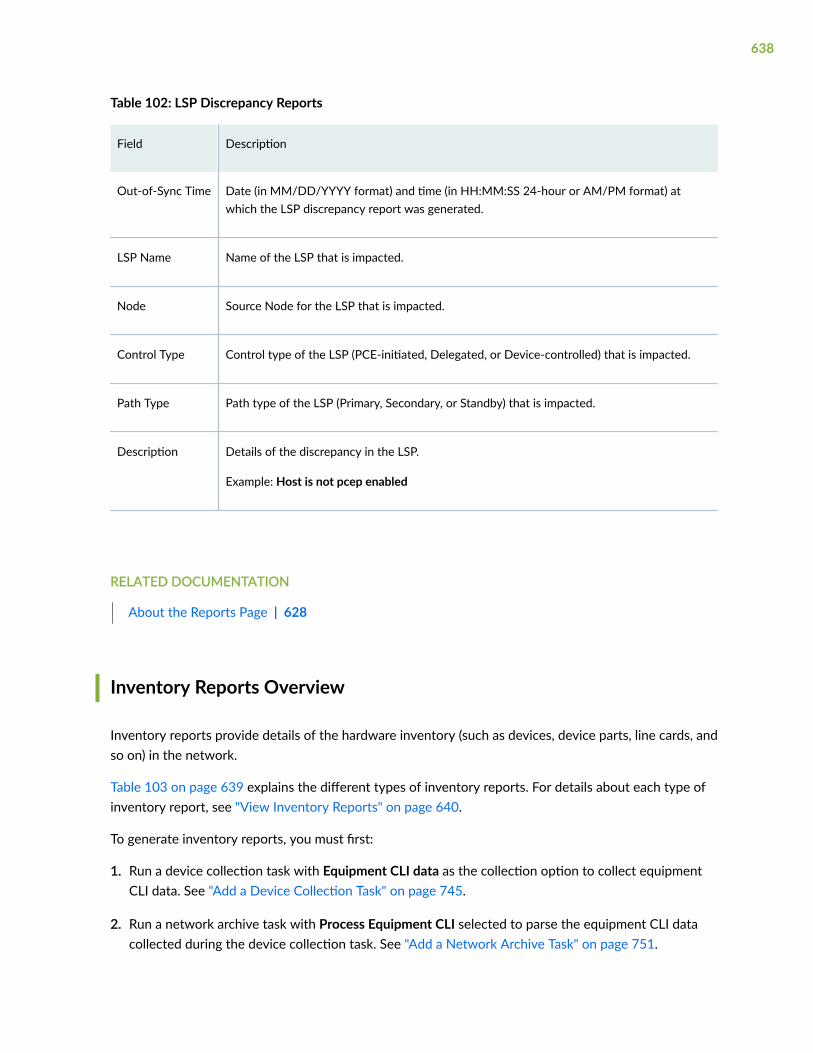
Table 102: LSP Discrepancy Reports
Field Description
Out-of-Sync Time Date (in MM/DD/YYYY format) and time (in HH:MM:SS 24-hour or AM/PM format) atwhich the LSP discrepancy report was generated.
LSP Name Name of the LSP that is impacted.
Node Source Node for the LSP that is impacted.
Control Type Control type of the LSP (PCE-initiated, Delegated, or Device-controlled) that is impacted.
Path Type Path type of the LSP (Primary, Secondary, or Standby) that is impacted.
Description Details of the discrepancy in the LSP.
Example: Host is not pcep enabled
RELATED DOCUMENTATION
About the Reports Page | 628
Inventory Reports Overview
Inventory reports provide details of the hardware inventory (such as devices, device parts, line cards, andso on) in the network.
Table 103 on page 639 explains the different types of inventory reports. For details about each type ofinventory report, see "View Inventory Reports" on page 640.
To generate inventory reports, you must first:
1. Run a device collection task with Equipment CLI data as the collection option to collect equipmentCLI data. See "Add a Device Collection Task" on page 745.
2. Run a network archive task with Process Equipment CLI selected to parse the equipment CLI datacollected during the device collection task. See "Add a Network Archive Task" on page 751.
638
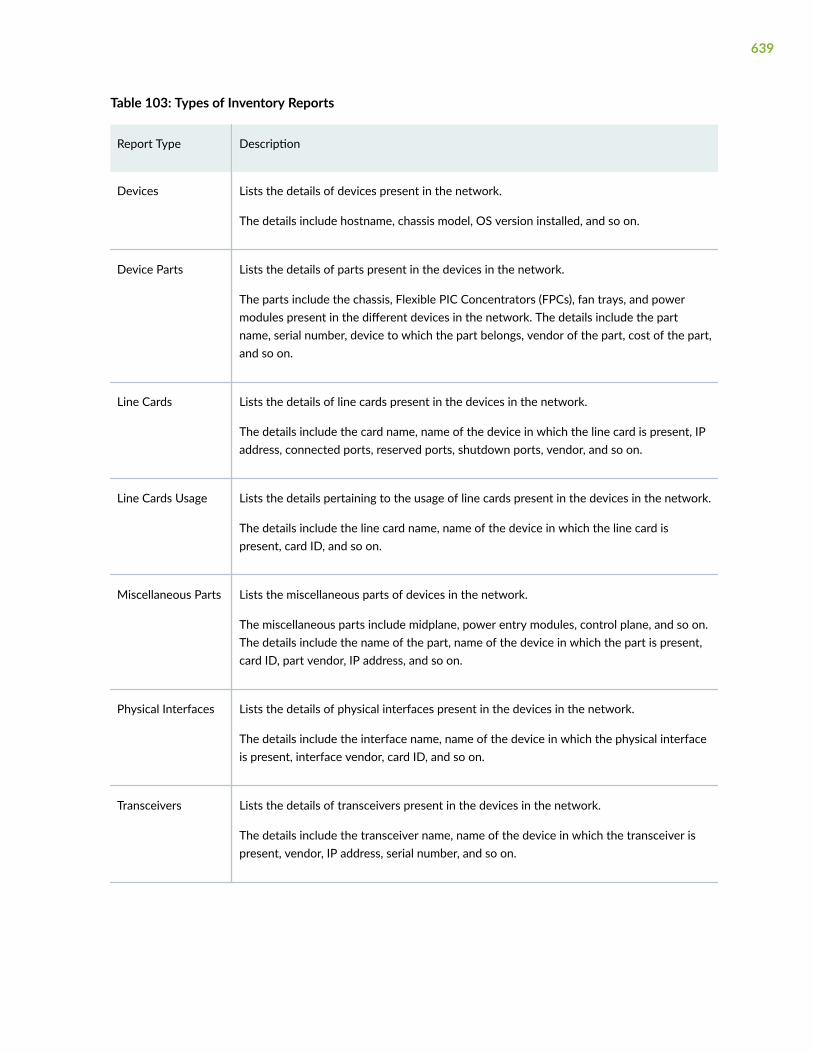
Table 103: Types of Inventory Reports
Report Type Description
Devices Lists the details of devices present in the network.
The details include hostname, chassis model, OS version installed, and so on.
Device Parts Lists the details of parts present in the devices in the network.
The parts include the chassis, Flexible PIC Concentrators (FPCs), fan trays, and powermodules present in the different devices in the network. The details include the partname, serial number, device to which the part belongs, vendor of the part, cost of the part,and so on.
Line Cards Lists the details of line cards present in the devices in the network.
The details include the card name, name of the device in which the line card is present, IPaddress, connected ports, reserved ports, shutdown ports, vendor, and so on.
Line Cards Usage Lists the details pertaining to the usage of line cards present in the devices in the network.
The details include the line card name, name of the device in which the line card ispresent, card ID, and so on.
Miscellaneous Parts Lists the miscellaneous parts of devices in the network.
The miscellaneous parts include midplane, power entry modules, control plane, and so on.The details include the name of the part, name of the device in which the part is present,card ID, part vendor, IP address, and so on.
Physical Interfaces Lists the details of physical interfaces present in the devices in the network.
The details include the interface name, name of the device in which the physical interfaceis present, interface vendor, card ID, and so on.
Transceivers Lists the details of transceivers present in the devices in the network.
The details include the transceiver name, name of the device in which the transceiver ispresent, vendor, IP address, serial number, and so on.
639
RELATED DOCUMENTATION
About the Reports Page | 628
View Inventory Reports
Paragon Automation enables you to generate and view Inventory reports that provide details of thehardware inventory in the network. For information on the types of Inventory reports and how togenerate them, see "Inventory Reports Overview" on page 638.
To access the page for to a specific Inventory report, select Monitoring > Reports > Inventory > Report-Name.
You can perform the following actions on this page:
• View the following Inventory reports:
• Devices, see Table 104 on page 641.
• Device Parts, see Table 105 on page 643.
• Line Cards, see Table 106 on page 644.
• Line Cards Usage, see Table 107 on page 646.
• Miscellaneous Parts, see Table 108 on page 647.
• Physical Interfaces, see Table 109 on page 648.
• Transceivers, see Table 110 on page 650.
• Download a report—Hover over the Download button on the top-right corner of the report andselect either CSV or JSON to download the report as a comma-separated values file (CSV) orJavaScript Object Notation (JSON) file, respectively.
• Show or hide columns in a report—Click the vertical ellipsis icon at the top-right corner of the reportand select the columns that you want displayed in the report.
Only the columns that you selected are displayed.
Table 104 on page 641 explains the fields displayed in the Devices report.
640

Table 104: Devices Report
Field Description
Device Name Name of the device present in the network.
Vendor Name of the device vendor.
Example: Juniper
IP Address IPv4 address of the device.
Source Filename of the configuration file from where the device details are collected.
System Name System name for the device.
Description Description for the device.
Contact Contact name for the device.
Location Physical location of the device.
Last update by CLI Date (in MM:DD:YYYY format) and time (in HH:MM:SS 12-hour or AM/PMformat) at which the configuration file was last updated as a result of devicecollection.
Chassis Type Type of chassis.
Example: WS-C6509-E
Hardware Version Hardware revision model of the chassis.
Hardware ID Serial number of the chassis.
ROM Version ROM monitor version.
641
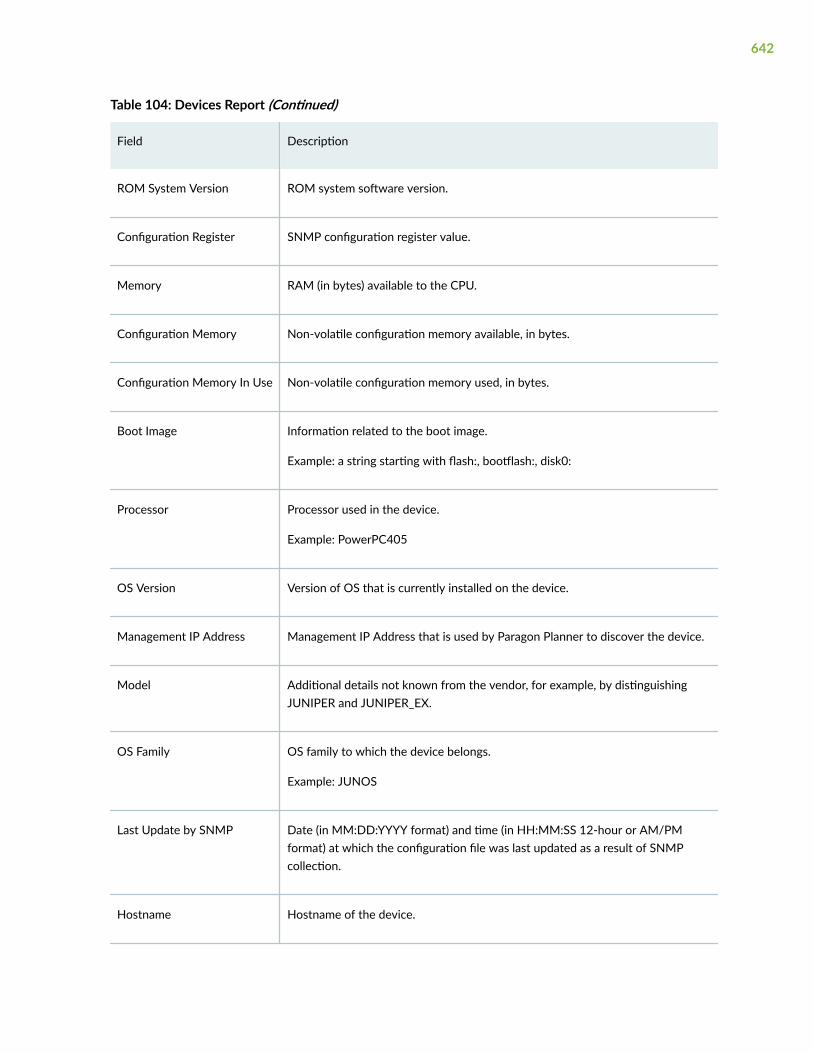
Table 104: Devices Report (Continued)
Field Description
ROM System Version ROM system software version.
Configuration Register SNMP configuration register value.
Memory RAM (in bytes) available to the CPU.
Configuration Memory Non-volatile configuration memory available, in bytes.
Configuration Memory In Use Non-volatile configuration memory used, in bytes.
Boot Image Information related to the boot image.
Example: a string starting with flash:, bootflash:, disk0:
Processor Processor used in the device.
Example: PowerPC405
OS Version Version of OS that is currently installed on the device.
Management IP Address Management IP Address that is used by Paragon Planner to discover the device.
Model Additional details not known from the vendor, for example, by distinguishingJUNIPER and JUNIPER_EX.
OS Family OS family to which the device belongs.
Example: JUNOS
Last Update by SNMP Date (in MM:DD:YYYY format) and time (in HH:MM:SS 12-hour or AM/PMformat) at which the configuration file was last updated as a result of SNMPcollection.
Hostname Hostname of the device.
642

Table 104: Devices Report (Continued)
Field Description
IPv6 IPv6 address of the device, if any.
AS Autonomous system (AS) number assigned to the device.
Table 105 on page 643 explains the fields displayed in the Device Parts report.
Table 105: Device Parts Report
Field Description
Name Name of the device part.
Device Name Name of the device to which this part belongs.
Vendor Name of the device vendor.
Example: Juniper
IP Address IP address of the device to which the part belongs.
Part Part number associated with the device part.
Serial Number Serial number of the device part.
Description Description for the device part.
Estimated Cost Estimated cost of the device part.
Hostname Hostname of the device.
AS AS number assigned to the device.
643

Table 105: Device Parts Report (Continued)
Field Description
Model Additional details not known from the vendor, for example, by distinguishing JUNIPER andJUNIPER_EX.
Card ID Location of the card on the device.
Example: S-0/1
Table 106 on page 644 explains the fields displayed in the Line Cards report.
Table 106: Line Cards Report
Field Description
Card Name Name of the line card.
For example: WS-X6704-10GE
Device Name Name of the device to which this part belongs.
Vendor Name of the device vendor.
Example: Juniper
IP Address The IP address of the device to which the part belongs.
Card ID Location of the card on the device.
Example: S-0/1
Connected Ports Sum of the number of ports that meet one or more of the following conditions:
• Number of ports that have a corresponding link in the model.
• Number of ports that are operationally up.
• Number of ports that have an IP address defined on the interface.
644

Table 106: Line Cards Report (Continued)
Field Description
Reserved Ports Number of reserved ports in the line card.
A port is considered reserved if the interface description in the configuration filecontains one or more of the following keywords:
• Reserved
• Booked
• Spare
Shutdown Ports Number of ports that have operational status or administrative status as Down.
Port Count Number of ports on the line card.
Part Part number of the line card.
Serial number Serial number of the line card.
FRU Line Cards Name of the field-replaceable unit (FRU) line card (applicable only to Cisco devices).
FRU Route Memory Route memory allocated to the FRU (applicable only to Cisco devices).
FRU Packet Memory Packet memory allocated to the FRU (applicable only to Cisco devices).
L3 Engine Type Type of L3 Engine (applicable only to Cisco devices).
L3 Engine Details related to the L3 engine (applicable only to Cisco devices).
TAN Top Assembly Number (TAN) or ordering number (applicable only to Cisco devices).
Description Description for the line card.
645
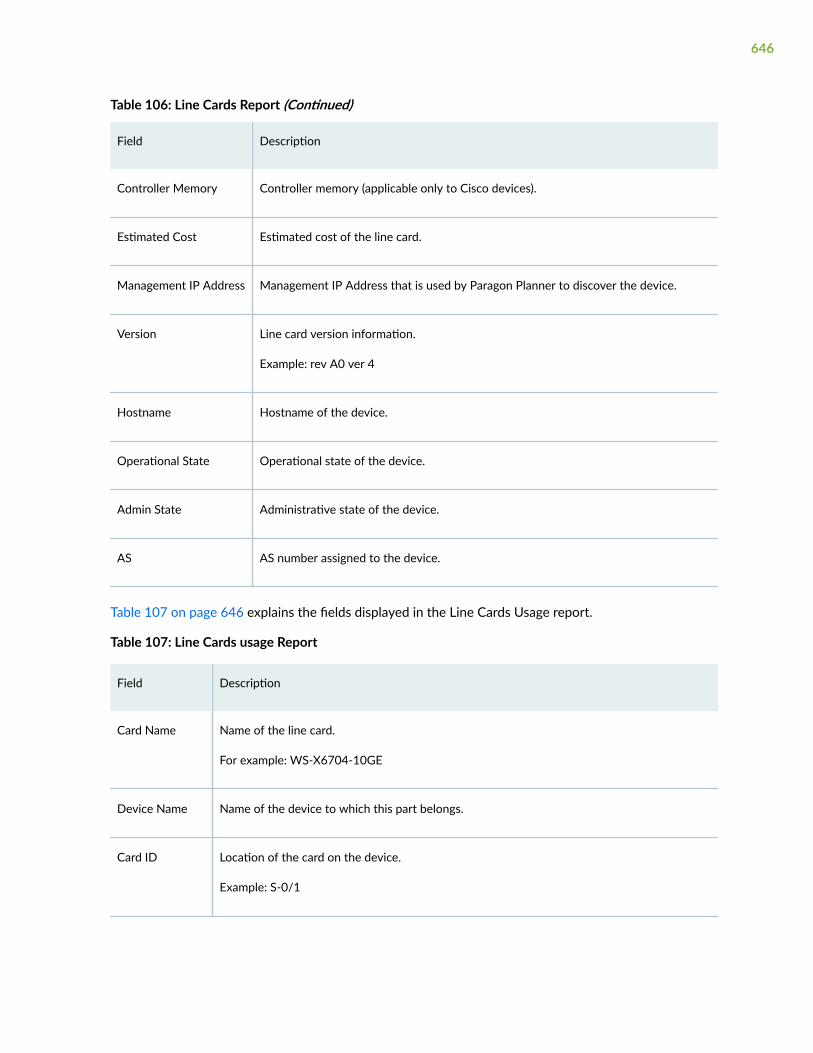
Table 106: Line Cards Report (Continued)
Field Description
Controller Memory Controller memory (applicable only to Cisco devices).
Estimated Cost Estimated cost of the line card.
Management IP Address Management IP Address that is used by Paragon Planner to discover the device.
Version Line card version information.
Example: rev A0 ver 4
Hostname Hostname of the device.
Operational State Operational state of the device.
Admin State Administrative state of the device.
AS AS number assigned to the device.
Table 107 on page 646 explains the fields displayed in the Line Cards Usage report.
Table 107: Line Cards usage Report
Field Description
Card Name Name of the line card.
For example: WS-X6704-10GE
Device Name Name of the device to which this part belongs.
Card ID Location of the card on the device.
Example: S-0/1
646

Table 107: Line Cards usage Report (Continued)
Field Description
Connected Ports Sum of the number of ports that meet one or more of the following conditions:
• Number of ports that have a corresponding link in the model.
• Number of ports that are operationally up.
• Number of ports that have an IP address defined on the interface.
Reserved Ports Number of reserved ports, based on the customizable keywords found in the description inthe configuration file.
Shutdown Ports Number of ports that have operational status or administrative status as Down.
Number of Ports Number of ports on the line card.
Hostname Hostname of the device.
Table 108 on page 647 explains the fields displayed in the Miscellaneous Parts report.
Table 108: Miscellaneous Parts Report
Field Description
Name Name of the device part.
Example: Power supply, fan, display
Device Name Name of the device to which this part belongs.
Vendor Name of the device vendor.
Example: Juniper
IP Address IP address of the device to which the part belongs.
647

Table 108: Miscellaneous Parts Report (Continued)
Field Description
Part Part number associated with the device part.
Serial Number Serial number of the device part.
Description Description for the device part.
Estimated Cost Estimated cost of the device part.
Hostname Hostname of the device.
AS AS number assigned to the device.
Model Additional details not known from the vendor, forexample, by distinguishing JUNIPER and JUNIPER_EX.
Card ID Location of the card on the device.
Example: S-0/1
Table 109 on page 648 explains the fields displayed in the Physical Interfaces report.
Table 109: Physical Interfaces Report
Field Description
Interface Name of the physical interface.
Example: GigabitEthernet0/0/0/0
Device Name Name of the device that contains the physical interface.
Vendor Name of the device vendor.
Example: Juniper
648
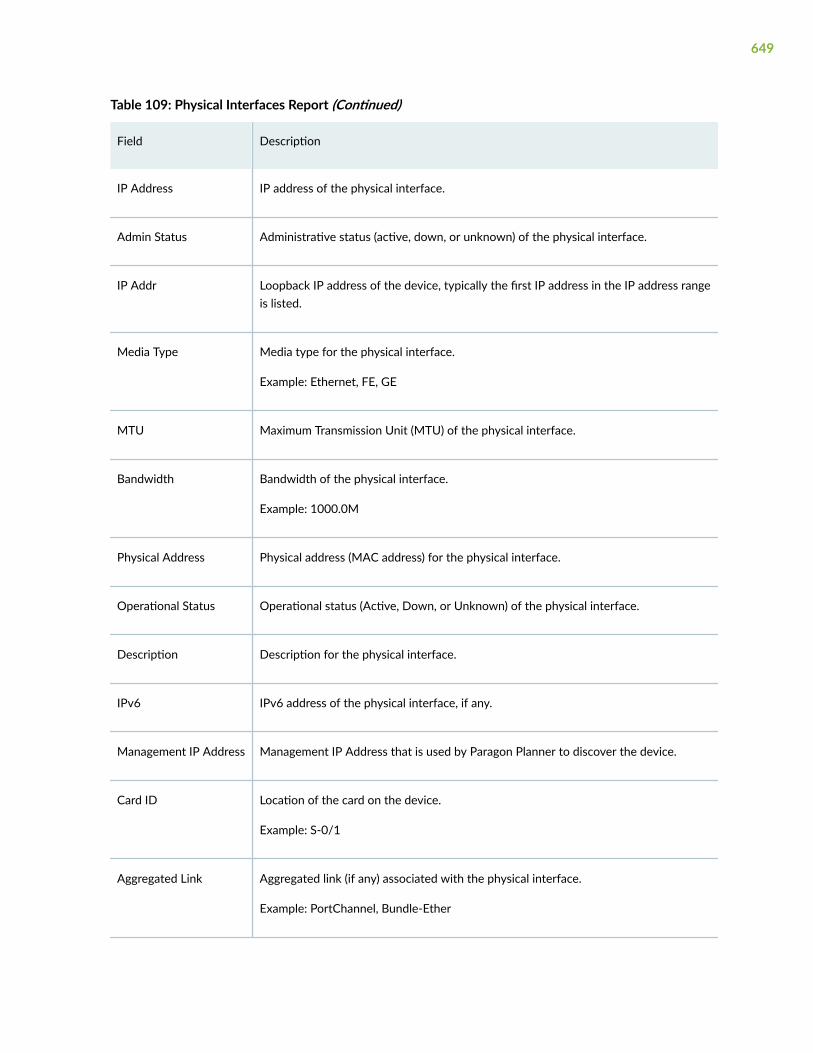
Table 109: Physical Interfaces Report (Continued)
Field Description
IP Address IP address of the physical interface.
Admin Status Administrative status (active, down, or unknown) of the physical interface.
IP Addr Loopback IP address of the device, typically the first IP address in the IP address rangeis listed.
Media Type Media type for the physical interface.
Example: Ethernet, FE, GE
MTU Maximum Transmission Unit (MTU) of the physical interface.
Bandwidth Bandwidth of the physical interface.
Example: 1000.0M
Physical Address Physical address (MAC address) for the physical interface.
Operational Status Operational status (Active, Down, or Unknown) of the physical interface.
Description Description for the physical interface.
IPv6 IPv6 address of the physical interface, if any.
Management IP Address Management IP Address that is used by Paragon Planner to discover the device.
Card ID Location of the card on the device.
Example: S-0/1
Aggregated Link Aggregated link (if any) associated with the physical interface.
Example: PortChannel, Bundle-Ether
649
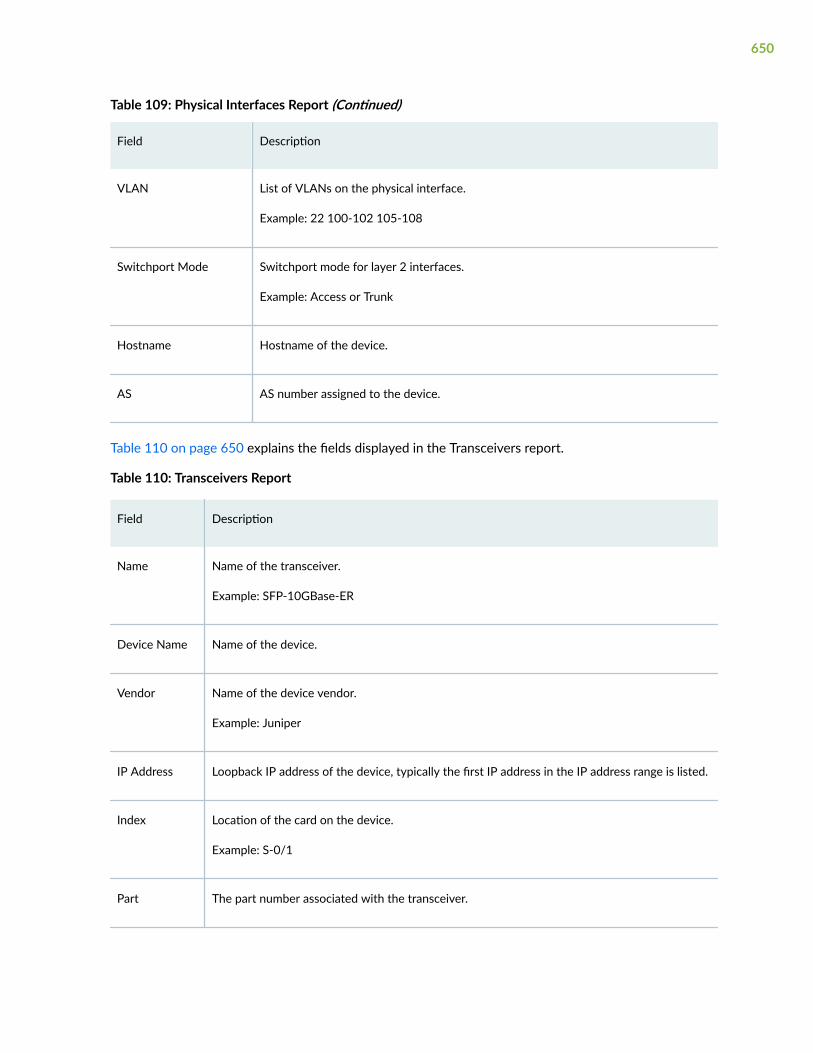
Table 109: Physical Interfaces Report (Continued)
Field Description
VLAN List of VLANs on the physical interface.
Example: 22 100-102 105-108
Switchport Mode Switchport mode for layer 2 interfaces.
Example: Access or Trunk
Hostname Hostname of the device.
AS AS number assigned to the device.
Table 110 on page 650 explains the fields displayed in the Transceivers report.
Table 110: Transceivers Report
Field Description
Name Name of the transceiver.
Example: SFP-10GBase-ER
Device Name Name of the device.
Vendor Name of the device vendor.
Example: Juniper
IP Address Loopback IP address of the device, typically the first IP address in the IP address range is listed.
Index Location of the card on the device.
Example: S-0/1
Part The part number associated with the transceiver.
650
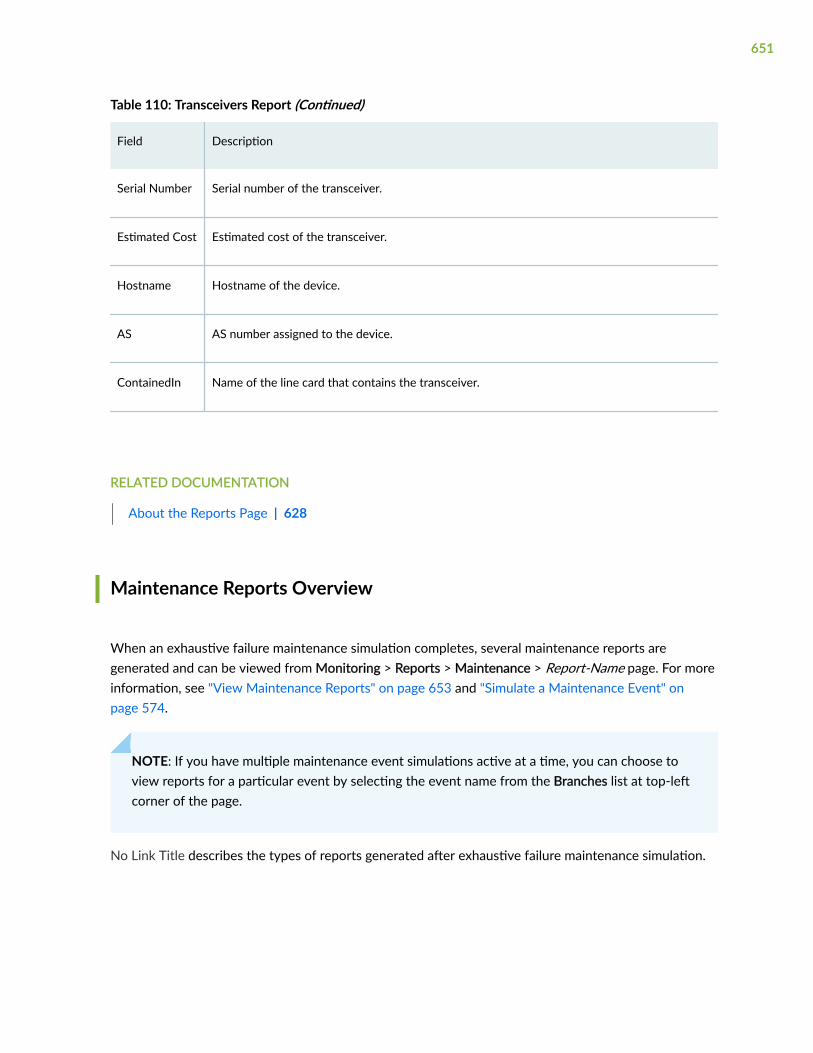
Table 110: Transceivers Report (Continued)
Field Description
Serial Number Serial number of the transceiver.
Estimated Cost Estimated cost of the transceiver.
Hostname Hostname of the device.
AS AS number assigned to the device.
ContainedIn Name of the line card that contains the transceiver.
RELATED DOCUMENTATION
About the Reports Page | 628
Maintenance Reports Overview
When an exhaustive failure maintenance simulation completes, several maintenance reports aregenerated and can be viewed from Monitoring > Reports > Maintenance > Report-Name page. For moreinformation, see "View Maintenance Reports" on page 653 and "Simulate a Maintenance Event" onpage 574.
NOTE: If you have multiple maintenance event simulations active at a time, you can choose toview reports for a particular event by selecting the event name from the Branches list at top-leftcorner of the page.
No Link Title describes the types of reports generated after exhaustive failure maintenance simulation.
651

Table 111: Types of Maintenance Reports
Report Name Description
Link Oversubscription Lists the links that reached over 100% utilization during the exhaustive failuresimulation.
Link Utilization Changes Shows changes in link RSVP bandwidth reservation if all LSPs were to be routed overtheir optimized paths instead of their current paths.
LSP Path Changes Shows changes to the tunnel paths, number of hops, path cost, and delay for PCE-initiated and PCC-delegated LSPs as a result of path analysis.
Maintenance Simulation Shows link utilization and LSP routing changes caused by maintenance events duringfailure simulation.
Path Delay Shows the worst path delay and distance experience by each tunnel and theassociated failure event that caused the worst-case scenario.
Peak InterfaceUtilization
Shows physical interfaces report with normal utilization, the worst utilization, and thecausing events during exhaustive failure simulation.
Peak Link Utilization Shows the peak utilization encountered from one or more elements that failed foreach link.
Peak SimulationSummary
Shows the summary view of the count, bandwidth, and hops of the tunnels that wereimpacted or failed during simulation.
Peak Tunnel Failure Lists the tunnels that were unable to reroute and the events that prevented thetunnels reroute during exhaustive failure simulation.
RELATED DOCUMENTATION
Simulate a Maintenance Event | 574
652

View Maintenance Reports
IN THIS SECTION
Tasks You Can Perform | 653
Link Oversubscription Report | 654
Link Utilization Changes Report | 655
LSP Path Changes Report | 656
Maintenance Simulation Report | 657
Path Delay Report | 658
Peak Interface Utilization Report | 659
Peak Link Utilization Report | 661
Peak Simulation Summary Report | 663
Peak Tunnel Failure | 665
To access an individual maintenance report page, click Monitoring > Reports > Maintenance > Report-Name.
NOTE: If you have multiple maintenance event simulations active at a time, you can choose toview reports for a particular event by selecting the event name from the Branches list at top-leftcorner of the page.
Tasks You Can Perform
You can perform the following tasks on individual report page:
• View details about individual reports.
• Link Oversubscription, see Table 112 on page 654.
• Link Utilization Changes, see Table 113 on page 655.
• LSP Path Changes, see Table 114 on page 656.
• Maintenance Simulation, see Table 115 on page 657.
653

• Path Delay, see Table 116 on page 658.
• Peak Interface Utilization, see Table 117 on page 659.
• Peak Link Utilization, see Table 118 on page 661.
• Peak Simulation Summary, see Table 119 on page 664.
• Peak Tunnel failure, see Table 120 on page 665.
• Download the report—Hover over the Download button and select a format, CSV or JSON, to exportthe detailed maintenance report.
• Show/Hide Columns—Choose to show or hide a specific column in the table.
Hover over the More Options (vertical ellipsis) > Show/Hide Columns and select the Column-Namecheck box of the columns you want to display on the page.
Link Oversubscription Report
If link oversubscription does not occur for the maintenance events, the report will be empty.
Table 112 on page 654 describes the fields on the Link Oversubscription Page.
Table 112: Fields on the Link Oversubscription Page
Field Description
Simulation Type Type of exhaustive maintenance simulation. It can be Node, Link, SRLG, or acombination of the three types.
Event Name of the network element under maintenance. It can be node name, link name orfacility (SRLG) name.
Layer Type of Layer—Demand or Tunnel.
Link Name Name of the link.
Node A Name or IP address of Node A (ingress node).
Interface Name of interface A.
654

Table 112: Fields on the Link Oversubscription Page (Continued)
Field Description
Node Z Name or IP address of Node Z (egress node).
Change Change in the link bandwidth (in bps).
Bandwidth Bandwidth (in bps) of the link.
Used Bandwidth Bandwidth (in bps) allocated for tunnels resulting from the specified maintenanceevent simulation.
Link Utilization Changes Report
Table 113 on page 655 describes the fields on the Link Utilization Changes Page.
Table 113: Fields on the Link Utilization Changes Page
Field Description
Link Name Name of the link.
Node:Interface Node and interface name of the local node.
Remote Node Name of the node at the remote end.
Change Change made to the link. Link Down is displayed when the link is under maintenance.If there is a change in link utilization, this field will be empty.
Bandwidth Total bandwidth (in bps) available for traffic.
New Utilization Percentage value of new link utilization. Range is between 0 and 1. For example, 0.8implies 80% link utilization.
655

Table 113: Fields on the Link Utilization Changes Page (Continued)
Field Description
Utilization Percentage value of original link utilization. Range is between 0 and 1. If the link isunder maintenance, this field will be empty.
Difference Difference between the new and original link utilization.
LSP Path Changes Report
Table 114 on page 656 describes the fields on the LSP Path Changes page.
Table 114: Fields on the LSP Path Changes Page
Field Description
LSP Name Name of the LSP.
Node A Name of Node A (ingress node).
Node Z Name of Node Z (egress node).
Hop Count Original hop count of the LSP.
New Hop Count New hop count of the LSP resulting from the specified maintenance event simulation.
Path Cost An integer value for the cost associated with the original LSP path. When an LSP isrouted over multiple links, path cost is the cumulative value of all individual link coststhat the LSP goes through.
New Path Cost An integer value for the cost associated with the new (rerouted) LSP path.
Path Displays the IP addresses that the original LSP goes through from Node A.
New Path Displays the IP addresses that the new (rerouted) LSP goes through from Node A.
656
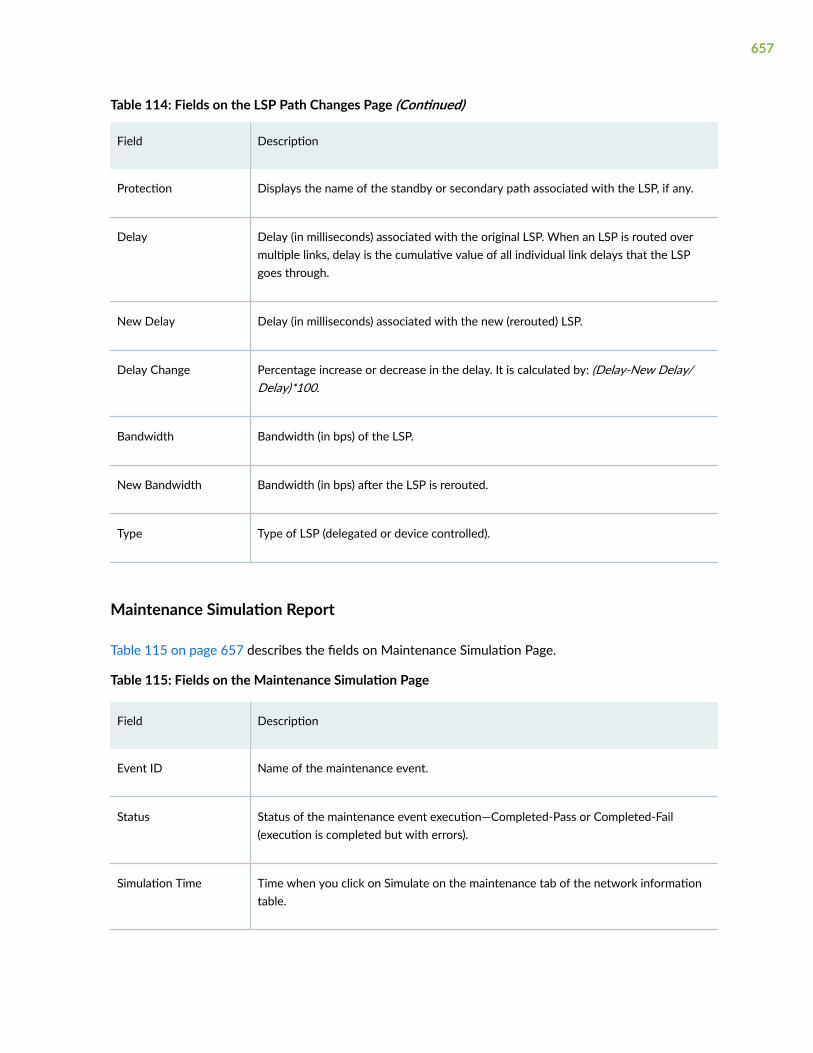
Table 114: Fields on the LSP Path Changes Page (Continued)
Field Description
Protection Displays the name of the standby or secondary path associated with the LSP, if any.
Delay Delay (in milliseconds) associated with the original LSP. When an LSP is routed overmultiple links, delay is the cumulative value of all individual link delays that the LSPgoes through.
New Delay Delay (in milliseconds) associated with the new (rerouted) LSP.
Delay Change Percentage increase or decrease in the delay. It is calculated by: (Delay-New Delay/Delay)*100.
Bandwidth Bandwidth (in bps) of the LSP.
New Bandwidth Bandwidth (in bps) after the LSP is rerouted.
Type Type of LSP (delegated or device controlled).
Maintenance Simulation Report
Table 115 on page 657 describes the fields on Maintenance Simulation Page.
Table 115: Fields on the Maintenance Simulation Page
Field Description
Event ID Name of the maintenance event.
Status Status of the maintenance event execution—Completed-Pass or Completed-Fail(execution is completed but with errors).
Simulation Time Time when you click on Simulate on the maintenance tab of the network informationtable.
657
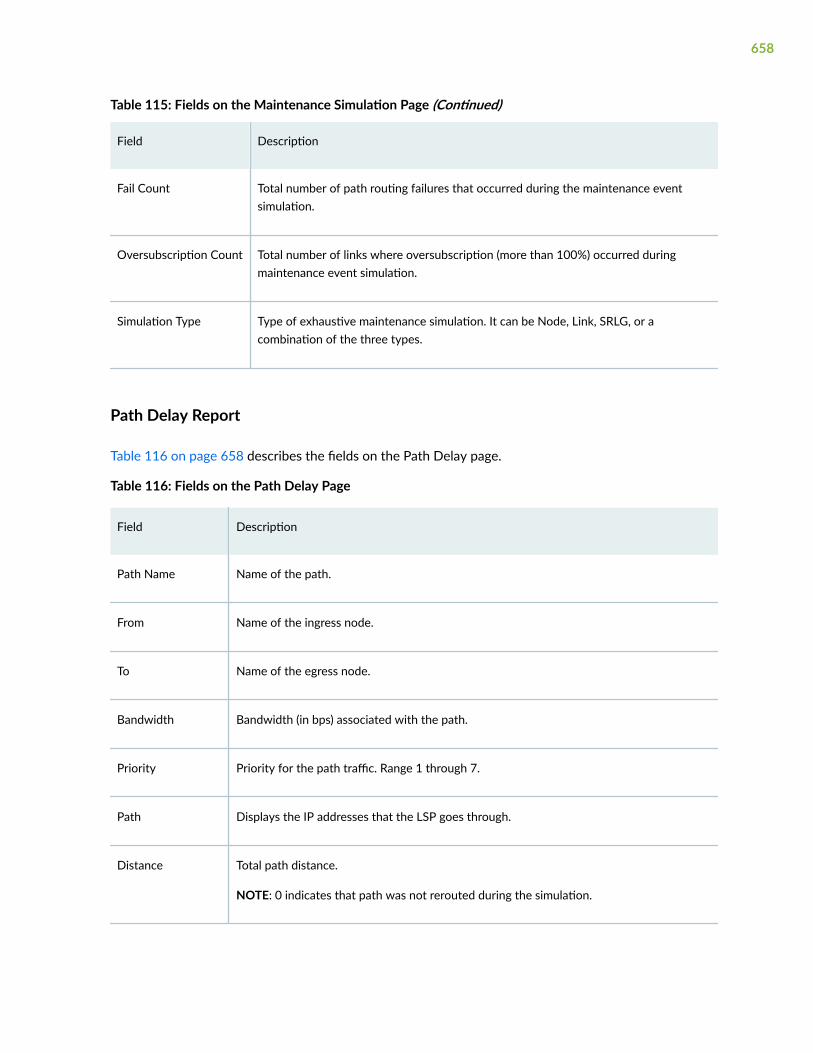
Table 115: Fields on the Maintenance Simulation Page (Continued)
Field Description
Fail Count Total number of path routing failures that occurred during the maintenance eventsimulation.
Oversubscription Count Total number of links where oversubscription (more than 100%) occurred duringmaintenance event simulation.
Simulation Type Type of exhaustive maintenance simulation. It can be Node, Link, SRLG, or acombination of the three types.
Path Delay Report
Table 116 on page 658 describes the fields on the Path Delay page.
Table 116: Fields on the Path Delay Page
Field Description
Path Name Name of the path.
From Name of the ingress node.
To Name of the egress node.
Bandwidth Bandwidth (in bps) associated with the path.
Priority Priority for the path traffic. Range 1 through 7.
Path Displays the IP addresses that the LSP goes through.
Distance Total path distance.
NOTE: 0 indicates that path was not rerouted during the simulation.
658

Table 116: Fields on the Path Delay Page (Continued)
Field Description
Delay Propagation delay of the path in normal mode.
Fail Count Number of times this path was disconnected during the maintenance event failuresimulation.
Worst Distance Worst path distance of the alternate routes that occurred during the maintenance eventfailure simulation.
Worst Delay Worst propagation delay of the alternate routes that occurred during the maintenanceevent failure simulation.
Worst Delay Cause Cause of the worst delay during the maintenance event simulation. It can be due to one ofthe following:
• NDFAIL (node failure)
• LINKFAIL (link failure)
• FACFAIL (facility failure)
• SIMPLACE (alias for element that is put under maintenance)
Delay Cause Event Network element that caused the worst delay during the maintenance event simulation. Itcan caused by a node, a link (From and To nodes are displayed), or a facility.
Peak Interface Utilization Report
Table 117 on page 659 describes fields on the Peak Interface Utilization page.
Table 117: Fields on the Peak Interface Utilization Page
Field Description
Node:Interface Name of the node and interface associated with the interface.
659

Table 117: Fields on the Peak Interface Utilization Page (Continued)
Field Description
Link Count Number of links associated to the interface.
Bandwidth Total bandwidth (in bps) available for the user traffic.
Used Bandwidth Bandwidth (in bps) used by tunnels in normal mode.
Peak Bandwidth Maximum bandwidth (in percentage) used by tunnels during the maintenance event failuresimulation. For example, 5 implies 50% utilization.
Utilization Bandwidth utilization (in percentage). It is calculated as 100*(UsedBandwidth/TotalBandwidth).
Peak Utilization Peak bandwidth utilization (in percentage). It is calculated as 100*(PeakBandwidth/TotalBandwidth).
Tunnel Count Number of tunnels carried by the link in normal mode.
Peak Tunnel Count Maximum number of tunnels carried by the link during the maintenance event failuresimulation.
Worst Load Cause Cause of the worst load (bandwidth utilization) during the maintenance event simulation.It can be due to one of the following:
• NDFAIL (node failure)
• LINKFAIL (link failure)
• FACFAIL (facility failure)
• SIMPLACE (alias for element that is put under maintenance)
Load Cause Event Network element that caused the worst load during the maintenance event simulation. Itcan caused by a node, a link (From and To nodes are displayed), or a facility.
660

Table 117: Fields on the Peak Interface Utilization Page (Continued)
Field Description
Worst Tunnel Cause Cause of the worst (or increased) tunnel count during the maintenance event simulation. Itcan be due to one of the following:
• NDFAIL (node failure)
• LINKFAIL (link failure)
• FACFAIL (facility failure)
• SIMPLACE (alias for element that is put under maintenance)
Tunnel Cause Event Network element that caused the worst tunnel count during the maintenance eventsimulation. It can caused by a node, a link (From and To nodes are displayed), or a facility.
Peak Link Utilization Report
Table 118 on page 661 describes the fields on Peak Link Utilization page.
Table 118: Fields on the Peak Link Utilization Page
Field Description
Link Name Name of the link.
Node A:Interface ID of node and associated interface for node A where the link originates.
Loc A Name of the source node where the link originates (ingress).
Node Z:Interface ID of node and associated interface for node Z where the link terminates (egress).
Loc Z Name of the node at Z end (egress).
661
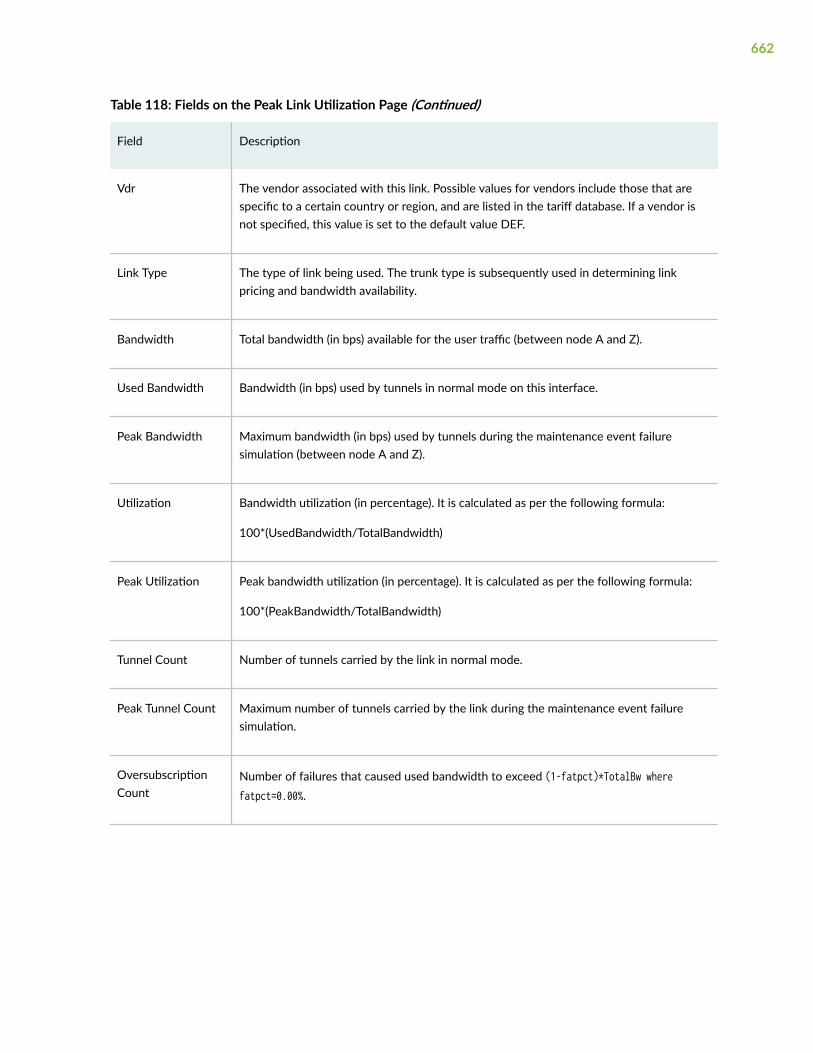
Table 118: Fields on the Peak Link Utilization Page (Continued)
Field Description
Vdr The vendor associated with this link. Possible values for vendors include those that arespecific to a certain country or region, and are listed in the tariff database. If a vendor isnot specified, this value is set to the default value DEF.
Link Type The type of link being used. The trunk type is subsequently used in determining linkpricing and bandwidth availability.
Bandwidth Total bandwidth (in bps) available for the user traffic (between node A and Z).
Used Bandwidth Bandwidth (in bps) used by tunnels in normal mode on this interface.
Peak Bandwidth Maximum bandwidth (in bps) used by tunnels during the maintenance event failuresimulation (between node A and Z).
Utilization Bandwidth utilization (in percentage). It is calculated as per the following formula:
100*(UsedBandwidth/TotalBandwidth)
Peak Utilization Peak bandwidth utilization (in percentage). It is calculated as per the following formula:
100*(PeakBandwidth/TotalBandwidth)
Tunnel Count Number of tunnels carried by the link in normal mode.
Peak Tunnel Count Maximum number of tunnels carried by the link during the maintenance event failuresimulation.
OversubscriptionCount
Number of failures that caused used bandwidth to exceed (1-fatpct)*TotalBw wherefatpct=0.00%.
662
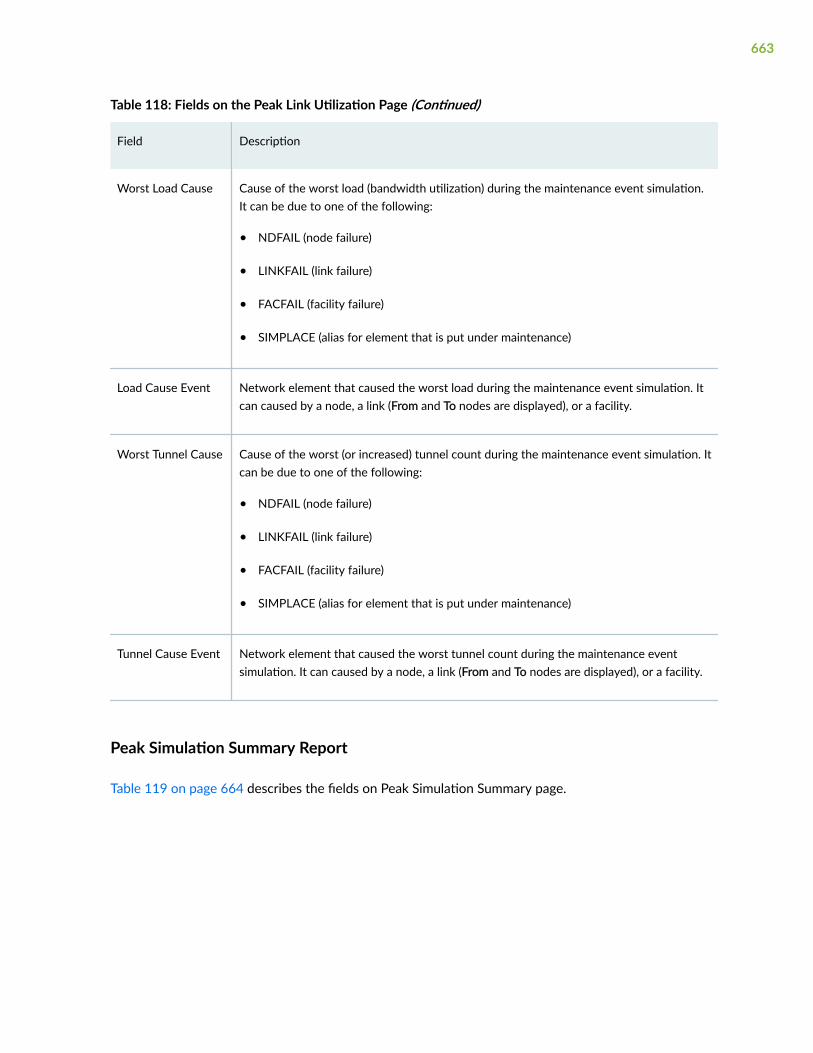
Table 118: Fields on the Peak Link Utilization Page (Continued)
Field Description
Worst Load Cause Cause of the worst load (bandwidth utilization) during the maintenance event simulation.It can be due to one of the following:
• NDFAIL (node failure)
• LINKFAIL (link failure)
• FACFAIL (facility failure)
• SIMPLACE (alias for element that is put under maintenance)
Load Cause Event Network element that caused the worst load during the maintenance event simulation. Itcan caused by a node, a link (From and To nodes are displayed), or a facility.
Worst Tunnel Cause Cause of the worst (or increased) tunnel count during the maintenance event simulation. Itcan be due to one of the following:
• NDFAIL (node failure)
• LINKFAIL (link failure)
• FACFAIL (facility failure)
• SIMPLACE (alias for element that is put under maintenance)
Tunnel Cause Event Network element that caused the worst tunnel count during the maintenance eventsimulation. It can caused by a node, a link (From and To nodes are displayed), or a facility.
Peak Simulation Summary Report
Table 119 on page 664 describes the fields on Peak Simulation Summary page.
663

Table 119: Fields on the Peak Simulation Summary Page
Field Description
Simulation Type Type of exhaustive maintenance simulation. It can be Node, Link, SRLG, or acombination of the three types.
Event Name of the network element under maintenance. It can be node name, link name orfacility (SRLG) name.
UP/Down Operation performed in the simulation—Up or Down.
Layer Type of Layer—Demand or Tunnel.
Impact Count Number of demands or tunnels impacted by the simulation.
Impact Bandwidth Total bandwidth (in bps) of the impacted demand or tunnel.
Fail Count Number of disconnected flows (demands or tunnels that were terminated at failednodes are not included).
Fail Bandwidth Total bandwidth (in bps) of disconnected flows
Fail BandwidthPercentage
100*FailedBandwidth/TotalFlowBandwidth percentage
Highest Priority Fail Highest priority of failed flows.
OversubscriptionCount
Number of links where bandwidth oversubscription has occurred.
Max Hop Maximum path hop count after failure.
Average Hop Average path hop count after failure.
Terminated Count Number of flows terminated at failed nodes.
664

Table 119: Fields on the Peak Simulation Summary Page (Continued)
Field Description
Terminated Bandwidth Total bandwidth (in bps) of flows terminated at failed nodes.
Peak Tunnel Failure
Table 120 on page 665 describes the fields on the Peak Tunnel Failure page.
Table 120: Fields on the Peak Tunnel Failure Page
Field Description
Simulation Type Type of exhaustive maintenance simulation. It can be Node, Link, SRLG, or acombination of the three types.
Event Name of the network element under maintenance. It can be node name, link name orfacility (SRLG) name.
Layer Type of Layer—Demand or Tunnel.
Path Name Name of the path.
From Name of the ingress node.
To Name of the egress node.
ToIPAddr IP address of the egress (To) node.
Bandwidth Total bandwidth (in bps) available for the user traffic.
Priority Setup and Hold priority for the LSP traffic. Range is 0 (highest priority) through 7(lowest priority). The default is 7, which is the standard MPLS LSP definition in JunosOS. For example, 7,0 implies that 7 is the setup priority and 0 is the hold priority.
665

Table 120: Fields on the Peak Tunnel Failure Page (Continued)
Field Description
Path Comment Comment (in text format) about the failed tunnel path. It can have one of the followingvalues:
• Not Routed—Tunnel has failed and has not been routed.
• Time Expired—Tunnel is no longer active in the network. For example, when youschedule an LSP, the LSP will be active only during the scheduled time period.When you run a maintenance simulation when this LSP is not in the scheduledtime period, it will be marked here as Time Expired.
Info Only when there is a node failure during maintenance simulation, this field displaysone of the following values:
• Pass Through—Implies that this LSP passes through but does not originate orterminates at the failed node.
• Terminated at Node—Implies that this LSP originates or terminates on the failednode.
666
CHAPTER 30
Analytics
IN THIS CHAPTER
Collect Analytics Data Overview | 667
View Analytics Data | 673
Collect Analytics Data Overview
IN THIS SECTION
Workflow to Collect Device Statistics | 669
Data Summarization and Retention Policy | 672
Paragon Automation Release 21.1 supports collecting analytics data from Juniper Networks devices andCisco IOS XR devices. Table 121 on page 668 lists the data that are collected from the JuniperNetworks devices and Cisco IOS XR devices.
667

Table 121: Data Collected for Analytics
Supported on
Data Collected byDefault
Ingest Type JuniperNetworksDevice
Cisco IOSXR
Rules Used to Collect Data
Label-SwitchedPath (LSP)statistics [RSVP,SR (both coloredand non-colored)][*
Yes JTI Yes No controller-telemetry /ctrl-label-switched-path
controller-telemetry /ctrl-label-switched-path-aggregation
Logical andphysicalinterfacestatistics
Yes JTI forJuniperNetworksdevices
OpenConfig forCisco IOSXR devices
Yes Yes controller-telemetry /ctrl-logical-interface
controller-telemetry /ctrl-logical-interface-aggregation,
controller-telemetry /ctrl-physical-interface
controller-telemetry /ctrl-physical-interface-aggregation
Segment ID(SID)
Yes JTI Yes No controller-telemetry /ctrl-sr-sid
Link Latency Yes iAgent Yes No controller-telemetry /ctrl-link-latency
LSP Latency Yes DerivedfromSyslog
Yes No contorller-telemetry /ctrl-lsp-latency
Quality ofService (QoS)
No JTI Yes No controller-telemetry /ctrl-egress-queue-interface
controller-telemetry /ctrl-ingress-queue-interface
668
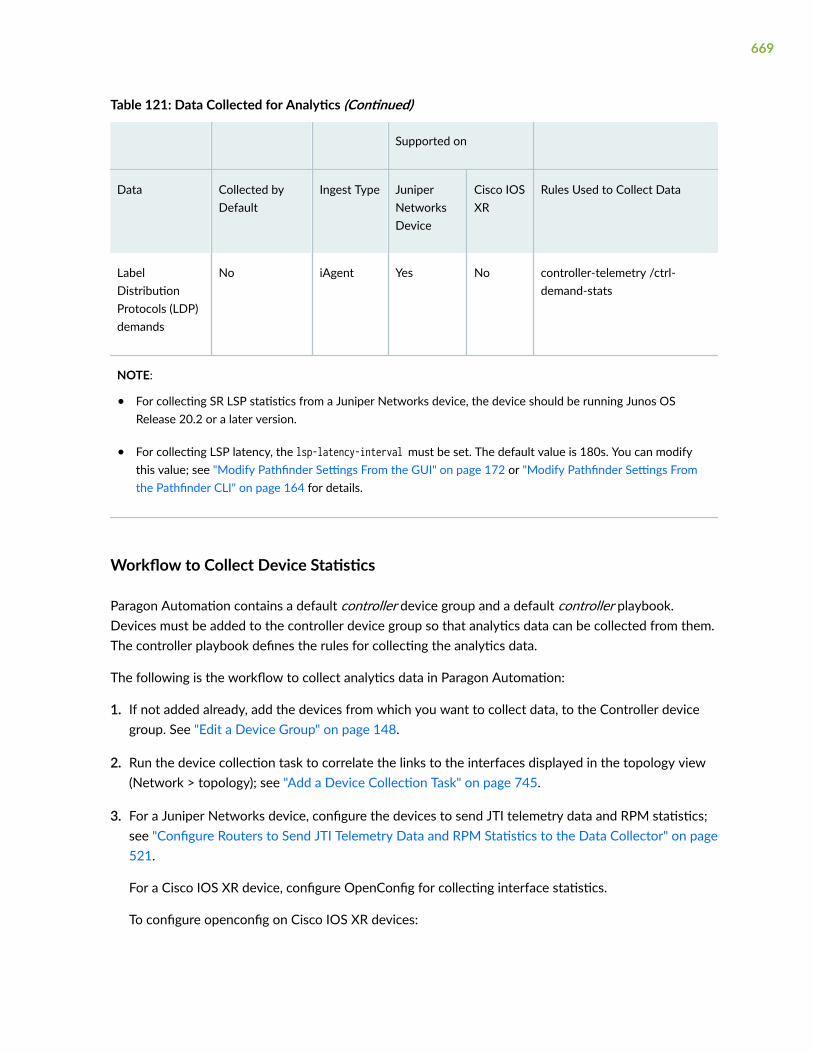
Table 121: Data Collected for Analytics (Continued)
Supported on
Data Collected byDefault
Ingest Type JuniperNetworksDevice
Cisco IOSXR
Rules Used to Collect Data
LabelDistributionProtocols (LDP)demands
No iAgent Yes No controller-telemetry /ctrl-demand-stats
NOTE:
• For collecting SR LSP statistics from a Juniper Networks device, the device should be running Junos OSRelease 20.2 or a later version.
• For collecting LSP latency, the lsp-latency-interval must be set. The default value is 180s. You can modifythis value; see "Modify Pathfinder Settings From the GUI" on page 172 or "Modify Pathfinder Settings Fromthe Pathfinder CLI" on page 164 for details.
Workflow to Collect Device Statistics
Paragon Automation contains a default controller device group and a default controller playbook.Devices must be added to the controller device group so that analytics data can be collected from them.The controller playbook defines the rules for collecting the analytics data.
The following is the workflow to collect analytics data in Paragon Automation:
1. If not added already, add the devices from which you want to collect data, to the Controller devicegroup. See "Edit a Device Group" on page 148.
2. Run the device collection task to correlate the links to the interfaces displayed in the topology view(Network > topology); see "Add a Device Collection Task" on page 745.
3. For a Juniper Networks device, configure the devices to send JTI telemetry data and RPM statistics;see "Configure Routers to Send JTI Telemetry Data and RPM Statistics to the Data Collector" on page521.
For a Cisco IOS XR device, configure OpenConfig for collecting interface statistics.
To configure openconfig on Cisco IOS XR devices:
669

a. Access the CLI of the IOS XR device.
b. Add the following configuration:
grpcport 32767no-tls!telemetry model-drivensensor-group JTIMON_INTERFACEsensor-path openconfig-interfaces:interfaces!subscription hbot_interfaces_sensor-group-id JTIMON_INTERFACE sample-interval 10000!subscription hbot_interfaces_interface_state_sensor-group-id JTIMON_INTERFACE sample-interval 10000!subscription hbot_interfaces_interface_subinterfaces_subinterface_state_sensor-group-id JTIMON_INTERFACE sample-interval 10000!!
c. Commit the configuration.
commit
4. Add optional rules to the controller playbook in Paragon Automation.
The rules for collecting LSP statistics, interface statistics, SID statistics, and link latency are added tothe controller playbook by default.
If you want to collect QoS and LDP demand statistics, you must add the rules for collecting thesestatistics manually. To add rules to the controller playbook.
a. Click the Configuration > Playbooks icon in the left navigation menu.
The Playbooks page appears.
b. Click the Controller playbook.
The Edit Playbook Controller page appears.
c. In the Rules field, click and select the following rules:
670

• controller-telemetry/ctrl-egress-queue-interface and controller-telemetry/ctrl-ingress-queue-interface for collecting QoS data.
• controller-telemetry/ctrl-demand-stats for collecting link delay statistics.
d. Click Save and Deploy.
A confirmation message appears that the playbook is successfully saved and deployed on thedevices in the controller device group.
For more details on editing a playbook, see "Edit a Playbook" on page 260
e. Pause the current playbook instance assigned to the controller device group and add the newplaybook instance. see "Manage Playbook Instances" on page 262 for details.
f. (Optional) Delete the paused playbook instance.
5. Commit the configuration.
commit
6. Add the following data rollup summarization profiles to the controller device group, if you addedrules for LDP demand statistics and QoS data in step "4" on page 670:
• ctrl-demand-stats-rollup-profile if you added rule for collecting LDP demand statistics.
• ctrl-egress-queue-interface-rollup-profile and ctrl-ingress-queue-interface-rollup-profile if youadded rule for collecting QoS data.
controller-default-rollup-profile is added to the controller device group by default.
For details about data summarization profiles, see "About the Data Summarization Page" on page 459and "Apply Data Summarization Profiles" on page 466.
•
7. Add devices to the collector device group to enable collecting the device data;
You can either add a device to a device group by.
• Editing the controller device group to add more devices; see "Edit a Device Group" on page 148
• Assigning the device to the controller device group; see "Edit Devices" on page 135
NOTE: The Junos telemetry interface (JTI) sensors use the system ID parameter of JuniperNetworks devices to collect data from the devices. So, if not already configured in Paragon
671

Automation, configure the system ID for the Juniper Networks devices. The system ID shouldbe in the following format: <host_name>:<jti_ip_address> and should have the same value asconfigured on the device; see "Edit Devices" on page 135 for configuring the system ID of adevice in Paragon Automation.
Data Summarization and Retention Policy
Paragon Automation uses summarization (rollup) profiles to rollup data so that the data is stored in asmaller disk space and performance of the time-series database (TSDB) is improved. Raw network anddevice data are grouped together into hourly and daily data by using aggregate functions. For moreinformation on data summarization, see "About the Data Summarization Page" on page 459.
By default, the data is retained for the following duration: :
• Daily rollup data is stored for 1000 days.
• Hourly rollup data is stored for 180 days.
• Raw data is stored for 14 days.
You can modify the default duration for which the rollup data is retained from the Ingest Settings pageAdministration > Ingest Settings > Retention Policy.
The network archive task uses the rolled-up data for providing network statistics. Also, statistics aredisplayed on the topology graphs by fetching long range data from rolled-up measurements based onthe rollup-query-cutoff-interval pathfinder setting.
rollup-query-cutoff-interval defines the time period for which raw data or rolled-up data is fetched. If datais queried for a time period less than or equal to the value set in rollup-query-cutoff-interval, raw data isfetched, If data is queried for a time greater than rollup-query-cutoff-interval, hourly rolled-up data isfetched. The default value is set to 7 days; that is, by default, rolled-up data is fetched when queried fordata greater than 7 days. For information about setting the rollup-query-cutoff-interval parameter, see"Modify Pathfinder Settings From the GUI" on page 172 or "Modify Pathfinder Settings From thePathfinder CLI" on page 164.
672
View Analytics Data
IN THIS SECTION
Analytics Widgets View | 673
Network Performance Data | 679
Traffic Through a Node | 683
Traffic and Delay Information for a Link | 684
Traffic and Delay Information for a Tunnel | 685
Traffic and Delay Information for an Interface | 687
Analytics Information on the Topology Map | 689
You can view the analytics data collected for your network so that the data can be interpreted and actedupon. You can view the network analytics data in:
• Widgets on the dashboard; see "Analytics Widgets View" on page 673
• Performance data in the topology view; see "Network Performance Data" on page 679
• Network information table
• Node traffic; see "Traffic Through a Node" on page 683
• Link data; see "Traffic and Delay Information for a Link" on page 684
• Tunnel data; see "Traffic and Delay Information for a Tunnel" on page 685
• Interface data; see "Traffic and Delay Information for an Interface" on page 687
• Topology view; see "Analytics Information on the Topology Map" on page 689.
Analytics data is collected in two forms—Historical data and Live aggregated data.
The historical data is used for generating network reports. The live aggregated data for one minute isdisplayed in the topology view.
Analytics Widgets View
The following widgets on the dashboard display the analytics data:
673
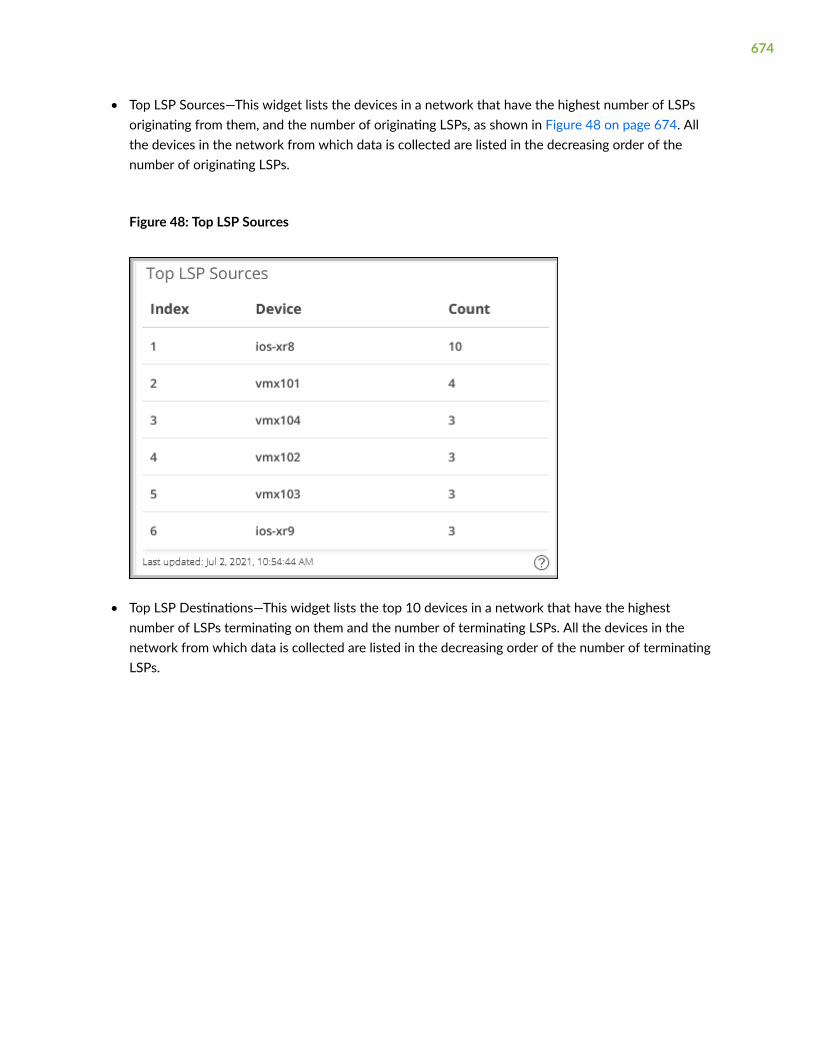
• Top LSP Sources—This widget lists the devices in a network that have the highest number of LSPsoriginating from them, and the number of originating LSPs, as shown in Figure 48 on page 674. Allthe devices in the network from which data is collected are listed in the decreasing order of thenumber of originating LSPs.
Figure 48: Top LSP Sources
• Top LSP Destinations—This widget lists the top 10 devices in a network that have the highestnumber of LSPs terminating on them and the number of terminating LSPs. All the devices in thenetwork from which data is collected are listed in the decreasing order of the number of terminatingLSPs.
674

• LSP Summary—This widget displays a bar graph that indicates the number of primary, secondary, andstandby LSPs that are Up (or Active) and Down in a network as shown in Figure 49 on page 675.
Figure 49: LSP Summary
675

• Top 10 Traffic-Devices—This widget displays a bar graph of the top 10 devices through whichmaximum traffic (in bps) is flowing, as shown in Figure 50 on page 676.
Figure 50: Top 10 Devices with Maximum Traffic
676
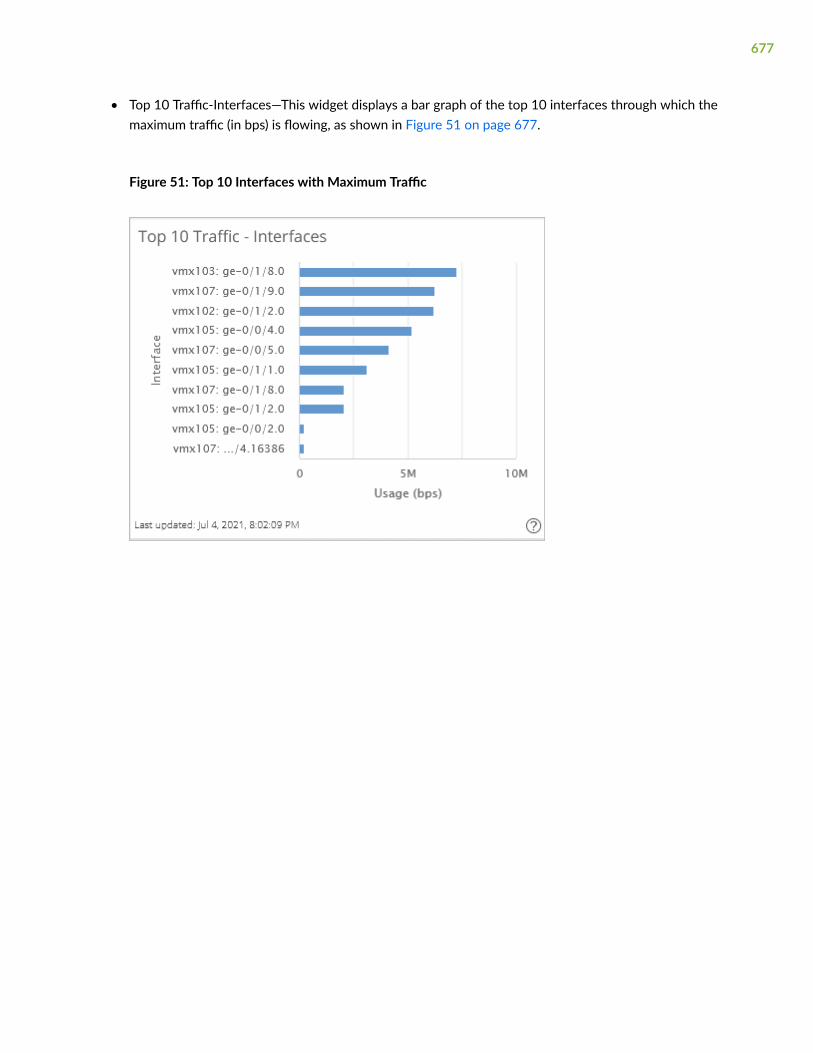
• Top 10 Traffic-Interfaces—This widget displays a bar graph of the top 10 interfaces through which themaximum traffic (in bps) is flowing, as shown in Figure 51 on page 677.
Figure 51: Top 10 Interfaces with Maximum Traffic
677

• Top 10 Traffic-LSPs—This widget displays a bar graph of the top 10 LSPs through which maximumtraffic ((in bps) is flowing, as shown in Figure 52 on page 678.
Figure 52: Top 10 LSPs with Maximum Traffic
• Top 10 Delay-Interfaces—This widget displays a bar graph of the top 10 interfaces with the maximummeasured delay.
678

• LSP Hop Count—This widget displays a bar graph of the hop count for each type of LSP (PCE-initiated, Delegated, and Device-controlled), as shown in Figure 53 on page 679.
Figure 53: LSP Hop Count
Network Performance Data
You can view the network performance in the topology view (Network > Topology). The topology view isupdated once every minute. You can view the following network performance data on the topologyview:
• RSVP Live Utilization—Shows the bandwidth utilization as reported by the devices from the trafficengineering database (through IGP).
• RSVP Utilization—Shows the color-coded links based on the reserved bandwidth, as calculated byParagon Pathfinder from the existing reservations (reported by using PCEP and/or Netconf). Thecolor legend is displayed at the bottom right corner of the topology view.
679
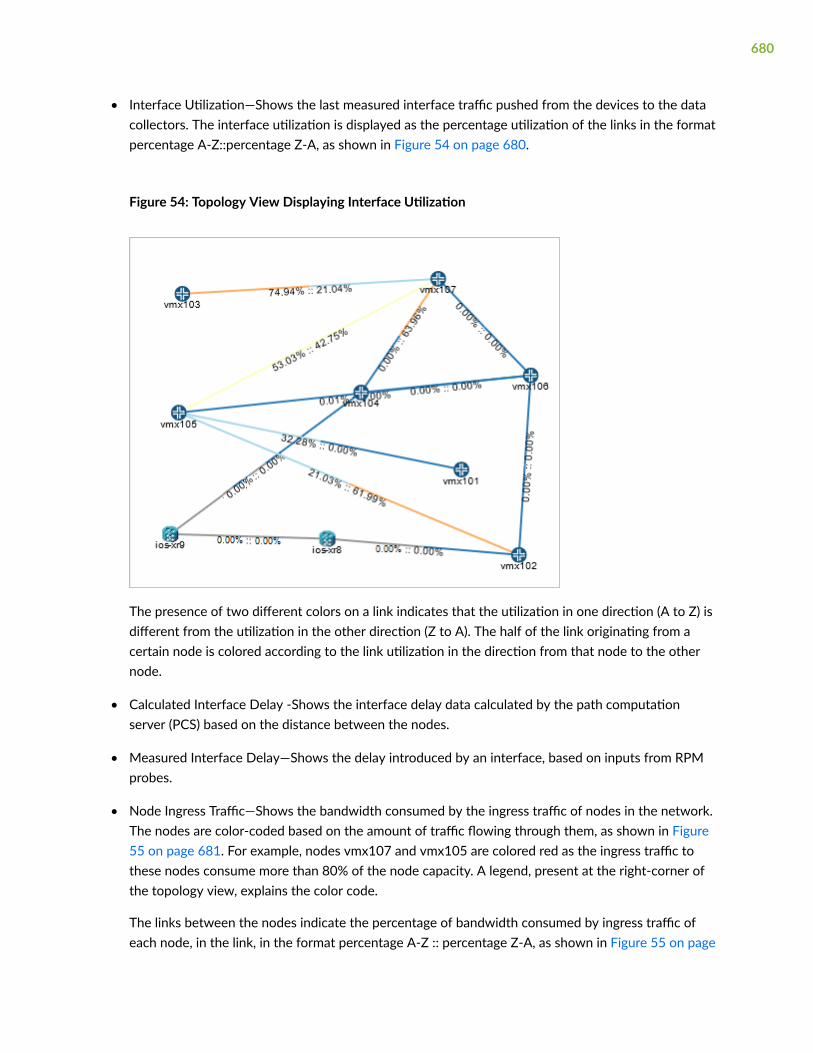
• Interface Utilization—Shows the last measured interface traffic pushed from the devices to the datacollectors. The interface utilization is displayed as the percentage utilization of the links in the formatpercentage A-Z::percentage Z-A, as shown in Figure 54 on page 680.
Figure 54: Topology View Displaying Interface Utilization
The presence of two different colors on a link indicates that the utilization in one direction (A to Z) isdifferent from the utilization in the other direction (Z to A). The half of the link originating from acertain node is colored according to the link utilization in the direction from that node to the othernode.
• Calculated Interface Delay -Shows the interface delay data calculated by the path computationserver (PCS) based on the distance between the nodes.
• Measured Interface Delay—Shows the delay introduced by an interface, based on inputs from RPMprobes.
• Node Ingress Traffic—Shows the bandwidth consumed by the ingress traffic of nodes in the network.The nodes are color-coded based on the amount of traffic flowing through them, as shown in Figure55 on page 681. For example, nodes vmx107 and vmx105 are colored red as the ingress traffic tothese nodes consume more than 80% of the node capacity. A legend, present at the right-corner ofthe topology view, explains the color code.
The links between the nodes indicate the percentage of bandwidth consumed by ingress traffic ofeach node, in the link, in the format percentage A-Z :: percentage Z-A, as shown in Figure 55 on page
680
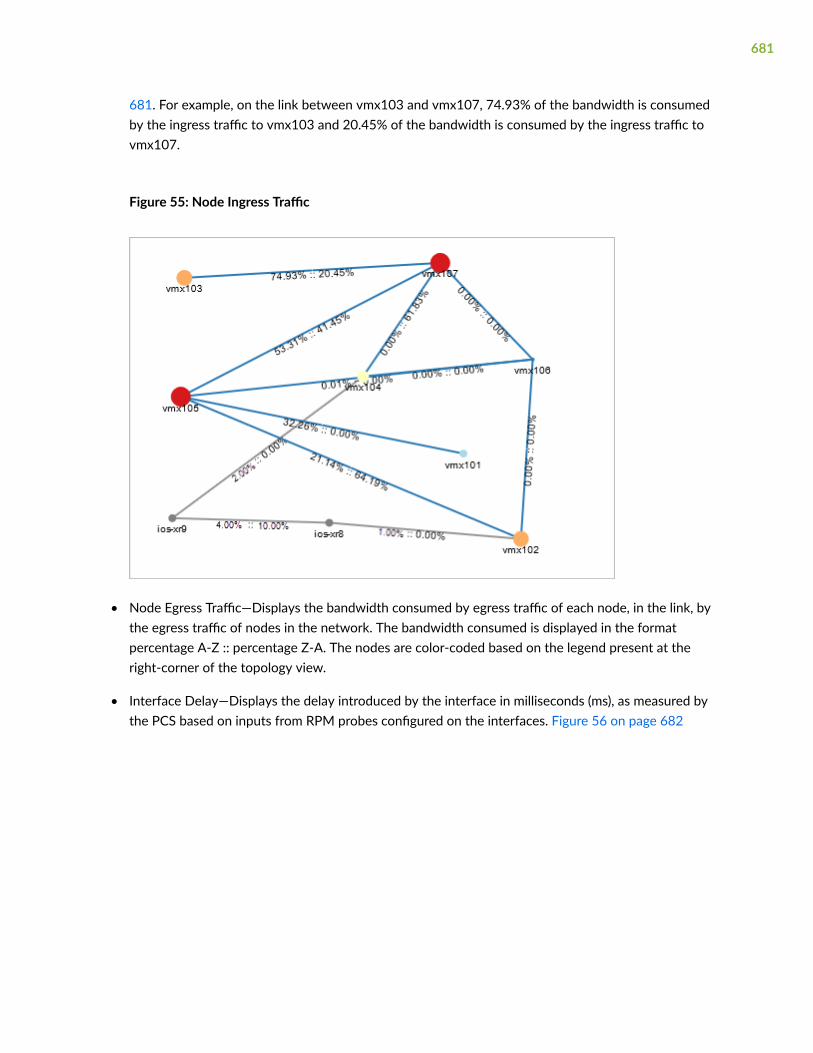
681. For example, on the link between vmx103 and vmx107, 74.93% of the bandwidth is consumedby the ingress traffic to vmx103 and 20.45% of the bandwidth is consumed by the ingress traffic tovmx107.
Figure 55: Node Ingress Traffic
• Node Egress Traffic—Displays the bandwidth consumed by egress traffic of each node, in the link, bythe egress traffic of nodes in the network. The bandwidth consumed is displayed in the formatpercentage A-Z :: percentage Z-A. The nodes are color-coded based on the legend present at theright-corner of the topology view.
• Interface Delay—Displays the delay introduced by the interface in milliseconds (ms), as measured bythe PCS based on inputs from RPM probes configured on the interfaces. Figure 56 on page 682
681

shows a topology view with the measured interface delay displayed on the links in the format delayA-Z :: delay Z-A.
Figure 56: Interface Delay
• Historical Interface Utilization—Shows the average interface utilization over a six day period; seeFigure 54 on page 680.
NOTE:
• Node egress traffic, node ingress traffic, and interface delay are historical data. You can viewthe current interface utilization and also historical interface utilization.
• The RSVP and live RSVP utilization data displayed might be different due to the way the liveutilization is reported. To reduce flooding, devices only report reservation changes wheneversome thresholds are crossed. In addition, the RSVP utilization can take into account other
682
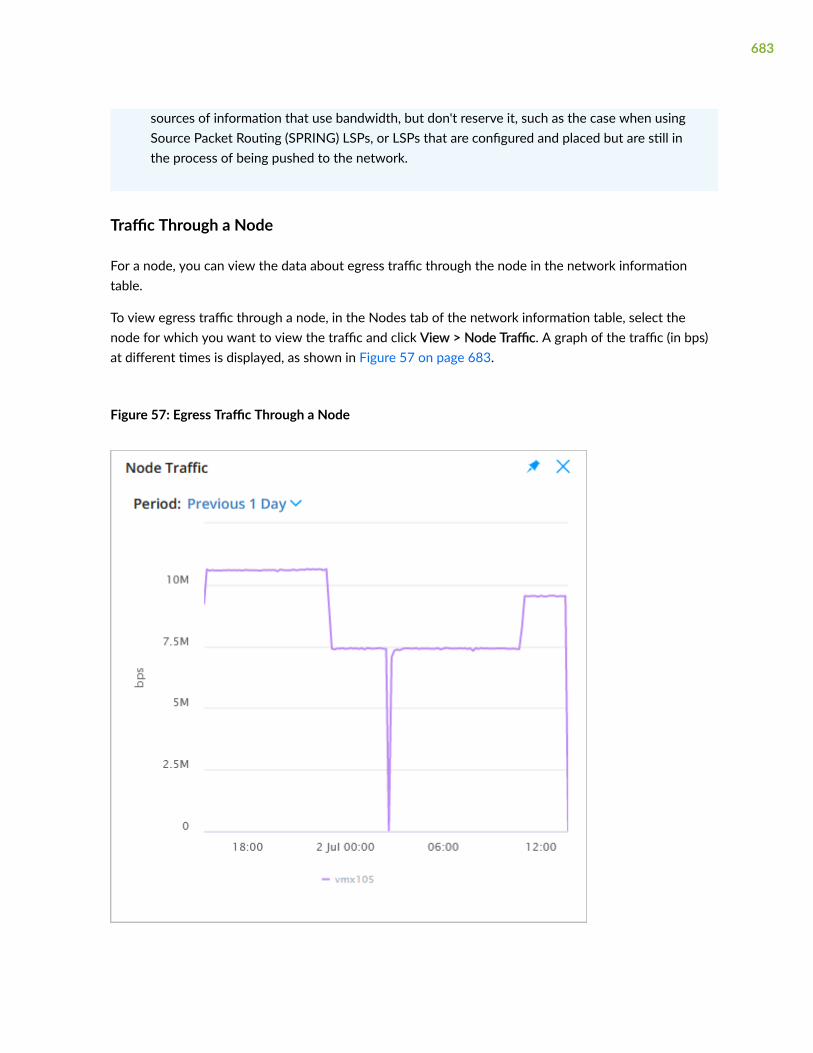
sources of information that use bandwidth, but don't reserve it, such as the case when usingSource Packet Routing (SPRING) LSPs, or LSPs that are configured and placed but are still inthe process of being pushed to the network.
Traffic Through a Node
For a node, you can view the data about egress traffic through the node in the network informationtable.
To view egress traffic through a node, in the Nodes tab of the network information table, select thenode for which you want to view the traffic and click View > Node Traffic. A graph of the traffic (in bps)at different times is displayed, as shown in Figure 57 on page 683.
Figure 57: Egress Traffic Through a Node
683
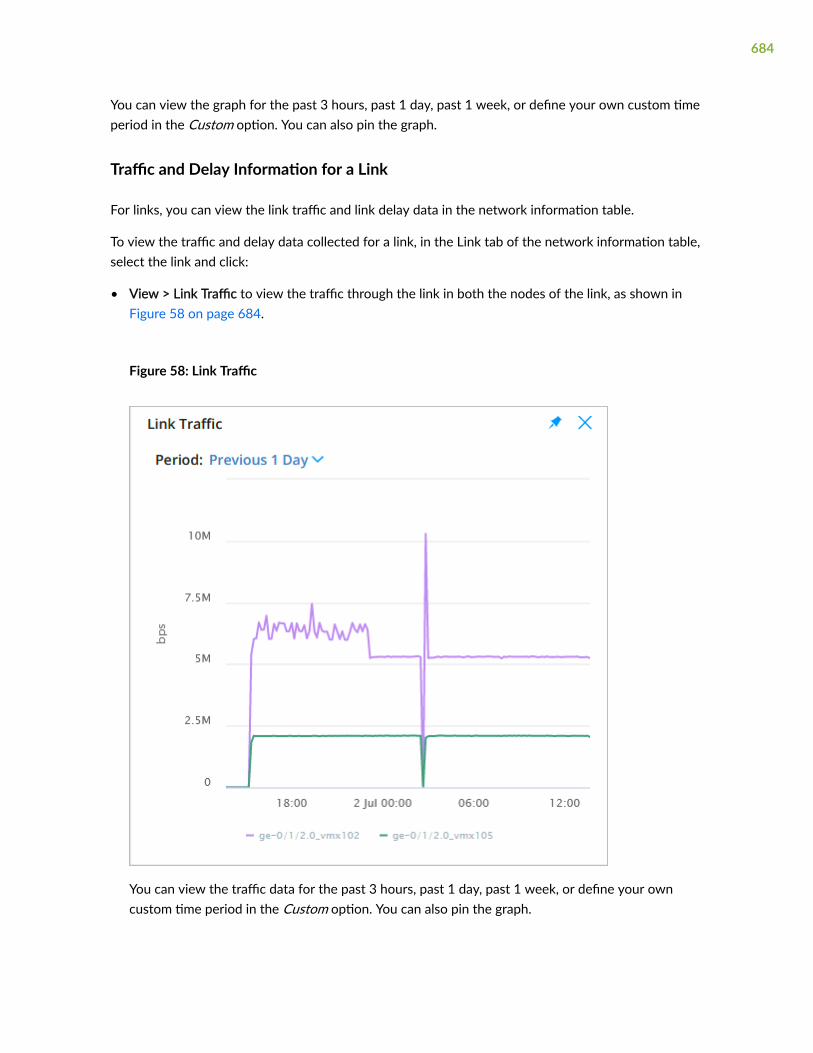
You can view the graph for the past 3 hours, past 1 day, past 1 week, or define your own custom timeperiod in the Custom option. You can also pin the graph.
Traffic and Delay Information for a Link
For links, you can view the link traffic and link delay data in the network information table.
To view the traffic and delay data collected for a link, in the Link tab of the network information table,select the link and click:
• View > Link Traffic to view the traffic through the link in both the nodes of the link, as shown inFigure 58 on page 684.
Figure 58: Link Traffic
You can view the traffic data for the past 3 hours, past 1 day, past 1 week, or define your owncustom time period in the Custom option. You can also pin the graph.
684
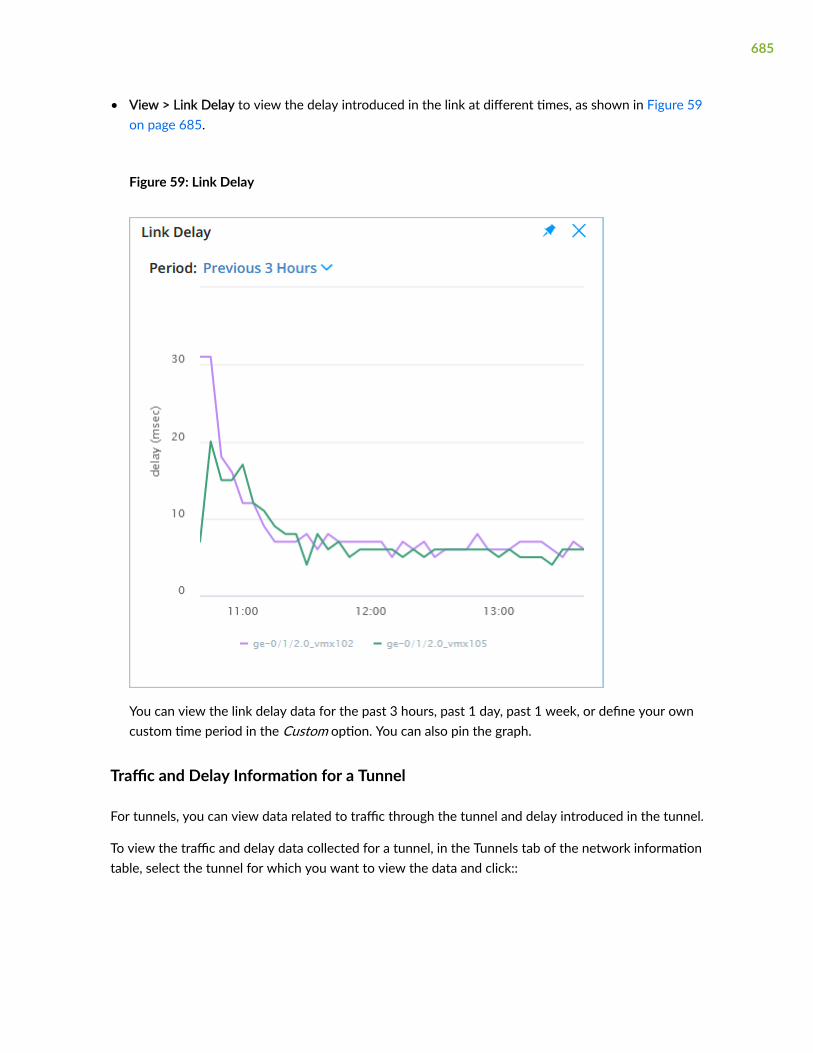
• View > Link Delay to view the delay introduced in the link at different times, as shown in Figure 59on page 685.
Figure 59: Link Delay
You can view the link delay data for the past 3 hours, past 1 day, past 1 week, or define your owncustom time period in the Custom option. You can also pin the graph.
Traffic and Delay Information for a Tunnel
For tunnels, you can view data related to traffic through the tunnel and delay introduced in the tunnel.
To view the traffic and delay data collected for a tunnel, in the Tunnels tab of the network informationtable, select the tunnel for which you want to view the data and click::
685

• View > LSP Traffic to view the traffic through the tunnel, as shown in Figure 60 on page 686.
Figure 60: Tunnel Traffic
NOTE: You can view LSP traffic data only for Juniper Networks devices.
You can view the link delay data for the past 3 hours, past 1 day, past 1 week, or define your owncustom time period in the Custom option. You can also pin the graph.
• View > Delay to view the delay introduced in the tunnel, as calculated by the PCS based on inputsfrom RPM probes, configured on the interfaces.
At any given time, the path computation element (PCE) is aware of the paths of all LSPs in thenetwork. Periodically, the controller uses the reported link delays to compute the end-to-end LSPdelay as the simple sum of all link delays in the LSP path.
686
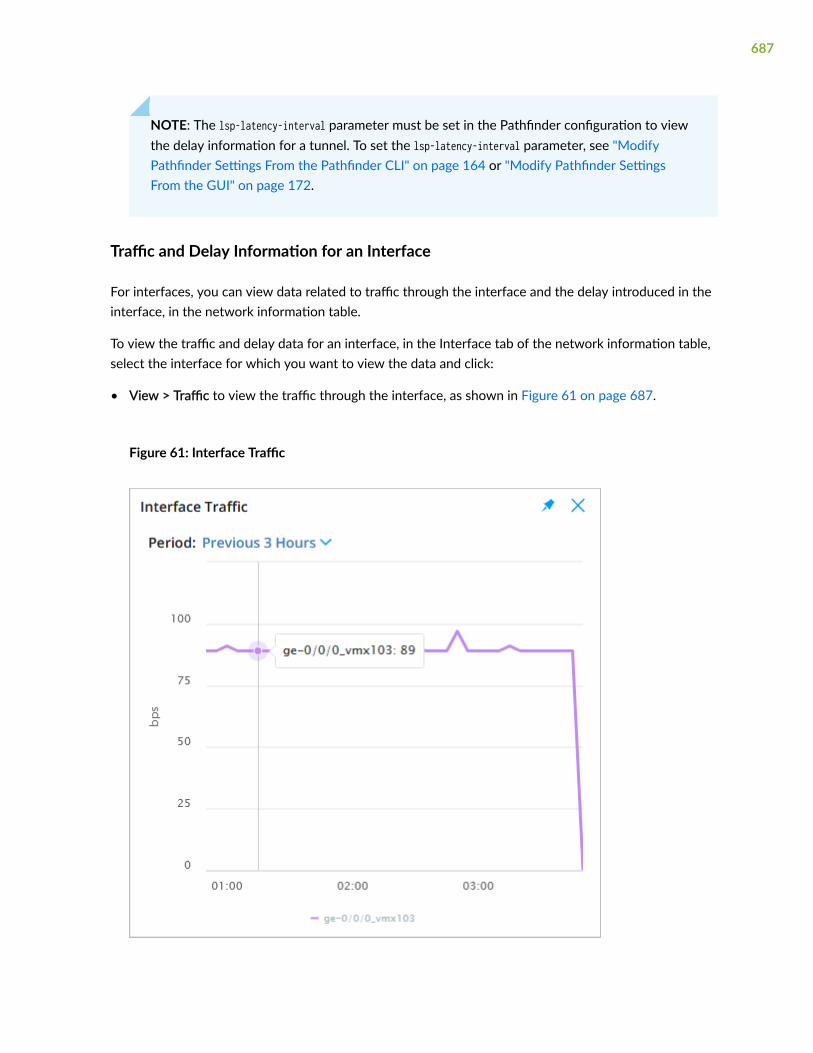
NOTE: The lsp-latency-interval parameter must be set in the Pathfinder configuration to viewthe delay information for a tunnel. To set the lsp-latency-interval parameter, see "ModifyPathfinder Settings From the Pathfinder CLI" on page 164 or "Modify Pathfinder SettingsFrom the GUI" on page 172.
Traffic and Delay Information for an Interface
For interfaces, you can view data related to traffic through the interface and the delay introduced in theinterface, in the network information table.
To view the traffic and delay data for an interface, in the Interface tab of the network information table,select the interface for which you want to view the data and click:
• View > Traffic to view the traffic through the interface, as shown in Figure 61 on page 687.
Figure 61: Interface Traffic
687

You can view the interface traffic data for the past 3 hours, past 1 day, past 1 week, or define yourown custom time period in the Custom option. You can also pin the graph.
• View > Delay to view the delay introduced in the interface, as shown in Figure 62 on page 688.
Figure 62: Interface Delay
You can view the interface delay data for the past 3 hours, past 1 day, past 1 week, or define yourown custom time period in the Custom option. You can also pin the graph.
Interface delay information is available only if:
• RPM probes are configured on the nodes.
• The rpm-log.slax script is loaded, to send the results of the probes to the data collectors.
NOTE: Paragon Automation does not automate the installation of this script on the router.You must install the script manually.
688

Analytics Information on the Topology Map
You can view the following analytics information on the topology map:
• Delay A-Z
• Measured delay A-Z
• Interface utilization
• RSVP bandwidth A-Z
• RSVP utilization A-Z
• RSVP live utilization A-Z
To view the information on the topology map, right-click on a link and select Link Label > Parameter asshown in Figure 63 on page 689.
Figure 63: Parameters to View Link Information
689

Figure 64 on page 690 shows the measured delay on a link displayed on the topology map.
Figure 64: Measured Delay Displayed on a Link
You can similarly view interface utilization, bandwidth, and other parameters of a link by right-clickingon a link and selecting the respective parameter for Link Label.
690

CHAPTER 31
691

9PART
Administration
Manage E-mail Templates | 693
Manage Audit Logs | 697
Configure External EMS | 701
Manage Ingest Settings | 707
Manage Task Scheduler | 735
Manage Security Settings | 764
License Management | 768

CHAPTER 32
Manage E-mail Templates
IN THIS CHAPTER
E-mail Templates Overview | 693
About the E-mail Templates Page | 694
Edit an E-mail Template | 695
E-mail Templates Overview
Paragon Automation Release 21.1 provides the following e-mail templates to communicate events, suchas user account created, password changed, and so on, related to a user account. The e-mail templatesare mapped to specific events and when the specific event occurs, the corresponding e-mail is sent fromParagon Automation to the user. For example, when a user account is created, the activation mail is sentout to the user informing about the user’s username, a link to set the password and the link to accessthe Paragon Automation portal.
You must first configure SMTP on Paragon Automation for the e-mails to be sent to the user. Forinformation about configuring SMTP settings, see "Configure SMTP Settings" on page 46.
Table 122 on page 693 describes the default e-mail templates provided by Paragon Automation.
Table 122: Default E-mail Templates
Template Name Description
Account Locked A mail is sent using this template when a user attempts to log in by using an incorrectpassword for more than five times.
Activation User Link A mail is sent using this template when you resend the activation link to a user.
Changed Password A mail is sent using this template when a user changes their password.
693

Table 122: Default E-mail Templates (Continued)
Template Name Description
Forgot AccountPassword
A mail is sent using this template when a user clicks the Forgot Password link in theParagon Automation Login page. The e-mail has the link the reset the password.
Invite User A mail is sent using this template when a user who is already added to a tenant adds auser to another tenant.
NOTE: This template is not applicable for this release.
Rest Your AccountPassword
A mail is sent using this template for a user to reset their Paragon Automation accountpassword. The account password must be changed once every three months.
New AccountCreated
A mail is sent using this template when a new user account is created. The e-mail containsthe link to set password, the username to log in to the Paragon Automation GUI and theURL of the Paragon Automation GUI.
Activate User A mail is sent to you, when you need to unlock a user or activate a user whose invite hasexpired. The mail contains the link to activate the user.
RELATED DOCUMENTATION
About the E-mail Templates Page | 694
About the E-mail Templates Page
IN THIS SECTION
Tasks You Can Perform | 695
Field Descriptions | 695
To access this page, click Administration > Authentication > Email Templates.
694
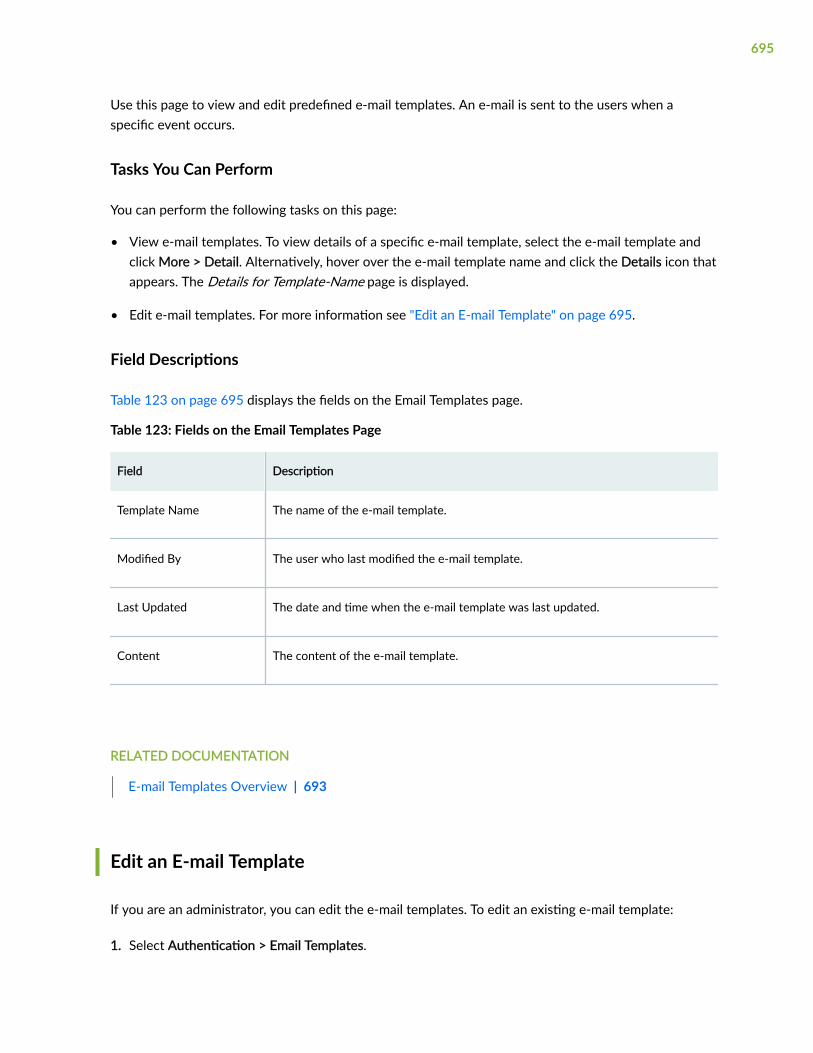
Use this page to view and edit predefined e-mail templates. An e-mail is sent to the users when aspecific event occurs.
Tasks You Can Perform
You can perform the following tasks on this page:
• View e-mail templates. To view details of a specific e-mail template, select the e-mail template andclick More > Detail. Alternatively, hover over the e-mail template name and click the Details icon thatappears. The Details for Template-Name page is displayed.
• Edit e-mail templates. For more information see "Edit an E-mail Template" on page 695.
Field Descriptions
Table 123 on page 695 displays the fields on the Email Templates page.
Table 123: Fields on the Email Templates Page
Field Description
Template Name The name of the e-mail template.
Modified By The user who last modified the e-mail template.
Last Updated The date and time when the e-mail template was last updated.
Content The content of the e-mail template.
RELATED DOCUMENTATION
E-mail Templates Overview | 693
Edit an E-mail Template
If you are an administrator, you can edit the e-mail templates. To edit an existing e-mail template:
1. Select Authentication > Email Templates.
695

The Email Templates page is displayed.
2. Select the e-mail template that you want to edit and click the edit (pencil) icon.
The Edit Email Template page appears.
3. Edit the content of the e-mail.
The e-mail template is in the Jinja format. You cannot edit the name of the e-mail template.
NOTE: If you want to view the default content at this stage, you can click Restore DefaultContent. However, the edits that you have made will not be saved.
4. Click OK to save the changes that you have made to the default content.
You have edited the content in the e-mail template.
RELATED DOCUMENTATION
E-mail Templates Overview | 693
696
CHAPTER 33
Manage Audit Logs
IN THIS CHAPTER
Audit Logs Overview | 697
About the Audit Logs Page | 698
Export Audit Logs | 699
Audit Logs Overview
An audit log is a record of a sequence of activities that have affected a specific operation or procedure.Audit logs are useful for tracing events and for maintaining historical data.
Audit logs contain information about tasks initiated by using the Paragon Automation GUI or APIs. Inaddition to providing information about the resources that were accessed, audit log entries usuallyinclude details about user-initiated tasks, such as the name of the user who initiated a task, the status ofthe task, and date and time of execution.
NOTE: Device-driven tasks (that is, tasks not initiated by the user) are not recorded in audit logs.
RELATED DOCUMENTATION
About the Audit Logs Page | 698
697
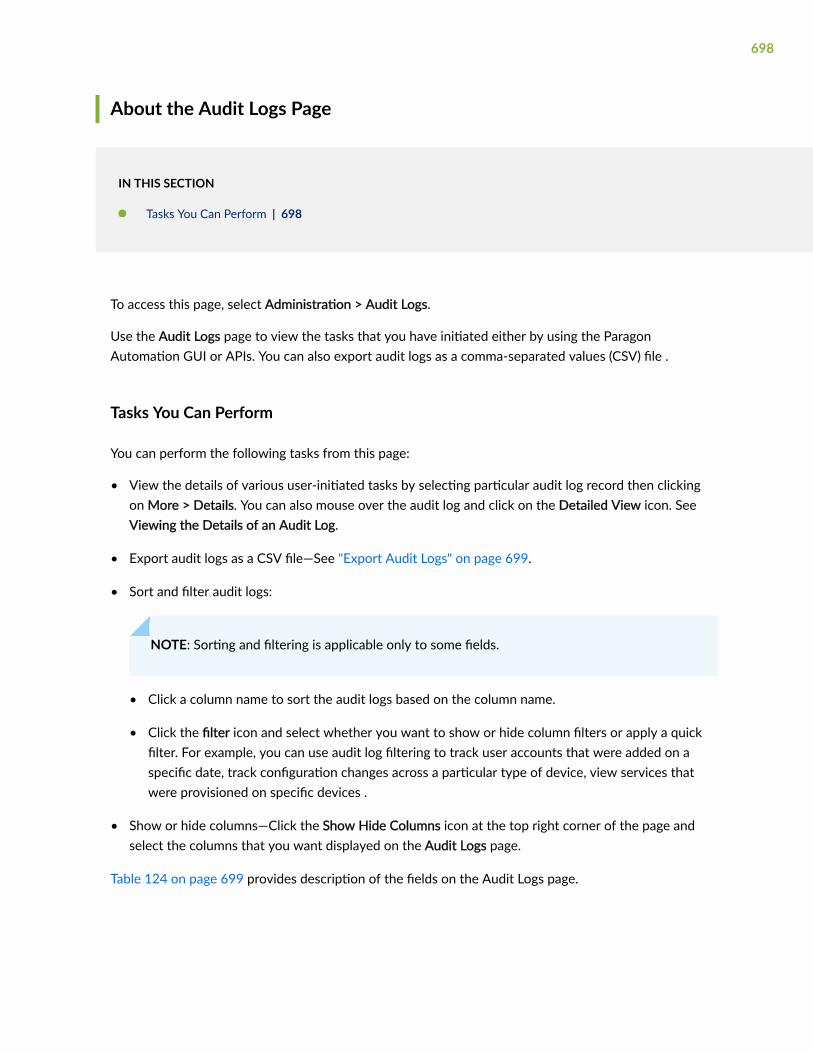
About the Audit Logs Page
IN THIS SECTION
Tasks You Can Perform | 698
To access this page, select Administration > Audit Logs.
Use the Audit Logs page to view the tasks that you have initiated either by using the ParagonAutomation GUI or APIs. You can also export audit logs as a comma-separated values (CSV) file .
Tasks You Can Perform
You can perform the following tasks from this page:
• View the details of various user-initiated tasks by selecting particular audit log record then clickingon More > Details. You can also mouse over the audit log and click on the Detailed View icon. SeeViewing the Details of an Audit Log.
• Export audit logs as a CSV file—See "Export Audit Logs" on page 699.
• Sort and filter audit logs:
NOTE: Sorting and filtering is applicable only to some fields.
• Click a column name to sort the audit logs based on the column name.
• Click the filter icon and select whether you want to show or hide column filters or apply a quickfilter. For example, you can use audit log filtering to track user accounts that were added on aspecific date, track configuration changes across a particular type of device, view services thatwere provisioned on specific devices .
• Show or hide columns—Click the Show Hide Columns icon at the top right corner of the page andselect the columns that you want displayed on the Audit Logs page.
Table 124 on page 699 provides description of the fields on the Audit Logs page.
698

Table 124: Fields on the Audit Logs Page
Field Description
Username Displays the username of the user who initiated the task.
Source IP Displays the IP address of the client from which the user initiated the task. For tasks that do nothave an associated Source IP address, this field is blank.
Object Name Displays the name of the object on which the task was initiated. An object can be a tenant, site,device, device image, template, and so on.
Operation Displays the name of the task that triggered the audit log.
Description Displays details about the task.
Status Displays the status of the task that triggered the audit log:
• Success—Job or task was completed successfully.
• Failure—Job or task failed and was terminated.
Logged time Time at which audit log is recorded.
Job ID Job ID contains a uniquely identified job which is associated with the audit log activity. The JobID value is a hyperlink, clicking it will open the Job overlay page which displays completeinformation about that particular job
Export Audit Logs
You can export audit logs as comma-separated values (CSV) file that can be opened or edited using anapplication such as Microsoft Excel. You can view and analyze the exported audit logs, as needed.
To export the audit logs:
1. Select Administration > Audit Logs. The Audit Logs page appears displaying the audit logs.
2. Click Export Logs> CSV.
699

A pop-up appears, with the following two options:
• Continue—To download all audit logs with all fields in CSV files.
• Filter—To minimize the content of export audit log, this option can be used to filter audit log fields.
NOTE: You can export audit logs for a maximum of 30 days prior to the current date and time.For example, if the current date is May 31, 2018, you can export the audit logs starting fromMay 1, 2018.
3. Click OK to export the audit logs. Depending on the settings of the browser that you are using, theCSV file containing the audit logs for the specified time period is either downloaded directly, or youare asked to open or save the file. You are returned to the Audit Logs page. After the file isdownloaded, you can open the CSV file in an application such as Microsoft Excel and view andanalyze the logs as required.
RELATED DOCUMENTATION
About the Audit Logs Page | 698
700
CHAPTER 34
Configure External EMS
IN THIS CHAPTER
About the External EMS Page | 701
Add an External EMS | 703
Edit and Delete an External EMS | 705
About the External EMS Page
IN THIS SECTION
Tasks You Can Perform | 702
Field Descriptions | 703
External EMS refers to a software such as Anuta ATOM, Contrail Service Orchestration, Junos SpaceSecurity Director, or any other open source software with EMS capabilities, that can be integrated withParagon Automation. When you integrate an External EMS with Paragon Automation, the devicesmanaged by the External EMS are added to Paragon Automation and you can manage those devices byusing Paragon Automation.
You can use this feature when you already have an EMS application managing your devices and you planto use Paragon Automation for managing devices going forward.
NOTE: Anuta ATOM is the only external EMS supported in Paragon Automation Release 21.1.
To access this page, click Administration > External EMS.
701
Tasks You Can Perform
You can perform the following tasks from this page:
• Add an External EMS application; see "Add an External EMS" on page 703.
• Edit and delete an External EMS application from Paragon Automation; see "Edit and Delete anExternal EMS" on page 705.
• Filter Entries—Filter the table entries by adding new filtering criteria.
Hover over the Filter (funnel) icon and select Add Filter. On the Add Criteria page, select the filteringcriteria from the Field and Condition list, and enter the text to be compared in the Value field. ClickAdd.
The filtered table entries are listed and the filter criteria name is displayed above the table columnnames.
You can click the cross (X) icon (next to the filter name) to remove the filtering criteria.
NOTE:
• You can add multiple filtering criteria. Once you add the multiple filtering criteria, you canselect the And condition to display the entries matching all the filtering criteria or selectthe Or condition to display the entries matching any one of the filtering criteria.
• Quick filter: Save the filtering criteria as quick filters. Once you have added all the filteringcriteria, you can save a particular criteria or multiple criteria for future use by clicking Save.
On the Save Filter window, enter a name for the filter, optionally toggle the Set as Defaultbutton if you want to use this filtering criteria by default, and click OK.
The saved filters are displayed under Quick Filters when you hover over the Filter (funnel)icon. You can then apply these saved filters to the table entries.
• Show/Hide Columns—Choose to show or hide a specific column in the table.
Hover over the More Options (vertical ellipsis) > Show/Hide Columns and select the Column-Namecheck box of the columns you want to display in the table.
• Reset Preference—Reset the displayed columns to the default set of columns for each tab in thetable.
Hover over the More Options (vertical ellipsis) and select Reset Preference.
702

• Sort Entries—Click the column name to highlight the up and down arrows next to the column name.Sort the table entries in ascending or descending order of that column by clicking the up or downarrow respectively.
Field Descriptions
Table 125 on page 703 lists the fields on the External EMS page.
Table 125: Fields on the External EMS Page
Field Description
Type The External EMS application.
Server Address The IPv4 address to access the External EMS application.
Username The username to log in to the External EMS application.
Parameters The parameters such as client ID and client secret configured for connecting with theExternal EMS application.
RELATED DOCUMENTATION
Integration with Anuta ATOM Overview | 86
About the Identity Providers Page | 77
Add an External EMS
Only an administrator or a user with privileges to add an External EMS application can add an ExternalEMS application to Paragon Automation.
Before you add an External EMS to Paragon Automation, ensure that you have an account created in theEMS application. To add the external EMS application to Paragon Automation, you need to provide thecredentials of your account in the external EMS application.
To add an external EMS to Paragon Automation:
1. Click Administration >External EMS in the left navigation menu.
703

The External EMS page appears.
2. Enter values referring to Table 126 on page 704.
3. Click OK.
A message indicating whether the External EMS application was successfully added or not isdisplayed. The External EMS application is listed on the External EMS page if the operation issuccessful.
Table 126 on page 704 lists the fields on the Add External EMS page.
Table 126: Fields on the Add External EMS Page
Field Description
Type Select the External EMS application that you want to integrate with Paragon Automationfrom the list. ATOM is the only supported external EMS in Paragon Automation Release21.1.
Server Address Enter the IPv4 address to access the External EMS application.
Username Enter the username to log in to the External EMS application.
Password Enter the password to log in to the External EMS application.
Parameters Add parameters, such as client ID and client secret, for connecting with the External EMSapplication.
To add the parameters, click the Add icon (+) provided in the Parameters field and enter theparameter and corresponding value in the text fields that appear. Add more parameters byclicking the Add (+) icon.
RELATED DOCUMENTATION
Register Paragon Automation with Keycloak | 90
Add Identity Providers | 80
704

Edit and Delete an External EMS
IN THIS SECTION
Edit an External EMS | 705
Delete an External EMS | 705
Only an administrator or a user with privileges to edit or delete an External EMS application can edit ordelete an External EMS application.
Edit an External EMS
You can edit the following parameters of an external EMS:
• IPv4 address to access the external EMS application.
• Username and password to log in to the external EMS application.
• Any parameters that are configured for connecting with the external EMS.
To edit an External EMS application:
1. Click Administration > External EMS in the left navigation menu.
The External EMS page appears.
2. Select the EMS that you want to edit and click the Edit (Pencil) icon .
The Edit External EMS page appears.
3. Edit the parameters by referring to Table 126 on page 704 and click OK.
A message appears indicating that the external EMS application is edited successfully and theupdates are displayed on the External EMS page.
Delete an External EMS
Only an administrator or a user with privileges to delete an External EMS application can delete anExternal EMS application.
To delete an EMS application that is integrated with Paragon Automation:
1. Click Administration > External EMS in the left navigation menu.
The External EMS page appears.
2. Select the External EMS application that you want to delete and click the Delete icon (Trashcan).
705
A confirmation message appears asking you to confirm whether you want to delete the application.
3. Click OK.
A message appears indicating that the external EMS application is deleted successfully and theExternal EMS application is no longer listed on the External EMS page.
SEE ALSO
About the External EMS Page | 701
Register Paragon Automation with Keycloak | 90
706

CHAPTER 35
Manage Ingest Settings
IN THIS CHAPTER
About the Ingest Settings Page | 707
Add Alert Blackouts | 711
About Alert Notifications | 713
Configure a Notification Profile | 713
Enable Alert Notifications for Device Groups and Network Groups | 719
Configure Report Settings | 720
Create a Scheduler Profile | 722
Configure a Retention Policy | 723
Configure Destination Settings | 725
Time Series Database (TSDB) Overview | 726
Manage TSDB Settings | 730
Backup and Restore the TSDB | 732
About the Ingest Settings Page
IN THIS SECTION
Tasks You Can Perform | 708
Field Descriptions | 708
To access this page from the Paragon Automation graphical user interface (GUI), click Administration >Ingest Settings.
707

Each time you navigate to Administration > Ingest Settings page, you first see the Alert BlackoutSettings tab. To view the other tabbed pages, click the tabs on the left. For example, click RetentionPolicy to view the Retention Policy Settings tab.
Tasks You Can Perform
You can perform the following tasks from this page:
• Add blackout periods for an alarm. See "Add Alert Blackouts" on page 711.
• Configure a notification profile. See "Configure a Notification Profile" on page 713.
• Configure a retention policy for the time series database (TSDB). See "Configure a Retention Policy"on page 723.
• Configure destination settings. See "Configure Destination Settings" on page 725.
• Create scheduler profiles. See "Create a Scheduler Profile" on page 722.
• Generate a report on demand. See "Configure Report Settings" on page 720.
• Configure TSDB settings. See "Manage TSDB Settings" on page 730.
Field Descriptions
Table 127 on page 708 describes the fields on the Ingest Settings page.
Table 127: Fields on the Ingest Settings Page
Field Description
Fields on the Alert Blackout Settings page
Device Group View the device group to which the blackout profile isapplied.
Topic View the topic(s) to which the blackout profile isapplied.
Resource View the resource(s) to which the blackout profile isapplied.
708
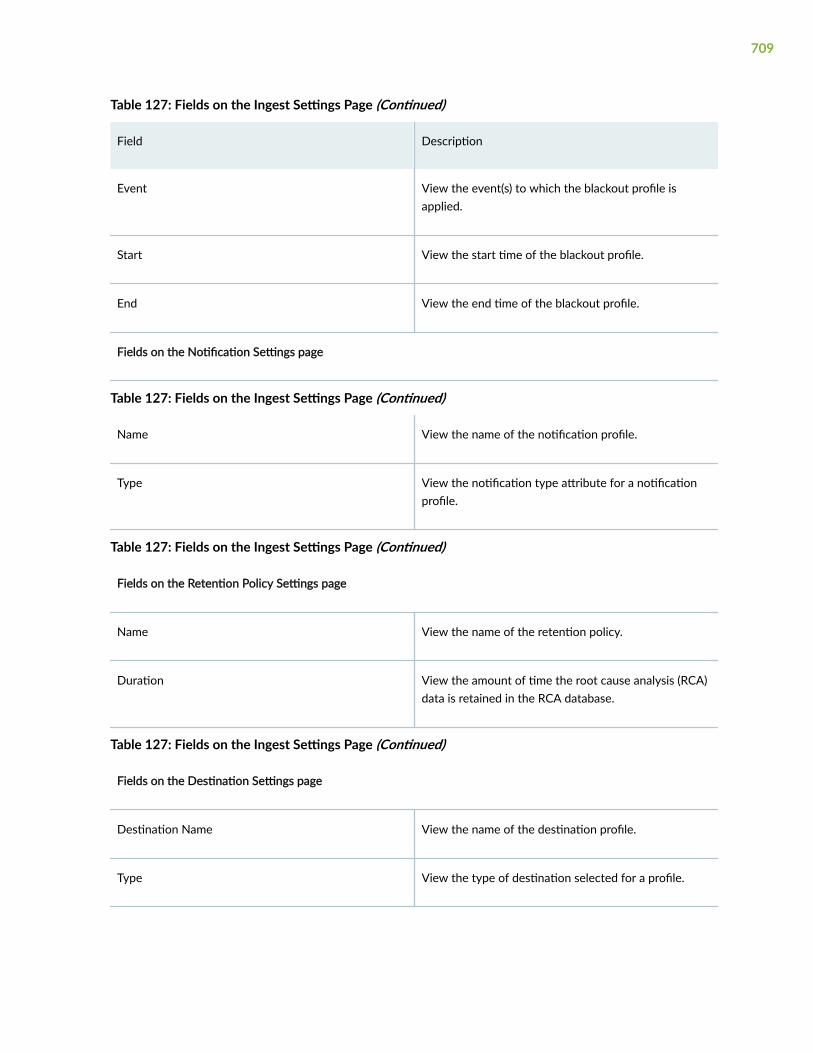
Table 127: Fields on the Ingest Settings Page (Continued)
Field Description
Event View the event(s) to which the blackout profile isapplied.
Start View the start time of the blackout profile.
End View the end time of the blackout profile.
Fields on the Notification Settings page
Table 127: Fields on the Ingest Settings Page (Continued)
Name View the name of the notification profile.
Type View the notification type attribute for a notificationprofile.
Table 127: Fields on the Ingest Settings Page (Continued)
Fields on the Retention Policy Settings page
Name View the name of the retention policy.
Duration View the amount of time the root cause analysis (RCA)data is retained in the RCA database.
Table 127: Fields on the Ingest Settings Page (Continued)
Fields on the Destination Settings page
Destination Name View the name of the destination profile.
Type View the type of destination selected for a profile.
709
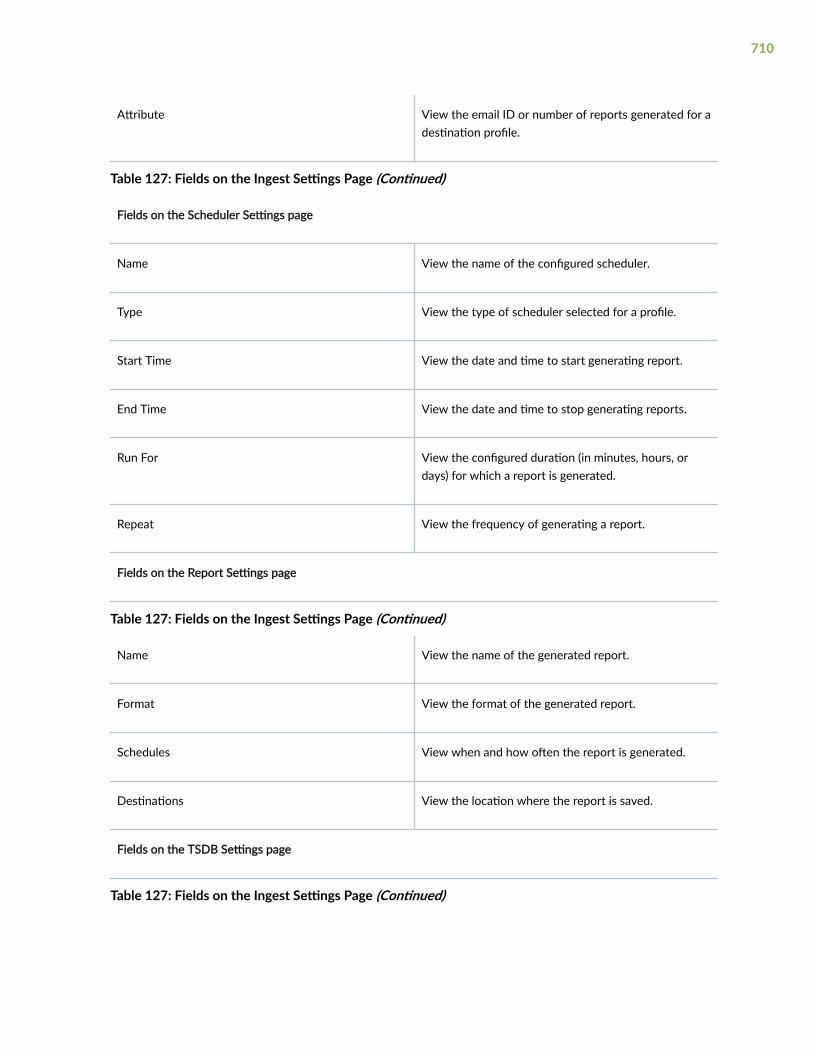
Attribute View the email ID or number of reports generated for adestination profile.
Table 127: Fields on the Ingest Settings Page (Continued)
Fields on the Scheduler Settings page
Name View the name of the configured scheduler.
Type View the type of scheduler selected for a profile.
Start Time View the date and time to start generating report.
End Time View the date and time to stop generating reports.
Run For View the configured duration (in minutes, hours, ordays) for which a report is generated.
Repeat View the frequency of generating a report.
Fields on the Report Settings page
Table 127: Fields on the Ingest Settings Page (Continued)
Name View the name of the generated report.
Format View the format of the generated report.
Schedules View when and how often the report is generated.
Destinations View the location where the report is saved.
Fields on the TSDB Settings page
Table 127: Fields on the Ingest Settings Page (Continued)
710

TSDB Nodes View the available TSDB nodes in the Paragon Insightsinstallation.
Replication Factor Enter a value to determine how many copies of thedatabase is needed.
Dedicate Set the slider to true to dedicate the node to TSDB.
Force Set the slider to true to ignore all system errors whenyou remove a failed TSDB node.
Add Alert Blackouts
You can add blackout periods to suppress or mute alarms during scheduled downtimes.
To add blackouts from the Paragon Automation graphical user interface (GUI):
1. Navigate to the Administration > Ingest Settings page.
The Alert Blackout Settings page is displayed.
2. Click (+) icon to add a new alert blackout setting.
The Add Alert Blackout page is displayed.
3. Enter the following information to configure a blackout alert:
Attributes Description
Blackout Start Select a blackout start date and time.
Blackout End Select a blackout end date and time.
Device Group Select a device group from the drop-down list to apply the blackout configuration.
Attribute Select an attribute from the drop-down list to apply the blackout configuration.
711

(Continued)
Attributes Description
Value If you have selected an attribute, provide a corresponding associated value. Only the alarmsthat match this attribute value will be suppressed from the alarms report table.
• If you have selected Resource as the attribute, select a corresponding value from theValue drop-down list.
• If you have selected Resource-Event as the attribute, select a corresponding value fromthe Value drop-down list.
• If you have selected Event as the attribute, enter an event in the Event text box.
• If you have selected Topic as the attribute, enter a topic in the Topic text box.
For example, for the Resource-Event attribute, you must specify a resource value from theValue drop-down list, as well as specify an Event value. Only those alarms generated by thespecified resource that match the Event value will be suppressed from the alarms reporttable.
Event Enter the name of the event that you want to apply the blackout configuration to.
The field is enabled when you select Event or Resource-Event attributes from the Attributedrop-down list.
4. Click Save to save the configuration.
RELATED DOCUMENTATION
About the Ingest Settings Page | 707
Configure a Notification Profile | 713
Configure a Retention Policy | 723
Configure Destination Settings | 725
Create a Scheduler Profile | 722
Configure Report Settings | 720
Manage TSDB Settings | 730
712

About Alert Notifications
Paragon Automation generates alerts that indicate when specific KPI events occur on your devices. Toreceive alert notifications for these KPI events, you must first configure a notification profile. Onceconfigured, you can enable alert notifications for specific device groups and network groups.
Paragon Automation supports the following notification delivery methods:
• Web Hook
• Slack
• Kafka Publish
• AMQP
• Microsoft Teams
You can perform the following tasks to enable a device group or network group to send alarmnotifications:
• To configure a notification profile. See "Configure a Notification Profile" on page 713.
• To enable alert notifications in device groups or network groups. See "Enable Alert Notifications forDevice Groups and Network Groups" on page 719.
Configure a Notification Profile
Configure a notification profile to define the delivery method used for sending notifications.
To configure a notification profile from the Paragon Automation graphical user interface (GUI):
1. Click Administration > Ingest Settings.
The Ingest Settings page is displayed.
2. Click the Notification tab to view the Notification Settings page.
3. Click (+) icon to add a new notification.
The Add Notification Setting page is displayed.
4. Enter the following information in the Add Notification Setting page:
713
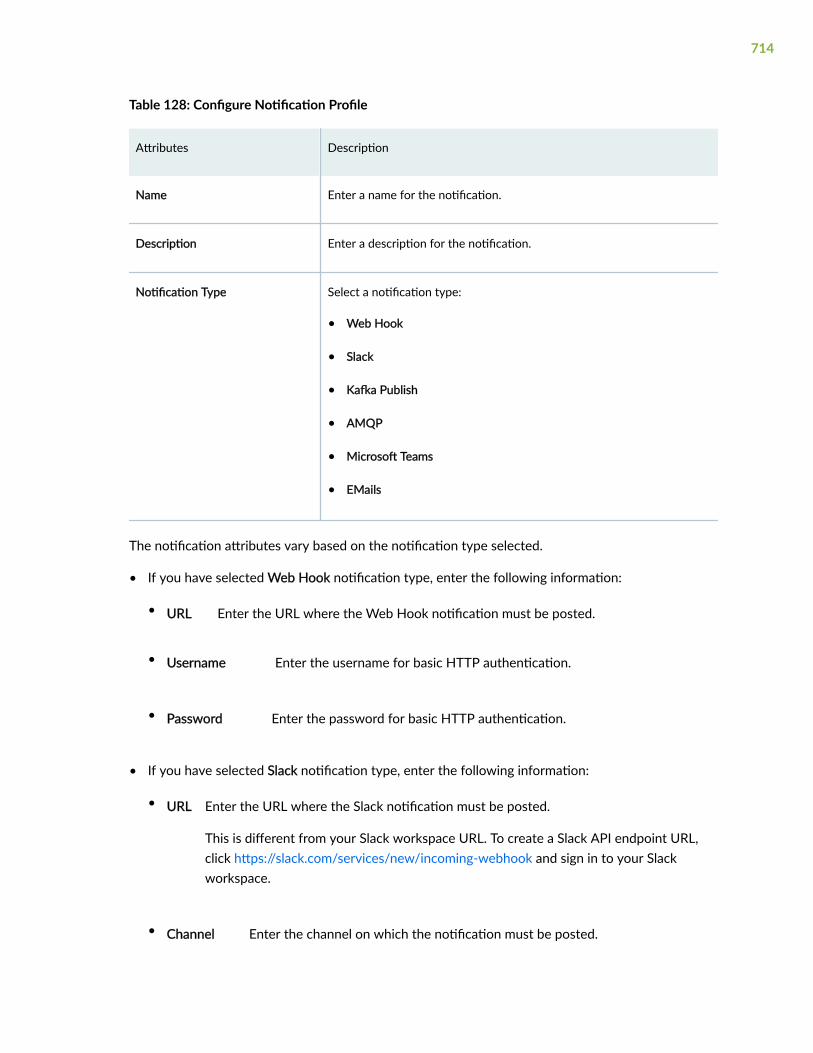
Table 128: Configure Notification Profile
Attributes Description
Name Enter a name for the notification.
Description Enter a description for the notification.
Notification Type Select a notification type:
• Web Hook
• Slack
• Kafka Publish
• AMQP
• Microsoft Teams
• EMails
The notification attributes vary based on the notification type selected.
• If you have selected Web Hook notification type, enter the following information:
• URL Enter the URL where the Web Hook notification must be posted.
• Username Enter the username for basic HTTP authentication.
• Password Enter the password for basic HTTP authentication.
• If you have selected Slack notification type, enter the following information:
• URL Enter the URL where the Slack notification must be posted.
This is different from your Slack workspace URL. To create a Slack API endpoint URL,click https://slack.com/services/new/incoming-webhook and sign in to your Slackworkspace.
• Channel Enter the channel on which the notification must be posted.
714

• If you have selected Kafka Publish notification type, enter the following information:
• Bootstrap Servers Enter Kafka host:port pairs to establish the initial connection to the Kafkacluster.
• Use Hash Partitioner Select this check box to store messages in consistent partitions basedon a partitioning scheme (key).
• Topic Enter the name of the Kafka topic in which data must be published.
By default, the Kafka topic naming convention for device group alarm notifications isdevice-group.device-id.topic.rule.trigger.
• Depending on the authentication protocols being used, the required authenticationparameters are listed here:
Protocol Required Parameters
SASL/SSL Username, password and certificate
SASL/Plaintext Username and password
SSL Certificate
Plaintext None
• Username Enter username for SASL/SSL or SASL/plaintext authentication.
• Password Enter password for SASL/SSL or SASL/plaintext authentication.
• Certificate Select Kafka server’s CA certificate from the drop-down list.
• UploadCertificate
Click Choose files and navigate to the location of the file that you wantto upload. The file must be in Privacy Enhanced Mail (.pem) format.
• If you selected AMQP Publish notification type, enter the following information:
715
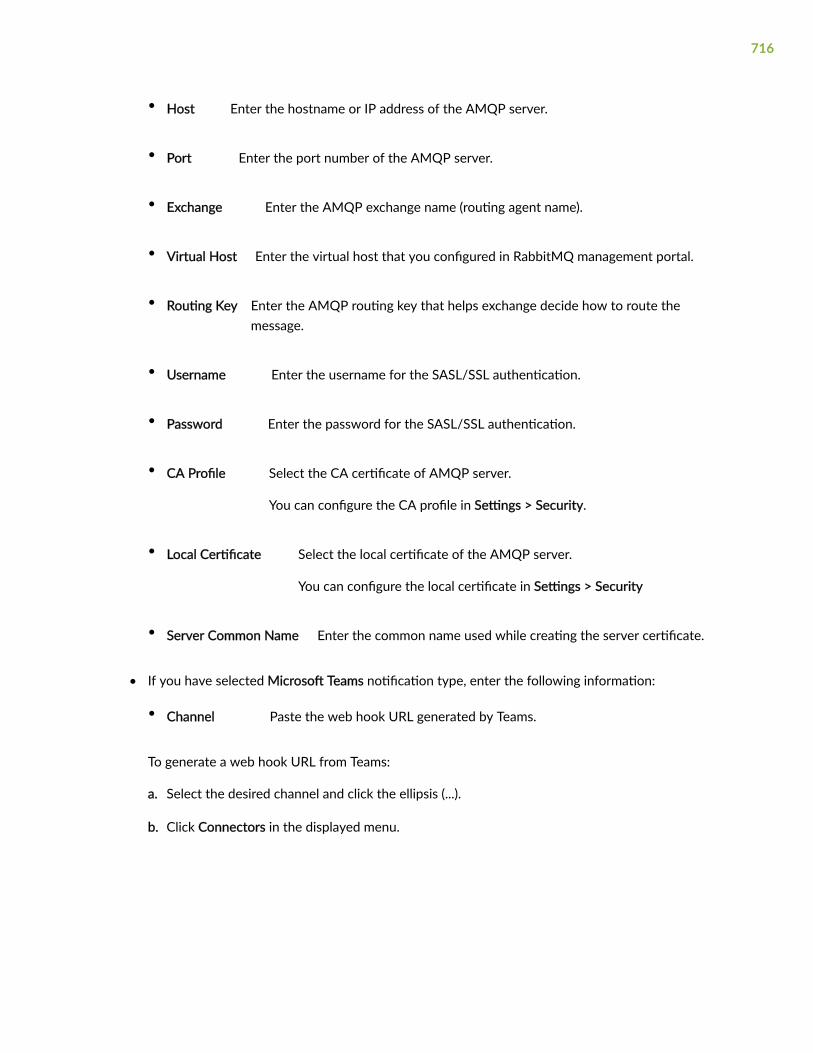
• Host Enter the hostname or IP address of the AMQP server.
• Port Enter the port number of the AMQP server.
• Exchange Enter the AMQP exchange name (routing agent name).
• Virtual Host Enter the virtual host that you configured in RabbitMQ management portal.
• Routing Key Enter the AMQP routing key that helps exchange decide how to route themessage.
• Username Enter the username for the SASL/SSL authentication.
• Password Enter the password for the SASL/SSL authentication.
• CA Profile Select the CA certificate of AMQP server.
You can configure the CA profile in Settings > Security.
• Local Certificate Select the local certificate of the AMQP server.
You can configure the local certificate in Settings > Security
• Server Common Name Enter the common name used while creating the server certificate.
• If you have selected Microsoft Teams notification type, enter the following information:
• Channel Paste the web hook URL generated by Teams.
To generate a web hook URL from Teams:
a. Select the desired channel and click the ellipsis (...).
b. Click Connectors in the displayed menu.
716
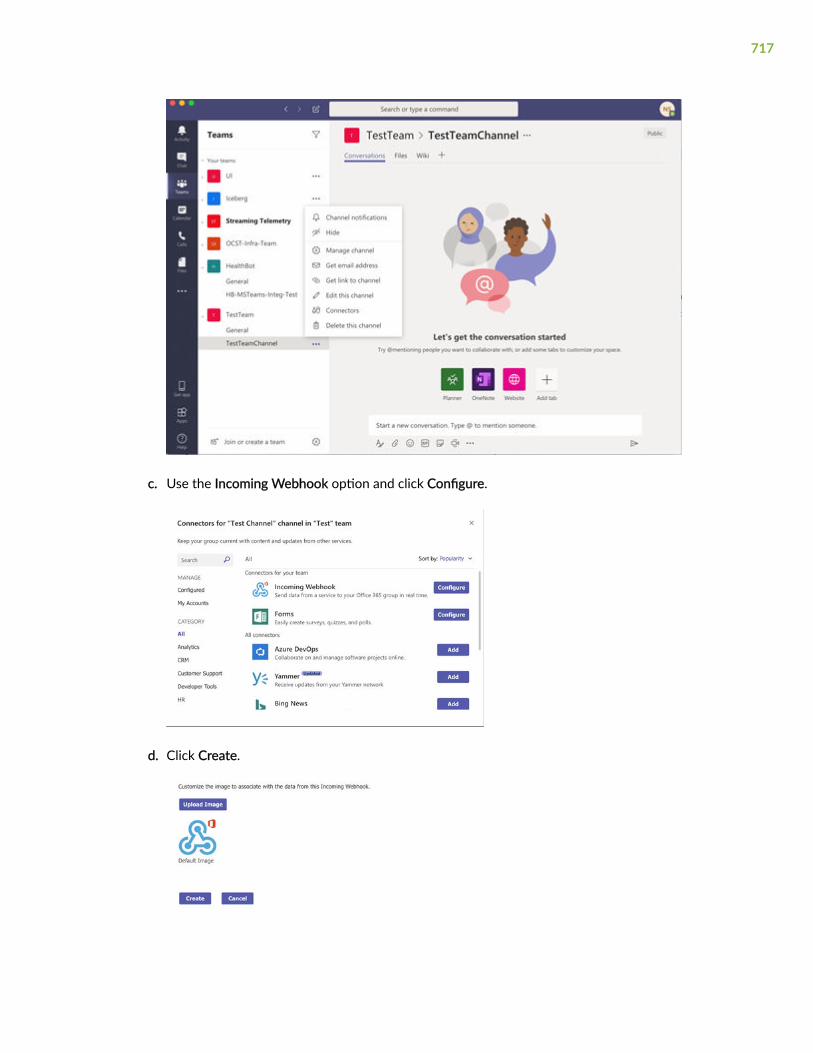
c. Use the Incoming Webhook option and click Configure.
d. Click Create.
717
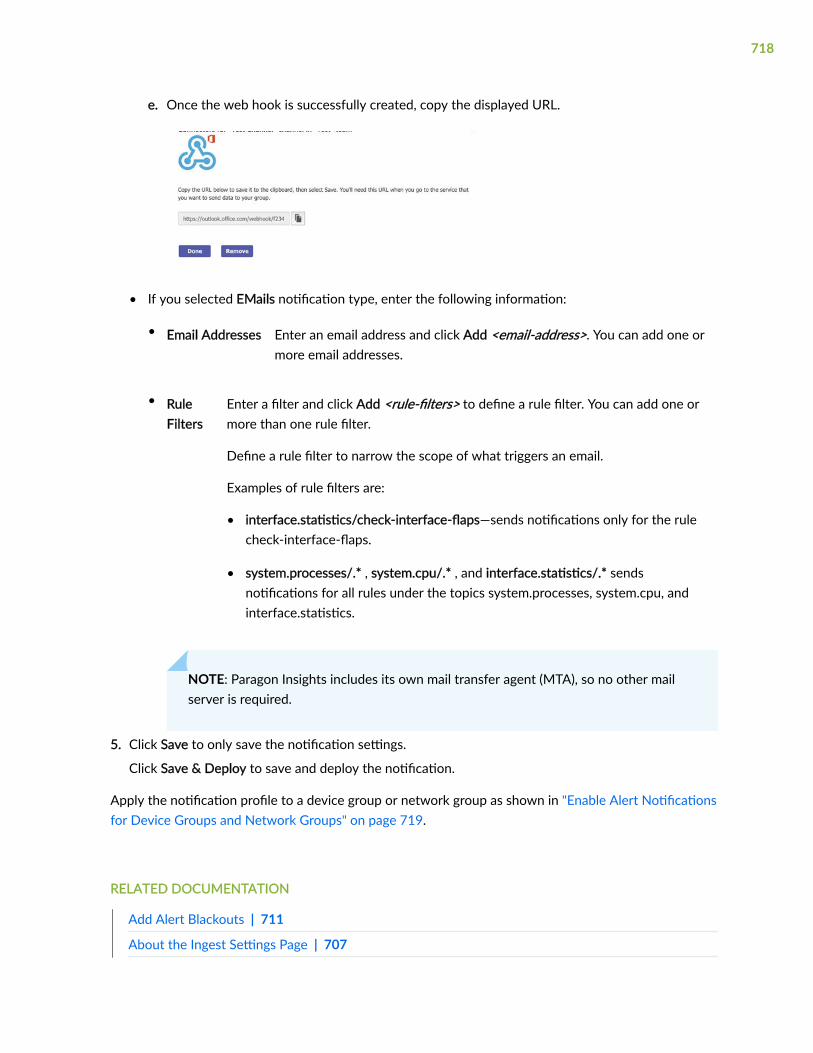
e. Once the web hook is successfully created, copy the displayed URL.
• If you selected EMails notification type, enter the following information:
• Email Addresses Enter an email address and click Add <email-address>. You can add one ormore email addresses.
• RuleFilters
Enter a filter and click Add <rule-filters> to define a rule filter. You can add one ormore than one rule filter.
Define a rule filter to narrow the scope of what triggers an email.
Examples of rule filters are:
• interface.statistics/check-interface-flaps—sends notifications only for the rulecheck-interface-flaps.
• system.processes/.* , system.cpu/.* , and interface.statistics/.* sendsnotifications for all rules under the topics system.processes, system.cpu, andinterface.statistics.
NOTE: Paragon Insights includes its own mail transfer agent (MTA), so no other mailserver is required.
5. Click Save to only save the notification settings.
Click Save & Deploy to save and deploy the notification.
Apply the notification profile to a device group or network group as shown in "Enable Alert Notificationsfor Device Groups and Network Groups" on page 719.
RELATED DOCUMENTATION
Add Alert Blackouts | 711
About the Ingest Settings Page | 707
718

Configure a Retention Policy | 723
Configure Destination Settings | 725
Create a Scheduler Profile | 722
Configure Report Settings | 720
Manage TSDB Settings | 730
Enable Alert Notifications for Device Groups and Network Groups
To enable notification profiles in device groups, network groups, or both, you must select notificationprofiles that you previously configured. For more information about alert notifications, see "About AlertNotifications" on page 713.
To enable alert notifications:
• 1. Select the Configuration > Device Group from the Paragon Automation menu.
The Device Group Configuration page appears.
2. Select the device group and click Edit (pencil icon).
The Edit Device page appears.
3. Navigate to Advanced > Notification in the edit page.
4. Select a notification profile for alert levels Major, Minor, or Normal.
You can select notification profile for any or all alert severity levels. You can select one or morenotification profiles for each alert level.
5. Do one of the following:
• Save — Save your edits but do not deploy the updated configuration. You can use this optionwhen, for example, you are making several changes and want to deploy all your updates at thesame time later.
If you choose only to save the changes, you can either commit or roll back the changes later.For more information, see "Commit or Roll Back Configuration Changes in Paragon Insights" onpage 151.
• Save & Deploy — Save the configuration in the GUI and deploy the configuration on yourproduction environment.
The notification profiles selected for each alert severity level generates alerts for devicegroup(s). You can view the alerts in Monitoring > Alarms and Alerts > Alerts page.
719
• 1. For Network Groups, select the Configuration > Network from the Paragon Automation menu.
The Network Configuration page appears.
2. Select the network group and click Edit (pencil icon).
The Edit Network Group Name page appears.
3. Expand the Notification section in the edit page.
4. Select a notification profile for alert levels Major, Minor, or Normal.
You can select notification profile for any or all alert severity levels. You can select one or morenotification profiles for each alert level.
5. Do one of the following:
• Save — Save your edits but do not deploy the updated configuration. You can use this optionwhen, for example, you are making several changes and want to deploy all your updates at thesame time later.
If you choose only to save the changes, you can either commit or roll back the changes later.For more information, see "Commit or Roll Back Configuration Changes in Paragon Insights" onpage 151.
• Save & Deploy — Save the configuration changes and commit it in the productionenvironment.
The notification profiles selected for each alert severity level generates alerts for networkgroup(s). You can view the alerts in Monitoring > Alarms and Alerts > Alerts page.
RELATED DOCUMENTATION
About the Alerts Page | 622
About Alert Notifications | 713
Configure Report Settings
You can use Paragon Insights to generate and download a report on-demand for a device group or anetwork group. You can download a report or receive it by email in HTML or JSON formats.
After you generate a report, you can re-download on-demand reports from the Reports page. Thesereports are saved with HB_MANUAL_REPORT report name.
720
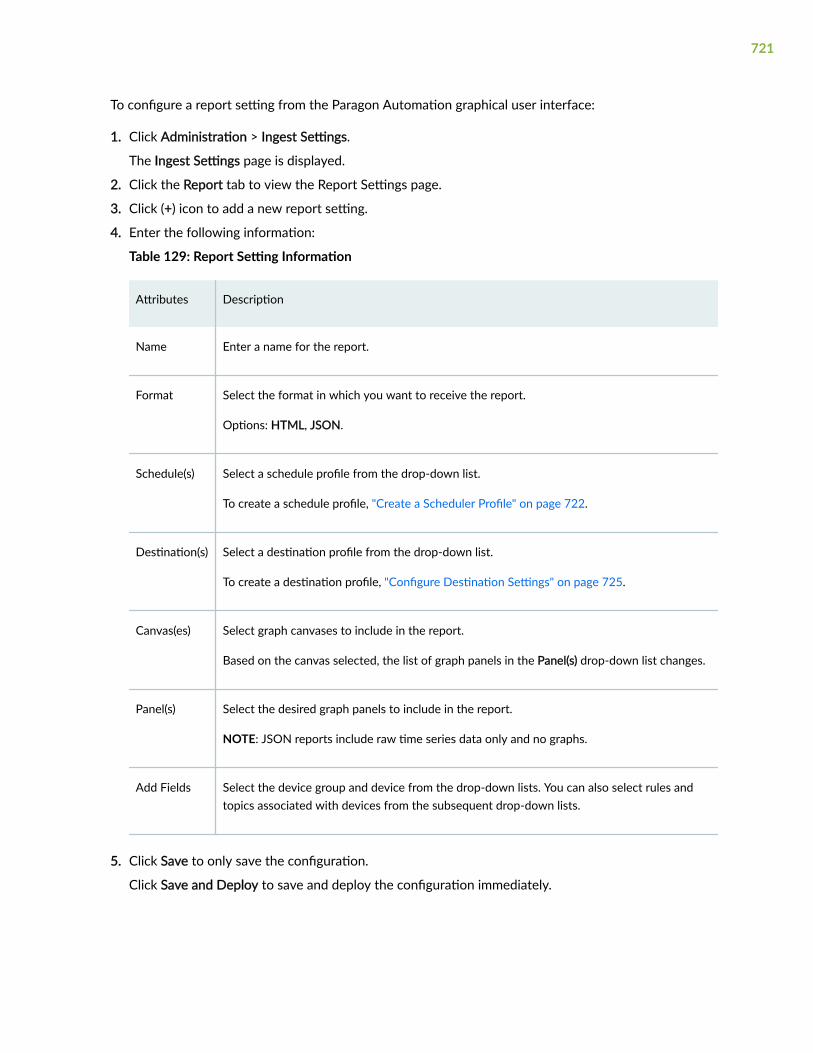
To configure a report setting from the Paragon Automation graphical user interface:
1. Click Administration > Ingest Settings.
The Ingest Settings page is displayed.
2. Click the Report tab to view the Report Settings page.
3. Click (+) icon to add a new report setting.
4. Enter the following information:
Table 129: Report Setting Information
Attributes Description
Name Enter a name for the report.
Format Select the format in which you want to receive the report.
Options: HTML, JSON.
Schedule(s) Select a schedule profile from the drop-down list.
To create a schedule profile, "Create a Scheduler Profile" on page 722.
Destination(s) Select a destination profile from the drop-down list.
To create a destination profile, "Configure Destination Settings" on page 725.
Canvas(es) Select graph canvases to include in the report.
Based on the canvas selected, the list of graph panels in the Panel(s) drop-down list changes.
Panel(s) Select the desired graph panels to include in the report.
NOTE: JSON reports include raw time series data only and no graphs.
Add Fields Select the device group and device from the drop-down lists. You can also select rules andtopics associated with devices from the subsequent drop-down lists.
5. Click Save to only save the configuration.
Click Save and Deploy to save and deploy the configuration immediately.
721
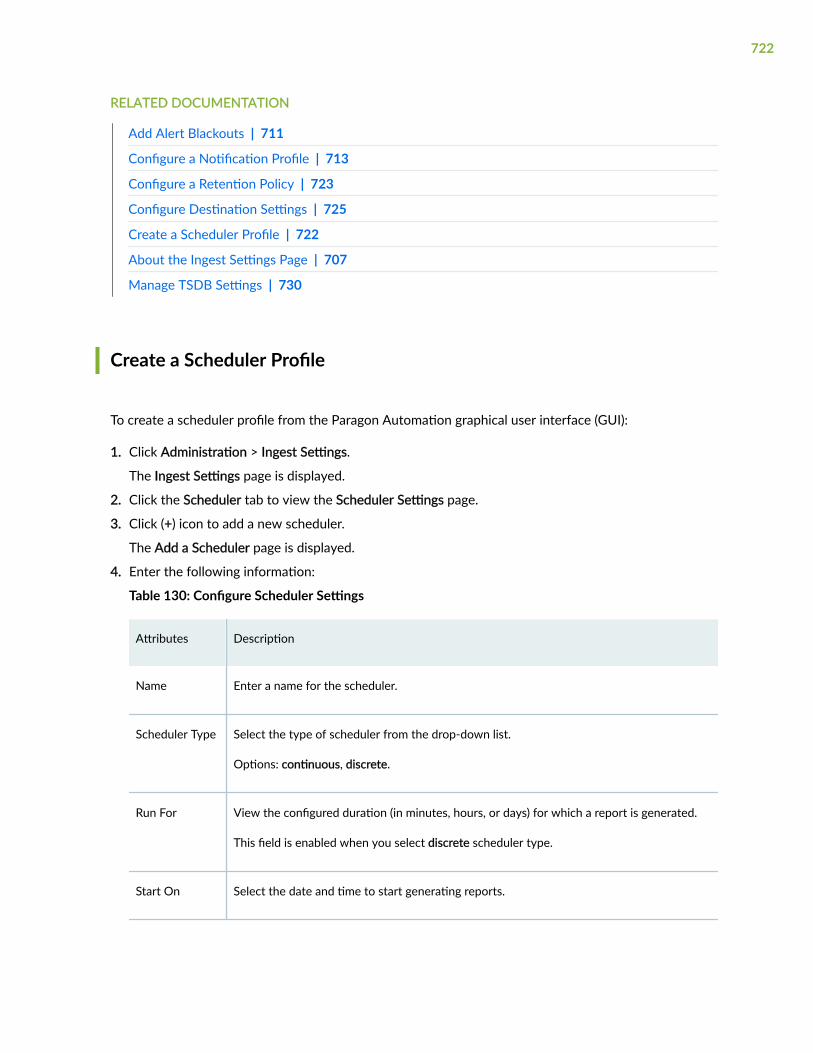
RELATED DOCUMENTATION
Add Alert Blackouts | 711
Configure a Notification Profile | 713
Configure a Retention Policy | 723
Configure Destination Settings | 725
Create a Scheduler Profile | 722
About the Ingest Settings Page | 707
Manage TSDB Settings | 730
Create a Scheduler Profile
To create a scheduler profile from the Paragon Automation graphical user interface (GUI):
1. Click Administration > Ingest Settings.
The Ingest Settings page is displayed.
2. Click the Scheduler tab to view the Scheduler Settings page.
3. Click (+) icon to add a new scheduler.
The Add a Scheduler page is displayed.
4. Enter the following information:
Table 130: Configure Scheduler Settings
Attributes Description
Name Enter a name for the scheduler.
Scheduler Type Select the type of scheduler from the drop-down list.
Options: continuous, discrete.
Run For View the configured duration (in minutes, hours, or days) for which a report is generated.
This field is enabled when you select discrete scheduler type.
Start On Select the date and time to start generating reports.
722
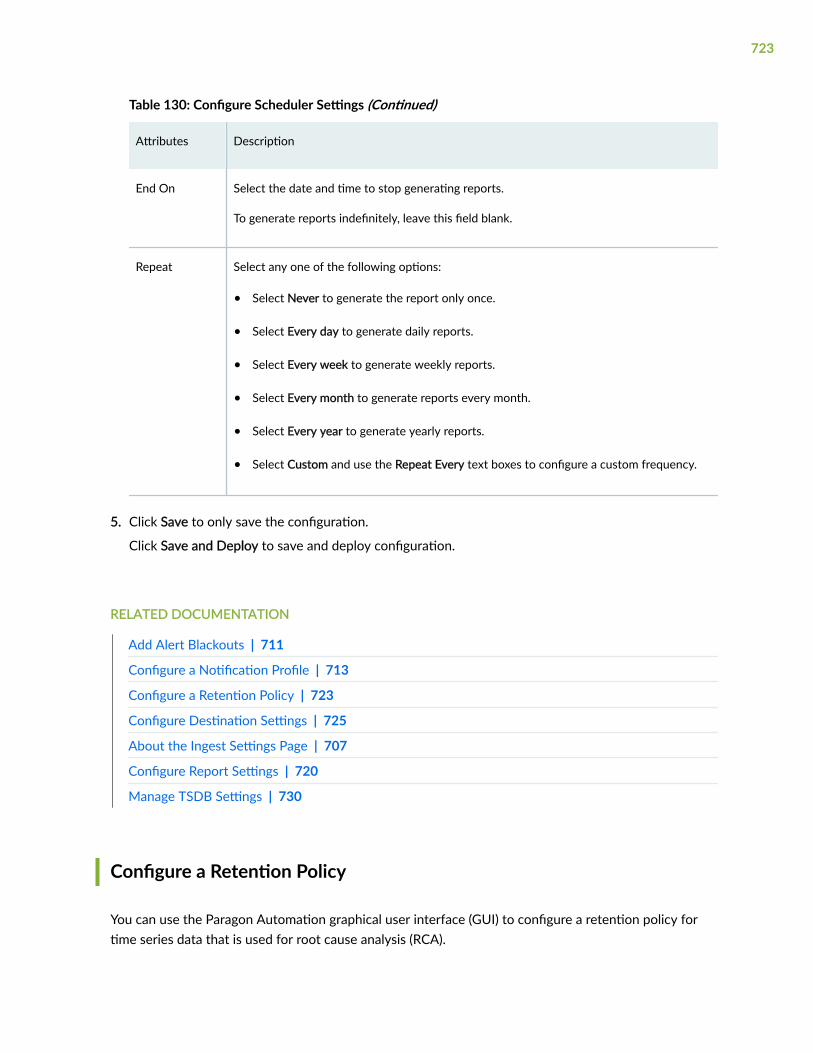
Table 130: Configure Scheduler Settings (Continued)
Attributes Description
End On Select the date and time to stop generating reports.
To generate reports indefinitely, leave this field blank.
Repeat Select any one of the following options:
• Select Never to generate the report only once.
• Select Every day to generate daily reports.
• Select Every week to generate weekly reports.
• Select Every month to generate reports every month.
• Select Every year to generate yearly reports.
• Select Custom and use the Repeat Every text boxes to configure a custom frequency.
5. Click Save to only save the configuration.
Click Save and Deploy to save and deploy configuration.
RELATED DOCUMENTATION
Add Alert Blackouts | 711
Configure a Notification Profile | 713
Configure a Retention Policy | 723
Configure Destination Settings | 725
About the Ingest Settings Page | 707
Configure Report Settings | 720
Manage TSDB Settings | 730
Configure a Retention Policy
You can use the Paragon Automation graphical user interface (GUI) to configure a retention policy fortime series data that is used for root cause analysis (RCA).
723

Retention policy is the amount of time the root cause analysis (RCA) data is retained in the RCAdatabase. By default, data is retained for seven days.
The following default retention policies are available in Paragon Automation:
• CTRL_DAILY_ROLLUP_RETENTION—Defines for how long the daily rollup data can be stored;default is 1000 days.
• CTRL_HOURLY_ROLLUP_RETENTION—Defines for how long the hourly rollup data can be stored;default is 180 days.
• CTRL_RAW_RETENTION—Defines for how long the raw data can be stored; default is 14 days.
To configure a retention policy:
1. Click Administration > Ingest Settings.
The Ingest Settings page is displayed.
2. Click the Retention Policy tab to view the Retention Policy Settings page.
3. Click (+) icon to add a retention policy.
4. Enter the following information:
Table 131: Configure Retention Policy
Attributes Description
Name Enter a name for the retention policy.
Duration Enter the duration, in hours or days, for the retention policy.
For example, 1 day is entered as 1d or 24h.
5. Click Save to only save the configuration.
Click Save and Deploy to save and deploy the configuration immediately.
You can now apply the retention policy to a device group.
RELATED DOCUMENTATION
Add Alert Blackouts | 711
Configure a Notification Profile | 713
About the Ingest Settings Page | 707
Configure Destination Settings | 725
724

Create a Scheduler Profile | 722
Configure Report Settings | 720
Manage TSDB Settings | 730
Add a Data Rollup Summarization Profile | 463
Add a Raw Data Summarization Profile | 461
Configure Destination Settings
To configure destination settings from the Paragon Automation graphical user interface (GUI):
1. Click Administration > Ingest Settings.
The Ingest Settings page is displayed.
2. Click the Destination tab to view the Destination Settings page.
3. Click (+) icon to add new destination settings.
4. Enter the following information:
Table 132: Configure Destination Settings
Attributes Description
Destination Name Enter a name for the destination setting.
The destination setting name cannot be changed after the settings have beendeployed.
Destination Type Select the destination type.
Options: Email, Disk.
Email Id Enter the email address to which the report must be sent.
This text box is displayed when you select Email as the destination type.
NOTE: Using the email option also saves a copy of the report to disk.
725
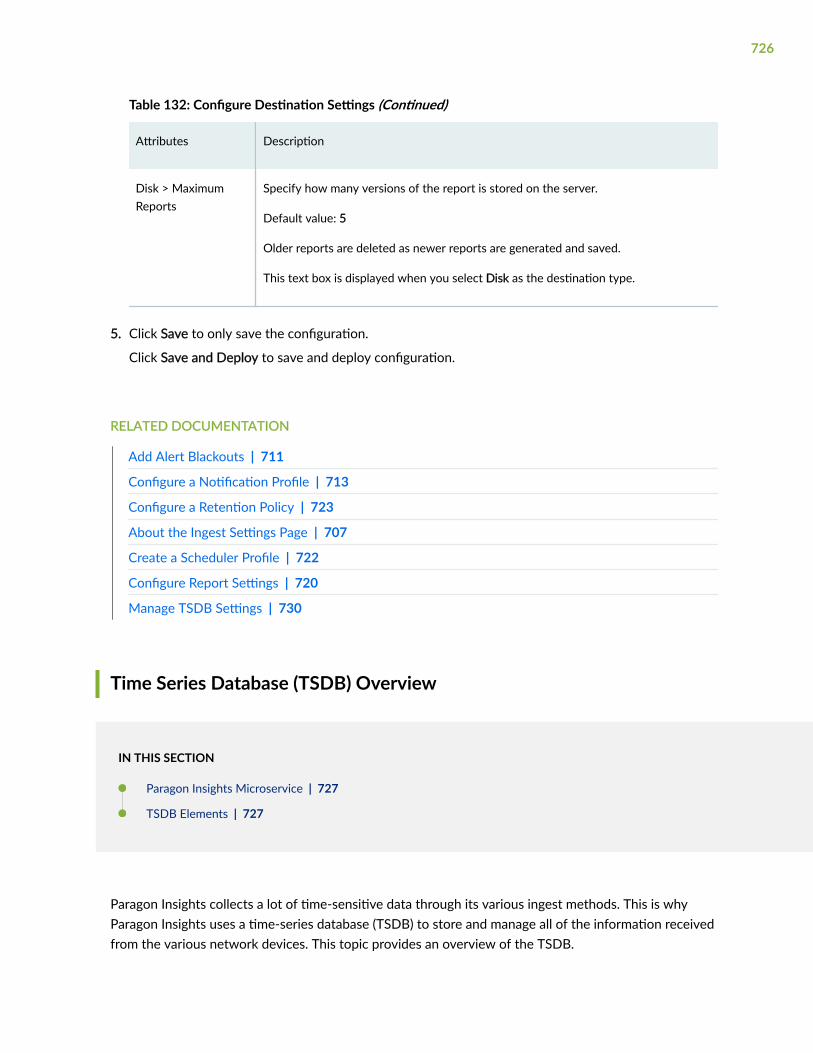
Table 132: Configure Destination Settings (Continued)
Attributes Description
Disk > MaximumReports
Specify how many versions of the report is stored on the server.
Default value: 5
Older reports are deleted as newer reports are generated and saved.
This text box is displayed when you select Disk as the destination type.
5. Click Save to only save the configuration.
Click Save and Deploy to save and deploy configuration.
RELATED DOCUMENTATION
Add Alert Blackouts | 711
Configure a Notification Profile | 713
Configure a Retention Policy | 723
About the Ingest Settings Page | 707
Create a Scheduler Profile | 722
Configure Report Settings | 720
Manage TSDB Settings | 730
Time Series Database (TSDB) Overview
IN THIS SECTION
Paragon Insights Microservice | 727
TSDB Elements | 727
Paragon Insights collects a lot of time-sensitive data through its various ingest methods. This is whyParagon Insights uses a time-series database (TSDB) to store and manage all of the information receivedfrom the various network devices. This topic provides an overview of the TSDB.
726

Paragon Insights Microservice
Paragon Insights uses Kubernetes for clustering its docker-based microservices across multiple physicalor virtual servers (nodes). Kubernetes clusters consist of a primary node and multiple worker nodes.During the Healthbot setup portion of Paragon Insights multinode installations, the installer asks for the IPaddresses (or hostnames) of the Kubernetes primary node and worker nodes. You can add as manyworker nodes to your setup as you need. However, the number of nodes you add must be more than thevalue of the replication factor.
TSDB Elements
Paragon Insights supports the following TSDB elements to provide TSDB high availability (HA).
Database Sharding
Database sharding refers to selectively storing data on certain nodes. This method distributes the dataamong available TSDB nodes and permits greater scaling. This ensures that a TSDB instance handlesonly a portion of the time series data from the devices.
To achieve sharding, Paragon Insights creates one database per device group/device pair and writes theresulting database to a system determined instance of TSDB hosted on one (or more) of the ParagonInsights nodes.
For example, consider that we have two devices, D1 and D2, and two device groups, G1 and G2. If D1resides in groups G1 and G2, and D2 resides only in group G2, then we end up with 3 databases: G1:D1,G2:D1, and G2:D2. Each database is stored on its own TSDB instance on a separate Paragon Insights
727

node as shown in Figure 65 on page 728. When a new device is onboarded and placed within a devicegroup, Paragon Insights chooses a TSDB database instance on which to store that device data.
Figure 65: Distributed TSDB
Figure 65 on page 728, shows 3 Paragon Insights nodes. Each of these nodes have a TSDB instance andother Paragon Insights services running.
NOTE:
• A maximum of 1 TSDB instance is allowed on any given Paragon Insights node. Therefore, aParagon Insights node can have 0 or 1 TSDB instances at any time.
• A Paragon Insights node can be dedicated to running only TSDB functions. No other ParagonInsights functions can run on nodes dedicated to running TSDB functions. This prevents otherParagon Insights functions from starving the TSDB instance of resources.
• We recommend that you dedicate nodes to TSDB to provide the best performance.
• Paragon Insights and TSDB nodes can be added to a running system using the ParagonInsights CLI.
728
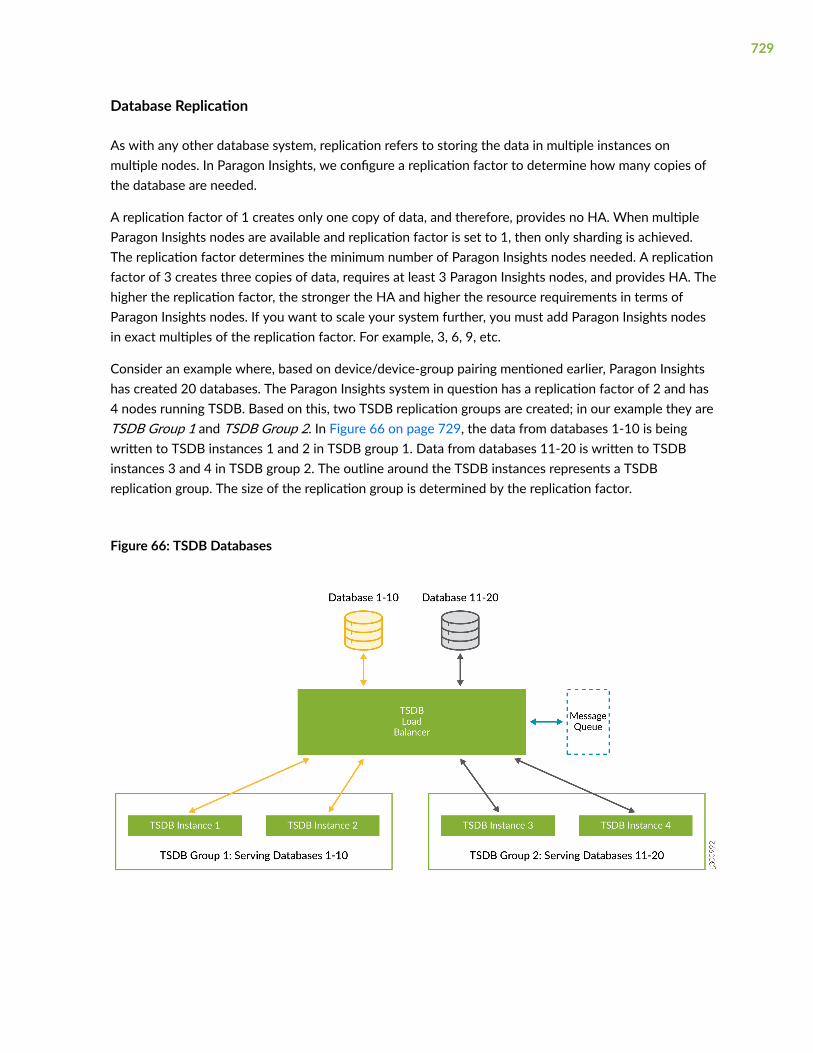
Database Replication
As with any other database system, replication refers to storing the data in multiple instances onmultiple nodes. In Paragon Insights, we configure a replication factor to determine how many copies ofthe database are needed.
A replication factor of 1 creates only one copy of data, and therefore, provides no HA. When multipleParagon Insights nodes are available and replication factor is set to 1, then only sharding is achieved.The replication factor determines the minimum number of Paragon Insights nodes needed. A replicationfactor of 3 creates three copies of data, requires at least 3 Paragon Insights nodes, and provides HA. Thehigher the replication factor, the stronger the HA and higher the resource requirements in terms ofParagon Insights nodes. If you want to scale your system further, you must add Paragon Insights nodesin exact multiples of the replication factor. For example, 3, 6, 9, etc.
Consider an example where, based on device/device-group pairing mentioned earlier, Paragon Insightshas created 20 databases. The Paragon Insights system in question has a replication factor of 2 and has4 nodes running TSDB. Based on this, two TSDB replication groups are created; in our example they areTSDB Group 1 and TSDB Group 2. In Figure 66 on page 729, the data from databases 1-10 is beingwritten to TSDB instances 1 and 2 in TSDB group 1. Data from databases 11-20 is written to TSDBinstances 3 and 4 in TSDB group 2. The outline around the TSDB instances represents a TSDBreplication group. The size of the replication group is determined by the replication factor.
Figure 66: TSDB Databases
729

Database Reads and Writes
As shown in Figure 65 on page 728, Paragon Insights can make use of a distributed messaging queue. Incases of performance problems or errors within a given TSDB instance, this allows for writes to thedatabase to be performed in a sequential manner ensuring that all data is written in proper timesequence.
All Paragon Insights microservices use standardized database query (read) and write functions. This canbe used even if the underlying database system is changed at some point in the future. This allows forflexibility in growth and future changes. Other read and write features of the database system include:
• In normal operation, database writes are sent to all TSDB instances within a TSDB group.
• Database writes can be buffered up to 1GB per TSDB instance so that failed writes can be retrieduntil successful.
• If problems persist and the buffer fills up, the oldest data is dropped in favor of new data.
• When buffering is active, database writes are performed sequentially so that new data cannot bewritten until the previous write attempts are successful.
• Database queries (reads) are sent to the TSDB instance which has reported the fewest write errors inthe last 5 minutes. If all instances are performing equally, then the query is sent to a random TSDBinstance in the required group.
RELATED DOCUMENTATION
Manage TSDB Settings | 730
Backup and Restore the TSDB | 732
Manage TSDB Settings
You can use the Paragon Automation GUI to configure the following time series database (TSDB)settings:
• Select one or more TSDB nodes.
• Dedicate all nodes or none of the available nodes as TSDB nodes.
• Force TSDB setting changes in case of system errors.
• Delete a node that has already been selected as a TSDB node.
730
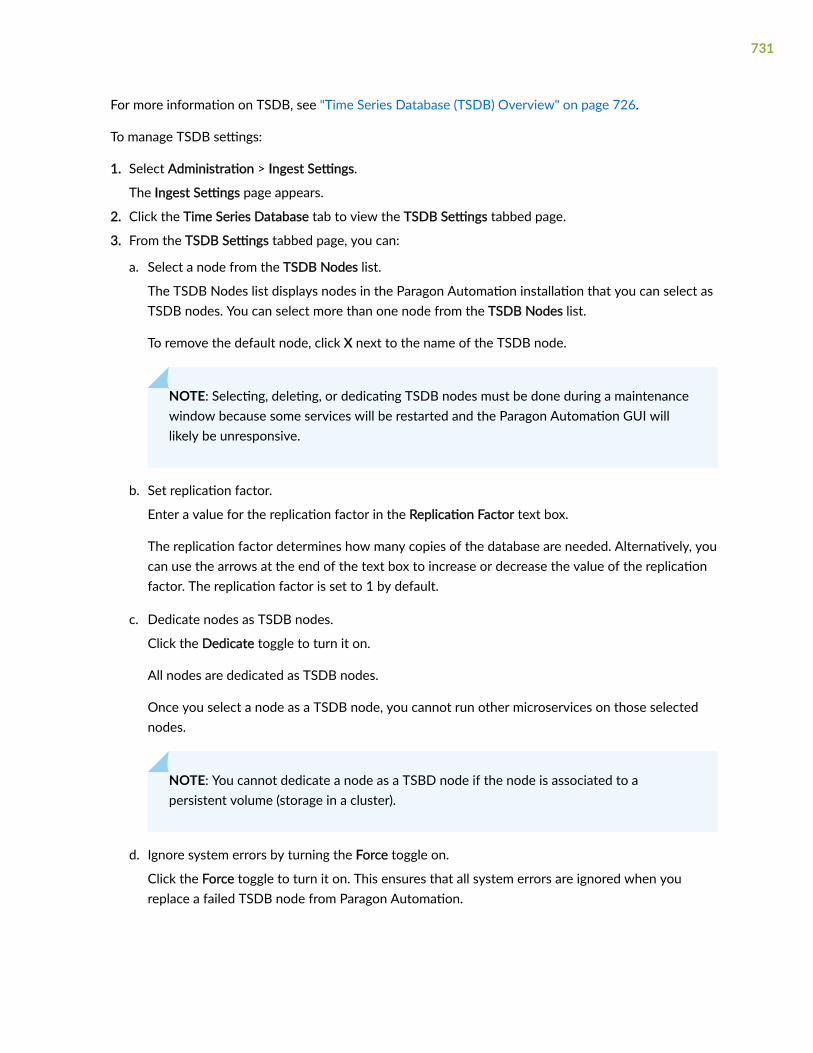
For more information on TSDB, see "Time Series Database (TSDB) Overview" on page 726.
To manage TSDB settings:
1. Select Administration > Ingest Settings.
The Ingest Settings page appears.
2. Click the Time Series Database tab to view the TSDB Settings tabbed page.
3. From the TSDB Settings tabbed page, you can:
a. Select a node from the TSDB Nodes list.
The TSDB Nodes list displays nodes in the Paragon Automation installation that you can select asTSDB nodes. You can select more than one node from the TSDB Nodes list.
To remove the default node, click X next to the name of the TSDB node.
NOTE: Selecting, deleting, or dedicating TSDB nodes must be done during a maintenancewindow because some services will be restarted and the Paragon Automation GUI willlikely be unresponsive.
b. Set replication factor.
Enter a value for the replication factor in the Replication Factor text box.
The replication factor determines how many copies of the database are needed. Alternatively, youcan use the arrows at the end of the text box to increase or decrease the value of the replicationfactor. The replication factor is set to 1 by default.
c. Dedicate nodes as TSDB nodes.
Click the Dedicate toggle to turn it on.
All nodes are dedicated as TSDB nodes.
Once you select a node as a TSDB node, you cannot run other microservices on those selectednodes.
NOTE: You cannot dedicate a node as a TSBD node if the node is associated to apersistent volume (storage in a cluster).
d. Ignore system errors by turning the Force toggle on.
Click the Force toggle to turn it on. This ensures that all system errors are ignored when youreplace a failed TSDB node from Paragon Automation.
731

When a TSDB node fails and the replication factor is set to one, the TSDB data for that node islost. In this scenario, the failed TSDB node must be removed from Paragon Automation.
In instances where the TSDB node is not successfully removed, setting the Force toggle to trueensures that all system errors are ignored when you remove a failed TSDB node from ParagonAutomation.
e. Delete a node that has already been assigned as a TSDB node.
To remove a node, click X next to the name of the TSDB node. The node is removed from theconfiguration settings when you deploy the new configuration.
4. Do one of the following:
• Click Save to only save the new configuration settings.
• Click Save & Deploy to save and deploy the new configuration settings.
RELATED DOCUMENTATION
Time Series Database (TSDB) Overview | 726
About the Ingest Settings Page | 707
Backup and Restore the TSDB
You can backup and restore the Time Series Database (TSDB) separately from other configurationelements.
An environment variable must be set on the Paragon Insights server prior to any backup or restoreoperation.
Use the following command to set the environment variable:
export HB_EXTRA_MOUNT1=/root/.kube/config
HB_EXTRA_MOUNT1 is a variable and user defined.
The generic command and the optional arguments (in square brackets) for performing backup andrestore is described here with examples.
healthbot tsdb (backup|restore) [-h] [--database DATABASE] [--all] --path PATH
732
The backup and restore operations for the TSDB are available only through the Paragon Insights CLI.The backup and restore commands are invoked by using a predefined python script, healthbot.py. Youmust have root access to the CLI interface of the Paragon Insights server in order to issue thesecommands.
The required arguments for the healthbot tsdb command are:
• backup—perform a backup operation
• restore—perform a restore operation
• --path PATH—create the backup file or restore the database(s) from the container at PATH where PATH isHB_EXTRA_MOUNT1.
• Starting with Paragon Automation Release 21.1.0, you can use the following commands.
• healthbot tsdb stop-services —stop service
• healthbot tsdb start-services --port <portnumber>—start service
NOTE: In Paragon Automation, the TSDB port is not exposed by default. External API queriesto TSDB do not need this port to be exposed as well. However, if you use external tools suchas Grafana, or you need run a query to the TSDB directly (and not through APIs), the TSDBport must be exposed by using the healthbot tsdb start-services command.
Optional Arguments
-h, --help show this help message and exit--database DATABASE Takes backup (or restore) of the given list of databases. Either database or all flag must be configured--all Takes backup (or restores) of all the databases. Either database or all flag must be configured
Example – Back up the TSDB and Store it in HB_EXTRA_MOUNT3
healthbot tsdb backup --path HB_EXTRA_MOUNT3
Example – Restore the TSDB from HB_EXTRA_MOUNT2
healthbot tsdb restore --path HB_EXTRA_MOUNT2
733

RELATED DOCUMENTATION
Time Series Database (TSDB) Overview | 726
734

CHAPTER 36
Manage Task Scheduler
IN THIS CHAPTER
About the Task Scheduler Page | 735
Add a Bandwidth Sizing Task | 739
Add a Container Normalization Task | 742
Add a Device Collection Task | 745
Add a Network Archive Task | 751
Add a Network Maintenance Task | 755
Add a Network Cleanup Task | 758
Edit and Delete Tasks | 762
About the Task Scheduler Page
IN THIS SECTION
Tasks You Can Perform | 736
Field Descriptions | 737
To access this page, select Administration > Task Scheduler.
Use the Task Scheduler page to view and manage custom (user-created) tasks in Paragon Pathfinder. Youcan only view the system tasks that are launched by the Path Computation Element (PCE) to run scripts;you cannot add, modify, or delete the tasks.
The system tasks are:
• CollectionCleanup: Purges old raw and aggregated analytics data.
735

• ESRollup: Aggregates the collected data from the previous hour.
Tasks You Can Perform
You can perform the following tasks from this page:
• View the list of scheduled and completed tasks, and their details—See Table 133 on page 737 forinformation.
• Add tasks—Currently, you can add the following tasks:
Task Group - Bandwidth Management:
• Bandwidth sizing task—See "Add a Bandwidth Sizing Task" on page 739.
• Container Normalization—See "Add a Container Normalization Task" on page 742.
Task Group - Collection Tasks:
• Device Collection—See "Add a Device Collection Task" on page 745.
Task Group - Utility Tasks:
• Network Archive—See "Add a Network Archive Task" on page 751.
• Network Maintenance—See "Add a Network Maintenance Task" on page 755.
• Network Cleanup—See "Add a Network Cleanup Task" on page 758
• Modify the parameters configured for a task—See "Edit and Delete Tasks" on page 762.
• Delete existing tasks—See "Edit and Delete Tasks" on page 762.
• View chained task groups—By default, the Task Scheduler page displays all the scheduled andcompleted tasks. If you want the chained tasks to be displayed separately, click the Toggle TaskGrouping icon on the top-right corner of the tasks table. From the list that appears, select ChainedTask Group. The chained tasks now appear in separate chained task groups.
To revert to the default view, click the Toggle Task Grouping icon and select Disable Grouping. TheTask Scheduler page now displays all the scheduled and completed tasks, without any grouping.
To expand or collapse the chained task groups, click the Toggle Task Grouping icon and select ExpandAll or Collapse All. The tasks under the chained task groups are displayed or collapsed. Alternatively,click the + or - icon beside the task group name to expand or collapse the tasks under a task group.
• Sort columns displayed in the table—Hover over any column heading and click the down arrow thatappears. From the list, select Sort Ascending or Sort Descending to sort the columns in ascendingorder or descending order, respectively.
736
• Show or hide columns displayed on the page—Hover over any column heading and click the downarrow that appears. From the list, select Columns and then, select the check boxes corresponding tothe columns that you want to view. The columns that you selected are displayed on the page.
• View the summary, status, and history of a task—Select a task and click the Summary tab to viewdetails of the task (such as the start date and time, end date and time, task result, and task status).Click the Status tab to view the detailed status (such as the job type and status) of the task. Click theHistory tab to view the start date and time and end date and time of the execution, each time thetask was executed. Click the + icon corresponding to an entry to view the detailed status of the task.
You can also download the task history as a comma-separated values (CSV) file to your local system.
To refresh the history, click the refresh icon (circular arrow) at the bottom of the History tab.
Field Descriptions
Table 133: Fields on the Task Scheduler Page
Field Description
ID ID generated for the task.
Type Type of the task.
Name Name of the task.
For system tasks, the name can be CollectionCleanup or ESRollup Task.
Created Date (in YYYY:MM:DD format) and time (HH:MM:SS 24-hour format) at which the taskwas created.
Frequency Periodicity of the recurrence (Immediately, Once, Minutes, Hourly, Daily, Weekly, Monthly,Yearly, or Immediately After (for chained tasks)).
Repeats The number of minutes, hours, days, weeks, months, or years after which the task isscheduled to recur.
This value is displayed only if the recurrence is scheduled.
Displays N/A if the task is scheduled to be executed immediately.
Displays Never if the task is not scheduled to recur.
737
Table 133: Fields on the Task Scheduler Page (Continued)
Field Description
Starts Date (in YYYY:MM:DD format) and time (HH:MM:SS 24-hour format) at which the taskstarts.
Ends Date (in YYYY:MM:DD format) and time (HH:MM:SS 24-hour format) at which the taskcompletes.
This value is displayed only if you’ve specified the end time for the task.
Displays N/A if the task is scheduled to be executed immediately.
Displays Never if the task is scheduled to never end.
Last Executed Date (in YYYY:MM:DD format) and time (HH:MM:SS 24-hour format) at which the taskwas last executed.
Status Current status of the task (Running, Scheduled, or Completed).
Dependency ID Automatically generated task ID of the task that is chained to this task.
For example, if you chain a device collection task to be executed immediately after abandwidth sizing task, this column displays the task ID of the bandwidth sizing task againstthe device collection task.
Chained TaskGroup
Group name of task that is chained to another task.
For example, if you chain a device collection task to be executed immediately after abandwidth sizing task, this column displays the task group name (that is, Bandwidth Sizing)of the bandwidth sizing task.
System Task Indicates whether the task is a system task (True) or user-created task (False).
738
Add a Bandwidth Sizing Task
The bandwidth sizing task periodically sends a new planned bandwidth for bandwidth sizing-enabledLSPs to the Path Computation Server (PCS). The PCS determines whether it needs to provision the newplanned bandwidth with a path that satisfies the new bandwidth requirement.
To add a bandwidth sizing task:
1. Select Administration > Task Scheduler.
The Task Scheduler page appears.
2. Click Add.
The Create New Task page (wizard) appears.
NOTE: You can have only one bandwidth sizing task per Paragon Automation server. If youattempt to add a second, the system will prompt you to approve overwriting the first one.
3. Configure the fields in each step of the wizard according to the guidelines provided in Table 134 onpage 739.
Click Next to go to the next step.
NOTE: Fields marked with an asterisk (*) are mandatory.
4. After you complete steps 1, 2, and 3 in the wizard, click Submit.
The details of the task that you added are displayed on the Task Scheduler page.
After the task is completed, select the task in the list to view the results in the Summary, Status, andHistory tabs.
Table 134: Fields on the Create New Task Wizard (Bandwidth Sizing)
Field Description
Step 1
Name Specify a meaningful name for the task.
Task Group From the list, select Bandwidth Management tasks.
739
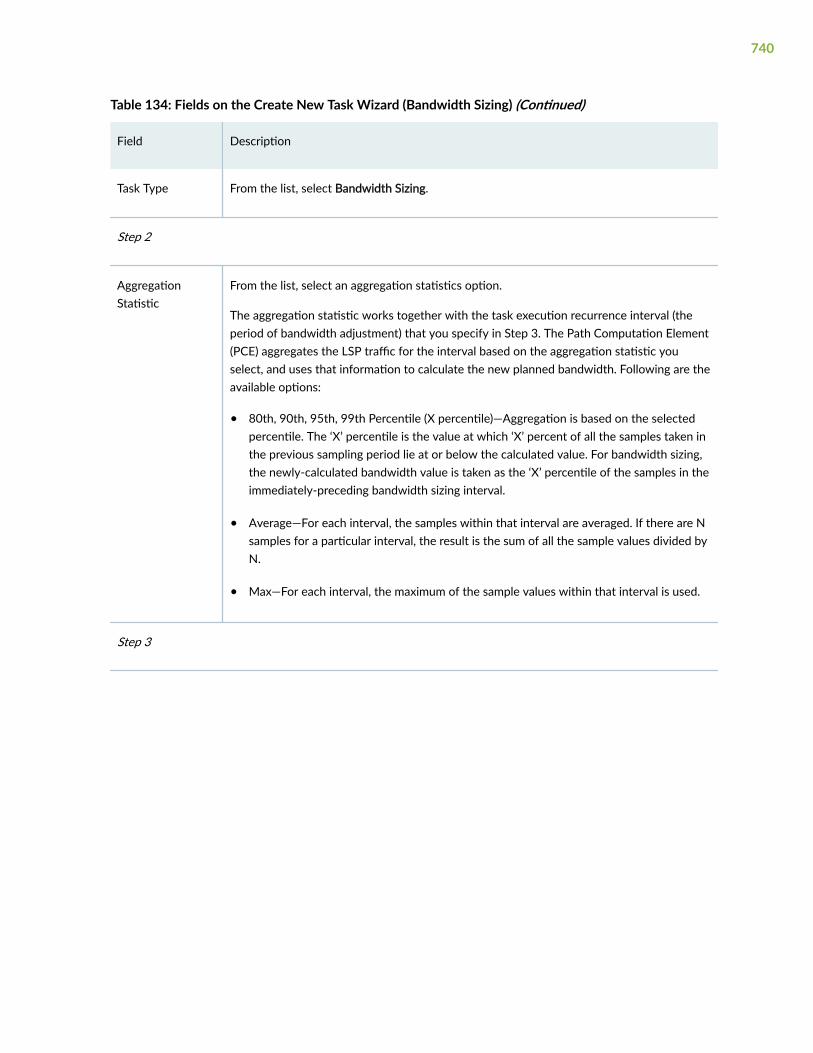
Table 134: Fields on the Create New Task Wizard (Bandwidth Sizing) (Continued)
Field Description
Task Type From the list, select Bandwidth Sizing.
Step 2
AggregationStatistic
From the list, select an aggregation statistics option.
The aggregation statistic works together with the task execution recurrence interval (theperiod of bandwidth adjustment) that you specify in Step 3. The Path Computation Element(PCE) aggregates the LSP traffic for the interval based on the aggregation statistic youselect, and uses that information to calculate the new planned bandwidth. Following are theavailable options:
• 80th, 90th, 95th, 99th Percentile (X percentile)—Aggregation is based on the selectedpercentile. The ‘X’ percentile is the value at which ‘X’ percent of all the samples taken inthe previous sampling period lie at or below the calculated value. For bandwidth sizing,the newly-calculated bandwidth value is taken as the ‘X’ percentile of the samples in theimmediately-preceding bandwidth sizing interval.
• Average—For each interval, the samples within that interval are averaged. If there are Nsamples for a particular interval, the result is the sum of all the sample values divided byN.
• Max—For each interval, the maximum of the sample values within that interval is used.
Step 3
740
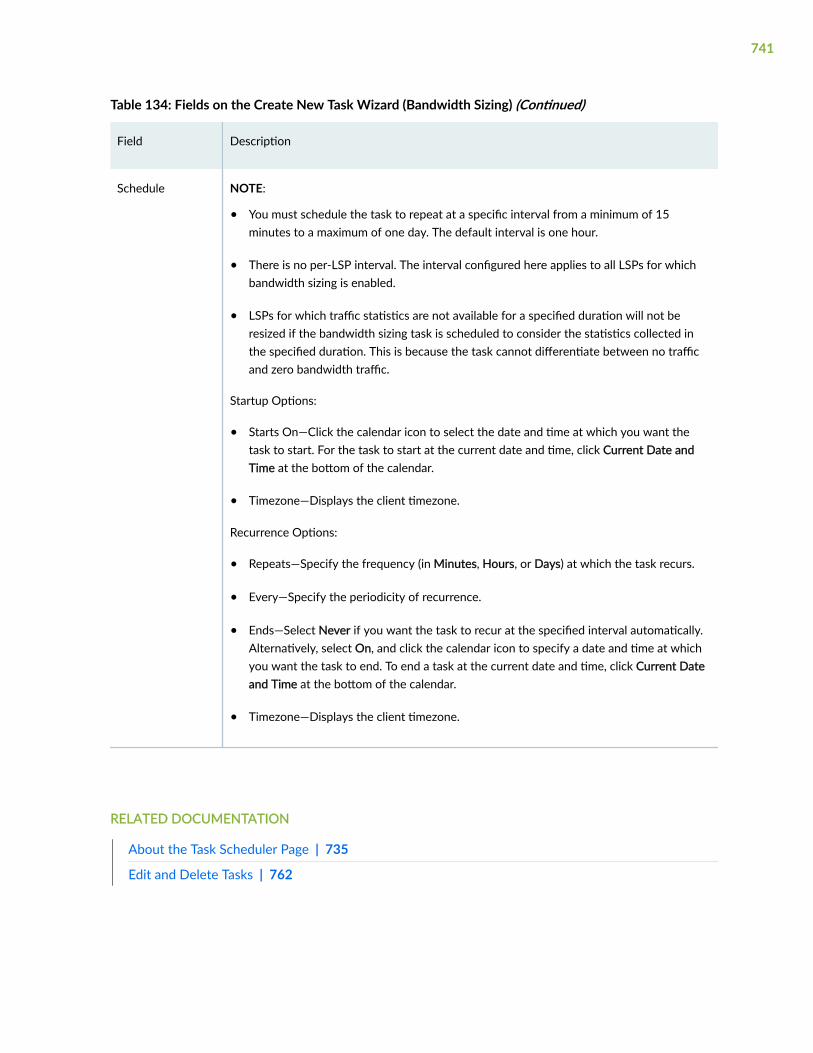
Table 134: Fields on the Create New Task Wizard (Bandwidth Sizing) (Continued)
Field Description
Schedule NOTE:
• You must schedule the task to repeat at a specific interval from a minimum of 15minutes to a maximum of one day. The default interval is one hour.
• There is no per-LSP interval. The interval configured here applies to all LSPs for whichbandwidth sizing is enabled.
• LSPs for which traffic statistics are not available for a specified duration will not beresized if the bandwidth sizing task is scheduled to consider the statistics collected inthe specified duration. This is because the task cannot differentiate between no trafficand zero bandwidth traffic.
Startup Options:
• Starts On—Click the calendar icon to select the date and time at which you want thetask to start. For the task to start at the current date and time, click Current Date andTime at the bottom of the calendar.
• Timezone—Displays the client timezone.
Recurrence Options:
• Repeats—Specify the frequency (in Minutes, Hours, or Days) at which the task recurs.
• Every—Specify the periodicity of recurrence.
• Ends—Select Never if you want the task to recur at the specified interval automatically.Alternatively, select On, and click the calendar icon to specify a date and time at whichyou want the task to end. To end a task at the current date and time, click Current Dateand Time at the bottom of the calendar.
• Timezone—Displays the client timezone.
RELATED DOCUMENTATION
About the Task Scheduler Page | 735
Edit and Delete Tasks | 762
741
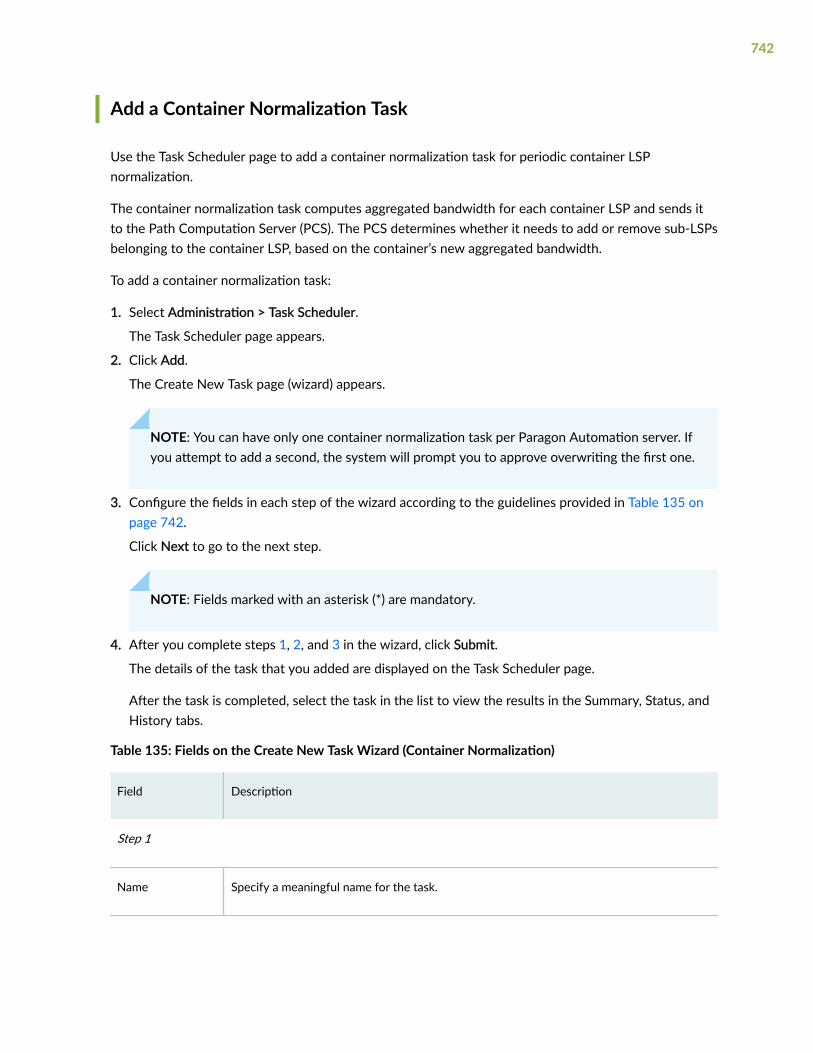
Add a Container Normalization Task
Use the Task Scheduler page to add a container normalization task for periodic container LSPnormalization.
The container normalization task computes aggregated bandwidth for each container LSP and sends itto the Path Computation Server (PCS). The PCS determines whether it needs to add or remove sub-LSPsbelonging to the container LSP, based on the container’s new aggregated bandwidth.
To add a container normalization task:
1. Select Administration > Task Scheduler.
The Task Scheduler page appears.
2. Click Add.
The Create New Task page (wizard) appears.
NOTE: You can have only one container normalization task per Paragon Automation server. Ifyou attempt to add a second, the system will prompt you to approve overwriting the first one.
3. Configure the fields in each step of the wizard according to the guidelines provided in Table 135 onpage 742.
Click Next to go to the next step.
NOTE: Fields marked with an asterisk (*) are mandatory.
4. After you complete steps 1, 2, and 3 in the wizard, click Submit.
The details of the task that you added are displayed on the Task Scheduler page.
After the task is completed, select the task in the list to view the results in the Summary, Status, andHistory tabs.
Table 135: Fields on the Create New Task Wizard (Container Normalization)
Field Description
Step 1
Name Specify a meaningful name for the task.
742

Table 135: Fields on the Create New Task Wizard (Container Normalization) (Continued)
Field Description
Task Group From the list, select Bandwidth Management tasks.
Task Type From the list, select Container Normalization.
Step 2
AggregationStatistic
From the list, select an aggregation statistics option.
The aggregation statistic works together with the task execution recurrence interval (theperiod of bandwidth adjustment) that you specify in Step 3. The Path Computation Element(PCE) aggregates the LSP traffic for the interval based on the aggregation statistic youselect, and uses that information to calculate the new aggregated bandwidth. Following arethe available options:
• 80th, 90th, 95th, 99th Percentile (X percentile)—Aggregation is based on the selectedpercentile. The ‘X’ percentile is the value at which ‘X’ percent of all the samples taken inthe previous sampling period lie at or below the calculated value.
• Average—For each interval, the samples within that interval are averaged. If there are Nsamples for a particular interval, the result is the sum of all the sample values divided byN.
• Max—For each interval, the maximum of the sample values within that interval is used.
Step 3
743

Table 135: Fields on the Create New Task Wizard (Container Normalization) (Continued)
Field Description
Schedule NOTE:
• You must schedule the task to repeat at a specific interval from a minimum of 15minutes to a maximum of one day. The default interval is one hour.
• Container LSPs for which traffic statistics are not available for a specified duration willnot be normalized if the container normalization task is scheduled to consider thestatistics collected in the specified duration. This is because the task cannotdifferentiate between no traffic and zero bandwidth traffic.
Startup Options:
• Starts On—Click the calendar icon to select the date and time at which the task starts.To start the task at the current date and time, click Current Date and Time at thebottom of the calendar.
• Timezone—Displays the client timezone.
Recurrence Options:
• Repeats—Specify the frequency (in Minutes, Hours, or Days) at which the task recurs.
• Every—Specify the periodicity of recurrence.
• Ends—Select Never if you want the task to recur at the specified interval automatically.Alternatively, select On, and click the calendar icon to specify a date and time at whichyou want the task to end. To end a task at the current date and time, click Current Dateand Time at the bottom of the calendar.
• Timezone—Displays the client timezone.
RELATED DOCUMENTATION
About the Task Scheduler Page | 735
Edit and Delete Tasks | 762
744
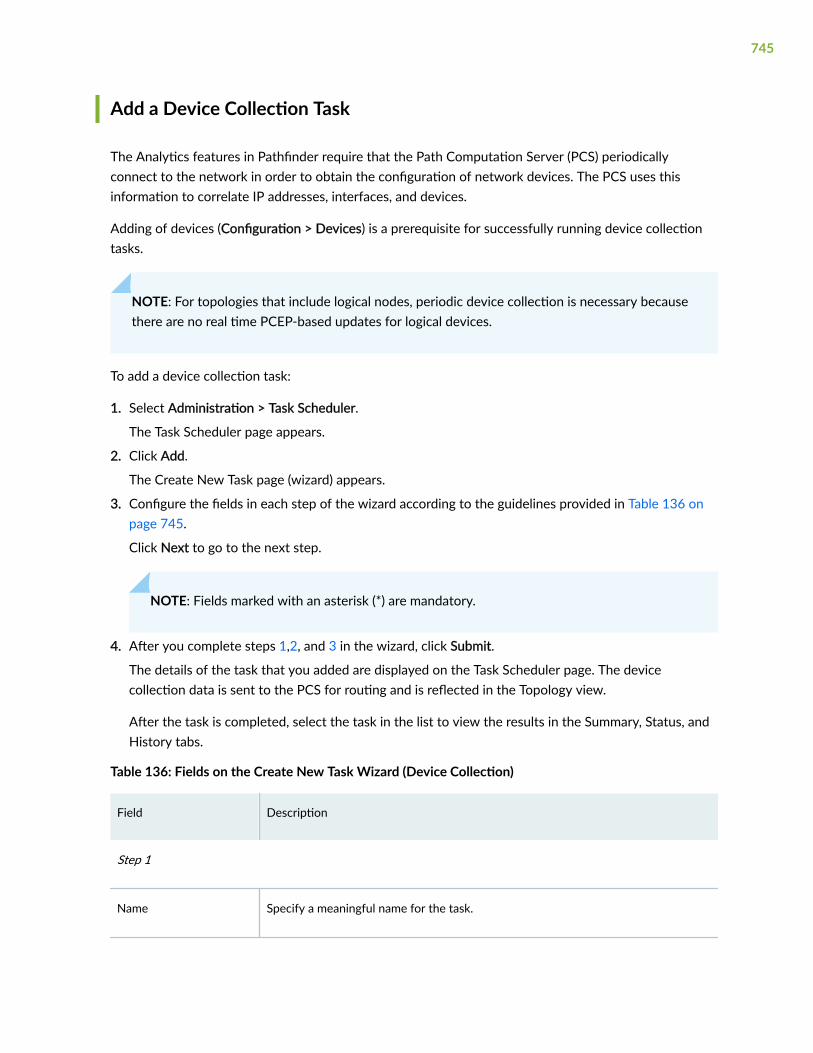
Add a Device Collection Task
The Analytics features in Pathfinder require that the Path Computation Server (PCS) periodicallyconnect to the network in order to obtain the configuration of network devices. The PCS uses thisinformation to correlate IP addresses, interfaces, and devices.
Adding of devices (Configuration > Devices) is a prerequisite for successfully running device collectiontasks.
NOTE: For topologies that include logical nodes, periodic device collection is necessary becausethere are no real time PCEP-based updates for logical devices.
To add a device collection task:
1. Select Administration > Task Scheduler.
The Task Scheduler page appears.
2. Click Add.
The Create New Task page (wizard) appears.
3. Configure the fields in each step of the wizard according to the guidelines provided in Table 136 onpage 745.
Click Next to go to the next step.
NOTE: Fields marked with an asterisk (*) are mandatory.
4. After you complete steps 1,2, and 3 in the wizard, click Submit.
The details of the task that you added are displayed on the Task Scheduler page. The devicecollection data is sent to the PCS for routing and is reflected in the Topology view.
After the task is completed, select the task in the list to view the results in the Summary, Status, andHistory tabs.
Table 136: Fields on the Create New Task Wizard (Device Collection)
Field Description
Step 1
Name Specify a meaningful name for the task.
745

Table 136: Fields on the Create New Task Wizard (Device Collection) (Continued)
Field Description
Task Group From the list, select Collection Tasks.
Task Type From the list, select Device Collection.
Step 2
Task Options Select the devices (All Devices, Selective Devices, or Device Groups) to be includedin the collection task:
• For all the three task options, the Other Options section appears, where youmust select the check boxes corresponding to the options that you want toconfigure. See the following row for details.
• When you select Selective Devices, a list of all the devices available to beincluded in the collection task is displayed. Select the check boxes correspondingto the devices you want to include.
• When you select Groups, the list of device groups configured on the DeviceGroups page (Configuration > Device Groups) is displayed. Select the checkboxes corresponding to the devices you want to include.
Task Options > Other Options
746

Table 136: Fields on the Create New Task Wizard (Device Collection) (Continued)
Field Description
Use management IP The behavior related to this option depends on whether the management IP isconfigured or not:
Default: Selected (Yes)
If you select Use management IP and:
• The management IP is configured—Only the management IP is tried forcollection, whether it is reachable or not.
• The management IP is not configured—The IP address is tried for collection.
If you don't select Use management IP and:
• The management IP is configured—The management IP is tried first for collection.If the management IP is configured but is not accessible, the IP address is triedfor collection.
• The management IP is not configured—The IP address is tried for collection.
Parse collection Parsing reads the content of the files and updates the network model accordingly. Ifyou don't select this option, the configuration files are collected on the server, butnot used in the model.
Default: Selected (Yes)
Archive BGP Files If you select this option, the memory consumption of large BGP files in Pathfinder isreduced by compressing data collection files that result from the device collectiontask.
Default: Selected (Yes)
Add to Database If you enable this option, raw and spec data are added to the database, making itavailable for import into Paragon Planner as a network. This data includes theunparsed collected data from the devices and the device collection task status. Theunparsed collected data contains the output of multiple show commands on thedevices. When you enable this option, a Description field appears.
Default: Not selected (No)
Description Specify a meaningful description for your reference.
747

Table 136: Fields on the Create New Task Wizard (Device Collection) (Continued)
Field Description
Archive raw data Raw data is archived in Elasticsearch.
Default: Selected (Yes)
Collection Options From the available options, select the check boxes corresponding to the types ofdata to be collected or processed.
By default, the Configuration, Interface, Tunnel Path, Transit Tunnel data arecollected.
You can click the Select All check box to select all the options automatically or clickthe Deselect All check box to clear all the selections.
NOTE: We recommend that you collect router configuration, tunnel path and tunneltransit show commands when running the device collection task so that the PCE canupdate the tunnel status and details based on the latest collection.
Equipment CLI data is collected in device collection tasks that include the EquipmentCLI option. The Process Equipment CLI option in Network Archive collection parsesthe Equipment CLI data collected in device collection and generates the InventoryReport available in both Paragon Pathfinder and Paragon Planner.
To view Hardware Inventory in Paragon Planner, you must run device collection withthe Equipment CLI collection option (collects the inventory data) and you must runNetwork Archive collection with the Process Equipment CLI option (processes theinventory data).
Each of the options results in the collection task capturing the results of variousshow commands. Table 137 on page 750 lists the show command output capturedfor each option.
Step 3
748

Table 136: Fields on the Create New Task Wizard (Device Collection) (Continued)
Field Description
Schedule NOTE:
• You can choose to run the collection only once, or to repeat it at specificintervals. The default interval is 15 minutes.
Startup Options:
• Starts Now—Select this option to start the device collection task at the currenttime.
• Starts On—Select this option and click the calendar icon to select the date andtime at which the task starts. To start the task at the current date and time, clickCurrent Date and Time at the bottom of the calendar.
• Timezone—Displays the client timezone.
Recurrence Options:
• Repeats—Specify the frequency (Never, Minutes, Hours, Days, Weekly, Monthly,or Yearly) with which the task recurs.
• Every—Specify the periodicity of recurrence.
• Ends—Select Never if you want the task to recur at the specified intervalautomatically. Alternatively, select On, and click the calendar icon to specify adate and time at which you want the task to end. To end a task at the currentdate and time, click Current Date and Time at the bottom of the calendar.
• Timezone—Displays the client timezone.
NOTE: Instead of scheduling recurrence, you can select to chain the task after analready-scheduled recurring task, so that it launches immediately after the other taskcompletes. Select Chain after another task. From the list of recurring tasks that isdisplayed, select the task after which you want to launch the task that you added.
Table 137 on page 750 lists the show command output captured for each Collection Option.
749
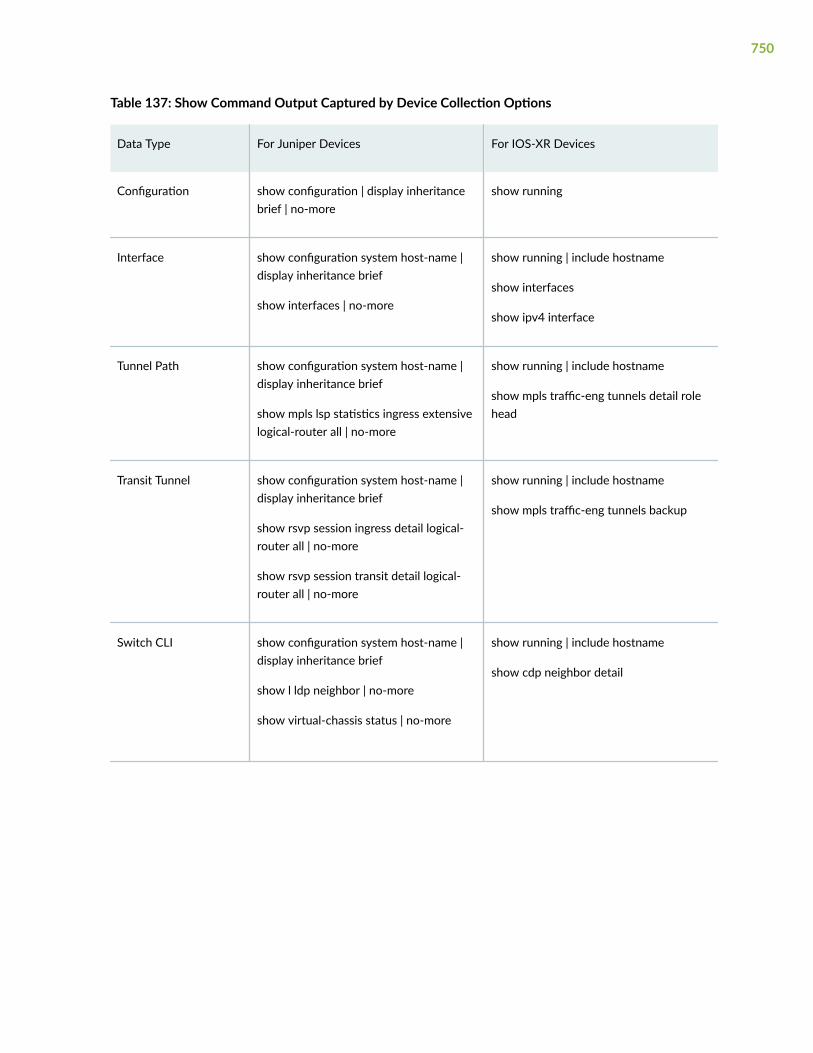
Table 137: Show Command Output Captured by Device Collection Options
Data Type For Juniper Devices For IOS-XR Devices
Configuration show configuration | display inheritancebrief | no-more
show running
Interface show configuration system host-name |display inheritance brief
show interfaces | no-more
show running | include hostname
show interfaces
show ipv4 interface
Tunnel Path show configuration system host-name |display inheritance brief
show mpls lsp statistics ingress extensivelogical-router all | no-more
show running | include hostname
show mpls traffic-eng tunnels detail rolehead
Transit Tunnel show configuration system host-name |display inheritance brief
show rsvp session ingress detail logical-router all | no-more
show rsvp session transit detail logical-router all | no-more
show running | include hostname
show mpls traffic-eng tunnels backup
Switch CLI show configuration system host-name |display inheritance brief
show l ldp neighbor | no-more
show virtual-chassis status | no-more
show running | include hostname
show cdp neighbor detail
750

Table 137: Show Command Output Captured by Device Collection Options (Continued)
Data Type For Juniper Devices For IOS-XR Devices
Equipment CLI show configuration system host-name |display inheritance brief
show version | no-more
show chassis hardware | no-more
show chassis fpc | no-more
show chassis hardware models | no-more
show version
show diag
show env all admin
show inventory
show inventory raw
RELATED DOCUMENTATION
About the Task Scheduler Page | 735
Edit and Delete Tasks | 762
Add a Network Archive Task
From the Task Scheduler page, you can launch collection tasks that create a network model in adatabase, for use in Paragon Planner. You also have the option to archive the network model.
Tunnel design attributes that are configured in the Tunnel tab of the GUI are inherited by ParagonPlanner, even though they are never pushed to the router. When you run Network Archive devicecollection, the tunnel information in Paragon Planner (which came from the router) is merged with thetunnel information in the PCE (which includes design attributes that are not pushed to the router). Themerged version is then available in Paragon Planner.
The following design attributes that are configured in the Provision LSP pages in the GUI are inheritedby Paragon Planner through network archive collection:
• Properties tab: Routing Method
• Advanced tab: Symmetric Pair Group, Diversity Group, and Diversity Level
• Constraints tab: Max Delay, Max Hop, and Max Cost
• Scheduling tab: All scheduling information
751
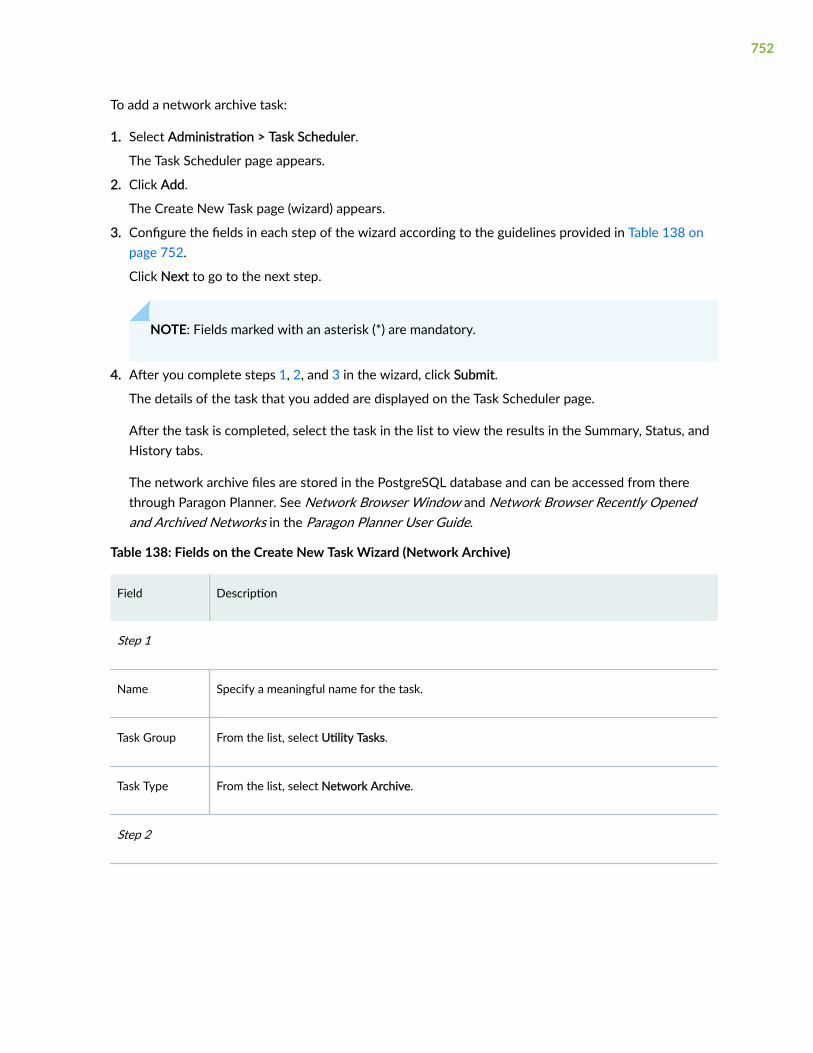
To add a network archive task:
1. Select Administration > Task Scheduler.
The Task Scheduler page appears.
2. Click Add.
The Create New Task page (wizard) appears.
3. Configure the fields in each step of the wizard according to the guidelines provided in Table 138 onpage 752.
Click Next to go to the next step.
NOTE: Fields marked with an asterisk (*) are mandatory.
4. After you complete steps 1, 2, and 3 in the wizard, click Submit.
The details of the task that you added are displayed on the Task Scheduler page.
After the task is completed, select the task in the list to view the results in the Summary, Status, andHistory tabs.
The network archive files are stored in the PostgreSQL database and can be accessed from therethrough Paragon Planner. See Network Browser Window and Network Browser Recently Openedand Archived Networks in the Paragon Planner User Guide.
Table 138: Fields on the Create New Task Wizard (Network Archive)
Field Description
Step 1
Name Specify a meaningful name for the task.
Task Group From the list, select Utility Tasks.
Task Type From the list, select Network Archive.
Step 2
752

Table 138: Fields on the Create New Task Wizard (Network Archive) (Continued)
Field Description
DemandOptions
Select one or more check boxes corresponding to the following options:
• Process Equipment CLI—Equipment CLI data is collected in device collection tasks thatinclude the Equipment CLI option. The Process Equipment CLI option in Network Archivecollection parses the Equipment CLI data collected in device collection and generates theinventory reports available in both Paragon Pathfinder and Paragon Planner.
To view the inventory reports in Paragon Pathfinder, navigate to Monitoring > Reports >Inventory in the Paragon Automation GUI.
To view hardware inventory in Paragon Planner, you must run device collection with theEquipment CLI collection option (collects the inventory data) and you must run NetworkArchive collection with the Process Equipment CLI option (processes the inventory data).
• Archive network data after processing—This option makes the created model available inParagon Planner under the Archives tab in the Network Browser window. Otherwise, theresult of the Network Archive collection task is reflected in the new spec file for the LatestNetwork Archive in Paragon Planner, but it is overwritten by the next Latest NetworkArchive.
Step 3
753

Table 138: Fields on the Create New Task Wizard (Network Archive) (Continued)
Field Description
Schedule Schedule the task to be triggered once or to recur automatically based on the intervals youspecify. The default interval is 15 minutes.
Startup Options:
• Starts On—Click the calendar icon to select the date and time at which the task starts. Tostart the task at the current date and time, click Current Date and Time at the bottom ofthe calendar.
• Timezone—Displays the client timezone.
Recurrence Options:
• Repeats—Specify the frequency (in Minutes, Hours, or Days) with which the task recurs.
• Every—Specify the periodicity of recurrence.
• Ends—Select Never if you want the task to recur at the specified interval automatically.Alternatively, select On, and click the calendar icon to specify a date and time at which youwant the task to end. To end a task at the current date and time, click Current Date andTime at the bottom of the calendar.
• Timezone—Displays the client timezone.
NOTE: Instead of scheduling recurrence, you can select to chain the task after an already-scheduled recurring task, so that it launches immediately after the other task completes.Select Chain after another task. From the list of recurring tasks that is displayed, select thetask after which you want to launch the task that you added.
RELATED DOCUMENTATION
About the Task Scheduler Page | 735
Edit and Delete Tasks | 762
754

Add a Network Maintenance Task
You can add a network maintenance task to schedule maintenance events for network elements, so thatyou can perform updates or other configuration tasks. Currently, you can add maintenance events onlyfor nodes with the overload bit set.
Maintenance events are planned failures at specific future dates and times. During a scheduledmaintenance event, the selected elements are considered logically down, and the system reroutes theLSPs around those elements during the maintenance period. After the maintenance event is completed,the default behavior is that all LSPs that were affected by the event are reoptimized.
NOTE: The Path Computation Element (PCE) attempts to reoptimize only PCE-initiated and PCC-delegated LSPs (not PCC-controlled LSPs).
To add a network maintenance task:
1. Select Administration > Task Scheduler.
The Task Scheduler page appears.
2. Click Add.
The Create New Task page (wizard) appears.
3. Configure the fields in each step of the wizard according to the guidelines provided in Table 139 onpage 756.
Click Next to go to the next step.
NOTE: Fields marked with an asterisk (*) are mandatory.
4. After you complete steps 1, 2, and 3 in the wizard, click Submit.
The details of the task that you added are displayed on the Task Scheduler page.
After the task is completed, select the task in the list to view the results in the Summary, Status, andHistory tabs.
Every time the task runs, it first checks the complete condition for the maintenance event created by thetask. If all the elements included in the maintenance task satisfy the complete condition (for example,overloadBit = false), it completes the maintenance event. Next, it looks for elements that match thecreate conditions (for example, overloadBit = true). If it finds such elements, it creates a newmaintenance event that includes those elements.
Just as for other maintenance events, the “M” symbol on the topology map indicates the affected nodes.In the Maintenance tab of the network information table, the maintenance event displays the commentCreated by maintenance task in the Comment column.
755
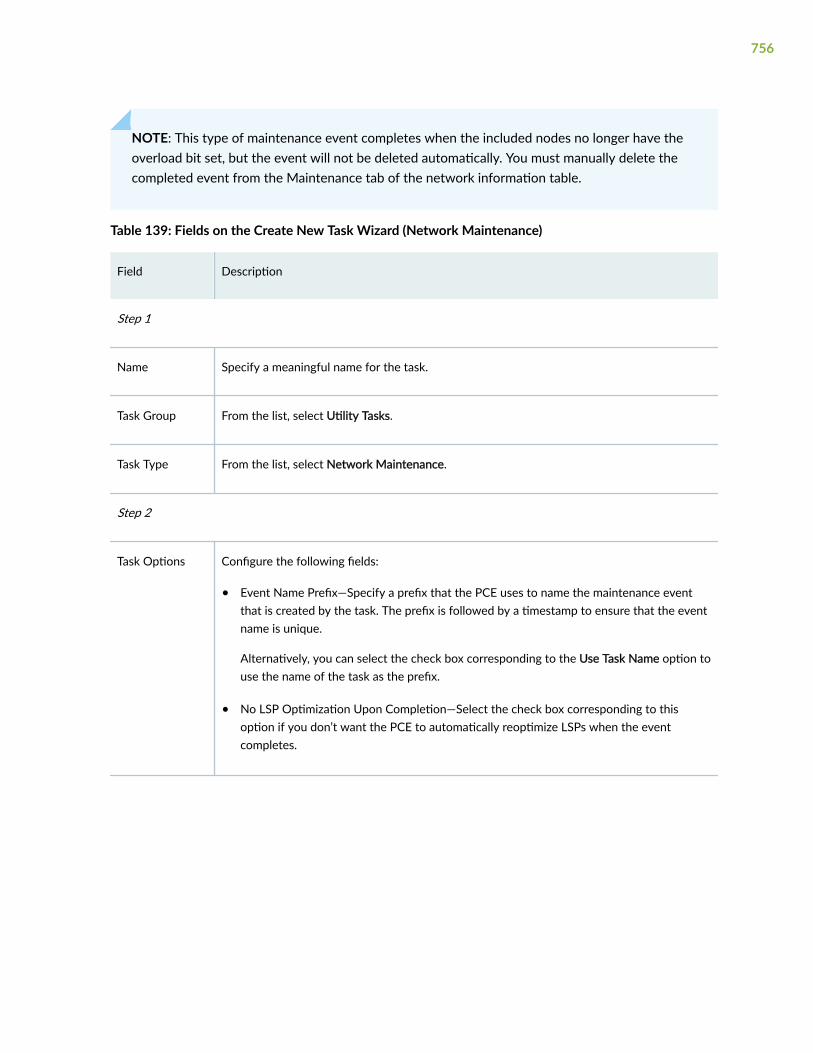
NOTE: This type of maintenance event completes when the included nodes no longer have theoverload bit set, but the event will not be deleted automatically. You must manually delete thecompleted event from the Maintenance tab of the network information table.
Table 139: Fields on the Create New Task Wizard (Network Maintenance)
Field Description
Step 1
Name Specify a meaningful name for the task.
Task Group From the list, select Utility Tasks.
Task Type From the list, select Network Maintenance.
Step 2
Task Options Configure the following fields:
• Event Name Prefix—Specify a prefix that the PCE uses to name the maintenance eventthat is created by the task. The prefix is followed by a timestamp to ensure that the eventname is unique.
Alternatively, you can select the check box corresponding to the Use Task Name option touse the name of the task as the prefix.
• No LSP Optimization Upon Completion—Select the check box corresponding to thisoption if you don’t want the PCE to automatically reoptimize LSPs when the eventcompletes.
756
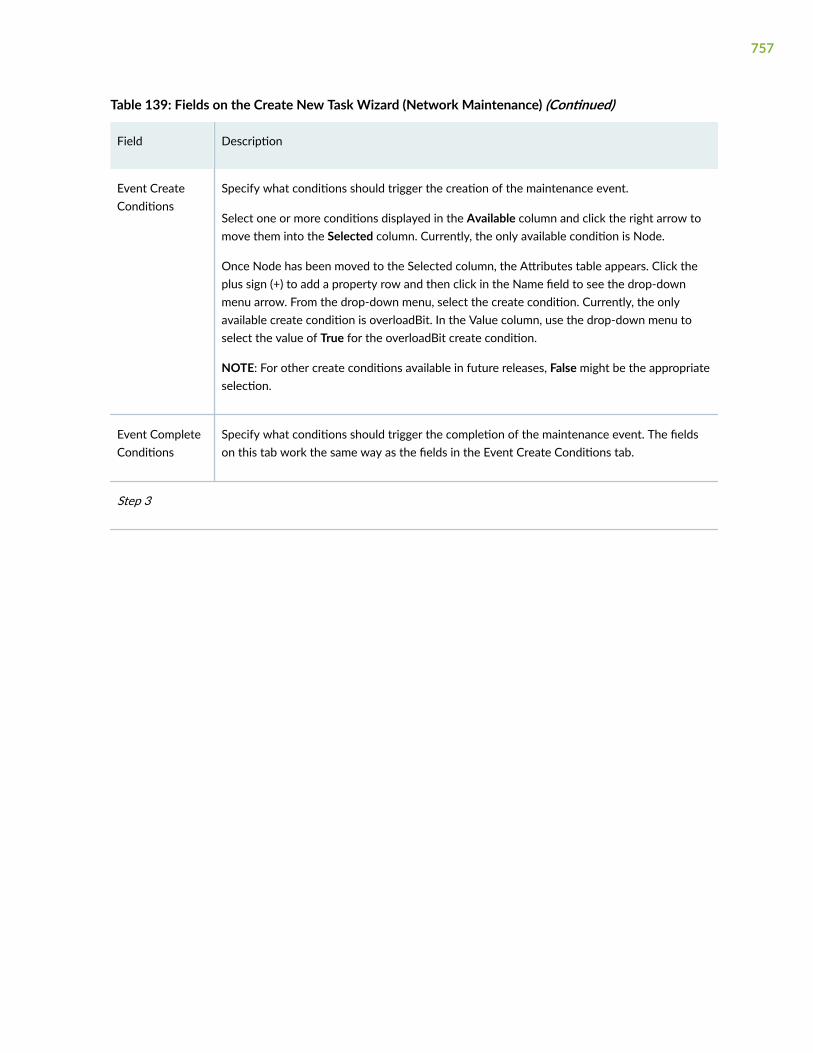
Table 139: Fields on the Create New Task Wizard (Network Maintenance) (Continued)
Field Description
Event CreateConditions
Specify what conditions should trigger the creation of the maintenance event.
Select one or more conditions displayed in the Available column and click the right arrow tomove them into the Selected column. Currently, the only available condition is Node.
Once Node has been moved to the Selected column, the Attributes table appears. Click theplus sign (+) to add a property row and then click in the Name field to see the drop-downmenu arrow. From the drop-down menu, select the create condition. Currently, the onlyavailable create condition is overloadBit. In the Value column, use the drop-down menu toselect the value of True for the overloadBit create condition.
NOTE: For other create conditions available in future releases, False might be the appropriateselection.
Event CompleteConditions
Specify what conditions should trigger the completion of the maintenance event. The fieldson this tab work the same way as the fields in the Event Create Conditions tab.
Step 3
757

Table 139: Fields on the Create New Task Wizard (Network Maintenance) (Continued)
Field Description
Schedule Schedule the task to be triggered once or to recur automatically based on the interval youspecify.
Startup Options:
• Starts On—Click the calendar icon to select the date and time at which the task starts. Tostart the task at the current date and time, click Current Date and Time at the bottom ofthe calendar.
• Timezone—Displays the client timezone.
Recurrence Options:
• Repeats—Specify the frequency (in Minutes, Hours, or Days) with which the task recurs.
• Every—Specify the periodicity of recurrence.
• Ends—Select Never if you want the task to recur at the specified interval automatically.Alternatively, select On, and click the calendar icon to specify a date and time at whichyou want the task to end. To end a task at the current date and time, click Current Dateand Time at the bottom of the calendar.
• Timezone—Displays the client timezone.
NOTE: Instead of scheduling recurrence, you can select to chain the task after an already-scheduled recurring task, so that it launches immediately after the other task completes.Select Chain after another task. From the list of recurring tasks that is displayed, select thetask after which you want to launch the task that you added.
RELATED DOCUMENTATION
About the Task Scheduler Page | 735
Edit and Delete Tasks | 762
Add a Network Cleanup Task
You can add a network cleanup task to clean up the network automatically. Automating this processsaves time, especially in large networks.
758

To add a network cleanup task:
1. Select Administration > Task Scheduler.
The Task Scheduler page appears.
2. Click Add.
The Create New Task page (wizard) appears.
3. Configure the fields in each step of the wizard according to the guidelines provided in Table 140 onpage 759.
Click Next to go to the next step.
NOTE: Fields marked with an asterisk (*) are mandatory.
4. After you complete steps 1, 2, and 3 in the wizard, click Submit.
The details of the task that you added are displayed on the Task Scheduler page.
After the task is completed, select the task in the list to view the results in the Summary, Status, andHistory tabs.
You can view the post-cleanup topology on the Topology page (Network > Topology). To ensure thatyou have the latest topology, right-click the blank space in the topology map and select ReloadNetwork. The latest topology is displayed in the topology map.
Table 140: Fields on the Create New Task Wizard (Network Cleanup)
Field Description
Step 1
Name Specify a meaningful name for the task.
Task Group From the list, select Utility Tasks.
Task Type From the list, select Network Cleanup.
Step 2
759

Table 140: Fields on the Create New Task Wizard (Network Cleanup) (Continued)
Field Description
Options Select one or more check boxes corresponding to the following options. By default, all the availableoptions are selected except Force remove links with user attributes.
• Purge down links—If you select this option, the links that are down are removed from the livenetwork and database.
• Force remove links with user attributes—If you select this option, the links that have customattributes defined in the controller are removed from the live network and database.
• Purge down nodes—If you select this option, the nodes that are down are removed from thelive network and database.
• Generate purge report—If you select this option, a report is generated every time the task isexecuted. The report indicates the actions taken as a result of the cleanup. Purge reports,identified with a timestamp, are stored in /opt/northstar/data/.network_plan/Report/purge_reports/
• Add notifications to timeline—If you select this option, you can see notifications relevant to theexecution of the task in the Timeline page. To get there, navigate to the Topology page(Network > Topology) and right-click on the blank space on the topology map. From the list thatappears, select Timeline.
Step 3
760
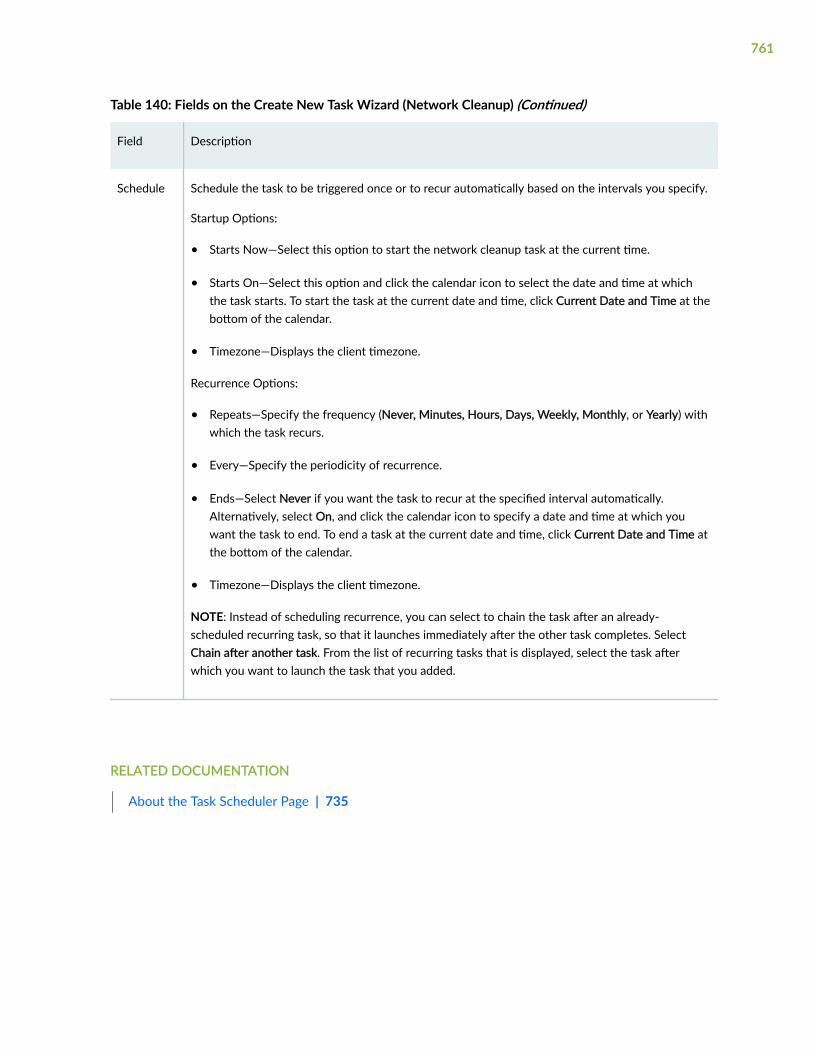
Table 140: Fields on the Create New Task Wizard (Network Cleanup) (Continued)
Field Description
Schedule Schedule the task to be triggered once or to recur automatically based on the intervals you specify.
Startup Options:
• Starts Now—Select this option to start the network cleanup task at the current time.
• Starts On—Select this option and click the calendar icon to select the date and time at whichthe task starts. To start the task at the current date and time, click Current Date and Time at thebottom of the calendar.
• Timezone—Displays the client timezone.
Recurrence Options:
• Repeats—Specify the frequency (Never, Minutes, Hours, Days, Weekly, Monthly, or Yearly) withwhich the task recurs.
• Every—Specify the periodicity of recurrence.
• Ends—Select Never if you want the task to recur at the specified interval automatically.Alternatively, select On, and click the calendar icon to specify a date and time at which youwant the task to end. To end a task at the current date and time, click Current Date and Time atthe bottom of the calendar.
• Timezone—Displays the client timezone.
NOTE: Instead of scheduling recurrence, you can select to chain the task after an already-scheduled recurring task, so that it launches immediately after the other task completes. SelectChain after another task. From the list of recurring tasks that is displayed, select the task afterwhich you want to launch the task that you added.
RELATED DOCUMENTATION
About the Task Scheduler Page | 735
761
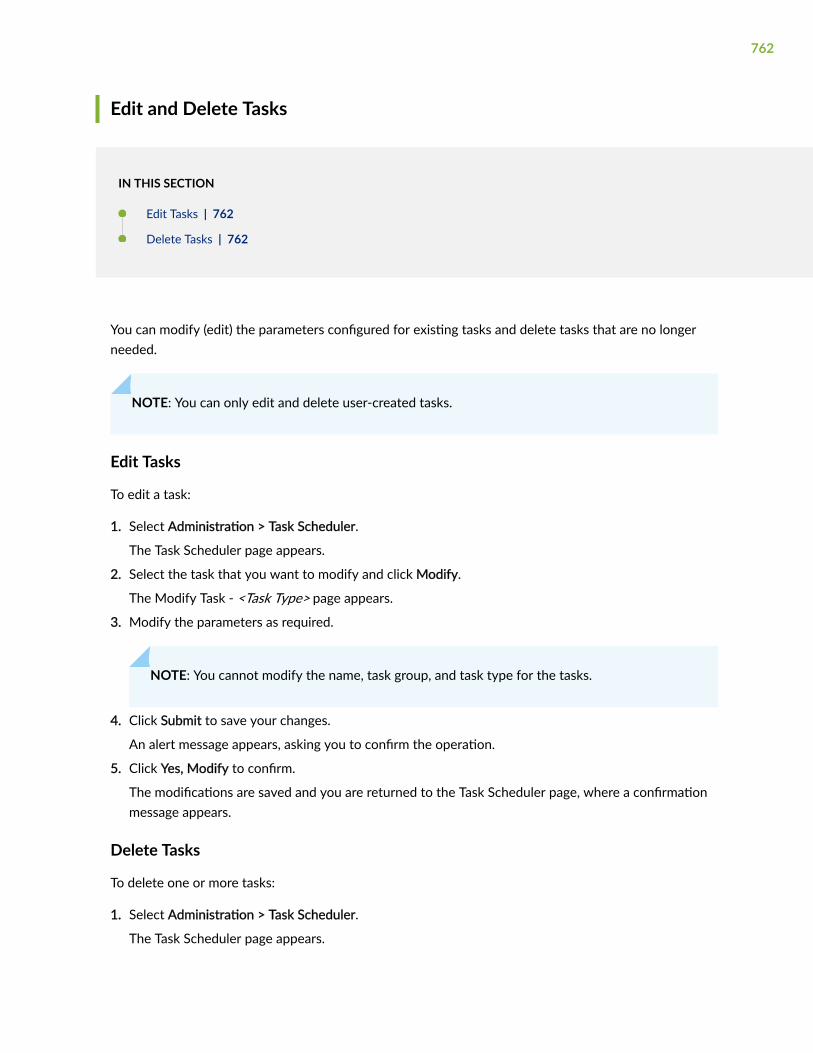
Edit and Delete Tasks
IN THIS SECTION
Edit Tasks | 762
Delete Tasks | 762
You can modify (edit) the parameters configured for existing tasks and delete tasks that are no longerneeded.
NOTE: You can only edit and delete user-created tasks.
Edit Tasks
To edit a task:
1. Select Administration > Task Scheduler.
The Task Scheduler page appears.
2. Select the task that you want to modify and click Modify.
The Modify Task - <Task Type> page appears.
3. Modify the parameters as required.
NOTE: You cannot modify the name, task group, and task type for the tasks.
4. Click Submit to save your changes.
An alert message appears, asking you to confirm the operation.
5. Click Yes, Modify to confirm.
The modifications are saved and you are returned to the Task Scheduler page, where a confirmationmessage appears.
Delete Tasks
To delete one or more tasks:
1. Select Administration > Task Scheduler.
The Task Scheduler page appears.
762

2. Select one or more tasks that you want to delete, and click Delete.
A confirmation message appears asking you to confirm the deletion.
3. Click Yes.
The selected tasks are deleted and you are returned to the Task Scheduler page, where aconfirmation message appears.
RELATED DOCUMENTATION
About the Task Scheduler Page | 735
763
CHAPTER 37
Manage Security Settings
IN THIS CHAPTER
About the Security Settings Page | 764
Configure Security Profiles for SSL Authentication | 766
About the Security Settings Page
IN THIS SECTION
Tasks You Can Perform | 765
Field Descriptions | 765
To access this page from the Paragon Automation graphical user interface (GUI), click Administration >Security.
Each time you navigate to the Security page, you first see the CA Profiles page. Click the tabs on theright to toggle between Local Certificate and CA Profile tabbed pages.
In Paragon Automation, you can create CA Profiles and Local Certificate profiles for secureauthentication in AMQP-based notifications. Paragon Insights supports various authentication methodsto provide secure data connection for Paragon Insights devices. Table 141 on page 765 provides anoverview of supported authentication methods and security parameters.
764
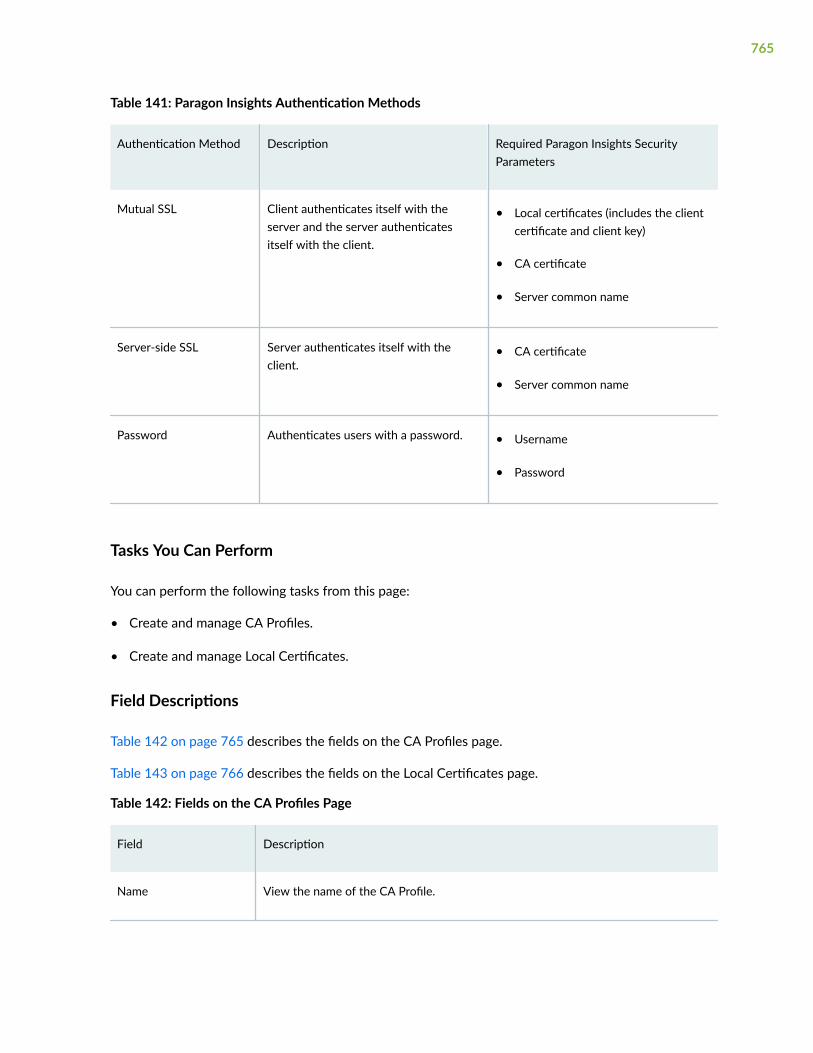
Table 141: Paragon Insights Authentication Methods
Authentication Method Description Required Paragon Insights SecurityParameters
Mutual SSL Client authenticates itself with theserver and the server authenticatesitself with the client.
• Local certificates (includes the clientcertificate and client key)
• CA certificate
• Server common name
Server-side SSL Server authenticates itself with theclient.
• CA certificate
• Server common name
Password Authenticates users with a password. • Username
• Password
Tasks You Can Perform
You can perform the following tasks from this page:
• Create and manage CA Profiles.
• Create and manage Local Certificates.
Field Descriptions
Table 142 on page 765 describes the fields on the CA Profiles page.
Table 143 on page 766 describes the fields on the Local Certificates page.
Table 142: Fields on the CA Profiles Page
Field Description
Name View the name of the CA Profile.
765

Table 142: Fields on the CA Profiles Page (Continued)
Field Description
Certificate View the uploaded certificate filename.
Table 143: Fields on the Local Certificate Page
Field Description
Name View the name of the Local Certificate profile.
Certificate View the uploaded client certificate filename.
Key View the uploaded client key filename.
RELATED DOCUMENTATION
Configure Security Profiles for SSL Authentication | 766
Configure Security Profiles for SSL Authentication
You can configure security profiles for (SSL) authentication from the Paragon Automation graphical userinterface (GUI).
For more information on security settings, see "About the Security Settings Page" on page 764.
To configure security profiles for SSL authentication:
1. Click Administration > Security.
The Security Settings page is displayed.
2. To add a CA profile:
a. Click the CA Profiles tab.
The CA Profiles page is displayed.
766

b. Click (+) icon to add a CA profile.
The Add CA Profiles page is displayed.
c. Enter the following information:
Name Enter a name for the CA profile.
UploadCertificate
Click Choose file and navigate to the location of the file that you want toupload. Select the CA certificate file and then click Open. The supported fileextension is .crt.
To add a local certificate profile:
a. Click the Local Certificates tab.
The Local Certificates page is displayed.
b. Click (+) icon to add a new local certificate profile.
The Add Local Certificate Profile page is displayed.
c. Enter the following information:
Name Enter a name for the local certificate profile.
UploadCertificate
Click Choose File and navigate to the location of the client certificate file.Select the file and then click Open. The supported file extension is .crt.
Upload Key Click Choose File and navigate to the location of the client key file. Select thefile and then click Open. The supported file extension is .key.
3. Click Save to only save the configuration.
Click Save and Deploy to save and deploy the configuration immediately.
RELATED DOCUMENTATION
About the Security Settings Page | 764
767

CHAPTER 38
License Management
IN THIS CHAPTER
Paragon Insights Licensing Overview | 768
About the License Management Page | 768
View, Add, or Delete Paragon Insights Licenses | 771
Paragon Insights Licensing Overview
Juniper Networks introduced the Juniper Flex Software Subscription Licensing model to provide anefficient way for you to manage licenses for hardware and software features. Paragon Insights uses thislicensing model. For more information, see the Paragon Insights Licensing topic in the Licensing Guide.
RELATED DOCUMENTATION
About the License Management Page | 768
View, Add, or Delete Paragon Insights Licenses | 771
About the License Management Page
IN THIS SECTION
Tasks You Can Perform | 769
Field Descriptions | 769
768

To access this page from the Paragon Automation graphical user interface (GUI), click Administration >License Management.
Juniper Networks introduced the Juniper Flex Software Subscription Licensing model to provide anefficient way for you to manage licenses for hardware and software features. Paragon Insights uses thislicensing model. For more information, see "Paragon Insights Licensing Overview" on page 768.
The License Management Page of the Paragon Automation GUI provides a complete view of theavailable license features, and details of all Paragon Insights licenses that are added.
Tasks You Can Perform
You can perform the following tasks from this page:
• Add a Paragon Insights License.
• Delete a Paragon Insights License.
• View Paragon Insights Licensing Features.
• View Status and Details of a Paragon Insights License.
Field Descriptions
Table 144 on page 769 describes the fields of the Feature Summary section.
Table 145 on page 770 describes the fields of the Added License section.
Table 144: View Details of Feature Summary Section
Attribute Description
Feature View the names of the Paragon Insights Licenses.
Description View a brief description of the Paragon Insights license.
License Limit View the number of valid Paragon Insights licenses successfully added andavailable for use.
Usage Count View the number of available licenses that are currently in use in thisinstance of Paragon Insights.
769

Table 144: View Details of Feature Summary Section (Continued)
Attribute Description
Valid Until View the date and time of when the license expires.
Compliance View color definitions that determine license compliance.
Green Feature licenses are in compliance with Juniper's End User LicenseAgreement.
Yellow Device feature licenses are >= 90% of the limit. You are gettingclose to running out of licenses. This status is applies only todevice feature licenses.
Red Feature licenses are not in compliance with Juniper's End UserLicense Agreement. Click on the red dot to view details about thecompliance issue.
Table 145: View Details of Added License Section
Attribute Description
License ID View the Paragon Insights license identification number generated throughthe Juniper Agile Licensing Portal.
SKU Name View the Paragon Insights software licensing package name.
Customer ID View the customer identification.
Order Type View the order type (commercial, demo, education, emergency, lab, andunknown).
Validity Type View the validity type of a license (date-based or permanent).
Start Date View the start date of the Paragon Insights license.
End Date View the end date of the Paragon Insights license.
770
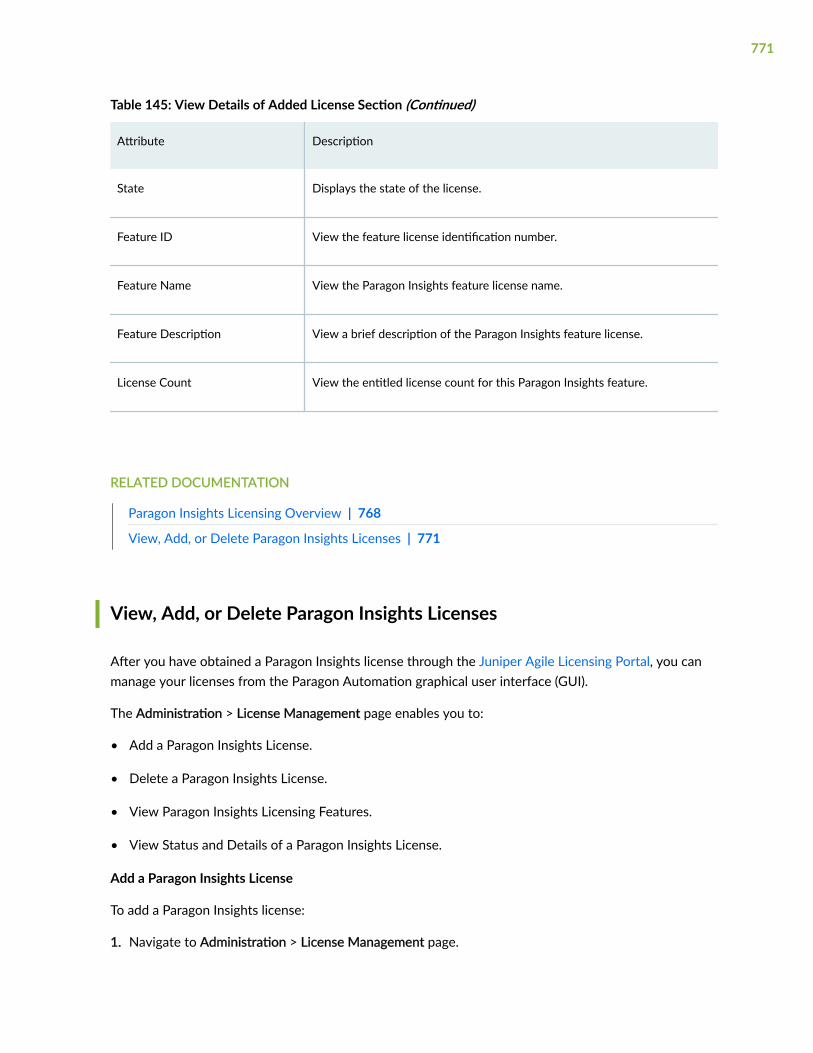
Table 145: View Details of Added License Section (Continued)
Attribute Description
State Displays the state of the license.
Feature ID View the feature license identification number.
Feature Name View the Paragon Insights feature license name.
Feature Description View a brief description of the Paragon Insights feature license.
License Count View the entitled license count for this Paragon Insights feature.
RELATED DOCUMENTATION
Paragon Insights Licensing Overview | 768
View, Add, or Delete Paragon Insights Licenses | 771
View, Add, or Delete Paragon Insights Licenses
After you have obtained a Paragon Insights license through the Juniper Agile Licensing Portal, you canmanage your licenses from the Paragon Automation graphical user interface (GUI).
The Administration > License Management page enables you to:
• Add a Paragon Insights License.
• Delete a Paragon Insights License.
• View Paragon Insights Licensing Features.
• View Status and Details of a Paragon Insights License.
Add a Paragon Insights License
To add a Paragon Insights license:
1. Navigate to Administration > License Management page.
771

The License Management page is displayed.
2. Click (+) icon in the Licenses Added section to add a new license.
The Add License page is displayed.
3. Click Browse and navigate to the location of the license file, that you want to add.
Select the file and then click Open.
The license file is now added to the Add License page.
4. Click Ok to confirm selection.
The license you added is now listed in the Licenses Added section of the License Management page.
Delete a Paragon Insights License
To delete and existing Paragon Insights license:
1. Navigate to Administration > License Management page.
The License Management page is displayed.
2. From the Licenses Added section, click the option button (available in beginning the row) of thelicense you want to delete, and then click Delete.
The Confirm Delete page is displayed.
3. Click Yes to delete the license.
View Paragon Insights Licensing Features
To view Paragon Insights licensing features, navigate to Administration > License Management page.
The Features Summary section, as given in Table 146 on page 772, provides information on theParagon Insights feature licensing attributes.
Table 146: Feature Licensing Attributes
Attribute Description
Feature View the name of the Paragon Insights license.
Description Brief description of the Paragon Insights feature license.
License Limit The number of valid Paragon Insights licenses successfully added andavailable for use.
772

Table 146: Feature Licensing Attributes (Continued)
Attribute Description
Usage Count The number of available licenses that are currently in use in this instance ofParagon Insights.
Valid Until Date and time when the license expires.
Compliance Color definitions (dot indicator) that determine license compliance:
Green Feature licenses are in compliance with Juniper's End User LicenseAgreement.
Yellow Device feature licenses are >= 90% of the limit. You are gettingclose to running out of licenses. This status applies only to devicefeature licenses.
Red Feature licenses are not in compliance with Juniper's End UserLicense Agreement. Click the red dot to view details about thecompliance issue.
View Status and Details of a Paragon Insights License
To view status and details of a Paragon Insights license, navigate to Administration > LicenseManagement page. The Added Licenses section provides information on the added Paragon Insightslicenses. You can also click the option button (available in beginning the row) of the license you want toview, and then click the More > Details to view more information about the license.
Table 147 on page 773 provides information on the Paragon Insights feature licensing attributes.
Table 147: View Details of Licenses Added
Attribute Description
License ID Identification number for the Paragon Insights license generated throughthe Juniper Agile Licensing Portal.
SKU Name Name of the Paragon Insights software licensing package.
Customer ID Identification for the customer.
773

Table 147: View Details of Licenses Added (Continued)
Attribute Description
Order Type Types include: Commercial, demo, education, emergency, lab, and unknown.
Validity Type Types include: Date-based or permanent.
Start Date Start date of the Paragon Insights license.
End Date End date of the Paragon Insights license.
State Displays the state of the license.
Feature ID Identification number for the feature license.
Feature Name Paragon Insights feature license name.
Feature Description Brief description of the Paragon Insights feature license.
License Count HBOT-Premium Allow premium capabilities in Paragon Insights.
HBOT-Advanced Allow advanced capabilities in Paragon Insights.
HBOT-C1 Number of C1 devices that can be managed by ParagonInsights.
HBOT-C2 Number of C2 devices that can be managed by ParagonInsights.
HBOT-C3 Number of C3 devices that can be managed by ParagonInsights.
HBOT-C4 Number of C4 devices that can be managed by ParagonInsights.
774

RELATED DOCUMENTATION
About the License Management Page | 768
Paragon Insights Licensing Overview | 768
775