Palakkad District - क द्र य भू म जल बोडर् जल संसाधन,...
150
क� �य भ ू �म जल बोड जल संसाधन, नद� �वकास और गंगा संर�ण मंालय भारत सरकार Central Ground Water Board Ministry of Water Resources, River Development and Ganga Rejuvenation Government of India Report on MAPPING OF HARD ROCK AQUIFER SYSTEM AND AQUIFER MANAGEMENT PLAN Palakkad District, Kerala केरल �े, �वेगम Kerala Region, Thiruvananthapuram
-
Upload
khangminh22 -
Category
Documents
-
view
0 -
download
0
Transcript of Palakkad District - क द्र य भू म जल बोडर् जल संसाधन,...
क� द्र�य भू�म जल बोडर्
जल संसाधन, नद� �वकास और गंगा संर�ण मंत्रालय
भारत सरकार Central Ground Water Board
Ministry of Water Resources, River Development and Ganga Rejuvenation
Government of India
Report
on
MAPPING OF HARD ROCK AQUIFER SYSTEM AND AQUIFER MANAGEMENT PLAN
Palakkad District, Kerala
केरल �ेत्र, �त्रवेन्द्गम Kerala Region, Thiruvananthapuram
MAPPING OF HARD ROCK AQUIFER SYSTEM AND AQUIFER MANAGEMENT PLAN IN CHITTUR & MALAMPUZHA BLOCKS OF
PALAKKAD DISTRICT, KERALA
भारत सरकार
GOVERNMENT OF INDIA
,
MINISTRY OF WATER RESOURCES, RIVER DEVELOPMENT & GANGA REJUVENATION
केन्द्रीय भूमिजल बोर्ड
CENTRAL GROUND WATER BOARD
PREFACE
The State of Kerala, located in the South-western tip of India, accounts for only 1.2 percent of its
geographical area but is home to about 3 percent of its population. Although bestowed with copious
average annual rainfall of more than 3000 mm and also endowed with large surface water resources, only a small portion of the available resources is being utilized. To overcome the paradoxical situation, a
proper understanding of the disposition, extents, characteristics, status of resource and quality aspects of
the water-bearing formations, is required to ensure judicious and planned utilization of this precious
natural resource and its long-term sustainability. Detailed aquifer mapping studies in Kerala State were taken up with this objective, prioritizing study of the Over exploited and Critical blocks along with
Coastal aquifers during the Twelfth plan.
The report titled “Mapping of hard rock aquifers systems in Chittur and Malampuzha Blocks of Palakkad district, Kerala” gives a complete and detailed scientific account of the various aspects of the hard rock
aquifers in the area including its vertical and horizontal dimensions, flow directions, quantum and quality
of the resources, of both - the shallow and deeper zones of the hard rock aquifers in Chittur and Malampuzha blocks. Voluminous data were generated consequent to hydrogeological studies, ground
water regime monitoring studies, exploratory drilling, geophysical studies etc carried out in the area, are
incorporated in the report. The information is further supplemented by documenting all the relevant
available data collected from concerned state department. It portrays the various ground water issues pertaining to the area alongwith recommendation for suitable interventions and remedial measures. Thus
it provides a total and holistic solution to the water security problems in the over exploited and critical
blocks of Palakkad district.
This document has been prepared under the guidance of Dr. N.Vinayachandran,Scientist D & Nodal
Officer, National Aquifer Mapping Studies in Kerala, Central Ground Water Board and through the
sincere and painstaking efforts of Sh.S.Singathurai, Scientist B, Dr. S.Shakti Murugan, Assistant Hydrogeologist, of the Central Ground Water Board, Kerala Region, Trivandrum. I take this opportunity
to thank all of them for their help and cooperation in the preparation of this report. I am also thankful to
the Chairman, Members and officers of CGWB, Faridabad for their valuable guidance in finalizing this
document. Thanks are also due to various organizations of Government of Kerala and Government of India for providing data required for the compilation of this document.
I hope this compilation will be of help to the planners, administrators and stakeholders in the water sector
in Kerala and will serve as a useful guide for the optimal and sustainable management of limited ground water resources in Chittur and Malampuzha Blocks.
Trivandrum
May 2016
(V.Kunhambu)
Regional Director
Table of Contents
1.0 INTRODUCTION ........................................................................................................................... 1
1.1 Objectives ..................................................................................................................................... 1
1.2 Approach and Methodology ........................................................................................................... 1
1.3 About the area ............................................................................................................................... 2
1.4 Climate.......................................................................................................................................... 2
1.5 Soil ............................................................................................................................................... 3
1.6 Cropping Pattern ........................................................................................................................... 3
1.7 Drainage ........................................................................................................................................ 3
1.8 Previous work ............................................................................................................................... 4
1.9 Geology of the area ....................................................................................................................... 5
1.10 Structures .................................................................................................................................... 6
2.0 DATA COLLECTION, GENERATION AND INTEGRATION ................................................ 7
2.1 Data collection and data gap analysis ............................................................................................. 7
2.1.1 Water Level Monitoring ......................................................................................................... 7
2.1.2 Exploration ............................................................................................................................. 8
2.1.3 VES and Profiling .................................................................................................................. 8
2.1.4 Water Quality Monitoring....................................................................................................... 8
2.2 Data Generation and Integration .................................................................................................... 9
2.2.1 Groundwater Exploration ....................................................................................................... 9
2.2.2 Vertical Electrical Sounding (VES) and Profiling ................................................................. 10
2.2.3 Water levels and piezometric heads ...................................................................................... 11
2.3 Water quality monitoring ............................................................................................................. 12
3.0 DATA INTERPRETATION AND AQUIFER MAPPING .......................................................... 16
3.1 Rainfall ....................................................................................................................................... 16
3.2 Soil Characteristics ...................................................................................................................... 19
3.3 Geomorphology ........................................................................................................................... 19
3.4 Drainage characteristics ............................................................................................................... 20
3.5 The aquifer systems ..................................................................................................................... 22
3.5.1 Thickness of weathered zone ................................................................................................ 23
3.5.2 Water levels ......................................................................................................................... 23
3.5.3 Saturated thickness of the weathered zone ............................................................................ 29
3.5.4 Water level trend .................................................................................................................. 30
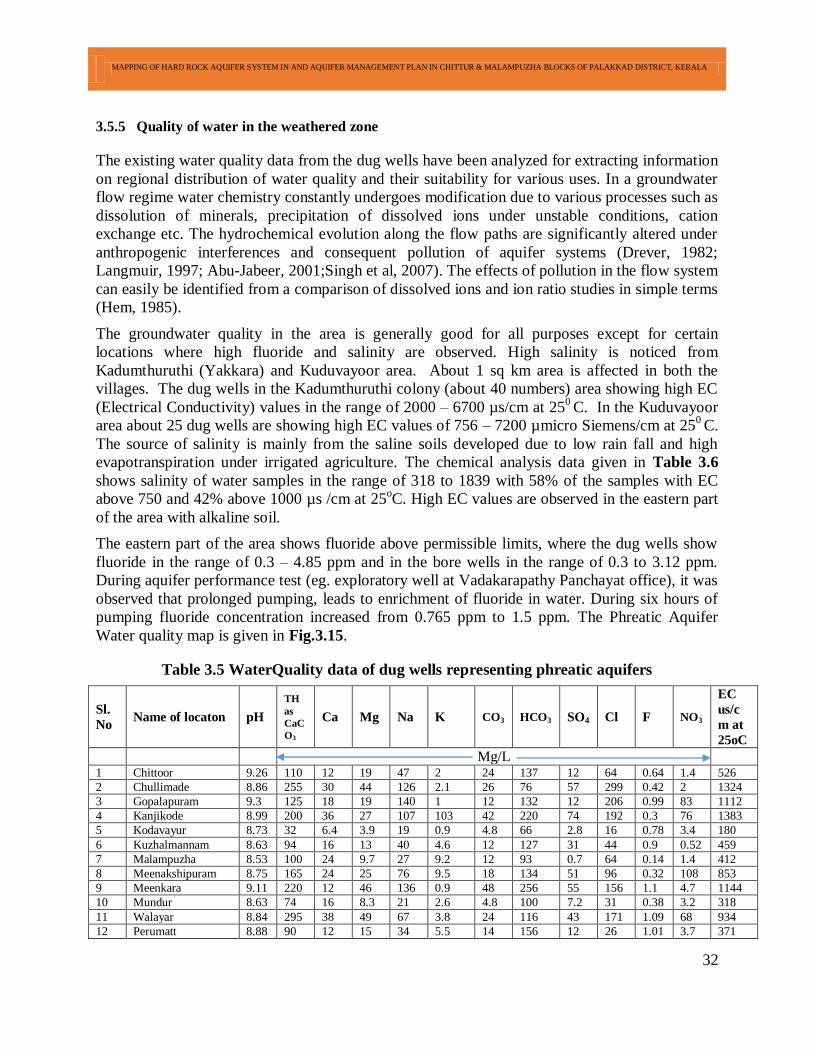
3.5.5 Quality of water in the weathered zone ................................................................................. 32
3.5.6 Groundwater potential of weathered zone ............................................................................. 35
3.5.7 Fracture Aquifer Geometry ................................................................................................... 37
3.5.8 Geophysical Investigations ................................................................................................... 39
3.5.9 Piezometric head in the fracture zone .................................................................................... 43
3.5.10 Groundwater and its relation to Geological Structures ......................................................... 46
3.5.11 Aquifer characteristics ........................................................................................................ 49
3.5.12 Groundwater potential of fracture aquifer system ................................................................ 51
3.5.13 Water quality in fracture aquifer system .............................................................................. 52
4. GROUNDWATER RESOURCES .................................................................................................. 56
4.1 Dynamic groundwater Resources in the weathered zone .............................................................. 56
4.2 Groundwater resources in the Fracture zone ................................................................................. 58
5. GROUNDWATER RELATED ISSUES ......................................................................................... 58
Sand mining ......................................................................................................................................... 59
Industrial pollution ............................................................................................................................... 60
6. AQUIFER MANAGEMENT PLAN ............................................................................................... 60
SUMMARY OF THE AQUIFER MAPPING .................................................................................... 66
LIST OF FIGURES Fig. 1.1 Location map of the study area ................................................................................................... 5
Fig. 1.2 Geology of the area ..................................................................................................................... 6
Fig. 2.1 Exploratory well locations in the area. ...................................................................................... 10
Fig 2.2 Integrated map of VES locations ................................................................................................ 11
Fig. 2.3 Locations of integrated water level monitoring wells and Piezometers....................................... 12
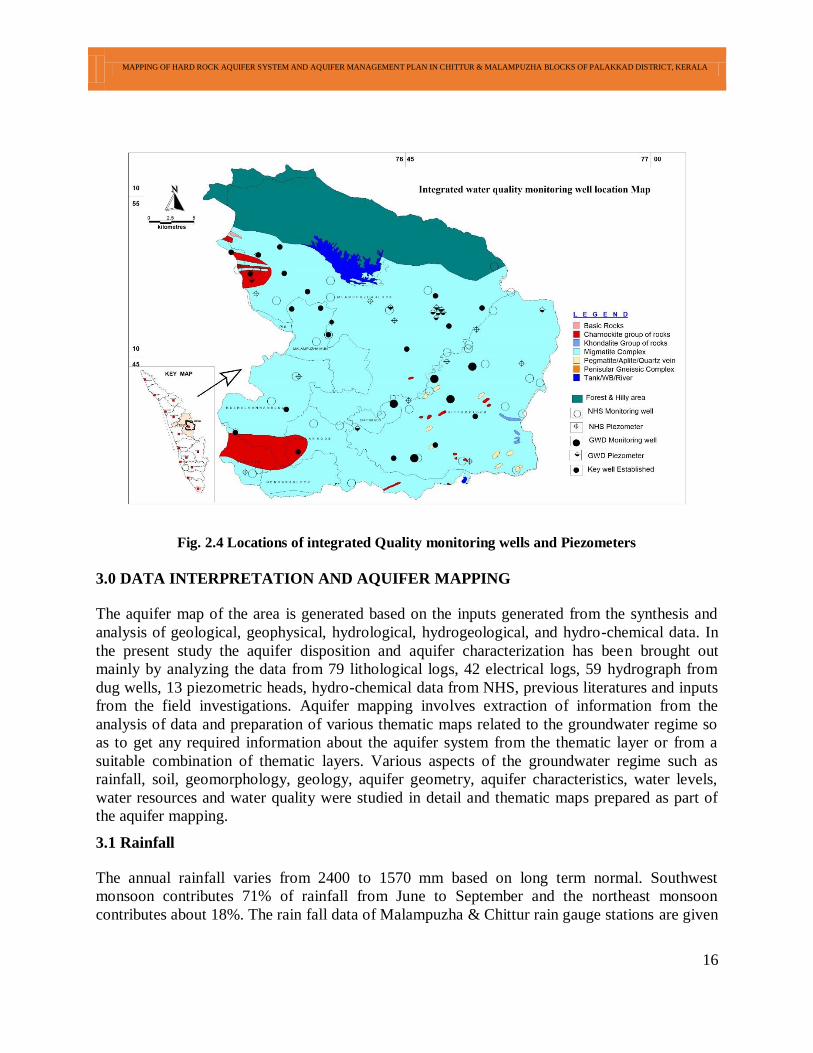
Fig. 2.4 Locations of integrated Quality monitoring wells and Piezometers ............................................ 16
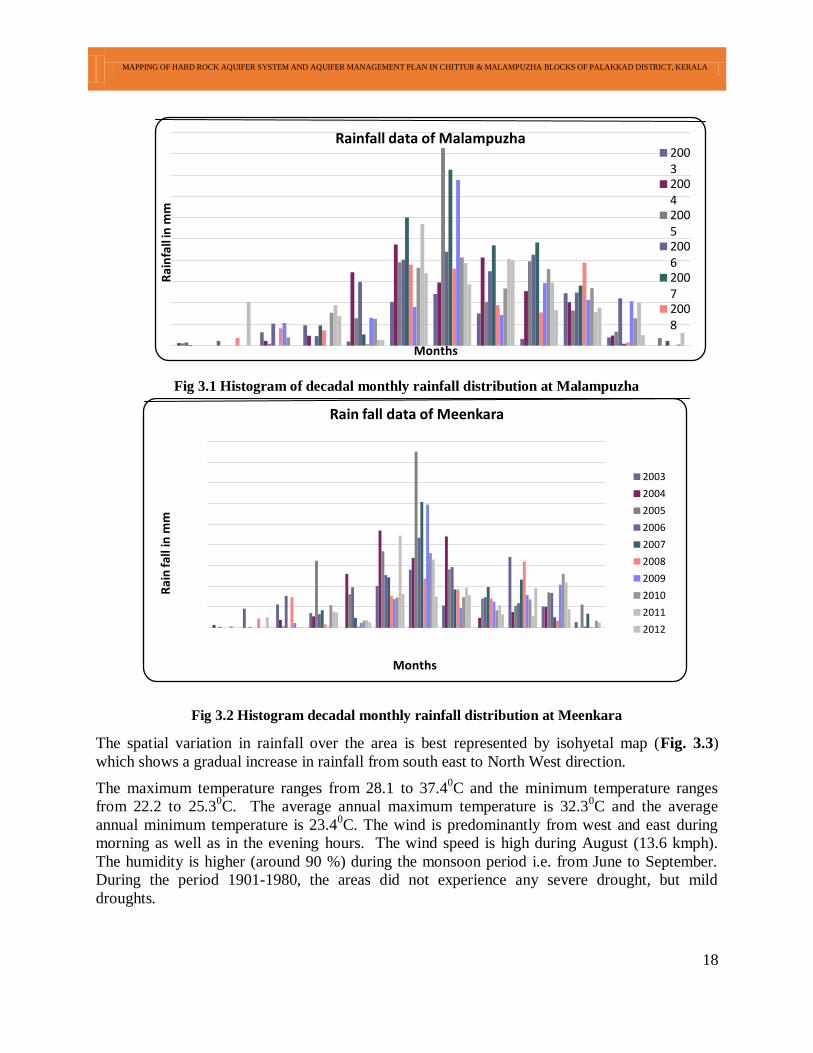
Fig 3.1 Histogram of decadal monthly rainfall distribution at Malampuzha ............................................ 18
Fig 3.2 Histogram decadal monthly rainfall distribution at Meenkara ..................................................... 18
Fig. 3.3 Isohyetal map of the Study area ................................................................................................ 19
Fig. 3.4 Soil map of the area .................................................................................................................. 20
Fig. 3.5 Geomorphology of the study area ............................................................................................. 21
Fig. 3.6 Drainage map of the area .......................................................................................................... 21
Fig. 3.7 The range in thickness of weathered zone ................................................................................. 24
Fig 3.7a : 3D view of the weathered zone .............................................................................................. 24
Fig.3.7b East west cross section showing the water level and weathered zone thickness in the area ........ 25
Fig. 3.8 Premonsoon water level map of the study area .......................................................................... 27
Fig. 3.9 Post monsoon water level map of the study area ........................................................................ 27
Fig.3.10 Water level fluctuation map ..................................................................................................... 28
Fig. 3.11 Water table elevation contour map .......................................................................................... 28
Fig. 3.12 Saturated thickness of aquifer during Pre-monsoon ................................................................. 29
Fig. 3.13 Saturated thickness of aquifer during post-monsoon ................................................................ 29
Fig.3.14 Water level trend in phreatic aquifers ....................................................................................... 31
Fig. 3.15 Water quality in the weathered zone ........................................................................................ 33
Fig. 3.16 Plotting of samples of NHS in Hill-Piper diagram ................................................................... 34
Fig. 3. 17 Groundwater potential map of phreatic aquifer system in the weathered zone ......................... 35
Fig 3.18 Aquifer map of the weathered zone .......................................................................................... 36
Fig. 3.19 Panel diagram displaying lateral and vertical variations in weathered thickness and depth of
occurrence of fractures .......................................................................................................................... 38
Fig. 3.20. Panel diagram displaying lateral and vertical variations in weathered thickness ...................... 38
Fig. 3.21a Apparent resistivity vs AB/2 at 6 locations in the area .......................................................... 42
Fig 3.21b. Apparent resistivity vs AB/2 graph at 3 locations in the area ................................................. 43
Fig 3.22 Piezometric head during pre-monsoon period ........................................................................... 45
Fig. 3.23 Piezometric head during post-monsoon period ........................................................................ 45
Fig. 3.24 Rose diagram showing the lineament trends in the area. .......................................................... 46
Fig. 3.25 Dolerite dyke intruded into the country rock, near Kanjikode. ................................................. 47
Fig.3.26 Pegmatite vein intruded in to the Hornblende biotite gneiss at Vadakarapathy .......................... 47
Fig. 3.27 Comparison of yield and lineament/fracture trends .................................................................. 48
Fig. 3.28 Ground water potential map of fracture aquifer system ............................................................ 52
Fig. 3.29Piper diagram of Exploratory Wells ......................................................................................... 54
Fig.3.30 Water quality in the fracture zone ............................................................................................ 54
Fig 3.31Aquifer map of fracture aquifer ................................................................................................. 55
LIST OF TABLES Table 1.1 Crop wise irrigation details ...................................................................................................... 3
Table 2.1 The data availability for data gap analysis ................................................................................ 7
Table 2.2 Ground Water Monitoring Wells of CGWB and SGWD ........................................................... 8
Table 2.3 Data requirement and data generated under aquifer mapping. ................................................... 9
Table 2.4 Summary of exploratory wells after integration ...................................................................... 10
Table 2.5 Monitoring wells details of phreatic aquifer ............................................................................ 13
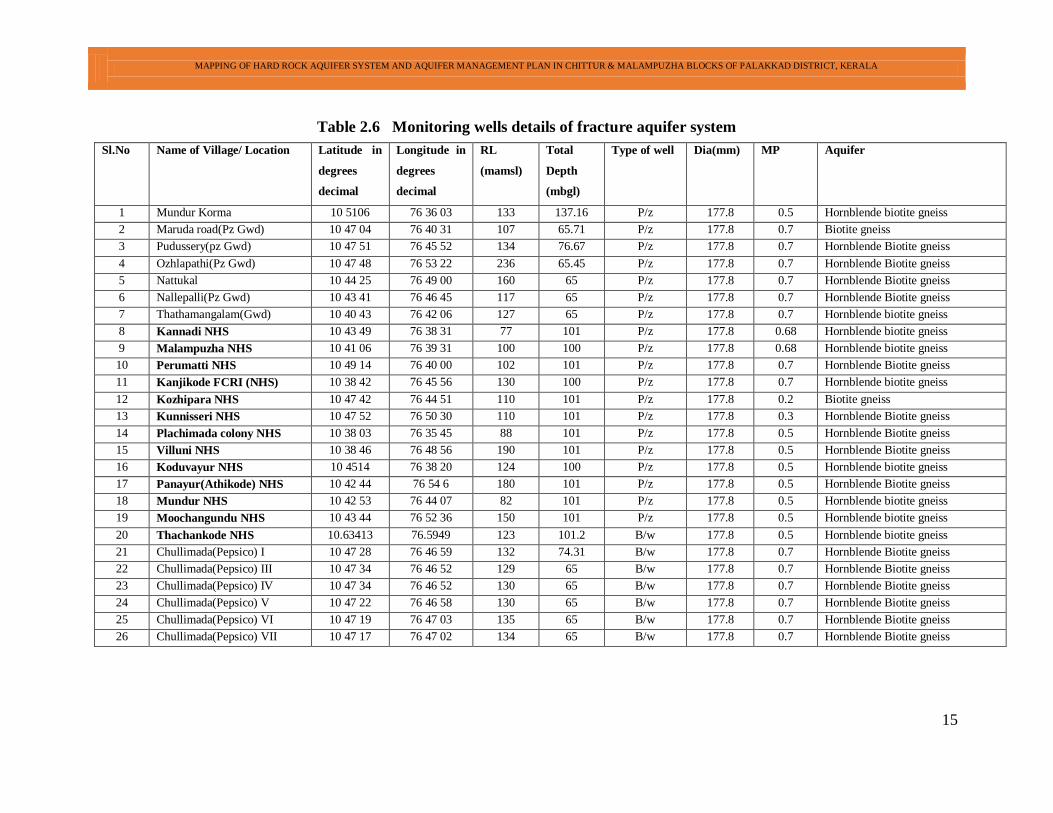
Table 2.6 Monitoring wells details of fracture aquifer system ............................................................... 15
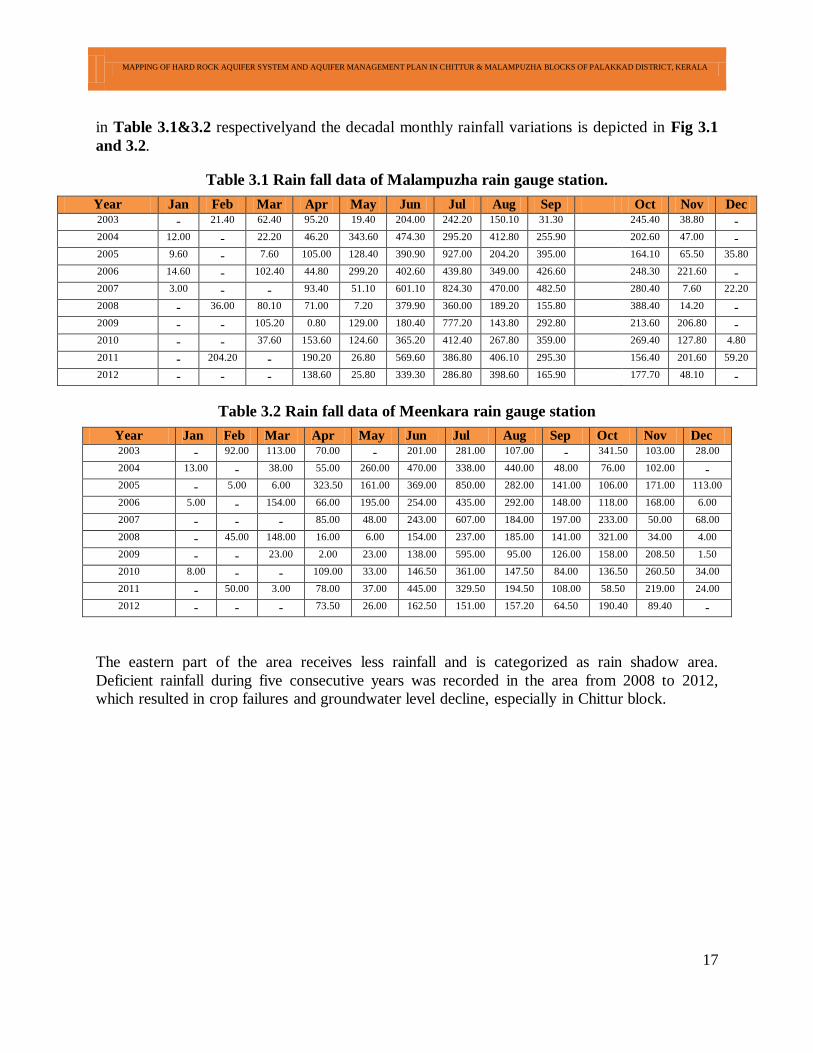
Table 3.1 Rain fall data of Malampuzha rain gauge station..................................................................... 17
Table 3.2 Rain fall data of Meenkara rain gauge station ......................................................................... 17
Table 3.3 Water level data from the Phreatic aquifers (dug wells) .......................................................... 25
Table 3.4. Water level trend values in the weathered zone. ..................................................................... 30
Table 3.5 WaterQuality data of dug wells representing phreatic aquifers ................................................ 32
Table 3.6 Interpretation of Geophysical (VES) data of the area .............................................................. 40
Table 3.7 Piezometric head data from the fracture aquifer system .......................................................... 44
Table 3.8 Percentage of lineaments observed in different trend directions .............................................. 46
Table 3.9 High yielding wells and its relation to Lineaments .................................................................. 48
Table 3.10 Exploratory Drilling in Chittur & Malampuzha blocks of Palakkad district (Data generated) 50
Table 3.11: Yield of bore wells in different ranges and their percentage ................................................. 51
Table 3.12 Water Chemistry of Exploratory wells in the Aquifer mapping study area ............................ 52
Table 4.1 Dynamic Ground water resources estimated for the Aquifer mapping study area .................... 57
Table 4.2 Groundwater in-storage in the fracture aquifer system ............................................................ 58
Table. 6.1 Viable solutions and interventions suggested for the water issues in the area ......................... 61
Table 6.2 Artificial Recharge Structures ................................................................................................ 62
Table 6.3 Artificial Recharge projects feasible for the area..................................................................... 63
Table 6.4 Groundwater augmentation from well recharge ...................................................................... 64
Table.6.5 Expected ground water scenario after implementation of management plans ........................... 64
MAPPING OF HARD ROCK AQUIFER SYSTEM AND AQUIFER MANAGEMENT PLAN IN CHITTUR & MALAMPUZHA BLOCKS OF PALAKKAD DISTRICT, KERALA
1
MAPPING OF HARD ROCK AQUIFER SYSTEM IN CHITTUR &
MALAMPUZHA BLOCKS OF PALAKKAD DISTRICT, KERALA (AAP 2013 –14)
1.0 INTRODUCTION
Mapping of the hard rock aquifer systems in Chittur & Malampuzha blocks of Palakkad district
was carried out during the Annual Action Plan (AAP) 2013-14 covering an area of 1000 sq.Km.
Aquifer mapping is a multi-disciplinary scientific process where data related to the aquifer
system and groundwater regime are integrated to characterize the quantity, quality and
movement of groundwater in aquifers. The study area is located on the famous structural gap on
the Sahyadri Ranges (Western Ghats) popularly known as ‘Palghat Gap’. This structural gap of
about 32 Km width is tectonically disturbed and the multi fracture systems in the area are
developed at different stages of deformation of the rock formations during the evolution of the
Gap structure. Because of this reason the groundwater potential as well as development in this
area is high. A better understanding of the hydrogeological processes that control the distribution
and availability of groundwater in the weathered and fracture zones of the aquifer system is
imperative for sustainable resource management. The sustainable development and management
of hard rock aquifer system involves development of strategies for balancing the water draft and
water availability. Integrated studies on various aspects of the groundwater regime have been
carried out to know the disposition and productivity of the aquifer systems.
The hydrogeological environment of the study area has been conceptualized from the study of
historical data (available data) on the groundwater regime and from the available technical
reports and publications. The data gaps could be identified from the analysis of historical data
which facilitated generation of new data in gap areas. The hydrogeological, hydrological,
geophysical, hydrochemical and meteorological data were analyzed for data gaps. Groundwater
draft from the aquifer systems has been evaluated from well inventory data and integrated use of
lithological and geophysical data used to refine the aquifer geometry of the area.
1.1 Objectives
Aquifer mapping is a process wherein a combination of geologic, geophysical, hydrologic and
chemical field and laboratory analyses are applied to characterize the quantity, quality and
sustainability of ground water in aquifers. Thus, the main objective of aquifer mapping is to
generate an aquifer map of the area in 1:50,000 scale so as to develop a management plan for
aquifer sustainability.
1.2 Approach and Methodology
The major activities envisaged under aquifer mapping to achieve the objectives are data gap
analysis, data generation, dataintegration, preparation ofthematic maps and development of
aquifer models. The data gap analysis primarily involves compilation, analysis and interpretation
of the existing data on the groundwater regime. The data inadequacy or data gaps identified from
this study forms the base for additional data generation. The existing data and the new data
generated under aquifer mapping activitieshave been integrated and various thematic maps
MAPPING OF HARD ROCK AQUIFER SYSTEM AND AQUIFER MANAGEMENT PLAN IN CHITTUR & MALAMPUZHA BLOCKS OF PALAKKAD DISTRICT, KERALA
2
depicting hydrogeology, hydrology, geomorphology, water quality etc and cross-sections, panel
diagrams, elevation models and aquifer geometry (2-D models and 3-D models) were prepared.
The information derived from various activities described above could be used to
i. Define the aquifer geometry and characterizethe aquifersystems.
ii. Define groundwater regime behaviour.
iii. Identify the recharge characteristics and resource potential.
iv. Identify the hydro-chemical characteristics of weathered and fracture aquifer systems
and the extent of contaminant/pollutant in groundwater, if any.
v. Arrive at an effective groundwater management plan.
1.3 About the area
The study area is situated in the eastern part of Palakkad district of KeralaState and is bounded
on the north by Attapady block, in the east by Coimbatore district of Tamil Nadu, in the south by
Kollengode block and in the west by parts of Kuzhalmannam, Alattur and Palakkad blocks. The
area lies between North latitudes 100 36' 34'' and 10
0 56'33'' and East longitudes 76
0 32'42'' and
760 54'28'', covering an areaof about 1000 sq.km of which 300 Sq Km falls under hilly and forest
category and the balance 700 Sq. Km is considered for aquifer mapping. The mapping area
includes whole of Malmpuzha and Chittur blocks and part of Kuzhalmannam, Kollangode,
Alattur and Nenmara blocks.The area falls in parts of Survey of India topo sheets 58B/9, 10, 13
and B/14 and is served by a good network of roads and rail connecting important adjoining
places in Kerala and Tamil Nadu. The National Highway NH 47 and the broad gauge rail
sectionsof Southern Railway such as Thiruvananthapuram-Palakkad-Coimbatore-Chennai and
Palakkad- Pollachi railspasses through the area.
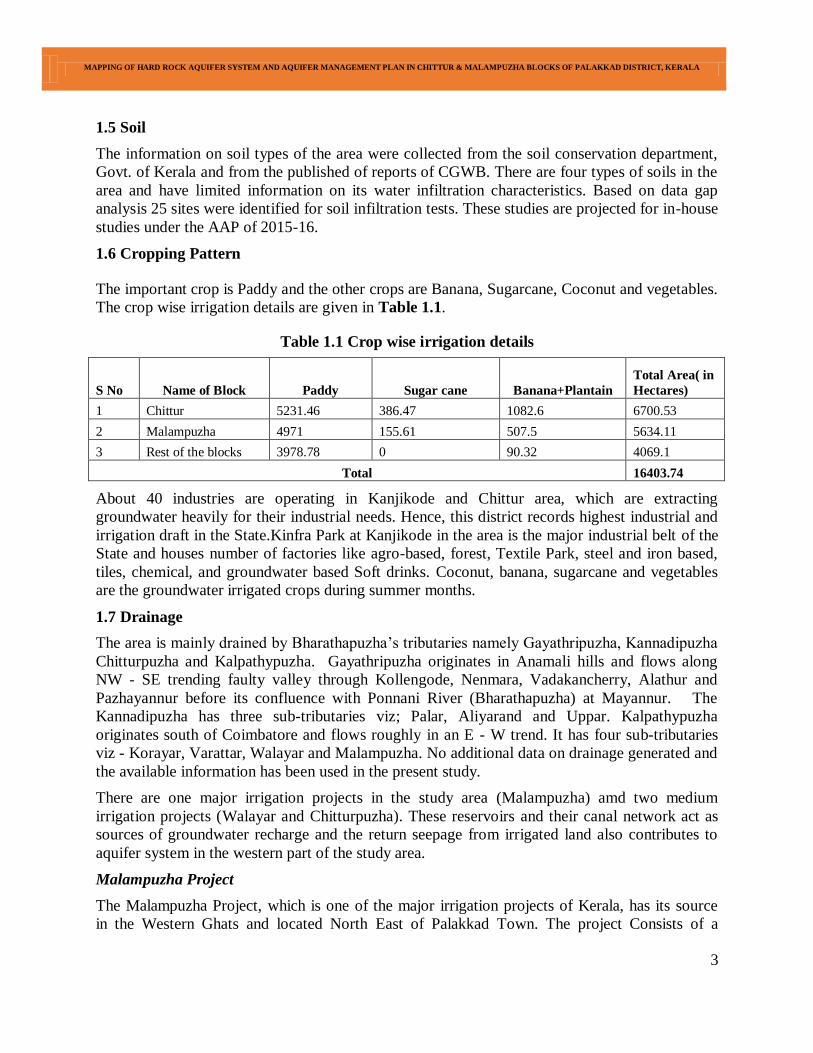
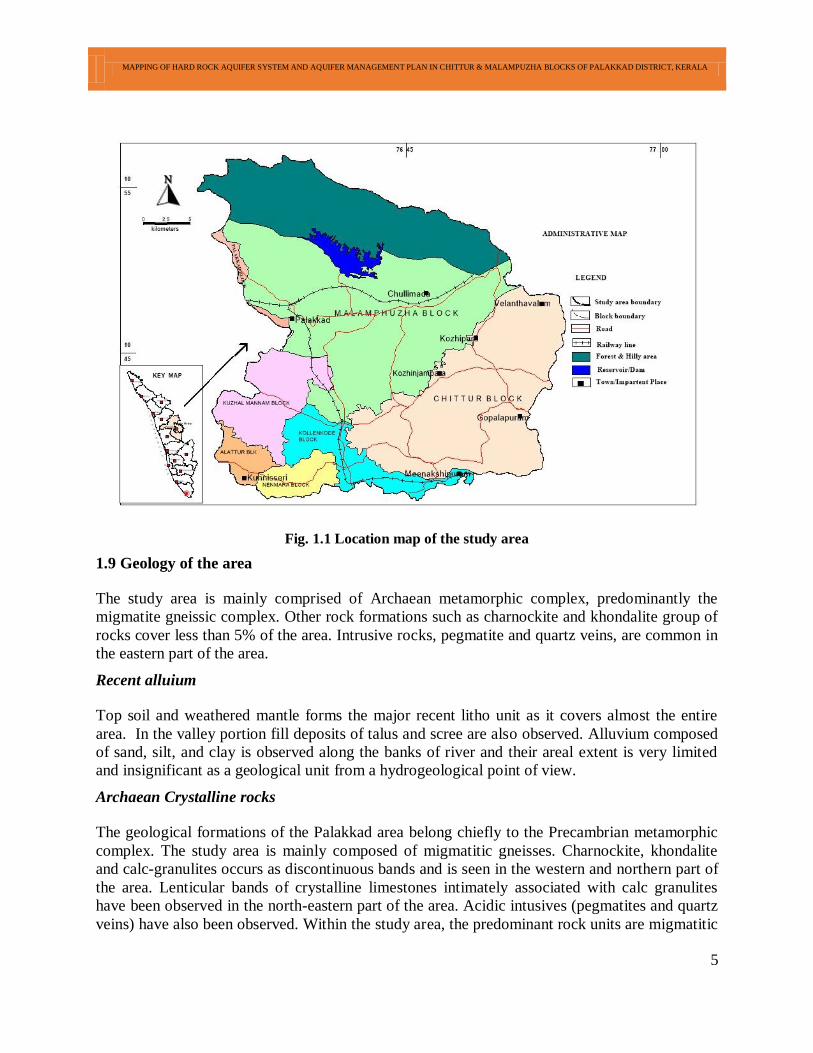
There are 45 villages and 22 panchayats in the study area and the location map of the study area
is given in. Fig.1.1. Majority of the population depend on both surface and ground water
resources to meet their water needs. As per 2011 census, the total population of the study area is
6, 75,841 in this 3, 31,381 are men and 3, 44,442 are women.
1.4 Climate
The climatic data from IMD station and the rainfall data from six rain gauge stations having
influence over the area were utilized. However, the rainfall data from two rain gauge stations
located within the area viz; Meenkara and Malampuzha were analysed in detail. The analysis of
existing data identified no data gaps for additional establishment of rain gauge stations.
The annual rainfall varies from 2400 to 1570 mm based on long term normal. Southwest
monsoon contributes 71% of rainfall from June to September and the northeast monsoon
contributes about 18%. The continuous five year (2008 to 2012) deficient rainfall has contributed
a lot in crop failures and to reduce the groundwater recharge as well as water level decline,
especially in Chittur and Malampuzha blocks.
MAPPING OF HARD ROCK AQUIFER SYSTEM AND AQUIFER MANAGEMENT PLAN IN CHITTUR & MALAMPUZHA BLOCKS OF PALAKKAD DISTRICT, KERALA
3
1.5 Soil
The information on soil types of the area were collected from the soil conservation department,
Govt. of Kerala and from the published of reports of CGWB. There are four types of soils in the
area and have limited information on its water infiltration characteristics. Based on data gap
analysis 25 sites were identified for soil infiltration tests. These studies are projected for in-house
studies under the AAP of 2015-16.
1.6 Cropping Pattern
The important crop is Paddy and the other crops are Banana, Sugarcane, Coconut and vegetables.
The crop wise irrigation details are given in Table 1.1.
Table 1.1 Crop wise irrigation details
S No Name of Block Paddy Sugar cane Banana+Plantain
Total Area( in
Hectares)
1 Chittur 5231.46 386.47 1082.6 6700.53
2 Malampuzha 4971 155.61 507.5 5634.11
3 Rest of the blocks 3978.78 0 90.32 4069.1
Total 16403.74
About 40 industries are operating in Kanjikode and Chittur area, which are extracting
groundwater heavily for their industrial needs. Hence, this district records highest industrial and
irrigation draft in the State.Kinfra Park at Kanjikode in the area is the major industrial belt of the
State and houses number of factories like agro-based, forest, Textile Park, steel and iron based,
tiles, chemical, and groundwater based Soft drinks. Coconut, banana, sugarcane and vegetables
are the groundwater irrigated crops during summer months.
1.7 Drainage
The area is mainly drained by Bharathapuzha’s tributaries namely Gayathripuzha, Kannadipuzha
Chitturpuzha and Kalpathypuzha. Gayathripuzha originates in Anamali hills and flows along
NW - SE trending faulty valley through Kollengode, Nenmara, Vadakancherry, Alathur and
Pazhayannur before its confluence with Ponnani River (Bharathapuzha) at Mayannur. The
Kannadipuzha has three sub-tributaries viz; Palar, Aliyarand and Uppar. Kalpathypuzha
originates south of Coimbatore and flows roughly in an E - W trend. It has four sub-tributaries
viz - Korayar, Varattar, Walayar and Malampuzha. No additional data on drainage generated and
the available information has been used in the present study.
There are one major irrigation projects in the study area (Malampuzha) amd two medium
irrigation projects (Walayar and Chitturpuzha). These reservoirs and their canal network act as
sources of groundwater recharge and the return seepage from irrigated land also contributes to
aquifer system in the western part of the study area.
Malampuzha Project
The Malampuzha Project, which is one of the major irrigation projects of Kerala, has its source
in the Western Ghats and located North East of Palakkad Town. The project Consists of a
MAPPING OF HARD ROCK AQUIFER SYSTEM AND AQUIFER MANAGEMENT PLAN IN CHITTUR & MALAMPUZHA BLOCKS OF PALAKKAD DISTRICT, KERALA
4
Masonry dam across Malampuzha, a tributary of Bharathapuzha, having a water spread area of
22 Sq.Km. A network of canal system including two main canals, one at left bank and the other
at right bank, branches and distributaries having a length of 320 km. to irrigate an area of 21349
ha. The Malampuzha reservoir water is being used for Irrigation, drinking water supply, industry,
fisheries, power generation, tourism, artificial recharge of groundwater.
Walayar Project
The Walayar project consists of an earthen dam with masonry spillway section across Walayar, a
tributary of Bharathapuzha. A left bank canal with two minor distributaries and tail end major
distributaries together irrigate 3238 hectares of land .The Reservoir intended to store 18.406
m.cum of water has a catchment area of 106.19 sq.km in Palakkad and Coimbatore Districts. The
Walayar dam is situated about 200m downstream of the confluence of Walayar and Navakara
River and the canal system is in Palakkad Taluk.
Chitturpuzha project
The Chitturpuzha project consists of Moolathara Regulator, Kunnamkattupathy Regulator,
Themaramadakku Regulator, Nurnee system and Meenakshipuram Lift Irrigation Scheme. The
project is situated in Chitturpuzha, one of the tributaries of Bharathapuzha which originates from
Anamalai hills of Tamilnadu. The total ayacut of the project is 16940 Ha located in ChitturTaluk
of Palakkad District.
1.8 Previous work
Major part of the study area was covered under Assisted Ground Water Project in Noyil, Ponnani
and Amaravathi River Basins, Tamil Nadu and Kerala - 1983.
The area is part of Palakkad district and the district has a very good data base on hydrogeology,
and geology. The compilation on ‘Hydrogeological conditions in Palghat district, Kerala’ by
John Kurian (1981) details the status of studies upto 1979. Subsequent works include the
Reappraisal Hydrogeological Survey in parts of Palakkad carried out by Sri K.Md Najeeb (1990-
91) and the environmental hydrogeological studies along Bharathapuzha by V. Dhinagaran
(1992-94). Drilling activities were carried out under Technology Mission and regular
groundwater exploration was taken up under drought eradication programme during the period
1987-91 and 2002 to 2002. Reports on “Ground water resources and development potential of
Palakkad district” had been published during the years 1997 and 2005 by CGWB, Kerala
Region.
MAPPING OF HARD ROCK AQUIFER SYSTEM AND AQUIFER MANAGEMENT PLAN IN CHITTUR & MALAMPUZHA BLOCKS OF PALAKKAD DISTRICT, KERALA
5
Fig. 1.1 Location map of the study area
1.9 Geology of the area
The study area is mainly comprised of Archaean metamorphic complex, predominantly the
migmatite gneissic complex. Other rock formations such as charnockite and khondalite group of
rocks cover less than 5% of the area. Intrusive rocks, pegmatite and quartz veins, are common in
the eastern part of the area.
Recent alluium
Top soil and weathered mantle forms the major recent litho unit as it covers almost the entire
area. In the valley portion fill deposits of talus and scree are also observed. Alluvium composed
of sand, silt, and clay is observed along the banks of river and their areal extent is very limited
and insignificant as a geological unit from a hydrogeological point of view.
Archaean Crystalline rocks
The geological formations of the Palakkad area belong chiefly to the Precambrian metamorphic
complex. The study area is mainly composed of migmatitic gneisses. Charnockite, khondalite
and calc-granulites occurs as discontinuous bands and is seen in the western and northern part of
the area. Lenticular bands of crystalline limestones intimately associated with calc granulites
have been observed in the north-eastern part of the area. Acidic intusives (pegmatites and quartz
veins) have also been observed. Within the study area, the predominant rock units are migmatitic
MAPPING OF HARD ROCK AQUIFER SYSTEM AND AQUIFER MANAGEMENT PLAN IN CHITTUR & MALAMPUZHA BLOCKS OF PALAKKAD DISTRICT, KERALA
6
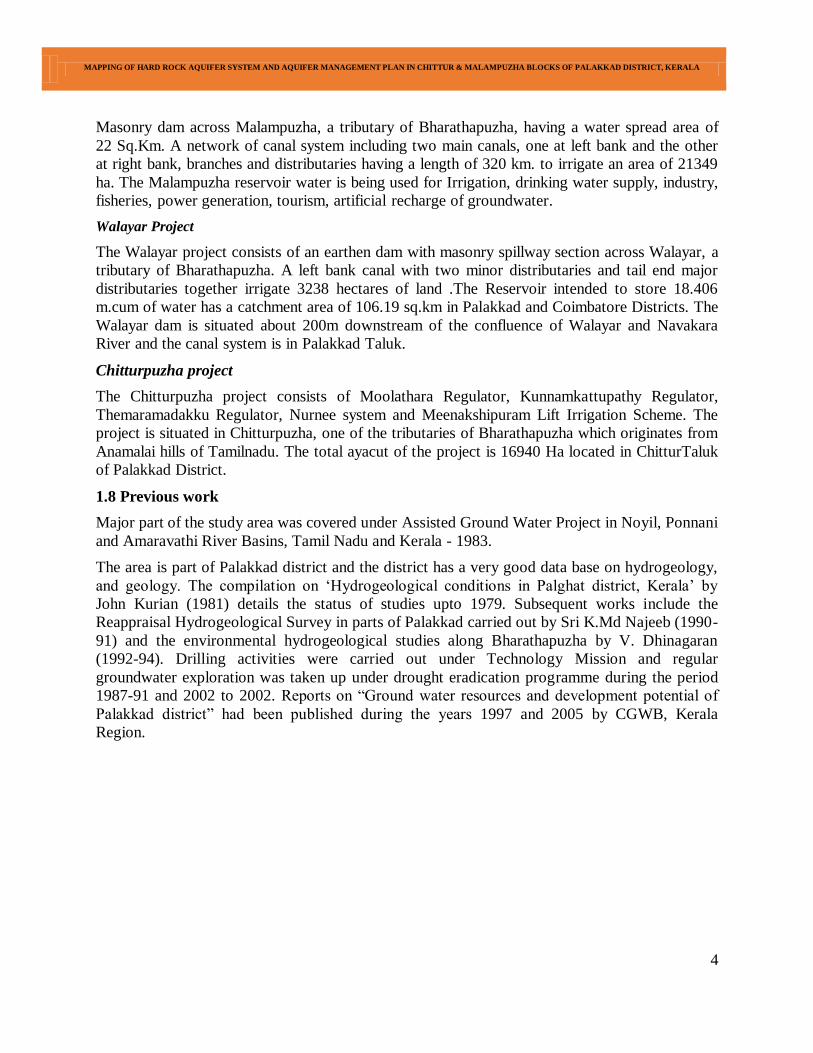
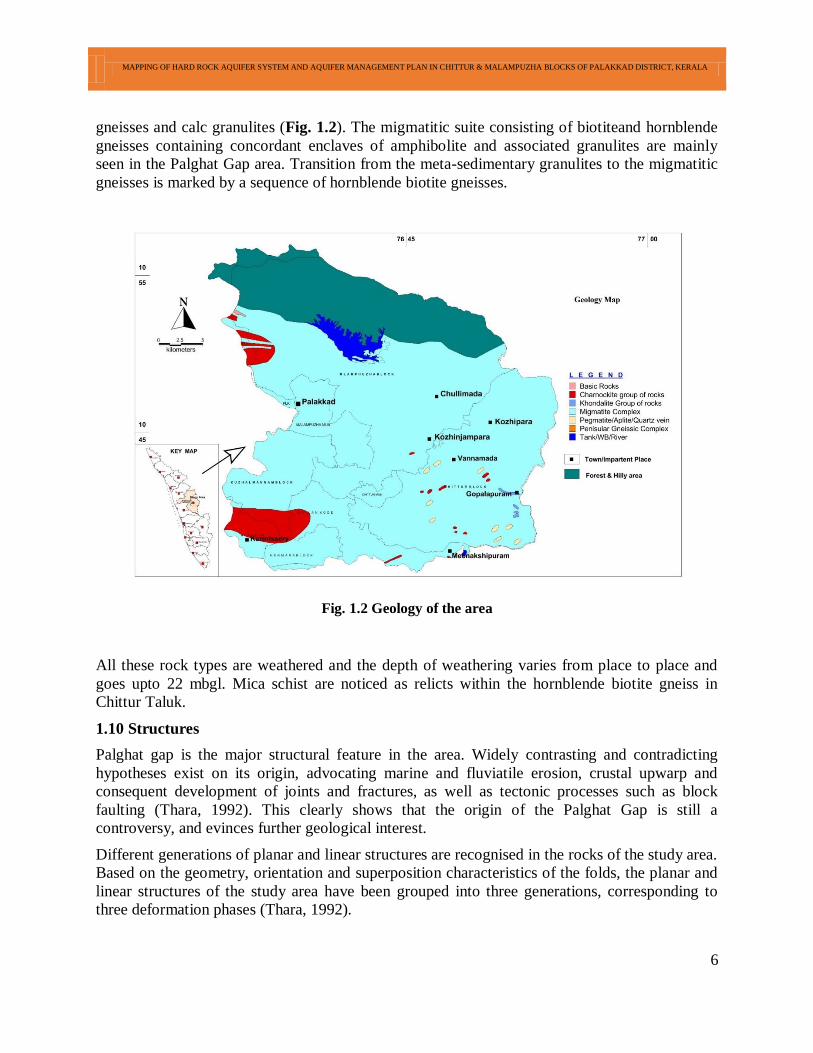
gneisses and calc granulites (Fig. 1.2). The migmatitic suite consisting of biotiteand hornblende
gneisses containing concordant enclaves of amphibolite and associated granulites are mainly
seen in the Palghat Gap area. Transition from the meta-sedimentary granulites to the migmatitic
gneisses is marked by a sequence of hornblende biotite gneisses.
Fig. 1.2 Geology of the area
All these rock types are weathered and the depth of weathering varies from place to place and
goes upto 22 mbgl. Mica schist are noticed as relicts within the hornblende biotite gneiss in
Chittur Taluk.
1.10 Structures
Palghat gap is the major structural feature in the area. Widely contrasting and contradicting
hypotheses exist on its origin, advocating marine and fluviatile erosion, crustal upwarp and
consequent development of joints and fractures, as well as tectonic processes such as block
faulting (Thara, 1992). This clearly shows that the origin of the Palghat Gap is still a
controversy, and evinces further geological interest.
Different generations of planar and linear structures are recognised in the rocks of the study area.
Based on the geometry, orientation and superposition characteristics of the folds, the planar and
linear structures of the study area have been grouped into three generations, corresponding to
three deformation phases (Thara, 1992).
MAPPING OF HARD ROCK AQUIFER SYSTEM AND AQUIFER MANAGEMENT PLAN IN CHITTUR & MALAMPUZHA BLOCKS OF PALAKKAD DISTRICT, KERALA
7
The tectonic framework of the area may be suggestive of a deep rooted rupture in E-W direction.
The general foliation trend of the gneisses in the E-W direction with steep dip to both sides, also
lead the earlier workers (Nageswara Rao & Srinivasan, 1980) to infer the presence of a first
order fold system in the Palakkad Gap area, across which prominent N-S lineaments were
identified. Folds in the south were reported by them to be overturned to the north and fractures in
the NW-SE, N-S, NNE-SSW, NE-SW and ENE-WSW directions were indicated to be
subsequent tectonic features. There are five lineament directions observed in the area viz; NE-
SW, N-S, ENE-WSW, NE-SW, and NNE-SSW. Lineaments could be identified from satellite
imageries and topo-sheets of 1:50,000 scale.
2.0 DATA COLLECTION, GENERATION AND INTEGRATION
2.1 Data collection and data gap analysis
The historical or available data on Geology, Geophysics, Hydrogeology and Hydrochemistry
generated under various studies by the department (CGWB) such as Systematic Hydrogeologial
studies, Reappraisal Hydrogeological studies, Groundwater Management studies, Exploratory
drilling, Microlevel hydrogeological studies and special studies have been utilized for data gap
analysis in conjunction with the data collected from various State and Central government
departments. The thematic layers on drainage, geomorphology, land use and land cover were
reproduced from the data obtained from concerned State departments. The existingdata on
various themes analyzed for finding the data gaps is given in Table 2.1 and the results of the data
gap analysis are described in detail in subsequent sections.
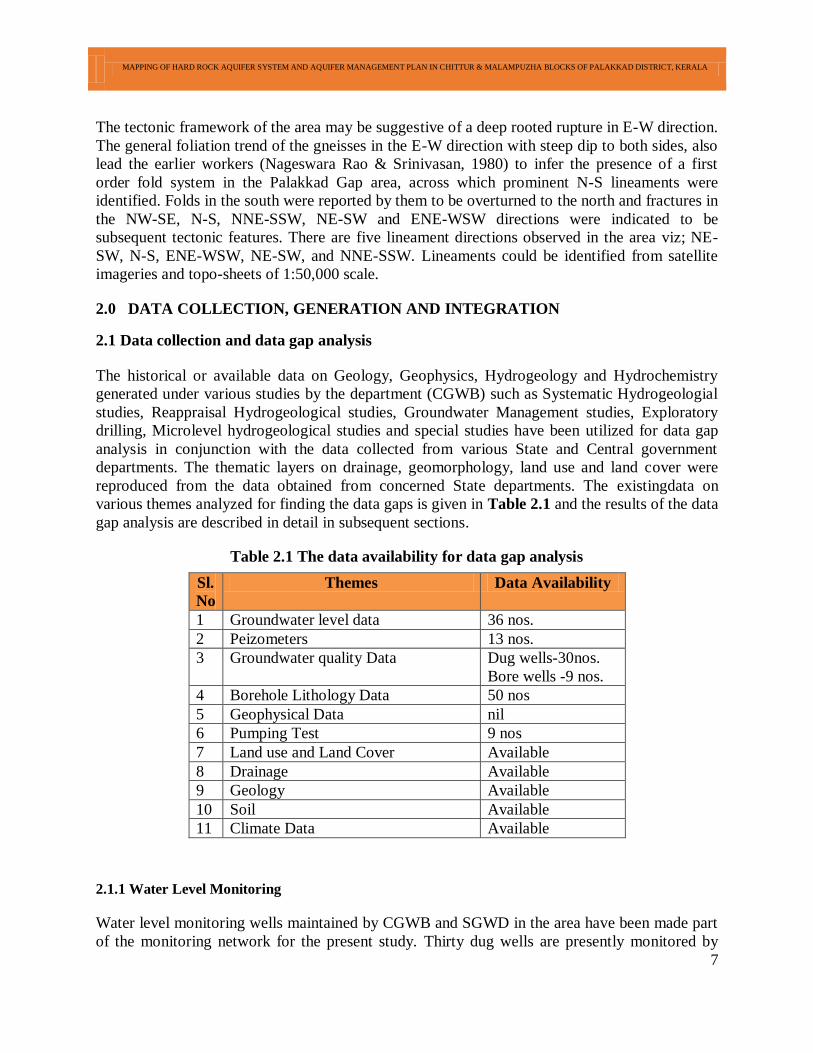
Table 2.1 The data availability for data gap analysis
Sl.
No
Themes Data Availability
1 Groundwater level data 36 nos.
2 Peizometers 13 nos.
3 Groundwater quality Data Dug wells-30nos.
Bore wells -9 nos.
4 Borehole Lithology Data 50 nos
5 Geophysical Data nil
6 Pumping Test 9 nos
7 Land use and Land Cover Available
8 Drainage Available
9 Geology Available
10 Soil Available
11 Climate Data Available
2.1.1 Water Level Monitoring
Water level monitoring wells maintained by CGWB and SGWD in the area have been made part
of the monitoring network for the present study. Thirty dug wells are presently monitored by
MAPPING OF HARD ROCK AQUIFER SYSTEM AND AQUIFER MANAGEMENT PLAN IN CHITTUR & MALAMPUZHA BLOCKS OF PALAKKAD DISTRICT, KERALA
8
CGWB and 6 dug wells by SGWD for water levels in the phreatic aquifer system. CGWB wells
are being monitored four times (January, April, August and November) in a year whereas, the
monitoring wells of State Ground Water Department (SGWD) are being monitored every month.
The status of water level monitoring wells of CGWB and SGWD in the area is listed in Table
2.2. The historical data from these stations have been used for data gap analysis and identified 23
new sites to fill up the data gaps.
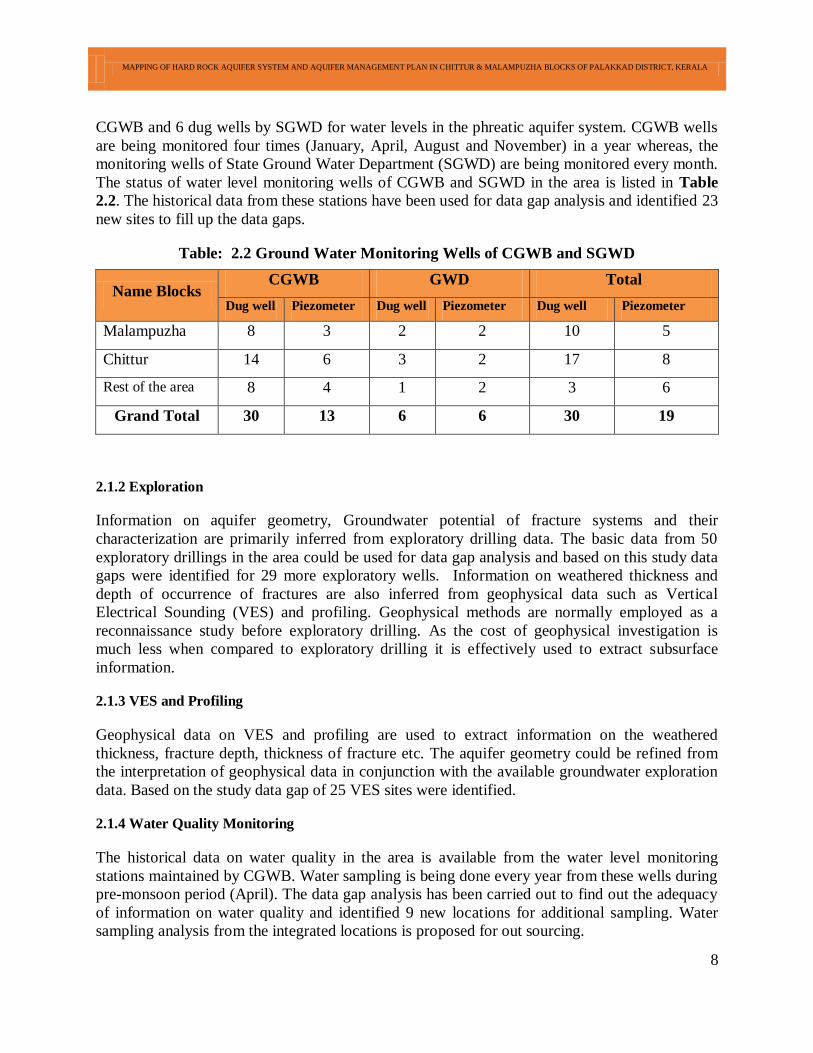
Table: 2.2 Ground Water Monitoring Wells of CGWB and SGWD
Name Blocks CGWB GWD Total
Dug well Piezometer Dug well Piezometer Dug well Piezometer
Malampuzha 8 3 2 2 10 5
Chittur 14 6 3 2 17 8
Rest of the area 8 4 1 2 3 6
Grand Total 30 13 6 6 30 19
2.1.2 Exploration
Information on aquifer geometry, Groundwater potential of fracture systems and their
characterization are primarily inferred from exploratory drilling data. The basic data from 50
exploratory drillings in the area could be used for data gap analysis and based on this study data
gaps were identified for 29 more exploratory wells. Information on weathered thickness and
depth of occurrence of fractures are also inferred from geophysical data such as Vertical
Electrical Sounding (VES) and profiling. Geophysical methods are normally employed as a
reconnaissance study before exploratory drilling. As the cost of geophysical investigation is
much less when compared to exploratory drilling it is effectively used to extract subsurface
information.
2.1.3 VES and Profiling
Geophysical data on VES and profiling are used to extract information on the weathered
thickness, fracture depth, thickness of fracture etc. The aquifer geometry could be refined from
the interpretation of geophysical data in conjunction with the available groundwater exploration
data. Based on the study data gap of 25 VES sites were identified.
2.1.4 Water Quality Monitoring
The historical data on water quality in the area is available from the water level monitoring
stations maintained by CGWB. Water sampling is being done every year from these wells during
pre-monsoon period (April). The data gap analysis has been carried out to find out the adequacy
of information on water quality and identified 9 new locations for additional sampling. Water
sampling analysis from the integrated locations is proposed for out sourcing.
MAPPING OF HARD ROCK AQUIFER SYSTEM AND AQUIFER MANAGEMENT PLAN IN CHITTUR & MALAMPUZHA BLOCKS OF PALAKKAD DISTRICT, KERALA
9
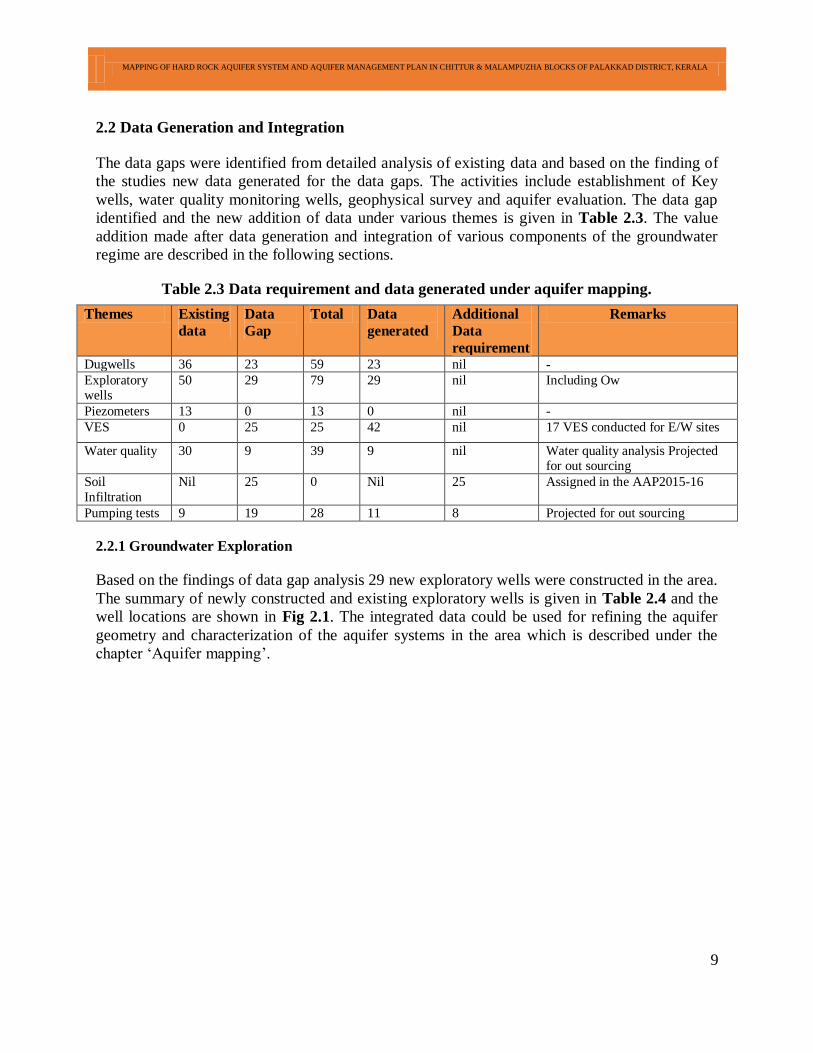
2.2 Data Generation and Integration
The data gaps were identified from detailed analysis of existing data and based on the finding of
the studies new data generated for the data gaps. The activities include establishment of Key
wells, water quality monitoring wells, geophysical survey and aquifer evaluation. The data gap
identified and the new addition of data under various themes is given in Table 2.3. The value
addition made after data generation and integration of various components of the groundwater
regime are described in the following sections.
Table 2.3 Data requirement and data generated under aquifer mapping.
Themes Existing
data
Data
Gap
Total Data
generated
Additional
Data
requirement
Remarks
Dugwells 36 23 59 23 nil -
Exploratory wells
50 29 79 29 nil Including Ow
Piezometers 13 0 13 0 nil -
VES 0 25 25 42 nil 17 VES conducted for E/W sites
Water quality 30 9 39 9 nil Water quality analysis Projected for out sourcing
Soil
Infiltration
Nil 25 0 Nil 25 Assigned in the AAP2015-16
Pumping tests 9 19 28 11 8 Projected for out sourcing
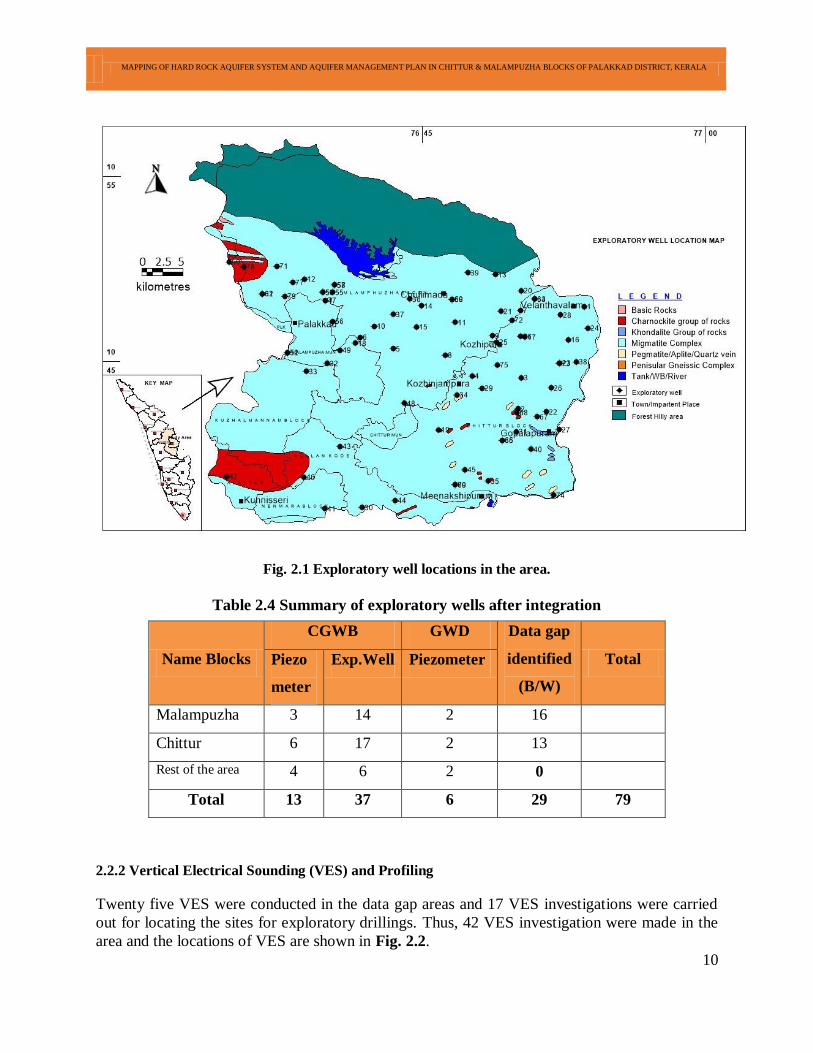
2.2.1 Groundwater Exploration
Based on the findings of data gap analysis 29 new exploratory wells were constructed in the area.
The summary of newly constructed and existing exploratory wells is given in Table 2.4 and the
well locations are shown in Fig 2.1. The integrated data could be used for refining the aquifer
geometry and characterization of the aquifer systems in the area which is described under the
chapter ‘Aquifer mapping’.
MAPPING OF HARD ROCK AQUIFER SYSTEM AND AQUIFER MANAGEMENT PLAN IN CHITTUR & MALAMPUZHA BLOCKS OF PALAKKAD DISTRICT, KERALA
10
Fig. 2.1 Exploratory well locations in the area.
Table 2.4 Summary of exploratory wells after integration
2.2.2 Vertical Electrical Sounding (VES) and Profiling
Twenty five VES were conducted in the data gap areas and 17 VES investigations were carried
out for locating the sites for exploratory drillings. Thus, 42 VES investigation were made in the
area and the locations of VES are shown in Fig. 2.2.
Name Blocks
CGWB GWD Data gap
identified
(B/W)
Total Piezo
meter
Exp.Well Piezometer
Malampuzha 3 14 2 16
Chittur 6 17 2 13
Rest of the area 4 6 2 0
Total 13 37 6 29 79
MAPPING OF HARD ROCK AQUIFER SYSTEM AND AQUIFER MANAGEMENT PLAN IN CHITTUR & MALAMPUZHA BLOCKS OF PALAKKAD DISTRICT, KERALA
11
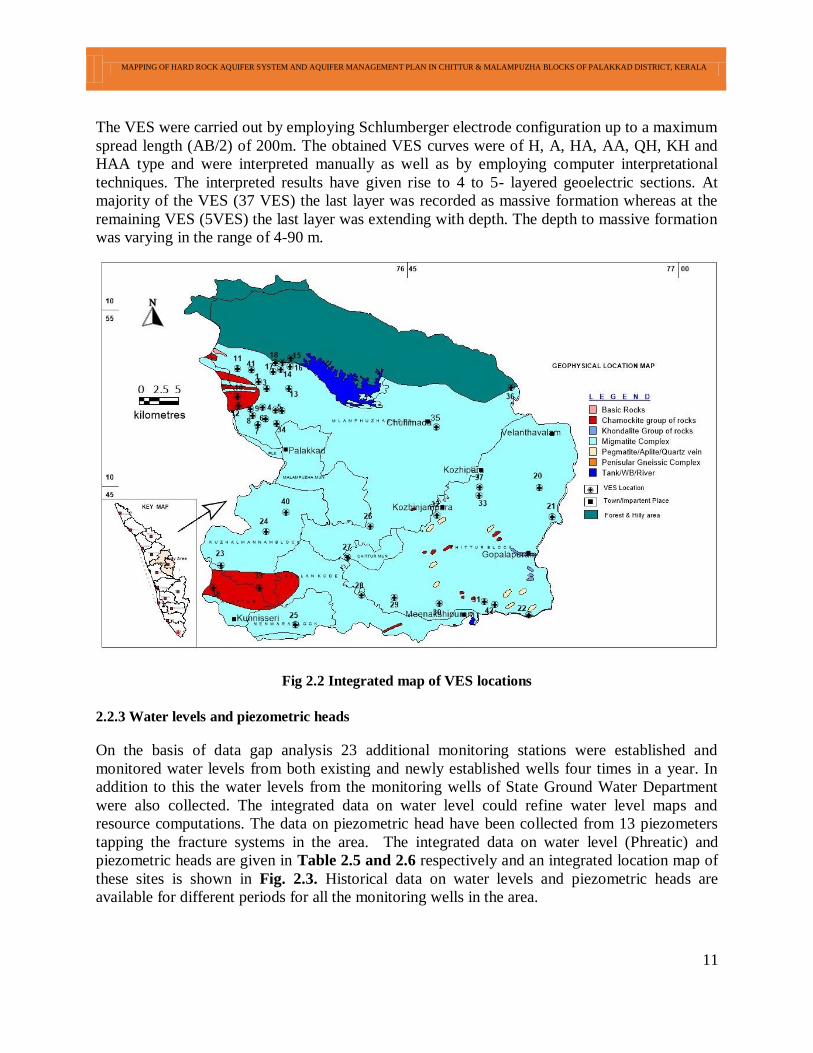
The VES were carried out by employing Schlumberger electrode configuration up to a maximum
spread length (AB/2) of 200m. The obtained VES curves were of H, A, HA, AA, QH, KH and
HAA type and were interpreted manually as well as by employing computer interpretational
techniques. The interpreted results have given rise to 4 to 5- layered geoelectric sections. At
majority of the VES (37 VES) the last layer was recorded as massive formation whereas at the
remaining VES (5VES) the last layer was extending with depth. The depth to massive formation
was varying in the range of 4-90 m.
Fig 2.2 Integrated map of VES locations
2.2.3 Water levels and piezometric heads
On the basis of data gap analysis 23 additional monitoring stations were established and
monitored water levels from both existing and newly established wells four times in a year. In
addition to this the water levels from the monitoring wells of State Ground Water Department
were also collected. The integrated data on water level could refine water level maps and
resource computations. The data on piezometric head have been collected from 13 piezometers
tapping the fracture systems in the area. The integrated data on water level (Phreatic) and
piezometric heads are given in Table 2.5 and 2.6 respectively and an integrated location map of
these sites is shown in Fig. 2.3. Historical data on water levels and piezometric heads are
available for different periods for all the monitoring wells in the area.
MAPPING OF HARD ROCK AQUIFER SYSTEM AND AQUIFER MANAGEMENT PLAN IN CHITTUR & MALAMPUZHA BLOCKS OF PALAKKAD DISTRICT, KERALA
12
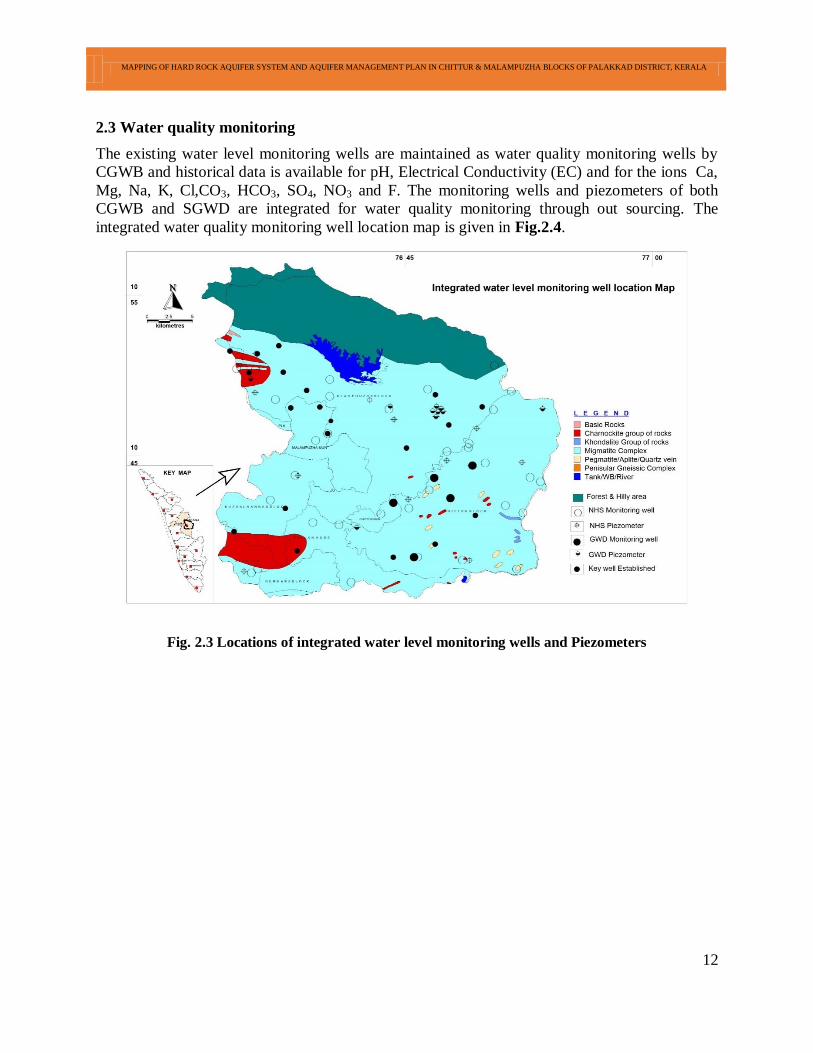
2.3 Water quality monitoring
The existing water level monitoring wells are maintained as water quality monitoring wells by
CGWB and historical data is available for pH, Electrical Conductivity (EC) and for the ions Ca,
Mg, Na, K, Cl,CO3, HCO3, SO4, NO3 and F. The monitoring wells and piezometers of both
CGWB and SGWD are integrated for water quality monitoring through out sourcing. The
integrated water quality monitoring well location map is given in Fig.2.4.
Fig. 2.3 Locations of integrated water level monitoring wells and Piezometers
MAPPING OF HARD ROCK AQUIFER SYSTEM AND AQUIFER MANAGEMENT PLAN IN CHITTUR & MALAMPUZHA BLOCKS OF PALAKKAD DISTRICT, KERALA
13
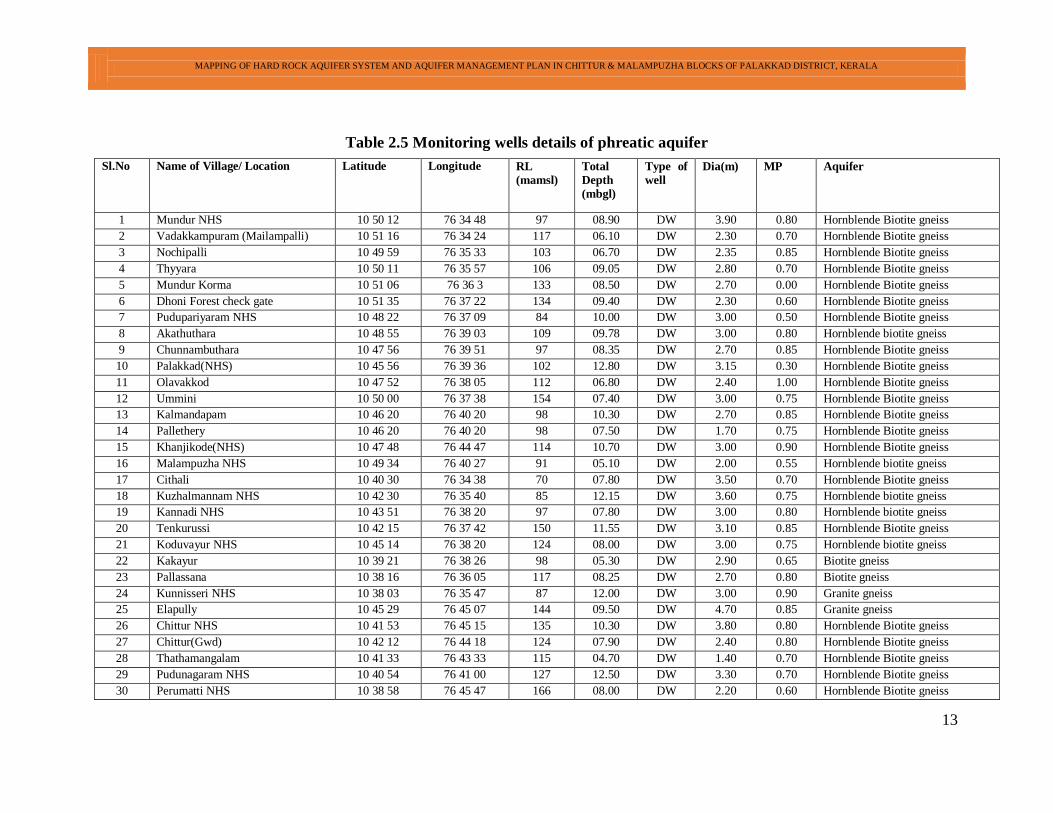
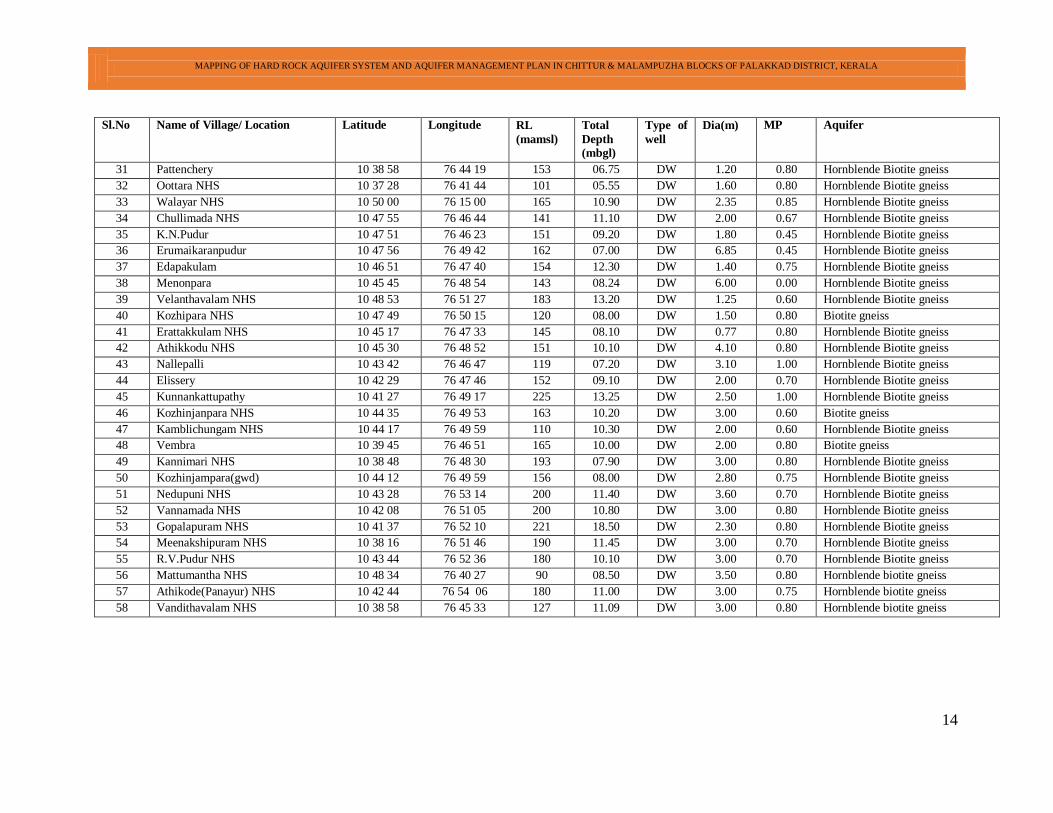
Table 2.5 Monitoring wells details of phreatic aquifer
Sl.No Name of Village/ Location Latitude Longitude RL
(mamsl)
Total
Depth
(mbgl)
Type of
well
Dia(m) MP Aquifer
1 Mundur NHS 10 50 12 76 34 48 97 08.90 DW 3.90 0.80 Hornblende Biotite gneiss
2 Vadakkampuram (Mailampalli) 10 51 16 76 34 24 117 06.10 DW 2.30 0.70 Hornblende Biotite gneiss
3 Nochipalli 10 49 59 76 35 33 103 06.70 DW 2.35 0.85 Hornblende Biotite gneiss
4 Thyyara 10 50 11 76 35 57 106 09.05 DW 2.80 0.70 Hornblende Biotite gneiss
5 Mundur Korma 10 51 06 76 36 3 133 08.50 DW 2.70 0.00 Hornblende Biotite gneiss
6 Dhoni Forest check gate 10 51 35 76 37 22 134 09.40 DW 2.30 0.60 Hornblende Biotite gneiss
7 Pudupariyaram NHS 10 48 22 76 37 09 84 10.00 DW 3.00 0.50 Hornblende Biotite gneiss
8 Akathuthara 10 48 55 76 39 03 109 09.78 DW 3.00 0.80 Hornblende biotite gneiss
9 Chunnambuthara 10 47 56 76 39 51 97 08.35 DW 2.70 0.85 Hornblende Biotite gneiss
10 Palakkad(NHS) 10 45 56 76 39 36 102 12.80 DW 3.15 0.30 Hornblende Biotite gneiss
11 Olavakkod 10 47 52 76 38 05 112 06.80 DW 2.40 1.00 Hornblende Biotite gneiss
12 Ummini 10 50 00 76 37 38 154 07.40 DW 3.00 0.75 Hornblende Biotite gneiss
13 Kalmandapam 10 46 20 76 40 20 98 10.30 DW 2.70 0.85 Hornblende Biotite gneiss
14 Pallethery 10 46 20 76 40 20 98 07.50 DW 1.70 0.75 Hornblende Biotite gneiss
15 Khanjikode(NHS) 10 47 48 76 44 47 114 10.70 DW 3.00 0.90 Hornblende Biotite gneiss
16 Malampuzha NHS 10 49 34 76 40 27 91 05.10 DW 2.00 0.55 Hornblende biotite gneiss
17 Cithali 10 40 30 76 34 38 70 07.80 DW 3.50 0.70 Hornblende Biotite gneiss
18 Kuzhalmannam NHS 10 42 30 76 35 40 85 12.15 DW 3.60 0.75 Hornblende biotite gneiss
19 Kannadi NHS 10 43 51 76 38 20 97 07.80 DW 3.00 0.80 Hornblende biotite gneiss
20 Tenkurussi 10 42 15 76 37 42 150 11.55 DW 3.10 0.85 Hornblende Biotite gneiss
21 Koduvayur NHS 10 45 14 76 38 20 124 08.00 DW 3.00 0.75 Hornblende biotite gneiss
22 Kakayur 10 39 21 76 38 26 98 05.30 DW 2.90 0.65 Biotite gneiss
23 Pallassana 10 38 16 76 36 05 117 08.25 DW 2.70 0.80 Biotite gneiss
24 Kunnisseri NHS 10 38 03 76 35 47 87 12.00 DW 3.00 0.90 Granite gneiss
25 Elapully 10 45 29 76 45 07 144 09.50 DW 4.70 0.85 Granite gneiss
26 Chittur NHS 10 41 53 76 45 15 135 10.30 DW 3.80 0.80 Hornblende Biotite gneiss
27 Chittur(Gwd) 10 42 12 76 44 18 124 07.90 DW 2.40 0.80 Hornblende Biotite gneiss
28 Thathamangalam 10 41 33 76 43 33 115 04.70 DW 1.40 0.70 Hornblende Biotite gneiss
29 Pudunagaram NHS 10 40 54 76 41 00 127 12.50 DW 3.30 0.70 Hornblende Biotite gneiss
30 Perumatti NHS 10 38 58 76 45 47 166 08.00 DW 2.20 0.60 Hornblende Biotite gneiss
MAPPING OF HARD ROCK AQUIFER SYSTEM AND AQUIFER MANAGEMENT PLAN IN CHITTUR & MALAMPUZHA BLOCKS OF PALAKKAD DISTRICT, KERALA
14
Sl.No Name of Village/ Location Latitude Longitude RL
(mamsl)
Total
Depth
(mbgl)
Type of
well
Dia(m) MP Aquifer
31 Pattenchery 10 38 58 76 44 19 153 06.75 DW 1.20 0.80 Hornblende Biotite gneiss
32 Oottara NHS 10 37 28 76 41 44 101 05.55 DW 1.60 0.80 Hornblende Biotite gneiss
33 Walayar NHS 10 50 00 76 15 00 165 10.90 DW 2.35 0.85 Hornblende Biotite gneiss
34 Chullimada NHS 10 47 55 76 46 44 141 11.10 DW 2.00 0.67 Hornblende Biotite gneiss
35 K.N.Pudur 10 47 51 76 46 23 151 09.20 DW 1.80 0.45 Hornblende Biotite gneiss
36 Erumaikaranpudur 10 47 56 76 49 42 162 07.00 DW 6.85 0.45 Hornblende Biotite gneiss
37 Edapakulam 10 46 51 76 47 40 154 12.30 DW 1.40 0.75 Hornblende Biotite gneiss
38 Menonpara 10 45 45 76 48 54 143 08.24 DW 6.00 0.00 Hornblende Biotite gneiss
39 Velanthavalam NHS 10 48 53 76 51 27 183 13.20 DW 1.25 0.60 Hornblende Biotite gneiss
40 Kozhipara NHS 10 47 49 76 50 15 120 08.00 DW 1.50 0.80 Biotite gneiss
41 Erattakkulam NHS 10 45 17 76 47 33 145 08.10 DW 0.77 0.80 Hornblende Biotite gneiss
42 Athikkodu NHS 10 45 30 76 48 52 151 10.10 DW 4.10 0.80 Hornblende Biotite gneiss
43 Nallepalli 10 43 42 76 46 47 119 07.20 DW 3.10 1.00 Hornblende Biotite gneiss
44 Elissery 10 42 29 76 47 46 152 09.10 DW 2.00 0.70 Hornblende Biotite gneiss
45 Kunnankattupathy 10 41 27 76 49 17 225 13.25 DW 2.50 1.00 Hornblende Biotite gneiss
46 Kozhinjanpara NHS 10 44 35 76 49 53 163 10.20 DW 3.00 0.60 Biotite gneiss
47 Kamblichungam NHS 10 44 17 76 49 59 110 10.30 DW 2.00 0.60 Hornblende Biotite gneiss
48 Vembra 10 39 45 76 46 51 165 10.00 DW 2.00 0.80 Biotite gneiss
49 Kannimari NHS 10 38 48 76 48 30 193 07.90 DW 3.00 0.80 Hornblende Biotite gneiss
50 Kozhinjampara(gwd) 10 44 12 76 49 59 156 08.00 DW 2.80 0.75 Hornblende Biotite gneiss
51 Nedupuni NHS 10 43 28 76 53 14 200 11.40 DW 3.60 0.70 Hornblende Biotite gneiss
52 Vannamada NHS 10 42 08 76 51 05 200 10.80 DW 3.00 0.80 Hornblende Biotite gneiss
53 Gopalapuram NHS 10 41 37 76 52 10 221 18.50 DW 2.30 0.80 Hornblende Biotite gneiss
54 Meenakshipuram NHS 10 38 16 76 51 46 190 11.45 DW 3.00 0.70 Hornblende Biotite gneiss
55 R.V.Pudur NHS 10 43 44 76 52 36 180 10.10 DW 3.00 0.70 Hornblende Biotite gneiss
56 Mattumantha NHS 10 48 34 76 40 27 90 08.50 DW 3.50 0.80 Hornblende biotite gneiss
57 Athikode(Panayur) NHS 10 42 44 76 54 06 180 11.00 DW 3.00 0.75 Hornblende biotite gneiss
58 Vandithavalam NHS 10 38 58 76 45 33 127 11.09 DW 3.00 0.80 Hornblende biotite gneiss
MAPPING OF HARD ROCK AQUIFER SYSTEM AND AQUIFER MANAGEMENT PLAN IN CHITTUR & MALAMPUZHA BLOCKS OF PALAKKAD DISTRICT, KERALA
15
Table 2.6 Monitoring wells details of fracture aquifer system
Sl.No Name of Village/ Location Latitude in
degrees
decimal
Longitude in
degrees
decimal
RL
(mamsl)
Total
Depth
(mbgl)
Type of well Dia(mm) MP Aquifer
1 Mundur Korma 10 5106 76 36 03 133 137.16 P/z 177.8 0.5 Hornblende biotite gneiss
2 Maruda road(Pz Gwd) 10 47 04 76 40 31 107 65.71 P/z 177.8 0.7 Biotite gneiss
3 Pudussery(pz Gwd) 10 47 51 76 45 52 134 76.67 P/z 177.8 0.7 Hornblende Biotite gneiss
4 Ozhlapathi(Pz Gwd) 10 47 48 76 53 22 236 65.45 P/z 177.8 0.7 Hornblende Biotite gneiss
5 Nattukal 10 44 25 76 49 00 160 65 P/z 177.8 0.7 Hornblende Biotite gneiss
6 Nallepalli(Pz Gwd) 10 43 41 76 46 45 117 65 P/z 177.8 0.7 Hornblende Biotite gneiss
7 Thathamangalam(Gwd) 10 40 43 76 42 06 127 65 P/z 177.8 0.7 Hornblende biotite gneiss
8 Kannadi NHS 10 43 49 76 38 31 77 101 P/z 177.8 0.68 Hornblende biotite gneiss
9 Malampuzha NHS 10 41 06 76 39 31 100 100 P/z 177.8 0.68 Hornblende biotite gneiss
10 Perumatti NHS 10 49 14 76 40 00 102 101 P/z 177.8 0.7 Hornblende Biotite gneiss
11 Kanjikode FCRI (NHS) 10 38 42 76 45 56 130 100 P/z 177.8 0.7 Hornblende biotite gneiss
12 Kozhipara NHS 10 47 42 76 44 51 110 101 P/z 177.8 0.2 Biotite gneiss
13 Kunnisseri NHS 10 47 52 76 50 30 110 101 P/z 177.8 0.3 Hornblende Biotite gneiss
14 Plachimada colony NHS 10 38 03 76 35 45 88 101 P/z 177.8 0.5 Hornblende Biotite gneiss
15 Villuni NHS 10 38 46 76 48 56 190 101 P/z 177.8 0.5 Hornblende Biotite gneiss
16 Koduvayur NHS 10 4514 76 38 20 124 100 P/z 177.8 0.5 Hornblende biotite gneiss
17 Panayur(Athikode) NHS 10 42 44 76 54 6 180 101 P/z 177.8 0.5 Hornblende Biotite gneiss
18 Mundur NHS 10 42 53 76 44 07 82 101 P/z 177.8 0.5 Hornblende biotite gneiss
19 Moochangundu NHS 10 43 44 76 52 36 150 101 P/z 177.8 0.5 Hornblende biotite gneiss
20 Thachankode NHS 10.63413 76.5949 123 101.2 B/w 177.8 0.5 Hornblende biotite gneiss
21 Chullimada(Pepsico) I 10 47 28 76 46 59 132 74.31 B/w 177.8 0.7 Hornblende Biotite gneiss
22 Chullimada(Pepsico) III 10 47 34 76 46 52 129 65 B/w 177.8 0.7 Hornblende Biotite gneiss
23 Chullimada(Pepsico) IV 10 47 34 76 46 52 130 65 B/w 177.8 0.7 Hornblende Biotite gneiss
24 Chullimada(Pepsico) V 10 47 22 76 46 58 130 65 B/w 177.8 0.7 Hornblende Biotite gneiss
25 Chullimada(Pepsico) VI 10 47 19 76 47 03 135 65 B/w 177.8 0.7 Hornblende Biotite gneiss
26 Chullimada(Pepsico) VII 10 47 17 76 47 02 134 65 B/w 177.8 0.7 Hornblende Biotite gneiss
MAPPING OF HARD ROCK AQUIFER SYSTEM AND AQUIFER MANAGEMENT PLAN IN CHITTUR & MALAMPUZHA BLOCKS OF PALAKKAD DISTRICT, KERALA
16
Fig. 2.4 Locations of integrated Quality monitoring wells and Piezometers
3.0 DATA INTERPRETATION AND AQUIFER MAPPING
The aquifer map of the area is generated based on the inputs generated from the synthesis and
analysis of geological, geophysical, hydrological, hydrogeological, and hydro-chemical data. In
the present study the aquifer disposition and aquifer characterization has been brought out
mainly by analyzing the data from 79 lithological logs, 42 electrical logs, 59 hydrograph from
dug wells, 13 piezometric heads, hydro-chemical data from NHS, previous literatures and inputs
from the field investigations. Aquifer mapping involves extraction of information from the
analysis of data and preparation of various thematic maps related to the groundwater regime so
as to get any required information about the aquifer system from the thematic layer or from a
suitable combination of thematic layers. Various aspects of the groundwater regime such as
rainfall, soil, geomorphology, geology, aquifer geometry, aquifer characteristics, water levels,
water resources and water quality were studied in detail and thematic maps prepared as part of
the aquifer mapping.
3.1 Rainfall
The annual rainfall varies from 2400 to 1570 mm based on long term normal. Southwest
monsoon contributes 71% of rainfall from June to September and the northeast monsoon
contributes about 18%. The rain fall data of Malampuzha & Chittur rain gauge stations are given
MAPPING OF HARD ROCK AQUIFER SYSTEM AND AQUIFER MANAGEMENT PLAN IN CHITTUR & MALAMPUZHA BLOCKS OF PALAKKAD DISTRICT, KERALA
17
in Table 3.1&3.2 respectivelyand the decadal monthly rainfall variations is depicted in Fig 3.1
and 3.2.
Table 3.1 Rain fall data of Malampuzha rain gauge station.
Year Jan Feb Mar Apr May Jun Jul Aug Sep Oct Nov Dec 2003 - 21.40 62.40 95.20 19.40 204.00 242.20 150.10 31.30 245.40 38.80 - 2004 12.00 - 22.20 46.20 343.60 474.30 295.20 412.80 255.90 202.60 47.00 - 2005 9.60 - 7.60 105.00 128.40 390.90 927.00 204.20 395.00 164.10 65.50 35.80
2006 14.60 - 102.40 44.80 299.20 402.60 439.80 349.00 426.60 248.30 221.60 - 2007 3.00 - - 93.40 51.10 601.10 824.30 470.00 482.50 280.40 7.60 22.20
2008 - 36.00 80.10 71.00 7.20 379.90 360.00 189.20 155.80 388.40 14.20 - 2009 - - 105.20 0.80 129.00 180.40 777.20 143.80 292.80 213.60 206.80 - 2010 - - 37.60 153.60 124.60 365.20 412.40 267.80 359.00 269.40 127.80 4.80
2011 - 204.20 - 190.20 26.80 569.60 386.80 406.10 295.30 156.40 201.60 59.20
2012 - - - 138.60 25.80 339.30 286.80 398.60 165.90 177.70 48.10 -
Table 3.2 Rain fall data of Meenkara rain gauge station
Year Jan Feb Mar Apr May Jun Jul Aug Sep Oct Nov Dec 2003 - 92.00 113.00 70.00 - 201.00 281.00 107.00 - 341.50 103.00 28.00
2004 13.00 - 38.00 55.00 260.00 470.00 338.00 440.00 48.00 76.00 102.00 - 2005 - 5.00 6.00 323.50 161.00 369.00 850.00 282.00 141.00 106.00 171.00 113.00
2006 5.00 - 154.00 66.00 195.00 254.00 435.00 292.00 148.00 118.00 168.00 6.00
2007 - - - 85.00 48.00 243.00 607.00 184.00 197.00 233.00 50.00 68.00
2008 - 45.00 148.00 16.00 6.00 154.00 237.00 185.00 141.00 321.00 34.00 4.00
2009 - - 23.00 2.00 23.00 138.00 595.00 95.00 126.00 158.00 208.50 1.50
2010 8.00 - - 109.00 33.00 146.50 361.00 147.50 84.00 136.50 260.50 34.00
2011 - 50.00 3.00 78.00 37.00 445.00 329.50 194.50 108.00 58.50 219.00 24.00
2012 - - - 73.50 26.00 162.50 151.00 157.20 64.50 190.40 89.40 -
The eastern part of the area receives less rainfall and is categorized as rain shadow area.
Deficient rainfall during five consecutive years was recorded in the area from 2008 to 2012,
which resulted in crop failures and groundwater level decline, especially in Chittur block.
MAPPING OF HARD ROCK AQUIFER SYSTEM AND AQUIFER MANAGEMENT PLAN IN CHITTUR & MALAMPUZHA BLOCKS OF PALAKKAD DISTRICT, KERALA
18
Fig 3.1 Histogram of decadal monthly rainfall distribution at Malampuzha
Fig 3.2 Histogram decadal monthly rainfall distribution at Meenkara
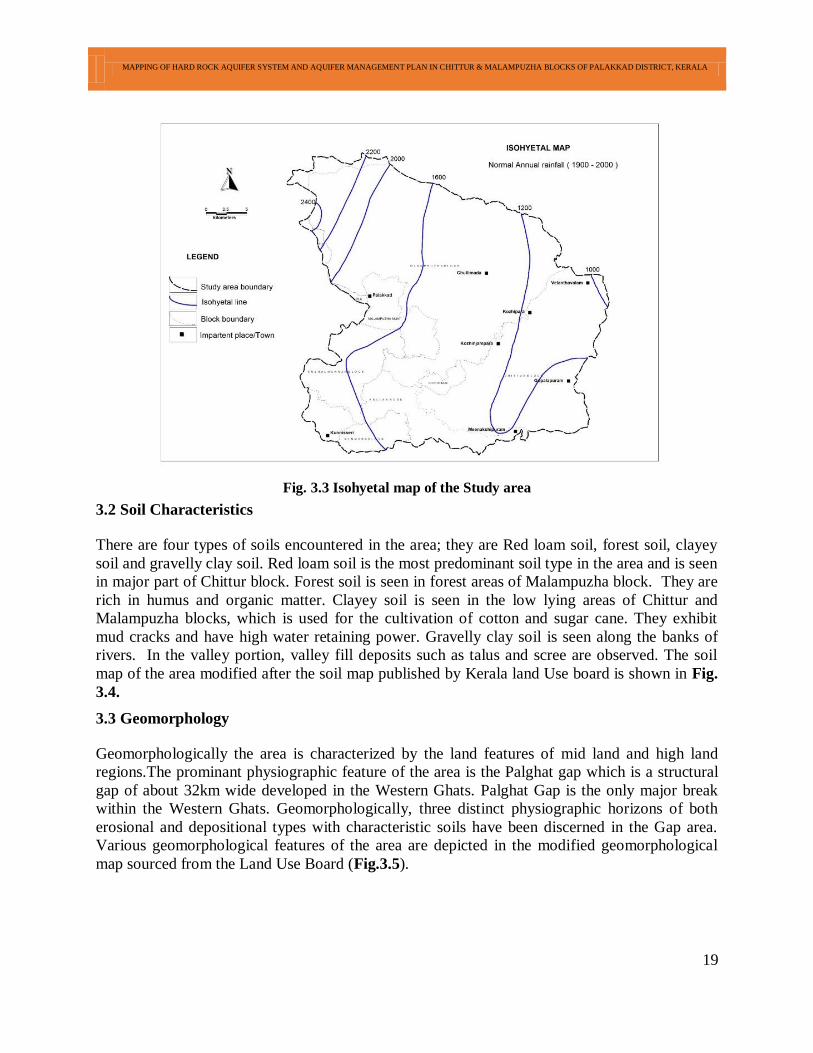
The spatial variation in rainfall over the area is best represented by isohyetal map (Fig. 3.3)
which shows a gradual increase in rainfall from south east to North West direction.
The maximum temperature ranges from 28.1 to 37.40C and the minimum temperature ranges
from 22.2 to 25.30C. The average annual maximum temperature is 32.3
0C and the average
annual minimum temperature is 23.40C. The wind is predominantly from west and east during
morning as well as in the evening hours. The wind speed is high during August (13.6 kmph).
The humidity is higher (around 90 %) during the monsoon period i.e. from June to September.
During the period 1901-1980, the areas did not experience any severe drought, but mild
droughts.
Rai
nfa
ll in
mm
Months
Rainfall data of Malampuzha 2003 2004 2005 2006 2007 2008
Rai
n fa
ll in
mm
Months
Rain fall data of Meenkara
2003
2004
2005
2006
2007
2008
2009
2010
2011
2012
MAPPING OF HARD ROCK AQUIFER SYSTEM AND AQUIFER MANAGEMENT PLAN IN CHITTUR & MALAMPUZHA BLOCKS OF PALAKKAD DISTRICT, KERALA
19
Fig. 3.3 Isohyetal map of the Study area
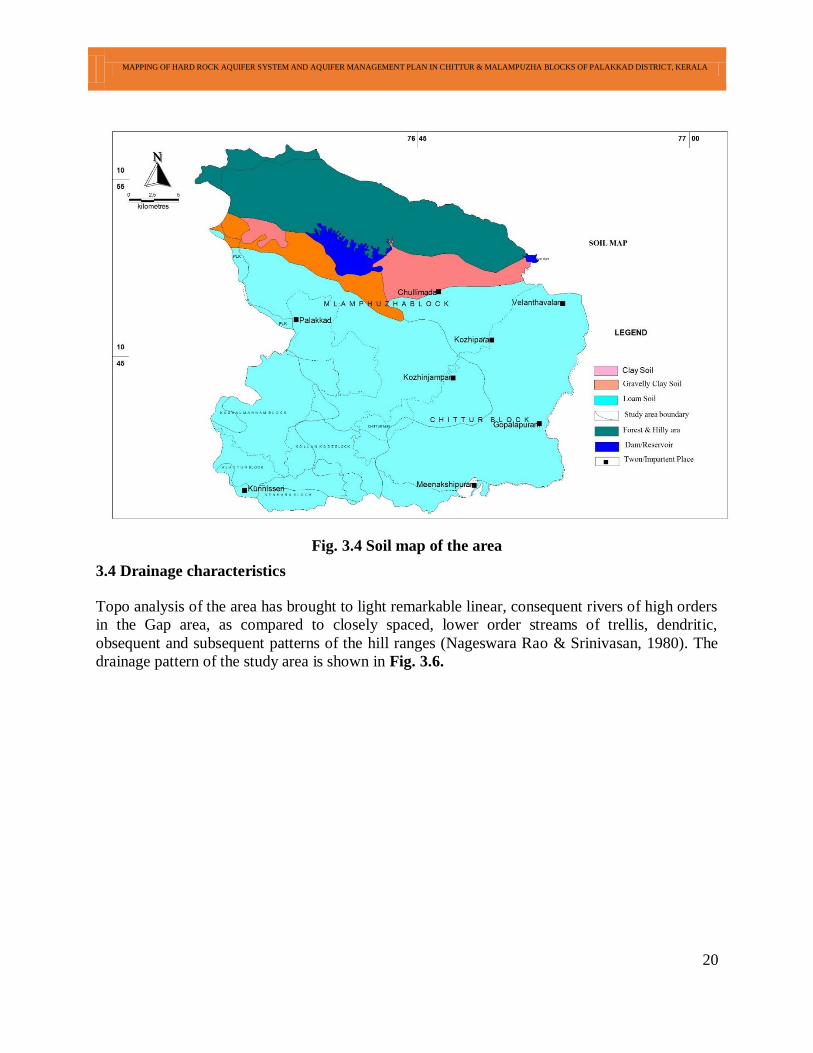
3.2 Soil Characteristics
There are four types of soils encountered in the area; they are Red loam soil, forest soil, clayey
soil and gravelly clay soil. Red loam soil is the most predominant soil type in the area and is seen
in major part of Chittur block. Forest soil is seen in forest areas of Malampuzha block. They are
rich in humus and organic matter. Clayey soil is seen in the low lying areas of Chittur and
Malampuzha blocks, which is used for the cultivation of cotton and sugar cane. They exhibit
mud cracks and have high water retaining power. Gravelly clay soil is seen along the banks of
rivers. In the valley portion, valley fill deposits such as talus and scree are observed. The soil
map of the area modified after the soil map published by Kerala land Use board is shown in Fig.
3.4.
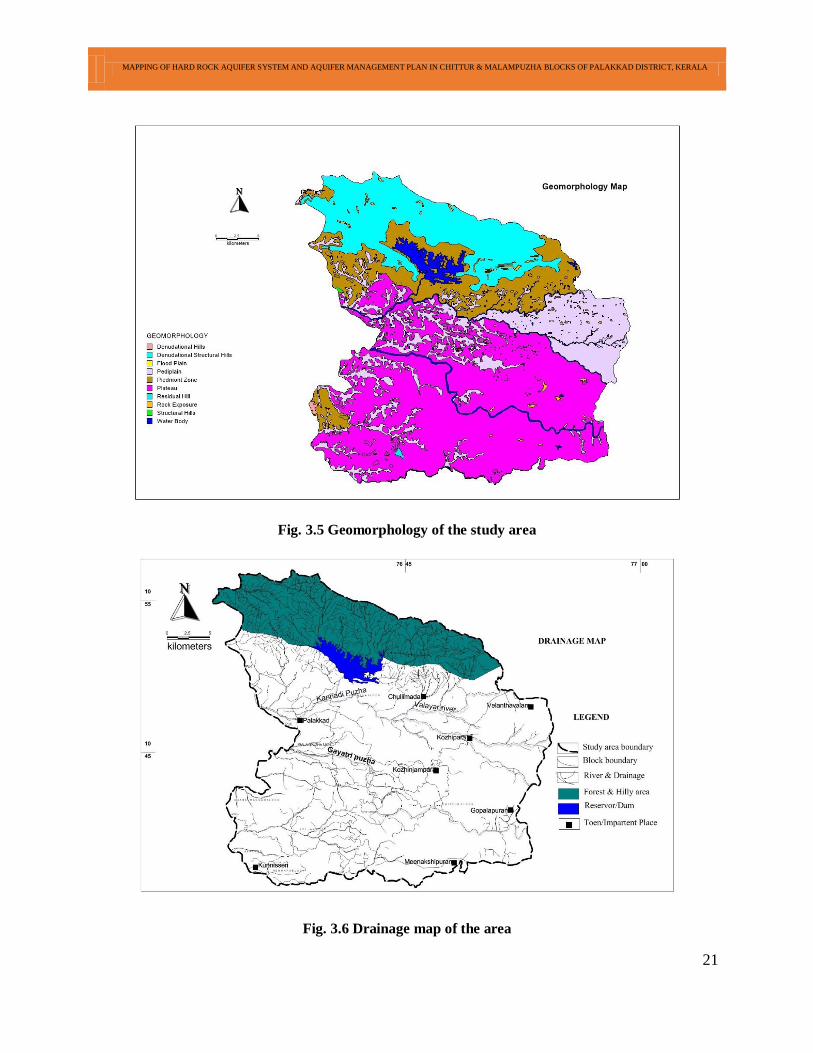
3.3 Geomorphology
Geomorphologically the area is characterized by the land features of mid land and high land
regions.The prominant physiographic feature of the area is the Palghat gap which is a structural
gap of about 32km wide developed in the Western Ghats. Palghat Gap is the only major break
within the Western Ghats. Geomorphologically, three distinct physiographic horizons of both
erosional and depositional types with characteristic soils have been discerned in the Gap area.
Various geomorphological features of the area are depicted in the modified geomorphological
map sourced from the Land Use Board (Fig.3.5).
MAPPING OF HARD ROCK AQUIFER SYSTEM AND AQUIFER MANAGEMENT PLAN IN CHITTUR & MALAMPUZHA BLOCKS OF PALAKKAD DISTRICT, KERALA
20
Fig. 3.4 Soil map of the area
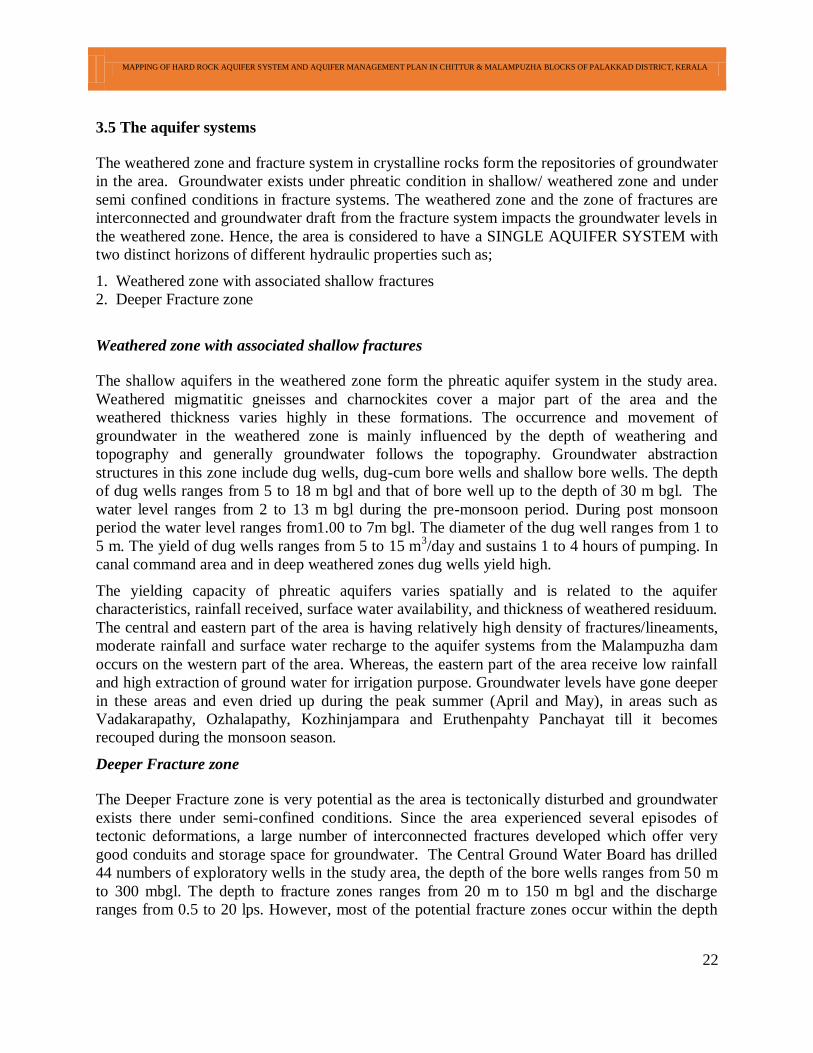
3.4 Drainage characteristics
Topo analysis of the area has brought to light remarkable linear, consequent rivers of high orders
in the Gap area, as compared to closely spaced, lower order streams of trellis, dendritic,
obsequent and subsequent patterns of the hill ranges (Nageswara Rao & Srinivasan, 1980). The
drainage pattern of the study area is shown in Fig. 3.6.
MAPPING OF HARD ROCK AQUIFER SYSTEM AND AQUIFER MANAGEMENT PLAN IN CHITTUR & MALAMPUZHA BLOCKS OF PALAKKAD DISTRICT, KERALA
21
Fig. 3.5 Geomorphology of the study area
Fig. 3.6 Drainage map of the area
MAPPING OF HARD ROCK AQUIFER SYSTEM AND AQUIFER MANAGEMENT PLAN IN CHITTUR & MALAMPUZHA BLOCKS OF PALAKKAD DISTRICT, KERALA
22
3.5 The aquifer systems
The weathered zone and fracture system in crystalline rocks form the repositories of groundwater
in the area. Groundwater exists under phreatic condition in shallow/ weathered zone and under
semi confined conditions in fracture systems. The weathered zone and the zone of fractures are
interconnected and groundwater draft from the fracture system impacts the groundwater levels in
the weathered zone. Hence, the area is considered to have a SINGLE AQUIFER SYSTEM with
two distinct horizons of different hydraulic properties such as;
1. Weathered zone with associated shallow fractures
2. Deeper Fracture zone
Weathered zone with associated shallow fractures
The shallow aquifers in the weathered zone form the phreatic aquifer system in the study area.
Weathered migmatitic gneisses and charnockites cover a major part of the area and the
weathered thickness varies highly in these formations. The occurrence and movement of
groundwater in the weathered zone is mainly influenced by the depth of weathering and
topography and generally groundwater follows the topography. Groundwater abstraction
structures in this zone include dug wells, dug-cum bore wells and shallow bore wells. The depth
of dug wells ranges from 5 to 18 m bgl and that of bore well up to the depth of 30 m bgl. The
water level ranges from 2 to 13 m bgl during the pre-monsoon period. During post monsoon
period the water level ranges from1.00 to 7m bgl. The diameter of the dug well ranges from 1 to
5 m. The yield of dug wells ranges from 5 to 15 m3/day and sustains 1 to 4 hours of pumping. In
canal command area and in deep weathered zones dug wells yield high.
The yielding capacity of phreatic aquifers varies spatially and is related to the aquifer
characteristics, rainfall received, surface water availability, and thickness of weathered residuum.
The central and eastern part of the area is having relatively high density of fractures/lineaments,
moderate rainfall and surface water recharge to the aquifer systems from the Malampuzha dam
occurs on the western part of the area. Whereas, the eastern part of the area receive low rainfall
and high extraction of ground water for irrigation purpose. Groundwater levels have gone deeper
in these areas and even dried up during the peak summer (April and May), in areas such as
Vadakarapathy, Ozhalapathy, Kozhinjampara and Eruthenpahty Panchayat till it becomes
recouped during the monsoon season.
Deeper Fracture zone
The Deeper Fracture zone is very potential as the area is tectonically disturbed and groundwater
exists there under semi-confined conditions. Since the area experienced several episodes of
tectonic deformations, a large number of interconnected fractures developed which offer very
good conduits and storage space for groundwater. The Central Ground Water Board has drilled
44 numbers of exploratory wells in the study area, the depth of the bore wells ranges from 50 m
to 300 mbgl. The depth to fracture zones ranges from 20 m to 150 m bgl and the discharge
ranges from 0.5 to 20 lps. However, most of the potential fracture zones occur within the depth
MAPPING OF HARD ROCK AQUIFER SYSTEM AND AQUIFER MANAGEMENT PLAN IN CHITTUR & MALAMPUZHA BLOCKS OF PALAKKAD DISTRICT, KERALA
23
of 120 mbgl. Bore wells located along the lineaments are yielding high compared to the wells
located away from the lineaments.
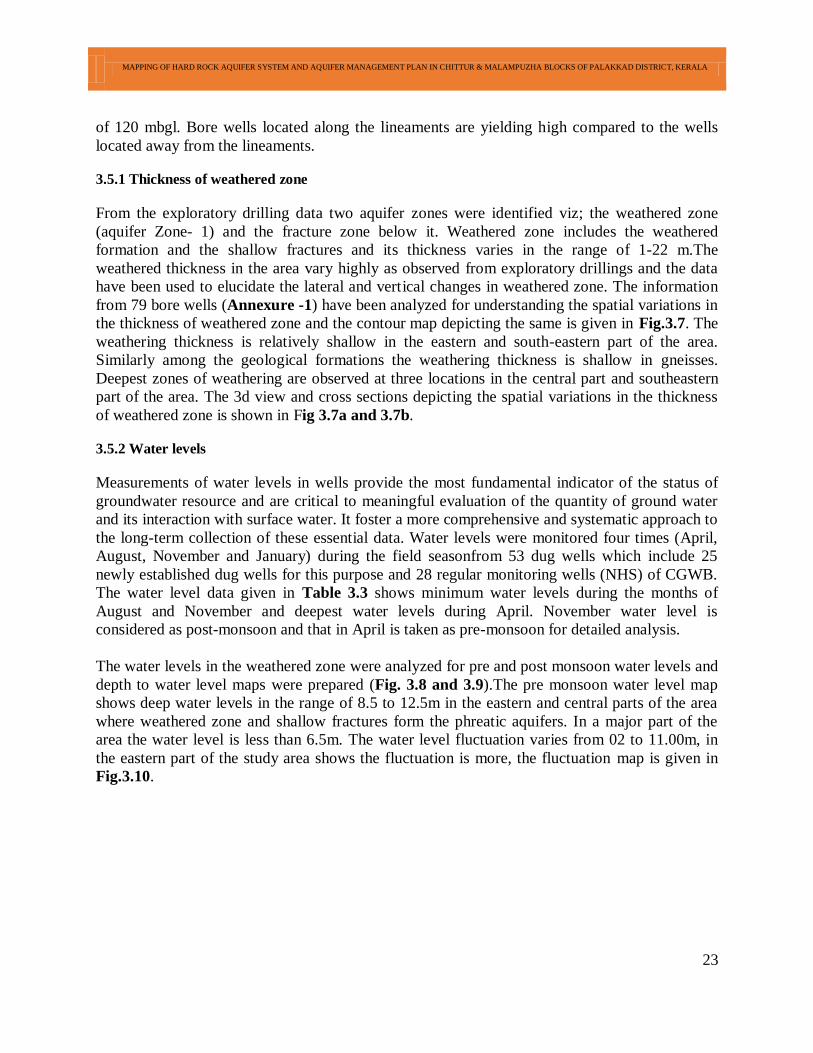
3.5.1 Thickness of weathered zone
From the exploratory drilling data two aquifer zones were identified viz; the weathered zone
(aquifer Zone- 1) and the fracture zone below it. Weathered zone includes the weathered
formation and the shallow fractures and its thickness varies in the range of 1-22 m.The
weathered thickness in the area vary highly as observed from exploratory drillings and the data
have been used to elucidate the lateral and vertical changes in weathered zone. The information
from 79 bore wells (Annexure -1) have been analyzed for understanding the spatial variations in
the thickness of weathered zone and the contour map depicting the same is given in Fig.3.7. The
weathering thickness is relatively shallow in the eastern and south-eastern part of the area.
Similarly among the geological formations the weathering thickness is shallow in gneisses.
Deepest zones of weathering are observed at three locations in the central part and southeastern
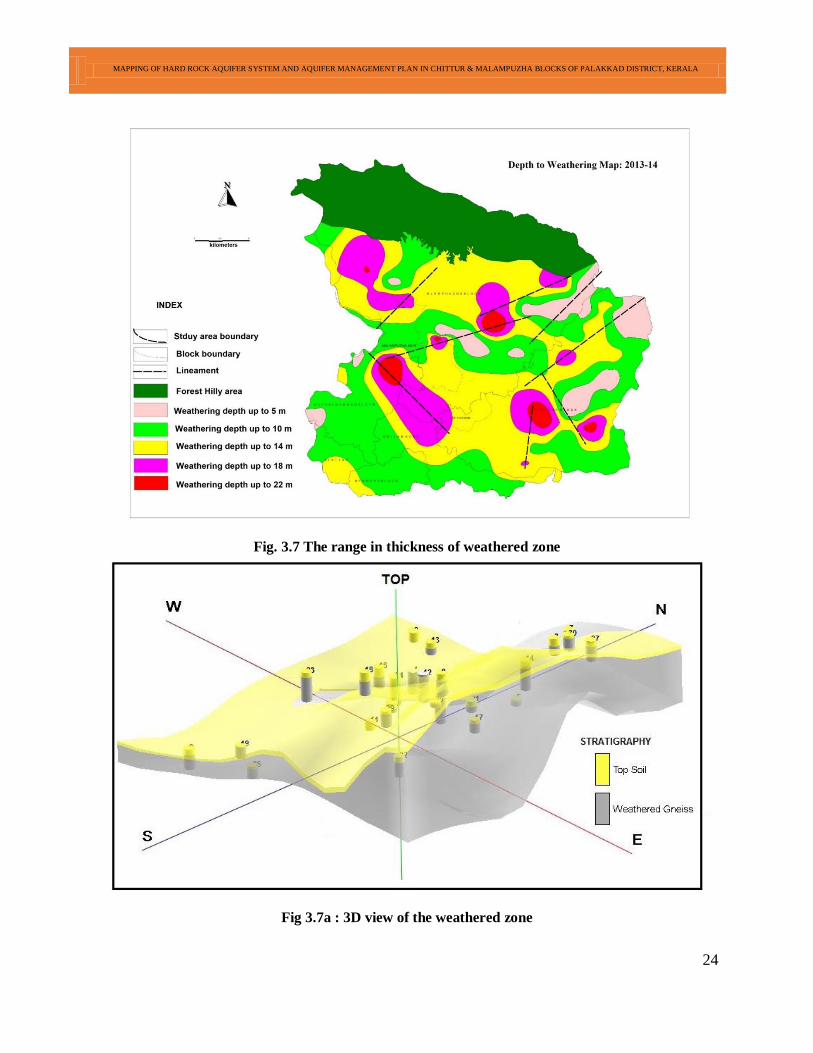
part of the area. The 3d view and cross sections depicting the spatial variations in the thickness
of weathered zone is shown in Fig 3.7a and 3.7b.
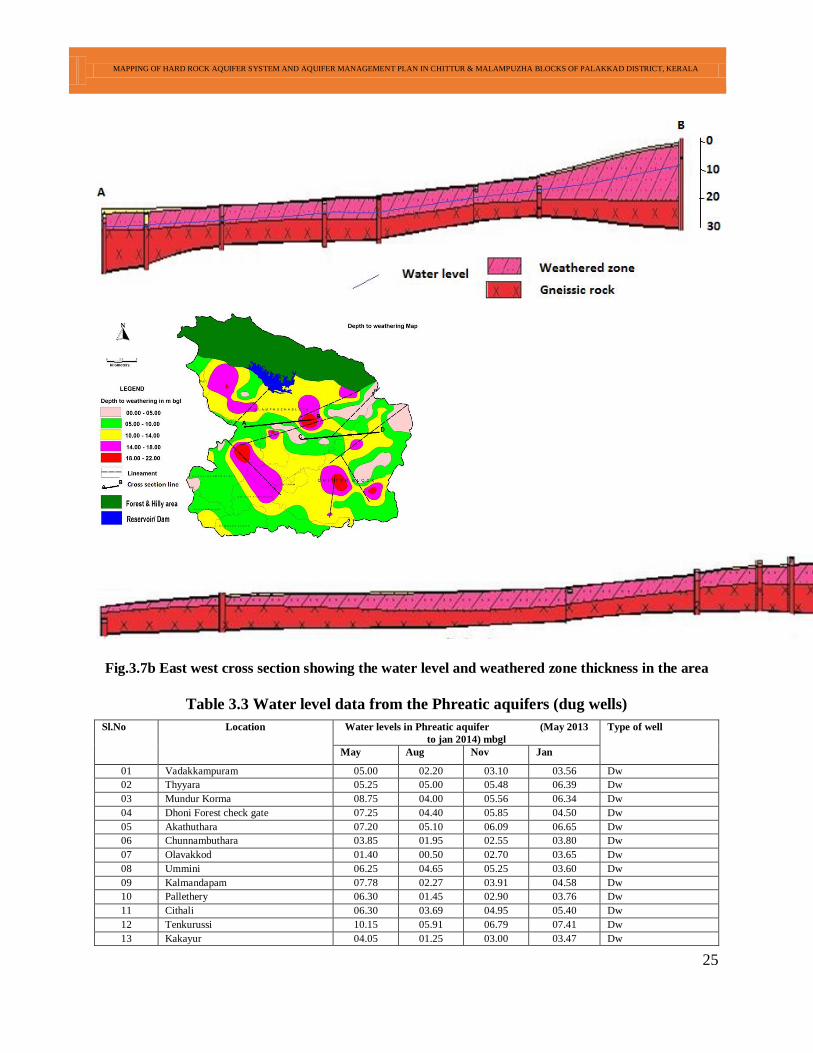
3.5.2 Water levels
Measurements of water levels in wells provide the most fundamental indicator of the status of
groundwater resource and are critical to meaningful evaluation of the quantity of ground water
and its interaction with surface water. It foster a more comprehensive and systematic approach to
the long-term collection of these essential data. Water levels were monitored four times (April,
August, November and January) during the field seasonfrom 53 dug wells which include 25
newly established dug wells for this purpose and 28 regular monitoring wells (NHS) of CGWB.
The water level data given in Table 3.3 shows minimum water levels during the months of
August and November and deepest water levels during April. November water level is
considered as post-monsoon and that in April is taken as pre-monsoon for detailed analysis.
The water levels in the weathered zone were analyzed for pre and post monsoon water levels and
depth to water level maps were prepared (Fig. 3.8 and 3.9).The pre monsoon water level map
shows deep water levels in the range of 8.5 to 12.5m in the eastern and central parts of the area
where weathered zone and shallow fractures form the phreatic aquifers. In a major part of the
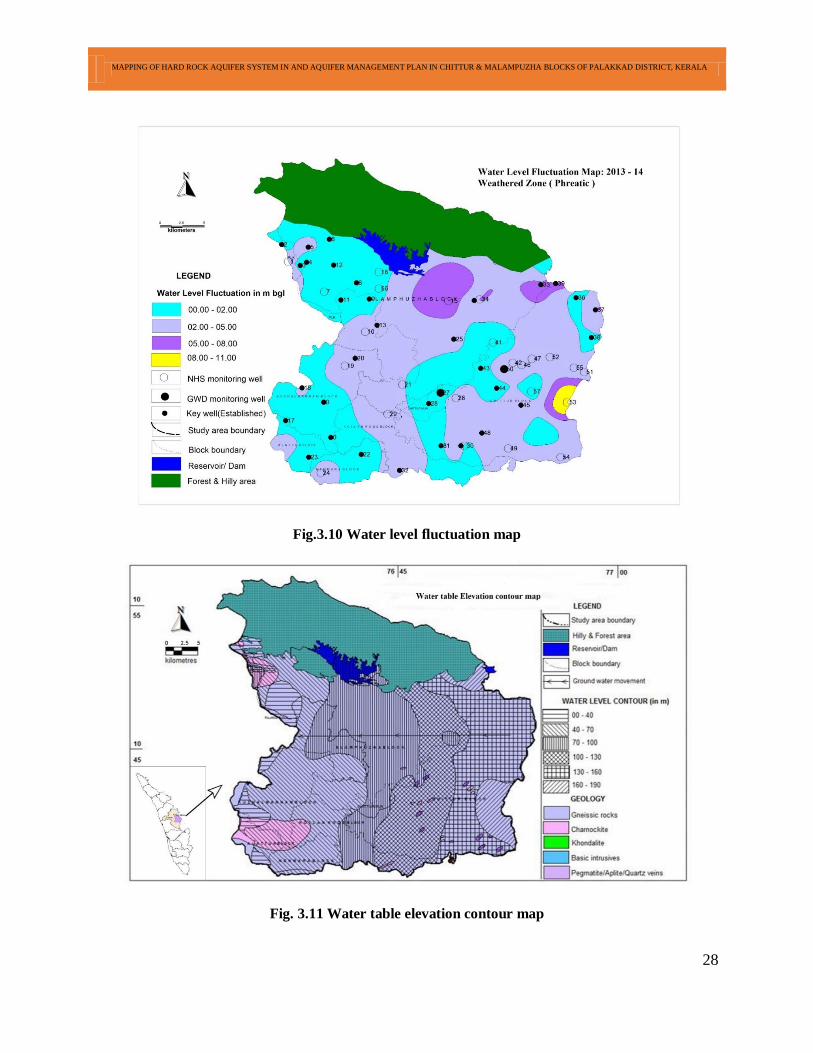
area the water level is less than 6.5m. The water level fluctuation varies from 02 to 11.00m, in
the eastern part of the study area shows the fluctuation is more, the fluctuation map is given in
Fig.3.10.
MAPPING OF HARD ROCK AQUIFER SYSTEM AND AQUIFER MANAGEMENT PLAN IN CHITTUR & MALAMPUZHA BLOCKS OF PALAKKAD DISTRICT, KERALA
24
Fig. 3.7 The range in thickness of weathered zone
Fig 3.7a : 3D view of the weathered zone
MAPPING OF HARD ROCK AQUIFER SYSTEM AND AQUIFER MANAGEMENT PLAN IN CHITTUR & MALAMPUZHA BLOCKS OF PALAKKAD DISTRICT, KERALA
25
Fig.3.7b East west cross section showing the water level and weathered zone thickness in the area
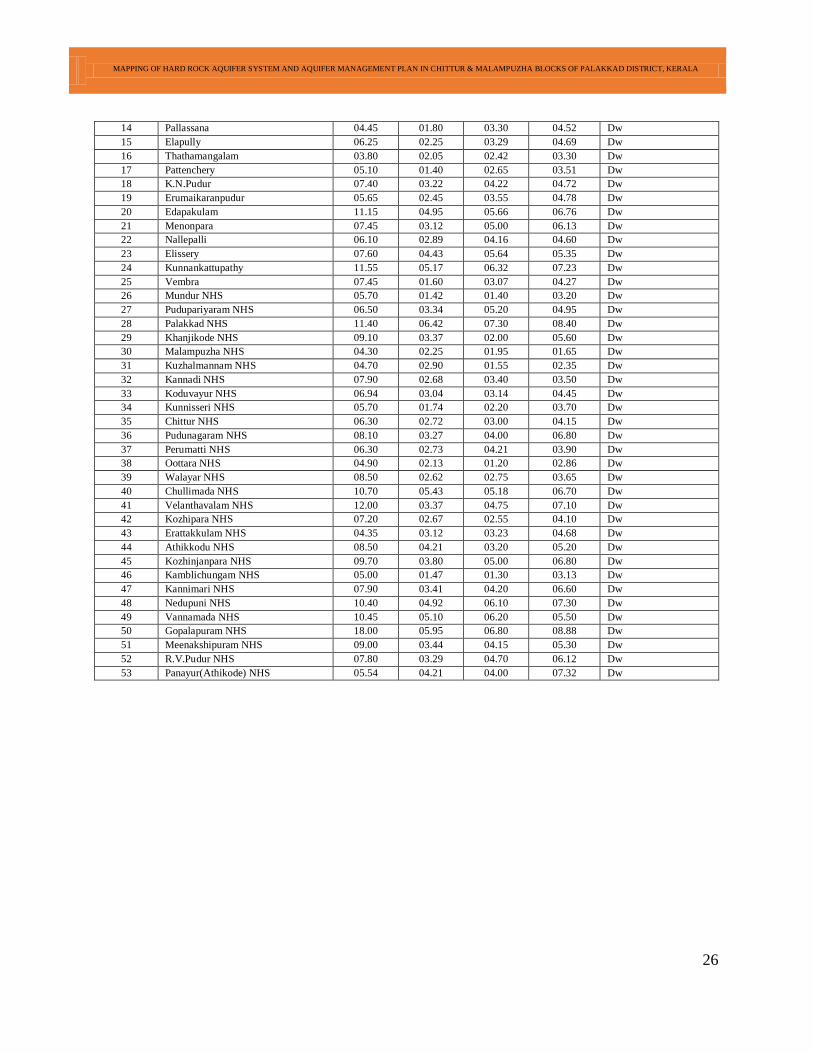
Table 3.3 Water level data from the Phreatic aquifers (dug wells)
Sl.No Location Water levels in Phreatic aquifer (May 2013
to jan 2014) mbgl
Type of well
May Aug Nov Jan
01 Vadakkampuram 05.00 02.20 03.10 03.56 Dw
02 Thyyara 05.25 05.00 05.48 06.39 Dw
03 Mundur Korma 08.75 04.00 05.56 06.34 Dw
04 Dhoni Forest check gate 07.25 04.40 05.85 04.50 Dw
05 Akathuthara 07.20 05.10 06.09 06.65 Dw
06 Chunnambuthara 03.85 01.95 02.55 03.80 Dw
07 Olavakkod 01.40 00.50 02.70 03.65 Dw
08 Ummini 06.25 04.65 05.25 03.60 Dw
09 Kalmandapam 07.78 02.27 03.91 04.58 Dw
10 Pallethery 06.30 01.45 02.90 03.76 Dw
11 Cithali 06.30 03.69 04.95 05.40 Dw
12 Tenkurussi 10.15 05.91 06.79 07.41 Dw
13 Kakayur 04.05 01.25 03.00 03.47 Dw
MAPPING OF HARD ROCK AQUIFER SYSTEM AND AQUIFER MANAGEMENT PLAN IN CHITTUR & MALAMPUZHA BLOCKS OF PALAKKAD DISTRICT, KERALA
26
14 Pallassana 04.45 01.80 03.30 04.52 Dw
15 Elapully 06.25 02.25 03.29 04.69 Dw
16 Thathamangalam 03.80 02.05 02.42 03.30 Dw
17 Pattenchery 05.10 01.40 02.65 03.51 Dw
18 K.N.Pudur 07.40 03.22 04.22 04.72 Dw
19 Erumaikaranpudur 05.65 02.45 03.55 04.78 Dw
20 Edapakulam 11.15 04.95 05.66 06.76 Dw
21 Menonpara 07.45 03.12 05.00 06.13 Dw
22 Nallepalli 06.10 02.89 04.16 04.60 Dw
23 Elissery 07.60 04.43 05.64 05.35 Dw
24 Kunnankattupathy 11.55 05.17 06.32 07.23 Dw
25 Vembra 07.45 01.60 03.07 04.27 Dw
26 Mundur NHS 05.70 01.42 01.40 03.20 Dw
27 Pudupariyaram NHS 06.50 03.34 05.20 04.95 Dw
28 Palakkad NHS 11.40 06.42 07.30 08.40 Dw
29 Khanjikode NHS 09.10 03.37 02.00 05.60 Dw
30 Malampuzha NHS 04.30 02.25 01.95 01.65 Dw
31 Kuzhalmannam NHS 04.70 02.90 01.55 02.35 Dw
32 Kannadi NHS 07.90 02.68 03.40 03.50 Dw
33 Koduvayur NHS 06.94 03.04 03.14 04.45 Dw
34 Kunnisseri NHS 05.70 01.74 02.20 03.70 Dw
35 Chittur NHS 06.30 02.72 03.00 04.15 Dw
36 Pudunagaram NHS 08.10 03.27 04.00 06.80 Dw
37 Perumatti NHS 06.30 02.73 04.21 03.90 Dw
38 Oottara NHS 04.90 02.13 01.20 02.86 Dw
39 Walayar NHS 08.50 02.62 02.75 03.65 Dw
40 Chullimada NHS 10.70 05.43 05.18 06.70 Dw
41 Velanthavalam NHS 12.00 03.37 04.75 07.10 Dw
42 Kozhipara NHS 07.20 02.67 02.55 04.10 Dw
43 Erattakkulam NHS 04.35 03.12 03.23 04.68 Dw
44 Athikkodu NHS 08.50 04.21 03.20 05.20 Dw
45 Kozhinjanpara NHS 09.70 03.80 05.00 06.80 Dw
46 Kamblichungam NHS 05.00 01.47 01.30 03.13 Dw
47 Kannimari NHS 07.90 03.41 04.20 06.60 Dw
48 Nedupuni NHS 10.40 04.92 06.10 07.30 Dw
49 Vannamada NHS 10.45 05.10 06.20 05.50 Dw
50 Gopalapuram NHS 18.00 05.95 06.80 08.88 Dw
51 Meenakshipuram NHS 09.00 03.44 04.15 05.30 Dw
52 R.V.Pudur NHS 07.80 03.29 04.70 06.12 Dw
53 Panayur(Athikode) NHS 05.54 04.21 04.00 07.32 Dw

MAPPING OF HARD ROCK AQUIFER SYSTEM IN AND AQUIFER MANAGEMENT PLAN IN CHITTUR & MALAMPUZHA BLOCKS OF PALAKKAD DISTRICT, KERALA
27
Fig. 3.8 Premonsoon water level map of the study area
Fig. 3.9 Post monsoon water level map of the study area
MAPPING OF HARD ROCK AQUIFER SYSTEM IN AND AQUIFER MANAGEMENT PLAN IN CHITTUR & MALAMPUZHA BLOCKS OF PALAKKAD DISTRICT, KERALA
28
Fig.3.10 Water level fluctuation map
Fig. 3.11 Water table elevation contour map
MAPPING OF HARD ROCK AQUIFER SYSTEM IN AND AQUIFER MANAGEMENT PLAN IN CHITTUR & MALAMPUZHA BLOCKS OF PALAKKAD DISTRICT, KERALA
29
The pattern of post monsoon water level in the area (Fig.3.9) is similar to that of pre monsoon
but the water level in major part of the area is below 3m and it is less than 5m in 90% of the area.
The water table elevation map (Fig 3.11) shows groundwater flow towards west, following the
topography.
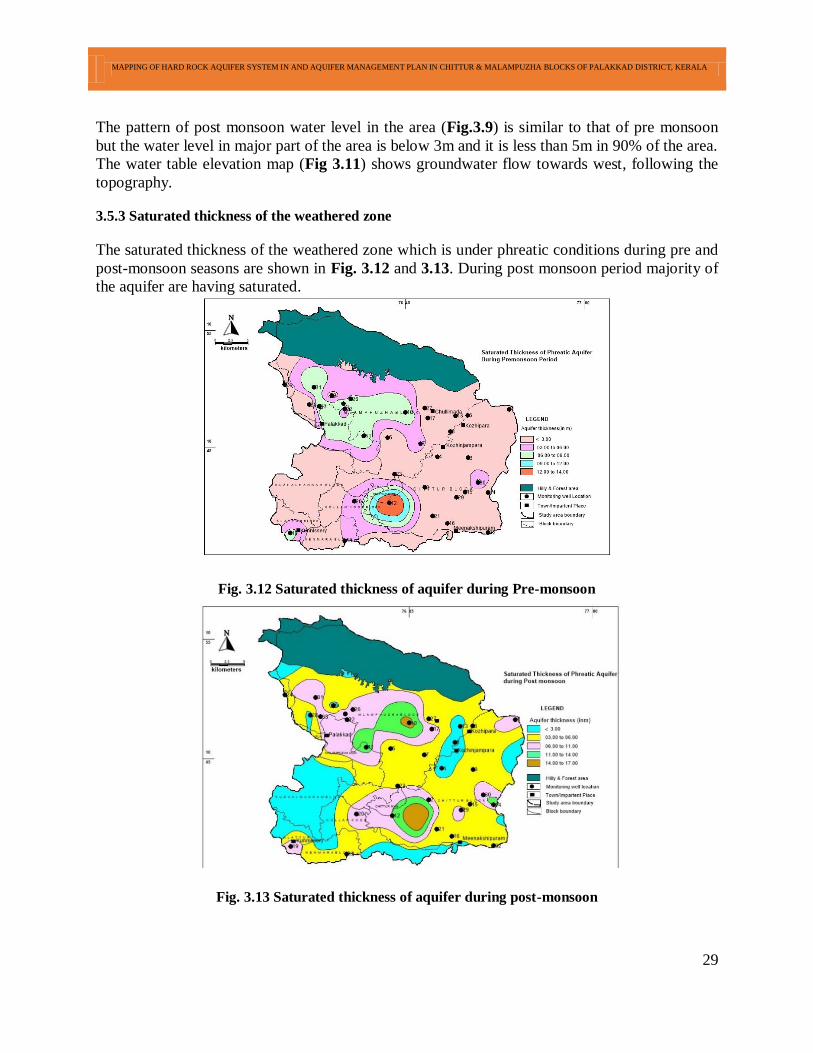
3.5.3 Saturated thickness of the weathered zone
The saturated thickness of the weathered zone which is under phreatic conditions during pre and
post-monsoon seasons are shown in Fig. 3.12 and 3.13. During post monsoon period majority of
the aquifer are having saturated.
Fig. 3.12 Saturated thickness of aquifer during Pre-monsoon
Fig. 3.13 Saturated thickness of aquifer during post-monsoon
MAPPING OF HARD ROCK AQUIFER SYSTEM IN AND AQUIFER MANAGEMENT PLAN IN CHITTUR & MALAMPUZHA BLOCKS OF PALAKKAD DISTRICT, KERALA
30
Thickness in the range of 2 to 5m.and the water levels are shallow (Fig.6.9), indicating limited
scope for artificial recharge. Whereas, during pre-monsoon period the saturated thickness is (Fig
3.12) mostly within 2m and the water levels are also deep, providing ample scope artificial
recharge. As the thickness of aquifer is limited even one meter rise in water level through
artificial recharge will have great impact on the groundwater scenario of the area.
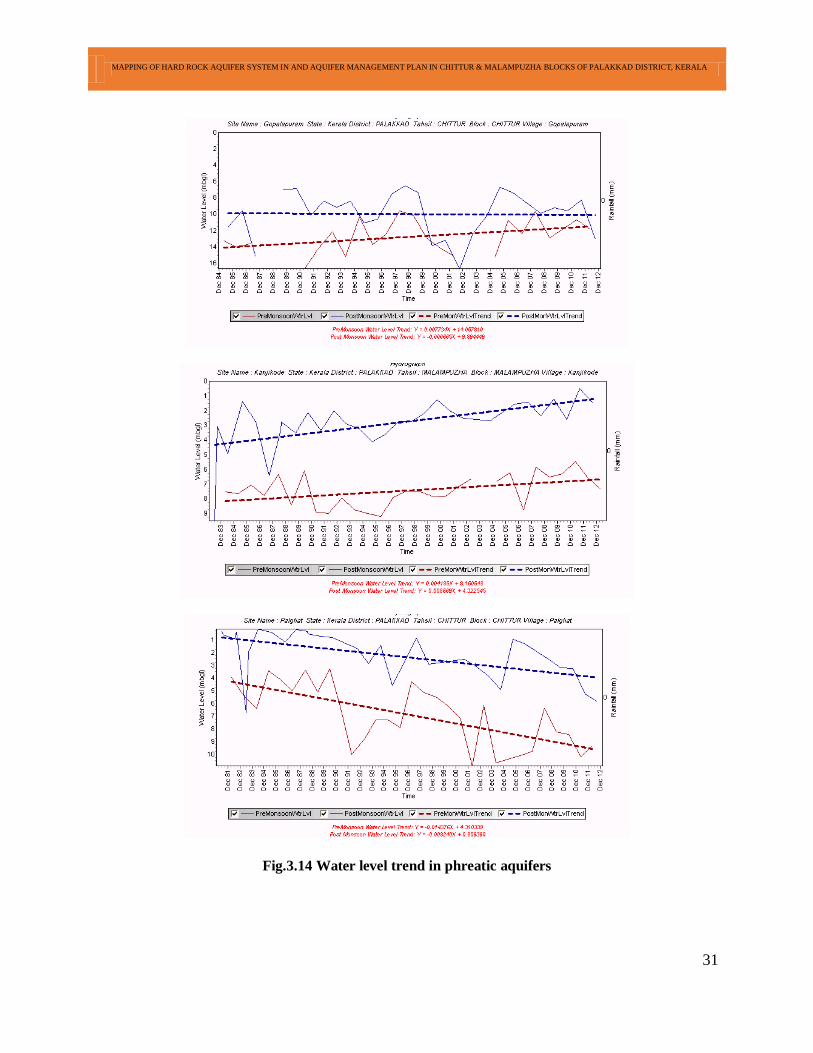
3.5.4 Water level trend
The water level data available for a long term help us in the protection, management, and
sustainable development of the aquifer system and make the best possible decisions. More than
50% of the regular monitoring wells of CGWB (NHS) are established within last 5 years and
because of that water level data for longer period could be analyzed from 13 NHS only and the
analysis result is given in Table 3.4.
Table 3.4. Water level trend values in the weathered zone.
Sl. No. Location
Data
Points Rise(m/year) Fall(m/year) Trend
1 Gopalapuram 7 0.2838
0.2838
2 Kanjikode 9 0.0491
0.0491
3 Kodavayur 9
0.164 -0.164
4 Koduvayur 9 0.212
0.212
5 Kozhinjampara-R1 6
0.43 -0.43
6 Malampuzha 10 0.0006
0.0006
7 Malampuzha1 9
0.0342 -0.0342
8 Meenakshipuram 10 0.0067
0.0067
9 Meenkara 7
0.3382 -0.3382
10 Palghat 9
0.0281 -0.0281
11 Perumatty 9
1.4046 -1.4046
12 Pudur 10 0.5419
0.5419
13 Walayar 9 0.0835 -0.0835
The water level trend values indicate significant rise or fall in 23% of the wells only. The fall in
water level is mainly observed in Chittur block and the rise in wells located in ayacut areas and
the water level trend of three representative NHS is given in Fig. 3.14.
MAPPING OF HARD ROCK AQUIFER SYSTEM IN AND AQUIFER MANAGEMENT PLAN IN CHITTUR & MALAMPUZHA BLOCKS OF PALAKKAD DISTRICT, KERALA
31
Fig.3.14 Water level trend in phreatic aquifers
MAPPING OF HARD ROCK AQUIFER SYSTEM IN AND AQUIFER MANAGEMENT PLAN IN CHITTUR & MALAMPUZHA BLOCKS OF PALAKKAD DISTRICT, KERALA
32
3.5.5 Quality of water in the weathered zone
The existing water quality data from the dug wells have been analyzed for extracting information
on regional distribution of water quality and their suitability for various uses. In a groundwater
flow regime water chemistry constantly undergoes modification due to various processes such as
dissolution of minerals, precipitation of dissolved ions under unstable conditions, cation
exchange etc. The hydrochemical evolution along the flow paths are significantly altered under
anthropogenic interferences and consequent pollution of aquifer systems (Drever, 1982;
Langmuir, 1997; Abu-Jabeer, 2001;Singh et al, 2007). The effects of pollution in the flow system
can easily be identified from a comparison of dissolved ions and ion ratio studies in simple terms
(Hem, 1985).
The groundwater quality in the area is generally good for all purposes except for certain
locations where high fluoride and salinity are observed. High salinity is noticed from
Kadumthuruthi (Yakkara) and Kuduvayoor area. About 1 sq km area is affected in both the
villages. The dug wells in the Kadumthuruthi colony (about 40 numbers) area showing high EC
(Electrical Conductivity) values in the range of 2000 – 6700 µs/cm at 250 C. In the Kuduvayoor
area about 25 dug wells are showing high EC values of 756 – 7200 µmicro Siemens/cm at 250
C.
The source of salinity is mainly from the saline soils developed due to low rain fall and high
evapotranspiration under irrigated agriculture. The chemical analysis data given in Table 3.6
shows salinity of water samples in the range of 318 to 1839 with 58% of the samples with EC
above 750 and 42% above 1000 µs /cm at 25oC. High EC values are observed in the eastern part
of the area with alkaline soil.
The eastern part of the area shows fluoride above permissible limits, where the dug wells show
fluoride in the range of 0.3 – 4.85 ppm and in the bore wells in the range of 0.3 to 3.12 ppm.
During aquifer performance test (eg. exploratory well at Vadakarapathy Panchayat office), it was
observed that prolonged pumping, leads to enrichment of fluoride in water. During six hours of
pumping fluoride concentration increased from 0.765 ppm to 1.5 ppm. The Phreatic Aquifer
Water quality map is given in Fig.3.15.
Table 3.5 WaterQuality data of dug wells representing phreatic aquifers
Sl.
No Name of locaton pH
TH
as
CaC
O3
Ca Mg Na K CO3 HCO3 SO4 Cl F NO3
EC
us/c
m at
25oC
Mg/L 1 Chittoor 9.26 110 12 19 47 2 24 137 12 64 0.64 1.4 526
2 Chullimade 8.86 255 30 44 126 2.1 26 76 57 299 0.42 2 1324
3 Gopalapuram 9.3 125 18 19 140 1 12 132 12 206 0.99 83 1112
4 Kanjikode 8.99 200 36 27 107 103 42 220 74 192 0.3 76 1383
5 Kodavayur 8.73 32 6.4 3.9 19 0.9 4.8 66 2.8 16 0.78 3.4 180
6 Kuzhalmannam 8.63 94 16 13 40 4.6 12 127 31 44 0.9 0.52 459
7 Malampuzha 8.53 100 24 9.7 27 9.2 12 93 0.7 64 0.14 1.4 412
8 Meenakshipuram 8.75 165 24 25 76 9.5 18 134 51 96 0.32 108 853
9 Meenkara 9.11 220 12 46 136 0.9 48 256 55 156 1.1 4.7 1144
10 Mundur 8.63 74 16 8.3 21 2.6 4.8 100 7.2 31 0.38 3.2 318
11 Walayar 8.84 295 38 49 67 3.8 24 116 43 171 1.09 68 934
12 Perumatt 8.88 90 12 15 34 5.5 14 156 12 26 1.01 3.7 371
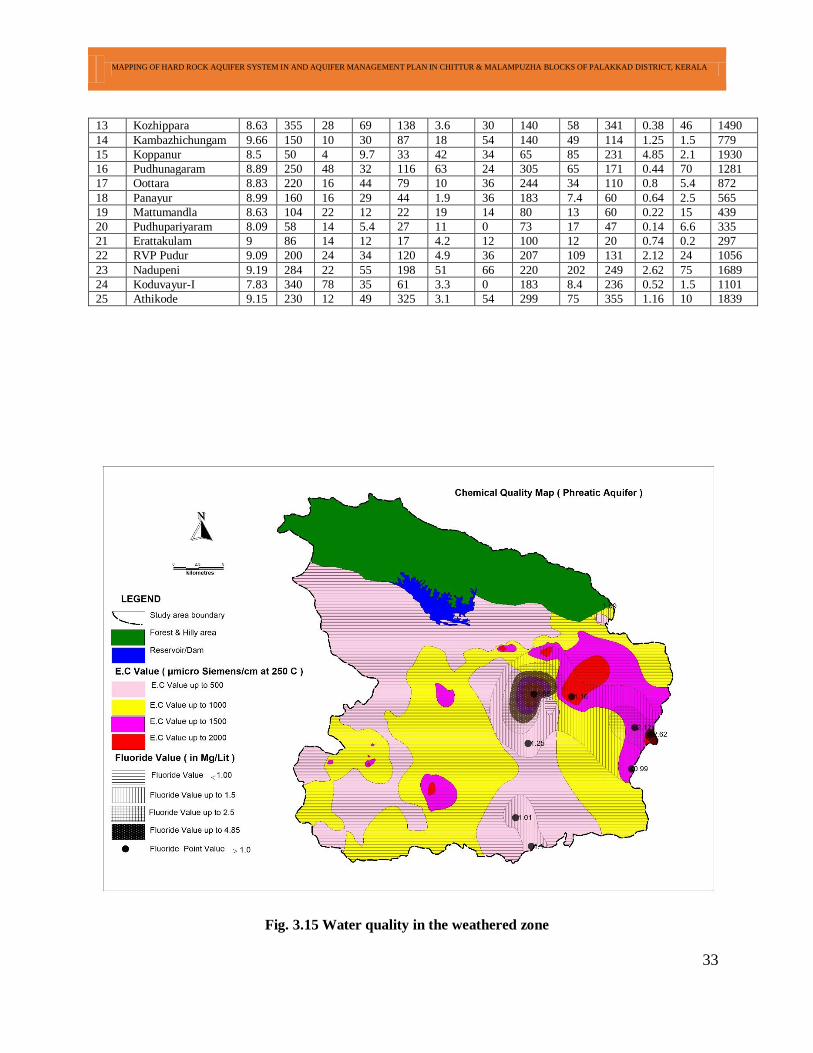
MAPPING OF HARD ROCK AQUIFER SYSTEM IN AND AQUIFER MANAGEMENT PLAN IN CHITTUR & MALAMPUZHA BLOCKS OF PALAKKAD DISTRICT, KERALA
33
13 Kozhippara 8.63 355 28 69 138 3.6 30 140 58 341 0.38 46 1490
14 Kambazhichungam 9.66 150 10 30 87 18 54 140 49 114 1.25 1.5 779
15 Koppanur 8.5 50 4 9.7 33 42 34 65 85 231 4.85 2.1 1930
16 Pudhunagaram 8.89 250 48 32 116 63 24 305 65 171 0.44 70 1281
17 Oottara 8.83 220 16 44 79 10 36 244 34 110 0.8 5.4 872
18 Panayur 8.99 160 16 29 44 1.9 36 183 7.4 60 0.64 2.5 565
19 Mattumandla 8.63 104 22 12 22 19 14 80 13 60 0.22 15 439
20 Pudhupariyaram 8.09 58 14 5.4 27 11 0 73 17 47 0.14 6.6 335
21 Erattakulam 9 86 14 12 17 4.2 12 100 12 20 0.74 0.2 297
22 RVP Pudur 9.09 200 24 34 120 4.9 36 207 109 131 2.12 24 1056
23 Nadupeni 9.19 284 22 55 198 51 66 220 202 249 2.62 75 1689
24 Koduvayur-I 7.83 340 78 35 61 3.3 0 183 8.4 236 0.52 1.5 1101
25 Athikode 9.15 230 12 49 325 3.1 54 299 75 355 1.16 10 1839
Fig. 3.15 Water quality in the weathered zone
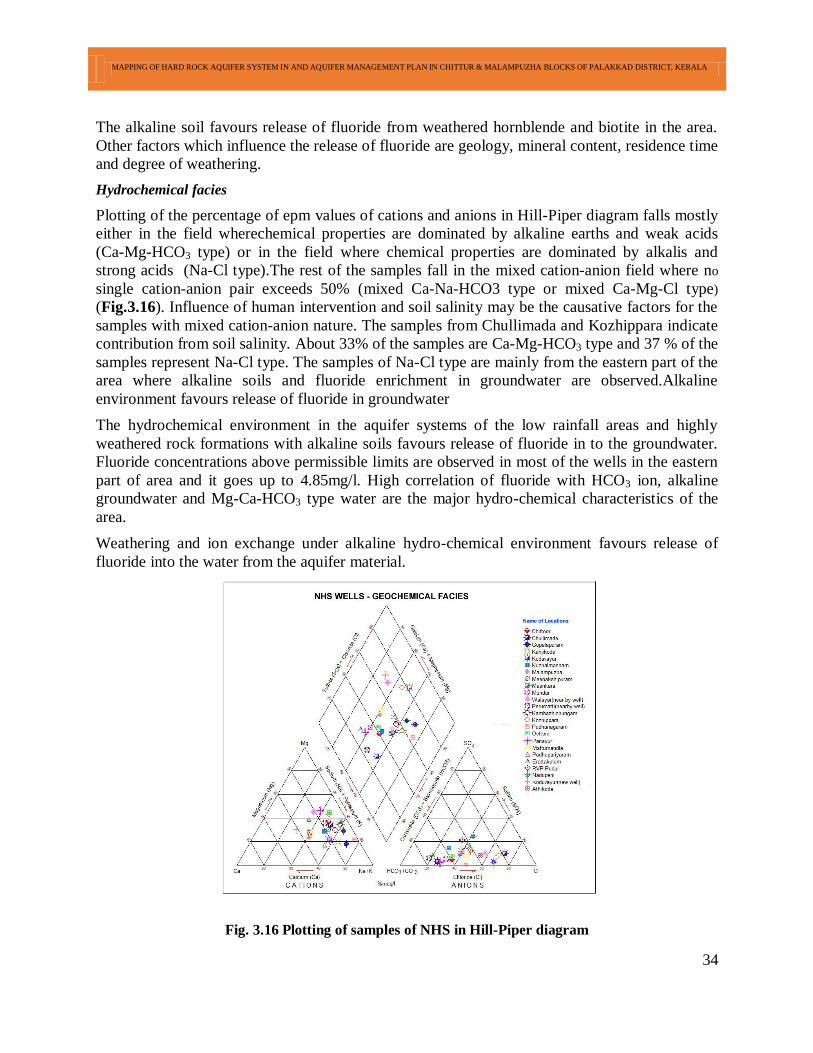
MAPPING OF HARD ROCK AQUIFER SYSTEM IN AND AQUIFER MANAGEMENT PLAN IN CHITTUR & MALAMPUZHA BLOCKS OF PALAKKAD DISTRICT, KERALA
34
The alkaline soil favours release of fluoride from weathered hornblende and biotite in the area.
Other factors which influence the release of fluoride are geology, mineral content, residence time
and degree of weathering.
Hydrochemical facies
Plotting of the percentage of epm values of cations and anions in Hill-Piper diagram falls mostly
either in the field wherechemical properties are dominated by alkaline earths and weak acids
(Ca-Mg-HCO3 type) or in the field where chemical properties are dominated by alkalis and
strong acids (Na-Cl type).The rest of the samples fall in the mixed cation-anion field where no
single cation-anion pair exceeds 50% (mixed Ca-Na-HCO3 type or mixed Ca-Mg-Cl type)
(Fig.3.16). Influence of human intervention and soil salinity may be the causative factors for the
samples with mixed cation-anion nature. The samples from Chullimada and Kozhippara indicate
contribution from soil salinity. About 33% of the samples are Ca-Mg-HCO3 type and 37 % of the
samples represent Na-Cl type. The samples of Na-Cl type are mainly from the eastern part of the
area where alkaline soils and fluoride enrichment in groundwater are observed.Alkaline
environment favours release of fluoride in groundwater
The hydrochemical environment in the aquifer systems of the low rainfall areas and highly
weathered rock formations with alkaline soils favours release of fluoride in to the groundwater.
Fluoride concentrations above permissible limits are observed in most of the wells in the eastern
part of area and it goes up to 4.85mg/l. High correlation of fluoride with HCO3 ion, alkaline
groundwater and Mg-Ca-HCO3 type water are the major hydro-chemical characteristics of the
area.
Weathering and ion exchange under alkaline hydro-chemical environment favours release of
fluoride into the water from the aquifer material.
Fig. 3.16 Plotting of samples of NHS in Hill-Piper diagram
MAPPING OF HARD ROCK AQUIFER SYSTEM IN AND AQUIFER MANAGEMENT PLAN IN CHITTUR & MALAMPUZHA BLOCKS OF PALAKKAD DISTRICT, KERALA
35
3.5.6 Groundwater potential of weathered zone
Based on the weathered thickness, aquifer geometry, water levels, groundwater yield and
hydraulic properties the groundwater potential map of the phreatic aquifer system is prepared
(Fig.3.17& 3.18). The central part of the study area is having relatively high groundwater
potential with yield of wells ranging up to 10 cum/hr. and sustains 2 to 4 hours of pumping.
Fig. 3. 17 Groundwater potential map of phreatic aquifer system in the weathered zone
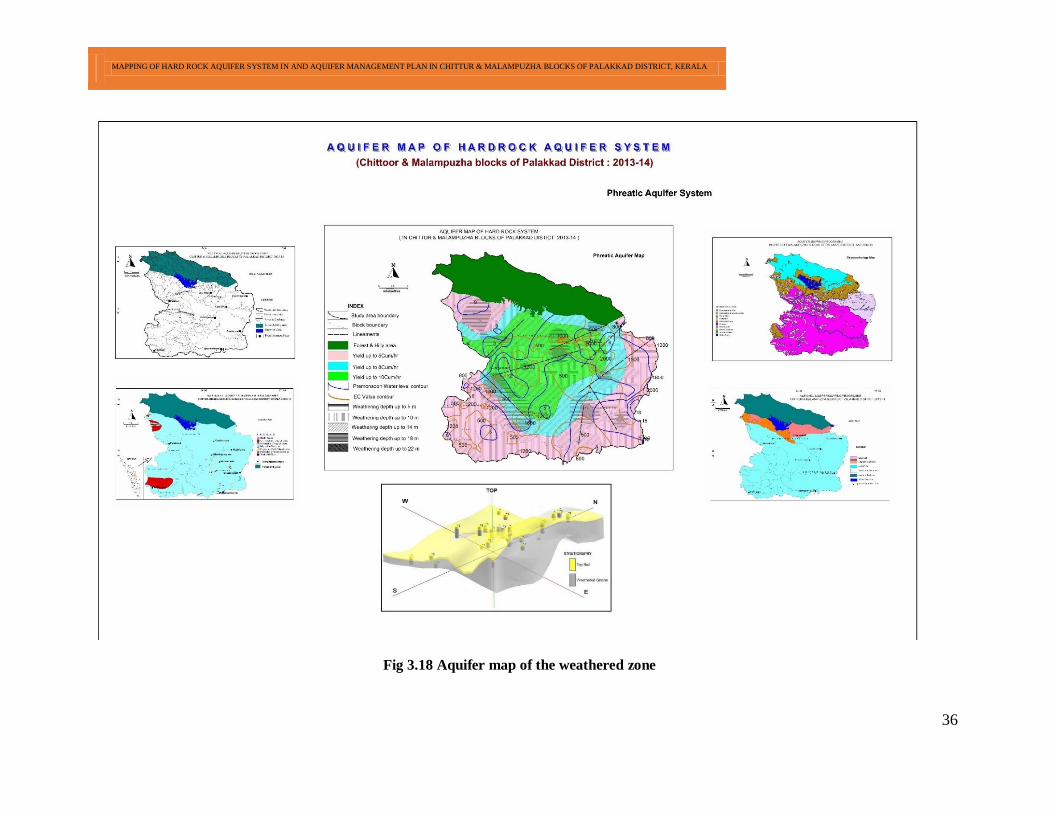
MAPPING OF HARD ROCK AQUIFER SYSTEM IN AND AQUIFER MANAGEMENT PLAN IN CHITTUR & MALAMPUZHA BLOCKS OF PALAKKAD DISTRICT, KERALA
36
Fig 3.18 Aquifer map of the weathered zone

MAPPING OF HARD ROCK AQUIFER SYSTEM AND AQUIFER MANAGEMENT PLAN IN CHITTUR & MALAMPUZHA BLOCKS OF PALAKKAD DISTRICT, KERALA
37
3.5.7 Fracture Aquifer Geometry
The information on weathered thickness and fracture zones from 12 exploratory wells have been
used for the preparation of panel diagrams (Fig.3.19 and 3.20). It shows relatively deep
weathering in the central and western part of the area. The hard rock below the weathered zone
consists of massive formation with fracture zones at varying depths. The fracture zones are
encountered in the depth range of 65-198.5 m in the exploratory wells representing different rock
formations with significant changes in yield and aquifer characteristics. They are confined to
Semi-confined in nature with a high frequency of occurrence of potential fractures within 120 m
depth. Deep fractures are also encountered in the area such as the one encountered in the
exploratory well at Vannamada at the depth of 190.00 m bgl but their frequency is very low. It is
a general practice in the area to go for deep drilling even after encountering a potential zone with
the expectation of augmented yield or for long survival of wells. This may not give expected
results as the study of exploration data reveals. However, the surface manifestations of fractures
in the area are best indicators of deep fractures and proper scientific investigations a prior
necessity for deep well drilling. Thus fracture pattern analysis in conjunction with the
exploration data has given meaningful information on the fracture aquifer systems in the area.
Dry fractures are mainly encountered in the eastern part of the area such as Meenakshipuram and
Thevarayankattai (near Menonpara). At these locations dry fractures are encountered at 135 and
183 m respectively and the reason for un-saturation is attributed to over exploitation and
consequent drying up of aquifer systems. Natural recharge in these areas is even otherwise low
due to low rainfall compared to other parts of the area.
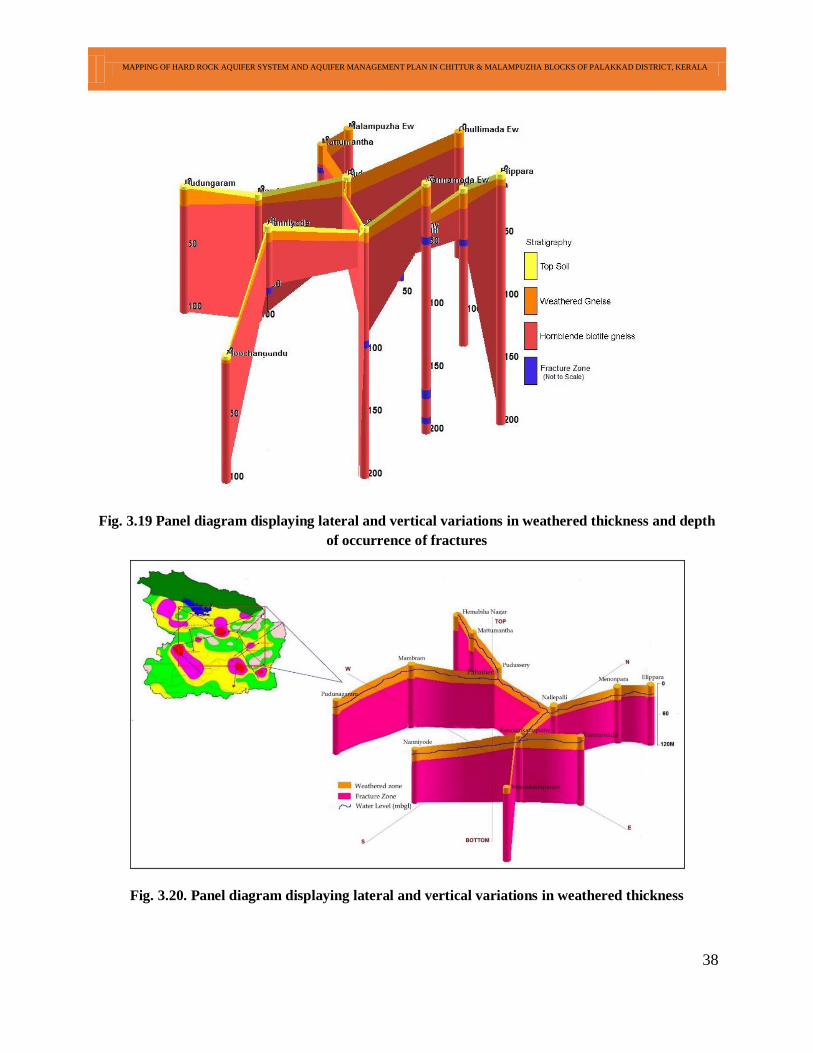
MAPPING OF HARD ROCK AQUIFER SYSTEM AND AQUIFER MANAGEMENT PLAN IN CHITTUR & MALAMPUZHA BLOCKS OF PALAKKAD DISTRICT, KERALA
38
Fig. 3.19 Panel diagram displaying lateral and vertical variations in weathered thickness and depth
of occurrence of fractures
Fig. 3.20. Panel diagram displaying lateral and vertical variations in weathered thickness
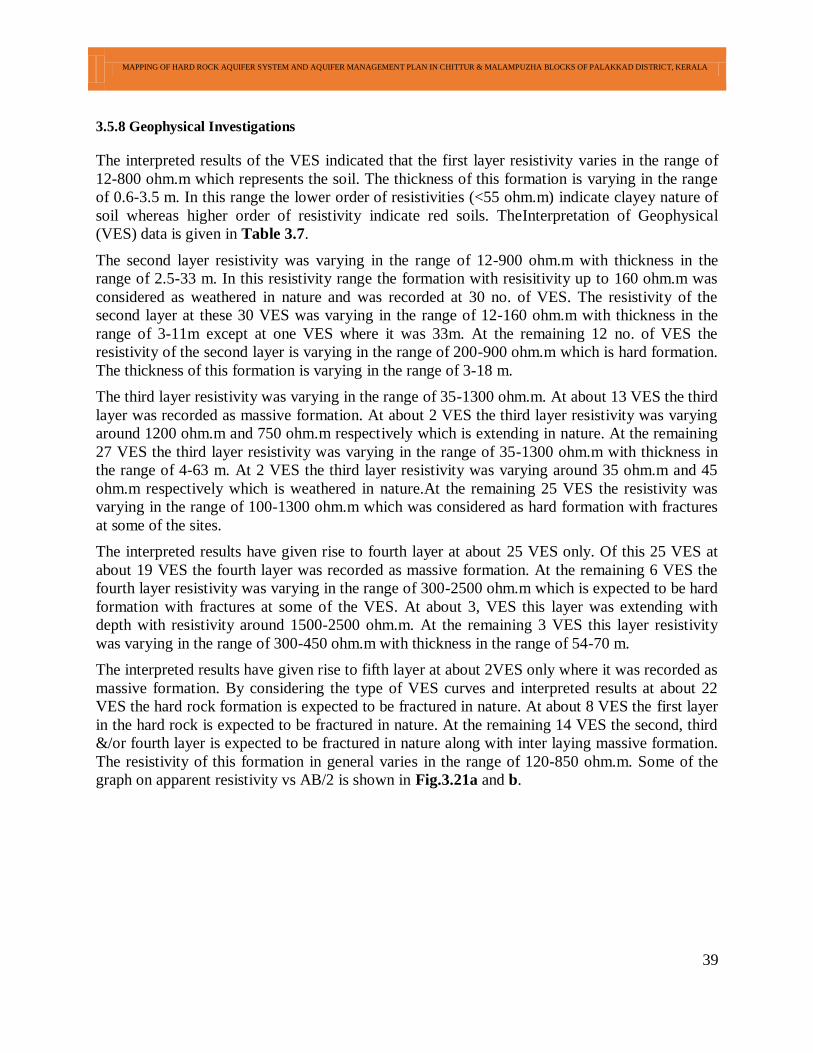
MAPPING OF HARD ROCK AQUIFER SYSTEM AND AQUIFER MANAGEMENT PLAN IN CHITTUR & MALAMPUZHA BLOCKS OF PALAKKAD DISTRICT, KERALA
39
3.5.8 Geophysical Investigations
The interpreted results of the VES indicated that the first layer resistivity varies in the range of
12-800 ohm.m which represents the soil. The thickness of this formation is varying in the range
of 0.6-3.5 m. In this range the lower order of resistivities (<55 ohm.m) indicate clayey nature of
soil whereas higher order of resistivity indicate red soils. TheInterpretation of Geophysical
(VES) data is given in Table 3.7.
The second layer resistivity was varying in the range of 12-900 ohm.m with thickness in the
range of 2.5-33 m. In this resistivity range the formation with resisitivity up to 160 ohm.m was
considered as weathered in nature and was recorded at 30 no. of VES. The resistivity of the
second layer at these 30 VES was varying in the range of 12-160 ohm.m with thickness in the
range of 3-11m except at one VES where it was 33m. At the remaining 12 no. of VES the
resistivity of the second layer is varying in the range of 200-900 ohm.m which is hard formation.
The thickness of this formation is varying in the range of 3-18 m.
The third layer resistivity was varying in the range of 35-1300 ohm.m. At about 13 VES the third
layer was recorded as massive formation. At about 2 VES the third layer resistivity was varying
around 1200 ohm.m and 750 ohm.m respectively which is extending in nature. At the remaining
27 VES the third layer resistivity was varying in the range of 35-1300 ohm.m with thickness in
the range of 4-63 m. At 2 VES the third layer resistivity was varying around 35 ohm.m and 45
ohm.m respectively which is weathered in nature.At the remaining 25 VES the resistivity was
varying in the range of 100-1300 ohm.m which was considered as hard formation with fractures
at some of the sites.
The interpreted results have given rise to fourth layer at about 25 VES only. Of this 25 VES at
about 19 VES the fourth layer was recorded as massive formation. At the remaining 6 VES the
fourth layer resistivity was varying in the range of 300-2500 ohm.m which is expected to be hard
formation with fractures at some of the VES. At about 3, VES this layer was extending with
depth with resistivity around 1500-2500 ohm.m. At the remaining 3 VES this layer resistivity
was varying in the range of 300-450 ohm.m with thickness in the range of 54-70 m.
The interpreted results have given rise to fifth layer at about 2VES only where it was recorded as
massive formation. By considering the type of VES curves and interpreted results at about 22
VES the hard rock formation is expected to be fractured in nature. At about 8 VES the first layer
in the hard rock is expected to be fractured in nature. At the remaining 14 VES the second, third
&/or fourth layer is expected to be fractured in nature along with inter laying massive formation.
The resistivity of this formation in general varies in the range of 120-850 ohm.m. Some of the
graph on apparent resistivity vs AB/2 is shown in Fig.3.21a and b.
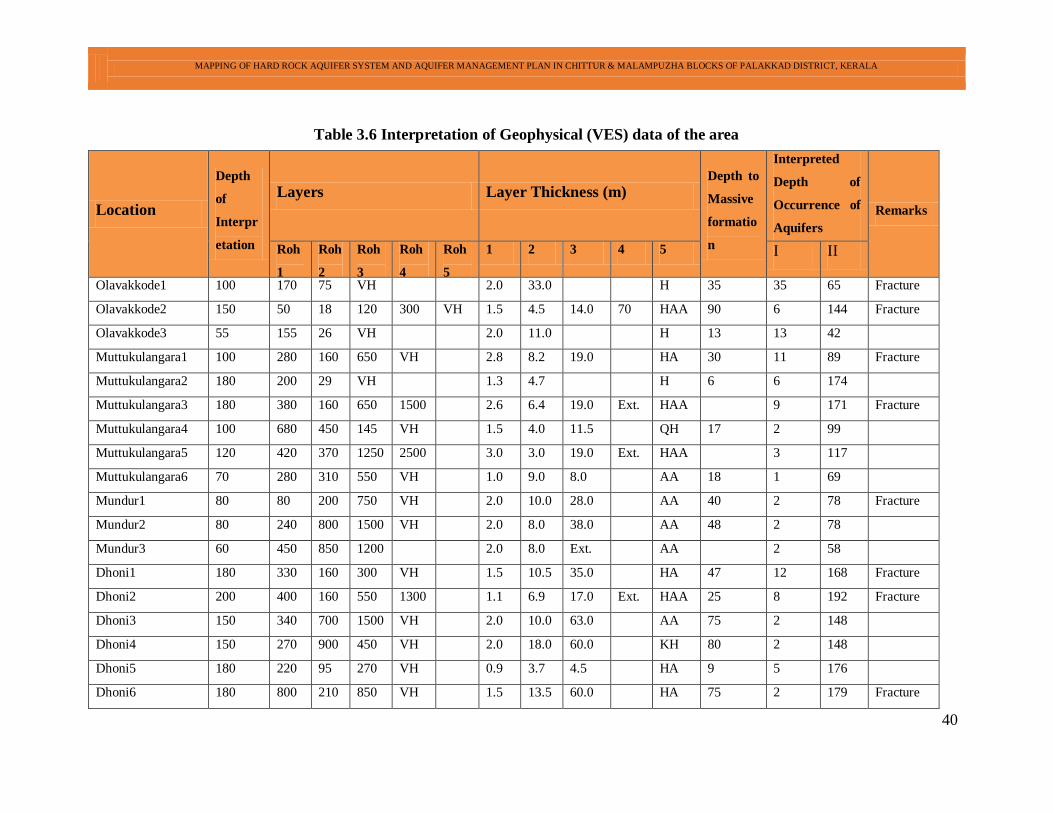
MAPPING OF HARD ROCK AQUIFER SYSTEM AND AQUIFER MANAGEMENT PLAN IN CHITTUR & MALAMPUZHA BLOCKS OF PALAKKAD DISTRICT, KERALA
40
Table 3.6 Interpretation of Geophysical (VES) data of the area
Location
Depth
of
Interpr
etation
Layers Layer Thickness (m) Depth to
Massive
formatio
n
Interpreted
Depth of
Occurrence of
Aquifers
Identified
Remarks
Roh
1
Roh
2
Roh
3
Roh
4
Roh
5
1 2 3 4 5 I II
Olavakkode1 100 170 75 VH 2.0 33.0 H 35 35 65 Fracture
Olavakkode2 150 50 18 120 300 VH 1.5 4.5 14.0 70 HAA 90 6 144 Fracture
Olavakkode3 55 155 26 VH 2.0 11.0 H 13 13 42
Muttukulangara1 100 280 160 650 VH 2.8 8.2 19.0 HA 30 11 89 Fracture
Muttukulangara2 180 200 29 VH 1.3 4.7 H 6 6 174
Muttukulangara3 180 380 160 650 1500 2.6 6.4 19.0 Ext. HAA 9 171 Fracture
Muttukulangara4 100 680 450 145 VH 1.5 4.0 11.5 QH 17 2 99
Muttukulangara5 120 420 370 1250 2500 3.0 3.0 19.0 Ext. HAA 3 117
Muttukulangara6 70 280 310 550 VH 1.0 9.0 8.0 AA 18 1 69
Mundur1 80 80 200 750 VH 2.0 10.0 28.0 AA 40 2 78 Fracture
Mundur2 80 240 800 1500 VH 2.0 8.0 38.0 AA 48 2 78
Mundur3 60 450 850 1200 2.0 8.0 Ext. AA 2 58
Dhoni1 180 330 160 300 VH 1.5 10.5 35.0 HA 47 12 168 Fracture
Dhoni2 200 400 160 550 1300 1.1 6.9 17.0 Ext. HAA 25 8 192 Fracture
Dhoni3 150 340 700 1500 VH 2.0 10.0 63.0 AA 75 2 148
Dhoni4 150 270 900 450 VH 2.0 18.0 60.0 KH 80 2 148
Dhoni5 180 220 95 270 VH 0.9 3.7 4.5 HA 9 5 176
Dhoni6 180 800 210 850 VH 1.5 13.5 60.0 HA 75 2 179 Fracture
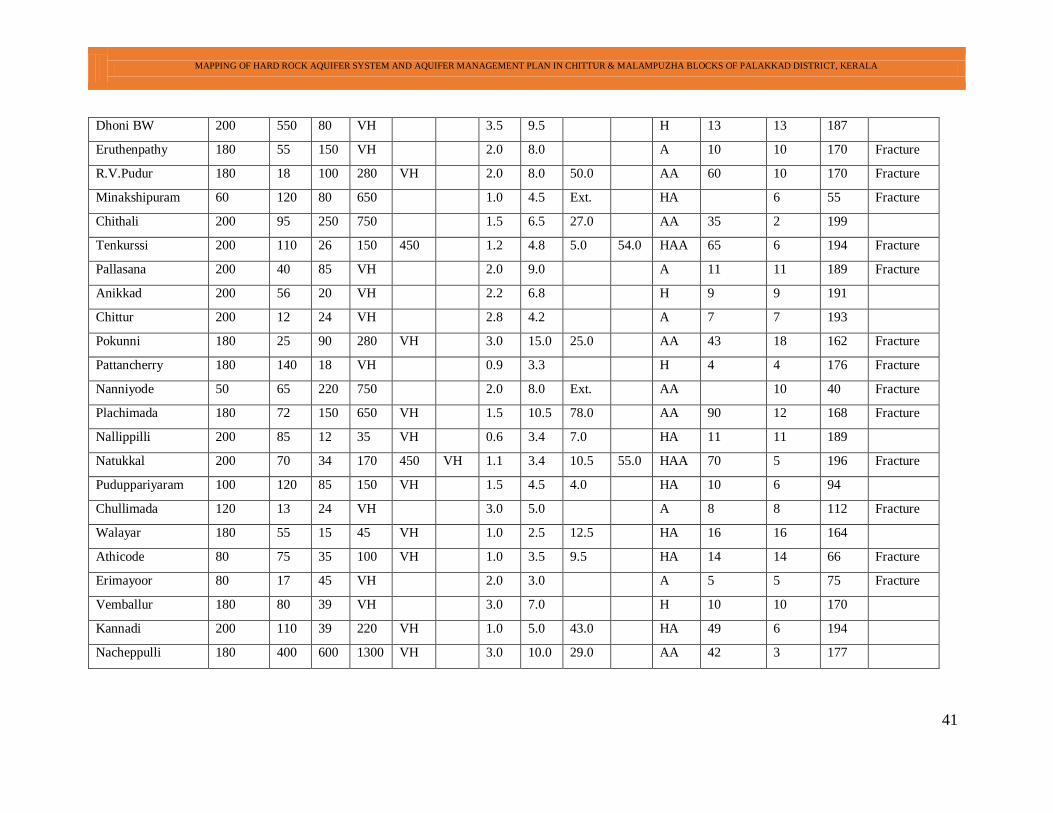
MAPPING OF HARD ROCK AQUIFER SYSTEM AND AQUIFER MANAGEMENT PLAN IN CHITTUR & MALAMPUZHA BLOCKS OF PALAKKAD DISTRICT, KERALA
41
Dhoni BW 200 550 80 VH 3.5 9.5 H 13 13 187
Eruthenpathy 180 55 150 VH 2.0 8.0 A 10 10 170 Fracture
R.V.Pudur 180 18 100 280 VH 2.0 8.0 50.0 AA 60 10 170 Fracture
Minakshipuram 60 120 80 650 1.0 4.5 Ext. HA 6 55 Fracture
Chithali 200 95 250 750 1.5 6.5 27.0 AA 35 2 199
Tenkurssi 200 110 26 150 450 1.2 4.8 5.0 54.0
0
HAA 65 6 194 Fracture
Pallasana 200 40 85 VH 2.0 9.0 A 11 11 189 Fracture
Anikkad 200 56 20 VH 2.2 6.8 H 9 9 191
Chittur 200 12 24 VH 2.8 4.2 A 7 7 193
Pokunni 180 25 90 280 VH 3.0 15.0 25.0 AA 43 18 162 Fracture
Pattancherry 180 140 18 VH 0.9 3.3 H 4 4 176 Fracture
Nanniyode 50 65 220 750 2.0 8.0 Ext. AA 10 40 Fracture
Plachimada 180 72 150 650 VH 1.5 10.5 78.0 AA 90 12 168 Fracture
Nallippilli 200 85 12 35 VH 0.6 3.4 7.0 HA 11 11 189
Natukkal 200 70 34 170 450 VH 1.1 3.4 10.5 55.0
0
HAA 70 5 196 Fracture
Puduppariyaram 100 120 85 150 VH 1.5 4.5 4.0 HA 10 6 94
Chullimada 120 13 24 VH 3.0 5.0 A 8 8 112 Fracture
Walayar 180 55 15 45 VH 1.0 2.5 12.5 HA 16 16 164
Athicode 80 75 35 100 VH 1.0 3.5 9.5 HA 14 14 66 Fracture
Erimayoor 80 17 45 VH 2.0 3.0 A 5 5 75 Fracture
Vemballur 180 80 39 VH 3.0 7.0 H 10 10 170
Kannadi 200 110 39 220 VH 1.0 5.0 43.0 HA 49 6 194
Nacheppulli 180 400 600 1300 VH 3.0 10.0 29.0 AA 42 3 177
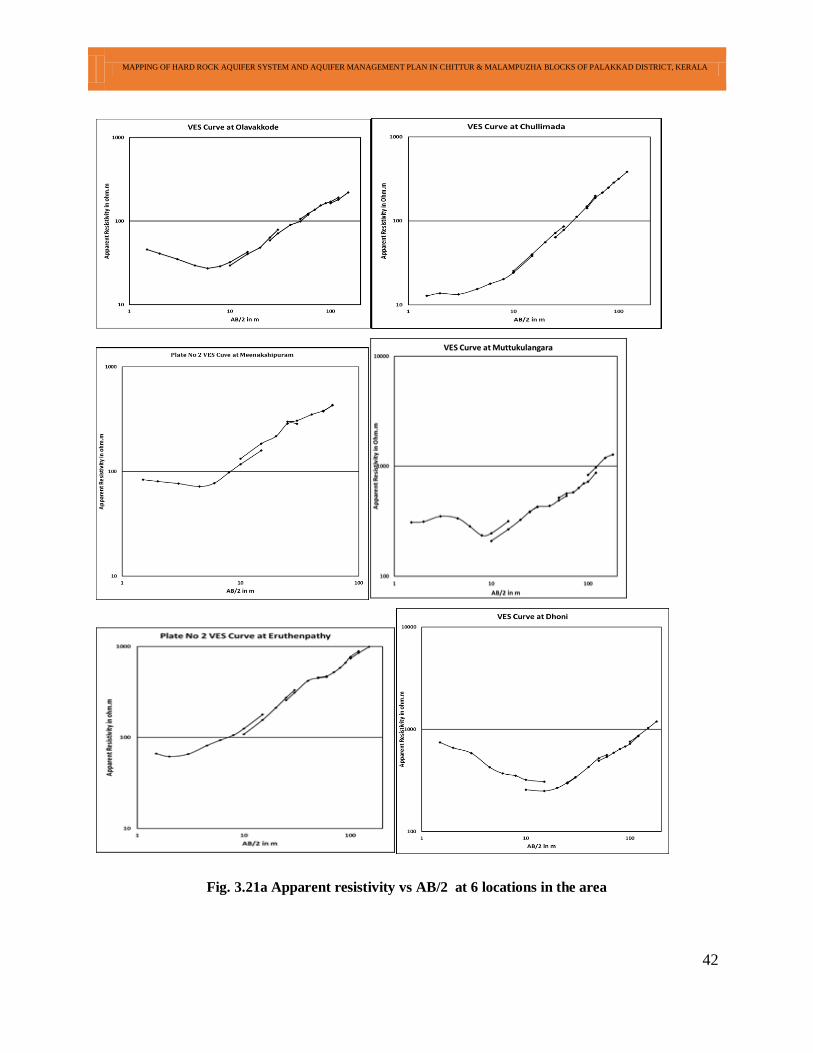
MAPPING OF HARD ROCK AQUIFER SYSTEM AND AQUIFER MANAGEMENT PLAN IN CHITTUR & MALAMPUZHA BLOCKS OF PALAKKAD DISTRICT, KERALA
42
Fig. 3.21a Apparent resistivity vs AB/2 at 6 locations in the area
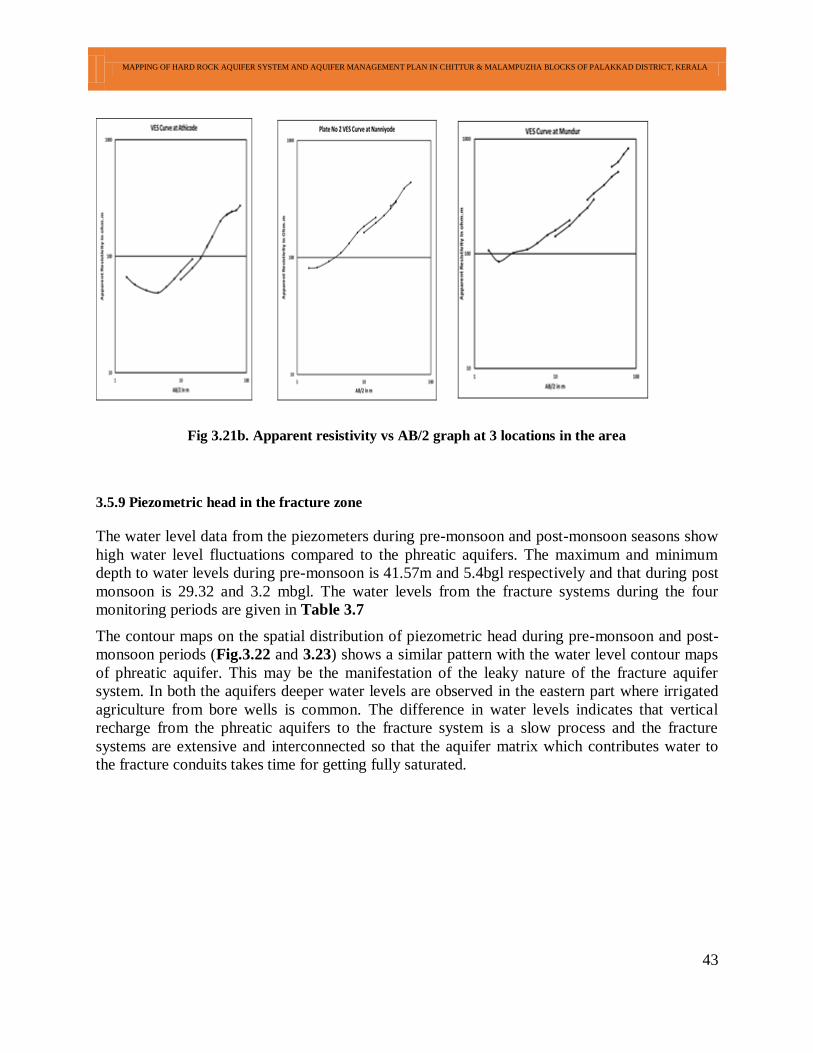
MAPPING OF HARD ROCK AQUIFER SYSTEM AND AQUIFER MANAGEMENT PLAN IN CHITTUR & MALAMPUZHA BLOCKS OF PALAKKAD DISTRICT, KERALA
43
Fig 3.21b. Apparent resistivity vs AB/2 graph at 3 locations in the area
3.5.9 Piezometric head in the fracture zone
The water level data from the piezometers during pre-monsoon and post-monsoon seasons show
high water level fluctuations compared to the phreatic aquifers. The maximum and minimum
depth to water levels during pre-monsoon is 41.57m and 5.4bgl respectively and that during post
monsoon is 29.32 and 3.2 mbgl. The water levels from the fracture systems during the four
monitoring periods are given in Table 3.7
The contour maps on the spatial distribution of piezometric head during pre-monsoon and post-
monsoon periods (Fig.3.22 and 3.23) shows a similar pattern with the water level contour maps
of phreatic aquifer. This may be the manifestation of the leaky nature of the fracture aquifer
system. In both the aquifers deeper water levels are observed in the eastern part where irrigated
agriculture from bore wells is common. The difference in water levels indicates that vertical
recharge from the phreatic aquifers to the fracture system is a slow process and the fracture
systems are extensive and interconnected so that the aquifer matrix which contributes water to
the fracture conduits takes time for getting fully saturated.
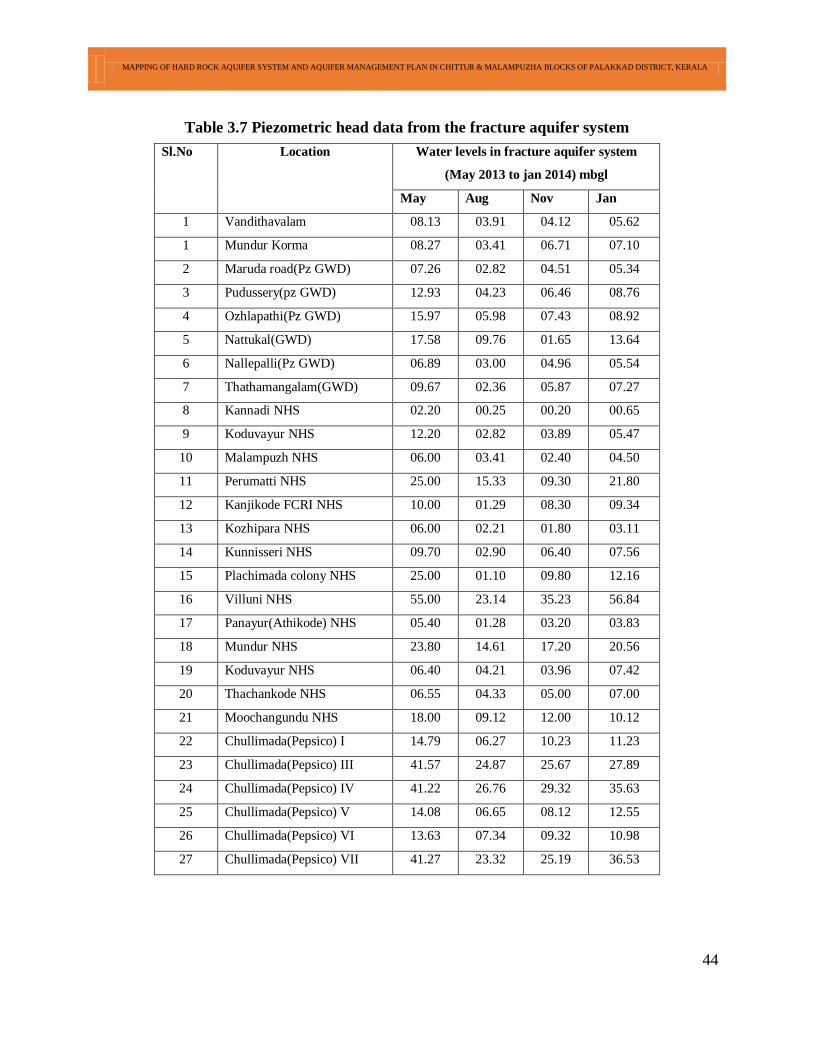
MAPPING OF HARD ROCK AQUIFER SYSTEM AND AQUIFER MANAGEMENT PLAN IN CHITTUR & MALAMPUZHA BLOCKS OF PALAKKAD DISTRICT, KERALA
44
Table 3.7 Piezometric head data from the fracture aquifer system
Sl.No Location Water levels in fracture aquifer system
(May 2013 to jan 2014) mbgl
May Aug Nov Jan
1 Vandithavalam 08.13 03.91 04.12 05.62
1 Mundur Korma 08.27 03.41 06.71 07.10
2 Maruda road(Pz GWD) 07.26 02.82 04.51 05.34
3 Pudussery(pz GWD) 12.93 04.23 06.46 08.76
4 Ozhlapathi(Pz GWD) 15.97 05.98 07.43 08.92
5 Nattukal(GWD) 17.58 09.76 01.65 13.64
6 Nallepalli(Pz GWD) 06.89 03.00 04.96 05.54
7 Thathamangalam(GWD) 09.67 02.36 05.87 07.27
8 Kannadi NHS 02.20 00.25 00.20 00.65
9 Koduvayur NHS 12.20 02.82 03.89 05.47
10 Malampuzh NHS 06.00 03.41 02.40 04.50
11 Perumatti NHS 25.00 15.33 09.30 21.80
12 Kanjikode FCRI NHS 10.00 01.29 08.30 09.34
13 Kozhipara NHS 06.00 02.21 01.80 03.11
14 Kunnisseri NHS 09.70 02.90 06.40 07.56
15 Plachimada colony NHS 25.00 01.10 09.80 12.16
16 Villuni NHS 55.00 23.14 35.23 56.84
17 Panayur(Athikode) NHS 05.40 01.28 03.20 03.83
18 Mundur NHS 23.80 14.61 17.20 20.56
19 Koduvayur NHS 06.40 04.21 03.96 07.42
20 Thachankode NHS 06.55 04.33 05.00 07.00
21 Moochangundu NHS 18.00 09.12 12.00 10.12
22 Chullimada(Pepsico) I 14.79 06.27 10.23 11.23
23 Chullimada(Pepsico) III 41.57 24.87 25.67 27.89
24 Chullimada(Pepsico) IV 41.22 26.76 29.32 35.63
25 Chullimada(Pepsico) V 14.08 06.65 08.12 12.55
26 Chullimada(Pepsico) VI 13.63 07.34 09.32 10.98
27 Chullimada(Pepsico) VII 41.27 23.32 25.19 36.53
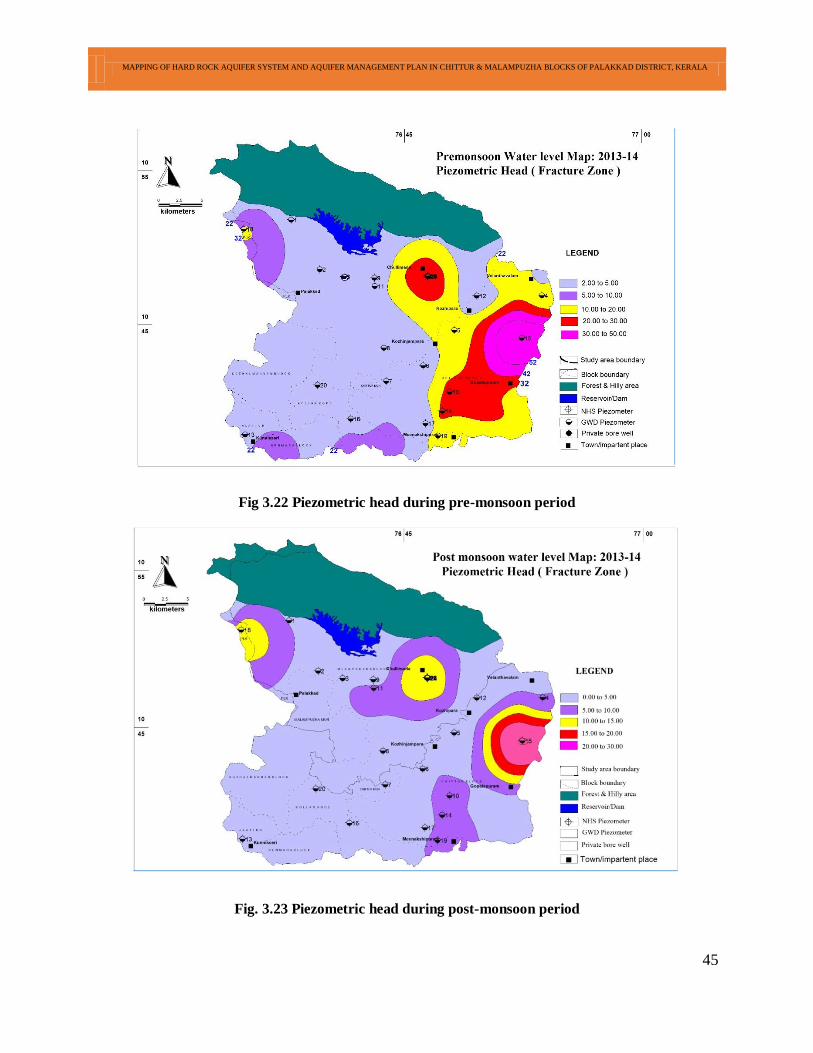
MAPPING OF HARD ROCK AQUIFER SYSTEM AND AQUIFER MANAGEMENT PLAN IN CHITTUR & MALAMPUZHA BLOCKS OF PALAKKAD DISTRICT, KERALA
45
Fig 3.22 Piezometric head during pre-monsoon period
Fig. 3.23 Piezometric head during post-monsoon period
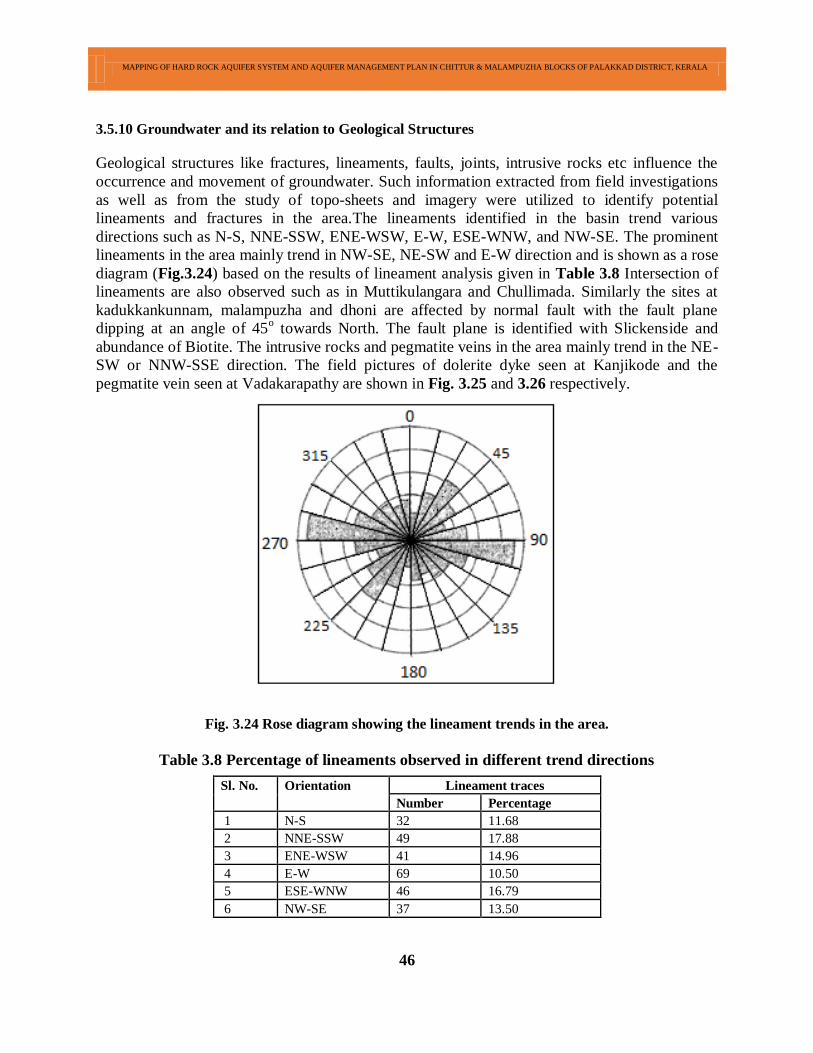
MAPPING OF HARD ROCK AQUIFER SYSTEM AND AQUIFER MANAGEMENT PLAN IN CHITTUR & MALAMPUZHA BLOCKS OF PALAKKAD DISTRICT, KERALA
46
3.5.10 Groundwater and its relation to Geological Structures
Geological structures like fractures, lineaments, faults, joints, intrusive rocks etc influence the
occurrence and movement of groundwater. Such information extracted from field investigations
as well as from the study of topo-sheets and imagery were utilized to identify potential
lineaments and fractures in the area.The lineaments identified in the basin trend various
directions such as N-S, NNE-SSW, ENE-WSW, E-W, ESE-WNW, and NW-SE. The prominent
lineaments in the area mainly trend in NW-SE, NE-SW and E-W direction and is shown as a rose
diagram (Fig.3.24) based on the results of lineament analysis given in Table 3.8 Intersection of
lineaments are also observed such as in Muttikulangara and Chullimada. Similarly the sites at
kadukkankunnam, malampuzha and dhoni are affected by normal fault with the fault plane
dipping at an angle of 45o towards North. The fault plane is identified with Slickenside and
abundance of Biotite. The intrusive rocks and pegmatite veins in the area mainly trend in the NE-
SW or NNW-SSE direction. The field pictures of dolerite dyke seen at Kanjikode and the
pegmatite vein seen at Vadakarapathy are shown in Fig. 3.25 and 3.26 respectively.
Fig. 3.24 Rose diagram showing the lineament trends in the area.
Table 3.8 Percentage of lineaments observed in different trend directions
Sl. No. Orientation Lineament traces
Number Percentage
1 N-S 32 11.68
2 NNE-SSW 49 17.88
3 ENE-WSW 41 14.96
4 E-W 69 10.50
5 ESE-WNW 46 16.79
6 NW-SE 37 13.50
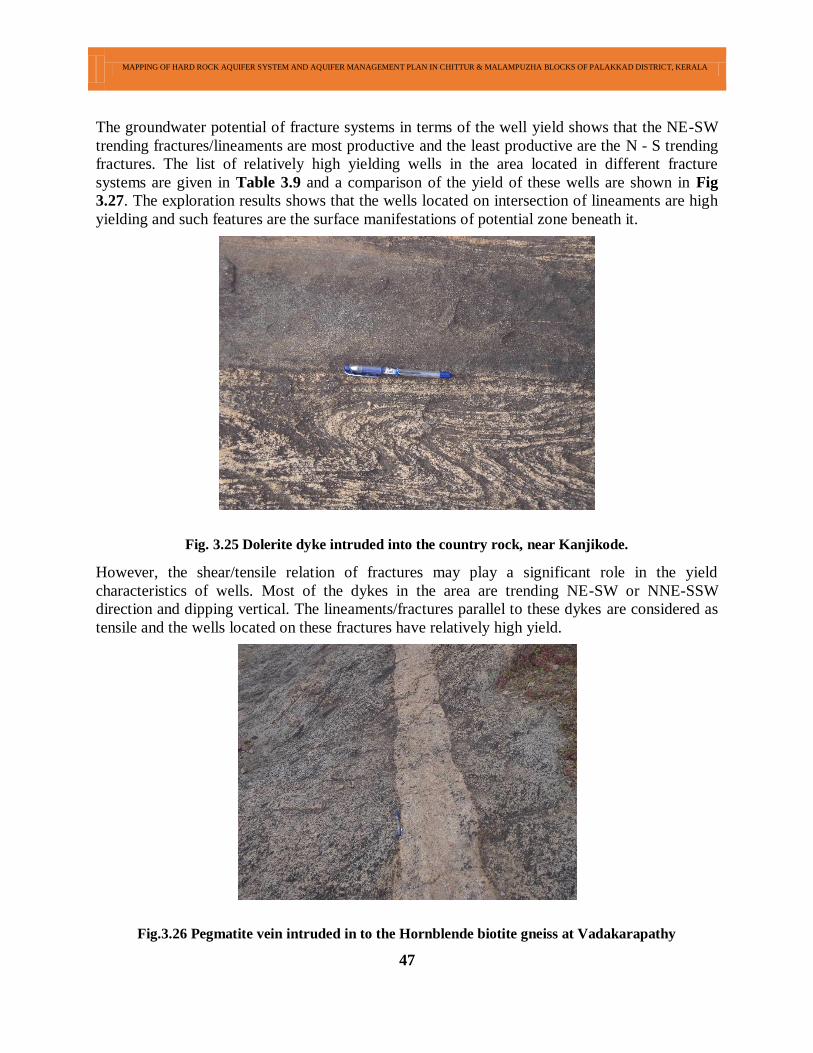
MAPPING OF HARD ROCK AQUIFER SYSTEM AND AQUIFER MANAGEMENT PLAN IN CHITTUR & MALAMPUZHA BLOCKS OF PALAKKAD DISTRICT, KERALA
47
The groundwater potential of fracture systems in terms of the well yield shows that the NE-SW
trending fractures/lineaments are most productive and the least productive are the N - S trending
fractures. The list of relatively high yielding wells in the area located in different fracture
systems are given in Table 3.9 and a comparison of the yield of these wells are shown in Fig
3.27. The exploration results shows that the wells located on intersection of lineaments are high
yielding and such features are the surface manifestations of potential zone beneath it.
Fig. 3.25 Dolerite dyke intruded into the country rock, near Kanjikode.
However, the shear/tensile relation of fractures may play a significant role in the yield
characteristics of wells. Most of the dykes in the area are trending NE-SW or NNE-SSW
direction and dipping vertical. The lineaments/fractures parallel to these dykes are considered as
tensile and the wells located on these fractures have relatively high yield.
Fig.3.26 Pegmatite vein intruded in to the Hornblende biotite gneiss at Vadakarapathy
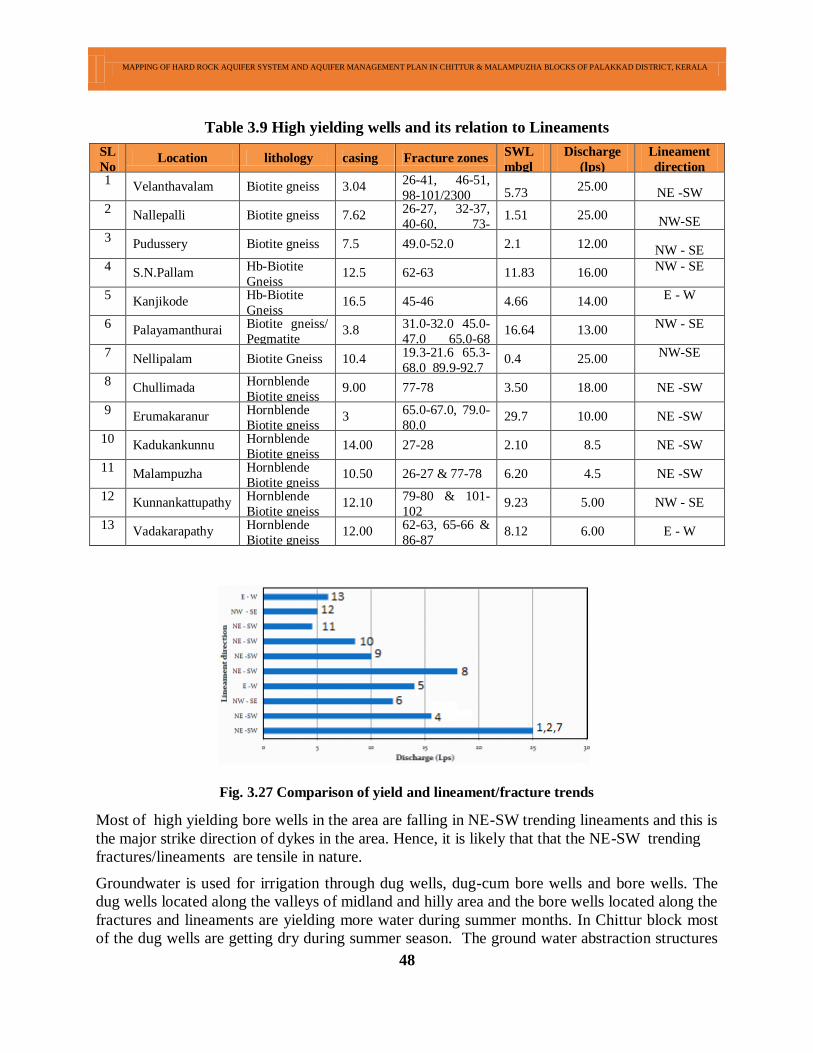
MAPPING OF HARD ROCK AQUIFER SYSTEM AND AQUIFER MANAGEMENT PLAN IN CHITTUR & MALAMPUZHA BLOCKS OF PALAKKAD DISTRICT, KERALA
48
Table 3.9 High yielding wells and its relation to Lineaments
SL
No Location lithology casing Fracture zones
SWL
mbgl
Discharge
(lps)
Lineament
direction 1
Velanthavalam Biotite gneiss 3.04 26-41, 46-51,
98-101/2300 5.73 25.00
NE -SW
2 Nallepalli Biotite gneiss 7.62
26-27, 32-37,
40-60, 73-
90/1500
1.51 25.00 NW-SE
3 Pudussery Biotite gneiss 7.5 49.0-52.0 2.1 12.00
NW - SE
4 S.N.Pallam
Hb-Biotite
Gneiss 12.5 62-63 11.83 16.00
NW - SE
5 Kanjikode
Hb-Biotite
Gneiss 16.5 45-46 4.66 14.00
E - W
6 Palayamanthurai
Biotite gneiss/
Pegmatite 3.8
31.0-32.0 45.0-
47.0 65.0-68
84.0-86.5
16.64 13.00 NW - SE
7 Nellipalam Biotite Gneiss 10.4
19.3-21.6 65.3-
68.0 89.9-92.7 0.4 25.00
NW-SE
8 Chullimada
Hornblende
Biotite gneiss 9.00 77-78 3.50 18.00 NE -SW
9 Erumakaranur
Hornblende
Biotite gneiss 3
65.0-67.0, 79.0-
80.0 29.7 10.00 NE -SW
10 Kadukankunnu
Hornblende
Biotite gneiss 14.00 27-28 2.10 8.5 NE -SW
11 Malampuzha
Hornblende
Biotite gneiss 10.50 26-27 & 77-78 6.20 4.5 NE -SW
12 Kunnankattupathy
Hornblende
Biotite gneiss 12.10
79-80 & 101-
102 9.23 5.00 NW - SE
13 Vadakarapathy
Hornblende
Biotite gneiss 12.00
62-63, 65-66 &
86-87 8.12 6.00 E - W
Fig. 3.27 Comparison of yield and lineament/fracture trends
Most of high yielding bore wells in the area are falling in NE-SW trending lineaments and this is
the major strike direction of dykes in the area. Hence, it is likely that that the NE-SW trending
fractures/lineaments are tensile in nature.
Groundwater is used for irrigation through dug wells, dug-cum bore wells and bore wells. The
dug wells located along the valleys of midland and hilly area and the bore wells located along the
fractures and lineaments are yielding more water during summer months. In Chittur block most
of the dug wells are getting dry during summer season. The ground water abstraction structures
MAPPING OF HARD ROCK AQUIFER SYSTEM AND AQUIFER MANAGEMENT PLAN IN CHITTUR & MALAMPUZHA BLOCKS OF PALAKKAD DISTRICT, KERALA
49
like Public tanks, ponds, bore wells and dug wells constructed in Malampuzha and Chittur
blocks.
3.5.11 Aquifer characteristics
The hydraulic properties of fracture systems are evaluated from pumping tests and the results of
which are given in Appendix-2. The Transmissivity value varies from 5.273 to 166.13 m2/day
and the Storativity values varies from 0.00011 to 0.00099. The aquifer characteristics ofthe
newly constructed 29 exploratory wells are given in Table 3.10.
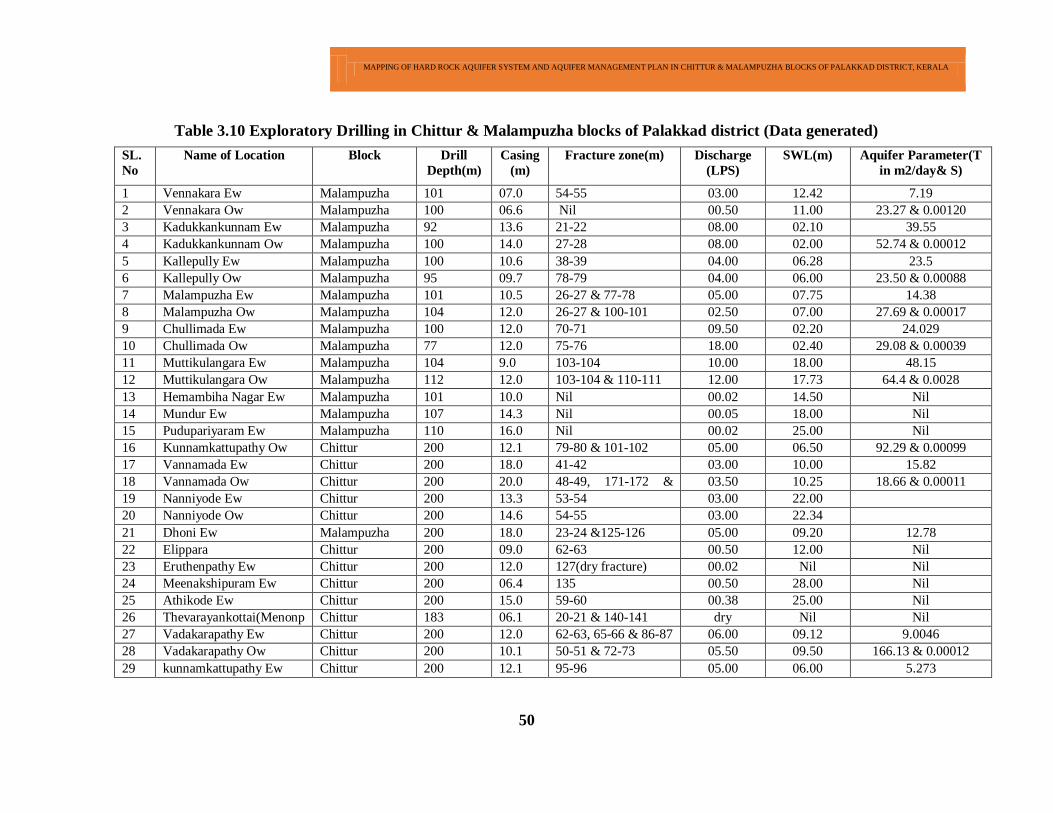
MAPPING OF HARD ROCK AQUIFER SYSTEM AND AQUIFER MANAGEMENT PLAN IN CHITTUR & MALAMPUZHA BLOCKS OF PALAKKAD DISTRICT, KERALA
50
Table 3.10 Exploratory Drilling in Chittur & Malampuzha blocks of Palakkad district (Data generated)
SL.
No
Name of Location Block Drill
Depth(m)
Casing
(m)
Fracture zone(m) Discharge
(LPS)
SWL(m) Aquifer Parameter(T
in m2/day& S)
1 Vennakara Ew Malampuzha 101 07.0 54-55 03.00 12.42 7.19
2 Vennakara Ow Malampuzha 100 06.6 Nil 00.50 11.00 23.27 & 0.00120
3 Kadukkankunnam Ew Malampuzha 92 13.6 21-22 08.00 02.10 39.55
4 Kadukkankunnam Ow Malampuzha 100 14.0 27-28 08.00 02.00 52.74 & 0.00012
5 Kallepully Ew Malampuzha 100 10.6 38-39 04.00 06.28 23.5
6 Kallepully Ow Malampuzha 95 09.7 78-79 04.00 06.00 23.50 & 0.00088
7 Malampuzha Ew Malampuzha 101 10.5 26-27 & 77-78 05.00 07.75 14.38
8 Malampuzha Ow Malampuzha 104 12.0 26-27 & 100-101 02.50 07.00 27.69 & 0.00017
9 Chullimada Ew Malampuzha 100 12.0 70-71 09.50 02.20 24.029
10 Chullimada Ow Malampuzha 77 12.0 75-76 18.00 02.40 29.08 & 0.00039
11 Muttikulangara Ew Malampuzha 104 9.0 103-104 10.00 18.00 48.15
12 Muttikulangara Ow Malampuzha 112 12.0 103-104 & 110-111 12.00 17.73 64.4 & 0.0028
13 Hemambiha Nagar Ew Malampuzha 101 10.0 Nil 00.02 14.50 Nil
14 Mundur Ew Malampuzha 107 14.3 Nil 00.05 18.00 Nil
15 Pudupariyaram Ew Malampuzha 110 16.0 Nil 00.02 25.00 Nil
16 Kunnamkattupathy Ow Chittur 200 12.1 79-80 & 101-102 05.00 06.50 92.29 & 0.00099
17 Vannamada Ew Chittur 200 18.0 41-42 03.00 10.00 15.82
18 Vannamada Ow Chittur 200 20.0 48-49, 171-172 &
191-192
03.50 10.25 18.66 & 0.00011
19 Nanniyode Ew Chittur 200 13.3 53-54 03.00 22.00
20 Nanniyode Ow Chittur 200 14.6 54-55 03.00 22.34
21 Dhoni Ew Malampuzha 200 18.0 23-24 &125-126 05.00 09.20 12.78
22 Elippara
Ew
Chittur 200 09.0 62-63 00.50 12.00 Nil
23 Eruthenpathy Ew Chittur 200 12.0 127(dry fracture) 00.02 Nil Nil
24 Meenakshipuram Ew Chittur 200 06.4 135 00.50 28.00 Nil
25 Athikode Ew Chittur 200 15.0 59-60 00.38 25.00 Nil
26 Thevarayankottai(Menonp
ara)
Chittur 183 06.1 20-21 & 140-141 dry Nil Nil
27 Vadakarapathy Ew Chittur 200 12.0 62-63, 65-66 & 86-87 06.00 09.12 9.0046
28 Vadakarapathy Ow Chittur 200 10.1 50-51 & 72-73 05.50 09.50 166.13 & 0.00012
29 kunnamkattupathy Ew Chittur 200 12.1 95-96 05.00 06.00 5.273
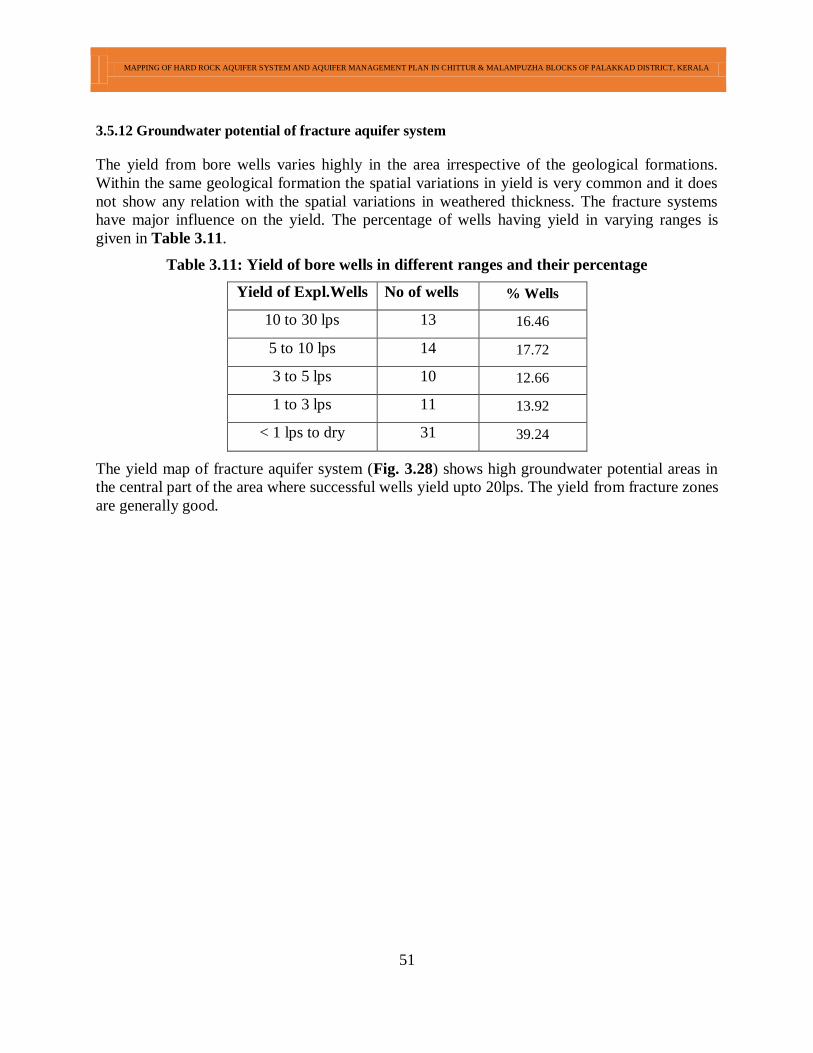
MAPPING OF HARD ROCK AQUIFER SYSTEM AND AQUIFER MANAGEMENT PLAN IN CHITTUR & MALAMPUZHA BLOCKS OF PALAKKAD DISTRICT, KERALA
51
3.5.12 Groundwater potential of fracture aquifer system
The yield from bore wells varies highly in the area irrespective of the geological formations.
Within the same geological formation the spatial variations in yield is very common and it does
not show any relation with the spatial variations in weathered thickness. The fracture systems
have major influence on the yield. The percentage of wells having yield in varying ranges is
given in Table 3.11.
Table 3.11: Yield of bore wells in different ranges and their percentage
Yield of Expl.Wells No of wells % Wells
10 to 30 lps 13 16.46
5 to 10 lps 14 17.72
3 to 5 lps 10 12.66
1 to 3 lps 11 13.92
< 1 lps to dry 31 39.24
The yield map of fracture aquifer system (Fig. 3.28) shows high groundwater potential areas in
the central part of the area where successful wells yield upto 20lps. The yield from fracture zones
are generally good.
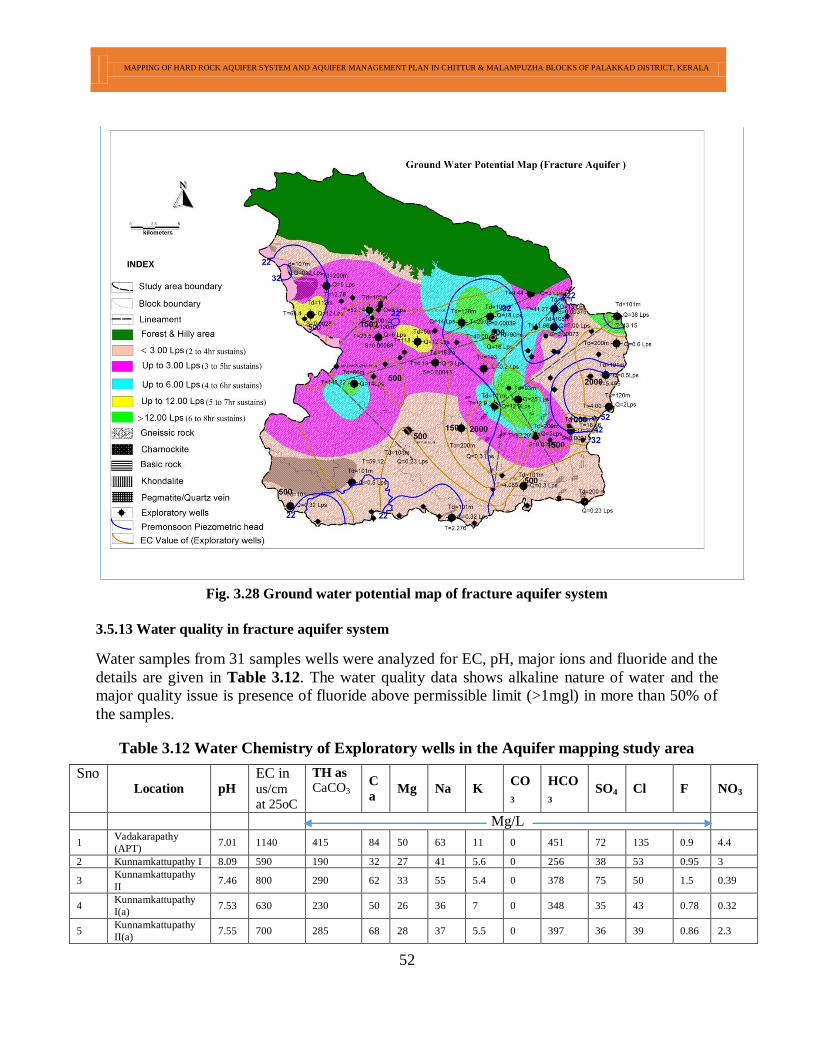
MAPPING OF HARD ROCK AQUIFER SYSTEM AND AQUIFER MANAGEMENT PLAN IN CHITTUR & MALAMPUZHA BLOCKS OF PALAKKAD DISTRICT, KERALA
52
Fig. 3.28 Ground water potential map of fracture aquifer system
3.5.13 Water quality in fracture aquifer system
Water samples from 31 samples wells were analyzed for EC, pH, major ions and fluoride and the
details are given in Table 3.12. The water quality data shows alkaline nature of water and the
major quality issue is presence of fluoride above permissible limit (>1mgl) in more than 50% of
the samples.
Table 3.12 Water Chemistry of Exploratory wells in the Aquifer mapping study area
Sno Location pH
EC in us/cm
at 25oC
TH as
CaCO3 C
a Mg Na K
CO
3
HCO
3 SO4 Cl F NO3
Mg/L
1 Vadakarapathy
(APT) 7.01 1140 415 84 50 63 11 0 451 72 135 0.9 4.4
2 Kunnamkattupathy I 8.09 590 190 32 27 41 5.6 0 256 38 53 0.95 3
3 Kunnamkattupathy
II 7.46 800 290 62 33 55 5.4 0 378 75 50 1.5 0.39
4 Kunnamkattupathy
I(a) 7.53 630 230 50 26 36 7 0 348 35 43 0.78 0.32
5 Kunnamkattupathy
II(a) 7.55 700 285 68 28 37 5.5 0 397 36 39 0.86 2.3
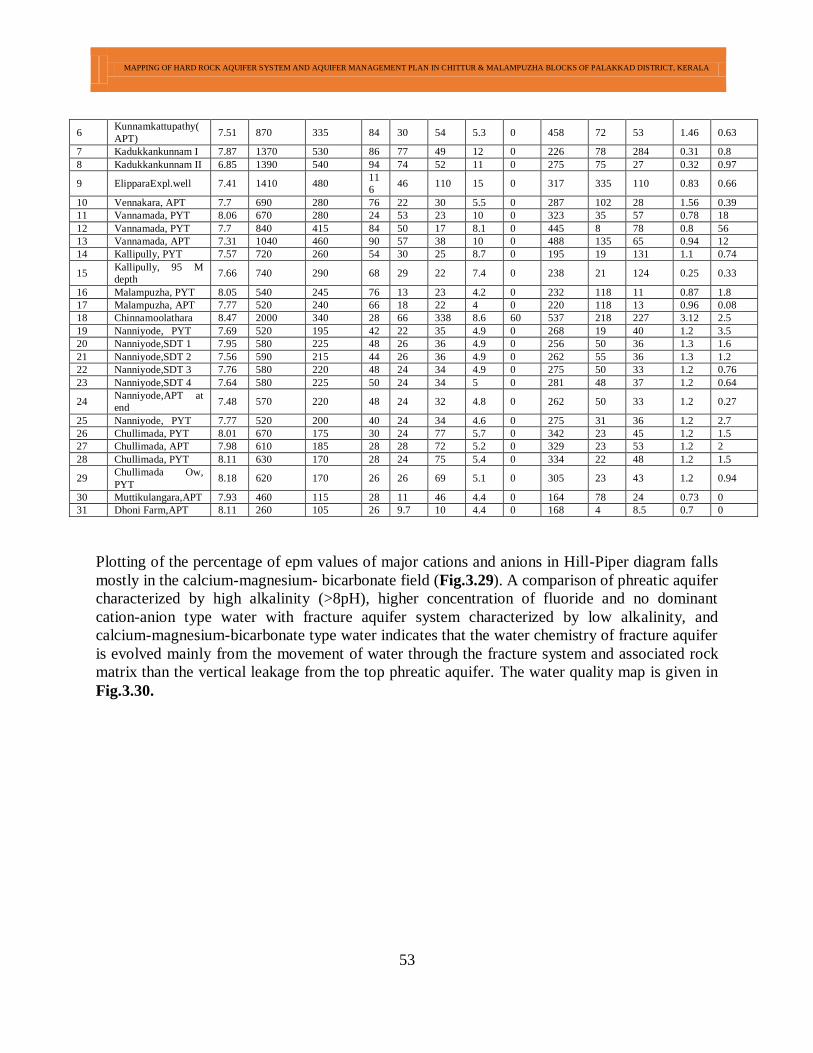
MAPPING OF HARD ROCK AQUIFER SYSTEM AND AQUIFER MANAGEMENT PLAN IN CHITTUR & MALAMPUZHA BLOCKS OF PALAKKAD DISTRICT, KERALA
53
6 Kunnamkattupathy(
APT) 7.51 870 335 84 30 54 5.3 0 458 72 53 1.46 0.63
7 Kadukkankunnam I 7.87 1370 530 86 77 49 12 0 226 78 284 0.31 0.8
8 Kadukkankunnam II 6.85 1390 540 94 74 52 11 0 275 75 27 0.32 0.97
9 ElipparaExpl.well 7.41 1410 480 11
6 46 110 15 0 317 335 110 0.83 0.66
10 Vennakara, APT 7.7 690 280 76 22 30 5.5 0 287 102 28 1.56 0.39
11 Vannamada, PYT 8.06 670 280 24 53 23 10 0 323 35 57 0.78 18
12 Vannamada, PYT 7.7 840 415 84 50 17 8.1 0 445 8 78 0.8 56
13 Vannamada, APT 7.31 1040 460 90 57 38 10 0 488 135 65 0.94 12
14 Kallipully, PYT 7.57 720 260 54 30 25 8.7 0 195 19 131 1.1 0.74
15 Kallipully, 95 M
depth 7.66 740 290 68 29 22 7.4 0 238 21 124 0.25 0.33
16 Malampuzha, PYT 8.05 540 245 76 13 23 4.2 0 232 118 11 0.87 1.8
17 Malampuzha, APT 7.77 520 240 66 18 22 4 0 220 118 13 0.96 0.08
18 Chinnamoolathara 8.47 2000 340 28 66 338 8.6 60 537 218 227 3.12 2.5
19 Nanniyode, PYT 7.69 520 195 42 22 35 4.9 0 268 19 40 1.2 3.5
20 Nanniyode,SDT 1 7.95 580 225 48 26 36 4.9 0 256 50 36 1.3 1.6
21 Nanniyode,SDT 2 7.56 590 215 44 26 36 4.9 0 262 55 36 1.3 1.2
22 Nanniyode,SDT 3 7.76 580 220 48 24 34 4.9 0 275 50 33 1.2 0.76
23 Nanniyode,SDT 4 7.64 580 225 50 24 34 5 0 281 48 37 1.2 0.64
24 Nanniyode,APT at
end 7.48 570 220 48 24 32 4.8 0 262 50 33 1.2 0.27
25 Nanniyode, PYT 7.77 520 200 40 24 34 4.6 0 275 31 36 1.2 2.7
26 Chullimada, PYT 8.01 670 175 30 24 77 5.7 0 342 23 45 1.2 1.5
27 Chullimada, APT 7.98 610 185 28 28 72 5.2 0 329 23 53 1.2 2
28 Chullimada, PYT 8.11 630 170 28 24 75 5.4 0 334 22 48 1.2 1.5
29 Chullimada Ow,
PYT 8.18 620 170 26 26 69 5.1 0 305 23 43 1.2 0.94
30 Muttikulangara,APT 7.93 460 115 28 11 46 4.4 0 164 78 24 0.73 0
31 Dhoni Farm,APT 8.11 260 105 26 9.7 10 4.4 0 168 4 8.5 0.7 0
Plotting of the percentage of epm values of major cations and anions in Hill-Piper diagram falls
mostly in the calcium-magnesium- bicarbonate field (Fig.3.29). A comparison of phreatic aquifer
characterized by high alkalinity (>8pH), higher concentration of fluoride and no dominant
cation-anion type water with fracture aquifer system characterized by low alkalinity, and
calcium-magnesium-bicarbonate type water indicates that the water chemistry of fracture aquifer
is evolved mainly from the movement of water through the fracture system and associated rock
matrix than the vertical leakage from the top phreatic aquifer. The water quality map is given in
Fig.3.30.
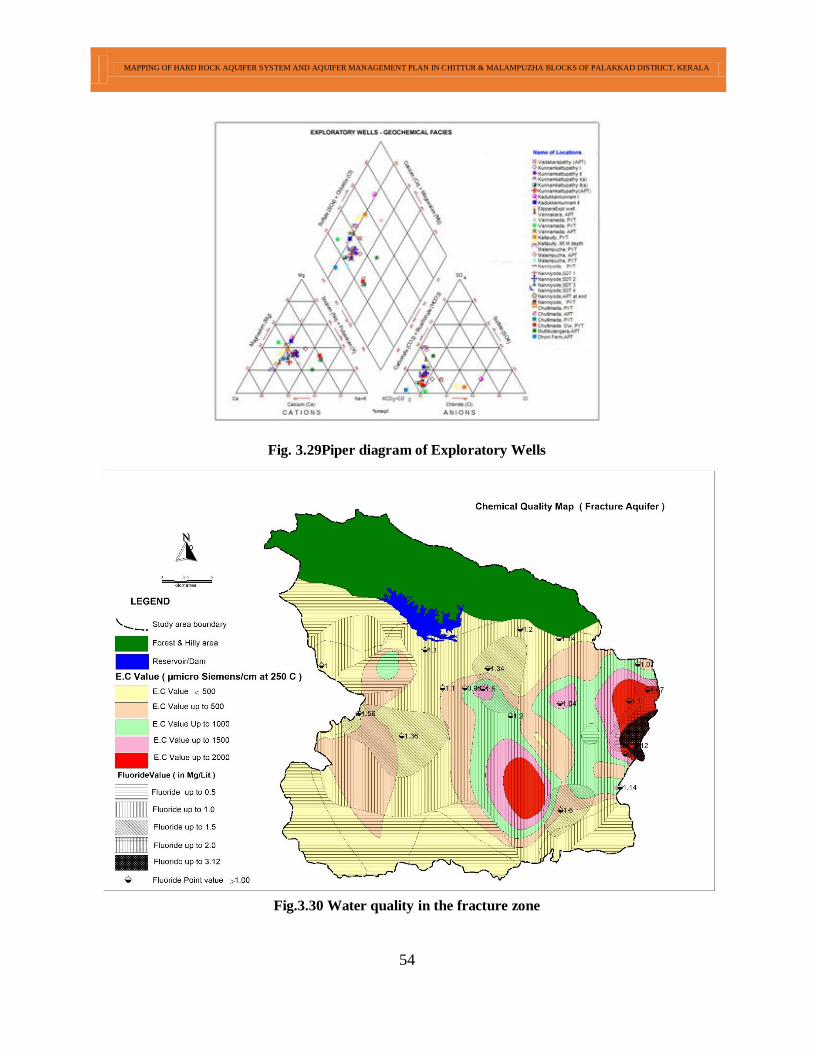
MAPPING OF HARD ROCK AQUIFER SYSTEM AND AQUIFER MANAGEMENT PLAN IN CHITTUR & MALAMPUZHA BLOCKS OF PALAKKAD DISTRICT, KERALA
54
Fig. 3.29Piper diagram of Exploratory Wells
Fig.3.30 Water quality in the fracture zone
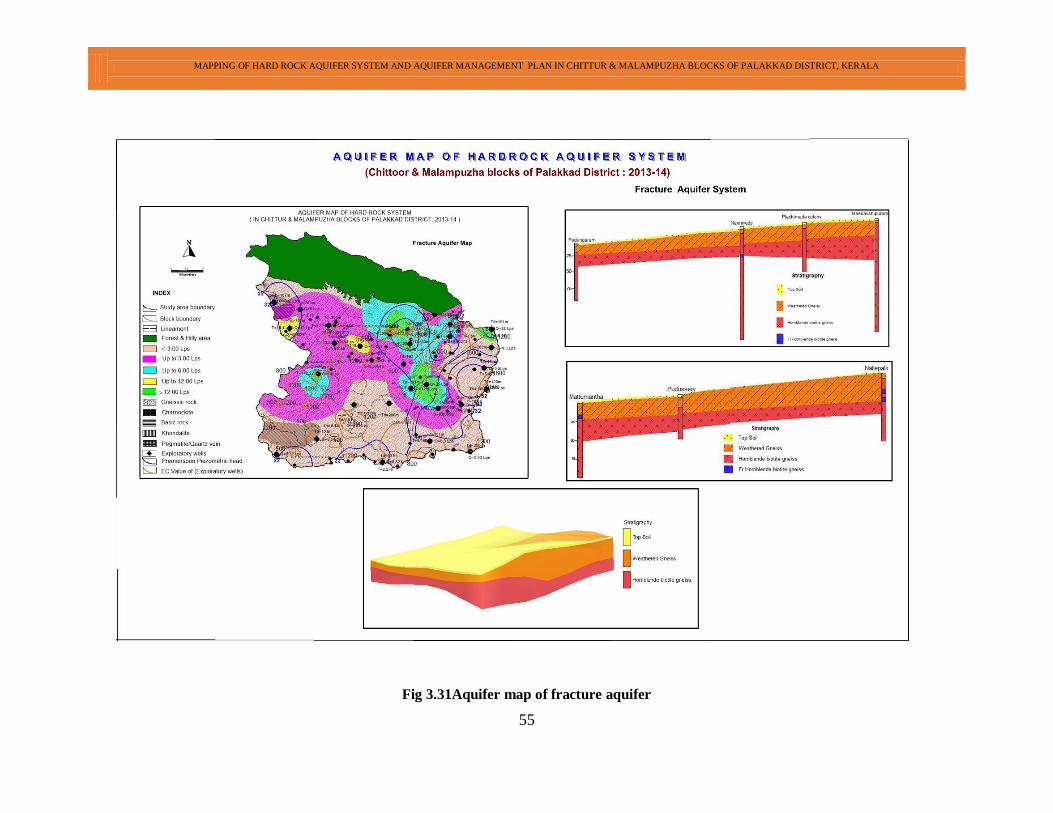
MAPPING OF HARD ROCK AQUIFER SYSTEM AND AQUIFER MANAGEMENT PLAN IN CHITTUR & MALAMPUZHA BLOCKS OF PALAKKAD DISTRICT, KERALA
55
Fig 3.31Aquifer map of fracture aquifer
MAPPING OF HARD ROCK AQUIFER SYSTEM AND AQUIFER MANAGEMENT PLAN IN CHITTUR & MALAMPUZHA BLOCKS OF PALAKKAD DISTRICT, KERALA
56
4. GROUNDWATER RESOURCES
4.1 Dynamic groundwater Resources in the weathered zone
Phreatic aquifers are major sources for irrigation and drinking water in the area. Groundwater
draft for irrigated agriculture in the area has been high and depletion in the resource is observed
over the years. Any decision about future utilizations depend on having a clear understanding of
the status of the resource, the amount that has already been extracted, the amount remaining, and
the impact of further depletion. The dynamic groundwater resources in the area are estimated
based on the methodology proposed by Groundwater Estimation Committee (GEC 1997
methodology).
In this study the area under command and non-command could not be separated mainly due to
non-availability of data pertaining to canal command areas of the State. Further, the irrigation
projects of Kerala are mostly planned for irrigating paddy along the topographic lows and as
such the irrigation canals are all centre controlled. Hence in each unit there are large areas along
the upstream side of the canal, which do not get benefits of surface water irrigation. Due to the
highly undulating topography of the mid land area where most of the canals exist, it is quite
difficult to accurately demarcate the areas under command and non-command. In view of the
factors mentioned above, the computations have been made by taking all assessment units as
non-canal command area. The recharge from canal segments and return seepage from irrigation
due to surface water in the command area have, however, been incorporated into the
computations.
The block wise groundwater resources in the area is estimated as per ground water estimation
methodology 1997. The stages of ground water development in Chittur is 100.9 % and is
categorised as over exploited and in Malampuzha block the stage of ground water development
is 92.27 and categorised as critical. Most of the rural water supply schemes use ground water as
the source, whereas the urban schemes depend on Surface water or both, rest of the population
(48 %) is depending on ground water. The block wise ground water resources estimated for the
area (Chittur & Malampuzha blocks and 9 panchayats of other 4 blocks) is given in Table 4.1.
Ground water Draft
Ground water draft in Chittur & Malampuzha blocks of Palakkad district is mainly for irrigation
and domestic uses. In view of the non-availability of data on the number of wells being used for
domestic purposes, the ground water draft for domestic uses has been computed block-wise on
the basis of 2011 population, projected to the year of assessment (2013). Domestic requirement
of water in the study area has been computed as the product of the population and the per-capita
water requirement (assumed as 150 L/day/person). The share of ground water in the requirement
has been computed as a percentage varying from 25 to 100%, arrived at on the basis of
availability of surface water sources for domestic water supply.The ground water draft has been
computed from the data on the block-wise number of irrigation wells collected by the State
Ground Water Dept., Government of Kerala. The ground water draft figures are arrived at by
multiplying the number of wells with the corresponding unit draft.
The Annual Ground Water Draft for all uses in the study area is 101.44 MCM.
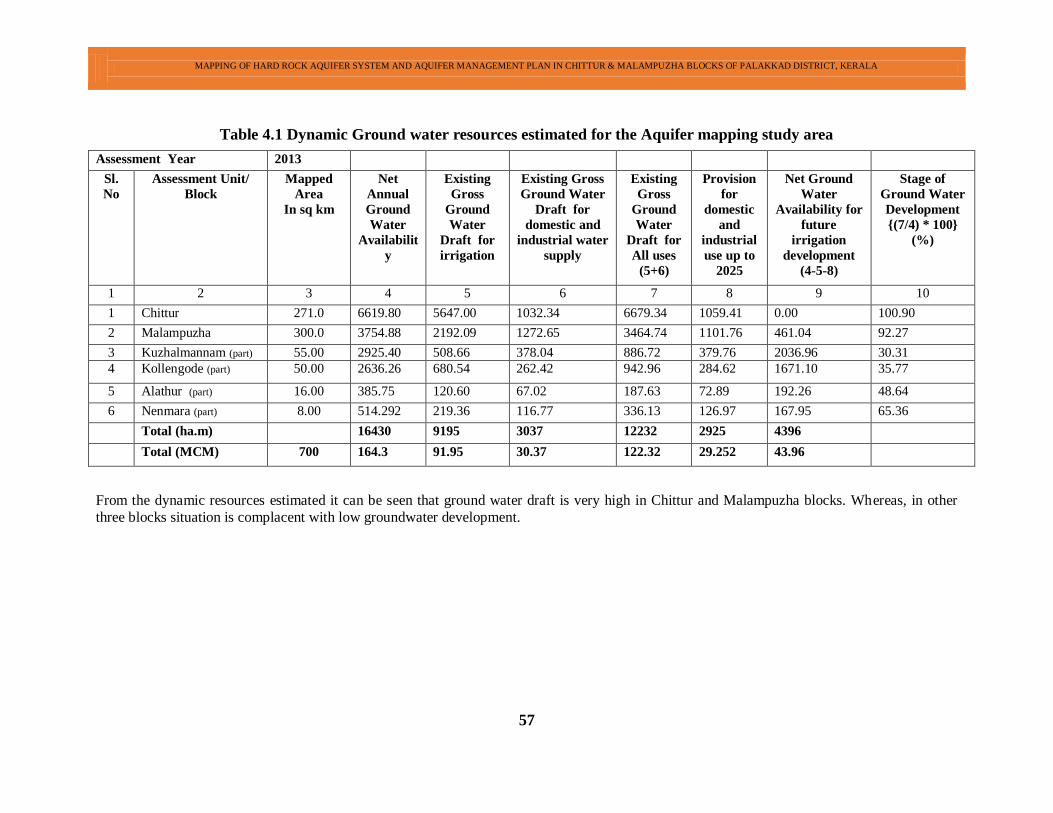
MAPPING OF HARD ROCK AQUIFER SYSTEM AND AQUIFER MANAGEMENT PLAN IN CHITTUR & MALAMPUZHA BLOCKS OF PALAKKAD DISTRICT, KERALA
57
Table 4.1 Dynamic Ground water resources estimated for the Aquifer mapping study area
Assessment Year 2013
Sl.
No
Assessment Unit/
Block
Mapped
Area
In sq km
Net
Annual
Ground
Water
Availabilit
y
Existing
Gross
Ground
Water
Draft for
irrigation
Existing Gross
Ground Water
Draft for
domestic and
industrial water
supply
Existing
Gross
Ground
Water
Draft for
All uses
(5+6)
Provision
for
domestic
and
industrial
use up to
2025
Net Ground
Water
Availability for
future
irrigation
development
(4-5-8)
Stage of
Ground Water
Development
{(7/4) * 100}
(%)
1 2 3 4 5 6 7 8 9 10
1 Chittur 271.0 6619.80 5647.00 1032.34 6679.34 1059.41 0.00 100.90
2 Malampuzha 300.0 3754.88 2192.09 1272.65 3464.74 1101.76 461.04 92.27
3 Kuzhalmannam (part) 55.00 2925.40 508.66 378.04 886.72 379.76 2036.96 30.31
4 Kollengode (part) 50.00 2636.26 680.54 262.42 942.96 284.62 1671.10 35.77
5 Alathur (part) 16.00 385.75 120.60 67.02 187.63 72.89 192.26 48.64
6 Nenmara (part) 8.00 514.292 219.36 116.77 336.13 126.97 167.95 65.36
Total (ha.m) 16430 9195 3037 12232 2925 4396
Total (MCM) 700 164.3 91.95 30.37 122.32 29.252 43.96
From the dynamic resources estimated it can be seen that ground water draft is very high in Chittur and Malampuzha blocks. Whereas, in other
three blocks situation is complacent with low groundwater development.
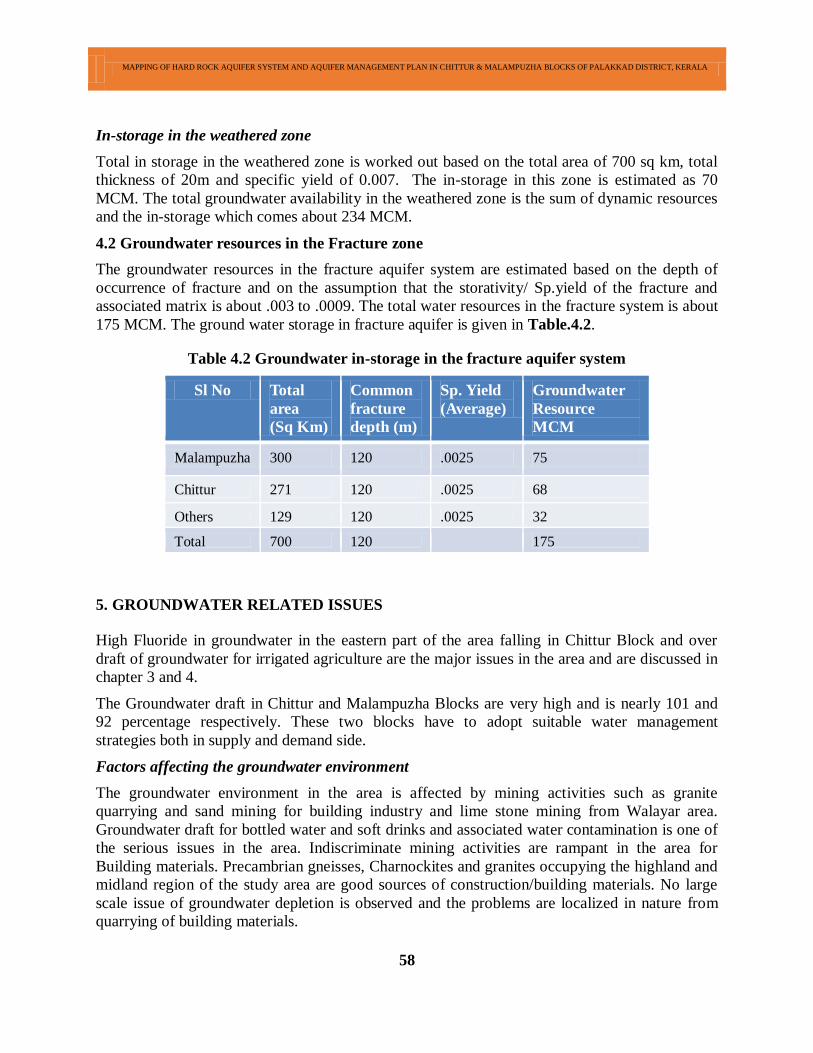
MAPPING OF HARD ROCK AQUIFER SYSTEM AND AQUIFER MANAGEMENT PLAN IN CHITTUR & MALAMPUZHA BLOCKS OF PALAKKAD DISTRICT, KERALA
58
In-storage in the weathered zone
Total in storage in the weathered zone is worked out based on the total area of 700 sq km, total
thickness of 20m and specific yield of 0.007. The in-storage in this zone is estimated as 70
MCM. The total groundwater availability in the weathered zone is the sum of dynamic resources
and the in-storage which comes about 234 MCM.
4.2 Groundwater resources in the Fracture zone
The groundwater resources in the fracture aquifer system are estimated based on the depth of
occurrence of fracture and on the assumption that the storativity/ Sp.yield of the fracture and
associated matrix is about .003 to .0009. The total water resources in the fracture system is about
175 MCM. The ground water storage in fracture aquifer is given in Table.4.2.
Table 4.2 Groundwater in-storage in the fracture aquifer system
Sl No Total
area
(Sq Km)
Common
fracture
depth (m)
Sp. Yield
(Average)
Groundwater
Resource
MCM
Malampuzha 300 120 .0025 75
Chittur 271 120 .0025 68
Others 129 120 .0025 32
Total 700 120 175
5. GROUNDWATER RELATED ISSUES
High Fluoride in groundwater in the eastern part of the area falling in Chittur Block and over
draft of groundwater for irrigated agriculture are the major issues in the area and are discussed in
chapter 3 and 4.
The Groundwater draft in Chittur and Malampuzha Blocks are very high and is nearly 101 and
92 percentage respectively. These two blocks have to adopt suitable water management
strategies both in supply and demand side.
Factors affecting the groundwater environment
The groundwater environment in the area is affected by mining activities such as granite
quarrying and sand mining for building industry and lime stone mining from Walayar area.
Groundwater draft for bottled water and soft drinks and associated water contamination is one of
the serious issues in the area. Indiscriminate mining activities are rampant in the area for
Building materials. Precambrian gneisses, Charnockites and granites occupying the highland and
midland region of the study area are good sources of construction/building materials. No large
scale issue of groundwater depletion is observed and the problems are localized in nature from
quarrying of building materials.
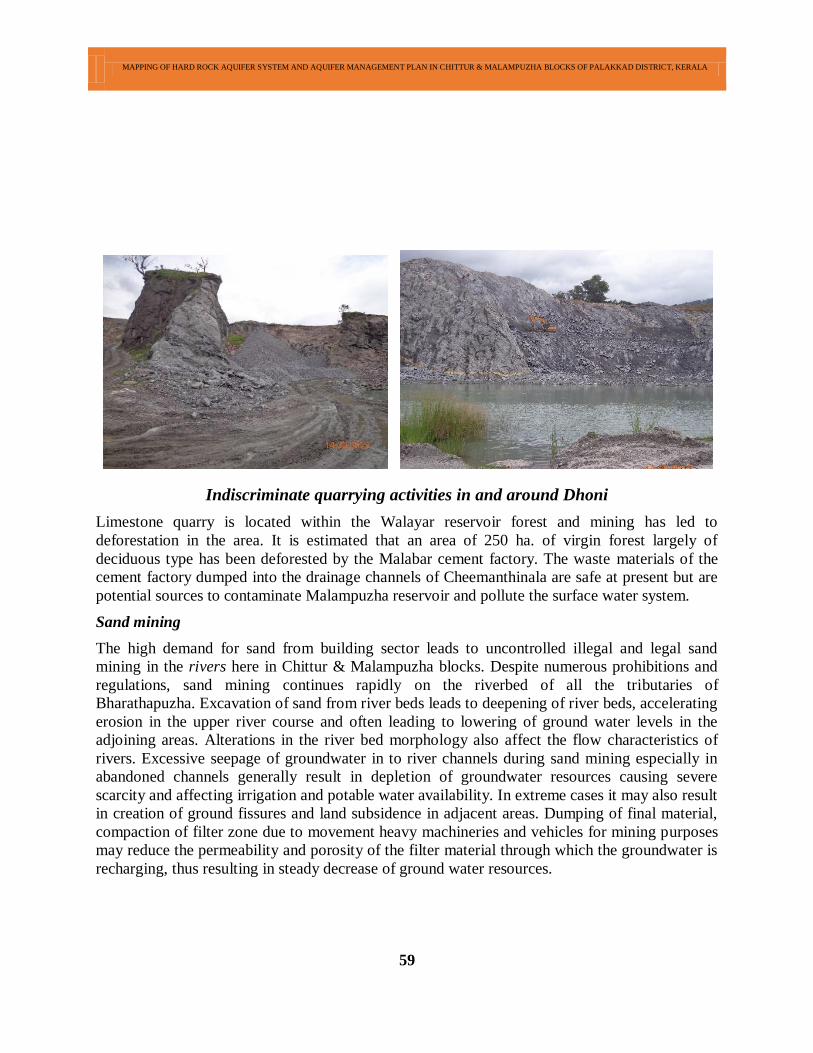
MAPPING OF HARD ROCK AQUIFER SYSTEM AND AQUIFER MANAGEMENT PLAN IN CHITTUR & MALAMPUZHA BLOCKS OF PALAKKAD DISTRICT, KERALA
59
Indiscriminate quarrying activities in and around Dhoni
Limestone quarry is located within the Walayar reservoir forest and mining has led to
deforestation in the area. It is estimated that an area of 250 ha. of virgin forest largely of
deciduous type has been deforested by the Malabar cement factory. The waste materials of the
cement factory dumped into the drainage channels of Cheemanthinala are safe at present but are
potential sources to contaminate Malampuzha reservoir and pollute the surface water system.
Sand mining
The high demand for sand from building sector leads to uncontrolled illegal and legal sand
mining in the rivers here in Chittur & Malampuzha blocks. Despite numerous prohibitions and
regulations, sand mining continues rapidly on the riverbed of all the tributaries of
Bharathapuzha. Excavation of sand from river beds leads to deepening of river beds, accelerating
erosion in the upper river course and often leading to lowering of ground water levels in the
adjoining areas. Alterations in the river bed morphology also affect the flow characteristics of
rivers. Excessive seepage of groundwater in to river channels during sand mining especially in
abandoned channels generally result in depletion of groundwater resources causing severe
scarcity and affecting irrigation and potable water availability. In extreme cases it may also result
in creation of ground fissures and land subsidence in adjacent areas. Dumping of final material,
compaction of filter zone due to movement heavy machineries and vehicles for mining purposes
may reduce the permeability and porosity of the filter material through which the groundwater is
recharging, thus resulting in steady decrease of ground water resources.
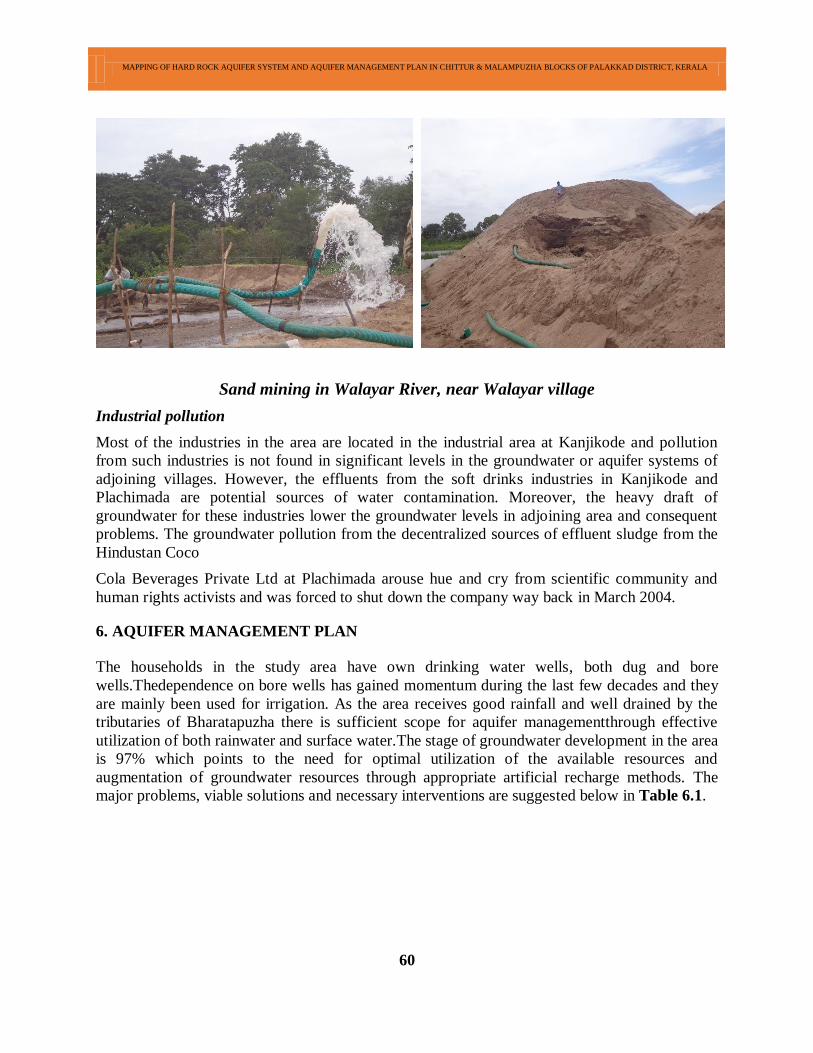
MAPPING OF HARD ROCK AQUIFER SYSTEM AND AQUIFER MANAGEMENT PLAN IN CHITTUR & MALAMPUZHA BLOCKS OF PALAKKAD DISTRICT, KERALA
60
Sand mining in Walayar River, near Walayar village
Industrial pollution
Most of the industries in the area are located in the industrial area at Kanjikode and pollution
from such industries is not found in significant levels in the groundwater or aquifer systems of
adjoining villages. However, the effluents from the soft drinks industries in Kanjikode and
Plachimada are potential sources of water contamination. Moreover, the heavy draft of
groundwater for these industries lower the groundwater levels in adjoining area and consequent
problems. The groundwater pollution from the decentralized sources of effluent sludge from the
Hindustan Coco
Cola Beverages Private Ltd at Plachimada arouse hue and cry from scientific community and
human rights activists and was forced to shut down the company way back in March 2004.
6. AQUIFER MANAGEMENT PLAN
The households in the study area have own drinking water wells, both dug and bore
wells.Thedependence on bore wells has gained momentum during the last few decades and they
are mainly been used for irrigation. As the area receives good rainfall and well drained by the
tributaries of Bharatapuzha there is sufficient scope for aquifer managementthrough effective
utilization of both rainwater and surface water.The stage of groundwater development in the area
is 97% which points to the need for optimal utilization of the available resources and
augmentation of groundwater resources through appropriate artificial recharge methods. The
major problems, viable solutions and necessary interventions are suggested below in Table 6.1.
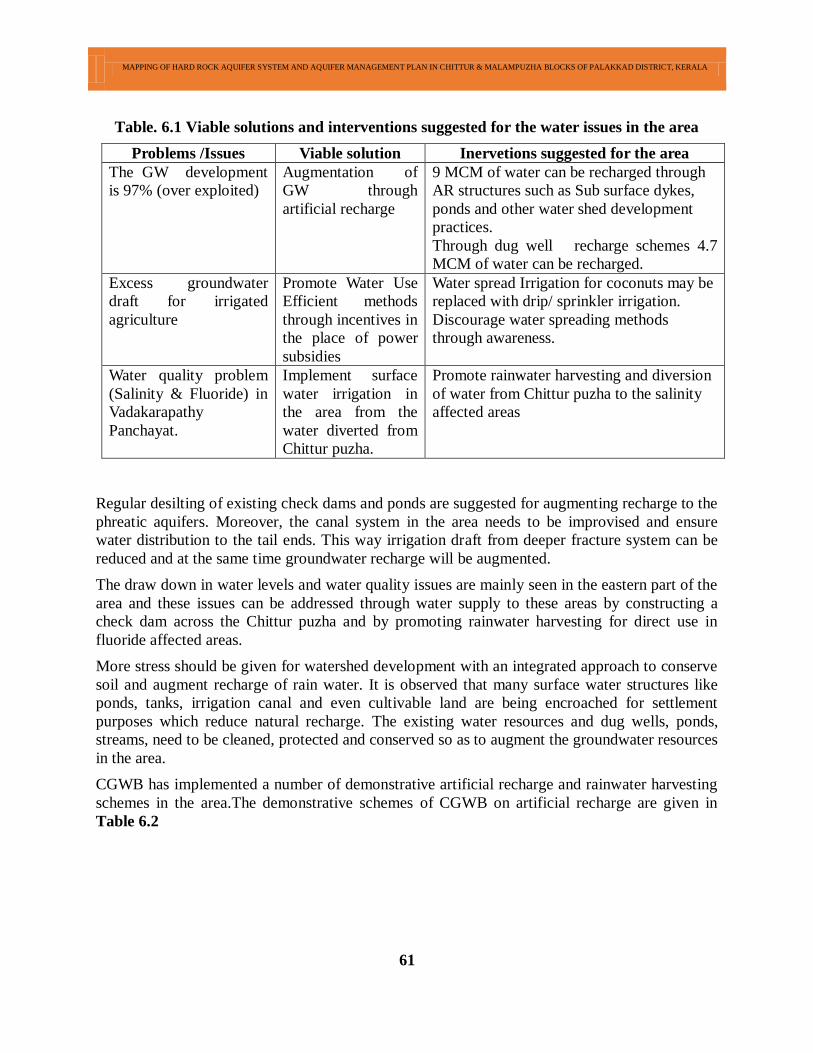
MAPPING OF HARD ROCK AQUIFER SYSTEM AND AQUIFER MANAGEMENT PLAN IN CHITTUR & MALAMPUZHA BLOCKS OF PALAKKAD DISTRICT, KERALA
61
Table. 6.1 Viable solutions and interventions suggested for the water issues in the area
Problems /Issues Viable solution Inervetions suggested for the area
The GW development
is 97% (over exploited)
Augmentation of
GW through
artificial recharge
9 MCM of water can be recharged through
AR structures such as Sub surface dykes,
ponds and other water shed development
practices.
Through dug well recharge schemes 4.7
MCM of water can be recharged.
Excess groundwater
draft for irrigated
agriculture
Promote Water Use
Efficient methods
through incentives in
the place of power
subsidies
Water spread Irrigation for coconuts may be
replaced with drip/ sprinkler irrigation.
Discourage water spreading methods
through awareness.
Water quality problem
(Salinity & Fluoride) in
Vadakarapathy
Panchayat.
Implement surface
water irrigation in
the area from the
water diverted from
Chittur puzha.
Promote rainwater harvesting and diversion
of water from Chittur puzha to the salinity
affected areas
Regular desilting of existing check dams and ponds are suggested for augmenting recharge to the
phreatic aquifers. Moreover, the canal system in the area needs to be improvised and ensure
water distribution to the tail ends. This way irrigation draft from deeper fracture system can be
reduced and at the same time groundwater recharge will be augmented.
The draw down in water levels and water quality issues are mainly seen in the eastern part of the
area and these issues can be addressed through water supply to these areas by constructing a
check dam across the Chittur puzha and by promoting rainwater harvesting for direct use in
fluoride affected areas.
More stress should be given for watershed development with an integrated approach to conserve
soil and augment recharge of rain water. It is observed that many surface water structures like
ponds, tanks, irrigation canal and even cultivable land are being encroached for settlement
purposes which reduce natural recharge. The existing water resources and dug wells, ponds,
streams, need to be cleaned, protected and conserved so as to augment the groundwater resources
in the area.
CGWB has implemented a number of demonstrative artificial recharge and rainwater harvesting
schemes in the area.The demonstrative schemes of CGWB on artificial recharge are given in
Table 6.2
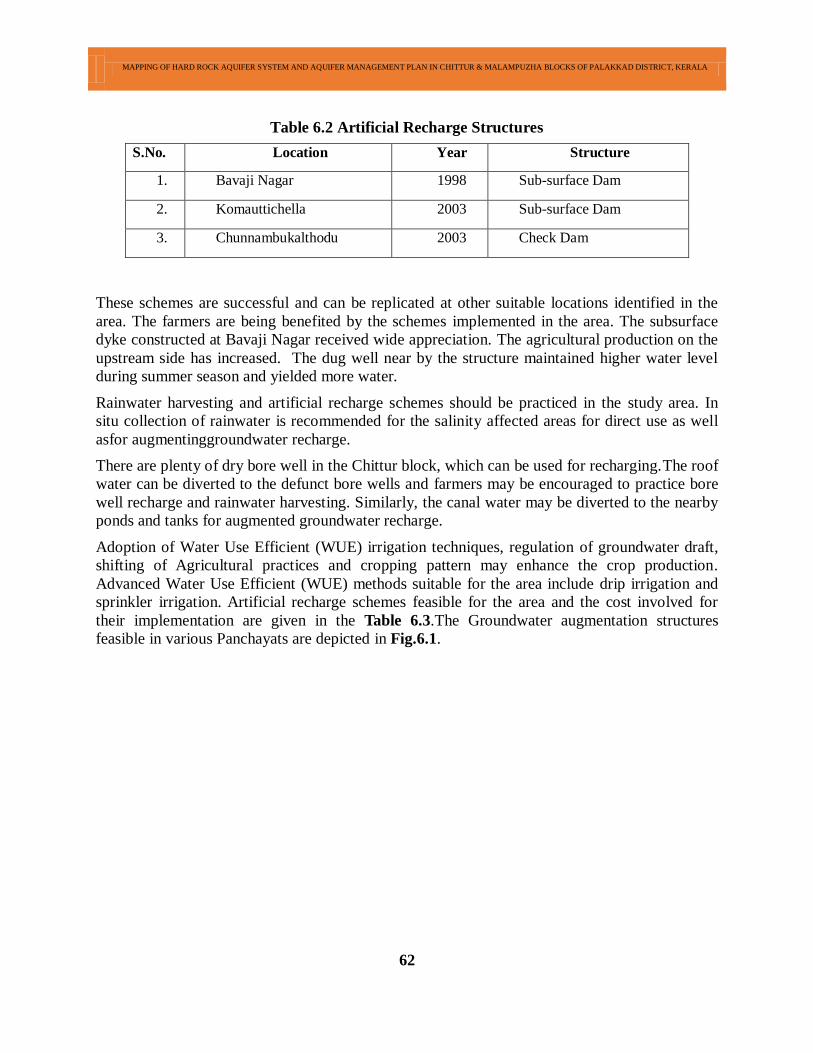
MAPPING OF HARD ROCK AQUIFER SYSTEM AND AQUIFER MANAGEMENT PLAN IN CHITTUR & MALAMPUZHA BLOCKS OF PALAKKAD DISTRICT, KERALA
62
Table 6.2 Artificial Recharge Structures
S.No. Location Year Structure
1. Bavaji Nagar 1998 Sub-surface Dam
2. Komauttichella 2003 Sub-surface Dam
3. Chunnambukalthodu 2003 Check Dam
These schemes are successful and can be replicated at other suitable locations identified in the
area. The farmers are being benefited by the schemes implemented in the area. The subsurface
dyke constructed at Bavaji Nagar received wide appreciation. The agricultural production on the
upstream side has increased. The dug well near by the structure maintained higher water level
during summer season and yielded more water.
Rainwater harvesting and artificial recharge schemes should be practiced in the study area. In
situ collection of rainwater is recommended for the salinity affected areas for direct use as well
asfor augmentinggroundwater recharge.
There are plenty of dry bore well in the Chittur block, which can be used for recharging.The roof
water can be diverted to the defunct bore wells and farmers may be encouraged to practice bore
well recharge and rainwater harvesting. Similarly, the canal water may be diverted to the nearby
ponds and tanks for augmented groundwater recharge.
Adoption of Water Use Efficient (WUE) irrigation techniques, regulation of groundwater draft,
shifting of Agricultural practices and cropping pattern may enhance the crop production.
Advanced Water Use Efficient (WUE) methods suitable for the area include drip irrigation and
sprinkler irrigation. Artificial recharge schemes feasible for the area and the cost involved for
their implementation are given in the Table 6.3.The Groundwater augmentation structures
feasible in various Panchayats are depicted in Fig.6.1.
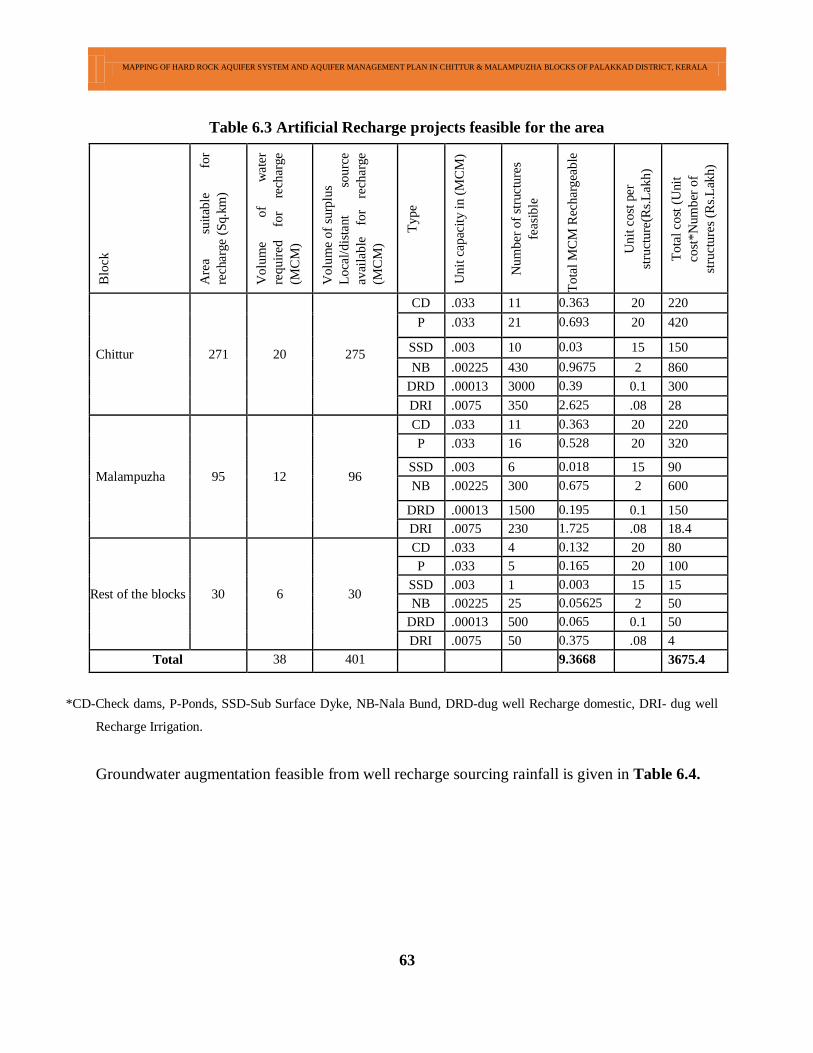
MAPPING OF HARD ROCK AQUIFER SYSTEM AND AQUIFER MANAGEMENT PLAN IN CHITTUR & MALAMPUZHA BLOCKS OF PALAKKAD DISTRICT, KERALA
63
Table 6.3 Artificial Recharge projects feasible for the area
*CD-Check dams, P-Ponds, SSD-Sub Surface Dyke, NB-Nala Bund, DRD-dug well Recharge domestic, DRI- dug well
Recharge Irrigation.
Groundwater augmentation feasible from well recharge sourcing rainfall is given in Table 6.4.
Blo
ck
Are
a su
itab
le
for
rech
arge
(Sq.k
m)
Volu
me
of
wat
er
requir
ed
for
rech
arge
(MC
M)
Volu
me
of
surp
lus
Loca
l/dis
tant
sourc
e
avai
lable
fo
r re
char
ge
(MC
M)
Type
Unit
cap
acit
y i
n (
MC
M)
Num
ber
of
stru
cture
s
feas
ible
Tota
l M
CM
Rec
har
gea
ble
Unit
cost
per
stru
cture
(Rs.
Lak
h)
Tota
l co
st (
Unit
cost
*N
um
ber
of
stru
cture
s (R
s.L
akh)
Chittur 271 20 275
CD .033 11 0.363 20 220
P .033 21 0.693 20 420
SSD .003 10 0.03 15 150
NB .00225 430 0.9675 2 860
DRD .00013 3000 0.39 0.1 300
DRI .0075 350 2.625 .08 28
Malampuzha 95 12 96
CD .033 11 0.363 20 220
P .033 16 0.528 20 320
SSD .003 6 0.018 15 90
NB .00225 300 0.675 2 600
DRD .00013 1500 0.195 0.1 150
DRI .0075 230 1.725 .08 18.4
Rest of the blocks 30 6 30
CD .033 4 0.132 20 80
P .033 5 0.165 20 100
SSD .003 1 0.003 15 15
NB .00225 25 0.05625 2 50
DRD .00013 500 0.065 0.1 50
DRI .0075 50 0.375 .08 4
Total 38 401 9.3668 3675.4
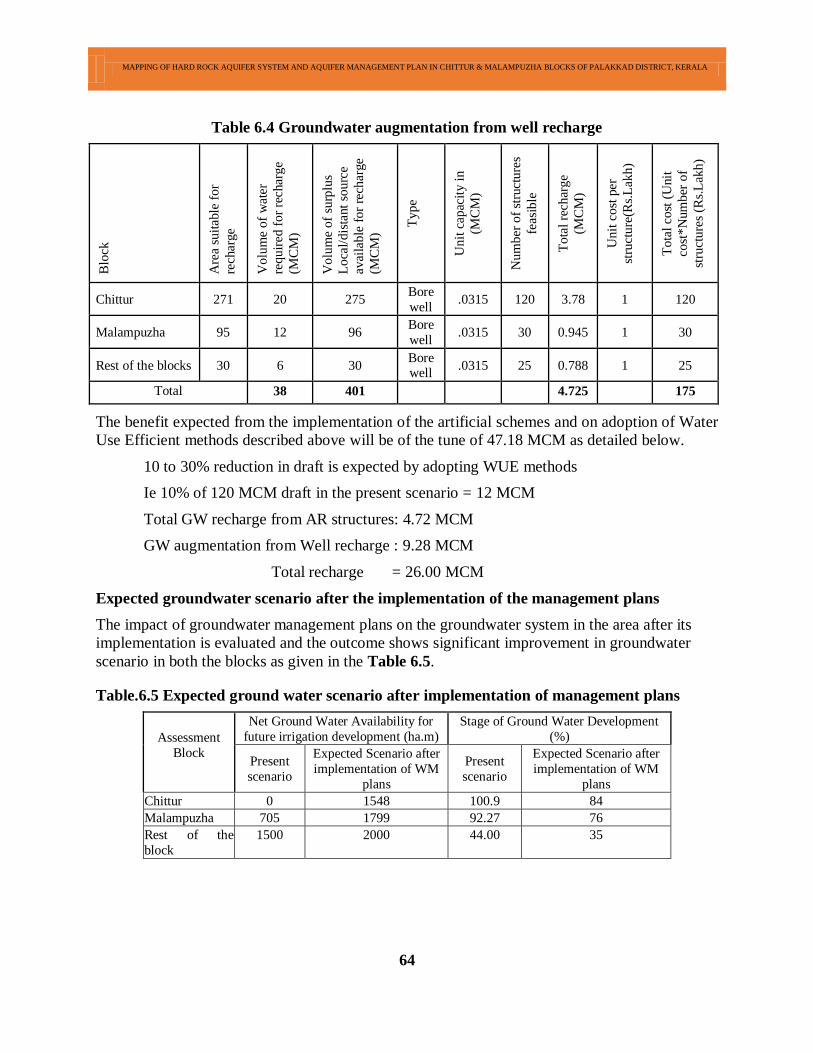
MAPPING OF HARD ROCK AQUIFER SYSTEM AND AQUIFER MANAGEMENT PLAN IN CHITTUR & MALAMPUZHA BLOCKS OF PALAKKAD DISTRICT, KERALA
64
Table 6.4 Groundwater augmentation from well recharge
Blo
ck
Are
a su
itab
le f
or
rech
arge
Volu
me
of
wat
er
requir
ed f
or
rech
arge
(MC
M)
Volu
me
of
surp
lus
Loca
l/dis
tant
sourc
e
avai
lable
for
rech
arge
(MC
M)
Type
Unit
cap
acit
y i
n
(MC
M)
Num
ber
of
stru
cture
s
feas
ible
Tota
l re
char
ge
(MC
M)
Unit
cost
per
stru
cture
(Rs.
Lak
h)
Tota
l co
st (
Unit
cost
*N
um
ber
of
stru
cture
s (R
s.L
akh)
Chittur 271 20 275 Bore
well .0315 120 3.78 1 120
Malampuzha 95 12 96 Bore
well .0315 30 0.945 1 30
Rest of the blocks 30 6 30 Bore well
.0315 25 0.788 1 25
Total 38 401 4.725 175
The benefit expected from the implementation of the artificial schemes and on adoption of Water
Use Efficient methods described above will be of the tune of 47.18 MCM as detailed below.
10 to 30% reduction in draft is expected by adopting WUE methods
Ie 10% of 120 MCM draft in the present scenario = 12 MCM
Total GW recharge from AR structures: 4.72 MCM
GW augmentation from Well recharge : 9.28 MCM
Total recharge = 26.00 MCM
Expected groundwater scenario after the implementation of the management plans
The impact of groundwater management plans on the groundwater system in the area after its
implementation is evaluated and the outcome shows significant improvement in groundwater
scenario in both the blocks as given in the Table 6.5.
Table.6.5 Expected ground water scenario after implementation of management plans
Assessment
Block
Net Ground Water Availability for
future irrigation development (ha.m)
Stage of Ground Water Development
(%)
Present
scenario
Expected Scenario after
implementation of WM
plans
Present
scenario
Expected Scenario after
implementation of WM
plans
Chittur 0 1548 100.9 84
Malampuzha 705 1799 92.27 76
Rest of the
block
1500 2000 44.00 35
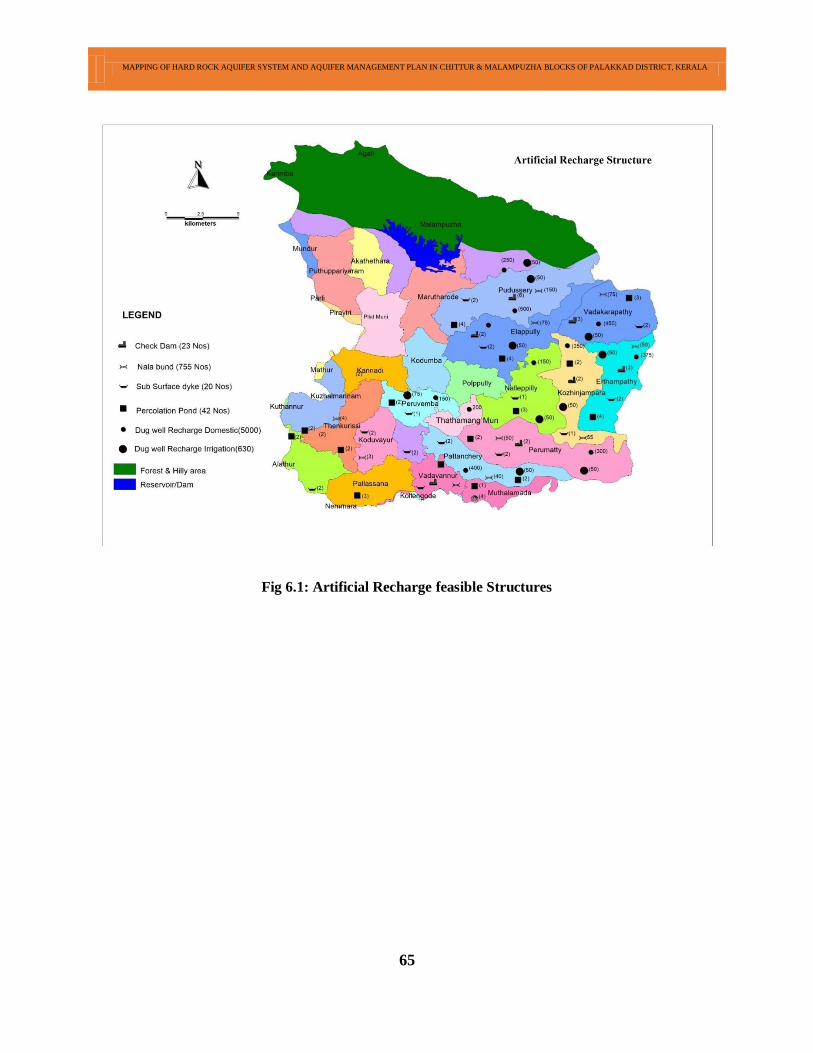
MAPPING OF HARD ROCK AQUIFER SYSTEM AND AQUIFER MANAGEMENT PLAN IN CHITTUR & MALAMPUZHA BLOCKS OF PALAKKAD DISTRICT, KERALA
65
Fig 6.1: Artificial Recharge feasible Structures
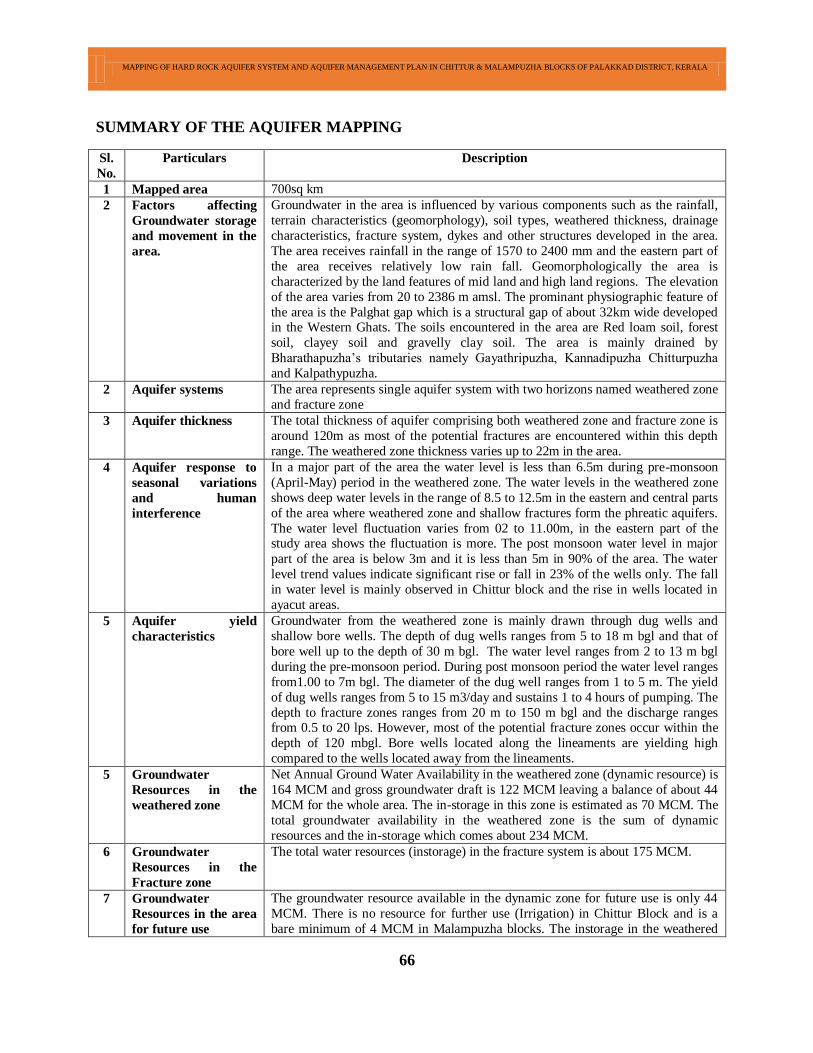
MAPPING OF HARD ROCK AQUIFER SYSTEM AND AQUIFER MANAGEMENT PLAN IN CHITTUR & MALAMPUZHA BLOCKS OF PALAKKAD DISTRICT, KERALA
66
SUMMARY OF THE AQUIFER MAPPING
Sl.
No.
Particulars Description
1 Mapped area 700sq km
2 Factors affecting
Groundwater storage
and movement in the
area.
Groundwater in the area is influenced by various components such as the rainfall,
terrain characteristics (geomorphology), soil types, weathered thickness, drainage
characteristics, fracture system, dykes and other structures developed in the area.
The area receives rainfall in the range of 1570 to 2400 mm and the eastern part of
the area receives relatively low rain fall. Geomorphologically the area is
characterized by the land features of mid land and high land regions. The elevation
of the area varies from 20 to 2386 m amsl. The prominant physiographic feature of
the area is the Palghat gap which is a structural gap of about 32km wide developed in the Western Ghats. The soils encountered in the area are Red loam soil, forest
soil, clayey soil and gravelly clay soil. The area is mainly drained by
Bharathapuzha’s tributaries namely Gayathripuzha, Kannadipuzha Chitturpuzha
and Kalpathypuzha.
2 Aquifer systems The area represents single aquifer system with two horizons named weathered zone
and fracture zone
3 Aquifer thickness The total thickness of aquifer comprising both weathered zone and fracture zone is
around 120m as most of the potential fractures are encountered within this depth
range. The weathered zone thickness varies up to 22m in the area.
4 Aquifer response to
seasonal variations
and human
interference
In a major part of the area the water level is less than 6.5m during pre-monsoon
(April-May) period in the weathered zone. The water levels in the weathered zone
shows deep water levels in the range of 8.5 to 12.5m in the eastern and central parts
of the area where weathered zone and shallow fractures form the phreatic aquifers.
The water level fluctuation varies from 02 to 11.00m, in the eastern part of the study area shows the fluctuation is more. The post monsoon water level in major
part of the area is below 3m and it is less than 5m in 90% of the area. The water
level trend values indicate significant rise or fall in 23% of the wells only. The fall
in water level is mainly observed in Chittur block and the rise in wells located in
ayacut areas.
5 Aquifer yield
characteristics
Groundwater from the weathered zone is mainly drawn through dug wells and
shallow bore wells. The depth of dug wells ranges from 5 to 18 m bgl and that of
bore well up to the depth of 30 m bgl. The water level ranges from 2 to 13 m bgl
during the pre-monsoon period. During post monsoon period the water level ranges
from1.00 to 7m bgl. The diameter of the dug well ranges from 1 to 5 m. The yield
of dug wells ranges from 5 to 15 m3/day and sustains 1 to 4 hours of pumping. The
depth to fracture zones ranges from 20 m to 150 m bgl and the discharge ranges from 0.5 to 20 lps. However, most of the potential fracture zones occur within the
depth of 120 mbgl. Bore wells located along the lineaments are yielding high
compared to the wells located away from the lineaments.
5 Groundwater
Resources in the
weathered zone
Net Annual Ground Water Availability in the weathered zone (dynamic resource) is
164 MCM and gross groundwater draft is 122 MCM leaving a balance of about 44
MCM for the whole area. The in-storage in this zone is estimated as 70 MCM. The
total groundwater availability in the weathered zone is the sum of dynamic
resources and the in-storage which comes about 234 MCM.
6 Groundwater
Resources in the
Fracture zone
The total water resources (instorage) in the fracture system is about 175 MCM.
7 Groundwater
Resources in the area
for future use
The groundwater resource available in the dynamic zone for future use is only 44
MCM. There is no resource for further use (Irrigation) in Chittur Block and is a
bare minimum of 4 MCM in Malampuzha blocks. The instorage in the weathered
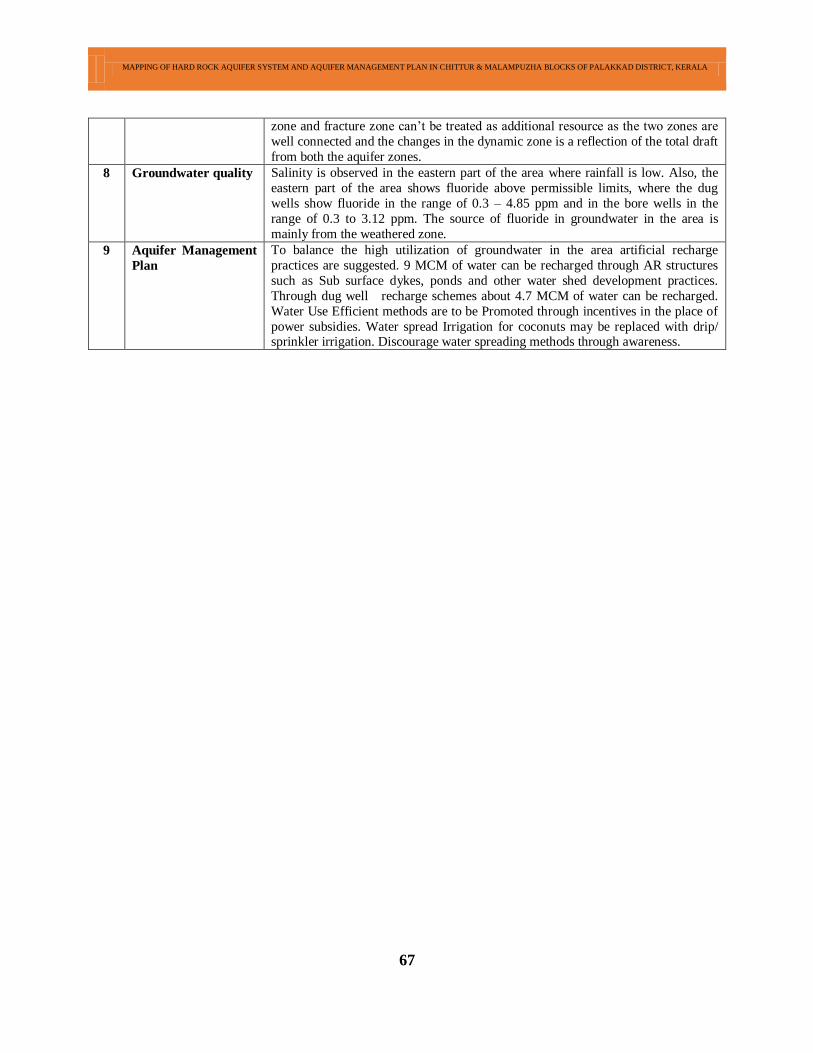
MAPPING OF HARD ROCK AQUIFER SYSTEM AND AQUIFER MANAGEMENT PLAN IN CHITTUR & MALAMPUZHA BLOCKS OF PALAKKAD DISTRICT, KERALA
67
zone and fracture zone can’t be treated as additional resource as the two zones are
well connected and the changes in the dynamic zone is a reflection of the total draft
from both the aquifer zones.
8 Groundwater quality Salinity is observed in the eastern part of the area where rainfall is low. Also, the
eastern part of the area shows fluoride above permissible limits, where the dug
wells show fluoride in the range of 0.3 – 4.85 ppm and in the bore wells in the
range of 0.3 to 3.12 ppm. The source of fluoride in groundwater in the area is
mainly from the weathered zone.
9 Aquifer Management
Plan
To balance the high utilization of groundwater in the area artificial recharge
practices are suggested. 9 MCM of water can be recharged through AR structures
such as Sub surface dykes, ponds and other water shed development practices.
Through dug well recharge schemes about 4.7 MCM of water can be recharged.
Water Use Efficient methods are to be Promoted through incentives in the place of
power subsidies. Water spread Irrigation for coconuts may be replaced with drip/ sprinkler irrigation. Discourage water spreading methods through awareness.
MAPPING OF HARD ROCK AQUIFER SYSTEM AND AQUIFER MANAGEMENT PLAN IN CHITTUR & MALAMPUZHA BLOCKS OF PALAKKAD DISTRICT, KERALA
PART-II
BLOCK WISE AQUIFER MAPS AND
MANAGEMENT PLANS
1. CHITTUR BLOCK
2. MALAMPUZHA BLOCK
MAPPING OF HARD ROCK AQUIFER SYSTEM AND AQUIFER MANAGEMENT PLAN IN CHITTUR & MALAMPUZHA BLOCKS OF PALAKKAD DISTRICT, KERALA
1. CHITTUR BLOCK
MAPPING OF HARD ROCK AQUIFER SYSTEM AND AQUIFER MANAGEMENT PLAN IN CHITTUR & MALAMPUZHA BLOCKS OF PALAKKAD DISTRICT, KERALA
TABLE OF CONTENTS
Contents
1.0 SALIENT INFORMATION: ............................................................................................. 71
1.1 About the area .......................................................................................................................................... 71
1.2 Population ................................................................................................................................................ 71
1.3 Rainfall .................................................................................................................................................... 72
1.4 Agricultre and Irrigation: .......................................................................................................................... 72
1.5 Ground water resources availability & Extraction: .................................................................................... 72
1.6 Existing & Future Water demands: ........................................................................................................... 73
1.7 Water level behaviour: ............................................................................................................................. 73
2.0 AQUIFER DISPOSITION: ............................................................................................... 75
2.1 Number of Aquifers: ................................................................................................................................ 75
3.0 GROUND WATER RESOURCES, EXTRACTION, CONTAMINATION & OTHER
ISSUES:.................................................................................................................................. 77
3.1 Aquifer wise resource availability and Extraction: .................................................................................... 77
In-storage in the Fracture zone ....................................................................................................................... 77
3.2 Chemical quality of ground water and Contamination: .............................................................................. 78
4.0 GROUND WATER RESOURCE ENHANCEMENT: ...................................................... 79
4.1 Aquifer wise space availability for recharge and proposed interventions: ................................................... 79
4.2 Other interventions Proposed, if any: ........................................................................................................ 81
5.0 DEMAND SIDE INTERVENTIONS ................................................................................ 82
5.1 Advanced irrigation practices: .................................................................................................................. 82
5.2 Change in cropping pattern: ...................................................................................................................... 82
5.3 Alternate water sources: ........................................................................................................................... 82
5.4 Regulation and control ............................................................................................................................. 82
5.5 Other Interventions proposed .................................................................................................................... 83
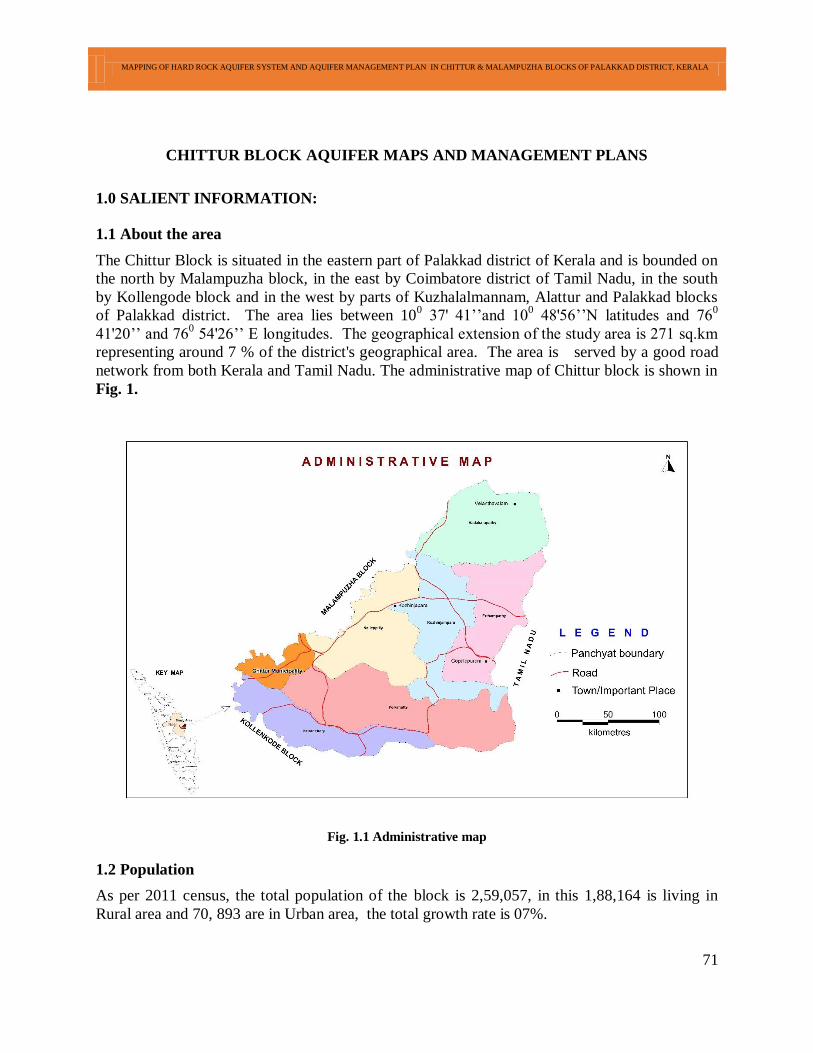
MAPPING OF HARD ROCK AQUIFER SYSTEM AND AQUIFER MANAGEMENT PLAN IN CHITTUR & MALAMPUZHA BLOCKS OF PALAKKAD DISTRICT, KERALA
71
CHITTUR BLOCK AQUIFER MAPS AND MANAGEMENT PLANS
1.0 SALIENT INFORMATION:
1.1 About the area
The Chittur Block is situated in the eastern part of Palakkad district of Kerala and is bounded on
the north by Malampuzha block, in the east by Coimbatore district of Tamil Nadu, in the south
by Kollengode block and in the west by parts of Kuzhalalmannam, Alattur and Palakkad blocks
of Palakkad district. The area lies between 100 37' 41’’and 10
0 48'56’’N latitudes and 76
0
41'20’’ and 760 54'26’’ E longitudes. The geographical extension of the study area is 271 sq.km
representing around 7 % of the district's geographical area. The area is served by a good road
network from both Kerala and Tamil Nadu. The administrative map of Chittur block is shown in
Fig. 1.
Fig. 1.1 Administrative map
1.2 Population
As per 2011 census, the total population of the block is 2,59,057, in this 1,88,164 is living in
Rural area and 70, 893 are in Urban area, the total growth rate is 07%.
MAPPING OF HARD ROCK AQUIFER SYSTEM AND AQUIFER MANAGEMENT PLAN IN CHITTUR & MALAMPUZHA BLOCKS OF PALAKKAD DISTRICT, KERALA
72
1.3 Rainfall
Rain fall varies from 1000 to 2200mm. the eastern part of the block receives up to 1000 mm and
the rainfall gradually increases towards north western part of the block upto 2200 mm.
1.4 Agricultre and Irrigation:
The principal crop of the block is Paddy and other important crops are Banana, coconut,
sugarcane and vegetables etc. The Gross cropped area is 20,543 hectares and the net shown area
is 15,791 hectares. The area is irrigated by both surface water as well as ground water. Aliyar,
Parmbikulam, and Moolathara regulaters Projects are important sources for surface water, other
sources are tanks and ponds, and the total area, under surface water irrigation is 5,830.72
hectares. The ground water extracted through abstraction structures like dug wells, shallow bore
wells and deep bore wells and irrigating an area of 6,700.53 hectares. The crop wise area
irrigated by ground water is given Table 1.1.
Table 1.1: Area under Irrigation in Chittur block of Palakkad district
S No Name of Block Paddy Sugar cane Banana+Plantain Total Area( in Hectares)
1 Chittoor 5231 386 1083 6700
Due to change in the land use and cropping pattern along with low income from paddy and
coconut, farmers are forced to change the cropping pattern to cash crops like sugarcane, Plantain,
vegetables and flower cultivation. Over dependence on groundwater for domestic, irrigation and
industrial purposes in the block has led to the lowering of water table and water scarcity.
1.5 Ground water resources availability & Extraction:
Phreatic aquifers are major sources for irrigation and drinking water in the area. Groundwater
draft for irrigated agriculture in the area has been high and depletion in the resource is observed
over the years. Any decision about future utilization depends on having a clear understanding of
the status of the resource, the amount that has already been extracted, the amount remaining, and
the impact of further depletion. The dynamic groundwater resources in the area are estimated
based on the methodology proposed by the Groundwater Estimation Committee (GEC 1997
methodology).
The groundwater resources in the fracture aquifer system are estimated based on the depth of
occurrence of fracture and on the assumption that the storativity/ Sp.yield of the fracture and
associated matrix is about .003 to .0009. The total water resources in the fracture system of the
block is about 68 MCM.
Ground water Draft
Ground water draft in Chittur block of Palakkad district is mainly for irrigation and domestic
uses. In view of the non-availability of data on the number of wells being used for domestic
purposes, the ground water draft for domestic uses has been computed block-wise on the basis of
2011 population, projected for the year of assessment (2013). Domestic requirement of water in
the study area has been computed as the product of the population and the per-capita water
requirement (assumed as 150 L/day/person). The share of groundwater in meeting the
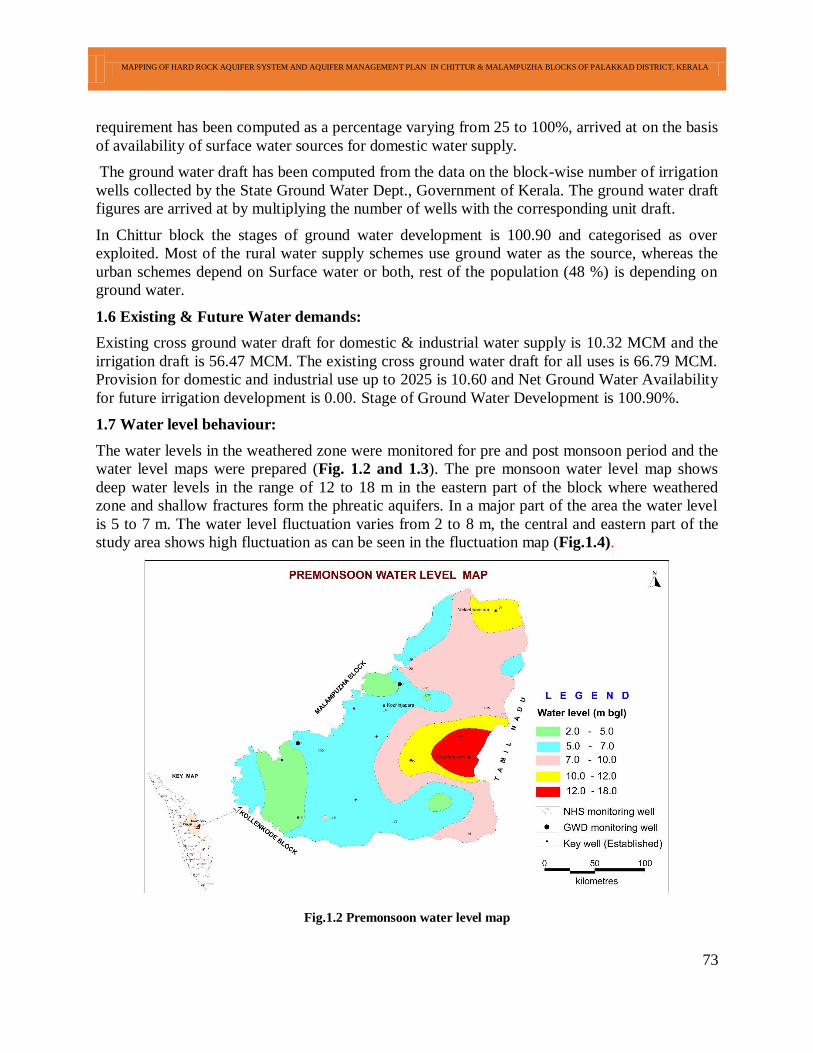
MAPPING OF HARD ROCK AQUIFER SYSTEM AND AQUIFER MANAGEMENT PLAN IN CHITTUR & MALAMPUZHA BLOCKS OF PALAKKAD DISTRICT, KERALA
73
requirement has been computed as a percentage varying from 25 to 100%, arrived at on the basis
of availability of surface water sources for domestic water supply.
The ground water draft has been computed from the data on the block-wise number of irrigation
wells collected by the State Ground Water Dept., Government of Kerala. The ground water draft
figures are arrived at by multiplying the number of wells with the corresponding unit draft.
In Chittur block the stages of ground water development is 100.90 and categorised as over
exploited. Most of the rural water supply schemes use ground water as the source, whereas the
urban schemes depend on Surface water or both, rest of the population (48 %) is depending on
ground water.
1.6 Existing & Future Water demands:
Existing cross ground water draft for domestic & industrial water supply is 10.32 MCM and the
irrigation draft is 56.47 MCM. The existing cross ground water draft for all uses is 66.79 MCM.
Provision for domestic and industrial use up to 2025 is 10.60 and Net Ground Water Availability
for future irrigation development is 0.00. Stage of Ground Water Development is 100.90%.
1.7 Water level behaviour:
The water levels in the weathered zone were monitored for pre and post monsoon period and the
water level maps were prepared (Fig. 1.2 and 1.3). The pre monsoon water level map shows
deep water levels in the range of 12 to 18 m in the eastern part of the block where weathered
zone and shallow fractures form the phreatic aquifers. In a major part of the area the water level
is 5 to 7 m. The water level fluctuation varies from 2 to 8 m, the central and eastern part of the
study area shows high fluctuation as can be seen in the fluctuation map (Fig.1.4).
Fig.1.2 Premonsoon water level map
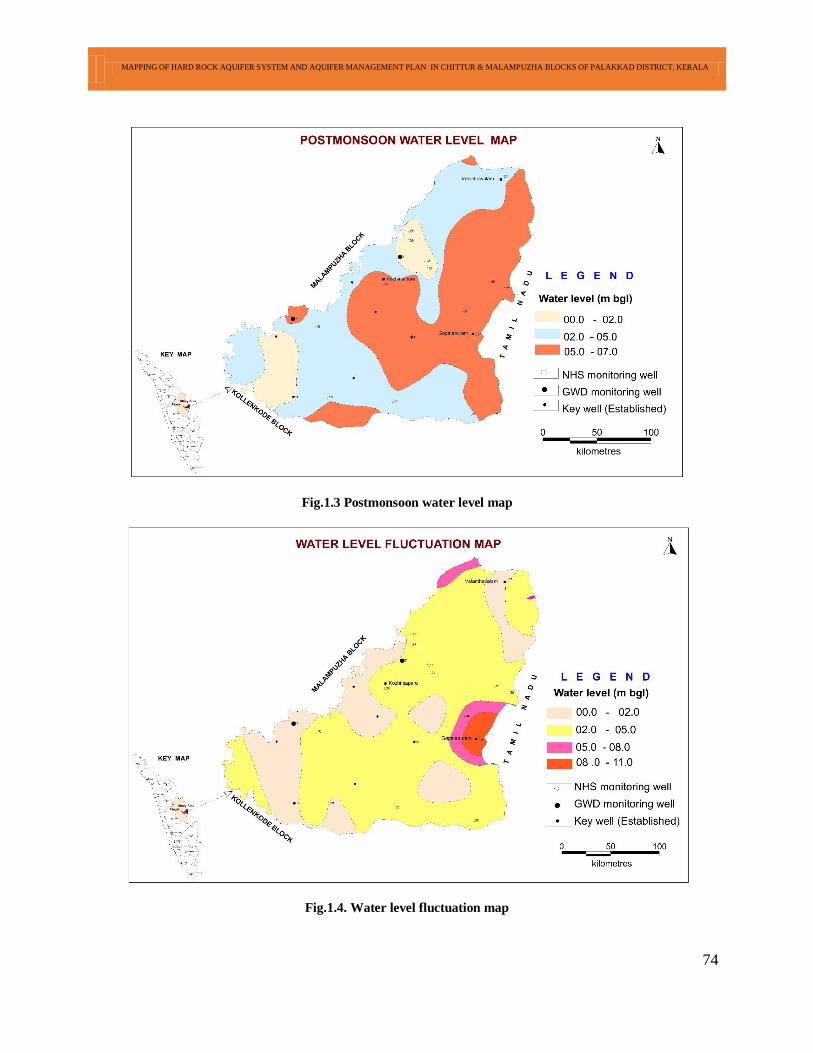
MAPPING OF HARD ROCK AQUIFER SYSTEM AND AQUIFER MANAGEMENT PLAN IN CHITTUR & MALAMPUZHA BLOCKS OF PALAKKAD DISTRICT, KERALA
74
Fig.1.3 Postmonsoon water level map
Fig.1.4. Water level fluctuation map
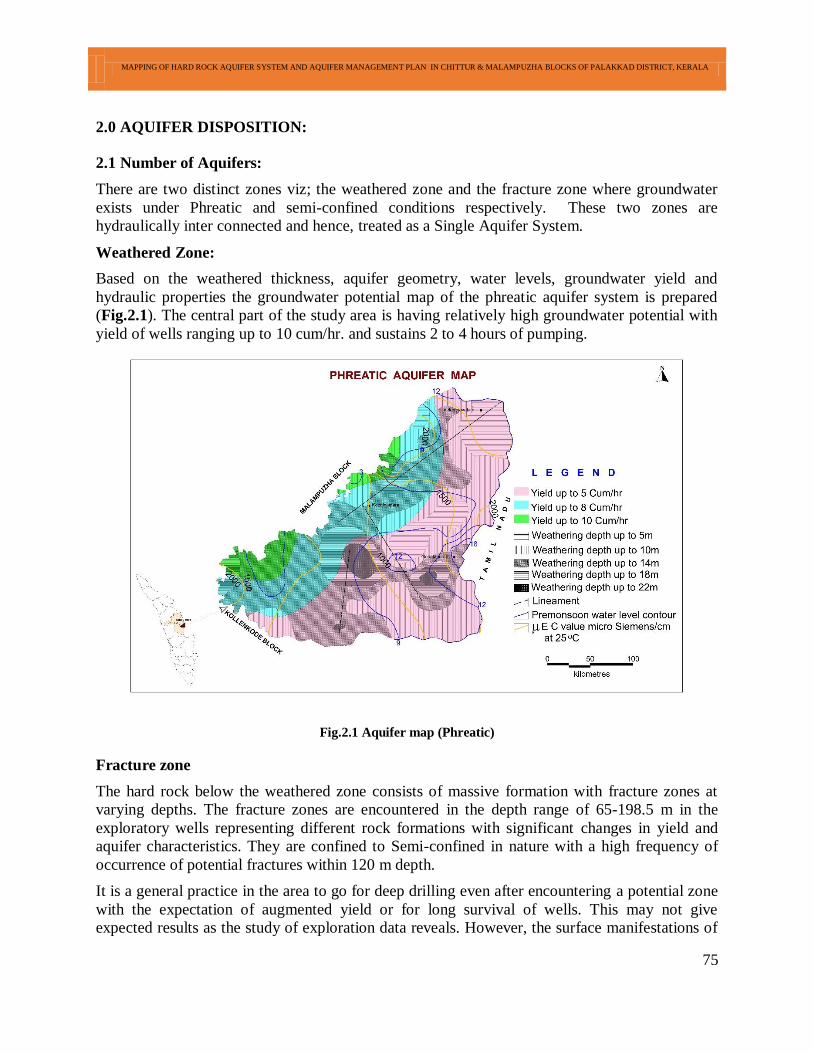
MAPPING OF HARD ROCK AQUIFER SYSTEM AND AQUIFER MANAGEMENT PLAN IN CHITTUR & MALAMPUZHA BLOCKS OF PALAKKAD DISTRICT, KERALA
75
2.0 AQUIFER DISPOSITION:
2.1 Number of Aquifers:
There are two distinct zones viz; the weathered zone and the fracture zone where groundwater
exists under Phreatic and semi-confined conditions respectively. These two zones are
hydraulically inter connected and hence, treated as a Single Aquifer System.
Weathered Zone:
Based on the weathered thickness, aquifer geometry, water levels, groundwater yield and
hydraulic properties the groundwater potential map of the phreatic aquifer system is prepared
(Fig.2.1). The central part of the study area is having relatively high groundwater potential with
yield of wells ranging up to 10 cum/hr. and sustains 2 to 4 hours of pumping.
Fig.2.1 Aquifer map (Phreatic)
Fracture zone
The hard rock below the weathered zone consists of massive formation with fracture zones at
varying depths. The fracture zones are encountered in the depth range of 65-198.5 m in the
exploratory wells representing different rock formations with significant changes in yield and
aquifer characteristics. They are confined to Semi-confined in nature with a high frequency of
occurrence of potential fractures within 120 m depth.
It is a general practice in the area to go for deep drilling even after encountering a potential zone
with the expectation of augmented yield or for long survival of wells. This may not give
expected results as the study of exploration data reveals. However, the surface manifestations of
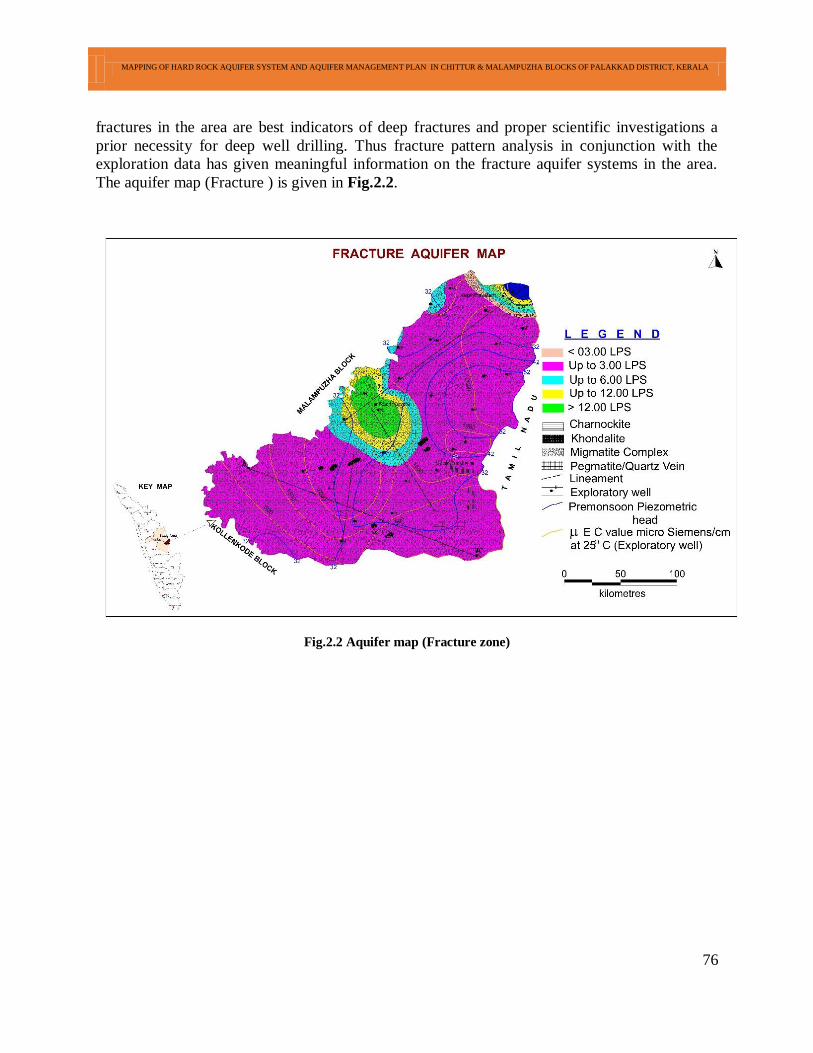
MAPPING OF HARD ROCK AQUIFER SYSTEM AND AQUIFER MANAGEMENT PLAN IN CHITTUR & MALAMPUZHA BLOCKS OF PALAKKAD DISTRICT, KERALA
76
fractures in the area are best indicators of deep fractures and proper scientific investigations a
prior necessity for deep well drilling. Thus fracture pattern analysis in conjunction with the
exploration data has given meaningful information on the fracture aquifer systems in the area.
The aquifer map (Fracture ) is given in Fig.2.2.
Fig.2.2 Aquifer map (Fracture zone)
2.2 3 D Aquifer disposition and basic Characteristics of each aquifer:
2.2 3 D Aquifer disposition and basic Characteristics of each aquifer:
2.2 3 D Aquifer disposition and basic Characteristics of each aquifer:
2.2 3 D Aquifer disposition and basic Characteristics of each aquifer:
2.2 3 D Aquifer disposition and basic Characteristics of each aquifer:
2.2 3 D Aquifer disposition and basic Characteristics of each aquifer:
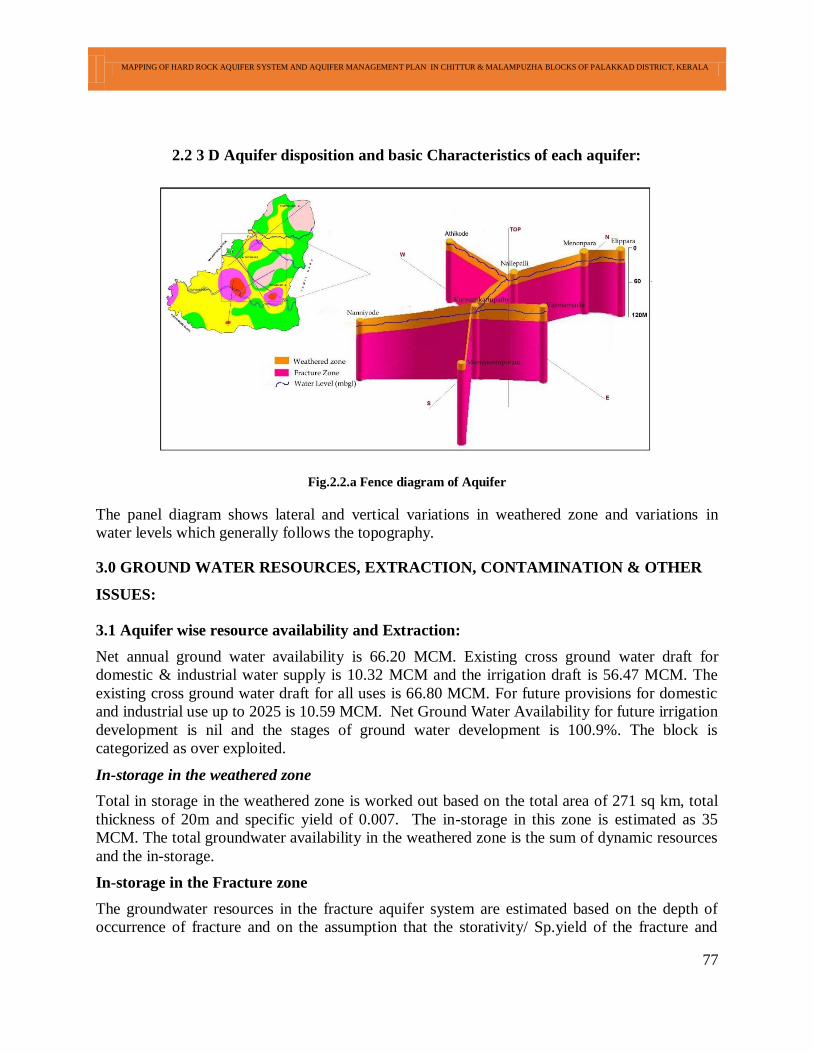
MAPPING OF HARD ROCK AQUIFER SYSTEM AND AQUIFER MANAGEMENT PLAN IN CHITTUR & MALAMPUZHA BLOCKS OF PALAKKAD DISTRICT, KERALA
77
2.2 3 D Aquifer disposition and basic Characteristics of each aquifer:
2.2 3 D Aquifer disposition and basic Characteristics of each aquifer:
Fig.2.2.a Fence diagram of Aquifer
The panel diagram shows lateral and vertical variations in weathered zone and variations in
water levels which generally follows the topography.
3.0 GROUND WATER RESOURCES, EXTRACTION, CONTAMINATION & OTHER
ISSUES:
3.1 Aquifer wise resource availability and Extraction:
Net annual ground water availability is 66.20 MCM. Existing cross ground water draft for
domestic & industrial water supply is 10.32 MCM and the irrigation draft is 56.47 MCM. The
existing cross ground water draft for all uses is 66.80 MCM. For future provisions for domestic
and industrial use up to 2025 is 10.59 MCM. Net Ground Water Availability for future irrigation
development is nil and the stages of ground water development is 100.9%. The block is
categorized as over exploited.
In-storage in the weathered zone
Total in storage in the weathered zone is worked out based on the total area of 271 sq km, total
thickness of 20m and specific yield of 0.007. The in-storage in this zone is estimated as 35
MCM. The total groundwater availability in the weathered zone is the sum of dynamic resources
and the in-storage.
In-storage in the Fracture zone
The groundwater resources in the fracture aquifer system are estimated based on the depth of
occurrence of fracture and on the assumption that the storativity/ Sp.yield of the fracture and
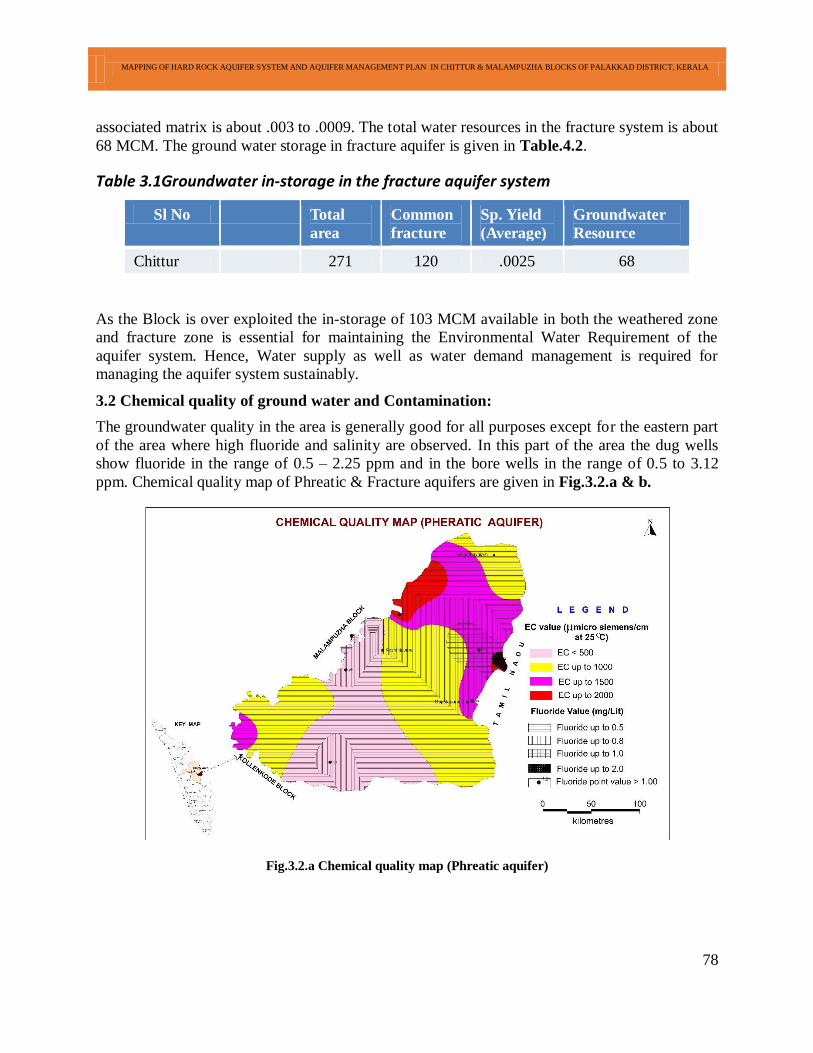
MAPPING OF HARD ROCK AQUIFER SYSTEM AND AQUIFER MANAGEMENT PLAN IN CHITTUR & MALAMPUZHA BLOCKS OF PALAKKAD DISTRICT, KERALA
78
associated matrix is about .003 to .0009. The total water resources in the fracture system is about
68 MCM. The ground water storage in fracture aquifer is given in Table.4.2.
Table 3.1Groundwater in-storage in the fracture aquifer system
Sl No Total
area
(Sq Km)
Common
fracture
depth (m)
Sp. Yield
(Average)
Groundwater
Resource
MCM Chittur 271 120 .0025 68
As the Block is over exploited the in-storage of 103 MCM available in both the weathered zone
and fracture zone is essential for maintaining the Environmental Water Requirement of the
aquifer system. Hence, Water supply as well as water demand management is required for
managing the aquifer system sustainably.
3.2 Chemical quality of ground water and Contamination:
The groundwater quality in the area is generally good for all purposes except for the eastern part
of the area where high fluoride and salinity are observed. In this part of the area the dug wells
show fluoride in the range of 0.5 – 2.25 ppm and in the bore wells in the range of 0.5 to 3.12
ppm. Chemical quality map of Phreatic & Fracture aquifers are given in Fig.3.2.a & b.
Fig.3.2.a Chemical quality map (Phreatic aquifer)
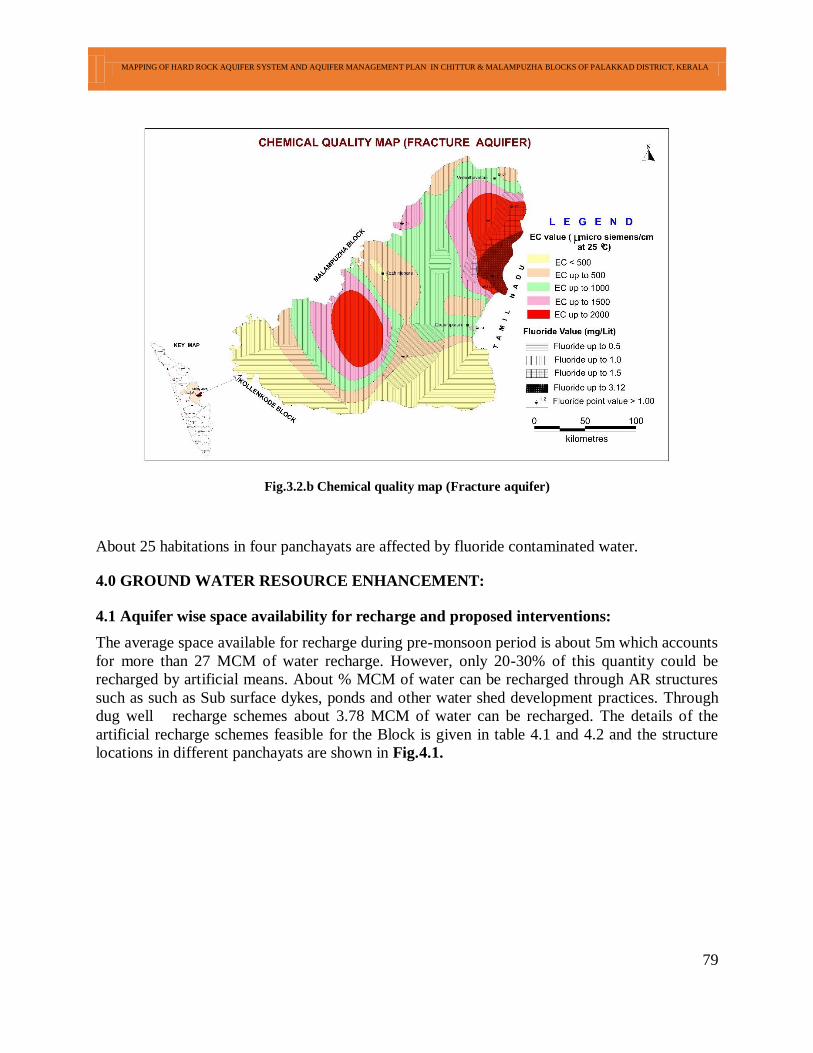
MAPPING OF HARD ROCK AQUIFER SYSTEM AND AQUIFER MANAGEMENT PLAN IN CHITTUR & MALAMPUZHA BLOCKS OF PALAKKAD DISTRICT, KERALA
79
Fig.3.2.b Chemical quality map (Fracture aquifer)
About 25 habitations in four panchayats are affected by fluoride contaminated water.
4.0 GROUND WATER RESOURCE ENHANCEMENT:
4.1 Aquifer wise space availability for recharge and proposed interventions:
The average space available for recharge during pre-monsoon period is about 5m which accounts
for more than 27 MCM of water recharge. However, only 20-30% of this quantity could be
recharged by artificial means. About % MCM of water can be recharged through AR structures
such as such as Sub surface dykes, ponds and other water shed development practices. Through
dug well recharge schemes about 3.78 MCM of water can be recharged. The details of the
artificial recharge schemes feasible for the Block is given in table 4.1 and 4.2 and the structure
locations in different panchayats are shown in Fig.4.1.
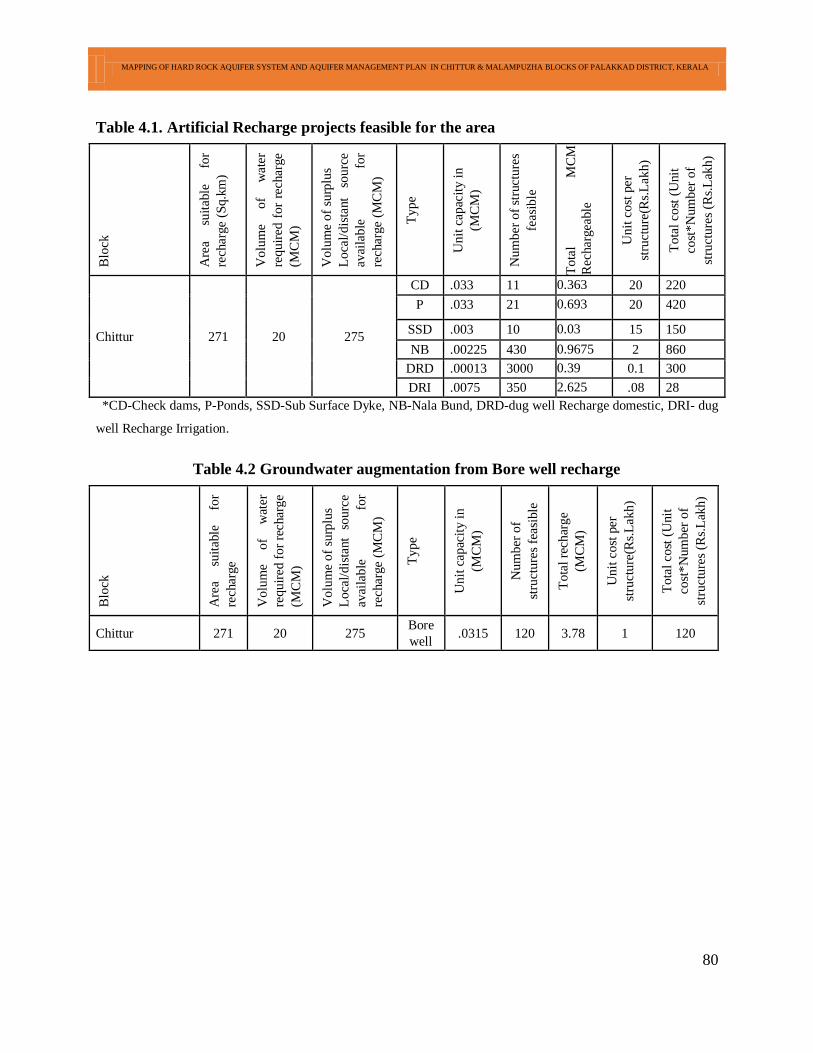
MAPPING OF HARD ROCK AQUIFER SYSTEM AND AQUIFER MANAGEMENT PLAN IN CHITTUR & MALAMPUZHA BLOCKS OF PALAKKAD DISTRICT, KERALA
80
Table 4.1. Artificial Recharge projects feasible for the area
*CD-Check dams, P-Ponds, SSD-Sub Surface Dyke, NB-Nala Bund, DRD-dug well Recharge domestic, DRI- dug
well Recharge Irrigation.
Table 4.2 Groundwater augmentation from Bore well recharge
Blo
ck
Are
a su
itab
le
for
rech
arge
Vo
lum
e o
f w
ater
req
uir
ed f
or
rech
arg
e
(MC
M)
Vo
lum
e o
f su
rplu
s
Lo
cal/
dis
tant
sou
rce
avai
lab
le
for
rech
arge
(MC
M)
Ty
pe
Un
it c
apac
ity
in
(MC
M)
Nu
mb
er o
f
stru
ctu
res
feas
ible
To
tal
rech
arg
e
(MC
M)
Un
it c
ost
per
stru
ctu
re(R
s.L
akh
)
To
tal
cost
(U
nit
cost
*N
um
ber
of
stru
ctu
res
(Rs.
Lak
h)
Chittur 271 20 275 Bore
well .0315 120 3.78 1 120
Blo
ck
Are
a su
itab
le
for
rech
arge
(Sq.k
m)
Volu
me
of
wat
er
requir
ed f
or
rech
arge
(MC
M)
Volu
me
of
surp
lus
Loca
l/dis
tant
sourc
e
avai
lable
fo
r
rech
arge
(MC
M)
Type
Unit
cap
acit
y i
n
(MC
M)
Num
ber
of
stru
cture
s
feas
ible
Tota
l M
CM
Rec
har
gea
ble
Unit
cost
per
stru
cture
(Rs.
Lak
h)
Tota
l co
st (
Unit
cost
*N
um
ber
of
stru
cture
s (R
s.L
akh)
Chittur 271 20 275
CD .033 11 0.363 20 220
P .033 21 0.693 20 420
SSD .003 10 0.03 15 150
NB .00225 430 0.9675 2 860
DRD .00013 3000 0.39 0.1 300
DRI .0075 350 2.625 .08 28
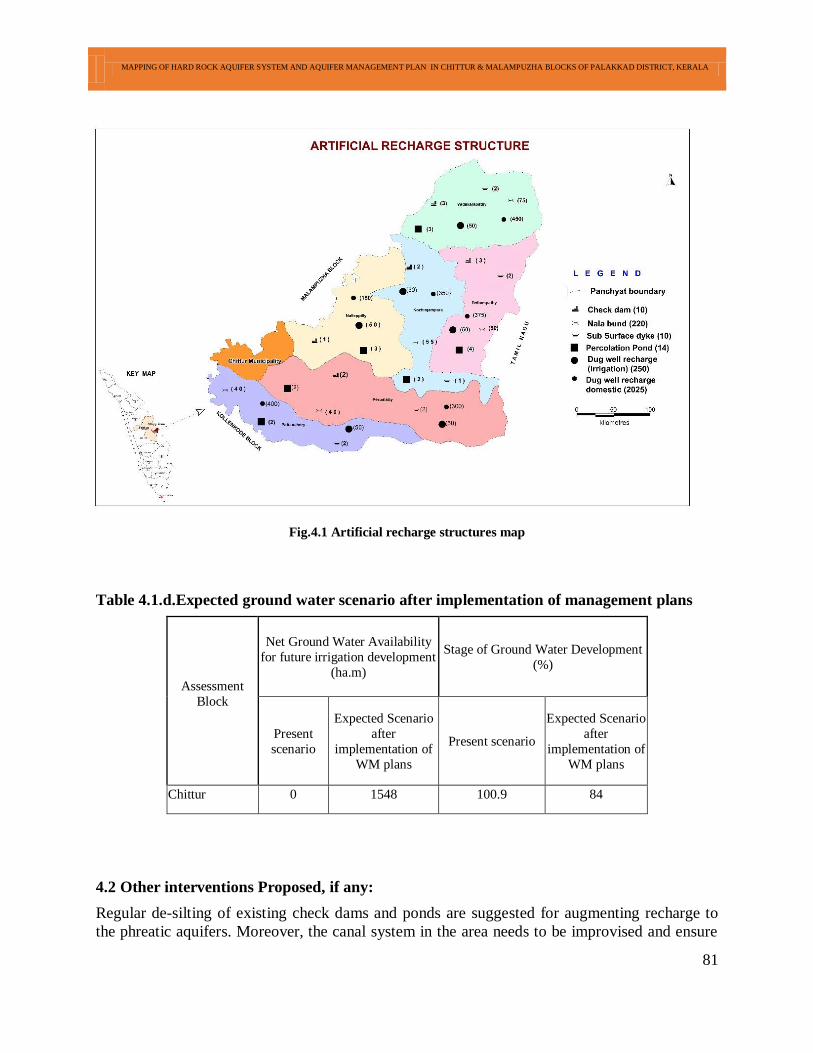
MAPPING OF HARD ROCK AQUIFER SYSTEM AND AQUIFER MANAGEMENT PLAN IN CHITTUR & MALAMPUZHA BLOCKS OF PALAKKAD DISTRICT, KERALA
81
Fig.4.1 Artificial recharge structures map
Table 4.1.d.Expected ground water scenario after implementation of management plans
Assessment
Block
Net Ground Water Availability
for future irrigation development
(ha.m)
Stage of Ground Water Development
(%)
Present
scenario
Expected Scenario
after
implementation of
WM plans
Present scenario
Expected Scenario
after
implementation of
WM plans
Chittur 0 1548 100.9 84
4.2 Other interventions Proposed, if any:
Regular de-silting of existing check dams and ponds are suggested for augmenting recharge to
the phreatic aquifers. Moreover, the canal system in the area needs to be improvised and ensure
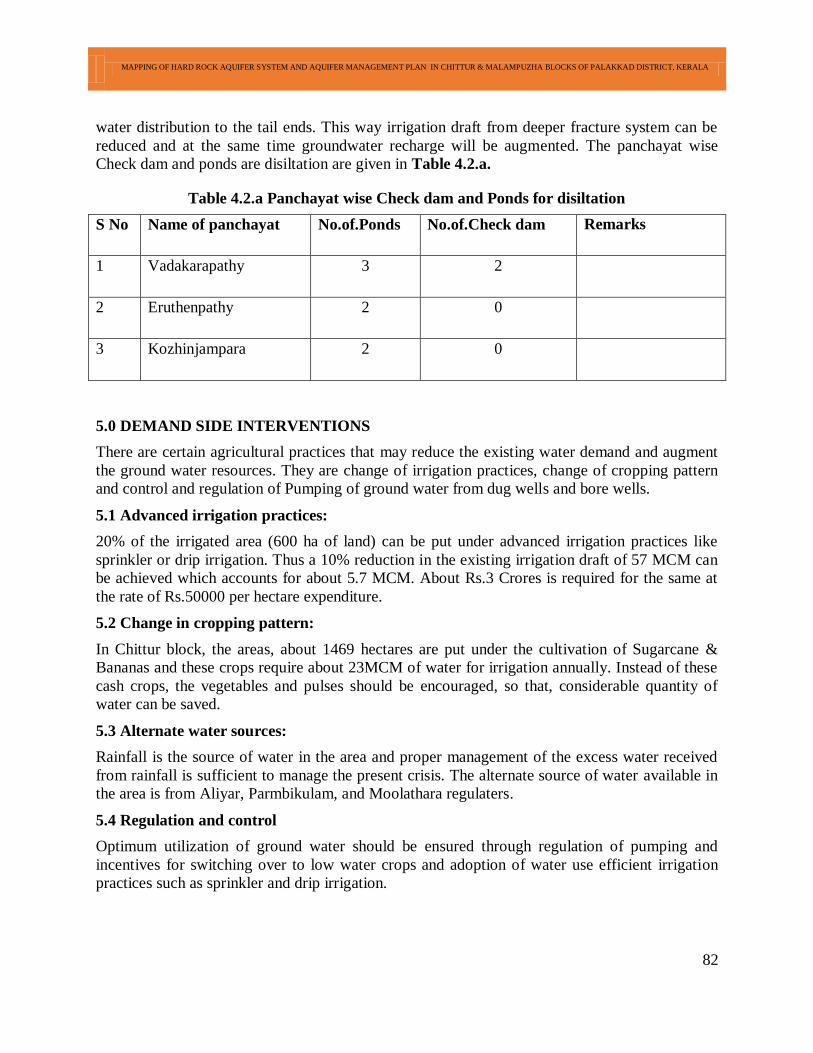
MAPPING OF HARD ROCK AQUIFER SYSTEM AND AQUIFER MANAGEMENT PLAN IN CHITTUR & MALAMPUZHA BLOCKS OF PALAKKAD DISTRICT, KERALA
82
water distribution to the tail ends. This way irrigation draft from deeper fracture system can be
reduced and at the same time groundwater recharge will be augmented. The panchayat wise
Check dam and ponds are disiltation are given in Table 4.2.a.
Table 4.2.a Panchayat wise Check dam and Ponds for disiltation
S No Name of panchayat No.of.Ponds No.of.Check dam Remarks
1 Vadakarapathy 3 2
2 Eruthenpathy 2 0
3 Kozhinjampara 2 0
5.0 DEMAND SIDE INTERVENTIONS
There are certain agricultural practices that may reduce the existing water demand and augment
the ground water resources. They are change of irrigation practices, change of cropping pattern
and control and regulation of Pumping of ground water from dug wells and bore wells.
5.1 Advanced irrigation practices:
20% of the irrigated area (600 ha of land) can be put under advanced irrigation practices like
sprinkler or drip irrigation. Thus a 10% reduction in the existing irrigation draft of 57 MCM can
be achieved which accounts for about 5.7 MCM. About Rs.3 Crores is required for the same at
the rate of Rs.50000 per hectare expenditure.
5.2 Change in cropping pattern:
In Chittur block, the areas, about 1469 hectares are put under the cultivation of Sugarcane &
Bananas and these crops require about 23MCM of water for irrigation annually. Instead of these
cash crops, the vegetables and pulses should be encouraged, so that, considerable quantity of
water can be saved.
5.3 Alternate water sources:
Rainfall is the source of water in the area and proper management of the excess water received
from rainfall is sufficient to manage the present crisis. The alternate source of water available in
the area is from Aliyar, Parmbikulam, and Moolathara regulaters.
5.4 Regulation and control
Optimum utilization of ground water should be ensured through regulation of pumping and
incentives for switching over to low water crops and adoption of water use efficient irrigation
practices such as sprinkler and drip irrigation.
MAPPING OF HARD ROCK AQUIFER SYSTEM AND AQUIFER MANAGEMENT PLAN IN CHITTUR & MALAMPUZHA BLOCKS OF PALAKKAD DISTRICT, KERALA
83
5.5 Other Interventions proposed
It is necessary to evolve a participatory mechanism wherein the farmer groups or associations
control the overall irrigation draft and choice of crop with effective support from the local
administration by way of technical guidance, incentives, marketing and fixing base level prize
for the products.
MAPPING OF HARD ROCK AQUIFER SYSTEM AND AQUIFER MANAGEMENT PLAN IN CHITTUR & MALAMPUZHA BLOCKS OF PALAKKAD DISTRICT, KERALA
2. MALAMPUZHA BLOCK
MAPPING OF HARD ROCK AQUIFER SYSTEM AND AQUIFER MANAGEMENT PLAN IN CHITTUR & MALAMPUZHA BLOCKS OF PALAKKAD DISTRICT, KERALA
1.0 SALIENT INFORMATION: ............................................................................................ 86
1.1 About the Block ......................................................................................................................................... 86
1.2 Population .................................................................................................................................................. 86
1.3 Rainfall ...................................................................................................................................................... 86
1.4 Agriculture and Irrigation: .......................................................................................................................... 87
1.5 Ground water resources availability & Extraction: ...................................................................................... 87
1.6 Existing & Future Water demands: ............................................................................................................. 88
1.7 Water level behaviour: ............................................................................................................................... 88
2.0 AQUIFER DISPOSITION:............................................................................................... 90
2.1 Number of Aquifers: .................................................................................................................................. 90
Fracture zone .................................................................................................................................................. 90
3.0 GROUND WATER RESOURCES, EXTRACTION. CONTAMINATION & OTHER
ISSUES: ................................................................................................................................... 94
3.1 Aquifer wise resource availability and Extraction: ...................................................................................... 94
3.2 Chemical quality of ground water and Contamination: ................................................................................ 94
4.0 GROUND WATER RESOURCE ENHANCEMENT: .................................................... 96
4.1 Aquifer wise space availability for recharge and proposed interventions: ..................................................... 96
4.2 Other interventions Proposed, if any: .......................................................................................................... 98
5.0 DEMAND SIDE INTERVENTIONS: .............................................................................. 98
5.1 Advanced irrigation practices: .................................................................................................................... 98
5.2 Change in cropping pattern: ........................................................................................................................ 99
5.3 Alternate water sources: ............................................................................................................................. 99
5.4 Regulation and control: .............................................................................................................................. 99
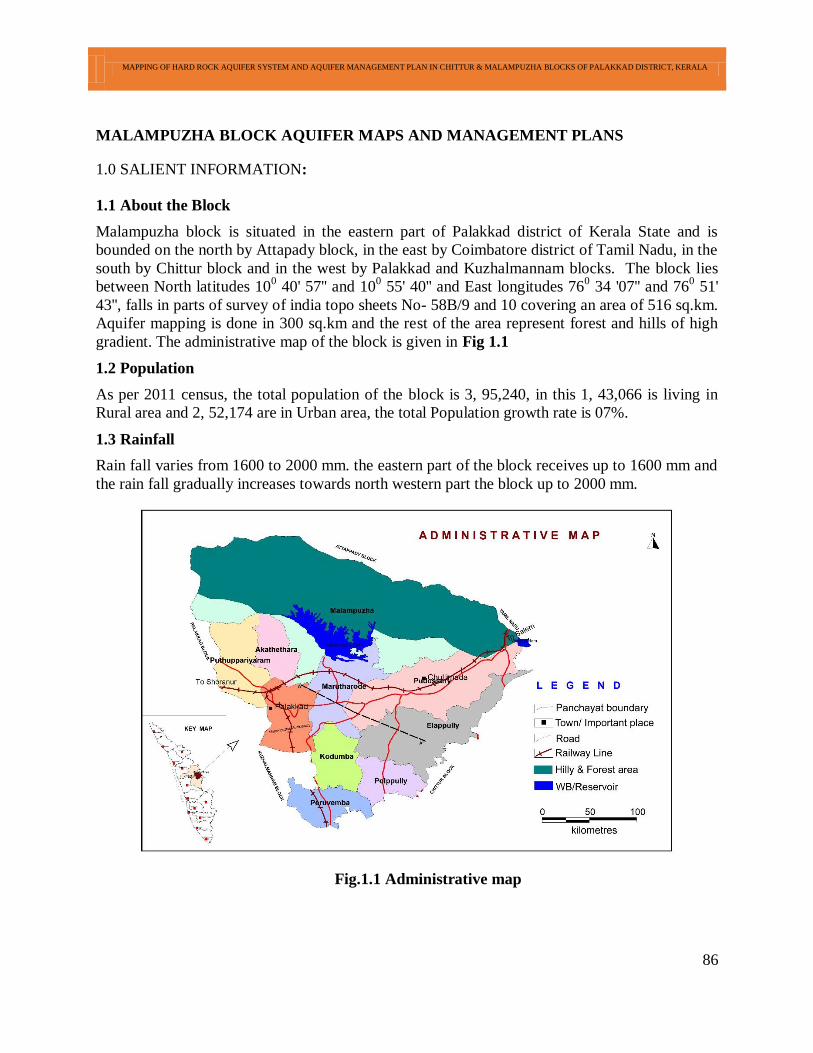
MAPPING OF HARD ROCK AQUIFER SYSTEM AND AQUIFER MANAGEMENT PLAN IN CHITTUR & MALAMPUZHA BLOCKS OF PALAKKAD DISTRICT, KERALA
86
MALAMPUZHA BLOCK AQUIFER MAPS AND MANAGEMENT PLANS
1.0 SALIENT INFORMATION:
1.1 About the Block
Malampuzha block is situated in the eastern part of Palakkad district of Kerala State and is
bounded on the north by Attapady block, in the east by Coimbatore district of Tamil Nadu, in the
south by Chittur block and in the west by Palakkad and Kuzhalmannam blocks. The block lies
between North latitudes 100 40' 57'' and 10
0 55' 40'' and East longitudes 76
0 34 '07'' and 76
0 51'
43'', falls in parts of survey of india topo sheets No- 58B/9 and 10 covering an area of 516 sq.km.
Aquifer mapping is done in 300 sq.km and the rest of the area represent forest and hills of high
gradient. The administrative map of the block is given in Fig 1.1
1.2 Population
As per 2011 census, the total population of the block is 3, 95,240, in this 1, 43,066 is living in
Rural area and 2, 52,174 are in Urban area, the total Population growth rate is 07%.
1.3 Rainfall
Rain fall varies from 1600 to 2000 mm. the eastern part of the block receives up to 1600 mm and
the rain fall gradually increases towards north western part the block up to 2000 mm.
Fig.1.1 Administrative map
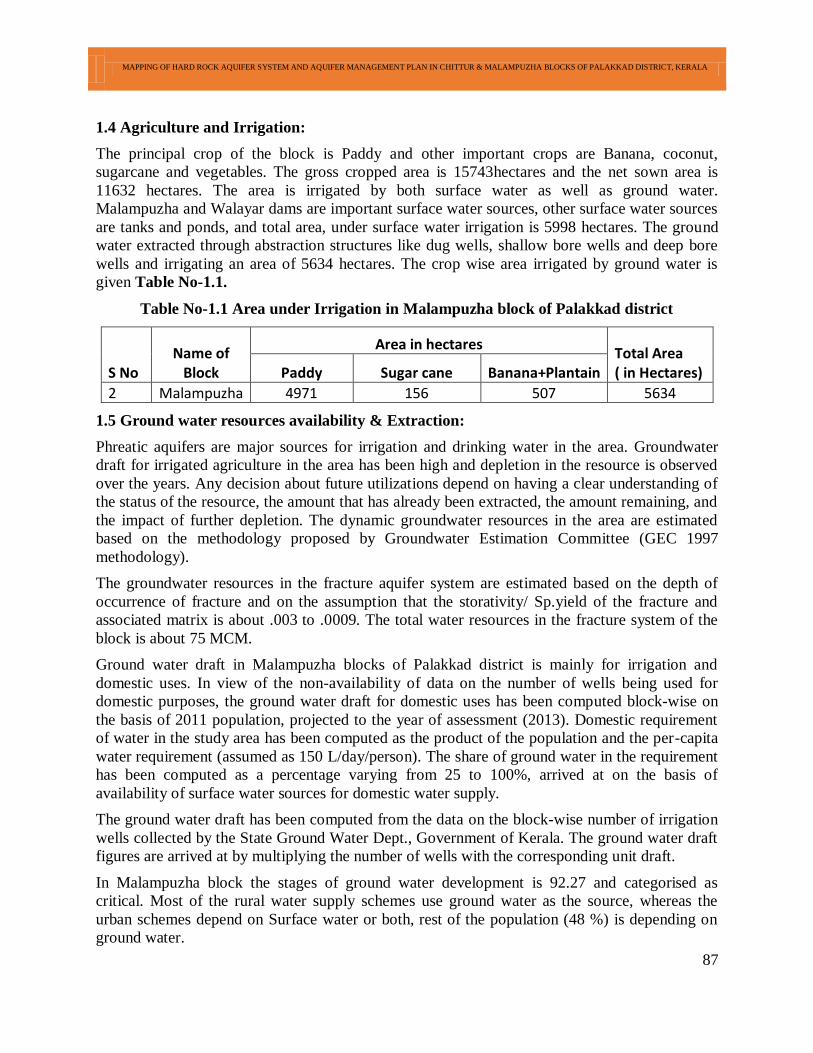
MAPPING OF HARD ROCK AQUIFER SYSTEM AND AQUIFER MANAGEMENT PLAN IN CHITTUR & MALAMPUZHA BLOCKS OF PALAKKAD DISTRICT, KERALA
87
1.4 Agriculture and Irrigation:
The principal crop of the block is Paddy and other important crops are Banana, coconut,
sugarcane and vegetables. The gross cropped area is 15743hectares and the net sown area is
11632 hectares. The area is irrigated by both surface water as well as ground water.
Malampuzha and Walayar dams are important surface water sources, other surface water sources
are tanks and ponds, and total area, under surface water irrigation is 5998 hectares. The ground
water extracted through abstraction structures like dug wells, shallow bore wells and deep bore
wells and irrigating an area of 5634 hectares. The crop wise area irrigated by ground water is
given Table No-1.1.
Table No-1.1 Area under Irrigation in Malampuzha block of Palakkad district
S No Name of
Block
Area in hectares Total Area ( in Hectares) Paddy Sugar cane Banana+Plantain
2 Malampuzha 4971 156 507 5634
1.5 Ground water resources availability & Extraction:
Phreatic aquifers are major sources for irrigation and drinking water in the area. Groundwater
draft for irrigated agriculture in the area has been high and depletion in the resource is observed
over the years. Any decision about future utilizations depend on having a clear understanding of
the status of the resource, the amount that has already been extracted, the amount remaining, and
the impact of further depletion. The dynamic groundwater resources in the area are estimated
based on the methodology proposed by Groundwater Estimation Committee (GEC 1997
methodology).
The groundwater resources in the fracture aquifer system are estimated based on the depth of
occurrence of fracture and on the assumption that the storativity/ Sp.yield of the fracture and
associated matrix is about .003 to .0009. The total water resources in the fracture system of the
block is about 75 MCM.
Ground water draft in Malampuzha blocks of Palakkad district is mainly for irrigation and
domestic uses. In view of the non-availability of data on the number of wells being used for
domestic purposes, the ground water draft for domestic uses has been computed block-wise on
the basis of 2011 population, projected to the year of assessment (2013). Domestic requirement
of water in the study area has been computed as the product of the population and the per-capita
water requirement (assumed as 150 L/day/person). The share of ground water in the requirement
has been computed as a percentage varying from 25 to 100%, arrived at on the basis of
availability of surface water sources for domestic water supply.
The ground water draft has been computed from the data on the block-wise number of irrigation
wells collected by the State Ground Water Dept., Government of Kerala. The ground water draft
figures are arrived at by multiplying the number of wells with the corresponding unit draft.
In Malampuzha block the stages of ground water development is 92.27 and categorised as
critical. Most of the rural water supply schemes use ground water as the source, whereas the
urban schemes depend on Surface water or both, rest of the population (48 %) is depending on
ground water.
MAPPING OF HARD ROCK AQUIFER SYSTEM AND AQUIFER MANAGEMENT PLAN IN CHITTUR & MALAMPUZHA BLOCKS OF PALAKKAD DISTRICT, KERALA
88
1.6 Existing & Future Water demands:
Existing cross ground water draft for domestic & industrial water supply is 12.73 MCM and the
irrigation draft is 21.92 MCM. The existing cross ground water draft for all uses is 34.65 MCM.
Net Ground Water Availability for future irrigation development is 4.61 MCM only and the
block is categorized as critical.
1.7 Water level behaviour:
The water levels in the weathered zone were monitored for pre and post monsoon period and the
water level maps were prepared (Fig. 1.2.a and 1.2.b). The pre monsoon water level map shows
deep water levels in the range of 10.00 to 12.00m in the eastern and central parts of the block
where weathered zone and shallow fractures form the phreatic aquifers. In a major part of the
area the water level is 5.00 to 7.00m. The water level fluctuation varies from 2 to 8.00m, the
central and eastern part of the study area shows the fluctuation is more, the fluctuation map is
given in Fig.1.2.c.
Fig.1.2.a. Premonsoon water level map
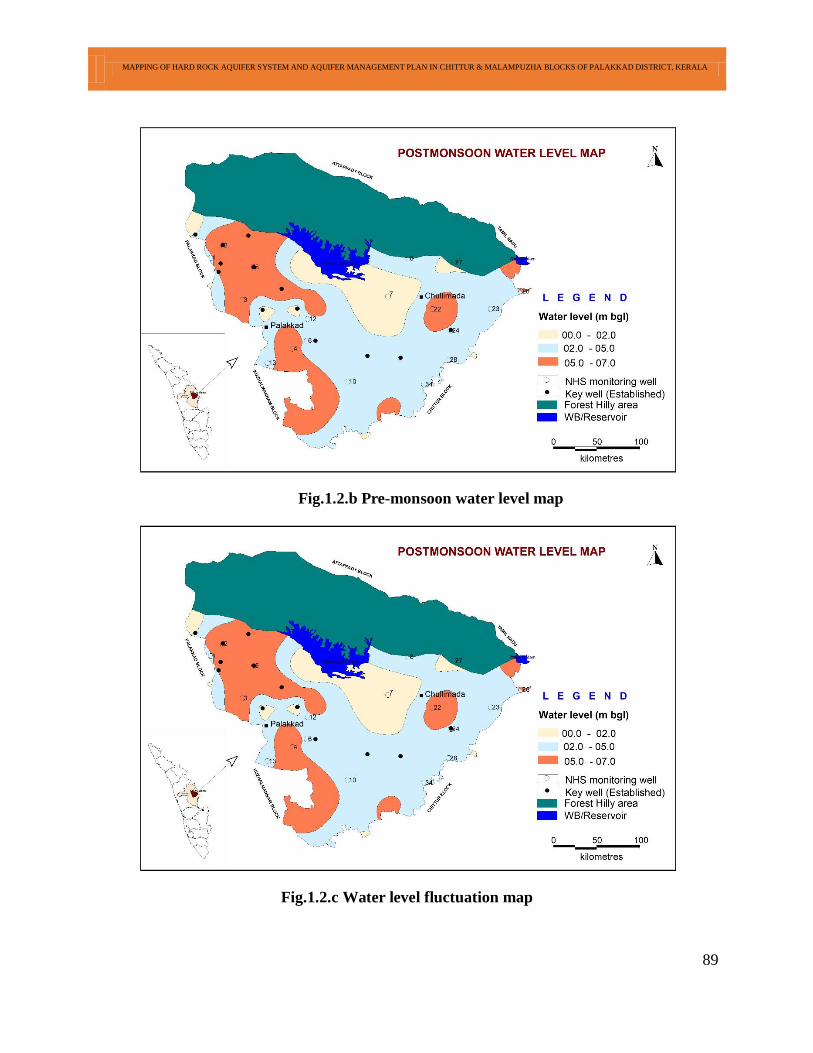
MAPPING OF HARD ROCK AQUIFER SYSTEM AND AQUIFER MANAGEMENT PLAN IN CHITTUR & MALAMPUZHA BLOCKS OF PALAKKAD DISTRICT, KERALA
89
Fig.1.2.b Pre-monsoon water level map
Fig.1.2.c Water level fluctuation map
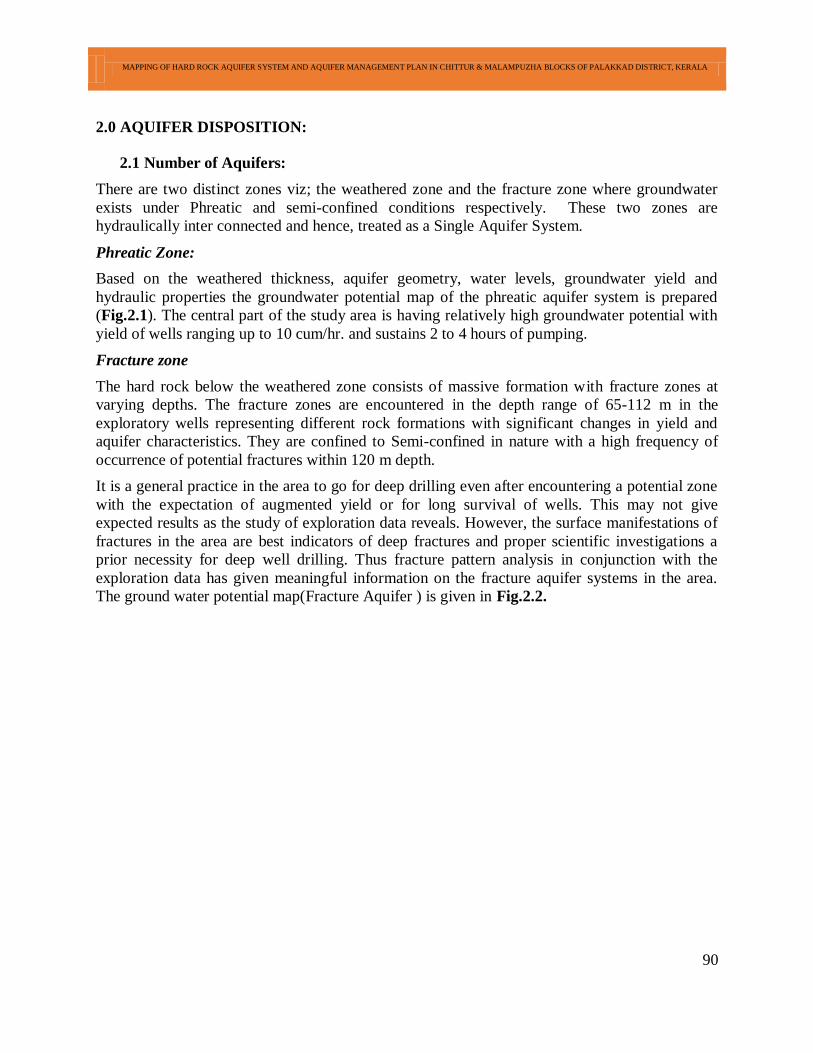
MAPPING OF HARD ROCK AQUIFER SYSTEM AND AQUIFER MANAGEMENT PLAN IN CHITTUR & MALAMPUZHA BLOCKS OF PALAKKAD DISTRICT, KERALA
90
2.0 AQUIFER DISPOSITION:
2.1 Number of Aquifers:
There are two distinct zones viz; the weathered zone and the fracture zone where groundwater
exists under Phreatic and semi-confined conditions respectively. These two zones are
hydraulically inter connected and hence, treated as a Single Aquifer System.
Phreatic Zone:
Based on the weathered thickness, aquifer geometry, water levels, groundwater yield and
hydraulic properties the groundwater potential map of the phreatic aquifer system is prepared
(Fig.2.1). The central part of the study area is having relatively high groundwater potential with
yield of wells ranging up to 10 cum/hr. and sustains 2 to 4 hours of pumping.
Fracture zone
The hard rock below the weathered zone consists of massive formation with fracture zones at
varying depths. The fracture zones are encountered in the depth range of 65-112 m in the
exploratory wells representing different rock formations with significant changes in yield and
aquifer characteristics. They are confined to Semi-confined in nature with a high frequency of
occurrence of potential fractures within 120 m depth.
It is a general practice in the area to go for deep drilling even after encountering a potential zone
with the expectation of augmented yield or for long survival of wells. This may not give
expected results as the study of exploration data reveals. However, the surface manifestations of
fractures in the area are best indicators of deep fractures and proper scientific investigations a
prior necessity for deep well drilling. Thus fracture pattern analysis in conjunction with the
exploration data has given meaningful information on the fracture aquifer systems in the area.
The ground water potential map(Fracture Aquifer ) is given in Fig.2.2.
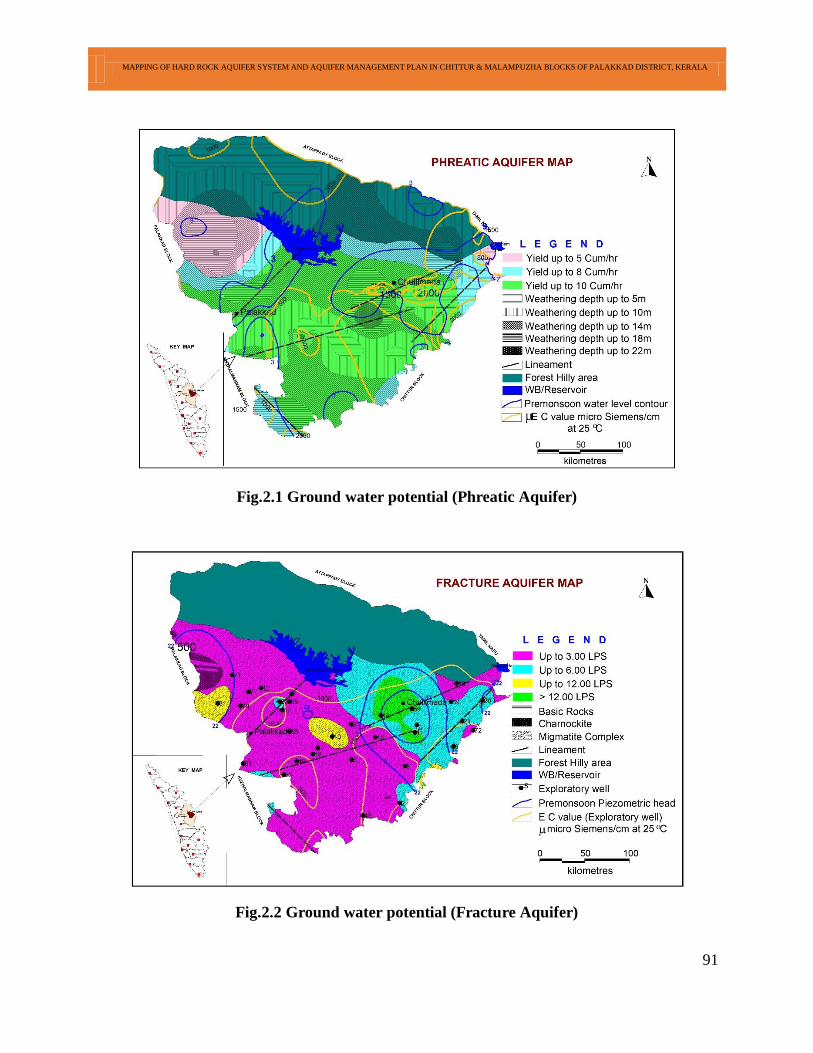
MAPPING OF HARD ROCK AQUIFER SYSTEM AND AQUIFER MANAGEMENT PLAN IN CHITTUR & MALAMPUZHA BLOCKS OF PALAKKAD DISTRICT, KERALA
91
Fig.2.1 Ground water potential (Phreatic Aquifer)
Fig.2.2 Ground water potential (Fracture Aquifer)
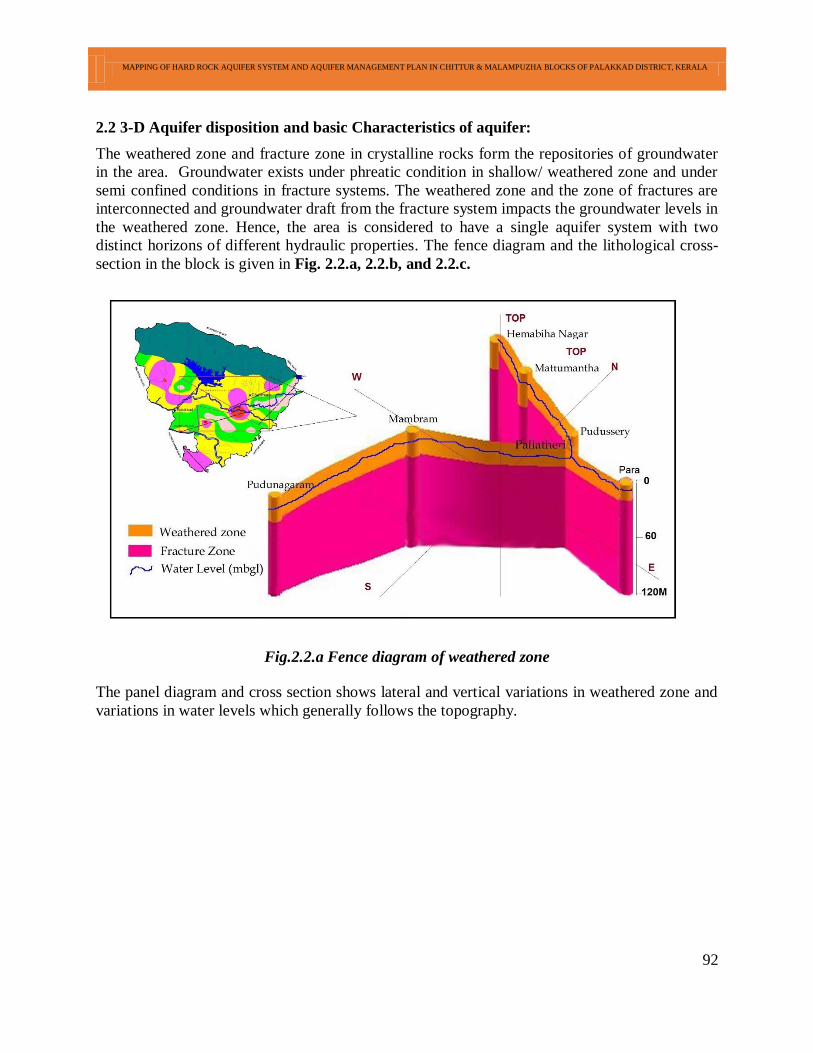
MAPPING OF HARD ROCK AQUIFER SYSTEM AND AQUIFER MANAGEMENT PLAN IN CHITTUR & MALAMPUZHA BLOCKS OF PALAKKAD DISTRICT, KERALA
92
2.2 3-D Aquifer disposition and basic Characteristics of aquifer:
The weathered zone and fracture zone in crystalline rocks form the repositories of groundwater
in the area. Groundwater exists under phreatic condition in shallow/ weathered zone and under
semi confined conditions in fracture systems. The weathered zone and the zone of fractures are
interconnected and groundwater draft from the fracture system impacts the groundwater levels in
the weathered zone. Hence, the area is considered to have a single aquifer system with two
distinct horizons of different hydraulic properties. The fence diagram and the lithological cross-
section in the block is given in Fig. 2.2.a, 2.2.b, and 2.2.c.
Fig.2.2.a Fence diagram of weathered zone
The panel diagram and cross section shows lateral and vertical variations in weathered zone and
variations in water levels which generally follows the topography.
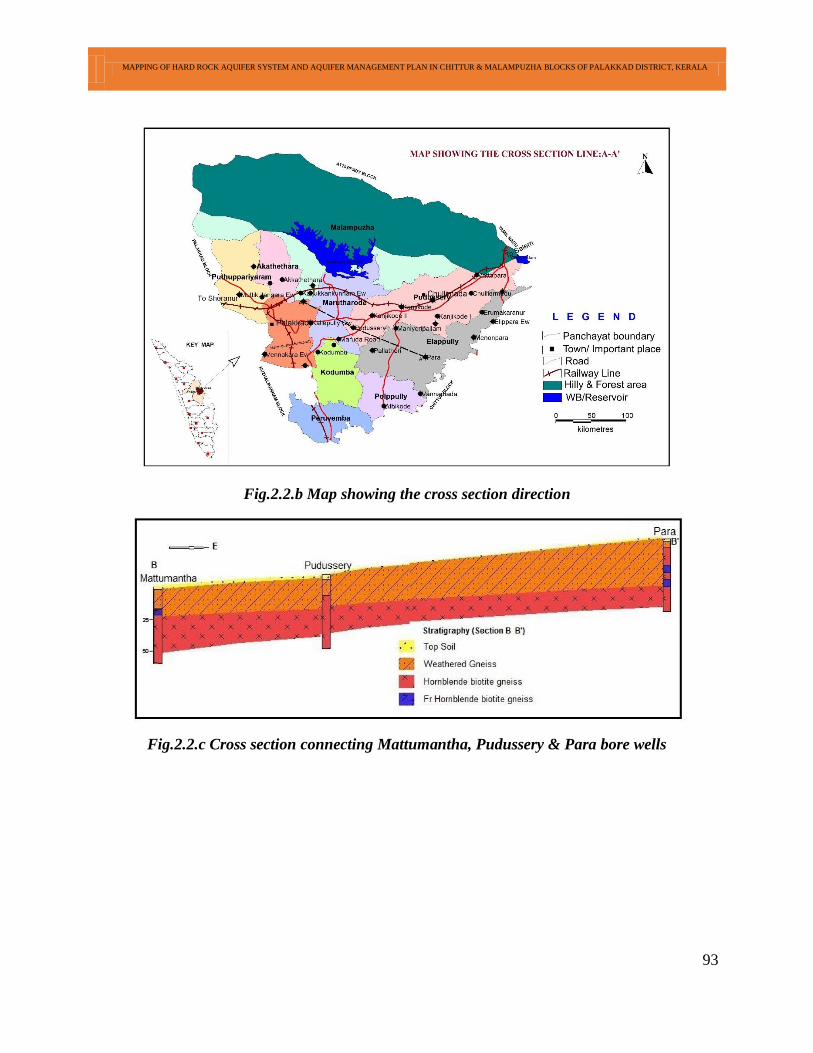
MAPPING OF HARD ROCK AQUIFER SYSTEM AND AQUIFER MANAGEMENT PLAN IN CHITTUR & MALAMPUZHA BLOCKS OF PALAKKAD DISTRICT, KERALA
93
Fig.2.2.b Map showing the cross section direction
Fig.2.2.c Cross section connecting Mattumantha, Pudussery & Para bore wells
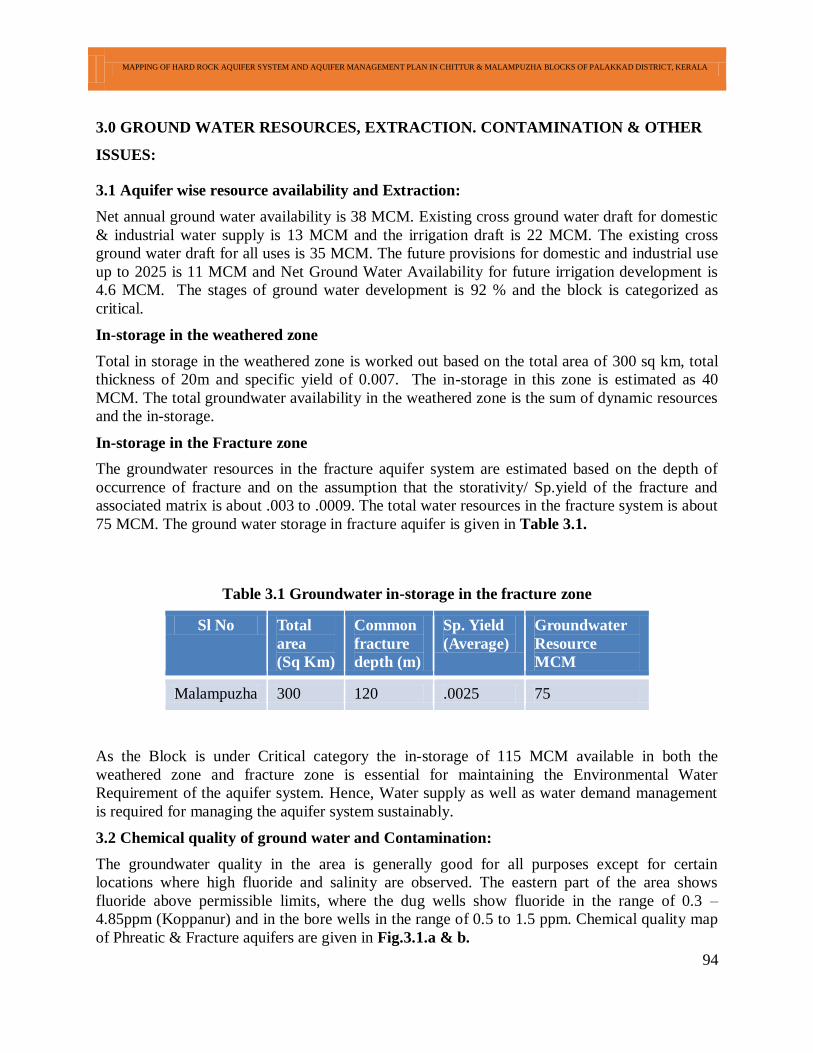
MAPPING OF HARD ROCK AQUIFER SYSTEM AND AQUIFER MANAGEMENT PLAN IN CHITTUR & MALAMPUZHA BLOCKS OF PALAKKAD DISTRICT, KERALA
94
3.0 GROUND WATER RESOURCES, EXTRACTION. CONTAMINATION & OTHER
ISSUES:
3.1 Aquifer wise resource availability and Extraction:
Net annual ground water availability is 38 MCM. Existing cross ground water draft for domestic
& industrial water supply is 13 MCM and the irrigation draft is 22 MCM. The existing cross
ground water draft for all uses is 35 MCM. The future provisions for domestic and industrial use
up to 2025 is 11 MCM and Net Ground Water Availability for future irrigation development is
4.6 MCM. The stages of ground water development is 92 % and the block is categorized as
critical.
In-storage in the weathered zone
Total in storage in the weathered zone is worked out based on the total area of 300 sq km, total
thickness of 20m and specific yield of 0.007. The in-storage in this zone is estimated as 40
MCM. The total groundwater availability in the weathered zone is the sum of dynamic resources
and the in-storage.
In-storage in the Fracture zone
The groundwater resources in the fracture aquifer system are estimated based on the depth of
occurrence of fracture and on the assumption that the storativity/ Sp.yield of the fracture and
associated matrix is about .003 to .0009. The total water resources in the fracture system is about
75 MCM. The ground water storage in fracture aquifer is given in Table 3.1.
Table 3.1 Groundwater in-storage in the fracture zone
Sl No Total
area
(Sq Km)
Common
fracture
depth (m)
Sp. Yield
(Average)
Groundwater
Resource
MCM
Malampuzha 300 120 .0025 75
As the Block is under Critical category the in-storage of 115 MCM available in both the
weathered zone and fracture zone is essential for maintaining the Environmental Water
Requirement of the aquifer system. Hence, Water supply as well as water demand management
is required for managing the aquifer system sustainably.
3.2 Chemical quality of ground water and Contamination:
The groundwater quality in the area is generally good for all purposes except for certain
locations where high fluoride and salinity are observed. The eastern part of the area shows
fluoride above permissible limits, where the dug wells show fluoride in the range of 0.3 –
4.85ppm (Koppanur) and in the bore wells in the range of 0.5 to 1.5 ppm. Chemical quality map
of Phreatic & Fracture aquifers are given in Fig.3.1.a & b.
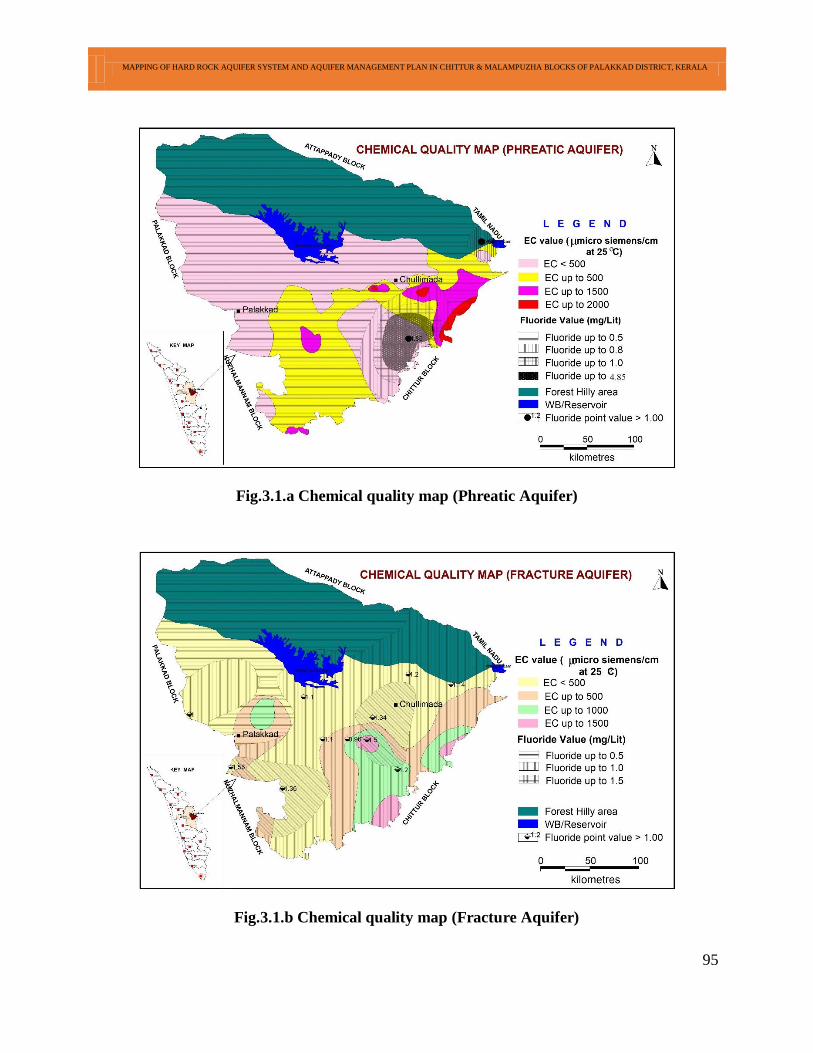
MAPPING OF HARD ROCK AQUIFER SYSTEM AND AQUIFER MANAGEMENT PLAN IN CHITTUR & MALAMPUZHA BLOCKS OF PALAKKAD DISTRICT, KERALA
95
Fig.3.1.a Chemical quality map (Phreatic Aquifer)
Fig.3.1.b Chemical quality map (Fracture Aquifer)

MAPPING OF HARD ROCK AQUIFER SYSTEM AND AQUIFER MANAGEMENT PLAN IN CHITTUR & MALAMPUZHA BLOCKS OF PALAKKAD DISTRICT, KERALA
96
Five habitations in Elapully and Pudussery panchayats are having fluoride contamination in
groundwater.
4.0 GROUND WATER RESOURCE ENHANCEMENT:
4.1 Aquifer wise space availability for recharge and proposed interventions:
The average space available for recharge during pre-monsoon period is about 5m which accounts
for more than 30 MCM of water recharge. However, only 20-30% of this quantity could be
recharged by artificial means. About 4.5 MCM of water can be recharged through AR structures
such as such as Sub surface dykes, ponds and other water shed development practices. Through
dug well recharge schemes about 1 MCM of water can be recharged. The details of the artificial
recharge schemes feasible for the Block is given in Table 4.1 and 4.2. The tentative locations for
the artificial recharge structures in various panchayats in the block are shown in Fig.4.1.
Table 4.1.a. Artificial recharge structures of Malampuzha block, Palakkad district
*CD-Check dams, P-Ponds, SSD-Sub Surface Dyke, NB-Nala Bund, DRD-dug well Recharge domestic, DRI- dug
well Recharge Irrigation.
Blo
ck
Are
a su
itab
le
for
rech
arge
(Sq.k
m)
Volu
me
of
wat
er
requir
ed
for
rech
arge
(MC
M)
Volu
me
of
surp
lus
Loca
l/dis
tant
sourc
e
avai
lable
fo
r
rech
arge
(MC
M)
Type
Unit
cap
acit
y i
n
(MC
M)
N
um
ber
of
stru
cture
s fe
asib
le
Tota
l M
CM
Rec
har
gea
ble
Unit
cost
per
stru
cture
(Rs.
Lak
h)
Tota
l co
st (
Unit
cost
*N
um
ber
of
stru
cture
s (R
s.L
akh)
Malampuzha 95 12 96
CD .033 11 0.363 20 220
P .033 16 0.528 20 320
SSD .003 6 0.018 15 90
NB .00225 300 0.675 2 600
DRD .00013 1500 0.195 0.1 150
DRI .0075 230 1.725 .08 18.4
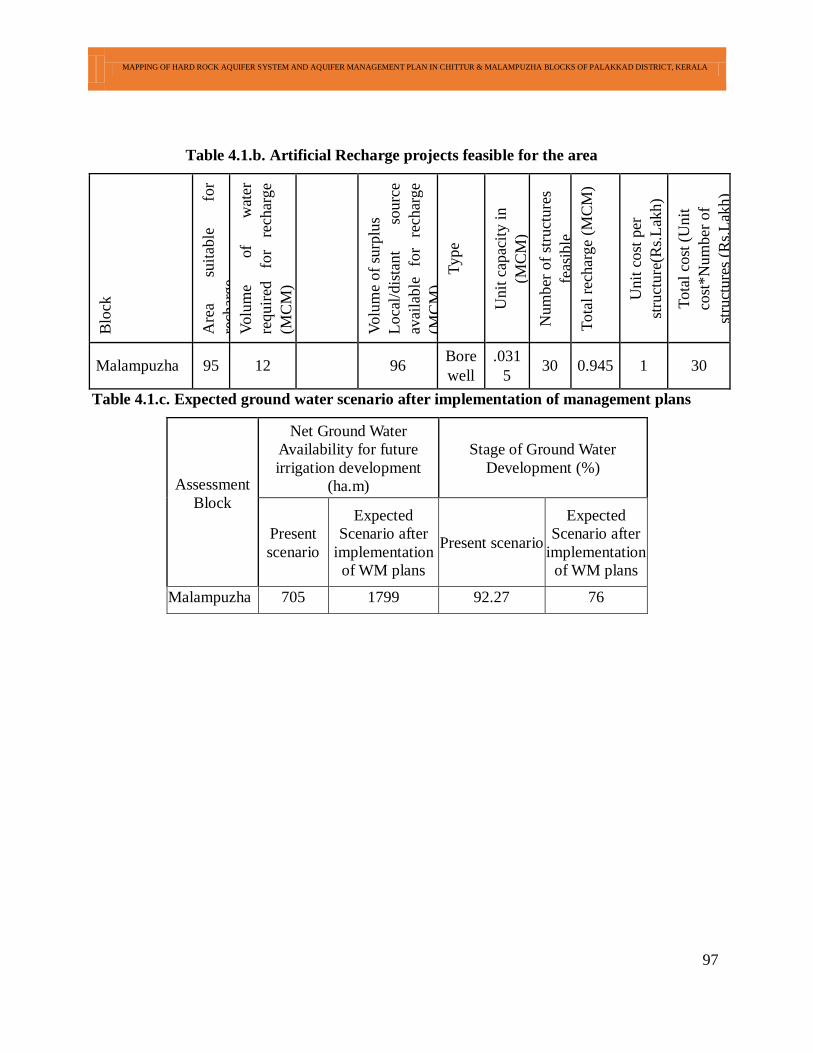
MAPPING OF HARD ROCK AQUIFER SYSTEM AND AQUIFER MANAGEMENT PLAN IN CHITTUR & MALAMPUZHA BLOCKS OF PALAKKAD DISTRICT, KERALA
97
Table 4.1.b. Artificial Recharge projects feasible for the area
Blo
ck
Are
a su
itab
le
for
rech
arge
Volu
me
of
wat
er
requir
ed
for
rech
arge
(MC
M)
Volu
me
of
surp
lus
Loca
l/dis
tant
sourc
e
avai
lable
fo
r re
char
ge
(MC
M)
Type
Unit
cap
acit
y i
n
(MC
M)
N
um
ber
of
stru
cture
s
feas
ible
Tota
l re
char
ge
(MC
M)
Unit
cost
per
stru
cture
(Rs.
Lak
h)
Tota
l co
st (
Unit
cost
*N
um
ber
of
stru
cture
s (R
s.L
akh)
Malampuzha 95 12
96 Bore
well
.031
5 30 0.945 1 30
Table 4.1.c. Expected ground water scenario after implementation of management plans
Assessment
Block
Net Ground Water
Availability for future
irrigation development
(ha.m)
Stage of Ground Water
Development (%)
Present
scenario
Expected
Scenario after
implementation
of WM plans
Present scenario
Expected
Scenario after
implementation
of WM plans
Malampuzha 705 1799 92.27 76
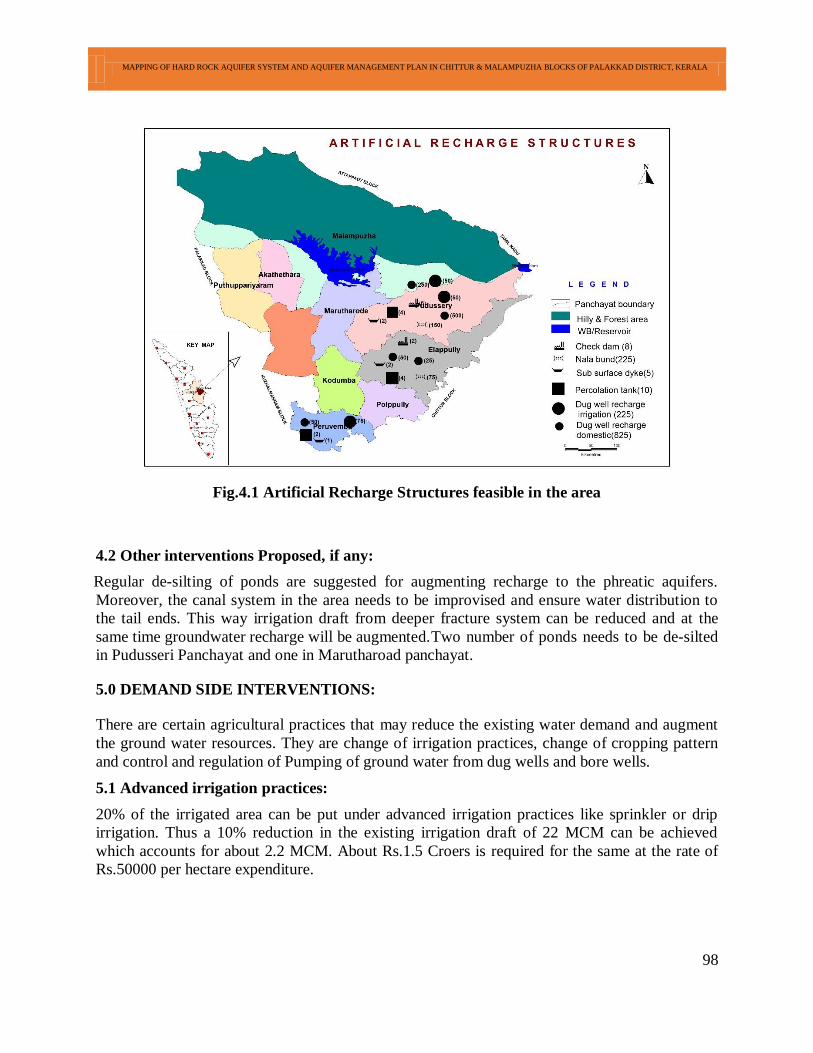
MAPPING OF HARD ROCK AQUIFER SYSTEM AND AQUIFER MANAGEMENT PLAN IN CHITTUR & MALAMPUZHA BLOCKS OF PALAKKAD DISTRICT, KERALA
98
Fig.4.1 Artificial Recharge Structures feasible in the area
4.2 Other interventions Proposed, if any:
Regular de-silting of ponds are suggested for augmenting recharge to the phreatic aquifers.
Moreover, the canal system in the area needs to be improvised and ensure water distribution to
the tail ends. This way irrigation draft from deeper fracture system can be reduced and at the
same time groundwater recharge will be augmented. Two number of ponds needs to be de-silted
in Pudusseri Panchayat and one in Marutharoad panchayat.
5.0 DEMAND SIDE INTERVENTIONS:
There are certain agricultural practices that may reduce the existing water demand and augment
the ground water resources. They are change of irrigation practices, change of cropping pattern
and control and regulation of Pumping of ground water from dug wells and bore wells.
5.1 Advanced irrigation practices:
20% of the irrigated area can be put under advanced irrigation practices like sprinkler or drip
irrigation. Thus a 10% reduction in the existing irrigation draft of 22 MCM can be achieved
which accounts for about 2.2 MCM. About Rs.1.5 Croers is required for the same at the rate of
Rs.50000 per hectare expenditure.
MAPPING OF HARD ROCK AQUIFER SYSTEM AND AQUIFER MANAGEMENT PLAN IN CHITTUR & MALAMPUZHA BLOCKS OF PALAKKAD DISTRICT, KERALA
99
5.2 Change in cropping pattern:
In Malampuzha block 663 hectars of land in Pudusseri and Maruda road panchyats are put under
cultivation of Sugarcane and Bananas which require about 10.29 MCM of water. Instead of these
cash crops, the vegetables can be cultivated, so that the water requirement can be reduced to
about 4.79 MCM.
5.3 Alternate water sources:
Rainfall is the source of water in the area and proper management of the excess water received
from rainfall is sufficient to manage the present crisis. The alternate source of water available in
the area is from Malampuzha dam.
5.4 Regulation and control:
In recent past, the area of Pudusseri Panchayat, started heavy withdrawal of ground water for
irrigation as well as for industrial purposes, it is affecting the ground water regime in the vicinity
and may lead to severe water crisis in future. As a solution, the malampuzha water may be
supplimented from Malampuzha dam to this panchayat. The dam is situated within 6 km radius.
Indiscriminate drilling at present is being regulated by the State Ground Water Authority.
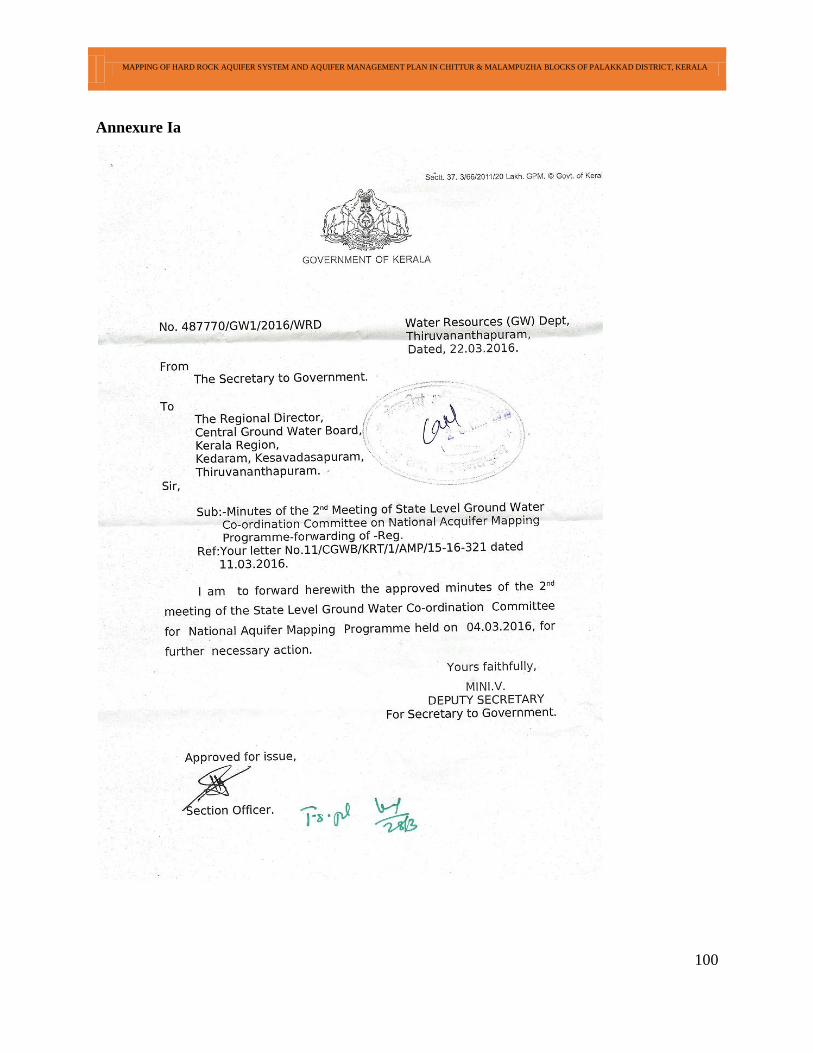
MAPPING OF HARD ROCK AQUIFER SYSTEM AND AQUIFER MANAGEMENT PLAN IN CHITTUR & MALAMPUZHA BLOCKS OF PALAKKAD DISTRICT, KERALA
100
Annexure Ia
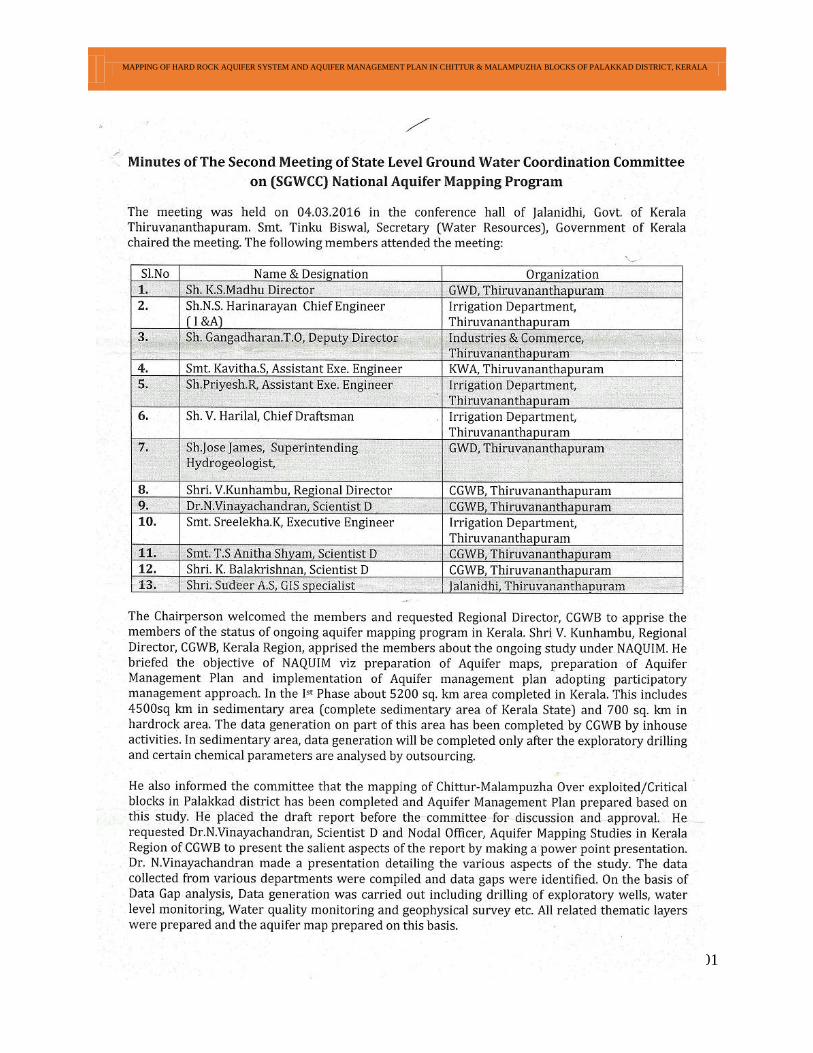
MAPPING OF HARD ROCK AQUIFER SYSTEM AND AQUIFER MANAGEMENT PLAN IN CHITTUR & MALAMPUZHA BLOCKS OF PALAKKAD DISTRICT, KERALA
101
MAPPING OF HARD ROCK AQUIFER SYSTEM AND AQUIFER MANAGEMENT PLAN IN CHITTUR & MALAMPUZHA BLOCKS OF PALAKKAD DISTRICT, KERALA
102
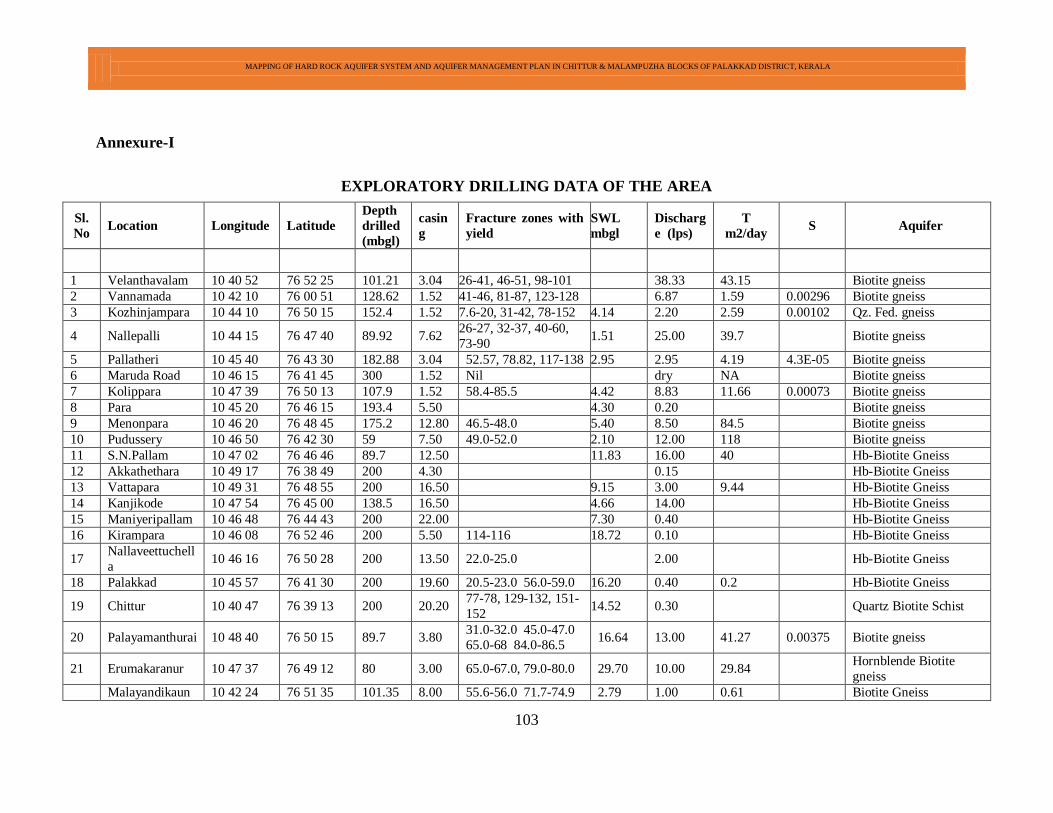
MAPPING OF HARD ROCK AQUIFER SYSTEM AND AQUIFER MANAGEMENT PLAN IN CHITTUR & MALAMPUZHA BLOCKS OF PALAKKAD DISTRICT, KERALA
103
Annexure-I
EXPLORATORY DRILLING DATA OF THE AREA
Sl.
No Location Longitude Latitude
Depth
drilled
(mbgl)
casin
g
Fracture zones with
yield
SWL
mbgl
Discharg
e (lps)
T
m2/day S Aquifer
1 Velanthavalam 10 40 52 76 52 25 101.21 3.04 26-41, 46-51, 98-101 38.33 43.15 Biotite gneiss
2 Vannamada 10 42 10 76 00 51 128.62 1.52 41-46, 81-87, 123-128 6.87 1.59 0.00296 Biotite gneiss
3 Kozhinjampara 10 44 10 76 50 15 152.4 1.52 7.6-20, 31-42, 78-152 4.14 2.20 2.59 0.00102 Qz. Fed. gneiss
4 Nallepalli 10 44 15 76 47 40 89.92 7.62 26-27, 32-37, 40-60,
73-90 1.51 25.00 39.7 Biotite gneiss
5 Pallatheri 10 45 40 76 43 30 182.88 3.04 52.57, 78.82, 117-138 2.95 2.95 4.19 4.3E-05 Biotite gneiss
6 Maruda Road 10 46 15 76 41 45 300 1.52 Nil dry NA Biotite gneiss
7 Kolippara 10 47 39 76 50 13 107.9 1.52 58.4-85.5 4.42 8.83 11.66 0.00073 Biotite gneiss
8 Para 10 45 20 76 46 15 193.4 5.50 4.30 0.20 Biotite gneiss
9 Menonpara 10 46 20 76 48 45 175.2 12.80 46.5-48.0 5.40 8.50 84.5 Biotite gneiss
10 Pudussery 10 46 50 76 42 30 59 7.50 49.0-52.0 2.10 12.00 118 Biotite gneiss
11 S.N.Pallam 10 47 02 76 46 46 89.7 12.50 11.83 16.00 40 Hb-Biotite Gneiss
12 Akkathethara 10 49 17 76 38 49 200 4.30 0.15 Hb-Biotite Gneiss
13 Vattapara 10 49 31 76 48 55 200 16.50 9.15 3.00 9.44 Hb-Biotite Gneiss
14 Kanjikode 10 47 54 76 45 00 138.5 16.50 4.66 14.00 Hb-Biotite Gneiss
15 Maniyeripallam 10 46 48 76 44 43 200 22.00 7.30 0.40 Hb-Biotite Gneiss
16 Kirampara 10 46 08 76 52 46 200 5.50 114-116 18.72 0.10 Hb-Biotite Gneiss
17 Nallaveettuchell
a 10 46 16 76 50 28 200 13.50 22.0-25.0 2.00 Hb-Biotite Gneiss
18 Palakkad 10 45 57 76 41 30 200 19.60 20.5-23.0 56.0-59.0 16.20 0.40 0.2 Hb-Biotite Gneiss
19 Chittur 10 40 47 76 39 13 200 20.20 77-78, 129-132, 151-
152 14.52 0.30 Quartz Biotite Schist
20 Palayamanthurai 10 48 40 76 50 15 89.7 3.80 31.0-32.0 45.0-47.0
65.0-68 84.0-86.5 16.64 13.00 41.27 0.00375 Biotite gneiss
21 Erumakaranur 10 47 37 76 49 12 80 3.00 65.0-67.0, 79.0-80.0 29.70 10.00 29.84 Hornblende Biotite
gneiss
Malayandikaun 10 42 24 76 51 35 101.35 8.00 55.6-56.0 71.7-74.9 2.79 1.00 0.61 Biotite Gneiss
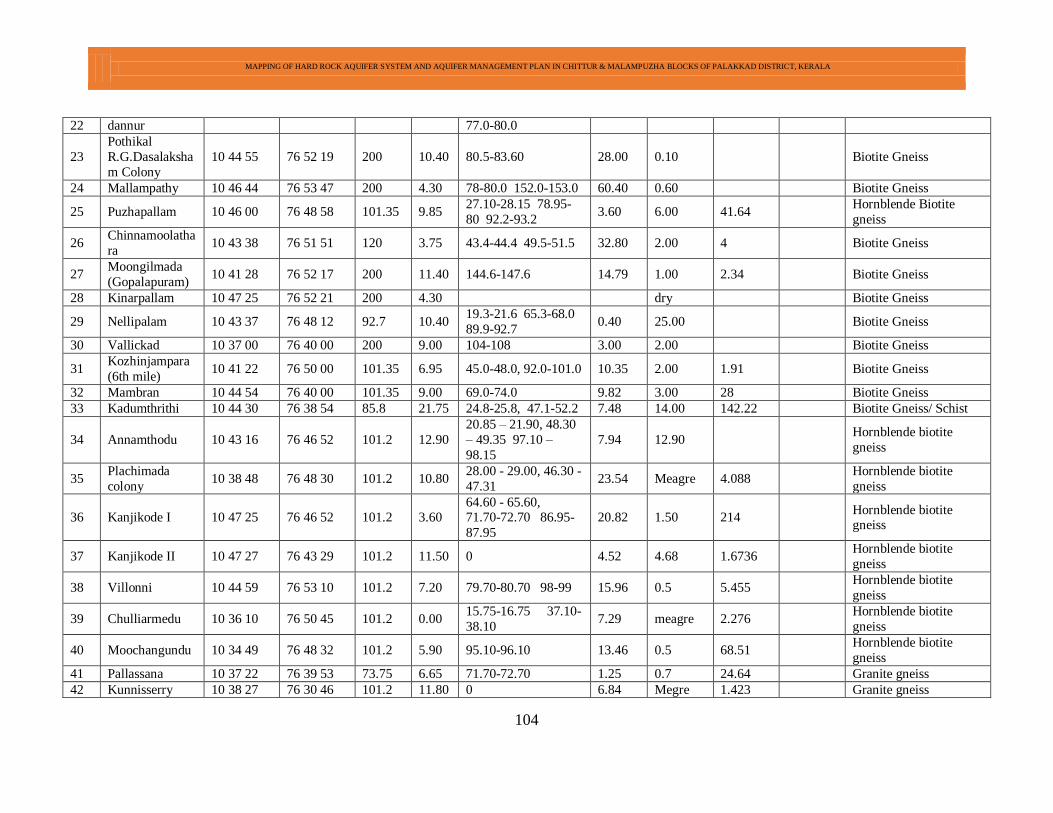
MAPPING OF HARD ROCK AQUIFER SYSTEM AND AQUIFER MANAGEMENT PLAN IN CHITTUR & MALAMPUZHA BLOCKS OF PALAKKAD DISTRICT, KERALA
104
22 dannur 77.0-80.0
23
Pothikal
R.G.Dasalaksha
m Colony
10 44 55 76 52 19 200 10.40 80.5-83.60 28.00 0.10 Biotite Gneiss
24 Mallampathy 10 46 44 76 53 47 200 4.30 78-80.0 152.0-153.0 60.40 0.60 Biotite Gneiss
25 Puzhapallam 10 46 00 76 48 58 101.35 9.85 27.10-28.15 78.95-
80 92.2-93.2 3.60 6.00 41.64
Hornblende Biotite
gneiss
26 Chinnamoolatha
ra 10 43 38 76 51 51 120 3.75 43.4-44.4 49.5-51.5 32.80 2.00 4 Biotite Gneiss
27 Moongilmada
(Gopalapuram) 10 41 28 76 52 17 200 11.40 144.6-147.6 14.79 1.00 2.34 Biotite Gneiss
28 Kinarpallam 10 47 25 76 52 21 200 4.30 dry Biotite Gneiss
29 Nellipalam 10 43 37 76 48 12 92.7 10.40 19.3-21.6 65.3-68.0
89.9-92.7 0.40 25.00 Biotite Gneiss
30 Vallickad 10 37 00 76 40 00 200 9.00 104-108 3.00 2.00 Biotite Gneiss
31 Kozhinjampara
(6th mile) 10 41 22 76 50 00 101.35 6.95 45.0-48.0, 92.0-101.0 10.35 2.00 1.91 Biotite Gneiss
32 Mambran 10 44 54 76 40 00 101.35 9.00 69.0-74.0 9.82 3.00 28 Biotite Gneiss
33 Kadumthrithi 10 44 30 76 38 54 85.8 21.75 24.8-25.8, 47.1-52.2 7.48 14.00 142.22 Biotite Gneiss/ Schist
34 Annamthodu 10 43 16 76 46 52 101.2 12.90
20.85 – 21.90, 48.30
– 49.35 97.10 –
98.15
7.94 12.90 Hornblende biotite
gneiss
35 Plachimada
colony 10 38 48 76 48 30 101.2 10.80
28.00 - 29.00, 46.30 -
47.31 23.54 Meagre 4.088
Hornblende biotite
gneiss
36 Kanjikode I 10 47 25 76 46 52 101.2 3.60 64.60 - 65.60, 71.70-72.70 86.95-
87.95
20.82 1.50 214 Hornblende biotite gneiss
37 Kanjikode II 10 47 27 76 43 29 101.2 11.50 0 4.52 4.68 1.6736 Hornblende biotite
gneiss
38 Villonni 10 44 59 76 53 10 101.2 7.20 79.70-80.70 98-99 15.96 0.5 5.455 Hornblende biotite
gneiss
39 Chulliarmedu 10 36 10 76 50 45 101.2 0.00 15.75-16.75 37.10-
38.10 7.29 meagre 2.276
Hornblende biotite
gneiss
40 Moochangundu 10 34 49 76 48 32 101.2 5.90 95.10-96.10 13.46 0.5 68.51 Hornblende biotite
gneiss
41 Pallassana 10 37 22 76 39 53 73.75 6.65 71.70-72.70 1.25 0.7 24.64 Granite gneiss
42 Kunnisserry 10 38 27 76 30 46 101.2 11.80 0 6.84 Megre 1.423 Granite gneiss
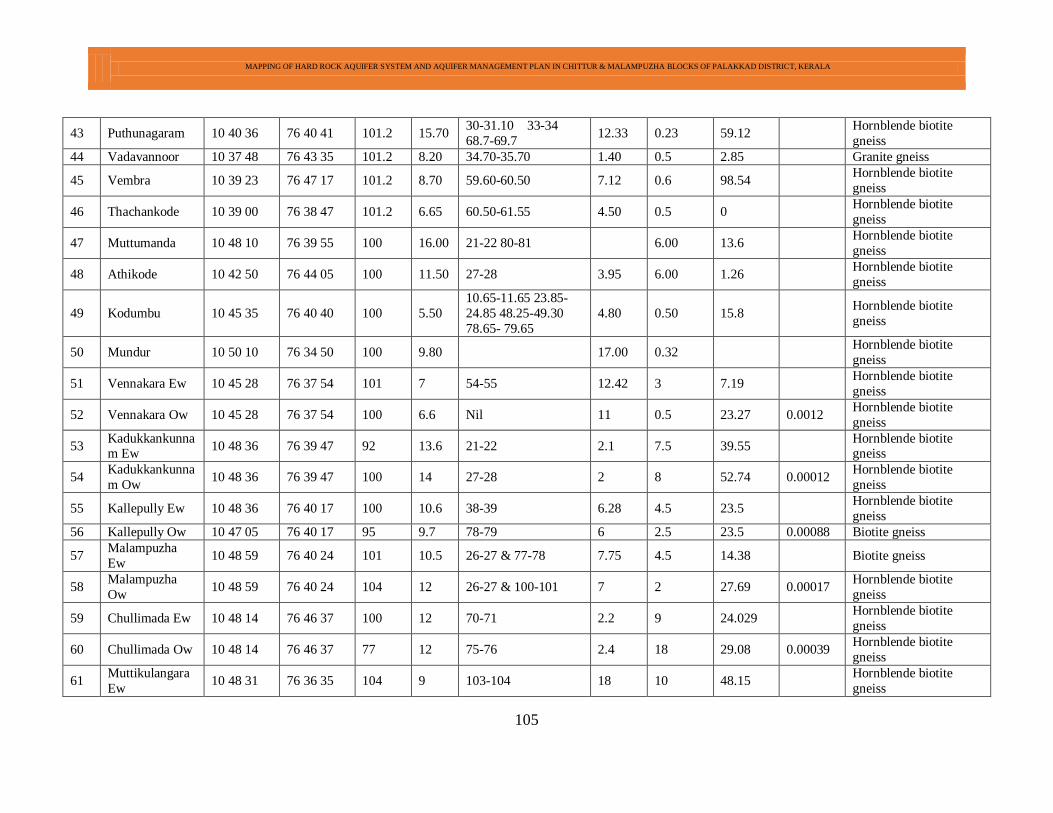
MAPPING OF HARD ROCK AQUIFER SYSTEM AND AQUIFER MANAGEMENT PLAN IN CHITTUR & MALAMPUZHA BLOCKS OF PALAKKAD DISTRICT, KERALA
105
43 Puthunagaram 10 40 36 76 40 41 101.2 15.70 30-31.10 33-34
68.7-69.7 12.33 0.23 59.12
Hornblende biotite
gneiss
44 Vadavannoor 10 37 48 76 43 35 101.2 8.20 34.70-35.70 1.40 0.5 2.85 Granite gneiss
45 Vembra 10 39 23 76 47 17 101.2 8.70 59.60-60.50 7.12 0.6 98.54 Hornblende biotite
gneiss
46 Thachankode 10 39 00 76 38 47 101.2 6.65 60.50-61.55 4.50 0.5 0 Hornblende biotite
gneiss
47 Muttumanda 10 48 10 76 39 55 100 16.00 21-22 80-81 6.00 13.6 Hornblende biotite
gneiss
48 Athikode 10 42 50 76 44 05 100 11.50 27-28 3.95 6.00 1.26 Hornblende biotite
gneiss
49 Kodumbu 10 45 35 76 40 40 100 5.50
10.65-11.65 23.85-
24.85 48.25-49.30
78.65- 79.65
4.80 0.50 15.8 Hornblende biotite
gneiss
50 Mundur 10 50 10 76 34 50 100 9.80 17.00 0.32 Hornblende biotite
gneiss
51 Vennakara Ew 10 45 28 76 37 54 101 7 54-55 12.42 3 7.19 Hornblende biotite
gneiss
52 Vennakara Ow 10 45 28 76 37 54 100 6.6 Nil 11 0.5 23.27 0.0012 Hornblende biotite
gneiss
53 Kadukkankunnam Ew
10 48 36 76 39 47 92 13.6 21-22 2.1 7.5 39.55 Hornblende biotite gneiss
54 Kadukkankunna
m Ow 10 48 36 76 39 47 100 14 27-28 2 8 52.74 0.00012
Hornblende biotite
gneiss
55 Kallepully Ew 10 48 36 76 40 17 100 10.6 38-39 6.28 4.5 23.5 Hornblende biotite
gneiss
56 Kallepully Ow 10 47 05 76 40 17 95 9.7 78-79 6 2.5 23.5 0.00088 Biotite gneiss
57 Malampuzha
Ew 10 48 59 76 40 24 101 10.5 26-27 & 77-78 7.75 4.5 14.38 Biotite gneiss
58 Malampuzha
Ow 10 48 59 76 40 24 104 12 26-27 & 100-101 7 2 27.69 0.00017
Hornblende biotite
gneiss
59 Chullimada Ew 10 48 14 76 46 37 100 12 70-71 2.2 9 24.029 Hornblende biotite
gneiss
60 Chullimada Ow 10 48 14 76 46 37 77 12 75-76 2.4 18 29.08 0.00039 Hornblende biotite
gneiss
61 Muttikulangara
Ew 10 48 31 76 36 35 104 9 103-104 18 10 48.15
Hornblende biotite
gneiss
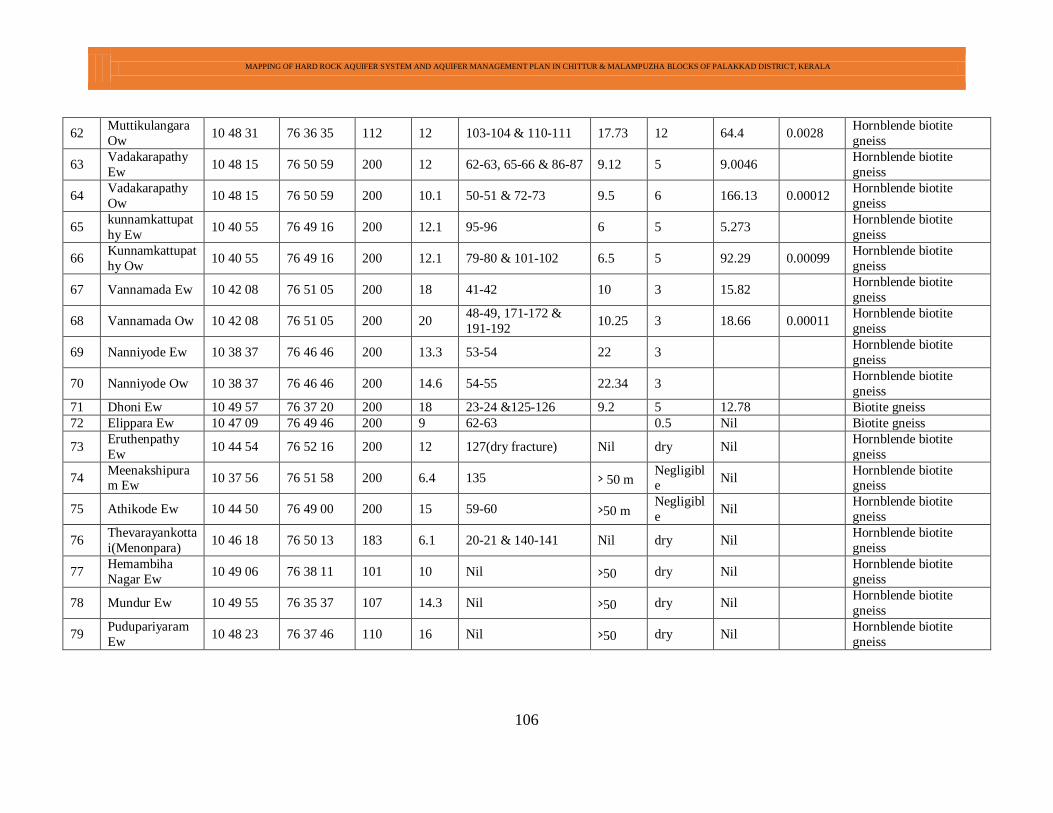
MAPPING OF HARD ROCK AQUIFER SYSTEM AND AQUIFER MANAGEMENT PLAN IN CHITTUR & MALAMPUZHA BLOCKS OF PALAKKAD DISTRICT, KERALA
106
62 Muttikulangara
Ow 10 48 31 76 36 35 112 12 103-104 & 110-111 17.73 12 64.4 0.0028
Hornblende biotite
gneiss
63 Vadakarapathy
Ew 10 48 15 76 50 59 200 12 62-63, 65-66 & 86-87 9.12 5 9.0046
Hornblende biotite
gneiss
64 Vadakarapathy
Ow 10 48 15 76 50 59 200 10.1 50-51 & 72-73 9.5 6 166.13 0.00012
Hornblende biotite
gneiss
65 kunnamkattupat
hy Ew 10 40 55 76 49 16 200 12.1 95-96 6 5 5.273
Hornblende biotite
gneiss
66 Kunnamkattupat
hy Ow 10 40 55 76 49 16 200 12.1 79-80 & 101-102 6.5 5 92.29 0.00099
Hornblende biotite
gneiss
67 Vannamada Ew 10 42 08 76 51 05 200 18 41-42 10 3 15.82 Hornblende biotite
gneiss
68 Vannamada Ow 10 42 08 76 51 05 200 20 48-49, 171-172 &
191-192 10.25 3 18.66 0.00011
Hornblende biotite
gneiss
69 Nanniyode Ew 10 38 37 76 46 46 200 13.3 53-54 22 3 Hornblende biotite
gneiss
70 Nanniyode Ow 10 38 37 76 46 46 200 14.6 54-55 22.34 3 Hornblende biotite
gneiss
71 Dhoni Ew 10 49 57 76 37 20 200 18 23-24 &125-126 9.2 5 12.78 Biotite gneiss
72 Elippara Ew 10 47 09 76 49 46 200 9 62-63 0.5 Nil Biotite gneiss
73 Eruthenpathy
Ew 10 44 54 76 52 16 200 12 127(dry fracture) Nil dry Nil
Hornblende biotite
gneiss
74 Meenakshipuram Ew
10 37 56 76 51 58 200 6.4 135 > 50 m Negligible
Nil Hornblende biotite gneiss
75 Athikode Ew 10 44 50 76 49 00 200 15 59-60 >50 m Negligibl
e Nil
Hornblende biotite
gneiss
76 Thevarayankotta
i(Menonpara) 10 46 18 76 50 13 183 6.1 20-21 & 140-141 Nil dry Nil
Hornblende biotite
gneiss
77 Hemambiha
Nagar Ew 10 49 06 76 38 11 101 10 Nil >50 dry Nil
Hornblende biotite
gneiss
78 Mundur Ew 10 49 55 76 35 37 107 14.3 Nil >50 dry Nil Hornblende biotite
gneiss
79 Pudupariyaram
Ew 10 48 23 76 37 46 110 16 Nil >50 dry Nil
Hornblende biotite
gneiss
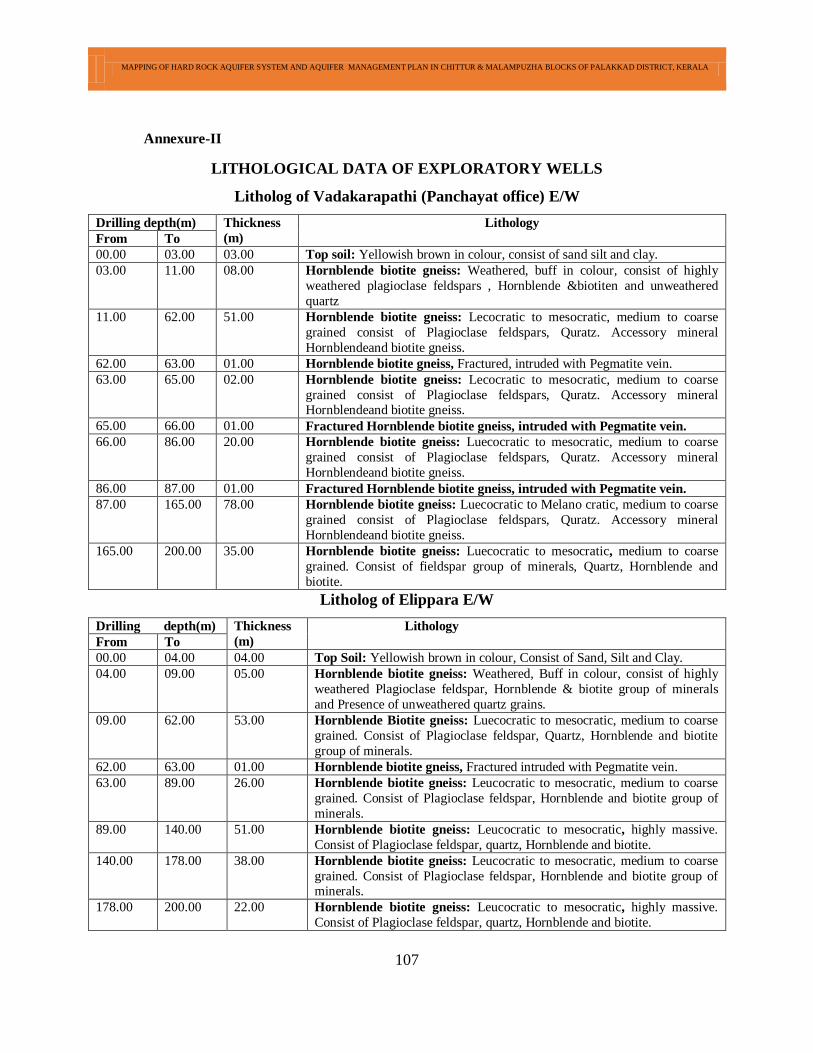
MAPPING OF HARD ROCK AQUIFER SYSTEM AND AQUIFER MANAGEMENT PLAN IN CHITTUR & MALAMPUZHA BLOCKS OF PALAKKAD DISTRICT, KERALA
107
Annexure-II
LITHOLOGICAL DATA OF EXPLORATORY WELLS
Litholog of Vadakarapathi (Panchayat office) E/W
Drilling depth(m) Thickness
(m)
Lithology
From To
00.00 03.00 03.00 Top soil: Yellowish brown in colour, consist of sand silt and clay.
03.00 11.00 08.00 Hornblende biotite gneiss: Weathered, buff in colour, consist of highly
weathered plagioclase feldspars , Hornblende &biotiten and unweathered
quartz
11.00 62.00 51.00 Hornblende biotite gneiss: Lecocratic to mesocratic, medium to coarse
grained consist of Plagioclase feldspars, Quratz. Accessory mineral
Hornblendeand biotite gneiss.
62.00 63.00 01.00 Hornblende biotite gneiss, Fractured, intruded with Pegmatite vein.
63.00 65.00 02.00 Hornblende biotite gneiss: Lecocratic to mesocratic, medium to coarse
grained consist of Plagioclase feldspars, Quratz. Accessory mineral Hornblendeand biotite gneiss.
65.00 66.00 01.00 Fractured Hornblende biotite gneiss, intruded with Pegmatite vein.
66.00 86.00 20.00 Hornblende biotite gneiss: Luecocratic to mesocratic, medium to coarse
grained consist of Plagioclase feldspars, Quratz. Accessory mineral
Hornblendeand biotite gneiss.
86.00 87.00 01.00 Fractured Hornblende biotite gneiss, intruded with Pegmatite vein.
87.00 165.00 78.00 Hornblende biotite gneiss: Luecocratic to Melano cratic, medium to coarse
grained consist of Plagioclase feldspars, Quratz. Accessory mineral
Hornblendeand biotite gneiss.
165.00 200.00 35.00 Hornblende biotite gneiss: Luecocratic to mesocratic, medium to coarse
grained. Consist of fieldspar group of minerals, Quartz, Hornblende and
biotite.
Litholog of Elippara E/W
Drilling depth(m) Thickness
(m)
Lithology
From To
00.00 04.00 04.00 Top Soil: Yellowish brown in colour, Consist of Sand, Silt and Clay.
04.00 09.00 05.00 Hornblende biotite gneiss: Weathered, Buff in colour, consist of highly
weathered Plagioclase feldspar, Hornblende & biotite group of minerals
and Presence of unweathered quartz grains.
09.00 62.00 53.00 Hornblende Biotite gneiss: Luecocratic to mesocratic, medium to coarse
grained. Consist of Plagioclase feldspar, Quartz, Hornblende and biotite
group of minerals.
62.00 63.00 01.00 Hornblende biotite gneiss, Fractured intruded with Pegmatite vein.
63.00 89.00 26.00 Hornblende biotite gneiss: Leucocratic to mesocratic, medium to coarse
grained. Consist of Plagioclase feldspar, Hornblende and biotite group of
minerals.
89.00 140.00 51.00 Hornblende biotite gneiss: Leucocratic to mesocratic, highly massive.
Consist of Plagioclase feldspar, quartz, Hornblende and biotite.
140.00 178.00 38.00 Hornblende biotite gneiss: Leucocratic to mesocratic, medium to coarse
grained. Consist of Plagioclase feldspar, Hornblende and biotite group of minerals.
178.00 200.00 22.00 Hornblende biotite gneiss: Leucocratic to mesocratic, highly massive.
Consist of Plagioclase feldspar, quartz, Hornblende and biotite.
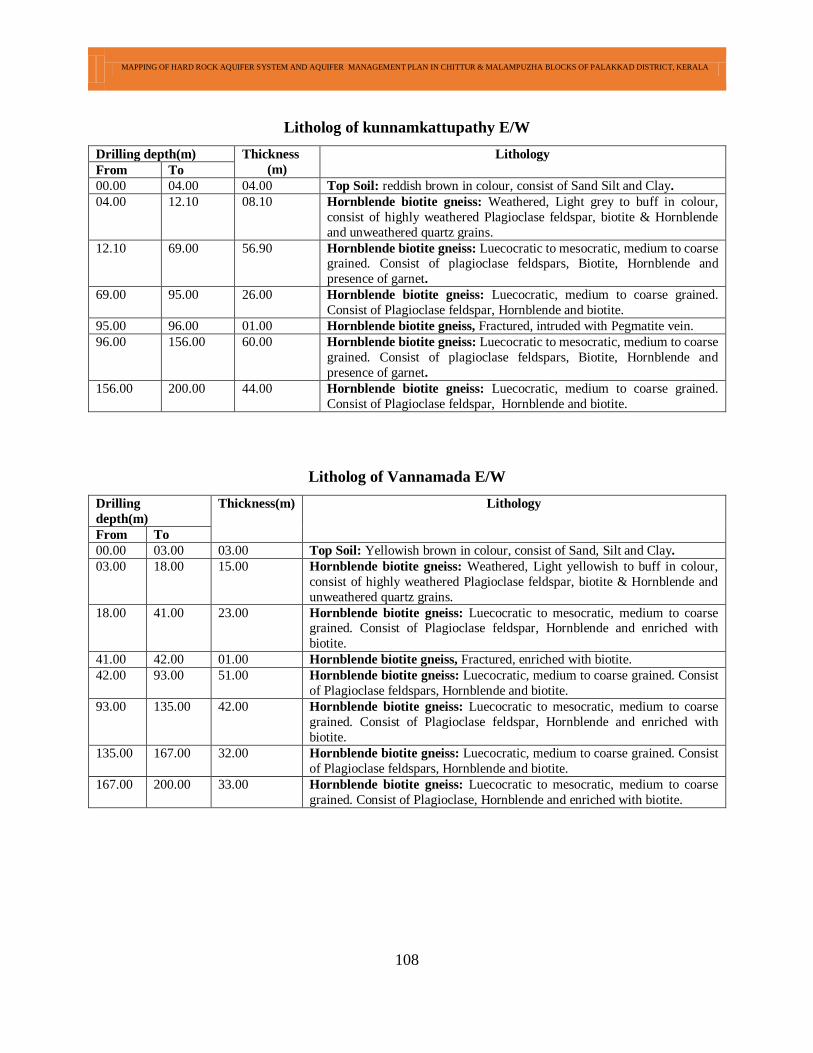
MAPPING OF HARD ROCK AQUIFER SYSTEM AND AQUIFER MANAGEMENT PLAN IN CHITTUR & MALAMPUZHA BLOCKS OF PALAKKAD DISTRICT, KERALA
108
Litholog of kunnamkattupathy E/W
Drilling depth(m) Thickness
(m)
Lithology
From To
00.00 04.00 04.00 Top Soil: reddish brown in colour, consist of Sand Silt and Clay.
04.00 12.10 08.10 Hornblende biotite gneiss: Weathered, Light grey to buff in colour,
consist of highly weathered Plagioclase feldspar, biotite & Hornblende
and unweathered quartz grains.
12.10 69.00 56.90 Hornblende biotite gneiss: Luecocratic to mesocratic, medium to coarse grained. Consist of plagioclase feldspars, Biotite, Hornblende and
presence of garnet.
69.00 95.00 26.00 Hornblende biotite gneiss: Luecocratic, medium to coarse grained.
Consist of Plagioclase feldspar, Hornblende and biotite.
95.00 96.00 01.00 Hornblende biotite gneiss, Fractured, intruded with Pegmatite vein.
96.00 156.00 60.00 Hornblende biotite gneiss: Luecocratic to mesocratic, medium to coarse
grained. Consist of plagioclase feldspars, Biotite, Hornblende and
presence of garnet.
156.00 200.00 44.00 Hornblende biotite gneiss: Luecocratic, medium to coarse grained.
Consist of Plagioclase feldspar, Hornblende and biotite.
Litholog of Vannamada E/W
Drilling
depth(m)
Thickness(m) Lithology
From To
00.00 03.00 03.00 Top Soil: Yellowish brown in colour, consist of Sand, Silt and Clay.
03.00 18.00 15.00 Hornblende biotite gneiss: Weathered, Light yellowish to buff in colour,
consist of highly weathered Plagioclase feldspar, biotite & Hornblende and
unweathered quartz grains.
18.00 41.00 23.00 Hornblende biotite gneiss: Luecocratic to mesocratic, medium to coarse grained. Consist of Plagioclase feldspar, Hornblende and enriched with
biotite.
41.00 42.00 01.00 Hornblende biotite gneiss, Fractured, enriched with biotite.
42.00 93.00 51.00 Hornblende biotite gneiss: Luecocratic, medium to coarse grained. Consist
of Plagioclase feldspars, Hornblende and biotite.
93.00 135.00 42.00 Hornblende biotite gneiss: Luecocratic to mesocratic, medium to coarse
grained. Consist of Plagioclase feldspar, Hornblende and enriched with
biotite.
135.00 167.00 32.00 Hornblende biotite gneiss: Luecocratic, medium to coarse grained. Consist
of Plagioclase feldspars, Hornblende and biotite.
167.00 200.00 33.00 Hornblende biotite gneiss: Luecocratic to mesocratic, medium to coarse
grained. Consist of Plagioclase, Hornblende and enriched with biotite.
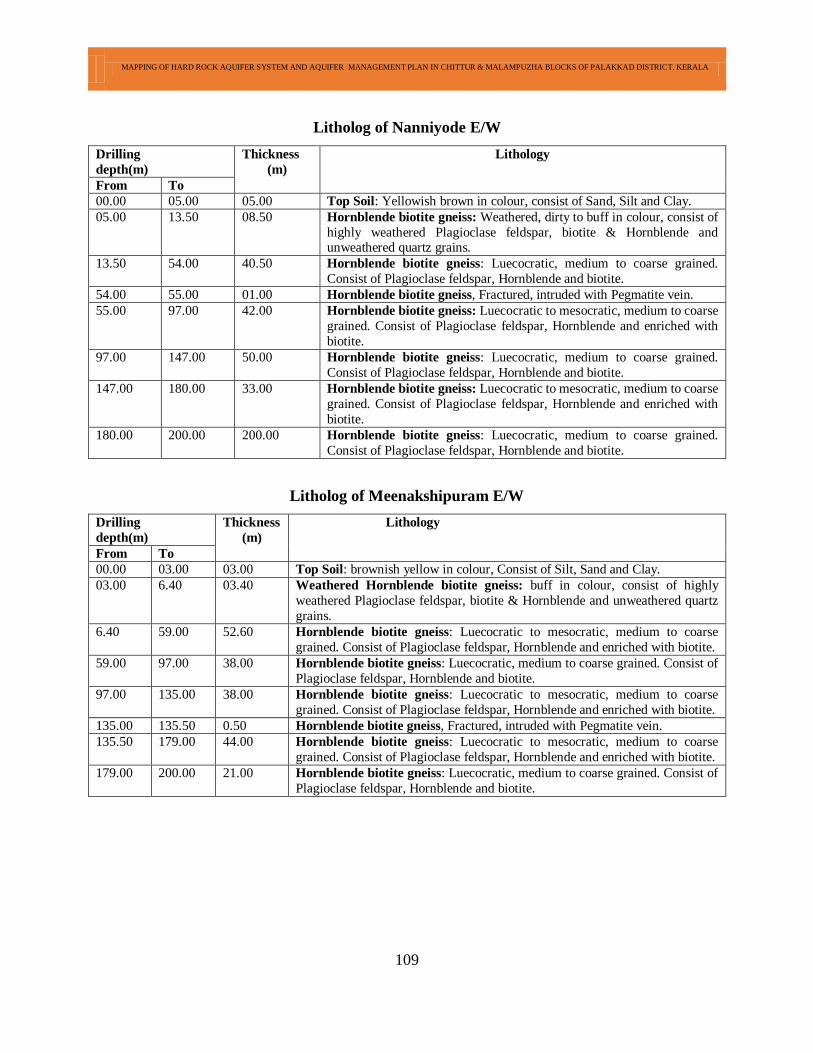
MAPPING OF HARD ROCK AQUIFER SYSTEM AND AQUIFER MANAGEMENT PLAN IN CHITTUR & MALAMPUZHA BLOCKS OF PALAKKAD DISTRICT, KERALA
109
Litholog of Nanniyode E/W
Drilling
depth(m)
Thickness
(m)
Lithology
From To
00.00 05.00 05.00 Top Soil: Yellowish brown in colour, consist of Sand, Silt and Clay.
05.00 13.50 08.50 Hornblende biotite gneiss: Weathered, dirty to buff in colour, consist of
highly weathered Plagioclase feldspar, biotite & Hornblende and unweathered quartz grains.
13.50 54.00 40.50 Hornblende biotite gneiss: Luecocratic, medium to coarse grained.
Consist of Plagioclase feldspar, Hornblende and biotite.
54.00 55.00 01.00 Hornblende biotite gneiss, Fractured, intruded with Pegmatite vein.
55.00 97.00 42.00 Hornblende biotite gneiss: Luecocratic to mesocratic, medium to coarse
grained. Consist of Plagioclase feldspar, Hornblende and enriched with
biotite.
97.00 147.00 50.00 Hornblende biotite gneiss: Luecocratic, medium to coarse grained.
Consist of Plagioclase feldspar, Hornblende and biotite.
147.00 180.00 33.00 Hornblende biotite gneiss: Luecocratic to mesocratic, medium to coarse
grained. Consist of Plagioclase feldspar, Hornblende and enriched with
biotite.
180.00 200.00 200.00 Hornblende biotite gneiss: Luecocratic, medium to coarse grained.
Consist of Plagioclase feldspar, Hornblende and biotite.
Litholog of Meenakshipuram E/W
Drilling
depth(m)
Thickness
(m)
Lithology
From To
00.00 03.00 03.00 Top Soil: brownish yellow in colour, Consist of Silt, Sand and Clay.
03.00 6.40 03.40 Weathered Hornblende biotite gneiss: buff in colour, consist of highly
weathered Plagioclase feldspar, biotite & Hornblende and unweathered quartz
grains.
6.40 59.00 52.60 Hornblende biotite gneiss: Luecocratic to mesocratic, medium to coarse
grained. Consist of Plagioclase feldspar, Hornblende and enriched with biotite.
59.00 97.00 38.00 Hornblende biotite gneiss: Luecocratic, medium to coarse grained. Consist of
Plagioclase feldspar, Hornblende and biotite.
97.00 135.00 38.00 Hornblende biotite gneiss: Luecocratic to mesocratic, medium to coarse
grained. Consist of Plagioclase feldspar, Hornblende and enriched with biotite.
135.00 135.50 0.50 Hornblende biotite gneiss, Fractured, intruded with Pegmatite vein.
135.50 179.00 44.00 Hornblende biotite gneiss: Luecocratic to mesocratic, medium to coarse
grained. Consist of Plagioclase feldspar, Hornblende and enriched with biotite.
179.00 200.00 21.00 Hornblende biotite gneiss: Luecocratic, medium to coarse grained. Consist of
Plagioclase feldspar, Hornblende and biotite.
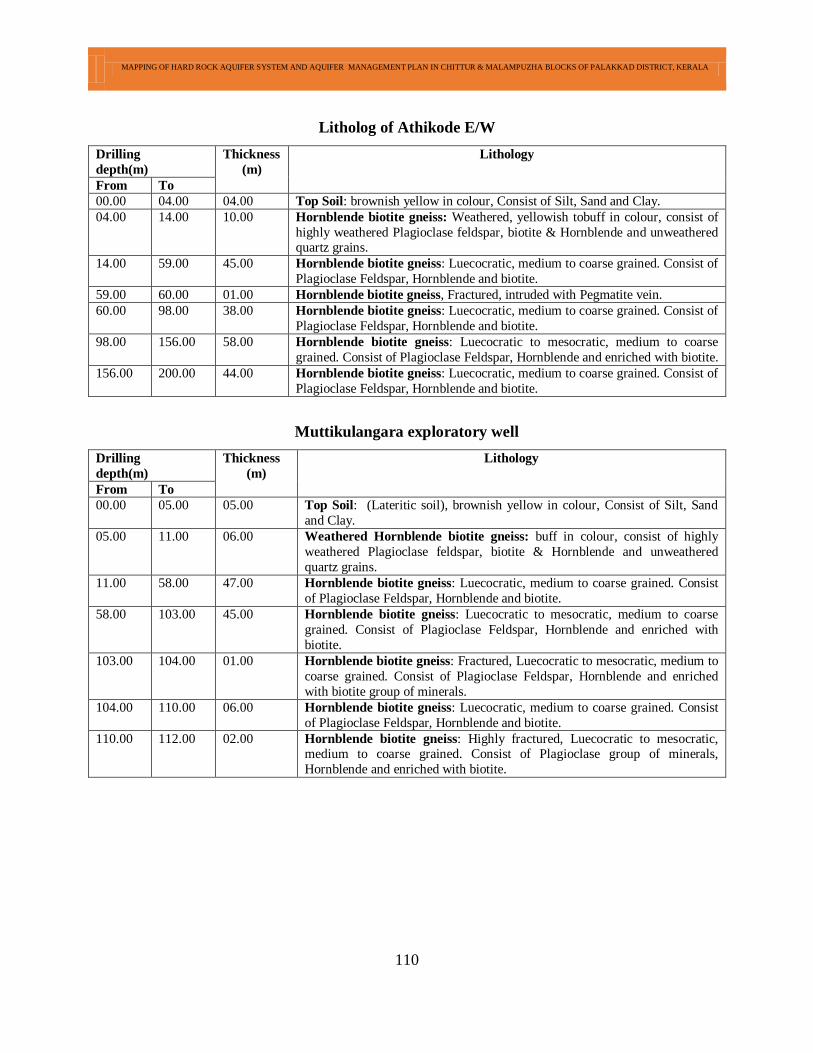
MAPPING OF HARD ROCK AQUIFER SYSTEM AND AQUIFER MANAGEMENT PLAN IN CHITTUR & MALAMPUZHA BLOCKS OF PALAKKAD DISTRICT, KERALA
110
Litholog of Athikode E/W
Drilling
depth(m)
Thickness
(m)
Lithology
From To
00.00 04.00 04.00 Top Soil: brownish yellow in colour, Consist of Silt, Sand and Clay.
04.00 14.00 10.00 Hornblende biotite gneiss: Weathered, yellowish tobuff in colour, consist of
highly weathered Plagioclase feldspar, biotite & Hornblende and unweathered quartz grains.
14.00 59.00 45.00 Hornblende biotite gneiss: Luecocratic, medium to coarse grained. Consist of
Plagioclase Feldspar, Hornblende and biotite.
59.00 60.00 01.00 Hornblende biotite gneiss, Fractured, intruded with Pegmatite vein.
60.00 98.00 38.00 Hornblende biotite gneiss: Luecocratic, medium to coarse grained. Consist of
Plagioclase Feldspar, Hornblende and biotite.
98.00 156.00 58.00 Hornblende biotite gneiss: Luecocratic to mesocratic, medium to coarse
grained. Consist of Plagioclase Feldspar, Hornblende and enriched with biotite.
156.00 200.00 44.00 Hornblende biotite gneiss: Luecocratic, medium to coarse grained. Consist of
Plagioclase Feldspar, Hornblende and biotite.
Muttikulangara exploratory well
Drilling
depth(m)
Thickness
(m)
Lithology
From To
00.00 05.00 05.00 Top Soil: (Lateritic soil), brownish yellow in colour, Consist of Silt, Sand
and Clay.
05.00 11.00 06.00 Weathered Hornblende biotite gneiss: buff in colour, consist of highly
weathered Plagioclase feldspar, biotite & Hornblende and unweathered
quartz grains.
11.00 58.00 47.00 Hornblende biotite gneiss: Luecocratic, medium to coarse grained. Consist
of Plagioclase Feldspar, Hornblende and biotite.
58.00 103.00 45.00 Hornblende biotite gneiss: Luecocratic to mesocratic, medium to coarse
grained. Consist of Plagioclase Feldspar, Hornblende and enriched with
biotite.
103.00 104.00 01.00 Hornblende biotite gneiss: Fractured, Luecocratic to mesocratic, medium to
coarse grained. Consist of Plagioclase Feldspar, Hornblende and enriched
with biotite group of minerals.
104.00 110.00 06.00 Hornblende biotite gneiss: Luecocratic, medium to coarse grained. Consist
of Plagioclase Feldspar, Hornblende and biotite.
110.00 112.00 02.00 Hornblende biotite gneiss: Highly fractured, Luecocratic to mesocratic, medium to coarse grained. Consist of Plagioclase group of minerals,
Hornblende and enriched with biotite.
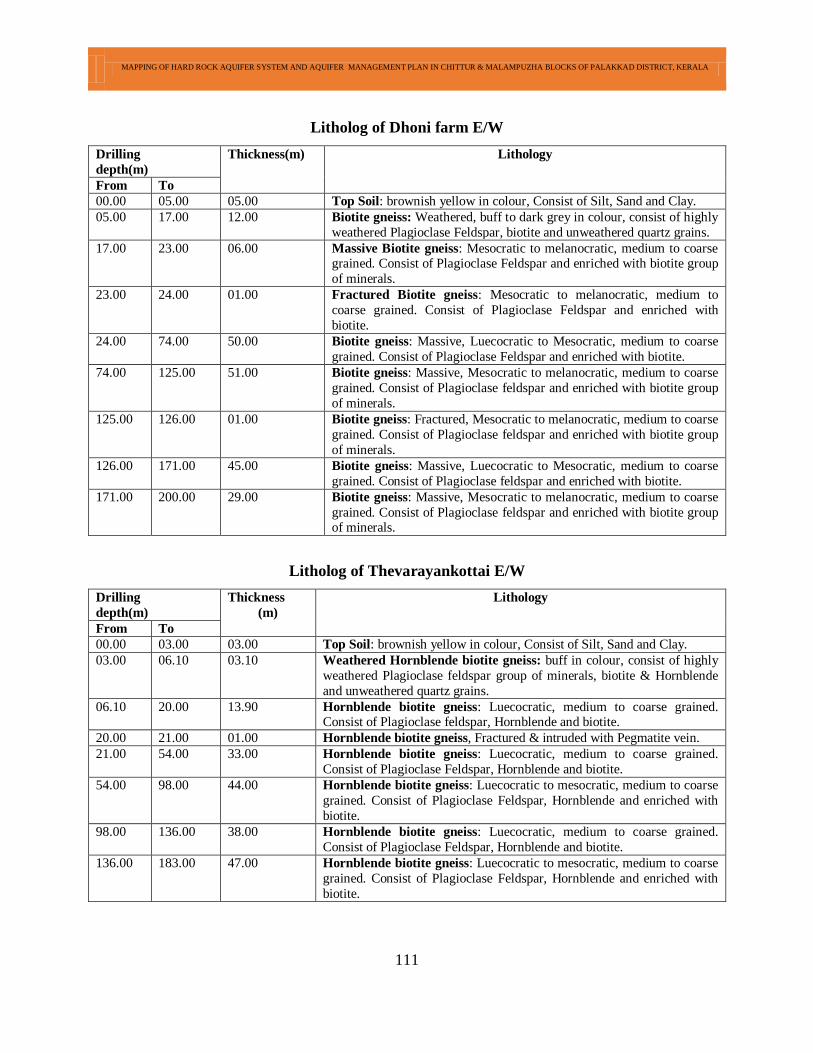
MAPPING OF HARD ROCK AQUIFER SYSTEM AND AQUIFER MANAGEMENT PLAN IN CHITTUR & MALAMPUZHA BLOCKS OF PALAKKAD DISTRICT, KERALA
111
Litholog of Dhoni farm E/W
Drilling
depth(m)
Thickness(m) Lithology
From To
00.00 05.00 05.00 Top Soil: brownish yellow in colour, Consist of Silt, Sand and Clay.
05.00 17.00 12.00 Biotite gneiss: Weathered, buff to dark grey in colour, consist of highly
weathered Plagioclase Feldspar, biotite and unweathered quartz grains.
17.00 23.00 06.00 Massive Biotite gneiss: Mesocratic to melanocratic, medium to coarse grained. Consist of Plagioclase Feldspar and enriched with biotite group
of minerals.
23.00 24.00 01.00 Fractured Biotite gneiss: Mesocratic to melanocratic, medium to
coarse grained. Consist of Plagioclase Feldspar and enriched with
biotite.
24.00 74.00 50.00 Biotite gneiss: Massive, Luecocratic to Mesocratic, medium to coarse
grained. Consist of Plagioclase Feldspar and enriched with biotite.
74.00 125.00 51.00 Biotite gneiss: Massive, Mesocratic to melanocratic, medium to coarse
grained. Consist of Plagioclase feldspar and enriched with biotite group
of minerals.
125.00 126.00 01.00 Biotite gneiss: Fractured, Mesocratic to melanocratic, medium to coarse
grained. Consist of Plagioclase feldspar and enriched with biotite group
of minerals.
126.00 171.00 45.00 Biotite gneiss: Massive, Luecocratic to Mesocratic, medium to coarse
grained. Consist of Plagioclase feldspar and enriched with biotite.
171.00 200.00 29.00 Biotite gneiss: Massive, Mesocratic to melanocratic, medium to coarse
grained. Consist of Plagioclase feldspar and enriched with biotite group of minerals.
Litholog of Thevarayankottai E/W
Drilling
depth(m)
Thickness
(m)
Lithology
From To
00.00 03.00 03.00 Top Soil: brownish yellow in colour, Consist of Silt, Sand and Clay.
03.00 06.10 03.10 Weathered Hornblende biotite gneiss: buff in colour, consist of highly
weathered Plagioclase feldspar group of minerals, biotite & Hornblende
and unweathered quartz grains.
06.10 20.00 13.90 Hornblende biotite gneiss: Luecocratic, medium to coarse grained. Consist of Plagioclase feldspar, Hornblende and biotite.
20.00 21.00 01.00 Hornblende biotite gneiss, Fractured & intruded with Pegmatite vein.
21.00 54.00 33.00 Hornblende biotite gneiss: Luecocratic, medium to coarse grained.
Consist of Plagioclase Feldspar, Hornblende and biotite.
54.00 98.00 44.00 Hornblende biotite gneiss: Luecocratic to mesocratic, medium to coarse
grained. Consist of Plagioclase Feldspar, Hornblende and enriched with
biotite.
98.00 136.00 38.00 Hornblende biotite gneiss: Luecocratic, medium to coarse grained.
Consist of Plagioclase Feldspar, Hornblende and biotite.
136.00 183.00 47.00 Hornblende biotite gneiss: Luecocratic to mesocratic, medium to coarse
grained. Consist of Plagioclase Feldspar, Hornblende and enriched with
biotite.
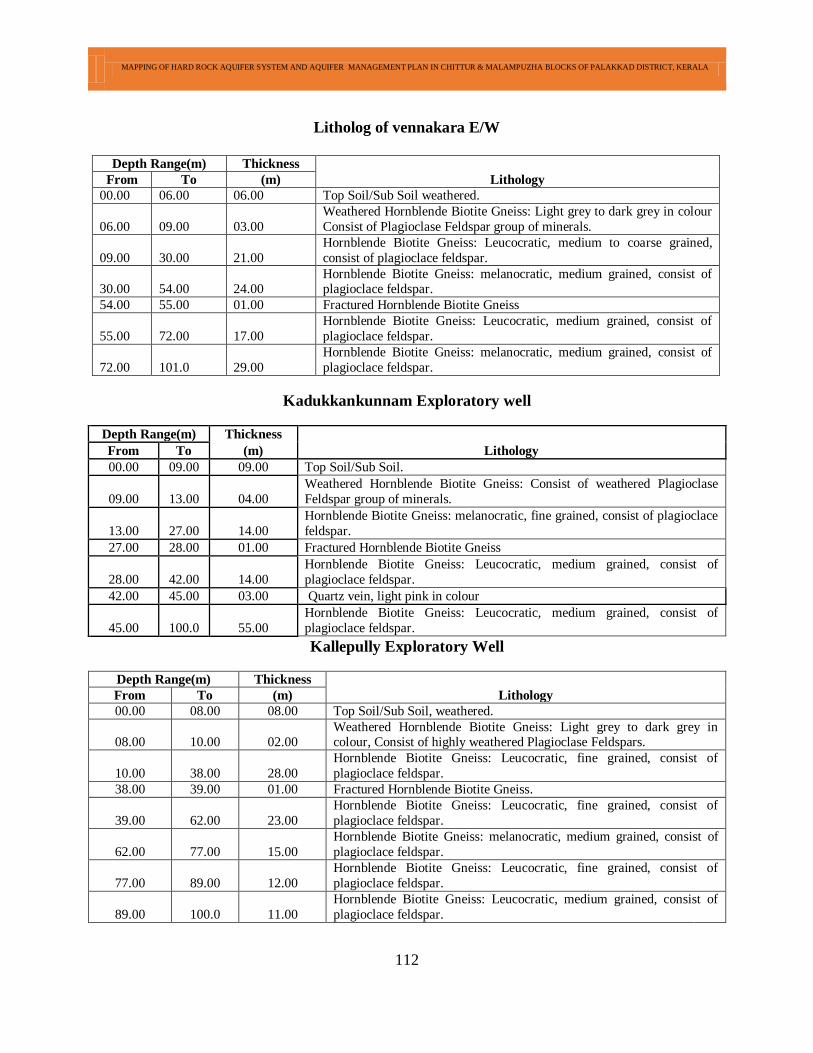
MAPPING OF HARD ROCK AQUIFER SYSTEM AND AQUIFER MANAGEMENT PLAN IN CHITTUR & MALAMPUZHA BLOCKS OF PALAKKAD DISTRICT, KERALA
112
Litholog of vennakara E/W
Depth Range(m) Thickness
Lithology From To (m)
00.00 06.00 06.00 Top Soil/Sub Soil weathered.
06.00 09.00 03.00
Weathered Hornblende Biotite Gneiss: Light grey to dark grey in colour
Consist of Plagioclase Feldspar group of minerals.
09.00 30.00 21.00
Hornblende Biotite Gneiss: Leucocratic, medium to coarse grained,
consist of plagioclace feldspar.
30.00 54.00 24.00 Hornblende Biotite Gneiss: melanocratic, medium grained, consist of plagioclace feldspar.
54.00 55.00 01.00 Fractured Hornblende Biotite Gneiss
55.00 72.00 17.00
Hornblende Biotite Gneiss: Leucocratic, medium grained, consist of
plagioclace feldspar.
72.00 101.0 29.00
Hornblende Biotite Gneiss: melanocratic, medium grained, consist of
plagioclace feldspar.
Kadukkankunnam Exploratory well
Depth Range(m) Thickness
Lithology From To (m)
00.00 09.00 09.00 Top Soil/Sub Soil.
09.00 13.00 04.00
Weathered Hornblende Biotite Gneiss: Consist of weathered Plagioclase
Feldspar group of minerals.
13.00 27.00 14.00
Hornblende Biotite Gneiss: melanocratic, fine grained, consist of plagioclace
feldspar.
27.00 28.00 01.00 Fractured Hornblende Biotite Gneiss
28.00 42.00 14.00
Hornblende Biotite Gneiss: Leucocratic, medium grained, consist of
plagioclace feldspar.
42.00 45.00 03.00 Quartz vein, light pink in colour
45.00 100.0 55.00
Hornblende Biotite Gneiss: Leucocratic, medium grained, consist of
plagioclace feldspar.
Kallepully Exploratory Well
Depth Range(m) Thickness
Lithology From To (m)
00.00 08.00 08.00 Top Soil/Sub Soil, weathered.
08.00 10.00 02.00 Weathered Hornblende Biotite Gneiss: Light grey to dark grey in colour, Consist of highly weathered Plagioclase Feldspars.
10.00 38.00 28.00
Hornblende Biotite Gneiss: Leucocratic, fine grained, consist of
plagioclace feldspar.
38.00 39.00 01.00 Fractured Hornblende Biotite Gneiss.
39.00 62.00 23.00
Hornblende Biotite Gneiss: Leucocratic, fine grained, consist of
plagioclace feldspar.
62.00 77.00 15.00
Hornblende Biotite Gneiss: melanocratic, medium grained, consist of
plagioclace feldspar.
77.00 89.00 12.00
Hornblende Biotite Gneiss: Leucocratic, fine grained, consist of
plagioclace feldspar.
89.00 100.0 11.00
Hornblende Biotite Gneiss: Leucocratic, medium grained, consist of
plagioclace feldspar.
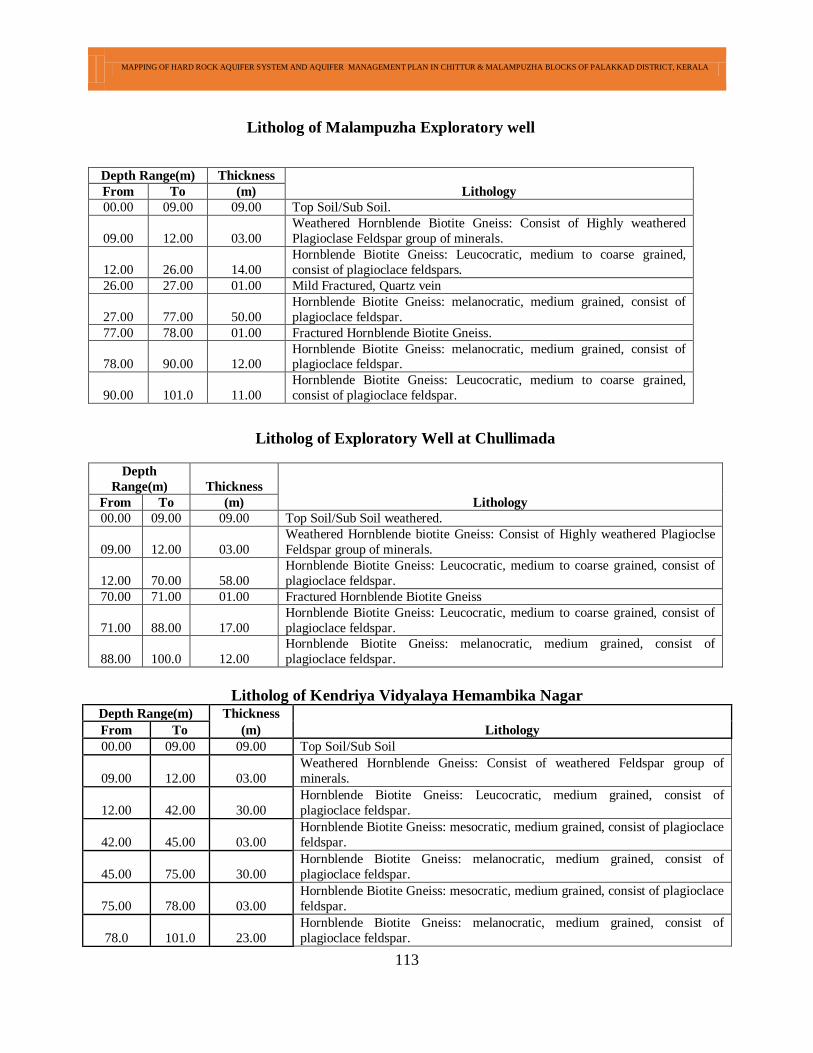
MAPPING OF HARD ROCK AQUIFER SYSTEM AND AQUIFER MANAGEMENT PLAN IN CHITTUR & MALAMPUZHA BLOCKS OF PALAKKAD DISTRICT, KERALA
113
Litholog of Malampuzha Exploratory well
Depth Range(m) Thickness
Lithology From To (m)
00.00 09.00 09.00 Top Soil/Sub Soil.
09.00 12.00 03.00
Weathered Hornblende Biotite Gneiss: Consist of Highly weathered
Plagioclase Feldspar group of minerals.
12.00 26.00 14.00
Hornblende Biotite Gneiss: Leucocratic, medium to coarse grained,
consist of plagioclace feldspars.
26.00 27.00 01.00 Mild Fractured, Quartz vein
27.00 77.00 50.00
Hornblende Biotite Gneiss: melanocratic, medium grained, consist of
plagioclace feldspar.
77.00 78.00 01.00 Fractured Hornblende Biotite Gneiss.
78.00 90.00 12.00 Hornblende Biotite Gneiss: melanocratic, medium grained, consist of plagioclace feldspar.
90.00 101.0 11.00
Hornblende Biotite Gneiss: Leucocratic, medium to coarse grained,
consist of plagioclace feldspar.
Litholog of Exploratory Well at Chullimada
Depth
Range(m) Thickness
Lithology From To (m)
00.00 09.00 09.00 Top Soil/Sub Soil weathered.
09.00 12.00 03.00
Weathered Hornblende biotite Gneiss: Consist of Highly weathered Plagioclse
Feldspar group of minerals.
12.00 70.00 58.00
Hornblende Biotite Gneiss: Leucocratic, medium to coarse grained, consist of
plagioclace feldspar.
70.00 71.00 01.00 Fractured Hornblende Biotite Gneiss
71.00 88.00 17.00
Hornblende Biotite Gneiss: Leucocratic, medium to coarse grained, consist of
plagioclace feldspar.
88.00 100.0 12.00
Hornblende Biotite Gneiss: melanocratic, medium grained, consist of
plagioclace feldspar.
Litholog of Kendriya Vidyalaya Hemambika Nagar Depth Range(m) Thickness
Lithology From To (m)
00.00 09.00 09.00 Top Soil/Sub Soil
09.00 12.00 03.00
Weathered Hornblende Gneiss: Consist of weathered Feldspar group of
minerals.
12.00 42.00 30.00
Hornblende Biotite Gneiss: Leucocratic, medium grained, consist of
plagioclace feldspar.
42.00 45.00 03.00
Hornblende Biotite Gneiss: mesocratic, medium grained, consist of plagioclace
feldspar.
45.00 75.00 30.00
Hornblende Biotite Gneiss: melanocratic, medium grained, consist of
plagioclace feldspar.
75.00 78.00 03.00
Hornblende Biotite Gneiss: mesocratic, medium grained, consist of plagioclace
feldspar.
78.0 101.0 23.00
Hornblende Biotite Gneiss: melanocratic, medium grained, consist of
plagioclace feldspar.
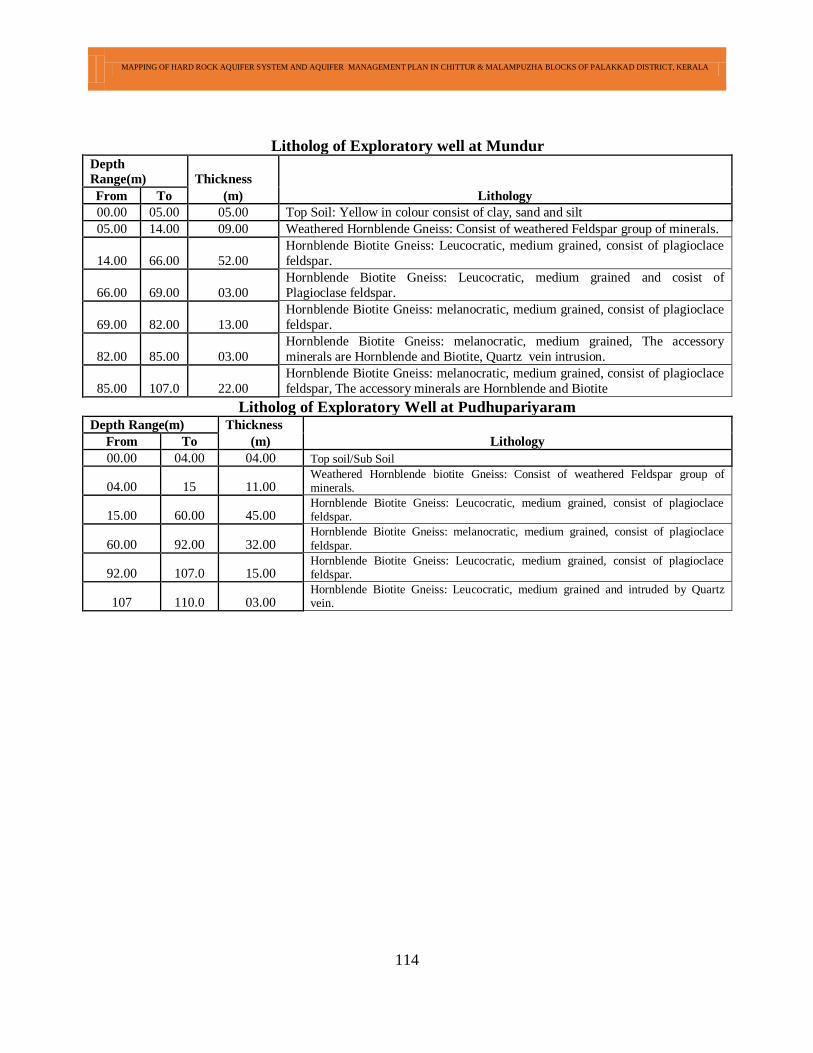
MAPPING OF HARD ROCK AQUIFER SYSTEM AND AQUIFER MANAGEMENT PLAN IN CHITTUR & MALAMPUZHA BLOCKS OF PALAKKAD DISTRICT, KERALA
114
Litholog of Exploratory well at Mundur Depth
Range(m) Thickness
Lithology From To (m)
00.00 05.00 05.00 Top Soil: Yellow in colour consist of clay, sand and silt
05.00 14.00 09.00 Weathered Hornblende Gneiss: Consist of weathered Feldspar group of minerals.
14.00 66.00 52.00
Hornblende Biotite Gneiss: Leucocratic, medium grained, consist of plagioclace
feldspar.
66.00 69.00 03.00
Hornblende Biotite Gneiss: Leucocratic, medium grained and cosist of
Plagioclase feldspar.
69.00 82.00 13.00
Hornblende Biotite Gneiss: melanocratic, medium grained, consist of plagioclace
feldspar.
82.00 85.00 03.00
Hornblende Biotite Gneiss: melanocratic, medium grained, The accessory
minerals are Hornblende and Biotite, Quartz vein intrusion.
85.00 107.0 22.00
Hornblende Biotite Gneiss: melanocratic, medium grained, consist of plagioclace
feldspar, The accessory minerals are Hornblende and Biotite
Litholog of Exploratory Well at Pudhupariyaram Depth Range(m) Thickness
Lithology From To (m)
00.00 04.00 04.00 Top soil/Sub Soil
04.00 15 11.00 Weathered Hornblende biotite Gneiss: Consist of weathered Feldspar group of minerals.
15.00 60.00 45.00 Hornblende Biotite Gneiss: Leucocratic, medium grained, consist of plagioclace feldspar.
60.00 92.00 32.00 Hornblende Biotite Gneiss: melanocratic, medium grained, consist of plagioclace
feldspar.
92.00 107.0 15.00 Hornblende Biotite Gneiss: Leucocratic, medium grained, consist of plagioclace feldspar.
107 110.0 03.00 Hornblende Biotite Gneiss: Leucocratic, medium grained and intruded by Quartz vein.
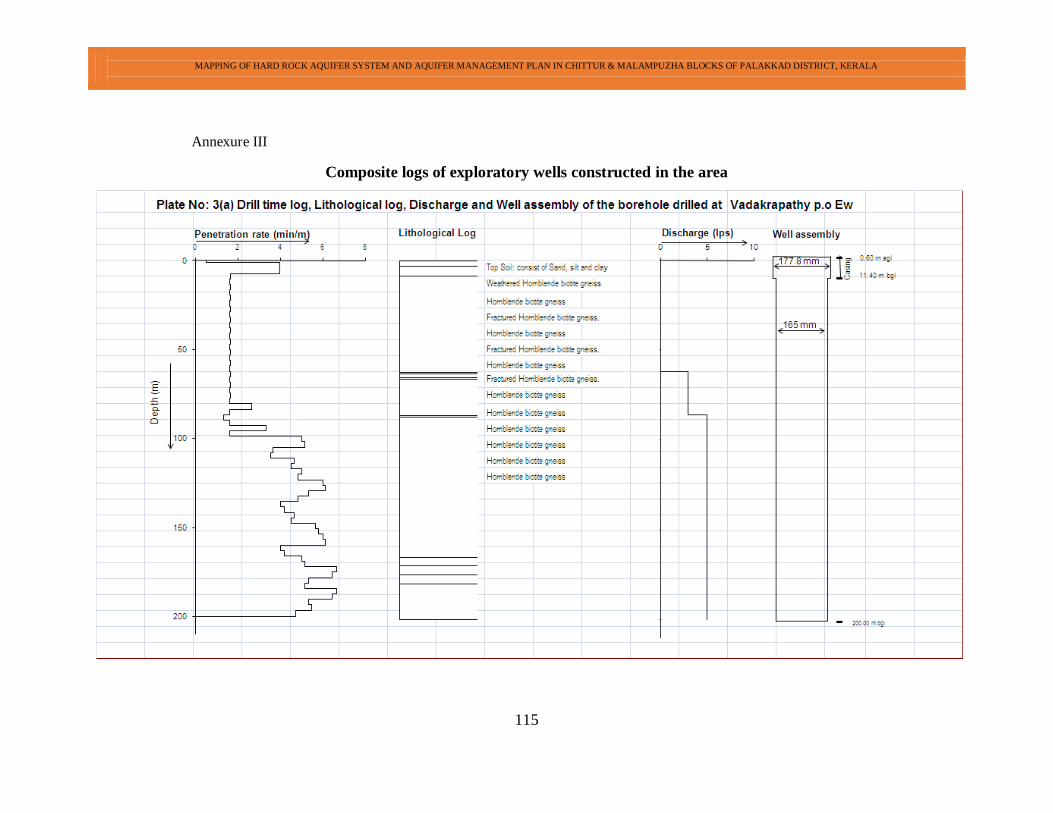
MAPPING OF HARD ROCK AQUIFER SYSTEM AND AQUIFER MANAGEMENT PLAN IN CHITTUR & MALAMPUZHA BLOCKS OF PALAKKAD DISTRICT, KERALA
115
Annexure III
Composite logs of exploratory wells constructed in the area
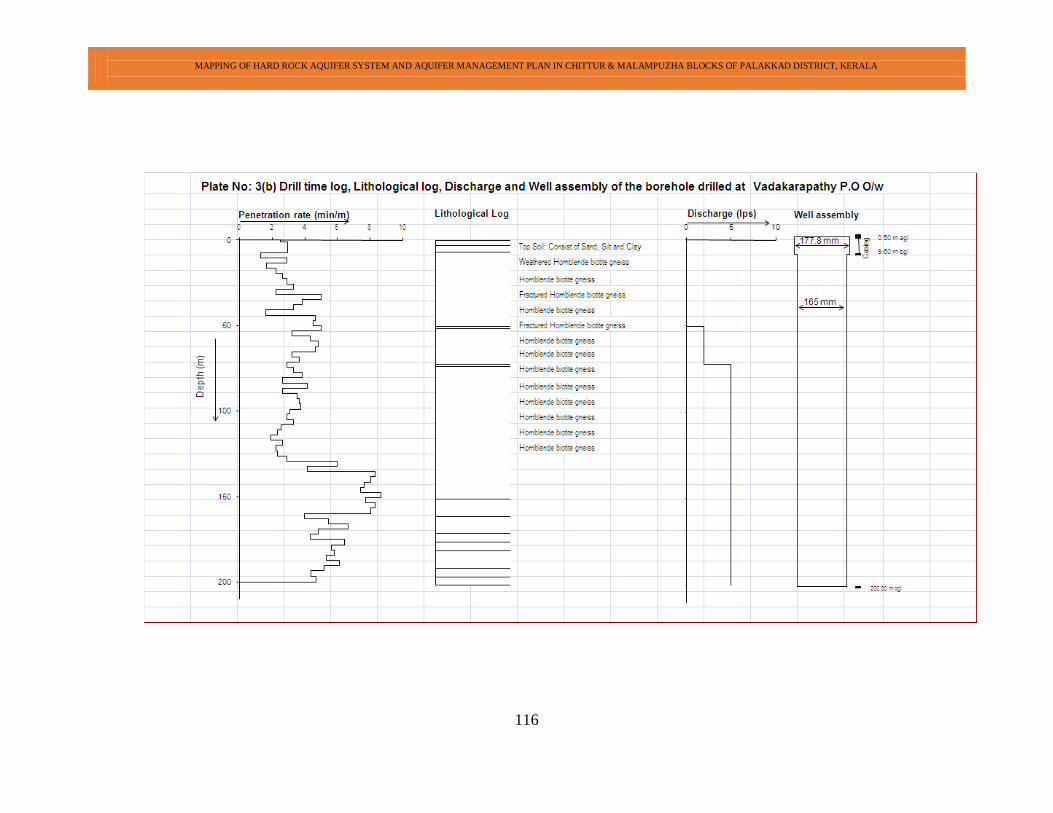
MAPPING OF HARD ROCK AQUIFER SYSTEM AND AQUIFER MANAGEMENT PLAN IN CHITTUR & MALAMPUZHA BLOCKS OF PALAKKAD DISTRICT, KERALA
116
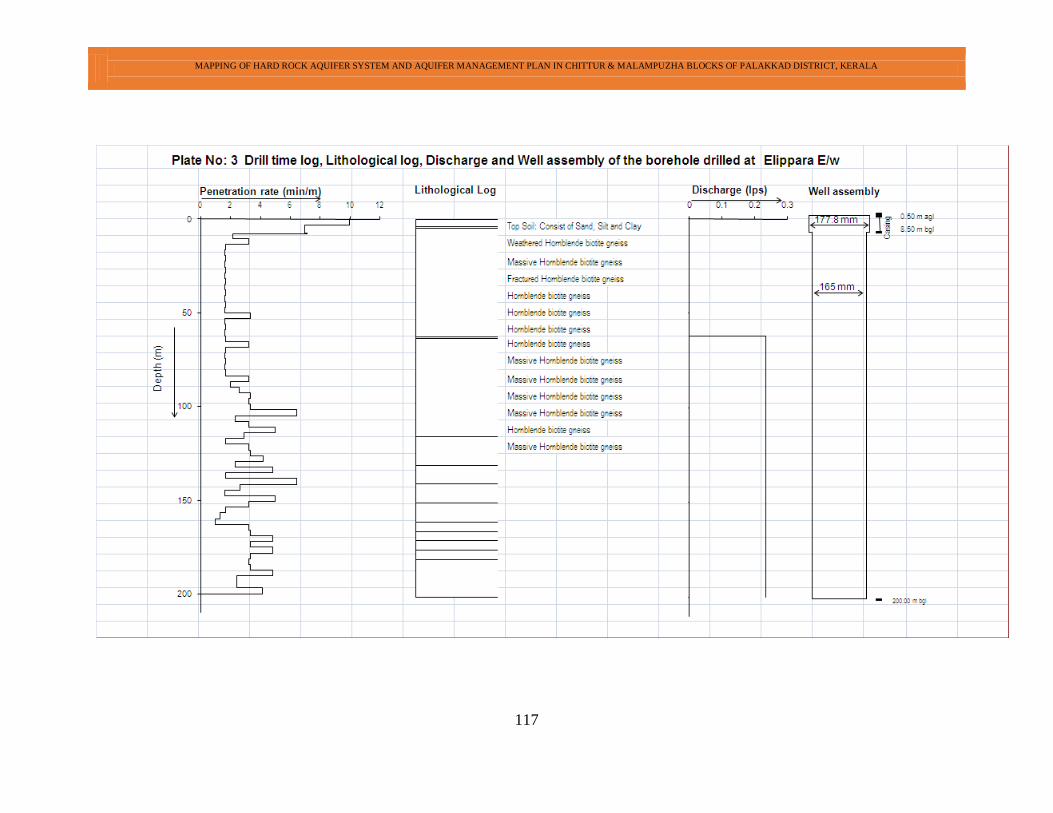
MAPPING OF HARD ROCK AQUIFER SYSTEM AND AQUIFER MANAGEMENT PLAN IN CHITTUR & MALAMPUZHA BLOCKS OF PALAKKAD DISTRICT, KERALA
117
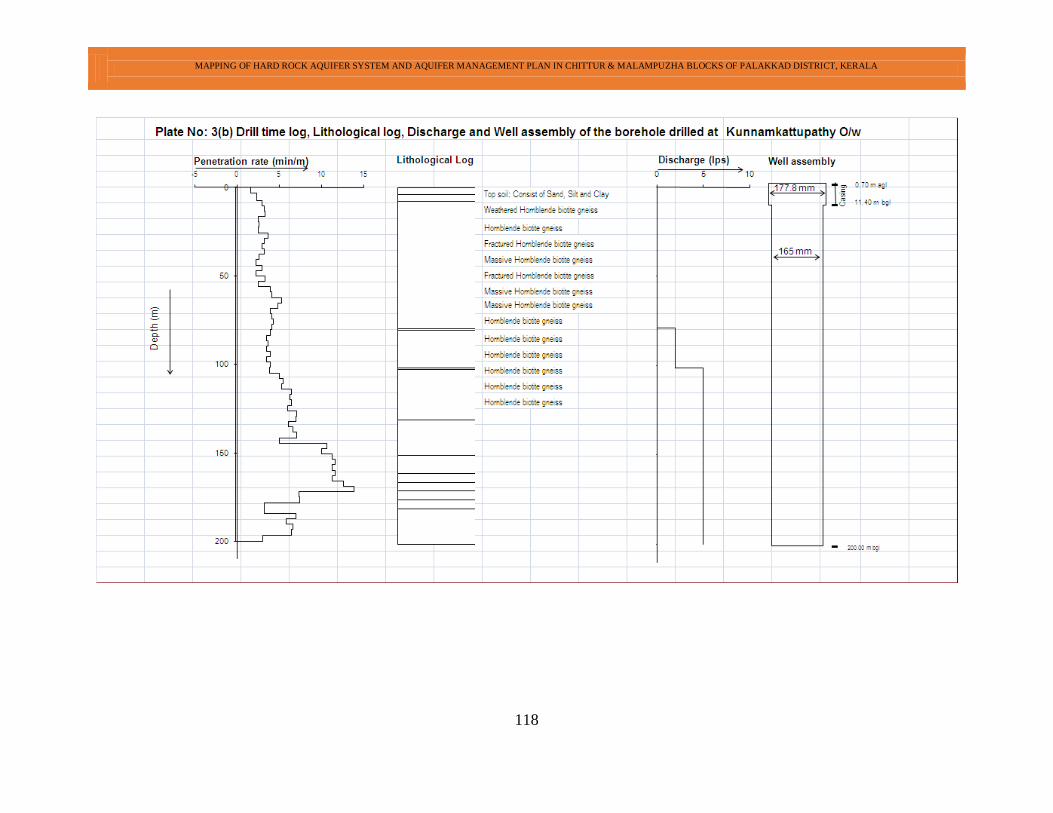
MAPPING OF HARD ROCK AQUIFER SYSTEM AND AQUIFER MANAGEMENT PLAN IN CHITTUR & MALAMPUZHA BLOCKS OF PALAKKAD DISTRICT, KERALA
118
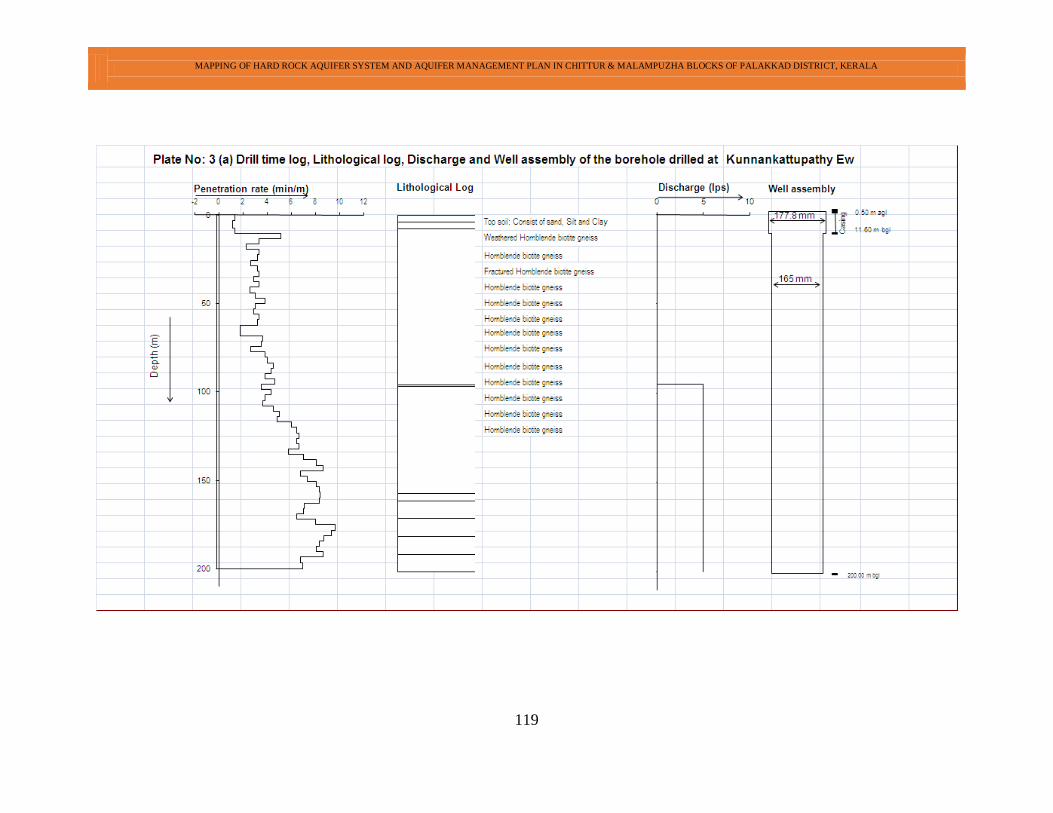
MAPPING OF HARD ROCK AQUIFER SYSTEM AND AQUIFER MANAGEMENT PLAN IN CHITTUR & MALAMPUZHA BLOCKS OF PALAKKAD DISTRICT, KERALA
119
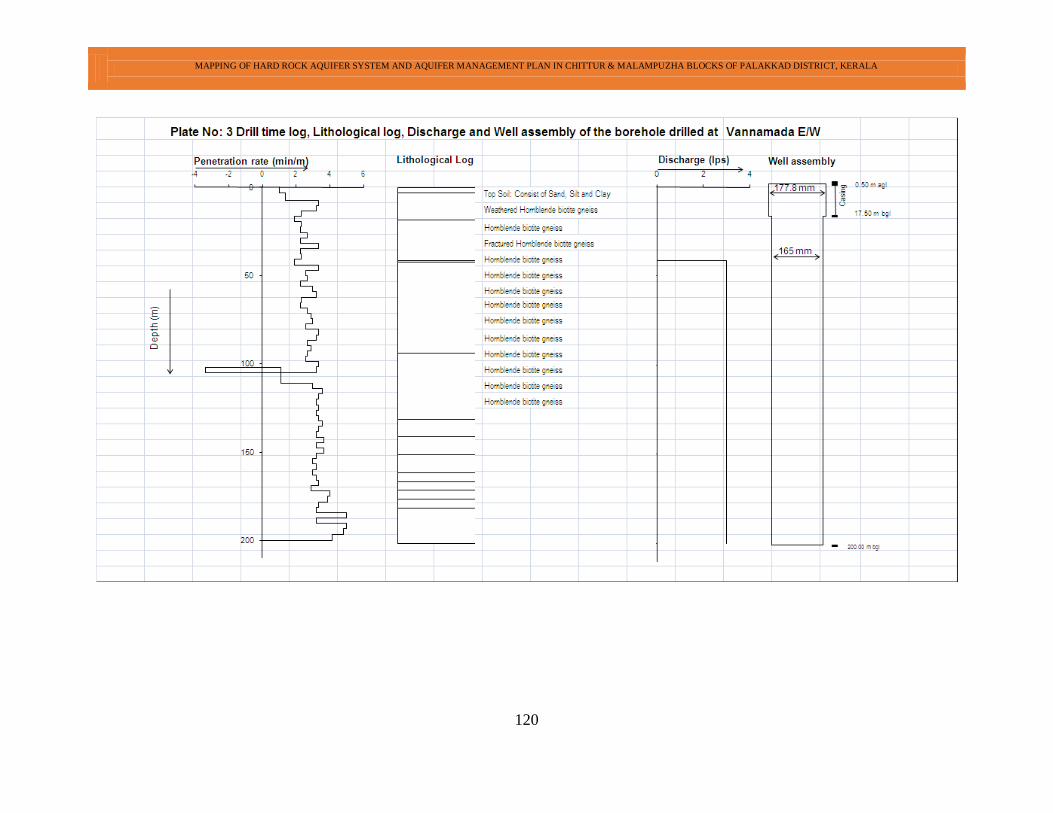
MAPPING OF HARD ROCK AQUIFER SYSTEM AND AQUIFER MANAGEMENT PLAN IN CHITTUR & MALAMPUZHA BLOCKS OF PALAKKAD DISTRICT, KERALA
120
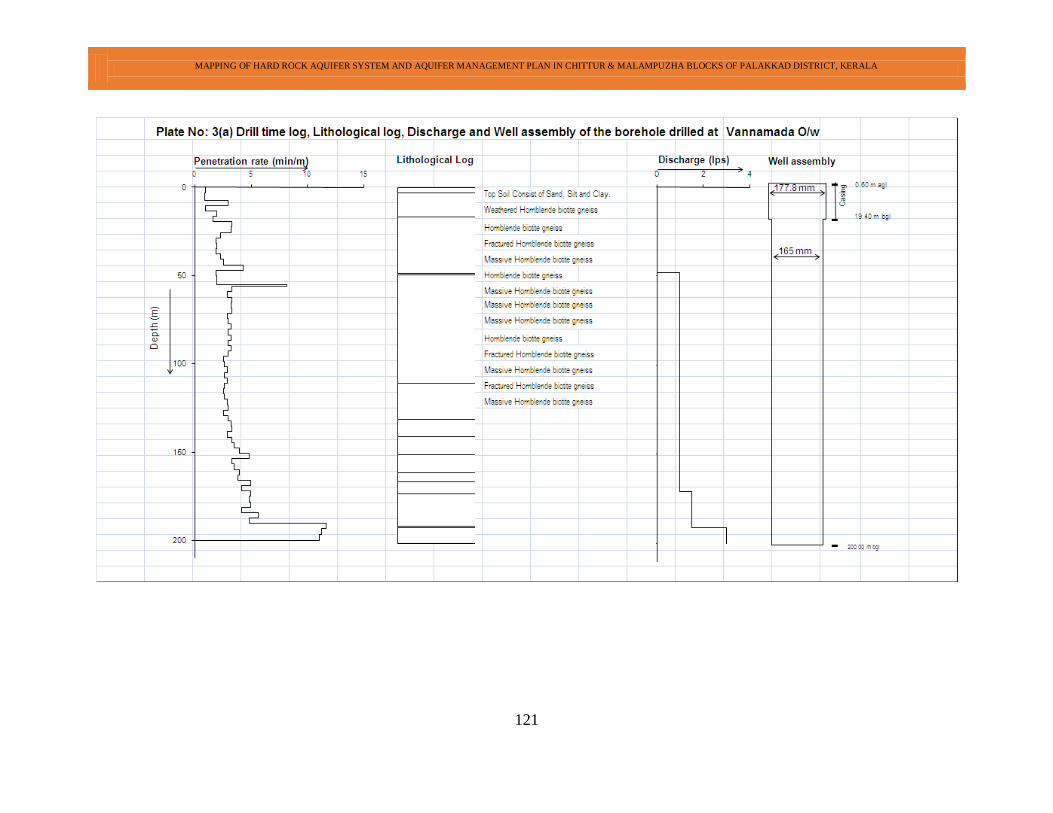
MAPPING OF HARD ROCK AQUIFER SYSTEM AND AQUIFER MANAGEMENT PLAN IN CHITTUR & MALAMPUZHA BLOCKS OF PALAKKAD DISTRICT, KERALA
121
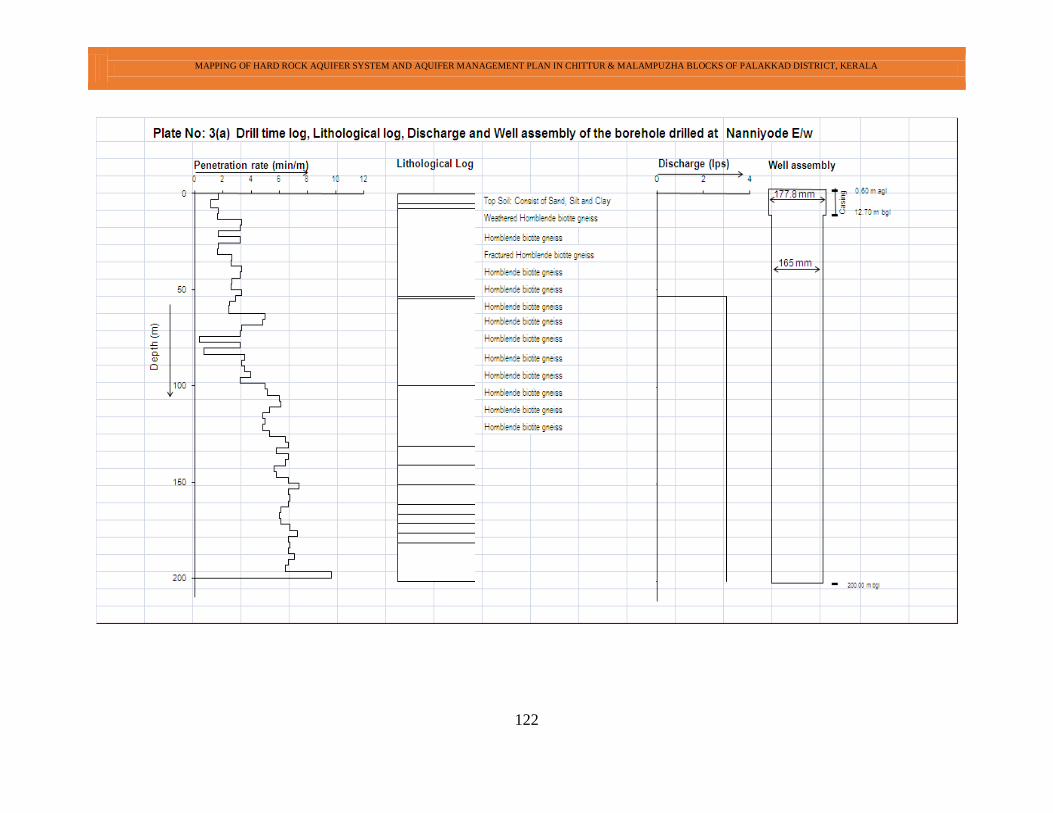
MAPPING OF HARD ROCK AQUIFER SYSTEM AND AQUIFER MANAGEMENT PLAN IN CHITTUR & MALAMPUZHA BLOCKS OF PALAKKAD DISTRICT, KERALA
122
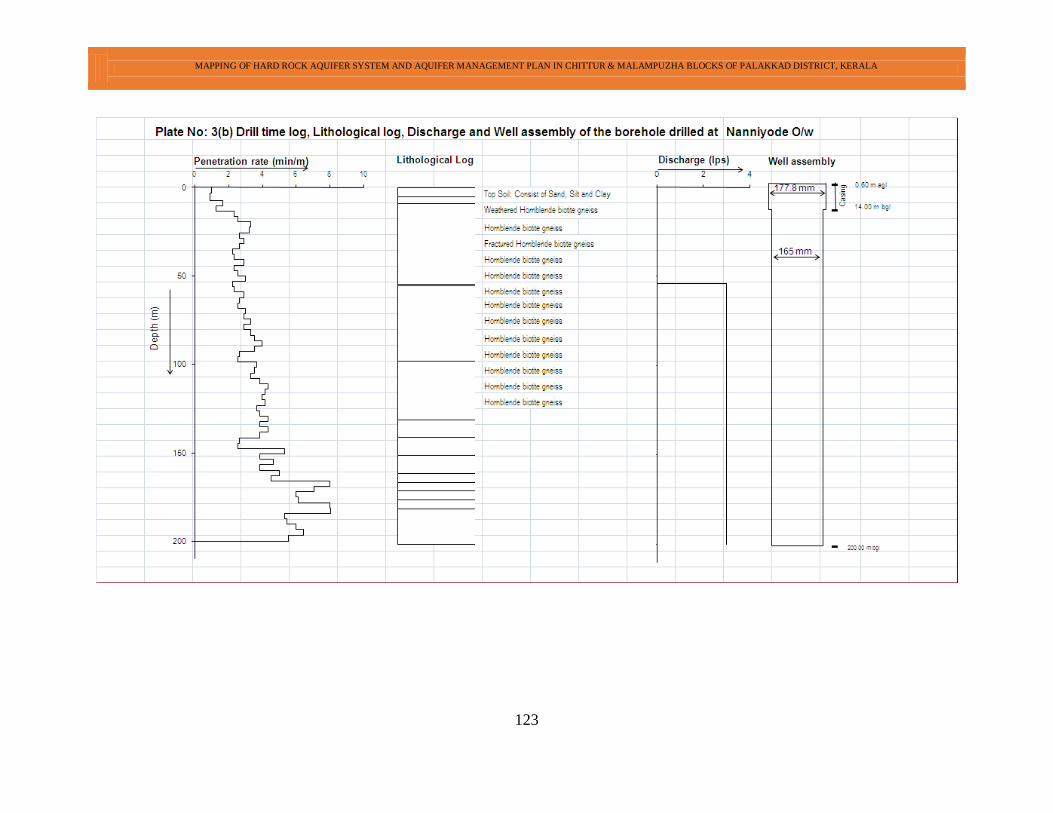
MAPPING OF HARD ROCK AQUIFER SYSTEM AND AQUIFER MANAGEMENT PLAN IN CHITTUR & MALAMPUZHA BLOCKS OF PALAKKAD DISTRICT, KERALA
123
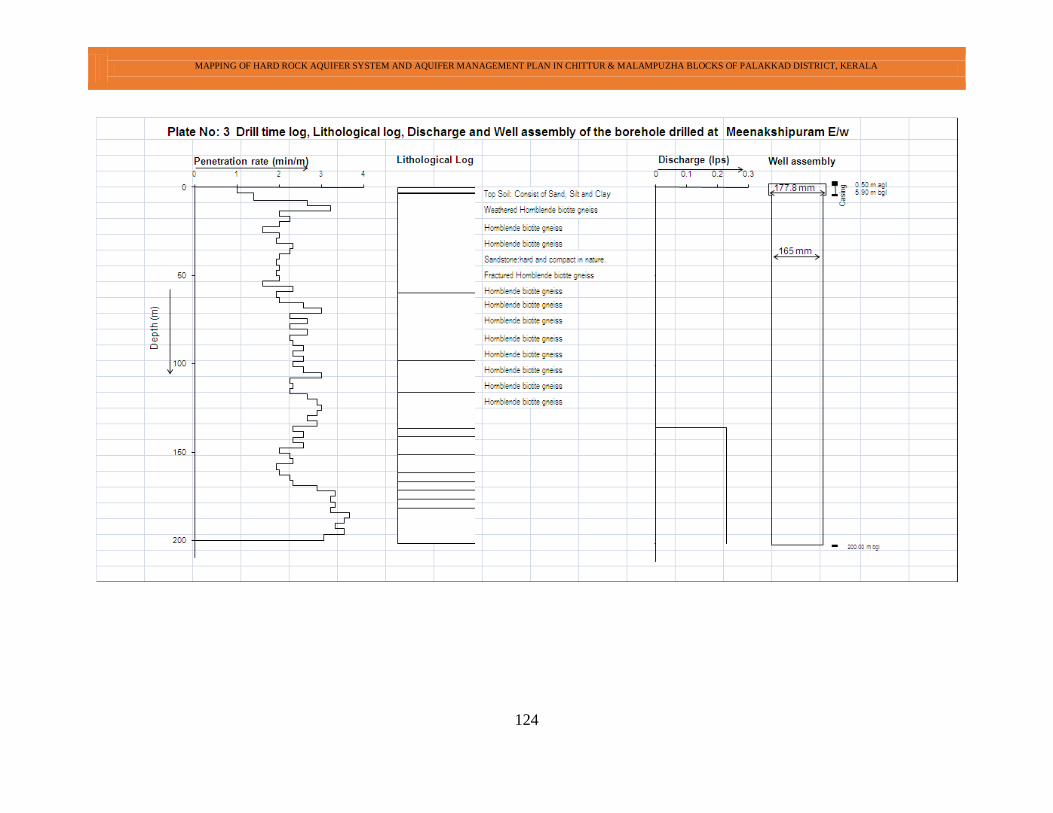
MAPPING OF HARD ROCK AQUIFER SYSTEM AND AQUIFER MANAGEMENT PLAN IN CHITTUR & MALAMPUZHA BLOCKS OF PALAKKAD DISTRICT, KERALA
124
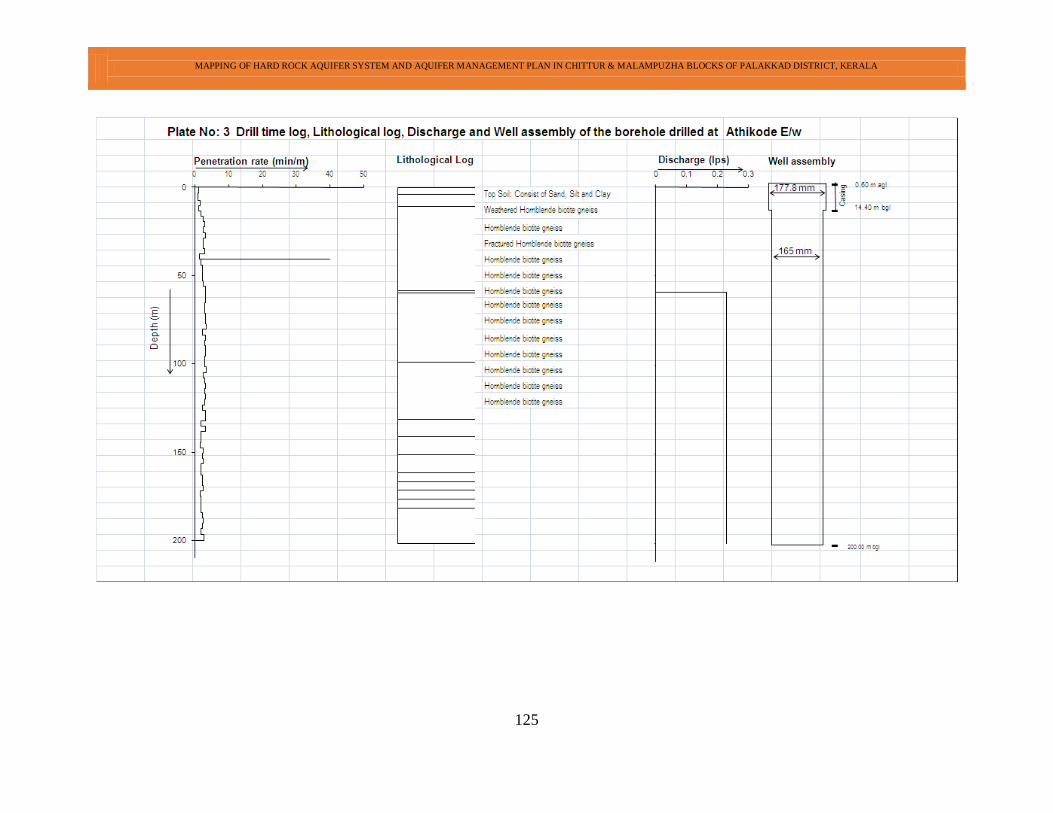
MAPPING OF HARD ROCK AQUIFER SYSTEM AND AQUIFER MANAGEMENT PLAN IN CHITTUR & MALAMPUZHA BLOCKS OF PALAKKAD DISTRICT, KERALA
125
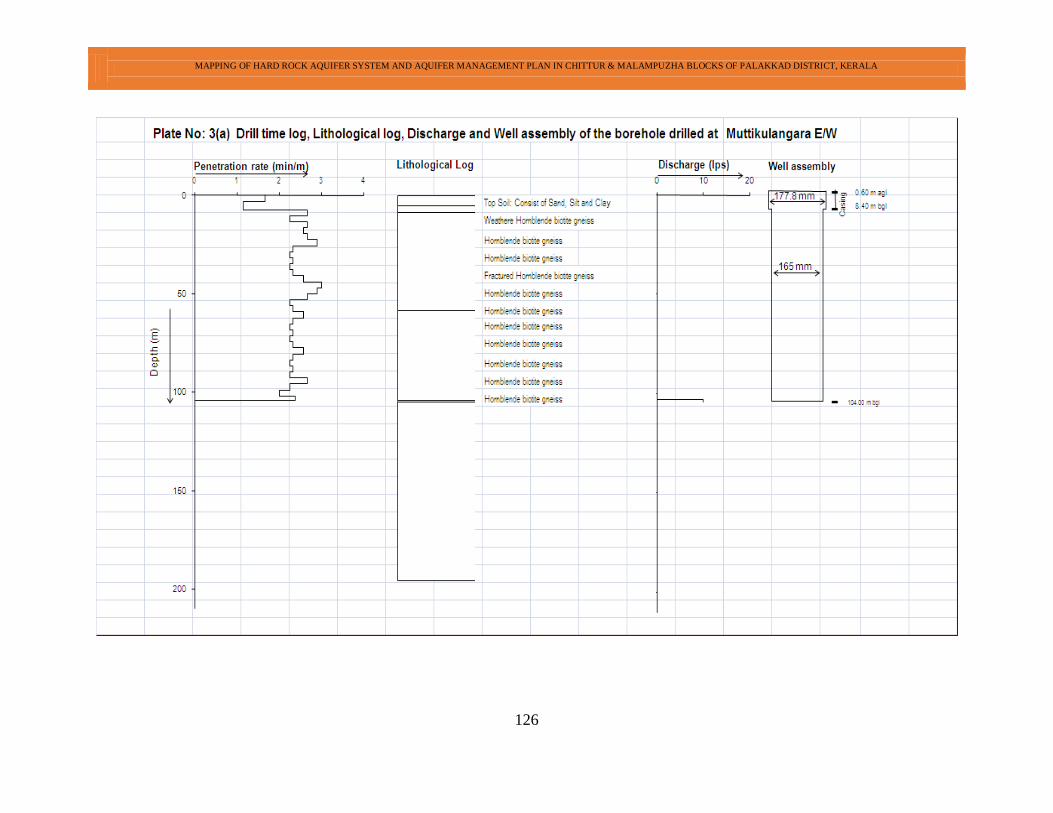
MAPPING OF HARD ROCK AQUIFER SYSTEM AND AQUIFER MANAGEMENT PLAN IN CHITTUR & MALAMPUZHA BLOCKS OF PALAKKAD DISTRICT, KERALA
126
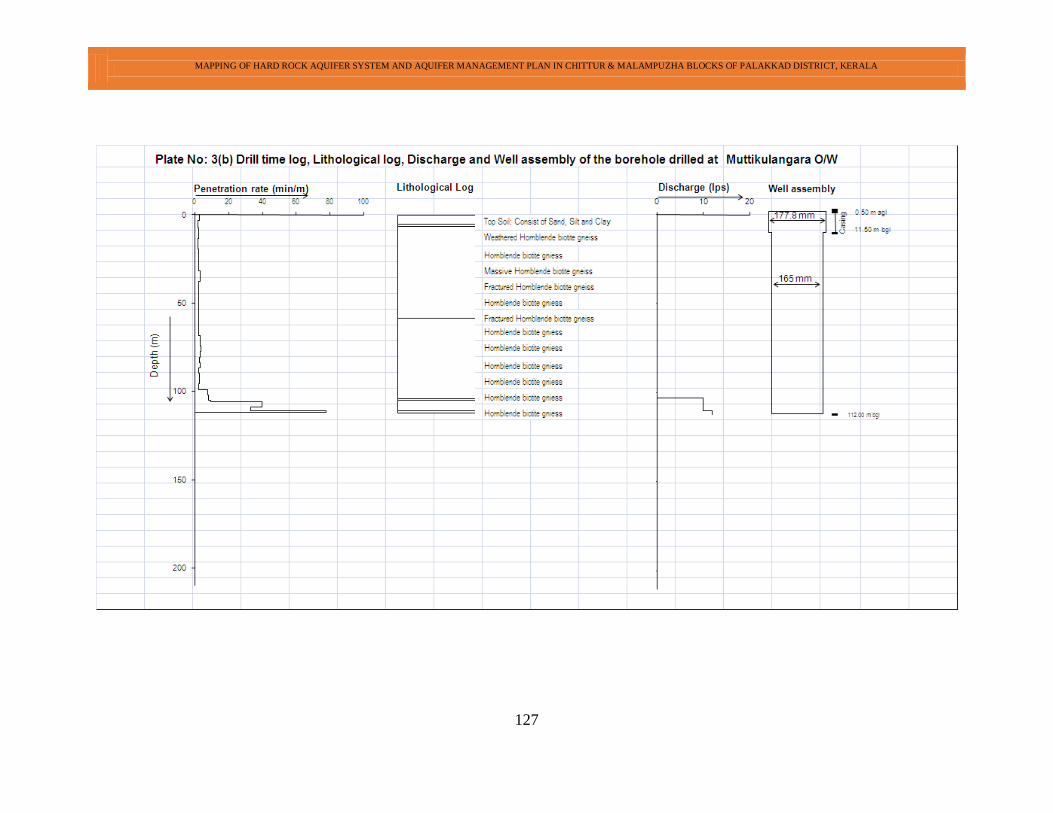
MAPPING OF HARD ROCK AQUIFER SYSTEM AND AQUIFER MANAGEMENT PLAN IN CHITTUR & MALAMPUZHA BLOCKS OF PALAKKAD DISTRICT, KERALA
127

MAPPING OF HARD ROCK AQUIFER SYSTEM AND AQUIFER MANAGEMENT PLAN IN CHITTUR & MALAMPUZHA BLOCKS OF PALAKKAD DISTRICT, KERALA
128
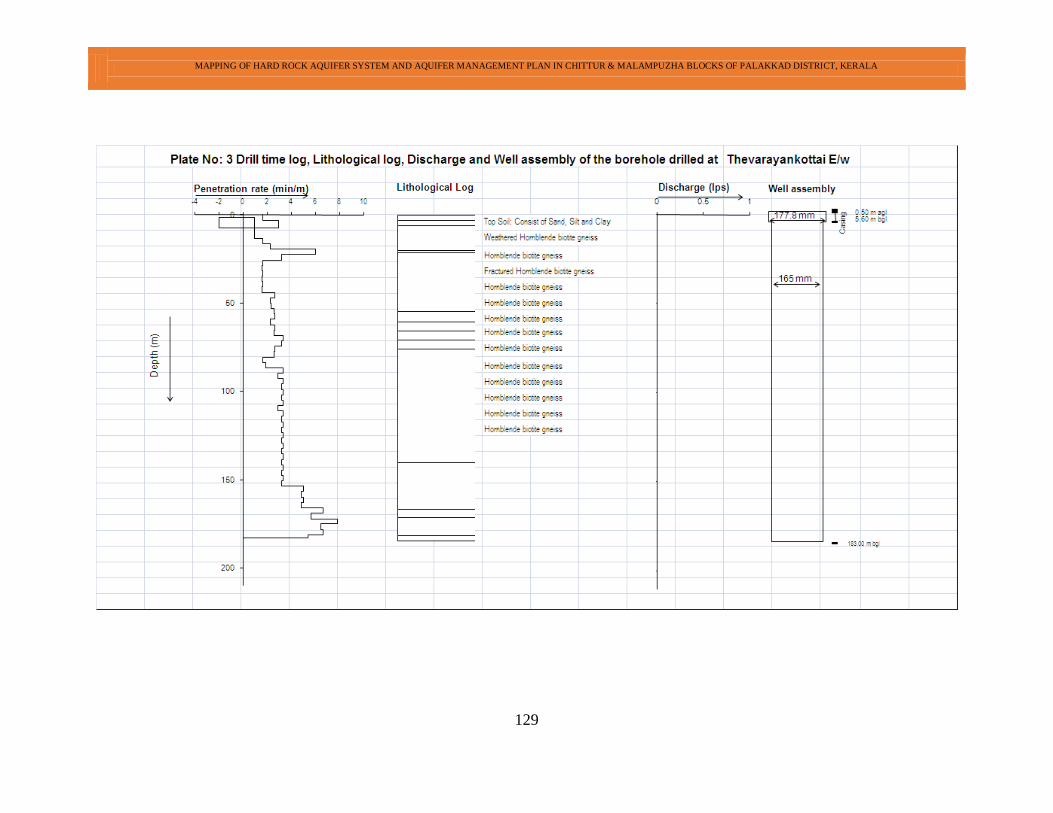
MAPPING OF HARD ROCK AQUIFER SYSTEM AND AQUIFER MANAGEMENT PLAN IN CHITTUR & MALAMPUZHA BLOCKS OF PALAKKAD DISTRICT, KERALA
129
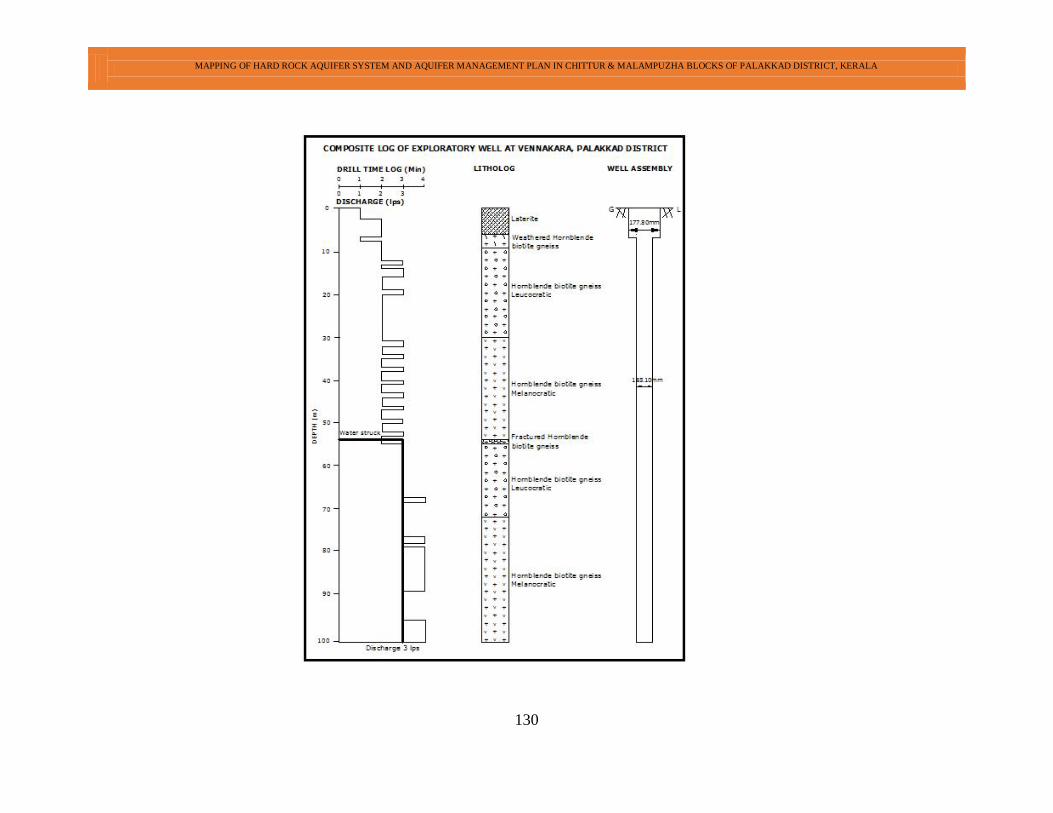
MAPPING OF HARD ROCK AQUIFER SYSTEM AND AQUIFER MANAGEMENT PLAN IN CHITTUR & MALAMPUZHA BLOCKS OF PALAKKAD DISTRICT, KERALA
130
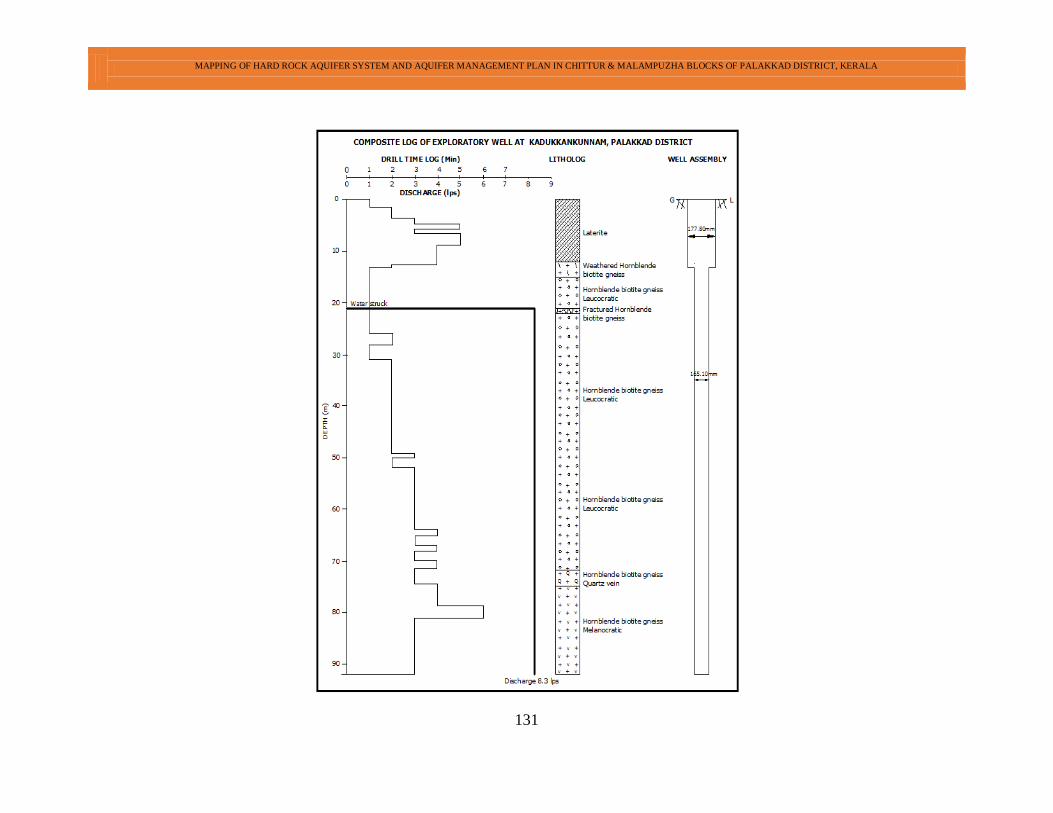
MAPPING OF HARD ROCK AQUIFER SYSTEM AND AQUIFER MANAGEMENT PLAN IN CHITTUR & MALAMPUZHA BLOCKS OF PALAKKAD DISTRICT, KERALA
131
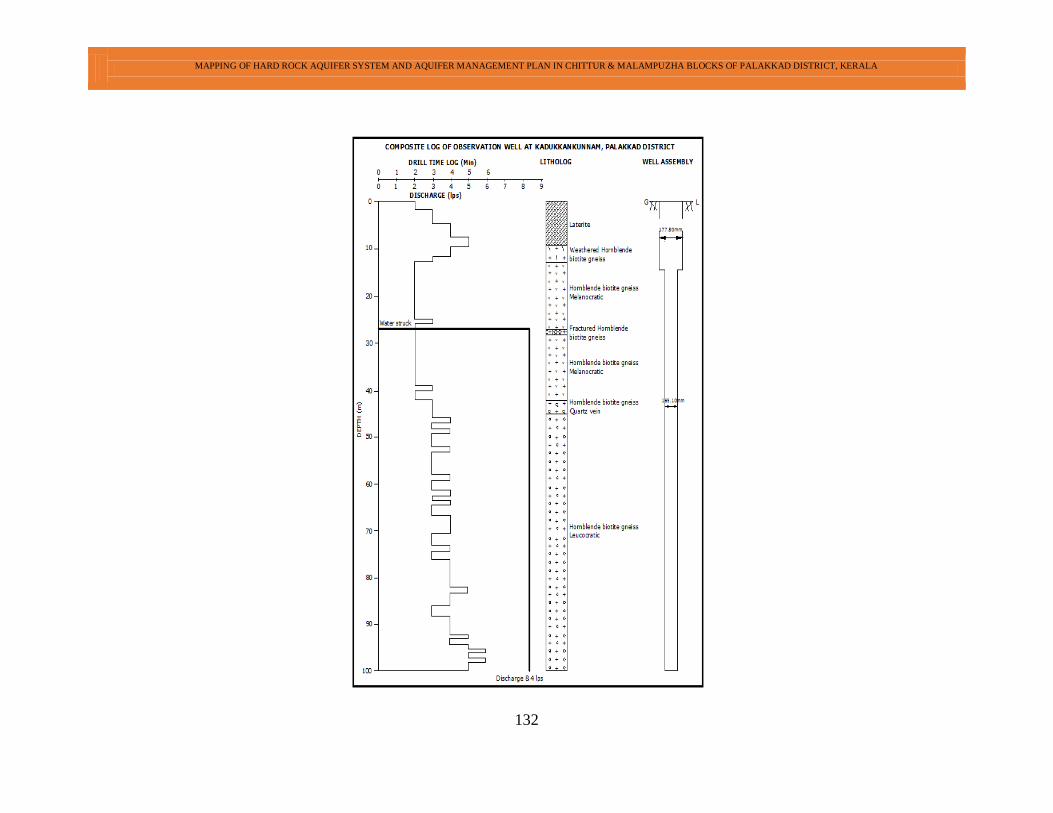
MAPPING OF HARD ROCK AQUIFER SYSTEM AND AQUIFER MANAGEMENT PLAN IN CHITTUR & MALAMPUZHA BLOCKS OF PALAKKAD DISTRICT, KERALA
132
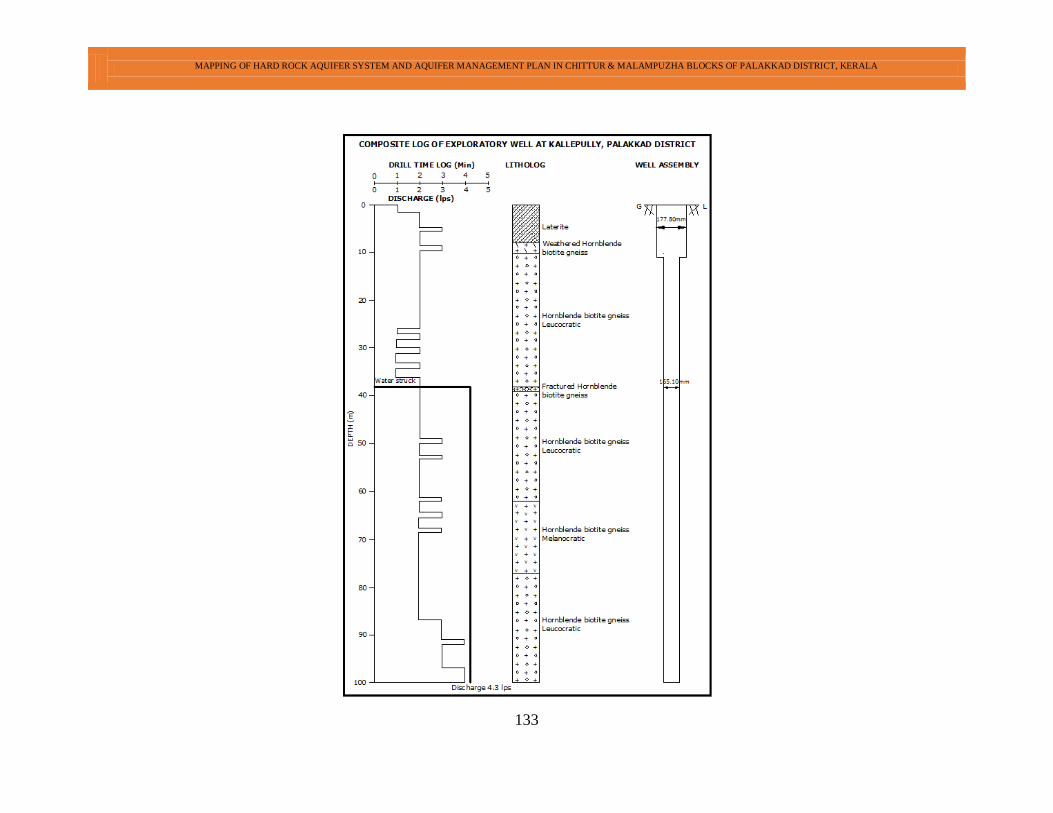
MAPPING OF HARD ROCK AQUIFER SYSTEM AND AQUIFER MANAGEMENT PLAN IN CHITTUR & MALAMPUZHA BLOCKS OF PALAKKAD DISTRICT, KERALA
133
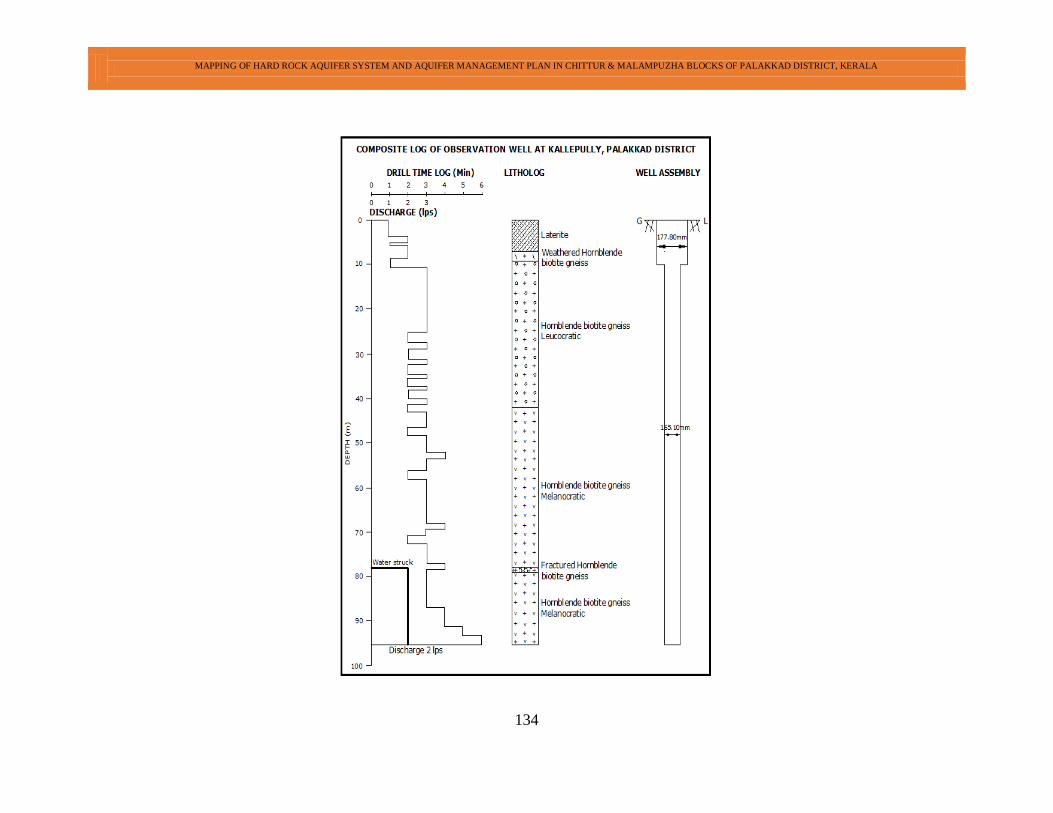
MAPPING OF HARD ROCK AQUIFER SYSTEM AND AQUIFER MANAGEMENT PLAN IN CHITTUR & MALAMPUZHA BLOCKS OF PALAKKAD DISTRICT, KERALA
134
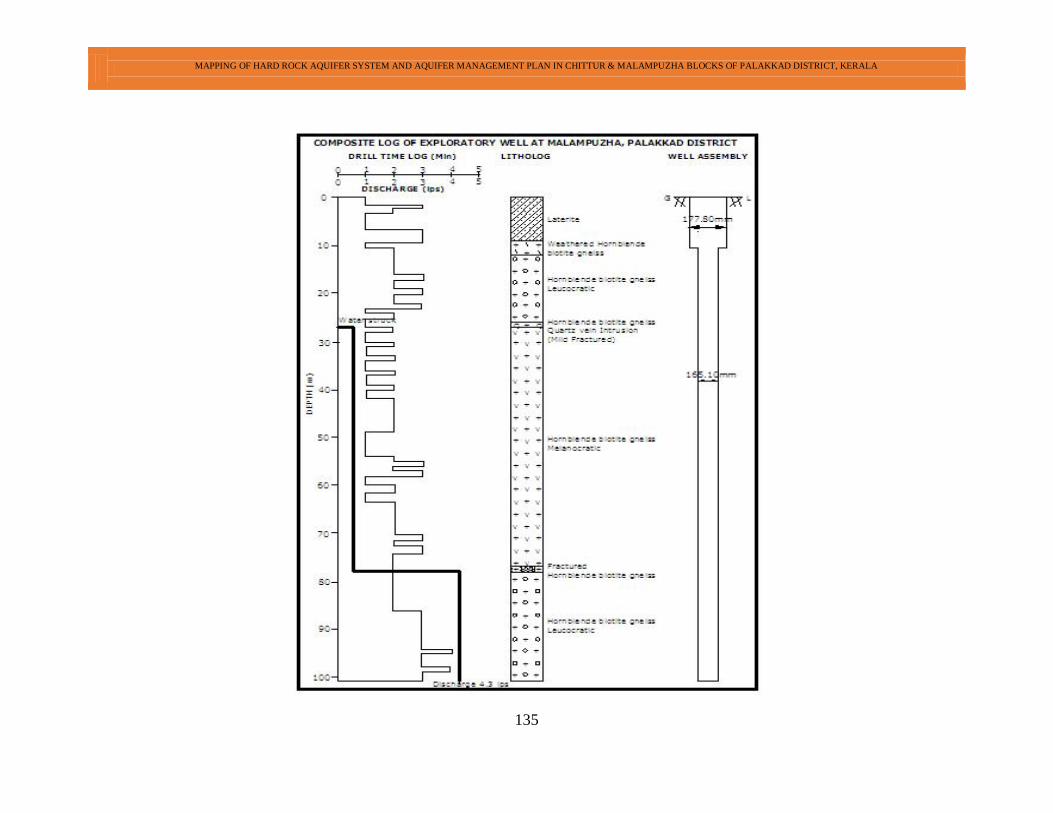
MAPPING OF HARD ROCK AQUIFER SYSTEM AND AQUIFER MANAGEMENT PLAN IN CHITTUR & MALAMPUZHA BLOCKS OF PALAKKAD DISTRICT, KERALA
135
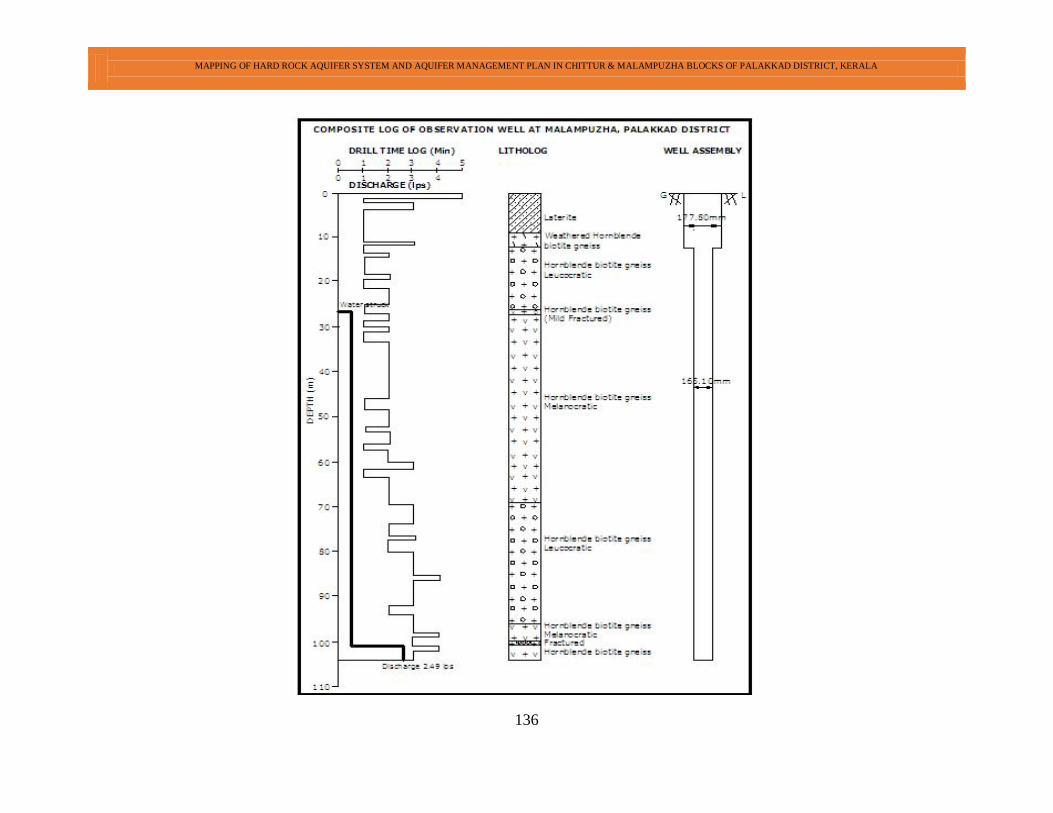
MAPPING OF HARD ROCK AQUIFER SYSTEM AND AQUIFER MANAGEMENT PLAN IN CHITTUR & MALAMPUZHA BLOCKS OF PALAKKAD DISTRICT, KERALA
136
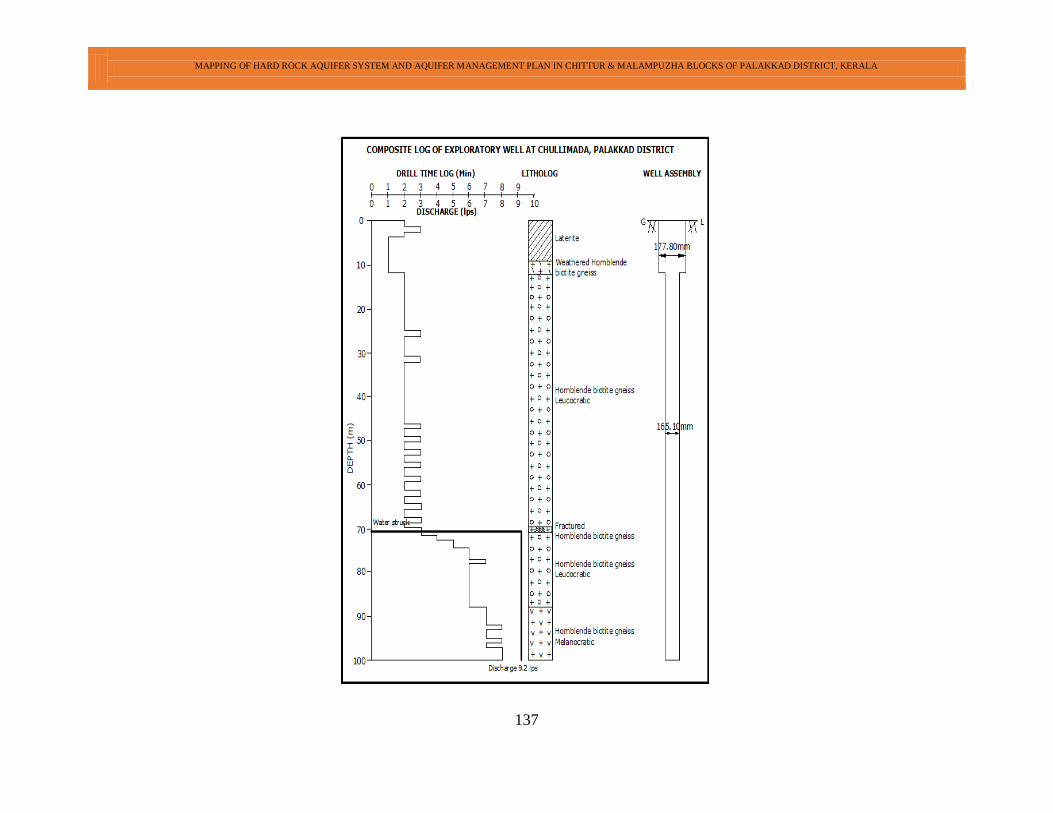
MAPPING OF HARD ROCK AQUIFER SYSTEM AND AQUIFER MANAGEMENT PLAN IN CHITTUR & MALAMPUZHA BLOCKS OF PALAKKAD DISTRICT, KERALA
137
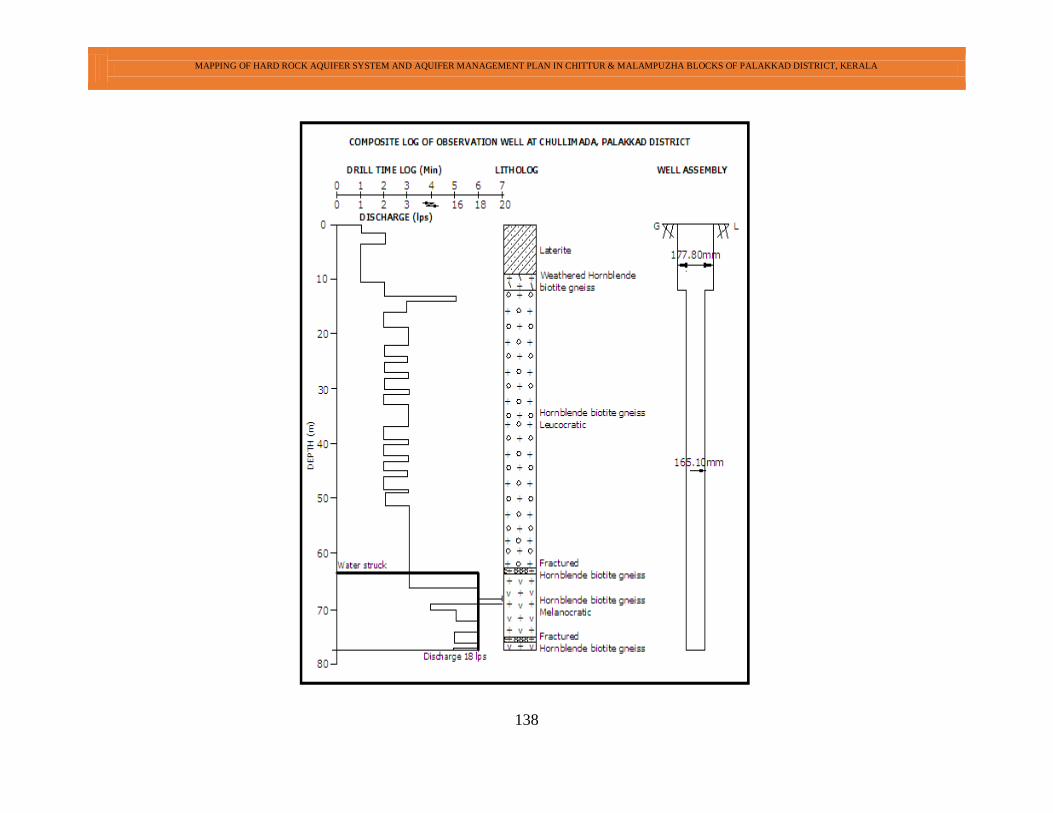
MAPPING OF HARD ROCK AQUIFER SYSTEM AND AQUIFER MANAGEMENT PLAN IN CHITTUR & MALAMPUZHA BLOCKS OF PALAKKAD DISTRICT, KERALA
138
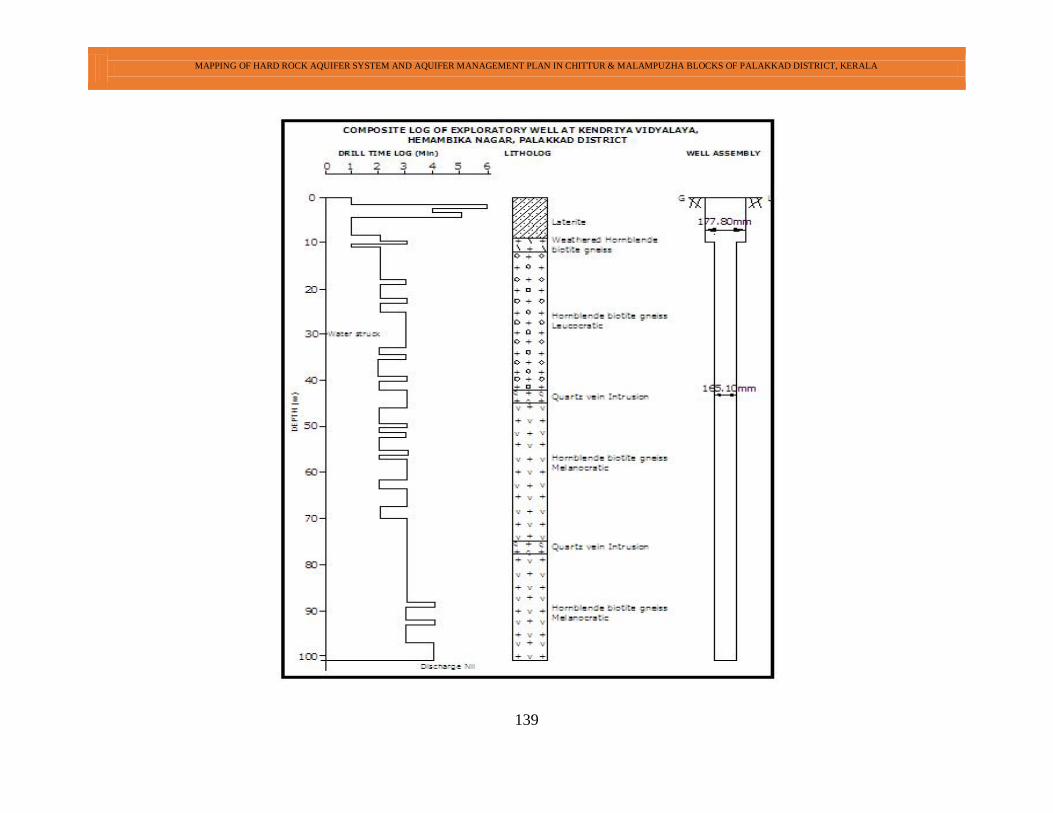
MAPPING OF HARD ROCK AQUIFER SYSTEM AND AQUIFER MANAGEMENT PLAN IN CHITTUR & MALAMPUZHA BLOCKS OF PALAKKAD DISTRICT, KERALA
139

MAPPING OF HARD ROCK AQUIFER SYSTEM AND AQUIFER MANAGEMENT PLAN IN CHITTUR & MALAMPUZHA BLOCKS OF PALAKKAD DISTRICT, KERALA
140
MAPPING OF HARD ROCK AQUIFER SYSTEM AND AQUIFER MANAGEMENT PLAN IN CHITTUR & MALAMPUZHA BLOCKS OF PALAKKAD DISTRICT, KERALA
141
CONTRIBUTORS’ PAGE
Principal Authors
S.Singathurai, Scientist-B
Dr. S.Sakthi Murugan, Asst. Hydrogeologist
Supervision & Guidance
Dr.Nandakumaran.P, Regional Director
V.Kunhambu, Regional Director
Anitha Shyam, Scientist-D (Nodal officer)
A.Ravi, Scientist-D (Supervision)
Scrutiny
Dr.N.Vinayachandran, Scientist-D
Mini Chandran, Scientist D
Hydrogeology
A.Ravi, Scientist-D (Team Leader)
S.Singathurai, Scientist-B
Dr.S.Sakthi Murugan, Asst.Hydrogeologist
Mohammad Rafi STA (HG)
Geophysics
K.Kotti Reddy, Scientist-D (Geophysics)
Hydrometerology
C.Rajkumar, Scientist-C
Hydrochemistry
V.N.Sreelatha, Scientist-D
Bindu.J.Viju, Scientist-B