Raibagh Taluk - क द्र य भू म ल बो जल संसाधन, नद...
15
क�दर य भ म लबो जल संसाधन, नद� �वकास और गंगा संर�ण मंताला भारत सरकार Central Ground Water Board Ministry of Water Resources, River Development and Ganga Rejuvenation Government of India Report on AQUIFER MAPPING AND MANAGEMENT PLAN Raibagh Taluk, Belgaum District,Karnataka द��ण पिचमी �ेत, ब�गलोर South Western Region,Bengaluru Draft Report
-
Upload
khangminh22 -
Category
Documents
-
view
1 -
download
0
Transcript of Raibagh Taluk - क द्र य भू म ल बो जल संसाधन, नद...
क� द्र�य भू�म �ल बो
जल ससंाधन, नद� �वकास और गगंा सरं�ण मतंाला
भारत सरकार Central Ground Water Board
Ministry of Water Resources, River Development and Ganga Rejuvenation
Government of India
Report on
AQUIFER MAPPING AND MANAGEMENT PLAN
Raibagh Taluk, Belgaum District,Karnataka
द��ण पिश्चमी �ेत, ब�गलोर South Western Region,Bengaluru
Draft Report
FOR OFFICIAL USE ONLY
Government of India Ministry of Water Resources,
River Development & Ganga Rejuvenation Central Ground Water Board
RAIBAG TALUK AQUIFER MAPS AND MANAGEMENT PLANS, BELGAUM DISTRICT, KARNATAKA STATE
By
T. RAJENDIRAN
Scientist ‘D’
Central Ground Water Board South Western Region
Bangalore March 2017
RAIBAG TALUK AQUIFER MAPS AND MANAGEMENT PLANS, BELGAUM DISTRICT, KARNATAKA STATE
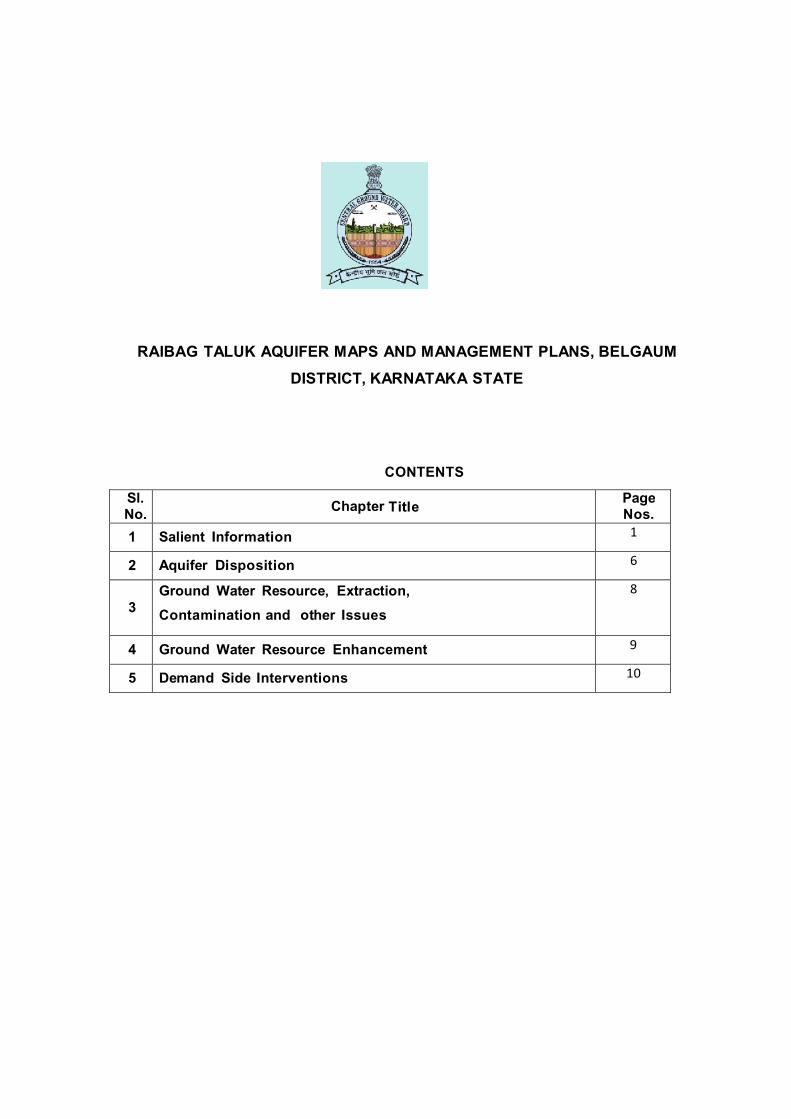
CONTENTS
Sl. No. Chapter Title Page
Nos. 1 Salient Information 1
2 Aquifer Disposition 6
3
Ground Water Resource, Extraction, Contamination and other Issues
8
4 Ground Water Resource Enhancement 9
5 Demand Side Interventions 10
1
AQUIFER MANAGEMENT PLAN OF RAIBAG TALUK, BELGAUM DISTRICT, KARNATAKA STATE
1.0 SALIENT INFORMATION
Name of the taluk: RAIBAG
District: Belgaum
State: Karnataka
Area: 959 sq.km.
Population: 4,05,489
Annual Normal Rainfall: 501 mm
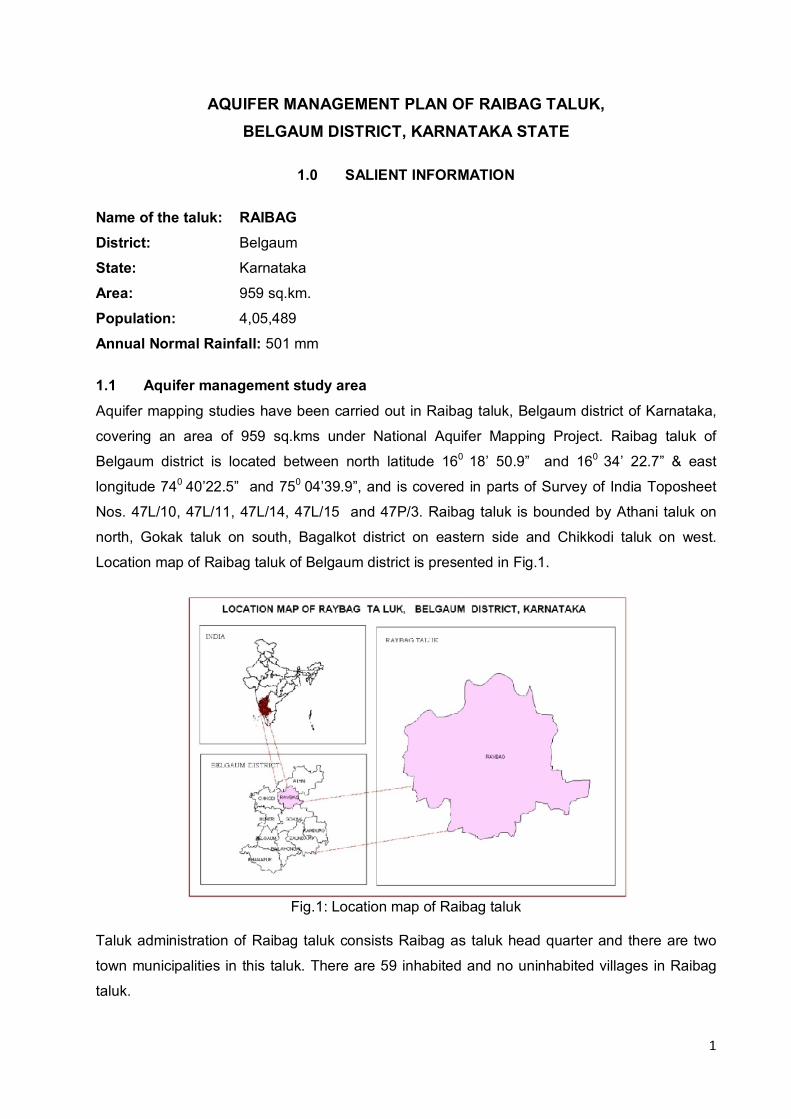
1.1 Aquifer management study area Aquifer mapping studies have been carried out in Raibag taluk, Belgaum district of Karnataka,
covering an area of 959 sq.kms under National Aquifer Mapping Project. Raibag taluk of
Belgaum district is located between north latitude 160 18’ 50.9” and 160 34’ 22.7” & east
longitude 740 40’22.5” and 750 04’39.9”, and is covered in parts of Survey of India Toposheet
Nos. 47L/10, 47L/11, 47L/14, 47L/15 and 47P/3. Raibag taluk is bounded by Athani taluk on
north, Gokak taluk on south, Bagalkot district on eastern side and Chikkodi taluk on west.
Location map of Raibag taluk of Belgaum district is presented in Fig.1.
Fig.1: Location map of Raibag taluk
Taluk administration of Raibag taluk consists Raibag as taluk head quarter and there are two
town municipalities in this taluk. There are 59 inhabited and no uninhabited villages in Raibag
taluk.
2
1.2 Population According to 2011 census, the population in Raibag taluk is 4,05,489, out of which 3,63,599
constitute the rural population and 41,890 constitute the urban population. The study area has
an overall population density of 423 persons per sq.km. The decadal variation in population
from 2001-2011 is 16.65% in Raibag taluk. 1.3 Rainfall Raibag taluk enjoys semi-arid climate. Dryness and hot weather prevails in major part of the
year. The area falls under Northern Dry agro-climatic zone of Karnataka state and is
categorized as drought prone.
The climate of the study area is quite agreeable and free from extremes. The year is usually
divided into four seasons: summer from March to May; rainy season or south-west monsoon
season from June to September; post-monsoon season covering the months of October and
November and dry or winter Season from December to February.
There is one rain gauge station located in Raibag taluk (Table-1). The data in respect of this
station from the year 1981 to 2010 is analysed and presented in Table-2. The data pertaining
to these gauges is of long term nature and are well maintained. It is presumed that they are
representative of the taluks and the same is used for analysis. Normal annual rainfall in Raibag
taluk for the period 1981 to 2010 is 501 mm.
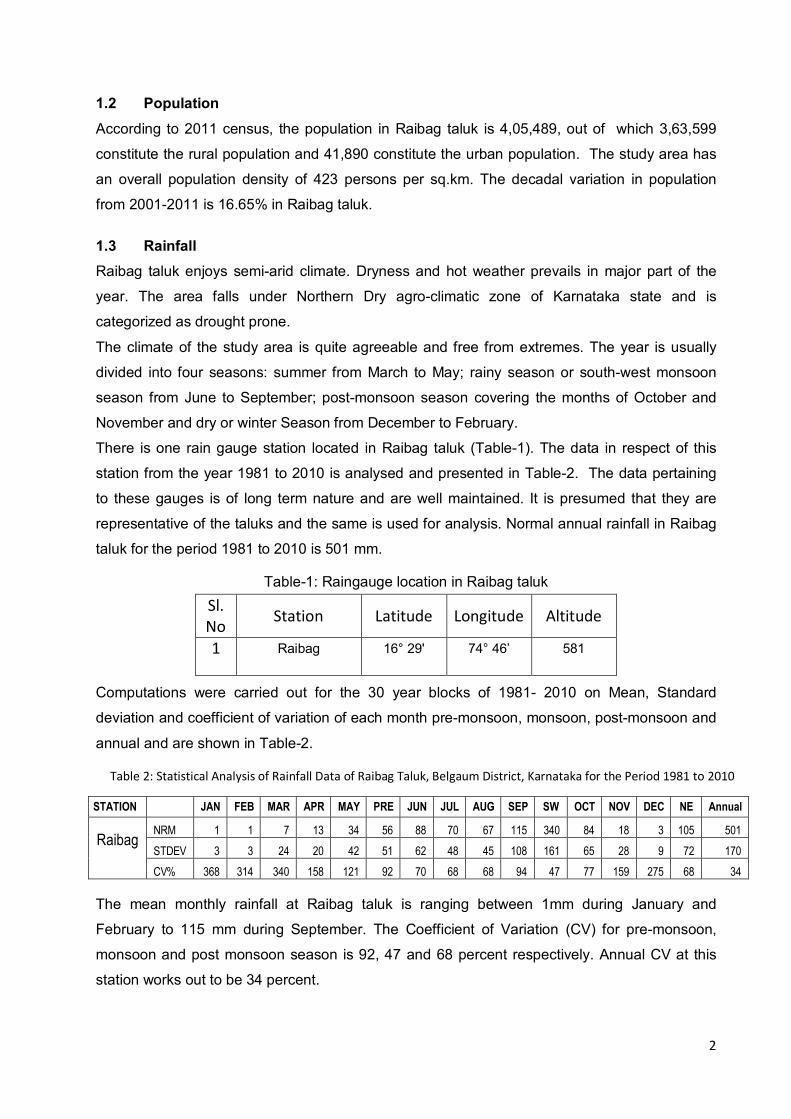
Table-1: Raingauge location in Raibag taluk Sl. No Station Latitude Longitude Altitude
1 Raibag 16° 29' 74° 46’ 581
Computations were carried out for the 30 year blocks of 1981- 2010 on Mean, Standard
deviation and coefficient of variation of each month pre-monsoon, monsoon, post-monsoon and
annual and are shown in Table-2.
Table 2: Statistical Analysis of Rainfall Data of Raibag Taluk, Belgaum District, Karnataka for the Period 1981 to 2010
The mean monthly rainfall at Raibag taluk is ranging between 1mm during January and
February to 115 mm during September. The Coefficient of Variation (CV) for pre-monsoon,
monsoon and post monsoon season is 92, 47 and 68 percent respectively. Annual CV at this
station works out to be 34 percent.
STATION JAN FEB MAR APR MAY PRE JUN JUL AUG SEP SW OCT NOV DEC NE Annual
Raibag NRM 1 1 7 13 34 56 88 70 67 115 340 84 18 3 105 501 STDEV 3 3 24 20 42 51 62 48 45 108 161 65 28 9 72 170 CV% 368 314 340 158 121 92 70 68 68 94 47 77 159 275 68 34
3
1.4 Agriculture & Irrigation
Agriculture is the main occupation in Raibag taluk. Major Kharif crops are maize, bajra, jowar,
tur and vegetables. Main crops of Rabi season are maize, horse gram, groundnut, and
sunflower (Table-3). Water intensive crops like sugarcane is grown in 71.54 % of total crop
area. Maize is grown in 35.7% and oil seeds in 2.3% of total crop area of taluk. Bajra & jowar
account 2% of total crop area. Table-3: Cropping pattern in Raibag taluk 2014-2015 (Ha)
Year
Padd
y
Mai
ze
Bajra
Jow
ar
Puls
es
Frui
ts
Vege
tabl
es
Oil
seed
s
Suga
rcan
e
Cot
ton
Area under cultivation (in ha)
2014-15 0 19353 135 937 1238 289 720 1255 38777 464
It is observed that net sown area accounts 50.18% and area sown more than once is 21.50% of
total geographical area in Raibag taluk (Table-4). Area not available for cultivation and Fallow
land cover 10% & 34.5% of total geographical area respectively. 50.73% of the net area
irrigated is through canals, 15.32% of the net area is irrigated through dug wells, 18.01% of net
area irrigated is from borewells and 15.93% from lift irrigation (Table-5).
Table-4: Details of land use in Raibag taluk, 2014-15 (Ha)
Taluk Total
Geographical Area
Area under Forest
Area not available for cultivation
Fallow land
Net sown area
Area sown more than once
Raibag 95900 2647 9657 33096 48127 20617 Source: District at a Glance 2014-15, Govt. of Karnataka
Table-5: Irrigation details in Raibag taluk (in ha)
Source of Irrigation Net area
irrigated (Ha.)
% of area
Canals 24750 50.73
Tanks 0 0
Wells 7475 15.32
Bore wells 8789 18.01
Lift Irrigation 7771 15.93
Other Sources 0 0
Total 48,785 Source: District at a Glance 2014-15, Govt. of Karnataka
4
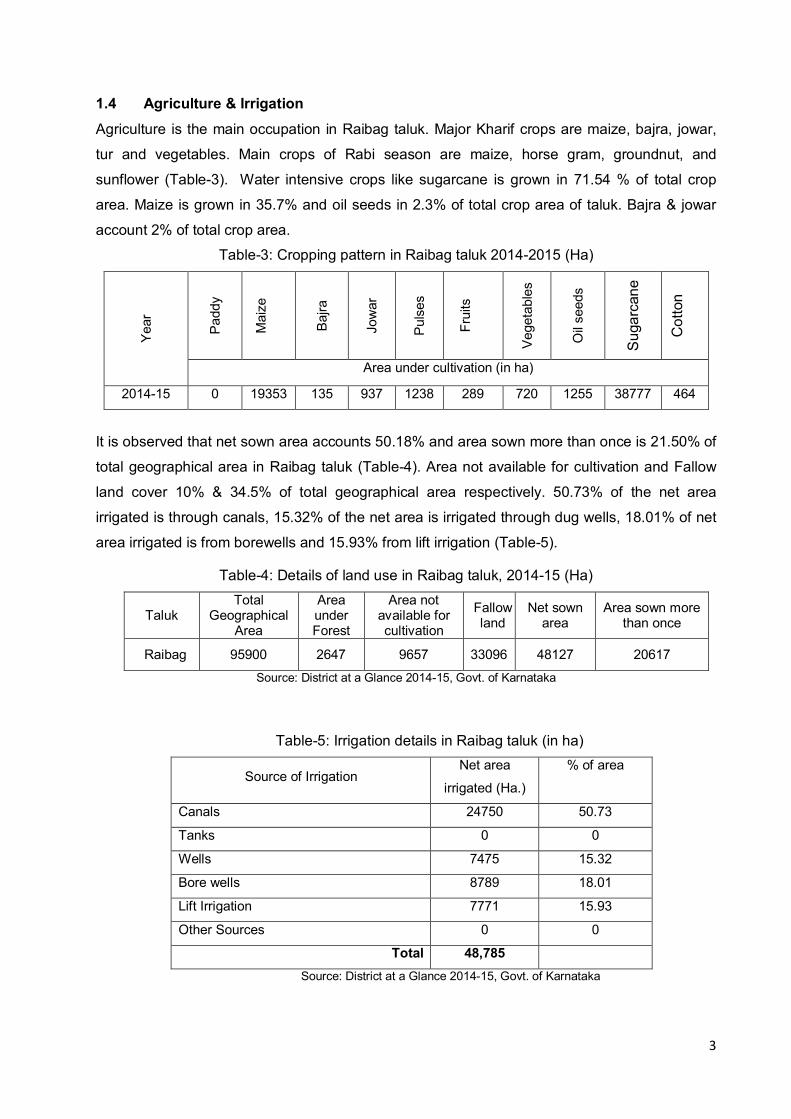
1.5 Geomorphology, Physiography and Drainage Raibag taluk is a plateau region formed by basaltic lava flows, which represents “Deccan
peneplain”. The elevation in the plains varies from 534 m in to 820 m amsl in the taluk. This
has its bearing on the regional slope which is towards northeast (Fig.3).
The river Krishna, along with its tributaries Ghataprabha and Malaprabha are perennial and
effluent in nature and flow in easterly direction. The drainage in the district is dendritic to sub-
dendritic in nature The drainage density varies from 0.80 to 3.4km/sq.km (Fig.3).
Fig.2: Geomorphology Fig.3: Drainage
1.6 Soil By and large, black soils predominate in Raibag taluk which is in the Deccan Trap terrain.
They are dark greyish-brown to very dark greyish-brown with clayey texture. These are
derived from the weathered products of basalts and limestone and are darker in valleys than
in high lands. Their texture varies from loam to clay, with low to moderate infiltration
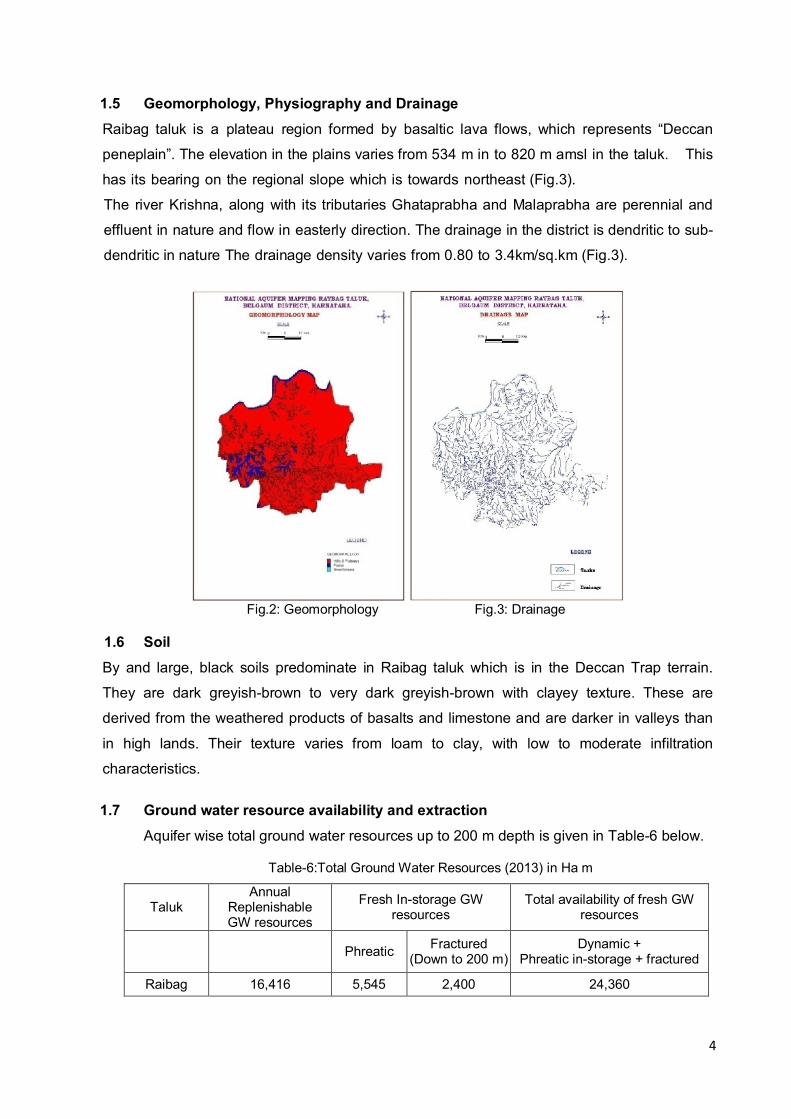
characteristics. 1.7 Ground water resource availability and extraction Aquifer wise total ground water resources up to 200 m depth is given in Table-6 below.
Table-6:Total Ground Water Resources (2013) in Ha m
Taluk Annual
Replenishable GW resources
Fresh In-storage GW resources
Total availability of fresh GW resources
Phreatic Fractured
(Down to 200 m) Dynamic +
Phreatic in-storage + fractured
Raibag 16,416 5,545 2,400 24,360
5
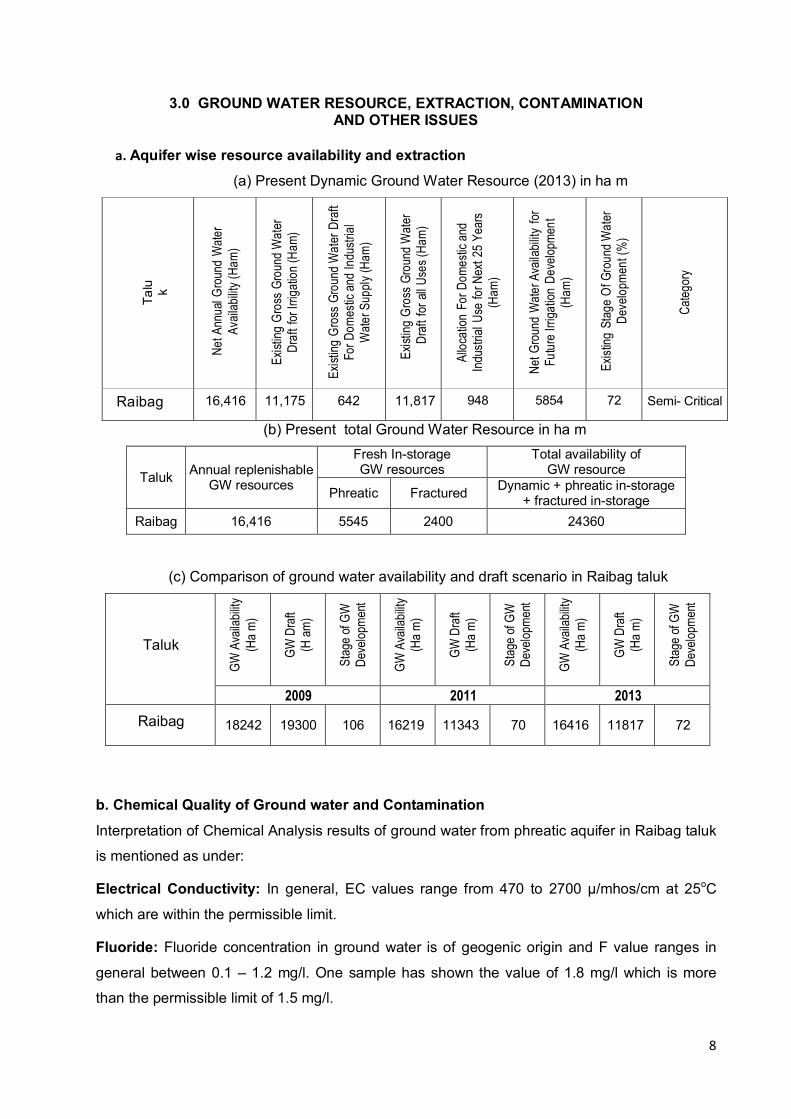
1.8 Existing and future water demands (as per GEC-2013)
Net ground water availability for future irrigation development : 5,854 Ha m
Domestic (Industrial sector) demand for next 25 years : 948 Ha m
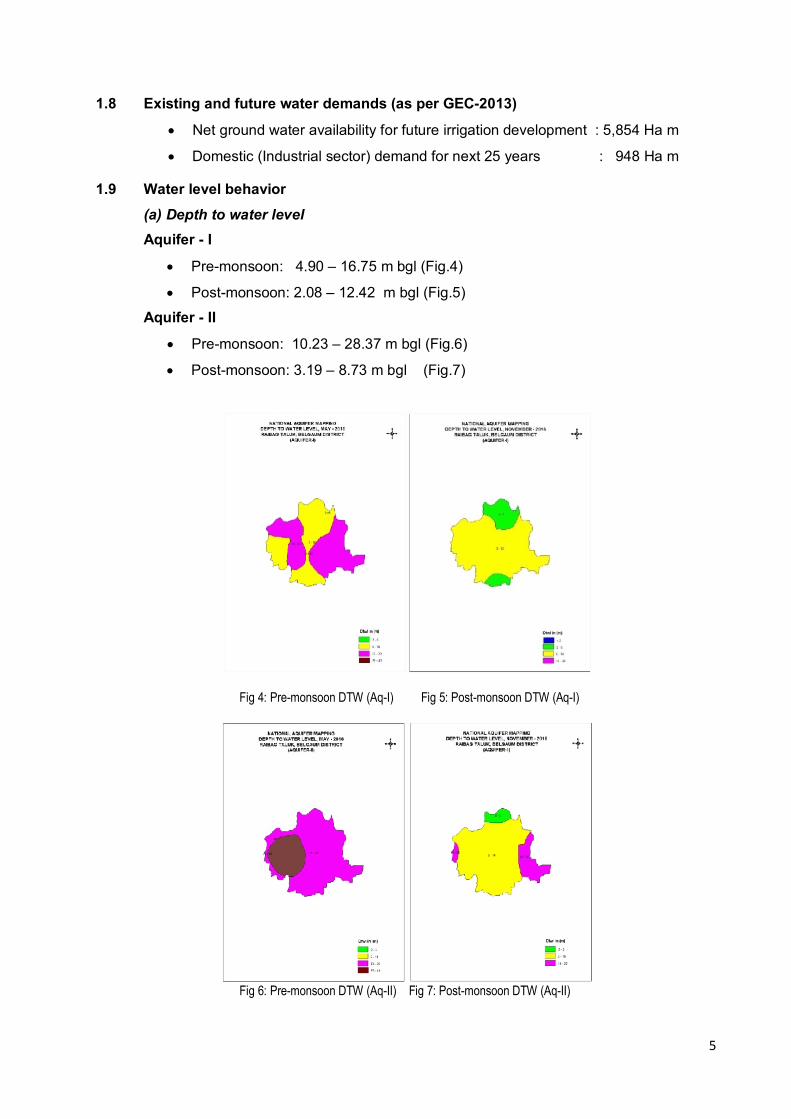
1.9 Water level behavior (a) Depth to water level
Aquifer - I
Pre-monsoon: 4.90 – 16.75 m bgl (Fig.4)
Post-monsoon: 2.08 – 12.42 m bgl (Fig.5) Aquifer - II
Pre-monsoon: 10.23 – 28.37 m bgl (Fig.6)
Post-monsoon: 3.19 – 8.73 m bgl (Fig.7)
Fig 4: Pre-monsoon DTW (Aq-I) Fig 5: Post-monsoon DTW (Aq-I)
Fig 6: Pre-monsoon DTW (Aq-II) Fig 7: Post-monsoon DTW (Aq-II)
6
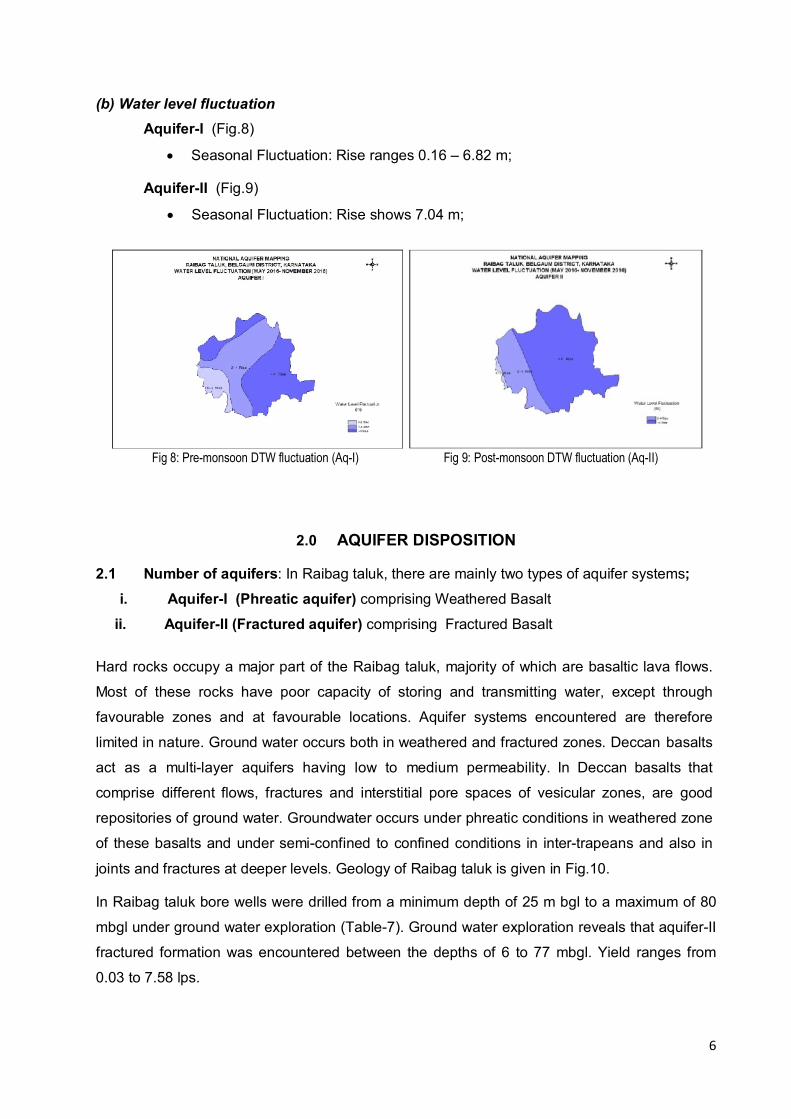
(b) Water level fluctuation Aquifer-I (Fig.8)
Seasonal Fluctuation: Rise ranges 0.16 – 6.82 m;
Aquifer-II (Fig.9)
Seasonal Fluctuation: Rise shows 7.04 m;
Fig 8: Pre-monsoon DTW fluctuation (Aq-I) Fig 9: Post-monsoon DTW fluctuation (Aq-II)
2.0 AQUIFER DISPOSITION
2.1 Number of aquifers: In Raibag taluk, there are mainly two types of aquifer systems; i. Aquifer-I (Phreatic aquifer) comprising Weathered Basalt
ii. Aquifer-II (Fractured aquifer) comprising Fractured Basalt
Hard rocks occupy a major part of the Raibag taluk, majority of which are basaltic lava flows.
Most of these rocks have poor capacity of storing and transmitting water, except through
favourable zones and at favourable locations. Aquifer systems encountered are therefore
limited in nature. Ground water occurs both in weathered and fractured zones. Deccan basalts
act as a multi-layer aquifers having low to medium permeability. In Deccan basalts that
comprise different flows, fractures and interstitial pore spaces of vesicular zones, are good
repositories of ground water. Groundwater occurs under phreatic conditions in weathered zone
of these basalts and under semi-confined to confined conditions in inter-trapeans and also in
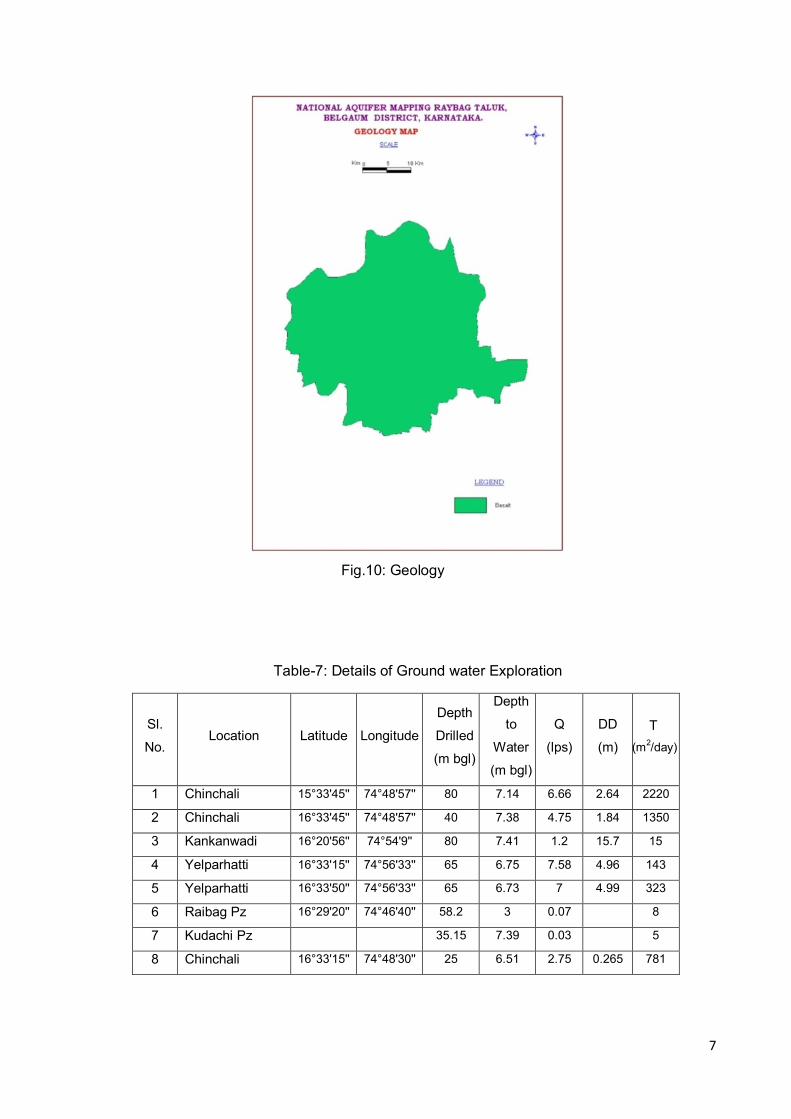
joints and fractures at deeper levels. Geology of Raibag taluk is given in Fig.10.
In Raibag taluk bore wells were drilled from a minimum depth of 25 m bgl to a maximum of 80
mbgl under ground water exploration (Table-7). Ground water exploration reveals that aquifer-II
fractured formation was encountered between the depths of 6 to 77 mbgl. Yield ranges from
0.03 to 7.58 lps.
7
Fig.10: Geology
Table-7: Details of Ground water Exploration
Sl.
No. Location Latitude Longitude
Depth
Drilled
(m bgl)
Depth
to
Water
(m bgl)
Q
(lps)
DD
(m) T
(m2/day)
1 Chinchali 15°33'45'' 74°48'57'' 80 7.14 6.66 2.64 2220
2 Chinchali 16°33'45'' 74°48'57'' 40 7.38 4.75 1.84 1350
3 Kankanwadi 16°20'56'' 74°54'9'' 80 7.41 1.2 15.7 15
4 Yelparhatti 16°33'15'' 74°56'33'' 65 6.75 7.58 4.96 143
5 Yelparhatti 16°33'50'' 74°56'33'' 65 6.73 7 4.99 323
6 Raibag Pz 16°29'20'' 74°46'40'' 58.2 3 0.07 8
7 Kudachi Pz 35.15 7.39 0.03 5
8 Chinchali 16°33'15'' 74°48'30'' 25 6.51 2.75 0.265 781
8
3.0 GROUND WATER RESOURCE, EXTRACTION, CONTAMINATION AND OTHER ISSUES
a. Aquifer wise resource availability and extraction
(a) Present Dynamic Ground Water Resource (2013) in ha m
Ta
lu k
Net A
nnua
l Gro
und
Wate
r Av
ailab
ility (
Ham)
Exist
ing G
ross
Gro
und W
ater
Dr
aft f
or Ir
rigati
on (H
am)
Exist
ing G
ross
Gro
und W
ater
Dra
ft
For D
omes
tic an
d In
dustr
ial
Wate
r Sup
ply (H
am)
Exist
ing G
ross
Gro
und W
ater
Dra
ft for
all U
ses (
Ham)
Alloc
ation
For
Dom
estic
and
Indus
trial U
se fo
r Nex
t 25
Year
s (H
am)
Net G
roun
d W
ater A
vaila
bility
for
Futur
e Irri
gatio
n De
velop
ment
(H
am)
Exist
ing S
tage
Of G
roun
d Wat
er
Deve
lopme
nt (%
)
Categ
ory
Raibag 16,416 11,175 642 11,817 948 5854 72 Semi- Critical
(b) Present total Ground Water Resource in ha m
Taluk Annual replenishable GW resources
Fresh In-storage GW resources
Total availability of GW resource
Phreatic Fractured Dynamic + phreatic in-storage + fractured in-storage
Raibag 16,416 5545 2400 24360
(c) Comparison of ground water availability and draft scenario in Raibag taluk
Taluk
GW A
vaila
bility
(H
a m)
GW D
raft
(H am
)
Stag
e of G
W
Deve
lopme
nt
GW A
vaila
bility
(H
a m)
GW D
raft
(Ha m
)
Stag
e of G
W
Deve
lopme
nt
GW A
vaila
bility
(H
a m)
GW D
raft
(Ha m
)
Stag
e of G
W
Deve
lopme
nt 2009 2011 2013
Raibag 18242 19300 106 16219 11343 70 16416 11817 72
b. Chemical Quality of Ground water and Contamination Interpretation of Chemical Analysis results of ground water from phreatic aquifer in Raibag taluk
is mentioned as under:
Electrical Conductivity: In general, EC values range from 470 to 2700 µ/mhos/cm at 25oC
which are within the permissible limit.
Fluoride: Fluoride concentration in ground water is of geogenic origin and F value ranges in
general between 0.1 – 1.2 mg/l. One sample has shown the value of 1.8 mg/l which is more
than the permissible limit of 1.5 mg/l.
9
Nitrate: Nitrate value ranges between 4.5 to 42 mg/l which are within the permissible limit of 45 mg/l. In general ground water quality in Raibag taluk is good for drinking purpose except in some
areas. Ground water samples have also been tested and found suitable for agriculture &
irrigation purposes.
4.0 GROUND WATER RESOURCE ENHANCEMENT
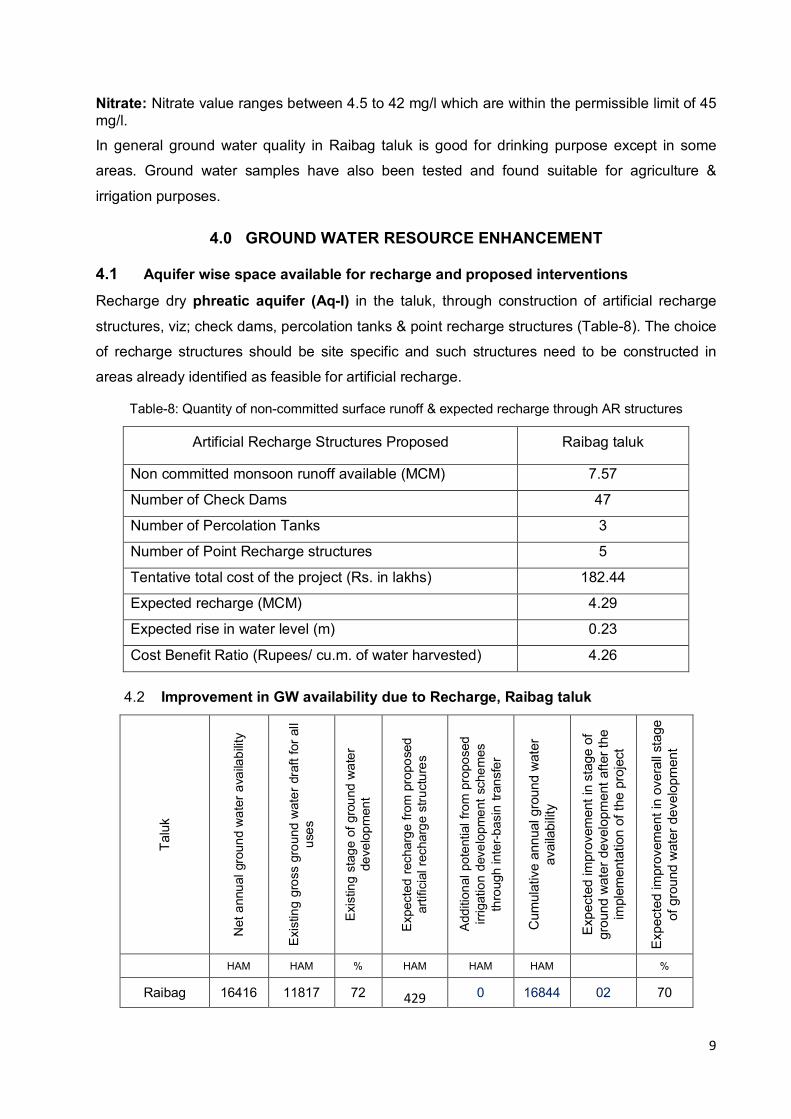
4.1 Aquifer wise space available for recharge and proposed interventions Recharge dry phreatic aquifer (Aq-I) in the taluk, through construction of artificial recharge
structures, viz; check dams, percolation tanks & point recharge structures (Table-8). The choice
of recharge structures should be site specific and such structures need to be constructed in
areas already identified as feasible for artificial recharge.
Table-8: Quantity of non-committed surface runoff & expected recharge through AR structures
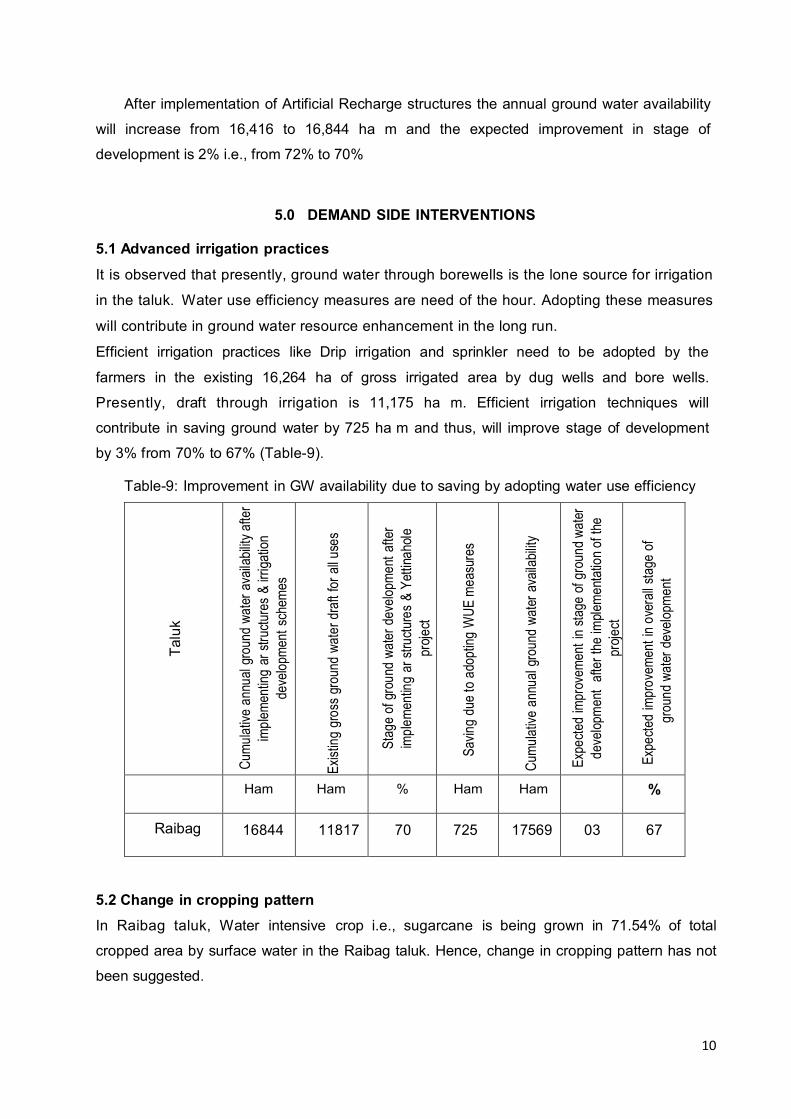
4.2 Improvement in GW availability due to Recharge, Raibag taluk
Artificial Recharge Structures Proposed Raibag taluk
Non committed monsoon runoff available (MCM) 7.57
Number of Check Dams 47
Number of Percolation Tanks 3
Number of Point Recharge structures 5
Tentative total cost of the project (Rs. in lakhs) 182.44
Expected recharge (MCM) 4.29
Expected rise in water level (m) 0.23
Cost Benefit Ratio (Rupees/ cu.m. of water harvested) 4.26
Talu
k
Net
ann
ual g
roun
d w
ater
ava
ilabi
lity
Exis
ting
gros
s gr
ound
wat
er d
raft
for a
ll us
es
Exis
ting
stag
e of
gro
und
wat
er
deve
lopm
ent
Expe
cted
rech
arge
from
pro
pose
d ar
tific
ial r
echa
rge
stru
ctur
es
Addi
tiona
l pot
entia
l fro
m p
ropo
sed
irrig
atio
n de
velo
pmen
t sch
emes
th
roug
h in
ter-b
asin
tran
sfer
Cum
ulat
ive
annu
al g
roun
d w
ater
av
aila
bilit
y
Expe
cted
impr
ovem
ent i
n st
age
of
grou
nd w
ater
dev
elop
men
t afte
r the
im
plem
enta
tion
of th
e pr
ojec
t
Expe
cted
impr
ovem
ent i
n ov
eral
l sta
ge
of g
roun
d w
ater
dev
elop
men
t
HAM HAM % HAM HAM HAM %
Raibag 16416 11817 72 429 0 16844 02 70
10
After implementation of Artificial Recharge structures the annual ground water availability
will increase from 16,416 to 16,844 ha m and the expected improvement in stage of
development is 2% i.e., from 72% to 70%
5.0 DEMAND SIDE INTERVENTIONS
5.1 Advanced irrigation practices It is observed that presently, ground water through borewells is the lone source for irrigation
in the taluk. Water use efficiency measures are need of the hour. Adopting these measures
will contribute in ground water resource enhancement in the long run.
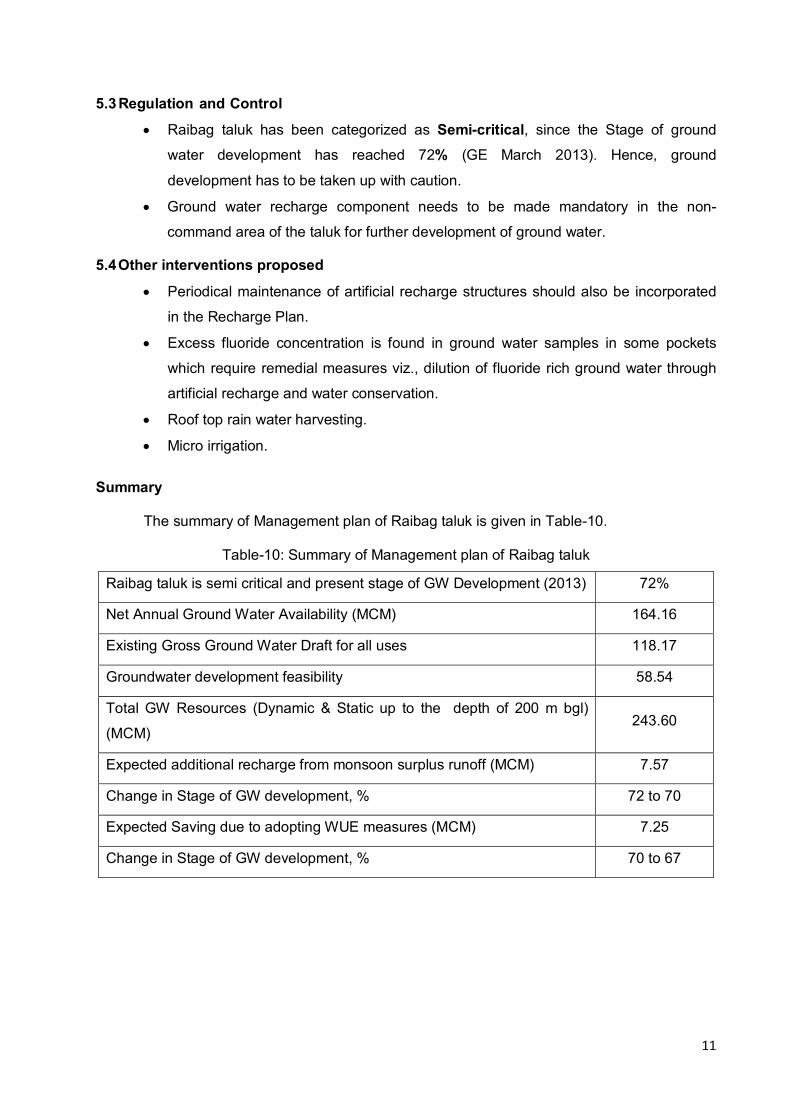
Efficient irrigation practices like Drip irrigation and sprinkler need to be adopted by the
farmers in the existing 16,264 ha of gross irrigated area by dug wells and bore wells.
Presently, draft through irrigation is 11,175 ha m. Efficient irrigation techniques will
contribute in saving ground water by 725 ha m and thus, will improve stage of development
by 3% from 70% to 67% (Table-9).
Table-9: Improvement in GW availability due to saving by adopting water use efficiency
Ta
luk
Cumu
lative
ann
ual g
roun
d wa
ter a
vaila
bility
after
im
pleme
nting
ar s
tructu
res
& irr
igatio
n de
velop
ment
sch
emes
Ex
isting
gro
ss g
roun
d wa
ter d
raft
for a
ll use
s
St
age
of gr
ound
wate
r dev
elopm
ent a
fter
imple
ment
ing a
r stru
cture
s &
Yettin
ahole
pr
oject
Sa
ving
due t
o ad
optin
g W
UE m
easu
res
Cumu
lative
ann
ual g
roun
d wa
ter a
vaila
bility
Expe
cted
impr
ovem
ent i
n sta
ge o
f gro
und w
ater
de
velop
men
t aft
er th
e im
plem
enta
tion o
f the
pr
oject
Expe
cted
impr
ovem
ent i
n ov
erall
stag
e of
gr
ound
wat
er d
evelo
pmen
t
Ham Ham % Ham Ham %
Raibag 16844 11817 70 725 17569 03 67
5.2 Change in cropping pattern
In Raibag taluk, Water intensive crop i.e., sugarcane is being grown in 71.54% of total
cropped area by surface water in the Raibag taluk. Hence, change in cropping pattern has not
been suggested.
11
5.3 Regulation and Control Raibag taluk has been categorized as Semi-critical, since the Stage of ground
water development has reached 72% (GE March 2013). Hence, ground
development has to be taken up with caution. Ground water recharge component needs to be made mandatory in the non-
command area of the taluk for further development of ground water.
5.4 Other interventions proposed
Periodical maintenance of artificial recharge structures should also be incorporated
in the Recharge Plan.
Excess fluoride concentration is found in ground water samples in some pockets
which require remedial measures viz., dilution of fluoride rich ground water through
artificial recharge and water conservation.
Roof top rain water harvesting.
Micro irrigation. Summary The summary of Management plan of Raibag taluk is given in Table-10.
Table-10: Summary of Management plan of Raibag taluk
Raibag taluk is semi critical and present stage of GW Development (2013) 72%
Net Annual Ground Water Availability (MCM) 164.16
Existing Gross Ground Water Draft for all uses 118.17
Groundwater development feasibility 58.54
Total GW Resources (Dynamic & Static up to the depth of 200 m bgl)
(MCM) 243.60
Expected additional recharge from monsoon surplus runoff (MCM) 7.57
Change in Stage of GW development, % 72 to 70
Expected Saving due to adopting WUE measures (MCM) 7.25
Change in Stage of GW development, % 70 to 67