भू-जल वार्षिक पर्िका २०१४-१५
171
GROUND WATER YEAR BOOK 2014-2015 भू-जल वाषिक पिका २०१४-१५ CENTRAL GROUND WATER BOARD क ीय भूमि जल बोि MINISTRY OF WATER RESOURCES, RD & GJ जल संसाधन, नदी वकास और गंगा संरण िंिालय GOVERNMENT OF INDIA भारत सरकार NORTH EASTERN REGION उर पूवी ेि GUWAHATI गुवाहाटी September 2015 मसतबर २०१५
-
Upload
khangminh22 -
Category
Documents
-
view
5 -
download
0
Transcript of भू-जल वार्षिक पर्िका २०१४-१५

GROUND WATER YEAR BOOK 2014-2015
भू-जल वार्षिक पर्िका २०१४-१५
CENTRAL GROUND WATER BOARD
कें द्रीय भूमि जल बोर्ि MINISTRY OF WATER RESOURCES, RD & GJ जल संसाधन, नदी र्वकास और गंगा संरक्षण िंिालय
GOVERNMENT OF INDIA भारत सरकार
NORTH EASTERN REGION उत्तर पूवी क्षेि
GUWAHATI गुवाहाटी
September 2015 मसतम्बर २०१५

i
FOREWORD
Ground water is a dynamic and replenishable resource and monitoring special and
temporal changes of this resource is essential for sustainable development and management.
The water level data is of paramount importance in development and management of water
resources in the country. Central Ground Water Board has decided to issue a Ground Water
Year Book annually for each State by compiling the hydrogeological, hydro chemical and
water level data collected from the Ground Water Monitoring Stations (GWMS) established
by the Board in the States. CGWB, NER has a permanent network of 645 GWMSs in North
Eastern Region covering the States of Arunachal Pradesh, Assam, Manipur, Meghalaya,
Nagaland and Tripura. Monitoring of water level and chemical quality furnish valuable
information on the ground water regime characteristics of the different hydrogeological units
in the States, i.e. the pattern of ground water movement, changes in recharge-discharge
relationship, behaviour of water level and changes in quantity of ground water in space and
time. It also helps in identifying and delineating water logged area, possible ground water
pollution hazards, area prone to lowering of water table/piezometric surface due to large-
scale withdrawal of ground water.
The behaviour of ground water level monitored from existing GWMSs and the
chemical quality of ground water along with the maps depicting the ground water scenario
for the period of measurement are presented and explained in this report.
The water level data of Ground Water Monitoring Wells in the States have been
effectively compiled, analyzed and presented in this report by K.Ramanand Sc-C, N.K. Jatav
Sc-B, Wonjano Mozhui Sc-B and G.Vengatajalapathi STA (Hydrogeology). The scientific
officers of the Regional Office have systematically collected field data from the GWMSs four
times a year viz. March, August, November and January. The sincere efforts of Sri P. Kalita,
Scientist ‘D’ and Sri.AK.Phukan Scientist ‘C’ in overall supervision of the work, in scrutiny,
processing and issuance are gratefully acknowledged.
It is hoped that this report would be of immense use for administrators, planners, and
officials as a reference in ground water development and planning in time and space.
Guwahati (Dr.UTPAL GOGOI)
30th
September, 2015 Regional Director

ii
GROUND WATER YEAR BOOK NORTH EASTERN REGION
2014-2015
CONTENTS
Sl.No Item Page No
Executive Summary
1. Introduction 1-4
2. Distribution Of Ground Water Monitoring Wells In The Region 5-6
3. Rainfall 7-12
4. Geology 13-14
5. Hydrogeology 15-16
6. Behavior of Water Level 17-36
7. Hydrochemistry 37-38
8. Conclusions 39-41
FIGURES
1 Physiographic map of North Eastern Region
2 Drainage map of North Eastern Region
3 Basin & Sub-Basin Map of North Eastern Region
4 Isohyet (Rainfall Distribution) Map of NER
5 Depth to Water Level Ranges, March 2014
6 Depth to Water Level Ranges, August 2014
7 Depth to Water Level Ranges, November 2014
8 Depth to Water Level Ranges, January 2015
9 Water Level Fluctuation (August 2014 and March 2014)
10 Water Level Fluctuation (November 2014 and March 2014)
11 Water Level Fluctuation (November 2014 and August2014)
12 Water Level Fluctuation (January 2015 and March 2014)
13 Water Level Fluctuation (January 2015 and August 2014)
14 Water Level Fluctuation (January 2015 and November 2014)
15 Water Level Fluctuation (March 2014 and March 2013)
16 Water Level Fluctuation (August 2014 and August 2013)

iii
17 Water Level Fluctuation (November 2014 and November 2013)
18 Water Level Fluctuation (January 2015 and January 2014)
19 Water Level Fluctuation (Decadal Mean (August 2004-2013) and August 2014)
20 Water Level Fluctuation (Decadal Mean (November 2004-2013) and November 2014)
21 Water Level Fluctuation (Decadal Mean (January 2005-2014) and January 2015)
22 Water Logging Conditions during March 2014
23 Water Logging Conditions during November 2014
24 Distribution of Iron in North Eastern Region
25 Distribution of Fluoride in North Eastern Region
26 Distribution of pH in North Eastern Region

iv
ANNEXURES
I Details of Ground Water Monitoring Wells in North Eastern Region
II Depth to Water Level in Ground Water Monitoring Wells (in meter below ground level) IIA Depth to Water Level in Monthly Monitored Ground Water Wells in NER (in meter below ground level) III Depth to Water Level Range, March 2014 IV Depth to Water Level Range, August 2014 V Depth to Water Level Range, November 2014 VI Depth to Water Level Range, January 2015 VII District wise Categorization of Water Level Fluctuation (August 2014 and March 2014) VIII District wise Categorization of Water Level Fluctuation (November 2014 and March 2014) IX District wise Categorization of Water Level Fluctuation (November 2014 and August2014) X District wise Categorization of Water Level Fluctuation (January 2015 and March 2014) XI District wise Categorization of Water Level Fluctuation (January 2015 and August 2014) XII District wise Categorization of Water Level Fluctuation (January 2015 and November 2014) XIII District wise Categorization of Water Level Fluctuation (March 2014 and March 2013) XIV District wise Categorization of Water Level Fluctuation (August 2014 and August 2013) XV District wise Categorization of Water Level Fluctuation (November 2014 and November 2013) XVI District wise Categorization of Water Level Fluctuation (January 2015 and January 2014)
XVII District wise Categorization of Water Level Fluctuation with 10 years Mean (August 2004- August 2013) – August - 2014
XVIII District wise Categorization of Water Level Fluctuation with 10 years Mean Period (November 2004- November 2013) – November- 2014
XIX District wise Categorization of Water Level Fluctuation with 10 years Mean Period (January 2005- January 2014) – January- 2015
XX Long Term Ground Water Level Trend –Pre monsoon (2008-2014) XXI Long Term Ground Water Level Trend –Post monsoon (2005-2014) XXII Chemical Qualities data of Ground Water in NER (2014-15)

i
EXECUTIVE SUMMARY
North Eastern Region covers seven states namely Arunachal Pradesh, Assam, Manipur,
Meghalaya, Mizoram, Nagaland and Tripura occupying an area of 2,55,083 sq. km. The
Region is mostly occupied by hilly terrain and only 77,068 sq. km. is occupied by valley area,
which forms 30% of the total area. In different hydrogeological formations of the Region,
645 Ground Water Monitoring Wells (GWMW) have been set up. Most of these wells are
located in valley areas. These wells are generally selected from existing ground water
abstraction structures i.e. open wells, tube wells, and purpose-built piezometers. There are
569 dug wells and 76 piezometers in the region, which are being monitored four times a
year i.e. during March 1st to 10th (This is the pre-monsoon water level and the water level as it
stands at the end of the ground water year after all the inputs and outputs have taken place. In
other words it is the resultant ultimate/lowest water level), August 20th to 30th (this water
level marks the peak of the water level hydrograph), November 1st to 10th(this is the post-
monsoon water level and the water level as it stands after the major portion of rainfall
recharge has taken place), and January 1st to 10th. Water samples are being collected for
chemical analysis during Pre-monsoon i.e. in the month of March when concentrations of
different chemical constituents are expected to be maximum.
Monitoring and investigation is required to gain an understanding of the regional and
temporal variations in quality and quantity of groundwater resources. Groundwater
monitoringcan be defined as the systematic measurement and observation of the groundwater
situation on a regular basis by measurement of water levels in wells and boreholes or of
spring discharge and assessing its chemical quality, which provides the simplest indicator of
changes in groundwater resources in quantity and/or quality. The objectives of the
groundwater monitoring are to measure depth to water level and collect ground water
samples for chemical analysis, thereby establish trends of water level and quality; to collect
data documenting any change in groundwater storage over time in the principal aquifers; to
provide both long-term and short-term data necessary to assess and predict the response of
hydrologic systems to natural climatic variations and human-induced stresses; and to provide
historical baseline data for studies of local/regional aquifers. Groundwater monitoring also
helps in identifying areas showing negative impact due to over-abstraction or contamination
or very shallow levels in Canal command e.g.

ii
Declining groundwater levels and depletion of groundwater reserves;
Reductions in stream/spring base flows;
Reduced access to groundwater water for drinking water supply and irrigation;
Subsidence and foundation damage
Deterioration of groundwater quality;
Increased costs for pumping and treatment;
Ground Water Monitoring Wells are distributed in three river basins, viz. Brahmaputra
(499), Meghna (121), and Imphal (25).
In unconsolidated formations 555 GWMWs are located, while in semi-consolidated
formations and consolidated formations 67 and 23 GWMWs are distributed respectively.
The rainfall is the main source of Ground Water recharge. North Eastern Region
receives a considerable amount of rainfall. The annual average rainfall varies from 900 mm
to more than 5000 mm.
Geologically, the area is underlain by consolidated to unconsolidated formations
ranging in age from Archaean to Recent.
Hydrogeologicaly, the area is grouped into porous and fissured formations based on the
nature of openings in the aquifer system. Alluvium and sedimentary formations and fissured
consolidated rocks form the main repositories of ground water.
Water levels in the region remain mostly within 5.00 mbgl in all the four
measurements. The summarized percentage of wells showing water levels in different depth
ranges are as follows.
Depth to water level
(mbgl)
March, 2014 % of wells
August, 2014 % of wells
November, 2014 % of wells
January, 2015 % of wells
0 – 2 13.7 68.1 34.4 15.8
2 – 5 56.9 25.0 51.9 63.9
5 – 10 22.9 5.0 9.3 15.5
10 – 20 4.3 1.2 2.5 2.8
>20 2.2 0.7 1.9 2.0

iii
Water level fluctuation of GWMWs during August’14, November’14 and January’15
with respect to Pre-monsoon (March’14) data show that there is a
Rise in water level in August 2014 in 94.5% wells.
Rise in water level in November 2014 in 87.7% wells.
Rise in water level in January, 2015 in 76.3% wells
Comparison of water levels of GWMWs during March’14, August’14, November’14
and January’ 15, with respect to the same month during the previous year show that there is a
Rise in water level in March 2014 in 48.9% wells.
Rise in water level in August 2014 in 72.7% wells.
Rise in water level in November 2014 in 50.4% wells.
Rise in water level in January 2015 in 55.7% wells.
Comparison of mean water level of the previous decade to the water level for the
same period during 2014-15 show that-
During August 2014, rise is recorded in 68.2% GWMWs, as
compared to decadal mean (August 2004-August’13).
During November 2014, rise is recorded in 51.5% GWMWs, as
compared to decadal mean (November 2004-November’13).
During January 2015, rise is recorded 46.1% GWMWs, as compared
to decadal mean (January 2005-January’14).
Trend analysis of Post-monsoon water level data of last ten years i.e.2005-2014;
falling trend record in 52.04% stations and rising trend in 47.96% stations.
During pre-monsoon period (March 2014), 13.70% stations show water logging
condition, whereas 17.30% stations shows prone to water logging condition. During post
monsoon period, 34.24% stations show water logging condition and 27.06% stations show
prone to water logging condition.
Water samples from GWMWs are collected during the month of March every year
when the soluble chemical constituents are expected to be maximum in concentration. In
general, the quality of ground water, in the North Eastern States is good for both irrigation
and drinking purposes. However, concentration of iron exceeds the permissible limit of
drinking water standards in some pockets. The water samples are collected from open wells
only. Higher concentrations of iron are also noticed in tube wells in different parts of North
Eastern States.

iv
As per 2011 resources estimation the region is enriched with more than 38.49 BCM of
replenishable ground water resources and the stage of development is less than 35%. If it is
planned properly this huge resource can be harnessed to develop the agro-economic scenario
of the region. However, for the hilly terrain (about 70% of the total geographical area) where
ground water is not sufficient, further development of spring water and rain water harvesting
may be taken up.
1
GROUND WATER YEAR BOOK NORTH EASTERN REGION
2014-2015
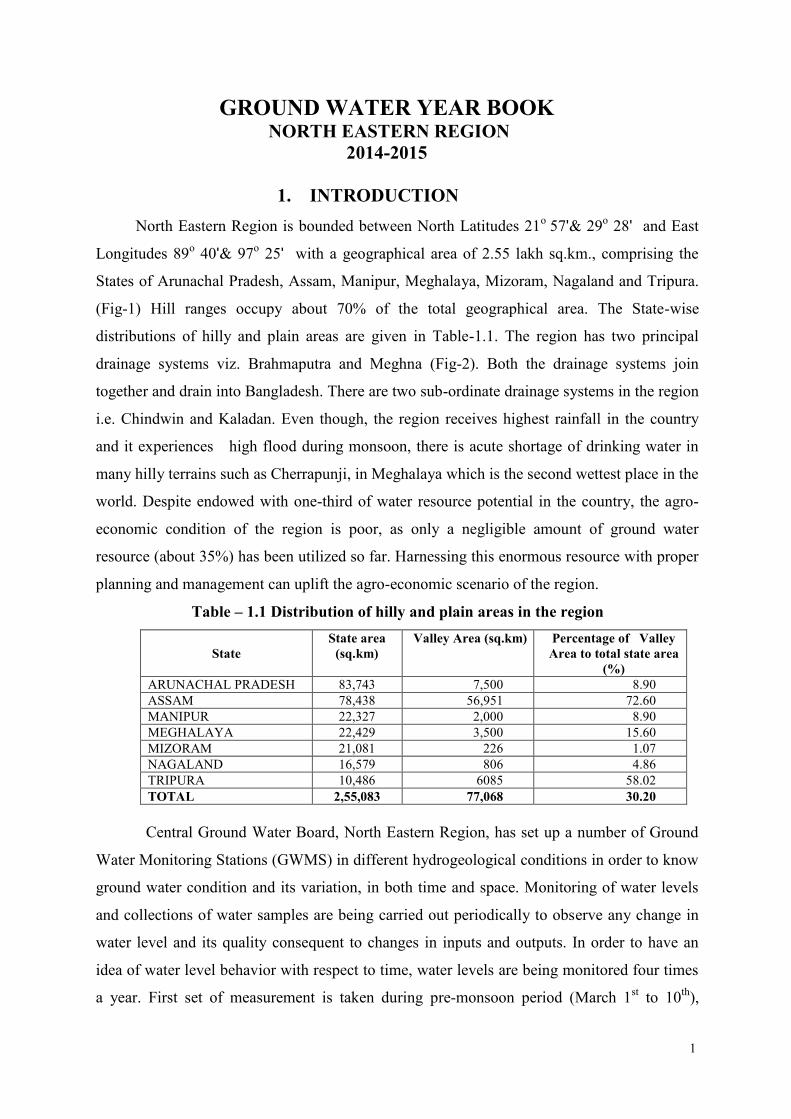
1. INTRODUCTION North Eastern Region is bounded between North Latitudes 21o 57'& 29o 28' and East
Longitudes 89o 40'& 97o 25' with a geographical area of 2.55 lakh sq.km., comprising the
States of Arunachal Pradesh, Assam, Manipur, Meghalaya, Mizoram, Nagaland and Tripura.
(Fig-1) Hill ranges occupy about 70% of the total geographical area. The State-wise
distributions of hilly and plain areas are given in Table-1.1. The region has two principal
drainage systems viz. Brahmaputra and Meghna (Fig-2). Both the drainage systems join
together and drain into Bangladesh. There are two sub-ordinate drainage systems in the region
i.e. Chindwin and Kaladan. Even though, the region receives highest rainfall in the country
and it experiences high flood during monsoon, there is acute shortage of drinking water in
many hilly terrains such as Cherrapunji, in Meghalaya which is the second wettest place in the
world. Despite endowed with one-third of water resource potential in the country, the agro-
economic condition of the region is poor, as only a negligible amount of ground water
resource (about 35%) has been utilized so far. Harnessing this enormous resource with proper
planning and management can uplift the agro-economic scenario of the region.
Table – 1.1 Distribution of hilly and plain areas in the region
State State area
(sq.km) Valley Area (sq.km) Percentage of Valley
Area to total state area (%)
ARUNACHAL PRADESH 83,743 7,500 8.90 ASSAM 78,438 56,951 72.60 MANIPUR 22,327 2,000 8.90 MEGHALAYA 22,429 3,500 15.60 MIZORAM 21,081 226 1.07 NAGALAND 16,579 806 4.86 TRIPURA 10,486 6085 58.02 TOTAL 2,55,083 77,068 30.20
Central Ground Water Board, North Eastern Region, has set up a number of Ground
Water Monitoring Stations (GWMS) in different hydrogeological conditions in order to know
ground water condition and its variation, in both time and space. Monitoring of water levels
and collections of water samples are being carried out periodically to observe any change in
water level and its quality consequent to changes in inputs and outputs. In order to have an
idea of water level behavior with respect to time, water levels are being monitored four times
a year. First set of measurement is taken during pre-monsoon period (March 1st to 10th),

2
second set is being taken during peak monsoon (August 20th to 30th), third measurement is
taken during post-monsoon (November 1st to 10th) and last set is being taken during January
1st to 10th.In North Eastern Region, it is observed that the ground water level builds up
considerably during last part of April as the area receives pre-monsoon rainfall during March
to May. Water samples are being collected once in a year during the pre-monsoon
measurement i.e. in the month of March. In addition to this, monthly water level data is
collected out by local Observers at 72 monitoring stations under ‘Participatory Monitoring
Programme’.
As on 31st January, 2015, there are 645 GWMS in the Region. The details of GWM
Stations are given in Annexure I and its district-wise distribution is given in Table 1.2
Table - 1.2 State and District wise distribution of GWMS
S.No Name of State / District
No. of Ground water Monitoring Stations ( As on
Jan.2015) DW PZ Total
ARUNACHAL PRADESH 1 Changlang 4 0 4 2 East Siang 7 0 7 3 Lohit 1 0 1 4 Papumpare 9 0 9 5 Tirap 3 0 3 Total 24 0 24 ASSAM 1 Baksha 2 0 2 2 Barpeta 10 4 14 3 Bongaigaon 11 0 11 4 Cachar 21 4 25 5 Darrang 25 3 28 6 Dhemaji 17 4 21 7 Dhubri 14 2 16 8 Dibrugarh 8 4 12 9 Goalpara 19 1 20 10 Golaghat 11 0 11 11 Hailakandi 4 1 5 12 Jorhat 21 0 21 13 Kamrup 42 2 44 14 Karbi Anglong 35 0 35 15 Karimganj 10 2 12 16 Kokrajhar 17 0 17

3
17 Lakhimpur 23 1 24
18 Morigaon 13 6 19 19 Nagaon 32 4 36 20 Nalbari 8 1 9 21 Sibsagar 13 0 13 22 Sonitpur 27 2 29 23 Tinsukia 13 0 13 Total 396 41 437 MANIPUR 1 Bishnupur 1 1 2 2 Chandel 3 0 3 3 Churachandpur 1 2 3 4 Imphal East 2 0 2 5 Imphal West 4 1 5 6 Senapati 1 0 1 7 Tamenglong 1 1 8 Thoubal 2 6 8 Total 14 11 25 MEGHALAYA 1 East Garo Hills 16 0 16 2 East Khasi Hills 9 0 9 3 Jaintia hills 2 0 2 4 Ri-Bhoi 2 0 2 5 South Garo Hills 5 0 5 6 West Garo Hills 21 4 25 7 West Khasi Hills 1 0 1 Total 56 4 60 NAGALAND 1 Dimapur 17 5 22 2 Kohima 2 1 3 3 Mokokchung 0 1 1 4 Mon 1 1 2 5 Phek 0 1 1 6 Tuensang 0 1 1 7 Wokha 2 1 3 Total 22 11 33 TRIPURA 1 Dhalai 6 0 6 2 North Tripura 14 0 14 3 South Tripura 18 0 18 4 West Tripura 19 9 28 Total 57 9 66 Grand Total 569 76 645

4
The present report deals with the analysis of the water levels of Ground Water
Monitoring Stations (GWMS) in North Eastern Region during the Water Year 2014-2015.
The GWMS in Nagaland and Manipur States and a few districts of Assam could not be
monitored regularly due to deterioration of law and order situation. There is no existing
GWMS in Mizoram State. In Arunachal Pradesh, there are only 24 monitoring stations and
those are restricted along the southern boundary of the state adjacent to Assam.

5
2. DISTRIBUTION OF GROUND WATER MONITORING WELLS
The distribution of Ground Water Monitoring Wells as per lithology and river basin
wise is dealt below:
2.1. Distribution of Ground Water Monitoring Wells as per lithology
About 86.04% of the total Network Wells are located in the Unconsolidated
Formation, 10.39% of the Wells are located in the Semi-consolidated Formations and the
remaining 3.57% are in the Consolidated Formations. The lithology-wise distribution of the
Network Wells is given in Table 2.1.
Table 2.1Distribution of GWMW in different Hydrogeological Units: Sl. No.
State No. of GWMS Unconsolidated
Formations Semi-consolidated
Formations Consolidated Formations
Total
1 Arunachal Pradesh 23 1 Nil 24 2 Assam 419 13 5 437 3 Manipur 12 13 Nil 25 4 Meghalaya 19 23 18 60 5 Nagaland 25 8 Nil 33 6 Tripura 57 9 Nil 66 Total 555 67 23 645
2.2. Distribution of Ground Water Monitoring Wells - River Basin and Sub- Basin wise
In all, there are four major River Basins and twenty-five Sub-basins in the North
Eastern Region. Out of the four major Basins, the Brahmaputra Basin occupies the major part
of the Region (Fig-3) and 77.35%(499) of the Network Wells are located in this Basin. In
Meghna Basin, about 18.75%(121) of the Wells are located and the remaining 3.90%
(25)Wells are located in the Imphal Basin. The Kaladan Basin forms the southernmost parts
of Mizoram there is no Network Well located in this basin. The distribution of GWMW in
different Basins and Sub-basins are shown in Table – 2.2.

6
Table – 2.2 Distribution of GWMW in different Basins and Sub-basins S. No. Basin/ Sub-basin District / (No.of GWMS) Total BRAHMAPUTRA 1. Champamati Dhubri (15) , Kokrajhar (14) 29 2. Manas Barpeta (14), Bongaigaon (11), Kokrajhar (3) Nalbari (6) 36 Baksa (2) 3. Mora Dhansiri Darrang (28), Kamrup (20), Nalbari (3), Sonitpur (9) 60 4. Kameng Sonitpur (3) 3 5. Badeng Pabnai Lakhimpur (3), Sonitpur (17) 20
6. Subansiri Papumpare (9), Dhemaji (5), Lakhimpur (21) 35
7. Siang East Siang (7), Dhemaji (16) 23
8. Lohit Changlang (2), Lohit (1) 3
9. Dibru Dibrugarh (6), Tinsukia (9) 15
10. Burhi Dihing Changlang (2), Tirap (1), Dibrugarh (5), Tinsukia (4) 12
11. Disang Tirap (2), Dibrugarh (1), Golaghat (2), Jorhat (21), 44 Sibsagar (13), Mon (2), Mokokchung (1), Nagaon (2)
12. Dhansiri Dimapur(21),Golaghat (9), Karbi Anglong (12), Kohima (3),Wokha (3), Phek(1), Tuensang (1) 50
13. Kalang- Kopili Kamrup (5), Karbi Anglong (23), Morigaon (19), 89 Nagaon (34), East Khasi (6), Ri-Bhoi (1), Dimapur (1)
14. Kulsi – Jinjinram Dhubri(1), Goalpara (20), Kamrup (19), East Garo(10), 74 Ri-Bhoi (1), West Garo (22), West Khasi (1)
IMPHAL 1. Imphal Bishnupur (2), Chandel (2), Churachandpur (3), 23
Imphal East (2), Imphal West (5), Senapati (1), Thoubal (8) 2. Tuyungbi Chandel (1), 1
MEGHNA 1. Soneswari – East Garo (6), East Khasi (3), Jaintia (2), 19
South Garo Hills (5), West Garo Hills (3) 2. Barak Cachar(25),Dhalai(6),Hailakandi(5),Karimganj(12),
North Tripura (14), West Tripura (21) 84 Tamenglong (1)
3. Gumti South Tripura (1), West Tripura (7) 08
4. Fenny South Tripura (17) 17
Total = 645

7
3. RAINFALL
The region is characterized by tropical monsoon climate with a rainy summer and dry
winter. Heavy rainfall is received during summer and occasional rainfall during winter.
January and February are the driest months. The rainfall received during summer is under the
spell of South-West monsoon. The onset of South-West monsoon in the region occurs by the
end of May or the first week of June and withdraws by late September or early October. But,
very often pre-monsoon showers are experienced during March and April. Copious rainfall is
received in certain parts of the region during the summer. Mawsynram, located in the State of
Meghalaya, has the unique distinction of recording the highest average annual precipitation in
the world. This is because of its peculiar geographical location. From March to May, the
region comes under the influence of equatorial Westerlies and receives precipitation with
occasional thundershowers.
The average monthly / annual rainfall of three years (2011-2013) recorded in
different stations of the region has been presented in Table 3.The isohyets showing the
rainfall pattern in the region on the basis of average annual rainfall, has been depicted in
Fig.4
Table 3.1 Rainfall data (2011-2013)
State / District Year Jan Feb Mar Apr May June July Aug Sept Oct Nov Dec
ARUNACHAL PRADESH
CHANGLANG 2011 0 0 0 0 87.1 536.3 423.7 151.7 152.8 39.1 8.5 0
2012 36.2 14.9 - - 46.2 372 537.8 308.9 308.2 166.6 3.9 16
2013 3.6 14.6 85.4 203.6 253.7 269.5 356 299.1 205.9 153.1 0 1.9
DIBANGVALLEY 2012 113 181 459 429 214 651 264 202 383 113 3.3 90
2013 57 81 185 233 471 127 123 64 293 295 22 8.5
EAST KAMENG 2011 0 0 55.9 6.3 36.4 123.9 437.8 163.5 254.8 9.8 2 0
2012 15.5 4 1 119.3 86.1 271.8 346.2 82.6 156.4 61.6 27 1.2
2013 0 19.6 25.9 57.3 157.1 300.1 248.2 164.4 199.9 75.3 0 17
EAST SIANG 2011 65.2 32.1 291.7 158.8 295.9 415 763.3 379.6 348.6 19.9 2.7 70.4
2012 69.2 39.3 120.7 300.9 460.2 1111.1 1628 479.6 1549.4 611.6 0 24
2013 9.2 23.4 90 132.7 325.6 533.4 1093.9 454 442.8 246.9 0 4.5
LOHIT 2011 43.6 23.8 338.1 152.1 152.7 404.5 452.1 204.6 245.3 53.9 3.8 20.5
2012 21.4 14.8 134 564.8 158 563.8 731.3 323.1 793.3 237.3 - 13.9
2013 16.6 21.6 152.3 304.3 467.4 306.6 482.7 309.4 270.5 130.3 5.3 1.2

8
State / District Year Jan Feb Mar Apr May June July Aug Sept Oct Nov Dec
LOWER SUBANSIRI 2011 2.8 8 79 32.8 125.2 171.4 204.1 157 85 17 45 7
2012 26 10 53 123 78 181 129 109 219 43 17.6 0
2013 0 - 109.6 61 78 26.2 34.2 102.6 - - - 15
PAPUMPARE 2011 9.5 27.4 139 182.9 375.6 460.6 1029.6 603.3 242.3 73.1 5.7 8.9
2012 19.1 5.5 42.7 240.8 291.7 884.7 728.2 482.6 487.8 315.1 8 38.3
2013 7.4 13.2 135.2 170.7 417.1 324.6 578 401.4 358.4 150.1 0.9 3.4
TAWANG 2011 0 243.4 226 338.3 182 181 39 62.1 2
2012 21 23 114 377 154.6 256 291 296 369.7 27 23.5 8
2013 1 40 174 353 356 161 396 270.4 183.3 124 50.5 17
TIRAP 2011 33.6 26 84.4 109.3 104.6 328.6 380 239.9 239.8 91.4 7.6 2.8
2012 58.4 13.4 64.8 373 266.7 381.7 685.9 329.1 235.5 131.5 0 23.2
2013 6.6 6.6 109 234.3 320.2 390.6 613.4 511 159.2 182.4 0 0.5
UPPER SIANG 2011 163.9 238.8 229 702.5 245.4 604.2 853.8 231.6 728.8 146.3 32.2 22.2
2012 178.6 144.4 206.2 800.3 520.5 1096.9 917.5 450.2 794.1 288.4 73.3 111.8
2013 66.2 76.8 195 324 697.7 438.6 536 191.2 800.8 175.8 50.2 14.9
UPPER SUBANSIRI 2011 21 10.6 158.4 152.6 131.4 280.2 354.8 265.8 125.4 22.8 13.2 24.6
2012 22 0 190.2 87 204.6 169.2 297.2 219.8 88.4 5.4 26
2013 7.7 26.6 52.4 141.6 302 225.2 246.8 79.3 70.6 67.8 20.8 32.1
WEST KAMENG 2011 9.9 28.2 51.9 44.7 249.3 294.5 616.5 365.7 313.7 42.9 10 3
2012 29.2 3 11.6 138.6 87.1 348.3 299.7 404.8 440.5 130.9 0 13.6
2013 0.3 56.7 52.6 106 268.8 334.8 216.6 410 329.6 114.1 0.2 34.6
WEST SIANG 2011 111.3 20.1 218.4 96.3 198.4 349.9 866.4 28.2 0
2012 0 4 109 139 139 423 368 306 435.5 255 29 25
2013 17 31 120 163.1 339.9 410.9 362.8 184.2 279.2 97.4 7 13.7
ASSAM
BAKSHA 2012 0 13.9 268.3 205.5 955.9 536.6 146.1 400.5 187.8 15.2 19.2
2013 1 8.9 48 127.8 244.6 299.3 240 187.7 242 78.5 0 10.3
BARPETA 2011 2.7 8.9 140.7 67.2 301.1 455.7 424.3 323.4 253 6.9 17.2 0
2012 8.1 15.9 3 288.5 211.7 1107.9 496.7 223.3 446.3 177.8 0 0.7
2013 0 12.8 18.3 134.2 356.2 293.9 494.6 248.3 498.5 121.8 5.8 0.5
BONGAIGAON 2011 1 10.4 119.4 47.6 219.2 258.2 412.6 370.6 241.1 66 35.6 0
2012 3.8 22.8 0.7 373.7 269.5 1354.1 667.6 211.5 564.1 224.5 2.4 0
2013 0 8.6 21.7 100.7 498.4 248.8 473.5 267.2 469.4 187 0 0

9
State / District Year Jan Feb Mar Apr May June July Aug Sept Oct Nov Dec
CACHAR 2011 14.1 12.2 73.8 114.2 454.2 398.5 480.1 383.5 281 87.3 0 0.1
2012 18.1 8.1 121.9 589.7 243.7 689.4 353.9 493.9 329.9 146.5 74.6 0
2013 0 3 74 139.2 661 256.8 496.7 518 222.4 183.7 0 1.3
CHIRANG 2011 3.8 4 130.8 64.8 291.8 239.2 623.4 448.2 80.4 8.6 10 0
2012 10.8 12 1.4 340.6 253.8 1396.8 819.2 182.3 586.7 148.6 0.7 1
2013 0 13.7 15.4 159.4 322.1 330.3 464 182 506.1 158.5 0 0.1
DHEMAJI 2012 0 32 43 423 338 576 366 587 115 4 14
2013 8 84 122 259 290 458 317 189 60 0 3
DHUBRI 2011 7.3 22.3 135.2 69.1 267 389.2 273.2 387.2 228.4 9 5.6 0.6
2012 6 14.8 0.5 138.2 199.2 1040.3 360 282.5 467.1 222.9 0 0
2013 0 8.7 6.4 114.5 266 358.7 183.2 280.8 175.6 112.2 7.4 0
DIBRUGARH 2011 14.5 12.8 168.9 145.5 126 297.2 463.4 280.6 267.6 64.9 2.3 20
2012 15.6 5.4 40.7 322.1 261.5 421.3 474.3 286.7 404.5 130.9 6.6 13
2013 8.3 3.1 114.2 215.5 413.1 331.9 457.2 413.3 220.8 171.8 0 3.7
GOALPARA 2011 14.6 0 80.7 41.7 252.4 407.2 395.6 231.8 149.9 25.6 31.5 0
2012 6 12 2.7 130.7 145.1 797.9 370.9 109.9 317.8 144.5 0 0
2013 0 11.8 22.2 242.9 531.2 467.1 208.5 234.4 197.1 94.6 2 0
GOLAGHAT 2011 14.1 3 63.2 61.9 308.3 231.6 490.1 201.9 135.2 29.7 4.1 2.1
2012 17.8 10.1 10.6 213.7 148 273.4 216.8 254.3 244.4 60.6 0.1 1.5
2013 0 10.3 76.7 62.6 237.8 137.1 262.7 327.9 124.6 143.3 0 6.7
HAILAKANDI 2011 8 3.5 24 46.1 262.8 147.3 313.6 239.7 136.5 46.6 0 0
2012 12.8 8.8 33 336.2 129.5 315.1 187.2 329.4 292.6 190 31.4 0
2013 0 3.5 4.9 80.2 605.9 82.6 427.2 467.3 152.2 168.1 0 1.6
JORHAT 2011 14.7 23.3 76.4 55.1 448.3 247.6 413.1 288.1 167.5 17.8 9.9 14.9
2012 9.7 5.2 12.4 261.6 133.6 209.7 394.8 242.9 225.5 63.8 1.1 7.4
2013 1.6 9.2 66.7 125.8 319.8 295.7 492.5 359.3 87.9 145.8 0 1.5
KAMRUP 2011 9.3 23.4 53.6 101.4 224.5 88.4 373.4 204 255.5 0.3 15.3 1.3
2012 5.2 7.6 23.3 382.2 181.4 396.4 343.7 309.7 180.2 57.7 0.2 4.7
2013 0 13.5 48.2 124 227.4 209.8 190.2 287.1 210.7 114.3 0 2.9
KAMRUP METRO 2011 14.6 14.6 142.3 23.5 112.1 169.1 130.7 217.5 145.4 10.7 0 0
2012 13.3 0.9 2.9 177.2 164.4 642.7 286.9 166 90.4 77.1 0 0
2013 0 9.2 15.9 80.7 279.7 223.9 185.3 116.1 116.6 148.9 0 0.5
KARBI ANGLONG 2011 7.6 12 43.4 41.3 55.1 260.3 207.3 144.5 49.2 23.3 0.2 0
2012 3 0 0.1 107.9 64.2 246.4 131.4 159.5 167.8 142 8.2 0
2013 0 4 42.3 68.2 244.9 226.3 255.4 129.9 202.2 78.6 0 0.5

10
State / District Year Jan Feb Mar Apr May June July Aug Sept Oct Nov Dec
KARIMGANJ 2011 9.9 0 35.3 28.5 174.9 345.4 498.5 508.4 195.4 94.2 0 0
2012 6.5 1 35 257.9 230.6 788.9 428.9 494.6 295 242 31.7 0
2013 0 5.2 28.6 86.5 489.9 325.5 452.3 504.1 289.2 156.2 0 0
KOKRAJHAR 2011 3 9 188 136.3 357.7 411.9 812 472.6 257.8 19 7.8 0
2012 3.1 19.5 4.4 238.4 231.9 1507.2 670.3 261.3 632.1 237.4 0 0
2013 0 18.9 9.4 169.1 442.7 388 663 408.4 571.3 207.9 0 0
LAKHIMPUR 2011 6.6 10.5 188.1 132.7 299.5 439.2 940.6 403.9 389.5 15.3 4.6 6.3
2012 11.4 3.2 29.9 243.2 295.7 575.2 536.6 369 454.8 190.5 11 14.5
2013 5.6 8.2 76.6 92.4 329.7 402.4 614.7 492.8 223.9 111.2 2.1 6
MORIGAON 2011 10.2 9.6 30.8 42.2 208.1 207.2 369.9 221 89.6 56.8 6.6 0
2012 23.9 0 14.8 182.3 106.6 266.8 274 241.2 251.6 56.4 0 0
2013 0 8.2 24.8 58 224.2 277 394.4 307 173.2 97 0 1.6
NALBARI 2011 11.3 16.1 136 79.4 246.8 203.6 313.1 276.9 212.6 8.8 4.7 0
2012 1.6 9.8 12 268.9 199.3 987 236 156.9 265.5 85.9 0.3 1.3
2013 0 11.1 27.3 124.5 290.5 251.5 257.4 227.5 190.2 142 2 1.8
NC HILLS 2011 0 8.2 54.6 62.9 215.1 75 253.4 197.6 88.6 21.1 0 0
2012 3.1 0 30.5 76.9 42.6 1428.5 790.5 77.9 264.7 250.9 47.3 0
2013 0 12.4 80.6 104.5 473.5 134.6 277 219.4 197.9 91.8 0 0
NAGAON 2011 9.8 3.4 31.6 25.7 200.2 243.2 240 221.9 115.3 35.3 0.7 0.4
2012 9.5 0 12.4 107.5 80.6 184.6 264.5 199.5 213.2 168.5 5.2 0
SIBSAGAR 2011 0 0 0 129 186.7 500.3 201 406.8 52.5 6.7 2
2012 22.7 4.1 37.8 347.6 176.3 208.2 324.3 285.3 205.4 45.3 0.1 4.4
2013 1.5 7.7 91.9 110.7 326.8 175.7 416.8 390.8 112.6 103.9 0 7.1
SONITPUR 2011 7.3 7.2 118.8 82 255.9 246 398 320.1 171.4 15.9 79.9 0.2
2012 6.3 3.3 28.6 254.5 216 571.9 298.2 253.6 253.9 163.5 5.8 1.5
TINSUKIA 2011 34.1 14.3 160.5 148 214.9 273.9 329.6 224.8 330.2 35.5 3.9 9.3
2012 23.1 6.8 29.9 304.7 216.5 417.3 488 329.7 636.5 187.1 6.2 17.8
2013 8.9 4.5 141.5 246 335 289 424 298.4 199.3 176.6 0.4 2.2
UDALGURI 2011 35.4 8 23.7 79.4 172.6 245 172.2 206.7 214.3 22.2 6.4 0
2012 0 1.2 29.2 247.6 215.4 856.4 269.3 387.4 518 195.4 9.8 3.2
2013 0 18 36.4 97.7 355.7 353.3 473.2 245.4 282.3 65.4 0 1.9
MANIPUR
IMPHAL EAST 2011 25.1 2.3 45.5 35.6 299.2 332.5 287.1 302.9 126.4 27.4 0 0

11
State / District Year Jan Feb Mar Apr May June July Aug Sept Oct Nov Dec
2012 19.6 0 56.8 158.7 93.2 311.9 270.8 246.3 272.3 137.4 80.8 0
2013 0 1 29 103.7 376.2 137.9 275.9 313.8 250.1 75.9 0 1.3
THOUBAL 2013 0 3 26 112 298 119 268 229 112 71 0 3
UKHRUL 2013 0 2 30 47 230 163 59 0 189 128 0 0
MEGHALAYA
EAST GARO HILLS 2011 0 29.1 191.4 69 460 533.4 424.6 550.1 329 30 0 0
2012 4 0 0 70 85 929 853 149.5 423 176 6 0
EAST KHASI HILS 2011 6.3 33.5 882.6 179.7 492.8 1443.8 1056 1379.9 620.3 57.2 6 2.7
2012 16.4 0 63.5 505.3 286.8 1367.6 2089.5 874.3 957.8 355.9 16.2 0.3
2013 0.3 19 16.4 275.1 864.2 1180.1 1223.8 894.4 513.6 308.5 0 0.1
JAINTIA HILLS 2012 15 0 6 84 87.5 885.9 978.3 362 617.1 352.2 15.5 0
2013 0 1 18.5 92.7 551 487 434 380.4 234.2 197 0 0
RI-BHOI 2011 1.2 17 57 110 320.1 512 276.7 292.2 343.3 105.2 102.9 17
2012 26.2 0 1.9 122.1 153.7 283.1 256.2 401 274.2 225.4 28 0
2013 0 14.2 47.2 137.3 336.9 305 212.9 394.9 166.6 105.9 0 0
SOUTH GARO HILLS 2012 0 0 0 7 16 580 592 560 217 222 6 2
2013 0 6 2 73 267 30 36 34 338 124 0 7
WEST GARO HILLS 2011 0.2 0 40.4 36 169.6 319.9 324.2 391.2 15.2 17 24.5 0
2012 2.8 13.6 0.5 39.9 87.6 572.9 340.3 264.5 326.6 154.5 0.2 0
2013 0 1.8 10.2 127 396 385.6 153.1 211 265.4 61.4 10 0
WEST KHASI HILLS 2013 0 20 26 59 321 102 90 110 46 0 0 0
MIZORAM
AIZWAL 2011 12 2.2 68.4 95.8 456.1 331.7 270.3 379.1 330 107.5 0 0
2012 18.7 8.6 34.3 307.4 221.8 531.2 219.8 420.5 330.4 161.1 92 0
2013 0 4 5.2 80.2 544.4 309.3 357.9 461.9 315.9 122.6 0 0
LAWNGTLAI 2012 0 0 93 171 119 723 333 464 420 186 13 0
2013 0 5 0 111 396 340 341 306 417 57 1 0
LUNGLEI 2012 0 0 42 249 227 642 337 215 302 291.1 39 0
2013 0 3 6 48 248 90 233 395 453 193 0 0
MAMIT 2012 38 0 13 264 22 457 150 364 201 131 17 0
2013 0 5 3 13 343 172 228 41 399 83 0 0

12
State / District Year Jan Feb Mar Apr May June July Aug Sept Oct Nov Dec
SAIHA 2013 0 6 0 49.6 457 401.4 376 628 836 419.5 10.6 0
SERCHHIP 2012 0 0 68 184 148.5 378 373 26 4 115 30 0
2013 0 2 2 51 405 177 143 220 79 85 0 0
NAGALAND
DIMAPUR 2011 0 0 - 0 149 201 122 118 120 22 0 0
2012 13.5 6 16 73 12.5 216.7 156 192 57.2 109.3 19.1 0
2013 0 0 64.7 131.2 237.6 195 277.5 295.5 149 137.6 0 0
KEPHIRE 2012 0 1 10 67 49.5 123.4 188 227.2 30 61.3 19 0
2013 0 3 15.3 30.4 11 88.9 223 108.4 100.1 54.2 0 1
KOHIMA 2011 8.9 5.2 43 34.3 211.6 164.2 199.6 153.5 215.1 27.4 0 0
2012 22.6 6.8 29.1 48.6 101.4 242 242.7 173.3 141.1 93.3 30.6 0
2013 0 17.2 54.7 81 283.3 247.6 391 265.5 178.3 99.5 0 1.9
MOKOKCHUNG 2012 0 0 42 219 98 269 498 386 246 62 8 0
2013 1 21 86 178 431 163 76 79 229 96 0 5
PHEK 13 0 50.2 57.6 254 420.3 255.2 221.4 100.7 59.4 0 -
8.2 0 13 113 78.9 396 360 336.4 201.5 80.9 21.7 0
0 1.7 33.5 91.2 160.6 94.9 269.2 283.5 181.5 190.6 0 0
TRIPURA
DHALAI 2011 1.3 7.9 14.6 34.2 328.3 364.4 150.8 149.5 188.6 9.5 0 0
2012 3.7 5.2 13 91.8 132.3 442.7 160.2 247.6 156.3 219.2 30.5 0.3
2013 0 4.3 11 114 686.7 150.2 208 414.8 171.4 107.5 0 1
NORTH TRIPURA 2011 13.6 12.4 70.1 100.1 562.7 422.9 500.6 317.7 229.9 37.2 0 0
2012 12.4 8.8 22.9 370.2 288.4 656.8 177.2 331.3 222.3 201.1 48.5 0.2
2013 0 4.4 3 107.2 846.8 328.3 337.6 440.7 197.6 157.3 0 12.6
SOUTH TRIPURA 2011 0.9 3.4 40 48.7 328.2 399.4 268.8 392.5 249.4 70.4 0 0
2012 11.4 11.1 13.2 191.8 125.7 500.6 364.5 290.1 218.5 111.5 54.8 0.5
2013 0 3.3 10.8 28.7 703.1 274.8 229.7 326.7 325.2 146.7 0 0.6
WEST TRIPURA 2011 1.2 1.7 55.5 50.3 409.9 407.8 228.1 341.9 169.7 63.7 0.3 0.1
2012 17.7 1.7 11.4 221.5 148.5 478.4 256.7 296.4 145.4 133.8 50.4 0.6
2013 1 7.6 7.8 85.2 594.2 244.5 178.8 233.1 284.6 176.8 0 3.6

13
4. GEOLOGY Geological Formations encountered, in the North Eastern Region, range in age from Archaean
to Recent. The generalized Geological succession of the Region is shown in Table–4.
Table – 4 Generalized Geological Successions in North Eastern India Age Group/ Formations Lithology Recent Newer Alluvium Clay, Silt, Sand as beds and lenses.
~~~~~~~~~~~~~~~~~~~~~~ Unconformity ~~~~~~~~~~~~~~~~~~~~~~~~
Pleistocene Older Alluvium Clay, coarse Sand, Shingle, Gravel & Boulder deposits as beds and lenses.
~~~~~~~~~~~~~~~~~~~~~~ Unconformity ~~~~~~~~~~~~~~~~~~~~~~~~
Pliocene Dihing Pebble beds, soft Sandy clay, conglomerate, Grit and Sandstone.
~~~~~~~~~~~~~~~~~~~~~~ Unconformity ~~~~~~~~~~~~~~~~~~~~~~~~
Mio-Pliocene Dupi Tila Sandstone, Mottled clay, Grit and Conglomerate.
~~~~~~~~~~~~~~~~~~~~~~ Unconformity ~~~~~~~~~~~~~~~~~~~~~~~~
Miocene Tipam
Mottled clay, Sandy shale, Grity sandstone, Ferruginous sandstone, Clay, Shale and Conglomerate.
Surma Shale, Sandy shale, Siltstone, Mudstone, Conglomerates etc.
~~~~~~~~~~~~~~~~~~~~~~ Unconformity ~~~~~~~~~~~~~~~~~~~~~~~~
Oligocene Barail Massive sandstone, Shale, Sandy shale etc.
Eocene Disang / Jaintia Shale, Sandstone, Marl, Limestone etc.
Upper Cretaceous Khasi Group Conglomerate, Arkose, Sandstone – Conglomerate alterations.
~~~~~~~~~~~~~~~~~~~~~~ Unconformity ~~~~~~~~~~~~~~~~~~~~~~~~
Jurassic (?) Sylhet Trap Basalt, Rhyolite, acid Tuff as flows and Lenses.
~~~~~~~~~~~~~~~~~~~~~~ Unconformity ~~~~~~~~~~~~~~~~~~~~~~~~
Pre-Cambrian Shillong Group Quartzite, Phyllite, Conglomerate, Dolerite, Basalt, Porphyritic and coarse Granite, Pegmatite.
~~~~~~~~~~~~~~~~~~~~~~ Unconformity ~~~~~~~~~~~~~~~~~~~~~~~~
Archaean Gneissic Complex Biotite-gneiss, Biotite-hornblende-Gneiss, Granite, Illemenite-quartz- schist, Mica-Schist etc.

14
The North Eastern Region can structurally be classified into five major Geotectonic
Provinces. These are as follows.
4.1. Shield area: The stable landmass of Assam-Meghalaya Plateau and the Mishimi massif
form the shield area which were unaffected by orogenic movements. The shield area is
separated from the other tectonic provinces by deep fractures in all sides.
4.2. Platform area: The areas bordering the shield area are termed as platform area. This
zone was also unaffected by Cenozoic orogenic movement. However, late Mesozoic and
Cenozoic marine and fluviatile sediments were deposited on this. The Upper Assam valley
extending from Mishimi hills to Karbi Anglong , its southern margin and the northern margin
of Cachar and N.C. Hills form the platform area, which is the eastern extension of Bengal
platform.
4.3. Shelf area: The narrow southern margin bordering the Shield area is known as shelf
area.
4.4. Mobile belt: TheGeosynclinalsdeposition on the northern part forming Himalayan
mountain system and the east and south-eastern parts forming Naga Patkai and Lushai Hill
ranges due to orogenic movement are termed as mobile belts.
4.5. Foredeeps: The depressions in the northern and south-eastern margin of the platform
are known as foredeeps. These foredeeps are covered by thick pile of molassic sediments
derived from still rising mountains of mobile belt.

15
5. HYDROGEOLOGY
Recharge to the ground water of an area is controlled, mainly by three factors –
Topography, Geology and Climate. Topography controls the gradient of an area. Geology
plays an important role in storage and transmission of ground water and Climate forms the
main source of ground water recharge through precipitation.
Based on the ground water occurrence and movement, the Geological Formations of the
Region can be broadly grouped into Porous and Fissured Formations.
(a) Porous Formations
1. Unconsolidated Formations
2. Semi-consolidated Formations
(b) Fissured Formations
1. Consolidated Formations
5.1 Porous Formations
5.1.1 Unconsolidated Formations:
Unconsolidated Formations (Alluvium) occupy about 77,068 sq.km areas which are
about 30% of the total area of the region and it covers mostly the plains of Brahmaputra
valley and Barak valley of Assam. This Alluvial Formation comprises of Clay, Silt, Sands of
various grain size and Gravel, etc. The foot-hill zone of Arunachal Pradesh comprises
Boulder, Pebble, Cobble, Gravel, Sand, Silt, Clay etc. known as ‘Bhaber Zone’. In general the
grain size of the formations decreases from north to south in the northern part of the
Brahmaputra River and from south to north in the southern part of the Brahmaputra River.
The foot-hill areas in northern and southern part form the recharge zone of ground water for
the plain areas of Assam.
Ground water, in general, occurs under unconfined to semi-confined conditions.
However, in parts of Darrang, Nalbari, northern part of Kamrup, part of Cachar districts of
Assam and southern part of West Garo Hills district of Meghalaya, ground water occurs under
confined conditions giving rise to auto flow wells.
A total of 555Ground Water Monitoring Stations are located in Unconsolidated
Formations. During the water year 2014-2015, the range of pre- and post-monsoon water
levels varied from 0.07 magl to 54.44 mbgl and 0.28 magl to 64.07 mbgl respectively.

16
5.1.2 Semi-consolidated Formations:
The Semi-consolidated Formations occupy the hill ranges of Tripura, southern hill
ranges of Arunachal Pradesh, eastern part of Nagaland, Manipur, Mizoram, eastern fringe of
Assam bordering Arunachal and Nagaland and hill ranges of Barak valley in southern Assam.
The semi-consolidated formations in the area belong to Tertiary age. The granular zones
comprise fine to medium grained sandstone, siltstone with intermittent shale beds. Ground
water, in these formations occurs mostly under semi-confined to confined conditions.
In the semi-consolidated formation, 67 GWM Stations are located. The pre- and post-
monsoon water levels ranged from 1.31 to 21.95 mbgl and 0.40 to 28.56 mbgl respectively.
5.2 Fissured Formations
5.2.1 Consolidated Formation:
The Consolidated Formations form the high hill ranges of Arunachal Pradesh, high
land plateau of Meghalaya, Karbi Anglong district of Assam and isolated inselbergs of
Brahmaputra valley scattered along both northern and southern bank of Brahmaputra River in
middle and lower Assam. This formation mostly comprises of gneissic and schistose rocks
belonging to Archaean and Pre-Cambrian age. These rocks are very compact and hard devoid
of primary porosity. However, the secondary porosity developed by fractures, fissures and
joints form ground water conduits and reservoirs. Due to high rainfall in the area, the
weathered residuum has developed a considerable thickness, which varies from 10 to 20 m in
general. This weathered residuum forms a good ground water reservoir. In the hill ranges of
the area, springs are a common sight, which emanate through contacts of joints, fractures,
topographic lows and hill slopes.
A total of 23 GWMS are located in consolidated formations. The range of water levels
during pre- & post-monsoon varied from 1.11 to 16.64 mbgl and 0.41 to 16.09 mbgl
respectively.
17
6. BEHAVIOUR OF WATER LEVEL DURING THE YEAR 2014-15 Based on the water level data collected from the Ground Water Monitoring Stations,
the following maps has been prepared for each monitoring period. The details of GWM
Stations and water level data during the year 2014– 2015are given in Annexure I and II.
i. Depth to water level maps
ii. Fluctuation of water level between Pre- and Post-monsoon.
iii. Fluctuation of water level in the current month with respect to that of the same
month of the previous year.
iv. Fluctuation of water level in the current month with respect to the average of the
preceding decade for the same month.
6.1 Depth to Water Level
6.1.1 Depth to Water level during March, 2014 (Fig. 5 and Annexure III)
Arunachal Pradesh
A significant part of Arunachal Pradesh is hilly and hence most of the monitoring
stations are located along the southern boundary.
Monitoring of GWMS during the month of March 2014 indicates that 13.04% (3) of
the monitored stations had water level within 0-2 mbgl, 60.87% (14) GWMS had water levels
between 2-5 mbgl 8.7% (2) GWMS had water level between 5-10 mbgl and 17.39% (4)
GWMS had water level between 10 and 20 mbgl. A minimum and maximum water level of
0.07 magl and 11.69 mbgl respectively were recorded at Papumpare district GWMS.
Assam
During the month of March 2014, 16.45% (50) of the monitored stations
exibited water levels within 0-2 mbgl, 60.2% (183) GWMS between 2-5 mbgl, 21.05% (64)
GWMS between 5-10 mbgl and 2.3% (7) GWMS between 10 and 20 mbgl. The minimum
and maximum water level 0.18 magl and 16.64 mbgl were recorded at Sonitpur and Dhubri
district GWMS respectively.
Meghalaya
The Depth to water level measured during March 2014, indicates that the majority of
the GWMS has water levels between 2-5 mbgl. Of the total monitored stations 12.9% (4) had
water level within 0-2 mbgl, 61.29% (19) had water level between 2 - 5 mbgl and 25.81% (8)
GWMS had water level between 5-10 mbgl. The minimum and maximum water level 1.11
mbgl and 7.78 mbgl were recorded at East Khasi Hills and West Garo Hills district GWMS
respectively.

18
Nagaland
Depth to water level measured during March 2014, showed that 25.81% (8) of the
monitored stations had water level within 2-5 mbgl, 35.49% (11) GWMS had water
levelsbetween 5-10 mbgl, 19.35% (6) GWMS had water level between 10-20 mbgl and
19.35% (6) of GWMS had water level >20 mbgl. The minimum and maximum water level of
2.86 mbgl and 28.08 mbgl were recorded at Kohima and Wokha district GWMS respectively.
Tripura
During the month of March 2014, 7.15% (4) of the monitored stations had water level
within 0-2 mbgl, 51.77% (29) GWMS had water level between 2 - 5 mbgl, 30.36% (17)
GWMS had water level between 5-10 mbgl and 3.57% (2) GWMS had water level between
10-20 mbgl and 7.15% (4) of GWMS had water level >20 mbgl. The minimum and
maximum water levels of 0.81 mbgl and 27.75 mbgl were recorded at South Tripura and
West Tripura district GWMS respectively.
6.1.2 Depth to Water levelduring August, 2014 (Fig. 6 and Annexure IV)
Arunachal Pradesh
Water level monitored during the month of August 2014 showed that 81% (17) of the
monitored stations had water level within 0-2 mbgl, 9.53% (2) GWMS had water level
between 2-5 mbgl, 4.76% (1) GWMS had water level between 5-10 mbgl and 4.76% (1)
GWMS had water level between 10-20 mbgl. Minimum and maximum water levels of 0.7
magl and 10.1 mbgl recorded at Papumpare district GWMS.
Assam
During the month of August 2014, 72% (237) of the monitored stations had water
level within 0-2 mbgl, 23.7% (78) GWMS had water level between 2-5 mbgl, 3.34% (11)
GWMS had water level between 5-10 mbgl and 0.91% (3) GWMS had water level between
10-20 mbgl. Minimum and maximum water levels 0.01 magl and 18.9 mbgl are recorded at
Karimganj and Dhubri District GWMS respectively.
Meghalaya
During the month of August 2014, 69.2% (9) of the monitored stations had water
level within 0-2 mbgl, 23.1% (3) GWMS had water level between 2-5 mbgl and 7.69% (1) had
water level of 5-10 mbgl. Minimum and maximum water levels 0.38 mbgl and 6.26 mbgl are
recorded at West Khasi Hills and East Khasi Hills District GWMS respectively.

19
Tripura
During the month of August 2014, it was observed that 41.7% (25) of the monitored
stations had water level within 0-2 mbgl, 38.3% (23) had water level between 2-5 mbgl,
13.3% (8) had water level between 5-10 mbgl, 1.67% (1) had water level between 10-20 mbgl
and 5% (3) had water level of more than 20 mbgl. The minimum and maximum water levels
0.13 mbgl and 28.6 mbgl are recorded at Dhalai and West Tripura District GWMS
respectively.
6.1.3 Depth to Water Levelduring November, 2014 (Fig. 7 and Annexure V)
Arunachal Pradesh
In Arunachal Pradesh the depth to water level measured from 21 GWMS during the month of
November 2014, it was observed that 28.6% (6) of the monitored stations had water level
within 0-2 mbgl, 42.9% (9) of the GWMS had water levels between 2-5 mbgl, 23.8% (5) of
the GWMS had water level between 5-10 mbgl and 4.76% (1) of GWMS had water level
between 10-20 mbgl has been recorded at only one station in Papumpare district. The
minimum and maximum water levels are 0.28 magl and 10.9 mbgl are recorded at Papumpare
district GWMS.
Assam
The depth to water level measured in 333 GWMS during November 2014 indicates
that 39.9% (133) of the monitored stations had water level within 0-2 mbgl, 53.2% (177) of
GWMS had water levels between 2 and 5 mbgl, 5.41% (18) of GWMS had water level
between 5-10 mbgl and 1.5% (5) of GWMS had water level between 10 and 20 mbgl. The
minimum and maximum water levels are 0.05 magl and 16.1 mbgl are recorded at Karimganj
and Dhubri district GWMS respectively.
Meghalaya
Depth to water level measured during November 2014 the maximum GWMS showing
water level between 2-5 mbgl, wells showed that 33.3% (10) of the monitored stations had
water level within 0-2 mbgl, 53.3% (16) of GWMS had water levels between 2 and 5 mbgl
and 13.3 (4) showed water level of 5-10 mbgl. The minimum and maximum water levels are
0.4 mbgl and 7.63 mbgl were recorded at Jaintia Hills and West Garo Hills district GWMS
respectively.

20
Nagaland
The depth to water level measured during November 2014 showed that the maximum
number of GWMS has water level between 2-5 mbgl, of all the monitored stations 6.25% (2)
of the stations had water level within 0-2 mbgl, 40.6% (13) had water levels between 2 and 5
mbgl, 18.8% (6) had water level between 5-10 mbgl. 15.6% (5) of monitoring stations had
water level between 10-20 mbgl and 18.8% (6) of the monitored stations had >20 mbgl. The
minimum and maximum water levels are 0.85 mbgl and 64.1 mbgl are recorded at Dimapur
and Phek district GWMS respectively.
Tripura
The depth to water level measured during November 2014 showed that 20.7% (12) of
the monitored stations had water level within 0-2 mbgl, 53.5% (31) had water levels between
2 and 5 mbgl, 19% (11) had water level between 5-10 mbgl, 1.72% (1) had water level
between 10 and 20 mbgl and 5.17% (3) had more than 20 mbgl. The minimum and maximum
water levels are 0.71 mbgl and 28.6 mbgl are recorded at South Tripura and West Tripura
district GWMS respectively.
6.1.4 Depth to water level during January, 2015 (Fig. 8 and Annexure VI )
Arunachal Pradesh
The depth to water level measured during January 2015 showed that 17% (4) of the
monitored stations had water level within 0-2 mbgl, 47.8% (11) had water levels between 2
and 5 mbgl, 22% (5) had water level between 5-10 mbgl and 13.04% (3) had water level
between 10 and 20 mbgl. The minimum and maximum water levels are 0.06 magl and 12.77
mbgl are recorded at Papumpare and East Siang district GWMS respectively.
Assam
The depth to water level measured during January 2015 showed that 16% (56) of the
monitored stations had water level within 0-2 mbgl, 69.5% (241) had water levels between 2
and 5 mbgl, 13% (45) had water level between 5-10 mbgl and 1.44% (5) had water level
between 10 and 20 mbgl. The minimum and maximum water levels are 0.2 magl and 19.21
mbgl are recorded at Karimganj and Karbi Anglong district GWMS respectively.
Meghalaya
The depth to water level measured during January 2015 showed that 24% (10) of the
monitored stations had water level within 0-2 mbgl, 63.4% (26) had water levels between 2
and 5 mbgl and 12% (5) showing water level between 5-10 mbgl. The minimum and

21
maximum water levels are 0.54 mbgl and 8.57 mbgl are recorded at East Khasi Hills and East
Khasi Hills district GWMS respectively.
Nagaland
The depth to water level measured during January 2015 showed that 3.1% (1) of the
monitored stations had water level within 0-2 mbgl, 34.4% (11) had water levels between 2
and 5 mbgl, 25% (8) had water level between 5-10 mbgl and 15.63% (5) had water level
between 10 and 20 mbgl and 21.87% (7) had water level >20mbgl. The minimum and
maximum water levels are 1.72 mbgl and 53.56 mbgl are recorded at Mokokchung and Phek
district GWMS respectively.
Tripura
The depth to water level measured during January 2015 showed that 14% (8) of the
monitored stations had water level within 0-2 mbgl, 54.2% (32) had water levels between 2
and 5 mbgl, 25% (15) had water level between 5-10 mbgl and 1.7% (1) had water level
between 10 and 20 mbgl and 5.08% (3) had water level >20 mbgl. The minimum and
maximum water levels are 0.76 mbgl and 29.26 mbgl are recorded South Tripura and West
Tripura district GWMS respectively.
6.2 Water Level Fluctuation with respect to August 2014
6.2.1 Water Level Fluctuation (August 2014 and March 2014) (Fig. 9 and Annexure
VII)
Arunachal Pradesh
All the stations showed rise in water level during August 2014 as compared to that of
March 2014. Of the total stations 30% (6) of the GWMS showed rise in water level within 0-
2 m, 50% (10) GWMS showed rise ion water level between 2-4 m and 20% (4) GWMS
showed rise of more than 4 m.
Assam
Water level during the month of August 2014 in comparion to March 2014 indicates
that 94.28% of the GWMS showed rise in water lever. Of all the stations showing rise
45.43% (119) showed rise in water level within 0-2 m, 34.73% (91) showed rise in water
level between 2-4 m and 14.12% (37) showed rise of more than 4 m. About 4.2% (11) of the
GWMS showed fall in water level between 0-2 m, 0.76% (2) show rise between 2-4 m and
0.76% (2) show rise of more than 4 m.
Meghalaya
Comparing the water level of August 2014 with March 2014 it shows that during
august majority of the GWMS showed rising trend. In these 44.45% (4) GWMS showed rise

22
in water level within 0-2 m, 11.11% (1) GWMS showed rise in water level between 2-4 m,
33.33% (3) showed rise of more than 4 m and 11.11% (1) showed fall between 0-2 m.
Tripura
During the month of August 2014 water level in comparison with March 2014 shows
that 55.56% (30) GWMS showed rise in water level within 0-2 m, 31.48% (17) GWMS
showed rise in water level between 2-4 m, 7.41% (4) GWMS showed rise of more than 4 m.
About 3.7% (2) show fall between 0-2 m and 1.85% (1) show fall between 2-4 m.
6.3 Water Level Fluctuation with respect to November 2014
6.3.1Water Level Fluctuation (November 2014 and March 2014) (Fig. 10 and Annexure VIII)
Arunachal Pradesh
By comparing the water level of November 2014 with March 2014 water level it is
found that 85.71% of the GWMS showed rising trend during November 2014. In these
57.13% (12) of the GWMS showed rise in water level within 0-2 m, 14.29% (3) of the
GWMS showed rise in water level between 2-4 m and 14.29% (3) GWMS showed rise of
more than 4 m. Only 14.29% (3) of the GWMS showed fall within 0-2 m.
Assam
By comparing the water level of November 2014 with March 2014 water level it is
found that 67.39% (186) of the GWMS showed rise in water level within 0-2 m, 17.75%
(49) of the GWMS showed rise in water level between 2-4 m and 3.63% (10) GWMS showed
rise in water level of more than 4 m. About 9.42% (26) GWMS showed fall in water level
between 0-2 m, 1.45% (4) GWMS Shows 2-4 m falling water level fluctuation, 0.36% (1)
GWMS showed fall in water level of more than 4.
Meghalaya
By comparing the water level of November 2014 with March 2014 water level it is
found that 90.48% (19) of the GWMS showed rising trend with water level 0-2 m and 9.52%
(2) of the GWMS showed rise in water level of more than 4 m.
Nagaland
During November 2014 as compared to March 2014 the water level of 35.48% (11) of
the GWMS had rise within 0-2 m, 16.13% (5) of the GWMS had rise between 2-4 m, 19.34%
(6) of the GWMS had rise of more than 4 m. On the contrary to that 12.9% (4) of GWMS
showed showed fall in water level between 0-2 m, 6.45% (2) GWMS show fall in water level
and 9.7% (3) show fall of more than 4 m.

23
Tripura
By comparing the water level of November 2014 with March 2014 water level it is
found the water level of 64.82% (35) of the GWMS showed rise in water level within 0-2 m,
20.37% (11) GWMS showed rise in water level between 2-4 m, 1.85% (1) showed rise in
water level of more than 4 m and 11.11% (6) GWMS showed 0-2 m falling water level
fluctuations, 1.85% (1) show fall of >4m.
6.3.2 Water Level Fluctuation (November 2014 and August 2014) (Fig. 11and Annexure
IX)
Arunachal Pradesh
Comparison of November 2014 water level with August 2014 water level indicates
that 5% (1) GWMS showed rise in water level within 0-2 m. 60% (12) showed fall having
water level within 0-2 m, 25% (5) of GWMS showed fall in water level between 2-4 m and
10% (2) GWMS showed fall of more than 4 m.
Assam
Comparison of November 2014 water level with August 2014 water level indicates
that 16.96% (49) of the GWMS showed rise in water level within 0-2 m, 1.40% (3) showed
rise in water level between 2-4 m, 0.69% (2) showed rise of > 4m and 64.01% (185) of the
GWMS showed fall in water level within 0-2 m, 14.88% (43) showed 2-4 m fall in water
level and 2.42% (7) showed more than 4 m fall in water level.
Meghalaya
Comparison of November 2014 water level with August 2014 shows that 2014
16.67% (2) of the GWMS showed rise in water level within 0-2 m, 8.33% (1) showed rise in
water level between 2-4 m and 66.67% (8) of the GWMS showed fall in water level within 0-
2 mbgl, 8.33% (1) showed fall in water level in between 2-4 m.
Tripura
Comparison of November 2014 water level with August 2014 shows that it is
observed that the water level of 22.81% (13) of the GWMS showed rise within 0-2 m
whereas 73.68% (42) of the GWMS showed 0-2 m fall in water level and 3.51% (2) of the
GWMS showed 2-4 m fall in water level.

24
6.4 Water Level Fluctuation with respect to January 2015
6.4.1 Water Level Fluctuation (January 2015 and March 2014) (Fig. 12 and Annexure X)
Arunachal Pradesh
By comparing the water level of January 2015 with March 2014 it was observed that
of all the monitored stations 38.1% (8) of the GWMS showed fall within 0-2 m, 4.76% (1)
showed fall between 2-4 m. About 52.38% (11) showed rise in water level between 0-2 m,
4.76% (1) showed rise in water level between 2-4 m.
Assam
By comparing the water level of January 2015 with March 2014 it was observed that
stations in the state 19.47% (51) of the GWMS showed fall in water level between 0-2 m,
3.82% (10) showed fall between 2-4 m, 1.15% (3) showed fall of more than 4 m and 66.03%
(173) of the GWMS showed rise in water level between 0-2 m, 7.63% (20) showed rise in
water level between 2-4 m, 1.9% (5) showed rise of more than 4 m.
Meghalaya
By comparing the water level of January 2015 with March 2014 it was observed that
stations in the state 7.69% (2) of the GWMS showed fall between 0-2 m and 3.85% (1)
showed fall between 2-4 m. On the other hand 76.92% (20) of the GWMS showed rise
between 0-2 m, 3.85% (1) showed rise in water level between 2-4 m and 7.69% (2) showed
rise of more than 4 m.
Nagaland
By comparing the water level of January 2015 with March 2014 it was observed that
of all the monitored stations stations in the state 11.9% (5) of the GWMS showed fall in
water level between 0-2 m, 7.15% (3) showed fall between 2-4 m and 2.38% (1) showed fall
of more than 4 m. About 59.52% (25) of the GWMS showed rise in water level between 0-2
m, 11.9% (5) showed rise between 2-4 m and 7.15% (3) showed rise of more than 4 m.
Tripura
By comparing the water level of January 2015 with March 2014 it was observed that
of all the monitored stations stations in the state 18% (9) of the GWMS showed fall in water
level between 0-2 m and 2% (1) showed fall of more than 4 m. About 70% (35) of the
GWMS showed rise in water level between 0-2 m and 10% (5) showed rise in between 2-4
m.

25
6.4.2 Water Level Fluctuation (January 2015 and August 2014) (Fig. 13 and Annexure
XI)
Arunachal Pradesh
By comparing the water level of January 2015 with August 2014 it was observed that
of all the monitored stations stations in the state 25% (5) of the GWMS show fall in water
level between 0-2 m, 45% (9) of the GWMS show fall between 2-4 m and 30% (6) of the
GWMS show fall of more than 4 m.
Assam
By comparing the water level of January 2015 with August 2014 it was observed that
of all the monitored stations stations in the state 51.84% (155) of the GWMS showed fall in
water level between 0-2 m, 33.44% (100) showed fall between 2-4 m and 5.69% (17) showed
fall of more than 4 m. About 7.36% (22) of the GWMS showed rise in water level between 0-
2 m, 1% (3) showed rise between 2-4 m and 0.67% (2) show rise of more than 4m.
Meghalaya
By comparing the water level of January 2015 with August 2014 it was observed that
of all the monitored stations stations in the state 53.85% (7) of the GWMS showed fall in
water level between 0-2 m, 7.69% (1) showed fall between 2-4 m and 7.69% (1) showed fall
of more than 4 m. About 23.08% (3) of the GWMS show rise in water level between 0-2 m
and 7.69% (1) show rise between 2-4 m.
Tripura
By comparing the water level of January 2015 with August 2014 it was observed that
of all the monitored stations stations in the state 75% (39) of the GWMS showed fall in water
level between 0-2 m, 13.46% (7) showed fall between 2-4 m and 1.92% (1) of the GWMS
showed fall of more than 4 m. About 9.62% (5) of the GWMS showed rise in water level
between 0-2 m.
6.4.3 Water Level Fluctuation (January 2015 and November 2014) (Fig. 14 and Annexure
XII)
Arunachal Pradesh
By comparing the water level of January 2015 with November 2014 it was observed
that of all the monitored stations in the state 85% (17) of the GWMS showed fall in water
level between 0-2 m, 10% (2) showed fall between 2-4 m and 5% (1) showed fall of more
than 4 m.

26
Assam
By comparing the water level of January 2015 with November 2014 it was observed
that of all the monitored stations stations in the state 75.24% (240) of the GWMS showed fall
in water level between 0-2 m, 7.52% (24) showed fall between 2-4 m, 1.88% (6) showed fall
of more than 4 m. About 13.79% (44) of the GWMS showed rise between 0-2 m, 0.94% (3)
showed rise between 2-4 m and 0.63% (2) of the GWMS showed rise of more than 4 m.
Meghalaya
By comparing the water level of January 2015 with November 2014 it was observed
that of all the monitored stations stations in the state 80% (24) of the GWMS showed fall in
water level between 0-2 m, 3.33% (1) showed fall between 2-4 m and 16.67% (5) of the
GWMS showed rise in water level between 0-2 m.
Nagaland
Comparing the water level of January 2015 with November 2014 it was observed that
of all the monitored stations in the state 50% (16) of the GWMS showed fall in water level 0-
2 m, 6.25% (2) showed fall between 2-4 m, 12.5% (4) showed fall of more than 4 m. About
18.75% (6) GWMS showed rise in water level between 0-2 m, 3.13% (1) showed rise in
water level between 2-4 m and 9.37% (3) showed rise in water level of more than 4m.
Tripura
By comparing the water level of January 2015 with November 2014 it was observed
that of all the monitored stations in the state 75.47% (0) of the GWMS showed fall in water
level between 0-2 m, 7.55% (4) showed fall between 2-4 m and 16.98% (9) showed rise in
water level between 0-2 m.
6.5 Fluctuation of Water Level with respect to previous year for the same month
6.5.1 March 2014 and March 2013 (Fig. 15 and Annexure XIII)
Arunachal Pradesh
By comparing the water level of March 2014 with March 2013 it was observed that of
all the monitored stations in the state 40.91% (9) of the GWMS showed fall between 0-2 m.
About 50% (11) of the GWMS showed rise in water level between 0-2 m and 9.9% (2)
showed rise in water level between 2-4 m.
Assam
By comparing the water level of March 2014 with March 2013 it was observed that of
all the monitored stations in the state 45.97% (114) of the GWMS showed fall in water level
between 0-2 m bgl, 3.22% (8) showed fall between 2-4 m and 2.02% (5) showed fall of more

27
than 4 m. About 41.53% (103) of the GWMS showed rise in water level between 0-2 m,
5.65% (4) showed rise in between 2-4 m and 1.61% (4) showed rise of more than 4 m.
Meghalaya
By comparing the water level of March 2014 with March 2013 it was observed that of
all the monitored stations in the state 52% (13) of the GWMS showed fall in water level
between 0-2 m and 8% (2) showed fall between 2-4 m. About 32% (8) of the GWMS showed
rise in water level between 0-2 m and 8% (2) showed rise in between 2-4 m.
Nagaland
By comparing the water level of March 2014 with March 2013 it was observed that of
all the monitored stations in the state 52.39% (11) of the GWMS showed fall in water level
between 0-2 m, 9.52% (2) showed fall between 2-4 m and 9.52% (2) showed fall in water
level of more than 4m. About 28.57% (6) of the GWMS showed rise in water level between
0-2 m.
Tripura
By comparing the water level of March 2014 with March 2013 it was observed that of
all the monitored stations in the state 36.67% (11) of the GWMS showed fall in water level
between 0-2 m, 60% (18) showed rise in water level between 0-2 m and 3.33% (1) showed
rise in water level between 2-4 m.
6.5.2 August 2014 and August 2013(Fig. 16 and Annexure XIV)
Arunachal Pradesh
By comparing the water level of August 2014 with August 2013 it was observed that
of all the monitored stations in the state 66.67% (14) of the GWMS showed rise in water
level between 0-2 m, 28.57% (6) showed rise in between 2-4 m and only 4.76% (1) of the
GWMS showed fall in water level between 0-2 m.
Assam
By comparing the water level of March 2014 with March 2013 it was observed that of
all the monitored stations in the state 67.68% (178) of the GWMS showed rise in water level
between 0-2 and 7.61% (20) showed rise between 2-4 m. About 22.43% (59) of the GWMS
showed fall in water level between 0-2, 1.9% (5) showed fall between 2-4 m and 0.38% (1)
GWMS showed fall of more than 4 m.

28
Meghalaya
By comparing the water level of March 2014 with March 2013 it was observed that of
all the monitored stations in the state 57.14% (4) of the GWMS showed rise in water level
between 0-2 m and 42.86% (3) of the GWMS showed fall in water level between 0-2 m.
Tripura
By comparing the water level of March 2014 with March 2013 it was observed that of all the
monitored stations in the state 50% (25) of the GWMS showed rise in water level between 0-
2 m, 2% (1) showed rise between 2-4 m, 44% (22) showed fall in water level between 0-2 m,
2% (1) showed fall between 2-4 m and 2% (1) showed fall of more than 4 m.
6.5.3 November 2014 and November2013 (Fig. 17 and Annexure XV)
Arunachal Pradesh
By comparing the water level of November 2014 with November 2013 it was
observed that of all the monitored stations in the state 35% (7) of the GWMS showed fall in
water level between 0-2 m and 60% (12) showed rise in water level between 0-2 m and 5%
(1) showed rise between 2-4 m.
Assam
By comparing the water level of November 2014 with November 2013 it was
observed that of all the monitored stations in the state 48.19% (120) of the GWMS showed
rise in water level between 0-2 m, 3.21% (8) showed rise between 2-4 m and 0.8% (2)
showed rise of more than 4 m. About 44.98% (112) of the GWMS showed fall in water level
between 0-2 m, 2.42% (6) showed fall between 2-4 m and 0.4% (1) showed fall of more than
4 m.
Nagaland
By comparing the water level of November 2014 with November 2013 it was
observed that of all the monitored stations in the state 35% (7) of the GWMS showed rise in
water level between 0-2 m and 5% (1) showed rise in water level between 2-4 m. About 40%
(8) of the GWMS showed fall in water level between 0-2 m, 5% (1) showed fall in water
level between 2-4 m and 15% (3) showed fall of more than 4 m.
Tripura
By comparing the water level of November 2014 with November 2013 it was
observed that of all the monitored stations in the state 35.29% (18) of the GWMS showed rise
in water level between 0-2 m and 5.88% (3) showed rise between 2-4 m. About 56.87% (29)
of the GWMS showed fall between 0-2 m and 1.96% (1) showed fall between 2-4 m.

29
6.5.4 January 2015 and January 2014 (Fig. 18 and Annexure XVI)
Arunachal Pradesh
By comparing the water level of January 2015 with January 2014 it was observed that
the maximum monitoring stations in the state shows rising trend. About 63.64% (14) of the
GWMS showed rise in water level between 0-2 m and 36.36% (8) of the GWMS showed fall
in water level between 0-2 m.
Assam
By comparing the water level of January 2015 with January 2014 it was observed that
the of all the monitored stations in the state 38.41% (111) of the GWMS showed fall in water
level between 0-2 m, 1.73%(5) showed fall between 2-4 m and 0.69% (2) showed fall of
more than 4 m bgl. About 56.06% (162) of the GWMS showed rise in between 0-2 m, 2.08%
(6) showed rise in between 2-4 m and 1.04% (3) showed rise of more than 4 m.
Meghalaya
By comparing the water level of January 2015 with January 2014 it was observed that the of
all the monitored stations in the state 36.37% (4) of the GWMS showed fall in water level
between 0-2 m and 9.09%(1) showed fall of more than 4 m. About 45.45% (5) of the GWMS
showed rise in water level between 0-2 m and 9.09% (1) showed rise in water level of more
than 4 m.
Nagaland
By comparing the water level of January 2015 with January 2014 it was observed that the of
all the monitored stations in the state 42.86% (9) of the GWMS showed rise in water level
between 0-2 m and 57.14% (12) of the GWMS showed fall in water level between 0-2 m.
Tripura
By comparing the water level of January 2015 with January 2014 it was observed that the of
all the monitored stations in the state 61.7% (29) of the GWMS showed fall in water level
between 0-2 m and 2.13% (1) showed fall in water level of more than 4 m. About 34.04%
(16) of the GWMS showed rise in water level between 0-2 m and 2.13% (1) showed rise
between 2-4 m.
6.6.1 August 2014 and Decadal Mean (August 2004-2013) (Fig. 19 and Annexure XVII)
Arunachal Pradesh
August 2014 water level has been compared with mean water level data of the same
period of preceding 10 years. 77.8% (7) GWMS shows 0-2 mbgl rising trend and 22.2% (2)

30
GWMS shows 2-4 mbgl rising trend. The minimum and maximum rising water levels are 0.3
mbgl and 2.33 mbgl are recorded at Papumpare and Tirap districts respectively.
Assam
August 2014 water level has been compared with mean water level data of the same
period of preceding 10 years. 58.14% (100) GWMS shows 0-2 mbgl rising trend, 5.81% (10)
GWMS shows 2-4 mbgl rising trend, 2.33% (4) GWMS shows >4 mbgl rising trend and
30.23% (52) GWMS shows 0-2 mbgl falling trend, 2.33% (4) GWMS Shows 2-4 mbgl
falling trend , 1.16% (2) GWMS shows >4 mbgl falling trend. The minimum and maximum
rising water levels are 0.01 mbgl and 51.02 mbgl are recorded at Cachar and Golaghat
districts GWMS respectively. The minimum and maximum falling water levels 0.01 mbgl
and 7.18 mbgl are recorded at Golaghat and Karbi Anglong District GWMS respectively.
Meghalaya
August 2014 water level has been compared with mean water level data of the same
period of preceding 10 years. 60% (3) GWMS shows 0-2 mbgl rising trend and 40% (2)
GWMS shows 0-2 mbgl falling trend. The minimum and maximum rising water levels are
0.23 mbgl and 0.39 mbgl are recorded at West Khasi Hills and Jaintia Hills districts GWMS
respectively. The minimum and maximum falling water levels 0.66 mbgl and 1.15 mbgl are
recorded at East Khasi Hills District GWMS.
Tripura
August 2014 water level has been compared with mean water level data of the same
period of preceding 10 years71.43% (20) GWMS shows 0-2 mbgl rising trend and 25% (7)
GWMS shows 0-2 mbgl falling trend, 3.57% (1) GWMS shows 2-4 mbgl falling trend in
water level. The minimum and maximum rising water levels are 0.01 mbgl and 1.55 mbgl are
recorded at North Tripura and West Tripura districts GWMS respectively. The minimum and
maximum falling water levels 0.05 mbgl and 3.55 mbgl are recorded at West Tripura district
GWMS.
6.6.2 November 2014 and Decadal Mean (Nov2004-2013) (Fig. 20 and Annexure XVIII)
Arunachal Pradesh
November 2014 water level has been compared with mean water level data of the
same period of preceding 10 years. 77.78% (7) GWMS shows 0-2 mbgl rising trend and
22.22% (2) GWMS shows 0-2 mbgl falling trend. The minimum and maximum rising water
levels are 0.13 mbgl and 1.05 mbgl are recorded at Changlang and Tirap districts
respectively. The maximum falling water levels 0.66 mbgl are recorded at Changlang district.

31
Assam
November 2014 water level has been compared with mean water level data of the
same period of preceding 10 years. 49.71% (87) GWMS shows rising trend within 0-2 mbgl
and 2.29% (4) GWMS shows rising trend between 2-4 mbgl and 0.57% (1) GWMS shows
rising trend >4 mbgl 47.43% (83) GWMS shows falling trend within 0-2 mbgl . The
maximum rising water level of 5.87 m recorded at Karbi Anglong district. The maximum
falling water 1.8 m recorded at district GWMS.
Meghalaya
November 2014 water level has been compared with mean water level data of the
same period of preceding 10 years. 50% (8) GWMS shows rising trend within 0-2 mbgl and
37.5% (6) GWMS shows falling trend within 0-2 mbgl and 12.5% (5) GWMS shows falling
trend between 2-4 mbgl. The maximum rising water level 1.46 m recorded at Jaintia hills
district and the maximum falling water level 2.42 m recorded at East khasi hill district.
Tripura
November 2014 water level has been compared with mean water level data of the
same period of preceding 10 years. 30.5% (7) GWMS shows rising trend within 0-2 mbgl and
60.8% (14) GWMS shows falling trend within 0-2 mbgl, 8.7% (2) GWMS shows 2-4 m
falling trend. The maximum rising water level 1.23 m maximum falling water level 0.66 m
recorded at North Tripura & South Tripura district GWMS respectively.
6.6.3 January 2015 and Decadal Mean (Jan 2005-2014) (Fig.21 and Annexure XIX)
Arunachal Pradesh
January 2015 water level has been compared with mean water level data of the same
period of preceding 10 years. 81.82% (9) GWMS shows 0-2 mbgl rising trend and 18.18%
(2) GWMS shows 0-2 mbgl falling trend. The maximum rising water level 1.41 m and
maximum falling water level 0.13 m recorded at Tirap and East Siang districts respectively.
Assam
January 2015 water level has been compared with mean water level data of the same
period of preceding 10 years. 44.62% (83) GWMS shows 0-2 mbgl rising trend, 1.08% (2)
GWMS shows 2-4 mbgl rising trend and 51.07% (95) GWMS Shows 0-2 mbgl falling trend
and 2.15% (4) GWMS shows 2-4 mbgl falling trend in water level and 1.08% (2) GWMS
shows >4 mbgl falling trend . The maximum rising water level 3.88 m and maximum falling
water level 7.99 m recorded at Karimganj and Karbi Anglong districts GWMS respectively.

32
Meghalaya
January 2015 water level has been compared with mean water level data of the same
period of preceding 10 years. 47.62% (10) GWMS shows 0-2 mbgl rising trend and 47.62%
(10) GWMS Shows 0-2 mbgl falling trend and 4.76% (1) GWMS shows 2-4 mbgl falling
trend in water level. The maximum rising water level 1.06 m and maximum falling water
level 3.01 m recorded at Jaintia Hills and East Khasi Hills districts GWMS respectively.
Tripura
January 2015 water level has been compared with mean water level data of the same
period of preceding 10 years. 34.62% (9) GWMS shows 0-2 mbgl rising trend 61.54% (16)
GWMS Shows 0-2 mbgl falling trend ,3.84% (1) GWMS shows >4 mbgl falling trend. The
maximum rising water level 1.08 m and maximum falling water levels 4.17 m recorded at
South Tripura and West Tripura districts GWMS respectively.
6.7 Ground Water Level Trend (2008-2014) Pre Monsoon
The historical water level data of GWMS, available in GWDES is analysed for
calculating long term water level trends (for the period 2008-2014) for pre monsoon period
separately (long term water level data, of last 10 years is not available for many stations).
Monitoring of Ground Water Monitoring Stations for pre-monsoon water level during March
has been commenced from the year, 2008 only.
A total number of 287 stations are analysed for pre-monsoon water level trends. The
frequency of stations showing rising or falling trends of water levels during pre-monsoon
period is given in Annexure-XX. State wise analysis is given below.
6.7.1 Arunachal Pradesh A total 11 stations are analysed for pre-monsoon water level trends. Out of these, 7
stations show rising trends ranging from 0.04 to 0.98m/year whereas, 4 stations show falling
water level trends ranging from 0.11 to 0.35m/year. The maximum fall is observed at
Changlang district. The declining water level trend has been observed, but is not significant.
6.7.2 Assam
A total 207 stations are analysed for pre-monsoon water level trends. Out of these,
100 stations show rising trends ranging from 0.001 to 0.919m/year whereas, 107 stations show
falling water level trends ranging from 0.002 to 1.3m/year. The water level trends show both
rising and falling trends all over the State. Rise has been observed in 100 (48 %) stations and
fall in 107 (52%) stations during post-monsoon period.

33
The rising trend above 0.20 m/year is observed in 34 stations in the State. The fall of
more than 0.20 m/yr has been observed in 28 stations in Assam. The maximum falling trend
has been found as 1.37m/yr. in Kamrup district GWMS. A general decline is observed in the
pre monsoon period.
6.7.3 Meghalaya
A total number of 26 stations are analysed for pre-monsoon water level trends. Out of
these, 5 stations shows rising trends ranging from 0.009 to 0.42m/year and 21 stations
declining water level trends ranging from 0.021 to 1.259m/year have been observed. Most of
the rising and declining trend has been restricted below 0.1m/year. Two stations indicated
raise the range of 0.20 m/year. The maximum fall is observed at Shillong Polo GWMS.
6.7.4 Nagaland A total 6 stations are analysed for pre-monsoon water level trends. Out of these, 2
stations show rising trends ranging from 0.15 to 0.66m/year whereas, 4 stations show falling
water level trends ranging from 0.11 to 1.437m/year. The maximum fall is observed at
Dimapur district. The declining water level trend has been observed at places, but is not
significant.
6.7.5 Tripura
Analysis for Tripura State is done for 37 stations for pre-monsoon water level trends.
Out of these, 13 stations show rising trend and 24 stations declining trend. The rising trend
ranged from 0.021 to 0.44 m/year and the declining trend in the range of 0.001 to
0.358m/year. Maximum decline and maximum rise of 0.661m/year and 0.318m/year have
been observed in West Tripura and South Tripura district GWMS respectively. Most of the
rise and decline have been recorded below 0.1m/year.
6.8 Ground Water Level Trend (2005-2014) Post Monsoon
The historical water level data of GWMS, available in GWDES is analysed for
calculating long term water level trends (for the period 2005-2014) for post monsoon period
separately (long term water level data, of last 10 years is not available for many stations). A
total number of 341 stations are analysed for post-monsoon water level trends. The frequency
of stations showing rising or falling trends of water levels during post-monsoon period is
given in Annexure-XXI. State wise analysis is given below.

34
6.8.1 Arunachal Pradesh A total 12 stations are analysed for post-monsoon water level trends. Out of these, 7
stations show rising trends ranging from 0.004 to 0.125m/year whereas, 5 stations show
falling water level trends ranging from 0.041 to 0.558m/year. The maximum fall is observed
at Pasighat in East Siang district. The declining water level trend has been observed at places,
but is not significant.
6.8.2 Assam
A total 242 stations are analysed for post-monsoon water level trends. Out of these,
124 stations show rising trends ranging from 0.006 to 1.407m/year whereas, 118 stations show
falling water level trends ranging from 0 to 0.657 m/year. The water level trends show both
rising and falling trends all over the State. Rise has been observed in 124 (51 %) stations and
fall in 118 (49%) stations during post-monsoon period.
The rising trend above 0.20 m/year is observed in 22 stations in the State. The fall of
more than 0.20 m/yr has been observed in 11 stations. The maximum falling trend has been
found as 0.657m/yr. in Karbi Anglong district GWMS. A general decline is observed in the
post monsoon period.
6.8.3 Meghalaya
A total number of 30 stations are analysed for post-monsoon water level trends. Out
of these, 12 stations shows rising trends ranging from 0.005 to 0.257m/year and 18 stations
declining water level trends ranging from 0.002 to 0.274m/year have been observed. Most of
the rising and declining trend has been restricted below 0.1m/year. Two stations indicated
raise the range of 0.20 m/year. The maximum fall is observed at East Garo Hills District.
6.8.4 Nagaland A total 17 stations are analysed for post-monsoon water level trends. Out of these, 8
stations show rising trends ranging from 0.005 to 0.269m/year whereas, 9 stations show
falling water level trends ranging from 0.01 to 1.737m/year. The maximum fall is observed at
Dimapur district. The declining water level trend has been observed at places, but is not
significant.
6.8.5 Tripura
Analysis for Tripura State is done for 39 stations for post-monsoon water level trends.
Out of these, 9 stations show rising trend and 30 stations declining trend. The rising trend

35
ranged from 0.036 to 0.327 m/year and the declining trend in the range of 0.006 to
0.789m/year. Maximum decline and maximum rise of 0.327m/year and 0.789m/year have
been observed in West Tripura and South Tripura district GWMS respectively. Most of the
rise and decline have been recorded below 0.1m/year.
6.9 Area under water logged and prone to water logging conditions (Fig.22 and Fig.23)
Water logging conditions prevail in many places of the North Eastern States. Water
level in phreatic condition is found to occur mostly within 5.0 mbgl throughout the year.
Water levels within 3.00 m bgl are recorded in about 31% (138) of the stations during pre-
monsoon and in about 61.2% (290) stations during post-monsoon. Such conditions have
occurred due to high rainfall recharge, shallow water level and poor ground water draft from
shallow aquifers. Low ground water gradients in valley areas results in water logging
conditions. Maps showing areas under water logged and prone to water logging conditions
are prepared (Fig. 22 and 23) for both pre- and post-monsoon periods based on water level
ranges of 0 to 2.0 mbgl and 2.0 to 3.0 mbgl respectively.
Water Logged Area and Area prone to water logging condition:
Water logged area is demarcated based on the water levels within 2.0 mbgl and 2 to 3
mbgl for areas prone to water logging, for both the pre- and post-monsoon periods. During
pre-monsoon period (March 2014), 13.7 % (61) stations show water logging condition,
whereas 17.3% (77) stations show prone to water logging condition. During post monsoon
period (November 2014) 34.2%(162) stations show water logging condition and 27%
(128)stations show prone to water logging condition. During Pre-monsoon period water
logged and prone to water logging areas have been observed in Darrang,Dhemaji,
Kamrup,Goalpara, Jorhat, Lakhimpur, Nalbari, Morigaon, Nagaon, Sibsagar, Sonitpur
Cachar, Karimganj and Tinsukia district in Assam and Dhalai, North Tripura and West
Tripura district in Tripura. In Arunachal Pradesh and Meghalaya also water logged and prone
to water logging areas has been observed in pockets.
During post-monsoon period (November 14), in major parts of Barpeta, Bongaigaon,
Cachar, Darrang, Dhemaji, Goalpara, Hailakandi, Jorhat, Kamrup, Karimganj, Nagaon,
Morigaon, Nalbari, Lakhimpur, Sonitpur and Tinsukia district and in parts of Dhubri,
Dibrugarh, Karbi angling and Sibsagar district in Assam and in Dhalai and in parts of South
Tripura, North Tripura and West Tripura district in Tripura water logged and prone to water
logging conditions has been observed. In Meghalaya, in East Garo Hills, East Khasi Hills,
West Garo Hills and in parts of Jaintia Hills and Ri-Bhoi district shallow water level has been

36
observed. Out of 473 analysed stations, 162(34.2%) stations recorded water level in the range
0 to 2 mbgl and 128(27%) stations in the range 2 to 3 mbgl. Remaining 183(38.8%) stations,
most of which are located near inselbergs or in hard rock areas show water levels more than 3
mbgl.
It is observed that in both pre and post monsoon periods, a large parts of the alluvial
area in the region show water level in the range of 0 to 3 mbgl (Fig 22 and 23). Water
logging condition during pre-monsoon period in major parts of Barpeta, Bongaigaon,
Dhubri, Golaghat, Jorhat, Karbi Anglong, Sibsagar and Tinsukia district has not been
observed but during post-monsoon period, most of these areas were under water logging
conditions. Occurrence of water logging conditions in the region is due to high rainfall,
shallow water level and a meagre ground water draft in vast flood plains of the Brahmaputra
and Barak river system.

37
7. HYDROCHEMISTRY
Chemical quality of ground water is being monitored every year for temporal and
spatial changes and to study their causes. Water samples are being collected in the month of
March (pre-monsoon) every year. Water quality standards for drinking use and the range of
chemical constituents analyzed and the values were compared with the standard values given
by BIS (IS 10500:2012). The overall chemical quality of North Eastern region for the year
2014-2015 is provided and in shown in Table – 7.
Table – 7 Chemical qualities of ground water samples of NE-region showing the
maximum and minimum values vis-à-vis drinking water standards (IS 10500:2012) S.No. 1 2 3 4 5 IS 10500:2012
State Assam Meghalaya Tripura Nagaland Arunachal Pradesh
Acceptable limit)
Permissible limit
Min Max Min Max Min Max Min Max Min Max pH 6.25 9.5 6.6 8.5 6.8 8.6 6.1 9 6.6 8.2 6.5-8.5 6.5-8.5 Turbidity, NTU 0.1 4.9 0.1 4.6 0.1 4.2 0.4 12 0.1 4 1 5 EC (µs/cm) 25⁰C 28.9 1780 77 392 74.2 367 79.1 1040 43.0 529 - - TDS
mg/
L (p
pm
)
15.1 915 7 201 32.5 169 37.8 534 20.9 285 500 2000 Carbonate alkalinity as CaCO3
8 120 8 40 8 72 8 64 6 32 - -
Bicarbonate alkalinity as CaCO3
4 436 8 88 8 144 8 216 4 136 - -
Total alkalinity as CaCO3
12 556 16 128 16 216 16 288 10 168 200 600
Chloride 2 273 6.8 85.4 6.8 71.8 9.9 247 9.9 188 250 1000 Sulphate 0.99 216 0.99 27.14 0.99 15.5 0.99 59.2 0.99 60.5 200 400 Nitrate 0.1 21.6 0.1 13.1 0.1 9.6 0.3 12.2 0.3 10.7 45 45 Flouride 0.01 2.93 0.01 0.42 0.1 0.58 0.02 0.97 0.05 0.53 1 1.5 Calcium
(as
Ca) 5.6 210 3.2 35.2 4.8 40 6.4 72 6.4 56 75 200
Magnesium (as Mg)
0.5 129 1 26.2 1.9 17.5 2.9 36.9 0.2 48 30 100
Total Hardness (as CaCO3)
20 1020 20 156 32 136 36 260 28 272 200 600
Sodium 0.2 190 0.23 38.2 2.1 36.5 6.8 117 1.49 40.3 - - Potassium 0.15 165 0.1 33.8 0.44 10.5 0.83 29.7 0.33 22.1 - - Iron 0.01 14.6 0.01 5.1 0.01 1.27 0.02 1.85 0.02 12.3 0.3 0.3

38
Table 7 shows the minimum and maximum values of 16 basic constituents of ground water
in North Eastern region. Among the seven states the minimum value of pH (6.1) was
observed in Nagaland where as the maximum pH (9.5) was found in Assam which exceeds
the permissible range of pH for drinking water, 6.5-8.5 (BIS10500:2012). In case of Total
Dissolved Solids, the level of TDS in the entire North East was within permissible limit but
in Assam and Nagaland some samples exceeded the acceptable limit as prescribed by BIS
(2012). In case of Chloride, except Assam, the other states were in safe range (250 mg/L and
1000 mg/L). Fluoride contamination of Ground water was found to some extent in Assam
(2.93 mg/L) where the value exceeds the permissible limit of 1.5 mg/L. In Assam the total
harness, calcium and magnesium content of groundwater exceeds the permissible limit of
1000 mg/L, 200 mg/L, 100 mg/L respectively; the values of total harness and magnesium in
other states of NE via Nagaland and Arunachal Pradesh were found exceeding the acceptable
limit. Iron contamination was found in maximum extent in North East. All the North eastern
states depicted higher concentration of Iron exceeding the permissible limit of 0.3 mg/L.
Maximum concentration of iron was observed in Assam (14.6 mg/L) . In Assam distributions
of iron in ground water with concentration of 1.0 to 3.0 mg/L is seen spread all over the
region whereas concentration of more than 3.0 mg/L is found mostly in Brahmaputra valley
of Assam. However, the ground water qualities for other constituents in all NE regions were
found within range for drinking purpose.
No major changes were observed in the Chemical quality of the NE regions except
TDS, Fluoride and Total harness content in ground water on Tripura are within the
permissible limit and the changes may be due the rainfall and other related factors.
39
8. CONCLUSIONS
1. Seven states viz. Arunachal Pradesh, Assam, Manipur, Meghalaya, Mizoram, Nagaland
and Tripura together form North Eastern Region occupying a geographical area of
2,55,083 sq. km. Most of the States are being hilly, only 30% of the total region is plain
area. Assam is the only State in the region, which is occupied by 73% of plain area. In
the Region, 645 stations are being monitored of which 437 are in Assam.
2. Geologically, the region is underlain by different formations, ranging in age from
Archaean to Recent. More than 90% of the aquifers in the region belong to the Recent
Alluvium and Tertiary Sandstones.
3. Hydro-geologically, the area is divided into Unconsolidated, Semi-consolidated and
Consolidated Formations. In the entire area, about 31% area is covered by
Unconsolidated Formations. Ground water occurs in unconfined to confined conditions.
Major parts of Manipur, Nagaland, Mizoram, Tripura, parts of Arunachal Pradesh,
Meghalaya and southern part of Assam States are underlain by Semi-consolidated
Formations of Tertiary sandstone. In Consolidated Formations, ground water is
restricted to the weathered residuum, joints and fractures.
4. During the year, 2014-15, the general depth to water level scenario in the region in
March, 2014, depicts water level within 5.0 mbgl, in 70.6%, i.e. 314 stations show a
depth range of 0 to 5 mbgl, out of which about 13.7% of the stations indicated water
level within 2 mbgl and 56.9% stations between 2 and 5 mbgl. 102 (22.9%) stations
recorded water level between 5 and 10 mbgl, most of which are located near the
inselbergs. Water levels ranging between 10 and 20 mbgl were observed in 19 (4.3%)
stations in East Siang, Papumpare districts of Arunachal Pradesh, Darrang, Dhubri ,
karbi Anglong and Sibsagar districts of Assam and piezometers of Dimapur, wokha
districts of Nagaland and South Tripura ,West Tripura districts of Tripura. Also 10 (2.2
%) of GWMS ie.piezometers of West Tripura and Nagaland shows water level at depths
beyond 20m have been observed.
The water level during post-monsoon period (November 2014) mostly ranges
between 0 and 5 mbgl. Water level within 5 mbgl has been recorded in 409(86.3%)
stations, out of which, 163(34.4%) stations recorded water level within 2 mbgl and 246
(51.9%) stations record water levels from 2 to 5 mbgl. 44 (9.3%) stations recorded water
level in the range of 5 to 10 mbgl and 12 (2.5%) stations show water levels in the range

40
of 10 to 20mbgl. 9 (1.9%) piezometers in Nagaland and Tripura shows water level
beyond 20mbgl.
During post-monsoon as compared to that of pre-monsoon rise in water level
within 4 m is recorded in 331(82.2%) stations. Rise is recorded within 2 m in 263 (65.3
%) stations and in the range of 2 to 4m in 68(16.9%) stations. 22 (5.5%) stations shows
more than 4mbgl rise in water level. 50 (12.4) stations shows fall in water level. out of
that 39 (9.7%) stations shows 0 to 2 mbgl fall in, 6 (1.5%) stations shows 2-4 mbgl fall
in and more than 4mbgl fall is observed in 5(1.2%) stations. The reverse ground water
scenario occurs at few places due to sufficient pre-monsoon shower resulting
considerable rise in water level during pre-monsoon and at some places due to scanty
and erratic rainfall received during monsoon period of 2014.
Water level monitored during November 2014 has been compared with mean
water level data of preceding 10 years. The compared result indicates, in general, a rise
in 116 (51.5%) stations and fall in 109 (48.5%) monitored stations. Rise within 2 m
have been observed in 111(49.3%) stations and in the range of 2 to 4m in 4 (1.8%)
stations respectively and beyond 4 m rise in 1(0.4%) station. Fall in water level with
respect to decadal mean have been observed within 2m in 105(46.7%) stations in the
range of 2m to 4m in 4(1.8%) stations.
5. Water levels of post-monsoon for last 10 years were taken for trend analysis. A total
number of 341 stations were analysed. During post monsoon period 180 stations show
a declining water level trend mostly within 0.19m/year. Only 27 stations showed
decline above 0.2m/year. Significant decline is not observed anywhere in the region.
The rise is observed in 161 stations ranging mostly from 0.19m/year. 29 stations
indicated rise above 0.2m/year.
6. Water levels of pre-monsoon for last 7 years were taken for trend analysis. A total
number of 287 stations were analysed. During pre-monsoon period 160 stations show a
declining water level trend mostly within 0.19m/year. Only 51 stations showed decline
above 0.2m/year. Significant decline is not observed anywhere in the region. The rise is
observed in 127 stations ranging mostly within 0.19m/year.
7. In general, the chemical quality of the ground water is good for both the domestic and
irrigation purposes except the sporadic occurrence of the high concentration of Iron in
considerable parts of the region. In those areas, Iron treatment plants are to be installed
and the water should be used only after proper treatment.

41
8. Development of ground water in North Eastern Region is still in nascent stage. There is
an ample scope for development of this replenishable natural resource. This region
being hilly, only 30% of the existing valley area can be developed. In the hilly area,
there is a very little scope for ground water development. However, the hilly terrain of
the region is bestowed with many perennial springs, which can be developed for both
the small-scale irrigation and domestic use. Moreover, rainfall in the region being quite
sufficient, roof-top rain water harvesting May also is adopted to augment ground water
resources in the area. If this natural resource is harnessed with proper planning and
management, the entire agro-economic scenario of the region can be uplifted.

Fig.1Physiographic Map of North Eastern Region

Fig.1 Physiographic map of North Eastern Region
Fig.2Drainage Map of North Eastern Region

Fig.3Basin & Sub-basin Map of North Eastern Region

Fig.4Isohyet (Rainfall Distribution) Map of North Eastern Region

Fig.5Depth to Water Level, March 2014 Map of North Eastern Region

Fig.6Depth to Water Level, August 2014 Map of North Eastern Region

Fig.7Depth to Water Level, November 2014 Map of North Eastern Region

Fig.8Depth to Water Level, January 2015 Map of North Easter Region

Fig.9 Water Level Fluctuation in August 2014 with respect to March 2014

Fig.10 Water Level Fluctuation in November 2014 with respect to March 2014

Fig.11 Water Level Fluctuation in November 2014 with respect to August 2014

Fig.12Water Level Fluctuation in January 2015 with respect to March 2014

Fig.13Water Level Fluctuation in January 2015 with respect to August 2014

Fig.14Water Level Fluctuation in January 2015 with respect to November 2014

Fig.15 Water Level Fluctuation in March 2014 with respect to March 2013

Fig.16Water Level Fluctuation in August 2014 with respect to August 2013

Fig.17Water Level Fluctuation in November 2014 with respect to November 2013

Fig.18Water Level Fluctuation in January 2015 with respect to January 2014

Fig.19Water Level Fluctuation in August 2014 with respect to Decadal Mean (Aug 04-2013) 2014

Fig.20Water Level Fluctuation in November 2014 with respect to Decadal Mean (Nov 04-2013) 2014

Fig.21Water Level Fluctuation in January 2015 with respect to Decadal Mean (Jan 05-2014) 2014

Fig.22Water Logging Condition during Pre Monsoon (March 2014)

Fig.23Water Logging Condition during Post Monsoon(November 2014)

Fig.24 Distribution of Iron in North Eastern Region

Fig.25 Distribution of Fluoride in North Eastern Region

Fig.26 Distribution of pH in North Eastern Region

ANNEXURE-I
DETAILS OF GROUND WATER MONITORING WELLS IN NORTH EASTERN REGION
Village Well No Well Type Latitude Longitude MP
magl RL
mamsl Geology Basin
State:Arunachal Pradesh District:Changlang Jairampur 92A4A1 Dug 27°12'30" 96°02'30" 1.10 185.65 Alluvium Brahmaputra Namchik 92A3A1 Dug 27°25'00" 96°02'45" 1.20 162.32 Alluvium Brahmaputra Namphai 92A3A2 Dug 27°27'30" 96°06'30" 0.70 199.15 Alluvium Brahmaputra Newlisan Kharsang 92A2A1 Dug 27°30'00" 96°08'00" 1.00 999.00 Alluvium Brahmaputra District:East Siang Berung 83M1B4 Dug 27°59'11" 95°20'06" 0.78 Alluvium Brahmaputra Oyen ARES12 Dug 27°52'32" 95°18'41" 125.00 Alluvium Brahmaputra Pasighat- III ARES16 Dug 27°03'52" 95°18'37" 0.70 188.00 Alluvium Brahmaputra Pasighat New ARES02A Dug 28°09'05" 95°17'45" 0.29 158.00 Alluvium Brahmaputra Pasighat-II ARES15 Dug 28°03'03" 95°20'10" 0.70 153.00 Alluvium Brahmaputra Ruksin ARES11 Dug 27°50'16" 95°12'32" 0.95 121.00 Alluvium Brahmaputra Sika Baman Todee ARES14 Dug 27°54'48" 95°20'37" 0.91 130.00 Alluvium Brahmaputra District: Lohit Lathow 83M2D1 Dug 27°40'00" 95°52'30" 0.86 143.25 Alluvium Brahmaputra District : Papumpare Banderedewa I ARPP04 Dug 27°06'19" 93°49'33" 0.57 Alluvium Brahmaputra Chimpu ARPP13 Dug 27°06'01" 93°42'00" 0.38 Sandstone Brahmaputra Itanagar I ARPP10 Dug 27°06'14" 93°38'30" 0.80 Alluvium Brahmaputra Itanagar II ARPP11 Dug 27°05'34" 93°37'29" 1.50 Alluvium Brahmaputra Kimin 83E3D2 Dug 27°18'30" 93°58'10" 0.95 150.05 Alluvium Brahmaputra Naharlagun I ARPP08 Dug 27°06'11" 93°41'41" 0.55 Alluvium Brahmaputra Nirjuli Vill IIA ARPP06 Dug 27°07'52" 93°43'59" 0.80 Alluvium Brahmaputra Nirjuli Vill IIB ARPP07 Dug 27°07'48" 93°44'01" 1.02 Alluvium Brahmaputra Sonajuli 83E4C1 Dug 27°02'45" 93°41'15" 0.62 117.23 Alluvium Brahmaputra District: Tirap Borduria 83M4B3 Dug 27°01'00" 95°28'00" 0.98 229.74 Alluvium Brahmaputra Deomali 83M4C1 Dug 27°12'00" 95°31'30" 0.87 148.86 Alluvium Brahmaputra Hukanjuri 83M4B4 Dug 27°00'30" 95°28'00" 0.82 239.35 Alluvium Brahmaputra State: Assam District: Baksha Barama 78N2B3 Dug 26°31'30" 91°22'04" 0.64 53.13 Alluvium Brahmaputra Jhargaon ASBS01 Dug 26°35'00" 91°35'15" 0.95 Alluvium Brahmaputra District: Barpeta Bhawanipur 78N3A1 Dug 26°29'05" 91°04'00" 0.74 48.10 Alluvium Brahmaputra Bhawanipur TW ASBP17 Pz 26°28'00" 91°04'25" 0.30 Alluvium Brahmaputra Daulasal ASBP14 Dug 26°16'06" 91°14'03" 1.07 Alluvium Brahmaputra Daulasal OW ASBP15 Pz 26°16'08" 91°13'17" 0.80 Alluvium Brahmaputra Dhupguri(Galia) ASBP13 Dug 26°25'30" 91°02'00" 0.98 Alluvium Brahmaputra Goraimari 78N2A4 Dug 26°36'40" 91°07'00" 0.60 Alluvium Brahmaputra Hastinapur 78N2A5 Dug 26°30'05" 91°07'10" 0.79 Alluvium Brahmaputra Hudukata 78N2A3 Dug 26°36'10" 91°06'20" 0.99 Alluvium Brahmaputra Nityanada OW ASBP18 Pz 26°33'07" 91°12'52" 0.70 Alluvium Brahmaputra Patacharkuchi ASBP16 Pz 26°30'20" 91°14'51" 1.00 Alluvium Brahmaputra Sarupeta 78N3A6 Dug 26°29'55" 91°04'30" 0.76 Alluvium Brahmaputra

Village Well No Well Type Latitude Longitude MP
magl RL
mamsl Geology Basin
Simla 78N2A1 Dug 26°41'00" 91°13'00" 0.97 53.11 Alluvium Brahmaputra Sorbhog 78J3D4 Dug 26°28'30" 90°54'10" 0.82 Alluvium Brahmaputra Ujanborbori 78N2A2 Dug 26°36'00" 91°06'00" 1.20 51.46 Alluvium Brahmaputra District: Bongaigaon Abhayapuri 78J3C2 Dug 26°22'00" 90°38'00" 1.04 38.94 Alluvium Brahmaputra Baitamari 78J3C1 Dug 26°22'00" 90°34'00" 0.86 44.45 Alluvium Brahmaputra Bijni 78J3C5 Dug 26°29'30" 90°42'30" 0.90 Alluvium Brahmaputra Bongaigaon New 78J3C9 Dug 26°29'30" 90°33'00" 0.83 Alluvium Brahmaputra Chalantapara 78J3C4 Dug 26°16'00" 90°35'30" 1.10 Alluvium Brahmaputra Chaprakata 78J3C7 Dug 26°29'20" 90°37'00" 0.92 Alluvium Brahmaputra Chaprakata (Dankinamari) ASBN10 Dug 26°29'14" 90°38'00" 0.65 Alluvium Brahmaputra Majgaon ASBN11 Dug 26°25'08" 90°35'27" 0.90 Alluvium Brahmaputra Manikpur 78J3D1 Dug 26°28'00" 90°46'30" 1.00 43.88 Alluvium Brahmaputra Medhipara(Deo) 78J3C6 Dug 26°18'25" 90°39'15" 0.44 Alluvium Brahmaputra North salmara 78J3C8 Dug 26°21'30" 90°37'00" 0.65 Alluvium Brahmaputra District: Cachar Atalbasti ASCR35 Dug 0.86 Alluvium Meghna Badribasti 83D1D7 Dug 24°48'35" 92°53'30" 1.00 22.28 Alluvium Meghna Badribasti OW 83D1D8 Pz 24°48'37" 92°53'28" 0.50 21.74 Sandstone Meghna Borjalinga 83D2D1 Dug 24°33'30" 92°48'00" 1.00 21.39 Alluvium Meghna Borkhola 83D1C8 Dug 24°56'20" 92°44'30" 0.65 21.03 Alluvium Meghna Dargakuna ASCR25 Dug 24°41'47" 92°45'28" 0.73 Alluvium Meghna Digharkhal 83D1C3 Dug 24°59'20" 92°30'00" 0.85 22.74 Alluvium Meghna Fulertol ASCR37 Dug 0.70 Alluvium Meghna Ghungoor TW 83D1D10 Pz 24°47'20" 92°47'54" 0.61 26.62 Sandstone Meghna Gosaipur Part-II ASCR34 Dug 0.92 Alluvium Meghna Hilara ASCR26 Dug 24°55'65" 92°35'43" 0.58 15.00 Alluvium Meghna Kalain 83D1C14 Dug 24°58'20" 92°35'00" 0.60 18.72 Alluvium Meghna Kalain PZ 83D1C13 Pz 24°57'30" 92°35'05" 0.51 18.22 Sandstone Meghna Kashipur ASCR31 Dug 0.94 Alluvium Meghna Katigora ASCR27 Dug 0.85 Alluvium Brahmaputra Masimpur ASCR23 Dug 0.60 Alluvium Brahmaputra Moinarbond 83D1D6 Dug 24°52'47" 92°53'05" 1.00 Alluvium Meghna Nagdirgram ASCR39 Dug 24°40'48" 92°52'48" 0.65 Alluvium Meghna Poilapul 83H1A9 Dug 24°50'10" 93°01'55" 0.85 27.00 Alluvium Meghna Razabazar 83H1A7 Dug 24°52'00" 93°03'00" 0.75 Alluvium Meghna Shivachal ASCR28 Dug 24°49'55" 92°43'56" 0.75 Alluvium Meghna Shivtila 83H1A4 Dug 24°50'00" 93°00'15" 0.85 25.42 Alluvium Meghna Silcoorie ASCR38 Dug 24°43'06" 92°46'37" 0.85 Sandstone Meghna Silkuri Pz 83D2D3 Pz 24°43'00" 92°47'00" 0.74 20.00 Sandstone Meghna Tarapur ASCR32 Dug 1.15 Alluvium Meghna District: Darrang Amjuli colony 78N1D2 Dug 26°49'00" 91°59'20" 0.75 179.18 Alluvium Brahmaputra Bengbari 78N2D10 Dug 26°43'25" 91°59'00" 1.00 104.88 Alluvium Brahmaputra Bhakatpara Ow ASDR33 Pz 26°32'20" 91°05'40" 0.65 Alluvium Brahmaputra Bhalukmari-I 83B2A7 Dug 26°41'55" 92°13'50" 0.82 Alluvium Brahmaputra Chamuapara 83B3A2 Dug 26°29'00" 92°00'06" 1.00 61.40 Alluvium Brahmaputra Dalgaon 83B2A2 Dug 26°33'03" 92°12'30" 0.73 68.48 Alluvium Brahmaputra Dharmajuli TG 78N2D5 Dug 26°44'00" 91°45'20" 1.26 120.11 Alluvium Brahmaputra Dimakuchi 78N2D7 Dug 26°44'50" 91°50'00" 1.34 123.77 Alluvium Brahmaputra

Village Well No Well Type Latitude Longitude MP
magl RL
mamsl Geology Basin
Dingdongpara 78N2D8 Dug 26°42'30" 91°50'30" 1.04 98.74 Alluvium Brahmaputra Gelabil (Thelamara) 83B2B6 Dug 26°42'50" 92°17'45" 0.73 Alluvium Brahmaputra Goroibari ASDR31 Dug 26°45'05" 92°08'30" 0.46 Alluvium Brahmaputra Hatitopagaon 83B1B1 Dug 26°50'41" 92°19'16" 0.76 140.86 Alluvium Brahmaputra Kalaigaon 78N2D3 Dug 26°34'30" 91°54'00" 0.77 69.22 Alluvium Brahmaputra Kendurtal 78N2D11 Dug 26°36'00" 91°56'00" 1.27 69.00 Alluvium Brahmaputra Khoirabari 78N2D6 Dug 26°36'20" 91°49'00" 1.09 75.54 Alluvium Brahmaputra Madanpur OW ASKM55 Pz 26°43'12" 91°16'07" 0.87 Alluvium Brahmaputra Madhupur 83B2A6 Dug 26°36'10" 92°14'20" 0.75 Alluvium Brahmaputra Majgaon OW ASDR34 Pz 26°28'30" 92°04'56" 0.55 Alluvium Brahmaputra Mangaldoi 83B3A1 Dug 26°26'00" 92°02'00" 0.65 55.59 Alluvium Brahmaputra Mangaldoi II 83B3A3 Dug 26°25'48" 92°01'15" 0.83 56.07 Alluvium Brahmaputra Nij Ghagrapar 78N1D1 Dug 26°45'10" 91°58'30" 0.82 117.20 Alluvium Brahmaputra Orang 83B2B1 Dug 26°42'50" 92°19'30" 0.65 85.17 Alluvium Brahmaputra Paneri 78N2D9 Dug 26°43'15" 91°55'00" 0.95 106.68 Alluvium Brahmaputra Paneri TG 78N2D1 Dug 26°45'00" 91°55'00" 0.69 128.47 Alluvium Brahmaputra Rowta chariali 83B2A3 Dug 26°42'02" 92°13'00" 0.82 100.83 Alluvium Brahmaputra Sinnangpara 83B2A5 Dug 26°40'00" 92°03'00" 0.95 92.35 Alluvium Brahmaputra Thekerabari .1 83B2A1 Dug 26°30'00" 92°07'30" 0.91 59.88 Alluvium Brahmaputra Udalguri 83B2A4 Dug 26°45'00" 92°06'30" 0.84 107.86 Alluvium Brahmaputra District: Dhemaji Akajan 83I2D1 Dug 27°31'30" 94°46'00" 1.10 105.66 Alluvium Brahmaputra Bhagaban charali 83I2D2 Dug 27°38'15" 94°47'44" 1.05 Alluvium Brahmaputra Bijoypur 83M1A3 Dug 27°45'10" 95°08'20" 1.00 122.29 Alluvium Brahmaputra Bokabil Ow ASDM24 Pz 27°29'50" 94°32'30" 0.80 Alluvium Brahmaputra Bordoloni 83I3B1 Dug 27°24'30" 94°24'00" 1.25 95.12 Alluvium Brahmaputra Chengali Pather Ow ASDM23 Pz 27°26'10" 94°31'30" 0.76 Alluvium Brahmaputra Dekapam ASDM21 Dug 27°44'57" 94°55'20" 0.50 140.00 Alluvium Brahmaputra Dhakuakhana1 ASDM07 Dug 27°12'16" 94°51'21" 0.73 Alluvium Brahmaputra Dhemaji 1 83I3C1 Dug 27°30'00" 94°32'40" 0.99 102.41 Alluvium Brahmaputra Dhemaji 2 ASDM 23 Dug 27°30'42" 94°35'16" 1.21 89.00 Alluvium Brahmaputra Dipa 83I2D3 Dug 27°42'10" 94°51'21" 0.95 Alluvium Brahmaputra Ghilamara ASDM11 Dug 27°18'28" 94°27'05" 0.86 Alluvium Brahmaputra Ghilamara Ow ASDM26 Pz 27°18'28" 94°27'05" 0.80 Alluvium Brahmaputra Gogamukh Hss Ow ASDM25 Pz 27°25'50" 94°15'45" 0.76 Alluvium Brahmaputra Jamuguri 83F1D3 Dug 26°53'00" 93°46'00" 0.37 83.44 Alluvium Brahmaputra Jonai murkongselek 83M1A1 Dug 27°50'12" 95°08'48" 0.80 124.36 Alluvium Brahmaputra Silapathar 83I2C1 Dug 27°32'50" 94°41'00" 0.98 114.68 Alluvium Brahmaputra Simen Chapori ASDM22 Dug 27°43'30" 94°52'55" 1.17 129.00 Alluvium Brahmaputra Siripani 83I2C3 Dug 27°34'58" 94°39'00" 0.45 Alluvium Brahmaputra Sisibargaon 83I2C2 Dug 27°32'30" 94°43'20" 0.97 108.21 Alluvium Brahmaputra Telem 83M2A1 Dug 27°42'45" 95°03'20" 1.01 126.98 Alluvium Brahmaputra District: Dhubri Bagaribari 78J4A4 Dug 26°12'10" 90°08'20" 0.81 Gneiss Brahmaputra Bahalpur 78J3B4 Dug 26°18'34" 90°27'52" 1.00 Alluvium Brahmaputra Balajan ASDH15 Dug 26°05'50" 89°53'13" 0.83 Alluvium Brahmaputra Bilasipara 78J4A1 Dug 26°13'00" 90°14'30" 0.85 34.90 Alluvium Brahmaputra Chapar 78J3B2 Dug 26°16'18" 90°27'36" 0.90 Alluvium Brahmaputra Civil Hospital ASDH18 Pz 26°10'12" 89°51'44" 0.87 Alluvium Brahmaputra Dakhin Tokesara ASDH16 Dug 26°06'12" 89°50'13" 1.36 Alluvium Brahmaputra

Village Well No Well Type Latitude Longitude MP
magl RL
mamsl Geology Basin
Dhubri Town 78F4D4 Dug 26°01'00" 89°59'00" 1.00 Alluvium Brahmaputra Matabag ASDH19 Pz 26°06'00" 89°59'00" 0.73 Alluvium Brahmaputra Moterjhar ASDH17 Dug 26°07'40" 89°52'30" 0.81 Alluvium Brahmaputra Panbari 78J4A2 Dug 26°09'00" 90°03'00" 0.86 44.20 Gneiss Brahmaputra Rupshi 78F4D3 Dug 26°03'59" 89°49'45" 0.90 Alluvium Brahmaputra Shapamari Beat ASDH13 Dug 26°13'30" 90°21'30" 0.91 Alluvium Brahmaputra Sonamukhi ASDH14 Dug 26°12'05" 90°18'30" 0.35 Alluvium Brahmaputra Tamarhat 78F4D2 Dug 26°11'30" 89°52'00" 0.80 36.76 Alluvium Brahmaputra Tipkai 78J3A2 Dug 26°17'00" 90°03'00" 0.66 Alluvium Brahmaputra District: Dibrugarh AMC Campus ASDB14 Pz 27°02'14" 94°02'14" 0.66 Alluvium Brahmaputra Azarguri gaon 83I3D4 Dug 27°19'00" 94°57'00" 0.64 100.51 Alluvium Brahmaputra Bamunbari 83I4D4 Dug 27°14'46" 94°59'35" 0.80 Alluvium Brahmaputra Barbaruah 83I3D6 Dug 27°23'55" 94°52'55" 1.05 Alluvium Brahmaputra Chabua 83M3A2 Dug 27°29'15" 95°11'30" 0.59 115.14 Alluvium Brahmaputra Dibrugarh 83I3D1 Dug 27°29'00" 94°54'30" 0.56 105.29 Alluvium Brahmaputra Dikom 83M3A1 Dug 27°28'00" 95°04'05" 0.68 109.94 Alluvium Brahmaputra Dirialgaon Pz 83M4B6 Pz 27°13'58" 95°22'09" 0.40 Alluvium Brahmaputra Domar Dolong Tw ASDB12 Pz 27°12'50" 94°57'00" 1.00 Alluvium Brahmaputra Jaipur Naharani 83M3A4 Dug 27°15'18" 95°14'17" 0.80 Alluvium Brahmaputra Lepetkata ASDB13 Dug 27°22'20" 94°52'22" 0.80 86.00 Alluvium Brahmaputra Melengial PWSS ASDB15 Pz 27°02'14" 95°26'34" 0.82 Alluvium Brahmaputra District: Goalpara Agia1 78J4C3 Dug 26°06'40" 90°32'55" 0.95 Alluvium Brahmaputra Agia2 ASGP21 Dug 26°04'56" 90°32'59" 0.65 Alluvium Brahmaputra Baida 78J4B3 Dug 26°02'00" 90°25'30" 0.90 38.22 Gneiss Brahmaputra Bhalukdubi (Goalpara) ASGP15 Dug 25°44'16" 90°49'21" 0.80 Alluvium Brahmaputra Damra 78K1D8 Dug 25°55'50" 90°46'37" 0.90 Alluvium Brahmaputra Dhupdhara 78O1A2 Dug 25°56'40" 91°04'00" 0.57 46.95 Alluvium Brahmaputra Dudhnai 78K1D1 Dug 25°58'51" 90°48'15" 0.95 49.20 Alluvium Brahmaputra Dudhnoi II ASGP17 Dug 25°57'07" 90°46'23" 0.75 Alluvium Brahmaputra Dwarka ASGP19 Dug 25°03'24" 90°29'43" 0.90 Alluvium Brahmaputra Goalpara Town 78J4C4 Dug 26°10'42" 90°38'04" 0.86 Alluvium Brahmaputra Khutabari 78N4A1 Dug 26°01'40" 91°04'30" 1.00 43.41 Alluvium Brahmaputra Krishnai 78J4C1 Dug 26°02'00" 90°40'30" 1.10 45.28 Alluvium Brahmaputra Lakhipur 78J4B1 Dug 26°04'30" 90°18'00" 0.95 32.16 Alluvium Brahmaputra Matia 78J4D1 Dug 26°05'40" 90°46'20" 0.60 37.90 Alluvium Brahmaputra Narangbari Pz 78J4B2 Pz 26°04'30" 90°25'30" 0.58 32.41 Alluvium Brahmaputra Pattarpara ASGP22 Dug 25°58'04" 90°54'23" 0.70 Alluvium Brahmaputra Rongjuli 78K1D2 Dug 25°58'10" 90°56'40" 0.70 45.51 Alluvium Brahmaputra Salpara ASGP16 Dug 26°00'46" 90°42'03" 0.70 Alluvium Brahmaputra Sarapara ASGP23 Dug 25°58'17" 90°57'09" 0.85 Alluvium Brahmaputra Teuli ASGP20 Dug 26°04'24" 90°37'47" 0.60 Alluvium Brahmaputra District: Golaghat Balibat ASGL09 Dug 0.20 75.00 Alluvium Brahmaputra Bokakhat1 ASGL12 Dug 26°38'14" 93°37'40" 0.70 Alluvium Brahmaputra Bongaon ASGL11 Dug 26°39'23" 93°48'09" 0.66 Alluvium Brahmaputra Dhalaguri ASGL14 Dug 26°31'48" 93°51'11" 0.72 Alluvium Brahmaputra Gaghibari Namghar ASGL10 Dug 26°31'38" 94°02'35" 0.82 Alluvium Brahmaputra Garampani ASGL15 Dug 26°23'34" 93°52'49" 0.75 Alluvium Brahmaputra

Village Well No Well Type Latitude Longitude MP
magl RL
mamsl Geology Basin
Golaghat 83F2D1 Dug 26°32'00" 93°59'00" 0.85 93.11 Alluvium Brahmaputra Haldibari Buri Ai ASGL13 Dug 26°35'09" 93°19'33" Alluvium Brahmaputra Kamargaon1 83F2C1 Dug 26°38'00" 93°43'00" 0.98 79.91 Alluvium Brahmaputra Kohra kaziranga 83F2B1 Dug 26°37'00" 93°27'30" 1.10 81.44 Alluvium Brahmaputra Oating 83J3A1 Dug 26°26'00" 94°00'30" 0.75 109.06 Alluvium Brahmaputra District: Hailakandi Burakhai ASHL08 Dug 0.80 Alluvium Meghna Katlicherra N ASHL02A Dug 24°27'05" 92°37'10" 0.20 31.54 Alluvium Meghna Monacherra 83D2C3 Pz 24°36'45" 92°33'15" 0.89 22.62 Sandstone Meghna Panchgram New ASHL05A Dug 24°51'30" 92°36'02" 0.90 Alluvium Meghna Syedband Part II ASHL01A Dug 24°43'39" 94°35'00" 0.90 Alluvium Meghna District: Jorhat Chandan Nagar ASJR23 Dug 26°44'30" 94°12'56" 0.38 Alluvium Brahmaputra Chengal Ati ASJR24 Dug 26°48'00" 94°05'04" 0.60 Alluvium Brahmaputra Chutuyakari ASJR31 Dug 26°42'25" 94°10'34" 0.76 Alluvium Brahmaputra Cinamara Tinali ASJR27 Dug 26°42'38" 94°13'57" 0.86 Alluvium Brahmaputra Cinemora ASJR18 Dug 26°42'34" 94°12'59" 0.53 Alluvium Brahmaputra Dabarapara charali 83J2B3 Dug 26°40'00" 94°20'30" 0.85 84.15 Alluvium Brahmaputra Dahotia ASJR29 Dug 26°43'17" 94°07'22" 0.75 Alluvium Brahmaputra Kokilamukh 83J1A3 Dug 26°49'07" 94°10'18" 0.51 Alluvium Brahmaputra Kolakhowa ASJR20 Dug 26°46'48" 94°13'28" 0.67 44.63 Alluvium Brahmaputra Lichubari ASJR21 Dug 26°43'38" 94°12'38" 0.92 Alluvium Brahmaputra Mariani 83J2B4 Dug 26°33'30" 94°19'30" 0.90 115.05 Alluvium Brahmaputra Meleng Kaparadharia ASJR28 Dug 26°47'25" 94°18'08" 0.75 Alluvium Brahmaputra Nefa Tiniali ASJR30 Dug 26°43'30" 94°11'36" 0.82 25.40 Alluvium Brahmaputra Rajoi TG 83J2B5 Dug 26°44'00" 94°20'00" 0.85 48.59 Alluvium Brahmaputra Rangajan PHE Sc ASJR26 Dug 26°38'21" 94°12'58" 0.80 21.27 Alluvium Brahmaputra Saklatinga TGI 83J2A11 Dug 26°43'12" 94°03'24" 0.90 Alluvium Brahmaputra Saruhoj ASJR19 Dug 26°43'12" 94°21'15" 0.82 Alluvium Brahmaputra Selenghat 83J2B2 Dug 26°42'30" 94°30'00" 1.05 97.03 Alluvium Brahmaputra Sodial Kacharigaon ASJR22 Dug 26°30'24" 94°09'25" 1.08 Alluvium Brahmaputra Tipamia 83J2A6 Dug 26°32'00" 94°11'00" 0.50 100.77 Alluvium Brahmaputra Titabor 83J2A7 Dug 26°30'00" 94°05'30" 0.35 96.59 Alluvium Brahmaputra District: Kamrup Abhaipur ASKM44 Dug 26°15'15" 91°33'30" 0.90 Alluvium Brahmaputra Agyathuri 78N4C2 Dug 26°12'30" 91°37'30" 0.85 49.80 Alluvium Brahmaputra Alikash Adarsh 78N4C16 Dug 26°14'00" 91°37'00" 1.05 Alluvium Brahmaputra Amingaon ASKM46 Dug 26°12'40" 91°41'32" 0.80 Alluvium Brahmaputra Azara 78N4C1 Dug 26°07'00" 91°30'00" 1.18 49.51 Alluvium Brahmaputra Bamfor ASKM50 Dug 26°06'10" 92°08'31" 0.96 Alluvium Brahmaputra Bamunigaon1 78N4B3 Dug 26°01'15" 91°19'40" 0.70 51.67 Alluvium Brahmaputra Bamunigaon2 ASKM40 Dug 26°06'41" 91°17'54" 0.80 Alluvium Brahmaputra Boko1 ASKM39 Dug 25°59'42" 91°16'04" 0.75 Alluvium Brahmaputra Boragaon 78N4C7 Dug 26°05'00" 91°37'00" 0.90 46.81 Alluvium Brahmaputra Borghuli 78N2C3 Dug 26°31'00" 91°40'00" 1.48 61.59 Alluvium Brahmaputra Charani ASKM48 Dug 26°30'05" 91°35'15" 0.85 Alluvium Brahmaputra Chhaygaon ASKM41 Dug 26°02'28" 91°21'35" 0.90 Alluvium Brahmaputra Darkuchi 78N2C4 Dug 26°30'30" 91°36'00" 0.72 62.56 Alluvium Brahmaputra Dhobartari ASKM45 Dug 26°15'30" 91°41'50" 0.81 Alluvium Brahmaputra Dirgheswari 78N4C12 Dug 26°14'18" 91°44'34" 0.93 50.73 Alluvium Brahmaputra

Village Well No Well Type Latitude Longitude MP
magl RL
mamsl Geology Basin
Dora Kahara ASKM47 Dug 26°17'30" 90°43'00" 0.62 Alluvium Brahmaputra Goreswar 78N2C2 Dug 26°31'55" 91°43'55" 0.60 60.44 Alluvium Brahmaputra Hajo 78N4C5 Dug 26°15'00" 91°32'00" 0.82 47.43 Alluvium Brahmaputra Hengulapara 78N3D3 Dug 26°29'30" 91°46'00" 0.78 Alluvium Brahmaputra Kachkatchi ASKM49 Dug 26°06'37" 92°10'06" 0.61 Alluvium Brahmaputra Kahara 78N3C2 Dug 26°18'10" 91°43'07" 0.90 52.25 Alluvium Brahmaputra Kahilipara 78N4D7 Dug 26°08'00" 91°46'00" 0.75 Gneiss Brahmaputra Khanapara 78N4D3 Dug 26°07'15" 91°49'05" 0.75 Alluvium Brahmaputra Khetri 83B4A3 Dug 26°06'30" 92°04'30" 0.80 65.25 Alluvium Brahmaputra Khetri II ASKM51 Dug 26°07'08" 92°06'06" 0.60 Alluvium Brahmaputra Maligaon 78N4C6 Dug 26°07'40" 91°37'40" 0.87 45.57 Alluvium Brahmaputra Mirza ASKM42 Dug 26°05'35" 91°32'50" 0.80 Alluvium Brahmaputra Naokata 78N2C7 Dug 26°38'50" 91°44'00" 1.06 84.51 Alluvium Brahmaputra Paltan bazar 78N4C14 Dug 26°10'42" 91°45'23" 0.84 Alluvium Brahmaputra Panikhaiti 78N4D4 Dug 26°11'30" 91°53'00" 0.66 52.34 Alluvium Brahmaputra Pattarkuchi 78N4D1 Dug 26°07'00" 91°55'00" 0.63 67.37 Alluvium Brahmaputra Rajapara 78O1A3 Dug 25°56'39" 91°07'05" 0.80 Alluvium Brahmaputra Rangia Ow ASKM54 Pz 26°27'45" 91°36'45" 0.45 Alluvium Brahmaputra Rani1 78N4C9 Dug 26°05'00" 91°40'00" 0.90 53.64 Alluvium Brahmaputra Rani2 ASKM43 Dug 26°03'55" 91°36'22" 0.85 Alluvium Brahmaputra Samanta Pathar ASKM36A Dug 0.92 Alluvium Brahmaputra Sonapur 83B4A2 Dug 26°07'00" 92°00'30" 0.85 61.71 Alluvium Brahmaputra Sonapur II ASKM52 Dug 26°07'58" 91°58'48" 1.00 Alluvium Brahmaputra Sualkuchi 78N4C11 Dug 26°10'15" 91°35'05" 0.87 Alluvium Brahmaputra Taptoli New ASKM35A Dug 0.50 Alluvium Brahmaputra Topatoli 83B4A4 Dug 26°06'30" 92°07'00" 0.98 58.54 Alluvium Brahmaputra Umsiang Ow ASKM53 Pz 25°44'03" 91°52'54" Alluvium Brahmaputra Zoo narangi rd 78N4D2 Dug 26°10'30" 91°47'10" 1.04 59.22 Alluvium Brahmaputra District: Karbi Anglong Adarakha Tiniali ASKA44 Dug 26°07'03" 93°47'06" 0.87 Alluvium Brahmaputra Balipathar 83F4D3 Dug 26°09'25" 93°48'00" 0.90 125.88 Alluvium Brahmaputra Boithalangsu 83C1C2 Dug 25°58'45" 92°36'19" 0.97 69.30 Alluvium Brahmaputra Bokajan I ASKA41 Dug 26°08'32" 93°51'10" 0.75 Alluvium Brahmaputra Bokajan II ASKA42 Dug 26°01'38" 93°45'48" 0.60 Alluvium Brahmaputra Bokoliaghat ASKA34 Dug 26°03'49" 93°11'06" 1.00 Alluvium Brahmaputra Bokulia 83G1C3 Dug 25°52'30" 93°32'00" 0.69 104.78 Alluvium Brahmaputra Dengaon R10 ASKA33 Dug 26°13'21" 92°58'47" 0.95 Alluvium Brahmaputra Dengaon R5 83B4D7 Dug 26°11'36" 92°57'57" 0.93 82.84 Alluvium Brahmaputra Dentaghat 83F3A1 Dug 26°16'41" 93°08'19" 0.90 103.24 Alluvium Brahmaputra Deopani 83F4D4 Dug 26°13'15" 93°50'32" 1.05 116.16 Alluvium Brahmaputra Dillai 83G1C4 Dug 25°57'45" 93°35'06" 0.69 Alluvium Brahmaputra Diphu 83G1B1 Dug 25°50'30" 93°27'00" 0.79 183.60 Sandstone Brahmaputra Dishobai ASKA35 Dug 26°03'49" 93°11'06" 0.67 Alluvium Brahmaputra Donkamokam 83C1C1 Dug 25°56'00" 92°42'31" 0.95 74.89 Alluvium Brahmaputra Ghouria Dhubi ASKA43 Dug 26°00'17" 93°46'07" 0.80 Alluvium Brahmaputra Habranrangapar 83F4A7 Dug 26°13'15" 93°03'14" 0.95 90.25 Alluvium Brahmaputra Hapjan 83G1C1 Dug 25°54'10" 93°32'00" 0.82 148.35 Sandstone Brahmaputra Hawaipur 83C1D5 Dug 25°50'46" 92°57'53" 0.67 86.90 Alluvium Brahmaputra Kalonga 83C1D2 Dug 25°51'43" 92°46'06" 0.77 91.92 Alluvium Brahmaputra Khatkhati 83G1D3 Dug 25°58'38" 93°45'45" 0.79 139.16 Alluvium Brahmaputra

Village Well No Well Type Latitude Longitude MP
magl RL
mamsl Geology Basin
Khatkhati CRBF ASKA40 Dug 26°02'22" 93°36'24" 0.72 Alluvium Brahmaputra Kheronighat 83C1D3 Dug 25°50'49" 92°53'52" 0.88 79.87 Alluvium Brahmaputra Langhing ASKA32 Dug 26°12'10" 93°08'01" 0.84 Alluvium Brahmaputra Manikpur 83F4A6 Dug 26°14'57" 93°09'04" 0.87 98.64 Alluvium Brahmaputra Manja Bus Stand ASKA39 Dug 25°58'12" 93°26'14" 0.20 Alluvium Brahmaputra Manja Forest 83G1B2 Dug 25°57'25" 93°26'33" 0.90 161.05 Alluvium Brahmaputra Mohendijua ASKA38 Dug 25°59'40" 93°24'39" 1.00 Alluvium Brahmaputra Phonglangso ASKA36 Dug 26°00'34" 93°15'44" 0.92 Alluvium Brahmaputra Phuloni 83F4A2 Dug 26°10'56" 93°08'49" 0.94 90.56 Alluvium Brahmaputra Saphapani ASKA45 Dug 26°11'48" 93°47'43" 0.89 Alluvium Brahmaputra Silanijan 83F3D1 Dug 26°19'00" 93°52'30" 0.80 106.35 Alluvium Brahmaputra Siljuri 83F2B2 Dug 26°32'30" 93°27'00" 0.71 79.78 Alluvium Brahmaputra Swarghati ASKA31 Dug 26°12'10" 93°06'33" 0.63 Alluvium Brahmaputra Terangaon ASKA37 Dug 26°01'02" 93°22'54" 1.00 Alluvium Brahmaputra District: Karimganj Badarpur 83D1C1 Dug 24°52'00" 92°34'00" 0.65 19.47 Alluvium Meghna Badarpur II ASKG13 Dug 24°51'43" 92°33'39" 0.65 Alluvium Meghna Badarpur Pz ASKG03 Dug 24°52'20" 92°35'10" 0.62 Alluvium Meghna Badarpur Pz 83D1C9 Pz 24°52'20" 92°35'10" 0.62 18.11 Sandstone Meghna Dhaulia 83D2B6 Dug 24°38'30" 92°21'15" 0.60 25.83 Alluvium Meghna Harinadik ASKG14 Pz 1.00 Alluvium Meghna Hatikira 83D3B1 Dug 24°26'00" 92°17'30" 0.66 28.88 Sandstone Meghna Karmganj ASKG15 Dug 0.90 Alluvium Meghna Kayasthagram ASKG16 Dug Alluvium Meghna Patharkandi ASKG17 Dug Alluvium Meghna Rk Nagar I 83D2B4 Dug 24°32'20" 92°29'00" 0.90 25.06 Sandstone Meghna Sarkaribari 83D2B7 Dug 24°33'45" 92°24'50" 0.85 19.22 Alluvium Meghna District: Kokrajhar Balemjhora 78F2D1 Dug 26°38'00" 89°53'30" 0.80 78.00 Alluvium Brahmaputra Bhowraguri 78J3A3 Dug 26°25'30" 90°04'30" 0.65 Alluvium Brahmaputra Bisumari 78J2B1 Dug 26°34'00" 90°18'00" 0.85 68.23 Alluvium Brahmaputra Borobazar 78J2C1 Dug 26°36'00" 90°40'48" 1.25 Alluvium Brahmaputra Deosiri 78J1B1 Dug 26°46'00" 90°28'00" 0.81 148.51 Alluvium Brahmaputra Dotma 78J3A1 Dug 26°29'30" 90°09'30" 0.83 51.65 Alluvium Brahmaputra Garubassa 78J2B5 Dug 26°33'30" 90°23'00" 0.86 Alluvium Brahmaputra Gossaigaon 78F3D1 Dug 26°26'30" 89°58'00" 1.15 47.29 Alluvium Brahmaputra Guma 78F3D2 Dug 26°21'48" 89°54'00" 1.20 Alluvium Brahmaputra Haltugaon 78J2C2 Dug 26°43'00" 90°34'00" 0.90 Alluvium Brahmaputra Kachugaon 78J2A1 Dug 26°34'00" 90°04'00" 0.65 57.28 Alluvium Brahmaputra Kokrajhar 78J3B1 Dug 26°22'45" 90°17'00" 1.00 44.69 Alluvium Brahmaputra Runikhata 78J2B2 Dug 26°38'00" 90°23'00" 1.20 81.78 Alluvium Brahmaputra Sataguri ASKK20 Dug 1.35 Alluvium Brahmaputra Serfanguri 78J2A2 Dug 26°34'09" 90°09'00" 0.78 Alluvium Brahmaputra Sidli 78J2B6 Dug 26°32'00" 90°28'00" 0.71 Alluvium Brahmaputra Ultapani 78J1B2 Dug 26°49'30" 90°15'20" 1.20 Alluvium Brahmaputra District: Lakhimpur Amguri ASLK23 Dug 26°53'00" 93°46'00" 1.00 Alluvium Brahmaputra Amsoi ASLK01 Dug 27°02'00" 93°43'00" 0.37 Alluvium Brahmaputra Basudeothan 83I3B8 Dug 27°15'30" 94°21'30" 0.83 89.56 Alluvium Brahmaputra Bhogpur charali 83E4D1 Dug 27°02'00" 93°50'10" 0.82 91.71 Alluvium Brahmaputra

Village Well No Well Type Latitude Longitude MP
magl RL
mamsl Geology Basin
Bihpuria 83E4D4 Dug 27°02'00" 93°54'30" 0.87 87.28 Alluvium Brahmaputra Boginadi(balijan) 83I3A1 Dug 27°23'23" 94°11'35" 0.83 96.87 Alluvium Brahmaputra Dejoo ASLK24 Dug 1.03 Alluvium Brahmaputra Dholpur 83F1D1 Dug 26°54'00" 93°47'00" 0.69 81.53 Alluvium Brahmaputra Dolanghat chara 83I4A3 Dug 27°10'00" 94°00'00" 0.46 93.99 Alluvium Brahmaputra Dowagaon 83I4B2 Dug 27°13'30" 94°20'30" 1.25 90.66 Alluvium Brahmaputra Harmoti 83E4D6 Dug 27°07'21" 93°51'20" 1.00 Alluvium Brahmaputra Islampur 83E4D3 Dug 27°04'55" 93°54'00" 0.90 86.98 Alluvium Brahmaputra Kadam 83I3A3 Dug 27°17'40" 94°09'10" 0.75 Alluvium Brahmaputra Kakai 83I3A2 Dug 27°17'00" 94°06'45" 0.90 110.84 Alluvium Brahmaputra Laluk 83E4D2 Dug 27°07'30" 93°54'30" 1.12 93.96 Alluvium Brahmaputra Madhupur ASLK22 Dug 27°19'20" 94°24'00" 0.90 Alluvium Brahmaputra Milanpur ASLK26 Dug 27°26'14" 94°17'53" 0.80 98.00 Alluvium Brahmaputra N Lakhimpur Ow ASLK27 Pz 27°11'56" 94°26'34" 0.65 Alluvium Brahmaputra N.lakhipur(old) 83I4A1 Dug 27°13'00" 94°06'30" 1.12 93.35 Alluvium Brahmaputra Naoboisa 83I4A4 Dug 27°10'07" 94°01'23" 0.91 93.46 Alluvium Brahmaputra Narayanpur 83F1D4 Dug 26°57'44" 93°51'26" 1.14 83.06 Alluvium Brahmaputra Panigaon 83I4A2 Dug 27°07'00" 94°06'42" 0.90 87.74 Alluvium Brahmaputra Pathalipam 83I3B6 Dug 27°26'30" 94°17'00" 0.99 100.92 Alluvium Brahmaputra Pathalipam II ASLK25 Dug 27°26'39" 94°12'47" 0.96 65.00 Alluvium Brahmaputra District: Morigaon Baghara 83B4B2 Dug 26°11'01" 92°17'51" 0.92 60.22 Alluvium Brahmaputra Baropujia ASMR14 Dug 26°16'28" 92°29'47" 0.98 Alluvium Brahmaputra Barukati Ow ASMR23 Pz 26°24'30" 92°14'00" 0.72 Alluvium Brahmaputra Basanaghat Ow ASMR19 Pz 26°08'30" 92°19'27" Alluvium Brahmaputra Charibahi Ow ASMR22 Pz 26°27'30" 92°17'30" 0.55 Alluvium Brahmaputra Daponibari Ow ASMR18 Pz 26°14'44" 92°23'10" Alluvium Brahmaputra Deosal ASMR12 Dug 0.94 Alluvium Brahmaputra Garmari gaon 83B3A4 Dug 26°15'21" 92°13'46" 1.00 Alluvium Brahmaputra Jagibhagatgaon Ow ASMR20 Pz 26°11'00" 91°14'20" 0.71 Alluvium Brahmaputra Jagiroad 83B4A1 Dug 26°07'00" 92°10'00" 0.62 65.24 Alluvium Brahmaputra Kumoi ASMR15 Dug 26°11'38" 92°14'46" 1.13 Alluvium Brahmaputra Morigaon 83B3B10 Dug 26°15'41" 92°22'53" 0.92 Alluvium Brahmaputra Nasatra 83B4A5 Dug 26°13'30" 92°13'00" 1.00 58.80 Alluvium Brahmaputra Nelle New ASMR11 Dug 26°57'45" 92°42'10" 0.84 Alluvium Brahmaputra Pabbarbhagia ASMR24 Dug 0.84 Alluvium Brahmaputra Pamibahua ASMR16 Dug 26°14'27" 92°15'50" 0.92 Alluvium Brahmaputra Shugumbari ASMR17 Dug 26°25'24" 92°25'13" 1.20 Alluvium Brahmaputra Silsang Namghar ASMR13 Dug 0.94 Alluvium Brahmaputra Solmari Ow ASMR21 Pz 26°13'45" 92°23'00" 0.72 Alluvium Brahmaputra District: Nagaon Amsoi 83B4B5 Dug 26°08'16" 92°25'27" 0.77 65.77 Alluvium Brahmaputra Bagori 83F2A4 Dug 26°33'00" 93°15'00" 1.15 73.08 Alluvium Brahmaputra Balijan Ow ASNG42 Pz 26°19'44" 92°51'07" Alluvium Brahmaputra Bamuni tinali 83B3D9 Dug 26°18'00" 92°47'00" 1.41 58.82 Alluvium Brahmaputra Beldonga mandir 83B4D8 Dug 26°08'19" 92°49'20" 0.84 80.01 Alluvium Brahmaputra Bichamari 83B3B1 Dug 26°25'00" 92°27'30" 0.87 56.42 Alluvium Brahmaputra Borchukhaba 83B3B5 Dug 26°18'10" 92°25'40" 1.04 56.60 Alluvium Brahmaputra Bordowa 83B3C2 Dug 26°24'20" 92°32'30" 1.01 57.78 Alluvium Brahmaputra Dakhinpath OW ASNG44 Pz 26°15'33" 92°38'38" 0.72 Alluvium Brahmaputra

Village Well No Well Type Latitude Longitude MP
magl RL
mamsl Geology Basin
Dalapani ASNG39 Dug 26°34'01" 92°51'44" 0.90 Alluvium Brahmaputra Dhing 83B3B6 Dug 26°29'00" 92°29'30" 0.49 60.15 Alluvium Brahmaputra Doboka 83B4D1 Dug 26°11'30" 92°51'00" 0.80 60.61 Alluvium Brahmaputra Ghasibasti Ow ASNG46 Pz 26°20'51" 92°52'31" 0.40 Alluvium Brahmaputra Gomotha ASNG34 Dug 26°20'44" 92°44'55" 0.85 Alluvium Brahmaputra Haldiati sub bt 83B4D6 Dug 26°10'19" 92°56'20" 0.89 85.20 Alluvium Brahmaputra Hatibatha ASNG35 Dug 26°20'11" 92°45'40" 0.68 Alluvium Brahmaputra Jurapukhuri 83C1D7 Dug 25°59'00" 92°55'44" 0.84 74.69 Alluvium Brahmaputra Kathiatoli 83B4C4 Dug 26°11'13" 92°44'06" 0.94 63.22 Alluvium Brahmaputra Kazirang Tourist Vil ASNG27 Dug 26°35'09" 93°23'42" 0.60 Alluvium Brahmaputra Kondali 83B3D5 Dug 26°15'45" 92°47'00" 0.99 82.99 Alluvium Brahmaputra Langteng TE 83F3A2 Dug 26°27'00" 93°04'00" 0.85 75.31 Gneiss Brahmaputra Lanka 83C1D1 Dug 25°54'47" 92°57'42" 0.72 79.71 Alluvium Brahmaputra Lumding 83G1A1 Dug 25°46'00" 93°10'30" 0.70 137.02 Sandstone Brahmaputra Mahariali ASNG38 Dug 26°17'02" 92°38'16" 0.60 Alluvium Brahmaputra Nadeorigaon 83B4D2 Dug 26°05'15" 92°47'00" 0.83 61.56 Alluvium Brahmaputra Natali ASNG37 Dug 26°33'00" 92°53'37" 0.66 Alluvium Brahmaputra Pahukata ASNG36 Dug 26°24'07" 92°48'31" 0.91 Alluvium Brahmaputra Phulaguri R5 ASNG41 Dug 26°01'58" 92°40'03" 0.80 Alluvium Brahmaputra Phulaguri R6 83F2A5 Dug 26°34'40" 93°11'07" 0.37 Alluvium Brahmaputra Rangamati Ow ASNG45 Pz 26°24'45" 92°25'45" Alluvium Brahmaputra Samuguri 83B3D7 Dug 26°24'30" 92°49'45" 0.70 63.75 Alluvium Brahmaputra Silghat 83B2D6 Dug 26°35'32" 92°56'04" 0.96 Alluvium Brahmaputra Sulung p.o. 83B3D8 Dug 26°24'00" 92°58'00" 0.74 66.49 Alluvium Brahmaputra Telia bebejia 83B3C7 Dug 26°25'00" 92°37'00" 0.50 66.96 Alluvium Brahmaputra Tirchang ASNG47 Dug 26°15'37" 92°35'45" 0.85 Alluvium Brahmaputra Zebra Khua ASNG33 Dug 0.85 Alluvium Brahmaputra District: Nalbari Aithabari 78N2B5 Dug 26°44'05" 91°21'30" 0.86 58.98 Alluvium Brahmaputra Arikuchi 78N3B4 Dug 26°22'18" 91°26'42" 0.90 44.99 Alluvium Brahmaputra Balilecha 78N3B6 Pz 26°25'04" 91°28'29" 0.50 Alluvium Brahmaputra Dhamdhama 78N2B1 Dug 26°33'22" 91°27'09" 0.71 61.24 Alluvium Brahmaputra Dumnibazar 78N2B2 Dug 26°35'30" 91°18'54" 0.57 77.75 Alluvium Brahmaputra Hazaregaon 78N2C10 Dug 26°42'55" 91°33'36" 0.81 81.56 Alluvium Brahmaputra Mithabari 78N1B2 Dug 26°45'42" 91°23'30" 0.93 112.60 Alluvium Brahmaputra Tamulpur 78N2C1 Dug 26°37'50" 91°34'15" 0.86 68.55 Alluvium Brahmaputra Tihu 78N3B3 Dug 26°28'30" 91°15'27" 0.93 51.63 Alluvium Brahmaputra District: Sibsagar Athkhel Grant ASSA05 Dug 26°46'52" 94°40'49" 0.50 Alluvium Brahmaputra Bandarmari 83I4C14 Dug 27°11'45" 94°44'55" 0.87 Alluvium Brahmaputra Betbari alimore 83I4C8 Dug 27°03'55" 94°42'45" 0.68 Alluvium Brahmaputra Demow Sukan 83I4C11 Dug 27°08'45" 94°44'50" 0.70 Alluvium Brahmaputra Dhapaboria 83I4C5 Dug 27°02'10" 94°36'00" 0.84 Alluvium Brahmaputra Geleki 83J1C9 Dug 26°48'15" 94°42'30" 0.43 Alluvium Brahmaputra Hanumanbagh 83J1C7 Dug 26°54'10" 94°43'15" 0.86 Alluvium Brahmaputra Madhurigohain Gaon ASSA03 Dug 26°06'00" 94°42'00" 1.00 Alluvium Brahmaputra Moranhat 83I4D1 Dug 27°12'00" 94°56'00" 0.50 106.43 Alluvium Brahmaputra Santak ASSA04 Dug 26°52'45" 94°48'00" 1.00 Alluvium Brahmaputra Sapekhati 83M4A1 Dug 27°05'00" 95°12'00" 1.00 110.71 Alluvium Brahmaputra Sibsagar 83J1C2 Dug 26°59'30" 94°38'00" 0.73 92.25 Alluvium Brahmaputra
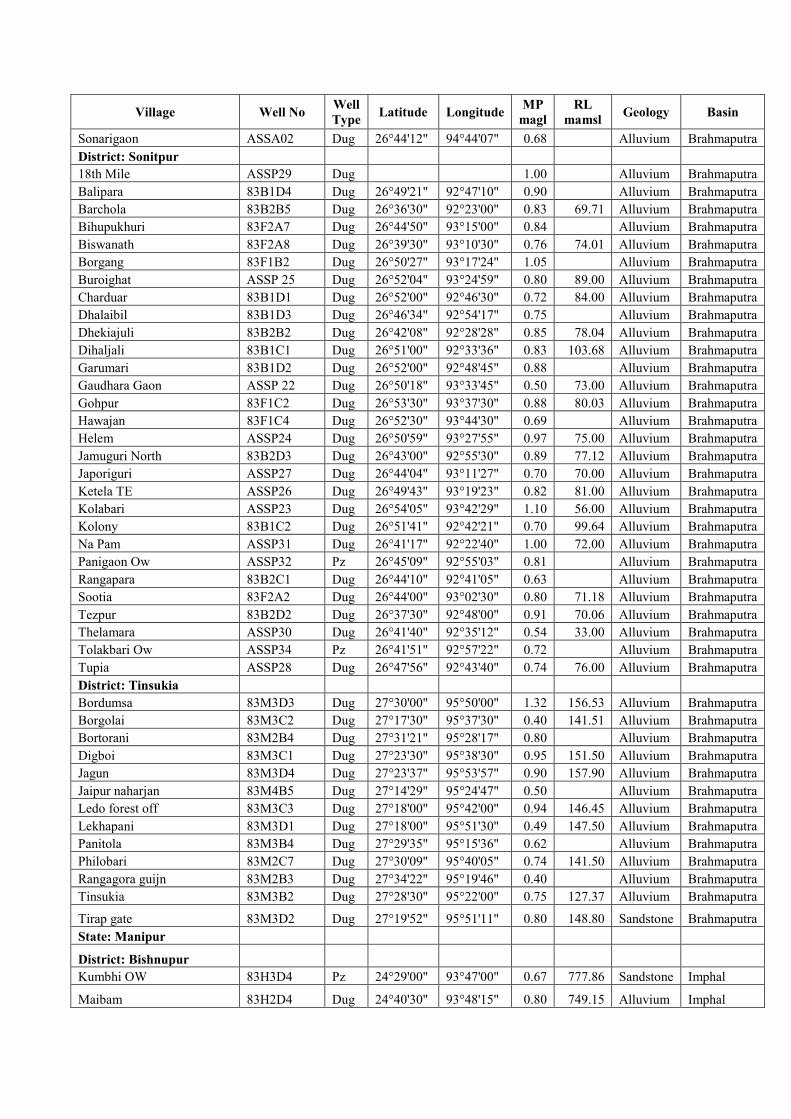
Village Well No Well Type Latitude Longitude MP
magl RL
mamsl Geology Basin
Sonarigaon ASSA02 Dug 26°44'12" 94°44'07" 0.68 Alluvium Brahmaputra District: Sonitpur 18th Mile ASSP29 Dug 1.00 Alluvium Brahmaputra Balipara 83B1D4 Dug 26°49'21" 92°47'10" 0.90 Alluvium Brahmaputra Barchola 83B2B5 Dug 26°36'30" 92°23'00" 0.83 69.71 Alluvium Brahmaputra Bihupukhuri 83F2A7 Dug 26°44'50" 93°15'00" 0.84 Alluvium Brahmaputra Biswanath 83F2A8 Dug 26°39'30" 93°10'30" 0.76 74.01 Alluvium Brahmaputra Borgang 83F1B2 Dug 26°50'27" 93°17'24" 1.05 Alluvium Brahmaputra Buroighat ASSP 25 Dug 26°52'04" 93°24'59" 0.80 89.00 Alluvium Brahmaputra Charduar 83B1D1 Dug 26°52'00" 92°46'30" 0.72 84.00 Alluvium Brahmaputra Dhalaibil 83B1D3 Dug 26°46'34" 92°54'17" 0.75 Alluvium Brahmaputra Dhekiajuli 83B2B2 Dug 26°42'08" 92°28'28" 0.85 78.04 Alluvium Brahmaputra Dihaljali 83B1C1 Dug 26°51'00" 92°33'36" 0.83 103.68 Alluvium Brahmaputra Garumari 83B1D2 Dug 26°52'00" 92°48'45" 0.88 Alluvium Brahmaputra Gaudhara Gaon ASSP 22 Dug 26°50'18" 93°33'45" 0.50 73.00 Alluvium Brahmaputra Gohpur 83F1C2 Dug 26°53'30" 93°37'30" 0.88 80.03 Alluvium Brahmaputra Hawajan 83F1C4 Dug 26°52'30" 93°44'30" 0.69 Alluvium Brahmaputra Helem ASSP24 Dug 26°50'59" 93°27'55" 0.97 75.00 Alluvium Brahmaputra Jamuguri North 83B2D3 Dug 26°43'00" 92°55'30" 0.89 77.12 Alluvium Brahmaputra Japoriguri ASSP27 Dug 26°44'04" 93°11'27" 0.70 70.00 Alluvium Brahmaputra Ketela TE ASSP26 Dug 26°49'43" 93°19'23" 0.82 81.00 Alluvium Brahmaputra Kolabari ASSP23 Dug 26°54'05" 93°42'29" 1.10 56.00 Alluvium Brahmaputra Kolony 83B1C2 Dug 26°51'41" 92°42'21" 0.70 99.64 Alluvium Brahmaputra Na Pam ASSP31 Dug 26°41'17" 92°22'40" 1.00 72.00 Alluvium Brahmaputra Panigaon Ow ASSP32 Pz 26°45'09" 92°55'03" 0.81 Alluvium Brahmaputra Rangapara 83B2C1 Dug 26°44'10" 92°41'05" 0.63 Alluvium Brahmaputra Sootia 83F2A2 Dug 26°44'00" 93°02'30" 0.80 71.18 Alluvium Brahmaputra Tezpur 83B2D2 Dug 26°37'30" 92°48'00" 0.91 70.06 Alluvium Brahmaputra Thelamara ASSP30 Dug 26°41'40" 92°35'12" 0.54 33.00 Alluvium Brahmaputra Tolakbari Ow ASSP34 Pz 26°41'51" 92°57'22" 0.72 Alluvium Brahmaputra Tupia ASSP28 Dug 26°47'56" 92°43'40" 0.74 76.00 Alluvium Brahmaputra District: Tinsukia Bordumsa 83M3D3 Dug 27°30'00" 95°50'00" 1.32 156.53 Alluvium Brahmaputra Borgolai 83M3C2 Dug 27°17'30" 95°37'30" 0.40 141.51 Alluvium Brahmaputra Bortorani 83M2B4 Dug 27°31'21" 95°28'17" 0.80 Alluvium Brahmaputra Digboi 83M3C1 Dug 27°23'30" 95°38'30" 0.95 151.50 Alluvium Brahmaputra Jagun 83M3D4 Dug 27°23'37" 95°53'57" 0.90 157.90 Alluvium Brahmaputra Jaipur naharjan 83M4B5 Dug 27°14'29" 95°24'47" 0.50 Alluvium Brahmaputra Ledo forest off 83M3C3 Dug 27°18'00" 95°42'00" 0.94 146.45 Alluvium Brahmaputra Lekhapani 83M3D1 Dug 27°18'00" 95°51'30" 0.49 147.50 Alluvium Brahmaputra Panitola 83M3B4 Dug 27°29'35" 95°15'36" 0.62 Alluvium Brahmaputra Philobari 83M2C7 Dug 27°30'09" 95°40'05" 0.74 141.50 Alluvium Brahmaputra Rangagora guijn 83M2B3 Dug 27°34'22" 95°19'46" 0.40 Alluvium Brahmaputra Tinsukia 83M3B2 Dug 27°28'30" 95°22'00" 0.75 127.37 Alluvium Brahmaputra
Tirap gate 83M3D2 Dug 27°19'52" 95°51'11" 0.80 148.80 Sandstone Brahmaputra State: Manipur
District: Bishnupur Kumbhi OW 83H3D4 Pz 24°29'00" 93°47'00" 0.67 777.86 Sandstone Imphal
Maibam 83H2D4 Dug 24°40'30" 93°48'15" 0.80 749.15 Alluvium Imphal

Village Well No Well Type Latitude Longitude MP
magl RL
mamsl Geology Basin
District: Chandel Khongsim 83L3A1 Dug 24°29'49" 94°01'12" 0.70 Alluvium Imphal Moreh 83L3B1 Dug 24°15'30" 94°18'30" 0.87 Alluvium Imphal Shairo 83H3D6 Dug 24°16'02" 93°52'41" 0.68 786.44 Alluvium Imphal District: Churachandpur Churachandpur 83H3C1 Dug 24°19'55" 93°41'00" 0.87 817.43 Alluvium Imphal Kongwai OW 83H3C3 Pz 24°26'24" 93°43'50" 0.50 780.95 Sandstone Imphal Saikot Tw 83H3C2 Pz 24°20'07" 93°43'46" 0.50 798.98 Sandstone Imphal District: Imphal East Jiribam 83H1A2 Dug 24°48'00" 93°07'00" 0.76 25.66 Sandstone Imphal Tengdongyem 83H1D5 Dug 24°54'27" 93°53'11" 0.74 807.79 Alluvium Imphal District: Imphal West Chaprau 83H1D3 Dug 24°54'19" 93°51'47" 0.83 Alluvium Imphal Imphal 83H1D2 Dug 24°48'26" 93°48'26" 0.38 783.62 Alluvium Imphal Lemakhong 83H1D6 Dug 24°55'58" 93°50'33" 0.70 Alluvium Imphal Lilong Pz 83H2D3 Pz 24°44'00" 93°56'00" 0.61 773.94 Sandstone Imphal Sekmai 83H1D1 Dug 24°57'30" 93°53'00" 0.70 824.18 Sandstone Imphal District:Senapati Motbung 83H1D4 Dug 24°59'52" 93°54'28" 0.70 891.15 Alluvium Imphal District: Tamenglong Kamrenga PZ 83H1A3 Pz 24°47'30" 93°09'00" 0.36 28.68 Sandstone Imphal
District: Thoubal Kakching Pz 83L3A3 Pz 24°29'25" 94°00'06" 0.35 Sandstone Imphal Khongjom Pz 83L2A3 Pz 24°35'21" 94°03'13" 0.50 Sandstone Imphal Pangaltabi Pz 83H3D2 Pz 24°20'00" 93°57'00" 0.58 793.52 Sandstone Imphal Sugnu Pz 83H3D1 Pz 24°17'00" 93°55'30" 0.80 777.95 Sandstone Imphal Wabagai lamkhai 83H2D2 Pz 24°31'30" 93°58'30" 0.50 772.13 Sandstone Imphal Waikhong 83H3D5 Dug 24°25'14" 93°55'52" 0.50 786.15 Alluvium Imphal Waikhong Pz 83H3D3 Pz 24°30'00" 93°56'00" 0.61 785.25 Alluvium Imphal Wangbol 83L2A1 Dug 24°31'00" 94°00'55" 0.61 779.31 Sandstone Imphal
State: Meghalaya
District: East Garo Hills Baiza Rongreng MLEG15 Dug 25°32'33" 90°35'06" 0.75 Sandstone Meghna Bajengdoba 78K1C2 Dug 25°53'10" 90°30'45" 0.97 Alluvium Brahmaputra Dainadubi MLEG11 Dug 25°53'56" 90°46'39" 0.80 Sandstone Brahmaputra Darugiri 78K2D2 Dug 25°37'09" 90°46'03" 0.77 Alluvium Brahmaputra Depa sarangma 78K1D4 Dug 25°52'00" 90°47'00" 0.00 63.95 Alluvium Brahmaputra Dobetkolgiri MEEG12 Dug 25°30'33" 90°36'42" 0.30 Sandstone Meghna Dobu MLEG13 Dug 25°33'58" 90°42'47" 0.60 Granite Brahmaputra Kharkutta 78K1D7 Dug 25°54'20" 90°53'40" 0.93 Alluvium Brahmaputra Mendal 78K1B1 Dug 25°49'29" 90°27'57" 0.80 Gneiss Brahmaputra Mendipathar 78K1C1 Dug 25°55'15" 90°30'30" 0.72 58.22 Alluvium Brahmaputra Narringirri MLEG14 Dug 25°36'37" 90°44'23" 0.85 Granite Brahmaputra Rongjeng 78K2D1 Dug 25°40'00" 90°48'15" 0.84 300.43 Quartzite Brahmaputra Rongmil 78K2D3 Dug 25°44'10" 90°49'28" 0.78 Gneiss Brahmaputra Samanda Megapagre MLEG16 Dug 25°34'38" 90°31'37" 1.00 Sandstone Meghna
Songsak MLEG17 Dug 25°39'48" 90°36'37" 0.85 Sandstone Meghna
Williamnagar 78K2C2 Dug 25°30'36" 90°31'10" 0.90 Alluvium Meghna

Village Well No Well Type Latitude Longitude MP
magl RL
mamsl Geology Basin
District: East Khasi Hills Balat 78O4B1 Dug 25°12'20" 91°24'00" 0.78 11.67 Gneiss Meghna Cherrapunji 78O3C1 Dug 25°17'00" 91°43'00" 0.20 1411.47 Gneiss Meghna Dhankheti MLEK08 Dug 25°23'58" 91°53'34" 0.86 Quartzite Brahmaputra Golf Link MLEK07 Dug 25°34'55" 91°50'40" 0.75 Quartzite Brahmaputra Lachuamiere MLEK09 Dug 25°34'14" 91°50'25" 0.80 Quartzite Brahmaputra Mawpat MLEK11 Dug 25°35'34" 91°55'09" 0.54 Quartzite Brahmaputra Nongmynsong MLEK12 Dug 25°34'47" 91°54'25" 0.52 Quartzite Brahmaputra Rynjah ( R & R Col) MLEK10 Dug 25°34'49" 91°54'00" 0.00 Quartzite Brahmaputra Shillong Polo 78O2D1 Dug 25°35'00" 91°53'00" 0.75 1426.67 Quartzite Brahmaputra District: Jaintia Hills Dauki 83C4A1 Dug 25°12'00" 92°02'00" 0.70 70.95 Alluvium Meghna Jowai 83C3A1 Dug 25°26'30" 92°10'30" 0.83 1219.08 Sandstone Meghna District: Ri-Bhoi Byrnihat MLRB02A Dug 25°42'39" 92°01'22" 0.45 Sandstone Brahmaputra Nongpoh 78O1D1 Dug 25°54'00" 91°53'00" 0.95 540.47 Gneiss Brahmaputra District: South Garo Hills Dimapara MLSG06 Dug 25°13'31" 90°14'39" 0.80 Sandstone Meghna Dumnikura MLSG02 Dug 25°11'06" 90°23'21" 0.96 Sandstone Meghna Gasuapara MLSG04 Dug 25°11'39" 90°20'56" 1.00 Sandstone Meghna Jatrokona MLSG05 Dug 25°12'06" 90°16'24" 0.85 Sandstone Meghna Khondoh MLSG03 Dug 25°12'25" 92°21'25" 0.90 Sandstone Meghna District: West Garo Hills Ampati 78G3D1 Dug 25°30'00" 89°57'30" 1.50 33.11 Alluvium Brahmaputra Asanang 78K2B1 Dug 25°35'58" 90°16'32" 0.77 Gneiss Brahmaputra Baljek ASWG17 Dug 25°39'50" 90°16'32" 0.70 Alluvium Brahmaputra Barengapara 78K4A1 Dug 25°13'00" 90°14'00" 0.98 15.45 Alluvium Brahmaputra Barengapara II ASWG22 Dug 25°14'17" 90°12'26" 0.80 Alluvium Brahmaputra Barkona 78G2D2 Pz 25°33'50" 89°57'00" 0.50 22.81 Sandstone Brahmaputra Belguri ASWG21 Dug 25°57'50" 90°20'34" 0.70 Alluvium Brahmaputra Betasing II ASWG25 Dug 25°30'40" 89°57'15" 0.70 Sandstone Brahmaputra Borkona 78G2D4 Dug 25°33'56" 89°56'35" 0.80 Alluvium Brahmaputra Garobandha 78K2A1 Dug 25°35'00" 90°02'00" 0.89 20.25 Sandstone Brahmaputra Ichaguri 78G2D1 Pz 25°33'14" 89°53'14" 0.50 23.19 Sandstone Brahmaputra Jarangkhona ASWG23 Dug 25°17'50" 90°00'33" 0.70 Sandstone Meghna Kherapara 78K3A2 Dug 25°20'30" 90°13'30" 0.89 138.56 Sandstone Brahmaputra Mahendraganj 78G3D2 Dug 25°18'00" 89°51'35" 1.00 17.51 Alluvium Brahmaputra Mahendraganj Pz 78G3D4 Pz 25°18'20" 89°51'15" 0.50 23.59 Sandstone Brahmaputra Nidanpur II ASWG19 Dug 25°56'07" 90°07'30" 0.90 Sandstone Brahmaputra Nongopara ASWG24 Dug 25°20'53" 89°50'39" 0.75 Sandstone Brahmaputra Phulbari 78K1A1 Dug 25°53'00" 90°03'00" 0.95 30.95 Alluvium Brahmaputra Phutamati ASWG20 Dug 25°56'36" 90°13'12" 0.80 Sandstone Brahmaputra Purkhasia 78K3A1 Dug 25°18'00" 90°01'00" 0.78 27.92 Alluvium Brahmaputra Rajabala ASWG26 Dug 25°45'20" 89°58'51" 0.72 Alluvium Brahmaputra Rongram ASWG18 Dug 25°50'39" 90°12'56" 0.90 Granite Brahmaputra Tikrikilla 78K1A2 Dug 25°56'45" 90°14'40" 0.87 36.95 Alluvium Brahmaputra Zikzak 78G3D3 Pz 25°23'30" 89°53'55" 1.00 25.59 Sandstone Brahmaputra Zikzak PZ 78G3D5 Dug 25°23'28" 89°53'56" 0.84 Alluvium Brahmaputra District: West Khasi Hills Mairang 78O2C1 Dug 25°34'40" 91°38'30" 0.30 Gneiss Brahmaputra

Village Well No Well Type Latitude Longitude MP
magl RL
mamsl Geology Basin
State: Nagaland District: Dimapur 3 Mile Bazar NLDM19 Dug 25°52'50'' 92°45'44'' 0.90 Alluvium Brahmaputra 7th Mile Colony NLDM21 Dug 25°50'38'' 93°46'27'' 0.70 Alluvium Brahmaputra Bade Bazar NLDM14 Dug 25°49'33'' 93°41'07'' 0.80 Alluvium Brahmaputra Chumkidima 83G1D1 Dug 25°48'00" 93°47'45" 0.85 191.90 Alluvium Brahmaputra Dgm Colony 83G1C8 Pz 25°54'46" 93°42'55" 0.23 152.00 Alluvium Brahmaputra Dgmofficedimapur 83G13GM10 Pz 1.20 Alluvium Brahmaputra Dhansiripar 83G1C5 Dug 25°46'00" 93°37'00" 0.80 168.54 Sandstone Brahmaputra Dimapur 83G1C2 Dug 25°54'20" 93°42'45" 0.70 152.26 Alluvium Brahmaputra Diphupar NLDM22 Dug 25°51'52'' 93°46'24'' 0.85 Alluvium Brahmaputra Doyabur DMC NLDM12 Dug 25°45'40'' 93°36'02'' 0.63 Alluvium Brahmaputra Industrial Estate 83G1C7 Dug 25°53'58" 93°41'59" 0.90 158.00 Alluvium Brahmaputra Jalukie 83G2C1 Dug 25°38'00" 93°39'00" 0.89 Alluvium Brahmaputra Lumthi colony 83G1D2 Pz 25°54'00" 93°45'50" 0.52 151.74 Sandstone Brahmaputra Maibiram NLDM13 Dug 25°46'58'' 93°37'25'' 0.70 Alluvium Brahmaputra Marwari Colony 83G1C9 Dug 25°54'10" 93°43'45" 0.76 152.00 Alluvium Brahmaputra Purana Bazar 83G1C10 Pz 25°54'54" 93°44'58" 0.50 140.00 Alluvium Brahmaputra Rilayan Colony NLDM24 Dug 25°54'10'' 93°41'04'' 1.19 Alluvium Brahmaputra Seirujha Colony Chumukedi 83G9GM11 Pz 1.00 Alluvium Brahmaputra Singrijan 83G1C6 Dug 25°50'00" 93°43'00" 0.66 Sandstone Brahmaputra Thilaxu Block-II NLDM16 Dug 25°52'38'' 93°44'15'' 0.61 Alluvium Brahmaputra Zakesatho Colony NLDM23 Dug 25°55'06'' 93°43'44'' 0.85 Alluvium Brahmaputra Zion Hospital NLDM18 Dug 25°54'39'' 93°44'46'' 0.85 Alluvium Brahmaputra District: Kohima Cathedral Complex 83K2A1 Dug 25°39'00" 94°06'25" 0.89 1590.00 Sandstone Brahmaputra NLSA Complex 83K2A2 Pz 25°43'02" 94°06'31" 0.50 1310.00 Sandstone Brahmaputra Sepfuzou Colony 83K2A3 Dug 25°41'03" 94°06'22" 0.76 1425.00 Sandstone Brahmaputra District: Mokokchung Lampi 83J3B1 Pz 26°27'30" 94°22'10" 0.50 189.91 Sandstone Brahmaputra District: Mon Mon Town 83N2GM14 Pz 0.80 Alluvium Brahmaputra Namsa 83J1D1 Dug 26°51'30" 94°56'30" 0.73 125.83 Alluvium Brahmaputra District: Phek Phek Town 83K6GM13 Pz 0.80 Alluvium Brahmaputra District: Tuensang Tuensang 83J16GM12 Pz Alluvium Brahmaputra District: Wokha New Market 83J4B2 Dug 26°05'39" 94°15'23" 0.41 1365.00 Sandstone Brahmaputra Tourist Lodge 83J4B1 Dug 26°06'20" 94°15'26" 0.80 1370.00 Alluvium Brahmaputra Wokha Town 83N2GM15 Pz Alluvium Brahmaputra State: Tripura District: Dhalai Abhanga N TRDL04 Dug 24°03'14" 91°49'51" 0.77 58.70 Alluvium Meghna Ambassa N TRDL06 Dug 23°54'55" 91°52'00" 0.92 58.89 Alluvium Meghna Darlang Basti TRDL02 Dug 24°06'43" 92°11'54" 0.90 Alluvium Meghna Durga Chowmuhani TRDL01 Dug 24°06'43" 92°11'54" 0.80 Alluvium Meghna Kamalpur 78P4D1 Dug 24°12'15" 91°50'30" 0.66 32.59 Alluvium Meghna Manu N TRDL05 Dug 24°00'00" 91°59'00" 0.95 39.50 Sandstone Meghna District: North Tripura

Village Well No Well Type Latitude Longitude MP
magl RL
mamsl Geology Basin
Bagbasa N TRNT10 Dug 24°20'26" 91°13'07" 0.95 Alluvium Meghna Chandramanikami TRNT18 Dug 24°06'43" 92°11'54" 0.90 Alluvium Meghna Dharmanagar 83D3B2 Dug 24°16'00" 92°16'00" 1.47 Alluvium Meghna Gauranagar N TRNT11 Dug 24°19'30" 92°01'00" 0.79 Sandstone Meghna Kanchanchhera TRNT12 Dug 24°05'08" 92°00'09" 0.74 Alluvium Meghna Kanchanpur 84A1A1 Dug 23°55'00" 92°12'00" 0.50 87.86 Sandstone Meghna Karaicherra TRNT14 Dug 24°08'24" 92°09'05" Alluvium Meghna Kumarghat 83D4A6 Dug 24°08'00" 92°03'00" 0.32 Sandstone Meghna Laljuri TRNT15 Dug 24°06'43" 92°11'54" 0.87 Alluvium Meghna Panchamnagar TRNT17 Dug 24°06'43" 92°11'54" 0.85 Alluvium Meghna Panisagar 83D4A1 Dug 24°14'30" 92°11'00" 0.78 41.60 Alluvium Meghna Pecharthal 83D4A7 Dug 24°11'57" 92°06'21" 0.68 Alluvium Meghna Rajnagar TRNT13 Dug 24°19'14" 92°07'05" 0.84 Alluvium Meghna Satnala TRNT16 Dug 24°08'00" 92°09'05" 1.05 Alluvium Meghna District: South Tripura Amarpur TRST05 Dug 23°30'49" 91°39'24" 0.89 Alluvium Meghna Amarpur0 79M2C2 Dug 23°31'30" 91°41'30" 0.75 40.03 Alluvium Meghna Ampi Colony TRST07 Dug 23°40'17" 91°38'30" 0.85 Alluvium Meghna Bampur TRST 06 Dug 23°33'44" 91°38'07" 0.96 Alluvium Meghna Dhawajnagar Udaipur 79M2B8 Dug 23°32'55" 91°28'35" 1.36 Alluvium Meghna Gardhang TRST11 Dug 23°17'50" 91°31'57" 0.74 Alluvium Meghna Garjee Bazar 79M3B4 Dug 23°25'36" 91°13'21" 0.80 32.62 Alluvium Meghna Hrishyamukh 79M4C4 Dug 23°08'30" 91°32'00" 0.80 23.64 Alluvium Meghna Jhajhari TRST08 Dug 23°13'49" 91°29'31" 0.77 Alluvium Meghna Kalachhara TRST10 Dug 23°08'27" 91°37'38" 0.90 Alluvium Meghna Kankraban TRST12 Dug 23°29'43" 91°24'49" 0.87 Alluvium Meghna Manu Bazar TRST 9 Dug 23°03'51" 91°38'55" 0.66 Alluvium Meghna Manurmukh TRST03A Dug 23°15'56" 91°29'17" 1.00 Alluvium Meghna Naobari TRST04 Dug 23°30'43" 91°33'57" 0.83 Alluvium Meghna Radhanagar TRST15 Dug 23°13'32" 91°19'46" 0.88 Alluvium Meghna Rajnagar TRST14 Dug 23°13'56" 91°23'30" 1.35 Alluvium Meghna Sabroom 79M4C1 Dug 23°57'30" 91°43'30" 0.83 18.75 Sandstone Meghna Santirbazar Purba TRST13 Dug 23°19'03" 91°35'13" 0.77 Alluvium Meghna District: West Tripura Badharghat DTW TRWT25 Pz 23°48'10" 91°16'17" 0.63 Alluvium Meghna Bagan Bazar TRWT33 Dug 23°58'13" 91°37'40" 0.92 Sandstone Meghna Bishalgarh 79M2B1 Dug 23°41'00" 91°17'00" 0.78 16.28 Alluvium Meghna Bodhjanagar Dtw TRWT19 Pz 23°52'19" 91°20'41" 0.75 Alluvium Meghna Bodhjanagar Stw TRWT20 Pz 23°52'58" 91°21'55" 0.95 Alluvium Meghna Chamapnagar1 TRWT39 Dug 23°48'32" 91°28'32" 0.80 Alluvium Meghna Dakshin Kalamcherra TRWT04A Dug 23°34'25" 91°12'33" 0.96 Alluvium Meghna East Narayanpur TRWT40 Dug 23°53'25" 91°14'48" 0.87 Alluvium Meghna Gongrai TRWT36 Dug 23°39'24" 91°27'14" 0.55 Alluvium Meghna Ishanpur TRWT31 Dug 24°02'43" 91°23'57" 0.80 Alluvium Meghna Kalyanpur 79M1C2 Dug 23°55'00" 91°36'40" 0.92 41.71 Alluvium Meghna Kathalia bazar 79M3B5 Dug 23°23'00" 91°19'00" 0.75 13.76 Alluvium Meghna Kenania 79M2A2 Dug 23°44'00" 91°11'00" 0.84 20.72 Alluvium Meghna Khowai 78P4C5 Dug 24°04'55" 91°36'58" 0.72 Alluvium Meghna Lichubagan STW TRWT22 Pz 23°52'16" 91°17'25" 0.58 Alluvium Meghna Mohanpur2 TRWT38 Dug 23°58'18" 91°22'22" 0.63 Alluvium Meghna

Village Well No Well Type Latitude Longitude MP
magl RL
mamsl Geology Basin
Nagicherra1 TRWT29 Pz 23°00'13" 91°19'49" 0.55 Alluvium Meghna Nagicherra2 TRWT30 Pz 23°48'13" 91°19'49" 0.63 Sandstone Meghna Narsinghgarh DTW TRWT28 Pz 23°54'15" 91°14'49" 0.70 Alluvium Meghna Paschim Howaibari TRWT34 Dug 23°48'36" 91°35'31" 0.70 Alluvium Meghna Simna 78P4B1 Dug 24°02'00" 91°24'30" 0.79 23.77 Sandstone Meghna Sipoyjala 79M2B7 Dug 23°41'30" 91°20'15" 0.68 Alluvium Meghna Sonamura1 79M3B6 Dug 23°28'00" 91°16'30" 0.81 Sandstone Meghna Subalsingh TRWT32 Dug 24°00'17" 91°27'26" 0.64 Alluvium Meghna Suryamaninagar DTW TRWT23 Pz 23°45'44" 91°15'46" 0.64 Alluvium Meghna Suryamaninagar STW TRWT24 Pz 23°45'44" 91°15'45" 0.63 Alluvium Meghna Tufaniamura TRWT35 Dug 23°41'55" 91°24'25" 0.72 Alluvium Meghna Tuimadhu TRWT37 Dug 23°50'06" 91°41'11" 0.96 Alluvium Meghna

ANNEXURE-II
Depth to Water level in Ground Water Monitoring Wells (in meter below ground level)
State / District Village Well No Well Type Mar-14 Aug-14 Nov-14 Jan-15
Arunachal Pradesh Changlang Jairampur 92A4A1 Dug 2.33 0.69 3.48 3.78 Namchik 92A3A1 Dug 3.95 1.07 2.74 3.42 Namphai 92A3A2 Dug 4.35 0.75 2.62 2.66 Newlisan Kharsang 92A2A1 Dug 2.87 1.02 4.25 5.23 East Siang Berung 83M1B4 Dug 2.85 NA NA 2.72 Oyen ARES12 Dug 3.45 0.58 0.58 NA Pasighat- III ARES16 Dug 10.95 5.28 5.61 12.77 Pasighat New ARES02A Dug 11.09 1.56 6.53 10.07 Pasighat-II ARES15 Dug 10.49 0.43 6.10 9.55 Ruksin ARES11 Dug 2.59 0.27 1.35 2.41 Sika Baman Todee ARES14 Dug NA 0.19 NA 2.45 Lohit Lathow 83M2D1 Dug 5.00 0.58 2.32 2.61 Papumpare Banderedewa I ARPP04 Dug 11.69 10.09 10.87 11.66 Chimpu ARPP13 Dug 3.10 0.64 2.62 3.35 Itanagar I ARPP10 Dug 4.15 0.85 2.21 3.52 Itanagar II ARPP11 Dug 2.27 NA 0.37 1.62 Kimin 83E3D2 Dug 1.48 0.95 1.44 1.50 Naharlagun I ARPP08 Dug 7.99 4.38 5.78 6.68 Nirjuli Vill IIA ARPP06 Dug 1.15 0.72 1.00 1.02 Nirjuli Vill IIB ARPP07 Dug -0.07 -0.70 -0.28 -0.06 Sonajuli 83E4C1 Dug NA NA NA 3.05 Tirap Borduria 83M4B3 Dug 4.17 1.22 4.10 5.36 Deomali 83M4C1 Dug 3.38 1.35 3.53 4.00 Hukanjuri 83M4B4 Dug 6.13 2.20 5.23 6.93 Assam Baksha Jhargaon ASBS01 Dug 3.08 NA 2.22 2.85 Barpeta Bhawanipur 78N3A1 Dug 3.76 0.69 2.57 3.28 Bhawanipur TW ASBP17 Pz 3.10 0.65 1.95 NA Daulasal ASBP14 Dug 4.95 0.02 2.25 3.80 Daulasal OW ASBP15 Pz 4.00 0.81 3.24 4.24 Dhupguri(Galia) ASBP13 Dug 2.92 0.36 1.27 2.23 Nityanada OW ASBP18 Pz 3.18 2.14 2.68 3.95 Patacharkuchi ASBP16 Pz NA 1.81 NA NA Sarupeta 78N3A6 Dug 4.42 1.56 3.69 3.79 Sorbhog 78J3D4 Dug 3.70 0.30 1.84 2.79 Ujanborbori 78N2A2 Dug 2.59 NA NA NA Bongaigaon Abhayapuri 78J3C2 Dug 3.66 1.65 2.51 4.10 Baitamari 78J3C1 Dug 4.24 0.05 1.99 3.49 Bijni 78J3C5 Dug 3.30 1.23 2.35 3.17 Bongaigaon New 78J3C9 Dug 4.17 0.21 2.37 3.66 Chalantapara 78J3C4 Dug 9.10 3.74 7.65 8.25 Chaprakata 78J3C7 Dug NA 0.76 3.77 2.17 Chaprakata (Dankinamari) ASBN10 Dug 2.20 0.47 1.88 3.42 Majgaon ASBN11 Dug 3.90 0.15 2.56 3.52 Manikpur 78J3D1 Dug 3.10 0.73 1.75 2.79
Medhipara(Deo) 78J3C6 Dug 4.25 0.41 3.26 3.63
North salmara 78J3C8 Dug NA 1.20 4.25 4.72

State / District Village Well No Well Type Mar-14 Aug-14 Nov-14 Jan-15
Cachar Atalbasti ASCR35 Dug NA 4.73 4.58 NA Badribasti 83D1D7 Dug 4.04 1.16 1.90 2.31 Badribasti OW 83D1D8 Pz 2.89 0.97 1.96 2.62 Borjalinga 83D2D1 Dug 1.28 0.71 0.80 0.69 Borkhola 83D1C8 Dug 1.83 0.70 1.31 0.78 Dargakuna ASCR25 Dug 1.40 1.20 1.24 0.75 Digharkhal 83D1C3 Dug 5.31 1.06 3.21 4.53 Fulertol ASCR37 Dug 5.07 0.64 2.38 2.68 Ghungoor TW 83D1D10 Pz 7.99 6.00 6.49 7.30 Gosaipur Part-II ASCR34 Dug 2.64 0.51 1.16 1.45 Hilara ASCR26 Dug 4.42 1.74 2.88 2.40 Kalain 83D1C14 Dug 4.74 0.20 1.32 1.19 Kalain PZ 83D1C13 Pz 2.13 0.83 1.08 1.44 Kashipur ASCR31 Dug NA 0.78 1.26 1.66 Katigora ASCR27 Dug 2.93 1.62 NA 2.02 Masimpur ASCR23 Dug 0.23 0.13 2.31 0.01 Moinarbond 83D1D6 Dug 3.50 1.08 2.86 3.83 Nagdirgram ASCR39 Dug 1.77 0.36 1.23 0.83 Poilapul 83H1A9 Dug 2.31 1.11 1.19 1.03 Razabazar 83H1A7 Dug 9.01 1.98 2.70 8.38 Shivachal ASCR28 Dug 4.08 1.02 2.62 NA Shivtila 83H1A4 Dug 7.67 0.52 2.43 6.92 Silcoorie ASCR38 Dug NA NA 0.92 NA Silkuri Pz 83D2D3 Pz 1.41 0.28 1.77 1.00 Tarapur ASCR32 Dug 1.53 0.15 0.13 NA Darrang Bengbari 78N2D10 Dug 3.77 2.83 3.07 6.12 Bhakatpara Ow ASDR33 Pz 4.57 2.63 3.28 4.72 Bhalukmari-I 83B2A7 Dug 3.92 0.61 3.19 3.76 Chamuapara 83B3A2 Dug 2.20 0.63 1.43 3.94 Dalgaon 83B2A2 Dug 4.76 2.60 2.84 4.72 Gelabil (Thelamara) 83B2B6 Dug NA 1.07 2.69 3.32 Goroibari ASDR31 Dug 1.90 1.02 1.69 3.84 Kalaigaon 78N2D3 Dug 2.31 0.23 1.48 2.08 Kendurtal 78N2D11 Dug 2.10 2.43 1.38 2.23 Madanpur OW ASKM55 Pz NA 1.23 NA NA Madhupur 83B2A6 Dug 3.72 2.72 3.30 3.56 Majgaon OW ASDR34 Pz 5.73 2.31 2.97 5.18 Mangaldoi 83B3A1 Dug 4.59 0.15 3.72 4.30 Mangaldoi II 83B3A3 Dug 4.54 1.49 2.98 3.65 Orang 83B2B1 Dug 2.82 0.09 1.87 2.60 Paneri 78N2D9 Dug 1.35 0.95 1.22 1.30 Paneri TG 78N2D1 Dug 10.51 4.33 3.68 6.53 Rowta chariali 83B2A3 Dug 3.08 0.46 2.23 2.92 Thekerabari .1 83B2A1 Dug 4.41 2.29 2.79 4.03 Udalguri 83B2A4 Dug 3.06 1.46 1.91 NA Dhemaji Akajan 83I2D1 Dug 3.48 0.27 2.00 4.46 Bhagaban charali 83I2D2 Dug 9.25 4.39 8.17 9.08 Bijoypur 83M1A3 Dug 2.78 0.17 1.79 2.47 Bokabil Ow ASDM24 Pz 3.85 1.11 2.30 3.16 Bordoloni 83I3B1 Dug 1.14 NA 0.35 1.06

State / District Village Well No Well Type Mar-14 Aug-14 Nov-14 Jan-15
Chengali Pather Ow ASDM23 Pz 2.50 0.34 1.29 2.03 Dekapam ASDM21 Dug 2.23 0.70 1.44 2.05 Dhakuakhana1 ASDM07 Dug NA NA 4.47 5.29 Dhemaji 1 83I3C1 Dug NA -0.99 NA NA Dhemaji 2 ASDM 23 Dug 2.28 0.55 0.82 1.87 Dipa 83I2D3 Dug 7.00 2.03 4.14 5.34 Ghilamara ASDM11 Dug NA NA 4.47 4.47 Ghilamara Ow ASDM26 Pz 3.73 NA 4.47 4.24 Gogamukh Hss Ow ASDM25 Pz NA 0.92 2.79 2.00 Jamuguri 83F1D3 Dug 3.04 NA 2.40 3.23 Jonai murkongselek 83M1A1 Dug 2.48 0.42 1.54 2.72 Silapathar 83I2C1 Dug 4.96 0.67 1.88 4.04 Simen Chapori ASDM22 Dug NA NA 4.41 5.17 Siripani 83I2C3 Dug 1.60 -0.04 NA 1.28 Sisibargaon 83I2C2 Dug 2.32 0.68 1.62 2.23 Telem 83M2A1 Dug 4.61 0.74 2.05 4.54 Dhubri Bagaribari 78J4A4 Dug 14.89 18.89 12.86 14.50 Bahalpur 78J3B4 Dug 4.50 0.80 2.55 3.75 Balajan ASDH15 Dug 4.07 0.30 NA 2.10 Bilasipara 78J4A1 Dug 3.44 NA 2.32 3.02 Chapar 78J3B2 Dug 4.27 1.02 3.48 2.31 Civil Hospital ASDH18 Pz 4.83 2.91 2.60 3.93 Dakhin Tokesara ASDH16 Dug 3.90 0.65 2.71 3.14 Dhubri Town 78F4D4 Dug 5.40 0.78 3.03 4.15 Matabag ASDH19 Pz NA 4.01 NA 5.23 Moterjhar ASDH17 Dug 5.03 0.99 3.23 4.89 Panbari 78J4A2 Dug 16.64 15.97 16.09 14.99 Rupshi 78F4D3 Dug 4.20 0.03 1.61 3.75 Shapamari Beat ASDH13 Dug 16.29 12.39 14.14 15.99 Sonamukhi ASDH14 Dug 1.91 0.45 1.37 1.58 Dibrugarh AMC Campus ASDB14 Pz NA 0.36 1.03 2.68 Azarguri gaon 83I3D4 Dug 3.71 0.45 2.84 3.67 Bamunbari 83I4D4 Dug 2.35 0.94 2.10 3.40 Barbaruah 83I3D6 Dug 4.65 1.55 2.85 4.49 Chabua 83M3A2 Dug NA 1.94 4.72 5.33 Dibrugarh 83I3D1 Dug 1.38 0.35 0.45 0.56 Dikom 83M3A1 Dug 5.15 2.82 3.98 4.93 Dirialgaon Pz 83M4B6 Pz NA 0.30 NA 0.98 Domar Dolong Tw ASDB12 Pz NA 0.46 1.53 1.68 Jaipur Naharani 83M3A4 Dug NA 0.73 3.63 3.96 Lepetkata ASDB13 Dug NA 0.34 2.46 2.78 Melengial PWSS ASDB15 Pz NA 0.40 1.34 2.98 Goalpara Agia1 78J4C3 Dug 5.05 NA 3.65 4.15 Agia2 ASGP21 Dug 4.85 1.98 3.05 3.33 Baida 78J4B3 Dug 4.90 NA 4.00 4.01 Bhalukdubi (Goalpara) ASGP15 Dug 7.35 2.27 4.50 4.81 Damra 78K1D8 Dug 5.40 3.79 4.15 4.61 Dhupdhara 78O1A2 Dug 5.13 1.06 3.83 3.85 Dudhnai 78K1D1 Dug 2.25 0.94 3.00 3.01 Dudhnoi II ASGP17 Dug 2.95 NA 4.40 4.45

State / District Village Well No Well Type Mar-14 Aug-14 Nov-14 Jan-15
Dwarka ASGP19 Dug 3.80 NA 1.40 1.71 Goalpara Town 78J4C4 Dug 3.64 6.21 7.54 8.24 Khutabari 78N4A1 Dug 3.70 NA 2.20 2.31 Krishnai 78J4C1 Dug 2.59 NA 2.64 2.70 Lakhipur 78J4B1 Dug 3.70 NA 2.84 2.92 Matia 78J4D1 Dug NA NA 3.00 3.16 Pattarpara ASGP22 Dug 4.10 0.93 1.50 2.08 Rongjuli 78K1D2 Dug 3.20 1.83 2.10 2.37 Salpara ASGP16 Dug 3.40 0.87 3.01 3.12 Sarapara ASGP23 Dug 4.10 1.94 2.30 2.66 Teuli ASGP20 Dug 5.00 NA 4.41 4.60 Golaghat Balibat ASGL09 Dug 3.10 NA 2.90 3.29 Bokakhat1 ASGL12 Dug 3.90 1.80 3.18 3.62 Bongaon ASGL11 Dug 7.10 1.96 6.30 4.50 Dhalaguri ASGL14 Dug NA 1.54 NA 4.49 Gaghibari Namghar ASGL10 Dug 1.80 1.20 2.03 1.74 Garampani ASGL15 Dug 9.70 4.63 6.15 6.20 Golaghat 83F2D1 Dug NA 1.23 2.55 2.53 Haldibari Buri Ai ASGL13 Dug NA 2.17 3.55 5.16 Kamargaon1 83F2C1 Dug 5.22 3.54 NA NA Kohra kaziranga 83F2B1 Dug NA 3.23 NA 8.05 Oating 83J3A1 Dug 5.35 1.86 4.20 5.66 Hailakandi Burakhai ASHL08 Dug 1.60 0.31 0.32 NA Katlicherra N ASHL02A Dug 4.63 0.48 1.66 2.89 Monacherra 83D2C3 Pz 3.09 1.61 1.60 1.50 Panchgram New ASHL05A Dug 8.08 0.71 2.71 7.07 Syedband Part II ASHL01A Dug 1.55 0.38 2.72 1.55 Jorhat Chandan Nagar ASJR23 Dug 1.32 1.20 1.77 2.63 Jorhat Chengal Ati ASJR24 Dug NA 1.48 1.78 2.74 Chutuyakari ASJR31 Dug NA 1.47 NA 3.46 Cinamara Tinali ASJR27 Dug NA 1.25 NA 3.66 Cinemora ASJR18 Dug 2.27 1.59 2.07 3.56 Dabarapara charali 83J2B3 Dug 2.61 1.26 1.30 2.79 Dahotia ASJR29 Dug 1.81 1.03 1.05 3.28 Kokilamukh 83J1A3 Dug 2.89 1.47 1.24 2.93 Kolakhowa ASJR20 Dug 2.13 1.87 1.23 4.41 Lichubari ASJR21 Dug 0.98 2.10 0.58 3.82 Mariani 83J2B4 Dug 1.95 2.24 1.45 3.78 Meleng Kaparadharia ASJR28 Dug 1.91 0.55 1.45 1.73 Nefa Tiniali ASJR30 Dug 0.48 1.62 0.66 2.99 Rajoi TG 83J2B5 Dug NA 1.41 NA 3.27 Rangajan PHE Sc ASJR26 Dug NA 2.54 NA 3.63 Saklatinga TGI 83J2A11 Dug NA 3.11 2.45 3.14 Saruhoj ASJR19 Dug NA 1.22 0.98 2.40 Selenghat 83J2B2 Dug NA 1.19 NA 2.31 Sodial Kacharigaon ASJR22 Dug 1.79 1.02 1.77 2.34 Tipamia 83J2A6 Dug NA 0.95 0.80 2.06 Titabor 83J2A7 Dug 2.15 1.95 2.05 3.10 Kamrup Abhaipur ASKM44 Dug 1.94 1.93 2.55 1.37 Agyathuri 78N4C2 Dug 4.15 1.01 3.20 5.08

State / District Village Well No Well Type Mar-14 Aug-14 Nov-14 Jan-15
Alikash Adarsh 78N4C16 Dug 3.00 0.90 2.60 4.10 Amingaon ASKM46 Dug 5.70 3.02 2.35 4.55 Azara 78N4C1 Dug 5.82 NA NA NA Bamfor ASKM50 Dug 3.49 1.64 1.13 2.20 Bamunigaon1 78N4B3 Dug 5.44 NA 3.20 3.32 Bamunigaon2 ASKM40 Dug NA 1.87 NA NA Boko1 ASKM39 Dug 3.75 2.50 2.96 3.17 Boragaon 78N4C7 Dug 6.06 NA NA NA Charani ASKM48 Dug NA 0.26 2.36 3.04 Chhaygaon ASKM41 Dug 7.40 1.25 2.80 3.02 Darkuchi 78N2C4 Dug 4.34 1.85 2.97 4.13 Dhobartari ASKM45 Dug 2.25 1.93 2.65 2.34 Dirgheswari 78N4C12 Dug 3.97 0.47 0.64 NA Dora Kahara ASKM47 Dug NA NA 3.31 4.03 Hajo 78N4C5 Dug 1.28 1.64 0.83 0.82 Kachkatchi ASKM49 Dug 3.50 2.33 1.93 3.06 Kahara 78N3C2 Dug 4.30 1.80 2.70 4.12 Kahilipara 78N4D7 Dug 6.09 NA NA NA Khanapara 78N4D3 Dug 8.20 NA NA NA Khetri 83B4A3 Dug 2.20 0.48 1.33 1.64 Khetri II ASKM51 Dug NA NA 1.43 2.41 Maligaon 78N4C6 Dug 1.00 NA NA NA Mirza ASKM42 Dug 8.00 3.22 4.61 5.34 Paltan bazar 78N4C14 Dug 1.06 NA NA NA Rajapara 78O1A3 Dug NA 1.83 2.21 2.79 Rangia Ow ASKM54 Pz 1.99 0.26 1.31 1.85 Rani1 78N4C9 Dug NA NA 2.62 2.96 Rani2 ASKM43 Dug NA 1.02 2.25 2.67 Samanta Pathar ASKM36A Dug NA NA NA 2.31 Sonapur 83B4A2 Dug 1.55 0.31 1.05 1.25 Sonapur II ASKM52 Dug 1.97 0.31 0.63 2.23 Sualkuchi 78N4C11 Dug 2.67 NA 1.78 2.26 Taptoli New ASKM35A Dug NA 1.06 NA NA Topatoli 83B4A4 Dug 1.80 0.47 0.88 1.91 Umsiang Ow ASKM53 Pz 7.01 NA NA NA Zoo narangi rd 78N4D2 Dug 8.20 NA NA NA Karbi Anglong Adarakha Tiniali ASKA44 Dug NA 1.36 1.93 4.25 Balipathar 83F4D3 Dug NA 1.53 2.10 3.27 Boithalangsu 83C1C2 Dug 5.37 3.15 NA NA Bokajan I ASKA41 Dug 11.45 3.79 9.45 4.39 Bokajan II ASKA42 Dug 4.08 3.40 4.23 2.80 Bokoliaghat ASKA34 Dug 6.10 1.54 1.40 NA Bokulia 83G1C3 Dug 3.00 1.36 2.16 3.05 Dengaon R10 ASKA33 Dug NA 2.51 NA NA Dengaon R5 83B4D7 Dug 4.31 1.52 1.19 3.66 Dentaghat 83F3A1 Dug NA 2.33 1.64 2.95 Dillai 83G1C4 Dug 3.91 6.11 3.69 6.56 Diphu 83G1B1 Dug 1.31 NA 1.61 19.21 Dishobai ASKA35 Dug 8.03 3.36 2.13 2.36 Ghouria Dhubi ASKA43 Dug 3.60 2.32 2.86 3.86

State / District Village Well No Well Type Mar-14 Aug-14 Nov-14 Jan-15
Habranrangapar 83F4A7 Dug NA NA NA 2.61 Hapjan 83G1C1 Dug NA NA 2.10 4.22 Kalonga 83C1D2 Dug NA 0.46 NA NA Khatkhati 83G1D3 Dug 4.81 3.07 3.81 4.04 Khatkhati CRBF ASKA40 Dug NA 2.39 NA 3.31 Kheronighat 83C1D3 Dug NA 1.24 NA NA Langhing ASKA32 Dug 3.31 2.39 1.08 2.05 Manikpur 83F4A6 Dug NA 0.69 NA 3.25 Manja Bus Stand ASKA39 Dug 5.70 7.69 4.45 4.45 Manja Forest 83G1B2 Dug 3.40 9.54 3.15 2.85 Mohendijua ASKA38 Dug 9.85 1.67 11.90 11.90 Phonglangso ASKA36 Dug 2.32 1.41 6.38 6.38 Phuloni 83F4A2 Dug 4.16 3.08 1.68 2.31 Saphapani ASKA45 Dug 6.51 2.19 3.71 4.67 Silanijan 83F3D1 Dug NA 7.90 5.80 5.89 Siljuri 83F2B2 Dug NA 4.12 NA 7.83 Swarghati ASKA31 Dug NA NA 2.07 2.49 Terangaon ASKA37 Dug 2.10 1.11 1.90 2.35 Karimganj Badarpur 83D1C1 Dug 5.55 0.80 2.52 3.34 Badarpur Pz ASKG03 Dug 1.30 0.29 NA 0.90 Badarpur Pz 83D1C9 Pz NA NA 0.98 0.91 Dhaulia 83D2B6 Dug 0.65 -0.01 0.05 0.01 Harinadik ASKG14 Pz 0.12 0.17 0.50 -0.20 Hatikira 83D3B1 Dug 1.94 NA 1.75 1.15 Karmganj ASKG15 Dug 0.80 0.34 0.93 0.04 Kayasthagram ASKG16 Dug 1.57 1.07 1.17 1.57 Patharkandi ASKG17 Dug 3.95 3.10 2.19 1.64 Rk Nagar I 83D2B4 Dug 2.93 0.34 1.02 0.87 Sarkaribari 83D2B7 Dug 1.55 0.85 0.62 0.61 Lakhimpur Amguri ASLK23 Dug 4.98 2.05 3.63 4.49 Bhogpur charali 83E4D1 Dug 2.45 0.98 1.66 1.78 Bihpuria 83E4D4 Dug 4.12 NA 1.80 3.56 Boginadi(balijan) 83I3A1 Dug 2.92 0.56 1.52 2.45 Dejoo ASLK24 Dug 2.22 0.85 1.60 1.88 Dholpur 83F1D1 Dug 1.48 NA NA NA Dolanghat chara 83I4A3 Dug 2.81 0.89 2.62 2.67 Harmoti 83E4D6 Dug 3.25 0.28 2.05 2.85 Islampur 83E4D3 Dug 5.05 2.27 3.66 4.61 Kadam 83I3A3 Dug 1.75 0.36 1.14 1.65 Laluk 83E4D2 Dug NA NA 1.34 1.86 Madhupur ASLK22 Dug NA NA NA 0.77 Milanpur ASLK26 Dug 3.55 0.47 1.32 2.53 N Lakhimpur Ow ASLK27 Pz 3.47 NA NA NA N.lakhipur(old) 83I4A1 Dug 2.20 NA NA 2.10 Naoboisa 83I4A4 Dug NA 0.35 NA NA Narayanpur 83F1D4 Dug 3.36 0.28 1.63 2.75 Panigaon 83I4A2 Dug 3.97 1.80 2.62 3.40
Pathalipam 83I3B6 Dug 3.44 1.44 2.51 3.26
Pathalipam II ASLK25 Dug 5.75 2.74 3.80 5.06

State / District Village Well No Well Type Mar-14 Aug-14 Nov-14 Jan-15
Morigaon Baghara 83B4B2 Dug 4.94 1.67 2.47 4.36 Baropujia ASMR14 Dug 2.11 2.72 2.25 3.25 Barukati Ow ASMR23 Pz 4.53 NA 3.28 3.47 Basanaghat Ow ASMR19 Pz 3.25 3.96 4.43 2.94 Charibahi Ow ASMR22 Pz 3.01 1.95 4.25 NA Daponibari Ow ASMR18 Pz NA NA 3.32 4.41 Deosal ASMR12 Dug NA NA 3.64 4.71 Garmari gaon 83B3A4 Dug 4.65 1.59 2.69 3.64 Jagibhagatgaon Ow ASMR20 Pz NA NA NA 2.85 Jagiroad 83B4A1 Dug 4.01 1.88 2.35 3.70 Kumoi ASMR15 Dug 2.66 1.02 1.22 2.17 Morigaon 83B3B10 Dug 1.94 1.58 0.96 1.64 Nasatra 83B4A5 Dug NA 0.65 NA NA Nelle New ASMR11 Dug 8.12 1.02 4.79 6.18 Pabbarbhagia ASMR24 Dug NA NA NA 2.61 Pamibahua ASMR16 Dug 4.34 3.31 3.27 4.27 Shugumbari ASMR17 Dug NA NA 2.16 2.92 Silsang Namghar ASMR13 Dug NA NA 4.32 5.18 Solmari Ow ASMR21 Pz 2.73 2.13 3.65 4.77 Nagaon Amsoi 83B4B5 Dug 3.46 2.45 3.28 4.35 Bagori 83F2A4 Dug 5.28 1.40 2.70 6.97 Balijan Ow ASNG42 Pz 4.09 2.43 2.18 2.83 Bamuni tinali 83B3D9 Dug NA NA NA 3.47 Beldonga mandir 83B4D8 Dug 3.06 1.41 2.52 2.87 Bichamari 83B3B1 Dug 3.18 2.15 3.02 3.36 Borchukhaba 83B3B5 Dug NA NA NA 5.53 Bordowa 83B3C2 Dug 3.44 0.89 1.12 1.55 Dakhinpath OW ASNG44 Pz 4.73 3.53 3.33 4.23 Dalapani ASNG39 Dug 4.96 3.62 2.78 3.66 Dhing 83B3B6 Dug 4.60 3.00 2.82 3.53 Doboka 83B4D1 Dug 4.26 4.26 2.72 3.76 Ghasibasti Ow ASNG46 Pz 2.83 1.16 1.05 2.85 Gomotha ASNG34 Dug 3.46 1.95 1.92 2.89 Haldiati sub bt 83B4D6 Dug 2.46 2.46 2.31 3.53 Hatibatha ASNG35 Dug 3.21 1.56 1.44 2.64 Jurapukhuri 83C1D7 Dug 6.29 5.89 5.64 5.94 Kathiatoli 83B4C4 Dug 1.23 0.34 0.56 1.39 Kazirang Tourist Vil ASNG27 Dug 9.83 3.05 9.53 6.17 Kondali 83B3D5 Dug 1.78 0.98 1.58 2.57 Lanka 83C1D1 Dug 6.18 5.12 6.41 5.98 Lumding 83G1A1 Dug 3.40 1.23 1.45 2.55 Mahariali ASNG38 Dug 1.70 0.89 2.00 2.40 Nadeorigaon 83B4D2 Dug 3.13 NA NA NA Natali ASNG37 Dug 3.70 1.98 1.56 2.57 Pahukata ASNG36 Dug 5.86 4.12 3.65 4.65 Phulaguri R5 ASNG41 Dug NA NA 1.00 1.67 Phulaguri R6 83F2A5 Dug 3.63 1.65 4.13 6.85 Rangamati Ow ASNG45 Pz 5.98 4.56 3.78 4.85 Samuguri 83B3D7 Dug 3.80 0.80 3.00 4.00 Silghat 83B2D6 Dug 6.34 3.89 2.14 3.16

State / District Village Well No Well Type Mar-14 Aug-14 Nov-14 Jan-15
Sulung p.o. 83B3D8 Dug 5.28 2.80 2.63 4.02 Tirchang ASNG47 Dug 5.15 NA NA NA Zebra Khua ASNG33 Dug 5.04 NA NA NA Nalbari Tamulpur 78N2C1 Dug 2.79 0.92 3.32 2.56 Tihu 78N3B3 Dug 2.19 0.79 2.15 4.71 Sibsagar Athkhel Grant ASSA05 Dug 15.30 NA 12.80 8.94 Sibsagar Bandarmari 83I4C14 Dug NA 1.45 2.23 3.62 Betbari alimore 83I4C8 Dug NA NA 3.45 3.68 Demow Sukan 83I4C11 Dug 5.10 2.31 4.40 3.67 Dhapaboria 83I4C5 Dug NA 1.90 2.16 3.59 Geleki 83J1C9 Dug NA 1.98 NA 3.55 Hanumanbagh 83J1C7 Dug NA 1.29 NA 2.52 Madhurigohain Gaon ASSA03 Dug 4.75 6.10 4.10 3.42 Moranhat 83I4D1 Dug 4.80 1.06 2.80 3.84 Santak ASSA04 Dug 11.40 NA 9.30 2.20 Sapekhati 83M4A1 Dug 6.08 2.45 2.30 3.00 Sibsagar 83J1C2 Dug 1.65 1.14 NA 3.99 Sonarigaon ASSA02 Dug NA 1.53 2.00 3.86 Sonitpur 18th Mile ASSP29 Dug 2.45 1.00 1.59 2.19 Balipara 83B1D4 Dug 2.05 0.95 1.73 2.10 Barchola 83B2B5 Dug NA 1.91 1.95 2.72 Bihupukhuri 83F2A7 Dug 8.45 5.83 6.07 6.90 Biswanath 83F2A8 Dug 9.02 3.89 5.65 7.63 Borgang 83F1B2 Dug 2.89 0.91 1.86 2.60 Buroighat ASSP 25 Dug 2.94 0.97 1.89 2.43 Charduar 83B1D1 Dug 3.50 1.77 2.87 3.38 Dhalaibil 83B1D3 Dug 5.23 2.88 3.54 4.65 Dhekiajuli 83B2B2 Dug 4.12 2.13 2.69 3.67 Garumari 83B1D2 Dug 6.33 0.57 1.64 3.84 Gohpur 83F1C2 Dug 2.23 0.39 1.17 1.81 Hawajan 83F1C4 Dug 3.45 0.31 1.03 3.09 Helem ASSP24 Dug 2.44 0.34 1.48 2.03 Jamuguri North 83B2D3 Dug 2.49 1.34 1.30 2.26 Japoriguri ASSP27 Dug 3.29 NA 1.97 NA Ketela TE ASSP26 Dug 3.22 0.86 1.96 2.44 Kolabari ASSP23 Dug 2.18 0.17 0.88 1.10 Na Pam ASSP31 Dug NA 0.63 1.27 1.87 Panigaon Ow ASSP32 Pz NA NA 2.37 NA Sootia 83F2A2 Dug 3.79 2.16 2.03 3.45 Tezpur 83B2D2 Dug 6.96 3.39 5.34 5.67 Thelamara ASSP30 Dug 3.62 1.01 2.00 3.36 Tolakbari Ow ASSP34 Pz 4.04 1.65 3.13 3.49 Tupia ASSP28 Dug 5.76 3.39 4.21 5.25 Tinsukia Bordumsa 83M3D3 Dug 0.28 0.84 1.71 1.50 Borgolai 83M3C2 Dug 2.32 0.83 1.42 2.36 Bortorani 83M2B4 Dug 1.90 0.54 1.65 2.30 Digboi 83M3C1 Dug 4.65 1.03 1.43 2.47 Jagun 83M3D4 Dug 4.42 1.27 2.65 3.97 Jaipur naharjan 83M4B5 Dug NA 0.74 1.43 2.33 Ledo forest off 83M3C3 Dug 2.31 0.76 4.97 5.64

State / District Village Well No Well Type Mar-14 Aug-14 Nov-14 Jan-15
Lekhapani 83M3D1 Dug 6.07 1.60 3.81 3.73 Panitola 83M3B4 Dug 4.71 0.64 3.64 4.54 Philobari 83M2C7 Dug NA 0.98 5.20 5.37 Rangagora guijn 83M2B3 Dug 2.20 0.64 1.98 2.48 Tinsukia 83M3B2 Dug 5.03 1.27 3.56 4.20 Tirap gate 83M3D2 Dug 4.75 1.47 4.90 5.32 Meghalaya East Garo Hills Baiza Rongreng MLEG15 Dug NA NA NA 4.11 Bajengdoba 78K1C2 Dug NA NA 3.40 3.52 Dainadubi MLEG11 Dug 4.21 NA 3.60 3.75 Darugiri 78K2D2 Dug 4.15 NA 2.56 3.51 Depa sarangma 78K1D4 Dug NA NA 2.12 2.81 Dobetkolgiri MEEG12 Dug NA NA NA 2.85 Dobu MLEG13 Dug NA NA NA 2.45 Kharkutta 78K1D7 Dug 4.32 NA 2.56 3.05 Mendal 78K1B1 Dug NA NA 1.85 2.29 Mendipathar 78K1C1 Dug NA NA 3.10 3.32 Narringirri MLEG14 Dug NA NA NA 2.13 Rongjeng 78K2D1 Dug 5.25 NA 5.05 4.74 Rongmil 78K2D3 Dug 3.90 NA 2.87 2.94 Samanda Megapagre MLEG16 Dug 3.30 NA NA 2.71 Songsak MLEG17 Dug NA NA NA 1.75 Williamnagar 78K2C2 Dug 2.08 NA NA 2.06 East Khasi Hills Balat 78O4B1 Dug 7.51 2.62 6.53 8.57 Cherrapunji 78O3C1 Dug 1.38 NA 0.41 0.54 Dhankheti MLEK08 Dug 1.86 2.24 1.76 1.63 Golf Link MLEK07 Dug 7.57 1.47 2.78 3.73 Lachuamiere MLEK09 Dug 1.11 0.45 0.85 1.01 Mawpat MLEK11 Dug NA 6.26 3.56 2.40 Nongmynsong MLEK12 Dug NA 1.44 2.73 2.72 Rynjah ( R & R Col) MLEK10 Dug NA 3.90 4.88 5.32 Shillong Polo 78O2D1 Dug 7.57 1.47 NA 1.25 Jaintia hills Dauki 83C4A1 Dug 3.08 0.75 1.57 1.86 Jowai 83C3A1 Dug NA 1.07 0.40 0.57 Ri-Bhoi Byrnihat MLRB02A Dug 2.75 1.05 1.70 2.60 Nongpoh 78O1D1 Dug 2.90 1.50 2.65 2.82 West Garo Hills Ampati 78G3D1 Dug 4.30 NA NA NA Asanang 78K2B1 Dug 4.03 NA 3.13 3.13 Baljek ASWG17 Dug 2.85 NA 2.10 2.38 Barengapara 78K4A1 Dug 5.03 NA NA 7.14 Barengapara II ASWG22 Dug 4.95 NA NA 3.92 Belguri ASWG21 Dug 7.10 NA 6.67 6.82 Garobandha 78K2A1 Dug 2.16 NA NA NA
Kherapara 78K3A2 Dug NA NA NA 3.27 Nidanpur II ASWG19 Dug NA NA 0.85 1.08 Nongopara ASWG24 Dug 2.45 NA NA NA Phulbari 78K1A1 Dug 7.47 NA 2.17 3.29 Phutamati ASWG20 Dug 2.70 NA 1.50 1.62 Purkhasia 78K3A1 Dug 4.92 NA NA NA Rongram ASWG18 Dug 3.20 NA 3.15 3.28 Tikrikilla 78K1A2 Dug 7.78 NA 7.63 7.69 Zikzak 78G3D3 Pz 4.25 NA NA NA

State / District Village Well No Well Type Mar-14 Aug-14 Nov-14 Jan-15
West Khasi Hills Mairang 78O2C1 Dug 1.16 0.38 0.73 0.80 Nagaland Dimapur 3 Mile Bazar NLDM19 Dug 8.15 NA 11.00 11.50 7th Mile Colony NLDM21 Dug 11.80 NA 8.50 8.58 Bade Bazar NLDM14 Dug 6.85 NA 4.90 9.11 Chumkidima 83G1D1 Dug 3.53 NA 0.85 3.08 Dgm Colony 83G1C8 Pz 21.01 NA 16.75 20.97 Dgmofficedimapur 83G13GM10 Pz 23.36 NA 27.58 28.11 Dhansiripar 83G1C5 Dug 4.28 NA 6.87 4.56 Dimapur 83G1C2 Dug 14.25 NA 4.00 11.19 Diphupar NLDM22 Dug 8.75 NA 2.65 2.71 Doyabur DMC NLDM12 Dug 7.47 NA 4.90 5.66 Industrial Estate 83G1C7 Dug 4.44 NA 4.50 3.79 Jalukie 83G2C1 Dug 9.20 NA 3.69 7.09 Maibiram NLDM13 Dug NA NA 5.30 5.82 Marwari Colony 83G1C9 Dug 6.34 NA 2.84 3.34 Purana Bazar 83G1C10 Pz 13.36 NA 12.80 10.95 Rilayan Colony NLDM24 Dug 18.81 NA 20.46 20.22
Seirujha Colony Chumukedi 83G9GM11 Pz 18.81 NA 12.20 12.45
Singrijan 83G1C6 Dug 5.59 NA 4.04 4.76 Thilaxu Block-II NLDM16 Dug 9.79 NA 11.14 4.56 Zakesatho Colony NLDM23 Dug 4.90 NA 5.60 5.64 Zion Hospital NLDM18 Dug 8.15 NA 7.35 8.08 Kohima Cathedral Complex 83K2A1 Dug 2.86 NA 1.81 2.86 NLSA Complex 83K2A2 Pz 4.22 NA 4.18 3.98 Sepfuzou Colony 83K2A3 Dug 6.29 NA 6.18 6.51 Mokokchung Lampi 83J3B1 Pz 3.17 NA 2.11 1.72 Mon Mon Town 83N2GM14 Pz 35.77 NA 34.49 34.38 Namsa 83J1D1 Dug 4.25 NA 2.44 3.36 Phek Phek Town 83K6GM13 Pz 54.44 NA 64.07 53.56 Tuensang Tuensang 83J16GM12 Pz 38.43 NA 37.41 37.42 Wokha New Market 83J4B2 Dug 11.58 NA 4.35 11.13 Tourist Lodge 83J4B1 Dug 5.52 NA 2.47 3.70 Wokha Town 83N2GM15 Pz 28.08 NA 49.59 26.82 Tripura Dhalai Abhanga N TRDL04 Dug 5.43 1.35 2.12 NA Ambassa N TRDL06 Dug 2.55 0.13 1.83 NA Darlang Basti TRDL02 Dug NA NA NA 4.00 Durga Chowmuhani TRDL01 Dug NA NA NA 4.04 Kamalpur 78P4D1 Dug 3.59 1.84 1.54 NA Manu N TRDL05 Dug 5.55 4.79 4.27 NA North Tripura Bagbasa N TRNT10 Dug 1.45 0.46 1.10 1.45 Chandramanikami TRNT18 Dug NA NA NA 4.14 Dharmanagar 83D3B2 Dug 4.98 4.02 4.12 4.47 Gauranagar N TRNT11 Dug 5.56 1.74 2.62 5.63 Kanchanchhera TRNT12 Dug 7.76 3.41 2.98 4.35 Kanchanpur 84A1A1 Dug NA 2.38 2.01 2.34 Karaicherra TRNT14 Dug NA 1.02 1.61 2.32 Kumarghat 83D4A6 Dug 5.38 3.61 4.01 5.40 Laljuri TRNT15 Dug NA 6.19 6.18 6.83

State / District Village Well No Well Type Mar-14 Aug-14 Nov-14 Jan-15
Panchamnagar TRNT17 Dug NA NA NA 5.16 Panisagar 83D4A1 Dug 3.72 2.44 2.77 3.83 Pecharthal 83D4A7 Dug 6.70 1.66 3.84 5.87 Rajnagar TRNT13 Dug 4.46 2.24 2.40 4.14 Satnala TRNT16 Dug NA NA NA 0.98 South Tripura Amarpur TRST05 Dug 2.11 1.10 1.58 1.58 Ampi Colony TRST07 Dug 5.75 4.89 5.13 5.13 Bampur TRST 06 Dug 4.14 2.96 3.29 3.29 Dhawajnagar Udaipur 79M2B8 Dug 4.54 2.38 3.54 3.54 Gardhang TRST11 Dug 0.81 0.38 0.71 0.76 Garjee Bazar 79M3B4 Dug 3.40 0.62 2.09 2.79 Hrishyamukh 79M4C4 Dug 4.95 2.40 3.81 4.12 Jhajhari TRST08 Dug 4.73 0.71 3.19 4.21 Kalachhara TRST10 Dug 5.77 3.98 5.14 5.36 Kankraban TRST12 Dug 10.33 8.69 9.52 9.52 Manu Bazar TRST 9 Dug 4.34 2.67 3.74 4.13 Manurmukh TRST03A Dug 1.15 0.68 1.07 1.06 Naobari TRST04 Dug 3.22 1.27 2.57 2.57 Radhanagar TRST15 Dug 4.02 1.42 3.18 3.56 Rajnagar TRST14 Dug 4.75 2.54 3.96 4.48 Sabroom 79M4C1 Dug 6.17 3.81 5.61 5.82 Santirbazar Purba TRST13 Dug 5.03 2.16 3.89 4.35 West Tripura Badharghat DTW TRWT25 Pz 4.09 3.36 3.55 3.73 Bagan Bazar TRWT33 Dug 3.98 1.35 1.68 1.96 Bishalgarh 79M2B1 Dug 3.32 2.59 4.12 4.19 Bodhjanagar Dtw TRWT19 Pz 21.85 20.81 20.42 20.75 Bodhjanagar Stw TRWT20 Pz 21.00 18.81 18.04 18.70 Chamapnagar1 TRWT39 Dug 2.80 1.11 1.79 1.98 Dakshin Kalamcherra TRWT04A Dug 1.69 1.39 2.56 2.93 East Narayanpur TRWT40 Dug 5.75 NA NA 3.58 Gongrai TRWT36 Dug 3.55 1.88 2.75 3.10 Ishanpur TRWT31 Dug 3.96 1.21 0.82 2.82 Kalyanpur 79M1C2 Dug 4.38 3.80 4.09 4.53 Kathalia bazar 79M3B5 Dug 2.75 1.64 2.92 3.16 Kenania 79M2A2 Dug 5.94 6.21 4.67 4.78 Khowai 78P4C5 Dug 2.08 1.52 2.16 1.88 Lichubagan STW TRWT22 Pz 5.84 5.09 6.27 6.55 Mohanpur2 TRWT38 Dug NA 0.86 0.86 3.11 Nagicherra1 TRWT29 Pz 27.75 25.47 24.73 25.59 Nagicherra2 TRWT30 Pz 21.95 28.58 28.56 29.26 Narsinghgarh DTW TRWT28 Pz 11.07 7.48 8.82 9.28 Paschim Howaibari TRWT34 Dug 4.35 2.32 3.06 3.87 Simna 78P4B1 Dug 6.19 4.65 5.61 5.39 Sipoyjala 79M2B7 Dug 2.49 1.97 NA NA Sonamura1 79M3B6 Dug 3.54 NA 1.53 2.65 Subalsingh TRWT32 Dug 7.91 5.84 6.90 7.23 Suryamaninagar DTW TRWT23 Pz 6.69 5.76 6.27 NA Suryamaninagar STW TRWT24 Pz 6.70 5.39 6.01 6.22 Tufaniamura TRWT35 Dug 4.62 4.31 3.95 4.26 Tuimadhu TRWT37 Dug 3.94 4.34 4.70 5.06

ANNEXURE – IIA Monthly Water level monitoring wells in NER
State / District Village Feb-14 Mar-14 Apr-14 May-14 Jun-14 Jul-14 Aug-14 Sep-14 Oct-14 Nov-14 Dec-14 Jan-15
ARUNACHAL PRADESH Changlang Jairampur 3.84 5.23 5.58 6.00 5.74 4.36 1.79 3.80 2.55 4.72 4.96 5.89 East Siang Ruksin 3.42 - 3.72 2.76 1.75 1.44 1.22 1.33 2.22 2.30 1.88 2.33 Papumpare Banderdewa-I 12.41 11.69 11.39 11.87 11.72 NA NA 10.03 10.28 10.87 11.12 12.23 Papumpare Chimpu 3.47 3.10 3.13 4.17 1.57 1.19 0.64 1.72 2.06 2.62 3.31 3.35 Papumpare Itanagar-I 3.82 4.15 3.85 4.60 1.98 NA NA 1.18 1.89 2.21 2.97 3.52 Papumpare Itanagar-II 1.80 2.27 2.15 2.96 0.86 0.91 0.85 0.32 0.31 0.37 0.76 1.62 Papumpare Naharlagun-I 7.49 7.99 7.84 7.92 NA 4.87 4.38 4.65 4.94 5.78 8.21 6.68 Papumpare Nirjuli Vill-I 1.12 1.15 1.03 1.33 0.96 0.67 0.72 1.57 0.90 1.00 1.06 1.02 Papumpare Nirjuli Vill-II NA -0.07 -0.27 0.18 -0.51 -0.39 -0.70 -0.58 -0.43 -0.28 -0.18 -0.06 ASSAM Bongaigaon Baithamari IB 3.84 4.34 4.24 4.24 1.24 0.74 1.44 0.94 1.34 2.24 2.79 3.74 Bongaigaon Manikpur 2.80 3.00 3.20 3.30 1.80 0.80 1.10 0.90 1.10 2.00 2.50 2.70 Cachar Borjalinga 0.76 2.32 1.44 1.27 0.95 1.40 0.80 0.78 0.92 0.86 0.88 0.90 Cachar Digarkhal 5.20 5.29 5.35 3.45 2.22 2.35 2.95 1.45 2.25 3.21 4.33 - Darrang Dalgaon 4.39 4.61 4.78 4.50 3.51 2.58 2.73 1.32 2.02 3.09 3.65 3.89 Darrang Thekerabari 4.28 4.54 4.73 4.44 3.47 2.57 2.69 1.22 2.04 3.04 3.54 3.87 Dhubri Bagaribari 14.60 14.75 14.83 14.94 14.80 15.01 13.84 14.75 13.93 13.11 13.71 14.50 Dhubri Bilasipara 3.25 3.35 3.40 2.72 0.92 1.17 1.81 1.88 1.69 2.57 2.84 3.02 Dhubri Chapar 4.50 4.67 4.79 4.98 4.30 2.35 -0.90 1.53 2.45 3.73 4.15 3.45 Dhubri Dhubri 4.90 5.10 5.30 7.00 1.25 0.90 1.30 0.90 1.65 2.00 4.10 4.40 Dhubri Rupshi 3.30 2.95 3.35 3.60 2.36 1.85 2.24 1.25 1.60 1.86 1.75 3.20 Dibrugarh Barbaruah 5.30 5.18 6.70 5.77 4.39 3.70 2.60 - - - - - Kamrup Agayathuri 5.35 4.15 5.05 4.15 4.00 0.90 2.05 1.35 1.75 3.45 4.10 5.05 Kamrup Hajo 1.12 1.12 1.66 2.12 0.64 0.13 1.07 - - - - - Kamrup Rangia 0.44 0.45 - - - - - - - - - - Kamrup Sonapur - - - - - - - - - - 4.17 4.76 Kamrup Sualkuchi - 3.64 - - - - - - - - - -

ANNEXURE – IIA Monthly Water level monitoring wells in NER
State / District Village Feb-14 Mar-14 Apr-14 May-14 Jun-14 Jul-14 Aug-14 Sep-14 Oct-14 Nov-14 Dec-14 Jan-15
Kamrup Tihu 1.73 1.77 1.75 2.23 0.89 0.96 0.84 0.57 0.88 1.47 1.65 1.86 Kamrup (M) Amingaon (GWMS) 5.22 4.92 5.27 3.47 3.27 3.00 3.40 0.24 4.08 3.44 5.05 5.71 Kamrup (M) Ashwaklanta Temple 6.46 2.39 3.42 2.79 2.58 2.15 1.61 1.84 3.26 2.67 4.22 4.00 Kamrup (M) Avayapuri 1.54 1.53 1.94 1.29 2.06 1.78 1.52 1.42 2.47 2.55 2.39 2.10 Kamrup (M) Azara PHC (GWMS) 4.64 5.82 5.68 3.60 3.77 0.66 0.93 0.58 1.26 1.68 4.45 5.55 Kamrup (M) Bakarapara 4.24 3.97 4.86 3.03 2.66 1.14 0.82 1.01 2.07 1.81 3.37 4.35 Kamrup (M) Basitha FG 10.74 10.74 11.74 10.77 11.30 10.03 8.70 11.54 10.56 10.83 11.77 12.20 Kamrup (M) Bhellaguri 2.40 3.45 3.67 2.41 2.18 0.73 0.66 0.62 1.26 0.85 1.83 2.38 Kamrup (M) Boragaon (GWMS) 8.56 6.06 8.46 1.33 1.42 0.85 0.86 0.93 1.67 1.31 2.55 7.63 Kamrup (M) Choonsali, Madhabpur 3.99 4.25 4.44 4.32 4.06 3.33 3.23 2.98 4.77 3.46 4.12 4.51 Kamrup (M) Dirgheshwari (GWMS) 3.60 3.68 4.02 3.83 2.58 0.93 1.12 1.02 1.80 1.82 3.58 4.41 Kamrup (M) Dte of Agri 7.30 8.10 8.36 7.73 6.55 4.45 4.75 NAP 5.93 5.37 7.06 8.45 Kamrup (M) Fatasil-Ambari 2.18 2.40 2.40 1.46 1.40 0.95 1.34 1.04 1.53 1.44 2.88 2.53 Kamrup (M) Ganesh Mandir, Narengi 3.97 5.27 5.47 4.10 3.74 2.89 2.77 2.75 3.62 4.64 3.48 3.95 Kamrup (M) Garigaon 1.45 NA NA 0.98 NA 0.36 0.21 GL 0.90 0.75 2.03 2.14 Kamrup (M) GMC 1.08 1.58 1.76 1.05 1.22 0.87 0.91 0.87 2.14 1.23 2.55 2.49 Kamrup (M) Hengrabari FG 1.60 1.60 1.64 0.95 0.91 1.13 1.33 1.34 2.08 1.55 2.09 2.25 Kamrup (M) kacharibastiChristian 8.52 8.92 9.02 NA 5.86 4.43 5.64 5.44 5.90 6.77 9.25 9.00 Kamrup (M) Kahilipara (GWMS) 1.73 6.09 8.83 2.84 2.37 1.36 1.20 1.65 2.21 1.98 2.89 3.42
Kamrup (M) Khanapara Sc. Museum (GWMS) 5.05 8.20 9.35 3.77 2.40 1.13 NA 0.92 2.08 2.44 4.32 4.75
Kamrup (M) krishnagar 4.63 GL 5.44 4.50 3.81 3.37 3.39 3.61 GL 4.29 5.40 5.87 Kamrup (M) Lachitpur 9.49 NA 10.27 4.94 4.37 0.97 1.29 1.22 2.27 3.38 6.45 7.78 Kamrup (M) Lakhra Chariali 4.67 5.57 5.57 5.02 4.57 3.83 3.94 1.47 4.04 3.63 3.91 6.10 Kamrup (M) Lakshmi Mandir 8.70 7.90 8.50 7.26 6.44 3.47 0.40 2.72 5.03 8.35 9.05 9.15 Kamrup (M) Lalganesh Chariali 3.06 GL 5.57 2.19 2.94 1.23 0.73 1.73 2.52 1.81 3.44 4.15 Kamrup (M) Lalmati New NA NA 2.82 2.35 0.51 NA 0.74 1.12 NA NA 2.60 4.00 Kamrup (M) Mairapatti 6.49 5.09 6.11 4.42 5.97 1.09 1.66 0.59 1.76 2.31 5.69 7.87

ANNEXURE – IIA Monthly Water level monitoring wells in NER
State / District Village Feb-14 Mar-14 Apr-14 May-14 Jun-14 Jul-14 Aug-14 Sep-14 Oct-14 Nov-14 Dec-14 Jan-15
Kamrup (M) Maligaon (GWMS) 1.20 1.00 1.10 0.68 0.55 0.55 0.13 0.63 1.00 0.45 1.45 1.60 Kamrup (M) Narangi 6.82 6.92 7.88 7.15 6.79 5.55 5.42 6.50 8.14 7.39 7.89 8.25 Kamrup (M) Paltan bazar (GWMS) 0.80 1.06 0.88 0.39 0.53 0.43 0.38 0.70 1.30 0.94 1.49 1.99 Kamrup (M) Panjabari 9.75 10.60 10.55 10.38 9.88 7.53 7.59 8.72 7.80 7.50 10.28 9.75 Kamrup (M) Patgaon 1.30 1.30 1.68 1.18 1.13 0.72 0.90 0.96 1.56 0.85 1.95 2.06 Kamrup (M) Patherquery 1.54 1.20 1.84 0.88 0.64 0.75 1.24 1.32 1.52 1.29 1.38 1.85 Kamrup (M) Sijubari NA 7.91 NA 4.83 4.44 3.46 3.11 3.20 4.43 4.45 5.66 9.55 Kamrup (M) Survey Odalbakra 6.50 7.85 6.42 6.66 3.57 4.85 3.50 2.09 5.43 5.39 6.67 7.10 Kamrup (M) Vishwakarma Temple 3.92 4.15 5.40 1.22 1.23 1.00 1.29 1.19 2.10 1.38 2.24 2.24 Kamrup (M) Wireless 1.82 1.50 1.50 0.97 0.74 0.71 0.37 1.02 1.60 1.17 1.88 1.85
Kamrup (M) Zoo Narengi Road HS (GWMS) 6.06 8.20 6.22 3.14 3.32 2.93 3.06 2.70 4.43 3.21 4.65 7.00
Karbi Anglong Dillai 3.41 3.46 3.91 4.01 6.11 6.01 6.11 2.91 3.11 3.91 4.21 4.31 Karbi Anglong Diphu - - - - - - - 12.33 14.71 18.21 18.43 18.42 Karbi Anglong Khatkhati 4.05 4.41 4.77 4.13 4.19 3.55 3.09 3.32 3.73 3.79 4.01 4.03 Karbi Anglong Siljuri 7.41 8.05 7.21 6.89 6.39 4.74 4.12 3.67 4.85 6.21 7.02 7.10 Karbi Anglong Silonijan 6.55 7.45 7.30 7.61 7.72 7.81 7.90 7.30 8.40 8.45 6.15 6.25 Karimganj Badarpur 4.55 4.75 5.55 2.75 1.35 0.75 0.95 1.15 1.35 1.95 2.95 3.75 Karimganj Dhualia - 0.48 0.45 0.45 0.50 0.50 0.65 0.55 0.50 0.45 0.40 Karimganj Hatikira 1.70 1.81 2.02 1.66 1.31 1.16 1.03 1.17 1.10 1.56 1.75 1.77 Lakhimpur North Lakhimpur 3.27 3.30 3.44 - 2.30 1.84 - 0.98 0.78 1.77 2.48 0.98 Nagaon Ding - - 4.81 5.21 4.61 4.31 2.51 2.26 2.03 2.93 3.25 3.91 Nagaon Gomatha 4.04 3.27 2.71 3.35 3.95 1.95 1.10 2.60 2.27 1.40 2.89 3.25 Nagaon Joraphukuri 6.36 6.30 6.32 6.34 6.26 6.52 6.06 5.76 5.84 5.82 5.94 6.09 Nagaon Lanka - - - - - - - - - 5.96 5.98 6.14 Nagaon Samuguri 3.42 3.80 4.40 3.90 4.90 2.90 0.80 3.90 3.60 3.90 4.00 3.60 Nagaon Sulung PO 4.29 5.28 5.46 5.41 5.46 2.51 2.06 4.15 3.28 2.63 4.12 Sibsagar Moranhat 4.80 5.20 5.88 5.12 3.73 2.10 2.70 3.30 3.00 2.77 - -

ANNEXURE – IIA Monthly Water level monitoring wells in NER
State / District Village Feb-14 Mar-14 Apr-14 May-14 Jun-14 Jul-14 Aug-14 Sep-14 Oct-14 Nov-14 Dec-14 Jan-15
Sibsagar Sapekhati 3.90 6.10 6.15 5.60 1.80 1.60 2.45 2.10 2.80 2.30 2.90 3.00 Sibsagar Sibsagar 3.65 3.42 3.54 3.25 3.37 2.13 1.16 1.49 2.33 2.78 2.96 3.00 Sonitpur Barchola 4.12 4.12 4.45 4.54 4.24 3.45 3.26 2.72 2.33 2.74 2.55 2.57 Tinsukia Jagun 4.60 5.33 2.57 3.65 3.30 4.36 2.17 2.23 1.50 2.88 3.55 4.95 Tinsukia Lekhapani 5.30 5.20 5.33 2.75 3.12 3.48 2.09 3.56 3.35 4.30 4.98 5.50 Tinsukia Panitola 4.95 5.16 1.80 1.40 1.60 1.50 1.26 3.80 4.12 5.00 5.76 5.27 Tinsukia Tinsukia - - - - - - - - - - - 5.90 Tinsukia Tipong 4.55 4.80 4.87 2.45 3.00 3.45 2.12 3.80 4.12 5.00 5.68 5.90 Tinsukia Tirap Gate 6.57 7.20 7.50 7.10 2.50 3.63 2.27 2.80 3.65 5.70 5.76 6.50 MEGHALAYA East Garo Hills Williamnagar 2.00 2.00 2.10 1.20 1.10 1.00 0.90 0.70 0.90 NA NA 2.06 East Khasi Hills Dhankheti 1.84 1.86 1.89 2.39 1.74 1.86 2.24 1.11 1.85 1.76 1.76 1.84 East Khasi Hills Golf Links 5.65 7.57 9.72 8.04 2.77 2.38 1.47 0.78 2.21 2.78 3.29 3.73 East Khasi Hills Lr. Lachaumiere 1.10 1.11 1.35 0.86 0.35 0.64 0.45 0.24 0.63 0.85 1.00 1.01 East Khasi Hills Mawpat - - - - - NA 6.26 1.56 2.46 3.56 4.86 2.40 East Khasi Hills Nongmynsong - - - - - NA 1.44 NA 4.93 2.73 2.85 2.72 East Khasi Hills Umpling/R&R Colony - - - - - - - - - 4.88 4.89 5.32 Ri-Bhoi Nongpoh 3.03 3.28 2.88 2.63 2.13 2.20 NA 1.73 1.78 3.03 3.78 2.82 West Khasi Hills Mairang 1.40 1.16 1.30 0.64 0.44 0.52 0.68 0.50 0.47 0.73 0.91 0.80
NAGALAND Dimapur Bamunpukhri-I village 6.84 7.37 7.78 7.85 5.71 5.44 3.41 4.68 4.13 NA 4.13 6.76
Dimapur DGM colony Quarter no28 4.65 5.31 4.78 4.67 2.78 2.45 0.80 1.46 0.84 NA 2.71 4.85
Dimapur F.O. compound,chumikedima
3.89 4.36 5.00 4.76 2.94 2.32 1.50 2.39 1.76 2.68 2.93 3.01
Dimapur Forest colony , Dimapur 14.30 15.13 14.10 14.15 6.61 6.44 1.90 2.78 2.54 3.17 3.69 11.09 Dimapur Govt. college, Dimapur 6.06 6.76 7.49 7.29 4.76 4.55 3.23 3.85 3.38 3.60 5.04 5.26 Dimapur vocational training centre 2.34 2.61 2.91 2.61 2.54 2.34 2.25 2.97 2.00 NA 2.46 2.20

ANNEXURE – IIA Monthly Water level monitoring wells in NER
State / District Village Feb-14 Mar-14 Apr-14 May-14 Jun-14 Jul-14 Aug-14 Sep-14 Oct-14 Nov-14 Dec-14 Jan-15
Kohima R.Angami’s Compound Sepfuzou Colony Kohima
6.64 6.67 6.66 6.25 5.63 5.30 1.66 2.23 2.32 6.32 6.05 6.65
Wokha Namsa, Agri.Seed Farm Tizit
4.03 4.57 5.30 2.91 2.34 2.25 0.95 1.71 1.45 2.39 3.00 3.31
Wokha Tourist Lodge Compound Wokha
4.79 5.52 5.60 4.65 4.43 4.14 0.47 1.28 1.74 2.52 3.75 3.75
TRIPURA Dhalai Ambassa 1.75 2.01 1.08 1.72 0.82 0.28 0.03 0.30 0.62 0.98 1.32 1.64 Khowai Bagan Bazaar - - - - - - - 1.20 1.29 1.52 1.81 2.00 Khowai Kalyanpur - - - - - - - 3.77 3.82 3.99 4.11 4.20 Khowai Khowai 2.11 2.22 1.96 1.64 1.56 1.57 1.63 1.25 1.74 1.98 2.00 1.85 North Tripura Baghbassa - 1.23 0.99 0.72 0.28 0.23 0.18 0.22 0.26 0.48 0.81 0.84 North Tripura Dharmanagar 4.38 5.27 5.16 4.10 3.89 4.00 3.86 3.91 3.95 4.75 5.17 5.36 North Tripura Panisagar 4.78 4.94 4.94 3.87 3.19 2.89 2.37 2.47 2.78 3.18 3.70 4.10 North Tripura Pecharthal 6.19 7.14 6.93 2.53 1.13 2.19 1.56 1.77 2.86 4.59 5.52 6.14 Unakoti Gaurngar 5.66 6.05 6.18 3.31 2.07 2.08 2.01 1.68 1.84 2.03 2.33 5.61 West Tripura AD Nagar 5.92 6.26 6.76 3.54 4.42 4.01 3.37 3.60 NA 5.13 4.49 4.49 West Tripura East Narayanpur 4.85 5.82 5.85 Dry 2.25 Dry Dry Dry NA NA 3.46 3.66 West Tripura Ishanpur - - - - - - - 0.43 0.55 1.62 2.42 2.85 West Tripura Jogindar nagar 6.41 7.04 7.28 Dry 4.86 4.53 4.23 4.40 NA 5.04 5.03 6.28 West Tripura Malainagar 5.19 5.41 5.74 4.10 4.48 4.60 4.14 4.32 NA 4.91 5.07 5.15 West Tripura Mohanpur - - - - - - - 0.90 1.27 2.07 3.09 3.29 West Tripura Nathpara 7.01 7.57 7.89 7.67 7.20 6.67 6.50 6.46 NA 6.87 6.87 6.94 West Tripura Radhakishore nagar 3.86 4.08 3.62 3.24 1.81 2.65 1.98 3.14 NA 3.26 3.24 3.52 West Tripura Simna 5.71 6.11 5.81 4.77 4.92 4.73 4.79 4.71 4.73 4.91 5.28 5.41 West Tripura SM Nagar 5.08 5.20 6.21 3.61 4.37 5.00 4.03 4.16 NA 4.90 6.49 4.94

ANNEXURE- III
DEPTH TO WATER LEVEL RANGE MARCH - 2014
State / District
No of WL measured
DTW( mbgl ) 0-2 (m) 2-5 (m) 5-10 (m) 10-20 (m) >20 (m)
Min Max No % No % No % No % No %
Arunachal Pradesh Changlang 4 2.33 4.35 0 0 4 100 0 0 0 0 0 0 East Siang 7 2.59 11.09 0 0 4 57.1 0 0 3 42.9 0 0 Lohit 1 5 5 0 0 1 100 0 0 0 0 0 0 Papumpare 8 -0.07 11.69 3 37.5 3 37.5 1 12.5 1 12.5 0 0 Tirap 3 3.38 6.13 0 0 2 66.7 1 33.3 0 0 0 0 Total 23 3 13.04 14 60.87 2 8.7 4 17.39 0 0 Assam Baksha 1 3.08 3.08 0 0 1 100 0 0 0 0 0 0 Barpeta 9 2.59 4.95 0 0 9 100 0 0 0 0 0 0 Bongaigaon 9 2.2 9.1 0 0 8 88.9 1 11.1 0 0 0 0 Cachar 22 0.23 9.01 7 31.8 10 45.5 5 22.7 0 0 0 0 Darrang 19 1.35 10.51 2 10.5 14 73.7 2 10.5 1 5.3 0 0 Dhemaji 16 1.14 9.25 2 12.5 12 75 2 12.5 0 0 0 0 Dhubri 13 1.91 16.64 1 7.7 7 53.8 2 15.4 3 23.1 0 0 Dibrugarh 5 1.38 5.15 1 20 3 60 1 20 0 0 0 0 Goalpara 19 2.25 7.35 0 0 14 73.7 5 26.3 0 0 0 0 Golaghat 7 1.8 9.7 1 14.3 2 28.6 4 57.1 0 0 0 0 Hailakandi 5 1.55 8.08 2 40 2 40 1 20 0 0 0 0 Jorhat 12 0.48 2.89 7 58.3 5 41.7 0 0 0 0 0 0 Kamrup 30 0.42 8.2 9 30 11 36.7 10 33.3 0 0 0 0 Karbi Anglong 20 1.31 11.45 1 5 12 60 6 30 1 5 0 0 Karimganj 10 0.12 5.55 7 70 2 20 1 10 0 0 0 0 Lakhimpur 17 1.48 5.75 2 11.8 13 76.5 2 11.8 0 0 0 0 Morigaon 13 1.94 8.12 1 7.7 10 76.9 2 15.4 0 0 0 0 Nagaon 32 1.23 9.83 3 9.4 19 59.4 10 31.3 0 0 0 0 Nalbari 2 2.19 2.79 0 0 2 100 0 0 0 0 0 0 Sibsagar 7 1.65 15.3 1 14.3 2 28.6 2 28.6 2 28.6 0 0 Sonitpur 23 -0.18 9.02 1 4.3 16 69.6 6 26.1 0 0 0 0 Tinsukia 13 0.28 6.07 2 15.4 9 69.2 2 15.4 0 0 0 0 Total 304 50 16.45 183 60.2 64 21.05 7 2.3 0 0 Meghalaya East Garo Hills 7 2.08 5.25 0 0 6 85.7 1 14.3 0 0 0 0 East Khasi Hills 6 1.11 7.57 3 50 0 0 3 50 0 0 0 0 Jaintia hills 1 3.08 3.08 0 0 1 100 0 0 0 0 0 0 Ri-Bhoi 2 2.75 2.9 0 0 2 100 0 0 0 0 0 0 West Garo Hills 14 2.16 7.78 0 0 10 71.4 4 28.6 0 0 0 0 West Khasi Hills 1 1.16 1.16 1 100 0 0 0 0 0 0 0 0

State / District
No of WL measured
DTW( mbgl ) 0-2 (m) 2-5 (m) 5-10 (m) 10-20 (m) >20 (m)
Min Max No % No % No % No % No %
Total 31 4 12.9 19 61.29 8 25.81 0 0 0 0
Nagaland Dimapur 20 3.53 23.36 0 0 4 20 9 45 5 25 2 10 Kohima 3 2.86 6.29 0 0 2 66.7 1 33.3 0 0 0 0 Mokokchung 1 3.17 3.17 0 0 1 100 0 0 0 0 0 0 Mon 2 4.25 35.77 0 0 1 50 0 0 0 0 1 50 Phek 1 54.44 54.44 0 0 0 0 0 0 0 0 1 100 Tuensang 1 38.43 38.43 0 0 0 0 0 0 0 0 1 100 Wokha 3 5.52 28.08 0 0 0 0 1 33.3 1 33.3 1 33.3 Total 31 0 0 8 25.81 11 35.49 6 19.35 6 19.35
Tripura Dhalai 4 2.55 5.55 0 0 2 50 2 50 0 0 0 0 North Tripura 8 1.45 7.76 1 12.5 3 37.5 4 50 0 0 0 0 South Tripura 17 0.81 10.33 2 11.8 10 58.8 4 23.5 1 5.9 0 0 West Tripura 27 1.69 27.75 1 3.7 14 51.9 7 25.9 1 3.7 4 14.8
Total 56 4 7.15 29 51.77 17 30.36 2 3.57 4 7.15 Grand Total 445 61 13.7 253 56.9 102 22.9 19 4.3 10 2.2

DEPTH TO WATER LEVEL RANGE AUGUST - 2014
State / District No of WL measured
DTW(mbgl) 0-2 (m) 2-5 (m) 5-10 (m) 10-20(m) >20 (m)
Min Max No % No % No % No % No %
Arunachal Pradesh Changlang 4 0.69 1.07 4 100 0 0 0 0 0 0 0 0 East Siang 6 0.19 5.28 5 83.3 0 0 1 16.7 0 0 0 0 Lohit 1 0.58 0.58 1 100 0 0 0 0 0 0 0 0 Papumpare 7 -0.7 10.1 5 71.4 1 14.3 0 0 1 14.3 0 0 Tirap 3 1.22 2.2 2 66.7 1 33.3 0 0 0 0 0 0 Total 21 17 81 2 9.53 1 4.76 1 4.76 0 0 Assam Barpeta 9 0.02 2.14 8 88.9 1 11.1 0 0 0 0 0 0 Bongaigaon 11 0.05 3.74 10 90.9 1 9.1 0 0 0 0 0 0 Cachar 24 0.13 6 22 91.7 1 4.2 1 4.2 0 0 0 0 Darrang 24 0.09 4.33 14 58.3 10 41.7 0 0 0 0 0 0 Dhemaji 15 -0.99 4.39 13 86.7 2 13.3 0 0 0 0 0 0 Dhubri 14 0.03 18.9 8 57.1 3 21.4 0 0 3 21.4 0 0 Dibrugarh 12 0.3 2.82 11 91.7 1 8.3 0 0 0 0 0 0 Goalpara 10 0.87 6.21 7 70 2 20 1 10 0 0 0 0 Golaghat 12 1.2 4.63 7 58.3 5 41.7 0 0 0 0 0 0 Hailakandi 5 0.31 1.61 5 100 0 0 0 0 0 0 0 0 Jorhat 23 0.55 3.11 18 78.3 5 21.7 0 0 0 0 0 0 Kamrup 26 0.18 3.22 22 84.6 4 15.4 0 0 0 0 0 0 Karbi Anglong 29 0.46 9.54 11 37.9 13 44.8 5 17.2 0 0 0 0 Karimganj 9 -0.01 3.1 8 88.9 1 11.1 0 0 0 0 0 0 Lakhimpur 14 0.28 2.74 11 78.6 3 21.4 0 0 0 0 0 0 Morigaon 12 0.65 3.96 8 66.7 4 33.3 0 0 0 0 0 0 Nagaon 28 0.34 5.89 13 46.4 13 46.4 2 7.1 0 0 0 0 Nalbari 2 0.79 0.92 2 100 0 0 0 0 0 0 0 0 Sibsagar 12 0.04 6.1 9 75 2 16.7 1 8.3 0 0 0 0 Sonitpur 23 0.17 5.83 16 69.6 6 26.1 1 4.3 0 0 0 0 Tinsukia 15 0.54 2.18 14 93.3 1 6.7 0 0 0 0 0 0 Total 329 237 72 78 23.7 11 3.34 3 0.91 0 0 Meghalaya East Khasi Hills 8 0.45 6.26 4 50 3 37.5 1 12.5 0 0 0 0 Jaintia hills 2 0.75 1.07 2 100 0 0 0 0 0 0 0 0 Ri-Bhoi 2 1.05 1.5 2 100 0 0 0 0 0 0 0 0 West Khasi Hills 1 0.38 0.38 1 100 0 0 0 0 0 0 0 0 Total 13 9 69.2 3 23.1 1 7.69 0 0 0 0 Tripura Dhalai 4 0.13 4.79 3 75 1 25 0 0 0 0 0 0 North Tripura 11 0.46 6.19 4 36.4 6 54.5 1 9.1 0 0 0 0 South Tripura 17 0.38 8.69 7 41.2 9 52.9 1 5.9 0 0 0 0 West Tripura 28 0.34 28.6 11 39.3 7 25 6 21.4 1 3.6 3 10.7 Total 60 25 41.7 23 38.3 8 13.3 1 1.67 3 5 Grand Total 423 288 68.1 106 25.1 21 5 5 1.2 3 0.7
ANNEXURE- IV

DEPTH TO WATER LEVEL RANGE NOVEMBER - 2014
State / District No of WL measured
DTW ( mbgl ) 0-2 (m) 2-5 (m) 5-10 (m) 10-20 (m) >20 (m)
Min Max No % No % No % No % No %
Arunachal Pradesh Changlang 4 2.62 4.25 0 0 4 100 0 0 0 0 0 0 East Siang 5 0.58 6.53 2 40 0 0 3 60 0 0 0 0 Lohit 1 2.32 2.32 0 0 1 100 0 0 0 0 0 0 Papumpare 8 -0.28 10.9 4 50 2 25 1 12.5 1 12.5 0 0
Tirap 3 3.53 5.23 0 0 2 66.7 1 33.3 0 0 0 0 Total 21 6 28.6 9 42.9 5 23.8 1 4.76 0 0
Assam Baksha 1 2.22 2.22 0 0 1 100 0 0 0 0 0 0 Barpeta 8 1.27 3.69 3 37.5 5 62.5 0 0 0 0 0 0 Bongaigaon 11 1.75 7.65 3 27.3 7 63.6 1 9.1 0 0 0 0 Cachar 25 0.13 6.49 15 60 9 36 1 4 0 0 0 0 Darrang 20 1.22 3.72 8 40 12 60 0 0 0 0 0 0 Dhemaji 19 0.35 8.17 9 47.4 9 47.4 1 5.3 0 0 0 0 Dhubri 12 1.37 16.1 2 16.7 7 58.3 0 0 3 25 0 0 Dibrugarh 11 0.45 4.72 4 36.4 7 63.6 0 0 0 0 0 0 Goalpara 19 1.4 7.54 2 10.5 16 84.2 1 5.3 0 0 0 0 Golaghat 10 2.03 6.3 0 0 8 80 2 20 0 0 0 0 Hailakandi 5 0.32 2.72 3 60 2 40 0 0 0 0 0 0 Jorhat 17 0.58 2.45 14 82.4 3 17.6 0 0 0 0 0 0 Kamrup 28 0.63 4.61 12 42.9 16 57.1 0 0 0 0 0 0 Karbi Anglong 25 1.08 11.9 8 32 12 48 4 16 1 4 0 0 Karimganj 10 0.05 2.52 8 80 2 20 0 0 0 0 0 0 Lakhimpur 15 1.14 3.8 8 53.3 7 46.7 0 0 0 0 0 0 Morigaon 16 0.96 4.79 2 12.5 14 87.5 0 0 0 0 0 0 Nagaon 29 0.56 9.53 10 34.5 16 55.2 3 10.3 0 0 0 0 Nalbari 2 2.15 3.32 0 0 2 100 0 0 0 0 0 0 Sibsagar 10 2 12.8 1 10 7 70 1 10 1 10 0 0 Sonitpur 25 0.88 6.07 15 60 7 28 3 12 0 0 0 0 Tinsukia 15 1.42 5.2 6 40 8 53.3 1 6.7 0 0 0 0 Total 333 133 39.9 177 53.2 18 5.41 5 1.5 0 0
Meghalaya East Garo Hills 9 1.85 5.05 1 11.1 7 77.8 1 11.1 0 0 0 0 East Khasi Hills 8 0.41 6.53 3 37.5 4 50 1 12.5 0 0 0 0 Jaintia hills 2 0.4 1.57 2 100 0 0 0 0 0 0 0 0 Ri-Bhoi 2 1.7 2.65 1 50 1 50 0 0 0 0 0 0 West Garo Hills 8 0.85 7.63 2 25 4 50 2 25 0 0 0 0 West Khasi Hills 1 0.73 0.73 1 100 0 0 0 0 0 0 0 0
Total 30 10 33.3 16 53.3 4 13.3 0 0 0 0
ANNEXURE- V

State / District No of WL measured
DTW ( mbgl ) 0-2 (m) 2-5 (m) 5-10 (m) 10-20 (m) >20 (m) Min Max No % No % No % No % No %
Nagaland Dimapur 21 0.85 27.6 1 4.8 8 38.1 5 23.8 5 23.8 2 9.5 Kohima 3 1.81 6.18 1 33.3 1 33.3 1 33.3 0 0 0 0 Mokokchung 1 2.11 2.11 0 0 1 100 0 0 0 0 0 0 Mon 2 2.44 34.5 0 0 1 50 0 0 0 0 1 50 Phek 1 64.07 64.1 0 0 0 0 0 0 0 0 1 100 Tuensang 1 37.41 37.4 0 0 0 0 0 0 0 0 1 100 Wokha 3 2.47 49.6 0 0 2 66.7 0 0 0 0 1 33.3 Total 32 2 6.25 13 40.6 6 18.8 5 15.6 6 18.8
Tripura Dhalai 4 1.54 4.27 2 50 2 50 0 0 0 0 0 0 North Tripura 11 1.1 6.18 2 18.2 8 72.7 1 9.1 0 0 0 0 South Tripura 17 0.71 9.52 3 17.6 10 58.8 4 23.5 0 0 0 0 West Tripura 26 0.82 28.6 5 19.2 11 42.3 6 23.1 1 3.8 3 11.5 Total 58 12 20.7 31 53.5 11 19 1 1.72 3 5.17 Grand Total 474 163 34.4 246 51.9 44 9.3 12 2.5 9 1.9

DEPTH TO WATER LEVEL RANGE JANUARY - 2015
State / District No of WL
measured
DTW(mbgl) 0-2 (m) 2-5 (m) 5-10 (m) 10-20 (m) >20 (m)
Min. Max. No % No % No % No % No %
Arunachal Pradesh Changlang 4 2.66 5.23 0 0 3 75 1 25 0 0 0 0 East Siang 6 2.41 12.77 0 0 3 50 1 17 2 33.3 0 0 Lohit 1 2.61 2.61 0 0 1 100 0 0 0 0 0 0 Papumpare 9 -0.06 11.66 4 44 3 33.3 1 11 1 11.1 0 0 Tirap 3 4 6.93 0 0 1 33.3 2 67 0 0 0 0 Total 23 4 17 11 47.8 5 22 3 13.04 0 0 Assam Baksha 1 2.85 2.85 0 0 1 100 0 0 0 0 0 0 Barpeta 7 2.23 4.24 0 0 7 100 0 0 0 0 0 0 Bongaigaon 11 2.17 8.25 0 0 10 90.9 1 9.1 0 0 0 0 Cachar 22 0 8.38 12 55 7 31.8 3 14 0 0 0 0 Darrang 19 1.3 6.53 1 5.3 15 78.9 3 16 0 0 0 0 Dhemaji 20 1.06 9.08 4 20 12 60 4 20 0 0 0 0 Dhubri 14 1.58 15.99 1 7.1 9 64.3 1 7.1 3 21.4 0 0 Dibrugarh 12 0.56 5.33 3 25 8 66.7 1 8.3 0 0 0 0 Goalpara 19 1.71 8.24 1 5.3 17 89.5 1 5.3 0 0 0 0 Golaghat 12 1.74 8.05 1 8.3 6 50 5 42 0 0 0 0 Hailakandi 5 0 7.07 3 60 1 20 1 20 0 0 0 0 Jorhat 21 1.73 4.41 1 4.8 20 95.2 0 0 0 0 0 0 Kamrup 28 0.82 7.63 6 21 19 67.9 3 11 0 0 0 0 Karbi Anglong 29 2.05 19.21 0 0 22 75.9 5 17 2 6.9 0 0 Karimganj 11 -0.2 3.34 10 91 1 9.1 0 0 0 0 0 0 Lakhimpur 17 0.77 5.06 5 29 11 64.7 1 5.9 0 0 0 0 Morigaon 17 1.64 6.18 1 5.9 14 82.4 2 12 0 0 0 0 Nagaon 31 1.39 6.97 3 9.7 22 71 6 19 0 0 0 0 Nalbari 2 2.56 4.71 0 0 2 100 0 0 0 0 0 0 Sibsagar 13 2.2 8.94 0 0 12 92.3 1 7.7 0 0 0 0 Sonitpur 23 1.1 7.63 3 13 16 69.6 4 17 0 0 0 0 Tinsukia 13 1.5 5.64 1 7.7 9 69.2 3 23 0 0 0 0 Total 347 56 16 241 69.5 45 13 5 1.44 0 0 Meghalaya East Garo Hills 16 1.75 4.74 1 6.3 15 93.8 0 0 0 0 0 0 East Khasi Hills 9 0.54 8.57 4 44 3 33.3 2 22 0 0 0 0 Jaintia hills 2 0.57 1.86 2 100 0 0 0 0 0 0 0 0 Ri-Bhoi 2 2.6 2.82 0 0 2 100 0 0 0 0 0 0 West Garo Hills 11 1.08 7.69 2 18 6 54.5 3 27 0 0 0 0 West Khasi Hills 1 0.8 0.8 1 100 0 0 0 0 0 0 0 0
Total 41 10 24 26 63.4 5 12 0 0 0 0
ANNEXURE- VI

State / District No of WL
measured
DTW(mbgl) 0-2 (m) 2-5 (m) 5-10 (m) 10-20 (m) >20 (m)
Min. Max. No % No % No % No % No %
Nagaland Dimapur 21 2.71 28.11 0 0 7 33.3 7 33 4 19 3 14.3 Kohima 3 2.86 6.51 0 0 2 66.7 1 33 0 0 0 0 Mokokchung 1 1.72 1.72 1 100 0 0 0 0 0 0 0 0 Mon 2 3.36 34.38 0 0 1 50 0 0 0 0 1 50 Phek 1 53.56 53.56 0 0 0 0 0 0 0 0 1 100 Tuensang 1 37.42 37.42 0 0 0 0 0 0 0 0 1 100 Wokha 3 3.7 26.82 0 0 1 33.3 0 0 1 33.3 1 33.3 Total 32 1 3.1 11 34.4 8 25 5 15.63 7 21.87
Tripura Dhalai 2 4 4.04 0 0 2 100 0 0 0 0 0 0 North Tripura 14 0.98 6.83 2 14 7 50 5 36 0 0 0 0 South Tripura 17 0.76 9.52 3 18 10 58.8 4 24 0 0 0 0 West Tripura 26 1.88 29.26 3 12 13 50 6 23 1 3.8 3 11.5
Total 59 8 14 32 54.2 15 25 1 1.7 3 5.08 Grand Total 502 79 16 321 63.9 78 16 14 2.8 10 2

State / District
Number of
Stations Analyzed
Fall Rise
0-2 m % 2-4 m % >4 m % 0-2 m % 2-4 m % >4 m %
Arunachal Pradesh Changlang 4 0 0 0 0 0 0 2 50 2 50 0 0 East Siang 5 0 0 0 0 0 0 0 0 2 40 3 60 Lohit 1 0 0 0 0 0 0 0 0 0 0 1 100 Papumpare 7 0 0 0 0 0 0 4 57.1 3 42.9 0 0 Tirap 3 0 0 0 0 0 0 0 0 3 100 0 0 Total 20 0 0 0 0 0 0 6 30 10 50 4 20 Assam Barpeta 8 0 0 0 0 0 0 1 12.5 6 75 1 12.5 Bongaigaon 9 0 0 0 0 0 0 1 11.1 6 66.7 2 22.2 Cachar 22 0 0 0 0 0 0 12 54.5 5 22.7 5 22.7 Darrang 19 1 5.3 0 0 0 0 7 36.8 9 47.4 2 10.5 Dhemaji 13 0 0 0 0 0 0 4 30.8 6 46.2 3 23.1 Dhubri 12 0 0 0 0 1 8.3 3 25 5 41.7 3 25 Dibrugarh 5 0 0 0 0 0 0 2 40 3 60 0 0 Goalpara 10 0 0 1 10 0 0 3 30 4 40 2 20 Golaghat 6 0 0 0 0 0 0 2 33.3 2 33.3 2 33.3 Hailakandi 5 0 0 0 0 0 0 3 60 0 0 2 40 Jorhat 12 3 25 0 0 0 0 9 75 0 0 0 0 Kamrup 21 1 4.8 0 0 0 0 11 52.4 6 28.6 3 14.3 Karbi Anglong 18 1 5.6 1 5.6 1 5.6 8 44.4 2 11.1 5 27.8 Karimganj 9 1 11.1 0 0 0 0 6 66.7 1 11.1 1 11.1
DISTRICT WISE CATEGORIZATION OF WATER LEVEL FLUCTUATION (AUGUST 2014 AND MARCH 2014)
ANNEXURE- VII

State / District
Number of
Stations Analyzed
Fall Rise
0-2 m % 2-4 m % >4 m % 0-2 m % 2-4 m % >4 m %
Lakhimpur 13 0 0 0 0 0 0 5 38.5 8 61.5 0 0 Morigaon 11 2 18.2 0 0 0 0 5 45.5 3 27.3 1 9.1 Nagaon 28 0 0 0 0 0 0 21 75 6 21.4 1 3.6 Nalbari 2 0 0 0 0 0 0 2 100 0 0 0 0 Sibsagar 5 1 20 0 0 0 0 1 20 3 60 0 0 Sonitpur 21 0 0 0 0 0 0 9 42.9 10 47.6 2 9.5 Tinsukia 13 1 7.7 0 0 0 0 4 30.8 6 46.2 2 15.4 Total 262 11 4.2 2 0.76 2 0.76 119 45.43 91 34.73 37 14.12 Meghalaya East Khasi Hills 5 1 20 0 0 0 0 1 20 0 0 3 60 Jaintia hills 1 0 0 0 0 0 0 0 0 1 100 0 0 Ri-Bhoi 2 0 0 0 0 0 0 2 100 0 0 0 0 West Khasi Hills 1 0 0 0 0 0 0 1 100 0 0 0 0 Total 9 1 11.11 0 0 0 0 4 44.45 1 11.11 3 33.33 Tripura Dhalai 4 0 0 0 0 0 0 2 50 1 25 1 25 North Tripura 8 0 0 0 0 0 0 4 50 2 25 2 25 South Tripura 17 0 0 0 0 0 0 9 52.9 7 41.2 1 5.9 West Tripura 25 2 8 0 0 1 4 15 60 7 28 0 0 Total 54 2 3.7 0 0 1 1.85 30 55.56 17 31.48 4 7.41 Grand Total 345 14 4.1 2 0.6 3 0.9 159 46.1 119 34.5 48 13.9

State / District Number of Stations Analyzed
Fall Rise 0-2 m % 2-4 m % >4 m % 0-2 m % 2-4 m % >4 m %
Arunachal Pradesh Changlang 4 2 50 0 0 0 0 2 50 0 0 0 0 East Siang 5 0 0 0 0 0 0 1 20 1 20 3 60 Lohit 1 0 0 0 0 0 0 0 0 1 100 0 0 Papumpare 8 0 0 0 0 0 0 7 87.5 1 12.5 0 0 Tirap 3 1 33.3 0 0 0 0 2 66.7 0 0 0 0 Total 21 3 14.29 0 0 0 0 12 57.13 3 14.29 3 14.29 Assam Baksha 1 0 0 0 0 0 0 1 100 0 0 0 0 Barpeta 8 0 0 0 0 0 0 7 87.5 1 12.5 0 0 Bongaigaon 9 0 0 0 0 0 0 8 88.9 1 11.1 0 0 Cachar 21 1 4.8 1 4.8 0 0 13 61.9 4 19 2 9.5 Darrang 18 0 0 0 0 0 0 16 88.9 1 5.6 1 5.6 Dhemaji 15 1 6.7 0 0 0 0 11 73.3 3 20 0 0 Dhubri 12 0 0 0 0 0 0 7 58.3 5 41.7 0 0 Dibrugarh 5 0 0 0 0 0 0 5 100 0 0 0 0 Goalpara 18 3 16.7 1 5.6 0 0 11 61.1 3 16.7 0 0 Golaghat 6 1 16.7 0 0 0 0 4 66.7 1 16.7 0 0 Hailakandi 5 1 20 0 0 0 0 2 40 1 20 1 20 Jorhat 12 2 16.7 0 0 0 0 10 83.3 0 0 0 0 Kamrup 22 2 9.1 0 0 0 0 13 59.1 5 22.7 2 9.1 Karbi Anglong 18 2 11.1 1 5.6 1 5.6 8 44.4 4 22.2 2 11.1 Karimganj 9 2 22.2 0 0 0 0 6 66.7 1 11.1 0 0 Lakhimpur 14 0 0 0 0 0 0 12 85.7 2 14.3 0 0 Morigaon 12 4 33.3 0 0 0 0 6 50 2 16.7 0 0 Nagaon 28 3 10.7 0 0 0 0 17 60.7 7 25 1 3.6 Nalbari 2 1 50 0 0 0 0 1 50 0 0 0 0 Sibsagar 6 0 0 0 0 0 0 3 50 3 50 0 0
DISTRICT WISE CATEGORIZATION OF WATER LEVEL FLUCTUATION (NOVEMBER 2014 AND MARCH 2014) ANNEXURE- VIII

State / District Number of Stations Analyzed
Fall Rise 0-2 m % 2-4 m % >4 m % 0-2 m % 2-4 m % >4 m %
Sonitpur 22 0 0 0 0 0 0 18 81.8 3 13.6 1 4.5 Tinsukia 13 3 23.1 1 7.7 0 0 7 53.8 2 15.4 0 0 Total 276 26 9.42 4 1.45 1 0.36 186 67.39 49 17.75 10 3.63 Meghalaya East Garo Hills 5 0 0 0 0 0 0 5 100 0 0 0 0 East Khasi Hills 5 0 0 0 0 0 0 4 80 0 0 1 20 Jaintia hills 1 0 0 0 0 0 0 1 100 0 0 0 0 Ri-Bhoi 2 0 0 0 0 0 0 2 100 0 0 0 0 West Garo Hills 7 0 0 0 0 0 0 6 85.7 0 0 1 14.3 West Khasi Hills 1 0 0 0 0 0 0 1 100 0 0 0 0 Total 21 0 0 0 0 0 0 19 90.48 0 0 2 9.52 Nagaland Dimapur 20 4 20 2 10 1 5 4 20 4 20 5 25 Kohima 3 0 0 0 0 0 0 3 100 0 0 0 0 Mokokchung 1 0 0 0 0 0 0 1 100 0 0 0 0 Mon 2 0 0 0 0 0 0 2 100 0 0 0 0 Phek 1 0 0 0 0 1 100 0 0 0 0 0 0 Tuensang 1 0 0 0 0 0 0 1 100 0 0 0 0 Wokha 3 0 0 0 0 1 33.3 0 0 1 33.3 1 33.3 Total 31 4 12.9 2 6.45 3 9.7 11 35.48 5 16.13 6 19.34 Tripura Dhalai 4 0 0 0 0 0 0 2 50 2 50 0 0 North Tripura 8 0 0 0 0 0 0 4 50 3 37.5 1 12.5 South Tripura 17 0 0 0 0 0 0 17 100 0 0 0 0 West Tripura 25 6 24 0 0 1 4 12 48 6 24 0 0 Total 54 6 11.11 0 0 1 1.85 35 64.82 11 20.37 1 1.85 Grand Total 403 39 9.7 6 1.5 5 1.2 263 65.3 68 16.9 22 5.5

State / District Number of Stations Analyzed
Fall Rise 0-2 m % 2-4 m % >4 m % 0-2 m % 2-4 m % >4 m %
Arunachal Pradesh Changlang 4 2 50 2 50 0 0 0 0 0 0 0 0 East Siang 5 2 40 0 0 2 40 1 20 0 0 0 0 Lohit 1 1 100 0 0 0 0 0 0 0 0 0 0 Papumpare 7 7 100 0 0 0 0 0 0 0 0 0 0 Tirap 3 0 0 3 100 0 0 0 0 0 0 0 0 Total 20 12 60 5 25 2 10 1 5 0 0 0 0 Assam Barpeta 8 5 62.5 3 37.5 0 0 0 0 0 0 0 0 Bongaigaon 11 5 45.5 6 54.5 0 0 0 0 0 0 0 0 Cachar 23 19 82.6 2 8.7 0 0 2 8.7 0 0 0 0 Darrang 20 16 80 2 10 0 0 2 10 0 0 0 0 Dhemaji 13 11 84.6 2 15.4 0 0 0 0 0 0 0 0 Dhubri 11 5 45.5 4 36.4 0 0 1 9.1 0 0 1 9.1 Dibrugarh 11 7 63.6 4 36.4 0 0 0 0 0 0 0 0 Goalpara 10 6 60 4 40 0 0 0 0 0 0 0 0 Golaghat 9 7 77.8 1 11.1 1 11.1 0 0 0 0 0 0 Hailakandi 5 2 40 2 40 0 0 1 20 0 0 0 0 Jorhat 16 8 50 0 0 0 0 8 50 0 0 0 0 Kamrup 23 17 73.9 2 8.7 0 0 4 17.4 0 0 0 0 Karbi Anglong 22 8 36.4 0 0 3 13.6 7 31.8 3 13.6 1 4.5 Karimganj 8 6 75 0 0 0 0 2 25 0 0 0 0
DISTRICT WISE CATEGORIZATION OF WATER LEVEL FLUCTUATION (NOVEMBER 2014 AND AUGUST 2014)
ANNEXURE- IX

State / District Number of Stations Analyzed
Fall Rise 0-2 m % 2-4 m % >4 m % 0-2 m % 2-4 m % >4 m %
Lakhimpur 13 13 100 0 0 0 0 0 0 0 0 0 0 Morigaon 11 6 54.5 2 18.2 0 0 3 27.3 0 0 0 0 Nagaon 28 10 35.7 2 7.1 1 3.6 15 53.6 0 0 0 0 Nalbari 2 1 50 1 50 0 0 0 0 0 0 0 0 Sibsagar 7 4 57.1 1 14.3 0 0 2 28.6 0 0 0 0 Sonitpur 23 21 91.3 0 0 0 0 2 8.7 0 0 0 0 Tinsukia 15 8 53.3 5 33.3 2 13.3 0 0 0 0 0 0 Total 289 185 64.01 43 14.88 7 2.42 49 16.96 3 1.04 2 0.69 Meghalaya East Khasi Hills 7 4 57.1 1 14.3 0 0 1 14.3 1 14.3 0 0 Jaintia hills 2 1 50 0 0 0 0 1 50 0 0 0 0 Ri-Bhoi 2 2 100 0 0 0 0 0 0 0 0 0 0 West Khasi Hills 1 1 100 0 0 0 0 0 0 0 0 0 0 Total 12 8 66.67 1 8.33 0 0 2 16.67 1 8.33 0 0 Tripura Dhalai 4 2 50 0 0 0 0 2 50 0 0 0 0 North Tripura 11 7 63.6 1 9.1 0 0 3 27.3 0 0 0 0 South Tripura 17 16 94.1 1 5.9 0 0 0 0 0 0 0 0 West Tripura 25 17 68 0 0 0 0 8 32 0 0 0 0 Total 57 42 73.68 2 3.51 0 0 13 22.81 0 0 0 0 Grand Total 378 247 65.3 51 13.5 9 2.4 65 17.2 4 1.1 2 0.5

State / District Number of Stations Analyzed
Fall Rise 0-2 m % 2-4 m % >4 m % 0-2 m % 2-4 m % >4 m %
Arunachal Pradesh Changlang 4 1 25 1 25 0 0 2 50 0 0 0 0 East Siang 5 1 20 0 0 0 0 4 80 0 0 0 0 Lohit 1 0 0 0 0 0 0 0 0 1 100 0 0 Papumpare 8 3 37.5 0 0 0 0 5 62.5 0 0 0 0 Tirap 3 3 100 0 0 0 0 0 0 0 0 0 0 Total 21 8 38.1 1 4.76 0 0 11 52.38 1 4.76 0 0 Assam Baksha 1 0 0 0 0 0 0 1 100 0 0 0 0 Barpeta 7 2 28.6 0 0 0 0 5 71.4 0 0 0 0 Bongaigaon 9 2 22.2 0 0 0 0 7 77.8 0 0 0 0 Cachar 21 1 4.8 0 0 0 0 17 81 3 14.3 0 0 Darrang 17 4 23.5 1 5.9 0 0 11 64.7 1 5.9 0 0 Dhemaji 16 4 25 0 0 0 0 12 75 0 0 0 0 Dhubri 13 0 0 0 0 0 0 13 100 0 0 0 0 Dibrugarh 5 1 20 0 0 0 0 4 80 0 0 0 0 Goalpara 18 3 16.7 0 0 1 5.6 11 61.1 3 16.7 0 0 Golaghat 6 2 33.3 0 0 0 0 2 33.3 2 33.3 0 0 Hailakandi 5 0 0 0 0 0 0 5 100 0 0 0 0 Jorhat 12 8 66.7 3 25 0 0 1 8.3 0 0 0 0 Kamrup 21 6 28.6 0 0 0 0 12 57.1 2 9.5 1 4.8 Karbi Anglong 17 3 17.6 2 11.8 2 11.8 8 47.1 0 0 2 11.8 Karimganj 10 0 0 0 0 0 0 7 70 3 30 0 0 Lakhimpur 15 0 0 0 0 0 0 15 100 0 0 0 0 Nagaon 28 9 32.1 1 3.6 0 0 16 57.1 2 7.1 0 0
DISTRICT WISE CATEGORIZATION OF WATER LEVEL FLUCTUATION (JANUARY 2015 AND MARCH 2014)
ANNEXURE- X

State / District Number of Stations Analyzed
Fall Rise 0-2 m % 2-4 m % >4 m % 0-2 m % 2-4 m % >4 m %
Nalbari 2 0 0 1 50 0 0 1 50 0 0 0 0 Sibsagar 7 0 0 1 14.3 0 0 3 42.9 1 14.3 2 28.6 Sonitpur 21 1 4.8 0 0 0 0 19 90.5 1 4.8 0 0 Tinsukia 11 5 45.5 1 9.1 0 0 3 27.3 2 18.2 0 0 Total 262 51 19.47 10 3.82 3 1.15 173 66.03 20 7.63 5 1.9 Meghalaya East Garo Hills 7 0 0 0 0 0 0 7 100 0 0 0 0 East Khasi Hills 6 1 16.7 0 0 0 0 3 50 1 16.7 1 16.7 Jaintia hills 1 0 0 0 0 0 0 1 100 0 0 0 0 Ri-Bhoi 2 0 0 0 0 0 0 2 100 0 0 0 0 West Garo Hills 9 1 11.1 1 11.1 0 0 6 66.7 0 0 1 11.1 West Khasi Hills 1 0 0 0 0 0 0 1 100 0 0 0 0 Total 26 2 7.69 1 3.85 0 0 20 76.92 1 3.85 2 7.69 Nagaland Dimapur 20 3 15 2 10 1 5 6 30 5 25 3 15 Kohima 3 1 33.3 0 0 0 0 2 66.7 0 0 0 0 Mokokchung 1 0 0 0 0 0 0 1 100 0 0 0 0 Mon 2 0 0 0 0 0 0 2 100 0 0 0 0 Morigaon 11 1 9.1 1 9.1 0 0 9 81.8 0 0 0 0 Phek 1 0 0 0 0 0 0 1 100 0 0 0 0 Tuensang 1 0 0 0 0 0 0 1 100 0 0 0 0 Wokha 3 0 0 0 0 0 0 3 100 0 0 0 0 Total 42 5 11.9 3 7.15 1 2.38 25 59.52 5 11.9 3 7.15 Tripura North Tripura 8 3 37.5 0 0 0 0 4 50 1 12.5 0 0 South Tripura 17 0 0 0 0 0 0 17 100 0 0 0 0 West Tripura 25 6 24 0 0 1 4 14 56 4 16 0 0 Total 50 9 18 0 0 1 2 35 70 5 10 0 0 Grand Total 401 75 18.7 15 3.7 5 1.2 264 65.8 32 8 10 2.5

State / District Number of Stations Analyzed
Fall Rise 0-2 m % 2-4 m % >4 m % 0-2 m % 2-4 m % >4 m %
Arunachal Pradesh Changlang 4 1 25 2 50 1 25 0 0 0 0 0 0 East Siang 5 0 0 2 40 3 60 0 0 0 0 0 0 Lohit 1 0 0 1 100 0 0 0 0 0 0 0 0 Papumpare 7 4 57.1 3 42.9 0 0 0 0 0 0 0 0 Tirap 3 0 0 1 33.3 2 66.7 0 0 0 0 0 0 Total 20 5 25 9 45 6 30 0 0 0 0 0 0 Assam Barpeta 7 2 28.6 5 71.4 0 0 0 0 0 0 0 0 Bongaigaon 11 2 18.2 8 72.7 1 9.1 0 0 0 0 0 0 Cachar 22 12 54.5 3 13.6 2 9.1 5 22.7 0 0 0 0 Darrang 19 4 21.1 13 68.4 1 5.3 1 5.3 0 0 0 0 Dhemaji 14 6 42.9 6 42.9 2 14.3 0 0 0 0 0 0 Dhubri 13 5 38.5 6 46.2 0 0 1 7.7 0 0 1 7.7 Dibrugarh 12 3 25 9 75 0 0 0 0 0 0 0 0 Goalpara 10 5 50 5 50 0 0 0 0 0 0 0 0 Golaghat 11 6 54.5 4 36.4 1 9.1 0 0 0 0 0 0 Hailakandi 5 1 20 1 20 1 20 2 40 0 0 0 0 Jorhat 21 18 85.7 3 14.3 0 0 0 0 0 0 0 0 Kamrup 22 13 59.1 5 22.7 2 9.1 2 9.1 0 0 0 0 Karbi Anglong 24 10 41.7 5 20.8 2 8.3 4 16.7 2 8.3 1 4.2 Karimganj 9 4 44.4 1 11.1 0 0 4 44.4 0 0 0 0 Lakhimpur 13 7 53.8 6 46.2 0 0 0 0 0 0 0 0 Morigaon 10 5 50 3 30 1 10 1 10 0 0 0 0
DISTRICT WISE CATEGORIZATION OF WATER LEVEL FLUCTUATION (JANUARY 2015 AND AUGUST 2014)
ANNEXURE- XI
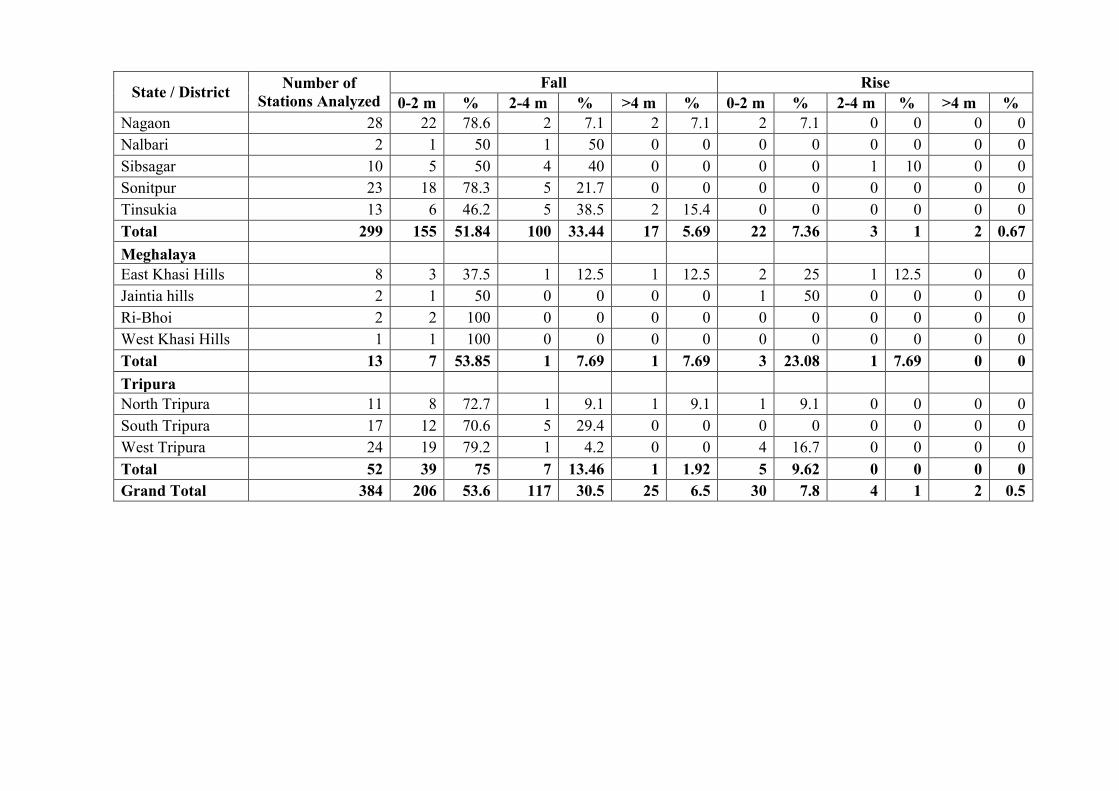
State / District Number of Stations Analyzed
Fall Rise 0-2 m % 2-4 m % >4 m % 0-2 m % 2-4 m % >4 m %
Nagaon 28 22 78.6 2 7.1 2 7.1 2 7.1 0 0 0 0 Nalbari 2 1 50 1 50 0 0 0 0 0 0 0 0 Sibsagar 10 5 50 4 40 0 0 0 0 1 10 0 0 Sonitpur 23 18 78.3 5 21.7 0 0 0 0 0 0 0 0 Tinsukia 13 6 46.2 5 38.5 2 15.4 0 0 0 0 0 0 Total 299 155 51.84 100 33.44 17 5.69 22 7.36 3 1 2 0.67 Meghalaya East Khasi Hills 8 3 37.5 1 12.5 1 12.5 2 25 1 12.5 0 0 Jaintia hills 2 1 50 0 0 0 0 1 50 0 0 0 0 Ri-Bhoi 2 2 100 0 0 0 0 0 0 0 0 0 0 West Khasi Hills 1 1 100 0 0 0 0 0 0 0 0 0 0 Total 13 7 53.85 1 7.69 1 7.69 3 23.08 1 7.69 0 0 Tripura North Tripura 11 8 72.7 1 9.1 1 9.1 1 9.1 0 0 0 0 South Tripura 17 12 70.6 5 29.4 0 0 0 0 0 0 0 0 West Tripura 24 19 79.2 1 4.2 0 0 4 16.7 0 0 0 0 Total 52 39 75 7 13.46 1 1.92 5 9.62 0 0 0 0 Grand Total 384 206 53.6 117 30.5 25 6.5 30 7.8 4 1 2 0.5

State / District Number of Stations Analyzed
Fall Rise 0-2 m % 2-4 m % >4 m % 0-2 m % 2-4 m % >4 m %
Arunachal Pradesh Changlang 4 4 100 0 0 0 0 0 0 0 0 0 0 East Siang 4 1 25 2 50 1 25 0 0 0 0 0 0 Lohit 1 1 100 0 0 0 0 0 0 0 0 0 0 Papumpare 8 8 100 0 0 0 0 0 0 0 0 0 0 Tirap 3 3 100 0 0 0 0 0 0 0 0 0 0 Total 20 17 85 2 10 1 5 0 0 0 0 0 0 Assam Baksha 1 1 100 0 0 0 0 0 0 0 0 0 0 Barpeta 7 7 100 0 0 0 0 0 0 0 0 0 0 Bongaigaon 11 10 90.9 0 0 0 0 1 9.1 0 0 0 0 Cachar 21 9 42.9 0 0 2 9.5 9 42.9 1 4.8 0 0 Darrang 19 13 68.4 6 31.6 0 0 0 0 0 0 0 0 Dhemaji 19 13 68.4 3 15.8 0 0 3 15.8 0 0 0 0 Dhubri 12 9 75 1 8.3 0 0 2 16.7 0 0 0 0 Dibrugarh 11 11 100 0 0 0 0 0 0 0 0 0 0 Goalpara 19 19 100 0 0 0 0 0 0 0 0 0 0 Golaghat 10 7 70 0 0 0 0 3 30 0 0 0 0 Hailakandi 5 1 20 0 0 1 20 3 60 0 0 0 0 Jorhat 16 11 68.8 5 31.3 0 0 0 0 0 0 0 0 Kamrup 27 22 81.5 1 3.7 1 3.7 3 11.1 0 0 0 0 Karbi Anglong 24 13 54.2 4 16.7 1 4.2 5 20.8 0 0 1 4.2 Karimganj 10 2 20 0 0 0 0 8 80 0 0 0 0 Lakhimpur 15 15 100 0 0 0 0 0 0 0 0 0 0 Morigaon 15 14 93.3 0 0 0 0 1 6.7 0 0 0 0 Nagaon 29 25 86.2 1 3.4 1 3.4 1 3.4 1 3.4 0 0 Nalbari 2 0 0 1 50 0 0 1 50 0 0 0 0 Sibsagar 10 6 60 0 0 0 0 2 20 1 10 1 10
DISTRICT WISE CATEGORIZATION OF WATER LEVEL FLUCTUATION (JANUARY 2015 AND NOVEMBER 2014)
ANNEXURE- XII

State / District Number of Stations Analyzed
Fall Rise 0-2 m % 2-4 m % >4 m % 0-2 m % 2-4 m % >4 m %
Sonitpur 23 21 91.3 2 8.7 0 0 0 0 0 0 0 0 Tinsukia 13 11 84.6 0 0 0 0 2 15.4 0 0 0 0 Total 319 240 75.24 24 7.52 6 1.88 44 13.79 3 0.94 2 0.63 Meghalaya East Garo Hills 9 8 88.9 0 0 0 0 1 11.1 0 0 0 0 East Khasi Hills 8 4 50 1 12.5 0 0 3 37.5 0 0 0 0 Jaintia hills 2 2 100 0 0 0 0 0 0 0 0 0 0 Ri-Bhoi 2 2 100 0 0 0 0 0 0 0 0 0 0 West Garo Hills 8 7 87.5 0 0 0 0 1 12.5 0 0 0 0 West Khasi Hills 1 1 100 0 0 0 0 0 0 0 0 0 0 Total 30 24 80 1 3.33 0 0 5 16.67 0 0 0 0 Nagaland Dimapur 21 11 52.4 2 9.5 3 14.3 3 14.3 1 4.8 1 4.8 Kohima 3 2 66.7 0 0 0 0 1 33.3 0 0 0 0 Mokokchung 1 0 0 0 0 0 0 1 100 0 0 0 0 Mon 2 1 50 0 0 0 0 1 50 0 0 0 0 Phek 1 0 0 0 0 0 0 0 0 0 0 1 100 Tuensang 1 1 100 0 0 0 0 0 0 0 0 0 0 Wokha 3 1 33.3 0 0 1 33.3 0 0 0 0 1 33.3 Total 32 16 50 2 6.25 4 12.5 6 18.75 1 3.13 3 9.37 Tripura North Tripura 11 9 81.8 2 18.2 0 0 0 0 0 0 0 0 South Tripura 17 10 58.8 0 0 0 0 7 41.2 0 0 0 0 West Tripura 25 21 84 2 8 0 0 2 8 0 0 0 0 Total 53 40 75.47 4 7.55 0 0 9 16.98 0 0 0 0 Grand Total 454 337 74.2 33 7.3 11 2.4 64 14.1 4 0.9 5 1.1

State / District Number of Stations Analyzed
Fall Rise 0-2 m % 2-4 m % >4 m % 0-2 m % 2-4 m % >4 m %
Arunachal Pradesh Changlang 4 1 25 0 0 0 0 1 25 2 50 0 0 East Siang 7 3 42.9 0 0 0 0 4 57.1 0 0 0 0 Lohit 1 1 100 0 0 0 0 0 0 0 0 0 0 Papumpare 7 4 57.1 0 0 0 0 3 42.9 0 0 0 0 Tirap 3 0 0 0 0 0 0 3 100 0 0 0 0 Total 22 9 40.91 0 0 0 0 11 50 2 9.09 0 0 Assam Baksha 1 1 100 0 0 0 0 0 0 0 0 0 0 Barpeta 7 5 71.4 0 0 0 0 2 28.6 0 0 0 0 Bongaigaon 8 3 37.5 0 0 0 0 5 62.5 0 0 0 0 Cachar 14 7 50 0 0 0 0 5 35.7 1 7.1 1 7.1 Darrang 16 12 75 0 0 1 6.3 3 18.8 0 0 0 0 Dhemaji 16 9 56.3 0 0 0 0 6 37.5 1 6.3 0 0 Dhubri 13 8 61.5 0 0 0 0 5 38.5 0 0 0 0 Dibrugarh 5 2 40 0 0 0 0 3 60 0 0 0 0 Goalpara 19 8 42.1 1 5.3 0 0 9 47.4 0 0 1 5.3 Golaghat 6 0 0 2 33.3 0 0 3 50 1 16.7 0 0 Hailakandi 2 1 50 0 0 0 0 1 50 0 0 0 0 Jorhat 9 1 11.1 0 0 0 0 7 77.8 1 11.1 0 0 Kamrup 22 12 54.5 1 4.5 0 0 6 27.3 3 13.6 0 0 Karbi Anglong 17 5 29.4 1 5.9 2 11.8 6 35.3 1 5.9 2 11.8 Karimganj 5 0 0 0 0 0 0 5 100 0 0 0 0 Lakhimpur 16 8 50 0 0 0 0 8 50 0 0 0 0 Morigaon 10 4 40 1 10 1 10 2 20 2 20 0 0 Nagaon 21 10 47.6 2 9.5 1 4.8 7 33.3 1 4.8 0 0 Nalbari 1 0 0 0 0 0 0 1 100 0 0 0 0 Sibsagar 4 3 75 0 0 0 0 1 25 0 0 0 0
DISTRICT WISE CATEGORIZATION OF WATER LEVEL FLUCTUATION (MARCH 2014 AND MARCH 2013)
ANNEXURE- XIII

State / District Number of Stations Analyzed
Fall Rise 0-2 m % 2-4 m % >4 m % 0-2 m % 2-4 m % >4 m %
Sonitpur 23 12 52.2 0 0 0 0 10 43.5 1 4.3 0 0 Tinsukia 13 3 23.1 0 0 0 0 8 61.5 2 15.4 0 0 Total 248 114 45.97 8 3.22 5 2.02 103 41.53 14 5.65 4 1.61 Meghalaya East Garo Hills 7 3 42.9 0 0 0 0 4 57.1 0 0 0 0 Jaintia hills 1 1 100 0 0 0 0 0 0 0 0 0 0 Ri-Bhoi 2 0 0 0 0 0 0 2 100 0 0 0 0 West Garo Hills 14 8 57.1 2 14.3 0 0 2 14.3 2 14.3 0 0 West Khasi Hills 1 1 100 0 0 0 0 0 0 0 0 0 0 Total 25 13 52 2 8 0 0 8 32 2 8 0 0 Nagaland Dimapur 11 6 54.5 2 18.2 1 9.1 2 18.2 0 0 0 0 Kohima 3 2 66.7 0 0 0 0 1 33.3 0 0 0 0 Mokokchung 1 0 0 0 0 0 0 1 100 0 0 0 0 Mon 2 1 50 0 0 0 0 1 50 0 0 0 0 Phek 1 1 100 0 0 0 0 0 0 0 0 0 0 Tuensang 1 0 0 0 0 1 100 0 0 0 0 0 0 Wokha 2 1 50 0 0 0 0 1 50 0 0 0 0 Total 21 11 52.39 2 9.52 2 9.52 6 28.57 0 0 0 0 Tripura Dhalai 1 1 100 0 0 0 0 0 0 0 0 0 0 North Tripura 5 2 40 0 0 0 0 3 60 0 0 0 0 South Tripura 6 2 33.3 0 0 0 0 4 66.7 0 0 0 0 West Tripura 18 6 33.3 0 0 0 0 11 61.1 1 5.6 0 0 Total 30 11 36.67 0 0 0 0 18 60 1 3.33 0 0 Grand Total 346 158 45.7 12 3.5 7 2 146 42.2 19 5.5 4 1.2

State / District Number of Stations Analyzed
Fall Rise 0-2 m % 2-4 m % >4 m % 0-2 m % 2-4 m % >4 m %
Arunachal Pradesh Changlang 4 0 0 0 0 0 0 4 100 0 0 0 0 East Siang 6 0 0 0 0 0 0 2 33.3 4 66.7 0 0 Lohit 1 0 0 0 0 0 0 1 100 0 0 0 0 Papumpare 7 1 14.3 0 0 0 0 6 85.7 0 0 0 0 Tirap 3 0 0 0 0 0 0 1 33.3 2 66.7 0 0 Total 21 1 4.76 0 0 0 0 14 66.67 6 28.57 0 0 Assam Barpeta 6 3 50 0 0 0 0 3 50 0 0 0 0 Bongaigaon 11 1 9.1 0 0 0 0 10 90.9 0 0 0 0 Cachar 12 5 41.7 0 0 0 0 7 58.3 0 0 0 0 Darrang 21 3 14.3 0 0 0 0 17 81 1 4.8 0 0 Dhemaji 13 0 0 0 0 0 0 11 84.6 2 15.4 0 0 Dhubri 12 3 25 0 0 1 8.3 7 58.3 1 8.3 0 0 Dibrugarh 12 0 0 0 0 0 0 12 100 0 0 0 0 Goalpara 10 3 30 0 0 0 0 5 50 2 20 0 0 Golaghat 12 0 0 0 0 0 0 9 75 3 25 0 0 Hailakandi 1 0 0 0 0 0 0 1 100 0 0 0 0 Jorhat 22 3 13.6 0 0 0 0 19 86.4 0 0 0 0 Kamrup 21 8 38.1 0 0 0 0 10 47.6 3 14.3 0 0 Karbi Anglong 16 2 12.5 2 12.5 0 0 9 56.3 3 18.8 0 0 Karimganj 4 2 50 0 0 0 0 2 50 0 0 0 0 Lakhimpur 13 3 23.1 0 0 0 0 9 69.2 1 7.7 0 0 Morigaon 8 4 50 1 12.5 0 0 3 37.5 0 0 0 0 Nagaon 19 11 57.9 2 10.5 0 0 4 21.1 2 10.5 0 0 Nalbari 2 1 50 0 0 0 0 1 50 0 0 0 0
DISTRICT WISE CATEGORIZATION OF WATER LEVEL FLUCTUATION (AUGUST 2014 AND AUGUST 2013)
ANNEXURE- XIV

State / District Number of Stations Analyzed
Fall Rise 0-2 m % 2-4 m % >4 m % 0-2 m % 2-4 m % >4 m %
Sibsagar 12 4 33.3 0 0 0 0 8 66.7 0 0 0 0 Sonitpur 21 3 14.3 0 0 0 0 17 81 1 4.8 0 0 Tinsukia 15 0 0 0 0 0 0 14 93.3 1 6.7 0 0 Total 263 59 22.43 5 1.9 1 0.38 178 67.68 20 7.61 0 0 Meghalaya East Khasi Hills 2 2 100 0 0 0 0 0 0 0 0 0 0 Jaintia hills 2 1 50 0 0 0 0 1 50 0 0 0 0 Ri-Bhoi 2 0 0 0 0 0 0 2 100 0 0 0 0 West Khasi Hills 1 0 0 0 0 0 0 1 100 0 0 0 0 Total 7 3 42.86 0 0 0 0 4 57.14 0 0 0 0 Tripura Dhalai 1 1 100 0 0 0 0 0 0 0 0 0 0 North Tripura 9 6 66.7 0 0 0 0 3 33.3 0 0 0 0 South Tripura 16 4 25 0 0 1 6.3 11 68.8 0 0 0 0 West Tripura 24 11 45.8 1 4.2 0 0 11 45.8 1 4.2 0 0 Total 50 22 44 1 2 1 2 25 50 1 2 0 0 Grand Total 341 85 24.9 6 1.8 2 0.6 221 64.8 27 7.9 0 0

State / District Number of Stations Analyzed
Fall Rise 0-2 m % 2-4 m % >4 m % 0-2 m % 2-4 m % >4 m %
Arunachal Pradesh Changlang 4 1 25 0 0 0 0 3 75 0 0 0 0 East Siang 5 0 0 0 0 0 0 4 80 1 20 0 0 Lohit 1 1 100 0 0 0 0 0 0 0 0 0 0 Papumpare 7 5 71.4 0 0 0 0 2 28.6 0 0 0 0 Tirap 3 0 0 0 0 0 0 3 100 0 0 0 0 Total 20 7 35 0 0 0 0 12 60 1 5 0 0 Assam Baksha 1 1 100 0 0 0 0 0 0 0 0 0 0 Barpeta 7 4 57.1 1 14.3 0 0 2 28.6 0 0 0 0 Bongaigaon 11 7 63.6 0 0 0 0 4 36.4 0 0 0 0 Cachar 16 10 62.5 0 0 0 0 6 37.5 0 0 0 0 Darrang 18 9 50 0 0 0 0 9 50 0 0 0 0 Dhemaji 19 12 63.2 0 0 0 0 7 36.8 0 0 0 0 Dhubri 12 5 41.7 0 0 0 0 7 58.3 0 0 0 0 Dibrugarh 11 5 45.5 0 0 0 0 6 54.5 0 0 0 0 Golaghat 9 1 11.1 0 0 0 0 8 88.9 0 0 0 0 Hailakandi 3 0 0 1 33.3 0 0 2 66.7 0 0 0 0 Jorhat 16 0 0 0 0 0 0 11 68.8 5 31.3 0 0 Kamrup 24 13 54.2 0 0 0 0 11 45.8 0 0 0 0 Karbi Anglong 12 5 41.7 0 0 1 8.3 5 41.7 1 8.3 0 0 Karimganj 6 2 33.3 0 0 0 0 3 50 0 0 1 16.7 Lakhimpur 12 7 58.3 0 0 0 0 5 41.7 0 0 0 0 Morigaon 6 2 33.3 2 33.3 0 0 2 33.3 0 0 0 0 Nagaon 18 9 50 1 5.6 0 0 6 33.3 1 5.6 1 5.6 Nalbari 2 2 100 0 0 0 0 0 0 0 0 0 0
DISTRICT WISE CATEGORIZATION OF WATER LEVEL FLUCTUATION (NOVEMBER 2014 AND NOVEMBER 2013)
ANNEXURE- XV

State / District Number of Stations Analyzed
Fall Rise 0-2 m % 2-4 m % >4 m % 0-2 m % 2-4 m % >4 m %
Sibsagar 10 1 10 0 0 0 0 8 80 1 10 0 0 Sonitpur 21 8 38.1 1 4.8 0 0 12 57.1 0 0 0 0 Tinsukia 15 9 60 0 0 0 0 6 40 0 0 0 0 Total 249 112 44.98 6 2.42 1 0.4 120 48.19 8 3.21 2 0.8 Meghalaya East Khasi Hills 2 1 50 1 50 0 0 0 0 0 0 0 0 Jaintia hills 2 1 50 0 0 0 0 1 50 0 0 0 0 Ri-Bhoi 2 1 50 0 0 0 0 1 50 0 0 0 0 West Khasi Hills 1 0 0 0 0 0 0 1 100 0 0 0 0 Total 7 3 42.86 1 14.28 0 0 3 42.86 0 0 0 0 Nagaland Dimapur 10 2 20 1 10 1 10 5 50 1 10 0 0 Kohima 3 2 66.7 0 0 0 0 1 33.3 0 0 0 0 Mon 2 1 50 0 0 0 0 1 50 0 0 0 0 Phek 1 0 0 0 0 1 100 0 0 0 0 0 0 Tuensang 1 1 100 0 0 0 0 0 0 0 0 0 0 Wokha 3 2 66.7 0 0 1 33.3 0 0 0 0 0 0 Total 20 8 40 1 5 3 15 7 35 1 5 0 0 Tripura Dhalai 4 1 25 0 0 0 0 3 75 0 0 0 0 North Tripura 8 3 37.5 0 0 0 0 3 37.5 2 25 0 0 South Tripura 16 12 75 0 0 0 0 4 25 0 0 0 0 West Tripura 23 13 56.5 1 4.3 0 0 8 34.8 1 4.3 0 0 Total 51 29 56.87 1 1.96 0 0 18 35.29 3 5.88 0 0 Grand Total 347 159 45.8 9 2.6 4 1.2 160 46.1 13 3.7 2 0.6

State / District Number of Stations Analyzed
Fall Rise 0-2 m % 2-4 m % >4 m % 0-2 m % 2-4 m % >4 m %
Arunachal Pradesh Changlang 4 0 0 0 0 0 0 4 100 0 0 0 0 East Siang 6 4 66.7 0 0 0 0 2 33.3 0 0 0 0 Lohit 1 0 0 0 0 0 0 1 100 0 0 0 0 Papumpare 8 4 50 0 0 0 0 4 50 0 0 0 0 Tirap 3 0 0 0 0 0 0 3 100 0 0 0 0 Total 22 8 36.36 0 0 0 0 14 63.64 0 0 0 0 Assam Baksha 1 1 100 0 0 0 0 0 0 0 0 0 0 Barpeta 7 4 57.1 0 0 0 0 3 42.9 0 0 0 0 Bongaigaon 10 10 100 0 0 0 0 0 0 0 0 0 0 Cachar 15 2 13.3 0 0 0 0 13 86.7 0 0 0 0 Darrang 17 10 58.8 2 11.8 0 0 5 29.4 0 0 0 0 Dhemaji 18 8 44.4 0 0 0 0 10 55.6 0 0 0 0 Dhubri 13 4 30.8 0 0 0 0 9 69.2 0 0 0 0 Dibrugarh 10 4 40 0 0 0 0 6 60 0 0 0 0 Goalpara 17 7 41.2 1 5.9 0 0 9 52.9 0 0 0 0 Golaghat 10 0 0 0 0 0 0 10 100 0 0 0 0 Hailakandi 3 1 33.3 0 0 0 0 1 33.3 1 33.3 0 0 Jorhat 21 0 0 0 0 0 0 21 100 0 0 0 0 Kamrup 22 8 36.4 0 0 1 4.5 12 54.5 1 4.5 0 0 Karbi Anglong 16 4 25 0 0 1 6.3 9 56.3 2 12.5 0 0 Karimganj 6 0 0 0 0 0 0 6 100 0 0 0 0 Lakhimpur 16 8 50 0 0 0 0 8 50 0 0 0 0 Morigaon 11 8 72.7 1 9.1 0 0 1 9.1 1 9.1 0 0 Nagaon 25 11 44 0 0 0 0 13 52 1 4 0 0 Nalbari 2 0 0 1 50 0 0 1 50 0 0 0 0
DISTRICT WISE CATEGORIZATION OF WATER LEVEL FLUCTUATION (JANUARY 2015 AND JANUARY 2014)
ANNEXURE- XVI

State / District Number of Stations Analyzed
Fall Rise 0-2 m % 2-4 m % >4 m % 0-2 m % 2-4 m % >4 m %
Sibsagar 13 2 15.4 0 0 0 0 8 61.5 0 0 3 23.1 Sonitpur 23 15 65.2 0 0 0 0 8 34.8 0 0 0 0 Tinsukia 13 4 30.8 0 0 0 0 9 69.2 0 0 0 0 Total 289 111 38.41 5 1.73 2 0.69 162 56.06 6 2.08 3 1.04 Meghalaya East Garo Hills 3 1 33.3 0 0 0 0 2 66.7 0 0 0 0 East Khasi Hills 3 0 0 0 0 1 33.3 1 33.3 1 33.3 0 0 Jaintia hills 2 1 50 0 0 0 0 1 50 0 0 0 0 Ri-Bhoi 2 2 100 0 0 0 0 0 0 0 0 0 0 West Khasi Hills 1 0 0 0 0 0 0 1 100 0 0 0 0 Total 11 4 36.37 0 0 1 9.09 5 45.45 1 9.09 0 0 Nagaland Dimapur 10 6 60 0 0 0 0 4 40 0 0 0 0 Kohima 3 2 66.7 0 0 0 0 1 33.3 0 0 0 0 Mokokchung 1 0 0 0 0 0 0 1 100 0 0 0 0 Mon 2 1 50 0 0 0 0 1 50 0 0 0 0 Phek 1 1 100 0 0 0 0 0 0 0 0 0 0 Tuensang 1 1 100 0 0 0 0 0 0 0 0 0 0 Wokha 3 1 33.3 0 0 0 0 2 66.7 0 0 0 0 Total 21 12 57.14 0 0 0 0 9 42.86 0 0 0 0 Tripura North Tripura 9 7 77.8 0 0 0 0 2 22.2 0 0 0 0 South Tripura 14 9 64.3 0 0 0 0 5 35.7 0 0 0 0 West Tripura 24 13 54.2 0 0 1 4.2 9 37.5 1 4.2 0 0 Total 47 29 61.7 0 0 1 2.13 16 34.04 1 2.13 0 0 Grand Total 390 164 42.1 5 1.3 4 1 206 52.8 8 2.1 3 0.8

State / District Number of
Stations Analysed
Range in m Rise Fall Rise Fall 0-2 m 2-4 m >4 m 0-2 m 2-4 m >4 m
Min Max Min Max No % No % No % No % No % No %
Arunachal Pradesh
Changlang 4 0.99 2.01 - - 3 75 1 25 0 0 0 0 0 0 0 0 Lohit 1 0.89 0.89 - - 1 100 0 0 0 0 0 0 0 0 0 0 Papumpare 1 0.3 0.3 - - 1 100 0 0 0 0 0 0 0 0 0 0 Tirap 3 1.65 2.33 - - 2 66.7 1 33.3 0 0 0 0 0 0 0 0 Total 9 7 77.78 2 22.22 0 0 0 0 0 0 0 0 Assam Barpeta 3 0.05 0.56 - - 3 100 0 0 0 0 0 0 0 0 0 0 Bongaigaon 9 0.34 2.46 0.59 0.59 7 77.8 1 11.1 0 0 1 11.1 0 0 0 0 Cachar 10 0.01 0.43 0.11 0.5 5 50 0 0 0 0 5 50 0 0 0 0 Darrang 16 0.33 2.27 0.02 1.46 9 56.3 1 6.3 0 0 6 37.5 0 0 0 0 Dhemaji 8 0.16 0.84 0.4 0.46 6 75 0 0 0 0 2 25 0 0 0 0 Dhubri 6 0.08 1.73 1.33 6.01 4 66.7 0 0 0 0 1 16.7 0 0 1 16.7 Dibrugarh 8 0.1 1.36 - - 8 100 0 0 0 0 0 0 0 0 0 0 Goalpara 5 0 1.47 0.01 0.01 4 80 0 0 0 0 1 20 0 0 0 0 Golaghat 4 2.34 51.02 0.33 0.33 0 0 2 50 1 25 1 25 0 0 0 0 Jorhat 7 - - 0.15 0.39 0 0 0 0 0 0 7 100 0 0 0 0 Kamrup 12 0.1 1.52 0.55 0.55 11 91.7 0 0 0 0 1 8.3 0 0 0 0 Karbi Anglong 14 0.32 5.41 0.11 7.18 2 14.3 2 14.3 1 7.1 6 42.9 2 14.3 1 7.1 Karimganj 4 0.79 4.01 0.01 0.35 1 25 0 0 1 25 2 50 0 0 0 0 Lakhimpur 10 0.02 0.51 0.08 0.4 7 70 0 0 0 0 3 30 0 0 0 0
DISTRICT WISE CATEGORIZATION OF WATER LEVEL FLUCTUATION 10 years Mean (August 2004- August 2013) – August - 2014
ANNEXURE- XVII

State / District Number of
Stations Analysed
Range in m Rise Fall Rise Fall 0-2 m 2-4 m >4 m 0-2 m 2-4 m >4 m
Min Max Min Max No % No % No % No % No % No %
Morigaon 4 0.18 0.18 0.11 0.78 1 25 0 0 0 0 3 75 0 0 0 0 Nagaon 16 0.01 4.72 0.85 3.49 5 31.3 3 18.8 1 6.3 5 31.3 2 12.5 0 0 Nalbari 2 0.3 0.59 - - 2 100 0 0 0 0 0 0 0 0 0 0 Sibsagar 8 0.05 0.73 0.24 0.87 4 50 0 0 0 0 4 50 0 0 0 0 Sonitpur 13 0.02 0.71 0.2 0.58 9 69.2 0 0 0 0 4 30.8 0 0 0 0 Tinsukia 13 0.17 2.63 - - 12 92.3 1 7.7 0 0 0 0 0 0 0 0 Total 172 100 58.14 10 5.81 4 2.33 52 30.23 4 2.33 2 1.16 Meghalaya East Khasi Hills 2 - - 0.66 1.15 0 0 0 0 0 0 2 100 0 0 0 0 Jaintia hills 1 0.39 0.39 - - 1 100 0 0 0 0 0 0 0 0 0 0 Ri-Bhoi 1 0.34 0.34 - - 1 100 0 0 0 0 0 0 0 0 0 0 West Khasi Hills 1 0.23 0.23 - - 1 100 0 0 0 0 0 0 0 0 0 0 Total 5 3 60 0 0 0 0 2 40 0 0 0 0 Tripura Dhalai 1 0.03 0.03 - - 1 100 0 0 0 0 0 0 0 0 0 0 North Tripura 6 0.01 0.86 - - 6 100 0 0 0 0 0 0 0 0 0 0 South Tripura 5 0.35 1.39 - - 5 100 0 0 0 0 0 0 0 0 0 0 West Tripura 16 0.07 1.55 0.05 3.55 8 50 0 0 0 0 7 43.8 1 6.3 0 0 Total 28 20 71.43 0 0 0 0 7 25 1 3.57 0 0 Grand Total 214 - - - - 130 60.7 12 5.6 4 1.9 61 28.5 5 2.3 2 0.9

State / District
Number of
Stations Analysed
Range in m Rise Fall Rise Fall 0-2 m 2-4 m >4 m 0-2 m 2-4 m >4 m
Min Max Min Max No % No % No % No % No % No %
Arunachal Pradesh Changlang 4 0.13 0.8 0 0.66 2 50 0 0 0 0 2 50 0 0 0 0 Lohit 1 0.29 0.29 - - 1 100 0 0 0 0 0 0 0 0 0 0 Papumpare 1 0.28 0.28 - - 1 100 0 0 0 0 0 0 0 0 0 0 Tirap 3 0.54 1.05 - - 3 100 0 0 0 0 0 0 0 0 0 0 Total 9 7 77.78 0 0 0 0 2 22.22 0 0 0 0 Assam Barpeta 3 - - 0.21 1.34 0 0 0 0 0 0 3 100 0 0 0 0 Bongaigaon 9 1.53 1.53 0.01 1.11 1 11.1 0 0 0 0 8 88.9 0 0 0 0 Cachar 13 0.01 1.8 0.06 0.66 7 53.8 0 0 0 0 6 46.2 0 0 0 0 Darrang 16 0.12 1.62 0.04 0.56 11 68.8 0 0 0 0 5 31.3 0 0 0 0 Dhemaji 10 0.03 0.36 0.08 1.45 7 70 0 0 0 0 3 30 0 0 0 0 Dhubri 7 0.16 1.55 0.04 0.78 3 42.9 0 0 0 0 4 57.1 0 0 0 0 Dibrugarh 7 0.08 0.58 0.06 1.07 4 57.1 0 0 0 0 3 42.9 0 0 0 0 Goalpara 10 0.22 0.54 0.1 1.66 2 20 0 0 0 0 8 80 0 0 0 0 Golaghat 1 0.6 0.6 - - 1 100 0 0 0 0 0 0 0 0 0 0 Jorhat 5 0.03 1.64 - - 5 100 0 0 0 0 0 0 0 0 0 0 Kamrup 14 0.27 1.62 0.04 1.43 6 42.9 0 0 0 0 8 57.1 0 0 0 0 Karbi Anglong 11 0.18 5.87 0.03 1.04 4 36.4 1 9.1 1 9.1 5 45.5 0 0 0 0 Karimganj 6 0.19 3.2 - - 5 83.3 1 16.7 0 0 0 0 0 0 0 0 Lakhimpur 11 0 0.61 0.12 0.38 6 54.5 0 0 0 0 5 45.5 0 0 0 0 Morigaon 3 - - 0.07 0.9 0 0 0 0 0 0 3 100 0 0 0 0 Nagaon 16 0 3.75 0.9 1.8 10 62.5 2 12.5 0 0 4 25 0 0 0 0 Nalbari 2 - - 0.7 1.27 0 0 0 0 0 0 2 100 0 0 0 0 Sibsagar 5 0.24 1.1 0.25 0.41 3 60 0 0 0 0 2 40 0 0 0 0 Sonitpur 13 0.12 0.95 0.05 0.7 6 46.2 0 0 0 0 7 53.8 0 0 0 0
DISTRICT WISE CATEGORIZATION OF WATER LEVEL FLUCTUATION 10 years Mean (November 2004- November 2013) – November - 2014
ANNEXURE- XVIII
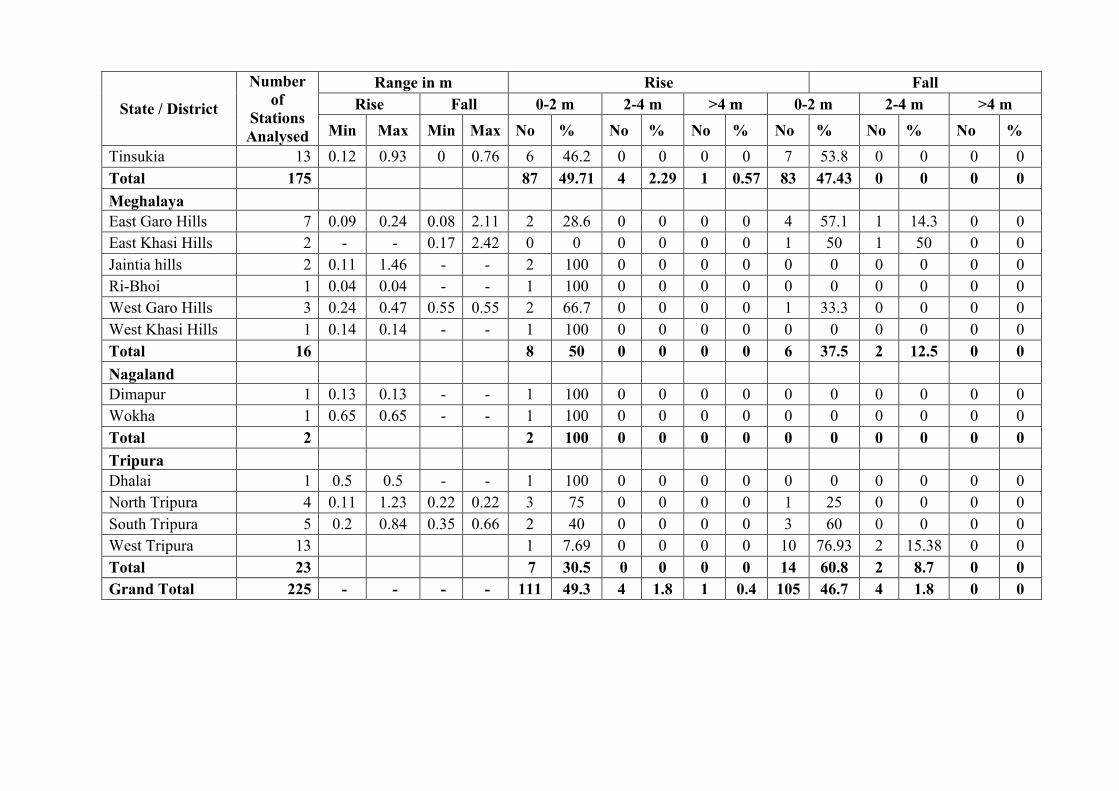
State / District
Number of
Stations Analysed
Range in m Rise Fall Rise Fall 0-2 m 2-4 m >4 m 0-2 m 2-4 m >4 m
Min Max Min Max No % No % No % No % No % No % Tinsukia 13 0.12 0.93 0 0.76 6 46.2 0 0 0 0 7 53.8 0 0 0 0 Total 175 87 49.71 4 2.29 1 0.57 83 47.43 0 0 0 0 Meghalaya East Garo Hills 7 0.09 0.24 0.08 2.11 2 28.6 0 0 0 0 4 57.1 1 14.3 0 0 East Khasi Hills 2 - - 0.17 2.42 0 0 0 0 0 0 1 50 1 50 0 0 Jaintia hills 2 0.11 1.46 - - 2 100 0 0 0 0 0 0 0 0 0 0 Ri-Bhoi 1 0.04 0.04 - - 1 100 0 0 0 0 0 0 0 0 0 0 West Garo Hills 3 0.24 0.47 0.55 0.55 2 66.7 0 0 0 0 1 33.3 0 0 0 0 West Khasi Hills 1 0.14 0.14 - - 1 100 0 0 0 0 0 0 0 0 0 0 Total 16 8 50 0 0 0 0 6 37.5 2 12.5 0 0 Nagaland Dimapur 1 0.13 0.13 - - 1 100 0 0 0 0 0 0 0 0 0 0 Wokha 1 0.65 0.65 - - 1 100 0 0 0 0 0 0 0 0 0 0 Total 2 2 100 0 0 0 0 0 0 0 0 0 0 Tripura Dhalai 1 0.5 0.5 - - 1 100 0 0 0 0 0 0 0 0 0 0 North Tripura 4 0.11 1.23 0.22 0.22 3 75 0 0 0 0 1 25 0 0 0 0 South Tripura 5 0.2 0.84 0.35 0.66 2 40 0 0 0 0 3 60 0 0 0 0 West Tripura 13 1 7.69 0 0 0 0 10 76.93 2 15.38 0 0 Total 23 7 30.5 0 0 0 0 14 60.8 2 8.7 0 0 Grand Total 225 - - - - 111 49.3 4 1.8 1 0.4 105 46.7 4 1.8 0 0

State / District
Number of
Stations Analysed
Range in m Rise Fall Rise Fall 0-2 m 2-4 m >4 m 0-2 m 2-4 m >4 m
Min Max Min Max No % No % No % No % No % No %
Arunachal Pradesh Changlang 4 0.03 0.67 0.05 0.05 3 75 0 0 0 0 1 25 0 0 0 0 East Siang 1 - - 0.13 0.13 0 0 0 0 0 0 1 100 0 0 0 0 Lohit 1 0.57 0.57 - - 1 100 0 0 0 0 0 0 0 0 0 0 Papumpare 2 0.02 0.39 - - 2 100 0 0 0 0 0 0 0 0 0 0 Tirap 3 0.36 1.41 - - 3 100 0 0 0 0 0 0 0 0 0 0 Total 11 9 81.82 0 0 0 0 2 18.18 0 0 0 0 Assam Barpeta 3 - - 0.24 0.79 0 0 0 0 0 0 3 100 0 0 0 0 Bongaigaon 9 0.73 1.93 0.02 1.29 2 22.2 0 0 0 0 7 77.8 0 0 0 0 Cachar 12 0.08 1.17 0.08 3.32 8 66.7 0 0 0 0 3 25 1 8.3 0 0 Darrang 15 0.12 0.9 0.03 1.78 6 40 0 0 0 0 9 60 0 0 0 0 Dhemaji 10 0.01 0.07 0.02 1.37 3 30 0 0 0 0 7 70 0 0 0 0 Dhubri 7 0.44 1.81 0.02 1.04 3 42.9 0 0 0 0 4 57.1 0 0 0 0 Dibrugarh 7 0.05 0.38 0.1 0.16 4 57.1 0 0 0 0 3 42.9 0 0 0 0 Goalpara 11 0.07 1.07 0.19 1.33 7 63.6 0 0 0 0 4 36.4 0 0 0 0 Golaghat 3 - - 0.49 1.17 0 0 0 0 0 0 3 100 0 0 0 0 Jorhat 7 0.45 0.64 0.05 0.51 3 42.9 0 0 0 0 4 57.1 0 0 0 0 Kamrup 13 0.13 2.22 0.12 4.8 3 23.1 1 7.7 0 0 8 61.5 0 0 1 7.7 Karbi Anglong 14 0.91 1.89 0.11 7.99 6 42.9 0 0 0 0 6 42.9 1 7.1 1 7.1 Karimganj 6 0.55 3.88 - - 5 83.3 1 16.7 0 0 0 0 0 0 0 0 Lakhimpur 12 0.03 0.54 0.04 0.63 6 50 0 0 0 0 6 50 0 0 0 0 Morigaon 3 0.1 0.1 0.33 0.51 1 33.3 0 0 0 0 2 66.7 0 0 0 0 Nagaon 16 0.07 1.84 0.07 2.23 9 56.3 0 0 0 0 6 37.5 1 6.3 0 0 Nalbari 2 0.02 0.02 2.92 2.92 1 50 0 0 0 0 0 0 1 50 0 0 Sibsagar 9 0.05 1.43 0.03 1.54 4 44.4 0 0 0 0 5 55.6 0 0 0 0 Sonitpur 14 0.03 0.92 0.04 0.74 3 21.4 0 0 0 0 11 78.6 0 0 0 0
DISTRICT WISE CATEGORIZATION OF WATER LEVEL FLUCTUATION 10 years Mean (January 2005- January 2014) – January - 2015
ANNEXURE- XIX

State / District
Number of
Stations Analysed
Range in m Rise Fall Rise Fall 0-2 m 2-4 m >4 m 0-2 m 2-4 m >4 m
Min Max Min Max No % No % No % No % No % No % Tinsukia 13 0.11 1.73 0.01 0.44 9 69.2 0 0 0 0 4 30.8 0 0 0 0 Total 186 83 44.62 2 1.08 0 0 95 51.07 4 2.15 2 1.08 Meghalaya East Garo Hills 9 0.14 0.47 0.2 1.71 3 33.3 0 0 0 0 6 66.7 0 0 0 0 East Khasi Hills 3 0.06 0.53 3.01 3.01 2 66.7 0 0 0 0 0 0 1 33.3 0 0 Jaintia hills 2 0.42 1.06 - - 2 100 0 0 0 0 0 0 0 0 0 0 Ri-Bhoi 1 0.57 0.57 - - 1 100 0 0 0 0 0 0 0 0 0 0 West Garo Hills 5 0.67 0.67 0.27 1.93 1 20 0 0 0 0 4 80 0 0 0 0 West Khasi Hills 1 0.26 0.26 - - 1 100 0 0 0 0 0 0 0 0 0 0 Total 21 10 47.62 0 0 0 0 10 47.62 1 4.76 0 0 Nagaland Dimapur 1 - - 5.16 5.16 0 0 0 0 0 0 0 0 0 0 1 100 Wokha 2 1.49 1.49 7.68 7.68 1 50 0 0 0 0 0 0 0 0 1 50 Total 3 1 33.33 0 0 0 0 0 0 0 0 2 66.67 Tripura North Tripura 6 0.21 0.42 0.01 0.29 2 33.3 0 0 0 0 4 66.7 0 0 0 0 South Tripura 5 0.07 1.08 0.17 0.18 3 60 0 0 0 0 2 40 0 0 0 0 West Tripura 15 0.06 1.04 0.1 4.17 4 26.7 0 0 0 0 10 66.7 0 0 1 6.7 Total 26 9 34.62 0 0 0 0 16 61.54 0 0 1 3.84 Grand Total 247 - - - - 112 45.3 2 0.8 0 0 123 49.8 5 2 5 2

LONG TERM GROUND WATER LEVEL TREND –PRE MONSOON
Period: March 2008 - March 2014
STATE / DISTRICT STATION WELL NO RISE FALL
Arunachal Pradesh Changlang Jairampur 92A4A1 - 0.113 Changlang Namchik 92A3A1 0.044 - Changlang Namphai 92A3A2 - 0.356 Changlang Newlisan Kharsang 92A2A1 0.288 - East Siang Berung 83M1B4 - 0.137 Lohit Lathow 83M2D1 - 0.209 Papumpare Kimin 83E3D2 0.099 - Papumpare Sonajuli 83E4C1 0.986 - Tirap Borduria 83M4B3 0.337 - Tirap Deomali 83M4C1 0.185 - Tirap Hukanjuri 83M4B4 0.635 - Assam Barpeta Bhawanipur 78N3A1 0.123 Barpeta Sarupeta 78N3A6 0.227 Barpeta Sorbhog 78J3D4 0.099 Bongaigaon Abhayapuri 78J3C2 0.018 Bongaigaon Baitamari 78J3C1 0.072 Bongaigaon Bijni 78J3C5 0.08 Bongaigaon Bongaigaon New 78J3C9 0.016 Bongaigaon Chalantapara 78J3C4 0.006 Bongaigaon Manikpur 78J3D1 0.048 Bongaigaon Medhipara(Deo) 78J3C6 0.136 Bongaigaon North salmara 78J3C8 0.042 Cachar Badribasti 83D1D7 0.476 Cachar Badribasti OW 83D1D8 0.048 Cachar Borjalinga 83D2D1 0.051 Cachar Borkhola 83D1C8 0.123 Cachar Digharkhal 83D1C3 0.339 Cachar Ghungoor TW 83D1D10 0.029 Cachar Kalain 83D1C14 0.684 Cachar Kalain PZ 83D1C13 0.138 Cachar Moinarbond 83D1D6 0.068 Cachar Palanghat 83D2D10 0.027 Cachar Razabazar 83H1A7 0.085 Cachar Shivtila 83H1A4 0.553 Darrang Baitamari (Beltala 83B2A8 0.04
ANNEXURE -XX

STATE / DISTRICT STATION WELL NO RISE FALL
Darrang Bengbari 78N2D10 0.007 Darrang Bhalukmari-I 83B2A7 0.119 Darrang Dalgaon 83B2A2 0.039 Darrang Gelabil (Thelamara) 83B2B6 0.029 Darrang Kalaigaon 78N2D3 0.002 Darrang Kendurtal 78N2D11 0.006 Darrang Madhupur 83B2A6 0.056 Darrang Mangaldoi 83B3A1 0.011 Darrang Mangaldoi II 83B3A3 0.086 Darrang Orang 83B2B1 0.016 Darrang Paneri 78N2D9 0.225 Darrang Paneri TG 78N2D1 0.743 Darrang Rowta chariali 83B2A3 0.019 Darrang Tangla 78N2D2 0.082 Darrang Thekerabari .1 83B2A1 0.012 Darrang Udalguri 83B2A4 0.034 Dhemaji Akajan 83I2D1 0.019 Dhemaji Bhagaban charali 83I2D2 0.026 Dhemaji Bijoypur 83M1A3 0.155 Dhemaji Bordoloni 83I3B1 0.04 Dhemaji Dhakuakhana1 ASDM07 0.115 Dhemaji Dhemaji 1 83I3C1 0.023 Dhemaji Ghilamara ASDM11 0.035 Dhemaji Jonai murkongselek 83M1A1 0.086 Dhemaji Silapathar 83I2C1 0.136 Dhemaji Siripani 83I2C3 0.076 Dhemaji Sisibargaon 83I2C2 0.069 Dhemaji Telem 83M2A1 0.061 Dhubri Bagaribari 78J4A4 0.096 Dhubri Bahalpur 78J3B4 0.021 Dhubri Bilasipara 78J4A1 0.039 Dhubri Chapar 78J3B2 0.044 Dhubri Dhubri Town 78F4D4 0.346 Dhubri Mancachar 78G2D3 0.008 Dhubri Panbari 78J4A2 0.157 Dhubri Rupshi 78F4D3 0.101 Dibrugarh Azarguri gaon 83I3D4 0.052 Dibrugarh Bamunbari 83I4D4 0.26 Dibrugarh Barbaruah 83I3D6 0.024 Dibrugarh Chabua 83M3A2 0.437 Dibrugarh Dibrugarh 83I3D1 0.092

STATE / DISTRICT STATION WELL NO RISE FALL
Dibrugarh Dikom 83M3A1 0.011 Dibrugarh Jaipur Naharani 83M3A4 0.052 Goalpara Agia1 78J4C3 0.075 Goalpara Baida 78J4B3 0.65 Goalpara Damra 78K1D8 0.02 Goalpara Dhupdhara 78O1A2 0.346 Goalpara Dudhnai 78K1D1 0.095 Goalpara Goalpara Town 78J4C4 0.393 Goalpara Khutabari 78N4A1 0.094 Goalpara Krishnai 78J4C1 0.199 Goalpara Lakhipur 78J4B1 0.044 Goalpara Matia 78J4D1 0.343 Goalpara Rongjuli 78K1D2 0.089 Golaghat Oating 83J3A1 0.164 Hailakandi Syedband Part II ASHL01A 0.15 Jorhat Dabarapara charali 83J2B3 0.068 Jorhat Kakojan1 83J1B1 0.198 Jorhat Mariani 83J2B4 0.402 Jorhat Rajoi TG 83J2B5 0.192 Jorhat Saklatinga TGI 83J2A11 0.558 Jorhat Selenghat 83J2B2 0.403 Jorhat Tipamia 83J2A6 0.162 Jorhat Titabor 83J2A7 0.076 Kamrup Agyathuri 78N4C2 0.762 Kamrup Alikash Adarsh 78N4C16 0.028 Kamrup Bamunigaon1 78N4B3 0.386 Kamrup Chandrapur 78N4D9 0.197 Kamrup Darkuchi 78N2C4 0.003 Kamrup Hajo 78N4C5 0.385 Kamrup Kahara 78N3C2 0.051 Kamrup Rajapara 78O1A3 0.392 Kamrup Rangia 78N3C1 0.238 Kamrup Sualkuchi 78N4C11 0.076 Kamrup Metro Amingaon(ii) 78N4C18 0.344 Kamrup Metro Azara 78N4C1 0.014 Kamrup Metro Boragaon 78N4C7 0.496 Kamrup Metro Kahilipara 78N4D7 0.466 Kamrup Metro Khanapara 78N4D3 1.371 Kamrup Metro Khetri 83B4A3 0.03 Kamrup Metro Maligaon 78N4C6 0.857 Kamrup Metro Rani1 78N4C9 0.351

STATE / DISTRICT STATION WELL NO RISE FALL
Kamrup Metro Sonapur 83B4A2 0.016 Kamrup Metro Topatoli 83B4A4 0.169 Kamrup Metro Zoo narangi rd 78N4D2 0.812 Karbi Anglong Balipathar 83F4D3 0.197 Karbi Anglong Boithalangsu 83C1C2 0.436 Karbi Anglong Bokajan 83F4D2 0.449 Karbi Anglong Bokulia 83G1C3 0.004 Karbi Anglong Dengaon R5 83B4D7 0.114 Karbi Anglong Deopani 83F4D4 0.178 Karbi Anglong Dillai 83G1C4 0.028 Karbi Anglong Diphu 83G1B1 0.726 Karbi Anglong Donkamokam 83C1C1 0.006 Karbi Anglong Hapjan 83G1C1 0.949 Karbi Anglong Hawaipur 83C1D5 0.033 Karbi Anglong Hidipi 83F4C1 0.34 Karbi Anglong Kalonga 83C1D2 0.407 Karbi Anglong Khatkhati 83G1D3 0.015 Karbi Anglong Kheronighat 83C1D3 0.095 Karbi Anglong Manja Forest 83G1B2 0.342 Karbi Anglong Phuloni 83F4A2 0.139 Karbi Anglong Silanijan 83F3D1 0.237 Karbi Anglong Siljuri 83F2B2 0.546 Karimganj Badarpur 83D1C1 0.697 Karimganj Badarpur Pz 83D1C9 0.565 Karimganj Dhaulia 83D2B6 0.042 Karimganj Hatikira 83D3B1 0.094 Karimganj Rk Nagar I 83D2B4 0.252 Karimganj Sarkaribari 83D2B7 0.025 Karimganj Shrigauri 83D1C5 0.069 Lakhimpur Bhogpur charali 83E4D1 0.124 Lakhimpur Bihpuria 83E4D4 0.04 Lakhimpur Boginadi(balijan) 83I3A1 0.078 Lakhimpur Dholpur 83F1D1 0.043 Lakhimpur Dolanghat chara 83I4A3 0.096 Lakhimpur Harmoti 83E4D6 0.064 Lakhimpur Islampur 83E4D3 0.004 Lakhimpur Kadam 83I3A3 0.01 Lakhimpur Laluk 83E4D2 0.049 Lakhimpur N.lakhipur(old) 83I4A1 0.034 Lakhimpur Naoboisa 83I4A4 0.028 Lakhimpur Narayanpur 83F1D4 0.148

STATE / DISTRICT STATION WELL NO RISE FALL
Lakhimpur Panigaon 83I4A2 0.013 Lakhimpur Pathalipam 83I3B6 0.002 Morigaon Baghara 83B4B2 0.129 Morigaon Garmari gaon 83B3A4 0.322 Morigaon Jagiroad 83B4A1 0.158 Morigaon Morigaon 83B3B10 0.011 Morigaon Nelle 83B4B4 0.567 Nagaon Amsoi 83B4B5 0.226 Nagaon Beldonga mandir 83B4D8 0.425 Nagaon Bichamari 83B3B1 0.608 Nagaon Bordowa 83B3C2 0.089 Nagaon Dhing 83B3B6 0.345 Nagaon Doboka 83B4D1 0.393 Nagaon Haldiati sub bt 83B4D6 0.01 Nagaon Jurapukhuri 83C1D7 0.143 Nagaon Kathiatoli 83B4C4 0.065 Nagaon Kondali 83B3D5 0.096 Nagaon Lanka 83C1D1 0.418 Nagaon Nadeorigaon 83B4D2 0.03 Nagaon Samuguri 83B3D7 0.144 Nagaon Silghat 83B2D6 0.309 Nagaon Sulung p.o. 83B3D8 0.023 Nagaon Telia bebejia 83B3C7 0.03 Nalbari Tamulpur 78N2C1 0.133 Nalbari Tihu 78N3B3 0.085 Sibsagar Bandarmari 83I4C14 0.243 Sibsagar Betbari alimore 83I4C8 0.301 Sibsagar Demow Sukan 83I4C11 0.204 Sibsagar Geleki 83J1C9 0.011 Sibsagar Hanumanbagh 83J1C7 0.437 Sibsagar Moranhat 83I4D1 0.066 Sibsagar Rajabari TE 83I4C7 0.469 Sibsagar Sapekhati 83M4A1 0.129 Sibsagar Sibsagar 83J1C2 0.316 Sonitpur Balipara 83B1D4 0.094 Sonitpur Bihupukhuri 83F2A7 0.105 Sonitpur Biswanath 83F2A8 0.043 Sonitpur Biswanath chara 83F2A6 0.367 Sonitpur Borgang 83F1B2 0.006 Sonitpur Charduar 83B1D1 0.002 Sonitpur Dhalaibil 83B1D3 0.014

STATE / DISTRICT STATION WELL NO RISE FALL
Sonitpur Dhekiajuli 83B2B2 0.037 Sonitpur Garumari 83B1D2 0.003 Sonitpur Gohpur 83F1C2 0.009 Sonitpur Hawajan 83F1C4 0.041 Sonitpur Jamuguri North 83B2D3 0.036 Sonitpur Sootia 83F2A2 0.037 Sonitpur Tezpur 83B2D2 0.001 Tinsukia Bordumsa 83M3D3 0.249 Tinsukia Borgolai 83M3C2 0.028 Tinsukia Bortorani 83M2B4 0.219 Tinsukia Digboi 83M3C1 0.383 Tinsukia Jagun 83M3D4 0.11 Tinsukia Jaipur naharjan 83M4B5 0.429 Tinsukia Ledo forest off 83M3C3 0.61 Tinsukia Lekhapani 83M3D1 0.145 Tinsukia Panitola 83M3B4 0.093 Tinsukia Rangagora guijn 83M2B3 0.036 Tinsukia Tinsukia 83M3B2 0.175 Tinsukia Tirap gate 83M3D2 0.08 Meghalaya East Garo Hills Bajengdoba 78K1C2 - 0.6 East Garo Hills Darugiri 78K2D2 - 0.13 East Garo Hills Depa sarangma 78K1D4 - 0.229 East Garo Hills Kharkutta 78K1D7 0.009 - East Garo Hills Mendal 78K1B1 0.03 - East Garo Hills Mendipathar 78K1C1 - 0.265 East Garo Hills Rongjeng 78K2D1 - 0.265 East Garo Hills Rongmil 78K2D3 - 0.313 East Garo Hills Williamnagar 78K2C2 - 0.054 East Khasi Hills Balat 78O4B1 - 0.336 East Khasi Hills Shillong Polo 78O2D1 - 1.259 Jaintia hills Dauki 83C4A1 - 0.234 Ri-Bhoi Nongpoh 78O1D1 - 0.021 West Garo Hills Ampati 78G3D1 - 0.063 West Garo Hills Asanang 78K2B1 - 0.097 West Garo Hills Barengapara 78K4A1 0.119 - West Garo Hills Borkona 78G2D4 - 0.22 West Garo Hills Garobandha 78K2A1 0.422 - West Garo Hills Kherapara 78K3A2 - 0.065 West Garo Hills Mahendraganj 78G3D2 - 0.106 West Garo Hills Nidanpur 78K1A3 - 0.301

STATE / DISTRICT STATION WELL NO RISE FALL
West Garo Hills Phulbari 78K1A1 - 0.614 West Garo Hills Purkhasia 78K3A1 - 0.229 West Garo Hills Tikrikilla 78K1A2 - 0.031 West Garo Hills Zikzak PZ 78G3D5 - 0.355 West Khasi Hills Mairang 78O2C1 0.009 -
Nagaland Dimapur Chumkidima 83G1D1 0.668 - Dimapur Dhansiripar 83G1C5 - 0.386 Dimapur Dimapur 83G1C2 - 1.437 Dimapur Jalukie 83G2C1 - 0.367 Dimapur Singrijan 83G1C6 0.155 - Mokokchung Lampi 83J3B1 - 0.117 Tripura Dhalai Abhanga N TRDL04 - 0.126 Dhalai Kamalpur 78P4D1 - 0.099 Dhalai Manu N TRDL05 - 0.013 North Tripura Bagbasa N TRNT10 0.163 - North Tripura Dharmanagar 83D3B2 - 0.011 North Tripura Gauranagar N TRNT11 0.44 - North Tripura Kumarghat 83D4A6 0.238 - North Tripura Panisagar 83D4A1 0.179 - North Tripura Pecharthal 83D4A7 0.402 -
South Tripura Dhawajnagar Udaipur 79M2B8 - 0.027
South Tripura Garjee Bazar 79M3B4 - 0.219 South Tripura Hrishyamukh 79M4C4 0.136 - South Tripura Manurmukh TRST03A 0.03 - South Tripura Sabroom 79M4C1 - 0.052 South Tripura Santirbazar 79M3C1 - 0.001 West Tripura Badharghat DTW TRWT25 - 0.127 West Tripura Bishalgarh 79M2B1 - 0.16 West Tripura Bodhjanagar Dtw TRWT19 - 0.205 West Tripura Bodhjanagar Stw TRWT20 - 0.358 West Tripura Champaknagar 79M1B6 0.14 -
West Tripura Dakshin Kalamcherra TRWT04A 0.124 -
West Tripura Kalyanpur 79M1C2 - 0.006 West Tripura Kathalia bazar 79M3B5 - 0.006 West Tripura Kenania 79M2A2 - 0.035 West Tripura Khowai 78P4C5 0.035 -

STATE / DISTRICT STATION WELL NO RISE FALL
West Tripura Lichubagan DTW TRWT21 - 0.233 West Tripura Lichubagan STW TRWT22 - 0.177 West Tripura Mohanpur 79M1B5 0.103 - West Tripura Nagicherra1 TRWT29 - 0.32 West Tripura Nagicherra2 TRWT30 0.021 - West Tripura Narsinghgarh DTW TRWT28 - 0.155 West Tripura Simna 78P4B1 - 0.092 West Tripura Sipoyjala 79M2B7 - 0.011 West Tripura Sonamura1 79M3B6 - 0.092
West Tripura Suryamaninagar DTW TRWT23 - 0.021
West Tripura Suryamaninagar STW TRWT24 - 0.038
West Tripura Teliamura 79M1C1 0.104 -

LONG TERM GROUND WATER LEVEL TREND –POST MONSOON
Period: November 2005 - November 2014
STATE / DISTRICT STATION WELL NO RISE FALL
Arunachal Pradesh Changlang Jairampur 92A4A1 - 0.092 Changlang Namchik 92A3A1 0.088 - Changlang Namphai 92A3A2 - 0.07 Changlang Newlisan Kharsang 92A2A1 0.025 - East Siang Berung 83M1B4 0.069 - East Siang Pasighat 82P4B1 - 0.558 Lohit Lathow 83M2D1 0.07 - Papumpare Kimin 83E3D2 0.085 - Papumpare Sonajuli 83E4C1 0.004 - Tirap Borduria 83M4B3 - 0.083 Tirap Deomali 83M4C1 - 0.041 Tirap Hukanjuri 83M4B4 0.125 - Assam Barpeta Bhawanipur 78N3A1 - 0.096 Barpeta Sarupeta 78N3A6 - 0.02 Barpeta Sorbhog 78J3D4 - 0.059 Barpeta Ujanborbori 78N2A2 0.106 - Bongaigaon Abhayapuri 78J3C2 - 0.036 Bongaigaon Baitamari 78J3C1 0.192 - Bongaigaon Bijni 78J3C5 - 0.087 Bongaigaon Bongaigaon New 78J3C9 - 0.065 Bongaigaon Chalantapara 78J3C4 - 0.179 Bongaigaon Chaprakata 78J3C7 - 0.018 Bongaigaon Manikpur 78J3D1 - 0.039 Bongaigaon Medhipara(Deo) 78J3C6 0.069 - Bongaigaon North salmara 78J3C8 - 0.099 Cachar Badribasti 83D1D7 - 0 Cachar Badribasti OW 83D1D8 - 0.011 Cachar Borjalinga 83D2D1 0.026 - Cachar Borkhola 83D1C8 0.05 - Cachar Digharkhal 83D1C3 0.058 - Cachar Ghungoor TW 83D1D10 0.129 - Cachar Kalain 83D1C14 - 0.073 Cachar Kalain PZ 83D1C13 - 0.005 Cachar Moinarbond 83D1D6 - 0.062
ANNEXURE -XXI

STATE / DISTRICT STATION WELL NO RISE FALL
Cachar Palanghat 83D2D10 0.007 - Cachar Panigram Pz 83D1D9 0.16 - Cachar Poilapul 83H1A9 0.085 - Cachar Razabazar 83H1A7 0.31 - Cachar Shivtila 83H1A4 0.009 - Cachar Silchar 83D1D1 0.018 - Darrang Baitamari (Beltala 83B2A8 - 0.062 Darrang Bengbari 78N2D10 0.212 - Darrang Bhalukmari-I 83B2A7 - 0.144 Darrang Chamuapara 83B3A2 - 0.083 Darrang Dalgaon 83B2A2 0.036 - Darrang Gelabil (Thelamara) 83B2B6 - 0.075 Darrang Kalaigaon 78N2D3 - 0.014 Darrang Kendurtal 78N2D11 - 0.001 Darrang Madhupur 83B2A6 - 0.148 Darrang Mangaldoi 83B3A1 0.006 - Darrang Mangaldoi II 83B3A3 0.026 - Darrang Orang 83B2B1 0.078 - Darrang Paneri 78N2D9 0.055 - Darrang Paneri TG 78N2D1 0.177 - Darrang Rowta chariali 83B2A3 - 0.061 Darrang Tangla 78N2D2 - 0.194 Darrang Thekerabari .1 83B2A1 0.072 - Darrang Udalguri 83B2A4 0.035 - Dhemaji Akajan 83I2D1 0.043 - Dhemaji Bhagaban charali 83I2D2 - 0.1 Dhemaji Bijoypur 83M1A3 0.049 - Dhemaji Bordoloni 83I3B1 0.041 - Dhemaji Dhakuakhana1 ASDM07 - 0.055 Dhemaji Dhemaji 1 83I3C1 0.061 - Dhemaji Ghilamara ASDM11 - 0.019 Dhemaji Jonai murkongselek 83M1A1 0.043 - Dhemaji Silapathar 83I2C1 0.045 - Dhemaji Siripani 83I2C3 0.023 - Dhemaji Sisibargaon 83I2C2 0.056 - Dhemaji Telem 83M2A1 0.076 - Dhubri Bagaribari 78J4A4 - 0.058 Dhubri Bahalpur 78J3B4 - 0.046 Dhubri Bilasipara 78J4A1 0.019 - Dhubri Chapar 78J3B2 - 0.01 Dhubri Dhubri Town 78F4D4 - 0.214

STATE / DISTRICT STATION WELL NO RISE FALL
Dhubri Mancachar 78G2D3 - 0.016 Dhubri Manipur Basti 78J4A5 0.249 - Dhubri Panbari 78J4A2 - 0.075 Dhubri Rupshi 78F4D3 0.197 - Dhubri Tamarhat 78F4D2 0.209 - Dibrugarh Azarguri gaon 83I3D4 0.006 - Dibrugarh Bamunbari 83I4D4 0.039 - Dibrugarh Barbaruah 83I3D6 - 0.03 Dibrugarh Chabua 83M3A2 - 0.194 Dibrugarh Dibrugarh 83I3D1 0.147 - Dibrugarh Dikom 83M3A1 - 0.006 Dibrugarh Jaipur Naharani 83M3A4 - 0.01 Goalpara Agia1 78J4C3 - 0.066 Goalpara Baida 78J4B3 - 0.015 Goalpara Damra 78K1D8 0.014 - Goalpara Dhupdhara 78O1A2 - 0.157 Goalpara Dudhnai 78K1D1 - 0.078 Goalpara Goalpara Town 78J4C4 0.174 - Goalpara Khutabari 78N4A1 - 0.11 Goalpara Krishnai 78J4C1 0.106 - Goalpara Lakhipur 78J4B1 - 0.103 Goalpara Matia 78J4D1 - 0.147 Goalpara Rongjuli 78K1D2 0.01 - Golaghat Kamargaon 83J2A4 - 0.286 Golaghat Kohra kaziranga 83F2B1 - 0.151 Golaghat Oating 83J3A1 - 0.156 Hailakandi Panchgram New ASHL05A - 0.177 Hailakandi Syedband Part II ASHL01A - 0.185 Jorhat Baghmaria 83J2A10 - 0.094 Jorhat Dabarapara charali 83J2B3 - 0.049 Jorhat Kakojan1 83J1B1 - 0.092 Jorhat Mariani 83J2B4 0.036 - Jorhat Rajoi TG 83J2B5 - 0.046 Jorhat Saklatinga TGI 83J2A11 - 0.068 Jorhat Selenghat 83J2B2 - 0.012 Jorhat Tipamia 83J2A6 0.031 - Jorhat Titabor 83J2A7 - 0.134 Kamrup Agyathuri 78N4C2 0.017 - Kamrup Alikash Adarsh 78N4C16 0.007 - Kamrup Bamunigaon1 78N4B3 - 0.151 Kamrup Chandrapur 78N4D9 - 0.007

STATE / DISTRICT STATION WELL NO RISE FALL
Kamrup Darkuchi 78N2C4 - 0.031 Kamrup Goreswar 78N2C2 0.081 - Kamrup Hajo 78N4C5 0.343 - Kamrup Kahara 78N3C2 0.068 - Kamrup Rajapara 78O1A3 - 0.023 Kamrup Rangia 78N3C1 0.4 - Kamrup Sualkuchi 78N4C11 0.016 - Kamrup Metro Amingaon(ii) 78N4C18 - 0.234 Kamrup Metro Azara 78N4C1 - 0.022 Kamrup Metro Boragaon 78N4C7 - 0.004 Kamrup Metro Dirgheswari 78N4C12 0.073 - Kamrup Metro Kahilipara 78N4D7 0.01 - Kamrup Metro Khanapara 78N4D3 - 0.072 Kamrup Metro Khetri 83B4A3 - 0.023 Kamrup Metro Maligaon 78N4C6 0.312 - Kamrup Metro Paltan bazar 78N4C14 0.071 - Kamrup Metro Panikhaiti 78N4D4 - 0.113 Kamrup Metro Rani1 78N4C9 - 0.061 Kamrup Metro Sonapur 83B4A2 0.148 - Kamrup Metro Topatoli 83B4A4 - 0.019 Kamrup Metro Zoo narangi rd 78N4D2 0.104 - Karbi Anglong Balipathar 83F4D3 0.049 - Karbi Anglong Boithalangsu 83C1C2 - 0.139 Karbi Anglong Bokajan 83F4D2 - 0.3 Karbi Anglong Bokulia 83G1C3 - 0.094 Karbi Anglong Borjan 83F4B1 0.115 - Karbi Anglong Dengaon R5 83B4D7 0.3 - Karbi Anglong Dentaghat 83F3A1 0.466 - Karbi Anglong Deopani 83F4D4 - 0.657 Karbi Anglong Dillai 83G1C4 - 0.116 Karbi Anglong Diphu 83G1B1 - 0.138 Karbi Anglong Donkamokam 83C1C1 - 0.356 Karbi Anglong Habranrangapar 83F4A7 1.407 - Karbi Anglong Hapjan 83G1C1 0.101 - Karbi Anglong Hawaipur 83C1D5 0.529 - Karbi Anglong Hidipi 83F4C1 - 0.272 Karbi Anglong Kalonga 83C1D2 0.545 - Karbi Anglong Khatkhati 83G1D3 - 0.16 Karbi Anglong Kheronighat 83C1D3 - 0.281 Karbi Anglong Manikpur 83F4A6 - 0.06 Karbi Anglong Manja Forest 83G1B2 - 0.028

STATE / DISTRICT STATION WELL NO RISE FALL
Karbi Anglong Phuloni 83F4A2 0.086 - Karbi Anglong Silanijan 83F3D1 0.059 - Karbi Anglong Siljuri 83F2B2 0.123 - Karimganj Badarpur 83D1C1 0.292 - Karimganj Badarpur Pz 83D1C9 0.017 - Karimganj Dhaulia 83D2B6 0.058 - Karimganj Hatikira 83D3B1 0.106 - Karimganj Rk Nagar I 83D2B4 0.162 - Karimganj Sarkaribari 83D2B7 0.075 - Karimganj Shrigauri 83D1C5 0.178 - Kokrajhar Kokrajhar 78J3B1 - 0.071 Lakhimpur Amsoi ASLK01 - 0.168 Lakhimpur Basudeothan 83I3B8 - 0.025 Lakhimpur Bhogpur charali 83E4D1 0.01 - Lakhimpur Bihpuria 83E4D4 0.07 - Lakhimpur Boginadi(balijan) 83I3A1 0.064 - Lakhimpur Dholpur 83F1D1 0.066 - Lakhimpur Dolanghat chara 83I4A3 0.01 - Lakhimpur Harmoti 83E4D6 0.028 - Lakhimpur Islampur 83E4D3 - 0.009 Lakhimpur Kadam 83I3A3 0.032 - Lakhimpur Kakai 83I3A2 0.22 - Lakhimpur Laluk 83E4D2 0.037 - Lakhimpur N.lakhipur(old) 83I4A1 - 0.012 Lakhimpur Naoboisa 83I4A4 - 0.061 Lakhimpur Narayanpur 83F1D4 0.12 - Lakhimpur Panigaon 83I4A2 - 0.01 Lakhimpur Pathalipam 83I3B6 - 0.035 Morigaon Baghara 83B4B2 - 0.033 Morigaon Garmari gaon 83B3A4 - 0.247 Morigaon Jagiroad 83B4A1 - 0.041 Morigaon Jaluguti 83B3B8 - 0.001 Morigaon Morigaon 83B3B10 0.009 - Morigaon Nasatra 83B4A5 - 0.067 Morigaon Nelle 83B4B4 0.007 - Nagaon Amsoi 83B4B5 - 0.188 Nagaon Bagori 83F2A4 0.273 - Nagaon Bamuni tinali 83B3D9 0.142 - Nagaon Beldonga mandir 83B4D8 - 0.052 Nagaon Bichamari 83B3B1 - 0.152 Nagaon Bordowa 83B3C2 - 0.124

STATE / DISTRICT STATION WELL NO RISE FALL
Nagaon Dhing 83B3B6 0.083 - Nagaon Doboka 83B4D1 - 0.012 Nagaon Haldiati sub bt 83B4D6 0.01 - Nagaon Jurapukhuri 83C1D7 - 0.169 Nagaon Kathiatoli 83B4C4 0.02 - Nagaon Kondali 83B3D5 - 0.028 Nagaon Langteng TE 83F3A2 0.325 - Nagaon Lanka 83C1D1 0.241 - Nagaon Lumding 83G1A1 0.519 - Nagaon Nadeorigaon 83B4D2 0.295 - Nagaon Phulaguri R6 83F2A5 - 0.113 Nagaon Samuguri 83B3D7 0.132 - Nagaon Silghat 83B2D6 0.314 - Nagaon Sulung p.o. 83B3D8 0.071 - Nagaon Telia bebejia 83B3C7 - 0.119 Nalbari Arikuchi 78N3B4 0.133 - Nalbari Tamulpur 78N2C1 - 0.185 Nalbari Tihu 78N3B3 - 0.056 Sibsagar Bandarmari 83I4C14 0.066 - Sibsagar Betbari alimore 83I4C8 - 0.002 Sibsagar Demow Sukan 83I4C11 0.041 - Sibsagar Geleki 83J1C9 - 0.27 Sibsagar Hanumanbagh 83J1C7 0.148 - Sibsagar Moranhat 83I4D1 - 0.055 Sibsagar Rajabari TE 83I4C7 0.059 - Sibsagar Sapekhati 83M4A1 - 0.06 Sibsagar Sibsagar 83J1C2 - 0.038 Sonitpur Balipara 83B1D4 - 0.082 Sonitpur Barchola 83B2B5 - 0.069 Sonitpur Bihupukhuri 83F2A7 0.067 - Sonitpur Biswanath 83F2A8 0.3 - Sonitpur Biswanath chara 83F2A6 - 0.633 Sonitpur Borgang 83F1B2 0.017 - Sonitpur Charduar 83B1D1 - 0.014 Sonitpur Dhalaibil 83B1D3 0.072 - Sonitpur Dhekiajuli 83B2B2 - 0.088 Sonitpur Garumari 83B1D2 0.063 - Sonitpur Gohpur 83F1C2 - 0.085 Sonitpur Hawajan 83F1C4 0.06 - Sonitpur Jamuguri North 83B2D3 - 0.014 Sonitpur Rangapara 83B2C1 0.012 -

STATE / DISTRICT STATION WELL NO RISE FALL
Sonitpur Sootia 83F2A2 0.076 - Sonitpur Tezpur 83B2D2 0.009 - Tinsukia Bordumsa 83M3D3 0.036 - Tinsukia Borgolai 83M3C2 0.187 - Tinsukia Bortorani 83M2B4 0.176 - Tinsukia Digboi 83M3C1 0.053 - Tinsukia Jagun 83M3D4 - 0.058 Tinsukia Jaipur naharjan 83M4B5 0.156 - Tinsukia Ledo forest off 83M3C3 - 0.022 Tinsukia Lekhapani 83M3D1 0.19 - Tinsukia Panitola 83M3B4 0.123 - Tinsukia Philobari 83M2C7 0.069 - Tinsukia Rangagora guijn 83M2B3 0.11 - Tinsukia Tinsukia 83M3B2 0.019 - Tinsukia Tirap gate 83M3D2 0.167 - Manipur Imphal East Jiribam 83H1A2 0.124 - Meghalaya East Garo Hills Bajengdoba 78K1C2 - 0.274 East Garo Hills Darugiri 78K2D2 - 0.056 East Garo Hills Depa sarangma 78K1D4 0.039 - East Garo Hills Kharkutta 78K1D7 - 0.045 East Garo Hills Mendal 78K1B1 0.044 - East Garo Hills Mendipathar 78K1C1 - 0.015 East Garo Hills Rongjeng 78K2D1 - 0.014 East Garo Hills Rongmil 78K2D3 - 0.146 East Garo Hills Williamnagar 78K2C2 0.005 - East Khasi Hills Balat 78O4B1 - 0.163 East Khasi Hills Cherrapunji 78O3C1 - 0.046 East Khasi Hills Mawngap 78O3D1 - 0.008 East Khasi Hills Shillong Polo 78O2D1 - 0.013 Jaintia hills Dauki 83C4A1 0.133 - Jaintia hills Jowai 83C3A1 0.257 - Ri-Bhoi Jorabat 78N4D6 0.233 - Ri-Bhoi Nongpoh 78O1D1 - 0.002 West Garo Hills Ampati 78G3D1 - 0.12 West Garo Hills Asanang 78K2B1 0.057 - West Garo Hills Barengapara 78K4A1 0.013 - West Garo Hills Borkona 78G2D4 - 0.233 West Garo Hills Garobandha 78K2A1 - 0.25 West Garo Hills Kherapara 78K3A2 - 0.072

STATE / DISTRICT STATION WELL NO RISE FALL
West Garo Hills Mahendraganj 78G3D2 - 0.086 West Garo Hills Nidanpur 78K1A3 - 0.102 West Garo Hills Phulbari 78K1A1 0.055 - West Garo Hills Purkhasia 78K3A1 0.108 - West Garo Hills Tikrikilla 78K1A2 0.021 - West Garo Hills Zikzak PZ 78G3D5 - 0.072 West Khasi Hills Mairang 78O2C1 0.041 - Nagaland Dimapur Chumkidima 83G1D1 0.269 - Dimapur Dgm Colony 83G1C8 - 1.202 Dimapur Dgmofficedimapur 83G13GM10 - 1.737 Dimapur Dhansiripar 83G1C5 - 0.511 Dimapur Dimapur 83G1C2 0.005 - Dimapur Industrial Estate 83G1C7 0.08 - Dimapur Jalukie 83G2C1 - 0.173 Dimapur Marwari Colony 83G1C9 0.258 - Dimapur Purana Bazar 83G1C10 - 0.812 Dimapur Singrijan 83G1C6 - 0.01 Kohima Cathedral Complex 83K2A1 0.227 - Kohima NLSA Complex 83K2A2 - 0.029 Kohima Sepfuzou Colony 83K2A3 - 0.366 Mokokchung Lampi 83J3B1 0.091 - Mon Namsa 83J1D1 0.098 - Wokha New Market 83J4B2 - 0.398 Wokha Tourist Lodge 83J4B1 0.137 - Tripura Dhalai Abhanga N TRDL04 - 0.081 Dhalai Ambassa 79M1D1 - 0.007 Dhalai Kamalpur 78P4D1 0.064 - Dhalai Manu N TRDL05 0.039 - North Tripura Bagbasa N TRNT10 0.05 - North Tripura Dharmanagar 83D3B2 0.063 - North Tripura Gauranagar N TRNT11 - 0.047 North Tripura Kumarghat 83D4A6 0.207 - North Tripura Panisagar 83D4A1 0.063 - North Tripura Pecharthal 83D4A7 - 0.107
South Tripura Dhawajnagar Udaipur 79M2B8 - 0.107
South Tripura Garjee Bazar 79M3B4 - 0.095 South Tripura Hrishyamukh 79M4C4 0.327 - South Tripura Manurmukh TRST03A 0.135 -

STATE / DISTRICT STATION WELL NO RISE FALL
South Tripura Sabroom 79M4C1 - 0.111 South Tripura Santirbazar 79M3C1 - 0.015 West Tripura Badharghat DTW TRWT25 - 0.168 West Tripura Bishalgarh 79M2B1 - 0.253 West Tripura Bodhjanagar Dtw TRWT19 - 0.175 West Tripura Bodhjanagar Stw TRWT20 - 0.409 West Tripura Champaknagar 79M1B6 - 0.279
West Tripura Dakshin Kalamcherra TRWT04A - 0.12
West Tripura Kalyanpur 79M1C2 - 0.03 West Tripura Kathalia bazar 79M3B5 - 0.068 West Tripura Kenania 79M2A2 - 0.134 West Tripura Khowai 78P4C5 0.036 - West Tripura Lichubagan DTW TRWT21 - 0.171 West Tripura Lichubagan STW TRWT22 - 0.23 West Tripura Mohanpur 79M1B5 - 0.241 West Tripura Nagicherra1 TRWT29 - 0.044 West Tripura Nagicherra2 TRWT30 - 0.789 West Tripura Nalchar 79M2B5 - 0.154 West Tripura Narsinghgarh DTW TRWT28 - 0.105 West Tripura Simna 78P4B1 - 0.085 West Tripura Sipoyjala 79M2B7 - 0.006 West Tripura Sonamura1 79M3B6 - 0.073
West Tripura Suryamaninagar DTW TRWT23 - 0.102
West Tripura Suryamaninagar STW TRWT24 - 0.071
West Tripura Teliamura 79M1C1 - 0.05

Annexure - XXII
CHEMICAL QUALITIES DATA OF GROUND WATER IN NER
S.No Village Well_Type pH EC
(µs/cm) 25C
Turbidity (NTU) TDS CO3-
2 HCO3-
1 Cl- SO4-2 NO3-1 F- Ca+2
(Ca) Mg+2 (Mg)
TH (as CaCO3) Na K Fe
ARUNACHAL PRADESH Changlang
1 Jairampur Dug Well 7.7 264 BDL 134 8 60 39.99 9.61 3.1 BDL 30.4 13.6 120 12.4 5.3 BDL 2 Namphai Dug Well 7.7 269.2 BDL 142 16 68 44.4 10.9 3.3 BDL 32 13.6 124 13.1 5.94 BDL
3 Newlisan Kharsang Dug Well 7.8 356 BDL 183.8 16 80 49.98 13.2 4.9 BDL 32 13.59 128 18.12 6.79 BDL
East Siang 4 Berung Dug Well 7.4 130.2 0.1 87.8 BDL 32 23.9 0.99 1.7 0.05 8 1.94 40 5.9 2.2 0.03 5 Pasighat New Dug Well 6.62 43.05 0.1 20.94 BDL 4 9.9 0.99 0.3 0.05 6.4 0.2 28 1.49 0.33 0.02 6 Pasighat-II Dug Well 7.3 127.8 BDL 61.1 BDL 44 21.8 1.74 2 0.28 16 8.5 84 7.04 2.2 1.12 7 Ruksin Dug Well 6.85 54.5 0 23.79 BDL 16 9.9 0.99 0.4 0.05 8 1.9 40 1.9 0.5 0.04
Lohit 8 Lathow Dug Well 8.06 357 BDL 192 16 80 51.3 13.27 5.3 BDL 36.8 14.1 132 22.5 9.42 BDL
Papumpare 9 Banderedewa I Dug Well 7.12 81.8 3 40.07 BDL 28 17.1 1.0 0.7 0.09 9.6 3.88 52 2.47 0.87 0.08
10 Banderedewa II Dug Well 7.7 249 BDL 125.7 6 52 39.99 8.29 3 1.88 28.8 13.6 120 12 5.28 BDL 11 Chimpu Dug Well 7.6 166.5 BDL 80 BDL 48 27.3 2.74 2.3 0.37 24 10.7 100 8.05 2.7 5.55 12 Itanagar I Dug Well 7.6 173 BDL 88 BDL 48 27.3 3.5 2.4 0.37 24 10.9 108 8.84 2.9 6.38 13 Itanagar II Dug Well 6.92 64.9 1 25.2 BDL 24 11.9 0.99 0.4 0.06 9.6 1.9 44 2.05 0.71 0.04 14 Kimin Dug Well 7.19 82.2 3.4 41.7 BDL 32 17.1 1.15 1 0.11 11.2 4.9 72 2.84 0.91 0.09 15 Naharlagun I Dug Well 7.2 93.9 4 43.4 BDL 32 17.9 1.15 1.1 0.16 11.2 4.9 76 2.9 1.04 0.1 16 Naharlagun II Dug Well 7.6 187.9 BDL 92.67 BDL 48 27.99 5.88 2.4 0.39 25.6 11.7 112 9.55 3.1 12.33 17 Nirjuli Vill IIA Dug Well 7.22 98.18 4.3 43.8 BDL 32 17.9 1.19 1.1 0.16 11.2 5.3 80 3.82 1.07 0.11 18 Nirjuli Vill IIB Dug Well 7.25 101 BDL 54.4 BDL 32 17.99 1.30 1.3 0.18 12.8 5.83 80 3.9 1.4 0.18
Tirap 19 Borduria Dug Well 8.1 391.1 BDL 192 16 88 71.8 16.16 6.7 BDL 38.4 16.50 136 24.67 11.2 BDL 20 Deomali Dug Well 8.14 410.6 BDL 193.6 24 104 79.4 26.84 10.7 BDL 41.6 29.1 196 29.1 11.8 BDL

S.No Village Well_Type pH EC
(µs/cm) 25C
Turbidity (NTU) TDS CO3-
2 HCO3-
1 Cl- SO4-2 NO3-1 F- Ca+2
(Ca) Mg+2 (Mg)
TH (as CaCO3) Na K Fe
21 Hukanjuri Dug Well 8.15 462.6 BDL 216.8 32 112 85.4 27.78 10.6 BDL 48 43.7 252 30.1 14.9 BDL ASSAM Baksha
22 Jhargaon Dug Well 8.4 734.7 3 175.9 32 164 116.0 41.7 BDL 1.56 59.2 37.86 264 82.2 29.3 BDL Barpeta
23 Bhawanipur Dug Well 8.7 535 BDL 263.9 48 132 86.0 30.4 12.8 1.08 46.4 29.6 236 58.9 17.7 12.2 24 Daulasal Dug Well 8.9 905 BDL 411 72 200 142.0 51.4 BDL BDL 70.4 43.7 292 96.74 32.5 BDL 25 Dhupguri(Galia) Dug Well 8.8 33.3 BDL 332 64 12 4.0 1.0 0 0 6.4 0.0 28 0.2 0.18 BDL 26 Goraimari Dug Well 8.4 509 2.7 175 32 124 77.4 28.25 8.7 0.95 43.2 26.21 208 51.67 15.58 5.16 27 Hastinapur Dug Well 9.1 287 BDL 621.3 96 76 36.0 9.0 2.2 0.36 27.2 12.6 132 20.5 5.81 0.75 28 Sarupeta Dug Well 8.5 77.26 4.6 197.5 40 24 7.9 1.0 0.1 0.01 9.6 1.0 40 2.1 0.8 0.01 29 Sorbhog Dug Well 8.7 783 BDL 264 48 180 134.0 45.33 BDL BDL 64 39.81 280 92 30.78 BDL
Bongaigaon 30 Abhayapuri Dug Well 8.2 66.9 1 132 24 20 6.0 0.99 0.1 0 8 1.0 36 1.65 0.67 BDL 31 Baitamari Dug Well 8.4 526 3 180 32 128 85.4 29.66 11.7 1 44.8 28.4 220 55 17.29 7.39 32 Bijni Dug Well 8.5 530 4.6 199 40 132 85.4 29.98 11.8 1.07 46.4 29.13 228 57.6 17.6 9.22 33 Bongaigaon New Dug Well 8.4 512 3 182 32 124 80.0 28.4 8.9 0.96 43.2 26.2 208 51.68 15.6 5.23 34 Chalantapara Dug Well 8 105.2 0.9 114 16 36 15.9 1.1 0.4 0.05 12.8 2.91 60 4.3 1.47 0.05 35 Chaprakata Dug Well 8.7 158 BDL 267 56 52 22.0 2.56 1.1 0.17 17.6 6.8 84 8.7 2.5 0.18 36 Majgaon Dug Well 8.4 689.3 3 182.5 32 156 107.2 37.97 BDL 1.35 56 34.95 260 77.7 25.4 BDL 37 Manikpur Dug Well 7.48 267 0.1 57.2 BDL 76 34.2 8.43 2 0.35 27.2 11.7 128 19.06 5.26 0.68 38 Medhipara(Deo) Dug Well 8 169.6 0.9 113.3 16 52 23.9 3.03 1.2 0.21 19.2 7.8 92 9.73 2.82 0.23 39 North salmara Dug Well 8.2 180.6 1 135 24 56 24.0 3.18 1.2 0.21 19.2 7.8 96 10.5 2.9 0.24
Cachar 40 Atalbasti Dug Well 7.4 61.84 0 56.8 0 20 6.0 0.99 0 0 8 0.97 36 1.39 0.63 BDL 41 Badribasti Dug Well 7.84 133.5 0.5 94.7 8 44 19.9 1.62 0.9 0.12 16 4.9 76 7.15 2.18 0.11 42 Borjalinga Dug Well 8.42 335 4.8 188.5 40 88 45.7 11.64 2.7 0.44 30.4 14.6 148 24.06 7.24 1.05 43 Borkhola Dug Well 8.05 217.3 1 122.9 16 64 30.0 5.7 1.6 0.3 24 9.7 112 16.15 3.95 0.46 44 Dargakuna Dug Well 8.15 610 1 130 16 148 99.3 32.64 BDL 1.26 51.2 33.0 248 67.7 20.66 BDL 45 Digharkhal Dug Well 7.78 396.8 0.3 82.6 BDL 104 60.0 18.38 4.2 0.64 36.8 20.4 180 35.5 10.4 2.06 46 Fulertol Dug Well 7.8 328 0.5 90.8 8 84 43.7 10.86 2.6 0.42 30.4 14.6 148 23.2 6.9 1.01

S.No Village Well_Type pH EC
(µs/cm) 25C
Turbidity (NTU) TDS CO3-
2 HCO3-
1 Cl- SO4-2 NO3-1 F- Ca+2
(Ca) Mg+2 (Mg)
TH (as CaCO3) Na K Fe
47 Gosaipur Part-II Dug Well 8.04 81 1 118 16 28 9.9 0.99 0.1 0.01 9.6 1.94 44 2.4 0.9 0.02 48 Hilara Dug Well 7.84 164 0.5 95 8 52 23.8 2.87 1.2 0.2 19.2 7.77 92 9.35 2.78 0.22 49 Kalain Dug Well 8.18 345.9 1 130.3 24 92 48.0 13.21 3 0.48 32 15.53 152 25.38 7.8 1.18 50 Kashipur Dug Well 7.89 342.7 0.6 96.5 16 88 48.0 12.6 2.9 0.47 32 15.5 152 24.94 7.5 1.14 51 Katigora Dug Well 7.95 167.3 0.7 108 16 52 23.8 3.03 1.2 0.2 19.2 7.8 92 9.68 2.82 0.23 52 Lakhipur Dug Well 8.26 410 1.2 143 24 108 64.0 19.79 5 0.67 38.4 22.3 188 37.5 11.1 2.58 53 Masimpur Dug Well 8.7 311.2 BDL 309 64 84 41.7 10.39 2.5 0.41 30 13.6 144 22.8 6.79 0.95 54 Moinarbond Dug Well 8.3 181.4 2 163.8 32 56 25.8 3.18 1.3 0.22 20.8 7.8 100 11.1 2.95 0.26 55 Nagdirgram Dug Well 8.64 224 BDL 258 48 68 30.0 6.2 1.7 0.31 24 9.71 116 16.97 4.04 0.53 56 Poilapul Dug Well 8 391.5 1 114.8 16 100 58.1 17.44 3.9 0.63 36.8 19.4 172 34.1 9.96 1.85 57 Razabazar Dug Well 8.66 39.78 BDL 258 48 12 6.0 0.99 0 0 8 0.00 28 0.38 0.2 BDL 58 Shivachal Dug Well 8.7 602 BDL 305.9 64 140 95.3 32.5 21.6 1.22 49.6 33.0 244 66 19.5 BDL 59 Shivtila Dug Well 7.72 261 0.3 79.7 BDL 72 34.0 7.7 1.9 0.34 27 11.7 124 18.64 5.14 0.64 60 Silcoorie Dug Well 7.9 293.9 0.7 105 16 80 37.6 9.1 2.2 0.37 28.8 12.6 136 21 5.9 0.81 61 Tarapur Dug Well 7.51 233 0.1 65.4 BDL 68 30.0 6.60 1.7 0.32 24 9.7 120 17.59 4.4 0.55
Darrang 62 Amjuli colony Dug Well 8.2 238.7 1.8 115 16 60 21.8 2.71 1.6 0.25 16 8.7 84 14.31 2.81 0.09 63 Bengbari Dug Well 8.2 357 1 134.9 24 96 50.0 15.1 3.3 0.51 32 16.7 160 27.7 8.54 1.34 64 Bhalukmari-I Dug Well 8.5 292.5 4.9 195 40 80 37.6 9.0 2.2 0.37 28 12.6 132 20.7 5.9 0.78 65 Chamuapara Dug Well 8.6 366 BDL 233.7 48 96 52.0 16.0 3.5 0.55 35.2 18.45 160 30.22 9.12 1.51 66 Dalgaon Dug Well 8.5 409.4 BDL 209 40 108 64.0 19.79 4.9 0.67 38.4 22.3 184 36.8 11.02 2.32 67 Kalaigaon Dug Well 8.6 621 BDL 233.9 48 148 100.0 33.27 BDL 1.29 52.8 33.98 252 70.14 22.6 BDL 68 Kendurtal Dug Well 8.6 461.3 BDL 230 48 120 73.4 25.0 7 0.84 40 24.3 200 45.4 13.7 4.26 69 Madhupur Dug Well 8.5 983 4.7 197.4 40 224 153.8 55.83 BDL BDL 76.8 46.6 300 104 42.5 BDL 70 Mangaldoi Dug Well 8.4 365 3 176.5 32 96 52.0 15.7 3.5 0.55 35.2 18.4 160 30.21 9.1 1.5 71 Mangaldoi II Dug Well 8.4 155.2 3 176 32 52 22.0 2.56 1 0.17 17.6 6.80 84 8.7 2.5 0.18 72 Orang Dug Well 8.5 527.7 4.6 199.7 40 128 85.4 29.8 11.7 1.01 44.8 29.1 220 55.25 17.4 8.13 73 Paneri Dug Well 8.3 352.4 1.5 151.4 24 92 50.0 14.62 3.1 0.5 32 16.5 156 26.5 8.14 1.27 74 Paneri TG Dug Well 8.3 203.9 1.4 149.8 24 60 29.8 4.75 1.5 0.26 22.4 8.74 108 14.5 3.53 0.39 75 Tangla Dug Well 8.5 218.7 4.6 196 40 68 30.0 5.69 1.6 0.3 24 9.7 112 16.53 3.98 0.5 76 Thekerabari .1 Dug Well 8.4 603 3 183 32 144 99.2 32.48 BDL 1.23 49.6 33.01 248 66.3 20.4 BDL 77 Udalguri Dug Well 8.8 362 BDL 322 64 96 63.5 15.72 3.4 0.54 33.6 17.48 160 29.53 9 1.44

S.No Village Well_Type pH EC
(µs/cm) 25C
Turbidity (NTU) TDS CO3-
2 HCO3-
1 Cl- SO4-2 NO3-1 F- Ca+2
(Ca) Mg+2 (Mg)
TH (as CaCO3) Na K Fe
Dhemaji 78 Akajan Dug Well 7.5 185 0.1 62.3 BDL 60 26.0 3.65 1.3 0.24 20.8 7.8 100 11.82 3.1 0.31 79 Bhagaban charali Dug Well 7.6 334.4 0.2 69.76 BDL 88 44.4 11.5 2.7 0.44 30.4 14.6 148 23.8 7.23 1.04 80 Bijoypur Dug Well 7.9 856 0.6 98 16 184 140.0 48.62 BDL BDL 67.2 41.5 280 94.5 31.3 BDL 81 Bordoloni Dug Well 7.61 162.9 0.2 71.8 BDL 52 23.8 2.87 1.2 0.2 19.2 6.80 92 9.26 2.76 0.22 82 Dekapam Dug Well 8.4 296.3 2.5 173.6 32 80 37.7 9.3 2.3 0.38 28.8 12.6 136 21.5 6.07 0.85 83 Dhemaji 1 Dug Well 7.9 185.3 0.6 98.7 16 60 26.0 3.97 1.3 0.24 20.8 8.7 100 12.39 3.16 0.35 84 Dipa Dug Well 7.19 143 0 45 BDL 48 21.8 1.9 1 0.15 17.6 5.83 80 7.7 2.4 0.15 85 Jamuguri Dug Well 7.42 566 0 56.8 BDL 136 92.0 31.54 15.7 1.16 48 31.07 240 62.93 18.3 13.62
86 Jonai murkongselek Dug Well 8.1 213 1 125 16 64 29.8 5.1 1.5 0.28 22.4 9.71 108 15.76 3.74 0.43
87 Silapathar Dug Well 7.36 230.6 0 53.5 BDL 68 30.0 6.5 1.7 0.31 24 9.71 120 17.3 4.33 0.54 88 Sisibargaon Dug Well 8.06 127 1 124.2 16 40 18.0 1.4 0.8 0.11 16 4.85 76 6.62 2 0.1 89 Telem Dug Well 7.62 245 0.2 72 BDL 72 32.0 7.3 1.8 0.33 25.6 10.7 120 18.3 4.9 0.61
Dhubri 90 Bagaribari Dug Well 8.4 411 3 183 32 108 64.9 19.9 5.2 0.67 38.4 22.3 188 37.92 11.12 2.72 91 Bahalpur Dug Well 8.5 337.3 4.6 200 40 88 46.0 11.8 2.7 0.45 30.4 14.6 152 24.2 7.34 1.09 92 Balajan Dug Well 8.4 1120 3 179 32 236 160.0 63.82 BDL BDL 83.2 48.5 308 105.6 55.08 BDL 93 Bilasipara Dug Well 8.4 124.6 3 178.2 32 40 17.9 1.30 0.6 0.09 14.4 4.85 72 5.99 1.9 0.09 94 Chapar Dug Well 8.7 99.37 BDL 260 48 32 14.0 1.0 0.3 0.03 12.8 2.9 52 3.85 1.28 0.03 95 Dakhin Tokesara Dug Well 8.7 411.2 BDL 266.7 56 108 64.9 20.26 5.3 0.68 38.4 22.3 188 38.1 11.31 2.75 96 Dhubri Town Dug Well 8.9 512.8 BDL 407.4 72 128 82.0 28.57 9.1 0.98 43.2 27.18 212 52.7 15.91 5.6 97 Panbari Dug Well 8.3 456 1.5 150.7 24 116 71.5 23.6 6.4 0.75 40 24.3 200 43.36 13.01 3.74 98 Rupshi Dug Well 8.5 239 4.9 207 40 68 30.8 6.9 1.7 0.32 24 10.68 120 17.62 4.6 0.59 99 Shapamari Beat Dug Well 7.9 201 0.6 99.35 16 60 28.0 4.59 1.5 0.26 22.4 8.7 104 13.9 3.4 0.38
100 Sonamukhi Dug Well 8.2 114 1 131.4 24 36 16.0 1.10 0.4 0.06 14.4 2.9 64 4.8 1.6 0.06 Dibrugarh
101 Azarguri gaon Dug Well 8.4 433.7 4 187 36 112 68.0 21.83 5.7 0.69 40 22.3 188 38.86 11.7 2.89 102 Barbaruah Dug Well 8.2 334.7 1 138.6 24 88 44.4 11.6 2.7 0.44 30.4 14.6 148 23.8 7.24 1.04 103 Chabua Dug Well 8.4 566 4 187 32 136 92.0 31.9 16.1 1.17 48 32.0 240 63.66 18.9 14.6 104 Dikom Dug Well 8.3 220.6 1.7 158 24 68 30.0 5.8 1.7 0.3 24 9.7 112 16.7 4 0.51 105 Lepetkata Dug Well 8.3 923 1.6 158 24 208 143.5 54.1 BDL BDL 72 44.7 292 99.02 32.9 BDL

S.No Village Well_Type pH EC
(µs/cm) 25C
Turbidity (NTU) TDS CO3-
2 HCO3-
1 Cl- SO4-2 NO3-1 F- Ca+2
(Ca) Mg+2 (Mg)
TH (as CaCO3) Na K Fe
Goalpara 106 Agia1 Dug Well 7.8 115 0.4 86.49 BDL 36 16.0 1.1 0.5 0.06 14.4 3.88 64 5.1 1.7 0.08
107 Bhalukdubi (Goalpara) Dug Well 7.8 270 0.4 86.8 BDL 76 34.2 8.51 2.1 0.35 27.2 11.7 128 19.2 5.3 0.7
108 Damra Dug Well 8.3 243 1.6 152.9 24 72 32.0 7.10 1.8 0.33 25.6 10.68 120 17.86 4.82 0.6 109 Dhupdhara Dug Well 7.7 534 0.2 74.7 BDL 132 85.4 30.0 11.9 1.08 46.4 29.1 232 57.8 17.6 11.77 110 Dudhnai Dug Well 9.5 28.9 BDL 915.4 BDL 4 2.0 0.99 0 0 5.6 0.0 20 0.2 0.15 BDL 111 Dwarka Dug Well 9.5 354 BDL 698.5 120 92 50.0 14.8 3.1 0.5 32 16.5 160 26.63 8.27 1.29 112 Krishnai Dug Well 7.8 79.9 0.4 87.6 BDL 24 7.9 1.0 0.1 0.01 9.6 1.9 44 2.2 0.88 0.02 113 Rongsai Dug Well 8.5 185.1 BDL 216 40 60 26.0 3.97 1.3 0.24 20.8 8.74 100 12.1 3.11 0.33 114 Salpara Dug Well 7.5 367 0.1 63.2 BDL 96 53.6 16.34 3.5 0.55 35.2 18.4 164 30.6 9.15 1.54 115 Teuli Dug Well 7.8 512 0.4 88 BDL 124 80.0 28.41 9 0.97 43.2 26.2 212 52.6 15.6 5.57
Golaghat 116 Bokakhat Dug Well 8.5 125.9 BDL 224 40 52 17.9 1.30 0.7 0.1 16 4.9 72 6.22 1.93 0.09 117 Bongaon Dug Well 8.5 52.17 BDL 221.2 40 16 6.0 0.99 0 0 8 0.0 32 0.47 0.4 BDL 118 Garampani Dug Well 8.4 450 4 187.3 40 116 69.5 23.40 6 0.74 40 23.30 196 42.04 12.4 3.54 119 Haldibari Buri Ai Dug Well 8 349 0.8 111.1 16 92 50.0 14.0 3 0.5 32 16.0 156 26.3 8.01 1.26 120 Oating Dug Well 8.3 160.2 2 165 32 52 22.0 2.81 1.1 0.18 19.2 6.80 92 9.05 2.6 0.21
Hailakandi 121 Burakhai Dug Well 8.3 382.1 1.8 160.2 32 99 55.6 16.66 3.6 0.58 35.2 19.42 168 31.8 9.28 1.65 122 Katlicherra N Dug Well 8.47 270.4 4.9 191 40 76 35.7 8.5 2.1 0.35 27.2 11.7 128 19.2 5.31 0.7 123 Monacherra Tube Well 8.1 144.8 1 129.7 16 48 21.8 1.93 1 0.15 17.6 5.83 80 7.8 2.4 0.15 124 Panchgram New Dug Well 8.26 302 1.2 143.3 24 84 41.7 10.23 2.5 0.4 28.8 13.59 140 22.3 6.64 0.92 125 R.k.nagar Dug Well 7.96 155 0.7 110 16 48 22.0 2.40 1 0.16 17.6 5.83 84 8.4 2.48 0.18
Jorhat 126 Chandan Nagar Dug Well 8.3 459.9 2 164 32 120 72.0 24.34 6.9 0.83 40 24.3 200 45.3 13.6 4.07 127 Cinemora Dug Well 8.6 600 BDL 255 48 140 94.0 32.01 19.9 1.21 48 33.01 240 64.43 19.1 BDL 128 Dahotia Dug Well 8.6 382.9 BDL 250.7 48 100 56.0 16.8 3.7 0.59 35.2 19.4 172 32.8 9.49 1.72 129 Kokilamukh Dug Well 8.7 1350 BDL 316.4 64 328 228.3 104.40 BDL BDL 124.8 68.0 500 140.4 136.8 130 Kolakhowa Dug Well 8.6 300.6 BDL 245 48 80 41.7 9.92 2.4 0.4 28.8 13.59 140 22.3 6.64 0.92 131 Lichubari Dug Well 8.6 613.5 BDL 250 48 148 99.3 32.80 BDL 1.28 51.2 34.0 252 69.4 22.59 BDL 132 Meleng Dug Well 8.4 302 4 187.1 36 84 41.7 10.2 2.5 0.4 28.8 13.6 144 22.4 6.73 0.92

S.No Village Well_Type pH EC
(µs/cm) 25C
Turbidity (NTU) TDS CO3-
2 HCO3-
1 Cl- SO4-2 NO3-1 F- Ca+2
(Ca) Mg+2 (Mg)
TH (as CaCO3) Na K Fe
Kaparadharia 133 Nefa Tiniali Dug Well 8.4 185 4.3 188 40 60 26.0 3.81 1.3 0.24 20.8 8.7 100 12.1 3.1 0.32
134 Rangajan PHE Sc Dug Well 7.8 392 0.4 88.65 8 103 58.1 17.8 4 0.64 36.8 19.7 176 34.3 9.97 1.92
135 Sodial Kacharigaon Dug Well 8.6 1233 BDL 243 48 260 188.0 78.86 BDL BDL 91.2 55.3 360 109 74.4 BDL
136 Titabor Dug Well 8.6 108 BDL 254 48 36 15.9 1.1 0.4 0.05 12.8 2.9 60 4.63 1.51 0.06 Kamrup
137 Abhaipur Dug Well 8.5 157 4.9 205.5 40 52 22.0 2.6 1.1 0.17 17.6 6.80 84 8.7 2.5 0.18 138 Agyathuri Dug Well 8.2 211 1 134.2 24 64 29.8 5.06 1.5 0.28 22.4 9.7 108 15.7 3.68 0.43 139 Bamunigaon1 Dug Well 8.4 460 3.3 185 32 120 72.0 24.81 7 0.83 40 24.27 200 45.3 13.6 4.24 140 Boko Dug Well 8.6 468.9 BDL 236 48 120 74.0 25.1 7 0.84 40 24.3 204 46.17 13.72 4.3 141 Chhaygaon Dug Well 8.4 358.8 3.9 185.9 32 96 51.6 15.40 3.3 0.53 33.6 17.5 160 28.9 8.7 1.38 142 Darkuchi Dug Well 8.4 332 3 177 32 84 44.0 10.86 2.6 0.43 30.4 14.6 148 23.4 7.1 1.03 143 Dhobartari Dug Well 8.5 401 4.9 205 40 104 61.5 19.32 4.5 0.65 38.4 21.4 180 36.5 10.55 2.25 144 Hajo Dug Well 8.7 333 BDL 264.4 48 84 44.0 11.17 2.6 0.43 30.4 14.6 148 23.7 7.14 1.04 145 Kachkatchi Dug Well 7.16 315.7 0 43.8 BDL 84 42.0 10.50 2.6 0.41 30.4 14.6 144 23.13 6.89 1 146 Kahara Dug Well 8.4 617 3.2 183.8 32 148 100.0 33.11 BDL 1.28 52.8 33.98 252 69.55 22.6 BDL 147 Mirza Dug Well 8.3 457.4 1.6 155 24 120 71.5 24.02 6.9 0.81 40 24.27 200 44.8 13.3 3.96 148 Sualkuchi Dug Well 8.8 456.9 BDL 334.3 64 116 71.5 23.71 6.7 0.77 40 24.3 200 44.5 13.1 3.87
Kamrup Metro 149 Amingaon Dug Well 8.4 742 3 178 32 164 116.2 42.8 BDL 1.7 60.8 37.86 264 83.39 29.6 BDL 150 Bamfor Dug Well 8 92 1 114.5 16 28 11.9 0.99 0.2 0.02 11.2 1.94 48 2.88 1.08 0.02 151 Dirgheswari Dug Well 8.5 184 BDL 209 40 56 25.8 3.48 1.3 0.23 20.8 7.8 100 11.7 3.04 0.28 152 Khetri Dug Well 8.7 142.9 BDL 303 56 48 21.8 1.9 1 0.15 17.6 5.83 80 7.7 2.36 0.14 153 Khetri II Dug Well 7.8 97.7 0.4 88.4 BDL 32 13.7 1.00 0.2 0.03 12.8 2.9 52 3.7 1.28 0.03 154 Samanta Pathar Dug Well 7.2 141.8 0 46.9 BDL 48 20.5 1.77 1 0.14 16 5.83 80 7.62 2.28 0.13 155 Sonapur Dug Well 6.57 161.5 0 19.42 BDL 52 23.8 2.87 1.1 0.19 19.2 6.80 92 9.07 2.66 0.21 156 Sonapur II Dug Well 6.9 213 0 35.4 BDL 64 29.8 5.22 1.5 0.28 24 9.7 112 15.9 3.77 0.43 157 Taptoli New Dug Well 7.3 104.5 0 51.06 BDL 32 15.9 1.1 0.3 0.05 12.8 2.91 60 4.25 1.45 0.05 158 Topatoli Dug Well 7.82 216.8 0.5 92.3 8 64 30.0 5.4 1.6 0.29 24 9.7 112 16.02 3.9 0.45 159 Umsiang Ow Tube Well 7.2 122 0 48.2 BDL 40 17.9 1.1 0.6 0.09 14.4 3.88 72 29.53 1.82 0.09

S.No Village Well_Type pH EC
(µs/cm) 25C
Turbidity (NTU) TDS CO3-
2 HCO3-
1 Cl- SO4-2 NO3-1 F- Ca+2
(Ca) Mg+2 (Mg)
TH (as CaCO3) Na K Fe
Karbi Anglong 160 Balipathar Dug Well 8.3 181 2 165.8 32 56 25.8 3.2 1.2 0.22 20.8 7.8 100 11.1 2.9 0.24 161 Boithalangsu Dug Well 7.04 165.5 0 41.44 BDL 52 23.8 3.03 1.2 0.2 19.2 7.8 92 9.58 2.8 0.22 162 Bokajan I Dug Well 8.04 184.4 1 120.5 16 56 25.8 3.7 1.3 0.23 20.8 7.8 100 11.8 3.1 0.3 163 Bokajan II Dug Well 8.4 61.45 4.2 188 40 20 6.0 1.0 0 0 8 0.7 36 1.22 0.61 BDL 164 Bokulia Dug Well 7.49 380 0.1 57.4 BDL 96 54.0 16.50 3.5 0.56 35.2 19.42 164 31.36 9.18 1.6 165 Dengaon R5 Dug Well 8.6 359.1 BDL 238.3 48 96 51.6 15.4 3.3 0.53 33.6 17.48 160 29.17 8.7 1.4 166 Dentaghat Dug Well 7.3 455 0 52.38 BDL 116 70.0 23.55 6.3 0.75 40 23.5 196 43.05 12.7 3.66 167 Deopani Dug Well 8.5 405.2 BDL 220.8 40 104 63.5 19.64 4.8 0.66 38.4 21.36 184 36.7 10.8 2.27 168 Dillai Dug Well 8.6 776.3 BDL 245 48 168 130.0 44.7 BDL 2.93 64 38.83 272 88.8 30.14 BDL 169 Diphu Dug Well 8.5 708 BDL 222 40 160 108.0 38.75 BDL 1.4 56 35.0 260 78.6 25.8 BDL 170 Dishobai Dug Well 8.9 780 BDL 470 80 172 132.0 45.18 BDL BDL 64 39.8 280 89 30.5 BDL 171 Donkamokam Dug Well 6.9 137 0 35.6 BDL 44 20.0 1.62 0.9 0.13 16 4.9 80 7.28 2.2 0.12 172 Ghouria Dhubi Dug Well 8.5 435 BDL 225 40 116 68.0 22.14 5.7 0.7 40 22.6 188 39.8 11.75 2.9 173 Habranrangapar Dug Well 7.6 328 0.2 70.32 BDL 84 42.0 10.70 2.6 0.42 30.4 14.56 144 23.2 6.9 1.01 174 Hawaipur Dug Well 7.66 142.5 0.2 73.8 BDL 48 21.8 1.8 1 0.14 16 5.83 80 7.7 2.3 0.14 175 Kalonga Dug Well 7.19 229 0 45.9 BDL 68 30.0 6.3 1.7 0.31 24 9.7 116 17.17 4.2 0.53 176 Khatkhati Dug Well 8.5 731.5 BDL 221.9 40 164 115.1 41.42 BDL 1.48 57.6 36.89 264 82.1 27.4 BDL 177 Kheronighat Dug Well 7.05 258.3 0 41.5 BDL 72 33.7 7.57 1.9 0.34 25.6 10.7 124 18.5 4.97 0.62 178 Langhing Dug Well 7.5 123.2 0.1 64 BDL 40 17.9 1.2 0.6 0.09 14.4 4.4 72 5.9 1.82 0.09 179 Manikpur Dug Well 8.5 344 4.6 203 40 88 48.0 12.65 2.9 0.47 32 15.53 152 25 7.6 1.15 180 Manja Bus Stand Dug Well 9.2 470 BDL 648.4 104 120 74.0 25.28 7.7 0.85 41.6 24.3 204 46.5 13.83 4.35 181 Manja Forest Dug Well 7.5 760 0.1 65.4 BDL 168 124.0 44.55 BDL 2.27 62.4 38.6 268 84.6 30 BDL 182 Mohendijua Dug Well 8.5 332 BDL 221.2 40 84 44.0 11.0 2.6 0.43 30.4 14.56 148 23.4 7.1 1.03 183 Phonglangso Dug Well 8.8 353 BDL 383.8 72 92 50.0 14.6 3.1 0.5 32 16.5 156 26.54 8.26 1.28
184 Phuloni Dug Well 7.66 260.6 0.2 73 BDL 72 34.0 7.7 1.9 0.34 25.6 10.68 124 18.6 5.11 0.62
185 Saphapani Dug Well 8.3 96.3 2 163.9 32 32 13.7 1.0 0.2 0.03 12.8 2.4 52 3.55 1.22 0.03 186 Silanijan Dug Well 7.9 243 0.7 105.7 16 72 31.8 7.1 1.7 0.33 25.6 10.68 120 17.8 4.65 0.59
187 Swarghati Dug Well 7.6 203 0.2 70.38 BDL 60 28.0 4.6 1.5 0.26 25.6 8.74 104 14.2 3.5 0.39
188 Terangaon Dug Well 8.7 57 BDL 313 64 16 6.0 0.99 0 0 8 0.5 32 1.13 0.59 BDL

S.No Village Well_Type pH EC
(µs/cm) 25C
Turbidity (NTU) TDS CO3-
2 HCO3-
1 Cl- SO4-2 NO3-1 F- Ca+2
(Ca) Mg+2 (Mg)
TH (as CaCO3) Na K Fe
Karimganj 189 Badarpur Dug Well 8.12 133.8 1 130 16 44 19.9 1.6 0.9 0.12 16 4.85 76 7.17 2.18 0.12 190 Dhaulia Dug Well 8.26 281.5 1.3 143.8 24 76 35.7 8.60 2.1 0.36 27.2 12.6 128 19.7 5.4 0.71 191 Hatikira Dug Well 8.3 388 1.8 162.1 32 100 58.0 16.97 3.8 0.62 35.2 19.42 172 33.78 9.9 1.81 192 Karmganj Dug Well 8.38 518 2.3 172.3 32 128 84.0 29.19 10.5 0.99 43.2 27.2 212 52.8 16.2 5.82 193 Kayasthagram Dug Well 8.25 535 1.2 140.5 24 132 88.0 30.8 12.8 1.08 46.4 29.9 236 59.5 17.8 12.69 194 Patharkandi Dug Well 8.38 356.3 2.3 170 32 92 50.0 14.95 3.1 0.51 32 16.5 160 27.4 8.5 1.32 195 Sarkaribari Dug Well 8.17 394.4 1 130 16 104 59.6 17.79 4.1 0.64 36.8 20.39 176 34.56 10 1.94
Lakhimpur 196 Amguri Dug Well 7.6 159.7 0.2 70.1 BDL 52 22.0 2.57 1.1 0.18 19.2 6.80 88 8.9 2.54 0.19 197 Amsoi Dug Well 8.2 238.7 1 136 24 96 51.6 15.40 3.3 0.51 32 17.48 160 27.8 8.59 1.34 198 Bhogpur charali Dug Well 7.5 127 0.1 60 BDL 40 18.0 1.3 0.8 0.11 16 4.85 76 6.5 5.9 0.1 199 Bihpuria Dug Well 7.71 555 0.3 77.13 BDL 132 90.0 30.92 13.6 1.09 46.4 30.10 240 60 18 12.79 200 Boginadi(balijan) Dug Well 8.3 203 1.3 148 24 60 28.0 4.6 1.5 0.26 22.4 8.74 104 14.06 3.44 0.38 201 Dejoo Dug Well 7.9 367 0.6 98.4 16 96 53.6 16.34 3.5 0.56 35.2 18.9 164 30.9 9.15 1.57 202 Dholpur Dug Well 7.6 233.2 0.2 68.7 BDL 68 30.8 6.63 1.7 0.32 24 9.7 120 17.6 4.4 0.58 203 Dolanghat chara Dug Well 7.5 139.5 0.1 60 BDL 44 20.0 1.62 0.9 0.13 16 4.9 80 7.47 2.2 0.12 204 Harmoti Dug Well 8.6 520.2 BDL 235 48 128 84.0 29.19 10.6 0.99 44.8 28.16 216 53.2 16.5 6.09 205 Kadam Dug Well 7.81 196 0.5 92 8 60 28.0 4.56 1.4 0.26 22.4 8.74 104 13.5 3.4 0.38 206 Laluk Dug Well 7.2 177.7 0 46.67 BDL 56 24.0 3.03 1.2 0.21 19.2 7.8 96 10.38 2.86 0.23 207 Milanpur Dug Well 7.73 130.5 0.3 80 BDL 40 19.8 1.46 0.8 0.11 16 4.9 76 6.81 2.03 0.11 208 Narayanpur Dug Well 7.68 153.7 0.2 74.07 BDL 48 21.8 2.24 1 0.16 17.6 5.83 80 8.22 2.47 0.17 209 Panigaon Dug Well 8 140 0.8 112.3 16 44 20.0 1.62 0.9 0.13 16 4.85 80 7.5 2.2 0.13 210 Pathalipam Dug Well 7.3 240.4 0 50.67 BDL 72 31.8 6.9 1.7 0.32 25 10.68 120 17.67 4.62 0.59 211 Pathalipam II Dug Well 7.31 298 0 53.4 BDL 80 40.0 9.6 2.4 0.39 28.8 12.9 140 21.69 6.18 0.89
Morigaon 212 Baghara Dug Well 9.1 297 BDL 627 104 80 38.0 9.61 2.3 0.38 28.8 12.6 140 21.6 6.15 0.87 213 Baropujia Dug Well 7.59 398.4 0.1 67.1 BDL 104 60.0 18.85 4.3 0.65 36.8 20.4 180 35.7 10.41 2.09 214 Barukati Ow Tube Well 7.82 95.06 0.5 93.08 8 28 11.9 1.02 0.2 0.03 11.2 1.94 52 3.08 1.13 0.03 215 Basanaghat Ow Tube Well 7.3 184.2 0 51.37 BDL 56 25.8 3.65 1.3 0.23 20.8 7.8 100 11.78 3.08 0.29 216 Charibahi Ow Tube Well 7.88 249.8 0.6 95.5 16 72 32.0 7.4 1.8 0.33 25.6 10.7 124 18.4 4.94 0.61 217 Daponibari Ow Tube Well 7.8 470.9 0.4 88.71 8 120 75.2 25.7 7.8 0.86 41.6 24.3 204 48.2 14.1 4.39

S.No Village Well_Type pH EC
(µs/cm) 25C
Turbidity (NTU) TDS CO3-
2 HCO3-
1 Cl- SO4-2 NO3-1 F- Ca+2
(Ca) Mg+2 (Mg)
TH (as CaCO3) Na K Fe
218 Deosal Dug Well 7.9 115 0.6 104 16 36 17.1 1.13 0.5 0.06 14.4 3.88 64 5.1 1.72 0.08 219 Garmari gaon Dug Well 8.5 405 BDL 216 40 104 62.0 19.5 4.7 0.65 38.4 21.36 184 36.6 10.73 2.26
220 Jagibhagatgaon Ow Tube Well 7.87 262.5 0.5 95.3 16 72 34.0 7.87 2 0.34 27.2 11.65 124 18.89 5.14 0.65
221 Jagiroad Dug Well 7.38 116 0 55.82 BDL 40 17.1 1.15 0.6 0.08 14.4 3.9 72 5.53 1.78 0.08 222 Kumoi Dug Well 7.56 148.8 0.1 65.8 BDL 48 21.8 2.24 1 0.16 17.6 5.8 80 8.18 2.47 0.17 223 Morigaon Dug Well 6.85 121.6 0 30.45 BDL 40 17.1 1.1 0.6 0.08 14.4 3.9 72 5.57 1.8 0.08 224 Nasatra Dug Well 7.8 459.8 0.5 89.09 8 120 71.8 24.02 6.9 0.82 40 24.3 200 44.9 13.43 4.04 225 Nelle Dug Well 8.8 445 BDL 353 72 116 68.3 23.40 5.9 0.74 40 23.3 196 40.7 12.2 3.38 226 Nelle New Dug Well 6.9 101.7 0 33.97 BDL 32 15.9 1.0 0.3 0.03 12.8 2.9 52 3.9 1.34 0.03 227 Pabbarbhagia Dug Well 7.8 216 0.4 88.5 8 64 30.0 5.4 1.5 0.28 24 9.7 112 16.01 3.8 0.45 228 Pamibahua Dug Well 8.7 341 BDL 296 56 88 46.0 11.80 2.8 0.46 30.4 15.3 152 24.4 7.39 1.12 229 Shugumbari Dug Well 7.9 154.4 0.6 102.3 16 48 22.0 2.40 1 0.16 17.6 5.83 80 8.27 2.47 0.18 230 Silsang Namghar Dug Well 7.5 181.3 0.1 65.07 BDL 56 25.8 3.18 1.2 0.22 20.8 7.8 100 11.1 2.92 0.24 231 Solmari Ow Tube Well 7.38 380.2 0 55.9 BDL 96 54.0 16.60 3.6 0.56 35.2 19.42 164 31.38 9.2 1.62
Nagaon 232 Bagori Dug Well 8.9 747 BDL 511 88 168 119.1 43.77 BDL 1.88 60.8 37.9 268 83.7 29.77 BDL 233 Bamuni tinali Dug Well 7.8 186 0.4 88.3 BDL 60 27.3 3.97 1.3 0.24 20.8 8.7 100 12.4 3.19 0.35 234 Beldonga mandir Dug Well 8.9 1200 BDL 420 80 252 181.9 77.14 BDL BDL 91.2 53.4 340 108.9 73 BDL 235 Bichamari Dug Well 7.8 349 0.5 89.6 8 92 50.0 13.9 3 0.5 32 15.5 156 26.17 7.95 1.24 236 Borchukhaba Dug Well 7.1 140 0 42.8 BDL 44 20.0 1.62 0.9 0.13 16 5.3 80 7.5 2.23 0.13 237 Bordowa Dug Well 8.8 364 BDL 356 72 96 52.0 15.7 3.5 0.55 33.6 18.4 160 29.6 9.06 1.5 238 Dakhinpath OW Tube Well 7.91 624 0.7 106 16 152 102.5 34.68 BDL 1.3 52.8 33.98 256 73 24.1 BDL 239 Dalapani Dug Well 9 1060 BDL 556 88 236 154.8 60.06 BDL BDL 83.2 47.6 304 105.3 54.4 BDL 240 Dhing Dug Well 7.9 182.3 0.6 104 16 56 25.8 3.34 1.3 0.23 20.8 7.8 100 11.6 3.03 0.28 241 Doboka Dug Well 7.7 526 0.2 75.14 BDL 128 85.4 29.51 11.5 1 44.8 28.2 220 53.78 17.08 7.3 242 Ghasibasti Ow Tube Well 7.9 148.7 0.6 99.7 16 48 21.8 2.09 1 0.16 17.6 5.8 80 8.15 2.45 0.17 243 Gomotha Dug Well 8.9 949 BDL 412 80 208 144.0 54.42 BDL BDL 72 44.7 300 99.4 34.7 BDL 244 Haldiati sub bt Dug Well 7.3 86.9 0 51.8 BDL 28 9.9 1.0 0.1 0.01 9.6 1.94 48 2.67 0.94 0.02 245 Hatibatha Dug Well 7.8 89.2 0.4 88.2 BDL 28 9.9 1.0 0.2 0.02 10 1.94 48 2.8 1.02 0.02 246 Jurapukhuri Dug Well 8.8 645 BDL 360 72 152 105.9 37.34 BDL 1.33 54.4 35.0 260 76.6 25.3 BDL 247 Kathiatoli Dug Well 7.59 103 0.2 68 BDL 32 15.9 1.0 0.3 0.04 12.8 2.9 56 4.15 1.39 0.03

S.No Village Well_Type pH EC
(µs/cm) 25C
Turbidity (NTU) TDS CO3-
2 HCO3-
1 Cl- SO4-2 NO3-1 F- Ca+2
(Ca) Mg+2 (Mg)
TH (as CaCO3) Na K Fe
248 Kazirang Tourist Vil Dug Well 8.3 433.4 2 164 32 112 66.0 21.4 5.5 0.68 40 22.3 188 38.8 11.7 2.87
249 Kondali Dug Well 7.2 162.3 0 47.22 BDL 52 23.8 2.87 1.1 0.2 19.2 6.80 92 9.17 2.7 0.22 250 Langteng TE Dug Well 7.6 107 0.2 70.9 BDL 36 15.9 1.07 0.4 0.05 12.8 2.91 60 4.5 1.49 0.05 251 Lanka Dug Well 7.64 115 0.2 72.6 BDL 36 16.0 1.1 0.5 0.06 14.4 3.9 64 5.07 1.7 0.07 252 Lumding Dug Well 7.75 191 0.3 81.1 BDL 60 27.8 4.44 1.4 0.26 22.4 8.7 104 13.26 3.3 0.37 253 Nadeorigaon Dug Well 7.98 114.6 0.7 111 16 36 16.0 1.11 0.5 0.06 14.4 2.9 64 4.85 1.65 0.06 254 Natali Dug Well 8.02 160 1 117 16 52 22.0 2.71 1.1 0.18 19.2 6.8 88 8.9 2.58 0.19 255 Pahukata Dug Well 7.8 234 0.5 89.9 8 68 30.8 6.9 1.7 0.32 24 9.7 120 17.6 4.47 0.58 256 Phulaguri Dug Well 8.9 1020 BDL 480.4 80 228 154.8 59.75 BDL BDL 80 47.57 304 104 49.6 BDL 257 Samuguri Dug Well 7.71 128 0.3 77.3 BDL 40 18.0 1.46 0.8 0.11 16 4.9 76 6.77 2.02 0.1 258 Silghat Dug Well 7.87 245 0.5 95 8 72 32.0 7.26 1.8 0.33 25.6 10.7 124 18.3 4.92 0.61 259 Sulung p.o. Dug Well 7.72 103.7 0.3 77.7 BDL 32 15.9 1.04 0.3 0.04 12.8 2.9 56 4.19 1.41 0.03 260 Tirchang Dug Well 9 1200 BDL 562 88 240 180.6 73.07 BDL BDL 89.6 53.4 320 107 67.6 BDL 261 Zebra Khua Dug Well 7.5 273.5 0.1 64.6 BDL 76 35.7 8.56 2.1 0.35 27.2 11.7 128 19.7 5.33 0.71
Nalbari 262 Balilecha Tube Well 7.5 95.02 0.1 64.64 BDL 28 11.9 1.0 0.2 0.02 11.2 1.94 48 2.91 1.09 0.02 263 Tamulpur Dug Well 8.4 337 3 175.5 32 88 46.0 11.80 2.7 0.44 30.4 14.6 148 24.06 7.3 1.09 264 Tihu Dug Well 8.5 388 BDL 211 40 100 58.0 17.1 3.8 0.63 35.2 19.4 172 34.1 9.92 1.84
Sibsagar 265 Demow Sukan Dug Well 8.5 125.8 BDL 223 40 40 17.9 1.3 0.7 0.1 14.4 4.9 72 6.1 1.93 0.09 266 Moranhat Dug Well 8.2 960 1.1 140 24 208 150.9 54.89 BDL BDL 73.6 45.6 300 102 34.7 BDL 267 Sapekhati Dug Well 8.6 342 BDL 256.1 48 88 47.6 12.6 2.8 0.46 31 15.5 152 24.67 7.49 1.13 268 Sibsagar Dug Well 8.6 721.8 BDL 252.5 48 160 109.2 40.3 BDL 1.45 56 35.92 260 79.06 26.2 BDL
Sonitpur 269 18th Mile Dug Well 7.5 230.7 0.1 61.57 BDL 68 30.0 6.47 1.7 0.31 24 9.7 120 17.45 4.4 0.55 270 Balipara Dug Well 8.1 207.6 1 129.5 16 64 29.8 4.91 1.5 0.27 22.4 9.71 108 15.7 3.66 0.43 271 Barchola Dug Well 8.09 388 1 124.8 16 100 58.0 17.0 3.7 0.62 35.2 19.4 172 33.54 9.73 1.8 272 Biswanath Dug Well 8.7 559 BDL 284 56 132 90.0 31.07 14.2 1.1 46.4 31.1 240 62.14 18.07 12.9 273 Biswanath chara Dug Well 7.7 130.5 0.2 74.4 BDL 44 19.8 1.46 0.8 0.11 16 10.68 76 6.86 2.03 0.11 274 Buroighat Dug Well 8.5 223 BDL 214.6 40 68 30.0 5.85 1.7 0.3 24 9.7 112 16.8 4 0.53 275 Charduar Dug Well 8.4 145.5 3.2 185 32 48 21.8 1.96 1 0.15 17.6 5.83 80 8.06 2.4 0.16

S.No Village Well_Type pH EC
(µs/cm) 25C
Turbidity (NTU) TDS CO3-
2 HCO3-
1 Cl- SO4-2 NO3-1 F- Ca+2
(Ca) Mg+2 (Mg)
TH (as CaCO3) Na K Fe
276 Dhalaibil Dug Well 7.9 298 0.6 99 16 80 40.0 9.6 2.4 0.4 28.8 13.59 140 21.8 6.38 0.9 277 Dhekiajuli Dug Well 7.5 107.9 0.1 57.5 BDL 36 15.9 1.1 0.4 0.05 12.8 2.9 60 4.55 1.5 0.05 278 Garumari Dug Well 8.5 267.8 BDL 211 40 76 34.2 8.51 2 0.35 27.2 11.65 128 19.07 5.3 0.69 279 Gohpur Dug Well 8.7 444 BDL 276 56 116 68.0 23.08 5.9 0.74 40 23.3 192 40.3 12.2 3.35 280 Helem Dug Well 8.3 204 1.6 152.1 24 60 29.8 4.75 1.5 0.27 22.4 8.74 108 14.77 3.55 0.4 281 Japoriguri Dug Well 7.5 241 0.1 62 BDL 72 31.8 6.94 1.7 0.32 25.6 10.7 120 17.7 4.64 0.59 282 Ketela TE Dug Well 8.2 69.8 1 135 24 24 7.9 0.99 0.1 0.01 9.6 1.0 40 2.06 0.7 0.01 283 Sootia Dug Well 8 187 0.9 112.5 16 60 27.3 4.12 1.3 0.25 20.8 8.7 100 12.4 3.2 0.35 284 Tezpur Dug Well 8.8 170 BDL 336.7 64 56 24.0 3.03 1.2 0.21 19.2 7.77 96 10 2.84 0.23 285 Thelamara Dug Well 8.2 217 1 136 24 64 30.0 5.53 1.6 0.29 24 9.71 112 16.12 3.94 0.46 286 Tupia Dug Well 8.1 407.5 1 126 16 104 63.5 19.79 4.8 0.66 38.4 21.4 184 36.7 10.98 2.3
Tinsukia 287 Borgolai Dug Well 6.25 114.6 0 15.1 BDL 36 16.0 1.1 0.5 0.06 14.4 3.9 64 4.89 1.65 0.06 288 Digboi Dug Well 8.2 133.1 1.1 139 24 44 19.9 1.46 0.8 0.12 16 4.85 28 7.12 2.13 0.11 289 Jagun Dug Well 8.02 347 1 117.5 16 92 48.0 13.67 3 0.49 32 15.53 152 25.92 7.9 1.2 290 Jaipur naharjan Dug Well 8.3 67 1.7 158 24 20 6.0 1.0 0.1 0 9.6 1.0 36 1.75 0.68 BDL
291 Kumsang Selenguri Dug Well 8.3 95.99 1.7 159 24 28 13.7 1.0 0.2 0.03 11.2 1.94 52 3.25 1.19 0.03
292 Lekhapani Dug Well 8.04 624 1 118 16 152 103.2 37.03 BDL 1.32 52.8 33.98 256 73.07 24.8 BDL 293 Panitola Dug Well 8.4 488.6 4 186.9 32 124 75.4 26.5 8.3 0.88 41.6 25.24 208 51 14.6 4.9 294 Tinsukia Dug Well 8.02 181.6 1 117.9 16 56 25.8 3.18 1.3 0.23 20.8 7.77 100 11.2 2.98 0.27 295 Tipong Dug Well 7.7 131 0.2 76.4 BDL 44 19.9 1.46 0.8 0.12 16 4.85 76 6.9 2.07 0.11 296 Tirap gate Dug Well 7.03 127 0 39.4 BDL 40 18.0 1.30 0.7 0.1 16 4.85 72 6.36 1.95 0.1
MEGHALAYA East Garo Hills
297 Dainadubi Dug Well 7.8 193.7 BDL 35.3 BDL 44 30.8 1.11 3.3 0.26 16 4.9 72 10.5 4.7 0.75 298 Darugiri Dug Well 8.5 285.5 BDL 69.7 8 52 47.8 1.87 BDL BDL 27.2 13.6 84 21.2 9.05 3.46 299 Kharkutta Dug Well 7.5 152.2 4.6 39.5 BDL 32 23.9 0.99 2.7 0.19 11.2 2.9 48 7.1 2.4 0.05 300 Rongjeng Dug Well 7.7 182.9 BDL 72.2 BDL 40 27.3 1.02 3 0.25 16 3.9 72 9.1 4.09 0.39
301 Samanda Megapagre Dug Well 7.5 154.4 BDL 44.1 BDL 36 23.9 0.99 3 0.24 11.2 2.9 48 7.6 3.5 0.06
302 Williamnagar Dug Well 8.1 242.1 BDL 141.8 BDL 52 37.6 1.43 13.1 BDL 24 5.8 80 14.5 8.3 1.59

S.No Village Well_Type pH EC
(µs/cm) 25C
Turbidity (NTU) TDS CO3-
2 HCO3-
1 Cl- SO4-2 NO3-1 F- Ca+2
(Ca) Mg+2 (Mg)
TH (as CaCO3) Na K Fe
East Khasi Hills 303 Balat Dug Well 8.5 311.8 BDL 86.2 16 64 61.5 10.72 BDL BDL 28.8 15.5 96 30.3 10.6 BDL 304 Cherrapunji Dug Well 6.6 77 0.1 74.9 BDL 8 6.8 0.99 0.1 0.01 8 1.0 20 0.23 0.1 0.01 305 Shillong Polo Dug Well 8.1 256.2 BDL 53 BDL 52 44.4 1.60 BDL BDL 24 6.8 84 20.8 8.7 1.86
Jaintia hills 306 Dauki Dug Well 7.9 206.7 BDL 154 BDL 48 34.2 1.15 4.6 0.38 16 4.9 72 10.6 5.6 1.1 307 Jowai Dug Well 7.3 116.6 BDL 64.1 BDL 28 20.5 0.99 1.5 0.09 8 1.9 40 5.3 1.7 0.03
Ri-Bhoi 308 Byrnihat Dug Well 8.48 328.6 BDL 178 16 72 68.3 12.51 BDL BDL 30.4 17.5 140 30.7 14.5 BDL 309 Nongpoh Dug Well 7.1 87.2 BDL 107 BDL 28 17.1 0.99 0.8 0.07 8 1.0 32 4.3 1.4 0.02
West Garo Hills 310 Asanang Dug Well 7.5 158.5 BDL 42.7 BDL 36 27.3 0.99 3 0.24 12.8 2.9 48 8.03 3.6 0.16 311 Belguri Dug Well 7.4 130.2 BDL 87.8 BDL 32 23.9 0.99 1.7 0.13 8 1.9 40 5.9 2.2 0.03 312 Garobandha Dug Well 7.9 236.3 BDL 141.2 BDL 48 34.2 1.21 5.4 0.42 17.6 4.9 80 12.1 7.1 1.24 313 Nongopara Dug Well 7.2 105.7 BDL 70 BDL 28 20.5 0.99 1.3 0.08 8 1.9 36 5.09 1.6 0.03 314 Phulbari Dug Well 8.5 392.6 BDL 94 40 88 85.4 27.10 BDL BDL 35.2 26.2 156 38.2 33.8 BDL 315 Phutamati Dug Well 7.6 159.5 3.1 38 BDL 40 27.3 0.99 3 0.25 12.8 2.9 56 9.04 4.06 0.2 316 Rongram Dug Well 7.1 84 BDL 58.8 BDL 24 17.1 0.99 0.7 0.05 8 1.0 28 3.8 1.3 0.02 317 Mairang Dug Well 7.2 97.1 BDL 134.7 BDL 28 20.5 0.99 1.3 0.07 8 1.9 32 4.7 1.5 0.02
NAGALAND Dimapur
318 3 Mile Bazar Dug Well 8.7 362 2 173 24 60 88.0 5.53 5.9 0.43 24 9.7 84 44.3 7.14 1.84 319 7th Mile Colony Dug Well 8.8 703 3 350 32 64 120.0 10.08 9.8 0.49 32 12.6 128 46.9 22 1.84 320 Bade Bazar Dug Well 8.5 314 1 156.2 8 44 60.0 3.03 2.7 0.31 16 6.8 72 28.8 2.27 1.81 321 Chumkidima Dug Well 6.1 79.1 0 37.8 0 0 0.0 0.99 0.3 0.02 0 0.0 0 6.8 0.33 1.65 322 Dgm Colony Tube Well 7.8 155 0.4 89.06 0 52 22.0 2.40 1 0.17 17.6 5.8 84 8.66 2.5 1.69 323 Dhansiripar Dug Well 8.2 228 1 112 0 8 9.9 1.30 1 0.05 6.4 2.9 36 16.7 1.02 1.72 324 Dimapur Dug Well 8.3 229 1 112.7 8 24 40.0 1.46 1.6 0.05 8 2.9 48 17.1 1.1 1.73 325 Diphupar Dug Well 8.9 860 3 409 32 96 120.0 16.34 10.8 0.97 32 12.6 132 72.7 22.1 1.62 326 Doyabur DMC Dug Well 8.5 303 1 150 8 40 60.0 2.09 2.1 0.28 16 5.8 56 27.1 2 1.8 327 Marwari Colony Dug Well 8.4 276 1 137 8 36 50.0 1.93 1.9 0.23 11.2 3.9 52 20.2 1.59 1.74

S.No Village Well_Type pH EC
(µs/cm) 25C
Turbidity (NTU) TDS CO3-
2 HCO3-
1 Cl- SO4-2 NO3-1 F- Ca+2
(Ca) Mg+2 (Mg)
TH (as CaCO3) Na K Fe
328 Singrijan Dug Well 8.4 289 1 141 8 40 58.0 1.93 2 0.23 16 4.9 52 25.9 1.8 1.79 329 Thilaxu Block-II Dug Well 8.6 320 1 157.2 8 50 68.0 3.34 3.4 0.38 20.8 7.8 80 29.4 3.3 1.82
330 Zakesatho Colony Dug Well 9 1040 12 534.5 32 100 171.9 28.57 12.2 BDL 35.2 26.2 188 77.7 22.1 0.9
331 Zion Hospital Dug Well 8.6 336 1 166 20 52 74.0 4.28 3.5 0.4 22.4 7.8 84 40.5 3.6 1.84 TRIPURA
Dhalai 332 Abhanga Dug Well 6.8 74.2 0.1 32.5 BDL 8 6.8 0.99 0.1 0.1 4.8 1.9 32 2.1 0.44 0.01 333 Ambassa Dug Well 8.2 212 0.1 99.4 BDL 60 19.9 0.99 1.5 0.25 16 8.7 72 13.63 2.7 0.08 334 Kamalpur Dug Well 7.3 98.9 0.1 45.9 BDL 16 7.9 6.00 0.4 0.11 8 2.9 40 6.1 0.88 0.02 335 Manu Dug Well 7.5 99.3 0.1 45.9 BDL 20 7.9 1.15 0.4 0.13 8 2.9 44 6.14 0.9 0.02
North Tripura 336 Baghbassa Dug Well 7.7 99.4 0.2 46.1 BDL 24 11.9 1.15 0.7 0.14 9.6 3.9 48 6.16 1.68 0.02 337 Dharmanagar Dug Well 7.75 107 0.2 49.4 BDL 24 13.7 1.30 0.7 0.14 9.6 4.9 48 6.24 1.88 0.03 338 Gauranagar Dug Well 7.8 108 0.4 51.1 BDL 28 13.9 1.46 0.9 0.16 9.6 5.8 48 6.3 1.92 0.03 339 Kanchanchhera Dug Well 7.87 143 0.5 65.7 BDL 40 13.9 1.93 1.1 0.18 11.2 5.8 52 8.7 2.1 0.04 340 Kumarghat Dug Well 7.7 99.3 0.2 46 BDL 20 11.9 1.15 0.7 0.13 9.6 3.9 44 6.15 1.65 0.02 341 Panisagar Dug Well 7.8 111 0.4 51.8 BDL 28 13.9 1.62 1 0.17 11.2 5.8 48 6.3 1.93 0.04 342 Pecharthal Dug Well 7.8 137 0.4 63.3 BDL 40 13.9 1.93 1 0.18 11.2 5.8 52 8.11 2.03 0.04 343 Rajnagar Dug Well 8.19 154 1.1 72.4 16 52 15.9 2.09 1.3 0.23 12.8 6.8 64 11.6 2.48 0.07
South Tripura 344 Amarpur Dug Well 8.2 212 1.6 99.4 16 60 19.9 2.56 1.5 0.25 16 8.7 72 13.63 2.7 0.08 345 Bampur Dug Well 8.2 221 1.7 101 16 60 21.8 2.71 1.5 0.25 16 8.7 72 14.06 2.79 0.08 346 Gardhang Dug Well 8.3 269 2.9 124 24 72 23.9 3.81 1.7 0.29 19.2 9.7 96 15.51 2.96 0.11 347 Garjee Bazar Dug Well 8.1 149 1 70.6 16 48 15.9 2.09 1.3 0.23 12.8 6.8 60 11.2 2.45 0.06 348 Hrishyamukh Dug Well 8.2 156.5 1.2 75.8 16 52 15.9 2.24 1.4 0.23 12.8 6.8 64 11.76 2.53 0.07 349 Jhajhari Dug Well 8.3 239.1 1.9 119.4 16 64 23.8 2.71 1.6 0.26 17.6 8.7 84 14.46 2.83 0.09 350 Kalachhara Dug Well 8.3 250 2.4 123.9 24 68 23.8 3.03 1.7 0.28 19.2 9.7 92 14.7 2.95 0.11 351 Kankraban Dug Well 8.3 271 2.98 124 24 72 25.8 3.81 1.7 0.29 20.8 10.7 100 15.6 2.98 0.12 352 Manu Bazar Dug Well 8.3 239.5 2.2 119.6 24 68 23.8 3.03 1.6 0.27 19.2 9.7 88 14.5 2.85 0.09 353 Manurmukh Dug Well 8 146 0.5 67.4 BDL 40 13.9 2.09 1.2 0.19 12.8 5.8 52 10.43 2.39 0.05 354 Radhanagar Dug Well 8.3 277 3.1 130 24 72 25.8 4.44 1.8 0.31 20.8 10.7 100 15.66 3.15 0.14

S.No Village Well_Type pH EC
(µs/cm) 25C
Turbidity (NTU) TDS CO3-
2 HCO3-
1 Cl- SO4-2 NO3-1 F- Ca+2
(Ca) Mg+2 (Mg)
TH (as CaCO3) Na K Fe
355 Rajnagar Dug Well 7.9 143 0.5 66.43 BDL 40 13.9 1.93 1.2 0.18 12.8 5.8 52 10.4 2.26 0.04 356 Sabroom Dug Well 8.2 165.2 1.4 85.1 16 56 17.9 2.56 1.4 0.24 14.4 7.8 68 12.2 2.66 0.07 357 Santi bazar Dug Well 8.2 157 1.3 80.03 16 52 15.9 2.40 1.4 0.24 14.4 7.8 64 12.1 2.54 0.07
West Tripura 358 Bagan Bazar Dug Well 8.6 306.2 BDL 157.9 48 116 41.0 13.68 4.8 0.44 30.4 14.6 124 23.79 5.01 BDL 359 Bishalgarh Dug Well 8.36 277 3.2 130 24 72 25.8 4.91 2.1 0.33 24 10.7 108 16.7 3.28 0.24 360 Champaknagar Dug Well 8.4 282 3.5 132 32 88 27.8 5.53 2.2 0.34 25.6 10.7 116 17.3 3.68 0.25
361 Dakshin Kalamcherra Dug Well 8.4 280 3.4 131 32 84 25.8 5.06 2.2 0.33 24 10.7 116 16.9 3.43 0.25
362 East Narayanpur Dug Well 8.5 295 4.1 145.2 32 100 34.2 7.10 2.5 0.36 27.2 11.7 120 19.2 4.73 1.27 363 Gongrai Dug Well 8.6 322.1 BDL 164 56 128 44.4 15.09 BDL 0.46 32 15.5 124 26.7 6.18 BDL 364 Ishanpur Dug Well 8.5 301.9 BDL 154.9 40 108 37.6 7.41 4.3 0.43 28.8 12.6 124 22.4 4.94 BDL 365 Kalyanpur Dug Well 8.4 285 4 132 32 92 30.8 6.00 2.3 0.34 25.6 10.7 116 17.3 3.72 0.3 366 Kathalia bazar Dug Well 8.4 287 4.2 135 32 92 30.8 6.16 2.4 0.35 27.2 11.7 120 17.9 3.75 0.74 367 Kenania Dug Well 8.4 288.7 4.1 136 32 96 30.8 6.16 2.5 0.36 27.2 11.7 120 18.4 3.9 1.11 368 Khowai Dug Well 8.4 294.3 4.1 139 32 100 30.8 6.79 2.5 0.36 27.2 11.7 120 19.1 3.91 1.18
369 Paschim Howaibari Dug Well 8.6 309.5 BDL 158.8 48 120 44.4 13.99 9.6 0.46 30.4 14.6 124 24.09 5.02 BDL
370 Simna Dug Well 8.5 295.8 4.1 149 40 100 34.2 7.26 2.7 0.37 27.2 11.7 120 19.57 4.81 5.1 371 Sipoyjala Dug Well 8.5 298.3 4.1 154.7 40 104 37.6 7.26 4.2 0.38 27.2 12.6 120 22.1 4.87 BDL 372 Sonamura Dug Well 8.5 299.4 BDL 154.8 40 108 37.6 7.26 4.3 0.4 28.8 12.6 124 22.28 4.9 BDL 373 Subalsingh Dug Well 8.5 304 BDL 155.3 40 108 41.0 9.92 4.7 0.44 28.8 13.6 124 23.7 4.97 BDL 374 Tufaniamura Dug Well 8.6 318 BDL 160.4 48 128 44.4 14.46 BDL 0.46 30.4 14.6 124 26.4 5.09 BDL 375 Tuimadhu Dug Well 8.6 367 BDL 166.9 64 128 47.8 15.40 BDL 0.46 35.2 15.5 128 27.9 6.42 BDL