Jukkal - क द्र य भू म ल बो जल संसाधन, नद वकास...
12
क�दर य भ म लबो जल संसाधन, नद� �वकास और गंगा संर�ण मंताला भारत सरकार Central Ground Water Board Ministry of Water Resources, River Development and Ganga Rejuvenation Government of India Report on AQUIFER MAPPING AND MANAGEMENT PLAN Jukkal Mandal, Nizamabad District, Telangana द��णी �ेत, हैदराबाद Southern Region, Hyderabad Draft Report
-
Upload
khangminh22 -
Category
Documents
-
view
2 -
download
0
Transcript of Jukkal - क द्र य भू म ल बो जल संसाधन, नद वकास...
क� द्र�य भू�म �ल बो
जल संसाधन, नद� �वकास और गंगा सरं�ण मतंाला
भारत सरकार Central Ground Water Board
Ministry of Water Resources, River Development and Ganga Rejuvenation
Government of India
Report on
AQUIFER MAPPING AND MANAGEMENT PLAN
Jukkal Mandal, Nizamabad District, Telangana
द��णी �ेत, हैदराबाद Southern Region, Hyderabad
Draft Report
भारत सरकार
जल संसाधन नदी िवकास एवम ्गगंा सरंक् म�ंालय क� �ीय भिूमजल बोडर
GOVERNMENT OF INDIA
MINISTRY OF WATER RESOURCES, RIVER DEVELOPMENT AND GANGA REJUVENATION
REPORT ON
AQUIFER MAPS & MANAGEMENT PLANS JUKKAL MANDAL, NIZAMABAD DISTRICT, TELANGANA STATE
CENTRAL GROUND WATER BOARD SOUTHERN REGION

HYDERABAD AUGUST-2016
Aquifer Maps & Management Plans-Jukkal Mandal,Nizamabad District. Page 1
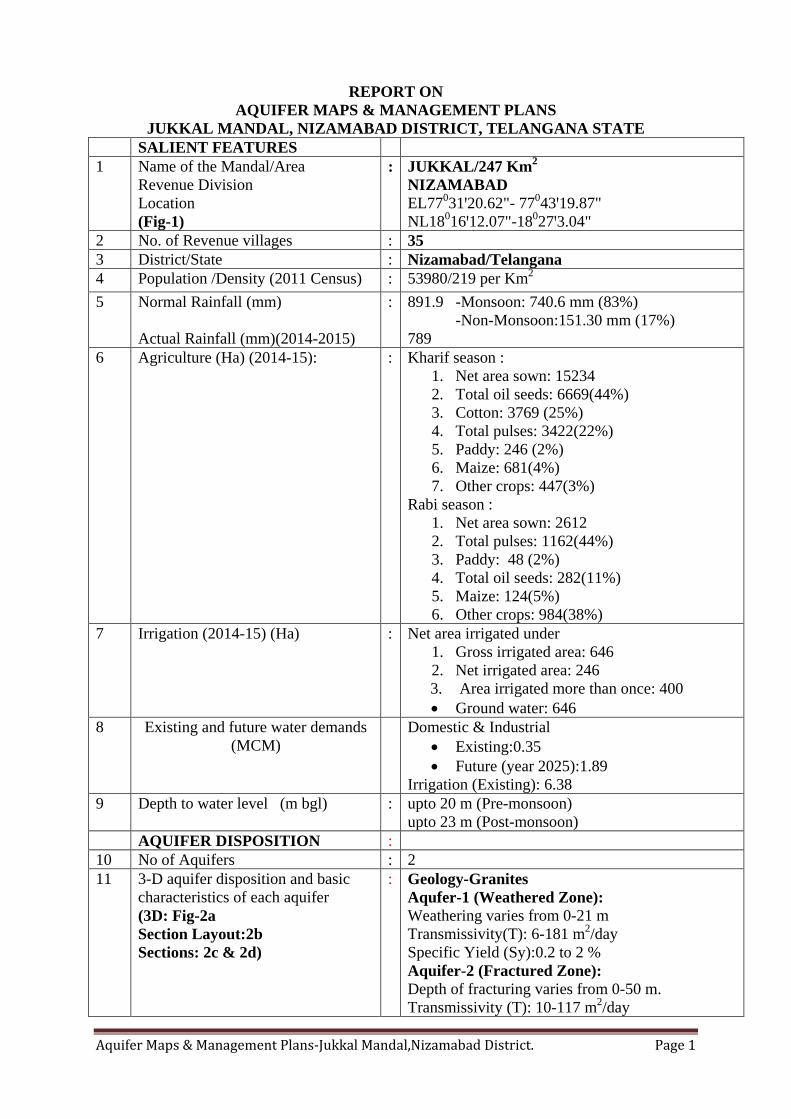
REPORT ON AQUIFER MAPS & MANAGEMENT PLANS
JUKKAL MANDAL, NIZAMABAD DISTRICT, TELANGANA STATE SALIENT FEATURES 1 Name of the Mandal/Area
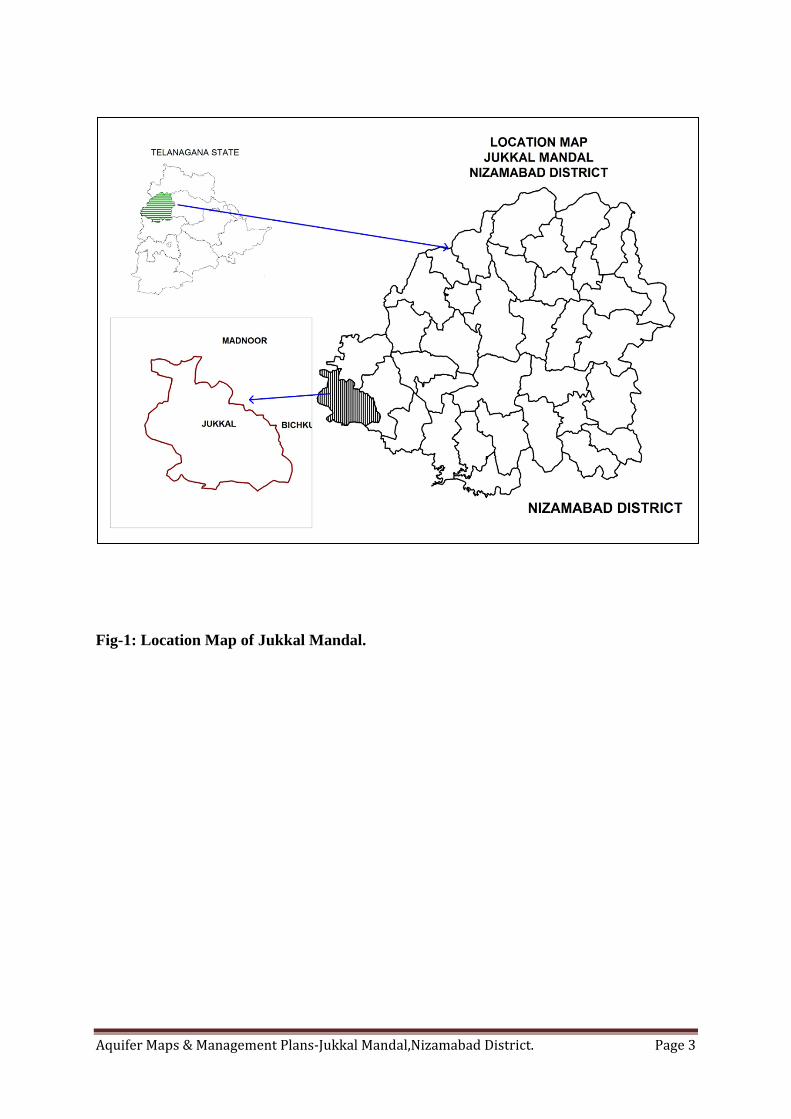
Revenue Division Location (Fig-1)
: JUKKAL/247 Km2 NIZAMABAD EL77031ꞌ20.62"- 77043ꞌ19.87" NL18016ꞌ12.07"-18027ꞌ3.04"
2 No. of Revenue villages : 35 3 District/State : Nizamabad/Telangana 4 Population /Density (2011 Census) : 53980/219 per Km2 5 Normal Rainfall (mm)
Actual Rainfall (mm)(2014-2015)
: 891.9 -Monsoon: 740.6 mm (83%) -Non-Monsoon:151.30 mm (17%) 789
6 Agriculture (Ha) (2014-15):
: Kharif season : 1. Net area sown: 15234 2. Total oil seeds: 6669(44%) 3. Cotton: 3769 (25%) 4. Total pulses: 3422(22%) 5. Paddy: 246 (2%) 6. Maize: 681(4%) 7. Other crops: 447(3%)
Rabi season : 1. Net area sown: 2612 2. Total pulses: 1162(44%) 3. Paddy: 48 (2%) 4. Total oil seeds: 282(11%) 5. Maize: 124(5%) 6. Other crops: 984(38%)
7 Irrigation (2014-15) (Ha) : Net area irrigated under 1. Gross irrigated area: 646 2. Net irrigated area: 246 3. Area irrigated more than once: 400 • Ground water: 646
8 Existing and future water demands (MCM)
Domestic & Industrial • Existing:0.35 • Future (year 2025):1.89
Irrigation (Existing): 6.38 9 Depth to water level (m bgl) : upto 20 m (Pre-monsoon)
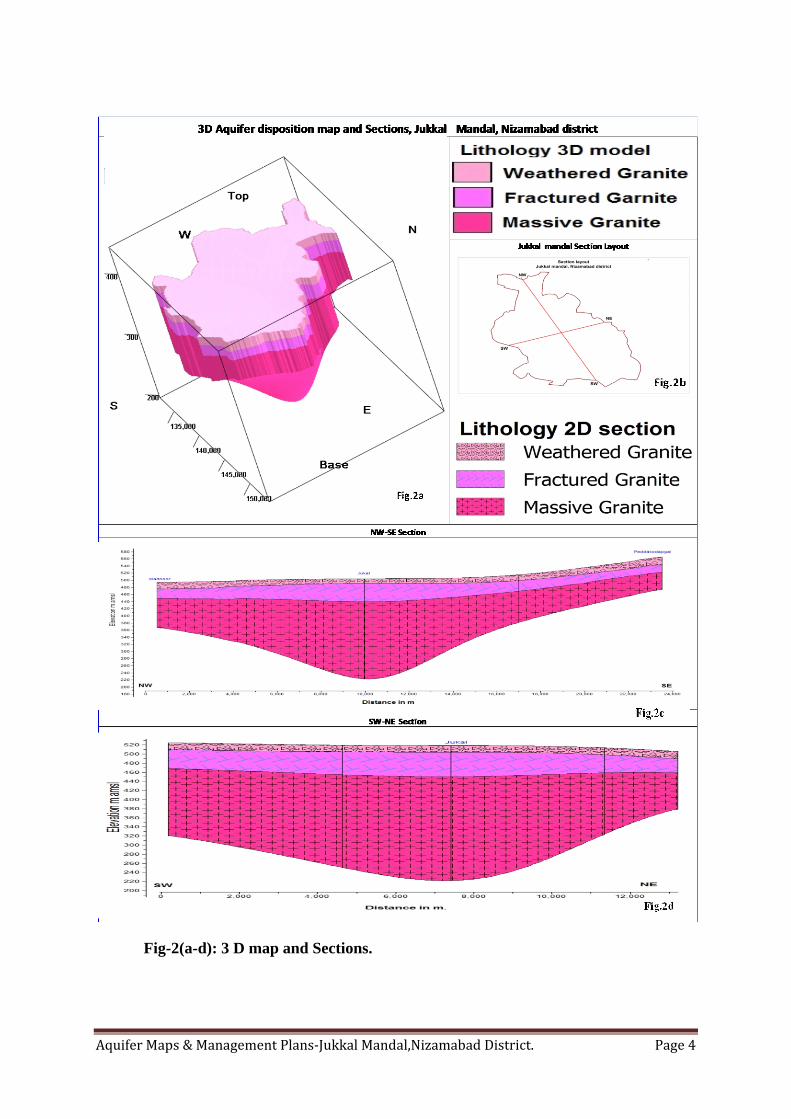
upto 23 m (Post-monsoon) AQUIFER DISPOSITION : 10 No of Aquifers : 2 11 3-D aquifer disposition and basic
characteristics of each aquifer (3D: Fig-2a Section Layout:2b Sections: 2c & 2d)
: Geology-Granites Aqufer-1 (Weathered Zone): Weathering varies from 0-21 m Transmissivity(T): 6-181 m2/day Specific Yield (Sy):0.2 to 2 % Aquifer-2 (Fractured Zone): Depth of fracturing varies from 0-50 m. Transmissivity (T): 10-117 m2/day
Aquifer Maps & Management Plans-Jukkal Mandal,Nizamabad District. Page 2
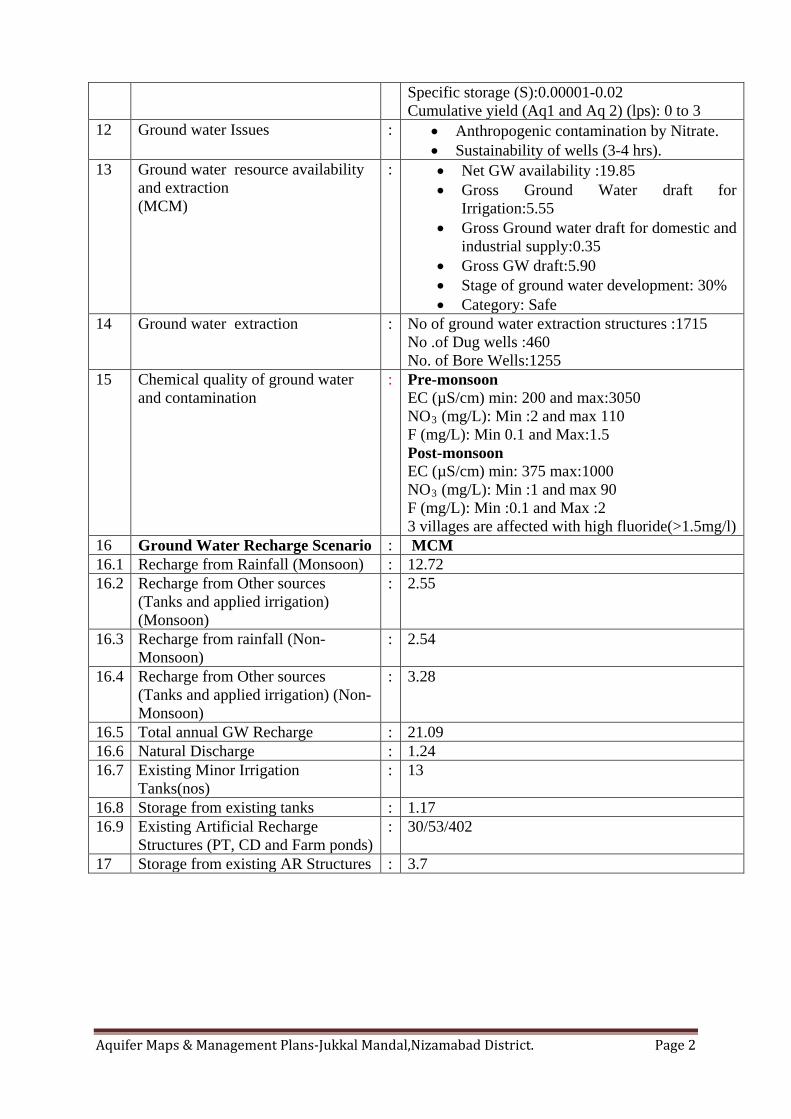
Specific storage (S):0.00001-0.02 Cumulative yield (Aq1 and Aq 2) (lps): 0 to 3
12 Ground water Issues : • Anthropogenic contamination by Nitrate. • Sustainability of wells (3-4 hrs).
13 Ground water resource availability and extraction (MCM)
: • Net GW availability :19.85 • Gross Ground Water draft for
Irrigation:5.55 • Gross Ground water draft for domestic and
industrial supply:0.35 • Gross GW draft:5.90 • Stage of ground water development: 30% • Category: Safe
14 Ground water extraction
: No of ground water extraction structures :1715 No .of Dug wells :460 No. of Bore Wells:1255
15 Chemical quality of ground water and contamination
: Pre-monsoon EC (µS/cm) min: 200 and max:3050 NO3 (mg/L): Min :2 and max 110 F (mg/L): Min 0.1 and Max:1.5 Post-monsoon EC (µS/cm) min: 375 max:1000 NO3 (mg/L): Min :1 and max 90 F (mg/L): Min :0.1 and Max :2 3 villages are affected with high fluoride(>1.5mg/l)
16 Ground Water Recharge Scenario : MCM 16.1 Recharge from Rainfall (Monsoon) : 12.72 16.2 Recharge from Other sources
(Tanks and applied irrigation) (Monsoon)
: 2.55
16.3 Recharge from rainfall (Non-Monsoon)
: 2.54
16.4 Recharge from Other sources (Tanks and applied irrigation) (Non-Monsoon)
: 3.28
16.5 Total annual GW Recharge : 21.09 16.6 Natural Discharge : 1.24 16.7 Existing Minor Irrigation
Tanks(nos) : 13
16.8 Storage from existing tanks : 1.17 16.9 Existing Artificial Recharge
Structures (PT, CD and Farm ponds) : 30/53/402
17 Storage from existing AR Structures : 3.7
Aquifer Maps & Management Plans-Jukkal Mandal,Nizamabad District. Page 3
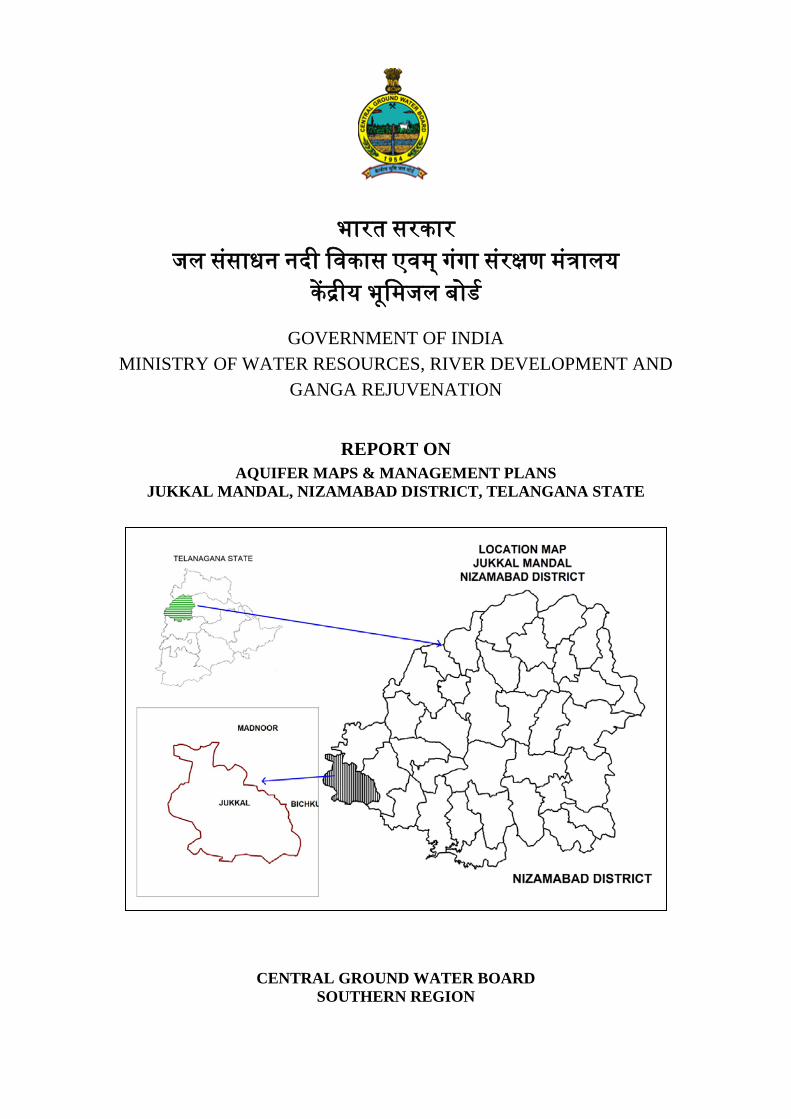
Fig-1: Location Map of Jukkal Mandal.
Aquifer Maps & Management Plans-Jukkal Mandal,Nizamabad District. Page 4
Fig-2(a-d): 3 D map and Sections.
Aquifer Maps & Management Plans-Jukkal Mandal,Nizamabad District. Page 5
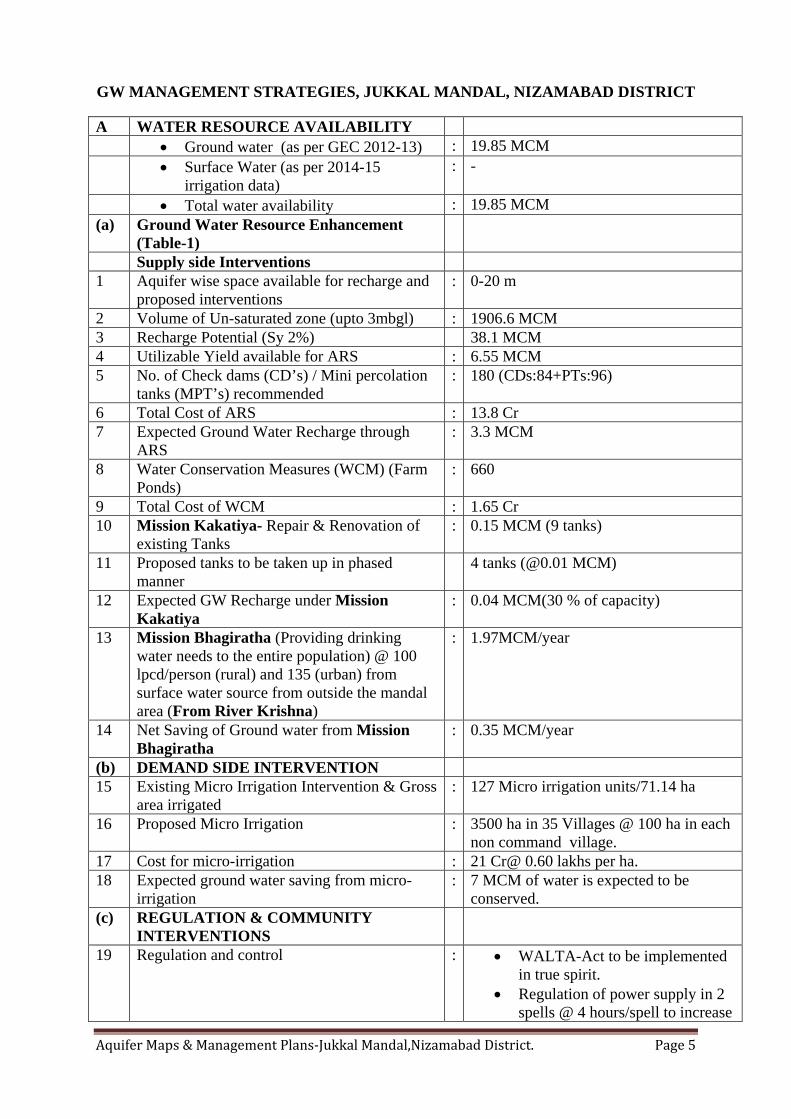
GW MANAGEMENT STRATEGIES, JUKKAL MANDAL, NIZAMABAD DISTRICT
A WATER RESOURCE AVAILABILITY • Ground water (as per GEC 2012-13) : 19.85 MCM • Surface Water (as per 2014-15
irrigation data) : -
• Total water availability : 19.85 MCM (a) Ground Water Resource Enhancement
(Table-1)
Supply side Interventions 1 Aquifer wise space available for recharge and
proposed interventions : 0-20 m
2 Volume of Un-saturated zone (upto 3mbgl) : 1906.6 MCM 3 Recharge Potential (Sy 2%) 38.1 MCM 4 Utilizable Yield available for ARS : 6.55 MCM 5 No. of Check dams (CD’s) / Mini percolation
tanks (MPT’s) recommended : 180 (CDs:84+PTs:96)
6 Total Cost of ARS : 13.8 Cr 7 Expected Ground Water Recharge through
ARS : 3.3 MCM
8 Water Conservation Measures (WCM) (Farm Ponds)
: 660
9 Total Cost of WCM : 1.65 Cr 10 Mission Kakatiya- Repair & Renovation of
existing Tanks : 0.15 MCM (9 tanks)
11 Proposed tanks to be taken up in phased
manner 4 tanks (@0.01 MCM)
12 Expected GW Recharge under Mission Kakatiya
: 0.04 MCM(30 % of capacity)
13 Mission Bhagiratha (Providing drinking water needs to the entire population) @ 100 lpcd/person (rural) and 135 (urban) from surface water source from outside the mandal area (From River Krishna)
: 1.97MCM/year
14 Net Saving of Ground water from Mission Bhagiratha
: 0.35 MCM/year
(b) DEMAND SIDE INTERVENTION 15 Existing Micro Irrigation Intervention & Gross
area irrigated : 127 Micro irrigation units/71.14 ha
16 Proposed Micro Irrigation : 3500 ha in 35 Villages @ 100 ha in each non command village.
17 Cost for micro-irrigation : 21 Cr@ 0.60 lakhs per ha. 18 Expected ground water saving from micro-
irrigation : 7 MCM of water is expected to be
conserved. (c) REGULATION & COMMUNITY
INTERVENTIONS
19 Regulation and control : • WALTA-Act to be implemented in true spirit.
• Regulation of power supply in 2 spells @ 4 hours/spell to increase
Aquifer Maps & Management Plans-Jukkal Mandal,Nizamabad District. Page 6
bore well/GW sustainability. • As mandatory measures power
connection may be given to only those farmers who are adopting micro irrigation for all new bore well to be constructed.
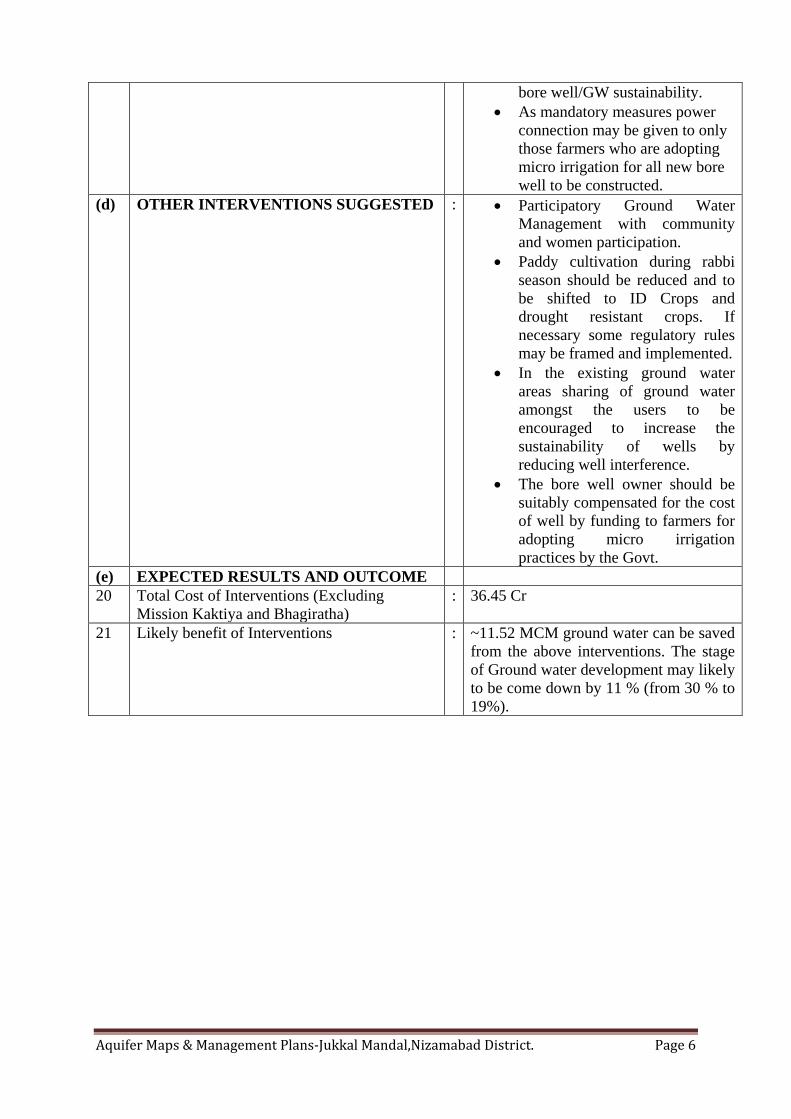
(d) OTHER INTERVENTIONS SUGGESTED : • Participatory Ground Water Management with community and women participation.
• Paddy cultivation during rabbi season should be reduced and to be shifted to ID Crops and drought resistant crops. If necessary some regulatory rules may be framed and implemented.
• In the existing ground water areas sharing of ground water amongst the users to be encouraged to increase the sustainability of wells by reducing well interference.
• The bore well owner should be suitably compensated for the cost of well by funding to farmers for adopting micro irrigation practices by the Govt.
(e) EXPECTED RESULTS AND OUTCOME 20 Total Cost of Interventions (Excluding
Mission Kaktiya and Bhagiratha) : 36.45 Cr
21 Likely benefit of Interventions : ~11.52 MCM ground water can be saved from the above interventions. The stage of Ground water development may likely to be come down by 11 % (from 30 % to 19%).
Aquifer Maps & Management Plans-Jukkal Mandal,Nizamabad District. Page 7
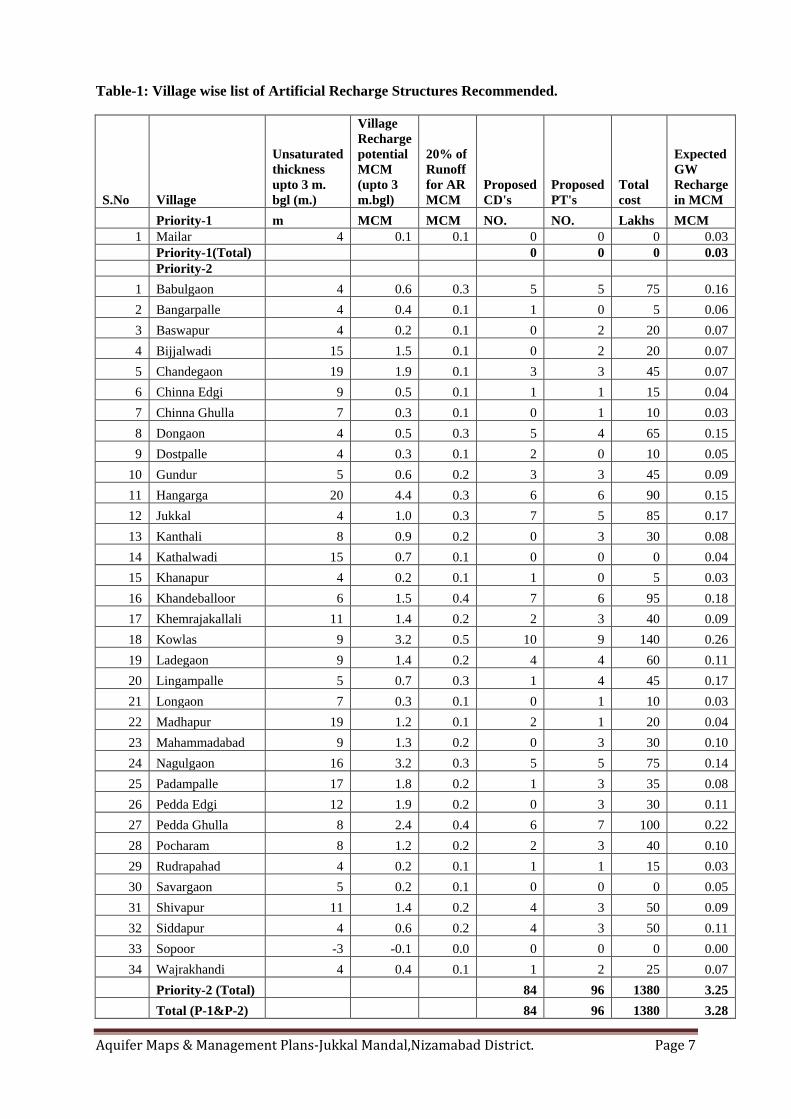
Table-1: Village wise list of Artificial Recharge Structures Recommended.
S.No Village
Unsaturated thickness upto 3 m. bgl (m.)
Village Recharge potential MCM (upto 3 m.bgl)
20% of Runoff for AR MCM
Proposed CD's
Proposed PT's
Total cost
Expected GW Recharge in MCM
Priority-1 m MCM MCM NO. NO. Lakhs MCM 1 Mailar 4 0.1 0.1 0 0 0 0.03
Priority-1(Total) 0 0 0 0.03 Priority-2
1 Babulgaon 4 0.6 0.3 5 5 75 0.16 2 Bangarpalle 4 0.4 0.1 1 0 5 0.06 3 Baswapur 4 0.2 0.1 0 2 20 0.07 4 Bijjalwadi 15 1.5 0.1 0 2 20 0.07 5 Chandegaon 19 1.9 0.1 3 3 45 0.07 6 Chinna Edgi 9 0.5 0.1 1 1 15 0.04 7 Chinna Ghulla 7 0.3 0.1 0 1 10 0.03 8 Dongaon 4 0.5 0.3 5 4 65 0.15 9 Dostpalle 4 0.3 0.1 2 0 10 0.05
10 Gundur 5 0.6 0.2 3 3 45 0.09 11 Hangarga 20 4.4 0.3 6 6 90 0.15 12 Jukkal 4 1.0 0.3 7 5 85 0.17 13 Kanthali 8 0.9 0.2 0 3 30 0.08 14 Kathalwadi 15 0.7 0.1 0 0 0 0.04 15 Khanapur 4 0.2 0.1 1 0 5 0.03 16 Khandeballoor 6 1.5 0.4 7 6 95 0.18 17 Khemrajakallali 11 1.4 0.2 2 3 40 0.09 18 Kowlas 9 3.2 0.5 10 9 140 0.26 19 Ladegaon 9 1.4 0.2 4 4 60 0.11 20 Lingampalle 5 0.7 0.3 1 4 45 0.17 21 Longaon 7 0.3 0.1 0 1 10 0.03 22 Madhapur 19 1.2 0.1 2 1 20 0.04 23 Mahammadabad 9 1.3 0.2 0 3 30 0.10 24 Nagulgaon 16 3.2 0.3 5 5 75 0.14 25 Padampalle 17 1.8 0.2 1 3 35 0.08 26 Pedda Edgi 12 1.9 0.2 0 3 30 0.11 27 Pedda Ghulla 8 2.4 0.4 6 7 100 0.22 28 Pocharam 8 1.2 0.2 2 3 40 0.10 29 Rudrapahad 4 0.2 0.1 1 1 15 0.03 30 Savargaon 5 0.2 0.1 0 0 0 0.05 31 Shivapur 11 1.4 0.2 4 3 50 0.09 32 Siddapur 4 0.6 0.2 4 3 50 0.11 33 Sopoor -3 -0.1 0.0 0 0 0 0.00 34 Wajrakhandi 4 0.4 0.1 1 2 25 0.07
Priority-2 (Total) 84 96 1380 3.25 Total (P-1&P-2) 84 96 1380 3.28

Aquifer Maps & Management Plans-Jukkal Mandal,Nizamabad District. Page 8