Nalgonda District (parts) - क द्र य भू म जल बोडर् जल...
77
क� �य भ ू �म जल बोड जल संसाधन, नद� �वकास और गंगा संर�ण मंालय भारत सरकार Central Ground Water Board Ministry of Water Resources, River Development and Ganga Rejuvenation Government of India Report on AQUIFER MAPPING AND GROUND WATER MANAGEMENT Parts of Nalgonda District (Phase-II), Telangana द��णी �े, हैदराबाद Southern Region, Hyderabad
-
Upload
khangminh22 -
Category
Documents
-
view
5 -
download
0
Transcript of Nalgonda District (parts) - क द्र य भू म जल बोडर् जल...
क दरय भम जल बोडर
जल ससाधन, नद वकास और गगा सरण मतरालय
भारत सरकार Central Ground Water Board
Ministry of Water Resources, River Development and Ganga Rejuvenation
Government of India
Report on
AQUIFER MAPPING AND GROUND WATER MANAGEMENT
Parts of Nalgonda District (Phase-II), Telangana
दणी तर, हदराबाद
Southern Region, Hyderabad
भारत सरकार
जल ससाधन नदी विकास एिम गगा सरकषण मतरालय
क दरीय भवमजलबोरड
GOVERNMENT OF INDIA
MINISTRY OF WATER RESOURCES, RIVER DEVELOPMENT AND
GANGA REJUVENATION
REPORT ON
AQUIFER MAPPING FOR SUSTAINABLE MANAGEMENT OF
GROUNDWATER RESOURCES IN PARTS OF NALGONDA
DISTRICT TELANGANA STATE (Phase-II)
CENTRAL GROUND WATER BOARD
SOUTHERN REGION
HYDERABAD
JUNE-2016
REPORT ON
AQUIFER MAPPING FOR SUSTAINABLE MANAGEMENT OF
GROUNDWATER RESOURCES IN PARTS OF NALGONDA
DISTRICT TELANGANA STATE
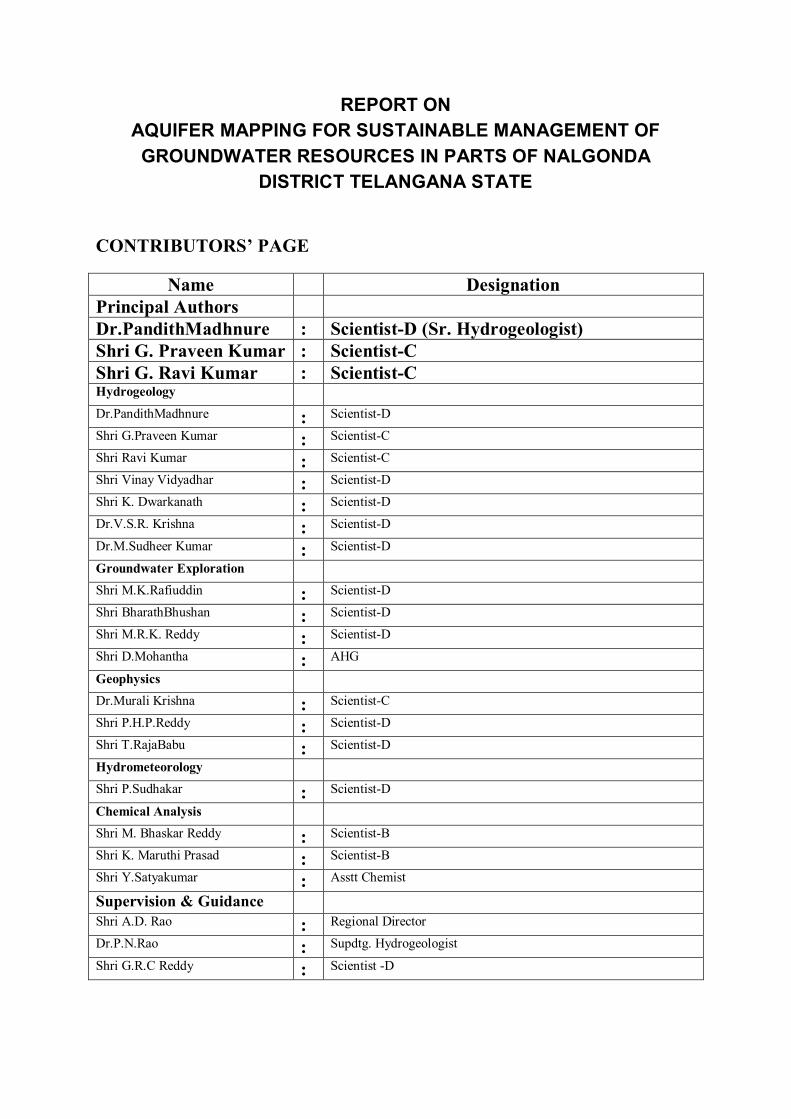
CONTRIBUTORS’ PAGE
Name Designation
Principal Authors
Dr.PandithMadhnure : Scientist-D (Sr. Hydrogeologist)
Shri G. Praveen Kumar : Scientist-C
Shri G. Ravi Kumar : Scientist-C Hydrogeology
Dr.PandithMadhnure : Scientist-D
Shri G.Praveen Kumar : Scientist-C
Shri Ravi Kumar : Scientist-C
Shri Vinay Vidyadhar : Scientist-D
Shri K. Dwarkanath : Scientist-D
Dr.V.S.R. Krishna : Scientist-D
Dr.M.Sudheer Kumar : Scientist-D
Groundwater Exploration
Shri M.K.Rafiuddin : Scientist-D
Shri BharathBhushan : Scientist-D
Shri M.R.K. Reddy : Scientist-D
Shri D.Mohantha : AHG
Geophysics
Dr.Murali Krishna : Scientist-C
Shri P.H.P.Reddy : Scientist-D
Shri T.RajaBabu : Scientist-D
Hydrometeorology
Shri P.Sudhakar : Scientist-D
Chemical Analysis
Shri M. Bhaskar Reddy : Scientist-B
Shri K. Maruthi Prasad : Scientist-B
Shri Y.Satyakumar : Asstt Chemist
Supervision & Guidance
Shri A.D. Rao : Regional Director
Dr.P.N.Rao : Supdtg. Hydrogeologist
Shri G.R.C Reddy : Scientist -D
REPORT ON
AQUIFER MAPPING FOR SUSTAINABLE MANAGEMENT OF
GROUNDWATER RESOURCES IN PARTS OF NALGONDA
DISTRICT TELANGANA STATE
EXECUTIVE SUMMARY
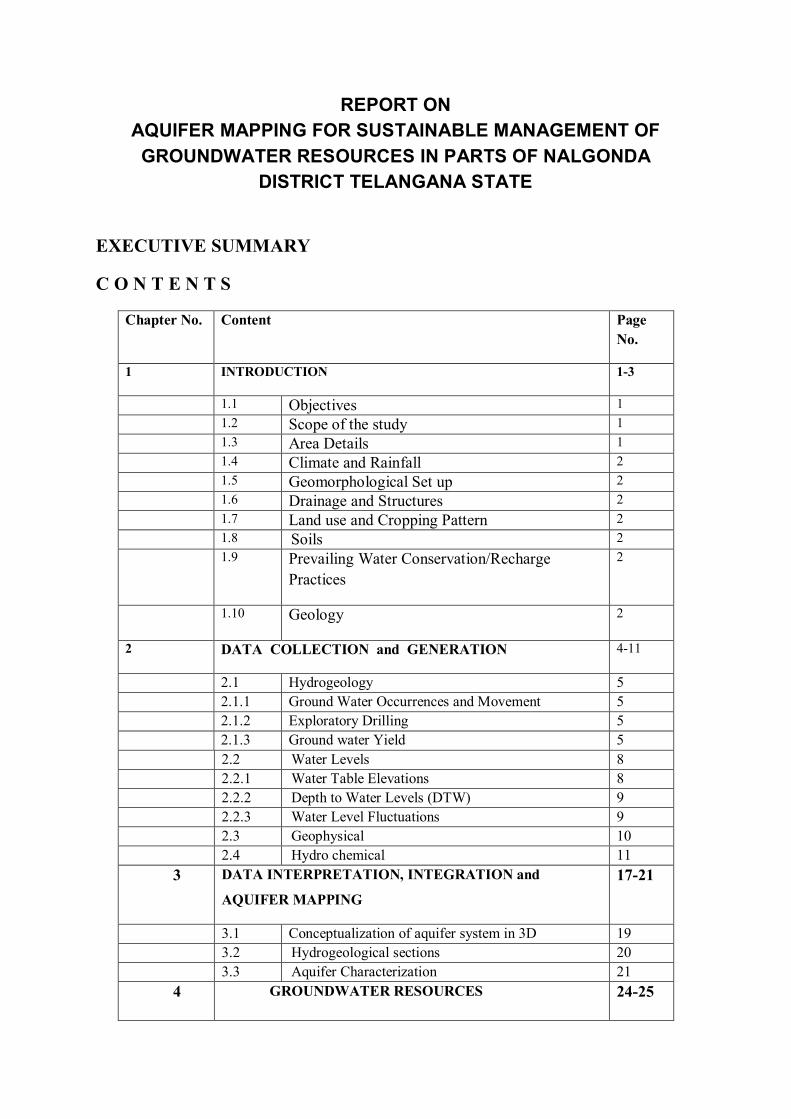
C O N T E N T S
Chapter No. Content Page
No.
1 INTRODUCTION 1-3
1.1 Objectives 1
1.2 Scope of the study 1
1.3 Area Details 1
1.4 Climate and Rainfall 2
1.5 Geomorphological Set up 2
1.6 Drainage and Structures 2
1.7 Land use and Cropping Pattern 2
1.8 Soils 2
1.9 Prevailing Water Conservation/Recharge
Practices
2
1.10 Geology 2
2 DATA COLLECTION and GENERATION 4-11
2.1 Hydrogeology 5
2.1.1 Ground Water Occurrences and Movement 5
2.1.2 Exploratory Drilling 5
2.1.3 Ground water Yield 5
2.2 Water Levels 8
2.2.1 Water Table Elevations 8
2.2.2 Depth to Water Levels (DTW) 9
2.2.3 Water Level Fluctuations 9
2.3 Geophysical 10
2.4 Hydro chemical 11
3 DATA INTERPRETATION, INTEGRATION and
AQUIFER MAPPING
17-21
3.1 Conceptualization of aquifer system in 3D 19
3.2 Hydrogeological sections 20
3.3 Aquifer Characterization 21
4 GROUNDWATER RESOURCES 24-25
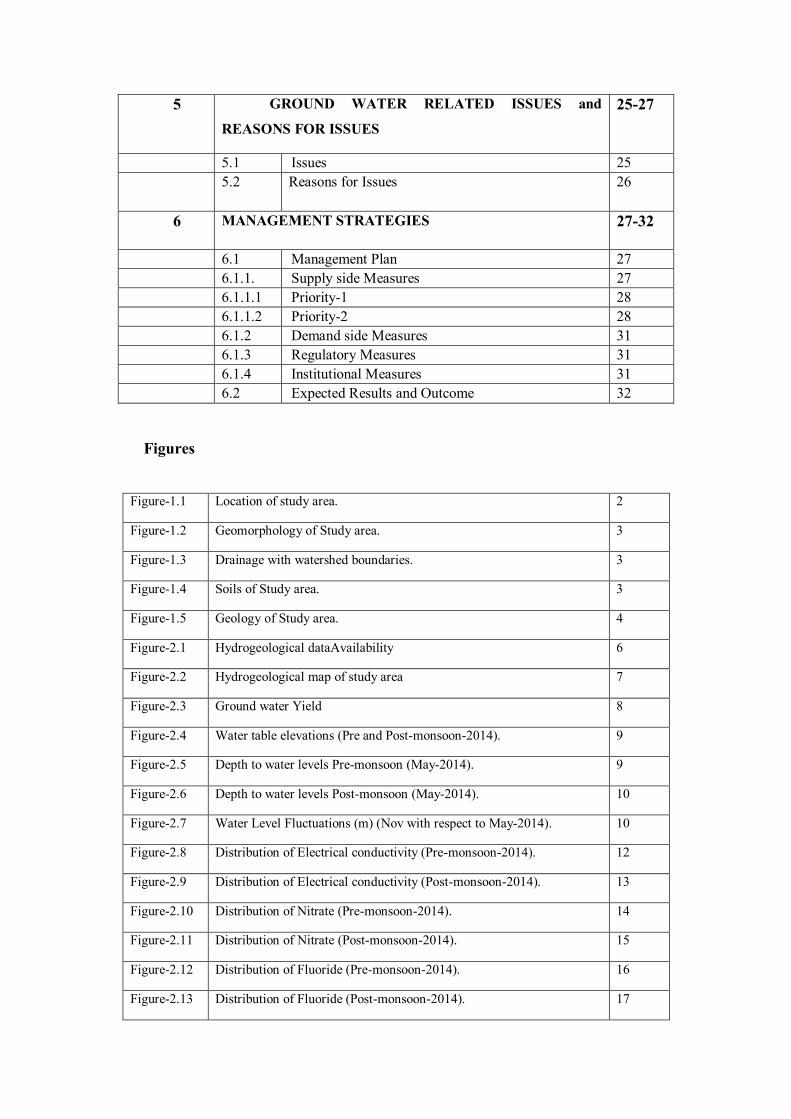
5 GROUND WATER RELATED ISSUES and
REASONS FOR ISSUES
25-27
5.1 Issues 25
5.2 Reasons for Issues 26
6 MANAGEMENT STRATEGIES 27-32
6.1 Management Plan 27
6.1.1. Supply side Measures 27
6.1.1.1 Priority-1 28
6.1.1.2 Priority-2 28
6.1.2 Demand side Measures 31
6.1.3 Regulatory Measures 31
6.1.4 Institutional Measures 31
6.2 Expected Results and Outcome 32
Figures
Figure-1.1 Location of study area. 2
Figure-1.2 Geomorphology of Study area. 3
Figure-1.3 Drainage with watershed boundaries. 3
Figure-1.4 Soils of Study area. 3
Figure-1.5 Geology of Study area. 4
Figure-2.1 Hydrogeological dataAvailability 6
Figure-2.2 Hydrogeological map of study area 7
Figure-2.3 Ground water Yield 8
Figure-2.4 Water table elevations (Pre and Post-monsoon-2014). 9
Figure-2.5 Depth to water levels Pre-monsoon (May-2014). 9
Figure-2.6 Depth to water levels Post-monsoon (May-2014). 10
Figure-2.7 Water Level Fluctuations (m) (Nov with respect to May-2014). 10
Figure-2.8 Distribution of Electrical conductivity (Pre-monsoon-2014). 12
Figure-2.9 Distribution of Electrical conductivity (Post-monsoon-2014). 13
Figure-2.10 Distribution of Nitrate (Pre-monsoon-2014). 14
Figure-2.11 Distribution of Nitrate (Post-monsoon-2014). 15
Figure-2.12 Distribution of Fluoride (Pre-monsoon-2014). 16
Figure-2.13 Distribution of Fluoride (Post-monsoon-2014). 17
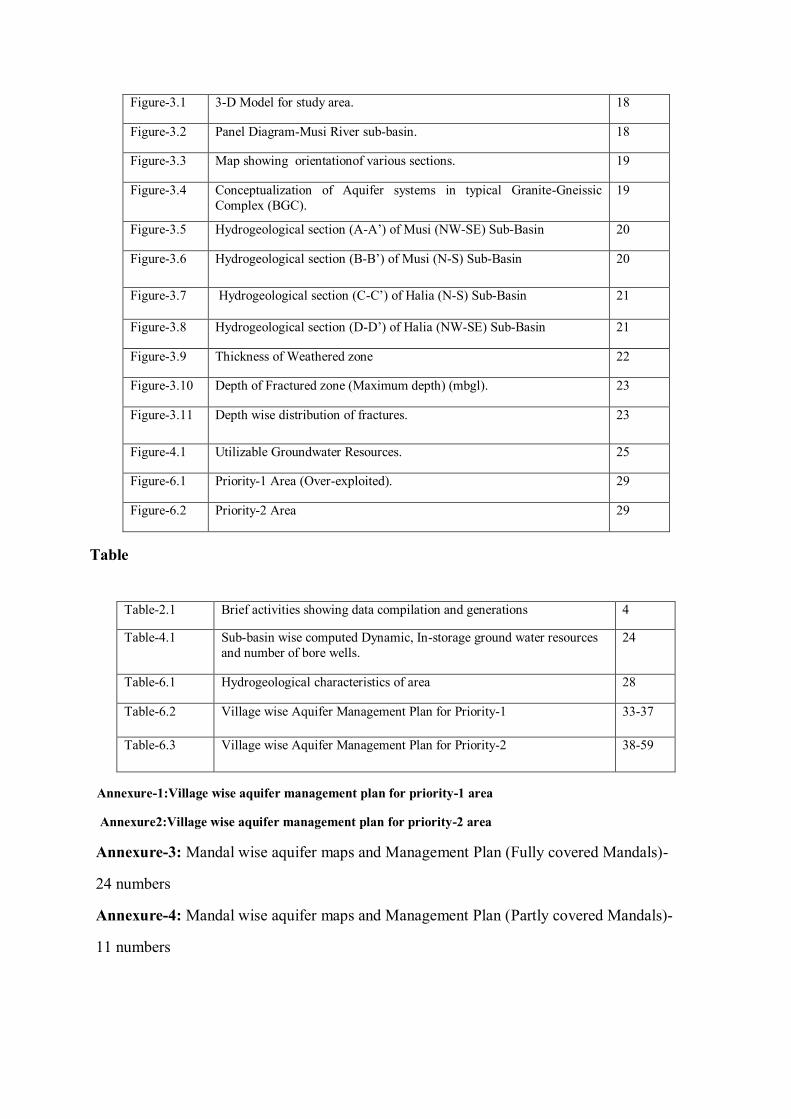
Table
Annexure-1:Village wise aquifer management plan for priority-1 area
Annexure2:Village wise aquifer management plan for priority-2 area
Annexure-3: Mandal wise aquifer maps and Management Plan (Fully covered Mandals)-
24 numbers
Annexure-4: Mandal wise aquifer maps and Management Plan (Partly covered Mandals)-
11 numbers
Figure-3.1 3-D Model for study area. 18
Figure-3.2 Panel Diagram-Musi River sub-basin. 18
Figure-3.3 Map showing orientationof various sections. 19
Figure-3.4 Conceptualization of Aquifer systems in typical Granite-Gneissic
Complex (BGC).
19
Figure-3.5 Hydrogeological section (A-A’) of Musi (NW-SE) Sub-Basin 20
Figure-3.6 Hydrogeological section (B-B’) of Musi (N-S) Sub-Basin 20
Figure-3.7 Hydrogeological section (C-C’) of Halia (N-S) Sub-Basin 21
Figure-3.8 Hydrogeological section (D-D’) of Halia (NW-SE) Sub-Basin 21
Figure-3.9 Thickness of Weathered zone 22
Figure-3.10 Depth of Fractured zone (Maximum depth) (mbgl). 23
Figure-3.11 Depth wise distribution of fractures. 23
Figure-4.1 Utilizable Groundwater Resources. 25
Figure-6.1 Priority-1 Area (Over-exploited). 29
Figure-6.2 Priority-2 Area 29
Table-2.1 Brief activities showing data compilation and generations 4
Table-4.1 Sub-basin wise computed Dynamic, In-storage ground water resources
and number of bore wells.
24
Table-6.1 Hydrogeological characteristics of area 28
Table-6.2 Village wise Aquifer Management Plan for Priority-1 33-37
Table-6.3 Village wise Aquifer Management Plan for Priority-2 38-59
REPORT ON
AQUIFER MAPPING FOR SUSTAINABLE MANAGEMENT OF
GROUNDWATER RESOURCES IN PARTS OF NALGONDA
DISTRICT TELANGANA STATE
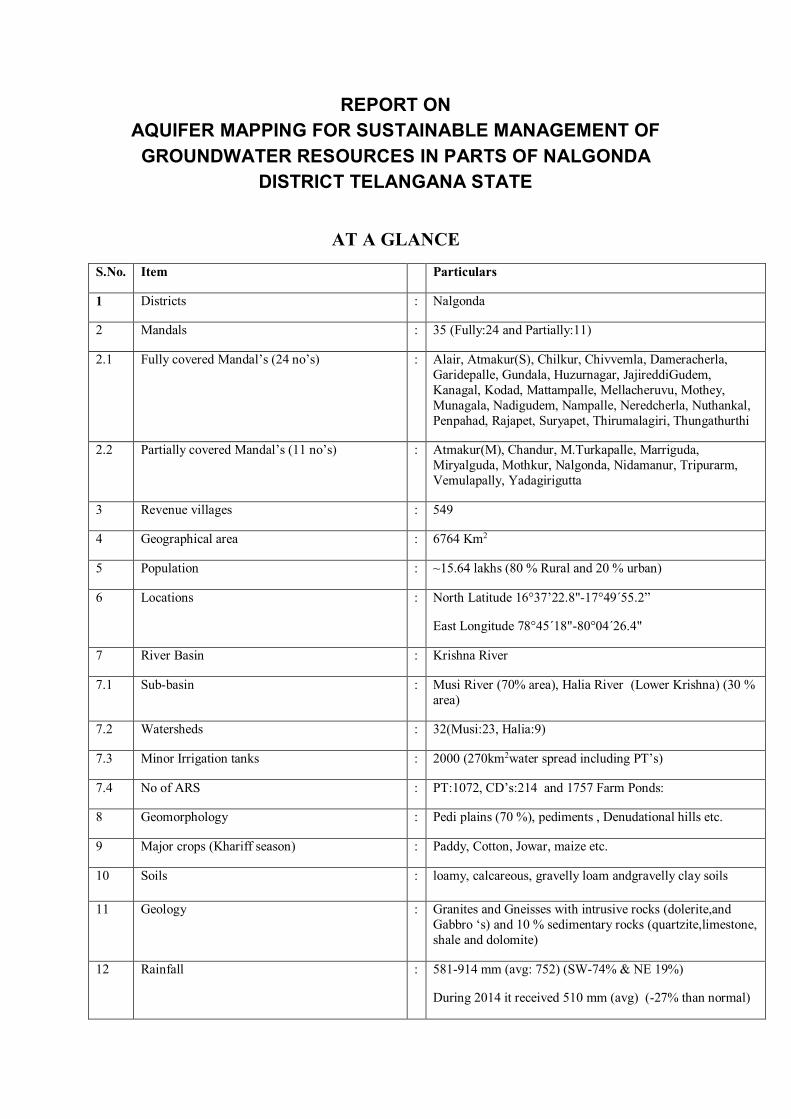
AT A GLANCE
S.No. Item Particulars
1 Districts : Nalgonda
2 Mandals : 35 (Fully:24 and Partially:11)
2.1 Fully covered Mandal’s (24 no’s) : Alair, Atmakur(S), Chilkur, Chivvemla, Dameracherla,
Garidepalle, Gundala, Huzurnagar, JajireddiGudem,
Kanagal, Kodad, Mattampalle, Mellacheruvu, Mothey,
Munagala, Nadigudem, Nampalle, Neredcherla, Nuthankal,
Penpahad, Rajapet, Suryapet, Thirumalagiri, Thungathurthi
2.2 Partially covered Mandal’s (11 no’s) : Atmakur(M), Chandur, M.Turkapalle, Marriguda,
Miryalguda, Mothkur, Nalgonda, Nidamanur, Tripurarm,
Vemulapally, Yadagirigutta
3 Revenue villages : 549
4 Geographical area : 6764 Km2
5 Population : ~15.64 lakhs (80 % Rural and 20 % urban)
6 Locations : North Latitude 16°37’22.8"-17°49´55.2”
East Longitude 78°45´18"-80°04´26.4"
7 River Basin : Krishna River
7.1 Sub-basin : Musi River (70% area), Halia River (Lower Krishna) (30 %
area)
7.2 Watersheds : 32(Musi:23, Halia:9)
7.3 Minor Irrigation tanks : 2000 (270km2water spread including PT’s)
7.4 No of ARS : PT:1072, CD’s:214 and 1757 Farm Ponds:
8 Geomorphology : Pedi plains (70 %), pediments , Denudational hills etc.
9 Major crops (Khariff season) : Paddy, Cotton, Jowar, maize etc.
10 Soils : loamy, calcareous, gravelly loam andgravelly clay soils
11 Geology : Granites and Gneisses with intrusive rocks (dolerite,and
Gabbro ‘s) and 10 % sedimentary rocks (quartzite,limestone,
shale and dolomite)
12 Rainfall : 581-914 mm (avg: 752) (SW-74% & NE 19%)
During 2014 it received 510 mm (avg) (-27% than normal)
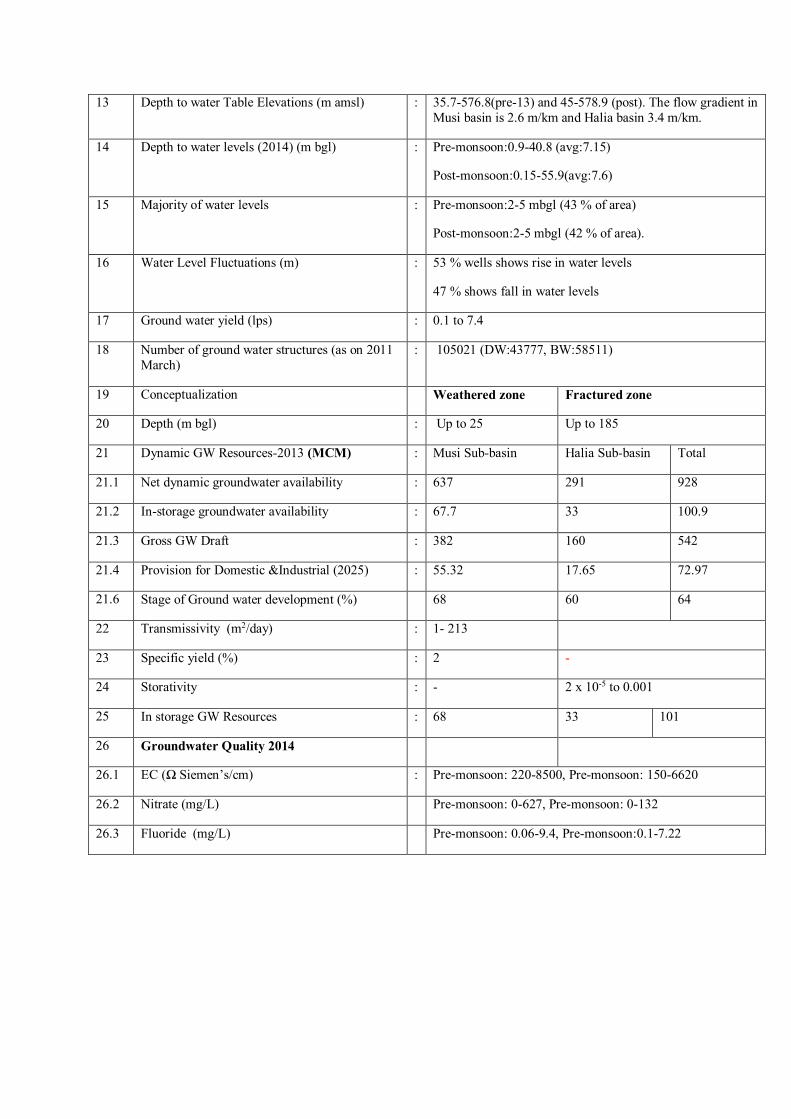
13 Depth to water Table Elevations (m amsl) : 35.7-576.8(pre-13) and 45-578.9 (post). The flow gradient in
Musi basin is 2.6 m/km and Halia basin 3.4 m/km.
14 Depth to water levels (2014) (m bgl) : Pre-monsoon:0.9-40.8 (avg:7.15)
Post-monsoon:0.15-55.9(avg:7.6)
15 Majority of water levels : Pre-monsoon:2-5 mbgl (43 % of area)
Post-monsoon:2-5 mbgl (42 % of area).
16 Water Level Fluctuations (m) : 53 % wells shows rise in water levels
47 % shows fall in water levels
17 Ground water yield (lps) : 0.1 to 7.4
18 Number of ground water structures (as on 2011
March)
: 105021 (DW:43777, BW:58511)
19 Conceptualization Weathered zone Fractured zone
20 Depth (m bgl) : Up to 25 Up to 185
21 Dynamic GW Resources-2013 (MCM) : Musi Sub-basin Halia Sub-basin Total
21.1 Net dynamic groundwater availability : 637 291 928
21.2 In-storage groundwater availability : 67.7 33 100.9
21.3 Gross GW Draft : 382 160 542
21.4 Provision for Domestic &Industrial (2025) : 55.32 17.65 72.97
21.6 Stage of Ground water development (%) 68 60 64
22 Transmissivity (m2/day) : 1- 213
23 Specific yield (%) : 2 -
24 Storativity : - 2 x 10⁻⁵ to 0.001
25 In storage GW Resources : 68 33 101
26 Groundwater Quality 2014
26.1 EC (Ω Siemen’s/cm) : Pre-monsoon: 220-8500, Pre-monsoon: 150-6620
26.2 Nitrate (mg/L) Pre-monsoon: 0-627, Pre-monsoon: 0-132
26.3 Fluoride (mg/L) Pre-monsoon: 0.06-9.4, Pre-monsoon:0.1-7.22
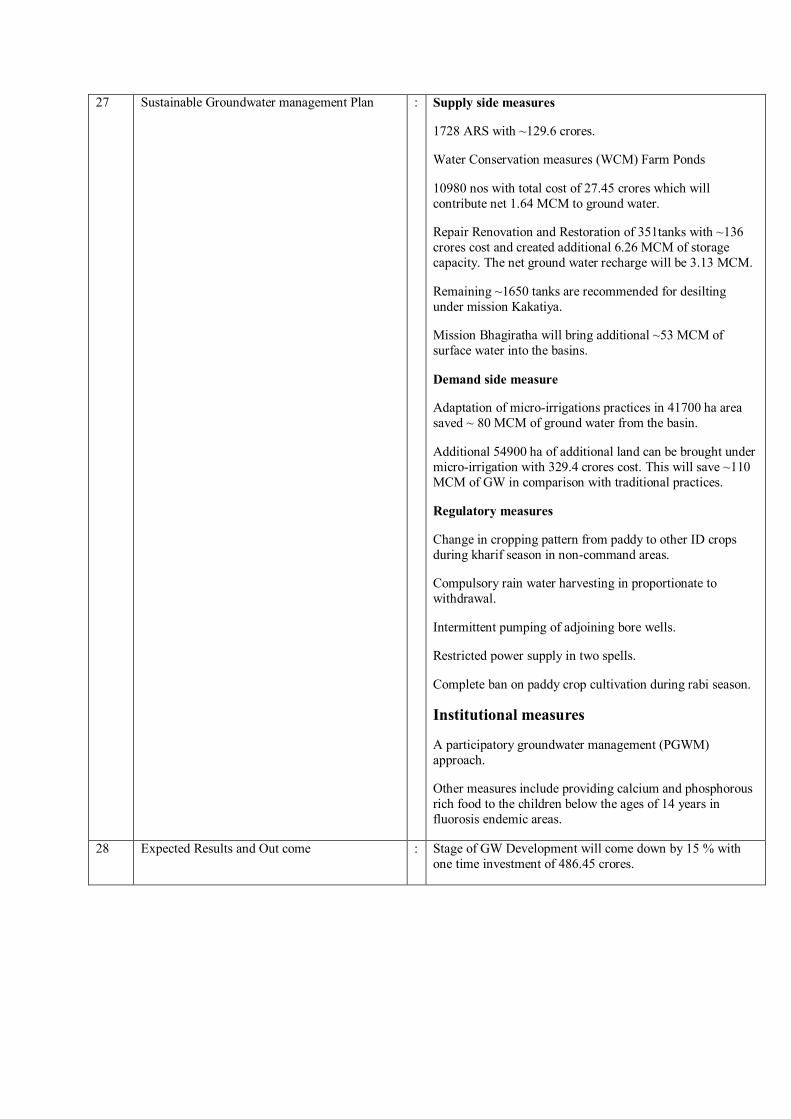
27 Sustainable Groundwater management Plan : Supply side measures
1728 ARS with ~129.6 crores.
Water Conservation measures (WCM) Farm Ponds
10980 nos with total cost of 27.45 crores which will
contribute net 1.64 MCM to ground water.
Repair Renovation and Restoration of 351tanks with ~136
crores cost and created additional 6.26 MCM of storage
capacity. The net ground water recharge will be 3.13 MCM.
Remaining ~1650 tanks are recommended for desilting
under mission Kakatiya.
Mission Bhagiratha will bring additional ~53 MCM of
surface water into the basins.
Demand side measure
Adaptation of micro-irrigations practices in 41700 ha area
saved ~ 80 MCM of ground water from the basin.
Additional 54900 ha of additional land can be brought under
micro-irrigation with 329.4 crores cost. This will save ~110
MCM of GW in comparison with traditional practices.
Regulatory measures
Change in cropping pattern from paddy to other ID crops
during kharif season in non-command areas.
Compulsory rain water harvesting in proportionate to
withdrawal.
Intermittent pumping of adjoining bore wells.
Restricted power supply in two spells.
Complete ban on paddy crop cultivation during rabi season.
Institutional measures
A participatory groundwater management (PGWM)
approach.
Other measures include providing calcium and phosphorous
rich food to the children below the ages of 14 years in
fluorosis endemic areas.
28 Expected Results and Out come : Stage of GW Development will come down by 15 % with
one time investment of 486.45 crores.
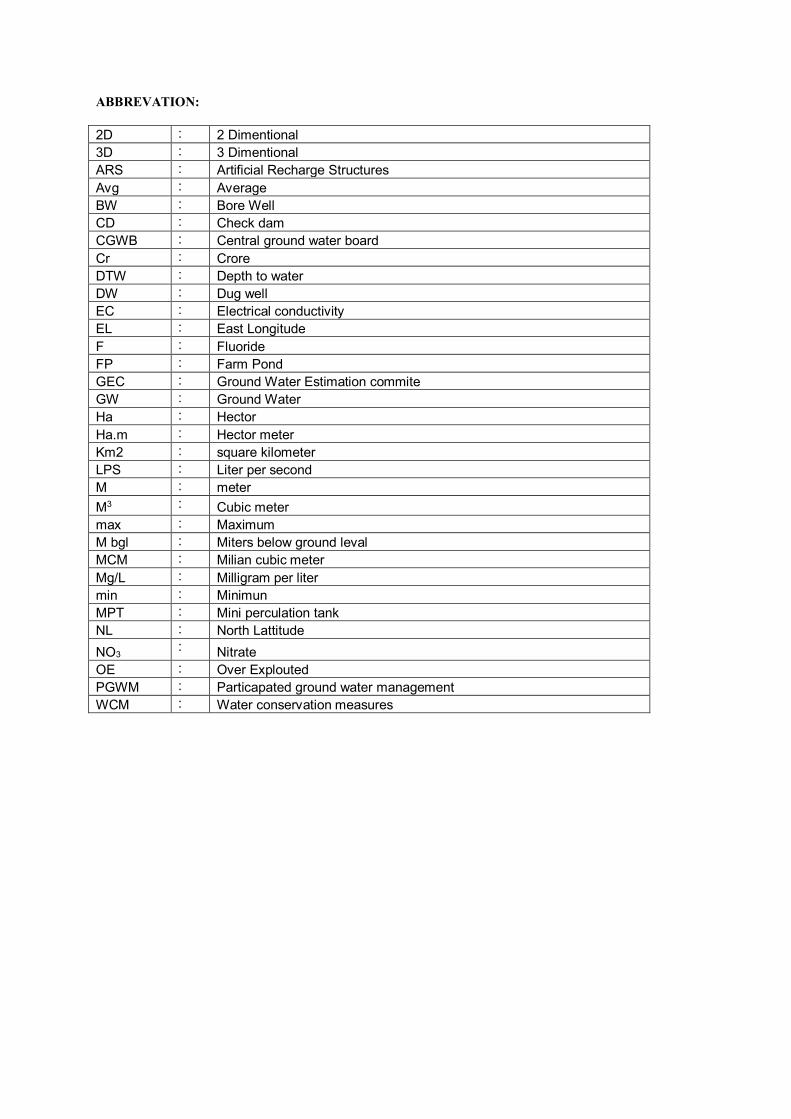
ABBREVATION:
2D : 2 Dimentional
3D : 3 Dimentional
ARS : Artificial Recharge Structures
Avg : Average
BW : Bore Well
CD : Check dam
CGWB : Central ground water board
Cr : Crore
DTW : Depth to water
DW : Dug well
EC : Electrical conductivity
EL : East Longitude
F : Fluoride
FP : Farm Pond
GEC : Ground Water Estimation commite
GW : Ground Water
Ha : Hector
Ha.m : Hector meter
Km2 : square kilometer
LPS : Liter per second
M : meter
M3 : Cubic meter
max : Maximum
M bgl : Miters below ground leval
MCM : Milian cubic meter
Mg/L : Milligram per liter
min : Minimun
MPT : Mini perculation tank
NL : North Lattitude
NO3 : Nitrate
OE : Over Explouted
PGWM : Particapated ground water management
WCM : Water conservation measures
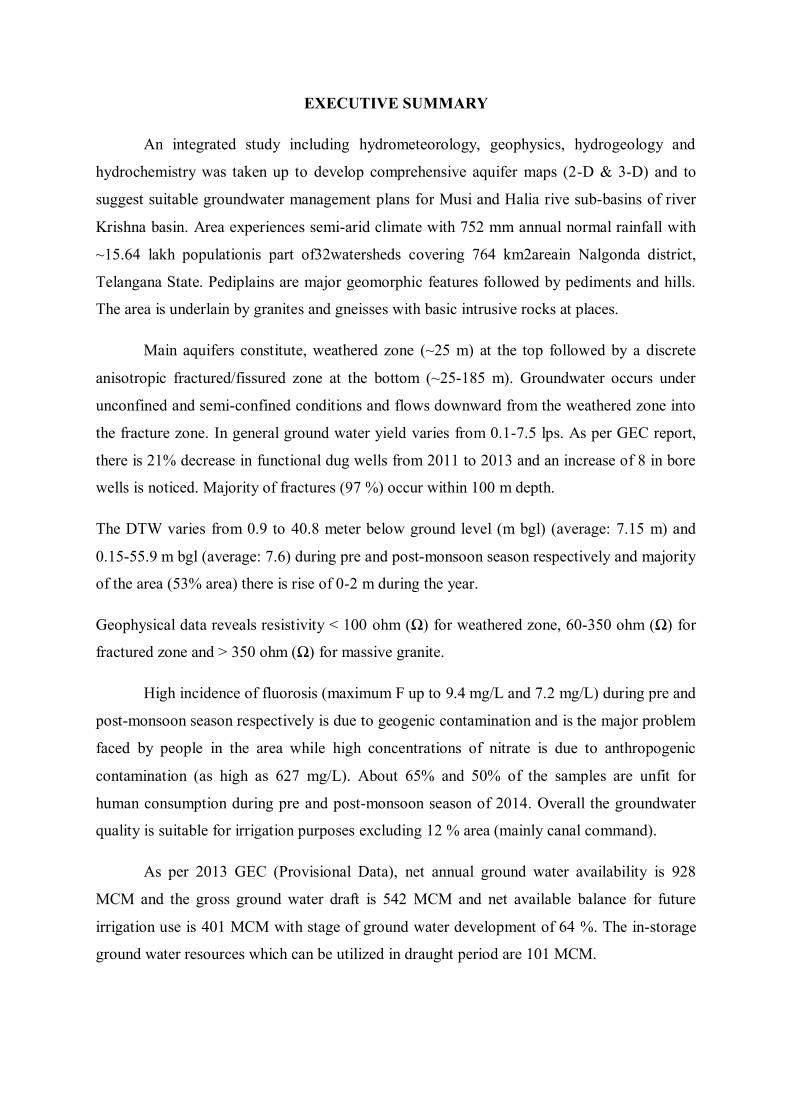
EXECUTIVE SUMMARY
An integrated study including hydrometeorology, geophysics, hydrogeology and
hydrochemistry was taken up to develop comprehensive aquifer maps (2-D & 3-D) and to
suggest suitable groundwater management plans for Musi and Halia rive sub-basins of river
Krishna basin. Area experiences semi-arid climate with 752 mm annual normal rainfall with
~15.64 lakh populationis part of32watersheds covering 764 km2areain Nalgonda district,
Telangana State. Pediplains are major geomorphic features followed by pediments and hills.
The area is underlain by granites and gneisses with basic intrusive rocks at places.
Main aquifers constitute, weathered zone (~25 m) at the top followed by a discrete
anisotropic fractured/fissured zone at the bottom (~25-185 m). Groundwater occurs under
unconfined and semi-confined conditions and flows downward from the weathered zone into
the fracture zone. In general ground water yield varies from 0.1-7.5 lps. As per GEC report,
there is 21% decrease in functional dug wells from 2011 to 2013 and an increase of 8 in bore
wells is noticed. Majority of fractures (97 %) occur within 100 m depth.
The DTW varies from 0.9 to 40.8 meter below ground level (m bgl) (average: 7.15 m) and
0.15-55.9 m bgl (average: 7.6) during pre and post-monsoon season respectively and majority
of the area (53% area) there is rise of 0-2 m during the year.
Geophysical data reveals resistivity < 100 ohm (Ω) for weathered zone, 60-350 ohm (Ω) for
fractured zone and > 350 ohm (Ω) for massive granite.
High incidence of fluorosis (maximum F up to 9.4 mg/L and 7.2 mg/L) during pre and
post-monsoon season respectively is due to geogenic contamination and is the major problem
faced by people in the area while high concentrations of nitrate is due to anthropogenic
contamination (as high as 627 mg/L). About 65% and 50% of the samples are unfit for
human consumption during pre and post-monsoon season of 2014. Overall the groundwater
quality is suitable for irrigation purposes excluding 12 % area (mainly canal command).
As per 2013 GEC (Provisional Data), net annual ground water availability is 928
MCM and the gross ground water draft is 542 MCM and net available balance for future
irrigation use is 401 MCM with stage of ground water development of 64 %. The in-storage
ground water resources which can be utilized in draught period are 101 MCM.
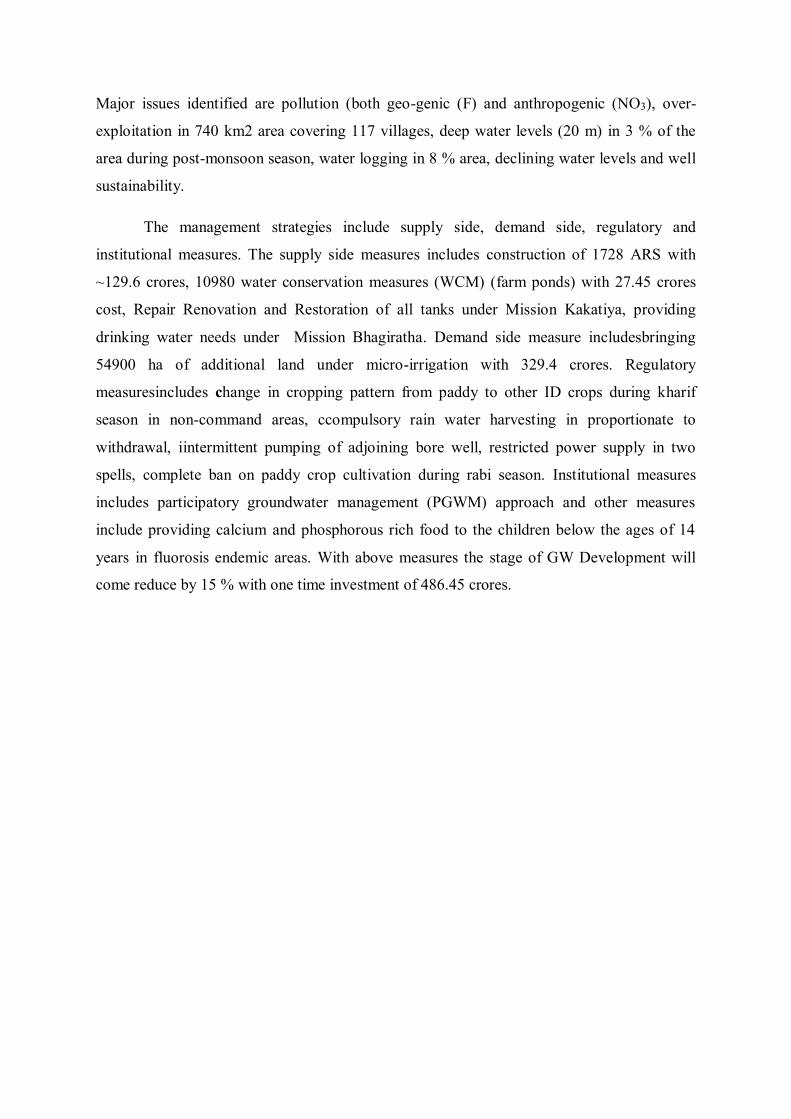
Major issues identified are pollution (both geo-genic (F) and anthropogenic (NO3), over-
exploitation in 740 km2 area covering 117 villages, deep water levels (20 m) in 3 % of the
area during post-monsoon season, water logging in 8 % area, declining water levels and well
sustainability.
The management strategies include supply side, demand side, regulatory and
institutional measures. The supply side measures includes construction of 1728 ARS with
~129.6 crores, 10980 water conservation measures (WCM) (farm ponds) with 27.45 crores
cost, Repair Renovation and Restoration of all tanks under Mission Kakatiya, providing
drinking water needs under Mission Bhagiratha. Demand side measure includesbringing
54900 ha of additional land under micro-irrigation with 329.4 crores. Regulatory
measuresincludes change in cropping pattern from paddy to other ID crops during kharif
season in non-command areas, ccompulsory rain water harvesting in proportionate to
withdrawal, iintermittent pumping of adjoining bore well, restricted power supply in two
spells, complete ban on paddy crop cultivation during rabi season. Institutional measures
includes participatory groundwater management (PGWM) approach and other measures
include providing calcium and phosphorous rich food to the children below the ages of 14
years in fluorosis endemic areas. With above measures the stage of GW Development will
come reduce by 15 % with one time investment of 486.45 crores.
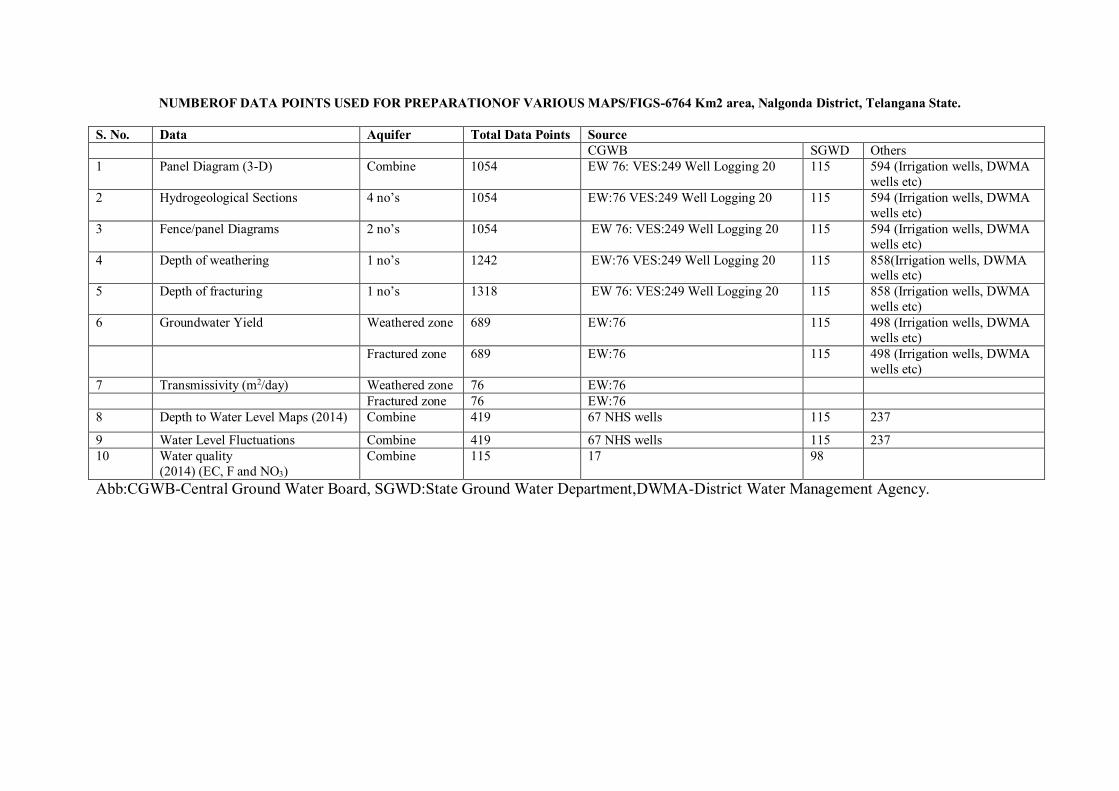
NUMBEROF DATA POINTS USED FOR PREPARATIONOF VARIOUS MAPS/FIGS-6764 Km2 area, Nalgonda District, Telangana State.
S. No. Data Aquifer Total Data Points Source
CGWB SGWD Others
1 Panel Diagram (3-D) Combine 1054 EW 76: VES:249 Well Logging 20 115 594 (Irrigation wells, DWMA
wells etc)
2 Hydrogeological Sections 4 no’s 1054 EW:76 VES:249 Well Logging 20 115 594 (Irrigation wells, DWMA
wells etc)
3 Fence/panel Diagrams 2 no’s 1054 EW 76: VES:249 Well Logging 20 115 594 (Irrigation wells, DWMA
wells etc)
4 Depth of weathering 1 no’s 1242 EW:76 VES:249 Well Logging 20 115 858(Irrigation wells, DWMA wells etc)
5 Depth of fracturing 1 no’s 1318 EW 76: VES:249 Well Logging 20 115 858 (Irrigation wells, DWMA
wells etc)
6 Groundwater Yield Weathered zone 689 EW:76 115 498 (Irrigation wells, DWMA
wells etc)
Fractured zone 689 EW:76 115 498 (Irrigation wells, DWMA
wells etc)
7 Transmissivity (m2/day) Weathered zone 76 EW:76
Fractured zone 76 EW:76
8 Depth to Water Level Maps (2014) Combine 419 67 NHS wells 115 237
9 Water Level Fluctuations Combine 419 67 NHS wells 115 237
10 Water quality
(2014) (EC, F and NO3)
Combine 115 17 98
Abb:CGWB-Central Ground Water Board, SGWD:State Ground Water Department,DWMA-District Water Management Agency.
1
1. INTRODUCTION
Aquifer mapping is a process wherein a combination of geologic, geophysical,
hydrologic and chemical analyses is applied to characterize the quantity, quality and
sustainability of ground water in aquifers. In recent past, there has been a paradigm shift from
“groundwater development” to “groundwater management”. As large parts of India
particularly hard rocks have become water stressed due to rapid growth in demand for water
due to population growth, irrigation, urbanization and changing lifestyle. Therefore, in order
to have an accurate and comprehensive micro-level picture of groundwater in India, aquifer
mapping in different hydrogeological settings at the appropriate scale is devised and
implemented,to enable robust groundwater management plans. This will help in achieving
drinking water security, improved irrigation facility and sustainability in water resources
development in large parts of rural and many parts of urban India. The aquifer mapping
program is important for planning suitable adaptation strategies to meet climate change also.
Thus the crux of NAQUIM is not merely mapping, but reaching the goal-that of ground water
management through community participation.
Hard rocks (Granites/Gneisses) lack primary porosity, and groundwater occurrence is
limited to secondary porosity developed by weathering and fracturing. Weathered zone is the
potential recharge zone for deeper fractures and excessive withdrawal from this zone lead to
drying up in places and reducing the sustainability of structures. Besides these quantitative
aspects, groundwater quality also represents a major challenge which is threatened by both
geogenic and anthropogenic pollution. In some places, the aquifers have high level of
geogenic contaminants, such as fluoride, rendering them unsuitable for drinking purposes.
High utilization of fertilizers for agricultural productions and improper development of
sewage system in rural/urban areas lead to point source pollution viz., nitrate and chloride.
1.1 Objectives:In view of the above challenges, an integrated hydrogeological study was
taken up to develop a reliable and comprehensive aquifer map and to suggest suitable
groundwater management plan on 1: 50,000 scale.
1.2 Scope of the study:The main scopeof study is summarised below.
1. Compilation of esisting data (exploration, geophysical, water level and water quality
with georeferncing)
2. Periodic long term monitoring of ground water regime (for water levels and water
quality) for creation of time series data base and ground water resource estimation.
3. Quantification of groundwater availability and assessing its quality.
4. To delineate aquifer in 3-D along with their characterization on 1:50, 000 scale.
5. Capacity building in all aspects of ground water development and management
through information, education and communication (IEC activities), information
dissemination, education, awareness and training.
6. Enhancement of coordination with concerned central/state govt. organizations and
academic/research institutions for sustainable ground water management.
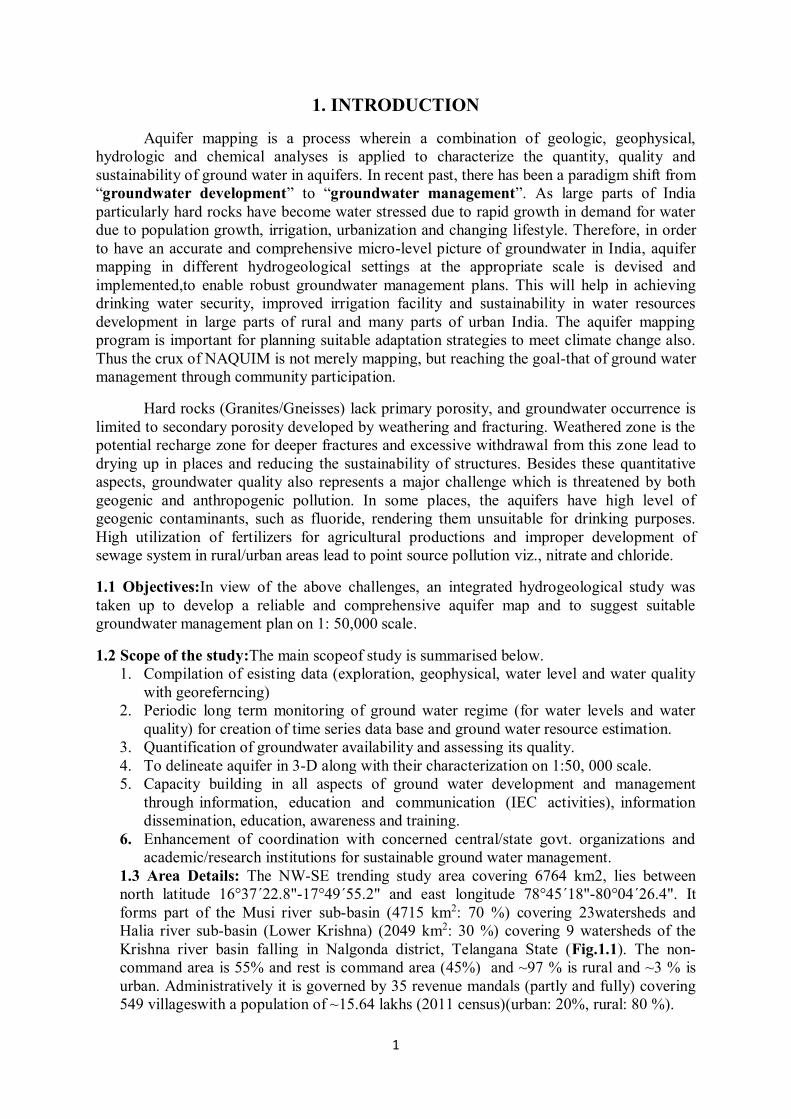
1.3 Area Details: The NW-SE trending study area covering 6764 km2, lies between
north latitude 16°37´22.8"-17°49´55.2" and east longitude 78°45´18"-80°04´26.4". It
forms part of the Musi river sub-basin (4715 km2: 70 %) covering 23watersheds and
Halia river sub-basin (Lower Krishna) (2049 km2: 30 %) covering 9 watersheds of the
Krishna river basin falling in Nalgonda district, Telangana State (Fig.1.1). The non-
command area is 55% and rest is command area (45%) and ~97 % is rural and ~3 % is
urban. Administratively it is governed by 35 revenue mandals (partly and fully) covering
549 villageswith a population of ~15.64 lakhs (2011 census)(urban: 20%, rural: 80 %).
2
Fig.1.1: Location of study area.
1.4 Climate and Rainfall:The area experiences semi-arid and tropical climate with annual
precipitation varying from 581-914 mm (average: 752) and during 2014, the area received
average precipitation of 510 mm (27 % less than normal).
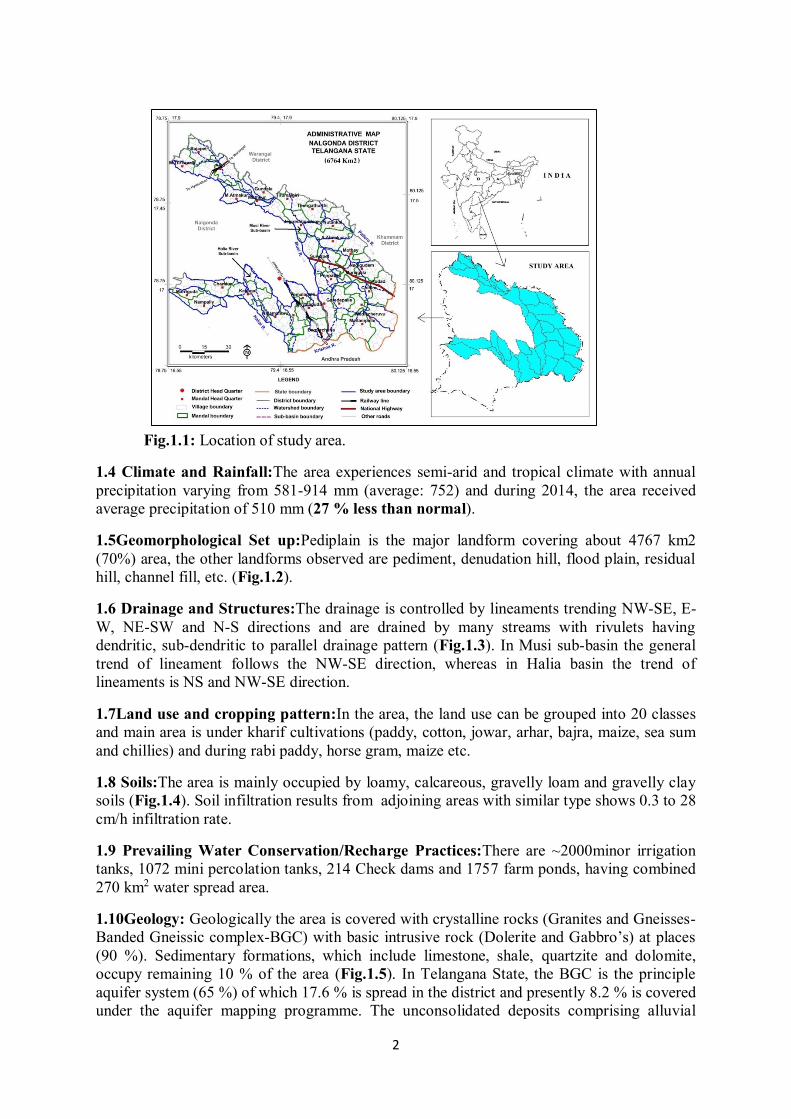
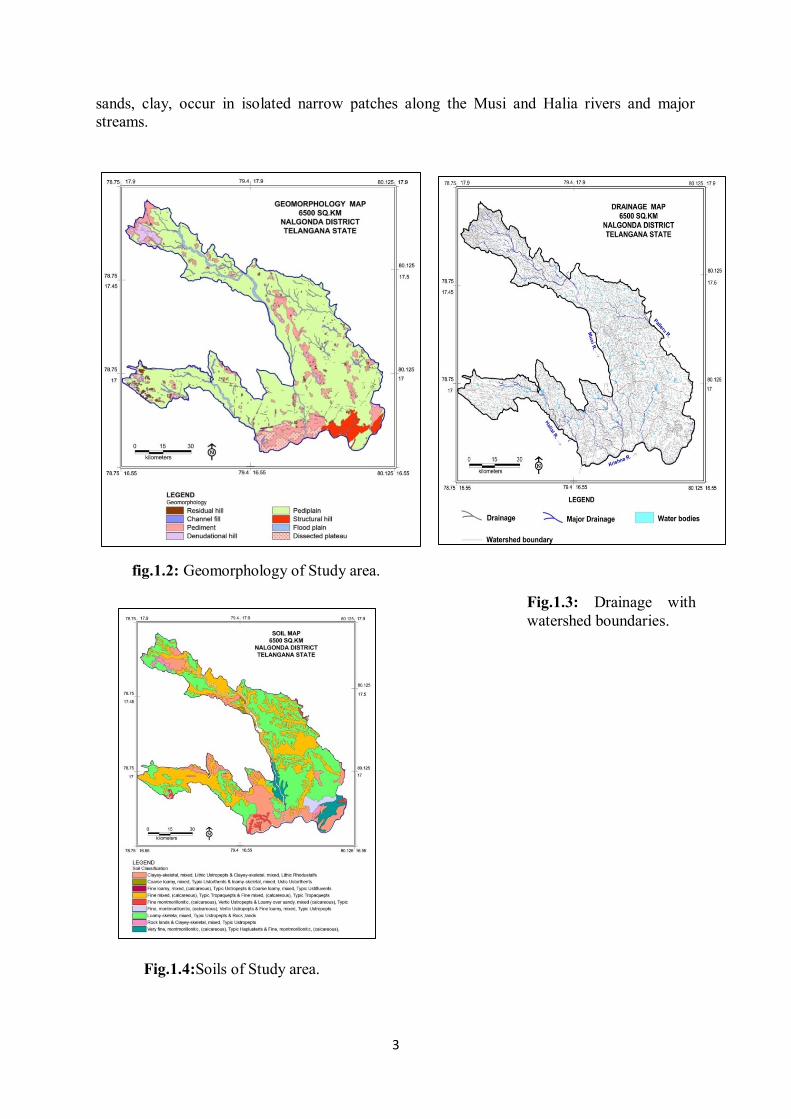
1.5Geomorphological Set up:Pediplain is the major landform covering about 4767 km2
(70%) area, the other landforms observed are pediment, denudation hill, flood plain, residual
hill, channel fill, etc. (Fig.1.2).
1.6 Drainage and Structures:The drainage is controlled by lineaments trending NW-SE, E-
W, NE-SW and N-S directions and are drained by many streams with rivulets having
dendritic, sub-dendritic to parallel drainage pattern (Fig.1.3). In Musi sub-basin the general
trend of lineament follows the NW-SE direction, whereas in Halia basin the trend of
lineaments is NS and NW-SE direction.
1.7Land use and cropping pattern:In the area, the land use can be grouped into 20 classes
and main area is under kharif cultivations (paddy, cotton, jowar, arhar, bajra, maize, sea sum
and chillies) and during rabi paddy, horse gram, maize etc.
1.8 Soils:The area is mainly occupied by loamy, calcareous, gravelly loam and gravelly clay
soils (Fig.1.4). Soil infiltration results from adjoining areas with similar type shows 0.3 to 28
cm/h infiltration rate.
1.9 Prevailing Water Conservation/Recharge Practices:There are ~2000minor irrigation
tanks, 1072 mini percolation tanks, 214 Check dams and 1757 farm ponds, having combined
270 km2 water spread area.
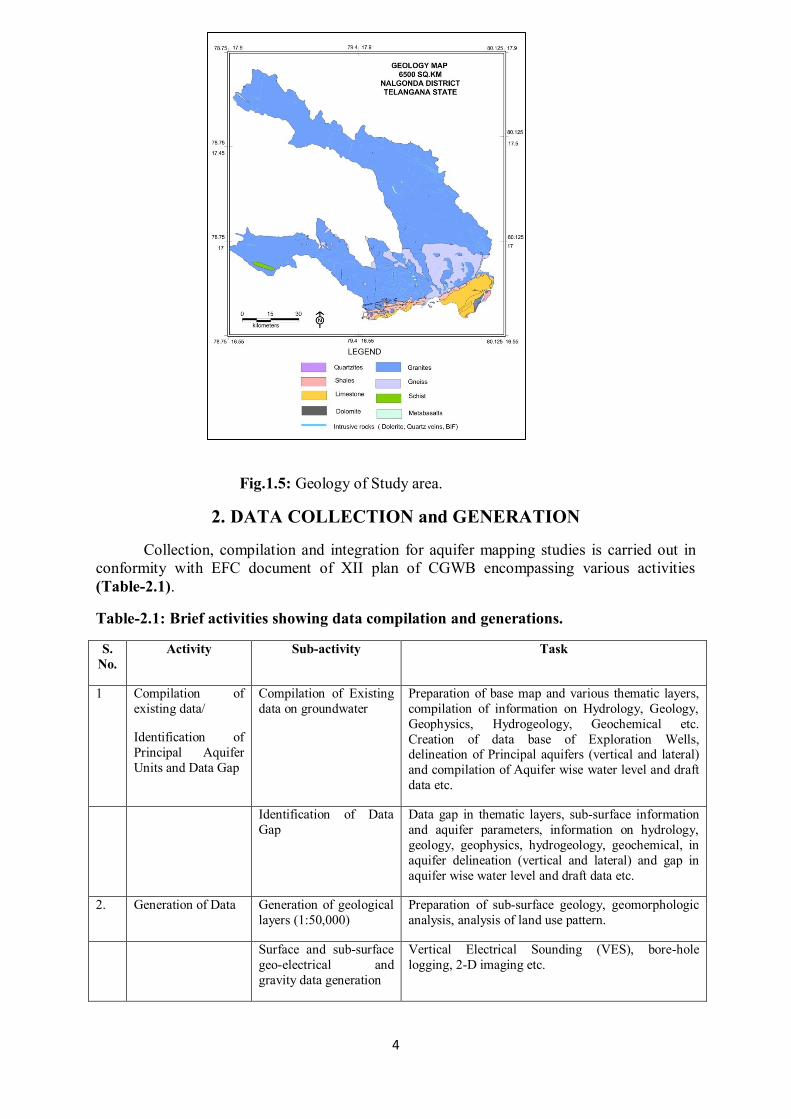
1.10Geology: Geologically the area is covered with crystalline rocks (Granites and Gneisses-
Banded Gneissic complex-BGC) with basic intrusive rock (Dolerite and Gabbro’s) at places
(90 %). Sedimentary formations, which include limestone, shale, quartzite and dolomite,
occupy remaining 10 % of the area (Fig.1.5). In Telangana State, the BGC is the principle
aquifer system (65 %) of which 17.6 % is spread in the district and presently 8.2 % is covered
under the aquifer mapping programme. The unconsolidated deposits comprising alluvial
3
sands, clay, occur in isolated narrow patches along the Musi and Halia rivers and major
streams.
fig.1.2: Geomorphology of Study area.
Fig.1.3: Drainage with
watershed boundaries.
Fig.1.4:Soils of Study area.
4
Fig.1.5: Geology of Study area.
2. DATA COLLECTION and GENERATION
Collection, compilation and integration for aquifer mapping studies is carried out in
conformity with EFC document of XII plan of CGWB encompassing various activities
(Table-2.1).
Table-2.1: Brief activities showing data compilation and generations.
S.
No.
Activity Sub-activity Task
1 Compilation of
existing data/
Identification of
Principal Aquifer
Units and Data Gap
Compilation of Existing
data on groundwater
Preparation of base map and various thematic layers,
compilation of information on Hydrology, Geology,
Geophysics, Hydrogeology, Geochemical etc.
Creation of data base of Exploration Wells, delineation of Principal aquifers (vertical and lateral)
and compilation of Aquifer wise water level and draft
data etc.
Identification of Data
Gap
Data gap in thematic layers, sub-surface information
and aquifer parameters, information on hydrology,
geology, geophysics, hydrogeology, geochemical, in
aquifer delineation (vertical and lateral) and gap in
aquifer wise water level and draft data etc.
2. Generation of Data Generation of geological
layers (1:50,000)
Preparation of sub-surface geology, geomorphologic
analysis, analysis of land use pattern.
Surface and sub-surface
geo-electrical and
gravity data generation
Vertical Electrical Sounding (VES), bore-hole
logging, 2-D imaging etc.
5
Hydrological Parameters
on groundwater recharge
Soil infiltration studies, rainfall data analysis, canal
flow and recharge structures.
Preparation of
Hydrogeological map
(1:50, 000 scale)
Water level monitoring, exploratory drilling, pumping
tests, preparation of sub-surface hydrogeological sections.
Generation of additional
water quality parameters
Analysis of groundwater for general parameters
including fluoride.
3. Aquifer Map
Preparation
(1:50,000 scale)
Analysis of data and
preparation of GIS layers
and preparation of
aquifer maps
Integration of Hydrogeological, Geophysical,
Geological and Hydro-chemical data.
4. Aquifer
Management Plan
Preparation of aquifer
management plan
Information on aquifer through training to
administrators, NGO’s, progressive farmers and
stakeholders etc. and putting in public domain.
2.1 Hydrogeology
Hydrogeology is concerned primarily with mode of occurrence, distribution,
movement and chemistry of water occurring in the subsurface in relation to the geological
environment. The occurrence and movement of water in the subsurface is broadly governed
by geological frameworks i.e., nature of rock formations including their porosity (primary
and secondary) and permeability. The principal aquifer in the area is granites and gneisses
and the occurrence and movement of ground water in these rocks is controlled by the degree
of interconnection of secondary pores/voids developed by fracturing and weathering. Based
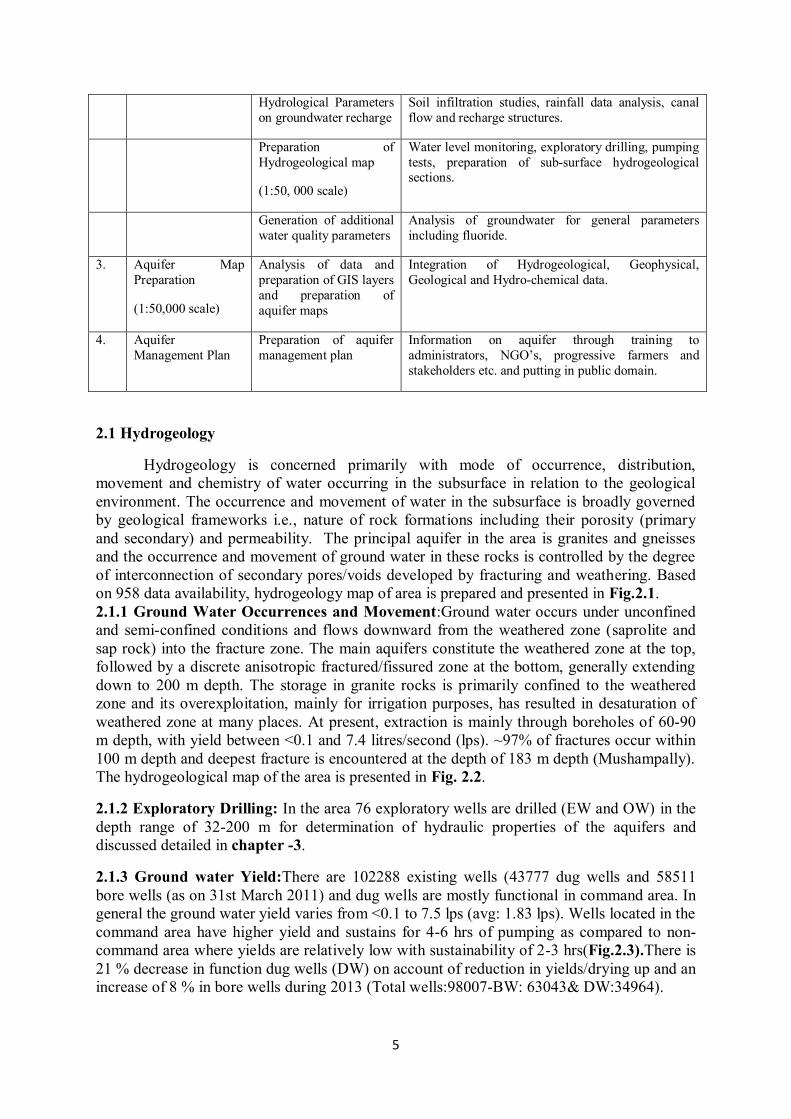
on 958 data availability, hydrogeology map of area is prepared and presented in Fig.2.1.
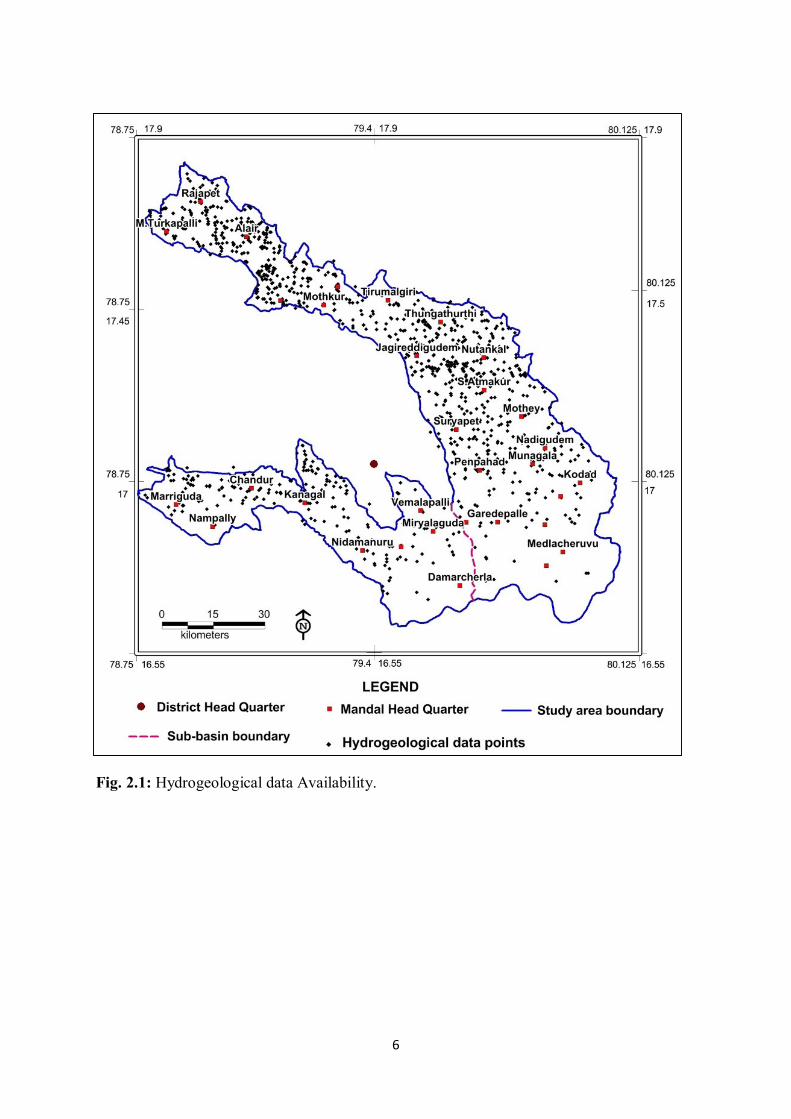
2.1.1 Ground Water Occurrences and Movement:Ground water occurs under unconfined
and semi-confined conditions and flows downward from the weathered zone (saprolite and
sap rock) into the fracture zone. The main aquifers constitute the weathered zone at the top,
followed by a discrete anisotropic fractured/fissured zone at the bottom, generally extending
down to 200 m depth. The storage in granite rocks is primarily confined to the weathered
zone and its overexploitation, mainly for irrigation purposes, has resulted in desaturation of
weathered zone at many places. At present, extraction is mainly through boreholes of 60-90
m depth, with yield between <0.1 and 7.4 litres/second (lps). ~97% of fractures occur within
100 m depth and deepest fracture is encountered at the depth of 183 m depth (Mushampally).
The hydrogeological map of the area is presented in Fig. 2.2.
2.1.2 Exploratory Drilling: In the area 76 exploratory wells are drilled (EW and OW) in the
depth range of 32-200 m for determination of hydraulic properties of the aquifers and
discussed detailed in chapter -3.
2.1.3 Ground water Yield:There are 102288 existing wells (43777 dug wells and 58511
bore wells (as on 31st March 2011) and dug wells are mostly functional in command area. In
general the ground water yield varies from <0.1 to 7.5 lps (avg: 1.83 lps). Wells located in the
command area have higher yield and sustains for 4-6 hrs of pumping as compared to non-
command area where yields are relatively low with sustainability of 2-3 hrs(Fig.2.3).There is
21 % decrease in function dug wells (DW) on account of reduction in yields/drying up and an
increase of 8 % in bore wells during 2013 (Total wells:98007-BW: 63043& DW:34964).
6
Fig. 2.1: Hydrogeological data Availability.
7
Fig.2.2: Hydrogeological map of study area.
8
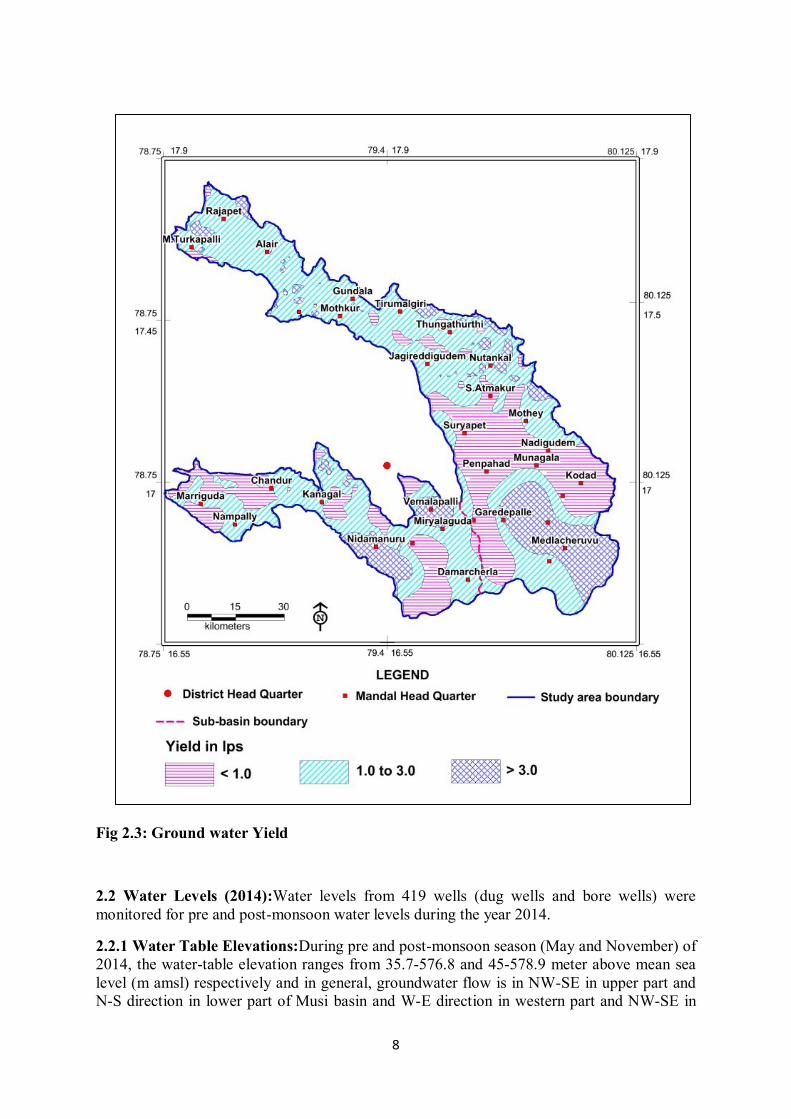
Fig 2.3: Ground water Yield
2.2 Water Levels (2014):Water levels from 419 wells (dug wells and bore wells) were
monitored for pre and post-monsoon water levels during the year 2014.
2.2.1 Water Table Elevations:During pre and post-monsoon season (May and November) of
2014, the water-table elevation ranges from 35.7-576.8 and 45-578.9 meter above mean sea
level (m amsl) respectively and in general, groundwater flow is in NW-SE in upper part and
N-S direction in lower part of Musi basin and W-E direction in western part and NW-SE in
9
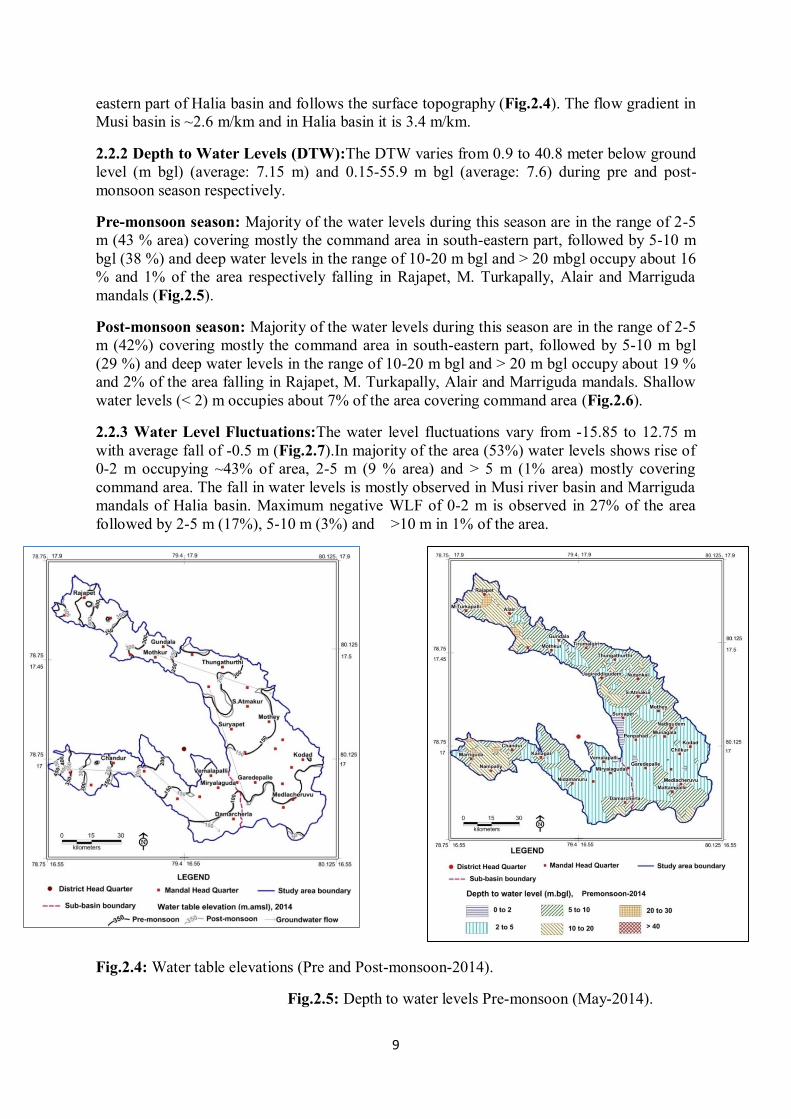
eastern part of Halia basin and follows the surface topography (Fig.2.4). The flow gradient in
Musi basin is ~2.6 m/km and in Halia basin it is 3.4 m/km.
2.2.2 Depth to Water Levels (DTW):The DTW varies from 0.9 to 40.8 meter below ground
level (m bgl) (average: 7.15 m) and 0.15-55.9 m bgl (average: 7.6) during pre and post-
monsoon season respectively.
Pre-monsoon season: Majority of the water levels during this season are in the range of 2-5
m (43 % area) covering mostly the command area in south-eastern part, followed by 5-10 m
bgl (38 %) and deep water levels in the range of 10-20 m bgl and > 20 mbgl occupy about 16
% and 1% of the area respectively falling in Rajapet, M. Turkapally, Alair and Marriguda
mandals (Fig.2.5).
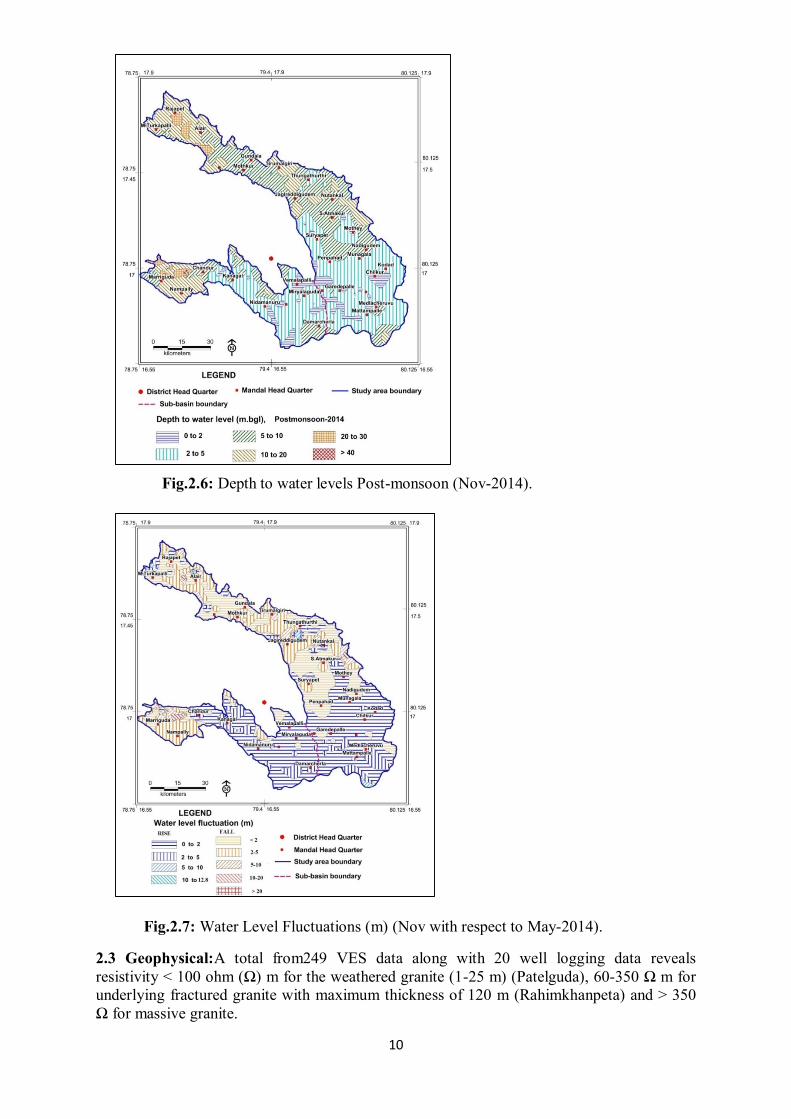
Post-monsoon season: Majority of the water levels during this season are in the range of 2-5
m (42%) covering mostly the command area in south-eastern part, followed by 5-10 m bgl
(29 %) and deep water levels in the range of 10-20 m bgl and > 20 m bgl occupy about 19 %
and 2% of the area falling in Rajapet, M. Turkapally, Alair and Marriguda mandals. Shallow
water levels (< 2) m occupies about 7% of the area covering command area (Fig.2.6).
2.2.3 Water Level Fluctuations:The water level fluctuations vary from -15.85 to 12.75 m
with average fall of -0.5 m (Fig.2.7).In majority of the area (53%) water levels shows rise of
0-2 m occupying ~43% of area, 2-5 m (9 % area) and > 5 m (1% area) mostly covering
command area. The fall in water levels is mostly observed in Musi river basin and Marriguda
mandals of Halia basin. Maximum negative WLF of 0-2 m is observed in 27% of the area
followed by 2-5 m (17%), 5-10 m (3%) and >10 m in 1% of the area.
Fig.2.4: Water table elevations (Pre and Post-monsoon-2014).
Fig.2.5: Depth to water levels Pre-monsoon (May-2014).
10
Fig.2.6: Depth to water levels Post-monsoon (Nov-2014).
Fig.2.7: Water Level Fluctuations (m) (Nov with respect to May-2014).
2.3 Geophysical:A total from249 VES data along with 20 well logging data reveals
resistivity < 100 ohm (Ω) m for the weathered granite (1-25 m) (Patelguda), 60-350 Ω m for
underlying fractured granite with maximum thickness of 120 m (Rahimkhanpeta) and > 350
Ω for massive granite.
11
2.4 Hydro chemical:
To understand chemical nature of groundwater, total 115wells is utilized from ground
water monitoring wells of CGWB and SGWD wells (mostly tapping combined aquifers)
during the pre and post-monsoon season of 2014. Parameters namely pH, EC (in µS/cm at 25
° C), TH, Ca, Mg, Na, K, CO3, HCO3, Cl, SO4, NO3 and F were analyzed.
Groundwater in the area is mildly alkaline to alkaline in nature in both seasons (pre-
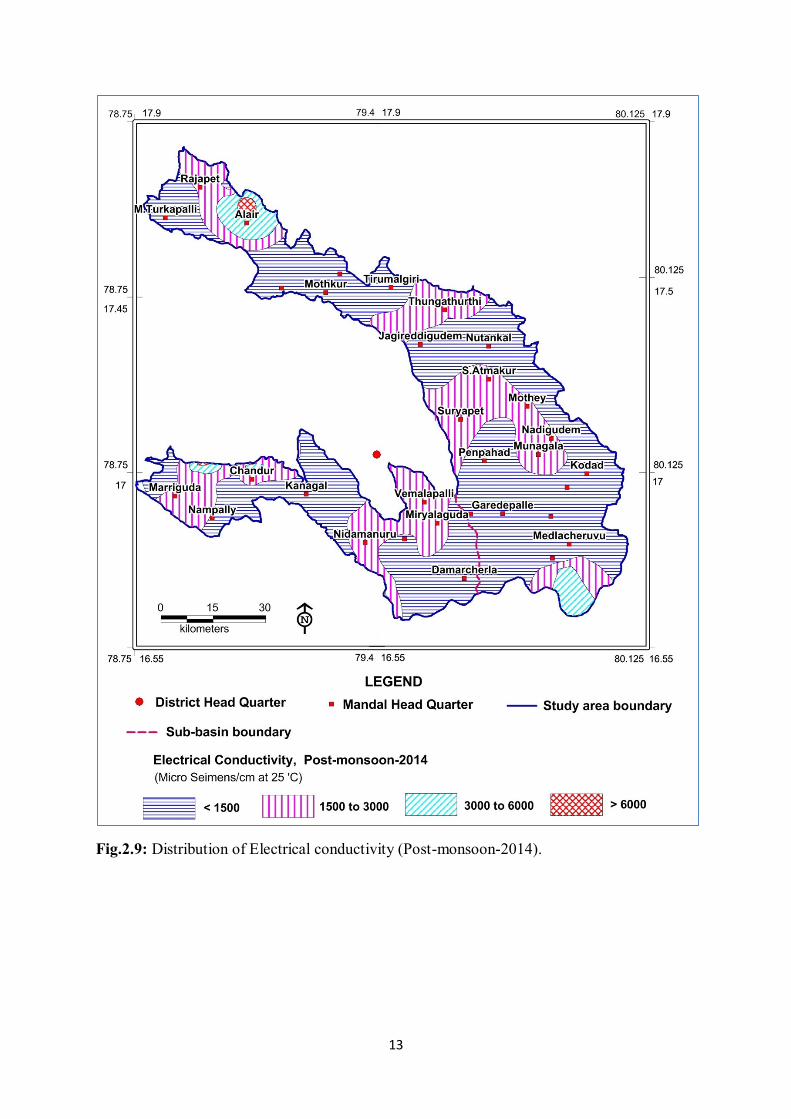
monsoon average pH 8.2 and post-monsoon average pH 8.3) with average EC of 1876 and
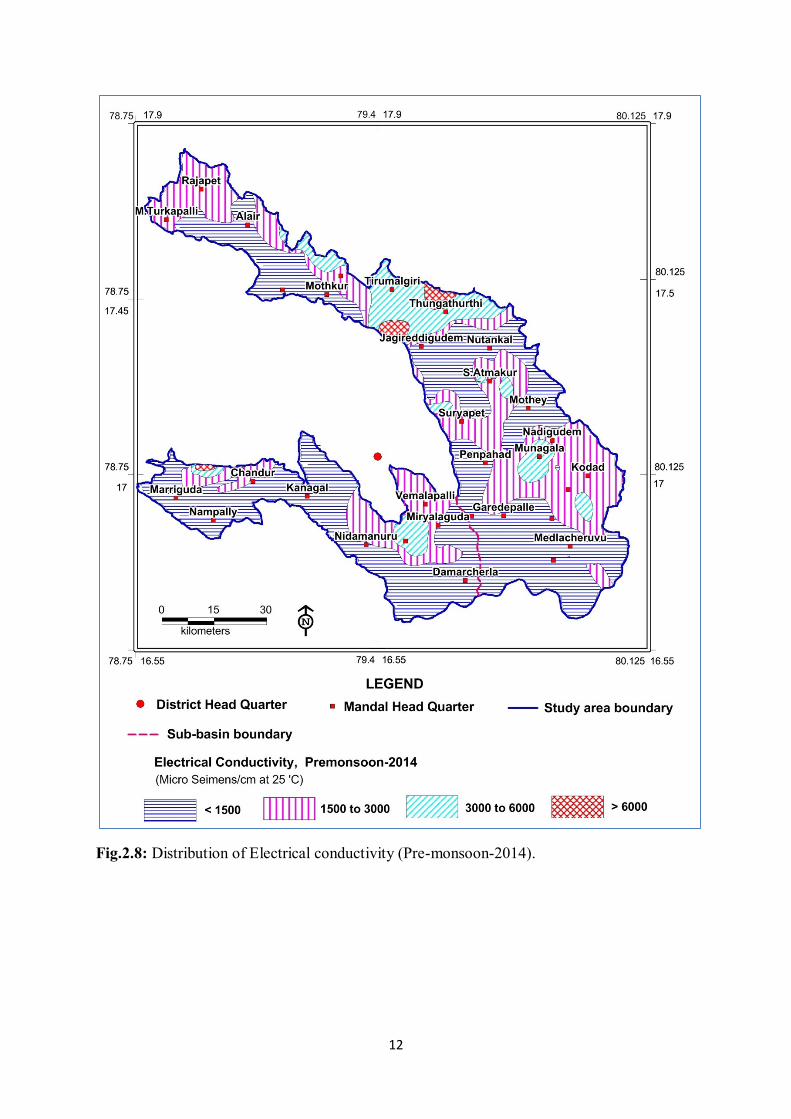
1580 µ Siemens/cm during pre and post-monsoon season respectively (Fig.2.8 and Fig.2.9).
More than 3000 EC is detected in 12 % and 4.5 % of the area during pre and post-monsoon
season. Average concentration of TDS and TH is 1175&464 and 1012&416 mg/L during pre
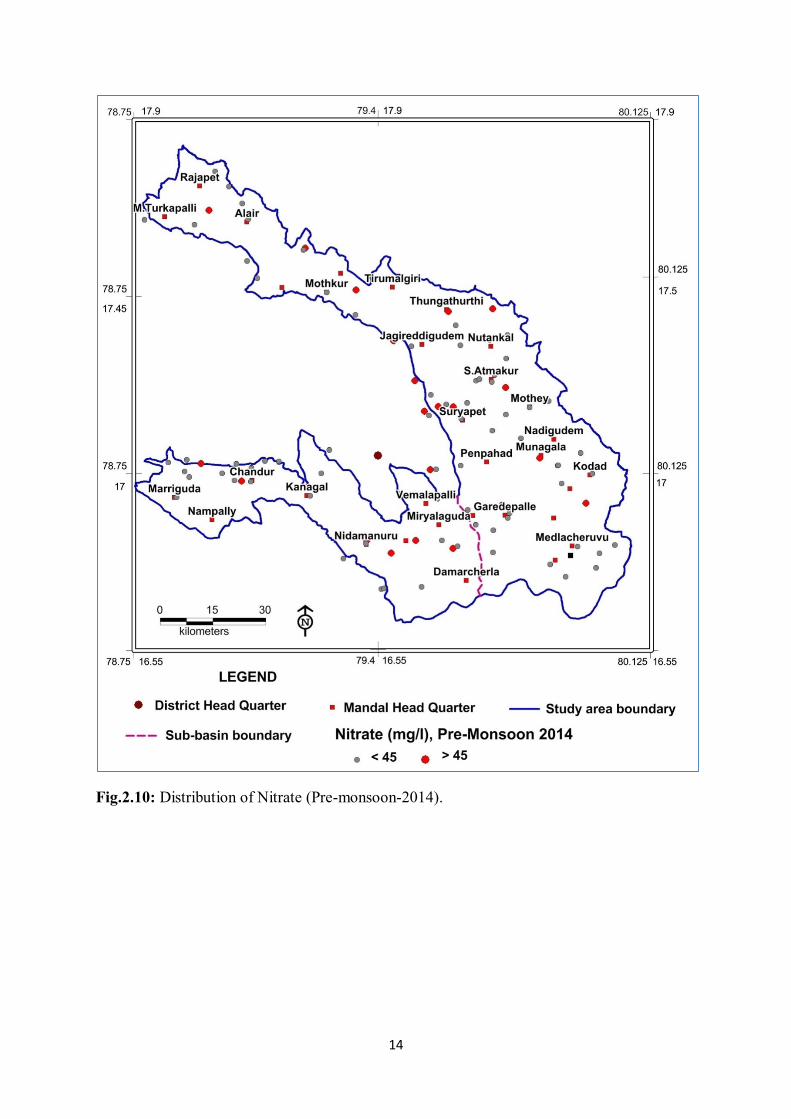
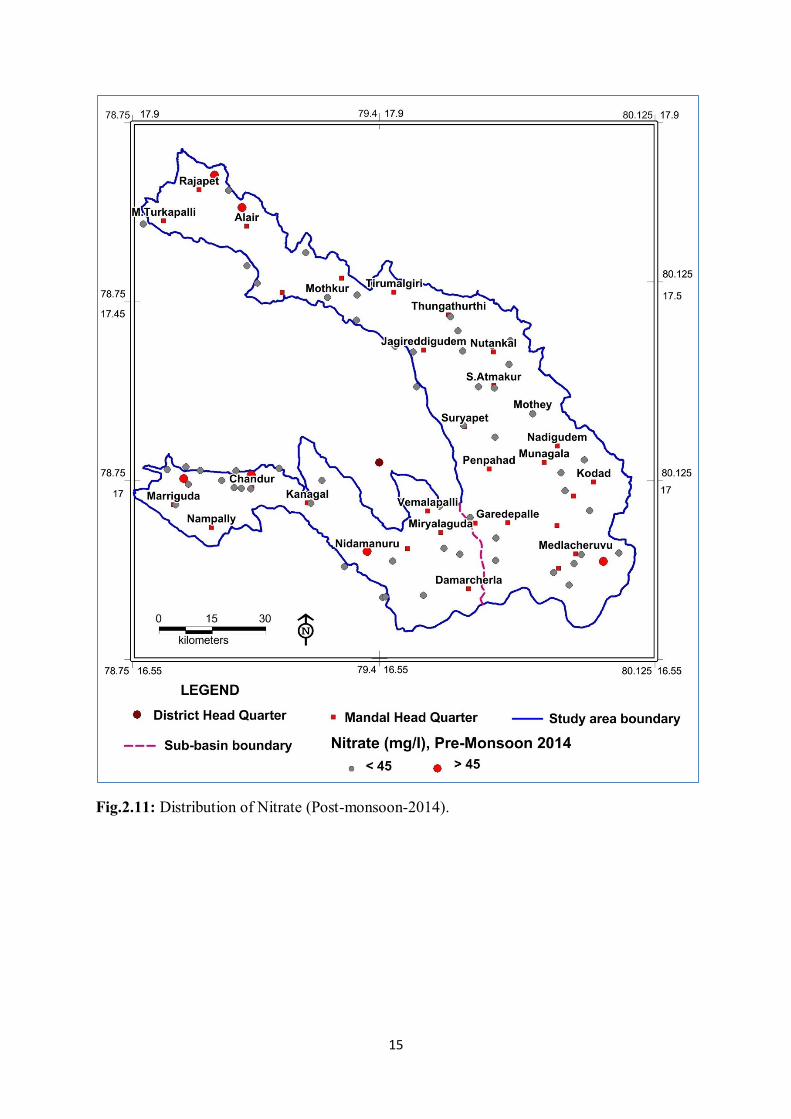
and post-monsoon season respectively. The concentration of NO3 ranges from 0-627 and 0-
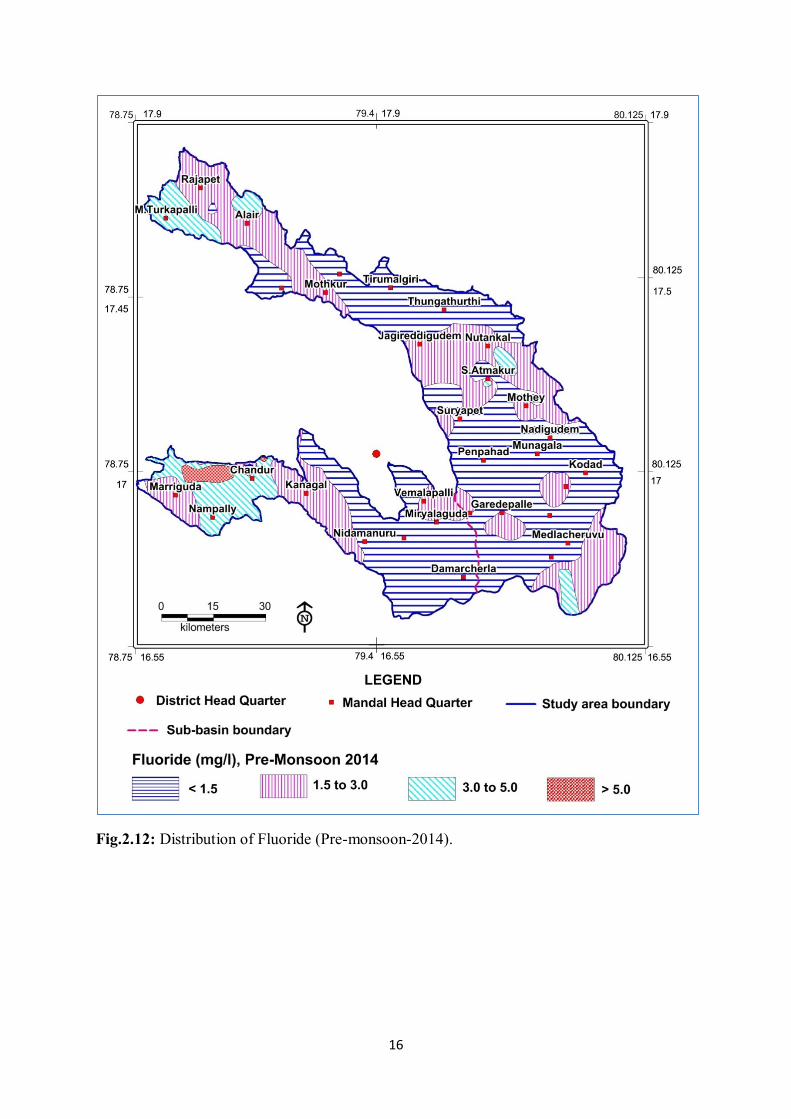
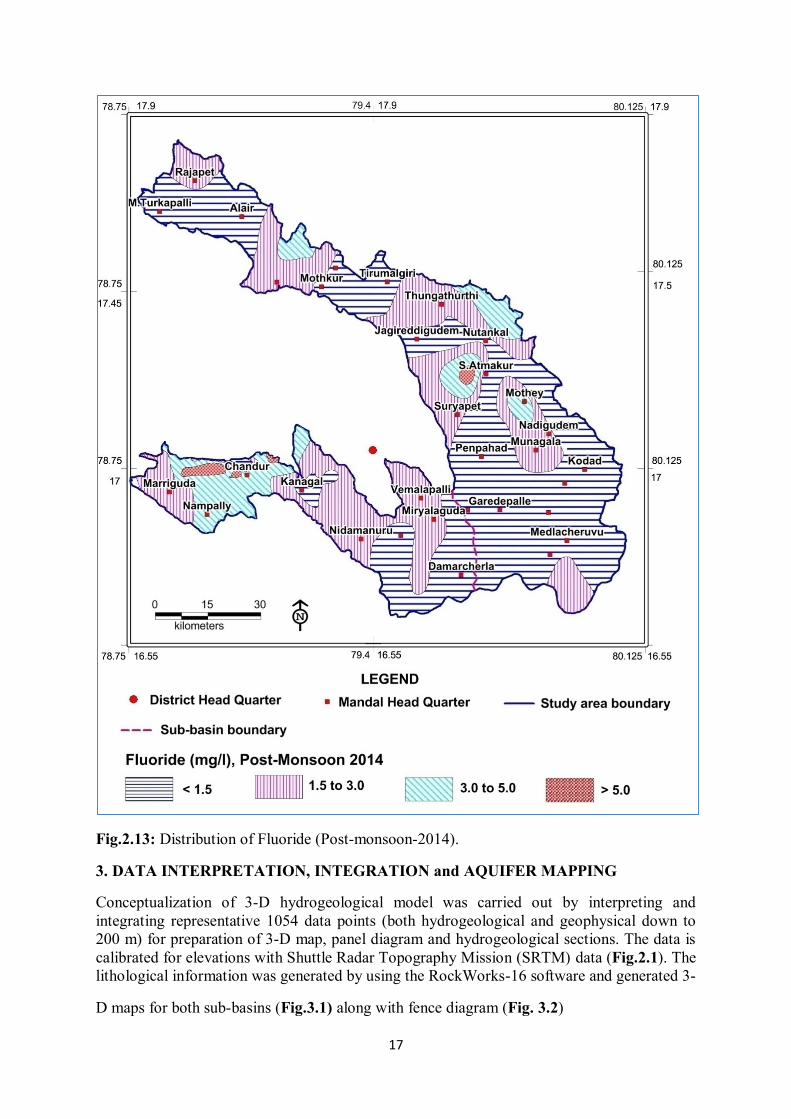
132 mg/L during pre and post monsoon season respectively (Fig.2.10 and Fig.2.11). Fluoride
concentration varies from 0.06-9.4 and 0.1-7.22 mg/L during pre and post monsoon
respectively (Fig.2.12 and Fig.2.13). It is found that about 65% and50 % of the samples
during pre and post-monsoon season are unfit for human consumption (BIS, 2012).
12
Fig.2.8: Distribution of Electrical conductivity (Pre-monsoon-2014).
13
Fig.2.9: Distribution of Electrical conductivity (Post-monsoon-2014).
14
Fig.2.10: Distribution of Nitrate (Pre-monsoon-2014).
15
Fig.2.11: Distribution of Nitrate (Post-monsoon-2014).
16
Fig.2.12: Distribution of Fluoride (Pre-monsoon-2014).
17
Fig.2.13: Distribution of Fluoride (Post-monsoon-2014).
3. DATA INTERPRETATION, INTEGRATION and AQUIFER MAPPING
Conceptualization of 3-D hydrogeological model was carried out by interpreting and
integrating representative 1054 data points (both hydrogeological and geophysical down to
200 m) for preparation of 3-D map, panel diagram and hydrogeological sections. The data is
calibrated for elevations with Shuttle Radar Topography Mission (SRTM) data (Fig.2.1). The
lithological information was generated by using the RockWorks-16 software and generated 3-
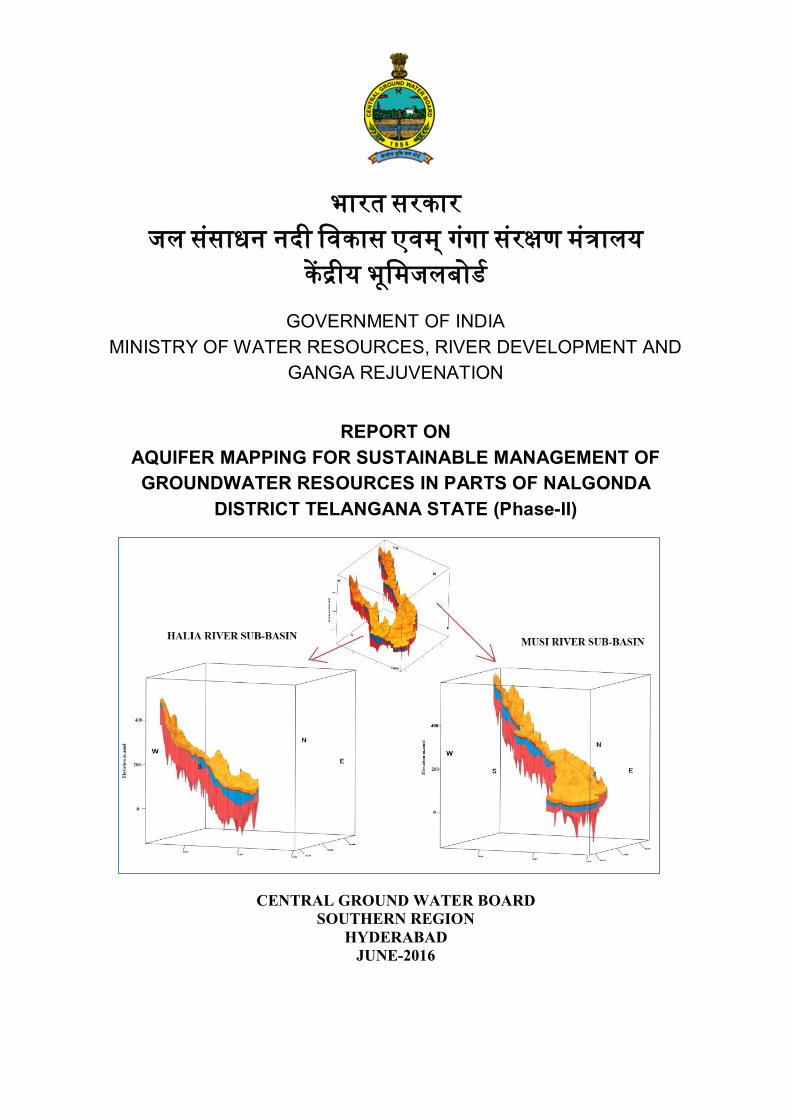
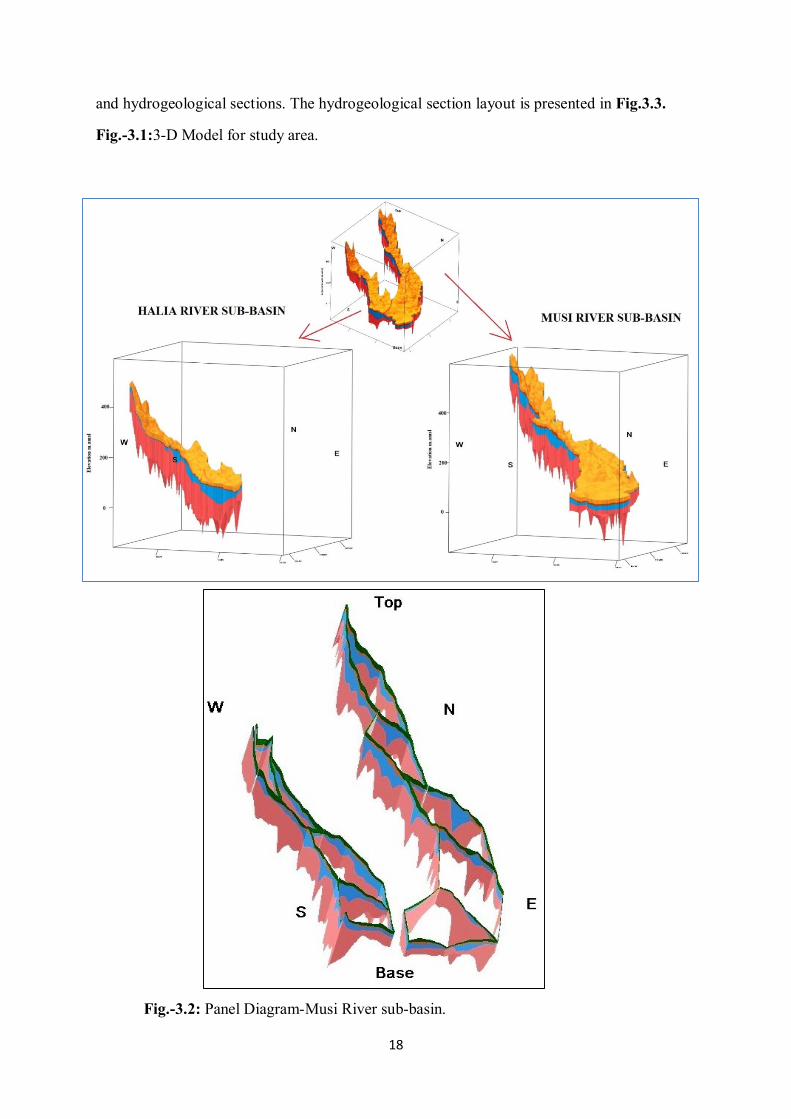
D maps for both sub-basins (Fig.3.1) along with fence diagram (Fig. 3.2)
18
and hydrogeological sections. The hydrogeological section layout is presented in Fig.3.3.
Fig.-3.1:3-D Model for study area.
Fig.-3.2: Panel Diagram-Musi River sub-basin.
19
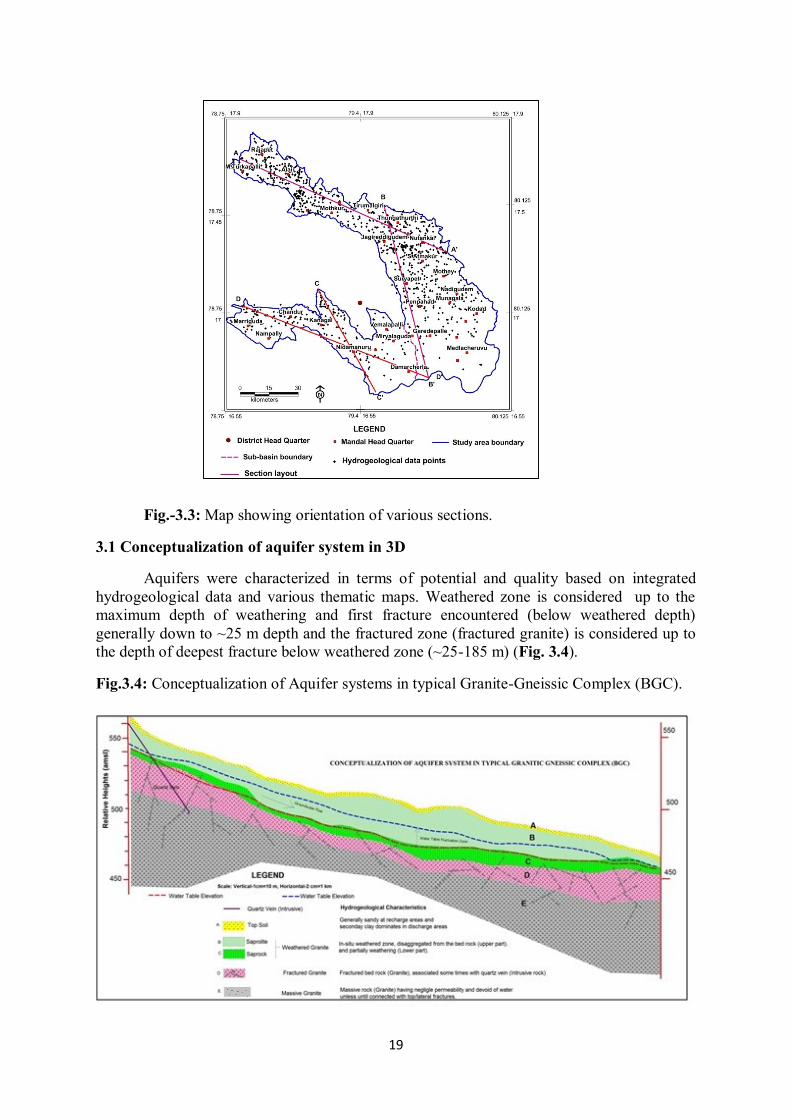
Fig.-3.3: Map showing orientation of various sections.
3.1 Conceptualization of aquifer system in 3D
Aquifers were characterized in terms of potential and quality based on integrated
hydrogeological data and various thematic maps. Weathered zone is considered up to the
maximum depth of weathering and first fracture encountered (below weathered depth)
generally down to ~25 m depth and the fractured zone (fractured granite) is considered up to
the depth of deepest fracture below weathered zone (~25-185 m) (Fig. 3.4).
Fig.3.4: Conceptualization of Aquifer systems in typical Granite-Gneissic Complex (BGC).
20
3.2 Hydrogeological Sections
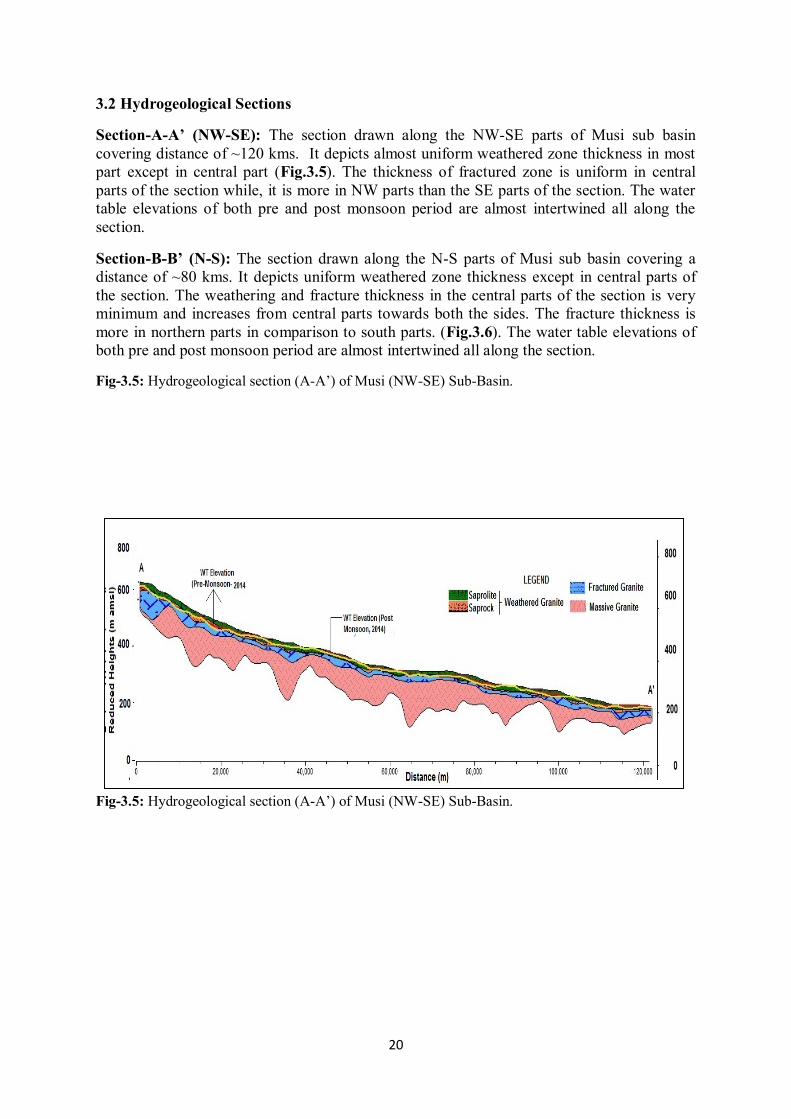
Section-A-A’ (NW-SE): The section drawn along the NW-SE parts of Musi sub basin
covering distance of ~120 kms. It depicts almost uniform weathered zone thickness in most
part except in central part (Fig.3.5). The thickness of fractured zone is uniform in central
parts of the section while, it is more in NW parts than the SE parts of the section. The water
table elevations of both pre and post monsoon period are almost intertwined all along the
section.
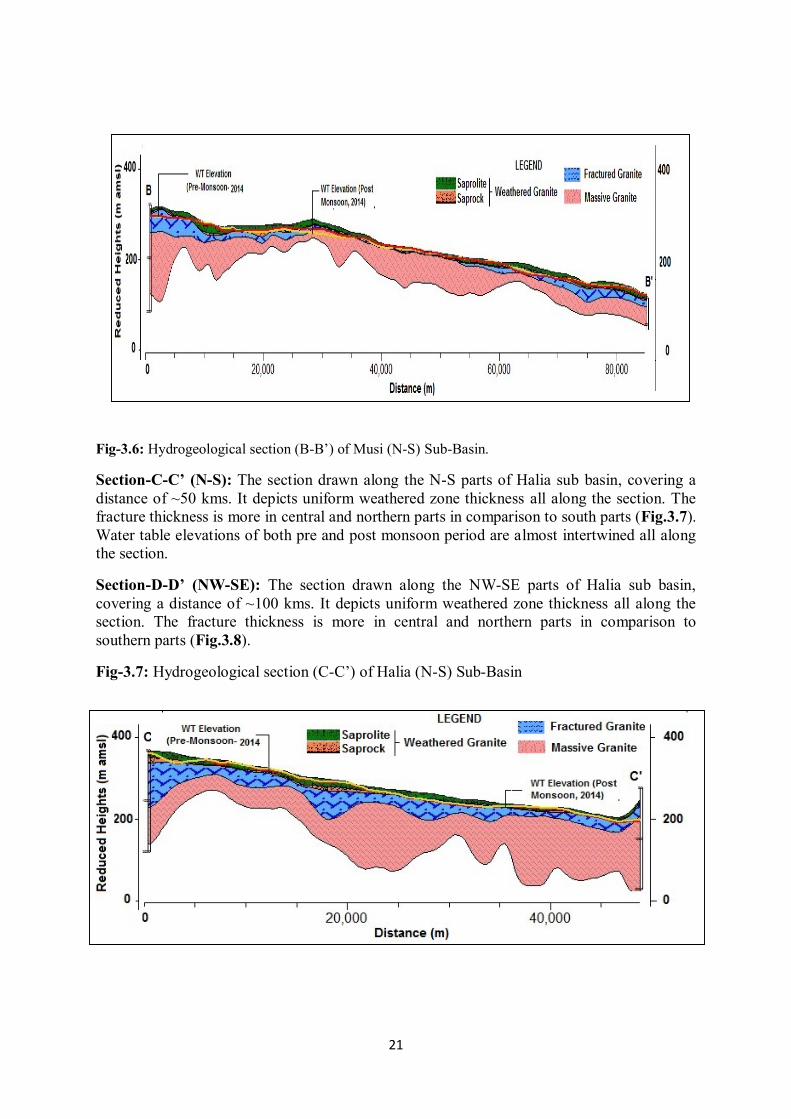
Section-B-B’ (N-S): The section drawn along the N-S parts of Musi sub basin covering a
distance of ~80 kms. It depicts uniform weathered zone thickness except in central parts of
the section. The weathering and fracture thickness in the central parts of the section is very
minimum and increases from central parts towards both the sides. The fracture thickness is
more in northern parts in comparison to south parts. (Fig.3.6). The water table elevations of
both pre and post monsoon period are almost intertwined all along the section.
Fig-3.5: Hydrogeological section (A-A’) of Musi (NW-SE) Sub-Basin.
Fig-3.5: Hydrogeological section (A-A’) of Musi (NW-SE) Sub-Basin.
21
Fig-3.6: Hydrogeological section (B-B’) of Musi (N-S) Sub-Basin.
Section-C-C’ (N-S): The section drawn along the N-S parts of Halia sub basin, covering a
distance of ~50 kms. It depicts uniform weathered zone thickness all along the section. The
fracture thickness is more in central and northern parts in comparison to south parts (Fig.3.7).
Water table elevations of both pre and post monsoon period are almost intertwined all along
the section.
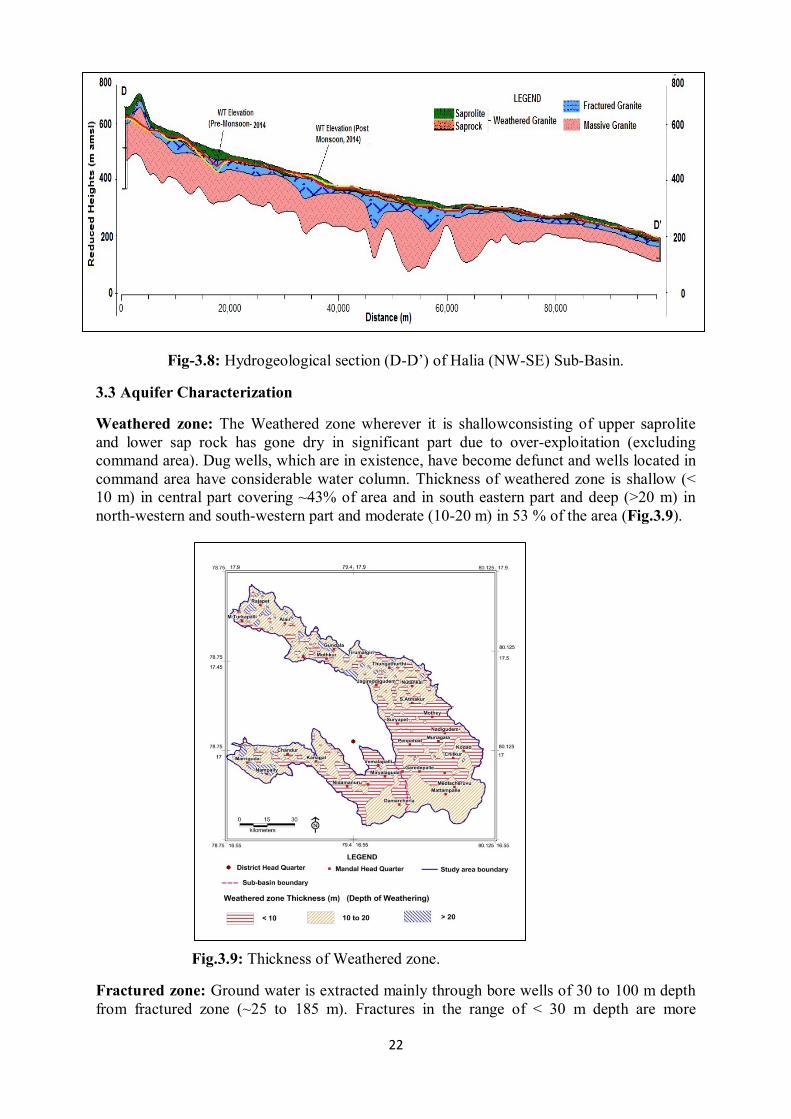
Section-D-D’ (NW-SE): The section drawn along the NW-SE parts of Halia sub basin,
covering a distance of ~100 kms. It depicts uniform weathered zone thickness all along the
section. The fracture thickness is more in central and northern parts in comparison to
southern parts (Fig.3.8).
Fig-3.7: Hydrogeological section (C-C’) of Halia (N-S) Sub-Basin
22
Fig-3.8: Hydrogeological section (D-D’) of Halia (NW-SE) Sub-Basin.
3.3 Aquifer Characterization
Weathered zone: The Weathered zone wherever it is shallowconsisting of upper saprolite
and lower sap rock has gone dry in significant part due to over-exploitation (excluding
command area). Dug wells, which are in existence, have become defunct and wells located in
command area have considerable water column. Thickness of weathered zone is shallow (<
10 m) in central part covering ~43% of area and in south eastern part and deep (>20 m) in
north-western and south-western part and moderate (10-20 m) in 53 % of the area (Fig.3.9).
Fig.3.9: Thickness of Weathered zone.
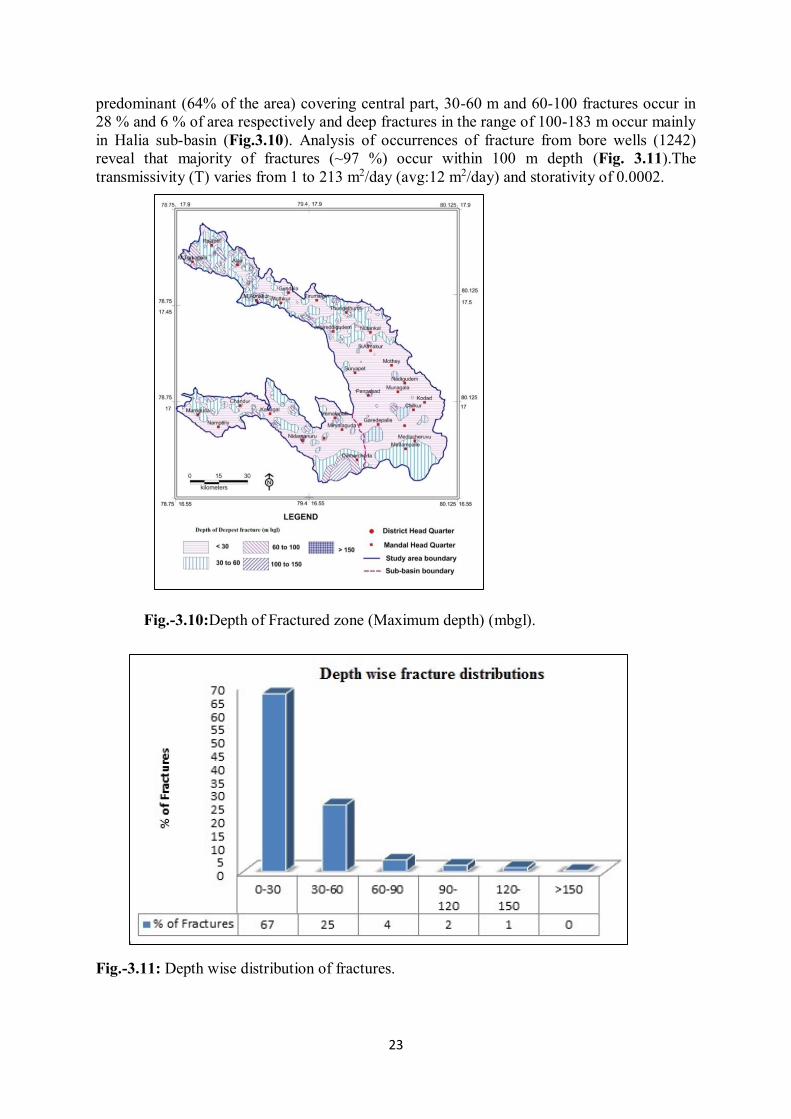
Fractured zone: Ground water is extracted mainly through bore wells of 30 to 100 m depth
from fractured zone (~25 to 185 m). Fractures in the range of < 30 m depth are more
23
predominant (64% of the area) covering central part, 30-60 m and 60-100 fractures occur in
28 % and 6 % of area respectively and deep fractures in the range of 100-183 m occur mainly
in Halia sub-basin (Fig.3.10). Analysis of occurrences of fracture from bore wells (1242)
reveal that majority of fractures (~97 %) occur within 100 m depth (Fig. 3.11).The
transmissivity (T) varies from 1 to 213 m2/day (avg:12 m2/day) and storativity of 0.0002.
Fig.-3.10:Depth of Fractured zone (Maximum depth) (mbgl).
Fig.-3.11: Depth wise distribution of fractures.
24
4. GROUNDWATER RESOURCES
In hard rocks, for practical purpose it is very difficult to compute zone wise (aquifer
wise) groundwater resources, because the weathered zone (WZ) and fractured zone (FZ) are
inter connected with fractures/joints and fractured zone gets recharged through weathered
zone. Therefore it is very difficult to demarcate the boundary between two aquifers; hence the
resources are estimated considering entire area as a single aquifer system. Village wise
dynamic and in-storage groundwater resources are computed and while computing dynamic
resources, actual area of village (falling in study area),and averagewater levels of last 10
years, computed specific yield (2%) are considered. While computing the in-storage
resources, the general depth of deepest fracture in the area, pre-monsoon water levels and 2
% of granular zone (i.e., 2% of zone below pre-monsoon water level and down to deepest
fracture) and 3 % of specific yield is considered (Table-4.1).
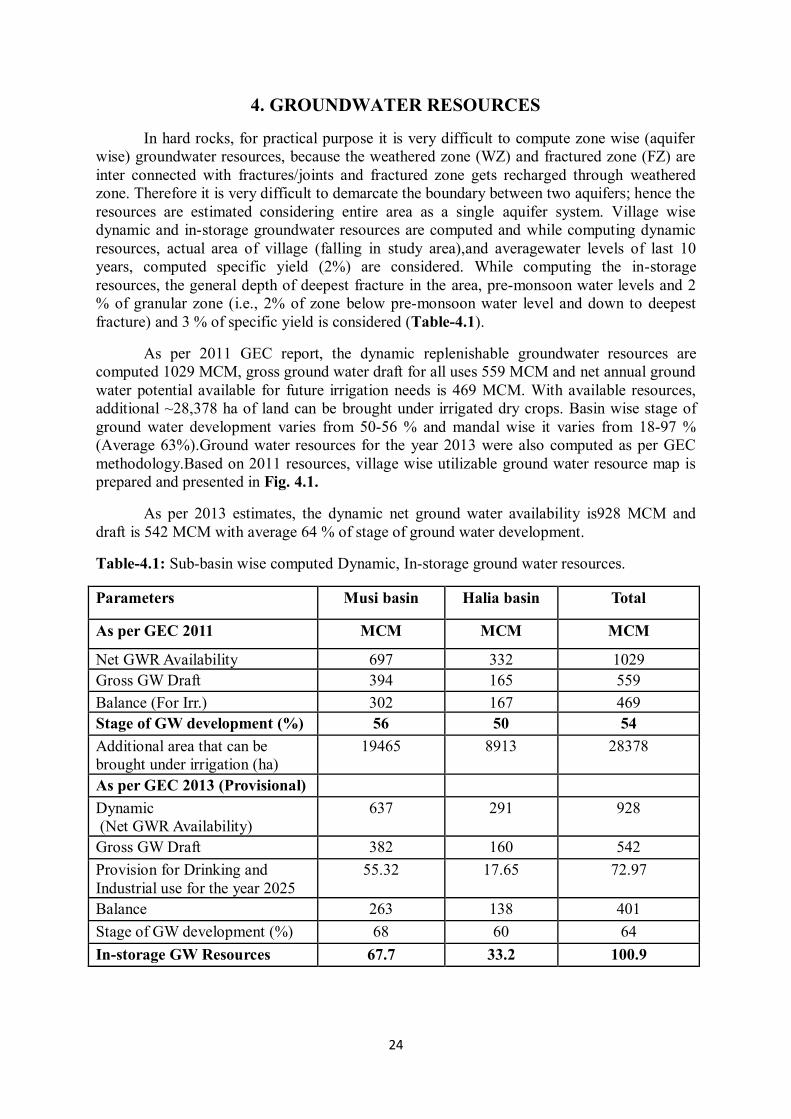
As per 2011 GEC report, the dynamic replenishable groundwater resources are
computed 1029 MCM, gross ground water draft for all uses 559 MCM and net annual ground
water potential available for future irrigation needs is 469 MCM. With available resources,
additional ~28,378 ha of land can be brought under irrigated dry crops. Basin wise stage of
ground water development varies from 50-56 % and mandal wise it varies from 18-97 %
(Average 63%).Ground water resources for the year 2013 were also computed as per GEC
methodology.Based on 2011 resources, village wise utilizable ground water resource map is
prepared and presented in Fig. 4.1.
As per 2013 estimates, the dynamic net ground water availability is928 MCM and
draft is 542 MCM with average 64 % of stage of ground water development.
Table-4.1: Sub-basin wise computed Dynamic, In-storage ground water resources.
Parameters Musi basin Halia basin Total
As per GEC 2011 MCM MCM MCM
Net GWR Availability 697 332 1029
Gross GW Draft 394 165 559
Balance (For Irr.) 302 167 469
Stage of GW development (%) 56 50 54
Additional area that can be
brought under irrigation (ha)
19465 8913 28378
As per GEC 2013 (Provisional)
Dynamic
(Net GWR Availability)
637 291 928
Gross GW Draft 382 160 542
Provision for Drinking and
Industrial use for the year 2025
55.32 17.65 72.97
Balance 263 138 401
Stage of GW development (%) 68 60 64
In-storage GW Resources 67.7 33.2 100.9
25
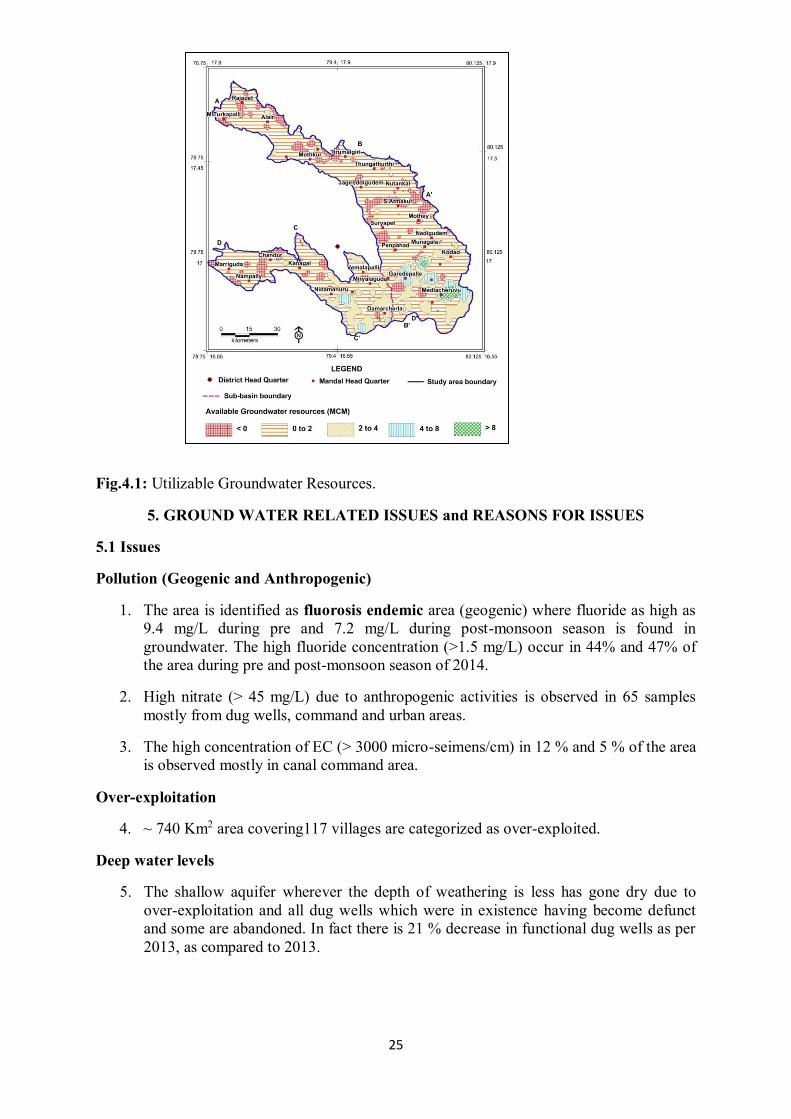
Fig.4.1: Utilizable Groundwater Resources.
5. GROUND WATER RELATED ISSUES and REASONS FOR ISSUES
5.1 Issues
Pollution (Geogenic and Anthropogenic)
1. The area is identified as fluorosis endemic area (geogenic) where fluoride as high as
9.4 mg/L during pre and 7.2 mg/L during post-monsoon season is found in
groundwater. The high fluoride concentration (>1.5 mg/L) occur in 44% and 47% of
the area during pre and post-monsoon season of 2014.
2. High nitrate (> 45 mg/L) due to anthropogenic activities is observed in 65 samples
mostly from dug wells, command and urban areas.
3. The high concentration of EC (> 3000 micro-seimens/cm) in 12 % and 5 % of the area
is observed mostly in canal command area.
Over-exploitation
4. ~ 740 Km2 area covering117 villages are categorized as over-exploited.
Deep water levels
5. The shallow aquifer wherever the depth of weathering is less has gone dry due to
over-exploitation and all dug wells which were in existence having become defunct
and some are abandoned. In fact there is 21 % decrease in functional dug wells as per
2013, as compared to 2013.
26
6. Deep water levels (> 20 mbgl) are observed during pre and post-monsoon season in
1% and 3% of the area respectively. The high percentage is due to deficient rainfall
during 2014 (-27%).
7. Declining water levels up to -0.58m/yr and -0.63 m/yr is observed during pre and
post-monsoon season in the last 10 years.
8. 8% increase in number of bore wells is observed in 2013 as compared to 2011.
Sustainability
9. Low yield (<1 lps) occurs in ~30 % of area and yields of bore wells have reduced
over a period of time and some bore wells which used to yield sufficient quantity of
water have gone dry and due to this rich farmers are acquiring water from nearby
places (if available) or transporting water from far off places (1-2 km) and saving the
commercial crops (sweat lime, papaya etc) thereby incurring lot of financial expenses.
Water Logging
10. Water logging during post-monsoon season is observed in 8% of the area mostly in
canal command area.
Water Marketing and other Issues
11. Water marketing is present in almost all over the area and people are buying bottled
water from the market for drinking purposes as there is no sufficient supply of surface
water.
12. Change in land use and cropping pattern from agricultural land to residential purposes
and from traditional crops to cash crops (cotton) during Kharif seasonis observed.
13. Based on ground water paddy is grown during rabi season in most of the area leading
to heavy withdrawal of ground water during non-monsoon period.
5.2 Reasons for Issues
Geo genic pollution (Fluoride)
1. Higher concentration of F in ground water is attributed due to source rock,which
contains avg. 810 ppm of F (higher than surrounding Hyderabad granite rocks).
2. Rock water interaction where acid-soluble fluoride bearing minerals (fluorite, fluoro-
apatite) gets dissolved under alkaline conditions.
3. Higher residence time of ground water in deeper aquifer.
Anthropogenic pollution (Nitrate)
4. Higher concentration is due to sewage disposal of treated and untreated effluents in
urban and rural areas.Use of NPK fertilizers and nitrogen fixation by leguminous
crops.
Over-exploitation and Deep water levels
5. Over-extraction, paddy cultivation during rabi season, ground water mining, limited
artificial measures etc.
27
Sustainability
6. Absence of primary porosity, negligible development of secondary porosity, Low
rainfall, desaturation of Weathered Zone and urbanization.
Water logging
7. Low development of ground water resources due to saline soils, shallow water table,
semi-arid conditions and surface water irrigation.
6. MANAGEMENT STRATEGIES
High dependence on groundwater coupled with absence of augmentation measures
has led to a steady fall in water levels and desaturation of weathered zone in some parts,
raising questions on sustainability of existing groundwater structures, food and drinking
water security. The studies revealed different behaviour of ground water in the weathered
zone (~ 25 m) and fractured zone (25-185 m). The occurrence of fractures in fractured zone
are very limited in extent, as the compression in the rock reduces the opening of fractures at
depth and the majority of fractures occur within 100 m depth (95%) (Fig.3.11). Higher NO3-
concentrations (> 45 mg/L) in weathered zone is due to sewage contamination and higher
concentration of F- (>1.5 mg/L) in weathered zone and fractured zone is due to local geology
(granite rock), high weathering, longer residence time and alkaline nature of groundwater.
6.1 Management Plan
The uneven distribution of groundwater availability and its utilization indicates that a single
management strategy cannot be adopted and it requires integrated hydrogeological aspects
along with socio-economic conditions to develop an appropriate management strategy. The
study suggests notable measures for sustainable groundwater management, which involves a
combination of various measures given below. Mandal wise aquifer maps and management
plans for fully covered and partly covered mandals are given in Annexure-1 and Annexure-
2 respectively.
1. Supply side measures
2. Demand side measures
3. Regulatory measures
4. Institutional measures
6.1.1 Supply side measures
Artificial Recharge structures:
Construction of 1728 artificial recharge structures (ARS) (117 villages: priority-1 and
432villages: priority-2 areas) are suggested by following standard methodology.
While formulating the village wise groundwater management plan, the unsaturated
volume of aquifer is estimated by multiplying the area with specific yield (283 MCM) and
unsaturated thickness (post-monsoon water levels below 3 m). Initially villagewise dynamic
groundwater resources of 2011 are considered (Fig.4.1). Potential surface run off is estimated
by following standard procedures. On conservative side 20 % runoff yield is considered as
non-committed yield for recommending artificial recharge structures. The pre-monsoon
28
groundwater quality is considered for categorising contaminated area (F >1.5 mg/l &EC
>3000). Nitrate is not considered here because it is point source pollution and localized.
Based on above criteria, the area can be prioritized into priority-1 which needs immediate
intervention and priority-2. Based on hydrogeological characteristics, the area is further sub-
divided into following 8 categories (Table-6.1).
Table-6.1: Hydrogeological characteristics of area.
Category Hydrogeological characterizations
1 High EC with additional scope for artificial recharge.
2 High EC with no additional scope for artificial recharge.
3 High F with additional scope for artificial recharge.
4 High F with no additionalscope for artificial recharge.
5 High EC and F with additional scope for artificial recharge.
6 High EC and F with no additional scope for artificial recharge.
7 Groundwater quality within permissible limits for drinking and irrigation with scope for artificial
recharge.
8 Groundwater quality within permissible limits for drinking and irrigation with no scope for artificial
recharge.
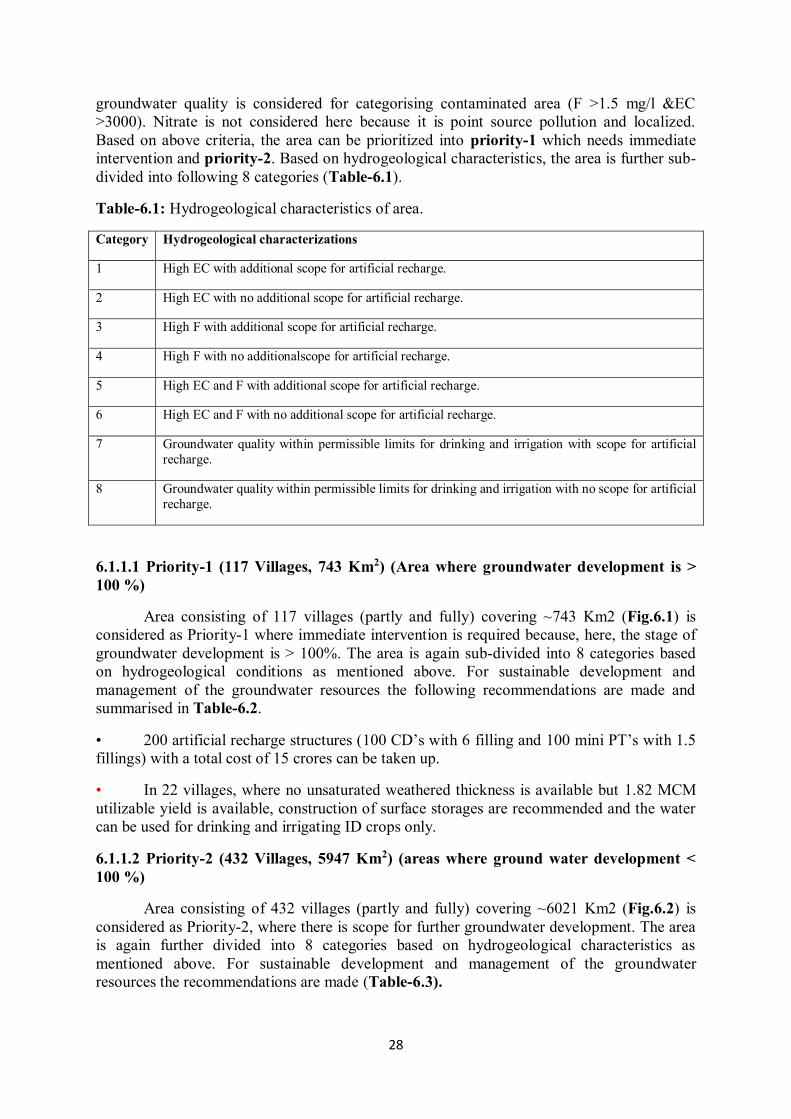
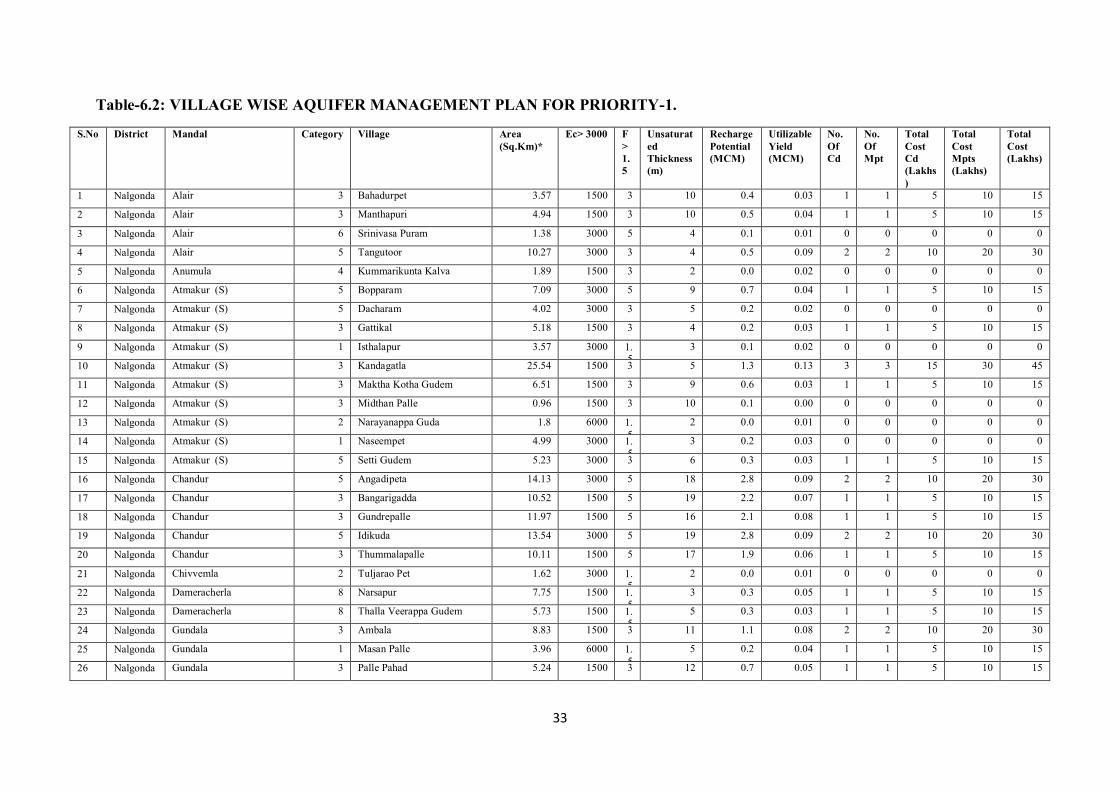
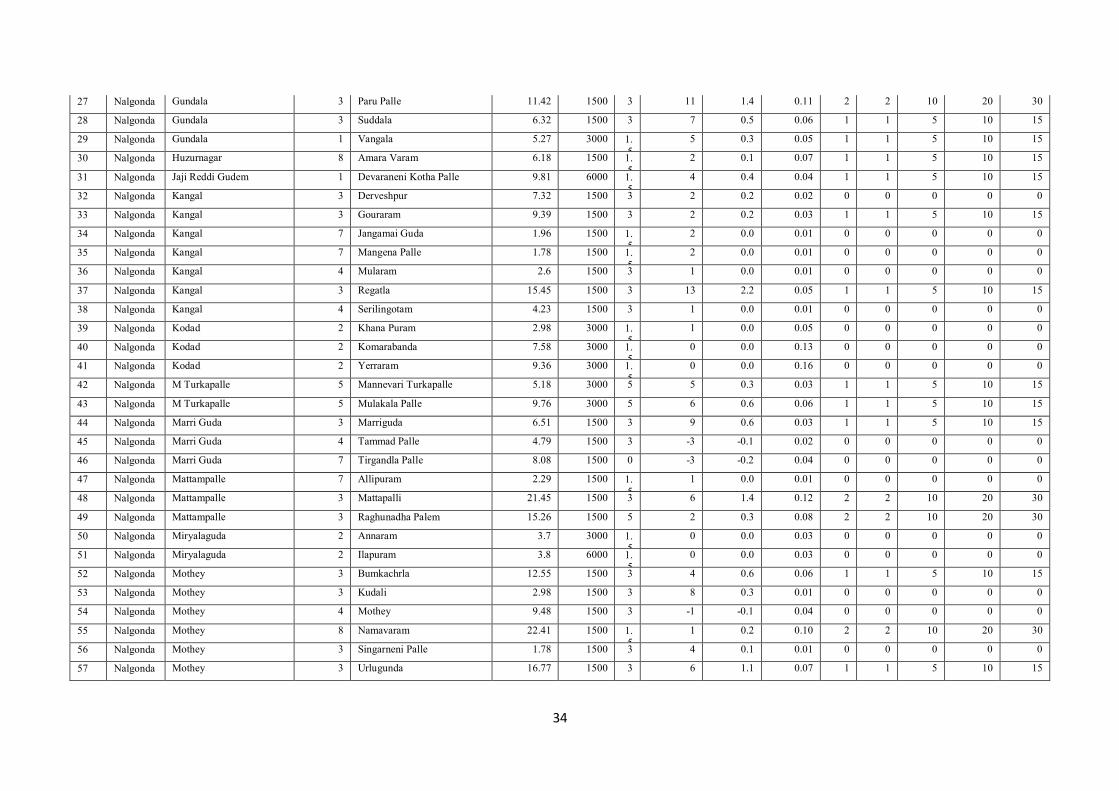
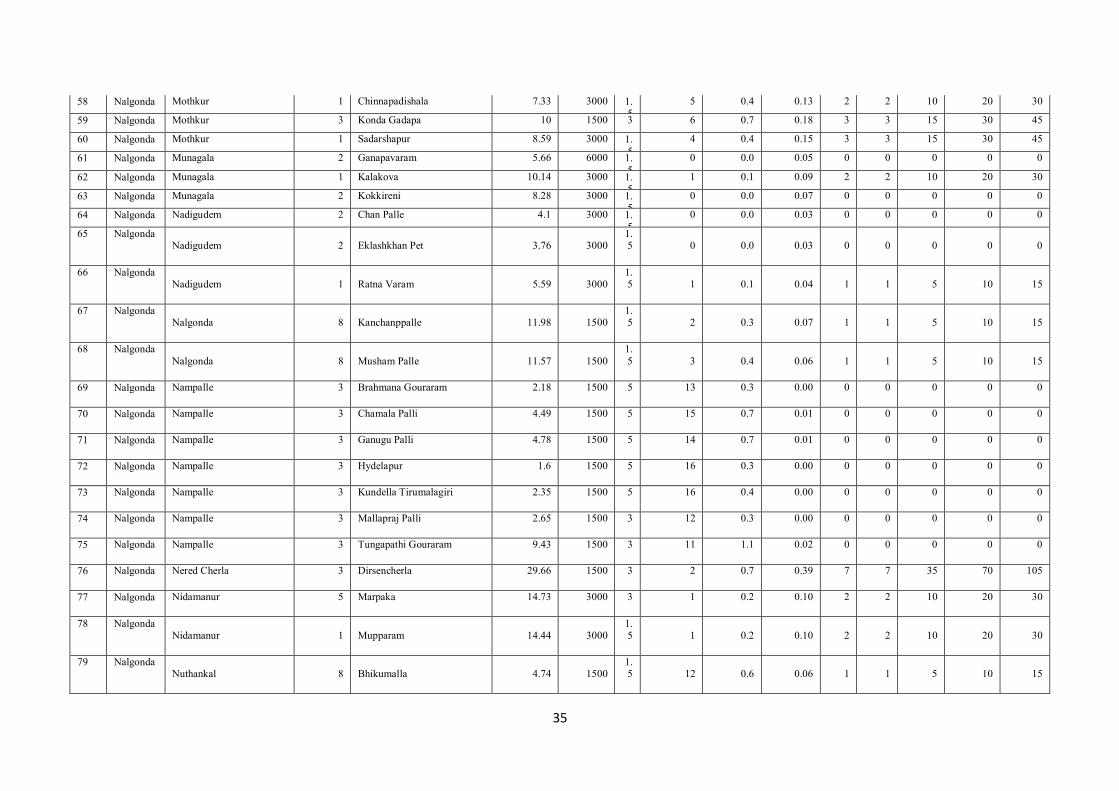
6.1.1.1 Priority-1 (117 Villages, 743 Km2) (Area where groundwater development is >
100 %)
Area consisting of 117 villages (partly and fully) covering ~743 Km2 (Fig.6.1) is
considered as Priority-1 where immediate intervention is required because, here, the stage of
groundwater development is > 100%. The area is again sub-divided into 8 categories based
on hydrogeological conditions as mentioned above. For sustainable development and
management of the groundwater resources the following recommendations are made and
summarised in Table-6.2.
• 200 artificial recharge structures (100 CD’s with 6 filling and 100 mini PT’s with 1.5
fillings) with a total cost of 15 crores can be taken up.
• In 22 villages, where no unsaturated weathered thickness is available but 1.82 MCM
utilizable yield is available, construction of surface storages are recommended and the water
can be used for drinking and irrigating ID crops only.
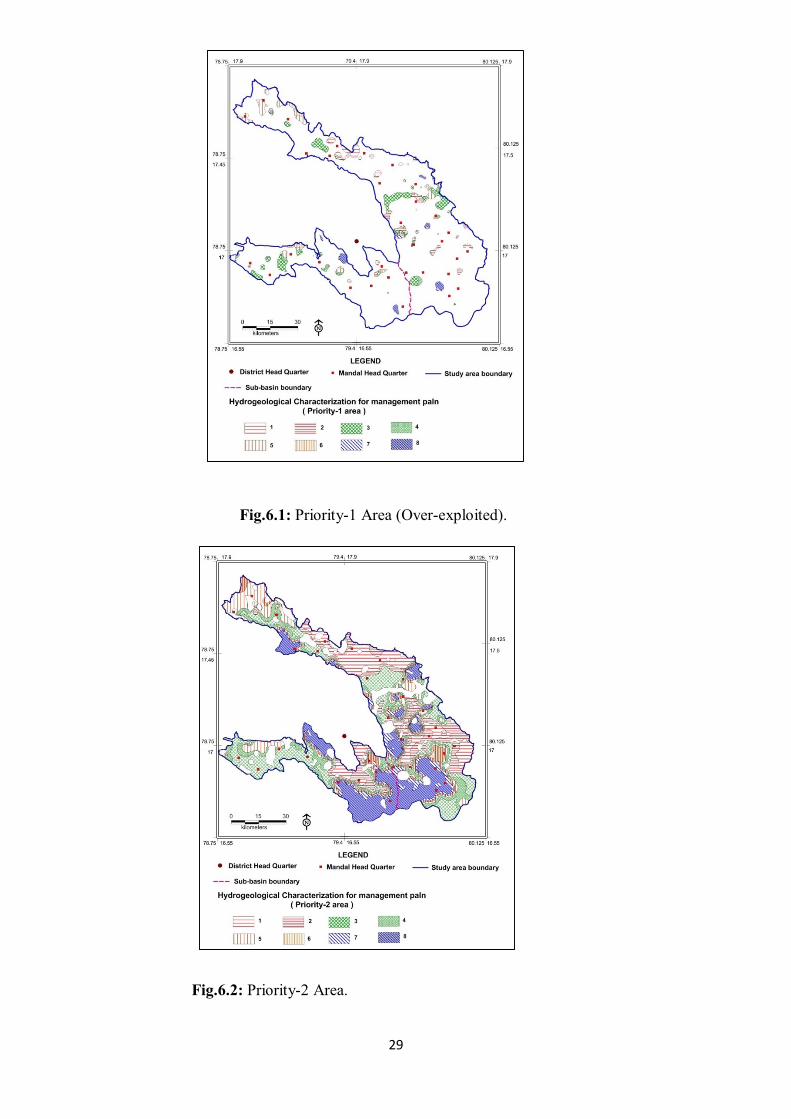
6.1.1.2 Priority-2 (432 Villages, 5947 Km2) (areas where ground water development <
100 %)
Area consisting of 432 villages (partly and fully) covering ~6021 Km2 (Fig.6.2) is
considered as Priority-2, where there is scope for further groundwater development. The area
is again further divided into 8 categories based on hydrogeological characteristics as
mentioned above. For sustainable development and management of the groundwater
resources the recommendations are made (Table-6.3).
29
Fig.6.1: Priority-1 Area (Over-exploited).
Fig.6.2: Priority-2 Area.
30
• 1528 artificial recharge structures (ARS) (764 CD’s with 6 fillings and 764mini PT’s
with 1.5 fillings) can be taken up with a cost estimate of 114.6 crores.
In 77 villages, where no unsaturated weathered thickness is available but 8.4 MCM utilizable
yield is available, there construction of surface storages are recommended and the water can
be used for drinking and irrigating dry (ID) crops only.
Water Conservation Measures(WCM) (Farm Ponds):
The farm ponds are the ideal water conservation structures, which are constructed in
the low lying areas of the farm. The ideal size of form ponds is 10 x 10 x3 m. In the area total
10980 farm ponds are recommended (20 in each village) with total cost of 27.45 crores. The
expected storage from this will be ~3.29 MCM and this will contribute ~1.64 MCM (50
%).of recharge to the ground water.
Mission Kakatiya (Repair Renovation and Restoration of existing tanks):
• De-silting of existing minor tanks (351 no’s) was taken under state Govt.
sponsored Mission Kaktiya-Phase-1 to remove 9.6 MCM of silt, out of which till
December 2015, 6.26 MCM is removed (with storage capacity of 175 MCM)
costing ~136 crores and this has created additional surface storage. The net
recharge to ground water will be 3.13 MCM and with this ~520 ha additional land
can be brought under irrigated dry (ID) crops in tank ayacut. There is need to take
remaining tanks (~1650 nos) in next phases for de-silting, this will greatly help in
stabilisation of tank ayacut and groundwater augmentation.
• Remaining 1650 tanks, check dams and percolation tanks can be de-silted
involving people’s participation through the Mahatma Gandhi National Rural
Employment Guarantee Scheme (MGNREGS) (NREGA 2005). This will also
help in sustainable management of groundwater resources.
• Some of de-silted tanks along Musi river may be filled with treated Musi river
water (free from heavy metals) during lean monsoon period as done in the upper
parts of Musi basin.
Mission Bhagiratha (Drinking water supply to every house hold):
• Presently, out of ~15.64 lakh population, ~5.5 lakh population from 532 villages
have been provided with protected water supply from surface water with per
capita of 40 lpd/person. In the area ~8 MCM/year of water is provided under multi
village scheme (MVS).
• Under Telangana Drinking Water Supply Project (TDWSP) also known as
Mission Bhagiratha, all the villages are proposed to be covered from the 3 water
grids segments AKBR(Ghanpur-Bhongir),Mallepally and Bhongir-Alair to
provide protected water from surface reservoirs (the schemes are at various stages
of completion). The scheme is to enhance the existing drinking water scheme and
provide 100 lpd/persons and 135 lpd/person in rural and urban areas respectively.
Thus all habitations (including fluoride affected) will be covered with the
implementation of this project.
• Imported water to the tune of ~53MCM from surface sources into the basins will
reduce the stress on groundwater, which can be effectively utilized to irrigate
~8800 ha of additional land under ID crops or the stage of ground water can be
reduced by 6 %.
31
6.1.2 Demand side measures: In order to manage the available resources more effectively
the following measures are recommended.
• Conjunctive use of ground water and surface water in the command area is
recommended where water levels are in the range of 0-5 m.bgl.
• Demand side measures include adaptation of micro irrigation practices which saves
~25 % water as compared to traditional flooding irrigation. In the area till date 36,300
no’s of drip and sprinklers are sanctioned which has irrigated ~41700 ha under ID
crops saving ~80 MCM of groundwater from the basin. Additional areas need to be
brought under micro irrigation.
• ~ 54900 ha of additional land that can be brought under micro-irrigation (@100
ha/village) costing about 329.4 crores (considering 1 unit/ha @0.6 lakh/ha). With this
110 MCM of ground water can be conserved over the traditional irrigation practices.
6.1.3 Regulatory measures
• Change in cropping pattern from water intensive paddy to other irrigated dry and
drought resistant crops that have a short growing season is recommended, particularly in
critical areas (Chandur mandal). If necessary some regulatory rules may be framed and
implemented.
• To avoid the interference of cone of depression between two productive wells,
intermittent pumping of borewells is recommended through regulatory mechanism.
• Complete ban on paddy cultivation during rabi season under ground water irrigation.
• Power supply should be regulated by giving power in 4 hour spells (two times a day,
in the morning and evening)to increase the sustainability of structures.
• As mandatory measures power connection may be given to only those farmers who
are adopting micro irrigation for all new bore well to be constructed.
6.1.4 Institutional measures
• A participatory groundwater management (PGWM) approach in sharing of
groundwater and monitoring resources on a constant basis along with effective
implementation of the existing Andhra Pradesh ‘Water, Land and Trees Act’ of 2002
(APWALTA 2002) are the other measures suggested.
• Subsidy/incentives on cost involved in sharing of groundwater may be given to the
farmers involved.
• In the existing ground water areas sharing of ground water amongst the users is to be
encouraged to increase the sustainability of wells by reducing well interference and to
promote this the bore well owner should be suitably compensated for the cost of well
by funding to farmers for adopting micro irrigation practices in the entire well
command area to be born by the Govt.
• The other measures includes, supplementary calcium and phosphorous rich food
should be provided to children in fluoride contaminated areas (Category-3 and 4),
creating awareness about safe drinking water habits, side effects of high fluoride and
nitrate rich groundwater, improving oral hygiene conditions are recommended. In
urban and rural areas the sewerage line should be constructed to arrest leaching of
nitrate. Going for salt tolerant plants like cheak pea, mustard etc where water levels
are deep and in shallow water table areas (Category-1 and 5), where EC is high, the
rice varieties like CSR-27, CSR-23, CSR-13 and CSR-10 are recommended in
Category-2 and 6.
32
6.2 EXPECTED RESULTS AND OUT COME
With the above interventions costing Rs 486.45 crores (excluding the cost involved in
Mission Kaktiya and Mission Bhagiratha), the likely benefit would be the net saving of 173
MCM of ground water. This will bring down the stage of ground water development by 15 %
(from 64% to 49 %).
Acknowledgment
The authors thank Shri K.B. Biswas, Chairman, and Sri. D. Saha, Member (SAM),
Sri. K.C.Naik, Member (ED & MM), of the Central Ground Water Board, Govt. of India and
S/Shri A.D.Rao, Regional Director, and Dr.P.N.Rao and GRC Reddy of CGWB, for
encouragement. The authors acknowledge State Ground Water Department and Rural Water
Supply department, Govt of Telangana for making available of field data. Authors also thank
the Executive Engineer and his drilling crew of CGWB, for carrying out the exploration
activity.
33
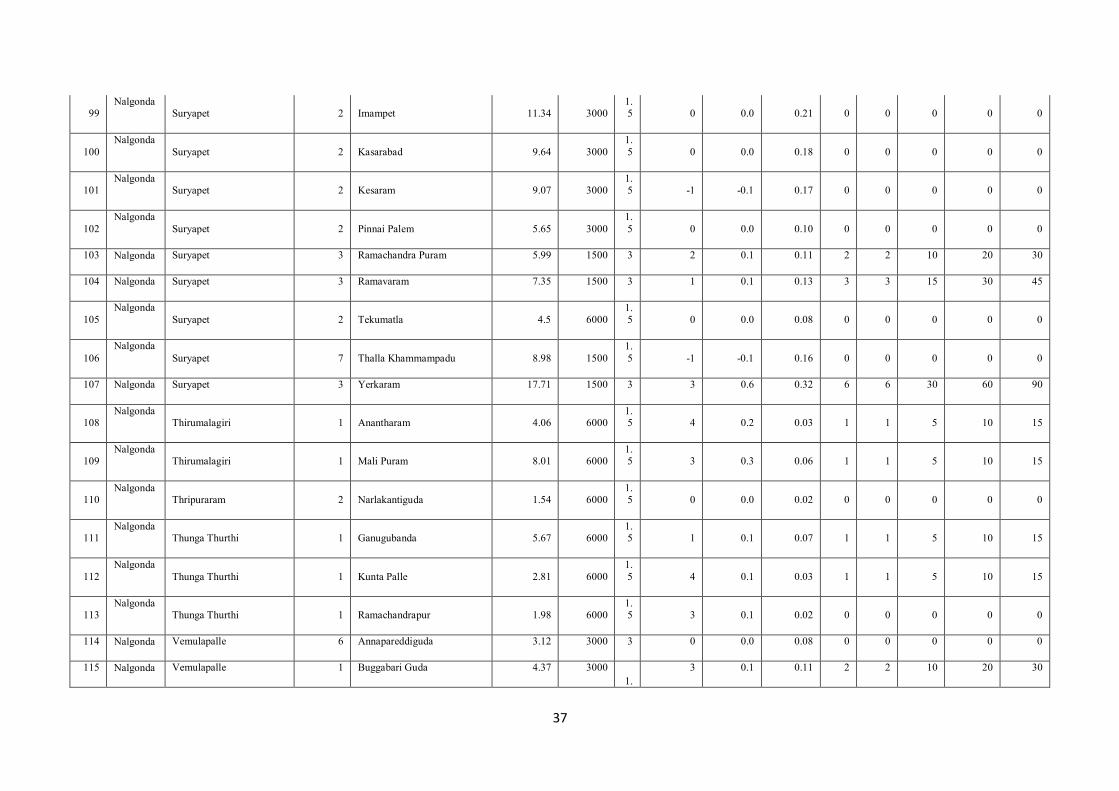
Table-6.2: VILLAGE WISE AQUIFER MANAGEMENT PLAN FOR PRIORITY-1.
S.No District Mandal Category Village Area
(Sq.Km)*
Ec> 3000 F
>
1.
5
Unsaturat
ed
Thickness
(m)
Recharge
Potential
(MCM)
Utilizable
Yield
(MCM)
No.
Of
Cd
No.
Of
Mpt
Total
Cost
Cd
(Lakhs
)
Total
Cost
Mpts
(Lakhs)
Total
Cost
(Lakhs)
1 Nalgonda Alair 3 Bahadurpet 3.57 1500 3 10 0.4 0.03 1 1 5 10 15
2 Nalgonda Alair 3 Manthapuri 4.94 1500 3 10 0.5 0.04 1 1 5 10 15
3 Nalgonda Alair 6 Srinivasa Puram 1.38 3000 5 4 0.1 0.01 0 0 0 0 0
4 Nalgonda Alair 5 Tangutoor 10.27 3000 3 4 0.5 0.09 2 2 10 20 30
5 Nalgonda Anumula 4 Kummarikunta Kalva 1.89 1500 3 2 0.0 0.02 0 0 0 0 0
6 Nalgonda Atmakur (S) 5 Bopparam 7.09 3000 5 9 0.7 0.04 1 1 5 10 15
7 Nalgonda Atmakur (S) 5 Dacharam 4.02 3000 3 5 0.2 0.02 0 0 0 0 0
8 Nalgonda Atmakur (S) 3 Gattikal 5.18 1500 3 4 0.2 0.03 1 1 5 10 15
9 Nalgonda Atmakur (S) 1 Isthalapur 3.57 3000 1.5
3 0.1 0.02 0 0 0 0 0
10 Nalgonda Atmakur (S) 3 Kandagatla 25.54 1500 3 5 1.3 0.13 3 3 15 30 45
11 Nalgonda Atmakur (S) 3 Maktha Kotha Gudem 6.51 1500 3 9 0.6 0.03 1 1 5 10 15
12 Nalgonda Atmakur (S) 3 Midthan Palle 0.96 1500 3 10 0.1 0.00 0 0 0 0 0
13 Nalgonda Atmakur (S) 2 Narayanappa Guda 1.8 6000 1.
5
2 0.0 0.01 0 0 0 0 0
14 Nalgonda Atmakur (S) 1 Naseempet 4.99 3000 1.
5
3 0.2 0.03 0 0 0 0 0
15 Nalgonda Atmakur (S) 5 Setti Gudem 5.23 3000 3 6 0.3 0.03 1 1 5 10 15
16 Nalgonda Chandur 5 Angadipeta 14.13 3000 5 18 2.8 0.09 2 2 10 20 30
17 Nalgonda Chandur 3 Bangarigadda 10.52 1500 5 19 2.2 0.07 1 1 5 10 15
18 Nalgonda Chandur 3 Gundrepalle 11.97 1500 5 16 2.1 0.08 1 1 5 10 15
19 Nalgonda Chandur 5 Idikuda 13.54 3000 5 19 2.8 0.09 2 2 10 20 30
20 Nalgonda Chandur 3 Thummalapalle 10.11 1500 5 17 1.9 0.06 1 1 5 10 15
21 Nalgonda Chivvemla 2 Tuljarao Pet 1.62 3000 1.5
2 0.0 0.01 0 0 0 0 0
22 Nalgonda Dameracherla 8 Narsapur 7.75 1500 1.5
3 0.3 0.05 1 1 5 10 15
23 Nalgonda Dameracherla 8 Thalla Veerappa Gudem 5.73 1500 1.5
5 0.3 0.03 1 1 5 10 15
24 Nalgonda Gundala 3 Ambala 8.83 1500 3 11 1.1 0.08 2 2 10 20 30
25 Nalgonda Gundala 1 Masan Palle 3.96 6000 1.
5
5 0.2 0.04 1 1 5 10 15
26 Nalgonda Gundala 3 Palle Pahad 5.24 1500 3 12 0.7 0.05 1 1 5 10 15
34
27 Nalgonda Gundala 3 Paru Palle 11.42 1500 3 11 1.4 0.11 2 2 10 20 30
28 Nalgonda Gundala 3 Suddala 6.32 1500 3 7 0.5 0.06 1 1 5 10 15
29 Nalgonda Gundala 1 Vangala 5.27 3000 1.
5
5 0.3 0.05 1 1 5 10 15
30 Nalgonda Huzurnagar 8 Amara Varam 6.18 1500 1.
5
2 0.1 0.07 1 1 5 10 15
31 Nalgonda Jaji Reddi Gudem 1 Devaraneni Kotha Palle 9.81 6000 1.5
4 0.4 0.04 1 1 5 10 15
32 Nalgonda Kangal 3 Derveshpur 7.32 1500 3 2 0.2 0.02 0 0 0 0 0
33 Nalgonda Kangal 3 Gouraram 9.39 1500 3 2 0.2 0.03 1 1 5 10 15
34 Nalgonda Kangal 7 Jangamai Guda 1.96 1500 1.5
2 0.0 0.01 0 0 0 0 0
35 Nalgonda Kangal 7 Mangena Palle 1.78 1500 1.
5
2 0.0 0.01 0 0 0 0 0
36 Nalgonda Kangal 4 Mularam 2.6 1500 3 1 0.0 0.01 0 0 0 0 0
37 Nalgonda Kangal 3 Regatla 15.45 1500 3 13 2.2 0.05 1 1 5 10 15
38 Nalgonda Kangal 4 Serilingotam 4.23 1500 3 1 0.0 0.01 0 0 0 0 0
39 Nalgonda Kodad 2 Khana Puram 2.98 3000 1.5
1 0.0 0.05 0 0 0 0 0
40 Nalgonda Kodad 2 Komarabanda 7.58 3000 1.5
0 0.0 0.13 0 0 0 0 0
41 Nalgonda Kodad 2 Yerraram 9.36 3000 1.
5
0 0.0 0.16 0 0 0 0 0
42 Nalgonda M Turkapalle 5 Mannevari Turkapalle 5.18 3000 5 5 0.3 0.03 1 1 5 10 15
43 Nalgonda M Turkapalle 5 Mulakala Palle 9.76 3000 5 6 0.6 0.06 1 1 5 10 15
44 Nalgonda Marri Guda 3 Marriguda 6.51 1500 3 9 0.6 0.03 1 1 5 10 15
45 Nalgonda Marri Guda 4 Tammad Palle 4.79 1500 3 -3 -0.1 0.02 0 0 0 0 0
46 Nalgonda Marri Guda 7 Tirgandla Palle 8.08 1500 0 -3 -0.2 0.04 0 0 0 0 0
47 Nalgonda Mattampalle 7 Allipuram 2.29 1500 1.
5
1 0.0 0.01 0 0 0 0 0
48 Nalgonda Mattampalle 3 Mattapalli 21.45 1500 3 6 1.4 0.12 2 2 10 20 30
49 Nalgonda Mattampalle 3 Raghunadha Palem 15.26 1500 5 2 0.3 0.08 2 2 10 20 30
50 Nalgonda Miryalaguda 2 Annaram 3.7 3000 1.5
0 0.0 0.03 0 0 0 0 0
51 Nalgonda Miryalaguda 2 Ilapuram 3.8 6000 1.5
0 0.0 0.03 0 0 0 0 0
52 Nalgonda Mothey 3 Bumkachrla 12.55 1500 3 4 0.6 0.06 1 1 5 10 15
53 Nalgonda Mothey 3 Kudali 2.98 1500 3 8 0.3 0.01 0 0 0 0 0
54 Nalgonda Mothey 4 Mothey 9.48 1500 3 -1 -0.1 0.04 0 0 0 0 0
55 Nalgonda Mothey 8 Namavaram 22.41 1500 1.5
1 0.2 0.10 2 2 10 20 30
56 Nalgonda Mothey 3 Singarneni Palle 1.78 1500 3 4 0.1 0.01 0 0 0 0 0
57 Nalgonda Mothey 3 Urlugunda 16.77 1500 3 6 1.1 0.07 1 1 5 10 15
35
58 Nalgonda Mothkur 1 Chinnapadishala 7.33 3000 1.5
5 0.4 0.13 2 2 10 20 30
59 Nalgonda Mothkur 3 Konda Gadapa 10 1500 3 6 0.7 0.18 3 3 15 30 45
60 Nalgonda Mothkur 1 Sadarshapur 8.59 3000 1.
5
4 0.4 0.15 3 3 15 30 45
61 Nalgonda Munagala 2 Ganapavaram 5.66 6000 1.
5
0 0.0 0.05 0 0 0 0 0
62 Nalgonda Munagala 1 Kalakova 10.14 3000 1.5
1 0.1 0.09 2 2 10 20 30
63 Nalgonda Munagala 2 Kokkireni 8.28 3000 1.5
0 0.0 0.07 0 0 0 0 0
64 Nalgonda Nadigudem 2 Chan Palle 4.1 3000 1.5
0 0.0 0.03 0 0 0 0 0
65 Nalgonda Nadigudem 2 Eklashkhan Pet 3.76 3000
1.5 0 0.0 0.03 0 0 0 0 0
66 Nalgonda Nadigudem 1 Ratna Varam 5.59 3000
1.5 1 0.1 0.04 1 1 5 10 15
67 Nalgonda Nalgonda 8 Kanchanppalle 11.98 1500
1.5 2 0.3 0.07 1 1 5 10 15
68 Nalgonda
Nalgonda 8 Musham Palle 11.57 1500
1.
5 3 0.4 0.06 1 1 5 10 15
69 Nalgonda Nampalle 3 Brahmana Gouraram 2.18 1500 5 13 0.3 0.00 0 0 0 0 0
70 Nalgonda Nampalle 3 Chamala Palli 4.49 1500 5 15 0.7 0.01 0 0 0 0 0
71 Nalgonda Nampalle 3 Ganugu Palli 4.78 1500 5 14 0.7 0.01 0 0 0 0 0
72 Nalgonda Nampalle 3 Hydelapur 1.6 1500 5 16 0.3 0.00 0 0 0 0 0
73 Nalgonda Nampalle 3 Kundella Tirumalagiri 2.35 1500 5 16 0.4 0.00 0 0 0 0 0
74 Nalgonda Nampalle 3 Mallapraj Palli 2.65 1500 3 12 0.3 0.00 0 0 0 0 0
75 Nalgonda Nampalle 3 Tungapathi Gouraram 9.43 1500 3 11 1.1 0.02 0 0 0 0 0
76 Nalgonda Nered Cherla 3 Dirsencherla 29.66 1500 3 2 0.7 0.39 7 7 35 70 105
77 Nalgonda Nidamanur 5 Marpaka 14.73 3000 3 1 0.2 0.10 2 2 10 20 30
78 Nalgonda Nidamanur 1 Mupparam 14.44 3000
1.5 1 0.2 0.10 2 2 10 20 30
79 Nalgonda Nuthankal 8 Bhikumalla 4.74 1500
1.5 12 0.6 0.06 1 1 5 10 15
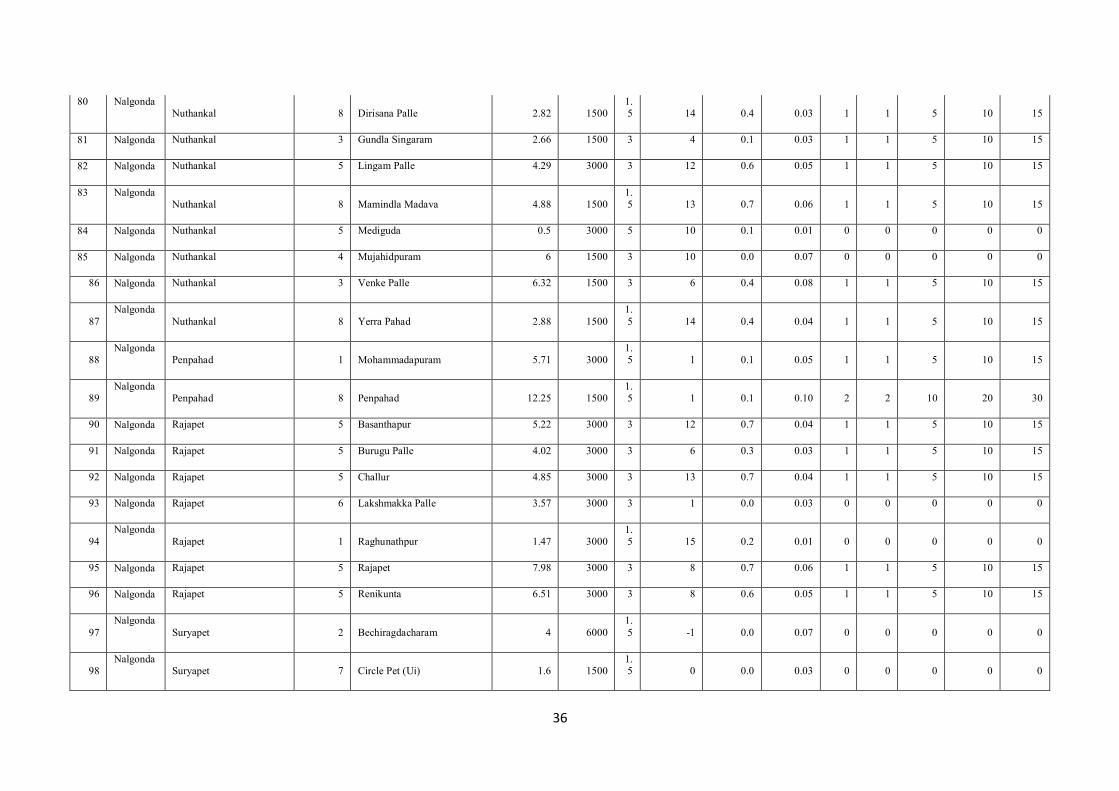
36
80 Nalgonda Nuthankal 8 Dirisana Palle 2.82 1500
1.5 14 0.4 0.03 1 1 5 10 15
81 Nalgonda Nuthankal 3 Gundla Singaram 2.66 1500 3 4 0.1 0.03 1 1 5 10 15
82 Nalgonda Nuthankal 5 Lingam Palle 4.29 3000 3 12 0.6 0.05 1 1 5 10 15
83 Nalgonda Nuthankal 8 Mamindla Madava 4.88 1500
1.5 13 0.7 0.06 1 1 5 10 15
84 Nalgonda Nuthankal 5 Mediguda 0.5 3000 5 10 0.1 0.01 0 0 0 0 0
85 Nalgonda Nuthankal 4 Mujahidpuram 6 1500 3 10 0.0 0.07 0 0 0 0 0
86 Nalgonda Nuthankal 3 Venke Palle 6.32 1500 3 6 0.4 0.08 1 1 5 10 15
87
Nalgonda
Nuthankal 8 Yerra Pahad 2.88 1500
1.
5 14 0.4 0.04 1 1 5 10 15
88 Nalgonda
Penpahad 1 Mohammadapuram 5.71 3000 1.5 1 0.1 0.05 1 1 5 10 15
89 Nalgonda
Penpahad 8 Penpahad 12.25 1500 1.5 1 0.1 0.10 2 2 10 20 30
90 Nalgonda Rajapet 5 Basanthapur 5.22 3000 3 12 0.7 0.04 1 1 5 10 15
91 Nalgonda Rajapet 5 Burugu Palle 4.02 3000 3 6 0.3 0.03 1 1 5 10 15
92 Nalgonda Rajapet 5 Challur 4.85 3000 3 13 0.7 0.04 1 1 5 10 15
93 Nalgonda Rajapet 6 Lakshmakka Palle 3.57 3000 3 1 0.0 0.03 0 0 0 0 0
94
Nalgonda
Rajapet 1 Raghunathpur 1.47 3000 1.5 15 0.2 0.01 0 0 0 0 0
95 Nalgonda Rajapet 5 Rajapet 7.98 3000 3 8 0.7 0.06 1 1 5 10 15
96 Nalgonda Rajapet 5 Renikunta 6.51 3000 3 8 0.6 0.05 1 1 5 10 15
97
Nalgonda
Suryapet 2 Bechiragdacharam 4 6000
1.
5 -1 0.0 0.07 0 0 0 0 0
98 Nalgonda
Suryapet 7 Circle Pet (Ui) 1.6 1500 1.5 0 0.0 0.03 0 0 0 0 0
37
99 Nalgonda
Suryapet 2 Imampet 11.34 3000 1.5 0 0.0 0.21 0 0 0 0 0
100
Nalgonda
Suryapet 2 Kasarabad 9.64 3000
1.
5 0 0.0 0.18 0 0 0 0 0
101 Nalgonda
Suryapet 2 Kesaram 9.07 3000 1.5 -1 -0.1 0.17 0 0 0 0 0
102
Nalgonda
Suryapet 2 Pinnai Palem 5.65 3000
1.
5 0 0.0 0.10 0 0 0 0 0
103 Nalgonda Suryapet 3 Ramachandra Puram 5.99 1500 3 2 0.1 0.11 2 2 10 20 30
104 Nalgonda Suryapet 3 Ramavaram 7.35 1500 3 1 0.1 0.13 3 3 15 30 45
105
Nalgonda
Suryapet 2 Tekumatla 4.5 6000 1.5 0 0.0 0.08 0 0 0 0 0
106
Nalgonda
Suryapet 7 Thalla Khammampadu 8.98 1500
1.
5 -1 -0.1 0.16 0 0 0 0 0
107 Nalgonda Suryapet 3 Yerkaram 17.71 1500 3 3 0.6 0.32 6 6 30 60 90
108 Nalgonda
Thirumalagiri 1 Anantharam 4.06 6000 1.5 4 0.2 0.03 1 1 5 10 15
109 Nalgonda
Thirumalagiri 1 Mali Puram 8.01 6000 1.5 3 0.3 0.06 1 1 5 10 15
110 Nalgonda
Thripuraram 2 Narlakantiguda 1.54 6000 1.5 0 0.0 0.02 0 0 0 0 0
111 Nalgonda
Thunga Thurthi 1 Ganugubanda 5.67 6000 1.5 1 0.1 0.07 1 1 5 10 15
112
Nalgonda
Thunga Thurthi 1 Kunta Palle 2.81 6000
1.
5 4 0.1 0.03 1 1 5 10 15
113 Nalgonda
Thunga Thurthi 1 Ramachandrapur 1.98 6000 1.5 3 0.1 0.02 0 0 0 0 0
114 Nalgonda Vemulapalle 6 Annapareddiguda 3.12 3000 3 0 0.0 0.08 0 0 0 0 0
115 Nalgonda Vemulapalle 1 Buggabari Guda 4.37 3000
1.
3 0.1 0.11 2 2 10 20 30
38
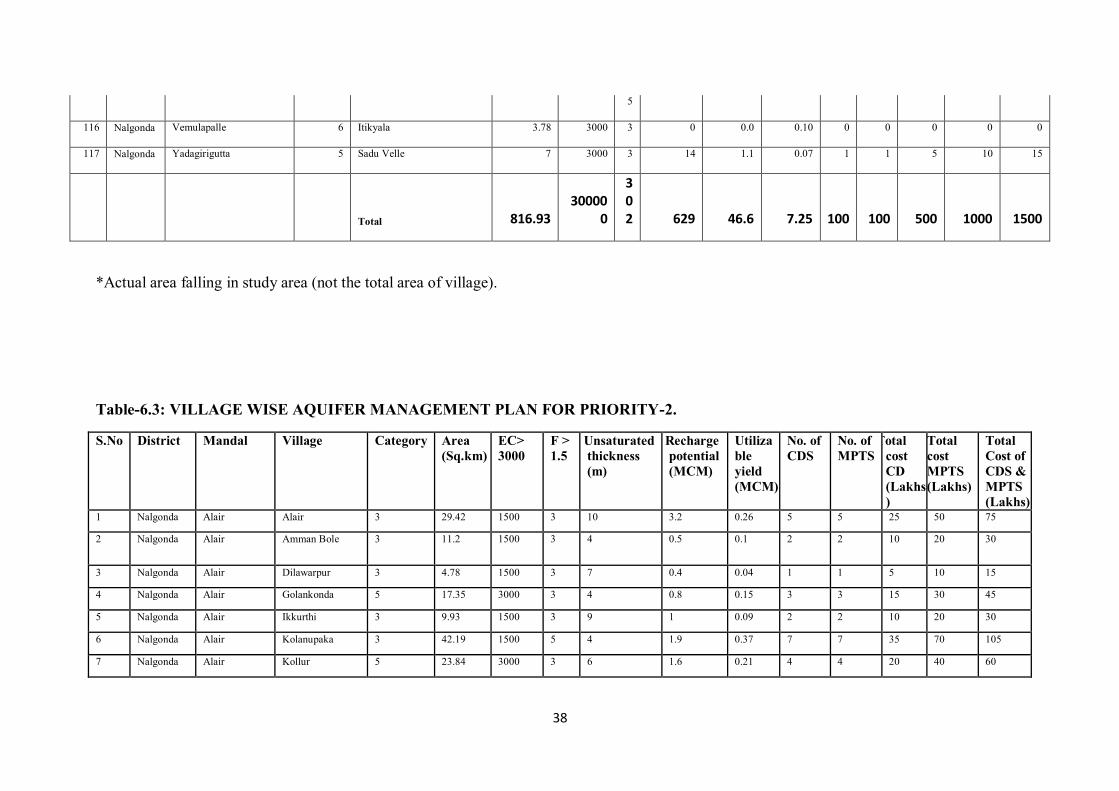
*Actual area falling in study area (not the total area of village).
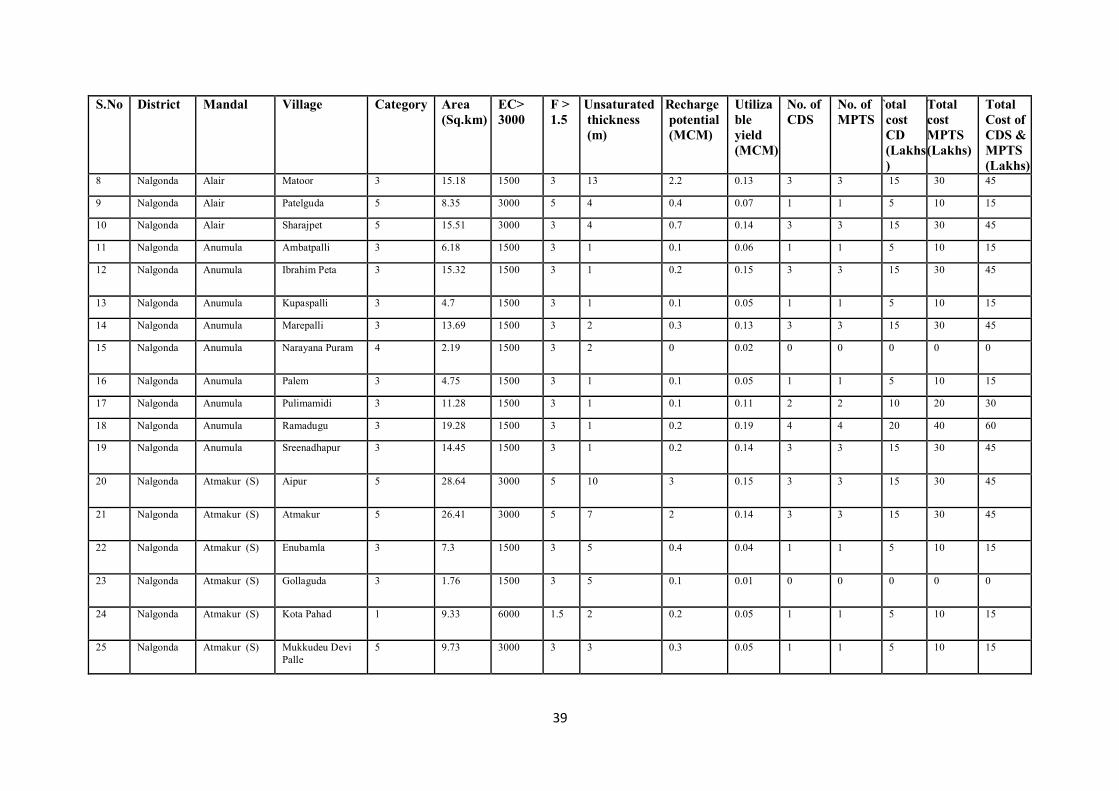
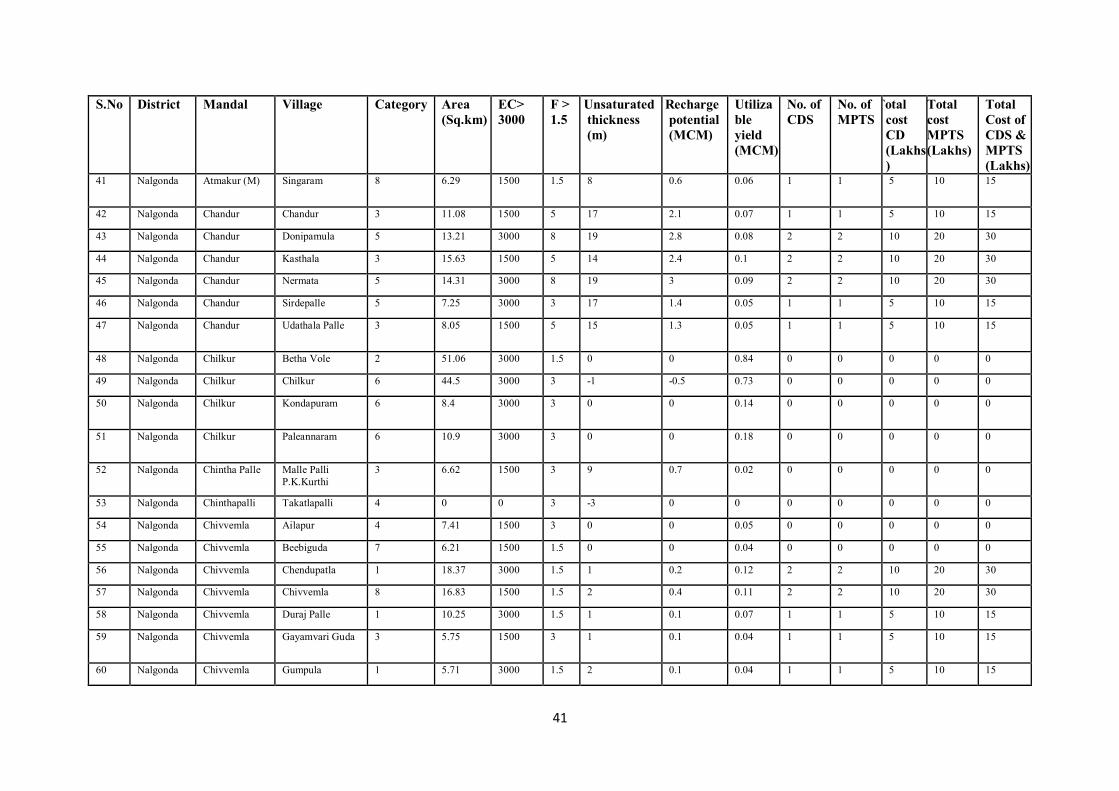
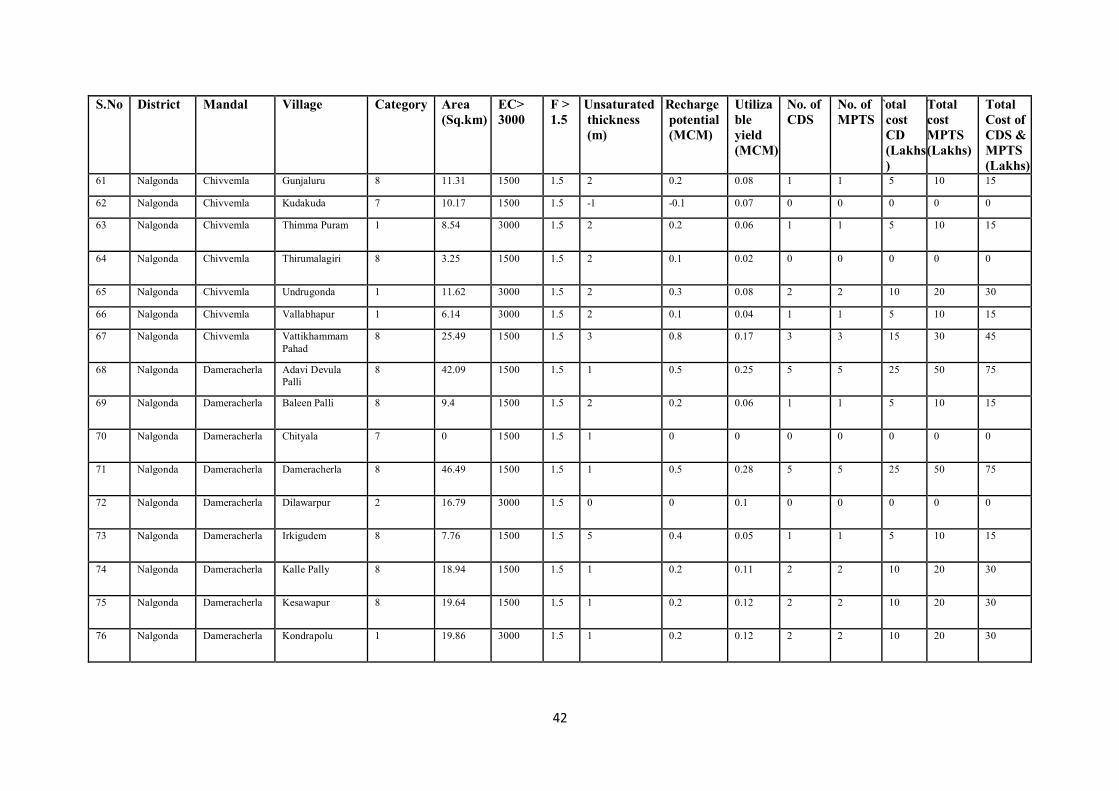
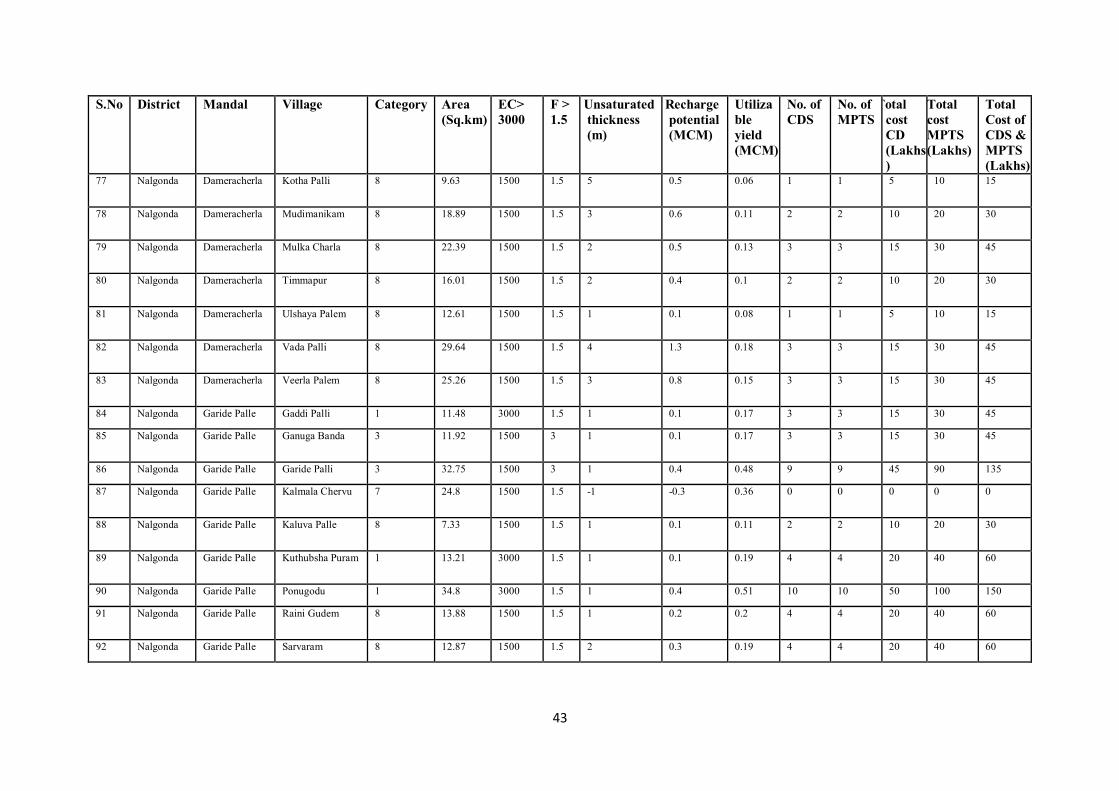
Table-6.3: VILLAGE WISE AQUIFER MANAGEMENT PLAN FOR PRIORITY-2.
S.No District Mandal Village Category Area
(Sq.km)
EC>
3000
F >
1.5
Unsaturated
thickness
(m)
Recharge
potential
(MCM)
Utiliza
ble
yield
(MCM)
No. of
CDS
No. of
MPTS
Total
cost
CD
(Lakhs
)
Total
cost
MPTS
(Lakhs)
Total
Cost of
CDS &
MPTS
(Lakhs) 1 Nalgonda Alair Alair 3 29.42 1500 3 10 3.2 0.26 5 5 25 50 75
2 Nalgonda Alair Amman Bole 3 11.2 1500 3 4 0.5 0.1 2 2 10 20 30
3 Nalgonda Alair Dilawarpur 3 4.78 1500 3 7 0.4 0.04 1 1 5 10 15
4 Nalgonda Alair Golankonda 5 17.35 3000 3 4 0.8 0.15 3 3 15 30 45
5 Nalgonda Alair Ikkurthi 3 9.93 1500 3 9 1 0.09 2 2 10 20 30
6 Nalgonda Alair Kolanupaka 3 42.19 1500 5 4 1.9 0.37 7 7 35 70 105
7 Nalgonda Alair Kollur 5 23.84 3000 3 6 1.6 0.21 4 4 20 40 60
5
116 Nalgonda Vemulapalle 6 Itikyala 3.78 3000 3 0 0.0 0.10 0 0 0 0 0
117 Nalgonda Yadagirigutta 5 Sadu Velle 7 3000 3 14 1.1 0.07 1 1 5 10 15
Total 816.93 30000
0
302 629 46.6 7.25 100 100 500 1000 1500
39
S.No District Mandal Village Category Area
(Sq.km)
EC>
3000
F >
1.5
Unsaturated
thickness
(m)
Recharge
potential
(MCM)
Utiliza
ble
yield
(MCM)
No. of
CDS
No. of
MPTS
Total
cost
CD
(Lakhs
)
Total
cost
MPTS
(Lakhs)
Total
Cost of
CDS &
MPTS
(Lakhs) 8 Nalgonda Alair Matoor 3 15.18 1500 3 13 2.2 0.13 3 3 15 30 45
9 Nalgonda Alair Patelguda 5 8.35 3000 5 4 0.4 0.07 1 1 5 10 15
10 Nalgonda Alair Sharajpet 5 15.51 3000 3 4 0.7 0.14 3 3 15 30 45
11 Nalgonda Anumula Ambatpalli 3 6.18 1500 3 1 0.1 0.06 1 1 5 10 15
12 Nalgonda Anumula Ibrahim Peta 3 15.32 1500 3 1 0.2 0.15 3 3 15 30 45
13 Nalgonda Anumula Kupaspalli 3 4.7 1500 3 1 0.1 0.05 1 1 5 10 15
14 Nalgonda Anumula Marepalli 3 13.69 1500 3 2 0.3 0.13 3 3 15 30 45
15 Nalgonda Anumula Narayana Puram 4 2.19 1500 3 2 0 0.02 0 0 0 0 0
16 Nalgonda Anumula Palem 3 4.75 1500 3 1 0.1 0.05 1 1 5 10 15
17 Nalgonda Anumula Pulimamidi 3 11.28 1500 3 1 0.1 0.11 2 2 10 20 30
18 Nalgonda Anumula Ramadugu 3 19.28 1500 3 1 0.2 0.19 4 4 20 40 60
19 Nalgonda Anumula Sreenadhapur 3 14.45 1500 3 1 0.2 0.14 3 3 15 30 45
20 Nalgonda Atmakur (S) Aipur 5 28.64 3000 5 10 3 0.15 3 3 15 30 45
21 Nalgonda Atmakur (S) Atmakur 5 26.41 3000 5 7 2 0.14 3 3 15 30 45
22 Nalgonda Atmakur (S) Enubamla 3 7.3 1500 3 5 0.4 0.04 1 1 5 10 15
23 Nalgonda Atmakur (S) Gollaguda 3 1.76 1500 3 5 0.1 0.01 0 0 0 0 0
24 Nalgonda Atmakur (S) Kota Pahad 1 9.33 6000 1.5 2 0.2 0.05 1 1 5 10 15
25 Nalgonda Atmakur (S) Mukkudeu Devi
Palle
5 9.73 3000 3 3 0.3 0.05 1 1 5 10 15

40
S.No District Mandal Village Category Area
(Sq.km)
EC>
3000
F >
1.5
Unsaturated
thickness
(m)
Recharge
potential
(MCM)
Utiliza
ble
yield
(MCM)
No. of
CDS
No. of
MPTS
Total
cost
CD
(Lakhs
)
Total
cost
MPTS
(Lakhs)
Total
Cost of
CDS &
MPTS
(Lakhs) 26 Nalgonda Atmakur (S) Nammikal 8 29.72 1500 1.5 4 1.3 0.15 3 3 15 30 45
27 Nalgonda Atmakur (S) Patharla Pahad 5 15.14 3000 3 4 0.6 0.08 1 1 5 10 15
28 Nalgonda Atmakur (S) Thummala
Penpahad
1 19.24 6000 1.5 2 0.4 0.1 2 2 10 20 30
29 Nalgonda Atmakur (S) Venkatapur 5 1.44 3000 5 6 0.1 0.01 0 0 0 0 0
30 Nalgonda Atmakur (M) Chada 8 46.97 1500 1.5 8 4.1 0.47 9 9 45 90 135
31 Nalgonda Atmakur (M) Chamapur 3 2.53 1500 3 13 0.4 0.03 0 0 0 0 0
32 Nalgonda Atmakur (M) Chande Palle 8 8.55 1500 1.5 4 0.4 0.09 2 2 10 20 30
33 Nalgonda Atmakur (M) Dursagani Palle 8 2.91 1500 1.5 4 0.1 0.03 1 1 5 10 15
34 Nalgonda Atmakur (M) Kalwapalle 8 4.51 1500 1.5 11 0.5 0.05 1 1 5 10 15
35 Nalgonda Atmakur (M) Khaprai Palle 3 14.87 1500 3 15 2.5 0.15 3 3 15 30 45
36 Nalgonda Atmakur (M) Koratikal 8 12.94 1500 1.5 18 2.6 0.13 2 2 10 20 30
37 Nalgonda Atmakur (M) Moripirala 8 9.99 1500 1.5 15 1.6 0.1 2 2 10 20 30
38 Nalgonda Atmakur (M) Rahimkhanpet 3 15.63 1500 3 17 2.9 0.16 3 3 15 30 45
39 Nalgonda Atmakur (M) Raipalle 8 3.75 1500 1.5 12 0.5 0.04 1 1 5 10 15
40 Nalgonda Atmakur (M) Sarvepalle 8 9.29 1500 1.5 12 1.2 0.09 2 2 10 20 30
41
S.No District Mandal Village Category Area
(Sq.km)
EC>
3000
F >
1.5
Unsaturated
thickness
(m)
Recharge
potential
(MCM)
Utiliza
ble
yield
(MCM)
No. of
CDS
No. of
MPTS
Total
cost
CD
(Lakhs
)
Total
cost
MPTS
(Lakhs)
Total
Cost of
CDS &
MPTS
(Lakhs) 41 Nalgonda Atmakur (M) Singaram 8 6.29 1500 1.5 8 0.6 0.06 1 1 5 10 15
42 Nalgonda Chandur Chandur 3 11.08 1500 5 17 2.1 0.07 1 1 5 10 15
43 Nalgonda Chandur Donipamula 5 13.21 3000 8 19 2.8 0.08 2 2 10 20 30
44 Nalgonda Chandur Kasthala 3 15.63 1500 5 14 2.4 0.1 2 2 10 20 30
45 Nalgonda Chandur Nermata 5 14.31 3000 8 19 3 0.09 2 2 10 20 30
46 Nalgonda Chandur Sirdepalle 5 7.25 3000 3 17 1.4 0.05 1 1 5 10 15
47 Nalgonda Chandur Udathala Palle 3 8.05 1500 5 15 1.3 0.05 1 1 5 10 15
48 Nalgonda Chilkur Betha Vole 2 51.06 3000 1.5 0 0 0.84 0 0 0 0 0
49 Nalgonda Chilkur Chilkur 6 44.5 3000 3 -1 -0.5 0.73 0 0 0 0 0
50 Nalgonda Chilkur Kondapuram 6 8.4 3000 3 0 0 0.14 0 0 0 0 0
51 Nalgonda Chilkur Paleannaram 6 10.9 3000 3 0 0 0.18 0 0 0 0 0
52 Nalgonda Chintha Palle Malle Palli
P.K.Kurthi
3 6.62 1500 3 9 0.7 0.02 0 0 0 0 0
53 Nalgonda Chinthapalli Takatlapalli 4 0 0 3 -3 0 0 0 0 0 0 0
54 Nalgonda Chivvemla Ailapur 4 7.41 1500 3 0 0 0.05 0 0 0 0 0
55 Nalgonda Chivvemla Beebiguda 7 6.21 1500 1.5 0 0 0.04 0 0 0 0 0
56 Nalgonda Chivvemla Chendupatla 1 18.37 3000 1.5 1 0.2 0.12 2 2 10 20 30
57 Nalgonda Chivvemla Chivvemla 8 16.83 1500 1.5 2 0.4 0.11 2 2 10 20 30
58 Nalgonda Chivvemla Duraj Palle 1 10.25 3000 1.5 1 0.1 0.07 1 1 5 10 15
59 Nalgonda Chivvemla Gayamvari Guda 3 5.75 1500 3 1 0.1 0.04 1 1 5 10 15
60 Nalgonda Chivvemla Gumpula 1 5.71 3000 1.5 2 0.1 0.04 1 1 5 10 15
42
S.No District Mandal Village Category Area
(Sq.km)
EC>
3000
F >
1.5
Unsaturated
thickness
(m)
Recharge
potential
(MCM)
Utiliza
ble
yield
(MCM)
No. of
CDS
No. of
MPTS
Total
cost
CD
(Lakhs
)
Total
cost
MPTS
(Lakhs)
Total
Cost of
CDS &
MPTS
(Lakhs) 61 Nalgonda Chivvemla Gunjaluru 8 11.31 1500 1.5 2 0.2 0.08 1 1 5 10 15
62 Nalgonda Chivvemla Kudakuda 7 10.17 1500 1.5 -1 -0.1 0.07 0 0 0 0 0
63 Nalgonda Chivvemla Thimma Puram 1 8.54 3000 1.5 2 0.2 0.06 1 1 5 10 15
64 Nalgonda Chivvemla Thirumalagiri 8 3.25 1500 1.5 2 0.1 0.02 0 0 0 0 0
65 Nalgonda Chivvemla Undrugonda 1 11.62 3000 1.5 2 0.3 0.08 2 2 10 20 30
66 Nalgonda Chivvemla Vallabhapur 1 6.14 3000 1.5 2 0.1 0.04 1 1 5 10 15
67 Nalgonda Chivvemla Vattikhammam
Pahad
8 25.49 1500 1.5 3 0.8 0.17 3 3 15 30 45
68 Nalgonda Dameracherla Adavi Devula
Palli
8 42.09 1500 1.5 1 0.5 0.25 5 5 25 50 75
69 Nalgonda Dameracherla Baleen Palli 8 9.4 1500 1.5 2 0.2 0.06 1 1 5 10 15
70 Nalgonda Dameracherla Chityala 7 0 1500 1.5 1 0 0 0 0 0 0 0
71 Nalgonda Dameracherla Dameracherla 8 46.49 1500 1.5 1 0.5 0.28 5 5 25 50 75
72 Nalgonda Dameracherla Dilawarpur 2 16.79 3000 1.5 0 0 0.1 0 0 0 0 0
73 Nalgonda Dameracherla Irkigudem 8 7.76 1500 1.5 5 0.4 0.05 1 1 5 10 15
74 Nalgonda Dameracherla Kalle Pally 8 18.94 1500 1.5 1 0.2 0.11 2 2 10 20 30
75 Nalgonda Dameracherla Kesawapur 8 19.64 1500 1.5 1 0.2 0.12 2 2 10 20 30
76 Nalgonda Dameracherla Kondrapolu 1 19.86 3000 1.5 1 0.2 0.12 2 2 10 20 30
43
S.No District Mandal Village Category Area
(Sq.km)
EC>
3000
F >
1.5
Unsaturated
thickness
(m)
Recharge
potential
(MCM)
Utiliza
ble
yield
(MCM)
No. of
CDS
No. of
MPTS
Total
cost
CD
(Lakhs
)
Total
cost
MPTS
(Lakhs)
Total
Cost of
CDS &
MPTS
(Lakhs) 77 Nalgonda Dameracherla Kotha Palli 8 9.63 1500 1.5 5 0.5 0.06 1 1 5 10 15
78 Nalgonda Dameracherla Mudimanikam 8 18.89 1500 1.5 3 0.6 0.11 2 2 10 20 30
79 Nalgonda Dameracherla Mulka Charla 8 22.39 1500 1.5 2 0.5 0.13 3 3 15 30 45
80 Nalgonda Dameracherla Timmapur 8 16.01 1500 1.5 2 0.4 0.1 2 2 10 20 30
81 Nalgonda Dameracherla Ulshaya Palem 8 12.61 1500 1.5 1 0.1 0.08 1 1 5 10 15
82 Nalgonda Dameracherla Vada Palli 8 29.64 1500 1.5 4 1.3 0.18 3 3 15 30 45
83 Nalgonda Dameracherla Veerla Palem 8 25.26 1500 1.5 3 0.8 0.15 3 3 15 30 45
84 Nalgonda Garide Palle Gaddi Palli 1 11.48 3000 1.5 1 0.1 0.17 3 3 15 30 45
85 Nalgonda Garide Palle Ganuga Banda 3 11.92 1500 3 1 0.1 0.17 3 3 15 30 45
86 Nalgonda Garide Palle Garide Palli 3 32.75 1500 3 1 0.4 0.48 9 9 45 90 135
87 Nalgonda Garide Palle Kalmala Chervu 7 24.8 1500 1.5 -1 -0.3 0.36 0 0 0 0 0
88 Nalgonda Garide Palle Kaluva Palle 8 7.33 1500 1.5 1 0.1 0.11 2 2 10 20 30
89 Nalgonda Garide Palle Kuthubsha Puram 1 13.21 3000 1.5 1 0.1 0.19 4 4 20 40 60
90 Nalgonda Garide Palle Ponugodu 1 34.8 3000 1.5 1 0.4 0.51 10 10 50 100 150
91 Nalgonda Garide Palle Raini Gudem 8 13.88 1500 1.5 1 0.2 0.2 4 4 20 40 60
92 Nalgonda Garide Palle Sarvaram 8 12.87 1500 1.5 2 0.3 0.19 4 4 20 40 60
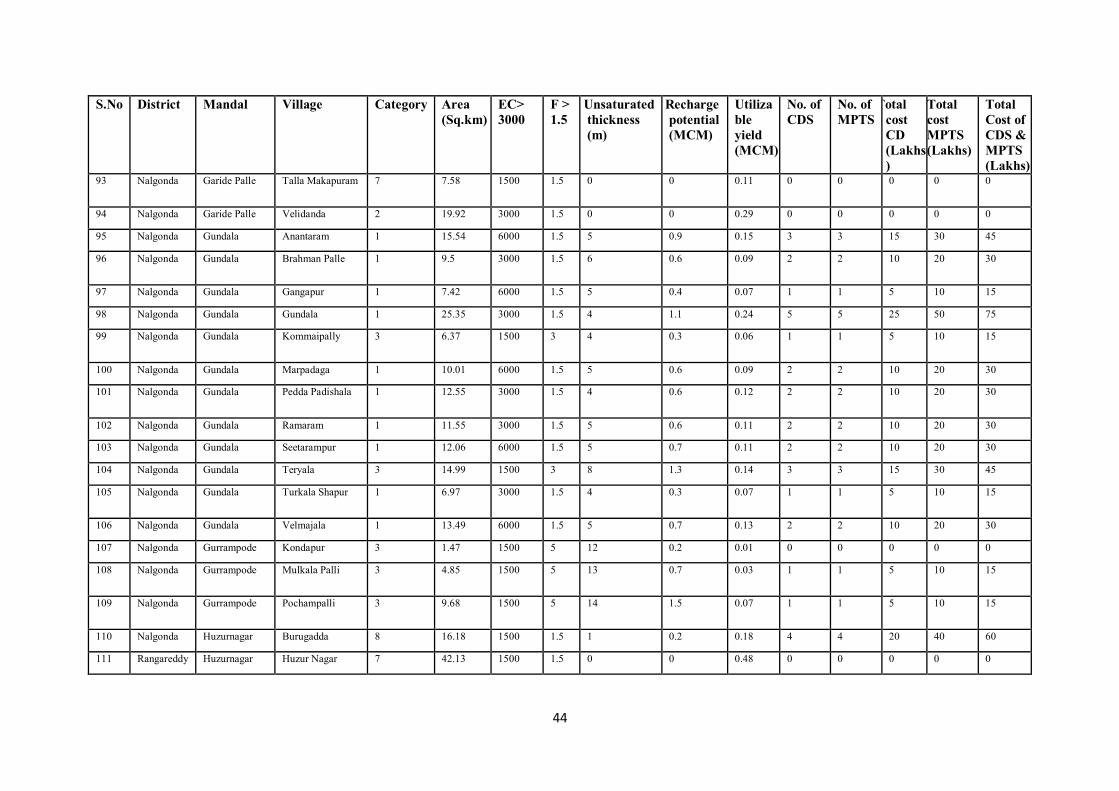
44
S.No District Mandal Village Category Area
(Sq.km)
EC>
3000
F >
1.5
Unsaturated
thickness
(m)
Recharge
potential
(MCM)
Utiliza
ble
yield
(MCM)
No. of
CDS
No. of
MPTS
Total
cost
CD
(Lakhs
)
Total
cost
MPTS
(Lakhs)
Total
Cost of
CDS &
MPTS
(Lakhs) 93 Nalgonda Garide Palle Talla Makapuram 7 7.58 1500 1.5 0 0 0.11 0 0 0 0 0
94 Nalgonda Garide Palle Velidanda 2 19.92 3000 1.5 0 0 0.29 0 0 0 0 0
95 Nalgonda Gundala Anantaram 1 15.54 6000 1.5 5 0.9 0.15 3 3 15 30 45
96 Nalgonda Gundala Brahman Palle 1 9.5 3000 1.5 6 0.6 0.09 2 2 10 20 30
97 Nalgonda Gundala Gangapur 1 7.42 6000 1.5 5 0.4 0.07 1 1 5 10 15
98 Nalgonda Gundala Gundala 1 25.35 3000 1.5 4 1.1 0.24 5 5 25 50 75
99 Nalgonda Gundala Kommaipally 3 6.37 1500 3 4 0.3 0.06 1 1 5 10 15
100 Nalgonda Gundala Marpadaga 1 10.01 6000 1.5 5 0.6 0.09 2 2 10 20 30
101 Nalgonda Gundala Pedda Padishala 1 12.55 3000 1.5 4 0.6 0.12 2 2 10 20 30
102 Nalgonda Gundala Ramaram 1 11.55 3000 1.5 5 0.6 0.11 2 2 10 20 30
103 Nalgonda Gundala Seetarampur 1 12.06 6000 1.5 5 0.7 0.11 2 2 10 20 30
104 Nalgonda Gundala Teryala 3 14.99 1500 3 8 1.3 0.14 3 3 15 30 45
105 Nalgonda Gundala Turkala Shapur 1 6.97 3000 1.5 4 0.3 0.07 1 1 5 10 15
106 Nalgonda Gundala Velmajala 1 13.49 6000 1.5 5 0.7 0.13 2 2 10 20 30
107 Nalgonda Gurrampode Kondapur 3 1.47 1500 5 12 0.2 0.01 0 0 0 0 0
108 Nalgonda Gurrampode Mulkala Palli 3 4.85 1500 5 13 0.7 0.03 1 1 5 10 15
109 Nalgonda Gurrampode Pochampalli 3 9.68 1500 5 14 1.5 0.07 1 1 5 10 15
110 Nalgonda Huzurnagar Burugadda 8 16.18 1500 1.5 1 0.2 0.18 4 4 20 40 60
111 Rangareddy Huzurnagar Huzur Nagar 7 42.13 1500 1.5 0 0 0.48 0 0 0 0 0
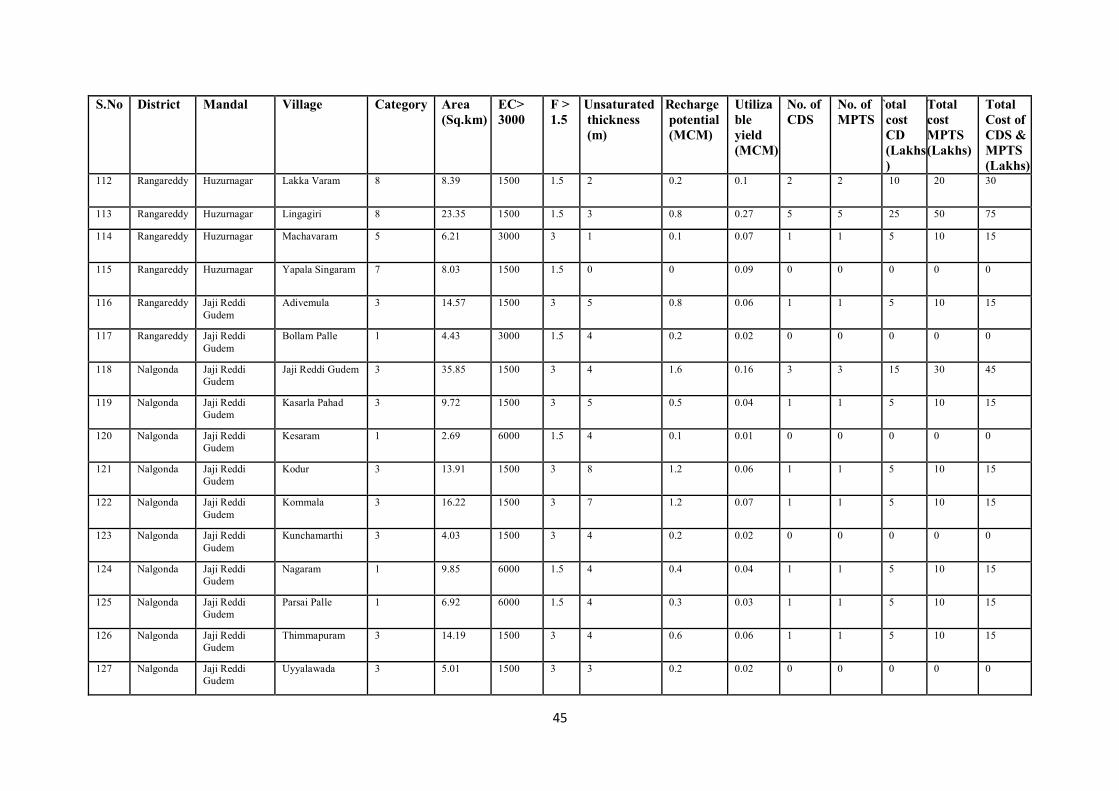
45
S.No District Mandal Village Category Area
(Sq.km)
EC>
3000
F >
1.5
Unsaturated
thickness
(m)
Recharge
potential
(MCM)
Utiliza
ble
yield
(MCM)
No. of
CDS
No. of
MPTS
Total
cost
CD
(Lakhs
)
Total
cost
MPTS
(Lakhs)
Total
Cost of
CDS &
MPTS
(Lakhs) 112 Rangareddy Huzurnagar Lakka Varam 8 8.39 1500 1.5 2 0.2 0.1 2 2 10 20 30
113 Rangareddy Huzurnagar Lingagiri 8 23.35 1500 1.5 3 0.8 0.27 5 5 25 50 75
114 Rangareddy Huzurnagar Machavaram 5 6.21 3000 3 1 0.1 0.07 1 1 5 10 15
115 Rangareddy Huzurnagar Yapala Singaram 7 8.03 1500 1.5 0 0 0.09 0 0 0 0 0
116 Rangareddy Jaji Reddi
Gudem
Adivemula 3 14.57 1500 3 5 0.8 0.06 1 1 5 10 15
117 Rangareddy Jaji Reddi
Gudem
Bollam Palle 1 4.43 3000 1.5 4 0.2 0.02 0 0 0 0 0
118 Nalgonda Jaji Reddi
Gudem
Jaji Reddi Gudem 3 35.85 1500 3 4 1.6 0.16 3 3 15 30 45
119 Nalgonda Jaji Reddi
Gudem
Kasarla Pahad 3 9.72 1500 3 5 0.5 0.04 1 1 5 10 15
120 Nalgonda Jaji Reddi
Gudem
Kesaram 1 2.69 6000 1.5 4 0.1 0.01 0 0 0 0 0
121 Nalgonda Jaji Reddi
Gudem
Kodur 3 13.91 1500 3 8 1.2 0.06 1 1 5 10 15
122 Nalgonda Jaji Reddi
Gudem
Kommala 3 16.22 1500 3 7 1.2 0.07 1 1 5 10 15
123 Nalgonda Jaji Reddi
Gudem
Kunchamarthi 3 4.03 1500 3 4 0.2 0.02 0 0 0 0 0
124 Nalgonda Jaji Reddi
Gudem
Nagaram 1 9.85 6000 1.5 4 0.4 0.04 1 1 5 10 15
125 Nalgonda Jaji Reddi
Gudem
Parsai Palle 1 6.92 6000 1.5 4 0.3 0.03 1 1 5 10 15
126 Nalgonda Jaji Reddi
Gudem
Thimmapuram 3 14.19 1500 3 4 0.6 0.06 1 1 5 10 15
127 Nalgonda Jaji Reddi
Gudem
Uyyalawada 3 5.01 1500 3 3 0.2 0.02 0 0 0 0 0
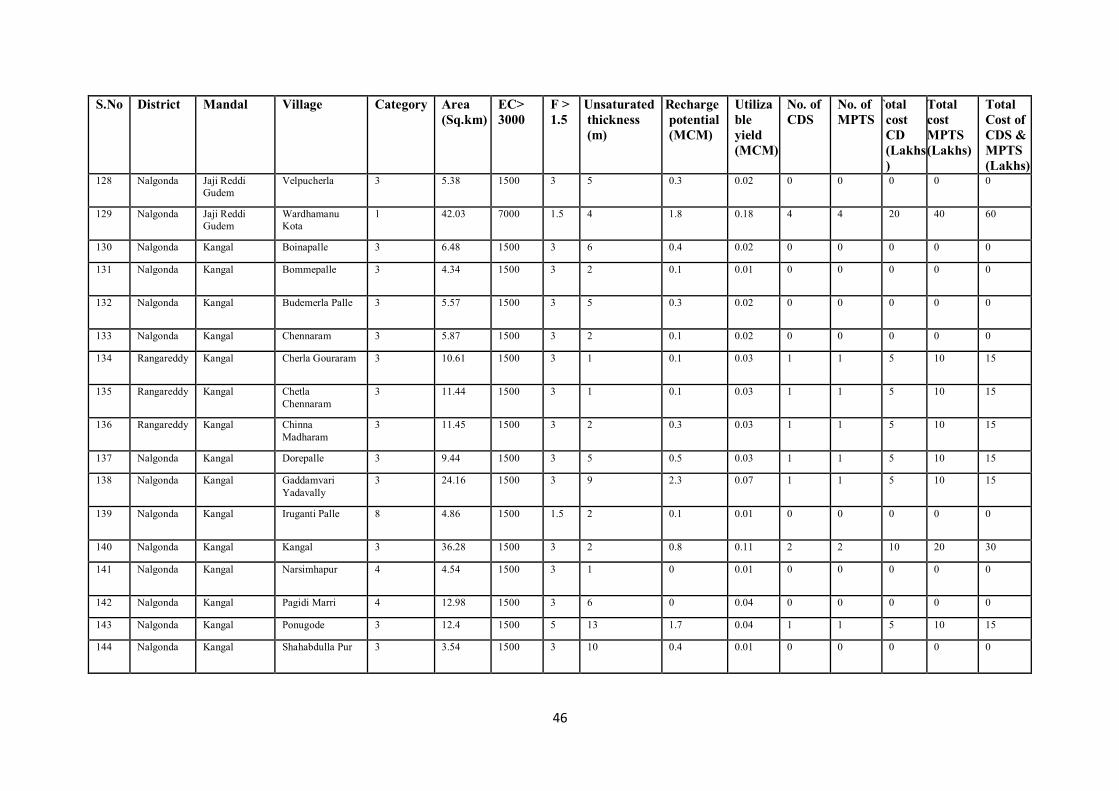
46
S.No District Mandal Village Category Area
(Sq.km)
EC>
3000
F >
1.5
Unsaturated
thickness
(m)
Recharge
potential
(MCM)
Utiliza
ble
yield
(MCM)
No. of
CDS
No. of
MPTS
Total
cost
CD
(Lakhs
)
Total
cost
MPTS
(Lakhs)
Total
Cost of
CDS &
MPTS
(Lakhs) 128 Nalgonda Jaji Reddi
Gudem
Velpucherla 3 5.38 1500 3 5 0.3 0.02 0 0 0 0 0
129 Nalgonda Jaji Reddi
Gudem
Wardhamanu
Kota
1 42.03 7000 1.5 4 1.8 0.18 4 4 20 40 60
130 Nalgonda Kangal Boinapalle 3 6.48 1500 3 6 0.4 0.02 0 0 0 0 0
131 Nalgonda Kangal Bommepalle 3 4.34 1500 3 2 0.1 0.01 0 0 0 0 0
132 Nalgonda Kangal Budemerla Palle 3 5.57 1500 3 5 0.3 0.02 0 0 0 0 0
133 Nalgonda Kangal Chennaram 3 5.87 1500 3 2 0.1 0.02 0 0 0 0 0
134 Rangareddy Kangal Cherla Gouraram 3 10.61 1500 3 1 0.1 0.03 1 1 5 10 15
135 Rangareddy Kangal Chetla
Chennaram
3 11.44 1500 3 1 0.1 0.03 1 1 5 10 15
136 Rangareddy Kangal Chinna
Madharam
3 11.45 1500 3 2 0.3 0.03 1 1 5 10 15
137 Nalgonda Kangal Dorepalle 3 9.44 1500 3 5 0.5 0.03 1 1 5 10 15
138 Nalgonda Kangal Gaddamvari
Yadavally
3 24.16 1500 3 9 2.3 0.07 1 1 5 10 15
139 Nalgonda Kangal Iruganti Palle 8 4.86 1500 1.5 2 0.1 0.01 0 0 0 0 0
140 Nalgonda Kangal Kangal 3 36.28 1500 3 2 0.8 0.11 2 2 10 20 30
141 Nalgonda Kangal Narsimhapur 4 4.54 1500 3 1 0 0.01 0 0 0 0 0
142 Nalgonda Kangal Pagidi Marri 4 12.98 1500 3 6 0 0.04 0 0 0 0 0
143 Nalgonda Kangal Ponugode 3 12.4 1500 5 13 1.7 0.04 1 1 5 10 15
144 Nalgonda Kangal Shahabdulla Pur 3 3.54 1500 3 10 0.4 0.01 0 0 0 0 0
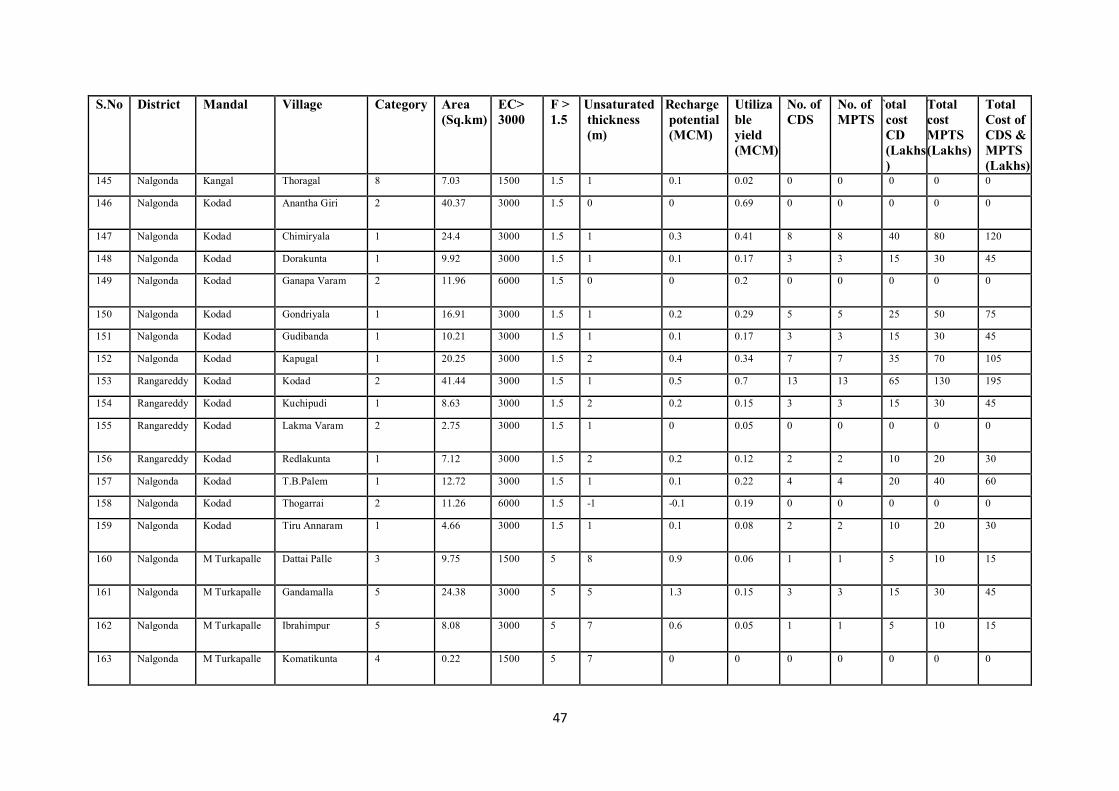
47
S.No District Mandal Village Category Area
(Sq.km)
EC>
3000
F >
1.5
Unsaturated
thickness
(m)
Recharge
potential
(MCM)
Utiliza
ble
yield
(MCM)
No. of
CDS
No. of
MPTS
Total
cost
CD
(Lakhs
)
Total
cost
MPTS
(Lakhs)
Total
Cost of
CDS &
MPTS
(Lakhs) 145 Nalgonda Kangal Thoragal 8 7.03 1500 1.5 1 0.1 0.02 0 0 0 0 0
146 Nalgonda Kodad Anantha Giri 2 40.37 3000 1.5 0 0 0.69 0 0 0 0 0
147 Nalgonda Kodad Chimiryala 1 24.4 3000 1.5 1 0.3 0.41 8 8 40 80 120
148 Nalgonda Kodad Dorakunta 1 9.92 3000 1.5 1 0.1 0.17 3 3 15 30 45
149 Nalgonda Kodad Ganapa Varam 2 11.96 6000 1.5 0 0 0.2 0 0 0 0 0
150 Nalgonda Kodad Gondriyala 1 16.91 3000 1.5 1 0.2 0.29 5 5 25 50 75
151 Nalgonda Kodad Gudibanda 1 10.21 3000 1.5 1 0.1 0.17 3 3 15 30 45
152 Nalgonda Kodad Kapugal 1 20.25 3000 1.5 2 0.4 0.34 7 7 35 70 105
153 Rangareddy Kodad Kodad 2 41.44 3000 1.5 1 0.5 0.7 13 13 65 130 195
154 Rangareddy Kodad Kuchipudi 1 8.63 3000 1.5 2 0.2 0.15 3 3 15 30 45
155 Rangareddy Kodad Lakma Varam 2 2.75 3000 1.5 1 0 0.05 0 0 0 0 0
156 Rangareddy Kodad Redlakunta 1 7.12 3000 1.5 2 0.2 0.12 2 2 10 20 30
157 Nalgonda Kodad T.B.Palem 1 12.72 3000 1.5 1 0.1 0.22 4 4 20 40 60
158 Nalgonda Kodad Thogarrai 2 11.26 6000 1.5 -1 -0.1 0.19 0 0 0 0 0
159 Nalgonda Kodad Tiru Annaram 1 4.66 3000 1.5 1 0.1 0.08 2 2 10 20 30
160 Nalgonda M Turkapalle Dattai Palle 3 9.75 1500 5 8 0.9 0.06 1 1 5 10 15
161 Nalgonda M Turkapalle Gandamalla 5 24.38 3000 5 5 1.3 0.15 3 3 15 30 45
162 Nalgonda M Turkapalle Ibrahimpur 5 8.08 3000 5 7 0.6 0.05 1 1 5 10 15
163 Nalgonda M Turkapalle Komatikunta 4 0.22 1500 5 7 0 0 0 0 0 0 0
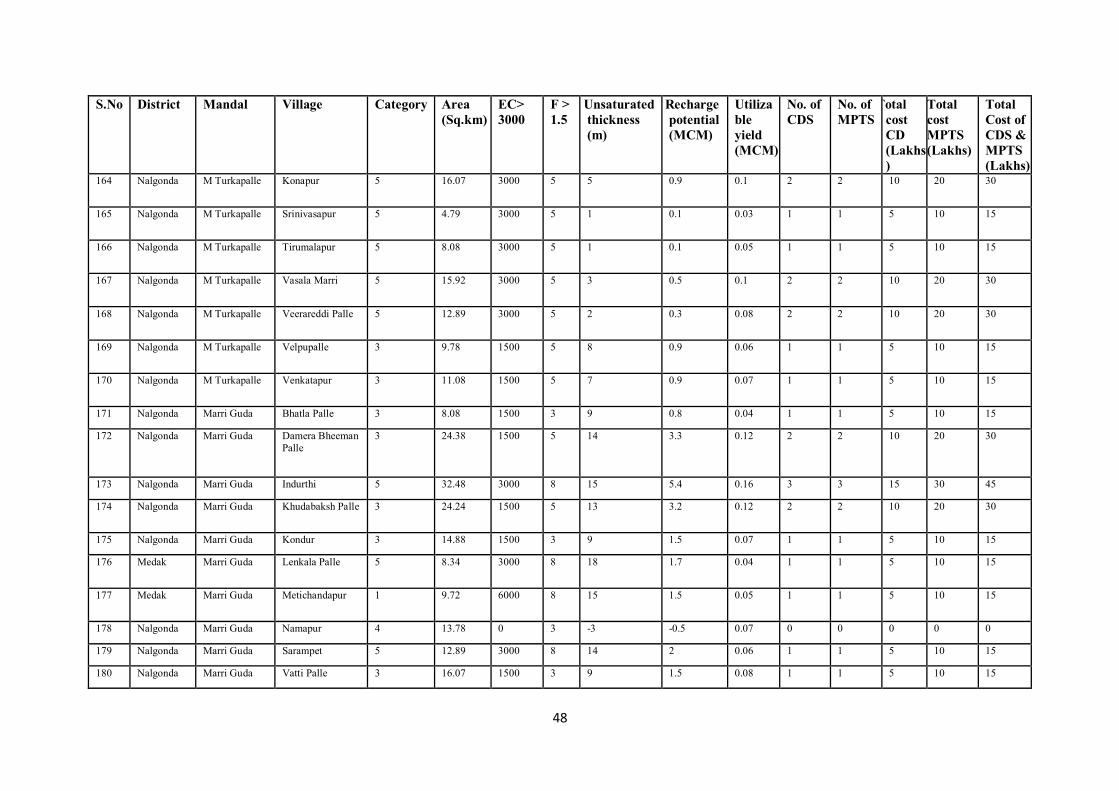
48
S.No District Mandal Village Category Area
(Sq.km)
EC>
3000
F >
1.5
Unsaturated
thickness
(m)
Recharge
potential
(MCM)
Utiliza
ble
yield
(MCM)
No. of
CDS
No. of
MPTS
Total
cost
CD
(Lakhs
)
Total
cost
MPTS
(Lakhs)
Total
Cost of
CDS &
MPTS
(Lakhs) 164 Nalgonda M Turkapalle Konapur 5 16.07 3000 5 5 0.9 0.1 2 2 10 20 30
165 Nalgonda M Turkapalle Srinivasapur 5 4.79 3000 5 1 0.1 0.03 1 1 5 10 15
166 Nalgonda M Turkapalle Tirumalapur 5 8.08 3000 5 1 0.1 0.05 1 1 5 10 15
167 Nalgonda M Turkapalle Vasala Marri 5 15.92 3000 5 3 0.5 0.1 2 2 10 20 30
168 Nalgonda M Turkapalle Veerareddi Palle 5 12.89 3000 5 2 0.3 0.08 2 2 10 20 30
169 Nalgonda M Turkapalle Velpupalle 3 9.78 1500 5 8 0.9 0.06 1 1 5 10 15
170 Nalgonda M Turkapalle Venkatapur 3 11.08 1500 5 7 0.9 0.07 1 1 5 10 15
171 Nalgonda Marri Guda Bhatla Palle 3 8.08 1500 3 9 0.8 0.04 1 1 5 10 15
172 Nalgonda Marri Guda Damera Bheeman
Palle
3 24.38 1500 5 14 3.3 0.12 2 2 10 20 30
173 Nalgonda Marri Guda Indurthi 5 32.48 3000 8 15 5.4 0.16 3 3 15 30 45
174 Nalgonda Marri Guda Khudabaksh Palle 3 24.24 1500 5 13 3.2 0.12 2 2 10 20 30
175 Nalgonda Marri Guda Kondur 3 14.88 1500 3 9 1.5 0.07 1 1 5 10 15
176 Medak Marri Guda Lenkala Palle 5 8.34 3000 8 18 1.7 0.04 1 1 5 10 15
177 Medak Marri Guda Metichandapur 1 9.72 6000 8 15 1.5 0.05 1 1 5 10 15
178 Nalgonda Marri Guda Namapur 4 13.78 0 3 -3 -0.5 0.07 0 0 0 0 0
179 Nalgonda Marri Guda Sarampet 5 12.89 3000 8 14 2 0.06 1 1 5 10 15
180 Nalgonda Marri Guda Vatti Palle 3 16.07 1500 3 9 1.5 0.08 1 1 5 10 15
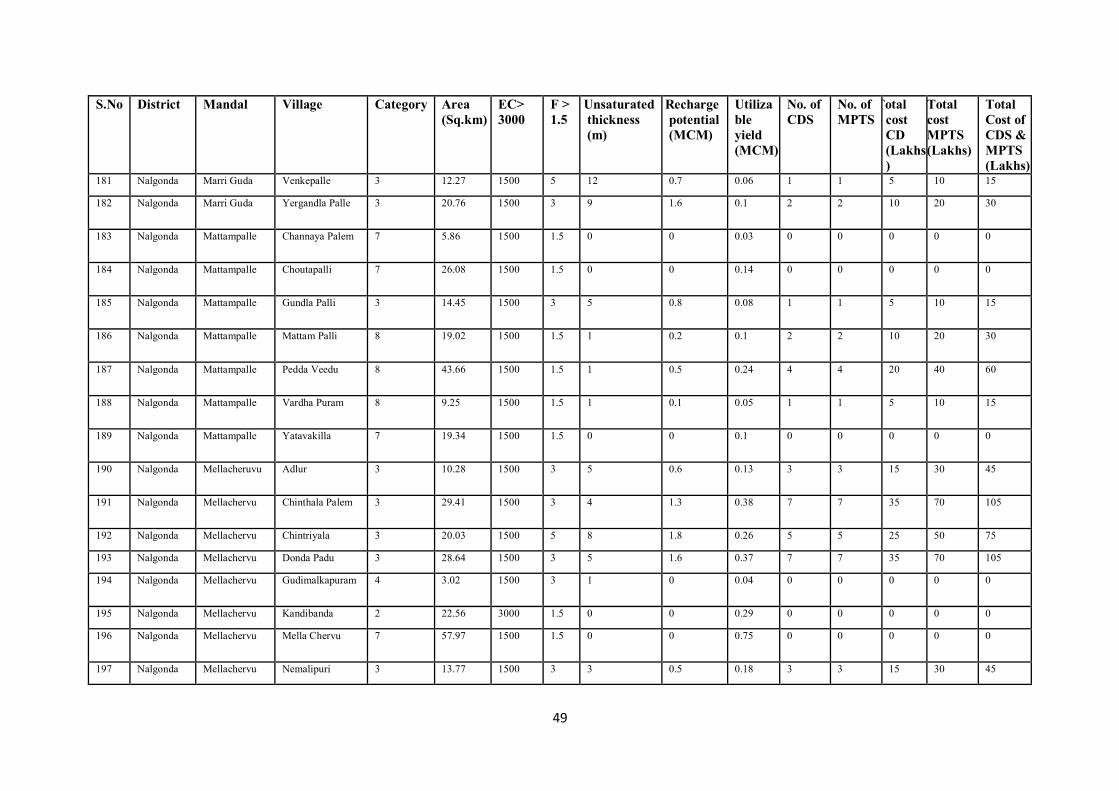
49
S.No District Mandal Village Category Area
(Sq.km)
EC>
3000
F >
1.5
Unsaturated
thickness
(m)
Recharge
potential
(MCM)
Utiliza
ble
yield
(MCM)
No. of
CDS
No. of
MPTS
Total
cost
CD
(Lakhs
)
Total
cost
MPTS
(Lakhs)
Total
Cost of
CDS &
MPTS
(Lakhs) 181 Nalgonda Marri Guda Venkepalle 3 12.27 1500 5 12 0.7 0.06 1 1 5 10 15
182 Nalgonda Marri Guda Yergandla Palle 3 20.76 1500 3 9 1.6 0.1 2 2 10 20 30
183 Nalgonda Mattampalle Channaya Palem 7 5.86 1500 1.5 0 0 0.03 0 0 0 0 0
184 Nalgonda Mattampalle Choutapalli 7 26.08 1500 1.5 0 0 0.14 0 0 0 0 0
185 Nalgonda Mattampalle Gundla Palli 3 14.45 1500 3 5 0.8 0.08 1 1 5 10 15
186 Nalgonda Mattampalle Mattam Palli 8 19.02 1500 1.5 1 0.2 0.1 2 2 10 20 30
187 Nalgonda Mattampalle Pedda Veedu 8 43.66 1500 1.5 1 0.5 0.24 4 4 20 40 60
188 Nalgonda Mattampalle Vardha Puram 8 9.25 1500 1.5 1 0.1 0.05 1 1 5 10 15
189 Nalgonda Mattampalle Yatavakilla 7 19.34 1500 1.5 0 0 0.1 0 0 0 0 0
190 Nalgonda Mellacheruvu Adlur 3 10.28 1500 3 5 0.6 0.13 3 3 15 30 45
191 Nalgonda Mellachervu Chinthala Palem 3 29.41 1500 3 4 1.3 0.38 7 7 35 70 105
192 Nalgonda Mellachervu Chintriyala 3 20.03 1500 5 8 1.8 0.26 5 5 25 50 75
193 Nalgonda Mellachervu Donda Padu 3 28.64 1500 3 5 1.6 0.37 7 7 35 70 105
194 Nalgonda Mellachervu Gudimalkapuram 4 3.02 1500 3 1 0 0.04 0 0 0 0 0
195 Nalgonda Mellachervu Kandibanda 2 22.56 3000 1.5 0 0 0.29 0 0 0 0 0
196 Nalgonda Mellachervu Mella Chervu 7 57.97 1500 1.5 0 0 0.75 0 0 0 0 0
197 Nalgonda Mellachervu Nemalipuri 3 13.77 1500 3 3 0.5 0.18 3 3 15 30 45
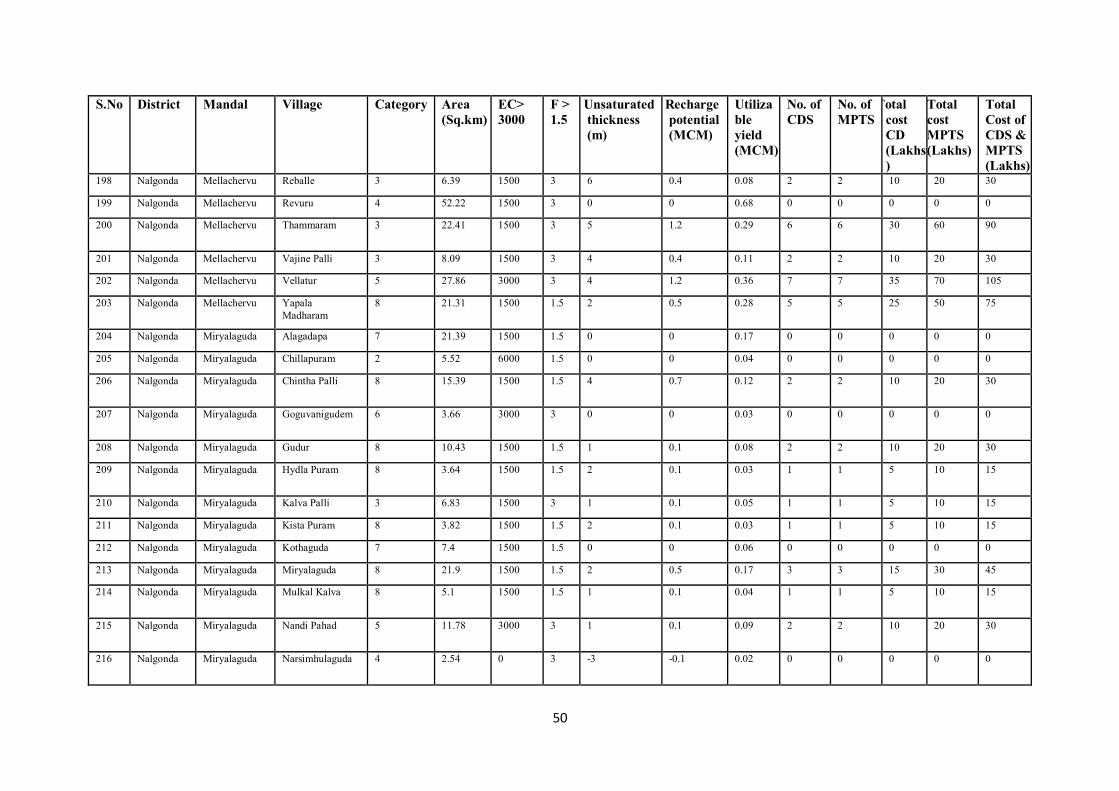
50
S.No District Mandal Village Category Area
(Sq.km)
EC>
3000
F >
1.5
Unsaturated
thickness
(m)
Recharge
potential
(MCM)
Utiliza
ble
yield
(MCM)
No. of
CDS
No. of
MPTS
Total
cost
CD
(Lakhs
)
Total
cost
MPTS
(Lakhs)
Total
Cost of
CDS &
MPTS
(Lakhs) 198 Nalgonda Mellachervu Reballe 3 6.39 1500 3 6 0.4 0.08 2 2 10 20 30
199 Nalgonda Mellachervu Revuru 4 52.22 1500 3 0 0 0.68 0 0 0 0 0
200 Nalgonda Mellachervu Thammaram 3 22.41 1500 3 5 1.2 0.29 6 6 30 60 90
201 Nalgonda Mellachervu Vajine Palli 3 8.09 1500 3 4 0.4 0.11 2 2 10 20 30
202 Nalgonda Mellachervu Vellatur 5 27.86 3000 3 4 1.2 0.36 7 7 35 70 105
203 Nalgonda Mellachervu Yapala
Madharam
8 21.31 1500 1.5 2 0.5 0.28 5 5 25 50 75
204 Nalgonda Miryalaguda Alagadapa 7 21.39 1500 1.5 0 0 0.17 0 0 0 0 0
205 Nalgonda Miryalaguda Chillapuram 2 5.52 6000 1.5 0 0 0.04 0 0 0 0 0
206 Nalgonda Miryalaguda Chintha Palli 8 15.39 1500 1.5 4 0.7 0.12 2 2 10 20 30
207 Nalgonda Miryalaguda Goguvanigudem 6 3.66 3000 3 0 0 0.03 0 0 0 0 0
208 Nalgonda Miryalaguda Gudur 8 10.43 1500 1.5 1 0.1 0.08 2 2 10 20 30
209 Nalgonda Miryalaguda Hydla Puram 8 3.64 1500 1.5 2 0.1 0.03 1 1 5 10 15
210 Nalgonda Miryalaguda Kalva Palli 3 6.83 1500 3 1 0.1 0.05 1 1 5 10 15
211 Nalgonda Miryalaguda Kista Puram 8 3.82 1500 1.5 2 0.1 0.03 1 1 5 10 15
212 Nalgonda Miryalaguda Kothaguda 7 7.4 1500 1.5 0 0 0.06 0 0 0 0 0
213 Nalgonda Miryalaguda Miryalaguda 8 21.9 1500 1.5 2 0.5 0.17 3 3 15 30 45
214 Nalgonda Miryalaguda Mulkal Kalva 8 5.1 1500 1.5 1 0.1 0.04 1 1 5 10 15
215 Nalgonda Miryalaguda Nandi Pahad 5 11.78 3000 3 1 0.1 0.09 2 2 10 20 30
216 Nalgonda Miryalaguda Narsimhulaguda 4 2.54 0 3 -3 -0.1 0.02 0 0 0 0 0
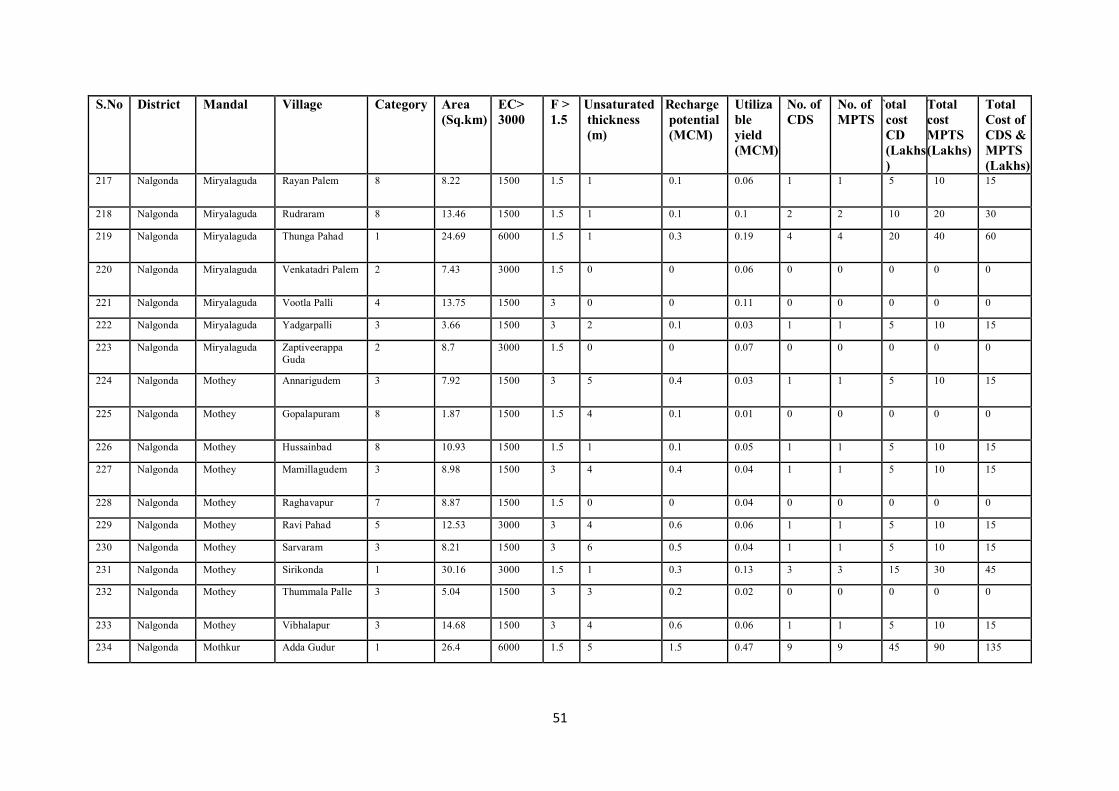
51
S.No District Mandal Village Category Area
(Sq.km)
EC>
3000
F >
1.5
Unsaturated
thickness
(m)
Recharge
potential
(MCM)
Utiliza
ble
yield
(MCM)
No. of
CDS
No. of
MPTS
Total
cost
CD
(Lakhs
)
Total
cost
MPTS
(Lakhs)
Total
Cost of
CDS &
MPTS
(Lakhs) 217 Nalgonda Miryalaguda Rayan Palem 8 8.22 1500 1.5 1 0.1 0.06 1 1 5 10 15
218 Nalgonda Miryalaguda Rudraram 8 13.46 1500 1.5 1 0.1 0.1 2 2 10 20 30
219 Nalgonda Miryalaguda Thunga Pahad 1 24.69 6000 1.5 1 0.3 0.19 4 4 20 40 60
220 Nalgonda Miryalaguda Venkatadri Palem 2 7.43 3000 1.5 0 0 0.06 0 0 0 0 0
221 Nalgonda Miryalaguda Vootla Palli 4 13.75 1500 3 0 0 0.11 0 0 0 0 0
222 Nalgonda Miryalaguda Yadgarpalli 3 3.66 1500 3 2 0.1 0.03 1 1 5 10 15
223 Nalgonda Miryalaguda Zaptiveerappa
Guda
2 8.7 3000 1.5 0 0 0.07 0 0 0 0 0
224 Nalgonda Mothey Annarigudem 3 7.92 1500 3 5 0.4 0.03 1 1 5 10 15
225 Nalgonda Mothey Gopalapuram 8 1.87 1500 1.5 4 0.1 0.01 0 0 0 0 0
226 Nalgonda Mothey Hussainbad 8 10.93 1500 1.5 1 0.1 0.05 1 1 5 10 15
227 Nalgonda Mothey Mamillagudem 3 8.98 1500 3 4 0.4 0.04 1 1 5 10 15
228 Nalgonda Mothey Raghavapur 7 8.87 1500 1.5 0 0 0.04 0 0 0 0 0
229 Nalgonda Mothey Ravi Pahad 5 12.53 3000 3 4 0.6 0.06 1 1 5 10 15
230 Nalgonda Mothey Sarvaram 3 8.21 1500 3 6 0.5 0.04 1 1 5 10 15
231 Nalgonda Mothey Sirikonda 1 30.16 3000 1.5 1 0.3 0.13 3 3 15 30 45
232 Nalgonda Mothey Thummala Palle 3 5.04 1500 3 3 0.2 0.02 0 0 0 0 0
233 Nalgonda Mothey Vibhalapur 3 14.68 1500 3 4 0.6 0.06 1 1 5 10 15
234 Nalgonda Mothkur Adda Gudur 1 26.4 6000 1.5 5 1.5 0.47 9 9 45 90 135
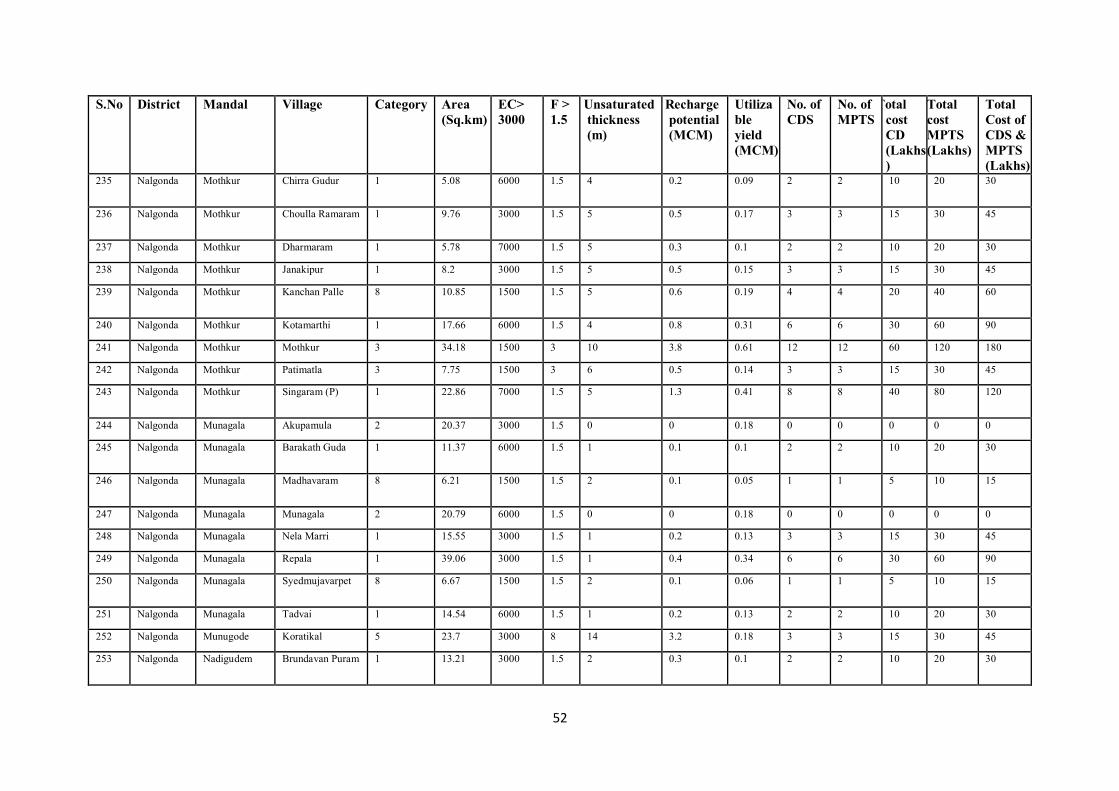
52
S.No District Mandal Village Category Area
(Sq.km)
EC>
3000
F >
1.5
Unsaturated
thickness
(m)
Recharge
potential
(MCM)
Utiliza
ble
yield
(MCM)
No. of
CDS
No. of
MPTS
Total
cost
CD
(Lakhs
)
Total
cost
MPTS
(Lakhs)
Total
Cost of
CDS &
MPTS
(Lakhs) 235 Nalgonda Mothkur Chirra Gudur 1 5.08 6000 1.5 4 0.2 0.09 2 2 10 20 30
236 Nalgonda Mothkur Choulla Ramaram 1 9.76 3000 1.5 5 0.5 0.17 3 3 15 30 45
237 Nalgonda Mothkur Dharmaram 1 5.78 7000 1.5 5 0.3 0.1 2 2 10 20 30
238 Nalgonda Mothkur Janakipur 1 8.2 3000 1.5 5 0.5 0.15 3 3 15 30 45
239 Nalgonda Mothkur Kanchan Palle 8 10.85 1500 1.5 5 0.6 0.19 4 4 20 40 60
240 Nalgonda Mothkur Kotamarthi 1 17.66 6000 1.5 4 0.8 0.31 6 6 30 60 90
241 Nalgonda Mothkur Mothkur 3 34.18 1500 3 10 3.8 0.61 12 12 60 120 180
242 Nalgonda Mothkur Patimatla 3 7.75 1500 3 6 0.5 0.14 3 3 15 30 45
243 Nalgonda Mothkur Singaram (P) 1 22.86 7000 1.5 5 1.3 0.41 8 8 40 80 120
244 Nalgonda Munagala Akupamula 2 20.37 3000 1.5 0 0 0.18 0 0 0 0 0
245 Nalgonda Munagala Barakath Guda 1 11.37 6000 1.5 1 0.1 0.1 2 2 10 20 30
246 Nalgonda Munagala Madhavaram 8 6.21 1500 1.5 2 0.1 0.05 1 1 5 10 15
247 Nalgonda Munagala Munagala 2 20.79 6000 1.5 0 0 0.18 0 0 0 0 0
248 Nalgonda Munagala Nela Marri 1 15.55 3000 1.5 1 0.2 0.13 3 3 15 30 45
249 Nalgonda Munagala Repala 1 39.06 3000 1.5 1 0.4 0.34 6 6 30 60 90
250 Nalgonda Munagala Syedmujavarpet 8 6.67 1500 1.5 2 0.1 0.06 1 1 5 10 15
251 Nalgonda Munagala Tadvai 1 14.54 6000 1.5 1 0.2 0.13 2 2 10 20 30
252 Nalgonda Munugode Koratikal 5 23.7 3000 8 14 3.2 0.18 3 3 15 30 45
253 Nalgonda Nadigudem Brundavan Puram 1 13.21 3000 1.5 2 0.3 0.1 2 2 10 20 30
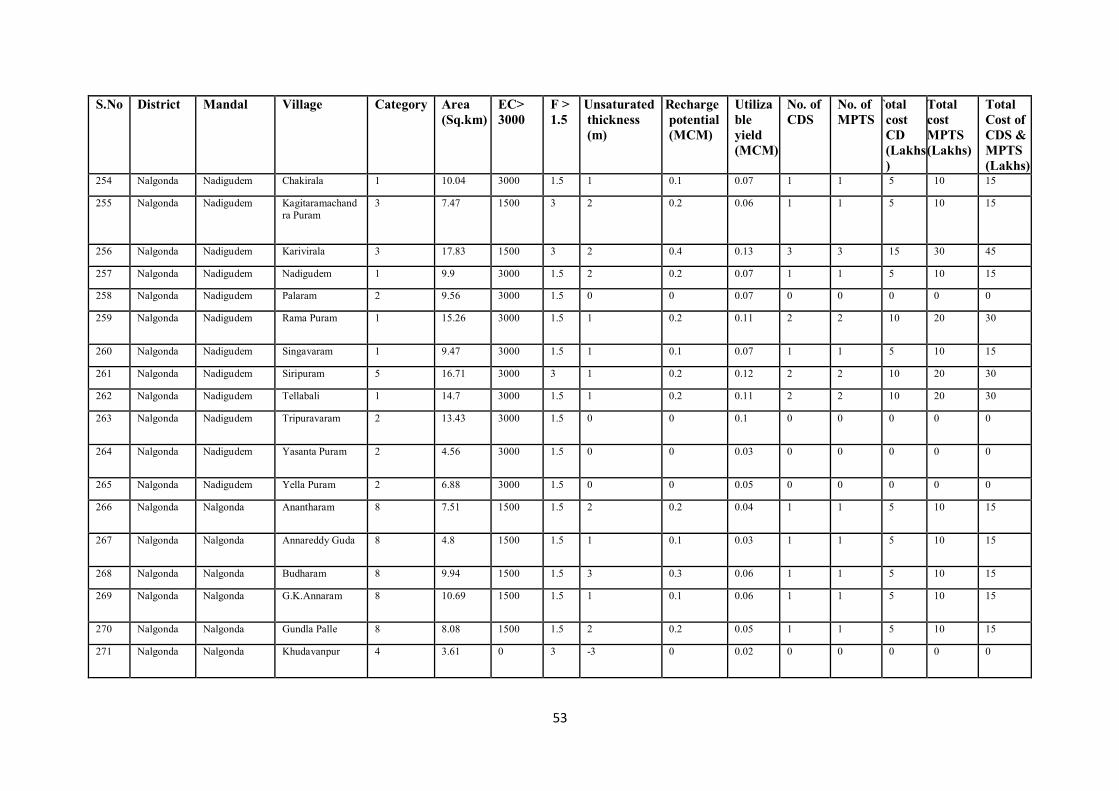
53
S.No District Mandal Village Category Area
(Sq.km)
EC>
3000
F >
1.5
Unsaturated
thickness
(m)
Recharge
potential
(MCM)
Utiliza
ble
yield
(MCM)
No. of
CDS
No. of
MPTS
Total
cost
CD
(Lakhs
)
Total
cost
MPTS
(Lakhs)
Total
Cost of
CDS &
MPTS
(Lakhs) 254 Nalgonda Nadigudem Chakirala 1 10.04 3000 1.5 1 0.1 0.07 1 1 5 10 15
255 Nalgonda Nadigudem Kagitaramachand
ra Puram
3 7.47 1500 3 2 0.2 0.06 1 1 5 10 15
256 Nalgonda Nadigudem Karivirala 3 17.83 1500 3 2 0.4 0.13 3 3 15 30 45
257 Nalgonda Nadigudem Nadigudem 1 9.9 3000 1.5 2 0.2 0.07 1 1 5 10 15
258 Nalgonda Nadigudem Palaram 2 9.56 3000 1.5 0 0 0.07 0 0 0 0 0
259 Nalgonda Nadigudem Rama Puram 1 15.26 3000 1.5 1 0.2 0.11 2 2 10 20 30
260 Nalgonda Nadigudem Singavaram 1 9.47 3000 1.5 1 0.1 0.07 1 1 5 10 15
261 Nalgonda Nadigudem Siripuram 5 16.71 3000 3 1 0.2 0.12 2 2 10 20 30
262 Nalgonda Nadigudem Tellabali 1 14.7 3000 1.5 1 0.2 0.11 2 2 10 20 30
263 Nalgonda Nadigudem Tripuravaram 2 13.43 3000 1.5 0 0 0.1 0 0 0 0 0
264 Nalgonda Nadigudem Yasanta Puram 2 4.56 3000 1.5 0 0 0.03 0 0 0 0 0
265 Nalgonda Nadigudem Yella Puram 2 6.88 3000 1.5 0 0 0.05 0 0 0 0 0
266 Nalgonda Nalgonda Anantharam 8 7.51 1500 1.5 2 0.2 0.04 1 1 5 10 15
267 Nalgonda Nalgonda Annareddy Guda 8 4.8 1500 1.5 1 0.1 0.03 1 1 5 10 15
268 Nalgonda Nalgonda Budharam 8 9.94 1500 1.5 3 0.3 0.06 1 1 5 10 15
269 Nalgonda Nalgonda G.K.Annaram 8 10.69 1500 1.5 1 0.1 0.06 1 1 5 10 15
270 Nalgonda Nalgonda Gundla Palle 8 8.08 1500 1.5 2 0.2 0.05 1 1 5 10 15
271 Nalgonda Nalgonda Khudavanpur 4 3.61 0 3 -3 0 0.02 0 0 0 0 0
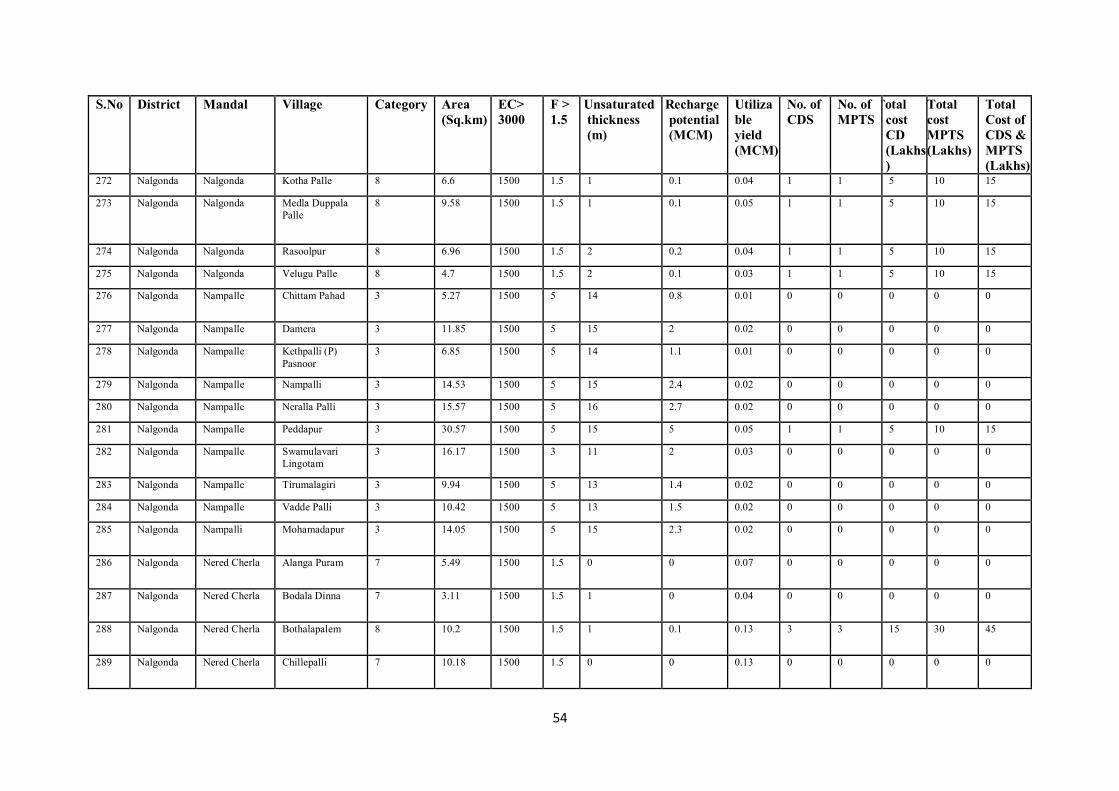
54
S.No District Mandal Village Category Area
(Sq.km)
EC>
3000
F >
1.5
Unsaturated
thickness
(m)
Recharge
potential
(MCM)
Utiliza
ble
yield
(MCM)
No. of
CDS
No. of
MPTS
Total
cost
CD
(Lakhs
)
Total
cost
MPTS
(Lakhs)
Total
Cost of
CDS &
MPTS
(Lakhs) 272 Nalgonda Nalgonda Kotha Palle 8 6.6 1500 1.5 1 0.1 0.04 1 1 5 10 15
273 Nalgonda Nalgonda Medla Duppala
Palle
8 9.58 1500 1.5 1 0.1 0.05 1 1 5 10 15
274 Nalgonda Nalgonda Rasoolpur 8 6.96 1500 1.5 2 0.2 0.04 1 1 5 10 15
275 Nalgonda Nalgonda Velugu Palle 8 4.7 1500 1.5 2 0.1 0.03 1 1 5 10 15
276 Nalgonda Nampalle Chittam Pahad 3 5.27 1500 5 14 0.8 0.01 0 0 0 0 0
277 Nalgonda Nampalle Damera 3 11.85 1500 5 15 2 0.02 0 0 0 0 0
278 Nalgonda Nampalle Kethpalli (P)
Pasnoor
3 6.85 1500 5 14 1.1 0.01 0 0 0 0 0
279 Nalgonda Nampalle Nampalli 3 14.53 1500 5 15 2.4 0.02 0 0 0 0 0
280 Nalgonda Nampalle Neralla Palli 3 15.57 1500 5 16 2.7 0.02 0 0 0 0 0
281 Nalgonda Nampalle Peddapur 3 30.57 1500 5 15 5 0.05 1 1 5 10 15
282 Nalgonda Nampalle Swamulavari
Lingotam
3 16.17 1500 3 11 2 0.03 0 0 0 0 0
283 Nalgonda Nampalle Tirumalagiri 3 9.94 1500 5 13 1.4 0.02 0 0 0 0 0
284 Nalgonda Nampalle Vadde Palli 3 10.42 1500 5 13 1.5 0.02 0 0 0 0 0
285 Nalgonda Nampalli Mohamadapur 3 14.05 1500 5 15 2.3 0.02 0 0 0 0 0
286 Nalgonda Nered Cherla Alanga Puram 7 5.49 1500 1.5 0 0 0.07 0 0 0 0 0
287 Nalgonda Nered Cherla Bodala Dinna 7 3.11 1500 1.5 1 0 0.04 0 0 0 0 0
288 Nalgonda Nered Cherla Bothalapalem 8 10.2 1500 1.5 1 0.1 0.13 3 3 15 30 45
289 Nalgonda Nered Cherla Chillepalli 7 10.18 1500 1.5 0 0 0.13 0 0 0 0 0
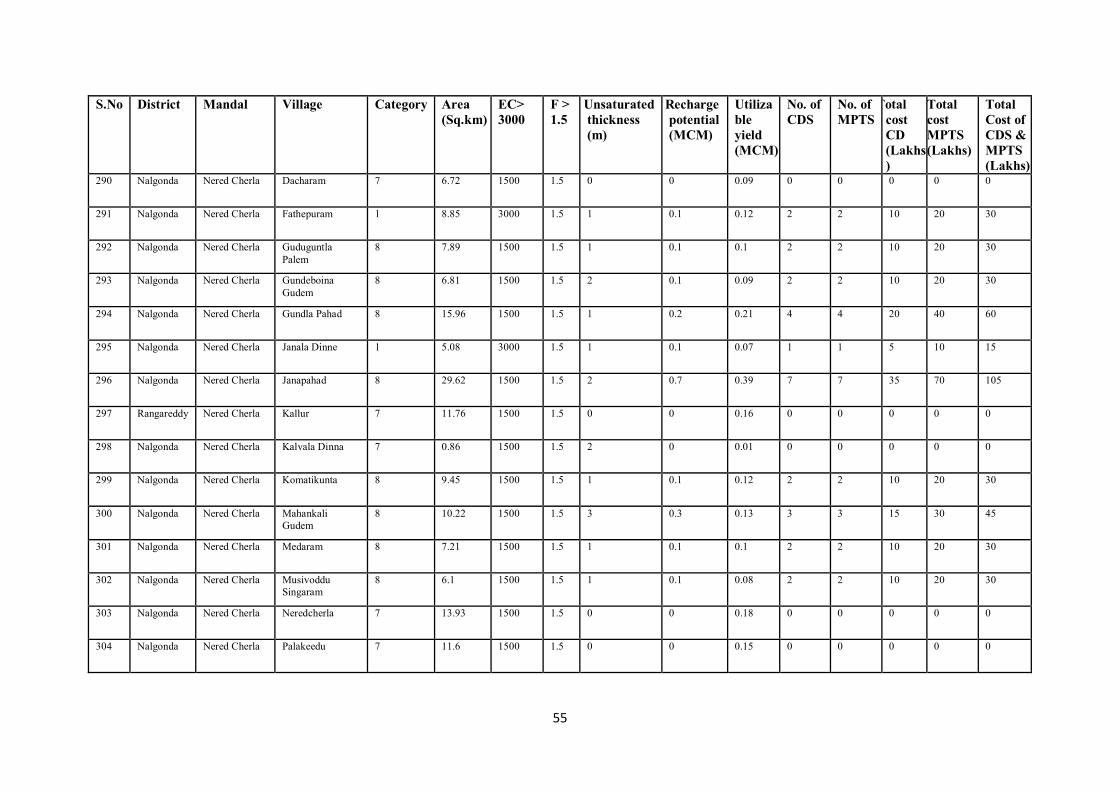
55
S.No District Mandal Village Category Area
(Sq.km)
EC>
3000
F >
1.5
Unsaturated
thickness
(m)
Recharge
potential
(MCM)
Utiliza
ble
yield
(MCM)
No. of
CDS
No. of
MPTS
Total
cost
CD
(Lakhs
)
Total
cost
MPTS
(Lakhs)
Total
Cost of
CDS &
MPTS
(Lakhs) 290 Nalgonda Nered Cherla Dacharam 7 6.72 1500 1.5 0 0 0.09 0 0 0 0 0
291 Nalgonda Nered Cherla Fathepuram 1 8.85 3000 1.5 1 0.1 0.12 2 2 10 20 30
292 Nalgonda Nered Cherla Guduguntla
Palem
8 7.89 1500 1.5 1 0.1 0.1 2 2 10 20 30
293 Nalgonda Nered Cherla Gundeboina
Gudem
8 6.81 1500 1.5 2 0.1 0.09 2 2 10 20 30
294 Nalgonda Nered Cherla Gundla Pahad 8 15.96 1500 1.5 1 0.2 0.21 4 4 20 40 60
295 Nalgonda Nered Cherla Janala Dinne 1 5.08 3000 1.5 1 0.1 0.07 1 1 5 10 15
296 Nalgonda Nered Cherla Janapahad 8 29.62 1500 1.5 2 0.7 0.39 7 7 35 70 105
297 Rangareddy Nered Cherla Kallur 7 11.76 1500 1.5 0 0 0.16 0 0 0 0 0
298 Nalgonda Nered Cherla Kalvala Dinna 7 0.86 1500 1.5 2 0 0.01 0 0 0 0 0
299 Nalgonda Nered Cherla Komatikunta 8 9.45 1500 1.5 1 0.1 0.12 2 2 10 20 30
300 Nalgonda Nered Cherla Mahankali
Gudem
8 10.22 1500 1.5 3 0.3 0.13 3 3 15 30 45
301 Nalgonda Nered Cherla Medaram 8 7.21 1500 1.5 1 0.1 0.1 2 2 10 20 30
302 Nalgonda Nered Cherla Musivoddu
Singaram
8 6.1 1500 1.5 1 0.1 0.08 2 2 10 20 30
303 Nalgonda Nered Cherla Neredcherla 7 13.93 1500 1.5 0 0 0.18 0 0 0 0 0
304 Nalgonda Nered Cherla Palakeedu 7 11.6 1500 1.5 0 0 0.15 0 0 0 0 0
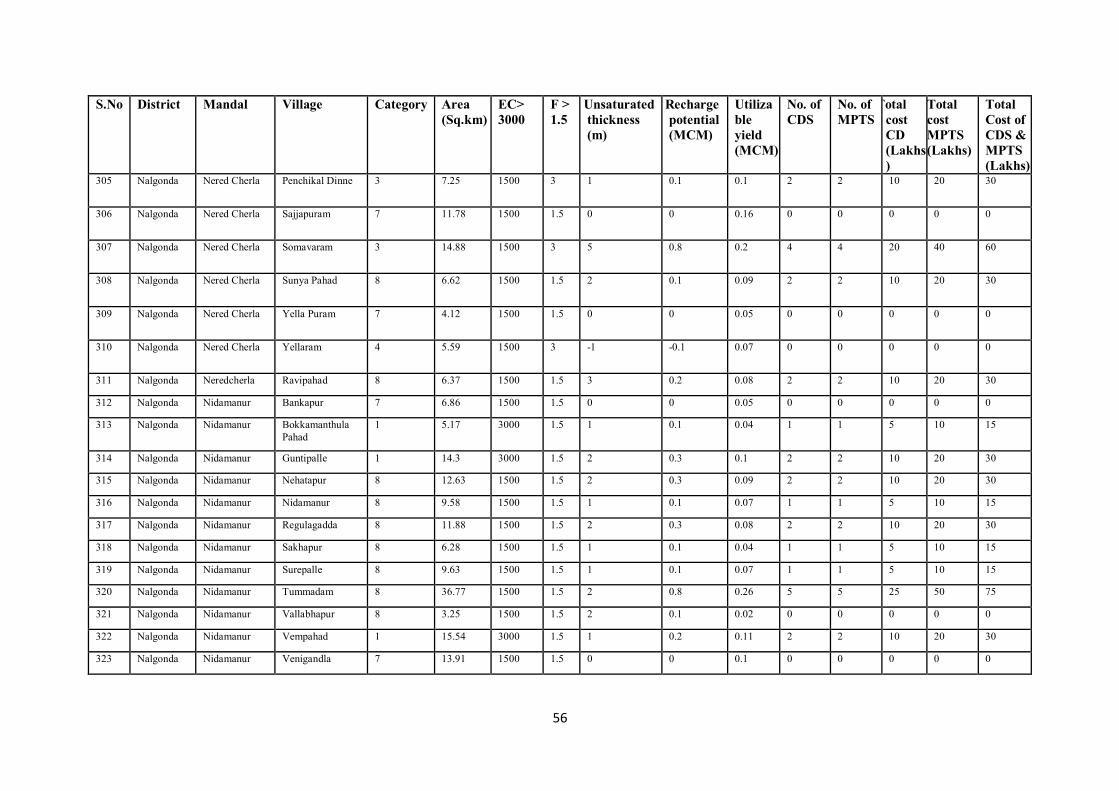
56
S.No District Mandal Village Category Area
(Sq.km)
EC>
3000
F >
1.5
Unsaturated
thickness
(m)
Recharge
potential
(MCM)
Utiliza
ble
yield
(MCM)
No. of
CDS
No. of
MPTS
Total
cost
CD
(Lakhs
)
Total
cost
MPTS
(Lakhs)
Total
Cost of
CDS &
MPTS
(Lakhs) 305 Nalgonda Nered Cherla Penchikal Dinne 3 7.25 1500 3 1 0.1 0.1 2 2 10 20 30
306 Nalgonda Nered Cherla Sajjapuram 7 11.78 1500 1.5 0 0 0.16 0 0 0 0 0
307 Nalgonda Nered Cherla Somavaram 3 14.88 1500 3 5 0.8 0.2 4 4 20 40 60
308 Nalgonda Nered Cherla Sunya Pahad 8 6.62 1500 1.5 2 0.1 0.09 2 2 10 20 30
309 Nalgonda Nered Cherla Yella Puram 7 4.12 1500 1.5 0 0 0.05 0 0 0 0 0
310 Nalgonda Nered Cherla Yellaram 4 5.59 1500 3 -1 -0.1 0.07 0 0 0 0 0
311 Nalgonda Neredcherla Ravipahad 8 6.37 1500 1.5 3 0.2 0.08 2 2 10 20 30
312 Nalgonda Nidamanur Bankapur 7 6.86 1500 1.5 0 0 0.05 0 0 0 0 0
313 Nalgonda Nidamanur Bokkamanthula
Pahad
1 5.17 3000 1.5 1 0.1 0.04 1 1 5 10 15
314 Nalgonda Nidamanur Guntipalle 1 14.3 3000 1.5 2 0.3 0.1 2 2 10 20 30
315 Nalgonda Nidamanur Nehatapur 8 12.63 1500 1.5 2 0.3 0.09 2 2 10 20 30
316 Nalgonda Nidamanur Nidamanur 8 9.58 1500 1.5 1 0.1 0.07 1 1 5 10 15
317 Nalgonda Nidamanur Regulagadda 8 11.88 1500 1.5 2 0.3 0.08 2 2 10 20 30
318 Nalgonda Nidamanur Sakhapur 8 6.28 1500 1.5 1 0.1 0.04 1 1 5 10 15
319 Nalgonda Nidamanur Surepalle 8 9.63 1500 1.5 1 0.1 0.07 1 1 5 10 15
320 Nalgonda Nidamanur Tummadam 8 36.77 1500 1.5 2 0.8 0.26 5 5 25 50 75
321 Nalgonda Nidamanur Vallabhapur 8 3.25 1500 1.5 2 0.1 0.02 0 0 0 0 0
322 Nalgonda Nidamanur Vempahad 1 15.54 3000 1.5 1 0.2 0.11 2 2 10 20 30
323 Nalgonda Nidamanur Venigandla 7 13.91 1500 1.5 0 0 0.1 0 0 0 0 0
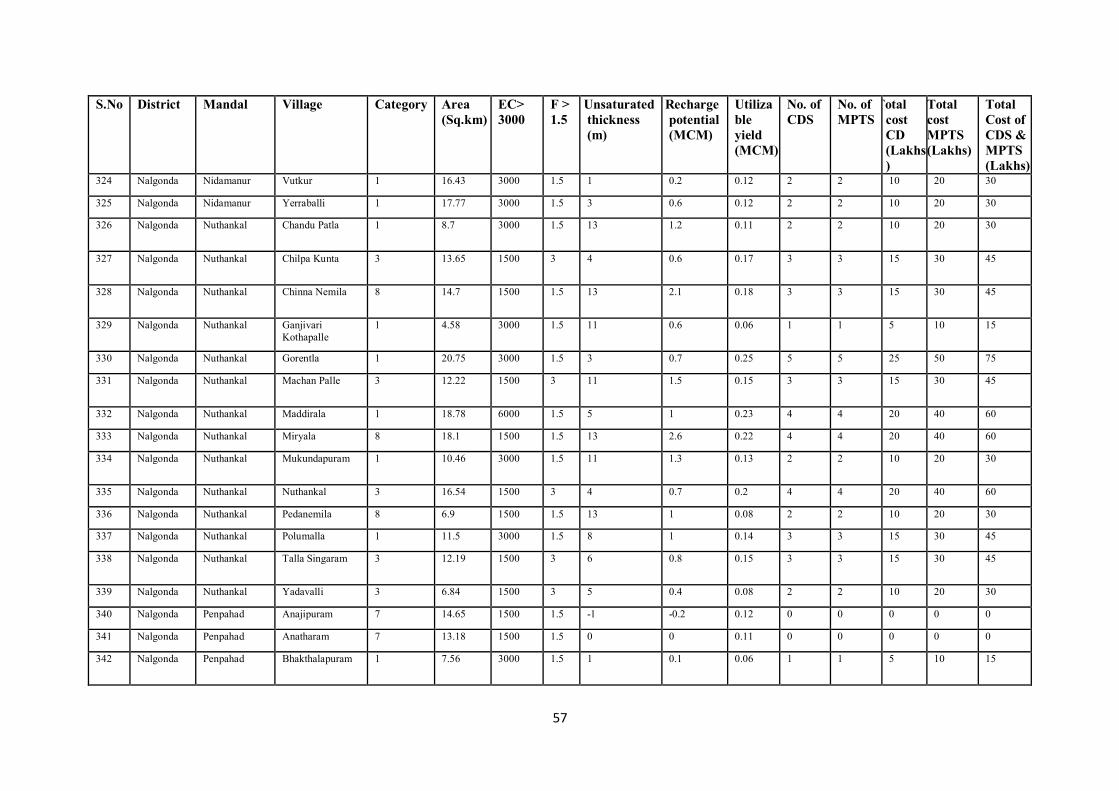
57
S.No District Mandal Village Category Area
(Sq.km)
EC>
3000
F >
1.5
Unsaturated
thickness
(m)
Recharge
potential
(MCM)
Utiliza
ble
yield
(MCM)
No. of
CDS
No. of
MPTS
Total
cost
CD
(Lakhs
)
Total
cost
MPTS
(Lakhs)
Total
Cost of
CDS &
MPTS
(Lakhs) 324 Nalgonda Nidamanur Vutkur 1 16.43 3000 1.5 1 0.2 0.12 2 2 10 20 30
325 Nalgonda Nidamanur Yerraballi 1 17.77 3000 1.5 3 0.6 0.12 2 2 10 20 30
326 Nalgonda Nuthankal Chandu Patla 1 8.7 3000 1.5 13 1.2 0.11 2 2 10 20 30
327 Nalgonda Nuthankal Chilpa Kunta 3 13.65 1500 3 4 0.6 0.17 3 3 15 30 45
328 Nalgonda Nuthankal Chinna Nemila 8 14.7 1500 1.5 13 2.1 0.18 3 3 15 30 45
329 Nalgonda Nuthankal Ganjivari
Kothapalle
1 4.58 3000 1.5 11 0.6 0.06 1 1 5 10 15
330 Nalgonda Nuthankal Gorentla 1 20.75 3000 1.5 3 0.7 0.25 5 5 25 50 75
331 Nalgonda Nuthankal Machan Palle 3 12.22 1500 3 11 1.5 0.15 3 3 15 30 45
332 Nalgonda Nuthankal Maddirala 1 18.78 6000 1.5 5 1 0.23 4 4 20 40 60
333 Nalgonda Nuthankal Miryala 8 18.1 1500 1.5 13 2.6 0.22 4 4 20 40 60
334 Nalgonda Nuthankal Mukundapuram 1 10.46 3000 1.5 11 1.3 0.13 2 2 10 20 30
335 Nalgonda Nuthankal Nuthankal 3 16.54 1500 3 4 0.7 0.2 4 4 20 40 60
336 Nalgonda Nuthankal Pedanemila 8 6.9 1500 1.5 13 1 0.08 2 2 10 20 30
337 Nalgonda Nuthankal Polumalla 1 11.5 3000 1.5 8 1 0.14 3 3 15 30 45
338 Nalgonda Nuthankal Talla Singaram 3 12.19 1500 3 6 0.8 0.15 3 3 15 30 45
339 Nalgonda Nuthankal Yadavalli 3 6.84 1500 3 5 0.4 0.08 2 2 10 20 30
340 Nalgonda Penpahad Anajipuram 7 14.65 1500 1.5 -1 -0.2 0.12 0 0 0 0 0
341 Nalgonda Penpahad Anatharam 7 13.18 1500 1.5 0 0 0.11 0 0 0 0 0
342 Nalgonda Penpahad Bhakthalapuram 1 7.56 3000 1.5 1 0.1 0.06 1 1 5 10 15
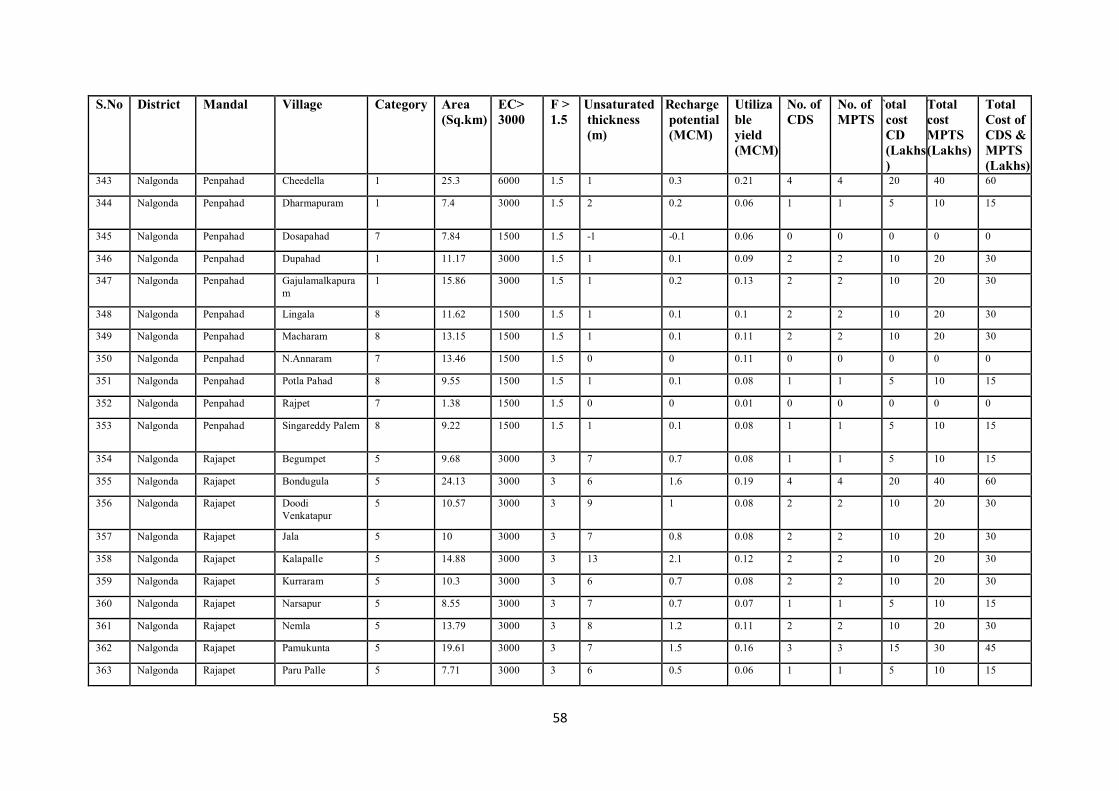
58
S.No District Mandal Village Category Area
(Sq.km)
EC>
3000
F >
1.5
Unsaturated
thickness
(m)
Recharge
potential
(MCM)
Utiliza
ble
yield
(MCM)
No. of
CDS
No. of
MPTS
Total
cost
CD
(Lakhs
)
Total
cost
MPTS
(Lakhs)
Total
Cost of
CDS &
MPTS
(Lakhs) 343 Nalgonda Penpahad Cheedella 1 25.3 6000 1.5 1 0.3 0.21 4 4 20 40 60
344 Nalgonda Penpahad Dharmapuram 1 7.4 3000 1.5 2 0.2 0.06 1 1 5 10 15
345 Nalgonda Penpahad Dosapahad 7 7.84 1500 1.5 -1 -0.1 0.06 0 0 0 0 0
346 Nalgonda Penpahad Dupahad 1 11.17 3000 1.5 1 0.1 0.09 2 2 10 20 30
347 Nalgonda Penpahad Gajulamalkapura
m
1 15.86 3000 1.5 1 0.2 0.13 2 2 10 20 30
348 Nalgonda Penpahad Lingala 8 11.62 1500 1.5 1 0.1 0.1 2 2 10 20 30
349 Nalgonda Penpahad Macharam 8 13.15 1500 1.5 1 0.1 0.11 2 2 10 20 30
350 Nalgonda Penpahad N.Annaram 7 13.46 1500 1.5 0 0 0.11 0 0 0 0 0
351 Nalgonda Penpahad Potla Pahad 8 9.55 1500 1.5 1 0.1 0.08 1 1 5 10 15
352 Nalgonda Penpahad Rajpet 7 1.38 1500 1.5 0 0 0.01 0 0 0 0 0
353 Nalgonda Penpahad Singareddy Palem 8 9.22 1500 1.5 1 0.1 0.08 1 1 5 10 15
354 Nalgonda Rajapet Begumpet 5 9.68 3000 3 7 0.7 0.08 1 1 5 10 15
355 Nalgonda Rajapet Bondugula 5 24.13 3000 3 6 1.6 0.19 4 4 20 40 60
356 Nalgonda Rajapet Doodi
Venkatapur
5 10.57 3000 3 9 1 0.08 2 2 10 20 30
357 Nalgonda Rajapet Jala 5 10 3000 3 7 0.8 0.08 2 2 10 20 30
358 Nalgonda Rajapet Kalapalle 5 14.88 3000 3 13 2.1 0.12 2 2 10 20 30
359 Nalgonda Rajapet Kurraram 5 10.3 3000 3 6 0.7 0.08 2 2 10 20 30
360 Nalgonda Rajapet Narsapur 5 8.55 3000 3 7 0.7 0.07 1 1 5 10 15
361 Nalgonda Rajapet Nemla 5 13.79 3000 3 8 1.2 0.11 2 2 10 20 30
362 Nalgonda Rajapet Pamukunta 5 19.61 3000 3 7 1.5 0.16 3 3 15 30 45
363 Nalgonda Rajapet Paru Palle 5 7.71 3000 3 6 0.5 0.06 1 1 5 10 15
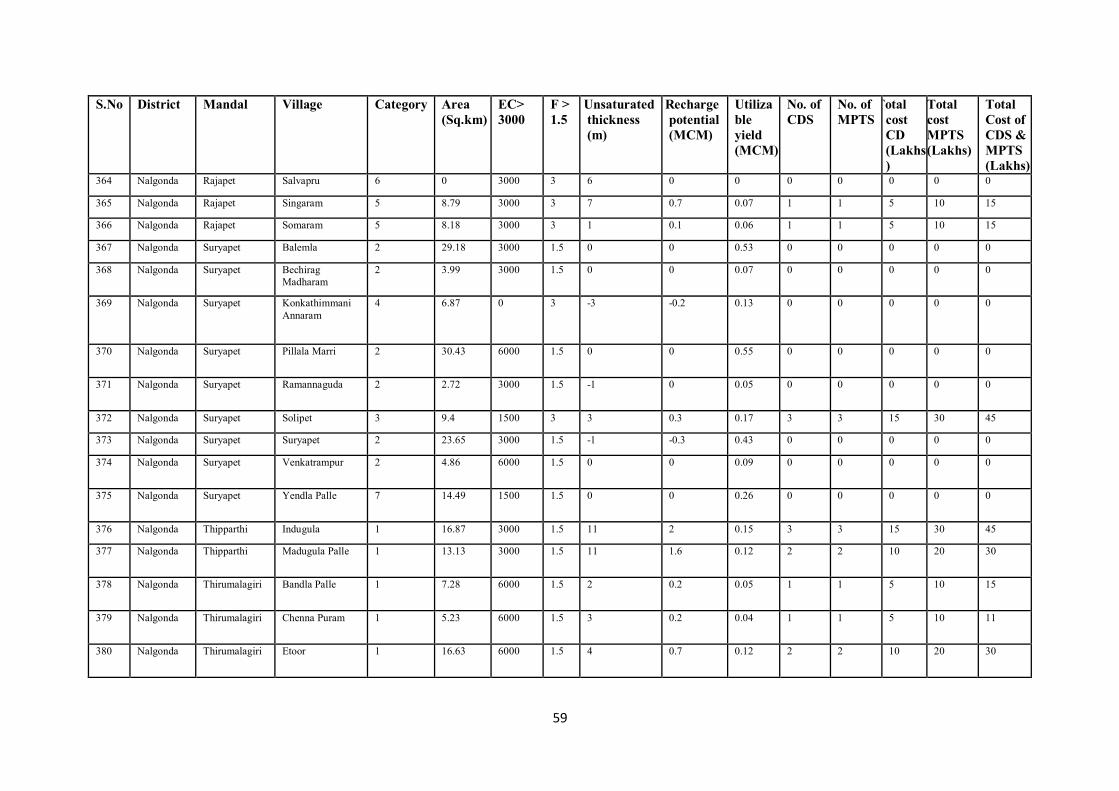
59
S.No District Mandal Village Category Area
(Sq.km)
EC>
3000
F >
1.5
Unsaturated
thickness
(m)
Recharge
potential
(MCM)
Utiliza
ble
yield
(MCM)
No. of
CDS
No. of
MPTS
Total
cost
CD
(Lakhs
)
Total
cost
MPTS
(Lakhs)
Total
Cost of
CDS &
MPTS
(Lakhs) 364 Nalgonda Rajapet Salvapru 6 0 3000 3 6 0 0 0 0 0 0 0
365 Nalgonda Rajapet Singaram 5 8.79 3000 3 7 0.7 0.07 1 1 5 10 15
366 Nalgonda Rajapet Somaram 5 8.18 3000 3 1 0.1 0.06 1 1 5 10 15
367 Nalgonda Suryapet Balemla 2 29.18 3000 1.5 0 0 0.53 0 0 0 0 0
368 Nalgonda Suryapet Bechirag
Madharam
2 3.99 3000 1.5 0 0 0.07 0 0 0 0 0
369 Nalgonda Suryapet Konkathimmani
Annaram
4 6.87 0 3 -3 -0.2 0.13 0 0 0 0 0
370 Nalgonda Suryapet Pillala Marri 2 30.43 6000 1.5 0 0 0.55 0 0 0 0 0
371 Nalgonda Suryapet Ramannaguda 2 2.72 3000 1.5 -1 0 0.05 0 0 0 0 0
372 Nalgonda Suryapet Solipet 3 9.4 1500 3 3 0.3 0.17 3 3 15 30 45
373 Nalgonda Suryapet Suryapet 2 23.65 3000 1.5 -1 -0.3 0.43 0 0 0 0 0
374 Nalgonda Suryapet Venkatrampur 2 4.86 6000 1.5 0 0 0.09 0 0 0 0 0
375 Nalgonda Suryapet Yendla Palle 7 14.49 1500 1.5 0 0 0.26 0 0 0 0 0
376 Nalgonda Thipparthi Indugula 1 16.87 3000 1.5 11 2 0.15 3 3 15 30 45
377 Nalgonda Thipparthi Madugula Palle 1 13.13 3000 1.5 11 1.6 0.12 2 2 10 20 30
378 Nalgonda Thirumalagiri Bandla Palle 1 7.28 6000 1.5 2 0.2 0.05 1 1 5 10 15
379 Nalgonda Thirumalagiri Chenna Puram 1 5.23 6000 1.5 3 0.2 0.04 1 1 5 10 11
380 Nalgonda Thirumalagiri Etoor 1 16.63 6000 1.5 4 0.7 0.12 2 2 10 20 30
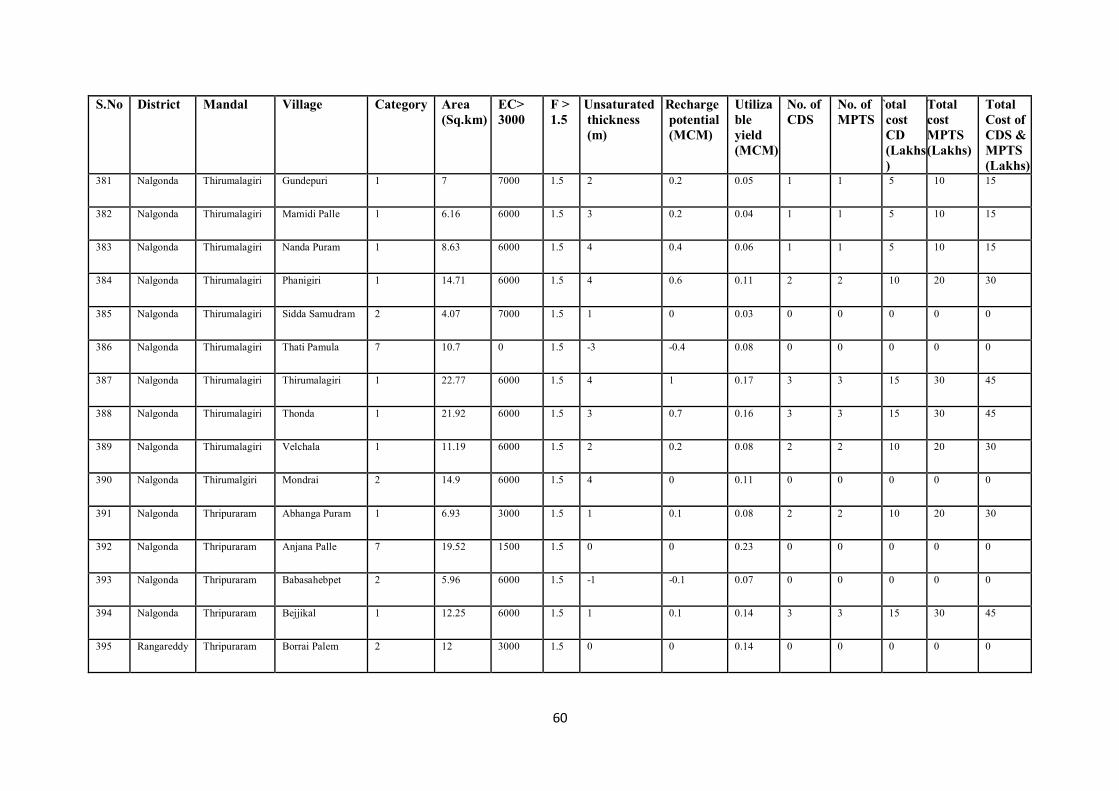
60
S.No District Mandal Village Category Area
(Sq.km)
EC>
3000
F >
1.5
Unsaturated
thickness
(m)
Recharge
potential
(MCM)
Utiliza
ble
yield
(MCM)
No. of
CDS
No. of
MPTS
Total
cost
CD
(Lakhs
)
Total
cost
MPTS
(Lakhs)
Total
Cost of
CDS &
MPTS
(Lakhs) 381 Nalgonda Thirumalagiri Gundepuri 1 7 7000 1.5 2 0.2 0.05 1 1 5 10 15
382 Nalgonda Thirumalagiri Mamidi Palle 1 6.16 6000 1.5 3 0.2 0.04 1 1 5 10 15
383 Nalgonda Thirumalagiri Nanda Puram 1 8.63 6000 1.5 4 0.4 0.06 1 1 5 10 15
384 Nalgonda Thirumalagiri Phanigiri 1 14.71 6000 1.5 4 0.6 0.11 2 2 10 20 30
385 Nalgonda Thirumalagiri Sidda Samudram 2 4.07 7000 1.5 1 0 0.03 0 0 0 0 0
386 Nalgonda Thirumalagiri Thati Pamula 7 10.7 0 1.5 -3 -0.4 0.08 0 0 0 0 0
387 Nalgonda Thirumalagiri Thirumalagiri 1 22.77 6000 1.5 4 1 0.17 3 3 15 30 45
388 Nalgonda Thirumalagiri Thonda 1 21.92 6000 1.5 3 0.7 0.16 3 3 15 30 45
389 Nalgonda Thirumalagiri Velchala 1 11.19 6000 1.5 2 0.2 0.08 2 2 10 20 30
390 Nalgonda Thirumalgiri Mondrai 2 14.9 6000 1.5 4 0 0.11 0 0 0 0 0
391 Nalgonda Thripuraram Abhanga Puram 1 6.93 3000 1.5 1 0.1 0.08 2 2 10 20 30
392 Nalgonda Thripuraram Anjana Palle 7 19.52 1500 1.5 0 0 0.23 0 0 0 0 0
393 Nalgonda Thripuraram Babasahebpet 2 5.96 6000 1.5 -1 -0.1 0.07 0 0 0 0 0
394 Nalgonda Thripuraram Bejjikal 1 12.25 6000 1.5 1 0.1 0.14 3 3 15 30 45
395 Rangareddy Thripuraram Borrai Palem 2 12 3000 1.5 0 0 0.14 0 0 0 0 0
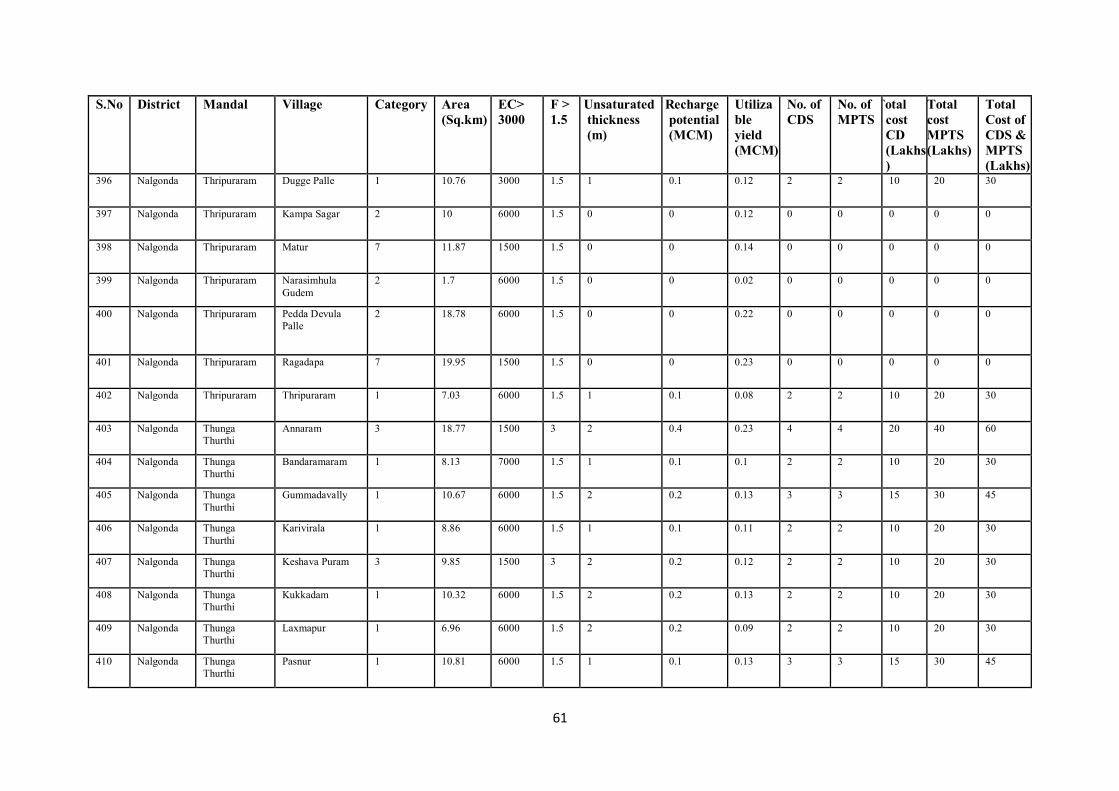
61
S.No District Mandal Village Category Area
(Sq.km)
EC>
3000
F >
1.5
Unsaturated
thickness
(m)
Recharge
potential
(MCM)
Utiliza
ble
yield
(MCM)
No. of
CDS
No. of
MPTS
Total
cost
CD
(Lakhs
)
Total
cost
MPTS
(Lakhs)
Total
Cost of
CDS &
MPTS
(Lakhs) 396 Nalgonda Thripuraram Dugge Palle 1 10.76 3000 1.5 1 0.1 0.12 2 2 10 20 30
397 Nalgonda Thripuraram Kampa Sagar 2 10 6000 1.5 0 0 0.12 0 0 0 0 0
398 Nalgonda Thripuraram Matur 7 11.87 1500 1.5 0 0 0.14 0 0 0 0 0
399 Nalgonda Thripuraram Narasimhula
Gudem
2 1.7 6000 1.5 0 0 0.02 0 0 0 0 0
400 Nalgonda Thripuraram Pedda Devula
Palle
2 18.78 6000 1.5 0 0 0.22 0 0 0 0 0
401 Nalgonda Thripuraram Ragadapa 7 19.95 1500 1.5 0 0 0.23 0 0 0 0 0
402 Nalgonda Thripuraram Thripuraram 1 7.03 6000 1.5 1 0.1 0.08 2 2 10 20 30
403 Nalgonda Thunga
Thurthi
Annaram 3 18.77 1500 3 2 0.4 0.23 4 4 20 40 60
404 Nalgonda Thunga
Thurthi
Bandaramaram 1 8.13 7000 1.5 1 0.1 0.1 2 2 10 20 30
405 Nalgonda Thunga
Thurthi
Gummadavally 1 10.67 6000 1.5 2 0.2 0.13 3 3 15 30 45
406 Nalgonda Thunga
Thurthi
Karivirala 1 8.86 6000 1.5 1 0.1 0.11 2 2 10 20 30
407 Nalgonda Thunga
Thurthi
Keshava Puram 3 9.85 1500 3 2 0.2 0.12 2 2 10 20 30
408 Nalgonda Thunga
Thurthi
Kukkadam 1 10.32 6000 1.5 2 0.2 0.13 2 2 10 20 30
409 Nalgonda Thunga
Thurthi
Laxmapur 1 6.96 6000 1.5 2 0.2 0.09 2 2 10 20 30
410 Nalgonda Thunga
Thurthi
Pasnur 1 10.81 6000 1.5 1 0.1 0.13 3 3 15 30 45
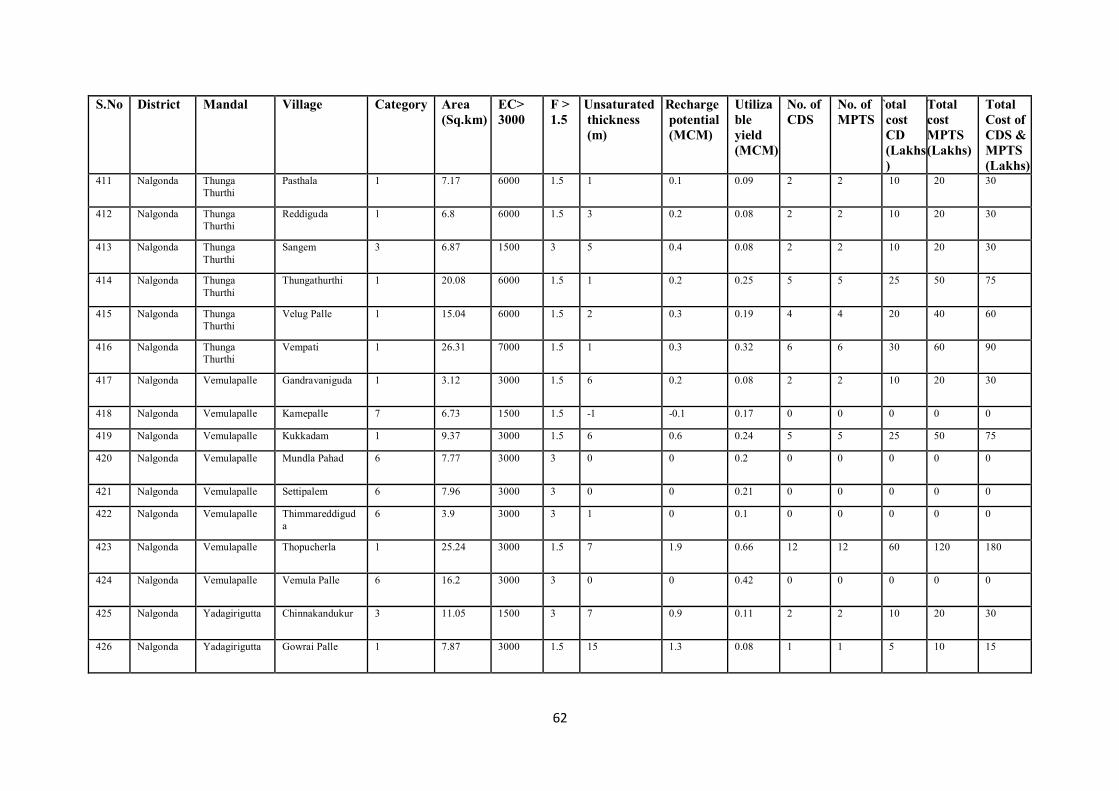
62
S.No District Mandal Village Category Area
(Sq.km)
EC>
3000
F >
1.5
Unsaturated
thickness
(m)
Recharge
potential
(MCM)
Utiliza
ble
yield
(MCM)
No. of
CDS
No. of
MPTS
Total
cost
CD
(Lakhs
)
Total
cost
MPTS
(Lakhs)
Total
Cost of
CDS &
MPTS
(Lakhs) 411 Nalgonda Thunga
Thurthi
Pasthala 1 7.17 6000 1.5 1 0.1 0.09 2 2 10 20 30
412 Nalgonda Thunga
Thurthi
Reddiguda 1 6.8 6000 1.5 3 0.2 0.08 2 2 10 20 30
413 Nalgonda Thunga
Thurthi
Sangem 3 6.87 1500 3 5 0.4 0.08 2 2 10 20 30
414 Nalgonda Thunga
Thurthi
Thungathurthi 1 20.08 6000 1.5 1 0.2 0.25 5 5 25 50 75
415 Nalgonda Thunga
Thurthi
Velug Palle 1 15.04 6000 1.5 2 0.3 0.19 4 4 20 40 60
416 Nalgonda Thunga
Thurthi
Vempati 1 26.31 7000 1.5 1 0.3 0.32 6 6 30 60 90
417 Nalgonda Vemulapalle Gandravaniguda 1 3.12 3000 1.5 6 0.2 0.08 2 2 10 20 30
418 Nalgonda Vemulapalle Kamepalle 7 6.73 1500 1.5 -1 -0.1 0.17 0 0 0 0 0
419 Nalgonda Vemulapalle Kukkadam 1 9.37 3000 1.5 6 0.6 0.24 5 5 25 50 75
420 Nalgonda Vemulapalle Mundla Pahad 6 7.77 3000 3 0 0 0.2 0 0 0 0 0
421 Nalgonda Vemulapalle Settipalem 6 7.96 3000 3 0 0 0.21 0 0 0 0 0
422 Nalgonda Vemulapalle Thimmareddigud
a
6 3.9 3000 3 1 0 0.1 0 0 0 0 0
423 Nalgonda Vemulapalle Thopucherla 1 25.24 3000 1.5 7 1.9 0.66 12 12 60 120 180
424 Nalgonda Vemulapalle Vemula Palle 6 16.2 3000 3 0 0 0.42 0 0 0 0 0
425 Nalgonda Yadagirigutta Chinnakandukur 3 11.05 1500 3 7 0.9 0.11 2 2 10 20 30
426 Nalgonda Yadagirigutta Gowrai Palle 1 7.87 3000 1.5 15 1.3 0.08 1 1 5 10 15
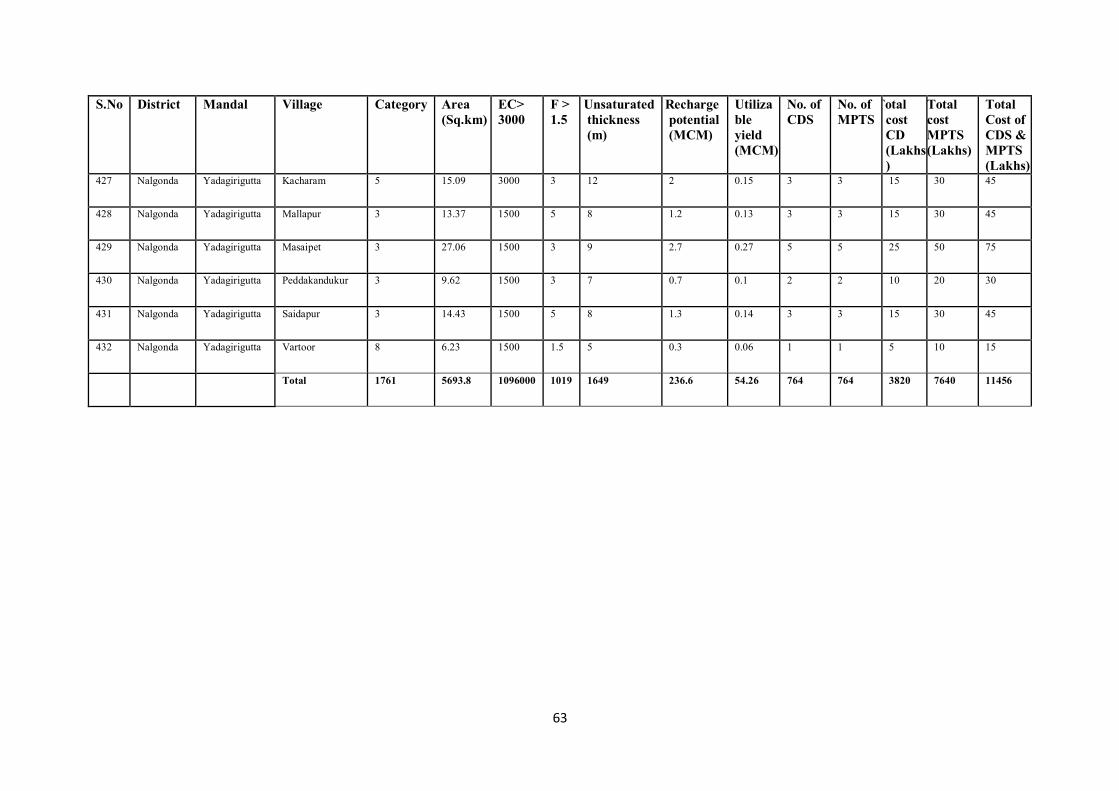
63
S.No District Mandal Village Category Area
(Sq.km)
EC>
3000
F >
1.5
Unsaturated
thickness
(m)
Recharge
potential
(MCM)
Utiliza
ble
yield
(MCM)
No. of
CDS
No. of
MPTS
Total
cost
CD
(Lakhs
)
Total
cost
MPTS
(Lakhs)
Total
Cost of
CDS &
MPTS
(Lakhs) 427 Nalgonda Yadagirigutta Kacharam 5 15.09 3000 3 12 2 0.15 3 3 15 30 45
428 Nalgonda Yadagirigutta Mallapur 3 13.37 1500 5 8 1.2 0.13 3 3 15 30 45
429 Nalgonda Yadagirigutta Masaipet 3 27.06 1500 3 9 2.7 0.27 5 5 25 50 75
430 Nalgonda Yadagirigutta Peddakandukur 3 9.62 1500 3 7 0.7 0.1 2 2 10 20 30
431 Nalgonda Yadagirigutta Saidapur 3 14.43 1500 5 8 1.3 0.14 3 3 15 30 45
432 Nalgonda Yadagirigutta Vartoor 8 6.23 1500 1.5 5 0.3 0.06 1 1 5 10 15
Total 1761 5693.8 1096000 1019 1649 236.6 54.26 764 764 3820 7640 11456