जल एँव संबिन्धत सांिख्यक - Central Water Commission
212
जल एँव संबिधत सांियक� WATER RESOURCES INFORMATION SYSTEM DIRECTORATE INFORMATION SYSTEM ORGANISATION WATER PLANNING & PROJECTS WING CENTRAL WATER COMMISSION जल संसाधन स ू चना णाल� �नदेशालय स ू चना णाल� संगठन जल आयोजन एंव प�रयोजना कंध के�य जल आयोग DECEMBER 2013 �दसबर 2013
-
Upload
khangminh22 -
Category
Documents
-
view
2 -
download
0
Transcript of जल एँव संबिन्धत सांिख्यक - Central Water Commission

जल एँव संबिन्धत सांिख्यक�
WATER RESOURCES INFORMATION SYSTEM DIRECTORATE INFORMATION SYSTEM ORGANISATION WATER PLANNING & PROJECTS WING CENTRAL WATER COMMISSION
जल संसाधन सूचना प्रणाल� �नदेशालय
सूचना प्रणाल� संगठन
जल आयोजन एंव प�रयोजना स्कंध
केन्द्र�य जल आयोग
DECEMBER 2013
�दसम्बर 2013

WATER AND RELATED
WW WATER RESOURCES INFORMATION SYSTEM DIRECTORATE
INFORMATION SYSTEM ORGANISATION WATER PLANNING & PROJECT WING
CENTRAL WATER COMMISSION DECEMBER 2013


Officials associated with the Publication 1. Shri D.P. Mondal Advisor 2. Shri S.K. Madaan Director 3. Shri Mohd. Islam Elahi Dy. Director 5. Shri Ashwani Kumar Assistant Director 6. Shri Ashwani Kumar Senior Statistical Officer. 7. Shri Anil Kumar Raisinghani Jr. Computor
vii

Acronyms BCM : Billion Cubic Metre CAD : Command Area Development CCA : Cultural Command Area cm : Centimeter cu m : Cubic Metre CWC : Central Water Commission CUI : Coverage under Irrigation ERM : Extension, Renovation & Modernization Project FF : Flood Forecasting FRL : Full Reservoir Level GDP : Gross Domestic Product GIA : Gross Irrigated Area GSA : Gross Sown Area GWH : Giga Watt Hours HFL : Highest Flood Level IPC : Irrigation Potential Created IPU : Irrigation Potential Utilised IWDP : Integrated Watershed Development Project KM : Kilometre KWH : Kilo Watt Hours Lakh Ha : Lakh Hectare M : Metre MCM : Million Cubic Metre mm : Millimeter Mha : Million Hectare MW : Mega Watt NCIWRD : National Commission on Integrated Water Resources Development NDP : Net Domestic Product NIA : Net Irrigated Area NRDWP : National Rural Drinking Water Programme NSA : Net Sown Area PL : Pond Level sq km : Square Kilometre TCA : Total Cultivable Area TMcum : Thousand Million Cubic Metre UIP : Ultimate Irrigation Potential UT : Union Territory % : Percentage
ix

CONTENTS Topics Page No
Foreword Preface List of Officials Acronym Water Sector At a Glance Chapter 1 - Introduction 1 Chapter 2 - Water and Related Resources 3 Chapter 3 - Resources Utilisation 16 Chapter 4 - Financial Performance 24 Chapter 5 - Environmental Performance 27 Appendix-I Tables
1 Per Capita Average Annual Availability of Water in India during 2010, 2025 & 2050
33
2 Basin Wise Storage in India as on 31.03.2013 34 3 Live Storage Capacity of Reservoirs in India as on 31.03.2013 35
4(A) Storage Position of Important Reservoirs of India at the end of each month during June 2010 to May 2011
36
4(B) Storage Position of Important Reservoirs of India at the end of each month during June 2009 to May 2010
52
5 Basin-wise Number of Hydrological Observation Stations by type 68 6 Ultimate Irrigation Potential by State 71 7 Number of Large Dams having capacity as on30th November 2012 Abstract by
State 72
8 Plan-wise Achievements of Irrigation Potential Created/ Utilised (Cumulative) under Major & Medium Irrigation Projects by State
74
9 Irrigation Potential Created and Utilized over plan periods 76 10 Year-wise Achievements of Irrigation Potential Created/Utilised under Major
& Medium Irrigation of XI plan by State 78
11 Year-wise Achievements of Irrigation Potential Created/Utilised under Minor Irrigation Projects of XI plan* by State
80
12 Irrigation Potential Created ,Utilised and Gross Irrigated Area by State, 2009-10
82
13(i) Project-wise Irrigation Potential Created (IPC) under AIBP 84 13(ii) Irrigation Potential Created by Major and Medium Irrigation Projects under
AIBP 94
13(iii) Central Assistance releases to States for Major, Medium, ERM Projets for the period 1996-97 to 2012-13 under AIBP
95
14 (i) Number of Major, Medium and ERM Irrigation Projects in India by State 96 14(ii) State-wise & project-wise financial status of Major, Medium and ERM
projects as reported completed in XI Plan 100
14(iii) State-wise & project-wise financial status of Major, Medium and EMR projects as reported completed with liabilities in XII plan
109
14 (iv) Abstract of New Projects under Appraisal in CWC 115 14 (v) List of Projects Accepted By Advisory Committee of MoWR upto December
2012 116
15 Physical Achievements of Field Channels (F.C.) under CAD Programme by State
119
16 Physical Achievements of Field Drains under CAD Programme by State 121 17 List of On-going Projects under CADWM Programme during the period
of XI Plan (2007-08 To 2011-12) as on March, 2012 123
xi

18 Plan-wise Financial Expenditure on Irrigation in India 133 19 Plan-wise Financial Expenditure on Irrigation in India (at 1993-94 prices) 135 20 State-wise and Plan-wise Financial Expenditure on Major and Medium
Irrigation 137
21 State-wise and Plan-wise Financial Expenditure on Minor Irrigation - State Sector
139
22 State-wise and Plan-wise Financial Expenditure on Minor Irrigation - Institutional
140
23 Central Releases under the Command Area Development Programme by State 141 24 State-wise Expenditure under CAD Programme - State Sector 143 25 Water Rates for flow Irrigation by State 146 26 Water Rates for Lift Irrigation by State 148 27 Flood Damage/Heavy Rains in India 150 28 State-wise Damage due to Flood / Heavy Rains during 2011 152 29 Flood Damage in India during 1953 TO 2011 (At 1993-94 Prices) 154 30 Plan-wise Expenditure Under Flood Management 156 31 Plan-wise Expenditure & Cumulative Benefits (Area Protected) under Flood
Management (At 1993-94 Prices) 157
32 State-wise Plan-wise Financial Expenditure on Flood Management Work 158 33 State-wise Progress of Physical Works under Flood Management till March
2011 160
34(A) Flood Forecasting Performance at various Forecasting stations during the flood season 2010
162
34B) Flood Forecasting Performance at various Forecasting stations during Flood Season 2009
172
35(A) Broad Features of Flood Forecasting Performance during the Flood season 2010
182
35(B) Broad Features of Flood Forecasting Performance during the Flood season 2009
185
36 Comparative Flood Forecasting Performance from 1986 to 2010 188 37 Projected Water Demand in India (By Different Uses) 189 38 Status of Coverage of Rural Habitations Under Rural Water Supply as on
1.04.2012 190
39 Detail of layers under India-WRIS 192 40 Status of Hydro Electric Potential Development- Region and State- wise 193 41 Status of Hydro Electric Power Potential Development-Basin-wise 196 42 Hydro Electric Power Installed Capacity and Generation - All India (Utilities) 197 43 List of Water Resources projects declared as National Projects 198
xii

Water Sector at a Glance
Item
1. Average Annual Precipitation (including snowfall) 4000 BCM
2. Geographical Area 328.7 Million Hectare
3. i) Census Population – 2001 1028.74 Million ii) Census Population – 2011 1210.19 Million
4. Estimated Annual Rainfall 2011 3669.35 BCM
5. Average Annual Water Resources Potential 1869 BCM
6. i) Per Capita Water Availability (2001) 1816 Cubic Meter ii) Per Capita Water Availability (2011) 1544 Cubic Meter
7. Estimated Utilisable Water i) Surface 690 BCM ii) Ground 431 BCM iii) Total 1121 BCM
8. a) Live Storage Capacity i) Completed Projects 253.388 BCM ii) Projects Under Construction 50.959 BCM
b) Storage Position of 81 Important Reservoirs (BCM) (June 2009 to May 2011)
Sl. No. Month Total Live
Storage Actual Storage Percentage of actual Storage
1. June-09 151.768 13.719 9 2. July-09 151.768 54.403 36 3. Aug-09 151.768 67.775 45 4. Sept-09 151.768 89.835 59 5. Oct-09 151.768 92.592 61 6. Nov-09 151.768 87.782 58 7. Dec-09 151.768 78.033 51 8. Jan-10 151.768 64.709 43 9. Feb-10 151.768 52.701 35 10. Mar-10 151.768 39.097 26 11. Apr-10 151.768 28.613 19 12. May-10 151.768 21.328 14 (June 2010 to May 2011) 1. June-10 151.768 20.312 13 2. July-10 151.768 46.224 30 3. Aug-10 151.768 92.351 61 4. Sept-10 151.768 114.601 76 5. Oct-10 151.768 112.921 74 6. Nov-10 151.768 113.473 75 7. Dec-10 151.768 104.214 69 8. Jan-11 151.768 89.403 59
xiii

9. Feb-11 151.768 73.779 49 10. Mar-11 151.768 58.256 38 11. Apr-11 151.768 47.322 31 12. May-11 151.768 36.441 24
9. Irrigation Potential
9.1 At the time of Independence (Pre-Plan)
Created & Utilised 22.6 Million Hectare
i) Major & Medium 9.7 Million Hectare ii) Minor Irrigation 12.9 Million Hectare a) Surface Water 6.4 Million Hectare b) Ground Water 6.5 Million Hectare
9.2 Potential Created
(Million Hectare)
Minor Total Period Major. & Med Surface
Water Ground Water
Total Major, Med & Minor
VI Plan (1980-85) 1.09 1.70 5.82 7.52 8.61 VII Plan (1985-90) 2.22 1.29 7.80 9.09 11.31 Annual Plan (1990-92) 0.82 0.47 3.27 3.74 4.56 VIII Plan (1992-97) 2.21 1.05 1.91 2.96 5.17 IX Plan (1997-2002) 4.10 1.09 2.50 3.59 7.69 X Plan (2002-07) 4.59 N.A N.A 3.20 7.79
9.3 Major & Medium (Surface Water)
i) Ultimate 58.5 Million Hectare ii) Created (Upto 2009-10) 44.4 Million Hectare iii) Utilised (Upto 2009-10) 34.4 Million Hectare
9.4 Minor Irrigation i) Ultimate 81.4 Million Hectare ii) Created (Upto 2009-10) 62.8 Million Hectare iii) Utilised (Upto 2009-10) 52.5 Million Hectare
9.5 Total (Major & Medium + Minor) i) Ultimate 139.9 Million Hectare ii) Created (Upto 2009-10) 107.2 Million Hectare iii) Utilised (Upto 2009-10) 86.9 Million Hectare
10. Number of Major, Medium & ERM Irrigation Projects (Tentative / Under finalisation) Major Projects Medium Projects ERM i) Completed in Pre Plan 74 143 - ii) Completed in Plan Period upto
IX Plan 154 773 91
iii) Completed in X Plan 32 40 30 iv) Completed in XI Plan* 35 62 19 iv) Spilled over Projects in XII Plan* 149 138 39 iv) New Projects in XII Plan * 27 32 27 * Figures are likely to be changed after receiving final data.
xiv

11. CAD Programme 11.1 Year of Commencement 1974-75 11.2 Cumulative Physical Achievement of Field Channels
(Upto March 2012) 20148.2 ‘000 Hectare
12. Land Use Classification (2009-10) (Million Hectare) Geographical Area 328.73 Forest Area 70.04 Total Cultivable Land 182.47 Net Sown Area 140.02 Gross Sown Area (Total Cropped Area) 192.20
13. Expenditure on Irrigation Sector
(Rs. Million) Period Major & Medium Minor CAD Total % of Expenditure
on Irrigation to Total plan
expenditure
First Plan (1951-56) 3762 656 Nil 4418 23
Seventh Plan (1985-90) 111073 61929 14475 187477 9 Annual Plan (1990-91) 26348 14878 2856 44082 8 Annual Plan (1991-92) 28240 15181 3338 46759 7 Eighth Plan (1992-97) 216692 104724 19379 340795 7 Ninth Plan (1997-02) 492896 112967 22228 628091 7 Tenth Plan (2002-07) 836471 171818 25348 1033637 7 Annual Plan (2007-08)
(Actual Expenses) 293906 48851 10703 353460 10
Annual Plan (2008-09) 323418 63167 5724 392308 8 (Actual Expenses) Annual Plan (2009-10) 331688 75349 7029 414065 8 (Actual Expenses) Annual Plan (2010-11)
(Revised Approved Outlay) 343101 91613 9705 444419 6
Annual Plan (2011-12) (Approved Outlay)
452620 127671 16057 596348 7
14. Flood Damages during 2011(Tentative)
i) Area Affected 1.81 Million Hectare ii) Cropped Area Affected 2.69 Million Hectare iii) Value of Damages to Crops 1386.10 Rs. Crore iv) Population Affected 15.91 Million v) Human Lives Lost 1761 No. vi) Cattle lost 36 Th. Nos. vii) No. of Houses Damage 1153 Th. Nos. viii) Value of Damaged Houses 410.48 Rs. Crore ix) Damage to Public Utility 6047.67 Rs. Crore x) Total Loss to Crop, House and Public Utility 7844.24 Rs. Crore
xv
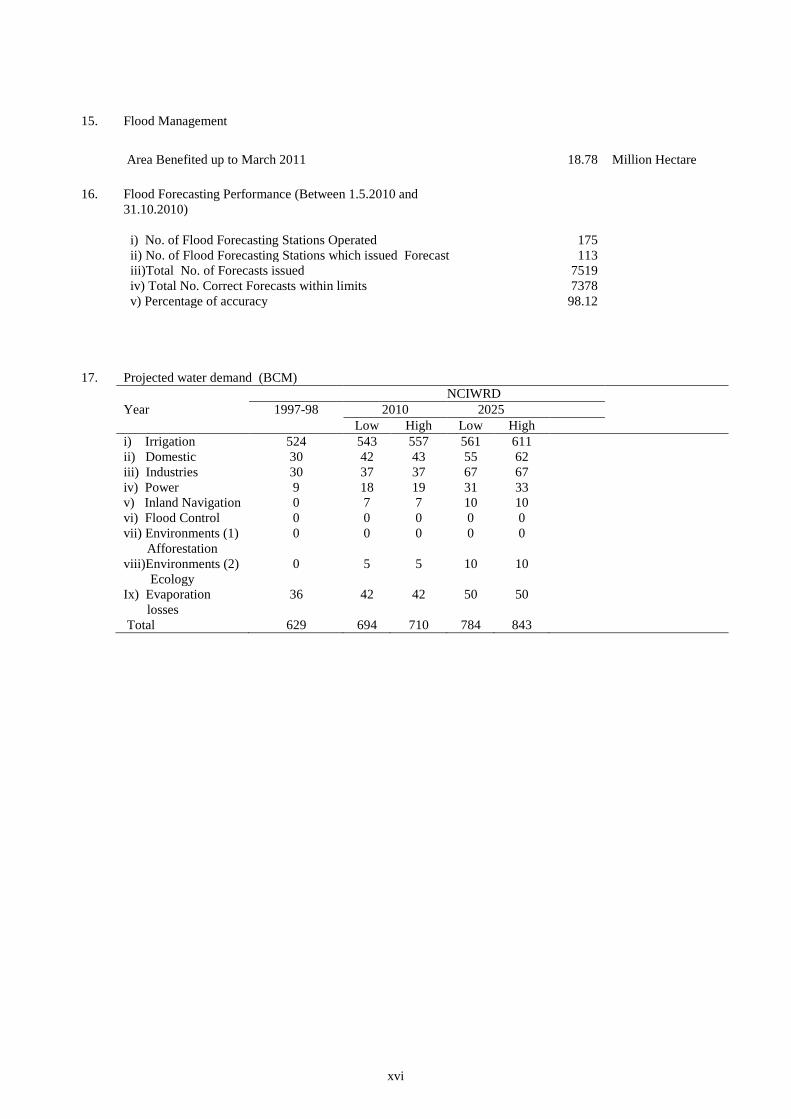
15. Flood Management Area Benefited up to March 2011 18.78 Million Hectare
16. Flood Forecasting Performance (Between 1.5.2010 and 31.10.2010)
i) No. of Flood Forecasting Stations Operated 175 ii) No. of Flood Forecasting Stations which issued Forecast 113 iii)Total No. of Forecasts issued 7519 iv) Total No. Correct Forecasts within limits 7378 v) Percentage of accuracy 98.12
17. Projected water demand (BCM) NCIWRD Year 1997-98 2010 2025 Low High Low High i) Irrigation 524 543 557 561 611 ii) Domestic 30 42 43 55 62 iii) Industries 30 37 37 67 67 iv) Power 9 18 19 31 33 v) Inland Navigation 0 7 7 10 10 vi) Flood Control 0 0 0 0 0 vii) Environments (1) 0 0 0 0 0 Afforestation viii)Environments (2) 0 5 5 10 10 Ecology Ix) Evaporation 36 42 42 50 50 losses Total 629 694 710 784 843
xvi

Chapter 1
Introduction Growing population coupled with sustainable developmental efforts has an increasing stress on water resources. The uneven distribution over time and space of water resources and their modification through human use and abuse are sources of water crises in many parts of the world. All these result in intensifying the pressure on water resources leading to tensions, conflict among users and excessive pressure on the environment. These demand the planners and policy makers for a proper management of water resources. This, in turn, calls for a reliable and adequate statistics on water and related aspects. According to the United Nations Educational, Scientific and Cultural Organisation (UNESCO)1 estimates, the total volume of water on earth is about 1.4 billion km3, which is enough to cover the earth with a layer of 3 km depth. However, World's oceans cover about three-fourths of earth’s surface while the fresh water constitutes a very small proportion of this enormous quantity available on the earth. It is only about 35 million km3 or 2.5% of the total volume. Of these, 24 million km3 or 68.9% is in the form of ice and permanent snow cover in mountainous regions, the Antarctic and Arctic regions and another 29.9% is present as ground water (shallow and deep groundwater basins up to 2,000 metres). The rest 0.3% is available in lakes, rivers and 0.9% in soil moisture, swamp water and permafrost atmosphere. Some useful facts and figures on world's water is presented in Box 1. The present publication is being brought out once in every two years and covers a wide range of data on water resources and its related resources in the country. The last edition of this publication was brought out in 2010. It comprises six chapters & two appendixes. Summary tables and charts have been included within the chapters to facilitate overview and better understanding. Chapter 1 presents introduction while Chapter 2 deals with key indicators of water resources including, inter-alia, water availability, creation of storages and ultimate irrigation potential. Chapter 3 deals with data on utilisation of water resources. Chapter 4 relates to agricultural production, production/output data on other water related sectors viz. Fisheries, Hydro-electric Power etc. Chapter 5 gives a brief account of financial resources used in irrigation projects. Social and environmental aspects of water resources development activities as well as data on flood damages and flood protection works are dealt with in Chapter 6. Detailed tables have been provided in Appendix-I and Glossary of terms in Appendix-II.
1 Source: Igor A. Shiklomanov, State Hydrological Institute (SHL. St. Petersburg) and United Nations Educational, Scientific and Cultural Organisation (UNESCO, Paris), 1999.
1

Box 1: Some Facts and Figures on Water
Food and Agriculture Organization of the United Nations (FAO)
• The daily drinking water requirement per person is 2-4 litres, but it takes 2000 to 5000 litres of water to produce one person's daily food.
• It takes 1000-3000 litres of water to produce just one kilo of rice. • In 2010, the estimated number of undernourished people worldwide was 925 million. • Over the period to 2050 the world's water will have to support the agricultural systems that
will feed and create livelihoods for an additional 2.7 billion people. • The extent of land under irrigation in the world is 277 million hectares, about 20 percent of
all cropland. Rainfed agriculture is practiced on the remaining 80 percent of the arable land. • The Intergovernmental Panel on Climate Change predicts yields from rain-dependent
agriculture could be down by 50 percent by 2020. • Due to climate change, Himalayan snow and ice, which provide vast amounts of water for
agriculture in Asia, are expected to decline by 20 percent by 2030. • Irrigation increases yields of most crops by 100 to 400 percent, and irrigated agriculture
currently contributes to 40 percent of the world's food production. • Water use has been growing at more than the rate twice of population increase in the last
century. • By 2025, 1800 million people will be living in countries or regions with absolute water
scarcity, and two-thirds of the world population could be under stress conditions.
World Water Assessment Programme (WWAP) • Poor drainage and irrigation practices have led to waterlogging and salinization of
approximately 10 percent of the world's irrigated lands. • How the world uses freshwater:
Irrigation- about 70%, Industry - about 22%, Domestic use - about 8%
Global Environment Outlook: environment for development (GEO-4)
• Water withdrawals are predicted to increase by 50 percent by 2025 in developing countries, and 18 per cent in developed countries.
Human Development Report 2006 • Over 1.4 billion people currently live in river basins where the use of water exceeds
minimum recharge levels, leading to the desiccation of rivers and depletion of groundwater. UN Water 1. The useable fresh water for ecosystem and humans is about 200000 Km3 of water (which is
less than 1% of all fresh water resources). 2. The Earth`s atmosphere contain approximately 13000 Km3 of water. 3. Each person needs 20-50 litres of water a day to ensure their basic needs for drinking,
cooking and cleaning. 4. More than one-sixth of the people worldwide does not have access to improved water
sources.
2
Chapter 2
Water and Related Resources
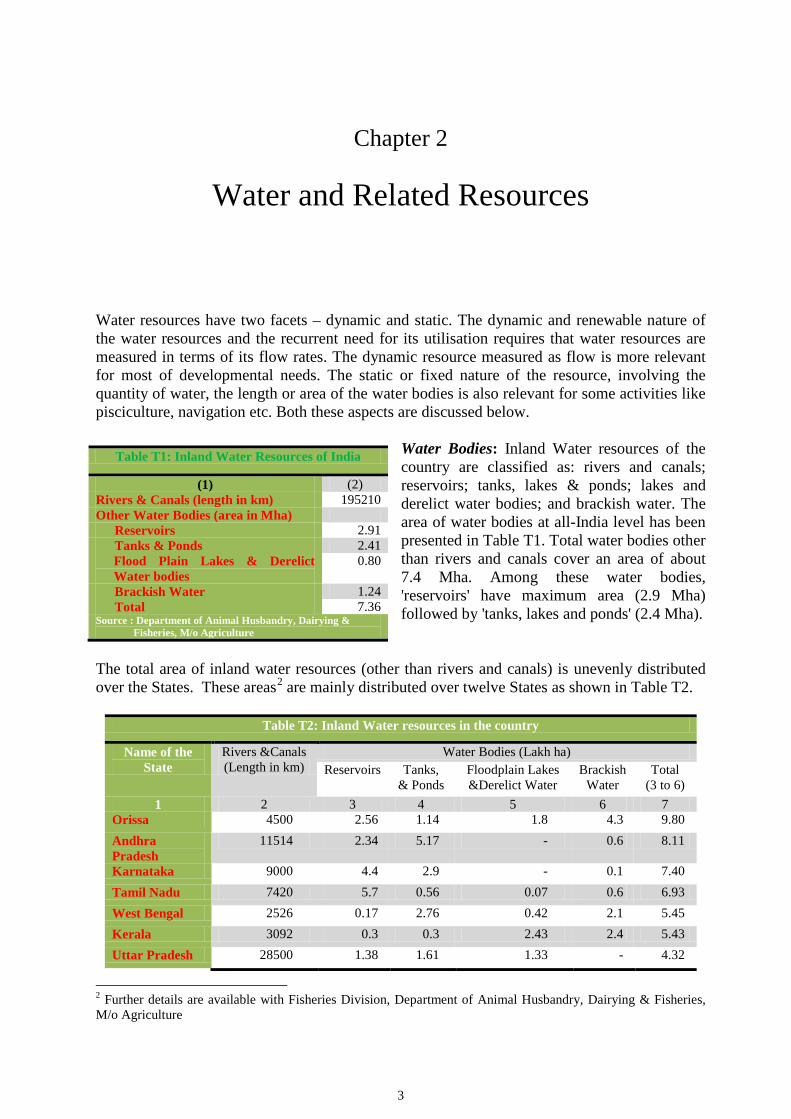
Water resources have two facets – dynamic and static. The dynamic and renewable nature of the water resources and the recurrent need for its utilisation requires that water resources are measured in terms of its flow rates. The dynamic resource measured as flow is more relevant for most of developmental needs. The static or fixed nature of the resource, involving the quantity of water, the length or area of the water bodies is also relevant for some activities like pisciculture, navigation etc. Both these aspects are discussed below.
Water Bodies: Inland Water resources of the country are classified as: rivers and canals; reservoirs; tanks, lakes & ponds; lakes and derelict water bodies; and brackish water. The area of water bodies at all-India level has been presented in Table T1. Total water bodies other than rivers and canals cover an area of about 7.4 Mha. Among these water bodies, 'reservoirs' have maximum area (2.9 Mha) followed by 'tanks, lakes and ponds' (2.4 Mha).
The total area of inland water resources (other than rivers and canals) is unevenly distributed over the States. These areas2 are mainly distributed over twelve States as shown in Table T2.
Table T2: Inland Water resources in the country
Name of the State
Rivers &Canals (Length in km)
Water Bodies (Lakh ha) Reservoirs
Tanks,
& Ponds Floodplain Lakes &Derelict Water
Brackish Water
Total (3 to 6)
1 2 3 4 5 6 7 Orissa 4500 2.56 1.14 1.8 4.3 9.80 Andhra Pradesh
11514 2.34 5.17 - 0.6 8.11
Karnataka 9000 4.4 2.9 - 0.1 7.40 Tamil Nadu 7420 5.7 0.56 0.07 0.6 6.93 West Bengal 2526 0.17 2.76 0.42 2.1 5.45 Kerala 3092 0.3 0.3 2.43 2.4 5.43 Uttar Pradesh 28500 1.38 1.61 1.33 - 4.32
2 Further details are available with Fisheries Division, Department of Animal Husbandry, Dairying & Fisheries, M/o Agriculture
Table T1: Inland Water Resources of India
(1) (2) Rivers & Canals (length in km) 195210 Other Water Bodies (area in Mha)
Reservoirs 2.91 Tanks & Ponds 2.41 Flood Plain Lakes & Derelict Water bodies
0.80
Brackish Water 1.24 Total 7.36
Source : Department of Animal Husbandry, Dairying & Fisheries, M/o Agriculture
3

Gujarat 3865 2.43 0.71 0.12 1 4.26 Maharashtra 16000 2.79 0.59 - 0.1 3.48 Arunachal Pradesh
2000 - 2.76 0.42 - 3.18
Rajasthan 5290 1.2 1.8 - - 3.00 Madhya Pradesh
17088 2.27 0.6 - - 2.87
Others incl UTs 84415 3.53 3.24 1.39 1.2 9.36 TOTAL 195210 29.07 24.14 7.98 12.4 73.59 Source : Department of Animal Husbandry, Dairying & Fisheries, M/o Agriculture
Rivers: India is blessed with many rivers with varying catchment area and water resources potential. The estimate of area of rivers and canals in the country is not available. However, their total length in the country is about 2 lakh km. According to the total length of rivers and canals the States and UTs have been classified and presented in Table T3. It shows Uttar Pradesh and Jammu & Kashmir are having the highest total length of rivers and canals. Rainfall3: The annual precipitation including snowfall, which is the main source of water in the country, is estimated to be of the order of 4000 BCM. A summary of rainfall in the country has been given in Table T4. Accordingly there is no specific trend of rainfall. In 2011, the total volume of rainfall was 3669 BCM as against 3989 BCM recorded during the previous calendar year registering a decrease of about 8%.
3 For further details please see website of IMD
Table T3: States by total length of rivers and canals
Length (km) Name of States/UT (1) (2)
<500 Andaman & Nicobar Is, Chandigarh, Dadra & Nagar Haveli, Daman & Diu, Delhi, Goa, Lakshadweep, Puducherry
500-999 Sikkim 1000-1999 Mizoram, Nagaland, Tripura 2000-4999 Arunachal Pradesh, Assam, Bihar,
Chhattisgarh, Gujarat, Himachal Pradesh, Jharkhand, Kerala, Manipur, Orissa, Uttarakhand, West Bengal
5000-9999 Haryana, Karnataka, Meghalaya, Rajasthan, Tamil Nadu,
10000-14999 Andhra Pradesh 15000-19999 Madhya Pradesh, Maharashtra, Punjab, 20000-24999 - 25000 & above Jammu & Kashmir, Uttar Pradesh Source: Department of Animal Husbandry, Dairying & Fisheries, M/o
Agriculture
Table T4: Volume of Rainfall in the country
Year 2001 2002 2003 2004 2005 2006 2007 2008 2009 2010 2011 (1) (2) (3) (4) (5) (6) (7) (8) (9) (10) (11) (12)
Total Rainfall (mm)
1110 930 1234 1086 1215 1161 1181 1117 954 1213 1116
Total Volume of Rainfall (BCM)
3648 3200 4057 3570 3996 3819 3882 3674 3136 3989 3669
4

Water Resources Potential: The water resources potential of the country which occurs as natural run off in the rivers is about 1869 BCM as per the estimates of Central Water Commission (CWC), considering both surface and ground water into account. Table T5 presents river basin-wise catchment area, average water resources potential and utilisable water resources potential. Of the major rivers, the river basin Ganga-Brahmaputra-Meghna is the largest in respect of catchment area of about 11 lakh sq km. The other major rivers with catchment area about one lakh sq km or more are: Indus, Godavari, Krishna, Mahanadi and Narmada. The table shows total water resources potential on an average during a year is 1869 BCM out of which only 690 BCM is utilisable. The River Basin Ganga-Brahmaputra-Meghna has annual water resources potential of 1111 BCM out of total 1869 BCM in the country. So far as
utilisable surface water is concerned, the proportion of utilisable surface water resources to water resources potential is very high in smaller basins. In Pennar and some other river basins the total utilization exceeds annual availability of natural flows. This is mainly because of: (i) the utilisation can approach or even exceed the average annual availability of natural flow as the total withdrawal (and not the consumptive use) is considered as utilisation (ii) the estimates of utilisable ground and surface water have been made independently by two organisations. The proportion of utilisable surface water to average water resources potential is found minimum in Brahmaputra sub-basin. The distribution of estimated utilisable surface water in the country has been presented in Figure 2. It shows the spread of
Table T5: Major River Basins ( BCM)
Sl. No.
River Basin Catchment Area
(Sq. Km.)
Average Water
Resources Potential
Utilisable Surface Water
Resources (1) (2) (3) (4) (5) 1 Indus (up to Border) 321289 73.31 46.0 2 Ganga- Brahmaputra-Meghna a) Ganga 861452 525.02 250.0 b) Brahmaputra 194413 537.24 24.0 c) Barak & Others 41723 48.36
3 Godavari 312812 110.54 76.3 4 Krishna 258948 78.12 58.0 5 Cauvery 81155 21.36 19.0 6 Subernarekha* 29196 12.37 6.8 7 Brahamani & Baitarni 51822 28.48 18.3 8 Mahanadi 141589 66.88 50.0 9 Pennar 55213 6.32 6.9 10 Mahi 34842 11.02 3.1 11 Sabarmati 21674 3.81 1.9 12 Narmada 98796 45.64 34.5 13 Tapi 65145 14.88 14.5 14 West Flowing Rivers From Tapi
to Tadri 55940 87.41 11.9
15 West Flowing Rivers From Tadri to Kanyakumari
56177 113.53 24.3
16 East Flowing Rivers Between Mahanadi & Pennar
86643 22.52 13.1
17 East Flowing Rivers Between Pennar And Kanyakumari
100139 16.46 16.5
18 West Flowing Rivers Of Kutch and Saurashtra including Luni
321851 15.10 15.0
19 Area of Inland drainage in Rajasthan
- Negl. -
20 Minor River Draining into Myanmar( Burma) &Bangladesh
36302 31.00 -
Total 1869.37 690.1 Source: B.P. Directorate, CWC. $: Reassessment of Water Resources Potential of India March 1993 and December 1999, CWC # : Report of the Standing Sub-Committee for assessment of availability and requirement of
water for diverse uses in the country, August 2000 Note: * : Combining Subernarekha and other small rivers between Subernarekha and
Batarni
5

utilisable surface water resources in the country. Ganga-Brahmaputra-Meghna system is the major contributor to total water resources potential of the country. Its share is 59% in total water resources potential of the various rivers. Due to various constraints of topography, uneven distribution of resource over space and time, it has been estimated that only about 1121 BCM of total potential of 1869 BCM can be put to beneficial use, 690 BCM being due to surface water resources. Again about 40% of utilisable surface water resources are presently in basin Ganga-Brahmaputra-Meghna.
The distribution of water resources potential in the country shows that the national per capita annual availability of water was 1816 cu m in 2001 while it was 1544 cu m in 2011. The estimated per capita average
availability during the year 2010 in Ganga-Brahmaputra-Meghna system was 2045 cu m while it was as low as 263 cu m in Sabarmati basin. The per capita availability in the country will be 1140 cu m in the year 2050 against 1608 cu m during 2010. Any situation of availability of less than 1000 cu m per capita is considered by international agencies as scarcity conditions. Krishna, Cauvery, Subernarekha, Pennar, Mahi, Sabarmati, Tapi, East Flowing Rivers and West Flowing Rivers of Kutch and Saurashtra including Luni are some of the basins, which fall into this category- out of which Cauvery, Pennar, Sabarmati and East Flowing rivers and West Flowing Rivers of Kutch and Saurashtra including Luni facing more acute water scarcity with per capita availability of water less than or around 500 cu m. Surface Storage: A total storage capacity of about 253.4 BCM has been created in the country due to the major & medium irrigation projects since completed. The projects under construction will contribute to additional 51 BCM. Thus likely storage available will be 304.3 BCM once the projects under construction are completed against the total water availability of 1869 BCM in the river basins of the country. Maximum storage (taking into consideration of projects under construction) lies in the Ganga Basin followed by Krishna, Godavari and Narmada. Pennar is the leading basin in terms of storage capacities as percentage of average annual flow. The storage capacities as percentage
Table T6: Percentage of Water Resources Potential in major basins
River Basin Water resources Potential
(% to total 1869 BCM)
Utilisable surface Water (% to total 690 BCM)
(1) (2) (3) Ganga-Brahmaputra- Meghna
59.4 39.7
Indus (up to Border) 3.9 6.7 Godavari 5.9 11.1 Krishna 4.2 8.4 Mahanadi 3.6 7.2 Narmada 2.4 5.0 Others 20.6 21.9
Figure 4 : Status Live Storage Capacity of Reservoirs in India (Billion Cubic Metres)
Completed Projects
57%
UnderConsideration
27%
Under Construction
16%
6

of average annual flow exceed 50% for Tapi, Krishna and Narmada while for Ganga and Brahmaputra sub-basins the corresponding figures are 11 % and 0.5 % respectively.
0
500
1000
1500
2000
2500
Cu m
INDU
S (U
p to
Bord
er)
Gang
a-Br
aham
putra
-Me
ghna
Goda
vari
Krish
na
Cauv
ery
Sube
rnar
ekha
Brah
aman
i &Ba
itarn
i
Maha
nadi
Penn
ar
Saba
rmat
i
Narm
ada
East
Flo
wing
Rive
rs
Figure 3: Estimated Per Capita Availability of Water in Different River Basins during 2010
585.6
12.4
525
56.3
110.5
43.478.1
54.8 73.316.3
66.914.5
45.623.5 21.4 9.1
0
100
200
300
400
500
600
700
Billi
on C
ubic
Met
res
Brah
ampu
tra
& B
arak Gan
ga
God
avar
i
Kris
hna
Indu
s
Mah
anad
i
Nar
mad
a
Cauv
ery
Figure 4: Basinwise Flow & Storage Potential in India
Average Annual Flow
Live Storage Capacity
The States of Andhra Pradesh, Gujarat, Karnataka, Madhya Pradesh, Maharashtra, Orissa and Uttar Pradesh together account for about 72 % of total live storage capacity in the country. Month-wise storage position of important reservoirs for the years 2009-10 and 2010-11 are presented in the Appendix. Hydrological Network of CWC CWC maintains 902 Hydrological and Hydro-meteorological stations across the country for collection of hydrological data on water level and discharge observations including silt measurements and snow-melt runoff for assessment of the water resources for planning and its optimal utilisation for
7

comprehensive and sustainable development. The basin-wise distribution of various types of hydrological stations is given in appendix tables. Ground water Total annual replenishable ground water potential of the country has been estimated as 431 BCM. The break-up of annual replenishable ground water resources by State with share 2.5% or more have been presented in Table T7. It shows 14 States comprise 91% of ground water potential. Among the States, Uttar Pradesh ranks first (17.5%) in terms of share of replenishable ground water resources followed by Maharashtra (8.3%), Madhya Pradesh (7.9%), Andhra Pradesh (7.8%), West Bengal (7.1%) and Assam (7.0%). CGWB classified the country into safe, semi critical and over exploited ground water resources. However, the units used were not uniform over the States. Units were blocks, talukas, water-sheds, mandals, island, district, and region. The summary of the classification with reference period March 20094 is presented in Table 8. It is seen that proportion of over-exploited area is highest in Delhi followed by Haryana and Daman & Diu. The number of States/UTs affected due to salinity is only 6; but among these States/UT, the problem of salinity is somewhat significant in Puducherry and Gujarat.
4 For further details please refer CGWB
Table T7: Annual Replenishable Ground Water Resources
State Annual Replenishable Ground Water Resources
(BCM / Year) % (1) (2)
Andhra Pradesh 33.83 7.8 Assam 30.35 7.0 Bihar 28.63 6.6 Chhattisgarh 12.22 2.8 Gujarat 18.43 4.3 Karnataka 16.81 3.9 Madhya Pradesh 33.95 7.9 Maharashtra 35.73 8.3 Orissa 17.78 4.1 Punjab 22.56 5.2 Rajasthan 11.86 2.8 Tamil Nadu 22.94 5.3 Uttar Pradesh 75.25 17.5 West Bengal 30.50 7.1 Others 40.19 9.3 Total 431.02 100.0 Sources : Central Ground Water Board, Min. of Water Resources
8

Figure 6: Annual Replenishable Ground Water Resources
PunjabRajasthan
mil Nadu
Uttar Pradesh
West Bengal
Orissa
Andhra Pradesh Assam
Bihar
Chattisgarh
Gujarat
Madhya PradeshMaharashtra
Assessment of ground water For assessment of ground water, Central Ground Water Board (CGWB) has drilled various types of bore holes in the country. The types of bore holes are Exploratory Well (EW), Observation Well (OW), Slim Hole (SH), Pizo Metre (PZ) and Deposit Well (DW). The cumulative total of these structures shows that there were 30202 structures as on 31.03.2011 in the country. Out of which DW constitutes about 12.0% while the remaining 88.0% are other
types of bore holes. Rajasthan, Andhra Pradesh, Orissa, Karnataka, Gujarat, Uttar Pradesh and
Table T8: Classification of area units by usage of ground water
% of units
Safe Semi-critical Critical Over-exploited Salinity affected
90+ Arunachal Pr. Assam, Bihar, Chhattisgarh, Goa, J&K, Jharkhand, Maharashtra, Manipur, Meghalaya, Mizoram, Nagaland, Orissa, Sikkim, Tripura, A&N Islands, Chandigarh, D& N Haveli
75-90 AP, HP, Kerala, WB Delhi 40-75 Gujarat, Karnataka, MP, UP,
Uttarakhnad, Lakshadweep, Puducherry
Daman &Diu, Lakshadweep
Haryana, Daman &Diu
20-40 TN Uttarakhnad Karnataka, TN, Puducherry
Puducherry
5-20 Delhi, Haryana AP, Delhi, Gujarat, Haryana, Karnataka, Kerala, MP, Maharashtra, TN, UP, Uttarakhnad, WB
Haryana, HP, TN
Gujarat, HP, MP, UP
Gujarat,
<5 Bihar, Chhattisgarh, Jharkhand
AP, Gujarat, Jharkhand, Karnataka, Kerala, MP, Maharashtra, UP
AP, Jharkhand, Kerala, Maharashtra
AP, Rajasthan, Orissa, TN
Sources : Central Ground Water Board, Min. of Water Resources
9

Madhya Pradesh account for 57% of the total bore holes in the country. Out of total DW schemes in the country, Rajasthan, Bihar and Uttar Pradesh account for 44% of total DW Schemes in the country.
Table T9: Bore Holes Drilled by Central Ground Water Board by State (as on 31.03.2011)
State Exploratory Well
Pizo Metre
Observation Well
Slim Hole Deposit Well
Total
(1) (2) (3) (4) (5) (6) (7) Rajasthan 1333 462 1108 93 591 2881 Andhra Pradesh 1341 629 1251 14 31 2802 Orissa 1760 177 1321 21 191 2452 Karnataka 1347 346 1227 7 5 2313 Gujarat 1083 485 918 25 255 2291 Uttar Pradesh 1018 165 821 39 501 2279 Madhya Pradesh 1261 149 929 8 149 2177 Maharashtra 1220 154 1140 2 166 1972 Tamil Nadu 1029 385 919 13 93 1878 Chhattisgarh 889 120 589 0 28 1218 Bihar 276 67 276 10 514 1033 Haryana 373 212 366 23 170 1021 Other States/UTs 2872 811 2791 106 941 5885 All States &UTs 15802 4162 13656 361 3635 30202 Sources : Central Ground Water Board, Min. of Water Resources
Irrigation potential The total ultimate irrigation potential (UIP) of the country stands at about 140 Mha. The share of Minor Irrigation is higher by 22.96 Mha as compared to that of Major & Medium Irrigation.
Table T10: Ultimate Irrigation Potential (‘000 ha) State Major &
Medium Minor Total
Surface Ground Sub-total (1) (2) (3) (4) (5) (6)
Andhra Pradesh 5000 2300 3960 6260 11260 Arunachal Pradesh 0 150 18 168 168 Assam 970 1000 900 1900 2870 Bihar 5224 1544 4120 5664 10888 Chhattisgarh 1147 81 490 571 1718 Goa 62 25 - 25 87 Gujarat 3000 347 2756 3103 6103 Haryana 3000 50 1462 1512 4512 Himachal Pradesh 50 235 68 303 353 Jammu & Kashmir 250 400 708 1108 1358 Jharkhand 1276 354 830 1184 2460 Karnataka 2500 900 2574 3474 5974 Kerala 1000 800 879 1679 2679 Madhya Pradesh 4853 2111 9250 11361 16214 Maharashtra 4100 1200 3652 4852 8952
10

Ground Water contributes more than 79% of the total ultimate potential through minor irrigation. Uttar Pradesh and Bihar are two largest states in term of potential due to Major &
Medium Irrigation Projects. These two states along with Madhya Pradesh, Andhra Pradesh and Maharashtra account for about 54% of the total ultimate potential of Major & Medium Irrigation in the country. The largest UIP for Minor Irrigation (Ground Water) exists in Uttar Pradesh. Andhra Pradesh and Madhya Pradesh are two major states in which potential of Minor Irrigation (Surface Water) is much higher than the remaining states. Uttar
Pradesh occupies the first place among the states having maximum potential due to all types of schemes. Dams Scenario Central Water Commission maintains the National Register of Large Dams. The State-wise
Manipur 135 100 369 469 604 Meghalaya 20 85 63 148 168 Mizoram 0 65 5 70 70 Nagaland 10 70 5 75 85 Orissa 3600 1000 4203 5203 8803 Punjab 3000 50 2917 2967 5967 Rajasthan 2750 600 1778 2378 5128 Sikkim 20 50 0 50 70 Tamil Nadu 1500 1200 2832 4032 5532 Tripura 100 100 81 181 281 Uttar Pradesh 12154 1186 16295 17481 29635 Uttarakhand 346 14 504 518 864 West Bengal 2300 1300 3318 4618 6918 All States 58367 17317 64066 81383 139750 All UTs 98 20 26 46 144 All-India 58465 17337 64092 81429 139894
Table T11: Number of Dams by State (as on 30.11.2012)
State/UT Completed Under Construction
Total State/UT Completed
Under Construction
Total
(1) (2) (3) (4) A&N Islands 2 0 2 Maharashtra 1693 152 1845 Andhra Pradesh 290 44 334 Manipur 3 2 5 Arunachal Pr. 1 0 1 Meghalaya 5 1 6 Assam 3 2 5 Mizoram 0 0 0 Bihar 24 4 28 Nagaland 0 0 0 Chhattisgarh 243 14 257 Orissa 198 6 204 Goa 5 0 5 Punjab 14 1 15 Gujarat 621 45 666 Rajasthan 201 10 211 Haryana 1 0 1 Sikkim 2 0 2 Himachal Pr. 13 6 19 Tamil Nadu 116 0 116 J& K 12 2 14 Tripura 1 0 1 Jharkhand 49 28 77 Uttar Pradesh 114 16 130 Karnataka 230 1 231 Uttarakhand 13 6 19 Kerala 58 1 59 West Bengal 28 0 28 Madhya Pradesh 899 7 906 Total 4839 348 5187 Source: Central Water Commission, (Dam Safety Monitoring Directorate) National Register of Large Dam
Figure 7: Ultimate Irrigation Potential
MinorGround
64.1
Major & Medium
58.5
Minor Surface
17.3
11
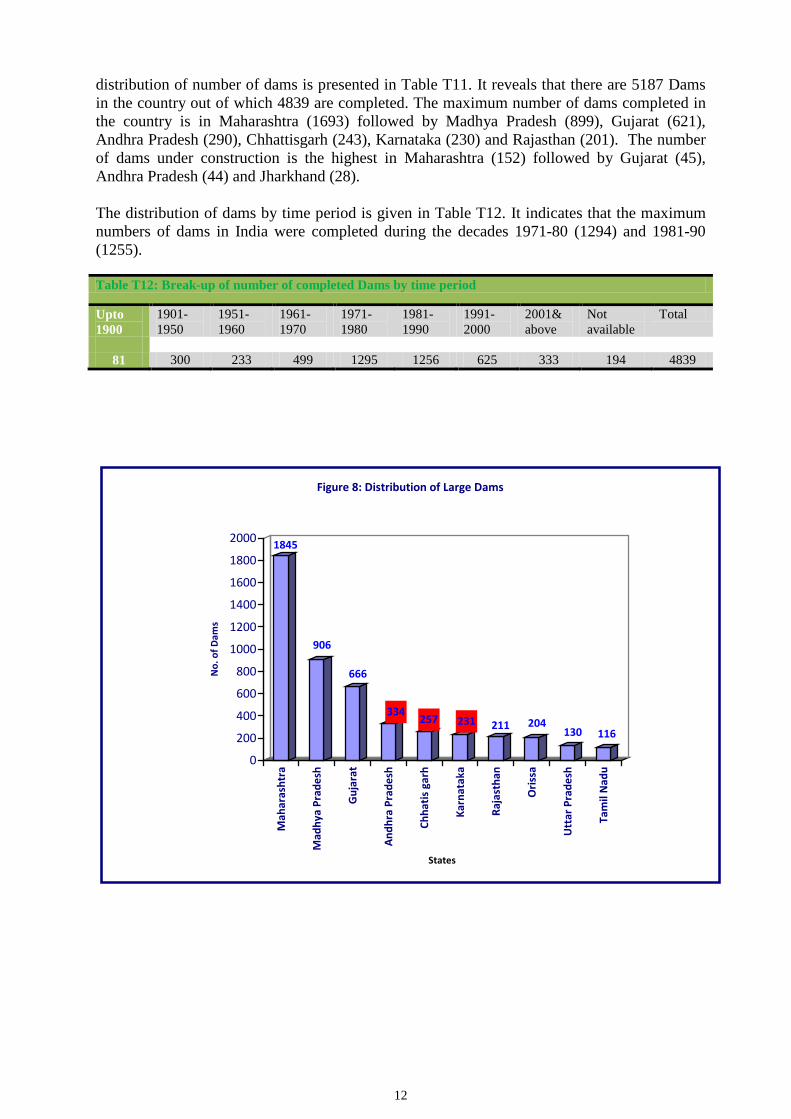
distribution of number of dams is presented in Table T11. It reveals that there are 5187 Dams in the country out of which 4839 are completed. The maximum number of dams completed in the country is in Maharashtra (1693) followed by Madhya Pradesh (899), Gujarat (621), Andhra Pradesh (290), Chhattisgarh (243), Karnataka (230) and Rajasthan (201). The number of dams under construction is the highest in Maharashtra (152) followed by Gujarat (45), Andhra Pradesh (44) and Jharkhand (28). The distribution of dams by time period is given in Table T12. It indicates that the maximum numbers of dams in India were completed during the decades 1971-80 (1294) and 1981-90 (1255). Table T12: Break-up of number of completed Dams by time period
Upto 1900
1901-1950
1951-1960
1961-1970
1971-1980
1981-1990
1991-2000
2001& above
Not available
Total
81 300 233 499 1295 1256 625 333 194 4839
1845
906
666
334257 231 211 204
130 116
0
200
400
600
800
1000
1200
1400
1600
1800
2000
No.
of D
ams
Mah
aras
htra
Mad
hya
Prad
esh
Guj
arat
Andh
ra P
rade
sh
Chha
tis g
arh
Karn
atak
a
Raja
stha
n
Oris
sa
Utt
ar P
rade
sh
Tam
il N
adu
States
Figure 8: Distribution of Large Dams
12

India-WRIS: Generation of Database & Implementation of Web enabled Water Resources Information System in the country
The national Water Policy (2002) recognizes that development and management of water resources need to be governed by national perspectives and aims to develop and conserve the scarce water resources in an integrated and environmentally sound basis. The policy emphasizes the need for effective and economical management of our water resources by intensifying research efforts in use of remote sensing technology and developing an information system. With uneven distribution of water with space and time, the management of water resources is a highly complex and tedious task. Moreover, over-exploitation and pollution hinders the availability and creates the scarcity and depletion of the resource. Hence, it calls for sustainable development of water resources across the regions in the country. Pre-requirement for optimal management of water resources are data acquisition and organization across the multidisciplinary domains including socio-economic, environmental issues including water quality aspects besides others. For this, the need is to develop Water Resources Information System dedicated for the management of water resources and to provide foundation for modeling and Spatial Decision Support System (SDSS). Central Water Commission (CWC), MoWR, initiated the project ‘Generation of Database and Implementation of Web enabled Water Resources Information System named as India –WRIS in 11th plan. The work of web enabled water resources information system (WRIS) amounting to Rs. 78.3164 Crore has been given to ISRO in Oct’ 2008. Central Water Commission & ISRO has signed an MOU on 3rd December 2008 to develop web enabled GIS based Water Resources Information System for the entire country during XI plan to be completed in 4 years. The information system will be on 1:50000 scale. WRIS has been jointly formulated by CWC and ISRO to generate nationally consistent water resources database to be completed by December 2012. India-WRIS will have 30 layers (appendix table) of information both spatial and non-spatial having 108 sub layers. Main group of database are as under: i. Watershed Atlas (Basin, River network & Digital Elevation Model) ii. Administrative layer (State Boundary, District boundary, Village boundary, Roads etc) iii. Water Resources project (Major, Medium project location & command boundaries,
Canal system) iv. Thematic layer (Land use land cover, waste land, Water bodies, Ground water well
maps, Litholog) v. Environment data (CWC Hydro-meteorological station, IMD stations & Water quality
stations) vi. Basin wise Report This results in the development of decision support system as per the requirement of various departments of different states of the country. This would also establish mechanisms for the exchange of knowledge among different agencies/ stakeholders for sustainable water resources in India. The VISION OF INDIA-WRIS is to provide a comprehensive, credible and contextual view of India’s water resources data along with allied natural resources data and information. The goal of the project is a ‘Single Window solution’ for all water resources and related data in a
13

standardized GIS format in national framework for water resources assessment and monitoring, planning and development, integrated water resources management (IWRM) and provide foundation for advanced modeling purposes to all departments, organizations, professionals and other stakeholders. It will allow users to Search, Access, Visualize, Understand and Analyze water resources data for planning, development and finally IWRM. 1) Status of Project:
• The First version of website of INDIA WARIS has been launched on 07 Dec, 2010 in New Delhi by Hon'ble Minister Water Resources. The URL of the website is www.india-wris.nrsc.gov.in/webgis.php#. Further, the development of Information System is under progress and the 2nd version INDIA WRIS was launched by Chairman, CWC on world water day i.e. 22nd Mar’ 2012. The full version with complete database of the project is anticipated to be launched by June’ 2014. Further, the development of Information System is under progress and in continuation of above, following achievements are made during 2012.
(i) River Basin Atlas of India was released by Hon’ble Union Minister (MoWR) on 1st November 2012.
(ii) The updated version i.e. 3rd version (that includes Live telemetry data in respect of CWC hydrological stations, Mobile Application version 1.0 for Android platform, Climate Trend analysis, 2D-3D linked view) is launched by Hon’ble Union Minister (MoWR) on 4th December 2012.
All unclassified data of CWC G&D stations has been uploaded at WRIS website recently in July 2013 as per Hydro-meterological data dissemination policy 2013.
The URL of the website is www.india-wris.nrsc.gov.in can be seen for more details.
• Financial Achievement – An amount of Rs. 53.11 crores has been incurred/ released to ISRO during 11th plan.
To maintain and update such a large volume of water resources data at national level it has been proposed during 12th plan to establish a new organization as NATIONAL WATER RESOURCES INFORMATION CENTRE (NWR-IC).
NATIONAL PROJECTS Government of India has approved a scheme of National Projects with a view to expedite completion of identified National Projects for the benefit of people. Such projects are provided financial assistance by the Government of India in the form of Central grant which is 90% of the cost of the irrigation& drinking water component of such projects for their completion in the time bound manner. The criterion for selection of National Projects is as under:
(i) International projects where usage of water in India is required by a treaty or where planning and early completion of the project is necessary in the interest of the country.
(ii) Inter-State Projects which are dragging on due to non-resolution of Inter -State
issues relating to sharing of costs, rehabilitation, aspects of power production etc., including river interlinking projects.
14

(iii) Intra-State Projects with additional potential of more than 2 lac hectare and with
no dispute regarding sharing of water and where hydrology is established. (iv) Extension, Renovation and Modernization (ERM) Projects envisaging
restoration of lost potential of 2lakh or more under the category of National Project subject to conditions.
Recently it has been decided that central assistance in XII Plan for ongoing National
Projects and new National Projects of special category states would be 90% and for new National Projects of non special category states/areas it would be 75%
Out of 15 Projects included in the scheme of National Projects, four projects namely Gosikhurd irrigation project (Maharashtra), Teesta Barrage Project (West Bengal), ShahpurKandi Project (Punjab) and SaryuNaharPariyojna (Uttar Pradesh) are under execution. Lakhwar Multipurpose Project has been accepted by Advisory Committee of MoWR. Three projects namelyKishau Multipurpose Project, Renuka Project and Ken-Betwa Link Project are under appraisal. Remaining seven projects are at various stages of investigation /DPR preparation. During XI Plan central assistance of Rs 2787.176 crore was released and during XII Plan central assistance of Rs 472098 crore has been released upto October 2013.
New projects could be considered for inclusion under the scheme of National Projects on receipt of proposals from the in the prescribed format from the state Governments after investment clearance from Planning Commission, clearance from Expenditure Finance Committee /Project Investment Board and on the recommendation there upon of high powered Steering Committee constituted for the purpose of overseeing the entire process of selection and implementation of National Projects and the approval by the Union Cabinet.
15
Chapter 3
Resources Utilisation
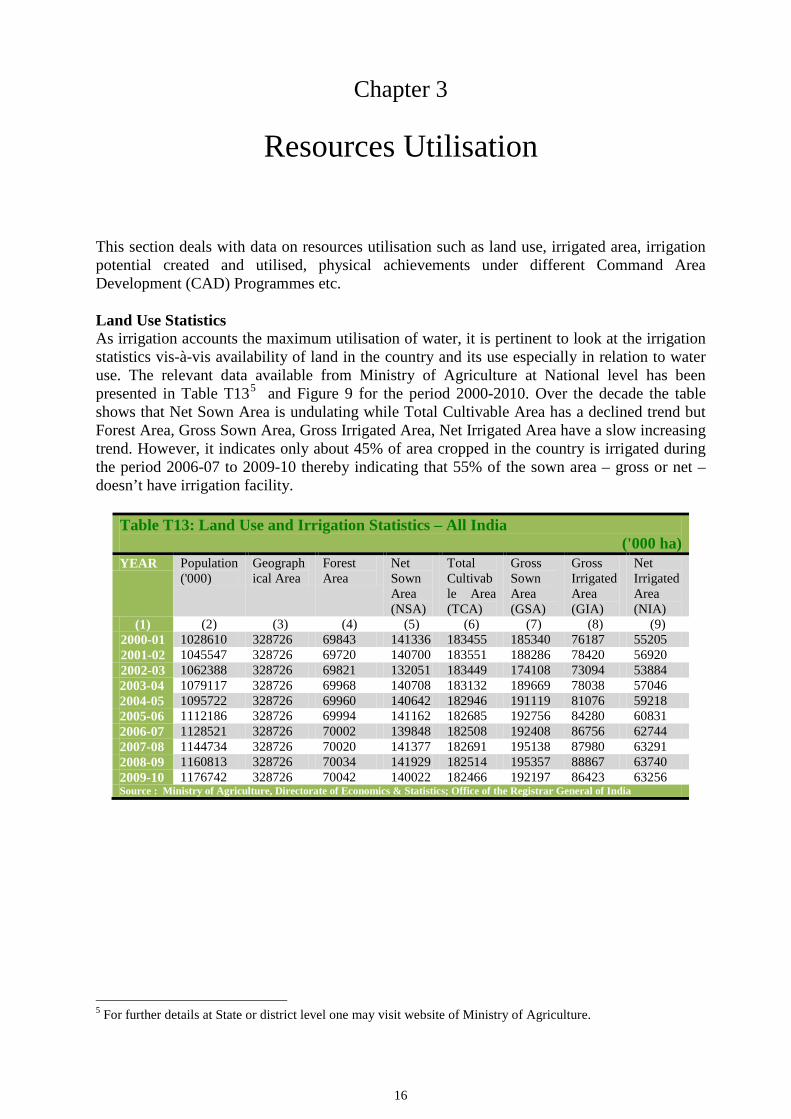
This section deals with data on resources utilisation such as land use, irrigated area, irrigation potential created and utilised, physical achievements under different Command Area Development (CAD) Programmes etc. Land Use Statistics As irrigation accounts the maximum utilisation of water, it is pertinent to look at the irrigation statistics vis-à-vis availability of land in the country and its use especially in relation to water use. The relevant data available from Ministry of Agriculture at National level has been presented in Table T135 and Figure 9 for the period 2000-2010. Over the decade the table shows that Net Sown Area is undulating while Total Cultivable Area has a declined trend but Forest Area, Gross Sown Area, Gross Irrigated Area, Net Irrigated Area have a slow increasing trend. However, it indicates only about 45% of area cropped in the country is irrigated during the period 2006-07 to 2009-10 thereby indicating that 55% of the sown area – gross or net – doesn’t have irrigation facility.
Table T13: Land Use and Irrigation Statistics – All India ('000 ha) YEAR Population
('000) Geographical Area
Forest Area
Net Sown Area (NSA)
Total Cultivable Area (TCA)
Gross Sown Area (GSA)
Gross Irrigated Area (GIA)
Net Irrigated Area (NIA)
(1) (2) (3) (4) (5) (6) (7) (8) (9) 2000-01 1028610 328726 69843 141336 183455 185340 76187 55205 2001-02 1045547 328726 69720 140700 183551 188286 78420 56920 2002-03 1062388 328726 69821 132051 183449 174108 73094 53884 2003-04 1079117 328726 69968 140708 183132 189669 78038 57046 2004-05 1095722 328726 69960 140642 182946 191119 81076 59218 2005-06 1112186 328726 69994 141162 182685 192756 84280 60831 2006-07 1128521 328726 70002 139848 182508 192408 86756 62744 2007-08 1144734 328726 70020 141377 182691 195138 87980 63291 2008-09 1160813 328726 70034 141929 182514 195357 88867 63740 2009-10 1176742 328726 70042 140022 182466 192197 86423 63256 Source : Ministry of Agriculture, Directorate of Economics & Statistics; Office of the Registrar General of India
5 For further details at State or district level one may visit website of Ministry of Agriculture.
16

0
50
100
150
200
Mha
2000-01
2001-02
2002-03
2003-04
2004-05
2005-06
2006-07
2007-08
2008-09
2009-10
Figure9: Selected Land Use Statistics - All India
Total Cultivable Area Net Sown Area Net Irrigated Area
Irrigated Area under Principal Crops For having an idea about the quantum of water used for irrigation it is important to know irrigated area under different crops as requirement of water varies from crop to crop. From the published data of Ministry of Agriculture Table T14 giving gross irrigated area for a few selected crops has been presented. It shows that gross irrigated area during 2009-10 was 86.4 Mha of which foodgrain crops contributed about 67.9%.
Table T14: Gross Irrigated Area for a Few Selected Crops – All India ('000 ha)
Crop / Year 1950-51 1960-61 1970-71 1980-81 1990-91 2000-01 2007-08 2008-09 2009-10 (1) (2) (3) (4) (5) (6) (7) (8) (9) (10)
Wheat 3402 4233 9924 15553 19511 22798 26101 25681 26209 Rice 9844 12523 14339 16364 19469 24337 25199 26597 24545 Rapeseed &
Mustard N.A. 138 356 990 3076 2759 4203 4449 3866
Foodgrains 18317 22065 30117 37851 44866 53609 59450 60372 58641
Cotton 465 967 1358 2115 2487 2766 3487 3313 3542 Total Gross
Irrigated Area 22563 27980 38195 49775 63204 76187 87980 88867 86423
Source : Ministry of Agriculture, Directorate of Economics & Statistics; Office of the Registrar General of India
Among the cereals, it is observed that irrigated area under rice varied between 24.3 and 26.6 Mha during the period 2000-01 to 2009-10. The irrigated area under wheat remained between 22.8 to 26.2 Mha during the same period.
Figure 10: Crop wise Irrigated Area druing 2009-10Wheat
Rice
Rapeseed & Mustard
Cotton
Other Crops
17

Sources of Irrigation and Area Irrigated The main sources of irrigation in the country are canals, tanks and wells including tubewells. These data are available from two sources. Ministry of Agriculture collects data on irrigation by its source and compiles irrigated area by source at various levels – district / State / Country. However, Planning Commission collects data on Irrigation Potential Area Created (IPC) and Utilised (IPU) for major and medium irrigation projects6. For minor irrigation schemes, Ministry of Water Resources conducts a census once in 5-6 years. These censuses provide IPC and IPU by source of irrigation. The last census was conducted in 2006-07. However, the last published data of Minor irrigation census pertains to 2000-01. Analysing the data relating to net area irrigated by source for the year 2009-107, it is observed that the major source of irrigation is ground water. Wells (considering all types of wells viz. dug well, shallow tubewell, deep tubewell) provided about 62% irrigation followed by canals with 26% at all- India level.
Table T15: Source-wise Net Irrigated Area in India
('000 ha.)
Year Canal Tank Wells Other Sources Total (All Sources)
(1) (2) (3) (4) (5) (6) 2000-01 16012 2466 33818 2909 55205
2001-02 15200 2186 35183 4350 56920 2002-03 14071 1803 34348 3662 53884 2003-04 14455 1916 36383 4292 57046 2004-05 14763 1734 35189 7531 59218 2005-06 16716 2083 36070 5962 60831
2006-07 17026 2078 37641 5998 62744
2007-08 16812 1978 38400 6103 63291 2008-09 16945 1985 38795 6015 63740
2009-10 16697 1638 39042 5880 63256 Source : Ministry of Agriculture, Directorate of Economics & Statistics; Office of the Registrar General of India
Irrigation development in the country As indicated earlier irrigation projects are classified as major, medium or minor irrigation projects8. The minor irrigation projects (schemes) are further divided into two categories viz. Surface Water Schemes and Ground Water Schemes. Major and medium irrigation projects are generally surface water projects.
6 Irrigation projects are classified on the basis of culturable command area (CCA) of the project. A project having CCA of more than 10,000 ha is termed as major irrigation project while CCA more than 2,000 ha and upto 20,000 ha is medium irrigation project. A project/scheme having CCA upto 2,000 ha is termed as minor irrigation scheme. 7 For further detailed data, please look at the website of Ministry of Agriculture. 8 The minor irrigation projects are often called minor irrigation schemes.
18

Analysing the data on potential created and utilised over different Plan periods, it is observed that irrigation potential created has increased from 22.6 Mha in pre-plan era to 101.7 Mha by the end of X Plan (2002-07). It is likely that irrigation potential created achieved as 108.91 Mha up to 2010-11 of XI Plan, out of this 45.3 Mha is from major & medium schemes and the remaining 63.6 Mha from minor schemes.
As regards irrigation potential utilised it is observed that the utilisation of total potential created was 22.6 Mha in pre-plan period which increased to 87.4 Mha by the end of 2010-11. The percentage of IPU to IPC upto VIII Plan remained 90% or more. However, the percentage started declining in subsequent plans. In XI Plan (upto 2010-11) it was around 80%.
0
5
10
15
20
25
Mha
PRE-
PLAN
I & II
III &
A.P
.(6
6-69
) IV V
A.P.
(78-
80) VI VII
A.P.
(90-
92)
VIII IX X
Plan - Period
Figure 11: Irrigation Potential Created & Utilised
Irrigation Potential Created Irrigation Potential Utilised
0
20
40
60
80
100
120
Mha
PRE-
PLAN
I & II
III &
A.P
.(6
6-69
) IV V
A.P.
(78-
80) VI VII
A.P.
(90-
92)
VIII IX X
Plan - Period
Figure 12: Irrigation Potential Created & Utilised -Cumulative
Irrigation Potential Created Irrigation Potential Utilised
Among the States, for major & medium, projects, the potential created at the end of X Plan (2002-07) is highest for Uttar Pradesh with 8.8 Mha followed by Andhra Pradesh and
19

Maharashtra with 3.6 and 3.5 Mha respectively. The total share of these three States was about 38% in creation of total irrigation potential. The percentage of potential created upto the end of X Plan to ultimate potential through Major & Medium Irrigation projects is 71% at national level. Table 16 gives ultimate irrigation potential (UIP), IPC and IPU of the States having percentage of IPU to IPC at least 80%.
Analysing the data on potential utilisation at the end of X Plan, it is found that about 81% of the potential created was utilised under major & medium irrigation projects at All-India level. Among the States, Tamil Nadu was at top with 99.6% utilisation whereas Punjab, Orissa, and Jammu & Kashmir and Andhra Pradesh were having 90% or more utilisation. For Minor Irrigation, the total ultimate potential for the country as whole is 81.4 Mha, while Potential Created and Utilised till the end of X Plan were 60.1 and 51.5 Mha respectively at All-India level. The percentage of potential created upto X Plan to ultimate potential is 73.8 at national level.
The percentage of potential utilised for minor irrigation till 2006-07 corresponding to potential created was 86% at All-India level. Among the States it is the highest for Tamil Nadu with 99.6% potential utilisation followed by Punjab at 98.2%. In a nutshell, at the end of X Plan, if all the major, medium and minor schemes are considered cumulatively, out of 140 Mha of ultimate potential 72.7% has been created of which 83.8% has been utilised at the national level.
Table T16: Achievements of Irrigation Potential Created / Utilised for Major & Medium Irrigation
('000 ha.) States Ultimate
Irrigation Potential
(UIP)
Potential Created upto X Plan
(IPC)
Potential Utilised upto X Plan
(IPU)
% of IPC to UIP
% of IPU to IPC
(1) (2) (3) (4) (5) (6)
Andhra Pradesh 5000 3600.2 3244.6 72.0 90.1
Haryana 3000 2193.7 1893.3 73.1 86.3 Jammu & Kashmir 250 187.3 174.6 74.9 93.2
Karnataka 2500 2637.7 2119.7 105.5 80.4 Orissa 3600 1974.4 1878.7 54.8 95.2 Punjab 3000 2574.7 2510.5 85.8 97.5 Rajasthan 2750 2861.6 2526.1 104.1 88.3 Tamil Nadu 1500 1562.6 1556.9 104.2 99.6 West Bengal 2300 1754.8 1573.6 76.3 89.7 All India 58465 41637.9 33739.6 71.2 81.0
20

0
10
20
30
40
50
60
70
80
90
Pot.
Util
ised
(M.H
a)
Pre-Plan
I II III AP IV V AP VI VII AP VIII IX X
Plan-Period
Figure 13: Planwise and Schemewise Irrigation Potential Utilised (Cumulative)
Major, Medium & Minor Irrigation Minor Irrigation - Ground + Surface Water Major & Medium Irrigation
State-wise data on irrigation potential created and utilised upto 2009-10 as per Planning Commission along with the Gross Irrigated Area from the Ministry of Agriculture are presented. It is observed that if all the Major, Medium and Minor schemes are considered cumulatively, a total of 107.2 Mha of irrigation potential has been created at the All-India level upto 2009-10 out of which 81% has been utilised. The gross irrigated area for 2009-10 is 86.4 Mha. Among the states the potential created upto 2009-10 is the highest for Uttar Pradesh at 33.8 Mha followed by Bihar and Andhra Pradesh at 8.0 and 7.2 Mha respectively. In terms of the GIA for the year 2009-01, Uttar Pradesh ranks first at 18.9 Mha followed by Punjab and Rajasthan at 7.7 and 7.3 Mha respectively.
0
20000
40000
60000
80000
100000
120000
140000
Pote
ntia
l
Ultimate Created Utilised
Figure 14: Irrigation Potential upto 2009-10 (Th. Ha.)
Total Minor Major & Medium
Number of Major & Medium Irrigation Projects Up to X Plan (1902-2007), there were 260 completed major projects and another 35 have been completed in XI Plan (2007-2012). The number of spilled over major projects in XII Plan is 149 out of which 49 are in Maharashtra and 30 in Andhra Pradesh. Among the States the
21

largest numbers of major projects completed up to the end of X Plan were in Uttar Pradesh (57) followed by Maharashtra (26) and Gujarat (19). The largest number of new Major Projects, 16, was identified in Madhya Pradesh while the maximum number of 49 ongoing major projects is in Maharashtra. A total of 956 medium projects were completed up to the X Plan and another 62 are completed in XI Plan period. 138 new medium projects have been included in XII Plan. The largest number of new projects (13) was identified in Madhya Pradesh. For ongoing medium projects, the maximum number is in Maharashtra (71) followed by Madhya Pradesh (13).
Besides major & medium projects there are Extension, Renovation and Modernisation (ERM) Projects also. 121 such projects were completed up to X Plan and 19 projects have been completed in XI Plan. Whereas, there are 39 ongoing ERM projects in XII Plan and 27 ERM new projects have been identified in XII Plan. AIBP Programme:
Accelerated Irrigation Benefits Programme (AIBP) was launched during 1996-97 to provide Central Loan Assistance (CLA) to major/medium irrigation projects in the country with the objective to accelerate the implementation of those projects which were in advanced stage of completion. While selecting the projects, special emphasis was given to Pre-fifth and Fifth Plan projects. Priorities were also given to those projects which were benefiting Tribal and Drought Prone Areas. However, under the revised AIBP Guidelines from the year 1999-2000 onwards, CLA under AIBP could also be extended to minor surface irrigation projects of special category states (N.E. States & Hilly States of H. P., Sikkim, J&K, Uttaranchal and projects benefiting KBK districts of Orissa).
Total Central Assistance of Rs. 48562.329 Crores for Major and Medium irrigation
(MMI) Projects to various States has been released till March 2013. 293 MMI projects have been benefitted by AIBP out of which 142 projects have been completed by various States up to March, 2013, 5 have been deferred and the remaining 146 are ongoing. The annual potential creation rate during the VII Plan and VIII Plan was 440 Th. ha. per year which increased to 820 Th. ha per year during the IX Plan and 1060 Th. ha. per year during X Plan after the introduction of AIBP. Further details have been provided in appendix table.
The Command Area Development (CAD) programme was started in 1974-75, as a centrally sponsored scheme to achieve speedy utilisation of irrigation potential created and also to improve productivity in selected irrigated commands. The important activities of this programme are development of field channels, land levelling, warabandi, and field drains etc. Land levelling has been discontinued since March 2004.
The cumulative achievement since inception of the programme shows 20.8 Mha field channels (till the end of March 2012) and 2.12 Mha field drains (upto March 2011) have been created. Analysing cumulative data for all the states, it is observed that the development of field channels up to March 2012 is the highest for Uttar Pradesh followed by Karnataka and Rajasthan. These States accounted for 50.4% of the total achievement under the programme. As regards Field drains under the programme, cumulative physical achievement upto March 2011 was 2.1 million hectare. Further details are available in appendix table.
22

At present, new AIBP guidelines for 12th Plan effective from October, 2013. More emphasis were given on the pari-passu implementation of Command Area Development (CAD) works for the potential utilization. The eligibility criteria for advanced stage of construction of new projects has been defined in terms of at least 50% of physical and financial progress on essential works like Head-Works, Earth Works, Land Acquisition, R&R etc.The central assistance in the form of central grant for new and ongoing projects which is;
(i) 90% central assistance(CA) of project cost(works Component) in case of special category States, and KBK region of Odissa
(ii) 75 % CA of project cost in Special Area i.e. Major/medium projects benefiting drought prone area, desert prone area, tribal area and flood prone area in non special category states and
(iii) 25% CA of project cost in case of Non-special category States except for (ii) above. Could be enhanced upto 50% for new projects subject to condition that the States actually carry out water sector reforms
The balance funds are to be arranged by the State Government from its own resources.
During a financial year, the sanctioned grant is released in two instalments.
(i) For projects receiving 25% CA: - 90 %(as Ist Install) after release of at least of 50% of State Share and balance 10% (IInd Install) after obtaining the UC of minimum of 50% of CA released earlier and
(ii) For projects receiving higher than 50 % CA: - 50% (Ist Install) after the State Releases its full Share and 50% (IInd Install) same as above.
Table T17: Number of Major, Medium & ERM Irrigation Projects in India Type of Project Completed upto XI Plan Spilled over Project in XII Plan New Project in XII Plan
(1) (2) (3) (4) Major Projects 295 149 27 Medium Projects 1018 138 32 ERM Projects 140 39 27 Total 1453 326 86
23

Chapter 4
Financial Performance
This chapter deals with the financial aspect of water and related sectors in the country. Financial Expenditure on Irrigation There has been a consistent increase in the annual average financial expenditure on irrigation sector over plan periods. But the expenditure has not matched with the growth of total plan expenditure on all sectors as is evident from the share of expenditure on irrigation to the total which declined from 23% in I Plan to about 7% in XI Plan.
Table T19: Expenditure on Irrigation (Rs. Crores)
Plan Major & Medium
Minor CAD Total Expenditure on Irrigation
Total Plan Expenditure in All Sector
% of Expenditure on Irrigation to Total Plan Expenditure
(1) (2) (3) (4) (5) (6) (7) I Plan 376.2 65.6 - 441.8 1960 23 X Plan 83647.1 17181.8 2534.8 103363.7 1525639 7 XI Plan 174473.3 40665.1 4921.8 220060.2 2888654 7.6
0
15000
30000
45000
60000
75000
90000
Rs. C
rore
s
V VI VII VIII IX X
Figure 15: Plan Wise Expenditure on Irrigation at Current Prices
Major & Medium Minor CAD
At constant prices9 (1993 - 94 = 100), the expenditure on irrigation sector is estimated to have increased from Rs. 6839.9 crores in 1st Plan to Rs. 55464.5 crores in the X Plan. It may be noted that the share of major & medium schemes is estimated to have declined from as high as 85% of the total expenditure in the irrigation sector in the I Plan to nearly 81% in the X Plan. This is apparently due to progressive emphasis on Minor Irrigation and Command Area Development Programmes in the subsequent years. Institutional assistance has also contributed
9 All-India Wholesale Price Index Number (Base 1993-94=100) has been used as deflator.
24

quite significantly in the development of minor irrigation in the country as is evident from the increasing institutional support to minor irrigation schemes in terms of total financial expenditure over different Plans. However, the total institutional expenditure also decreased in X Plan as compared to that in the IX Plan.
Table T20: Share of Expenditure on Major & Medium, Minor and CAD at constant Prices
Plan Major & Medium Minor CAD 1 2 3 4
I Plan 85.15% 14.85% - X Plan 80.93% 16.62% 2.45%
Of the total expenditure (estimated) on major & medium irrigation schemes, a large share of above 81% is estimated to be contributed by the states of Andhra Pradesh, Gujarat, Karnataka, Madhya Pradesh, Maharashtra, and Uttar Pradesh during X Plan. Of the total expenditure on minor irrigation under State Expenditure during X Plan, about 66% was incurred by the States of Andhra Pradesh, Bihar, Chhattisgarh, Gujarat, Karnataka, Madhya Pradesh and Maharashtra. Under institutional minor irrigation schemes a large share (83%) of the total expenditure during X Plan was contributed by states Andhra Pradesh, Bihar, Karnataka, Madhya Pradesh, Maharashtra, Punjab, Rajasthan and Uttar Pradesh.
Table T21: Expenditure on Major, Medium and Minor Irrigation – Contribution of Selected States during X Plan
(Rs. Crores) States Major & medium Minor State Sector Minor Institutional
1 2 3 4 Andhra Pradesh 20434.2 1742.2 277.8 Gujarat 10496.2 1638.6 148.7 Karnataka 16505.4 987.9 235.7 Madhya Pradesh 5429.3 1222.5 368.5 Maharashtra 10313.3 1560.3 277.6 Uttar Pradesh 4876.1 618.6 754.7
Command Area Development Programme Command Area Development (CAD) programme primarily aims at the speedy utilisation of irrigation potential created. It is a centrally sponsored scheme started during 1974-75. Central
Figure 17: Share of Expenditure on Major & Medium and Minor Irrigation during X Plan
Major & Medium Minor CAD
25

Government offers assistance to the State Governments for implementation of various activities like land leveling, field channel, warabandi etc. Beginning with the CAD share of 3.6% in V Plan of the combined expenditure on major & medium, minor and CAD programmes it decreased to 2.45% during X Plan.
As regards, expenditure under State sector of CAD programmes Haryana, Karnataka, Maharashtra, Rajasthan and Uttar Pradesh Constituted about 61% of the total State sector expenditure upto X Plan.
Table T22: Expenditure for Selected States under Command Area Development
Programme up to X Plan (Rs. Crores)
State Haryana Karnataka Maharashtra Rajasthan Tamil Nadu
Uttar Pradesh
Expenditure: State Sector
452.51 451.85 1087.90 1092.45 276.20 767.55
Figure 18: State Sector Expenditure for selected States under CAD Programme upto X Plan
Haryana Karnataka Maharashtra Rajasthan
Tamil Nadu Uttar Pradesh Other States
Haryana, Karnataka, Maharashtra, Rajasthan, Tamil Nadu & Uttar Pradesh are the major States accounting for about 66% of releases till XI Plan as under Central assistance to CAD programme.
Table T23: Expenditure for Selected States under Command Area Development Programme up to X Plan
(Rs. Crores) Haryana Karnataka Maharashtra Rajasthan Tamil
Nadu Uttar
Pradesh Central Releases
452.71 525.42 346.72 663.76 378.60 1056.25
Figure 19: Central Releases for Selected States Under CAD Programme upto XI Plan
Haryana Karnataka MaharashtraRajasthan Tamil Nadu Uttar PradeshOther States
26

Chapter 5
Environmental Performance
This chapter presents information regarding environmental aspects of water resources development activities. It includes data on degraded land and their distribution according to various problems, flood damages, financial expenditure on flood protection works and physical benefit thereof, performance of flood forecasting network, financial and physical progress of drinking water supply schemes in rural areas.
Table T24: Extent of various kinds of Land Degradation in India
(Lakh ha) Water &
Wind Erosion
Water Logged
Alkali / Sodic Soil
Acid Soil Saline Soil Mining / Industrial
Waste
Total Degraded Area
948.68 9.15 37.08 179.26 27.29 2.58 1204.04
Figure 20: Extent of various kinds of land degradation in India
Water & Wind Erosion Water Logged Alkali / Sodic Soil Acid Soil Saline Sail Mining/Industrial Waste
Land Resources and its Degradation10
As per the data available from the Ministry of Agriculture, a total of 120.40 Mha of land was estimated to be degraded in the country. Out of this, Madhya Pradesh and Chhattisgarh together accounted for 18.88 Mha while Uttar Pradesh and Uttarakhand together accounted for 15.84 Mha of degraded land. The extent of degraded land in Rajasthan, Maharashtra, Andhra Pradesh, and Karnataka was 20.43 Mha, 9.73 Mha, 9.19 Mha and 8.09Mha respectively. These eight States together accounted for about 68% of the total degraded land in the country. Cause-wise, water and wind erosion accounted for the major part (78.8%) of the total degraded land in the country, followed by soil acidity (14.9%) and alkali soil (3.1%). Thus, at all-India level the Water and Wind Erosion is the predominant cause for land degradation in the country.
10 For further details please see website of Ministry of Agriculture (NRMD, DAC)
27

At State level also, except for Chhattisgarh, Kerala, Rajasthan and a few north-eastern states water erosion is the predominant cause for land degradation. Wind erosion is the main cause behind land degradation in Rajasthan and Gujarat whereas soil acidity is the main cause for land degradation in Kerala, Chhattisgarh, Assam, Arunachal Pradesh, Manipur, and Nagaland.
Land degradation affects availability of land for agricultural use and fertility of soil and has ultimate bearing on productivity and consequently on production. Land affected by special problems, erosion and other problems, therefore, needs immediate treatment in the light of rapid population growth and increasing demand for food grain production which is important for food security. In view of importance and gravity of the problem, the Ministries of Agriculture and Rural Development have taken up a number of programmes for treatment of degraded lands through various Watershed Development Programmes. A total of 219.73 lakh ha of land is reported to have been treated up to March 2012 in the country involving an expenditure of Rs.12244.98 crores through the schemes under M/o Agriculture while 356.40 lakh ha of area in the country is reported to have been treated up to March 2012 with an investment of Rs 15723.02 crores through the schemes under Ministry of Rural Development.
Table T25: Progress of Watershed Development Programme upto XI Plan
Area Developed
(Lakh ha) Expenditure (Rs. Crores)
(A) Ministry of Agriculture 219.73 12244.98 (B) Ministry of Rural
Development 356.40 15723.02
Total (A+B) 576.13 27968.00 Flood Flood is one of the most devastating natural calamities, which has been causing extensive damage to life and property besides perpetrating tremendous sufferings. Since flood is a natural phenomenon, it is usually difficult to predict a definite trend especially with regard to the time and place of its occurrence. As such, the effort usually is to take appropriate advance flood protection measures. The area affected by floods was 2.29 Mha in 1953 and 1.90 Mha in 2011 with a peak of 17.5 Mha during 1978. At current prices, the damage to crops was in the wide range of Rs. 5.87 crore in 1965 and Rs. 5880.7 crore in 2010. The floods also caused damage to crops worth Rs 1393.85 crore in 2011. In addition, there was a great loss of human lives and livestock often affecting the poor strata of the population. Taking into consideration the other factors such as serious disruption and massive health rehabilitation measures needed, the loss could indeed be tremendous. The total damage caused by floods is estimated to the tune of Rs.19490 crore during 2010. Orissa and Uttar Pradesh were worst effected in terms of public utilities, as per the information available for the States for 2011 (up to 31.12.11).
Table T26: Flood Damages in India
Year Area affected (Mha)
Population affected (Millions)
Damage to crops (Rs. Crores
Damage to houses (Rs. crores)
Damage to public utilities (Rs. crores)
Cattle lost Nos. ('000)
Human Life Lost (No.)
Total damages to crops, houses and public utilities (Rs. crores)
2011 1.90 15.97 1393.85 410.48 6053.57 36 1761 7857.89 Maximum (Year)
17.50 (1978)
70.45 (1978)
7307.23 (2003)
10809.80 (2009)
17509.35 (2009)
618 (1979)
11316 (1977)
32554.78 (2009)
28

Figure 21: Flood Damages - Area Affected
0
5
10
15
1960 1965 1970 1975 1980 1985 1990 1995 2000 2005 2009 2010 2011
Years
Mill
ion
Ha.
There has been a considerable increase in the governmental expenditure on flood management over the past years. It has gone up from Rs.13 crore during I Plan to Rs.4344 crore during X Plan and Rs 17,130 in XI plan. The central assistance in flood control work has risen from Rs. 453.7 crore in the IX plan to Rs.742.8 crore in X Plan and Rs 1194 crore in XI Plan.
Table T27: Expenditure under Flood Management Work (Rs. crores) States & UT's Centre Total
I Plan 13.2 - 13.2 V Plan 242.5 56.1 298.6 X Plan 3601.4 742.8 4344.2 XI Plan 15936.7 1193.5 17130.2
Among the states the maximum expenditure for flood management during X Plan is for Uttar Pradesh followed by Bihar and West Bengal. As far as the area benefited upto 2011 due to flood management work is concerned, Punjab ranks first followed by Bihar and West Bengal.
Table T28: Expenditure on Flood Management Work for Selected States (Rs. crores)
State Expenditure (upto X Plan) West Bengal 1639.5 Bihar 1518.9 Uttar Pradesh 1404.6 Andhra Pradesh 932.0 Punjab 829.4 Haryana 643.1
29

Figure 22 : Expenditure on Flood Managment Work upto X Plan
West Bengal
Bihar
Uttar Pradesh
Andhra Pradesh
Punjab
Haryana
others
Table : T29 Flood Forecasting Performance
Year Total No. of
Forecasts issued Within +/-15 cm or
+/-20% cumec of deviation from actual
Percentage of accuracy
2000 6443 6251 97.02 2001 5463 5342 97.79 2002 4241 4151 97.88 2003 6600 6375 96.59 2004 4889 4696 96.05 2005 5618 5423 96.53 2006 6663 6377 95.71 2007 8223 7990 97.17 2008 6691 6554 97.95 2009 4010 3927 97.93 2010 7519 7378 98.12
Flood forecasting is one of the most important non-structural methods of flood control in which there has been significant contribution by CWC. Network performance for the flood season 2010 (7378 accurate forecasts out of 7519 issued) has been very successful 98.12% of forecasts were correct within +/-15 cms or +/- 20% cumecs. Over the years, the percentage of forecasts accuracy has been maintained at 96 to 97% and above apparently due to improvement in methodology and acquisition of latest technology. Water Requirement The requirement of fresh water both for irrigation and other uses is growing continuously. The requirement of water for various sectors has been assessed by the National Commission on Integrated Water Resources Development(NCIWRD) in the year 2000.This requirement is based on the assumption that irrigation efficiency will increase to 60 % from the current level of 35 -40 %. The Standing Committee of MOWR also assesses it periodically. The total water demand for all the uses is likely to be 1180 BCM by 2050 as per NCIWRD. Though major share of this would be consumed for irrigation purposes, this in no way undermines importance of providing potable drinking water. In fact, it may be presumed that drinking water provision would have to be given an added thrust since the lack of such facility is likely to entail serious social, economic and health impact.
30

Figure 23: Estimated Sector wise Demand in India during 2050 (As per NCIWRD)
Irrigation Domestic Industry Power Others
600
900
1200
2010 2025 2050
BCM
Years
Figure 24: Projected Water Demand in India (As per NCIWRD)
Low High
Different schemes and programmes are being implemented with the objective of providing access to safe drinking water in rural areas of the whole country. Data on status of coverage of rural habitations under the Rural Water Supply scheme as on April 2012 has been provided in Appendix. Expenditure under Accelerated Rural Water Supply Programme11 for supply of drinking water to rural areas during XI Plan was Rs.34636 crore out of which the maximum expenditure was by Rajasthan (Rs.4541 crore) followed by Uttar Pradesh (Rs 3587 crore) and Maharashtra (Rs.2869 crore).
------------------xxx---------------------
11 For further details see website of Ministry of Drinking Water and Sanitation
31

Appendix 1: Tables
Table 1: Per Capita Average Annual Availability of Water in India during 2010, 2025 & 2050
Sl No.
River Basin Average Annual Water
Resources Potential (BCM)$
Estimated Population (Million) #
Estimated per capita Average Annual Water Avaialability(M3)
2010 2025 2050 2010 2025 2050
1 2 3 4 5 6 7 8 9 1 Indus (up to Border) 73.3 57.69 69.2 81.41 1270.58 1059.25 900.38 2 Ganga-Brahmputra-Meghna a) Ganga 525 494.47 593.04 697.69 1061.74 885.27 752.48 b) Brahmaputra 537.2 40.07 48.06 56.54 13406.54 11177.69 9501.24 c)Barak & Others 48.4 8.54 10.24 12.05 5667.45 4726.56 4016.59 3 Godavari 110.5 74.36 89.18 104.92 1486.01 1239.07 1053.18 4 Krishna 78.1 83.72 100.41 118.13 932.87 777.81 661.14 5 Cauvery 21.4 40.34 48.39 56.93 530.49 442.24 375.90 6 Subernarekha 12.4 12.94 15.52 18.26 958.27 798.97 679.08 7 Brahamani & Baitarni 28.5 13.49 16.18 19.04 2112.68 1761.43 1496.85 8 Mahanadi 66.9 36.63 43.93 51.68 1826.37 1522.88 1294.51 9 Pennar 6.3 13.36 16.02 18.85 471.56 393.26 334.22 10 Mahi 11 14.46 17.34 20.40 760.72 634.37 539.22 11 Sabarmati 3.8 14.46 17.34 20.40 262.79 219.15 186.27 12 Narmada 45.6 20.24 24.28 28.56 2252.96 1878.09 1596.64 13 Tapi 14.9 20.38 24.44 28.75 731.11 609.66 518.26 14 West Flowing Rivers From
Tapi to Tadri 87.4 35.53 42.61 50.13 2459.89 2051.16 1743.47
15 West Flowing Rivers From Tadri to Kanyakumari
113.5 44.89 53.84 63.34 2528.40 2108.09 1791.92
16 East Flowing Rivers Between Mahanadi & Pennar
22.5 32.5 38.97 45.85 692.31 577.37 490.73
17 East Flowing Rivers Between Pennar And Kanyakumari
16.5 61.96 74.32 87.43 266.30 222.01 188.72
18 West Flowing Rivers Of Kutch and Saurashtra including Luni
15.1 30.43 36.5 42.94 496.22 413.69 351.65
19 Area of Inland drainage in Rajasthan
Negl. 9.78 11.73 13.79 - - -
20 Minor River Draining into Myanmar( Burma) & Bangladesh
31 2.07 2.48 2.91 14975.85 12500.00 10652.92
TOTAL 1869.3 1162.31 1394.02 1640.00 1608.26 1340.94 1139.82 Source: B.P. Directorate, CWC. $: Reassessment of Water Resources Potential of India March 1993, CWC.
#: Report of the Standing Sub-Committee for assesment of availability and requirement of water . for diverse uses in the country, August 2000
33

Appendix 1: Tables
Table 2: Basin Wise Storage in India as on 31.03.2013
Basin Code as per WRIS
Basin Name Average annual
flow (BCM)
TOTAL LIVE STORAGE CAPACITY ( BCM)
Completed Projects
Under Construction
Projects
Total % of aveargae annual
flow 1 2 3 4 5 1 Indus 73.3 16.223 0.1002 16.323 22.3 2a Ganga 525.0 48.677 7.649 56.326 10.7 2b Brahmaputra 537.2 1.718 0.795 2.513 0.5 2c Barak & Others 48.4 0.719 9.172 9.891 20.4 3 Godavari 110.5 35.033 8.412 43.444 39.3 4 Krishna 78.1 50.651 4.156 54.807 70.2 5 Cauvery 21.4 9.083 0.015 9.098 42.5 6 Subernarekha 12.4 0.309 2.150 2.459 19.8 7 Brahmani & Baitarni 28.5 5.515 0.703 6.218 21.8 8 Mahanadi 66.9 13.006 1.461 14.467 21.6 9 Pennar 6.3 2.938 2.141 5.079 80.6 10 Mahi 11.0 5.017 0.150 5.167 47.0 11 Sabarmati 3.8 1.577 0.109 1.686 44.4 12 Narmada 45.6 17.622 6.835 24.457 53.6 13 Tapi 14.9 9.137 1.558 10.695 71.8 14 WFR from Tapi to Tadri 87.4 14.668 2.430 17.098 19.6 15 WFR fom Tadri to
Kanyakumari 113.5 11.023 1.416 12.439 11.0
16 EFR between Mahanandi and Pennar
22.5 2.676 1.181 3.857 17.1
17 EFR between Pennar and Kanyakumari
16.5 1.441 0.015 1.456 8.8
18 WFR of Saurashtra and Kutchh including Luni
15.1 6.336 0.511 6.847 45.3
19 Area of Inland Drainage of Rajasthan
- 0.000 0.000 0.000
20 Minor River Draining into Myanmar and Bengladesh
31.0 0.019 0.000 0.019 0.1
20a Area of North Ladakh not draining into Indus
0.00 0.000 0.000 0.000
TOTAL in BCM 1869.4 253.388 50.959 304.348 16.3
Source : Central Water Commission (WM Directorate)
34

Appendix 1: Tables
Table 3: Live Storage Capacity of Reservoirs in India as on 31.03.2013
Sl.No. Name of State TOTAL LIVE STORAGE CAPACITY ( BCM) Completed
Projects Under
Construction Projects
Total
1 2 3 4 5 1 ANDHRA PRADESH 28.716 7.062 35.778 2 ASSAM 0.012 0.547 0.559 3 ARUNACHAL PRADESH 0.000 0.241 0.241 4 BIHAR 2.613 0.436 3.049 5 CHHATTISGARH 6.736 0.877 7.613 6 GOA 0.290 0.000 0.290 7 GUJARAT 18.359 8.175 26.534 8 HIMACHAL PRADESH 13.792 0.100 13.891 9 JAMMU AND KASHMIR 0.029 .000 0.029
10 JHARKHAND 2.436 6.039 8.475 11 KARNATAKA 31.896 0.736 32.632 12 KERALA 9.768 1.264 11.032 13 MADHYA PRADESH 33.075 1.695 34.770 14 MAHARASHTRA 37.358 10.736 48.094 15 MANIPUR 0.407 8.509 8.916 16 MEGHALAYA 0.479 0.007 0.486 17 MIZORAM 0.000 0.663 0.663 18 NAGALAND 1.220 0.000 1.220 19 ORISSA 23.934 0.896 24.830 20 PUNJAB 2.402 0.00002 2.402 21 RAJASTHAN 9.708 0.443 10.152 22 SIKKIM 0.007 0.000 0.007 23 TAMILNADU 7.859 0.013 7.872 24 TRIPURA 0.312 0.000 0.312 25 UTTARAKHAND 5.670 1.613 7.283 26 UTTAR PARDESH 14.263 0.724 14.987 27 WEST BENGAL 2.027 0.184 2.212 28 ANDAMAN & NICOBAR
ISLAND 0.019 0.000 0.019
TOTAL in BCM 253.388 50.959 304.348 Source : 1. Central Water Commission (WM Directorate) Note : BCM: BILLION CUBIC METRE
35

Appendix 1: Tables Table 4(A): Storage Position of Important Reservoirs of India at the end of each month
during June 2010 to May 2011
Sl. No.
Name of Reservoirs
Location
Live Capacity
at FRL in BCM
June 2010 July 2010 August 2010
Level (m)
Live Storage
BCM
Percent- age of normal storage
Level (m)
Live Storage
BCM
Percent- age of normal storage
Level (m)
Live Storage
BCM
Percent- age of normal storage
1 2 3 4 5 6 7 8 9 10 11 12 13 1* SRISAILAM (AP ) 8.288 246.28 1.34 89 256.73 3.085 106 269.7 8.262 144
2* NAGARJUNA SAGAR (AP ) 6.841 158.8 1.75 117 158.56 1.701 92 175.69 5.667 166
3 SRIRAMSAGAR (AP ) 2.3 318.94 0.129 33 327.69 1.131 549 332.35 1.591 164
4 SOMASILA (AP ) 1.994 90.61 0.543 253 92.15 0.694 371 95.06 1.031 358
5 LOWER MANAIR (AP ) 0.621 266.84 0.062 43 267 0.064 44 278.71 0.551 233
6 TENUGHAT (JHA) 0.821 257.01 0.225 90 258.62 0.285 96 259.95 0.339 106
7 MAITHON (JHA) 0.471 136.54 0.062 38 138.31 0.134 49 143.42 0.291 74
8* PANCHET HILL (JHA) 0.184 120.8 0.03 47 122.81 0.09 76 122.62 0.083 49
9 KONAR (JHA) 0.176 417.91 0.058 322 417.91 0.058 66 419.28 0.074 60
10 TILAIYA (JHA) 0.142 364.11 0.012 50 364.33 0.016 28 364.62 0.021 26
11* UKAI (GUJ) 6.615 87.27 0.616 49 93.1 1.688 66 102.17 5.061 118
12 SABARMATI(DHAROI) (GUJ) 0.735 176.59 0.013 14 179.3 0.079 42 184 0.281 97
13* KADANA (GUJ) 1.472 120.32 0.552 120 119.71 0.512 83 121.72 0.651 92
14 SHETRUNJI (GUJ) 0.3 47.42 0.016 22 52.87 0.133 88 54.62 0.232 132
15 BHADAR (GUJ) 0.188 100.22 0.01 25 105.12 0.09 107 107.81 0.185 175
16 DAMANGANGA (GUJ) 0.502 66.45 0.086 75 70.1 0.166 97 75.2 0.315 96
17 DANTIWADA (GUJ) 0.399 162.06 0 0 164.21 0.007 17 171.3 0.063 64
18 PANAM (GUJ) 0.697 107.45 0.014 8 110.15 0.05 18 118.35 0.226 59
19* GOBIND SAGAR(BHAKRA) (HP ) 6.229 464.09 0.805 48 491.35 3.069 99 511.06 5.799 124
20* PONG DAM(BEAS) (HP ) 6.157 390.38 0.417 47 401.1 1.588 73 421.55 5.416 141
21 KRISHNARAJA SAGARA (KAR) 1.163 739.92 0.115 57 744.63 0.387 56 748.83 0.742 78
22* TUNGABHADRA (KAR) 3.276 484.97 0.317 72 493.15 1.51 71 497.7 2.94 103
Contd...
36

Appendix 1: Tables Table 4(A): Storage Position of Important Reservoirs of India at the end of each month
during June 2010 to May 2011
Sl. No.
Name of Reservoirs
Location
Live Capacity
at FRL in BCM
June 2010 July 2010 August 2010
Level (m)
Live Storage
BCM
Percent- age of normal storage
Level (m)
Live Storage
BCM
Percent- age of normal storage
Level (m)
Live Storage
BCM
Percent- age of normal storage
1 2 3 4 5 6 7 8 9 10 11 12 13 23 GHATAPRABHA(HIDKAL) (KAR) 1.391 638.61 0.174 84 653.96 0.8 88 661.49 1.282 102 24 BHADRA (KAR) 1.785 647.26 0.767 168 650.44 1.025 94 654.53 1.426 95
25 LINGANAMAKKI (KAR) 4.294 535.51 0.595 74 543.77 1.775 80 547.49 2.682 81
26 NARAYANPUR (KAR) 0.863 488 0.391 86 489.04 0.491 74 491.35 0.748 96
27 MALAPRABHA(RENUKA) (KAR) 0.972 624.62 0.174 249 627.82 0.386 110 630.36 0.581 99
28 KABINI (KAR) 0.275 691.47 0.034 31 695.43 0.232 103 695.08 0.214 94
29 HEMAVATHY (KAR) 0.927 876.22 0.094 52 883.71 0.422 67 886.83 0.622 82
30 HARANGI (KAR) 0.22 858.91 0.049 77 870.15 0.18 90 871.32 0.216 100
31 SUPA (KAR) 4.12 520.74 0.626 88 533 1.307 86 542.19 1.923 79
32 VANI VILAS SAGAR (KAR) 0.802 636.94 0.093 60 636.2 0.089 59 637.53 0.106 70
33* ALMATTI (KAR) 3.105 514 1.079 179 518.93 2.728 119 519.56 3.071 107
34* GERUSOPPA (KAR) 0.13 49.6 0.1 91 53.22 0.119 106 54.29 0.126 113
35 KALLADA(PARAPPAR) (KRL) 0.507 98.42 0.17 108 107.75 0.318 128 111.02 0.403 124
36* IDAMALAYAR (KRL) 1.018 132.3 0.18 77 144.75 0.402 80 152.2 0.59 84
37* IDUKKI (KRL) 1.46 708.2 0.37 132 714.57 0.64 111 720.91 0.866 105
38* KAKKI (KRL) 0.447 951.3 0.118 110 965.89 0.234 109 972.05 0.305 102
39* PERIYAR (KRL) 0.173 860.76 0.051 78 862.81 0.087 93 961.83 0.069 77
40* GANDHI SAGAR (MP ) 6.827 381.18 0.023 9 381.02 0 0 384.51 0.535 26
41 TAWA (MP ) 1.944 346.83 0.804 181 350.89 1.279 118 355.18 1.944 111
42* BARGI (MP ) 3.18 404.25 0.134 56 410.45 0.729 64 418.75 2.115 91
43* BANSAGAR (MP ) 5.166 324.35 0.148 166 327.59 0.653 165 330.75 1.345 126
44* INDIRA SAGAR (MP ) 9.745 244.17 0.276 484 245.28 0.539 42 254.48 4.09 128
Contd...
37
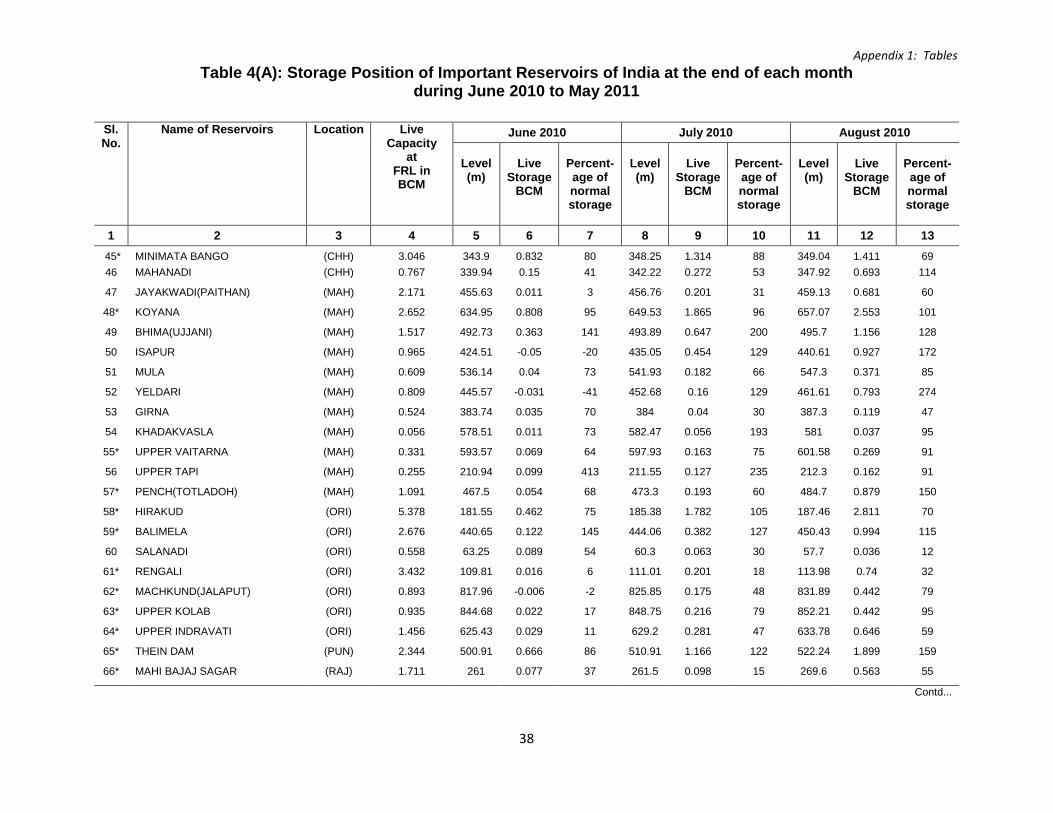
Appendix 1: Tables Table 4(A): Storage Position of Important Reservoirs of India at the end of each month
during June 2010 to May 2011
Sl. No.
Name of Reservoirs
Location
Live Capacity
at FRL in BCM
June 2010 July 2010 August 2010
Level (m)
Live Storage
BCM
Percent- age of normal storage
Level (m)
Live Storage
BCM
Percent- age of normal storage
Level (m)
Live Storage
BCM
Percent- age of normal storage
1 2 3 4 5 6 7 8 9 10 11 12 13 45* MINIMATA BANGO (CHH) 3.046 343.9 0.832 80 348.25 1.314 88 349.04 1.411 69 46 MAHANADI (CHH) 0.767 339.94 0.15 41 342.22 0.272 53 347.92 0.693 114
47 JAYAKWADI(PAITHAN) (MAH) 2.171 455.63 0.011 3 456.76 0.201 31 459.13 0.681 60
48* KOYANA (MAH) 2.652 634.95 0.808 95 649.53 1.865 96 657.07 2.553 101
49 BHIMA(UJJANI) (MAH) 1.517 492.73 0.363 141 493.89 0.647 200 495.7 1.156 128
50 ISAPUR (MAH) 0.965 424.51 -0.05 -20 435.05 0.454 129 440.61 0.927 172
51 MULA (MAH) 0.609 536.14 0.04 73 541.93 0.182 66 547.3 0.371 85
52 YELDARI (MAH) 0.809 445.57 -0.031 -41 452.68 0.16 129 461.61 0.793 274
53 GIRNA (MAH) 0.524 383.74 0.035 70 384 0.04 30 387.3 0.119 47
54 KHADAKVASLA (MAH) 0.056 578.51 0.011 73 582.47 0.056 193 581 0.037 95
55* UPPER VAITARNA (MAH) 0.331 593.57 0.069 64 597.93 0.163 75 601.58 0.269 91
56 UPPER TAPI (MAH) 0.255 210.94 0.099 413 211.55 0.127 235 212.3 0.162 91
57* PENCH(TOTLADOH) (MAH) 1.091 467.5 0.054 68 473.3 0.193 60 484.7 0.879 150
58* HIRAKUD (ORI) 5.378 181.55 0.462 75 185.38 1.782 105 187.46 2.811 70
59* BALIMELA (ORI) 2.676 440.65 0.122 145 444.06 0.382 127 450.43 0.994 115
60 SALANADI (ORI) 0.558 63.25 0.089 54 60.3 0.063 30 57.7 0.036 12
61* RENGALI (ORI) 3.432 109.81 0.016 6 111.01 0.201 18 113.98 0.74 32
62* MACHKUND(JALAPUT) (ORI) 0.893 817.96 -0.006 -2 825.85 0.175 48 831.89 0.442 79
63* UPPER KOLAB (ORI) 0.935 844.68 0.022 17 848.75 0.216 79 852.21 0.442 95
64* UPPER INDRAVATI (ORI) 1.456 625.43 0.029 11 629.2 0.281 47 633.78 0.646 59
65* THEIN DAM (PUN) 2.344 500.91 0.666 86 510.91 1.166 122 522.24 1.899 159
66* MAHI BAJAJ SAGAR (RAJ) 1.711 261 0.077 37 261.5 0.098 15 269.6 0.563 55
Contd...
38

Appendix 1: Tables Table 4(A): Storage Position of Important Reservoirs of India at the end of each month
during June 2010 to May 2011
Sl. No.
Name of Reservoirs
Location
Live Capacity
at FRL in BCM
June 2010 July 2010 August 2010
Level (m)
Live Storage
BCM
Percent- age of normal storage
Level (m)
Live Storage
BCM
Percent- age of normal storage
Level (m)
Live Storage
BCM
Percent- age of normal storage
1 2 3 4 5 6 7 8 9 10 11 12 13 67 JHAKAM (RAJ) 0.132 336.65 0.008 50 336.65 0.008 17 345.7 0.033 41
68* RANA PRATAP SAGAR (RAJ) 1.436 345.76 0.26 50 346.97 0.392 59 348.42 0.644 67
69 LOWER BHAWANI (TN ) 0.792 269.65 0.306 97 270.43 0.3 68 272.01 0.407 82
70* METTUR(STANLEY) (TN ) 2.647 228.7 1.197 127 229.02 1.227 107 230.72 1.393 92
71 VAIGAI (TN ) 0.172 264.51 0.004 9 269.84 0.027 50 273.99 0.072 104
72 PARAMBIKULAM (TN ) 0.38 539.97 0.078 79 545.35 0.167 80 549.63 0.246 88
73 ALIYAR (TN ) 0.095 312.95 0.052 226 315.56 0.067 146 319.16 0.09 132
74* SHOLAYAR (TN ) 0.143 972.85 0.03 63 990.33 0.086 83 994.62 0.104 85
75 GUMTI (TRP) 0.312 88.6 0.111 88 89 0.117 69 90.1 0.162 81
76 MATATILA (UP ) 0.707 305.38 0.409 254 306.45 0.502 170 307.45 0.604 111
77* RIHAND (UP ) 5.649 253.69 0.184 43 255.82 0.794 62 256.86 1.106 46
78* RAMGANGA (UKH) 2.196 319.4 0.053 23 332.56 0.431 88 352.99 1.343 148
79* TEHRI (UKH) 2.615 742.8 0.043 21 782.7 0.966 121 821.2 2.254 153
80 MAYURAKSHI (WB ) 0.48 111.12 0.074 68 112.59 0.108 45 112.53 0.107 44
81 KANGSABATI (WB ) 0.914 121.92 0.013 10 122.16 0.022 7 123.78 0.082 19
Total Storage 151.768 20.312 46.224 92.351 Percentage 13 30 61
Contd...
39

Appendix 1: Tables
Table 4(A): Storage Position of Important Reservoirs of India at the end of each month During June 2010 to May 2011
Sl. Name of Reservoirs Location Live Sept-2010 Oct-2010 Nov-2010 No.
Capacity at Level Live
Percent- Level Live
Percent- Level Live
Percent-
FRL in (m) Storage age of (m) Storage age of (m) Storage age of BCM BCM normal BCM normal BCM normal storage storage storage 1 2 3 4 5 6 7 8 9 10 11 12 13
1* SRISAILAM (AP ) 8.288 269.65 8.239 126 269.6 8.204 122 269.55 8.175 134
2* NAGARJUNA SAGAR (AP ) 6.841 178.73 6.524 174 179.56 6.763 147 179.19 6.841 188
3 SRIRAMSAGAR (AP ) 2.3 332.54 1.684 119 332.54 2.3 175 332.54 2.3 265
4 SOMASILA (AP ) 1.994 97.26 1.352 257 97.48 1.387 150 99.9 1.854 190
5 LOWER MANAIR (AP ) 0.621 280.42 0.621 209 280.42 0.621 188 280.42 0.621 176
6 TENUGHAT (JHA) 0.821 259.89 0.337 103 260.24 0.354 108 259.7 0.329 101
7 MAITHON (JHA) 0.471 146.64 0.459 99 145.67 0.404 88 145.08 0.373 81
8* PANCHET HILL (JHA) 0.184 125.83 0.184 105 122.98 0.097 56 123.26 0.107 60
9 KONAR (JHA) 0.176 420.35 0.088 56 420.02 0.084 54 419.65 0.078 55
10 TILAIYA (JHA) 0.142 364.83 0.026 23 364.97 0.028 25 364.88 0.027 28
11* UKAI (GUJ) 6.615 103.59 5.814 114 103.05 5.529 115 102.88 5.438 124
12 SABARMATI(DHAROI) (GUJ) 0.735 186.68 0.467 136 186.49 0.452 137 186.08 0.421 149
13* KADANA (GUJ) 1.472 125.71 0.989 115 123.01 0.755 93 123.14 0.765 96
14 SHETRUNJI (GUJ) 0.3 55.53 0.3 162 55.53 0.3 169 57.42 0.291 181
15 BHADAR (GUJ) 0.188 107.9 0.188 158 107.77 0.184 161 107.59 0.175 184
16 DAMANGANGA (GUJ) 0.502 79.65 0.493 109 79.9 0.502 105 79.9 0.502 111
17 DANTIWADA (GUJ) 0.399 173.23 0.093 84 172.44 0.08 79 170.81 0.057 73
18 PANAM (GUJ) 0.697 123.6 0.448 109 123.05 0.42 107 122.8 0.407 110
19* GOBIND SAGAR(BHAKRA) (HP ) 6.229 512.27 5.992 119 511.78 5.913 127 509.29 5.524 136
20* PONG DAM(BEAS) (HP ) 6.157 424.59 6.15 145 423.1 5.78 154 420.23 5.102 163
21 KRISHNARAJA SAGARA (KAR) 1.163 751.14 0.994 110 752.44 1.155 124 752.5 1.163 146
22* TUNGABHADRA (KAR) 3.276 497.74 2.955 107 797.57 2.893 111 497.74 2.955 142
Contd...
40

Appendix 1: Tables
Table 4(A): Storage Position of Important Reservoirs of India at the end of each month During June 2010 to May 2011
Sl. Name of Reservoirs Location Live Sept-2010 Oct-2010 Nov-2010 No.
Capacity at Level Live
Percent- Level Live
Percent- Level Live
Percent-
FRL in (m) Storage age of (m) Storage age of (m) Storage age of BCM BCM normal BCM normal BCM normal storage storage storage 1 2 3 4 5 6 7 8 9 10 11 12 13
23 GHATAPRABHA(HIDKAL) (KAR) 1.391 662.95 1.387 110 662.95 1.387 116 661.87 1.316 142
24 BHADRA (KAR) 1.785 657.27 1.729 117 657.58 1.764 124 657.58 1.77 133
25 LINGANAMAKKI (KAR) 4.294 552 3.572 104 552.61 3.749 113 552.96 3.846 128
26 NARAYANPUR (KAR) 0.863 491.72 0.795 103 491.92 0.822 109 491.55 0.773 99
27 MALAPRABHA(RENUKA) (KAR) 0.972 631.82 0.729 117 631.9 0.738 118 632.1 0.76 156
28 KABINI (KAR) 0.275 694.18 0.165 82 693.06 0.108 53 694.3 0.171 130
29 HEMAVATHY (KAR) 0.927 888.8 0.769 110 888.49 0.745 118 890.47 0.913 202
30 HARANGI (KAR) 0.22 871.2 0.212 113 869.36 0.161 119 868.91 0.151 256
31 SUPA (KAR) 4.12 547.86 2.305 88 548.39 2.442 95 548.28 2.431 103
32 VANI VILAS SAGAR (KAR) 0.802 639.15 0.145 83 641.79 0.221 97 647.77 0.427 187
33* ALMATTI (KAR) 3.105 519.6 3.051 102 519.6 3.051 106 519.6 3.051 129
34* GERUSOPPA (KAR) 0.13 51.04 0.107 92 51 0.107 90 50.69 0.106 91
35 KALLADA(PARAPPAR) (KRL) 0.507 112.63 0.415 113 115.81 0.488 118 116.08 0.493 118
36* IDAMALAYAR (KRL) 1.018 157.56 0.694 92 161.64 0.807 106 162.76 0.838 116
37* IDUKKI (KRL) 1.46 724.44 1.03 111 727.87 1.209 123 729.62 1.304 133
38* KAKKI (KRL) 0.447 974.22 0.333 102 976.35 0.362 103 978.63 0.397 111
39* PERIYAR (KRL) 0.173 861.31 0.061 73 861.47 0.063 62 865.52 0.14 124
40* GANDHI SAGAR (MP ) 6.827 386.8 1.032 47 386.51 0.959 47 384.37 0.509 32
41 TAWA (MP ) 1.944 355.4 1.944 108 355.09 1.944 109 353.84 1.746 117
42* BARGI (MP ) 3.18 422.7 3.175 115 422.15 3.045 118 421.5 2.87 133
43* BANSAGAR (MP ) 5.166 334.02 2.217 177 332.8 1.861 186 332.28 1.709 213
44* INDIRA SAGAR (MP ) 9.745 259.65 7.548 177 259.11 7.118 182 258.46 6.624 213
Contd...
41

Appendix 1: Tables
Table 4(A): Storage Position of Important Reservoirs of India at the end of each month During June 2010 to May 2011
Sl. Name of Reservoirs Location Live Sept-2010 Oct-2010 Nov-2010 No.
Capacity at Level Live
Percent- Level Live
Percent- Level Live
Percent-
FRL in (m) Storage age of (m) Storage age of (m) Storage age of BCM BCM normal BCM normal BCM normal storage storage storage 1 2 3 4 5 6 7 8 9 10 11 12 13
45* MINIMATA BANGO (CHH) 3.046 351.68 1.73 79 348.88 1.393 66 348.54 1.352 72
46 MAHANADI (CHH) 0.767 348.49 0.747 131 348.7 0.767 157 348.71 0.767 155
47 JAYAKWADI(PAITHAN) (MAH) 2.171 461.2 1.238 92 461.39 1.295 95 461.89 1.448 118
48* KOYANA (MAH) 2.652 659.44 2.652 103 659.33 2.652 107 659.18 2.652 117
49 BHIMA(UJJANI) (MAH) 1.517 496.83 1.517 152 496.83 1.517 142 496.83 1.517 153
50 ISAPUR (MAH) 0.965 440.99 0.963 162 441 0.964 156 441 0.964 168
51 MULA (MAH) 0.609 551.03 0.543 112 551.66 0.575 115 552.3 0.609 131
52 YELDARI (MAH) 0.809 461.77 0.809 206 461.77 0.809 184 461.77 0.809 207
53 GIRNA (MAH) 0.524 388.86 0.163 52 389.15 0.171 54 389.4 0.178 62
54 KHADAKVASLA (MAH) 0.056 581.13 0.038 97 579.52 0.02 71 579.7 0.022 79
55* UPPER VAITARNA (MAH) 0.331 603.5 0.331 107 603.5 0.331 107 603.5 0.331 110
56 UPPER TAPI (MAH) 0.255 213.99 0.254 109 214 0.255 101 214 0.255 105
57* PENCH(TOTLADOH) (MAH) 1.091 489.6 1.017 151 488.13 0.911 161 487.39 0.861 191
58* HIRAKUD (ORI) 5.378 192.02 5.377 111 191.61 5.149 109 191.87 5.292 120
59* BALIMELA (ORI) 2.676 458.14 1.985 169 458.73 2.066 153 459.94 2.272 175
60 SALANADI (ORI) 0.558 65.68 0.126 33 62.39 0.078 24 60.05 0.058 18
61* RENGALI (ORI) 3.432 118.21 1.726 59 118.57 1.832 65 118.52 1.835 79
62* MACHKUND(JALAPUT) (ORI) 0.893 836.52 0.758 110 836.8 0.769 106 837.85 0.861 130
63* UPPER KOLAB (ORI) 0.935 855.61 0.709 124 855.88 0.734 124 856.09 0.755 137
64* UPPER INDRAVATI (ORI) 1.456 638.45 1.082 87 639.42 1.177 99 639.4 1.175 108
65* THEIN DAM (PUN) 2.344 524 2.039 166 521.23 1.818 166 518.86 1.651 171
66* MAHI BAJAJ SAGAR (RAJ) 1.711 274.35 0.986 84 274.15 0.965 83 272.3 0.796 78
Contd...
42

Appendix 1: Tables
Table 4(A): Storage Position of Important Reservoirs of India at the end of each month During June 2010 to May 2011
Sl. Name of Reservoirs Location Live Sept-2010 Oct-2010 Nov-2010 No.
Capacity at Level Live
Percent- Level Live
Percent- Level Live
Percent-
FRL in (m) Storage age of (m) Storage age of (m) Storage age of BCM BCM normal BCM normal BCM normal storage storage storage 1 2 3 4 5 6 7 8 9 10 11 12 13
67 JHAKAM (RAJ) 0.132 351.35 0.063 70 351.5 0.065 72 348.45 0.046 64
68* RANA PRATAP SAGAR (RAJ) 1.436 349.02 0.756 79 349.29 0.789 87 349.12 0.762 112
69 LOWER BHAWANI (TN ) 0.792 269.99 0.32 71 268.57 0.267 56 274.02 0.563 104
70* METTUR(STANLEY) (TN ) 2.647 226.93 1.039 69 224.07 0.811 51 240.34 2.58 159
71 VAIGAI (TN ) 0.172 276.73 0.118 182 273.83 0.07 67 278.86 0.164 134
72 PARAMBIKULAM (TN ) 0.38 550.34 0.259 88 552.16 0.295 98 555 0.353 119
73 ALIYAR (TN ) 0.095 319.84 0.094 157 319.95 0.095 158 319.95 0.095 153
74* SHOLAYAR (TN ) 0.143 1000.1
8 0.13 107 1000.6
2 0.132 120 1001.0
5 0.134 135
75 GUMTI (TRP) 0.312 90.35 0.172 79 91.2 0.207 98 90.48 0.178 98
76 MATATILA (UP ) 0.707 308.27 0.688 103 306.64 0.521 82 304.71 0.349 67
77* RIHAND (UP ) 5.649 258.17 1.551 48 257.92 1.468 48 257.68 1.386 51
78* RAMGANGA (UKH) 2.196 364.23 2.114 173 365.43 2.196 169 365.39 2.196 169
79* TEHRI (UKH) 2.615 823.6 2.367 128 819.77 2.197 119 818.3 2.152 124
80 MAYURAKSHI (WB ) 0.48 114.99 0.179 51 112.64 0.109 35 112.59 0.108 37
81 KANGSABATI (WB ) 0.914 125.38 0.149 26 124.13 0.095 21 124.16 0.097 21
Total Storage 151.768 114.601 112.921 113.473 Percentage 76 74 75
Contd...
43
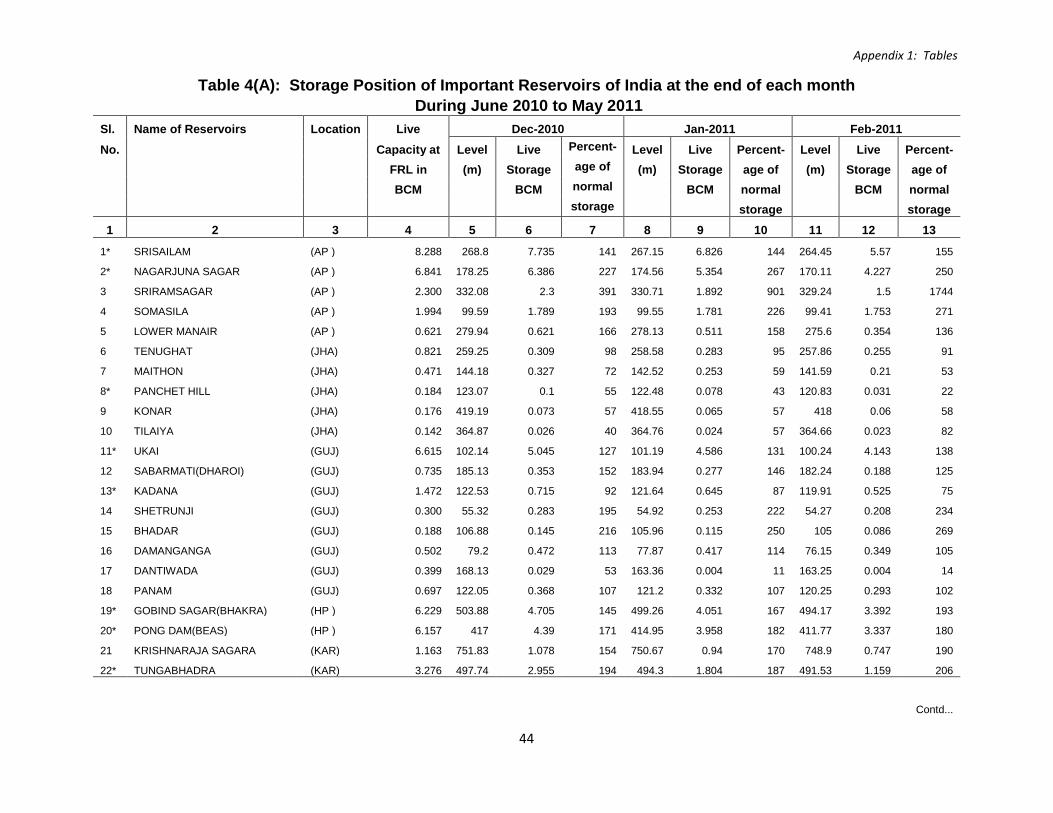
Appendix 1: Tables
Table 4(A): Storage Position of Important Reservoirs of India at the end of each month During June 2010 to May 2011
Sl. Name of Reservoirs Location Live Dec-2010 Jan-2011 Feb-2011 No. Capacity at Level Live Percent- Level Live Percent- Level Live Percent- FRL in (m) Storage age of (m) Storage age of (m) Storage age of BCM BCM normal BCM normal BCM normal storage storage storage 1 2 3 4 5 6 7 8 9 10 11 12 13
1* SRISAILAM (AP ) 8.288 268.8 7.735 141 267.15 6.826 144 264.45 5.57 155
2* NAGARJUNA SAGAR (AP ) 6.841 178.25 6.386 227 174.56 5.354 267 170.11 4.227 250
3 SRIRAMSAGAR (AP ) 2.300 332.08 2.3 391 330.71 1.892 901 329.24 1.5 1744
4 SOMASILA (AP ) 1.994 99.59 1.789 193 99.55 1.781 226 99.41 1.753 271
5 LOWER MANAIR (AP ) 0.621 279.94 0.621 166 278.13 0.511 158 275.6 0.354 136
6 TENUGHAT (JHA) 0.821 259.25 0.309 98 258.58 0.283 95 257.86 0.255 91
7 MAITHON (JHA) 0.471 144.18 0.327 72 142.52 0.253 59 141.59 0.21 53
8* PANCHET HILL (JHA) 0.184 123.07 0.1 55 122.48 0.078 43 120.83 0.031 22
9 KONAR (JHA) 0.176 419.19 0.073 57 418.55 0.065 57 418 0.06 58
10 TILAIYA (JHA) 0.142 364.87 0.026 40 364.76 0.024 57 364.66 0.023 82
11* UKAI (GUJ) 6.615 102.14 5.045 127 101.19 4.586 131 100.24 4.143 138
12 SABARMATI(DHAROI) (GUJ) 0.735 185.13 0.353 152 183.94 0.277 146 182.24 0.188 125
13* KADANA (GUJ) 1.472 122.53 0.715 92 121.64 0.645 87 119.91 0.525 75
14 SHETRUNJI (GUJ) 0.300 55.32 0.283 195 54.92 0.253 222 54.27 0.208 234
15 BHADAR (GUJ) 0.188 106.88 0.145 216 105.96 0.115 250 105 0.086 269
16 DAMANGANGA (GUJ) 0.502 79.2 0.472 113 77.87 0.417 114 76.15 0.349 105
17 DANTIWADA (GUJ) 0.399 168.13 0.029 53 163.36 0.004 11 163.25 0.004 14
18 PANAM (GUJ) 0.697 122.05 0.368 107 121.2 0.332 107 120.25 0.293 102
19* GOBIND SAGAR(BHAKRA) (HP ) 6.229 503.88 4.705 145 499.26 4.051 167 494.17 3.392 193
20* PONG DAM(BEAS) (HP ) 6.157 417 4.39 171 414.95 3.958 182 411.77 3.337 180
21 KRISHNARAJA SAGARA (KAR) 1.163 751.83 1.078 154 750.67 0.94 170 748.9 0.747 190
22* TUNGABHADRA (KAR) 3.276 497.74 2.955 194 494.3 1.804 187 491.53 1.159 206
Contd...
44

Appendix 1: Tables
Table 4(A): Storage Position of Important Reservoirs of India at the end of each month During June 2010 to May 2011
Sl. Name of Reservoirs Location Live Dec-2010 Jan-2011 Feb-2011 No. Capacity at Level Live Percent- Level Live Percent- Level Live Percent- FRL in (m) Storage age of (m) Storage age of (m) Storage age of BCM BCM normal BCM normal BCM normal storage storage storage 1 2 3 4 5 6 7 8 9 10 11 12 13
23 GHATAPRABHA(HIDKAL) (KAR) 1.391 657.49 1.007 160 652.94 0.742 202 648.29 0.519 260
24 BHADRA (KAR) 1.785 657.75 1.785 135 656.45 1.635 140 654.24 1.395 147
25 LINGANAMAKKI (KAR) 4.294 551.82 3.52 133 549.92 3.03 137 547.75 2.517 139
26 NARAYANPUR (KAR) 0.863 491.34 0.747 95 490.87 0.691 93 491.01 0.708 109
27 MALAPRABHA(RENUKA) (KAR) 0.972 630.58 0.592 191 628.12 0.391 209 626.7 0.291 294
28 KABINI (KAR) 0.275 694.38 0.175 154 694.58 0.185 146 693.78 0.146 166
29 HEMAVATHY (KAR) 0.927 888.85 0.774 289 888.61 0.755 315 887.09 0.642 310
30 HARANGI (KAR) 0.220 864.35 0.084 420 865.13 0.092 354 865.41 0.095 380
31 SUPA (KAR) 4.120 545.87 2.22 107 542.8 1.97 108 539.1 1.696 110
32 VANI VILAS SAGAR (KAR) 0.802 647.03 0.442 200 646.88 0.433 210 646.3 0.399 218
33* ALMATTI (KAR) 3.105 518.51 2.54 143 517.57 2.151 178 514.15 1.114 153
34* GERUSOPPA (KAR) 0.130 46.18 0.083 73 50.63 0.105 98 51.3 0.109 101
35 KALLADA(PARAPPAR) (KRL) 0.507 113.91 0.445 112 113.68 0.439 124 111.08 0.373 127
36* IDAMALAYAR (KRL) 1.018 157.3 0.687 107 153.8 0.604 110 147.88 0.468 104
37* IDUKKI (KRL) 1.460 729.16 1.279 144 726.19 1.117 146 722.39 0.936 150
38* KAKKI (KRL) 0.447 978.02 0.387 119 975.65 0.353 125 973.14 0.319 130
39* PERIYAR (KRL) 0.173 865.37 0.137 159 863.78 0.105 194 862.07 0.073 197
40* GANDHI SAGAR (MP ) 6.827 382.76 0.243 20 382.24 0.163 18 381.13 0.015 2
41 TAWA (MP ) 1.944 351.65 1.396 122 348.63 0.997 131 344.94 0.642 128
42* BARGI (MP ) 3.180 420.05 2.464 145 418.4 2.038 154 416.15 1.57 149
43* BANSAGAR (MP ) 5.166 331.65 1.557 229 330.38 1.256 249 329.28 0.996 242
44* INDIRA SAGAR (MP ) 9.745 256.76 5.445 227 255 4.333 255 253.41 3.532 257
Contd...
45

Appendix 1: Tables
Table 4(A): Storage Position of Important Reservoirs of India at the end of each month During June 2010 to May 2011
Sl. Name of Reservoirs Location Live Dec-2010 Jan-2011 Feb-2011 No. Capacity at Level Live Percent- Level Live Percent- Level Live Percent- FRL in (m) Storage age of (m) Storage age of (m) Storage age of BCM BCM normal BCM normal BCM normal storage storage storage 1 2 3 4 5 6 7 8 9 10 11 12 13
45* MINIMATA BANGO (CHH) 3.046 348.37 1.331 75 347.93 1.279 77 347.62 1.245 81
46 MAHANADI (CHH) 0.767 348.68 0.765 153 347.62 0.664 140 346.18 0.547 121
47 JAYAKWADI(PAITHAN) (MAH) 2.171 461.6 1.358 125 461.14 1.222 132 460.55 1.047 132
48* KOYANA (MAH) 2.652 658.22 2.652 129 655.22 2.336 127 651.33 2.014 123
49 BHIMA(UJJANI) (MAH) 1.517 496.83 1.517 178 496.5 1.407 204 495.54 1.106 214
50 ISAPUR (MAH) 0.965 440.32 0.9 178 439.53 0.828 186 438.63 0.732 193
51 MULA (MAH) 0.609 552.07 0.597 154 550.33 0.508 162 549.68 0.476 193
52 YELDARI (MAH) 0.809 461.53 0.785 234 460.62 0.693 259 459.54 0.592 279
53 GIRNA (MAH) 0.524 389.38 0.179 76 388.81 0.161 86 388 0.139 95
54 KHADAKVASLA (MAH) 0.056 579.33 0.018 90 579.94 0.025 167 578.05 0.007 47
55* UPPER VAITARNA (MAH) 0.331 602.85 0.31 108 601.98 0.283 112 601.32 0.262 128
56 UPPER TAPI (MAH) 0.255 213.74 0.239 112 213.26 0.212 116 212.59 0.176 114
57* PENCH(TOTLADOH) (MAH) 1.091 486.72 0.817 227 484.79 0.697 197 483.64 0.63 261
58* HIRAKUD (ORI) 5.378 191.69 5.186 127 190.65 4.596 131 189.22 3.786 123
59* BALIMELA (ORI) 2.676 460.13 2.304 197 458.14 1.987 204 455.8 1.666 211
60 SALANADI (ORI) 0.558 59.44 0.053 18 57.75 0.037 15 54.48 0.016 7
61* RENGALI (ORI) 3.432 118.35 1.785 78 117.77 1.628 86 116.7 1.363 81
62* MACHKUND(JALAPUT) (ORI) 0.893 838.05 0.778 122 837.36 0.815 148 836.89 0.773 166
63* UPPER KOLAB (ORI) 0.935 856.07 0.753 147 855.41 0.69 153 854.1 0.584 149
64* UPPER INDRAVATI (ORI) 1.456 638.87 1.123 113 637.65 1.004 120 636.4 0.882 127
65* THEIN DAM (PUN) 2.344 513.62 1.332 173 506.73 0.951 175 504.39 0.836 167
66* MAHI BAJAJ SAGAR (RAJ) 1.711 269.2 0.531 66 265.8 0.315 50 263.1 0.169 36
Contd...
46
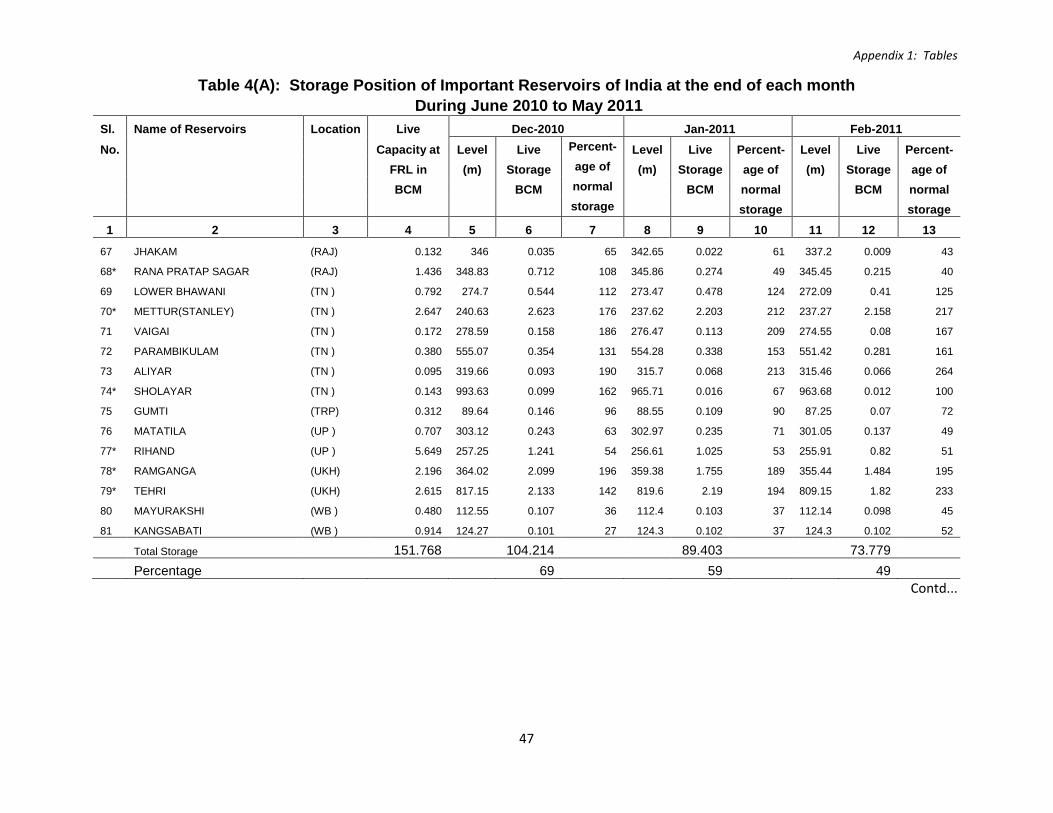
Appendix 1: Tables
Table 4(A): Storage Position of Important Reservoirs of India at the end of each month During June 2010 to May 2011
Sl. Name of Reservoirs Location Live Dec-2010 Jan-2011 Feb-2011 No. Capacity at Level Live Percent- Level Live Percent- Level Live Percent- FRL in (m) Storage age of (m) Storage age of (m) Storage age of BCM BCM normal BCM normal BCM normal storage storage storage 1 2 3 4 5 6 7 8 9 10 11 12 13
67 JHAKAM (RAJ) 0.132 346 0.035 65 342.65 0.022 61 337.2 0.009 43
68* RANA PRATAP SAGAR (RAJ) 1.436 348.83 0.712 108 345.86 0.274 49 345.45 0.215 40
69 LOWER BHAWANI (TN ) 0.792 274.7 0.544 112 273.47 0.478 124 272.09 0.41 125
70* METTUR(STANLEY) (TN ) 2.647 240.63 2.623 176 237.62 2.203 212 237.27 2.158 217
71 VAIGAI (TN ) 0.172 278.59 0.158 186 276.47 0.113 209 274.55 0.08 167
72 PARAMBIKULAM (TN ) 0.380 555.07 0.354 131 554.28 0.338 153 551.42 0.281 161
73 ALIYAR (TN ) 0.095 319.66 0.093 190 315.7 0.068 213 315.46 0.066 264
74* SHOLAYAR (TN ) 0.143 993.63 0.099 162 965.71 0.016 67 963.68 0.012 100
75 GUMTI (TRP) 0.312 89.64 0.146 96 88.55 0.109 90 87.25 0.07 72
76 MATATILA (UP ) 0.707 303.12 0.243 63 302.97 0.235 71 301.05 0.137 49
77* RIHAND (UP ) 5.649 257.25 1.241 54 256.61 1.025 53 255.91 0.82 51
78* RAMGANGA (UKH) 2.196 364.02 2.099 196 359.38 1.755 189 355.44 1.484 195
79* TEHRI (UKH) 2.615 817.15 2.133 142 819.6 2.19 194 809.15 1.82 233
80 MAYURAKSHI (WB ) 0.480 112.55 0.107 36 112.4 0.103 37 112.14 0.098 45
81 KANGSABATI (WB ) 0.914 124.27 0.101 27 124.3 0.102 37 124.3 0.102 52
Total Storage 151.768 104.214 89.403 73.779 Percentage 69 59 49
Contd...
47
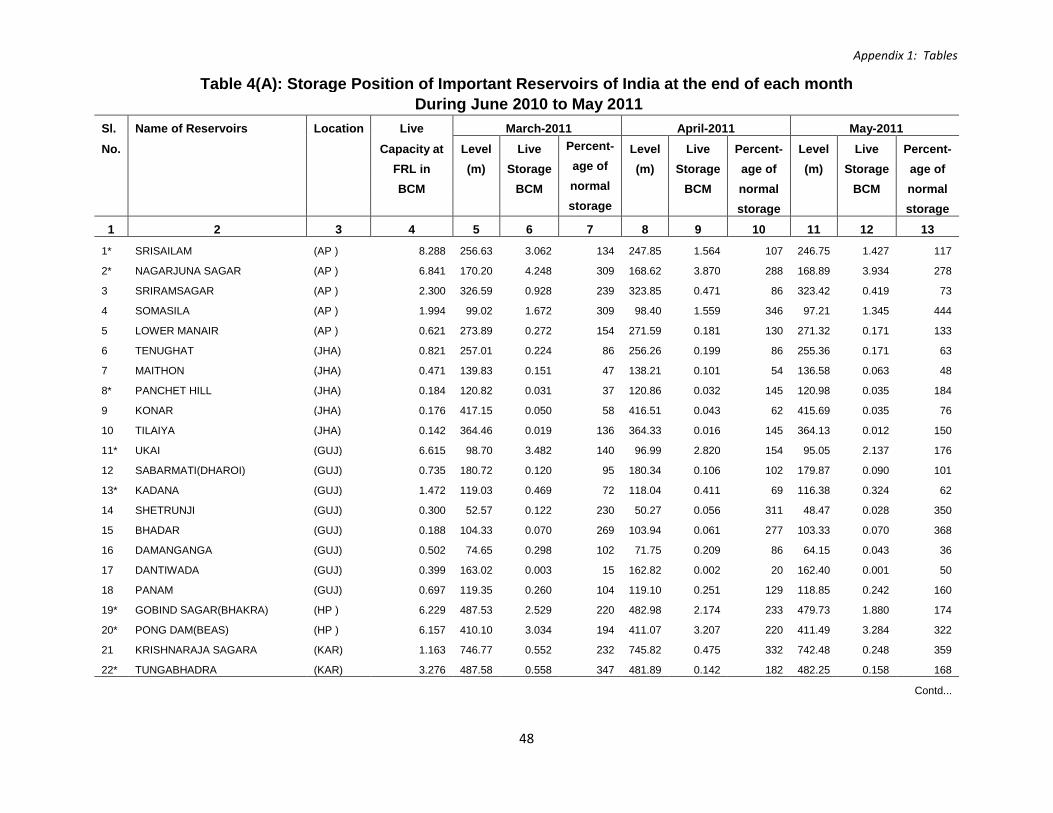
Appendix 1: Tables
Table 4(A): Storage Position of Important Reservoirs of India at the end of each month During June 2010 to May 2011
Sl. Name of Reservoirs Location Live March-2011 April-2011 May-2011 No. Capacity at Level Live Percent- Level Live Percent- Level Live Percent- FRL in (m) Storage age of (m) Storage age of (m) Storage age of BCM BCM normal BCM normal BCM normal storage storage storage 1 2 3 4 5 6 7 8 9 10 11 12 13
1* SRISAILAM (AP ) 8.288 256.63 3.062 134 247.85 1.564 107 246.75 1.427 117
2* NAGARJUNA SAGAR (AP ) 6.841 170.20 4.248 309 168.62 3.870 288 168.89 3.934 278
3 SRIRAMSAGAR (AP ) 2.300 326.59 0.928 239 323.85 0.471 86 323.42 0.419 73
4 SOMASILA (AP ) 1.994 99.02 1.672 309 98.40 1.559 346 97.21 1.345 444
5 LOWER MANAIR (AP ) 0.621 273.89 0.272 154 271.59 0.181 130 271.32 0.171 133
6 TENUGHAT (JHA) 0.821 257.01 0.224 86 256.26 0.199 86 255.36 0.171 63
7 MAITHON (JHA) 0.471 139.83 0.151 47 138.21 0.101 54 136.58 0.063 48
8* PANCHET HILL (JHA) 0.184 120.82 0.031 37 120.86 0.032 145 120.98 0.035 184
9 KONAR (JHA) 0.176 417.15 0.050 58 416.51 0.043 62 415.69 0.035 76
10 TILAIYA (JHA) 0.142 364.46 0.019 136 364.33 0.016 145 364.13 0.012 150
11* UKAI (GUJ) 6.615 98.70 3.482 140 96.99 2.820 154 95.05 2.137 176
12 SABARMATI(DHAROI) (GUJ) 0.735 180.72 0.120 95 180.34 0.106 102 179.87 0.090 101
13* KADANA (GUJ) 1.472 119.03 0.469 72 118.04 0.411 69 116.38 0.324 62
14 SHETRUNJI (GUJ) 0.300 52.57 0.122 230 50.27 0.056 311 48.47 0.028 350
15 BHADAR (GUJ) 0.188 104.33 0.070 269 103.94 0.061 277 103.33 0.070 368
16 DAMANGANGA (GUJ) 0.502 74.65 0.298 102 71.75 0.209 86 64.15 0.043 36
17 DANTIWADA (GUJ) 0.399 163.02 0.003 15 162.82 0.002 20 162.40 0.001 50
18 PANAM (GUJ) 0.697 119.35 0.260 104 119.10 0.251 129 118.85 0.242 160
19* GOBIND SAGAR(BHAKRA) (HP ) 6.229 487.53 2.529 220 482.98 2.174 233 479.73 1.880 174
20* PONG DAM(BEAS) (HP ) 6.157 410.10 3.034 194 411.07 3.207 220 411.49 3.284 322
21 KRISHNARAJA SAGARA (KAR) 1.163 746.77 0.552 232 745.82 0.475 332 742.48 0.248 359
22* TUNGABHADRA (KAR) 3.276 487.58 0.558 347 481.89 0.142 182 482.25 0.158 168
Contd...
48

Appendix 1: Tables
Table 4(A): Storage Position of Important Reservoirs of India at the end of each month During June 2010 to May 2011
Sl. Name of Reservoirs Location Live March-2011 April-2011 May-2011 No. Capacity at Level Live Percent- Level Live Percent- Level Live Percent- FRL in (m) Storage age of (m) Storage age of (m) Storage age of BCM BCM normal BCM normal BCM normal storage storage storage 1 2 3 4 5 6 7 8 9 10 11 12 13
23 GHATAPRABHA(HIDKAL) (KAR) 1.391 641.97 0.277 220 640.72 0.236 315 636.92 0.131 468
24 BHADRA (KAR) 1.785 651.59 1.133 161 648.31 0.848 186 644.58 0.576 202
25 LINGANAMAKKI (KAR) 4.294 544.59 1.890 141 541.54 1.397 153 536.65 0.803 146
26 NARAYANPUR (KAR) 0.863 488.53 0.440 88 487.02 0.305 92 486.63 0.268 85
27 MALAPRABHA(RENUKA) (KAR) 0.972 622.94 0.104 151 622.63 0.092 170 622.37 0.083 189
28 KABINI (KAR) 0.275 691.72 0.045 115 690.83 0.007 64 689.11 0.000 0
29 HEMAVATHY (KAR) 0.927 883.05 0.388 273 878.49 0.175 211 874.52 0.053 126
30 HARANGI (KAR) 0.220 865.37 0.094 427 864.54 0.086 430 864.51 0.086 453
31 SUPA (KAR) 4.120 534.21 1.358 112 529.05 1.039 111 524.28 0.784 114
32 VANI VILAS SAGAR (KAR) 0.802 646.12 0.389 232 645.20 0.351 225 644.99 0.342 239
33* ALMATTI (KAR) 3.105 511.64 0.622 240 509.62 0.315 254 509.24 0.268 288
34* GERUSOPPA (KAR) 0.130 52.32 0.114 102 52.04 0.113 95 53.93 0.123 111
35 KALLADA(PARAPPAR) (KRL) 0.507 104.50 0.255 120 98.02 0.163 107 90.60 0.085 71
36* IDAMALAYAR (KRL) 1.018 140.60 0.321 96 132.94 0.189 79 123.99 0.076 50
37* IDUKKI (KRL) 1.460 717.18 0.706 149 713.06 0.541 163 706.47 0.314 145
38* KAKKI (KRL) 0.447 966.52 0.240 127 958.90 0.173 125 946.19 0.091 100
39* PERIYAR (KRL) 0.173 861.07 0.060 150 861.99 0.072 147 862.05 0.073 140
40* GANDHI SAGAR (MP ) 6.827 381.15 0.018 4 380.49 -0.049 -13 380.17 0.000 0
41 TAWA (MP ) 1.944 342.93 0.471 116 342.81 0.461 116 342.60 0.442 114
42* BARGI (MP ) 3.180 414.40 1.254 155 411.95 0.914 169 409.10 0.583 191
43* BANSAGAR (MP ) 5.166 328.54 0.843 248 327.74 0.682 341 326.50 0.434 368
44* INDIRA SAGAR (MP ) 9.745 251.40 2.606 242 249.88 1.998 270 247.56 1.201 270
Contd...
49

Appendix 1: Tables
Table 4(A): Storage Position of Important Reservoirs of India at the end of each month During June 2010 to May 2011
Sl. Name of Reservoirs Location Live March-2011 April-2011 May-2011 No. Capacity at Level Live Percent- Level Live Percent- Level Live Percent- FRL in (m) Storage age of (m) Storage age of (m) Storage age of BCM BCM normal BCM normal BCM normal storage storage storage 1 2 3 4 5 6 7 8 9 10 11 12 13
45* MINIMATA BANGO (CHH) 3.046 347.34 1.215 87 346.94 1.173 96 346.26 1.124 106
46 MAHANADI (CHH) 0.767 343.00 0.320 75 340.61 0.183 49 339.08 0.109 33
47 JAYAKWADI(PAITHAN) (MAH) 2.171 459.87 0.862 132 459.08 0.668 138 458.19 0.473 146
48* KOYANA (MAH) 2.652 647.07 1.662 122 641.38 1.198 117 634.77 0.799 110
49 BHIMA(UJJANI) (MAH) 1.517 494.84 0.902 335 493.40 0.523 1687 491.96 0.192 93
50 ISAPUR (MAH) 0.965 437.57 0.638 197 436.55 0.559 222 435.83 0.506 291
51 MULA (MAH) 0.609 546.63 0.345 174 544.92 0.281 228 541.07 0.156 390
52 YELDARI (MAH) 0.809 457.96 0.460 295 456.82 0.378 525 455.44 0.290 853
53 GIRNA (MAH) 0.524 387.69 0.130 114 386.77 0.105 119 385.68 0.079 127
54 KHADAKVASLA (MAH) 0.056 578.57 0.011 100 578.08 0.007 88 579.21 0.017 213
55* UPPER VAITARNA (MAH) 0.331 599.50 0.207 128 597.30 0.148 125 597.07 0.142 173
56 UPPER TAPI (MAH) 0.255 211.69 0.132 109 211.06 0.105 131 209.70 0.035 106
57* PENCH(TOTLADOH) (MAH) 1.091 482.38 0.561 319 481.37 0.510 421 480.27 0.457 502
58* HIRAKUD (ORI) 5.378 187.93 3.068 140 185.76 1.943 134 183.34 0.990 146
59* BALIMELA (ORI) 2.676 453.12 1.319 271 450.13 0.961 255 447.81 0.720 661
60 SALANADI (ORI) 0.558 53.34 0.011 7 52.86 0.009 6 52.65 0.009 7
61* RENGALI (ORI) 3.432 115.82 1.162 93 114.42 0.843 104 110.80 0.164 62
62* MACHKUND(JALAPUT) (ORI) 0.893 836.07 0.714 192 835.33 0.661 223 834.56 0.604 277
63* UPPER KOLAB (ORI) 0.935 852.80 0.486 161 851.24 0.370 180 849.05 0.231 188
64* UPPER INDRAVATI (ORI) 1.456 634.57 0.711 142 632.11 0.508 161 630.14 0.346 206
65* THEIN DAM (PUN) 2.344 504.29 0.832 140 508.96 2.344 282 511.64 1.184 128
66* MAHI BAJAJ SAGAR (RAJ) 1.711 260.50 0.060 17 260.35 0.053 19 260.15 0.043 20
Contd...
50
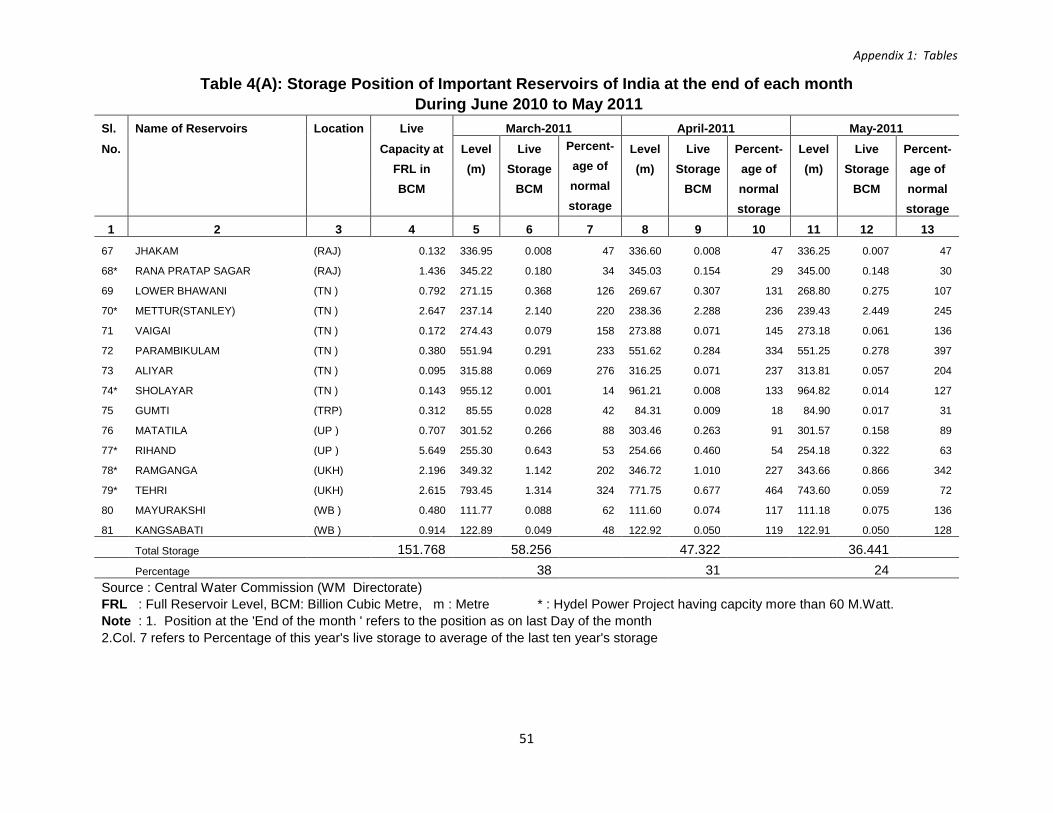
Appendix 1: Tables
Table 4(A): Storage Position of Important Reservoirs of India at the end of each month During June 2010 to May 2011
Sl. Name of Reservoirs Location Live March-2011 April-2011 May-2011 No. Capacity at Level Live Percent- Level Live Percent- Level Live Percent- FRL in (m) Storage age of (m) Storage age of (m) Storage age of BCM BCM normal BCM normal BCM normal storage storage storage 1 2 3 4 5 6 7 8 9 10 11 12 13
67 JHAKAM (RAJ) 0.132 336.95 0.008 47 336.60 0.008 47 336.25 0.007 47
68* RANA PRATAP SAGAR (RAJ) 1.436 345.22 0.180 34 345.03 0.154 29 345.00 0.148 30
69 LOWER BHAWANI (TN ) 0.792 271.15 0.368 126 269.67 0.307 131 268.80 0.275 107
70* METTUR(STANLEY) (TN ) 2.647 237.14 2.140 220 238.36 2.288 236 239.43 2.449 245
71 VAIGAI (TN ) 0.172 274.43 0.079 158 273.88 0.071 145 273.18 0.061 136
72 PARAMBIKULAM (TN ) 0.380 551.94 0.291 233 551.62 0.284 334 551.25 0.278 397
73 ALIYAR (TN ) 0.095 315.88 0.069 276 316.25 0.071 237 313.81 0.057 204
74* SHOLAYAR (TN ) 0.143 955.12 0.001 14 961.21 0.008 133 964.82 0.014 127
75 GUMTI (TRP) 0.312 85.55 0.028 42 84.31 0.009 18 84.90 0.017 31
76 MATATILA (UP ) 0.707 301.52 0.266 88 303.46 0.263 91 301.57 0.158 89
77* RIHAND (UP ) 5.649 255.30 0.643 53 254.66 0.460 54 254.18 0.322 63
78* RAMGANGA (UKH) 2.196 349.32 1.142 202 346.72 1.010 227 343.66 0.866 342
79* TEHRI (UKH) 2.615 793.45 1.314 324 771.75 0.677 464 743.60 0.059 72
80 MAYURAKSHI (WB ) 0.480 111.77 0.088 62 111.60 0.074 117 111.18 0.075 136
81 KANGSABATI (WB ) 0.914 122.89 0.049 48 122.92 0.050 119 122.91 0.050 128
Total Storage 151.768 58.256 47.322 36.441 Percentage 38 31 24 Source : Central Water Commission (WM Directorate)
FRL : Full Reservoir Level, BCM: Billion Cubic Metre, m : Metre * : Hydel Power Project having capcity more than 60 M.Watt. Note : 1. Position at the 'End of the month ' refers to the position as on last Day of the month
2.Col. 7 refers to Percentage of this year's live storage to average of the last ten year's storage
51

Appendix 1: Tables
Table 4(B): Storage Position of Important Reservoirs of India at the end of each month during June 2009 to May 2010
Sl. Name of Reservoirs Location Live Jun-09 Jul-09 Aug-09 No. Capacity at Level Live Percent- Level Live Percent- Level Live Percent-
FRL in (m) Storage age of (m) Storage age of (m) Storage age of BCM BCM normal BCM normal BCM normal storage storage storage 1 2 3 4 5 6 7 8 9 10 11 12 13
1* SRISAILAM (AP ) 8.288 245.73 1.316 88 259.33 3.753 115 263.28 5.496 89
2* NAGARJUNA SAGAR (AP ) 6.841 154.84 0.998 64 153.07 0.68 34 154.38 0.915 23
3 SRIRAMSAGAR (AP ) 2.300 318.64 -0.754 297 318.82 -0.748 -187 322.75 -0.521 -42
4 SOMASILA (AP ) 1.994 88.91 0.399 189 86.18 0.207 99 85.38 0.158 45
5 LOWER MANAIR (AP ) 0.621 268.30 0.089 60 267.84 0.079 52 267.68 0.076 27
6 TENUGHAT (JHA) 0.821 254.81 0.152 58 258.07 0.265 89 261.61 0.413 133
7 MAITHON (JHA) 0.471 134.89 0.032 18 138.02 0.096 33 145.59 0.4 103
8* PANCHET HILL (JHA) 0.184 120.05 0.012 16 122.76 0.088 70 127.34 0.184 114
9 KONAR (JHA) 0.176 414.83 0.029 362 415.34 0.033 35 417.81 0.057 44
10 TILAIYA (JHA) 0.142 364.01 0.010 40 364.3 0.015 23 365.35 0.037 44
11* UKAI (GUJ) 6.615 88.09 0.738 56 95.08 2.148 84 95.7 2.358 51
12 SABARMATI(DHAROI) (GUJ) 0.735 177.82 0.038 48 182.16 0.182 113 182.94 0.212 79
13* KADANA (GUJ) 1.472 121.11 0.606 121 124 0.837 134 123.22 0.771 112
14 SHETRUNJI (GUJ) 0.300 46.52 0.008 12 53.52 0.166 120 53.42 0.16 95
15 BHADAR (GUJ) 0.188 100.28 0.011 30 103.4 0.049 60 104.94 0.084 79
16 DAMANGANGA (GUJ) 0.502 63.27 0.027 23 69.45 0.151 85 74.15 0.283 86
17 DANTIWADA (GUJ) 0.399 162.23 0.001 20 165.32 0.012 32 165.17 0.011 12
18 PANAM (GUJ) 0.697 115.70 0.151 85 118.25 0.223 83 118.05 0.216 56
19* GOBIND SAGAR(BHAKRA) (HP ) 6.229 463.71 0.783 48 478.49 1.776 55 491.84 3.12 64
20* PONG DAM(BEAS) (HP ) 6.157 388.64 0.295 34 394.88 0.845 38 402.03 1.717 40
21 KRISHNARAJA SAGARA (KAR) 1.163 736.37 0.000 0 752.47 1.159 180 751.91 1.09 115
22* TUNGABHADRA (KAR) 3.276 483.58 0.226 46 497.69 2.938 140 497.7 2.94 102
Contd...
52

Appendix 1: Tables
Table 4(B): Storage Position of Important Reservoirs of India at the end of each month during June 2009 to May 2010
Sl. Name of Reservoirs Location Live Jun-09 Jul-09 Aug-09 No. Capacity at Level Live Percent- Level Live Percent- Level Live Percent-
FRL in (m) Storage age of (m) Storage age of (m) Storage age of BCM BCM normal BCM normal BCM normal storage storage storage 1 2 3 4 5 6 7 8 9 10 11 12 13
23 GHATAPRABHA(HIDKAL) (KAR) 1.391 630.17 0.013 5 660.77 1.228 136 661.75 1.301 103
24 BHADRA (KAR) 1.785 641.04 0.362 69 656.06 1.591 145 657.74 1.784 119
25 LINGANAMAKKI (KAR) 4.294 530.71 0.331 39 550.72 3.229 150 552.15 3.615 109
26 NARAYANPUR (KAR) 0.863 487.36 0.332 71 491.61 0.781 127 492.06 0.838 109
27 MALAPRABHA(RENUKA) (KAR) 0.972 620.31 0.022 26 629.87 0.536 146 629.95 0.542 89
28 KABINI (KAR) 0.275 690.39 0.000 0 696.02 0.266 121 694.06 0.161 69
29 HEMAVATHY (KAR) 0.927 874.00 0.037 20 890.37 0.904 151 889.3 0.811 106
30 HARANGI (KAR) 0.220 854.88 0.021 30 871.28 0.215 109 871.37 0.218 101
31 SUPA (KAR) 4.120 518.53 0.536 75 541.34 1.859 120 545.16 2.155 87
32 VANI VILAS SAGAR (KAR) 0.802 633.33 0.031 21 633.17 0.029 20 634.18 0.043 28
33* ALMATTI (KAR) 3.105 507.75 0.095 13 519.31 2.907 128 519.6 3.051 107
34* GERUSOPPA (KAR) 0.130 49.24 0.098 88 52.53 0.116 104 53.24 0.12 108
35 KALLADA(PARAPPAR) (KRL) 0.507 94.46 0.122 66 102.22 0.221 80 105.14 0.266 77
36* IDAMALAYAR (KRL) 1.018 124.28 0.079 31 150.88 0.536 105 156.58 0.669 92
37* IDUKKI (KRL) 1.460 702.77 0.202 60 714.48 0.597 97 716.78 0.689 79
38* KAKKI (KRL) 0.447 959.94 0.182 161 972.84 0.315 146 974.18 0.332 111
39* PERIYAR (KRL) 0.173 858.96 0.024 33 863.36 0.097 102 861.34 0.061 67
40* GANDHI SAGAR (MP ) 6.827 381.30 -0.067 -22 385.06 0.641 93 386.12 0.874 40
41 TAWA (MP ) 1.944 338.57 0.194 37 353.05 1.611 154 354.67 1.906 110
42* BARGI (MP ) 3.180 404.35 0.141 51 410.6 0.747 63 412.55 0.996 40
43* BANSAGAR (MP ) 5.166 324.10 0.118 128 326.17 0.368 87 326.54 0.443 39
44* INDIRA SAGAR (MP ) 9.745 244.24 0.291 493 253.75 3.581 423 254.82 4.26 141
Contd...
53
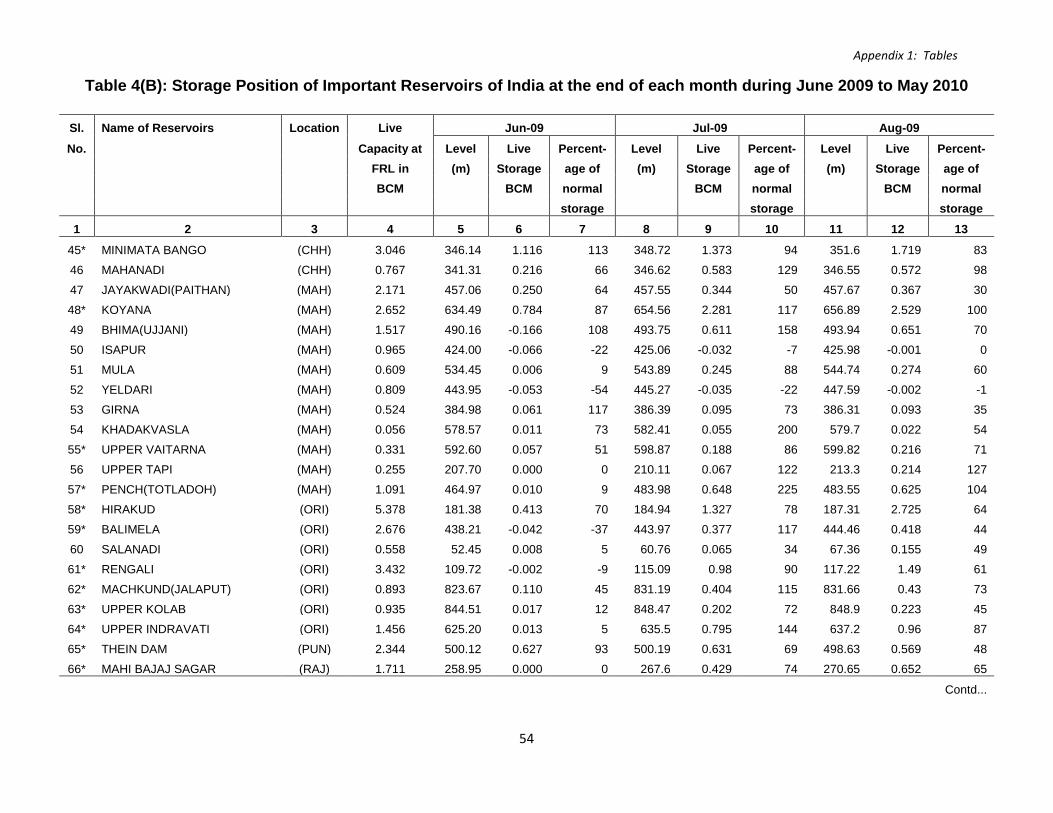
Appendix 1: Tables
Table 4(B): Storage Position of Important Reservoirs of India at the end of each month during June 2009 to May 2010
Sl. Name of Reservoirs Location Live Jun-09 Jul-09 Aug-09 No. Capacity at Level Live Percent- Level Live Percent- Level Live Percent-
FRL in (m) Storage age of (m) Storage age of (m) Storage age of BCM BCM normal BCM normal BCM normal storage storage storage 1 2 3 4 5 6 7 8 9 10 11 12 13
45* MINIMATA BANGO (CHH) 3.046 346.14 1.116 113 348.72 1.373 94 351.6 1.719 83
46 MAHANADI (CHH) 0.767 341.31 0.216 66 346.62 0.583 129 346.55 0.572 98
47 JAYAKWADI(PAITHAN) (MAH) 2.171 457.06 0.250 64 457.55 0.344 50 457.67 0.367 30
48* KOYANA (MAH) 2.652 634.49 0.784 87 654.56 2.281 117 656.89 2.529 100
49 BHIMA(UJJANI) (MAH) 1.517 490.16 -0.166 108 493.75 0.611 158 493.94 0.651 70
50 ISAPUR (MAH) 0.965 424.00 -0.066 -22 425.06 -0.032 -7 425.98 -0.001 0
51 MULA (MAH) 0.609 534.45 0.006 9 543.89 0.245 88 544.74 0.274 60
52 YELDARI (MAH) 0.809 443.95 -0.053 -54 445.27 -0.035 -22 447.59 -0.002 -1
53 GIRNA (MAH) 0.524 384.98 0.061 117 386.39 0.095 73 386.31 0.093 35
54 KHADAKVASLA (MAH) 0.056 578.57 0.011 73 582.41 0.055 200 579.7 0.022 54
55* UPPER VAITARNA (MAH) 0.331 592.60 0.057 51 598.87 0.188 86 599.82 0.216 71
56 UPPER TAPI (MAH) 0.255 207.70 0.000 0 210.11 0.067 122 213.3 0.214 127
57* PENCH(TOTLADOH) (MAH) 1.091 464.97 0.010 9 483.98 0.648 225 483.55 0.625 104
58* HIRAKUD (ORI) 5.378 181.38 0.413 70 184.94 1.327 78 187.31 2.725 64
59* BALIMELA (ORI) 2.676 438.21 -0.042 -37 443.97 0.377 117 444.46 0.418 44
60 SALANADI (ORI) 0.558 52.45 0.008 5 60.76 0.065 34 67.36 0.155 49
61* RENGALI (ORI) 3.432 109.72 -0.002 -9 115.09 0.98 90 117.22 1.49 61
62* MACHKUND(JALAPUT) (ORI) 0.893 823.67 0.110 45 831.19 0.404 115 831.66 0.43 73
63* UPPER KOLAB (ORI) 0.935 844.51 0.017 12 848.47 0.202 72 848.9 0.223 45
64* UPPER INDRAVATI (ORI) 1.456 625.20 0.013 5 635.5 0.795 144 637.2 0.96 87
65* THEIN DAM (PUN) 2.344 500.12 0.627 93 500.19 0.631 69 498.63 0.569 48
66* MAHI BAJAJ SAGAR (RAJ) 1.711 258.95 0.000 0 267.6 0.429 74 270.65 0.652 65
Contd...
54
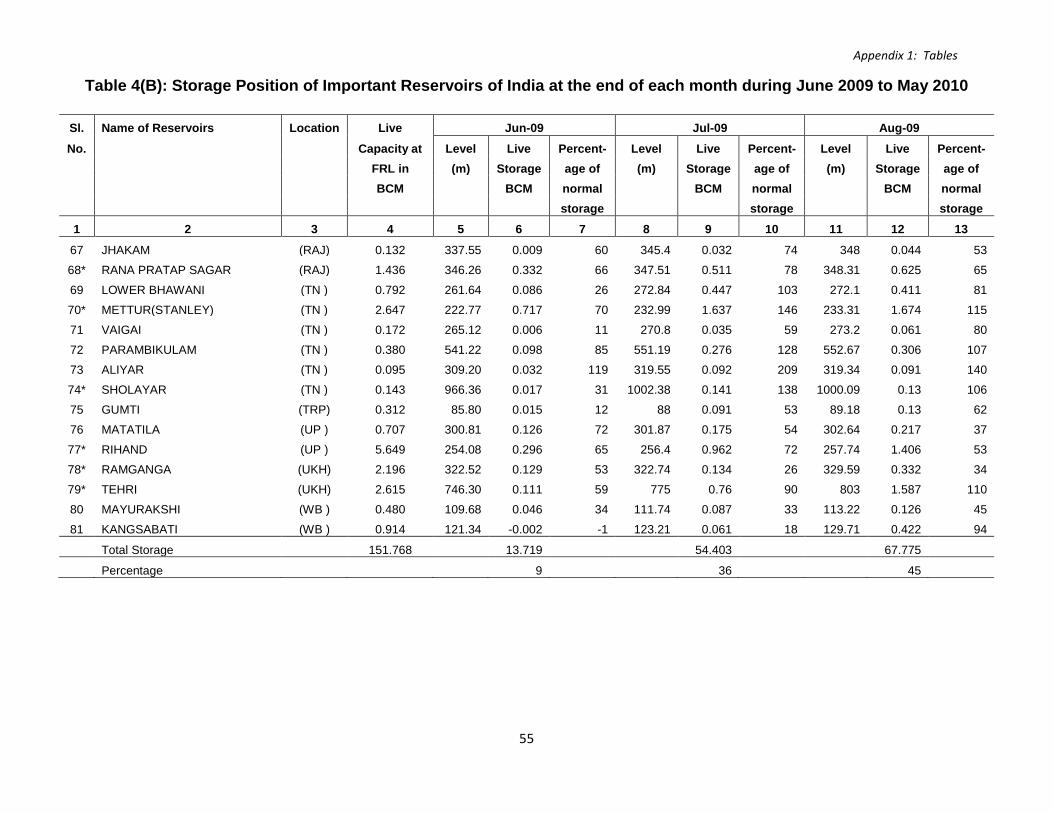
Appendix 1: Tables
Table 4(B): Storage Position of Important Reservoirs of India at the end of each month during June 2009 to May 2010
Sl. Name of Reservoirs Location Live Jun-09 Jul-09 Aug-09 No. Capacity at Level Live Percent- Level Live Percent- Level Live Percent-
FRL in (m) Storage age of (m) Storage age of (m) Storage age of BCM BCM normal BCM normal BCM normal storage storage storage 1 2 3 4 5 6 7 8 9 10 11 12 13
67 JHAKAM (RAJ) 0.132 337.55 0.009 60 345.4 0.032 74 348 0.044 53
68* RANA PRATAP SAGAR (RAJ) 1.436 346.26 0.332 66 347.51 0.511 78 348.31 0.625 65
69 LOWER BHAWANI (TN ) 0.792 261.64 0.086 26 272.84 0.447 103 272.1 0.411 81
70* METTUR(STANLEY) (TN ) 2.647 222.77 0.717 70 232.99 1.637 146 233.31 1.674 115
71 VAIGAI (TN ) 0.172 265.12 0.006 11 270.8 0.035 59 273.2 0.061 80
72 PARAMBIKULAM (TN ) 0.380 541.22 0.098 85 551.19 0.276 128 552.67 0.306 107
73 ALIYAR (TN ) 0.095 309.20 0.032 119 319.55 0.092 209 319.34 0.091 140
74* SHOLAYAR (TN ) 0.143 966.36 0.017 31 1002.38 0.141 138 1000.09 0.13 106
75 GUMTI (TRP) 0.312 85.80 0.015 12 88 0.091 53 89.18 0.13 62
76 MATATILA (UP ) 0.707 300.81 0.126 72 301.87 0.175 54 302.64 0.217 37
77* RIHAND (UP ) 5.649 254.08 0.296 65 256.4 0.962 72 257.74 1.406 53
78* RAMGANGA (UKH) 2.196 322.52 0.129 53 322.74 0.134 26 329.59 0.332 34
79* TEHRI (UKH) 2.615 746.30 0.111 59 775 0.76 90 803 1.587 110
80 MAYURAKSHI (WB ) 0.480 109.68 0.046 34 111.74 0.087 33 113.22 0.126 45
81 KANGSABATI (WB ) 0.914 121.34 -0.002 -1 123.21 0.061 18 129.71 0.422 94
Total Storage 151.768 13.719 54.403 67.775
Percentage 9 36 45
55

Appendix 1: Tables
Table 4(B): Storage Position of Important Reservoirs of India at the end of each month during June 2009 to May 2010
Sl. Name of Reservoirs Location Live Sep-09 Oct-09 Nov-09 No. Capacity at Level Live Percent- Level Live Percent- Level Live Percent-
FRL in (m) Storage age of (m) Storage age of (m) Storage age of BCM BCM normal BCM normal BCM normal storage storage storage 1 2 3 4 5 6 7 8 9 10 11 12 13
1* SRISAILAM (AP ) 8.288 269.55 8.175 128 269.4 8.086 120 269.38 8.074 134
2* NAGARJUNA SAGAR (AP ) 6.841 163.46 2.623 66 175.9 5.727 124 170.81 4.396 120
3 SRIRAMSAGAR (AP ) 2.300 325.74 -0.123 -7 325.77 -0.118 -8 325.37 -0.181 -17
4 SOMASILA (AP ) 1.994 88.17 0.42 83 97.73 1.432 178 98.27 1.533 181
5 LOWER MANAIR (AP ) 0.621 267.71 0.077 24 267.63 0.075 21 267.46 0.072 20
6 TENUGHAT (JHA) 0.821 261.12 0.39 125 261.27 0.398 125 261.15 0.393 124
7 MAITHON (JHA) 0.471 149.01 0.471 102 148.04 0.471 102 147.32 0.471 103
8* PANCHET HILL (JHA) 0.184 127.39 0.184 105 126.23 0.184 106 125.71 0.184 103
9 KONAR (JHA) 0.176 425.20 0.165 104 425.44 0.17 108 424.95 0.161 112
10 TILAIYA (JHA) 0.142 369.90 0.142 126 369.31 0.142 127 368.61 0.134 140
11* UKAI (GUJ) 6.615 98.96 3.59 67 98.6 3.443 69 98.26 3.309 72
12 SABARMATI(DHAROI) (GUJ) 0.735 183.09 0.23 72 182.47 0.199 67 181.15 0.142 53
13* KADANA (GUJ) 1.472 125.45 0.966 123 124.39 0.869 117 124.16 0.85 117
14 SHETRUNJI (GUJ) 0.300 53.37 0.157 91 53.27 0.152 92 51.67 0.091 59
15 BHADAR (GUJ) 0.188 105.00 0.086 77 104.59 0.075 69 103.02 0.042 46
16 DAMANGANGA (GUJ) 0.502 79.15 0.47 104 79.85 0.501 105 79.8 0.499 111
17 DANTIWADA (GUJ) 0.399 164.90 0.01 9 164.68 0.009 9 164.3 0.007 9
18 PANAM (GUJ) 0.697 117.95 0.213 51 116.65 0.176 44 115.7 0.151 40
19* GOBIND SAGAR(BHAKRA) (HP ) 6.229 499.56 4.09 79 499.54 4.088 85 495.76 3.598 87
20* PONG DAM(BEAS) (HP ) 6.157 407.99 2.661 58 405.21 2.188 54 402.6 1.799 53
21 KRISHNARAJA SAGARA (KAR) 1.163 751.99 1.098 124 751.86 1.081 115 752.2 1.124 143
22* TUNGABHADRA (KAR) 3.276 497.72 2.947 106 497.44 2.846 108 496.28 2.437 116
Contd...
56

Appendix 1: Tables
Table 4(B): Storage Position of Important Reservoirs of India at the end of each month during June 2009 to May 2010
Sl. Name of Reservoirs Location Live Sep-09 Oct-09 Nov-09 No. Capacity at Level Live Percent- Level Live Percent- Level Live Percent-
FRL in (m) Storage age of (m) Storage age of (m) Storage age of BCM BCM normal BCM normal BCM normal storage storage storage 1 2 3 4 5 6 7 8 9 10 11 12 13
23 GHATAPRABHA(HIDKAL) (KAR) 1.391 662.95 1.387 111 662.7 1.373 115 659.67 1.151 124
24 BHADRA (KAR) 1.785 657.75 1.785 122 657.39 1.742 123 657.17 1.77 134
25 LINGANAMAKKI (KAR) 4.294 553.98 4.155 124 553.6 4.038 124 552.58 3.74 128
26 NARAYANPUR (KAR) 0.863 492.17 0.856 112 491.5 0.767 101 492.02 0.834 108
27 MALAPRABHA(RENUKA) (KAR) 0.972 630.63 0.606 98 632.84 0.848 139 632.3 0.783 169
28 KABINI (KAR) 0.275 694.77 0.192 96 694.26 0.169 80 692.39 0.076 54
29 HEMAVATHY (KAR) 0.927 890.46 0.912 134 889.15 0.799 126 885.65 0.543 117
30 HARANGI (KAR) 0.220 871.37 0.218 121 868.92 0.151 111 862.25 0.072 122
31 SUPA (KAR) 4.120 549.13 2.509 95 549.46 2.54 98 547.56 2.367 99
32 VANI VILAS SAGAR (KAR) 0.802 637.96 0.117 70 639.73 0.159 66 639.93 0.164 67
33* ALMATTI (KAR) 3.105 519.60 3.051 102 519.59 3.046 106 519.6 3.051 135
34* GERUSOPPA (KAR) 0.130 54.55 0.127 111 50.24 0.103 85 53.35 0.12 103
35 KALLADA(PARAPPAR) (KRL) 0.507 109.80 0.359 97 114.7 0.46 112 115.48 0.478 116
36* IDAMALAYAR (KRL) 1.018 161.90 0.813 108 162.48 0.83 108 161.5 0.802 111
37* IDUKKI (KRL) 1.460 721.41 0.889 94 723.75 0.998 100 724.8 1.047 106
38* KAKKI (KRL) 0.447 978.92 0.401 125 980.9 0.437 127 980.6 0.43 124
39* PERIYAR (KRL) 0.173 862.11 0.074 93 862.2 0.076 72 866.4 0.16 152
40* GANDHI SAGAR (MP ) 6.827 388.07 1.339 57 387.88 1.298 58 387.1 1.098 62
41 TAWA (MP ) 1.944 355.37 1.944 108 355.21 1.944 109 354.73 1.918 131
42* BARGI (MP ) 3.180 416.45 1.63 56 416.4 1.62 60 416.45 1.63 74
43* BANSAGAR (MP ) 5.166 330.71 1.335 107 330.06 1.181 121 329.95 1.155 151
44* INDIRA SAGAR (MP ) 9.745 259.38 7.331 196 259.54 7.459 224 258.85 6.918 279
Contd...
57

Appendix 1: Tables
Table 4(B): Storage Position of Important Reservoirs of India at the end of each month during June 2009 to May 2010
Sl. Name of Reservoirs Location Live Sep-09 Oct-09 Nov-09 No. Capacity at Level Live Percent- Level Live Percent- Level Live Percent-
FRL in (m) Storage age of (m) Storage age of (m) Storage age of BCM BCM normal BCM normal BCM normal storage storage storage 1 2 3 4 5 6 7 8 9 10 11 12 13
45* MINIMATA BANGO (CHH) 3.046 350.80 1.612 70 348.4 1.335 60 348.2 1.311 67
46 MAHANADI (CHH) 0.767 345.32 0.48 83 344.73 0.433 84 344.64 0.426 81
47 JAYAKWADI(PAITHAN) (MAH) 2.171 458.19 0.473 33 458.33 0.502 33 458.4 0.516 38
48* KOYANA (MAH) 2.652 658.50 2.652 103 658.55 2.652 108 657.07 2.553 113
49 BHIMA(UJJANI) (MAH) 1.517 495.26 1.025 101 496.85 1.517 142 497.29 1.517 157
50 ISAPUR (MAH) 0.965 427.37 0.053 8 427.39 0.054 8 427.23 0.048 7
51 MULA (MAH) 0.609 546.20 0.328 65 546.31 0.332 63 548.88 0.439 93
52 YELDARI (MAH) 0.809 449.52 0.05 11 449.79 0.057 11 449.86 0.059 13
53 GIRNA (MAH) 0.524 387.29 0.119 37 387.48 0.124 37 389.77 0.188 64
54 KHADAKVASLA (MAH) 0.056 580.34 0.029 69 580.46 0.03 103 580.77 0.034 136
55* UPPER VAITARNA (MAH) 0.331 600.46 0.232 73 600.61 0.236 74 600.5 0.234 75
56 UPPER TAPI (MAH) 0.255 214.00 0.255 113 214 0.255 104 214 0.255 105
57* PENCH(TOTLADOH) (MAH) 1.091 486.83 0.825 118 484.4 0.673 110 483.03 0.596 121
58* HIRAKUD (ORI) 5.378 189.90 4.167 84 191.01 4.799 101 190.65 4.595 103
59* BALIMELA (ORI) 2.676 446.20 0.568 45 447.26 0.667 46 449.48 0.889 65
60 SALANADI (ORI) 0.558 70.62 0.221 57 70.86 0.226 63 67.65 0.16 45
61* RENGALI (ORI) 3.432 119.98 2.269 74 120.52 2.452 84 120.05 2.331 97
62* MACHKUND(JALAPUT) (ORI) 0.893 833.20 0.517 71 833.78 0.561 74 832.82 0.496 72
63* UPPER KOLAB (ORI) 0.935 849.78 0.266 43 849.78 0.266 42 849.46 0.25 43
64* UPPER INDRAVATI (ORI) 1.456 637.90 1.029 81 637.58 0.997 82 637.1 0.951 87
65* THEIN DAM (PUN) 2.344 499.03 0.574 47 498.91 0.58 57 500.12 0.627 74
66* MAHI BAJAJ SAGAR (RAJ) 1.711 274.55 1.008 89 275 1.047 93 272.75 0.835 85
Contd...
58
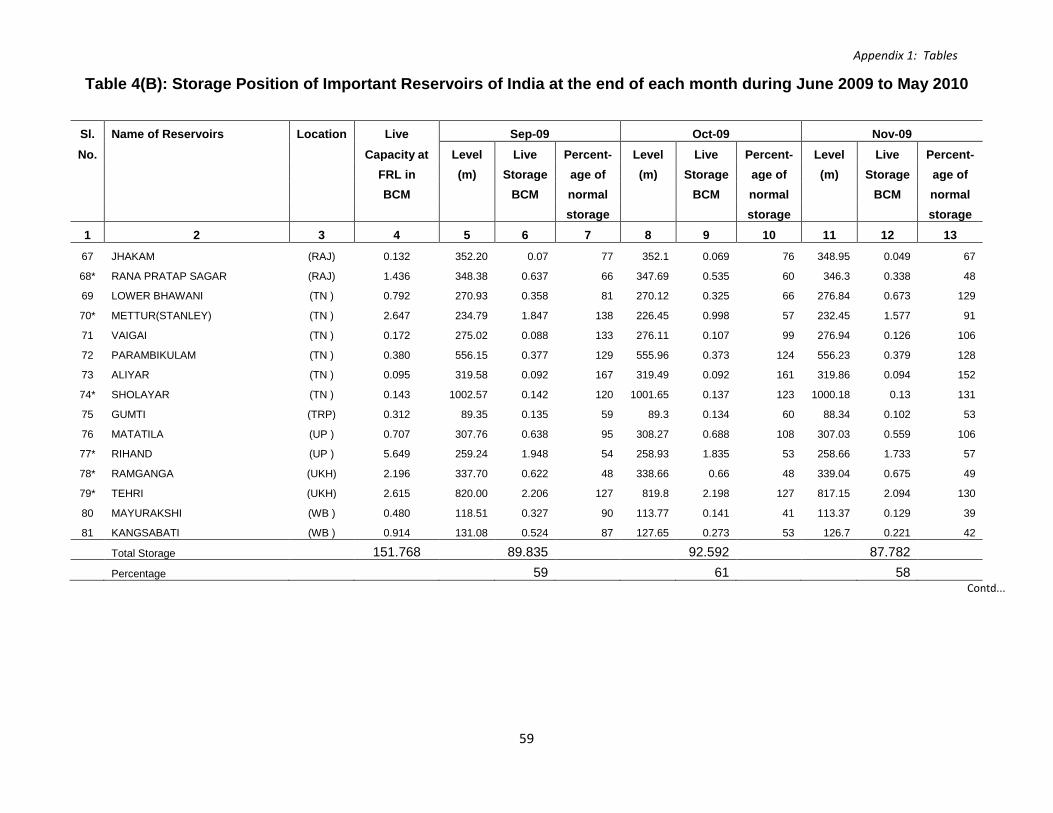
Appendix 1: Tables
Table 4(B): Storage Position of Important Reservoirs of India at the end of each month during June 2009 to May 2010
Sl. Name of Reservoirs Location Live Sep-09 Oct-09 Nov-09 No. Capacity at Level Live Percent- Level Live Percent- Level Live Percent-
FRL in (m) Storage age of (m) Storage age of (m) Storage age of BCM BCM normal BCM normal BCM normal storage storage storage 1 2 3 4 5 6 7 8 9 10 11 12 13
67 JHAKAM (RAJ) 0.132 352.20 0.07 77 352.1 0.069 76 348.95 0.049 67
68* RANA PRATAP SAGAR (RAJ) 1.436 348.38 0.637 66 347.69 0.535 60 346.3 0.338 48
69 LOWER BHAWANI (TN ) 0.792 270.93 0.358 81 270.12 0.325 66 276.84 0.673 129
70* METTUR(STANLEY) (TN ) 2.647 234.79 1.847 138 226.45 0.998 57 232.45 1.577 91
71 VAIGAI (TN ) 0.172 275.02 0.088 133 276.11 0.107 99 276.94 0.126 106
72 PARAMBIKULAM (TN ) 0.380 556.15 0.377 129 555.96 0.373 124 556.23 0.379 128
73 ALIYAR (TN ) 0.095 319.58 0.092 167 319.49 0.092 161 319.86 0.094 152
74* SHOLAYAR (TN ) 0.143 1002.57 0.142 120 1001.65 0.137 123 1000.18 0.13 131
75 GUMTI (TRP) 0.312 89.35 0.135 59 89.3 0.134 60 88.34 0.102 53
76 MATATILA (UP ) 0.707 307.76 0.638 95 308.27 0.688 108 307.03 0.559 106
77* RIHAND (UP ) 5.649 259.24 1.948 54 258.93 1.835 53 258.66 1.733 57
78* RAMGANGA (UKH) 2.196 337.70 0.622 48 338.66 0.66 48 339.04 0.675 49
79* TEHRI (UKH) 2.615 820.00 2.206 127 819.8 2.198 127 817.15 2.094 130
80 MAYURAKSHI (WB ) 0.480 118.51 0.327 90 113.77 0.141 41 113.37 0.129 39
81 KANGSABATI (WB ) 0.914 131.08 0.524 87 127.65 0.273 53 126.7 0.221 42
Total Storage 151.768 89.835 92.592 87.782 Percentage 59 61 58
Contd...
59
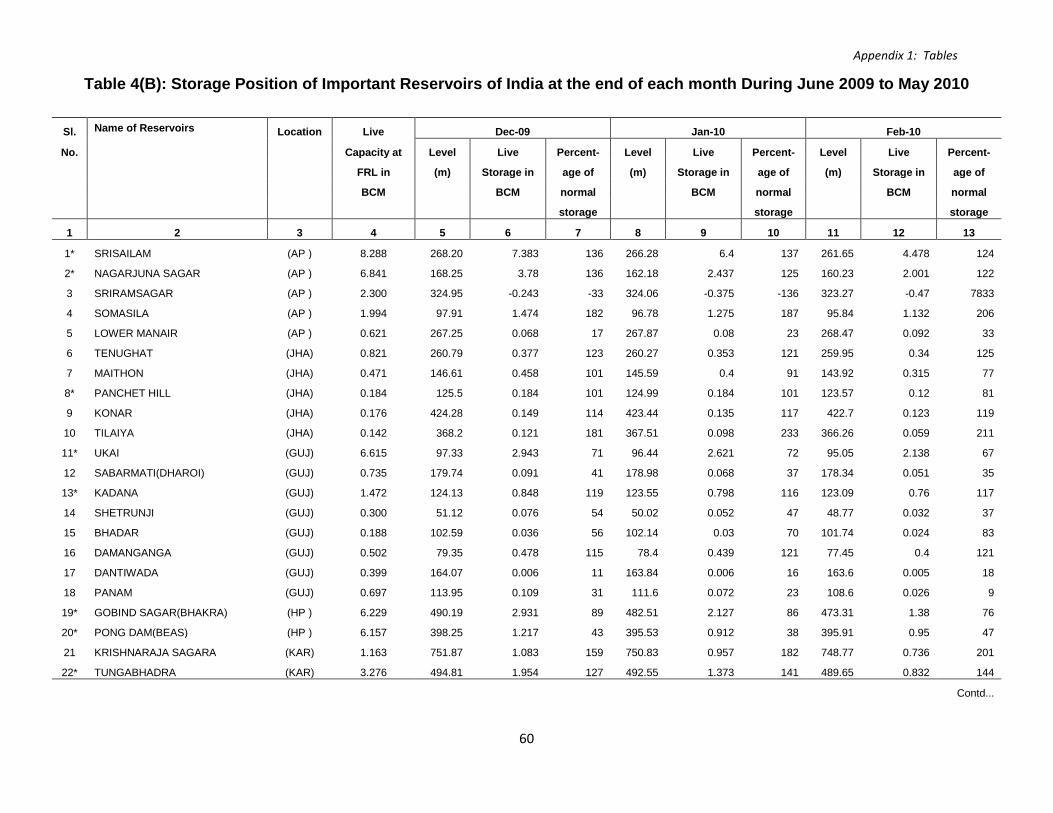
Appendix 1: Tables
Table 4(B): Storage Position of Important Reservoirs of India at the end of each month During June 2009 to May 2010
Sl. Name of Reservoirs Location Live Dec-09 Jan-10 Feb-10
No. Capacity at Level Live Percent- Level Live Percent- Level Live Percent-
FRL in (m) Storage in age of (m) Storage in age of (m) Storage in age of
BCM BCM normal BCM normal BCM normal
storage storage storage
1 2 3 4 5 6 7 8 9 10 11 12 13
1* SRISAILAM (AP ) 8.288 268.20 7.383 136 266.28 6.4 137 261.65 4.478 124
2* NAGARJUNA SAGAR (AP ) 6.841 168.25 3.78 136 162.18 2.437 125 160.23 2.001 122
3 SRIRAMSAGAR (AP ) 2.300 324.95 -0.243 -33 324.06 -0.375 -136 323.27 -0.47 7833
4 SOMASILA (AP ) 1.994 97.91 1.474 182 96.78 1.275 187 95.84 1.132 206
5 LOWER MANAIR (AP ) 0.621 267.25 0.068 17 267.87 0.08 23 268.47 0.092 33
6 TENUGHAT (JHA) 0.821 260.79 0.377 123 260.27 0.353 121 259.95 0.34 125
7 MAITHON (JHA) 0.471 146.61 0.458 101 145.59 0.4 91 143.92 0.315 77
8* PANCHET HILL (JHA) 0.184 125.5 0.184 101 124.99 0.184 101 123.57 0.12 81
9 KONAR (JHA) 0.176 424.28 0.149 114 423.44 0.135 117 422.7 0.123 119
10 TILAIYA (JHA) 0.142 368.2 0.121 181 367.51 0.098 233 366.26 0.059 211
11* UKAI (GUJ) 6.615 97.33 2.943 71 96.44 2.621 72 95.05 2.138 67
12 SABARMATI(DHAROI) (GUJ) 0.735 179.74 0.091 41 178.98 0.068 37 178.34 0.051 35
13* KADANA (GUJ) 1.472 124.13 0.848 119 123.55 0.798 116 123.09 0.76 117
14 SHETRUNJI (GUJ) 0.300 51.12 0.076 54 50.02 0.052 47 48.77 0.032 37
15 BHADAR (GUJ) 0.188 102.59 0.036 56 102.14 0.03 70 101.74 0.024 83
16 DAMANGANGA (GUJ) 0.502 79.35 0.478 115 78.4 0.439 121 77.45 0.4 121
17 DANTIWADA (GUJ) 0.399 164.07 0.006 11 163.84 0.006 16 163.6 0.005 18
18 PANAM (GUJ) 0.697 113.95 0.109 31 111.6 0.072 23 108.6 0.026 9
19* GOBIND SAGAR(BHAKRA) (HP ) 6.229 490.19 2.931 89 482.51 2.127 86 473.31 1.38 76
20* PONG DAM(BEAS) (HP ) 6.157 398.25 1.217 43 395.53 0.912 38 395.91 0.95 47
21 KRISHNARAJA SAGARA (KAR) 1.163 751.87 1.083 159 750.83 0.957 182 748.77 0.736 201
22* TUNGABHADRA (KAR) 3.276 494.81 1.954 127 492.55 1.373 141 489.65 0.832 144
Contd...
60

Appendix 1: Tables
Table 4(B): Storage Position of Important Reservoirs of India at the end of each month During June 2009 to May 2010
Sl. Name of Reservoirs Location Live Dec-09 Jan-10 Feb-10
No. Capacity at Level Live Percent- Level Live Percent- Level Live Percent-
FRL in (m) Storage in age of (m) Storage in age of (m) Storage in age of
BCM BCM normal BCM normal BCM normal
storage storage storage
1 2 3 4 5 6 7 8 9 10 11 12 13
23 GHATAPRABHA(HIDKAL) (KAR) 1.391 655.67 0.876 140 650.54 0.622 171 646.13 0.428 224
24 BHADRA (KAR) 1.785 657.66 1.773 135 656.87 1.683 147 654.86 1.462 159
25 LINGANAMAKKI (KAR) 4.294 550.98 3.297 129 548.91 2.778 130 546.83 2.315 132
26 NARAYANPUR (KAR) 0.863 491.74 0.798 104 491.84 0.812 112 491.98 0.83 134
27 MALAPRABHA(RENUKA) (KAR) 0.972 630.35 0.58 206 628.66 0.433 283 626.57 0.281 380
28 KABINI (KAR) 0.275 692.51 0.082 69 693.2 0.116 91 692.4 0.076 87
29 HEMAVATHY (KAR) 0.927 880.68 0.264 93 878.17 0.163 62 877.42 0.135 61
30 HARANGI (KAR) 0.220 856.28 0.03 158 857.87 0.04 167 858.24 0.043 187
31 SUPA (KAR) 4.120 545.65 2.201 105 543.18 2 109 539.56 1.729 112
32 VANI VILAS SAGAR (KAR) 0.802 639.13 0.16 67 639.59 0.156 71 638.13 0.12 61
33* ALMATTI (KAR) 3.105 518.70 2.622 159 517.25 2.029 185 514.82 1.276 196
34* GERUSOPPA (KAR) 0.130 52.01 0.118 104 51.33 0.109 103 50.3 0.103 94
35 KALLADA(PARAPPAR) (KRL) 0.507 115.56 0.481 124 112.15 0.406 116 107.85 0.32 110
36* IDAMALAYAR (KRL) 1.018 159.26 0.739 116 155.56 0.646 118 150.02 0.515 114
37* IDUKKI (KRL) 1.460 723.38 0.981 109 720.83 0.862 112 717.26 0.709 113
38* KAKKI (KRL) 0.447 978.05 0.388 124 975.35 0.348 128 972.58 0.312 133
39* PERIYAR (KRL) 0.173 862.99 0.09 108 860.37 0.045 85 859 0.024 60
40* GANDHI SAGAR (MP ) 6.827 385.47 0.738 54 383.66 0.385 39 383.25 0.315 44
41 TAWA (MP ) 1.944 353.51 1.692 154 351.04 1.302 180 348.2 0.946 201
42* BARGI (MP ) 3.180 416.00 1.54 91 415.15 1.379 105 414.3 1.238 120
43* BANSAGAR (MP ) 5.166 329.61 1.074 169 328.38 0.812 173 328 0.735 196
44* INDIRA SAGAR (MP ) 9.745 256.98 5.589 299 254.02 3.845 286 252.12 2.925 262
Contd...
61

Appendix 1: Tables
Table 4(B): Storage Position of Important Reservoirs of India at the end of each month During June 2009 to May 2010
Sl. Name of Reservoirs Location Live Dec-09 Jan-10 Feb-10
No. Capacity at Level Live Percent- Level Live Percent- Level Live Percent-
FRL in (m) Storage in age of (m) Storage in age of (m) Storage in age of
BCM BCM normal BCM normal BCM normal
storage storage storage
1 2 3 4 5 6 7 8 9 10 11 12 13
45* MINIMATA BANGO (CHH) 3.046 348.10 1.299 71 347.75 1.259 75 347.35 1.216 79
46 MAHANADI (CHH) 0.767 344.3 0.401 75 343.88 0.375 75 343.55 0.355 75
47 JAYAKWADI(PAITHAN) (MAH) 2.171 458.13 0.462 37 457.36 0.306 29 456.95 0.233 25
48* KOYANA (MAH) 2.652 656.08 2.435 120 654.69 2.292 126 653.42 2.186 138
49 BHIMA(UJJANI) (MAH) 1.517 497.02 1.517 189 496.85 1.517 246 496.16 1.302 291
50 ISAPUR (MAH) 0.965 427.10 0.043 7 426.96 0.037 7 426.64 0.025 6
51 MULA (MAH) 0.609 548.90 0.44 113 546.83 0.352 111 545.71 0.309 126
52 YELDARI (MAH) 0.809 451.38 0.111 28 450.33 0.072 22 449.35 0.045 17
53 GIRNA (MAH) 0.524 390.06 0.196 81 389.93 0.193 104 389.25 0.174 123
54 KHADAKVASLA (MAH) 0.056 580.49 0.031 172 580.4 0.03 214 580.49 0.031 238
55* UPPER VAITARNA (MAH) 0.331 600.35 0.231 79 599.42 0.205 80 598.32 0.173 83
56 UPPER TAPI (MAH) 0.255 213.91 0.249 119 213.44 0.221 123 212.82 0.186 123
57* PENCH(TOTLADOH) (MAH) 1.091 482.55 0.57 144 480.54 0.47 125 478.8 0.392 151
58* HIRAKUD (ORI) 5.378 190.41 4.459 108 189.77 4.097 117 188.63 3.457 114
59* BALIMELA (ORI) 2.676 449.03 0.843 69 450.34 0.984 100 448.64 0.804 103
60 SALANADI (ORI) 0.558 67.34 0.155 46 66.08 0.133 47 65.46 0.123 50
61* RENGALI (ORI) 3.432 119.56 2.164 92 119.39 2.108 109 118.95 1.966 116
62* MACHKUND(JALAPUT) (ORI) 0.893 831.50 0.421 63 829.5 0.321 55 827.17 0.225 45
63* UPPER KOLAB (ORI) 0.935 849.44 0.249 47 849.42 0.248 54 848.9 0.223 56
64* UPPER INDRAVATI (ORI) 1.456 637.22 0.962 97 636.78 0.919 105 635.68 0.812 110
65* THEIN DAM (PUN) 2.344 499.51 0.604 92 497.77 0.536 123 498.75 0.574 146
66* MAHI BAJAJ SAGAR (RAJ) 1.711 270.05 0.603 78 267.2 0.399 65 262.9 0.16 34
Contd...
62

Appendix 1: Tables
Table 4(B): Storage Position of Important Reservoirs of India at the end of each month During June 2009 to May 2010
Sl. Name of Reservoirs Location Live Dec-09 Jan-10 Feb-10
No. Capacity at Level Live Percent- Level Live Percent- Level Live Percent-
FRL in (m) Storage in age of (m) Storage in age of (m) Storage in age of
BCM BCM normal BCM normal BCM normal
storage storage storage
1 2 3 4 5 6 7 8 9 10 11 12 13
67 JHAKAM (RAJ) 0.132 344.65 0.029 55 338.1 0.01 29 337.9 0.01 50
68* RANA PRATAP SAGAR (RAJ) 1.436 345.54 0.228 33 345.53 0.226 37 345.63 0.238 42
69 LOWER BHAWANI (TN ) 0.792 275.65 0.599 129 274.48 0.532 148 273.31 0.47 155
70* METTUR(STANLEY) (TN ) 2.647 232.40 1.572 100 227.66 1.103 97 226.99 1.045 96
71 VAIGAI (TN ) 0.172 274.74 0.083 97 271.63 0.043 78 269.02 0.022 42
72 PARAMBIKULAM (TN ) 0.380 555.6 0.366 137 553.99 0.332 153 552.28 0.298 176
73 ALIYAR (TN ) 0.095 315.07 0.075 150 313.75 0.056 187 313.85 0.057 285
74* SHOLAYAR (TN ) 0.143 985.92 0.069 103 969.47 0.023 70 962.65 0.011 52
75 GUMTI (TRP) 0.312 87.70 0.083 51 86.2 0.042 32 85.47 0.027 25
76 MATATILA (UP ) 0.707 307.21 0.578 146 306.96 0.552 179 306.75 0.531 221
77* RIHAND (UP ) 5.649 258.05 1.51 58 257.19 1.22 55 256.61 1.025 54
78* RAMGANGA (UKH) 2.196 336.30 0.567 50 332.61 0.433 44 331.82 0.406 50
79* TEHRI (UKH) 2.615 810.45 1.845 133 797.75 1.415 137 783.9 0.999 142
80 MAYURAKSHI (WB ) 0.480 113.29 0.127 38 113.1 0.122 39 112.93 0.117 51
81 KANGSABATI (WB ) 0.914 126.70 0.221 52 124.59 0.113 35 124.59 0.113 50
Total Storage 151.768 78.033 64.709 52.701
Percentage 51 43 35 Contd...
63

Appendix 1: Tables
Table 4(B): Storage Position of Important Reservoirs of India at the end of each month during June 2009 to May 2010
Sl. Name of Reservoirs Location Live Mar-10 Apr-10 May-10 No. Capacity at Level Live Percent- Level Live Percent- Level Live Percent-
FRL in (m) Storage in age of (m) Storage in age of (m) Storage in age of BCM BCM normal BCM normal BCM normal storage storage storage 1 2 3 4 5 6 7 8 9 10 11 12 13
1* SRISAILAM (AP ) 8.288 253.88 2.410 103 247.25 1.490 103 245.03 1.246 111
2* NAGARJUNA SAGAR (AP ) 6.841 157.86 1.568 117 157.61 1.520 116 158.64 1.719 121
3 SRIRAMSAGAR (AP ) 2.300 320.95 -0.651 186 319.86 -0.707 133 319.28 0.732 132
4 SOMASILA (AP ) 1.994 95.08 1.033 231 94.09 0.910 249 91.95 0.673 283
5 LOWER MANAIR (AP ) 0.621 268.19 0.087 44 267.98 0.082 52 267.20 0.068 46
6 TENUGHAT (JHA) 0.821 257.68 0.249 96 256.82 0.218 93 256.02 0.192 70
7 MAITHON (JHA) 0.471 142.23 0.241 70 138.16 0.099 50 137.00 0.071 51
8* PANCHET HILL (JHA) 0.184 123.14 0.103 137 120.57 0.025 125 119.92 0.009 43
9 KONAR (JHA) 0.176 421.74 0.109 131 419.53 0.077 107 418.08 0.060 120
10 TILAIYA (JHA) 0.142 364.30 0.016 123 364.06 0.012 120 363.90 0.008 114
11* UKAI (GUJ) 6.615 93.40 1.745 67 91.57 1.362 71 88.75 0.843 65
12 SABARMATI(DHAROI) (GUJ) 0.735 177.87 0.039 32 177.39 0.029 29 176.84 0.018 21
13* KADANA (GUJ) 1.472 122.68 0.727 121 121.57 0.639 116 120.65 0.573 118
14 SHETRUNJI (GUJ) 0.300 48.52 0.029 57 48.07 0.023 144 47.52 0.017 283
15 BHADAR (GUJ) 0.188 101.19 0.018 75 100.40 0.012 60 99.45 0.006 33
16 DAMANGANGA (GUJ) 0.502 76.30 0.355 123 74.55 0.294 123 68.15 0.123 95
17 DANTIWADA (GUJ) 0.399 163.25 0.004 20 162.91 0.003 30 162.38 0.001 50
18 PANAM (GUJ) 0.697 108.00 0.018 7 107.85 0.017 9 107.65 0.016 10
19* GOBIND SAGAR(BHAKRA) (HP ) 6.229 462.72 0.731 63 463.18 0.753 83 462.44 0.717 67
20* PONG DAM(BEAS) (HP ) 6.157 395.45 0.904 54 395.46 0.905 59 393.37 0.690 65
21 KRISHNARAJA SAGARA (KAR) 1.163 746.09 0.497 234 743.44 0.306 255 739.95 0.116 215
22* TUNGABHADRA (KAR) 3.276 483.93 0.247 143 479.61 0.064 83 481.37 0.121 138
Contd...
64

Appendix 1: Tables
Table 4(B): Storage Position of Important Reservoirs of India at the end of each month during June 2009 to May 2010
Sl. Name of Reservoirs Location Live Mar-10 Apr-10 May-10 No. Capacity at Level Live Percent- Level Live Percent- Level Live Percent-
FRL in (m) Storage in age of (m) Storage in age of (m) Storage in age of BCM BCM normal BCM normal BCM normal storage storage storage 1 2 3 4 5 6 7 8 9 10 11 12 13
23 GHATAPRABHA(HIDKAL) (KAR) 1.391 641.65 0.263 216 638.06 0.159 209 634.92 0.089 287
24 BHADRA (KAR) 1.785 652.22 1.192 177 649.22 0.922 216 646.39 0.702 275
25 LINGANAMAKKI (KAR) 4.294 543.50 1.700 132 539.82 1.162 134 536.74 0.702 136
26 NARAYANPUR (KAR) 0.863 490.02 0.594 121 487.03 0.306 94 487.62 0.356 123
27 MALAPRABHA(RENUKA) (KAR) 0.972 625.48 0.215 430 624.87 0.187 505 624.51 0.168 600
28 KABINI (KAR) 0.275 690.82 0.006 15 689.70 0.000 0 688.31 0.000 0
29 HEMAVATHY (KAR) 0.927 876.09 0.090 60 874.61 0.054 62 874.22 0.044 113
30 HARANGI (KAR) 0.220 856.59 0.032 168 855.03 0.021 117 855.63 0.026 163
31 SUPA (KAR) 4.120 533.49 1.311 108 527.34 0.943 100 522.65 0.709 103
32 VANI VILAS SAGAR (KAR) 0.802 637.93 0.116 64 636.54 0.085 50 637.08 0.095 61
33* ALMATTI (KAR) 3.105 512.40 0.756 402 511.86 0.660 1158 510.99 0.515 1256
34* GERUSOPPA (KAR) 0.130 48.49 0.094 82 50.20 0.103 84 53.00 0.118 107
35 KALLADA(PARAPPAR) (KRL) 0.507 101.30 0.207 98 97.03 0.151 99 93.94 0.116 97
36* IDAMALAYAR (KRL) 1.018 142.62 0.360 105 135.66 0.230 91 128.20 0.123 73
37* IDUKKI (KRL) 1.460 712.26 0.512 107 708.94 0.396 120 704.91 0.266 125
38* KAKKI (KRL) 0.447 965.81 0.235 131 957.83 0.164 125 948.23 0.101 117
39* PERIYAR (KRL) 0.173 858.72 0.021 47 858.94 0.024 45 859.15 0.027 47
40* GANDHI SAGAR (MP ) 6.827 382.92 0.263 51 382.36 0.181 47 381.82 0.106 34
41 TAWA (MP ) 1.944 347.38 0.851 242 347.20 0.835 246 346.95 0.814 244
42* BARGI (MP ) 3.180 412.95 1.081 140 410.35 0.717 138 407.85 0.436 151
43* BANSAGAR (MP ) 5.166 327.58 0.651 213 326.54 0.441 255 325.41 0.273 276
44* INDIRA SAGAR (MP ) 9.745 249.57 1.883 199 247.14 1.104 163 245.74 0.692 171
Contd...
65

Appendix 1: Tables
Table 4(B): Storage Position of Important Reservoirs of India at the end of each month during June 2009 to May 2010
Sl. Name of Reservoirs Location Live Mar-10 Apr-10 May-10 No. Capacity at Level Live Percent- Level Live Percent- Level Live Percent-
FRL in (m) Storage in age of (m) Storage in age of (m) Storage in age of BCM BCM normal BCM normal BCM normal storage storage storage 1 2 3 4 5 6 7 8 9 10 11 12 13
45* MINIMATA BANGO (CHH) 3.046 346.85 1.167 85 346.05 1.109 94 344.25 0.874 85
46 MAHANADI (CHH) 0.767 343.18 0.331 76 341.70 0.240 65 340.52 0.179 56
47 JAYAKWADI(PAITHAN) (MAH) 2.171 456.48 0.154 20 455.96 0.072 12 455.65 0.018 4
48* KOYANA (MAH) 2.652 650.16 1.917 147 643.00 1.340 136 635.84 0.855 119
49 BHIMA(UJJANI) (MAH) 1.517 494.82 0.897 410 493.87 0.630 2739 492.42 0.293 113
50 ISAPUR (MAH) 0.965 426.27 0.010 3 426.01 0.000 0 424.30 -0.057 -25
51 MULA (MAH) 0.609 544.80 0.276 142 540.41 0.138 111 536.75 0.052 133
52 YELDARI (MAH) 0.809 449.24 0.042 22 445.93 -0.026 -25 445.61 -0.030 -56
53 GIRNA (MAH) 0.524 388.05 0.140 132 387.16 0.115 142 385.55 0.075 132
54 KHADAKVASLA (MAH) 0.056 580.00 0.025 278 578.39 0.009 112 577.96 0.006 67
55* UPPER VAITARNA (MAH) 0.331 596.72 0.135 82 595.23 0.098 82 593.80 0.071 84
56 UPPER TAPI (MAH) 0.255 212.20 0.157 134 211.33 0.117 154 209.94 0.060 200
57* PENCH(TOTLADOH) (MAH) 1.091 476.92 0.316 170 473.41 0.199 154 469.35 0.091 97
58* HIRAKUD (ORI) 5.378 187.89 2.506 114 185.01 1.633 117 183.80 1.143 188
59* BALIMELA (ORI) 2.676 447.13 0.656 140 445.37 0.496 141 443.03 0.300 390
60 SALANADI (ORI) 0.558 65.72 0.110 61 63.19 0.088 57 63.16 0.088 66
61* RENGALI (ORI) 3.432 117.23 1.493 118 115.00 0.972 121 113.09 0.581 270
62* MACHKUND(JALAPUT) (ORI) 0.893 824.56 0.137 34 821.86 0.064 20 819.24 0.013 6
63* UPPER KOLAB (ORI) 0.935 848.26 0.192 64 846.93 0.127 63 846.30 0.096 83
64* UPPER INDRAVATI (ORI) 1.456 633.76 0.644 117 630.95 0.413 111 628.23 0.216 93
65* THEIN DAM (PUN) 2.344 497.84 0.539 109 497.83 0.539 75 500.46 0.644 79
66* MAHI BAJAJ SAGAR (RAJ) 1.711 261.50 0.098 28 261.40 0.094 34 261.10 0.081 39
Contd...
66

Appendix 1: Tables
Table 4(B): Storage Position of Important Reservoirs of India at the end of each month during June 2009 to May 2010
Sl. Name of Reservoirs Location Live Mar-10 Apr-10 May-10 No. Capacity at Level Live Percent- Level Live Percent- Level Live Percent-
FRL in (m) Storage in age of (m) Storage in age of (m) Storage in age of BCM BCM normal BCM normal BCM normal storage storage storage 1 2 3 4 5 6 7 8 9 10 11 12 13
67 JHAKAM (RAJ) 0.132 337.65 0.010 62 337.35 0.009 56 337.05 0.008 57
68* RANA PRATAP SAGAR (RAJ) 1.436 345.93 0.284 52 345.62 0.239 43 345.62 0.238 45
69 LOWER BHAWANI (TN ) 0.792 271.04 0.363 134 269.08 0.285 133 268.84 0.276 116
70* METTUR(STANLEY) (TN ) 2.647 226.14 0.973 91 226.26 0.983 92 227.37 1.077 98
71 VAIGAI (TN ) 0.172 267.82 0.015 26 266.54 0.010 18 266.64 0.011 22
72 PARAMBIKULAM (TN ) 0.380 548.82 0.231 194 545.19 0.165 201 541.16 0.097 139
73 ALIYAR (TN ) 0.095 313.40 0.055 275 314.91 0.063 242 312.88 0.052 217
74* SHOLAYAR (TN ) 0.143 961.60 0.009 64 961.40 0.009 100 960.47 0.007 64
75 GUMTI (TRP) 0.312 81.35 0.000 0 82.99 0.000 0 84.20 0.007 10
76 MATATILA (UP ) 0.707 307.85 0.647 252 307.09 0.575 229 304.98 0.373 244
77* RIHAND (UP ) 5.649 255.67 0.749 52 254.54 0.426 41 253.96 0.262 41
78* RAMGANGA (UKH) 2.196 328.10 0.285 48 323.68 0.159 34 321.82 0.112 40
79* TEHRI (UKH) 2.615 764.60 0.504 135 748.90 0.163 116 743.35 0.054 61
80 MAYURAKSHI (WB ) 0.480 111.92 0.092 63 110.76 0.066 106 110.54 0.062 64
81 KANGSABATI (WB ) 0.914 122.28 0.026 23 122.01 0.016 36 121.80 0.010 23
Total Storage 151.768 39.097 28.613 22.792
Percentage 26 19 15 Source : Central Water Commission (WM Directorate)
FRL : Full Reservoir Level, BCM: Billion Cubic Metre, m : Metre * : Hydel Power Project having capcity more than 60 M.Watt. Note : 1. Position at the 'End of the month ' refers to the position as on last Day of the month
2. Col 7 refers to Percentage of this year's live storage to average of the last ten year's storage
67
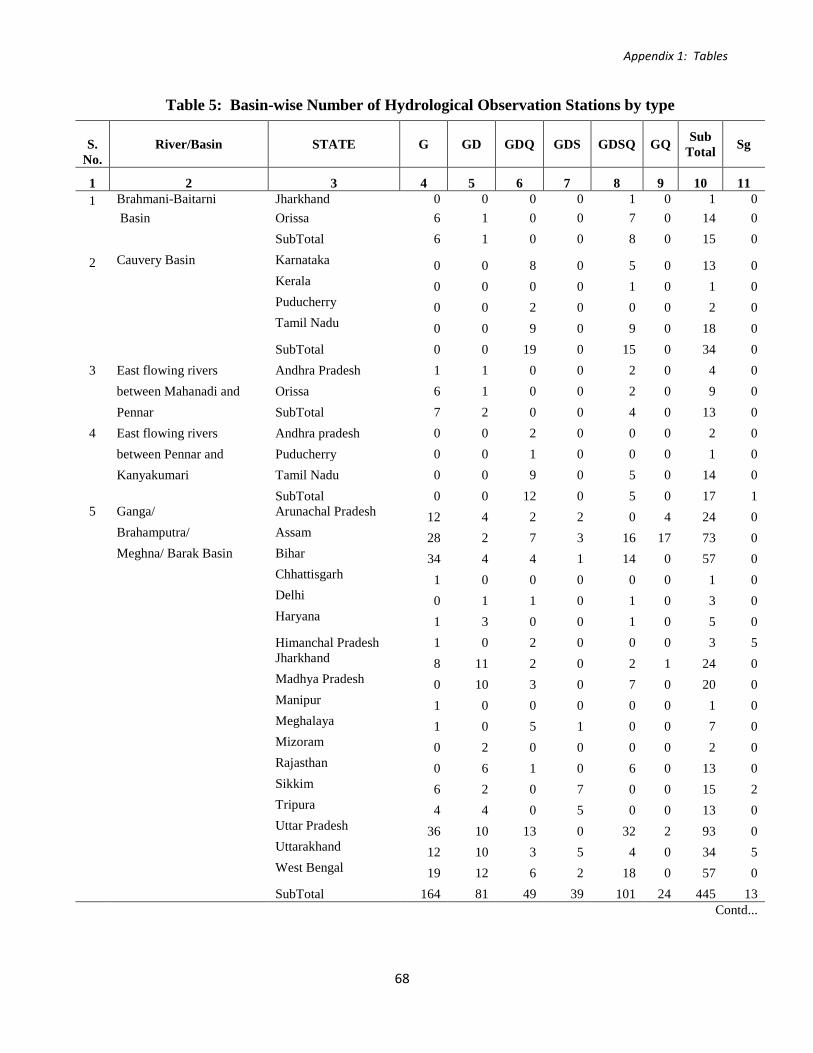
Appendix 1: Tables
Table 5: Basin-wise Number of Hydrological Observation Stations by type
S. No.
River/Basin
STATE
G
GD
GDQ
GDS
GDSQ
GQ
Sub Total Sg
1 2 3 4 5 6 7 8 9 10 11 1 Brahmani-Baitarni Jharkhand 0 0 0 0 1 0 1 0
Basin Orissa 6 1 0 0 7 0 14 0 SubTotal 6 1 0 0 8 0 15 0
2 Cauvery Basin Karnataka 0 0 8 0 5 0 13 0 Kerala 0 0 0 0 1 0 1 0 Puducherry 0 0 2 0 0 0 2 0 Tamil Nadu 0 0 9 0 9 0 18 0 SubTotal 0 0 19 0 15 0 34 0 3 East flowing rivers Andhra Pradesh 1 1 0 0 2 0 4 0 between Mahanadi and Orissa 6 1 0 0 2 0 9 0 Pennar SubTotal 7 2 0 0 4 0 13 0 4 East flowing rivers Andhra pradesh 0 0 2 0 0 0 2 0
between Pennar and Puducherry 0 0 1 0 0 0 1 0
Kanyakumari Tamil Nadu 0 0 9 0 5 0 14 0
SubTotal 0 0 12 0 5 0 17 1
5 Ganga/ Arunachal Pradesh 12 4 2 2 0 4 24 0 Brahamputra/ Assam 28 2 7 3 16 17 73 0 Meghna/ Barak Basin Bihar 34 4 4 1 14 0 57 0 Chhattisgarh 1 0 0 0 0 0 1 0 Delhi 0 1 1 0 1 0 3 0 Haryana 1 3 0 0 1 0 5 0 Himanchal Pradesh 1 0 2 0 0 0 3 5 Jharkhand 8 11 2 0 2 1 24 0 Madhya Pradesh 0 10 3 0 7 0 20 0 Manipur 1 0 0 0 0 0 1 0 Meghalaya 1 0 5 1 0 0 7 0 Mizoram 0 2 0 0 0 0 2 0 Rajasthan 0 6 1 0 6 0 13 0 Sikkim 6 2 0 7 0 0 15 2 Tripura 4 4 0 5 0 0 13 0 Uttar Pradesh 36 10 13 0 32 2 93 0 Uttarakhand 12 10 3 5 4 0 34 5 West Bengal 19 12 6 2 18 0 57 0 SubTotal 164 81 49 39 101 24 445 13
Contd...
68

Appendix 1: Tables
Table 5: Basin-wise Number of Hydrological Observation Stations by type
S. No.
River/Basin
STATE
G
GD
GDQ
GDS
GDSQ
GQ
Sub Total Sg
1 2 3 4 5 6 7 8 9 10 11 6 Godavari Basin Andhra Pradesh 11 3 1 0 5 0 20 0 Chhattisgarh 1 6 0 0 3 0 10 0 Karnataka 0 0 0 0 1 0 1 0 Madhya Pradesh 1 4 0 0 0 0 5 0 Marharashtra 12 9 1 1 12 1 36 0 Orissa 0 4 0 0 1 0 5 0 SubTotal 25 26 2 1 22 1 77 0 7 Indus Basin Himachal Pradesh 4 4 0 1 2 0 11 4 Jammu & Kashmir 3 4 3 1 4 0 15 19 SubTotal 7 8 3 2 6 0 26 23 8 Krishna Basin Andhra Pradesh 7 2 4 0 2 1 16 0 Karnataka 8 4 5 0 8 0 25 0 Maharashtra 1 7 1 0 3 0 12 0 SubTotal 16 13 10 0 13 1 53 0 9 Mahanadi Basin Chhattisgarh 6 2 1 0 12 0 21 0
Orissa 12 1 0 0 5 0 18 0
SubTotal 18 3 1 0 17 0 39 0 10 Mahi Basin Gujarat 3 1 0 0 1 0 5 0 Madhya Pradesh 0 0 0 0 1 0 1 0
Rajasthan 3 1 1 0 1 0 6 0 SubTotal 6 2 1 0 3 0 12 0
11 Narmada Basin Gujarat 3 0 0 0 2 0 5 0 Madhya Pradesh 5 0 7 0 9 0 21 0 SubTotal 8 0 7 0 11 0 26 0
12 Pennar Basin Andhra pradesh 0 0 6 0 2 0 8 0 SubTotal 0 0 6 0 2 0 8 0
13 Sabarmati Basin Gujarat 6 3 2 0 1 0 12 0 Rajasthan 1 0 0 0 0 0 1 0 SubTotal 7 3 2 0 1 0 13 0
14 Subarnarekha Basin Jharkhand 0 0 1 0 3 0 4 0 Orissa 5 1 0 0 1 0 7 0
West Bengal 0 1 0 0 0 0 1 0
SubTotal 5 2 1 0 4 0 12 0 Contd...
69

Appendix 1: Tables
Table 5: Basin-wise Number of Hydrological Observation Stations by type
S. No.
River/Basin
STATE
G
GD
GDQ
GDS
GDSQ
GQ
Sub Total Sg
1 2 3 4 5 6 7 8 9 10 11 15 Tapi Basin Gujarat 3 0 1 0 0 0 4 0 Madhya Pradesh 2 0 0 0 1 0 3 0 Maharashtra 7 1 0 1 2 0 11 0 SubTotal 12 1 1 1 3 0 18 0
16 West flowing rivers Dadra & Nagar Haveli 4 0 0 0 0 0 4 0
from Tapi to Tadri Goa 0 2 0 0 0 0 2 0 Gujarat 2 1 1 0 2 0 6 0 Maharashtra 2 4 3 0 1 0 10 0 SubTotal 8 7 4 0 3 0 22 0
17 West flowing rivers Karanataka 0 0 5 0 1 0 6 0 from Tadri to
Kanyakumari Kerala 0 0 4 0 16 0 20 0 Tamil Nadu 0 0 2 0 1 0 3 0 SubTotal 0 0 11 0 18 0 29 0
18 West flowing rivers Gujarat 3 3 1 0 3 0 10 0 of Kutchh & Saurashtra Rajasthan 1 2 1 0 0 0 4 0 SubTotal 4 5 2 0 3 0 14 0
19 Area of Inland Drainage in Rajasthan Desert
0 0 0 0 0 0 0 0
Sub Total 0 0 0 0 0 0 0 0
20 Minor Rivers draining Myanmar (Burma) and
2 0 0 3 0 0 5 0
Bangladesh Sub Total 2 0 0 3 0 0 5 0
Grand Total 295 154 131 33 239 26 878 36 Source : R.D. Dte.,Central Water Commission
Note: One of the site is H.O. site, where Sg observations are also being observed. Hence not counted for total number of stations.
G - Gauge Site, GD - Gauge & Discharge Site
GQ - Gauge & Water Quality Site
GDS - Gauge, Discharge & Silt Site
GDQ - Gauge, Discharge & Water Quality Site
GDSQ - Gauge, Discharge, Silt & Water Quality Site
Sg - Snow Gauge Site
70

Appendix 1: Tables
Table 6: Ultimate Irrigation Potential by State
( '000 Hactares)
Sl. No.
State/U.T.
Major & Medium Surface Water
Minor Irrigation Total
( Major, Medium
& Minor)
Surface Water
Ground Water
Total
1 2 3 4 5 6 7 1 Andhra Pradesh 5000 2300 3960 6260 11260 2 Arunachal Pradesh 0 150 18 168 168 3 Assam 970 1000 900 1900 2870 4 Bihar 5224 1544 4120 5664 10888 5 Chattisgarh 1147 81 490 571 1718 6 Goa 62 25 - 25 87 7 Gujarat 3000 347 2756 3103 6103 8 Haryana 3000 50 1462 1512 4512 9 Himachal Pradesh 50 235 68 303 353 10 Jammu & Kashmir 250 400 708 1108 1358 11 Jarkhand 1276 354 830 1184 2460 12 Karnataka 2500 900 2574 3474 5974 13 Kerala 1000 800 879 1679 2679 14 Madhya Pradesh 4853 2111 9250 11361 16214 15 Maharashtra 4100 1200 3652 4852 8952 16 Manipur 135 100 369 469 604 17 Meghalaya 20 85 63 148 168 18 Mizoram 0 65 5 70 70 19 Nagaland 10 70 5 75 85 20 Orissa 3600 1000 4203 5203 8803 21 Punjab 3000 50 2917 2967 5967 22 Rajasthan 2750 600 1778 2378 5128 23 Sikkim 20 50 0 50 70 24 Tamil Nadu 1500 1200 2832 4032 5532 25 Tripura 100 100 81 181 281 26 Uttar Pradesh 12154 1186 16295 17481 29635 27 Uttarakhand 346 14 504 518 864 28 West Bengal 2300 1300 3318 4618 6918 Total States 58367 17317 64066 81383 139750 Total UTs 98 20 26 46 144 Grand Total 58465 17337 64092 81429 139894 Source : Central Water Commission, P & P Directorate and Ministry of Water Resources (Minor Irrigation Division).
71

Appendix 1: Tables
Table 7: Number of Large Dams having capacity as on 30th November 2012 Abstract by State
Sl. State/U.T. Number of Dams Completed During The Period Year of Total Under Total No. Upto 1901 1951 1961 1971 1981 1991 2001 Construction Completed Cons- 1900 to to to to to to & not Dams truction 1950 1960 1970 1980 1990 2000 Beyond Available 1 2 3 4 5 6 7 8 9 10 11 12 13 14 1* Andaman & Nicobar Islands 0 0 0 0 1 0 0 1 0 2 0 2 2 Andhra Pradesh 7 35 16 22 31 26 15 12 126 290 44 334 3 Arunachal Pradesh 0 0 0 0 0 0 0 1 0 1 0 1 4 Assam 0 0 0 0 0 0 0 1 2 3 2 5 5 Bihar 1 0 1 8 5 6 1 2 0 24 4 28 6 Chhattisgarh 0 11 1 18 51 98 37 26 1 243 14 257 7 Goa 0 0 0 0 0 3 2 0 0 5 0 5 8 Gujarat 6 59 57 86 154 151 56 23 6 621 45 666 9 Himachal Pradesh 0 0 0 1 2 2 1 5 2 13 6 19
10 Haryana 1 1 1 11 Jammu & Kashmir 0 0 0 0 2 2 1 4 3 12 2 14 12 Jharkhand 0 0 9 5 11 21 0 0 3 49 28 77 13 Karnataka 6 24 11 39 49 54 17 14 16 230 1 231 14 Kerala 1 1 9 15 10 10 9 3 0 58 1 59 15 Madhya Pradesh 3 86 35 67 220 301 93 66 28 899 7 906 16 Maharashtra 20 40 23 152 622 416 304 113 3 1693 152 1845 17 Manipur 0 0 0 0 1 0 1 1 0 3 2 5 18 Meghalaya 0 0 1 1 1 0 1 1 0 5 1 6 19 Mizoram 0 0 0 0 0 0 0 0 0 0 0 0 20 Nagaland 0 0 0 0 0 0 0 0 0 0 0 0 21 Orissa 2 2 4 8 55 77 33 13 4 198 6 204 22 Punjab 0 0 1 0 0 4 6 3 0 14 1 15 23 Rajasthan 31 8 33 23 29 36 26 15 0 201 10 211 24 Sikkim 0 0 0 0 0 0 1 1 0 2 0 2 25 Tamil Nadu 0 10 10 26 26 17 8 19 0 116 0 116
Contd...
72

Appendix 1: Tables
Table 7: Number of Large Dams having capacity as on 30th November 2012 Abstract by State
Sl. State/U.T. Number of Dams Completed During The Period Year of Total Under Total No. Upto 1901 1951 1961 1971 1981 1991 2001 Construction Completed Cons- 1900 to to to to to to & not Dams truction 1950 1960 1970 1980 1990 2000 Beyond Available 1 2 3 4 5 6 7 8 9 10 11 12 13 14
26 Tripura 0 0 0 0 1 0 0 0 0 1 0 1 27 Uttar Pradesh 4 24 21 22 16 14 11 2 0 114 16 130 28 Uttarakhand 0 0 0 5 4 2 0 2 0 13 6 19 29 West Bengal 0 0 1 1 4 16 2 4 0 28 0 28 Total 81 300 233 499 1295 1256 625 333 194 4839 348 5187 Source: - Central Water Commission, (Dam Safety Monitoring Directorate) National Register of Large Dam. * Union Territory (UT)
DEFINITION OF LARGE DAMS FOR INCLUSION UNDER NRLD Dams other than Earthen and Rock fill dams A large dam is classified as one with a maximum height of more than 15 metres from its deepest foundation to the crest. A dam between 10 and 15 metres in height from its deepest foundation is also included in the classification of a large dam provided one of the following conditions is satisfied: a) length of crest of the dam is not less than 500 metres or b) capacity of the reservoir formed by the dam is not less than one million cubic metres or c) the maximum flood discharge dealt with by the dam is not less than 2000 cubic metres per second or d) the dam has specially difficult foundation problems, or e) the dam is of unusual design Earthen and Rock fill dams A dam exceeding 15m in height above deepest river bed level and a dam between 10 and 15 m height provided volume of earthwork exceeds 0.75 million m3 and storage exceeds 1 million m3 or the maximum flood discharge exceeds 2000 cumecs.”
73

Appendix 1: Tables
Table 8: Plan-wise Achievements of Irrigation Potential Created/Utilised(Cumulative) under Major & Medium Irrigation Projects by State
('000 Hectare)
Sl. State/UTs. Ultimate Sixth Plan Seventh Plan Annual Plan Eighth Plan Ninth Plan Tenth Plan % of % of
No. Potential 1980-85 1985-90 1990-92 1992-97 1997-2002 2002-07 IPC IPU
IPC IPU IPC IPU IPC IPU IPC IPU IPC IPU IPC IPU to UIP to IPC
1 2 3 4 5 6 7 8 9 10 11 12 13 14 15 16 17 1 Andhra Pradesh 5000 2902.0 2695.0 2991.0 2836.0 2999.0 2847.0 3045.1 2883.8 3303.2 3051.6 3600.2 3244.6 72.0 90.1 2 Arunachal Pradesh 0 0.0 0.0 0.0 0.0 0.0 0.0 0.0 0.0 0.0 0.0 1.2 0.8 0.0 65.0 3 Assam 970 98.0 55.0 144.0 97.0 176.0 111.0 196.7 138.2 243.9 174.4 302.7 211.0 31.2 69.7 4 Bihar 5224 2556.0 2009.0 2743.0 2259.0 2766.0 2295.0 2802.5 2324.2 2680.0 1714.8 2879.0 1814.9 55.1 63.0 5 Chattisgarh 1147 Included in M.P. 922.5 760.7 1137.0 948.2 99.1 83.4 6 Goa 62 1.0 0.0 13.0 5.0 13.0 12.0 13.0 12.1 21.2 15.3 33.8 23.3 54.4 69.1 7 Gujarat 3000 1055.0 646.0 1199.0 855.0 1246.0 986.0 1350.0 1200.0 1430.4 1300.8 2230.5 1835.4 74.4 82.3 8 Haryana 3000 1923.0 1745.0 2021.0 1791.0 2035.0 1791.0 2078.8 1833.6 2099.5 1850.0 2193.7 1893.3 73.1 86.3 9 Himachal Pradesh 50 6.0 5.0 8.0 6.0 8.0 4.0 10.6 5.6 13.4 7.5 15.5 8.2 30.9 53.3
10 Jammu & Kashmir 250 153.0 112.0 158.0 117.0 158.0 136.0 173.7 147.6 179.7 168.8 187.3 174.6 74.9 93.2 11 Jharkhand 1277 Included in Bihar 354.5 230.5 397.8 245.8 31.2 61.8 12 Karnataka 2500 1165.0 1053.0 1308.0 1183.0 1377.0 1192.0 1666.0 1471.7 2121.1 1844.8 2637.7 2119.7 105.5 80.4 13 Kerala 1000 375.0 342.0 402.0 355.0 416.0 367.0 513.3 464.3 609.5 558.9 669.5 591.4 66.9 88.3 14 Madhya Pradesh 4853 1592.0 1072.0 1815.0 1269.0 1962.0 1395.0 2317.6 1621.0 1386.9 875.6 1931.9 1173.3 39.8 60.7 15 Maharashtra 4100 1722.0 754.0 1986.0 976.0 2030.0 1036.0 2313.0 1287.7 3239.0 2147.2 3494.2 2313.1 85.2 66.2 16 Manipur 135 40.0 25.0 59.0 46.0 59.0 50.0 63.0 52.0 91.2 72.9 106.6 81.4 78.9 76.4 17 Meghalaya 20 - - - - 0.0 0.0 0.0 0.0 - - 0.0 0.0 0.0 0.0 18 Mizoram 0 - - - - 0.0 0.0 0.0 0.0 - - 0.0 0.0 0.0 0.0 19 Nagaland 10 - - - - 0.0 0.0 0.0 0.0 0.0 0.0 0.0 0.0 0.0 0.0 20 Orissa 3600 1236.0 1178.0 1356.0 1254.0 1409.0 1326.0 1557.8 1442.7 1826.6 1794.2 1974.4 1878.7 54.8 95.2 21 Punjab 3000 2252.0 2234.0 2344.0 2303.0 2367.0 2309.0 2512.9 2452.3 2542.5 2486.0 2574.7 2510.5 85.8 97.5 22 Rajasthan 2750 1712.0 1551.0 1913.0 1740.0 1999.0 1887.0 2273.9 2088.4 2482.2 2313.9 2861.6 2526.1 104.1 88.3 23 Sikkim 20 0.0 0.0 0.0 0.0 0.0 0.0 0.0 0.0 0.0 0.0 0.0 0.0 0.0 0.0 24 Tamil Nadu 1500 1499.0 1506.0 1539.0 1536.0 1545.0 1541.0 1545.5 1545.5 1549.3 1549.3 1562.6 1556.9 104.2 99.6
Contd...
74
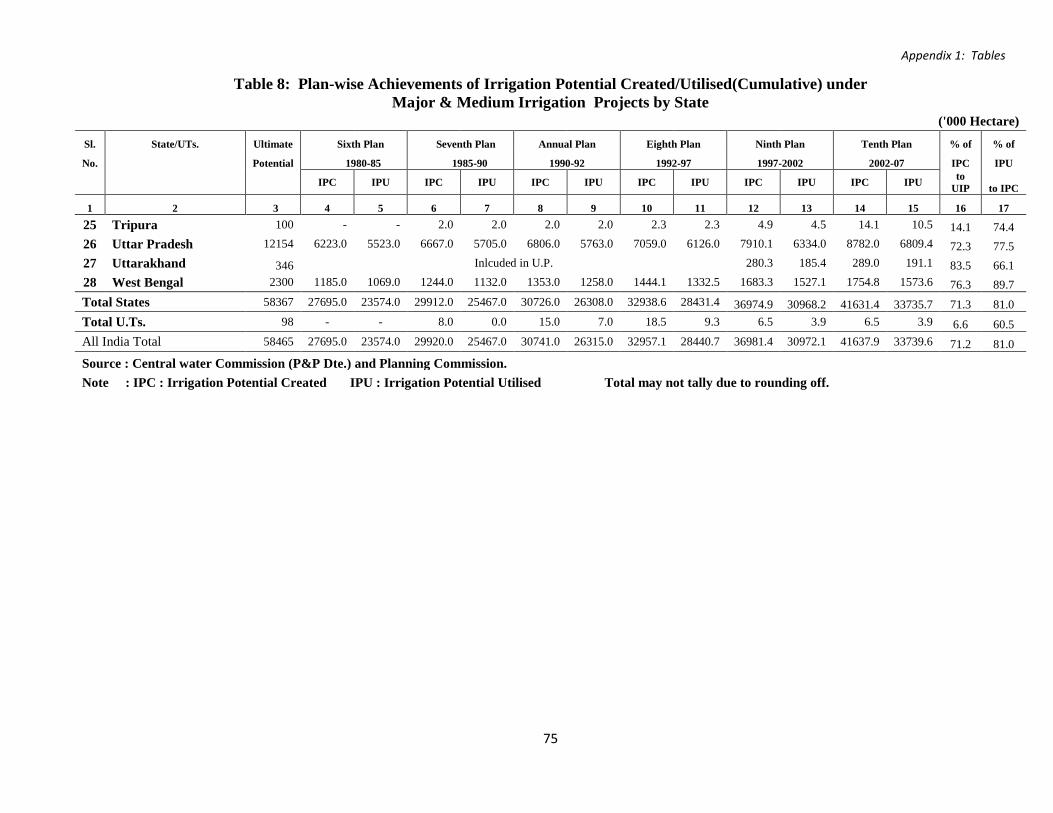
Appendix 1: Tables
Table 8: Plan-wise Achievements of Irrigation Potential Created/Utilised(Cumulative) under Major & Medium Irrigation Projects by State
('000 Hectare)
Sl. State/UTs. Ultimate Sixth Plan Seventh Plan Annual Plan Eighth Plan Ninth Plan Tenth Plan % of % of
No. Potential 1980-85 1985-90 1990-92 1992-97 1997-2002 2002-07 IPC IPU
IPC IPU IPC IPU IPC IPU IPC IPU IPC IPU IPC IPU to UIP to IPC
1 2 3 4 5 6 7 8 9 10 11 12 13 14 15 16 17 25 Tripura 100 - - 2.0 2.0 2.0 2.0 2.3 2.3 4.9 4.5 14.1 10.5 14.1 74.4 26 Uttar Pradesh 12154 6223.0 5523.0 6667.0 5705.0 6806.0 5763.0 7059.0 6126.0 7910.1 6334.0 8782.0 6809.4 72.3 77.5 27 Uttarakhand 346 Inlcuded in U.P. 280.3 185.4 289.0 191.1 83.5 66.1 28 West Bengal 2300 1185.0 1069.0 1244.0 1132.0 1353.0 1258.0 1444.1 1332.5 1683.3 1527.1 1754.8 1573.6 76.3 89.7 Total States 58367 27695.0 23574.0 29912.0 25467.0 30726.0 26308.0 32938.6 28431.4 36974.9 30968.2 41631.4 33735.7 71.3 81.0 Total U.Ts. 98 - - 8.0 0.0 15.0 7.0 18.5 9.3 6.5 3.9 6.5 3.9 6.6 60.5 All India Total 58465 27695.0 23574.0 29920.0 25467.0 30741.0 26315.0 32957.1 28440.7 36981.4 30972.1 41637.9 33739.6 71.2 81.0 Source : Central water Commission (P&P Dte.) and Planning Commission.
Note : IPC : Irrigation Potential Created IPU : Irrigation Potential Utilised Total may not tally due to rounding off.
75

Appendix 1: Tables
Table 9: Irrigation Potential Created and Utilized over plan periods
(Million ha)
Sl.No. Plan Potential created Potential Utilized
Major &
Medium
Minor Total
Major &
Medium
Minor Total Surface
Water Ground Water
Total Surface Water
Ground Water
Total
1 2 3 4 5 6 7 8 9 10 11 12
Upto 1951 (Pre‐Plan) Cumulative 9.70 6.40 6.50 12.90 22.60 9.70 6.40 6.50 12.90 22.60 1
2 I Plan During 2.50 0.03 1.13 1.16 3.66 1.28 0.03 1.13 1.16 2.44
(1951‐56) Cumulative 12.20 6.43 7.63 14.06 26.26 10.98 6.43 7.63 14.06 25.04
3 II Plan During 2.13 0.02 0.67 0.69 2.82 2.07 0.02 0.67 0.69 2.76
(1956‐61) Cumulative 14.33 6.45 8.30 14.75 29.08 13.05 6.45 8.30 14.75 27.80
4 III Plan During 2.24 0.03 2.22 2.25 4.49 2.12 3.03 2.22 2.25 4.37
(1961‐66) Cumulative 16.57 6.48 10.52 17.00 33.57 15.17 6.48 10.52 17.00 32.17
5 Annual Plans During 1.53 0.02 1.98 2.00 3.53 1.58 0.02 1.98 2.00 3.58
(1966‐69) Cumulat ive 18.10 6.50 12.50 19.00 37.10 16.75 6.50 12.50 19.00 35.75
6 IV Plan During 2.60 0.50 4.00 4.50 7.10 1.64 0.50 4.00 4.50 6.14
(1969‐1974) Cumulative 20.70 7.00 16.50 23.50 44.20 18.39 7.00 16.50 23.50 41.89
7 V Plan During 4.02 0.50 3.30 3.80 7.82 2.70 0.50 3.30 3.80 6.50
(1974‐1978) Cumulative 24.72 7.50 19.80 27.30 52.02 21.16 7.50 19.80 27.30 48.46
8 Annual Plans During 1.89 0.50 2.20 2.70 4.59 1.48 0.50 2.20 2.70 4.18
(1978‐1980) Cumulat ive 26.61 8.00 22.00 30.00 56.61 22.64 8.00 22.00 30.00 52.64
9 VI Plan During 1.09 1.70 5.82 7.52 8.61 0.93 1.01 4.24 5.25 6.18 (1980‐1985) Cumulative 27.70 9.70 27.82 37.52 65.22 23.57 9.01 26.24 35.25 58.82
10 VII Plan During 2.22 1.29 7.80 9.09 11.31 1.90 0.96 6.91 7.87 9.77 (1985‐1990) Cumulat ive 29.92 10.90 35.62 46.52 76.44 25.47 9.97 33.15 43.12 68.59
Contd...
76

Appendix 1: Tables
Table 9: Irrigation Potential Created and Utilized over plan periods
(Million ha)
Sl.No. Plan Potential created Potential Utilized
Major &
Medium
Minor Total
Major &
Medium
Minor Total Surface
Water Ground Water
Total Surface Water
Ground Water
Total
1 2 3 4 5 6 7 8 9 10 11 12
11 Annual Plan During 0.82 0.47 3.27 3.74 4.56 0.85 0.32 3.10 3.42 4.27 (1990‐1992) Cumulat ive 30.74 11.46 38.89 50.35 81.09 26.31 10.29 36.25 46.54 72.85
12 VIII Plan During 2.21 1.05 1.91 2.96 5.17 2.13 0.78 1.45 2.23 4.36 (1992‐1997) Cumulat ive 32.95 12.51 40.80 53.31 86.26 28.44 11.07 37.70 48.77 77.21
13 IX Plan During 4.10 1.09 2.50 3.59 7.69 2.57 0.37 0.85 1.22 3.79 (1997‐2002) Cumulative 37.05 13.60 43.30 56.90 93.95 31.01 11.44 38.55 49.99 81.00
14 X Plan During 4.59 N.A N.A 3.20 7.79 2.73 N.A N.A 1.49 4.22 (2002‐2007) Cumulative 41.64 N.A N.A 60.10 101.74 33.74 N.A N.A 51.48 85.22
15 XI Plan* During 3.70 N.A N.A 3.47 7.17 0.92 N.A N.A 1.25 2.17 (2007‐2012) Cumulative 45.34 N.A N.A 63.57 108.91 34.66 N.A N.A 52.73 87.39
Source : Planning Commission(Report of the working group on MMI and CAD for the XII Five Year Plan) * : The figures upto 2010‐11 have been considered. It includes likely achievement figure for 2010‐11.
77
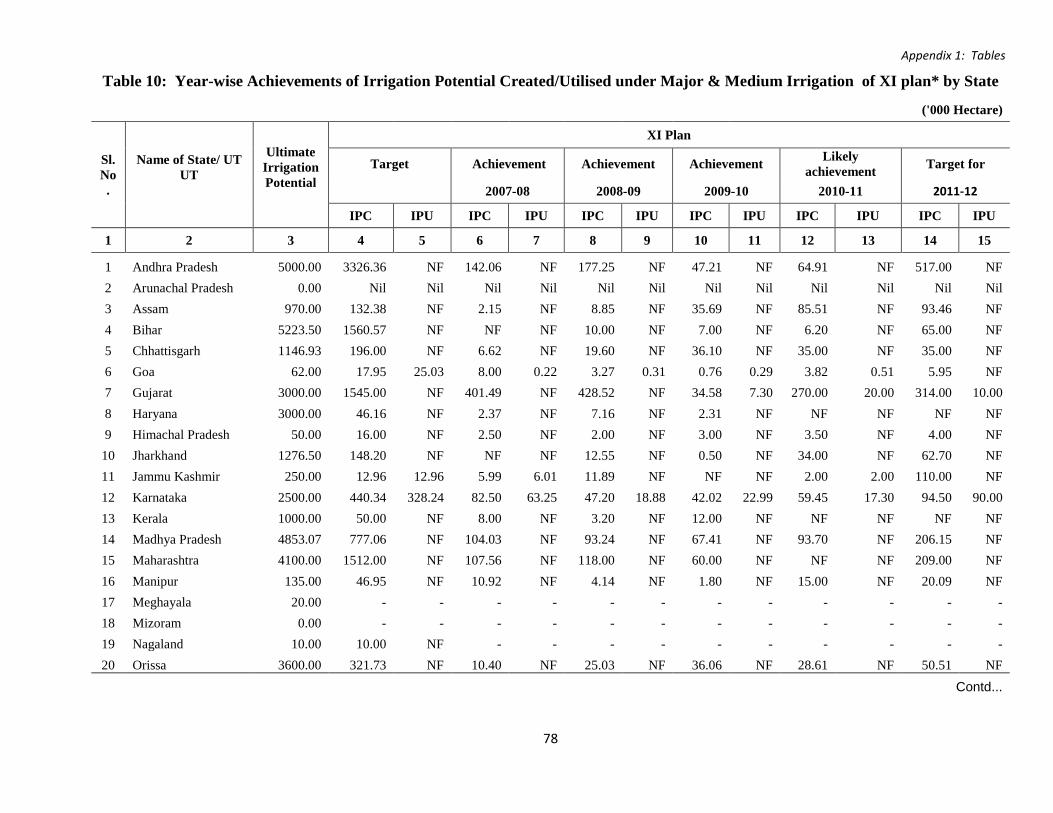
Appendix 1: Tables
Table 10: Year-wise Achievements of Irrigation Potential Created/Utilised under Major & Medium Irrigation of XI plan* by State
('000 Hectare)
Sl. No.
Name of State/ UT UT
Ultimate Irrigation Potential
XI Plan
Target Achievement Achievement Achievement Likely achievement Target for
2007-08 2008-09 2009-10 2010-11 2011-12
IPC IPU IPC IPU IPC IPU IPC IPU IPC IPU IPC IPU
1 2 3 4 5 6 7 8 9 10 11 12 13 14 15
1 Andhra Pradesh 5000.00 3326.36 NF 142.06 NF 177.25 NF 47.21 NF 64.91 NF 517.00 NF 2 Arunachal Pradesh 0.00 Nil Nil Nil Nil Nil Nil Nil Nil Nil Nil Nil Nil 3 Assam 970.00 132.38 NF 2.15 NF 8.85 NF 35.69 NF 85.51 NF 93.46 NF 4 Bihar 5223.50 1560.57 NF NF NF 10.00 NF 7.00 NF 6.20 NF 65.00 NF 5 Chhattisgarh 1146.93 196.00 NF 6.62 NF 19.60 NF 36.10 NF 35.00 NF 35.00 NF 6 Goa 62.00 17.95 25.03 8.00 0.22 3.27 0.31 0.76 0.29 3.82 0.51 5.95 NF 7 Gujarat 3000.00 1545.00 NF 401.49 NF 428.52 NF 34.58 7.30 270.00 20.00 314.00 10.00 8 Haryana 3000.00 46.16 NF 2.37 NF 7.16 NF 2.31 NF NF NF NF NF 9 Himachal Pradesh 50.00 16.00 NF 2.50 NF 2.00 NF 3.00 NF 3.50 NF 4.00 NF
10 Jharkhand 1276.50 148.20 NF NF NF 12.55 NF 0.50 NF 34.00 NF 62.70 NF 11 Jammu Kashmir 250.00 12.96 12.96 5.99 6.01 11.89 NF NF NF 2.00 2.00 110.00 NF 12 Karnataka 2500.00 440.34 328.24 82.50 63.25 47.20 18.88 42.02 22.99 59.45 17.30 94.50 90.00 13 Kerala 1000.00 50.00 NF 8.00 NF 3.20 NF 12.00 NF NF NF NF NF 14 Madhya Pradesh 4853.07 777.06 NF 104.03 NF 93.24 NF 67.41 NF 93.70 NF 206.15 NF 15 Maharashtra 4100.00 1512.00 NF 107.56 NF 118.00 NF 60.00 NF NF NF 209.00 NF 16 Manipur 135.00 46.95 NF 10.92 NF 4.14 NF 1.80 NF 15.00 NF 20.09 NF 17 Meghayala 20.00 - - - - - - - - - - - - 18 Mizoram 0.00 - - - - - - - - - - - - 19 Nagaland 10.00 10.00 NF - - - - - - - - - - 20 Orissa 3600.00 321.73 NF 10.40 NF 25.03 NF 36.06 NF 28.61 NF 50.51 NF
Contd...
78

Appendix 1: Tables
Table 10: Year-wise Achievements of Irrigation Potential Created/Utilised under Major & Medium Irrigation of XI plan* by State
('000 Hectare)
Sl. No.
Name of State/ UT UT
Ultimate Irrigation Potential
XI Plan
Target Achievement Achievement Achievement Likely achievement Target for
2007-08 2008-09 2009-10 2010-11 2011-12
IPC IPU IPC IPU IPC IPU IPC IPU IPC IPU IPC IPU
1 2 3 4 5 6 7 8 9 10 11 12 13 14 15
21 Punjab 3000.00 177.32 NF 43.51 NF 29.25 NF NF NF NF NF NF NF 22 Rajasthan 2750.00 824.30 NF 124.20 NF 54.20 NF 59.85 NF 32.50 NF 34.50 NF 23 Sikkim 20.00 - - - - - - - - - - - - 24 TamilNadu 1500.00 NF NF 4.23 NF 3.48 NF 4.00 NF NF NF NF NF 25 Tripura 100.00 8.97 NF 1.01 NF 1.27 NF 3.85 NF 6.57 NF 3.03 NF 26 Uttar Pradesh 12154.00 1170.00 1170.13 85.82 165.00 49.53 200.00 29.00 150.00 172.80 250.00 163.97 250.00 27 Uttarakhand 346.00 - - - - - - - - - - - - 28 West Bengal 2300.00 303.07 NF NF NF 5.00 NF 5.34 NF 30.97 NF 76.18 NF
29 Union Territories 98.00 Nil Nil Nil Nil Nil Nil Nil Nil Nil Nil Nil Nil
Total 58465.00 12643.32 1536.36 1153.35 234.48 1114.63 219.19 488.49 180.58 944.54 289.81 2065.04 350.00
Source : Planning Commission * : Figures under reconciliation with states NF: Not furnished by the State
79

Appendix 1: Tables Table 11: Year-wise Achievements of Irrigation Potential Created/Utilised under Minor Irrigation Projects of XI plan* by State
('000 Hectare)
Sl. No. Name of State/ UT
Ultimate Irrigation Potential
Cumulative achievement
XI Plan Target Achievement Achievement Achievement Likely
achievement Target for
Up to X Plan 2007-08 2008-09 2009-10 2010-11 2011-12
IPC IPU IPC IPU IPC IPU IPC IPU IPC IPU IPC IPU IPC IPU
1 2 3 4 5 6 7 8 9 10 11 12 13 14 15 16 17
1 Andhra Pradesh 6260.00 3092.42 2843.92 222.70 NF 58.40 NF 60.01 NF 33.84 NF 34.68 NF 55.46 NF
2 Arunachal Pradesh 168.00 114.37 86.61 42.00 NF 7.00 NF 4.35 NF 1.57 NF 2.46 NF 2.50 NF
3 Assam 1900.00 631.98 508.56 137.86 NF 11.45 NF 25.65 NF 45.46 NF 188.86 NF 154.57 NF
4 Bihar 5663.50 4758.78 3793.33 1384.00 NF NF NF 366.00 NF NF NF NF NF 400.00 NF
5 Chhattisgarh 571.00 556.76 378.11 604.00 NF 20.39 NF 60.40 NF 4.75 NF 120.00 NF 80.00 NF
6 Goa 54.00 24.39 20.92 2.70 2.30 0.27 0.23 0.31 0.26 0.11 0.09 0.56 0.46 0.30 0.25
7 Gujarat 3103.00 2019.42 1892.54 60.00 NF 1.98 2.94 16.27 NF 9.30 4.79 20.00 10.00 5.00 5.00
8 Haryana 1512.00 1637.67 1583.50 Nil Nil Nil Nil Nil Nil Nil Nil Nil Nil Nil Nil
9 Himachal Pradesh 303.00 171.09 144.77 15.00 NF 2.70 NF 2.80 NF 3.63 NF 3.00 NF 3.00 NF
10 Jharkhand 1183.50 661.09 500.83 120.00 NF 15.52 NF 17.73 NF 10.32 NF 14.14 NF 26.87 NF
11 Jammu Kashmir 1108.00 390.35 367.63 3.34 3.34 23.76 20.53 31.09 NF NF NF 21.00 15.20 68.00 NF
12 Karnataka 3474.00 1641.89 1592.22 50.00 50.00 8.94 8.94 16.04 16.04 17.30 17.30 14.26 14.26 10.00 10.00
13 Kerala 1679.00 687.02 629.36 200.00 NF 20.00 NF 8.63 NF 26.00 NF NF NF NF NF
14 Madhya Pradesh 11361.00 2340.88 2217.28 267.00 NF 22.68 NF 49.48 NF 28.70 NF 46.30 NF 46.30 NF
15 Maharastra 4852.00 3055.60 2648.12 276.00 NF NF NF 43.00 NF NF NF 52.00 NF
16 Manipur 469.00 92.69 73.30 22.30 NF NF 7.50 NF NF NF 9.00 NF 11.50 NF
17 Meghayala 148.00 61.57 53.89 16.50 NF 1.80 NF 2.03 NF 3.28 NF 4.33 NF 4.76 NF
18 Mizoram 70.00 21.26 14.95 21.26 NF 9.00 NF 9.00 NF 3.87 2.30 4.93 3.00 3.68 2.20
19 Nagaland 75.00 93.17 72.20 22.00 NF 0.78 NF 3.50 NF 9.61 NF 8.95 NF 8.50 NF
20 Orissa 5203.00 1648.91 1441.97 147.27 NF 33.40 NF 35.79 NF 53.25 NF 32.40 NF 62.20 NF
21 Punjab 2967.00 3430.08 3368.20 108.68 NF 26.67 NF 17.92 NF NF NF NF NF NF NF
22 Rajasthan 2378.00 2467.90 2374.44 70.47 NF 5.00 NF 5.87 NF 2.99 NF 3.00 NF 3.00 NF
Contd...
80

Appendix 1: Tables Table 11: Year-wise Achievements of Irrigation Potential Created/Utilised under Minor Irrigation Projects of XI plan* by State
('000 Hectare)
Sl. No. Name of State/ UT
Ultimate Irrigation Potential
Cumulative achievement
XI Plan Target Achievement Achievement Achievement Likely
achievement Target for
Up to X Plan 2007-08 2008-09 2009-10 2010-11 2011-12
IPC IPU IPC IPU IPC IPU IPC IPU IPC IPU IPC IPU IPC IPU
1 2 3 4 5 6 7 8 9 10 11 12 13 14 15 16 17
23 Sikkim 50.00 34.47 25.62 10.00 NF 1.50 NF 1.13 NF 1.14 NF 1.50 NF 1.50 NF
24 TamilNadu 4032.00 2137.33 2128.40 NF NF 4.83 NF 52.83 NF 69.00 NF NF NF NF NF
25 Tripura 181.00 134.98 116.35 30.00 NF 2.13 NF 1.83 NF 1.97 NF 9.33 NF 11.63 NF
26 Uttar Pradesh 17481.00 23603.67 18871.32 2990.36 2218.39 520.05 406.10 407.96 312.53 275.90 208.30 240.00 165.20 261.50 179.20
27 Uttarakhand 518.00 518.75 408.84 187.36 NF 17.49 NF 23.00 NF NF NF 12.14 NF 13.97 NF
28 West Bengal 4618.00 4022.68 3282.25 174.00 NF NF 47.00 38.00 NF NF NF NF NF NF
Total(States) 81382.00 60051.17 51443.44 7184.80 2274.03 815.72 438.74 1274.12 366.83 611.14 232.78 756.16 208.12 1230.78 196.65 29 A&N Islands 2.10 1.88 1.50 NF 0.35 NF 0.07 NF 0.07 NF 0.07 NF 0.04 NF 30 Chandigarh 0.30 0.28 Nil Nil Nil Nil Nil Nil Nil Nil Nil Nil Nil Nil 31 D&N Haveli 1.35 1.07 0.45 NF NF NF 0.06 NF 0.03 NF 0.04 NF 0.06 NF 32 Daman&Diu 17.76 10.44 2.00 NF 2.00 NF 2.00 NF 2.00 NF 2.00 NF 2.00 NF 33 Delhi 21.64 18.52 Nil Nil Nil Nil Nil Nil Nil Nil Nil Nil Nil Nil 34 Lakshadweep Nil Nil Nil Nil Nil Nil Nil Nil Nil Nil Nil NF Nil Nil 35 Puducherry 7.97 6.06 Nil Nil Nil Nil Nil Nil Nil Nil Nil NF Nil Nil
Total(UT"s) 46.00 51.12 38.26 3.95 0.00 2.35 0.00 2.13 0.00 2.10 0.00 2.11 0.00 2.10 0.00 Total(States&UT's) 81428.00 60102.29 51481.70 7188.75 2274.03 818.07 438.74 1276.24 366.83 613.24 232.78 758.27 208.12 1232.88 196.65
Source : Planning Commission * : Figures under reconciliation with states NF: Not furnished by the State
81

Appendix 1: Tables
Table 12: Irrigation Potential Created ,Utilised and Gross Irrigated Area by State, 2009-10
( '000 Hectare) Sl. Name Potential Created Potential Utilised *
Gross Irrigated
Area* 2009-10
Gap (8)-(9)
No. of Upto 2009-10 Upto 2009-10
the Major
& Minor Total Major& Minor Total State/UTs. Medium Medium 1 2 3 4 5 6 7 8 9 10
1 Andhra Pradesh 3967 3245 7211 3245 2844 6089 5764 325
2 Arunachal Pradesh 1 127 128 1 87 87 56 31
3 Assam 349 715 1064 211 509 720 225 495
4 Bihar 2896 5125 8021 1815 3793 5608 4625 983
5 Chhattisgarh 1199 642 1842 948 378 1326 1487 -161
6 Goa 46 25 71 24 22 46 38 8
7 Gujarat 3095 2047 5142 1843 1900 3743 4933 -1190
8 Haryana 2206 1638 3843 1893 1584 3477 5545 -2068
9 Himachal Pradesh 23 180 203 8 145 153 188 -35
10 Jharkhand 411 705 1115 246 501 747 155 592
11 Jammu & Kashmir 205 445 650 181 392 573 480 93
12 Karnataka 2809 1684 4494 2225 1635 3859 4096 -237
13 Kerala 693 742 1434 591 629 1221 455 766
14 Madhya Pradesh 2197 2442 4638 1173 2217 3391 7162 -3771
15 Maharashtra 3780 3099 6878 2313 2648 4961 4352 609
16 Manipur 123 100 224 81 73 155 52 103
17 Meghalaya 0 69 69 0 54 54 74 -20
18 Mizoram 0 43 43 0 17 17 10 7
19 Nagaland 0 107 107 0 72 72 85 -13
20 Orissa 2046 1771 3817 1879 1442 3321 3197 124
21 Punjab 2647 3475 6122 2511 3368 5879 7714 -1835
22 Rajasthan 3100 2482 5582 2526 2374 4901 7309 -2408
23 Sikkim 0 38 38 0 26 26 18 8
24 Tamil Nadu 1574 2264 3838 1557 2128 3685 3238 447
Contd...
82
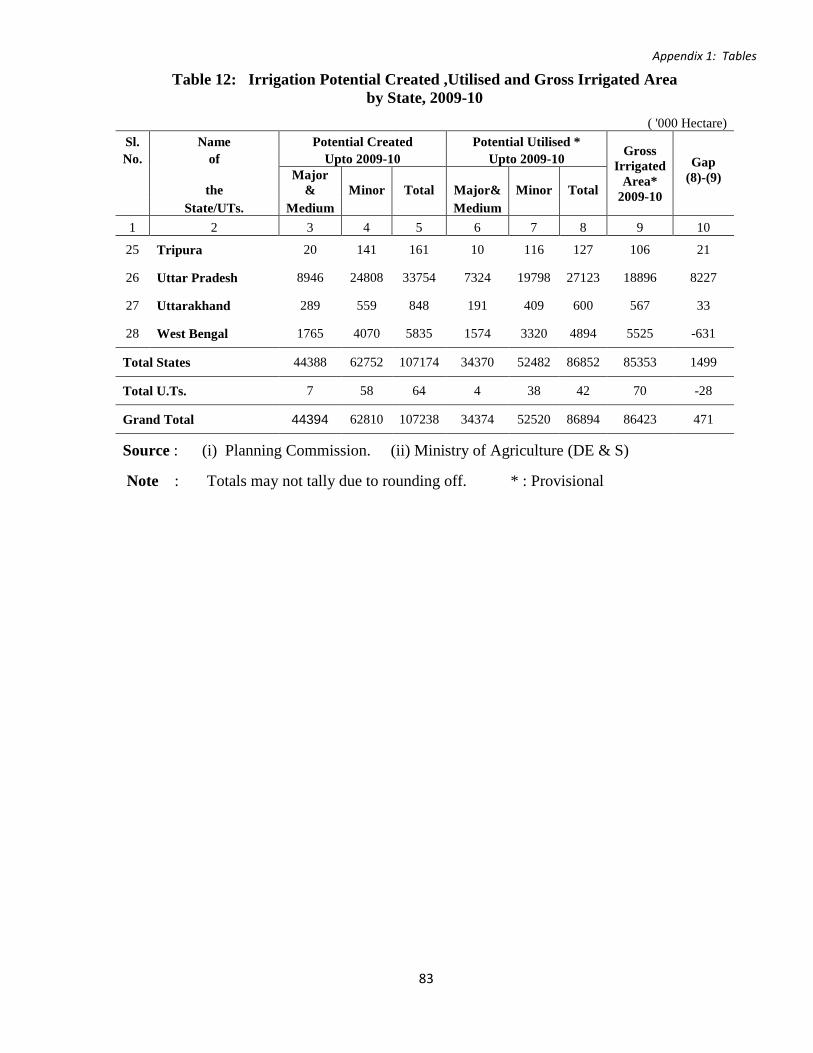
Appendix 1: Tables
Table 12: Irrigation Potential Created ,Utilised and Gross Irrigated Area by State, 2009-10
( '000 Hectare) Sl. Name Potential Created Potential Utilised *
Gross Irrigated
Area* 2009-10
Gap (8)-(9)
No. of Upto 2009-10 Upto 2009-10
the Major
& Minor Total Major& Minor Total State/UTs. Medium Medium 1 2 3 4 5 6 7 8 9 10
25 Tripura 20 141 161 10 116 127 106 21
26 Uttar Pradesh 8946 24808 33754 7324 19798 27123 18896 8227
27 Uttarakhand 289 559 848 191 409 600 567 33
28 West Bengal 1765 4070 5835 1574 3320 4894 5525 -631
Total States 44388 62752 107174 34370 52482 86852 85353 1499
Total U.Ts. 7 58 64 4 38 42 70 -28
Grand Total 44394 62810 107238 34374 52520 86894 86423 471
Source : (i) Planning Commission. (ii) Ministry of Agriculture (DE & S)
Note : Totals may not tally due to rounding off. * : Provisional
83

Appendix 1: Tables Table 13 (1) : Project -wise Irrigation Potential Created (IPC) under AIBP
( '000 Hectare)
State Sr. No Project Name
Project Potential Irrigation Potential created
under AIBP during 2011-12
Potential Created
under AIBP upto 3/2012
Ultimate Potential
Created before AIBP
Target for AIBP
1 2 3 4 5 6 7 8 Andhra Pradesh C 1 Sriramsagar St.I 392.000 255.040 137.040 137.040
C 2 Cheyyeru(Annamaya) 7.890 0.000 9.105 9.105
C 3 Priyadarshini Jurala 41.360 1.200 40.160 40.160
C 4 Somasila 38.475 0.000 38.475 39.774
C 5 Nagarjunsagar 89.280 848.850 27.944 27.944
C 6 Madduvalasa 99.280 0.000 10.000 10.000
C 7 Gundalavagu 1.045 0.000 1.045 1.045
C 8 Maddigedda 2.520 1.105 1.415 1.415
x 9 Kanupur Canal 7.638 7.077 0.561 0.000
10. Yerrakalva Res. 9.996 3.035 6.961 5.060
C 11 Vamsdhara St-II Ph I 25.203 8.100 17.103 24.487
12. FFC of SRSP 40.000 0.000 40.000 0.000
13. SRSP St.II 178.066 0.000 178.066 119.416
14. Tadipudi LIS 83.609 0.000 83.609 50.601
15. Pushkara LIS 75.235 4.051 71.184 48.559
16. Ralivagu 2.428 0.000 2.428 1.012
17. Gollavagu 3.845 0.000 3.845 0.607
18. Mathadivagu 3.440 0.000 3.440 2.024
19. Peddavagu 6.073 0.000 6.073 0.000
20. Gundlakdamma 32.400 0.000 32.400 23.440
C 21 Veligallu 9.713 0.000 9.713 9.713
C 22 Alisagar LIS 21.770 0.000 21.770 21.769
23. J. Chokka Rao LIS 249.000 0.000 249.000 16.188
C 24 Guthpa LIS 15.698 15.698 15.698
25. Neelwai 5.260 0.000 5.260 0.000
26 Sri Komaram Bheem 9.915 0.000 9.915 0.000
27. Thotapally Barrage 48.563 0.000 48.563 25.900
28 Tarakarama thirtha Sagaram 10.000 0.000 10.000 0.000
C 29 Swarnamukhi 4.656 0.000 4.656 3.651
30 Palemvagu 4.100 0.000 4.100 0.000
31. Musurumilli 9.164 0.000 9.164 6.537
32 Rajiv Bhima LIS 82.153 0.000 82.153 0.000
33. Indira Sagar (Polavaram) 436.000 0.000 436.000 0.000
Total 2045.775 1128.458 1616.846 0.000 641.145
Assam
C 1 Pahumara 12.955 1.200 11.755 10.551
C 2 Hawaipur lift 3.887 0.000 3.887 3.887
C 3. Rupahi Lift 5.668 0.000 2.768 2.768
4. Dhansiri 83.366 15.000 68.366 41.258
Contd..
84

Appendix 1: Tables Table 13 (1) : Project -wise Irrigation Potential Created (IPC) under AIBP
( '000 Hectare)
State Sr. No Project Name
Project Potential Irrigation Potential created
under AIBP during 2011-12
Potential Created
under AIBP upto 3/2012
Ultimate Potential
Created before AIBP
Target for AIBP
1 2 3 4 5 6 7 8
5. Champamati 24.994 0.000 24.994 9.746
6. Borolia 13.562 0.000 13.562 3.300
C 7 Bordikarai 34.042 25.452 7.406 7.203
8. Burhi Dihing lift 5.054 0.564 4.490 2.425
C 9 Intg. Irr. Scheme in Kollong Basin 34.400 25.753 8.647 3.775
C 10 Kolonga @ 2.690 0.000 2.690 0.000
C 11 Mod. Of Jamuna Irr. 42.014 28.256 13.758 12.700
Total 262.632 96.225 162.323 0.000 97.613
Bihar 0.000
1. Western Kosi 234.800 22.750 212.050 145.675
C 2 Upper Kiul 19.000 7.320 11.680 10.180
3. Durgawati 36.317 16.020 20.297 3.300
Bansagar [IS] 94.000 0.000 94.000 0.000
C 4 Orni Reservoir 9.717 0.160 9.557 9.459
C 5. Bilasi Reservoir 4.000 0.000 4.000 4.000
C 6 Sone Modernisation 900.000 585.420 314.580 290.580
7. Batane 12.126 7.320 4.806 0.000
8. Punpun 13.680 0.000 13.680 0.000 0.000
C 9
Restoration of Kosi Barrage and its appurtenants for sustaining created irrigation Potential (ERM)
0.000 792.000 0.000 0.000
Total 1323.640 1430.990 684.650 0.000 463.194
Chhattisgarh 0.000
C 1 Hasdeo Bango 392.000 122.500 86.500 86.500
C 2 Shivnath Diversion 5.870 0.632 5.238 5.238
C 3 Jonk Diversion 14.569 5.000 9.569 7.870
4. Koserteda 11.120 0.000 11.120 6.500
C 5 Mahanadi Res Project 264.311 250.428 13.883 13.760
C 6 Barnai 2.820 1.312 1.508 1.508
C 7 Minimata (Hasdeo Bango Ph. IV) 40.874 2.474 38.400 38.400
8. Kelo Project 22.810 0.000 22.810 0.000
9. Kharung(ERM) 15.800 5.500 10.300 4.000 5.000
10. Sutiapat 6.960 4.060 2.900 0.600 0.600
11. Maniyari Tank (ERM) 14.515 3.037 11.478
Total 791.649 391.906 213.706 4.600 165.376
Goa 0.000
C 1 Salauli Ph-I 14.106 4.806 9.300 9.300
2. Tillari 14.521 0.000 14.521 0.170 8.747
Total 28.627 4.806 23.821 0.170 18.047
Contd..
85

Appendix 1: Tables Table 13 (1) : Project -wise Irrigation Potential Created (IPC) under AIBP
( '000 Hectare)
State Sr. No Project Name
Project Potential Irrigation Potential created
under AIBP during 2011-12
Potential Created
under AIBP upto 3/2012
Ultimate Potential
Created before AIBP
Target for AIBP
1 2 3 4 5 6 7 8
Gujarat 0.000
1. Sardar Sarovar 1792.000 0.000 1792.000 21.267 545.276
C 2 Jhuj 5.810 2.912 2.907 2.907
C 3 Sipu 22.080 19.665 1.016 1.016
C 4 Mukteshwar 6.190 0.565 5.066 5.066
C 5 Harnav - II 3.440 2.940 0.000 0.000
C 6 Umaria 2.370 2.062 0.162 0.162
C 7. Damanganga 51.650 42.594 6.686 6.686
C 8 Karjan 70.380 55.730 5.989 5.989
C 9 Sukhi 25.250 21.585 3.488 3.488
C 10 Deo 8.530 7.580 0.103 0.103
C 11 Watrak 16.870 12.574 3.714 3.714
C 12 Aji-IV 3.750 0.000 3.750 3.750
C 13 Ozat-II 9.400 0.000 1.800 3.338
C 14 Brahmini-II 2.062 0.000 2.062 2.062
C 15 Bhadar-II 8.570 0.000 1.500 6.000
Total 2028.352 168.207 1830.243 21.267 589.557 Haryana 0.000 C 1 Gurgaon canal # 81.000 61.000 0.000
C 2 WRCP 155.500 23.530 131.970 115.222
x 3 J. L. N. Lift Irr. 164.000 95.000 69.000 0.000
Total 400.500 179.530 200.970 0.000 115.222
Himachal Pradesh 0.000
1. Shahnehar Irr. project 24.760 0.000 24.760 18.026
2. Sidhata 5.350 0.000 5.350 0.823
3. Changer Lift 3.041 0.000 3.041 3.041
4. Balh Vally (Left Bank) 4.354 0.000 4.354 0.940
Total 37.505 0.000 37.505 0.000 22.830
J&K 0.000
C 1. Marwal Lift* 11.420 0.030 11.390 0.000
C 2 Lethpora Lift* 3.200 0.542 2.658 2.656
C 3. Koil Lift* 2.300 0.150 2.150 0.000
4. Mod. of Ranbir Canal* 15.266 1.600 13.666 7.442
5. Mod. of New Pratap Canal 13.309 10.511 2.619 2.348
C 6 Mod. of Kathua Canal 3.300 0.093 3.207 3.207
7. Rajpora Lift 2.430 0.000 2.430 1.593
8. Tral Lift 6.000 0.000 6.000 0.910
C 9 Igophey 4.373 0.900 3.473 3.473
C 10 Rafiabad High Lift Irr. 2.932 0.000 2.932 2.932
C 11. Mod. of Zaingir Canal 2.140 0.000 2.140 2.140
Contd..
86

Appendix 1: Tables Table 13 (1) : Project -wise Irrigation Potential Created (IPC) under AIBP
( '000 Hectare)
State Sr. No Project Name
Project Potential Irrigation Potential created
under AIBP during 2011-12
Potential Created
under AIBP upto 3/2012
Ultimate Potential
Created before AIBP
Target for AIBP
1 2 3 4 5 6 7 8
12. Mod. Of Dadi Canal 4.650 2.077 2.573 1.973
C 13 Mod. Of Martand Canal 6.498 4.709 1.789 1.789
C 14 Mod. Of Mav Khul 9.352 6.806 2.547 2.547
C 15 Mod. of Babul Canal 3.077 2.388 0.689 0.289
16. Mod. Kandi Canal 3.229 0.000 3.229 0.000
17. Prakachik Khows Canal 2.262 0.000 2.262 0.400
18. Mod. Of Ahji Canal 8.316 6.101 2.215 0.730
19. Restoration & Mod. Of Main Ravi Canal 50.749 12.232 38.517 0.000
Total 154.803 48.139 106.486 0.000 34.429
Jharkhand 0.000
1. Gumani 16.194 0.000 16.194 0.000
x 2 Torai + 8.000 0.000 8.000 0.000
C 3. Latratu 9.900 3.800 6.100 6.100
C 4 Kansjore 6.264 0.000 6.264 6.264
5. Sonua 8.008 0.000 8.008 0.000
6. Surangi 2.601 0.000 2.601 0.000
C 7. Tapkara Reservoir 1.860 0.041 1.819 1.520
8. Upper Sankh 7.069 0.000 7.069 0.400
9. Panchkhero 3.085 0.000 3.085 0.000
10. Subernarekha Multipurpose 236.846 2.200 234.646
Total 299.827 6.041 293.786 0.000 14.284
Karnataka 0.000
1. Upper Krishna St.I 458.894 215.000 243.904 148.799
2. Malaprabha 218.190 161.556 48.090 49.031
C 3 Hirehalla 8.330 0.000 8.330 4.180
C 4 Ghataprabha St.III 177.822 38.098 148.800 111.574
5. Karanja 35.640 4.674 30.966 18.119
6. Upper Krishna St.II 226.688 18.799 178.321 165.247
C 7 Gandori Nala 8.094 0.000 8.094 7.943
C 8 Maskinallah 3.001 3.001 3.502
C 9 Votehole 7.487 7.487 0.000 0.000
10. Varahi 15.702 0.142 15.560 0.383
11. Dudhganga 15.167 3.800 11.367 0.000
12. Mod. Canal System of Bhadra Reservoir Canal System (ERM) 177.337 153.223 24.114 147.561
13. Hipparagi LIS 74.742 0.000 74.742 31.813
14. Restoration Bhimasamundra Tank 3.600 2.800 0.800 0.000
15. Bhima LIS 24.292 0.000 24.292 0.581
16. Guddada Malapura Lift 5.261 0.000 5.261 0.000
Total 1460.247 605.579 825.642 0.000 688.733
Contd..
87

Appendix 1: Tables Table 13 (1) : Project -wise Irrigation Potential Created (IPC) under AIBP
( '000 Hectare)
State Sr. No Project Name
Project Potential Irrigation Potential created
under AIBP during 2011-12
Potential Created
under AIBP upto 3/2012
Ultimate Potential
Created before AIBP
Target for AIBP
1 2 3 4 5 6 7 8 Kerala 0.000 C 1 Kallada 80.579 43.778 9.276 9.276
2. Muvattupuzha 37.737 4.900 32.105 0.268 25.654
3. Karapuzha 9.874 0.000 9.874 0.000 0.608
4. Kanhirapuzha 9.714 8.467 1.247 1.060 1.240
5. Chitturpuzha 16.940 11.976 4.964 6.226 6.226
Total 154.844 57.145 57.466 7.554 43.004
Madhya Pradesh 0.000
1. Indira Sagar Unit- I 0.000 0.000
Indira Sagar Unit- II (CCA) 169.000 0.000 62.200 6.121 41.727
C 2 Bansagar Unit-I 0.000 0.000 0.000 0.000
Bansagar Unit-II (CCA) 249.359 0.000 154.543 30.660 128.744
C 3 Upper Wainganga 105.300 70.000 28.255 28.255
C C Rajghat Dam 0.000 0.000 0.000 0.000
4. Sindh Phase II 162.100 3.053 159.047 2.175 79.429
C 5 Sindh Phase I 44.900 31.984 10.580 5.212
6. Mahi 26.430 0.000 26.430 2.000 26.430
7. Bariarpur LBC 43.850 0.000 43.850 8.000 32.460
C 8 Urmil R.B.C. 7.700 4.877 2.123 2.123
C 9. Banjar 2.400 1.334 1.095 1.095
10. Bawanthadi 29.412 0.000 29.412 1.000 28.018
11. Mahan 19.740 0.000 19.740 4.254 9.000
12. Omkareshwar Phase I (CCA) 24.000 0.000 24.000 10.800
13. Bargi Diversion Ph - I
245.000
0.000 21.194 15.248
Bargi Diversion Ph -I I 0.000 31.899 0.800 21.584
Bargi Diversion Ph -I I I 0.000 26.000 0.000 0.000
14. Pench Div-I 96.959 0.000 28.268 0.000
Omkareshwar, Ph.-II 19.578 0.000 19.578 0.300
Omkareshwar, Ph.-III 48.592 0.000 48.592 16.195 17.200
Indira Sagar Canal Ph. III 20.700 0.000 20.700 0.000 0.000
15. Upper Beda 9.917 0.000 9.917 1.301 8.694
16. Punasa LIS 35.008 0.000 35.008 5.000 17.600
17. Lower Goi 15.686 0.000 15.686 0.000 0.000
Indira Sagar Unit IV 19.600 0.000 19.600 0.000 0.000
Bargi Diversion Ph-IV 0.000 34.000 0.000 0.000
18. Jobat 9.848 7.000 2.848 0.548 2.048
19. Sagar(Sagad) 17.061 0.000 17.061 0.000 0.000
20. Singhpur 10.200 0.000 10.200 0.000 0.000
21. Sanjay Sagar (Bah) 17.807 0.000 17.807 0.000 0.000
Total 1450.147 118.248 919.633 78.054 475.967
Contd..
88
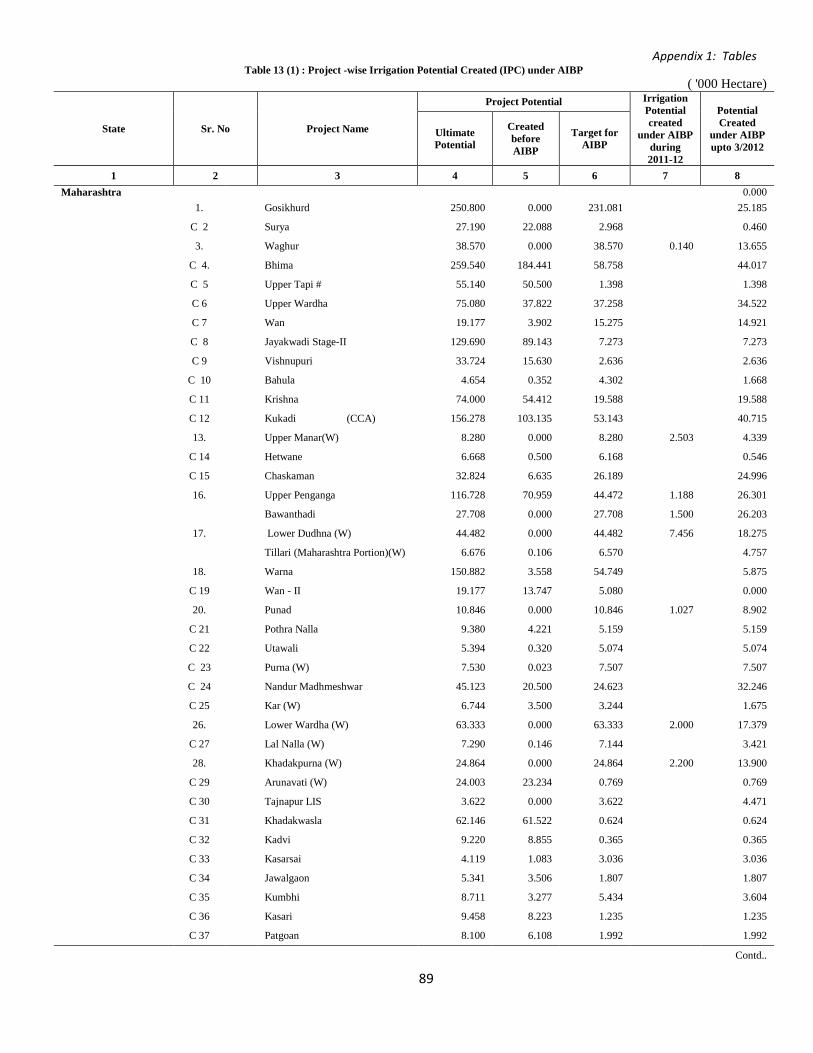
Appendix 1: Tables Table 13 (1) : Project -wise Irrigation Potential Created (IPC) under AIBP
( '000 Hectare)
State Sr. No Project Name
Project Potential Irrigation Potential created
under AIBP during 2011-12
Potential Created
under AIBP upto 3/2012
Ultimate Potential
Created before AIBP
Target for AIBP
1 2 3 4 5 6 7 8 Maharashtra 0.000 1. Gosikhurd 250.800 0.000 231.081 25.185
C 2 Surya 27.190 22.088 2.968 0.460
3. Waghur 38.570 0.000 38.570 0.140 13.655
C 4. Bhima 259.540 184.441 58.758 44.017
C 5 Upper Tapi # 55.140 50.500 1.398 1.398
C 6 Upper Wardha 75.080 37.822 37.258 34.522
C 7 Wan 19.177 3.902 15.275 14.921
C 8 Jayakwadi Stage-II 129.690 89.143 7.273 7.273
C 9 Vishnupuri 33.724 15.630 2.636 2.636
C 10 Bahula 4.654 0.352 4.302 1.668
C 11 Krishna 74.000 54.412 19.588 19.588
C 12 Kukadi (CCA) 156.278 103.135 53.143 40.715
13. Upper Manar(W) 8.280 0.000 8.280 2.503 4.339
C 14 Hetwane 6.668 0.500 6.168 0.546
C 15 Chaskaman 32.824 6.635 26.189 24.996
16. Upper Penganga 116.728 70.959 44.472 1.188 26.301
Bawanthadi 27.708 0.000 27.708 1.500 26.203
17. Lower Dudhna (W) 44.482 0.000 44.482 7.456 18.275
Tillari (Maharashtra Portion)(W) 6.676 0.106 6.570 4.757
18. Warna 150.882 3.558 54.749 5.875
C 19 Wan - II 19.177 13.747 5.080 0.000
20. Punad 10.846 0.000 10.846 1.027 8.902
C 21 Pothra Nalla 9.380 4.221 5.159 5.159
C 22 Utawali 5.394 0.320 5.074 5.074
C 23 Purna (W) 7.530 0.023 7.507 7.507
C 24 Nandur Madhmeshwar 45.123 20.500 24.623 32.246
C 25 Kar (W) 6.744 3.500 3.244 1.675
26. Lower Wardha (W) 63.333 0.000 63.333 2.000 17.379
C 27 Lal Nalla (W) 7.290 0.146 7.144 3.421
28. Khadakpurna (W) 24.864 0.000 24.864 2.200 13.900
C 29 Arunavati (W) 24.003 23.234 0.769 0.769
C 30 Tajnapur LIS 3.622 0.000 3.622 4.471
C 31 Khadakwasla 62.146 61.522 0.624 0.624
C 32 Kadvi 9.220 8.855 0.365 0.365
C 33 Kasarsai 4.119 1.083 3.036 3.036
C 34 Jawalgaon 5.341 3.506 1.807 1.807
C 35 Kumbhi 8.711 3.277 5.434 3.604
C 36 Kasari 9.458 8.223 1.235 1.235
C 37 Patgoan 8.100 6.108 1.992 1.992
Contd..
89
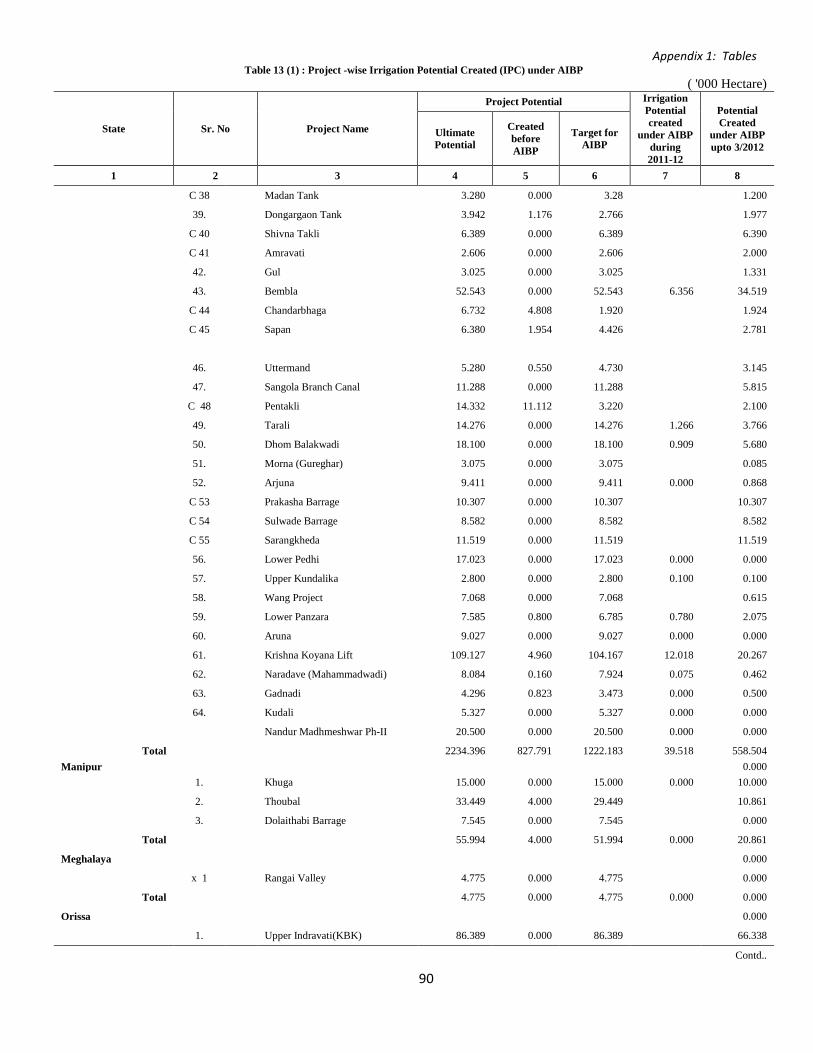
Appendix 1: Tables Table 13 (1) : Project -wise Irrigation Potential Created (IPC) under AIBP
( '000 Hectare)
State Sr. No Project Name
Project Potential Irrigation Potential created
under AIBP during 2011-12
Potential Created
under AIBP upto 3/2012
Ultimate Potential
Created before AIBP
Target for AIBP
1 2 3 4 5 6 7 8
C 38 Madan Tank 3.280 0.000 3.28 1.200
39. Dongargaon Tank 3.942 1.176 2.766 1.977
C 40 Shivna Takli 6.389 0.000 6.389 6.390
C 41 Amravati 2.606 0.000 2.606 2.000
42. Gul 3.025 0.000 3.025 1.331
43. Bembla 52.543 0.000 52.543 6.356 34.519
C 44 Chandarbhaga 6.732 4.808 1.920 1.924
C 45 Sapan 6.380 1.954 4.426 2.781
46. Uttermand 5.280 0.550 4.730 3.145
47. Sangola Branch Canal 11.288 0.000 11.288 5.815
C 48 Pentakli 14.332 11.112 3.220 2.100
49. Tarali 14.276 0.000 14.276 1.266 3.766
50. Dhom Balakwadi 18.100 0.000 18.100 0.909 5.680
51. Morna (Gureghar) 3.075 0.000 3.075 0.085
52. Arjuna 9.411 0.000 9.411 0.000 0.868
C 53 Prakasha Barrage 10.307 0.000 10.307 10.307
C 54 Sulwade Barrage 8.582 0.000 8.582 8.582
C 55 Sarangkheda 11.519 0.000 11.519 11.519
56. Lower Pedhi 17.023 0.000 17.023 0.000 0.000
57. Upper Kundalika 2.800 0.000 2.800 0.100 0.100
58. Wang Project 7.068 0.000 7.068 0.615
59. Lower Panzara 7.585 0.800 6.785 0.780 2.075
60. Aruna 9.027 0.000 9.027 0.000 0.000
61. Krishna Koyana Lift 109.127 4.960 104.167 12.018 20.267
62. Naradave (Mahammadwadi) 8.084 0.160 7.924 0.075 0.462
63. Gadnadi 4.296 0.823 3.473 0.000 0.500
64. Kudali 5.327 0.000 5.327 0.000 0.000
Nandur Madhmeshwar Ph-II 20.500 0.000 20.500 0.000 0.000
Total 2234.396 827.791 1222.183 39.518 558.504 Manipur 0.000 1. Khuga 15.000 0.000 15.000 0.000 10.000
2. Thoubal 33.449 4.000 29.449 10.861
3. Dolaithabi Barrage 7.545 0.000 7.545 0.000
Total 55.994 4.000 51.994 0.000 20.861
Meghalaya 0.000
x 1 Rangai Valley 4.775 0.000 4.775 0.000
Total 4.775 0.000 4.775 0.000 0.000
Orissa 0.000
1. Upper Indravati(KBK) 86.389 0.000 86.389 66.338
Contd..
90

Appendix 1: Tables Table 13 (1) : Project -wise Irrigation Potential Created (IPC) under AIBP
( '000 Hectare)
State Sr. No Project Name
Project Potential Irrigation Potential created
under AIBP during 2011-12
Potential Created
under AIBP upto 3/2012
Ultimate Potential
Created before AIBP
Target for AIBP
1 2 3 4 5 6 7 8
2. Subernarekha 187.462 4.326 183.136 39.858
3. Rengali 143.490 0.000 143.490 22.515
4. Anandpur Barr. Ph.-I / Integrated Anandpur Barr. 65.877 40.800 5.877 5.877
C 5 Upper Kolab(KBK) 88.760 68.010 21.400 21.400
C 6 Titlagarh St-II (KBK) 2.670 0.470 2.200 2.700
7. Lower Indra(KBK) 38.870 0.000 38.870 17.160
8. Lower Suktel(KBK) 40.424 0.000 40.424 0.000
C 9 Potteru(KBK) 109.880 102.600 7.280 7.280
C 10 Naraj Barrage 0.000 0.000 0.000 0.000
11. Telengiri(KBK) 13.829 0.000 13.829 0.000
12. RET Irrigation(KBK) 8.500 0.000 8.500 0.000
13. Kanupur 29.578 0.000 29.578 0.000
14. Chheligada Dam 3.000 0.000 3.000 0.000
C 15 Improvement to Sason Canal System 0.000 0.000 16.282 16.282
C 16 Salandi Left Main Canal- 6.84 km - 14.33 km (Ambahata Canal)
0.000 0.000 3.650 3.650
C 17 Improvement to Salki Irrigation 0.000 0.000 20.140 20.140
18. Rukura-Tribal 7.648 0.000 7.648 0.000
Total 826.377 216.206 631.693 0.000 223.200
Punjab 0.000
C 1. Ranjit Sagar Dam 0.000 0.000 0.000 0.000
C 2 Remodelling of UBDC $ 118.000 0.000 118.000 100.990
C 3 Irr. to H.P. below Talwara 0.000 0.000 0.000 0.000
4. Shahpur Kandi Dam [NP] 0.000 0.000 0.000 0.000
5. Kandi Canal Extension (Ph.II) $ 23.326 0.000 23.326 0.000 17.728
6. Rehabilitation of Ist Patiala Feeder and Kotla Branch Project 68.624 0.000 68.624 0.000 61.600
7.
RF Relining of Rajasthan Feeder Cannal & Sirhind Feeder Canal [RD 179000 to RD 496000]
93.117 0.000 93.117 0.000 0.000
SF 34.548 0.000 34.548 0.000 0.000
Total 337.615 0.000 337.615 0.000 180.318
Rajasthan 0.000
C 1. Jaismand (Modernisation) 8.353 4.634 2.398 2.398
C 2 Chhapi 7.000 0.000 6.991 6.556
C 3 Panchana 10.606 4.500 6.106 6.106
4. IGNP Stage-II 1071.000 407.000
C 5. Bisalpur 55.224 0.000 1.800 1.800
6. Narmada Canal 245.881 0.000 245.881 11.000 216.093
C 7. Gambhiri (Modernisation) 4.770 2.532 0.925 0.925
C 8 Chauli 8.963 0.000 8.963 8.960
Contd..
91

Appendix 1: Tables Table 13 (1) : Project -wise Irrigation Potential Created (IPC) under AIBP
( '000 Hectare)
State Sr. No Project Name
Project Potential Irrigation Potential created
under AIBP during 2011-12
Potential Created
under AIBP upto 3/2012
Ultimate Potential
Created before AIBP
Target for AIBP
1 2 3 4 5 6 7 8
C 9 Mahi Bajaj Sagar 71.200 52.794 18.406 18.406
10. Mod. of Gang Canal 96.510 5.646 69.694 0.925 68.328
Total 508.507 70.106 1432.164 11.925 736.572
Tripura 0.000
1. Manu 7.600 0.000 7.600 3.185
2. Gumti 9.800 2.180 7.620 4.765
3. Khowai 9.320 0.000 9.320 8.642
Total 26.720 2.180 24.540 0.000 16.592
Tamilnadu 0.000
C 1. WRCP 0.000 0.000 0.000
Total 0.000 0.000 0.000 0.000 0.000
Uttar Pradesh 0.000
C 1 Upper Ganga including 187.000 132.820 18.270 18.270
Madhya Ganga Canal 35.905 34.107
C 2 Sarda Sahayak 1925.100 1536.640 388.460 366.680
3. Saryu Nahar 1076.000 92.000 505.000 563.800
C 4 Providing Kharif Channel in H.K. Doab 11.600 0.000 11.040 11.038
C 5 Rajghat Dam 0.000 0.000 0.000 0.000
C 6 Gunta Nala Dam 3.880 0.000 3.880 3.880
7. Bansagar Canal 150.132 0.000 150.132 0.000
C 8 Gyanpur Pump Canal 37.260 35.760 1.500 1.500
C 9 Eastern Ganga Canal 105.000 32.714 72.286 69.125
C 10 Rajghat Canal 138.661 77.571 43.353 41.005
C 11 Mod. of Agra Canal 50.000 15.000 35.000 37.800
C 12 Jarauli Pump Canal 39.750 0.000 39.748 17.625
13. Mod. of Lachhura Dam 46.485 31.910 14.575 31.910
14. Improving Irr. Intensity of Hardoi Branch System 95.961 0.000 95.961 83.188
15. Madhya Ganga Canal Ph-II 146.532 0.000 146.532 33.960
16. Kachnoda Dam 10.850 0.000 10.850 3.255
17. Arjun Shyak 59.485 15.104 44.381 0.000
18. Restoring Cap. of Sarda Sahayak [NP] 790.000 0.000 790.000 105.560
Total 4873.696 1969.519 2406.873 0.000 1422.703
Uttrakhand
x 1 Lakhwar Vyasi 40.000 0.000 0.000 0.000
C 2 Tehri 270.000 0.000 270.000 0.000
Total 310.000 0.000 270.000 0.000 0.000
West Bengal 0.000
1. Teesta Barrage 526.688 79.610 342.150 88.660
C 2. Kangsabati 401.660 319.600 82.060 17.800
Contd..
92

Appendix 1: Tables Table 13 (1) : Project -wise Irrigation Potential Created (IPC) under AIBP
( '000 Hectare)
State Sr. No Project Name
Project Potential Irrigation Potential created
under AIBP during 2011-12
Potential Created
under AIBP upto 3/2012
Ultimate Potential
Created before AIBP
Target for AIBP
1 2 3 4 5 6 7 8
C 3 Mod. of Barrage and Irri. System of DVC 8.000 0.000 8.000 4.896
4. Tatko 2.494 1.296 1.198 0.674
5. Patloi 2.158 0.000 2.158 0.270
C 6 Hanumata 2.766 1.512 1.254 1.189
7. Subarnarekha Barrage 114.198 0.000 114.198 0.000
Total 1057.964 402.018 551.018 0.000 113.489
294. Grand Total 20674.592 7734.601 13905.932 163.088 6641.639
Source : Mon-(C), Project Monitoring Organisation, Central Water Commission.
C : Completed X : Deferred
93

Appendix 1: Tables Table 13(ii) : Year-wise Irrigation Potential Created by Major and Medium Irrigation Projects under AIBP
( '000 Hectare)
State
Project Potential Potential Created under AIBP during Potential Created under AIBP upto
3/2012
Ultimate Potential
Created before AIBP
Target for AIBP 96-97 97-98 98-99 99-2000 2000-01 2001-02 2002-03 2003-04 2004-05 2005-06 2006-07 2007-08 2008-09 2009-10 2010-11 2011-12
1 2 3 4 5 6 7 8 9 10 11 12 13 14 15 16 17 18 19 20 21
Andhra Pradesh 2045.775 1128.458 1616.846 0 18.66 40.665 16.921 8.839 36.449 75.825 11.288 14.121 82.505 48.422 91.499 85.4225 11.296 99.232 0 641.145
Assam 262.632 96.225 162.323 1.130 4.446 4.725 7.900 7.206 7.999 3.653 3.950 4.118 2.692 2.800 4.326 8.795 7.162 26.711 0.000 97.613
Bihar 1323.640 1430.990 684.650 1.180 0.000 8.000 7.791 13.525 43.299 47.950 44.785 60.377 174.648 44.770 6.400 10.000 0.469 0.000 0.000 463.194
Chhattisgarh 791.649 391.906 213.706 0.000 0.000 0.000 3.500 2.696 36.192 19.207 11.906 15.969 11.646 11.940 15.820 18.862 10.205 2.833 4.600 165.376
Goa 28.627 4.806 23.821 0.000 0.000 1.479 0.539 0.147 0.893 1.716 2.920 1.800 0.252 0.414 4.891 1.500 0.526 0.800 0.170 18.047
Gujarat 2028.352 168.207 1830.243 16.120 20.383 36.529 28.438 40.616 15.355 11.980 61.364 77.946 34.087 81.840 68.197 20.885 25.658 28.892 21.267 589.557
Haryana 400.500 179.530 200.970 12.090 12.400 14.970 21.120 11.230 12.320 3.266 2.956 7.885 6.896 10.089 0.000 0.000 0.000 0.000 0.000 115.222
Himachal Pradesh 37.505 0.000 37.505 0.000 0.000 0.243 0.243 0.332 0.165 0.324 0.486 0.486 0.486 3.533 3.335 4.146 4.042 5.011 0.000 22.830
J&K 154.803 48.139 106.486 0.000 0.000 0.000 0.622 0.878 2.428 5.587 2.620 1.076 1.319 1.190 4.523 4.737 4.231 5.218 0.000 34.429
Jharkhand 299.827 6.041 293.786 0.000 0.000 1.800 1.400 1.800 3.600 2.020 1.000 0.000 0.000 0.500 0.000 0.000 0.507 1.657 0.000 14.284
Karnataka 1460.247 605.579 825.642 0.770 3.105 7.190 8.481 4.816 66.920 54.970 129.232 69.148 50.478 76.012 21.732 42.012 108.121 45.746 0.000 688.733
Kerala 154.844 57.145 57.466 0.426 1.578 0.000 0.802 1.646 5.924 4.800 9.219 4.995 0.646 2.712 0.953 0.117 1.632 0.000 7.554 43.004
Madhya Pradesh 1450.147 118.248 919.633 0.000 0.000 0.000 5.000 9.473 9.318 16.680 11.161 51.298 18.981 15.449 82.060 49.832 37.554 91.107 78.054 475.967
Maharashtra 2234.396 827.791 1222.183 0.460 26.938 24.124 11.981 21.548 10.490 12.899 27.587 35.971 39.626 50.327 78.147 77.356 68.944 32.588 39.518 558.504
Manipur 55.994 4.000 51.994 0.000 0.000 0.000 0.000 0.000 0.000 0.000 0.000 0.000 0.000 5.000 5.921 4.140 1.800 4.000 0.000 20.861
Meghalaya 4.775 0.000 4.775 0.000 0.000 0.000 0.000 0.000 0.000 0.000 0.000 0.000 0.000 0.000 0.000 0.000 0.000 0.000 0.000 0.000
Orissa 826.377 216.206 631.693 1.312 17.221 13.541 8.725 13.039 6.409 4.070 40.000 15.518 4.150 4.605 14.401 10.731 29.373 40.105 0.000 223.200
Punjab 337.615 0.000 337.615 0.000 0.000 0.000 0.000 14.160 79.750 2.090 0.000 4.990 4.534 4.666 4.796 27.442 12.890 25.000 0.000 180.318
Rajasthan 508.507 70.106 1432.164 0.825 51.620 58.987 34.774 12.700 29.095 37.363 50.367 55.327 79.191 60.148 127.465 52.000 44.000 30.785 11.925 736.572
Tripura 26.720 2.180 24.540 0.620 0.210 0.100 0.670 0.750 0.890 0.000 0.000 0.519 2.050 3.008 1.725 1.266 4.273 0.511 0.000 16.592
Tamilnadu 0.000 0.000 0.000 0.000 0.000 0.000 0.000 0.000 0.000 0.000 0.000 0.000 0.000 0.000 0.000 0.000 0.000 0.000 0.000 0.000
Uttar Pradesh 4873.696 1969.519 2406.873 29.020 42.610 38.200 56.100 351.230 68.220 78.860 30.069 93.549 111.300 88.616 79.650 105.178 37.343 212.758 0.000 1422.703
Uttrakhand 310.000 0.000 270.000 0.000 0.000 0.000 0.000 0.000 0.000 0.000 0.000 0.000 0.000 0.000 0.000 0.000 0.000 0.000 0.000 0.000
West Bengal 1057.964 402.018 551.018 11.700 3.150 10.000 11.346 16.249 10.135 5.428 2.545 2.474 5.153 2.309 7.6 4.85 5.28 15.27 0 113.489
Grand Total 20674.592 7727.094 13905.932 75.653 202.321 260.553 226.353 532.880 445.851 388.688 443.455 517.567 630.640 518.350 623.441 529.272 415.306 668.223 163.088 6641.639
Source: Mon-(C), Project Monitoring Organisation, Central Water Commission.
94
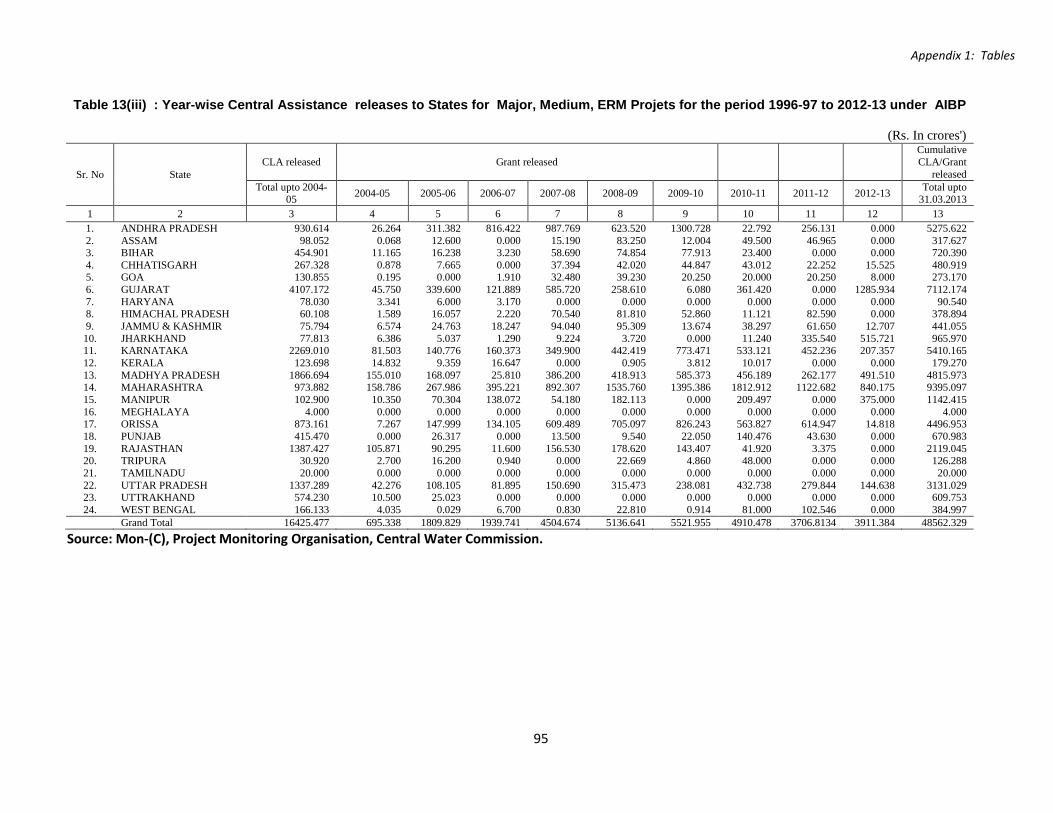
Appendix 1: Tables
Table 13(iii) : Year-wise Central Assistance releases to States for Major, Medium, ERM Projets for the period 1996-97 to 2012-13 under AIBP
(Rs. In crores')
Sr. No State CLA released Grant released
Cumulative CLA/Grant
released Total upto 2004-
05 2004-05 2005-06 2006-07 2007-08 2008-09 2009-10 2010-11 2011-12 2012-13 Total upto 31.03.2013
1 2 3 4 5 6 7 8 9 10 11 12 13 1. ANDHRA PRADESH 930.614 26.264 311.382 816.422 987.769 623.520 1300.728 22.792 256.131 0.000 5275.622 2. ASSAM 98.052 0.068 12.600 0.000 15.190 83.250 12.004 49.500 46.965 0.000 317.627 3. BIHAR 454.901 11.165 16.238 3.230 58.690 74.854 77.913 23.400 0.000 0.000 720.390 4. CHHATISGARH 267.328 0.878 7.665 0.000 37.394 42.020 44.847 43.012 22.252 15.525 480.919 5. GOA 130.855 0.195 0.000 1.910 32.480 39.230 20.250 20.000 20.250 8.000 273.170 6. GUJARAT 4107.172 45.750 339.600 121.889 585.720 258.610 6.080 361.420 0.000 1285.934 7112.174 7. HARYANA 78.030 3.341 6.000 3.170 0.000 0.000 0.000 0.000 0.000 0.000 90.540 8. HIMACHAL PRADESH 60.108 1.589 16.057 2.220 70.540 81.810 52.860 11.121 82.590 0.000 378.894 9. JAMMU & KASHMIR 75.794 6.574 24.763 18.247 94.040 95.309 13.674 38.297 61.650 12.707 441.055 10. JHARKHAND 77.813 6.386 5.037 1.290 9.224 3.720 0.000 11.240 335.540 515.721 965.970 11. KARNATAKA 2269.010 81.503 140.776 160.373 349.900 442.419 773.471 533.121 452.236 207.357 5410.165 12. KERALA 123.698 14.832 9.359 16.647 0.000 0.905 3.812 10.017 0.000 0.000 179.270 13. MADHYA PRADESH 1866.694 155.010 168.097 25.810 386.200 418.913 585.373 456.189 262.177 491.510 4815.973 14. MAHARASHTRA 973.882 158.786 267.986 395.221 892.307 1535.760 1395.386 1812.912 1122.682 840.175 9395.097 15. MANIPUR 102.900 10.350 70.304 138.072 54.180 182.113 0.000 209.497 0.000 375.000 1142.415 16. MEGHALAYA 4.000 0.000 0.000 0.000 0.000 0.000 0.000 0.000 0.000 0.000 4.000 17. ORISSA 873.161 7.267 147.999 134.105 609.489 705.097 826.243 563.827 614.947 14.818 4496.953 18. PUNJAB 415.470 0.000 26.317 0.000 13.500 9.540 22.050 140.476 43.630 0.000 670.983 19. RAJASTHAN 1387.427 105.871 90.295 11.600 156.530 178.620 143.407 41.920 3.375 0.000 2119.045 20. TRIPURA 30.920 2.700 16.200 0.940 0.000 22.669 4.860 48.000 0.000 0.000 126.288 21. TAMILNADU 20.000 0.000 0.000 0.000 0.000 0.000 0.000 0.000 0.000 0.000 20.000 22. UTTAR PRADESH 1337.289 42.276 108.105 81.895 150.690 315.473 238.081 432.738 279.844 144.638 3131.029 23. UTTRAKHAND 574.230 10.500 25.023 0.000 0.000 0.000 0.000 0.000 0.000 0.000 609.753 24. WEST BENGAL 166.133 4.035 0.029 6.700 0.830 22.810 0.914 81.000 102.546 0.000 384.997 Grand Total 16425.477 695.338 1809.829 1939.741 4504.674 5136.641 5521.955 4910.478 3706.8134 3911.384 48562.329
Source: Mon-(C), Project Monitoring Organisation, Central Water Commission.
95

Appendix 1: Tables Table 14(i) : Number of Major, Medium and ERM Irrigation Projects in India by State
Sl. No.
Name of the State/UTs.
Major Project Medium Project Completed
in Pre-plan
Period
Completed in Plan Period upto IX
Plan
Completed in X Plan
Completed in XI Plan*
Spilled over
projects in XII Plan*
new Projects in XII Plan*
Completed in Pre-
plan Period
Completed in Plan Period upto IX
Plan
Completed in X Plan
Completed in XI Plan*
Spilled over
projects in XII Plan*
new Projects in XII Plan*
1 2 3 4 5 6 7 8 9 10 11 12 13 14
1 Andhra Pradesh 11 5 6 13 30 1 45 69 7 14 10 NR
2 Arunachal Pradesh 0 0 0 NR NR NR 0 0 0 NR NR NR
3 Assam 0 2 2 0 2 0 0 8 1 1 1 0 4 Bihar 2 14 1 1 8 2 2 17 1 1 2 1 5 Chhattisgarh 4 3 1 3 2 3 4 22 2 1 4 1 6 Goa 0 0 1 0 1 0 0 1 0 0 0 0 7 Gujarat 2 17 0 0 1 0 0 114 1 6 4 0 8 Haryana 1 5 1 4 2 0 0 0 0 1 1 0
9 Himachal Pradesh 0 0 0 1 0 0 0 4 0 2 0 0
10 Jammu & Kashmir 1 1 0 0 0 0 6 10 2 0 0 0
11 Jharkhand 0 1 0 NR 6 0 0 35 3 6 4 0 12 Karnataka 4 4 0 5 11 0 8 30 1 13 11 2 13 Kerala 0 10 1 1 1 0 0 7 0 0 3 0 14 Madhya Pradesh 2 9 4 2 15 16 10 91 1 2 13 13 15 Maharashtra 5 16 5 2 49 4 16 171 12 10 71 12 16 Manipur 0 1 0 0 1 0 0 4 0 1 1 2 17 Meghalaya 0 0 0 0 0 0 0 0 0 0 0 0
Contd...
96

Appendix 1: Tables Table 14(i) : Number of Major, Medium and ERM Irrigation Projects in India by State
Sl. No.
Name of the State/UTs.
Major Project Medium Project Completed
in Pre-plan
Period
Completed in Plan Period upto IX
Plan
Completed in X Plan
Completed in XI Plan*
Spilled over
projects in XII Plan*
new Projects in XII Plan*
Completed in Pre-
plan Period
Completed in Plan Period upto IX
Plan
Completed in X Plan
Completed in XI Plan*
Spilled over
projects in XII Plan*
new Projects in XII Plan*
1 2 3 4 5 6 7 8 9 10 11 12 13 14 18 Mizoram 0 0 0 0 0 0 0 0 0 0 0 0 19 Nagaland 0 0 0 0 0 0 0 0 0 0 0 0 20 Orissa 3 6 3 0 11 0 3 37 6 1 13 1 21 Punjab 3 5 0 0 1 0 0 2 0 0 0 0 22 Rajasthan 1 5 2 3 NR 0 42 55 3 2 0 0 23 Sikkim 0 0 0 NR NR NR 0 0 0 NR NR NR 24 Tamil Nadu 17 5 0 0 0 0 7 39 0 0 0 0 25 Tripura 0 0 0 NR NR NR 0 0 0 NR NR NR 26 Uttarakhand 0 0 5 0 0 0 0 0 0 0 0 0 27 Uttar Pradesh 15 42 0 0 6 1 0 40 0 0 0 0
28 West Bengal 3 3 0 0 2 0 0 17 0 1 0 0
TOTAL 74 154 32 35 149 27 143 773 40 62 138 32 Contd...
97

Appendix 1: Tables Table 14(i) : Number of Major, Medium and ERM Irrigation Projects in India by State
‘(in Nos.)
Sl. No.
Name of the State/UTs.
ERM Total Compl-eted in Plan
Period upto IX
Plan
Compl-eted in X Plan
Compl-eted in
XI Plan*
Spilled over
projects in XII Plan*
new Projects in XII Plan*
Compl-eted in
Pre-plan
Period
Compl-eted in Plan
Period upto IX
Plan
Compl-eted in X
Plan
Compl-eted in
XI Plan*
Compl-eted
upto XI Plan*
Spilled over
projects in XII Plan*
new Projects in XII Plan*
1 2 15 16 17 18 19 20 21 22 23 24 25 26
1 Andhra Pradesh 0 6 1 2 0 56 74 19 28 177 42 1 2 Arunachal Pradesh 0 0 NR NR NR 0 0 0 NR NR NR NR 3 Assam 1 0 0 0 0 0 11 3 1 15 3 0 4 Bihar 2 0 1 3 0 4 33 2 3 42 13 3 5 Chhattisgarh 2 0 0 1 0 8 27 3 4 42 7 4 6 Goa 0 0 0 0 0 0 1 1 0 2 1 0 7 Gujarat 12 0 0 13 0 2 143 1 6 152 18 0 8 Haryana 12 1 1 0 0 1 17 2 6 26 3 0 9 Himachal Pradesh 0 0 0 0 0 0 4 0 3 7 0 0
10 Jammu & Kashmir 4 2 0 0 0 7 15 4 0 26 0 0 11 Jharkhad 1 0 0 4 0 0 37 3 6 46 14 0 12 Karnataka 0 0 3 0 0 12 34 1 21 68 22 2 13 Kerala 1 0 1 0 0 0 18 1 2 21 4 0 14 Madhya Pradesh 1 0 6 2 4 12 101 5 10 128 30 33 15 Maharashtra 1 3 1 4 0 21 188 20 13 242 124 16 16 Manipur 0 0 0 0 0 0 5 0 1 6 2 2 17 Meghalaya 0 0 0 0 0 0 0 0 0 0 0 0 18 Mizoram 0 0 0 0 0 0 0 0 0 0 0 0
Contd...
98

Appendix 1: Tables Table 14(i) : Number of Major, Medium and ERM Irrigation Projects in India by State
‘(in Nos.)
Sl. No.
Name of the State/UTs.
ERM Total Compl-eted in Plan
Period upto IX
Plan
Compl-eted in X Plan
Compl-eted in
XI Plan*
Spilled over
projects in XII Plan*
new Projects in XII Plan*
Compl-eted in
Pre-plan
Period
Compl-eted in Plan
Period upto IX
Plan
Compl-eted in X
Plan
Compl-eted in
XI Plan*
Compl-eted
upto XI Plan*
Spilled over
projects in XII Plan*
new Projects in XII Plan*
1 2 15 16 17 18 19 20 21 22 23 24 25 26 19 Nagaland 0 0 0 0 0 0 0 0 0 0 0 0 20 Orissa 8 13 5 5 21 6 51 22 6 85 29 22 21 Punjab 8 3 0 2 2 3 15 3 0 21 3 2 22 Rajasthan 7 0 0 0 0 43 67 5 5 120 0 0 23 Sikkim 0 0 NR NR NR 0 0 0 NR NR NR NR 24 Tamil Nadu 11 1 0 0 0 24 55 1 0 80 0 0 25 Tripura 0 0 NR NR NR 0 0 0 NR NR NR NR 26 Uttarakhand 0 1 0 0 0 0 0 6 0 6 0 0
27 Uttar Pradesh 20 0 0 3 0 15 102 0 0 117 9 1
28 W.Bengal 0 0 0 0 0 3 20 0 1 24 2 0
TOTAL 91 30 19 39 27 217 1018 102 116 1453 326 86 Source: Central Water Commission ( P & P Directorate)
E.R.M. : Extention, Renovation and Modernisation Projects. Note- * : Figures are likely to be changed after receiving final data. NR : Non availability of data
99

Appendix 1: Tables Table 14 (ii) : STATE-WISE & PROJECT-WISE FINANCIAL STATUS OF MAJOR, MEDIUM AND ERM PROJECTS AS REPORTED COMPLETED IN XI PLAN
STATE Project Name Type of Project Status
Approval
Status
Un approved Cost
Original Cost
Latest Estimated Cost
Start Year
Upto X Plan
2007-08
2008-09
2009-10
2010-11
2011-12
Liability in XII
Plan
Beyond XII plan
Cumm. Cost
1 2 3 4 5 6 7 8 9 10 11 12 13 14 15 16 17 18
ANDHRA PRADESH
Alisagar Lift Irrigation Scheme Major Completed in XI
Plan APD 0.00 107.87 261.30 2005.00 210.67 34.61 3.74 10.17 5.64 20.00 0 0 284.83
ANDHRA PRADESH
Arugula Raja Ram Guthpa Lift Irrigation Scheme
Major Completed in XI Plan APD 0.00 145.00 198.02 2005.00 130.06 32.39 8.39 20.39 21.42 25.00 0 0 237.65
ANDHRA PRADESH
Chagalandu Lift Irrigation Scheme Major Completed in XI
Plan APD 0.00 61.23 70.77 1999.00 70.44 1.59 1.17 0.23 8.07 5.00 0 0 86.50
ANDHRA PRADESH
Guru Raghavendra Project
Major Completed in XI Plan UA 130.42 0.00 0.00 2004.00 71.78 40.58 17.76 6.46 12.40 21.00 0 0 169.98
ANDHRA PRADESH
Kandula Obula Reddy Gundlakamma Reservoir project
Major Completed in XI Plan UA 592.18 0.00 0.00 2004.00 308.24 133.25 34.79 28.78 10.76 76.36 0 0 592.18
ANDHRA PRADESH
Kunool Cuddapah Canal Modernisation Project
Major Completed in XI Plan UA 0.00 0.00 0.00 1998.00 718.93 6.54 18.14 7.67 13.49 39.00 0 0 803.77
ANDHRA PRADESH
Lendi Interstate Project Major Completed in XI
Plan UA 0.00 0.00 263.89 2007.00 96.19 25.79 7.94 36.48 30.07 60.00 0 0 256.47
ANDHRA PRADESH
Modernisation of Godavari Delta System and Drainage System including lining in Vulnerable
Major Completed in XI Plan UA 0.00 0.00 1690.00 2008.00 0.00 0.00 57.00 37.89 15.65 166.54 0 0 277.08
ANDHRA PRADESH
Siddapuram Lift Irrigation Scheme Major Completed in XI
Plan UA 89.72 0.00 0.00 2008.00 0.00 0.00 7.42 18.00 13.48 33.73 0 0 72.63
ANDHRA PRADESH Somasila Project Major Completed in XI
Plan UA 1196.00 0.00 0.00 1978.00 736.74 129.11 92.71 62.61 55.10 140.00 0 0 1216.27
ANDHRA PRADESH
Sri Magunta Subbarami Reddy Ramatheertham Balancing Reservoir
Major Completed in XI Plan UA 52.00 0.00 0.00 2005.00 17.22 18.27 10.26 1.04 0.28 4.93 0 0 52.00
ANDHRA PRADESH
Thota Venkatachalam Pushkara Lift Irrigation Scheme
Major Completed in XI Plan UA 1196.00 0.00 608.04 2004.00 342.11 76.48 44.92 74.59 31.50 45.00 0 0 614.60
Contd..
100

Appendix 1: Tables Table 14 (ii) : STATE-WISE & PROJECT-WISE FINANCIAL STATUS OF MAJOR, MEDIUM AND ERM PROJECTS AS REPORTED COMPLETED IN XI PLAN
STATE Project Name Type of Project Status
Approval
Status
Un approved Cost
Original Cost
Latest Estimated Cost
Start Year
Upto X Plan
2007-08
2008-09
2009-10
2010-11
2011-12
Liability in XII
Plan
Beyond XII plan
Cumm. Cost
1 2 3 4 5 6 7 8 9 10 11 12 13 14 15 16 17 18
ANDHRA PRADESH
Thotapalli Barrage Project Major Completed in XI
Plan UA 1196.00 0.00 0.00 2004.00 190.94 114.26 63.30 30.38 43.11 40.00 0 0 481.99
ANDHRA PRADESH
Tungabhadra Project High Level Stage Two
Major Completed in XI Plan UA 1196.00 0.00 467.26 1967.00 377.09 7.39 5.34 8.00 7.32 8.00 0 0 413.14
ANDHRA PRADESH
Bhupatipalem Reservoir Scheme Final
Medium Completed in XI Plan UA 0.00 0.00 187.91 2004.00 1.54 15.00 81.34 26.79 26.01 30.00 0 0 180.68
ANDHRA PRADESH
Choutpally Hanumanth Reddy Lift Irrigation Scheme
Medium Completed in XI Plan UA 0.00 0.00 55.50 2005.00 18.87 15.50 12.01 1.45 3.19 5.00 0 0 56.02
ANDHRA PRADESH Gollavagu Project Medium Completed in XI
Plan UA 1196.00 0.00 0.00 2004.00 71.62 3.24 1.49 0.45 3.35 5.60 0 0 85.75
ANDHRA PRADESH
Kovvadakalva Reservoir Scheme Medium Completed in XI
Plan UA 0.00 0.00 68.09 2000.00 60.56 0.38 0.10 0.10 0.05 1.06 0 0 62.25
ANDHRA PRADESH
Madduvalasa Reservoir Project Medium Completed in XI
Plan UA 0.00 0.00 132.00 1976.00 130.21 0.60 0.03 27.42 5.23 0.00 0 0 163.49
ANDHRA PRADESH
Madduvalasa Reservoir Project Stage two
Medium Completed in XI Plan APD 0.00 39.03 57.87 2009.00 0.00 0.00 0.00 0.00 3.03 20.00 0 0 23.03
ANDHRA PRADESH
Mathadivagu Project Medium Completed in XI
Plan UA 0.00 0.00 0.00 2004.00 29.31 12.04 12.95 1.94 0.19 1.50 0 0 57.93
ANDHRA PRADESH
Musurumilli Reservoir Scheme Medium Completed in XI
Plan APD 0.00 207.00 218.65 2005.00 53.54 31.45 25.86 38.12 31.47 20.00 0 0 200.44
ANDHRA PRADESH Neelwai Project Medium Completed in XI
Plan APD 0.00 90.50 0.00 2004.00 8.71 10.92 2.65 3.95 2.94 8.50 0 0 37.67
ANDHRA PRADESH
Peddagedda Reservoir Project Final
Medium Completed in XI Plan APD 0.00 26.52 0.00 2004.00 85.65 11.48 5.57 0.79 0.21 0.00 0 0 103.70
ANDHRA PRADESH Ralivagu Project Medium Completed in XI
Plan APD 0.00 33.30 0.00 2004.00 41.51 2.52 3.23 0.57 0.00 0.00 0 0 47.83
ANDHRA PRADESH
Sri K.V.Rama Krishna Surampalem Reservoir Project
Medium Completed in XI Plan APD 0.00 44.38 78.70 1999.00 48.80 2.33 1.14 0.44 1.54 0.25 0 0 54.50
ANDHRA PRADESH
Swarnamukhi Barrage Medium Completed in XI
Plan UA 52.04 0.00 0.00 2005.00 32.08 11.49 0.24 6.95 6.41 9.00 0 0 66.17
Contd..
101

Appendix 1: Tables Table 14 (ii) : STATE-WISE & PROJECT-WISE FINANCIAL STATUS OF MAJOR, MEDIUM AND ERM PROJECTS AS REPORTED COMPLETED IN XI PLAN
STATE Project Name Type of Project Status
Approval
Status
Un approved Cost
Original Cost
Latest Estimated Cost
Start Year
Upto X Plan
2007-08
2008-09
2009-10
2010-11
2011-12
Liability in XII
Plan
Beyond XII plan
Cumm. Cost
1 2 3 4 5 6 7 8 9 10 11 12 13 14 15 16 17 18
ANDHRA PRADESH
Vasireddy Krishna Murthy Naidu Janjhavathi Reservoir Project
Medium Completed in XI Plan UA 0.00 0.00 0.00 1976.00 98.41 13.10 4.44 2.35 2.39 10.00 0 0 130.69
28 6896.36 754.83 4358.00 3951.22 750.31 523.93 454.01 354.30 795.47 0 0 6829.24
ASSAM Buridehing Medium Completed in XI Plan APD 0.00 17.27 0.00 1980.00 0.00 0.00 0.00 0.00 18.28 5.73 0 0 24.01
1 0.00 17.27 0.00 0.00 0.00 0.00 0.00 18.28 5.73 0 0 24.01
BIHAR Western Kosi Canal Project Major Completed in XI
Plan APD 0.00 13.49 1307.21 1971.00 759.12 234.94 76.61 84.67 50.67 101.20 0 0 1307.21
BIHAR Mandai Wier Scheme Medium Completed in XI
Plan UA 89.05 0.00 0.00 2007.00 0.00 7.79 18.00 9.16 5.00 0.00 0 0 39.95
BIHAR
Restoration of Lt. and Rt. Main Canal Under Kulti Irrigation Scheme
Medium Completed in XI Plan UA 0.81 0.00 0.00 2009.00 0.00 0.00 0.00 0.11 0.32 0.38 0 0 0.81
3 89.86 13.49 1307.21 759.12 242.73 94.61 93.94 55.99 101.58 0 0 1347.97
CHHATTISGARH MAHANADI RESERVIOR PROJECT
Major Completed in XI Plan APD 0.00 566.88 845.00 2000.00 656.52 51.97 56.14 63.77 74.67 20.00 0 0 923.07
CHHATTISGARH Minimata (Hasdeo) Bango Project Bilaspur
Major Completed in XI Plan APD 0.00 115.30 1660.88 1962.00 1380.13 79.80 95.37 83.92 75.56 36.48 0 0 1751.26
CHHATTISGARH RAJIV SAMODA NISDA DIVERSION SCHEME PHASE II
Major Completed in XI Plan UA 114.45 0.00 0.00 2006.00 0.00 10.54 7.25 3.07 5.40 1.17 0 0 27.43
CHHATTISGARH
KOSARTEDA MEDIUM IRRIGATION PROJECT
Medium Completed in XI Plan APD 0.00 6.01 154.65 1981.00 17.54 58.57 11.06 10.77 17.74 7.00 0 0 122.68
4 114.45 688.19 2660.53 2054.19 200.88 169.82 161.53 173.37 64.65 0 0 2824.44
GUJARAT Bhadar II Medium Completed in XI Plan APD 0.00 138.56 138.56 1998.00 96.12 7.87 9.13 11.76 4.21 9.46 0 0 138.55
GUJARAT Demi III Medium Completed in XI Plan APD 0.00 39.04 75.16 1998.00 32.76 0.83 2.20 2.80 0.14 0.10 0 0 38.83
GUJARAT Umrecha Medium Completed in XI Plan APD 0.00 22.43 14.97 2004.00 4.48 5.35 0.00 0.00 0.00 0.00 0 0 9.83
Contd..
102

Appendix 1: Tables Table 14 (ii) : STATE-WISE & PROJECT-WISE FINANCIAL STATUS OF MAJOR, MEDIUM AND ERM PROJECTS AS REPORTED COMPLETED IN XI PLAN
STATE Project Name Type of Project Status
Approval
Status
Un approved Cost
Original Cost
Latest Estimated Cost
Start Year
Upto X Plan
2007-08
2008-09
2009-10
2010-11
2011-12
Liability in XII
Plan
Beyond XII plan
Cumm. Cost
1 2 3 4 5 6 7 8 9 10 11 12 13 14 15 16 17 18
GUJARAT Und II Medium Completed in XI Plan APD 0.00 19.48 68.40 1986.00 6.55 0.22 0.58 0.39 0.54 0.96 0 0 9.24
GUJARAT Varansi Medium Completed in XI Plan APD 0.00 0.13 16.80 2001.00 6.19 0.47 0.20 0.40 0.50 0.32 0 0 8.08
GUJARAT Vartu II Medium Completed in XI Plan APD 0.00 24.28 57.15 1991.00 0.13 2.21 3.13 3.96 8.30 6.45 0 0 24.18
6 0.00 243.91 371.04 146.23 16.94 15.24 19.31 13.69 17.29 0 0 228.70
HARYANA
Augmentation of Irrigation Potential of Ottu Lake in Sirsa District under RIDF XIII
Major Completed in XI Plan UA 69.68 0.00 0.00 2007.00 0.00 14.65 4.83 25.05 0.42 24.74 0 0 69.69
HARYANA
haryana irrigation project for better water management
Major Completed in XI Plan UA 171.62 0.00 0.00 2009.00 0.00 0.00 27.59 33.43 20.00 62.30 0 0 143.32
HARYANA
Irrigation Project for better water Management under RIDF XIV
Major Completed in XI Plan UA 143.34 0.00 0.00 2009.00 0.00 0.00 27.59 33.43 20.02 62.30 0 0 143.34
HARYANA NCR WATER SUPPLY CHANNEL Major Completed in XI
Plan UA 322.00 0.00 0.00 2008.00 322.00 0.00 145.27 109.94 19.60 8.50 0 0 605.31
HARYANA
Rehabilitation Modernisation of canal and Renovation of drains rechargeground water
Major Completed in XI Plan UA 322.00 0.00 0.00 2008.00 47.70 7.70 20.00 20.00 0.00 19.58 0 0 114.98
HARYANA
Irrigation Project for better Water Management under RIDF XIII
Medium Completed in XI Plan UA 114.62 0.00 0.00 2007.00 0.00 63.57 25.38 10.70 4.87 10.09 0 0 114.61
6 1143.26 0.00 0.00 369.70 85.92 250.66 232.55 64.91 187.51 0 0 1191.25
Contd..
103

Appendix 1: Tables Table 14 (ii) : STATE-WISE & PROJECT-WISE FINANCIAL STATUS OF MAJOR, MEDIUM AND ERM PROJECTS AS REPORTED COMPLETED IN XI PLAN
STATE Project Name Type of Project Status
Approval
Status
Un approved Cost
Original Cost
Latest Estimated Cost
Start Year
Upto X Plan
2007-08
2008-09
2009-10
2010-11
2011-12
Liability in XII
Plan
Beyond XII plan
Cumm. Cost
1 2 3 4 5 6 7 8 9 10 11 12 13 14 15 16 17 18
HIMACHAL PRADESH
Shahnehar Major Irrigation Project in Dist. Kangra (H P)
Major Completed in XI Plan APD 0.00 143.32 310.89 1997.00 158.49 53.34 33.83 46.40 22.87 70.46 0 0 385.39
HIMACHAL PRADESH
Balh valley (Left Bank) Medium Irrigation project
Medium Completed in XI Plan APD 0.00 41.64 103.78 2004.00 3.51 3.01 4.00 40.00 20.00 33.26 0 0 103.78
HIMACHAL PRADESH
Sidhatha Irrigation Project District Kangra (HP)
Medium Completed in XI Plan APD 0.00 33.62 95.29 1997.00 34.02 13.73 10.78 9.08 7.76 19.92 0 0 95.29
3 0.00 218.58 509.96 196.02 70.08 48.61 95.48 50.63 123.64 0 0 584.46
JHARKHAND DHANSINGHTOLI RESERVOIR SCHEME
Medium Completed in XI Plan UA 29.52 0.00 0.00 1986.00 29.52 0.33 0.50 0.00 0.00 0.00 0 0 30.35
JHARKHAND KANSJORE RESERVOIR SCHEME
Medium Completed in XI Plan UA 52.97 0.00 0.00 1986.00 48.20 2.00 1.00 2.78 1.03 0.00 0 0 55.01
JHARKHAND NAKTI RESERVOIR SCHEME Medium Completed in XI
Plan UA 35.16 0.00 0.00 1987.00 14.97 12.00 7.42 1.97 3.25 0.00 0 0 39.61
JHARKHAND SONUA RESERVOIR SCHEME
Medium Completed in XI Plan UA 82.65 0.00 0.00 1987.00 64.89 1.89 5.77 2.41 1.21 0.02 0 0 76.19
JHARKHAND SURANGI RESERVOIR SCHEME
Medium Completed in XI Plan UA 41.17 0.00 0.00 1987.00 36.41 3.28 0.51 2.96 1.05 0.00 0 0 44.21
JHARKHAND UPPERSANKH RESERVOIR SCHEME
Medium Completed in XI Plan UA 141.19 0.00 0.00 1986.00 92.43 11.72 11.69 5.63 5.93 11.24 0 0 138.64
6 382.66 0.00 0.00 286.42 31.22 26.89 15.75 12.47 11.26 0 0 384.01
KARNATAKA DD Urs Canal Project Major Completed in XI
Plan UA 18.50 0.00 0.00 1979.00 408.21 29.29 12.14 16.67 21.06 1.00 0 0 488.38
KARNATAKA Ghataprabha project third stage
Major Completed in XI Plan UA 18.50 0.00 1210.51 1972.00 990.45 76.25 55.68 83.67 108.3
5 85.00 0 0 1399.40
KARNATAKA Harangi Major Completed in XI Plan UA 11.00 0.00 0.00 1969.00 443.73 48.68 36.12 29.21 16.01 7.00 0 0 580.74
KARNATAKA Kabini Major Completed in XI Plan UA 3.20 0.00 0.00 1959.00 522.90 38.90 17.02 66.94 96.06 90.00 0 0 831.82
Contd..
104

Appendix 1: Tables Table 14 (ii) : STATE-WISE & PROJECT-WISE FINANCIAL STATUS OF MAJOR, MEDIUM AND ERM PROJECTS AS REPORTED COMPLETED IN XI PLAN
STATE Project Name Type of Project Status
Approval
Status
Un approved Cost
Original Cost
Latest Estimated Cost
Start Year
Upto X Plan
2007-08
2008-09
2009-10
2010-11
2011-12
Liability in XII
Plan
Beyond XII plan
Cumm. Cost
1 2 3 4 5 6 7 8 9 10 11 12 13 14 15 16 17 18
KARNATAKA Malaprabha Major Completed in XI Plan UA 20.00 0.00 1383.48 1962.00 883.25 57.74 55.07 69.08 96.44 168.10 0 0 1329.68
KARNATAKA Mulwad Lift Irrigation Scheme A
Major Completed in XI Plan UA 20.00 0.00 0.00 1992.00 275.58 9.41 7.57 2.91 9.85 3.02 0 0 308.34
KARNATAKA Timmapur Lift Irrigation Scheme Major Completed in XI
Plan UA 95.00 0.00 0.00 2006.00 0.00 12.13 3.10 3.21 9.34 75.00 0 0 102.78
KARNATAKA Arkavathy Medium Completed in XI Plan UA 22.25 0.00 0.00 1984.00 116.21 23.15 11.35 23.74 15.59 10.00 0 0 200.04
KARNATAKA Bannahallihundi LIS Medium Completed in XI
Plan UA 16.25 0.00 0.00 2006.00 5.01 3.27 5.66 4.06 1.06 2.50 0 0 21.56
KARNATAKA CONSTRUCTION OF SONNA LIS Medium Completed in XI
Plan UA 20.00 0.00 0.00 2006.00 8.95 3.00 2.50 2.50 0.00 0.95 0 0 17.90
KARNATAKA Gandorinala Project Medium Completed in XI
Plan UA 18.50 0.00 240.00 1992.00 178.71 15.95 18.07 26.72 14.52 0.00 0 0 253.97
KARNATAKA Hirehalla Medium Completed in XI Plan UA 6.35 0.00 0.00 1979.00 291.33 2.21 3.76 7.81 12.69 40.51 0 0 358.31
KARNATAKA Iggalur Medium Completed in XI Plan UA 3.42 0.00 0.00 1986.00 68.91 8.13 2.31 2.48 1.78 3.00 0 0 86.62
KARNATAKA JAVALAHALLA LIS Medium Completed in XI Plan UA 3.33 0.00 0.00 2005.00 0.39 0.00 0.00 0.00 0.00 0.05 0 0 0.44
KARNATAKA KAMASAMUDRA LIS Medium Completed in XI
Plan UA 70.00 0.00 0.00 1984.00 38.34 6.49 3.10 3.71 2.12 1.60 0 0 55.36
KARNATAKA MALALURU LIS Medium Completed in XI Plan UA 5.95 0.00 0.00 1997.00 0.00 0.00 0.00 0.00 0.10 4.10 0 0 4.20
KARNATAKA Manchanbele Medium Completed in XI Plan UA 2.37 0.00 0.00 1969.00 78.19 6.11 0.63 1.53 1.97 0.50 0 0 88.93
KARNATAKA Taraka Medium Completed in XI Plan UA 1.70 0.00 0.00 1970.00 52.33 4.77 2.17 3.21 3.60 1.00 0 0 67.08
KARNATAKA TEGGISIDDAPUR LIS Medium Completed in XI
Plan UA 20.00 0.00 0.00 2009.00 12.60 0.00 0.00 0.00 12.60 23.05 0 0 48.25
KARNATAKA Uduthorehalla Medium Completed in XI Plan UA 7.55 0.00 0.00 1982.00 192.06 28.76 4.89 1.20 1.24 0.50 0 0 228.65
KARNATAKA VOTEHOLE Medium Completed in XI Plan UA 2.05 0.00 0.00 1976.00 53.18 1.38 0.66 0.78 0.52 1.18 0 0 57.70
21 385.92 0.00 2833.99 4620.34 375.63 241.78 349.44 424.90 518.06 0 0 6530.15
KERALA Idamalayar Irrigation Project Major Completed in XI
Plan APD 0.00 107.00 1.00 1992.00 423.00 229.76 47.89 35.62 14.21 15.00 0 0 765.48
Contd..
105
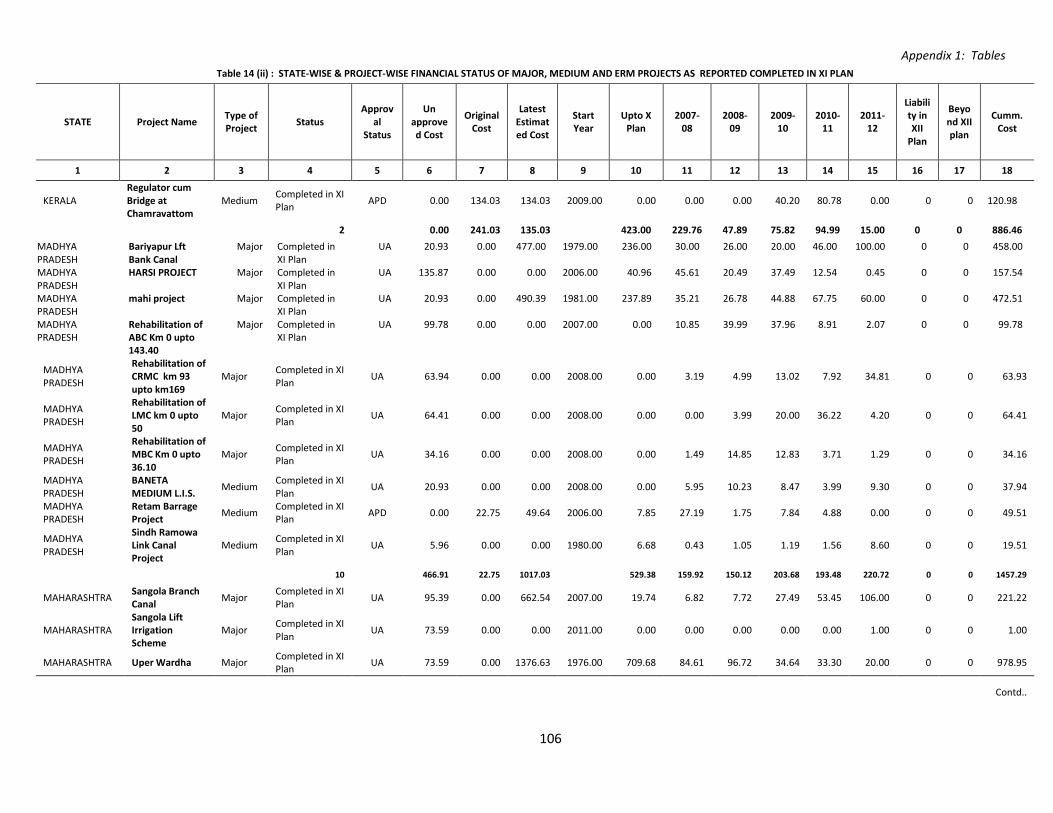
Appendix 1: Tables Table 14 (ii) : STATE-WISE & PROJECT-WISE FINANCIAL STATUS OF MAJOR, MEDIUM AND ERM PROJECTS AS REPORTED COMPLETED IN XI PLAN
STATE Project Name Type of Project Status
Approval
Status
Un approved Cost
Original Cost
Latest Estimated Cost
Start Year
Upto X Plan
2007-08
2008-09
2009-10
2010-11
2011-12
Liability in XII
Plan
Beyond XII plan
Cumm. Cost
1 2 3 4 5 6 7 8 9 10 11 12 13 14 15 16 17 18
KERALA Regulator cum Bridge at Chamravattom
Medium Completed in XI Plan APD 0.00 134.03 134.03 2009.00 0.00 0.00 0.00 40.20 80.78 0.00 0 0 120.98
2 0.00 241.03 135.03 423.00 229.76 47.89 75.82 94.99 15.00 0 0 886.46 MADHYA PRADESH
Bariyapur Lft Bank Canal
Major Completed in XI Plan
UA 20.93 0.00 477.00 1979.00 236.00 30.00 26.00 20.00 46.00 100.00 0 0 458.00
MADHYA PRADESH
HARSI PROJECT Major Completed in XI Plan
UA 135.87 0.00 0.00 2006.00 40.96 45.61 20.49 37.49 12.54 0.45 0 0 157.54
MADHYA PRADESH
mahi project Major Completed in XI Plan
UA 20.93 0.00 490.39 1981.00 237.89 35.21 26.78 44.88 67.75 60.00 0 0 472.51
MADHYA PRADESH
Rehabilitation of ABC Km 0 upto 143.40
Major Completed in XI Plan
UA 99.78 0.00 0.00 2007.00 0.00 10.85 39.99 37.96 8.91 2.07 0 0 99.78
MADHYA PRADESH
Rehabilitation of CRMC km 93 upto km169
Major Completed in XI Plan UA 63.94 0.00 0.00 2008.00 0.00 3.19 4.99 13.02 7.92 34.81 0 0 63.93
MADHYA PRADESH
Rehabilitation of LMC km 0 upto 50
Major Completed in XI Plan UA 64.41 0.00 0.00 2008.00 0.00 0.00 3.99 20.00 36.22 4.20 0 0 64.41
MADHYA PRADESH
Rehabilitation of MBC Km 0 upto 36.10
Major Completed in XI Plan UA 34.16 0.00 0.00 2008.00 0.00 1.49 14.85 12.83 3.71 1.29 0 0 34.16
MADHYA PRADESH
BANETA MEDIUM L.I.S. Medium Completed in XI
Plan UA 20.93 0.00 0.00 2008.00 0.00 5.95 10.23 8.47 3.99 9.30 0 0 37.94
MADHYA PRADESH
Retam Barrage Project Medium Completed in XI
Plan APD 0.00 22.75 49.64 2006.00 7.85 27.19 1.75 7.84 4.88 0.00 0 0 49.51
MADHYA PRADESH
Sindh Ramowa Link Canal Project
Medium Completed in XI Plan UA 5.96 0.00 0.00 1980.00 6.68 0.43 1.05 1.19 1.56 8.60 0 0 19.51
10 466.91 22.75 1017.03 529.38 159.92 150.12 203.68 193.48 220.72 0 0 1457.29
MAHARASHTRA Sangola Branch Canal Major Completed in XI
Plan UA 95.39 0.00 662.54 2007.00 19.74 6.82 7.72 27.49 53.45 106.00 0 0 221.22
MAHARASHTRA Sangola Lift Irrigation Scheme
Major Completed in XI Plan UA 73.59 0.00 0.00 2011.00 0.00 0.00 0.00 0.00 0.00 1.00 0 0 1.00
MAHARASHTRA Uper Wardha Major Completed in XI Plan UA 73.59 0.00 1376.63 1976.00 709.68 84.61 96.72 34.64 33.30 20.00 0 0 978.95
Contd..
106

Appendix 1: Tables Table 14 (ii) : STATE-WISE & PROJECT-WISE FINANCIAL STATUS OF MAJOR, MEDIUM AND ERM PROJECTS AS REPORTED COMPLETED IN XI PLAN
STATE Project Name Type of Project Status
Approval
Status
Un approved Cost
Original Cost
Latest Estimated Cost
Start Year
Upto X Plan
2007-08
2008-09
2009-10
2010-11
2011-12
Liability in XII
Plan
Beyond XII plan
Cumm. Cost
1 2 3 4 5 6 7 8 9 10 11 12 13 14 15 16 17 18
MAHARASHTRA Dhapewada Lift Irrigation Scheme Stage 1
Medium Completed in XI Plan APD 0.00 24.01 185.68 1996.00 70.42 6.70 10.73 1.30 40.00 25.00 0 0 154.15
MAHARASHTRA Dongargaon Project Medium Completed in XI
Plan APD 0.00 1.50 67.04 1979.00 33.08 3.03 4.55 1.68 13.41 16.00 0 0 71.75
MAHARASHTRA Haranghat L.I.S. Medium Completed in XI Plan APD 0.00 49.20 0.00 1999.00 0.00 28.00 10.00 5.00 5.70 0.50 0 0 49.20
MAHARASHTRA Kirmiri L.I.S. Medium Completed in XI Plan APD 0.00 27.89 0.00 1997.00 26.46 1.11 0.24 0.24 0.00 0.00 0 0 28.05
MAHARASHTRA Madan Tank Project Medium Completed in XI
Plan UA 88.09 0.00 88.09 1997.00 74.60 3.07 2.53 0.60 1.40 9.00 0 0 91.20
MAHARASHTRA Pimpalgaon (Dhale) Project Medium Completed in XI
Plan UA 95.39 0.00 0.00 1997.00 54.89 3.96 3.81 1.07 17.07 14.58 0 0 95.38
MAHARASHTRA PRAKASHA BARRAGE Medium Completed in XI
Plan UA 95.39 0.00 0.00 1999.00 118.64 38.81 20.05 7.16 4.98 2.00 0 0 191.64
MAHARASHTRA Sondyatola Lift Irrigation Scheme
Medium Completed in XI Plan UA 73.59 0.00 103.31 1995.00 46.45 4.08 13.86 1.91 25.00 0.00 0 0 91.30
MAHARASHTRA Wagholi Buti LIS Medium Completed in XI Plan UA 9.50 0.00 48.32 1993.00 37.27 2.04 2.16 0.57 2.15 1.50 0 0 45.69
MAHARASHTRA Zhansinagar Lift Irrigation Scheme
Medium Completed in XI Plan UA 9.50 0.00 45.18 2004.00 12.82 1.00 6.61 1.38 20.00 15.00 0 0 56.81
13 614.03 102.60 2576.79 1204.05 183.23 178.98 83.04 216.46 210.58 0 0 2076.34
MANIPUR Dolaithabi Barrage Project Manipur
Medium Completed in XI Plan APD 0.00 18.86 215.52 1992.00 58.86 15.59 13.92 41.31 49.90 93.50 0 0 273.08
1 0.00 18.86 215.52 58.86 15.59 13.92 41.31 49.90 93.50 0 0 273.08
ORISSA Extension of Daha Irrigation Project
ERM Completed in XI Plan UA 10.24 0.00 0.00 2005.00 5.07 4.32 6.96 5.52 2.80 0.00 0 0 24.67
ORISSA
Extension of Sumandal canal (Salia Irrigation Project)
ERM Completed in XI Plan UA 2.62 0.00 0.00 2004.00 1.59 0.12 0.00 0.00 0.00 0.00 0 0 1.71
Contd..
107

Appendix 1: Tables Table 14 (ii) : STATE-WISE & PROJECT-WISE FINANCIAL STATUS OF MAJOR, MEDIUM AND ERM PROJECTS AS REPORTED COMPLETED IN XI PLAN
STATE Project Name Type of Project Status
Approval
Status
Un approved Cost
Original Cost
Latest Estimated Cost
Start Year
Upto X Plan
2007-08
2008-09
2009-10
2010-11
2011-12
Liability in XII
Plan
Beyond XII plan
Cumm. Cost
1 2 3 4 5 6 7 8 9 10 11 12 13 14 15 16 17 18
ORISSA
Renovation of Rampur Berkley Distributary(Hirakud Dam Project)
ERM Completed in XI Plan UA 26.42 0.00 0.00 2007.00 0.00 1.08 10.00 14.94 6.00 0.00 0 0 32.02
ORISSA Renovation of Bahuda Irrigation Project
ERM Completed in XI Plan UA 11.88 0.00 0.00 2005.00 4.11 4.89 2.27 0.45 0.11 0.00 0 0 11.83
ORISSA Renovation of Satiguda Irrigation Project
ERM Completed in XI Plan UA 4.29 0.00 0.00 2005.00 0.86 2.47 0.98 0.00 0.00 0.00 0 0 4.31
ORISSA Bagh Barrage Project Medium Completed in XI
Plan APD 0.00 44.72 0.00 1997.00 55.09 6.85 7.61 4.98 3.13 0.00 0 0 77.66
6 55.45 44.72 0.00 66.72 19.73 27.82 25.89 12.04 0.00 0 0 152.20
RAJASTHAN Bisalpur Major Completed in XI Plan APD 0.00 309.07 657.91 1985.00 662.69 27.93 16.39 11.85 10.24 0.00 0 0 729.10
RAJASTHAN Mahi Major Completed in XI Plan APD 0.00 3.04 538.58 1971.00 890.97 22.01 27.14 0.00 0.00 0.00 0 0 940.12
RAJASTHAN Ratanpura Distributory Major Completed in XI
Plan APD 0.00 27.53 0.00 2000.00 22.02 0.32 0.12 0.51 0.00 0.00 0 0 22.97
RAJASTHAN Bandi Sendra Medium Completed in XI Plan APD 0.00 37.02 0.00 1998.00 26.64 4.37 1.93 0.00 0.00 0.00 0 0 32.94
RAJASTHAN Sukali Medium Completed in XI Plan APD 0.00 42.90 0.00 1998.00 32.08 7.50 4.35 0.00 0.00 0.00 0 0 43.93
5 0.00 419.56 1196.49 1634.40 62.13 49.93 12.36 10.24 0.00 0 0 1769.06
WEST BENGAL Patloi Irrigation Project (Revised) Medium Completed in XI
Plan APD 0.00 0.90 17.28 1977.00 8.88 0.37 1.01 1.08 0.35 5.96 0 0 17.65
1 0.00 0.90 17.28 8.88 0.37 1.01 1.08 0.35 5.96 0 0 17.65
0.00
TOTAL MJ 45, MD 66, ERM 5 116 UA78,
APD38 10148.91 2786.69 17198.87 16308.52 2444.44 1841.21 1865.19 1746.01 2370.94 0 0 26576.31
Source: Report of the Working Group on Major & Medium and Command Area Development for the XII Five Year Plan (2012‐17) MoWR
108
Appendix 1: Tables Table 14 (iii) : State-wise & project-wise financial status of Major, Medium and EMR projects as reported completed with liabilities in XII plan
STATE Project Name Type of Project
Special Classification
Status Approv
al Status
Un approved Cost
Original Cost
Latest Estimated Cost
Start Year
Upto X Plan
2007-08
2008-09
2009-10
2010-11
2011-12
Liability in XII
Plan
Beyond XII plan
Cumm. Cost
1 2 3 4 5 6 7 8 9 10 11 12 13 14 15 16 17 18 19
ANDHRA PRADESH
Sri Tenneti Viswanatham Pedderu Reservoir Project Final
Medium
Improvement of Water Management
Completed with
liabilities in XII plan
APD 0 26.27 38.41 1999 40.07 3.22 0.25 0.02 1.15 4.42 5.4 0 54.53
1 0 26.27 38.41 40.07 3.22 0.25 0.02 1.15 4.42 5.4 0 54.53
GUJARAT Guhai ERM Not Applicable
Completed with liabilities in XII plan
APD 0 0.029 0.057 2007 0 0.35 1.32 0.22 0.61 0.7 2.5 0 5.7
GUJARAT Panam High Level Canal Medium
Improvement of Water Management
Completed with liabilities in XII plan
APD 0 130.71 260 2004 16.25 27.98 42.5 33.18 27.95 34 94.39 0 276.25
2 0 130.73 260.05 16.25 28.33 43.82 33.4 28.56 34.7 96.89 0 281.95
HIMACHAL PRADESH
Changer Area Medium Lift Irrigation Project in Distt. Bilaspur (HP)
Medium Not Applicable
Completed with liabilities in XII plan
APD 0 28.37 88.09 1999 16.23 30.98 20.94 9.14 5.96 2 2 2 89.25
1 0 28.37 88.09 16.23 30.98 20.94 9.14 5.96 2 2 2 89.25
JHARKHAND AJAY BARRAGE PROJECT Major
Not Applicable
Completed with liabilities in XII plan
UA 351.84 0 0 1975 255.01 10.7 12.32 7.15 12.42 20 5 0 322.6
Contd..
109

Appendix 1: Tables Table 14 (iii) : State-wise & project-wise financial status of Major, Medium and EMR projects as reported completed with liabilities in XII plan
STATE Project Name Type of Project
Special Classification
Status Approv
al Status
Un approved Cost
Original Cost
Latest Estimated Cost
Start Year
Upto X Plan
2007-08
2008-09
2009-10
2010-11
2011-12
Liability in XII
Plan
Beyond XII plan
Cumm. Cost
1 2 3 4 5 6 7 8 9 10 11 12 13 14 15 16 17 18 19
JHARKHAND GUMANI BARRAGE PROJECT
Major Not Applicable
Completed with liabilities in XII plan
APD 0 3.8389 185.76 1976 110.88 18.48 15.45 4.236 3.352 33.35 5 0 190.76
JHARKHAND BATANE RESERVOIR SCHEME
Medium Not Applicable
Completed with liabilities in XII plan
UA 116.02 0 0 1984 30 5.16 0.5 4.75 2.96 3.6 3 0 49.97
JHARKHAND BHAIRWA RESERVOIR SCHEME
Medium Not Applicable
Completed with liabilities in XII plan
UA 122.64 0 0 1987 61.98 15.99 2.75 5.96 0 28 8 0 122.68
JHARKHAND KATRI RESERVOIR SCHEME
Medium Not Applicable
Completed with liabilities in XII plan
UA 47.97 0 0 1986 54.18 0.73 0.34 0 0 0 0 0 55.25
JHARKHAND Kesho Reservoir Scheme Medium
Not Applicable
Completed with liabilities in XII plan
UA 102.88 0 0 1988 4 24.98 20 4.5 14.05 30 5 0 102.53
JHARKHAND PANCHKHERO RESERVOIR SCHEME
Medium Not Applicable
Completed with liabilities in XII plan
APD 0 9.55 75.69 1990 40.28 17.16 8.25 2 0.59 11 5 0 84.28
JHARKHAND RAMREKHA RESERVOIR SCHEME
Medium Not Applicable
Completed with liabilities in XII plan
UA 53.86 0 0 1982 25.63 12.92 8.48 0.8 1.39 4 0.5 0 53.72
JHARKHAND TAJNA RESERVOIR SCHEME
Medium Not Applicable
Completed with liabilities in XII plan
APD 0 87.76 0 2011 0 0 0 0 0 25.23 62.53 0 87.76
Contd..
110

Appendix 1: Tables Table 14 (iii) : State-wise & project-wise financial status of Major, Medium and EMR projects as reported completed with liabilities in XII plan
STATE Project Name Type of Project
Special Classification
Status Approv
al Status
Un approved Cost
Original Cost
Latest Estimated Cost
Start Year
Upto X Plan
2007-08
2008-09
2009-10
2010-11
2011-12
Liability in XII
Plan
Beyond XII plan
Cumm. Cost
1 2 3 4 5 6 7 8 9 10 11 12 13 14 15 16 17 18 19
9 795.21 101.14 261.45 581.96 106.12 68.09 29.39 34.76 155.18 94.03 0 1069.55
KARNATAKA Almatti Left Bank Canal Major
Not Applicable
Completed with liabilities in XII plan
APD 0 79.42 182.26 1993 137.75 2.31 3.42 0.53 1.35 4 5.82 0 155.18
KARNATAKA TLBC Major Not Applicable
Completed with
liabilities in XII plan
UA 17.74 0 0 1950 294.57 21.42 18.45 191.7 360.12 354.57 350 0 1590.83
KARNATAKA Maskinala Project Medium
Not Applicable
Completed with
liabilities in XII plan
UA 3.11 0 0 1976 47.42 1.23 1.03 1.33 1 1.45 5 0 58.46
3 20.85 79.42 182.26 479.74 24.96 22.9 193.56 362.47 360.02 360.82 0 1804.47
MADHYA PRADESH Barchar Project Medium
Improvement of Water Management
Completed with liabilities in XII plan
UA 3.5 0 0 1981 18.14 0.53 0.924 0.149 0.11 0.17 0.23 0 20.253
MADHYA PRADESH
MACHAK DISTRIBUTORY EXT PROJECT
Medium Not Applicable
Completed with liabilities in XII plan
UA 44.28 0 0 2003 15.31 7.28 0.78 0.1 0.3 0.54 6.34 0 30.65
MADHYA PRADESH
Mahan Gulab sagar Medium Project
Medium Not Applicable
Completed with
liabilities in XII plan
UA 3.11 0 486.96 1983 110.43 24.14 29.24 21.92 66.87 104 103.23 0 459.83
Contd..
111

Appendix 1: Tables Table 14 (iii) : State-wise & project-wise financial status of Major, Medium and EMR projects as reported completed with liabilities in XII plan
STATE Project Name Type of Project
Special Classification
Status Approv
al Status
Un approved Cost
Original Cost
Latest Estimated Cost
Start Year
Upto X Plan
2007-08
2008-09
2009-10
2010-11
2011-12
Liability in XII
Plan
Beyond XII plan
Cumm. Cost
1 2 3 4 5 6 7 8 9 10 11 12 13 14 15 16 17 18 19
MADHYA PRADESH
Mardan pur (LIS) Medium
Not Applicable
Completed with liabilities in XII plan
UA 16.28 0 0 2008 8.4 0 0 0 0 0 7.88 0 16.28
4 67.17 0 486.96 152.28 31.95 30.944 22.169 67.28 104.71 117.68 0 527.013
MAHARASHTRA Bhima(Ujani)Project Major
Not Applicable
Completed with liabilities in XII plan
UA 1992.78 0 0 1965 1092.37 29.84 19 50.57 58.29 50 692.71 0 1992.78
MAHARASHTRA Pench Project Major Not Applicable
Completed with liabilities in XII plan
UA 168.93 0 0 2008 0 0 8.129 1.7852 8.3418 20 168.33 0 206.586
MAHARASHTRA Amba Medium
Improvement of Water Management
Completed with
liabilities in XII plan
UA 3.11 0 0 1970 16.96 0.186 0.228 0.43 0.235 0.625 25 0 43.664
MAHARASHTRA AMRAWATI PROJECT Medium
Not Applicable
Completed with liabilities in XII plan
APD 0 4.63 0 1985 46.76 1.58 0.74 1.41 0.8 10 18 0 79.29
MAHARASHTRA Benitura Medium Project Medium
Not Applicable
Completed with liabilities in XII plan
UA 45.56 0 0 1986 26.41 0.15 0.38 0.22 1 1 0 0 29.16
MAHARASHTRA Borghat L.I.S. Medium Not Applicable
Completed with liabilities in XII plan
UA 121.46 0 0 2009 0 0 12.071 5.144 8.24 35 67.19 0 127.645
Contd..
112

Appendix 1: Tables Table 14 (iii) : State-wise & project-wise financial status of Major, Medium and EMR projects as reported completed with liabilities in XII plan
STATE Project Name Type of Project
Special Classification
Status Approv
al Status
Un approved Cost
Original Cost
Latest Estimated Cost
Start Year
Upto X Plan
2007-08
2008-09
2009-10
2010-11
2011-12
Liability in XII
Plan
Beyond XII plan
Cumm. Cost
1 2 3 4 5 6 7 8 9 10 11 12 13 14 15 16 17 18 19
MAHARASHTRA Pothara Nalla Project Medium
Not Applicable
Completed with liabilities in XII plan
APD 0 63.08 0 1982 19.32 14.04 8.39 22.12 9.79 3 76.34 0 153
MAHARASHTRA Ruti Medium Project Medium
Not Applicable
Completed with liabilities in XII plan
UA 5.04 0 0 1999 1.77 0.53 0 0.07 0 1.52 1.15 0 5.04
8 2336.88 67.71 0 1203.59 46.32 48.93 81.74 86.69 121.14 1048.72 0 2637.165
ORISSA Titilagarh Irrigation Project
Medium Not Applicable
Completed with liabilities in XII plan
APD 0 21.13 0 1995 44.09 24.67 19.86 30.46 2.24 2 10 0 133.32
1 0 21.13 0 44.09 24.67 19.86 30.46 2.24 2 10 0 133.32
RAJASTHAN Gang Canal Modernization Major
Improvement of Water Management
Completed with liabilities in XII plan
APD 0 445.79 621.42 2000 339.6 41.52 24.94 16.57 10 50 138.79 0 621.42
RAJASTHAN
Rajasthan Water Sector Restructuring Project (RWSRP)
Major
Special Repairs not covered under ERM
Completed with liabilities in XII plan
APD 0 733.59 0 2002 433.47 85.09 66.8 99.18 55 100 137.46 0 977
RAJASTHAN Gagrin Medium
Improvement of Water Management
Completed with liabilities in XII plan
APD 0 80.12 0 2006 1.96 16.92 6.52 11.97 25 10 7.75 0 80.12
Contd..
113
Appendix 1: Tables Table 14 (iii) : State-wise & project-wise financial status of Major, Medium and EMR projects as reported completed with liabilities in XII plan
STATE Project Name Type of Project
Special Classification
Status Approv
al Status
Un approved Cost
Original Cost
Latest Estimated Cost
Start Year
Upto X Plan
2007-08
2008-09
2009-10
2010-11
2011-12
Liability in XII
Plan
Beyond XII plan
Cumm. Cost
1 2 3 4 5 6 7 8 9 10 11 12 13 14 15 16 17 18 19
RAJASTHAN Gardada Medium
Improvement of Water Management
Completed with
liabilities in XII plan
UA 3.11 0 0 2003 47.68 26.41 27.08 9.29 2.65 2.4 31.53 0 147.04
RAJASTHAN Lhasi Medium
Improvement of Water Management
Completed with liabilities in XII plan
APD 0 44.73 0 2007 0 21.97 9.25 10 10.25 15 25.53 0 92
RAJASTHAN Piplad Medium
Improvement of Water Management
Completed with liabilities in XII plan
APD 0 33.64 0 2006 2 4.32 9.55 15 21 10 3.31 0 65.18
RAJASTHAN Takli Medium
Improvement of Water Management
Completed with liabilities in XII plan
APD 0 51.81 0 2006 2 3.26 7.64 0.8 34.48 25 58.26 0 131.44
7 3.11 1389.68 621.42 826.71 199.49 151.78 162.81 158.38 212.4 402.63 0 2114.2
UTTAR PRADESH SARYU NAHAR PROJECT Major
Not Applicable
Completed with liabilities in XII plan
APD 0 78.68 7270.32 1978 2245.13 280.99 270.42 80.2 167.54 339 3887.04 0 7270.32
1 0 78.68 7270.32 2245.13 280.99 270.42 80.2 167.54 339 3887.04 0 7270.32
WEST BENGAL Tatko Irrigation Project (Revised)
Medium
Improvement of Water Management
Completed with liabilities in XII plan
APD 0 0.9875 19.76 1977 10.2031 0.365 1.139 0.0729 0 4.6 3.7 0 20.08
1 0.9875 19.76 10.2031 0.365 1.139 0.0729 0 4.6 3.7 0 20.08
TOTAL 9 MJ, 28MD, 1ERM
11 IWM, 26 NA, 1Spl. Rep.
38 19UA, 19APD 3223.22 1924.14 9228.72 5616.25 777.40 679.09 642.97 915.039 1340.18 6028.9 2 16001.86
Source: Report of the Working Group on Major & Medium and Command Area Development for the XII Five Year Plan (2012‐17) MoWR
114

Appendix 1: Tables Table 14 (iv): Abstract of New Projects under Appraisal in CWC.
Sl no.
Name of States Major Medium Total A B Total A B Total A B Total
1 2 3 4 5 6 7 8 9 10 11 1 Andhra Pradesh 2 2 4 0 6 6 2 8 10 2 Arunachal Pradesh 0 0 0 0 0 0 0 0 0 3 Assam 0 0 0 1 0 1 1 0 1 4 Bihar 0 4 4 0 0 0 0 4 4 5 Chhattisgarh 0 1 1 0 0 0 0 1 1 6 Goa, Daman, Diu 0 0 0 0 0 0 0 0 0 7 Gujarat 0 1 1 0 0 0 0 1 1 8 Haryana 0 2 2 0 0 0 0 2 2 9 Himachal Pradesh 1 0 1 2 1 3 3 1 4 10 J & K 0 1 1 1 3 4 1 4 5 11 Jharkhand 0 3 3 0 0 0 0 3 3 12 Karnataka 2 2 4 1 0 1 3 2 5 13 Kerala 0 1 1 0 0 0 0 1 1 14 Madhya Pradesh 4 2 6 2 2 4 6 4 10 15 Maharashtra 5 3 8 14 3 17 19 6 25 16 Manipur 0 2 2 2 5 7 2 7 9 17 Meghalaya 0 0 0 0 0 0 0 0 0 18 Mizoram 0 0 0 0 0 0 0 0 0 19 Nagaland 0 0 0 0 0 0 0 0 0 20 Orissa 2 4 6 6 6 12 8 10 18 21 Punjab 0 3 3 0 1 1 0 4 4 22 Rajasthan 1 3 4 1 3 4 2 6 8 23 Sikkim 0 0 0 0 0 0 0 0 0 24 Tamil Nadu 1 0 1 0 0 0 1 0 1 25 Tripura 0 0 0 0 0 0 0 0 0 26 Uttar Pradesh 0 6 6 0 0 0 0 6 6 27 Uttarakhand 2 1 3 0 2 2 2 3 5 28 West Bengal 0 0 0 0 0 0 0 0 0 Grand Total 20 41 61 30 32 62 50 73 123
Source: Central Water Commission, PA (N), PAO
115

Appendix 1: Tables
Table 14 (v) : List of Projects Accepted By Advisory Committee of MoWR upto December 2012.
Sl no Meeting no
Date of meeting
Name of project State Major/Medium Estimated cost Rs. Cr
Price level Benefits in Ha./ MW
Date of approval by Planning Commission
1 2 3 4 5 6 7 8 9 10
1 113th 12.01.2012 Eastern Gandak Canal System (Gandak Phase‐II),
Bihar Mjajor‐New‐ ERM
1799.5 2011‐12 146,000 12/13.9.12
2 113th 12.01.2012 Udersthan Barrage & other Iner‐connected and Independent Schemes.
Bihar Major‐New‐ ERM
531.01 2011‐12 41,052 28.05.2012
3 113th 12.01.2012 Madhya Pradesh Water Sector Restructuring Project (MPWSRP)
Madhya Pradesh
New‐ERM 1919 2011.12 488,682 5/11/2012
4 113th 12.01.2012 Orissa Integrated Irrigated Agriculture and Water Management Investment Programme (OIIAWMIP)‐ Tranche‐II
Orissa New‐ERM 471.43 2010‐11 79,863
5 113th 12.01.2012 Rajgarh Medium Irrigation Project Rajasthan New‐Medium 192.13 (irrigation‐
140.46, drinking
water supply‐51.46)
2010‐11 8,568 21.09.2012
6 113th 12.01.2012 Bank Protection Works from Ismailpur to Bindtoli in downstream of Vikramshila Bridge on the left bank of river Ganga in Bhagalpur District.
Bihar Flood Control 23.39 2011‐12 90,215 (Population 150000 nos)
26.06.2012
7 113th 12.01.2012 Bagaha Town Protection Works Phase‐I on the left bank of river Gandak in west Champaran District
Bihar Flood Control 48.91 2011‐12 4000 (Population 100000 nos)
26.06.2012
8 113th 12.01.2012 Flood Protection Works along left and right banks of river Beas in Districts Gurdaspur, Hoshiarpur and kapurthala.
Punjab Flood Control 46.12 2009 1800 (Popualtion 225000)
5/22/2012
9 113th 12.01.2012 Purna Barrage (Ner Dhamana) Irrigation Project.(Revised)
Maharashtra
Medium Revised
617.46 2009‐10 7024 26.03.2012
Contd..
116

Appendix 1: Tables
Table 14 (v) : List of Projects Accepted By Advisory Committee of MoWR upto December 2012.
Sl no Meeting no
Date of meeting
Name of project State Major/Medium Estimated cost Rs. Cr
Price level Benefits in Ha./ MW
Date of approval by Planning Commission
10 114th 28.03.2012 Raising and Strengthening of Adhwara and Khiroi left embankment from RD 0.0 Km to RD 43.60 Km & from RD 44.00 Km to RD 90.50 Km. and Right embankment from RD 0.0 Km to RD 81.50 Km in Sitamarhi, Madhubani and Darbhanga districts of Bihar.
Bihar New‐ Flood Control
167.03 2011 141760 ha./Popuation 17,32,000 nos.
11 114th 28.03.2012 Improvement of embankment and ancillary works in Kandi and other adjoining areas of the districts of Murshidabad
West Bengal New‐ Flood Control
438.94 2011 51000 ha./ Ppulation5,00,000
nos.
13.06.2012
12 114th 28.03.2012 Construction of Mahadewa‐ uska embankment along right bank of river Kunra in Siddharthnagar district of Uttar Pradesh ( Scope Change)
Uttar Pradesh
Revised‐Flood Control
27.76 2008‐09 1924 ha./Population
16184 nos.
13 114th 28.03.2012 Construction of Balrampur‐Bhadaria embankment along right bank of river Rapti in Balrampur district of Uttar Pradesh
Uttar Pradesh
Revised‐Flood Control
25.61 2008‐09 14373 ha./Population
56000nos.
14 115th 24.07.2012 Andhra Pradesh Irrigation and Livelihood Improvement Project
Andhra Pradesh
Major ‐ ERM 1131.136 2010‐11 114,878
15 115th 24.07.2012 Restoration of Western Gandak Canal System, (Saran Main Canal &Its Distribution System)
Bihar New ‐ Major ‐ERM
2169.51 2011‐12 478,000
16 115th 24.07.2012 Minimata (Hasdeo) Bango Project Chhattisgarh Major ‐ ERM 492.31 2011‐12 45,116 restoration
17 115th 24.07.2012 Medium Irrigation Project to Nadaun Area in Tahsil ‐ Nadaun, District ‐ Hamirpur
Himachal Pradesh
Medium ‐New 97.59 Jul‐11 6,471
18 115th 24.07.2012 Mahuar Medium Irrigation Project Madhya Pradesh
New ‐ Medium 191.2707 2009 13,775
19 115th 24.07.2012 Bilgaon Irrigation Project Madhya Pradesh
New ‐ Medium 182.22 2009 12,285 14.12.2012
20 115th 24.07.2012 Thoubal Multipurpose Project Manipur Revised ‐ Major
1387.85 2011 33,387 12.09.2012
Contd..
117

Appendix 1: Tables
Table 14 (v) : List of Projects Accepted By Advisory Committee of MoWR upto December 2012.
Sl no Meeting no
Date of meeting
Name of project State Major/Medium Estimated cost Rs. Cr
Price level Benefits in Ha./ MW
Date of approval by Planning Commission
21 115th 24.07.2012 Khuga Multipurpose Project Manipur Revised‐ Medium
433.91 2011 14,755 19.09.2012
22 115th 24.07.2012 Dolaithabi Barrage Project Manipur Revised‐ Medium
360.05 2011 7,545 20.09.2012
23 115th 24.07.2012 Imphal Barrage Project Manipur ERM‐ Medium 16.8 2011 6,400
24 115th 24.07.2012 Sekmal Barrage Project Manipur ERM‐ Medium 10.2 2011 8,500
25 115th 24.07.2012 Revised Estimate of Rehabilitation of 1st Patiala Feeder & Kotla Branch with 20% enhanced capacity and changed value of "N"
Punjab Revised‐ Major 199.39 2011‐12 334,109
26 115th 24.07.2012 Construction of Lining of Tumaria‐ Bahalla & Naktiya Feeder
Uttarkhand ERM‐ Medium 11.2 2010‐11 7,890 restoaration 2,54 and
Add.creation10 ha
14.12.2012
27 116th 14.12.2012 Anti erosion works from km 0.650 of Retired bund ‐1 of Sakraur Bhikharipur Ring bund to km 13.600 of Main bund of Sakraur Bhikharipur along left bank of river Sarayu/Ghaghra in Gonda district
Uttar Pradesh
Flood Control . 41.51 2010 2,675 ha, Population 18430
28 116th 14.12.2012 Construction of Marginal Embankment upstream of Elgin bridge along right bank of river Ghaghra in the district of Barabanki
Uttar Pradesh
Flood Control . 170.08 2010 44,250 ha, Population 334680
29 116th 14.12.2012 Flood protection works along left benk of river Ghaghra in the disrict of Basti
Uttar Pradesh
Flood Control . 80.24 2010 24,743 ha, Population 496480
30 116th 14.12.2012 ERM of Malan Canal System Uttarakhand ERM‐ Medium 11.4 2010‐11 3984 ha (Restoration 753 ha
and Additional i 41 h )
31 116th 14.12.2012 Lakhwar Multipurpose project Uttarakhand Multipurpose 3966.51 2012 33,780
Source: Central Water Commission, PA(N),PAO
118

Appendix 1: Tables
Table 15: Physical Achievements of Field Channels (F.C.) under CAD Programme by State
(‘ 000 Hactare)
Sl. Name of Cummulative Achievement of of F.C. up to
end of Achievemnet During
Total XI Plan
Cumulative Achievement upto XI Plan (31.03.2012)
No. States VII Plan VIII Plan IX.Plan X.Plan XI Plan 1985-90 1992-97 1997-02 2002-07 2007-08 2008-09 2009-10 2010-11 2011-12
1 2 3 4 5 6 7 8 9 10 11 12 13 1 Andhra Pradesh 650.8 664.6 680.2 738.1 30.9 4.3 4.0 0.0 0.3 39.4 777.5 2 Arunachal Pradesh 0.0 0.0 1.0 9.0 9.1 0.0 1.2 0.3 0.8 11.5 20.4 3 Assam 38.4 54.1 56.1 56.6 0.0 0.0 2.0 1.4 1.5 4.9 61.5 4 Bihar 1220.9 1282.4 1297.3 1344.0 0.0 31.6 19.0 37.0 39.0 126.4 1470.5 5 Chattisgarh 0.0 0.0 1.5 51.3 40.7 27.7 29.0 29.0 27.9 154.3 205.6 6 Goa 5.3 10.3 10.4 10.4 1.0 0.0 0.9 0.6 0.5 3.0 13.4 7 Gujarat 766.1 852.0 889.9 1107.6 21.0 7.0 0.2 1.6 13.0 42.9 1150.4 8 Haryana 114.3 312.7 429.4 597.3 17.9 85.9 54.0 53.8 44.0 255.6 852.9 9 Himachal Pradesh 6.3 10.7 15.7 22.2 0.0 0.0 0.1 0.5 0.0 0.6 22.9
10 Jammu & Kashmir 27.4 55.5 77.9 98.3 6.0 10.2 9.7 14.8 16.7 57.4 155.7 11 Jharkhand 0.0 0.0 0.0 0.0 0.0 0.0 0.0 0.0 0.0 0.0 0.0 12 Karnataka 897.8 1043.0 1116.2 1485.5 36.8 26.5 12.1 21.9 17.4 114.8 1600.3 13 Kerala 46.2 153.7 174.1 182.3 0.4 0.5 0.1 0.2 0.2 1.4 183.7 14 Madhya Pradesh 833.5 995.8 1031.2 1073.1 9.5 9.5 10.3 10.2 22.4 62.0 1135.0 15 Maharashtra 889.2 1113.1 1223.9 1248.1 34.0 11.5 20.7 12.4 10.3 88.9 1337.0 16 Manipur 20.8 36.8 50.6 63.9 0.0 3.4 5.4 6.0 7.1 22.0 85.9 17 Meghalaya 0.0 1.0 1.1 2.2 0.0 0.0 0.0 0.1 0.3 0.4 2.5 18 Mizoram 0.0 0.0 0.1 0.9 0.0 0.0 0.0 0.0 0.1 0.1 0.9 19 Nagaland 0.0 0.0 2.0 3.7 0.0 0.0 0.0 0.0 0.1 0.1 3.8 20 Orissa 256.8 346.5 396.4 437.4 11.0 14.0 18.5 27.4 33.0 103.9 541.3 21 Punjab 0.0 0.0 222.7 351.5 38.3 59.8 56.2 54.7 42.5 251.4 603.0 22 Rajasthan 613.6 925.5 1177.2 1427.1 17.5 12.3 40.8 46.2 14.4 131.3 1558.4 23 Sikkim 0.0 0.0 0.1 0.2 0.0 0.0 0.0 0.0 0.0 0.0 0.2 24 Tamil Nadu 317.9 629.6 850.8 1041.7 20.4 20.8 18.6 23.8 26.4 110.0 1151.8
Contd...
119

Appendix 1: Tables
Table 15: Physical Achievements of Field Channels (F.C.) under CAD Programme by State
(‘ 000 Hactare)
Sl. Name of Cummulative Achievement of of F.C. up to
end of Achievemnet During
Total XI Plan
Cumulative Achievement upto XI Plan (31.03.2012)
No. States VII Plan VIII Plan IX.Plan X.Plan XI Plan 1985-90 1992-97 1997-02 2002-07 2007-08 2008-09 2009-10 2010-11 2011-12
1 2 3 4 5 6 7 8 9 10 11 12 13 25 Tripura 0.1 0.3 0.3 0.4 0.0 0.0 0.0 0.0 0.0 0.0 0.4 26 Uttar Pradesh 4378.0 5375.0 5936.0 6575.3 98.6 85.8 67.0 69.0 79.1 399.5 6974.9 27 Uttrakhand 0.0 0.0 0.0 4.9 0.0 0.5 6.6 0.0 0.0 7.0 11.9 28 West Bengal 55.3 90.1 112.5 135.5 1.6 18.6 8.2 1.9 60.6 90.9 226.4
Total 11138.7 13952.7 15754.6 18068.7 394.7 429.7 384.5 412.9 457.7 2079.5 20148.2 Source : Ministry of Water Resources (CAD Wing.) Remarks : 1. F.C.-Field Channels. 2. Total may not tally due to rounding off. Note: Figures for the year 2011-12 in respect of Assam & Manipur are provisional.
120

Appendix 1: Tables
Table 16: Physical Achievements of Field Drains under CAD Programme by State (‘ 000 Hectare)
Sl. No.
Name of States
Cumulative Achievement of Field Drains up to end of Achievement During Cumulative Achievement
upto 31.03.2011
VII Plan 1985-90
VIII Plan 1992-97
IX.Plan 1997-02
X.Plan 2002-07
2007-08
2008-09
2009-10
2010-11
TOTAL (four Years)
1 2 3 4 5 6 7 8 9 10 11 12
1 Andhra Pradesh 9.1 9.1 9.1 9.1 0.0 0.0 0.0 0.0 0.0 9.1 2 Arunachal Pradesh 0.0 0.0 0.7 6.9 0.4 0.3 0.0 0.0 0.7 7.6 3 Assam 11.6 21.0 21.8 22.1 0.0 0.0 0.0 0.0 0.0 22.1 4 Bihar 0.0 0.0 0.0 18.8 0.0 12.1 1.6 0.1 13.8 32.7 5 Chattisgarh 0.0 0.0 0.0 0.0 0.0 0.0 0.0 0.0 0.0 0.0 6 Goa 0.0 0.0 0.0 0.0 0.0 0.0 0.0 0.0 0.0 0.0 7 Gujarat 2.2 2.9 2.9 33.7 0.0 0.0 0.0 0.0 0.0 33.7 8 Haryana 0.0 0.0 0.0 24.3 0.0 1.5 15.4 0.0 17.0 41.3 9 Himachal Pradesh 0.0 0.6 2.3 6.0 0.0 0.0 0.0 0.0 0.0 6.0
10 Jammu & Kashmir 0.4 6.8 13.5 26.8 1.9 1.3 7.3 9.4 19.9 46.7 11 Jarkhand 0.0 0.0 0.0 0.0 0.0 0.0 0.0 0.0 0.0 0.0 12 Karnataka 8.1 27.6 37.8 69.9 3.2 18.4 30.9 29.7 82.1 152.1 13 Kerala 0.0 7.1 95.7 129.9 0.6 1.7 0.0 0.2 2.4 132.3 14 Madhya Pradesh 19.8 37.8 37.8 37.8 0.0 0.0 0.0 0.0 0.0 37.8 15 Maharashtra 165.8 292.4 392.5 439.0 0.0 0.0 17.1 4.4 21.6 460.6 16 Manipur 4.1 11.2 12.6 15.6 0.0 4.1 5.5 2.2 11.8 27.4 17 Meghalaya 0.0 0.0 0.0 0.0 0.0 0.0 0.0 0.0 0.0 0.0 18 Mizoram 0.0 0.0 0.1 1.0 0.0 0.0 0.0 0.0 0.0 1.0 19 Nagaland 0.0 5.8 7.8 11.0 0.0 0.0 0.0 0.0 0.0 11.0
Contd...
121

Appendix 1: Tables
Table 16: Physical Achievements of Field Drains under CAD Programme by State (‘ 000 Hectare)
Sl. No.
Name of States
Cumulative Achievement of Field Drains up to end of Achievement During Cumulative Achievement
upto 31.03.2011
VII Plan 1985-90
VIII Plan 1992-97
IX.Plan 1997-02
X.Plan 2002-07
2007-08
2008-09
2009-10
2010-11
TOTAL (four Years)
1 2 3 4 5 6 7 8 9 10 11 12
20 Orissa 31.3 96.1 114.4 133.6 1.8 3.4 0.6 8.8 14.6 148.2 21 Punjab 0.0 0.0 0.0 0.0 0.0 0.0 0.0 0.0 0.0 0.0 22 Rajasthan 9.2 16.3 35.0 42.8 1.4 0.0 0.0 0.5 1.9 44.8 23 Sikkim 0.0 0.0 0.1 0.1 0.0 0.0 0.0 0.0 0.0 0.1 24 Tamil Nadu 29.2 29.2 29.4 173.9 48.2 72.3 0.8 1.2 122.5 296.4 25 Tripura 0.1 0.1 0.1 0.1 0.0 0.0 0.0 0.0 0.0 0.1 26 Uttar Pradesh 133.1 209.0 310.7 562.4 12.2 14.4 14.8 2.1 43.5 605.9 27 Uttarakhand 0.0 0.0 0.0 0.5 0.0 0.0 0.0 0.0 0.0 0.5 28 West Bengal 0.0 0.0 0.0 0.0 0.0 0.0 0.0 0.0 0.0 0.0 Total 423.9 773.0 1124.3 1765.4 69.8 129.5 94.1 58.5 351.9 2117.3 Source : Ministry of Water Resources (CAD Wing)
Note : Totals may not tally due to rounding off.
122
Appendix 1: Tables
Table 17 : List of On-going Projects under CADWM Programme during the period of XI Plan (2007-08 To 2011-12) as on March, 2012
( ‘000 ha)
S. No. Project Name Districts benefitted Year of
Inclusion CCA CCA
Covered till 31.3.2012
Reported balance of executable
CCA 1 2 3 4 5 6 7 ANDHARA PRADESH
1 Sriramsagar Project Karimnagar, Adilabad, Warangal, Nizamabad, Khammam & Nalgonda 1974-75 411.000 393.941 17.059
2 Srisailam R.B.C Kurnool 1995-96 76.890 32.322 44.568 TOTAL 487.890 426.263 61.627 ARUNACHAL PRADESH
3 Cluster of 62 MI in 4 panchayats In the district of Papumpare Namely Sagalee, Megio, Balijan And Itanagar
Lower & Upper Dibang Valley, Lohit, Anjaw, Changlang, Tirap 2000-01 2.760 2.760 0.000
4 Cluster of 102 MI schemes under Daporijo and Itanagar Circle
Tawang, West Kameng, East Kameng, Papurm Pare, Lower Subansiri, Upper Subansiri, E/Siang, U/Sing W/Siang, Kurung Kumey.
2006-07 7.470 4.527 2.943
5 Cluster of 39 MI schemes under Namsai Circle Lower/Upper Dibang, Lohit Anjaw, Tirap 2006-07 3.340 2.164 1.176
TOTAL 13.570 9.451 4.119 ASSAM 6 Bordikarai Sonitpur 1992-93 16.990 0.410 16.580 7 Kaldiya Barpeta 1992-93 9.830 7.560 2.270 8 Dakadong Barpeta 1992-93 4.940 3.350 1.590 9 Pahumara Irrigation Barpeta 2010-11 9.259 1.000 8.259 TOTAL 41.019 12.320 28.699 BIHAR
10 Gandak Muzaffarpur, Vaishali, East. Champaran, Gopalganj, Siwan, saran, Samastipur
1974-75 960.000 622.819 337.181
11 Badua and Chandan Bhagalpur, banka, Munger 1974-75 106.380 70.115 36.265 Contd...
123

Appendix 1: Tables
Table 17 : List of On-going Projects under CADWM Programme during the period of XI Plan (2007-08 To 2011-12) as on March, 2012
( ‘000 ha)
S. No. Project Name Districts benefitted Year of
Inclusion CCA CCA
Covered till 31.3.2012
Reported balance of executable
CCA 1 2 3 4 5 6 7 12 Kiul Lakhisari, Shekhpura, Jamui 1991-92 22.260 16.635 5.625
13 Kosi Saharsa, Supaul, Madhupura, Purnia, Araria, Katihar, Darbhanga, Madhubani 1974-75 440.000 418.911 21.089
14 Sone Patna, Bhojpur, Buxar, Rohtas, Bhabhus, Aurangabad, Gaya, Jehanabad and arwal
1974-75 865.000 482.442 382.558
15 North Koel Project Aurangabad, Gaya 1991-92 123.000 7.391 115.609 TOTAL 2516.640 1618.313 898.327 CHHATISGARH
16 Ballar Raipur 1985-86 6.550 4.362 2.188 17 Mahanadi, Tandula, Jonk and Kodar Dhamtari, Raipur, Durg, Mahasamund 1983-84 497.659 231.503 266.156 18 Hasdeo Phase-2 Korba, Raigarh, Janjgir-Champa 2003-04 168.000 105.291 62.709 19 Khapri Irrigation Project Durg 2011-12 4.588 0.000 4.588 TOTAL 676.797 341.156 335.641 GUJARAT
20 Sardar Sarovar Phase –I Vadodara, Bharuch, Narmada, Panchmahal 2003-04 446.610 277.836 168.774
TOTAL 446.610 277.836 168.774 GOA
21 Tillari Talukas, Bicholim, Bardez 2007-08 14.521 3.847 10.674 TOTAL 14.521 3.847 10.674
HARYANA
22 Bhakra canal Project Phase - II Hisar, Siras, Fatehbad, ambala, Kurukshetra, kaithal, Karnal & Jind. 2009-10 351.853 94.530 257.323
Contd...
124

Appendix 1: Tables
Table 17 : List of On-going Projects under CADWM Programme during the period of XI Plan (2007-08 To 2011-12) as on March, 2012
( ‘000 ha)
S. No. Project Name Districts benefitted Year of
Inclusion CCA CCA
Covered till 31.3.2012
Reported balance of executable
CCA 1 2 3 4 5 6 7
23 Western Yamuna canal Phase -VI Rothak, Jhajjar, Sonepat, Jind, Bhiwani, Hisar, Gurgaon & Panipat. 2007-08 205.600 70.145 135.455
24 JLN Canal Phase-II Jhajjar, Rewari, Mahandergarh, Bhiwani & Gurgaon. 2007-08 99.383 6.564 92.819
TOTAL 656.836 171.239 485.597 HIMACHAL PRADESH
25 Cluster of 40 MI schemes in Drang & Sadar block of Dist. Mandi. Mandi 2003-04 1.377 1.300 0.077
26 Cluster of 38 MI schemes in pandonga haroli saloh area in Tehsil Una of Dist. Una. Una 2003-04 1.468 1.108 0.360
27 Cluster of 42 MI schemes in Tehsil Sarkaghat District Mandi Mandi 2003-04 1.087 0.870 0.217
28 Cluster of 27 MI schemes in Nallagarh area of District Solan Solan 2003-04 2.209 0.260 1.949
29 Cluster of 12 MI schemes in Rampur block of District Shimla Shimla 2003-04 0.766 0.232 0.534
30 Cluster of various MI schemes in Paonta & Shillai Tehsil in Distt. Sirmour Sirmur 2007-08 2.342 0.000 2.342
31 Shah Nahar Project Kangra 2011-12 15.287 0.000 15.287 TOTAL 24.536 4.258 20.278 JAMMU & KASHMIR
32 Ego-Phey Canal Leh 1987-88 3.000 0.873 2.127 33 Dachnipora-Rajpora Anantnag, Pulwama 2007-08 12.526 6.437 6.089 34 Ahaji Beerua Budgam 2008-09 8.813 2.450 6.363 35 Ganderbal Ganderbal, Srinagar 2011-12 6.892 0.097 6.795 36 Ranbir Canal Jammu 2006-07 38.600 22.552 16.048
Contd...
125

Appendix 1: Tables
Table 17 : List of On-going Projects under CADWM Programme during the period of XI Plan (2007-08 To 2011-12) as on March, 2012
( ‘000 ha)
S. No. Project Name Districts benefitted Year of
Inclusion CCA CCA
Covered till 31.3.2012
Reported balance of executable
CCA 1 2 3 4 5 6 7 37 Dehgam Veernag Anantnag, Kulgam 2006-07 2.934 2.584 0.350 38 Tongri Canal Shopian and Kulgam 2010-11 4.064 0.752 3.312 39 Zainegeer canal (Kashmir CADA) Baramulla , Bandipora 2003-04 5.100 4.544 0.556 40 Sonawari Baramulla and Bandipura 2010-11 20.370 0.752 19.618 41 Kathua canal Command (Jammu CADA) Proposed for closure 2003-04 8.463 4.627 3.836 42 Arin-Bandipora Bandipora 2007-08 2.860 2.116 0.744 43 Khemil-Kupwara Kupwara 2007-08 7.300 2.526 4.774 44 Doda-Sangaldhan Gool-Rajouri Cluster Doda, Rajouri, Ramban 2007-08 4.177 4.235 0.000 45 Ferozpora Tangmarg Project of Kashmir Command Baramulla 2009-10 9.644 2.057 7.587 46 New Partap Canal Project of Jammu Command Jammu 2010-11 9.028 0.595 8.433 47 Vaishow Command Project Pulwama, Ahopian and Kulgam 2011-12 13.738 0.089 13.649 48 Kargil Projects Kargil 2011-12 12.000 0.097 11.903 49 Uri-Narvaw Project Baramulla 2011-12 6.770 0.682 6.088 TOTAL 176.279 58.065 118.272 JHARKHAND
50 Kanchi Weir Scheme 2003-04 17.800 0.000 17.800 51 Mayurakshi Left Bank Canal System 2003-04 9.500 0.000 9.500 TOTAL 27.300 0.000 27.300 KARNATAKA
52 Ghataprabha Belgaum and Bagalakote 1974-75 317.430 259.608 57.822
53 Malaparaba Dharwad, Belgaum, Gadag, Bagalakote 1974-75 214.980 193.588 21.392
54 Tungbhadra Koppal & Raichur, Bellary 1974-75 529.000 354.615 174.385
55 Upper Krishna Gulbarga, Yadgiri, Bagalkot, Bijapur, raichur 1974-75 622.000 567.297 54.703
56 Bhadra Reservoir Chikmagalur, Shimoga and Davanagree 1996-97 105.570 92.196 13.374 Contd...
126

Appendix 1: Tables
Table 17 : List of On-going Projects under CADWM Programme during the period of XI Plan (2007-08 To 2011-12) as on March, 2012
( ‘000 ha)
S. No. Project Name Districts benefitted Year of
Inclusion CCA CCA
Covered till 31.3.2012
Reported balance of executable
CCA 1 2 3 4 5 6 7 57 Amarja Gulbarga 2003-04 8.903 0.035 8.868 58 Bennithora Cittapur Taluka, Gulbarga 2003-04 20.234 18.891 1.343 59 Karanja Irrigation Project Bidar 2009-10 35.614 20.922 14.692 60 Upper Mullamari Bidar 2010-11 3.279 0.000 3.279 61 Gandorinala Gulbarga 2010-11 8.094 6.246 1.848 62 Lower Mullamari Gulbarga 2010-11 9.713 2.283 7.430 63 Chulkinala Gulbarga 2010-11 4.047 0.000 4.047 TOTAL 1878.864 1515.681 363.183 KERALA
64 Kallada Kollam, Pathanamthitta, Alappuzha 2006-07 53.514 0.225 53.289 65 Muvattupuzha Valley Irrigation Project Idukki, Ernakulam, Kottayam 2009-10 19.237 0.000 19.237 66 Kanhirapuzha Palakkad 1998-99 9.720 7.434 2.286 67 Pazhassi Kannur 1998-99 11.530 1.882 9.648 TOTAL 94.001 9.541 84.460 MADHYA PRADESH
68 Kolar Sehore 1985-86 45.000 11.354 33.646 69 Rani Avanti Bai( Bargi) Jabalpur, Narsinghpur 1990-91 157.000 33.967 123.033 70 Upper Wainganga Seoni 1985-86 112.900 103.007 9.893 71 Bagh Balaghat 1985-86 16.600 16.412 0.188 72 Harsi Gwalior 1985-86 44.354 41.979 2.375 73 Kunwar Chain Sagar (dudhi) Rajgarh 2003-04 3.700 3.136 0.564
74 Rajghat Canal Project Ashok Nagar, Shivpuri, Tikamgarh, Datia, Bhind 2010-11 164.789 0.388 164.401
75 Bariyarpur Left Bank Canal Chhatarpur 2011-12 46.682 0.000 46.682 76 Bansagar Project Rewa, Satna, Sidhi and Shahdol 2011-12 154.687 0.000 154.687 TOTAL 745.712 220.478 525.234
Contd...
127

Appendix 1: Tables
Table 17 : List of On-going Projects under CADWM Programme during the period of XI Plan (2007-08 To 2011-12) as on March, 2012
( ‘000 ha)
S. No. Project Name Districts benefitted Year of
Inclusion CCA CCA
Covered till 31.3.2012
Reported balance of executable
CCA 1 2 3 4 5 6 7 MAHARASHTRA
77 Khadakwasla * Pune 1983-84 77.680 46.457 31.223 78 Kukadi 1979-80 132.000 138.361 0.000 79 Surya ** 1983-84 14.700 1.100 13.600 80 Krishna 1974-75 74.000 72.939 1.061 81 Chaskaman Pune 1996-97 43.420 34.774 8.646 82 Upper Penganga Nanded, Hingoli, Yeotmal 1974-75 104.000 83.076 20.924 83 Lower Wunna Nagpur, Wardha 1996-97 21.594 17.475 4.119 84 Bhima Solapur 1974-75 126.000 113.783 12.217 85 Nandur Madhumeshwar Canal Project Ahmednagar, Aurangabad 2009-10 52.864 11.198 41.666 86 Dhombalkawadi Irr.Project Pune and Satara 2010-11 28.100 1.165 26.935 TOTAL 674.358 520.328 160.391
* Approved In XVIII meeting of IMSC for deletion. The state govt has, however, requested for continuation of this project and delete upper wandha project, on which 63.46 th. ha. CCA is get to be covered. ** Approved In XVIII meeting of IMSC for fore elosore. Formal request with details awaited from state government.
MANIPUR 87 cluster of 21 MI scheme in Bishnupur District Bishnupur 2007-08 9.600 6.539 3.061
88 Cluster of 37 MI scheme in Thoubal,Ukhrul, Chandel and Churachandpur district Thoubal, Uhrul and Churachandpur 2007-08 6.420 4.754 1.666
89 Cluster of 28 MI scheme in East and West Districts of Imphal Imphal West, Imphal East 2007-08 6.665 5.743 0.922
90 Khuga Multipupose Project Churachandpur 2010-11 9.575 3.317 6.258 91 Thoubal Irrigation Project, Ph-II Thoubal 2010-11 2.485 1.900 0.585 TOTAL 34.745 28.292 6.453 MEGHALAYA
92 Cluster of 10 MI schemes viz. Tienglam and Pdem etc. 2001-02 2.440 1.354 1.086
Contd...
128

Appendix 1: Tables
Table 17 : List of On-going Projects under CADWM Programme during the period of XI Plan (2007-08 To 2011-12) as on March, 2012
( ‘000 ha)
S. No. Project Name Districts benefitted Year of
Inclusion CCA CCA
Covered till 31.3.2012
Reported balance of executable
CCA 1 2 3 4 5 6 7
93 Cluster of 6 MI schemes -Kynrut, Phudumjer, Nongtraw, Kharukol, Nekora, Madan Umtheid
West khasi Hills, Ri-Bhoi, South Garo Hills 2010-11 0.380 0.371 0.009
TOTAL 2.820 1.725 1.095 MIZORAM
94 Cluster of 5 Minor Irrigation projects Aizawl, Champai 2011-12 0.222 0.000 0.222
95 Cluster of 60MI Schemes Phase-II I Aizawl, Lunget and Chhimtuipui District 2003-04 3.040 0.000 3.040
TOTAL 3.262 0.000 3.262 NAGALAND
96 Cluster of 13 Minor Irrigation Projects at Changki Valley Mokokchung 2011-12 1.080 0.000 1.080 TOTAL 1.080 0.000 1.080 ORISSA
97 Sunie Irrigation Project Mayurganj, Balasore 2009-10 10.000 5.850 4.150 98 Jaimangla Ganjam 1998-99 7.350 2.352 4.998
99 Hirakud Sambalpur, Badgarh, Bolangir, Subaranpur 1974-75 153.240 145.555 7.685
100 Rengali Irrigation Project, LBC-I & LBC-II Phase-I Angul, Dhenkanal, 2011-12 41.333 0.000 41.333
101 Mahanadi delta 1974-75 Puri, Khurda, Cuttack, Jajpur, Kendrapara, Jagatsinghpur 1974-75 336.300 30.079 306.221
102 Rushikulya Ganjam 1994-95 61.230 17.995 43.235 103 Salandi Right Bhadrak, Keonjhar 1994-95 40.180 12.037 28.143 104 Baitarani Bhadra, Jajpur 1998-99 32.770 9.395 23.375 105 Potteru Malkangiri 1985-86 70.100 17.763 52.337 106 Upper Kolab Koraput 2003-04 47.200 19.808 27.392 107 Gohira Irrigation Project Deogarh 2009-10 9.172 5.600 3.572 108 Upper Indrawati Major Irrigation Project Kalahandi 2009-10 128.000 5.441 122.559 109 Remal Irrigation Project Keonjhar 2009-10 4.313 3.313 1.000
TOTAL 941.188 275.188 666.000 Contd...
129

Appendix 1: Tables
Table 17 : List of On-going Projects under CADWM Programme during the period of XI Plan (2007-08 To 2011-12) as on March, 2012
( ‘000 ha)
S. No. Project Name Districts benefitted Year of
Inclusion CCA CCA
Covered till 31.3.2012
Reported balance of executable
CCA 1 2 3 4 5 6 7
PUNJAB
110 Bhatinda Br Part-II Ludhiana, Barnala, Bathinda & Muktsar 2008-09 181.707 66.941 114.766
111 Upper Bari Doab Canal Command Guraspur, Amritsar, & Taran Taran 2003-04 184.861 33.504 151.357 112 Sirhind Feeder Part-II Command Project Ferozpur, faridkot & Muktsar. 2007-08 314.496 128.573 185.923
TOTAL 681.064 229.018 452.046 RAJASTHAN
113 Chambal Kota, Bundi, baran 1974-75 229.000 120.578 108.422
114 Amar Singh Sub-Branch and Jassana district of Bhakra canal System. Hanumangarh 1998-99 67.210 31.738 35.472
115 Sidhmukh Nohar Hanumangarh, Churu 2003-04 111.460 98.310 13.150 116 Bisalpur Project Tonk, Deoli, Todarisng, Uniyara 2005-06 81.800 31.605 50.195 117 Gang Canal Sriganganagar 2010-11 183.201 0.000 183.201
TOTAL 672.671 282.231 390.440 SIKKIM
118 A Cluster of 17 Minor irrigation of North and East district of Sikkim 2000-01 1.030 0.000 1.030
119 A Cluster of 21 MI Schemes of South & West district of Sikkim 2000-01 1.220 0.107 1.113
TOTAL 2.250 0.107 2.143 TAMIL NADU
120 Wellington Reservoir Cuddalore 2008-09 11.153 9.650 1.503 121 Kalingarayan Anicut Erode 2011-12 4.800 0.000 4.800
Contd... 122 Gundar-Chittar-Karuppanadi Tirunelveli 2008-09 15.000 15.002 0.000 123 Kodiveri Anicut Erode 2008-09 9.916 8.884 1.032 124 Thirukoilur Anicut Villupuram 2008-09 9.783 9.466 0.317 125 Varadhamanadhi reservoir Dindigul 2011-12 2.323 0.000 2.323
130

Appendix 1: Tables
Table 17 : List of On-going Projects under CADWM Programme during the period of XI Plan (2007-08 To 2011-12) as on March, 2012
( ‘000 ha)
S. No. Project Name Districts benefitted Year of
Inclusion CCA CCA
Covered till 31.3.2012
Reported balance of executable
CCA 1 2 3 4 5 6 7
126 Vaigai Project Maduri, Sivagangai, Ramnathapuram 2010-11 50.188 22.486 27.702 127 Kodaganar Project (DPAP criteria) Dindigul, Karur 2010-11 4.117 2.748 1.369
TOTAL 107.280 68.236 39.046 TRIPURA
128 Cluster of 4 MI Projects 2003-04 0.440 0.216 0.224 TOTAL 0.440 0.216 0.224 UTTAR PRADESH
129 Sharda Shayak Canal System p-II
Lakhimpur Khiri, Sitapur, Barabanki, Lucknow, Raebareli, Pratapgarh, Sultanpur, Faizabad, Ambednagar, Jaunpur, Azamgarh, Mao, Allahabad, Varanasi, Gazipur, Balia.
2009-10 330.000 46.012 283.988
130 Tumaria dam canal System Allahabad 2000-01 64.010 23.010 41.000
131 Sarda Canal Project Bareilly, Pilibhit, Shahjahanpur, Hardoi, Unnao, Raebareilly, Kheri, sitapur, Lucknow, Barabanki
1989-90 1613.000 925.982 687.018
132 East Ganga Canal Bijnor, Jyotiba Fule Nagar 1990-91 233.000 76.510 156.490 133 Lower Rajghat Lalitpur 2009-10 43.210 18.700 24.510 134 Betwa & Gursarai Canal Jhansi, Jaloun, Hamirpur 1990-91 422.000 271.190 150.810 135 Ken Canal System Banda 1990-91 222.000 109.410 112.590 136 Belan Pump Canal System Allahabad 1997-98 71.050 43.920 27.130 137 Tons Pump Canal System Allahabad 1997-98 34.000 27.560 6.440 138 Jakhloun Pump Canal System Lalitpur 2009-10 29.870 18.470 11.400 139 Son Pump Canal System 1997-98 93.650 48.600 45.050
Contd...
131

Appendix 1: Tables
Table 17 : List of On-going Projects under CADWM Programme during the period of XI Plan (2007-08 To 2011-12) as on March, 2012
( ‘000 ha)
S. No. Project Name Districts benefitted Year of
Inclusion CCA CCA
Covered till 31.3.2012
Reported balance of executable
CCA 1 2 3 4 5 6 7
140 Saryu Canal System Phase-II Bahraich, Gonda, Sidharth Nagar, Basti, Gorakkpur, Santkabirnagar, Balrampur, Sravasti
2009-10 280.000 24.316 255.684
141 Upper Ganga Canal Manda, Meja, Korawan, Urua 1990-91 457.000 363.510 93.490 142 Madhya Ganga Canal Allahabad 1990-91 229.000 77.340 151.660 143 Sirsi dam Project Allahabad, Mirzapur 2010-11 44.880 0.600 44.280
TOTAL 4166.670 2075.130 2091.540 UTTARAKHAND
144 Laster Canal's Offshoots 2001-02 1.120 0.000 1.120 145 Nathuwala & Balawala Canals 2001-02 1.120 1.605 0.000 146 Jatowala & Prateetpurcanal 2001-02 0.540 0.262 0.278 147 Tumaria Dam canal system 2003-04 32.530 2.094 30.436
TOTAL 35.310 3.961 31.834 WEST BENGAL
148 D.V.C System Burdwan, Hooghly, Bankura, Howrah 1974-75 391.970 73.647 318.323 149 Kangsabati Bankura, Midnapur, Hooghly 1974-75 340.750 91.671 249.079 150 Mayurakshi Birbhum, Murshidabad, Burdwan 1974-75 226.630 45.128 181.502
151 Teesta Barrage Jalpaiguri, Darjeeling, Uttar Dinajpur, Cooch Behar, Malda 1983-84 165.000 4.861 160.139
Total= 1124.350 215.307 909.043 G.Total= 16248.06 8368.19 7886.78
Source : Ministry of Water Resources (CAD Wing) Note : CCA - Cultural Command Area.
132

Appendix 1: Tables
Table 18: Plan-wise Financial Expenditure on Irrigation in India (Rs. Crores)
Sl. No. Period
Major &
Medium
Minor Command Area
Deveopment
Major, Medium, Minor and CAD Total Plan
Expenditure in All
Sectors
Percentage of Expend
on Irrigation to Total
State Institu- tional Total Total Cumul-
ative
Average per year
1 2 3 4 5 6 7 8 9 10 11 12 1. First Plan(1951-56) 376.2 65.6 NEG. 65.6 - 441.8 441.8 88.4 1960 23
2. Second Plan(1956-61) 380.0 142.2 19.4 161.6 - 541.6 983.4 108.3 4672 12
3. Third Plan(1961-66) 576.0 326.1 115.4 441.5 - 1017.5 2000.9 203.5 8577 12 4. Annual Plans(1966-69) 429.8 321.3 234.7 556.0 - 985.9 2986.7 328.6 6625 15 5. Fourth Plan(1969-74) 1242.3 506.2 661.1 1167.3 - 2409.6 5396.3 481.9 15779 15 6. Fifth Plan(1974-78) 2516.2 627.5 798.8 1426.3 147.6 4090.1 9486.4 1022.5 28653 14 7. Annual Plans(1978-80) 2078.6 496.2 480.4 976.6 215.3 3270.5 12756.9 1635.3 22950 14 8. Sixth Plan(1980-85) 7368.8 1979.3 1437.6 3416.8 743.1 11528.7 24285.6 2305.8 109292 11 9. Seventh Plan(1985-90) 11107.3 3131.9 3061.0 6192.9 1447.5 18747.7 43033.2 3749.5 218730 9 10. Annual Plan(1990-91) 2634.8 812.2 675.6 1487.8 285.6 4408.2 47441.5 4408.2 58369 8
11. Annual Plan(1991-92) 2824.0 844.1 674.0 1518.1 333.8 4675.9 52117.4 4675.9 64751 7 12. Eighth Plan (1992-97) 21669.2 6230.6 4241.8 10472.4 1937.9 34079.5 86196.9 6815.9 485457 7
13 Ninth Plan (1997-2002) 49289.6 8635.0 2661.7 11296.7 2222.8 62809.1 149006.0 12561.8 859200 7
14 Tenth Plan (2002 - 2007) 83647.1 13924.3 3257.4 17181.7 2534.8 103363.6 252369.7 20672.7 1525639 7
15 Eleventh Plan (2007 - 2012)
(a) Actual Expenditure (2007-2008) 29390.6 4449.9 435.2 4885.1 1070.3 35346.0 287715.7 35346.0 371569 10
(b) Actual Expenditure (2008-2009) 32341.8 5770.8 545.9 6316.7 572.4 39230.8 39230.8 39230.8 477236 8
Contd... 133
Appendix 1: Tables
Table 18: Plan-wise Financial Expenditure on Irrigation in India (Rs. Crores)
Sl. No. Period
Major &
Medium
Minor Command Area
Deveopment
Major, Medium, Minor and CAD Total Plan
Expenditure in All
Sectors
Percentage of Expend
on Irrigation to Total
State Institu- tional Total Total Cumul-
ative
Average per year
1 2 3 4 5 6 7 8 9 10 11 12
(c) Actual Expenditure (2009-2010) 33168.8 7038.1 496.8 7534.9 702.9 41406.5 80637.4 41406.5 529024 8
(d) Revi. Approved Outlay (2010-2011) 34310.1 8241.0 920.3 9161.3 970.5 44441.9 125079.3 44441.9 688816 6
(e) Approved Outlay (2011-12) 45262.0 12106.6 660.5 12767.1 1605.7 59634.8 184714.0 59634.8 822009 7
Source: 1. Ministry of Water Resources, Minor Irrigation Division (for Column 5), 2. Annual Plan Document of Planning Commission (for Column-3, 4& 7). 3. Economic Survey 2011-12(for Column-11) Totals may not tally due to rounding off.
134

Appendix 1: Tables
Table 19: Plan-wise Financial Expenditure on Irrigation in India (at 1993-94 prices)
(Rs.Crores)
Sl. No. Period
Major &
Medium
Minor Command
Area Development
Major, Medium, Minor and CAD Total Plan
Expenditure in All
Sectors
Percentage of Expend on
Irrigation to Total State Institu-
tional Total Total Cumul- ative
Average per year
1 2 3 4 5 6 7 8 9 10 11 12
1. First Plan(1951-56) 5824.1 1015.8 NEG. 1015.8 - 6839.6 6839.0 1368.0 30340.6 23 2. Second Plan(1956-61) 5277.8 1975.4 268.8 2244.2 - 7521.9 13658.1 1504.4 64888.9 12
3. Third Plan(1961-66) 6414.3 3631.4 1284.7 4916.1 - 11330.4 22281.2 2266.1 95512.2 12
4. Annual Plans(1966-69) 3376.4 2524.0 1844.0 4367.9 - 7744.3 23461.9 2581.3 52042.4 15
5. Fourth Plan(1969-74) 7783.8 3171.7 4142.0 7313.7 - 15097.5 33811.2 3019.4 98865.9 15
6. Fifth Plan(1974-78) 9886.8 2465.6 3138.7 5604.3 580.0 16071.1 37274.5 4017.7 112585.5 14
7. Annual Plans(1978-80) 7192.3 1717.0 1662.3 3379.2 745.1 11316.6 44141.4 5658.5 79411.8 14
8. Sixth Plan(1980-85) 17330.3 4654.9 3380.9 8035.8 1747.5 27113.6 57115.6 5422.9 257036.7 11
9. Seventh Plan(1985-90) 18980.3 5351.8 5230.6 10582.5 2473.5 32036.3 73535.9 6407.2 373769.7 9
10. Annual Plan(1990-91) 3575.1 1102.0 916.7 2018.7 387.5 5981.3 64371.0 5981.3 79198.1 8
Contd...
135

Appendix 1: Tables
Table 19: Plan-wise Financial Expenditure on Irrigation in India (at 1993-94 prices)
(Rs.Crores)
Sl. No. Period
Major &
Medium
Minor Command
Area Development
Major, Medium, Minor and CAD Total Plan
Expenditure in All
Sectors
Percentage of Expend on
Irrigation to Total State Institu-
tional Total Total Cumul- ative
Average per year
1 2 3 4 5 6 7 8 9 10 11 12
11. Annual Plan(1991-92) 3365.9 1006.1 803.3 1809.5 397.9 5573.2 62118.5 5573.2 77176.4 7
12. Eighth Plan (1992-97) 19567.6 5626.3 3830.4 9456.7 1750.0 30774.3 77837.2 6154.9 438375.7 7 13 Ninth Plan (1997-2002) 33493.9 5867.8 1808.7 7676.5 1510.5 42680.8 101254.4 8536.2 583854.3 7 14 Tenth Plan (2002 - 2007) 44884.7 7471.7 1747.9 9219.7 1360.2 55464.5 135420.5 11092.9 818651.5 7
15 Eleventh Plan (2007 - 2012) 13625.7 2063.0 201.8 2264.8 496.2 16386.7 133387.0 16386.6 172261.9 10 (a) Actual Expenditure (2007-2008)
(b) Actual Expenditure (2008-2009) 13827.2 2467.2 233.4 2700.6 244.7 16772.5 16772.5 16772.5 204034.2 8
(c) Actual Expenditure (2009-2010) 13655.3 2897.5 204.5 3102.0 289.4 17046.7 33197.8 17046.7 217795.0 8
Source: 1. Ministry of Water Resources, Minor Irrigation Division (for Column 5), 2. Annual Plan Document of Planning Commission (for Column-3,4& 7). 3. Economic Survey 2011-12(for Column-11)
Totals may not tally due to rounding off. Note : (All India WPI (Base 1993-94=100) has been used as deflator)
136

Appendix 1: Tables
Table 20 : State-wise and Plan-wise Financial Expenditure on Major and Medium Irrigation
(Rs.Crores)
Sl. Name of the Ninth Tenth Actual Actual Actual Revised Appoved No. State/Uts. Plan Plan Expenditure Expenditure Expenditure Appoved Outlay
Outlay
(1997-02)
(2002-07) (2007-08) (2008-09) (2009-10)
(2010-11) (2011-12)
1 2 3 4 5 6 7 8 9
1 Andhra Pradesh 4045.8 20434.2 11285.5 8097.9 10488.1 9072.3 12054.5
2 Arunachal Pradesh 1.7 2.2 0.5 0.5 0.0 0.6 0.7
3 Assam 213.0 106.2 23.3 80.9 90.5 36.2 151.6
4 Bihar 1621.9 1597.3 559.2 519.9 514.5 561.8 984.9
5 Chhatisgarh 160.6 1503.4 444.4 586.7 850.5 720.1** 1253.8
6 Goa 224.2 571.5 118.2 117.5 88.6 107.2** 110.7
7 Gujarat 5298.4 10496.2 4020.4 6907.6 4299.7 4560.1** 8080.1
8 Haryana 1154.4 1297.8 662.6 705.2 669.7 575.0** 600.0
9 Himachal Pradesh 65.1 153.9 96.0 80.0 85.1 62.0 101.8
10 Jammu & Kashmir 128.5 262.1 49.9 62.1 118.0* 101.8** 125.8
11 Jharkhad 167.0 1248.2 694.5 322.9 215.4 408.0 886.3
12 Karnataka 8700.5 16505.4 2058.4 2020.9 2939.4 3600.0 5434.0
13 Kerala 703.3 672.0 121.7 117.2 82.2 218.0 271.1
14 Madhya Pradesh 2203.7 5429.3 1941.1 1691.5 1652.3 2042.7** 2323.4
15 Maharashtra 14807.3 10313.3 2982.5 6196.1 6278.7 6985.3** 6113.0
16 Manipur 171.7 229.8 107.4 40.7 126.6 275.2 262.3
17 Meghalaya 10.7 2.8 0.0 0.0 0.0 0.2** 23.6
18 Mizoram 0.1 0.1 0.0 0.0 0.0 0.0 0.0
19 Nagaland 0.9 0.1 0.1 0.1 0.2 0.0 0.0
20 Orissa 2331.2 2388.6 1298.4 1283.4 1182.8 1189.1 1310.0
21 Punjab 334.9 500.4 91.8 77.3 78.2 187.3 503.6
22 Rajasthan 1725.1 3028.8 595.3 586.6 569.8 447.5 609.9
23 Sikkim 2.2 0.0 0.0 0.0 0.0 0.0** 0.0
Contd...
137

Appendix 1: Tables
Table 20 : State-wise and Plan-wise Financial Expenditure on Major and Medium Irrigation
(Rs.Crores)
Sl. Name of the Ninth Tenth Actual Actual Actual Revised Appoved No. State/Uts. Plan Plan Expenditure Expenditure Expenditure Appoved Outlay
Outlay
(1997-02)
(2002-07) (2007-08) (2008-09) (2009-10)
(2010-11) (2011-12)
1 2 3 4 5 6 7 8 9
24 Tamil Nadu 1218.5 1091.0 220.4 384.1 644.3 324.4 370.9
25 Tripura 32.4 41.7 6.1 9.7 15.6 58.8 38.2
26 Uttar Pradesh 3014.7 4876.1 1695.2 1971.1 1609.0 1831.7 1920.0
27 Uttarakhand 61.0 316.9 127.8 216.3 310.3 399.7** 290.5
28 West Bengal 667.8 293.1 98.3 118.9 87.5 362.7** 1160.0 Total for States 49066.7 83361.9 29298.7 32194.9 32996.7 34127.5 44980.3 Total for U.Ts. 4.2 4.0 0.1 1.1 2.6 1.1** 4.6 Total States & U.Ts. 49070.9 83365.9 29298.8 32196.0 32999.3 34128.6 44984.9 Central Sector 218.7 281.2 91.8 145.8 169.5 181.5 277.1 GRAND TOTAL 49289.6 83647.1 29390.6 32341.8 33168.8 34310.1 45262.0
Source : Planning Commission Remarks : Totals may not tally due to rounding off. * :Revised Approved Outlay.** : Approved Outlay.
138

Appendix 1: Tables
Table 21: State-wise and Plan-wise Financial Expenditure on Minor Irrigation - State Sector
(Rs.Crores)
Sl. State/U.ts. Ninth Tenth Actual Actual Actual Revised Approved No. Plan Plan Expenditure Expenditure Expenditure Approved Outlay
Outlay
(1997-
02) (2002-
07) (2007-08) (2008-09) (2009-10) (2010-11) (2011-12) 1 2 3 4 5 6 7 8 9 1. Andhra Pradesh 976.3 1742.2 661.1 684.4 954.6 1681.4 2563.6 2. Arunachal Pradesh 94.6 142.8 58.7 70.1 70.2 113.9 74.1 3. Assam 382.2 145.6 9.9 144.1 370.3 431.0 192.5 4. Bihar 231.6 825.1 109.7 80.9 78.4 64.9 255.5 5 Chattisgarh 71.5 972.3 509.0 296.1 154.3 69.9** 758.4 6 Goa 26.7 99.5 31.5 39.2 39.3 60.0** 69.1 7 Gujarat 933.3 1638.6 697.9 875.1 1016.9 986.5** 1140.5 8 Haryana 200.9 0.0 0.0 0.0 0.0 0.0** 0.0 9 Himachal Pradesh 232.7 327.7 89.2 140.4 130.4 141.5 161.9
10 Jammu & Kashmir 142.9 275.6 59.0 113.7 196.1* 152.3** 209.8 11 Jharkhand 39.3 199.8 102.5 77.2 46.5 50.0** 648.7 12 Karnataka 459.0 987.9 362.0 591.3 551.9 787.6 956.8 13 Kerala 225.8 113.7 28.8 34.1 37.0 78.2 75.3 14 Madhya Pradesh 746.3 1222.5 130.1 540.2 627.8 691.7** 694.0 15 Maharashtra 1348.6 1560.3 114.8 463.9 895.5 809.7** 1200.0 16 Manipur 30.1 197.7 57.3 3.9 50.3 63.4 63.4 17 Meghalaya 34.2 33.7 11.9 40.8 43.1 86.0** 101.6 18 Mizoram 26.3 85.1 33.1 66.4 48.0 59.4 78.4 19 Nagaland 25.3 57.5 45.5 49.7 74.0 143.3 141.6 20 Orissa 435.7 403.1 175.7 180.8 228.8 256.0 592.4 21 Punjab 189.0 185.0 60.9 145.9 202.9 169.9 140.3 22 Rajasthan 259.5 505.5 225.9 176.2 144.3 144.3 257.0 23 Sikkim 19.4 21.0 6.2 15.5 30.9 99.9** 46.6 24 Tamil Nadu 287.7 393.2 82.1 84.6 20.0 45.6 173.8 25 Tripura 75.3 137.5 23.6 23.7 21.2 14.8 99.3 26 Uttar Pradesh 362.0 618.6 303.8 354.6 431.1 566.9 619.0 27 Uttarakhand 19.6 393.4 218.6 275.7 368.6 209.0** 235.0 28 West Bengal 346.1 161.0 62.7 129.1 114.8 147.5** 390.5
Total States 8221.7 13445.9 4271.3 5697.5 6947.1 8124.5 11939.0 Union Territories
29 A & N Island 3.6 67.4 2.1 2.0 2.2** 2.4 30 Chandigarh 8.0 0.4 0.5 0.5 0.5** 0.2*** 31 D & N Haveli 4.2 3.1 0.0 1.4 8.6** 10.1 32 Daman & Diu 0.6 0.4 0.2 0.2 0.2** 0.2 33 Delhi 0.2 28.2 1.9 0.3 0.2** 0.1 34 Lakshadweep 0.0 0.0 0.0 0.0 0.0** 0.0 35 Puducherry 54.5 13.1 11.6 13.8 13.3 20.2
Total U.Ts 55.3 98.7 112.5 16.2 18.2 25.0 33.1 Total States & U.Ts 8277.0 13544.6 4383.9 5713.7 6965.3 8149.5 11972.1 Central Sector 358.0 379.7 66.0 57.1 72.8 91.5 134.5 Grand Total 8635.0 13924.3 4449.9 5770.8 7038.1 8241.0 12106.6 Source : Ministry of Water Resources(Minor Irrigation Division),Annual Plan Documents & Planning Commission * :Revised Approved Outlay. ** : Approved Outlay. *** : Approval yet to be issued Note : Totals may not tally due to rounding off.
139

Appendix 1: Tables
Table 22: State-wise and Plan-wise Financial Expenditure on Minor Irrigation - Institutional
(Rs. Crores)
Sl. No.
State/ U.T.
IXth Plan (1997-02)
Xth Plan (2002-07)
XI th Plan (2007-08) (2008-09) (2009-10) (2010-11) (2011-12)
1 2 3 4 5 6 7 8 9 1 Andhra Pradesh 364.69 277.84 14.84 43.85 47.72 42.57 70.12 2 Arunachal Pradesh 0.00 0.30 0.28 0.15 0.00 0.00 0.00 3 Assam 0.02 1.72 2.61 0.01 0.09 0.00 0.14 4 Bihar 12.92 283.58 12.49 0.00 1.08 39.38 32.73
5 Chhattisgarh Included in M.P. 40.97 5.03 3.58 2.81 1.22 0.51
6 Goa,Daman & Diu 0.94 0.18 0.00 0.06 0.00 0.00 0.00 7 Gujarat 40.46 148.73 19.32 19.19 45.82 52.70 75.22 8 Haryana 183.90 168.88 64.71 98.44 138.26 192.64 144.03 9 Himachal Pradesh 113.10 21.25 3.14 6.76 0.00 9.90 0.00
10 Jammu & Kashmir 0.51 0.08 0.00 0.00 0.00 0.00 0.00
11 Jharkhand Included in Bihar 1.82 2.53 0.01 0.00 1.93 0.00
12 Karnataka 127.43 235.73 49.17 97.63 26.43 215.69 28.74 13 Kerala 92.59 73.65 7.52 11.31 8.54 0.14 131.97 14 Madhya Pradesh 146.29 368.52 60.20 59.98 17.37 35.57 26.20 15 Maharashtra 102.16 277.57 23.65 11.52 7.84 35.18 18.89 16 Manipur 0.00 0.38 0.00 0.00 0.00 0.00 0.00 17 Meghalya 0.00 0.00 0.00 0.00 0.00 0.00 0.00 18 Mizoram 0.11 0.18 0.00 0.00 0.00 0.00 0.00 19 Nagaland 0.00 0.00 0.33 0.33 0.00 0.00 0.00 20 Orissa 1.24 21.64 3.31 1.22 1.74 0.97 0.10 21 Punjab 197.80 275.91 30.81 87.43 16.25 146.83 26.02 22 Rajasthan 363.74 252.79 22.54 31.59 53.20 40.91 27.63 23 Sikkim 0.00 0.00 0.00 0.00 0.00 0.00 0.00 24 Tamil Nadu 15.72 54.49 6.90 17.43 22.00 26.34 29.76 25 Tripura 0.09 0.12 0.00 0.00 0.00 0.00 0.00
26 Uttarakhand Included in U.P. 0.08 0.13 0.06 0.00 0.15 0.00
27 Uttar Pradesh 884.08 754.70 103.91 54.87 106.88 77.19 47.95 28 West Bengal 11.85 13.98 1.67 0.32 0.70 0.99 0.51 Total States 2659.64 3255.09 435.09 545.74 496.73 920.32 660.51
29 A & N Island - 0.04 0.00 0.01 0.01 0.02 0.00 30 Chandigarh - 0.00 0.00 0.04 0.00 0.00 0.00 31 Dadar & N. Haveli - 0.00 0.00 0.00 0.00 0.00 0.00 4 Daman & Diu - 0.00
32 Delhi - 0.00 0.00 0.00 0.00 0.00 0.00 33 Puducherry - 2.19 0.11 0.07 0.01 0.00 0.00 34 Lakshadweep - 0.03 0.00 0.00 0.00 0.00 0.00
Total U.Ts. 2.00 2.26 0.11 0.12 0.02 0.02 0.00 GRAND TOTAL 2661.64 3257.35 435.20 545.86 496.75 920.34 660.51 Source: Ministry of Water Resources (Minor Irrigation Division). Note: - Total may not tally due to rounding off.
140

Appendix 1: Tables
TABLE 23: Central Releases under the Command Area Development Programme by State
( Rs. in Lakh)
Sl. No.
Name of the State Total upto end of VIII Plan
Up to IX Plan
Upto X Plan
During XI Plan Total XI Plan
Cumulative upto
31.03.2012 2007-08 2008-09 2009-10 2010-11 2011-12
1 2 3 4 5 6 7 8 9 10 11 12 1 Andhra Pradesh 5458.2 9297.74 9297.74 0.00 0.00 0.00 0.00 0.00 0.00 9297.74 2 Arunachal Pradesh 0.0 48.50 573.86 238.59 250.00 0.00 40.98 56.39 585.96 1159.81 3 Assam 1874.0 2066.41 2066.41 0.00 594.61 0.00 226.00 0.00 820.61 2887.02 4 Bihar 10918.4 11218.43 11848.54 0.00 0.00 6095.19 2669.09 2943.86 11708.14 23556.68 5 Chattisgarh 0.0 46.32 2106.34 0.00 0.00 0.00 8285.09 1392.17 9677.26 11783.60 6 Goa 897.9 917.93 917.93 0.00 0.00 0.00 80.56 6.42 86.98 1004.91 7 Gujarat 9838.8 10928.72 15038.72 3057.66 0.00 0.00 893.86 682.00 4633.52 19672.24 8 Haryana 8372.8 14450.80 22509.31 2332.22 4411.19 5451.28 4767.24 5800.62 22762.55 45271.86 9 Himachal Pradesh 414.5 780.41 1184.70 0.00 0.00 0.00 0.00 0.00 0.00 1184.70
10 Jammu & Kashmir 1881.1 2890.36 4753.74 777.61 1292.83 1432.35 2250.19 2005.52 7758.50 12512.24 11 Jharkhand 0.0 0.00 0.00 0.00 0.00 0.00 0.00 0.00 0.00 0.00 12 Karnataka 11031.2 18310.06 31450.96 5771.29 1500.00 3170.04 5341.51 5308.00 21090.84 52541.80 13 Kerala 6475.1 9522.83 9990.23 0.00 0.00 0.00 106.25 418.08 524.33 10514.56 14 Madhya Pradesh 8259.4 8818.12 10966.79 490.07 0.00 589.67 1000.00 5510.11 7589.85 18556.64 15 Maharashtra 21443.6 25327.54 25873.48 622.27 2623.63 3404.79 0.00 2148.27 8798.96 34672.44 16 Manipur 813.0 1273.41 2065.16 184.07 554.47 938.77 1200.00 927.02 3804.33 5869.49 17 Meghalaya 55.9 74.29 118.02 0.00 0.00 3.56 25.52 0.00 29.08 147.10 18 Mizoram 0.0 11.88 72.95 6.43 0.00 0.00 0.00 13.00 19.43 92.38 19 Nagaland 10.0 164.59 339.19 19.43 0.00 0.00 0.00 15.00 34.43 373.62 20 Orissa 4682.4 7594.18 9455.11 1101.91 2976.25 1577.80 3563.07 3102.85 12321.88 21776.99 21 Punjab 0.0 5985.55 12262.93 3589.24 6091.13 0.00 6000.00 3000.00 18680.37 30943.29 22 Rajasthan 30109.1 43117.43 54716.28 1804.38 4630.31 2980.85 0.00 2244.07 11659.61 66375.89 23 Sikkim 0.0 5.50 6.75 0.00 0.00 0.00 0.00 0.00 0.00 6.75 24 Tamil Nadu 9504.5 17914.50 26969.48 1740.48 0.00 4650.00 1500.00 2999.82 10890.30 37859.78
Contd...
141

Appendix 1: Tables
TABLE 23: Central Releases under the Command Area Development Programme by State
( Rs. in Lakh)
Sl. No.
Name of the State Total upto end of VIII Plan
Up to IX Plan
Upto X Plan
During XI Plan Total XI Plan
Cumulative upto
31.03.2012 2007-08 2008-09 2009-10 2010-11 2011-12
1 2 3 4 5 6 7 8 9 10 11 12 25 Tripura 12.2 12.18 19.70 0.00 0.00 0.00 0.00 0.00 0.00 19.70 26 Uttar Pradesh 33944.1 49287.65 66308.40 5746.30 7094.76 9475.99 7000.00 10000.00 39317.05 105625.46 27 Uttarakhand 0.0 0.00 435.49 0.00 409.92 0.00 0.00 0.00 409.92 845.41 28 West Bengal 2077.7 3174.18 3748.14 231.58 0.00 1600.00 690.95 0.00 2522.53 6270.67 Total 168073.84 243239.50 325096.33 27713.517 32429.10 41370.29 45640.31 48573.20 195726.42 520822.75
Source : Ministry of Water Resources (CAD Wing)
142

Appendix 1: Tables
Table 24: State-wise Expenditure under CAD Programme - State Sector
(Rs. Crores)
Sl. No.
Name of the State/UT
Eighth Plan
Ninth Plan
Tenth Plan Cummul-ative upto
Actual Expendi-
ture
Actual Expendi-
ture
Actual Expendi-
ture
Revised Approved
Outlay
Appoved Outlay
(1992-97) (1997-02) (2002-07) Tenth Plan (2007-08) (2008-09) (2009-10) (2010-11) (2011-12)
1 2 3 4 5 6 7 8 9 10 11
1 Andhra Pradesh 80.14 49.18 38.60 274.81 17.07 9.68 6.06 15.56 26.53
2 Arunachal Pradesh 1.61 4.99 11.16 17.76 2.40 2.50 0.30 1.51 3.00
3 Assam 13.34 31.14 47.99 109.05 0.75 2.95 7.18 11.10 19.28
4 Bihar 31.53 62.66 48.22 212.97 434.39 25.95 73.12 55.00 90.00
5 Chhattisgarh 0.00 1.57 73.42 74.99 20.98 30.06 21.35 64.12** 21.96
6 Goa 5.19 9.70 16.27 40.28 3.75 4.16 5.50 6.31** 6.92
7 Gujarat 43.75 61.34 19.05 200.40 6.08 5.71 12.53 11.38** 13.63
8 Haryana 29.92 143.03 182.76 452.51 26.84 27.32 45.85 141.00** 90.00
9 Himachal Pradesh 2.86 4.38 11.91 21.85 1.34 0.02 0.00 2.00 10.00
10 Jammu & Kashmir 8.95 20.58 46.77 93.00 19.50 23.84 11.00* 18.00** 18.00
11 Jharkhand 0.00 0.00 6.00 6.00 0.12 0.12 21.62 2.00** 2.00
12 Karnataka 77.29 97.90 140.92 451.85 64.68 69.41 73.00 104.00 438.15
13 Kerala 41.86 41.80 39.36 157.53 4.79 4.06 2.65 6.27 4.25
14 Madhya Pradesh 37.72 17.43 21.50 346.70 5.11 6.35 7.71 10.00** 18.25 Contd...
143
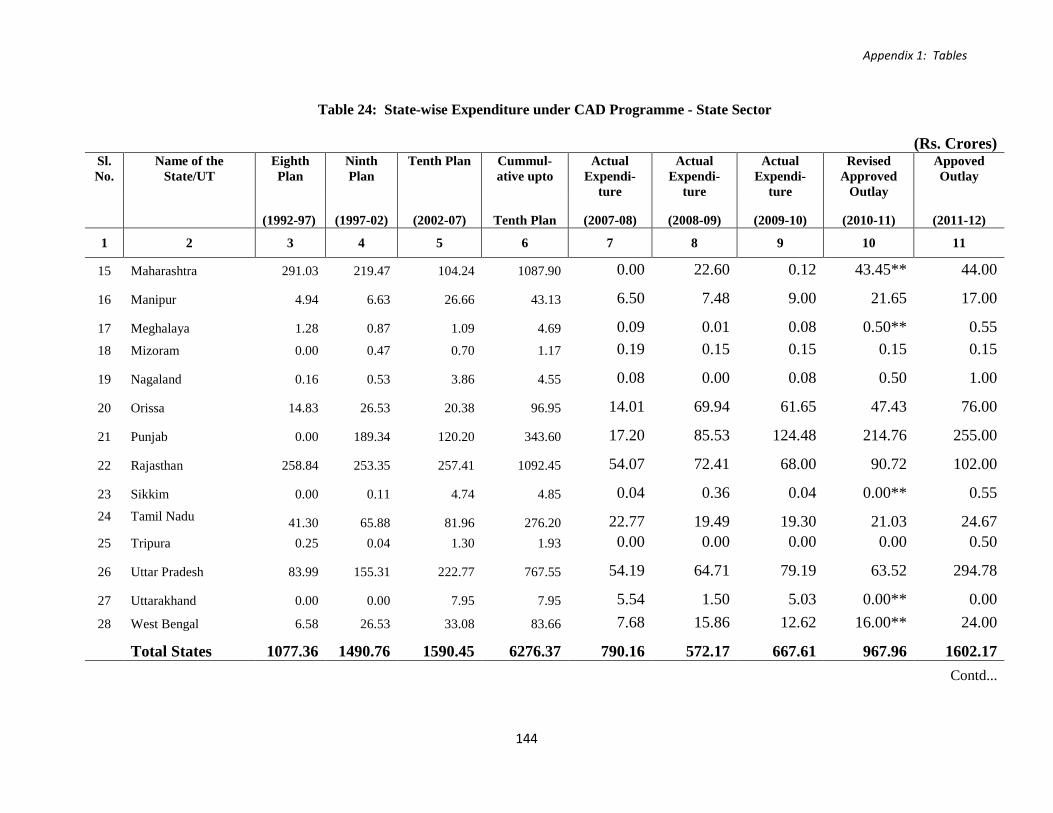
Appendix 1: Tables
Table 24: State-wise Expenditure under CAD Programme - State Sector
(Rs. Crores)
Sl. No.
Name of the State/UT
Eighth Plan
Ninth Plan
Tenth Plan Cummul-ative upto
Actual Expendi-
ture
Actual Expendi-
ture
Actual Expendi-
ture
Revised Approved
Outlay
Appoved Outlay
(1992-97) (1997-02) (2002-07) Tenth Plan (2007-08) (2008-09) (2009-10) (2010-11) (2011-12)
1 2 3 4 5 6 7 8 9 10 11
15 Maharashtra 291.03 219.47 104.24 1087.90 0.00 22.60 0.12 43.45** 44.00
16 Manipur 4.94 6.63 26.66 43.13 6.50 7.48 9.00 21.65 17.00
17 Meghalaya 1.28 0.87 1.09 4.69 0.09 0.01 0.08 0.50** 0.55 18 Mizoram 0.00 0.47 0.70 1.17 0.19 0.15 0.15 0.15 0.15
19 Nagaland 0.16 0.53 3.86 4.55 0.08 0.00 0.08 0.50 1.00
20 Orissa 14.83 26.53 20.38 96.95 14.01 69.94 61.65 47.43 76.00
21 Punjab 0.00 189.34 120.20 343.60 17.20 85.53 124.48 214.76 255.00
22 Rajasthan 258.84 253.35 257.41 1092.45 54.07 72.41 68.00 90.72 102.00
23 Sikkim 0.00 0.11 4.74 4.85 0.04 0.36 0.04 0.00** 0.55 24 Tamil Nadu 41.30 65.88 81.96 276.20 22.77 19.49 19.30 21.03 24.67 25 Tripura 0.25 0.04 1.30 1.93 0.00 0.00 0.00 0.00 0.50
26 Uttar Pradesh 83.99 155.31 222.77 767.55 54.19 64.71 79.19 63.52 294.78
27 Uttarakhand 0.00 0.00 7.95 7.95 5.54 1.50 5.03 0.00** 0.00 28 West Bengal 6.58 26.53 33.08 83.66 7.68 15.86 12.62 16.00** 24.00
Total States 1077.36 1490.76 1590.45 6276.37 790.16 572.17 667.61 967.96 1602.17 Contd...
144

Appendix 1: Tables
Table 24: State-wise Expenditure under CAD Programme - State Sector
(Rs. Crores)
Sl. No.
Name of the State/UT
Eighth Plan
Ninth Plan
Tenth Plan Cummul-ative upto
Actual Expendi-
ture
Actual Expendi-
ture
Actual Expendi-
ture
Revised Approved
Outlay
Appoved Outlay
(1992-97) (1997-02) (2002-07) Tenth Plan (2007-08) (2008-09) (2009-10) (2010-11) (2011-12)
1 2 3 4 5 6 7 8 9 10 11
Union Territories
29 A & N Island 0.00 0.00 0.00 0.00 0.00 0.00 0.00 0.00** 0.00
29 Chandigarh 0.00 0.00 0.00 0.00 0.00 0.00 0.00 0.00** 0.00
29 D & N Haveli 0.00 0.77 1.07 4.51 2.30 0.20 2.00 2.50** 3.50
30 Daman & Diu 0.00 0.10 0.05 0.48 0.00 0.00 0.00 0.00** 0.00
33 Delhi 0.00 0.00 0.00 0.00 0.00 0.00 0.00 0.00** 0.00
34 Lakshadweep 0.00 0.00 0.00 0.00 0.00 0.00 0.00 0.00** 0.00
35 Puducherry 0.00 0.00 0.00 0.00 0.00 0.00 33.28 0.00 0.00
Total U.Ts. 0.00 0.87 1.12 4.99 2.30 0.20 35.28 2.50 3.50
Total States & Uts 1077.36 1491.63 1591.57 6281.36 792.46 572.37 702.89 970.46 1605.67
Source : Ministry of Water Resources (CAD Wing). & Planning Commission Note : Totals may not tally due to rounding off. * : Revised Approved Outlay ** : Approved Outlay
145

Appendix 1: Tables
Table 25: Water Rates for flow Irrigation by State
FOR IRRIGATION PURPOSES Status Sl States/UTs Flow Irrigation as
No. Rate Date since on (Rs/ha) applicable 1 2 3 4 5 1 Andhra Pradesh 148.20 to 1235.00 01.07.1996 12.01.2010 2 Arunachal Pradesh No water rates - 29.12.2008 3 Assam 150.00 to 751.00 30.03.2000 07.03.2009 4 Bihar 74.10 to 370.50 17.11.95/26.11.01* 08.02.2010 5 Chhattisgarh 123.50 to 741.00 15.06.1999 05.02.2010 6 Delhi 34.03 to 1067.04 N.A. 14.01.2009 7 Goa 60.00 to 300.00 01.02.1988 09.03.2010 8 Gujarat 160.00 to 300.00 01.01.2007 04.02.2010 9 Haryana 24.70 to 197.60 27.07.2000 02.02.2010
10 Himachal Pradesh 28.17 01.04.2009 03.02.2010 11 Jammu & Kashmir 29.65 to 74.13 01.04.2005 04.02.2010 12 Jharkhand 74.10 to 370.50 26.11.2001 & 14.11.1995 13.01.2009 13 Karnataka 37.05 to 988.45 13.07.2000 30.01.2009 14 Kerala 37.00 to 99.00 18.09.1974 06.02.2009 15 Madhya Pradesh 50.00 to 960.00 01.11.2005 05.01.2010 16 Maharashtra 238.00 to 6297.00 01.07.2003 02.04.2009 17 Manipur 45.00 to 150.00 August,2003 27.12.2008 18 Meghalaya No water rates - 09.03.2010 19 Mizoram No water rates - 06.02.2009 20 Nagaland No water rates - 15.01.2009 21 Orissa 28.00 to 930.00 05.04.2002 05.01.2010
Contd...
146
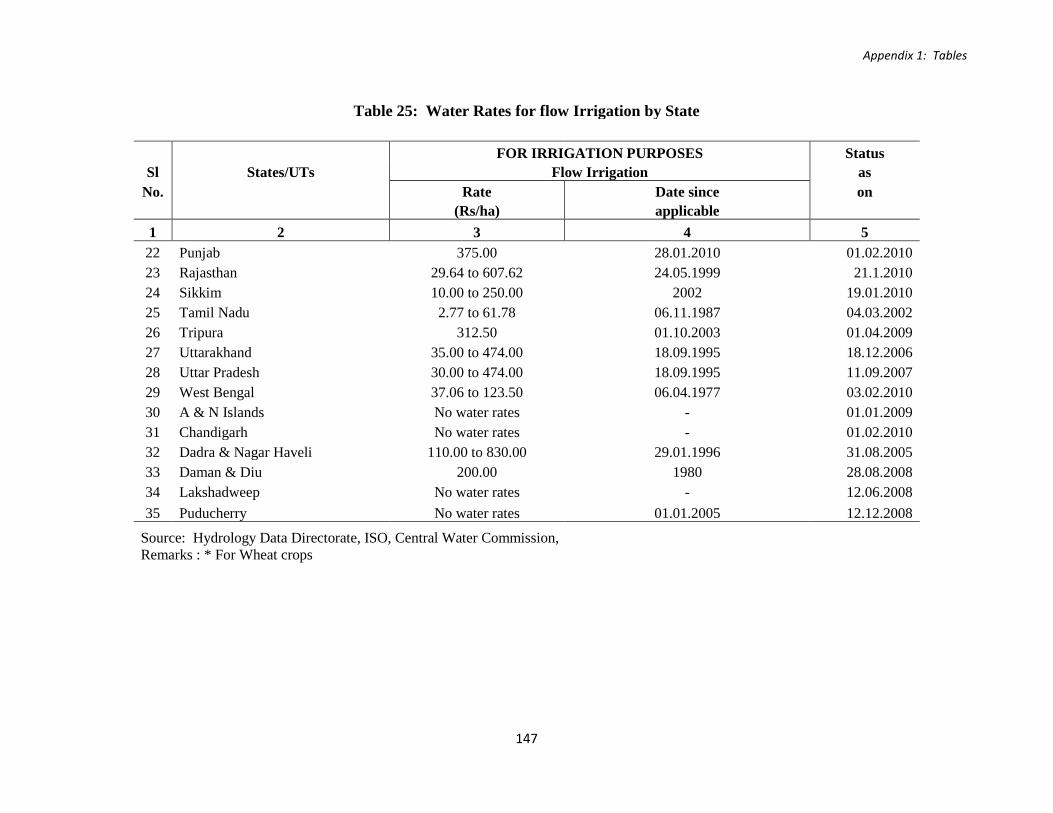
Appendix 1: Tables
Table 25: Water Rates for flow Irrigation by State
FOR IRRIGATION PURPOSES Status Sl States/UTs Flow Irrigation as
No. Rate Date since on (Rs/ha) applicable 1 2 3 4 5
22 Punjab 375.00 28.01.2010 01.02.2010 23 Rajasthan 29.64 to 607.62 24.05.1999 21.1.2010 24 Sikkim 10.00 to 250.00 2002 19.01.2010 25 Tamil Nadu 2.77 to 61.78 06.11.1987 04.03.2002 26 Tripura 312.50 01.10.2003 01.04.2009 27 Uttarakhand 35.00 to 474.00 18.09.1995 18.12.2006 28 Uttar Pradesh 30.00 to 474.00 18.09.1995 11.09.2007 29 West Bengal 37.06 to 123.50 06.04.1977 03.02.2010 30 A & N Islands No water rates - 01.01.2009 31 Chandigarh No water rates - 01.02.2010 32 Dadra & Nagar Haveli 110.00 to 830.00 29.01.1996 31.08.2005 33 Daman & Diu 200.00 1980 28.08.2008 34 Lakshadweep No water rates - 12.06.2008 35 Puducherry No water rates 01.01.2005 12.12.2008
Source: Hydrology Data Directorate, ISO, Central Water Commission, Remarks : * For Wheat crops
147

Appendix 1: Tables
Table 26: Water Rates for Lift Irrigation by State
FOR IRRIGATION PURPOSES Status Sl States/UTs Lift Irrigation as
No. Rate Date since on (Rs/ha) applicable 1 2 3 4 5 1 Andhra Pradesh 148.20 to 1235.00 07.01.1996 12.01.2010 2 Arunachal Pradesh No water rates specified for irrigation - 29.12.2008 3 Assam 150.00 to 751.00 30.03.2000 07.03.2009 4 Bihar 333.45. to 1970.75 06.05.1998 08.02.2010 5 Chhattisgarh 123.50 to 741.00 15.06.1999 05.02.2010 6 Delhi 33.35 to 1067.04 N.A. 14.01.2009 7 Goa 120.00 to 600.00 01.02.1988 09.03.2010 8 Gujarat 160.00 to 300.00 01.01.2007 04.02.2010 9 Haryana 43.23 to 98.80 27.07.2000 02.02.2010 10 Himachal Pradesh 56.34 01.04.2009 03.02.2010 11 Jammu & Kashmir 74.13 to 741.30 01.04.2005 04.02.2010 12 Jharkhand No separate rate for lift irrigation - 13.01.2009 13 Karnataka No separate rate for lift irrigation - 30.01.2009 14 Kerala 17.00 to 148.50 18.09.1974 09.03.2010 15 Madhya Pradesh 50.00 to 960.00 01.11.2005 15.03.2010 16 Maharashtra 297.00 to 5405.00 01.07.2003 13.04.2010 17 Manipur 45.00 to 150.00 01.08.2003 27.12.2008 18 Meghalaya No water rates - 23.02.2010 19 Mizoram No water rates - 31.01.2010 20 Nagaland No water rates - 12.01.2009 21 Orissa No separate rate for lift irrigation 05.04.2000 30.03.2010
Contd...
148

Appendix 1: Tables
Table 26: Water Rates for Lift Irrigation by State
FOR IRRIGATION PURPOSES Status Sl States/UTs Lift Irrigation as
No. Rate Date since on (Rs/ha) applicable 1 2 3 4 5 22 Punjab 375 08.01.2010 01.02.2010 23 Rajasthan 14.80 to 1215.24 24.05.1999 21.01.2010 24 Sikkim No separate rate for lift irrigation - 19.01.2010 25 Tamil Nadu No separate rate for lift irrigation - 02.01.2009 26 Tripura 312.50 01.10.2003 01.04.2009 27 Uttarakhand 15.00 to 237.00 18.09.1995 06.01.2009 28 Uttar Pradesh 15.00 to 237.00 18.09.1995 30.12.2008 29 West Bengal 251.94 to 2015.52 01.07.2003 03.02.2010 30 A & N Islands No water rates - 13.01.2009 31 Chandigarh 23.00 per hour 01.01.2010 01.02.2010 32 Dadra & Nagar Haveli 75.00 to 275.00 NA 31.08.2005 33 Daman & Diu 200.00 1980 28.08.2008 34 Lakshadweep No water rates - 12.06.2008 35 Puducherry No separate rate for lift irrigation 01.01.2005 12.12.2008
Source: Hydrology Data Directorate, ISO, Central Water Commission
149

Appendix 1: Tables
TABLE 27: Flood Damage/Heavy Rains in India Sl. No.
Year Area affected
(M.Ha.)
Population affected
(Million)
Damage to Crops Damage to H
Cattle lost Nos.
(‘000)
Human live lost
(Nos.)
Damage to public utilities
(Rs. Crore)
Total damages Crops, Houses
& Public utilities in Rs. Crores (Col.
6+8+11)
Area
(M.Ha.)
Value
(Rs. Crore)
Nos.
(‘000)
Value
(Rs. Crore) 1 2 3 4 5 6 7 8 9 10 11 12 1 1953 2.29 24.28 0.93 42.08 265 7.42 47 37 2.90 52.40 2 1960 7.53 8.35 2.27 42.55 610 14.31 14 510 6.31 63.17 3 1965 1.46 3.61 0.27 5.87 113 0.20 7 79 1.07 7.14 4 1970 8.46 31.83 4.91 162.78 1434 48.61 19 1076 76.44 287.83 5 1975 6.17 31.36 3.85 271.49 804 34.10 17 686 166.05 471.64 6 1980 11.46 54.12 5.55 366.37 2533 170.85 59 1913 303.28 840.50 7 1985 8.38 59.59 4.65 1425.37 2450 583.86 43 1804 2050.04 4059.27 8 1990 9.30 40.26 3.18 695.61 1020 213.73 134 1855 455.27 1708.92 9 1991 6.36 33.89 2.70 579.02 1134 180.42 41 1187 728.89 1488.33
10 1992 2.65 19.26 1.75 1027.58 687 306.28 79 1533 2010.67 3344.53 11 1993 11.44 30.41 3.21 1308.63 1926 528.32 211 2864 1445.53 3282.49 12 1994 4.81 27.55 3.96 888.62 915 165.21 52 2078 740.76 1794.59 13 1995 5.25 35.93 3.25 1714.79 2002 1307.89 62 1814 679.63 3702.31 14 1996 8.05 44.73 3.83 1124.49 727 176.59 73 1803 861.39 3005.74 15 1997 4.57 29.66 2.26 692.74 505 152.50 28 1402 1985.93 2831.18 16 1998 10.85 47.44 7.50 2594.17 1933 1108.78 107 2889 5157.77 8860.72 17 1999 7.77 27.99 1.75 1850.87 1613 1299.06 91 745 462.83 3612.76 18 2000 5.38 45.01 3.58 4246.62 2629 680.94 123 2606 3936.98 8864.54 19 2001 6.18 26.46 3.96 688.48 716 816.47 33 1444 5604.46 7109.42 20 2002 7.09 26.32 2.19 913.09 762 599.37 22 1001 1062.08 2574.54 21 2003 6.12 43.20 4.27 7307.23 775 756.48 15 2166 3262.15 11325.87
Contd..
150

Appendix 1: Tables
TABLE 27: Flood Damage/Heavy Rains in India Sl. No.
Year Area affected
(M.Ha.)
Population affected
(Million)
Damage to Crops Damage to H
Cattle lost Nos.
(‘000)
Human live lost
(Nos.)
Damage to public utilities
(Rs. Crore)
Total damages Crops, Houses
& Public utilities in Rs. Crores (Col.
6+8+11)
Area
(M.Ha.)
Value
(Rs. Crore)
Nos.
(‘000)
Value
(Rs. Crore) 1 2 3 4 5 6 7 8 9 10 11 12
22 2004 5.31 43.73 2.89 778.69 1664 879.60 134 1813 1656.09 3529.71 23 2005 12.56 22.93 12.30 2370.92 716 380.53 120 1455 4688.22 7660.49 24 2006 1.10 25.22 1.82 2850.67 1497 3636.85 267 1431 13303.93 21546.29 25 2007 7.14 41.40 8.79 3121.53 3280 2113.11 89 3389 8049.04 13425.34 26 2008 3.43 29.91 3.19 3401.56 1567 1141.89 102 2876 5046.48 9595.34 27 2009 3.84 29.54 3.59 4232.61 1236 10809.80 63 1513 17509.35 32554.77 28 2010 2.62 18.30 4.99 5887.38 294 875.95 40 1582 12757.25 19520.59 29 2011 1.90 15.97 2.72 1393.85 1153 410.48 36 1761 6053.57 7857.89
TOTAL 426.25 1913.39 223.57 66009.63 74042 33373.32 5699 97551 110203.29 213114.90 AVG 7.22 32.43 3.79 1118.81 1255 565.65 97 1653 1867.85 3612.12 MAX 17.50 70.45 12.30 7307.23 3508 10809.80 618 11316 17509.35 32554.77 (YEAR
) 1978 1978 2005 2003 1978 2009 1979 1977 2009 2009
Source : Central Water Commision [FFM Directorate]
151

Appendix 1: Tables
Table 28: Statewise Damage due to Flood / Heavy Rains during 2011* Sl. Name of the Area Population Damage to Crops Damage To Houses Cattle Human Damage to Total Damages No. State/UTs. Affected Affected
lost lives Public to crops,
(Mill. Ha.) Area Value Nos Value Nos. lost Utilities houses &
(Million) (M.Ha.) (Rs.Crores) (Rs.Crores) Nos. (Rs.Crores) public utilities
(Rs Crores) 1 2 3 4 5 6 7 8 9 10 11 12
1 Andhra Pradesh 0 0.00 0.00 0.00 0 0.00 0 0 0.00 0.00
2 Arunachal Pradesh 0.00 0.12 0.00 0.50 0 0.00 3 20 1203.30 1203.80
3 Assam 0.00 0.00 0.00 0.00 0 0.00 0 0 0.00 0.00
4 Bihar 0.00 0.58 0.16 59.87 34906 17.79 39 143 25.79 103.45
5 Chhattisgarh 0.02 0.17 0.01 3.79 39126 4.49 318 21 53.78 62.06
6 Goa 0 0 Neg 1.00 185 1.00 13 1 0.00 1.15
7 Gujarat 0.00 0.018 0.00 3.06 5007 3.35 212 110 5.83 12.24
8 Haryana 0.00 0.00 0.00 0.00 0 0.00 0 0 0.00 0.00
9 Himachal Pradesh 0.03 0.61 0.16 417.39 8467 0.48 2372 51 618.60 1036.47
10 Jammu&Kashmir 0.00 0.00 0.00 0.00 0 0.00 0 0 0 0.00
11 Jharkhand 0.00 0.00 0.00 0.00 0 0.00 0 0 0.00 0.00
12 Karnataka 0.00 0.00 0.00 0.00 0 0.00 0 0 0.00 0.00
13 Kerala 0.00 0.37 0.01 60.21 8436 9.32 466 119 71.53 141.07
14 Madhya Pradesh 0.00 0.00 0.008 0.004 15431 6.51 203 82 2.45 8.97
15 Maharashtra 0.00 0.00 0.00 0.00 0 0.00 0 106 0.00 0.00
16 Manipur 0.083 0.066 0.025 7.75 Nil Nil Nil Nil 5.90 13.65
17 Meghalaya 0.00 0.00 0.00 0.00 0 0.00 0 0 0.00 0.00
18 Mizoram 0.00 0.00 0.00 0.00 0 0.00 0 0 0.00 0.00
19 Nagaland 0.00 0.00 0.00 0.00 0 0.00 0 0 0.00 0.00 Contd...
152

Appendix 1: Tables
Table 28: Statewise Damage due to Flood / Heavy Rains during 2011* Sl. Name of the Area Population Damage to Crops Damage To Houses Cattle Human Damage to Total Damages No. State/UTs. Affected Affected
lost lives Public to crops,
(Mill. Ha.) Area Value Nos Value Nos. lost Utilities houses &
(Million) (M.Ha.) (Rs.Crores) (Rs.Crores) Nos. (Rs.Crores) public utilities
(Rs Crores) 1 2 3 4 5 6 7 8 9 10 11 12 20 Orissa 0.00 5.98 0.52 0.00 178481 0.00 1487 87 2874.41 2874.41
21 Punjab 0.00 0.00 0.20 59.56 2538 6.47 28901 38 31.19 97.22
22 Rajasthan 0.00 0.00 0.00 0.00 0 0.00 0 0 0.00 0.00
23 Sikkim 0.00 0.00 0.00 0.00 0 0.00 0 0.00 0.00 0.00
24 Tamil Nadu 0.00 0.00 0.00 0.00 0 0.00 0 0 0.00 0.00
25 Tripura 0.002 0.08 0.00 5.86 653 0.60 29 14 1.05 7.50
26 U.P 0.53 2.31 0.40 199.94 313436 79.37 239 729 1159.13 1438.44
27 Uttarakhand 0.00 0 0 0 3325 0 1407 54 0 0.00
28 West Bengal 1.23 5.68 1.23 575.30 542519 281.56 293 186 0.60 857.46
29 Andaman&Nicobar 0.00 0.00 0.00 0.00 0 0.00 0 0 0.00 0.00
30 Chandigarh 0.00 0.00 0.00 0.00 0 0.00 0 0 0.00 0.00
31 Dadra & Nagar Haveli 0.00 0.00 0.00 0.00 0 0.00 0 0 0.00 0.00
32 Daman & Diu 0.00 0.00 0.00 0.00 0 0.00 0 0 0.00 0.00
33 Delhi 0.00 0.00 0.00 0.00 0 0.00 0 0 0.00 0.00
34 Lakshadweep 0.00 0.00 0.00 0.00 0 0.00 0 0 0.00 0.00
35 Puducherry 0.00 0.00 Neg 0.00 8 0.02 0 0 0.00 0.02
Total 1.90 15.97 2.72 1393.85 1152518 410.48 35982 1761 6053.57 7857.89
Source : Central water Commision (FFM Directorate) * : Figures are Tentative. Note : Neg : Negliable
153
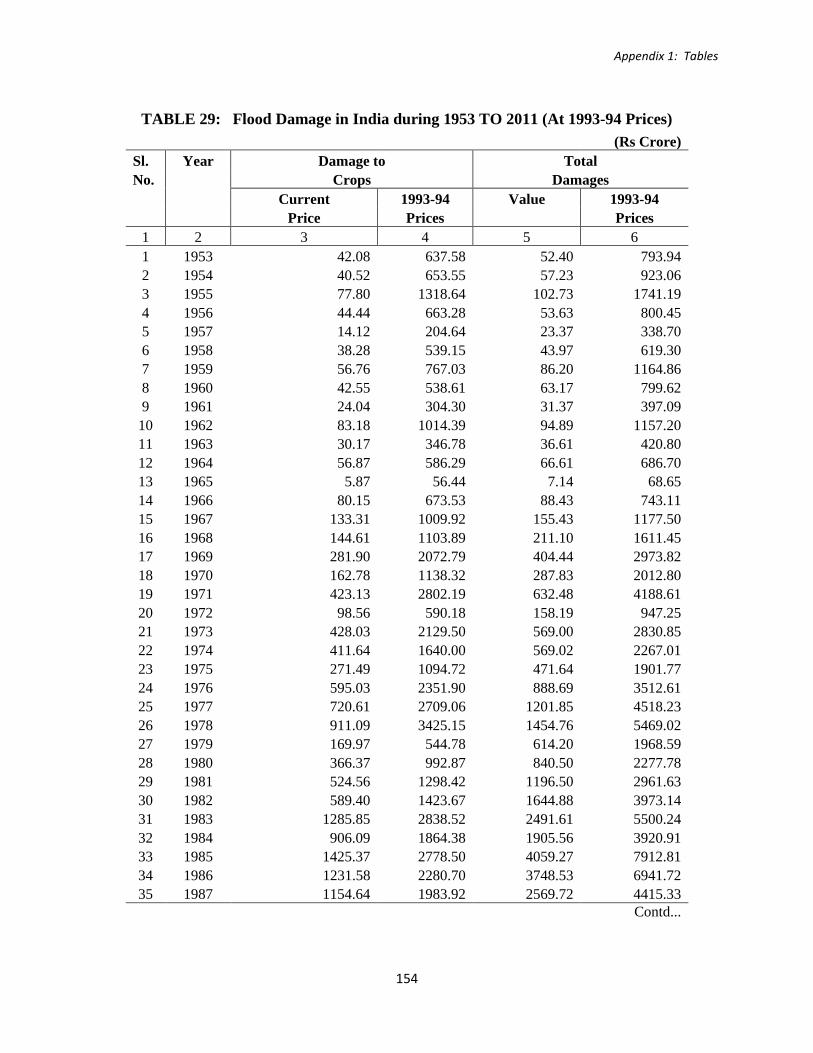
Appendix 1: Tables
TABLE 29: Flood Damage in India during 1953 TO 2011 (At 1993-94 Prices)
(Rs Crore)
Sl. Year Damage to Total No. Crops Damages Current 1993-94 Value 1993-94 Price Prices
Prices
1 2 3 4 5 6 1 1953 42.08 637.58 52.40 793.94 2 1954 40.52 653.55 57.23 923.06 3 1955 77.80 1318.64 102.73 1741.19 4 1956 44.44 663.28 53.63 800.45 5 1957 14.12 204.64 23.37 338.70 6 1958 38.28 539.15 43.97 619.30 7 1959 56.76 767.03 86.20 1164.86 8 1960 42.55 538.61 63.17 799.62 9 1961 24.04 304.30 31.37 397.09
10 1962 83.18 1014.39 94.89 1157.20 11 1963 30.17 346.78 36.61 420.80 12 1964 56.87 586.29 66.61 686.70 13 1965 5.87 56.44 7.14 68.65 14 1966 80.15 673.53 88.43 743.11 15 1967 133.31 1009.92 155.43 1177.50 16 1968 144.61 1103.89 211.10 1611.45 17 1969 281.90 2072.79 404.44 2973.82 18 1970 162.78 1138.32 287.83 2012.80 19 1971 423.13 2802.19 632.48 4188.61 20 1972 98.56 590.18 158.19 947.25 21 1973 428.03 2129.50 569.00 2830.85 22 1974 411.64 1640.00 569.02 2267.01 23 1975 271.49 1094.72 471.64 1901.77 24 1976 595.03 2351.90 888.69 3512.61 25 1977 720.61 2709.06 1201.85 4518.23 26 1978 911.09 3425.15 1454.76 5469.02 27 1979 169.97 544.78 614.20 1968.59 28 1980 366.37 992.87 840.50 2277.78 29 1981 524.56 1298.42 1196.50 2961.63 30 1982 589.40 1423.67 1644.88 3973.14 31 1983 1285.85 2838.52 2491.61 5500.24 32 1984 906.09 1864.38 1905.56 3920.91 33 1985 1425.37 2778.50 4059.27 7912.81 34 1986 1231.58 2280.70 3748.53 6941.72 35 1987 1154.64 1983.92 2569.72 4415.33
Contd...
154
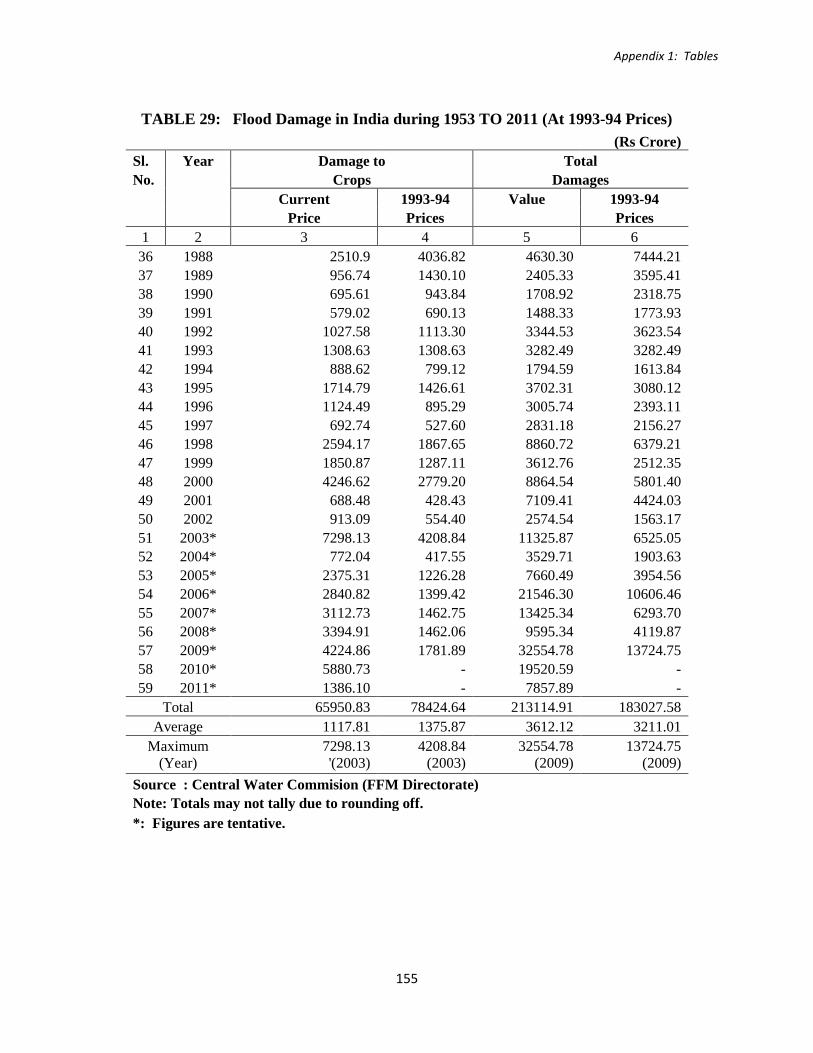
Appendix 1: Tables
TABLE 29: Flood Damage in India during 1953 TO 2011 (At 1993-94 Prices)
(Rs Crore)
Sl. Year Damage to Total No. Crops Damages Current 1993-94 Value 1993-94 Price Prices
Prices
1 2 3 4 5 6 36 1988 2510.9 4036.82 4630.30 7444.21 37 1989 956.74 1430.10 2405.33 3595.41 38 1990 695.61 943.84 1708.92 2318.75 39 1991 579.02 690.13 1488.33 1773.93 40 1992 1027.58 1113.30 3344.53 3623.54 41 1993 1308.63 1308.63 3282.49 3282.49 42 1994 888.62 799.12 1794.59 1613.84 43 1995 1714.79 1426.61 3702.31 3080.12 44 1996 1124.49 895.29 3005.74 2393.11 45 1997 692.74 527.60 2831.18 2156.27 46 1998 2594.17 1867.65 8860.72 6379.21 47 1999 1850.87 1287.11 3612.76 2512.35 48 2000 4246.62 2779.20 8864.54 5801.40 49 2001 688.48 428.43 7109.41 4424.03 50 2002 913.09 554.40 2574.54 1563.17 51 2003* 7298.13 4208.84 11325.87 6525.05 52 2004* 772.04 417.55 3529.71 1903.63 53 2005* 2375.31 1226.28 7660.49 3954.56 54 2006* 2840.82 1399.42 21546.30 10606.46 55 2007* 3112.73 1462.75 13425.34 6293.70 56 2008* 3394.91 1462.06 9595.34 4119.87 57 2009* 4224.86 1781.89 32554.78 13724.75 58 2010* 5880.73 - 19520.59 - 59 2011* 1386.10 - 7857.89 -
Total 65950.83 78424.64 213114.91 183027.58 Average 1117.81 1375.87 3612.12 3211.01
Maximum 7298.13 4208.84 32554.78 13724.75 (Year) '(2003) (2003) (2009) (2009)
Source : Central Water Commision (FFM Directorate) Note: Totals may not tally due to rounding off. *: Figures are tentative.
155

Appendix 1: Tables
TABLE 30: Planwise Expenditure under Flood Management
(Rs Crore)
Sl. Period States Centre Total Cumulative & benefits No. U.Ts (Area-
protected in
Million Ha. at the end of the period) 1 2 3 4 5 6 1. First Plan (1954-56) 13.21 - 13.21 1.00 2. Second Plan (1956-61) 48.06 - 48.06 3.24 3. Third Plan (1961-66) 82.09 - 82.09 5.43 4. Annual Plans(1966-69) 41.96 - 41.96 5.83 5. Fourth Plan (1969-74) 157.37 4.67 162.04 8.04 6. Fifth Plan (1974-78) 242.46 56.15 298.61 9.98 7. Annual Plans (1978-80) 290.13 39.83 329.96 11.21 8. Sixth Plan (1980-85) 618.88 167.97 786.85 13.01 9. Seventh Plan(1985-90) 781.02 160.56 941.58 13.80
10. Annual Plan(1990-92) 393.61 66.83 460.44 14.20 11 Eighth Plan (1992-97) 1,641.14 226.17 1,867.31 15.29 12 Ninth Plan (1997-2002) 2,469.59 453.70 2,923.29 N.A 13 Tenth Plan (2002-2007) 3,601.38 742.80 4,344.18 18.22 14 Annual Plan (2007-2008) 4,824.60 97.69 4,922.29 N.A Actual Expenditure
15 Annual Plan 2008-09 2,094.90 250.36 2,345.26 N.A Actual Expenditure
16 Annual Plan 2009-10 2,211.60 250.04 2,461.64 N.A Actual Expenditure
17 Annual Plan 2010-11 2,225.95 287.00 2,512.95 18.78 Revised Approved Outlay
18 Annual Plan 2011-12 4,579.62 308.41 4,888.03 N.A Approved Outlay
Sources: Central Water Commission(FMP Directorate), Planning Commission.
156
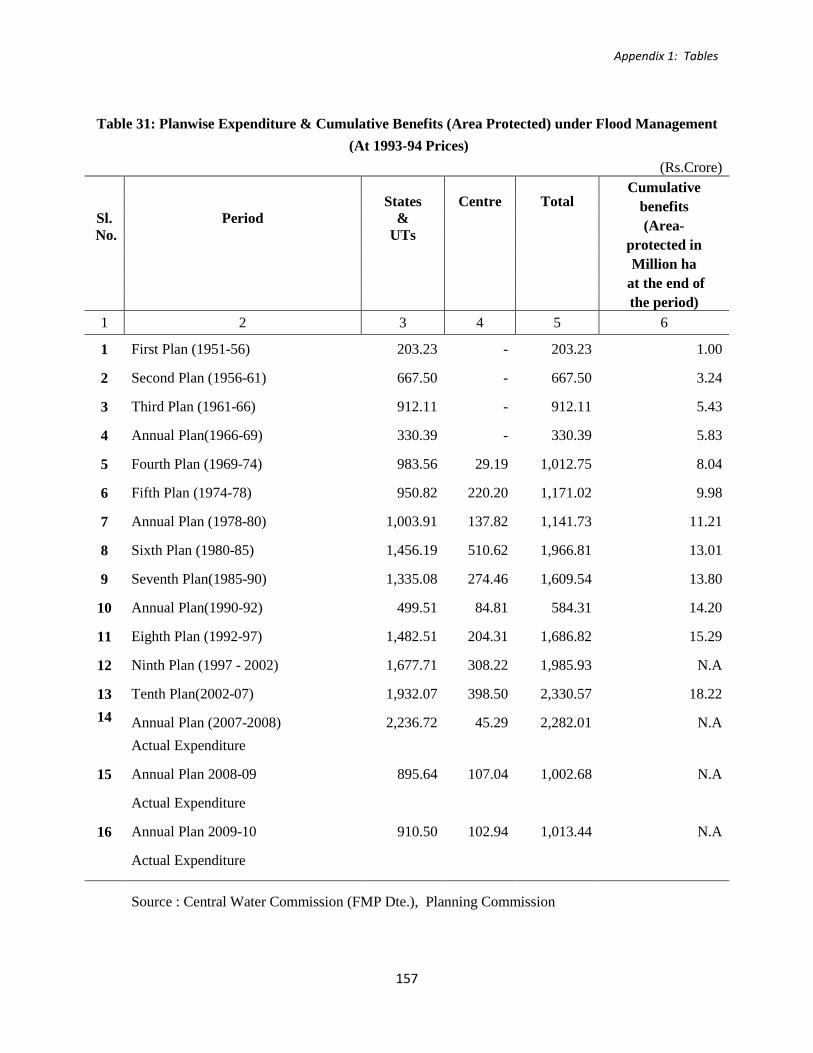
Appendix 1: Tables
Table 31: Planwise Expenditure & Cumulative Benefits (Area Protected) under Flood Management (At 1993-94 Prices)
(Rs.Crore)
Sl. No.
Period
States &
UTs
Centre
Total
Cumulative benefits (Area-
protected in Million ha
at the end of the period)
1 2 3 4 5 6
1 First Plan (1951-56) 203.23 - 203.23 1.00
2 Second Plan (1956-61) 667.50 - 667.50 3.24
3 Third Plan (1961-66) 912.11 - 912.11 5.43
4 Annual Plan(1966-69) 330.39 - 330.39 5.83
5 Fourth Plan (1969-74) 983.56 29.19 1,012.75 8.04
6 Fifth Plan (1974-78) 950.82 220.20 1,171.02 9.98
7 Annual Plan (1978-80) 1,003.91 137.82 1,141.73 11.21
8 Sixth Plan (1980-85) 1,456.19 510.62 1,966.81 13.01
9 Seventh Plan(1985-90) 1,335.08 274.46 1,609.54 13.80
10 Annual Plan(1990-92) 499.51 84.81 584.31 14.20
11 Eighth Plan (1992-97) 1,482.51 204.31 1,686.82 15.29
12 Ninth Plan (1997 - 2002) 1,677.71 308.22 1,985.93 N.A
13 Tenth Plan(2002-07) 1,932.07 398.50 2,330.57 18.22 14 Annual Plan (2007-2008) 2,236.72 45.29 2,282.01 N.A
Actual Expenditure
15 Annual Plan 2008-09 895.64 107.04 1,002.68 N.A
Actual Expenditure
16 Annual Plan 2009-10 910.50 102.94 1,013.44 N.A
Actual Expenditure
Source : Central Water Commission (FMP Dte.), Planning Commission
157

Appendix 1: Tables
Table 32: State-wise Planwise Financial Expenditure on Flood Management Work
(Rs Crores)
Sl. No. State/ UT During
IX Plan Upto IX
Plan During X
Plan Upto X
Plan
Actual Expendi-
ture
Actual Expendi-
ture
Actual Expendi-
ture
Revised Approved
Outlay
Approved Outlay
(1997-02) (1997-02) (1902-07) (1902-07) (2007-08) (2008-09) (2009-10) (2010-11) (2011-12) 1 2 3 4 5 6 7 8 9 10 11 1 Andhra Pradesh 214.64 676.91 255.04 931.95 252.32 209.46 290.67 202.70 325.06 2 Arunachal Pradesh 20.07 47.72 35.85 83.57 5.95 46.10 36.14 70.39 39.76 3 Assam 73.66 322.19 136.79 458.98 86.88 103.47 137.52 60.00 648.87 4 Bihar 316.98 1044.57 474.37 1518.94 232.18 670.47 404.94 412.03 983.88 5 Chhatisgarh 0.09 0.09 3.02 3.11 3.70 3.34 5.39 5.00** 7.50 6 Goa 6.61 11.99 29.81 41.80 18.10 37.94 72.35 69.90** 79.95 7 Gujarat 15.60 70.21 7.76 77.97 90.13 84.05 99.85 112.32** 93.31 8 Haryana 93.62 390.51 252.56 643.07 69.98 86.00 82.61 73.40** 100.00 9 Himachal Pradesh 31.05 51.64 79.08 130.72 22.79 27.52 70.97 105.00 92.53
10 Jammu & Kashmir 76.35 244.66 127.91 372.57 7.23 9.83 25.68* 30.33** 96.66 11 Jharkhand 0.00 0.00 125.97 125.97 4.11 2.12 8.26 15.00** 18.00 12 Karnataka 51.81 109.35 50.68 160.03 19.37 13.70 14.08 16.30 14.50 13 Kerala 116.44 305.75 41.45 347.20 41.05 24.57 94.43 30.35 200.35 14 Madhya Pradesh 14.71 18.92 14.48 33.40 13.30 9.87 7.25 10.00** 11.00 15 Maharashtra 8.01 115.85 17.44 133.29 3107.03 17.36 8.77 15.85** 29.02 16 Manipur 32.14 81.76 48.55 130.31 18.08 27.38 21.67 167.58 97.22 17 Meghalya 12.04 22.51 10.05 32.56 2.26 3.12 2.50 2.50** 2.75 18 Mizoram 0.00 1.11 0.00 1.11 0.00 0.00 0.00 0.00 0.00 19 Nagaland 0.44 1.40 14.40 15.80 7.08 4.44 7.58 0.68 5.00 20 Orissa 53.50 160.20 15.39 175.59 53.50 38.69 129.86 154.50 270.00 21 Punjab 349.56 703.35 126.08 829.43 43.57 109.97 70.91 45.22 131.47 22 Rajasthan 28.45 132.71 28.34 161.05 1.86 1.62 1.82 2.00 2.00
Contd...
158

Appendix 1: Tables
Table 32: State-wise Planwise Financial Expenditure on Flood Management Work
(Rs Crores)
Sl. No. State/ UT During
IX Plan Upto IX
Plan During X
Plan Upto X
Plan
Actual Expendi-
ture
Actual Expendi-
ture
Actual Expendi-
ture
Revised Approved
Outlay
Approved Outlay
(1997-02) (1997-02) (1902-07) (1902-07) (2007-08) (2008-09) (2009-10) (2010-11) (2011-12) 1 2 3 4 5 6 7 8 9 10 11
23 Sikkim 8.36 11.61 15.89 27.50 5.95 16.88 6.68 9.20** 96.74 24 Tamil Nadu 0.00 34.70 0.00 34.70 0.00 0.00 0.00 155.39 182.80 25 Tripura 26.73 56.94 34.86 91.80 11.55 9.22 8.00 1.86 36.92 26 Uttar Pradesh 139.88 495.00 909.64 1404.64 301.13 314.97 238.17 298.45 535.00 27 Uttarakhand 3.52 3.52 83.42 86.94 23.62 18.14 6.50 5.50** 10.50 28 West Bengal 653.69 1220.57 418.89 1639.46 146.19 140.90 289.48 78.55** 328.25 Total States 2348.73 6335.74 3357.72 9693.46 4588.91 2031.13 2142.08 2150.00 4439.04
29 A & N Island 0.00 2.52 12.38 14.90 202.08 2.94 4.92 9.61** 15.23 30 Chandigarh 0.00 0.00 0.55 0.55 0.00 0.00 0.00 0.00** 0.00 31 Dadar & N. Haveli 0.00 0.00 0.00 0.00 1.00 0.00 0.00 0.00** 0.00 32 Daman & Diu 1.36 3.21 1.33 4.54 0.36 0.16 0.26 0.30** 2.40 33 Delhi 77.92 289.71 106.20 395.91 0.00 41.84 59.32 37.80** 59.95 34 Lakshadweep 18.39 31.21 16.21 47.42 4.65 4.00 5.02 4.00** 3.00 35 Puducherry 23.19 44.23 106.99 151.22 27.60 14.83 0.00 24.24 60.00
Total U.Ts. 120.86 370.88 243.66 614.5 235.69 63.77 69.52 75.95 140.58 Total States & Uts 2469.59 6706.62 3601.38 10308.00 4824.60 2094.90 2211.60 2225.95 4579.62 Central Sector 453.70 3229.95 742.80 3972.75 97.69 250.36 250.04 287.00 308.41 GRAND TOTAL 2923.29 9936.57 4344.18 14280.75 4922.29 2345.26 2461.64 2512.95 4888.03 Source: Annual Plan Documents & Planning Commission. *: Revised Approved Outlay. **: Approved Outlay. Note: - Total may not tally due to rounding off.
159

Appendix 1: Tables
Table 33: State-wise Progress of Physical Works under Flood Management till March 2011
Sl. No.
Name of the State/U.T
Area Benefitted
Upto March 2011
Length of Embankments
Length of Drainage Channels
Villages Raised/
Protected
Town/Village Protection
Work
Raised Platforms
(Million Ha) (Km) (Km) (No.) (No.) (No.) 1 2 3 4 5 6 7 8 1 Andhra Pradesh 1.311 2230.00 13569.00 23 72 - 2 Arunachal Pradesh 0.100 65.23 16.92 17 30 - 3 Assam 2.110 4467.90 857.79 1100 795 - 4 Bihar 2.949 3610.00 365.00 0 204 58 5 Chhattisgarh 0.000 0.00 0.00 0 0 - 6 Delhi 0.078 83.00 453.00 0 0 - 7 Goa 0.003 23.19 32.77 0 2 - 8 Gujarat 0.483 104.12 271.00 30 805 - 9 Haryana 2.000 1144.00 4385.00 98 448 7
10 Himachal Pradesh 0.018 159.16 11.00 82 0 - 11 Jammu & Kashmir 0.217 560.68 324.00 1301 22 - 12 Jharkhand 0.001 14.00 0.00 5 2 - 13 Karnataka 0.005 73.52 10.00 0 30 - 14 Kerala 0.346 205.74 82.19 6 4 - 15 Madhya Pradesh 0.004 26.00 0.00 0 37 - 16 Maharashtra 0.001 44.50 110.00 0 0 - 17 Manipur 0.132 577.00 166.00 512 38 - 18 Meghalaya 0.015 112.00 0.00 10 8 - 19 Mizoram 0.000 0.00 0.00 0 38 - 20 Nagaland 0.632 10.52 0.00 0 8 -
Contd...
160

Appendix 1: Tables
Table 33: State-wise Progress of Physical Works under Flood Management till March 2011
Sl. No.
Name of the State/U.T
Area Benefitted
Upto March 2011
Length of Embankments
Length of Drainage Channels
Villages Raised/
Protected
Town/Village Protection
Work
Raised Platforms
(Million Ha) (Km) (Km) (No.) (No.) (No.) 1 2 3 4 5 6 7 8
21 Orissa 0.630 7137.75 650.00 14 29 - 22 Punjab 3.190 1370.00 6622.00 0 3 - 23 Rajasthan 0.082 145.00 197.00 0 25 - 24 Sikkim 0.041 101.81 64.86 0 18 - 25 Tamil Nadu 0.122 87.00 19.00 4 46 - 26 Tripura 0.033 141.74 95.23 0 11 - 27 Uttar Pradesh 1.703 2097.00 3995.00 4511 65 - 28 Uttarakhand 0.002 9.00 0.00 0 6 - 29 West Bengal 2.568 10539.00 7392.76 0 48 - 30 A&N Islands 0.000 0.00 0.00 0 0 - 31 Chandigarh 0.000 0.00 0.00 0 0 - 32 Dadra & Nagar Haveli 0.000 0.00 0.00 0 0 - 33 Daman & Diu 0.000 0.00 0.00 0 0 - 34 Lakshadweep 0.000 0.00 0.00 0 0 - 35 Puducherry 0.004 61.00 20.00 0 0 -
Grand Total 18.78 35199.86 39709.52 7713 2794 65
Source : Flood Management Planning (FMP) Directortae , Central Water Commission
161

Appendix 1: Tables
Table 34 (A) : Flood Forecasting Performance at various Forecasting stations during the flood season 2010
Sl.No. Name of the river
Name of FF site
Name of State
Warning Level (m)
Danger level (m)
Highest Flood Level Maximum Level -2010 During 2010
Level (m)
Date/ Month/
Year
Level (m)
Date and Time DD/MM/YY: HH)
No.of Forecasts
issued
No.of Forecasts
within limits
Percent-age of accuracy
1 2 3 4 5 6 7 8 9 10 11 12 13 Ganga Basin 1 Alaknanda Srinagar Uttarakhand 539.00 540.00 536.85 05/09/1995 536.00 19/09/2010 1:00 0 0 2 Ganga Rishikesh Uttarakhand 339.50 340.50 341.72 03/09/1978 341.50 19/09/2010 5:00 35 27 77.14 3 Ganga Haridwar Uttarakhand 293.00 294.00 296.23 02/09/1978 296.30 19/09/2010 8:00 51 34 66.67 4 Ganga Narora Barrage Uttar Pradesh 180.18 06/09/1978 180.61 23/09/2010;10:00 72 70 97.22 5 Ganga Kannauj Uttar Pradesh 124.97 125.97 126.24 29/08/1998 126.78 27/09/2010;07:00 44 44 100.00 6 Ganga Ankinghat Uttar Pradesh 123.00 124.00 124.31 09/09/1978 124.49 28/09/2010;05:00 44 44 100.00 7 Ganga Kanpur Uttar Pradesh 113.00 114.00 113.47 02/09/1967 114.08 29/09/2010;14:00 53 51 96.23 8 Ganga Dalmau Uttar Pradesh 98.36 99.36 99.84 03/08/1973 99.63 30/09/2010;19:00 37 37 100.00 9 Ganga Phphamau Uttar Pradesh 83.73 84.73 87.98 08/09/1978 81.36 02/10/2010:17 0 0
10 Ganga Allahabad Chhatnag Uttar Pradesh 83.73 84.73 88.03 08/09/1978 79.54 02/10/2010:12 0 0
11 Ganga Mirzapur Uttar Pradesh 76.72 77.72 80.34 09/09/1978 72.76 03/10/2010:08 0 0 12 Ganga Varanasi Uttar Pradesh 70.26 71.26 73.90 09/09/1978 67.58 03/10/2010:17 0 0 13 Ganga Ghazipur Uttar Pradesh 62.11 63.11 65.22 09/09/1978 61.33 03/10/2010:16 0 0 14 Ganga Buxar Bihar 59.32 60.32 62.09 1948 58.42 03/10/2010 (17-24) hrs 0 0 15 Ganga Ballia Uttar Pradesh 56.62 57.62 60.25 14/09/2003 57.60 26/09/2010:01 33 33 100.00
16 Ganga Patna Dighaghat Bihar 49.45 50.45 52.52 23/08/1975 49.77 25/0/9/2010 20 hrs 28 28 100.00
17 Ganga Patna Gandhighat Bihar 47.60 48.60 50.27 14/08/1994 48.77 20/09/2010 20 hrs 46 46 100.00
18 Ganga Hathidah Bihar 40.76 41.76 43.15 07/08/1971 41.78 21/09/2010 08 hrs 44 44 100.00 19 Ganga Munger Bihar 38.33 39.33 40.99 19/09/1976 38.14 02/09/2010 14 hrs 0 0
Contd...
162

Appendix 1: Tables
Table 34 (A) : Flood Forecasting Performance at various Forecasting stations during the flood season 2010
Sl.No. Name of the river
Name of FF site
Name of State
Warning Level (m)
Danger level (m)
Highest Flood Level Maximum Level -2010 During 2010
Level (m)
Date/ Month/
Year
Level (m)
Date and Time DD/MM/YY: HH)
No.of Forecasts
issued
No.of Forecasts
within limits
Percent-age of accuracy
1 2 3 4 5 6 7 8 9 10 11 12 13 20 Ganga Bhagalpur Bihar 32.68 33.68 34.20 17/09/2003 33.26 03/09/2010 17 hrs 35 35 100.00 21 Ganga Kahalgaon Bihar 30.09 31.09 32.87 17/09/2003 31.59 03/09/2010 11 hrs 45 45 100.00 22 Ganga Sahibgunj Jharkhand 26.25 27.25 30.91 1998 27.96 03/09/2010 03 hrs 52 52 100.00 23 Ganga Farakka West Bengal 21.25 22.25 25.14 07/09/1998 23.13 03/09/2010 23 hrs 99 97 97.98 24 Ramganga Moradabad Uttar Pradesh 189.60 190.60 192.68 03/09/1978 192.88 21/09/2010;02:00 39 37 94.87 25 Ramganga Bareilly Uttar Pradesh 162.70 163.70 162.88 06/08/1978 162.82 22/09/2010;21:00 5 5 100.00 26 Yamuna Tajewala Weir Haryana 328.27 03/09/1978 338.10 20.09.10 0 0 27 Yamuna Mawi Uttar Pradesh 230.00 230.85 232.45 26/09/1988 232.33 21.09.10 47 44 93.62
28 Yamuna Delhi Rly Bridge NCT Delhi 204.00 204.83 207.49 06/09/1978 207.11 22.09.10 46 42 91.30
29 Yamuna Mathura Uttar Pradesh 164.20 165.20 169.73 08/09/1978 167.34 26.09.10 65 65 100.00 30 Yamuna Agra Uttar Pradesh 151.40 152.40 154.76 09/09/1978 152.08 27/Sep/10 00 12 12 100.00 31 Yamuna Etawa Uttar Pradesh 120.92 121.92 126.13 11/09/1978 122.41 29/Sep/10 00 17 16 94.12 32 Yamuna Auraiya Uttar Pradesh 112.00 113.00 118.19 25/08/1996 105.13 30/Sep/10 00 0 0 33 Yamuna Kalpi Uttar Pradesh 107.00 108.00 112.98 25/08/1996 100.09 23/09/2010 01 0 0 34 Yamuna Hamirpur Uttar Pradesh 102.63 103.63 108.59 12/09/1983 94.43 23/09/2010 18 0 0 35 Yamuna Chilaghat Uttar Pradesh 99.00 100.00 105.16 06/09/1978 91.99 05/09/2010 15 0 0 36 Yamuna Naini Uttar Pradesh 83.74 84.74 87.99 08/09/1978 80.14 02/10/2010 18 0 0 37 Sahibi Dhansa NCT Delhi 211.44 212.44 213.58 06/08/1977 210.38 23.09.10 0 0
38 Chambal Gandhisagar Dam
Madhya Pradesh 0 0
39 Betwa Mohana Uttar Pradesh 121.66 122.66 133.35 11/09/1983 113.79 27/07/2010 19 0 0 Contd...
163

Appendix 1: Tables
Table 34 (A) : Flood Forecasting Performance at various Forecasting stations during the flood season 2010
Sl.No. Name of the river
Name of FF site
Name of State
Warning Level (m)
Danger level (m)
Highest Flood Level Maximum Level -2010 During 2010
Level (m)
Date/ Month/
Year
Level (m)
Date and Time DD/MM/YY: HH)
No.of Forecasts
issued
No.of Forecasts
within limits
Percent-age of accuracy
1 2 3 4 5 6 7 8 9 10 11 12 13 40 Betwa Sahjina Uttar Pradesh 103.54 104.54 108.67 12/09/1983 93.87 23/09/2010 17 0 0 41 Ken Banda Uttar Pradesh 103.00 104.00 113.29 7/7/2005 102.30 27/07/2010 20 0 0
42 Gomati Lucknow HanumanSetu Uttar Pradesh 108.50 109.50 110.85 11/09/1971 106.32 28/09/2010;20:00 0 0
43 Gomati Jaunpur Uttar Pradesh 73.07 74.07 77.74 22/09/1971 70.06 30/09/2010:18 0 0 44 SAI Raibareli Uttar Pradesh 100.00 101.00 104.81 17/09/1982 98.25 03/08/2010;13:00 0 0 45 Ghaghra Elgin Bridge Uttar Pradesh 105.07 106.07 107.56 10/10/2009 107.16 26/08/2010 05 73 71 97.26 46 Ghaghra Ayodhya Uttar Pradesh 91.73 92.73 94.01 11/10/2009 93.91 27/08/2010 21 77 75 97.40 47 Ghaghra Turtipar Uttar Pradesh 63.01 64.01 66.00 28/08/1998 64.80 29/08/2010 21 76 75 98.68 48 Ghaghra Darauli Bihar 59.82 60.82 61.74 29/08/1998 61.05 29/08/2010 14 hrs 50 50 100.00 49 Ghaghra Gangpur Siswan Bihar 56.04 57.04 58.01 18/09/1983 57.41 31/08/2010 09 hrs 41 41 100.00 50 Ghaghra Chhapra Bihar 52.68 53.68 54.59 03/09/1982 50.88 26/09/2010 07hrs 0 0 51 Rapti Balrampur Uttar Pradesh 103.62 104.62 105.25 11/09/2000 104.47 25/08/2010 22 21 21 100.00 52 Rapti Bansi Uttar Pradesh 83.90 84.90 85.82 21/08/1998 84.89 29/08/2010 22 29 29 100.00
53 Rapti Gorakpur Birdghat Uttar Pradesh 73.98 74.98 77.54 23/08/1998 75.98 29/08/2010 22 44 44 100.00
54 Sone Inderpuri Bihar 107.20 108.20 108.85 23/08/1975 104.10 14/07/2010 08 hrs 0 0 55 Sone Koelwar Bihar 54.52 55.52 58.88 20/07/1971 52.01 25/09/2010 18 hrs 0 0 56 Sone Maner Bihar 51.00 52.00 53.79 10/09/1976 51.31 25/09/2010 21 hrs 20 20 100.00 57 PunPun Sripalpur Bihar 49.60 50.60 53.91 18/09/1976 50.23 20/09/2010 06 hrs 6 6 100.00 58 Gandak Khadda Uttar Pradesh 95.00 96.00 97.50 23/07/2002 96.30 24/08/2010 15 hrs 109 109 100.00 59 Gandak Chatia Bihar 68.15 69.15 70.04 26/07/2002 69.45 2708/2010 04 hrs 12 12 100.00
Contd...
164
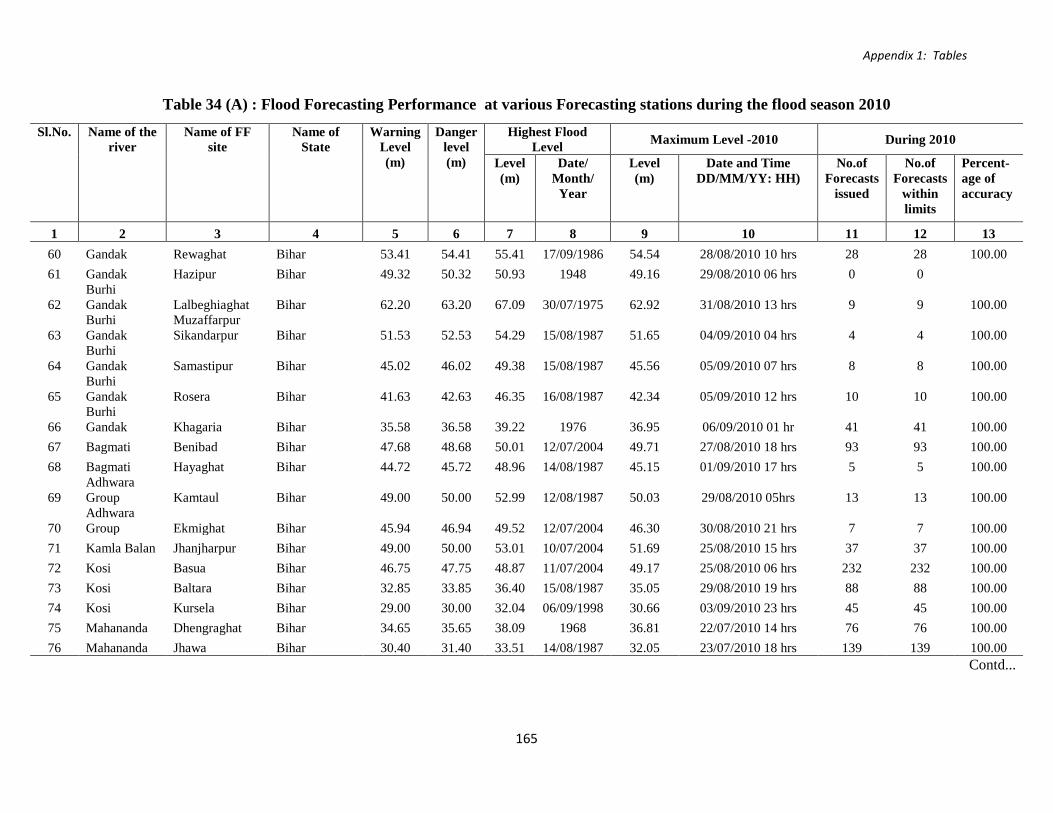
Appendix 1: Tables
Table 34 (A) : Flood Forecasting Performance at various Forecasting stations during the flood season 2010
Sl.No. Name of the river
Name of FF site
Name of State
Warning Level (m)
Danger level (m)
Highest Flood Level Maximum Level -2010 During 2010
Level (m)
Date/ Month/
Year
Level (m)
Date and Time DD/MM/YY: HH)
No.of Forecasts
issued
No.of Forecasts
within limits
Percent-age of accuracy
1 2 3 4 5 6 7 8 9 10 11 12 13 60 Gandak Rewaghat Bihar 53.41 54.41 55.41 17/09/1986 54.54 28/08/2010 10 hrs 28 28 100.00 61 Gandak Hazipur Bihar 49.32 50.32 50.93 1948 49.16 29/08/2010 06 hrs 0 0
62 Burhi Gandak Lalbeghiaghat Bihar 62.20 63.20 67.09 30/07/1975 62.92 31/08/2010 13 hrs 9 9 100.00
63 Burhi Gandak
Muzaffarpur Sikandarpur Bihar 51.53 52.53 54.29 15/08/1987 51.65 04/09/2010 04 hrs 4 4 100.00
64 Burhi Gandak Samastipur Bihar 45.02 46.02 49.38 15/08/1987 45.56 05/09/2010 07 hrs 8 8 100.00
65 Burhi Gandak Rosera Bihar 41.63 42.63 46.35 16/08/1987 42.34 05/09/2010 12 hrs 10 10 100.00
66 Burhi Gandak Khagaria Bihar 35.58 36.58 39.22 1976 36.95 06/09/2010 01 hr 41 41 100.00
67 Bagmati Benibad Bihar 47.68 48.68 50.01 12/07/2004 49.71 27/08/2010 18 hrs 93 93 100.00 68 Bagmati Hayaghat Bihar 44.72 45.72 48.96 14/08/1987 45.15 01/09/2010 17 hrs 5 5 100.00
69 Adhwara Group Kamtaul Bihar 49.00 50.00 52.99 12/08/1987 50.03 29/08/2010 05hrs 13 13 100.00
70 Adhwara Group Ekmighat Bihar 45.94 46.94 49.52 12/07/2004 46.30 30/08/2010 21 hrs 7 7 100.00
71 Kamla Balan Jhanjharpur Bihar 49.00 50.00 53.01 10/07/2004 51.69 25/08/2010 15 hrs 37 37 100.00 72 Kosi Basua Bihar 46.75 47.75 48.87 11/07/2004 49.17 25/08/2010 06 hrs 232 232 100.00 73 Kosi Baltara Bihar 32.85 33.85 36.40 15/08/1987 35.05 29/08/2010 19 hrs 88 88 100.00 74 Kosi Kursela Bihar 29.00 30.00 32.04 06/09/1998 30.66 03/09/2010 23 hrs 45 45 100.00 75 Mahananda Dhengraghat Bihar 34.65 35.65 38.09 1968 36.81 22/07/2010 14 hrs 76 76 100.00 76 Mahananda Jhawa Bihar 30.40 31.40 33.51 14/08/1987 32.05 23/07/2010 18 hrs 139 139 100.00
Contd...
165
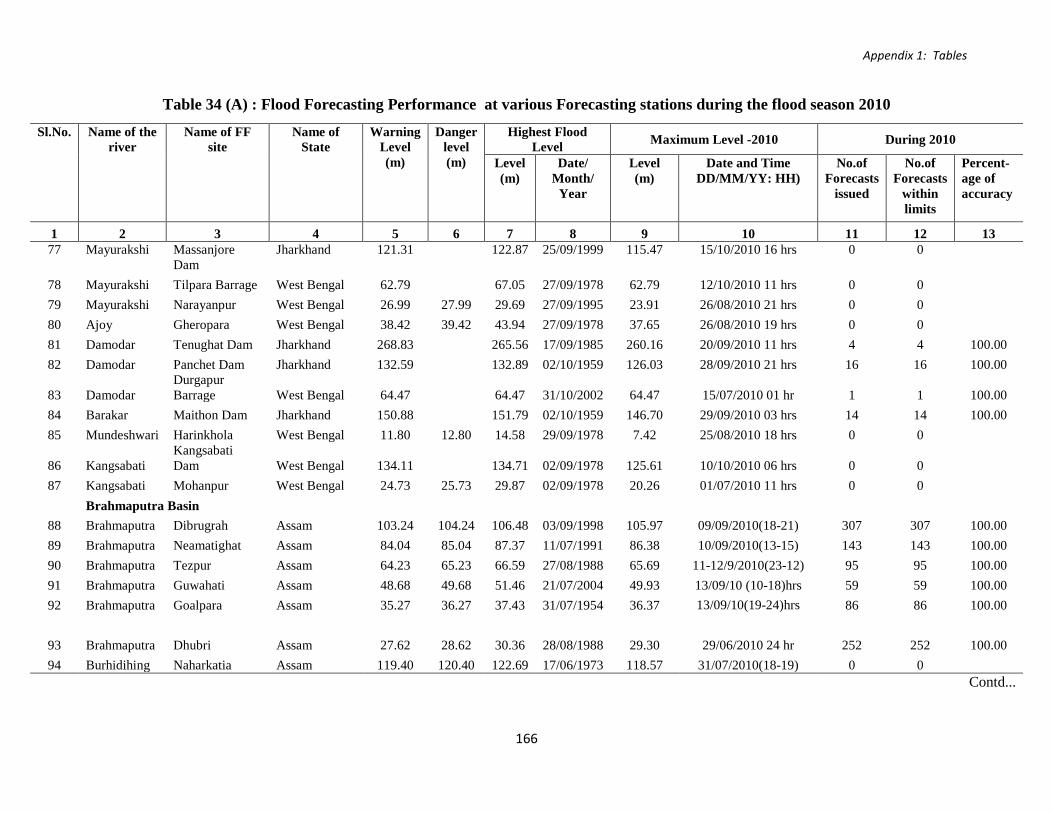
Appendix 1: Tables
Table 34 (A) : Flood Forecasting Performance at various Forecasting stations during the flood season 2010
Sl.No. Name of the river
Name of FF site
Name of State
Warning Level (m)
Danger level (m)
Highest Flood Level Maximum Level -2010 During 2010
Level (m)
Date/ Month/
Year
Level (m)
Date and Time DD/MM/YY: HH)
No.of Forecasts
issued
No.of Forecasts
within limits
Percent-age of accuracy
1 2 3 4 5 6 7 8 9 10 11 12 13 77 Mayurakshi Massanjore
Dam Jharkhand 121.31 122.87 25/09/1999 115.47 15/10/2010 16 hrs 0 0
78 Mayurakshi Tilpara Barrage West Bengal 62.79 67.05 27/09/1978 62.79 12/10/2010 11 hrs 0 0 79 Mayurakshi Narayanpur West Bengal 26.99 27.99 29.69 27/09/1995 23.91 26/08/2010 21 hrs 0 0 80 Ajoy Gheropara West Bengal 38.42 39.42 43.94 27/09/1978 37.65 26/08/2010 19 hrs 0 0 81 Damodar Tenughat Dam Jharkhand 268.83 265.56 17/09/1985 260.16 20/09/2010 11 hrs 4 4 100.00 82 Damodar Panchet Dam Jharkhand 132.59 132.89 02/10/1959 126.03 28/09/2010 21 hrs 16 16 100.00
83 Damodar Durgapur Barrage West Bengal 64.47 64.47 31/10/2002 64.47 15/07/2010 01 hr 1 1 100.00
84 Barakar Maithon Dam Jharkhand 150.88 151.79 02/10/1959 146.70 29/09/2010 03 hrs 14 14 100.00 85 Mundeshwari Harinkhola West Bengal 11.80 12.80 14.58 29/09/1978 7.42 25/08/2010 18 hrs 0 0
86 Kangsabati Kangsabati Dam West Bengal 134.11 134.71 02/09/1978 125.61 10/10/2010 06 hrs 0 0
87 Kangsabati Mohanpur West Bengal 24.73 25.73 29.87 02/09/1978 20.26 01/07/2010 11 hrs 0 0 Brahmaputra Basin
88 Brahmaputra Dibrugrah Assam 103.24 104.24 106.48 03/09/1998 105.97 09/09/2010(18-21) 307 307 100.00 89 Brahmaputra Neamatighat Assam 84.04 85.04 87.37 11/07/1991 86.38 10/09/2010(13-15) 143 143 100.00 90 Brahmaputra Tezpur Assam 64.23 65.23 66.59 27/08/1988 65.69 11-12/9/2010(23-12) 95 95 100.00 91 Brahmaputra Guwahati Assam 48.68 49.68 51.46 21/07/2004 49.93 13/09/10 (10-18)hrs 59 59 100.00 92 Brahmaputra Goalpara Assam 35.27 36.27 37.43 31/07/1954 36.37 13/09/10(19-24)hrs 86 86 100.00
93 Brahmaputra Dhubri Assam 27.62 28.62 30.36 28/08/1988 29.30 29/06/2010 24 hr 252 252 100.00 94 Burhidihing Naharkatia Assam 119.40 120.40 122.69 17/06/1973 118.57 31/07/2010(18-19) 0 0
Contd...
166

Appendix 1: Tables
Table 34 (A) : Flood Forecasting Performance at various Forecasting stations during the flood season 2010
Sl.No. Name of the river
Name of FF site
Name of State
Warning Level (m)
Danger level (m)
Highest Flood Level Maximum Level -2010 During 2010
Level (m)
Date/ Month/
Year
Level (m)
Date and Time DD/MM/YY: HH)
No.of Forecasts
issued
No.of Forecasts
within limits
Percent-age of accuracy
1 2 3 4 5 6 7 8 9 10 11 12 13 95 Burhidihing Khowang Assam 101.11 102.11 103.92 25/08/1988 102.52 23/07/2010(09-17) 50 50 100.00 96 Desang Nanglamoraghat Assam 93.46 94.46 96.49 06/09/1998 95.88 22/07/2010(06-09) 84 84 100.00 97 Dikhow Shivsagar Assam 91.40 92.40 95.62 08/07/1974 93.81 27-28/06/10(23-03) 101 100 99.01 98 Subansiri Badatighat Assam 81.53 82.53 86.84 28/06/1972 82.35 10/09/2010(21-24) 41 41 100.00 99 Dhansiri (S) Golaghat Assam 88.50 89.50 91.30 11/10/1986 89.98 09/10/2010(2400) 117 117 100.00
100 Dhansiri (S) Numaligarh Assam 76.42 77.42 79.87 24/09/1985 78.88 22/08/2010(13-15) 258 256 99.22 101 Jiabharali Jiabharali_NTX Assam 76.00 77.00 78.50 26/07/2007 77.75 23/08/2010(08-12) 355 352 99.15 102 Kopilli Kampur Assam 59.50 60.50 61.86 16/06/1973 61.52 10/10/2010(16-18) 12 12 100.00 103 Kopilli Dharmatul Assam 55.00 56.00 58.09 21/07/2004 55.65 12/10/2010(09-24) 31 31 100.00
104 Puthimari Puthimari _NHX Assam 50.81 51.81 55.08 31/08/2008 54.22 28/06/10(18-19)hrs 307 297 96.74
105 Pagladiya Pagladia_NTX Assam 51.75 52.75 55.45 08/07/2004 52.51 28/06/10(18-19)hrs 18 18 100.00 106 Beki Beki Rd Bridge Assam 44.10 45.10 46.20 04/08/2000 45.80 28/06/2010 (05-06) hrs 471 471 100.00 107 Manas Manas NHX Assam 47.81 48.42 50.08 15/09/1984 48.79 28/06/2010 (12-13)hrs 34 34 100.00 108 Sankosh Golakganj Assam 28.94 29.94 30.95 08/09/2007 30.45 12/07/2010 (04-06) hrs 170 169 99.41 109 Raidak-I Tufanganj West Bengal 34.22 35.30 36.36 21/07/1993 34.84 12/07/2010 (07-11) hrs 18 16 88.89 110 Torsa Ghughumari West Bengal 39.80 40.41 41.46 03/08/2000 40.58 21/07/2010 (19-21) hrs 58 57 98.28 111 Jaldhaka NH-31 West Bengal 80.00 80.90 81.33 28/08/1972 80.30 09/7/2010 (14) hr 45 45 100.00 112 Jaldhaka Mathabhanga West Bengal 47.70 48.20 49.85 07/09/2007 48.00 21/07/2010 (16-17)hrs 5 5 100.00 113 Tista Domohani West Bengal 85.65 85.95 89.30 04/10/1968 86.09 24/08/2010 (02-03) hrs 115 115 100.00 114 Tista Mekhliganj West Bengal 65.45 65.95 66.45 13/07/1996 65.91 23/08/2010 (24)hr 45 45 100.00
Contd...
167

Appendix 1: Tables
Table 34 (A) : Flood Forecasting Performance at various Forecasting stations during the flood season 2010
Sl.No. Name of the river
Name of FF site
Name of State
Warning Level (m)
Danger level (m)
Highest Flood Level Maximum Level -2010 During 2010
Level (m)
Date/ Month/
Year
Level (m)
Date and Time DD/MM/YY: HH)
No.of Forecasts
issued
No.of Forecasts
within limits
Percent-age of accuracy
1 2 3 4 5 6 7 8 9 10 11 12 13 Barak & Meghna Basins
115 Barak APGhat Assam 18.83 19.83 21.84 01/08/1989 20.72 10/06/10(21-24)hrs 118 115 97.46 116 Katakhal Matizuri Assam 19.27 20.27 22.73 10/09/2007 21.13 06/06/10(06-07) 79 79 100.00 117 Kushiyara Karimganj Assam 13.94 14.94 16.55 09/09/2007 16.57 10/06/10(23-24)hrs 241 241 100.00
118 Manu Kailashar Tripura 24.34 25.34 25.79 07/06/1993 24.99 09/10/10(15-16)hrs 5 1 20.00 119 Gumti Sonamura Tripura 11.50 12.50 14.42 23/07/1993 11.77 09/10/10(08-09)hrs 2 1 50.00
Eastern Rivers (Excluding Mahanadi)
120 Subernarekna Rajghat Odisha 9.45 10.36 12.69 19/06/2008 7.11 20/09/2010 17 hrs 0 0
121 Burhabalang NH_5 _Road Bridge Odisha 7.21 8.13 9.50 12/10/1973 7.34 19/09/2010 14 hrs 1 1 100.00
122 Baitarni Anandpur Odisha 37.44 38.36 41.20 19/08/1975 35.53 20/09/2010 06 hrs 0 0 123 Baitarni Akhuapada Odisha 17.83 21.95 16/08/1960 17.40 25/07/2010 06 hrs 0 0 124 Brahmani Jenapur Odisha 22.00 23.00 24.78 20/08/1975 19.72 07/08/2010 15 hrs 0 0 125 Rushikuluya Purushottampur Odisha 15.83 16.83 19.65 04/11/1990 15.28 08/09/2010 15 hrs 0 0 126 Vamsadhara Gunupur Odisha 83.00 84.00 88.75 17/09/1980 82.67 06/08/2010 06 hrs 0 0 127 Vamsadhara Kashinagar Odisha 53.60 54.60 58.93 18/09/1980 55.00 05/08/2010 04 hrs 52 52 100.00
128 Vamsadhara Gotta Barrage Andhra Pradesh 34.84 34.84 39.92 07/10/1999 34.84 01/07/2010 01 hr 7 7 100.00
Mahanadi Basin 129 Mahanadi Hirakud Dam Odisha 192.02 192.30 30/01/1998 192.02 25/09/2010 18 hrs 59 58 98.31
Contd...
168

Appendix 1: Tables
Table 34 (A) : Flood Forecasting Performance at various Forecasting stations during the flood season 2010
Sl.No. Name of the river
Name of FF site
Name of State
Warning Level (m)
Danger level (m)
Highest Flood Level Maximum Level -2010 During 2010
Level (m)
Date/ Month/
Year
Level (m)
Date and Time DD/MM/YY: HH)
No.of Forecasts
issued
No.of Forecasts
within limits
Percent-age of accuracy
1 2 3 4 5 6 7 8 9 10 11 12 13 130 Mahanadi Naraj Odisha 25.41 26.41 27.61 31/08/1982 26.76 25/09/2010 24 hrs 12 12 100.00 131 Mahanadi Alipingal Devi Odisha 10.85 11.76 13.05 20/09/2008 8.50 21/09/2010 08 hrs 0 0 132 Mahanadi Nimapara Odisha 9.85 10.76 11.60 31/08/1982 6.86 08/08/2010 24 hrs 0 0
Godavari Basin 133 Godavari Kopergaon Maharashtra 490.90 493.68 499.17 1969 489.85 04/08/2010 19 hrs 0 0 134 Godavari Jaikwadi Dam Maharashtra 463.91 464.69 12/10/1990 461.31 11/10/2010 13 hrs 0 0 135 Godavari Gangakhed Maharashtra 374.00 375.00 377.57 1947 369.91 13/08/2010 19 hrs 0 0 136 Godavari Nanded Maharashtra 353.00 354.00 357.10 06/08/2006 346.30 07/08/2010 14 hrs 0 0
137 Godavari Sriram Sagar Andhra Pradesh 332.54 332.72 13/10/1990 332.54 12/09/2010 19 hrs 29 27 93.10
138 Godavari Kaleswaram Andhra Pradesh 103.50 104.75 107.05 15/08/1986 103.81 09/09/2010 07 hrs 3 3 100.00
139 Godavari Eturunagaram Andhra Pradesh 73.29 75.79 77.66 24/08/1990 75.93 07/08/2010 24 hrs 61 56 91.80
140 Godavari Dummagudam Andhra Pradesh 53.00 55.00 60.25 16/08/1986 56.23 08/08/2010 07 hrs 51 47 92.16
141 Godavari Bhadrachalam Andhra Pradesh 45.72 48.77 55.66 16/08/1986 50.81 08/08/2010 14 hrs 72 68 94.44
142 Godavari Kunavaram Andhra Pradesh 37.74 39.24 51.30 16/08/1986 42.00 09/08/2010 03 hrs 62 56 90.32
143 Godavari Rajamundry Andhra Pradesh 17.68 19.51 20.48 16/08/1986 18.37 09/08/2010 07 hrs 25 22 88.00
144 Godavari Dowalaiswaram Andhra Pradesh 14.25 16.08 18.36 8/16/1986 16.14 09/08/2010 09 hrs 80 80 100.00
145 Wardha Balharsha Maharashtra 171.50 174.00 176.00 15/08/1986 172.25 08/08/2010 08 hrs 9 8 88.89 Contd...
169

Appendix 1: Tables
Table 34 (A) : Flood Forecasting Performance at various Forecasting stations during the flood season 2010
Sl.No. Name of the river
Name of FF site
Name of State
Warning Level (m)
Danger level (m)
Highest Flood Level Maximum Level -2010 During 2010
Level (m)
Date/ Month/
Year
Level (m)
Date and Time DD/MM/YY: HH)
No.of Forecasts
issued
No.of Forecasts
within limits
Percent-age of accuracy
1 2 3 4 5 6 7 8 9 10 11 12 13 146 Wainganga Bhandara Maharashtra 244.00 244.50 250.90 16/09/2005 243.95 08/09/2010 22 hrs 0 0 147 Wainganga Pauni Maharashtra 226.73 227.73 232.35 07/09/1994 226.38 09/09/2010 06 hrs 0 0
148 Manjira Singur Dam Andhra Pradesh 523.60 523.60 15/10/1999 523.60 12/09/2010 08 hrs 21 20 95.24
149 Manjira Nizamsagar Dam
Andhra Pradesh 428.24 428.24 10/15/1999 428.24 02/09/2010 24 hrs 13 13 100.00
150 Indravati Jagdalpur Chhatisgarh 539.50 540.80 544.68 09/07/1973 544.08 06/08/2010 19 hrs 57 51 89.47 Krishna Basin
151 Krishna Arjunwad Maharashtra 542.07 543.29 543.69 05/08/2005 0 0 152 Krishna Alamati Dam Karnataka 519.60 519.60 18/09/2002 519.60 30/8/2010 06 hrs 31 30 96.77
153 Krishna Narayanpur Dam Karnataka 492.25 492.22 26/09/2008 492.03 21/10/2010 15 hrs 43 41 95.35
154 Krishna Priyadarshini Andhra Pradesh 318.52 316.50 21/10/1993 318.20 28/06/2010 09 hrs 133 127 95.49
155 Krishna Srisailam Dam Andhra Pradesh 269.75 273.25 03/10/2009 269.75 30/08/2010 01 hr 133 124 93.23
156 Krishna Prakasham Barrage
Andhra Pradesh 18.30 21.50 07/10/1903 17.39 15/06/2010 01 hr 110 100 90.91
157 Bhima Deongaon Karnataka 402.00 404.50 407.34 13/08/2006 400.05 23/08/2010 17 hrs 0 0
158 Tungbhadra Tungabhadra Dam Karnataka 497.74 497.74 05/10/1992 497.74 21/08/2010 16 hrs 150 145 96.67
159 Tungbhadra Mantralayam Andhra Pradesh 310.00 312.00 318.77 02/10/2009 312.69 25/08/2010 08 hrs 14 14 100.00
Southern River System:
160 Pennar Nellore Andhra Pradesh 15.91 17.28 18.70 30/11/1882 13.60 28/08/2010 08 hrs 0 0
Contd...
170

Appendix 1: Tables
Table 34 (A) : Flood Forecasting Performance at various Forecasting stations during the flood season 2010
Sl.No. Name of the river
Name of FF site
Name of State
Warning Level (m)
Danger level (m)
Highest Flood Level Maximum Level -2010 During 2010
Level (m)
Date/ Month/
Year
Level (m)
Date and Time DD/MM/YY: HH)
No.of Forecasts
issued
No.of Forecasts
within limits
Percent-age of accuracy
1 2 3 4 5 6 7 8 9 10 11 12 13 Western River Systems:
161 Banas Dantiwada Dam Gujarat 182.88 185.06 186.04 01/09/1973 173.23 22/09/2010 11 hrs 0 0 162 Sabarmati Dharoi Dam Gujarat 187.45 192.25 189.63 03/09/1990 186.77 08/10/2010 08 hrs 1 1 100.00
163 Sabarmati Ahmedabad Shubhash Bridge Gujarat 44.09 45.34 47.45 19/08/2006 41.84 15/10/2010 19 hrs 0 0
164 Mahi Kadana Dam Gujarat 126.19 127.71 127.74 09/09/1989 125.96 25/09/2010 04 hrs 0 0 165 Mahi Wanakbori Gujarat 71.00 72.54 76.10 12/08/2006 67.59 10/09/2010 09 hrs 0 0 166 Naramada Mandla Madhya Pradesh 437.20 437.80 439.41 18/08/1974 436.22 26/07/2010 10 hrs 0 0 167 Naramada Hoshangabad Madhya Pradesh 292.83 293.83 300.90 30/08/1973 290.05 05/09/2010 14 hrs 0 0 168 Naramada Garudeswar Gujarat 30.48 31.09 41.65 06/09/1970 18.93 10/09/2010 06 hrs 0 0 169 Naramada Bharuch Gujarat 6.71 7.31 12.65 07/09/1970 6.10 11/09/2010 06 hrs 0 0 170 Tapi Hatnur Dam Maharashtra 212.00 214.00 214.00 12/10/1989 214.00 01/10/201008 hrs 111 110 99.10 171 Tapi Ukai Dam Gujarat 102.41 105.16 105.51 08/10/1990 103.81 19/09/2010 15 hrs 79 79 100.00 172 Tapi Surat Gujarat 8.50 9.50 12.50 09/08/2006 6.80 11/09/2010 07 hrs 0 0 173 Damanganga Madhuban Dam Gujarat 79.86 82.40 80.60 27/09/1993 80.00 07/10/2010 06 hrs 1 1 100.00 174 Damanganga Vapi Town Gujarat 18.20 19.20 23.76 03/08/2004 16.10 09/09/2010 11 hrs 0 0 175 Damanganga Daman
Dadra & Nagar Haveli 2.60 3.40 4.00 03/08/2004 1.90 26/06/2010 16 hrs 0 0
Total Forecasts 7519 7378 98.12
Level Forecasts 6491 6390 98.44
Inflow Forecast 1028 988 96.11
Source : Central Water Commission (Flood Forecasting Monitoring Directoirate)
Note : FF : Flood Forecasting m: Meter
171

Appendix 1: Tables
Table 34 (B) : Flood Forecasting Performance at various Forcasting stations during Flood Season 2009
Sl.No.
Name of the river
Name of FF site Name of State Warning
Level (m)
Danger level
(m)
Highest Flood Level Maximum Level -2009 During 2009 Level (m)
Date/ Month/
Year
Level (m) Date and Time DD/MM/YY:HH)
No.of Forecasts issued
No.of Forecasts within limits
Percent-age of accuracy
1 2 3 4 5 6 7 8 9 10 11 12 13 Ganga Basin 1 Alaknanda Srinagar Uttaranchal 539.00 540.00 536.85 05/09/1995 534.35 11/Sep/09 01 0 0 2 Ganga Rishikesh Uttaranchal 339.50 340.50 341.72 03/09/1978 339.02 11/Sep/09 04 0 0 3 Ganga Haridwar Uttaranchal 293.00 294.00 296.23 02/09/1978 293.15 11/Sep/09 05 1 0 0 4 Ganga Narora Barrage Uttar Pradesh 180.18 06/09/1978 179.16 29/Jul/09 06 4 3 75 5 Ganga Kannauj Uttar Pradesh 124.97 125.97 126.24 29/08/1998 124.48 15/Sep/09 19 0 0 6 Ganga Ankinghat Uttar Pradesh 123.00 124.00 124.31 09/09/1978 122.62 15/Sep/09 14 0 0 7 Ganga Kanpur Uttar Pradesh 113.00 114.00 113.47 02/09/1967 111.98 16/Sep/09 09 0 0 8 Ganga Dalmau Uttar Pradesh 98.36 99.36 99.84 03/08/1973 97.85 17/Sep/09 01 0 0 9 Ganga Phphamau Uttar Pradesh 83.73 84.73 87.98 08/09/1978 78.77 17/Aug/09 21 0 0
10 Ganga Allahabad Chhatnag Uttar Pradesh 83.73 84.73 88.03 08/09/1978 77.53 14/Sep/09 00 0 0
11 Ganga Mirzapur Uttar Pradesh 76.72 77.72 80.34 09/09/1978 70.52 14/Sep/09 17 0 0 12 Ganga Varanasi Uttar Pradesh 70.26 71.26 73.90 09/09/1978 65.31 15/Sep/09 02 0 0 13 Ganga Ghazipur Uttar Pradesh 62.11 63.11 65.22 09/09/1978 59.29 15/Sep/09 21 0 0 14 Ganga Buxar Bihar 59.32 60.32 62.09 1948 56.58 16/Sep/09 06 0 0 15 Ganga Ballia Uttar Pradesh 56.62 57.62 60.25 14/09/2003 55.89 16/Sep/09 14 0 0 16 Ganga Patna Dighaghat Bihar 49.45 50.45 52.52 23/08/1975 48.67 15/Oct/09 13 0 0 17 Ganga Patna Gandhighat Bihar 47.60 48.60 50.27 14/08/1994 47.57 25/Aug/09 17 2 2 100 18 Ganga Hathidah Bihar 40.76 41.76 43.15 07/08/1971 40.91 26/Aug/09 13 7 7 100 19 Ganga Munger Bihar 38.33 39.33 40.99 19/09/1976 37.05 27/Aug/09 16 0 0 20 Ganga Bhagalpur Bihar 32.68 33.68 34.20 17/09/2003 32.18 27/Aug/09 08 0 0
Contd...
172

Appendix 1: Tables
Table 34 (B) : Flood Forecasting Performance at various Forcasting stations during Flood Season 2009
Sl.No.
Name of the river
Name of FF site Name of State Warning
Level (m)
Danger level
(m)
Highest Flood Level Maximum Level -2009 During 2009 Level (m)
Date/ Month/
Year
Level (m) Date and Time DD/MM/YY:HH)
No.of Forecasts issued
No.of Forecasts within limits
Percent-age of accuracy
1 2 3 4 5 6 7 8 9 10 11 12 13 21 Ganga Kahalgaon Bihar 30.09 31.09 32.87 17/09/2003 30.59 27/Aug/09 04 13 13 100 22 Ganga Sahibgunj Jharkhand 26.25 27.25 30.91 1998 27.19 28/Aug/09 05 34 34 100 23 Ganga Farakka West Bengal 21.25 22.25 25.14 07/09/1998 22.58 27/Aug/09 10 82 81 98.78 24 Ramganga Moradabad Uttar Pradesh 189.60 190.60 192.68 03/09/1978 189.95 13/Sep/09 17 5 5 100 25 Ramganga Bareilly Uttar Pradesh 162.70 163.70 162.88 06/08/1978 161.12 19/Aug/09 19 0 0 26 Yamuna Tajewala Weir Haryana 328.27 03/09/1978 335.80 11/Sep/09 02 0 0 27 Yamuna Mawi Uttar Pradesh 230.00 230.85 232.45 26/09/1988 230.98 12/Sep/09 21 4 4 100 28 Yamuna Delhi Rly Bridge NCT Delhi 204.00 204.83 207.49 06/09/1978 205.33 15/Sep/09 03 5 4 80 29 Yamuna Mathura Uttar Pradesh 164.20 165.20 169.73 08/09/1978 165.15 16/Sep/09 23 8 8 100 30 Yamuna Agra Uttar Pradesh 151.40 152.40 154.76 09/09/1978 149.98 17/Sep/09 18 0 0 31 Yamuna Etawa Uttar Pradesh 120.92 121.92 126.13 11/09/1978 119.00 18/Sep/09 18 0 0 32 Yamuna Auraiya Uttar Pradesh 112.00 113.00 118.19 25/08/1996 104.68 27/Jul/09 08 0 0 33 Yamuna Kalpi Uttar Pradesh 107.00 108.00 112.98 25/08/1996 99.53 28/Jul/09 03 0 0 34 Yamuna Hamirpur Uttar Pradesh 102.63 103.63 108.59 12/09/1983 93.46 28/Jul/09 18 0 0 35 Yamuna Chilaghat Uttar Pradesh 99.00 100.00 105.16 06/09/1978 92.56 13/Sep/09 01 0 0 36 Yamuna Naini Uttar Pradesh 83.74 84.74 87.99 08/09/1978 78.22 13/Sep/09 22 0 0 37 Sahibi Dhansa NCT Delhi 211.44 212.44 213.58 06/08/1977 210.50 14/Sep/09 08 0 0
38 Chambal Gandhisagar Dam Madhya Pradesh 0 0
39 Betwa Mohana Uttar Pradesh 121.66 122.66 133.35 11/09/1983 114.95 12/Sep/09 02 0 0 40 Betwa Sahjina Uttar Pradesh 103.54 104.54 108.67 12/09/1983 93.98 12/Sep/09 23 0 0 41 Ken Banda Uttar Pradesh 103.00 104.00 113.29 7/7/2005 105.50 12/Sep/09 11 5 5 100.00
Contd...
173
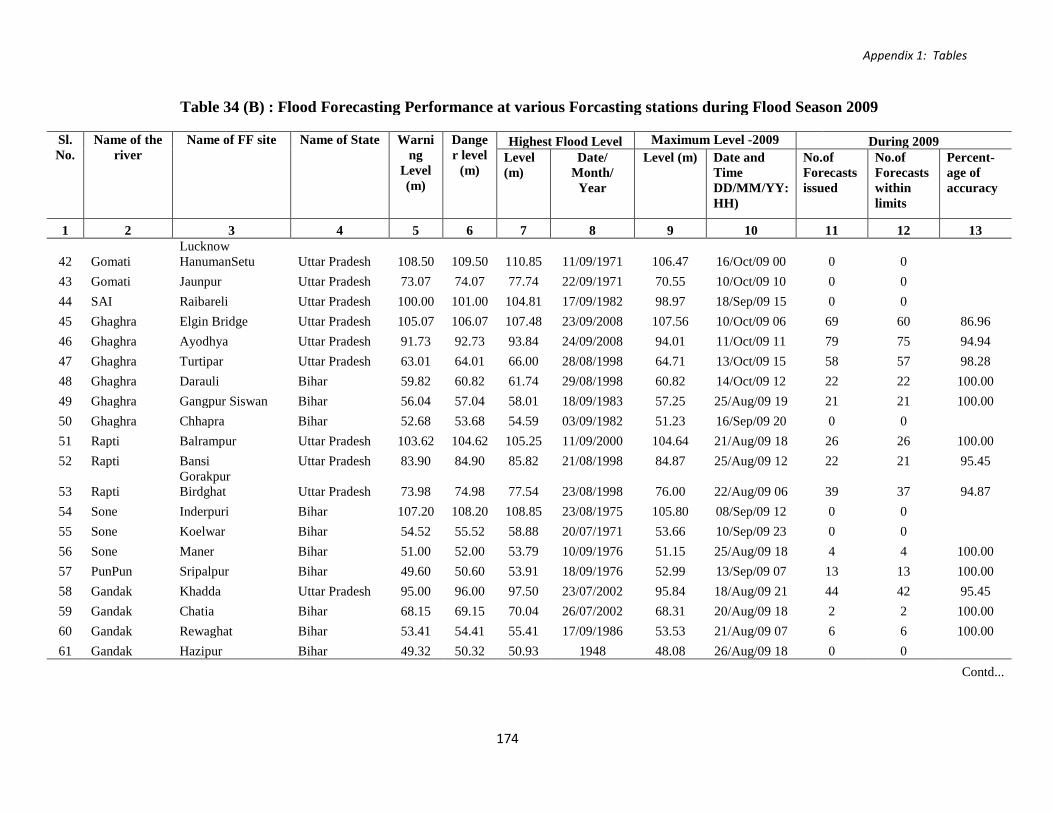
Appendix 1: Tables
Table 34 (B) : Flood Forecasting Performance at various Forcasting stations during Flood Season 2009
Sl.No.
Name of the river
Name of FF site Name of State Warning
Level (m)
Danger level
(m)
Highest Flood Level Maximum Level -2009 During 2009 Level (m)
Date/ Month/
Year
Level (m) Date and Time DD/MM/YY:HH)
No.of Forecasts issued
No.of Forecasts within limits
Percent-age of accuracy
1 2 3 4 5 6 7 8 9 10 11 12 13
42 Gomati Lucknow HanumanSetu Uttar Pradesh 108.50 109.50 110.85 11/09/1971 106.47 16/Oct/09 00 0 0
43 Gomati Jaunpur Uttar Pradesh 73.07 74.07 77.74 22/09/1971 70.55 10/Oct/09 10 0 0 44 SAI Raibareli Uttar Pradesh 100.00 101.00 104.81 17/09/1982 98.97 18/Sep/09 15 0 0 45 Ghaghra Elgin Bridge Uttar Pradesh 105.07 106.07 107.48 23/09/2008 107.56 10/Oct/09 06 69 60 86.96 46 Ghaghra Ayodhya Uttar Pradesh 91.73 92.73 93.84 24/09/2008 94.01 11/Oct/09 11 79 75 94.94 47 Ghaghra Turtipar Uttar Pradesh 63.01 64.01 66.00 28/08/1998 64.71 13/Oct/09 15 58 57 98.28 48 Ghaghra Darauli Bihar 59.82 60.82 61.74 29/08/1998 60.82 14/Oct/09 12 22 22 100.00 49 Ghaghra Gangpur Siswan Bihar 56.04 57.04 58.01 18/09/1983 57.25 25/Aug/09 19 21 21 100.00 50 Ghaghra Chhapra Bihar 52.68 53.68 54.59 03/09/1982 51.23 16/Sep/09 20 0 0 51 Rapti Balrampur Uttar Pradesh 103.62 104.62 105.25 11/09/2000 104.64 21/Aug/09 18 26 26 100.00 52 Rapti Bansi Uttar Pradesh 83.90 84.90 85.82 21/08/1998 84.87 25/Aug/09 12 22 21 95.45
53 Rapti Gorakpur Birdghat Uttar Pradesh 73.98 74.98 77.54 23/08/1998 76.00 22/Aug/09 06 39 37 94.87
54 Sone Inderpuri Bihar 107.20 108.20 108.85 23/08/1975 105.80 08/Sep/09 12 0 0 55 Sone Koelwar Bihar 54.52 55.52 58.88 20/07/1971 53.66 10/Sep/09 23 0 0 56 Sone Maner Bihar 51.00 52.00 53.79 10/09/1976 51.15 25/Aug/09 18 4 4 100.00 57 PunPun Sripalpur Bihar 49.60 50.60 53.91 18/09/1976 52.99 13/Sep/09 07 13 13 100.00 58 Gandak Khadda Uttar Pradesh 95.00 96.00 97.50 23/07/2002 95.84 18/Aug/09 21 44 42 95.45 59 Gandak Chatia Bihar 68.15 69.15 70.04 26/07/2002 68.31 20/Aug/09 18 2 2 100.00 60 Gandak Rewaghat Bihar 53.41 54.41 55.41 17/09/1986 53.53 21/Aug/09 07 6 6 100.00 61 Gandak Hazipur Bihar 49.32 50.32 50.93 1948 48.08 26/Aug/09 18 0 0
Contd...
174
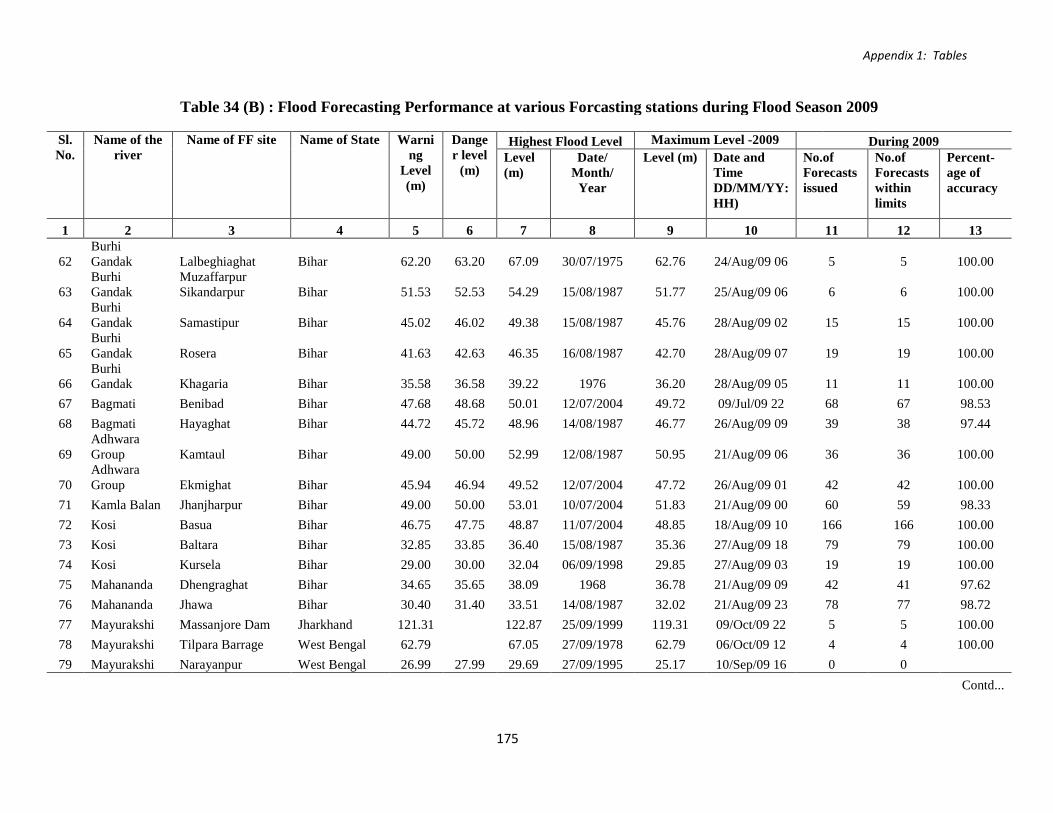
Appendix 1: Tables
Table 34 (B) : Flood Forecasting Performance at various Forcasting stations during Flood Season 2009
Sl.No.
Name of the river
Name of FF site Name of State Warning
Level (m)
Danger level
(m)
Highest Flood Level Maximum Level -2009 During 2009 Level (m)
Date/ Month/
Year
Level (m) Date and Time DD/MM/YY:HH)
No.of Forecasts issued
No.of Forecasts within limits
Percent-age of accuracy
1 2 3 4 5 6 7 8 9 10 11 12 13
62 Burhi Gandak Lalbeghiaghat Bihar 62.20 63.20 67.09 30/07/1975 62.76 24/Aug/09 06 5 5 100.00
63 Burhi Gandak
Muzaffarpur Sikandarpur Bihar 51.53 52.53 54.29 15/08/1987 51.77 25/Aug/09 06 6 6 100.00
64 Burhi Gandak Samastipur Bihar 45.02 46.02 49.38 15/08/1987 45.76 28/Aug/09 02 15 15 100.00
65 Burhi Gandak Rosera Bihar 41.63 42.63 46.35 16/08/1987 42.70 28/Aug/09 07 19 19 100.00
66 Burhi Gandak Khagaria Bihar 35.58 36.58 39.22 1976 36.20 28/Aug/09 05 11 11 100.00
67 Bagmati Benibad Bihar 47.68 48.68 50.01 12/07/2004 49.72 09/Jul/09 22 68 67 98.53 68 Bagmati Hayaghat Bihar 44.72 45.72 48.96 14/08/1987 46.77 26/Aug/09 09 39 38 97.44
69 Adhwara Group Kamtaul Bihar 49.00 50.00 52.99 12/08/1987 50.95 21/Aug/09 06 36 36 100.00
70 Adhwara Group Ekmighat Bihar 45.94 46.94 49.52 12/07/2004 47.72 26/Aug/09 01 42 42 100.00
71 Kamla Balan Jhanjharpur Bihar 49.00 50.00 53.01 10/07/2004 51.83 21/Aug/09 00 60 59 98.33 72 Kosi Basua Bihar 46.75 47.75 48.87 11/07/2004 48.85 18/Aug/09 10 166 166 100.00 73 Kosi Baltara Bihar 32.85 33.85 36.40 15/08/1987 35.36 27/Aug/09 18 79 79 100.00 74 Kosi Kursela Bihar 29.00 30.00 32.04 06/09/1998 29.85 27/Aug/09 03 19 19 100.00 75 Mahananda Dhengraghat Bihar 34.65 35.65 38.09 1968 36.78 21/Aug/09 09 42 41 97.62 76 Mahananda Jhawa Bihar 30.40 31.40 33.51 14/08/1987 32.02 21/Aug/09 23 78 77 98.72 77 Mayurakshi Massanjore Dam Jharkhand 121.31 122.87 25/09/1999 119.31 09/Oct/09 22 5 5 100.00 78 Mayurakshi Tilpara Barrage West Bengal 62.79 67.05 27/09/1978 62.79 06/Oct/09 12 4 4 100.00 79 Mayurakshi Narayanpur West Bengal 26.99 27.99 29.69 27/09/1995 25.17 10/Sep/09 16 0 0
Contd...
175

Appendix 1: Tables
Table 34 (B) : Flood Forecasting Performance at various Forcasting stations during Flood Season 2009
Sl.No.
Name of the river
Name of FF site Name of State Warning
Level (m)
Danger level
(m)
Highest Flood Level Maximum Level -2009 During 2009 Level (m)
Date/ Month/
Year
Level (m) Date and Time DD/MM/YY:HH)
No.of Forecasts issued
No.of Forecasts within limits
Percent-age of accuracy
1 2 3 4 5 6 7 8 9 10 11 12 13 80 Ajoy Gheropara West Bengal 38.42 39.42 43.94 27/09/1978 40.15 07/Sep/09 14 2 2 100.00 81 Damodar Tenughat Dam Jharkhand 268.83 265.56 17/09/1985 263.33 07/Sep/09 19 20 20 100.00 82 Damodar Panchet Dam Jharkhand 132.59 132.89 02/10/1959 131.57 07/Sep/09 23 40 40 100.00 83 Damodar Durgapur Barrage West Bengal 64.47 64.47 31/10/2002 64.47 28 28 100.00 84 Barakar Maithon Dam Jharkhand 150.88 151.79 02/10/1959 151.36 07/Sep/09 16 26 21 80.77 85 Mundeshwari Harinkhola West Bengal 11.80 12.80 14.58 29/09/1978 14.43 08/Sep/09 21 6 6 100.00 86 Kangsabati Kangsabati Dam West Bengal 134.11 134.71 02/09/1978 133.33 07/Sep/09 13 17 17 100.00 87 Kangsabati Mohanpur West Bengal 24.73 25.73 29.87 02/09/1978 24.18 09/Sep/09 08 0 0 Brahmaputra Basin
88 Brahmaputra Dibrugrah Assam 103.24 104.24 106.48 03/09/1998 105.53 01/Jul/09 07 307 307 100.00 89 Brahmaputra Neamatighat Assam 84.04 85.04 87.37 11/07/1991 85.56 02/Jul/09 09 71 71 100.00 90 Brahmaputra Tezpur Assam 64.23 65.23 66.59 27/08/1988 65.25 24/Aug/09 07 40 40 100.00 91 Brahmaputra Guwahati Assam 48.68 49.68 51.46 21/07/2004 48.94 24/Aug/09 01 8 8 100.00 92 Brahmaputra Goalpara Assam 35.27 36.27 37.43 31/07/1954 35.74 26/Aug/09 01 19 19 100.00 93 Brahmaputra Dhubri Assam 27.62 28.62 30.36 28/08/1988 28.99 22/Aug/09 06 103 103 100.00 94 Burhidihing Naharkatia Assam 119.40 120.40 122.69 17/06/1973 118.12 17/Aug/09 09 0 0 95 Burhidihing Khowang Assam 101.11 102.11 103.92 25/08/1988 102.49 23/Aug/09 02 22 22 100.00 96 Desang Nanglamoraghat Assam 93.46 94.46 96.49 06/09/1998 96.04 11/Jul/09 21 64 64 100.00 97 Dikhow Shivsagar Assam 91.40 92.40 95.62 08/07/1974 94.14 11/Jul/09 08 46 46 100.00 98 Subansiri Badatighat Assam 81.53 82.53 86.84 28/06/1972 82.10 24/Aug/09 10 48 48 100.00 99 Dhansiri (S) Golaghat Assam 88.50 89.50 91.30 11/10/1986 88.90 26/Sep/09 00 9 9 100.00
Contd...
176

Appendix 1: Tables
Table 34 (B) : Flood Forecasting Performance at various Forcasting stations during Flood Season 2009
Sl.No.
Name of the river
Name of FF site Name of State Warning
Level (m)
Danger level
(m)
Highest Flood Level Maximum Level -2009 During 2009 Level (m)
Date/ Month/
Year
Level (m) Date and Time DD/MM/YY:HH)
No.of Forecasts issued
No.of Forecasts within limits
Percent-age of accuracy
1 2 3 4 5 6 7 8 9 10 11 12 13 100 Dhansiri (S) Numaligarh Assam 76.42 77.42 79.87 24/09/1985 77.80 25/Aug/09 12 106 106 100.00 101 Jiabharali Jiabharali_NTX Assam 76.00 77.00 78.50 26/07/2007 77.56 29/Jul/09 18 194 193 99.48 102 Kopilli Kampur Assam 59.50 60.50 61.86 16/06/1973 61.08 11/Oct/09 06 3 3 100.00 103 Kopilli Dharmatul Assam 55.00 56.00 58.09 21/07/2004 55.17 11/Oct/09 19 5 5 100.00 104 Puthimari Puthimari _NHX Assam 50.81 51.81 55.08 31/08/2008 52.82 03/Jul/09 19 228 225 98.68 105 Pagladiya Pagladia_NTX Assam 51.75 52.75 55.45 08/07/2004 52.78 02/Jul/09 19 20 20 100.00 106 Beki Beki NHX Assam 44.10 45.10 46.20 04/08/2000 45.38 20/Aug/09 00 292 292 100.00 107 Manas Manas NHX Assam 47.81 48.42 50.08 15/09/1984 48.08 17/Aug/09 11 5 5 100.00 108 Sankosh Golakganj Assam 28.94 29.94 30.95 08/09/2007 30.24 20/Aug/09 23 78 78 100.00 109 Raidak-I Tufanganj West Bengal 34.22 35.30 36.36 21/07/1993 34.65 06/Jul/09 07 7 7 100.00 110 Torsa Ghughumari West Bengal 39.80 40.41 41.46 03/08/2000 40.40 20/Aug/09 21 38 36 94.74 111 Jaldhaka NH-31 West Bengal 80.00 80.90 81.33 28/08/1972 80.49 08/Oct/09 05 11 11 100.00 112 Jaldhaka Mathabhanga West Bengal 47.70 48.20 49.85 07/09/2007 48.18 20/Aug/09 17 2 2 100.00 113 Tista Domohani West Bengal 85.65 85.95 89.30 04/10/1968 86.45 20/Aug/09 11 56 56 100.00 114 Tista Mekhliganj West Bengal 65.45 65.95 66.45 13/07/1996 66.10 20/Aug/09 13 24 24 100.00
Barak & Meghna Basins 115 Barak APGhat Assam 18.83 19.83 21.84 01/08/1989 19.48 02/Aug/09 12 16 16 100.00 116 Katakhal Matizuri Assam 19.27 20.27 22.73 10/09/2007 19.74 28/Aug/09 17 10 10 100.00 117 Kushiyara Karimganj Assam 13.94 14.94 16.55 09/09/2007 15.96 22/Aug/09 17 63 63 100.00 118 Manu Kailashar Tripura 24.34 25.34 25.79 07/06/1993 24.37 01/Jul/09 21 0 0 119 Gumti Sonamura Tripura 11.50 12.50 14.42 23/07/1993 11.64 02/Jul/09 06 1 1 100.00
Contd...
177

Appendix 1: Tables
Table 34 (B) : Flood Forecasting Performance at various Forcasting stations during Flood Season 2009
Sl.No.
Name of the river
Name of FF site Name of State Warning
Level (m)
Danger level
(m)
Highest Flood Level Maximum Level -2009 During 2009 Level (m)
Date/ Month/
Year
Level (m) Date and Time DD/MM/YY:HH)
No.of Forecasts issued
No.of Forecasts within limits
Percent-age of accuracy
1 2 3 4 5 6 7 8 9 10 11 12 13
Eastern Rivers (Excluding Mahanadi)
120 Subernarekna Rajghat Orissa 9.45 10.36 12.69 19/06/2008 11.17 09/Sep/09 12 7 7 100.00
121 Burhabalang NH_5 _Road Bridge Orissa 7.21 8.13 9.50 12/10/1973 8.30 02/Oct/09 23 4 3 75.00
122 Baitarni Anandpur Orissa 37.44 38.36 41.20 19/08/1975 37.67 21/Jul/09 13 2 2 100.00 123 Baitarni Akhuapada Orissa 17.83 21.95 16/08/1960 18.00 03/Oct/09 10 7 7 100.00 124 Brahmani Jenapur Orissa 22.00 23.00 24.78 20/08/1975 22.50 22/Jul/09 09 2 2 100.00 125 Rushikuluya Purushottampur Orissa 15.83 16.83 19.65 04/11/1990 17.30 20/Jul/09 05 8 8 100.00 126 Vamsadhara Gunupur Orissa 83.00 84.00 88.75 17/09/1980 84.00 19/Jul/09 16 7 6 85.71 127 Vamsadhara Kashinagar Orissa 53.60 54.60 58.93 18/09/1980 55.65 19/Jul/09 19 81 76 93.83
128 Vamsadhara Gotta Barrage Andhra Pradesh 34.84 34.84 39.92 07/10/1999 38.12 25/Jul/09 22 10 10 100.00
Mahanadi Basin 129 Mahanadi Hirakud Dam Orissa 192.02 192.30 30/01/1998 50 49 98.00 130 Mahanadi Naraj Orissa 25.41 26.41 27.61 31/08/1982 26.11 21/Jul/09 14 17 16 94.12 131 Mahanadi Alipingal Devi Orissa 10.85 11.76 13.05 20/09/2008 10.86 21/Jul/09 14 1 1 100.00 132 Mahanadi Nimapara Orissa 9.85 10.76 11.60 31/08/1982 10.04 21/Jul/09 19 4 4 100.00
Godavari Basin 133 Godavari Kopergaon Maharashtra 490.90 493.68 499.17 1969 489.75 25/Jul/09 05 0 0 134 Godavari Jaikwadi Dam Maharashtra 463.91 464.69 12/10/1990 458.47 06/Oct/09 12 0 0 135 Godavari Gangakhed Maharashtra 374.00 375.00 377.57 1947 366.56 26/Aug/09 07 0 0 136 Godavari Nanded Maharashtra 353.00 354.00 357.10 06/08/2006 344.52 06/Oct/09 17 0 0
Contd...
178

Appendix 1: Tables
Table 34 (B) : Flood Forecasting Performance at various Forcasting stations during Flood Season 2009
Sl.No.
Name of the river
Name of FF site Name of State Warning
Level (m)
Danger level
(m)
Highest Flood Level Maximum Level -2009 During 2009 Level (m)
Date/ Month/
Year
Level (m) Date and Time DD/MM/YY:HH)
No.of Forecasts issued
No.of Forecasts within limits
Percent-age of accuracy
1 2 3 4 5 6 7 8 9 10 11 12 13
137 Godavari Sriram Sagar Andhra Pradesh 332.54 332.72 13/10/1990 326.17 08/Oct/09 16 0 0
138 Godavari Kaleswaram Andhra Pradesh 103.50 104.75 107.05 15/08/1986 99.08 25/Jul/09 12 0 0
139 Godavari Eturunagaram Andhra Pradesh 73.29 75.79 77.66 24/08/1990 70.47 29/Aug/09 04 0 0
140 Godavari Dummagudam Andhra Pradesh 53.00 55.00 60.25 16/08/1986 49.09 28/Aug/09 21 0 0
141 Godavari Bhadrachalam Andhra Pradesh 45.72 48.77 55.66 16/08/1986 42.06 29/Aug/09 00 0 0
142 Godavari Kunavaram Andhra Pradesh 37.74 39.24 51.30 16/08/1986 30.32 29/Aug/09 09 0 0
143 Godavari Rajamundri Andhra Pradesh 17.68 19.51 20.48 16/08/1986 14.50 29/Aug/09 07 0 0
144 Godavari Dowalaiswaram Andhra Pradesh 14.25 16.08 18.36 16/08/1986 14.14 14/Jul/09 12 0 0
145 Wardha Balharsha Maharashtra 171.50 174.00 176.00 15/08/1986 161.47 04/Sep/09 06 0 0 146 Wainganga Bhandara Maharashtra 244.00 244.50 250.90 16/09/2005 244.05 23/Jul/09 14 3 3 100.00 147 Wainganga Pauni Maharashtra 226.73 227.73 232.35 07/09/1994 226.73 23/Jul/09 17 4 3 75.00
148 Manjira Singur Dam Andhra Pradesh 523.60 523.60 15/10/1999 520.15 12/Oct/09 06 0 0
149 Manjira Nizamsagar Dam Andhra Pradesh 428.24 428.24 15/10/1999 421.90 11/Sep/09 15 0 0
150 Indravati Jagdalpur Chhatisgarh 539.50 540.80 544.68 07/09/1973 538.80 26/Aug/09 22 0 0 Krishna Basin
151 Krishna Arjunwad Maharashtra 542.07 543.29 543.69 05/08/2005 0 0 Contd...
179
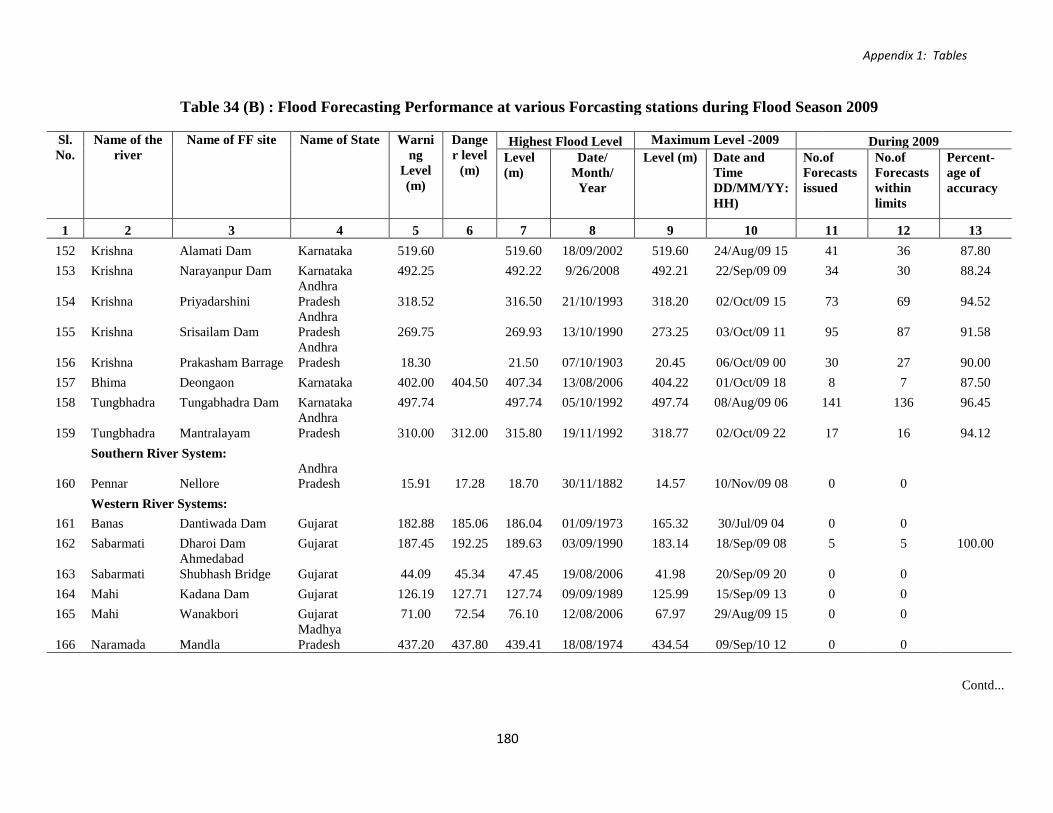
Appendix 1: Tables
Table 34 (B) : Flood Forecasting Performance at various Forcasting stations during Flood Season 2009
Sl.No.
Name of the river
Name of FF site Name of State Warning
Level (m)
Danger level
(m)
Highest Flood Level Maximum Level -2009 During 2009 Level (m)
Date/ Month/
Year
Level (m) Date and Time DD/MM/YY:HH)
No.of Forecasts issued
No.of Forecasts within limits
Percent-age of accuracy
1 2 3 4 5 6 7 8 9 10 11 12 13 152 Krishna Alamati Dam Karnataka 519.60 519.60 18/09/2002 519.60 24/Aug/09 15 41 36 87.80 153 Krishna Narayanpur Dam Karnataka 492.25 492.22 9/26/2008 492.21 22/Sep/09 09 34 30 88.24
154 Krishna Priyadarshini Andhra Pradesh 318.52 316.50 21/10/1993 318.20 02/Oct/09 15 73 69 94.52
155 Krishna Srisailam Dam Andhra Pradesh 269.75 269.93 13/10/1990 273.25 03/Oct/09 11 95 87 91.58
156 Krishna Prakasham Barrage Andhra Pradesh 18.30 21.50 07/10/1903 20.45 06/Oct/09 00 30 27 90.00
157 Bhima Deongaon Karnataka 402.00 404.50 407.34 13/08/2006 404.22 01/Oct/09 18 8 7 87.50 158 Tungbhadra Tungabhadra Dam Karnataka 497.74 497.74 05/10/1992 497.74 08/Aug/09 06 141 136 96.45
159 Tungbhadra Mantralayam Andhra Pradesh 310.00 312.00 315.80 19/11/1992 318.77 02/Oct/09 22 17 16 94.12
Southern River System:
160 Pennar Nellore Andhra Pradesh 15.91 17.28 18.70 30/11/1882 14.57 10/Nov/09 08 0 0
Western River Systems: 161 Banas Dantiwada Dam Gujarat 182.88 185.06 186.04 01/09/1973 165.32 30/Jul/09 04 0 0 162 Sabarmati Dharoi Dam Gujarat 187.45 192.25 189.63 03/09/1990 183.14 18/Sep/09 08 5 5 100.00
163 Sabarmati Ahmedabad Shubhash Bridge Gujarat 44.09 45.34 47.45 19/08/2006 41.98 20/Sep/09 20 0 0
164 Mahi Kadana Dam Gujarat 126.19 127.71 127.74 09/09/1989 125.99 15/Sep/09 13 0 0 165 Mahi Wanakbori Gujarat 71.00 72.54 76.10 12/08/2006 67.97 29/Aug/09 15 0 0
166 Naramada Mandla Madhya Pradesh 437.20 437.80 439.41 18/08/1974 434.54 09/Sep/10 12 0 0
Contd...
180

Appendix 1: Tables
Table 34 (B) : Flood Forecasting Performance at various Forcasting stations during Flood Season 2009
Sl.No.
Name of the river
Name of FF site Name of State Warning
Level (m)
Danger level
(m)
Highest Flood Level Maximum Level -2009 During 2009 Level (m)
Date/ Month/
Year
Level (m) Date and Time DD/MM/YY:HH)
No.of Forecasts issued
No.of Forecasts within limits
Percent-age of accuracy
1 2 3 4 5 6 7 8 9 10 11 12 13
167 Naramada Hoshangabad Madhya Pradesh 292.83 293.83 300.90 30/08/1973 296.70 10/Sep/09 04 11 10 90.91
168 Naramada Garudeswar Gujarat 30.48 31.09 41.65 06/09/1970 24.00 12/Sep/09 20 0 0 169 Naramada Bharuch Gujarat 6.71 7.31 12.65 07/09/1970 6.10 13/Sep/09 12 0 0 170 Tapi Hatnur Dam Maharashtra 212.00 214.00 214.00 12/10/1989 214.00 27/Sep/09 06 31 29 93.55 171 Tapi Ukai Dam Gujarat 102.41 105.16 105.51 08/10/1990 99.58 17/Sep/09 06 5 5 100.00 172 Tapi Surat Gujarat 8.50 9.50 12.50 09/08/2006 5.10 23/Jul/09 16 0 0 173 Damanganga Madhuban Dam Gujarat 79.86 82.40 80.60 27/09/1993 79.75 15/Oct/09 18 8 8 100.00 174 Damanganga Vapi Town Gujarat 18.20 19.20 23.76 03/08/2004 17.30 22/Jul/09 23 0 0
175 Damanganga Daman Dadra & Nagar Haveli 2.60 3.40 4.00 03/08/2004 2.30 24/Jul/09 16 0 0
Total Forecasts 4010 3927 97.93
Level Forecasts 3343 3298 98.65
Inflow Forecast 667 629 94.30
Source : Central Water Commission (Flood Forecasting Monitoring Directoirate)
Note : FF : Flood Forecasting m: Meter
181

Appendix 1: Tables
Table 35 (A) : Broad Features of Flood Forecasting Performance during the Flood season 2010
Sl.No Details of Flood Forecasting Performance during the Flood season 2010 No.of FF Sites
Percentage of FF sites
1 2 3 4
1 Number of Operational Flood Forecasting stations during the Flood season 175 100
2 Flood Forecasting Sites where no forecasts were issued/ required because water level/ inflowwere below warning during the flood season 62 35.43
3 Flood Forecasting sites where forecasts were actually issued. 113 64.57
4 Sites with performance accuracy between 0.0 % to 25.0% 1 0.88%
5 Sites with performance accuracy between 25.1 % to 50.0% 1 0.88%
6 Sites with performance accuracy between 50.1 % to 75.0% 1 0.88%
7 Sites with performance accuracy between 75.1 % to 99.99% 36 31.87%
8 Sites with 100% performance accuracy i.e. where all forecasts issued were within permissible limit of accuracy 74 65.49%
9 Details of Unprecedented Flood Events during Flood Season - 2010 See separate statement with information of item 9
10 Details of High Flood Events during Flood Season - 2010 See separate statement with information of item 10
Contd...
182

Appendix 1: Tables
Table 35 (A): Broad features of Flood Forecasting Performance during Flood Season 2010
Sl .No
River Station State Danger level
in metres
Existing Highest Flood Level (HFL)
New HFL Duration
Level in
metres
Date of occurrence
Level in
metres
Date of occurrence
From To
1 2 3 4 5 6 7 8 9 10 11
9. Unprecedented flood events in India under CWC FF & W Network - 2010 flood season 1 Ganga Haridwar U.K. 294.00 296.23 02/09/1978 296.3 19/9/2010 19/09/2010 08.00 19.09.2010 10.00
2 Ganga Kannauj U.P. 125.97 126.24 29/08/1998 126.78 27/09/2010 23/09/2010; 14:00 30/09/2010;10:00
3 Ganga Ankinghat U.P. 124.00 124.305 9/9/1978 124.49 28/09/2010 26/09/2010; 05:00 28/09/2010; 24:00
4 Ganga Kanpur U.P. 114.00 113.47 2/9/1967 114.08 29/09/2010 25/09/2010; 07:00 02/10/2010; 16:00
5 Ramganga Moradabad U.P. 190.60 192.68 09/03/1978 192.88 21/09/2010 20/09/2010; 23:00 21/09/2010; 05:00
6 Kosi Basua Bihar 47.75 48.87 11.07.2004 49.17 25/Aug/10 00 21/08/2010 07:00 24/08/2010 09:00
21/08/2010 20:00 26/08/2010 07:00
7 Kushiyara Karimgunj Assam 14.94 16.55 09/09/07& 11/09/07
16.57 10/06/2010& 11/06/2010
10/06/2010 (2300) 11/06/10 (1000)
Unprecedented flood : Flood level => HF L
Contd...
183

Appendix 1: Tables
Table 35 (A) : Broad features of Flood Forecasting Performance during Flood Season 2010
Sl.No
River Station State District Danger level in metres
Existing HFL Duration of High Flood
Level in metres
Date of occurrence
From To
1 2 3 4 5 6 7 8 9 10 10. High Flood Events during Flood Season - 2010
1 Ganga Rishikesh Uttarakhand Haridwar 340.50 341.72 05.09.1995 19.09.2010 01:00 19.09.2010 13:00 2 Ganga Haridwar Uttarakhand Haridwar 294.00 296.23 02.09.1978 19.09.2010 02:00 19.09.2010 16:00 3 Ganga Kannauj U.P. Kannauj 125.97 126.24 29/08/1998 27.08.2010 02:00
18.09.2010 12:00 02.09.2010 24:00 01.10.2010 17:00
4 Ganga Ankinghat U.P. Kanpur Dehat
124 124.305 9/9/1978 22.09.2010 14:00 01.10.2010 12:00
5 Ganga Kanpur U.P. Kanpur Dehat
114 113.47 2/9/1967 27.08.2010 04:00 19.09.2010 03:00
03.09.2010 22:00 03.10.2010 19:00
6 Ganga Dalmau U.P. Raebareilly 99.36 99.84 3/8/1973 28.09.2010 17:00 02.10.2010 17:00 7 Ramganga Moradabad U.P. Moradabad 190.60 192.68 3/9/1978 20.09.2010 17:00 21.09.2010 14:00 8 Ramganga Bareilly U.P. Bareilly 163.07 162.881 6/8/1978 20.09.2010 22:00 24.09.2010 02:00 9 Yamuna Mawi U.P Muzaffar
Nagar 230.85 232.45 26.09.88 10.09.2010 07:00
21.09.2010 02:00 10.09.2010 13:00 22.09.2010 08:00
10 Yamuna Delhi Railway Bridge Delhi Delhi 204.83 207.49 06.09.78 22.09.2010 13:00 23.09.2010 08:00 11 Ghagra Elgin Bridge U.P. Barabanki 106.07 107.556 10.10.2009 25/8/2010 00:00 28/08/2010 3:00 12 Ghagra Ayodhya U.P. Faizabad 92.73 94.01 11.10.2009 24/8/2010 21:00 5/9/2010 7:00 13 Bagmathi Benibad Bihar Muzzafarpur 48.68 50.01 12.07.2004 26/8/2010 2:00 28/8/2010 21:00 14 Kosi Basua Bihar Supaul 47.75 48.87 11.07.2004 17/8/2010 23:00 27/8/2010 8:00 15 Sankosh Golokganj Assam Dhubri 29.94 30.95 08.09.2007 12/7/2010 4:00 12/7/2010 6:00 16 Beki Road Bridge Assam Barpeta 45.10 46.20 04.08.2000 27/06/2010 22:00 28/06/2010 1300 12/07/2010 00:00 12/07/2010 0300 18/07/2010 1800 19/07/2010 0200 21/07/2010 1600 22/07/2010 0200
17 Kopili Kampur Assam Nagaon 60.5 61.86 16/06/1973 10/10/2010 1000 11/10/2010 0400 18 Kushiyara Karimgunj Assam Karimgunj 14.94 16.55 09/09/07&
11/09/07 08/06/10(22) 15/06/10(01) 20/09/10(12)
12/06/10(17) 22/06/10(10) 22/09/10(17)
Source : Flood Forecasting Monitoring Directorate High Flood : Flood level>=HFL-0.5 m and < HFL
184

Appendix 1: Tables
Table 35 (B) : Broad Features of Flood Forecasting Performance during the Flood season 2009
Sl.No Details of Flood Forecasting Performance during the Flood season 2009 No.of FF Sites
Percentage of FF sites
1 2 3 4
1 Number of Operational Flod Forecasting stations during the Flood season 175 100
2 Flood Forecasting sites where "No Forecast" was issued / required because water level at those sites were below warning stages during the flood season. 68 38.86
3 Flood Forecasting sites where forecasts were actually issued. 107 61.14
4 Sites with performance accuracy between 0.0 % to 25.0% 1 0.93
5 Sites with performance accuracy between 25.1 % to 50.0% 0 0.00
6 Sites with performance accuracy between 50.1 % to 75.0% 3 2.80
7 Sites with performance accuracy between 75.1 % to 99.99% 31 28.98
8 Sites with 100% performance accuracy i.e. where all forecasts issued were within permissible limit of accuracy 72 67.29
9 Details of Unprecedented Flood Events during Flood Season - 2009 See separate statement with information of item 9
10 Details of High Flood Events during Flood Season - 2009 See separate statement with information of item 10
Contd...
185

Appendix 1: Tables
Table 35 (B) : Broad Features of Flood Forecasting Performance during the Flood season 2009
Sl .No
River Station State Danger level in metres
Existing Highest Flood Level (HFL)
New HFL Duration of Unprecedented Flood Situation
Level in metres
Date of occurrence
Level in metres
Date of occurrence
From To
1 2 3 4 5 6 7 8 9 10 11
9. Unprecedented flood events in India under CWC FF & W Network - 2009 flood season 1 Ghaghra Elgin Bridge Uttar Pradesh 106.07 107.48 23/09/2008 107.56 10/10/2009 10/10/2009
6:00:00 AM 10/10/2009 16:00:00
2 Ghaghra Ayodhya Uttar Pradesh 92.73 93.84 24/09/2008 94.01 11/10/2009 11/10/2009 11:00:00 AM
11/10/2009 20:00:00
3 Tungbhadra Mantralayam Andhra Pradesh
312.00 315.80 19/11/1992 318.77 2/10/2009 1/10/2009 22:00:00
3/10/2009 7:00:00 AM
Unprecedented flood : Flood level >= HFL
Contd...
186
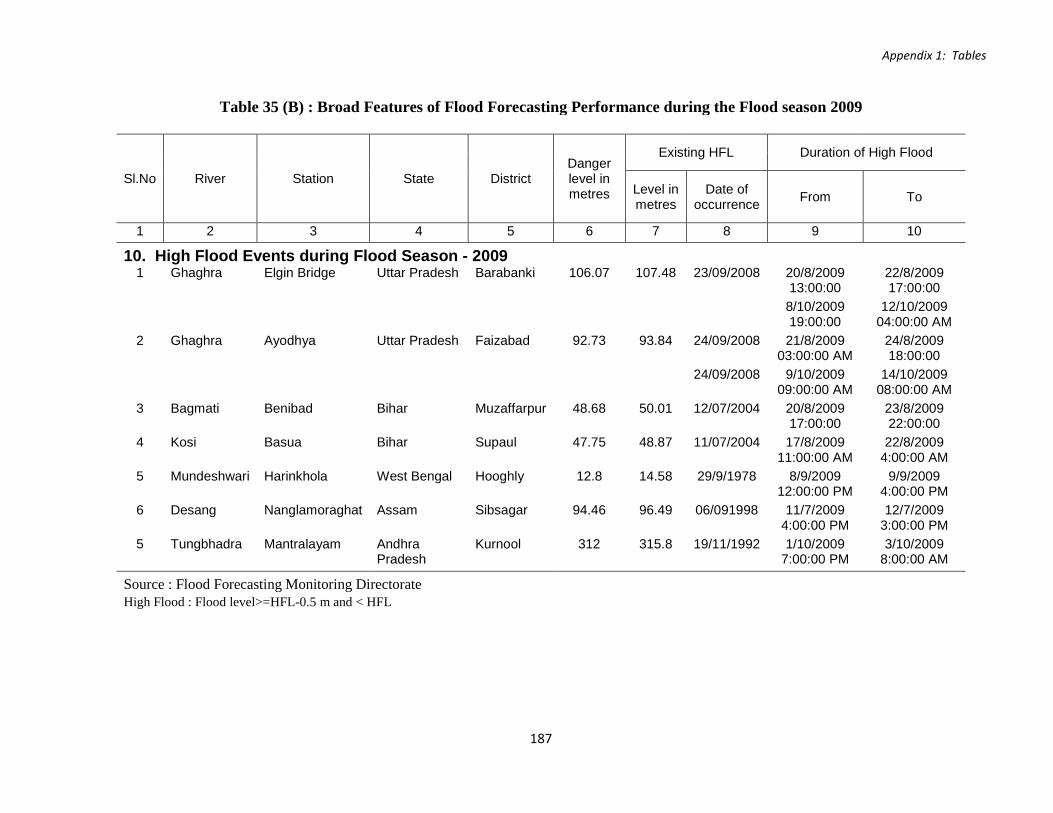
Appendix 1: Tables
Table 35 (B) : Broad Features of Flood Forecasting Performance during the Flood season 2009
Sl.No River Station State District Danger level in metres
Existing HFL Duration of High Flood
Level in metres
Date of occurrence From To
1 2 3 4 5 6 7 8 9 10
10. High Flood Events during Flood Season - 2009 1 Ghaghra Elgin Bridge Uttar Pradesh Barabanki 106.07 107.48 23/09/2008 20/8/2009
13:00:00 22/8/2009 17:00:00
8/10/2009 19:00:00
12/10/2009 04:00:00 AM
2 Ghaghra Ayodhya Uttar Pradesh Faizabad 92.73 93.84 24/09/2008 21/8/2009 03:00:00 AM
24/8/2009 18:00:00
24/09/2008 9/10/2009 09:00:00 AM
14/10/2009 08:00:00 AM
3 Bagmati Benibad Bihar Muzaffarpur 48.68 50.01 12/07/2004 20/8/2009 17:00:00
23/8/2009 22:00:00
4 Kosi Basua Bihar Supaul 47.75 48.87 11/07/2004 17/8/2009 11:00:00 AM
22/8/2009 4:00:00 AM
5 Mundeshwari Harinkhola West Bengal Hooghly 12.8 14.58 29/9/1978 8/9/2009 12:00:00 PM
9/9/2009 4:00:00 PM
6 Desang Nanglamoraghat Assam Sibsagar 94.46 96.49 06/091998 11/7/2009 4:00:00 PM
12/7/2009 3:00:00 PM
5 Tungbhadra Mantralayam Andhra Pradesh
Kurnool 312 315.8 19/11/1992 1/10/2009 7:00:00 PM
3/10/2009 8:00:00 AM
Source : Flood Forecasting Monitoring Directorate
High Flood : Flood level>=HFL-0.5 m and < HFL
187

Appendix 1: Tables
Table 36 : Comparative Flood Forcasting Performance from 1986 to 2010
Year
No.of Level Forecasts issued No.of Inflow Forecasts issued Total No.of Forecasts issued
Total Within +/-15 cm of deviation from
actual
Percentage of
accuracy Total
Within +/-20% cumec of
deviation from actual
Percentage of
accuracy Total
Within +/-15 cm or +/-20%
cumec of deviation from
actual
Percentage of
accuracy
1 2 3 4 5 6 7 8 9 10 1986 3956 3635 91.89 831 744 89.53 4787 4379 91.48 1987 4793 4560 95.14 1021 965 94.52 5814 5525 95.03 1988 5472 5131 93.77 1510 1425 94.37 6982 6556 93.90 1989 4323 4081 94.40 1213 1181 97.36 5536 5262 95.05 1990 6578 6124 93.10 1988 1947 97.94 8566 8071 94.22 1991 5234 4890 93.43 1369 1335 97.52 6603 6225 94.28 1992 3588 3418 95.26 1176 1149 97.70 4764 4567 95.86 1993 5226 5066 96.94 1417 1372 96.82 6643 6438 96.91 1994 5472 5158 94.26 2004 1929 96.26 7476 7087 94.80 1995 5393 5201 96.44 1024 988 96.48 6417 6189 96.45 1996 5104 4945 96.88 1363 1321 96.92 6467 6266 96.89 1997 4059 3895 95.96 1406 1368 97.30 5465 5263 96.30 1998 6401 5264 82.24 1542 1511 97.99 7943 6775 85.30 1999 5550 5428 97.80 1505 1398 92.89 7055 6826 96.75 2000 5622 5504 97.90 821 747 90.99 6443 6251 97.02 2001 4606 4533 98.42 857 809 94.40 5463 5342 97.79 2002 3618 3549 98.09 623 602 96.63 4241 4151 97.88 2003 5989 5789 96.66 611 586 95.91 6600 6375 96.59 2004 4184 4042 96.61 705 654 92.77 4889 4696 96.05 2005 4323 4162 96.28 1295 1261 97.37 5618 5423 96.53 2006 5070 4827 95.21 1593 1550 97.30 6663 6377 95.71 2007 6516 6339 97.28 1707 1651 96.72 8223 7990 97.17 2008 5670 5551 97.90 1021 1003 98.24 6691 6554 97.95 2009 3343 3298 98.65 667 629 94.30 4010 3927 97.93 2010 6491 6390 98.44 1028 988 96.11 7519 7378 98.12
Average 5063 4831 95.42 1212 1165 96.12 6275 5996 95.55 Source : Flood Forecasting Monitoring Directorate
188

Appendix 1: Tables
Table 37 : Projected Water Demand in India (By Different Uses)
Sl No. Sector Total water reqierment for different uses (in BCM)
Year 2010 2025 2050
1997-98 Low High Low High Low High 1 2 3 4 5 6 7 8 9
1 Irrigation 524 543 557 561 611 628 807 2 Domestic 30 42 43 55 62 90 111 3 Industries 30 37 37 67 67 81 81 4 Power 9 18 19 31 33 63 70 5 Inland Navigation 0 7 7 10 10 15 15 6 Flood Control 0 0 0 0 0 0 0
7 Environment(1) Afforestation
0 0 0 0 0 0 0
8 Environment(2) Ecology 0 5 5 10 10 20 20
9 Evaporation losses 36 42 42 50 50 76 76
TOTAL 629 694 710 784 843 973 1180 Source :Basin Planning Directorate, CWC, --"National Commission on Integrated Water Resources Development (NCIWRD-1999) BCM : Billion Cubic Meters
189

Appendix 1: Tables
Table 38 : Status of Coverage of Rural Habitations Under Rural Water Supply as on 1.04.2012
Sl. No.
Name of the State UT
Total Habitations
No. of Habitations
with Population
Coverage > 0 and < 25%
No. of Habitations
with Population
Coverage >= 25 and <
50%
No. of Habitations
with Population Coverage >= 50
and < 75%
No. of Habitations
with Population
Coverage >= 75 and <
100%
No. of Habitations with 100% Population Coverage
1 2 3 4 5 6 7 8
1. Andhra Pradesh 72407 4298 7258 8074 8214 44563
2. Arunachal Pradesh 5612 1301 659 567 324 2761
3. Assam 86976 18048 8331 7527 4133 48937
4. Bihar 107642 1287 2825 3502 5531 94497
5. Chhatisgarh 72231 98 5146 13587 12804 40596
6. Goa 347 0 43 1 1 302
7. Gujarat 34415 9 153 250 341 33662
8. Haryana 7385 12 40 219 1102 6012
9. Himachal Pradesh 53201 4910 3343 1899 702 42347
10 Jammu & Kashmir 12826 3431 1030 1169 1298 5898
11 Jharkhand 118981 447 31 202 797 117504
12 Karnataka 59532 3586 11333 11992 9050 23571
13. Kerala 11883 0 0 0 0 11883
14. Madhya Pradesh 127197 481 4856 17160 18146 86554
15. Maharashtra 98842 438 3495 7791 1493 85625
16. Manipur 2870 413 368 395 106 1588
17. Meghalaya 9326 1251 1560 935 510 5070
18. Mizoram 777 10 16 20 20 711
19. Nagaland 1432 212 16 43 23 1138
20. Orissa 141928 542 19520 33387 14176 74303
21. Punjab 15170 1973 197 501 819 11680
22. Rajasthan 121133 30988 11104 4952 2380 71709
Contd...
190

Appendix 1: Tables
Table 38 : Status of Coverage of Rural Habitations Under Rural Water Supply as on 1.04.2012
Sl. No.
Name of the State UT
Total Habitations
No. of Habitations
with Population
Coverage > 0 and < 25%
No. of Habitations
with Population
Coverage >= 25 and <
50%
No. of Habitations
with Population Coverage >= 50
and < 75%
No. of Habitations
with Population
Coverage >= 75 and <
100%
No. of Habitations with 100% Population Coverage
1 2 3 4 5 6 7 8
23. Sikkim 2498 96 273 320 4 1805
24. Tamil Nadu 94614 2257 2915 3945 1382 84115
25 Tripura 8132 1123 1203 1761 802 3243
26 Uttar Pradesh 260110 0 0 0 14242 245868
27 Uttarakhand 39142 4085 2400 2433 3136 27088
28 West Bengal 95395 264 1378 5410 673 87670
29 Andaman & Nicobar 491 53 4 0 0 434
30 Dadra & Nagar Haveli 70 70 0 0 0 0
31 Daman & Diu 21 21 0 0 0 0
33 Lakshadweep 9 9 0 0 0 0
34 Puducherry 248 0 0 0 2 246
35 Chandigarh 18 0 0 0 0 18
Total 1662861 81713 89497 128042 102211 1261398 Source :- Ministry of Rural Development, Department of Drinking Water Supply. Note : There may be variation in the above data till it is finalised by the respective State Govt.
191

Appendix 1: Tables
Table 39: Detail of layers under India-WRIS
S.No Name of GIS layer 1 2
1 Basin, sub basin, catchment, water shed 2 River network 3 Digital Elevation model 4 Administrative boundary like International, state, district & block
boundary 5 Village boundary 6 Town/village location and extent 7 Road network 8 Major tourist station 9 Location of major & medium irrigation projects 10 Location of Hydroelectric project 11 Location of multipurpose projects 12 Major & medium irrigation command boundary 13 Waterlogged and salt affected area in major & medium command 14 Soil samples of major & medium irrigation project command 15 Canal network 16 Surface water bodies 17 Ground water observation well location & data 18 Litholog data with aquifer data 19 Landuse/land cover 20 Land degradation 21 Wasteland map 22 Snow cover area 23 Flood inundation map 24 Drought prone area map 25 Inland navigation waterways 26 Inter-basin transfer link as per NWDA 27 Hydro-meteorological (Gauge & Discharge) sites of CWC 28 Meteorological station of IMD & CWC 29 Climate related data 30 Pollution monitoring station/water quality station of CWC
Source: Remote Sensing Directorate, CWC.
192

Appendix 1: Tables
Table 40: Status of Hydro Electric Potential Development- Region and State- wise ( In terms of Installed capacity - Above 25 MW)
As on 30.09.2013
Region/ State
Identified Capacity as per reassessment
study
Capacity Under Operation
Capacity Under Construction
Capacity Under Operation + Under Construction
Capacity yet to be taken up under construction
Total Above 25 MW
(MW) (MW) (MW) % (MW) (%) (MW) (%) (MW) %
NORTHERN
Jammu & Kashmir 14146 13543 2504.00 18.49 1795.00 13.25 4299.00 31.74 9244.00 68.26
Himachal Pradesh 18820 18540 7594.00 40.96 3912.00 21.10 11506.00 62.06 7034.00 37.94
Punjab 971 971 1206.30 100.00 0.00 0.00 1206.30 100.00 0.00 0.00
Haryana 64 64 0.00 0.00 0.00 0.00 0.00 0.00 64.00 100.00
Rajasthan 496 483 411.00 85.09 0.00 0.00 411.00 85.09 72.00 14.91
Uttarakhand 18175 17998 3426.35 19.04 1196.00 6.65 4622.35 25.68 13375.65 74.32
Uttar Pradesh 723 664 501.60 75.54 0.00 0.00 501.60 75.54 162.40 24.46
Sub Total (NR) 53395 52263 15643.25 29.93 6903.00 13.21 22546.25 43.14 29716.75 56.86
WESTERN
Madhya Pradesh. 2243 1970 2395.00 100.00 400.00 20.30 2795.00 100.00 0.00 0.00
Chhattisgarh 2242 2202 120.00 5.45 0.00 0.00 120.00 5.45 2082.00 94.55
Gujarat 619 590 550.00 93.22 0.00 0.00 550.00 93.22 40.00 6.78
Contd..
193

Appendix 1: Tables
Table 40: Status of Hydro Electric Potential Development- Region and State- wise ( In terms of Installed capacity - Above 25 MW)
As on 30.09.2013
Region/ State
Identified Capacity as per reassessment
study
Capacity Under Operation
Capacity Under Construction
Capacity Under Operation + Under Construction
Capacity yet to be taken up under construction
Total Above 25 MW
(MW) (MW) (MW) % (MW) (%) (MW) (%) (MW) %
Maharashtra 3769 3314 2487.00 75.05 0.00 0.00 2487.00 75.05 827.00 24.95
Goa 55 55 0.00 0.00 0.00 0.00 0.00 0.00 55.00 100.00
Sub total (WR) 8928 8131 5552.00 68.28 400.00 4.92 5952.00 73.20 2179.00 26.80
SOUTHERN
Andhra Pradesh 4424 4360 2177.75 49.95 410.00 9.40 2587.75 59.35 1772.25 40.65
Karnataka 6602 6459 3585.40 55.51 0.00 0.00 3585.40 55.51 2873.60 44.49
Kerala 3514 3378 1881.50 55.70 100.00 2.96 1981.50 58.66 1396.50 41.34
Tamilnadu 1918 1693 1782.20 100.00 0.00 0.00 1782.20 100.00 0.00 0.00
Sub Total (SR) 16458 15890 9426.85 59.33 510.00 3.21 9936.85 62.54 5953.15 37.46
EASTERN
Jharkhand 753 582 170.00 29.21 0.00 0.00 170.00 29.21 412.00 70.79
Bihar 70 40 0.00 0.00 0.00 0.00 40.00 100.00
Orissa 2999 2981 2027.50 68.01 0.00 0.00 2027.50 68.01 953.50 31.99
Contd..
194

Appendix 1: Tables
Table 40: Status of Hydro Electric Potential Development- Region and State- wise ( In terms of Installed capacity - Above 25 MW)
As on 30.09.2013
Region/ State
Identified Capacity as per reassessment
study
Capacity Under Operation
Capacity Under Construction
Capacity Under Operation + Under Construction
Capacity yet to be taken up under construction
Total Above 25 MW
(MW) (MW) (MW) % (MW) (%) (MW) (%) (MW) %
West Bengal 2841 2829 272.20 9.62 160.00 5.66 432.20 15.28 2396.80 84.72
Sikkim 4286 4248 669.00 15.75 2322.00 54.66 2991.00 70.41 1257.00 29.59
Sub Total (ER) 10949 10680 3138.70 29.39 2482.00 23.24 5620.70 52.63 5059.30 47.37 NORTH EASTERN
Meghalaya 2394 2298 282.00 12.27 40.00 1.74 322.00 14.01 1976.00 85.99
Tripura 15 0 0.00 0.00 0.00 0.00
Manipur 1784 1761 105.00 5.96 0.00 0.00 105.00 5.96 1656.00 94.04
Assam 680 650 375.00 57.69 0.00 0.00 375.00 57.69 275.00 42.31
Nagaland 1574 1452 75.00 5.17 0.00 0.00 75.00 5.17 1377.00 94.83
Arunachal Pd 50328 50064 405.00 0.81 2710.00 5.41 3115.00 6.22 46949.00 93.78
Mizoram 2196 2131 0.00 0.00 60.00 2.82 60.00 2.82 2071.00 97.18
Sub Total (NER) 58971 58356 1242.00 2.13 2810.00 4.82 4052.00 6.94 54304.00 93.06
ALL INDIA 148701 145320 35002.80 24.09 13105.00 9.02 48107.80 33.10 97212.20 66.90
Source: Central Electricity Authority, HP& I Division Note: - 1. Does not include pumped storage schemes
2. In some states the total of the capacity developed and balance capacity is different from the potential assessed . This is due to underassessment of the potential initially.
3. In addition to above 9 PSS ( 4785.6 MW) are under operation and 2 PSS (1080 MW) are under construction
195
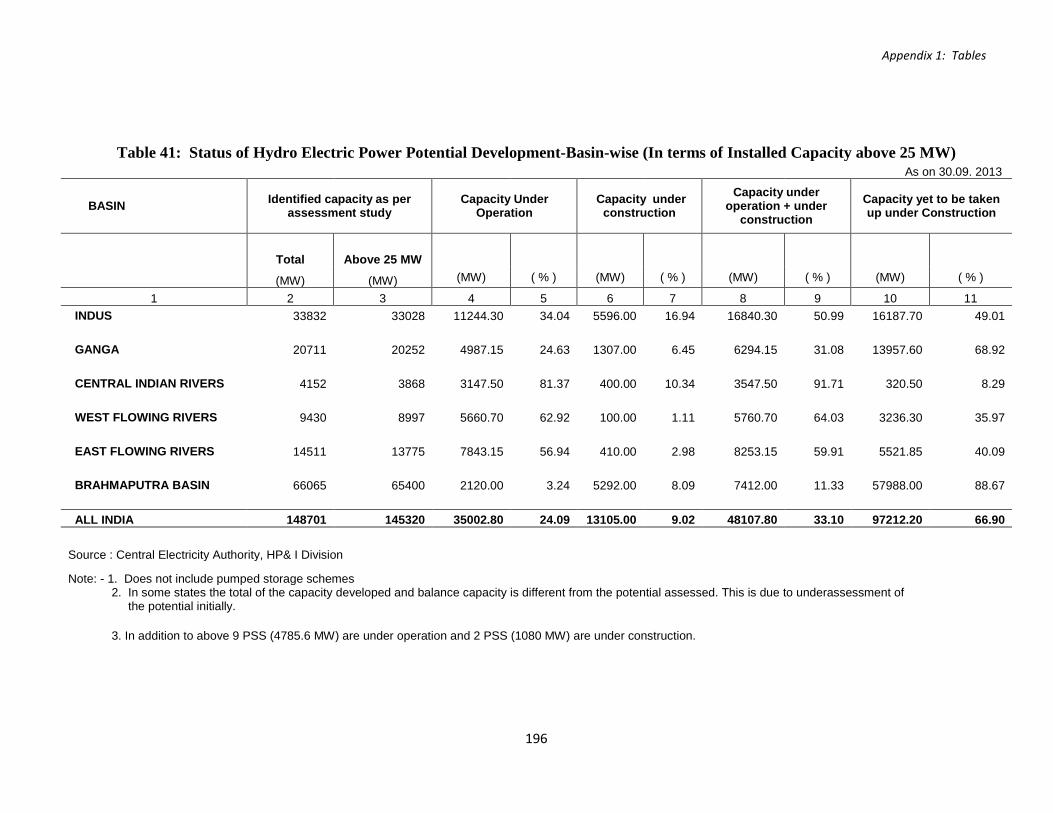
Appendix 1: Tables
Table 41: Status of Hydro Electric Power Potential Development-Basin-wise (In terms of Installed Capacity above 25 MW)
As on 30.09. 2013
BASIN Identified capacity as per assessment study
Capacity Under Operation
Capacity under construction
Capacity under operation + under
construction Capacity yet to be taken up under Construction
Total Above 25 MW
(MW) (MW) (MW) ( % ) (MW) ( % ) (MW) ( % ) (MW) ( % )
1 2 3 4 5 6 7 8 9 10 11 INDUS 33832 33028 11244.30 34.04 5596.00 16.94 16840.30 50.99 16187.70 49.01 GANGA 20711 20252 4987.15 24.63 1307.00 6.45 6294.15 31.08 13957.60 68.92 CENTRAL INDIAN RIVERS 4152 3868 3147.50 81.37 400.00 10.34 3547.50 91.71 320.50 8.29 WEST FLOWING RIVERS 9430 8997 5660.70 62.92 100.00 1.11 5760.70 64.03 3236.30 35.97 EAST FLOWING RIVERS 14511 13775 7843.15 56.94 410.00 2.98 8253.15 59.91 5521.85 40.09 BRAHMAPUTRA BASIN 66065 65400 2120.00 3.24 5292.00 8.09 7412.00 11.33 57988.00 88.67 ALL INDIA 148701 145320 35002.80 24.09 13105.00 9.02 48107.80 33.10 97212.20 66.90
Source : Central Electricity Authority, HP& I Division
Note: - 1. Does not include pumped storage schemes 2. In some states the total of the capacity developed and balance capacity is different from the potential assessed. This is due to underassessment of
the potential initially.
3. In addition to above 9 PSS (4785.6 MW) are under operation and 2 PSS (1080 MW) are under construction.
196

Appendix 1: Tables
Table 42 : Hydro Electric Power Installed Capacity and Generation - All India(Utilities)
Sl. Year Installed Capacity(Utilities) Generation(Utilities) Load No. Total Hydro Percentage Total Hydro Percentage Factor (MW) (MW) Installed (GWH) (GWH) Generation Capacity of of Total Total 1 2 3 4 5 6 7 8 9 1 1947.0 1361.8 508.1 37.3 4073.3 2194.5 53.9 49.0 2 1950.0 1712.5 559.3 32.7 5106.7 2519.8 49.3 51.0 3 1955.0 2694.8 939.5 34.9 8592.5 3742.2 43.6 45.0 4 1960-61 4653.1 1916.7 41.2 16937.0 7836.6 46.3 47.0 5 1965-66 9027.0 4123.7 45.7 32990.1 15225.0 46.2 42.0 6 1973.7 16663.6 6965.3 41.8 66689.0 28971.8 43.4 47.0 7 1979-80 28447.8 11384.0 40.0 104627.3 45477.6 43.5 46.0 8 1985-86 46796.0 15471.6 33.1 170350.1 51020.8 30.0 38.0 9 1989-90 63627.3 18307.6 28.8 245437.9 62116.1 25.3 39.0 10 1990-91 66086.3 18753.4 28.4 264328.6 71641.3 27.1 44.0 11 1995-96 83293.5 20985.6 25.2 379877.1 72579.2 19.1 NA 12 1996-97 85795.4 21658.1 25.2 395889.5 68900.8 17.4 NA 13 1997-98 89102.3 21904.5 24.6 421747.3 74581.7 17.7 NA 14 1998-99 93293.5 22479.1 24.1 448544.1 82922.6 18.5 NA 15 1999-00 97884.5 23856.8 24.4 481055.2 80755.5 16.8 NA 16 2000-01 101626.2 25152.9 24.8 501204.1 74361.9 14.8 NA 17 2001-02 105046.0 26268.8 25.0 517439.4 73579.9 14.2 NA 18 2002-03 107877.4 26766.8 24.8 532693.0 64013.7 12.0 NA 19 2003-04 112683.5 29506.8 26.2 565101.7 75242.5 13.3 NA 20 2004-05 118425.7 30942.2 26.1 594456.2 84610.4 14.2 NA 21 2005-06 124287.2 32325.8 26.0 623819.5 101494.4 16.3 NA 22 2006-07 132329.2 34653.8 26.2 670654.2 113501.6 16.9 NA 23 2007-08 143061.0 35908.8 25.1 722625.5 120386.7 16.7 NA 24 2008-09 147965.41 36877.76 24.9 741167.36 110098.5 14.9 NA 25 2009-10 159398.5 36863.4 23.1 799850.6 104059.4 13.0 NA 26 2010-11 173626.4 37567.4 21.6 844748.2 114415.5 13.5 NA 27 2011-12 199877.0 38990.4 19.5 922451.1 130511.5 14.1 NA 28 2012-13* 223343.6 39491.4 17.7 963722.2 113626.2 11.8 NA
Sources : Central Electricity Authority (DMLF Division) MW : Mega Watt GWH : Giga Watt Hours
N.A. : Not Available
* Provisional
197

Appendix 1: Tables
Table 43: List of Water Resources projects declared as National Projects Sl.
No. Name of the Project 1) Irrigation (ha.)
2) Power (MW) 3) Storage (MAF)
State
1 Teesta Barrage 1) 9.23 lakh 2) 1000 MW 3) Barrage
West Bengal
2 ShahpurKandi 1) .37 lakh 2) 168 MW 3) 0.012 MAF
Punjab
3 Bursar 1) 1 lakh (indirect) 2) 1230 MW 3) 1 MAF
J&K
4 2nd Ravi Vyas Link Harness water flowing across border of about 3 MAF
Punjab
5. Ujh multipurpose project 1) 0.32 lakh ha 2) 280 MW 3) 0.66 MAF
J&K
6. Gyspa project 1) 0.50 lakh ha 2) 240 MW 3) 0.6 MAF
HP
7. LakhvarVyasi 1) 0.49 lakh 2) 420 MW 3) 0.325 MAF
Uttarakhand
8. Kishau 1) 0.97 Lakh 2) 600 MW 3) 1.04 MAF
HP/ Uttarakhand
9. Renuka 1) Drinking water 2) 40 MW 3) 0.44 MAF
HP
10. Noa‐Dehang Dam Project 1) 8000 ha. 2) 75 MW 3) 0.26 MAF
Arunanchal Pradesh
11. Kulsi Dam Project 1) 23,900 ha. 2) 29 MW 3) 0.28 MAF
Assam
12. Upper Siang 1) Indirect 2) 9500 MW 3) 17.50 MAF 4) Flood moderation
Arunanchal Pradesh
13 Gosi khurd 1) 2.50 lakh 2) 3 MW 3) 0.93 MAF
Maharashtra
14 Ken Betwa 1) 6.46 lakh 2) 72 MW 3) 2.25 MAF
Madhya Pradesh
15 Saryu Nahar Pariyojana 1) 4.86 lakh (additional) 2) – 3) Barrage
Uttar Pradesh
Source: PCP Directorate, CWC
MAF‐ Million Acre Feet MW – Mega Watt
198

Appendix II
GLOSSARY OF TERMS
Area sown more than once This represents the areas on which crops are cultivated more than once during the agricultural year. This is obtained by deducting Net Area Sown from Total Cropped Area.
Cropping Intensity It is the ratio of gross (total) area sown to the net area sown expressed as a percentage.
Culturable Command Area (CCA)
It is the area which can be physically irrigated from a scheme and is fit for cultivation.
Dam Any artificial barrier which impounds or diverts water. A dam is generally considered hydrologically significant if
it is 1.25 feet (0.4 meter) or more in height from the natural bed of the stream and has a storage of at least 15 acre-feet or it has an impounding capacity of 50 acre-feet or more and is at least six feet (2 meters) above the natural bed of the stream.
Large Dam A dam exceeding 15m in height above deepest river bed level and a dam between 10 and 15 m height provided volume of earthwork exceeds 0.75 million cubic meter and storage exceeds 1 million cubic meter or the maximum flood discharge exceeds 2000 cumecs.
Gross Area sown This is the sum total of the areas under all crops over the various seasons in an agriculture year (i.e. from the 1st July to 30th June next year).
Gross reservoir Capacity
The total amount of storage capacity available in a reservoir for all purposes from the streambed to the normal water or normal water or normal pool surface level. It does not include surcharge, but does include dead storage
Ground water Water within the earth that supplies wells and springs; water in the zone of saturation where all openings in rocks and soil are filled, the upper surface of which forms the water table.
Irrigated Area
The area is assumed to be irrigated for cultivation through such sources as canals (Govt. & Private), tanks, tube-wells, other wells and other sources.
Net Irrigated Area
It is the total area which is irrigated counting area irrigated more than once on the same land in an agricultural year once only.
199

Gross Irrigated Area Habitation
It is the total area irrigated under various crops in a year, counting the area irrigated under more than one crop during the same year as many times as the number of crops grown and irrigated.
Habitation means a place where people have settled permanently. Temporary settlement like that of quarry workers, construction workers, farm workers, nomads etc. will not be classified as habitation.
Irrigation Potential Created (IPC)
The Irrigation potential created by a project at a given time during or after its construction is the aggregate gross area that can be irrigated annually by the quantity of water that could be made available by all the connected and completed works up to the end of the water courses or the last point in the water delivery system. It is the area that can be irrigated from a project in a design agriculture year that is from the 1July to 30 June next year for the projected cropping pattern and accepted water allowance on its full development. Before an area is included under potential created, it has to be ensured that the water for the area to be reported upon is available and the conveyance system up to and including the irrigation outlet to serve an area up to 40 hectares in the area to be irrigated is completed.
Irrigation Potential Utilised The Irrigation potential utilised is the total gross area actually irrigated by a project/scheme during the agricultural year under consideration.
Live capacity It is the total amount of storage capacity available in a reservoir for all purposes, from the dead storage level to the normal water or normal pool level surface level. It does not include surcharge, or dead storage, but does include inactive storage, active conservation storage and exclusive flood control storage.
Major Irrigation Scheme A scheme having Culturable Command Area (CCA) more than 10,000 hectares is classified as major irrigation scheme.
Medium Irrigation Scheme A scheme having CCA more than 2,000 hectares and up to 10,000 hectares individually is classified as medium irrigation scheme.
Minor Irrigation Scheme A scheme having CCA up to 2,000 hectares individually is classified as minor irrigation scheme.
Net Area Sown It is the total area sown with crops and orchards, counting areas sown more than once in the same agricultural year only once.
Reporting Area for Land Utilisation Statistics
The Reporting area stands for the area for which data on land use classification are available.
River Basin
River Basin is the basic hydrological unit for water resources planning and management.
200

Runoff Water which is not absorbed by the soil and flows to lower ground, eventually draining into a stream, river, or other body of water. It is that part of precipitation that flows toward the streams on the surface of the ground or within the ground. Runoff is composed of base flow and surface runoff.
Runoff/ potential Runoff/ potential of a river for a specified period at a site is the total volume of water flow/passed from/through the site during the specified period. It is the notional depth of water in mm over the catchment, equivalent to annual runoff (in Cum.)/Catchment Area (km2)* 1000 and calculated at the discharge measurement station.
Surface runoff The runoff that travels overland to the stream channel. Rain that falls on the stream channel is often lumped with this quantity.
Surface water Water that flows in streams and rivers and in natural lakes, in wetlands, and in reservoirs constructed by humans
Total Cultivable Area This consists of net area sown, current fallows, fallow lands other than current fallows, culturable waste and land under miscellaneous tree crops.
Ultimate Irrigation Potential
The ultimate irrigation potential is the gross area that can be irrigated from a project in design year for the projected cropping pattern and assumed water allowance on its full development. The gross irrigated area will be the aggregate of the areas irrigated in the different crop seasons, the areas under two seasonal and perennial crops being counted only once in the year.
The Ultimate Irrigation Potential of ground water may however, be taken as the total area that can be irrigated by utilizing the Annually Rechargeable Ground Water Resource Available for Irrigation considering the gross irrigation requirement of crops grown in an unit area.
201