Ambedkarnagar District - केंद्रीय भूमि जल बोर्ड जल संसाधन, नदी ...
Upload
khangminh22Category
view
1download
0
कें द्रीय भमूि जल बोर्ड
जल संसाधन, नदी मिकास और गंगा संरक्षण
मिभाग, जल शमि ितं्रालय
भारत सरकार
Central Ground Water Board Department of Water Resources, River Development and Ganga Rejuvenation,
Ministry of Jal Shakti Government of India
AQUIFER MAPPING AND MANAGEMENT
OF GROUND WATER RESOURCES BATAULI BLOCK, SURGUJA DISTRICT,
CHHATTISGARH
उत्तर िध्य छत्तीसगढ़ क्षेत्र, रायपुर
North Central Chhattisgarh Region, Raipur

Acknowledgement
The author is grateful to Shri G C Pati, Chairman, Central Ground Water Board for
giving opportunity for preparation of Aquifer Map and Management Plan of Batauli Block,
Surguja district of Chhattisgarh state. I express my sincere gratitude to Shri G.L.Meena,
Member (WQ & WTT) CGWB for giving valuable guidance, encouragement and suggestions
during the preparation of this report. The author is thankful to Dr. S.K.Samanta, Head of the
Office, Central Ground Water Board, NCCR, Raipur extending valuable guidance and
constant encouragement during the preparation of this report. I am extremely grateful to Sh.
A.K.Patre, Scientist-D, for his continuous guidance and support during preparation of this
report. The author is also thankful to Sh A.K. Biswal, Sc-D and Sh. J.R.Verma, Sc.D for the
guidance and suggestions. I would like to acknowledge the help rendered by Smt Prachi
Gupta, Sc-B while preparing aquifer map. The author is also thankful to Sh G Sreenath, Sc-B
and Sh Sidhanta Sahu, Sc-B for providing the data of ground water exploration in Surguja
district. The efforts made by Sh. T.S. Chouhan, Draftsman, for digitization of maps are
thankfully acknowledged. The author is also thankful to the state agencies for providing the
various needful data. The author is thankful to Technical Section, Data Centre, Chemical
Section, Report Processing Section and Library of CGWB, NCCR, Raipur for providing the
various needful data.
Uddeshya Kumar
Scientist-B (JHG)
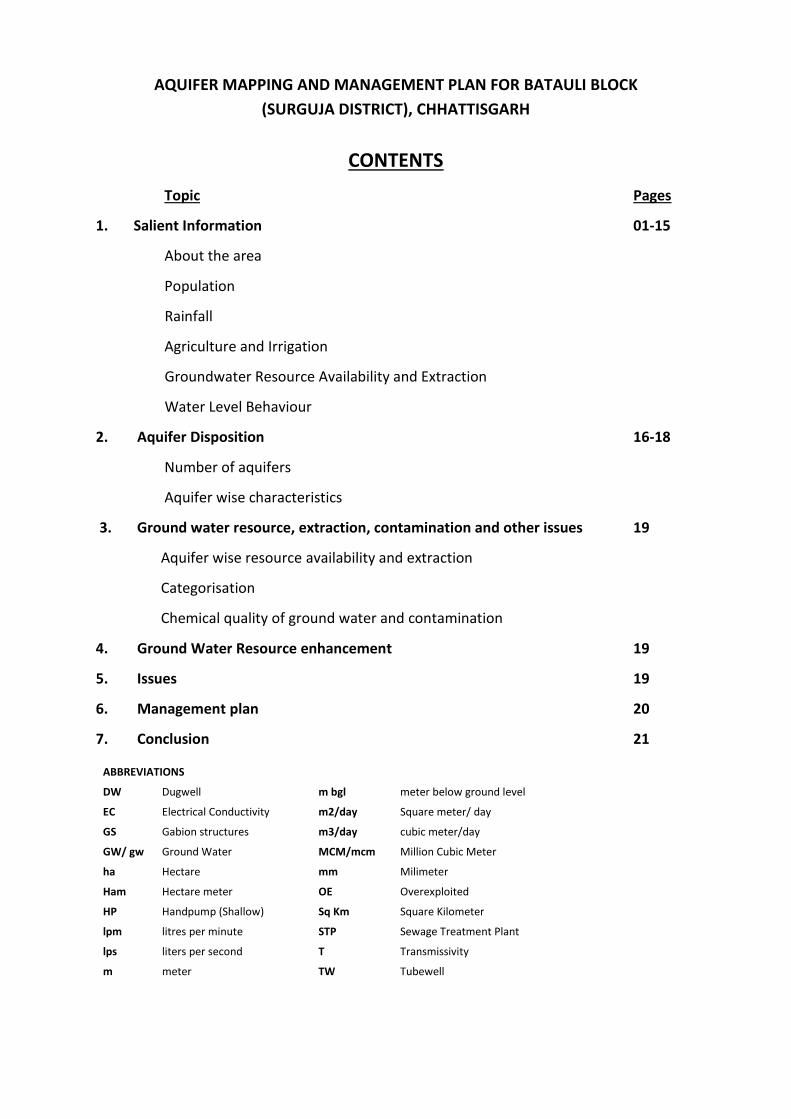
AQUIFER MAPPING AND MANAGEMENT PLAN FOR BATAULI BLOCK
(SURGUJA DISTRICT), CHHATTISGARH
CONTENTS
Topic Pages
1. Salient Information 01-15
About the area
Population
Rainfall
Agriculture and Irrigation
Groundwater Resource Availability and Extraction
Water Level Behaviour
2. Aquifer Disposition 16-18
Number of aquifers
Aquifer wise characteristics
3. Ground water resource, extraction, contamination and other issues 19
Aquifer wise resource availability and extraction
Categorisation
Chemical quality of ground water and contamination
4. Ground Water Resource enhancement 19
5. Issues 19
6. Management plan 20
7. Conclusion 21
ABBREVIATIONS
DW Dugwell m bgl meter below ground level
EC Electrical Conductivity m2/day Square meter/ day
GS Gabion structures m3/day cubic meter/day
GW/ gw Ground Water MCM/mcm Million Cubic Meter
ha Hectare mm Milimeter
Ham Hectare meter OE Overexploited
HP Handpump (Shallow) Sq Km Square Kilometer
lpm litres per minute STP Sewage Treatment Plant
lps liters per second T Transmissivity
m meter TW Tubewell
1
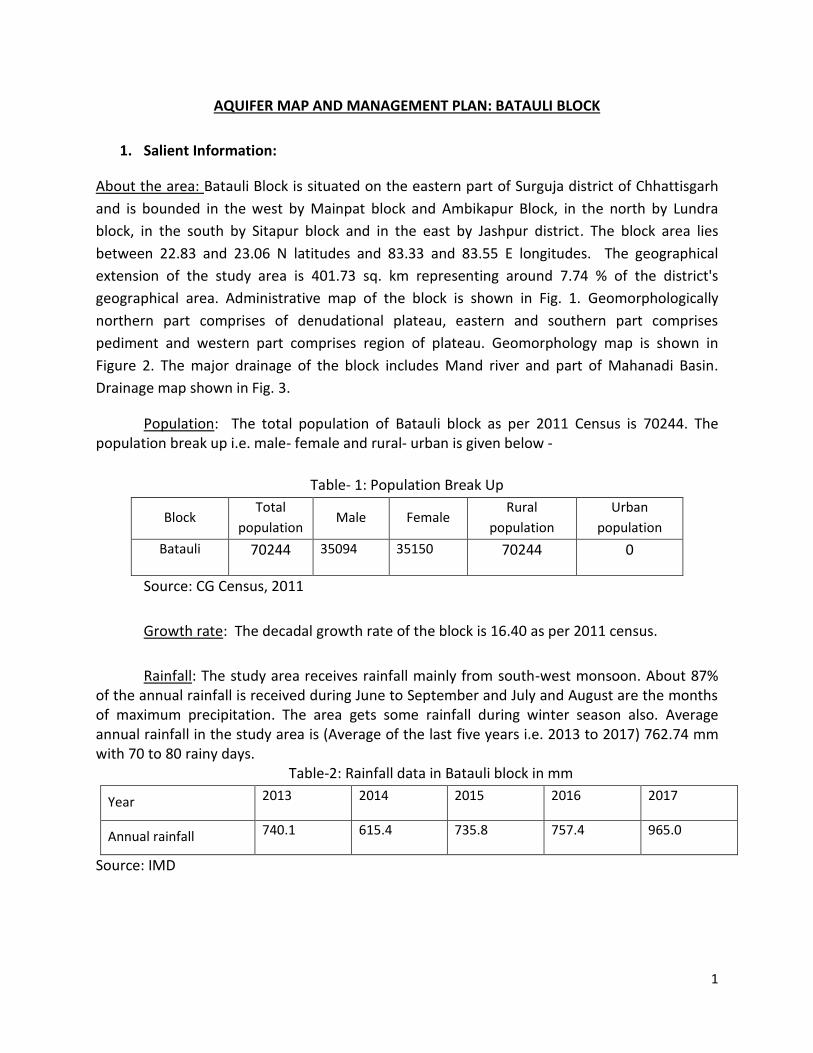
AQUIFER MAP AND MANAGEMENT PLAN: BATAULI BLOCK
1. Salient Information:
About the area: Batauli Block is situated on the eastern part of Surguja district of Chhattisgarh
and is bounded in the west by Mainpat block and Ambikapur Block, in the north by Lundra
block, in the south by Sitapur block and in the east by Jashpur district. The block area lies
between 22.83 and 23.06 N latitudes and 83.33 and 83.55 E longitudes. The geographical
extension of the study area is 401.73 sq. km representing around 7.74 % of the district's
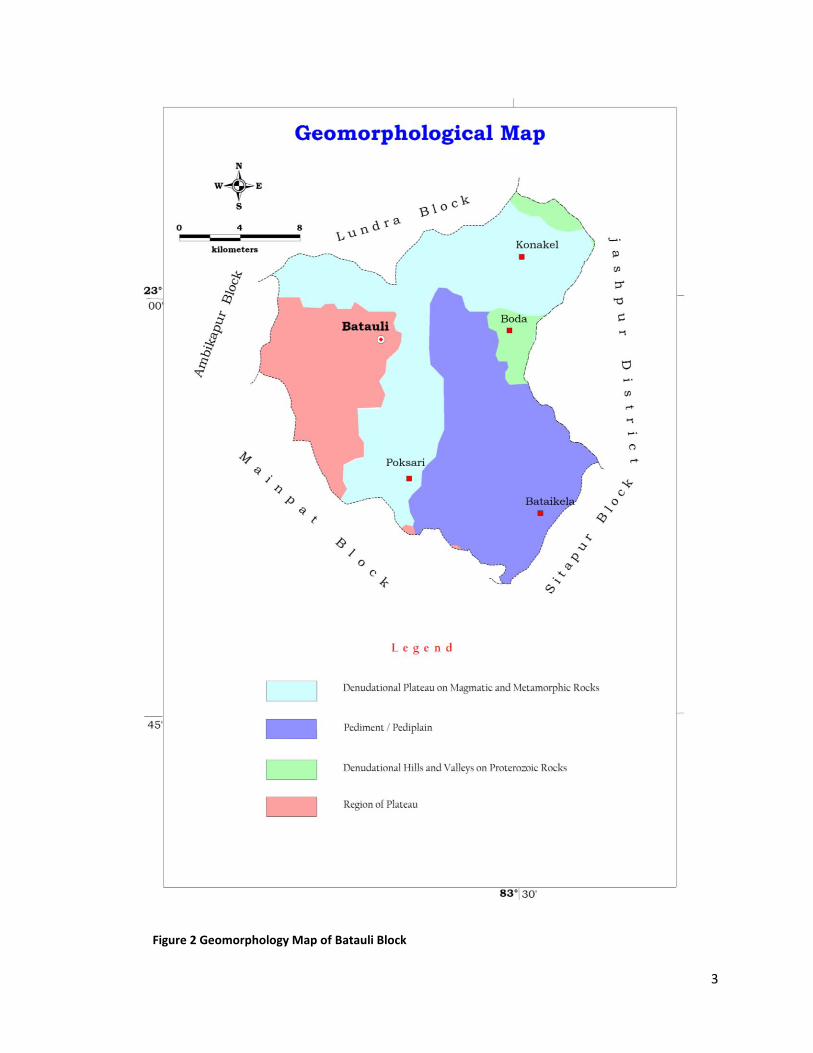
geographical area. Administrative map of the block is shown in Fig. 1. Geomorphologically
northern part comprises of denudational plateau, eastern and southern part comprises
pediment and western part comprises region of plateau. Geomorphology map is shown in
Figure 2. The major drainage of the block includes Mand river and part of Mahanadi Basin.
Drainage map shown in Fig. 3.
Population: The total population of Batauli block as per 2011 Census is 70244. The population break up i.e. male- female and rural- urban is given below -
Table- 1: Population Break Up
Block Total
population Male Female
Rural
population
Urban
population
Batauli 70244 35094 35150 70244 0
Source: CG Census, 2011
Growth rate: The decadal growth rate of the block is 16.40 as per 2011 census.
Rainfall: The study area receives rainfall mainly from south-west monsoon. About 87% of the annual rainfall is received during June to September and July and August are the months of maximum precipitation. The area gets some rainfall during winter season also. Average annual rainfall in the study area is (Average of the last five years i.e. 2013 to 2017) 762.74 mm with 70 to 80 rainy days.
Table-2: Rainfall data in Batauli block in mm
Year 2013 2014 2015 2016 2017
Annual rainfall 740.1 615.4 735.8 757.4 965.0
Source: IMD

2
Figure 1 Administrative Map of Batauli Block
3
Figure 2 Geomorphology Map of Batauli Block

4
Figure 3 Drainage Map of Batauli Block
5
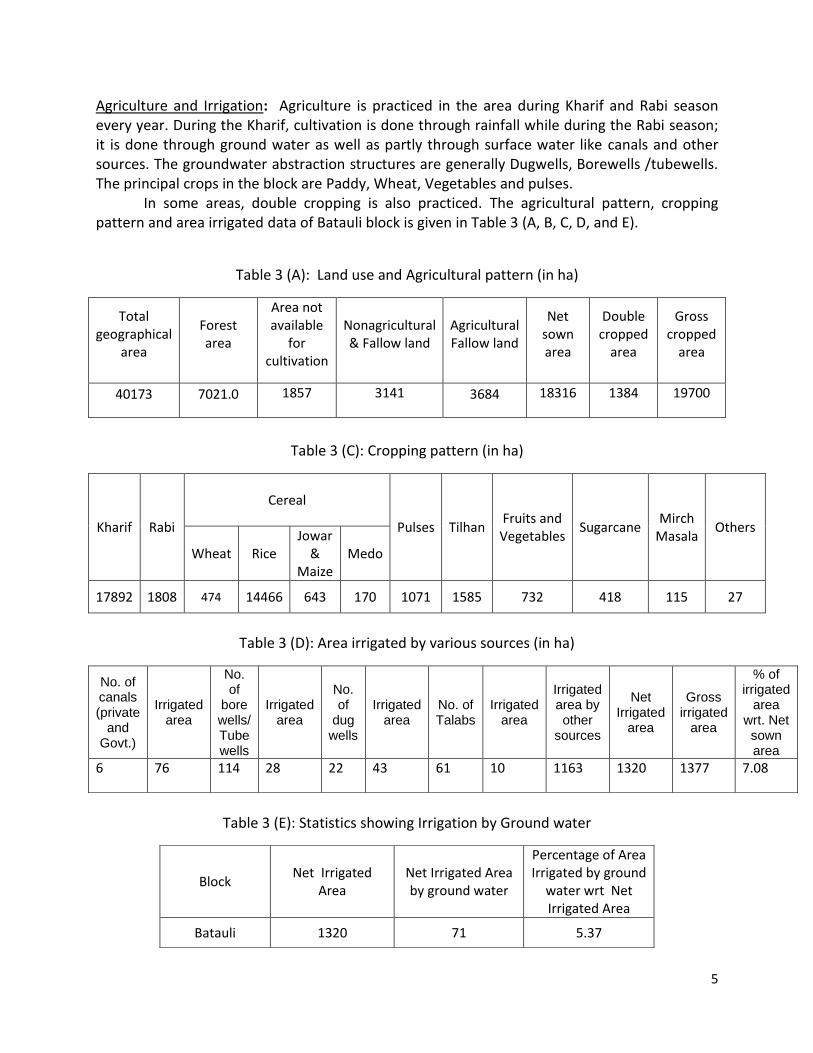
Agriculture and Irrigation: Agriculture is practiced in the area during Kharif and Rabi season every year. During the Kharif, cultivation is done through rainfall while during the Rabi season; it is done through ground water as well as partly through surface water like canals and other sources. The groundwater abstraction structures are generally Dugwells, Borewells /tubewells. The principal crops in the block are Paddy, Wheat, Vegetables and pulses.
In some areas, double cropping is also practiced. The agricultural pattern, cropping pattern and area irrigated data of Batauli block is given in Table 3 (A, B, C, D, and E).
Table 3 (A): Land use and Agricultural pattern (in ha)
Total geographical
area
Forest area
Area not available
for cultivation
Nonagricultural & Fallow land
Agricultural Fallow land
Net sown area
Double cropped
area
Gross cropped
area
40173 7021.0 1857 3141 3684 18316 1384 19700
Table 3 (C): Cropping pattern (in ha)
Kharif Rabi
Cereal
Pulses Tilhan Fruits and Vegetables
Sugarcane Mirch
Masala Others
Wheat Rice Jowar
& Maize
Medo
17892 1808 474 14466 643 170 1071 1585 732 418 115 27
Table 3 (D): Area irrigated by various sources (in ha)
Table 3 (E): Statistics showing Irrigation by Ground water
No. of canals (private
and Govt.)
Irrigated area
No. of
bore wells/ Tube wells
Irrigated area
No. of
dug wells
Irrigated area
No. of Talabs
Irrigated area
Irrigated area by other
sources
Net Irrigated
area
Gross irrigated
area
% of irrigated
area wrt. Net sown area
6 76 114 28 22 43 61 10 1163 1320 1377 7.08
Block Net Irrigated
Area Net Irrigated Area by ground water
Percentage of Area Irrigated by ground
water wrt Net Irrigated Area
Batauli 1320 71 5.37
6
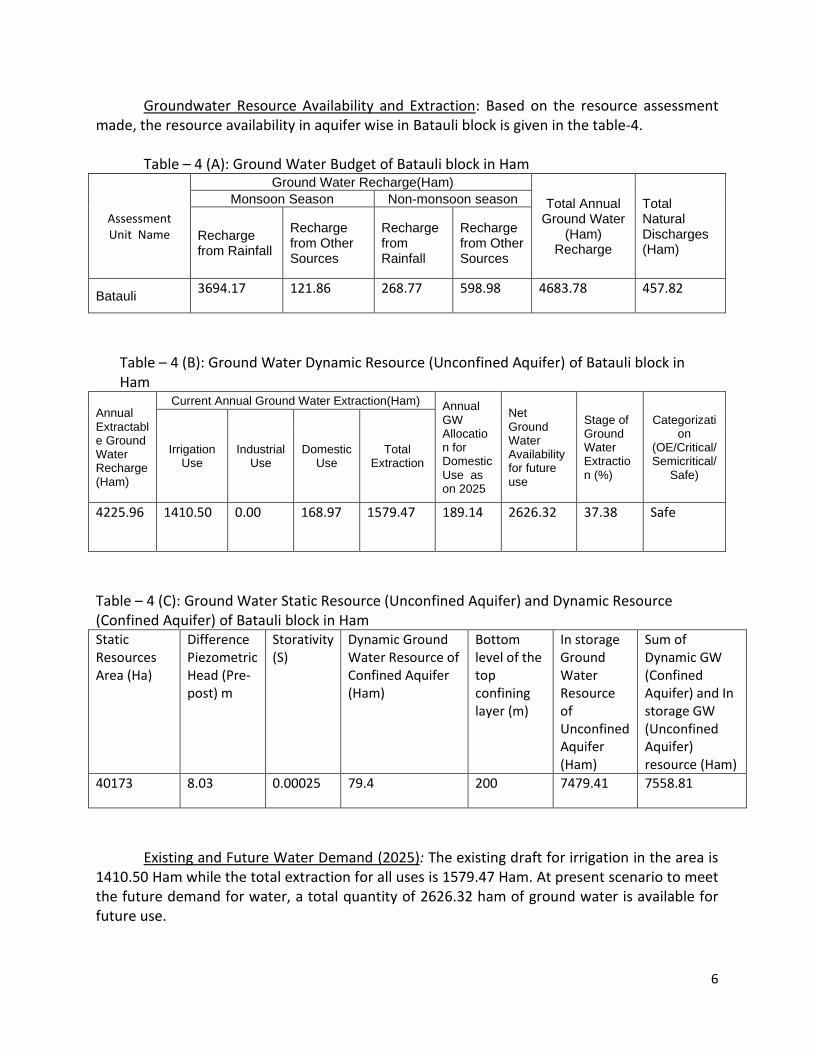
Groundwater Resource Availability and Extraction: Based on the resource assessment made, the resource availability in aquifer wise in Batauli block is given in the table-4.
Table – 4 (A): Ground Water Budget of Batauli block in Ham
Assessment Unit Name
Ground Water Recharge(Ham)
Total Annual Ground Water
(Ham) Recharge
Total Natural Discharges (Ham)
Monsoon Season Non-monsoon season
Recharge from Rainfall
Recharge from Other Sources
Recharge from Rainfall
Recharge from Other Sources
Batauli 3694.17 121.86 268.77 598.98 4683.78 457.82
Table – 4 (B): Ground Water Dynamic Resource (Unconfined Aquifer) of Batauli block in Ham
Annual Extractable Ground Water Recharge (Ham)
Current Annual Ground Water Extraction(Ham) Annual GW Allocation for Domestic Use as on 2025
Net Ground Water Availability for future use
Stage of Ground Water Extraction (%)
Categorization
(OE/Critical/Semicritical/
Safe)
Irrigation Use
Industrial Use
Domestic Use
Total Extraction
4225.96 1410.50 0.00 168.97 1579.47 189.14 2626.32 37.38 Safe
Table – 4 (C): Ground Water Static Resource (Unconfined Aquifer) and Dynamic Resource (Confined Aquifer) of Batauli block in Ham Static Resources Area (Ha)
Difference Piezometric Head (Pre-post) m
Storativity (S)
Dynamic Ground Water Resource of Confined Aquifer (Ham)
Bottom level of the top confining layer (m)
In storage Ground Water Resource of Unconfined Aquifer (Ham)
Sum of Dynamic GW (Confined Aquifer) and In storage GW (Unconfined Aquifer) resource (Ham)
40173 8.03 0.00025 79.4 200 7479.41 7558.81
Existing and Future Water Demand (2025): The existing draft for irrigation in the area is
1410.50 Ham while the total extraction for all uses is 1579.47 Ham. At present scenario to meet the future demand for water, a total quantity of 2626.32 ham of ground water is available for future use.
7
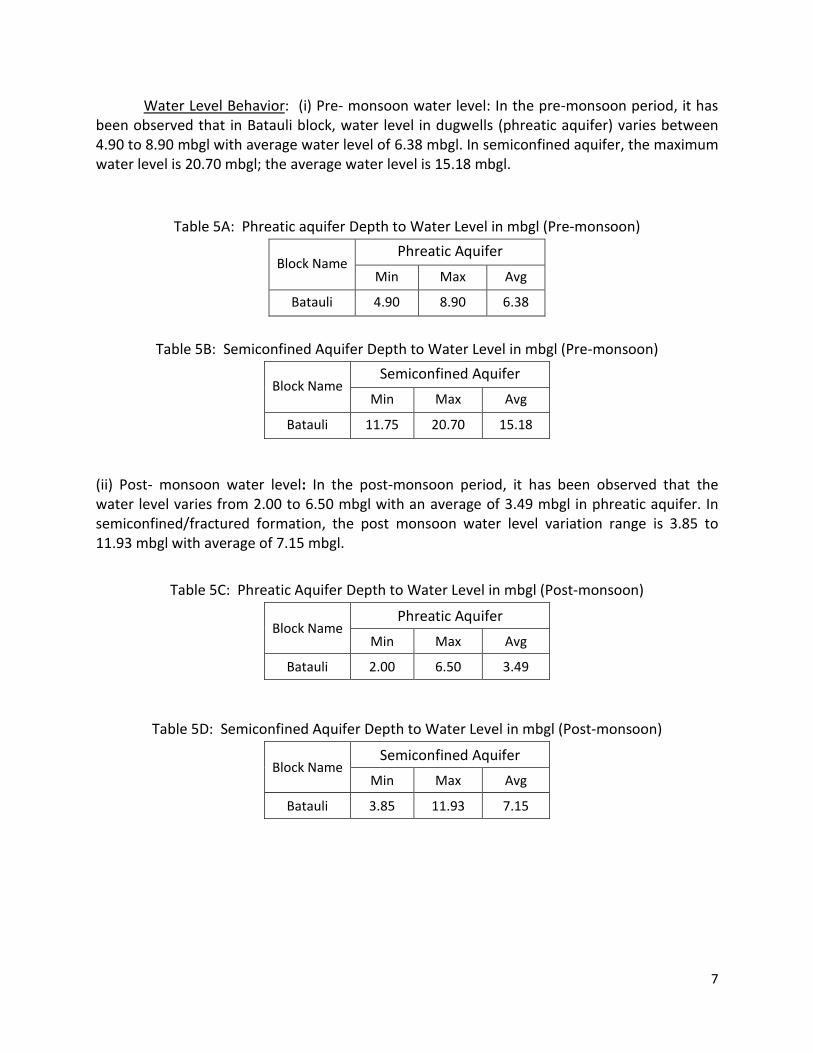
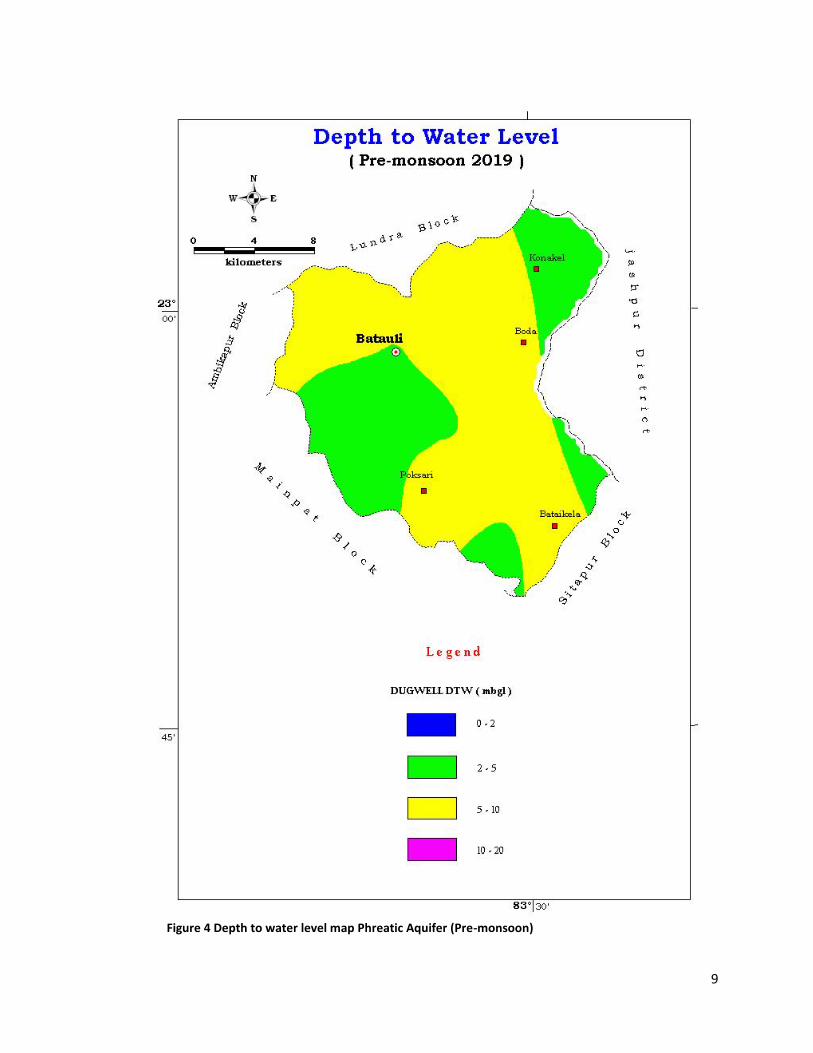
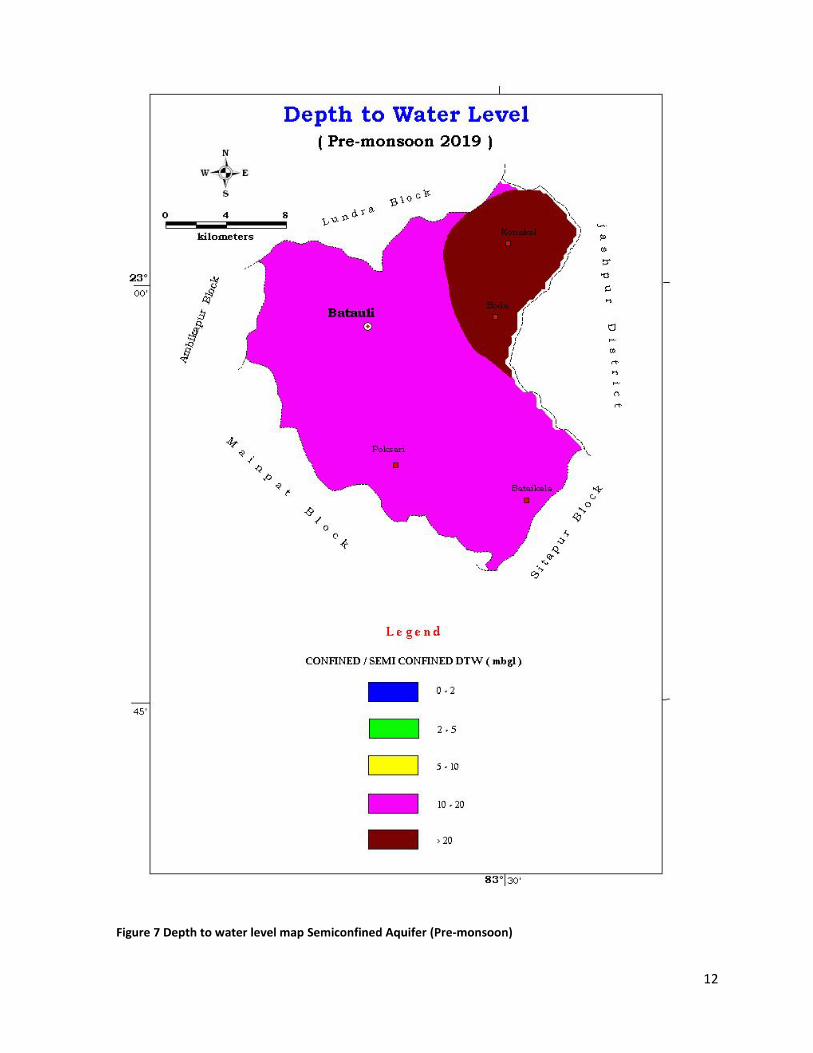
Water Level Behavior: (i) Pre- monsoon water level: In the pre-monsoon period, it has been observed that in Batauli block, water level in dugwells (phreatic aquifer) varies between 4.90 to 8.90 mbgl with average water level of 6.38 mbgl. In semiconfined aquifer, the maximum water level is 20.70 mbgl; the average water level is 15.18 mbgl.
Table 5A: Phreatic aquifer Depth to Water Level in mbgl (Pre-monsoon)
Block Name Phreatic Aquifer
Min Max Avg
Batauli 4.90 8.90 6.38
Table 5B: Semiconfined Aquifer Depth to Water Level in mbgl (Pre-monsoon)
Block Name Semiconfined Aquifer
Min Max Avg
Batauli 11.75 20.70 15.18
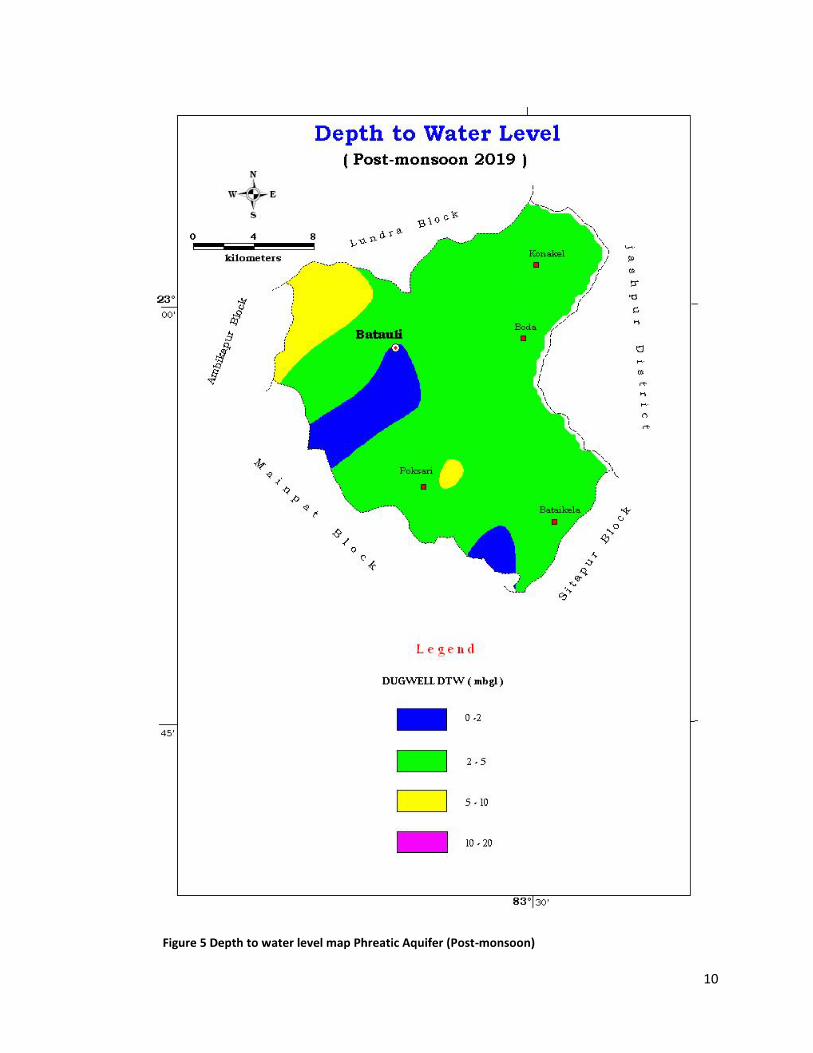
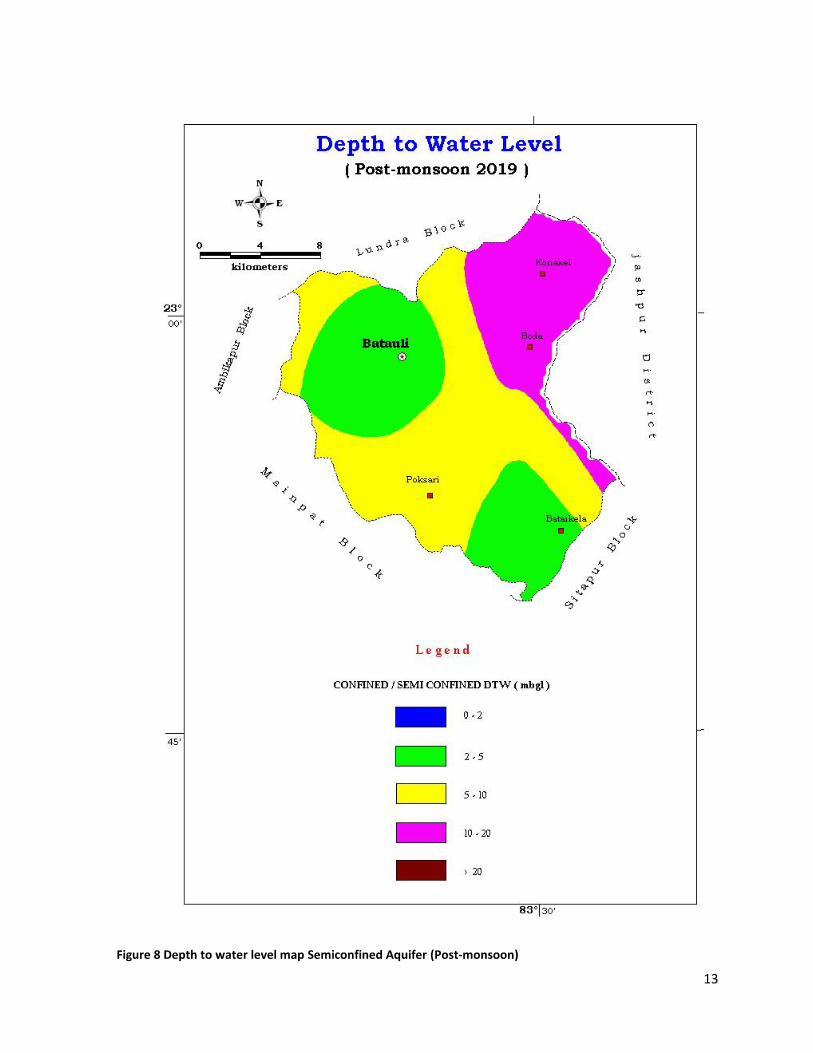
(ii) Post- monsoon water level: In the post-monsoon period, it has been observed that the water level varies from 2.00 to 6.50 mbgl with an average of 3.49 mbgl in phreatic aquifer. In semiconfined/fractured formation, the post monsoon water level variation range is 3.85 to 11.93 mbgl with average of 7.15 mbgl.
Table 5C: Phreatic Aquifer Depth to Water Level in mbgl (Post-monsoon)
Block Name Phreatic Aquifer
Min Max Avg
Batauli 2.00 6.50 3.49
Table 5D: Semiconfined Aquifer Depth to Water Level in mbgl (Post-monsoon)
Block Name Semiconfined Aquifer
Min Max Avg
Batauli 3.85 11.93 7.15

8
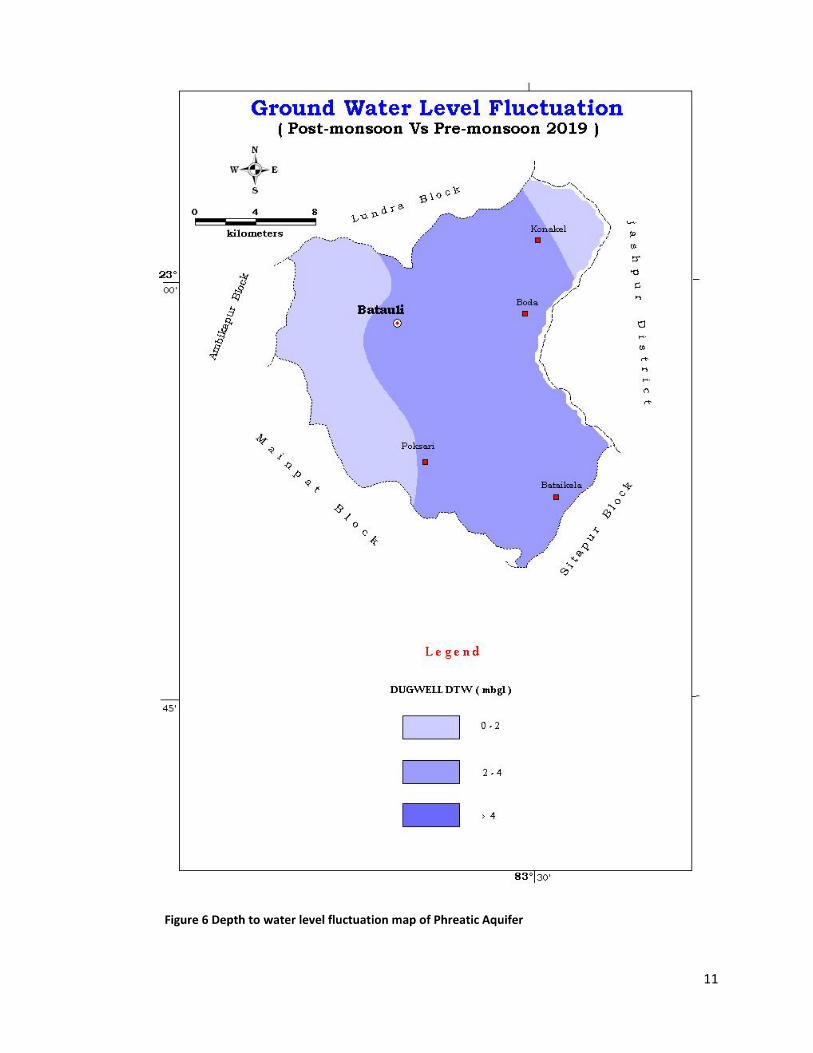
(iii) Seasonal water level fluctuation: The water level fluctuation data indicates that in Batauli block, water level fluctuation in phreatic aquifer varies from 0.50 to 3.85 m with an average fluctuation of 2.90 m. Water level fluctuation in semiconfined Aquifer varies from 6.88 to 8.86 m with an average fluctuation of 8.03 m.
Table 5E: Phreatic Aquifer Depth to Water Level Fluctuation (meter)
Block Name Phreatic Aquifer Min Max Avg
Batauli 0.50 3.85 2.90
Table 5F: Semiconfined Aquifer Depth to Water Level Fluctuation (meter)
Block Name Semiconfined Aquifer
Min Max Avg
Batauli 6.88 8.86 8.03
9
Figure 4 Depth to water level map Phreatic Aquifer (Pre-monsoon)
10
Figure 5 Depth to water level map Phreatic Aquifer (Post-monsoon)
11
Figure 6 Depth to water level fluctuation map of Phreatic Aquifer
12
Figure 7 Depth to water level map Semiconfined Aquifer (Pre-monsoon)
13
Figure 8 Depth to water level map Semiconfined Aquifer (Post-monsoon)

14
Figure 9 Depth to water level fluctuation map of Semiconfined Aquifer
15
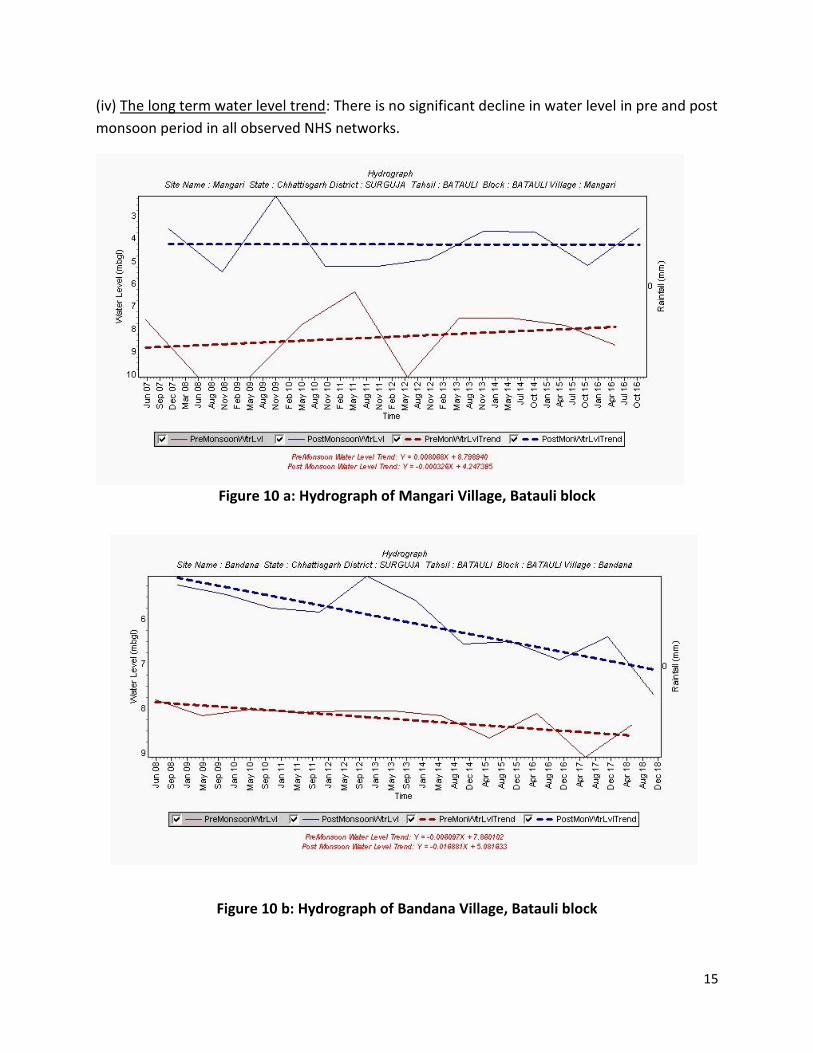
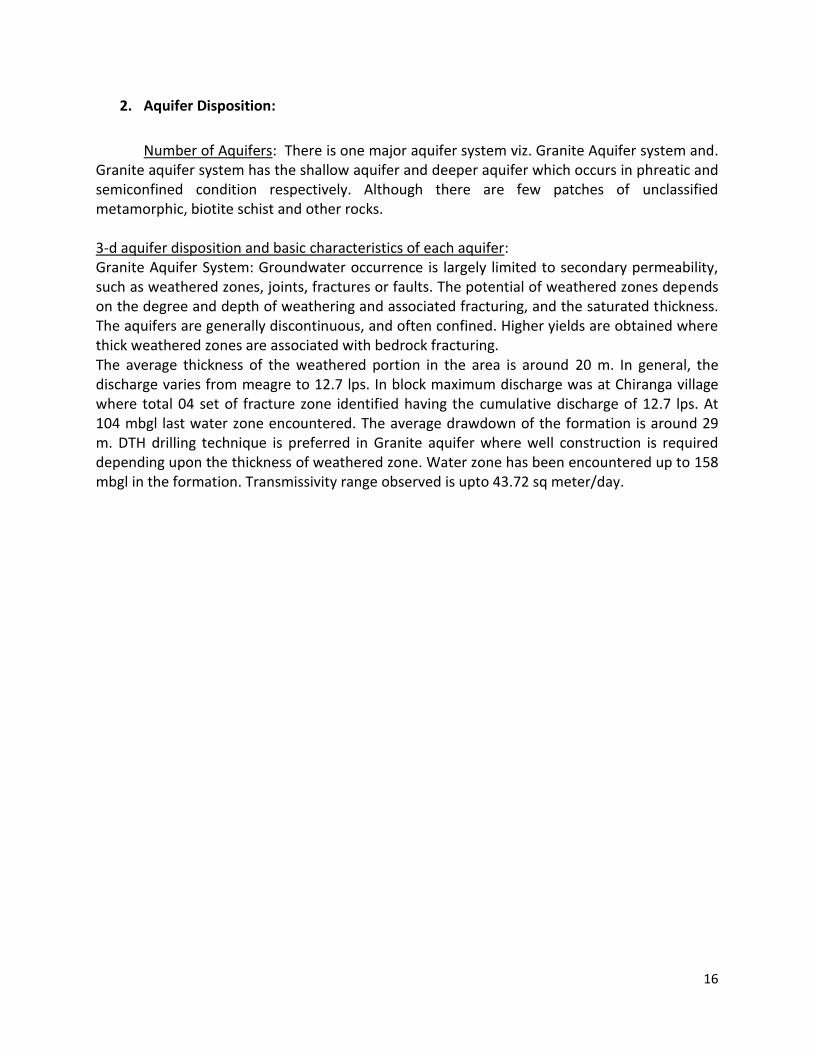
(iv) The long term water level trend: There is no significant decline in water level in pre and post
monsoon period in all observed NHS networks.
Figure 10 a: Hydrograph of Mangari Village, Batauli block
Figure 10 b: Hydrograph of Bandana Village, Batauli block
16
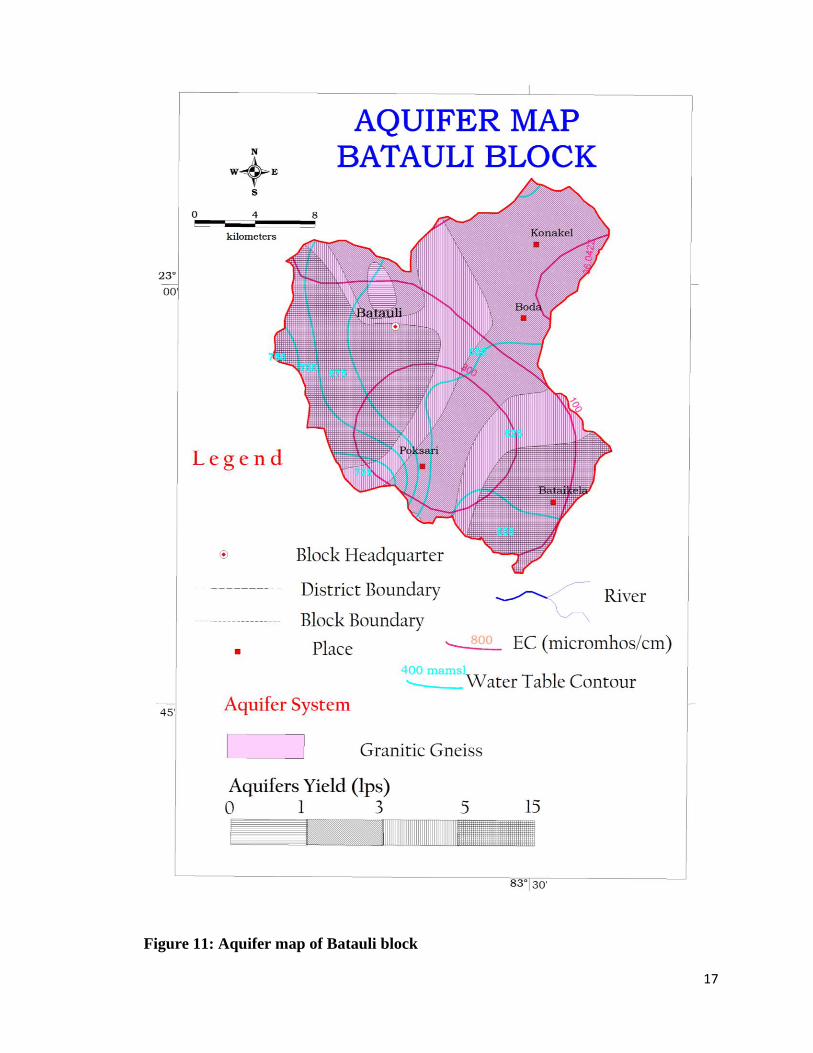
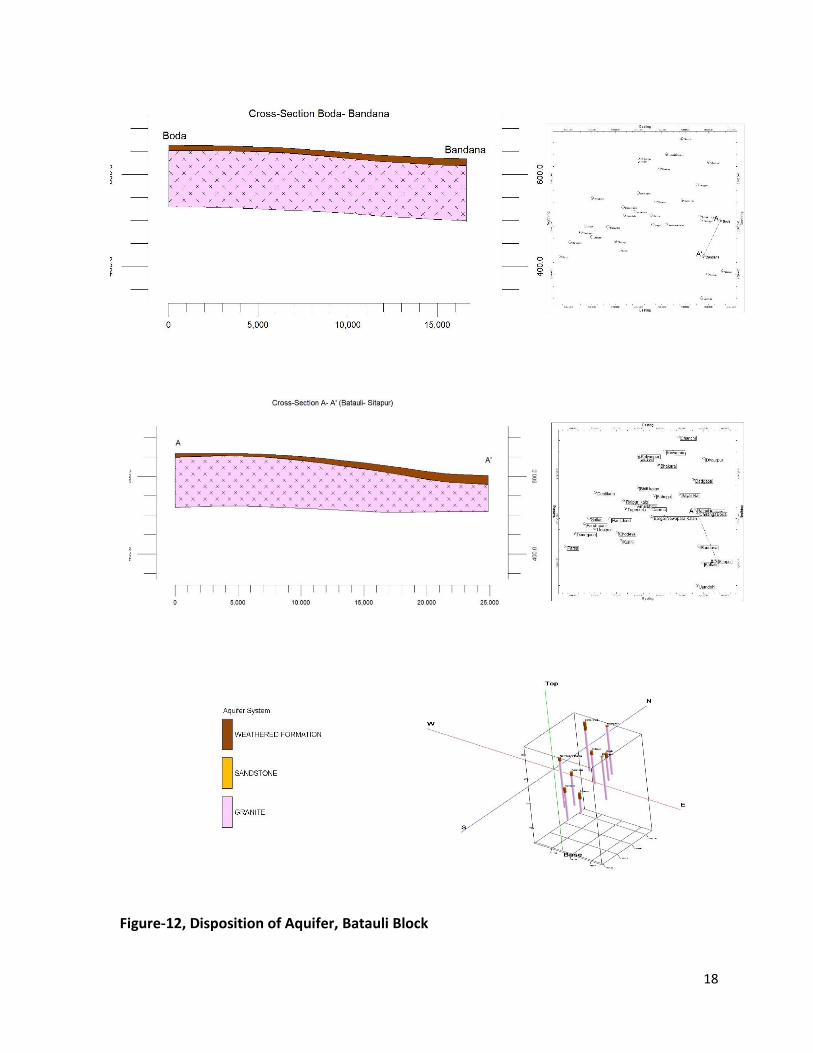
2. Aquifer Disposition:
Number of Aquifers: There is one major aquifer system viz. Granite Aquifer system and. Granite aquifer system has the shallow aquifer and deeper aquifer which occurs in phreatic and semiconfined condition respectively. Although there are few patches of unclassified metamorphic, biotite schist and other rocks. 3-d aquifer disposition and basic characteristics of each aquifer: Granite Aquifer System: Groundwater occurrence is largely limited to secondary permeability, such as weathered zones, joints, fractures or faults. The potential of weathered zones depends on the degree and depth of weathering and associated fracturing, and the saturated thickness. The aquifers are generally discontinuous, and often confined. Higher yields are obtained where thick weathered zones are associated with bedrock fracturing. The average thickness of the weathered portion in the area is around 20 m. In general, the discharge varies from meagre to 12.7 lps. In block maximum discharge was at Chiranga village where total 04 set of fracture zone identified having the cumulative discharge of 12.7 lps. At 104 mbgl last water zone encountered. The average drawdown of the formation is around 29 m. DTH drilling technique is preferred in Granite aquifer where well construction is required depending upon the thickness of weathered zone. Water zone has been encountered up to 158 mbgl in the formation. Transmissivity range observed is upto 43.72 sq meter/day.
17
Figure 11: Aquifer map of Batauli block
18
Figure-12, Disposition of Aquifer, Batauli Block
19
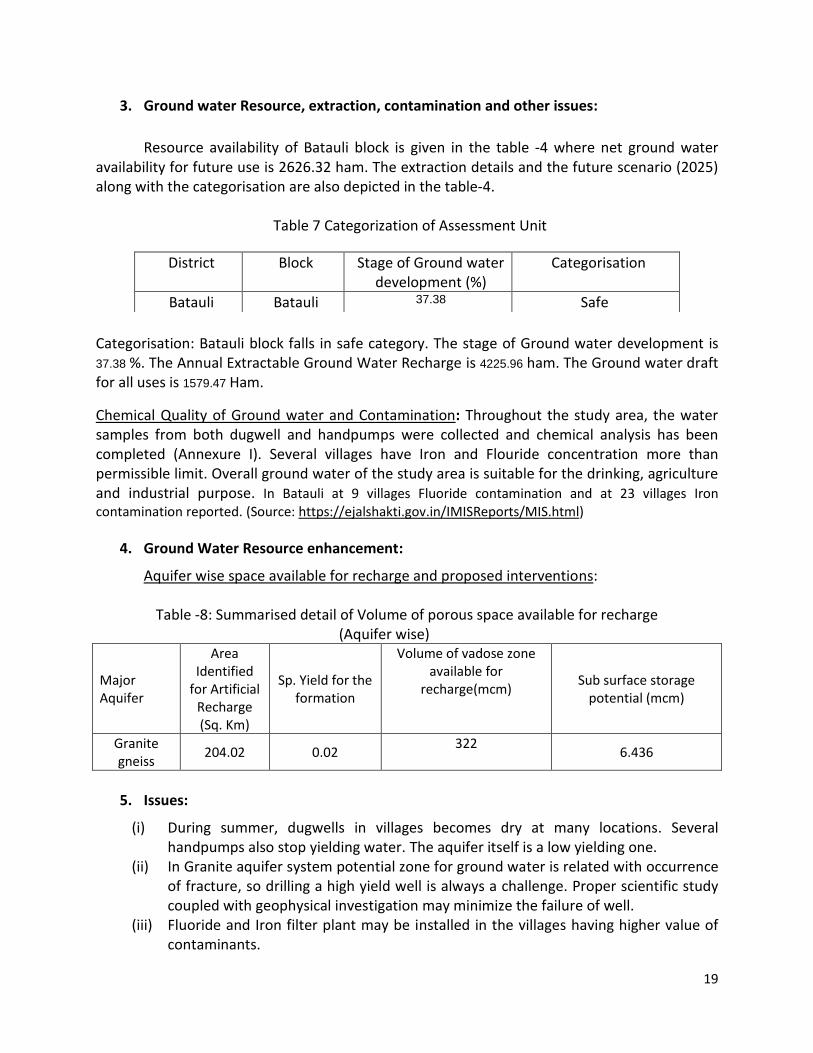
3. Ground water Resource, extraction, contamination and other issues:
Resource availability of Batauli block is given in the table -4 where net ground water
availability for future use is 2626.32 ham. The extraction details and the future scenario (2025) along with the categorisation are also depicted in the table-4.
Table 7 Categorization of Assessment Unit
Categorisation: Batauli block falls in safe category. The stage of Ground water development is 37.38 %. The Annual Extractable Ground Water Recharge is 4225.96 ham. The Ground water draft for all uses is 1579.47 Ham.
Chemical Quality of Ground water and Contamination: Throughout the study area, the water samples from both dugwell and handpumps were collected and chemical analysis has been completed (Annexure I). Several villages have Iron and Flouride concentration more than permissible limit. Overall ground water of the study area is suitable for the drinking, agriculture and industrial purpose. In Batauli at 9 villages Fluoride contamination and at 23 villages Iron contamination reported. (Source: https://ejalshakti.gov.in/IMISReports/MIS.html)
4. Ground Water Resource enhancement:
Aquifer wise space available for recharge and proposed interventions:
Table -8: Summarised detail of Volume of porous space available for recharge (Aquifer wise)
Major Aquifer
Area Identified
for Artificial Recharge (Sq. Km)
Sp. Yield for the formation
Volume of vadose zone available for
recharge(mcm) Sub surface storage
potential (mcm)
Granite gneiss
204.02 0.02 322
6.436
5. Issues:
(i) During summer, dugwells in villages becomes dry at many locations. Several handpumps also stop yielding water. The aquifer itself is a low yielding one.
(ii) In Granite aquifer system potential zone for ground water is related with occurrence of fracture, so drilling a high yield well is always a challenge. Proper scientific study coupled with geophysical investigation may minimize the failure of well.
(iii) Fluoride and Iron filter plant may be installed in the villages having higher value of contaminants.
District
Block
Stage of Ground water development (%)
Categorisation
Batauli Batauli 37.38 Safe
20
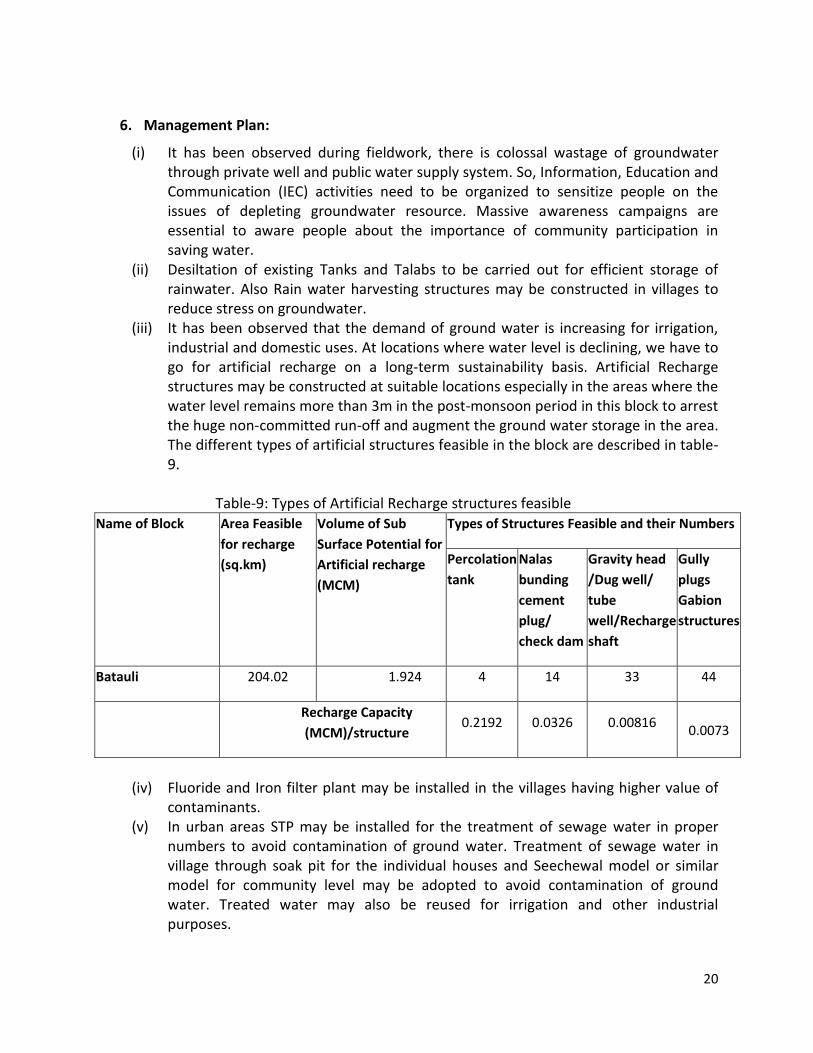
6. Management Plan:
(i) It has been observed during fieldwork, there is colossal wastage of groundwater through private well and public water supply system. So, Information, Education and Communication (IEC) activities need to be organized to sensitize people on the issues of depleting groundwater resource. Massive awareness campaigns are essential to aware people about the importance of community participation in saving water.
(ii) Desiltation of existing Tanks and Talabs to be carried out for efficient storage of rainwater. Also Rain water harvesting structures may be constructed in villages to reduce stress on groundwater.
(iii) It has been observed that the demand of ground water is increasing for irrigation, industrial and domestic uses. At locations where water level is declining, we have to go for artificial recharge on a long-term sustainability basis. Artificial Recharge structures may be constructed at suitable locations especially in the areas where the water level remains more than 3m in the post-monsoon period in this block to arrest the huge non-committed run-off and augment the ground water storage in the area. The different types of artificial structures feasible in the block are described in table-9.
Table-9: Types of Artificial Recharge structures feasible Name of Block Area Feasible
for recharge
(sq.km)
Volume of Sub
Surface Potential for
Artificial recharge
(MCM)
Types of Structures Feasible and their Numbers
Percolation
tank
Nalas
bunding
cement
plug/
check dam
Gravity head
/Dug well/
tube
well/Recharge
shaft
Gully
plugs
Gabion
structures
Batauli 204.02 1.924 4 14 33 44
Recharge Capacity
(MCM)/structure 0.2192 0.0326 0.00816
0.0073
(iv) Fluoride and Iron filter plant may be installed in the villages having higher value of
contaminants. (v) In urban areas STP may be installed for the treatment of sewage water in proper
numbers to avoid contamination of ground water. Treatment of sewage water in village through soak pit for the individual houses and Seechewal model or similar model for community level may be adopted to avoid contamination of ground water. Treated water may also be reused for irrigation and other industrial purposes.

21
(vi) Since the stage of development in the block is 37.38 %. There is scope of utilizing more ground water for future irrigation purpose. Additional number of Ground water abstraction structure may be developed for the effective utilization of ground water resources in the block. The ground water is presently developed through dug wells and tube wells. Yield potential for the block has been shown in Aquifer map (fig 11). Sites for wells need to be selected only after proper scientific investigation. The ground water quality also needs to be ascertained and the wells used for water supply should be first checked for Iron, Fluoride and other pollutants. Table 10: Potential of Additional GW abstraction structure creation
Net Groundwater availability (ham)
Stage of ground water Development (%)
Present ground water draft (Ham)
Ground water draft at 70% stage of development (ham)
Surplus ground water at present Stage of Development (ham)
Number of TW Recommended in each block (Assuming unit draft as 1.6 ham/structure/year)
Number of DW Recommended in each block (Assuming unit draft as 0.72 ham/structure/year)
4225.96 37.38 1579.47 2958.17 1378.70 517 766
7. Conclusion:
For effective utilization of Ground water existing draft for irrigation may be coupled with micro irrigation system. Change in irrigation pattern, optimum use of available resource, use of ground water potential created after artificial recharge can lead to groundwater savings and increase in gross cropped area of the block (Table: 11). Table 11: Detail of groundwater saved through change in cropping pattern and other interventions
Block Existing Gross Ground Water Draft for Irrigation in Ham
Additional Saving of GW after using Micro Irrigation methods in Ham (Assuming 30 % saving)
GW Potential created after Artificial recharge structure in Ham
Development by new GW abstraction structure
Additional GW irrigation Potential created in Ham
Additional Irrigation potential creation for Maize/ wheat in winter season in Ha (Assuming 500 mm water requirement)
Percent increase in Crop area compare to Gross cropped area
Batauli 1410.50 423.15 192.37 1378.70 1937.79 3875.58 19.67%
Copyright © 2022 FDOKUMEN