क द्र य भू म जल बोडर् जल संसाधन, नद वकास...
56
क� �य भ ू �म जल बोड जल संसाधन, नद� �वकास और गंगा संर�ण मंालय भारत सरकार Central Ground Water Board Ministry of Water Resources, River Development and Ganga Rejuvenation Government of India Report on NATIONAL AQUIFER MAPPING AND MANAGEMENT PLAN Parts of Bhadrakh District, Odisha द��ण प ू व� �े, भ ु वनेवर South Eastern Region, Bhubaneswar
-
Upload
khangminh22 -
Category
Documents
-
view
0 -
download
0
Transcript of क द्र य भू म जल बोडर् जल संसाधन, नद वकास...
क� द्र�य भू�म जल बोडर्
जल संसाधन, नद� �वकास और गंगा संर�ण मंत्रालय
भारत सरकार Central Ground Water Board
Ministry of Water Resources, River Development and Ganga Rejuvenation
Government of India
Report on
NATIONAL AQUIFER MAPPING AND MANAGEMENT PLAN
Parts of Bhadrakh District, Odisha
द��ण पूव� �ते्र, भुवनेश् वर South Eastern Region, Bhubaneswar
GGoovveerrnnmmeenntt ooff IInnddiiaa
MMIINNIISSTTRRYY OOFF WWAATTEERR RREESSOOUURRCCEESS,, RRIIVVEERR DDEEVVEELLOOPPMMEENNTT && GGAANNGGAA RREEJJUUVVEENNAATTIIOONN
NNAATTIIOONNAALL AAQQUUIIFFEERR MMAAPPPPIINNGG && MMAANNAAGGEEMMEENNTT
HHYYDDRROOGGEEOOLLOOGGIICCAALL FFRRAAMMEEWWOORRKK,, GGRROOUUNNDD WWAATTEERR DDEEVVEELLOOPPMMEENNTT PPRROOSSPPEECCTTSS && AAQQUUIIFFEERR MMAANNAAGGEEMMEENNTT PPLLAANN OOFF BBHHAADDRRAAKKHH DDIISSTTRRIICCTT,, OODDIISSHHAA
CCEENNTTRRAALL GGRROOUUNNDD WWAATTEERR BBOOAARRDD SSoouutthh EEaasstteerrnn RReeggiioonn,, BBhhuubbaanneesswwaarr
MMaayy –– 22001177
HHYYDDRROOGGEEOOLLOOGGIICCAALL FFRRAAMMEEWWOORRKK,, GGRROOUUNNDD WWAATTEERR DDEEVVEELLOOPPMMEENNTT
PPRROOSSPPEECCTTSS && AAQQUUIIFFEERR MMAANNAAGGEEMMEENNTT PPLLAANN OOFF BBHHAADDRRAAKKHH DDIISSTTRRIICCTT,,
OODDIISSHHAA
CCOONNTTRRIIBBUUTTOORRSS PPAAGGEE
Data Acquisition : Shri A. K. Biswal, Scientist-‘D’
Shri P. Das, Scientist-‘B’
Shri S. K. Samantray, Scientist-‘B’
Shri D. Biswas, Scientist-‘D’
Data Processing : Dr. N. C. Nayak, Scientist-‘D’
Shri P. Das, Scientist-‘B’
Shri A. K. Biswal, Scientist-‘D’
Data Compilation & Editing : Dr. N. C. Nayak, Scientist-‘D’
Shri A. Choudhury, Asst. Hydrogeologist
Data Interpretation : Dr. N. C. Nayak, Scientist-‘D’
Map Preparation : Dr. N. C. Nayak, Scientist-‘D
Shri A. Choudhury, Asst. Hydrogeologist
Report Preparation : Dr. N. C. Nayak, Scientist-‘D’
Technical Guidance : Shri P. K. Mohapatra, Scientist-‘D’
Overall Supervision : Shri D. P. Pati, Regional Director
HHYYDDRROOGGEEOOLLOOGGIICCAALL FFRRAAMMEEWWOORRKK,, GGRROOUUNNDD WWAATTEERR DDEEVVEELLOOPPMMEENNTT PPRROOSSPPEECCTTSS &&
AAQQUUIIFFEERR MMAANNAAGGEEMMEENNTT PPLLAANN OOFF BBHHAADDRRAAKKHH DDIISSTTRRIICCTT,, OODDIISSHHAA
C O N T E N T S
CHAPTER TITLE PAGE
I INTRODUCTION
1.1 Location 1
1.2 Socio-Economic Condition 2
1.3 Land Use 3
1.4 Agriculture 5
1.5 Irrigation 6
1.6 Climate 9
1.7 Physiography and Drainage 11
1.8 Geomorphology 13
1.9 Soil 14
II DATA COLLECTION AND GENERATION
2.1 Geology 15
2.2 Hydrogeology 16
III DATA INTERPRETATION, INTREGRATION & AQUIFER MAPPING
3.1 Shallow aquifer 24
3.2 Deeper aquifers 27
1. Yield Characteristics of non-saline area 32
2. Yield Characteristics of saline area 32
3. Basement condition 36
4. Ground water quality 37
IV GROUND WATER RESOURCES 41
V ISSUES AND MANAGEMENT STRATEGY 43
SUMMARY AND CONCLUSION 50
ACKNOWLEDGEMENTS 50
REFERENCES 51
1
AQUIFER MAPPING REPORT OF BHADRAK DISTRICT, ODISHA UNDER NAQUIM, MINISTRY OF WATER RESOURCES, RIVER DEVELOPMENT AND GANGA REJUVENATION,
GOVT. OF INDIA
I. INTRODUCTION
1.1 Location:
Bhadrakh district is one of the coastal districts of Odisha State bounded by north latitudes
20044’20” and 21
019’33” and east longitudes 86
016’30” and 86
059’20”. It is covered under
the Survey of India Sheet Numbers 74K & 73L (1:250,000). It spreads over an area of
around 2505 Sq. Kilometers bounded by Jajpur district on its south, Keonjhar district on its
west and by Bay of Bengal on the east. The district comprises of 7 Community Development
Blocks with its headquarter Bhadrakh, which is a Municipality. Basudevpur, Chandbali and
Dhamnagar are other major towns and business centers. The Akhandalamani Shiva Temple,
which is situated at Aridi in the study area, is a famous pilgrim center. The Bhadrakali
Temple from which the district owes its name, is situated 10 Kms east of Bhadrakh town.
The recently commissioned Dhamara port is a big boom for the development of the area.
Fig -1.1: Administrative map of Bhadrak District
2
1.2 Socio-Economic Condition:
The study area is thickly populated having a total population of around 15,06,337 living in
an area spreading over 2505 km2. The district shows the highest decadal growth rate of
around 12.9% among all the districts in the state. The population density is around 601
persons per square kilometer, which is very high as compared to State’s average of 270. It
stands 6th
in terms of literacy rate with 82.8%, 6th
in terms of density of population and 4th
from the bottom in terms of geographical area distribution in the state. Around 22.2 % and
2% of the population belongs to schedule caste and schedule tribe community.
88% of the State’s population lives in villages with agriculture being their main occupation.
The work force constitutes around 31% of the population. Agriculture and fishery is the
backbone of the area’s economy and the introduction of marine aquaculture and prawn
farming has improved the socio-economic condition in the saline tracts, which were
otherwise treated as unproductive areas.
Table – 1.1
(Demographical break up based on 2011 Population Census) Sl
No
Blocks Names Total
Population
Male Female SC
Population
ST
Population
Total
Workers
Geographical
Area in
Sq.Km
Bhadrakh District
1 Bhadrakh 217849 110916 106933 42876 11750 69490 315.41
2 Basudevpur 219108 109642 109466 52257 583 67427 389.21
3 Bhandaripokhari 127158 63751 63407 29632 4134 40133 237.13
4 Bonth 152063 76918 75145 37926 7932 48084 235.21
5 Chandbali 250037 126367 123670 56192 885 77707 528.45
6 Dhamnagar 181281 91334 89947 41917 1077 54440 230.29
7 Tihidi 194768 97557 97211 58023 619 61123 324.40
Total 1333749 675642 658107 286723 25141 385119 2505*
Urban Local Bodies (ULB)
1 Bhadrakh(M) 1,21,338 62,335 59,003 10,021 4,560 38,524 45.36
2 Basudevpur(NAC) 33,690 16,927 16,763 5,626 103 9,785 47.78
3 Dhamnagar(NAC) 22,920 11,758 16,763 2,584 197 6,479 18.69
4 Erei(CT) 7,890 3,985 3,905 419 1,221 2,657 4.60
* The district total is not additive
Source: Census of India and Directorate of Economics & Statistics, Govt. of Odisha.
3
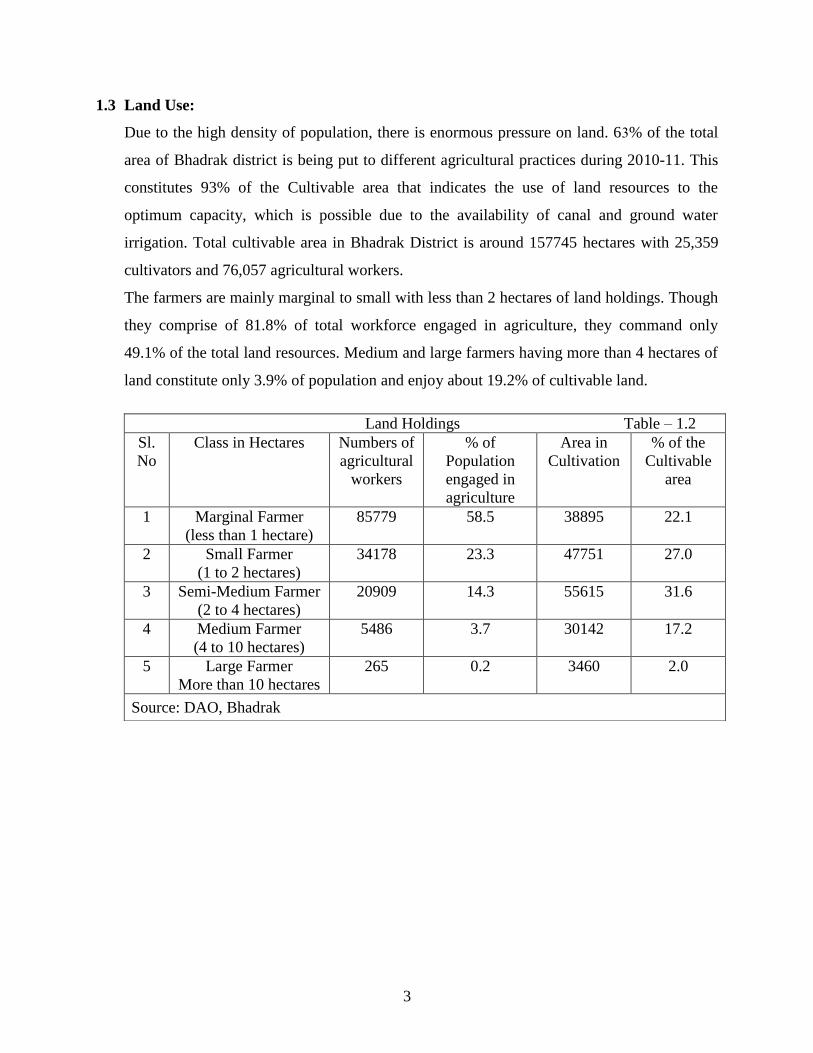
1.3 Land Use:
Due to the high density of population, there is enormous pressure on land. 63% of the total
area of Bhadrak district is being put to different agricultural practices during 2010-11. This
constitutes 93% of the Cultivable area that indicates the use of land resources to the
optimum capacity, which is possible due to the availability of canal and ground water
irrigation. Total cultivable area in Bhadrak District is around 157745 hectares with 25,359
cultivators and 76,057 agricultural workers.
The farmers are mainly marginal to small with less than 2 hectares of land holdings. Though
they comprise of 81.8% of total workforce engaged in agriculture, they command only
49.1% of the total land resources. Medium and large farmers having more than 4 hectares of
land constitute only 3.9% of population and enjoy about 19.2% of cultivable land.
Land Holdings Table – 1.2
Sl.
No
Class in Hectares Numbers of
agricultural
workers
% of
Population
engaged in
agriculture
Area in
Cultivation
% of the
Cultivable
area
1 Marginal Farmer
(less than 1 hectare)
85779 58.5 38895 22.1
2 Small Farmer
(1 to 2 hectares)
34178 23.3 47751 27.0
3 Semi-Medium Farmer
(2 to 4 hectares)
20909 14.3 55615 31.6
4 Medium Farmer
(4 to 10 hectares)
5486 3.7 30142 17.2
5 Large Farmer
More than 10 hectares
265 0.2 3460 2.0
Source: DAO, Bhadrak
4
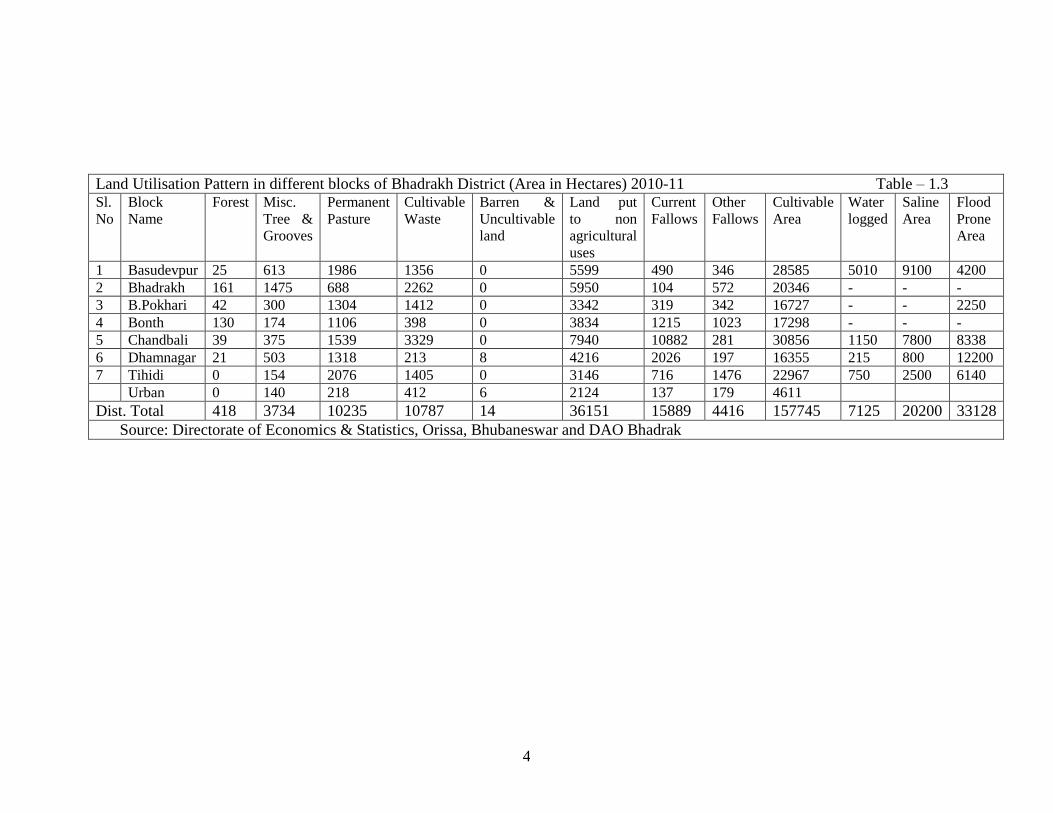
Land Utilisation Pattern in different blocks of Bhadrakh District (Area in Hectares) 2010-11 Table – 1.3 Sl.
No
Block
Name
Forest Misc.
Tree &
Grooves
Permanent
Pasture
Cultivable
Waste
Barren &
Uncultivable
land
Land put
to non
agricultural
uses
Current
Fallows
Other
Fallows
Cultivable
Area
Water
logged
Saline
Area
Flood
Prone
Area
1 Basudevpur 25 613 1986 1356 0 5599 490 346 28585 5010 9100 4200
2 Bhadrakh 161 1475 688 2262 0 5950 104 572 20346 - - -
3 B.Pokhari 42 300 1304 1412 0 3342 319 342 16727 - - 2250
4 Bonth 130 174 1106 398 0 3834 1215 1023 17298 - - -
5 Chandbali 39 375 1539 3329 0 7940 10882 281 30856 1150 7800 8338
6 Dhamnagar 21 503 1318 213 8 4216 2026 197 16355 215 800 12200
7 Tihidi 0 154 2076 1405 0 3146 716 1476 22967 750 2500 6140
Urban 0 140 218 412 6 2124 137 179 4611
Dist. Total 418 3734 10235 10787 14 36151 15889 4416 157745 7125 20200 33128
Source: Directorate of Economics & Statistics, Orissa, Bhubaneswar and DAO Bhadrak
5
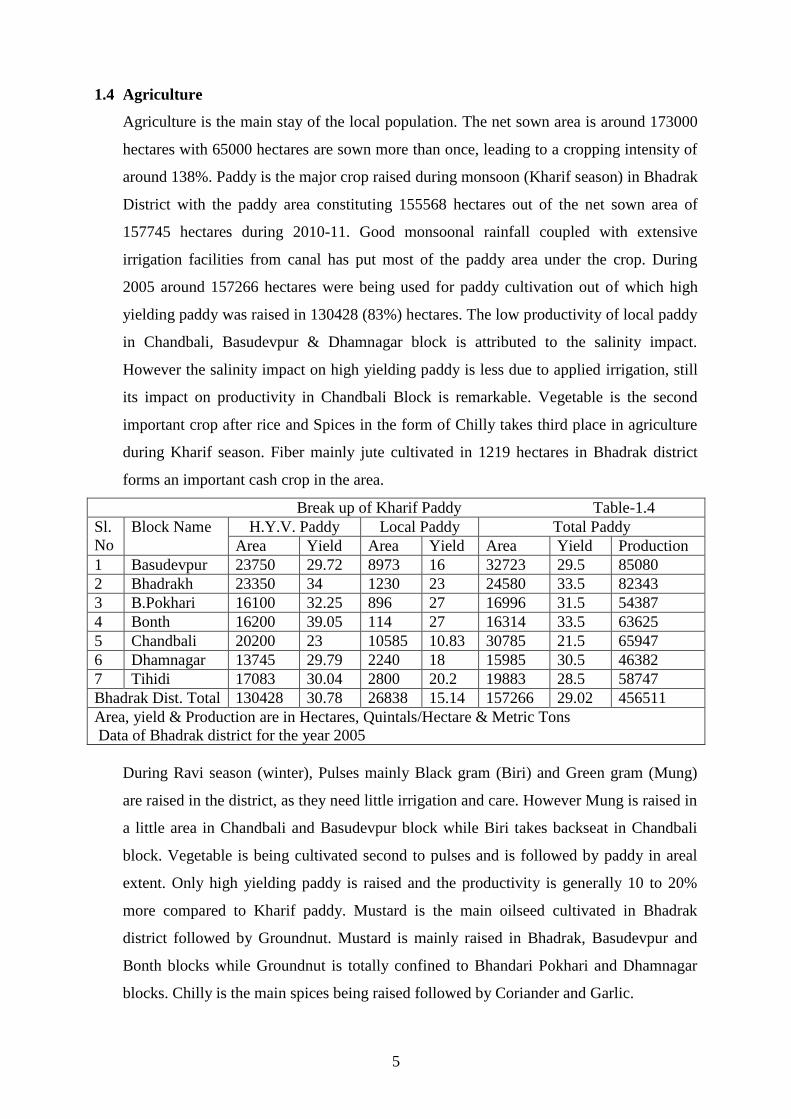
1.4 Agriculture
Agriculture is the main stay of the local population. The net sown area is around 173000
hectares with 65000 hectares are sown more than once, leading to a cropping intensity of
around 138%. Paddy is the major crop raised during monsoon (Kharif season) in Bhadrak
District with the paddy area constituting 155568 hectares out of the net sown area of
157745 hectares during 2010-11. Good monsoonal rainfall coupled with extensive
irrigation facilities from canal has put most of the paddy area under the crop. During
2005 around 157266 hectares were being used for paddy cultivation out of which high
yielding paddy was raised in 130428 (83%) hectares. The low productivity of local paddy
in Chandbali, Basudevpur & Dhamnagar block is attributed to the salinity impact.
However the salinity impact on high yielding paddy is less due to applied irrigation, still
its impact on productivity in Chandbali Block is remarkable. Vegetable is the second
important crop after rice and Spices in the form of Chilly takes third place in agriculture
during Kharif season. Fiber mainly jute cultivated in 1219 hectares in Bhadrak district
forms an important cash crop in the area.
Break up of Kharif Paddy Table-1.4
Sl.
No
Block Name H.Y.V. Paddy Local Paddy Total Paddy
Area Yield Area Yield Area Yield Production
1 Basudevpur 23750 29.72 8973 16 32723 29.5 85080
2 Bhadrakh 23350 34 1230 23 24580 33.5 82343
3 B.Pokhari 16100 32.25 896 27 16996 31.5 54387
4 Bonth 16200 39.05 114 27 16314 33.5 63625
5 Chandbali 20200 23 10585 10.83 30785 21.5 65947
6 Dhamnagar 13745 29.79 2240 18 15985 30.5 46382
7 Tihidi 17083 30.04 2800 20.2 19883 28.5 58747
Bhadrak Dist. Total 130428 30.78 26838 15.14 157266 29.02 456511
Area, yield & Production are in Hectares, Quintals/Hectare & Metric Tons
Data of Bhadrak district for the year 2005
During Ravi season (winter), Pulses mainly Black gram (Biri) and Green gram (Mung)
are raised in the district, as they need little irrigation and care. However Mung is raised in
a little area in Chandbali and Basudevpur block while Biri takes backseat in Chandbali
block. Vegetable is being cultivated second to pulses and is followed by paddy in areal
extent. Only high yielding paddy is raised and the productivity is generally 10 to 20%
more compared to Kharif paddy. Mustard is the main oilseed cultivated in Bhadrak
district followed by Groundnut. Mustard is mainly raised in Bhadrak, Basudevpur and
Bonth blocks while Groundnut is totally confined to Bhandari Pokhari and Dhamnagar
blocks. Chilly is the main spices being raised followed by Coriander and Garlic.
6
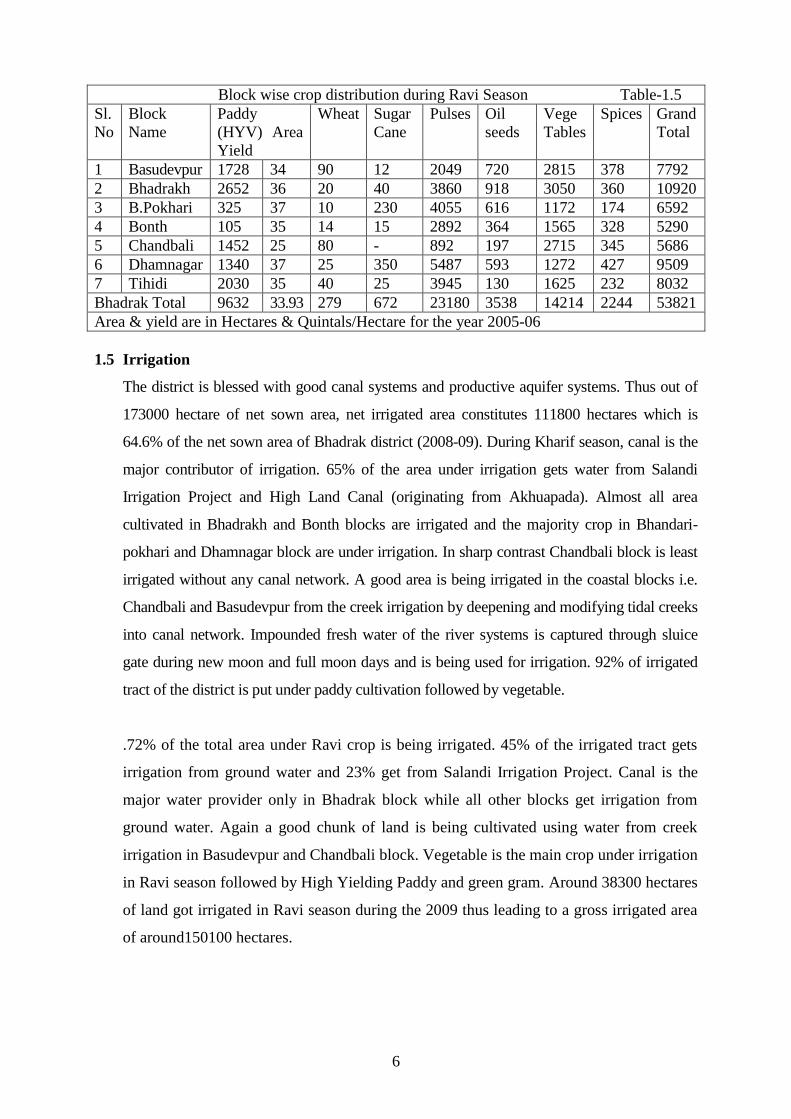
Block wise crop distribution during Ravi Season Table-1.5
Sl.
No
Block
Name
Paddy
(HYV) Area
Yield
Wheat Sugar
Cane
Pulses Oil
seeds
Vege
Tables
Spices Grand
Total
1 Basudevpur 1728 34 90 12 2049 720 2815 378 7792
2 Bhadrakh 2652 36 20 40 3860 918 3050 360 10920
3 B.Pokhari 325 37 10 230 4055 616 1172 174 6592
4 Bonth 105 35 14 15 2892 364 1565 328 5290
5 Chandbali 1452 25 80 - 892 197 2715 345 5686
6 Dhamnagar 1340 37 25 350 5487 593 1272 427 9509
7 Tihidi 2030 35 40 25 3945 130 1625 232 8032
Bhadrak Total 9632 33.93 279 672 23180 3538 14214 2244 53821
Area & yield are in Hectares & Quintals/Hectare for the year 2005-06
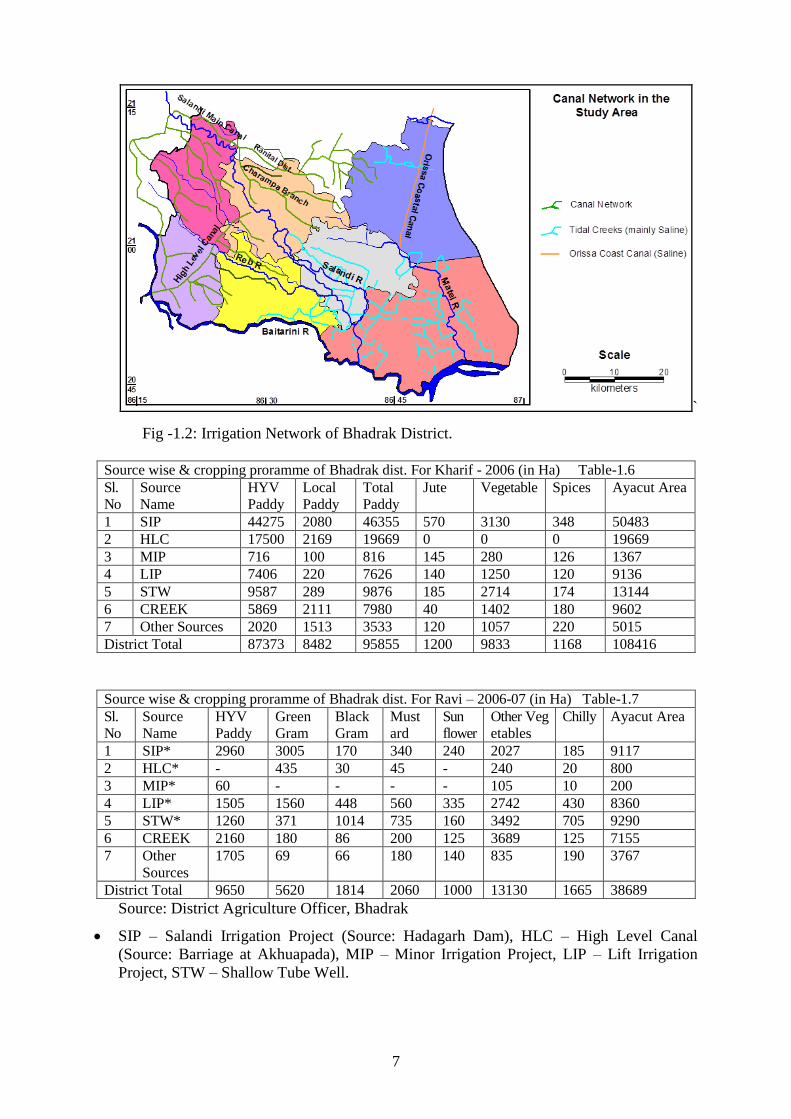
1.5 Irrigation
The district is blessed with good canal systems and productive aquifer systems. Thus out of
173000 hectare of net sown area, net irrigated area constitutes 111800 hectares which is
64.6% of the net sown area of Bhadrak district (2008-09). During Kharif season, canal is the
major contributor of irrigation. 65% of the area under irrigation gets water from Salandi
Irrigation Project and High Land Canal (originating from Akhuapada). Almost all area
cultivated in Bhadrakh and Bonth blocks are irrigated and the majority crop in Bhandari-
pokhari and Dhamnagar block are under irrigation. In sharp contrast Chandbali block is least
irrigated without any canal network. A good area is being irrigated in the coastal blocks i.e.
Chandbali and Basudevpur from the creek irrigation by deepening and modifying tidal creeks
into canal network. Impounded fresh water of the river systems is captured through sluice
gate during new moon and full moon days and is being used for irrigation. 92% of irrigated
tract of the district is put under paddy cultivation followed by vegetable.
.72% of the total area under Ravi crop is being irrigated. 45% of the irrigated tract gets
irrigation from ground water and 23% get from Salandi Irrigation Project. Canal is the
major water provider only in Bhadrak block while all other blocks get irrigation from
ground water. Again a good chunk of land is being cultivated using water from creek
irrigation in Basudevpur and Chandbali block. Vegetable is the main crop under irrigation
in Ravi season followed by High Yielding Paddy and green gram. Around 38300 hectares
of land got irrigated in Ravi season during the 2009 thus leading to a gross irrigated area
of around150100 hectares.
7
`
Fig -1.2: Irrigation Network of Bhadrak District.
Source wise & cropping proramme of Bhadrak dist. For Kharif - 2006 (in Ha) Table-1.6
Sl.
No
Source
Name
HYV
Paddy
Local
Paddy
Total
Paddy
Jute Vegetable Spices Ayacut Area
1 SIP 44275 2080 46355 570 3130 348 50483
2 HLC 17500 2169 19669 0 0 0 19669
3 MIP 716 100 816 145 280 126 1367
4 LIP 7406 220 7626 140 1250 120 9136
5 STW 9587 289 9876 185 2714 174 13144
6 CREEK 5869 2111 7980 40 1402 180 9602
7 Other Sources 2020 1513 3533 120 1057 220 5015
District Total 87373 8482 95855 1200 9833 1168 108416
Source wise & cropping proramme of Bhadrak dist. For Ravi – 2006-07 (in Ha) Table-1.7 Sl.
No
Source
Name
HYV
Paddy
Green
Gram
Black
Gram
Must
ard
Sun
flower
Other Veg
etables
Chilly Ayacut Area
1 SIP* 2960 3005 170 340 240 2027 185 9117
2 HLC* - 435 30 45 - 240 20 800
3 MIP* 60 - - - - 105 10 200
4 LIP* 1505 1560 448 560 335 2742 430 8360
5 STW* 1260 371 1014 735 160 3492 705 9290
6 CREEK 2160 180 86 200 125 3689 125 7155
7 Other
Sources
1705 69 66 180 140 835 190 3767
District Total 9650 5620 1814 2060 1000 13130 1665 38689
Source: District Agriculture Officer, Bhadrak
SIP – Salandi Irrigation Project (Source: Hadagarh Dam), HLC – High Level Canal
(Source: Barriage at Akhuapada), MIP – Minor Irrigation Project, LIP – Lift Irrigation
Project, STW – Shallow Tube Well.
8
Blockwise & Source wise irrigation for Kharif season 2006 (Area in Ha.) Table-1.8
Sl.
No
Block Name Salandi Irrigation Project
Left Right Total
H.L.C M.I.P Lift Irrigation Pr.
Number Area
Shallow Tubewell
Number Area
Creeks Other
Sources
Total
1 Basudevpur 5501 - 5501 59 88 1760 1285 3120 4610 964 16044
2 Bhadrakh 13375 1755 15130 4771 622 72 1440 1531 4462 - 75 26500
3 B.Pokhari - 5337 5337 6900 - 103 1545 707 1496 - 190 15468
4 Bonth 1067 16754 17821 - - 42 756 70 173 - 50 18800
5 Chandbali - - - - - 16 480 - - 4045 1010 5535
6 Dhamnagar - - - 7998 134 129 1935 846 2133 817 1350 14367
7 Tihidi 6694 - 6694 - 552 61 1220 680 1760 100 1376 11702
Bhadrak Total 26637 23846 50483 19669 1367 511 9136 5119 13144 9602 5015 108416
Blockwise & Source wise irrigation for Ravi season 2006-07 (Area in Ha.) Table-1.9
Sl.
No
Block Name Salandi Irrigation Project
Left Right Total
H.L.C M.I.P Lift Irrigation Pr.
Number Area
Shallow Tubewell
Number Area
Creeks Other
Sources
Total
1 Basudevpur 300 - 300 - - 88 1340 1100 1980 2360 360 6340
2 Bhadrakh 6900 - 6900 - 200 72 1080 1050 1890 - 75 10145
3 B.Pokhari - - - 800 - 103 1545 660 1188 - 190 3723
4 Bonth 600 817 1417 - - 42 840 990 1782 - 75 4114
5 Chandbali - - - - - 16 400 - - 4045 420 4865
6 Dhamnagar - - - - - 129 1935 750 1350 - 1547 4832
7 Tihidi 500 - 500 - - 61 1220 650 1100 750 1100 4670
Bhadrak Total 8300 817 9117 800 200 511 8360 5200 9290 7155 3767 38689
Source: District Agricultural Officer, Bhadrak
9
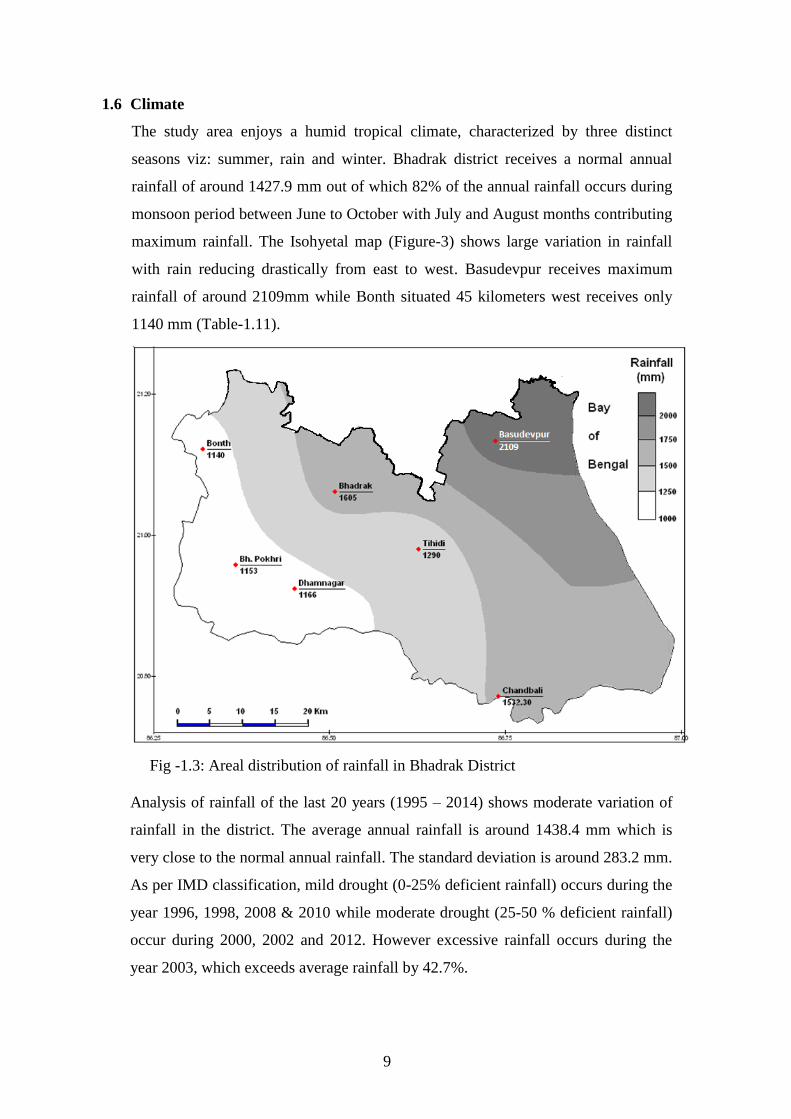
1.6 Climate
The study area enjoys a humid tropical climate, characterized by three distinct
seasons viz: summer, rain and winter. Bhadrak district receives a normal annual
rainfall of around 1427.9 mm out of which 82% of the annual rainfall occurs during
monsoon period between June to October with July and August months contributing
maximum rainfall. The Isohyetal map (Figure-3) shows large variation in rainfall
with rain reducing drastically from east to west. Basudevpur receives maximum
rainfall of around 2109mm while Bonth situated 45 kilometers west receives only
1140 mm (Table-1.11).
Fig -1.3: Areal distribution of rainfall in Bhadrak District
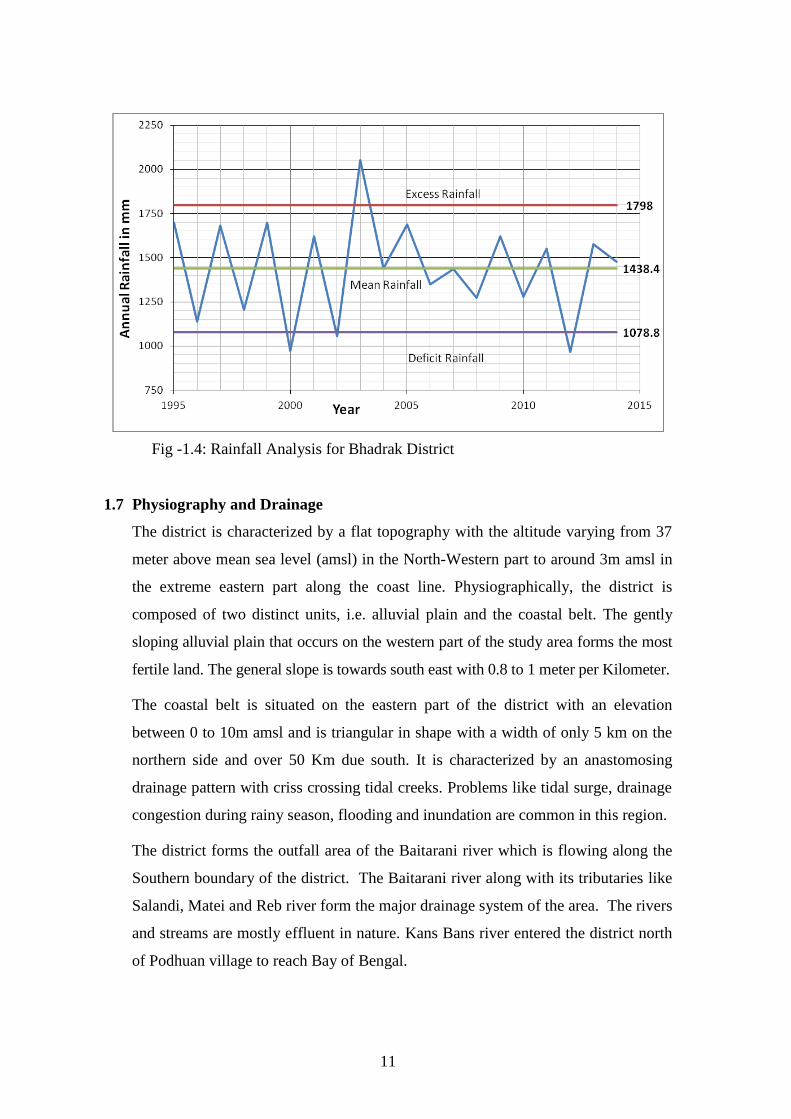
Analysis of rainfall of the last 20 years (1995 – 2014) shows moderate variation of
rainfall in the district. The average annual rainfall is around 1438.4 mm which is
very close to the normal annual rainfall. The standard deviation is around 283.2 mm.
As per IMD classification, mild drought (0-25% deficient rainfall) occurs during the
year 1996, 1998, 2008 & 2010 while moderate drought (25-50 % deficient rainfall)
occur during 2000, 2002 and 2012. However excessive rainfall occurs during the
year 2003, which exceeds average rainfall by 42.7%.
10
Block wise & Month wise Normal Rainfall of Bhadrak District (1901 to 1990) (data in mm) Table-1.10
Sl.
No
Block
Name
Janu
ary
Febr
uary
March April May June July August Septem
ber
October Novem
ber
Decem
ber
Total
1 Basudevpur 12 25 51 79 120 244 431 466 375 240 61 5 2109
2 Bhadrakh 15 30 36 50 103 271 353 320 210 171 40 6 1605
3 B.Pokhari 14 35 35 30 73 195 218 242 183 87 38 3 1153
4 Bonth 12 29 30 42 83 137 281 260 134 100 26 6 1140
5 Chandbali 9.6 32.2 38.7 51.4 75.8 187.4 282.2 325.9 295.6 186.1 38.1 8.3 1532.3
6 Dhamnagar 9 32 37 52 92 167 220 295 157 83 19 3 1166
7 Tihidi 11 23 25 54 93 186 270 273 163 150 39 3 1290
Dist. Average 11.8 29.6 36.1 51.2 91.4 198.4 293.6 311.7 216.8 145.3 37.3 4.9 1427.9
Source: District Agricultural Officer, Bhadrak
Year and Block wise Annual Rainfall of Bhadrak District (1995 to 2014) (data in mm) Table-1.11
Year Basudevpur Bhadrakh B.Pokhari Bonth Chandbali Dhamnagar Tihidi District Average
1995 2701.6 1922.3 1173.9 1547.1 1487.3 1549.0 1491.9 1696.2
1996 1996.0 1170.2 997.0 974.0 920.5 1020.0 899.0 1139.5
1997 2879.0 1853.0 1000.0 1490.0 1374.0 1647.0 1521.0 1680.6
1998 1797.0 1224.0 923.0 1323.5 1249.2 706.0 1203.8
1999 2981.0 2087.0 1373.5 1170.0 1767.2 815.0 1699.0
2000 1147.0 1149.0 733.0 1090.0 749.8 968.0 972.8
2001 2579.0 1523.0 1033.0 1211.0 1605.9 1610.0 1778.0 1620.0
2002 1529.0 1016.0 571.0 1078.0 1260.5 916.0 1009.0 1054.2
2003 2173.0 1676.0 2295.0 1850.0 2366.5 2133.5 1874.0 2052.6
2004 1752.0 1454.0 1432.0 1481.0 1318.5 1181.0 1441.2 1437.1
2005 2581.0 1669.0 1737.0 903.0 1973.9 1005.0 1937.0 1686.6
2006 1972.0 1731.0 982.0 1088.0 1452.8 827.0 1401.0 1350.5
2007 1857.0 1723.0 1158.0 824.0 1822.3 812.0 1848.0 1434.9
2008 1304.0 1421.0 1276.0 1294.0 1813.6 501.2 1300.0 1272.8
2009 1675.0 1713.0 1430.0 1992.0 1618.9 1366.0 1544.4 1619.9
2010 1459.0 1313.0 1178.0 1137.0 1256.7 1247.0 1353.2 1277.7
2011 1352.0 1632.0 1622.0 1602.5 1630.0 1664.0 1345.0 1549.6
2012 989.0 1077.0 1013.0 901.8 1158.0 994.0 629.0 966.0
2013 2043.0 1426.0 1355.0 1673.1 1577.6 1762.0 1198.0 1576.4
2014 1846.0 1234.3 1495.0 1465.0 1308.7 1442.2 1550.0 1477.3
Mean & SD 1930.6, 573.9 1500.7, 300.4 1238.9, 382.1 1304.7, 325.1 1485.6, 368.2 1275.1, 422.5 1330.4, 390.2 1438.4, 283.2
Source: Officer of Special Relief Commissioner, Govt. of Odisha
11
Fig -1.4: Rainfall Analysis for Bhadrak District
1.7 Physiography and Drainage
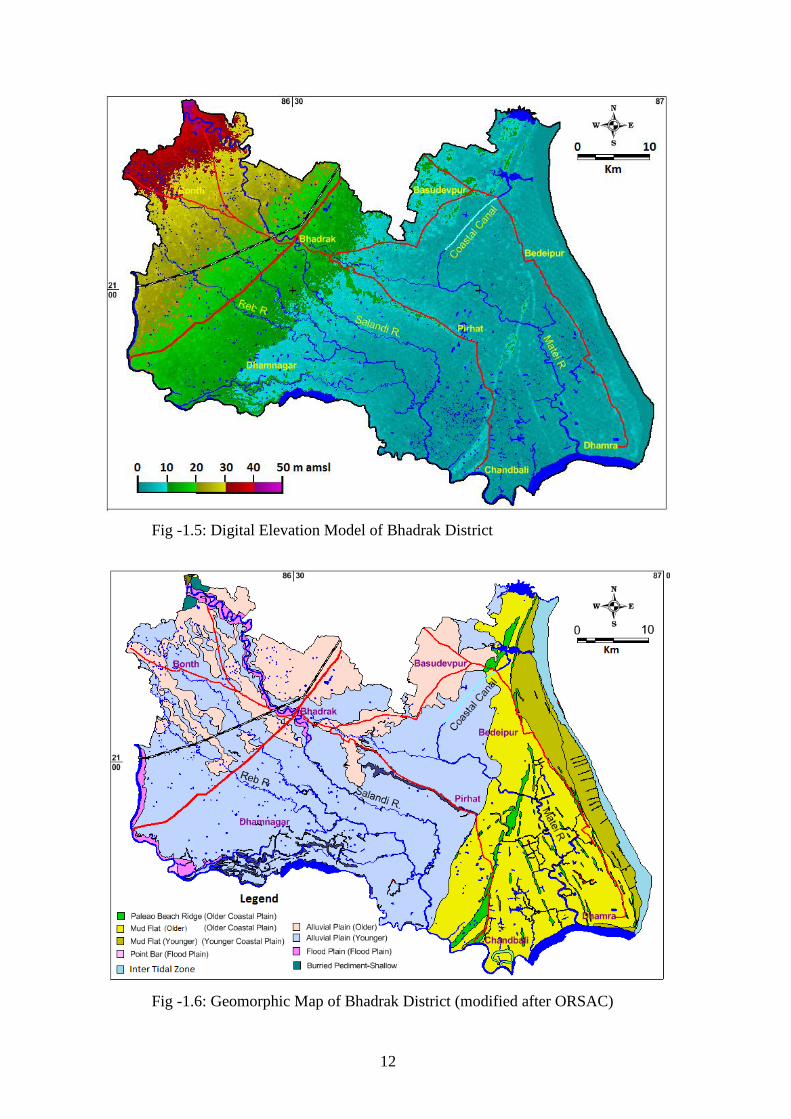
The district is characterized by a flat topography with the altitude varying from 37
meter above mean sea level (amsl) in the North-Western part to around 3m amsl in
the extreme eastern part along the coast line. Physiographically, the district is
composed of two distinct units, i.e. alluvial plain and the coastal belt. The gently
sloping alluvial plain that occurs on the western part of the study area forms the most
fertile land. The general slope is towards south east with 0.8 to 1 meter per Kilometer.
The coastal belt is situated on the eastern part of the district with an elevation
between 0 to 10m amsl and is triangular in shape with a width of only 5 km on the
northern side and over 50 Km due south. It is characterized by an anastomosing
drainage pattern with criss crossing tidal creeks. Problems like tidal surge, drainage
congestion during rainy season, flooding and inundation are common in this region.
The district forms the outfall area of the Baitarani river which is flowing along the
Southern boundary of the district. The Baitarani river along with its tributaries like
Salandi, Matei and Reb river form the major drainage system of the area. The rivers
and streams are mostly effluent in nature. Kans Bans river entered the district north
of Podhuan village to reach Bay of Bengal.
12
Fig -1.5: Digital Elevation Model of Bhadrak District
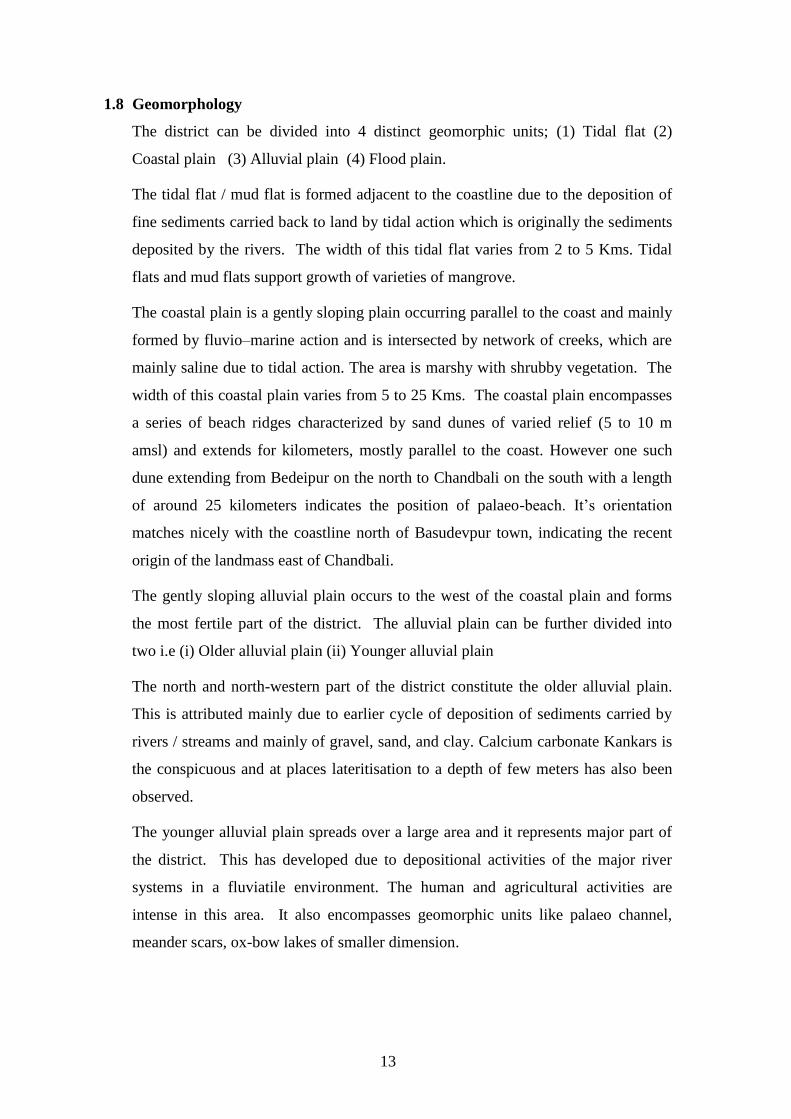
Fig -1.6: Geomorphic Map of Bhadrak District (modified after ORSAC)
13
1.8 Geomorphology
The district can be divided into 4 distinct geomorphic units; (1) Tidal flat (2)
Coastal plain (3) Alluvial plain (4) Flood plain.
The tidal flat / mud flat is formed adjacent to the coastline due to the deposition of
fine sediments carried back to land by tidal action which is originally the sediments
deposited by the rivers. The width of this tidal flat varies from 2 to 5 Kms. Tidal
flats and mud flats support growth of varieties of mangrove.
The coastal plain is a gently sloping plain occurring parallel to the coast and mainly
formed by fluvio–marine action and is intersected by network of creeks, which are
mainly saline due to tidal action. The area is marshy with shrubby vegetation. The
width of this coastal plain varies from 5 to 25 Kms. The coastal plain encompasses
a series of beach ridges characterized by sand dunes of varied relief (5 to 10 m
amsl) and extends for kilometers, mostly parallel to the coast. However one such
dune extending from Bedeipur on the north to Chandbali on the south with a length
of around 25 kilometers indicates the position of palaeo-beach. It’s orientation
matches nicely with the coastline north of Basudevpur town, indicating the recent
origin of the landmass east of Chandbali.
The gently sloping alluvial plain occurs to the west of the coastal plain and forms
the most fertile part of the district. The alluvial plain can be further divided into
two i.e (i) Older alluvial plain (ii) Younger alluvial plain
The north and north-western part of the district constitute the older alluvial plain.
This is attributed mainly due to earlier cycle of deposition of sediments carried by
rivers / streams and mainly of gravel, sand, and clay. Calcium carbonate Kankars is
the conspicuous and at places lateritisation to a depth of few meters has also been
observed.
The younger alluvial plain spreads over a large area and it represents major part of
the district. This has developed due to depositional activities of the major river
systems in a fluviatile environment. The human and agricultural activities are
intense in this area. It also encompasses geomorphic units like palaeo channel,
meander scars, ox-bow lakes of smaller dimension.
14
1.9 Soil
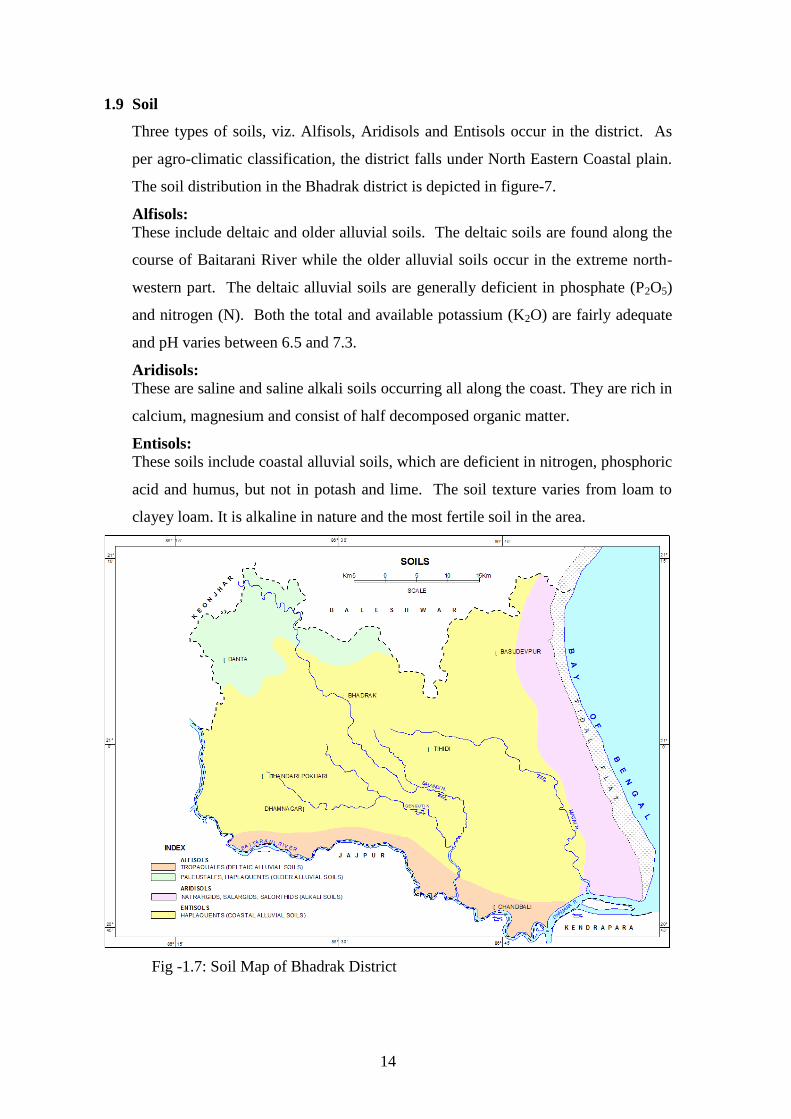
Three types of soils, viz. Alfisols, Aridisols and Entisols occur in the district. As
per agro-climatic classification, the district falls under North Eastern Coastal plain.
The soil distribution in the Bhadrak district is depicted in figure-7.
Alfisols:
These include deltaic and older alluvial soils. The deltaic soils are found along the
course of Baitarani River while the older alluvial soils occur in the extreme north-
western part. The deltaic alluvial soils are generally deficient in phosphate (P2O5)
and nitrogen (N). Both the total and available potassium (K2O) are fairly adequate
and pH varies between 6.5 and 7.3.
Aridisols:
These are saline and saline alkali soils occurring all along the coast. They are rich in
calcium, magnesium and consist of half decomposed organic matter.
Entisols:
These soils include coastal alluvial soils, which are deficient in nitrogen, phosphoric
acid and humus, but not in potash and lime. The soil texture varies from loam to
clayey loam. It is alkaline in nature and the most fertile soil in the area.
Fig -1.7: Soil Map of Bhadrak District
15
II. DATA COLLECTION AND GENERATION
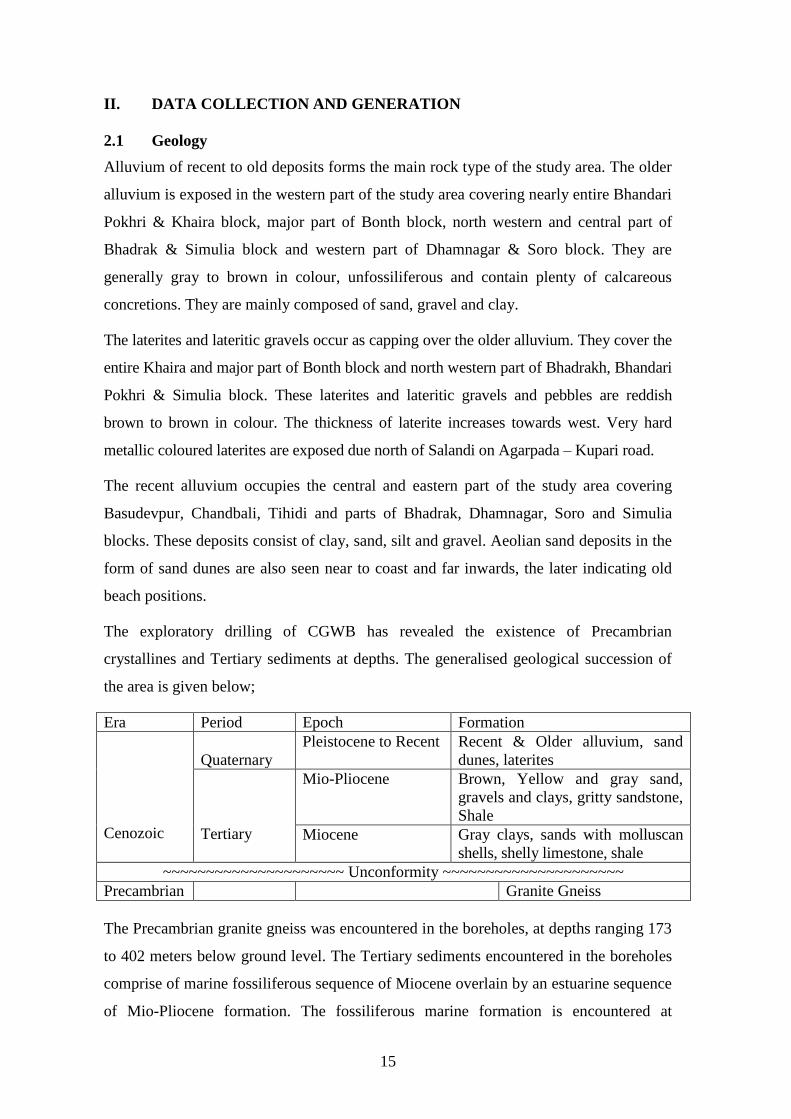
2.1 Geology
Alluvium of recent to old deposits forms the main rock type of the study area. The older
alluvium is exposed in the western part of the study area covering nearly entire Bhandari
Pokhri & Khaira block, major part of Bonth block, north western and central part of
Bhadrak & Simulia block and western part of Dhamnagar & Soro block. They are
generally gray to brown in colour, unfossiliferous and contain plenty of calcareous
concretions. They are mainly composed of sand, gravel and clay.
The laterites and lateritic gravels occur as capping over the older alluvium. They cover the
entire Khaira and major part of Bonth block and north western part of Bhadrakh, Bhandari
Pokhri & Simulia block. These laterites and lateritic gravels and pebbles are reddish
brown to brown in colour. The thickness of laterite increases towards west. Very hard
metallic coloured laterites are exposed due north of Salandi on Agarpada – Kupari road.
The recent alluvium occupies the central and eastern part of the study area covering
Basudevpur, Chandbali, Tihidi and parts of Bhadrak, Dhamnagar, Soro and Simulia
blocks. These deposits consist of clay, sand, silt and gravel. Aeolian sand deposits in the
form of sand dunes are also seen near to coast and far inwards, the later indicating old
beach positions.
The exploratory drilling of CGWB has revealed the existence of Precambrian
crystallines and Tertiary sediments at depths. The generalised geological succession of
the area is given below;
Era Period Epoch Formation
Cenozoic
Quaternary
Pleistocene to Recent Recent & Older alluvium, sand
dunes, laterites
Tertiary
Mio-Pliocene Brown, Yellow and gray sand,
gravels and clays, gritty sandstone,
Shale
Miocene Gray clays, sands with molluscan
shells, shelly limestone, shale
~~~~~~~~~~~~~~~~~~~~~ Unconformity ~~~~~~~~~~~~~~~~~~~~~
Precambrian Granite Gneiss
The Precambrian granite gneiss was encountered in the boreholes, at depths ranging 173
to 402 meters below ground level. The Tertiary sediments encountered in the boreholes
comprise of marine fossiliferous sequence of Miocene overlain by an estuarine sequence
of Mio-Pliocene formation. The fossiliferous marine formation is encountered at
16
different depths ranging from 72 to 330 mbgl. The younger unfossiliferous estuarine
sediments are encountered from 29 to 601 mbgl in different boreholes.
2.2 Hydrogeology
The vast alluvial deposits form the main repository of ground water in the District. The
phreatic aquifer is commonly been tapped by dug wells and shallow tube wells and are
commonly been used both for domestic and irrigational use. However in the eastern part
of the district which is underlain by saline formations, deeper tube wells and hand
pumps constructed by Rural Water Supply and Sanitation (RWS & S) Department,
Govt. of Odisha is used only for water supply purpose. The presence of saline formations
makes the area hydro-geologically complex and hence necessary precautionary measures
like logging of the aquifers and cement sealing to prevent the inflow of saline water into
the well are to be taken care of for extensive ground water extraction.
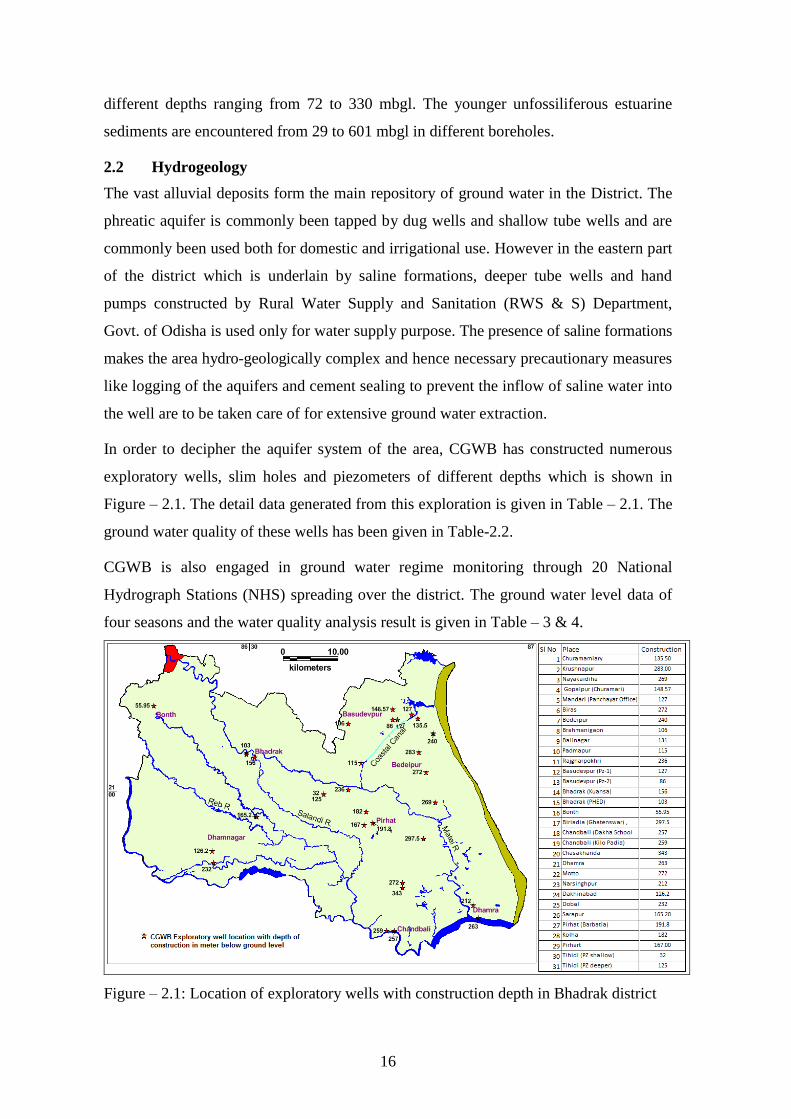
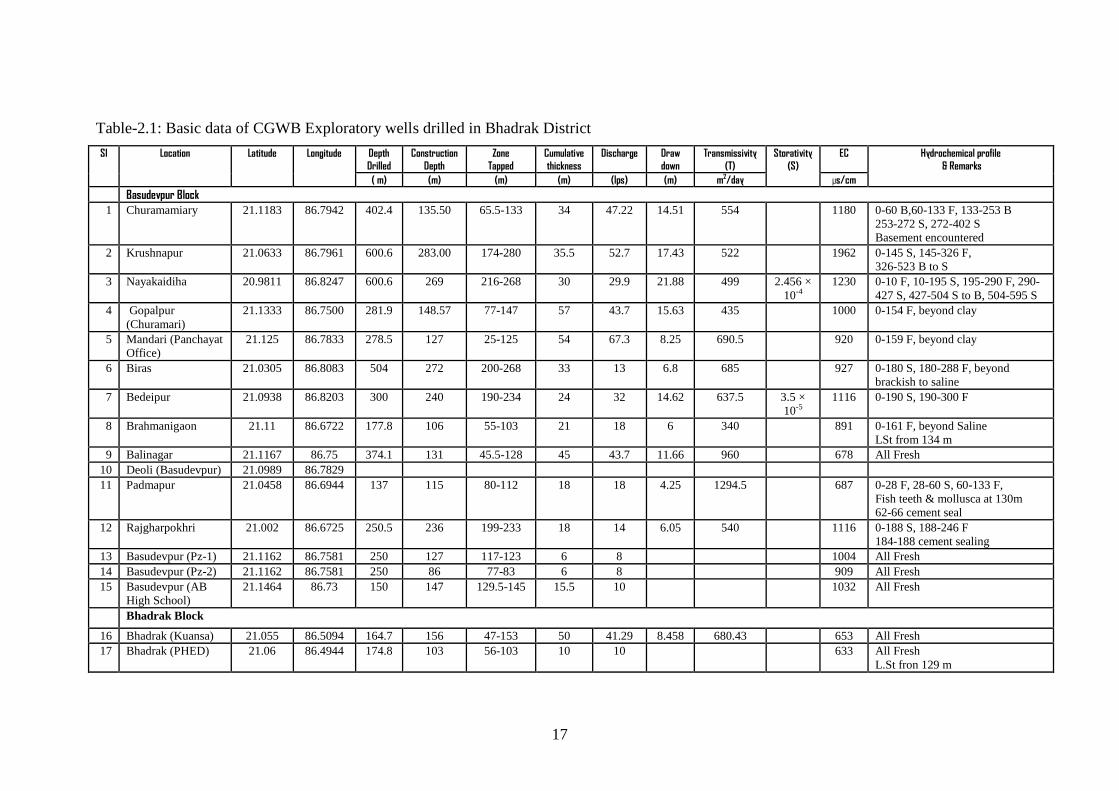
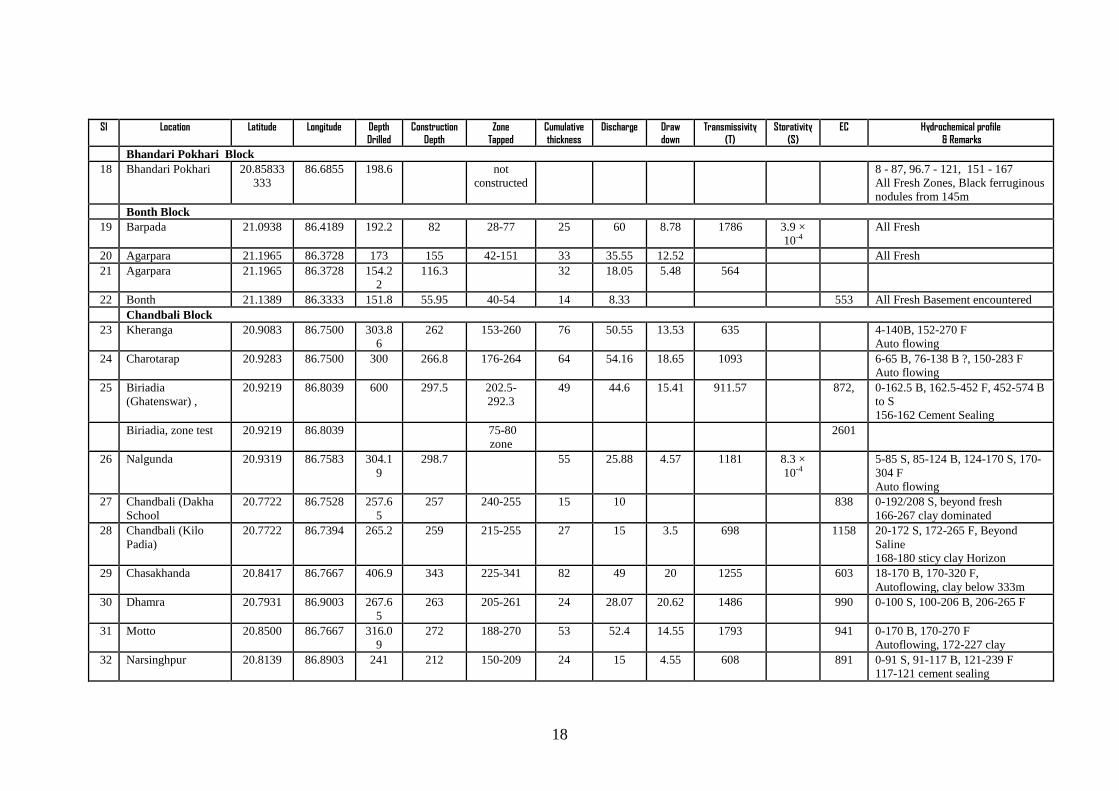
In order to decipher the aquifer system of the area, CGWB has constructed numerous
exploratory wells, slim holes and piezometers of different depths which is shown in
Figure – 2.1. The detail data generated from this exploration is given in Table – 2.1. The
ground water quality of these wells has been given in Table-2.2.
CGWB is also engaged in ground water regime monitoring through 20 National
Hydrograph Stations (NHS) spreading over the district. The ground water level data of
four seasons and the water quality analysis result is given in Table – 3 & 4.
Figure – 2.1: Location of exploratory wells with construction depth in Bhadrak district
17
Table-2.1: Basic data of CGWB Exploratory wells drilled in Bhadrak District
Sl Location Latitude Longitude Depth
Drilled
Construction
Depth
Zone
Tapped
Cumulative
thickness
Discharge Draw
down
Transmissivity
(T)
Storativity
(S)
EC Hydrochemical profile
& Remarks
( m) (m) (m) (m) (lps) (m) m2/day µs/cm
Basudevpur Block
1 Churamamiary 21.1183 86.7942 402.4 135.50 65.5-133 34 47.22 14.51 554 1180 0-60 B,60-133 F, 133-253 B
253-272 S, 272-402 S
Basement encountered
2 Krushnapur 21.0633 86.7961 600.6 283.00 174-280 35.5 52.7 17.43 522 1962 0-145 S, 145-326 F,
326-523 B to S
3 Nayakaidiha 20.9811 86.8247 600.6 269 216-268 30 29.9 21.88 499 2.456 ×
10-4
1230 0-10 F, 10-195 S, 195-290 F, 290-
427 S, 427-504 S to B, 504-595 S
4 Gopalpur
(Churamari)
21.1333 86.7500 281.9 148.57 77-147 57 43.7 15.63 435 1000 0-154 F, beyond clay
5 Mandari (Panchayat
Office)
21.125 86.7833 278.5 127 25-125 54 67.3 8.25 690.5 920 0-159 F, beyond clay
6 Biras 21.0305 86.8083 504 272 200-268 33 13 6.8 685 927 0-180 S, 180-288 F, beyond
brackish to saline
7 Bedeipur 21.0938 86.8203 300 240 190-234 24 32 14.62 637.5 3.5 ×
10-5
1116 0-190 S, 190-300 F
8 Brahmanigaon 21.11 86.6722 177.8 106 55-103 21 18 6 340 891 0-161 F, beyond Saline
LSt from 134 m
9 Balinagar 21.1167 86.75 374.1 131 45.5-128 45 43.7 11.66 960 678 All Fresh
10 Deoli (Basudevpur) 21.0989 86.7829
11 Padmapur 21.0458 86.6944 137 115 80-112 18 18 4.25 1294.5 687 0-28 F, 28-60 S, 60-133 F,
Fish teeth & mollusca at 130m
62-66 cement seal
12 Rajgharpokhri 21.002 86.6725 250.5 236 199-233 18 14 6.05 540 1116 0-188 S, 188-246 F
184-188 cement sealing
13 Basudevpur (Pz-1) 21.1162 86.7581 250 127 117-123 6 8 1004 All Fresh
14 Basudevpur (Pz-2) 21.1162 86.7581 250 86 77-83 6 8 909 All Fresh
15 Basudevpur (AB
High School)
21.1464 86.73 150 147 129.5-145 15.5 10 1032 All Fresh
Bhadrak Block
16 Bhadrak (Kuansa) 21.055 86.5094 164.7 156 47-153 50 41.29 8.458 680.43 653 All Fresh
17 Bhadrak (PHED) 21.06 86.4944 174.8 103 56-103 10 10 633 All Fresh
L.St fron 129 m
18
Sl Location Latitude Longitude Depth
Drilled
Construction
Depth
Zone
Tapped
Cumulative
thickness
Discharge Draw
down
Transmissivity
(T)
Storativity
(S)
EC Hydrochemical profile
& Remarks
Bhandari Pokhari Block
18 Bhandari Pokhari 20.85833
333
86.6855 198.6 not
constructed
8 - 87, 96.7 - 121, 151 - 167
All Fresh Zones, Black ferruginous
nodules from 145m
Bonth Block
19 Barpada 21.0938 86.4189 192.2 82 28-77 25 60 8.78 1786 3.9 ×
10-4
All Fresh
20 Agarpara 21.1965 86.3728 173 155 42-151 33 35.55 12.52 All Fresh
21 Agarpara 21.1965 86.3728 154.2
2
116.3 32 18.05 5.48 564
22 Bonth 21.1389 86.3333 151.8 55.95 40-54 14 8.33 553 All Fresh Basement encountered
Chandbali Block
23 Kheranga 20.9083 86.7500 303.8
6
262 153-260 76 50.55 13.53 635 4-140B, 152-270 F
Auto flowing
24 Charotarap 20.9283 86.7500 300 266.8 176-264 64 54.16 18.65 1093 6-65 B, 76-138 B ?, 150-283 F
Auto flowing
25 Biriadia
(Ghatenswar) ,
20.9219 86.8039 600 297.5 202.5-
292.3
49 44.6 15.41 911.57 872, 0-162.5 B, 162.5-452 F, 452-574 B
to S
156-162 Cement Sealing
Biriadia, zone test 20.9219 86.8039 75-80
zone
2601
26 Nalgunda 20.9319 86.7583 304.1
9
298.7 55 25.88 4.57 1181 8.3 ×
10-4
5-85 S, 85-124 B, 124-170 S, 170-
304 F
Auto flowing
27 Chandbali (Dakha
School
20.7722 86.7528 257.6
5
257 240-255 15 10 838 0-192/208 S, beyond fresh
166-267 clay dominated
28 Chandbali (Kilo
Padia)
20.7722 86.7394 265.2 259 215-255 27 15 3.5 698 1158 20-172 S, 172-265 F, Beyond
Saline
168-180 sticy clay Horizon
29 Chasakhanda 20.8417 86.7667 406.9 343 225-341 82 49 20 1255 603 18-170 B, 170-320 F,
Autoflowing, clay below 333m
30 Dhamra 20.7931 86.9003 267.6
5
263 205-261 24 28.07 20.62 1486 990 0-100 S, 100-206 B, 206-265 F
31 Motto 20.8500 86.7667 316.0
9
272 188-270 53 52.4 14.55 1793 941 0-170 B, 170-270 F
Autoflowing, 172-227 clay
32 Narsinghpur 20.8139 86.8903 241 212 150-209 24 15 4.55 608 891 0-91 S, 91-117 B, 121-239 F
117-121 cement sealing
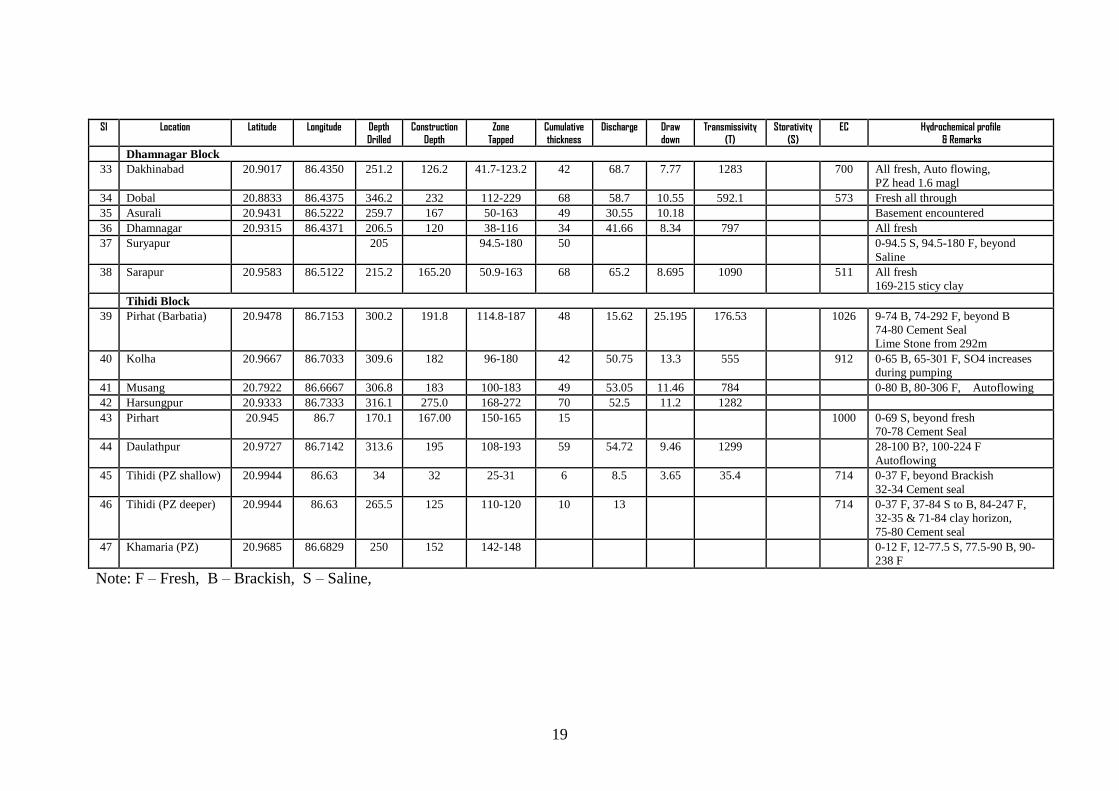
19
Sl Location Latitude Longitude Depth
Drilled
Construction
Depth
Zone
Tapped
Cumulative
thickness
Discharge Draw
down
Transmissivity
(T)
Storativity
(S)
EC Hydrochemical profile
& Remarks
Dhamnagar Block
33 Dakhinabad 20.9017 86.4350 251.2 126.2 41.7-123.2 42 68.7 7.77 1283 700 All fresh, Auto flowing,
PZ head 1.6 magl
34 Dobal 20.8833 86.4375 346.2 232 112-229 68 58.7 10.55 592.1 573 Fresh all through
35 Asurali 20.9431 86.5222 259.7 167 50-163 49 30.55 10.18 Basement encountered
36 Dhamnagar 20.9315 86.4371 206.5 120 38-116 34 41.66 8.34 797 All fresh
37 Suryapur 205 94.5-180 50 0-94.5 S, 94.5-180 F, beyond
Saline
38 Sarapur 20.9583 86.5122 215.2 165.20 50.9-163 68 65.2 8.695 1090 511 All fresh
169-215 sticy clay
Tihidi Block
39 Pirhat (Barbatia) 20.9478 86.7153 300.2 191.8 114.8-187 48 15.62 25.195 176.53 1026 9-74 B, 74-292 F, beyond B
74-80 Cement Seal
Lime Stone from 292m
40 Kolha 20.9667 86.7033 309.6 182 96-180 42 50.75 13.3 555 912 0-65 B, 65-301 F, SO4 increases
during pumping
41 Musang 20.7922 86.6667 306.8 183 100-183 49 53.05 11.46 784 0-80 B, 80-306 F, Autoflowing
42 Harsungpur 20.9333 86.7333 316.1 275.0 168-272 70 52.5 11.2 1282
43 Pirhart 20.945 86.7 170.1 167.00 150-165 15 1000 0-69 S, beyond fresh
70-78 Cement Seal
44 Daulathpur 20.9727 86.7142 313.6 195 108-193 59 54.72 9.46 1299 28-100 B?, 100-224 F
Autoflowing
45 Tihidi (PZ shallow) 20.9944 86.63 34 32 25-31 6 8.5 3.65 35.4 714 0-37 F, beyond Brackish
32-34 Cement seal
46 Tihidi (PZ deeper) 20.9944 86.63 265.5 125 110-120 10 13 714 0-37 F, 37-84 S to B, 84-247 F,
32-35 & 71-84 clay horizon,
75-80 Cement seal
47 Khamaria (PZ) 20.9685 86.6829 250 152 142-148 0-12 F, 12-77.5 S, 77.5-90 B, 90-
238 F
Note: F – Fresh, B – Brackish, S – Saline,
20
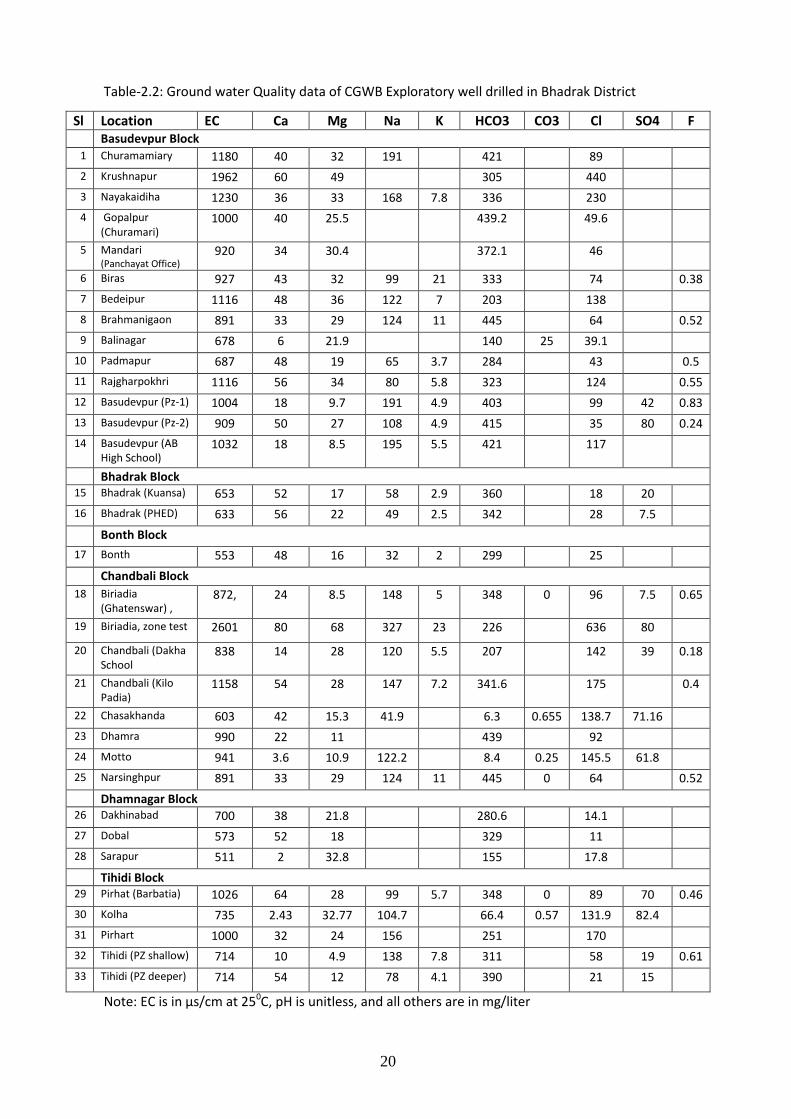
Table-2.2: Ground water Quality data of CGWB Exploratory well drilled in Bhadrak District
Sl Location EC Ca Mg Na K HCO3 CO3 Cl SO4 F Basudevpur Block
1 Churamamiary 1180 40 32 191 421 89
2 Krushnapur 1962 60 49 305 440
3 Nayakaidiha 1230 36 33 168 7.8 336 230
4 Gopalpur (Churamari)
1000 40 25.5 439.2 49.6
5 Mandari (Panchayat Office)
920 34 30.4 372.1 46
6 Biras 927 43 32 99 21 333 74 0.38
7 Bedeipur 1116 48 36 122 7 203 138
8 Brahmanigaon 891 33 29 124 11 445 64 0.52
9 Balinagar 678 6 21.9 140 25 39.1
10 Padmapur 687 48 19 65 3.7 284 43 0.5
11 Rajgharpokhri 1116 56 34 80 5.8 323 124 0.55
12 Basudevpur (Pz-1) 1004 18 9.7 191 4.9 403 99 42 0.83
13 Basudevpur (Pz-2) 909 50 27 108 4.9 415 35 80 0.24
14 Basudevpur (AB High School)
1032 18 8.5 195 5.5 421 117
Bhadrak Block 15 Bhadrak (Kuansa) 653 52 17 58 2.9 360 18 20
16 Bhadrak (PHED) 633 56 22 49 2.5 342 28 7.5
Bonth Block
17 Bonth 553 48 16 32 2 299 25
Chandbali Block
18 Biriadia (Ghatenswar) ,
872, 24 8.5 148 5 348 0 96 7.5 0.65
19 Biriadia, zone test 2601 80 68 327 23 226 636 80
20 Chandbali (Dakha School
838 14 28 120 5.5 207 142 39 0.18
21 Chandbali (Kilo Padia)
1158 54 28 147 7.2 341.6 175 0.4
22 Chasakhanda 603 42 15.3 41.9 6.3 0.655 138.7 71.16
23 Dhamra 990 22 11 439 92
24 Motto 941 3.6 10.9 122.2 8.4 0.25 145.5 61.8
25 Narsinghpur 891 33 29 124 11 445 0 64 0.52
Dhamnagar Block 26 Dakhinabad 700 38 21.8 280.6 14.1
27 Dobal 573 52 18 329 11
28 Sarapur 511 2 32.8 155 17.8
Tihidi Block 29 Pirhat (Barbatia) 1026 64 28 99 5.7 348 0 89 70 0.46
30 Kolha 735 2.43 32.77 104.7 66.4 0.57 131.9 82.4
31 Pirhart 1000 32 24 156 251 170
32 Tihidi (PZ shallow) 714 10 4.9 138 7.8 311 58 19 0.61
33 Tihidi (PZ deeper) 714 54 12 78 4.1 390 21 15
Note: EC is in µs/cm at 250C, pH is unitless, and all others are in mg/liter
21
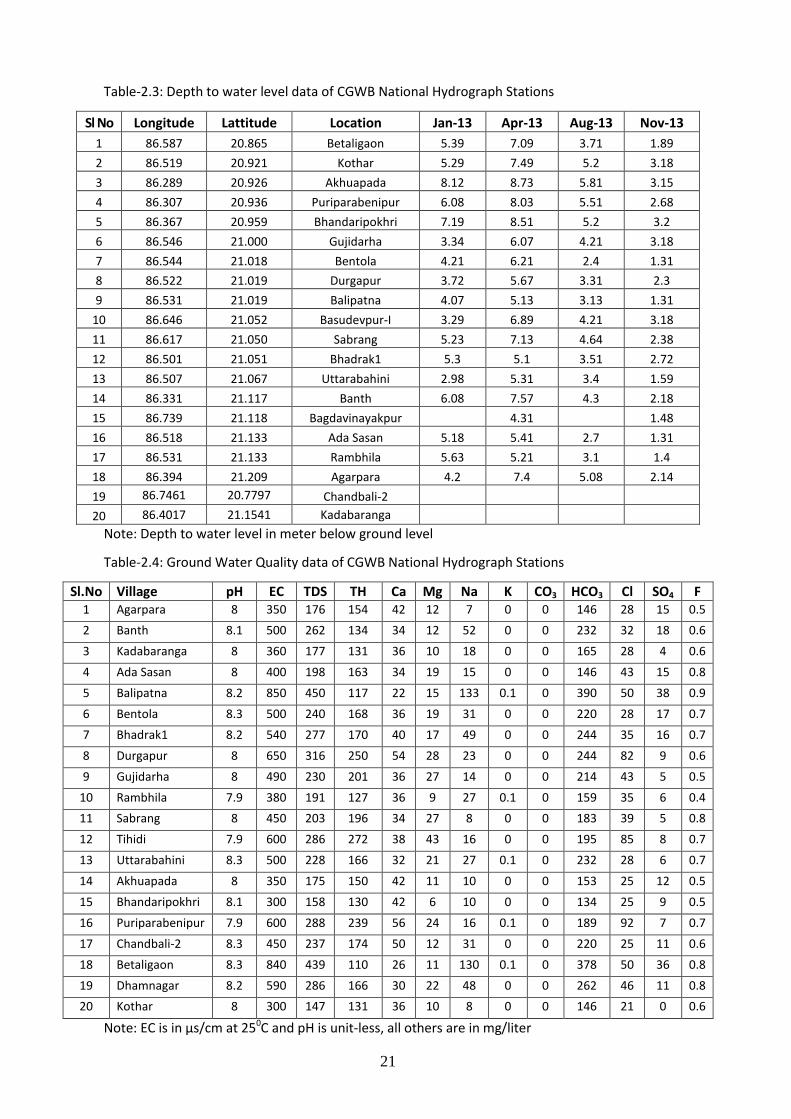
Table-2.3: Depth to water level data of CGWB National Hydrograph Stations
Sl No Longitude Lattitude Location Jan-13 Apr-13 Aug-13 Nov-13
1 86.587 20.865 Betaligaon 5.39 7.09 3.71 1.89
2 86.519 20.921 Kothar 5.29 7.49 5.2 3.18
3 86.289 20.926 Akhuapada 8.12 8.73 5.81 3.15
4 86.307 20.936 Puriparabenipur 6.08 8.03 5.51 2.68
5 86.367 20.959 Bhandaripokhri 7.19 8.51 5.2 3.2
6 86.546 21.000 Gujidarha 3.34 6.07 4.21 3.18
7 86.544 21.018 Bentola 4.21 6.21 2.4 1.31
8 86.522 21.019 Durgapur 3.72 5.67 3.31 2.3
9 86.531 21.019 Balipatna 4.07 5.13 3.13 1.31
10 86.646 21.052 Basudevpur-I 3.29 6.89 4.21 3.18
11 86.617 21.050 Sabrang 5.23 7.13 4.64 2.38
12 86.501 21.051 Bhadrak1 5.3 5.1 3.51 2.72
13 86.507 21.067 Uttarabahini 2.98 5.31 3.4 1.59
14 86.331 21.117 Banth 6.08 7.57 4.3 2.18
15 86.739 21.118 Bagdavinayakpur 4.31 1.48
16 86.518 21.133 Ada Sasan 5.18 5.41 2.7 1.31
17 86.531 21.133 Rambhila 5.63 5.21 3.1 1.4
18 86.394 21.209 Agarpara 4.2 7.4 5.08 2.14
19 86.7461 20.7797 Chandbali-2 20 86.4017 21.1541 Kadabaranga
Note: Depth to water level in meter below ground level
Table-2.4: Ground Water Quality data of CGWB National Hydrograph Stations
Sl.No Village pH EC TDS TH Ca Mg Na K CO3 HCO3 Cl SO4 F 1 Agarpara 8 350 176 154 42 12 7 0 0 146 28 15 0.5
2 Banth 8.1 500 262 134 34 12 52 0 0 232 32 18 0.6
3 Kadabaranga 8 360 177 131 36 10 18 0 0 165 28 4 0.6
4 Ada Sasan 8 400 198 163 34 19 15 0 0 146 43 15 0.8
5 Balipatna 8.2 850 450 117 22 15 133 0.1 0 390 50 38 0.9
6 Bentola 8.3 500 240 168 36 19 31 0 0 220 28 17 0.7
7 Bhadrak1 8.2 540 277 170 40 17 49 0 0 244 35 16 0.7
8 Durgapur 8 650 316 250 54 28 23 0 0 244 82 9 0.6
9 Gujidarha 8 490 230 201 36 27 14 0 0 214 43 5 0.5
10 Rambhila 7.9 380 191 127 36 9 27 0.1 0 159 35 6 0.4
11 Sabrang 8 450 203 196 34 27 8 0 0 183 39 5 0.8
12 Tihidi 7.9 600 286 272 38 43 16 0 0 195 85 8 0.7
13 Uttarabahini 8.3 500 228 166 32 21 27 0.1 0 232 28 6 0.7
14 Akhuapada 8 350 175 150 42 11 10 0 0 153 25 12 0.5
15 Bhandaripokhri 8.1 300 158 130 42 6 10 0 0 134 25 9 0.5
16 Puriparabenipur 7.9 600 288 239 56 24 16 0.1 0 189 92 7 0.7
17 Chandbali-2 8.3 450 237 174 50 12 31 0 0 220 25 11 0.6
18 Betaligaon 8.3 840 439 110 26 11 130 0.1 0 378 50 36 0.8
19 Dhamnagar 8.2 590 286 166 30 22 48 0 0 262 46 11 0.8
20 Kothar 8 300 147 131 36 10 8 0 0 146 21 0 0.6
Note: EC is in µs/cm at 250C and pH is unit-less, all others are in mg/liter
22
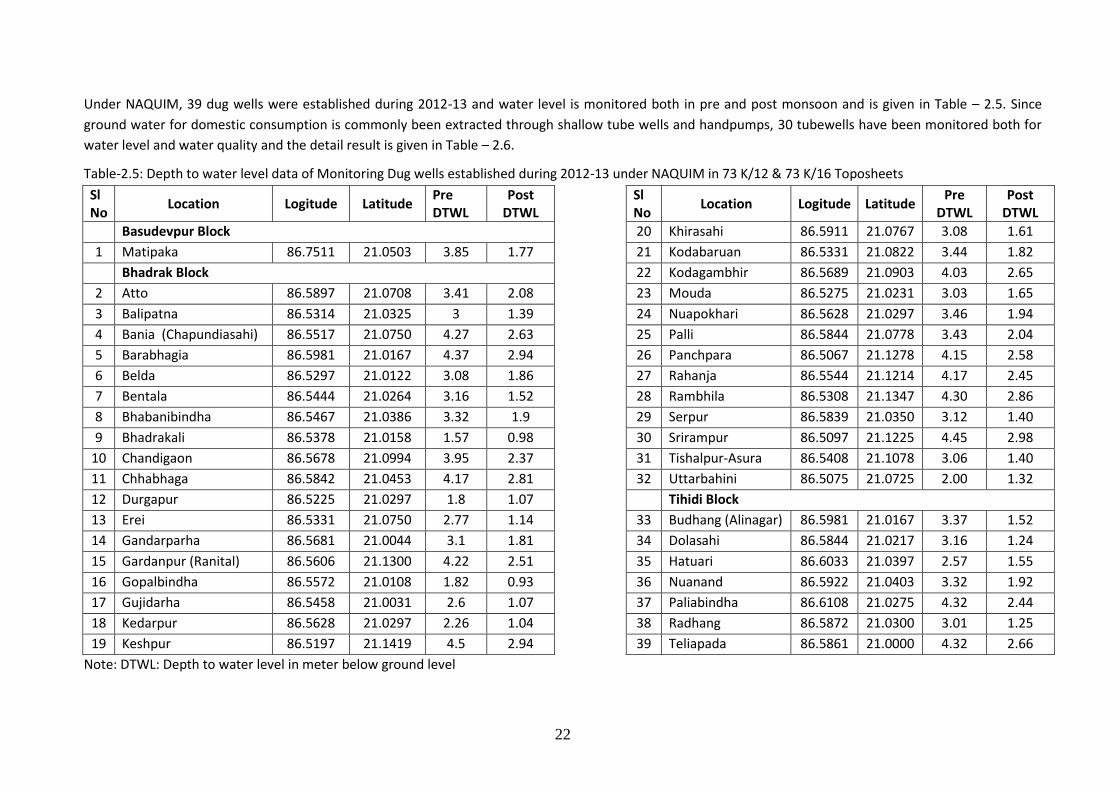
Under NAQUIM, 39 dug wells were established during 2012-13 and water level is monitored both in pre and post monsoon and is given in Table – 2.5. Since
ground water for domestic consumption is commonly been extracted through shallow tube wells and handpumps, 30 tubewells have been monitored both for
water level and water quality and the detail result is given in Table – 2.6.
Table-2.5: Depth to water level data of Monitoring Dug wells established during 2012-13 under NAQUIM in 73 K/12 & 73 K/16 Toposheets
Sl No
Location Logitude Latitude Pre DTWL
Post DTWL
Sl No
Location Logitude Latitude Pre
DTWL Post
DTWL
Basudevpur Block 20 Khirasahi 86.5911 21.0767 3.08 1.61
1 Matipaka 86.7511 21.0503 3.85 1.77 21 Kodabaruan 86.5331 21.0822 3.44 1.82
Bhadrak Block 22 Kodagambhir 86.5689 21.0903 4.03 2.65
2 Atto 86.5897 21.0708 3.41 2.08 23 Mouda 86.5275 21.0231 3.03 1.65
3 Balipatna 86.5314 21.0325 3 1.39 24 Nuapokhari 86.5628 21.0297 3.46 1.94
4 Bania (Chapundiasahi) 86.5517 21.0750 4.27 2.63 25 Palli 86.5844 21.0778 3.43 2.04
5 Barabhagia 86.5981 21.0167 4.37 2.94 26 Panchpara 86.5067 21.1278 4.15 2.58
6 Belda 86.5297 21.0122 3.08 1.86 27 Rahanja 86.5544 21.1214 4.17 2.45
7 Bentala 86.5444 21.0264 3.16 1.52 28 Rambhila 86.5308 21.1347 4.30 2.86
8 Bhabanibindha 86.5467 21.0386 3.32 1.9 29 Serpur 86.5839 21.0350 3.12 1.40
9 Bhadrakali 86.5378 21.0158 1.57 0.98 30 Srirampur 86.5097 21.1225 4.45 2.98
10 Chandigaon 86.5678 21.0994 3.95 2.37 31 Tishalpur-Asura 86.5408 21.1078 3.06 1.40
11 Chhabhaga 86.5842 21.0453 4.17 2.81 32 Uttarbahini 86.5075 21.0725 2.00 1.32
12 Durgapur 86.5225 21.0297 1.8 1.07 Tihidi Block
13 Erei 86.5331 21.0750 2.77 1.14 33 Budhang (Alinagar) 86.5981 21.0167 3.37 1.52
14 Gandarparha 86.5681 21.0044 3.1 1.81 34 Dolasahi 86.5844 21.0217 3.16 1.24
15 Gardanpur (Ranital) 86.5606 21.1300 4.22 2.51 35 Hatuari 86.6033 21.0397 2.57 1.55
16 Gopalbindha 86.5572 21.0108 1.82 0.93 36 Nuanand 86.5922 21.0403 3.32 1.92
17 Gujidarha 86.5458 21.0031 2.6 1.07 37 Paliabindha 86.6108 21.0275 4.32 2.44
18 Kedarpur 86.5628 21.0297 2.26 1.04 38 Radhang 86.5872 21.0300 3.01 1.25
19 Keshpur 86.5197 21.1419 4.5 2.94 39 Teliapada 86.5861 21.0000 4.32 2.66
Note: DTWL: Depth to water level in meter below ground level
23
Table-2.6: Ground water Quality data of Monitoring Dug wells established during 2012-13 under NAQUIM
Sl No Location Longitude Lattitude Pre_WL Post_WL Type pH EC Ca Mg Na K CO3 HCO3 Cl SO4 F
1 Agapur 86.6839 21.0339 2.95 1.24 TW 8.93 1791 8 34 628 1.2 15 311.1 401.2 42.6 1.04
2 Albaga 86.6681 21.0919 5.18 2.11 TW 8.04 500 30 33 19.4 0.1 0 122 106.5 10.9 0.74
3 Apartbindha,Bhadrak 86.5000 21.0503 4.14 3.21 TW 8.09 330 34 15 8.7 0.2 0 140.3 32.0 2.9 0.53
4 Ayodhya,Raghupur 86.7339 21.0514 2.76 2.40 TW 8.3 870 14 23 133.5 0.7 3 268.4 67.5 82.9 0.64
5 Bachhada 86.7844 21.2008 7.89 6.35 TW 8.1 1272 28 50 137 0.7 0 170.8 237.9 90.5 0.96
6 Bachhada 86.7844 21.2008 7.97 6.40 TW 8.08 1115 20 29 152 0.4 0 201.3 134.9 71.9 0.87
7 Badakiari 86.7000 21.0508 2.76 0.91 TW 8.08 1109 30 38 88 0.6 0 152.5 220.1 45.4 0.82
8 Bagdabinayakpur 86.7003 21.1003 6.62 2.12 TW 7.92 297 30 9 10 0.2 0 128.1 14.2 4.2 1.00
9 Balimedh 86.7506 21.0169 5.93 5.43 TW 8.18 1046 26 34 81.6 0.9 0 164.7 152.7 94.0 0.54
10 Barapur 86.7836 21.1839 7.87 6.76 TW 8.17 644 18 27 50.6 0.7 0 176.9 32.0 78.8 0.82
11 Binapada 86.7014 21.0681 4.15 2.53 TW 8.09 527 24 28 31.6 0.6 0 158.6 28.4 59.1 0.83
12 Binayakpur 86.7167 21.0847 5.91 2.85 TW 7.96 315 24 13 100.8 0.1 0 109.8 28.4 3.3 0.90
13 By-pass, Bhadrak 86.5008 21.0667 2.02 1.40 TW 8.02 410 36 12 14 0.1 0 115.9 42.6 9.6 0.85
14 Chandimal 86.8000 21.0511 6.05 5.87 TW 8.19 972 20 33 93.1 0.8 0 213.5 120.7 83.6 0.54
15 Chirol 86.7014 21.0839 5.04 2.34 TW 7.98 564 18 39 25.1 0.2 0 115.9 92.3 16.0 0.94
16 Chudamani 86.7675 21.1336 6.96 4.30 TW 7.9 1761 52 49 149.5 0.1 0 140.3 248.5 81.8 0.85
17 Dadhibamanpur 86.7003 21.0336 3.35 1.97 TW 8.47 2220 10 32 341.3 0.2 6 329.4 497.0 64.1 1.10
18 Dohrasahi 86.6981 21.0044 3.00 1.71 TW 8.26 694 14 18 105.9 0.4 0 268.4 46.2 47.2 0.65
19 Eram 86.7839 21.1508 9.81 7.24 TW 8 1056 28 58 51.5 0.1 0 122 241.4 31.4 0.76
20 EreiBhadrak 86.5333 21.0669 3.07 NA TW 8.04 400 32 26 14.5 0.1 0 189.1 42.6 5.3 0.69
21 Garadpur,Bhadrak 86.5014 21.0339 4.02 3.08 TW 7.86 650 42 33 26.7 0.2 0 158.6 106.5 14.6 0.64
22 Korkora,Bhadrak 86.5000 21.0175 4.44 3.14 TW 7.94 350 30 19 14 0 0 183 21.3 3.4 0.95
23 Kumarpur 86.8006 21.1828 5.52 3.35 TW 7.87 1980 102 53 175 0.3 0 128.1 308.9 158.0 0.70
24 Lunga 86.6847 21.0669 4.74 2.50 TW 8.22 520 16 22 42.8 0.6 0 195.2 17.8 39.8 0.88
25 Mandari 86.7639 21.1169 7.46 4.22 TW 8.02 600 22 23 41.6 0.1 0 134.2 85.2 26.5 1.01
26 Matipaka 86.7511 21.0503 5.71 5.20 TW 8.21 1050 16 29 99.3 0.9 0 195.2 142.0 91.2 0.44
27 Patna Mishrapur 86.7200 21.0181 2.66 2.17 TW 8.22 1000 24 33 262.6 0.4 0 189.1 514.8 49.3 0.55
28 Ramachandrapur 86.7667 21.0681 3.24 1.67 TW 8.37 2788 32 34 375 0.8 3 250.1 639.0 127.9 0.97
29 Sadanandapur 86.6506 21.0336 3.24 1.09 TW 8.37 720 58 61 15.6 0.6 60 256.2 63.9 12.4 0.88
30 Santhia,Bhadrak 86.5003 21.0506 3.80 3.22 TW 7.95 700 30 28 48.5 0.1 0 152.5 110.1 7.4 0.54
24
III DATA INTERPRETATION, INTREGRATION AND AQUIFER MAPPING
3.1 Shallow aquifers: Ground water occurs under phreatic condition in shallow aquifers
and is commonly been utilized by means of dug wells. Generally the depth of dug wells
varies from 4.3 to 12.2 meter below ground level with average depth of around 7m. The
shallow aquifer is commonly overlain by 3 to 6 meter of silt to clay layer, which
necessitates the need for deep dug wells. The diameter of the dug wells varies from 0.5 to
3m. The wells are generally lined to the total depth except in the lateritic aquifer, which is
present in the western part of the district.
The average depth to water level during pre-monsoon period ranges from 3 to 5 meter.
However deep water level condition is found in three pockets:
(a) In the south western part, in parts of Bonth, Bhandari Pokhri and Dhamnagar blocks
(b) In the north western part surrounding Agarpada and Kupari where the main shallow
aquifer is laterite
(c) In and around Basudevpur
The deepest water level of around 7.50 mbgl was found at Bandhatia village on
Dhamnagar - Kothar road. Most part of Simulia block shows shallow water level due to
canal recharge during summer.
Fig -3.1: Pre-monsoon depth to water level map of Bhadrak District
25
The post monsoon water level remains shallow within 3 m below ground level in most
part of the district. Again Bandhatia well is an exception with depth to water level at
4.36 mbgl. Generally the water level fluctuation between Pre & Post Monsoon seasons
varies from 1 to 2m. However, very high fluctuation of around 4 to 5 meters is observed
in and around Kupari, Agarpada and Bandhatia village. Long term water level trend
shows no appreciable rise and fall in the area.
In addition to this, for detail study 32 & 7 dug wells have been monitored in Bhadrakh
and Tihidi block respectively. To know both the water level and quality of shallow
aquifer, 30 tube wells were monitored in both the blocks, which details are mentioned
in Table – 2.6.
Fig -3.2: Post-monsoon depth to water level map of Bhadrak District
The quality ground water is very good with EC ranging from 350 to 850 µs/cm and all
chemicals under permissible limit. Ca-Mg-HCO3 type of water is encountered in the
phreatic aquifer in most part of the district. However water samples of Tihidi, Durgapur
and Puripara-Benipur show somewhat higher in chloride content with an appreciate
amount of Ca-Mg-HCO3, which indicates mixing of saline water with fresh ground
water. Tihidi and Durgapur being situated on the line separating saline and fresh water
area, different types of water qualities are observed in the same locality. Na-HCO3 type
of water with some amount of sulphate content is observed at Balipatna and Betaligaon
which indicates freshening up of the shallow aquifers by meteoric water. The ground
water quality of phreatic aquifer is enumerated in Figure – 3.3 & 3.4.
26
Fig -3.3: Quality of shallow aquifer of Bhadrak District (Stiff Diagram)
Fig -3.4: Quality of shallow aquifer of Bhadrak District (Piper Diagram)
27
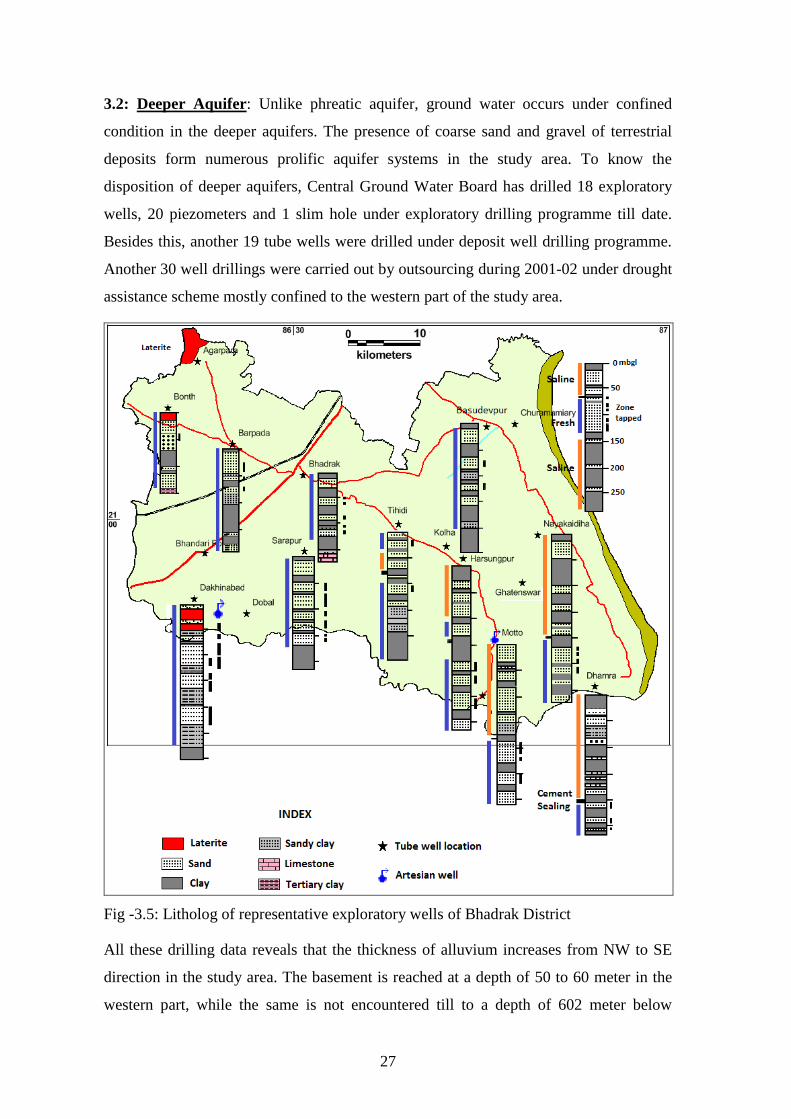
3.2: Deeper Aquifer: Unlike phreatic aquifer, ground water occurs under confined
condition in the deeper aquifers. The presence of coarse sand and gravel of terrestrial
deposits form numerous prolific aquifer systems in the study area. To know the
disposition of deeper aquifers, Central Ground Water Board has drilled 18 exploratory
wells, 20 piezometers and 1 slim hole under exploratory drilling programme till date.
Besides this, another 19 tube wells were drilled under deposit well drilling programme.
Another 30 well drillings were carried out by outsourcing during 2001-02 under drought
assistance scheme mostly confined to the western part of the study area.
Fig -3.5: Litholog of representative exploratory wells of Bhadrak District
All these drilling data reveals that the thickness of alluvium increases from NW to SE
direction in the study area. The basement is reached at a depth of 50 to 60 meter in the
western part, while the same is not encountered till to a depth of 602 meter below
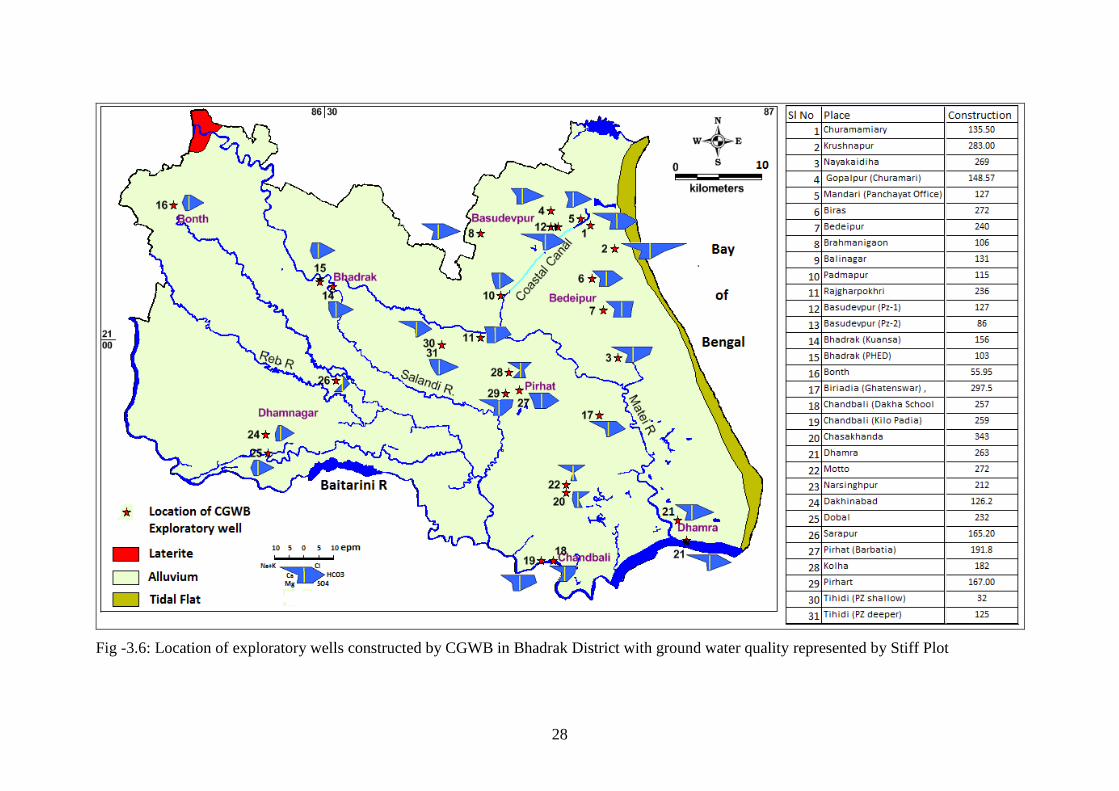
28
Fig -3.6: Location of exploratory wells constructed by CGWB in Bhadrak District with ground water quality represented by Stiff Plot
29
Nayakandihi and Biriadia situated near to the coast. The study of the lithological log of
tube wells reveals the presence of alternate sand and clay layers deposited in gently
sloping sedimentary basin. Ferruginous and calcareous concretions, rock fragments,
Molluscan shell fragments and heavy minerals are also noticed in some of the wells.
Tertiary in the form of clay and Limestone deposited in a marine environment is also
encountered in the north central part of the study area.
Though generally argillaceous sediments predominate towards east, predominant clay
horizon also occurs in the central and north eastern part. The thickness of the clay
horizon varies from 50m (Barpada and Asurali) to 137 m (Mandari). This clay horizon
occurs at 104 mbgl at Barpada, 194 mbgl at Asurali, 191 mbgl at Tihidi and 163 mbgl at
Basudevpur (mandari). Commonly it is deep grey in colour. Again thick remarkable clay
horizon associated with shale and limestone, which is characteristics of Tertiary, is
observed in the lithologs of Bhadrakh (107.7 to 174.8mbgl). This limestone is in
continuation of that found on the southern part of the adjacent Baleswar district, where
limestone formations are encountered at different depths, i.e., Saud (88.5 to 247mbgl),
Talanagar (88.5 to 202mbgl), Markona (93.8 to 194.4mbgl).
In general, the calcareous facies predominates in the NW part while clay dominates in
the SE part of the sedimentary basin. Besides this major clay horizon, numerous clay
layers varying in thickness from 1 to 10 m are encountered in all the tube wells at
different depths. The colour of the clay layers varies from brown, reddish brown, gray
and deep steel gray. The brown and reddish brown clays are generally terrestrial in
origin and are restricted to shallow depths and are found in the western part of the
district. The gray and deep gray generally occurs from very shallow depths in the central
and eastern part. The dark sticky clay is generally of marine origin.
The sand grains vary in size from fine to very coarse and are yellow, yellowish brown,
grayish white and gray in colour and are quartzo-felspathic in nature. They are angular
to sub rounded in shape. The sand grains occur as i) only sand zone ii) mixed with
either clay and gravel iii) mixed with both clay and gravel. Generally mixture of fine to
coarse or medium grains is quite common, while sometimes highly sorted medium to
coarse sand horizons are also encountered. The thickness of individual sand layers
ranges from 1 to 28 m.
The gravels are generally medium to fine in size, grayish white to brownish in colour,
30
subrounded in nature and quartzitic in composition. Though the gravels have been
encountered in most of the tube wells, the prominent occurrences are observed along the
southern sector of the district. Deep drilling at Ghanteswar and Naikandihi indicates the
presence of gravels down to a depth of 600 mbgl. In the northern part, gravels are
generally restricted to shallow depth.
The sand and gravel horizon forms the prolific aquifers in the district. The thickness of
individual aquifer varies from 1 to 70m with the average thickness ranging from 4 to 10
m. The aquifer zones containing fresh water all through occupies the western part of the
study area while the aquifer zones contain saline and fresh water at different depths in
the eastern part. Top saline condition is observed in the entire Chandbali block, eastern
part of the Tihidi and Dhamnagar Block (55% & 45% respectively) and narrow eastern
part of Basudevpur Block (30%). The saline tract is triangular in shape with a wide base
of 50 km in the southern part. The Dhusuri – Tihidi – Lunga – Mandari – Chudamani Aria
line demarcates the saline tract on the east from the rest. The spatial distribution of the
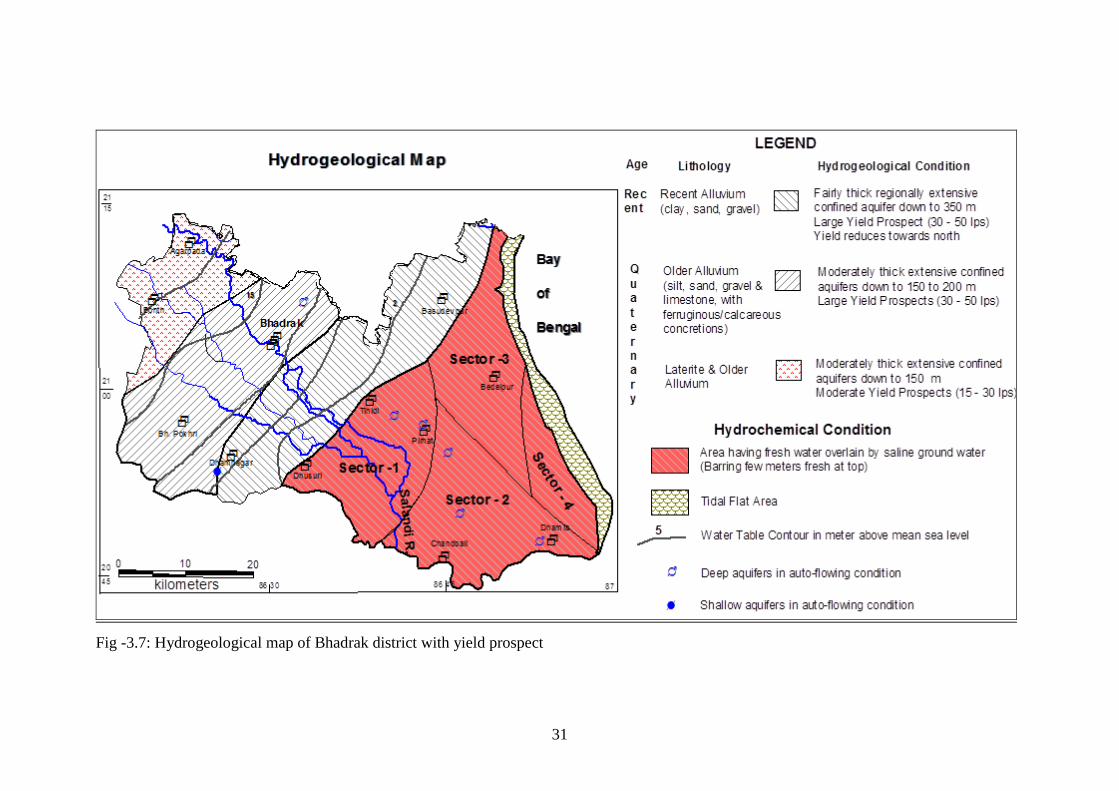
fresh water and saline water bearing areas are shown in Figure – 3.7.
CGWB has constructed numerous deep tube wells both exploratory and production to
decipher the aquifer characteristics and their yield potentials. The depths of these tube
wells vary from 92 to 343 mbgl. The cumulative thickness of the aquifer zones tapped
varies from 16 to 76 m with the average thickness around 35 to 50m. The yield varies
from 15 to 68 lps (average value ranging from 30 to 50 lps) for drawdowns ranging from
5.48 to 25.19m (average being 13 to 17m). The static water level varies from 1.2 m
above ground level to 6.36m below ground level. The artesian conditions with the water
level heights varying between 0.3 to 1.2 m above ground level exists in the South
eastern part covering Chandbali – Dhamara – Matto – Musang - Daulatpur - Kohla area.
These are all deeper aquifers, which are auto-flowing in the saline tract. The
Transmissivity values ranges from 177 to 1790 m2/day with the majority of the values
falling between 500 to 1000 m2/day. The Storage Coefficient values varies from
2.1110-4
to 8.3 10-4
.
31
Fig -3.7: Hydrogeological map of Bhadrak district with yield prospect
32
Yield Characteristics of Non – Saline areas:
The non-saline area forms 62% of the study area covering most of the west central and
northern part. The depth of the aquifer zones tapped varies from 8 to 163 mbgl with the
exception at Dhobal, where aquifer zones upto 229 m is being tapped. The cumulative
thickness of aquifer zones varies from 25 to 85 m with discharge varying from 31 to 68
lps. High discharge coupled with less drawdown makes the aquifer very much potential
from the yield perspective. Shallow aquifers tapped between 42 to 126 mbgl are auto-
flowing in and around Dhobal. Generally the thickness of potential aquifers reduces
northwestwards which is being reflected in the yields of the tube wells. The
hydrogeological details of individual tubewells are given in Table –3.1.
Table 3.1: Hydrogeological details of the wells constructed in non-Saline area
Location Depth
drilled
(mbgl)
Depth range
of aquifer
zones (mbgl)
tapped
Cummulative
Thickness of
aquifer
tapped (m)
Yield
(lps)
S.W.L.
(mbgl)
Drawdown
(m)
Agarpada 173 42-151 33 35 5.3 12.52
Bonth 151 14-142 85 30 2.7
Bh. Pokhri 199 8-160 85 - - -
Dhakhinbad 251 42-126 63 68 1.6(agl) 7.77
Dhobal 346 112-229 68 58 2.59 10.5
Dhobal 150 42-118 24 30 0.9(agl) 1.85 ?
Barpada 193 28-77 25 60 0.46 8.78
Dhamnagar 210 38-116 34 41 0.70 8.34
Sarapur 215 50-163 75 65 1.95 8.69
Asurali 260 50-163 51 31 4.22 10.18
Bhadrak
(Kuans)
165 47-153 49 41 5.89 8.45
Basudevpur
(Balinagar)
374 46-128 45 44 4.27 11.66
Mandari 300 62-125 43 44 4.57 14.14
Gopalpur
(Churamani)
282 77-146 57 43 2.38 15.63
* mbgl- meters below ground level agl – above ground level lps – liters per second
Yield Characteristics of Saline areas:
Saline tract covers an area of around 1300 km2 showing complex hydrogeological
setting. The fresh water bearing formations are overlain by saline formations and are
encountered at different depths varying from 37 m & 60 m (at Tihidi & Chudamani
Aria) to 200 m (at Dhamara). Based on the depth at which this aquifer is encountered at
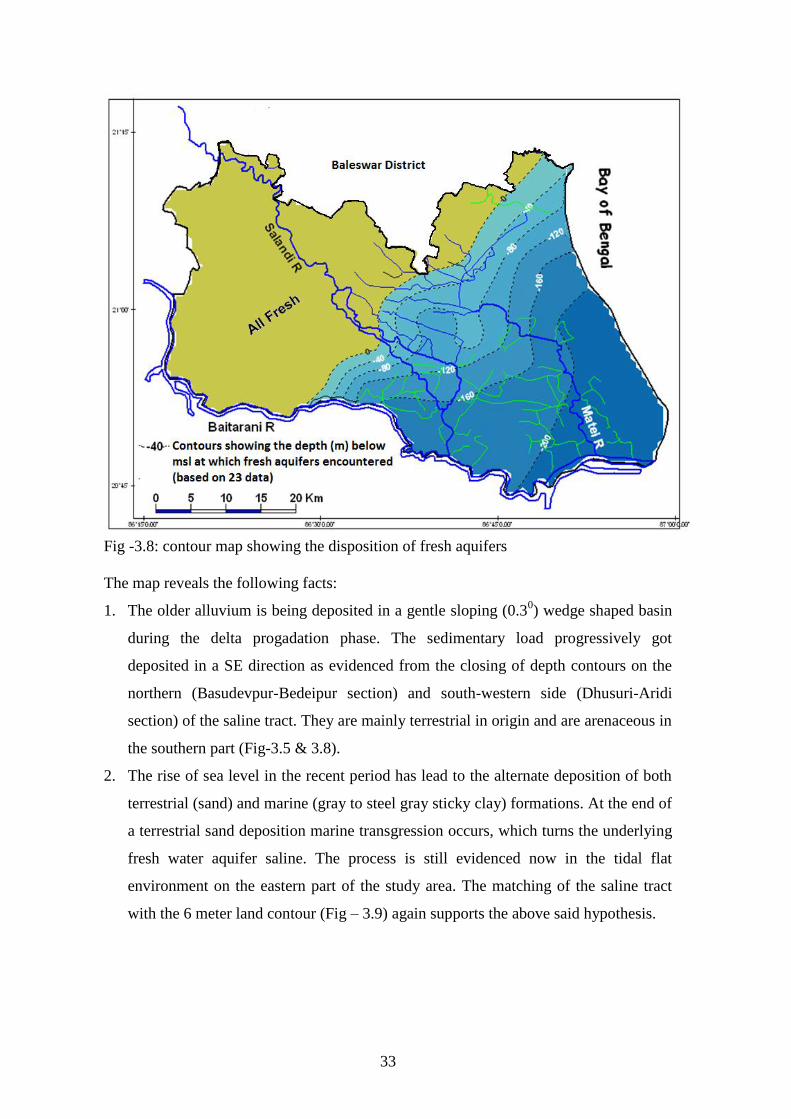
different locations of the district, a contour map is generated as shown in Fig –3.8.
33
Fig -3.8: contour map showing the disposition of fresh aquifers
The map reveals the following facts:
1. The older alluvium is being deposited in a gentle sloping (0.30) wedge shaped basin
during the delta progadation phase. The sedimentary load progressively got
deposited in a SE direction as evidenced from the closing of depth contours on the
northern (Basudevpur-Bedeipur section) and south-western side (Dhusuri-Aridi
section) of the saline tract. They are mainly terrestrial in origin and are arenaceous in
the southern part (Fig-3.5 & 3.8).
2. The rise of sea level in the recent period has lead to the alternate deposition of both
terrestrial (sand) and marine (gray to steel gray sticky clay) formations. At the end of
a terrestrial sand deposition marine transgression occurs, which turns the underlying
fresh water aquifer saline. The process is still evidenced now in the tidal flat
environment on the eastern part of the study area. The matching of the saline tract
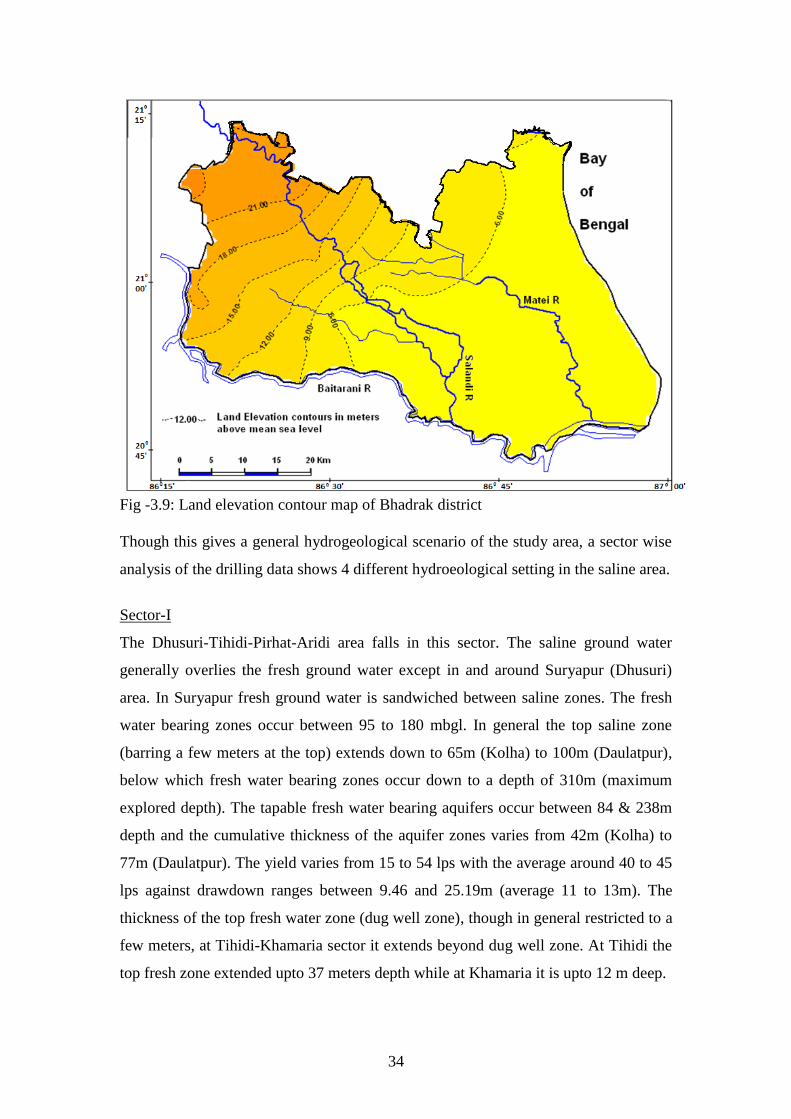
with the 6 meter land contour (Fig – 3.9) again supports the above said hypothesis.
34
Fig -3.9: Land elevation contour map of Bhadrak district
Though this gives a general hydrogeological scenario of the study area, a sector wise
analysis of the drilling data shows 4 different hydroeological setting in the saline area.
Sector-I
The Dhusuri-Tihidi-Pirhat-Aridi area falls in this sector. The saline ground water
generally overlies the fresh ground water except in and around Suryapur (Dhusuri)
area. In Suryapur fresh ground water is sandwiched between saline zones. The fresh
water bearing zones occur between 95 to 180 mbgl. In general the top saline zone
(barring a few meters at the top) extends down to 65m (Kolha) to 100m (Daulatpur),
below which fresh water bearing zones occur down to a depth of 310m (maximum
explored depth). The tapable fresh water bearing aquifers occur between 84 & 238m
depth and the cumulative thickness of the aquifer zones varies from 42m (Kolha) to
77m (Daulatpur). The yield varies from 15 to 54 lps with the average around 40 to 45
lps against drawdown ranges between 9.46 and 25.19m (average 11 to 13m). The
thickness of the top fresh water zone (dug well zone), though in general restricted to a
few meters, at Tihidi-Khamaria sector it extends beyond dug well zone. At Tihidi the
top fresh zone extended upto 37 meters depth while at Khamaria it is upto 12 m deep.
35
Sector-II
The Harsinghpur-Nalgunda- Matto-Chandbali-Dhamra area falls in this sector. The
depth of the boreholes varies from 267 m (Dhamra) to 407 m (Chasakhanda) with the
average depth around 300 meters. The extension of top saline zone varies from 125 m
(Harsinghpur) to 206 m (Dhamra) bgl and on an average it extends down to 170 mbgl
in Nalgunda-Chandbali section. Below this depth the formation continues to be fresh
water bearing down to 407 m depth, which is the maximum drilled depth. The fresh
water aquifer zones occur between 153 and 342 mbgl and the cumulative thickness of
aquifers ranges from 12m (Dhamra) to 76m (Kherang). The yield varies from 28 lps
at Dhamra to 54 lps at Charotaraf. The average drawdown ranges from 13 to 18 m.
The static water levels rest within 1 mbgl and in majority of cases (Charotaraf to
Chandbali section) it is under flowing condition (0.1 to 1magl).
Sector-III
The Chudamani Aria-Krushnapur-Ghanteswar section falls in this sector. In this
sector fresh ground water bearing zones are sandwiched between saline ground water
zones. The extension of top saline zone though varies from 60 m (Chudamani Aria) to
195 mbgl (Nayakandihi), generally top saline zone extends down from 145 to 170 m
in most of the cases. The bottom of the saline zone occurs at 133 m depth at
Chudamani Aria and at 452 m depth at Ghanteswar and it extends beyond 600 m
depth. The depth range of fresh water bearing zones, occurring in between top and
bottom saline zones varies from 60 to 133 m at Chudamani Aria, 145 to 326 m at
Krushnapur, 195 to 290 m at Nayakandihi and 162 to 452 m at Ghanteswar. The
depth range of fresh water bearing tapable aquifer zone varies from 65 to 292 mbgl
and the cumulative thickness of the aquifer zones tapped from 24m (Bedeipur) to 60m
(Ghanteswar). The yield varies from 30 to 53 lps against the drawdown of 14.5 to
22m. The static water level varies from 0.04m (Ghanteswar) to 4 mbgl (Chudamani
Aria) with the majority of the values lying within 1 mbgl.
Sector-IV
The Dosingha-Gourprasad-Bansada-Baincha section falls in this sector and occurs as
an elongated zone along the coast, covering the extreme eastern part of Chandbali
block. In this sector though CGWB has not drilled any well. RWS&S under DANIDA
Project drilled numbers of hand pump fitted tubewells. Detailed hydrogeological
36
information of these wells is not available except the disposition of fresh and saline
zones. Moreover the entire thickness of the freshwater zones was also not explored. In
majority of cases, drilling stopped after encountering the fresh water zone occurring
below the saline water zones. The drilling data of DANIDA indicates that, though this
sector is very close to the sea, the extension of the top saline zone varies from 75 m
(Gauraprasad) to 130m (Bansada) bgl and in majority of cases it is restricted within
100 mbgl and below this depth fresh water bearing zones occur. At Baincha two fresh
water zones occur, first one from 116 to 146m and second from 200 to 240mbgl. The
disposition at Baincha is saline/Fresh/Saline/Fresh. This type of situation is not
reported from any other place of the study area.
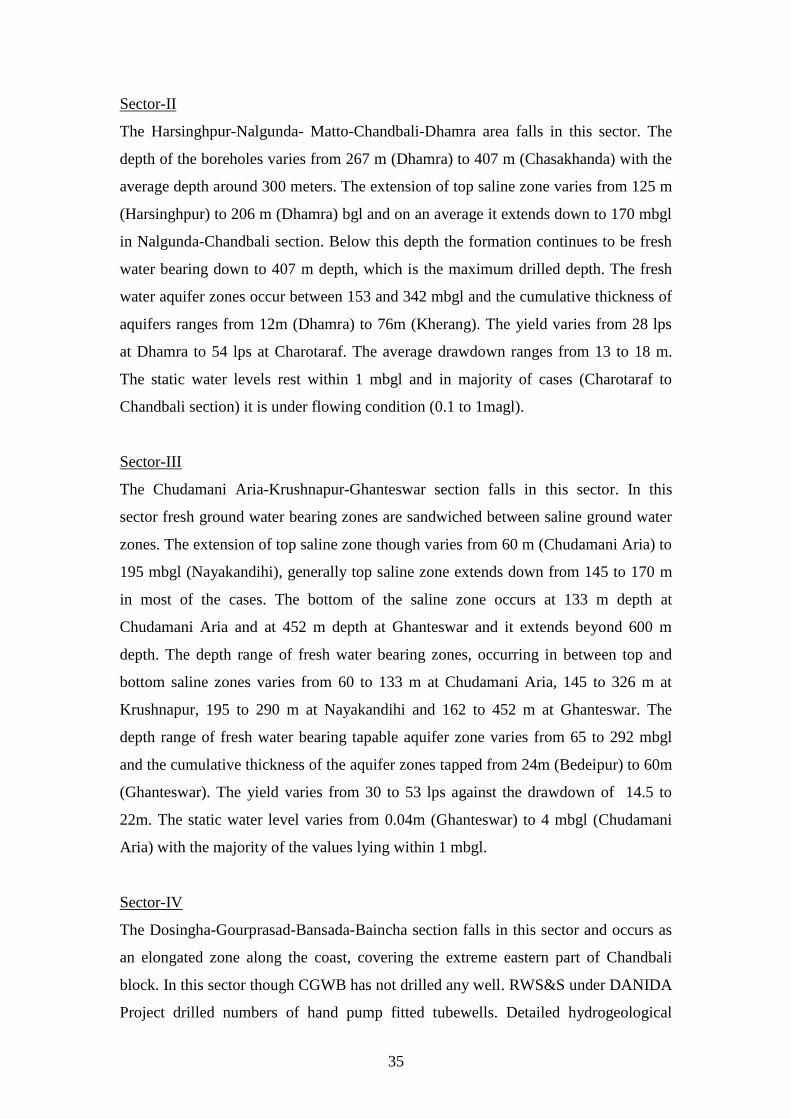
Basement Condition
Based on the basement data of 7 drilling locations and considering the deep drilling
data of Nayakandihi, Biriadiha, Dhobal and Sahur, approximate basement contour
map is prepared by Minimum Curvature Method. This is verified against all other
drilling data and accordingly corrected to give a final and most possible basement
map (Fig – 3.10).
Fig -3.10: Basement contour map of Bhadrak district (approximate)
37
It is interesting to note that the fresh water and saline water boundary (Fig – 3.7 &
3.8) closely follows the basement contour. This indicates the deposition of sediments
(now in contrasting hydrogeological conditions i.e. fresh and saline) occurs in similar
basin condition and slope. The all-fresh aquifers extending to 350 meter in the
western part forms the recharge zone for the deep aquifers encountered in the eastern
saline tract. This is again reflected in the chemical quality of the ground water on its
way from west to east from west to east as described in quality chapter..
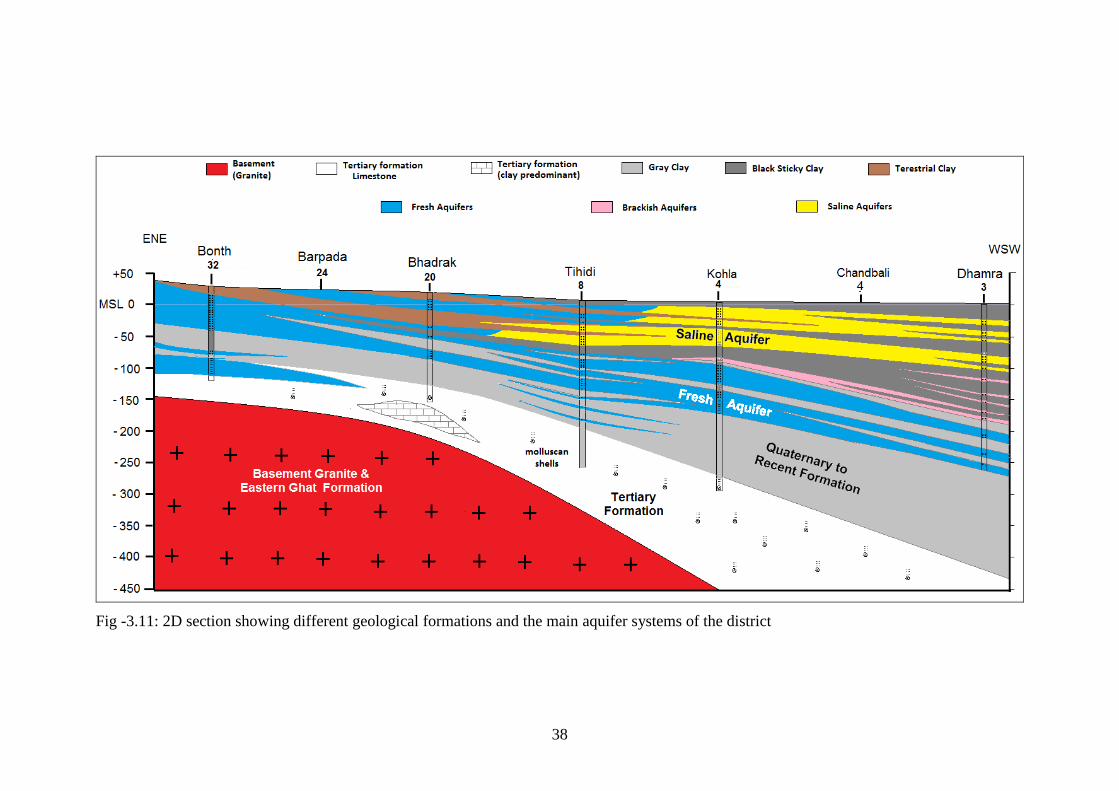
With this backdrop, a 2D section from Bonth in the west to Dhamra in the east is
drawn and is given in figure – 3.11. The section clearly shows the stratigraphic
sequence and the depositoal history of both terrestrial and marine formations. It also
depicted the occurrence of fresh and saline water aquifers and the recharge zone of the
deeper fresh aquifer systems present in the eastern part of the district.. A 3D model is
also created incorporating all the drilling data to decipher the disposition of the
aquifer systems in the district and is given in figure- 3.12.
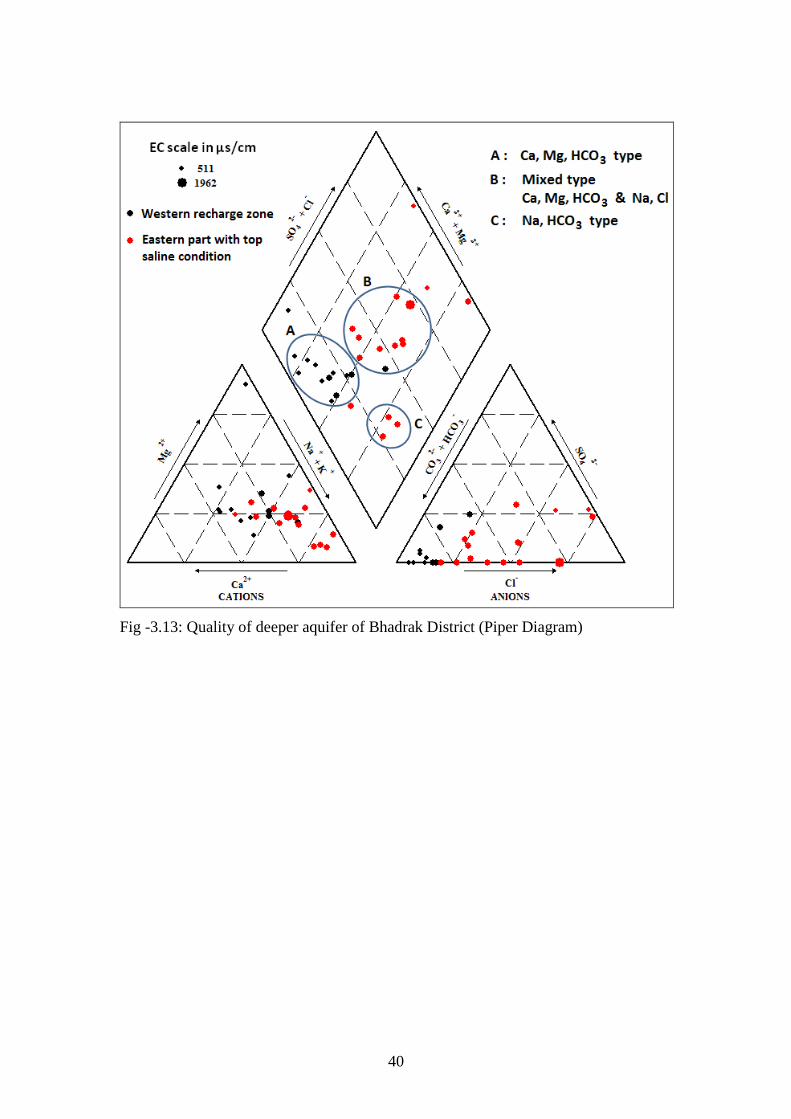
Ground Water Quality
The ground water of Bonth, Bhadrakh & Dhamnagar block which fall on the western
part of the district have EC between 500 to 700 s/cm with chloride content less than
50 ppm and is Ca,Mg,HCO3 type. The ground water quality of the deeper aquifers is
good and is devoid of hazards like iron and fluoride and thus is portable. The quality
is also very good from irrigation point of view with quality falling in C2S1 type of
USSL Classification.
Top saline condition is observed in the eastern part of the district and deeper aquifers
with EC between 900 to 1250 s/cm are the only source of ground water. The ground
water quality is generally mixed type with Ca,Mg,HCO3 and Na,Cl type. However at
some places i.e., Dhamra, Chudamaniyar & Ghaneswar, Na,HCO3 type of ground
water is observed. Ground water of Nayakandihi, Bedeipur, Chandbali & Matto
shows a typical type, i.e., Na,HCO3 and Na,Cl type (Fig-3.6 & 3.13). The ground
water is free from iron and fluoride and is portable. It is also suitable for irrigation as
it falls in the C2S1 and C3S1 class of USSL Classification. However the difficulties in
the construction of tube wells due to the top saline condition, restricts its use for
irrigation. Moreover proximity to sea and limited recharge zone of this aquifer, needs
a careful planning before going for its extensive utilization especially for agriculture.
38
Fig -3.11: 2D section showing different geological formations and the main aquifer systems of the district
39
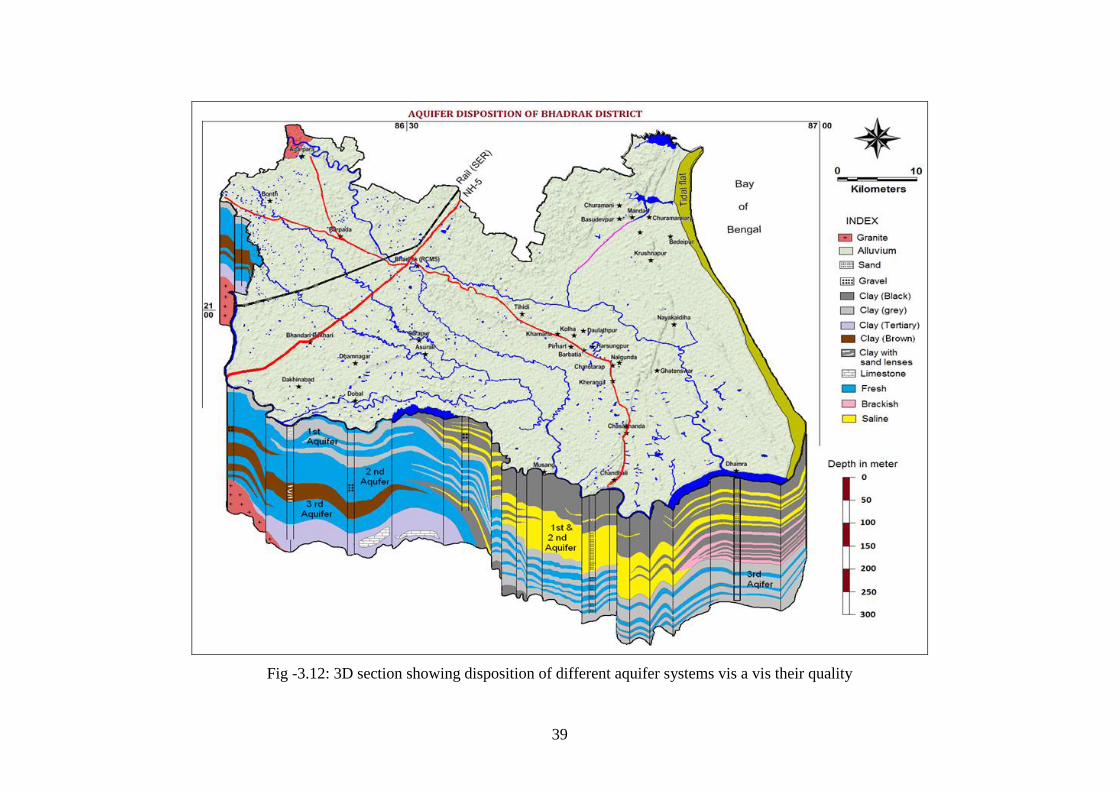
Fig -3.12: 3D section showing disposition of different aquifer systems vis a vis their quality
40
Fig -3.13: Quality of deeper aquifer of Bhadrak District (Piper Diagram)
41
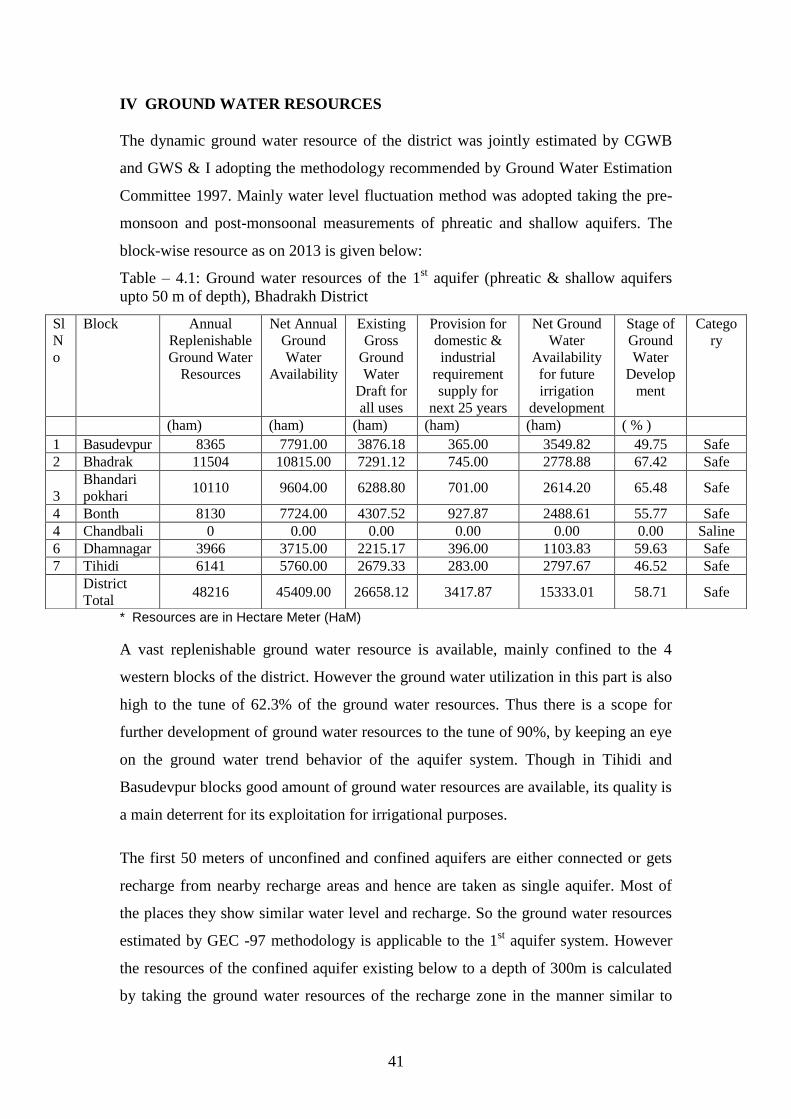
IV GROUND WATER RESOURCES
The dynamic ground water resource of the district was jointly estimated by CGWB
and GWS & I adopting the methodology recommended by Ground Water Estimation
Committee 1997. Mainly water level fluctuation method was adopted taking the pre-
monsoon and post-monsoonal measurements of phreatic and shallow aquifers. The
block-wise resource as on 2013 is given below:
Table – 4.1: Ground water resources of the 1st aquifer (phreatic & shallow aquifers
upto 50 m of depth), Bhadrakh District
* Resources are in Hectare Meter (HaM)
A vast replenishable ground water resource is available, mainly confined to the 4
western blocks of the district. However the ground water utilization in this part is also
high to the tune of 62.3% of the ground water resources. Thus there is a scope for
further development of ground water resources to the tune of 90%, by keeping an eye
on the ground water trend behavior of the aquifer system. Though in Tihidi and
Basudevpur blocks good amount of ground water resources are available, its quality is
a main deterrent for its exploitation for irrigational purposes.
The first 50 meters of unconfined and confined aquifers are either connected or gets
recharge from nearby recharge areas and hence are taken as single aquifer. Most of
the places they show similar water level and recharge. So the ground water resources
estimated by GEC -97 methodology is applicable to the 1st aquifer system. However
the resources of the confined aquifer existing below to a depth of 300m is calculated
by taking the ground water resources of the recharge zone in the manner similar to
Sl
N
o
Block
Annual
Replenishable
Ground Water
Resources
Net Annual
Ground
Water
Availability
Existing
Gross
Ground
Water
Draft for
all uses
Provision for
domestic &
industrial
requirement
supply for
next 25 years
Net Ground
Water
Availability
for future
irrigation
development
Stage of
Ground
Water
Develop
ment
Catego
ry
(ham) (ham) (ham) (ham) (ham) ( % ) 1 Basudevpur 8365 7791.00 3876.18 365.00 3549.82 49.75 Safe
2 Bhadrak 11504 10815.00 7291.12 745.00 2778.88 67.42 Safe
3
Bhandari
pokhari 10110 9604.00 6288.80 701.00 2614.20 65.48 Safe
4 Bonth 8130 7724.00 4307.52 927.87 2488.61 55.77 Safe 4 Chandbali 0 0.00 0.00 0.00 0.00 0.00 Saline
6 Dhamnagar 3966 3715.00 2215.17 396.00 1103.83 59.63 Safe 7 Tihidi 6141 5760.00 2679.33 283.00 2797.67 46.52 Safe
District
Total 48216 45409.00 26658.12 3417.87 15333.01 58.71 Safe
42
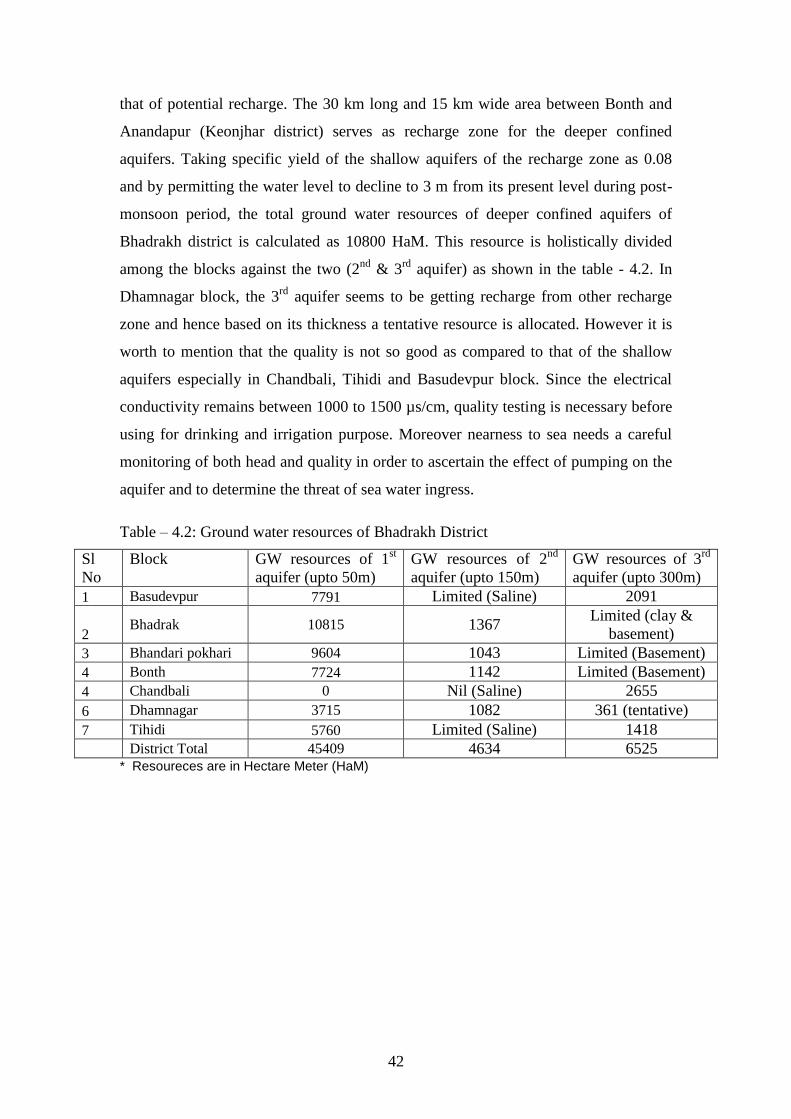
that of potential recharge. The 30 km long and 15 km wide area between Bonth and
Anandapur (Keonjhar district) serves as recharge zone for the deeper confined
aquifers. Taking specific yield of the shallow aquifers of the recharge zone as 0.08
and by permitting the water level to decline to 3 m from its present level during post-
monsoon period, the total ground water resources of deeper confined aquifers of
Bhadrakh district is calculated as 10800 HaM. This resource is holistically divided
among the blocks against the two (2nd
& 3rd
aquifer) as shown in the table - 4.2. In
Dhamnagar block, the 3rd
aquifer seems to be getting recharge from other recharge
zone and hence based on its thickness a tentative resource is allocated. However it is
worth to mention that the quality is not so good as compared to that of the shallow
aquifers especially in Chandbali, Tihidi and Basudevpur block. Since the electrical
conductivity remains between 1000 to 1500 µs/cm, quality testing is necessary before
using for drinking and irrigation purpose. Moreover nearness to sea needs a careful
monitoring of both head and quality in order to ascertain the effect of pumping on the
aquifer and to determine the threat of sea water ingress.
Table – 4.2: Ground water resources of Bhadrakh District
Sl
No
Block GW resources of 1st
aquifer (upto 50m)
GW resources of 2nd
aquifer (upto 150m)
GW resources of 3rd
aquifer (upto 300m)
1 Basudevpur 7791 Limited (Saline) 2091
2 Bhadrak 10815 1367
Limited (clay &
basement)
3 Bhandari pokhari 9604 1043 Limited (Basement)
4 Bonth 7724 1142 Limited (Basement)
4 Chandbali 0 Nil (Saline) 2655
6 Dhamnagar 3715 1082 361 (tentative)
7 Tihidi 5760 Limited (Saline) 1418
District Total 45409 4634 6525 * Resoureces are in Hectare Meter (HaM)
43
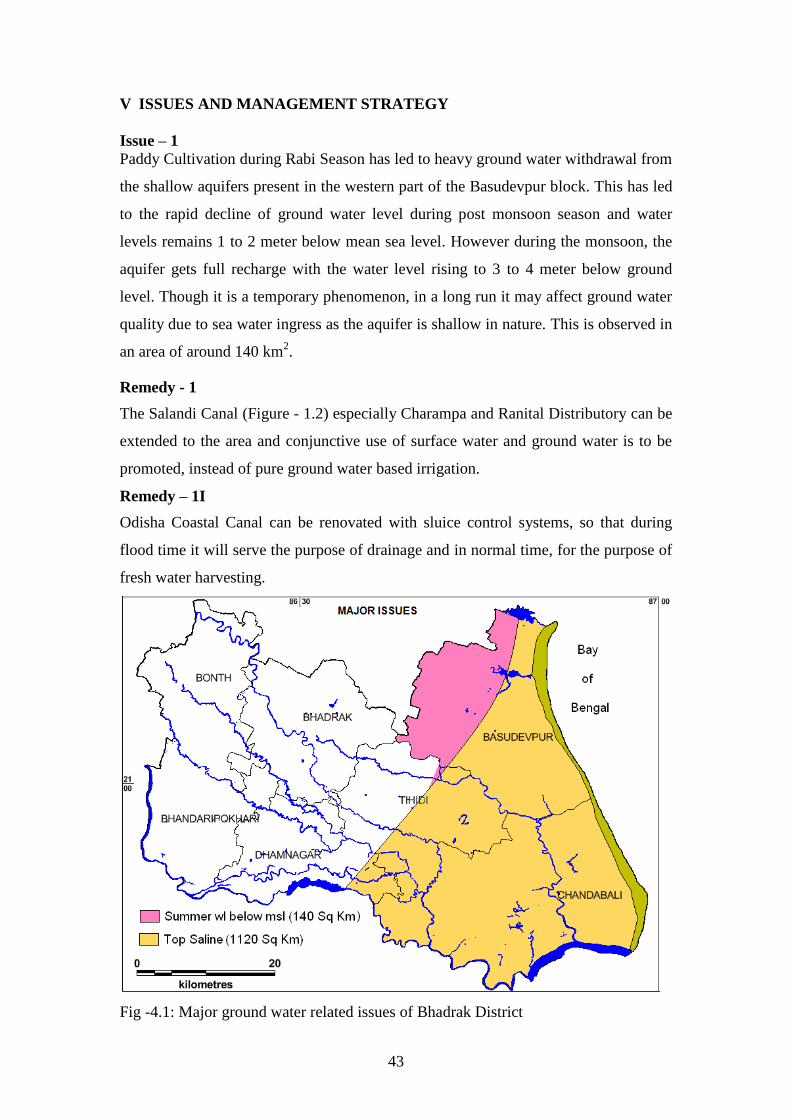
V ISSUES AND MANAGEMENT STRATEGY
Issue – 1
Paddy Cultivation during Rabi Season has led to heavy ground water withdrawal from
the shallow aquifers present in the western part of the Basudevpur block. This has led
to the rapid decline of ground water level during post monsoon season and water
levels remains 1 to 2 meter below mean sea level. However during the monsoon, the
aquifer gets full recharge with the water level rising to 3 to 4 meter below ground
level. Though it is a temporary phenomenon, in a long run it may affect ground water
quality due to sea water ingress as the aquifer is shallow in nature. This is observed in
an area of around 140 km2.
Remedy - 1
The Salandi Canal (Figure - 1.2) especially Charampa and Ranital Distributory can be
extended to the area and conjunctive use of surface water and ground water is to be
promoted, instead of pure ground water based irrigation.
Remedy – 1I
Odisha Coastal Canal can be renovated with sluice control systems, so that during
flood time it will serve the purpose of drainage and in normal time, for the purpose of
fresh water harvesting.
Fig -4.1: Major ground water related issues of Bhadrak District
44
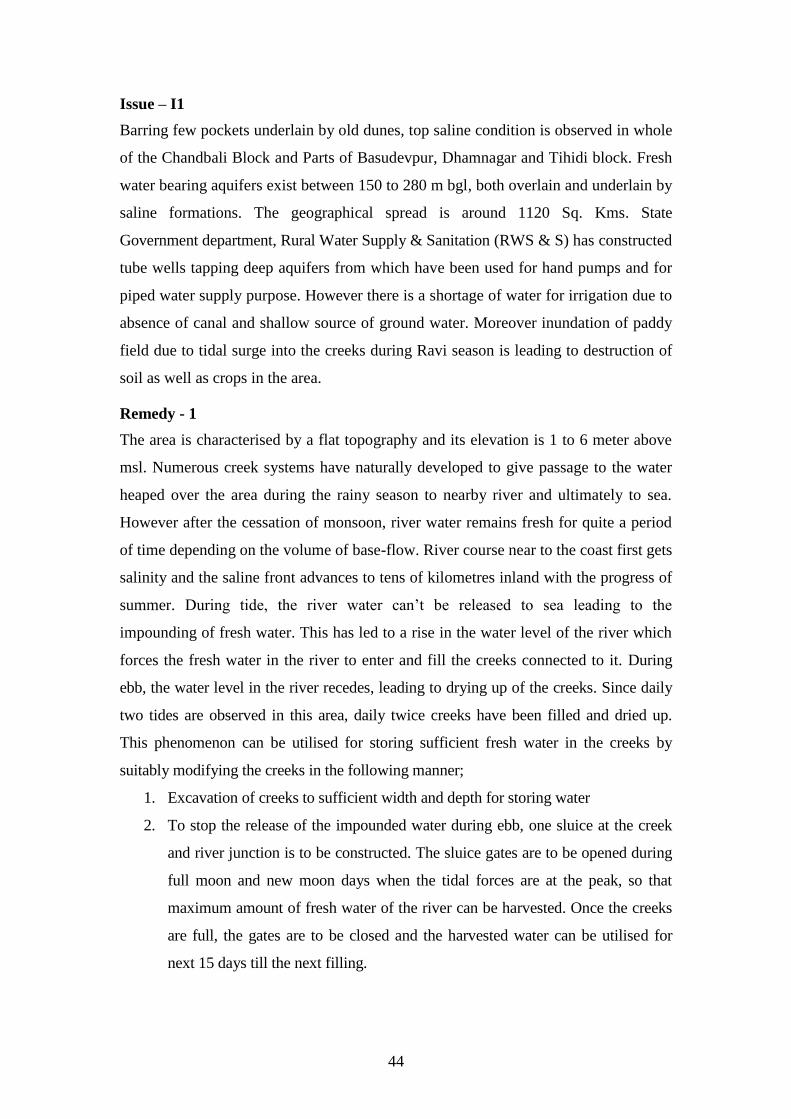
Issue – I1
Barring few pockets underlain by old dunes, top saline condition is observed in whole
of the Chandbali Block and Parts of Basudevpur, Dhamnagar and Tihidi block. Fresh
water bearing aquifers exist between 150 to 280 m bgl, both overlain and underlain by
saline formations. The geographical spread is around 1120 Sq. Kms. State
Government department, Rural Water Supply & Sanitation (RWS & S) has constructed
tube wells tapping deep aquifers from which have been used for hand pumps and for
piped water supply purpose. However there is a shortage of water for irrigation due to
absence of canal and shallow source of ground water. Moreover inundation of paddy
field due to tidal surge into the creeks during Ravi season is leading to destruction of
soil as well as crops in the area.
Remedy - 1
The area is characterised by a flat topography and its elevation is 1 to 6 meter above
msl. Numerous creek systems have naturally developed to give passage to the water
heaped over the area during the rainy season to nearby river and ultimately to sea.
However after the cessation of monsoon, river water remains fresh for quite a period
of time depending on the volume of base-flow. River course near to the coast first gets
salinity and the saline front advances to tens of kilometres inland with the progress of
summer. During tide, the river water can’t be released to sea leading to the
impounding of fresh water. This has led to a rise in the water level of the river which
forces the fresh water in the river to enter and fill the creeks connected to it. During
ebb, the water level in the river recedes, leading to drying up of the creeks. Since daily
two tides are observed in this area, daily twice creeks have been filled and dried up.
This phenomenon can be utilised for storing sufficient fresh water in the creeks by
suitably modifying the creeks in the following manner;
1. Excavation of creeks to sufficient width and depth for storing water
2. To stop the release of the impounded water during ebb, one sluice at the creek
and river junction is to be constructed. The sluice gates are to be opened during
full moon and new moon days when the tidal forces are at the peak, so that
maximum amount of fresh water of the river can be harvested. Once the creeks
are full, the gates are to be closed and the harvested water can be utilised for
next 15 days till the next filling.
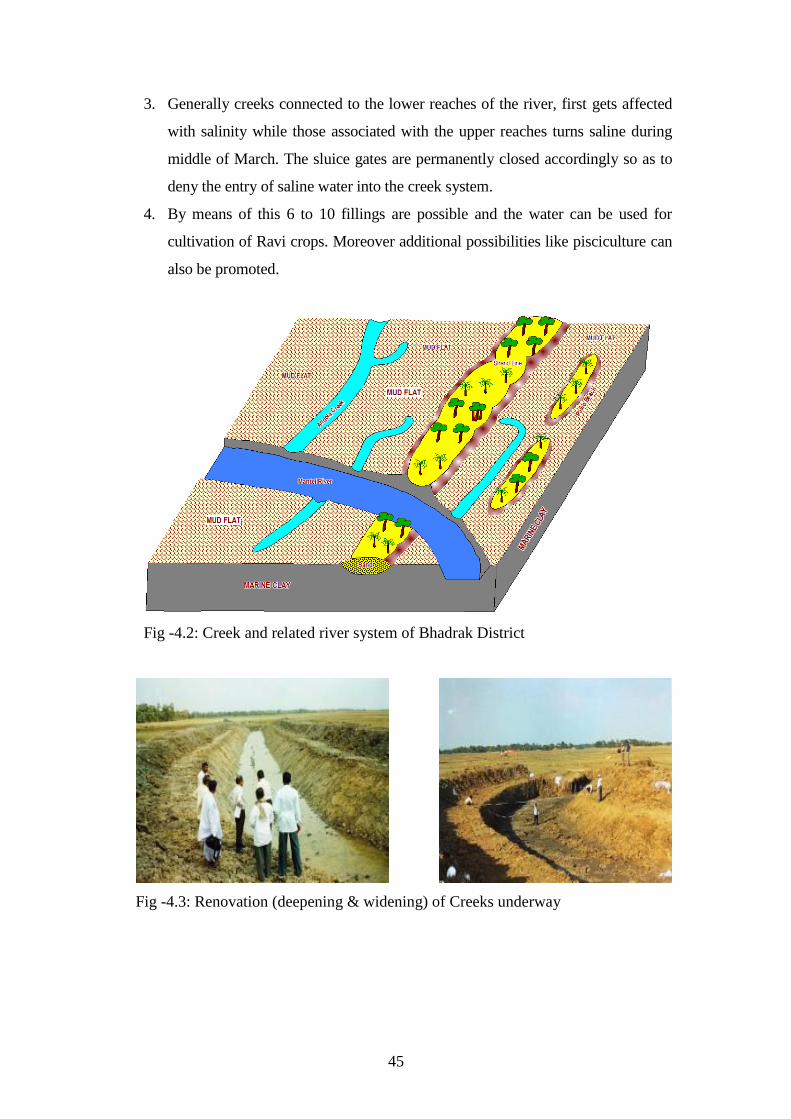
45
3. Generally creeks connected to the lower reaches of the river, first gets affected
with salinity while those associated with the upper reaches turns saline during
middle of March. The sluice gates are permanently closed accordingly so as to
deny the entry of saline water into the creek system.
4. By means of this 6 to 10 fillings are possible and the water can be used for
cultivation of Ravi crops. Moreover additional possibilities like pisciculture can
also be promoted.
Fig -4.2: Creek and related river system of Bhadrak District
Fig -4.3: Renovation (deepening & widening) of Creeks underway
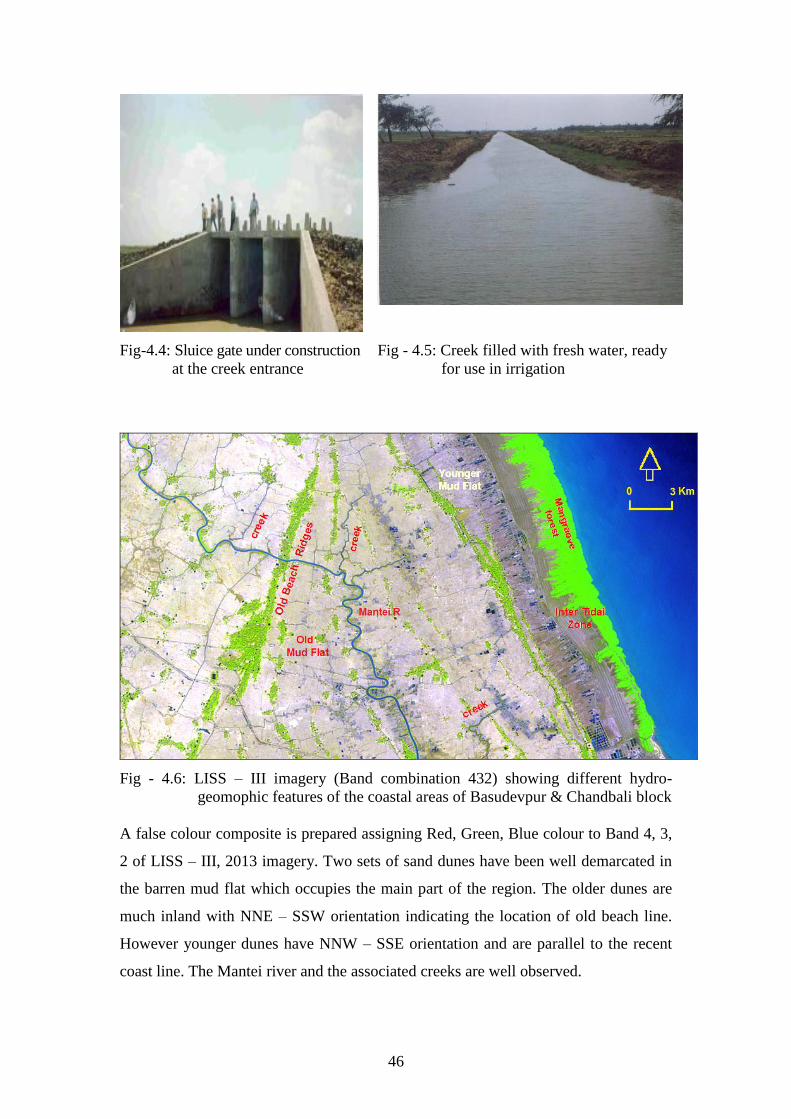
46
Fig-4.4: Sluice gate under construction
at the creek entrance
Fig - 4.5: Creek filled with fresh water, ready
for use in irrigation
Fig - 4.6: LISS – III imagery (Band combination 432) showing different hydro-
geomophic features of the coastal areas of Basudevpur & Chandbali block
A false colour composite is prepared assigning Red, Green, Blue colour to Band 4, 3,
2 of LISS – III, 2013 imagery. Two sets of sand dunes have been well demarcated in
the barren mud flat which occupies the main part of the region. The older dunes are
much inland with NNE – SSW orientation indicating the location of old beach line.
However younger dunes have NNW – SSE orientation and are parallel to the recent
coast line. The Mantei river and the associated creeks are well observed.
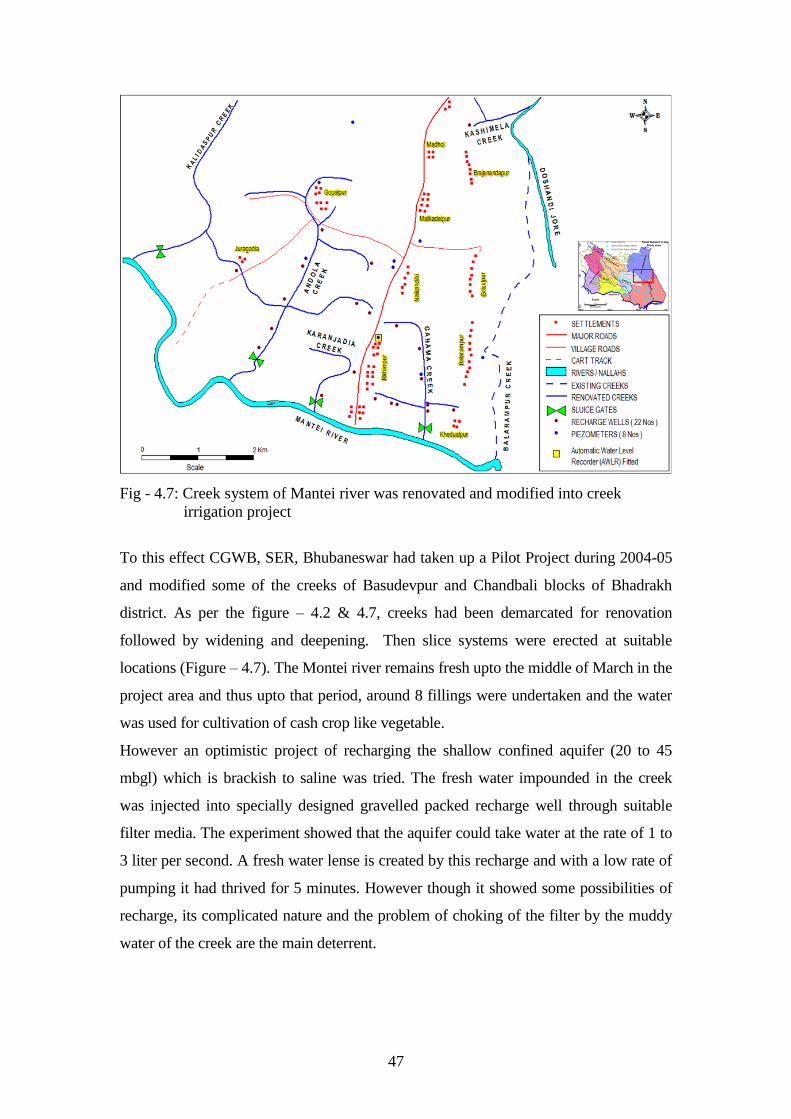
47
Fig - 4.7: Creek system of Mantei river was renovated and modified into creek
irrigation project
To this effect CGWB, SER, Bhubaneswar had taken up a Pilot Project during 2004-05
and modified some of the creeks of Basudevpur and Chandbali blocks of Bhadrakh
district. As per the figure – 4.2 & 4.7, creeks had been demarcated for renovation
followed by widening and deepening. Then slice systems were erected at suitable
locations (Figure – 4.7). The Montei river remains fresh upto the middle of March in the
project area and thus upto that period, around 8 fillings were undertaken and the water
was used for cultivation of cash crop like vegetable.
However an optimistic project of recharging the shallow confined aquifer (20 to 45
mbgl) which is brackish to saline was tried. The fresh water impounded in the creek
was injected into specially designed gravelled packed recharge well through suitable
filter media. The experiment showed that the aquifer could take water at the rate of 1 to
3 liter per second. A fresh water lense is created by this recharge and with a low rate of
pumping it had thrived for 5 minutes. However though it showed some possibilities of
recharge, its complicated nature and the problem of choking of the filter by the muddy
water of the creek are the main deterrent.
48
Cost implications:
• A total of 27 Creeks & Sub-Creeks were renovated spanning a length of 93.65
Kms in Basudevpur & Chandbali Blocks with a total cost of Rs 647 Lakhs,
implemented during 2004-05
• Approximate present cost of Renovation = Rs. 259 Lakhs (Pro Rata)
(@ 10% of the Present Costing which is 4 times the original implemented Cost)
• Additional Creeks proposed to be modified = 50 Nos
• Approximate renovation cost = Rs. 4793 Lakhs
• Total Cost of renovation of 27 Old + = Rs. 5232 Lakhs
50 Proposed New Creeks
• Cost per Year on Principal(@ 10Years Life) = Rs. 523.2 Lakhs
• Interest Component = Rs. 392 Lakhs
(Soft Loan @7.5% per annum)
• Total Yearly Cost = Rs. 915.6 Lakhs
• Additional area to be benefitted(From New Creeks) = 5000 Ha
• Monetary Return from Cultivation of Rabi Paddy, = Rs. 1000 Lakhs
Wheat & vegetables (@ Rs. 25,000/- per Ha Flat Rate Combined)
• Monetary Return from Pisciculture = Rs. 250 Lakhs
(@ Rs. 5 lakhs per Creek)
Total Yearly Benefit = Rs. 1250 Lakhs
The cost benefit analysis shows that with an initial cost of 52 Crores, a huge amount
of water can be made available for irrigation in the area.
Remedy – 1I
Tidal creeks are not present in all part of the saline belt and hence deeper aquifers are
to be exploited for extending irrigation in these area. Around 50 numbers of deep
Tube Wells tapping the 3rd
Aquifer (150 – 300 mbgl) can to be constructed and
energized. Since these aquifers are both underlain and overlain by saline formations,
controlled pumping is to be adopted. By pumping the well for 10 hours at a rate of 25
to 30 liter/second, 20 Hectares of area under Potato, oilseeds and low water requiring
vegtables can be irrigated taking 75 - 90 days of growing season. Hence 50 such
energized tube wells can be constructed as an experimental basis to see its efficacy.
49
Cost implications:
• Total Area proposed to be irrigated on experimental basis = 1000 Ha
• Approximate cost of Tube Well, Transformer & Pumps etc = Rs.1000 Lakh
• (including conveyance)
• Life of Wells + Peripherals = 20 years
• Cost per Year(including maintenance ) = Rs. 50 Lakhs
• Interest Component(soft loan @ 7.5% / annum) = Rs. 75 lakhs
• Total Cost per year = Rs. 125 Lakhs
• Revenue collected from Irrigation = Rs 10 Lakhs
(Water Cess @ Rs. 1000/- per Ha)
• Benefit to farmer from Patato / Oil Seed / Vegetable = Rs. 250 lakhs
(@ Rs 25,000 per Hectare)
• Benefit Per Year = Rs. 260 Lakhs
All these above calculations are tentative and will vary as per the design and location.
Since top saline condition exists in the region, rigorous GW regime monitoring (both
level & quality) will be mandatory to know if there is any adverse impact of pumping
in form of sea water ingress.
50
SUMMARY AND CONCLUSION
The study area being part of the coastal tract of Orissa, is rich in natural resources like
land, man power and water resources. As its economy solely depends upon agriculture
and its allied activities like fishery, water resource and its management plays
important role for its development. As such there is no dearth of water resources in
the district due to wide spread canal network and good amount of ground water
resources. However water quality is a major hindrance in the use of ground water in
the saline tract present in the eastern part of the district. As the potential fresh water
aquifers exist beyond 195 mbgl in most part of the Chandbali block, it is not possible
for a common man to have even his own drinking water source. Thus government’s
initiative is very much essential especially for the development of the saline tract.
Moreover this tract faces problems like water logging and drainage congestion, which
are to be addressed. Under this backdrop, the author has recommended some of the
strategies to tackle these major issues related to ground water which will improve the
situation in the district.
ACKNOWLEDGEMENTS
The author expresses his sincere thanks to the Chairman and Member (SAM) for their
inspiration and guidance during preparation of the report. Sincere thanks also goes to
the scrutiny and reviewing committee, CHQ, Faridabad who have given constructive
suggestions and inputs regarding the study. He is also thankful to the Regional
Director, CGWB, SER, Bhubaneswar for extending all possible support during field
and report preparation work. Thanks are also due to the numerous previous workers
who were attended drilling and well testing in the area. Last but not the least, the
different Central and State Government Organizations who have contributed a lot in
providing valuable data have been acknowledged.
51
REFERENCES
1. Bhatnagar, N. C. et. al. (1970) – Geology and ground water resources of parts of
Balasore and Cuttack districts, Orissa, Bulletin, G.S.I, Series B. No. 29.
2. Basic Data Reports of Tube wells and Slim holes drilled in Bhadrakh and
Balasore district, C.G.W.B.
3. Chakldar. S. (1981) – Report on the exploration by deep drilling in parts of coastal
Orissa. C.G.W.B. Tech. Report. Series A. No. 12.
4. Das, P. K. (1998) - Ground Water Resource and Development Potential of
Bhadrak district, Orissa, CGWB Technical report. Series ‘D’.
5. District Statistical Hand Book of Bhadrak and Balasore 2005, Directorate of
Economics and Statistics, Orissa, Bhubaneswar Publication
6. Hydrogeological Atlas of Orissa, Published by CGWB, SER, Bhubaneswar.
7. Naik, K. C., Behera, S. C., Nayak, N.C. (2005) – A report on “Arresting salinity
ingress & artificial recharge to ground water in parts o Basudevpur & Chandbali
blocks of Bhadrak District, Orissa”, CGWB Technical report.
8. Nayak, N.C. (2008) - Ground water management studies in Bhadrakh and
adjoining areas of Balasore district, Odisha, CGWB Technical report
9. Raju, D. V. N. (1991) – Ground Water Resource and Development Potential of
Balasore district, Orissa, CGWB Technical report.