हीरे-मोती सोवियत भूमि की जातियों की लोक-कथाएं - Internet Archive
Upload
khangminh22Category
view
2download
0
केन्द्रीय भूमि जल बोर्ड जल संसाधन, नदी विकास और गंगा संरक्षण
विभाग, जल शक्ति मंत्रालय
भारि सरकार Central Ground Water Board
Department of Water Resources, River Development and Ganga Rejuvenation,
Ministry of Jal Shakti Government of India
AQUIFER MAPPING AND MANAGEMENT
OF GROUND WATER RESOURCES
Malda District West Bengal
पूिी क्षेत्र, कोलकािा Eastern Region, Kolkata

i
Technical Report: Series ‘A’ No. 211 For official use only
Government of India
MINISTRY OF JAL SHAKTI, DEPARTMENT OF WATER RESOURCES, RIVER DEVELOPMENT & GANGA REJUVENATION
REPORT ON
AQUIFER MAPPING AND MANAGEMENT PLAN IN MALDA DISTRICTS, WEST BENGAL
DEBASISH BAGCHI Scientist –‘B’
Central Groundwater Board Eastern Region, Kolkata
June 2022

,,
FOREWORD
Aquifer Mapping and Management programme was taken up by the Central
Ground Water Board (CGWB) during the Xllth Plan to characterize aquifers in three
dimensions and formula te an aquifer management plan for benefit of the stakeholders.
With this objective, Aquifer Mapping and Management study was taken up in Malda
district during the Annual Action Plan: 2019-20 and 2020-21. The management plans
for fifteen Community Oevelopment Blacks of Malda district are prepared for
sustainable management of groundwater resources through conjunctive use, increasing
water use efficiency through novel methods and addressing the challenges of arsenic
and fluoride contamination by critical analysis and interpretation of relevant data.
Hydrogeological, geophysical and hydrochemical data collected from field
surveys was analysed using dedicated software to prepare thematic maps on aquifer
geometry and cross-correlation and to assess suitability of groundwater for drinking
and irrigational use for the benefit of the local populace. Non-committed surface runoff
was estimated block-wise for adoption of rainwater harvesting and augmentation of
water resources through managed aquifer recharge. Seasonal, annual and decadal
fluctuations in groundwater level were depicted through thematic maps. A Public
Interaction Programme was organized for benefit of the stakeholders, wherein
outcomes of aquifer mapping and management study were presented. This was
followed by knowledge sharing with the district administration with an objective to
make informed decisions on planning and implementation of water conservation
practices at district and block level. The primary objective of such programme and
meeting was to adopt participatory groundwater management by the state government
and the stakeholders with the philosophy "Know Your Aquifer- Manage Your Aquifer".
This report contains valuable information on aquifers of Malda district brought
out through 2-0 cross-sections and 3-0 models along with specific recommendations to
tackJe the challenging issues of arsenic and fluoride •contamination. I appreciate the
efforts made by Sh. Oebasish Bagchi, Scientist-B (HG) in bringing out this report. I
sincerely hope that it will be extremely useful to the policy makers, planners,
administrators and groundwater data managers.
(Dr. Anadi Gayen) Head of Office
ii i

ii
EXECUTIVE SUMMARY
Aquifer Mapping and Management study was taken up in Malda district with an area of 3733 km2. Quaternary alluvial sediments comprising Younger Alluvium (Aquifer Code: AL 01) and Older Alluvium ((Aquifer Code: AL 03) constitute the aquifers in the area, which occurs in the depth range of 17 m to 178 m. Older Alluvium is exposed in the Barind Tract characterized by thick layers of clay, deeper water level condition and relatively less groundwater potential as compared to the Younger Alluvium. The Barind Tract is conspicuous in eastern part of Malda district covering Bamongola, Habibpur, Gazole and parts of Old Malda community development blocks. Due to variation in lithofacies, aquifer geometry is not regular. Bore hole logs of Central Ground Water Board and state government departments (Public Health Engineering Directorate, Agri-Irrigation Department) have indicated a persistent clay layer, which is thinner in the northern, eastern and central part and thicker (> 10 m) in the southern part of the district. Aquifers consisting of medium to coarse sand and gravel are underlain by metavolcanic rocks of Garo-Rajmahal Gap at Araidanga (Ratua-II block), Mandilpur (Old Malda block) and Narendrapur (English Bazar block) in variable depth range of ~130 m to ~281 m. Based on subsurface lithological data of 53 Exploratory Wells and Tube Wells, two aquifer systems (Aquifer-1A and Aquifer-1B) have been identified, except in Habibpur, Old Malda and Harishchandrapur-II blocks where only a single aquifer system has been interpreted. This is also supported by interpretation of Vertical Electric Sounding data in Habibpur and Manikchak blocks. Geophysical study revealed that the recommended drilling depth of tube wells in Habibpur and Manikchak block should be between 40 and 180 m.
Drilling data of Exploratory Wells and Observation Wells has revealed highly variable discharge, ranging from 626.40 m3/day at Bhaluka to 5034.53 m3/day at Mandilpur. Drawdown was found to vary from 1.11 m at Bhaluka to 9.84 m at Nityanandapur, while transmissivity was ranging from 207.81 m2/day at Narendrapur to 7170.0 m2/day at Araidanga. Storage co-efficient of aquifer (depth 81 to 105 m) was 9.9 x 10⁻² at Araidanga, indicating a semi-confined aquifer. Seasonal fluctuation in groundwater level indicated rise in 81.94% of the total number of monitoring wells, whereas decadal fluctuation revealed long-term rise in 94.44% of the wells in pre-monsoon and in 90.00% of the wells in post-monsoon. Significant long-term decline was not observed. Malda district is affected by arsenic contamination in groundwater (in eight blocks) and also by fluoride contamination (in two blocks). Data of CGWB has shown highest arsenic concentration of 0.402 mg/L at Sujapur in Kaliachak-I block and highest fluoride concentration of 4.54 mg/L at Sripur in Ratua-II block. Remediation of arsenic problem has been done through Arsenic Removal Plants installed by the Arsenic Area Water Supply Scheme of PHED. Five such water supply schemes dedicatedly commissioned for arsenic removal is functional in Ratua-I and Ratua-II block with a design population of 37710 and cumulative water supply of 4112 m3/day. High iron concentration in groundwater was found in tube wells located in Manikchak, Bamongola, Gazole, English Bazar and Kalaichak-III block. However, groundwater was suitable for agri-irrigational use, which was confirmed from Wilcox Diagram and U. S. Salinity Diagram, with majority of samples falling under S1-C2 or S1-C3 class.

iii
Adoption of demand side aquifer management may not be a priority due to low stage of groundwater development (<70%) for the entire district. However, Habibpur and Harishchandrapur-I blocks were categorized as Semi-critical (as on 31-3-2013) based on long-term declining trend in ground water level. However, subsequent assessment of dynamic groundwater resources (as on 31-3-2017) indicates that both the blocks are under Safe category. Managed aquifer recharge is possible in Kaliachak-I, Gazole and Old Malda blocks, that too in the shallow, unconfined aquifer (Aquifer-1A) occurring in the depth range of ~20 m to ~30 m. Feasible structures for implementing managed aquifer recharge (artificial recharge) are the percolation tanks, injection wells and recharge shafts in the pre-existing tanks and ponds. Estimation of block wise non-committed surface runoff for rain water harvesting and managed aquifer recharge shows high variability, with maximum volume of 83.86 MCM in Gazole block and minimum of 18.31 MCM I Kaliachak-I block. The calculations also show only 22.5% of the surface runoff can be utilized for recharge and harvesting. Based on monsoon rainfall data, the volume of rain water available for harvesting in 27 Census Towns of the district has been estimated at 0.003 MCM whereas for English Bazar and Old Malda Municipality, the estimated volume was 0.015 MCM.
It is possible to implement block level aquifer management plans with active participation of the district administration and the stakeholders. Cultivation of summer paddy needs to be reduced by at least 10% of the present production, especially in the Barind Tract where water scarcity in summer is a growing problem. Crops like peanut, maize, jute and soya bean needs to be grown, which have higher water use efficiency as compared to paddy. However, there should be a provision for crop subsidy by the state government keeping in mind the poor socio-economic conditions of the small and marginal farmers.
As a part of the celebration of 75 years of Indian independence through Azadi Ka Amrit Mahotsav programme, one Public Interaction Programme was organized on 28th July 2021. This was followed by a presentation of the Aquifer Mapping Study in Malda district in the office of the District Magistrate, Malda (in physical mode) on 15th November 2021. The outcomes of the present study was shared to the District Magistrate, Additional District Magistrate (General), Additional District Magistrate (Development), representatives from state government departments like Public Health Engineering Directorate, Malda Division and Arsenic Area Water Supply Division, State Water Investigation Directorate, Agri-irrigation Department and Agriculture Department. The possibility of dovetailing components of the aquifer management and water resources conservation can be explored through various central government and state government aided programmes like Pradahan Mantri Krishi Sinchai Yojana – Har Khet Ko Pani, Jal Shakti Abhiyan – Catch The Rain, Jal Dharo – Jal Bharo with active participation of the stakeholders. The central theme of developing a holistic aquifer management plan, whether in district, block or village level, should be Know Your Aquifer – Manage Your Aquifer. In order to achieve this, block wise Aquifer Management Plans of Malda district are being launched in web platform through Aquifer Information and Management System.

REPORT ON AQUIFER MAPPING, MALDA DISTRICT, WEST BENGAL (AAP: 2019-20, 2020-21)
CONTENTS
Executive Summary
Malda District At a Glance 1 - 4
CHAPTER 1: INTRODUCTION 5 - 14
1.1 Location 5
1.2 Area and Administrative Units 5
Fig. 1.1 Administrative Map, Malda district 6
1.3 Demographic Details 6
1.4 Land Use, Agriculture and Cropping Pattern 7
Table 1.1 Year wise details of Land Use, Malda district 8
Table 1.2 Year wise variation in production and yield of principal crops, Malda district
9
1.5 Irrigation Practices 10
Table 1.3 Irrigation by different sources, Malda district 10
1.6 Urban area, Industries and Mining Activities 11
1.7 Economy of the District 11
Table 1.4 Irrigation sources and area irrigated (ha) for each type, Malda district
12
1.8 Previous Studies 12
CHAPTER 2: HYDROMETEOROLOGY 13 - 17
2.1 Climate 13
2.2 Rainfall 13
Table 2.1 Month wise Rainfall Data, Malda district 13
Fig. 2.1 Monthly Rainfall (2020) and Average Rainfall with Rainy Days (2016), Malda City
14
iv

2.3 Temperature 14
Table 2.2 Monthly minimum and maximum temperature (°C), Malda district
14
Table 2.3 Month wise mean minimum and maximum temperature (°C) 15
Fig. 2.2 Maximum, Minimum and Average Temperature in Malda City (2016)
15
2.4 Humidity 15
Fig. 2.3 Average Cloud Cover (%) and Relative Humidity (%) in Malda City (year: 2016)
16
2.5 Wind Velocity 16
Fig. 2.4 Average and Maximum Wind Speed and Gust (mph) in Malda City (year: 2016)
16
CHAPTER 3: GEOMORPHOLOGY 18 - 23
3.1 Physiography 18
Fig. 3.1 Geomorphological map of Malda district 19
Fig. 3.2 Relief and Slope map of Malda district 19
3.2 Land Use Land Cover 20
Fig. 3.3 Land Use Land Cover map of Malda district 20
3.3 Drainage 21
Fig. 3.4 Drainage map of Malda district 21
3.4 Soil Type 22
Fig. 3.5 Soil map of Malda district 23
CHAPTER 4: GEOLOGY 24 - 29
4.1 Surface Geology 24
4.2 Subsurface Geology 24
Fig. 4.1 Diagrams showing subsurface lithological correlation, Malda district
25
4.3 Exploratory Drilling 25
Table 4.1 Details of Exploratory Drilling (In House), Malda district 26
v

CHAPTER 5: GEOPHYSICAL SURVEY 30 - 35
5.1 Geoelectric Section and Panel Diagram 31
Fig. 5.1 Geoelectric Section, Habibpur block (after Ghosh Dastidar and Adhikari 2008)
32
Fig. 5.2 Panel Diagram, Manikchak block (after Ghosh Dastidar and Adhikari 2008)
33
5.2 Recommendations 34
5.3 Conclusion 34
CHAPTER 6: HYDROGEOLOGY 36 - 83
6.1 Regional Hydrogeology 36
6.2 Aquifer System 36
6.3 Aquifer Geometry 36
Fig. 6.1 Hydrogeological map of Malda district 37
6.4 Occurrence, movement and distribution of groundwater 38
6.5 Aquifer Characteristics and Aquifer Parameters 38
Table 6.1 Block wise hydrogeological details with drilling depth of Tube Wells
39
6.6 Depth to Water Level 40
Fig. 6.2 Location map showing exploratory wells and tube wells (both CGWB and PHED, Govt. of West Bengal) in Malda district
41
Fig. 6.3 Fence Diagram showing 3-D disposition and correlation of aquifers in Malda district
42
Fig. 6.4 Depth to Water Level map, Pre-monsoon 2020, Malda district 44
Fig. 6.5 Depth to Water Level map, Post-monsoon 2020, Malda district 45
Table 6.2 Depth to Water Level and other relevant data of Piezometers installed by State Water Investigation Directorate (SWID), Malda Division
46
6.7 Water table contours and groundwater flow direction 50
Fig. 6.6 Water Table Map showing regional groundwater flow direction, pre-monsoon 2020, Malda district
51
Fig. 6.7 Water Table Map showing regional groundwater flow direction, 52
vi

post-monsoon 2020, Malda district
6.8 Seasonal Fluctuation in groundwater level 52
Table 6.3 Seasonal fluctuation in groundwater level, Malda district 53
Fig. 6.8 Seasonal fluctuation in groundwater level (pre-monsoon versus post-monsoon, 2020), Malda district
56
6.8 Decadal (long-term) fluctuation in groundwater level 56
Table 6.4 Decadal fluctuation in groundwater level (pre-monsoon 2020 versus pre-monsoon, 2010-2019), Malda district
57
Table 6.5 Decadal fluctuation in groundwater level (post-monsoon 2020 versus post-monsoon, 2010-2019), Malda district
59
6.9 Pre-monsoon and post-monsoon long term (decadal) trend analysis
61
Fig. 6.9 Map showing decadal fluctuation in groundwater level (pre-monsoon 2020 versus pre-monsoon, 2010-2019), Malda district
62
Fig. 6.10 Map showing decadal fluctuation in groundwater level (post-monsoon 2020 versus post-monsoon, 2010-2019), Malda district
63
6.10 Groundwater resources 64
Table 6.6 Details of two Semi-critical Blocks in Malda district (as on 31-3-2013)
65
Table 6.7 Input parameters utilized for estimation of dynamic groundwater resources of Malda district (as on 31-3-2013)
66
Table 6.8 Block wise groundwater resource of Malda district (as on 31-3-2013)
66
Fig. 6.11 Water table map (pre-monsoon 2020), Chanchal-I block 68
Fig. 6.12 Water table map (pre-monsoon 2020), Chanchal-II block 68
Fig. 6.13 Water table map (pre-monsoon 2020), Gazole block 69
Fig. 6.14 Water table map (pre-monsoon 2020), English Bazar block 69
Fig. 6.15 Water table map (pre-monsoon 2020), Habibpur block 70
Fig. 6.16 Water table map (pre-monsoon 2020), Harishchandrapur-I block
70
Fig. 6.17 Water table map (pre-monsoon 2020), Harishchandrapur-II block
71
vii

Fig. 6.18 Water table map (pre-monsoon 2020), Kaliachak-I block 71
Fig. 6.19 Water table map (pre-monsoon 2020), Kaliachak-II block 72
Fig. 6.20 Water table map (pre-monsoon 2020), Kaliachak-III block 72
Fig. 6.21 Water table map (pre-monsoon 2020), Old Malda block 73
Fig. 6.22 Water table map (pre-monsoon 2020), Manikchak block 73
Fig. 6.23 Water table map (pre-monsoon 2020), Ratua-I block 74
Fig. 6.24 Water table map (pre-monsoon 2020), Ratua-II block 74
Fig. 6.25 Water table map (pre-monsoon 2020), Bamongola block 75
Fig. 6.26 Water table map (post-monsoon 2020), Bamongola block 76
Fig. 6.27 Water table map (post-monsoon 2020), English Bazar block 76
Fig. 6.28 Water table map (post-monsoon 2020), Chanchal-I block 77
Fig. 6.29 Water table map (post-monsoon 2020), Chanchal-II block 77
Fig. 6.30 Water table map (post-monsoon 2020), Gazole block 78
Fig. 6.31 Water table map (post-monsoon 2020), Harishchandrapur-I block
78
Fig. 6.32 Water table map (post-monsoon 2020), Harishchandrapur-II block
79
Fig. 6.33 Water table map (post-monsoon 2020), Habibpur block 79
Fig. 6.34 Water table map (post-monsoon 2020), Kaliachak-I block 80
Fig. 6.35 Water table map (post-monsoon 2020), Kaliachak-II block 80
Fig. 6.36 Water table map (post-monsoon 2020), Kalaichak-III block 81
Fig. 6.37 Water table map (post-monsoon 2020), Manikchak block 81
Fig. 6.38 Water table map (post-monsoon 2020), Old Malda block 82
Fig. 6.39 Water table map (post-monsoon 2020), Ratua-I block 82
Fig. 6.40 Water table map (post-monsoon 2020), Ratua-II block 83
CHAPTER 7: HYDROCHEMISTRY 84 – 92
7.1 Groundwater quality in shallow aquifers 84
Table 7.1 General range of chemical parameters in shallow aquifers, Malda district
85
7.2 Groundwater quality in deeper aquifers 85
vii

Table 7.2 Chemical quality of raw water before distribution through piped water supply schemes, Malda district
87
Table 7.3 Summary table on quality of groundwater, Malda district 88
Fig. 7.1 Samples of aquifer mapping study (Malda district), plotted in Piper Trilinear Diagram (A) and Modified Piper Diagram (B)
89
Fig. 7.2 Gibbs Diagram of groundwater samples, Malda district 90
7.3 Suitability of groundwater for irrigation 90
Fig. 7.3 Suitability of groundwater for irrigation use, Malda district; shown in (A) Wilcox Diagram and (B) US Salinity Diagram
91
CHAPTER 8: AQUIFER MANAGEMENT PLAN 93 - 155
8.1 Groundwater related issues and problems 93
8.2 Supply side and demand side aquifer management 94
8.3 Aquifer Management Plan for drinking and domestic Sector 94
Table 8.1 Groundwater based water supply schemes commissioned in Malda district
95
Table 8.2 Details of schemes for arsenic removal in groundwater, Ratua-I and Ratua-II blocks, Malda district
96
8.4 Aquifer Management Plan for irrigation sector 96
8.5 Aquifer Management through Artificial Recharge and Rain Water Harvesting
97
Table 8.3 Details of Artificial Recharge in three blocks of Malda district 98
8.6 Non committed surface runoff for Artificial Recharge and Rain Water Harvesting
99
Table 8.4 Estimation of non-committed surface runoff for Rain Water Harvesting, Malda district
99
8.7 Block Wise Aquifer Management Plans, Malda district 100
8.7.1 Aquifer Management Plan, Kaliachak-I block, Malda district 101
8.7.2 Aquifer Management Plan, Kaliachak-II block, Malda district 104
8.7.3 Aquifer Management Plan, Kaliachak-III block, Malda district 106
8.7.4 Aquifer Management Plan, English Bazar block, Malda district 108
8.7.5 Aquifer Management Plan, Manikchak block, Malda district 112
viii

8.7.6 Aquifer Management Plan, Ratua-I block, Malda district 116
8.7.7 Aquifer Management Plan, Ratua-II block, Malda district 120
8.7.8 Aquifer Management Plan, Chanchal-I block, Malda district 124
8.7.9 Aquifer Management Plan, Chanchal-II block, Malda district 129
8.7.10 Aquifer Management Plan, Bamongola block, Malda district 133
8.7.11 Aquifer Management Plan, Harishchandrapur-I block, Malda district
137
8.7.12 Aquifer Management Plan, Harishchandrapur-II block, Malda district
140
8.7.13 Aquifer Management Plan, Habibpur block, Malda district 144
8.7.14 Aquifer Management Plan, Gazole block, Malda district 148
8.7.15 Aquifer Management Plan, Old Malda block, Malda district 155
CHAPTER 9: CONCLUSION AND RECOMMENDATIONS 156 - 160
9.1 Conclusion 156
9.2 Recommendations 159
REFERENCES 161
FIELD PHOTOGRAPHS 162
ACKNOWLEDGEMENT 164
ix

1
REPORT ON AQUIFER MAPPING IN MALDA DISTRICT, WEST BENGAL MALDA DISTRICT AT A GLANCE
S. No.
Items Statistics
1. GENERAL INFORMATIONGeographical Area 3733 km2
Co-OrdinatesLatitude - 240 40' 20" N to 250 32' 08" N Longitude - 870 45' 50" E to 880 28' 10" E
Administrative Setup District Head Quarter English Bazar (25000'14" N, 88011'20" E) Nos. of Sub-Divisions 2 (Malda Sadar and Chanchal) Nos. of Blocks 15 (Kaliachak-I, Kaliachak-II, Kaliachak-III,
Manikchak, Ratua-I, Ratua-II, English Bazar, Old Malda, Chanchal-I, Chanchal-II, Gazole, Bamongola, Habibpur, Harishchandrapur-I and Harishchandrapur-II)
Number of Gram Panchayat 146 Number of Gram Samsad 2008 Number of Mouza 1814 Number of Municipality 2 Number of Villages 3701 (d) Population (Census, 2011)(with Population Density and Literacy %)
Total: 3988845 Male: 2051541(51.43% of total) Female: 1937304(48.57% of total) Rural: 3447185 (86.42% of total) Urban: 541660 (13.58% of total) Population of Scheduled Caste: 835430 Population of Scheduled Tribe: 313984 Population Density: 1069 person per km2
Literacy: 52.30% Male literacy: 56.0% Female literacy: 48.0%
(e) Normal Rainfall, Annual Rainfall &Temperature
Normal Rainfall: 1485.8 mm Annual Rainfall: 1297.9 mm (2019)
1614.4 mm (2020) Temperature: Maximum – 420C Minimum – 90C

2
2. GEOMORPHOLOGY(a) Major Physiographic Units (a) Barind
(b) Diara or Younger Alluvium(c) Tal or Swampy Area
(b) Major Drainage Perennial rivers: Ganga, Mahananda, Kalindri,Fulhar, Tangon
3. LAND USE (km2as on 31-3-2021)Forest Area 16.79 Cultivable Area 2800.00 Net Cultivable Area 2599.21 Orchard & Horticultural Crops 750.00 Pasture & other Grazing Land 4.35 Cultivable Waste Land 0.86 Land under Non-Agricultural Use 817.67 Miscellaneous (Trees &Groves, not included in Sown Area) 28.53
Current Fallow Land 499.54 Other Fallow Land 2.04 Gross Cropped Area 4747.01 Net Sown Area 2343.19 Cropping Intensity 196.0 %
4. MAJOR SOIL TYPE Red Soil, Lateritic Soil, Older and Younger Alluvial Soils
5. AREA UNDER PRINCIPAL CROPS(Year: 2016)
Cropped Area– 232160 ha Rice (Aus, Aman, Boro) – 204194 ha Total Cereals: 266173 ha Total Pulses: 2265 ha Total Food Grains: 288823 ha Total Oilseeds: 35951 ha Total Fibers: 22297 ha Total Miscellaneous Crops: 1049 ha
6. IRRIGATION Areas & No. of Structures (2016-17) (a) Minor IrrigationTube Wells Heavy Duty Tube Well (HDTW)
Number: 326, Area Irrigated: 65.90 km2
Medium Duty Tube Well (MDTW) Number:39, Area Irrigated: 4.89km2
Low Duty Tube Well (LDTW) Number: 204, Area Irrigated: 13.54 km2
Shallow Tube Well (STW)

3
Number: 33616, Area Irrigated: 833.06 km2
Dug Well Number: 0, Area Irrigated: 0 Tanks/Ponds Number: 30, Area Irrigated: 13.93km2
Surface Flow (weirs, diversions etc.) & Other Sources
Number: 466, Area Irrigated: 250.37 km2
Surface Lift from Rivers (RLI) Number: 483, Area Irrigated: 96.14 km2
(b) Overall Irrigation Status Percentage of Irrigated Area to Cultivated
Area – 55.04 % Area irrigated by Groundwater 917.39 km2
Area Irrigated by Surface Water 360.44 km2
Net Irrigated Area 1445.88 km2
Total Irrigated Area 1277.83 km2
7. NUMBER OF ACTIVE GROUND WATERMONITORING WELLS OF CGWB(as on 31.3.2021)
89 Dug Wells – 56 Piezometer – 19 Tube Wells – 14
8. GEOLOGICAL FORMATION Younger and Older Alluvium 9. HYDROGEOLOGY
Major Water Bearing Formation Quaternary Alluvium Pre-Monsoon Depth to Water Level (2020) 2.28 to 15.27 mbgl in Dug Wells
3.65 to 27.79 mbgl in Piezometers/TWsPost-Monsoon Depth to Water Level (2020) 1.28 to 8.77 mbgl in Dug Wells
1.30 to 23.72 mbgl in Piezometers/TWs10. GROUND WATER EXPLORATION (CGWB) as on 31-3-2021
No. of Wells Drilled 8 Depth Range (m) Maximum depth drilled 280.51 m bgl Discharge (lps) 13.48 lps to 58.27 lps Storativity (S) 9.9 x 10⁻² (in Araidanga OW, Ratua–II block) Transmissivity (T) 202.0 to 2969.0 m2/day
11. GROUND WATER QUALITY(a) Presence of chemical constituents more tha
permissible limit Arsenic, Iron
(b) Type of water Ca-Mg-HCO3 12. DYNAMIC GROUND WATER RESOURCES (as on 31-3-2017)
(a) Total Annual Ground Water Recharge 233310.85 ham (b) Net Annual Ground Water Availability 99252.75 ham (c) Gross Annual Ground Water Extraction 113283.91 ham (d) Annual Ground Water Allocation forDomestic Use (up to 2042 AD)
5465.13 ham

4
(e) Net Ground Water Availability for FutureUse
99252.75 ham
(c) Stage of Ground Water Development 53.09 % 13. AWARENESS AND TRAINING ACTIVITY
(a) Number of Mass Awareness ProgrammeOrganized
Nil
(b) Number of Water Management TrainingProgramme Organized
One
14. EFFORTS OF ARTIFICIAL RECHARGE ANDRAIN WATER HARVESTING(a) Projects Completed by CGWB
(No. and Amount Spent)Nil
(b) Projects Completed under the TechnicalGuidance of CGWB (Nos.)
Nil
15. GROUNDWATER CONTROL ANDREGULATION(a) No. of Over Exploited Blocks Nil (b) No. of Critical Blocks Nil (c) No. of Blocks Notified Nil
16. MAJOR GROUND WATER RELATEDPROBLEMS AND ISSUES
(1) Arsenic contamination in eight blocks ofthe district.
(2) Fluoride contamination in Ratua-II andBamongola blocks.
(3) Iron concentration in groundwater abovepermissible limit in major parts of thedistrict, especially in tube wells.
1. INTRODUCTION

5
1.1 Location
Malda district, lying on the northern side of the River Ganga, is located on the Garo-Rajmahal Gap separating the deltaic West Bengal in the south and is underlain by Quaternary alluvial deposits of two different ages, namely Recent and Pleistocene.
The district lies between the north latitude 240 40' 20" N to 250 32' 08" N and east longitude 870 45' 50" E to 88028' 10" E. Malda district falls in the Survey of India degree sheet nos. 72 O, 72 P, 78 C and 78 D. The district forms the northeastern part of the Indo-Gangetic alluvial plain and is flanked by the mighty river Ganga on its western and south-western boundary and by the international border with Bangladesh on the eastern and south-eastern boundary. The district is bounded by Pakur district (Jharkhand) in the west, by Purnea district (Bihar) in the north-west, by Uttar Dinajpur district in the north, by Dakshin Dinajpur district in the north and north-east and by Murshidabad district in the south. The terrain is generally flat with very low variation in surface relief with a gentle southerly sloping tract.
Malda district, the gateway of North Bengal and once the capital of Gour–Banga,is well connected by all-weather roads and railway to state capital Kolkata, national capital New Delhi and other parts of the country. Most of the trains that are bound for North Bengal and North Eastern states of India pass through Malda City Station located in the district headquarter Malda. Malda City is located on the confluence of the rivers Kalindri and Mahananda. Two National Highways, NH-34 and NH-31 pass through the district. Apart from this, state highways, a network of secondary and tertiary motorable roads connect various other prominent locations like Gazole, Habibpur, Manikchak, Harishchandrapur, Chanchal, Samshi, Ratua, Bamongola, Milki, Laxmipur, Kaliachak, Tulsihata etc. besides several large and small villages within the district. Total length of surfaced roads in the district was 4270.98 km whereas that of unsurfaced road was 4655.90 km (District Statistical Handbook, 2016).
1.2 Area and Administrative Units
The total geographical area of Malda district is 3733 km2. The district has 2 Sub-Divisions consisting of 15 Development Blocks. There are 13 Police Stations, 146 Gram Panchayats, 2268 Gram Sansads, 3701 villages (out of which 1613 were inhabited) and 10641 habitations. The district itself is located on the southernmost part of North Bengal and falls under the Jalpaiguri Division. The district consists of two subdivisions –Malda Sadar and Chanchal. The district headquarters is in English Bazar, which is a prominent place of commercial activities. Other prominent locations in Malda Sadar Sub-division are Mangalbari, Sahapur, Nimasarai, Kamlabari, Old Malda etc. Important places in Chanchal Sub-division include Chanchal, Ratua, Tulsihata, Harishchandrapur, Barduary, Bhaluka, Malatipur, Pukhuriya etc. The administrative map of Malda district is shown in Fig. 1.1.

6
Fig. 1.1Administrative Map, Malda district
1.3 Demographic Details
As per the latest available data (Census, 2011), total population in Malda district was 3988845, out of which male and female populations were 2051541 and 1937304 respectively. The overall density of population was 1068 per sq. km. Rural population was 86.42% of the total population, whereas only 13.58% of population was urban population. The district recorded a sex ratio of 944 females per 1000 males. The major languages spoken in Malda district are Bengali, Urdu, Hindi and Maithili.

7
The overall literacy rate in the district is 61.73%, with male and female literacy rates being 66.24% and 56.96% (District Statistical Handbook, 2016). As per latest Census data, the percentage of Scheduled Caste and Scheduled Tribe in the total population were 20.94% and 7.87% respectively. A religion-based census has indicated that out of the total population, Muslim population was 59%, Hindu population was 40% and remaining 1% population was formed by people of other religion.
As per the economic condition, Malda district has been ranked as one of the most underdeveloped districts in West Bengal. Agriculture remains the main livelihood of the people, primarily due to the absence of any mineral resource in the district.
1.4 Land Use, Agriculture and Cropping Pattern
Net area under cultivation with respect to total geographical area for Malda district is one of the highest in West Bengal and has reached the optimum, leaving thereby a little scope for further extension of cultivated land. The ratio of net area sown to total area ranges between 49.4% in Kaliachak–I block and 95% in Chanchal–I block and the ratio is more than 75% in twelve blocks (out of fifteen) in the district.
Land use pattern of urban and rural areas mainly depends on socio-economic and socio-cultural factors. The change in land use pattern can be explained as follows: 1. The rapid growth of population demands for rapid increase in agricultural productions by
bringing more and more areas under cultivation. In this regard, cropping pattern also plays asignificant role as ‘Boro’ paddy cultivation is gaining importance at unprecedented level throughbringing more areas under this.
2. Rapid urbanization of the area is also changing the land use pattern regularly and more and moreareas are being brought under urban activities and settlements.
Almost entire cultivated land is under double cropping with cropping intensity of 196%. Geomorphological conditions play an important role on land use and cropping pattern. In Malda district, agriculture is confined to ‘Tal” or swampy area, “Diara” or flood plain area and “Barind” tract or relatively elevated land with occasional waterlogging condition. Swampy or ‘Tal’ area is mainly used for jute and paddy cultivation and its southern part is used for cultivation of ‘Rabi’ crops, whereas ‘Boro’ paddy (high yielding summer paddy) is produced in low-lying areas of ‘Barind’ tract. In ‘Diara’ or flood plain area (highly fertile), paddy is the main crop, though sugarcane, oil seeds, and barley are also grown. The junction of ‘Diara’ and ‘Tal’ area is extensively used for cultivation of various crops and for mango production. The year wise pattern of land use is summarized in Table 1.1.

8
Table1.1 Year wise details of Land Use, Malda district
Year Geogra- phical Area
(ha)
Forest Area
(ha)
Area under
Non-Agri-cultural
Use (ha)
Barren &
Uncul-turable
land (ha)
Permanent Pastures & other Grazing
Land (ha)
Land under Misc. Tree Groves not included in
Net Area Sown (ha)
Cultiv- able
Waste Land (ha)
Fallow Land other
than Current Fallow
(ha)
Current Fallow
(ha)
Net Area Sown
(ha)
2002 371050 1680 84640 - - 3050 90 300 52800 228490 2003 371050 1680 84060 - - 3010 90 300 49650 232260 2004 370860 1680 83580 - - 2990 100 310 54610 227590 2005 370860 1680 86720 - - 2690 100 670 57460 221540 2006 370860 1680 84420 - - 2900 100 300 70080 211400 2009 370860 1680 88620 - - 3430 90 330 60710 216000 2010 370860 1680 90110 - - 3240 100 300 57450 217980 2011 370860 1680 75280 - - 2930 80 300 59520 231070 2012 370860 1680 80820 - - 2930 90 300 53960 231080 2013 370860 1680 81250 - - 2990 90 270 52420 232160 2014 370862 1679 81767 -- -- 2853 86 204 49954 234319
Source: Directorate of Agriculture (Evaluation), Govt. of West Bengal
Agricultural Practices
Malda district is mainly agrarian. More than 87 % of the net cropped area is under paddy cultivation with rice being the staple food. Out of three varieties of paddy, Aman (autumn paddy) is grown over a large area. Crop production for Aus paddy, potato and barley are far below state average. However, productivity is at par or even more with state average for sugarcane, wheat and Aman paddy.
Cropping Pattern
The principal crops are paddy, potato, wheat, pulses, mustard and other oilseed, jute, sugarcane and other Rabi crops. Among the food grains, paddy is the principal crop. Boro and Aman are the main types. Jute cultivation ranks next to paddy. Among cash crops, mango ranks as principal fruit grown in 23179 ha. English Bazar is the best mango growing block. Other important mango-growing blocks are Manikchak, Harishchandrapur–I and II, Kaliachak–I, II and III and Old Malda. The district is famous for production of raw silk yarn, which annually gives 85% of total production of silk in West Bengal. Mulberry plantation, essential for production of raw silk yarn is found in the district’s central and eastern part. The details of production and yield of principal crops is given in Table 1.2 (Source: Directorate of Agriculture, Govt. of West Bengal).

9
Table 1.2 Year wise variation in production and yield of principal crops, Malda district
Crops 2009-10 2010-11 2011-12 2012-13 2013-14
Food Grains Prod. Yield Prod. Yield Prod. Yield Prod. Yield Prod. Yield
1. Rice 614.5 2834 630.5 3140 612.0 2986 644.6 3105 704.4 3544
Aus 11.8 2031 5.5 1600 8.5 2317 5.5 1781 6.1 1943
Aman 378.5 2647 379.5 2859 386.1 2671 412.6 2833 462.1 3407
Boro 224.2 3296 245.5 3802 217.4 3835 226.5 3847 236.2 3935
2. Wheat 129.4 2938 144.0 3027 131.8 3030 125.1 2784 131.7 2944
3. Barley 1.4 1132 2.1 1378 1.9 1467 2.0 1419 1.9 1419
4. Maize 19.9 2314 20.2 2299 29.4 2164 40.3 1979 42.7 2630
Total Cereals 765.2 2827 796.8 3081 775.1 2944 812.0 2960 880.7 3373
6. Gram 4.8 1464 2.4 1074 3.8 1113 4.7 1446 3.6 1132
7. Tur 0.1 1100 0.1 1094 <50 ton 448 <50 ton 1359 <50 ton 1286
8. Other Pulses 18.9 1089 13.9 976 14.3 907 18.0 1016 17.9 967
Total Pulses 23.8 1149 16.4 989 18.1 943 22.7 1083 21.5 992
Total Food Grains 789.0 2707 813.2 2955 793.2 2808 834.7 2827 902.2 3191
Oil Seeds
1. Rapeseed & Mustard 38.4 1174 31.8 1047 36.6 1128 35.8 1062 38.3 1087
2. Linseed 0.1 663 0.1 623 <50 ton 726 <50 ton 493 0.1 682
3. Other Oil seeds 0.2 677 0.4 629 0.3 767 0.5 933 0.7 916
Total Oil Seeds 38.7 1166 32.3 1035 36.9 1123 36.3 1059 39.1 1081
Fibres
1. Jute 307.8 16.9 255.6 14.2 313.2 14.6 394.6 16.6 396.1 16.1
2. Mesta 2.2 13.2 5.1 11.9 4.8 7.6 4.7 8.3 4.4 7.8
3. Other Fibres - - - - - - - - - -
Total Fibres 310.0 16.9 260.7 14.1 318.0 14.4 399.3 16.4 400.5 15.9
Miscellaneous Crops
1. Sugarcane 212.8 98701 221.0 98925 253.9 116395 216.5 104567 210.2 102366
2. Potato 151.8 34382 146.8 29153 147.0 38048 176.8 36077 164.7 32175
3. Tobacco 0.1 657 0.1 656 0.1 650 0.1 658 - - 4. Chillies (dry) 2.8 1102 2.8 1105 2.8 1085 2.8 1086 2.9 1116
5. Ginger 0.4 1593 0.4 1641 0.4 1642 0.4 1660 0.6 2162
Total Misc. Crops 367.9 38726 371.1 36029 404.2 44418 396.6 39652 378.4 37694

10
1.5 Irrigation Practices
Malda is endowed with vast groundwater resources. Groundwater is mainly tapped by shallow and deep tube wells. However, this resource is limited in ‘Barind’ tract. Irrigation facilities are also created from surface water sources like rivers, ponds and tanks. No major irrigation project exists in the district as per government data source. Irrigation infrastructure entirely depends on minor irrigation schemes. As per latest available data, no government irrigation canal exists in the district. Minor irrigation with surface water comprises river lift irrigation, irrigation from tanks and ponds. Total irrigated area in the district is 127783 ha, which is about 45.64% of cultivable area. Area irrigated by groundwater is 91739 ha whereas that by surface water is 36044 ha (District Statistical Handbook, 2016). Details of various sources of irrigation is given in Table 1.3.
Table 1.3 Irrigation by different sources, Malda district (area in thousand ha)
Year Tank HDTW MDTW LDTW STW RLI ODW Others Total Nos. Area Nos. Area Nos Area Nos. Area Nos. Area Nos. Area Nos. Are
a Nos. Area Nos. Area
2009-10 255 1.333 326 6.568 39 0.450 145 0.886 33459 82.813 483 9.423 - - 446 24.990 126.463
2010-11 255 1.323 326 6.606 39 0.459 145 0.903 33515 83.003 483 9.471 - - 446 24.999 126.764
2011-12 255 1.391 326 6.570 39 0.468 192 1.248 33595 83.242 483 9.596 - - 446 25.029 127.544
2012-13 255 1.389 326 6.585 39 0.477 192 1.256 33602 83.275 483 9.606 - - 446 25.032 127.620
2013-14 255 1.393 326 6.590 39 0.489 204 1.354 33616 83.306 483 9.614 - - 446 25.037 127.783
HDTW – Heavy Duty Tube Well MDTW – Medium Duty Tube Well LDTW - Low Duty Tube Well
STW- Shallow Tube Well RLI - River Lift Irrigation ODW – Open Dug Well
Source: 1) Irrigation and Waterways Directorate, Govt. of WB
2) Agriculture Office, Malda
3) Agri Mechanical & Agri Irrigation Department, Malda
Surface Water Irrigation: Sources of surface water are mainly the perennial rivers and streams. Small water bodies like pond, tank, bils are also important sources of surface water irrigation particularly during Rabi and Boro crop seasons. Apart from tanks, irrigation is also being done by surface flow schemes like weirs, diversions etc. Latest available data indicates that total area irrigated by surface water schemes is 36044 ha.

11
River Lift Irrigation: As per latest data of state government, a total of 483 river-lift-irrigation (RLI) schemes are operational in Malda district, where the water is drawn from major rivers like Ganga, Mahananda, Kalindri, Tangon and Punarbhaba. The command area for each scheme is about 25 ha. The total area irrigated by such RLI schemes is 9614 ha (District Statistical Handbook, 2016).
Irrigation from Ponds, Tanks and other Water Conservation Structures: Tanks, Bills and ponds irrigate a major part of the net irrigated area in water scarce area particularly in Barind tract, where ground water potential is comparatively low. These structures are also act as rainwater conservation structures. 255 tanks are now being used for Irrigation. In Bamongola block, more than 40% of net irrigated area is covered by tank due to absence of significant number of deep tube wells. Some tanks are used for non-irrigation purpose (for fisheries). Total area irrigated by tanks, bills and other surface water bodies is 1393 ha.
Groundwater Irrigation: Heavy Duty (HDTW), Medium Duty (MDTW) and Low Duty Deep Tube Wells (LDTW) and Shallow Tube Wells (STW) are the groundwater irrigation sources in Malda district. A total of 91739 ha of land is being irrigated by 326 HDTW (area irrigated: 6590 ha), 39 MDTW (489 ha), 204 LDTW (1354 ha) and 33616 STW (83306 ha). Details of irrigation sources like surface water irrigation, river lift irrigation and groundwater irrigation is given in Table1.4.
1.5 Urban area, Industries and Mining activities
There are two municipalities in the district namely English Bazaar and Old Malda covering an area of 22.63 km2. Rapid urbanization brings more and more areas under residential and industrial sector. The district has no known mineral resources. The main industries present in Malda district are food products, wood, silk and synthetic fibre textiles, printing, publishing and allied industries, nonmetallic mineral products etc.
1.6 Economy of the District
Economy of the district is primarily based on agriculture. Main agricultural products are paddy, wheat, jute and rabi crops. Poor economy is due to low per capita income, low yield per acre of land, backwardness in industrialisation, shortage of capital and entrepreneurship and lack of infrastructure and large labour surplus. Production of raw-silk yarn in this district is about 85% of the total output of West Bengal, which amounts to about Rupees Four Crore annually. Production and trading of mango is another important aspect of the economy. About 45000 acres of land are covered by mango orchards which, in normal years, produces 360000 tonnes of mango with a value of around 5.5 Crore Rupees.

12
Table 1.4. Irrigation sources and area irrigated (ha) for each type, Malda district (Period: 2014-15)
Name of Block Tank RLI DTW STW Others Total
No. Area No. Area No. Area No. Area No. Area No. Area Harishchandrapur-I
- - 14 378 33 395 3126 9294 25 1482 3198 11549
Harishchandrapur-II
- - 42 535 11 170 4520 12490 12 705 4585 13900
Chanchal-I 6 33 26 419 32 686 2166 6940 36 1848 2266 9926 Chanchal-II - - 33 399 34 608 2250 6646 46 2235 2363 9888 Ratua-I - - 37 1021 40 692 2678 7048 16 986 2771 9747 Ratua-II - - 67 1431 79 1240 1449 3828 55 2953 1650 9452 Gazole 71 450 51 1060 91 793 4066 8049 65 3559 4344 13911 Bamongola 56 300 36 550 - - 1892 4458 10 864 1994 6172 Habibpur 71 358 56 930 31 197 1856 3678 99 5607 2113 10770 Old Malda 51 252 51 1133 61 948 1201 2310 24 1529 1388 6172 English Bazar - - 25 580 50 1054 1098 2876 34 2021 1207 6531 Manikchak - - 27 701 21 482 2441 5546 10 555 2499 7284 Kaliachak-I - - 4 .. 17 312 1340 2946 5 278 1366 3536 Kaliachak-II - - 11 385 26 440 808 1728 5 203 850 2756 Kaliachak-III - - 3 92 43 416 2725 5469 4 212 2775 6189 TOTAL 255 1393 483 9614 569 8433 33616 83306 466 25037 35369 127783
1.7 Previous Studies
Central Ground Water Board (CGWB) has completed Systematic Hydrogeological Surveys and groundwater exploration in Malda district. Systematic hydrogeological surveys were initiated by the Groundwater Division of Geological Survey of India during the period 1961-1967. Sh. M. Srivastava and Dr. D.K. Khan (1983) were the first to give a comprehensive hydrogeological account of the district. Subsequently, Reappraisal Hydrogeological Survey in Malda district was completed by Sh. Amlanjyoti Kar of CGWB during 1998-1999.
Under the All India Ground Water Exploration Project (1958-1959), exploratory drilling was undertaken at Mandilpur (Old Malda block), Kangsa (Bamongola block) and Nityanandapur (Habibpur block). During the Annual Action Plan: 2006-07, groundwater exploration was continued to delineate the geometry and characteristics of deeper arsenic-free aquifers under which exploratory drillings were carried out at Bhaluka (Ratua-I block and Harishchandrapur-II block), Araidanga (Ratua–II block) and Narendrapur (English Bazar block) where tube wells were constructed by tapping the aquifers using cement sealing technique for arresting the water supposed to be percolated from arsenic contaminated upper aquifer.

13
2. HYDROMETEOROLOGY2.1 Climate
The district is characterized by a humid tropical climate, which is marked by extreme to very hot, oppressive and sultry summer (380 - 400 C), short and fairly cold winter and a protracted monsoon with plentiful rains and moisture in the air throughout the year. Basically, there are four seasons in the year. The period from March to May is the summer season. The rainy season starts in June with the onset of southwest monsoon and continues till the middle/end of September. October and the first half of November constitutes the autumn or post monsoon season. Winter starts in end of November and continues till end of February. December and January are the coldest months with temperature hovering in between 7 0C to 11 0C.
2.2 Rainfall Normal rainfall in Malda district is 1453 mm whereas average number of rainy days (having daily rainfall exceeding 2.5 mm) in a year is 67. Main source of rainfall is the southwest monsoon, which contributes 78 % of the total annual rainfall. Maximum rainfall is recorded in July and August, whereas November, December and January are mostly dry. Sometimes torrential rain for short duration occurs from March to May. Eastern part of the district receives more rainfall than the western part. Monitoring of rainfall is done by India Meteorological Department in Malda City and also by the State Government through eight rain gauge stations located mostly in Block Seed Farms. Month wise rainfall data for five years (period: 2016-2020) is given in Table 2.1 and a bar diagram for the monthly rainfall data of 2016 is shown in Fig. 2.1.
Table 2.1 Month wise Rainfall data, Malda district
Source: India Meteorological Department
Month Rainfall (mm) 2016 2017 2018 2019 2020 Average
January 16.9 0.9 0 0 8.3 5.22 February 0 0 7.6 38.1 35.1 16.16 March 2.1 12.4 22.9 3.6 49.0 18.0 April 21.6 94.8 112.0 77.0 77.8 76.64 May 85.4 110.6 153.6 121.1 137.5 121.64 June 157.4 76.5 85.3 98.8 361.9 155.98 July 407.3 352.6 230.2 373.5 346.5 342.02 August 152.1 580.5 148.9 104.0 217.4 240.58 September 337.9 200.1 133.4 364.9 317.0 270.66 October 72.0 143.9 51.2 145.6 52.7 93.08 November 12.3 0 0 0 0 0 December 8.3 5.7 12.3 1.3 0 3.86

14
2.3 Temperature
Mean annual temperature of the district is 25 0C. Late December and early January are marked as the coolest period when minimum temperature generally remains around 7 0C to 11 0C, which sometimes goes down to 4 0C. In winter, day temperature scales around 25 0C to 27 0C. May is the hottest month with temperature soaring as high as 43 0C. Generally, temperature rises from the beginning of March and day temperature goes up to 40 ˚C in April and May. Mean minimum and maximum temperature in the district are 22 0C and 31 0C respectively. The monthly minimum, maximum, monthly mean minimum and monthly mean maximum temperature (period: 2010-2014) is given in Table 2.2 and Table 2.3. The minimum, maximum and average temperature at Malda City is shown in Fig. 2.2.
Table 2.2 Yearly minimum and maximum temperature (°C), Malda district
Month 2010 2011 2012 2013 2014 Max Min Max Min Max Min Max Min Max Min
January 26 8 26 5 28 10 27 5 27 9 February 32 13 31 13 34 11 32 13 30 10 March 40 19 37 15 39 17 38 17 38 16 April 41 22 39 19 41 20 42 19 41 22 May 42 21 37 21 43 21 43 22 42 21 June 40 22 37 25 42 25 37 22 38 22 July 36 26 35 25 36 26 36 26 36 25 August 38 26 37 24 36 26 36 25 34 25 September 35 25 37 25 .. .. 37 24 36 24 October 35 22 35 20 35 20 34 22 35 22 November 34 17 32 17 32 15 31 16 33 16 December 30 9 31 9 27 8 29 10 28 9 Annual 42 8 39 5 43 8 43 5 42 9
Fig. 2.1 Monthly Rainfall (2016) and Average Rainfall with Rainy Days (2016), Malda City

15
Table 2.3 Month wise mean minimum and maximum temperature (0C)
Month 2010 2011 2012 2013 2014 Mean Max
Mean Min
Mean Max
Mean Min
Mean Max
Mean Min
Mean Max
Mean Min
Mean Max
Mean Min
January 21 11 21 11 23 13 22 11 23 13 February 28 16 28 16 28 16 28 16 25 15 March 35 22 33 21 34 20 34 21 32 20 April 37 26 34 23 35 24 35 24 37 24 May 35 25 34 25 38 27 34 25 38 26 June 34 26 34 26 36 28 34 27 34 27 July 33 27 33 27 33 27 34 28 33 27 August 34 27 32 27 34 28 33 27 33 27 September 33 26 33 26 .. .. 34 27 32 26 October 32 24 33 25 32 24 31 24 32 24 November 30 21 29 20 28 18 29 19 30 19 December 25 14 24 14 22 13 25 15 23 13
Source: India Meteorological Department
2.4 Humidity
The district has a humid climate throughout the year and humidity ranges between 54 to 84 % as recorded at 8:30 AM. Maximum relative humidity (RH) varies from 54 to 94% whereas the minimum RH varies from 35 to 80%. The relative humidity is the maximum during monsoon season in the month of August and the minimum in spring viz. during the months of February and March. Graphical representation of average Clod Cover and Relative Humidity in Malda City (Year: 2016) is given in Fig. 2.3.
Fig. 2.2 Maximum, Minimum and Average Temperature in Malda City (2016)

16
2.5 Wind Velocity
Wind velocity varies from month to month and it attains maximum value during the winter months of November to January. Sometimes cyclonic wind and hailstorms lash the districtin the months of March-April. Wind speed plays an important role in the evaporation and evapo-transpiration process.
2.6 Potential Evapo-transpiration
Specific data on Potential Evapo-transpiration (PET) are not available for the district. However, in the month of May, Precipitation (P) exceeds 0.5 times the Potential Evapo-transpiration (PET) indicating favourable moisture condition for germination of clouds. The period wherein P is greater than PET is known as humid or wet period. In this condition, precipitation (P) exceeds the Potential Evapo-transpiration (PET) demand of crop and replenishes the moisture deficit in storage. Humid period commences in the last week of May and continues up to first week of October. During post-humid period (after
Fig. 2.4 Average and Maximum Wind Speed and Gust (mph) in Malda City (year: 2016)
Fig. 2.3 Average Cloud Cover (%) and Relative Humidity (%) in Malda City (year: 2016)

17
the first week of October), precipitation is less than Potential Evapo-transpiration and soil moisture starts declining. In Malda City, recorded lowest and highest normal Potential Evapo-transpiration (year: 2016) are 61.2 mm in December and 187.6 mm in May. The total annual Potential Evapo-transpiration in Malda district was 1363 mm in 2016.

18
3. GEOMORPHOLOGY
3.1 Physiography
Malda district is characterized mainly by low-lying plains, sloping towards south with undulating areas on the northeast having a flat to gently rolling topography, with an elevation varying from 22.0 m to 39.7 m above mean sea level (amsl). The highest elevation of 39.7 m amsl is located at Gazole in the east central part of the district.
Mahananda River divides the district into two regions - the eastern region, consisting mainly of older alluvial and relatively unfertile soil, is commonly known as the ‘Barind’ tract. The western region is further subdivided by Kalindri River into two areas. The northern part is known as ‘Tal’ and the southern part is known as ‘Diara’. Thus, the district can be divided into three distinct geomorphic units namely Barind, Diara and Tal, which are local terms but deeply entrenched into standard literature. A brief description of the three geomorphic landforms is given below.
3.1.1 Barind: The Barind tract is peculiar due to its physiographic characteristics. It is predominantly developed in Bamongola, Gazole, Habibpur and Old Malda blocks in the eastern and east central part of the district. The Barind tract consists of relatively unfertile older alluvial soil exposed in relatively elevated highlands with wide undulating tract and interspersed between shallow stretches and deeper depressions. This zone consists of reddish brown, clayey soil.
3.1.2 Diara: The flat, very fertile and thickly populated land between the Ganga River on the west, Mahananda River on the east and Kalindri River on the north comprises younger and older alluvial plains, which is locally known as Diara. This unit is the result of accretion of flood plain deposits. In this zone, the soil is predominated by loam followed by sandy loam. It is well developed in English Bazar, Manikchak and Kaliachak–I, II and III blocks.
3.1.3 Tal: The zone falling in the western part of Mahananda River and northern part of Kalindri River covering Ratua–I and II blocks and Harishchandrapur-I and II blocks, is locally known as Tal or swampy area. This is a low-lying area sloping down towards south and is vulnerable to inundation during monsoon period. Soil in Tal is of clayey loam type. Several depressed, swampy areas, locally known as Bils are frequently observed in the Tal zone. The largest of such Bils is the Ahora Bil covering an area of about 5 km2 in the southwest of Barind Tract in Bamongola block. A series of such Bils is exposed in a linear pattern to the east of Mahananda River, extending from English Bazar to Gour. Isolated Bils are also found in the flood plains or Diara zone.
Geomorphological map of Malda district is shown in Fig. 3.1, which shows four geomorphic class viz. alluvial plain, active delta plain, meander flood plain and marshy/inundated plain. Majority of land surface in the district has a very low slope (< 5 m/km) except for the Barind tract in parts of Bamongola, Habibpur and Gazole blocks, where the slope is higher (5-10 m/km). The Relief and Slope map of Malda district is shown in Fig. 3.2.

19
Fig. 3.2 Relief and slope map of Malda district
Fig. 3.1 Geomorphological map of Malda district

20
3.2 Land Use Land Cover
Land cover is the natural class of landform whereas land use is the usage pattern by human for a particular land cover type. Although these two terms are often used together, the natural classes like forest land, wetland etc. are distinct from human made classes like built-up area, agricultural land etc. Water bodies can be both natural like rivers and streams, large ponds (Bils) as well as artificial like irrigational tanks and ponds, canals etc. In Malda district, major land use/land cover types are agricultural land, water bodies (rivers, streams, ponds), wetlands (marshy and seasonally inundated areas comprising the Tal zone), forest land and built-up area (human settlements). Land Use Land Cover map of Malda district is shown in Fig. 3.3.
Fig. 3.3 Land Use Land Cover map of Malda district

21
3.3 Drainage
The most important natural drainage in Malda district are the major perennial rivers like Ganga, Fulahar, Mahananda, Kalindri, Tangon, Nagri and Punarbhaba, which constitute the main drainage system. Ganga and Mahananda rivers constitute the largest drainage network in the district. Almost all the major rivers are meandering in nature and have left typical ox-bow lakes along their abandoned channels. These rivers played an important role in overall geomorphological set-up of the district. Drainage map of Malda district is shown in Fig. 3.4.
Fig. 3.4 Drainage map of Malda district

22
Ganga River marks the western and south-western boundary of the district and flows south easterly through Manikchak block and western boundary of Kaliachak-I and II blocks for 172 km before entering Bangladesh. It drains only the western and south-western parts of the district. Tributaries of Ganga River in Malda district are Fulahar and Kalindri. Mahananda River enters Malda district through the tri-junction of Chanchal–I, Ratua–II and Gazole blocks and drains the central part. The river flows from north to south for 88.6 km before entering Bangladesh. It divides Malda district into a) the eastern part having higher altitude and b) the western part having lower altitude. Punarbhaba River enters from northeast of Bamongola block, flows along with its tributary Haria Nadi for 64.4 km before entering Dakshin Dinajpur district. Tangon River enters the district at the junction of Bamongola and Gazole blocks, then flows south easterly through the Barind tract and meets Mahananda River near Muchia in Habibpur block. Kalindri River flows through English Bazar and Manikchak blocks and joins Mahananda River to the north of Malda City. Tangon River divides the Older Alluvial area (Barind Tract) into two parts a) Bamongola and Habibpur blocks with large water bodies in the east and b) Gazole and Old Malda blocks in the west.
3.4 Soil Type
Soils of Malda district can be divided into two groups, a) gangetic alluvial soil and b) red soil. Mahananda River separates the gangetic alluvial soil in the western part from the red soil in the eastern part. Gangetic alluvial soil is further sub-divided into three types based on texture, namely a) Gangetic riverine soil which occurs in Harishchandrapur-I and II, Manikchak, Kaliachak-I, II, III and western part of Ratua-I block, b) Gangetic flat land soil which occurs mainly in Chanchal-I and II, Ratua-II and parts of Gazole, Old Malda and English bazar blocks and c) Gangetic low land soil, which occurs in Ratua-I and Chanchal-II blocks.
Gangetic alluvial soils have one or two sandy layers made up of fine to very fine sand of grey and greyish white colour. The soil is rich in calcium and almost neutral in reaction. Clay content is fairly high whereas organic matter, potash and phosphorous contents are low to medium. The soil is fertile and used extensively for cultivation especially for paddy, jute, pulses and oil seeds. Main constituents of this soil are – sand: 7-9%, sandy loam: 15-16%, loam: 45–47%, clay loam: 5-13%, silt loam: 11-12% and clay: 5-6%. It is very fertile and used extensively for cultivation of paddy, jute, pulses and oil seeds (Ghosh Dastidar and Adhikari 2008). The red soil occurs in eastern part of Malda district, covering the ‘Barind’ tract. It is reddish to reddish brown in colour. Constituents of this soil are - sandy loam: 0.5%, loam: 10-12%, clay loam: 32-35% and clay: 55-57% (Ghosh Dastidar and Adhikari 2008). The soil is mildly acidic with low organic matter and phosphate content. It is also fertile and suitable for high yielding paddy (Aman and Boro), jute and Rabi crops. Soil map of Malda district depicting four principal categories, is shown in Fig. 3.5. This map shows three soil classes based on texture, viz. fine loamy, coarse loamy and fine silty soil. Fine loamy soil is exposed in major part of the district whereas fine silty soil occurs in the eastern and southern most parts. Coarse loamy soil occurs as scattered patches in the northern, western and south central parts.

23
Fig. 3.5 Soil map of Malda district

24
4. GEOLOGY4.1 Surface Geology
The geological setting of Malda district is a result of subsidence and concomitant deposition in Garo-Rajmahal Gap in the fore deep area in front of the Himalaya. Large scale sedimentation by the Himalayan rivers in Pleistocene and Holocene (Recent) periods deposited alluvial sediments of two age groups namely Older Alluvium of Pleistocene age and Younger Alluvium of Holocene age.
Older Alluvium of Pleistocene age occupies the eastern part of the district covering Gazole, Habibpur, Bamongola and Old Malda blocks. This alluvium is composed of argillaceous sediment (clay) and calcareous material, which has imparted a reddish brown colour to the soil as the lateritisation of sediment is often observed in surface clay. The clays are very stiff and plastic in nature.
Younger (or Newer) Alluvium of Holocene age is exposed in western part of the district to the west of Mahananda River, which has a fairly thick sedimentary succession deposited in the deltaic flood plains. The fluviatile sediment is characterized by dark grey colour, high moisture and organic matter content, which consists of a sequence of clay, silt, micaceous sand (fine to coarse grained) and sub-rounded to rounded gravel. In Barind tract, older alluvial deposits occur along Tangon and Punarbhaba Rivers.
4.2 Subsurface Geology
Subsurface lithological data collected from several tube wells drilled by State Govt. agencies and from the exploratory boreholes drilled by Central Ground Water Board reveals that thickness of alluvial deposits increases towards east and southeast. Rajmahal Traps are exposed in Sahebganj district of Bihar, which is to the west and southwest of Malda district. Bore holes drilled in Manikchak and Kaliachak blocks indicate the occurrence of hard rock below 100 m depth. The Older Alluvium occurs in the Barind tract to the east of Mahananda River. It is composed of silt, clay, sand and gravel with ferruginous nodules and calcareous concretions (kankars). Litho-facies variation is a common feature that controls occurrence and movements of groundwater in the ‘Barind’ tract. In Harishchandrapur and Kaliachak blocks, thickness of top clay layer varies from 3 to 15 m, which is underlain by a layer of fine sand having thickness varying from 10 to 20 m.
A layer of medium to coarse sand (20–60 m thick) underlies the fine sand layer. Thickness of topsoil increases towards north and gets intercalated with silt and fine sand. In Quaternary alluvium, potential aquifers comprising sand, gravel and pebble occurs in the depth range of 15 to 134 m bgl. Subsurface lithological correlation diagram and disposition of aquifers are shown in Fig.4.1.

25
4.3 Exploratory Drilling
Central Ground Water Board (CGWB), Eastern Region (ER) has drilled exploratory boreholes and observation wells in 12 locations falling in nine Developmental Blocks of Malda district (as on 31-3-2021), as given below: Kangsa and Bamongola in Bamongola block, Mandilpur and Maligram in Old Malda block, Nityanandapur in Habibpur block, Amar Singhee and Gobindapur in Ratua-I block, Araidanga in Ratua–II block, Arbara and Kharba Jamuria in Chanchal-I block, Bhaluka in Harischandrapur-II block, Kandar (Kocha) and Pandua in Gazole block, Narendrapur and Malda Sadar Hospital in English Bazar block (as on 31-7-2021). The borehole at Mandilpur encountered gneissic rock at 259.70 m bgl underneath the alluvial formation (Ghosh Dastidar and Adhikari 2008). Groundwater in these tube wells is in general potable and suitable for domestic and irrigational use. Various drilling details of the exploratory drilling (in house) by CGWB, ER are summarized in Table 4.1.
Fig. 4.1 Diagrams showing subsurface lithological correlation, Malda district

26
Table 4.1 Details of Exploratory Drilling (In House), Malda district
Sl No
Location Block Co-ordinate (in DD)
Drilled Depth (m)
Well Construction Depth (m)
Aquifer Zones Tapped (mbgl)
Static Water Level (mbgl)
Discharge
Drawdown
Transmissivity, T (m2/day), Storativity (S)
Chemical Quality
Agency and Year of Construction
1. Mandilpur (EW)
Old Malda 25.0406 88.1842
280.51 140.0 Older Alluvium
35.76– 45.93, 59.05– 75.55
104.75 – 124.67, 131.23– 137.79
10.57 58.27 lps
5.41 m 296.90 m2/day Potable ETO
2. Kangsa Bamongola
25.104 88.371
169.29 157.27 Bore Hole
74.65-110.07, 134.11-137.16
NA NA NA NA NA ETO
3. Nityanan-dapur (EW)
Habibpur 25.0008 88.3599
165.68 139.0 Older Alluvium
50.03– 56.63,
102.49–118.99 125.52– 136.74
19.90 13.48 lps
9.84 m 1125.02 m2/day
Potable ETO

27
4. Bhaluka (DEW)
Harischan-drapur -II
25.2502 87.8927
250.99 244.0 Alluvium
217.0 - 241.0
Cement Sealing 160–163 m
NA 8.33 lps NA NA Potable CGWB 2006-07
5. Bhaluka (IEW)
Harischan-drapur -II
25.2502 87.8927
149.60 146.0 Alluvium
105–127, 130-142CementSealing80 – 85m
5.44 46.53 lps
NA NA Potable CGWB 2006-07
6. Bhaluka (SEW)
Harischan-drapur -II
25.2502 87.8927
61.20 53.0 Alluvium
36.0 - 50.0 clay
packing from
GL to 10 mbgl
5.51 7.25 lps 1.11 m 1140.74 m2/day
Potable CGWB 2006-07
7. Bhaluka (EW)
Harischan-drapur -II
25.2502 87.8927
223.80 223.0 Alluvium
209 – 221 clay
packing from
GL to 10 mbgl
NA NA NA NA Potable CGWB 2006-07

28
Sl No
Location Block Co-ordinate (in DD)
Drilled Depth (m)
Well Construction Depth (m)
Aquifer Zones Tapped (mbgl)
Static Water Level (mbgl)
Discharge
Drawdown
Transmissivity, T (m2/day), Storativity (S)
Chemical Quality
Agency and Year of Construction
8. Araidanga (EW)
Ratua - II 25.1175 87.9885
145.00 108.0 Alluvium
81 - 105 6.41 35.0 lps 1.33 m 6214.0 m2/day Potable CGWB 2007-08
9. Araidanga (OW)
Ratua - II 25.1175 87.9885
138.00 108.0 Alluvium
81 - 105
6.98 16.95 lps
NA 7170 m2/day S = 0.099
Potable CGWB 2007-08
10. Malda Sadar Hospital
English Bazar
25.033 88.133
NA 118.87 Alluvium
18.3 – 106.7
NA NA NA NA Potable CGWB
11. Narendrapur (EW)
English Bazar
24.9294 88.1188
156.00 98.0 Older Alluvium
83 – 95 Cement Sealing 67 – 70 m
1.81 33.33 lps
5.33 m 207.81 m2/day Potable CGWB 2007-08
12. Arbara Chanchal-I 25.431 88.036
NA 108.0 Younger Alluvium
24-37.5, 51.0-90.0
NA NA NA NA Potable CGWB
13. Kharbari Jhamuria
Chanchal-I 25.423 88.083
NA 120.0 Younger Alluvium
45-57,60-78,81-93,102-112.5
NA NA NA NA Potable CGWB
14. Bamongola High School
Bamongola
25.165 88.341
200.5 127.0 Older Alluvium
112.0-124.0
13.70 11.05 lps
5.95 m NA Potable CGWB 2019-20

29
Sl No
Location Block Co-ordinate (in DD)
Drilled Depth (m)
Well Construction Depth (m)
Aquifer Zones Tapped (mbgl)
Static Water Level (mbgl)
Discharge
Drawdown
Transmissivity, T (m2/day), Storativity (S)
Chemical Quality
Agency and Year of Construction
15. Pandua A.K. High School
Gazole 25.132 88.154
200.0 160.0 Older Alluvium
103-109, 123-132, 148-157
16.50 45.8 lps NA NA Potable CGWB 2020-21
16. Gani Khan Chowdhury Institute of Engineering & Technology, Maligram (EW-I)
Old Malda 25.052 88.166
200.0 130.0 Younger Alluvium
103-109, 115-127
NA NA NA NA NA CGWB 2020-21
17. Gani Khan Chowdhury Institute of Engineering & Technology, Maligram (EW-II)
Old Malda 25.052 88.166
200.2 124.0 Younger Alluvium
97-103,109-121
15.25 45.3 lps NA NA NA CGWB 2020-21

30
5. GEOPHYSICAL SURVEY
Surface geophysical survey in the form of Vertical Electric Sounding (VES) was carried out in 20 locations in parts of Habibpur, Bamongola, Manikchak and Ratua-II blocks of Malda district during the AAP: 2005-2006 by Dr. S.K. Adhikari (Ghosh Dastidar and Adhikari 2008). The area covered by VES was bounded by north latitudes 240 38' 30″ to 250 32'08” and east longitudes 87045'50” to 880 28'10”.
A summary of the geophysical survey in Malda district is given below.
To delineate potential aquifer in the Barind Tract in Habibpur block, to exploreindirectly arsenic-free aquifer in Manikchak block and to detect the presence of inter-trappeans if any, Vertical Electrical Sounding (VES) were completed at 17 locations inHabibpur and Manikchak blocks. Out of these, 4 VES locations were in Manikchakblock and remaining 13 were in Habibpur block. Two VES survey were completed inthe southern part of Bamongola block and one VES in the southern part of Ratua-IIblock. The VES field data were interpreted using empirical curves in differentorientations. Disposition of various layers, potential zones of groundwateroccurrence and presence of inter-trappeans were delineated using GeoelectricSections and Panel Diagram.
The maximum current electrode separation (AB) was kept at 800 m to get themaximum depth of investigation. The apparent resistivity was plotted on double logpaper and the types of field curves were obtained as A, HA, HK, KQ and H types. Allthe curves were interpreted by partial curve matching technique and with the help ofcomputer programme ‘RESIST’ (Ghosh Dastidar and Adhikari, 2008).
A correlation of the interpreted VES data with available nearby litholog data wasmade by the authors. The following resistivity range with respect to lithology is givenGhosh Dastidar and Adhikari:
Resistivity range(ohm.m) Lithology 7-160 Topsoil 5-15 Clay 16-30 Fine to medium sand 15-26 Weathered basalt 30-112 Sand, coarse 160-240 Gravel 60-70 Partially weathered basalt 420 Basalt
With the help of interpreted results, Geoelectric Section for Habibpur block and PanelDiagram for Manikchak block were prepared. It was observed that in general a fourto five layered subsurface structure can be identified. These sections are discussedbelow.
31
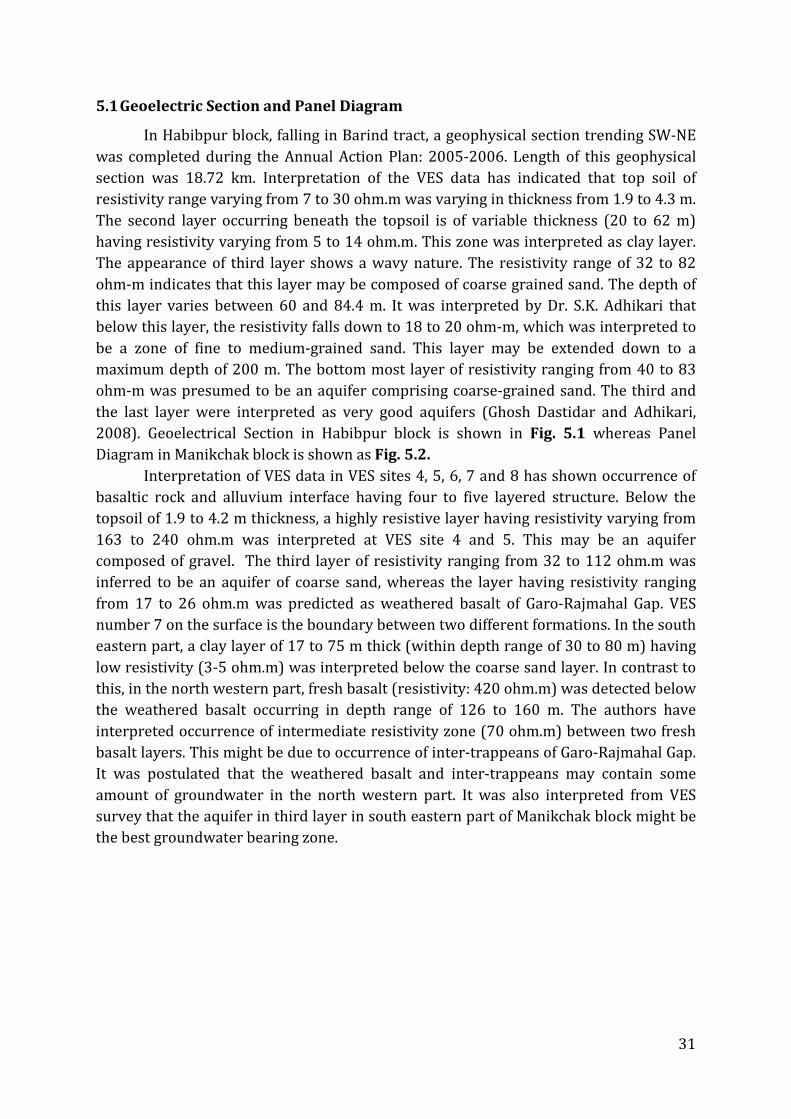
5.1 Geoelectric Section and Panel Diagram
In Habibpur block, falling in Barind tract, a geophysical section trending SW-NE was completed during the Annual Action Plan: 2005-2006. Length of this geophysical section was 18.72 km. Interpretation of the VES data has indicated that top soil of resistivity range varying from 7 to 30 ohm.m was varying in thickness from 1.9 to 4.3 m. The second layer occurring beneath the topsoil is of variable thickness (20 to 62 m) having resistivity varying from 5 to 14 ohm.m. This zone was interpreted as clay layer. The appearance of third layer shows a wavy nature. The resistivity range of 32 to 82 ohm-m indicates that this layer may be composed of coarse grained sand. The depth of this layer varies between 60 and 84.4 m. It was interpreted by Dr. S.K. Adhikari that below this layer, the resistivity falls down to 18 to 20 ohm-m, which was interpreted to be a zone of fine to medium-grained sand. This layer may be extended down to a maximum depth of 200 m. The bottom most layer of resistivity ranging from 40 to 83 ohm-m was presumed to be an aquifer comprising coarse-grained sand. The third and the last layer were interpreted as very good aquifers (Ghosh Dastidar and Adhikari, 2008). Geoelectrical Section in Habibpur block is shown in Fig. 5.1 whereas Panel Diagram in Manikchak block is shown as Fig. 5.2.
Interpretation of VES data in VES sites 4, 5, 6, 7 and 8 has shown occurrence of basaltic rock and alluvium interface having four to five layered structure. Below the topsoil of 1.9 to 4.2 m thickness, a highly resistive layer having resistivity varying from 163 to 240 ohm.m was interpreted at VES site 4 and 5. This may be an aquifer composed of gravel. The third layer of resistivity ranging from 32 to 112 ohm.m was inferred to be an aquifer of coarse sand, whereas the layer having resistivity ranging from 17 to 26 ohm.m was predicted as weathered basalt of Garo-Rajmahal Gap. VES number 7 on the surface is the boundary between two different formations. In the south eastern part, a clay layer of 17 to 75 m thick (within depth range of 30 to 80 m) having low resistivity (3-5 ohm.m) was interpreted below the coarse sand layer. In contrast to this, in the north western part, fresh basalt (resistivity: 420 ohm.m) was detected below the weathered basalt occurring in depth range of 126 to 160 m. The authors have interpreted occurrence of intermediate resistivity zone (70 ohm.m) between two fresh basalt layers. This might be due to occurrence of inter-trappeans of Garo-Rajmahal Gap. It was postulated that the weathered basalt and inter-trappeans may contain some amount of groundwater in the north western part. It was also interpreted from VES survey that the aquifer in third layer in south eastern part of Manikchak block might be the best groundwater bearing zone.

32
Fig. 5.1 Geoelectric Section, Habibpur block (after Ghosh Dastidar and Adhikari 2008)

33
Fig. 5.2 Panel Diagram, Manikchak block (after Ghosh Dastidar and Adhikari 2008)

34
5.2 Recommendations
Following the analysis of VES data, potential aquifer zones were demarcated in parts of Habibpur and Manikchak blocks. The third layer and the fifth layer in Habibpur block were identified as most suitable for construction of tube wells. In Manikchak block, the authors recognized weathered basalt and coarse sand as potential aquifers for construction of tube wells. Therefore, depending on the extension of this granular zone/ weathered rock the following drilling depths were recommended for 17 VES locations falling in Habibpur and Manikchak blocks (Ghosh Dastidar and Adhikari, 2008).
VES No.
Aquifer thickness (m)
Recommended depth for drilling (m)
1. Below 50 80 2. Below 65.8 90 3. 47.9-84.3 90 4. 2.6-84.7 90 5 4.2-30.3 40 6. 2.8-184.8 180 7. 2.2-3.96, 12.06-23.76, 57.76-84.76,
below 159.6170
8. 4.2 –126.6 126 9 Below 29.5 40 10. Below 200.3 110 11. Below 28 50 12. Below 131.8 145 13. Below 230 250 14. Below 30.8 50 15. 28.7-76.7 80 16. Below 48 60 17. Below 13.5 50
7.3 Conclusion
A total of 20 Vertical Electric Sounding (VES) were carried out during the Annual Action Plan: 2005-06, out of which 17 VES sites were in Habibpur and Manikchak blocks (Ghosh Dastidar and Adhikari, 2008). Based on VES data, two Geoelectrical Section was prepared for Habibpur block and Panel Diagram for Manikchak block. Analysis of VES data indicated that in Habibpur block, two sets of good aquifers are found in the depth range of 26 to 85 m and 130 to 200 m. The depth of these aquifers generally varies from place to place. Interpretation of VES data also revealed that aquifers are made up of coarse-grained sand. In between the two aquifers, another aquifer of much less groundwater potential was inferred. It was inferred that this third aquifer is composed of fine to medium-grained sand, in contrast to the other two aquifers consisting of coarse sand (Ghosh Dastidar and Adhikari, 2008).

35
In Manikchak block, interpretation of the Panel Diagram reveals a boundary between basalt and alluvial formation at VES site 7. In the north-western part, presence of weathered basalt along with inter-trappeans (of Garo-Rajmahal Gap) was interpreted by the authors. In the south-eastern part of Manikchak block, an aquifer comprising coarse sand and having good groundwater potential was inferred in the depth range of 30 to 80 m (Ghosh Dastidar and Adhikari, 2008).

36
6. HYDROGEOLOGY
6.1 Regional Hydrogeology
Regional hydrogeological set up of Malda district is characterized by aquifer geometry and aquifer disposition, which are controlled by the spatio-temporal distribution of Quaternary alluvial deposits. The alluvial sediments are categorized into Older alluvium (Aquifer Code: AL-03) and Younger alluvium (Aquifer Code: AL-01). Groundwater generally occurs in two Major Aquifer Systems viz. Aquifer-IA and Aquifer-IB. Aquifer-IA is shallow and occurs under unconfined (rarely semi confined) conditions in the depth range of ~25 m bgl to ~70 m bgl. Aquifer-IB occurs at moderately deep levels, in the depth range of 50 m bgl to ~180 m bgl. The aquifer geometry is governed by variations in grain size distribution of alluvium that has been deposited by major perennial rivers. Coarse sand and gravel having variable texture constitute potential aquifers down to ~90 m bgl in the eastern part and ~150 mbgl in the western part of the district.
Regional hydrogeological framework of Malda district is based on mode of occurrence of groundwater, nature and extent of aquifers and their hydrological, hydrodynamic and hydrochemical properties. During aquifer mapping studies, several promising saturated granular zones are observed to be present in the depth range of 17 to 178 m bgl. Shallow aquifers are in unconfined to semi-confined conditions whereas moderately deep aquifers (especially in Barind tract) occur under confining conditions. A general predominance of sand over clay is observed in the alluvial sequence with occasional discontinuous clay lenses and layers of silty clay. Hydrogeological map of Malda district is shown in Fig. 6.1.
6.2. Aquifer System: Although basaltic rocks of Garo-Rajmahal gap and granite gneiss (?) at Mandilpur has been reported at deeper levels (>150 m bgl), details of aquifer disposition of the hard rock aquifer systems (250-400 m) in Malda district is yet to be known, as far as the in-house drilling is concerned. The main water bearing formations (mostly leaky and unconfined aquifers) are Quaternary sediments of Recent (Holocene) and Pleistocene age. Aquifer materials consist of sands of variable grain size (from very fine grained to coarse grained) and gravels. Groundwater occurs in the interstices within the granular zones. The nature of aquifer materials in horizontal and vertical extent is not uniform due to frequent variation in lithofacies in the depositional basin viz. the Ganga Basin.
6.3 Aquifer Geometry: The aquifer geometry of the district is depicted as lithological cross sections and fence diagrams, block wise for all the 15 developmental blocks in Malda district. It is observed that broadly two Aquifer Groups (Aquifer-1A and Aquifer-1B) exist in major parts of Malda district, which is inferred due to development of relatively thick (5-20 m) clay layers between the shallow and the deeper aquifers. However, in parts of Old Malda, Habibpur

37
and Harishchandrapur-II blocks, a single aquifer group (Aquifer-1A) has been developed due to very thin or inconspicuous layers of clay between the promising granular zones of sand and gravel. In the Barind tract, predominance of clay over sand is generally observed. Generally, both vertical and lateral facies variation is commonly observed in the aquifers developed in Malda district.
Fig. 6.1 Hydrogeological map of Malda district

38
6.4 Occurrence, movement and distribution of groundwater
Occurrence and movement of groundwater in unconsolidated formation of the district is mainly controlled by porosity and permeability of the aquifer materials, which changes from place to place. Therefore, depth of occurrence of groundwater also differs from one place to another. The porous formation in the district can be divided into (a) Recent alluvial deposits constituting regionally extensive aquifers and (b) older alluvial deposits constituting discontinuous aquifers. The porous formation covers entire district within the depth range of ~270 m, although in Manikchak block the depth of porous formation is restricted to ~100 m. Groundwater occurs mainly under unconfined condition. However, in some patches particularly in north-western part (Tulsihata-Chanchol section) and in Bamongola block, groundwater occurs under semi-confined condition.
In general, the movement of groundwater is controlled by the hydraulic gradient. The direction of groundwater flow can be visualized from the water table contour map (both pre-monsoon and post-monsoon, 2020). Generally, as depicted from the water table contour map (pre-monsoon), groundwater flows towards the east and south east in the north-western part of Malda district. The disposition of water table contour map shows that in the northern part the district, the Mahananda River is effluent, at least during the pre-monsoon period but become influent in the southern part of the district viz. in English Bazar and Old Malda blocks.
6.5 Aquifer Characteristics and Aquifer Parameters
Hydrogeological details of exploratory wells constructed by Central Ground Water Board (CGWB) and other State Government Agencies in Malda district reveals that yield potential of aquifers increase from east to west and southwest. Aquifer characteristics vary in different hydrogeological units prevailing in the district.
In general, potential aquifers are encountered in the depth zone of 17 to 178 m below ground level. The thickness of the aquifers varies from place to place. As per in-house drilling data of CGWB, Static Water Level (SWL) in the tube wells ranges from 5.44 m bgl at Bhaluka to 19.90 m bgl at Nityanandapur, whereas discharge was found to be varying from 7.25 lps at Bhaluka to 58.27 lps at Mandilpur. Drawdown in the tube wells was ranging from 1.11 m at Bhaluka to 9.84 m at Nityanandapur. Transmissivity of the aquifers, as computed by pumping test, was found to be varying from 207.81 m2/day at NarendrapurExploratory Well (EW) in English Bazar block to 7170.0 m2/day at NityanandapurEW in Habibpur block. Storage Co-efficient of the aquifer in the depth range of 81 to 105 m at Araidanga(Ratua-II block) was calculated as 9.9 x 10⁻². This indicates the semi-confined nature of the aquifer in this area.
Quaternary alluvium deposits consisting of sand, silt, clay, and gravel is exposed in the district. In general, groundwater in the shallow aquifers (up to depth of 80 m) occurs under unconfined condition. Such aquifers are developed through shallow, low duty tube wells

39
(LDTW), which are capable of yielding 25 to 30 m3/hr of water with 5 HP pump and are mainly used locally for irrigation. Groundwater in the deeper aquifers (below the depth of 100 m and up to the explored depth of 280.51 m) occurs under unconfined to semi-confined condition. Deeper aquifers are developed mainly by electrical submersible pump fitted heavy duty tube wells (HDTW) for use in large-scale drinking water supply and irrigation. These pumps are generally capable of yielding groundwater in the range from ~50 to 100 m3/hr. A summary table showing block wise hydrogeological data in Malda district (based on CGWB data, data of PHED and SWID, Government of West Bengal), is given in Table 6.1.
Table 6.1 Block wise hydrogeological details with drilling depth of tube wells
Sl. No.
Block Drilled Depth of TWs (m)
Depth range of promising Granular Zones (m bgl)
Discharge (m3/hr)
Drawdown (m)
1. English Bazaar 70 - 156 70 - 108 133.44 - 216
3 - 5
2. Old Malda 96 - 159 30 - 44, 50 - 99, 105 - 125, 130 - 138
135 - 259 7 - 11
3. Habibpur 67 - 156 21 - 76, 94 - 110 46 - 133.77 5 - 9 4. Bamongola 155 - 186 98 - 140 10 - 22 6 - 12 5. Gazole 137 - 179 43 - 56, 76 - 105, 145 - 178 89 - 247 7 - 12 6. Manikchak 73 - 112 19 - 25, 46 - 75 207.0 3 7. Chanchal-I 106.0 – 248.47 39 - 57, 60 - 82, 85 - 106,
115 - 149 108 - 122.88
8 - 9
8. Chanchal-II 106 - 133 28 - 45, 79 - 130 152 - 182.88
6.4
9. Harishchandrapur-I 96 - 150 32 - 48, 51 - 106, 108 - 118, 121-149
103.5 – 188.0
3.5 - 7.32
10. Harishchandrapur-II 90 - 251 52 - 146, 217 - 241 152.4 -182.4
3 - 7.5
11. Ratua-I 92.0 – 149.6 36 - 50, 72 - 84, 94 - 127, 130 - 142
197.8 3.35
12. Ratua-II 100 - 118 61 - 91, 100 - 109 180 - 200 2.1 - 4.3 13 Kaliachak – I 45 - 64 30 - 41 180 - 200 2 - 4 14 Kaliachak – II 60 - 85 18 - 80 210 - 215 3.5 - 6 15 Kaliachak – III 49 - 81 17 – 62, 68 - 78 202 - 215 3 - 6
During the NAQUIM study, lithological data (in the form of strata charts) was collected from the Office of the Executive Engineer, Public Health Engineering Department (PHED),

40
Malda Division and also from the Executive Engineer, Arsenic Area Water Supply Scheme, Laxmipur, Malda. On the basis of the data compiled by the author (both In House drilling data and data collected from PHED), lithological logs of 53 exploratory wells/production tube wells has been analyzed for preparation of lithological cross sections, fence/panel diagrams and 3-D block diagrams showing both lithology and stratigraphic successions. Based on this data, fence/panel diagrams for the entire Malda district and 12 developmental blocks (out of 15) were prepared using Rockworks software. Subsurface lithological data for Kaliachak-I,Kaliachak-II and Kaliachak-III blocks were not available due to absence of In House drilling byCGWB in these three blocks and also due to unavailability of bore hole data by the PHED andState Water Investigation Directorate (SWID). Hence, aquifer geometry and correlationbetween different Aquifer Groups was not possible for these three blocks.
A map showing locations of the 53 exploratory wells/production tube wells in Malda district is shown in Fig. 6.2. Based on the subsurface lithological data, two Aquifer Groups were recognized viz. Aquifer-IA and Aquifer-1B. With the help of the data of CGWB and that of PHED, Government of West Bengal, a Fence Diagram for entire Malda district has been prepared, which is shown in Fig. 6.3.
6.6 Depth to Water Level
Depth to water level has been analyzed based on the data collected from active Groundwater Monitoring Wells (GWMW) in Malda district. The monitoring was carried out during January, April (pre-monsoon), August (monsoon) and November (post-monsoon) following standard protocol. In the present analysis, the Water Table (WT) was calculated from Depth to Water Level (DTW) data during the years 2019 and 2020. Thematic maps were prepared on the basis of data collected during pre-monsoon and post-monsoon. A perusal of the data indicates that during pre-monsoon 2019, DTW was minimum (1.64 m bgl) at Kadubari dug well in Gazole block whereas maximum pre-monsoon DTW (14.20 m bgl) was recorded at Matoil tube well in Gazole block, followed by 8.32 m bgl at Jalalpur piezometer in Chanchal-II block. During pre-monsoon 2019, the shallowest water level of 0.67 m bgl was recorded at Agampur dug well in Gazole block, followed by 0.69 m bgl at Bholanathpur dug well in English Bazar block. During post-monsoon 2019, the deepest water level of 8.48 m bgl was recorded at Jalalpur piezometer in Chanchal-II block, followed by 7.32 m bgl at Samshi piezometer in Ratua-I block.
During pre-monsoon 2020, the shallowest depth to water level was 0.32 m bgl at Kadubari dug well in Gazole block, followed by 0.38 m bgl at Nalagola in Bamongola block. During post-monsoon 2020, the deepest water level was 5.96 m bgl at Jalalpur piezometer in Chanchal-II block, followed by 5.90 m bgl at Ratua tube well in Ratua-I block. The shallowest depth to water level (post-monsoon 2020) was 0.49 m at Aiho dug well in the boundary of Old Malda

41
and Habibpur blocks, followed by 0.58 m bgl at Bholanathpur dug well in English Bazar block and subsequently by 0.83 m bgl at Adina dug well in Gazole block.
Fig. 6.2 Location map showing exploratory wells and tube wells (both CGWB and PHED, Govt. of West Bengal) in Malda district

42
Fig. 6.3 Fence Diagram showing 3-D disposition and correlation of aquifers in Malda district

43
During pre-monsoon 2020, the shallowest depth to water level was 0.32 m bgl at Kadubari dug well in Gazole block, followed by 0.38 m bgl at Nalagola in Bamongola block. During post-monsoon 2020, the deepest water level was 5.96 m bgl at Jalalpur piezometer in Chanchal-II block, followed by 5.90 m bgl at Ratua tube well in Ratua-I block. The shallowest depth to water level (post-monsoon 2020) was 0.49 m at Aiho dug well in the boundary of Old Malda and Habibpur blocks, followed by 0.58 m bgl at Bholanathpur dug well in English Bazar block and subsequently by 0.83 m bgl at Adina dug well in Gazole block.
For preparation of pre-monsoon and post-monsoon depth to water level (DTW) maps, five categories have been identified viz. 0-5 m, >5 – 10 m, >10 – 15 m, >15 to 20 m and >20 m bgl. The DTW maps for pre-monsoon 2020 and for post-monsoon 2020 are shown in Fig. 6.4 and Fig. 6.5, respectively. A study of these maps clearly indicates the extent of shallow DTW in larger parts of Malda district during the post-monsoon period, as compared to the pre-monsoon period.
A visual analysis of Fig. 6.4 and Fig. 6.5 reveals that the highest DTW condition is observed in the south eastern part of Malda district, specifically confined to the south central part of Habibpur block. Deepest water level (>20 m bgl) is also observed as a small patch in the south western part of Bamongola block, both during the pre-monsoon and post-monsoon period in the year 2020. Relatively shallow depth to water level (0-5 m bgl and >5-10 m bgl) was found to occur extensively in the north western, central, western, south central and southern parts of Malda district. Intermediate i.e. moderately deep water level (>10-15 m bgl and >15-20 mbgl) condition was observed in east central and south eastern parts of the district, falling in Gazole, Bamongola and Habibpur blocks. Therefore, it may be concluded that the Older Alluvium (Barind tract) is characterized by deeper water levels as compared to the Younger Alluvium.
Apart from the in house monitoring data, depth to water level and lithological log of fifty five wells (including piezometer and dug well) was collected from State Water Investigation Directorate (SWID), Water Resources Investigation and Development Directorate (WRIDD), Government of West Bengal. The data of 39 Piezometers, fitted with Digital Water Level Recorder (DWLR) system is available for 39 Piezometers and Dug Wells. The relevant data on location, drilled depth, depth of zones tapped and depth to water level (DTW) for pre-monsoon (April 2020) and post-monsoon (November 2020), which was collected from SWID, Malda Division, is given in Table 6.2.

44
Fig. 6.4 Depth to Water Level map, Pre-monsoon 2020, Malda district

45
Fig. 6.5 Depth to Water Level map, Post-monsoon 2020, Malda district

46
Table 6.2 Depth to Water Level and other relevant data of Piezometers installed by State Water Investigation Directorate (SWID), Malda Division
Sl. No.
Hydrograph Station No.
Name of Block Location Type of Well
Depth (m)
Zone (m)
Latitude Longitude DTW (April 2020)
DTW (Nov. 2020)
Remarks
1 1 Harishchandrapur-I BDO Office Piezometer (PZ)
55.57 49.48-53.23
25.4132 87.8855 5.84 4.20 DWLR
2 2 Harishchandrapur-I Tulshitola Irri. Bungalow
PZ 65.34 58.24-62.54
25.4542 87.9076 3.74 4.49 DWLR
3 50 Harishchandrapur-II
Datian MNGD Primary School (Road from Barduary Bazar)
PZ NA NA 25.4353 87.8345 5.26 5.04 DWLR
4 51 Harishchandrapur-II
Daulatpur GPO PZ NA NA 25.3706 87.9139 7.96 6.24 DWLR
5 52 Harishchandrapur-II
JagannathpurPurbapara Primary School, behind Fatepur village
PZ NA NA 25.3230 87.8891 4.82 3.01 DWLR
6 4 Chanchal-I Chanchal BSF Camp
PZ 55.81 50.63-54.29
25.3867 88.0095 9.08 6.34 DWLR
7 5 Chanchal-I Kharba APO PZ 45.22 38.42-42.42
25.4227 88.0785 6.87 6.76 NA
8 30 Chanchal-I Bhagabanpur APO
PZ 67.80 NA 25.4414 88.0425 6.44 6.37 DWLR

47
9 6 Chanchal-II Malatipur APO PZ 42.41 NA 25.3292 88.0191 9.35 8.29 DWLR
10 7 Chanchal-II Kajaldighi Primary School, Samsi
Dug Well 78.99 NA 25.2874 88.0006 3.41 3.30 P-tubedefunct.
11 37 Chanchal-II Jalalpur APO PZ 41.97 NA 25.3322 88.0640 8.33 8.31 NA
12 8 Ratua-I Ratua Mango Research Farm
PZ NA NA 25.2170 87.9249 6.05 0 DWLR
13 9 Ratua-I Bhaluka Irrigation Bungalow
PZ 59.54 53.04-57.04
25.2785 87.8803 5.90 5.57 DWLR
14 34 Ratua-I Vado APO PZ 44.28 38.49-42.15
25.2438 87.9620 8.76 8.64 DWLR
15 10 Ratua-II Gobarjana APO PZ 49.22 43.78-47.44
25.1058 88.0063 6.66 5.67 DWLR
16 38 Ratua-II Sripur APO PZ 54.16 NA 25.2189 88.0641 10.59 0 DWLR
17 35 Manikchak Kalindri High School
PZ 60.26 NA 25.0621 87.9629 5.58 4.78 DWLR
18 NA Kaliachak-I Kaliachak-II GPO (NimnaBuniyadi Vidyalaya, Baliadanga)
PZ NA NA 24.8626 88.0181 3.40 3.62 DWLR
19 NA Kaliachak-I Jaluabathan GPO, Mallikpara
PZ NA NA 24.8626 88.0944 4.29 0 DWLR
20 NA Kaliachak-I Kaliachak-I BDO Office,
PZ NA NA 24.8717 88.0313 3.67 0 N.A.

48
Baliadanga 21 N.A. Kaliachak-I Sujapur GPO,
ChotoSujapur PZ NA NA 24.9192 88.0931 3.43 2.84 DWLR
22 N.A. Kaliachak-I Jalalpur GPO, Sherpur
PZ NA NA 24.8969 88.0660 2.74 3.06 DWLR
23 N.A. Kaliachak-I Alinagar GPO (Baro Masjid),Nurnagar
PZ NA NA 24.8855 87.9936 3.72 3.67 NA
24 16 Kaliachak-II Mothabari Health Centre
PZ 43.33 NA 24.9334 88.0357 3.29 4.27 DWLR
25 17 Kaliachak-II Muthabari High Sch.
PZ 48.82 43.24-47.31
24.9296 88.0363 4.28 2.66 DWLR
26 19 Kaliachak-III Birnagar High School/ Panchayat Office
PZ 61.34 54.99-58.99
24.8391 87.9512 4.35 0 DWLR
27 20 Old Malda Malda P. W. D. Godown
PZ 49.38 44.17-47.38
25.0163 88.1478 9.16 9.68 DWLR
28 21 Old Malda Mandilpur B. S. F. Camp
PZ 95.03 87.86-91.86
25.0661 88.1451 0 7.34 DWLR
29 39 Old Malda Muchia A.P.O. PZ 63.59 NA 24.9654 88.2225 15.46 16.18 DWLR
30 22 English Bazar Englishbazar B. S. F. Camp
PZ 43.24 38.03-41.69
24.9803 88.1419 5.80 0 DWLR
31 33 English Bazar Phulbaria A.P.O.
PZ 57.15 NA 25.0438 88.0316 7.56 0 DWLR
32 NA English Bazar Agro Industries Complex
PZ NA NA 24.9874 88.1402 7.37 0 DWLR
33 24N Gazole Near Gazole Dug Well NA NA 25.2203 88.1940 1.16 1.02 NA

49
Block Seed Farm
34 29 Gazole Balarampur A.K. Kendra
PZ 69.23 62.03-66.05
25.2003 88.2272 17.23 17.06 N.A.
35 NA Gazole Deotala GPO (21 mile)
PZ N.A. NA 25.2645 88.2722 16.10 10.12 DWLR
36 NA Gazole Pandua GPO, Alampur, Adina
PZ N.A. NA 25.1676 88.1720 3.39 16.26 DWLR
37 25 Bamongola Ramkrishnapur B.S.F. Camp
PZ 99.83 92.87-99.81
25.1582 88.3543 25.37 22.47 DWLR
38 28 New
Bamongola Pakuya APO PZ NA NA 25.1255 88.3673 8.42 0 DWLR
39 27 Habibpur Block Seed Farm,Habibpur
PZ 63.80 56.44-60.47
24.9853 88.2556 16.51 13.21 DWLR
Index: DWLR – Digital Water Level Recorder, NA – Not Available, APO – Anchal Panchayat Office, GPO – Gram Panchayat Office, BDO – Block Development Officer, BSF – Border
Security Force

50
Analysis of depth to water level data of SWID, Malda Division reveals that during pre-monsoon 2020, the shallowest depth to water level (DTW) of 1.16 m bglwas recorded in a dug well near Gazole Block Seed Farm, which was followed by 2.74 m bgl in a piezometer fitted with DWLR at Sherpur, under the Jalalpur Gram Panchayat Office (GPO) in Chanchal-II block. The deepest DTW of 25.37 m bgl was observed at Ramkrishnapur B.S.F. piezometer in Bamongola block, which is followed by 17.23 m bgl at Balarampur Krishak Kendra in Gazole block. During post-monsoon 2020, the shallowest DTW of 1.02 m bgl was observed near Gazole Block Seed Farm, followed by 2.66 m bgl at Mothabari High School in Kalaichak-II block. The deepest water level of 22.47 m bgl was recorded again at Ramkrishnapur B.S.F. piezometer in Bamongola block, followed by 17.06 m bgl in the piezometer at Balarampur Krishak Kendra in Gazole block.
A perusal of the data reveals that deepest water level (>20 m bgl) was observed in the eastern part of Gazole block and in the western part of Bamongola block during the pre-monsoon period, 2020. Deeper water level condition (>15 to 20 m bgl) was observed in the south eastern part of Old Malda block and in the south central and southern parts of Habibpur block. Apart from this, major parts of Malda district are characterized by shallow water level (0 to 15 m) in pre-monsoon 2020. In post-monsoon 2020, deepest water level (>20 m bgl) was observed in south eastern part of Gazole block, northern and north eastern parts of Habibpur block and in major parts of Bamongola block, except its northern part. Shallowest water level (0-5 m bgl) was observed in southern part of Manikchak block, western part of English Bazar block, almost throughout the entire area in Kaliachak-I, Kaliachak-II and Kaliachak-III blocks, in north western part of Malda district falling in Harishchandrapur-I, Harishchandrapur-II blocks and within a small area in the north western part of Gazole block.
6.7 Water table contours and groundwater flow direction
During the present study, elevations of the monitoring wells and key observation wells (KOW) were measured in field using portable GPS receiver. The GPS data was subsequently transferred into desktop platform using Garmin Mapbasic software. With the help of elevation and depth to water level data, reduced level of each of the monitoring wells was calculated. The elevation of the Water Table data was used for preparation of water table contour maps, for the entire district as well as for the 15 developmental blocks.
During preparation of these maps, a uniform contour interval (CI) of 3 m was used for pre-monsoon and post-monsoon, 2020 for Malda district as a whole. The regional groundwater flow direction was interpreted with the 3 m CI. However, while preparing the water table contour maps at block level, the CI was kept at 2 m so as to have sufficient number of WT contours for determination of local groundwater flow direction. The Water Table Contour Maps of Malda district for pre-monsoon and post-monsoon 2020, are shown in Fig. 5.8 and Fig. 5.9, respectively.

51
Fig. 6.6 Water Table Map showing regional groundwater flow direction, pre-monsoon 2020, Malda district

52
6.8 Seasonal Fluctuation in groundwater level
Using the depth to water level (DTW) data of pre-monsoon and post-monsoon 2020, the seasonal fluctuation in groundwater level has been calculated for 72 wells including ground water monitoring wells (GWMW) of CGWB and piezometers of State Water Investigation Directorate (SWID), Government of West Bengal. The seasonal fluctuation (pre-monsoon versus post-monsoon 2020) data is given in Table 6.3.
A perusal of data in the table reveals that, out of total 72 wells, 59 wells have shown seasonal rise in water level whereas only 13 wells have shown seasonal decline. Among the 59 wells showing seasonal rise, majority of wells (46 out of 59, 63.89% of total) have shown rise in the range 0-2 m, 10 wells (out of 59, 16.95%) have shown seasonal rise from >2 to 4 m and only 3 wells (out of 59, 5.08% of total) have shown seasonal rise ranging from >4 to 6 m. A total of 13 wells out of 72 wells (18.06% of total number) have shown seasonal decline ranging from 0 to 2 m, whereas only one monitoring well at Ratua has recorded seasonal decline in the range >2 – 4 m during the year 2020. The map showing seasonal fluctuation in groundwater level in Malda district is shown in Fig. 6.8.
Fig. 6.7 Water Table Map showing regional groundwater flow direction, post-monsoon 2020, Malda district

53
Table 6.3 Seasonal fluctuation in groundwater level, Malda district
SL NO.
BLOCK WELL NO. LOCATION Depth to Water Level
(Pre-monsoon
2020)
Depth to Water Level
(Pre-monsoon
2020)
Fluctuation (m)
1 CHANCHAL-II WBMDNA-15 Jalalpur 8.33 8.31 0.02 2 CHANCHAL-II WBMDNA-14 Kajaldighi Primary School 3.41 3.30 0.11 3 CHANCHAL-II WBMDNA-13 Malatipur 9.35 8.29 1.06 4 CHANCHAL-I WBMDNA-12 Paschim Bhagabanpur 6.44 6.37 0.07 5 CHANCHAL-I WBMDNA-11 Kharba 6.87 6.76 0.11 6 CHANCHAL-I WBMDNA-36 Kanua (Opposite B. Ed. College) 4.86 4.42 0.44 7 CHANCHAL-I WBMDNA-35 Paharpur 7.12 6.44 0.68 8 BAMONGOLA WBMD87 Charakdanga 1.01 0.80 0.21 9 BAMONGOLA WBMD104 Agampur 3.77 2.64 1.13
10 ENGLISH BAZAR WBMDNA-41 Phulbaria 4.28 4.13 0.15 11 ENGLISH BAZAR WBMDNA-38 Milki Primary Health Centre 2.57 2.31 0.26 12 ENGLISH BAZAR WBMD12 Bholanathpur 0.87 0.58 0.29 13 ENGLISH BAZAR WBMDNA-1 Bholanathpur 3.41 3.04 0.37 14 ENGLISH BAZAR WBMD09B Bottally 2.22 1.54 0.68 15 ENGLISH BAZAR WBMDNA-42 Mangalbari (Behula Bridge) 4.90 4.21 0.69 16 ENGLISH BAZAR WBMD63 ChotoMohanpara-I 5.25 3.48 1.77 17 ENGLISH BAZAR WBMD64 ChotoMohanpara-II 5.59 3.72 1.87 18 GAZOLE WBMDNA-44 Deotala (Near Post Office) 3.06 2.54 0.52 19 GAZOLE WBMD73 Matoil 2.49 1.75 0.74 20 HABIBPUR WBMD79 Kokabeni 1.94 1.37 0.57
21 HARISHCHANDRAPUR-I WBMDNA-34 IOL Petrol Pump, 5.07 4.82 0.25

54
Harishchandrapur 22 HARISHCHANDRAPUR-I WBMDNA-37 Mianhat (Janaki Nagar) 3.81 3.27 0.54 23 HARISHCHANDRAPUR-I WBMD96 Tulsihata 3.83 2.35 1.48 24 HARISHCHANDRAPUR-I WBMDNA-5 BDO Office, Harishchandrapur 5.84 4.20 1.64 25 HARISHCHANDRAPUR-II WBMDNA-9 Datian Primary School 5.26 5.04 0.22 26 HARISHCHANDRAPUR-II WBMDNA-7 Daulatpur Gram Panchayat
Office (GPO) 7.96 6.24 1.72
27 HARISHCHANDRAPUR-II WBMDNA-8 Jagannathpur Primary School 4.82 3.01 1.81 28 KALIACHAK-I WBMDNA-23 Alinagar GPO, Nurnagar Mosque 3.72 3.67 0.05 29 KALIACHAK-I WBMDNA-21 Sujapur GPO, ChotoSujapur 3.43 2.84 0.59 30 KALIACHAK-II WBMD61 PuratanPataldanga 2.91 2.76 0.15 31 KALIACHAK-II WBMD102 Mothabari (High School) 4.08 3.92 0.16 32 KALIACHAK-II WBMDNA-25 Muthabari High School 4.28 2.66 1.62 33 KALIACHAK-III WBMD49 16 Mile 2.46 2.15 0.31 34 KALIACHAK-III WBMD47 17 Mile 2.51 2.10 0.41 35 MANIKCHAK WBMD-02A Manikchak (near SBI) 4.82 4.58 0.24 36 MANIKCHAK WBMD67 Mohana-II 4.58 2.88 1.70 37 MANIKCHAK WBMDNA-19 Kalindri High School 5.58 4.78 0.80 38 MANIKCHAK WBMD66 Mohana-I 4.07 2.75 1.32 39 OLD MALDA WBMD14 Malda Town 1.54 0.94 0.60 40 OLD MALDA WBMDNA-32 Sahapur 6.71 5.46 1.25 41 RATUA-I WBMDNA-35 Bhagabanpur 7.33 6.58 0.75 42 RATUA-I WBMDNA-16 Bhaluka Irrigation Bungalow 5.90 5.57 0.33 43 RATUA-I WBMDNA-17 Bhado 8.76 8.64 0.12 44 RATUA-I WBMDNA-40 Debipur 5.17 4.90 0.27 45 RATUA-II WBMDNA-18 Gobarjana 6.66 5.67 0.99 46 RATUA-II WBMDNA-39 Pukuriya More 4.92 4.68 0.24 47 CHANCHAL-II WBMD95 Jalalpur 8.32 5.96 2.36

55
48 CHANCHAL-I WBMDNA-10 Block Seed Farm, Chanchal 9.08 6.34 2.74 49 BAMONGOLA WBMD07C Bamongola 5.18 2.21 2.97 50 ENGLISH BAZAR WBMD29 Milki 5.10 2.04 3.06 51 HABIBPUR WBMD04 Habibpur 3.38 1.22 2.16 52 HABIBPUR WBMD04A Haldarpara (Habibpur) 3.38 0.47 2.91 53 HABIBPUR WBMDNA-2 Block Seed Farm, Habibpur 16.51 13.21 3.30 54 MANIKCHAK WBMD31B Begamganj 4.73 2.67 2.06 55 MANIKCHAK WBMD69 Mohana-IV 5.62 2.74 2.88 56 RATUA-I WBMD37B Debipur 4.73 1.01 3.72 57 ENGLISH BAZAR WBMD01A Nimasarai 7.34 2.10 5.24 58 GAZOLE WBMD75 Pandua 6.50 1.49 5.01 59 KALIACHAK-III WBMD89 Pagla Bridge 6.13 1.13 5.00 60 BAMONGOLA WBMD86 Paikpara 1.88 1.95 -0.0761 BAMONGOLA WBMD88 Nalagola 0.38 1.37 -0.9962 GAZOLE WBMD06 Deotala 0.77 1.09 -0.3263 GAZOLE WBMD15 Mashaldighi 2.03 2.43 -0.4064 GAZOLE WBMD22 Gazole 0.32 1.31 -0.9965 GAZOLE WBMD93 Kadubari 0.32 1.24 -0.9266 HARISHCHANDRAPUR-I WBMDNA-6 Tulsihata Irrigation Bungalow 3.74 4.49 -0.75
67 KALIACHAK-I WBMDNA-20 Baliadanga Lower Buniadi School
3.40 3.62 -0.22
68 KALIACHAK-I WBMDNA-22 Jalalpur GPO, Sherpur 2.74 3.06 -0.3269 KALIACHAK-II WBMDNA-24 Muthabari Health Centre 3.29 4.27 -0.9870 OLD MALDA WBMDNA-26 PWD Godown, Malda Town 9.16 9.68 -0.5271 OLD MALDA WBMDNA-27 Muchia Panchayat Office 15.46 16.18 -0.7272 RATUA-I WBMD42 Ratua (Tube Well) 3.83 5.90 -2.07

56
6.8 Decadal (long-term) fluctuation in groundwater level
Apart from the seasonal fluctuation in groundwater level in Malda district, the long-term trend of either rise or decline in groundwater level has been calculated. For this the mean depth to water level (DTW) data for the pre-monsoon period for one decade (from 2010 to 2019, total 10 years) was calculated, which was then compared with pre-monsoon groundwater level data of 2020. Similarly, mean of long-term or decadal data (2010 to 2019) for post-monsoon period was compared with the post-monsoon, 2020 DTW data of Malda district. Subsequently, the long-term rise and/or decline in groundwater level, both for pre-monsoon and post-monsoon periods, were estimated. The data on long-term fluctuation in groundwater level for pre-monsoon period is summarized in Table 5.4 whereas the long-term fluctuation for post-monsoon period is summarized in Table 5.5.
Fig. 6.8 Seasonal fluctuation in groundwater level (pre-monsoon versus post-monsoon, 2020), Malda district

57
Table 6.4 Decadal fluctuation in groundwater level (pre-monsoon 2020 versus pre-monsoon, 2010-2019), Malda district
Sl. No.
Block Name Location Well No. Well Type
Long-term DTW
Pre-monsoon (2010-2019)
DTW Pre-monsoon,
2020
Rise (m) Decline (m)
1. Kaliachak-I 16 Mile WBMD49 TW 6.78 2.46 4.32 -- 2. Kaliachak-I Mahajantala WBMD48 TW 5.96 1.66 4.30 -- 3. Kaliachak-III 17 Mile WBMD47 TW 3.57 2.51 1.06 -- 4. Kaliachak-III Doriapur WBMD99 DW 4.70 3.12 1.58 --
5. Kaliachak-III Birnagar WBMD59 TW 3.22 1.91 1.31 -- 6. Kaliachak-III Pagla Bridge WBMD89 TW 4.34 6.13 -- -1.797. Manikchak Begamganj WBMD31B DW 5.71 4.73 0.98 -- 8. Manikchak Mohana-1 WBMD66 DW 5.60 4.07 1.53 -- 9. Manikchak Mohana-2 WBMD67 DW 5.88 4.58 1.30 -- 10. Manikchak Mohana-3 WBMD68 DW 4.91 6.93 -- -2.0211. Manikchak Mohana-4 WBMD69 DW 6.06 5.62 0.44 -- 12. Bamongola Bamongola WBMD07C TW 8.49 5.18 3.31 -- 13. Bamongola Charakdanga WBMD87 DW 5.65 1.01 4.64 -- 14. Bamongola Makuli
(Khiripara) WBMD27 DW 5.03 0.95 4.08 --
15. Bamongola Nalagola WBMD88 DW 4.00 0.38 3.62 -- 16. Bamongola Paikpara WBMD86 DW 6.87 1.88 4.99 -- 17. Habibpur Habibpur WBMD04 DW 6.31 3.38 2.93 -- 18. Habibpur Tajpur WBMD79 DW 5.05 1.94 3.11 -- 19. English Bazar Battaly WBMD09B DW 6.07 2.22 3.85 --

58
Sl. No.
Block Name Location Well No. Well Type
Long-term DTW
Pre-monsoon (2010-2019)
DTW Pre-monsoon,
2020
Rise (m) Decline (m)
20. English Bazar Bholanathpur WBMD12 DW 3.26 0.87 2.39 -- 21. English Bazar Choto
Mohanpara-2 WBMD63 DW 7.28 5.25 2.03 --
22. English Bazar Choto Mohanpara-3
WBMD64 DW 6.99 5.59 1.40 --
23. English Bazar Milki WBMD29 DW 6.32 5.10 1.22 -- 24. Ratua-I Debipur WBMD37B DW 5.56 4.73 0.83 -- 25. Ratua-I Ratua WBMD42 TW 5.77 3.83 1.94 -- 26. Ratua-II Peerganj WBMD76 DW 7.94 6.02 1.92 -- 27. Gazole Deotala WBMD06 DW 2.67 0.77 1.90 -- 28. Gazole Mashaldighi WBMD15 DW 9.70 7.03 2.67 -- 29. Gazole Matoil WBMD91 TW 10.05 7.54 2.51 -- 30. Gazole Pandua WBMD16A DW 4.29 1.77 2.52 -- 31. Gazole Pandua-1 WBMD75 DW 11.31 6.50 4.81 -- 32. Harishchandrapur-I Tulsihata WBMD40 TW 6.93 3.83 3.10 -- 33. Harishchandrapur-II Baroduari WBMD41 DW 6.34 4.22 2.12 -- 34. Chanchal-II Jalalpur WBMD95 PZ 8.83 8.32 0.51 -- 35. Old Malda Malda Town WBMD14 DW 9.88 6.54 3.34 -- 36. Old Malda Muchia WBMD11 DW 7.26 4.94 2.32 --

59
Table 6.5 Decadal fluctuation in groundwater level (post-monsoon 2020 versus post-monsoon, 2010-2019), Malda district
Sl. No.
Block Name Location Well No. Well Type DTW (Post-monsoon 2020
Long-term Post- monsoon DTW (2010-2019)
Long-term Fluctuation Rise (m)
Long-term Fluctuation Decline (m)
1. Kaliachak - I 16 Mile WBMD49 TW 2.15 4.62 2.47 -- 2. Kaliachak - I Pagla Bridge WBMD89 TW 1.95 2.82 0.87 -- 3. Kaliachak - I Kaliachak WBMD83 DW 1.83 2.98 1.15 -- 4. Kaliachak - I Khaschandpur WBMD60 DW 2.94 3.59 0.65 --
5. Kaliachak - II Kuriatar WBMD45A TW 1.84 3.72 1.88 -- 6. Kaliachak - III Doriapur WBMD46A TW 1.30 2.53 1.23 -- 7. Kaliachak - III Birnagar WBMD59 DW 1.55 2.02 0.47 -- 8. Kaliachak - III 17 Mile WBMD47 TW 2.10 2.02 -- -0.089. Gazole Adina WBMD81 DW 0.83 1.98 1.15 --10. Gazole Deotala WBMD06 DW 1.09 1.47 0.38 --11. Gazole Kadubari WBMD22 DW 1.31 2.97 1.66 --12. Gazole Gazole WBMD93 TW 1.24 2.77 1.53 --13. Gazole Ghoksol WBMD80 DW 1.43 3.10 1.67 --14. Gazole Mashaldighi WBMD15 DW 2.43 3.80 1.37 --15. Gazole Matoil WBMD73 DW 1.75 4.63 2.88 --16. Gazole Panchamukhi WBMD98 PZ 3.36 4.83 1.47 --17. Gazole Pandua WBMD16A DW 1.10 2.20 1.10 --18. Bamongola Bamongola WBMD07C TW 2.21 3.99 1.77 --19. Bamongola Charakdanga WBMD87 DW 0.80 3.10 2.30 --20. Bamongola Paikpara WBMD86 DW 1.95 1.84 -- -0.11

60
21. Bamongola Nalagola WBMD88 DW 1.37 1.67 0.30 -- 22. Habibpur Habibpur WBMD04 DW 1.22 2.18 0.96 -- 23. Habibpur Tajpur WBMD79 DW 1.37 2.47 1.10 -- 24. Harishchandrapur-I Tulsihata WBMD40 TW 2.35 5.06 2.71 -- 25. Harishchandrapur-II Baroduari WBMD41 DW 3.04 4.39 1.35 -- 26. English Bazar Battaly WBMD09B DW 1.54 4.82 3.28 -- 27. English Bazar Bholanathpur WBMD12 DW 0.58 2.04 1.46 -- 28. English Bazar ChotoMohanpar
a WBMD64 DW 3.72 5.66 1.94 --
29. English Bazar Milki WBMD29 DW 2.04 4.92 2.88 -- 30. Manikchak Mohana - 1 WBMD66 DW 2.75 3.75 1.00 -- 31. Manikchak Najirpur WBMD31B DW 2.67 3.71 1.04 -- 32. Manikchak Begamganj WBMD70 DW 2.62 3.64 1.02 -- 33. Ratua - I Bhaluka WBMD21 PZ 4.19 4.73 0.54 -- 34. Ratua – I Ratua WBMD17A DW 3.36 4.17 0.82 -- 35. Ratua - I Ratua WBMD42 TW 5.90 4.11 -- -1.7936. Ratua - I Debipur WBMD37B DW 3.71 3.46 -- -0.2537. Old Malda Jadupur WBMD82 DW 2.65 5.30 2.65 --38. Old Malda Aiho WBMD85 DW 0.49 2.04 1.55 --39. Old Malda Malda Town WBMD14 DW 1.79 3.58 1.79 --40. Chanchal - II Jalalpur WBMD95 PZ 5.96 7.22 1.26 --
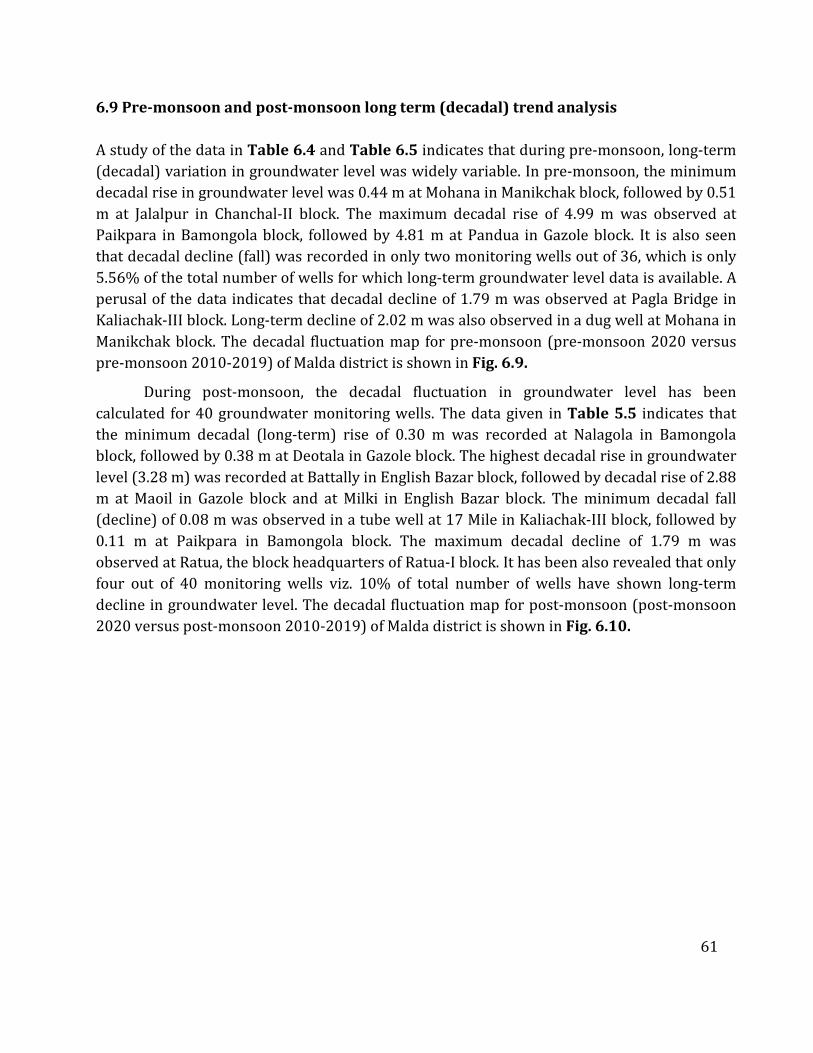
61
6.9 Pre-monsoon and post-monsoon long term (decadal) trend analysis
A study of the data in Table 6.4 and Table 6.5 indicates that during pre-monsoon, long-term (decadal) variation in groundwater level was widely variable. In pre-monsoon, the minimum decadal rise in groundwater level was 0.44 m at Mohana in Manikchak block, followed by 0.51 m at Jalalpur in Chanchal-II block. The maximum decadal rise of 4.99 m was observed at Paikpara in Bamongola block, followed by 4.81 m at Pandua in Gazole block. It is also seen that decadal decline (fall) was recorded in only two monitoring wells out of 36, which is only 5.56% of the total number of wells for which long-term groundwater level data is available. A perusal of the data indicates that decadal decline of 1.79 m was observed at Pagla Bridge in Kaliachak-III block. Long-term decline of 2.02 m was also observed in a dug well at Mohana in Manikchak block. The decadal fluctuation map for pre-monsoon (pre-monsoon 2020 versus pre-monsoon 2010-2019) of Malda district is shown in Fig. 6.9.
During post-monsoon, the decadal fluctuation in groundwater level has been calculated for 40 groundwater monitoring wells. The data given in Table 5.5 indicates that the minimum decadal (long-term) rise of 0.30 m was recorded at Nalagola in Bamongola block, followed by 0.38 m at Deotala in Gazole block. The highest decadal rise in groundwater level (3.28 m) was recorded at Battally in English Bazar block, followed by decadal rise of 2.88 m at Maoil in Gazole block and at Milki in English Bazar block. The minimum decadal fall (decline) of 0.08 m was observed in a tube well at 17 Mile in Kaliachak-III block, followed by 0.11 m at Paikpara in Bamongola block. The maximum decadal decline of 1.79 m was observed at Ratua, the block headquarters of Ratua-I block. It has been also revealed that only four out of 40 monitoring wells viz. 10% of total number of wells have shown long-term decline in groundwater level. The decadal fluctuation map for post-monsoon (post-monsoon 2020 versus post-monsoon 2010-2019) of Malda district is shown in Fig. 6.10.

62
Fig. 6.9 Map showing decadal fluctuation in groundwater level (pre-monsoon 2020 versus pre-monsoon 2010-2019), Malda district

63
Fig. 6.10 Map showing decadal fluctuation in groundwater level (post-monsoon 2020 versus post-monsoon, 2010-2019), Malda district

64
6.10 Groundwater resources
Dynamic Groundwater Resources of Malda district (as on 31st March, 2013) was estimated jointly by CGWB and SWID, Government of West Bengal, following the methodology recommended by Groundwater Resources Estimation Committee (GEC, 1997). Though assessment of dynamic ground water resources has been completed for a later period (as on 31st March 2017), the resources are yet to be validated through Government Order by the Government of West Bengal. Accordingly, dynamic ground water resources (as on 31-3-2013) have been considered for inclusion in the present report.
Dynamic groundwater resources have been estimated separately for both the command and non-command areas of Malda district. As per the assessment, two blocks viz. Habibpur and Harishchandrapur-I were in the Semi-critical category of groundwater development, as on 31st March 2013. Details of these blocks along with valid reasons for categorization of the blocks are presented in Table 6.6. A summary of dynamic ground water resources of the district is given below.
1. Total Ground Water Recharge 150784.98ham 2. Provision for Natural Discharge 4697.37ham 3. Net Annual Ground Water Availability 136087.61ham 4. Existing Ground Water Draft for Irrigation 59108.60 ham 5. Existing Ground Water Draft for Domestic Use 4261.62 ham 6. Existing Ground Water Draft for Industrial Use 2130.81 ham 7. Existing Ground Water Draft for All Uses 65501.03 ham 8. Stage of Ground Water Development (SOD) 48.13 % 9. Allocation for Domestic and Industrial Water Supply for 25 years(up to 2038)
9828.37 ham
10. Net Ground Water Availability for Future Irrigation Development 67150.64 ham 11. Categorization of Block Safe: 13
Semi-critical: 02
For estimation of dynamic ground water resources, the number of ground water abstraction structures (dug wells, shallow tube wells and deep tube wells), depth to water level (DTW) in the monitoring wells and rainfall are important parameters. A table showing the input parameters utilized for assessment of the resources (as on 31-3-2013) is given in Table 6.7. A summary table of the salient findings of the dynamic ground water resources (as on 31-3-2013), which also gives block wise data on ground water resources of Malda district, is given in Table 6.8.

65
Table 6.6 Details of two Semi-critical Blocks in Malda district (as on 31-3-2013)
Name of Block
(Ground Water
Assessment Unit)
Nature of Ground Water
Assessment Sub- Unit
Stage of Ground Water
Development (SOD) %
Is there a significant decline of water level trend
( '+' denotes falling and '-' denotes rising trend)
Category as per SOD
Categorization done based on
Trend (cm/y
r)
Pre-monsoo
n
Trend (cm/yr
)
Post- monso
on
Habibpur
Command -- -- -- -- -- -- Water Level Trend
Non-Command 19.92 21.43
Yes 23.50
Yes Semi-critical
Poor Ground Water Quality
-- -- -- -- -- --
Harishchandrapur-I
Command -- Nil Nil Nil Nil -- Stage of Development
Non-Command 93.18 9.82 No 13.87
No Semi-critical
Poor Ground Water Quality
-- Nil Nil Nil Nil --
Table 6.7 Input parameters utilized for estimation of dynamic groundwater resources of Malda district (as on 31-3-2013)
Block Rainfall (mm)
Avg. Pre-monsoon Water Level
(m bgl)
Avg. Post-
monsoon Water Level
(m bgl)
Avg. Seasonal
Fluctuation (m)
No. of
DTW
No. of
STW
No. of DW
Bamongola 1212.66 17.21 11.21 5.99 0 403 0 Chanchal-I 1261.08 6.58 4.84 1.75 30 1831 6 Chanchal-II 1221.77 7.56 6.60 0.96 38 2942 8 English Bazar 954.14 6.09 5.34 0.76 53 1583 0 Gazole 1120.20 9.36 6.44 2.92 26 2613 10 Habibpur 1062.40 17.71 14.86 2.85 1 1382 4 Harishchandrapur-I 1294.97 5.82 5.24 0.58 13 3020 0 Harishchandrapur-II 1285.59 5.24 3.22 2.02 13 4303 6 Kaliachak-I 995.25 4.83 3.56 1.27 15 1590 1 Kaliachak-II 1004.26 4.45 3.82 0.63 27 1042 1 Kaliachak-III 1054.58 4.33 2.97 1.36 38 3883 2 Manikchak 1115.72 5.33 3.62 1.72 21 1416 9 Old Malda 945.51 9.18 7.53 1.65 61 1085 1 Ratua-I 1154.35 7.10 5.03 2.07 35 2537 4 Ratua-II 1052.29 8.78 5.99 2.79 28 2061 8 TOTAL -- -- -- -- 399 31691 60

66
Table 6.8 Block wise groundwater resource of Malda district (as on 31-3-2013)
Name of Groundwater Assessment Unit
Type of Groundwater Assessment Sub-unit
Recharge from Rainfall (ham)
Recharge from Other Sources (ham)
Total Annual Ground Water Recharge (ham)
Provision for Natural Discharge(ham)
Net Annual Ground Water Avail-ability (ham)
Existing Gross Ground Water Draft for irrigation (ham)
Existing Ground Water Draft for Domestic Use (ham)
Existing Ground Water Draft for Industrial Use (ham)
Existing Gross Ground Water Draft for All Uses (ham)
Provision for domestic and industrial requirement up to 2035 (ham)
Net Ground Water Availability for future irrigation development (ham)
Stage of Ground Water Development (%)
Monsoon Non-monsoon
Monsoon
Non-monsoon
1 2 3 4 5 6 7 8 9 10 11 12 13 14 15 16 Bamongola Non-
Command 5544.74 1165.45 381.77 617.92 7709.88 770.99 6938.89 644.80 164.81 82.40 892.01 380.09 5914.00 12.86
Chanchal-I Non-Command
4755.55 1009.48 518.97 1338.68 7622.67 381.13 7241.54 3562.00 225.62 112.81 3900.43 520.33 3159.21 53.86
Chanchal-II Non-Command
4052.52 1277.70 608.94 1742.74 7681.89 768.19 6913.70 5508.40 213.95 106.97 5829.32 493.41 911.89 84.32
English Bazar Non-Command
4809.16 1516.26 422.30 1245.30 7993.02 799.30 7193.72 3645.80 502.12 251.06 4398.97 1158.00 2389.92 61.15
Gazole Non-Command
13831.57 2907.26 2936.15 5080.35 24755.33 2475.53 22279.80 4730.80 381.70 190.85 5303.35 880.29 16668.71 23.80
Habibpur Non-Command
10665.37 2241.76 411.25 1173.00 14491.37 1449.14 13042.23 2233.80 243.03 121.52 2598.35 560.49 10247.94 19.92
Harishchandrapur-II
Non-Command
6433.93 1352.35 671.51 2344.02 10801.81 1080.18 9721.63 7160.20 256.49 128.24 7544.93 591.53 1969.90 77.61

67
1 2 3 4 5 6 7 8 9 10 11 12 13 14 15 Kaliachak-I Non-
Command 3121.14 656.03 283.89 685.24 4746.30 474.63 4271.67 2859.40 402.70 201.35 3463.46 928.74 483.53 81.08
Kaliachak-I Non-Command
4398.30 1386.72 207.74 464.80 6457.55 645.76 5811.79 2234.60 273.80 136.90 2645.30 631.45 2945.74 45.52
Kaliachak-I Non-Command
7704.96 1619.51 644.12 1698.97 11667.56 1166.76 10500.80 7011.60 368.31 184.15 7564.06 849.41 2639.79 72.03
Manikchak Non-Command
9531.08 2003.34 320.72 650.45 12505.59 1250.56 11255.03 2710.20 277.32 138.66 3126.19 639.58 7905.25 27.78
Old Malda Non-Command
6049.64 1271.58 319.83 1408.74 9049.79 904.98 8144.81 3017.40 251.53 125.77 3394.70 580.11 4547.30 41.68
Ratua-I Non-Command
6828.48 1435.28 504.45 1580.27 10348.48 1034.85 9313.63 4795.80 281.51 140.75 5218.06 649.23 3868.60 56.03
Ratua-II Non-Command
5151.95 1082.89 489.75 1765.31 8489.89 848.99 7640.90 3888.80 208.39 104.20 4201.39 480.61 3271.49 54.99
TOTAL DISTRICT 96263.27 21992.81 9181.20 23347.70 150784.98 14697.3
7
136087.6
1
59108.60 4261.62 2130.81 65501.03 9828.37 67150.64 48.13

68
WATER TABLE MAP (PRE-MONSOON 2020) BLOCKS OF MALDA DISTRICT
Fig. 6.11 Water table map (pre-monsoon 2020), Chanchal-I block
Fig. 6.12 Water table map (pre-monsoon 2020), Chanchal-II block

69
Fig. 6.14 Water table map (pre-monsoon 2020), English Bazar block
Fig. 6.13 Water table map (pre-monsoon 2020), Gazole block

70
Fig. 6.15 Water table map (pre-monsoon 2020), Habibpur
Fig. 6.16 Water table map (pre-monsoon 2020),
Harishchandrapur-I block

71
Fig. 6.17 Water table map (pre-monsoon 2020),
Harishchandrapur-II block
Fig. 6.18 Water table map (pre-monsoon 2020),
Kaliachak-I block

72
Fig. 6.19 Water table map (pre-monsoon 2020), Kaliachak-II block
Fig. 6.20 Water table map (pre-monsoon 2020), Kaliachak-III block

73
Fig. 6.21 Water table map (pre-monsoon 2020),
Old Malda block
Fig. 6.22 Water table map (pre-monsoon 2020),
Manikchak block

74
Fig. 6.23 Water table map (pre-monsoon 2020), Ratua-I block
Fig. 6.24 Water table map (pre-monsoon 2020), Ratua-II block

75 Fig. 6.25 Water table map (pre-monsoon 2020), Bamongola block

76
WATER TABLE MAP (POST-MONSOON 2020) BLOCKS OF MALDA DISTRICT
Fig. 6.26 Water table map (post-monsoon 2020),
Bamongola block
Fig. 6.27 Water table map (post-monsoon 2020),
English Bazar block

77
Fig. 6.28 Water table map (post-monsoon 2020), Chanchal-I block
Fig. 6.29 Water table map (post-monsoon 2020), Chanchal-II block

78
Fig. 6.30 Water table map (post-monsoon 2020), Gazole block
Fig. 6.31 Water table map (post-monsoon 2020), Harishchandrapur-I block

79
Fig. 6.32 Water table map (post-monsoon 2020),
Harishchandrapur-II block
Fig. 6.33 Water table map (post-monsoon 2020),
Habibpur block

80
Fig. 6.34 Water table map (post-monsoon 2020),
Kaliachak-I block
Fig. 6.35 Water table map (post-monsoon 2020),
Kaliachak-II block

81
Fig. 6.36 Water table map (post-monsoon 2020),
Kaliachak-III block
Fig. 6.37 Water table map (post-monsoon 2020),
Manikchak block

82
Fig. 6.38 Water table map (post-monsoon 2020), Old Malda block
Fig. 6.39 Water table map (post-monsoon 2020), Ratua-I block
83 Fig. 6.40 Water table map (post-monsoon 2020), Ratua-II block

84
7. HYDROCHEMISTRY
7.1 Groundwater quality in shallow aquifers
A part of Malda district is affected by arsenic contamination in groundwater while another part is affected by fluoride contamination. Groundwater occurring in depth range of ~20 to ~95 m is affected by high arsenic in eight blocks viz. English Bazar, Manikchak, Ratua-I, Ratua-II, Chanchal-II, Kaliachak–I, Kaliachak-II and Kaliachak-III. Fluoride contamination in groundwater has been reported from Ratua-II and Bamongola blocks, which has been documented by the Fluoride Task Force, Government of West Bengal. High iron in groundwater has been reported from several locations in tube well water samples. Due to oxidation and co-precipitation of iron from ferrous to ferric state, dug well water is devoid of high iron. However, one growing concern is the rapid decline in the number of active dug wells over the last decade. Available data has revealed that groundwater in shallow aquifers is mildly alkaline and classified as Ca-HCO3 type based on hydrochemical analysis.
Groundwater samples were collected from the monitoring wells tapping the shallow aquifer during pre-monsoon period in 2019 and 2020. Basic analysis and heavy metal analysis was done in the NABL accredited lab of CGWB, ER, Kolkata. The objective of the analysis was to determine the type of groundwater and to assess the extent of groundwater contamination, especially with reference to arsenic and fluoride. The results of chemical analysis reveal that generally groundwater is suitable for domestic and irrigational use, except for high arsenic, fluoride and iron in parts of the district.
During the present study, fifty-two samples were collected from the ground water monitoring wells and key observation wells (year: 2019 and 2020). The analysis result has shown arsenic concentration above the Permissible Limit (0.01 mg/L or 10 µg/L) in few locations like Pagla Bridge in Kaliachak-III block (129.10 µg/L), Thakurbari in Kaliachak-I block (76.73 µg/L) and Mothabari in Kaliachak-II block (33.94 µg/L). Highest fluoride concentration of 4.54 mg/L was observed in a tube well at Sripur in Ratua-II block, which is much beyond the acceptable limit of 1.50 mg/L for fluoride. Iron concentration above the desirable limit (1.0 mg/L) was recorded in tube wells at Pandua (2.03 mg/L) and at Pagla Bridge (1.85 mg/L). High iron in groundwater is evident by the bittersweet astringent taste and reddish-brown coloured stain in the utensils. However, iron can be removed relatively easily by keeping the water overnight and then filtration using locally available cloth. Although arsenic has a strong geochemical affinity with iron, the extent of arsenic contamination in remaining seven blocks is to be deciphered through periodic analysis, both during pre-monsoon and post-monsoon. Uranium above permissible limit (30 µg/L) was found in a single water sample collected from a tube well near Rathbari More, Malda City. However, as the concentration (34 µg/L) only marginally exceeds the permissible limit, more detailed sampling and analysis are required in future.

85
Range of various major constituents in groundwater in the shallow aquifers of Malda district is given in Table 7.1. Table 7.1 General range of chemical parameters in shallow aquifers, Malda district
BDL: Below Detection Limit
7.2 Groundwater quality in deeper aquifers
In the deeper aquifers (depth >60 m), arsenic in groundwater was detected from piped water supply schemes (at pump houses) by the Public Health Engineering Directorate (PHED), Govt. of West Bengal. The latest data collected in the year 2019 and 2020 from PHED, Malda Division and from PHED, Arsenic Area Water Supply Division at Laxmipur, has shown occurrence of arsenic in six blocks viz. Chanchal-I, Chanchal-II, Ratua-I, Ratua-II, English Bazar and Manikchak. Apart from arsenic, parameters like pH, turbidity, iron, manganese, Total Hardness and fluoride are also obtained from PHED, Malda Division. The block wise details on chemical analysis in piped water supply schemes are given in Table 7.2.
Table 7.2 Chemical quality of raw water before distribution through piped water supply schemes, Malda district
Block Scheme Name
Tube Well No.
Date of testing
Chemical Parameters pH Turbidity
(mg/L) Iron (mg/L)
Manganese (mg/L)
Total Hardness (mg/L)
Total Arsenic (mg/L)
Fluoride (mg/L)
English Bazar
Sailpur W/S Scheme
TW-I 18-8-2020
7.12 2.16 0.93 0.11 304 0.0098 0.30
TW-II
18-8-2020
7.11 1.24 0.72 0.07 300 0.0059 0.29
Jotgopal (Mini) W/S Scheme
TW-I 18-8-2020
7.08 2.64 1.36 0.32 324 BDL 0.33
Constituents Range Constituents Range pH 7.4 - 8.2 K BDL – 43 mg/L EC 194 – 2900 µS/cm HCO3 67 – 958 mg/L Fe 0.01 – 2.25 mg/L SO4 BDL – 123 mg/L Ca 4 – 188 mg/L Cl 14 – 978 mg/L Mg 2 – 89 mg/L F BDL – 4.54 mg/L Na 7 – 1193 mg/L PO4 BDL – 0.71 mg/L

86
Manikchak Uttar Chandipur W/S Scheme
TW-I 08-8-2019
7.38 3.16 2.90 0.16 344 0.053 --
TW-II
08-8-2019
7.28 7.86 3.35 0.005 328 0.051 --
Chanchal-I Dhanjana W/S Scheme
TW-I 14-1-2020
7.08 0.88 0.072 0.098 208 BDL --
Khanpur-Hulaspur W/S Scheme
TW-I 15-1-2020
7.04 0.60 0.036 0.014 204 BDL --
Chanchal-II Jalalpur W/S Scheme
TW-I 11-8-2020
7.10 1.26 0.521 0.014 196 BDL --
Gourhanda W/S --Scheme
TW-I 17-8-2020
7.22 2.14 0.342 BDL 160 BDL --
Ratua-I Baharal Jalalpur W/S Scheme
TW-I 28-8-2020
6.92 3.67 0.956 0.233 260 0.004 --
Samsi Jalalpur W/S Scheme
TW-I 14-8-2020
7.28 2.53 0.456 0.042 180 BDL --
Ratua-II Araidanga W/S Scheme
TW-I 25-8-2020
8.00 4.26 0.17 0.06 336 0.012 --
TW-II
25-8-2020
7.00 3.92 0.31 0.04 352 0.016 --
Nasipur W/S Scheme
TW-I 29-8-2020
7.00 9.82 0.81 0.53 300 0.003 --
TW-II
29-8-2020
7.00 9.15 0.68 0.39 268 BDL --
Source: Office of the Executive Engineer, PHED, Malda Division
A perusal of the above table indicates that generally groundwater in deeper aquifers is potable, except for high iron concentrations at Daulatpur (3.06 mg/L), Harishankarpur (2.07 mg/L), Jotgopal Water Supply Scheme (1.36 mg/L) and Uttar Chandipur Water Supply Scheme (2.90 mg/L and 3.35 mg/L). Arsenic concentration above the Maximum Permissible Limit (0.01 mg/L or 10 µg/L) was observed in Uttar Chandipur Water Supply Scheme in

87
Manikchak block having concentrations of 0.053 mg/L and 0.051 mg/L. high total Hardness (TH) was also seen in the raw water for distribution through the water supply schemes in English Bazar block (TH varying from 300 to 324 mg/L), Chanchal-I block (TH of 204 and 208 mg/L), Ratua-I block (TH of 260 mg/L), Ratua-II block (TH varying from 268 mg/L to 352 mg/L) and Manikchak block (TH of 328 and 344 mg/L).
To remedy the problem of high arsenic, it is recommended to install Arsenic Removal Plants on priority. Another alternative is to adopt conjunctive use of surface water and groundwater or commissioning of exclusively surface water based water supply from perennial rivers like Mahananda, Tangon, Fulahar and Nagri. Based on detailed chemical analysis, the parameter wise tabular data is presented in Table 7.3.
The major ion compositions of groundwater samples in Malda district do not vary much. Based on concentration of major cations and anions in 53 groundwater samples, a Piper Trilinear Diagram and Modified Piper Diagram (Chadha Diagram) are prepared, which is shown in Fig. 7.1.
The Piper Trilinear Diagram (Fig. 7.1.A) reveals that groundwater is generally rich in Mg2+ and/or Ca2+ ions (85% of samples) with bicarbonate (HCO3-) as a dominant anion (89% of samples). The diagram also shows that as per cationic concentration, groundwater chemistry was mainly characterized by prevalence of calcium, magnesium and bicarbonate ions, whether in dug well or in tube well samples. Groundwater is classified mainly as either sodium bicarbonate type or as magnesium bicarbonate type with very few samples (5 out of 53 or 9.43%) falling in mixed class.
Modified Piper diagram or Chadha diagram (Fig. 7.1B) reveals that 90% groundwater samples are either classified as calcium-magnesium-bicarbonate type or calcium-magnesium-chloride type with similar ionic compositions, which indicates rapid and frequent water-rock exchange and absence of delayed recharge in the area. Most of the samples are originated from shallow aquifers that are characterized by rainfall recharge. It is also inferred that weathering and solution are the major physico-chemical processes involved in the characterization of groundwater in Malda district. Groundwater is fresh and potable as it is either calcium bicarbonate or magnesium bicarbonate type of water. The low sodium and chloride content in groundwater indicates absence of inland salinity hazard. Thus, groundwater is also suitable for agri-irrigational use.

90
Table 7.3: Summary table on quality of groundwater, Malda District
Constituents
Tota
l Sam
ple
Anal
ysed
Malda District IS 10500:2012 No. of
Samples beyond
Acceptable Limit
Samples beyond
Acceptable Limit
(%)
No. of Samples beyond
Permissible Limit
Samples beyond
Permissible Limit
(%)
Acceptable Limit
Permissible Limit Min Max Average
pH
53
7.12 8.45 7.90 ± 0.30 6.5-8.5 6.5-8.5 - - - -
EC (µs/cm) 25⁰C 153 1915 773 ± 429 - - - - - -
TDS
mg/
L (p
pm)
134 986 447 ± 221 500 2000 18 34 - -
Carbonate alkalinity as CaCO3 - - - - - - - - -
Bicarbonate alkalinity as CaCO3 70 695 299 ± 146 - - - - - -
Total alkalinity as CaCO3 57 570 245 ± 120 200 600 32 60 - -
Chloride 7 310 86 ± 73 250 1000 01 02 - -
Sulphate Traces 154 18 ± 34 200 400 - - - - Nitrate Traces 135 6 ± 19 45 45 01 02 01 02 Fluoride Traces 1.48 0.65 ± 0.42 1.0 1.5 - - - -
Calcium (as Ca) 8 208 49 ± 36 75 200 09 17 01 02
Magnesium (as Mg) 4 110 35 ± 21 30 100 26 49 01 02
Total Hardness (as CaCO3) 42 571 248 ± 134 200 600 28 53 - -
Sodium 5 115 51 ± 28 - - - - - -
Potassium 0.3 90.5 14.9 ± 21.5 - - - - - -
Uranium Traces 0.015 0.004 ± 0.005 0.03 0.03 - - - -
Iron Traces 6.58 0.98 ± 1.54 1.0 1.0 10 19 10 19
Arsenic 159 Traces 0.40 0.02 ± 0.06 0.01 0.01 47 29 47 29

91
Fig. 7.1 Samples of aquifer mapping study (Malda district), plotted in Piper Trilinear Diagram (A) and Modified Piper Diagram (B)
The Gibbs Plot of groundwater samples of Malda district is shown in Fig. 7.2. It has been evident from the distribution of samples in the Gibbs Plot that chemical composition of groundwater is mainly affected by rock-water interaction and the processes of evaporation and sedimentation. Most of the groundwater samples are obtained from areas with ratios of Na+/(Na++Ca2+) or Cl−/(Cl−+HCO3−) less than 0.5 signifies the dominance of rock-water interactions and chemical weathering of rock forming minerals. Samples with Na+/(Na++Ca2+) or Cl−/(Cl−+HCO3−) ratios greater than 0.5 and TDS levels between 134 – 986 mg l-1 shows that the groundwater chemistry has been controlled not only by rock weathering interaction but also by evaporation precipitation at places.

92
Fig. 7.2 Gibbs Diagram of groundwater samples, Malda District
7.3 Suitability of groundwater for irrigation
Groundwater suitability for irrigation in Malda district can be best explained with the help of Wilcox Diagram and classification scheme invented by United States Salinity Lab (USSL). The USSL diagram and Wilcox plot best explains the combined effect of sodium hazard (S) and salinity hazard (C). The Wilcox and USSL Diagrams are shown in Fig. 7.3. Analysis ofthe figure reveals that a majority of the groundwater samples collected from Malda districtfalls in S1-C2 and S1-C3 class that are generally suitable for irrigation. Considering the pH, EC,Sodium Absorption Ratio (SAR), Residual Sodium Carbonate (RSC) and Total Hardness (TH),the Wilcox Diagram and USSL Diagram both reveals that groundwater in Malda district issuitable for agri-irrigational use.

93
Fig. 7.3 Suitability of groundwater for irrigation use, Malda district; shown in (A) Wilcox Diagram and (B) US Salinity Diagram
A summary table for high arsenic (As) in groundwater of Malda district, as per in house data of 159 samples analyzed for arsenic in groundwater, is given below.
No. of Block from which As> 0.01 mg/L has been reported 10
Total no. of Sample Analysed 159
Samples with As concentration> 0.01 mg/L 47 % of sample having As concentration> 0.01 mg/L 29.0% Highest concentration reported (mg/L) 0.402
Block Kaliachak-I Location Sujapur
A summary of the major findings of the hydrochemical scenario of Malda district is given below. According to Arsenic Task Force, Government of West Bengal, eight blocks of Malda
District viz. English Bazar, Kaliachak-I, Kaliachak-II, Kaliachak-III, Manikchak, Ratua-I, Ratua-II and Chanchal-II have been identified as arsenic affected blocks. Inaddition, as per CGWB analysis, elevated level of arsenic in groundwater has beendetected in three additional blocks – Gazole, Harischandrapur-I and Old Malda.Further studies are required to confirm the findings.

94
As per the database of Fluoride Task Force, Government of West Bengal, two blockshave been identified as fluoride contaminated viz. Bamongola and Ratua-II.Available data of Public Health Engineering Directorate, Malda Division hasindicated sporadically high fluoride in groundwater in Old Malda block, althoughCGWB analysis has not revealed high fluoride in Old Malda block.
Occurrences of iron exceeding the permissible limit of 1.0 mg/L were found in fewlocations of Bamongola, English Bazar, Gazole, Kaliachak-III and Manikchak block.Due to unpleasant taste of iron-rich groundwater, villagers rarely use the source fordrinking. However, iron contaminated groundwater has been found to beoccasionally used for domestic use due to absence of suitable alternate source.
It has also been observed that groundwater of shallow tube wells are usuallycontaminated with arsenic and iron, whereas dug wells do not show anycontamination as such. This is due to oxygen rich environment in the open dugwells, which results in oxidation of ferrous iron into ferric iron (Fe+3) and trivalentarsenic to much less toxic pentavalent arsenic (As+5) and their removal from thedissolved state into precipitates.
In respect of suitability assessment for irrigational use, groundwater in Maldadistrict was mostly found suitable for irrigational use as majority of the sampleseither belong to S1-C2 or S1-C3 class.
Facies classification of groundwater in Malda district has shown that maximumnumber of groundwater samples belong to Ca2+-Mg2+-HCO3- type (90% of the totalnumber of sample analyzed), which indicates rapid and frequent water-rockexchange and recharge of phreatic and shallow aquifer with recent fresh water inthe Gangetic Alluvial Plain in Malda district.

93
8. AQUIFER MANAGEMENT PLAN
8.1 Groundwater related issues and problems
Some of the groundwater related issues and problems in Malda district are given below:
Arsenic beyond Permissible Limit (>0.01 mg/L or 10 µg/L) is reported in eight blocks:
English Bazar, Manikchak, Kaliachak-I, Kaliachak-II, Kaliachak-III, Ratua-I, Ratua-II and
Chanchal-II. According to the report of Arsenic Task Force (Govt. of West Bengal),
1983601 people including rural population of 1794550 and urban population of 189051
are affected by arsenic toxicity. A total of 1146 habitations in eight blocks of the district
are affected by arsenic contamination (Talukdar and Bandopadhyay 2017).
Water supply tube wells of Public Health Engineering Directorate (PHED) are mainly
confined to shallow or moderately deep aquifers (from 45 to 100 m), resulting in high
arsenic in groundwater. Thus, surface water based schemes are exclusively used for
water supply in arsenic affected blocks.
Bamongola and Ratua-II blocks are reported to be affected by fluoride contamination in
groundwater (fluoride >1.5 mg/L) affecting a rural population of 2110 (Fluoride Task
Force and PHED, Govt. of West Bengal). Analysis by CGWB has shown fluoride
concentration of 1.5 mg/L at Peerganj in Ratua-II block. Latest data of PHED (Pers.
Comm.) has shown fluoride of 2.07 mg/L at Samsabad in Old Malda block.
Iron contamination in groundwater was observed at Pandua in Gazole block and Pagla
Bridge in Kaliachak-III block. Historical data has revealed sporadic iron contamination in
Kaliachak-I, II and III, Chanchal-I and II, Ratua-I and II, Harishchandrapur-I and II,
English Bazar, Old Malda and Manikchak block.
High groundwater abstraction through irrigational tube wells may lead to downward
migration of arsenic rich water used for agriculture, which could eventually lead to
horizontal movement of arsenic contaminated groundwater into arsenic free aquifers
(Aquifer-1A) at shallow to moderately deep levels. This may lead to arsenic
contamination in previously uncontaminated aquifers (Sikdar and Chakraborty 2007).
Soil acidity and soil erosion are observed in Kaliachak-II and III, Manikchak, English
Bazar, Harishchandrapur-I and II block. Large residential and cultivated areas and
several hectares of mango orchards are affected by soil erosion and collapse of
riverbanks of Ganga and Fulahar rivers. Indiscriminate use of chemical fertilizers for
achieving higher crop yields has increased the acidity of top soil in Ratua-I and Ratua-II
blocks, which may result in diminished agricultural production.
Water logging during monsoon and post-monsoon are observed in low lying Taal and
Diara areas in Harishchandrapur-I and II, Manikchak, Kaliachak-II and Ratua-I blocks,

94
with high rate of deposition of sand and silt. This reduces rate of infiltration and
downward percolation, resulting in less groundwater recharge.
8.2 Supply side and demand side aquifer management
For an effective and efficient management of the groundwater resources, formulation of an
Aquifer Management Plan (AMP) at district and block level is very important. A sustainable
management of aquifers will depend on total available groundwater resources, present
status of groundwater development and groundwater quality issues, if any. Supply side
management of an Aquifer Management Plan (AMP) focuses on increasing the volume of
water available through ways like a) finding new resources, b) increasing storage capacity,
c) diverting water to increase water supply at a particular location and d) using technology
to create clean, potable water from a previously unutilized source. Demand side
management, on the other hand, can be defined as reducing the volume of water that is
being used by the stakeholders for specific purpose like household use, farming, municipal
or industrial needs. The main objective is to increase the Water Use Efficiency throughout
the year.
Due to low Stage of Groundwater Development (48.13%) in Malda district, there is no
justification in implementing demand side management at district level. However, supply
side management interventions may be adopted through implementation of water
resources augmentation programmes like direct increase in storage potential through rain
water harvesting or indirectly replenishing the shallow aquifers through artificial recharge
in feasible areas. A detailed discussion on this aspect is given separately.
8.3 Aquifer Management Plan for drinking and domestic sector
The nodal agency for drinking and domestic water supply in rural and urban areas of Malda
district is the Public Health Engineering Directorate (PHED), Government of West Bengal.
Water supply schemes are implemented through PHED, Malda Division and PHED, Arsenic
Area Water Supply Division. As on March 2020, total number of Piped Water Supply
Schemes (PWSS) in Malda district was 120. Another 33 water supply schemes are being
implemented under various projects by the PHED, Malda Division. Seven PWSS are
awaiting sanction with a designed population of 31348 (District Survey Report, 2021). Two
schemes covering Old Malda, Habibpur and Bamongola blocks are being implemented with
funding through Mahatma Gandhi National Rural Employment Guarantee Act (MGNREGA)
and Pradhan Mantri Krishi Sinchai Yojana – Har Khet Ko Pani (PMKSY-HKKP) project.
As on March 2021, there are 21200 functional tube wells in Malda district. Out of the
total rural population, 63.11% is covered by the commissioned Piped Water Supply

95
Schemes (PWSS) maintained by the Public Health Engineering Directorate, Malda Division.
Apart from this, 4.84% of the population is being covered under the ongoing PWSS. It is
envisaged that after commissioning of all schemes, 71.06% of the rural population would
have potable water supply. A project on implementation of 50 Dual Use Solar Pump Fitted
Water Supply Scheme is under pipeline, which will cover Old Malda, Ratua-I, Gazole,
Habibpur, Kaliachak-I, Kaliachak-II, Chanchal-I, Chanchal-II, Harishchandrapur-I and
Harishchandrapur-II block (District Survey Report 2021). Two water supply schemes are
presently operational in Malda Sadar Hospital and Chanchal Sadar Hospital by the PHED,
Malda Division. A list of seventeen groundwater based water supply schemes
commissioned under Master Plan by the PHED, Malda Division in English Bazar,
Manikchak, Ratua-I and Ratua-II blocks is given in Table 8.1.
Table 8.1 Groundwater based water supply schemes commissioned in Malda district
Sl.
No.
Name of Scheme Block Population benefited
1 Dakshin Chandipur Manikchak 6092
2 Gopalpur Manikchak 15477
3 Mahabbatpur Manikchak 2643
4 Barachak English Bazar 863
5 Itakhola English Bazar 453
6 Jot Basanta English Bazar 11076
7 Sahazalalpur English Bazar 2790
8 Bhado Ratua-I 16844
9 Bihari Ratua-I 7559
10 Bijrabhita & its adjacent mouzas Ratua-I 14799
11 Kankot Ratua-I 9581
12 Mahammadpur Ratua-I 2254
13 Mahespur Ratua-I 1999
14 Gobarjana & its adjacent mouzas Ratua-II 7230
15 Kadamtali & its adjacent mouzas Ratua-II 10933
16 Magura Ratua-II 15971
17 Pirpur Ratua-II 1796
(Source: Master Plan, PHED, Govt. of West Bengal)
For arsenic removal in groundwater, five water supply schemes were made functional
by the PHED, Arsenic Area Water Supply Division in Ratua-I and Ratua-II blocks. The
schemes cater to a design population of 37710 with cumulative supply of 4112 m3/day.
Details of these schemes are given in Table 8.2.

96
Table 8.2 Details of schemes for arsenic removal in groundwater, Ratua-I and Ratua-
II blocks, Malda district
Name of Scheme Block Capacity (m3/hr) Clear water supplied (m3/day)
Design Population
Maheshpur Water Supply Scheme (WSS)
Ratua-I 12.0 192.0 2665
Bakhra WSS Ratua-I 39.0 624.0 6306 Sultanpur WSS Ratua-II 51.0 816.0 1847 Sambalpur WSS Ratua-II 99.0 1584.0 17548
Pirpur WSS Ratua-II 11.0 176.0 1847
Total 212.0 3392.0 37710
(Source: Arsenic Area Water Supply Division, PHED)
The data in Table 8.2 shows that the largest water supply scheme for arsenic-free
drinking water is at Sambalpur having capacity of 1584 m3/day catering to the
requirement of a rural population of 17548. The water supply scheme at Pirpur has the
lowest capacity (176 m3/day) catering to the water requirement of 1847 people.
8.4 Aquifer Management Plan for irrigation sector
Due to extensive agricultural activities in Malda district, an unprecedented stress has been
imposed on Aquifer-IA and Aquifer-IB. Cultivation of summer paddy (Boro Dhaan) has
adversely affected available groundwater resources, which is being extracted through
33616 Shallow Tube Wells and 569 Deep Tube Wells as per 5th Minor Irrigation Census
(Source: Statistical Handbook, 2014). Irrigation is dependent on surface storage also in the
form of 255 tanks. In addition to this, 446 Surface Flow Schemes and 483 River Lift
Irrigation (RLI) schemes are utilized to irrigate the total Cultivable Command Area (CCA) of
1277.83 km2 Out of the total CCA, 956.30 km2 was under groundwater irrigation and
364.56 km2 under surface water irrigation. Boro paddy is cultivated primarily in low lying
areas of Barind Tract. In Malda district, Irrigation Potential Created by groundwater
resources is 1402.68 km2, which is more than twice the potential created by surface water
irrigation (622 km2).
As the semi-confined and confined aquifers are already under stress, it is not
recommended to install additional tube wells for irrigation. Instead, a modification in
cropping pattern may be adopted depending on local socio-economic and cultural

97
(psychological) conditions. Crop diversification technique is also recommended, keeping
the fundamental crops unchanged. Less water intensive crops like sunflower (standing
crop height: 350-500 mm), ginger (standing height: 350-400 mm) and beans (standing
height: 300-400 mm) needs to be cultivated along with onion (standing height: 350-550
mm) and tobacco (standing height: 400-600 mm) simultaneously with reduction of
cultivation of sugarcane, which is a highly water intensive crop with standing height
ranging from 1500 to 2500 mm.
Sufficient number of irrigational tube wells is already operational in Malda district.
Hence, there is very little justification to construct additional Medium Duty Tube Wells
(MDTW) or Heavy Duty Tube Wells (HDTW) to increase irrigation efficiency. A much better
way to optimize groundwater resources is to adopt crop diversification and modification in
cropping pattern, keeping the fundamental crops (mainly paddy) unchanged. Summer
paddy (Boro Dhaan) cultivation needs to be reduced at least by 10% of present production
considering the adverse impact of lowering of groundwater level in the peak summer
season. Cropping of novel varieties (peanuts, maize, soybean) and increasing the
horticultural activity through cultivation of varieties like sunflower will result in increasing
the water use efficiency.
8.5 Aquifer Management through Artificial Recharge and Rain Water Harvesting
Due to predominantly confined and semi-confined nature of aquifers in Malda district, the
scope of artificial recharge is generally very less, except for Kaliachak-I, Old Malda and
Gazole blocks. The details of priority areas identified for limited artificial recharge based on
the unsaturated aquifer volume, has been enumerated under the latest Master Plan of
Artificial Recharge (CGWB 2020). Rain water harvesting technique, especially roof top rain
water harvesting in urban and peri-urban areas like Malda Town, Gazole, Habibpur,
Chanchal, Harishchandrapur, Ratua and Manikchak is feasible. Open area rain water
harvesting is suitable for rural areas. Normal Rainfall in Malda district is sufficiently high
(1453 mm) to harness the potential of water conservation and management through
conjunctive use of surface water and groundwater.
As per latest Master Plan on Artificial Recharge (CGWB 2020), only three blocks
namely Kaliachak-I, Old Malda and Gazole are suitable for artificial recharge. The recharge
structures should be constructed on priority in areas having post-monsoon depth to water
level >9 m bgl. Details on surface water requirement and artificial recharge worthy areas
are given in Table 8.3. A perusal of the table shows that the highest artificial recharge
worthy area of 2.04131 km2 is in Kaliachak-I block. This is followed successively by
recharge worthy area of 0.25582 km2 in Gazole block and 0.02194 km2 in Bamongola block.

98
Out of the total mappable area under NAQUIM study (3733 km2), only 2.32 km2
(0.062% of total) is suitable for artificial recharge, out of which 2.04 km2 is in Kaliachak-I
block. Feasible recharge structures recommended are Percolation Tanks (PT), Re-
excavation of Existing Tanks with Recharge Shafts (REET), and Injection Wells (IW).
Table 8.3 Details of Artificial Recharge in three blocks of Malda district
Block Total utilizable volume of surface
runoff (MCM)
Unsaturated aquifer volume for recharge (MCM)
Area suitable for Artificial Recharge
(km2)
Recharge structures recommended
Percolation
Tank
Re-excavation
of Existing
Tank with
Recharge Shaft
Injection
Well
Kaliachak-I 0.685 12.248 2.041 One One One
Old Malda 0.007 0.132 0.022 -- -- --
Gazole 0.086 1.535 0.256 -- -- --
Total 0.778 13.914 2.319 One One One
*MCM: Million Cubic Metre
(Source: Master Plan for Artificial Recharge, CGWB 2020)
A perusal of Table 8.3 reveals that among all the blocks, Kaliachak-I has the
highest potential for artificial recharge. Recharge potential for feasible structures are:
a) Percolation Tank: 0.343 MCM
b) Re-excavation of Existing Tanks with Recharge Shaft: 0.137 MCM
c) Injection Well: 0.206 MCM
Due to occurrence of Older Alluvium, feasibility of artificial recharge is very less both for
semi-confined aquifers (tapped by MDTW) or the unconfined aquifers (tapped by Dug
Wells). Hence, bulk of the non-committed surface run-off needs to be harnessed through
water conservation structures like storage tank and traditional rain water harvesting
through small pits and cement concrete tanks, depending on the socio-economic
considerations at village or community level. There is an urgent need to involve Non-
Government Organizations, Self Help Groups, Gram Sabha/Gram Panchayat and District
Administration in a synergistic manner for effective implementation of participatory
management at village and block level. Formulation and implementation of village level
Aquifer Management Plan is possible through participatory groundwater management.

99
8.6 Non-committed surface runoff for artificial recharge and rain water harvesting
The volume of surface runoff that can be harvested without creating any adverse effect on
the environment has been estimated. Parameters used for this estimation are the normal
annual rainfall, geographical area, runoff co-efficient and soil type. The non-committed
surface runoff after deducting the Environmental Flow (e flow) component is given in
Table 8.4.
Table 8.4 Estimation of non-committed surface runoff for rain water harvesting,
Malda district
Block Area,
A (km2)
Normal
Monsoon
Rainfall,
Rn (mm)
Volume of
Monsoon
Rainfall, Vmr
((A*Rn)*103)
/106
(MCM)
Runoff
Coefficient,
C (for land
slope: 0-5%)
Total volume
of surface
runoff
available
annually, Vt
(Vmr*C) in
MCM
V =
0.75* Vt
( MCM)
Non-
Committe
d Surface
Runoff,
Vnc
(0.5*V) in
MCM
Non-
Committed
Surface Runoff
after
considering e-
flow, Vf
(0.6*Vnc) in
MCM
Kaliachak-I 112.0 1453.0 162.74 0.50 81.37 61.03 30.52 18.31
Kaliachak-II 223.0 1453.0 324.02 0.50 162.01 121.51 60.76 36.46
Kaliachak-III 260.0 1453.0 377.78 0.50 188.89 141.67 70.84 42.50
English
Bazar
242.0 1453.0 351.63 0.50 175.82 131.87 65.94 39.56
Bamongola 206.0 1453.0 299.32 0.50 149.66 112.25 56.13 33.68
Habibpur 396.0 1453.0 575.39 0.50 287.70 215.78 107.89 64.73
Manikchak 325.0 1453.0 472.23 0.50 236.12 177.09 88.55 53.13
Old Malda 217.0 1453.0 315.30 0.50 157.65 118.24 59.12 35.47
Ratua-I 231.0 1453.0 335.64 0.50 167.82 125.87 62.94 37.76
Ratua-II 174.0 1453.0 252.82 0.50 126.41 94.81 47.41 28.45
Chanchal-I 162.0 1453.0 235.39 0.50 117.70 88.28 44.14 26.48
Chanchal-II 205.0 1453.0 297.87 0.50 148.94 111.71 55.86 33.52

100
Gazole 513.0 1453.0 745.39 0.50 372.70 279.53 139.77 83.86
Harishchand
rapur-I
171.0 1453.0 248.46 0.50 124.23 93.17 46.59 27.95
Harishchand
rapur-II
217.0 1453.0 315.30 0.50 157.65 118.24 59.12 35.47
District Total 2654.67 1991.05 995.58 597.33
From Table 8.4, it is seen that at district level, total volume of surface runoff available
in a year is 2654.67 MCM, out of which non-committed surface runoff available annually for
rain water harvesting (after deducting the environmental flow) is 597.33 MCM. Thus only
22.5% of the available volume of surface runoff can be utilized for rain water harvesting. It
is also revealed that a high variability exists in the volume of non-committed surface runoff
at block level for implementing rain water harvesting. Highest water availability of 83.86
MCM is calculated for Gazole block and the lowest volume of 18.31 MCM is calculated for
Kaliachak-I block. As discussed in Section 8.4, there is very little scope for implementing
artificial recharge schemes in Malda district.
Based on Monsoon Rainfall of 1219.8 mm (year: 2019), total volume of water available
for implementing rainwater harvesting for 27 Census Towns (Aiho, Kendua, Chanchal,
Sahapur, Kachu Pukur, Rangavita, Bamangram, Jadupur, Baliadanga, Nazirpur, Chhatianmor,
Alipur, Birodhi etc.) was estimated at 0.003 MCM, which would require an expenditure of
Rupees Twelve Lakh for implementation of the scheme. For the two Municipal Bodies (English
Bazar Municipality and Old Malda Municipality), the volume of rain water available for
harvesting is estimated at 0.015 MCM with total expenditure of Rupees Forty Lakh for
implementation of the scheme (Master Plan of Artificial Recharge, 2020).
8.7 Block Level Aquifer Management Plan, Malda district
For a detailed understanding of aquifer architecture, aquifer geometry and
correlation between aquifers at block level, block wise Aquifer Management Plans (AMP) of
Malda district are prepared. The AMPs also serve as an integral component for
development of the Aquifer Information and Management System (AIMS), which is
proposed to be launched through web based platform. The main objective of developing
the AIMS is to facilitate the stakeholders in understanding the aquifer wise availability and
chemical quality of groundwater for drinking, irrigational and industrial use. Aquifer
Management Plans for 15 community developmental blocks in Malda district are given in
the following pages.

101
Aquifer Management Plan Kaliachak-I block, Malda district, West Bengal
(112.0 km2 area covered under NAQUIM)
GENERAL INFORMATION
State Name West Bengal District name Malda
Block Name Kaliachak-I
Location Located in the southern part of Malda district
Geographical Area 112.0 km2
Basin/Sub-basin Ganga/ Bhagirathi
Principal Aquifer System Alluvium (Code - AL) Aquifer-I: Average depth range is from 20 to 45 m bgl (deep tube wells of state government are absent due to high Arsenic)
Major Aquifer System Younger Alluvium (Aquifer Code - AL01):Single Aquifer System, depth range varies from 30-41 mbgl (based on limited Piezometer data of state government department)
Annual Rainfall 2019: 1139.4 mm, 2020: 1681.7 mm
AQUIFER DISPOSITION
Aquifer Disposition Aquifer-I: Phreatic aquifer occurring at shallow depth (<60 m) Occurs throughout the block Underlain by hard crystalline rocks (Precambrian
basement of Garo-Rajmahal gap) at >100 m bgl (CGWB2001)
Aquifer material is Younger Alluvium of Late Quaternaryage
Generally, Aquifers occur in the depth range of 30.0 to41.0 m bgl (CGWB, 2001)
Status of GW Exploration Exploratory Wells: 0 Observation Wells: 0 Piezometers: 8 (State Water Investigation Directorate)
Aquifer Characteristics Due to extremely high Arsenic concentration throughout Kaliachak-I block, no groundwater based water supply and distribution scheme has been implemented. As a consequence, litholog/strata chart of bore holes in this block are not available, thereby precluding characterization of Aquifers in this block.
Groundwater Monitoring Status
4 monitoring wells (at Kaliachak, Thakurbari, Sujapur and Khaschandpur/Makku Sahutala) Average DTW (pre-monsoon 2020): 3.46 m bgl Average DTW (post-monsoon 2020): 3.13 m bgl Average water table elevation ((pre-monsoon 2020): 26.54 m Average water table elevation ((post-monsoon 2020): 26.87 m
Groundwater Quality Aquifer – I (Single Aquifer System): Arsenic contaminationreported in 317 habitations (Arsenic>0.01 mg/L). Total riskpopulation = 392517 (Rural: 269058, Urban: 123459)
NABL Data of CGWB, ER: During Special Drive on Arsenic(2015-16), Arsenic concentration in groundwater was found

102
to be varying randomly at various locations viz. Gidhnipara (0.009 mg/L), Nauda (0.035 mg/L), Jalalpur (0.057 mg/L), Chandpur (0.094 mg/L), Balidanga (0.164 mg/L), Kaliachak Dalal More (0.237 mg/L) and Sujapur (0.402 mg/L).
Groundwater Monitoring Wells of CGWB: Arsenicconcentration was variable e.g. Kaliachak (0.184 mg/L),Thakurbari (0.0767 mg/L) and Sujapur (0.001 mg/L). Highmagnesium (>30 mg/L) is recorded at Sujapur (43 mg/L),Kaliachak (44 mg/L) and Sultanganj (51 mg/L).
Aquifer Characteristics AQUIFER DEPTH
RANGE (mbgl)
THICKNESS (m)
DISCHARGE (m3/hr)
Drawdown (m)
Aquifer-I 30.0 – 41.0 14.3 180-200 2.0 – 4.0
*Transmissivity (T) and Storage Co-efficient(S) are not available
Groundwater Resource *Total annual GW Recharge: 7537.06 ham*Total Annual GW Extraction: 5040.65 ham*Stage of GW Extraction: 66.88%*Category: Safe
Future Water Demand *Annual GW allocation for future domestic use (up to 2042):511.56 ham
Aquifer Management plan
Groundwater Management Plan
Problem 1: Ground water contamination caused by arsenic in Younger Alluvium of Aquifer-I.
Block Arsenic
(<0.01 mg/L)
Arsenic
(>0.01<0.05
mg/L)
Arsenic
(>0.05 mg/L)
No. of tube wells
with high
Arsenic
(maximum As
concentration) % Count % Count % Count
Kaliachak-I 0 0 9.1
5
29 90.8
5
288 317
(0.216 mg/L)
Table showing details of tube wells with high Arsenic content
Management strategy: 1. Installation of arsenic removal plants to make potable
water from the single aquifer system (Aquifer-I).2. Rainwater harvesting.3. Use of surface water in entire block, primarily due to
Arsenic contamination in groundwater throughout thisblock (Arsenic Hot Spot area).
4. Alternate cropping (like horticulture instead ofconventional paddy cultivation) to be adopted toeliminate bio-magnification of arsenic in food grains.
5. Implementation of modern irrigation practices like dripwater irrigation system, sprinklers can be made.
6. Rain water harvesting and artificial recharge structures tobe implemented.
7. For removal of Arsenic, water treatment plants have beenestablished at Dariapur and Baishnab Nagar by the PublicHealth Engineering Directorate, Govt. of West Bengal bytapping surface water from Bhagirathi River.

103
AR & Conservation Possibilities
1. Schemes for Artificial Recharge techniques needs to beadopted in Kalaiachak-I block.
2. Recharge techniques should be adopted on priority inareas having post-monsoon depth to water level > 9 mbgl,and with long-term declining trend.
3. Total utilizable volume of surface runoff is 0.685 MCM.
4. Total area suitable for recharge is 2.04 km2 whereasunsaturated aquifer volume for Artificial Recharge hasbeen estimated at 12.248 MCM (CGWB 2020).
4. Using standard method (Dhruvanarayana, 1993), a total of68.50 ham of rainwater has been calculated to beharvested. This water can be used for construction ofsuitable structures for artificial recharge and conservationof water.
5. Recharge structures recommended are: Percolation Tank(potential: 0.343 MCM), Re-excavation of Existing Tankwith Recharge Shaft (0.137 MCM) and Injection Well(0.206 MCM) as per the Master Plan of Artificial Recharge(CGWB 2020).

104
Aquifer Management Plan Kaliachak-II block, Malda district, West Bengal
(223.0 km2 area covered under NAQUIM)
GENERAL INFORMATION
State Name West Bengal District name Malda
Block Name Kaliachak-II
Location Located in the southern part of Malda district
Geographical Area 223.0 km2
Basin/Sub-basin Ganga/ Bhagirathi
Principal Aquifer System Alluvium (Code - AL) Single aquifer system occurring at shallow (<60 m ) to moderately deep (60 – 100 m) levels throughout the block (deep tube wells of state government are absent due to high Arsenic)
Major Aquifer System Younger Alluvium (Aquifer Code - AL01): Single Aquifer System, depth range varies from is from 18-80 mbgl (based on limited Piezometer data of state government (SWID)
Annual Rainfall 2019: 1139.4 mm, 2020: 1681.7 mm
AQUIFER DISPOSITION
Aquifer Disposition Aquifer-I: Occurs under phreatic/semi confined condition Promising aquifers at shallow to moderately deep levels Occurs throughout the block Underlain by hard crystalline rocks (Precambrian
basement of Garo-Rajmahal gap) at >100 m bgl (CGWB2001)
Aquifer material: Younger Alluvium (Holocene)Status of GW Exploration Exploratory Wells: 0
Observation Wells: 0 Piezometers: 6 (State Water Investigation Directorate)
Aquifer Characteristics Due to extremely high Arsenic concentration throughout Kaliachak-II block, no groundwater based water supply and distribution scheme has been implemented. As a consequence, litholog/strata chart of bore holes in this block are not available, thereby precluding characterization of Aquifers in this block.
Groundwater Monitoring Status
3 monitoring wells (at Kuriatar, Mothabari and Puratan Pataldanga) Average DTW (pre-monsoon 2020): 2.91 m bgl Average DTW (post-monsoon 2020): 2.76 m bgl Average Water Table elevation (pre-monsoon 2020): 26.54 m Average Water Table elevation (post-monsoon 2020): 26.87 m
Groundwater Quality Aquifer – I: Arsenic contamination reported in 317 habitations(Arsenic>0.01 mg/L). Total risk population = 392517 (Rural:269058, Urban: 123459)
NABL Data of CGWB, ER: During Special Drive on Arsenic(2015-16), Arsenic concentration in groundwater was found

105
to be varying randomly at various locations viz. at Meherapur/Birpara (0.001 mg/L), Ganga Prasad Colony (0.002 mg/L), Kashim Bazar (0.014 mg/L), Puratan Pataldanga (0.030 mg/L), Birampur (0.035 mg/L), Kahala (0.036 mg/L), Durlavpur/Kakmari (0.054 mg/L) and Raipara (0.078 mg/L).
Groundwater Monitoring Wells of CGWB: Arsenicconcentration was variable and high e.g. at Kuriatar (0.026mg/L) and Mothabari (0.034 mg/L and 0.049 mg/L). ). Highmagnesium (>30 mg/L) is recorded at Puratan Pataldanga (52mg/L).
Aquifer Characteristics AQUIFER DEPTH
RANGE (mbgl)
THICKNESS (m)
DISCHARGE (m3/hr)
DRAW DOWN (m)
Aquifer-I 18.0-80.0 -- 210-215 3.5-6.0
*Transmissivity (T) and Storage Co-efficient(S) are not available
Groundwater Resource *Total Annual GW Recharge: 13691.00 ham
*Total Annual GW Extraction: 3925.64 ham
*Stage of GW Extraction: 28.67%
*Category: Safe
Future Water Demand *Annual GW allocation for future domestic use (up to 2042):274.26 ham
Aquifer Management plan
AR & Water Conservation Possibilities
1. Artificial Recharge in Kaliachak-II block is generally not suitablefor implementing Artificial Recharge schemes according to thelatest Master Plan for Artificial Recharge (CGWB 2020).
2. However, water conservation through open area rainwaterharvesting in rural areas may be adopted depending on detailedvillage level (need based) survey.

106
Aquifer Management Plan Kaliachak-III block, Malda district, West Bengal
(260.0 km2 area covered under NAQUIM)
GENERAL INFORMATION
State Name West Bengal
District name Malda
Block Name Kaliachak-III
Location Located in the southernmost part of Malda district
Geographical Area 260.0 km2
Basin/Sub-basin Ganga/ Bhagirathi
Principal Aquifer System Alluvium (Code - AL) Single Aquifer System occurring at shallow (<60 m) level (deep tube wells of state government are absent due to high Arsenic)
Major Aquifer System Younger Alluvium(Aquifer Code - AL01):Average depth range variable for Aquifer-1A and Aquifer-1B Aquifer-1A: 38.0 – 42.0 m bgl Aquiufer-1B: 55.0 – 78.0 m bgl (based on limited Piezometer data of state government department)
Annual Rainfall 2019: 1335.0 mm, 2020: 1643.3 mm
AQUIFER DISPOSITION
Aquifer Disposition Aquifer-I: Phreatic aquifer (shallow to moderately deep aquifers without thick (>10 m) clay layers)
Occurs throughout the block Underlain by hard crystalline rocks (Precambrian basement of
Garo-Rajmahal gap) at >100 m bgl (CGWB 2001) Aquifer material: Younger Alluvium (Holocene)
Status of GW Exploration Exploratory Wells: 0 Observation Wells: 0 Piezometers: 2 (State Water Investigation Directorate/SWID)
Aquifer Characteristics Due to extremely high Arsenic concentration throughout Kaliachak-II block, no groundwater based water supply and distribution scheme has been implemented. As a consequence, litholog/strata chart of bore holes in this block are not available, thereby precluding characterization of Aquifers in this block.
Groundwater Monitoring Status
6 monitoring wells Average DTW (pre-monsoon 2020): 2.21 m bgl Average DTW (post-monsoon 2020): 1.85 m bgl Average Water Table elevation (pre-monsoon 2020): 21.12 m Average Water Table elevation (post-monsoon 2020): 20.82 m
Groundwater Quality Aquifer – I: Arsenic contamination reported in 145 habitations(Arsenic > 0.01 mg/L). Total risk population = 359071 (Rural:329147, Urban: 29924)
NABL Data of CGWB, ER: During Special Drive on Arsenic (2015-16), Arsenic concentration in groundwater was found to bevarying randomly at various locations viz. at Satangapar (0.001mg/L), Baishnab Nagar (0.003 mg/L), Kalinagar (0.005 mg/L),Krishnapur (0.025 mg/L) and 18 Mile/Jalalditola (0.115 mg/L).

107
Groundwater Monitoring Wells of CGWB: Arsenic concentrationwas found to be varying e.g. 0.004 mg/L (Mahajantala), 0.008mg/L (Doriapur), 0.022 (17 Mile), 0.044 (16 mile), 0.060 mg/L(Birnagar) and 0.129 mg/L (Pagla Bridge). High magnesium (>30mg/L) is recorded at Birnagar (77 mg/L).
Aquifer Potential AQUIFER DEPTH
RANGE (mbgl)
THICKNESS (m)
DISCHARGE (m3/hr)
DRAW DOWN (m)
Aquifer-IA 38.0-42.0 4.0 -- --
Aquifer-IB 55.0-78.0 23.0 202-215 3.0-6.0
Groundwater Resource *Annual Extractable GW Recharge: 20561.12 ham*Total Annual GW Extraction: 12602.06 ham*Stage of GW Extraction: 61.29%*Category: Safe
Future Water Demand *Annual GW allocation for future domestic use (up to 2042): 473.31ham
Aquifer Management Plan
Groundwater Management Plan
Problem 1: Ground water contamination caused by arsenic in Younger Alluvium of Aquifer-I (single aquifer system).
Block Arsenic (<0.01 mg/L)
Arsenic (>0.01<0.05
mg/L)
Arsenic (>0.05 mg/L)
No. of tube wells with high Arsenic (maximum As concentration)
% Count % Count % Count
Kaliachak-III 0 0 19.31 28 80.69
117 145 (0.992 mg/L)
Table showing percentage of tube wells having arsenic content.
Management strategy: 1. Installation of arsenic removal plants to make potable water
from Aquifer-I.2. Rainwater harvesting, especially open area rainwater
harvesting in the rural areas.3. Conjunctive use of surface water and ground water.4. Alternate cropping (like horticulture instead of conventional
paddy cultivation) to be adopted to eliminate bio-magnification of arsenic in food grains.
5. Implementation of modern irrigation practices like drip waterirrigation system, sprinkler based micro irrigation system canbe done.
AR & Water Conservation Possibilities
1. Artificial Recharge in Kaliachak-III block is generally not suitablefor implementing Artificial Recharge schemes according to the latestMaster Plan for Artificial Recharge (CGWB 2020).
2. However, water conservation through open area rainwaterharvesting in rural areas may be adopted depending on detailedvillage level (need based) survey.

108
Aquifer Management Plan English Bazar block, Maldadistrict, West Bengal
(242.0 km2 area covered under NAQUIM)
GENERAL INFORMATION
State Name West Bengal
District name Malda
Block Name English Bazar
Location Located in south eastern part of Malda district
Geographical Area 242.0 km2
Basin/Sub-basin Ganga/ Bhagirathi
Principal Aquifer System Alluvium (Aquifer Code: AL)
Single Aquifer System
Major Aquifer System Younger Alluvium of Holocene age (Code- AL01)
Aquifer-IA:Depth range varies from 25.0 to 46.0 mbgl (shallow
aquifer)
Aquifer-1B: Depth range varies from 52.0 to 110.0 mbgl (moderately
deep aquifer)
Annual Rainfall 2019: 1484.5 mm, 2020: 1738.0 mm
AQUIFER DISPOSITION
Aquifer Disposition Aquifer-I: Phreatic aquifer (shallow to moderately deep) Occurs throughout the block Underlain by hard crystalline rocks (Garo-Rajmahal Gap) Aquifer material is Younger Alluvium (Holocene age)
Fig. 1: Elevation map showing location of Exploratory Wells, English Bazar
block

109
Fig. 2: Lithological cross section along NW-SE, English Bazar block
Status of GW Exploration Exploratory Wells: 4 Observation Wells:0 Piezometers: 5 (State Water Investigation Directorate)
Aquifer Characteristics AQUIFER DEPTH
RANGE (mbgl)
THICKNESS (m)
DISCHARGE (m3/hr)
T (m2/day)
Aquifer-IA 25.0-46.0 21.0 0.6-40.0 207.81
Aquifer-IB 52.0-110.0 58.0
Fig. 3: Fence Diagram showing correlation of aquifers, English Bazar block

110
Fig. 4: Block Diagram showing aquifer disposition in 3-D, English Bazar block
Groundwater Monitoring
Status
5 monitoring wells (Bholanathpur, Bot Tolly, Milki, Krishna Nagar,
Chhoto Mohanpara)
Average DTW (pre-monsoon 2020): 3.81 m bgl
Average DTW (post-monsoon 2020): 2.27 m bgl
Average water table elevation ((pre-monsoon 2020): 21.19 m
Average water table elevation ((post-monsoon 2020): 22.73 m
Groundwater Quality *Aquifer–I: Arsenic contamination reported in 155 habitations
(Arsenic >0.01 mg/L). Total risk population = 274627 (Rural: 242797,
Urban: 31830)
* NABL Data of CGWB, ER: Arsenic concentration in groundwater
found to be varying from 0.001 mg/L at Bholanathpur & Chhoto
Mohanpara, 0.028 mg/L at Phulbaria and 0.15 mg/L at Milki (CGWB
Special Drive on Arsenic, 2016 and NAQUIM studies: 2020-21)
Groundwater Resource
(as on 31-3-2017)
*Annual Extractable GW Recharge: 16007.84 ham
*Total Annual GW Extraction: 6900.32 ham
*Stage of GW Extraction: 43.11%
*Category: Safe
Future Water Demand
(as on 31-3-2017)
*GW allocation for future domestic use (up to 2042 AD): 662.85 ham
Aquifer Management planGroundwater Management Plan
Problem 1: Ground water contamination caused by arsenic in Younger Alluvium of Aquifer-I.

111
Block Arsenic
(<0.01
mg/L)
Arsenic
(>0.01<0.05
mg/L)
Arsenic
(>0.05 mg/L)
No. of Tube
Wells with
high Arsenic
(maximum As
concentration) % Count % Count % Count
English
Bazar 0 0 34.19 53 65.8
1 102 155
(0.238 mg/L at Kanaipur)
Groundwater management strategies: 1. Installation of arsenic removal plants to extract potable water
from Aquifer-I.2. Rainwater harvesting in rural areas.3. Conjunctive use of surface water and ground water.4. Alternate cropping (like horticulture instead of conventional
paddy cultivation) to be adopted to eliminate bio-magnification of arsenic in food grains.
5. Implementation of modern irrigation practices like drip waterirrigation system, sprinklers can be made.
Artificial Recharge and Water Conservation Possibilities
1. Implementation of Artificial Recharge schemes in English Bazarblock is generally not feasible according to the latest Master Plan forArtificial Recharge (CGWB 2020).
2. However, water conservation through open area rainwaterharvesting in rural areas may be adopted depending on detailedvillage level (need based) survey.

112
Aquifer Management Plan Manikchak block, Malda district, West Bengal
(325.0 km2 area covered under NAQUIM)
GENERAL INFORMATION
State Name West Bengal
District name Malda
Block Name Manikchak
Location Located in the western part of Malda district
Geographical Area 325.0 km2
Basin/Sub-basin Ganga/ Bhagirathi
Principal Aquifer System Alluvium (Code - AL) Single Aquifer System occurring at shallow (<60 m) level
Major Aquifer System Younger Alluvium(Aquifer Code - AL01):Average depth range variable for Aquifer-1A and Aquifer-1B Aquifer-1A: – 12.2 -70.1 m bgl Aquiufer-1B: 73.2 – 103.6 m bgl
Annual Rainfall 2019: 1461.0 mm, 2020: 1550.2 mm
AQUIFER DISPOSITION
Aquifer Disposition Aquifer-I: Phreatic aquifer (shallow to moderately deep aquifers without thick (>10 m) clay layers)
Occurs throughout the block Underlain by hard crystalline rocks (Precambrian basement of
Garo-Rajmahal gap) Aquifer material: Younger Alluvium (Holocene)
Fig. 1. Elevation map showing location of Exploratory Wells, Manikchak
block

113
Fig 2: Lithological cross section along SE-NW, Manikchak block
Fig. 3. Fence diagram showing disposition of Aquifers along Biswambar Binodpur-Gopalpur Section, Manikchak block
Status of GW Exploration Exploratory Wells: 5 Observation Wells: 0 Piezometers: 3 (State Water Investigation Directorate/SWID)
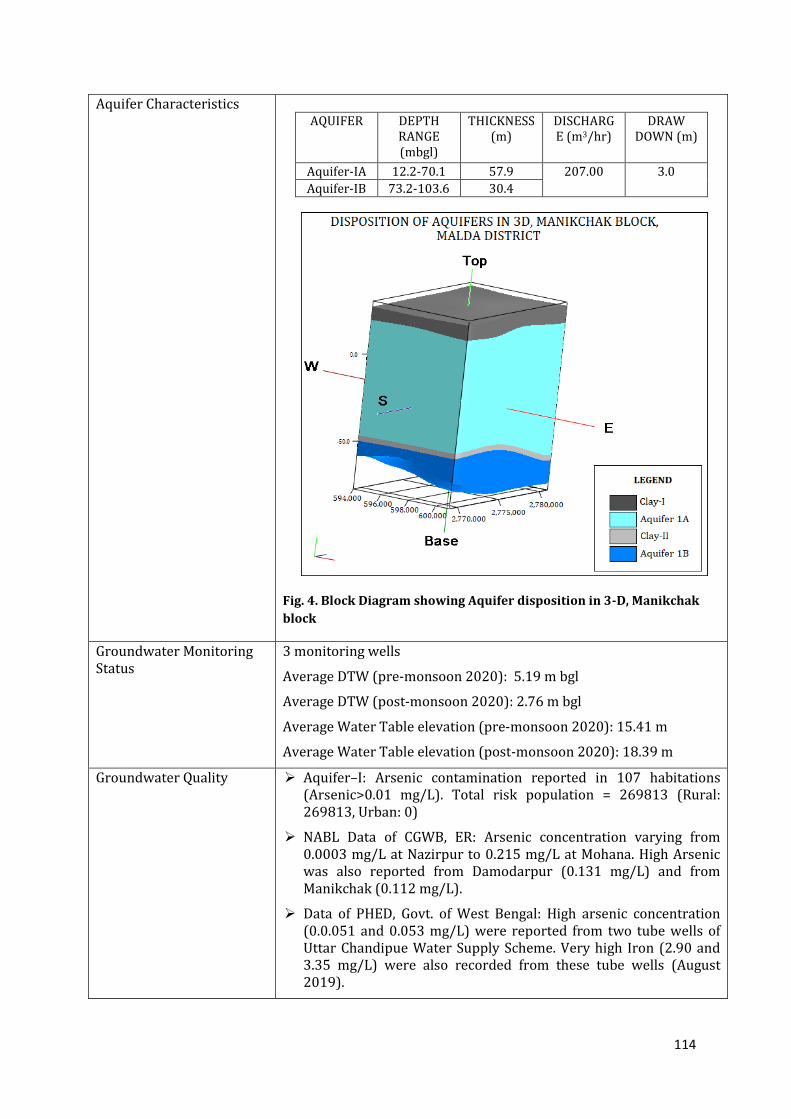
114
Aquifer Characteristics AQUIFER DEPTH
RANGE (mbgl)
THICKNESS (m)
DISCHARGE (m3/hr)
DRAW DOWN (m)
Aquifer-IA 12.2-70.1 57.9 207.00 3.0
Aquifer-IB 73.2-103.6 30.4
Fig. 4. Block Diagram showing Aquifer disposition in 3-D, Manikchak
block
Groundwater Monitoring Status
3 monitoring wells
Average DTW (pre-monsoon 2020): 5.19 m bgl
Average DTW (post-monsoon 2020): 2.76 m bgl
Average Water Table elevation (pre-monsoon 2020): 15.41 m
Average Water Table elevation (post-monsoon 2020): 18.39 m
Groundwater Quality Aquifer–I: Arsenic contamination reported in 107 habitations(Arsenic>0.01 mg/L). Total risk population = 269813 (Rural:269813, Urban: 0)
NABL Data of CGWB, ER: Arsenic concentration varying from0.0003 mg/L at Nazirpur to 0.215 mg/L at Mohana. High Arsenicwas also reported from Damodarpur (0.131 mg/L) and fromManikchak (0.112 mg/L).
Data of PHED, Govt. of West Bengal: High arsenic concentration(0.0.051 and 0.053 mg/L) were reported from two tube wells ofUttar Chandipue Water Supply Scheme. Very high Iron (2.90 and3.35 mg/L) were also recorded from these tube wells (August2019).

115
Groundwater Resource *Annual Extractable GW Recharge: 18626.75 ham
*Total Annual GW Extraction: 4778.78 ham
*Stage of GW Extraction: 25.66%
*Category: Safe
Future Water Demand *Annual GW allocation for future domestic use (up to 2042): 356.53ham
Aquifer Management planGroundwater Management Issues Groundwater Management Plan
Problem 1: Ground water contamination caused by arsenic in younger Alluvium of Aquifer-I (single aquifer system).
Block Arsenic
(<0.01
mg/L)
Arsenic
(>0.01<0.05
mg/L)
Arsenic
(>0.05 mg/L)
No. of Tube
Wells with
high Arsenic
(maximum As
concentration) % Count % Count % Count
Manikchak 0 0 18.69 20 81.31 87 107
(0.072 mg/L)
Table showing percentage of tube wells having arsenic content.
Groundwater management strategies:
1. Installation of arsenic removal plants to make potable waterfrom Aquifer-I.
2. Rainwater harvesting in rural areas.
3. Use of surface water.
4. Alternate cropping (like horticulture instead of conventionalpaddy cultivation) to be adopted to eliminate bio-magnification of arsenic in food grains.
5. Alternate cropping (like horticulture instead of conventionalpaddy cultivation) to be adopted to eliminate bio-magnification of arsenic in food grains.
6. Implementation of modern irrigation practices like drip waterirrigation system, sprinklers can be made.
AR & Conservation Possibilities
1. Artificial Recharge schemes in Manikchak block are generally notsuitable according to the latest Master Plan for Artificial Recharge(CGWB 2020).
2. However, water conservation through open area rainwaterharvesting in rural areas may be adopted depending on detailedvillage level (micro level) survey.

116
Aquifer Management Plan Ratua-I block, Malda district, West Bengal
(231.0 km2 area covered under NAQUIM)
GENERAL INFORMATION
State Name West Bengal
District name Malda
Block Name Ratua-I
Location Located in the western part of Malda district
Geographical Area 231.0 km2
Basin/Sub-basin Ganga/ Bhagirathi
Principal Aquifer System Alluvium (Code - AL) Single Aquifer System occurring at shallow depth (<60 m bgl)
Major Aquifer System Younger Alluvium(Aquifer Code-AL01): Average depth range variable for Aquifer-1A and Aquifer-1B Aquifer-1A: 38.50 – 42.20 m bgl Aquiufer-1B: 53.0 – 57.0 m bgl
Annual Rainfall 2019: 1461.0mm, 2020: 1550.2 mm
AQUIFER DISPOSITION
Aquifer Disposition Aquifer-I: Phreatic aquifer (shallow to moderately deep aquifers without thick (>10 m) clay layers)
Occurs throughout the block Underlain by hard crystalline rocks (Precambrian basement of
Garo-Rajmahal gap) Aquifer material: Younger Alluvium (Holocene)
Fig. 1: Elevation map showing location of Exploratory Wells, Ratua-I block

117
Fig. 2: Lithological cross section along South-North East-West, Ratua-I block
Fig. 3. Block Diagram showing disposition of aquifers in 3-D, Ratua-I block
Status of GW Exploration Exploratory Wells: 3 Observation Wells: 0 Piezometers: 3 (State Water Investigation Directorate/SWID)
Aquifer Characteristics AQUIFER DEPTH
RANGE
(mbgl)
THICKNESS
(m)
DISCHARG
E (m3/hr)
DRAW
DOWN (m)
Aquifer-IA 24.0-55.5 31.5 167.5 -
205.0
2.5-5.44
Aquifer-IB 61.5-131.2 69.7
Groundwater Monitoring Status
3 monitoring wells Average DTW (pre-monsoon 2020): 5.19 m bgl Average DTW (post-monsoon 2020): 2.76 m bgl Average Water Table elevation (pre-monsoon 2020): 15.41 m

118
Average Water Table elevation (post-monsoon 2020): 18.39 m
Groundwater Quality Aquifer–I: Arsenic contamination reported in 234 habitations(Arsenic>0.01 mg/L). Total risk population = 275388 (Rural:275388, Urban: 0)
NABL Data of CGWB, ER: During Special Drive on Arsenic (2016),arsenic concentration in groundwater was found to be variable viz.0.00004 mg/L at Motiganj, 0.001 mg/L at Pakurtala, 0.006 mg/L atDurgapur, 0.019 mg/L at Makaiya and 0.138 mg/L at Baharal.
NAQUIM Studies (2019-2021): Arsenic concentration was found tobe variable viz. 0.001 mg/L at Ratanapur Hat (Samshi) and 0.007mg/L at Debipur. High magnesium (>30 mg/L) was found at Ratua(36 mg/L) & Ratanpur Hat (52 mg/L) during pre-monsoon, 2020.
Aquifer Potential Aquifers in Ratua-I block have good groundwater potential, ranging from 53 litre per second (lps) to 57 lps. Transmissivity (Shallow Exploratory Well of CGWB) was found to be varying from 1140.74 m2/day to 1824.30 m2/day.
Groundwater Resource (as on 31-3-2017)
*Annual Extractable GW Recharge: 15068.04 ham*Total Annual GW Extraction: 10106.33 ham*Stage of GW Extraction: 67.07 %*Category: Safe
Future Water Demand (as on 31-3-2017)
*Annual GW allocation for future domestic use (up to 2042 AD):371.04 ham
Aquifer Management plan
Groundwater Management Plan
Problem 1: Ground water contamination caused by arsenic in Younger Alluvium of Aquifer-I (single aquifer system).
Block Arsenic (<0.01 mg/L)
Arsenic (>0.01<0.05
mg/L)
Arsenic (>0.05 mg/L)
No. of Tube Wells with high Arsenic (maximum As concentration)
% Count % Count % Count
Ratua-I 0 0 40.60 95 59.40
139 234 (0.05 mg/L
at Darbasini)
Table showing percentage of tube wells having arsenic content, Ratua-I block.
Management strategy: 1. Installation of arsenic removal plants to make potable water
from Aquifer-I.2. Rainwater harvestingin rural areas need to be implemented.3. Conjunctive use of surface water and ground water.4. Alternate cropping (like horticulture instead of conventional
paddy cultivation) to be adopted to eliminate bio-magnification of arsenic in food grains.
5. Implementation of modern irrigation practices like dripirrigation system, sprinkler based micro irrigation system canbe done.
6. Crops suggested for better management are wheat, pulses,mustard, vegetables, which require low water column depthand thus have low crop water requirement.

119
Artificial Recharge and Water Conservation Possibilities
1. The areas in Ratua-I block are generally not suitable forimplementing Artificial Recharge schemes according to thelatest Master Plan for Artificial Recharge (CGWB 2020).
2. However, water conservation through open area rainwaterharvesting in rural areas and roof top rainwater harvesting insemi-urban areas should be adopted depending on localhydrometeorological conditions.

120
Aquifer Management Plan Ratua-II block, Malda district, West Bengal
(174.0 km2 area covered under NAQUIM)
GENERAL INFORMATION
State Name West Bengal
District name Malda
Block Name Ratua-II
Location Located in the central part of Malda district
Geographical Area 174.0 km2
Basin/Sub-basin Ganga/ Bhagirathi
Principal Aquifer System Alluvium (Code - AL)
Single Aquifer System occurring at shallow (<60 m) to intermediate
(>60 but <120 m) depth
Major Aquifer System Younger Alluvium (Aquifer Code- AL01): Average depth range
variable for Aquifer-1A and Aquifer-1B
Aquifer-1A: 43.8– 57.0 m bgl
Aquiufer-1B: 91.0 – 109.0 m bgl
Annual Rainfall 2019: 1461.0 mm, 2020: 1550.2 mm
AQUIFER DISPOSITION
Aquifer Disposition Aquifer-I: Confined aquifers (shallow to moderately deep aquifers
with thick (>10 m) clay layers)
Occurs throughout the block
Underlain by hard crystalline rocks (basalt? with conchoidal
fractures) at >145 m, as seen at Araidanga
Aquifer material: Younger Alluvium (Holocene)
Fig. 1: Elevation map showing location of Exploratory Wells, Ratua-II block

121
Fig. 2: Lithological cross section along South-North, Ratua-II block
Fig. 3: Block Diagram showing aquifer disposition in 3-D, Ratua-II block

122
Status of GW Exploration Exploratory Wells: 3
Observation Wells: 1 (CGWB)
Piezometers: 3 (State Water Investigation Directorate/SWID)
Aquifer Characteristics
AQUIFER DEPTH RANGE
(mbgl)
THICKNESS
(m)
DISCHA
RGE
(m3/hr)
DRAW
DOWN (m)
Aquifer-IA 17.2-109.4 13.2 42.0 –
200.0
0.99 – 1.39
Aquifer-IB 129.8 – 140.0 18.0
Groundwater Monitoring
Status
3 monitoring wells
Average DTW (pre-monsoon 2020): 5.27 m bgl
Average DTW (post-monsoon 2020): 4.68m bgl
Average Water Table elevation (pre-monsoon 2020): 14.76 m
Average Water Table elevation (post-monsoon 2020): 15.32 m
Groundwater Quality Aquifer–I: Arsenic contamination reported in 78 habitations
(Arsenic >0.01 mg/L). Latest data shows Arsenic concentration
varying from 0.003 mg/L at Nasipur Water Supply Scheme to
0.016 mg/L at Araidanga Water Supply Scheme (PHED 2020).
Total risk population affected by Arsenic contamination in Ratua-
II block is 202080 (Rural: 202080, Urban: 0)
NABL Data of CGWB, ER: During Special Drive on Arsenic
(Period: 2015-16), high Arsenic was found at Naugama (0.003
mg/L), Araidanga (0.019 mg/L), Paranpur (0.035 mg/L & 0.065
mg/L). During groundwater exploration at Araidanga (2009)
Arsenic concentration varied from 0.033 to 0.045 mg/L.
Aquifer Potential Aquifers in Ratua-II block have good groundwater potential. Data of
CGWB indicates that sustainable discharge was variable from 50 litre
per second (lps) to 56 lps.
Groundwater Resource
(as on 31-3-2017)
*Annual Extractable GW Recharge: 15670.95 ham
*Total Annual GW Extraction: 10436.25 ham
*Stage of GW Extraction: 66.60%
*Category: Safe
Future Water Demand
(as on 31-3-2017)
*Annual GW allocation for future domestic use (up to 2042): 281.35
ham
Aquifer Management plan
Groundwater Management
Plan
Problem 1: Ground water contamination caused by arsenic in
younger Alluvium of Aquifer-I (single aquifer system).
Block Arsenic
(<0.01
mg/L)
Arsenic
(>0.01<0.05
mg/L)
Arsenic
(>0.05
mg/L)
No. of Tube
Wells with high
Arsenic
(maximum As
concentration)
% Count % Count % Coun
t
Ratua-II 0 0 55.13 43 44.8
7
35 78
(0.065 mg/L
at Paranpur)

123
Table showing percentage of wells having high arsenic content.
Problem 2: Ground water contamination caused by fluoride in
younger Alluvium of Aquifer-I (single aquifer system).
High fluoride concentration was reported in tube wells in Ratua-II
block. NABL data of CGWB, ER shows fluoride concentration above
the maximum permissible limit at Sripur (4.54 mg/L) and Pirganj
(1.50 mg/L) during NAQUIM studies (period: 2019-20).
Management strategy:
1. Installation of arsenic removal plants to make potable water
from Aquifer-I.
2. Rainwater harvesting, especially open area rainwater
harvesting in the rural areas of Ratua-II block.
3. Conjunctive use of surface water and ground water.
4. Alternate cropping (like horticulture instead of conventional
paddy cultivation) to be adopted to eliminate bio-
magnification of arsenic in food grains.
5. In areas affected with high fluoride concentration in
groundwater, surface water-based water treatment plants
need to be established by the state government.
Artificial Recharge and
Water Conservation
Possibilities
1. The areas in Ratua-II block are generally not suitable for
implementing Artificial Recharge schemes according to the
latest Master Plan for Artificial Recharge (CGWB 2020).
2. However, water conservation through open area rainwater
harvesting in rural areas may be adopted depending on local
hydrometeorological conditions.

124
Aquifer Management Plan Chanchal-I block, Malda district, West Bengal
(162.0 km2 area covered under NAQUIM)
GENERAL INFORMATION
State Name West Bengal
District name Malda
Block Name Chanchal-I
Location Located in the northern part of Malda district
Geographical Area 162.0 km2
Basin/Sub-basin Ganga/ Bhagirathi
Principal Aquifer System Alluvium (Code - AL) Two Aquifer System, first aquifer occurring at shallow to intermediate (>60<100 m) depth and second (deeper) aquifer occurring at >100 m depth
Major Aquifer System Younger Alluvium (Aquifer Code - AL01): Average depth range variable for Aquifer-1A and Aquifer-1B Aquifer-I: 21.0 – 100.0 m bgl Aquifer-II: 124.0 – 165.0 m bgl
Annual Rainfall 2019: 1461.0 mm, 2020: 1550.2 mm
AQUIFER DISPOSITION
Aquifer Disposition Aquifer-I: Confined aquifers (shallow to moderately deep aquifers with thick (>10 m) clay layers)
Occurs throughout the block Aquifer material: Younger Alluvium (Holocene)
Aquifer-II: Confined aquifers at deeper levels (>100 m bgl and extending to >150 m bgl)
Occurs throughout the block
Fig. 1: Elevation map showing location of Exploratory Wells, Chanchal-I block

125
Fig. 2. Lithological cross section along SE-NW, Chanchal-I block
Fig. 3. Lithological cross section along West-East, Chanchal-I block

126
Fig. 4. Lithological cross section along SW-NE, Chanchal-I block
Status of GW Exploration Exploratory Wells: 7 Observation Wells: 0 Piezometers: 3 (State Water Investigation Directorate/SWID)
Aquifer Characteristics AQUIFER DEPTH
RANGE (mbgl)
THICKNESS (m)
DISCHARGE
(m3/hr)
DRAW DOWN (m)
Aquifer-I 21.0 -100.0 79.0 141.0 – 190.0
2.7 – 6.0
Aquifer-II 124.0-165.0 41.0
Fig. 5: Fence
Diagram showing
cross-correlation
of lithology,
Chanchal-I block

127
Fig. 6. Block Diagram showing aquifer disposition in 3-D, Chanchal-I block
Groundwater Monitoring Status
5 Key Observation Wells (KOW) Average DTW (pre-monsoon 2020): 6.87 m bgl Average DTW (post-monsoon 2020): 6.07 m bgl Average Water Table elevation (pre-monsoon 2020): 24.25 m Average Water Table elevation (post-monsoon 2020): 25.28 m
Groundwater Quality *Aquifer–I and Aquifer-II: Arsenic contamination is not reported ingroundwater of Chanchal-I block* NABL Data of CGWB, ER: Arsenic concentration of 0.002 mg/L wasrecorded in Chanchal Block Seed Farm
Aquifer Potential The deeper aquifer (Aquifer-II) is promising, having sustainable discharge varying from 39 litre per second (lps) to 53 lps
Groundwater Resource *Annual Extractable GW Recharge: 11022.67 ham*Total Annual GW Extraction: 6545.66 ham*Stage of GW Extraction: 59.38%*Category: Safe
Future Water Demand *Annual GW allocation for future domestic use (up to 2042): 275.52ham

128
Aquifer Management planGroundwater Management Plan
Management strategy:
1. Rainwater harvesting, preferably open area rainwaterharvesting in rural areas of Chanchal-I block.
2. Conjunctive use of surface water and ground water.
3. Two Water Supply Schemes are presently functional atKhanpur-Hulaspur and Dhanjana, both of them are based ongroundwater (Source: Public Health Engineering Directorate,Govt. of West Bengal).
Artificial Recharge and Water Conservation Possibilities
1. The areas in Chanchal-I block are generally not suitable forimplementing Artificial Recharge schemes according to thelatest Master Plan for Artificial Recharge (CGWB 2020).
2. However, water conservation through open area rainwaterharvesting in rural areas and roof top rainwater harvesting inurban areas (Chanchal) may be adopted depending ondetailed micro level studies.

129
Aquifer Management Plan Chanchal-II block, Malda district, West Bengal
(205.0 km2 area covered under NAQUIM)
GENERAL INFORMATION
State Name West Bengal
District name Malda
Block Name Chanchal-II
Location Located in the northern part of Malda district
Geographical Area 205.0 km2
Basin/Sub-basin Ganga/ Bhagirathi
Principal Aquifer System Alluvium (Code - AL) Two Aquifer System, first aquifer occurring at shallow to intermediate (>60<100 m) depth and second (deeper) aquifer occurring at >100 m depth
Major Aquifer System Younger Alluvium(Aquifer Code - AL01): Average depth range variable for Aquifer-1A and Aquifer-1B Aquifer-I: 32.0 – 96.0 m bgl Aquifer-II: 119.0 – 218.0 m bgl
Annual Rainfall 2019: 1461.0 mm, 2020: 1550.2 mm
AQUIFER DISPOSITION
Aquifer Disposition Aquifer-I: Shallow to moderately deep aquifers with thick (>10 m) clay layers)
Occurs throughout the block Aquifer material: Younger Alluvium (Holocene)
Aquifer-II: Confined aquifers (>100 m bgl & extending to >200 m bgl) Occurs throughout the block Underlain by crystalline rocks (Precambrian basement of
Garo-Rajmahal Gap) at deeper levels (>300 m?)
Fig. 1: Elevation map showing location of Exploratory Wells, Chanchal-II block

130
Fig. 2: Lithological cross section along W-E, Chanchal-II block
Fig. 3: Fence Diagram along Gourhanda–Malatipur-Jalalpur, Chanchal-II block

131
Status of GW Exploration Exploratory Wells: 2 Observation Wells: 3 Piezometers: 3 (State Water Investigation Directorate/SWID)
Aquifer Characteristics
Fig. 4. Block Diagram showing aquifer disposition in 3-D, Chanchal-II block
Groundwater Monitoring Status
3 monitoring wells Average DTW (pre-monsoon 2020): 7.03 m bgl Average DTW (post-monsoon 2020): 6.63 m bgl Average Water Table elevation (pre-monsoon 2020): 19.97 m Average Water Table elevation (post-monsoon 2020): 20.37 m
Groundwater Quality Aquifer–I: Arsenic contamination reported in only one habitation(Arsenic>0.01<0.05 mg/L) as per Report of Arsenic Task Force,Govt. of West Bengal.
NABL Data of CGWB, ER: Arsenic concentration in groundwaterwas found to be varying from Traces (BDL) at Malatipur, 0.0001mg/L at Kandaran and 0.001 mg/L at Jalalpur
Aquifer-II: The deeper aquifer is free from Arsenic contamination

132
Aquifer Potential AQUIFER DEPTH
RANGE (mbgl)
THICKNESS (m)
DISCHARGE
(m3/hr)
DRAW DOWN (m)
Aquifer-I 32.0 - 96.0 64.0 188.0 – 232.0
1.5 – 5.0
Aquifer-II 119.0 – 218.0
99.0
Groundwater Resource *Annual Extractable GW Recharge: 16366.18 ham
*Total Annual GW Extraction: 11384.68 ham
*Stage of GW Extraction: 69.56%
*Category: Safe
Future Water Demand *Annual GW allocation for future domestic use (up to 2042): 277.59
ham
Aquifer Management planGroundwater Management Plan
Block Arsenic
(<0.01 mg/L)
Arsenic (>0.01<0.05
mg/L)
Arsenic
(>0.05 mg/L)
No. of Tube Wells with high Arsenic (maximum As concentration) % Count % Count % Coun
t
Chanchal-II
0 0 NA NA NA NA One
(0.001 mg/L at Jalalpur)
Problem 1: Ground water contamination caused by arsenic in younger Alluvium of Aquifer-I (shallow to moderately deep aquifers).
Table showing percentage of wells having high arsenic content.
Management strategy:
1. Installation of arsenic removal plants to ensure supply ofpotable water from Aquifer-I.
2. Rainwater harvesting, especially open area rainwaterharvesting in rural areas.
3. Conjunctive use of surface water and ground water.
4. Alternate cropping (like horticulture instead of conventionalpaddy cultivation) to be adopted to eliminate bio-magnification of arsenic in food grains.
5. Two Water Supply Schemes (groundwater based) atGourhanda and Jalalpur are functional (Source: Public HealthEngineering Directorate, Govt. of West Bengal).
Artificial Recharge & Conservation Possibilities
1. The areas in Chanchal-II block are generally not suitable forimplementing Artificial Recharge schemes according to thelatest Master Plan for Artificial Recharge (CGWB 2020).
2. However, water conservation through open area rainwaterharvesting in rural areas may be adopted depending ondetailed village level (need based) survey.

133
Aquifer Information and Management System Bamongola block, Malda district, West Bengal
(206.0 km2 area covered under NAQUIM)
GENERAL INFORMATION
State Name West Bengal
District name Malda
Block Name Bamongola
Location Located in the north eastern part of Malda district
Geographical Area 206.0 km2
Basin/Sub-basin Ganga/ Bhagirathi
Principal Aquifer System Alluvium (Code - AL)
Single Aquifer System occurring at intermediate (>60 but <150 m)
and moderately deep (>150 but <200 m) levels
Major Aquifer System Older Alluvium(Aquifer Code-AL03):Average depth range variable for
Aquifer-1A and Aquifer-1B
Aquifer-1A: 30.0– 63.0 m bgl
Aquiufer-1B: 128.0 – 163.0m bgl
Annual Rainfall 2019: 1457.2 mm, 2020: 1701.3 mm
AQUIFER DISPOSITION
Aquifer Disposition Aquifer-I: Confined aquifers (moderately deep aquifers with thick (>10 m) clay layers) developed in Older Alluvium of Barind Tract
Occurs throughout the block Underlain by hard crystalline rocks (Precambrian basement of
Garo-RajmahalGap) at deeper levels (>300 m?) Aquifer material: Older Alluvium (Quaternary age)
Fig. 1: Elevation map showing location of Exploratory Wells, Bamongola block

134
Fig. 2:
Lithological
cross section
along W-E,
Bamongola
block
Fig. 3:
Lithological
cross section
along SW-NE,
Bamongola
block
Fig. 4: Fence
Diagram
along
Mirzapur-
Gopalpur-
Bamongola,
Bamongola
block

135
Fig. 5: Block Diagram showing aquifer disposition in 3-D, Bamongola
block
Status of GW Exploration Exploratory Wells: 6
Observation Wells: 0
Piezometers: 3 (CGWB &State Water Investigation Directorate)
Aquifer Characteristics AQUIFER DEPTH
RANGE
(mbgl)
THICKNES
S
(m)
DISCHARG
E (m3/hr)
DRAW
DOWN (m)
Aquifer-IA 30.0 – 63.0 33.0 10.0 – 40.0 6.0 – 12.0
Aquifer-IB 128.0-
163.0
35.0
Groundwater Monitoring
Status
3 monitoring wells
Average DTW (pre-monsoon 2020): 1.88m bgl
Average DTW (post-monsoon 2020): 1.58bgl
Average Water Table elevation (pre-monsoon 2020):31.52m
Average Water Table elevation (post-monsoon 2020): 30.42m
Groundwater Quality Arsenic contamination wasnot reported in Bamongola block.
NABL Data of CGWB, ER: Arsenic concentration was below the
Acceptable Limit at various locations e.g. Bamongola (0.0001

136
mg/L), Paikpara (0.0003 mg/L), Nalagola (0.0004 mg/L),
Charakdanga (0.0005 mg/L) & Khiripara/Makuli (0.001 mg/L).
High magnesium (>30 mg/L) was observed at Paikpara (51
mg/L) and Bamongola (63 mg/L). Fluoride concentration of 1.25
mg/L was recorded at Charakdanga, which is above the
Permissible Limit (1.0 mg/L).
Aquifer Potential Aquifers in Bamongola block have limited groundwater potential.
Data of CGWB indicates that the sustainable discharge was variable
from 3 litre per second (lps) to 11 lps.
Groundwater Resource *Annual Extractable GW Recharge: 8154.53 ham
*Total Annual GW Extraction: 1098.66ham
*Stage of GW Extraction: 13.47 %
*Category: Safe
Future Water Demand *Annual GW allocation for future domestic use (up to 2042): 223.69
ham
Aquifer Management plan
Groundwater Management
Plan
Problem 1: Ground water contamination caused by fluoride in
younger Alluvium of Aquifer-I (single aquifer system).
High fluoride concentration in groundwater was reported in few tube
wells of Bamongolablock. As per NABL data (CGWB, ER) fluoride
concentration above the maximum permissible limit was observed at
Charakdanga (1.25 mg/L).
Management strategy:
1. Rainwater harvesting, especially open area rainwater
harvesting in the rural areas.
2. Conjunctive use of surface water and ground water.
3. In areas affected with high fluoride concentration in
groundwater, either fluoride removal filter plants neec to be
established or water supply schemes based on surface water
need to be made functional by the state government.
Artificial Recharge and
Water Conservation
Possibilities
1. The areas in Bamongola block are generally not suitable for
implementing Artificial Recharge schemes according to the
latest Master Plan for Artificial Recharge (CGWB 2020).
2. However, water conservation through open area rainwater
harvesting in rural areas may be adopted depending on
detailed village level (need based) survey. Roof top rainwater
harvesting schemes may be implemented in urban areas
(Bamongola and Pakuahat).

137
Aquifer Management Plan Harishchandrapur-I block, Malda district, West Bengal
(171.0 km2 area covered under NAQUIM)
GENERAL INFORMATION
State Name West Bengal
District name Malda
Block Name Harishchandrapur-I
Location Located in north western part of Malda district
Geographical Area 171.0 km2
Basin/Sub-basin Ganga/ Bhagirathi
Principal Aquifer System Alluvium (Code - AL)
Single Aquifer System occurring at shallow (<60 m) to intermediate
(>60 but <120 m) depth
Major Aquifer System Younger Alluvium (Aquifer Code-AL01): Average depth range variable
for Aquifer-1A, Aquifer-1B& Aquifer-1C.
Aquifer-1A: 12.0– 43.0 m bgl
Aquifer-1B: 35.0 – 83.0m bgl
Aquifer-1C: 101.0 – 162.0 m bgl (limited occurrence)
Annual Rainfall 2019: 1446.2 mm, 2020: 1631.3 mm
AQUIFER DISPOSITION
Aquifer Disposition Aquifer Group I: Mostly confined aquifers (shallow to moderately deep) with thick (>10 m) clay layers, developed in a special geomorphic unit locally known as “Tal”.
Occurs throughout the block Underlain by hard crystalline rocks (Precambrian basement of
Garo-Rajmahal gap) at deeper levels (>300 m?) Aquifer material: Younger Alluvium (Holocene)
Fig. 1: Elevation map showing location of Exploratory Wells,
Harishchandrapur-I block

138
Fig. 2: Lithological cross section along E-W, Harishchandrapur-I block
Status of GW Exploration Exploratory Wells: 3 Observation Wells: 0 Piezometers: 3 (State Water Investigation Directorate, SWID)
Aquifer Characteristics AQUIFER DEPTH
RANGE (mbgl)
THICKNESS (m)
DISCHARGE (m3/hr)
DRAW DOWN (m)
Aquifer-IA 12.0 – 43.0 31.0 188.0 5.3 7.0
Aquifer-IB 35.0 - 83.0 48.0
Aquifer-IC 101.0 - 162.0
61.0
Groundwater Monitoring Status
2 monitoring wells and 2 Key Observation Wells (KOW) Average DTW (pre-monsoon 2020): 4.62 m bgl Average DTW (post-monsoon 2020): 4.20m bgl Average Water Table elevation (pre-monsoon 2020):24.39m Average Water Table elevation (post-monsoon 2020): 24.81 m
Groundwater Quality Arsenic contamination was not reported in Harishchandrapur-I
block.
NABL Data of CGWB, ER: Arsenic concentration was below the
Acceptable Limit in one tube well at Tulsihata (0.002 mg/L) but in
another, marginally high Arsenic (0.015 mg/L) was reported
(Arsenic Special Drive, 2015-16). High Iron (2.25 mg/L) and high
Magnesium (41 mg/L) were found in a tube well at Tulsihata.
Other parameters are below the Acceptable Limit as per the latest
guidelines of BIS.

139
Aquifer Potential Aquifers in Harishchandrapur-I block have good groundwater
potential. Data of CGWB indicates that the sustainable discharge was
52 litre per second (CGWB 2001).
Groundwater Resource *Annual Extractable GW Recharge: 14109.33 ham
*Total Annual GW Extraction:9641.07ham
*Stage of GW Extraction:68.33%
*Category: Safe
Future Water Demand *Annual GW allocation for future domestic use (up to 2042): 267.81
ham
Aquifer Management planGroundwater Management Plan
Management strategy:
1. Rainwater harvesting, especially open area rainwater
harvesting in the rural areas and roof top rainwater
harvesting in semi-urban areas (Tulsihata).
2. Conjunctive use of surface water and ground water.
Artificial Recharge and Water Conservation Possibilities
1. The areas in Harishchandrapur-I block are generally not
suitable for implementing Artificial Recharge schemes
according to the latest Master Plan for Artificial Recharge
(CGWB 2020).
2. However, water conservation through open area rainwater
harvesting in rural areas may be adopted based on micro level
survey.

140
Aquifer Management Plan Harishchandrapur-II block, Malda district, West Bengal
(217.0 km2 area covered under NAQUIM)
GENERAL INFORMATION
State Name West Bengal
District name Malda
Block Name Harishchandrapur-II
Location Located in the north western part of Malda district
Geographical Area 217.0 km2
Basin/Sub-basin Ganga/ Bhagirathi
Principal Aquifer System Alluvium (Code - AL) Single Aquifer System occurring at shallow (<60 m) to intermediate (>60 but <150 m) depth
Major Aquifer System Younger Alluvium (Aquifer Code - AL01): Average depth range variable for Aquifer-1A, Aquifer-1B and Aquifer-1C Aquifer-1A: 9.0 – 102.0 m bgl Aquifer-1B: 58.0 – 151.0 m bgl Aquifer-1C (Deeper Aquifer): 217.0 – 241.0 m bgl
Annual Rainfall 2019: 1446.2 mm, 2020: 1631.3 mm
AQUIFER DISPOSITION
Aquifer Disposition Aquifer-I: Semi confined to confined aquifers (shallow to moderately deep aquifers with relatively thin (< 10 m) clay layers), developed in a special geomorphic unit locally known as “Tal”
Occurs throughout the block Underlain by hard crystalline rocks (Precambrian basement of
Garo-Rajmahal gap) at deeper levels (>300 m?) Aquifer material: Younger Alluvium (Holocene)
Fig. 1. Elevation map showing location of Exploratory Wells

141
Fig. 2: Lithological cross section along NNW-SSE, Harishchandrapur-II block
Fig. 3. Fence diagram along Barduari-Talgachhi, Harishchandrapur-II block
Status of GW Exploration Exploratory Wells: 5 Observation Wells: 0 Piezometers: 3 (State Water Investigation Directorate (SWID)

142
Aquifer Characteristics AQUIFER DEPTH
RANGE (mbgl)
THICKNESS (m)
DISCHARGE (m3/hr)
DRAW DOWN (m)
Aquifer-IA 9.0 – 102.0 93.0 125.0 – 197.0
4.2 – 7.5
Aquifer-IB 58.0-151.0 93.0
Aquifer-IC 217.0-241.0
24.0 108.0 5.8 – 6.3
Fig. 4. Block Diagram showing disposition of aquifer in 3-D,
Harishchandrapur-II block
Groundwater Monitoring Status
3 monitoring wells Average DTW (pre-monsoon 2020): 6.01m bgl Average DTW (post-monsoon 2020): 4.76 m bgl Average Water Table elevation (pre-monsoon 2020): 24.65 m Average Water Table elevation (post-monsoon 2020): 25.90 m
Groundwater Quality Arsenic contamination was not reported in Harishchandrapur-IIblock.
NABL Data of CGWB, ER: Arsenic concentration was below theAcceptable Limit at Barduary (0.003 mg/L). Other parameterswere also below the Acceptable Limit as per the latest guidelinesof BIS.
Aquifer Potential Aquifers in Harishchandrapur-II block have good groundwater potential. Data of CGWB indicates that the sustainable discharge in tube wells was varying from 35 litre per second (lps) to 55 lps.

143
Groundwater Resource *Annual Extractable GW Recharge: 19728.70 ham
*Total Annual GW Extraction: 13350.82 ham
*Stage of GW Extraction: 67.67 %
*Category: Safe
Future Water Demand *Annual GW allocation for future domestic use (up to 2042): 343.68
ham
Aquifer Management planGroundwater Management Plan
Management strategy:
1. Rainwater harvesting, especially open area rainwaterharvesting in the rural areas.
2. Conjunctive use of surface water and ground water.
Artificial Recharge and Water Conservation Possibilities
1. The areas in Harishchandrapur-II block are generally notsuitable for implementing Artificial Recharge schemesaccording to the latest Master Plan for Artificial Recharge(CGWB 2020).
2. However, water conservation through open area rainwaterharvesting in rural areas may be adopted based on micro levelsurvey.

144
Aquifer Management Plan Habibpur block, Malda district, West Bengal
(396.0 km2 area covered under NAQUIM)
GENERAL INFORMATION
State Name West Bengal
District name Malda
Block Name Habibpur
Location Located in the eastern part of Malda district
Geographical Area 396.0 km2
Basin/Sub-basin Ganga/ Bhagirathi
Principal Aquifer System Alluvium (Code - AL)
Single Aquifer System comprising Aquifer-IA and Aquifer-IB having
variable depth and thickness throughout the block.
Aquifer-IA: Occurs at shallow to intermediatedepth (>60 but <150 m)
Aquifer-IB: Deeper aquifer occurring in the depth range of 150 to
>200 m
Major Aquifer System OlderAlluvium(Aquifer Code- AL03):Average depth range variable for
the single Aquifer System
Aquifer-IA: 32.0– 127.0m bgl
Aquifer-IB: >150 to 210.0 m bgl
Annual Rainfall 2019: 1193.8mm, 2020: 1579.4 mm
AQUIFER DISPOSITION
Aquifer Disposition Aquifer-IA: Confined aquifers (shallow to moderately deep aquifers) with very thick (>30 m) clay layers
Occurs throughout the block Aquifer material: Older Alluvium (Quaternary)
Fig. 1: Elevation map showing location of Exploratory Wells, Habibpur block

145
Fig. 2: Lithological cross section along SW-NE, Habibpurblock
Fig. 3: Fence Diagram along KenduaBulbulchandi – Habibpur-Dakshin Brindabanbati, Habibpur block

146
Fig. 4: Block diagram showing aquifer disposition in 3-D, Habibpur block
Status of GW Exploration Exploratory Wells: 2 Observation Wells: 1 Piezometers: 2 (State Water Investigation Directorate)
Aquifer Characteristics AQUIFER DEPTH
RANGE (mbgl)
THICKNESS (m)
DISCHARGE
(m3/hr)
DRAW DOWN (m)
Aquifer-IA 32.0 – 127.0
95.0 46.0 – 47.7
6.0
Aquifer-IB >150.0 –210.0
60.0
Groundwater Monitoring
Status
5 monitoring wells (including 3 Key Observation Wells)
Average DTW (pre-monsoon 2020): 12.51m bgl

147
Average DTW (post-monsoon 2020): 9.89 m bgl
Average Water Table elevation (pre-monsoon 2020): 20.16m
Average Water Table elevation (post-monsoon 2020): 22.78m
Groundwater Quality Arsenic contamination has not been reported in Habibpur block.
NABL Data of CGWB, ER: Arsenic concentration in groundwater
was found to be varying from Traces (Below Detection Limit) to
0.0003 mg/L at Habibpur and 0.001 mg/L at Kokabeni/Tajpur
(Arsenic Special Drive, 2016 and NAQUIM studies, 2020).
Aquifer Potential Aquifers in Habibpur block generally have good groundwater
potential with sustainable discharge of 13 litre per second (lps), as
per in house data of CGWB
Groundwater Resource
(as on 31-3-2017)
*Annual Extractable GW Recharge: 11678.09ham
*Total Annual GW Extraction: 4420.47ham
*Stage of GW Extraction: 37.85%
*Category: Safe
Future Water Demand
(as on 31-3-2017)
*Annual GW allocation for future domestic use (up to 2042): 311.14
ham
Aquifer Management planGroundwater Management
Plan
Management strategy:
1. Rainwater harvesting especially open area rainwater harvesting in
rural areas and roof top rainwater harvesting in semi-urban areas
(Habibpur and Bulbulchandi).
2. Conjunctive use of surface water and ground water.
Artificial Recharge&Water
Conservation Possibilities
1. Implementation of Artificial Recharge schemes in Habibpur block is
generally not feasible according to the latest Master Plan for Artificial
Recharge (CGWB 2020).
2. However, water conservation through open area rainwater
harvesting in rural areas and through roof top rainwater harvesting in
semi-urban areas should be adopted depending on local
hydrometeorological conditions.

148
Aquifer Management Plan Gazole block, Malda district, West Bengal
(513.0 km2 area covered under NAQUIM)
GENERAL INFORMATION
State Name West Bengal
District name Malda
Block Name Gazole
Location Located in the north eastern part of Malda district
Geographical Area 513.0 km2
Basin/Sub-basin Ganga/ Bhagirathi
Principal Aquifer System Alluvium (Code - AL)
Two Aquifer System, first aquifer occurring at shallow to intermediate
i.e. <60 <150 m and second (deeper) aquifer occurring at
intermediate to deeper levels (>120 and also >200 m).
Major Aquifer System Older Alluvium (Aquifer Code - AL03): Average depth range variable
for Aquifer-1A and Aquifer-1B
Aquifer-IA: 50.0 – 153.0 m bgl
Aquifer-IB: 128.0 – 218.0 m bgl
Annual Rainfall 2019: 1027.5 mm, 2020: 1643.6 mm
AQUIFER DISPOSITION
Aquifer Disposition Aquifer-IA: Confined aquifers (shallow to moderately deep aquifers) with thick (>10 m) clay layers
Occurs throughout the block Aquifer material: Older Alluvium (Quaternary)
Aquifer-IB: Confined aquifers at deeper levels (>100 m bgl and extending to >200 m bgl)
Occurs throughout the block Underlain by hard crystalline rocks (Precambrian basement of
Garo-Rajmahal Gap) at deeper levels (>300 m?)
Fig. 1: Elevation map showing location of Exploratory Wells, Gazole block

149
Fig. 2: Lithological cross section along SW-NE, Gazole block
Fig. 3: Block Diagram showing aquifer disposition in 3-D, Gazole block Status of GW Exploration Exploratory Wells: 4
Observation Wells: 0 Piezometers: 6 (CGWB & State Water Investigation Directorate)

150
Aquifer Characteristics AQUIFER DEPTH
RANGE (mbgl)
THICKNESS (m)
DISCHARGE
(m3/hr)
DRAW DOWN (m)
Aquifer-IA 50.0 – 153.0
103.0 89.0 – 247.0
7.0 – 12.0
Aquifer-IB 128.0 – 218.0
90.0
Groundwater Monitoring
Status
10 monitoring wells
Average DTW (pre-monsoon 2020): 2.15 m bgl
Average DTW (post-monsoon 2020): 1.66 m bgl
Average Water Table elevation (pre-monsoon 2020): 24.99 m
Average Water Table elevation (post-monsoon 2020): 27.59 m
Groundwater Quality Arsenic contamination has not been reported in Gazole block,
except for one sporadic value of 0.082 mg/L at Ghaksole (CGWB
Arsenic Special Drive, 2015-16).
NABL Data of CGWB, ER: Arsenic concentration in groundwater
was found to be varying from Traces (BDL) to 0.0001 mg/L at
Matoil, 0.0004 mg/L at Panchamukhi & Gazole, 0.002 mg/L
Pandua and 0.003 mg/L at Mashaldighi. High Magnesium (>30
mg/L) was found at Pandua (36 mg/L), Agampur (51 mg/L) and
Gazole (52 mg/L).
Aquifer Potential The deeper aquifer (Aquifer-IB) has very good groundwater potential,
having sustainable discharge varying from 25 litre per second (lps) to
69 lps.
Groundwater Resource *Annual Extractable GW Recharge: 15563.62 ham
*Total Annual GW Extraction: 7881.88 ham
*Stage of GW Extraction: 50.64 %
*Category: Safe
Future Water Demand *Annual GW allocation for future domestic use (up to 2042): 485.56
ham
Aquifer Management planGroundwater Management Plan
Management strategy:
1. Rainwater harvesting, especially open area rainwater
harvesting in rural areas and roof top rainwater harvesting in
semi-urban areas (Gazole).
2. Conjunctive use of surface water and ground water.
Artificial Recharge & Water
Conservation Possibilities
1. Schemes for Artificial Recharge techniques may be adopted in
Gazole block.
2. Recharge techniques should be adopted on priority in areas
having post-monsoon depth to water level > 9 m bgl, and with
long-term declining trend.
3. Using standard parameters in Master Plan for Artificial
Recharge (CGWB, 2020), the calculations show:

151
Volume of surface runoff = 0.086 MCM
Surface water requirement = 0.230 MCM
Unsaturated Aquifer volume (suitable for Artificial
Recharge) = 1.535 MCM
Priority area for implementing Artificial Recharge =
0.255 km2

152
Aquifer Management Plan Old Malda block, Malda district, West Bengal
(217.0 km2 area covered under NAQUIM)
GENERAL INFORMATION
State Name West Bengal
District name Malda
Block Name Old Malda
Location Located in the south-central part of Malda district
Geographical Area 217.0 km2
Basin/Sub-basin Ganga/ Bhagirathi
Principal Aquifer System Alluvium (Code - AL)
Single Aquifer System comprising Aquifer-IA and Aquifer-IB having
variable depth and thickness throughout the block.
Aquifer-IA: Occurs extensively at shallow depth (<60 m)
Aquifer-IB: Relatively deeper aquifer occurring in shallow to
intermediate depth range (from <60 m to <150 m)
Major Aquifer System OlderAlluvium(Aquifer Code- AL03):Average depth range variable for
the single Aquifer System comprising Aquifer-IA & Aquifer-IB
Aquifer-IA: 19.0– 44.0m bgl
Aquifer-IB:48.0 – 134.0 m bgl
Annual Rainfall 2019: 1136.7mm, 2020: 1361.0 mm
AQUIFER DISPOSITION
Aquifer Disposition Aquifer-IA: Confined aquifers (shallow to moderately deep) withthick (>10 m) clay layers
Occurs throughout the block Aquifer material: Older Alluvium (Quaternary) Underlain by Precambrian Basement (granite gneiss) at 213
m bgl (at observed in Exploratory Well at Mandilpur)
Fig. 1: Elevation map showing location of Exploratory Wells, Old Maldablock

153
Fig. 2: Lithological cross section, Old Malda block
Fig. 3: Fence diagram along Mekpur-Mamdilpur-Maligram-
Nityanandapur, Old Malda block

154
Fig. 4: Lithological cross section, Old Malda block
Status of GW Exploration Exploratory Wells: 3 Observation Wells: 0 Piezometers: 2 (State Water Investigation Directorate (SWID)

155
Aquifer Characteristics
AQUIFER DEPTH RANGE (mbgl)
THICKNESS (m)
DISCHARGE (m3/hr)
DRAW DOWN
(m)
TRANSMISSIVITY
(m2/day)
Aquifer-IA 19.0 – 44.0
25.0 135 - 259 7.0 – 11.0
2969.0
Aquifer-IB 48.0 – 134.0
86.0
Groundwater Monitoring
Status
5 monitoring wells (including 1 Key Observation Well)
Average DTW (pre-monsoon 2020):4.40m bgl
Average DTW (post-monsoon 2020):2.39 m bgl
Average Water Table elevation (pre-monsoon 2020):21.60 m
Average Water Table elevation (post-monsoon 2020): 25.37 m
Groundwater Quality Arsenic contamination has not been reported in Old Maldablock.
NABL Data of CGWB, ER:Arsenic concentration in groundwater
was found to be varying fromTraces (BDL) to 0.0003 mg/L at
Habibpur and 0.001 mg/L at Kokabeni/Tajpur (Arsenic Special
Drive of CGWB, 2015-16).
Aquifer Potential Aquifers in Old Malda block have good groundwater potential with
sustainable discharge varying from 38 litre per second (lps) to 72 lps.
Groundwater Resource *Annual Extractable GW Recharge: 9613.44 ham
*Total Annual GW Extraction: 5170.64 ham
*Stage of GW Extraction: 53.79%
*Category: Safe
Future Water Demand *Annual GW allocation for future domestic use (up to 2042): 349.24
ham
Aquifer Management planGroundwater Management
Plan
Management strategy:
1. Rainwater harvesting especially open area rainwater harvesting in
rural areas and roof top rainwater harvesting in urban and semi-
urban areas (Malda Town, Mangalbari and Sahapur).
2. Conjunctive use of surface water and ground water.
Artificial Recharge&Water
Conservation Possibilities
1. As per the Master Plan on Artificial Recharge (CGWB 2020), an
insignificant area of 0.022 km2 is the recharge worthy area. Volume of
unsaturated aquifer available for Artificial Recharge is 0.132 MCM.
2. However, water conservation through open area rainwater
harvesting in rural areas may be adopted depending on detailed
micro level survey.

156
9. CONCLUSION AND RECOMMENDATIONS
9.1 CONCLUSION
Malda district is located in the southernmost part of North Bengal, with Ganga River at Farakka flowing along its southern boundary. The district is bounded by latitudes 24040'20” N to 25032'08” and longitudes 87045'50” E to 88028'10” E. An area of 3733 km2 was covered during Aquifer Mapping and Management study in the AAP: 2019-20 and 2020-21. The salient points of the study are given below:
Malda district is flanked by Ganga River on its western and southwestern boundary. It isbounded by Pakur district (Jharkhand) in the west, by Purnea district (Bihar) in thenorthwest, by Uttar Dinajpur and Dakshin Dinajpur district in the north and northeast, byMurshidabad district in the south and by the international border with Bangladesh on theeast and southeast.
Double cropping is usually practiced with cropping intensity of 196.0%. Flood plain area(Diara) is the most fertile land. Net sown area in the district i s 2343.19 km2 with a verylow cultivable waste land. Forest land is very less (16.79 km2) without any permanentpasture and other grazing land. Principal crops grown in the district include paddy (Aus,Aman and Boro), potato, wheat, various types of pulses, mustard and other oilseeds, jute,sugarcane and other Rabi crops.
The area under groundwater irrigation is 917.39 km2, which is irrigated with a total of34185 heavy duty, medium duty and low duty tube wells.
Southwest monsoon is the main source of rainfall. Normal rainfall in the district is 1453mm. Average annual number of rainy days (daily rainfall ≥ 2.5 mm) was 67. In 2020, thehighest monthly rainfall was 346.5 mm in July whereas the lowest was 8.3 mm in January.
Three major geomorphological types in the district are Barind, Diara and Tal. Eastern partof the district, comprising mainly Older Alluvium, is known as the Barind Tract. Youngerand Older alluvial plains are locally known as ‘Diara’. ‘Tal’ is the swampy interfluvesexposed between Mahananda and Kalindri rivers in northern part of the district.
Source of surface water in the district is mainly from the perennial rivers, tanks, waterbodies (bils) and numerous small ponds. Ganga, Mahananda, Kalindri, Tangon andPunarbhaba Rivers are the major natural drainage in the district.
Geological setting of the district is a result of shallow subsidence and deposition of Gangaalluvium in the Garo-Rajmahal Gap. Large-scale sedimentation by the Himalayan Riverscaused deposition of Older Alluvium of Pleistocene age and Younger Alluvium of Holoceneage.

157
Main water bearing formations are Quaternary alluvial sediments (Older Alluvium andYounger Alluvium) comprising sands of varying grades, silt and clay with occasionalgravels. Due to facies variation during basin evolution, aquifer geometry is not regular.Sub-surface lithological data indicates that top clay layer has a thickness varying from 3 mto 15 m. Top clay is thinner in northern, eastern and central parts and relatively thicker inthe eastern part of the district. This layer is underlain by sands of variable grain size andthickness (10 to 30 m) and occasionally hard rock (granite gneiss, metavolcanics) indepth range >130 m at Araidanga (Ratua-II block), Mandilpur (Old Malda block) andNarendrapur (English Bazar block).
Generally, potential aquifers exist in depth range of 17 m to 178 m. Preparation of blockwise aquifer maps have indicated that two major aquifer systems have developed viz.Aquifer-1A and Aquifer-1B, except in Habibpur, Old Malda and Harishchandrapur-IIblocks where only Aquifer-1A has been developed. Aquifer-1A occurs under unconfinedcondition in the depth range of ~25 to ~70 m whereas Aquifer-1B occurs under semi- confined to confined condition in the depth range of ~90 to ~180 m.
Coarse sand and gravel constitutes potential aquifers down to ~90 m depth in the easternpart and down to ~180 m depth in the central and western parts of Malda district. Aquifergeometry and architecture at deeper levels (>250 m to ~400 m depth) needs to bedeciphered through deep groundwater exploration.
Thickness of the aquifers varies widely from place to place. In-house drilling dataindicates Static Water Level varying from 5.44 m bgl at Bhaluka to 19.90 m bgl atNityanandapur. Discharge of tube wells was varying from 626.40 m3/day at Bhaluka(Ratua-I block) to 5034.53 m3/day at Mandilpur (Old Malda block). Drawdown wasranging from 1.11 m at Bhaluka to 9.84 m at Nityanandapur. Transmissivity was rangingfrom 207.81 m2/day at Narendrapur (English Bazar block) to 7170.0 m2/day at Araidanga(Ratua-II block). Storage Co-efficient of aquifer in the depth range of 81 to 105 m was 9.9x 10⁻²at Araidanga, thereby indicating semi-confined nature of the aquifer.
Analysis of seasonal fluctuation in groundwater level (year: 2020) has indicated that 59wells out of 72 (81.94% of total) had shown seasonal rise in groundwater level whereas13 wells (18.06% of total) had recorded seasonal decline. The decadal (long-term)fluctuation was done using decadal mean (2010 to 2019) and data of 2020. The analysisindicates that in pre-monsoon, 34 wells out of 36 (94.44% of total) have recorded decadalrise. In post-monsoon, decadal analysis in 40 monitoring wells has indicated that 36 wells(90% of total) show decadal rise in groundwater level. The analysis also reveals absenceof long-term decline in groundwater level.
Assessment of Dynamic Groundwater Resources (as on 31-3-2013) reveals that totalgroundwater recharge was 150784.98 ham, whereas existing gross groundwater draft for

158
all uses was 65501.03 ham. Net annual groundwater availability was 136087.61 ham whereas allocation for future domestic and industrial water supply was 9828.37 ham. Stage of Groundwater Development was 48.13% with 13 out of 15 blocks falling under “Safe” category. Habibpur and Harishchandrapur-I blocks were categorized as “Semi Critical” blocks following the GEC-1997 methodology.
Based on Vertical Electrical Sounding (VES) in Habibpur block (Barind Tract), coarse sandwas interpreted as a promising aquifer in the depth range 26-85 m and 130-200 m. InManikchak block, weathered basalt and coarse sand were identified as promising aquifersin the depth range of 30-80 m, which is prone to arsenic contamination. From VES data,the recommended drilling depth was interpreted between 40 and 180 m.
Chemical analysis of groundwater indicated high arsenic (>0.01 mg/L) in English Bazar,Manikchak, Ratua-I, Ratua-II, Chanchal-II, Kaliachak–I, Kaliachak-II and Kaliachak-IIIblocks (Arsenic Task Force, Govt. of West Bengal). Sporadically high arsenic alsoidentified in Old Malda, Gazole and Harishchandrapur-I block. During the Arsenic SpecialDrive, analysis of 159 samples revealed high arsenic in 47 samples with arsenicconcentration ranging from 0.215 mg/L at Mohana (Manikchak block) to 0.402 mg/L atSujapur (Kaliachak-I block).
According to Fluoride Task Force, Govt. of West Bengal, Bamongola and Ratua-II blocksare identified as fluoride contaminated (fluoride ≥ 1.50 mg/L). Data of CGWB has shownhigh fluoride at Sripur (4.54 mg/L) in Ratua-II block and marginally high fluoride atChhoto Mohanpara (1.80 mg/L) in English Bazar block.
High iron (>1.0 mg/L) was recorded in many locations in Malda district. Ironconcentration was found to vary from 2.90 mg/L to 3.35 mg/L in Uttar Chandipur WaterSupply Scheme and 1.36 mg/L in Jotgopal Scheme. Data of CGWB has revealed high ironin 10 samples out of 53 (18.87% of total) with concentration of 6.58 mg/L at ChhotoMohanpara, 6.24 mg/L at Manikchak, 3.45 mg/L at Mahajantala, 3.17 mg/L at Bamongola,2.03 mg/L at Pandua and 1.85 mg/L at Pagla Bridge.
Plotting of groundwater samples in Piper Trilinear Diagram and Modified Piper (Chadha)Diagram, Wilcox Diagram and U.S. Salinity Diagram has revealed that groundwater ofshallow and deeper aquifers are suitable both for drinking and irrigation. Hydrochemicalfacies classification indicated that groundwater is of Ca-Mg-HCO3 type.
Groundwater originated from shallow aquifers is characterized by recharge from freshwater and major hydrochemical process is weathering-solution. Low sodium andchloride content in groundwater signifies absence of inland salinity hazard.
Plotting of groundwater samples in Wilcox Diagram and USSL Diagram has revealed thatmajority of samples fall either in S1-C2 or S1-C3 class. This indicates suitability ofgroundwater for irrigational use.

159
The outcomes of present study were shared in physical mode to Sh. Rajarshi Mitra (IAS) andDistrict Magistrate, Malda in his office on 15th November 2021. PowerPoint presentation wasmade in presence of the Additional District Magistrate (General), Additional DistrictMagistrate (Development), representatives from concerned state government departmentslike Public Health Engineering Directorate, Malda Division and Arsenic Area Water SupplyDivision, departments under the Water Resources Investigation and DevelopmentDepartment (WRIDD) like State Water Investigation Directorate, Water ResourcesDevelopment Directorate (WRDD), Agri-irrigation Department and Agriculture Department.
9.2 RECOMMENDATIONS
Based on the outcome of the present study on Aquifer Mapping and Management, the following recommendations are suggested for an effective and scientifically sustainable management of the aquifers of Malda district:
Conjunctive use of surface water and groundwater needs to be adopted. Cultivation ofsummer paddy (Boro rice) through numerous shallow and deep tube wells has resultedin unprecedented stress on the aquifer system. Therefore, instead of installing additionaltube wells for agri-irrigation, a modification in cropping pattern should be adopted. Borocultivation needs to be reduced by at least 10% of the present production.
Crops like peanuts, sunflower, soybean and ginger needs to be grown instead of water- intensive paddy crop, especially during peak summer season. However, crop subsidy hasto be given by the state government to the small and marginal farmers due to their poorsocio-economic condition.
Borehole logs are not available in Kaliachak-I, Kaliachak-II and Kaliachak-III block.Therefore, subsurface data generation through exploration is to be taken up urgently inthis area. The data would help in preparation of block level Aquifer Management Plans forthese blocks and aid in deciphering the depth range of arsenic contaminated aquifers inthe southernmost part of Malda district.
Due to very low stage of groundwater development (<70%) for the entire district,adoption of demand side groundwater management may not be a priority. On the otherhand, supply side aquifer management is possible through implementation of rain waterharvesting and managed aquifer recharge in Kaliachak-I, Gazole and Old Malda blocks, asper the available data on latest Master Plan for Artificial Recharge (CGWB 2020).
Artificial recharge can be implemented through Percolation Tanks, Injection Wells and byRe-excavation of Existing Tanks with Recharge Shafts. Only shallow aquifer (Aquifer-1A)in the depth range of ~25 to ~30 m is suitable for artificial recharge. Except three blocks,

160
scope of artificial recharge is negligible due to presence of thick (>10 m) clay layers.
There is very good potential for water conservation through rainwater harvesting due tohigh Normal Rainfall (1453 mm) in Malda district. Possibility of implementing roof toprain water harvesting in urban and peri-urban areas (Malda Town, Gazole, Chanchal,Ratua, Harishchandrapur, Manikchak, Habibpur) and open area rain water harvesting inrural areas may be explored.
Estimation of non-committed surface run off for water conservation through rain waterharvesting has indicated that 22.5% of total surface runoff in Malda district can beutilized for rain water harvesting. Highest availability of non-committed surface runoffexists in Gazole block and lowest in Kaliachak-I block. Accordingly, given the existing fundposition, prioritization can be done by the district administration for implementation ofpilot projects at block level.
Based on Monsoon Rainfall (1219.8 mm in 2020), volume of water available forimplementing rainwater harvesting in 27 Census Towns is estimated at 0.003 MCM withan estimated cost of twelve lakh rupees. In two Municipal Bodies (English Bazar and OldMalda), the estimated rainwater volume for rainwater harvesting is 0.015 MCM with anestimated cost of forty lakh rupees.
Depending on the local socio-economic condition, it is prudent to adopt participatoryground water management at village and community level.
There is a growing need to involve the village and community through programmes likePublic Interaction Programme, which was organized through Google Meet platform on 28th
July 2021. In this programme, the outcomes of the aquifer mapping and management study inMalda district was shared to representatives from state government departments, academicinstitutes, farmers, social workers and students of the district. More such programmes may betaken up in a phased manner in block headquarters of all fifteen community developmentblocks of the district for generating better impact on the importance of sustainablegroundwater management through participatory approach at village and community level.
This was followed by a presentation of the Aquifer Mapping Study in Malda district in theoffice of the District Magistrate, Malda (in physical mode) on 15th November 2021.
For an effective conservation of rainwater and groundwater, various state governmentand central government aided schemes need to be implemented in a phased manner.Examples of such schemes include the Jal Dhoro Jal Bhoro programme by the Governmentof West Bengal, Pradhan Mantri Krishi Sinchai Yojana – Har Khet Ko Pani (PMKSY-HKKP)project and Jal Shakti Abhiyan (Phase-I and II) of the Ministry of Jal Shakti and theMinistry of Rural Development, Government of India.

161
REFERENCES
Bureau of Applied Economics and Statistics (2014) District Statistical Handbook, Malda, Department of Statistics and Programme Implementation, Govt. of West Bengal
Central Ground Water Board (2013) Manual on Aquifer Mapping, Ministry of Water Resources, Govt. of India, Faridabad, 72 p.
Central Ground Water Board (2014) Aquifer Systems of West Bengal, Ministry of Water Resources, Govt. of India, Eastern Region, Kolkata
Central Ground Water Board (2020) Master Plan for Artificial Recharge to Ground Water in India, Ministry of Jal Shakti, Govt. of India, Faridabad
District Survey Report of Malda (2021) Government of West Bengal, 145 p.
Ghosh Dastidar, D. and Adhikari, S.K. (2008) Ground Water Management Study in parts of Malda District, West Bengal, Central Ground Water Board, Eastern Region, Kolkata; Technical Report Series-D, No. 206
Guha, R.K. (2009) Ground Water Exploration in West Bengal, Central Ground Water Board, Eastern Region, Kolkata; Technical Report Series-D, No. 219
Saha, D.B. (2001) Ground Water Resources and Development of Malda district, West Bengal, Central Ground Water Board, Eastern Region, Kolkata
Sikdar, P. and Chakraborty, S. (2007) Genesis of arsenic in groundwater of North Bengal Plain using PCA: A case study of English Bazar Block, Malda District, India. Hydrological Processes, John Wiley & Co., https://doi.org./10.1002/hyp.6742
Srivastava M. and Khan D.K. (1983) Hydrogeology of Malda district, Central Ground Water Board, Eastern Region, Kolkata
Talukdar T. and Bandopadhyay S. (2017) Hydrogeological Framework and Ground Water Resources of West Bengal State, Central Ground Water Board, Ministry of Water Resources, River Development and Ganga Rejuvenation, Govt. of India
West Bengal Drinking Water Sector Improvement Project (2016) Arsenic and Fluoride in Drinking Water in West Bengal: Characteristics, Implications, and Mitigation (RRP IND 49107-006)

162
FIELD PHOTOGRAPHS
Ground Water Monitoring being carried out during NAQUIM study at Haldar Para, Habibpur block, Malda district
Measurement of water level in Key Observation Well established at Kanua, Chanchal-I block, Malda district during NAQUIM study (AAP: 2020-2021)

163
Water Treatment Plant of Public Health Engineering Directorate (PHED), Govt. of West Bengal at Dariapur, Kaliachak-III block. The plant is used for removal of Arsenic and also for rural water supply in Kaliachak-I, Kalaichak-II, Kalaichak-III and Manikchak blocks, Malda district
Inside view of Arsenic Removal cum Water Treatment Plant (PHED, GoWB) at Dariapur, Kaliachak-III block, Malda district

164
ACKNOWLEDGEMENT
The author is thankful to Sh. Amlanjyoti Kar, Head of Office (Retd.), Dr. S.K. Samanta, Regional Director (Retd.) and Dr. Anadi Gayen, Head of Office, CGWB, ER for the overall guidance and supervision during preparation of the manuscript of this report. Special thanks are due to Ms. Mahasweta Mukherjee and Ms. Rajyashree Nandi, Young Professionals, CGWB, ER for painstakingly preparing a number of thematic maps that are integral components of the Block Level Aquifer Management Plans of Malda district. Sincere thanks are due to Sh. Anirvan Chowdhury, Scientist-B (HG), Smt. Sandhya Yadav, Scientist-E (HG), Sh. Tapan Talukdar, Scientist-D (Retd.), Smt. Rose Anita Kujur, Scientist-E (HG), Dr. S.K. Adhikari, Scientist-B (Retd.), Dr. Indranil Roy, Scientist-C (HG), Chirashree Mohanty Scientist-C (HG) ( for processing the Report) and other office colleagues of CGWB, ER, Kolkata for their valuable suggestions and constructive criticisms during the NAQUIM Study in Malda district. Last but not the least, a special thanks to my family for the patience and support extended during preparation of this report, many a times beyond office hours and on holidays.
Copyright © 2022 FDOKUMEN