Evidence for orbital and North Atlantic climate forcing in alpine ...
Upload
khangminh22Category
view
1download
0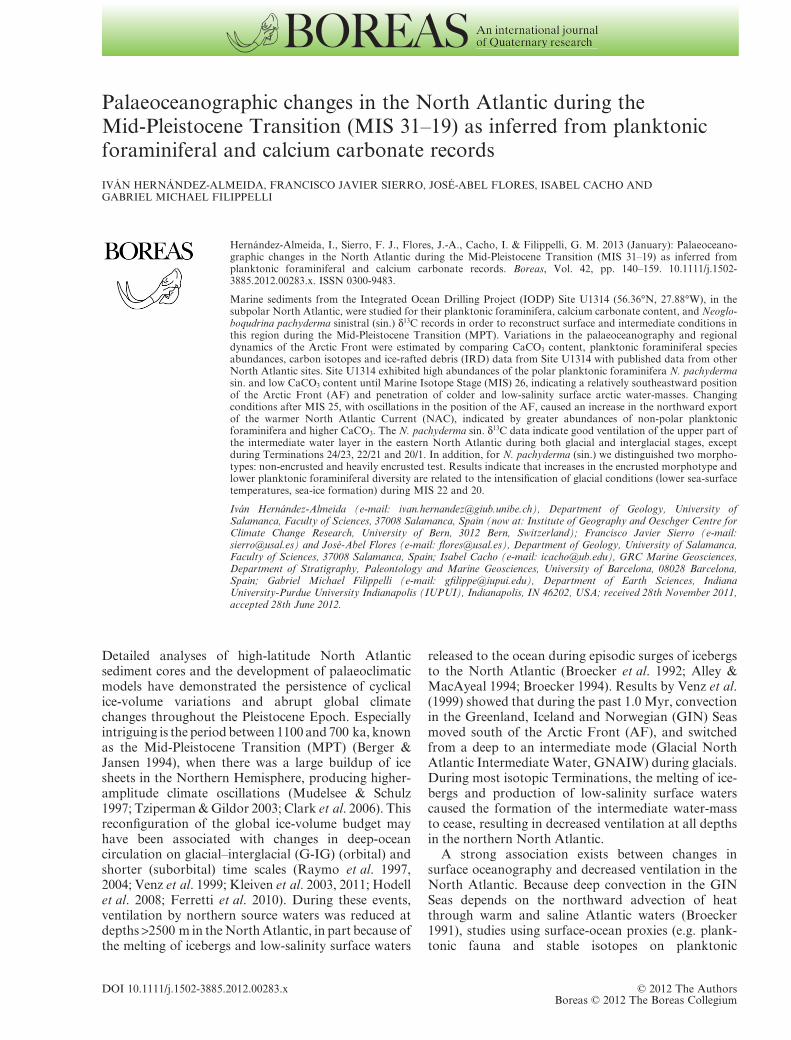
Palaeoceanographic changes in the North Atlantic during theMid-Pleistocene Transition (MIS 31–19) as inferred from planktonicforaminiferal and calcium carbonate records
IVÁN HERNÁNDEZ-ALMEIDA, FRANCISCO JAVIER SIERRO, JOSÉ-ABEL FLORES, ISABEL CACHO ANDGABRIEL MICHAEL FILIPPELLI
Hernández-Almeida, I., Sierro, F. J., Flores, J.-A., Cacho, I. & Filippelli, G. M. 2013 (January): Palaeoceano-graphic changes in the North Atlantic during the Mid-Pleistocene Transition (MIS 31–19) as inferred fromplanktonic foraminiferal and calcium carbonate records. Boreas, Vol. 42, pp. 140–159. 10.1111/j.1502-3885.2012.00283.x. ISSN 0300-9483.
Marine sediments from the Integrated Ocean Drilling Project (IODP) Site U1314 (56.36°N, 27.88°W), in thesubpolar North Atlantic, were studied for their planktonic foraminifera, calcium carbonate content, and Neoglo-boqudrina pachyderma sinistral (sin.) d13C records in order to reconstruct surface and intermediate conditions inthis region during the Mid-Pleistocene Transition (MPT). Variations in the palaeoceanography and regionaldynamics of the Arctic Front were estimated by comparing CaCO3 content, planktonic foraminiferal speciesabundances, carbon isotopes and ice-rafted debris (IRD) data from Site U1314 with published data from otherNorth Atlantic sites. Site U1314 exhibited high abundances of the polar planktonic foraminifera N. pachydermasin. and low CaCO3 content until Marine Isotope Stage (MIS) 26, indicating a relatively southeastward positionof the Arctic Front (AF) and penetration of colder and low-salinity surface arctic water-masses. Changingconditions after MIS 25, with oscillations in the position of the AF, caused an increase in the northward exportof the warmer North Atlantic Current (NAC), indicated by greater abundances of non-polar planktonicforaminifera and higher CaCO3. The N. pachyderma sin. d13C data indicate good ventilation of the upper part ofthe intermediate water layer in the eastern North Atlantic during both glacial and interglacial stages, exceptduring Terminations 24/23, 22/21 and 20/1. In addition, for N. pachyderma (sin.) we distinguished two morpho-types: non-encrusted and heavily encrusted test. Results indicate that increases in the encrusted morphotype andlower planktonic foraminiferal diversity are related to the intensification of glacial conditions (lower sea-surfacetemperatures, sea-ice formation) during MIS 22 and 20.
Iván Hernández-Almeida (e-mail: [email protected]), Department of Geology, University ofSalamanca, Faculty of Sciences, 37008 Salamanca, Spain (now at: Institute of Geography and Oeschger Centre forClimate Change Research, University of Bern, 3012 Bern, Switzerland); Francisco Javier Sierro (e-mail:[email protected]) and José-Abel Flores (e-mail: [email protected]), Department of Geology, University of Salamanca,Faculty of Sciences, 37008 Salamanca, Spain; Isabel Cacho (e-mail: [email protected]), GRC Marine Geosciences,Department of Stratigraphy, Paleontology and Marine Geosciences, University of Barcelona, 08028 Barcelona,Spain; Gabriel Michael Filippelli (e-mail: [email protected]), Department of Earth Sciences, IndianaUniversity-Purdue University Indianapolis (IUPUI), Indianapolis, IN 46202, USA; received 28th November 2011,accepted 28th June 2012.
Detailed analyses of high-latitude North Atlanticsediment cores and the development of palaeoclimaticmodels have demonstrated the persistence of cyclicalice-volume variations and abrupt global climatechanges throughout the Pleistocene Epoch. Especiallyintriguing is the period between 1100 and 700 ka, knownas the Mid-Pleistocene Transition (MPT) (Berger &Jansen 1994), when there was a large buildup of icesheets in the Northern Hemisphere, producing higher-amplitude climate oscillations (Mudelsee & Schulz1997; Tziperman & Gildor 2003; Clark et al. 2006). Thisreconfiguration of the global ice-volume budget mayhave been associated with changes in deep-oceancirculation on glacial–interglacial (G-IG) (orbital) andshorter (suborbital) time scales (Raymo et al. 1997,2004; Venz et al. 1999; Kleiven et al. 2003, 2011; Hodellet al. 2008; Ferretti et al. 2010). During these events,ventilation by northern source waters was reduced atdepths >2500 m in the North Atlantic, in part because ofthe melting of icebergs and low-salinity surface waters
released to the ocean during episodic surges of icebergsto the North Atlantic (Broecker et al. 1992; Alley &MacAyeal 1994; Broecker 1994). Results by Venz et al.(1999) showed that during the past 1.0 Myr, convectionin the Greenland, Iceland and Norwegian (GIN) Seasmoved south of the Arctic Front (AF), and switchedfrom a deep to an intermediate mode (Glacial NorthAtlantic Intermediate Water, GNAIW) during glacials.During most isotopic Terminations, the melting of ice-bergs and production of low-salinity surface waterscaused the formation of the intermediate water-massto cease, resulting in decreased ventilation at all depthsin the northern North Atlantic.
A strong association exists between changes insurface oceanography and decreased ventilation in theNorth Atlantic. Because deep convection in the GINSeas depends on the northward advection of heatthrough warm and saline Atlantic waters (Broecker1991), studies using surface-ocean proxies (e.g. plank-tonic fauna and stable isotopes on planktonic
bs_bs_banner
DOI 10.1111/j.1502-3885.2012.00283.x © 2012 The AuthorsBoreas © 2012 The Boreas Collegium
foraminifera) may provide valuable information forunderstanding changes in the deep ocean. Micropalae-ontological records and sea surface temperature (SST)reconstructions from the North Atlantic show majorvariations in the composition and structure of plank-tonic assemblages throughout the MPT, related tosevere cold surface-water events associated with theice-sheet expansion and ice-rafted debris (IRD) dis-charge events that resulted in the stagnation of deepNorth Atlantic waters (Wright & Flower 2002; Reidet al. 2007; Marino et al. 2008, 2011; McClymont et al.2008; Shimada et al. 2008). Although data exist for awide range of organisms, we focus here mainly onplanktonic foraminifera.
Because planktonic foraminifera offer multipleapproaches to the reconstruction of surface ocean con-ditions (changes in assemblage, diversity, variations insize and morphology, etc.), they have frequently beenused as a tracer of North Atlantic water-masses (e.g.Stehli 1965; Ruddiman 1969; McIntyre et al. 1972;Balsam & Flessa 1978; Ruddiman et al. 1989; Bauch1994; Johannessen et al. 1994; Fronval et al. 1998;Wright & Flower 2002; Kandiano et al. 2004), andespecially to monitor changes in the position of the AF,which marks the southward extent of cold arctic watersand also sea ice (Swift & Aagaard 1981). Planktonicforaminifera can also provide insight into deeper con-ditions of the water column via the isotopic com-position of some relatively deep-dwelling species. Anexample is the polar species N. pachyderma sin., whichhas been demonstrated to reflect conditions along thepycnocline (Bé & Tolderlund 1971; Carstens & Wefer1992; Wu & Hillaire-Marcel 1994; Kohfeld et al. 1996).Several recent studies in the Labrador Sea (westernNorth Atlantic) have reconstructed the conditions inthe upper part of the intermediate water layer from theisotopic composition of N. pachyderma sin. (Hillaire-Marcel & Bilodeau 2000; Hillaire-Marcel et al. 2001a;Hillaire-Marcel et al. 2011).
In this paper, we use new high-resolution planktonicforaminiferal assemblage data, d13C of N. pachydermasin., the Shannon–Weaver diversity index and the per-centage of CaCO3 from Integrated Ocean DrillingProgram (IODP) Site U1314 between 1069 and 779 kato obtain information of past sea-surface hydrologicalparameters. We examine the response of planktonicforaminiferal species to palaeoenvironmental varia-tions during the MPT, with special emphasis on theinterrelations between the environment and palae-oecology of a poorly known encrusted morphotype ofN. pachyderma sin., and its potential as a valuable cli-matic index. Data are compared with available CaCO3
content and planktonic foraminiferal records fromneighbouring sites in the subpolar North Atlantic tomonitor the AF oscillations and implications for theheat and moisture transport to the boreal ice-sheetregions. Finally, we examine the potential of the d13C
signal from N. pachyderma sin. as an intermediatewater circulation proxy in the subpolar North Atlantic.The aim of this study is to increase the geographiccoverage of proxy records for a better interpretation oftemporal and spatial palaeoceanographic changes inthe subpolar North Atlantic during the MPT.
Study area and site location
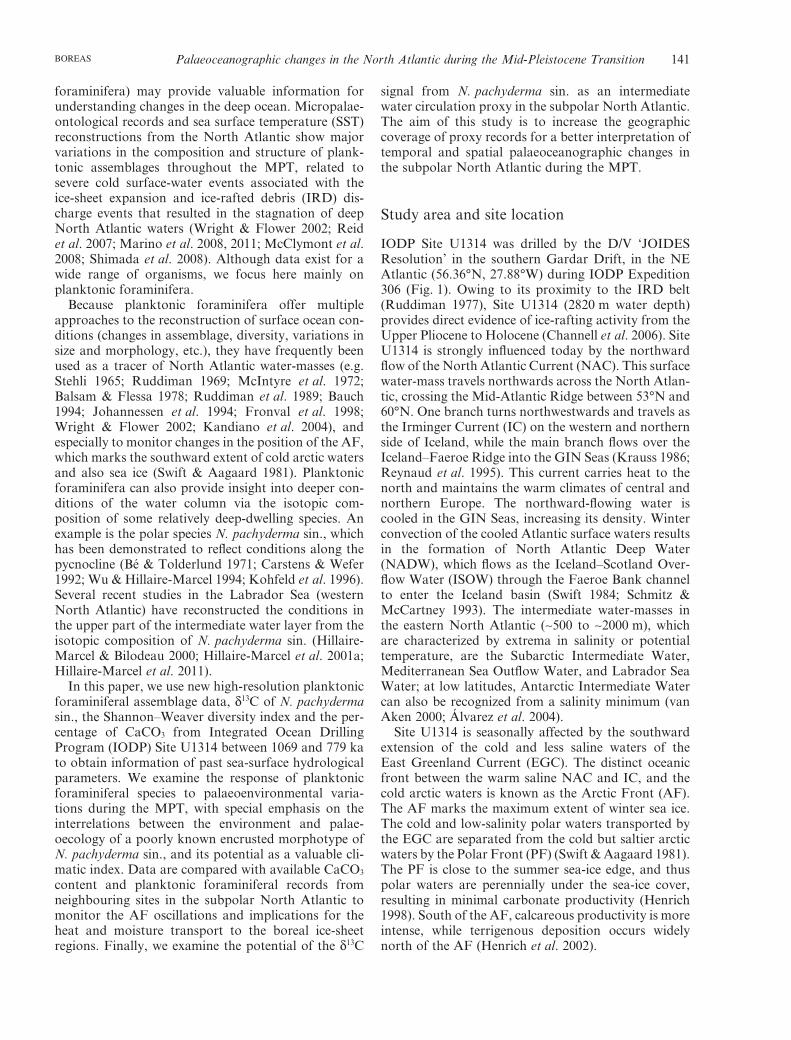
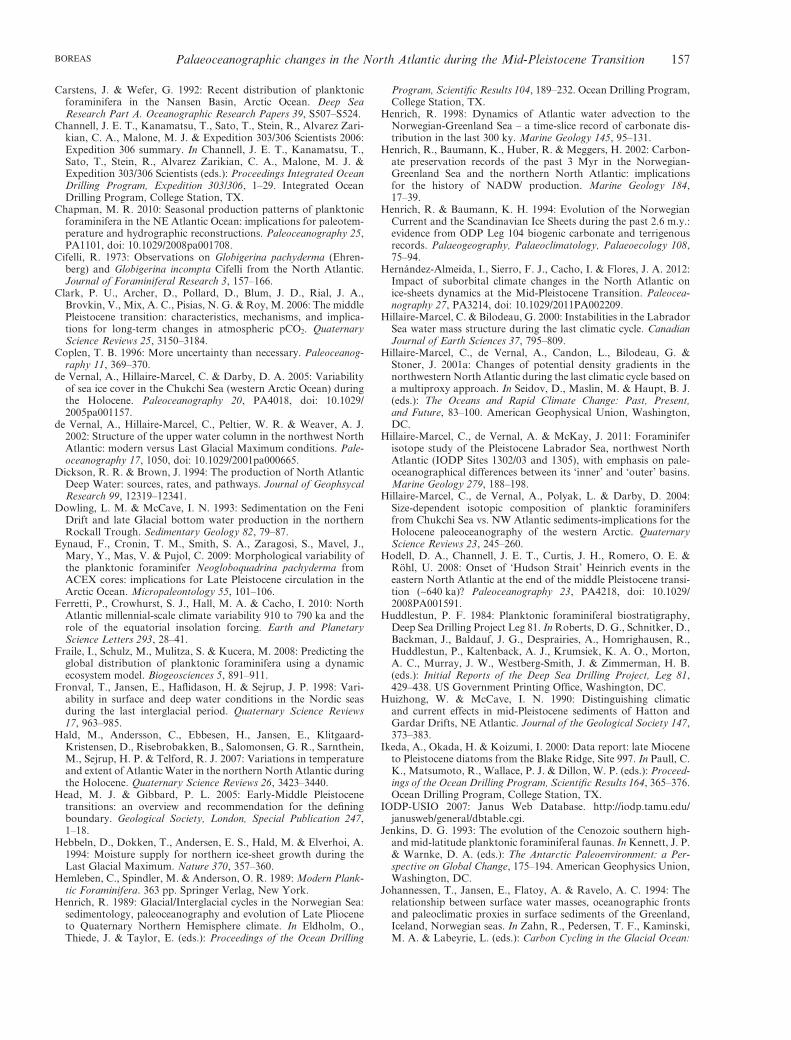
IODP Site U1314 was drilled by the D/V ‘JOIDESResolution’ in the southern Gardar Drift, in the NEAtlantic (56.36°N, 27.88°W) during IODP Expedition306 (Fig. 1). Owing to its proximity to the IRD belt(Ruddiman 1977), Site U1314 (2820 m water depth)provides direct evidence of ice-rafting activity from theUpper Pliocene to Holocene (Channell et al. 2006). SiteU1314 is strongly influenced today by the northwardflow of the North Atlantic Current (NAC). This surfacewater-mass travels northwards across the North Atlan-tic, crossing the Mid-Atlantic Ridge between 53°N and60°N. One branch turns northwestwards and travels asthe Irminger Current (IC) on the western and northernside of Iceland, while the main branch flows over theIceland–Faeroe Ridge into the GIN Seas (Krauss 1986;Reynaud et al. 1995). This current carries heat to thenorth and maintains the warm climates of central andnorthern Europe. The northward-flowing water iscooled in the GIN Seas, increasing its density. Winterconvection of the cooled Atlantic surface waters resultsin the formation of North Atlantic Deep Water(NADW), which flows as the Iceland–Scotland Over-flow Water (ISOW) through the Faeroe Bank channelto enter the Iceland basin (Swift 1984; Schmitz &McCartney 1993). The intermediate water-masses inthe eastern North Atlantic (~500 to ~2000 m), whichare characterized by extrema in salinity or potentialtemperature, are the Subarctic Intermediate Water,Mediterranean Sea Outflow Water, and Labrador SeaWater; at low latitudes, Antarctic Intermediate Watercan also be recognized from a salinity minimum (vanAken 2000; Álvarez et al. 2004).
Site U1314 is seasonally affected by the southwardextension of the cold and less saline waters of theEast Greenland Current (EGC). The distinct oceanicfront between the warm saline NAC and IC, and thecold arctic waters is known as the Arctic Front (AF).The AF marks the maximum extent of winter sea ice.The cold and low-salinity polar waters transported bythe EGC are separated from the cold but saltier arcticwaters by the Polar Front (PF) (Swift & Aagaard 1981).The PF is close to the summer sea-ice edge, and thuspolar waters are perennially under the sea-ice cover,resulting in minimal carbonate productivity (Henrich1998). South of the AF, calcareous productivity is moreintense, while terrigenous deposition occurs widelynorth of the AF (Henrich et al. 2002).
Palaeoceanographic changes in the North Atlantic during the Mid-Pleistocene Transition 141BOREAS
Material and methods
The sedimentary sequence recovered at this Site U1314varies in colour from very dark grey to light grey tohues of greenish grey, and consists mainly of predomi-nantly nannofossil oozes enriched in biogenic and ter-rigenous components, and terrigenous silty clay withvarying proportions of calcareous (e.g. nannofossils,foraminifers) and siliceous (e.g. diatoms and radiolar-ians) organisms. More detailed core descriptions are inChannell et al. (2006).
Samples were taken every 4 cm as 2-cm-thick slicesbetween 60 and 84.16 m composite depth (mcd). Eachsample was oven-dried, weighed, and wet-sieved overa 63-mm screen, and then oven-dried again. Later,samples were dry-sieved into two fractions, 63–150 mmand >150 mm. Census counts and picking for the stableisotope analyses were carried out in the >150-mm frac-tion. Full census counts were completed every othersample (total 325 samples), with an average resolutionof ~0.9 ka (see ‘Chronology and age–depth model-ling’). Each sample was split as many times as necessaryto obtain an aliquot that contained about 400 plank-tonic foraminifers, and then species of planktonicand benthic foraminifera, mineral grains, ash, lithicfragments, radiolarians, ostracodes and planktonicforaminiferal fragments were counted and relativeabundances and fluxes were calculated. Our taxonomy
criteria for planktonic foraminiferal specimens followthat of Bé (1977) and Hemleben et al. (1989). Diversitypatterns of the planktonic foraminiferal assemblagewere determined using the Shannon–Weaver diversityindex (Shannon & Weaver 1963), given by the follow-ing equation:
H p pi ii
S
= − ( )=∑ ln
1
(1)
where H is the Shannon–Weaver diversity index, pi isthe fraction of the entire population made up of species1, s is the number of species encountered, and S is thesum from species i to species S. This index is sensitive toboth changes in the number of species and their relativeabundance in the sample. High values can result froman addition of species, greater equality in abundance,or both. In the modern Atlantic Ocean, planktonicforaminiferal diversity shows a strong correlationwith SST. Polar waters of both hemispheres show thelowest diversity, being dominated by a single species(N. pachyderma), while the highest diversity and largestsizes are found in the oligotrophic subtropical gyres(Rutherford et al. 1999). A more detailed discussion ofthis index and its use in ecological studies is providedby Pielou (1975).
The total carbon (TC) content of the sediment wasmeasured in 584 samples using a UIC Coulometrics
30º N
40ºN
50º N
60º N
70º N
80º N
60º W50° W
40º W 30º W 20º W10º W
0º
984
ISO
W
NA
DW
DSO
W
NAC
NA
DW
LSW
LDW
EG
C
NC
LC
U1314
983
980
985
1304
IC
GardarDrift
982
U131U13UUU
989
044
dardriftf
Fig. 1. Location of IODP Site U1314(black star: 56°21’N, 27°W; 2820 m waterdepth), and other North Atlantic sites (seeTable 1). Modern surface (red), and deepcirculation (blue) in the North Atlantic(Krauss 1986; Schmitz & McCartney 1993).Map generated with ocean data viewv.3.4.3. software (Schlitzer 2008).EGC = East Greenland Current;NC = Norwegian Current; LC = LabradorCurrent); NAC = North Atlantic Current;IC = Irminger Current; DSOW = DenmarkStrait Overflow Water; ISOW = IcelandScotland Overflow Water; LSW = LabradorSea Water; NADW = North Atlantic DeepWater; LDW = Lower Deep Water. Thisfigure is available in colour at http://www.boreas.dk.
142 Iván Hernández-Almeida et al. BOREAS
CM150 carbon analyser. For total organic carbon(TOC) analyses, first we removed the total inorganiccarbon (TIC) following standard procedures (VanIperen & Helder 1985). About 0.2 g of powdered samplewas digested in 2N HCl in 50-mL centrifuge tubes, andshaken by hand periodically until carbonate reactionwas no longer visible. The samples were dried overnightat ~70°C to evaporate excess HCl. In order to ensurethat all HCl was removed, samples were rinsed withdeionized water, and then centrifuged and decanted.After two rounds, wet sediment was transferred to a vialand dried overnight at 65°C. TOC was then measuredusing a Flash 2000 Combustion CHNS/O analyser.
TIC and CaCO3 were then calculated from theweight percentages of the TC and TOC using thefollowing equations:
TIC TC TOC TOC= −( ) − ( ) ×( )[ ] ×100 1 100 8 33 100.(2)
CaCO TIC3 8 33% .= × (3)
The accumulation rates of planktonic foraminifera(PF AR=Planktonic Foraminifera Accumulation Rate)to estimate surface productivity was calculated usingthe following equation:
PFAR planktonic foraminiferal concentration MAR= ×
(4)
where PF AR is given in the number of individualscm-2 ka-1; the planktonic foraminiferal concentration isthe number of individuals g-1; MAR is the mass accu-mulation rate (g cm-2 ka-1) (MAR=SR ¥ DBD); SR isthe sedimentation rate (cm ka-1); and DBD is the drybulk density (g cm-3). SR and DBD are published inHernández-Almeida et al. 2012) and the IODP-USIO(2007) Janus web database, respectively.
In order to estimate carbonate dissolution, a plank-tonic foraminiferal fragmentation index (FI) was cal-culated by measuring the ratio between planktonicforaminiferal fragments and whole tests. Furthermore,we estimate the ratio of benthic to planktonic foramini-fers B/(P+B) in the >150-mm size fraction. In general,dissolution produces more planktonic foraminiferalfragments and preferentially removes planktonic fora-minifers, which leads to a higher FI and B/(P+B) ratio(Thunell 1976).
The benthic and planktonic stable isotope recordswere previously published by Hernández-Almeida et al.(2012). One to eight tests of Cibicidoides spp. (mainlyC. wuellerstorfi and occasionally C. pachyderma) werepicked from the >250-mm size fraction, and one to eightindividuals were used for isotopic analysis. When thisspecies was absent, we picked specimens of Melonispompilioides from the same size fraction to produce a
continuous signal. In order to elaborate a homogenousisotope record from both species, we calculated themean difference between the two species in 74 samplescovering the 1069 to 400 ka period (this study; Alonso-Garcia et al. 2011). The average difference was used toadjust both records: -0.11‰ for the oxygen and +0.6‰for the carbon isotopes.
For the planktonic foraminiferal stable isotopestudy, we chose to analyse Neogloboquadrina pachy-derma sinistral (sin.), because this species is presentthroughout the studied section. A minimum of 15 speci-mens from the size range between 150 and 250 mm werepicked. Benthic and planktonic specimens of eachsample were crushed, ultrasonicated and cleaned withmethanol before the isotopic analyses. Benthic andplanktonic foraminiferal stable isotope analyses werecarried out in a Finnigan MAT 252 mass spectro-meter at the University of Barcelona. Calibration to theVienna Pee Dee Belemnite (VPDB) standard scale(Coplen 1996) was made through the NBS-19 standard,and the analytical precision was better than 0.06‰ ford18O and than 0.02‰ for d13C.
Because d13C values measured in planktonicforaminiferal tests are related to nutrient concentra-tions (Broecker & Peng 1982), the analyses of carbonisotopes in N. pachyderma sin. aim to reconstruct thestructure of the bottom of the pycnocline (the upperpart of the intermediate water layer). To test the poten-tial of N. pachyderma sin. d13C as a tracer of interme-diate ventilation, we compared our record with benthicd13C data from Site 982, which is bathed by the well-ventilated GNAIW during glacial stages between 0 and1.0 Ma (Venz et al. 1999) The ~0.9‰ offset betweenbenthic and planktonic d13C records from Sites 982 andU1314 represents the metabolic and vital effects of d13Cvalues of N. pachyderma sin. These are well constrainedby a shift of +0.9‰ vs. d13C in dissolved inorganiccarbon (DIC) (Labeyrie & Duplessy 1985). At the levelof the pycnocline (upper part of the intermediate layer),where N. pachyderma sin. lives (e.g. Bé & Tolderlund1971; Simstich et al. 2003), the seawater d13C is alreadypartially affected by the addition of CO2 with low 13C,recycled from settling organic matter (Kroopnick1985). To facilitate comparison with the ODP Site 982(1145 m depth) benthic d13C record, our N. pachydermasin. d13C record was adjusted to a ‘Cibicidoides’ scale byadding +0.9‰ (Labeyrie & Duplessy 1985).
Finally, we compared our records with otheravailable proxies at ODP Sites 982 (CaCO3, IRD)(Baumann & Huber 1999; Venz et al. 1999) and 983,980 and 984 (CaCO3, planktonic foraminiferal assem-blages) (Ortiz et al. 1999; Wright & Flower 2002) inorder to provide a regional perspective of palaeoceano-graphic changes in the subpolar North Atlantic.Benthic d18O records from former sites were used tocorrelate these records with the LR04 benthic d18Ostack, and thus with the Site U1314 age.
Palaeoceanographic changes in the North Atlantic during the Mid-Pleistocene Transition 143BOREAS
Notes on taxonomy of Neogloboquadrinapachyderma sinistral
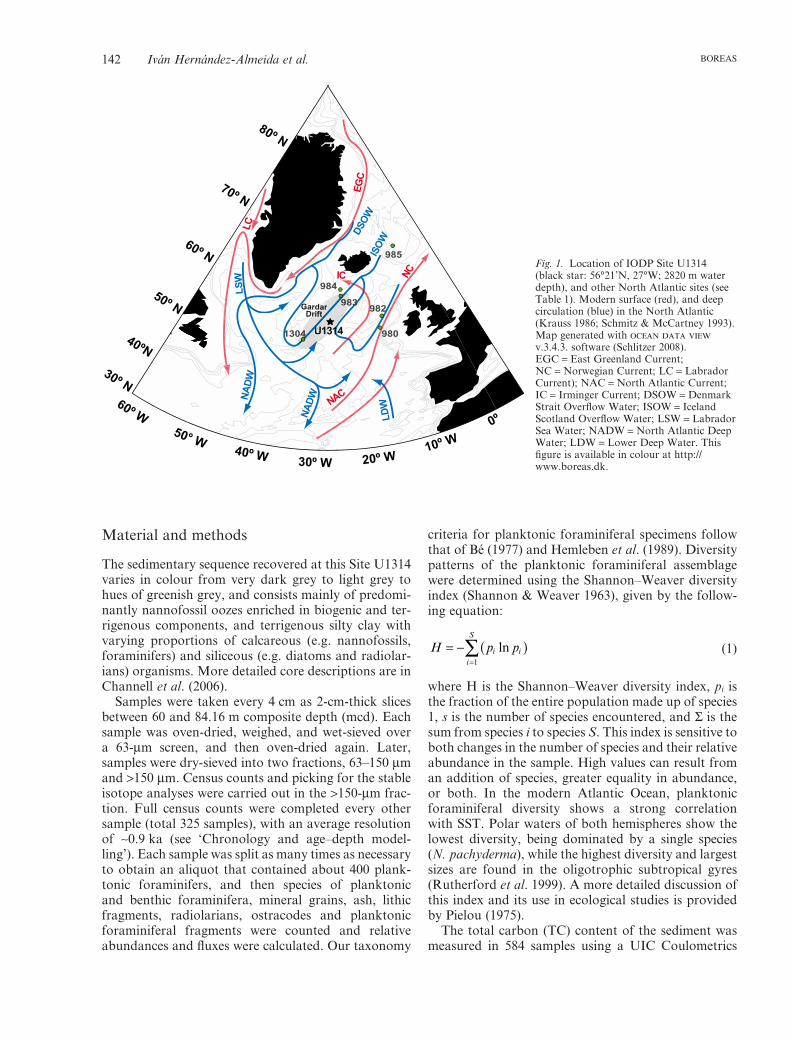
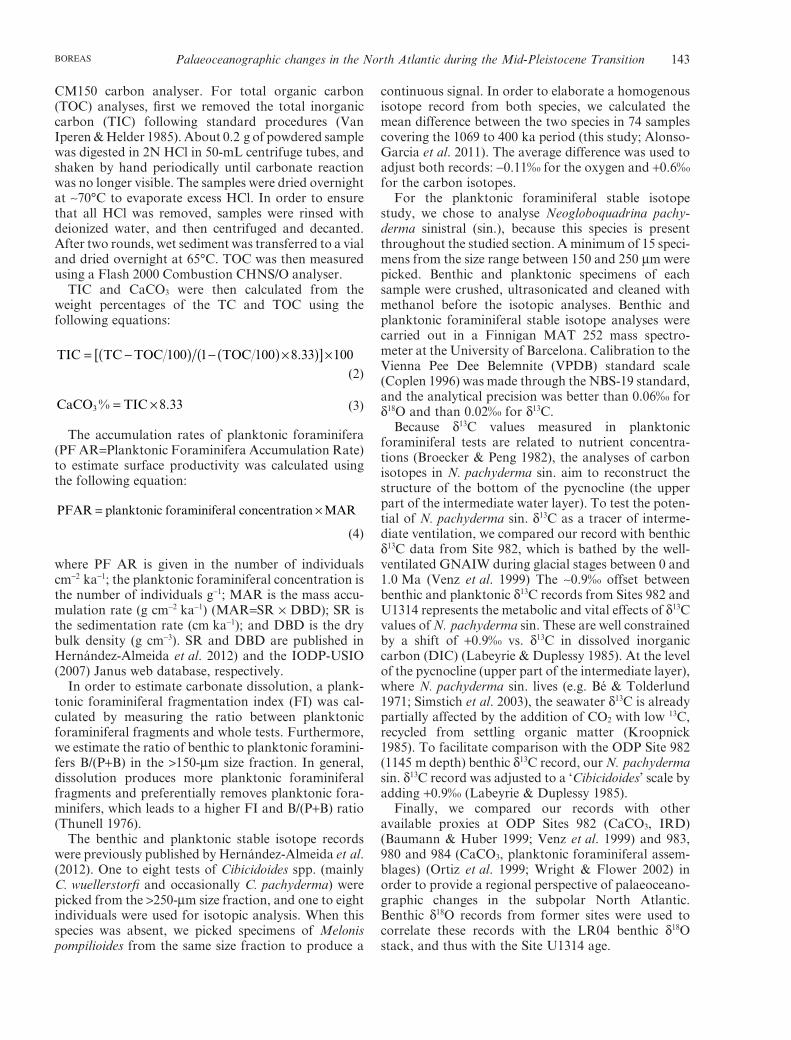
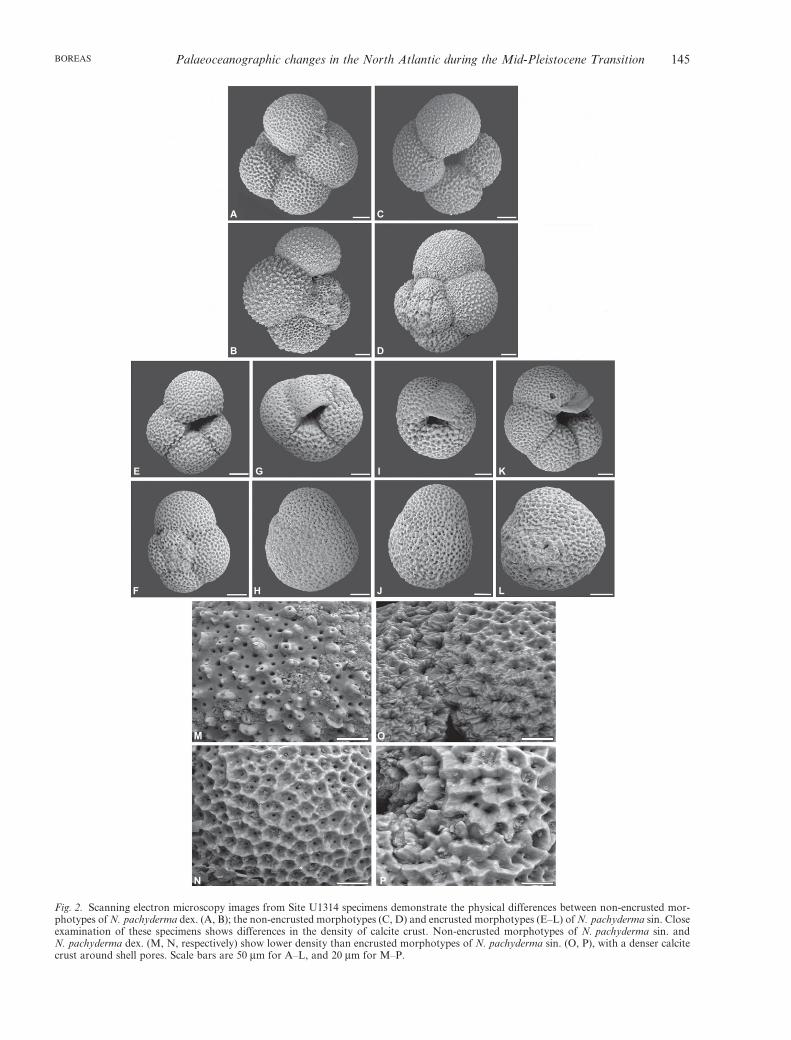
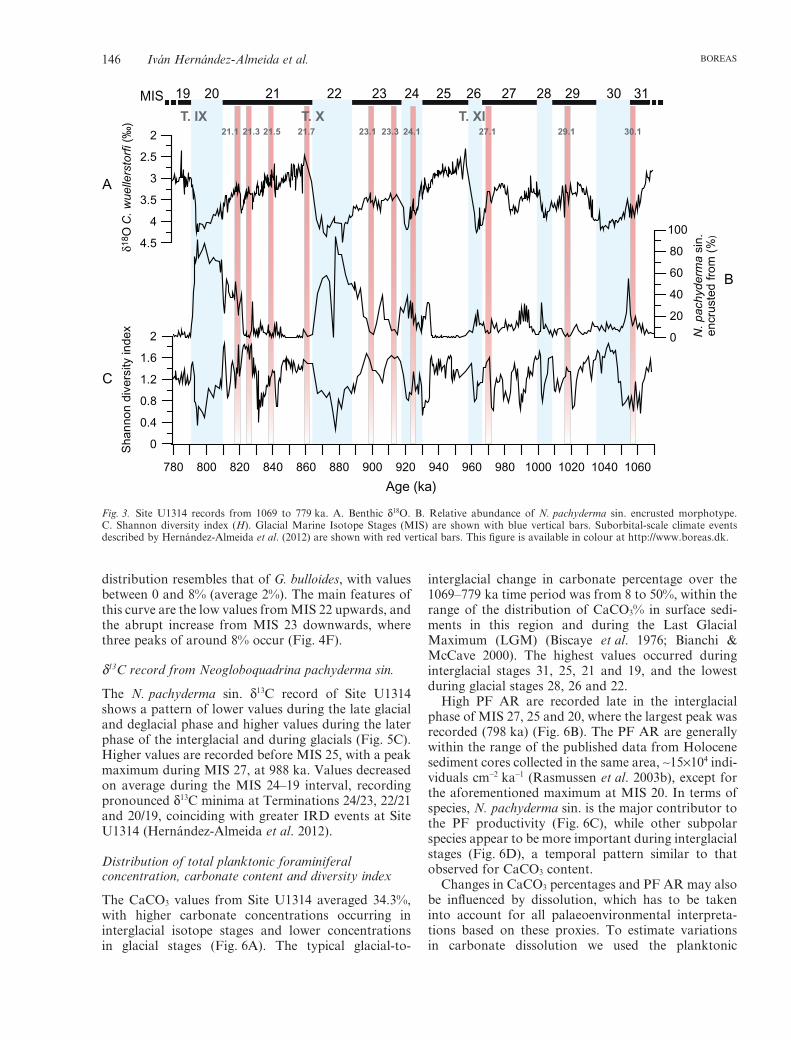
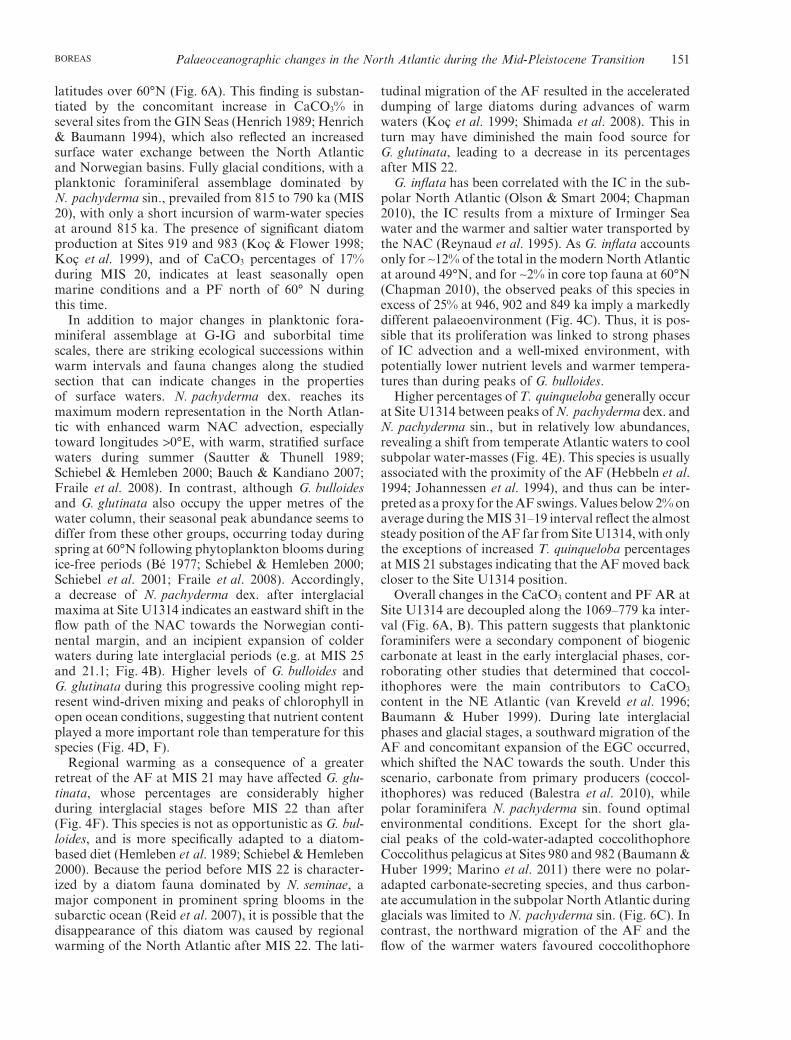
Microscopic investigation of planktonic foraminiferafor quantitative analyses was conducted under a lightmicroscope, but we also performed visual inspection ofthe specimens using scanning electron microscopyin order to make a morphotype separation. In oursamples, we clearly distinguished the two coiling direc-tions of N. pachyderma, namely dextral and sinistral(Fig. 2A, B and N are dextral, C, D and M sinistral,respectively). Within the sinistral coiling, we identifiedtwo morphotypes on the basis of the criteria of Srini-vasan & Kennett (1974) and Vilks (1974). The twomorphotypes are characterized as (i) non-encrustedN. pachyderma sin. with a smooth, shiny, reticulatesurface, and larger latter chambers and lobate shape(Fig. 2C, D), and (ii) an encrusted morphotype withtiny and compact chambers, an opaque and quadrateshell, and a heavily encrusted crystalline surface(Fig. 2E–L, O–P). These morphotypes are close tothose that are recognized in North Atlantic and Arcticsediments (Eynaud et al. 2009; Moller et al. 2011). AtSite U1314, encrusted individuals of N. pachydermasin. appear more abundant during the last two glacialstages, at MIS 22 and 20, replacing the lobate form ofthis species (Fig. 3A, B). Large numbers of theencrusted morphotypes of N. pachyderma sin. firstappear close to the Plio/Pleistocene boundary, in con-junction with the deposition of glacial detritus and theabsence of other cold-water species, such as N. atlan-tica and non-encrusted N. pachyderma sin. (Poore &Berggren 1975; Huddlestun 1984). It is unclear whetherthis encrusted form results from a process that convertsnon-ecrusted N. pachyderma sin. into encrusted mor-photypes by a secondary calcification that takes placebelow critical water depths (Bé 1960; Kohfeld et al.1996; Volkmann & Mensch 2001), or if they are indeeddifferent morphotypes entirely (Bergami et al. 2009).What is clear is that they occupy two distinct environ-ments. The non-encrusted morphotype is found in themixed layer, between 100 and 150 m, above the mainpycnocline, whereas the encrusted morphotype is asso-ciated with greater depths up to 300 m, within the mainpycnocline (Kohfeld et al. 1996; Stangeew 2001;Bergami et al. 2009).
Chronology and age–depth modelling
The conversion from core depth to time was derived bydirect correlation of the benthic foraminiferal oxygenisotope record from Site U1314 and the LR04 benthicisotope stack (Lisiecki & Raymo 2005). All correlationswere performed using the AnalySeries 2.0 software(Paillard & Yiou 1996). The final age model for the24.16-m studied section spans an interval of ~290 ka(1069 to 779 ka) through the early and mid-Pleistocene,based on 13 stratigraphic tie points, yielding a temporal
resolution of 547 years for the full-resolution recordsand 1094 years for the every-other-sample records.Between tie points, sedimentation rates were assumedconstant based on shipboard preliminary stratigraphy(Channell et al. 2006). The resulting sedimentationrates are moderately high (average 9.3 cm ka-1) anddiffer greatly between glacial (as low as 1.15 cm ka-1)and interglacial (up to 27 cm ka-1) intervals, which is aconsistent feature in the area of the Gardar Drift(Huizhong & McCave 1990; Dickson & Brown 1994).The variability of sedimentation rates can be attributedto changes in the intensity of the ISOW (Bianchi &McCave 2000). Further details of the age model con-struction can be found in Hernández-Almeida et al.(2012). Isotopic events labelled at Site U1314 records(30.1, 29.1, 27.1, 24.1, 23.3, 23.1, 21.7, 21.5, 21.3 and21.1) correspond to nomenclature given to suborbital-scale climate events observed in the benthic d18O recordfrom Site U1314 by Hernández-Almeida et al. (2012).
Results
Fauna
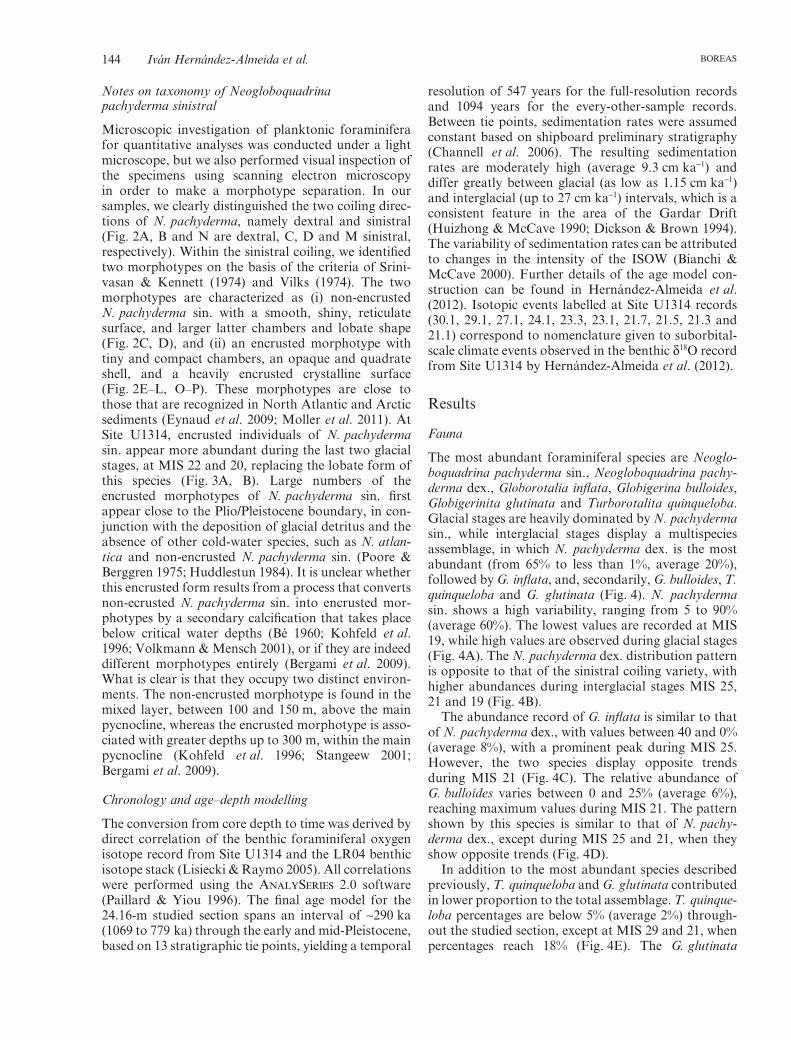
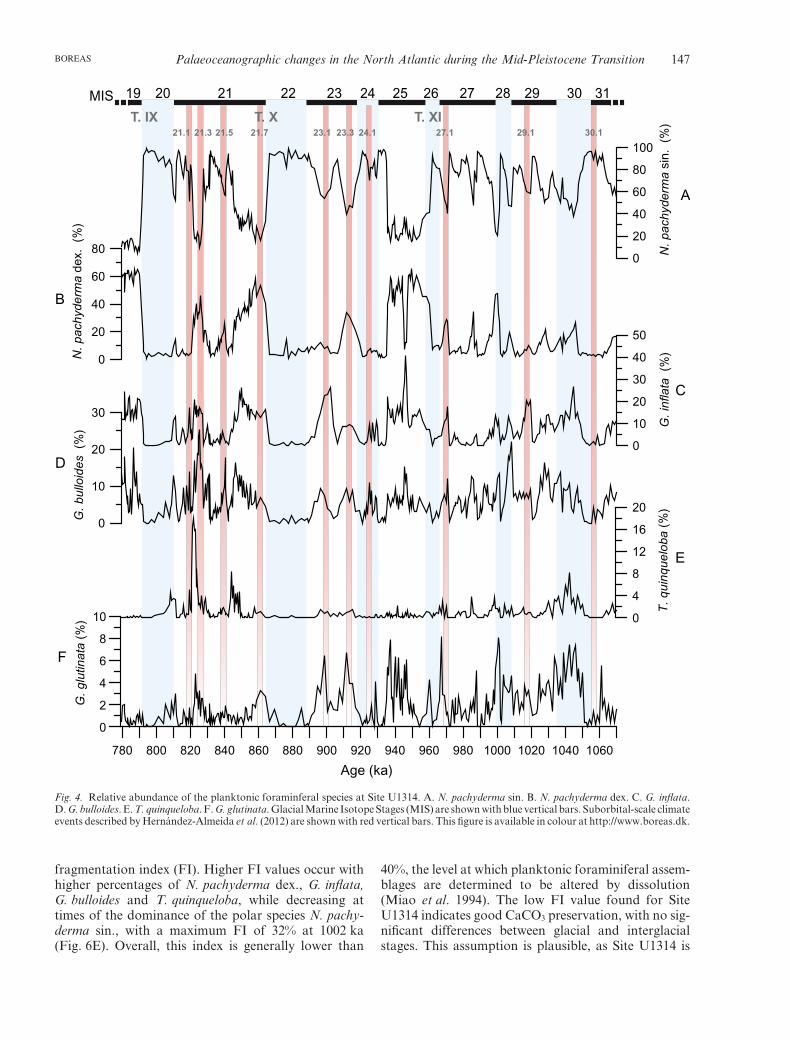
The most abundant foraminiferal species are Neoglo-boquadrina pachyderma sin., Neogloboquadrina pachy-derma dex., Globorotalia inflata, Globigerina bulloides,Globigerinita glutinata and Turborotalita quinqueloba.Glacial stages are heavily dominated by N. pachydermasin., while interglacial stages display a multispeciesassemblage, in which N. pachyderma dex. is the mostabundant (from 65% to less than 1%, average 20%),followed by G. inflata, and, secondarily, G. bulloides, T.quinqueloba and G. glutinata (Fig. 4). N. pachydermasin. shows a high variability, ranging from 5 to 90%(average 60%). The lowest values are recorded at MIS19, while high values are observed during glacial stages(Fig. 4A). The N. pachyderma dex. distribution patternis opposite to that of the sinistral coiling variety, withhigher abundances during interglacial stages MIS 25,21 and 19 (Fig. 4B).
The abundance record of G. inflata is similar to thatof N. pachyderma dex., with values between 40 and 0%(average 8%), with a prominent peak during MIS 25.However, the two species display opposite trendsduring MIS 21 (Fig. 4C). The relative abundance ofG. bulloides varies between 0 and 25% (average 6%),reaching maximum values during MIS 21. The patternshown by this species is similar to that of N. pachy-derma dex., except during MIS 25 and 21, when theyshow opposite trends (Fig. 4D).
In addition to the most abundant species describedpreviously, T. quinqueloba and G. glutinata contributedin lower proportion to the total assemblage. T. quinque-loba percentages are below 5% (average 2%) through-out the studied section, except at MIS 29 and 21, whenpercentages reach 18% (Fig. 4E). The G. glutinata
144 Iván Hernández-Almeida et al. BOREAS
B D
M O
N P
A C
E G I K
F H J L
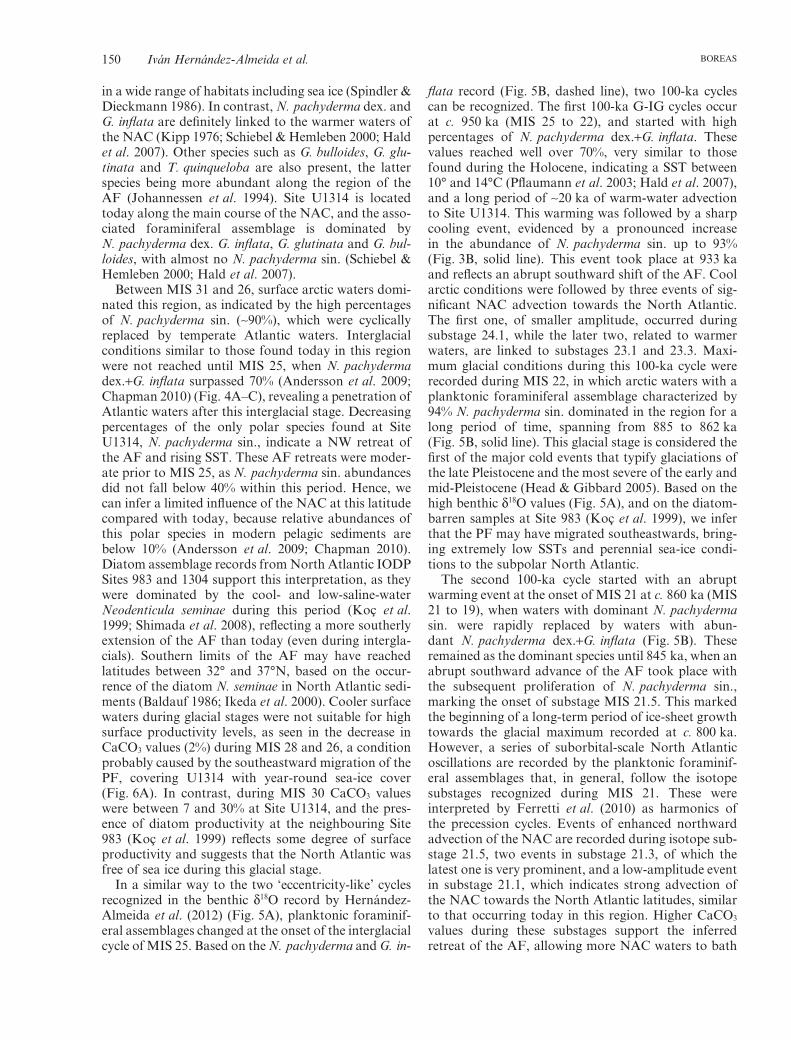
Fig. 2. Scanning electron microscopy images from Site U1314 specimens demonstrate the physical differences between non-encrusted mor-photypes of N. pachyderma dex. (A, B); the non-encrusted morphotypes (C, D) and encrusted morphotypes (E–L) of N. pachyderma sin. Closeexamination of these specimens shows differences in the density of calcite crust. Non-encrusted morphotypes of N. pachyderma sin. andN. pachyderma dex. (M, N, respectively) show lower density than encrusted morphotypes of N. pachyderma sin. (O, P), with a denser calcitecrust around shell pores. Scale bars are 50 mm for A–L, and 20 mm for M–P.
Palaeoceanographic changes in the North Atlantic during the Mid-Pleistocene Transition 145BOREAS
distribution resembles that of G. bulloides, with valuesbetween 0 and 8% (average 2%). The main features ofthis curve are the low values from MIS 22 upwards, andthe abrupt increase from MIS 23 downwards, wherethree peaks of around 8% occur (Fig. 4F).
d13C record from Neogloboquadrina pachyderma sin.
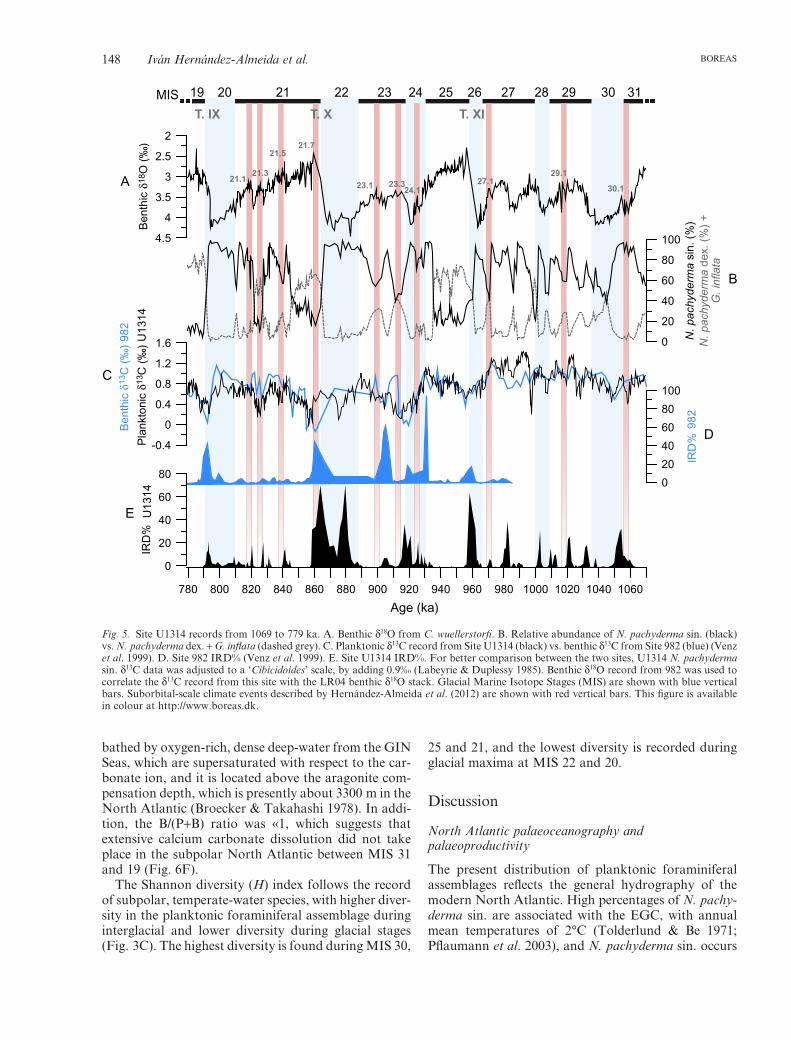
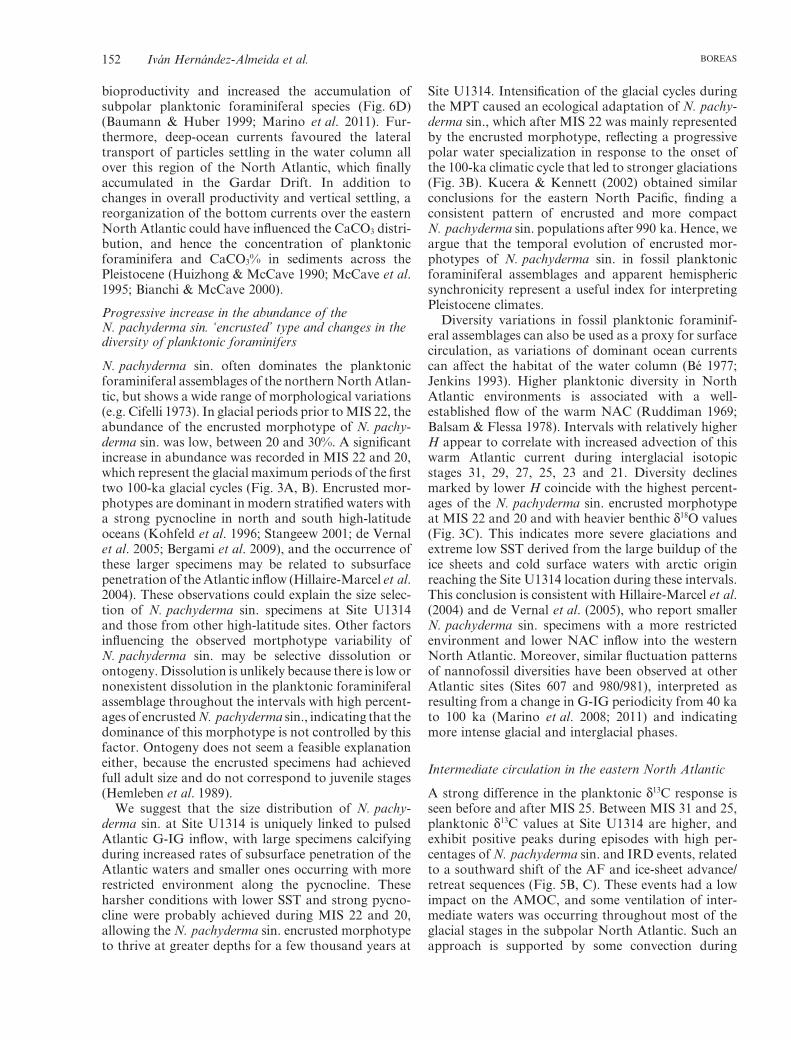
The N. pachyderma sin. d13C record of Site U1314shows a pattern of lower values during the late glacialand deglacial phase and higher values during the laterphase of the interglacial and during glacials (Fig. 5C).Higher values are recorded before MIS 25, with a peakmaximum during MIS 27, at 988 ka. Values decreasedon average during the MIS 24–19 interval, recordingpronounced d13C minima at Terminations 24/23, 22/21and 20/19, coinciding with greater IRD events at SiteU1314 (Hernández-Almeida et al. 2012).
Distribution of total planktonic foraminiferalconcentration, carbonate content and diversity index
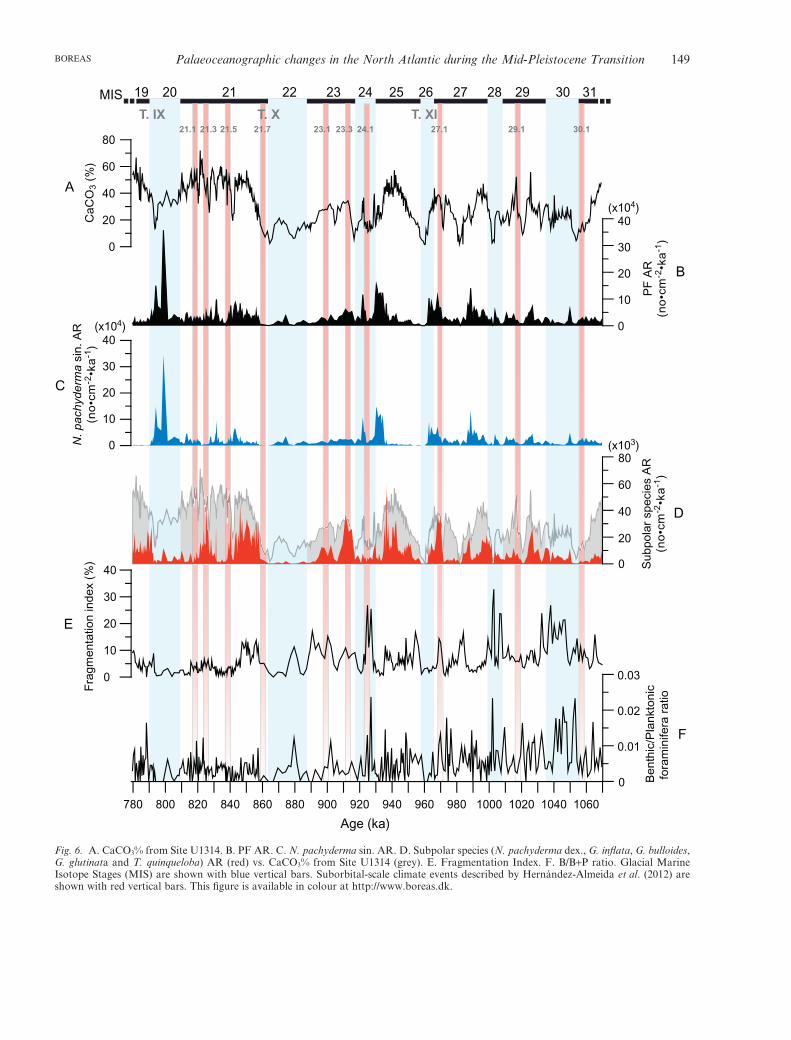
The CaCO3 values from Site U1314 averaged 34.3%,with higher carbonate concentrations occurring ininterglacial isotope stages and lower concentrationsin glacial stages (Fig. 6A). The typical glacial-to-
interglacial change in carbonate percentage over the1069–779 ka time period was from 8 to 50%, within therange of the distribution of CaCO3% in surface sedi-ments in this region and during the Last GlacialMaximum (LGM) (Biscaye et al. 1976; Bianchi &McCave 2000). The highest values occurred duringinterglacial stages 31, 25, 21 and 19, and the lowestduring glacial stages 28, 26 and 22.
High PF AR are recorded late in the interglacialphase of MIS 27, 25 and 20, where the largest peak wasrecorded (798 ka) (Fig. 6B). The PF AR are generallywithin the range of the published data from Holocenesediment cores collected in the same area, ~15¥104 indi-viduals cm-2 ka-1 (Rasmussen et al. 2003b), except forthe aforementioned maximum at MIS 20. In terms ofspecies, N. pachyderma sin. is the major contributor tothe PF productivity (Fig. 6C), while other subpolarspecies appear to be more important during interglacialstages (Fig. 6D), a temporal pattern similar to thatobserved for CaCO3 content.
Changes in CaCO3 percentages and PF AR may alsobe influenced by dissolution, which has to be takeninto account for all palaeoenvironmental interpreta-tions based on these proxies. To estimate variationsin carbonate dissolution we used the planktonic
19 20 21 22 23 24 25 26 27 28 29 30 31 MIS
A
21.7 23.1 23.3 24.1 27.1 29.1 30.1 21.3 21.1 21.5
T. IX T. X T. XI
780 800 820 840 860 880 900 920 940 960 980 1000 1020 1040 1060
Age (ka)
4.5
4
3.5
3
2.5
2δ1
8 OC
. w
uelle
rsto
rfi (
‰)
B
0
20
40
60
80
100
N.
pach
yd
erm
asi
n.e n
cru s
ted
from
( %)
C
0
0.4
0.8
1.2
1.6
2
Sha
nnon
dive
rsity
inde
x
Fig. 3. Site U1314 records from 1069 to 779 ka. A. Benthic d18O. B. Relative abundance of N. pachyderma sin. encrusted morphotype.C. Shannon diversity index (H). Glacial Marine Isotope Stages (MIS) are shown with blue vertical bars. Suborbital-scale climate eventsdescribed by Hernández-Almeida et al. (2012) are shown with red vertical bars. This figure is available in colour at http://www.boreas.dk.
146 Iván Hernández-Almeida et al. BOREAS
fragmentation index (FI). Higher FI values occur withhigher percentages of N. pachyderma dex., G. inflata,G. bulloides and T. quinqueloba, while decreasing attimes of the dominance of the polar species N. pachy-derma sin., with a maximum FI of 32% at 1002 ka(Fig. 6E). Overall, this index is generally lower than
40%, the level at which planktonic foraminiferal assem-blages are determined to be altered by dissolution(Miao et al. 1994). The low FI value found for SiteU1314 indicates good CaCO3 preservation, with no sig-nificant differences between glacial and interglacialstages. This assumption is plausible, as Site U1314 is
19 20 21 22 23 24 25 26 27 28 29 30 31 MIS
F
E
D
A
B
C
21.7 23.1 23.3 24.1 27.1 29.1 30.1 21.3 21.1 21.5
T. IX T. X T. XI
780 800 820 840 860 880 900 920 940 960 980 1000 1020 1040 1060
Age (ka)
0
2
4
6
8
10
G.
glu
tina
ta (
%) 0
4
8
12
16
20
T.
qu
inq
ue
loba (
%)
0
10
20
30
G.
bu
lloid
es (
%)
0
10
20
30
40
50
G.
infla
ta (
%)
0
20
40
60
80
N.
pa
ch
yde
r ma d
e x.
(%)
0
20
40
60
80
100
N.
pa
ch
yde
r ma
sin
. (%
)
Fig. 4. Relative abundance of the planktonic foraminferal species at Site U1314. A. N. pachyderma sin. B. N. pachyderma dex. C. G. inflata.D. G. bulloides. E. T. quinqueloba. F. G. glutinata. Glacial Marine Isotope Stages (MIS) are shown with blue vertical bars. Suborbital-scale climateevents described by Hernández-Almeida et al. (2012) are shown with red vertical bars. This figure is available in colour at http://www.boreas.dk.
Palaeoceanographic changes in the North Atlantic during the Mid-Pleistocene Transition 147BOREAS
bathed by oxygen-rich, dense deep-water from the GINSeas, which are supersaturated with respect to the car-bonate ion, and it is located above the aragonite com-pensation depth, which is presently about 3300 m in theNorth Atlantic (Broecker & Takahashi 1978). In addi-tion, the B/(P+B) ratio was «1, which suggests thatextensive calcium carbonate dissolution did not takeplace in the subpolar North Atlantic between MIS 31and 19 (Fig. 6F).
The Shannon diversity (H) index follows the recordof subpolar, temperate-water species, with higher diver-sity in the planktonic foraminiferal assemblage duringinterglacial and lower diversity during glacial stages(Fig. 3C). The highest diversity is found during MIS 30,
25 and 21, and the lowest diversity is recorded duringglacial maxima at MIS 22 and 20.
Discussion
North Atlantic palaeoceanography andpalaeoproductivity
The present distribution of planktonic foraminiferalassemblages reflects the general hydrography of themodern North Atlantic. High percentages of N. pachy-derma sin. are associated with the EGC, with annualmean temperatures of 2°C (Tolderlund & Be 1971;Pflaumann et al. 2003), and N. pachyderma sin. occurs
19 20 21 22 23 24 25 26 27 28 29 30 31 MIS
21.7
23.1 23.3 24.1
27.1 29.1
30.1
21.3 21.1
21.5
T. IX T. X T. XI
780 800 820 840 860 880 900 920 940 960 980 1000 1020 1040 1060
Age (ka)
0
20
40
60
80
100
-0.4
0
0.4
0.8
1.2
1.6
4.5
4
3.5
3
2.5
2B
enth
icδ1
8 O(‰
)
0
20
40
60
80
0
20
40
60
80
100
N.
pa
chyde
rma
sin.
(%)
N.
pa
ch
yd
erm
ade
x .(%
)+
G.in
fla
ta
IRD
%98
2
Pla
nkto
nic
δ13 C
(‰
) U
1314
Ben
thic
δ13
C (
‰)
982
IRD
%U
1314
C
D
A
E
B
Fig. 5. Site U1314 records from 1069 to 779 ka. A. Benthic d18O from C. wuellerstorfi. B. Relative abundance of N. pachyderma sin. (black)vs. N. pachyderma dex. + G. inflata (dashed grey). C. Planktonic d13C record from Site U1314 (black) vs. benthic d13C from Site 982 (blue) (Venzet al. 1999). D. Site 982 IRD% (Venz et al. 1999). E. Site U1314 IRD%. For better comparison between the two sites, U1314 N. pachydermasin. d13C data was adjusted to a ‘Cibicidoides’ scale, by adding 0.9‰ (Labeyrie & Duplessy 1985). Benthic d18O record from 982 was used tocorrelate the d13C record from this site with the LR04 benthic d18O stack. Glacial Marine Isotope Stages (MIS) are shown with blue verticalbars. Suborbital-scale climate events described by Hernández-Almeida et al. (2012) are shown with red vertical bars. This figure is availablein colour at http://www.boreas.dk.
148 Iván Hernández-Almeida et al. BOREAS
19 20 21 22 23 24 25 26 27 28 29 30 31 MIS
C
A
D
F
B
E
21.7 23.1 23.3 24.1 27.1 29.1 30.1 21.3 21.1 21.5
T. IX T. X T. XI
0
10
20
30
40
780 800 820 840 860 880 900 920 940 960 980 1000 1020 1040 1060
Age (ka)
0
10
20
30
40
0
20
40
60
80
Ca
CO
3(%
)
0
0.01
0.02
0.03
0
20
40
60
800
10
20
30
40
Benth
ic/P
lankt
onic
fora
min
ifera
ratio
Subpola
r sp
eci
es
AR
(no
•cm
-2•k
a-1
)
N. pachyderm
a s
in. A
R(n
o•c
m-2
•ka
-1)
PF
AR
(no
•cm
-2•k
a-1
)
(x104)
(x104)
(x103)
Fra
gm
enta
tion in
dex
(%)
Fig. 6. A. CaCO3% from Site U1314. B. PF AR. C. N. pachyderma sin. AR. D. Subpolar species (N. pachyderma dex., G. inflata, G. bulloides,G. glutinata and T. quinqueloba) AR (red) vs. CaCO3% from Site U1314 (grey). E. Fragmentation Index. F. B/B+P ratio. Glacial MarineIsotope Stages (MIS) are shown with blue vertical bars. Suborbital-scale climate events described by Hernández-Almeida et al. (2012) areshown with red vertical bars. This figure is available in colour at http://www.boreas.dk.
Palaeoceanographic changes in the North Atlantic during the Mid-Pleistocene Transition 149BOREAS
in a wide range of habitats including sea ice (Spindler &Dieckmann 1986). In contrast, N. pachyderma dex. andG. inflata are definitely linked to the warmer waters ofthe NAC (Kipp 1976; Schiebel & Hemleben 2000; Haldet al. 2007). Other species such as G. bulloides, G. glu-tinata and T. quinqueloba are also present, the latterspecies being more abundant along the region of theAF (Johannessen et al. 1994). Site U1314 is locatedtoday along the main course of the NAC, and the asso-ciated foraminiferal assemblage is dominated byN. pachyderma dex. G. inflata, G. glutinata and G. bul-loides, with almost no N. pachyderma sin. (Schiebel &Hemleben 2000; Hald et al. 2007).
Between MIS 31 and 26, surface arctic waters domi-nated this region, as indicated by the high percentagesof N. pachyderma sin. (~90%), which were cyclicallyreplaced by temperate Atlantic waters. Interglacialconditions similar to those found today in this regionwere not reached until MIS 25, when N. pachydermadex.+G. inflata surpassed 70% (Andersson et al. 2009;Chapman 2010) (Fig. 4A–C), revealing a penetration ofAtlantic waters after this interglacial stage. Decreasingpercentages of the only polar species found at SiteU1314, N. pachyderma sin., indicate a NW retreat ofthe AF and rising SST. These AF retreats were moder-ate prior to MIS 25, as N. pachyderma sin. abundancesdid not fall below 40% within this period. Hence, wecan infer a limited influence of the NAC at this latitudecompared with today, because relative abundances ofthis polar species in modern pelagic sediments arebelow 10% (Andersson et al. 2009; Chapman 2010).Diatom assemblage records from North Atlantic IODPSites 983 and 1304 support this interpretation, as theywere dominated by the cool- and low-saline-waterNeodenticula seminae during this period (Koç et al.1999; Shimada et al. 2008), reflecting a more southerlyextension of the AF than today (even during intergla-cials). Southern limits of the AF may have reachedlatitudes between 32° and 37°N, based on the occur-rence of the diatom N. seminae in North Atlantic sedi-ments (Baldauf 1986; Ikeda et al. 2000). Cooler surfacewaters during glacial stages were not suitable for highsurface productivity levels, as seen in the decrease inCaCO3 values (2%) during MIS 28 and 26, a conditionprobably caused by the southeastward migration of thePF, covering U1314 with year-round sea-ice cover(Fig. 6A). In contrast, during MIS 30 CaCO3 valueswere between 7 and 30% at Site U1314, and the pres-ence of diatom productivity at the neighbouring Site983 (Koç et al. 1999) reflects some degree of surfaceproductivity and suggests that the North Atlantic wasfree of sea ice during this glacial stage.
In a similar way to the two ‘eccentricity-like’ cyclesrecognized in the benthic d18O record by Hernández-Almeida et al. (2012) (Fig. 5A), planktonic foraminif-eral assemblages changed at the onset of the interglacialcycle of MIS 25. Based on the N. pachyderma and G. in-
flata record (Fig. 5B, dashed line), two 100-ka cyclescan be recognized. The first 100-ka G-IG cycles occurat c. 950 ka (MIS 25 to 22), and started with highpercentages of N. pachyderma dex.+G. inflata. Thesevalues reached well over 70%, very similar to thosefound during the Holocene, indicating a SST between10° and 14°C (Pflaumann et al. 2003; Hald et al. 2007),and a long period of ~20 ka of warm-water advectionto Site U1314. This warming was followed by a sharpcooling event, evidenced by a pronounced increasein the abundance of N. pachyderma sin. up to 93%(Fig. 3B, solid line). This event took place at 933 kaand reflects an abrupt southward shift of the AF. Coolarctic conditions were followed by three events of sig-nificant NAC advection towards the North Atlantic.The first one, of smaller amplitude, occurred duringsubstage 24.1, while the later two, related to warmerwaters, are linked to substages 23.1 and 23.3. Maxi-mum glacial conditions during this 100-ka cycle wererecorded during MIS 22, in which arctic waters with aplanktonic foraminiferal assemblage characterized by94% N. pachyderma sin. dominated in the region for along period of time, spanning from 885 to 862 ka(Fig. 5B, solid line). This glacial stage is considered thefirst of the major cold events that typify glaciations ofthe late Pleistocene and the most severe of the early andmid-Pleistocene (Head & Gibbard 2005). Based on thehigh benthic d18O values (Fig. 5A), and on the diatom-barren samples at Site 983 (Koç et al. 1999), we inferthat the PF may have migrated southeastwards, bring-ing extremely low SSTs and perennial sea-ice condi-tions to the subpolar North Atlantic.
The second 100-ka cycle started with an abruptwarming event at the onset of MIS 21 at c. 860 ka (MIS21 to 19), when waters with dominant N. pachydermasin. were rapidly replaced by waters with abun-dant N. pachyderma dex.+G. inflata (Fig. 5B). Theseremained as the dominant species until 845 ka, when anabrupt southward advance of the AF took place withthe subsequent proliferation of N. pachyderma sin.,marking the onset of substage MIS 21.5. This markedthe beginning of a long-term period of ice-sheet growthtowards the glacial maximum recorded at c. 800 ka.However, a series of suborbital-scale North Atlanticoscillations are recorded by the planktonic foraminif-eral assemblages that, in general, follow the isotopesubstages recognized during MIS 21. These wereinterpreted by Ferretti et al. (2010) as harmonics ofthe precession cycles. Events of enhanced northwardadvection of the NAC are recorded during isotope sub-stage 21.5, two events in substage 21.3, of which thelatest one is very prominent, and a low-amplitude eventin substage 21.1, which indicates strong advection ofthe NAC towards the North Atlantic latitudes, similarto that occurring today in this region. Higher CaCO3
values during these substages support the inferredretreat of the AF, allowing more NAC waters to bath
150 Iván Hernández-Almeida et al. BOREAS
latitudes over 60°N (Fig. 6A). This finding is substan-tiated by the concomitant increase in CaCO3% inseveral sites from the GIN Seas (Henrich 1989; Henrich& Baumann 1994), which also reflected an increasedsurface water exchange between the North Atlanticand Norwegian basins. Fully glacial conditions, with aplanktonic foraminiferal assemblage dominated byN. pachyderma sin., prevailed from 815 to 790 ka (MIS20), with only a short incursion of warm-water speciesat around 815 ka. The presence of significant diatomproduction at Sites 919 and 983 (Koç & Flower 1998;Koç et al. 1999), and of CaCO3 percentages of 17%during MIS 20, indicates at least seasonally openmarine conditions and a PF north of 60° N duringthis time.
In addition to major changes in planktonic fora-miniferal assemblage at G-IG and suborbital timescales, there are striking ecological successions withinwarm intervals and fauna changes along the studiedsection that can indicate changes in the propertiesof surface waters. N. pachyderma dex. reaches itsmaximum modern representation in the North Atlan-tic with enhanced warm NAC advection, especiallytoward longitudes >0°E, with warm, stratified surfacewaters during summer (Sautter & Thunell 1989;Schiebel & Hemleben 2000; Bauch & Kandiano 2007;Fraile et al. 2008). In contrast, although G. bulloidesand G. glutinata also occupy the upper metres of thewater column, their seasonal peak abundance seems todiffer from these other groups, occurring today duringspring at 60°N following phytoplankton blooms duringice-free periods (Bé 1977; Schiebel & Hemleben 2000;Schiebel et al. 2001; Fraile et al. 2008). Accordingly,a decrease of N. pachyderma dex. after interglacialmaxima at Site U1314 indicates an eastward shift in theflow path of the NAC towards the Norwegian conti-nental margin, and an incipient expansion of colderwaters during late interglacial periods (e.g. at MIS 25and 21.1; Fig. 4B). Higher levels of G. bulloides andG. glutinata during this progressive cooling might rep-resent wind-driven mixing and peaks of chlorophyll inopen ocean conditions, suggesting that nutrient contentplayed a more important role than temperature for thisspecies (Fig. 4D, F).
Regional warming as a consequence of a greaterretreat of the AF at MIS 21 may have affected G. glu-tinata, whose percentages are considerably higherduring interglacial stages before MIS 22 than after(Fig. 4F). This species is not as opportunistic as G. bul-loides, and is more specifically adapted to a diatom-based diet (Hemleben et al. 1989; Schiebel & Hemleben2000). Because the period before MIS 22 is character-ized by a diatom fauna dominated by N. seminae, amajor component in prominent spring blooms in thesubarctic ocean (Reid et al. 2007), it is possible that thedisappearance of this diatom was caused by regionalwarming of the North Atlantic after MIS 22. The lati-
tudinal migration of the AF resulted in the accelerateddumping of large diatoms during advances of warmwaters (Koç et al. 1999; Shimada et al. 2008). This inturn may have diminished the main food source forG. glutinata, leading to a decrease in its percentagesafter MIS 22.
G. inflata has been correlated with the IC in the sub-polar North Atlantic (Olson & Smart 2004; Chapman2010), the IC results from a mixture of Irminger Seawater and the warmer and saltier water transported bythe NAC (Reynaud et al. 1995). As G. inflata accountsonly for ~12% of the total in the modern North Atlanticat around 49°N, and for ~2% in core top fauna at 60°N(Chapman 2010), the observed peaks of this species inexcess of 25% at 946, 902 and 849 ka imply a markedlydifferent palaeoenvironment (Fig. 4C). Thus, it is pos-sible that its proliferation was linked to strong phasesof IC advection and a well-mixed environment, withpotentially lower nutrient levels and warmer tempera-tures than during peaks of G. bulloides.
Higher percentages of T. quinqueloba generally occurat Site U1314 between peaks of N. pachyderma dex. andN. pachyderma sin., but in relatively low abundances,revealing a shift from temperate Atlantic waters to coolsubpolar water-masses (Fig. 4E). This species is usuallyassociated with the proximity of the AF (Hebbeln et al.1994; Johannessen et al. 1994), and thus can be inter-preted as a proxy for the AF swings. Values below 2% onaverage during the MIS 31–19 interval reflect the almoststeady position of the AF far from Site U1314, with onlythe exceptions of increased T. quinqueloba percentagesat MIS 21 substages indicating that the AF moved backcloser to the Site U1314 position.
Overall changes in the CaCO3 content and PF AR atSite U1314 are decoupled along the 1069–779 ka inter-val (Fig. 6A, B). This pattern suggests that planktonicforaminifers were a secondary component of biogeniccarbonate at least in the early interglacial phases, cor-roborating other studies that determined that coccol-ithophores were the main contributors to CaCO3
content in the NE Atlantic (van Kreveld et al. 1996;Baumann & Huber 1999). During late interglacialphases and glacial stages, a southward migration of theAF and concomitant expansion of the EGC occurred,which shifted the NAC towards the south. Under thisscenario, carbonate from primary producers (coccol-ithophores) was reduced (Balestra et al. 2010), whilepolar foraminifera N. pachyderma sin. found optimalenvironmental conditions. Except for the short gla-cial peaks of the cold-water-adapted coccolithophoreCoccolithus pelagicus at Sites 980 and 982 (Baumann &Huber 1999; Marino et al. 2011) there were no polar-adapted carbonate-secreting species, and thus carbon-ate accumulation in the subpolar North Atlantic duringglacials was limited to N. pachyderma sin. (Fig. 6C). Incontrast, the northward migration of the AF and theflow of the warmer waters favoured coccolithophore
Palaeoceanographic changes in the North Atlantic during the Mid-Pleistocene Transition 151BOREAS
bioproductivity and increased the accumulation ofsubpolar planktonic foraminiferal species (Fig. 6D)(Baumann & Huber 1999; Marino et al. 2011). Fur-thermore, deep-ocean currents favoured the lateraltransport of particles settling in the water column allover this region of the North Atlantic, which finallyaccumulated in the Gardar Drift. In addition tochanges in overall productivity and vertical settling, areorganization of the bottom currents over the easternNorth Atlantic could have influenced the CaCO3 distri-bution, and hence the concentration of planktonicforaminifera and CaCO3% in sediments across thePleistocene (Huizhong & McCave 1990; McCave et al.1995; Bianchi & McCave 2000).
Progressive increase in the abundance of theN. pachyderma sin. ‘encrusted’ type and changes in thediversity of planktonic foraminifers
N. pachyderma sin. often dominates the planktonicforaminiferal assemblages of the northern North Atlan-tic, but shows a wide range of morphological variations(e.g. Cifelli 1973). In glacial periods prior to MIS 22, theabundance of the encrusted morphotype of N. pachy-derma sin. was low, between 20 and 30%. A significantincrease in abundance was recorded in MIS 22 and 20,which represent the glacial maximum periods of the firsttwo 100-ka glacial cycles (Fig. 3A, B). Encrusted mor-photypes are dominant in modern stratified waters witha strong pycnocline in north and south high-latitudeoceans (Kohfeld et al. 1996; Stangeew 2001; de Vernalet al. 2005; Bergami et al. 2009), and the occurrence ofthese larger specimens may be related to subsurfacepenetration of the Atlantic inflow (Hillaire-Marcel et al.2004). These observations could explain the size selec-tion of N. pachyderma sin. specimens at Site U1314and those from other high-latitude sites. Other factorsinfluencing the observed mortphotype variability ofN. pachyderma sin. may be selective dissolution orontogeny. Dissolution is unlikely because there is low ornonexistent dissolution in the planktonic foraminiferalassemblage throughout the intervals with high percent-ages of encrusted N. pachyderma sin., indicating that thedominance of this morphotype is not controlled by thisfactor. Ontogeny does not seem a feasible explanationeither, because the encrusted specimens had achievedfull adult size and do not correspond to juvenile stages(Hemleben et al. 1989).
We suggest that the size distribution of N. pachy-derma sin. at Site U1314 is uniquely linked to pulsedAtlantic G-IG inflow, with large specimens calcifyingduring increased rates of subsurface penetration of theAtlantic waters and smaller ones occurring with morerestricted environment along the pycnocline. Theseharsher conditions with lower SST and strong pycno-cline were probably achieved during MIS 22 and 20,allowing the N. pachyderma sin. encrusted morphotypeto thrive at greater depths for a few thousand years at
Site U1314. Intensification of the glacial cycles duringthe MPT caused an ecological adaptation of N. pachy-derma sin., which after MIS 22 was mainly representedby the encrusted morphotype, reflecting a progressivepolar water specialization in response to the onset ofthe 100-ka climatic cycle that led to stronger glaciations(Fig. 3B). Kucera & Kennett (2002) obtained similarconclusions for the eastern North Pacific, finding aconsistent pattern of encrusted and more compactN. pachyderma sin. populations after 990 ka. Hence, weargue that the temporal evolution of encrusted mor-photypes of N. pachyderma sin. in fossil planktonicforaminiferal assemblages and apparent hemisphericsynchronicity represent a useful index for interpretingPleistocene climates.
Diversity variations in fossil planktonic foraminif-eral assemblages can also be used as a proxy for surfacecirculation, as variations of dominant ocean currentscan affect the habitat of the water column (Bé 1977;Jenkins 1993). Higher planktonic diversity in NorthAtlantic environments is associated with a well-established flow of the warm NAC (Ruddiman 1969;Balsam & Flessa 1978). Intervals with relatively higherH appear to correlate with increased advection of thiswarm Atlantic current during interglacial isotopicstages 31, 29, 27, 25, 23 and 21. Diversity declinesmarked by lower H coincide with the highest percent-ages of the N. pachyderma sin. encrusted morphotypeat MIS 22 and 20 and with heavier benthic d18O values(Fig. 3C). This indicates more severe glaciations andextreme low SST derived from the large buildup of theice sheets and cold surface waters with arctic originreaching the Site U1314 location during these intervals.This conclusion is consistent with Hillaire-Marcel et al.(2004) and de Vernal et al. (2005), who report smallerN. pachyderma sin. specimens with a more restrictedenvironment and lower NAC inflow into the westernNorth Atlantic. Moreover, similar fluctuation patternsof nannofossil diversities have been observed at otherAtlantic sites (Sites 607 and 980/981), interpreted asresulting from a change in G-IG periodicity from 40 kato 100 ka (Marino et al. 2008; 2011) and indicatingmore intense glacial and interglacial phases.
Intermediate circulation in the eastern North Atlantic
A strong difference in the planktonic d13C response isseen before and after MIS 25. Between MIS 31 and 25,planktonic d13C values at Site U1314 are higher, andexhibit positive peaks during episodes with high per-centages of N. pachyderma sin. and IRD events, relatedto a southward shift of the AF and ice-sheet advance/retreat sequences (Fig. 5B, C). These events had a lowimpact on the AMOC, and some ventilation of inter-mediate waters was occurring throughout most of theglacial stages in the subpolar North Atlantic. Such anapproach is supported by some convection during
152 Iván Hernández-Almeida et al. BOREAS
winter south of the AF, as depicted by the high benthic13C values at Site 982 (Venz et al. 1999). Increased d13Cvalues are also observed at the Rockall Plateau andGardar Drift during the LGM and are interpreted toresult from a shift in the convection cell from theNordic Seas to the subpolar North Atlantic in a processanalogous to that for the glacial production of Labra-dor Sea Water (Dowling & McCave 1993; Oppo &Lehman 1993).
After MIS 25, negative d13C peaks lasting well intothe subsequent interglacials are observed during Termi-nations at 24/23, 22/21 and 20/19, coinciding with thelowest benthic d13C and greatest IRD delivery at Sites982 and U1314 (Fig. 5C–E). This suggests decreasedventilation of the intermediate water-mass in the NENorth Atlantic, as already demonstrated by severalauthors (Venz et al. 1999; Spero & Lea 2002; Voelkeret al. 2010). These less ventilated intermediate watersprobably arose from the influx of fresher, colder andnutrient-rich Subarctic Intermediate Water to the deep-water convection area of the Rockall Plateau (Álvarezet al. 2004), or from Antarctic Intermediate Water thatpenetrated farther northwards, as during the last degla-ciation (Rickaby & Elderfield 2005).
Finally, the observed decrease in the average d13C atSite U1314 after 950 ka (Fig. 5C) coincides with thefindings of Kleiven et al. (2003) of a decrease in theglacial d13C gradient between intermediate and deepsites after that age, suggesting a stronger suppression ofthermohaline circulation at all depths after MIS 25,which is characteristic of Late Pleistocene Termina-tions (Raymo 1997).
Implications of the regional AF dynamic
Thermal gradients between the east and west subpolarNorth Atlantic can be observed by comparing thedifferences in carbonate content of the sedimentsfrom Sites 984, 983, 980, 982 and U1314 (Table 1). Ingeneral, we observe synchronous fluctuations of car-bonate sedimentation with higher carbonate values eastof the 20°W meridian, although differences were more
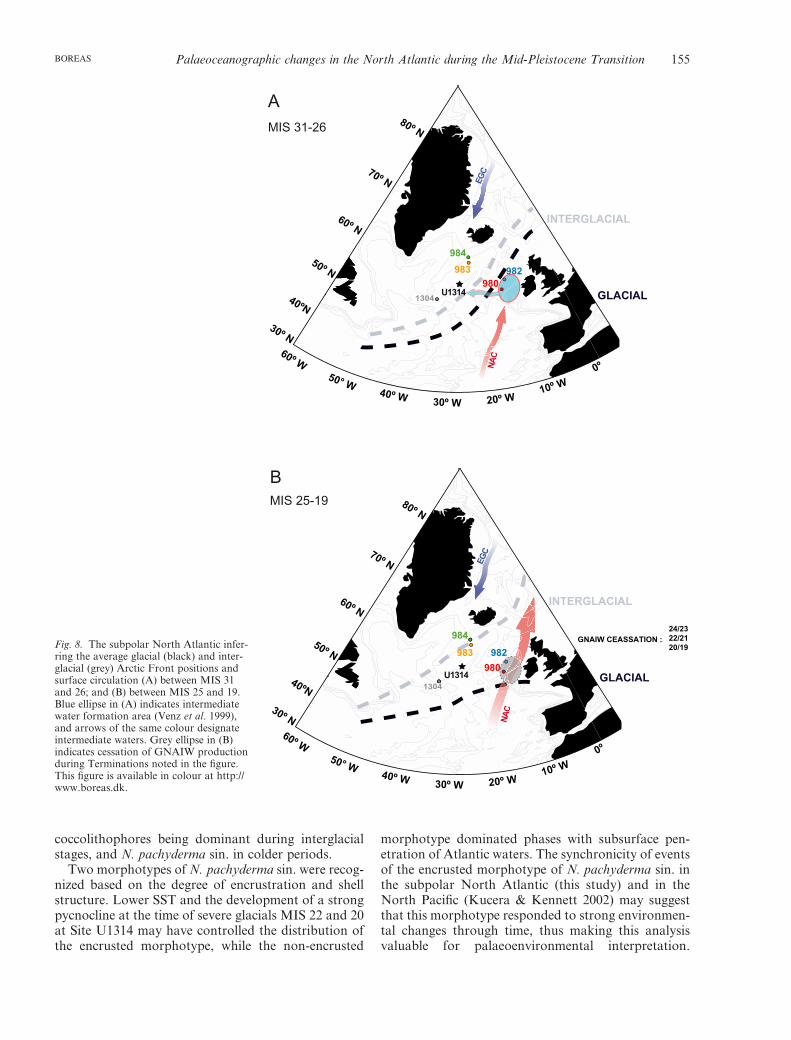
pronounced before MIS 25. A comparison of carbon-ate records between the two sites with the largest sepa-ration (984 and 980; 900 km away) shows differences>60% (Fig. 7A). As high carbonate productivity fluc-tuations in this region were probably caused by varia-tions in the extent of warm Atlantic water inflow(Baumann & Huber 1999), we argue that spatial andtemporal differences are related to the configuration ofthe AF. A dominant northeasterly position of the AFtowards the Faeroe Islands, with relatively small AFswings until MIS 26, led to dominant arctic conditionswith limited carbonate bioproductivity NW of the AF,explaining the lower values at Sites 984, 983 and U1314(Fig. 8A). This situation is true for these locationstoday, where the inflow of warm and saline Atlanticwater is compressed to the east, between Iceland andthe Faeroe Islands and through the Faeroe–ShetlandChannel as it flows northwards into the GIN Seas(Orvik & Niiler 2002), resulting in a strong west–easttemperature gradient. These results also show that well-ventilated intermediate waters formed in the RockallPlateau even during G-IG transitions (Fig. 8A).
The structure of circulation changed during MIS 25,21 and 19, with broader AF swings allowing a greaternorthward intrusion of warm surface waters thatreached cores located in a more western position (Site984, 980 and U1314) (Fig. 8B). The existence of agreater flow of Atlantic waters into the GIN Seasduring interglacial stages 25, 21 and 19 would providethe necessary moisture for growing ice sheets during theglacial inception phase (Ruddiman & McIntyre 1981c;Raymo & Nisancioglu 2003), and thus may explain thebuildup of larger ice sheets in the Northern Hemisphereduring the MPT. However, the influx of less salinearctic waters and/or melting icebergs during Termina-tions within this interval deflected the NAC waternorthward flow towards winter convection areas of theRockall Plateau, causing a reduction in the carbonateproductivity in the area and the ventilation of interme-diate waters (Fig. 8B).
Although faunal records from Sites 980 and 984 onlyspan from 990 and 890 (respectively) to 779 ka, the
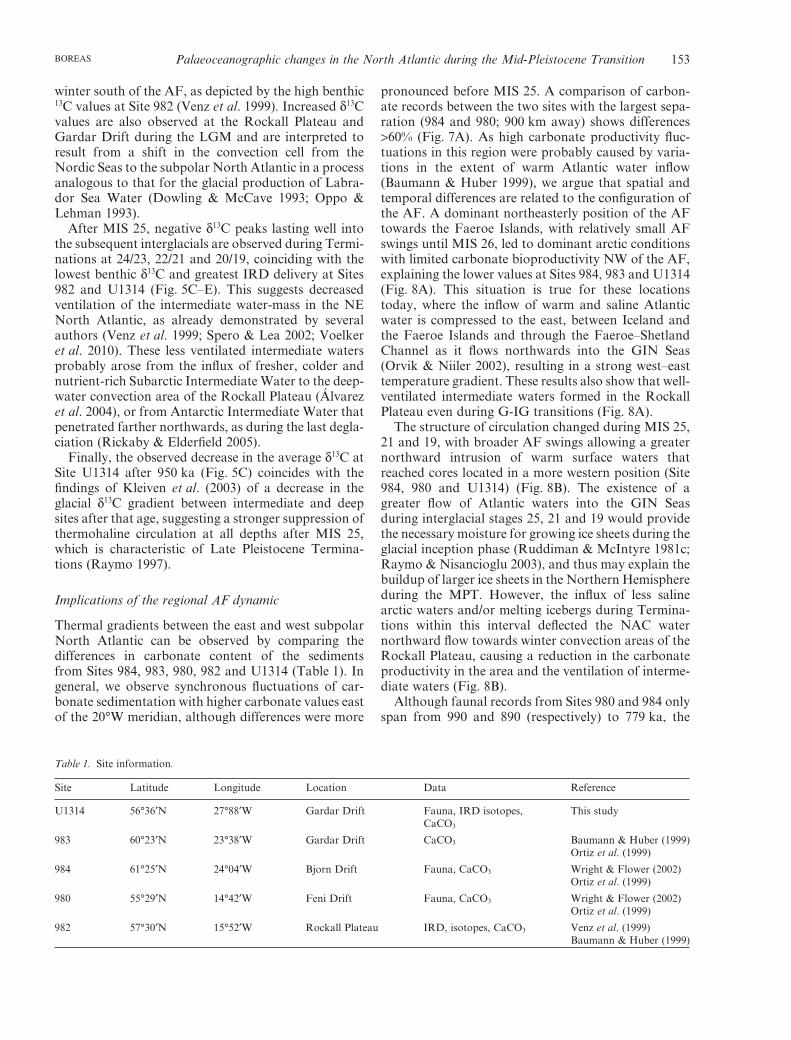
Table 1. Site information.
Site Latitude Longitude Location Data Reference
U1314 56°36′N 27°88′W Gardar Drift Fauna, IRD isotopes,CaCO3
This study
983 60°23′N 23°38′W Gardar Drift CaCO3 Baumann & Huber (1999)Ortiz et al. (1999)
984 61°25′N 24°04′W Bjorn Drift Fauna, CaCO3 Wright & Flower (2002)Ortiz et al. (1999)
980 55°29′N 14°42′W Feni Drift Fauna, CaCO3 Wright & Flower (2002)Ortiz et al. (1999)
982 57°30′N 15°52′W Rockall Plateau IRD, isotopes, CaCO3 Venz et al. (1999)Baumann & Huber (1999)
Palaeoceanographic changes in the North Atlantic during the Mid-Pleistocene Transition 153BOREAS
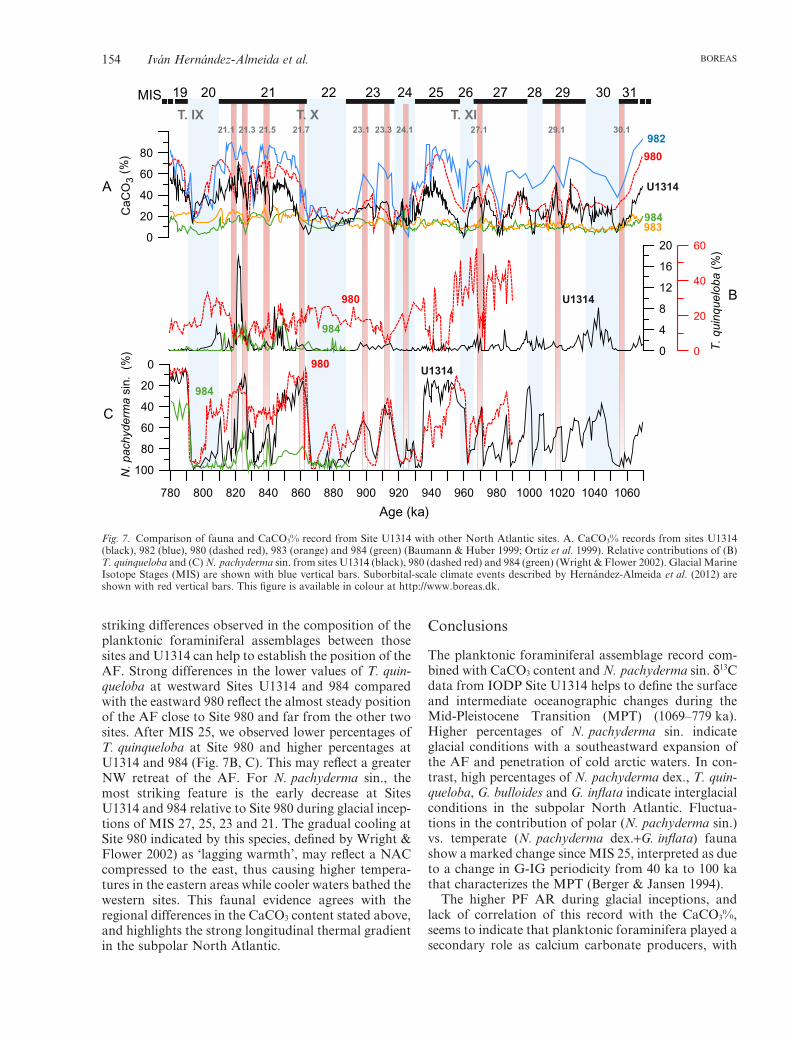
striking differences observed in the composition of theplanktonic foraminiferal assemblages between thosesites and U1314 can help to establish the position of theAF. Strong differences in the lower values of T. quin-queloba at westward Sites U1314 and 984 comparedwith the eastward 980 reflect the almost steady positionof the AF close to Site 980 and far from the other twosites. After MIS 25, we observed lower percentages ofT. quinqueloba at Site 980 and higher percentages atU1314 and 984 (Fig. 7B, C). This may reflect a greaterNW retreat of the AF. For N. pachyderma sin., themost striking feature is the early decrease at SitesU1314 and 984 relative to Site 980 during glacial incep-tions of MIS 27, 25, 23 and 21. The gradual cooling atSite 980 indicated by this species, defined by Wright &Flower 2002) as ‘lagging warmth’, may reflect a NACcompressed to the east, thus causing higher tempera-tures in the eastern areas while cooler waters bathed thewestern sites. This faunal evidence agrees with theregional differences in the CaCO3 content stated above,and highlights the strong longitudinal thermal gradientin the subpolar North Atlantic.
Conclusions
The planktonic foraminiferal assemblage record com-bined with CaCO3 content and N. pachyderma sin. d13Cdata from IODP Site U1314 helps to define the surfaceand intermediate oceanographic changes during theMid-Pleistocene Transition (MPT) (1069–779 ka).Higher percentages of N. pachyderma sin. indicateglacial conditions with a southeastward expansion ofthe AF and penetration of cold arctic waters. In con-trast, high percentages of N. pachyderma dex., T. quin-queloba, G. bulloides and G. inflata indicate interglacialconditions in the subpolar North Atlantic. Fluctua-tions in the contribution of polar (N. pachyderma sin.)vs. temperate (N. pachyderma dex.+G. inflata) faunashow a marked change since MIS 25, interpreted as dueto a change in G-IG periodicity from 40 ka to 100 kathat characterizes the MPT (Berger & Jansen 1994).
The higher PF AR during glacial inceptions, andlack of correlation of this record with the CaCO3%,seems to indicate that planktonic foraminifera played asecondary role as calcium carbonate producers, with
19 20 21 22 23 24 25 26 27 28 29 30 31 MIS
C
B
A
21.7 23.1 23.3 24.1 27.1 29.1 30.1 21.3 21.1 21.5
T. IX T. X T. XI
780 800 820 840 860 880 900 920 940 960 980 1000 1020 1040 1060
Age (ka)
100
80
60
40
20
00
4
8
12
16
20
0
20
40
600
20
40
60
80
U1314
982
984
U1314
984
980
980
983
U1314
984
980
T.
quin
que
loba
(%)
N.
pa
ch
yd
erm
asi
n.(%
)C
aCO
3(%
)
Fig. 7. Comparison of fauna and CaCO3% record from Site U1314 with other North Atlantic sites. A. CaCO3% records from sites U1314(black), 982 (blue), 980 (dashed red), 983 (orange) and 984 (green) (Baumann & Huber 1999; Ortiz et al. 1999). Relative contributions of (B)T. quinqueloba and (C) N. pachyderma sin. from sites U1314 (black), 980 (dashed red) and 984 (green) (Wright & Flower 2002). Glacial MarineIsotope Stages (MIS) are shown with blue vertical bars. Suborbital-scale climate events described by Hernández-Almeida et al. (2012) areshown with red vertical bars. This figure is available in colour at http://www.boreas.dk.
154 Iván Hernández-Almeida et al. BOREAS
coccolithophores being dominant during interglacialstages, and N. pachyderma sin. in colder periods.
Two morphotypes of N. pachyderma sin. were recog-nized based on the degree of encrustration and shellstructure. Lower SST and the development of a strongpycnocline at the time of severe glacials MIS 22 and 20at Site U1314 may have controlled the distribution ofthe encrusted morphotype, while the non-encrusted
morphotype dominated phases with subsurface pen-etration of Atlantic waters. The synchronicity of eventsof the encrusted morphotype of N. pachyderma sin. inthe subpolar North Atlantic (this study) and in theNorth Pacific (Kucera & Kennett 2002) may suggestthat this morphotype responded to strong environmen-tal changes through time, thus making this analysisvaluable for palaeoenvironmental interpretation.
INTERGLACIAL
GLACIAL
30º N
40ºN
50º N
60º N
70º N
80º N
60º W50° W
40º W 30º W 20º W10º W
0º
EGC
MIS 31-26
MIS 25-19
GNAIW CEASSATION :24/2322/2120/19
A
B
30º N
40ºN
50º N
60º N
70º N
80º N
60º W50° W
40º W 30º W 20º W10º W
0º
984
1304
INTERGLACIAL
GLACIAL
NA
C
983
C
U1314980
982
NA
C
EGC
984
U13141304
983
980
982Fig. 8. The subpolar North Atlantic infer-ring the average glacial (black) and inter-glacial (grey) Arctic Front positions andsurface circulation (A) between MIS 31and 26; and (B) between MIS 25 and 19.Blue ellipse in (A) indicates intermediatewater formation area (Venz et al. 1999),and arrows of the same colour designateintermediate waters. Grey ellipse in (B)indicates cessation of GNAIW productionduring Terminations noted in the figure.This figure is available in colour at http://www.boreas.dk.
Palaeoceanographic changes in the North Atlantic during the Mid-Pleistocene Transition 155BOREAS
Shannon diversity index oscillations define surface cir-culation patterns in the North Atlantic: high diversitywas related to the increased advection of the warmAtlantic current, while low diversity was typical ofcolder waters.
The N. pachyderma sin. d13C signature reflects con-ditions in the upper part of the intermediate waterlayer. Minima in the N. pachyderma sin. d13C recordduring Terminations 24/23, 22/21 and 20/19, coincidingwith low benthic d13C values and high IRD input atSite 982, suggest the cessation of intermediate waterproduction (GNAIW) in the Rockall Plateau, and/orpenetration of AAIW into the subpolar North Atlantic(Venz et al. 1999). Based on the planktonic d13C values,the resumption of strong intermediate North Atlanticcirculation was delayed until well into the subsequentinterglacial, but was active during most of glacialstages because deep convection shifted south of theAF, around the Rockall Plateau.
We observe a strong longitudinal thermal (E–W)gradient in this part of the North Atlantic defined bythe position of the AF. From MIS 31 to 25, the AF wassteady, located south of Sites U1314 and 984, limitingheat flux westwards, while eastward Sites 980 and 982were influenced by a more intense NAC flow, andallowed a northward transport of heat during glacialinceptions. As the result of the steep east–west SSTgradient, CaCO3 productivity was lower NW of the AFduring this interval (Sites 984, 983 and U1314). DuringMIS 22, the most extreme surface cold conditionsoccurred, probably with perennial sea ice, a conse-quence of the southward migration of the PF. DuringMIS 21 and 19, a greater retreat of AF allowed aregional warming that increased carbonate bioproduc-tivity in the Site U1314 area.
Acknowledgements. – This work was funded by the Ministeriode Ciencia e Innovación Project GRACCIE (CONSOLIDER-INGENIO CSD 2007-00067) and CGL2008-05560/BTE, andCGL2011-26493 as well as by Junta de Castilla y Leon Grupo GR34,and by a MEC FPI Grant to Iván Hernández-Almeida (BES-2006–12787), and by a grant from the US National Science Foundation (toG.M. Filippelli). We are grateful to Karl-Heinz Bauman for provid-ing carbonate and fauna records from ODP Site 982. The manuscriptbenefited from comments by Maryline Vautravers, Jon Eiriksson andanother anonymous reviewer. This research used samples from IODPExpedition 306.
Referencesvan Aken, H. M. 2000: The hydrography of the mid-latitude North-
east Atlantic Ocean: II: the intermediate water masses. Deep SeaResearch Part I: Oceanographic Research Papers 47, 789–824.
Alley, R. B. & MacAyeal, D. R. 1994: Ice-rafted debris associatedwith binge/purge oscillations of the Laurentide Ice Sheet. Paleocea-nography 9, 503–511.
Alonso-Garcia, M., Sierro, F. J., Kucera, M., Flores, J. A., Cacho, I.& Andersen, N. 2011: Ocean circulation, ice sheet growth andinterhemispheric coupling of millennial climate variability duringthe mid-Pleistocene (ca 800–400 ka). Quaternary Science Reviews30, 3234–3247.
Álvarez, M., Pérez, F. F., Bryden, H. & Ríos, A. F. 2004: Physicaland biogeochemical transports structure in the North Atlantic sub-polar gyre. Journal of Geophysical Research 109, C03027, doi:10.1029/2003jc002015.
Andersson, C., Pausata, F. S. R., Jansen, E., Risebrobakken, B. &Telford, R. J. 2009: Holocene trends in the foraminifer record fromthe Norwegian Sea and the North Atlantic Ocean. Climate of thePast, Discussion 5, 2081–2113.
Baldauf, J. G. 1986: Diatom biostratigraphic and palaeoceano-graphic interpretations for the middle to high latitude NorthAtlantic Ocean. Geological Society, London, Special Publications21, 243–252.
Balestra, B., Ziveri, P., Baumann, K., Troelstra, S. & Monechi, S.2010: Surface water dynamics in the Reykjanes Ridge area duringthe Holocene as revealed by coccolith assemblages. Marine Micro-paleontology 76, 1–10.
Balsam, W. L. & Flessa, K. W. 1978: Patterns of planktonicforaminiferal abundance and diversity in surface sediments ofthe western North Atlantic. Marine Micropaleontology 3, 279–294.
Bauch, H. A. 1994: Significance of variability in Turborotalita quin-queloba (Natland) test size and abundance for paleoceanographicinterpretations in the Norwegian-Greenland Sea. Marine Geology121, 129–141.
Bauch, H. A. & Kandiano, E. S. 2007: Evidence for early warmingand cooling in North Atlantic surface waters during the last inter-glacial. Paleoceanography 22, PA1201, doi: 10.1029/2005pa001252.
Baumann, K. & Huber, R. 1999: Sea-surface gradients between theNorth Atlantic and the Norwegian Sea during the last 3.1 m.y.:comparison of Sites 982 and 985. In Raymo, M. E., Jansen, E.,Blum, P. & Herbert, T. D. (eds.): Proceedings of the Ocean DrillingProgram, Scientific Results 162, 179–190. Ocean Drilling Program,College Station, TX.
Bé, A. H. W. 1977: An ecological, zoogeographic and taxonomicreview of recent planktonic foraminifera. In Ramsay, A. T. S. (ed.):Oceanic Micropaleontology, 1–100. Academic Press, London.
Bé, A. W. H. 1960: Some observations on Arctic planktonicforaminifera. Contributions from the Cushman Foundation forForaminiferal Research 11, 64–68.
Bé, A. W. H. & Tolderlund, D. S. 1971: Distribution and ecology ofliving planktonic foraminifera in surface waters of the Atlantic andIndian Oceans. In Funnel, B. M. & Riedel, W. R. (eds.): Micropal-eontology of the Oceans, 105–149. Cambridge University Press,Cambridge.
Bergami, C., Capotondi, L., Langone, L., Giglio, F. & Ravaioli, M.2009: Distribution of living planktonic foraminifera in the RossSea and the Pacific sector of the Southern Ocean (Antarctica).Marine Micropaleontology 73, 37–48.
Berger, W. H. & Jansen, E. 1994: Mid-Pleistocene climate shift: theNansen connection. In Johannessen, T., Muench, R. D. & Over-land, J. E. (eds.): The Polar Oceans and Their Role in Shaping theGlobal Environment: The Nansen Centennial Volume, 295–311.American Geophysical Union, Geophysical Monographs, Wash-ington, DC.
Bianchi, G. G. & McCave, I. N. 2000: Hydrography and sedimenta-tion under the deep western boundary current on Björn andGardar Drifts, Iceland Basin. Marine Geology 165, 137–169.
Biscaye, P. E., Kolla, V. & Turekian, K. K. 1976: Distribution ofcalcium carbonate in surface sediments of the Atlantic Ocean.Journal of Geophsycal Research 81, 2595–2603.
Broecker, W. 1991: The great ocean conveyor. Oceanography 4,79–89.
Broecker, W., Bond, G., Klas, M., Clark, E. & McManus, J. 1992:Origin of the northern Atlantic’s Heinrich events. Climate Dynam-ics 6, 265–273.
Broecker, W. S. 1994: Massive iceberg discharges as triggers forglobal climate change. Nature 372, 421–424.
Broecker, W. S. & Peng, T. H. 1982: Tracers in the Sea. 690 pp.Eldigio Press, Palisades.
Broecker, W. S. & Takahashi, T. 1978: The relationship betweenlysocline depth and in situ carbonate ion concentration. Deep-SeaResearch 25, 65–95.
156 Iván Hernández-Almeida et al. BOREAS
Carstens, J. & Wefer, G. 1992: Recent distribution of planktonicforaminifera in the Nansen Basin, Arctic Ocean. Deep SeaResearch Part A. Oceanographic Research Papers 39, S507–S524.
Channell, J. E. T., Kanamatsu, T., Sato, T., Stein, R., Alvarez Zari-kian, C. A., Malone, M. J. & Expedition 303/306 Scientists 2006:Expedition 306 summary. In Channell, J. E. T., Kanamatsu, T.,Sato, T., Stein, R., Alvarez Zarikian, C. A., Malone, M. J. &Expedition 303/306 Scientists (eds.): Proceedings Integrated OceanDrilling Program, Expedition 303/306, 1–29. Integrated OceanDrilling Program, College Station, TX.
Chapman, M. R. 2010: Seasonal production patterns of planktonicforaminifera in the NE Atlantic Ocean: implications for paleotem-perature and hydrographic reconstructions. Paleoceanography 25,PA1101, doi: 10.1029/2008pa001708.
Cifelli, R. 1973: Observations on Globigerina pachyderma (Ehren-berg) and Globigerina incompta Cifelli from the North Atlantic.Journal of Foraminiferal Research 3, 157–166.
Clark, P. U., Archer, D., Pollard, D., Blum, J. D., Rial, J. A.,Brovkin, V., Mix, A. C., Pisias, N. G. & Roy, M. 2006: The middlePleistocene transition: characteristics, mechanisms, and implica-tions for long-term changes in atmospheric pCO2. QuaternaryScience Reviews 25, 3150–3184.
Coplen, T. B. 1996: More uncertainty than necessary. Paleoceanog-raphy 11, 369–370.
de Vernal, A., Hillaire-Marcel, C. & Darby, D. A. 2005: Variabilityof sea ice cover in the Chukchi Sea (western Arctic Ocean) duringthe Holocene. Paleoceanography 20, PA4018, doi: 10.1029/2005pa001157.
de Vernal, A., Hillaire-Marcel, C., Peltier, W. R. & Weaver, A. J.2002: Structure of the upper water column in the northwest NorthAtlantic: modern versus Last Glacial Maximum conditions. Pale-oceanography 17, 1050, doi: 10.1029/2001pa000665.
Dickson, R. R. & Brown, J. 1994: The production of North AtlanticDeep Water: sources, rates, and pathways. Journal of GeophsycalResearch 99, 12319–12341.
Dowling, L. M. & McCave, I. N. 1993: Sedimentation on the FeniDrift and late Glacial bottom water production in the northernRockall Trough. Sedimentary Geology 82, 79–87.
Eynaud, F., Cronin, T. M., Smith, S. A., Zaragosi, S., Mavel, J.,Mary, Y., Mas, V. & Pujol, C. 2009: Morphological variability ofthe planktonic foraminifer Neogloboquadrina pachyderma fromACEX cores: implications for Late Pleistocene circulation in theArctic Ocean. Micropaleontology 55, 101–106.
Ferretti, P., Crowhurst, S. J., Hall, M. A. & Cacho, I. 2010: NorthAtlantic millennial-scale climate variability 910 to 790 ka and therole of the equatorial insolation forcing. Earth and PlanetaryScience Letters 293, 28–41.
Fraile, I., Schulz, M., Mulitza, S. & Kucera, M. 2008: Predicting theglobal distribution of planktonic foraminifera using a dynamicecosystem model. Biogeosciences 5, 891–911.
Fronval, T., Jansen, E., Haflidason, H. & Sejrup, J. P. 1998: Vari-ability in surface and deep water conditions in the Nordic seasduring the last interglacial period. Quaternary Science Reviews17, 963–985.
Hald, M., Andersson, C., Ebbesen, H., Jansen, E., Klitgaard-Kristensen, D., Risebrobakken, B., Salomonsen, G. R., Sarnthein,M., Sejrup, H. P. & Telford, R. J. 2007: Variations in temperatureand extent of Atlantic Water in the northern North Atlantic duringthe Holocene. Quaternary Science Reviews 26, 3423–3440.
Head, M. J. & Gibbard, P. L. 2005: Early-Middle Pleistocenetransitions: an overview and recommendation for the definingboundary. Geological Society, London, Special Publication 247,1–18.
Hebbeln, D., Dokken, T., Andersen, E. S., Hald, M. & Elverhoi, A.1994: Moisture supply for northern ice-sheet growth during theLast Glacial Maximum. Nature 370, 357–360.
Hemleben, C., Spindler, M. & Anderson, O. R. 1989: Modern Plank-tic Foraminifera. 363 pp. Springer Verlag, New York.
Henrich, R. 1989: Glacial/Interglacial cycles in the Norwegian Sea:sedimentology, paleoceanography and evolution of Late Plioceneto Quaternary Northern Hemisphere climate. In Eldholm, O.,Thiede, J. & Taylor, E. (eds.): Proceedings of the Ocean Drilling
Program, Scientific Results 104, 189–232. Ocean Drilling Program,College Station, TX.
Henrich, R. 1998: Dynamics of Atlantic water advection to theNorwegian-Greenland Sea – a time-slice record of carbonate dis-tribution in the last 300 ky. Marine Geology 145, 95–131.
Henrich, R., Baumann, K., Huber, R. & Meggers, H. 2002: Carbon-ate preservation records of the past 3 Myr in the Norwegian-Greenland Sea and the northern North Atlantic: implicationsfor the history of NADW production. Marine Geology 184,17–39.
Henrich, R. & Baumann, K. H. 1994: Evolution of the NorwegianCurrent and the Scandinavian Ice Sheets during the past 2.6 m.y.:evidence from ODP Leg 104 biogenic carbonate and terrigenousrecords. Palaeogeography, Palaeoclimatology, Palaeoecology 108,75–94.
Hernández-Almeida, I., Sierro, F. J., Cacho, I. & Flores, J. A. 2012:Impact of suborbital climate changes in the North Atlantic onice-sheets dynamics at the Mid-Pleistocene Transition. Paleocea-nography 27, PA3214, doi: 10.1029/2011PA002209.
Hillaire-Marcel, C. & Bilodeau, G. 2000: Instabilities in the LabradorSea water mass structure during the last climatic cycle. CanadianJournal of Earth Sciences 37, 795–809.
Hillaire-Marcel, C., de Vernal, A., Candon, L., Bilodeau, G. &Stoner, J. 2001a: Changes of potential density gradients in thenorthwestern North Atlantic during the last climatic cycle based ona multiproxy approach. In Seidov, D., Maslin, M. & Haupt, B. J.(eds.): The Oceans and Rapid Climate Change: Past, Present,and Future, 83–100. American Geophysical Union, Washington,DC.
Hillaire-Marcel, C., de Vernal, A. & McKay, J. 2011: Foraminiferisotope study of the Pleistocene Labrador Sea, northwest NorthAtlantic (IODP Sites 1302/03 and 1305), with emphasis on pale-oceanographical differences between its ‘inner’ and ‘outer’ basins.Marine Geology 279, 188–198.
Hillaire-Marcel, C., de Vernal, A., Polyak, L. & Darby, D. 2004:Size-dependent isotopic composition of planktic foraminifersfrom Chukchi Sea vs. NW Atlantic sediments-implications for theHolocene paleoceanography of the western Arctic. QuaternaryScience Reviews 23, 245–260.
Hodell, D. A., Channell, J. E. T., Curtis, J. H., Romero, O. E. &Röhl, U. 2008: Onset of ‘Hudson Strait’ Heinrich events in theeastern North Atlantic at the end of the middle Pleistocene transi-tion (~640 ka)? Paleoceanography 23, PA4218, doi: 10.1029/2008PA001591.
Huddlestun, P. F. 1984: Planktonic foraminiferal biostratigraphy,Deep Sea Drilling Project Leg 81. In Roberts, D. G., Schnitker, D.,Backman, J., Baldauf, J. G., Desprairies, A., Homrighausen, R.,Huddlestun, P., Kaltenback, A. J., Krumsiek, K. A. O., Morton,A. C., Murray, J. W., Westberg-Smith, J. & Zimmerman, H. B.(eds.): Initial Reports of the Deep Sea Drilling Project, Leg 81,429–438. US Government Printing Office, Washington, DC.
Huizhong, W. & McCave, I. N. 1990: Distinguishing climaticand current effects in mid-Pleistocene sediments of Hatton andGardar Drifts, NE Atlantic. Journal of the Geological Society 147,373–383.
Ikeda, A., Okada, H. & Koizumi, I. 2000: Data report: late Mioceneto Pleistocene diatoms from the Blake Ridge, Site 997. In Paull, C.K., Matsumoto, R., Wallace, P. J. & Dillon, W. P. (eds.): Proceed-ings of the Ocean Drilling Program, Scientific Results 164, 365–376.Ocean Drilling Program, College Station, TX.
IODP-USIO 2007: Janus Web Database. http://iodp.tamu.edu/janusweb/general/dbtable.cgi.
Jenkins, D. G. 1993: The evolution of the Cenozoic southern high-and mid-latitude planktonic foraminiferal faunas. In Kennett, J. P.& Warnke, D. A. (eds.): The Antarctic Paleoenvironment: a Per-spective on Global Change, 175–194. American Geophysics Union,Washington, DC.
Johannessen, T., Jansen, E., Flatoy, A. & Ravelo, A. C. 1994: Therelationship between surface water masses, oceanographic frontsand paleoclimatic proxies in surface sediments of the Greenland,Iceland, Norwegian seas. In Zahn, R., Pedersen, T. F., Kaminski,M. A. & Labeyrie, L. (eds.): Carbon Cycling in the Glacial Ocean:
Palaeoceanographic changes in the North Atlantic during the Mid-Pleistocene Transition 157BOREAS
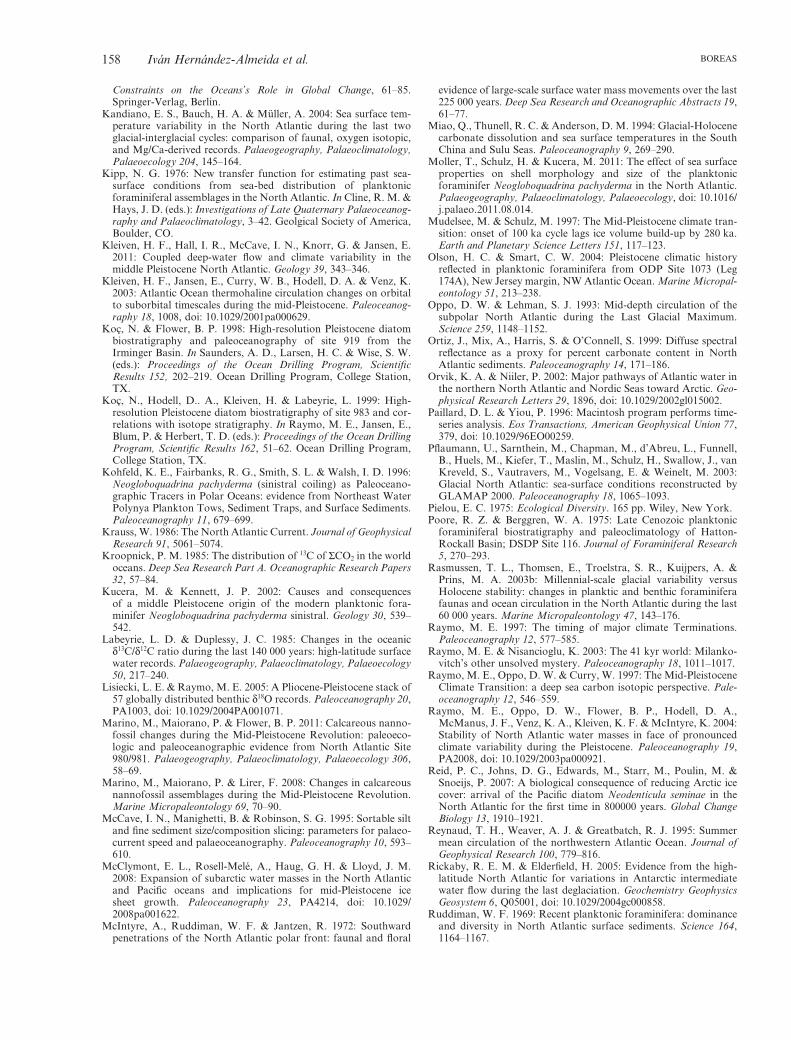
Constraints on the Oceans’s Role in Global Change, 61–85.Springer-Verlag, Berlin.
Kandiano, E. S., Bauch, H. A. & Müller, A. 2004: Sea surface tem-perature variability in the North Atlantic during the last twoglacial-interglacial cycles: comparison of faunal, oxygen isotopic,and Mg/Ca-derived records. Palaeogeography, Palaeoclimatology,Palaeoecology 204, 145–164.
Kipp, N. G. 1976: New transfer function for estimating past sea-surface conditions from sea-bed distribution of planktonicforaminiferal assemblages in the North Atlantic. In Cline, R. M. &Hays, J. D. (eds.): Investigations of Late Quaternary Palaeoceanog-raphy and Palaeoclimatology, 3–42. Geolgical Society of America,Boulder, CO.
Kleiven, H. F., Hall, I. R., McCave, I. N., Knorr, G. & Jansen, E.2011: Coupled deep-water flow and climate variability in themiddle Pleistocene North Atlantic. Geology 39, 343–346.
Kleiven, H. F., Jansen, E., Curry, W. B., Hodell, D. A. & Venz, K.2003: Atlantic Ocean thermohaline circulation changes on orbitalto suborbital timescales during the mid-Pleistocene. Paleoceanog-raphy 18, 1008, doi: 10.1029/2001pa000629.
Koç, N. & Flower, B. P. 1998: High-resolution Pleistocene diatombiostratigraphy and paleoceanography of site 919 from theIrminger Basin. In Saunders, A. D., Larsen, H. C. & Wise, S. W.(eds.): Proceedings of the Ocean Drilling Program, ScientificResults 152, 202–219. Ocean Drilling Program, College Station,TX.
Koç, N., Hodell, D.. A., Kleiven, H. & Labeyrie, L. 1999: High-resolution Pleistocene diatom biostratigraphy of site 983 and cor-relations with isotope stratigraphy. In Raymo, M. E., Jansen, E.,Blum, P. & Herbert, T. D. (eds.): Proceedings of the Ocean DrillingProgram, Scientific Results 162, 51–62. Ocean Drilling Program,College Station, TX.
Kohfeld, K. E., Fairbanks, R. G., Smith, S. L. & Walsh, I. D. 1996:Neogloboquadrina pachyderma (sinistral coiling) as Paleoceano-graphic Tracers in Polar Oceans: evidence from Northeast WaterPolynya Plankton Tows, Sediment Traps, and Surface Sediments.Paleoceanography 11, 679–699.
Krauss, W. 1986: The North Atlantic Current. Journal of GeophysicalResearch 91, 5061–5074.
Kroopnick, P. M. 1985: The distribution of 13C of SCO2 in the worldoceans. Deep Sea Research Part A. Oceanographic Research Papers32, 57–84.
Kucera, M. & Kennett, J. P. 2002: Causes and consequencesof a middle Pleistocene origin of the modern planktonic fora-minifer Neogloboquadrina pachyderma sinistral. Geology 30, 539–542.
Labeyrie, L. D. & Duplessy, J. C. 1985: Changes in the oceanicd13C/d12C ratio during the last 140 000 years: high-latitude surfacewater records. Palaeogeography, Palaeoclimatology, Palaeoecology50, 217–240.
Lisiecki, L. E. & Raymo, M. E. 2005: A Pliocene-Pleistocene stack of57 globally distributed benthic d18O records. Paleoceanography 20,PA1003, doi: 10.1029/2004PA001071.
Marino, M., Maiorano, P. & Flower, B. P. 2011: Calcareous nanno-fossil changes during the Mid-Pleistocene Revolution: paleoeco-logic and paleoceanographic evidence from North Atlantic Site980/981. Palaeogeography, Palaeoclimatology, Palaeoecology 306,58–69.
Marino, M., Maiorano, P. & Lirer, F. 2008: Changes in calcareousnannofossil assemblages during the Mid-Pleistocene Revolution.Marine Micropaleontology 69, 70–90.
McCave, I. N., Manighetti, B. & Robinson, S. G. 1995: Sortable siltand fine sediment size/composition slicing: parameters for palaeo-current speed and palaeoceanography. Paleoceanography 10, 593–610.
McClymont, E. L., Rosell-Melé, A., Haug, G. H. & Lloyd, J. M.2008: Expansion of subarctic water masses in the North Atlanticand Pacific oceans and implications for mid-Pleistocene icesheet growth. Paleoceanography 23, PA4214, doi: 10.1029/2008pa001622.
McIntyre, A., Ruddiman, W. F. & Jantzen, R. 1972: Southwardpenetrations of the North Atlantic polar front: faunal and floral
evidence of large-scale surface water mass movements over the last225 000 years. Deep Sea Research and Oceanographic Abstracts 19,61–77.
Miao, Q., Thunell, R. C. & Anderson, D. M. 1994: Glacial-Holocenecarbonate dissolution and sea surface temperatures in the SouthChina and Sulu Seas. Paleoceanography 9, 269–290.
Moller, T., Schulz, H. & Kucera, M. 2011: The effect of sea surfaceproperties on shell morphology and size of the planktonicforaminifer Neogloboquadrina pachyderma in the North Atlantic.Palaeogeography, Palaeoclimatology, Palaeoecology, doi: 10.1016/j.palaeo.2011.08.014.
Mudelsee, M. & Schulz, M. 1997: The Mid-Pleistocene climate tran-sition: onset of 100 ka cycle lags ice volume build-up by 280 ka.Earth and Planetary Science Letters 151, 117–123.
Olson, H. C. & Smart, C. W. 2004: Pleistocene climatic historyreflected in planktonic foraminifera from ODP Site 1073 (Leg174A), New Jersey margin, NW Atlantic Ocean. Marine Micropal-eontology 51, 213–238.
Oppo, D. W. & Lehman, S. J. 1993: Mid-depth circulation of thesubpolar North Atlantic during the Last Glacial Maximum.Science 259, 1148–1152.
Ortiz, J., Mix, A., Harris, S. & O’Connell, S. 1999: Diffuse spectralreflectance as a proxy for percent carbonate content in NorthAtlantic sediments. Paleoceanography 14, 171–186.
Orvik, K. A. & Niiler, P. 2002: Major pathways of Atlantic water inthe northern North Atlantic and Nordic Seas toward Arctic. Geo-physical Research Letters 29, 1896, doi: 10.1029/2002gl015002.
Paillard, D. L. & Yiou, P. 1996: Macintosh program performs time-series analysis. Eos Transactions, American Geophysical Union 77,379, doi: 10.1029/96EO00259.
Pflaumann, U., Sarnthein, M., Chapman, M., d’Abreu, L., Funnell,B., Huels, M., Kiefer, T., Maslin, M., Schulz, H., Swallow, J., vanKreveld, S., Vautravers, M., Vogelsang, E. & Weinelt, M. 2003:Glacial North Atlantic: sea-surface conditions reconstructed byGLAMAP 2000. Paleoceanography 18, 1065–1093.
Pielou, E. C. 1975: Ecological Diversity. 165 pp. Wiley, New York.Poore, R. Z. & Berggren, W. A. 1975: Late Cenozoic planktonic
foraminiferal biostratigraphy and paleoclimatology of Hatton-Rockall Basin; DSDP Site 116. Journal of Foraminiferal Research5, 270–293.
Rasmussen, T. L., Thomsen, E., Troelstra, S. R., Kuijpers, A. &Prins, M. A. 2003b: Millennial-scale glacial variability versusHolocene stability: changes in planktic and benthic foraminiferafaunas and ocean circulation in the North Atlantic during the last60 000 years. Marine Micropaleontology 47, 143–176.
Raymo, M. E. 1997: The timing of major climate Terminations.Paleoceanography 12, 577–585.
Raymo, M. E. & Nisancioglu, K. 2003: The 41 kyr world: Milanko-vitch’s other unsolved mystery. Paleoceanography 18, 1011–1017.
Raymo, M. E., Oppo, D. W. & Curry, W. 1997: The Mid-PleistoceneClimate Transition: a deep sea carbon isotopic perspective. Pale-oceanography 12, 546–559.
Raymo, M. E., Oppo, D. W., Flower, B. P., Hodell, D. A.,McManus, J. F., Venz, K. A., Kleiven, K. F. & McIntyre, K. 2004:Stability of North Atlantic water masses in face of pronouncedclimate variability during the Pleistocene. Paleoceanography 19,PA2008, doi: 10.1029/2003pa000921.
Reid, P. C., Johns, D. G., Edwards, M., Starr, M., Poulin, M. &Snoeijs, P. 2007: A biological consequence of reducing Arctic icecover: arrival of the Pacific diatom Neodenticula seminae in theNorth Atlantic for the first time in 800000 years. Global ChangeBiology 13, 1910–1921.
Reynaud, T. H., Weaver, A. J. & Greatbatch, R. J. 1995: Summermean circulation of the northwestern Atlantic Ocean. Journal ofGeophysical Research 100, 779–816.
Rickaby, R. E. M. & Elderfield, H. 2005: Evidence from the high-latitude North Atlantic for variations in Antarctic intermediatewater flow during the last deglaciation. Geochemistry GeophysicsGeosystem 6, Q05001, doi: 10.1029/2004gc000858.
Ruddiman, W. F. 1969: Recent planktonic foraminifera: dominanceand diversity in North Atlantic surface sediments. Science 164,1164–1167.
158 Iván Hernández-Almeida et al. BOREAS
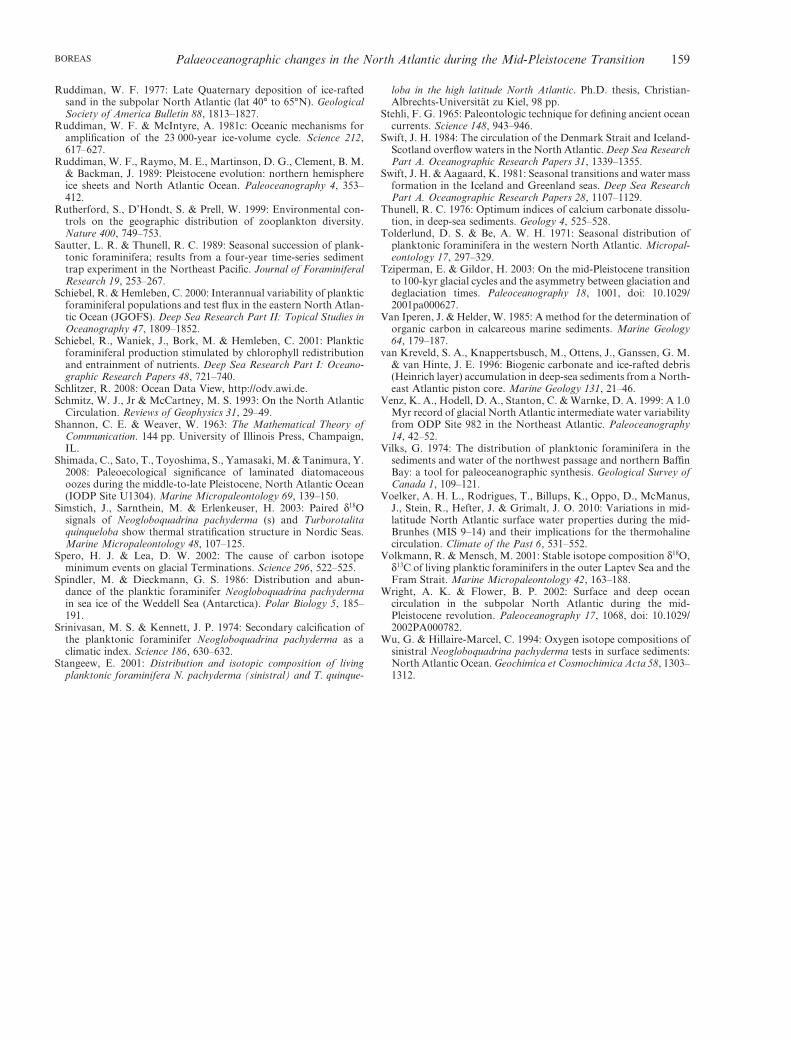
Ruddiman, W. F. 1977: Late Quaternary deposition of ice-raftedsand in the subpolar North Atlantic (lat 40° to 65°N). GeologicalSociety of America Bulletin 88, 1813–1827.
Ruddiman, W. F. & McIntyre, A. 1981c: Oceanic mechanisms foramplification of the 23 000-year ice-volume cycle. Science 212,617–627.
Ruddiman, W. F., Raymo, M. E., Martinson, D. G., Clement, B. M.& Backman, J. 1989: Pleistocene evolution: northern hemisphereice sheets and North Atlantic Ocean. Paleoceanography 4, 353–412.
Rutherford, S., D’Hondt, S. & Prell, W. 1999: Environmental con-trols on the geographic distribution of zooplankton diversity.Nature 400, 749–753.
Sautter, L. R. & Thunell, R. C. 1989: Seasonal succession of plank-tonic foraminifera; results from a four-year time-series sedimenttrap experiment in the Northeast Pacific. Journal of ForaminiferalResearch 19, 253–267.
Schiebel, R. & Hemleben, C. 2000: Interannual variability of plankticforaminiferal populations and test flux in the eastern North Atlan-tic Ocean (JGOFS). Deep Sea Research Part II: Topical Studies inOceanography 47, 1809–1852.
Schiebel, R., Waniek, J., Bork, M. & Hemleben, C. 2001: Plankticforaminiferal production stimulated by chlorophyll redistributionand entrainment of nutrients. Deep Sea Research Part I: Oceano-graphic Research Papers 48, 721–740.
Schlitzer, R. 2008: Ocean Data View, http://odv.awi.de.Schmitz, W. J., Jr & McCartney, M. S. 1993: On the North Atlantic
Circulation. Reviews of Geophysics 31, 29–49.Shannon, C. E. & Weaver, W. 1963: The Mathematical Theory of
Communication. 144 pp. University of Illinois Press, Champaign,IL.
Shimada, C., Sato, T., Toyoshima, S., Yamasaki, M. & Tanimura, Y.2008: Paleoecological significance of laminated diatomaceousoozes during the middle-to-late Pleistocene, North Atlantic Ocean(IODP Site U1304). Marine Micropaleontology 69, 139–150.
Simstich, J., Sarnthein, M. & Erlenkeuser, H. 2003: Paired d18Osignals of Neogloboquadrina pachyderma (s) and Turborotalitaquinqueloba show thermal stratification structure in Nordic Seas.Marine Micropaleontology 48, 107–125.
Spero, H. J. & Lea, D. W. 2002: The cause of carbon isotopeminimum events on glacial Terminations. Science 296, 522–525.
Spindler, M. & Dieckmann, G. S. 1986: Distribution and abun-dance of the planktic foraminifer Neogloboquadrina pachydermain sea ice of the Weddell Sea (Antarctica). Polar Biology 5, 185–191.
Srinivasan, M. S. & Kennett, J. P. 1974: Secondary calcification ofthe planktonic foraminifer Neogloboquadrina pachyderma as aclimatic index. Science 186, 630–632.
Stangeew, E. 2001: Distribution and isotopic composition of livingplanktonic foraminifera N. pachyderma (sinistral) and T. quinque-
loba in the high latitude North Atlantic. Ph.D. thesis, Christian-Albrechts-Universität zu Kiel, 98 pp.
Stehli, F. G. 1965: Paleontologic technique for defining ancient oceancurrents. Science 148, 943–946.
Swift, J. H. 1984: The circulation of the Denmark Strait and Iceland-Scotland overflow waters in the North Atlantic. Deep Sea ResearchPart A. Oceanographic Research Papers 31, 1339–1355.
Swift, J. H. & Aagaard, K. 1981: Seasonal transitions and water massformation in the Iceland and Greenland seas. Deep Sea ResearchPart A. Oceanographic Research Papers 28, 1107–1129.
Thunell, R. C. 1976: Optimum indices of calcium carbonate dissolu-tion, in deep-sea sediments. Geology 4, 525–528.
Tolderlund, D. S. & Be, A. W. H. 1971: Seasonal distribution ofplanktonic foraminifera in the western North Atlantic. Micropal-eontology 17, 297–329.
Tziperman, E. & Gildor, H. 2003: On the mid-Pleistocene transitionto 100-kyr glacial cycles and the asymmetry between glaciation anddeglaciation times. Paleoceanography 18, 1001, doi: 10.1029/2001pa000627.
Van Iperen, J. & Helder, W. 1985: A method for the determination oforganic carbon in calcareous marine sediments. Marine Geology64, 179–187.
van Kreveld, S. A., Knappertsbusch, M., Ottens, J., Ganssen, G. M.& van Hinte, J. E. 1996: Biogenic carbonate and ice-rafted debris(Heinrich layer) accumulation in deep-sea sediments from a North-east Atlantic piston core. Marine Geology 131, 21–46.
Venz, K. A., Hodell, D. A., Stanton, C. & Warnke, D. A. 1999: A 1.0Myr record of glacial North Atlantic intermediate water variabilityfrom ODP Site 982 in the Northeast Atlantic. Paleoceanography14, 42–52.
Vilks, G. 1974: The distribution of planktonic foraminifera in thesediments and water of the northwest passage and northern BaffinBay: a tool for paleoceanographic synthesis. Geological Survey ofCanada 1, 109–121.
Voelker, A. H. L., Rodrigues, T., Billups, K., Oppo, D., McManus,J., Stein, R., Hefter, J. & Grimalt, J. O. 2010: Variations in mid-latitude North Atlantic surface water properties during the mid-Brunhes (MIS 9–14) and their implications for the thermohalinecirculation. Climate of the Past 6, 531–552.
Volkmann, R. & Mensch, M. 2001: Stable isotope composition d18O,d13C of living planktic foraminifers in the outer Laptev Sea and theFram Strait. Marine Micropaleontology 42, 163–188.
Wright, A. K. & Flower, B. P. 2002: Surface and deep oceancirculation in the subpolar North Atlantic during the mid-Pleistocene revolution. Paleoceanography 17, 1068, doi: 10.1029/2002PA000782.
Wu, G. & Hillaire-Marcel, C. 1994: Oxygen isotope compositions ofsinistral Neogloboquadrina pachyderma tests in surface sediments:North Atlantic Ocean. Geochimica et Cosmochimica Acta 58, 1303–1312.
Palaeoceanographic changes in the North Atlantic during the Mid-Pleistocene Transition 159BOREAS
Copyright © 2022 FDOKUMEN