The ontogeny of foraging in squirrel monkeys, Saimiri oerstedi
Upload
independentCategory
view
0download
0
MARINE ECOLOGY PROGRESS SERIESMar Ecol Prog Ser
Vol. 410: 257–268, 2010doi: 10.3354/meps08617
Published July 14
INTRODUCTION
In the study of seabird diet, conventional methodssuch as the analysis of stomach contents (e.g. stomachflushing; Wilson 1984, Barrett et al. 2007) have beenused to assess which prey items are captured by birdsduring their last foraging trip. However, this may bebiased towards prey types that are more resistant todigestion (Votier et al. 2003) or those with hard body
parts (e.g. squid beaks) that are retained in the stom-ach (Wilson et al. 1985). The use of isotopic signaturesin animal ecology has become an important tool in thestudy of trophic ecology (Hodum & Hobson 2000, Post2002). Although stable isotopes do not provide thetaxonomic detail provided by conventional dietaryanalysis, they avoid prey digestibility biases becauseonly assimilated food is taken into account. However,in the absence of spatial information (i.e. where the
© Inter-Research 2010 · www.int-res.com*Email: [email protected]
Foraging ecology of Cory’s shearwaters in differentoceanic environments of the North Atlantic
Vitor H. Paiva1, 3,*, José Xavier1, Pedro Geraldes2, Ivan Ramirez2, Stefan Garthe3, Jaime A. Ramos1
1Department of Life Sciences, Institute of Marine Research (IMAR/CMA), University of Coimbra, Apartado 3046, 3001-401, Coimbra, Portugal
2SPEA-Portuguese Society for the Study of Birds, Avenida da Liberdade No.105-2° Esq., 1250-140 Lisboa, Portugal3Research and Technology Centre (FTZ), University of Kiel, Hafentörn 1, 25761 Büsum, Germany
ABSTRACT: The use of stable isotopes of animal tissues to infer diet and habitat selection hasemerged as a powerful tool, particularly when combined with conventional dietary analysis to pro-vide an integrated view of the assimilated diet. We used 3 techniques during 3 yr (2006 to 2008) on 6different populations of Cory’s shearwaters Calonectris diomedea), ranging from neritic (Berlengasarchipelago) to oceanic areas (Azores, Desertas and Selvagens archipelagos), to evaluate the trophicand foraging ecology of this species over the North Atlantic. We deployed data loggers to track for-aging movements and feeding locations, and collected blood and diet samples from each individualafter each foraging excursion. We also measured the isotopic signatures of the main prey species foreach population. Analysis of stomach regurgitations showed that Trachurus picturatus was the mainprey for populations exploiting oceanic environments (Azores and Desertas); Sardina pilchardus andBelone belone dominated the diet of birds feeding in neritic areas (Berlengas); and Trachurus trachu-rus, Scomber sp. and Exocoetus volitans were important for birds exploiting both neritic and oceanicareas (Selvagens). Cephalopods (squid) were important for all populations. The birds’ blood δ13C sig-natures matched those of their main prey items. The blood δ13C signature was negatively correlatedwith the latitude of the main feeding locations of individuals and segregated populations exploitingneritic and shelf systems from those feeding in oceanic and seamount areas. Even the signatures ofgeographically different populations that fed in the same oceanic regions were similar. The δ15N sig-nature was negatively correlated with the abundance of cephalopods in the diet. Results from a sta-ble isotopic mixing model estimated higher proportions of cephalopods in the birds’ diet than propor-tions obtained by direct diet inferences, presumably due to the advanced digestion stage ofcephalopods in the regurgitations. Our findings should have broader relevance to the study of forag-ing ecology of other top marine predators in the north Atlantic region.
KEY WORDS: Stable isotopes · Data loggers · Remote tracking · Seabird · Diet sampling
Resale or republication not permitted without written consent of the publisher
Mar Ecol Prog Ser 410: 257–268, 2010
individuals foraged and fed), we may only argue thatthose animals came from isotopically similar locationsand/or fed upon isotopically similar prey (Inger &Bearhop 2008). This is because the fundamental the-ory behind the isotopic concept is that the isotopic sig-nature of predators is directly influenced by what theyconsume (Hobson & Clark 1992, Bearhop et al. 2004).This means that the stable carbon signature (δ13C,13C:12C) of consumers are usually similar to that oftheir diets, and the stable nitrogen ratio (δ15N,15N:14N) reflects the signature at the base of the foodweb and the predators’ trophic position (Vanderklift &Ponsard 2003). Specifically, stable carbon (δ13C) sig-natures vary little along the food chain (~0.8‰ trophiclevel–1; Minagawa & Wada 1984), while stable nitro-gen (δ15N) signatures typically increase between 2and 5‰ trophic level–1 (Michener & Schell 1994, Post2002). During the incubation and chick-rearingphases, pelagic seabird species such as the Cory’sshearwater Calonectris diomedea borealis show dif-ferent foraging strategies to exploit the marine envi-ronment, as directly conditioned by what is happen-ing at the nest. The incubation shifts of Cory’sshearwaters may last up to 20 d, but are on average 5to 7 d long (Mougin et al. 1988, Granadeiro 1991).When feeding chicks, several pelagic seabird speciesincluding Cory’s shearwaters have a dual foragingstrategy (Weimerskirch 1998, Paiva et al. 2010a), i.e.parents alternate between long (≥5 d) and short (≤4 d)trips to cope with the need to frequently feed theirchicks without compromising their own requirements(they restore their energetic reserves after the longtrips) (Baduini & Hyrenbach 2003). This dual foragingstrategy determines which areas are exploited byadults and, ultimately, the diet composition of theindividuals. The diet of Cory’s shearwaters is mainlycomposed of epi- and mesopelagic fishes (e.g. scom-brids, trumpet fish Macrorhamphosus sp., boarfishCapros aper and belonids), cephalopods and crusta-ceans (Furness 1994, Monteiro et al. 1996, Granadeiroet al. 1998). Overall, studies reporting quantitativeinformation on Cory’s shearwater diet for the differentbreeding populations of the north Atlantic are veryscarce. Diet studies are limited to some colonies of theAzores (Granadeiro et al. 1998, Magalhães 2007), butother colonies such as those in the Berlengas (anisland in the Portuguese continental shelf), Madeira orSelvagens archipelagos have not been researched. Inthis study, we present an integrative approach toinvestigate the foraging ecology of 6 different popula-tions of Cory’s shearwaters breeding in the Azores(Corvo, Faial and Sta. Maria), Berlengas, Madeira(Desertas) and Selvagens archipelagos over 2 repro-ductive periods (incubation and chick rearing) and3 yr of study (2006 to 2008).
Recently, Navarro et al. (2009) reported that the 2sympatrically breeding subspecies of Cory’s shearwa-ters in the Mediterranean (Calonectris diomedea dio-medea and C. diomedea borealis) exhibited foragingsegregation, as measured both by their isotopic signa-tures and tracking of their movements. However, thecombination of different methods (i.e. foraging loca-tions, diet composition and isotopic signatures) tointerpret the feeding ecology of Cory’s shearwatershas not been examined for populations breeding in thearchipelagos of the Azores, Berlengas, Madeira andSelvagens. To fully understand the isotopic segrega-tion of individuals, we remotely tracked foragingCory’s shearwaters, and collected blood and diet sam-ples from tracked individuals on their return to thecolony. This procedure enabled us to explain the forag-ing activity of different populations of the same speciesbased on their isotopic signatures and diet composi-tion. In particular, we tested the following predictions:(1) the stable carbon signature is normally more en-riched in benthic and inshore food webs than in pela-gic and offshore food webs (France 1995). In addition,the carbon isotopic signature of particulate organicmatter (POM; at the base of the food web) is reportedto be higher in low latitudes and lower in high latitudes(Hofmann et al. 2000). The same pattern could beobserved in the δ13C levels of marine plankton (Wadaet al. 1987), reflecting the variation in sea-surface tem-perature and CO2 in the marine ecosystem (Goericke &Fry 1994). Consequently, this pattern should be re-flected in organisms at higher trophic levels such asseabirds (Quillfeldt et al. 2005, Cherel et al. 2007). Weexpect blood carbon signatures of Cory’s shearwatersto decrease from Selvagens (southern colony) to theAzores (northern colonies) and from shelf systems suchas Berlengas to oceanic environments such as theAzores; (2) during the breeding period, the blood car-bon signature of breeders should change in a pre-dictable manner in response to the different areasexploited by birds (Paiva et al. 2010b). During incuba-tion, we expect adult Cory’s shearwaters to have δ13Cisotopic signatures that are shaped by those of preytaken during their long trips, as food consumed duringshort foraging trips should be masked by the prepon-derance of prey taken during long excursions. This isbecause stable isotopic values obtained from wholeblood are believed to retain information on diet and at-sea foraging habitat selection from a few weeks priorto sample collection (Pearson et al. 2003). While feed-ing chicks, adults increase the number of short tripsbut maintain long excursions for self feeding (Magal-hães et al. 2008). At this time, we expect adults to haveδ13C values that are similar to those during incubation(i.e. mostly shaped by the diet during long trips), asprey captured during short excursions should be
258
Paiva et al.: Foraging ecology of Cory’s shearwaters
mostly delivered to the chicks and not assimilated byadults; (3) because cephalopods collected on regurgi-tations are usually found in an advanced digestionstage (Granadeiro et al. 1998), it is hard to evaluatefrom their beaks whether they are from a recent or apast foraging trip. We considered only fresh beaks (i.e.those with attached flesh or with still undigested trans-parent chitin) to belong to the current trip. By usingstable isotope mixing models (Phillips & Gregg 2003),we aim to quantify the relative importance of cephalo-pods in the diet of Cory’s shearwaters.
MATERIALS AND METHODS
Between 2006 and 2008, we deployed data loggerson Cory’s shearwaters breeding in different colonies ofthe North Atlantic (see Fig. 1) to track their move-ments, foraging behaviour and the location of their for-aging grounds. After returning from the foraging trip,each tracked individual was subjected to direct dietsampling (regurgitation of stomach content) and col-lection of ~100 µl of blood for stable isotope analysis.This work was performed on 15 ind. campaign–1 and 1foraging trip animal–1 during both the incubation andthe chick-rearing periods (Table 1). Colonies targetedby this study are located in distinct environments.Corvo (COR), Faial (FAI), Sta. Maria (SMA) and Deser-tas (DES) are located in an oceanic environment (i.e.islands within a short continental shelf of ≤200 mdepth). Berlengas (BER) is situated in a neritic areawithin the large Portuguese continental shelf system,and Selvagens (SEL) is located in an oceanic area (alsowith a short continental shelf) but at a closer distancefrom a large shelf system (the African coast) than theother oceanic islands.
Diet collection and identification. Prey items weresampled immediately after blood collection to ensure
that isotopic signatures of prey were more represen-tative of synthesized blood tissue (Inger & Bearhop2008). Food samples were obtained using the ‘wateroff-loading technique’, which involved pumping of saltwater to the bird’s stomach, causing regurgitation(Wilson 1984). Whenever possible, adults were sam-pled within the first hour after sunset to increase theprobability of obtaining undigested remains of foodfrom their stomachs (Granadeiro et al. 1998). Birdswith empty stomachs were not considered in the analy-sis. Samples were then frozen until identification andstable isotope analysis. In the laboratory, fresh preyitems were washed with water, identified and sepa-rated from accumulated items. Some of the identifiableprey samples were prepared for stable isotope analy-sis. Identification of fish prey was based almost totallyon the examination of otoliths and bones (Tuset et al.2008). Crustacean remains were strongly digested andidentification of species was not possible.
Stable isotope analysis. Main food items taken byCory’s shearwaters were analyzed to create a basis forthe interpretation of the isotopic signatures of blood(Cherel et al. 2007). We selected samples from as manydiverse locations as possible because at least the δ13Csignature should vary in the different areas inhabitedby the prey species (Inger & Bearhop 2008). Prior toanalysis, fish samples were carefully inspected to re-move nonmuscle matter (e.g. bone or scales in fish tis-sue), in order to remove inorganic carbonates that areless negative in δ13C than other fractions (DeNiro &Epstein 1978). Doing so eliminates the need to useacidification methods, which could positively skew thenitrogen isotopic signature of tissues (Bunn et al. 1995)due to leaching of organic nitrogen from compounds(e.g. nucleic acids and amino acids; Goering et al.1990, Pinnegar & Polunin 2002). Muscle samples werecut into the smallest pieces possible and lipids wereextracted from prey samples using 5 repeated rinses
259
Place Colony Date Reproductive phase Trip duration (d) Mean ± SD (range)
Faial (FAI) Capelo June 2006 Incubation 7.7 ± 4.5 (1 to 14)Desertas (DES) Deserta grande July 2006 Incubation 8.1 ± 6.2 (1 to 19)Faial Capelo August 2006 Chick rearing 3.9 ± 3.5 (1 to 11)Berlengas (BER) Berlenga September 2006 Chick rearing 2.6 ± 1.4 (1 to 5)Berlengas Berlenga June 2007 Incubation 2.5 ± 6.9 (1 to 16)Sta. Maria (SMA) Vila islet July 2007 Incubation 7.4 ± 6.9 (1 to 16)Corvo (COR) Corvo August 2007 Chick rearing 5.4 ± 4.9 (1 to 14)Berlengas Berlenga September 2007 Chick rearing 1.2 ± 0.6 (1 to 3)Selvagens (SEL) Selvagem grande August 2008 Chick rearing 4.0 ± 3.1 (1 to 9)
Table 1. Calonectris diomedea. Breeding location, date of study and reproductive phase for the different populations subjectedto tracking, blood collection and diet sampling (N = 15 ind. for all study colonies). The same individuals were subjected to all
3 procedures; diet and blood samples were collected at the end of the foraging excursion
Mar Ecol Prog Ser 410: 257–268, 2010
(10 min duration) of 2:1 chloroform:methanol prior toanalysis (Hobson & Clark 1992, Kojadinovic et al.2008). Because lipid extraction would also change theδ15N isotope signature, we analyzed separate samplesof each of the main species for δ13C (subjected to lipidextraction) and δ15N (without lipid extraction) isotopes(Kojadinovic et al. 2008). Between rinses, sampleswere centrifuged for 5 min at 800 g. The supernatantcontaining the lipids was then discarded, whereas thepellet was dried on an aluminum plate for 48 h at 60°C.Consistently lower C:N values of the lipid-deficientsamples in relation to bulk samples and similar C:Nratios between prey species indicated that lipid extrac-tion following the described method was sufficientlyefficient for all different prey samples (Kojadinovich etal. 2008). Whole blood was dried in an aspirating hoodfor 48 h at 60°C for ethanol evaporation, as lipids inblood have been proven to be negligible (Bearhop etal. 2000, Cherel et al. 2005a). Both samples of bloodand prey items were then ground into a homogeneouspowder (Das et al. 2003), with all utensils beingcleaned with ethanol after the processing of each sam-ple to avoid cross contamination. Stable carbon andnitrogen isotope analyses were carried out on 0.41 ±0.03 mg (range: 0.32 to 0.49) subsamples that wereplaced in tin cups. Isotopic ratios were determined bycontinuous-flow isotope-ratio mass spectrometry (CF-IRMS). Results are presented conventionally as δ val-ues (‰) relative to Pee Dee Belemnite (PDB) for δ13C,and atmospheric nitrogen (N2) for δ15N.
Tracking devices. We ringed and collected biometricmeasures from all birds that were used for loggerdeployments. Biometric measures included body mass,wing length, tarsus length, head and bill length (fromthe tip of the bill to the back of the head), culmen,gonys and bill depth. These measures were used in adiscriminant function as described by Granadeiro(1993) to determine the sex of individuals. Dead-reck-oning devices (i.e. compass-temperature loggers orcompass-Tlog, earth & OCEAN Technologies) wereattached with Tesa tape (Wilson et al. 1997) to the 4central tail feathers. Attachment of tags took <10 minand birds were immediately returned to their nest.Overall, tags and attachment tape weighed ~15 g,which was approximately 1.7 to 2.5% of bird bodyweight. After retrieval of devices, birds were alwaysweighed, as birds should gain weight either to relievetheir mate on the nest (incubation period) or to feedtheir chick (chick-rearing period). During the incuba-tion period, 50 birds were again weighed on the dayafter logger removal to obtain a better measure ofassimilated mass: 93% of the birds increased in weight(mean: 18.1 g, range: 9 to 53 g). On Berlengas, duringthe chick-rearing period of 2007, birds carrying log-gers had a similar weight increment (N = 15; 90.3 ±
22.7 g) as those without loggers (N = 20; 86.1 ± 33.4 g;t46 = 0.82, p = 0.5). Moreover, fledging success of birdswith or without loggers was similar (83.3%, N = 28 vs.84.1%, N = 20).
Intervals for collection of data on bearings and air orwater temperature by tracking data loggers were setbetween 1 to 4 s for the chick-rearing period (memorylasted for 4 to 12 d), and 5 to 6 s for the incubationperiod (memory lasted for 20 to 24 d). The accuracy ofthese devices was not validated with GPS loggers, butresults from a contemporary work made with GPS log-gers in Corvo, Berlengas and Selvagens revealed simi-lar track patterns and main foraging areas for neigh-bouring Cory’s shearwaters (Paiva et al. 2010d).Moreover, recent studies showed good results on thereconstructed excursions of common guillemots (Thax-ter et al. 2008). The software MT-Comp v6 (JensenSoftware System) was used for track reconstruction,enabling the discrimination between flight, swim andfeeding events using a dead-reckoning technique(Antonia et al. 1995, Wilson et al. 2007). The routestaken by Cory’s shearwaters were reconstructed usingthe archived directional information together withtheir speed (general cruising speed for Cory’s shear-water = 10 m s–1; Paiva et al. 2010c), and the directionalinformation was converted into a vector. From thedirection and speed information, vectors for each sub-sequent data point were calculated and strung to-gether to reconstruct the full foraging track. We know3 main sources of error to influence the difference be-tween the start and end point positions (i.e. the colonylocation) in a raw reconstructed track, namely (1) set-ting a mean flight speed, which assumes that the birdalways travels at the same speed, when there is actualvariation along the track; (2) setting the speed to 0 ms–1 when the birds are resting at the water surface,when there is actually some motion associated withsurface currents; and (3) the wind information that isinitially not set in the software but when entered im-proves the shape of the track by significantly adjustingthe end position to the colony of origin. In order tominimize wind drift error, especially for trips lastingseveral days, we added wind speed and directioninformation to the MT-Comp software for track re-construction. Daily composites of wind characteris-tics were obtained from http://cersat.ifremer.fr/data/discovery/by_parameter/ocean_wind/mwf_quikscat.Details of the steps used for track reconstruction can befound in Paiva et al. (2010b). Dive events were identi-fied as sudden changes in the temperature sensor datathat were accompanied by peaks of activity in the com-pass registry. Doubtful registries of potential diveswere always discarded and considered as in-waterperiods. More details on interpretation of bird behav-iour from this brand of devices are available in Thaxter
260
Paiva et al.: Foraging ecology of Cory’s shearwaters
et al. (2008). Diving locations of birds at sea were exa-mined using the Animal Movement Extension Arc-View GIS (Hooge & Eichenlaub 1997), applying fixedkernel density (FKD) estimates with least-squarescross validation (Worton 1989, Beisiegel & Mantovani2006). We considered the 50% FKD estimates to re-present the core area of diving activity (i.e. feedingactivity). To characterize the marine environmentsexploited by Cory’s shearwaters while foraging, bathy-metry and chl a were respectively obtained from www.ngdc.noaa.gov/mgg/global/global.html and http://oceancolor.gsfc.nasa.gov/.
Statistical procedures. Normality (Kolmogorov-Smirnov test) and homoscedasticity (Levene’s test) ofthe data were verified before each statistical test. Be-cause the sampling effort was not even between popu-lations (i.e. some populations were sampled only dur-ing incubation, while others during incubation andchick rearing, for example), analyses of δ13C and δ15Nstable isotope segregation between populations wereperformed using Generalized Linear Mixed Models(GLMMs, Faraway 2006). Bird identity nested withinisland was included in all models as a random term.The GLMM used a quasi-Poisson error distributionwith a logarithmic link function for the count data(Schall 1991). Two separate GLMMs tested the isotopicsegregation of populations sampled during the incuba-tion (FAI, SMA, BER and DES) and chick-rearing(COR, FAI, BER, SEL) phases. A third GLMM testedthe main and interaction effects of population (BER orFAI) and breeding phase (incubation and chick rear-ing) on the isotopic segregation of birds. Initially, sexand trip type (i.e. long or short trips) were tested as fac-tors but both variables were dropped from all modelsdue to their lack of significance (all models: p > 0.14and p > 0.09, respectively). Between year (chick-provi-sioning period – 2006 and 2007) differences in isotopicsignatures were also tested for the population of BERusing GLMMs, with bird identity being nested withinyear as a random term. Thereafter, only the values ofBER 2007 were used to analyze isotopic segregationamong populations. Spearman correlations between(1) latitude and blood δ13C isotopic signature; (2) lati-tude and blood δ15N values; and (3) blood δ15N signa-ture and proportion of fish in the diet were calculated.GLMMs were used to (1) inspect differences in theδ15N values among main prey items of the birds’ diet;and (2) test for differences in the δ15N signature of eachprey between breeding sites. If the same prey speciesshare similar δ15N signature for the different colonies,direct comparisons of the birds’ trophic levels (i.e.blood δ15N signature) among colonies is possible. Allmodels included prey species nested within island (i.e.the breeding site where the diet item was collected) asa random term. Chi-square tests were used to investi-
gate differences in the numerical frequency of themain prey in the diet of Cory’s shearwaters betweenshort and long trips. All analyses were performedusing the R software (version 2.9.2, R DevelopmentCore Team 2009) with a significance level of p < 0.05.Means are presented with their SDs.
Two-source stable isotope mixing models. To deter-mine the isotopic contribution of the 2 main foodsources (fish and cephalopods) to the birds’ blood tis-sue, we constructed mixing models using the programISOSOURCE (Phillips & Gregg 2003). These modelsgenerate the relative contributions of fish and cephalo-pods in the birds’ diet composition. To apply these mod-els, isotopic values for food items must be adjusted tothe trophic level of consumers by using specific enrich-ment factors (Gannes et al. 1998). Based on the litera-ture, we applied mean respective enrichment factors of2.7 and –0.9‰ to δ15N and δ13C values between fishspecies and whole blood of birds (Cherel et al. 2005a).Since no isotope fractionation value between cephalo-pods and whole blood of seabirds is available in the lit-erature, we applied values based on birds (N = 9, fromdifferent places) whose diet was almost exclusivelycomposed of cephalopods. Thus, we used 2.5 and 0.1‰as δ15N and δ13C fractionation values, respectively. Wedeveloped 4 isotopic mixing models for populationssampled during chick rearing. Because diet samplescollected during chick rearing are expected to be lessdigested (due to the higher number of short trips), thecomparison of diet proportions estimated by the modeland those obtained in diet samples during chick rearingshould be more reliable. Each model was constructedusing isotopic values from diet samples (N = 8 to 20)that were obtained only from the specific breeding lo-cation for which the model was developed (e.g. themodel for Berlengas was constructed only with preycollected from Berlengas birds. This should improve theaccuracy of the different isotopic mixing models.
RESULTS
Conventional diet
Overall, the different populations of Cory’s shearwa-ters fed predominantly on fish species, with a diversityvarying from 3 to 5 species between breeding locali-ties, reproductive phases and seasons (Table 2). Acrossthe colonies, fish species maintained their importanceduring both incubation and chick rearing. The domi-nance of Trachurus picturatus (mean numerical fre-quency = 75.7%) as the main prey item for populationsexploiting oceanic environments (COR, FAI, SMAand DES) was evident. Birds exploiting coastal andneritic systems had diets based on Sardina pilchardus
261
Mar Ecol Prog Ser 410: 257–268, 2010
(27.3%), Belone belone (26.1%) and Trachurus trachu-rus (16.2%) for BER birds and Scomber sp. (48.3%) andExocoetus volitans (20.3%) for SEL birds. Althoughless important than fish, cephalopods comprised up to22.3% (mean = 13.7%) of the numerical frequency,and were therefore considered as a main prey item forall areas. Crustacea had a minor importance in the dietof Cory’s shearwaters, comprising only a maximum of7.4% in Corvo, and was excluded from analysis(Table 2). Moreover, the numerical frequency of themain prey items did not differ between short and longtrips (all p > 0.10). Interestingly, the frequencies ofcephalopods in the diet of adults were always higherafter long trips than after short excursions.
Marine areas exploited by foraging Cory’sshearwaters
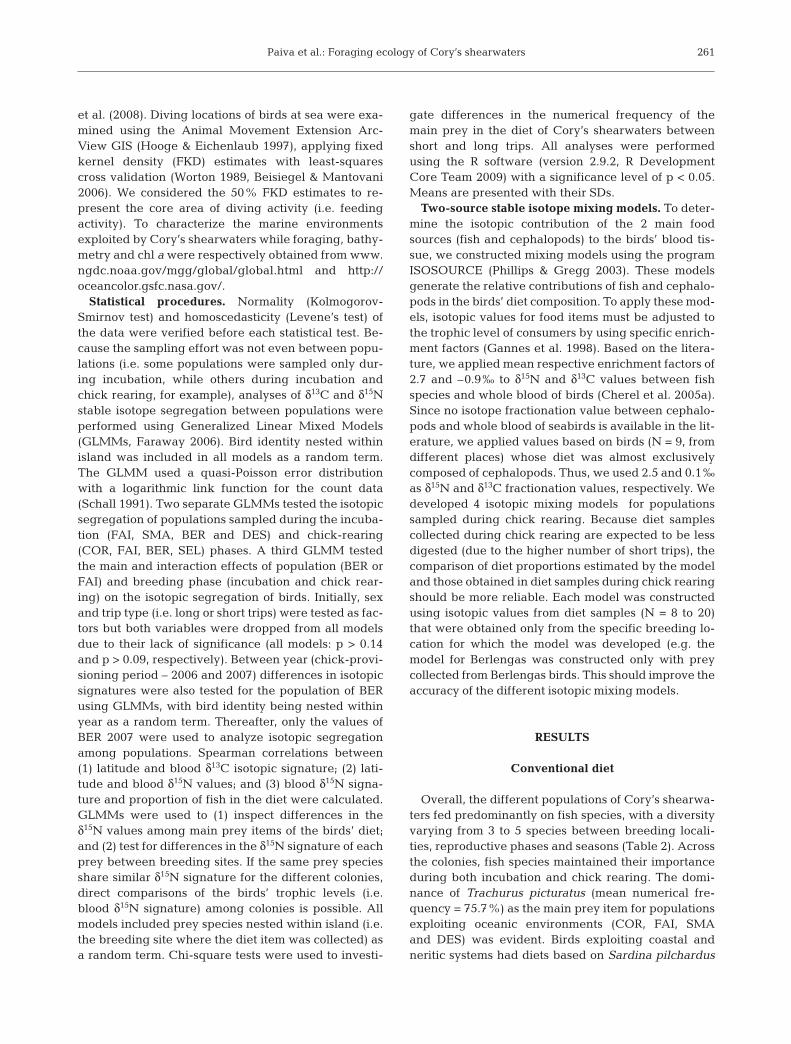
Diverse populations of Cory’s shearwaters showed aclear spatial segregation during foraging excursions,with both habitats close to shore and pelagic environ-ments being exploited. Frequencies of trip durationseparated short (≤4 d) from long (≥5 d) foraging trips inthe different populations. During incubation, the mostrepeated pattern was 1 short trip (mean for all studysites = 1 d) and 1 long trip for several days (mean for allstudy sites = 7 d). Throughout this period, birds fromAzorean populations (FAI, SMA), DES and BER fed inareas north of the Azores, mostly exploiting knownseamount areas and probably a frontal region occur-ring there (Fig. 1). In contrast, during chick rearing,each individual usually alternated 5 short trips (mean
for all study sites = 1 d) with 1 long one (mean for allstudy sites = 6 d). At this phase, habitats exploited bybirds from BER were almost exclusively located closeto the breeding colony, whereas SEL birds alternatedbetween exploiting closer environments and the Afri-can coastal area. Moreover, COR and FAI birds main-tained the exploitation of northern waters, althoughexploited areas were not as distant for FAI birds asthose exploited during incubation (Fig. 1).
Comparison of isotopic signatures betweenincubation and chick rearing
We first constructed GLMMs for the populationswhere both incubation and chick-rearing periods weresampled (i.e. Faial and Berlengas, Table 1). With thisdata, GLMMs explained 19.3 and 58.8% of the originalvariance in δ13C and δ15N signatures. No significant ef-fect of breeding period (F1,58 = 1.38, p = 0.10), popula-tion (F1,58 = 2.01, p = 0.16) or interaction (F1,58 = 3.03,p = 0.24) on the carbon signature of both populationswas observed. However, birds from both populationshad enriched δ15N values during chick rearing relativeto those during incubation (F1,58 = 5.11, p = 0.003), al-though no significant differences were observed be-tween populations when data from the 2 breedingperiods were combined (F1,58 = 2.47, p = 0.12; Fig. 2).Moreover, during both incubation and chick rearing,birds from BER fed on higher trophic level prey thanbirds from FAI (F1,58 = 6.44, p = 0.01).
Since breeding period segregated the trophic levels(i.e. δ15N) of the FAI and BER populations, we con-
262
Trip type Faial S. Maria Corvo Desertas Selvagens BerlengasInc 06 Chick 06 Inc 07 Chick 07 Inc 06 Chick 08 Chick 06 Inc 07 Chick 07
ST LT ST LT ST LT ST LT ST LT ST LT ST LT ST LT ST LT
N 4 11 9 6 3 12 10 5 3 12 8 7 13 2 13 2 12 3N (flushings with food) 3 9 8 6 3 10 9 5 3 10 7 6 12 2 11 2 11 3N (prey items) 15 48 55 29 19 62 33 39 15 47 39 28 40 11 38 17 43 19Prey speciesFish 82.7 77.7 85.8 85.2 81.3 79.1 76.4 76.0 90.0 81.0 90.7 88.7 86.9 84.6 87.3 79.9 88.1 87.7
Trachurus picturatus 77.0 72.8 81.3 82.5 74.4 74.9 65.1 71.9 80.9 71.9 – – – – – – – –Macrorhamphosus sp. – – – – 3.2 2.3 5.7 2.2 – – – – – – – – – –Trachurus trachurus – – – – – – – – – – 9.8 10.2 16.5 17.1 20.0 15.4 14.7 13.3Sardina spp. – – – – – – – – – – 9.0 8.2 31.7 28.4 13.8 11.9 38.6 39.2Belone belone – – – – – – – – 4.3 5.2 – – 28.0 28.9 38.2 38.7 19.7 20.5Scomber sp. – – – – – – – – – – 47.7 48.9 8.8 8.0 11.1 12.0 10.2 9.0Exocoetus volitans – – – – – – – – – – 22.1 18.4 – – – – – –
Other or unidentified fish 5.7 4.9 4.5 2.7 3.7 1.9 5.6 1.9 4.8 3.9 2.1 3.0 1.9 2.2 4.2 1.9 4.9 5.7Cephalopods 17.3 22.3 12.3 13.2 18.7 19.9 14.2 18.7 10.0 19.0 9.3 11.3 11.5 12.9 11.8 20.1 11.9 12.3Crustacea – – 1.9 1.6 – 1.0 9.4 5.3 – – – – 1.6 2.5 0.9 – – –
Table 2. Calonectris diomedea. Numerical frequency (%) of the main prey items composing the stomach content of the different popula-tions feeding in the north Atlantic. Other fish species included Macrorhamphosus sp. and Capros aper for Santa Maria and Corvo. Pagellussp. was also present in the diet of birds (chick rearing) from Faial and Corvo. ST: short trips, LT: long trips, Inc: incubation period, Chick:
chick-rearing period. N: number of individual birds. –: not found in stomach contents on that site
Paiva et al.: Foraging ecology of Cory’s shearwaters
ducted an independent analysis for the populationssampled during incubation (FAI, SMA, BER, DES) andchick rearing (COR, FAI, BER, SEL). During incuba-tion, GLMMs explained 75.3 and 67.2% of the originalvariance in δ13C and δ15N signatures, respectively. Atthis time, birds from BER had similar carbon signaturesas those from FAI, and both had higher signatures thanindividuals from SMA, which had similar levels asbirds from DES (F3,56 = 27.53, p < 0.001; Fig. 2). Basedon blood δ15N values, birds from BER and SMA foragedat a higher trophic level than birds from DES and FAI(F3,56 = 10.45, p < 0.001). Therefore, blood samplestaken during incubation were likely to represent iso-topic signatures of food assimilated during long trips.During chick rearing, the models explained 55.1 and62.9% of the original variance in δ13C and δ15N signa-tures, respectively. Birds from FAI showed similar δ13Csignatures as those of BER, and both had lower signa-tures than SEL birds and higher signatures than CORbirds (F3,56 = 29.33, p < 0.001; Fig. 2). The δ15N valuessegregated populations from BER and COR that hadhigher values than those from SEL and FAI (F3,56 =11.92, p < 0.001). At Berlengas, we found significantdifferences between years (2006 and 2007) during thechick-rearing period for both blood δ13C (–18.87 ± 0.23vs. –18.34 ± 0.13; GLMM: F1,29 = 6.88, p = 0.01, respec-tively) and δ15N (12.87 ± 0.26 vs. 13.34 ± 0.17; GLMM:F1,29 = 5.71, p = 0.02), with values being higher for bothsignatures in 2007 than in 2006.
263
Fig. 1. Calonectris diomedea. Representation of the 50% fixed kernel density estimates for diving locations of short (––––, left)and long (-----, right) foraging excursions. The mean chlorophyll composites (chl a, mg m–3) for all months and years of study(left) and bathymetry (m) of the north Atlantic (right) are also shown, as well as some oceanographic features (i.e. seamountsand banks). MAR: Mid-Atlantic Ridge. 1: Corvo (COR), 2: Faial (FAI), 3: Santa Maria (SMA), 4: Berlengas (BER), 5: Desertas
(DES), 6: Selvagens (SEL). I,C: incubation or chick-rearing. 06, 07,08: sampling year 2006, 2007, 2008
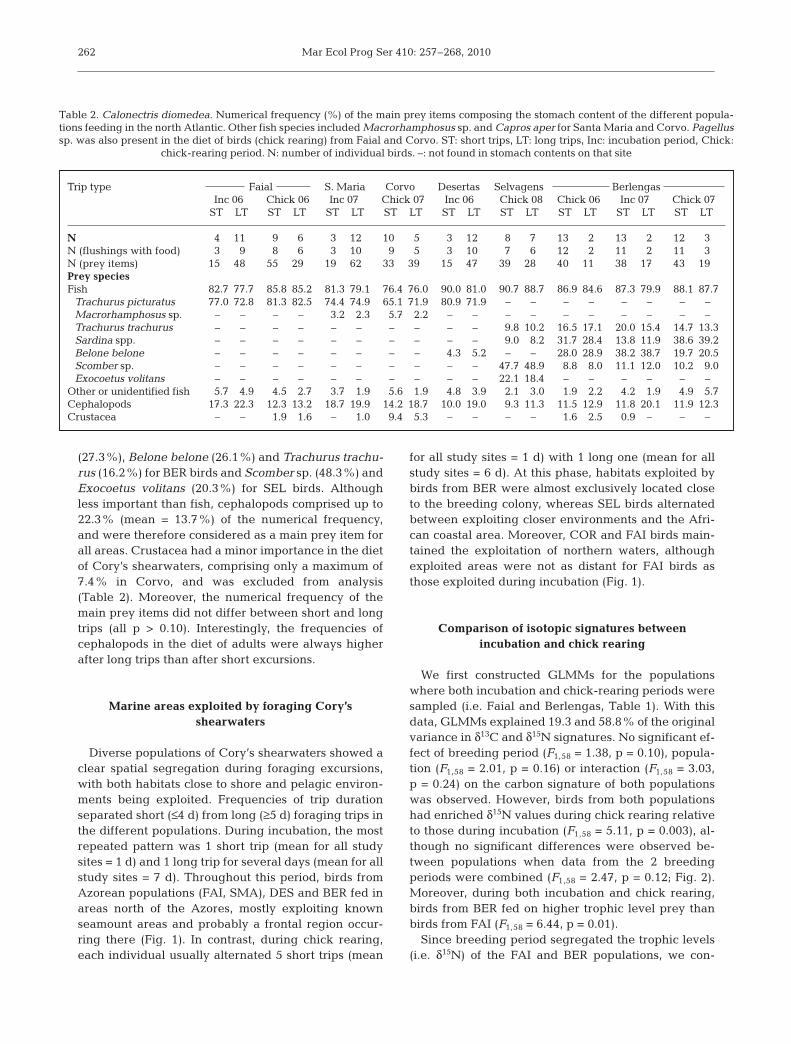
Fig. 2. Calonectris diomedea. Stable isotope ratios of carbon(δ13C) and nitrogen (δ15N) for blood of adult Cory’s shearwa-ters during incubation (h) and chick rearing (m) at sea dis-placements. (d) Isotopic signatures of the main prey items oftheir diet. TRAP: Trachurus picturatus, SCOM: Scomber sp.,SARD: Sardina spp., CEPH: Cephalopod (Mastigoteuthissp.), EXOC: Exocoetus volitans, TRAT: Trachurus trachurus,BELO: Belone belone. Birds from Berlengas performed onlyshort foraging excursions in September 2006. SEL: Sel-vagens, BER: Berlengas, FAI: Faial, COR: Corvo, SMA:Santa Maria, DES: Desertas. Numbers at the end of labels
represent sampling year
Mar Ecol Prog Ser 410: 257–268, 2010
Overall, the isotopic signatures of the different pop-ulations corresponded well with the signatures of theirmain prey items based on the δ15N signature (Fig. 2).Main relationships were between the Trachurus pic-turatus δ13C isotopic signature and blood values ofCOR, SMA and FAI birds. Signatures of BER birdswere related with Sardina pilchardus, Belone belone,Trachurus trachurus and Scomber sp. δ13C signatures.The carbon signature of Exocoetus volitans was onlyrelated with that of SEL birds. Moreover, we found anegative significant correlation between the propor-tion of cephalopods in the diet (in relation to fish) andblood δ15N value (rs = –0.61, p = 0.01, N = 120). On theother hand, main food items of the different popula-tions had different signatures of δ15N (GLMM: F5,51 =4.54, p = 0.003), with the main difference being thelower trophic level of cephalopods in relation to highertrophic positions of fish prey species. When consider-ing the same prey species collected from differentbreeding sites, the nitrogen signature did not differsignificantly for Trachurus picturatus (COR, FAI, SMA,DES; GLMM: F3,33 = 1.98, p = 0.14), Trachurus trachu-rus (BER, SEL; F1,39 = 1.02, p = 0.32), Sardina pilchar-dus (BER, SEL; F1,39 = 2.09, p = 0.16), Scomber sp.(BER, SEL; F1,39 = 2.23, p = 0.14), and cephalopods(COR, FAI, SMA, BER, DES, SEL; F5,56 = 2.14, p = 0.07).This indicates that these different prey share similarδ15N signatures, allowing δ15N signatures of birds to becompared among populations. Overall, the birds’blood and their prey were segregated by their δ15N(GLMM: F5,206 = 9.32, p < 0.0001), with birds havingsignificantly higher values than their prey.
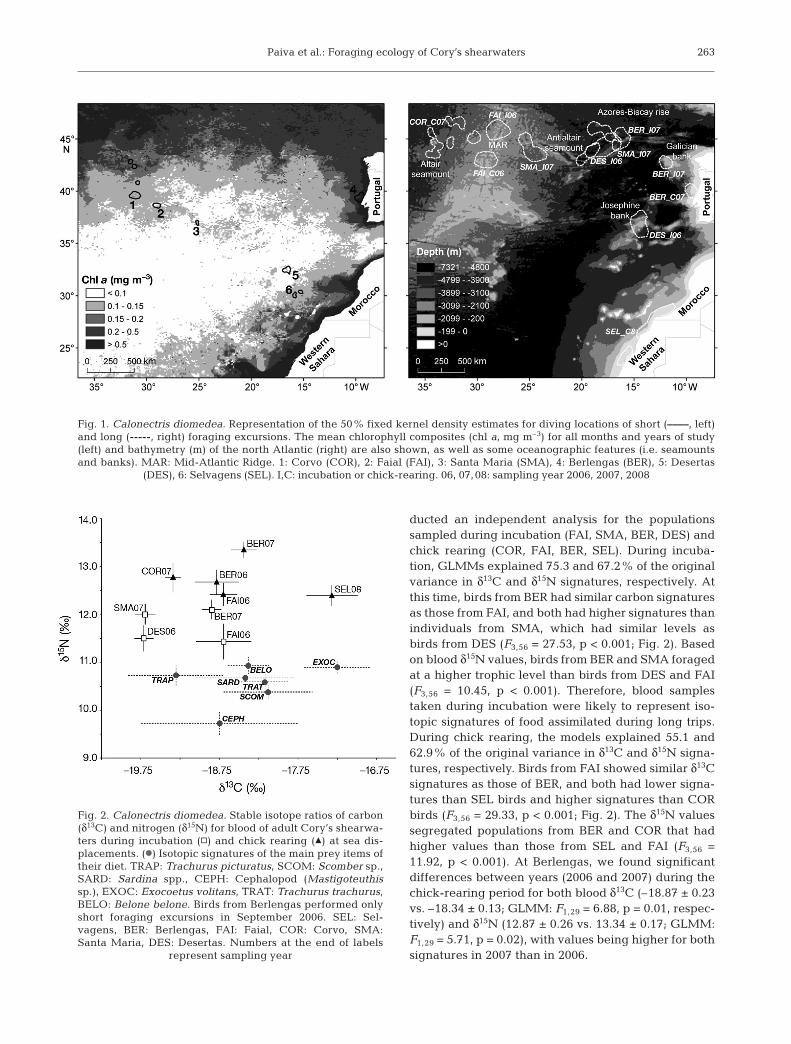
When δ13C values were plotted in relation to latitude,a high negative correlation was obtained (rs = –0.86, p <0.001, N = 9; Fig. 3), reflecting mostly a choice between2 types of feeding grounds: (a) oceanic environmentsand seamount features, which were exploited mostlyduring long trips of incubation, and had lower isotopicvalues, and (b) neritic waters and shelf systems, whichwere exploited mostly during short trips of chick rear-ing, and had higher isotopic values. When the sameplot was used for the blood δ15N signature, it segre-gated birds exploiting neritic waters (related withhigher trophic level prey) from individuals exploitingoceanic environments (related with lower trophic levelprey) (Fig. 3). However, the blood δ15N signature wasnot correlated with the latitude where birds mostly fed(rs = –0.30, p = 0.21, N = 9).
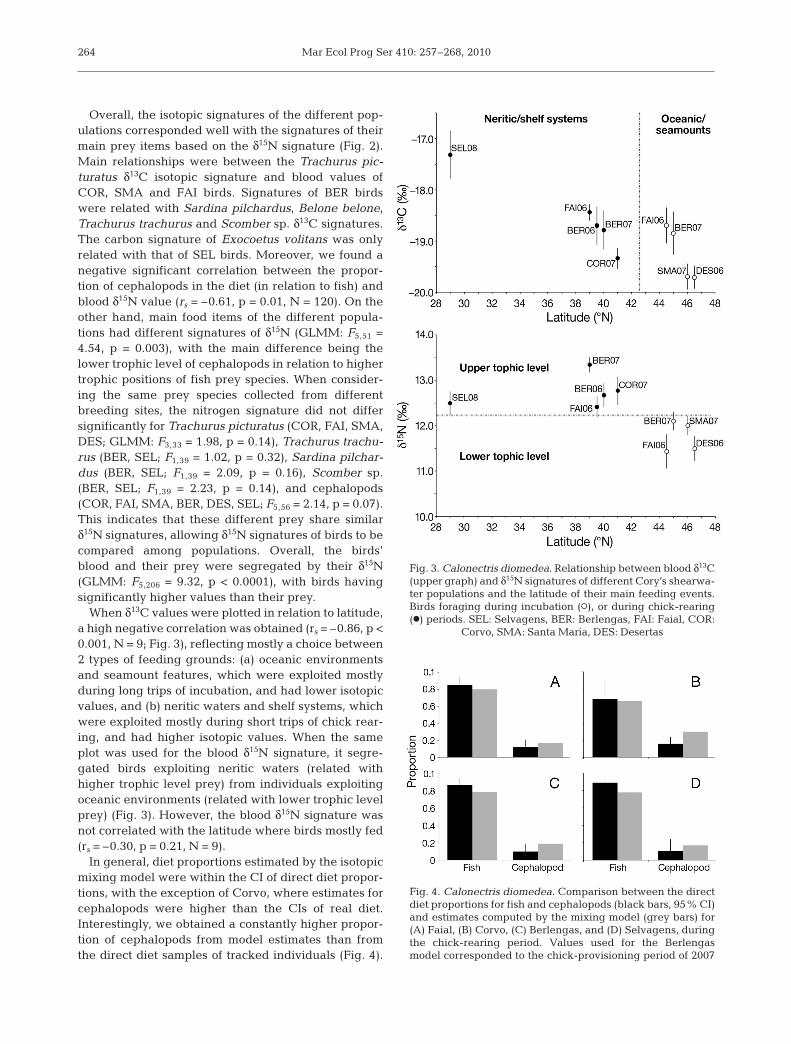
In general, diet proportions estimated by the isotopicmixing model were within the CI of direct diet propor-tions, with the exception of Corvo, where estimates forcephalopods were higher than the CIs of real diet.Interestingly, we obtained a constantly higher propor-tion of cephalopods from model estimates than fromthe direct diet samples of tracked individuals (Fig. 4).
264
Fig. 3. Calonectris diomedea. Relationship between blood δ13C(upper graph) and δ15N signatures of different Cory’s shearwa-ter populations and the latitude of their main feeding events.Birds foraging during incubation (s), or during chick-rearing(d) periods. SEL: Selvagens, BER: Berlengas, FAI: Faial, COR:
Corvo, SMA: Santa Maria, DES: Desertas
Fig. 4. Calonectris diomedea. Comparison between the directdiet proportions for fish and cephalopods (black bars, 95% CI)and estimates computed by the mixing model (grey bars) for(A) Faial, (B) Corvo, (C) Berlengas, and (D) Selvagens, duringthe chick-rearing period. Values used for the Berlengasmodel corresponded to the chick-provisioning period of 2007
Paiva et al.: Foraging ecology of Cory’s shearwaters
DISCUSSION
The feeding and foraging ecology of a north Atlantictop marine predator was studied by combining data onforaging activity derived from compass loggers (i.e.feeding locations), direct diet sampling, and blood δ13Cand δ15N stable isotope analyses of the same individu-als at several breeding places of the north Atlantic.Thus, we illustrated the capacity of blood stable iso-tope signatures to unravel trophic ecological niches ofdifferent populations of a pelagic seabird like theCory’s shearwater in a vast oceanic area. Apart fromdata on diet composition of Cory’s shearwaters breed-ing in the Azores (Granadeiro et al. 1998, Magalhães2007), we present the first data on the feeding ecologyof populations of this species breeding in Berlengas,Desertas and Selvagens archipelagos.
The role of the carbon isotopic tracer in describingforaging choices and at-sea distribution
δ13C values usually segregate the feeding habits ofconsumers in inshore and benthic environments (moreenriched) from those of consumers in offshore andpelagic environments (more depleted) (France 1995,Hobson et al. 2002). Moreover, the relative importanceof the horizontal (inshore–offshore) and the vertical(benthic–pelagic) components ultimately depends onthe sources of carbon influencing the base of the foodweb (Hobson et al. 1994). δ13C signatures also segre-gated our Cory’s shearwater populations exploitingneritic and shelf systems from those feeding in oceanicenvironments (mostly seamounts but also frontal re-gions) in the northern Atlantic waters. However, whenthe foraging habitat of consumers is homogeneous, theability of δ13C to segregate between inshore and off-shore foraging choices seems to be compromised, suchas in tropical environments (Catry et al. 2008). On theother hand, our data show a negative correlationbetween blood δ13C signature and latitude, thus prob-ably reflecting δ13C patterns at the base of the foodweb and consequently, in the entire food chain. Basedon our results, the δ13C signature of Cory’s shearwatersfeeding in the North African coast increased with de-creasing latitude (Navarro et al. 2007). Moreover, thecarbon isotope signature of feathers of Cory’s shear-waters was significantly lower on birds from Sta. Maria(Azores) than on those breeding on Canarias (Ramos etal. 2009a), and on birds in the Atlantic region than onthose from the Mediterranean areas (Ramos et al.2009b). Following the previous rationale, individualsexploiting the same area should possess identical car-bon signatures. In fact, this was confirmed, for exam-ple, by the overlapping feeding areas and signatures of
birds from DES and SMA during incubation (Fig. 1),when both were feeding in the Azores-Biscay rise areaand on a frontal region. Nevertheless, highest values ofcarbon signatures in our study were found for the pop-ulations of SEL and BER that exploited the coastal sys-tems of the African and Portuguese shelves, respec-tively. This is likely due to the enhanced primaryproduction in SEL and BER (Davenport et al. 2002,Sousa et al. 2008) that probably increased the δ13C val-ues of zooplankton and phytoplankton, δ13C being pos-itively correlated with productivity (Laws et al. 1995).Therefore, the effect of the strong primary productivityalong the neritic areas of SEL and BER may be camou-flaging the effect of latitude. Thus, we cannot deter-mine which of the 2 gradients (latitude or productivity,or a combination of both) is shaping the carbon signa-tures of predators in the north Atlantic. Further studiesare needed in order to disentangle this issue.
The influence of breeding period on carbon isotopicsegregation
During the incubation period, birds retained in theirblood the δ13C isotopic signatures of prey caught in themost distant feeding areas (i.e. feeding areas of longtrips). Because the turnover of whole blood is relativelyquick (i.e. a few weeks; Pearson et al. 2003) and birdsonly engaged in 1 daily trip before their long (severaldays) foraging displacements, this was an expectedresult for most of the populations. While chick rearing,Faial birds maintained the carbon signature they hadduring incubation. Another expectation that was veri-fied was the similarity of the carbon signature of Faialbirds during incubation and chick rearing. Indeed,birds increased the number of short trips to feed theirchicks but maintained long excursions for self feeding.However, the blood carbon signature of birds fromBER was different between incubation and chick rear-ing. Here the number of short trips was high even dur-ing incubation, with 80% of birds exploiting the Portu-guese continental shelf and 20% travelling to northernareas to exploit seamounts and frontal regions. Fur-thermore, BER birds had higher δ13C signatures duringchick rearing than during incubation. This means thatbirds fed on at least some of the same species that theydelivered to their chicks, reflecting the different iso-topic trophic niches exploited during short trips ofchick rearing and long trips of incubation. Cherel et al.(2007) reported that short-tailed shearwaters (Puffinustenuirostris) performing short trips had similar δ13Cvalues as those returning from long excursions, butbirds made 2 consecutive short trips after each longtrip in their study. However, as Cory’s shearwatersusually performed 5 short daily trips after a long trip,
265
Mar Ecol Prog Ser 410: 257–268, 2010
their carbon signature would more likely represent anaverage value that is between values of food acquiredduring short and long trips. Besides, the different pop-ulations of Cory’s shearwaters captured higher trophiclevel prey during the chick-provisioning period thanduring the incubation phase. Because the adult bloodδ15N was constantly higher during chick feeding thanduring incubation, we may argue that adults targetedhigher-quality food to feed their chicks. Indeed, thisstrategy is used by other seabird species, such as theAdélie penguins (Pygoscelis adeliae; Cherel 2008) andlittle terns (Sternula albifrons; Paiva et al. 2006). How-ever, the diet composition of Faial and Berlengas birdschanged little between breeding periods (incubationvs. chick rearing).
Are cephalopods being underestimated in diet sampling?
Overall, the nitrogen isotopic signature segregatedpopulations that were feeding mostly on prey ofhigher trophic level when foraging in neritic systems,from populations assimilating lower trophic level preywhen feeding in oceanic systems (mainly seamountareas). Scavenging on fisheries discards by this spe-cies (Valeiras 2003) may also contribute to the lowernitrogen levels of individuals. We realize that the for-aging behaviour and diet of Cory’s shearwaters maybe influenced by fishery activity (Bartumeus et al.2010), but we did not find clear evidence of birdsfeeding on discards, i.e. all items found in prey sam-ples appeared to be caught naturally. Direct relation-ships between blood carbon signatures of birds andthose of their main prey have been reported for sev-eral seabird species (e.g. Cherel et al. 2005a, 2005b),suggesting a direct influence of prey trophic level inshaping consumer trophic position (Inger & Bearhop2008). This was also observed in our study, where thedifferent populations of Cory’s shearwaters had simi-lar carbon signatures as their main prey species.Because the trophic level (nitrogen isotope) was simi-lar among pelagic fish species, and lower than that ofcephalopods, an increasing proportion of cephalopodsin the birds’ diet should decrease the blood δ15N. Thisfact should partly explain the negative correlationbetween the proportion of cephalopods in the diet andthe blood δ15N signature. The highest number oferoded cephalopod beaks was collected during theincubation period (V. H. Paiva unpubl. data) whenlong trips were more common. Moreover, cephalopodbeaks that were obtained from stomach flushing ofthe birds were usually much eroded, and we consid-ered them to be from old foraging trips (Granadeiro etal. 1998). This should lead to an underestimation of
cephalopods in the diet, which is a plausible explana-tion for the higher blood nitrogen values during thechick-rearing than during the incubation period.Moreover, results from the stable isotope mixing mod-els always estimated higher proportions of cephalo-pods, highlighting the potential underestimation ofcephalopods in the diet of adult birds. On the otherhand, the difference in the δ15N signature betweenthe birds’ blood and their prey encompasses only 1trophic level (~3.3‰; McCutchan et al. 2003), sug-gesting that the described diet composition (Table 2)indeed represented the main prey items of the birds.
CONCLUSIONS
Overall, the present work illustrates how a topmarine predator like the Cory’s shearwater exploitsdifferent habitats and trophic niches in coastal andpelagic areas of the north Atlantic. We showed thatδ13C and δ15N stable isotope signatures could trace andsegregate foraging niches of upper trophic level pre-dators in the north Atlantic. (1) The blood δ13C signa-ture was negatively correlated with the latitude ofmain feeding locations, and segregated individualsfeeding in neritic and shelf systems from those feedingin oceanic and seamount areas. (2) The blood nitrogensignature clearly segregated populations feeding onupper trophic level prey from those exploiting lowertrophic level items, with cephalopods playing a role inshaping lower nitrogen signatures. The spatial segre-gation and diet composition heterogeneity betweenpopulations of the same region might be a strategy toreduce competition for space and resources. This mayexplain how seabirds can coexist within a region,although further studies are needed. (3) Findings ofthis study may have a broader relevance to the study offoraging ecology of other upper trophic level predatorsin the north Atlantic region.
Acknowledgements. V.H.P. acknowledges the support givenby ‘Fundação para a Ciência e Tecnologia’ (Portugal, SFRH /BD / 21557 / 2005). This work was logistically supported bythe LIFE Project Marine Important Bird Areas founded by theE.U. and conducted by the ‘Sociedade Portuguesa para oEstudo das Aves’ (BirdLife International partner in Portugal).We thank the following institutions and colleagues for logisti-cal support in the different study sites: the National Con-servation and Biodiversity Institution (ICNB), especially thewardens of the Berlengas Natural Reserve; the Regional Sec-retary for the Environment and Sea (SRAM), P. Dominguesand J. Bried for the work in Corvo, Faial and Sta. Maria(Azores); and the Madeira Natural Park for the work in Sel-vagens and Desertas archipelagos (Madeira). C. Paiva and E.Rodrigues provided help in the laboratory; and three anony-mous referees made valuable comments on a draft version ofthe manuscript.
266
Paiva et al.: Foraging ecology of Cory’s shearwaters
LITERATURE CITED
Antonia L, Antonia P, Benvenuti S, Ioale P, Massa B,Bonadonna F (1995) The homing behaviour of Cory’sshearwaters (Calonectris diomedea) studied by means of adirection recorder. J Exp Biol 198:359–362
Baduini CL, Hyrenbach D (2003) Biogeography of procellari-iform foraging strategies: Does ocean productivity influ-ence provisioning? Mar Ornithol 31:101–112
Barrett RT, Camphuysen KJ, Anker-Nilssen T, Chardine JWand others (2007) Diet studies of seabirds: a review andrecommendations. ICES J Mar Sci 64:1675–1691
Bartumeus F, Giuggioli L, Louzao M, Bretagnolle V, Oro D,Levin SA (2010) Fishery discards impact on seabird move-ment patterns at regional scales. Curr Biol 20:215–222
Bearhop S, Teece MA, Waldron S, Furness RW (2000) Influ-ence of lipid and uric acid on δ13C and δ15N values of avianblood: implications for trophic studies. Auk 117:504–507
Bearhop S, Adams CE, Waldron S, Fuller RA, Macleod H(2004) Determining trophic niche width: a novel approachusing stable isotope analysis. J Anim Ecol 73:1007–1012
Beisiegel BM, Mantovani W (2006) Habitat use, home rangeand foraging preferences of the coati Nasua nasua in apluvial tropical Atlantic forest area. J Zool (Lond) 269:77–87
Bunn SE, Loneragan NR, Kempster MA (1995) Effects of acidwashing on stable isotope ratios of C and N in penaeidshrimp and seagrass: implication for food web studiesusing multiple stable isotopes. Limnol Oceanogr 40:622–625
Catry T, Ramos JA, Le Corre M, Kojadinovic P, Bustamante P(2008) The role of stable isotopes and mercury concentra-tions to describe seabird foraging ecology in tropical envi-ronments. Mar Biol 155:637–647
Cherel Y (2008) Isotopic niches of emperor and Adélie pen-guins in Adélie Land, Antarctica. Mar Biol 154:813–821
Cherel Y, Hobson KA, Hassani S (2005a) Isotopic discrimina-tion between food and blood and feathers of captive pen-guins: implications for dietary studies in the wild. PhysiolBiochem Zool 78:106–115
Cherel Y, Hobson KA, Weimerskirch H (2005b) Using stableisotopes to study resource acquisition and allocation inprocellariiform seabirds. Oecologia 145:533–540
Cherel Y, Hobson KA, Guinet C, Vanpé C (2007) Stable iso-topes document seasonal changes in trophic niches andwinter foraging individual specialization in diving pre-dators from the Southern Ocean. J Anim Ecol 76:826–836
Das K, Lepoint G, Leroy Y, Bouquegneau JM (2003) Marinemammals from the southern North Sea: feeding ecologydata from δ13C and δ15N measurements. Mar Ecol Prog Ser263:287–298
Davenport R, Neuer S, Helmke P, Perez-Marrero J, Llinas O(2002) Primary productivity in the northern Canary Islandsregion as inferred from SeaWiFS imagery. Deep-Sea Res II49:3481–3496
DeNiro MJ, Epstein S (1978) Influence of diet on the distribu-tion of carbon isotopes in animals. Geochim CosmochimActa 42:495–506
Faraway JJ (2006) Extending the linear model with R: gener-alized linear, mixed effects and nonparametric regressionmodels. Chapman & Hall/CRC, Boca Raton, FA
France R (1995) Critical examination of stable isotope analysisas a means for tracing carbon pathways in stream eco-systems. Can J Fish Aquat Sci 52:651–656
Furness RW (1994) An estimate of the quantity of squid con-sumed by seabirds in the eastern North Atlantic andadjoining seas. Fish Res 21:165–177
Gannes LZ, del Rio CM, Koch HP 1998. Natural abundancevariations in stable isotopes and their potential uses in ani-mal physiological ecology. Comp Biochem Physiol A 119:725–737
Goericke R, Fry B (1994) Variations of marine plankton δ13Cwith latitude, temperature, and dissolved CO2 in the worldocean. Global Biogeochem Cycles 8:85–90
Goering J, Alexander V, Haubenstock N (1990) Seasonal vari-ability of stable carbon and nitrogen isotope ratios oforganisms in a North Pacific bay. Estuar Coast Mar Sci 30:239–260
Granadeiro JP (1991) The breeding biology of Cory’s shear-water Calonectris diomedea on Berlenga Island, Portugal.Seabird 13:30–39
Granadeiro JP (1993) Variation in measurements of Cory’sshearwater between populations and sexing by discrimi-nant analysis. Ringing Migr 14:103–112
Granadeiro JP, Monteiro LR, Furness RW (1998) Diet andfeeding ecology of Cory’s shearwater Calonectrisdiomedea in the Azores, north-east Atlantic. Mar EcolProg Ser 166:267–276
Hobson KA, Clark RG (1992) Assessing avian diets using sta-ble isotopes. I. Turnover of 13C in tissues. Condor 94:181–188
Hobson KA, Piatt JF, Pitocchelli J (1994) Using stable isotopesto determine seabird trophic relationships. J Anim Ecol 63:786–798
Hobson KA, Gilchrist G, Falk K (2002) Isotopic investigationsof seabirds of the North Water Polynya: contrastingtrophic relationships between the eastern and westernsectors. Condor 104:1–11
Hodum PJ, Hobson KA (2000) Trophic relationships amongAntarctic fulmarine petrels: insights into dietary overlapand chick provisioning strategies inferred from stable-iso-tope (d15N and d13C) analyses. Mar Ecol Prog Ser 198:273–281
Hofmann M, Wolf-Gladrow DA, Takahashi T, Sutherland SC,Six KD, Maier-Reimer E (2000) Stable carbon isotope dis-tribution of particulate organic matter in the ocean: amodel study. Mar Chem 72:131–150
Hooge PN, Eichenlaub B (1997) Animal movement extensionto Arcview, ver. 1.1. Alaska Science Center - BiologicalScience Office, US Geological Survey, Anchorage, AK
Inger R, Bearhop S (2008) Applications of stable isotopeanalyses to avian ecology. Ibis 150:447–461
Kojadinovic J, Richard P, Le Corre M, Cosson RP, BustamanteP (2008) Effects of lipid extraction on δ13C and δ15N valuesin seabird muscle, liver and feathers. Waterbirds 31:169–178
Laws EA, Popp BN, Bidigare RR, Kennicutt MC, Macko SA(1995) Dependence of phytoplankton carbon isotopic com-position on growth rate and [CO2]aq: theoretical consider-ations and experimental results. Geochim CosmochimActa 59:1131–1138
Magalhães MC (2007) Foraging ecology of Cory’s shearwa-ters in the Azores Islands. PhD thesis, University of Leeds
Magalhães MC, Santos RS, Hamer KC (2008) Dual-foragingof Cory’s shearwaters in the Azores: feeding locations,behavior at sea and implications for food provisioning ofchicks. Mar Ecol Prog Ser 359:283–293
McCutchan JH, Lewis WM, Kendall C, McGrath CC (2003)Variation in trophic shift for stable isotope ratios of carbon,nitrogen, and sulfur. Oikos 102:378–390
Michener RH, Schell DM (1994) Stable isotope ratios as trac-ers in marine aquatic food webs. In: Lajtha K, MichenerRH (eds) Stable isotopes in ecology and environmental sci-ence. Blackwell Scientific Publications, Oxford, p 138–157
267
Mar Ecol Prog Ser 410: 257–268, 2010
Minagawa M, Wada E (1984) Stepwise enrichment of 15Nalong food chains: further evidence for the relation be-tween 15N and animal age. Geochim Cosmochim Acta 48:1135–1140
Monteiro LR, Ramos JA, Furness RW, del Nevo AJ (1996)Movements, morphology, moult, diet and feeding of sea-birds in the Azores. Colon Waterbirds 19:82–97
Mougin JL, Jouanin C, Roux F (1988) Le calcul de la durée desperiodes d’incubation chez le Puffin cendré Calonectrisdiomedea borealis de l’ile Selvagem Grande (30° 09’ N,15° 52’ W). Cyanopica 4:155–165
Navarro J, Gonzalez-Solis J, Viscor G (2007) Nutritional andfeeding ecology in Cory’s shearwater Calonectris dio-medea during breeding. Mar Ecol Prog Ser 351:261–271
Navarro J, Forero MG, González-Solís J, Igual JM, Bécares J,Hobson KA (2009) Foraging segregation between twoclosely related shearwaters breeding in sympatry. BiolLett 5:545–548 doi:10.1098/rsbl.2009.0150
Paiva VH, Ramos JA, Catry T, Pedro P, Medeiros R, Palma J(2006) Influence of environmental factors and energeticvalue of food on little tern Sterna albifrons chick growthand food delivery. Bird Study 53:1–11
Paiva VH, Geraldes P, Ramírez I, Meirinho A, Garthe S,Ramos JA (2010a) Plasticity of a pelagic seabird speciesforaging along a marine productivity gradient. Mar EcolProg Ser 398:259–274
Paiva VH, Geraldes P, Ramírez I, Meirinho A, Garthe S, RamosJA (2010b) Oceanographic characteristics of areas used byCory’s shearwaters during short and long foraging trips inthe North Atlantic. Mar Biol 157:1385–1399
Paiva VH, Guilford T, Meade J, Geraldes P, Ramos JA, GartheS (2010c) Flight dynamics of Cory’s shearwater foraging ina coastal environment. J Zool 113:47–56
Paiva VH, Geraldes P, Ramirez I, Ramos JA, Garthe S (2010d)How area restricted search of a pelagic seabird changeswhile performing a dual foraging strategy. Oikos. doi:10.1111/j.1600-0706.2010.18294.x
Pearson SF, Levey DJ, Greenberg CH, del Rio CM (2003)Effects of elemental composition on the incorporation ofdietary nitrogen and carbon isotopic signatures in anomnivorous songbird. Oecologia 135:516–523
Phillips DL, Gregg JW (2003) Source partitioning using stableisotopes: coping with too many sources. Oecologia 136:261–269
Pinnegar JK, Polunin NVC (2002) Differential fractionation ofδ13C and δ15N among fish tissues: implications for thestudy of trophic interactions. Funct Ecol 13:225–231
Post DM (2002) Using stable isotopes to estimate trophic posi-tion: models, methods, and assumptions. Ecology 83:703–718
Quillfeldt P, McGill RAR, Furness RW (2005) Diet and forag-ing areas of Southern Ocean seabirds and their preyinferred from stable isotopes: review and case study ofWilson’s storm-petrel. Mar Ecol Prog Ser 295:295–304
R Development Core Team (2009) R: a language and environ-
ment for statistical computing. R Foundation for StatisticalComputing, Vienna, Austria, available at www.R-project.org.
Ramos R, González-Solís J, Forero MG, Moreno R, Gómez-Díaz E, Ruiz X, Hobson KA (2009a) The influence ofbreeding colony and sex on mercury, selenium and leadlevels and carbon and nitrogen stable isotope signaturesin summer and winter feathers of Calonectris shearwaters.Oecologia 159:345–354
Ramos R, González-Solís J, Ruiz X (2009b) Linking isotopicand migratory patterns in a pelagic seabird. Oecologia160:97–105
Schall R (1991) Estimation in generalised linear models withrandom effects. Biometrika 78:719–727
Sousa FM, Nascimento S, Casimiro H, Boutov D (2008) Iden-tification of upwelling areas on the sea surface tempera-ture images using fuzzy clustering. Remote Sens Environ112:2817–2823
Thaxter CB, Daunt F, Hamer KC, Watanuki Y and others(2008) Otolith atlas for the western Mediterranean, northand central eastern Atlantic. Sci Mar 72S1:7–198
Tuset VM, Lombarte A, Assis CA (2008) Otolith atlas for thewestern Mediterranean, north and central eastern Atlan-tic. Sci Mar 72S1:7–198
Valeiras J (2003) Attendance of scavenging seabirds attrawler discards off Galicia, Spain. Sci Mar 67:77–82
Vanderklift MA, Ponsard S (2003) Sources of variation in con-sumer-diet δ15N enrichment: a meta-analysis. Oecologia136:169–182
Votier SC, Bearhop S, MacCormick A, Ratcliffe N, FurnessRW (2003) Assessing the diet of great skuas, Catharactaskua, using five different techniques. Polar Biol 26:20–26
Wada E, Terazaki M, Kabaya Y, Nemoto T (1987) 15N and 13Cabundances in the Antarctic Ocean with emphasis on thebiogeochemical structure of the food web. Deep-Sea Res34:829–841
Weimerskirch H (1998) How can pelagic seabird provision itschicks when relying on a distance resource? Cyclic atten-dance, foraging decision and body condition in sootyshearwaters. J Anim Ecol 67:99–109
Wilson RP (1984) An improved pump for penguins and otherseabirds. J Field Ornithol 55:109–112
Wilson RP, La Cock GD, Wilson MP, Mollagee F (1985) Differ-ential digestion of fish and squid in jackass penguinsSpheniscus demersus. Ornis Scand 16:77–79
Wilson RP, Piitz K, Peters G, Culik B, Scolaro JA, CharrassinJB, Ropert-Coudert Y (1997) Long-term attachment oftransmitting and recording devices to penguins and otherseabirds. Wildl Soc Bull 25:101–106
Wilson RP, Liebsch N, Davies IM, Quintana F and others(2007) All at sea with animal tracks; methodological andanalytical solutions for the resolution of movement. Deep-Sea Res II 54:193–210
Worton BJ (1989) Kernel methods for estimating the utilizationdistribution in home-range studies. Ecology 70:164–168
268
Editorial responsibility: Yves Cherel, Villiers-en-Bois, France
Submitted: October 8, 2009; Accepted: April 9, 2010Proofs received from author(s): June 22, 2010
Copyright © 2022 FDOKUMEN