Alkyl nitrates in outflow from North America over the North Atlantic during Intercontinental...
21
Alkyl nitrates in outflow from North America over the North Atlantic during Intercontinental Transport of Ozone and Precursors 2004 Claire E. Reeves, 1 Jana Slemr, 1 David E. Oram, 1 David Worton, 1 Stuart A. Penkett, 1 David J. Stewart, 1 Ruth Purvis, 2 Nicola Watson, 3 Jim Hopkins, 3 Ally Lewis, 3 John Methven, 4 Donald R. Blake, 5 and Elliot Atlas 6 Received 26 May 2006; revised 18 October 2006; accepted 15 January 2007; published 26 April 2007. [1] This paper is based on alkyl nitrate measurements made over the North Atlantic as part of the International Consortium for Research on Atmospheric Transport and Transformation (ICARTT). The focus is on the analysis of air samples collected on the UK BAe-146 aircraft during the Intercontinental Transport of Ozone and Precursors (ITOP) project, but air samples collected on board the NASA DC-8 and NOAA WP-3D aircraft as part of a Lagrangian experiment are also used. The ratios between the alkyl nitrates and their parent hydrocarbons are compared with those expected from chemical theory. Further, a box model is run to investigate the temporal evolution of the alkyl nitrates in three Lagrangian case studies and compared to observations. The air samples collected during ITOP do not appear to be strongly influenced by oceanic sources, but rather are influenced by emissions from the N.E. United States and from Alaskan fires. There also appears to be a widespread common source of ethyl nitrate and 1-propyl nitrate other than from their parent hydrocarbons. The general agreement between the alkyl nitrate data and photochemical theory suggests that during the first few days of transport from the source region, photochemical production of alkyl nitrates, and thus ozone, had taken place. The observations in the more photochemically processed air masses are consistent with the alkyl nitrate production reactions no longer dominating the peroxy radical self/cross reactions. Further, the results also suggest that the rates of photochemical processing in the Alaskan smoke plumes were small. Citation: Reeves, C. E., et al. (2007), Alkyl nitrates in outflow from North America over the North Atlantic during Intercontinental Transport of Ozone and Precursors 2004, J. Geophys. Res., 112, D10S37, doi:10.1029/2006JD007567. 1. Introduction [2] Alkyl nitrates are produced photochemically in the atmosphere through the oxidation of parent hydrocarbons [Arey et al., 2001; Atkinson and Arey , 2003; Atkinson et al., 1987; Roberts, 1990]. They are important tropospheric trace gas species, because their photochemical formation occurs through the same chemistry that also leads to the production of ozone. This chemistry is largely controlled by the availability of nitrogen oxides and alkyl nitrates can also act as reservoirs of these species. They can con- stitute a significant fraction of the total reactive odd nitrogen with the relative amount being greater remote from sources [Blake et al., 2003; Day et al., 2003; Flocke et al., 1991, 1998; Nowak et al., 2004; Ridley et al., 1997; Rosen et al., 2004; Shepson et al., 1993; Talbot et al., 1999, 2000, 2003]. Since the alkyl nitrates have atmospheric lifetimes ranging from several days to about a month, depending on the alkyl chain length, they can be transported over long distances [Atherton, 1989], and thus can be important for the redistri- bution of nitrogen oxides. [3] Alkyl nitrate sources also include the ocean. Atmo- spheric data collected over the equatorial Pacific has shown this region to be strongly enhanced in the short- chain alkyl nitrates [Atlas et al., 1993; Blake et al., 1999, 2003]. Similarly the equatorial Pacific Ocean has been found to be supersaturated with respect to the atmosphere for methyl, ethyl, 1-propyl and 2-propyl nitrates [Dahl et al., 2005]. However measurements made from 60°N to 60°S in the surface waters of the Atlantic show that, while large parts of the transect were found to be supersaturated in methyl and ethyl nitrates particularly between the JOURNAL OF GEOPHYSICAL RESEARCH, VOL. 112, D10S37, doi:10.1029/2006JD007567, 2007 Click Here for Full Articl e 1 School of Environmental Sciences, University of East Anglia, Norwich, UK. 2 Facility for Airborne Atmospheric Measurements, Cranfield Univer- sity, Cranfield, UK. 3 Department of Chemistry, University of York, York, UK. 4 Department of Meteorology, University of Reading, Reading, UK. 5 Department of Chemistry, University of California, Irvine, California, USA. 6 Rosenstiel School of Marine and Atmospheric Science, Division of Marine and Atmospheric Chemistry, University of Miami, Miami, Florida, USA. Copyright 2007 by the American Geophysical Union. 0148-0227/07/2006JD007567$09.00 D10S37 1 of 21
-
Upload
independent -
Category
Documents
-
view
4 -
download
0
Transcript of Alkyl nitrates in outflow from North America over the North Atlantic during Intercontinental...

Alkyl nitrates in outflow from North America over the North
Atlantic during Intercontinental Transport of Ozone and Precursors
2004
Claire E. Reeves,1 Jana Slemr,1 David E. Oram,1 David Worton,1 Stuart A. Penkett,1
David J. Stewart,1 Ruth Purvis,2 Nicola Watson,3 Jim Hopkins,3 Ally Lewis,3
John Methven,4 Donald R. Blake,5 and Elliot Atlas6
Received 26 May 2006; revised 18 October 2006; accepted 15 January 2007; published 26 April 2007.
[1] This paper is based on alkyl nitrate measurements made over the North Atlantic aspart of the International Consortium for Research on Atmospheric Transport andTransformation (ICARTT). The focus is on the analysis of air samples collected on theUK BAe-146 aircraft during the Intercontinental Transport of Ozone and Precursors(ITOP) project, but air samples collected on board the NASA DC-8 and NOAA WP-3Daircraft as part of a Lagrangian experiment are also used. The ratios between the alkylnitrates and their parent hydrocarbons are compared with those expected from chemicaltheory. Further, a box model is run to investigate the temporal evolution of the alkylnitrates in three Lagrangian case studies and compared to observations. The air samplescollected during ITOP do not appear to be strongly influenced by oceanic sources,but rather are influenced by emissions from the N.E. United States and from Alaskan fires.There also appears to be a widespread common source of ethyl nitrate and 1-propyl nitrateother than from their parent hydrocarbons. The general agreement between the alkylnitrate data and photochemical theory suggests that during the first few days of transportfrom the source region, photochemical production of alkyl nitrates, and thus ozone, hadtaken place. The observations in the more photochemically processed air masses areconsistent with the alkyl nitrate production reactions no longer dominating the peroxyradical self/cross reactions. Further, the results also suggest that the rates of photochemicalprocessing in the Alaskan smoke plumes were small.
Citation: Reeves, C. E., et al. (2007), Alkyl nitrates in outflow from North America over the North Atlantic during Intercontinental
Transport of Ozone and Precursors 2004, J. Geophys. Res., 112, D10S37, doi:10.1029/2006JD007567.
1. Introduction
[2] Alkyl nitrates are produced photochemically in theatmosphere through the oxidation of parent hydrocarbons[Arey et al., 2001; Atkinson and Arey, 2003; Atkinson etal., 1987; Roberts, 1990]. They are important tropospherictrace gas species, because their photochemical formationoccurs through the same chemistry that also leads to theproduction of ozone. This chemistry is largely controlledby the availability of nitrogen oxides and alkyl nitrates
can also act as reservoirs of these species. They can con-stitute a significant fraction of the total reactive odd nitrogenwith the relative amount being greater remote from sources[Blake et al., 2003; Day et al., 2003; Flocke et al., 1991,1998; Nowak et al., 2004; Ridley et al., 1997; Rosen et al.,2004; Shepson et al., 1993; Talbot et al., 1999, 2000, 2003].Since the alkyl nitrates have atmospheric lifetimes rangingfrom several days to about a month, depending on the alkylchain length, they can be transported over long distances[Atherton, 1989], and thus can be important for the redistri-bution of nitrogen oxides.[3] Alkyl nitrate sources also include the ocean. Atmo-
spheric data collected over the equatorial Pacific hasshown this region to be strongly enhanced in the short-chain alkyl nitrates [Atlas et al., 1993; Blake et al., 1999,2003]. Similarly the equatorial Pacific Ocean has beenfound to be supersaturated with respect to the atmospherefor methyl, ethyl, 1-propyl and 2-propyl nitrates [Dahl etal., 2005]. However measurements made from 60�N to60�S in the surface waters of the Atlantic show that, whilelarge parts of the transect were found to be supersaturatedin methyl and ethyl nitrates particularly between the
JOURNAL OF GEOPHYSICAL RESEARCH, VOL. 112, D10S37, doi:10.1029/2006JD007567, 2007ClickHere
for
FullArticle
1School of Environmental Sciences, University of East Anglia,Norwich, UK.
2Facility for Airborne Atmospheric Measurements, Cranfield Univer-sity, Cranfield, UK.
3Department of Chemistry, University of York, York, UK.4Department of Meteorology, University of Reading, Reading, UK.5Department of Chemistry, University of California, Irvine, California,
USA.6Rosenstiel School of Marine and Atmospheric Science, Division of
Marine and Atmospheric Chemistry, University of Miami, Miami, Florida,USA.
Copyright 2007 by the American Geophysical Union.0148-0227/07/2006JD007567$09.00
D10S37 1 of 21

equator and 40�S, the temperate regions, particularly in theNorthern Hemisphere, were close to equilibrium with theoverlying atmosphere suggesting this region not to be amajor source and possibly even a sink [Chuck et al.,2002]. Biomass burning has also been found to be a sourceof alkyl nitrates [Friedli et al., 2001; Simpson et al., 2002].[4] This paper examines alkyl nitrate data collected over
the North Atlantic. The field experiment and sampling andanalytical techniques are described in section 2. In section 3the concentration data are presented and examined in termsof the correlations between the different alkyl nitrates, andbetween the alkyl nitrates and carbon monoxide. The relation-ship between the alkyl nitrates and their parent hydrocarbonsare explained with respect to the chemical production and lossreactions and the observations compared to the theory. TheLagrangian observations are compared to box model calcu-lations. The conclusions drawn collectively from these differ-ent analytical approaches are presented in section 4.
2. Methodology
2.1. Aircraft Campaign
[5] The data presented in this paper were collected as partof the International Consortium for Research on AtmosphericTransport and Transformation (ICARTT) [Fehsenfeld et al.,2006]. This paper focuses on data collected on board theUK BAe-146 aircraft during the Intercontinental Transportof Ozone and Precursors (ITOP) project [Lewis et al., 2007],which was the UK contribution to ICARTT, but also usesdata collected on board the NASA DC-8 and NOAAWP-3D aircraft as part of a Lagrangian experiment[Methven et al., 2006].[6] During ITOP the BAe-146 aircraft, which is operated
by the Facility for Atmospheric Airborne Measurements(FAAM), was based at Horta (38�N, 28�W) on the island ofFaial, part of the Portuguese Azores archipelago. Data from10 flights are presented during the summer of 2004: B029(15 July), B030 (17 July), B031 (19 July), B032 (20 July),B033 (22 July), B034 (25 July), B035 (28 July), B036(29 July), B037 (31 July), B038 (1 August). For moredetails of the air masses sampled and meteorologicalconditions during each flight see the ITOP overview paper[Lewis et al., 2007].
2.2. Sampling and Analysis
2.2.1. Alkyl Nitrates and Nonmethane Hydrocarbons[7] Whole air samples (WAS) were collected on board
the BAe-146 in 3L, stainless steel canisters, which werenormally pressurized to 3 bar. The canisters were silco-treated by the manufacturers Restek, which involvesspraying a thin layer of pure silica on the internal walland electropolishing to minimize surface reactivity. Thecanisters are only used for aircraft samples and are neverused in urban pollution. Occasionally they are cleaned byfilling with humidified nitrogen and evacuating. Duringcampaigns they are vacuum cleaned between samplesusing a rotary pump drawing air first via a mist filterand then a liquid nitrogen cold trap. The canisters aretypically evacuated preflight to 1 � 10�2 torr over aperiod of 1–2 hours.[8] Approximately 280 samples from 10 flights were
analyzed for alkyl nitrates by gas chromatography/mass
spectrometry (GC/MS) by the University of East Anglia(UEA) group. The WAS were connected by stainless steeltubing to a preconcentrator (Marks International Ltd), con-sisting of an Air Server and UnityTM thermal desorber. Theair samples were dried by a Nafion dryer (PermapureTM)before being trapped on a two bed packed cold trap (Carbo-graph 1TD and Carboxen 1000) at �10�C. The GC (Agilent6890N) and MS (Agilent 5973) were from Agilent Tech-nologies and a Restek 502.2 column (105 m, 0.32 mm ID,1.8 mm film thickness) was used. The carrier gas washelium, (Research Grade, purity �99.99999%). The MSwas operated in negative ion chemical ionization (NICI)mode using methane as reagent gas (purity �99.9995) andthe selected ions were m/e 46 for all nitrates and for theRO fragments they were m/e 43, 57, 71 and 85 for C2,C3, C4 and C5 respectively. Concentrations of methyl,ethyl, 1-propyl, 2-propyl, 2-butyl, 2-methyl-3-butyl andthe sum of 2- and 3-pentyl nitrates (hereafter referred toas 2 + 3-pentyl nitrate) are presented. The detection limitis <0.01 pptv and the precision error <5–10% on dupli-cate analyses. The accuracy is determined by that of thecalibration standard provided by the Rosenstiel School ofMarine and Atmospheric Science (RSMAS) group andmeasurement comparison (see below).[9] C2-C9 NMHCs were determined from the same
whole air samples as the alkyl nitrates, analyzed usingcapillary gas chromatography following the methodologyof Hopkins et al. [2003] by the University of York (UoY)group. Briefly 1 L of air sample was taken from thecanister, dried using a cold finger at �30�C and precon-centrated on a two stage carbon microtrap held at �20�C.On thermal desorption, the analytes were split approxi-mately 50:50 between a 50 m 0.53 mm i.d. Al2O3 PLOTcolumn for hydrocarbon analysis, and a 20 m 0.53Lowox, PLOT column for carbonyl and C7-C9 NMHCanalysis. Detection was via parallel Flame IonizationDetectors (FID). Regular calibration was made with ref-erence to ppbv level compressed gas standards, and zerosamples performed for each flight. The detection limit wasstructure-dependent, between 2 and 10 pptv. The accuracy,which comes from the gas standard is gravimetricallymade, is 5% and the precision around 3% at concentra-tions above 50 pptv. Below this value an empiricallyderived power function defines both the accuracy andprecision since other factors such as integration errors anduncertainty in the blank value become significant. As theconcentrations reach 10 ppt uncertainty and precisions are�20–30% and at 2 pptv level these have reached�100%.[10] A maximum of 168 evacuated two liter stainless steel
canisters were filled to 40 psi using a metal bellows pump ineach flight of the NASA DC-8 aircraft. The canisters weremade by University of California Irvine (UCI) and not silco-treated. Prior to the flight they were evacuated to a pressureof 10�2 torr and filled to one atmosphere with purified UHPhelium. They were then evacuated to 10�2 torr again afterwhich about 20 torr of purified water vapor was added toreduce wall loss of some halocarbons and alkyl nitrates.After each flight the canisters were shipped back to the UCIhome laboratory for analysis of methane, CO, C2-C10
NMHCs, selected sulphur compounds, halocarbons andC1-C5 alkyl nitrates. Flame ionization, electron capture,
D10S37 REEVES ET AL.: ALKYL NITRATES OVER THE NORTH ATLANTIC
2 of 21
D10S37

and mass-spec detection were used for the analysis. Themeasurement precision for NMHCs is 1–3% and theabsolute accuracy is between 2 and 10%. For alkyl nitratesthe measurement precision is 2–4%. The accuracy isdetermined by that of the calibration standard provided bythe RSMAS group (see below).[11] Whole air samples collected on board the NOAA
WP-3D were analyzed by the RSMAS group using GC-FIDfor C1-C5 NMHC, and by selected ion GC/MS for the alkylnitrates. The WP-3D canisters were precleaned by repeatedflushing with wet zero air at 60–80 C. The canisters were
sent to the field with 1.5 atm of wet zero air. Prior to flight,the canisters were evacuated, flushed with pure N2, and3 torr of water vapor was added to each canister. Thecanisters were not silco-treated but the above treatmenthas been shown to be effective in stabilizing nitrates (upto C5). Detection limits for the alkyl nitrates were 0.1–0.3 pptv, while the precision was approximately 5%. Theaccuracy of the calibration standard is under investigation.This calibration standard was used by all three groups (theUCI group from the start and the UEA group following thecomparison exercise described below). For the hydrocar-
Figure 1. Time series of alkyl nitrate data from the BAe-146 and DC-8 aircraft during the in-flightcomparison. The three time periods of data correspond to level runs at 22,000 ft, 12,000 ft and 1,000 ft.
D10S37 REEVES ET AL.: ALKYL NITRATES OVER THE NORTH ATLANTIC
3 of 21
D10S37

bons the detection limits were <3 ppt for C2 and C3 and<1 ppt for C4 and higher, with an accuracy of better than15–20% and a precision of 3–5%.2.2.2. Nonmethane Hydrocarbon and Alkyl NitrateMeasurement Comparison[12] Thirty two sample canisters were filled simulta-
neously to 40 psi with air collected from a remote SouthernCalifornia research site. Four canisters were sent to sixdifferent research groups involved in VOC analysis fromvarious platforms for the ICARTT program. Three of thelaboratories were involved in hydrocarbon and alkyl nitratemeasurements as part of the Lagrangian experiment. Theagreement between the three laboratories (UoY, UCI, andRSMAS) for the alkyl nitrate parent hydrocarbons was ±3%for ethane, ±1% for propane, ±1% for n-butane, ±5% fori-pentane and ±15% for n-pentane. For the alkyl nitrates, theUCI and RSMAS groups had both used a standard calibratedin the RSMAS lab and the difference between the mea-surements for the comparison canisters were less than 1%for methyl and 1-propyl nitrate, 3% for ethyl nitrate, 9%for 2-propyl nitrate, 4% for 2-butyl and 3-pentyl nitrate, and5% for 2-pentyl nitrate. The UEA calibration scale wasadjusted through this comparison exercise to agree withthe scale used by the other two labs, with the exception of3-methyl-2-butyl which was not reported for the compari-son. The ratios of the UEA value to the mean of the othertwo labs before adjustment were as follows: methyl nitrate0.71; ethyl nitrate 0.84; 2-propyl nitrate 0.92; 1-propylnitrate 0.70; 2-butyl-nitrate 0.74; 2 + 3-pentyl-nitrate 0.61.
2.2.3. In-Flight Comparison Between the DC-8and BAe-146[13] Flight B035 on 28 July 2004 included a period of
comparison with the NASA DC-8, part of a coordinatedplan devised by both INTEX and ITOP science teams. Theaircraft rendezvoused west of the Azores (�38�N, �38�W)and both planes flew in wing-tip to wing-tip formation forapproximately 70 min, performing level runs at 22,000 ft,12,000 ft and 1,000 ft in cloud free air. This allowed bothaircraft to sample the same air masses and compare thecommon measurements quantitatively over an altitude rangeof 21,000 ft. The concentrations of pollutants were gener-ally low throughout the comparison. This led to low con-centrations of alkyl nitrates, which did not extend over awide range of concentrations (Figure 1). The highest con-centrations were observed during the high-level run at22,000 ft. In general the agreement between the measure-ments on the BAe-146 and DC-8 are good, with absolutedifferences mostly less than 0.2 pptv and often less than0.1 pptv (Table 1). This equates to relative differences ofmostly less than 20% and often less than 10% (Table 1).The main exception was methyl nitrate data, where anumber of BAe-146 samples collected on the midlevel(12,000 ft) and low-level (1,000 ft) runs had relativelyhigh values compared to the DC-8 (i.e., 1 pptv (40%)greater).2.2.4. Other Measurements[14] On the BAe-146 CO was measured using an aero-
laser UV monitor [Gerbig et al., 1999] with 10 s integrationand 2 ppbv detection limit, with an overall measurementuncertainty at 95% confidence of 3% plus 1 ppbv. O3 wasmeasured by a thermo environmental (TECO 49) UVphotometric instrument with an overall measurement uncer-tainty at 95% of 5% plus 2 ppbv. NO was measured bychemiluminescence [Brough et al., 2003] with an accuracyof ±8% and precision of 2–4% depending on the flight.
3. Results and Discussions
3.1. Alkyl Nitrates and Concentrations
[15] Figure 2 shows the alkyl nitrate data from the ITOPflights (B029 to B038). The data are presented as a seriesof data points sequential in time between 15 July and1 August, with the division between each flight indicatedby the vertical dashed lines. In general methyl nitrate wasthe most abundant alkyl nitrate, followed by 2-propyl,2-butyl, ethyl, 2 + 3-pentyl, 2-methyl-3-butyl and 1-propyl,however the absolute concentrations and the relative con-centrations of the alkyl nitrates varied between different airmasses.[16] The air masses sampled were divided into ‘‘marine’’
(O3 < 40 ppb, CO < 90 ppb, H2O > 10,000 ppm, around40 samples), ‘‘fire plumes’’ (CO > 250 ppb, ethane > 1600 ppt,benzene > 140 ppt, 10 samples) and ‘‘other’’ (around200 samples). Although the criteria for defining ‘‘fire plumes’’are not specific to biomass burning, analysis of back trajecto-ries confirmed that such high concentrations of these tracerswere only encountered when it was clearly indicated thatair came from the fire burning regions of Alaska and Canada.The mean concentrations in ‘‘other’’ air masses exhibit therelative order of concentrations described above (Figure 3).In the ‘‘marine’’ air masses methyl nitrate shows a slightly
Table 1. Alkyl Nitrate Data From the In-Flight Comparison
Between the BAe-146 and DC-8 Divided Into the Three Altitude
Runsa
Methyl Ethyl 2-Propyl 1-Propyl 2-Butyl 2 + 3-Pentyl
22,000 ftDC8, pptv
Mean 1.73 1.25 2.40 0.25 1.57 0.46stdev 0.07 0.08 0.34 0.02 0.14 0.12
BAe, pptvMean 1.70 1.07 1.70 0.29 1.35 0.87stdev 0.02 0.04 0.10 0.00 0.15 0.16
Difference, pptv �0.02 �0.18 �0.72 0.03 �0.22 0.41Difference, % �1.3 �17.0 �43.1 11.3 �15.9 46.7
12,000 ftDC8, pptv
Mean 1.49 0.76 0.79 0.09 0.26 0.09stdev 0.03 0.03 0.05 0.02 0.02 NA
BAe, pptvMean 2.31 0.95 0.78 0.13 0.32 0.10Stdev 0.57 0.15 0.18 0.07 0.09 0.06
Difference, pptv 0.81 0.19 �0.01 0.04 0.06 0.01Difference, % 35.2 20.2 �0.8 29.2 18.5 10.0
1,000 ftDC8, pptv
Mean 1.53 0.79 0.70 0.08 0.26 0.12stdev 0.04 0.02 0.06 0.02 0.02 NA
BAe, pptvMean 2.62 1.10 0.77 0.19 0.32 0.11stdev 0.61 0.16 0.21 0.08 0.10 0.07
Difference, pptv 1.09 0.31 0.07 0.10 0.06 �0.01Difference, % 41.7 28.3 9.6 55.6 19.0 �8.4
aPresented are the means and standard deviations (stdev) for the samplescollected on each run and the absolute and relative difference between thedata from the two aircraft.
D10S37 REEVES ET AL.: ALKYL NITRATES OVER THE NORTH ATLANTIC
4 of 21
D10S37

higher mean concentration to ‘‘other’’ air masses (2.40 com-pared to 2.29 ppt), but the concentrations of the other alkylnitrates are lower by around 30–50% with the exception ofethyl nitrate which is lower by about 15% (1.33 compared to1.57 ppt), such that it becomes the secondmost abundant alkylnitrate. This suggests that the methyl nitrate may have beeninfluenced by an oceanic source, but the predominant sourceof the other alkyl nitrates observed during ITOP was terres-trial.[17] With the exception of methyl nitrate (‘‘other’’ and
‘‘marine’’) and 2-propyl nitrate (‘‘other’’), the mean concen-trations of the alkyl nitrates in the ‘‘fire plumes’’ (flight B032)were greater than in the other air masses, with 2 + 3-pentylnitrate being the most abundant (Figures 2 and 3). This is ingeneral agreement with observations of C1-C5 alkyl nitratesbeing emitted from wild fires in North America (California,Montana and Colorado) [Friedli et al., 2001] and C1-C4 alkylnitrates from Australian savanna burning [Simpson et al.,2002]. However, where as Simpson et al. [2002] observedmethyl nitrate to dominate alkyl nitrate emissions during theflaming stage of the savanna burning, methyl nitrate was notfound to dominate in the ITOP ‘‘fire plume’’ data. This issimilar to the observations of Blake et al. [1999, 2003] whodid not observe evidence for enhanced concentrations ofmethyl nitrate in air influenced by tropical biomass burning.None of the previous studies reported a dominance of thepentyl nitrates in biomass burning plumes as observed in theITOP data.[18] The minimum and maximum values for the ‘‘other’’
air masses demonstrate that there are a number of differentair masses assigned to this category, some of whichcontained very low concentrations of the alkyl nitrates andothers which were clearly impacted by terrestrial emissionsof VOCs (anthropogenic or biogenic) giving higher con-centrations of alkyl nitrates than observed in either the‘‘marine’’ or ‘‘fire plume’’ air masses. The highest alkylnitrate concentration was observed during flight B031 (airfrom New York) for 2-methyl-3-butyl nitrate (13.7 ppt),when the maximum concentration of 2 + 3-pentyl nitrate(9.0 ppt) was also measured. It is quite possible that some ofthe ‘‘marine’’ maximum concentrations of the alkyl nitrateswere impacted by terrestrial emissions (e.g., 5.4 pptv of2-methyl-3-butyl nitrate and 1.7 pptv for 2 + 3-pentyl nitrateobserved during flight B030).[19] The alkyl nitrate concentrations observed during
ITOP over the mid-North Atlantic are typical of thoseobserved a few days downwind of a precursor sourceregion. They are generally slightly higher than those ob-served over the Pacific during the PEM-Tropics A and Bnorth of 10�N between 2 and 8 km altitude [Blake et al.,2003], with the exception of methyl nitrate, while thoseduring TRACE-P which studied Asian outflow [Simpson etal., 2003] are slightly higher. This reflects the relativeproximity to anthropogenic sources. Similarly measure-ments made at Chebogue Point, Nova Scotia duringNARE-93 [Roberts et al., 1998] and over the western NorthAtlantic in pollution outflow from North America duringNARE-97 [Stroud et al., 2001] tend to be slightly higherthan observed during ITOP. Data from over the NorthAmerican [Bertman et al., 1995; O’Brien et al., 1997;Ostling et al., 2001; Stroud et al., 2001] and European
Figure 2. Alkyl nitrate data from the ITOP flights (B029to B038). The data are presented as a series of data pointssequential in time between 15 July and 1 August, with thedivision between each flight indicated by the vertical dashedlines. In the top plot are the ozone and carbon monoxideconcentrations along with the altitude of the BAe-146 at thetime of the WAS samples.
D10S37 REEVES ET AL.: ALKYL NITRATES OVER THE NORTH ATLANTIC
5 of 21
D10S37

[Flocke et al., 1998] continents and Hong Kong [Wang etal., 2003] are much higher.
3.2. Relationship Between Alkyl Nitrates
[20] The correlation coefficients (r) and the gradients ofthe linear relationships between each pair of alkyl nitrates
were calculated (Table 2) for 4 flight groups: B031, which isbelieved to have sampled air from the N. York region andshowed elevated concentrations of the alkyl nitrates, inparticular the pentyl nitrates; B032 which was highlyinfluenced by Alaskan fire plumes with CO concentrationsup to 600 ppb; B036, B037 and B038, which are thought to
Figure 3. Minimum, maximum and mean concentrations of the alkyl nitrates for three types of air masscategory: (left) ‘‘marine,’’ (middle) ‘‘other,’’ and (right) ‘‘fire plumes.’’ The definitions of these air masstypes are described in the text.
Table 2. Correlation Coefficients (r) and Slopes (in Parentheses) of the Linear Relationships Between Each Pair of Alkyl Nitrate for the
Four Flight Groups: B031; B032; B036, B027 and B038; and B029, B030, B033, B034 and B035
Methyl Ethyl 2-Propyl 1-Propyl 2-Butyl 3-Methyl-2-Butyl 2 + 3-Pentyl
B031Methyl � � � (� � �) 0.82 (0.74) 0.81 (0.52) 0.73 (1.67) 0.68 (0.32) 0.58 (0.10) 0.55 (0.14)
Ethyl 0.82 (0.92) � � � (� � �) 0.98 (0.71) 0.98 (2.50) 0.97 (0.51) 0.91 (0.17) 0.91 (0.26)
2-propyl 0.81 (1.25) 0.98 (1.36) � � � (� � �) 0.96 (3.39) 0.94 (0.69) 0.88 (0.23) 0.88 (0.35)
1-propyl 0.73 (0.32) 0.98 (0.39) 0.96 (0.27) � � � (� � �) 1.00 (0.21) 0.96 (0.07) 0.96 (0.11)
2-butyl 0.68 (1.43) 0.97 (1.83) 0.94 (1.29) 1.00 (4.80) � � � (� � �) 0.98 (0.35) 0.98 (0.54)
3-methyl-2-butyl 0.58 (3.37) 0.91 (4.75) 0.88 (3.30) 0.96 (12.81) 0.98 (2.71) � � � (� � �) 1.00 (1.52)2 + 3-pentyl 0.55 (2.12) 0.91 (3.12) 0.88 (2.17) 0.96 (8.42) 0.98 (1.78) 1.00 (0.66) � � � (� � �)
B032Methyl � � � (� � �) 0.91 (0.84) 0.98 (0.35) 0.80 (1.63) 0.88 (0.45) 0.53 (0.25) 0.31 (0.10)
Ethyl 0.91 (0.99) � � � (� � �) 0.89 (0.35) 0.97 (2.15) 0.95 (0.53) 0.66 (0.34) 0.54 (0.19)
2-propyl 0.98 (2.70) 0.89 (2.28) � � � (� � �) 0.79 (4.48) 0.87 (1.23) 0.50 (0.66) 0.26 (0.23)
1-propyl 0.80 (0.39) 0.97 (0.43) 0.79 (0.14) � � � (� � �) 0.94 (0.24) 0.74 (0.17) 0.67 (0.11)
2-butyl 0.88 (1.71) 0.95 (1.70) 0.87 (0.61) 0.94 (3.78) � � � (� � �) 0.80 (0.74) 0.61 (0.39)
3-methyl-2-butyl 0.53 (1.12) 0.66 (1.28) 0.50 (0.38) 0.74 (3.21) 0.80 (0.86) � � � (� � �) 0.90 (0.62)2 + 3-pentyl 0.31 (0.94) 0.54 (1.53) 0.26 (0.28) 0.67 (4.20) 0.61 (0.96) 0.90 (1.30) � � � (� � �)
B036, B027, and B038Methyl � � � (� � �) 0.71 (1.02) 0.50 (0.24) 0.49 (1.64) 0.42 (0.18) 0.38 (0.52) 0.34 (0.38)
Ethyl 0.71 (0.49) � � � (� � �) 0.92 (0.31) 0.88 (2.02) 0.83 (0.25) 0.79 (0.74) 0.76 (0.59)
2-propyl 0.50 (1.03) 0.92 (2.74) � � � (� � �) 0.86 (5.86) 0.94 (0.83) 0.90 (2.50) 0.86 (1.97)
1-propyl 0.49 (0.15) 0.88 (0.39) 0.86 (0.13) � � � (� � �) 0.87 (0.11) 0.82 (0.33) 0.85 (0.28)
2-butyl 0.42 (0.97) 0.83 (2.77) 0.94 (1.05) 0.87 (6.62) � � � (� � �) 0.93 (2.90) 0.94 (2.41)
3-methyl-2-butyl 0.38 (0.28) 0.79 (0.84) 0.90 (0.32) 0.82 (2.02) 0.93 (0.30) � � � (� � �) 0.96 (0.79)2 + 3-pentyl 0.34 (0.31) 0.76 (0.99) 0.85 (0.38) 0.85 (2.56) 0.94 (0.36) 0.96 (1.17) � � � (� � �)
B029, B030, B033, B034, and B035Methyl � � � (� � �) 0.67 (1.04) 0.24 (0.26) 0.35 (1.49) 0.10 (0.10) �0.05 (�0.05) �0.09 (�0.11)
Ethyl 0.67 (0.43) � � � (� � �) 0.77 (0.51) 0.88 (2.27) 0.68 (0.42) 0.35 (0.14) 0.56 (0.37)
2-propyl 0.24 (0.22) 0.77 (1.17) � � � (� � �) 0.86 (3.39) 0.87 (0.81) 0.46 (0.30) 0.72 (0.73)
1-propyl 0.35 (0.08) 0.88 (0.34) 0.86 (0.22) � � � (� � �) 0.88 (0.21) 0.47 (0.07) 0.78 (0.20)
2-butyl 0.10 (0.09) 0.68 (1.10) 0.87 (0.93) 0.88 (3.72) � � � (� � �) 0.62 (0.41) 0.88 (0.96)
3-methyl-2-butyl �0.05 (�0.08) 0.35 (0.86) 0.46 (0.72) 0.47 (3.03) 0.62 (0.92) � � � (� � �) 0.75 (1.23)2 + 3-pentyl �0.09 (�0.07) 0.56 (0.84) 0.72 (0.70) 0.78 (3.05) 0.88 (0.80) 0.75 (0.45) � � � (� � �)
D10S37 REEVES ET AL.: ALKYL NITRATES OVER THE NORTH ATLANTIC
6 of 21
D10S37

have sampled air from the N.E. United States and showedelevated alkyl nitrate concentrations in particular those of2-propyl nitrate and 2-butyl nitrates; and B029, B030,B033, B034 and B035, the remaining flights, whichpredominantly sampled air with low concentrations ofalkyl nitrates and contained most of the air classifiedabove as ‘‘marine’’ (see Figure 2).[21] The poorest correlation coefficients were found for
flights B029, B030, B033, B034 and B035. This may bebecause more samples are included in this group possiblygiving a larger variety of air masses, or because the concen-trations of alkyl nitrates were generally low in these flights.[22] For flight B032 (Alaskan fire plume) on the whole
there were good correlations betweenmethyl, ethyl, 1-propyl,2-propyl and 2-butyl nitrates (0.79 � r � 0.98). The pentylnitrates were well correlated with each other (r = 0.90), butexhibited weaker correlations with the other alkyl nitrates(e.g., r = 0.31 and 0.26 for 2 + 3-pentyl nitrates withmethyl nitrate and 2-propyl nitrate, respectively).[23] For flight B031 (N. York plume) there was a very
good correlation between all alkyl nitrates (0.88 � r � 1.00)except for methyl nitrate. The pentyl nitrates and 2-butylnitrate were highly correlated with each other (0.96 � r �1.00).
[24] Flights B036, B037 and B038 exhibited a similarpattern of correlation to flight B031, with very goodcorrelations between all alkyl nitrates (0.76 � r � 0.96)except for methyl nitrate, although the correlation coeffi-cients were slightly poorer, presumably because of thewider range of air masses sampled and mixing with sur-rounding air masses. The pentyl nitrates and 2-butyl nitratewere highly correlated with each other (0.93 � r � 0.96).[25] Although the correlation patterns between the alkyl
nitrates were similar for B031 and for B036, B037 andB038, the ratios between the alkyl nitrates were sometimesvery different (Figure 4) (Table 2). The most obviousdifference is between the pentyl nitrates and the othernitrates, illustrated by the relationships between 3-methyl-2-butyl nitrate and 2-butyl nitrate (Figure 4, top left), with agradient of 2.71 for B031 and only 0.30 for flights B036,B037 and B038. This clearly suggests that although theprecursor species for the pentyl nitrates and the C2-C4 alkylnitrates may be strongly related, their ratio may be differentin some source regions within the N.E. of the United States.There is little NMHC data with which to confirm this,because for flight B031 for which there are measurementsof alkyl nitrates all but 1 sample was below the detectionlimit for i-pentane. However, this one data point does agree
Figure 4. Relationships between pairs of alkyl nitrates for four sets of ITOP flights.
D10S37 REEVES ET AL.: ALKYL NITRATES OVER THE NORTH ATLANTIC
7 of 21
D10S37

with the above conclusion since the ratio between i-pentaneand n-butane was 0.99 compared to an average of 0.33 forflights B036, B037 and B038.[26] Since 1-propyl nitrate and 2-propyl nitrate both have
the same parent hydrocarbon (propane), they should exhibitgood correlations with each other. Further the ratio of2-propyl nitrate to 1-propyl nitrate close to source should bearound 5.6 on the basis of the abstraction ratios for thereaction of OH with propane and the branching ratios of thesubsequent reactions of the peroxy radicals with NO (a1
and a3 in Table 3). The data from ITOP exhibit reasonablygood correlations (Table 2 and Figure 4, top right). Thegradient for flights B036, B037 and B038 is 5.9, verysimilar to that predicted from the kinetics, while thegradients for some of the other flight groups are as low as3.4. This could be explained by an additional source of1-propyl nitrate other than propane.[27] Interestingly 1-propyl nitrate is correlated more
strongly with ethyl nitrate than with 2-propyl nitrate andthe ratios between 1-propyl nitrate and ethyl nitrate are moreconsistent between flights (Table 2 and Figure 4, bottomleft). This suggests similar emission ratios of precursorspecies (e.g., ethane and propane) from different sources(e.g., automobile exhaust or biomass burning) or a singlewidespread source, perhaps a common precursor species.[28] The correlation between ethyl nitrate and methyl
nitrate shows reasonably good agreement, but the ratiobetween these nitrates varies between flights (Figure 4,bottom right). This is consistent with some commonalityin sources, but with different sources having differentemission characteristics (e.g., from the ocean or fromprecursor species emitted in automobile exhaust or biomassburning). Variations in ratios of ethyl nitrate to methylnitrate have been used to distinguish between marine airand urban/industrial air [Blake et al., 2003; Simpson et al.,2003]. Flights B029, B030, B033, B034 and B035 had thelowest gradient (ethyl nitrate/methyl nitrate) (although poor-est correlation coefficient), which is consistent with the factthat most of the marine air sampled in ITOP was duringthese flights. On occasions (e.g., flights B033 and B034)
methyl nitrate was also observed at greater concentrations inthe marine boundary than in the free troposphere. Thissuggests that while the oceanic source may have had aninfluence on the methyl nitrate, its impact on ethyl nitrate(and by correlation, 1-propyl nitrate) is less clear. The ITOPdata suggest that the air sampled during the campaign wasnot strongly influenced by an oceanic source of alkylnitrates. This is consistent with concentrations of alkylnitrates in the temperate waters of the North Atlantic beingclose to equilibrium with the overlying atmosphere [Chucket al., 2002].
3.3. Relationship Between Alkyl Nitrates andTheir Parent Alkane
[29] Bertman et al. [1995] derived a simple relationshipbetween alkyl nitrates and their parent alkanes (RH). Thealkanes react with OH to form alkyl radicals (R�), whichrapidly react with oxygen to form an alkyl peroxy radical(ROO�).
RHþ �OH ! R� þ H2O ð1Þ
R� þ O2 ! ROO� ð2Þ
When the alkyl peroxy radical reacts with NO it can eitherlose an oxygen atom to form an alkoxy radical (RO�) orbond with the NO to form an alkyl nitrate (RONO2).
ROO� þ NO ! RO� þ NO2 ð3aÞ
ROO� þ NO ! RONO2 ð3bÞ
The alkyl nitrates are lost through photolysis and reactionwith OH
RONO2 þ hn ! RO� þ NO2 ð4Þ
RONO2 þ OH ! products ð5Þ
Table 3. Kinetic Data Relating to the Formation of Alkyl Nitrate Precursor Peroxy Radicals From Parent Hydrocarbon
RHk1a (�10�12 cm3
molecule�1 s�1) RO2 a1 a3
k5a (�10�12 cm3
molecule�1 s�1) j4b (�10�6 s�1)
Ethane 0.248 ethyl 1 0.014c,d 0.18 0.73e,f,g
Propane 1.09 2-propyl 0.727h 0.042i 0.29 1.10e,f,g
Propane 1.09 1-propyl 0.272h 0.02d,i 0.58 0.77e,g
n-butane 2.36 2-butyl 0.855j 0.084k 0.86 0.91e,f
n-pentane 3.8 2-pentyl 0.568l 0.106k 1.7 1.2f
n-pentane 3.8 3-pentyl 0.349l 0.126k 1.0 1.2f
i-pentane 3.6 3-methyl-2-butyl 0.285l 0.141m 1.7 1.2n
aAtkinson and Arey [2003].bPhotolysis rates are for 40�N, 5 km altitude, 1 July and 24 hour averages.cRanschaert et al. [2000].dAtkinson et al. [1982].eClemitshaw et al. [1997].fRoberts and Fajer [1989].gZhu and Kellis [1997].hDroege and Tully [1986a].iCarter and Atkinson [1989].jDroege and Tully [1986b].kArey et al. [2001].lKwok and Atkinson [1995].mMaster Chemical Mechanism [Jenkin et al., 1997; Saunders et al., 1997, 2003].nAssumed the same photolysis rate as for the 2- and 3-pentyl nitrates.
D10S37 REEVES ET AL.: ALKYL NITRATES OVER THE NORTH ATLANTIC
8 of 21
D10S37

Assuming that the only source of the alkyl nitrate is from itsparent hydrocarbon, that the reaction of the alkane with OH(reaction 1) is the rate determining step in the formation ofthe alkyl nitrate and that no peroxy radical self reactionstake place (i.e., NO rich atmosphere) then the rate offormation and loss of the alky nitrates can be summarized asthe following:
RH ! RONO2 at rate bkA where kA ¼ k1 OH½ ;b ¼ a1:a3
ð6Þ
RONO2 ! products at rate kB where kB ¼ j4 þ k5 OH½ ð7Þ
where k1 is the rate of reaction 1, a1 represents theproportion of the alkane that forms the particular alkoxyisomer, [OH] is the molecular density of OH, a3 is thebranching ratio of reaction 3 that forms the alkyl nitrate, j4 isthe photolytic loss rate of the alkyl nitrate and k5 the rate ofreaction 5. A relationship between the alkyl nitrates andtheir parent hydrocarbon concentrations as a function oftime (t) can be described by the following equation[Bertman et al., 1995]:
RONO2½ ¼ bkA � 1� e kA � kBð Þtð Þ þ RONO2½ 0 � e kA � kBð Þt
RH½ kB � kAð Þ RH½ 0 ð8Þ
where [RONO2]0 and [RH]0 are the initial concentrations ofthe alkyl nitrate and parent hydrocarbon respectively.Further, if it is assumed that the concentration of the alkylnitrate is initially zero (i.e., no direct emissions), then therelationship between the alkyl nitrates and their parenthydrocarbon can be simplified as follows [Bertman et al.,1995]:
RONO2½ ¼ bkA � 1� e kA � kBð Þtð ÞRH½ kB � kAð Þ ð9Þ
Note that mixing with surrounding air is ignored inequations (6) and (7). This simplification is made on theassumption that when looking at ratios in equations (8) and(9) mixing will affect the alkyl nitrate and parenthydrocarbon similarly.[30] Using the kinetic data in Table 3, the ratio between
the parent hydrocarbon and the alkyl nitrate can be calcu-lated with equation (9) for various times of t, assuming anaverage concentration of OH. By plotting ratios of alkylnitrate to parent hydrocarbon concentrations against eachother the observed data can be compared to the valuesderived from the kinetic data (Figure 5). On the basis of astudy of the ICARTT Lagrangian experiment [Arnold et al.,2007] a value of 2 � 106 molecules cm�3 has been assumedfor [OH] for curves in Figure 5 and the points that equate tovalues of 1 day and 10 days for t are marked. The overallposition of the line is not sensitive to the value of OH, butprocessing times are shifted along the line.[31] In general, the observed data agrees reasonably well
with the kinetic curves, which is somewhat surprising giventhe various assumptions made above and the uncertainties inthe measurements. The main difference between the ITOPdata set and that of previous studies is that it spans a greaterextent of the kinetic curve, such that the agreement or
deviations can be examined over a wider range of photo-chemical ages (from <1 day to nearly 10 days given thevalue of OH used). The mean NO concentration observedduring ITOP (20 ± 31 pptv [Lewis et al., 2007]) is below thelimit of 100–200 pptv at which the efficiency of the alkylnitrate formation is reduced because of competition betweenthe reaction of ROO� with NO and ROO� self/cross reac-tions [Roberts et al., 1998]. Also the concentrations of thehydrocarbons were often close to the detection limit, par-ticularly for the longer-chain hydrocarbons, thus increasingthe uncertainty in the calculated ratios. In fact the concen-trations of the larger parent hydrocarbons were often belowthe detection limit, hence the reduced number of data pointsfor these compounds.[32] In all but one of the plots in Figure 5, the ratio of
2-butyl nitrate to n-butane is used on the x axis, because it isthought that the only significant source of butyl nitrate isfrom n-butane [Roberts et al., 1998]. In such plots many ofthe data points for the ratios of ethyl nitrate and 1-propylnitrate to their parent hydrocarbons (Figure 5, top) are abovethe theoretical curves, particularly those points with ratiosthat are indicative of less photochemically processed air.This is consistent with studies over N. America [Bertman etal., 1995; Roberts et al., 1998; Stroud et al., 2001], whichhave suggested that this could be explained by sources ofthe alkyl nitrates other than from the parent hydrocarbon.Simpson et al. [2003] observed this for ethyl nitrate, but not1-propyl nitrate, in Asian outflow over the Pacific. Asdiscussed above (Figure 4), these alkyl nitrates exhibited astrong correlation with each other. If the ratio of these alkylnitrates to their parent hydrocarbons are plotted against eachother (Figure 5, middle left), there is also a very goodcorrelation, showing that both these nitrates were oftensimultaneously enhanced relative to their parent hydrocar-bon concentrations. This could be due to a commonprecursor, other than one of their parent hydrocarbons, forboth these nitrates. This could be the fragmentation of alonger-chained hydrocarbon giving rise to a number ofsmaller peroxy radicals and subsequently smaller chainalkyl nitrates (e.g., a C5 hydrocarbon leading to C2 andC3 alkyl nitrates). This finding appears to apply to all of the4 different groups of flights, suggesting a widespread sourceof this precursor.[33] A similar behavior is also seen for 2-propyl nitrate in
that there are also a number of data points above the kineticcurve for the short photochemical processing times whenplotted against the ratio of 2-butyl nitrate to n-butane(Figure 5, middle right), suggesting another source otherthan propane. Again this is consistent with previous studieselsewhere [Bertman et al., 1995; Roberts et al., 1998;Simpson et al., 2003; Stroud et al., 2001]. As discussedabove the ratio of 2-propyl nitrate to 1-propyl nitrate, basedsimply on their relative formation rates from propane,should be around 5.6 close to source. Equation (9) alsoconsiders their loss rates and using the kinetic data in Table 3and an OH concentration of 2 � 106 molecules cm�3 givesvalues for the ratio of 2-propyl nitrate to 1-propyl nitrate of5.7 after 1 day of processing increasing to 6.3 at 10 days.Using an OH concentration of 1 � 106 molecules cm�3
leads to a ratio that barely changes such that by 10 days it isat a value of 5.5. Photochemical processing is therefore notexpected to lead to a decrease in the ratio, closer to the value
D10S37 REEVES ET AL.: ALKYL NITRATES OVER THE NORTH ATLANTIC
9 of 21
D10S37

Figure 5. Relationships between various ratios of alkyl nitrates to their parent hydrocarbons. Theobservations are divided into four sets of flights. The model line is calculated using equation (9), datafrom Table 1 and an assumed concentration of OH of 2 � 106 molecules cm�3. The points on the modelcurve that correspond to 1 and 10 days of photochemical processing are marked.
D10S37 REEVES ET AL.: ALKYL NITRATES OVER THE NORTH ATLANTIC
10 of 21
D10S37

of 4 often observed. Thus plotting the ratios of 2-propylnitrate and 1-propyl nitrate to propane against each other(not shown), which is essentially the same as plotting theratios of the two propyl nitrates together, gives fairly goodcorrelation, but with ratios of 2-propyl nitrate/propane to1-propyl nitrate/propane that are often low compared to thekinetic curve. This is particularly so for flight B032 whichsampled mostly fire plumes and for which the 2-propylnitrate to 1-propyl nitrate ratio was often as low as 2. This isagain consistent with an additional source of 1-propylnitrate other than propane.[34] Another reason for the deviations from the curve at
the short photochemical processing times could be thepresence of small initial concentrations of the alkyl nitrates.This is illustrated in Figure 6 for ethyl nitrate where anadditional model line has been added that corresponds to aninitial ratio between ethyl nitrate and ethane of 0.05%(equation (8)). This certainly improves the fit to the ob-served data prior to 3 days of photochemical processing andthe same can be said for the 1-propyl and 2-propyl nitrates.This is consistent with these shorter-chain nitrates havinglifetimes such that they are almost always observed to haveconcentrations significantly above zero (i.e., above detec-tion limit) (Table 1). It could also indicate a primary sourceof these alkyl nitrates [Bertman et al., 1995].[35] It is also noticeable for the ethyl, 1-propyl and
2-propyl nitrates that at the longer processing times theirratios to their parent hydrocarbons are often below thetheoretical curves (Figure 5, top). It should be noted thatequation (8) and (9) assume that there is sufficient NOpresent for the rate determining step of the formation of thealkyl nitrate to be the loss of the parent hydrocarbon. InFigure 6 there is a third model line calculated fromequation (8) but with b set to zero on the basis of theassumption that the formation of the alkyl nitrate ceases
after 3 days of processing. The observed data tends to bespanned by themodel lines suggesting reality is somewhere inbetween depending on the relative importance of the reactionof the peroxy radicals with NO (reaction 3) or themselves.[36] As described above, equation (9) assumes mixing
will affect the alkyl nitrate and parent hydrocarbon similarly.However, for the short-chain alkyl nitrates (e.g., ethyl),where the lifetime of the alkyl nitrate is shorter than forthe parent hydrocarbon (i.e., kB > kA), mixing in of older airmasses will cause a decrease in the ratio of alkyl nitrate toparent hydrocarbon [Roberts et al., 1998]. Since kA > kB for2-butyl nitrate, when ethyl nitrate/ethane is plotted against2-butyl nitrate/n-butane (Figure 6), mixing could also ex-plain points being below the kinetic curve at the longerprocessing times. For 1-propyl nitrate and 2-propyl nitratethe relative sizes of kA and kB are sensitive to the OH valueand assumed photolysis loss rates for the alkyl nitrates.Using the rates in Table 3, an OH concentration equal to1 � 106 molecules cm�3 leads to kB > kA, where as for OHequal to 2 � 106 molecules cm�3 kA > kB. Thus the sign ofthe change in the ratio of the propyl nitrates to propane isdependent on the concentration of OH.[37] The concentrations of the C4 and smaller alkyl
nitrates are not particularly elevated in the smoke plumesof flight B032, despite their parent hydrocarbons (ethane,propane and n-butane) being significantly elevated abovebackground concentrations. This gives low alkyl nitrate toparent hydrocarbon ratios suggesting that the smoke plumesare not well processed photochemically. This is consistentwith the observations of ozone, which are not elevated inthese samples while the CO concentrations are very high(Figure 2), and with high concentrations of ethylene persist-ing in these plumes [Lewis et al., 2007]. On the other handthe pentyl nitrates are elevated in concentration along withthe pentanes in these samples. This gives rise to ratios above
Figure 6. Relationships between the ratios of ethyl nitrate to ethane versus 2-butyl nitrate to n-butane.The observations are divided into four sets of flights. The model lines are calculated using equation (8)and data from Table 1 and an assumed concentration of OH of 2 � 106 molecules cm�3. The solid modelline assumes initial concentrations of the alkyl nitrates are zero (i.e., equation (9)). The dashed model lineassumes that the initial ratio between ethyl nitrate and ethane is 0.05%. The dotted model line assumesthat the initial ratio between ethyl nitrate and ethane is 0.05% and that no alkyl nitrate production occursafter 3 days (i.e., b = 0).
D10S37 REEVES ET AL.: ALKYL NITRATES OVER THE NORTH ATLANTIC
11 of 21
D10S37
the kinetic curve when plotted against the ratio of 2-butylnitrate to n-butane (Figure 5, bottom). Since the parenthydrocarbon is expected to be the only source of the pentylnitrate, it is not clear why the pentyl nitrates appear to bebeing produced more efficiently in these plumes than thesmaller alkyl nitrates.[38] While the pentyl nitrate data for flight B032 is
mostly elevated relative to the pentanes, the reverse is truefor the data from the other flights with data points fallingbelow the kinetic curve in Figure 5. This cannot beexplained by low NO concentrations leading to no orinsignificant formation of the alkyl nitrates. This is because,if there is no further formation of the alkyl nitrates, thentheir ratios to their parent hydrocarbons is simply a functionof the relative lifetimes of the alkyl nitrates to those of theirparent hydrocarbons (i.e., kB relative to kA). Since thelifetimes of the pentyl nitrates relative to their parenthydrocarbons are greater than that of 2-butyl nitrate to itsparent, this would lead to higher ratios of the pentyl nitratesto the pentanes relative to the ratio of 2-butyl nitrate ton-butane. One possible explanation for the data falling belowthe kinetic curve might be the fragmentation of the pentanesleading to smaller chain peroxy radicals and subsequentlysmaller chain alkyl nitrates, instead of the pentyl nitrates.[39] Unfortunately only a few of the air samples collected
during flight B031 were analyzed for both hydrocarbonsand alkyl nitrates. For those that exist the alkyl nitrate toparent hydrocarbon ratios are often relatively large suggest-ing photochemically processed pollution. In theory, using
equation (9), calculated ratios of alkyl nitrate to parenthydrocarbon will either continue to increase indefinitely ifkA > kB (i.e., the lifetime of the alkyl nitrate is greater thanthe lifetime of the parent hydrocarbon) or increase toward aconstant value (bkA/(kB � kA)) if kB > kA (i.e., the lifetimeof the parent hydrocarbon is greater than the lifetime of thealkyl nitrate). However, the concentrations of the hydro-carbons decrease to a point where they become below thedetection limit of the analytical system. Thus, in practice thesamples that appear to be the most photochemically pro-cessed, may be those that initially contained the highestburden of parent hydrocarbons.
3.4. Relationship Between Alkyl Nitrates and CO
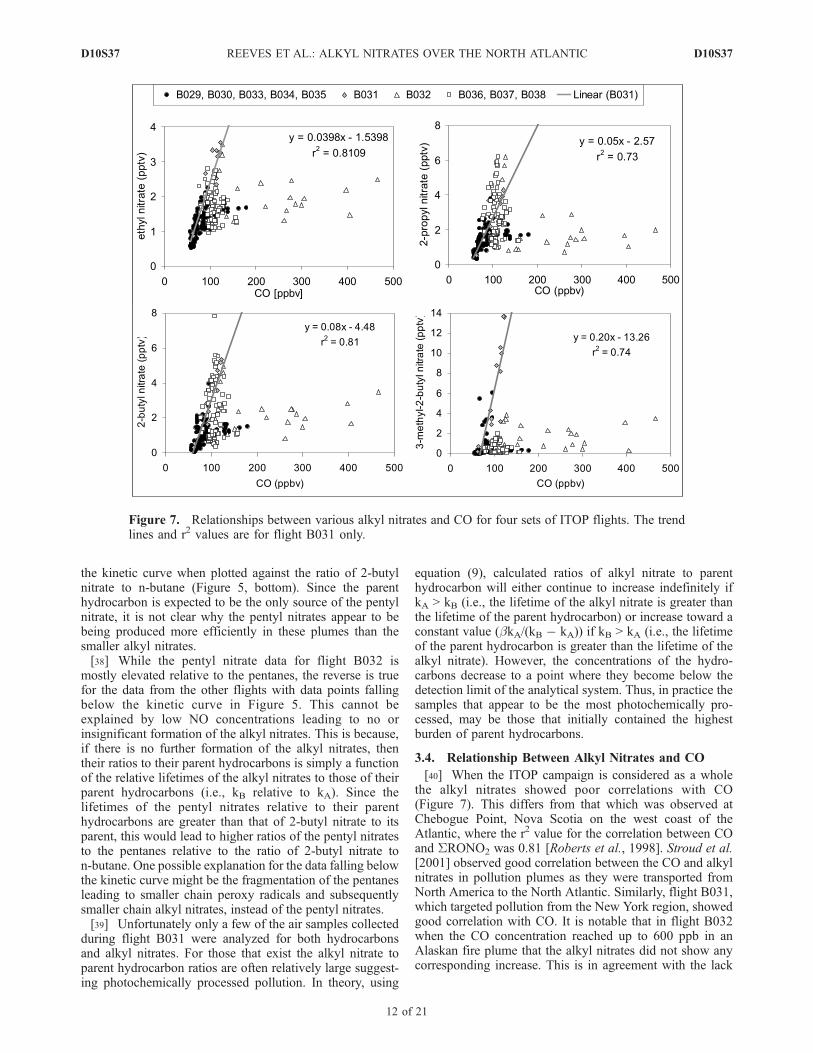
[40] When the ITOP campaign is considered as a wholethe alkyl nitrates showed poor correlations with CO(Figure 7). This differs from that which was observed atChebogue Point, Nova Scotia on the west coast of theAtlantic, where the r2 value for the correlation between COand SRONO2 was 0.81 [Roberts et al., 1998]. Stroud et al.[2001] observed good correlation between the CO and alkylnitrates in pollution plumes as they were transported fromNorth America to the North Atlantic. Similarly, flight B031,which targeted pollution from the New York region, showedgood correlation with CO. It is notable that in flight B032when the CO concentration reached up to 600 ppb in anAlaskan fire plume that the alkyl nitrates did not show anycorresponding increase. This is in agreement with the lack
Figure 7. Relationships between various alkyl nitrates and CO for four sets of ITOP flights. The trendlines and r2 values are for flight B031 only.
D10S37 REEVES ET AL.: ALKYL NITRATES OVER THE NORTH ATLANTIC
12 of 21
D10S37

of a positive relationship between CO and ozone in thesefire plumes.[41] Using equation (9), one can calculate a photochem-
ical age t from the observed ratios of the alkyl nitrate toits parent hydrocarbon. Figure 8 shows the relationship of2-propyl nitrate to CO shaded by the photochemical agecalculated from the 2-butyl nitrate to n-butane ratio. Thereis a tendency for the data points which exhibit a lower2-propyl nitrate to CO ratio to be the less photochemicallyaged air, which partially explains the scatter seen in thealkyl nitrate to CO plots. It is probable that the age of airsampled at Chebogue Point was less variable than thatsampled during ITOP, and hence the better correlation ofthe alkyl nitrates with CO.
3.5. Lagrangian Experiment
[42] Part of the ICARTT project was aimed at carryingout a Lagrangian experiment (ICARTT Lagrangian-2K4Experiment). Methven et al. [2006] describes how thiswas done and defines several Lagrangian connections thatinvolved the BAe-146 aircraft sampling air previouslysampled by either the NOAA WP-3D or the NASA DC-8 aircraft. Arnold et al. [2007] used the concentrations of thenonmethane hydrocarbons in several of these cases toestimate the mean OH and the air mass dilution rates.Following this a box model has been set up to examinethe evolution of the alkyl nitrates and their parent hydro-carbon with time. It essentially uses equation (6) and (7) todescribe the loss of the parent hydrocarbon and the forma-tion and loss of the alkyl nitrates, along with OH asestimated by Arnold et al. [2007]. In addition equation (10)is used to take account of the mixing with background air.
dX=dt ¼ �K X� Xbð Þ ð10Þ
where X is the concentration of the alkyl nitrate orhydrocarbon, Xb is the background concentrations of X,and K is the mixing rate (s�1) for each case study asdetermined by Arnold et al. [2007]. Each model run wasinitialized by concentrations of the alkyl nitrates and parent
hydrocarbons as observed by the upwind aircraft. Xb wastaken to be the median concentrations observed by the BAe-146 for all flights.[43] Figures 9–14 compare the observed concentrations
of the various alkyl nitrates, their parent hydrocarbons andthe ratio between the alkyl nitrates and their parents withthose calculated in various model runs for Lagrangian cases1, 2 and 5 as defined by Methven et al. [2006]. Arnold et al.[2007] used a ‘‘concentration’’ method to estimate the meanOH, which also considered the rate of mixing of the airmass with surrounding air. Thus optimum values for bothOH and K were determined, along with uncertainty rangesrepresented by the 25th and 75th percentiles. Cases 1 and 5both involved sampling of the air mass by the BAe-146 ontwo different days. Arnold et al. [2007] treated these asseparate Lagrangian connections and thus determined OHconcentrations and mixing rates for each case separately(i.e., case 1a, case 1b, case 5a and case 5b). For cases 1 and5, the alkyl nitrate model was run using the values of OHand K from 1a and 5a, respectively. The values for 1b and5b did not differ greatly from these.[44] Case 1 involved sampling an air mass on three
occasions: the DC-8 on 15 July (day 197), the BAe-146on 19 July (B031, day 201) and again on 25 July (B034,day 207). The air mass received emissions from the NewYork region. By 25 July it had almost reached the Portu-guese coast before returning westward toward the Azores.Figures 9 and 10 show that, within the uncertainty range ofthe optimum values of OH and K as determined for case 1a,the downwind concentrations of propyl nitrate and 2-butylnitrate observed on day 201 (case 1a) can be reproduced. Byday 207 (case 1b) the observed concentrations of propylnitrate are lower than calculated, although the observed andcalculated concentrations of 2-butyl nitrate are in reasonablygood agreement. The model does a good job of reproducingthe parent hydrocarbon concentrations and these concen-trations are not very sensitive to the uncertainty in thevalues of OH and K (given by the 25th and 75th percentileranges). These results suggest that the overprediction of thepropyl nitrate on day 207 is not likely to be due tounaccounted mixing. A possible reason for this overpredic-tion could be that the production rate of the alkyl nitratesmight have been reduced by the concentration of NO fallingto a level at which the reaction of peroxy radicals with NOdo not dominate the self/cross reaction of the peroxyradicals. This is entirely consistent with the mean concen-tration of NO observed by the BAe-146 in the Lagrangianair mass on days 201 and 207 being only 23 pptv and6 pptv, respectively. To illustrate this, a model run wasperformed in which it was assumed that the concentrationof NO went to zero on day 201 and the production of thealkyl nitrates stopped. This captures the 1-propyl nitrateconcentration and its ratio to propane on day 207. Theconcentration of 2-butyl nitrate was little affected by thischange since n-butane had reached sufficiently low con-centrations by day 201 that, even assuming that all theperoxy radicals reacted with NO, the production of 2-butylnitrate was small compared to its loss rate. The calculatedratio of 2-butyl nitrate to n-butane is larger than observed,but this really illustrates that when the concentrations ofalkyl nitrates and their parent hydrocarbons become low,small absolute errors can lead to large errors in the ratios.
Figure 8. Relationship between 2-propyl nitrate and CO,shaded according to photochemical age as calculated fromthe ratio of 2-butyl nitrate to n-butane.
D10S37 REEVES ET AL.: ALKYL NITRATES OVER THE NORTH ATLANTIC
13 of 21
D10S37

The agreement between the calculated and observed con-centrations for ethyl and 2-propyl are qualitatively thesame as described above for 1-propyl nitrate and thosefor 2 + 3-pentyl nitrates are similar to 2-butyl nitrate.[45] Case 5 also involved the sampling of an air mass on
three occasions: the WP-3D on 28 July (day 210), the
BAe-146 on 31 July (B037, day 213) and again on 1 August(B038, day 214). The air mass received emissions from theeastern United States and was transported at low level by afrontal system. Figures 11 and 12 show the plots for case 5for ethyl and 2-butyl nitrate. The observed concentrationsfor these two nitrates, and for 1-propyl, 2-propyl and 2 +
Figure 9. Time evolution of 1-propyl nitrate, its parent hydrocarbon (propane), and the ratio betweenthem for the Lagrangian case 1. Case 1a uses the median of the optimum values of OH and K [Arnold etal., 2007], high OH uses the 75th percentile for OH, low OH uses the 25th percentile for OH, high K usesthe 75th percentile for K, low K uses the 25th percentile for K, and NO goes to zero assumes zero NOfrom day 201 onward. The observed data represent the mean for the WAS samples taken during the timeperiod identified as a Lagrangian match.
D10S37 REEVES ET AL.: ALKYL NITRATES OVER THE NORTH ATLANTIC
14 of 21
D10S37

3-pentyl nitrates, are qualitatively the same as case 1, inthat the concentrations dropped rapidly between the secondand third times of sampling. The concentrations of ethyl,1-propyl and 2-butyl nitrates increased between days 210and 213, but then fell considerably by day 214. Using thevalues of OH and K determined for case 5a the model
captures the observed increase in ethyl nitrate and itproduces an increase in 1-propyl nitrate, but slightly lessthan observed. It does not, however, simulate the increasein 2-butyl nitrate, the reason for which is unclear given thatthe model does a good job of reproducing the n-butane.Switching off the production of the alkyl nitrates by
Figure 10. Time evolution of 2-butyl nitrate, its parent hydrocarbon (n-butane), and the ratio betweenthem for the Lagrangian case 1. Case 1a uses the median of the optimum values of OH and K [Arnold etal., 2007], high OH uses the 75th percentile for OH, low OH uses the 25th percentile for OH, high K usesthe 75th percentile for K, low K uses the 25th percentile for K, and NO goes to zero assumes zero NOfrom day 201 onward. The observed data represent the mean for the WAS samples taken during the timeperiod identified as a Lagrangian match.
D10S37 REEVES ET AL.: ALKYL NITRATES OVER THE NORTH ATLANTIC
15 of 21
D10S37

assuming NO goes to zero can also lead to a sharp declinein concentration between days 213 and 214. The meanconcentration of NO observed by the BAe-146 in theLagrangian air mass on day 213 and day 214 was only14 pptv and 4 pptv, respectively, well below the 100–200 pptv level at which the efficiency of the alkyl nitrateformation is reduced [Roberts et al., 1998].
[46] Case 2 involved the sampling of an air mass on twooccasions: the DC-8 on 18 July (day 200), and the BAe-146on 20 July (B032, day 202). The air mass sampled in thiscase was an Alaskan smoke plume with relatively highconcentrations of hydrocarbons, some of which were greaterin downwind samples. These plumes tended to be quitenarrow and a small error in the Lagrangian matching is the
Figure 11. Time evolution of ethyl nitrate, its parent hydrocarbon (ethane) and the ratio between themfor the Lagrangian case 5. Case 5a uses the median of the optimum values of OH and K [Arnold et al.,2007], high OH uses the 75th percentile for OH, low OH uses the 25th percentile for OH, high K uses the75th percentile for K, low K uses the 25th percentile for K, and NO goes to zero assumes zero NO fromday 213 onward. The observed data represent the mean for the WAS samples taken during the time periodidentified as a Lagrangian match.
D10S37 REEVES ET AL.: ALKYL NITRATES OVER THE NORTH ATLANTIC
16 of 21
D10S37
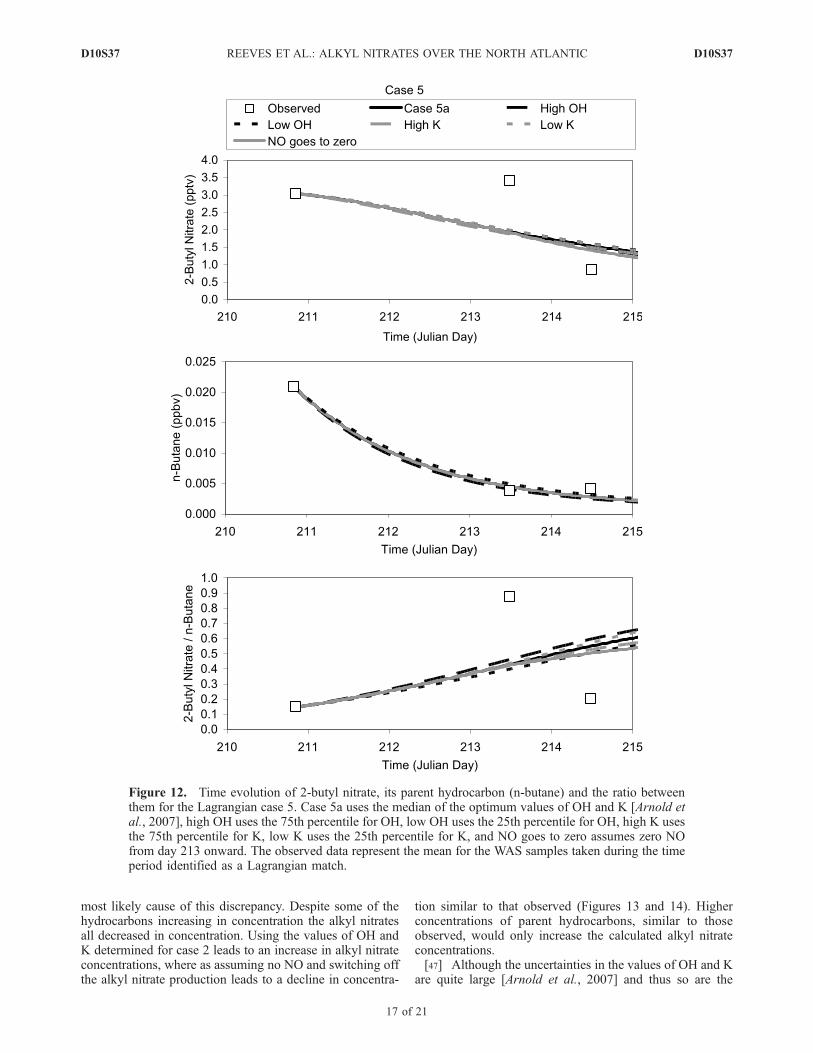
most likely cause of this discrepancy. Despite some of thehydrocarbons increasing in concentration the alkyl nitratesall decreased in concentration. Using the values of OH andK determined for case 2 leads to an increase in alkyl nitrateconcentrations, where as assuming no NO and switching offthe alkyl nitrate production leads to a decline in concentra-
tion similar to that observed (Figures 13 and 14). Higherconcentrations of parent hydrocarbons, similar to thoseobserved, would only increase the calculated alkyl nitrateconcentrations.[47] Although the uncertainties in the values of OH and K
are quite large [Arnold et al., 2007] and thus so are the
Figure 12. Time evolution of 2-butyl nitrate, its parent hydrocarbon (n-butane) and the ratio betweenthem for the Lagrangian case 5. Case 5a uses the median of the optimum values of OH and K [Arnold etal., 2007], high OH uses the 75th percentile for OH, low OH uses the 25th percentile for OH, high K usesthe 75th percentile for K, low K uses the 25th percentile for K, and NO goes to zero assumes zero NOfrom day 213 onward. The observed data represent the mean for the WAS samples taken during the timeperiod identified as a Lagrangian match.
D10S37 REEVES ET AL.: ALKYL NITRATES OVER THE NORTH ATLANTIC
17 of 21
D10S37

uncertainties in the calculated alkyl nitrate concentrations,these model runs produce results which corroborate some ofthe findings discussed above. Over the first few days ofcases 1 and 5 the results suggest that the alkyl nitrates hadbeen photochemical produced. This is consistent with thegeneral agreement between the kinetic data and the hydro-
carbon ratios (Figure 5), particularly at the shorter photo-chemical processing times. This implies that ozone had alsobeen produced since one branch of the alkyl nitrate formingreaction (3) produces NO2 (3a), which when photolyzedleads to ozone. However, after about 3 days the resultssuggest that the production of the alkyl nitrates may have
Figure 13. Time evolution of ethyl nitrate, its parent hydrocarbon (ethane) and the ratio between themfor the Lagrangian case 2. Case 2 uses the median of the optimum values of OH and K [Arnold et al.,2007], high OH uses the 75th percentile for OH, low OH uses the 25th percentile for OH, high K uses the75th percentile for K, low K uses the 25th percentile for K, and NO set to zero assumes zero NO. Theobserved data represent the mean for the WAS samples taken during the time period identified as aLagrangian match.
D10S37 REEVES ET AL.: ALKYL NITRATES OVER THE NORTH ATLANTIC
18 of 21
D10S37

been considerably reduced, again consistent with the rela-tionship between the kinetic data and the alkyl nitrate tohydrocarbon ratios at the longer photochemical timescales(Figures 5 and 6). If these reductions in alkyl nitratesconcentrations were due to net photochemical loss, asopposed to mixing, then the alkyl nitrates would have beena source of NOX. Although the rate of ozone production
may be low, in these remote regions of the N. Atlantic,where the NO concentrations are low, the balance betweenozone production and destruction is highly sensitive to NOX
[Reeves et al., 2002]. The mean NO observed during theITOP flights was 20 pptv. Assuming an NO/NO2 ratio of 1,typical of 5 km altitude over the mid-Atlantic [Reeves et al.,2002], this equates to approximately 40 pptv of NOX, which
Figure 14. Time evolution of 2-butyl nitrate, its parent hydrocarbon (n-butane) and the ratio betweenthem for the Lagrangian case 2. Case 2 uses the median of the optimum values of OH and K [Arnold etal., 2007], high OH uses the 75th percentile for OH, low OH uses the 25th percentile for OH, high K usesthe 75th percentile for K, low K uses the 25th percentile for K, and NO set to zero assumes zero NO. Theobserved data represent the mean for the WAS samples taken during the time period identified as aLagrangian match.
D10S37 REEVES ET AL.: ALKYL NITRATES OVER THE NORTH ATLANTIC
19 of 21
D10S37

coincidently was the NOX compensation point for ozoneproduction previously calculated for this altitude [Reeves etal., 2002]. The mean concentration of the sum of the alkylnitrates reported during ITOP is 10 pptv, which equates toan additional 25% of the observed NOX. Thus the alkylnitrate source of NOX, albeit small, could contribute tomaintaining ozone levels as the air undergoes long-rangetransport. The lack of photochemical production of the alkylnitrates, and thus ozone, in case 2 is consistent with thealkyl nitrate to hydrocarbon ratios being small and the lackof correlation between the alkyl nitrates and CO in thesmoke plumes (Flight B032).
4. Conclusions
[48] The alkyl nitrate concentrations observed duringITOP are typical of those found a few days downwind ofprecursor source regions. Although there is some evidencefor an oceanic source of methyl nitrate, for the most part theair samples collected during ITOP do not appear to bestrongly influenced by oceanic sources of the alkyl nitrates.Elevated concentrations were observed in air masses whichhave been influenced by emissions from the N.E. UnitedStates and from Alaskan fires. The large variations in ratiosbetween the C5 and C2-C4 nitrates suggest that emissionratios for the parent hydrocarbons vary between differentregions of the N.E. United States.[49] In general the alkyl nitrate data agrees well with
photochemical theory. This suggests that at least during thefirst few days of transport from the source region photo-chemical production of alkyl nitrates had taken place. Thisimplies that ozone production had also occurred. There alsoappears to be a widespread common source of ethyl nitrateand 1-propyl nitrate other than from their parent hydro-carbons. This might be from longer-chain hydrocarbons,possibly pentanes.[50] The observations in the more photochemically pro-
cessed air masses are consistent with the concentration ofNO dropping to a point where the rates of the alkyl nitrateproduction reactions no longer dominate the peroxy radicalself/cross reactions. However, in these low levels of NO,where the balance between ozone production and destruc-tion is highly sensitive to NOX, the alkyl nitrates mightcontribute to maintaining the ozone levels in air as itundergoes long-range transport.[51] The observed patterns of the alkyl nitrates also
suggest that the rates of photochemical processing in theAlaskan smoke plumes were small and that the rates ofozone formation in these air masses were low.
[52] Acknowledgments. The ITOP project was funded throughthe NERC Upper Troposphere–Lower Stratosphere Ozone programme.The authors wish to thank FAAM, Directflight and Avalon for making theaircraft campaign possible. The Lagrangian experiment was a result ofconsiderable effort from the ICARTT consortium. Claire Reeves alsowishes to thank Steve Arnold for useful discussions of the modeling andto acknowledge financial support from the NERC Centre for AtmosphericScience through the Distributed Institute for Atmospheric Composition.Stuart Penkett was funded by the Leverhulme Trust.
ReferencesArey, J., S. M. Aschmann, E. S. C. Kwok, and R. Atkinson (2001), Alkylnitrate, hydroxyalkyl nitrate, and hydroxycarbonyl formation from theNOx-air photooxidations of C5-C8 n-alkanes, J. Phys. Chem. A, 105,1020–1027.
Arnold, S. R., et al. (2007), Statistical inference of OH concentrations andair mass dilution rates from successive observations of nonmethanehydrocarbons in single air masses, J. Geophys. Res., doi:10.1029/2006JD007594, in press.
Atherton, C. (1989), Organic nitrates in remote marine environments: evi-dence for long range-transport, Geophys. Res. Lett., 16, 1289–1292.
Atkinson, R., and J. Arey (2003), Atmospheric degradation of volatileorganic compounds, Chem. Rev., 103, 4605–4638.
Atkinson, R., S. M. Aschmann, W. P. L. Carter, A. M. Winer, and J. N. Pitts(1982), Alkyl nitrate formation from the NOx-air photooxidations ofC2-C8 N-alkanes, J. Phys. Chem., 86, 4563–4569.
Atkinson, R., S. M. Aschmann, and A. M. Winer (1987), Alkyl nitrateformation from the reaction of a series of branched RO2 radicals withNO as a function of temperature and pressure, J. Atmos. Chem., 5, 91–102.
Atlas, E., W. Pollock, J. Greenberg, L. Heidt, and A. M. Thompson (1993),Alkyl nitrates, nonmethane hydrocarbons, and halocarbon gases over theequatorial Pacific Ocean during SAGA 3, J. Geophys. Res., 98(D9),16,933–16,948.
Bertman, S. B., J. M. Roberts, D. D. Parrish, M. P. Buhr, P. D. Goldan,W. C. Kuster, F. C. Fehsenfeld, S. A. Montzka, and H. Westberg(1995), Evolution of alkyl nitrates with air mass age, J. Geophys.Res., 100(D11), 22,805–22,814.
Blake, N. J., D. Blake, O. W. Wingenter, B. C. Sive, C. H. Kang, D. C.Thornton, A. J. Bandy, E. Atlas, F. Flocke, J. M. Harris, and F. S.Rowland (1999), Aircraft measurements of latitudinal, vertical, andseasonal variations of NMHCs, methyl nitrate, methyl halides, andDMS during the First Aerosol Characterization Experiment (ACE 1),J. Geophys. Res., 104, 21,803–21,817.
Blake, N. J., D. R. Blake, A. L. Swanson, E. Atlas, F. Flocke, and F. S.Rowland (2003), Latitudinal, vertical, and seasonal variations of C1-C4
alkyl nitrates in the troposphere over the Pacific Ocean during PEM-Tropics A and B: Oceanic and continental sources, J. Geophys. Res.,108(D2), 8242, doi:10.1029/2001JD001444.
Brough, N., et al. (2003), Intercomparison of aircraft instruments on boardthe C-130 Hercules and Falcon 20 over eastern Europe during EXPORT2000, Atmos. Chem. Phys., 3, 2127–2138.
Carter, W. P. L., and R. Atkinson (1989), Alkyl nitrate formation from theatmospheric photooxidation of alkanes: A revised estimation method,J. Atmos. Chem., 8, 165–173.
Chuck, A. L., S. M. Turner, and P. S. Liss (2002), Direct evidence for amarine source of C1 and C2 alkyl nitrates, Science, 297, 1151–1154.
Clemitshaw, K. C., J. Williams, O. V. Rattigan, D. E. Shallcross, K. S. Law,and R. A. Cox (1997), Gas-phase ultraviolet absorption cross-sectionsand atmospheric lifetimes of several C2-C5 alkyl nitrates, J. Photochem.Photobiol. A Chem., 102, 117–126.
Dahl, E. E., S. A. Yvon-Lewis, and E. S. Saltzman (2005), Saturationanomalies of alkyl nitrates in the tropical Pacific Ocean, Geophys. Res.Lett., 32, L20817, doi:10.1029/2005GL023896.
Day, D. A., M. B. Dillon, P. J. Wooldridge, J. A. Thornton, R. S. Rosen,E. C. Wood, and R. C. Cohen (2003), On alkyl nitrates, O3, and the‘‘missing NOy,’’ J. Geophys. Res., 108(D16), 4501, doi:10.1029/2003JD003685.
Droege, A. T., and F. P. Tully (1986a), Hydrogen-atom abstraction fromalkanes by OH. 3. Propane, J. Phys. Chem., 90, 1949–1954.
Droege, A. T., and F. P. Tully (1986b), Hydrogen-atom abstraction fromalkanes by OH. 5. Normal-butane, J. Phys. Chem., 90, 5937–5941.
Fehsenfeld, F. C., et al. (2006), International Consortium for AtmosphericResearch on Transport and Transformation (ICARTT): North America toEurope—Overview of the 2004 summer field study, J. Geophys. Res.,111, D23S01, doi:10.1029/2006JD007829.
Flocke, F., A. Volz-Thomas, and D. Kley (1991), Measurements of alkylnitrates in rural and polluted air masses, Atmos. Environ., Part A, 25,1951–1960.
Flocke, F., A. Volz-Thomas, H.-J. Buers, W. Patz, H.-J. Garthe, and D. Kley(1998), Long-term measurements of alkyl nitrates in southern Germany:1. General behavior and seasonal and diurnal variation, J. Geophys. Res.,103, 5729–5746.
Friedli, H. R., E. Atlas, V. R. Stroud, L. Giovanni, T. Campos, and L. F.Radke (2001), Volatile organic trace gases emitted from North Americanwildfires, Global Biogeochem. Cycles, 15, 435–452.
Gerbig, C., S. Schmitgen, D. Kley, A. Volz-Thomas, K. Dewey, andD. Haaks (1999), An improved fast-response vacuum-UV resonancefluorescence CO instrument, J. Geophys. Res., 104, 1699–1704.
Hopkins, J. R., K. A. Read, and A. C. Lewis (2003), A two column methodfor long-term monitoring of non-methane hydrocarbons (NMHCs) andoxygenated volatile organic compounds, J. Environ. Monit., 5, 8–13.
Jenkin, M. E., S. M. Saunders, and M. J. Pilling (1997), The troposphericdegradation of volatile organic compounds: A protocol for mechanismdevelopment, Atmos. Environ., 31, 81–104.
D10S37 REEVES ET AL.: ALKYL NITRATES OVER THE NORTH ATLANTIC
20 of 21
D10S37

Kwok, E. S. C., and R. Atkinson (1995), Estimation of hydroxyl radicalreaction rate constants for gas-phase organic compounds using a structure-reactivity relationship: An update, Atmos. Environ., 29, 1685–1695.
Lewis, A. C., et al. (2007), Chemical composition observed over the mid-Atlantic and the detection of pollution signatures far from source regions,J. Geophys. Res., 112, D10S39, doi:10.1029/2006JD007584.
Methven, J., et al. (2006), Establishing Lagrangian connections betweenobservations within air masses crossing the Atlantic during the Interna-tional Consortium for Atmospheric Research on Transport and Transfor-mation experiment, J. Geophys. Res., 111, D23S62, doi:10.1029/2006JD007540.
Nowak, J. B., et al. (2004), Gas-phase chemical characteristics of Asianemission plumes observed during ITCT 2K2 over the eastern NorthPacific Ocean, J. Geophys. Res., 109, D23S19, doi:10.1029/2003JD004488.
O’Brien, J. M., P. B. Shepson, Q. Wu, T. Biesenthal, J. W. Bottenheim,H. A. Wiebe, K. G. Anlauf, and P. Brickell (1997), Production anddistribution of organic nitrates, and their relationship to carbonyl com-pounds in an urban environment, Atmos. Environ., 31, 2059–2069.
Ostling, K., B. Kelly, S. Bird, S. Bertman, M. Pippin, T. Thornberry, andM. A. Carroll (2001), Fast-turnaround alkyl nitrate measurements duringthe PROPHET 1998 summer intensive, J. Geophys. Res., 106, 24,439–24,449.
Ranschaert, D. L., N. J. Schneider, and M. J. Elrod (2000), Kinetics ofthe C2H5O2 + NOx reactions: Temperature dependence of the overallrate constant and the C2H5ONO2 branching channel of C2H5O2 +NO, J. Phys. Chem. A, 104, 5758–5765.
Reeves, C. E., et al. (2002), Potential for photochemical ozone formation inthe troposphere over the North Atlantic as derived from aircraft observa-tions during ACSOE, J. Geophys. Res., 107(D23), 4707, doi:10.1029/2002JD002415.
Ridley, B. A., E. L. Atlas, J. G. Walega, G. L. Kok, T. A. Staffelbach, J. P.Greenberg, F. E. Grahek, P. G. Hess, and D. D. Montzka (1997), Aircraftmeasurements made during the spring maximum of ozone over Hawaii:Peroxides, CO, O3, NOy, condensation nuclei, selected hydrocarbons,halocarbons, and alkyl nitrates between 0.5 and 9 km altitude, J. Geo-phys. Res., 102, 18,935–18,961.
Roberts, J. M. (1990), The atmospheric chemistry of organic nitrates,Atmos. Environ., Part A, 24, 243–287.
Roberts, J. M., and R. W. Fajer (1989), UV absorption cross sections oforganic nitrates of potential atmospheric importance and estimation ofatmospheric lifetimes, Environ. Sci. Technol., 23, 945–951.
Roberts, J. M., S. B. Bertman, D. D. Parrish, F. C. Fehsenfeld, B. T. Jobson,and H. Niki (1998), Measurement of alkyl nitrates at Chebogue Point,Nova Scotia during the 1993 North Atlantic Regional Experiment(NARE) intensive, J. Geophys. Res., 103, 13,569–13,580.
Rosen, R. S., E. C. Wood, P. J. Wooldridge, J. A. Thornton, D. A. Day,W. Kuster, E. J. Williams, B. T. Jobson, and R. C. Cohen (2004),Observations of total alkyl nitrates during Texas Air Quality Study2000: Implications for O3 and alkyl nitrate photochemistry, J. Geophys.Res., 109, D07303, doi:10.1029/2003JD004227.
Saunders, S. M., M. E. Jenkin, R. G. Derwent, and M. J. Pilling (1997),World Wide Web site of a Master Chemical Mechanism (MCM) for usein tropospheric chemistry models, Atmos. Environ., 31, 1249.
Saunders, S. M., M. E. Jenkin, R. G. Derwent, and M. J. Pilling (2003),Protocol for the development of the Master Chemical Mechanism, MCMv3 (Part A): Tropospheric degradation of non-aromatic volatile organiccompounds, Atmos. Chem. Phys., 3, 161–180.
Shepson, P. B., K. G. Anlauf, J. W. Bottenheim, H. A. Wiebe, N. Gao,K. Muthuramu, and G. I. MacKay (1993), Alkyl nitrates and theircontribution to reactive nitrogen at a rural site in Ontario, Atmos.Environ., Part A, 27, 749–757.
Simpson, I. J., S. Meinardi, D. R. Blake, N. J. Blake, F. S. Rowland,E. Atlas, and F. Flocke (2002), A biomass burning source of C1–C4
alkyl nitrates, Geophys. Res. Lett., 29(24), 2168, doi:10.1029/2002GL016290.
Simpson, I. J., N. J. Blake, D. R. Blake, E. Atlas, F. Flocke, J. H. Crawford,H. E. Fuelberg, C. M. Kiley, S. Meinardi, and F. S. Rowland (2003),Photochemical production and evolution of selected C2–C5 alkyl nitratesin tropospheric air influenced by Asian outflow, J. Geophys. Res.,108(D20), 8808, doi:10.1029/2002JD002830.
Stroud, C. A., et al. (2001), Alkyl nitrate measurements during STERAO1996 and NARE 1997: Intercomparison and survey of results, J. Geo-phys. Res., 106, 23,043–23,053.
Talbot, R. W., et al. (1999), Reactive nitrogen budget during the NASASONEX mission, Geophys. Res. Lett., 26, 3057–3060.
Talbot, R. W., J. E. Dibb, E. M. Scheuer, J. D. Bradshaw, S. T. Sandholm,H. B. Singh, D. R. Blake, N. J. Blake, E. Atlas, and F. Flocke (2000),Tropospheric reactive odd nitrogen over the South Pacific in australspringtime, J. Geophys. Res., 105, 6681–6694.
Talbot, R., et al. (2003), Reactive nitrogen in Asian continental outflowover the western Pacific: Results from the NASATransport and ChemicalEvolution over the Pacific (TRACE-P) airborne mission, J. Geophys.Res., 108(D20), 8803, doi:10.1029/2002JD003129.
Wang, T., A. J. Ding, D. R. Blake, W. Zahorowski, C. N. Poon, and Y. S.Li (2003), Chemical characterization of the boundary layer outflow ofair pollution to Hong Kong during February–April 2001, J. Geophys.Res., 108(D20), 8787, doi:10.1029/2002JD003272.
Zhu, L., and D. Kellis (1997), Temperature dependence of the UV absorp-tion cross sections and photodissociation products of C3-C5 alkylnitrates, Chem. Phys. Lett., 278, 41–48.
�����������������������E. Atlas, Rosenstiel School of Marine and Atmospheric Science, Division
of Marine and Atmospheric Chemistry, University of Miami, Miami, FL33149, USA.D. R. Blake, Department of Chemistry, University of California, Irvine,
CA 92697, USA.J. Hopkins, A. Lewis, and N. Watson, Department of Chemistry,
University of York, York YO10 5DD, UK.J. Methven, Department of Meteorology, University of Reading, Reading
RG6 6BB, UK.D. E. Oram, S. A. Penkett, C. E. Reeves, J. Slemr, D. J. Stewart, and
D. Worton, School of Environmental Sciences, University of EastAnglia, Norwich NR4 7TJ, UK. ([email protected])R. Purvis, Facility for Airborne Atmospheric Measurements, Cranfield
University, Cranfield MK43 0AL, UK.
D10S37 REEVES ET AL.: ALKYL NITRATES OVER THE NORTH ATLANTIC
21 of 21
D10S37