Introduction to Seismic methods - Interreg North-West Europe
Upload
khangminh22Category
view
0download
0

2 | P a g e
North West Spatial Development Framework 2017
Approved by the Director-General North West Provincial Government
……………………………………. ……………………
The Director-General Date
Dr. K.L. Sebego
Approved by the Premier North West Provincial Government
…………………………………. ………………………
The Premier Date
Hon. S.O.R. Mahumapelo
Final Draft

3 | P a g e
TABLE OF CONTENTS
1 CHAPTER 1: INTRODUCTION 16
1.1 Background 16
1.2 The Spatial Planning and Land Use Management Act 2013. 17
2 CHAPTER 2: POLICY AND LEGISLATION CONTEXT 19
2.1 Introduction 19
2.2 Spatial Policies and Initiatives 20
2.2.1 International and Regional Context 20
2.2.1.1 Background 20
2.2.1.2 Sustainable development 20
2.2.1.3 International Cooperation and Development 22
2.2.1.3.1 UNESCO’s programme on Man and the Biosphere (MaB) 22
2.2.1.3.2 The UN Convention on Wetlands of International Importance - the Ramsar Convention 22
2.2.1.3.3 Unesco Convention concerning the Protection of the World Cultural and Natural Heritage, 1972 23
2.2.1.3.4 United Nations Framework Convention on Climate Change (UNFCCC) 23
2.2.1.3.5 United Nations Convention to Combat Desertification, particularly in Africa 24
2.2.1.3.6 The NEPAD Spatial Development Programme (SDP) 24
2.2.2 National Policies 26
2.2.2.1 National Spatial Development Policies 26
2.2.2.2 National Economic Development Policies 27
2.2.3 The North West Provincial Rebranding, Repositioning and Renewal (RRR) Strategy 28
2.2.4 Policy Objectives of the North West Spatial Development Framework 29
2.3 Legislative Context 31
2.3.1 Spatial Justice 31
2.3.2 Spatial Sustainability 31
2.3.3 Efficiency 31
2.3.4 Spatial Resilience 31
2.3.5 Good administration 32
3 CHAPTER 3: SPATIAL CHALLENGES AND OPPORTUNITIES 33
3.1 Introduction 33
3.2 Spatial implications of the Integrated Development Policies in South Africa 33
3.3 Natural Structural Elements 35
3.3.1 Natural Resources 35
3.3.1.1 Climate 35
3.3.1.2 Hydrology 37
3.3.1.2.1 Surface Water Resources 37
3.3.1.2.1.1 Crocodile-West and Marico Catchments 39

4 | P a g e
3.3.1.2.1.2 Upper Vaal Catchment 39
3.3.1.2.1.3 Middle Vaal Catchment 40
3.3.1.2.1.4 Lower Vaal Catchment 40
3.3.1.2.2 Groundwater Resources 40
3.3.1.2.2.1 Eastern Kalahari Hydrogeological Region 48
3.3.1.2.2.2 Western Highveld Hydrogeological Region 48
3.3.1.2.2.3 Karst Belt Hydrogeological Region 48
3.3.1.2.2.4 Western Bankeveld & Marico Bushveld Hydrogeological Region 49
3.3.1.2.3 Western Bushveld Complex Hydrogeological Region 49
3.3.1.2.4 Central Highveld Hydrogeological Region 50
3.3.1.2.5 Ghaap Plateau Hydrogeological Region 50
3.3.2 Geology 51
3.3.2.1 Background 51
3.3.2.2 Minerals 51
3.3.3 Soils 52
3.3.4 Biodiversity 57
3.3.4.1 Biodiversity Development Implications 60
3.3.4.1.1 Core Protection Areas 60
3.3.4.1.2 Biodiversity Trends and Conflicts 61
3.3.5 Natural Constraints 69
3.4 Spatial Development Elements within North West 71
3.4.1 Regional and intra-regional accessibility and mobility 71
3.4.1.1 Road links 71
3.4.1.2 Railway Systems 71
3.4.1.3 Airports 71
3.4.2 The spatial development pattern 72
3.4.3 Clusters of population and economic concentrations 73
3.4.3.1 Main concentrations of economic activity and population (Regional Nodes) 73
3.4.3.2 Large Population concentrations 76
3.4.3.3 The medium size population concentrations (population 100000-150000) 76
3.4.3.4 Small population concentrations (population 100000-150000) 76
3.4.4 A system of interactive activity nodes 79
3.4.5 Economic and Transportation Corridor Development 81
3.4.5.1 Regional Spatial Development initiatives 81
3.4.5.2 Routes, corridors and nodal development 82
3.4.5.2.1 The Platinum (N4) Development Corridor 84
3.4.5.3 The Treasure (N12) Route Corridor 84
3.4.5.4 The Western (N18) Frontier Corridor 84
3.4.5.5 The N14 route 84
3.4.5.6 The R503/N14/R53 route 84
3.4.5.7 The R510/R30 /R53 route (Eastern Development Belt) 84
3.4.5.8 New National Corridor 84
3.4.6 Existing Nodal Hierarchy, Corridor Focus and Potential Development Nodes 86
3.4.6.1 District Related Competitive Edge 92
3.4.7 Economic Infrastructure 102
3.4.7.1 Strategic Integrated Projects (SIPS) 102
3.4.7.2 Economic Infrastructure Projects 104
3.4.7.3 Information, Communication and Technology (ICT) 105
3.4.7.4 Tourism Development 106
3.4.7.4.1 Bojanala Platinum District Municipality 107
3.4.7.4.2 Dr Kenneth Kaunda District Municipality 107

5 | P a g e
3.4.7.4.3 Ngaka Modiri Molema District Municipality 109
3.4.7.4.4 Dr Ruth Segomotsi Mompati District Municipality 110
3.4.8 Existing Development Pattern 110
3.4.8.1 Distribution of Natural Resources 117
3.4.8.2 The Spatial Legacy of Apartheid 117
3.4.8.3 Accessibility 118
3.4.8.4 Urbanisation 118
3.4.8.5 Other urban and rural structuring elements 123
3.4.8.5.1 Population Densities 123
3.4.8.5.2 Urban Edges 128
3.4.8.5.3 Housing 130
3.4.8.5.3.1 Community Facilities 130
3.4.8.6 Rural development 131
3.4.8.7 Engineering Infrastructure 131
3.4.8.7.1 Water 131
3.4.8.7.1.1 Bulk Water Infrastructure 131
3.4.8.7.1.2 Developments and Strategic Perspective 148
3.4.8.7.1.3 Water Resources Development 148
3.4.8.7.1.4 Groundwater Development and Protection 149
3.4.8.7.1.5 Water Services Development 149
3.4.8.8 Electricity 155
3.4.8.8.1 Existing Networks 156
3.4.8.8.2 Forward Planning 156
3.4.8.8.3 Access to Electricity 158
4 CHAPTER 4: SPATIAL DEVELOPMENT FRAMEWORK 160
4.1 Introduction 160
Strategy Development 161
4.2 161
Introduction 161
4.2.1 161
4.2.2 Spatial Development Values 161
Provincial Spatial Development Scenarios 163
4.2.3 163
4.2.4 Development Philosophy 169
4.2.5 Spatial Development Concept 170
4.3 Development Strategies 172
Support economic development and job creation guiding 172
4.3.1 Strategic Objective 1: Focus development on regional spatial development initiatives, development
corridors, development zones and nodes 173
4.3.1.1 Spatial Development Strategy 173
4.3.1.2 Strategic Focus Areas: 173
4.3.1.2.1 Supporting Regional and Sub regional Development initiatives 173
4.3.1.2.2 Strengthening of development corridors, zones and nodes 175
4.3.1.2.3 Integrating growth within North West Province 176
4.3.1.3 Strategic Projects and Actions 176
4.3.2 Strategic Objective 2: Protect biodiversity, water and agricultural resources 179
4.3.2.1 Spatial Development Strategies 179

6 | P a g e
4.3.2.2 Strategic Focus Areas: 179
4.3.2.3 Strategic Projects and Actions 185
4.3.3 Strategic Objective 3: Infrastructure Investment 185
4.3.3.1 Spatial Development Strategies 185
4.3.3.2 Strategic Focus Areas 186
4.3.3.2.1 Basic Infrastructure 186
4.3.3.2.2 Focusing Investment on Economic Infrastructure: 193
4.3.3.2.3 Integrating Infrastructure into Development Nodes and Densely Populated Large Population
Concentrations (rural/long distance commuter areas) 198
4.3.3.3 Strategic Projects 200
4.3.4 Strategic Objective 4: Economic development and job creation supporting and guiding the spatial
development pattern of North West 202
4.3.4.1 Spatial Development Strategies 202
4.3.4.2 Growth Strategies 203
4.3.4.2.1 Revival Strategy 203
4.3.4.2.2 Kick Start Strategy 203
4.3.4.2.3 Growth Management Strategy 204
4.3.4.2.4 Diversification Strategy 205
4.3.4.3 Strategic Development Guidelines on Municipal Basis 205
4.3.4.4 Strategic Projects 205
4.3.5 Strategic Objective 5: Balancing urbanisation and the development of rural areas within North West 207
4.3.5.1 Spatial Development Strategies 207
4.3.5.2 Strategic Focus Areas: 207
4.3.5.3 Strategic Projects and Actions 215
4.3.5.3.1 Urban areas 215
4.3.5.3.2 Rural Areas 216
5 CHAPTER 5: IMPLEMENTATION FRAMEWORK 218
5.1 Introduction 218
5.2 Growth Targets: What will be required to ensure Sustainability and Job Creation 219
5.2.1 Growth Target 219
5.2.2 Mechanism to achieve High Growth Scenario 220
5.2.2.1 Land use planning and management 220
5.2.2.2 Settlement planning 220
5.2.2.3 Economic development 221
5.2.2.4 Infrastructure investment 221
5.2.2.5 Human resource development 222
5.2.2.6 Facilitative Governance 222
5.2.2.7 Industrialisation 222
5.2.2.8 Leverage Mechanisms 223
5.3 Implementation Framework 224
5.3.1 Strategic Spatial Development Implementation Guidelines 224
5.3.1.1 Social development and human settlements guidelines 224
5.3.1.2 Rural development guidelines 224
5.3.1.3 Infrastructure development guidelines 224
5.3.1.4 Economic development guidelines 225
5.3.2 Catalytic Capital Projects and Programmes 225
5.3.3 Municipal Implementation Frameworks 226

7 | P a g e
5.3.3.1 Bojanala District 226
5.3.3.1.1 Moretele Local Municipality 226
5.3.3.1.1.1 Development Guidelines 226
5.3.3.1.1.2 Implementation Plans and Programmes 227
5.3.3.1.2 Madibeng Local Municipality 233
5.3.3.1.2.1 Development Guidelines 233
5.3.3.1.2.2 Implementation Plans and Programmes 234
5.3.3.1.3 Rustenburg Local Municipality 242
5.3.3.1.3.1 Development Guidelines 242
5.3.3.1.3.2 Implementation Plans and Programmes 243
5.3.3.1.4 Kgetlengrivier Local Municipality 251
5.3.3.1.4.1 Development Guidelines 251
5.3.3.1.4.2 Implementation Plans and Programmes 251
5.3.3.1.5 Moses Kotane Local Municipality 258
5.3.3.1.5.1 Development Guidelines 258
5.3.3.1.5.2 Implementation Plans and Programmes 259
5.3.3.2 Ngaka Modiri Molema District 266
5.3.3.2.1 Ratlou Local Municipality 266
5.3.3.2.1.1 Development Guidelines 266
5.3.3.2.1.2 Implementation Plans and Programmes 266
5.3.3.2.2 Tswaing Local Municipality 272
5.3.3.2.2.1 Development Guidelines 272
5.3.3.2.2.2 Implementation Plans and Programmes 272
5.3.3.2.3 Mahikeng Local Municipality 279
5.3.3.2.3.1 Development Guidelines 279
5.3.3.2.3.2 Implementation Plans and Programmes 280
5.3.3.2.4 Ditsobotla Local Municipality 288
5.3.3.2.4.1 Development Guidelines 288
5.3.3.2.4.2 Implementation Plans and Programmes 289
5.3.3.2.5 Ramotshere Moiloa Local Municipality 296
5.3.3.2.5.1 Development Guidelines 296
5.3.3.2.5.2 Implementation Plans and Programmes 296
5.3.3.3 Dr Ruth Segomotsi Mompati District 303
5.3.3.3.1 Kagisano / Molopo Local Municipality 303
5.3.3.3.1.1 Development Guidelines 303
5.3.3.3.1.2 Implementation Plans and Programmes 303
5.3.3.3.2 Naledi Local Municipality 309
5.3.3.3.2.1 Development Guidelines 309
5.3.3.3.2.2 Implementation Plans and Programmes 309
5.3.3.3.3 Mamusa Local Municipality 315
5.3.3.3.3.1 Development Guidelines 315
5.3.3.3.3.2 Implementation Plans and Programmes 315
5.3.3.3.4 Greater Taung Local Municipality 321
5.3.3.3.4.1 Development Guidelines 321
5.3.3.3.4.2 Implementation Plans and Programmes 321
5.3.3.3.5 Lekwa -Teemane Local Municipality 328
5.3.3.3.5.1 Development Guidelines 328
5.3.3.3.5.2 Implementation Plans and Programmes 328
5.3.3.4 Dr Kenneth Kaunda District 335
5.3.3.4.1 NW 405 Local Municipality (Tlokwe / Ventersdorp) 335
5.3.3.4.1.1 Development Guidelines 335
8 | P a g e
5.3.3.4.1.2 Implementation Plans and Programmes 336
5.3.3.4.2 City of Matlosana Local Municipality 342
5.3.3.4.2.1 Development Guidelines 342
5.3.3.4.2.2 Implementation Plans and Programmes 343
6 BIBLIOGRAPHY 356
7 AKNOWLEDGEMENTS 359

9 | P a g e
TABLES Table 3-1: Land Capability Classification ........................................................................................................................................ 53 Table 3-2: Summary of Change Analysis for each North West Province Municipality ................................................................... 63 Table 3-3: Population Concentrations. Socio Economic and Economic Development Indicators .................................................. 77 Table 3-4: Nodal Hierarchy ............................................................................................................................................................ 79 Table 3-5: Transportation Corridors* ............................................................................................................................................ 82 Table 3-6: Current Nodal Hierarchy, Corridor Focus and Potential Development Nodes .............................................................. 86 Table 3-7: Bojanala District ............................................................................................................................................................ 93 Table 3-8: Dr Kenneth Kaunda District ........................................................................................................................................... 95 Table 3-9: Dr Ruth Segomotsi Mompati District ............................................................................................................................ 98 Table 3-10: Ngaka Modiri Molema District .................................................................................................................................. 100 Table 3-11: Settlement Types: Households per Municipality ...................................................................................................... 116 Table 3-12 : Nature Reserves ....................................................................................................................................................... 117 Table 3-13: Population Growth Distribution ................................................................................................................................ 120 Table 3-14: Population Densities Per LM ..................................................................................................................................... 124 Table 3-15: On-Site Sanitation per Local Municipality – Number of Households and %............................................................. 132 Table 3-16: Summary of Non-Revenue Water And Water Losses per District Municipality ........................................................ 136 Table 3-17: Water Service Levels per Local Municipality from The 2011 Census ........................................................................ 152 Table 4-1: A Framework for Linking The Spatial Planning Categories (Cba Map Categories) to Land Use Planning and Decision-
Making Guidelines .............................................................................................................................................................. 180 Table 4-3 Capital Infrastructure Investment ................................................................................................................................ 201 Table 4-4: Local Municipality Growth Strategy per Municipality ................................................................................................. 206 Table 4-5 Primary And Secondary Towns With a Sub Regional Context ...................................................................................... 208 Table 4-6 Rural Development Nodes (Small Towns) .................................................................................................................... 212 Table 4-7 Rural Strategic Projects and Programmes .................................................................................................................... 216 Table 5-1: Labour Absorption Modelling, Annual Gain or Loss (2003 To 2013) ........................................................................... 219 Table 5-2 A Menu of Options ....................................................................................................................................................... 223 Table 5-3: Moretele Local Municipality 10 Year Land Budget (Ha) .............................................................................................. 226 Table 5-5: Madibeng Local Municipality 10 Year Land Budget (Ha)............................................................................................. 233 Table 5-7: Rustenburg Local Municipality 10 Year Land Budget (Ha) .......................................................................................... 242 Table 5-9: Kgetlengrivier Local Municipality 10 Year Land Budget (Ha) ...................................................................................... 251 Table 5-11: Moses Kotane Local Municipality 10 Year Land Budget (Ha) .................................................................................... 258 Table 5-13: Ratlou Local Municipality 10 Year Land Budget (Ha) ................................................................................................ 266 Table 5-15: Tswaing Local Municipality 10 Year Land Budget (Ha) .............................................................................................. 272 Table 5-17: Mahikeng Local Municipality 10 Year Land Budget (Ha) ........................................................................................... 279 Table 5-19: Ditsobotla Local Municipality 10 Year Land Budget (Ha) .......................................................................................... 288 Table 5-21: Ramotshere Moiloa Local Municipality 10 Year Land Budget (Ha) ........................................................................... 296 Table 5-23: Kagisano / Molopo Local Municipality 10 Year Land Budget (Ha) ............................................................................. 303 Table 5-25: Naledi Local Municipality 10 Year Land Budget (Ha) ................................................................................................ 309 Table 5-27: Mamusa Local Municipality 10 Year Land Budget (Ha) ............................................................................................. 315 Table 5-29: Greater Taung Local Municipality 10 Year Land Budget (Ha) .................................................................................... 321 Table 5-30 Greater Taung Implementation Plan.......................................................................................................................... 322 Table 5-30: Lekwa-Teemane Local Municipality 10 Year Land Budget (Ha) ................................................................................ 328 Table 5-32: Tlokwe Local Municipality 10 Year Land Budget (Ha) ............................................................................................... 335 Table 5-33 NW 405 Implementation Plan ................................................................................................................................... 337 Table 5-34: City of Matlosana Local Municipality 10 Year Land Budget (Ha) ............................................................................... 342 Table 5-36 City of Matlosana Implementation Plan .................................................................................................................... 344

10 | P a g e
MAPS
Map 2-1 Spatial Development Initiatives 25 Map 3-1 Annual Rainfall 36 Map 3-2: The Annual Solar Radiation in South Africa 36 Map 3-3: Surface Water Management Areas in The North West Province 38 Map 3-4: Overview Of Groundwater Resources in The North West Province 42 Map 3-5: Groundwater Resources: Bojanala District Municipality 43 Map 3-6: Groundwater Resources: Ngaka Modiri Molema District Municipality 44 Map 3-7: Groundwater Resources: Dr Ruth Segomotsi Mompati District Municipality 45 Map 3-8: Groundwater Resources: Dr Kenneth Kaunda District Municipality 46 Map 3-9: Hydrological Regions in the North West Province 47 Map 3-10: Geology 51 Map 3-11 Mineral Deposits with The Mining Activity 52 Map 3-12 Land Capability 54 Map 3-13 Agricultural Potential 55 Map 3-14: Erodibility Index 56 Map 3-15 Terrestrial Critical Biodiversity Areas and Ecological Support Areas 59 Map 3-16: Aquatic Critical Biodiversity Areas and Ecological Support Areas 59 Map 3-17: Biodiversity vs. Agriculture 67 Map 3-18: Biodiversity vs. Mining 67 Map 3-19: Biodiversity vs. Settlements 68 Map 3-20: Biodiversity Compilation With All Conflicts 68 Map 3-22 Natural Constraints 70 Map 3-23 Regional Setting 72 Map 3-24 Gva Distribution (Municipal) 74 Map 3-25 Population Distribution (Municipal) 75 Map 3-26 Population Concentrations (Municipal) 75 Map 3-27 Nodal System 81 Map 3-28: Development Corridors and Zones 85 Map 3-29: North West Existing Development Pattern 111 Map 3-30 Bojanala Dm Existing Development Pattern 112 Map 3-31 Dr Kenneth Kaunda DM Existing Development Pattern 112 Map 3-32 Dr Ruth Segomotsi Mompati DM Existing Development Pattern 113 Map 3-33: Ngaka Modiri Molema DM Existing Development Pattern 113 Map 3-34: Settlement Distribution 114 Map 3-35 Bojanala DM Settlement Distribution 114 Map 3-36 Dr Kenneth Kaunda DM Settlement Distribution 115 Map 3-37 Dr Ruth Segomotsi Mompati DM Settlement Distribution 115 Map 3-39 Rural Communities And Traditional Authorities 121 Map 3-41 Racial Segregation 122 Map 3-43 Population Density for Bojanala Platinum District 125 Map 3-44 Population Density for Dr Kenneth Kaunda District 126 Map 3-45 Population Density for Dr Ruth Segomotsi Mompati District 126 Map 3-47 Urban Edges for Bojanala District 128 Map 3-48 Urban Edges for Dr Kenneth Kaunda District 129 Map 3-49 Urban Edges for Dr Ruth Segomotsi Mompati District 129 Map 3-50 Urban Edges for Ngaka Modiri Molema District 130 Map 3-51 Access to Sanitation for Bojanala District 134 Map 3-52 Access to Sanitation for Dr Kenneth Kaunda District 134 Map 3-53 Access to Sanitation for Dr Ruth Segomotsi Mompati District 135 Map 3-54 Access to Sanitation for Ngaka Modiri Molema District 135 Map 3-55 Illustration of WSA Head Office / Town and Area Of Jurisdiction 137 Map 3-56: Wastewater Treatment Works – Green Drop Risk Rating, 2012 140 Map 3-57: Areas not Included in Current Water Supply Projects 151 Map 3-58: Existing Water Needs Categorisation 154 Map 3-59: Existing Sanitation Needs Categorisation 154 Map 3-60 Key Distribution Infrastructure 155 Map 3-61 Existing Networks 156 Map 3-62 The GCCA-2022 Transmission Supply Area Generation Connection Capacities 157 Map 3-63 Planned Transmission Power Corridors 158 Map 3-64 Access to Electricity 159 Map 4-1 Population Concentrations 164 Map 4-2 Development Scenario 1 165 Map 4-3 Development Scenario 2 168

11 | P a g e
Map 4-4 North West Spatial Development Concept 171 Map 4-5: Strategic Objective 1: Capitalise On Regional Spatial Development Initiatives 174 Map 4-6: Development Corridors and Nodes 177 Map 4-7 Strategic Projects 178 Map 4-8 Critical Biodiversity Areas 179 Map 4-9 Biodiversity Resource Critical Areas 180 Map 4-10: Ecological Corridors to Combat Climate Change 183 Map 4-11: Agricultural Resource Critical Areas 184 Map 4-12: On-Site Sanitation 188 Map 4-13: Groundwater As Source 188 Map 4-14: Existing and Planned Transmission Power Corridors 192 Map 4-15: Electricity Priority Areas 192 Map 4-16: Mining Potential Critical Resources (Mining And Prospecting Applications) 196 Map 4-18 Development Of Tourism Routes and Nodes 197 Map 4-19: 5 Cities Projects 210 Map 4-20 Agri-Parks 212 Map 4-21: Rural Strategic Projects 217 Map 5-1 : Bojanala Platinum District Implementation Framework (Biodiversity) – Moretele LM 230 Map 5-2: Bojanala Platinum District Implementation Framework (Nodes & Links) – Moretele LM 231 Map 5-3: Bojanala Platinum District Implementation Framework (Rural Development) – Moretele LM 232 Map 5-4 : Bojanala Platinum District Implementation Framework (Biodiversity) – Madibeng LM 239 Map 5-5: Bojanala Platinum District Implementation Framework (Nodes & Links) – Madibeng LM 240 Map 5-6: Bojanala Platinum District Implementation Framework (Rural Development) – Madibeng LM 241 Map 5-7 : Bojanala Platinum District Implementation Framework (Biodiversity) – Rustenburg LM 248 Map 5-8: Bojanala Platinum District Implementation Framework (Nodes & Links) – Rustenburg LM 249 Map 5-9: Bojanala Platinum District Implementation Framework (Rural Development) – Rustenburg LM 250 Map 5-10 : Bojanala Platinum District Implementation Framework (Biodiversity) – Kgetlengrivier LM 255 Map 5-11: Bojanala Platinum District Implementation Framework (Nodes & Links) – Kgetlengrivier LM 256 Map 5-12: Bojanala Platinum District Implementation Framework (Rural Development) – Kgetlengrivier LM 257 Map 5-13 : Bojanala Platinum District Implementation Framework (Biodiversity) – Moses Kotane LM 263 Map 5-14: Bojanala Platinum District Implementation Framework (Nodes & Links) – Moses Kotane LM 264 Map 5-15: Bojanala Platinum District Implementation Framework (Rural Development) – Moses Kotane LM 265 Map 5-16: Ngaka Modiri Molema District Implementation Framework (Environmental) – Ratlou LM 269 Map 5-17: Ngaka Modiri Molema District Implementation Framework (Nodes & Links) – Ratlou LM 270 Map 5-18: Ngaka Modiri Molema District Implementation Framework (Rural Development) – Ratlou LM 271 Map 5-19: Ngaka Modiri Molema District Implementation Framework (Environmental) – Tswaing LM 276 Map 5-20: Ngaka Modiri Molema District Implementation Framework (Nodes & Links) – Tswaing LM 277 Map 5-21: Ngaka Modiri Molema District Implementation Framework (Rural Development) – Tswaing LM 278 Map 5-22: Ngaka Modiri Molema District Implementation Framework (Environmental) – Mahikeng LM 285 Map 5-23: Ngaka Modiri Molema District Implementation Framework (Nodes & Links) – Mahikeng LM 286 Map 5-24: Ngaka Modiri Molema District Implementation Framework (Rural Development) – Mahikeng LM 287 Map 5-25: Ngaka Modiri Molema District Implementation Framework (Environmental) – Ditsobotla LM 293 Map 5-26: Ngaka Modiri Molema District Implementation Framework (Nodes & Links) – Ditsobotla LM 294 Map 5-27: Ngaka Modiri Molema District Implementation Framework (Rural Development) – Ditsobotla LM 295 Map 5-28: Ngaka Modiri Molema District Implementation Framework (Environmental) - Ramotshere Moiloa LM 300 Map 5-29: Ngaka Modiri Molema District Implementation Framework (Nodes & Links) - Ramotshere Moiloa LM 301 Map 5-30: Ngaka Modiri Molema District Implementation Framework (Rural Development) - Ramotshere Moiloa LM 302 Map 5-31: Dr Ruth Segomotsi Mompati District Implementation Framework (Environmental) – Kagisano LM 306 Map 5-32: Dr Ruth Segomotsi Mompati District Implementation Framework (Nodes & Links) – Kagisano LM 307 Map 5-33: Dr Ruth Segomotsi Mompati District Implementation Framework (Rural Development) – Kagisano LM 308 Map 5-34: Dr Ruth Segomotsi Mompati District Implementation Framework (Environmental) – Naledi LM 312 Map 5-35: Dr Ruth Segomotsi Mompati District Implementation Framework (Nodes & Links) – Naledi LM 313 Map 5-36: Dr Ruth Segomotsi Mompati District Implementation Framework (Rural Development) – Naledi LM 314 Map 5-37: Dr Ruth Segomotsi Mompati District Implementation Framework (Environmental) – Mamusa LM 318 Map 5-38: Dr Ruth Segomotsi Mompati District Implementation Framework (Nodes & Links) – Mamusa LM 319 Map 5-39: Dr Ruth Segomotsi Mompati District Implementation Framework (Rural Development) – Mamusa LM 320 Map 5-41: Dr Ruth Segomotsi Mompati District Implementation Framework (Nodes & Links) – Greater Taung LM 326 Map 5-42: Dr Ruth Segomotsi Mompati District Implementation Framework (Rural Development) – Greater Taung LM 327 Map 5-43: Dr Ruth Segomotsi Mompati District Implementation Framework (Nodes & Links) – Lekwa Teemane LM 332 Map 5-44: Dr Ruth Segomotsi Mompati District Implementation Framework (Rural Development) – Lekwa Teemane LM 333 Map 5-45: Dr Ruth Segomotsi Mompati District Implementation Framework (Environmental) – Lekwa Teemane LM 334 Map 5-46: Dr Kenneth Kaunda District Implementation Framework (Environmental) – NW 405 LM 339 Map 5-47: Dr Kenneth Kaunda District Implementation Framework (Nodes & Links) – NW 405 LM 340 Map 5-48: Dr Kenneth Kaunda District Implementation Framework (Rural Development) – NW 405 LM 341 Map 5-49: Dr Kenneth Kaunda District Implementation Framework (Environmental) – City Of Matlosana LM 347 Map 5-50: Dr Kenneth Kaunda District Implementation Framework (Nodes & Links) – City Of Matlosana LM 348

12 | P a g e
Map 5-51: Dr Kenneth Kaunda District Implementation Framework (Rural Development) – City Of Matlosana LM 349 Map 5-52: Dr Kenneth Kaunda District Implementation Framework (Environmental) – Maquassi Hills LM 353 Map 5-50: Dr Kenneth Kaunda District Implementation Framework (Nodes & Links) – Maquassi Hills LM 354 Map 5-52: Dr Kenneth Kaunda District Implementation Framework (Rural Development) – Maquassi Hills LM 355

13 | P a g e
FIGURES
Figure 1-1: Methodology ............................................................................................................................................ 16 Figure 2-1: RRR Strategy ............................................................................................................................................. 29 Figure 3-1: Bojanala District ....................................................................................................................................... 95 Figure 3-2: Dr Kenneth Kaunda District ...................................................................................................................... 97 Figure 3-3: Dr Ruth Segomotsi Mompati District ....................................................................................................... 99 Figure 3-4: Ngaka Modiri Molema District ............................................................................................................... 101 Figure 3-5: Percentage of Population Residing in Urban Areas (2011) .................................................................... 119 Figure 4-1: Chapter 4 Lay-Out .................................................................................................................................. 160 Figure 4-2: Strategic Focus Areas ............................................................................................................................. 172 Figure 4-3: Strategic Objective ................................................................................................................................. 214 Figure 5-1: Chapter 5 Lay-Out .................................................................................................................................. 218

14 | P a g e
ABBREVIATIONS
1 ACT 2 Agriculture, Culture and Tourism
3 AP 4 Agri Park
5 C2C 6 Coast 2 Coast Corridor
7 CBA 8 Critical Biodiversity Area
9 CBD 10 Central Business District
11 CRDP 12 Comprehensive Rural Development Programme
13 CSD 14 United Nations Commission on Sustainable Development
15 DEDET 16 Department of Economic Development and Tourism
17 DM 18 District Municipality
19 DMR 20 Department of Mineral Resources
Dr RSMDM Dr Ruth Segomotsi Mompati District Municipality
Dr KKDM Dr Kenneth Kaunda District Municipality
ESA Ecological Support Area
FDI Foreign Direct Investment
FLISP Financed Linked Individual Subsidy Programme
FPSU Farmer Production Support Unit
GWS Ground Water System
ICT Information and Communication Technologies
IDP Integrated Development Plan
IRP Integrated Resource Plan
ITC Information Technology and Communication
LM Local Municipality
MaB Man and Biosphere
MIG Municipal Infrastructure Grant
MJ Mega Joule
MPCC Multi Purpose Community Centre
NLTA National Land Transport Act
NDP National Development Plan
NMMDM Ngaka Modiri Molema District Municipality
NSSD National Strategy for Sustainable Development
NWP North West Province
NWBSP North West Biodiversity Sector Plan

15 | P a g e
NDPG Neighbourhood Development Partnership Grant
NEPAD New Partnership for Africa's Development
NWP North West Province
PPP Public Private Partnership
READ Rural, Economic and Environmental Development
REDZ Renewable Energy Development Zones
RHR Reconciliation, Healing and Renewal
RISDP Regional Indicative Strategic Development Plan
RRR Rebranding, Repositioning and Renewal
SADC Southern African Development Community
SANRAL South African National Roads Agency Limited
SDF Spatial Development Framework
SDI Spatial Development Initiative
SDG Sustainable Development Goals
SIP Strategic Infrastructure Projects
SMME Small and Medium Enterprises
SPD Spatial Development Programme
SPLUMA Spatial Planning and Land Use Management Act
TDP Transmission Development Plan
UNESCO United Nations Education, Scientific and Cultural Organization
UNCED United Nations Conference on Environment and Development
UNFCCC United Nations Framework Convention on Climate Change
WC/WDM Water Conservation/Water Demand Management
WSA Water Service Authority
WTW Water Treatment Works
WWTW Wastewater Treatment Works

16 | P a g e
21 CHAPTER 1: INTRODUCTION
21.1 Background
The review of the North West Spatial Development Framework 2012 was commissioned by the Office of
the Premier of North West Province. The review is necessitated by the promulgation of the Spatial and
Land Use Management Act 2013 and the need to align national, provincial, regional and municipal
spatial plans, policies and strategies. The North West Spatial Development Framework will eventually
form part of a system of plans including:
A National Spatial Development Framework.
Regional Spatial Development Frameworks.
Provincial Spatial Development Frameworks.
Municipal Spatial Development Frameworks.
The North West Provincial Spatial Development Framework is provided in five chapters:
Chapter 1: Introduction.
Chapter 2: Legislation and Policy Context.
Chapter 3: Spatial Challenges and Opportunities.
Chapter 4: Provincial Spatial Development Framework.
Chapter 5: Implementation Instruments.
The Lay out of this document is summarised in Figure 1-1.
Figure 21-1: Methodology

17 | P a g e
21.2 The Spatial Planning and Land Use Management Act 2013.
The preparation, content and legal effect of provincial spatial development framework is prescribed in
Section 15, 16 and 17 of the Spatial and Land Use Management Act 2013.
Section 15: Preparation of a Provincial Spatial Framework
(1) The Premier of each province must compile, determine and publish a provincial spatial development
framework for the province.
(2) A provincial spatial development framework must be consistent with the national spatial development
framework.
(3) Provincial spatial development frameworks must coordinate, integrate and align:
(a) provincial plans and development strategies with policies of national government;
(b) the plans, policies and development strategies of provincial departments; and
(c) the plans, policies and development strategies of municipalities.
(4) An Executive Council must adopt and approve a provincial spatial development framework for the
province within five years from the date of commencement of this Act.
(5) An Executive Council may amend the provincial spatial development framework when necessary and
must review it at least once every five years.
(6) Before determining a provincial spatial development framework contemplated in subsection (1) and
any proposed amendments to the provincial spatial development framework contemplated in
subsection (5), the Premier must:
(a) give notice of the proposed provincial spatial development framework in the Gazette and the
media;
(b) invite the public to submit written representations in respect of the proposed provincial
spatial development framework to the Premier within 60 days after the publication of the
notice referred to in paragraph (a); and
(c) consider all representations received in respect of the proposed provincial spatial
development framework.
(7) A provincial spatial development framework and any amendment must be approved by the Executive
Council and published in the Provincial Gazette and the media.
Section 16: Content of provincial spatial development framework
A provincial spatial development framework must:
(a) provide a spatial representation of the land development policies, strategies and objectives of the
province, which must include the province’s growth and development strategy where applicable;
(b) indicate the desired and intended pattern of land use development in the province, including the
delineation of areas in which development in general or development of a particular type would not
be appropriate;
(c) coordinate and integrate the spatial expression of the sectoral plans of provincial departments;
(d) provide a framework for coordinating municipal spatial development frameworks with each other
where they are contiguous;
(e) coordinate municipal spatial development frameworks with the provincial spatial development
framework and any regional spatial development frameworks as they apply in the relevant province;
(f) incorporate any spatial aspects of relevant national development strategies and programmes as they
apply in the relevant province.

18 | P a g e
Section 17:: Legal effect of provincial spatial development framework
(1) A provincial spatial development framework comes into operation upon approval by the Executive
Council and publication to that effect in the Provincial Gazette.
(2) All provincial development plans, projects and programmes must be consistent with the provincial
spatial development framework.
(3) The provincial spatial development framework cannot confer on any person the right to use or
develop any land except as may be approved in terms of this Act, relevant provincial legislation or a
municipal land use scheme.

19 | P a g e
22 CHAPTER 2: POLICY AND LEGISLATION CONTEXT
22.1 Introduction
The legislation and policy context is informed by Spatial Policies and Initiatives and a Legal Framework
providing Objectives guiding what the Spatial Development Framework wants to achieve.
FIGURE 21-1: METHODOLOGY

20 | P a g e
22.2 Spatial Policies and Initiatives
22.2.1 International and Regional Context
22.2.1.1 Background
International agreements, protocols and conventions between the South African Government and the
international community both globally, continentally and regionally is binding on all spheres of government
and will support integrated development on a global and regional scale.
On a global scale South Africa is signatory to inter alia:
The United Nation’s Sustainable Development Goals (SDG).
Agenda 21 (1992).
UNESCO’s Man and Biosphere Programme (MaB).
Unesco Convention concerning the Protection of the World Cultural and Natural Heritage.
United Nations Framework Convention on Climate Change (UNFCCC).
The UN Convention on Wetlands of International Importance - the Ramsar Convention.
United Nations Convention to Combat Desertification in those Countries Experiencing Serious
Drought and/or Desertification, particularly In Africa.
As part of the African Union, South Africa also subscribes to the strategic framework for Pan-African socio-
economic development of the New Partnership for Africa's Development (NEPAD).
Within the southern African context, South Africa as member of the Southern African Development
Community (SADC) forms part of development agreements including the Regional Indicative Strategic
Development Plan (RISDP).
These agreements, protocols and conventions the following fundamental objectives of these agreements to
provide sustainable development through:
Integration into the continental and global economies.
Regional development integration.
Regionally balanced and equitable development.
Poverty eradication.
Improvement of quality of life.
Responsible management of natural resources and protection of the environment.
Rational use of land.
Spatial development options need to support the implementation of the agreements, protocols and
conventions providing an interactive network of regional and local corridors, nodes and zones to
which economic development can be directed supported by catalyst economic, engineering and social
infrastructure programs and projects.
22.2.1.2 Sustainable development
"Development that meets the needs of the present without compromising the ability of future
generations to meet their own needs" 1- is a commonly accepted definition qualified by three equal
aspects of Sustainability - Social, Biophysical and Economic. Business and society cannot exist without a
sustainable biophysical basis. Furthermore, political power, policy and decisions are recognised as a fourth
critical aspect.
1 Brundtland Report: - Report of the World Commission on Environment and Development 1987

21 | P a g e
The focus on regional development in order to promote sustainable development supported by Agenda 21
prepared by The United Nations Commission on Sustainable Development (CSD) emanating from the
United Nations Conference on Environment and Development (UNCED), 1992.
The United Nations Commission on Sustainable Development (CSD) was mandated to ensure the effective
implementation of the outcomes of Agenda 21. This includes the monitoring and reporting on
implementation of agreements at local, national and international levels.
The objectives of Agenda 21 are the alleviation of poverty, hunger, sickness and illiteracy worldwide while
halting the deterioration of ecosystems, which sustain life. As such, CSD provides a forum for considering
issues relating to the three core elements of sustainable development (namely economic, social and
environmental).
Agenda 21 focuses on partnerships involving the public and all relevant stakeholders to resolve
developmental problems and to plan strategically for the future. It also tries to address the practicalities of
applying sustainable development principles in human activity and development.
In line with the goals set by Agenda 21, development goals are set for South Africa2 of which the following
are directly applicable to development in the North West Province:
International Cooperation to Accelerate Sustainable Development in Developing Countries and
Related Domestic Policies (Trade).
Changing consumption patterns including:
o Changing consumption patterns energy.
o Changing consumption patterns transport.
Demographic dynamics and sustainability.
Protecting and promoting human health.
Promoting sustainable human settlement development.
Integrating environment and development in decision making.
Protection of the atmosphere.
Integrated approach to the planning and management of land resources.
Combating deforestation.
Managing Fragile Ecosystems: Combating Desertification and drought.
Managing fragile ecosystems: Sustainable mountain development.
Promoting sustainable agriculture and rural development.
Conservation of biological diversity.
Environmentally sound management of biotechnology and transfer of environmentally sound
technology, cooperation and capacity building.
Protection of the quality and supply of freshwater resources.
In terms of sustainability, the North West Province Spatial Development Framework needs to provide
objectives which:
Adopt a holistic approach to spatial development in order to minimise the long-term negative
impacts of current land use or development decisions.
Ensure that spatial planning serves national, provincial and/or local interest.
Support the long-term adequacy or availability of physical, social and economic resources to
support or carry development.
Protect existing natural, environmental and cultural resources.
2 World Summit on Sustainable Development Johannesburg Summit 2002. South Africa Country Profile

22 | P a g e
Ensure that land which is currently in agricultural use would only be reallocated to other uses
where real need exists and prime agricultural land should remain in production.
Support mining as a vital economic driver in the province without jeopardizing the biodiversity value
of the environment.
Adopt a climate change strategy that will provide for responsible actions to curb the effect of global
warming and climate change.
22.2.1.3 International Cooperation and Development
International cooperation and development within the Southern African context is supported by the
following integrated programmes:
22.2.1.3.1 UNESCO’s programme on Man and the Biosphere (MaB)
The MaB programme provides for an internationally recognized biosphere reserve network. Six biosphere
reserves have been recognised in South Africa of which the Magaliesberg Biosphere Reserve in North
West covers almost 358‚000ha.
Biosphere reserves consist of three components, namely:
Core areas: are securely protected areas for conserving biological diversity, monitoring minimally
disturbed ecosystems, and undertaking non-destructive research and other low-impact uses (education)
e.g. National Parks, Nature Reserves, World Heritage Sites and Ramsar Sites.
Buffer zone: usually surrounds or adjoins the core areas, and is used for co-operative activities
compatible with sound ecological practices, including environmental education, recreation, ecotourism
and applied basic research; and
Transitional area: contains a variety of agricultural activities, settlements and other uses in which local
communities, management agencies, scientists, non-governmental organizations, cultural groups,
economic interest and other stakeholders work together to manage and sustainably develop the area’s
resources.
Within the Magaliesburg Biosphere Reserve, 58‚000 ha make up the core area‚ 110‚000 ha the buffer area
and 190‚000 ha the transition area.
22.2.1.3.2 The UN Convention on Wetlands of International Importance - the Ramsar Convention
The Convention is the intergovernmental treaty that provides the framework for the conservation and wise
use of wetlands and their resource. Barberspan Nature Reserve is a Ramsar Wetland Site.
The reserve is 3118 ha in extent, of which about 2 000 ha is water. The pan is connected with the Harts
River via a channel and is the largest of a series of depressions along this channel. The pan itself is about
600m wide and 1 550m long. It is a natural, shallow, alkaline lake which is perennial. Other pans in the
vicinity are non-perennial. It is one of the few permanent natural water bodies on the western highveld and
provides food and shelter during the dry months for large numbers of waterfowl. Migrating aquatic species
use the pan as an important stopover. Almost 300 species of birds have been recorded here, about one-
fifth being migrants.

23 | P a g e
22.2.1.3.3 Unesco Convention concerning the Protection of the World Cultural and Natural Heritage, 1972
In 2007 the Vredefort Dome World Heritage Site was declared a World Heritage Site under UNESCO’s
Convention concerning the Protection of the World Cultural and Natural Heritage. The World Heritage
Convention Act 1999 (Act No 49 of 1999) in terms of which this listing was done also recognises the
following fossil hominid sites occurring in the province as a World Heritage Site.
Fossil Hominid Sites listed by UNESCO include:
Cradle of Humankind
Taung Skull Fossil Site.
The Taung Skull, found in a limestone quarry at Dart Pinnacle amongst numerous archaeological and
paleontological sites south-west of the Sterkfontein Valley area, is a specimen of the species
Australopithecus Africanus. Fossils found in the many archaeological caves of the Makapan Valley have
enabled the identification of several specimens of early hominids, more particularly of Paranthropus, dating
back between 4.5 million and 2.5 million years, as well as evidence of the domestication of fire 1.8 million
to 1 million years ago. Collectively these sites have produced abundant scientific information on the
evolution of modern humans over at least the past 3.5 million years. They constitute a vast reserve of
scientific information, with enormous potential.
22.2.1.3.4 United Nations Framework Convention on Climate Change (UNFCCC) South Africa ratified the United Nations Framework Convention on Climate Change (UNFCCC) in August
1997. The primary objective of this multilateral agreement is to achieve the stabilisation of greenhouse gas
(GHG) concentrations in the atmosphere at a level that would prevent dangerous anthropogenic activities
from interfering with the climate system. Such a level should be achieved within a time frame sufficient to
allow ecosystems to adapt naturally to climate change, to ensure that food production is not threatened and
to enable development to proceed in a sustainable manner.
In terms of Articles 4.1(c), (j) and 12 of the Convention, countries are periodically required to submit reports
to the Conference of Parties on various topics regarding their attempts to address climate change. In order
to fulfil these requirements, South Africa prepared an Initial National Communication in 2000. In July 2002,
the South African Government acceded to the Kyoto Protocol. This was deemed necessary as the
international community recognised that the commitments set out in the UNFCCC were inadequate for
achieving its ultimate objectives. Over this period South Africa compiled a detailed Country Study on a
sectoral basis. This study, with information obtained from the Intergovernmental Panel on Climate Change
(IPCC) Third Assessment Reports, made a significant contribution to the national Department of
Environmental Affairs and Tourism (DEAT) launching South Africa’s National Climate Change Response
Strategy in 2004.
Implications of climate change for South Africa
According to the latest scientific information, key impacts predicted for Africa for the period 2020 to 2050
include (IPCC 2007) the following:
Between 75 and 250 million people will experience greater water stress by 2020.
Rain-fed agricultural yields could be reduced by 50% by 2020 in some countries.
There could be a 10 to 30% reduction in average river run-off and water availability by mid-century.
Drought-affected areas will increase in extent.
Flood risk in high rainfall areas will increase.
Ecosystem structures will change and there will be a loss of biodiversity if temperatures increase
more than 1,5 °C to 2,5°C.
Human health challenges will arise, e.g. possible changes in malaria transmission potential.

24 | P a g e
Key risks of climate change for a water-stressed area such as the North West province include threats to
water supplies and changing rainfall patterns. Temperature increases could enlarge the areas prone to
malaria and other vector-borne diseases. Temperature changes could also pose various challenges to crop
cultivation. Higher carbon dioxide levels could reduce proteins in grasslands in livestock producing areas,
in particular in poorer, drier parts of the country, and fisheries and the livelihoods of fishing communities will
be affected by changes in the sea temperature. The impact of climate change is increasingly emerging as
possibly the greatest threat to biodiversity loss.
22.2.1.3.5 United Nations Convention to Combat Desertification, particularly in Africa
The United Nations Convention to Combat Desertification in those Countries Experiencing Serious Drought
and/or Desertification, particularly in Africa was adopted by the Convention on 17 June 1994.
The objective of this Convention is to combat desertification and mitigate the effects of drought in countries
experiencing serious drought and/or desertification, particularly in Africa, through effective action at all
levels, supported by international cooperation and partnership arrangements, in the framework of an
integrated approach which is consistent with Agenda 21, with a view to contributing to the achievement of
sustainable development in affected areas.
Achieving this objective will involve long-term integrated strategies that focus simultaneously, in affected
areas, on improved productivity of land, and the rehabilitation, conservation and sustainable management
of land and water resources, leading to improved living conditions, in particular at the community level.
Principles
In order to achieve the objective of this Convention and to implement its provisions, the Parties shall be
guided, inter alia, by the following:
a) the Parties should ensure that decisions on the design and implementation of programmes to combat
desertification and/or mitigate the effects of drought are taken with the participation of populations and
local communities and that an enabling environment is created at higher levels to facilitate action at
national and local levels;
b) the Parties should, in a spirit of international solidarity and partnership, improve cooperation and
coordination at sub regional, regional and international levels, and better focus financial, human,
organizational and technical resources where they are needed;
c) the Parties should develop, in a spirit of partnership, cooperation among all levels of government,
communities, non-governmental organizations and land holders to establish a better understanding of
the nature and value of land and scarce water resources in affected areas and to work towards their
sustainable use; and
d) the Parties should take into full consideration the special needs and circumstances of affected
developing country Parties, particularly the least developed among them.
22.2.1.3.6 The NEPAD Spatial Development Programme (SDP)
The Coast 2 Coast Corridor consists of the Maputo Development Corridor, Gauteng SDI, Platinum
SDI (where it traverses North West) and Walvis Bay SDI and this creates a seamless link on the sub-
continent between the Indian and south Atlantic Oceans.
The Coast 2 Coast Corridor (C2C) aims to promote regional integration, economic growth, and employment
creation, mobilisation of private sector investment and local economic empowerment of adjacent
communities in and between the countries of Namibia, Botswana, South Africa, Swaziland and
Mozambique.
It aims to offer tourists a wide diversity of African experiences on a single route passing through five
countries, each of which offers special attractions and cultures.

25 | P a g e
Map 22-1 Spatial Development Initiatives
Source: National Development Plan 2030 (adapted)

26 | P a g e
22.2.2 National Policies
22.2.2.1 National Spatial Development Policies
The objectives of sustainable development to support the alleviation of poverty need to form an integral
part of decision making at all spheres of Government. The optimal integration of the aspects of social,
economic, institutional, political, physical and engineering services into decision making is a prerequisite for
coherent growth and the alignment of policies, institutions and strategies.
At national level the National Development Plan: Vision for 2030 focuses on the following key priority
areas:
An economy that will create more jobs.
Improving Infrastructure.
Transition to low carbon economy.
An inclusive and integrated rural economy.
Reversing the spatial effects of apartheid.
Improving the quality of education, training and innovation.
Quality health for all.
Social protection.
Building safer communities.
Reforming the public sector.
National spatial development interventions including:
Gauteng as a national Node of Competiveness which strongly associates with the nearby
economic activity nodes of Brits and Rustenburg as part of the Maputo Development Corridor
The primary transnational development corridor and cross border infrastructure connections
include the Platinum Spatial Development Initiative (SDI).
The national competiveness corridor connecting Gauteng with Ethikweni building on the Durban -
Gauteng Freight Corridor providing indirect accessibility of North West Province to the Durban
Harbour.
Rural Restructuring Zones. These zones include the more densely parts of the rural communities
where there is sufficient numbers of people to provide the basis for viable markets. The rural
restructuring zones within North West affect the municipalities of Moretele, Madibeng, Moses
Kotana, Mahikeng, Ratlou, Ditsabotla, Tswaing, Greater Taung and Kagisano/ Molopo.
Resource critical zones.
The National Infrastructure Plan 2012 aims to transform the economic landscape while simultaneously
creating significant numbers of new jobs, and strengthen the delivery of basic services. The plan also
supports the integration of African economies. Strategic Infrastructure Project: Unlocking the economic
opportunities in North West Projects has a direct impact on the development and spatial planning of the
North West Province
The National Strategy for Sustainable Development (NSSD) promotes the development of effective
tools, process and frameworks to manage the integration between social demands, natural resource
protection, sustainable use and economic development. The objectives of the NSSD include the following:
Protect the natural resource base as a priority in order to achieve a sustainable supply of
environmental goods and services.
Ensure sustainable livelihoods and food security.
Align policy and legislation that integrates and gives effect to sustainable development at
the levels/spheres where it matters most.

27 | P a g e
Complementary to the above, The National Spatial Development Perspective (NSDP) provides
principles and notions to be addressed in all Provincial and Local Municipality integrated plans to
contribute to the broader growth and development policy objectives of government to ensure the above:
The following principles are included:
i. Rapid economic growth that is sustained and inclusive is a pre-requisite for the achievement of
other policy objectives, amongst which poverty alleviation is key.
ii. Government has a constitutional obligation to provide basic services to all citizens (e.g. water, energy
health and educational facilities) wherever they reside.
iii. Beyond the constitutional obligation identified in Principle 2 above, Government spending on fixed
investment, should be focused on localities of economic growth and/or economic potential in order
to:
gear up private sector investment
stimulate sustainable economic activities
create long-term employment opportunities
Efforts to address past and current social inequalities should focus on people not places
iv. In localities where there are both high levels of poverty and development potential, this could
include fixed capital investment beyond basic services to exploit the potential of those localities
In localities with low development potential, Government spending should focus on providing social
transfers, human resource development and labour market intelligence which would enable people to
become more mobile and migrate to localities that are more likely to provide sustainable employment or
other economic opportunities
In order to overcome the spatial distortions of Apartheid, future settlement and economic development
opportunities should be channeled into activity corridors and nodes that are adjacent to or link the
main growth centres
v. Infrastructure investment should primarily support localities that will become major growth nodes in
South Africa and the SADC region to create regional gateways to the global economy.
The Comprehensive Rural Development Programme (CRDP) has the ultimate vision of creating vibrant,
equitable and sustainable rural communities through a three-pronged strategy based on:
A coordinated and integrated broad-based agrarian transformation which includes the
establishment of rural business initiatives, agro-industries, co-operatives, cultural initiatives and
vibrant local markets in rural settings, the empowerment of rural people and communities
(especially women and youth), and the revitalisation of old, and revamping of new economic,
social, and information and communication infrastructure, public amenities and facilities in villages
and small rural towns.
Strategically increasing rural development.
An improved land reform programme aiming at tenure reform, restitution and land redistribution.
The North West Spatial Development Framework needs to spatially accommodate the execution CRDP by
promoting agrarian transformation, rural development and land reform.
22.2.2.2 National Economic Development Policies
In order to provide for sustainable economic growth and eradicate poverty, The Growth Path supports the
deepening of the domestic and regional market by growing employment, increasing incomes and
undertaking other measures to improve equity and income distribution, and widening of the market for
South African goods and services through a stronger focus on exports to the region and other rapidly
growing economies.

28 | P a g e
The Growth Path focuses on areas that have the potential for creating employment on a large scale
(“jobs drivers”), mostly by the private sector and securing strong and sustainable growth in the next
decade.
The jobs drivers identified are;
1. Substantial public investment in infrastructure both to create employment directly in
construction, operation and maintenance as well as the production of inputs, and indirectly
by improving efficiency across the economy.
2. Targeting more labour-absorbing activities across the main economic sectors – the agricultural
and mining value chains, manufacturing and services.
3. Taking advantage of new opportunities in the knowledge and green economies.
4. Leveraging social capital in the social economy and the public services.
5. Fostering rural development and regional integration.
In each of these areas, a special effort needs to be made to generate opportunities for young people, who
face the highest unemployment rate.
The Industrial Policy Action Plan (IPAP) advances the work of the Economic Sectors and Employment
Cluster. It contributes to:
Rural development through interventions in a range of sector such as agro processing, bio-
fuels, forestry, cultural industries, aquaculture, tourism.
Advanced technological capabilities through interventions in the nuclear, advanced materials,
aerospace, and ICT industries.
A serious first step towards the systematic promotion of Green and energy-efficient goods and
services.
Downstream mineral beneficiation.
Strengthened linkages between Tourism and Cultural industries.
Stronger integration between sector strategies, skills development plans and
commercialisation of publicly funded innovation.
The North West Spatial Development Framework needs to spatially accommodate the Job Drivers of the
New Growth Path and the Industrial Policy Action Plan within North West, which include:
Infrastructure Development for Employment and Development ( Jobs Driver 1) which includes:
o Industrial Areas
o Infrastructure
The Comprehensive Rural Development Programme attending to a large rural population.
Tourism, agriculture, mining and agro processing strategic interventions (Job Driver 2.)
Manufacturing.
Green Economies to ensure the conservation of the environment which provides employment
opportunities in the mining, agricultural, and tourism sector.
22.2.3 The North West Provincial Rebranding, Repositioning and Renewal (RRR) Strategy
The North West Provincial Rebranding, Repositioning and Renewal (RRR) Strategy, aims to support the successful implementation of the National Development Plan (NDP). The RRR contributes expressively to the NDP objectives and therefore strife to bring about the desired socio-economic transformation to the people within the province.

29 | P a g e
Figure 22-1: RRR Strategy
The Rebranding, Repositioning and Renewal (RRR) provincial strategy is anchored by 5
concretes, focusing on:
1. Agriculture, Culture and Tourism (ACT) and its tributaries
The ACT concrete is the anchor of economic growth especially in rural areas where poverty, unemployment and inequality is at the highest. All other sectors of the economy such as mining, manufacturing and retail will serve as tributaries to ACT.
2. Villages, Townships and Small Dorpies (VTSD)
The VTSD concrete aims to address the skewed economic landscape in the province by ensuring that the previously marginalised villages, townships and small dorpies are developed and economically vibrant.
3. Reconciliation, Healing and Renewal (RHR) Reconciliation, Healing and Renewal seek to bring together the people of the province and to become involved and deal with issues i.e. moral and social cohesion, past experiences and pains.
4. The Setsokotsane Approach
The Setskogotsane for Radical Socio-Economic Transformation, which place bias focus to the previously marginalised Villages, Townships and Small Dorpies, promotes the multi-sectoral partnership and encouraging a spirit of cooperation in improving the lives of all people within the province.
5. The Saamtrek-Saamwerk Philosophy
The Saamtrek-Saamwerk Philosophy promotes the multi-sectoral partnership and encouraging the spirit of cooperation in improving the lives of the people of North West Province.
22.2.4 Policy Objectives of the North West Spatial Development Framework
The North West Spatial Development Framework needs to be conducive for sustainable development and
will provide for the execution of the following objectives:

30 | P a g e
1. The alignment of international agreements, protocols and policies on sustainable development as
determined by Agenda 21.
2. The integration of international cooperation and development programmes which includes the
Spatial Development Initiatives (SDI’s) involving the Coast to Coast Development Corridor.
3. Giving spatial effect to objectives set by National Government Policies on Sustainability to support
the optimal integration of the aspects of social, economic, institutional, political, physical and
engineering services. The objectives include:
a. The National Development Plan 2030 which promotes an economy that will create more
jobs, improving Infrastructure, transition to low carbon economy, an inclusive and
integrated rural economy, reversing the spatial effects of apartheid ,improving the quality of
education, training and innovation, quality health for all, social, protection, building safer
communities and reforming the public sector.
b. The National Strategy for Sustainable Development (NSSD) promoting the integration
between social demands, natural resource protection, sustainable use and economic
development.
c. The Comprehensive Rural Development Programme (CRDP) integrating broad-based
agrarian transformation, strategically increasing rural development and land reform
programme aiming at tenure reform, restitution and land redistribution.
4. The implementation of the North West Rebranding, Repositioning and Renewal (RRR) Strategy.
5. Restructuring and eliminating the disparate spatial development patterns provided by apartheid
planning, applying the principles of SPLUMA.
6. Creating an enabling environment for sustainable employment and economic growth and
infrastructure development, promoting the objectives of the National Growth Path, the Industrial
Policy Action Plan (IPAP) and The National Infrastructure Plan.
7. Providing for the integration of the objectives of sustainable housing.
8. Reducing inherited spatial divisions and distorted spatial patterns through spatial restructuring
tenure reform, restitution and land redistribution.
9. Addressing the inequality in the spatial distribution of economic activities and population in the
province.
10. Maintaining and developing national and regional roads, railway and airport linkages promoting
national, regional and provincial accessibility support the development of transportation corridors.
11. The optimal utilisation of natural resources by:
a. Ensuring that the latest biodiversity priority areas highlighted in the North West Biodiversity
Sector Plan (READ, 2015) are taken cognisance of, by the different sectors whose policies
and decisions impact on biodiversity.
b. Enhancing the quantity and protecting the quality of water resources
c. Utilising the mineral resources in a responsible way attending to the effect of it on the
environment.
d. Protecting and high and unique potential agriculture land and the reduction of available
land due to the development of mines, urban and rural areas and forestry.

31 | P a g e
22.3 Legislative Context
Spatial Planning and Land Use Management Act 2013 sets five development principles that govern
land use management viz.
Spatial Justice.
Spatial Sustainability.
Efficiency.
Spatial Resilience.
Good Administration
22.3.1 Spatial Justice
The principle of spatial justice requires that:
Past spatial and other development imbalances must be redressed through improved access to and use of land.
Spatial development frameworks and policies at all spheres of government must address the inclusion of persons and areas that were previously excluded, with an emphasis on informal settlements, former homeland areas and areas characterised by widespread poverty and deprivation.
Spatial planning mechanisms, including land use schemes, must incorporate provisions that enable redress in access to land by disadvantaged communities and persons.
Land use management systems must include all areas of a municipality and specifically include provisions that are flexible and appropriate for the management of disadvantaged areas, informal settlements and former homeland areas.
Land development procedures must include provisions that accommodate access to secure tenure and the incremental upgrading of informal areas.
A municipal planning tribunal considering an application before it, may not be impeded or restricted in the exercise of its discretion solely on the ground that the value of land or property is affected by the outcome of the application.
22.3.2 Spatial Sustainability
The principle of spatial sustainability requires that land use management systems must:
Promote land development that is within the fiscal, institutional and administrative means of the Republic.
Ensure that special consideration is given to the protection of prime and unique agricultural land.
Uphold consistency of land use measures in accordance with environmental management instruments.
Promote and stimulate the effective and equitable functioning of land markets.
Consider all current and future costs to all parties for the provision of infrastructure and social services in land developments.
Promote land development in locations that are sustainable and limit urban sprawl.
Result in communities that are viable.
22.3.3 Efficiency
The principle of efficiency requires that:
Land development optimises the use of existing resources and infrastructure.
Decision-making procedures are designed to minimize negative financial, social, economic or environmental impacts.
Development application procedures are efficient and streamlined and timeframes are adhered to by all parties.
22.3.4 Spatial Resilience
The principle of spatial resilience accommodates flexibility in spatial plans, policies and land use management systems to ensure sustainable livelihoods in communities most likely to suffer the impacts of economic and environmental shocks.

32 | P a g e
22.3.5 Good administration
The principle of good administration in spatial planning determines that:
All spheres of government ensure an integrated approach to land use and land development that is guided by the spatial planning and land use management systems as embodied in this Act.
All government departments must provide their sector inputs and comply with any other prescribed requirements during the preparation or amendment of spatial development frameworks.
The requirements of any law relating to land development and land use are met timeously.
The preparation and amendment of spatial plans, policies, land use schemes as well as procedures for development applications, include transparent processes of public participation that afford all parties the opportunity to provide inputs on matters affecting them.
Policies, legislation and procedures must be clearly set in order to inform and empower members of the public.

33 | P a g e
23 CHAPTER 3: SPATIAL CHALLENGES AND OPPORTUNITIES
23.1 Introduction
Chapter 3 provides the spatial challenges facing North West Province that will support the future spatial
pattern. The spatial dimensions are informed by the:
Spatial implications of the Integrated Development Policies in South Africa.
Development Implications of the development elements of spatial development within North West.
The socio economic profile and distribution of the population within North West.
Development priorities.
23.2 Spatial implications of the Integrated Development Policies in South
Africa
Spatial development policies in South Africa provide for a combination of “top down” and “bottom up”
approaches. A top down approach provides for government interventions attending to the social, economic
and natural environmental needs within certain regions, district and communities. A bottom up approach
focuses on the sustainable inclusion of communities in the development process of their areas.
The National Spatial Development Perspective (NSDP) recommends mechanisms to bring about optimum
alignment between infrastructure investment and development programmes within localities.
The NSDP gives direction to a trend to where investment of infrastructure should take place and
acknowledges the importance of PGDS’s and IDP’s in considering local spatial planning. It presents a “top
down” development approach promoting Government’s infrastructure investment on localities of economic
growth and/or economic potential. In localities with low development potential, it propagates that
Government spending should focus on providing social transfers, human resource development and labour
market intelligence which would enable people to become more mobile and migrate to localities that are
more likely to provide sustainable employment or other economic opportunities.
This approach supports urbanisation and promotes the competitive advantages of economic growth nodes
in the region, attracting outside investment and providing opportunities to local people. The existing spatial
context of the North West Province however requires a more balanced approach to spatial development in
support of rural communities.
The Government’s rural development policy represents very much a “bottom up” approach attaining
“socially cohesive and stable rural communities with “viable institutions, sustainable economies and
universal access to social amenities, able to attract and retain skilled and knowledgeable people, who are
equipped to contribute to growth and development”. The approach of this policy is to empower communities
to take responsibility for their economic, social and environmental well-being and support socio economic
development.
This” bottom up” approach propagates the empowerment of marginalised rural communities to enable them
to unlock the economic and spatial potential of their areas, providing them with sustainable livelihoods and
environments.
The National Development Plan: Vision for 2030 at national level focuses on the following key priority
areas:
An economy that will create more jobs by:
o Creating an environment for sustainable employment and economic growth.
34 | P a g e
o Promoting employment in labour absorbing industries.
o Promoting exports.
o Strengthening the capacity of government to implement its economic policy.
o Leadership among stakeholders to mobilise around a national vision.
Transforming human settlements by:
o Reducing inherited spatial divisions and distorted spatial patterns.
o Unlocking development potential through targeted investment in economic and social
infrastructure and institutional support.
o Spatial investment frameworks to support growth and inform infrastructure investment.
o Producing economic dynamics by concentrating productive activity, entrepreneurs, workers
and consumers in a place without congestion (Planned Urbanisation).
Improving Economic in South Africa’s Infrastructure by:
o Investing in energy infrastructure.
o Investment in water infrastructure.
An inclusive and integrated rural economy by:
o Agriculture development based on successful land reform, employment creation and
strong environmental safeguard.
o Quality basic services particularly education, health care and public transport.
o Developing industries such as agro processing, tourism and small enterprise development
in areas with greater economic potential.
The combination of these policy approaches supports a balanced development of the spatial economy,
providing for both concentrated and dispersed economic and social development providing opportunities for
sustainable development for both the urban and rural areas in support of the The National Growth Path, the
National Development Plan and the North West, Rebranding, Repositioning and Renewal Strategy.
These developmental policies provide for priority intervention areas, promoting economic growth and
development, especially where it addresses job-creation and poverty reduction, in an environmentally
sustainable manner within a spatial context and incorporating the principles of good governance. The
combined effect of these policies provides for:
Combinations of choices for people.
Provincial economic growth priorities such as targeted growth areas, priority sectors and corridor
development, the creation of jobs and the eradication of poverty.
Integrated engineering and social infrastructure strategies.
A system of accessible and interactive economic nodes supported by vibrant rural areas
accommodating and catalysing growth and development.
High-level spatial interactions and linkages both within the province and between the province and
its neighbours, including corridor development and national and provincial infrastructure
development plans.

35 | P a g e
23.3 Natural Structural Elements
23.3.1 Natural Resources
The natural resources of the North West Province drive all economic and social activity in the province.
Natural features of interest include the following:
Altitudes ranging from 920 - 1782 metres above mean sea level provide the Province with one of
the most uniform terrains of all the South African provinces.
Gently undulating plains characterise the central and western parts, while the eastern section is
more mountainous and includes the scenic Magaliesberg.
Ancient igneous rock formations dominate the north-eastern and north-central areas of the
Province. The Gatsrand between Potchefstroom and Carletonville is considered to be one of the
most ancient landscapes preserved anywhere in the world.
The geology of the province is significant because of its mineral resources which are rich in
exploitable platinum, gold, uranium, iron, chrome, manganese and diamonds.
Natural resources that affect the spatial development framework for the province are:
Climate.
Hydrology.
Geology.
Soils.
Biodiversity.
23.3.1.1 Climate
Climate plays an important role in determining the availability of water resources, the nature of the natural
landscape and vegetation types. As of late, the number of sun days and the frequency of wind has become
a significant consideration in terms of the availability of alternative power. There is a wide variation in
climate throughout the Province as illustrated below:
Rainfall is highly variable both in time and regionally. On average, the western part of the Province
receives less than 300 mm per annum, the central part around 550 mm, while the eastern and
south-eastern parts receive over 600 mm. See Map 3-1.
Droughts and floods occur regularly at both provincial and local scales. They play a significant role
in almost every aspect of the social, economic and ecological environment within the Province.
Evaporation exceeds rainfall in most parts of the Province.
There are wide seasonal and daily variations in temperature, being very hot in summer (daily
average high temperatures of 32ºC in January) and mild to cold in winter (average daily minimum
in July is 0,9ºC).
The far western part is arid, encompassing the eastern portion of the Kalahari Desert. The central
part of the Province is typically semi-arid, with the eastern part region being predominantly
temperate.
In the western half of the province, the annual solar radiation is the second highest in the country
and measures between 8501 and 9000 MJ/m2 as illustrated in Map 23-2.
Wind power potential in the province is low.3
3 North West Department of Economic Development, Environment, Conservation and Tourism. Renewable Energy Strategy for the North West Province. December 2012

36 | P a g e
Map 23-1 Annual Rainfall
Source: Department of Water and Sanitation
Map 23-2: The Annual Solar Radiation in South Africa4
Source: North West Department of Economy and Enterprise Development
4 North West Department of Economic Development, Environment, Conservation and Tourism. Renewable Energy Strategy for the North West Province. December 2012

37 | P a g e
23.3.1.2 Hydrology
The hydrological regime in the province is divided into surface and ground water5
23.3.1.2.1 Surface Water Resources
Surface water is dependent on rainfall, soil conditions and land cover. Three primary catchments drain the
province: The Limpopo, Vaal and Orange River catchments. The North West Province hosts four Water
Management Areas (WMA); namely the Crocodile (West) and Marico, Upper Vaal, Middle Vaal and the
Lower Vaal. The Middle and Upper Vaal WMAs extend significantly beyond the North West provincial
boundary differ markedly in terms of surface and groundwater resource availability, associated dependent
landscape ecology, sensitivity for exploitation and their conservation priority.
The rainfall pattern within the province is varied, with the western portion that includes a section of the
Kalahari Desert classified as arid and only receiving 300 mm per annum, a central part which is semi-arid
receiving 500 mm per annum and a temperate eastern section receiving the most rainfall - about 600mm per
annum. This relatively low rainfall creates a naturally water stressed condition. In line with these conditions,
the North West faces a multitude of issues with regards to water availability, since most surface water
resources are non-perennial, resulting in water stress and limiting development.
5 North West Environmental Outlook 2013

38 | P a g e
Map 23-3: Surface Water Management Areas in the North West Province
Source: Department of Water and Sanitation

39 | P a g e
23.3.1.2.1.1 Crocodile-West and Marico Catchments
The Bojanala Platinum District Municipality (BPDM) falls within two main river systems, namely the
Crocodile West and Groot Marico. The Crocodile West system includes the largest portion of domestic and
industrial/mining consumers.
Crocodile West
The Crocodile West catchment is largely augmented from the return wastewater from the Gauteng
Province, which in turn is augmented from transfers from the Lesotho Highlands Water Project and the
Thukela-Vaal Transfer Scheme. Water in this catchment is expected to increase with time due to higher
levels of service and increased population growth, but water quality is of concern.
The main rivers in this catchment are the Pienaars, Jukskei, Elands, Crocodile and Bierspruit. The
Crocodile River is used directly for abstraction and water supply to the Brits Water Supply Scheme. Water is
further abstracted from the rivers for irrigation requirements.
The main dams or dams of importance in this catchment are the Roodeplaat and Rietvlei (in the Gauteng
Province), Klipvoor, Hartbeespoort, Roodekopjes, Vaalkop, Bospoort, Koster, Swartruggens, Lindley’s Poort
and Madikwe Dams. Most of these dams, except Klipvoor, Roodekopjes and Lindley’s Poort, are use
directly for domestic and industrial water supply. Furthermore, the majority of dams, except Vaalkop and
Bospoort, are also used for irrigation.
Marico
The Marico catchment is a smaller catchment comprising the north-western part of the BPDM and the
northern part of the NMMDM.
The main rivers in this catchment are the Groot-Marico, Klein-Marico, Marico and Ngotwane. Rivers are
used for direct abstraction and treatment of domestic water. Otherwise, water is abstracted from the rivers
for irrigation requirements. The main dams or dams of importance in this catchment are the Molatedi,
Sehujwane, Ngotwane, Klein Maricopoort, Kromellenboog, Pella, Madikwe and Marico-Bosveld. All dams,
except the Ngotwane, Klein Maricopoort, Kromellenboog and Marico-Bosveld Dams, are utilised for
domestic water supply. Otherwise, water is also used for irrigation purposes.
23.3.1.2.1.2 Upper Vaal Catchment
A small portion of the BPDM (south) and the DrKKDM (east), fall within the Upper Vaal Catchment area.
The remainder of this Catchment includes the southern portion of Gauteng, south-western portion of
Mpumalanga and eastern portion of the Free State Provinces.
Water quality is largely affected by treated effluent (not meeting license requirements) as well as acid mine
drainage.
The main rivers in this catchment, apart from the Vaal, are the Mooi and Loopspruit (applicable to the North
West Province). Water is utilised from the river systems for irrigation and mining. The Mooi River system
provides the water to the Potchefstroom Dam, which is used for this area’s domestic water supply. The
other main dam in this catchment is the Boskop Dam, utilised for irrigation purposes.
Mining activities in this area may affect the return flows further downstream (Potchefstroom Dam, Boskop
Dam, Wonderfontein Spruit) if water is re-used and it may also affect water quality.

40 | P a g e
23.3.1.2.1.3 Middle Vaal Catchment
The northern portion of the Middle Vaal Catchment includes most of the Dr KKDM and a smaller portion of
the Ditsobotla LM in the NMMDM. The remainder of this catchment comprises the central portion of the
Free State Province.
As with the Upper Vaal Catchment, water quality is largely affected by treated effluent (not meeting license
requirements) as well as acid mine drainage. The main river in this catchment, apart from the Vaal, is the
Schoonspruit (applicable to the NWP). There are a number of secondary rivers, denoting the quaternary
catchment areas, such as Bamboesspruit, Klipspruit, Makwassiespruit, Rietspruit and Taaibosspruit. Water
is utilised from the river systems for irrigation and mining. The Vaal River is the main source of water for
domestic and industrial/mining supply.
The main dams or dams of importance in this catchment are the Allemanskraal, Johan Neser Dam (also
known as Klerksdorp Dam), Koppies and Erfenis. The Johan Neser Dam is supplied from a tributary of the
Vaal River, namely the Schoonspruit River. The Johan Neser Dam is not utilised for a domestic water
supply scheme (only adjacent property owners utilise the Dam for domestic supply), but rather for irrigation
and recreation. Most of the other dams are utilised for irrigation and recreation.
23.3.1.2.1.4 Lower Vaal Catchment
The Lower Vaal WMA is the second-largest WMA in South Africa and includes the whole of the Dr RSMDM
as well as the north-east portion of the Northern Cape and a small corner of the Free State.
As with the Upper Vaal Catchment, water quality is largely affected by treated effluent (not meeting license
requirements) as well as acid mine drainage.
The main rivers in this catchment, apart from the Vaal, are the Harts, Molopo and Kuruman (applicable to
the NWP). There are a number of other rivers such as the Droë Harts, Klein-Harts, Moshaweng, Phepane
and Setlagole. Many however are non-perennial. Water is utilised for irrigation such as the Vaalharts
Irrigation Scheme and for domestic supply via the Vaalharts Irrigation Canal and direct abstraction from the
Vaal River.
The main dams or dams of importance in this catchment are the Bloemhof, Barberspan, Wentzel (also
known as Schweizer-Reneke Dam), Spitskop and Vaalharts. Of these, the Bloemhof Dam (located on the
Vaal River), is utilised for domestic water supply, irrigation and recreation. The Wentzel Dam supplies water
to the town of Schweizer-Reneke. The Spitskop Dam, together with the Vaalharts Dam, forms part of the
Vaalharts Irrigation Scheme, which in turn provides water for irrigation as well as domestic use. Dams in
this WMA are also utilised for irrigation and recreation.
23.3.1.2.2 Groundwater Resources
This section describes the main groundwater resources in the NWP. This section provides a brief overview
and focuses more on groundwater developed for larger consumptive use such as for local borehole
schemes or for industrial and mining use.
An overview of groundwater resources is provided in Map 3-4 overleaf. The groundwater resources within
the districts are indicated on:
Map 23-5: Groundwater Resources: Bojanala District Municipality
Map 23-6: Groundwater Resources: Ngaka Modiri Molema District Municipality
Map 23-7: Groundwater Resources: Dr Ruth Segomotsi Mompati District Municipality
Map 23-8: Groundwater Resources: Dr Kenneth Kaunda District Municipality

41 | P a g e
The Groundwater Master Plan for the North West Province6 addresses groundwater sources in the various
geo-hydrological regions. These regions are illustrated on Map 23-4 and briefly discussed in this section.
Where possible, major groundwater consumers or entities, impacting groundwater quantity and quality will
be highlighted. The DWS Groundwater Master Plan for the NWP does not include the Moretele LM. There
are no Groundwater Master Plans for the Gauteng and the Limpopo Provinces.
6 DWS (DWAF), Groundwater Master Plan for the North West Province. 2010

42 | P a g e
Map 23-4: Overview of Groundwater Resources in the North West Province
Source: Department of Water and Sanitation

43 | P a g e
MAP 23-5: Groundwater Resources: Bojanala District Municipality
Source: Department of Water and Sanitation

44 | P a g e
MAP 23-6: Groundwater Resources: Ngaka Modiri Molema District Municipality
Source: Department of Water and Sanitation
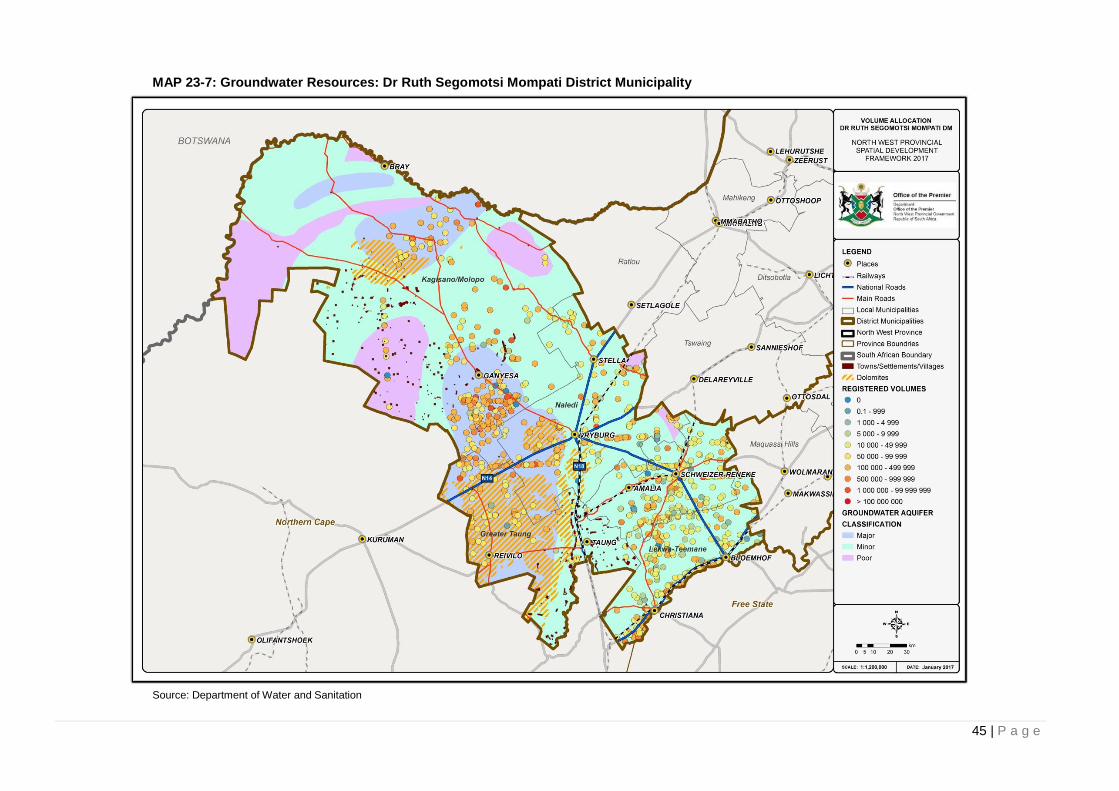
45 | P a g e
MAP 23-7: Groundwater Resources: Dr Ruth Segomotsi Mompati District Municipality
Source: Department of Water and Sanitation

46 | P a g e
MAP 23-8: Groundwater Resources: Dr Kenneth Kaunda District Municipality
Source: Department of Water and Sanitation

47 | P a g e
Map 23-9: Hydrological Regions in the North West Province
Source: Department of Water and Sanitation

48 | P a g e
23.3.1.2.2.1 Eastern Kalahari Hydrogeological Region
This region includes the northern half of the Dr RSMDM and a large portion of the western NMMDM.
Groundwater is utilised for communal and small town water supply, agriculture (irrigation and livestock)
and to a lesser extent for mining.
The largest portion this region is covered by recent sand deposits of the Kalahari Group. Some
outcrops of sedimentary rocks of different Groups and Supergroups also occur. This region is mapped
as intergranular and fractured aquifer with a very low to extremely low development potential however,
when considering irrigated agriculture; the development potential may be higher than initially estimated.
Dolomitic outcrops shown on the Geological Map of South Africa (1984) indicate that dolomite could
occur underneath the Kalahari sands.
Information on groundwater use, abstraction volumes and groundwater quality is limited. The NW
Groundwater Master Plan suggests amongst others to establish a Water User Association (WUA) for
the Tosca area to better manage this resource.
23.3.1.2.2.2 Western Highveld Hydrogeological Region
This region includes the southern-central portion of the North West Province, between Taung in the
south-west, to Lichtenburg in the central-northern area. Groundwater is utilised for communal and small
town water supply, agriculture (irrigation and livestock) and also for mining (mainly diamonds and gold).
The region is underlain mostly by volcanic rocks of the Ventersdorp Supergroup. The Vryburg and
Johannesburg Hydrogeological map (2522 and 2526 respectively) indicate the aquifer types as
fractured with an extremely low to medium development potential. In smaller areas such as Coligny,
aquifer types are mapped as intergranular and fractured with a high development potential.
Information on groundwater use, abstraction volumes and groundwater quality is limited except for
Delareyville where some monitoring takes place. It is important that the Local Municipalities and WSAs
in this area develop, implement and maintain a groundwater monitoring programme, seeing that
groundwater is used for irrigation as well as sole source of water for urban communities.
23.3.1.2.2.3 Karst Belt Hydrogeological Region
The Karst Belt is a dolomitic region stretching in a band from Lobatse in Botswana west of Zeerust, past
Lichtenburg and Ventersdorp, in the municipal areas of Ditsobotla LM and Ventersdorp LM, towards
and around the built-up areas of Mogale City in the Gauteng Province and even further eastwards.
Groundwater is utilised for communal, small town and larger town water supply, industries, agriculture
(irrigation and livestock) and also for mining. Groundwater (from the Molopo Eye and Grootfontein well
fields) makes up around 50% of the water supplied to Mahikeng. Groundwater is also used for water
supply to Lichtenburg, Ventersdorp and Zeerust, amongst others.
Rocks found here belong to the Chuniespoort Group and the hydrogeological maps of Johannesburg
and Vryburg shows this area as karst aquifer with a medium to high development potential. The
groundwater in this area is highly susceptible to pollution due to the nature of the geological formations.
Furthermore, many springs feed the river supply systems and could therefore face an additional risk to
quality of water in the surface water sources if the groundwater systems are polluted.
This aquifer is shared with the neighbouring country of Botswana and although detailed analysis is
available on the groundwater use in NWP, more investigation is required on water use in Botswana to
ensure sustainable management of this resource.

49 | P a g e
The North West Groundwater Master Plan further recommended the establishment of WUAs to assist in
the management and protection of this resource, especially the Grootfontein Compartment (supplies
the Mahikeng area and irrigation in the Bo-Molopo area).
23.3.1.2.2.4 Western Bankeveld & Marico Bushveld Hydrogeological Region
This Region runs north of the Karst Belt, starting in the west (encompasses almost the entire
Ramotshere Moiloa LM) with the border of Botswana and continuing to the east through the western
half of the Moses Kotane LM, the further south-east towards the Gauteng Province, following the
Magaliesberg Mountain range.
Groundwater is utilised for communal, small town and larger town water supply, industries, agriculture
(irrigation and livestock) and also for mining. Groundwater is the main source of water for the majority of
residents in the Ramotshere Moiloa LM and in the western half of the Moses Kotane LM. It is also the
main water source for Derby and it is used to augment water supply in Swartruggens and Koster and it
also used by the mining sector.
The rocks underlying this region are predominantly sedimentary of nature and mostly belonging to the
Pretoria Group. The aquifer types are mapped (Johannesburg and Polokwane Hydrogeological maps)
as intergranular and fractured with a low to medium development potential.
Similar to other areas, there is a complete lack of groundwater use information for the areas supplied.
There have been concerns raised on the quality of groundwater, which is affected by the on-site
sanitation and agricultural activities in the area. Even if the Groundwater Protocol (to protect
groundwater sources during on-site sanitation installation) was followed, little is known on the efficacy
thereof to protect the sources. The North West Groundwater Master Plan also mentioned that
overgrazing may increase runoff and in turn affect groundwater aquifer recharge as well as quality.
Close cooperation is required between the municipalities and the DWS to establish and implement
programmes for groundwater monitoring and protection.
23.3.1.2.3 Western Bushveld Complex Hydrogeological Region
The Western Bushveld Complex follows closely the geological region rich in platinum group metals in
this area: stretching from the northern portion of the City of Tshwane Metropolitan Municipality, towards
Brits and Rustenburg, through the eastern half of the Moses Kotane LM and further north in the Moses
Kotane and Madibeng LMs. The main towns in this region (Mogwase, Rustenburg, Boitekong, Brits,
Soshanguve and Akasia, etc.) are predominantly supplied from surface water sources.
Groundwater is utilised by smaller towns and rural settlements, mines and industries and for agricultural
use.
The aquifers are mapped as both fractured and intergranular and fractured and are formed by igneous
rocks of the Bushveld Complex with a low to medium potential.
The mining activities in this region play an important role in the use and protection of groundwater
resources. Mines are predominantly supplied potable water from surface water sources. Few mines
utilise groundwater and treated effluent water for processes.
Similar to the other regions, there is very little information on groundwater abstracted, used (all sectors)
and pollution risks and the management thereof. The municipalities do not have any groundwater
abstraction records for domestic supply. Water use licensing and registration records are available for
this area, but would still need to be supplemented with actual water use information.

50 | P a g e
23.3.1.2.4 Central Highveld Hydrogeological Region
The Central Highveld region encompasses the central and southern portion of the Gauteng Province
and continues further south-west into the Dr KKDM, including the eastern part of Klerksdorp and all of
Orkney and a portion of the central area of the City of Matlosana LM, including some of the small rural
town of Hartbeesfontein. Only the latter rural town is supplied from groundwater, the remainder of
groundwater use occurs from rural communities, mines and agriculture.
This area is heavily impacted by mining activity – recent as well as closed mines – and most relate to
gold mining. This type of mining activity result in acid mine drainage if mines are closed, shafts empty,
but groundwater seepage result in the dissolution of minerals and iron, lowering the pH of the
groundwater. This water in turn may enter the surface, resulting in acid mine drainage: polluting surface
water (as well as groundwater) sources and having a detrimental effect on the environment. This
phenomenon is evident on the West Rand, from where water drains naturally towards the Vaal River.
The geological formations underlying this Region consist of mostly of sediments of the Witwatersrand
Supergroup. The aquifers are mapped as fractured and intergranular and fractured aquifers with a very
low to low development potential. There is a dolomitic region running from Orkney, through Klerksdorp
in a north-easterly direction towards Westonarea.
Very little information is available on groundwater use, abstraction and quality risks associated with
urban development and mining activities.
23.3.1.2.5 Ghaap Plateau Hydrogeological Region
The Ghaap Plateau includes a small area in the south-western corner of the Dr RSMDM, just west of
Taung, continuing north to Vryburg and further west to Kuruman in the Northern Cape. It stretches
further south into the Northern Cape towards Griekwastad. The town of Reivilo falls within this region
and utilises boreholes for water supply. Vryburg utilises both surface water (from the Vaalharts Irrigation
Scheme) and groundwater as source. There are a few other settlements in this area utilising
groundwater, whereas groundwater is also used in agriculture (irrigation and livestock) and a few
mining operations.
This whole region’s geology is indicated as dolomites and this in general provide groundwater of good
quality and high yields, therefore very good development potential.
Except for the town of Vryburg, little is known on the groundwater abstracted and utilised in the
remainder of this region. The All Towns Strategy (2011) for Vryburg indicated that the groundwater
sources utilised for the town have been fully developed and need to be carefully managed. The
groundwater table in the Reivilo area is very shallow (between 1.2 and 3 metres) and this may make it
vulnerable to pollution (Reivilo All Towns Strategy, 2011).

51 | P a g e
23.3.2 Geology
23.3.2.1 Background
The geological history of South Africa is a long and complex one, which goes back some 3.7 billion
years. The keystone on and around which the rest of the geological formations of South Africa have
developed is the Kaapvaal Craton, which underlies the northern part of the country. It is made up
largely of Archaean gneisses and granitoids (Basement Complex), along with lesser volumes of
metamorphosed, volcano sedimentary rocks.
The geology of North West played a major role in the economic development and distribution of the
population of the North West Province providing:
Minerals (chrome and platinum) and diamonds
Topographical features supporting tourism eg. Pilanesberg and Vredefort
High-yield potential dolomitic geological formations
Map 23-10: Geology
Source: Department of Mineral Resources (DMR)
23.3.2.2 Minerals
North West has a wealth of mineral deposits, and the distribution of these reserves on which mining
industry is built entrenched the existing development patterns in large parts of the province.
Most of the provincial mining activity is found in the Bojanala Platinum District (Rustenburg) and Dr
Kenneth Kaunda District (Klerksdorp) as a result of the rich mineral deposits, predominantly gold and
platinum group metals, located in these areas. Extensive mining is done all over the province and the
minerals found include Gold, Platinum group metals, Andalusite, Amosite Asbestos, Kaolin, Chromium,

52 | P a g e
Copper, Alluvial Diamonds, Fluorine, Iron, Gypsum, Mercury, Limestone and Dolomite, Magnesite,
Manganese, Sodium, Nickel, Phosphate, Lead, Thorium, Titanium, Uranium, Vanadium, Zinc.
A generalised geology map of the province indicates that the western quadrant of the province is
dominated by sand deposits, with the eastern side being rich in mineral deposits and the central area
domonated by a quartsite deposits. The mining activity is mostly associate with the northern and
eastern areas of the province, from where the platinum, treasure development corridors were
identified. Map 3.11 shows the mineral deposits and the mining activity in the province.
Map 23-11 Mineral Deposits with the Mining Activity
Source: Department of Mineral Resources (DMR)
23.3.3 Soils
Agriculture is by far the most extensive land use in the NW province. It takes many forms, including
commercial dry land and irrigated cultivation, livestock farming, game farming, as well as subsistence
farming. The strong agricultural character also means that the province is considered to be
predominantly rural.
Climatic conditions, water availability and soil conditions dictate the success of agriculture in the
province. Of all the various soil characteristics, erodibility is the most critical to understand. The
erodibility of soils can be described as their sensitivity to the effects of wind and water on the soil
structure. This property is expressed as an erodibility index, where low values indicate high
susceptibility to erosion, and high values correspondingly indicate a low susceptibility to erosion.
The productive land for food production is protected by legislation which includes the Conservation of
Agricultural Resources Act (Act 43 of 1983), the Subdivision of Agricultural Land Act (Act 70 of 1970)
and Draft Preservation and Development of Agricultural Land Framework Bill 2015 promote the

53 | P a g e
objectives of sustainable utilisation of natural agricultural resources, and control the subdivision and
change of use of agricultural land and prime- and unique agricultural land, in support of biodiversity.
The Land Capability classification within North West indicates the suitability of soils for most kinds of
field crops and divides it into 8 classes. The National Department of Agriculture considers Class 1- 4 as
well as existing arable land as high potential agricultural land. The department is in the process of
refining the land capability classes.
Table 23-1: Land Capability Classification
Class 1 Soils have slight limitations that restrict their use.
Class 2 Soils have moderate limitations that restrict the choice of plants or that require moderate conservation
practices.
Class 3 Soils have severe limitations that restrict the choice of plants or that require special conservation
practices, or both.
Class 4 Soils have very severe limitations that restrict the choice of plants or that require very careful
management, or both.
Class 5 Soils are subject to little or no erosion but have other limitations, impractical to remove, that restrict their
use mainly to pasture, rangeland, forestland, or wildlife habitat.
Class 6 Soils have severe limitations that make them generally unsuitable for cultivation and that restrict their use
mainly to pasture, rangeland, forestland, or wildlife habitat.
Class 7 Soils have very severe limitations that make them unsuitable for cultivation and that restrict their use
mainly to grazing, forestland, or wildlife habitat.
Class 8 Soils and miscellaneous areas have limitations that preclude commercial plant production and that
restrict their use to recreational purposes, wildlife habitat, watershed, or esthetic purposes.
High and medium soil erodability indices have a significant influence on the degradation of the
agricultural potential of land, aggravated by unmanaged human settlement. See Map 23-14.

54 | P a g e
Map 23-12 Land Capability
Source: National Department of Agriculture

55 | P a g e
Map 23-13 Agricultural Potential
Source: National Department of Agriculture

56 | P a g e
Map 23-14: Erodibility Index
Source: National Department of Agriculture

57 | P a g e
23.3.4 Biodiversity
The North West Biodiversity Sector Plan7 was developed in 2015 to inform land use planning,
environmental assessments, land use authorisations, water use authorisations and natural resource
management, by a range of sectors whose policies and decisions impact on biodiversity. This is done
by providing a map of biodiversity priority areas, referred to as Critical Biodiversity Areas and Ecological
Support Areas, with accompanying land use planning and decision-making guidelines.
Land use patterns indicate that 31% of the province is irreversibly modified. This area comprises:
69% of the North West is in a natural or near-natural state,
3.5% is urban,
25.6% is croplands and
0.7% is mining,
The North West supports a total of 41 South African vegetation types. Thirteen of these are threatened
and seven are endemic to the province.
A total of 16 threatened plant species, 31 threatened mammal species, and 40 threatened bird species
have been listed for the province.
The vegetation of the province can be divided into seven broad biogeographic regions based on the
climate, predominate soils and landforms, and dominant vegetation forms:
1. The flat, sand cover Kalahari plain in the west supports mostly open savanna type vegetation 2. Ghaap Plateau in the south west and including the dolomitic out-lier at Morokweng. 3. The Bankenveld includes the Magaliesberg, Swartruggens and Dwarsberg on the border with
Limpopo, and has bushveld vegetation of the hills and broad-leaf or Acacia savannas in the valleys.
4. Western Grasslands cover the central and eastern plains of the province. Trees are mostly absent in this landscape except on ridges/koppies or azonal habitats.
5. The Bushveld Basin located on the plains north of the Magaliesberg-Swartruggens is covered mainly by dense Acacia bushveld on heavy soils or broadleaf woodlands on sandy soils.
6. The Lower-Vaal Valley has mostly arid bushveld type vegetation. 7. The characteristic Vredefort Dome landscape has similar structure vegetation to the
Bankenveld with woodland on the hills and grassland in the valleys.
Three Important Bird Areas of South Africa fall entirely within the province, and another three fall
partially within the province.
The Magaliesberg Mountain Range is a Protected Environment in terms of the National Environmental
Management: Protected Areas Act (No. 57 of 2003) and a Biosphere Reserve due to the high
biodiversity value of this area, which also represents one of the Important Bird Areas.
The Harts River supports the Barberspan Reserve wetland Ramsar site near Lichtenberg. Several
relatively pristine dolomitic eyes (springs) are supported in the province and a number of freshwater
springs, lakes and waterfalls that have created very unique tufa systems are recognized to be of
international importance. The North West Province is currently in the process of registering the Marico
Biosphere Reserve through UNESCO that would encompass the upper reaches of the Marico River,
the dolomitic eyes and tufas south of Groot Marico and the water recharge areas (Malmanie karst
system) for these dolomitic eyes.
7 North West Department of Rural, Environment and Agricultural Development (READ)

58 | P a g e
In the North West there are 15 Type 1 (formally protected) protected areas that cover 1.94% (203 258
ha) of the province. Conservation areas, i.e. Magaliesberg Protected Environment, excluding Kgaswane
Mountain Reserve (27 061 ha) and two municipal reserves (6 019 ha.) that have been validated, cover
approximately 0.32% of the province. The total area under conservation, i.e. validated protected areas
(PAs) and conservation areas (CAs) amount to 236 338 ha (2.25%)8 .The validation of over 140 000 ha
of Private Nature Reserves9, is currently underway. Many of these Private Nature Reserves will need to
be deproclaimed due to changing land-uses.
The Vredefort Dome World Heritage Site with a provincial area of 47 331 ha., the Taung Skull Site
(3 629 ha.) and the Cradle of Humankind World Heritage Site with a provincial area of 8 828 ha., the
Magaliesberg Biosphere Reserve with a provincial area of 220 178 ha and the proposed Marico
Biosphere Reserve (approx. 443 000 ha.), all have conservation and environmental sustainability as
their core principles. Biosphere Reserves are nominated by national governments all over the world and
are internationally recognized by declaration through UNESCO.
The key pressures on biodiversity in the North West are associated with agriculture (cropping and game
breeding), mining and urban settlements. Whilst there is a definite concentration of mining taking place
in the Platinum Belt and the Golden Highway, to the east of the province, and generally close to
Gauteng, there is significant loss of natural habitat taking place across the entire province.
Wetland and river ecosystem diversity is high, with 55% of the wetland systems and 80% of the river
systems classified as threatened ecosystems. The Harts River supports the Barberspan Reserve
wetland Ramsar site near Lichtenberg. Several dolomitic eyes (springs) are supported in the North
West that are in a relatively pristine state. A number of freshwater springs, lakes and waterfalls that
have created very unique tufa systems are recognized to be of international importance (Roux, 2015b)
(see Section 2.2). A high diversity of bird species occur which has resulted in the designation of three
Important Bird Areas of South Africa in the North West, while another three extend across provincial
boundaries.
The Magaliesberg Mountain Range extends 120km eastward from Rustenberg in the North West to the
Gauteng Province’s Hartebeespoort Dam. The Magaliesberg is a Protected Environment in terms of the
National Environmental Management: Protected Areas Act (No. 57 of 2003) and has also been
incorporated into a Biosphere Reserve due to the high biodiversity value of this area. It also represents
one of the province’s 6 Important Bird Areas.
The Taung heritage site is situated within the Dr Ruth Segomotsi Mompati District Municipality (Greater
Taung Local Municipality), to the south-west of the province.
Map 3-15 and Map 3-16 show the Terrestrial and Aquatic Critical Biodiversity Areas and Ecological
Support Areas for the province. Several important biodiversity features occur within the North West.
8 READ, 2015
9 South African Protected Area Database (SAPAD) (www.environment.gov.za)

59 | P a g e
Map 23-15 Terrestrial Critical Biodiversity Areas and Ecological Support Areas
Source: READ. North West Biodiversity Sector Plan 2015
Map 23-16: Aquatic Critical Biodiversity Areas and Ecological Support Areas
Source. READ: North West Biodiversity Sector Plan 2015

60 | P a g e
23.3.4.1 Biodiversity Development Implications
23.3.4.1.1 Core Protection Areas
The biodiversity within North West province makes a large contribution to economic development within
the province. The proposed expansion of the Pilanesberg National Park, linking it to Madikwe Game
Reserve via the “Heritage Park Corridor” will allow for connectivity between these two protected areas,
to ensure healthy, connected landscapes and habitats that support, and are supported by, local
communities. This initiative will promote the wildlife economy of the province, e.g. ecotourism, green
jobs, game farming etc. The initiative is a 20-year project culminating in linking up with Limpopo
Province and Botswana.
Several important biodiversity features which need to be protected occur within the North West, viz.:
The Harts River supports the Barberspan Reserve wetland Ramsar site, which also falls within an
Important Bird Area
The upper reaches of the Marico River and tributaries are a priority, referred to as river Freshwater
Ecosystem Priority Areas.
Dolomitic eyes (springs) with unique biodiversity and active tufa formations that are in a relatively
pristine state are supported in the Blue Pools, Molopo, Molemane and Marico rivers. The Ngotwane
River and Schoonspruit River are also fed by a dolomitic eye.
The Malmani karst system located approximately between Molemane and Ventersdorp is the
recharge area for all the major eyes in the province. This area is possibly the single most important
ecosystem service area in the province given that it is responsible for regulating and maintaining
the fresh water resouces for the majority of the provinces population.
Associated with all the dolomitic eyes of the Malmani karst system are extensive peat wetlands.
These are nationally unique ecosystems that provide an immense ecosystem service. Apart from
being massive carbon sinks these wetland systems filters, clean and regulate the flow of fresh
water from the dolomitic eyes. These wetlands have very high ecosystem service value and make a
disproportionately large contribution to human well-being in the province.
All river systems that are in a natural or near-natural ecological state (ecological category A/B:
largely natural) are important as they represent a representative sample of the diversity of
freshwater ecosystem types in the province that should remain in a good ecological state. For
example, in the Marico Catchment these include the Rietspruit, Bokkraal, Ribbokfontein se Loop,
Kaaloog se Loop and the upper reaches of the Groot Marico River. The Magaliesberg Mountains is
the source of the Sterkstroom River, a tributary of the Crocodile River, which is also in a good
ecological condition.
The Vulnerable Nile crocodile is rare in the province and is found throughout the bushveld regions,
but numbers are declining in rivers in protected areas, for example the Olifants River.
Within the South African context, the North West is not characterized by a large diversity of
endemic or rare species. This does not mean that the province does not have important
biodiversity. With nearly 3000 native plant and 120 mammal species recorded from the province, it
can be considered as being species rich and so there is no shortage of species that need
conservation consideration.
The Griqualand West Centre of Endemism falls partially within the North West, centred on the
Ghaap Plateau (Taung and Reivilo) and stretching to Morokweng and Vryburg.
Three important bird areas of South Africa fall entirely within the province, namely: Pilanesberg
National Park, Botsolano Nature Reserve; and Barberspan and Leeupan. Another three fall partially
within the province, namely: Magaliesberg to the north-west and Spitskop Dam; and Sandveld and
Bloemhof Dam Reserve to the south.

61 | P a g e
The Magaliesberg Mountain Range: This extensive mountainous area that stretches 120km across
the North West and Gauteng provinces delivers the most important ecosystem service in the
province - clean, fresh water. The Magaliesberg is therefore invaluable ecological infrastructure that
supports all the settlements, agricultural, mining and industrial development in the south of the
province. It is especially important from a water resource perspective. Overgrazing, deforestation
and poor development planning, as well as poor construction and maintenance of roads, can
damage wetland and river ecological infrastructure. Impacts occur downstream in the form of soil
erosion, gully erosion or the siltation of dams required for economic development and human
consumption.
23.3.4.1.2 Biodiversity Trends and Conflicts
Land-cover is a key information requirement for a wide range of landscape planning, inventory and
management activities, ranging from environmental resource management to telecommunication
planning. To inform the trends and guide the Provincial Spatial Development Framework, the land
cover comparison had been done from 1990 to 2014 and from 2006 to 2014.
Table 3-2 shows the comparisons for each municipality.
Furthermore the conflicts between the four main land cover sets were completed to determine the
focus areas for guideline development and planning. Comparisons were drawn with the biodiversity
and with the agricultural data sets the two bases. Table 23-2 indicates the components that are
included on each map. The conflict assessments that were derived are:
1. Biodiversity Compilation, which is a compilation of the critical biodiversity areas with the
corridors that is identified in the Biodiversity Sector Plan 2015.
2. Biodiversity Compilation with Agriculture indicated the province is dominated by agriculture.
See Map 3-17.
3. Biodiversity Compilation with Mining shows the large areas of mining, but with a closer
investigation of the maps, the illegal mining activity adjacent to the river systems can clearly
be defined. See Map 3-18.
4. Biodiversity Compilation with Settlements indicates what a small percentage of the province is
dedicated to urban development. See Map 3-19.
5. Biodiversity Compilation with all conflicts provided the mining agriculture and settlements. See
Map 3-20.
6. Settlement and mining conflicting with agriculture shows the areas of agriculture activity that
is threatened by mining activity. See Map 3-21.
The NWBSP
10 recognises the following pressures on the biodiversity which gave a negative influence
on the sustainability thereof:
1. Whilst there is a definite concentration of mining taking place in the Platinum Belt and the Golden Highway / Treasure Development Corridor to the east of the province, and generally close to Gauteng, there is significant loss of natural habitat taking place across the entire province due primarily to:
Agriculture (cropping, livestock and game ranching, and game breeding).
Mining and urban expansion. 2. Other pressures, not associated with land use change impacts, but which result in the
degradation of natural habitat and loss of biodiversity include:
The dependence of rural communities on natural harvestable products.
Poor water catchment and river management.
Climate change.
10
North West Provincial Government .Department: Rural, Environment and Agriculture Development. North West Biodiversity Sector Plan, 2015.

62 | P a g e
3. Environmental degradation also place significant pressures on biodiversity in the North West due to:
Alien invasive species encroachment.
Bush encroachment (bush thickening and associated chemical control).
Genetically modified crops.
Harvesting, poaching and trading in indigenous species.
4. Freshwater features and water quality are influenced by the following factors:
Changes in water quality (e.g. acid mine drainage, wastewater from treatment plants, fertilizer and pesticide run-off).
Changes in water flow regimes within urban areas (e.g. catchment hardening and increased storm water flows) and mining areas (e.g. river diversions). For example, water quality in the Crocodile River is severely degraded and alterations in flow have occurred).
Increased storm water run-off from urban areas and failing waste treatment works have also resulted in channel and flow modification, as well as degraded water quality. For example, Baberspan, which is a Ramsar site, is threatened by raw sewage outfalls at Lichtenburg, Biesiesvlei, Sannieshof and Schweizer-Reneke urban areas.
Rising population and increased growth in the mining, agricultural and industrial sectors pose increasing threats on the aquatic resources.
Groundwater extraction creates potential imbalances between the rate of utilisation and sufficient groundwater replenishment.
Alien fish species, such as the common carp (Cyprinus carpio), have altered natural habitat in the Crocodile River, whereas largemouth bass (Micropterus salmoides) threaten fish species in the Groot Marico River.
Alien plant infestations also impact on river systems, for example along the Hex River near Rustenburg; and infestations of the alien reed, Arundo donax.
5. Although the protected area network and its expansion through land purchase and biodiversity stewardship agreements can play an important role in protecting specific sites, the combination of habitat loss, development pressures, and high land values is likely to preclude protected area expansion from being the dominant conservation mechanism in the region. Hence, the use of controls related to land use (e.g. land use schemes, SDFs) and development approvals (both strategically using EMFs and reactively via the EIA process) represent the best prospect for ensuring long-term persistence of biodiversity in the province. The Biodiversity Sector Plan should inform all of these tools and regulatory processes.

63 | P a g e
Table 23-2: Summary of Change Analysis for each North West Province Municipality
1990 2013/2014 Change
Hectares Hectares Hectares %
Moretele
Natural (Untransformed) 102922.5 107130.9 4208.4 4.09
Cultivation 18386.91 14819.67 -3567.24 -19.4
Plantations/Woodlots 15.75 9.27 -6.48 -41.14
Mines 155.07 52.29 -102.78 -66.28
Erosion/Bare Soil 409.68 298.44 -111.24 -27.15
Urban 15904.17 15483.51 -420.66 -2.64
Madibeng
Natural (Untransformed) 301972.3 304466.1 2493.81 0.83
Cultivation 58896.72 51736.68 -7160.04 -12.16
Plantations/Woodlots 1598.49 936 -662.49 -41.44
Mines 2058.12 3385.17 1327.05 64.48
Erosion/Bare Soil 824.31 1250.1 425.79 51.65
Urban 18305.55 21881.43 3575.88 19.53
Rustenburg
Natural (Untransformed) 264400.7 259868.4 -4532.22 -1.71
Cultivation 54395.1 49438.44 -4956.66 -9.11
Plantations/Woodlots 3345.21 2476.8 -868.41 -25.96
Mines 3656.7 8291.07 4634.37 126.74
Erosion/Bare Soil 1455.48 3031.56 1576.08 108.29
Urban 14805.18 18952.02 4146.84 28.01
Kgetlengrivier
Natural (Untransformed) 311359.1 318463.5 7104.33 2.28
Cultivation 79651.08 71744.94 -7906.14 -9.93
Plantations/Woodlots 2146.14 1845.72 -300.42 -14
Mines 896.22 774.54 -121.68 -13.58
Erosion/Bare Soil 2082.15 2966.49 884.34 42.47
Urban 861.84 1201.41 339.57 39.4
Moses Kotane
Natural (Untransformed) 503056.8 504759.8 1702.98 0.34
Cultivation 36027.18 23932.62 -12094.6 -33.57
Plantations/Woodlots 21.42 13.23 -8.19 -38.24
Mines 1053.18 2641.32 1588.14 150.79
Erosion/Bare Soil 6531.3 11716.02 5184.72 79.38
Urban 24766.74 28393.65 3626.91 14.64
Ratlou
Natural (Untransformed) 303442.1 320402.1 16959.96 5.59
Cultivation 168765.6 150801.6 -17964 -10.64
Plantations/Woodlots 89.37 59.85 -29.52 -33.03
Mines 174.87 651.6 476.73 272.62

64 | P a g e
1990 2013/2014 Change
Hectares Hectares Hectares %
Erosion/Bare Soil 46.8 68.22 21.42 45.77
Urban 15909.12 16444.53 535.41 3.37
Tswaing
Natural (Untransformed) 192325.8 201266.1 8940.33 4.65
Cultivation 396174.7 385426.8 -10747.9 -2.71
Plantations/Woodlots 1692.09 1409.13 -282.96 -16.72
Mines 885.69 1403.64 517.95 58.48
Erosion/Bare Soil 465.39 747.09 281.7 60.53
Urban 4879.44 6170.31 1290.87 26.46
Mahikeng
Natural (Untransformed) 229942.8 234693.9 4751.1 2.07
Cultivation 115265.3 109407.8 -5857.56 -5.08
Plantations/Woodlots 595.44 360.36 -235.08 -39.48
Mines 2622.78 2880.99 258.21 9.84
Erosion/Bare Soil 122.67 226.53 103.86 84.67
Urban 21164.22 22143.69 979.47 4.63
Ditsobotla
Natural (Untransformed) 361581.1 372519.7 10938.6 3.03
Cultivation 270233.9 256748.9 -13485.1 -4.99
Plantations/Woodlots 2644.83 2883.42 238.59 9.02
Mines 5436.81 5419.35 -17.46 -0.32
Erosion/Bare Soil 297.54 1282.59 985.05 331.06
Urban 5874.12 7214.4 1340.28 22.82
Ramotshere Moiloa
Natural (Untransformed) 645129.5 653026.4 7896.96 1.22
Cultivation 47336.76 28626.93 -18709.8 -39.52
Plantations/Woodlots 227.97 154.53 -73.44 -32.21
Mines 1580.22 1899 318.78 20.17
Erosion/Bare Soil 11368.8 19018.44 7649.64 67.29
Urban 13216.59 16134.48 2917.89 22.08
Naledi
Natural (Untransformed) 532367.9 549334.4 16966.44 3.19
Cultivation 156679.4 139544.5 -17134.9 -10.94
Plantations/Woodlots 177.48 143.01 -34.47 -19.42
Mines 3784.5 3651.21 -133.29 -3.52
Erosion/Bare Soil 198.09 187.11 -10.98 -5.54
Urban 1189.62 1536.84 347.22 29.19
Mamusa
Natural (Untransformed) 189734.9 204080.9 14346 7.56
Cultivation 168604.8 152991.5 -15613.4 -9.26
Plantations/Woodlots 213.39 171.81 -41.58 -19.49

65 | P a g e
1990 2013/2014 Change
Hectares Hectares Hectares %
Mines 2043.54 2837.7 794.16 38.86
Erosion/Bare Soil 36.9 137.25 100.35 271.95
Urban 825.66 1240.11 414.45 50.2
Greater Taung
Natural (Untransformed) 526529.7 532027 5497.29 1.04
Cultivation 16395.03 11764.71 -4630.32 -28.24
Plantations/Woodlots 72.45 35.64 -36.81 -50.81
Mines 1294.11 1258.47 -35.64 -2.75
Erosion/Bare Soil 2986.02 960.84 -2025.18 -67.82
Urban 16710.3 17940.96 1230.66 7.36
Lekwa-Teemane
Natural (Untransformed) 286631.2 296391.1 9759.87 3.41
Cultivation 72306.18 59142.6 -13163.6 -18.21
Plantations/Woodlots 181.53 120.33 -61.2 -33.71
Mines 7583.22 10160.73 2577.51 33.99
Erosion/Bare Soil 279.9 824.76 544.86 194.66
Urban 1096.11 1438.65 342.54 31.25
Kagisano-Molopo
Natural (Untransformed) 2097086 2172873 75786.39 3.61
Cultivation 278504.6 201698.8 -76805.7 -27.58
Plantations/Woodlots 73.98 104.4 30.42 41.12
Mines 691.56 715.05 23.49 3.4
Erosion/Bare Soil 1242.99 449.01 -793.98 -63.88
Urban 9529.47 11288.88 1759.41 18.46
Ventersdorp
Natural (Untransformed) 248788.9 252291.6 3502.71 1.41
Cultivation 124056.9 120299 -3757.86 -3.03
Plantations/Woodlots 914.22 829.8 -84.42 -9.23
Mines 1476.18 903.33 -572.85 -38.81
Erosion/Bare Soil 53.73 81.99 28.26 52.6
Urban 816.84 1701 884.16 108.24
Tlokwe City
Natural (Untransformed) 187229.3 192884.9 5655.6 3.02
Cultivation 67138.83 60873.21 -6265.62 -9.33
Plantations/Woodlots 1339.56 1283.49 -56.07 -4.19
Mines 913.41 612.09 -301.32 -32.99
Erosion/Bare Soil 183.15 518.13 334.98 182.9
Urban 10348.38 10980.81 632.43 6.11
City of Matlosana
Natural (Untransformed) 236069.3 242677.4 6608.07 2.8
Cultivation 106414.3 96815.7 -9598.59 -9.02

66 | P a g e
1990 2013/2014 Change
Hectares Hectares Hectares %
Plantations/Woodlots 1092.51 958.95 -133.56 -12.23
Mines 3814.74 4867.83 1053.09 27.61
Erosion/Bare Soil 128.16 274.5 146.34 114.19
Urban 8366.22 10290.87 1924.65 23.01
Maquassi Hills
Natural (Untransformed) 241452.7 258708.5 17255.79 7.15
Cultivation 217539.8 197376.8 -20163 -9.27
Plantations/Woodlots 825.84 769.32 -56.52 -6.84
Mines 2801.16 4934.97 2133.81 76.18
Erosion/Bare Soil 121.95 306.36 184.41 151.22
Urban 1296.9 1942.38 645.48 49.77
Source: Geoterraimage. READ 2015

67 | P a g e
Map 23-17: Biodiversity vs. Agriculture
Source: Geoterraimage. READ 2015
Map 23-18: Biodiversity vs. Mining
Source: Geoterraimage, READ 2015

68 | P a g e
Map 23-19: Biodiversity vs. Settlements
Source: Geoterraimage, READ 2015
Map 23-20: Biodiversity Compilation with all conflicts
Source: Geoterraimage. READ 2015

69 | P a g e
Map 23-21: Settlement and Mining conflicts with Agriculture
Source: READ 2015
23.3.5 Natural Constraints
Natural constraints restricting development include the following:
River systems and wetland clusters.
Biodiversity factors.
Topographical constraints including morphological aspects, slopes and dolomitic areas.
See Map 23-22 Natural Constraints

70 | P a g e
Map 23-22 Natural Constraints
Source: North West Biodiversity Sector Plan, 2015.

71 | P a g e
23.4 Spatial Development Elements within North West
North West lies in the northern part of South Africa, north - east of the Northern Cape Province, west of
the Free State Province and Gauteng Province and south of Limpopo Province. It borders Botswana in
the east. The Geographical size of North West is 104 882 km2.
11
23.4.1 Regional and intra-regional accessibility and mobility
North West has excellent regional and intraregional accessibility supported by a system of regional and
national linkages, providing different levels of mobility within the province.
23.4.1.1 Road links
The roads of regional importance supporting the development of transportation development corridors
North West is linked to surrounding areas by a system of national and provincial roads. The national
and provincial roads systems within the North West provide the following regional links supporting the
development of transportation development corridors:
The N4 linking Tshwane with Walvis Bay harbour (Platinum Corridor). Development nodes
within along this route include Brits (Madibeng LM), Rustenburg, Swartruggens (Kgetlengriver
LM), Groot Marico and Zeerust (Ramotshere Moloa LM).
The N12 route between Johannesburg and Kimberley (Treasure Development Corridor)
including the development nodes of Potchefstroom (Tlokwe LM), Klerksdorp (Matlosana LM),
Wolmaranstad (Maquassi Hills LM) and Christiana (Lekwa Teemane LM).
The N14 route linking Gauteng with Kuruman (Northern Cape) including the development
nodes of Ventersdorp, Delareyville (Tswaing LM) and Vryburg (Naledi LM).
The N18 linking Gaborone (Botswana) with Mahikeng, Setlagole (Ratlou LM), Vryburg (Naledi
LM), Taung (Greater Taung) and Christiana and Kimberley (N17).
23.4.1.2 Railway Systems
The railway system provides the following main links:
Johannesburg - Potchefstroom - Klerksdorp - Christiana - Kimberley (Cape Town).
Johannesburg - Koster - Zeerust - Mahikeng - Setlagole - Vryburg - Taung - Kimberley (Cape
Town).
Johannesburg - Ventersdorp - Delareyville - Wolmaranstad - Taung - Kimberley.
Tshwane - Brits - Rustenburg - Ellisras.
Kimberley - Mahikeng - Lobatse - Gaborone - Francistown - Buluwayo - Lusaka - Dar es Alaam.
23.4.1.3 Airports
Two major airports are provided:
Pilanesberg International Airport (ACSA).
The Mahikeng Airport (North West Province Department of Transport and Roads).
Other smaller airfields include:
11
North West Provincial Legislature. www. nwpl.gov.za
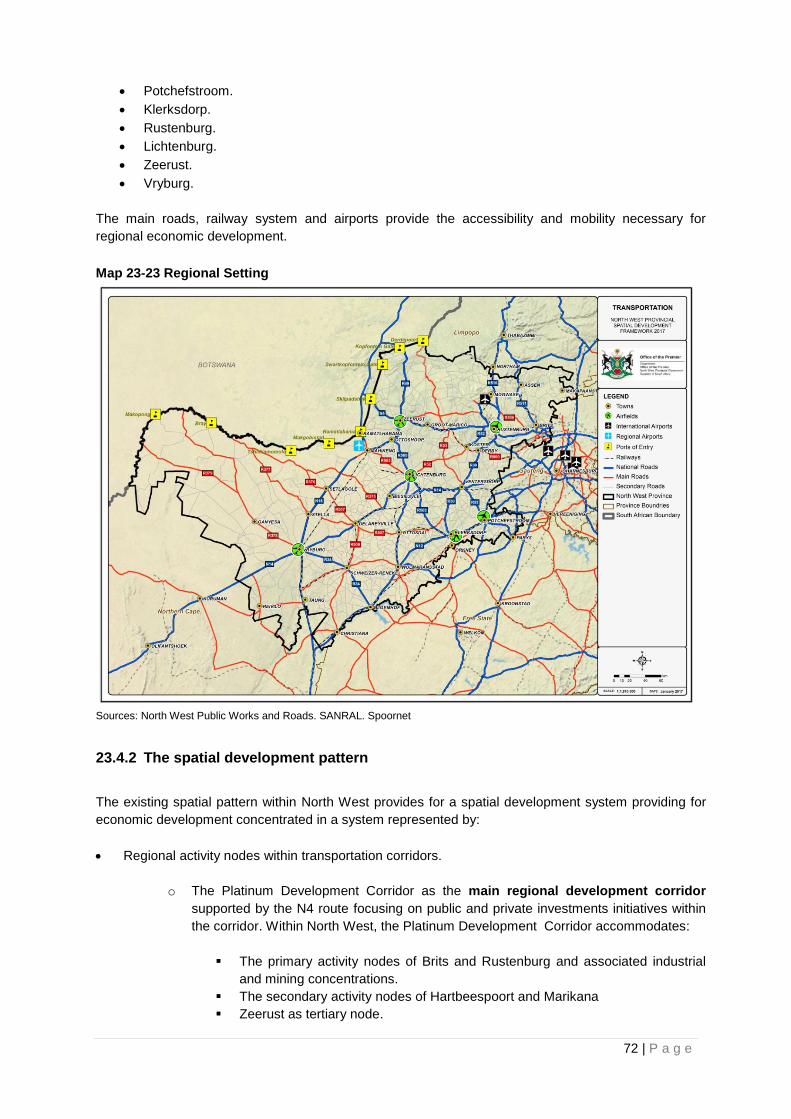
72 | P a g e
Potchefstroom.
Klerksdorp.
Rustenburg.
Lichtenburg.
Zeerust.
Vryburg.
The main roads, railway system and airports provide the accessibility and mobility necessary for
regional economic development.
Map 23-23 Regional Setting
Sources: North West Public Works and Roads. SANRAL. Spoornet
23.4.2 The spatial development pattern
The existing spatial pattern within North West provides for a spatial development system providing for
economic development concentrated in a system represented by:
Regional activity nodes within transportation corridors.
o The Platinum Development Corridor as the main regional development corridor
supported by the N4 route focusing on public and private investments initiatives within
the corridor. Within North West, the Platinum Development Corridor accommodates:
The primary activity nodes of Brits and Rustenburg and associated industrial
and mining concentrations.
The secondary activity nodes of Hartbeespoort and Marikana
Zeerust as tertiary node.

73 | P a g e
The tertiary activity nodes of Swartruggens, Lehurutse, Groot Marico and
Swartruggens.
o The N12 development corridor supporting the Johannesburg- Cape Town
transportation corridor with;
Potchefstroom and Klerksdorp as primary activity nodes.
Stilfontein and Wolmaranstad as secondary nodes.
Bloemhof and Christiana as tertiary nodes.
o The concentration of North West’s economic development and population into the main
subregional/regional development nodes of Madibeng, Rustenburg, Mahikeng and
Matlosana
Attracting subregional trade, industry and services providing for the existing
population and adjoining rural areas.
Providing economic growth, providing employment to the existing as well future
urban and rural hinterland population.
A system of smaller activity nodes interconnected with each other and the regional corridor and
activity nodes by a system of roads providing economic and social infrastructure for their respective
populations and economies.
The development of poor rural communities, remote from economic activity nodes which also form
part of rural communities with economic, social and engineering infrastructure to enable them to
participate in the local and regional economies.
A strong developed tourism sector as a result of the biodiversity provided by regional, national,
provincial and private protected and conservation areas.
Agriculture taking up the largest part of the province.
23.4.3 Clusters of population and economic concentrations
The distribution of population and economic activity indicate a definite pattern of categories of local
municipalities representing main concentrations, the rural communities, medium sized population
concentrations and small concentrations.
23.4.3.1 Main concentrations of economic activity and population (Regional Nodes)
The main concentrations of economic activity provide the regional activity centres, which provide
collectively the basis for the development of future development corridors and already accommodate a
strong urbanisation trend. Approximately 63% of the total economic activity of North West is
concentrated into the 4 local economies of Madibeng, Rustenburg, Mahikeng and Matlosana
Municipalities. These municipalities represent approximately 50% of the North West population and
58% of the North West labour force.
All the main concentrations experienced very low or declining economic growth rates. The population
growth rates within these concentrations are exceeding the population growth rates by far especially in
Madibeng (2.4%) and Rustenburg (3.1%).
Should slow economic growth rates prevail, it can be expected that it will assist in lower incomes and
GVA’s per capita and higher unemployment. High employment growth rates are however necessary to
ensure the eradication of poverty. The concentration of economic activities into the 4 municipalities
supported by the large accessible activity nodes of Madibeng, Rustenburg, Mahikeng and Matlosana

74 | P a g e
provides a strong basis for further urbanisation and nuclei for attracting and distributing economic
development.
Map 23-24 GVA Distribution (Municipal)
Source: Demacon. 2015

75 | P a g e
Map 23-25 Population Distribution (Municipal)
Source: Demacon. 2015
Map 23-26 Population Concentrations (Municipal)
Source: Statistics SA (Adapted)

76 | P a g e
23.4.3.2 Large Population concentrations
Large population concentrations are represented by Moretele, Moses Kotana, Disobotla, Ramotshere,
Greater Taung, Tlokwe, Ratlou, Tswaing and Kagisano. These economies make up 30.5% of the total
North West population and represent 28% of the total provincial economy and 29% of its labour force.
The rural community areas, representing poverty pockets with low levels of social, economic and
engineering infrastructure are spatially segregated from main economic activity nodes and people of
these areas have to travel long distances to employment and service nodes. These areas have little
economic development potential and have to rely on social grants and public capital spending.
23.4.3.3 The medium size population concentrations (population 100000-150000)
The medium sized population concentrations are represented by Ratlou, Tswaing and Kagisano-
Molopo. The population represents 9.7% of the North West population, the economy 2.9% and labour
force 14.5%. Tswaing has the highest population growth rate at 0.9% p.a.
All local economies are not growing or declining. Employment experienced limited or negative growth.
23.4.3.4 Small population concentrations (population 100000-150000)
Small population concentrations are represented by Kgetlengrivier, Naledi, Mamusa, Lekwe- Teemane,
Ventersdorp and Maquassi Hills. The population represents 10.0% of the North West population, the
economy 6.4% and labour force 8.8%. Kgetlengrivier (2.6% p.a) and Ventersdorp experiences the
highest population growth rates with Lekwa Teemane declining at -0.4% p.a. With the exception of
Ventersdorp (0.3% p.a.) and Maquassi Hills (1.2% p.a.) all the municipalities have declining economies.

77 | P a g e
Table 23-3: Population Concentrations. Socio economic and Economic Development Indicators
Tra
dit
ion
al R
ura
l C
om
mu
nit
ies
Po
pu
lati
on
(2016 e
st.
)
Po
pu
lati
on
% (
2015)
Lo
ng
Te
rm P
op
ula
tio
n G
row
th %
Siz
e o
f th
e e
co
no
my %
(2013)
Em
plo
ym
en
t R
ate
% (
2013)
Siz
e o
f L
ab
ou
r fo
rce %
(2013)
La
bo
ur
pa
rtic
ipa
tio
n
Rate
%
(2013)
GV
A p
er
cap
ita (
2013)
GV
A D
istr
ibu
tio
n (
2013)
GV
A A
nn
ua
l G
row
th
Avera
ge
An
nu
al in
co
me (
2015)
Aid
s (
%)
Madibeng X 531761 13.9 2.4 14.6 76 14.1 58.4 28 991.4 14.6 0.6 103 210 13.4
Rustenburg X 617126 16.1 3.1 26.9 81 21.0 69.0 46 275.2 26.9 -0.6 119 264 14.4
Mahikeng X 327320 8.6 1.3 9.2 75 9.1 50.1 29 665.3 9.2 1.8 107 979 11.5
Matlosana 426060 11.1 1.0 12.1 80 13.7 57.8 28 894.3 12.1 0.6 101 432 12.7
Main Population Concentrations 1902267 49.7 2.1 62.7 78.5 58.0 60.0 34692.75 62.7 0.4 108827.6 13.2
Moretele X 209803 5.5 0.7 3.9 78 4.7 41.6 20 014.9 4.0 3.4 50 275 12.2
Moses Kotane X 272553 7.1 0.6 7.9 71 7.5 52.7 31 130.1 8.0 2.9 69 296 13.4
Ditsobotla X 166087 4.3 1.1 4.8 67 6.3 52.6 27 002.7 4.8 3.9 89 689 14.4
Ramotshere Moiloa X 167966 4.4 1.2 2.1 70 2.7 34.2 13 204.7 2.1 1.8 63 871 11.5
Greater Taung X 197424 5.2 0.2 2.4 77 2.2 26.7 15 402.5 2.4 6.8 46 741 12.7
Tlokwe 154571 4.0 0.9 6.6 87 5.4 64.9 38 661.8 6.6 1.5 143 512 11.8
Large Pop. Concentrations 1168404 30.5 0.7 27.9 74.0 28.7 46.5 24309.52 27.9 5.5 74008.5 12.7
Ratlou X 118692 3.1 0.8 0.7 55 1.3 25.6 5 838.5 0.7 1.1 43 958 10.7

78 | P a g e
Tra
dit
ion
al R
ura
l C
om
mu
nit
ies
Po
pu
lati
on
(2016 e
st.
)
Po
pu
lati
on
% (
2015)
Lo
ng
Te
rm P
op
ula
tio
n G
row
th %
Siz
e o
f th
e e
co
no
my %
(2013)
Em
plo
ym
en
t R
ate
% (
2013)
Siz
e o
f L
ab
ou
r fo
rce %
(2013)
La
bo
ur
pa
rtic
ipa
tio
n
Rate
%
(2013)
GV
A p
er
cap
ita (
2013)
GV
A D
istr
ibu
tio
n (
2013)
GV
A A
nn
ua
l G
row
th
Avera
ge
An
nu
al in
co
me (
2015)
Aid
s (
%)
Tswaing X 136764 3.6 1.9 1.5 75 1.9 37.7 11 097.0 1.5 1.3 68 883 11.2
Kagisano X 117529 3.1 0.7 0.8 65 1.3 27.2 8 570.2 0.8 0.9 55 484 12.7
Medium Pop. Concentrations 372985 9.7 1.2 2.9 65.2 4.5 30.2 8627.43 2.9 1.1 56726.1 11.5
Kgetlengrivier 56680 1.5 2.6 1.1 70 1.3 57.4 19 801.7 1.1 -0.3 88 146 11.6
Naledi 75185 2.0 1.3 1.4 66 1.9 54.2 23 371.9 1.4 0.9 98 196 11.1
Mamusa 67265 1.8 2.1 0.7 80 1.0 41.6 12 949.7 0.7 0.1 65 539 11.3
Lekwa-Teemane 32809 0.9 -0.4 0.6 68 1.0 52.1 13 003.0 0.6 -2.4 70 113 10.9
Ventersdorp 63699 1.7 3.3 0.8 73 1.0 43.4 13 511.3 0.8 0.8 59 068 11.5
Maquassi Hills 86389 2.3 1.6 1.7 63 2.6 50.9 21 316.4 1.7 3.1 72 110 11.1
Small Pop. Concentrations 382027 10.0 1.8 6.4 67.9 8.8 50.2 18007.66 6.4 0.5 76131.6 11.3
Source: Demacon. 2015 (Adapted)

79 | P a g e
23.4.4 A system of interactive activity nodes
The existing distribution of development and activity nodes provides the basis for future development
options within North West. The activity nodes within the regional development nodes and main road
and transportation linkages are indicated in Map 3-27.
In order to develop a nodal hierarchy for the province three values were acknowledged according to
which the various settlement nodes were rated – GVA size, Formal Employment Size, Education Levels
and Population Size. According to these ratings we identified the level of significance and whether it
represents a growth or concentration point. These indicators were integrated to reflect its nodal order
size – Primary, secondary, tertiary or fourth order.
The spatial structure of the regional nodes of Rustenburg, Madibeng, Matlosana and Mahikeng and
large concentrations of Moretele, Moses Kotane, Ditsobotla, Ramotshere, Greater Taung and Tlokwe
have a major influence on the efficient functioning of nodal systems within the province. The structural
elements include the identified regional activity nodes, and existing and emerging corridors integrating
with regional development corridors.
Table 23-4: Nodal Hierarchy
Town Order Significance
Rustenburg Primary Regional
Klerksdorp Primary Regional
Potchefstroom Primary Sub-Regional
Mahikeng Primary Regional
Brits Primary Sub-Regional
Orkney Secondary Sub-Regional
Lichtenburg Secondary Sub-Regional
Stilfontein Secondary Local
Vryburg Secondary Regional
Schweizer-Reneke Secondary Sub-Regional
Hartbeespoort Secondary Sub-Regional
Marikana Secondary Local
Wolmaranstad Secondary Sub-Regional
Ventersdorp Secondary Sub-Regional
Taung Tertiary Local
Bloemhof Tertiary Local
Zeerust Tertiary Sub-Regional
Coligny Tertiary Local
Koster Tertiary Sub-Regional
Ganyesa Tertiary Local

80 | P a g e
Town Order Significance
Mooinooi Tertiary Local
Ottosdal Tertiary Sub-Regional
Christiana Tertiary Sub-Regional
Delareyville Tertiary Sub-Regional
Setlagole Fourth order Local
Reivilo Fourth order Local
Setlopo Fourth order Local
Leeudoringstad Fourth order Sub-Regional
Lehurutshe Fourth order Local
Lethabong / Haartebeesfontein Fourth order Local
Sannieshof Fourth order Local
Hartbeesfontein Fourth order Local
Jericho Fourth order Local
Makwassie Fourth order Local
Stella Fourth order Local
Swartruggens Fourth order Local
Groot Marico Fourth order Local
Mogwase Fourth order Local
Ramokoka Fourth order Local
Ottoshoop Fourth order Local
Amalia Fourth order Local
Derby Fourth order Local
Bray Fourth order Local
Source: Demacon 2015

81 | P a g e
Map 23-27 Nodal System
Source: Demacon 2015
23.4.5 Economic and Transportation Corridor Development
23.4.5.1 Regional Spatial Development initiatives
Regional Development Spatial Initiatives provide a myriad of development opportunities within North
West and its broader region.
A range of Regional and Provincial Spatial Development Initiatives affects North West directly providing
an integrated system of economic development corridors supporting regional, provincial and local social
and economic development. These include:
The Platinum Development Corridor (PDC) as part of the Coast 2 Coast Corridor (C2C) that
links Maputo with Walvis Bay, attracts public as well as private investment
The Treasure Route Corridor between Johannesburg, Potchefstroom, Klerksdorp and areas
further south along the N12 national road.
The Western Frontier Corridor which is part of a north-south SADC initiative through
Botswana southwards
The positive impact of these development initiatives on the development of the natural, social and
economic resources of the province is evident and is the result of co-coordinated medium and long term
interventions. The success of implementation of an initiative will however depend on the extent of
integration of the individual initiatives with other initiatives.

82 | P a g e
23.4.5.2 Routes, corridors and nodal development
Table 23-5: Transportation Corridors*
Route N4 N12 N18
N14
R53/R30/N4/R510 R503/N14/R53
Corridor Platinum Development Corridor
Treasure Route Corridor
Western Frontier Corridor
Eastern Development Belt
New Development Corridor
District Municipality LM LM LM LM LM LM
Bojanala District
Kgetlengrivier
Kgetlengrivier
Madibeng
Madibeng
Rustenburg
Rustenburg
Dr Kenneth Kaunda District
Maquassi Hills
Ventersdorp Matlosana Tlokwe
Matlosana
Tlokwe Ventersdorp
Tlokwe
Ventersdorp
Dr Ruth Segomotsi Mompati District
Lekwa-Teemane Greater Taung Greater Taung
Naledi Naledi
Ngaka Modiri Molema District Ramotshere Moiloa
Mahikeng Tswaing Ditsobotla
Ratlou Ditsobotla Mahikeng
Population (2016 est.) 1 373 533 699 829 718 621 473 073 1 849 897 1074038
Population % of Province 35.9 18.3 18.8 12.4 48.4 28.0
Population Growth 2.1 1.5 1.6 1.6 1.9 1.1
Size of Economy % of Province (2013)
44.7 21.2 13.3 5.5 62.8 32.7
GVA per Capita (2013) 34 416.9 29 119.7 19 555.8 12 794.2 34 710.4 30 242
GVA Annual Growth (2013) 2.6 2.0 2.5 2.1 2.4 2.3

83 | P a g e
Route N4 N12 N18
N14
R53/R30/N4/R510 R503/N14/R53
Corridor Platinum Development Corridor
Treasure Route Corridor
Western Frontier Corridor
Eastern Development Belt
New Development Corridor
District Municipality LM LM LM LM LM LM
Labour Force Size % of Province 39.1 22.7 14.5 7.0 56.5 32.5
Employment % 40.1 23.6 13.9 6.7 59.2 34.4
Source: Demacon 2015. (Adapted)
* Note: Statistics include sum totals for entire municipalities

84 | P a g e
23.4.5.2.1 The Platinum (N4) Development Corridor
The Platinum Development Corridor, as transportation corridor linking Gauteng, the economic heartland
of the South Africa with the Maputo harbor, is supported by the N4 and the Johannesburg- Mahikeng
railway line, which traverses through the Bojanala and Ngaka Modiri Molema Districts.
23.4.5.3 The Treasure (N12) Route Corridor
The Treasure (N12) Route Corridor serves the Kenneth Kaunda District linking the Maquassi Hills,
Matlosana, Tlokwe, and Lekwa-Teemane Local Municipalities. The Treasure Corridor is supported by
the Johannesburg – Cape Town railway line.
23.4.5.4 The Western (N18) Frontier Corridor
The Western development corridor intersects with the Platinum and Treasure development corridors at
Zeerust and west of Taung. The corridor also includes the local economies of Greater Taung, Naledi,
Mahikeng and Ratlou.
23.4.5.5 The N14 route
The N14 route provides the link between Gauteng and the Northern Cape and is supported by the
Johannesburg Vryburg railway line also joining up with the Johannesburg-Cape Town railway line in the
west.
23.4.5.6 The R503/N14/R53 route
The R503/N14/R53 route links Tlokwe with Mahikeng, via Ventersdorp and Lichtenburg.
23.4.5.7 The R510/R30 /R53 route (Eastern Development Belt)
The R510/R30/R53 route links Kgetlengrivier, Madibeng, Rustenburg, Matlosana, Tlokwe and
Ventersdorp. These municipalities are situated on the western fringe of the economic hub of Gauteng
and interact with the economy of Gauteng.
23.4.5.8 New National Corridor
The R503/N14/R53 route links Gaborone, Mahikeng, Lichtenburg, Klerksdorp, Potchefstroom, Parys and Sasolburg.

85 | P a g e
Map 23-28: Development Corridors and Zones
Source: NDP. SANRAL. North West PDP

86 | P a g e
23.4.6 Existing Nodal Hierarchy, Corridor Focus and Potential Development Nodes
The existing hierarchy of corridors and nodes as provided by the Spatial Development Frameworks of municipalities are summarised below.
Table 23-6: Current Nodal Hierarchy, Corridor Focus and Potential Development Nodes
Municipality First Order Nodes Second Order
Nodes Other Nodes Development Corridors
Potential Development
Nodes Sectoral Drivers
Bojanala
Kgetlengrivier None specified Koster Swartruggens
Derby
N4
Other important routes:
R52
R30
R509
R53
Ratsagai
Mazista
Magaliesberg Biosphere
Trade
Finance and business
Mining
Transport and
communication
Madibeng Brits Hartbeespoort
Jericho
N4
Other important routes:
R104
R556
R511
R512
R560
R3
R513
Hebron
Lethlabile
Mmakau
Ifafi
Schoemansville
Mothutlung
Peacanwood
Mining
Finance and business
Transport and
communication
Community, social and
other personal services
Trade
Manufacturing
Moretele None Specified None Specified None Specified
Mathibestad
Makapanstad
Selepe
Tladistad
Finance and business
General government
services
Community, social and
other personal services

87 | P a g e
Municipality First Order Nodes Second Order
Nodes Other Nodes Development Corridors
Potential Development
Nodes Sectoral Drivers
Moses Kotane None Specified None Specified Mogwase
Ramokoka
No development
corridor
Other important routes:
R510
R565
Mabeskraal
Ledig
Lerome
Moruleng
Saulspoort
Madikwe
Pella
Mokgalwaneng
Bodirelo Industrial area
Mining
Finance and business
Transport and
communication
Trade
Rustenburg Rustenburg Marikana Mooinooi
N4 Platinum Corridor
Other important routes:
R104
R24
R510
Rustenburg CBD
Boitekong
Phokeng
Robega Cluster
Luka Cluster
Tlaseng Cluster
Thekwane Cluster
Hartbeesfontein Cluster
Mining
Finance and business
Transport and
communication
Trade
Dr Kenneth Kaunda
City of Matlosana Klerksdorp Stilfontein
Orkney Hartbeesfontein
N12 Treasure Corridor
Other important routes:
R30
R503
R507
R502
Klerksdorp, Orkney and
Stilfontein including the
neighbourhoods of
Jouberton, Kanana,
Khuma, Alabama /
Manzilpark as well as
Vaal River Village will
develop into one
integrated urban node
Tigane
Vaal Reefs
Alabame / Manzil Park
Dominionville
Trade
Finance and business
services
Community, social and
other personal services
Mining
Manufacturing

88 | P a g e
Municipality First Order Nodes Second Order
Nodes Other Nodes Development Corridors
Potential Development
Nodes Sectoral Drivers
Maquassi Hills None Specified Wolmaransstad
Leeudoringstad
Makwassie
N12 Treasure Corridor
Other important routes:
R504
R502
R505
Witpoort
Trade
Finance and business
services
Mining
Community, social and
other personal services
General government
services
Tlokwe Potchefstroom None Specified None Specified
N12 Treasure Corridor
Other important routes:
R53
R501
R54
Klipdrift node
Lindequesdrift
Boskop Node
Matlwang Rural Village
Venterskroon
Finance and business
services
Community, social and
other personal services
General government
services
Agriculture
Ventersdorp None Specified
Ventersdorp
None specified
N14
Other important routes:
R53
R30
Welgevonden
Boikhutso
Goedgeveonden
Finance and business
services
Community, social and
other personal services
General government
services
Agriculture
Dr Ruth Segomotsi Mompati
Lekwa-Teemane None specified None Specified Christiana
Bloemhof
N12 Treasure Corridor
Other important routes:
R34
R506
Bloemhof CBD
Christiana CBD
Agriculture
Transport and
communication
Manufacturing
Community, social and
other personal services

89 | P a g e
Municipality First Order Nodes Second Order
Nodes Other Nodes Development Corridors
Potential Development
Nodes Sectoral Drivers
Greater Taung None Specified None Specified Taung
Reivilo
N18
N14
Other important routes:
R371
R372
R504
Rooiwal / Lethola /
Matolong / Batlhaping /
Randstad / Colong /
Makwating / Nhole /
Manokwane
Diplankeng / Dipitsing /
Magogong /
Lothwanyeng
Lower / Upper
Majeokgoro
Dryharts / Lehatlheng
Pudimo
Mokgareng / Lokgabeng
/ Ditompong
General government
services
Finance and business
services
Community, social and
other personal services
Electricity and water
Trade
Kagisano /
Molopo None Specified None Specified
Ganyesa
Bray
No development
corridors
Other important routes:
R378
R379
Ganyesa and
Morokweng
Piet Plessis
Trade
Transport and
communication
Finance and business
services
Community, social and
other personal services
General government
services
Manufacturing
Mamusa None Specified Schweizer
Reneke Amalia
No development
corridors
Other important routes:
R34
R506
R504
Mamusa
Molatswaeneng
Glaudina
Migdol
Finance and business
services
Community, social and
other personal services
Agriculture
Trade
General government
services

90 | P a g e
Municipality First Order Nodes Second Order
Nodes Other Nodes Development Corridors
Potential Development
Nodes Sectoral Drivers
Naledi None Specified Vryburg Stella
N14
N18
Other important routes:
R34
R376
Vryburg Regional
Development Hub
Vryburg CBD
Community, social and
other personal services
General government
services
Transport and
communication
Finance and business
services
Construction
Ngaka Modiri Molema
Ditsobotla None Specified Lichtenburg Coligny
N14
Other important routes:
R505
R503
R52
Itsoseng-Bodibe
Bakerville
Grootpan
Bodenstein
Gerdau
Sprinbokpan
Trade
Finance and business
services
Agriculture
Community, social and
other personal services
Manufacturing
General government
services
Mahikeng Mahikeng None Specified Setlopo
Ottoshoop
N18
Other important routes:
R503
R49
R505
Mahikeng CBD
Trade
Finance and business
services
Agriculture
General government
services
Construction
Manufacturing

91 | P a g e
Municipality First Order Nodes Second Order
Nodes Other Nodes Development Corridors
Potential Development
Nodes Sectoral Drivers
Ratlou None specified None Specified Setlagole
N18
Other important routes:
R375
R376
R507
Disaneng / Mokgobistad
Setlagole / Madibogo
Setlagole Commercial
Hub
Madibogo Gateway
Node
Kraaipan Cultural Node
Mareetsane Gateway
Node
Trade
Community, social and
other personal services
General government
services
Agriculture, forestry and
fishing
Construction
Mining
Ramotshere-
Moiloa None Specified None Specified
Zeerust
Lehurutse
Groot Marico
N4 Platinum Corridor
Other important routes:
R49
Clusters in close
proximity to the Platinum
Highway and the
Gaborone road such as:
Zeerust-Ikageleng
Lekubu / Braklaagte
Mokopa
Nietverdiendt
Doornlaagte
Trade
Finance and business
services
Manufacturing
Electricity and water
Community, social and
other personal services
Mining
Tswaing None Specified None Specified Delareyville
Sannieshof
N14
Other important routes:
R505
R507
R506
R377
R375
Khunwana
Ottosdal
Middelton
Community, social and
other personal services
Transport and
communication
Trade
Finance and business
services
General government
services
Source: Demacon 2015

92 | P a g e
23.4.6.1 District Related Competitive Edge
The following diagram indicates the factor inputs – levers that will be influenced through development.
Diagram 23-1: Building Blocks for Sustainable Economic Development
Source: Demacon 2016
The main building blocks for sustainable economic development are:
Land
o Availability of resources (renewable and non renewable within the framework of sound
environmental management).
o Bulk service capacity.
o Availability of land for spatial expansion.
o Stability of utilities.
o Stable business environment.
o Security of tenure.
o Security of real estate values.
o Spatial expansion capacity.
Labour / demographics
o Labour supply and demand.
o Availability of skills.
o Physical mental aptitudes.
o Labour absorption rate.
o Population growth.
o Downstream demand.
o Social / cultural tolerance.

93 | P a g e
Capital
o Capital formation.
o Investment leveraging.
o Attractive risk and return profile.
o Capital growth, income stream growth.
o Business formation.
o Expansion capacity.
Entrepreneurship
o Global competitiveness.
o Research & Development capacity.
o Energy.
o Job creation.
o Work ethic: focus on production – not industrial action.
o Profitable environment, minimal red tape.
o Human, intellectual & social capital formation.
In order to provide a sustainable economic long term plan the competitive advantage of the area has
to be determined. This is done through analyses of the basic and non-basic sectors.
The following tables provide a summary of the nodes, corridors, focus areas and competitive edge of
the district municipalities.
Table 23-7: Bojanala District
Number of First Order Nodes Two (Rustenburg, Brits)
Number of Second Order Nodes Two (Marikana, Hartbeespoort)
Major Development Corridors N4 Platinum Corridor
Mining Focus Area
Rustenburg
Marikana
Madibeng
Primary Industrial Cluster Rustenburg
Madibeng
Agricultural Cluster
Koster
Swartruggens
Derby
Key Tourism Nodes / Clusters /
Attractions
Bojanala-Rustenburg region is covered in natural bushveld
vegetation. With the added attraction of the Magaliesberg, this region
has much to offer to the eco-tourist. It is a natural game area with a
number of fine game parks.
There is a large variety of historical and cultural interests to be found
in the area, such as the German community of Kroondal that dates
back to 1857, the indigenous Bafokeng, Bakgatla and Botswana
tribes with their totemic and other tribal traditions.
Bojanala-Eastern Region is situated close to Gauteng, and is the
most scenic region of the province. If you like adventure, this is your
kind of region. Water activities, mountain sports, hang-gliding,
parasailing, abseiling, hiking trails, angling, yachting, ballooning,
cable way and leisure.
This region is host to the internationally-renowned Lost City Sun City
complex with two designer golf courses, 6000-seat Superbowl, the
largest casino and gaming complex in the country and its situation in
the extinct Pilanesberg volcano formed more than 1300 million years

94 | P a g e
ago. It is adjacent to the Pilanesberg Game Reserve which is home
to thousands of animals including the Big Five – lion, leopard, rhino,
buffalo and elephant.
Here rests the Cradle of Humankind, set around the Rustenburg,
Magaliesberg and Hartbeespoort regions. The area abounds with
relics from the Stone Age and early middle and late Iron Age. There
are a large number of arts, crafts and curio outlets, especially in the
Hartbeespoort Dam and Rustenburg areas. Many form part of the
Crocodile, Rustenburg and Magliesburg Arts and Crafts Rambles –
ever popular with visitors.
The northwest of the region borders on the Madikwe Game Reserve,
a haven to visitors who want to live the African experience:
Sun City
Hartbeespoort Dam
Hartbeespoort Aerial Cableway
De Wildt Cheetah and Wildlife Centre
Bush Babies Monkey Sanctuary
Magaliesberg Biosphere Reserve
Cradle of Humankind World Heritage Site
Kgaswane Game Reserve
Madikwe Game Reserve
Pilanesberg Game Reserve
Competitive Edge
The Eastern Limb of the Bushveld Complex is situated
within Bojanala District Municipality
Bojanala-Rustenburg region is covered in natural bushveld
vegetation. With the added attraction of the Magaliesberg,
this region has much to offer to the eco-tourist. It is a natural
game area with a number of fine game parks.
As a result of the linkage with Gauteng the majority of the
provincial manufacturing activity (51%) takes place in the
eastern part of the province, in the Bojanala Platinum DM.
Land
o Availability of resources
o Bulk service capacity
o Availability of land for spatial expansion
o Stability of utilities
o Spatial expansion capacity
Labour / demographics
o Labour supply & demand
o Availability of skills
o Physical mental aptitudes
o Labour absorption rate
o Downstream demand
Capital
o Capital formation
o Investment leveraging
o Attractive risk and return profile
o Capital growth, income stream growth
o Business formation
o Expansion capacity
Source: Demacon, 2016

95 | P a g e
Figure 23-1: Bojanala District
Source: Demacon, 2015
Table 23-8: Dr Kenneth Kaunda District
Number of First Order Nodes Two- City bof Matlosana and Tlokwe
Number of Second Order Nodes
Four
Stilfontein
Orkney
Wolmaransstad
Ventersdorp
Major Development Corridors N12 and N14 Treasure Corridor
Mining Focus Area
Largest parts of:
Tlokwe LM
Matlosana LM
Maquassi Hills LM
Ventersdorp LM
Primary Industrial Cluster
KOSH area – Klerksdorp, Orkney, Stilfontein,
Hartbeesfontein
KOSH area
Wolmaranstad
N12 Corridor
Agriculture
Largest parts of:
Tlokwe LM
Matlosana LM
Maquassi Hills LM
Ventersdorp LM
Key Tourism Nodes / Clusters /
Attractions
An outdoor adventurer’s paradise, offering hiking trails, mountain
biking trails, canoeing, white water rafting, mountain climbing,
abseiling.
Lodges along the Vaal River afford some of the best angling and
Wholesale & retail trade; catering and
accommodation
General government services
Agriculture, forestry and fishing
Mining
Manufacturing
Electricity & water
Construction
Transport & communication
Finance and business services
Community, social and other personal services
-80.0%
-75.0%
-70.0%
-65.0%
-60.0%
-55.0%
-50.0%
-45.0%
-40.0%
-35.0%
-30.0%
-25.0%
-20.0%
-15.0%
-10.0%
-5.0%
0.0%
5.0%
10.0%
15.0%
20.0%
25.0%
30.0%
35.0%
-50
.0%
-45
.0%
-40
.0%
-35
.0%
-30
.0%
-25
.0%
-20
.0%
-15
.0%
-10
.0%
-5.0
%
0.0
%
5.0
%
10
.0%
15
.0%
20
.0%
25
.0%
30
.0%
35
.0%
40
.0%
45
.0%
50
.0%
55
.0%
60
.0%
65
.0%
70
.0%
75
.0%
80
.0%
Loca
l Se
cto
r R
ela
tive
Gro
wth
(%
)
National Sectoral Growth (%)

96 | P a g e
flyfishing opportunities in South Africa.
Boskop Dam Reserve
Vredefort Dome
Klerksdorp Mine Tours
Sunwa Water Experiences
The Vaal River
Wolwespruit Nature Reserve
Bona Bona Game Farm
Agriculture The district municipality consists of suitable agricultural land
(defined as the best available land for agriculture)
Competitive Edge
Land
o Availability of resources
o Bulk service capacity
o Availability of land for spatial expansion
o Stability of utilities
o Stable business environment
o Security of tenure
o Spatial expansion capacity
Labour / demographics
o Labour supply & demand
o Availability of skills
o Physical mental aptitudes
o Labour absorption rate
Capital
o Capital formation
o Investment leveraging
o Attractive risk and return profile
o Capital growth, income stream growth
o Business formation
o Expansion capacity
Entrepreneurship
o Global competitiveness
o Research & Development capacity
o Energy
o Job creation
o Work ethic: focus on production – not industrial
action
o Profitable environment, minimal red tape
o Human, intellectual & social capital formation
Source: Demacon, 2015

97 | P a g e
Figure 23-2: Dr Kenneth Kaunda District
Source: Demacon, 2015
Wholesale & retail trade; catering and
accommodation
General government services
Agriculture, forestry and fishing
Mining
Manufacturing
Electricity & water
Construction Transport & communication
Finance and business services
Community, social and other personal services
-65.0% -60.0% -55.0% -50.0% -45.0% -40.0% -35.0% -30.0% -25.0% -20.0% -15.0% -10.0%
-5.0% 0.0% 5.0%
10.0% 15.0% 20.0% 25.0% 30.0% 35.0% 40.0% 45.0% 50.0% 55.0% 60.0% 65.0% 70.0% 75.0% 80.0% 85.0% 90.0% 95.0%
100.0% 105.0% 110.0% 115.0% 120.0% 125.0%
-55
.0%
-50
.0%
-45
.0%
-40
.0%
-35
.0%
-30
.0%
-25
.0%
-20
.0%
-15
.0%
-10
.0%
-5.0
%
0.0
%
5.0
%
10
.0%
15
.0%
20
.0%
25
.0%
30
.0%
35
.0%
40
.0%
45
.0%
50
.0%
55
.0%
60
.0%
65
.0%
70
.0%
75
.0%
Loca
l Se
cto
r R
ela
tive
Gro
wth
(%
)
National Sectoral Growth (%)

98 | P a g e
Table 23-9: Dr Ruth Segomotsi Mompati District
Number of First Order Nodes None
Number of Second Order Nodes Two (Schweizer-Reneke, Vryburg)
Major Development Corridors
N18
N14
N12
Mining Focus Area
The district is mainly rural with agricultural activities
throughout the municipality.
Vryburg is known as the Texas of South Africa due to its
cattle farming.
Primary Industrial Cluster Mining is limited
Agricultural Cluster Industrial activities are limited.
A small amount of industries can be found in Vryburg.
Key Tourism Nodes / Clusters /
Attractions
The larger part of the region is still commonly known as Stellaland.
Taung is the site of the discovery of the Taung skull, one of the
world’s most important archaelogical discoveries. The region is also
affectionately known as “The Texas of South Africa” given its strong
mining and agricultural economy.
The region is situated 1,200m above sea level and has an annual
average rainfall of 430mm. The climate is dry and healthy, particularly
in winter when days are sunny and bracing. Summers are hot with
temperatures ranging from 16 – 38 degrees C.
The vast expanses of this African savannah bushland is home to a
great variety of game species, including lion, buffalos and rhino to be
encountered at number of privately owned game reserves.
Taung Heritage Route
Bloemhof Dam Nature Reserve
Molopo Game Reserve
SA Lombard Nature Reserve
Leon Taljaard
Competitive Edge
Land
o Availability of resources
o Availability of land for spatial expansion
o Security of tenure
o Spatial expansion capacity
Labour / demographics
o Labour supply & demand
o Downstream demand
o Social / cultural tolerance
Source: Demacon, 2015

99 | P a g e
Figure 23-3: Dr Ruth Segomotsi Mompati District
Source: Demacon, 2015
Wholesale & retail trade; catering and
accommodation
General government services
Agriculture, forestry and fishing
Mining
Manufacturing
Electricity & water
Construction
Transport & communication
Finance and business services
Community, social and other personal services
-88.0%
-83.0%
-78.0%
-73.0%
-68.0%
-63.0%
-58.0%
-53.0%
-48.0%
-43.0%
-38.0%
-33.0%
-28.0%
-23.0%
-18.0%
-13.0%
-8.0%
-3.0%
2.0%
7.0%
12.0%
17.0%
22.0%
27.0%
32.0%
37.0%
42.0%
47.0%
52.0%
57.0%
-60
.0%
-55
.0%
-50
.0%
-45
.0%
-40
.0%
-35
.0%
-30
.0%
-25
.0%
-20
.0%
-15
.0%
-10
.0%
-5.0
%
0.0
%
5.0
%
10
.0%
15
.0%
20
.0%
25
.0%
30
.0%
35
.0%
40
.0%
45
.0%
50
.0%
55
.0%
60
.0%
65
.0%
70
.0%
75
.0%
Loca
l Se
cto
r R
ela
tive
Gro
wth
(%
)
National Sectoral Growth (%)

100 | P a g e
Table 23-10: Ngaka Modiri Molema District
Number of First Order Nodes One (Mahikeng)
Number of Second Order Nodes Two (Mmabatho, Lichtenburg)
Major Development Corridors
N18
N4
N14
Mining Focus Area Largest part of Ditsobotla and Ramotshere Moiloa Local
Municipalities
Primary Industrial Cluster Mining is limited
Agricultural Cluster Lichtenburg
Mahikeng
Key Tourism Nodes / Clusters /
Attractions
The area is fairly flat and dry in the west, becoming bushveld towards
the east. The Central Region offers game viewing – including the Big
5 – bird watching, hunting, fishing, sport, hospitality, conference
facilities, shopping, gaming, Anglo-Boer War sites and a number of
excellent guest houses and guest farms.
Madikwe Game Reserve
Anglo Boer War Sites
Molemane Eye
Barberspan Bird Sanctuary
Botsalano Game Reserve
Disaneng Dam
Henk Joubert Game Reserve
Kortkloof Cultural Village
Leopard Park Golf Course
Mahikeng Game Reserve
NWU Mahikeng Campus
Proposed Marico Biosphere Reserve
Competitive Edge
Land
o Availability of resources
o Availability of land for spatial expansion
o Spatial expansion capacity
Labour / demographics
o Labour supply & demand
o Availability of skills
o Labour absorption rate
o Downstream demand
Capital
o Capital formation
o Investment leveraging
o Attractive risk and return profile
o Capital growth, income stream growth
o Business formation
o Expansion capacity
Entrepreneurship
o Global competitiveness
o Research & Development capacity
o Job creation
o Human, intellectual & social capital formation
Source: Demacon, 2015

101 | P a g e
Figure 23-4: Ngaka Modiri Molema District
Source: Demacon, 2015
Wholesale & retail trade; catering and
accommodation
General government services
Agriculture, forestry and fishing
Mining
Manufacturing
Electricity & water
Construction
Transport & communication
Finance and business services
Community, social and other personal services
-65.0%
-60.0%
-55.0%
-50.0%
-45.0%
-40.0%
-35.0%
-30.0%
-25.0%
-20.0%
-15.0%
-10.0%
-5.0%
0.0%
5.0%
10.0%
15.0%
20.0%
25.0%
30.0%
35.0%
40.0%
45.0%
50.0%
55.0%
60.0%
65.0%
70.0%
-60
.0%
-55
.0%
-50
.0%
-45
.0%
-40
.0%
-35
.0%
-30
.0%
-25
.0%
-20
.0%
-15
.0%
-10
.0%
-5.0
%
0.0
%
5.0
%
10
.0%
15
.0%
20
.0%
25
.0%
30
.0%
35
.0%
40
.0%
45
.0%
50
.0%
55
.0%
60
.0%
65
.0%
70
.0%
75
.0%
80
.0%
Loca
l Se
cto
r R
ela
tive
Gro
wth
(%
)
National Sectoral Growth (%)

102 | P a g e
23.4.7 Economic Infrastructure
The National Infrastructure Plan prepared by the Presidential Infrastructure Co-ordinating Commission
(PICC) is intended to transform the economic landscape of South Africa, create significant numbers of new
jobs, strengthen the delivery of basic services to the people of South Africa and support the integration of
African economies. It sets out the challenges and enablers South Africa needs to respond to in the building
and developing of infrastructure.
23.4.7.1 Strategic Integrated Projects (SIPS)
Eighteen Strategic Integrated Projects (SIPs) have been developed and approved to support economic
development and address service delivery in the poorest provinces. Each SIP comprise of a large number of
specific infrastructure components and programmes. The following SIP’s will have a direct impact on
economic development within North West:
SIP 4: Unlocking economic opportunities in the North West.
SIP 6: Integrated Municipal Infrastructure Project.
SIP 7: Integrated urban space and public transport programme.
SIP 8: Green energy in support of the South African economy.
SIP 9: Electricity generation to support socio-economic development.
SIP 10: Electricity transmission and distribution for all.
SIP 11: Agri-logistics and rural infrastructure.
SIP 12: Revitalisation of public hospitals and other health facilities.
SIP 13: National school build programme.
SIP 14: Higher education Infrastructure.
SIP 15: Expanding access to communication technology.
SIP 17: Regional integration for African cooperation and development.
SIP 18: Water and sanitation infrastructure.
SIP 4: Unlocking Economic Opportunities in the North West
Acceleration of investments in road, rail, bulk water, water treatment and transmission
infrastructure.
Enabling reliable supply and basic service delivery.
Facilitate development of mining, agricultural activities and tourism opportunities.
Open up beneficiation opportunities in North West province.
SIP 6: Integrated municipal infrastructure project
Develop national capacity to assist the 23 districts with the fewest resources (19 million people) to
address all the maintenance backlogs and upgrades required in water, electricity and sanitation bulk
infrastructure.
The road maintenance programme will enhance service delivery capacity thereby impacting
positively on the population.
SIP 7: Integrated urban space and public transport programme
Coordinate planning and implementation of public transport, human settlement, economic and
social infrastructure and location decisions into sustainable urban settlements connected by
densified transport corridors. This will focus on the 12 largest urban centres of the country, including
all the metros in South Africa. Significant work is underway on urban transport integration.

103 | P a g e
SIP 8: Green Energy in support of the South African economy
Support sustainable green energy initiatives on a national scale through a diverse range of clean
energy options as envisaged in the Integrated Resource Plan (IRP2010).
Support bio-fuel production facilities
SIP 9: Electricity generation to support socio-economic development
Accelerate the construction of new electricity generation capacity in accordance with the IRP2010 to
meet the needs of the economy and address historical imbalances.
Monitor implementation of major projects such as new power stations: Medupi, Kusile and Ingula.
SIP 10: Electricity transmission and distribution for all
Expand the transmission and distribution network to address historical imbalances, provide access
to electricity for all and support economic development.
Align the 10-year transmission plan, the services backlog, the national broadband roll-out and the
freight rail line development to leverage off regulatory approvals, supply chain and project
development capacity.
SIP 11: Agri-logistics and rural infrastructure
Improve investment in agricultural and rural infrastructure that supports expansion of production and
employment, small-scale farming and rural development, including:
Facilities for storage (silos, fresh-produce facilities, packing houses)
Transport links to main networks (rural roads, branch train-line, ports)
Fencing of farms
Irrigation schemes to poor areas
Improved R&D on rural issues (including expansion of agricultural colleges)
Processing facilities (abattoirs, dairy infrastructure)
Aquaculture incubation schemes
Rural tourism infrastructure.
SIP 12: Revitalisation of public hospitals and other health facilities
Build and refurbish hospitals, other public health facilities and revamp 122 nursing colleges. The
SIP contains major builds for six hospitals.
Extensive capital expenditure to prepare the public healthcare system to meet the requirements of
the National Health Insurance (NHI) system.
SIP 13: National school build programme
A national school build programme driven by uniformity in planning, procurement, contract
management and provision of basic services.
Replace inappropriate school structures and address basic service backlog and provision of basic
services under the Accelerated School Infrastructure Delivery Initiative (ASIDI).
Address national backlogs in classrooms, libraries, computer labs and admin buildings.
The Accelerated Schools Infrastructure Delivery Initiative (ASIDI) is funded from the Schools
Infrastructure Backlog Grant (SIBG). Updates on the programme are available as:
o School by school updates.
o The asidi brief newsletter.
104 | P a g e
SIP 14: Higher education infrastructure
Infrastructure development for higher education, focusing on lecture rooms, student
accommodation, libraries and laboratories, as well as ICT connectivity.
Development of university towns with a combination of facilities from residence, retail to recreation
and transport.
Potential to ensure shared infrastructure such as libraries by universities, FETs and other
educational institutions.
Two new universities will be built - in Northern Cape and Mpumalanga.
SIP 15: Expanding access to communication technology
Provide for broadband coverage to all households by 2020 by:
o Establishing core Points of Presence (POPs) in district municipalities.
o Extend new Infraco fibre networks across provinces linking districts.
o Establish POPs and fibre connectivity at local level.
Penetrate the network into deep rural areas.
While the private sector will invest in ICT infrastructure for urban and corporate networks,
government will co-invest for township and rural access, as well as for e-government, school and
health connectivity.
The school roll-out focus is initially on the 125 Dinaledi (science and maths-focussed) schools and 1
525 district schools.
Part of digital access to all South Africans includes TV migration nationally from analogue to digital
broadcasting.
SIP 17: Regional integration for African cooperation and development
Participate in mutually beneficial infrastructure projects to unlock long-term socio-economic benefits
by partnering with fast-growing African economies with projected growth ranging between 3% and
10%.
The projects involving transport, water and energy also provide competitively-priced, diversified,
short and medium to long-term options for the South African economy. For example, electricity
transmission in Mozambique (CESUL) could assist in providing cheap, clean power in the short-
term whilst Grand Inga in the Democratic Republic of Congo (DRC) is long-term.
All these projects complement the Free Trade Area (FTA) discussions to create a market of 600
million people in South, Central and East Africa.
SIP 18: Water and sanitation infrastructure
A 10-year plan to address the estimated backlog of adequate water to supply 1.4 million households
and 2.1 million households to basic sanitation. The project will involve provision of sustainable
supply of water to meet social needs and support economic growth.
Projects will provide for new infrastructure, rehabilitation and upgrading of existing infrastructure, as
well as improve management of water infrastructure.
23.4.7.2 Economic Infrastructure Projects
The main infrastructure projects envisaged for North West Province include Mahikeng Airport and
Logistics Hub, and the Cradle of Humankind World Heritage Site Buffer Zone (although the core area
of the Cradle of Humankind is not situated in North West, it can have a profound impact on the development
of the North West).
As part of the Provincial Growth and Development Strategy, the North West has identified for itself a
development (including industrial development) and economic growth niche in the transport and trade
facilitation sectors. This is occasioned by the strategic and central location of North West Province in the

105 | P a g e
Republic of South Africa (in the middle of the Coast-to-Coast Spatial Development Initiative between
Maputo (in the East) and Walvis Bay (in the West)) and in the Southern African Development Community
(SADC) region. However, such development and economic growth initiatives can only be satisfactorily
manifested where activities of an international nature are possible. One such example is the proposed
Industrial Development Zone, for which access to an international port of entry for import and export
activities is an absolute requirement. Mahikeng airport as an international port of entry is an anchor for the
success of the Industrial Development Zone. We intend to unveil the strategy that will make this noble
intention as success.
The Cradle of Humankind World Heritage Site Buffer Zone is a new initiative from the Gauteng
Department of Agriculture, Conservation and Environment (GDACE) “intended to create a layer of additional
environmental and land use protection to cushion the WHS against developments and activities”. The
proposed new buffer zone around the Cradle covers almost the entire Mogale City save for the existing
built-up areas, the area to the east of the R28 and some outlying areas in the western part of Mogale City.
Currently, GDACE is still in the process of finalising the Environmental Management Framework for the
Cradle of Humankind World Heritage Site and the buffer zone, with the result that there is currently no clarity
on the type and intensity of land uses proposed for the buffer zone.
23.4.7.3 Information, Communication and Technology (ICT)
Government’s adoption of the National Development Plan (NDP) as a roadmap continues to be the point of
departure for all state departments, to deliver the key national strategic priorities of poverty eradication,
improved economic growth and social development. ICT is central to making these endeavours a reality for
citizens, through enabling service delivery and contributing to modernising the state.
The development of the Information and Communications Technologies (ICTs) facilitates and promotes
growth in the economy and the country. Expansion of ICT networks not only plays a role in the development
of industries but can also directly contribute to the development of SMME’s which has the potential to
directly contribute to poverty reduction. ICT development has the following advantages in that they:
Provide reliable access to markets (local, regional and international) through increased use of
affordable communications (phone, fax, email).
Improve contact with suppliers, and transport links to and from markets through databases of
enterprises, products, and suppliers.
Inform choices, particularly regarding prices of raw materials and finished goods, enabling better
prices for enterprises when dealing with traders.
Provide information about locally and internationally available non-financial business development
services (e.g., training schemes, business skills, and marketing).
Provide direct or intermediated access to business development services (e.g., training packages,
advice on better practice).
Provide access to legal information, including information on contract law, tax, law, registration and
regulation.
Provide improved access to information about financial services, and access to financial services
(e.g., via micro-finance institutions).
In the 2015 State of the Nation address, President Jacob Zuma announced that eight municipalities were
set to have full broadband capability within five years. These are Dr Kenneth Kaunda in North West, Gert
Sibande in Mpumalanga, OR Tambo in the Eastern Cape, Pixley ka Seme in the Northern Cape, Thabo
Mofutsanyane in the Free State, Umgungundlovu and Umzinyathi in KwaZulu-Natal, and Vhembe in
Limpopo. In addition to these eight, the cities of Cape Town, Johannesburg, Tshwane and Ethewkini have
programmes and plans in place.
106 | P a g e
23.4.7.4 Tourism Development
Tourism is a priority economic sector in the government’s Medium-Term Strategic Framework (MTSF),
which identifies the following overall priorities:
Creating decent work and sustainable livelihoods.
Education.
Health.
Rural development, food security and land reform.
The fight against crime and corruption, and building cohesive and sustainable communities.
Tourism is one of the six core pillars of growth as identified in the New Growth Plan. Tourism is one of the
areas expected to contribute to the development of, among others, rural areas and culture (craft) by growing
the economy and creating jobs.
There is an inverse or negative correlation (hence inherent incompatibility) between leisure tourism
establishments and mining activity. Whilst a mine has a LOM (Life of Mine), the contribution by the tourism
activities potentially continues in infinity. In view of the superior sustainability profile of tourism, compared
with that of a mine, it is evident that the accrued long term benefits of tourism, by far exceeds and outweighs
the benefits of a mine which will span only 20 to 50 years – a mine that will also irreversibly scar a most
iconic feature of the natural landscape, thereby permanently diminishing the regional tourism potential and
eroding future growth potential in this ‘sector’ (based on its natural, historic growth trajectory). Tourism offers
appreciable long term net gains over mining. Similarly, the sustained employment potential of tourism is
superior (in numbers and sustainability) compared to those potentially created by mining.
The Pilanesberg is the setting for what was at the time arguably one of the most icon, man-made tourist
attractions globally – the Sun City complex. The Pilanesberg National Park measures 57 200 hectare and
gained national park status in 1979. The total annual number of visitors numbers 926 046.
The Pilanesberg is situated on western limb of the Bushveld Igneous Complex, which has seen increasing
friction between mining and leisure tourism as a consequence of encroaching mining activity on
Pilanesberg.
Allegations have been made that mining in the area has intensified water shortages as the Pilanesberg
Platinum mine is alleged to divert the flow of rivers and disposing of waste water in a manner that may be
detrimental to regional water resources. The mines are, however, not only accused of exploiting water
resources and threatening future conservation efforts to secure and extend natural heritage sites – leisure
tourist numbers have been reported to dwindle in recent years.
Regardless of accusations and allegations which are inevitably emotionally charged, tourist patronage
numbers indicate that the Pilanesberg natural wonder has been systematically compromised by increasing
mining activity in the surrounding region. Tourism numbers at the park have decreased over the past 10
years due to the encroachment of mines on the National Park. According to the Pilanesberg Statistics
department, visitor numbers have decreased by approximately 4.7% over the past 10 years.
Save for proportionally larger visitor numbers from China over the years, Sun City – which is more directly
exposed to the encroaching mining activity from the south – appears to be suffering the same fate. Informal
observations indicate that the Palace at Sun City (opened in December 1992), appears long overdue for a
major refurbishment - a delayed refurbishment that is informed by inter alia financial considerations, of
which the risks associated with encroaching mining activity would be a consideration.
Albeit that mining activity potentially stimulates the demand for business tourism establishments in the
immediate vicinity (typically in nearby towns, close to social amenities, retail facilities, etc), such demand
appears to be marginal, compared with the sustained demand from leisure tourism, provided an area holds
such potential. Dwindling leisure tourist numbers at the Pilanesberg National Park over the past decade, in

107 | P a g e
the face of encroaching platinum mining activity, affirm this natural averseness between leisure tourism and
mining.
23.4.7.4.1 Bojanala Platinum District Municipality
The main tourism attractions the region has to offer, are closely linked to the comparative advantages the
area has to offer with regard to its natural assets, the occurrence of many heritage sites relating to iron /
stone age, Anglo-Boer history and indigenous tribes such as the Tswana and Ndebele, and the variety of
minerals and mining activities found in the area. Tourism attractions include:
Implementation of Heritage Park (including development at Molatedi Dam).
Further development of tourism facilities around Sun City node.
Development of tourism facilities at Borakolalo Reserve (Klipvoordam).
Upgrading of Papatso cultural village and establishment of incubator for arts, crafts and cultural
industries.
Heritage Park Tourism company.
Improved road access to Hartbeespoortdam tourism node.
Soccer World Cup precinct development.
Traditional Art Gallery and cultural information centre (Rustenburg).
Bospoortdam Tourism/Waterfront development (Rustenburg).
In response to the importance of the Bojanala Platinum District as far as biodiversity is concerned, the North
West Parks and Tourism board is also considering the extension of a number of existing nature reserves
and conservation areas. The most notable of these include the existing Heritage Park development which is
envisaged to link the Madikwe Game Reserve in the west with the Pilanesberg National Park in the east.
Other proposed initiatives include the possible expansion of the Vaalkopdam nature reserve to link up with
the Pilanesberg National Park as well as the expansion of the Borakalalo nature reserve to link up with
Vaalkop. This will create a conservation corridor stretching from the Borakalalo nature reserve in the east
through Vaalkopdam, Pilanesberg up to the Madikwe Game Reserve in the west. Other potential areas of
conservation include the Magaliesberg area as well as some the Norite hills not damaged by mining and
quarrying activities.
23.4.7.4.2 Dr Kenneth Kaunda District Municipality
The Dr Kenneth Kaunda District Tourism, Incentive (Investment) and Marketing Strategy 2010 identifies the following tourism initiatives and products:
The Treasure Route SDI involving the integration and packaging of tourism products within urban as well as rural areas including: Vredefort Dome World Heritage Site
o A Vredefort Dome Geotrail accentuating the tectonic impact of the meteorite collision 2 billion years ago. This involves:
The development of a tourism information center as a port of entry on the Tlokwe side, integrated with the Vredefort Tourism Information Centre.
Upgrading of roads and the provision of geosites. Informative roadside panels. Geological lay-bys and viewpoints. Integration with other projects on the Treasure Route such as:
A mining and geology experience in Matlosana and diamond cutting and polishing in Wolmaranstad and Ventersdorp.
Existing nature reserves. An upmarket, small and exclusive tented camp with Spa.

108 | P a g e
Encourage the development of good quality caravan and camping facilities along the Vaal River. In addition, existing poor quality facilities should be upgraded.
Develop and promote the area for teambuilding. The area has a wide-range of adventure and teambuilding facilities. These need to be packaged and the area needs to be marketed as a teambuilding capital of South Africa.
Develop and promote “zero environmental footprint" camping weekends in the Dome to minimize the environmental impacts caused.
Promote events and activities around adventure themes, stargazing, etc.
Potchefstroom
o The marketing of Potchefstroom with North West University as a Student City offering entertainment, adventure, events, culture, heritage and quality sporting facilities for visitors.
o Walking and cycling heritage routes. o Pub Safaris include accommodation, transport and a tour of a wide-range of pubs, bars,
shebeens and restaurants spanning Tlokwe and neighbouring townships. o Events hosted by NW University – The North West University is a well-known educational
institution which has a number of events, guest lectures, seminars, concerts, displays, exhibitions, competitions, etc.
o Leverage of High Performance Institute. o Potchefstroom Dam.
Matlosana
o Affordable mining resort with a mining theme could be developed using the facilities currently available at a defunct mining town. The proposed resort could leverage off the mining assets by offering visitors mine tours, geological experiences and in addition could appeal to school and university groups for educational retreats/ camps. It is suggested that the resort could include:
An authentic mining and geology experience. Non-mining recreational activities such as golf, quad biking, canoeing, fishing,
swimming pools and waterslides, and children's resort style activities. Linking the resort with activities along the Vaal River. Linking activities to school curriculum and provide a schools programme.
o Heritage routes covering Anglo Boer War sites, architectural landmarks, monuments and gravesites.
Ventersdorp
o Farm stall, restaurant and visitor information centre –along the N14 at Ventersdorp. o Diamonds cutting and polishing as part of a enterprise hub at the visitor information centre o Affordable agricultural resort - Leveraging off the strong agricultural sector. The resort
should incorporate a fully functioning farm. o Agricultural Trade exhibition – Leveraging off the strong agricultural base in the area, o Fishing – To cater for the needs of the local recreational market in particular it is suggested
that fishing and related facilities at the Rietspruit Dam be developed.
Maquassi Hills
o King Maquassi – Build on the story of this local icon by developing an accessible small museum in Wolmaransstad (along the N12) interpreting the history of King Maquassi.
o Affordable game lodge experience – Develop an affordable game lodge experience – aimed at the South African domestic traveller in particular. Similarly affordable hunting camps to attract domestic leisure tourists to Maquassi Hills area can be developed or existing facilities can be adapted to meet these needs.
o King Maquassi heritage route, which will feature the various monuments and the gravesite of King Maquassi.
o Develop products to support local recreational activities at Wolwespruit Nature Reserve (along the Vaal River) and the Witpoort Dam. This could include basic accommodation facilities, camping/ caravanning facilities, day-visitor facilities, signage and interpretation and related infrastructure.
Promoting agri – tourism also supported by game farming.

109 | P a g e
Building on existing annual events such as Aardklop in Potchefstroom.
Tourism products driven by the private sector and public sector based on the premises that: o The private sector will drive a significant portion of tourism product development. o The public sector has a key role in some aspects of tourism development, and a facilitation
and regulatory role in other areas.
Consideration of tourism products which will meet current and possible future demand from the different identified target markets.
The functional distribution of tourism information centres including: o the primary tourism information centre at the existing info centre in Potchefstroom o Supporting information provision points including:
An info centre in Ventersdorp located along the N14. An info centre located at Vredefort World Heritage Site as an entry point to the
district from the neighbouring Free State province. An info centre incorporated into the existing Goudkoppie Cultural Village located
along the N12 in Klerksdorp, Matlosana. Unmanned kiosks/stands and/or interactive screens in one of the busy fuel service
stations in the Wolmaransstad city centre.
23.4.7.4.3 Ngaka Modiri Molema District Municipality
Another development on the cards for the North West Province is the development of the 'Heritage Park'
conservation corridor that will join Madikwe and Pilanesberg.
The 60 000-hectare Madikwe Game Reserve, established in 1991, has been developed as a premier game
reserve with very high tourism potential. A successful conservation plan has created this exceptional wildlife
reservation for the preservation of a unique wilderness area of Kalahari thornveld. The reserve has a wide
diversity of habitats, ranging from the perennial Marico River to large open plains with steep cliffs on the
Rant van Tweedepoort, boulder-strewn koppies and the Dwarsberg mountain range. The varied vegetation
reflects the interplay of the low rainfall (approximately 540mm per annum), complex geology (such as
dolomites, Bushveld Igneous Complex, etc), broken topography (Inselbergs, Dwarsberg Mountains, plains,
and the perennial Marico River) and diverse soil formations. Madikwe, which is a transition zone between
the Kalahari thornveld and bushveld ecological regions of Southern Africa, is host to many game and bird
species. An extensive restocking programme of game species has been implemented.
The North West Parks Board, following a people-based wildlife conservation approach aimed at benefiting
local communities, manages it. The primary objective of the Madikwe Game Reserve is to stimulate
ecologically sustainable economic activity based on wildlife through joint venture operations involving the
Parks Board, private sector and local people for the benefit of the people of the region. Madikwe is run as a
three-way partnership between the State, local communities and the private sector. It is not solely a
protected area or tourism destination, but also a social and economic core around which the development of
the region can be based. An exciting development is the creation of the 'Heritage Park' conservation corridor
that will join Madikwe and Pilanesberg, creating a prime eco-tourism destination.
The proposed corridor follows a new Open Africa tourist route, the Segarona Heritage Experience, which
was launched in 2012. This new route runs between Pilanesberg and Madikwe, and includes the Bakgatla
tribal lands, and the towns of Derdepoort, Zeerust and Groot Marico (and many others). The rural villages
connected by this route offer insight into the struggle history of South Africa and the cultural heritage of the
many African clans who still live in the area.
The proposed Marico Biosphere Reserve will enhance the economy through job creation, ecotourism and
sustainable development.
The aim is to introduce the traveler to the cultural attractions through interaction with people and local
guides.

110 | P a g e
23.4.7.4.4 Dr Ruth Segomotsi Mompati District Municipality
Highest conservation importance is allocated to individual wetlands or clusters of wetlands. Ecological
buffers (500m) are included as an ecological support area. Possible threats have been identified for the
following protected areas:
Bloemhof Nature Reserve.
o Pressure on the endemic yellow fish due to extensive tourism and fishing activities.
o Mining Pressures.
S.A. Lombard Nature Reserve.
o Pressures from agricultural activities on surrounding farms.
o Mining Pressures.
The local municipalities are strongly supportive of the growth of game farming, game trading and
responsible hunting. It also realises the immense potential for the expansion of eco-tourism opportunities.
Future strategies should take note of the rapid growth in hunting, game farming and game trading among
the African population. Opportunities must be explored to direct a significant portion of this aspirational
market towards Naledi.
23.4.8 Existing Development Pattern
The existing development pattern of North West as shown on Map 3-29 is characterised by:
A settlement pattern of urban and rural settlements consisting of:
o Urban Areas.
o Rural Dense Settlements.
o Rural Scattered Settlements.
o Villages.
Agriculture
o Cultivated areas.
o Natural Areas/ Grazing land.
Mining Areas.
Industrial Areas.
Nature Reserves.
Dams.
Airports.
A system of roads.
A system of railway lines.
The existing development patterns for the respective districts are indicated as:
Map 23-30 Bojanala DM Existing Development Pattern.
Map 23-31 Dr Kenneth Kaunda DM Existing Development Pattern.

111 | P a g e
Map 23-32 Dr Ruth Segomotsi Mompati DM Existing Development Pattern.
Map 23-33: Ngaka Modiri Molema DM Existing Development Pattern.
The existing settlement pattern and structure within North West is mainly the result of:
The distribution of natural resources in the province.
The legacy of Apartheid.
Regional accessibility provided by a system of roads and railway lines.
A strong urbanisation trend.
Other urban and rural structuring elements.
Map 23-29: North West Existing Development Pattern
Source: READ 2015.

112 | P a g e
Map 23-30 Bojanala DM Existing Development Pattern
Source: READ 2015. Demacon 2015
Map 23-31 Dr Kenneth Kaunda DM Existing Development Pattern
Source: READ 2015. Demacon (adapted)

113 | P a g e
Map 23-32 Dr Ruth Segomotsi Mompati DM Existing Development Pattern
Source: Read 2015. Demacon (Adapted)
Map 23-33: Ngaka Modiri Molema DM Existing Development Pattern
Source: READ 2015. Demacon (adapted)

114 | P a g e
Map 23-34: Settlement Distribution
Source: Statistics SA
Map 23-35 Bojanala DM Settlement Distribution
Source: Statistics SA
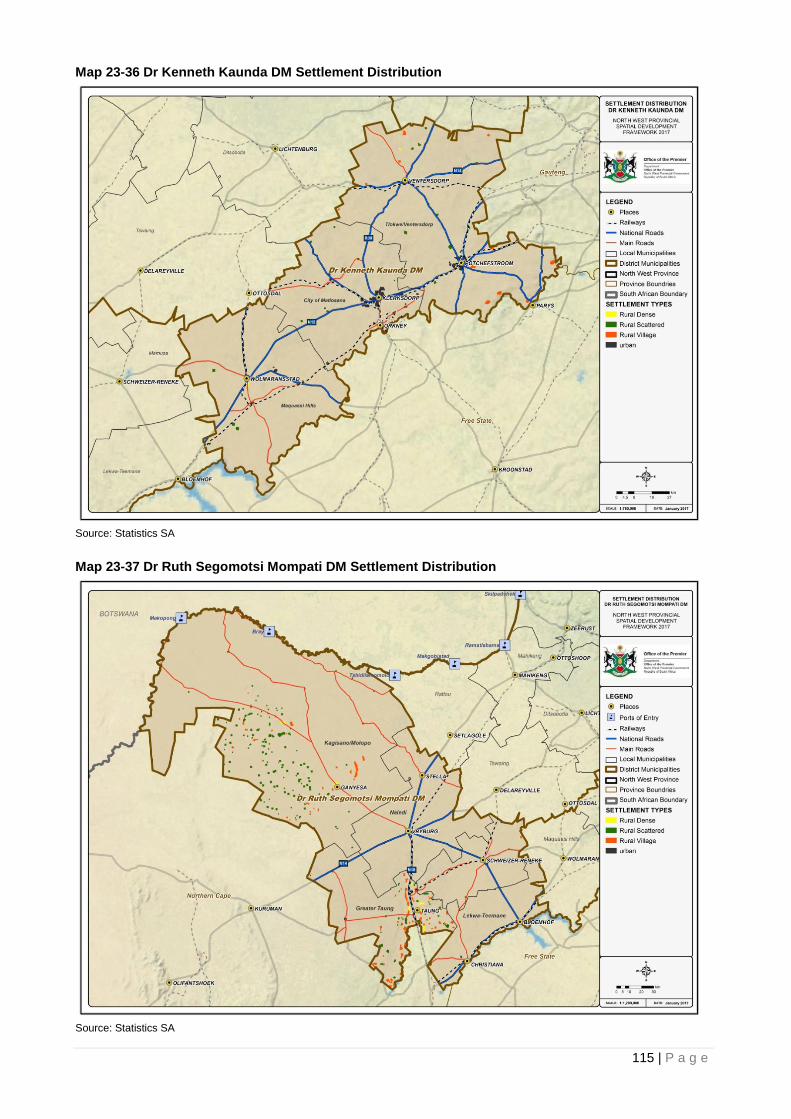
115 | P a g e
Map 23-36 Dr Kenneth Kaunda DM Settlement Distribution
Source: Statistics SA
Map 23-37 Dr Ruth Segomotsi Mompati DM Settlement Distribution
Source: Statistics SA

116 | P a g e
Map 23-38 Ngaka Modiri Molema DM Settlement Distribution
Source: Statistics SA
Table 23-11: Settlement Types: Households per Municipality
Municipality Urban Tribal/ Traditional
Farming Total % Urban % Tribal/ Traditional
% Farming
Moretele 7,408 179,540 0 186,948 3.96 96.04 0
Madibeng 132,427 278,329 66,624 477,380 27.74 58.30 13.96
Rustenburg 373,485 164,922 11,168 549,575 67.96 30.01 2.03
Kgetlengrivier 33,917 0 17,132 51,049 66.44 0.00 33.56
Moses Kotane 17,876 224,054 624 242,554 7.37 92.37 0.26
Ratlou 0 102,030 5,309 107,339 0.00 95.05 4.95
Tswaing 41,370 50,860 31,987 124,217 33.30 40.94 25.75
Mahikeng 64,623 218,474 8,430 291,527 22.17 74.94 2.89
Ditsobotla 88,426 40,718 39,758 168,902 52.35 24.11 23.54
Ramotshere Moiloa 27,884 106,184 16,645 150,713 18.50 70.45 11.04
Naledi 51,308 2,760 12,713 66,781 76.83 4.13 19.04
Mamusa 52,603 0 7,752 60,355 87.16 0.00 12.84
Greater Taung 4,182 170,581 2,879 177,642 2.35 96.03 1.62
Lekwa-Teemane 48,786 0 4,462 53,248 91.62 0.00 8.38
Kagisano/Molopo 5,295 84,461 16,033 105,789 5.01 79.84 15.16
Ventersdorp 22,239 0 34,462 56,701 39.22 0.00 60.78
Tlokwe City Council 148,988 798 12,976 162,762 91.54 0.49 7.97
City of Matlosana 370,608 0 28,067 398,675 92.96 0.00 7.04

117 | P a g e
Municipality Urban Tribal/ Traditional
Farming Total % Urban % Tribal/ Traditional
% Farming
Maquassi Hills 62,004 0 15,790 77,794 79.70 0.00 20.30
NW Province 1,553,429 1,623,711 332,811 3,509,951 44.26 46.26 9.48
Source: Statistics SA 2011
23.4.8.1 Distribution of Natural Resources
The distribution of natural resources provided the basis for urban and rural development in the North West
Province providing for:
The development of gold, platinum and chrome mines mainly concentrated in Rustenburg,
Madibeng and Matlosana and diamond mines in the southern parts of the Dr Kenneth Kaunda
District (Wolmaranstad) and Ngaka Modiri Molema District (Delareyville).
Natural areas providing for nature reserves and conservancies supporting the tourism and wildlife
industries. The nature reserves are listed in Table 3-12.
Agricultural areas providing for cultivation, grazing and game farming.
Table 23-12 : Nature Reserves
Category and PA Name Management Authority Extent in NW (ha)
Total Extent (ha)
Protected Areas (PA) Total North West Parks Board 236 127
Barberspan Nature Reserve North West Parks Board 3 155
Bloemhof Dam Nature Reserve North West Parks Board 14 935
Borakalalo National Park North West Parks Board 11 967
Boskopdam Nature Reserve North West Parks Board 3 067
Botsalano Game Reserve North West Parks Board 5 671
Highveld Nature Resave North West Parks Board 8 609
Kgaswane Mountain Reserve North West Parks Board 5 493
Leon Taljaard Nature Reserve North West Parks Board 877
Lictenburg Game Breeding Center North West Parks Board 5 142
Madikwe Game Reserve North West Parks Board 56 606 60 473
Mafikeng Game Reserve North West Parks Board 4 611
Magaliesberg Protected Environment NW READ 27 066 32 714
Molemane Game Reserve North West Parks Board 5 253
Molopo Game Reserve North West Parks Board 24 100
Pilanesberg National Park North West Parks Board 49 543
S.A. Lombard Nature Reserve North West Parks Board 3 636
Vaalkopdam Nature Reserve North West Parks Board 4 654
Wolwespruit Nature Reserve North West Parks Board 1 742
Biosphere Reserve and World Heritage Sites Total 279 991
Magaliesberg Biosphere Reserve National DEA 220 228 358 822
Cradle of Humankind WHS National DEA 8 802 50 695
Taung Skull Fossil Site WHS National DEA 3 629
Vredefort Dome WHS National DEA 47 332 74 961
Source: North West Biodiversity Sector Plan 2015
23.4.8.2 The Spatial Legacy of Apartheid
Apartheid planning provided North West with a spatial legacy in which black people were consigned to
places severed from sustainable employment centers, services and livelihoods. More than 45% of the North
West population still resides in areas formerly destined as the homeland of Bophuthatswana. This situation
was added to by the segregation of people based on race on the periphery of most towns in created
townships and group areas. The result of this is a spatial development structure that provides North West
with poverty and inequality traps in rural and urban areas, with low levels of economic, social and
engineering infrastructure.

118 | P a g e
Within the underdeveloped Traditional Authorities and rural communities indicated on Map 23-39 Rural
Communities and Traditional Authorities, densification of certain settlements took place, whilst in smaller
concentrations, population growth in settlements declined, but poverty remains. Poor people, living in
neighbourhoods created along racial lines, are severed from economic and employment centres and has to
travel long distances to work, to shop or make use of social facilities. The planning of urban areas and
settlements need to consider the needs of these people and ensure that the injustices of the past are set
right. See Map 23-40 Poverty Concentrations Distribution.
The occupancy of land along racial lines is still strong as illustrated on Map 23-41 Racial Segregation. The
redistribution of ownership is an ongoing process involving the restitution of land and the transformation of
urban areas to ensure the integration of poor people.
23.4.8.3 Accessibility
Regional accessibility supports economic development within the province and interactivity between
regional economic nodes. Regional accessibility within the North West Province is provided by a well-
developed system of transnational, national and regional roads, railways and airports supporting the
development of a system of development nodes. Accessibility of North West Province to the broader region
is supported by the following:
The N4 linking Tshwane with Walvis Bay harbour (Platinum Development Corridor) supported by
the Johannesburg - Koster - Zeerust - Mahikeng and Tshwane - Brits - Rustenburg - Ellisras
railway lines
The N12 route between Johannesburg and Kimberley (Treasure Route Corridor) supported by the
Johannesburg- Potchefstroom- Kleksdorp- Christiana – Kimberley ( Cape Town) railway line
The N14 route linking Gauteng with Kuruman ( Northern Cape)
The N18 linking Gaborone (Botswana ) with Mahikeng and Kimberley ( Western Frontier Corridor)
supported by the Mahikeng – Setlagole – Vryburg - Taung- Kimberley (Cape Town) railway line
The Mahikeng - Lobatse - Gaborone - Francistown - Bulawayo - Lusaka- Dar es Alaam regional
road and railway (North south corridor)
Regional airports including the Pilanesberg International Airport (ACSA) and the Kgosi Montshioa
Airport (Mahikeng Airport at Mahikeng and smaller airfields
Accessibility of North West Province to Tshwane via the N4 and to Johannesburg via the N12 and the
mobility function of these roads are relatively good. The following aspects with regard to accessibility and
mobility however need to be addressed:
The continuous upgrading of the mobility function of all regional routes:
o Restricting local accessibility and providing free flow interchanges.
o Providing by pass roads around development nodes where the mobility function has been
compromised.
The accessibility of the N14 to Gauteng.
The accessibility of the Rustenburg and Brits development nodes to Johannesburg.
The lack of accessibility of the rural areas within the Bojanala and Dr Ruth Segomotsi Mompati
District Municipalities to the main road system restricting socio economic development.
23.4.8.4 Urbanisation
Rapid urbanisation over the past two decades had a significant impact on the existing disparate settlement
structure. Within urban areas people flocked to existing towns and created informal settlements adding to
the existing poverty pockets and providing immense pressure on the provision of economic, social and
engineering infrastructure.

119 | P a g e
The main population concentrations of Madibeng, Rustenburg, Mahikeng and Matlosana, making up 50 %
of the provincial population, contributed 67% of the province’s population growth. Growth within these
municipalities is supported by a strong urbanisation trend with people moving from rural areas to urban built
up areas and a positive migration rate. It is within these areas that the highest demands for land, services
and goods in urban areas place high pressures on local authorities to meet these growing demands.
The economies of Madibeng, Rustenburg and Matlosana are concentrated on a declining mining industry
under severe pressure. This results in:
A general decline in the economy of these nodes.
A drop in living standards.
Proliferation of informal settlements.
Poor living conditions in informal settlements due to a lack of basic infrastructure - clean water,
sanitation, refuse removal, electricity.
Pressure on housing delivery.
Pressure on the existing dysfunctional engineering and social infrastructure.
The focus of government in the transformation of these nodes needs to be supported by all role players
including the mining houses, national government departments and agencies, provincial government and
local municipalities.
The effects of urbanisation differ within the different District Municipalities:
The Bojanala District, accommodating 46% (2011) of the provincial urban population
accommodates Madibeng and Rustenburg which provide for 54% of the provincial population
growth.
The Ngaka Modiri Molema District, accommodating 30% (2011) of the provincial urban population
accommodates the main population concentration of Mahikeng which provide for 8.6% of the
provincial population growth and large population concentrations of Disoboltla and Ramotshere
making up 6.1% of the population growth.
Dr Ruth Segomotsi Mompati District accommodating 23% (2011) of the provincial urban
population accommodates the large population concentration of Greater Taung which provide for
only 0.6% of the provincial population growth.
The share of Dr Kenneth Kaunda District accommodating 13% (2011) of the provincial urban
population is declining. It accommodates the population concentration of Matlosana and Tlokwe
which provide for 6.6% and 2,2 % of the of the provincial population growth.
Figure 23-5: Percentage of Population Residing In Urban Areas (2011)
Source: Statistics SA
0.0%
5.0%
10.0%
15.0%
20.0%
25.0%
30.0%
35.0%
40.0%
45.0%
50.0%
2001 2002 2003 2004 2005 2006 2007 2008 2009 2010 2011
BPDM NMMDM DRSMDM DKKDM

120 | P a g e
Table 23-13: Population Growth Distribution
Municipalities
Po
pu
lati
on
% (
20
15)
Lo
ng
T
erm
P
op
ula
tio
n
Gro
wth
%
%
of
Po
pu
lati
on
Gro
wth
Madibeng 13.9 2.4 21.2%
Rustenburg 16.1 3.1 32.9%
Mahikeng 8.6 1.3 6.7%
Matlosana 11.1 1.0 6.6%
Main Population Concentrations 49.7 2.2% 67.5%
Moretele 5.5 0.7 2.3%
Moses Kotane 7.1 0.6 2.5%
Ditsobotla 4.3 1.1 2.9%
Ramotshere 4.4 1.2 3.2%
Greater Taung 5.2 0.2 0.6%
Tlokwe 4 0.9 2.2%
Large Pop. Concentrations 30.5 0.8% 13.6%
Ratlou 3.1 0.8 1.5%
Tswaing 3.6 1.9 4.2%
Kagisano 3.1 0.7 1.3%
Medium Pop. Concentrations 9.7 1.2% 7.0%
Kgetlengrivier 1.5 2.6 2.5%
Naledi 2 1.3 1.5%
Mamusa 1.8 2.1 2.3%
Lekwa-Teemane 0.9 -0.4 -0.2%
Ventersdorp 1.7 3.3 3.6%
Maquassi Hills 2.3 1.6 2.2%
Small Pop. Concentrations 10 1.9% 12.0%
Total 100.0%
100.0%
Source: Demacon 2015

121 | P a g e
Map 23-39 Rural Communities and Traditional Authorities
Source: Department of Rural Development and Land Reform

122 | P a g e
Map 23-40 Poverty Concentrations Distribution
Source: Statistics South Africa 2011
Map 23-41 Racial Segregation
Source: Statistics South Africa 2011

123 | P a g e
Map 23-42 Land Claims
Source: Department of Rural Development and Land Reform 2015
23.4.8.5 Other urban and rural structuring elements
23.4.8.5.1 Population Densities
The existing urban densities within North West are relatively low. In order to create efficient urban areas
with high densities of mixed land uses within close proximity of economic activity nodes and transportation
systems, residential densities within the urban nodes need to be enhanced. The Spatial Development
Frameworks of most local municipalities within North West provide urban activity nodes, corridors and
spines allowing for higher density land uses.
Densification adds to the demand for social and engineering infrastructure, already under pressure, and
requires the upgrading of services and social infrastructure including facilities such as schools, clinics,
recreation facilities and parks. The need for social facilities and the availability of land or buildings to provide
therefore restrict the creation of sustainable neighbourhoods and towns. These aspects need to be
attended to in the densification policies of the local municipalities.
See:
Map 23-43 Population Density for Bojanala Platinum District.
Map 23-44 Population Density for Dr Kenneth Kaunda District.
Map 23-45 Population Density for Dr Ruth Segomotsi Mompati District.
Map 23-46 Population Density for Ngaka Modiri Molema District.

124 | P a g e
Table 23-14: Population Densities per LM
Municipalities Population Area (ha) Average Density
Bojanala 1530437 1839982.5 0.83
Kgetlengrivier 51047 399008.4 0.13
Rural 6351 111.8 56.82
Urban 27126 2828.1 9.59
Madibeng 477385 384944.4 1.24
Rural 270401 28438.9 9.51
Urban 136657 22748.2 6.01
Moretele 186956 138175.7 1.35
Rural 169980 27199.5 6.25
Urban 11505 317.7 36.21
Moses Kotane 263236 574379.2 0.46
Rural 234450 44998.3 5.21
Urban 15883 2193.6 7.24
Rustenburg 551813 343474.9 1.61
Rural 180211 15037.9 11.98
Urban 327410 12770.8 25.64
Dr Kenneth Kaunda 695933 1471324.9 0.47
City of Matlosana 398674 357925.2 1.11
Urban 366715 14795.0 24.79
Maquassi Hills 77793 467088.3 0.17
Rural 1200 133.9 8.96
Urban 61742 2868.0 21.53
Tlokwe City Council 162763 268340.6 0.61
Rural 982 2537.3 0.39
Urban 142196 5963.0 23.85
Ventersdorp 56703 377970.7 0.15
Rural 20689 1402.3 14.75
Urban 22074 5772.4 3.82
Dr Ruth Segomotsi Mompati 463558 4419419.4 0.10
Greater Taung 177648 569437.6 0.31
Rural 159421 28669.1 5.56
Urban 12960 1262.1 10.27
Kagisano/Molopo 105528 2413945.8 0.04
Rural 84442 32105.2 2.63
Urban 3938 4539.3 0.87
Lekwa-Teemane 53249 370980.3 0.14
Urban 48787 10559.4 4.62
Mamusa 60352 364368.4 0.17
Rural 5902 1700.1 3.47
Urban 46273 838.1 55.21
Naledi 66781 700687.2 0.10

125 | P a g e
Municipalities Population Area (ha) Average Density
Urban 54090 8124.6 6.66
Ngaka Modiri Molema 839547 2839651.3 0.30
Ditsobotla 168901 650123.9 0.26
Rural 60564 5319.5 11.39
Urban 68464 7508.4 9.12
Mahikeng 285852 372455.3 0.77
Rural 195879 92379.4 2.12
Urban 71867 2757.8 26.06
Ramotshere Moiloa 153241 723599.3 0.21
Rural 105419 23342.9 4.52
Urban 30022 10478.3 2.87
Ratlou 107337 492644.8 0.22
Rural 101319 33558.0 3.02
Urban 202 24.5 8.26
Tswaing 124216 600828.0 0.21
Rural 45648 6364.2 7.17
Urban 45207 5205.0 8.69
Source: Statistics South Africa 2011
Map 23-43 Population Density for Bojanala Platinum District
Source: Statistics South Africa 2011 (adapted)

126 | P a g e
Map 23-44 Population Density for Dr Kenneth Kaunda District
Source: Statistics South Africa 2011 (adapted)
Map 23-45 Population Density for Dr Ruth Segomotsi Mompati District
Source: Statistics South Africa 2011 (adapted)
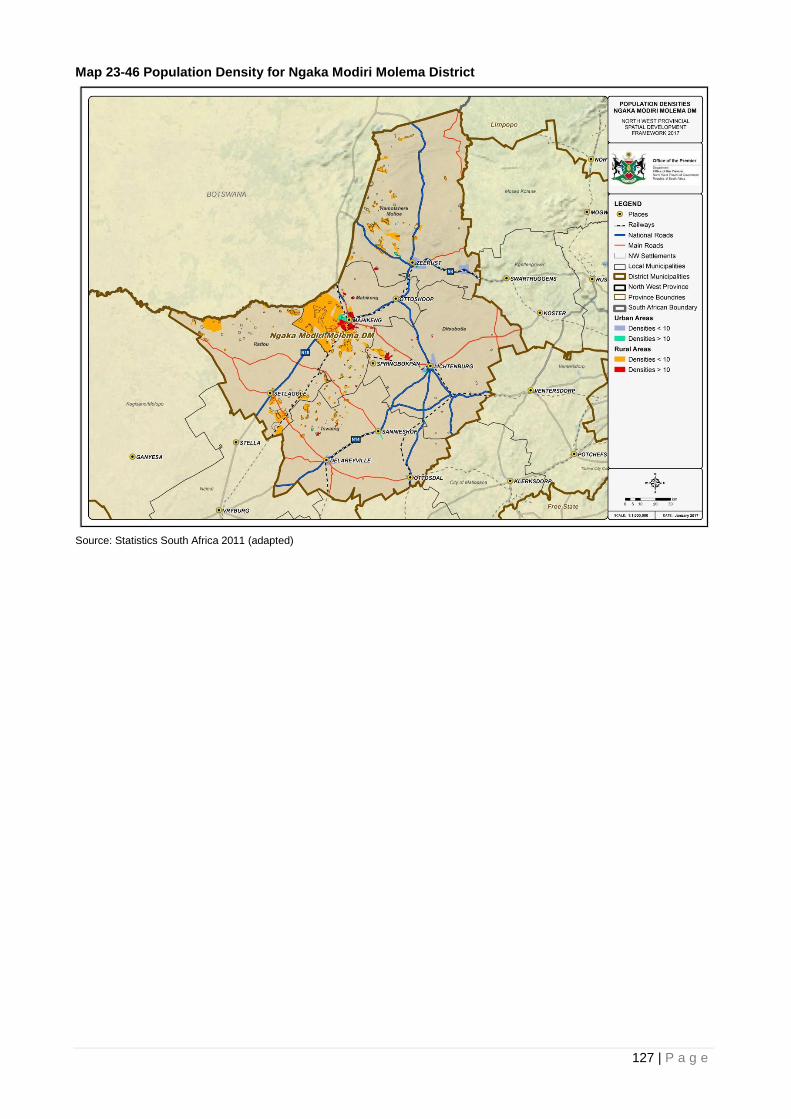
127 | P a g e
Map 23-46 Population Density for Ngaka Modiri Molema District
Source: Statistics South Africa 2011 (adapted)

128 | P a g e
23.4.8.5.2 Urban Edges
To contain urban sprawl and to provide compact urban development, a well determined and enforced urban
edge needs to be demarcated that considers the long term demand for all urban land uses, the preservation
of open space, prime and unique agriculture land, areas of natural beauty, heritage sites and critical
environmental areas. Urban development takes place within the urban edges in the form of infill
development and densification.
The municipalities within North West are actively involved in the demarcation of urban edges in the
preparation and review processes of spatial development frameworks to ensure that prime and unique
agriculture land is not unnecessarily compromised by urban development.
See:
Map 23-47 Urban Edges for Bojanala District.
Map 23-48 Urban Edges for Dr Kenneth Kaunda District.
Map 23-49 Urban Edges for Dr Ruth Segomotsi Mompati District.
Map 3-50 Urban Edges for Ngaka Modiri Molema District.
Map 23-47 Urban Edges for Bojanala District
Source: Local Municipal SDFs. National Department of Agriculture (Act 70 OF 70)

129 | P a g e
Map 23-48 Urban Edges for Dr Kenneth Kaunda District
Source: Local Municipal SDFs. National Department of Agriculture (Act 70 of 70)
Map 23-49 Urban Edges for Dr Ruth Segomotsi Mompati District
Source: Local Municipal SDFs. National Department of Agriculture (Act 70 of 70)

130 | P a g e
Map 23-50 Urban Edges for Ngaka Modiri Molema District
Source: Local Municipal SDF’s. National Department of Agriculture (Act 70 of 70)
23.4.8.5.3 Housing
The strong urbanisation trend causing an influx of people into towns and dense human settlements puts
pressure on housing delivery. All municipalities already experience housing backlogs, which exacerbate
the already dismal housing situation. This large demand for housing resulted in the development of informal
housing areas on the periphery of existing towns and settlements adding pressure on the existing
dysfunctional engineering and social infrastructure and roads. The timely provision of housing is of
cardinal importance to the general well-being of urban areas and its people.
The provision of housing needs to consider a variety of housing choices involving high, medium and low
density developments to provide in the housing typology needs of all individuals. Sustainable
neighbourhoods require the integration of all social and economic facilities to serve the daily needs of its
people.
An integrated housing strategy at provincial level and integrated housing planning as part of the Housing
Chapter of the IDP and the SDF at municipal level, will ensure the sustainable integration of housing into
urban areas.
23.4.8.5.3.1 Community Facilities
Community facilities within urban areas form an integral part of the urban areas and the demand and
geographical distribution thereof needs to be provided for within the communities taking into consideration
the local needs of the communities. It is therefore necessary to attend to the provision of local community
facilities in the local IDPs and SDFs of municipalities in conjunction with the relevant provincial and national
departments.

131 | P a g e
23.4.8.6 Rural development
Rural communities include the sparsely populated areas where people depend on farms or natural
resources for their livelihoods, including the villages and small towns in these areas with little or no
economic infrastructure. The rural community areas that involve larger settlements are also included. The
distribution of rural settlements is indicated on Map 3-29. A strong focus on rural areas is needed to ensure
the sustainable regeneration thereof and the integration of urban and rural areas in support of each other.
23.4.8.7 Engineering Infrastructure
23.4.8.7.1 Water
23.4.8.7.1.1 Bulk Water Infrastructure
The North West Province is generally considered as an area with low to average rainfall conditions. This
highlights the importance of sustainable water management in lieu of sustainable development in this area.
The spatial challenges and opportunities as it relates to the North West Province are discussed herein.
Challenges in water resource, water source and water services range in extent and character, but revolve
around human and environmental interactions.
On-site Sanitation
Provision of access to basic12
services remains one of the top and most challenging priorities for a
municipality. This includes the provision of basic sanitation: at least a Ventilated Improved Pit latrine and
basic water: potable water within a distance of 200m. The municipalities have made substantial progress in
providing basic services in the last two decades. This has brought additional challenges however in the
form of operation and management of existing sanitation installations, specifically on-site installations.
The most prevalent on-site basic on-site sanitation technology is Ventilated Improved Pit latrines. Sanitation
practiced below RDP standards include pit latrines (not lined and not ventilated), the bucket system and no
form of sanitation or open defecation. All these however pose a risk to groundwater sources if the water
table is high and furthermore to human health if groundwater sources are used for consumption.
The responsibility for pit or rather VIP emptying is that of the Water Services Authority (as it is a health risk
in emptying and safe disposal of the pit contents). Very few municipalities actually make provision for
assistance to consumers in this regard. The design life of a VIP will depend on the number of people
served, but can be anything between five and ten years. This means that many of the households provided
with VIP installations and where the municipality is not assisting in pit emptying, are put at risk in terms of
personal health as polluting groundwater sources.
The areas in the NWP most affected by on-site sanitation include:
Madibeng LM: 107 602 households.
Rustenburg LM: 84 645 households.
Moses Kotane LM: 64 078 households.
Mahikeng LM: 56 600 households.
Moretele LM: 48 629 households.
Greater Taung LM: 43 440 households.
There are a total of 570 856 households with on-site sanitation (2011 Census) in the North West Province,
of which 97 890 households are reliant on groundwater as source (boreholes, springs). Of the latter, most
are within the Mahikeng LM (21 492 households), Madibeng LM (16 460 households) and Ditsobotla LM
(8 569 households).
12
Refer to the basic levels of service according to RDP standards

132 | P a g e
It can be further illustrated in Table 23-15 that provides a summary of the on-site sanitation for each Local
Municipality in the North West Province according to the 2011 Census.
Note: None of the municipalities in the NWP have any groundwater monitoring, management and
protection programmes.
Table 23-15: On-Site Sanitation per Local Municipality – Number of Households and %
Local Municipality VIP, Pit and other on-site sanitation, including none
VIPs as percentage of on-site sanitation, including none
Non-VIP as percentage of on-site sanitation, including none
No. of HH utilising Groundwater
Madibeng LM 107 602 13% 87% 16 460
Rustenburg LM 84 645 19% 81% 5 480
Moses Kotane LM 64 078 16% 84% 6 189
Mahikeng LM 56 600 23% 77% 21 492
Moretele LM 48 629 29% 71% 4 644
Greater Taung LM 43 440 32% 68% 2 929
Ramotshere Moiloa LM 29 729 9% 91% 5 807
Ratlou LM 25 562 27% 73% 4 856
Kagisano/Molopo LM 24 016 51% 49% 5 662
Ditsobotla LM 23 193 17% 83% 8 569
Tswaing LM 19 082 15% 85% 3 899
Tlokwe City Council LM 8 232 10% 90% 1 939
Ventersdorp LM 7 973 59% 41% 3 367
City of Matlosana LM 6 901 10% 90% 2 162
Naledi LM 5 694 19% 81% 727
Mamusa LM 5 233 32% 68% 872
Kgetlengrivier LM 4 705 22% 78% 1 479
Maquassi Hills LM 4 157 6% 94% 958
Lekwa-Teemane LM 1 385 11% 89% 399
Total 570 856 21% 79% 97 890
Source: Statistics South Africa 2011
Groundwater Monitoring and Management; Information Systems
In lieu of the above, the municipalities and Water Services Providers need to have information systems to
record borehole equipment, spring protection, groundwater abstraction, borehole yield, borehole depth,
water quality, etc.
Groundwater quality (for domestic use) is affected by unsafe sanitation, industrial or mining pollution as well
as agricultural activities (livestock, fertilizers). Natural aquifer characteristics may also contribute in the form
of elevated (unsafe) levels of salts and fluoride. Problems with groundwater quality are experienced on the
following regions:
Northern part of the Madibeng LM (salinity, nitrates due to on-site sanitation).
Northern and central part of the Moses Kotane LM (nitrates and to a lesser extent magnesium and TDS
13; livestock sharing water sources used for domestic consumption).
13
TDS: Total Dissolved Solids, used as a measurement of inorganic salts dissolved in water.

133 | P a g e
Ramotshere Moiloa LM (nitrates and magnesium due to on-site sanitation and livestock sharing water sources for domestic consumption).
Eastern part of the Tswaing LM (nitrates from agricultural fertilizer).
The northern area of the Kagisano-Molopo LM (brackish water, fluorides, salts and nitrates). Elevated levels of nitrates are most probably due to on-site sanitation and livestock.
Mamusa LM (nitrates due to on-site sanitation).
The pollution risk is higher in areas with higher water table levels and where limited surface water resources
occur.
There are no formal urban areas or densely populated areas in the Dr KKDM that utilise groundwater for
domestic water supply. Individual and farming communities may utilise this source, but information on
groundwater quality is not available for these specific consumers. It is noted that this area is a gold mining
area and groundwater may be at risk due to mines that have closed and dewatering of mines (dissolving
metals in the water, lowering the pH).
Ageing Infrastructure
Many of the early-established towns in the North West Province have infrastructure that dates back thirty or
more years from when it was first installed. A number of municipalities face the challenge of providing for
the unserved, but still maintaining existing infrastructure. This was reported and evident in areas such as
Brits, Rustenburg, Potchefstroom, Klerksdorp, Makwassie, Wolmaransstad, Mahikeng and Mmabatho,
Lichtenburg, Zeerust and Vryburg.
Ageing infrastructure result in higher operational and maintenance costs if appropriate preventative
maintenance cannot be implemented. High maintenance costs compete with new capital investment for
new developments. Pipe bursts and leakages interrupt supply and channel resources away from where it
could serve existing and new customers. Furthermore, meters that are old and not calibrated provide
incorrect readings, resulting in loss of revenue.
Illegal Connections and Informal Settlements
Illegal connections still rate high on the challenges experienced in sustainable and adequate water
provision. Illegal connections interfere with the quantities of supply to legally-connected consumers and put
the integrity (health) of consumers at risk when exposing the pipelines and content to the environment. It
reduces water volumes supposedly allocated for a certain number of consumers and it may reduce
pressure in the water supply pipelines, interfering with the system operations. It furthermore increases the
loss in revenue in contributing to non-metered water consumption (metered losses) and physical water
losses.
Most urban or developed areas not yet providing all consumers with at least basic levels of service have a
problem of consumers illegally connecting to existing water supply schemes.
Informal settlements are more evident in the areas with high economic potential or areas closer to urban
developments such as Rustenburg, Brits, Klerksdorp (Alabama, Tigane and Kanana), Huhudi, Colridge,
Rekgaratilhile and Reivilo-Boipelo. Managing illegal occupation of land remains a challenge for all
municipalities and to ensure safe water and sanitation services are provided (in-situ or relocation).

134 | P a g e
Map 23-51 Access to Sanitation for Bojanala District
Source: Statistics South Africa 2011
Map 23-52 Access to Sanitation for Dr Kenneth Kaunda District
Source: Statistics South Africa 2011

135 | P a g e
Map 23-53 Access to Sanitation for Dr Ruth Segomotsi Mompati District
Source: Statistics South Africa 2011
Map 23-54 Access to Sanitation for Ngaka Modiri Molema District
Source: Statistics South Africa 2011

136 | P a g e
Water Conservation/Water Demand Management (WC/WDM)
The Department of Water and Sanitation (DWS) puts a high rating on WC/WDM activities when evaluating
any new applications for funding for water supply projects. WC/WDM is critical in the optimal utilisation of
existing, local water sources and the efficient management of water supply.
In order to develop an appropriate WC/WDM plan, a Water Services Provider (WSP) needs to have
information on existing water abstracted, treated, stored, supplied and used. Metering of all bulk
components and of consumers’ supply is therefore critical. Such information is utilised to develop a water
balance, where the WSP would be able to deduct how to address Revenue (focus on increasing) and Non-
Revenue (focus on decreasing) water.
Water losses are generally more prevalent in surface-supplied water schemes, but do not exclude
groundwater-supplied schemes.
A summary of the Non-Revenue Water and Water Losses, per District Municipality (for municipal
consumers) is presented in Table 23-16.
Table 23-16: Summary of Non-Revenue Water and Water Losses per District Municipality
District Municipality Revenue Water (Ml/d)
Non-Revenue Water (Ml/d)
Water Losses (Ml/d)
Non-Revenue Water (%)
Water Losses (%)
Bojanala Platinum (last available data from 2012)
63.75 54.53 53.90 46.1 45.6
Ngaka Modiri Molema (last available data from 2010)
32.47 15.03 15.03 31.6 31.6
Dr Ruth Segomotsi Mompati (last available data from 2009)
11.73 4.18 4.18 26.3 26.3
Dr Kenneth Kaunda (last available data from 2012)
38.13 6.33 6.33 14.2 14.2
Source: National Non-Revenue / Water Loss Assessment, 2013
The non-revenue water and water losses for the Dr Ruth Segomotsi Mompati DM and Dr Kenneth Kaunda
DM is doubtful. The metered water abstraction and consumption figures need to be updated for all supply
areas in the North West Province.
To illustrate: at a tariff of R8/kl, a loss of 10Ml/d translates to potential financial losses of R80 000 per day –
a significant amount if summarised per annum: R29.2 million!
Information Systems and Record-Keeping
Each Water Services Authority (WSA) is responsible for the provision of water and sanitation services within
its area of jurisdiction. Without adequate information at hand on existing water supply infrastructure, it
makes it more difficult for the WSA to plan and execute water supply projects. Many WSAs do not have all
the as-built drawings of existing infrastructure in an information system, ready for interrogation and use in
water development planning as well as management.
WSAs need to ensure that they obtain all as-build drawings of infrastructure from consultants and if
possible, consolidate it with existing information in a system that can be utilised for infrastructure and asset
management. Information may also be collected, stored and accessed using a CAD or GIS14
. Asset
14
CAD: Computer Aided Drawing. Typically used for engineering design and as-built drawings. GIS: Geographic Information System. Typically used for representation of geographically orientated information for mapping, querying and analysis.

137 | P a g e
registers need to be spatially enabled and accurate, providing the latest information on infrastructure
components’ age, condition, capacities, materials, etc.
Even though some WSAs have a GIS, it may not be optimally utilised for the purpose of engineering
infrastructure (water, sanitation, roads, stormwater and electricity). It will depend on where the GIS is
hosted (Department) and the assigned responsibilities for the maintenance of the GIS.
Rural Extent
Most municipal areas have a large rural component in terms of geographic extent. Households in rural
areas are more dispersed and further located from formal infrastructure and developed water sources. The
distance required to travel to and from settlements or components such as pump stations or reservoirs is
larger than for denser-developed urban areas, therefore increasing maintenance costs and affecting staff
availability.
In Map 23-55 below, the distance requirements per WSA main town is illustrated geographically. It is clear
that the District-level WSAs have a greater challenge in terms of the geographic area that it covers.
Map 23-55 Illustration of WSA head office / town and area of jurisdiction
Source: UWP 2015
The longest distance (as the crow flies) from a WSA main town to the furthest corner of its area of
jurisdiction is nearly 250km (Vryburg towards the north-west of the Kagisano-Molopo LM). The WSA with
the shortest average distance to reach all consumers within its area of jurisdiction is the Moretele LM
(average of 16km).
In Figure 3-6 below, the piped water level of service is provided for the urban, traditional areas & rural
areas and farmland from the 2011 Census.

138 | P a g e
A total of 88% of all urban areas are supplied with piped water inside the yard or inside the dwelling
compared to 38% of all traditional or tribal areas that are supplied with a higher level of service. Bringing
higher levels of service to all consumers is more challenging in rural areas as the topography, distances,
source development and operational aspects all contribute to increased costs and management effort.
Figure 23-6: Piped Water Level of Service per Geographic Sub-Place Type
Source: UWP 2015
Surface Water Users and Quality
In South Africa, the largest water consumer is agriculture, in the form of irrigated water use – predominantly
from surface water sources. Second to that are the municipalities or domestic consumers and thirdly mines
and industries. Competing for the same, limited water sources, creates a challenging environment for
conserving our water, utilising water for development and growth and protecting the quality of water for our
use as well as that of the environment.
In the agricultural areas of Schweizer Reneke, Ottosdal, Koster and Swartruggens, water quality is affected
by runoff from lands which use fertilizer to increase production. This may lead to the development of algal
blooms and more specifically blue-green algae, which produces toxic components. It would further increase
the treatment costs of water used for domestic consumption.
One of the main sources affecting surface water quality is wastewater treatment works (WWTW) that are
not operated according to its license conditions for effluent quality released back into the environment. The
most prominent example is the Hartbeespoort Dam near Brits, which receives the poor quality water from
Gauteng. This is the most eutrophic – actually hypertrophic – dam in South Africa, which is in a nutrient-
enriched state to the extent of causing algal blooms, specifically blue-green algae.
Furthermore, the Spitskop Dam (near Vaalharts) and the Baberspan Dam (between Delareyville and
Sannieshof) are also reported as having high levels of blue-green algae and surface scum. Pollution in the
Spitskop Dam is likely caused by agricultural runoff and fertilizer loads in the water sources. Pollution in the
Baberspan Dam however, is exacerbated by poor management of wastewater and effluent in the catchment
area.
The Hartbeespoort Dam forms part of the Crocodile River catchment and both these sources are used for
abstraction for domestic water supply (and irrigation). The Spitskop Dam forms part of the Harts River
catchment and the Vaalharts Irrigation Scheme. Both are utilised for irrigation as well as domestic water
Farm
Tribal or Tradional area
Urban area
0
100,000
200,000
300,000
400,000
500,000
Piped in dwelling or
yard
Piped within 200m
Piped > 200m No access
WATER SERVICE LEVEL BY GEO-TYPE (NO. OF HOUSEHOLDS)
Farm Tribal or Tradional area Urban area

139 | P a g e
supply. Map 23-56 overleaf provides an overview of the 2012 Green Drop Risk Rating for the WWTWs
within the province.

140 | P a g e
Map 23-56: Wastewater Treatment Works – Green Drop Risk Rating, 2012
Source: UWP 2015

141 | P a g e
Urban Development
Urban development is considered a challenge not only to provide for the extension of water supply
services to new consumers, but also to accommodate the densification typology of housing
developments. Increased costs for land and development necessitated the need to densify settlements
which is a great advantage to the consumer. It brings people closer to services and their workplace.
The municipalities, however, need to make provision for the increased water requirements (volume)
and infrastructure (bulk and reticulation) to meet those requirements.
All well-established town areas are faced with increased urban development and densification due to
economic development and urbanisation.
Spatial challenges per Main Nodes
This section provides a brief overview of the spatial challenges faced in the primary nodal areas of the
NWP, related to water and sanitation.
Rustenburg, Brits, Marikana and Hartbeespoort
The Rustenburg and Brits areas are highly affected by the mining development and operations,
both in terms of water and sanitation services and a water source management. The mining
operations (and potential mining operations) attract people into the area, putting strain on the
development of additional water supply and sanitation infrastructure, especially to provide for
informal settlements. The applicable municipalities are further limited to develop on municipal land,
which is not within the safety boundaries set by the mining operations (mine site and blasting
limitations).
Furthermore, communities located on tribal authority land, should be served by the municipalities
Rustenburg and Madibeng (both Water Services Authorities). The Royal Bafokeng Administration
however provides services to people within its area of jurisdiction. There are a number of traditional
authority areas next to or around Rustenburg and Brits, in which the municipalities need still to
provide adequate water and sanitation services.
All municipalities face the continued challenge of ageing infrastructure, leakages, vandalism, illegal
connections and making provision for densification of settlements. This requires additional man-
power and financial resources that could have been spent on the maintenance and operation of
existing infrastructure and provision for new connections and bulk water supply.
Water sources are shared resources and in this case, shared and managed by various institutions
(municipalities, mines, Water Boards and the Department of Water and Sanitation). Coordinating
activities between the institutions to promote development requires initiative, cooperation and
leadership.
Water quality in the Hartbeespoort Dam (direct water source for the Hartbeespoort residents and
part of the Crocodile River system – a direct source for Brits) is of concern and has been an on-
going problem. The poor quality of treated (and untreated) sewer effluent from Gauteng is the main
source of pollution. It increases the treatment costs, putting increased financial strain onto the
Madibeng LM for ensuring sustained water quality, meeting national standards.
Klerksdorp
The Klerksdorp urban node is largely formalised and its main challenges are to maintain existing,
ageing water supply and sanitation infrastructure whilst providing for new consumers and continued

142 | P a g e
higher levels of service. Programmes for leak detection and repair and pressure management
should be developed to ensure sustainable water supply. Physical losses are estimated to be 24%
of the system input volume; therefore potential for WC/WDM exists.
This area is renowned for its gold mining activities (and to a lesser extent uranium and other
minerals), but as a result, is also affected by acid mine drainage. When mines closed, dewatering of
shafts discontinued and water seeped back into the shafts, but is now exposed to metals and other
mining-related infrastructure. The metals and other exposed components react with the water and
become acidic. When left untreated and not dewatered, it may raise to the surface, where it pollutes
the environment, surface water and forms a health and environmental hazard.
The City of Matlosana has to take into consideration the siting of developments due to dolomitic
areas within Stilfontein and Khuma urban areas.
Potchefstroom
Water supply to consumers are affected by the limits in bulk water treatment and storage
infrastructure, however a project is currently under way to upgrade the WTW capacity. This will
ensure continued water supply to current consumers and further developments in the area. Due to
the increase in densification and new developments, some of the existing reticulated infrastructure
is not appropriate and would need to be redesigned and replaced.
The Tlokwe LM has to take into consideration the siting of developments due to the dolomitic areas
within the Potchefstroom and Ikageng urban areas.
Mining (gold and uranium) operations in the upper catchment could affect groundwater quality and
pose a risk to the environment (decanting acid mine water) and surface water sources.
Mahikeng ( including Mmabatho15
)
The Mahikeng including Mmabatho area obtains water from surface and groundwater sources. The
surface water source is the Setumo Dam, but this dam is also the water resource where the treated
effluent from the Mmabatho WWTW is released into. The Mahikeng WWTW releases its treated
effluent into the Molopo River, between Cookes Lake and Lotlamoreng Dam. The Molopo River
flows into the Setumo Dam. The water sources are at high risk and already impacted by poor
quality treated effluent, this affects the raw water quality abstracted and treated for domestic
consumption. (High treatment costs, varying raw water quality and environmental degradation of
the water sources.).
It has been suggested by the All Towns Strategy for the Mahikeng Cluster (2015) to conduct a
water use Validation and Verification study to establish the water used by the domestic, industrial
and irrigation users. Especially for the groundwater sources (Molopo eye and Grootfontein wellfield)
since the registered water use allocations for municipal use is 10.95 million m³/a and for irrigators, it
is 11 million m³/a. According to the Drought Operating Rules for Stand Alone Dams Study (2013),
the maximum available groundwater resources are 8.8 million m3/a, however this is only based on
preliminary analysis results and detailed hydrogeological investigations are required to increase the
accuracy and confidence levels of information. The DWS is in the process of assisting in this regard
as the water sources in this cluster is shared not only between different water user categories, but
also with the neighbouring country of Botswana.
15
The municipality has very little information on water use and water wastage, resulting in unreliable figures for leaks and
actual use to conduct a water balance. This affects the planning ability of the Water Services Authority to ensure adequate
water supply and management of water sources.

143 | P a g e
Spatial Opportunities
Water is a key development resource for anyone whether it is for personal, industrial or mining,
agriculture or municipal use. South African water law also made provision for water used by the
environment’s ecosystems en order to ensure the sustainability of our resources. This section describes
the key spatial opportunities linked to the use, development and protection of the water sources
within the NWP.
a. Groundwater Development
There are a number of areas that are underlain by high-yield potential dolomitic geological
formations. These sources can be developed to ensure at least basic water supply to all
consumers. A feasibility study is currently under way in the Kagisano-Molopo LM on providing basic
and improved water services in this area.
Development of regional groundwater schemes and improvement of existing groundwater supply
could be investigated in areas such as Moretele LM, Madibeng LM, Moses Kotane LM, most of the
NMMDM and Dr RSMDM.
In areas where mining operations are active, dewatering of mines can also be investigated as an
opportunity to augment water supply to domestic consumers.
Water development to support agricultural activities such as crop production and livestock should
be encouraged as it will enhance the economic status of people and encourage further
infrastructure developments.
The WSAs in the North West Province may lead the way to develop and implement suitable
groundwater management and monitoring programmes, starting with metering of water abstractions
and water use. This would assist greatly in developing water balances for the aquifers utilised for
domestic consumption.
Water quality monitoring and management must be included in the management programmes for
groundwater as there are many activities impacting on groundwater quality (on-site sanitation,
fertilizers, livestock and mining).
b. Surface Water Development
There are a number of surface water sources that could be developed further as part of an
integrated approach for water use in the larger catchment areas such as the Klipvoor Dam, Vaalkop
Dam, Bloemhof Dam and Spitskop Dam. Furthermore, with improved operating rules of water
resources, sources such as the Crocodile, Elands, Setlagole River, Schoonspruit River, Mooi River
and Harts River could be further developed. The Vaal River, being one of the larger water sources
in South Africa and forming the southern border of the North West Province, could also be included
as a developmental opportunity for all water use sectors.
The Hartbeespoort Dam is part of a water remedial programme – Metsi a Me – to address the
hypertrophic status of the Dam. A number of activities have been developed, tested, initiated and
implemented since 2008. This is an on-going effort by the DWS in improving the water quality in the
Dam, but it remains dependent on the water quality received upstream of the Dam, from Gauteng.
Lessons learnt from the Metsi a Me programme, can be applied to other dams in the North West
Province with similar environmental conditions.
A number of the dams mentioned in this section, along with smaller waterbodies and rivers are and
should be further developed for recreational use and to promote further tourism development. Along

144 | P a g e
with economic opportunities, secondary benefits include raising awareness to conserve and protect
the natural resources and attract further investment into the North West Province.
c. Water Conservation and Water Demand Management
Water Conservation and Water Demand Management (WC/WDM) is receiving a higher priority from
the Department of Water and Sanitation (DWS) funding programmes and applying funding criteria
for considering new projects. Utilising local water sources, optimising existing infrastructure and
conservation of the water resources are critical in achieving sustainable water supply and sanitation
services.
Industries and mining are not excluded from implementing WC/WDM as it has a direct financial and
operational effect. Most mines are applying some form of recycling to ensure re-use of water in
mining process and limited release of effluent. Mines in the Rustenburg area are utilising treated
effluent from the Rustenburg WWTW, reducing therefore their need for potable water and creating
a revenue stream for the Rustenburg LM. Similar opportunities exist in Brits, Klerksdorp and
Stilfontein amongst others. Treated effluent from municipalities can also be applied towards
irrigation of public spaces and recreational areas, instead of using treated, potable water.
The irrigation sector is also subject to improved efficiency measures not only as a financial
consideration, but also environmental. The irrigation boards already implement some form of
WC/WDM activities such as refurbishment of canals and improved irrigation technology. This could
make more water available for other developments (urban, agricultural, industrial, etc.). This is
evident in the areas supplied from and near the Vaalharts Irrigation Scheme.
All water use sectors play a role in the overall management and operation of water resources in a
particular catchment area, or in shared water courses. Repairing leaks, adequate pressure
management to prevent pipe bursts, improved management of water and wastewater treatment
works, metering of bulk supplies and consumers – all have a direct positive influence on the
availability and quality of our water resources, not to mention improved asset management and
reduced costs to deal with ad-hoq emergencies.
d. Water Re-Use
There are a number of wastewater treatment works in the province, some of which have a fairly
large treatment capacity. It does not however limit the option to consider re-use of treated effluent
by the municipality or other (such as for irrigation or industrial users) consumers. The following are
the largest (>10Ml/d design capacity) WWTW within the province:
o Brits WWTW (18Ml/d), operating at 79%.
o Klerksdorp WWTW (36Ml/d), operating at 70%.
o Lichtenburg WWTW (20Ml/d), operating at 96%.
o Mmabatho WWTW (24.5Ml/d), operating at 69%.
o Orkney WWTW (22Ml/d), operating at 40%.
o Potchefstroom WWTW (45Ml/d), operating at 71%.
o Rustenburg WWTW (42Ml/d), operating at 84%.
o Stilfontein WWTW (36Ml/d), operating at 49%.
The responsible WSAs should consider the inclusion of re-use in the feasibility investigations and
design of wastewater treatment works both new and if upgrading is planned, such as the Koster
WWTW.

145 | P a g e
It is important however that the operational standards of the WWTW be maintained and kept as a
low risk. The 2012 Green Drop risk rating indicated that of the above, the Mmabatho WWTW
received a high risk rating and the Klerksdorp WWTW a medium risk rating. The best-performing
WWTW were Potchefstroom and Rustenburg with low risk ratings.
Treated effluent from the Rustenburg WWTW is already being utilised by the municipality (for
irrigation) and by some of the mines.
Furthermore, mines that are dewatering can be considered as an opportunity for further
investigation to re-use the water (if not already used by the mine processes).
e. Urban Development
Urban development and densification provides the opportunity to provide more cost-effective
services to a larger portion of the population. Costs to provide services increase with the distance
required to build new infrastructure and transport the goods (in this case, water, sewerage) to and
from the point of production and point of use.
Urban planning and development or formalisation of new townships should ensure optimal use of
land and facilities. Further benefits include a reduction in transportation costs for residents as they
are closer to amenities and services; decreased travel time; increased security; improved response
times in case of emergency, likely higher levels of service; etc.
Municipalities can improve planning and budgeting to allow for existing infrastructure upgrades
versus the extension of infrastructure to new areas. Densification of urban areas further reduces the
extent of suitable land required for urban development as this poses a challenge for many
municipalities.
f. Irrigation Efficiency
According to the 2013 NWRS2, water requirements for irrigation would largely remain the same,
even though it is expected that there will be an increase in small-scale farmers. This would depend
however on the irrigation efficiency of schemes. Irrigation is the largest water user in the country
and any potential savings that could be achieved in this sector, would have a potential significant
impact in ensuring water can be developed and utilised optimally for economic, socio and
environmental benefit.
The Vaalharts Irrigation Scheme is the largest and oldest irrigation scheme in the country,
consisting of a canal system of 1 176 kilometres. It irrigates 39 820 hectares of land, supporting an
estimated 1 040 irrigation farmers. It furthermore provides industrial water to six municipalities and
nine other industrial raw water users16
. The current initiative to refurbish and upgrade the scheme
has the potential water saving of 40 million m³/a (109.58Ml/d), which could be allocated towards
water for development, assisting emerging irrigation farmers. (This applies to the whole of the
Vaalharts Irrigation Scheme, which serves areas in the North West Province and Northern Cape
Province).
In the Bojanala Platinum DM, the potential savings that could be achieved from the Crocodile
(West) and Hartbeespoort Irrigation schemes are estimated to be 51.65 million m³/a (141.51Ml/d).
In the Dr Kenneth Kaunda DM, the potential savings that could be achieved from the Schoonspruit
GWS and Mooi River GWS are estimated to be 18.06 million m³/a (49.5Ml/d). In the Ngaka Modiri
Molema DM, the potential savings that could be achieved from the Marico-Bosveld and Klein
16
Taken from the Request for Proposal for Multi-Stakeholder Funding and Investment Plan for Vaalharts Irrigation Scheme Upgrading, April, 2015.

146 | P a g e
Maricopoort Irrigation Schemes are estimated to be 9.06 million m³/a (24.82Ml/d). Lastly, in the Dr
Ruth Segomotsi Mompati DM, the potential savings that could be achieved from the Vaalharts
Irrigation Scheme, operations applicable to the DM, are estimated to be 9.18 million m³/a
(25.15Ml/d)17
.
If irrigation efficiency can be improved in many of the irrigation schemes, the water made available
would assist in unlocking economic opportunities in many of the rural areas of the NWP. It requires
however large capital investment and coordination between the DWS (often the owner of the bulk
infrastructure), Irrigation Boards and WSAs, amongst other.
g. Rainwater Harvesting
Rainwater harvesting has been considered in many of the All Towns Reconciliation Strategies for
urban areas to assist in alleviating the water requirements from formal water supply infrastructure.
Households equipped with rainwater harvesting tanks can utilise the raw water for non-potable
purposes such as cleaning, washing of clothes or watering the garden. It will be more feasible in
areas of higher rainfall, but it will nevertheless alleviate the water required from groundwater or from
treated surface water.
h. Water for Development: Tourism and Recreation
The North West Province has a number of waterbodies that can and are utilised for purposes other
than water supply to municipalities, mines and industry and agriculture. Dams, pans and rivers
often form part of conservation areas that ensure the protection of the water and surrounding
environment. Examples include the Hartbeespoort Dam, Bloemhof Dam, Vaal River, Baberspan
and many other areas utilised for water sports, bird watching, camping, fishing and other activities.
Further developing and protecting water resources can contribute to the development of tourism
and economy of the NWP.
Spatial Opportunities per Main Node
This section provides a brief overview of the spatial opportunities faced in the primary nodal areas of
the NWP, related to water and sanitation.
Rustenburg, Brits, Marikana and Hartbeespoort
Very little groundwater sources are utilised in this area to supplement the water supply. There is an
opportunity to investigate the options for groundwater use, considering new developments in areas
such as Marikana and the areas along the N4 corridor between Brits and Rustenburg. The
Madibeng LM has a Regional Bulk Infrastructure Grant project to upgrade the Brits WTW and
further upgrade bulk water supply to the Brits and Lethlabile water supply scheme.
Water sources in this catchment are expected to have an increased yield due to the increase in
return volumes upstream, from consumers in Gauteng. This however may be offset by the
increased water requirements in the neighbouring Limpopo catchment due to developments in
Lephalale. Water transfers into Lephalale are planned via the Mokolo Crocodile Water
Augmentation Project.
There are opportunities for water re-use in the form of treated effluent, which is already the case in
Rustenburg.
17
Development of a Water Provisioning and Management Plan in the North West Province: 2008 – 2030. Final Draft, March 2011.
147 | P a g e
Klerksdorp
The towns of Klerksdorp, Stilfontein, Khuma, Orkney and Kanana are provided with water from the
Midvaal Water Company’s WTW, which abstracts water from the Vaal River. The WTW has a
design capacity of 250Ml/d and is operating at 50%. The Midvaal Water Company also provides
water to the mining industry (various shafts in the area), but the mining activities have scaled down
(and therefore water use) due to the economic climate and mines reaching their end of life. This
allows implies that the availability of water supply should not hamper any new developments in this
region.
Klerksdorp and surrounding suburbs and towns (Jouberton, Alabama, Manzilpark, Kanana, Orkney,
Stilfontein and Khuma) already have high levels of service and very small backlogs in water and
sanitation services, which could ensure that the City of Matlosana LM can achieve universal access
for all consumers within the national target of 2019.
The water source – Vaal River – is part of the Integrated Vaal River System and is managed and
operated under careful guidance according to operating rules developed for this system
(augmented from the Lesotho Water Project). Water abstractions by the Midvaal Water Company
and releases of treated effluent by the Klerksdorp, Orkney and Stilfontein WWTWs are recorded
and monitored. The total design capacity of the three towns’ WWTWs are 68.3Ml/d
(24.930 million m³/a) and they are operating at 57% of their combined capacities.
The gold mining activities are associated with acid mine draining. This requires the continued
pumping and treatment of water to ensure safe releases back into the environment and returns to
water resources. This, together with the potential re-use of municipal treated effluent, should be
further investigated as water source options for domestic (including irrigation of public and
recreational spaces) and industrial re-use. This includes supplying water to the Midvaal Water
Company.
Potchefstroom
Water sources seem to be sufficient until 2026 (All Towns Strategy, 2015). Irrigation water use from
the Mooi River system needs to be verified as there is potential to supplement domestic water
requirements if the full irrigation allocation is not going to be utilised.
Potchefstroom already has a high level of service and a very small backlog in water and sanitation
services, which could ensure that the Tlokwe LM can achieve universal access for all consumers
within the national target of 2019. There is a Regional Bulk Infrastructure Grant Project under way
to increase bulk supply capacity (upgrade of the WTW), which will ensure that the current and
future water requirements can be met.
An assessment is required into the re-use of treated mine water which could be utilised to augment
water supply, but which also could affect the water available in Boskop and Potchefstroom Dams.
Groundwater is a potential source for augmenting water supply in the area as there are dolomitic
compartments. Mining (gold and uranium) operations however could affect groundwater quality.
Mahikeng
The Mahikeng LM urban area, according to the 2011 Census, only had 138 households that were
below RDP water levels of service. If this is the case, the urban area can achieve universal access
for all consumers within the national target of 2019. Due to the lack of adequate information on
water supply and consumption, opportunities exist in developing and implementing an appropriate
WC/WDM programme for this area.

148 | P a g e
The Mahikeng Cluster Area is supplied from various water sources, namely the Setumo Dam,
Grootfontein wellfields and Molopo eye. There is currently a Regional Bulk Infrastructure Grant
project in order to re-instate the capacity of the Mmabatho WTW which cannot operate according to
design due to the poor quality of water from the Setumo Dam. The Mmabatho WTW is also being
upgraded during this project.
The DWS is preparing a Terms of Reference for the development of a Larger Reconciliation
Strategy for this region, ensuring water requirements can be met for current and future consumers.
It is expected that this will be a two-year study period, possibly commencing during the 2016
calendar year.
23.4.8.7.1.2 Developments and Strategic Perspective
This section describes the major developments taking place related to water resources and water
services provision. Linkages to the National Development Plan, NWRS2 and Provincial Development
Plan are also established to lead to a strategic perspective for the NWP.
23.4.8.7.1.3 Water Resources Development
This section address larger water resource development and infrastructure such as large dams and
water transfer schemes that are the responsibility of DWS. It is expected that flow in the Vaal River
would remain positive with the implementation of the Lesotho Highlands Water Project, Phase 2. This
project is anticipated to be commissioned during 2020 to 2023. However, the recent meeting of the
Strategy Steering Committee for the Vaal River System raised concern over the lack of progress made
to implement WC/WDM and increase savings of water (June, 2015).
Augmentation to Lephalale from the Crocodile (West) Catchment
The increased mining operations and energy generation in the Lephalale area of the Waterberg District
Municipality have resulted in increased water requirements which cannot be entirely met by local
sources. The DWS is busy augmenting supply to Lephalale via the Mokolo Crocodile Water
Augmentation Project. Water in the Crocodile (West) catchment will likely increase due to increased
return flows from wastewater from Gauteng.
Molatedi Dam, TSWASA Agreement
An agreement was signed in 1988 for water in the Marico, Upper Molopo and Ngotwane catchment
areas between South Africa, Botswana and the then Bophuthatswana government (the TSWASA
agreement). A volume of seven million cubic metres per annum (7 million m³/a or 19.2Ml/d) has been
allocated to the government of Botswana, for transfer to Gaborone. Due to the increased water
requirements and poor summer rainfall (2014/2015) in South Africa, this allocation has recently (DWS
communication of 16 September 2015) been reduced to 5 million m³/a (13.7Ml/d). The agreement does
not include any reference to the groundwater sources shared between the countries.
Klipvoor Dam
The Klipvoor Dam lies within the northern portion of the Madibeng LM and is currently utilised for
irrigation. It forms part of the Borakalalo National Park and therefore a conservation area.
The Magalies Water Board is considering utilising the Dam for water augmentation to the Madibeng,
Moretele and as far as the Bela Bela Local Municipalities. Detail feasibility studies are however required
to establish the available yield from the dam for the purpose of domestic supply and utilisation by
irrigated agriculture.

149 | P a g e
Hartbeespoort Dam
The Hartbeespoort Dam is a key area for development, tourism and recreation and forms part of the
Crocodile (West) catchment area. The DWS continues with activities to improve the water quality of the
Dam (being hypertrophic).
Vaalharts Irrigation Scheme
The Vaalharts Irrigation Scheme is in the process of being rehabilitated and refurbished. This would
ensure more efficient use of water and therefore making more water available for potentially new urban
as well as agricultural development. A preliminary study estimated that R4 billion would be required
over a period of 20 years to rehabilitate and upgrade the infrastructure, ensuring its sustained and
efficient operation.
23.4.8.7.1.4 Groundwater Development and Protection
There are no coordinated, regional developments of groundwater sources and this is definitely an
opportunity for the NWP and WSAs, seeing the cross-border nature of the groundwater sources. The
NWP has limited surface water sources available for further development and groundwater provides the
opportunity not only for human development, but also economic growth in the form of employment and
business development.
Areas that could potentially benefit from regional groundwater scheme development include:
Northern area of Madibeng and Moretele LMs:
Ventersdorp LM – rural area to the north of Ventersdorp.
Northern area of the Ditsobotla LM.
Southern area of the Ramotshere Moiloa LM.
Eastern area of the Mahikeng LM.
Whole of the Greater Taung LM.
Western area of the Naledi LM.
North-central area of the Kagisano-Molopo LM.
Groundwater abstraction and quality management would remain a priority to ensure sustainable
development of the source.
23.4.8.7.1.5 Water Services Development
The WSAs would continue making provision for and development of water supply infrastructure and
sanitation in urban and peri-urban areas. Furthermore, regional bulk infrastructure schemes are being
planned and implemented to ensure water requirements can be met for current and future
developments. This section focuses rather on the larger scheme developments.

150 | P a g e
Regional Bulk Infrastructure Grant (RBIG) Projects
RBIG projects are mostly for the development of water supply, but may include bulk infrastructure
development for treatment works larger than 2Ml/d (design capacity).
The following areas have registered RBIG projects for regional water supply development:
Kagisano Molopo Bulk Water Supply (feasibility study for water supply to ensure adequate
services for the municipality).
Greater Mamusa Bulk Water Supply (refurbishment and upgrade of the Bloemhof WTW and
abstraction works, storage and bulk pipeline from Bloemhof to Schweizer Reneke).
Moretele Bulk Water Supply (upgrade of the Klipdrift WTW, additional storage, extension of
water supply and raising of the Pienaars River weir).
Pilanesberg Regional Bulk Water Supply (upgrade of the Vaalkop WTW, pumping, bulk pipeline
to new Mafenya reservoir north of Phokeng).
Taung / Naledi Bulk Water Supply (refurbishment of the Pudimoe 1967 WTW, additional WTW
module, upgrade of Pudimoe 2003 WTW, bulk pipeline to Vryburg, bulk pipeline from Taung
Dam to a new WTW at Taung, storage and reticulation).
Ratlou Bulk Water Supply (water supply to Setlagole, Thutlwane and neighbouring Kraaipan
and Madibogo).
Ventersdorp Bulk Water Supply (upgrade of the Ventersdorp WTW, bulk pipeline and new
storage to Ventersdorp area).
The following RBIG projects relate to the upgrade or refurbishment of WTW and WWTW:
Madibeng Bulk Water Supply (refurbishment and upgrade of the Brits WTW).
Mahikeng Bulk Water Supply (refurbishment and upgrade of the Mmabatho WTW).
Potchefstroom WTW upgrade.
Koster Waste Water Treatment Works (new WWTW).
Wolmaransstad Waste Water Treatment Works (upgrading of the Wolmaransstad WWTW).
However, as illustrated in Map 23-57 below, the areas along the N4 (highway) corridor and the rural
areas of the Madibeng LM, Ramotshere Moiloa LM, Ditsobotla LM and the Tswaing LM are not included
in specific regional or local (MIG, MWIG Programmes) water-related projects, but have a total estimated
water supply backlog of 25 000 households.

151 | P a g e
Map 23-57: Areas not included in Current Water Supply Projects
Source: UWP 2015
Water for Industry and Mining
The majority of large scale mining operations are situated along the Western Bushveld Complex (along
the N4 highway between Gauteng, towards Brits, Rustenburg and around the Pilanesberg Nature
Reserve) and the Klerksdorp area (including Stilfontein, Vaal Reefs and Orkney). Smaller mining
operations are scattered within the province, but has a lesser impact on water resources and water
quality than the larger operations.
The gold mining areas increase the risk of water pollution both of surface and groundwater sources
through decanting acid mine water. The platinum group metals mining areas also have to manage
dewatering of mines, but do not pose an acid mine drainage risk.
Mines utilise water as much as possible with very little to no discharge by re-use of water for mine
processes. An opportunity exists for treated municipal wastewater to be used by the mining sector,
instead of mines abstracting directly or being supplied only with potable water.
Water for Agriculture (Irrigation, Livestock)
There are a number of irrigation schemes in the NWP, used mainly for crop, fruit and vegetable
production on a large or commercial scale. There are however opportunities to develop community
irrigation and water supply schemes suitable for crop, fruit and vegetable production as well as the
maintenance of livestock.
Table 23-17 provides a summary of the water service levels of each Local Municipality in the North
West Province according to the 2011 Census.

152 | P a g e
Table 23-17: Water Service Levels Per Local Municipality from the 2011 Census
Local Municipality
Urban / Rural No. of Households
No. of Households Above RDP
No. of Households At RDP
No. of Households Below RDP
BOJANALA PLATINUM DISTRICT MUNICIPALITY
Moretele
Urban 2337 1596 548 193
Tribal Land, Farming 49726 35483 4847 9396
Madibeng
Urban 44560 36448 3659 4453
Tribal Land, Farming 116163 72733 12897 30533
Rustenburg
Urban 132544 113202 6696 12646
Tribal Land, Farming 66499 54652 2494 9353
Kgetlengrivier
Urban 8711 7525 586 600
Tribal Land, Farming 5961 4503 531 927
Moses Kotane
Urban 6302 5717 493 92
Tribal Land, Farming 68891 36581 17966 14344
Sub-Total 501 694 368440 50717 82537
NGAKA MODIRI MOLEMA DISTRICT MUNICIPALITY
Ratlou
Urban - - - -
Tribal Land, Farming 4269 12200 10420
Tswaing
Urban 26889 7471 670 2274
Tribal Land, Farming 7546 8284 4389
Mahikeng
Urban 10415 21066 89 138
Tribal Land, Farming 23453 15384 24108
Ditsobotla
Urban 20219 20384 2555 1770
Tribal Land, Farming 8969 4547 6274
Ramotshere Moiloa
Urban 21293 7538 380 356
Tribal Land, Farming 15745 8377 8344
Sub-Total 227 000 116441 52486 58073
Dr RUTH SEGOMOTSI MOMPATI DISTRICT MUNICIPALITY
Naledi
Urban 14214 11598 1550 1066
Tribal Land, Farming 4359 2901 973 485
Mamusa
Urban 12585 9800 1427 1358
Tribal Land, Farming 2040 1311 390 339

153 | P a g e
Local Municipality
Urban / Rural No. of Households
No. of Households Above RDP
No. of Households At RDP
No. of Households Below RDP
Greater Taung
Urban 957 842 93 22
Tribal Land, Farming 47656 9038 24775 13 843
Lekwa Teemane
Urban 13245 13032 93 120
Tribal Land, Farming 1686 1382 138 166
Kagisano-Molopo
Urban 1499 1277 148 74
Tribal Land, Farming 27032 8777 9740 8515
Sub-Total 125 273 59 958 39 327 25 988
Dr KENNETH KAUNDA DISTRICT MUNICIPALITY
Ventersdorp
Urban 6372 5390 460 522
Tribal Land, Farming 8190 4637 2676 877
Tlokwe City Council
Urban 48261 45171 1595 1495
Tribal Land, Farming 4276 2769 769 738
City of Matlosana
Urban 114257 111462 1198 1597
Tribal Land, Farming 6185 4188 1162 835
Maquassi Hills
Urban 15975 15285 278 412
Tribal Land, Farming 4531 2299 1451 781
Sub-Total 208047 191201 9589 7257
SUB-TOTAL
Urban 486 509 434 803 22 518 29 188
Tribal Land, Farming 575 505 301 236 129 601 144 668
GRAND TOTAL
Urban and Rural 1 062 014 736 039 152 119 173 856
Percentage of total 100% 69% 14% 16%
From the above, the municipality with an overall majority of urban households below RDP, is the
Rustenburg LM – 12 646 households. This is largely due to the influx of people looking for employment
opportunities in the mining sector, thereby an increase in informal settlements.
The municipalities with most rural households below RDP are Madibeng LM and Mahikeng LM having
30 533 and 24 108 households respectively below RDP. The situation in the Madibeng LM is to an
extent similar to the Rustenburg LM, and in addition, people are also seeking employment in the
neighbouring Gauteng Province whilst staying in the Madibeng LM.

154 | P a g e
Map 23-58: Existing Water Needs Categorisation
Source: Statistics South Africa 2011
Map 23-59: Existing Sanitation Needs Categorisation
Source: Statistics South Africa 2011

155 | P a g e
23.4.8.8 Electricity
Electricity within the North West Province is primarily provided by Eskom to re-distributors - mainly
municipalities (10%), commercial (5%), agriculture (5%), mining (30%), industrial (30%) and Residential
(20%).
Electricity for supply to the North West Province is mostly generated by Matimba Power Station in
Limpopo which will be augmented by the Medupi Power Station in future.
Load Drivers within the province. North West Province is provided by two customer load networks
(CLN) viz. Rustenburg CLN and Carletonville CLN with the main load drivers within:
Rustenburg CLN
o Platinum mining and smelting operations
o Home to the largest platinum refinery; and two largest platinum mines
o The 4th largest integrated ferrochrome producer is based in the North West Province
Carletonville CLN
o Supplies predominantly gold mines
o Richest gold-producing hub
Map 23-60 Key Distribution Infrastructure
Source: Eskom 2015

156 | P a g e
23.4.8.8.1 Existing Networks
Map 23-61 Existing Networks
Source: Eskom 2015
23.4.8.8.2 Forward Planning
The provision of electricity is managed by the Department of Energy (Energy Planner,) which is
accountable for the Integrated Resource Plan (IRP).The Integrated Resource Plan (IRP) is intended to
drive all new generation capacity development.
The Long-term Electricity Planning18 goal is to ensure sustainable development considering:
Technical constraints.
Economic constraints.
Social constraints.
Externalities.
The purpose of the IRP is the identification of the requisite investments in the electricity sector that
maximize the national interest by the identification of the investments in the electricity sector that allows
the country to meet the forecasted demand with the minimum cost to the country.
The Integrated Resource Plan provides a Strategic Grid Plan which formulates long term strategic
transmission corridor requirements. The Plan is based on a range of generation scenarios, and
associated strategic network analysis. The horizon date is 20 years and it is updated every 2 - 3 years.
The transmission grid is divided into supply areas that are used to conduct the load forecast, and those
areas have a certain number of MTS substations supplied by them. The supply areas cross provincial 18
Integrated Resource Plan for Electricity (IRP) 2010-2030. Update Report 2013. 21 November 2013
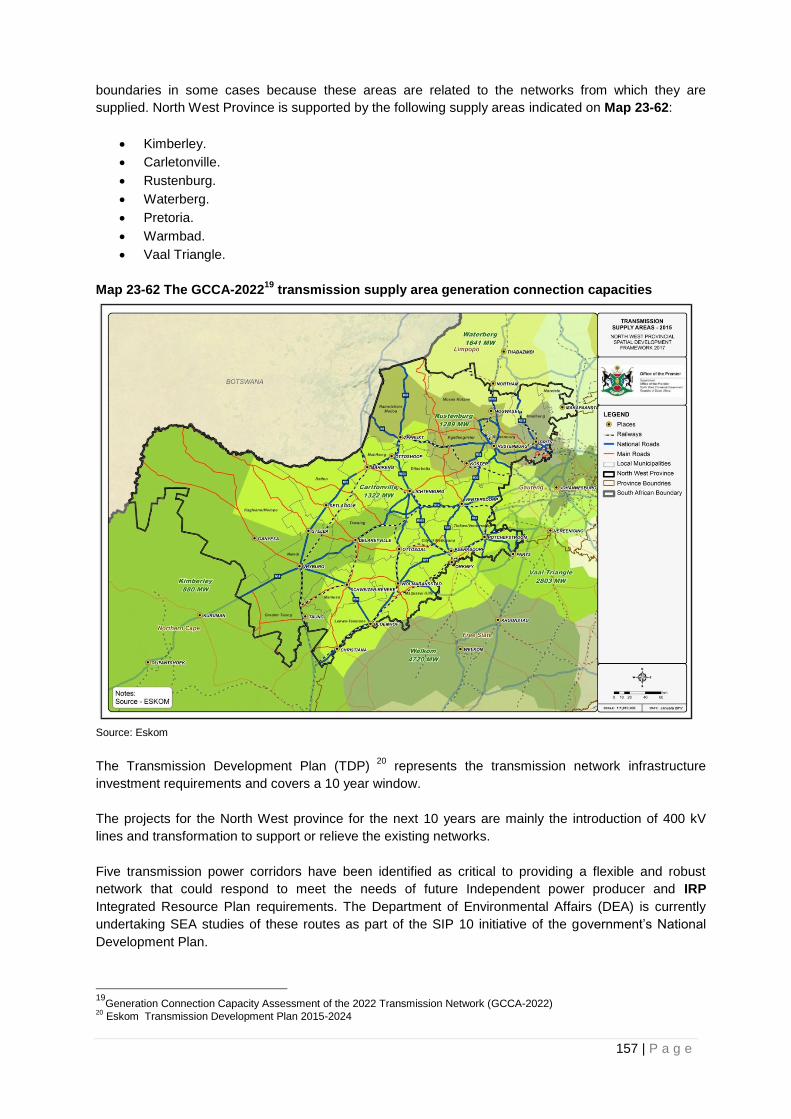
157 | P a g e
boundaries in some cases because these areas are related to the networks from which they are
supplied. North West Province is supported by the following supply areas indicated on Map 23-62:
Kimberley.
Carletonville.
Rustenburg.
Waterberg.
Pretoria.
Warmbad.
Vaal Triangle.
Map 23-62 The GCCA-202219
transmission supply area generation connection capacities
Source: Eskom
The Transmission Development Plan (TDP) 20
represents the transmission network infrastructure
investment requirements and covers a 10 year window.
The projects for the North West province for the next 10 years are mainly the introduction of 400 kV
lines and transformation to support or relieve the existing networks.
Five transmission power corridors have been identified as critical to providing a flexible and robust
network that could respond to meet the needs of future Independent power producer and IRP
Integrated Resource Plan requirements. The Department of Environmental Affairs (DEA) is currently
undertaking SEA studies of these routes as part of the SIP 10 initiative of the government’s National
Development Plan.
19
Generation Connection Capacity Assessment of the 2022 Transmission Network (GCCA-2022) 20
Eskom Transmission Development Plan 2015-2024

158 | P a g e
The location of the potential MTS substation projects for additional grid access and the transmission
power corridor routes are shown in Map 23-63 Planned Transmission Power Corridors.A Renewable
Energy Development Zone (REDZ) connecting to the grid is provided for in Naledi LM and Kagisano
Molopo LM.
Map 23-63 Planned Transmission Power Corridors
Source: Eskom
23.4.8.8.3 Access to Electricity
Map 3-64 indicates that the municipalities with an overall majority of households with access to
electricity include:
City of Matlosana LM.
Tlokwe City Council LM.
Rustenburg LM.
Lekwa Teemane
Kagisano-Molopo LM and Ramotshere Moiloa LM are the two municipalities with the lowest access to
electricity.

159 | P a g e
Map 23-64 Access to Electricity
Source: Statistics South Africa

160 | P a g e
24 CHAPTER 4: SPATIAL DEVELOPMENT FRAMEWORK
24.1 Introduction
The Spatial Challenges and Opportunities provided as part of Chapter 3 provide the crucial
components that underlie sustainable development, i.e. need for basic infrastructure and development
for the poor, economic growth and development, environmental conservation and improved livelihoods.
These spatial development priorities form the basis for guiding specific decisions regarding the desired
spatial development and arrangement of broad land uses within North West and investment and
development spending.
Chapter 4 Spatial Framework provides a Spatial Framework and Development Strategies that will
manage future growth and associated change in a way that protects and enhance the use of natural
resources, biodiversity and lifestyle values. This requires a highly sustainable pattern of development
based on the efficient utilisation of land and infrastructure, supported by management decisions over ad-
hoc and dispersed forms of development.
The Development Strategies provides for five (5) Strategic Objectives, each providing for a set of Spatial
Development Strategies, Strategic Focus Areas and Strategic Projects.
Future growth scenarios are defined providing for the baseline and sustainable growth targets.
The layout of Chapter 4 is summarised in Figure 4-1.
Figure 24-1: Chapter 4 Lay-Out

161 | P a g e
24.2 Strategy Development
24.2.1 Introduction
The development strategies of the North West Spatial Development Framework need to be supportive of
the objectives of the Vision 2030 National Development Plan and international and national policies,
principles and initiatives to reduce poverty and inequality over the next two decades.
The National Development Plan 2030 provides desired socio economic outcomes, mechanisms to
achieve it and conditions necessary to provide the focus for strategic priorities.
The socio economic outcomes include:
Economy and employment.
Improving education, training and innovation.
Social protection.
Mechanisms necessary to achieve the outcomes include:
Economic Infrastructure.
Transforming human settlements.
Environmental sustainability and resilience.
Inclusive rural economy.
The conditions necessary include:
Building a capable and developmental state.
Fighting corruption.
Building supportive, safe and cohesive communities.
In order to provide spatial dimension to the National Development Plan 2030, the North West Spatial
Development Framework needs to support the National Development Plan 2030 and also provide
guidance for future spatial development that is aligned to national, provincial, regional, district and local
planning.
24.2.2 Spatial Development Values
In order to plan and manage the spatial implementation of development in the province it is crucial that
all stakeholders agree on the core values which will help shape the spatial framework of the province.
The core values are intended to achieve integration between stakeholders through better linkages
connecting sector programmes, aligned infrastructure, social services, government spending, private
sector investment and economic development.
The core values for the North West Province are recommended to be the following:
Environmental integrity and sustainability through achieving a balance between safeguarding
natural resources, optimising the livelihoods of communities and developing a flourishing
economy.
Optimum use of existing resources including agriculture, forestry, renewable energy potential,
already impacted land (brown field areas) minerals, bulk infrastructure, roads, transportation and
social facilities.
Reduced settlement sprawl and more compact formalized settlement through densification and
diverse, mixed land uses.

162 | P a g e
Rapid economic growth that is sustained and inclusive.
Government spending on fixed investment focused on localities of economic growth and /
or economic potential in order to gear up private sector investment stimulates sustainable
activities and create long-term employment opportunities.
Development of productive land uses (creating economic opportunity) could stimulate
needed economic growth, job creation and tax base expansion. This will increase municipal
income enabling increased public sector investment to be focused towards social upliftment.
Where low economic potential exists investments should be directed at projects and
programmes to address poverty and the provision of basic services in order to address past
and current social inequalities.
The economic development of rural areas (CRDP).
Strategic capital investment in future settlement and economic development opportunities should
be channeled into activity corridors and nodes that are adjacent or link to the main growth
centres in order for them to become regional gateways.
Integration, synergy and linkages between urban and rural areas supported by appropriate
infrastructure.
Community based spatial planning and enforceable land use management based on agreed
sustainable community development codes with unified provincial legislation.
Correction of the historically distorted spatial patterns of settlement with optimum use of
existing infrastructure, integration of residential and employment opportunities in close proximity
to each other.
Achieving integrated development at community level.
Monitoring and evaluation of achievement in service delivery.
Source: Demacon

163 | P a g e
24.2.3 Provincial Spatial Development Scenarios
When considering future possibilities in the context of historical trends and dynamics there are believed
to be at least two possible growth scenarios for the province.
Essentially the “low growth, inequitable share development scenario” sees the existing trends
continuing-the baseline scenario
The “growth intervention, equitable share development scenario” pre-supposes interventions
through development management tools and spatial development plans will result in positive, beneficial
change which alters current trends towards a higher growth trajectory and more sustainable outcome.
This would involve more compact formalised development in integrated settlement regions, containing
productive rural resources linked to employment and economic growth in the primary and secondary
nodes and revitalised tertiary and fourth order settlements. This refers to the high-growth scenario.
Each of these is discussed in more depth below:
Scenario 1: Baseline – Low Growth: Inequitable Share
The main urban centres, immediate adjacent rural areas and the main transport corridors linking them
are the areas where urban and peripheral urban growth can be expected over the next 15 to 20 years.
The main features of the scenario therefore are expected to be as follows:
Strong private sector investment in high growth areas with a large onus for infrastructure
upgrade.
Broad based government expenditure aimed at addressing social need in poverty stricken areas.
The aforementioned stimulates isolated tax base growth; effectively penalises private sector
initiative; and ultimately increases the net tax burden.
Low and negative population growth is anticipated to continue within the core urban areas –
Rustenburg, Brits, Mahikeng, Potchefstroom and Klerksdorp – as urbanisation continues. There
will be large scale demand for urban and peripheral urban sites with a consequent demand for
urban level services.
Continued and extensive peripheral urban settlement development in the relatively high
population regions – Mahikeng, Rustenburg, Madibeng, City of Matlosana and Tlokwe.
Relative population stagnation is anticipated in the freehold land areas to the western side of the
province – Kagisano, Ratlou and Twaing.
Continued moderate levels of population growth are anticipated within the rural communities
towards the South-West and North-Eastern areas of the province – Ramotshere Moiloa, Moses
Kotane, Ditsobotla and Greater Taung.
This scenario is expected to continue to fuel the following development impacts:
It will result in more and more challenges affecting areas that are supposed to be conserved for
future generations – biodiversity hot spots could be destroyed.
In about 15 to 20 years valuable resources such as the forests and other precious resources will
shrink and eventually vanish. Agricultural soils will be washed away, there will be no grazing
land for rural households, poverty levels will increase and rural land will continue to lose its
value.
If efforts are not made to improve the rural areas to ensure that migration is discouraged, the
urban areas could become overpopulated resulting in the depletion of resources, breakdown of
infrastructure, and lack of facilities to support them. This situation will result in government
reaction rather than planning for future growth.

164 | P a g e
Vacant and local commonage land resources will become fully developed with time. As the land
release process is complex, it will be difficult for the urban areas to expand resulting in a lack of
development. Property values will increase with resultant increased in rents. The costs of living
will be pushed to very high levels.
Peripheral urban settlement sprawl if unchecked would also result in government continuing to
pour out resources for infrastructure in unsustainable settlements.
Existing infrastructure will be overstretched in some of the towns with numerous negative
implications as result.
Infrastructure as well as some key roads has already outgrown their planned capacities.
The imbalance between population, jobs and economic opportunities within the province will be
sustained.
Economic and employment growth will continue along its current trajectory, maintaining the
joblessness cycle within the province.
Evidently, the baseline scenario is not the preferred option to address future growth within the
province.
Map 24-1 Population Concentrations
Source: Statistics SA 2011(Adapted)

165 | P a g e
Map 24-2 Development Scenario 1

166 | P a g e
Scenario 2: High-Growth – Growth Intervention Development
The high road/ high growth scenario reflects a much more optimistic scenario. However, this scenario will
require direct decisive interventions. The high-growth scenario will require exceptional growth rates of
approximately 8.7%. It will require decisive and well thought through accurately aimed public
sector interventions. There should be a refrain from following a “blanket approach” where politics
determine expenditure. Future development should be bound by economic rationale – meaning that
money should be invested in locations where it will have maximum impact. This will result in an improved
spatial development pattern, with:
Strong private sector investment in high growth areas, supported by focused government
infrastructure investment to optimise the growth effect and subsequent income-generating,
revenue side of the tax equation (i.e. accelerate taxable / productive investment).
Onus for infrastructure upgrade vests with government and is not shifted to private sector.
Private sector responds, establishing higher confidence levels, which lead to greater investment
propensity.
More tax revenue is generated – creating more scope for social investment in low growth areas.
Government investment in low growth / marginal markets should be highly focused and
strategically aimed at high potential nodes and corridors – enhancing attractiveness for (income
generating) private sector investment (multibillion Rand private sector investments have a much
greater and more sensible job creation impact – and success rate – compared with relatively
small scale, government-funded entrepreneurial projects).
The emphasis will gradually shift from government investment in social services and non-
revenue generating subsidy housing to new income generating commercial developments, job
creation and concomitant tax base expansion – yielding a more equitable and sustainable overall
development scenario.
Focused economic development in the high population concentrations within Rustenburg,
Madibeng, Mahikeng, City of Matlosana and Greater Taung activity nodes as Economic Focus
Zones to be developed in tandem with the first order nodes.
The aforementioned will stimulate broad based tax base growth; effectively rewarding private
sector initiative; and ultimately reducing the tax burden on individual contributors.
This scenario will need to include planning for the following issues:
Land use management:
The massive demand for urban and peripheral urban land requires strong, integrated and
transparent land use planning and management systems at a local level, where potential land
use conflicts can be resolved.
Land use planning within the rural areas and communal land areas are also vital and conflicts in
terms of land allocation, planning and management between local government and traditional
authorities should be resolved.
Settlement planning:
The extensive demand for urban and peripheral urban sites requires high quality integrated
planning between the main government service providers of housing, water, waste and
sanitation, education, health, roads and transport.
It is vital that strong and integrated settlement planning capacity is built at local level to provide
well planned, located and serviced urban and peripheral urban sites.
Improved and integrated settlement planning will be achieved within the next 15 to 20 years,
enabling formalisation of compact settlements along effective transport routes.
Informal township areas should be formalised and effectively serviced and provided with the
required social and educational facilities. Accessibility to these townships should also be
increased in order to ensure proper linkages to economic / labour nodes.

167 | P a g e
Economic development:
Employment creation is vital in the rural areas and rural towns of the province. It goes without saying
that the main task of government is to facilitate business investment, growth and development to create
these jobs. The economic sectors of growth and opportunity in the province should be targeted, namely:
agriculture, mining, manufacturing, trade, finance and business services, general government services
and construction.
The establishment, nurturing and growth of small businesses, which tends to employ more people
relative to the scale of their investment, are especially important, particularly in the context of rural
development. Some of the key constraints to business growth and development include lack of land
tenure, lack of business, technical or managerial skills, lack of market information and knowledge, lack of
access to credit, isolation from markets through poor roads and infrastructure and insufficient demand to
support sufficient sales in poor communities. It is critical that resources are targeted at businesses that
have a sound business model, a good prospect for success and a clear path to commercial
independence.
Infrastructure:
The high-growth scenario must be based on successful implementation of integrated infrastructure
development which will be geared towards sustaining both rural and urban development initiatives.
Strategic transport corridors should link the rural areas with urban areas. Integrated programmes need
to be carried out in share impact areas of potential and economic opportunity.
Human resource development:
Lack of co-ordination and capacity constraints in key provincial departments and agencies, compounded
by leadership and staff changes in crucial departments and entities has led to the non-implementation of
government policy. If no efforts are directed towards redressing this situation in 15 to 20 years, no plans
would be implemented and there would be complete chaos with each department championing their
cause at the expense of the next depart
Governance:
Irreversible physical damage to the environment would increase in future if no action is taken to correct
the problem of overlapping legislation and policy instruments. The managed development scenario as
prescribed by SPLUMA assumes that a single legislative instrument is established at national and
provincial levels to ensure that a wall to wall planning and land use management system is introduced.
The long term vision of formalisation of compact settlements will need co-ordination and cooperation
across all government spheres and relevant stakeholders, in particular focusing on peripheral urban and
rural settlements.
Lack of coordination and capacity constraints have a direct impact on the quality of development
management, resulting in scattered development rather than integration. Issues of lack of coordination
also apply in cases where other government spheres are preparing spatial plans and the need for a
framework to guide all these processes cannot be over emphasised.
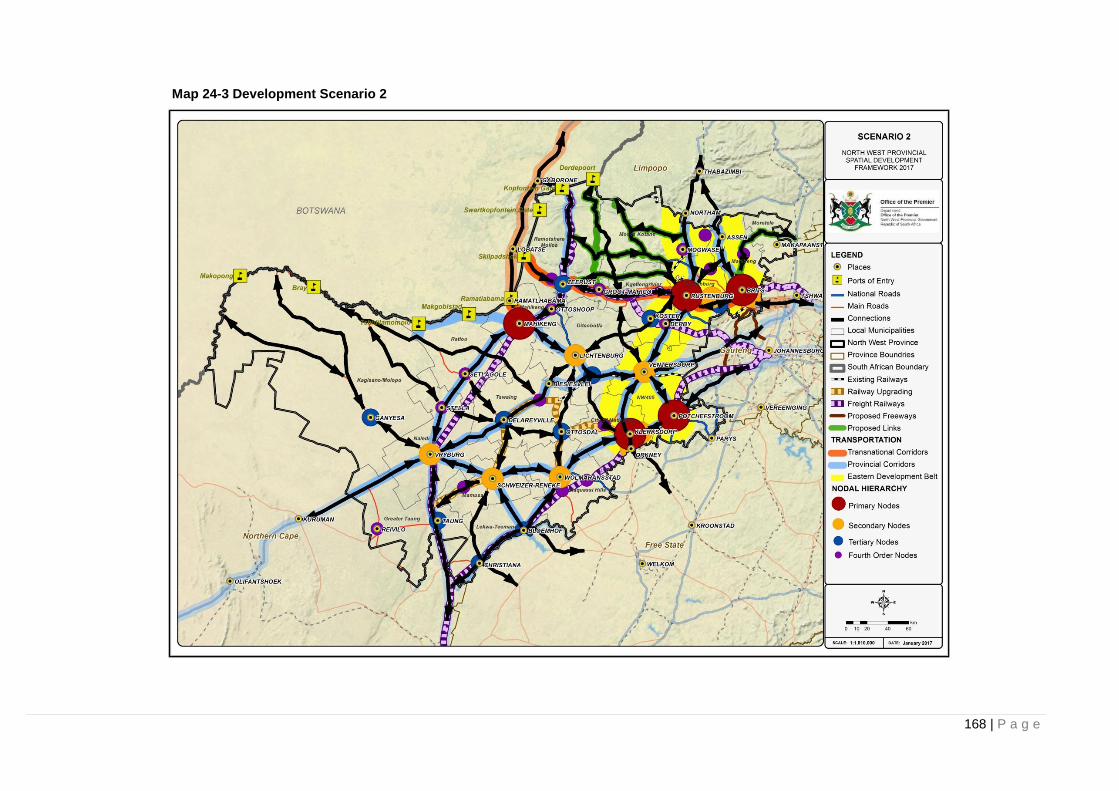
168 | P a g e
Map 24-3 Development Scenario 2
169 | P a g e
24.2.4 Development Philosophy
North West Province comprises numerous unique and significant development potential attributes
including the environmental quality of life in certain areas, availability of resources, temperate climate
and rural development opportunities. Whilst water resources are restricted in certain areas they are more
available in others. There is a large population with potential to be a strong market, with the development
of skills and rural economy. The growth of the informal economy presents a substantial opportunity and
urbanisation forces are immense and offer opportunities for improved quality of life, access to services
and amenities.
A future functional spatial development pattern for North West requires the integration of sustainable
natural resources, economic development and job creation and human development to provide the
Spatial Development Vision:
“A sustainable urban and rural spatial development pattern focussed on a modern, ecologically
sustainable economy, supported by a suitably skilled labour force and providing for quality of
living“
It is believed the future spatial perspective would comprise a Spatial Development Framework of
managed human settlements clustered in settlement nodes and corridors alongside productive areas,
managed ecological natural resource areas and connected to a network of strategic transportation
routes, open to the global, national and provincial economy.
In the context of a future development framework which underpins the Spatial Development Framework
vision for the North West Province, there are several strategic requirements which need to be addressed.
These include the following:
Harnessing the opportunities provided by urbanisation forces to achieve effective rural
development;
Adopting a flexible approach which suits the province and enables sustainable development
rather than inhibits growth and development.
Creating world class infrastructure, services and amenities to attract investment.
Integrated infrastructure development planning responding to long term forecasted requirements.
Pro-active planning which integrates aspiring economic activities into the mainstream economies
and urban fabric.
Safeguarding existing resources and creating opportunities for renewable energy development;
Prioritise areas in the province to develop.
Connecting the spatial frameworks to catalytic programmes in an implementation framework and
plan.
Creating opportunities for increased international, national, provincial and municipal connectivity,
linked by strategic transportation routes in the province.
Achieving improved quality of life in our settlements through formalisation, provision of planned
amenities and consolidation of land uses.
Gearing up of spatial planning capacity, skills, systems and procedures to achieve the vision.
Moving forward, the development philosophy for the province needs to ensure that the SDF is an
enabling management tool which supports the strategic “developmental state” approach in those
identified areas where development should be actively promoted in accordance with the policies and
strategic objectives of the communities, municipalities and the departments in the province.
In addition, there is a need to adapt the spatial planning, land use management systems and policy
frameworks to meet the unique needs of developmental governance within North West. Fulfillment of the

170 | P a g e
abovementioned strategic requirements, core values and principles is of paramount importance in order
to achieve consensus on the future spatial vision of the province.
24.2.5 Spatial Development Concept
As a first step towards a holistic spatial development strategy for North West, a Spatial Development
Concept was formulated. This Spatial Development Concept models spatial direction and context to
future developments. This framework promotes, clarifies and refines the spatial development principles
and development priorities supported by relevant policies and legislation and define the desired spatial
form of North West. The Spatial Development Concept is depicted on Map 24-4.

171 | P a g e
Map 24-4 North West Spatial Development Concept

172 | P a g e
24.3 Development Strategies
A set of interrelated strategic development objectives provide the foundation for the spatial development
strategies for North West supporting the Spatial Development Concept. Five strategic objectives were
identified providing Strategic Focus Areas (Areas of intervention on provincial, district regional and local
level):
Strategic Objective 1:
Focus development on regional spatial development initiatives, development corridors, development
zones and nodes
Strategic Objective 2:
Protect biodiversity, water and agricultural resources
Strategic Objective 3:
Promote Infrastructure Investment
Strategic Objective 4:
Support economic development and job creation guiding the spatial development pattern of North West
Strategic Objective 5:
Balance urbanisation and the development of rural areas within North West
Figure 24-2: Strategic Focus Areas

173 | P a g e
24.3.1 Strategic Objective 1: Focus development on regional spatial development
initiatives, development corridors, development zones and nodes
24.3.1.1 Spatial Development Strategy
Focussed development involving:
The integration of regional and sub regional spatial development initiatives, with the aim of
leveraging bilateral investments to have an overall greater regional impact.
The strengthening of development corridors, development zones and development nodes.
24.3.1.2 Strategic Focus Areas:
24.3.1.2.1 Supporting Regional and Sub regional Development initiatives
Supportive development initiatives on a regional and subregional scale include:
The Platinum Development Corridor / Trans-Kalahari Mega Africa Corridor (N4) as part of the
Coast 2 Coast Corridor (C2C).
The North-South Mega Africa Corridor linking Cairo with Cape Town including the N1.
The following development objectives support regional co-operation:
Increased sustainable economic growth in targeted sectors, which include:
Improved agricultural productivity.
Increased trade.
Improved management of transboundary resources and tourism.
Effective support for international agreements and programs.

174 | P a g e
Map 24-5: Strategic Objective 1: Capitalise on Regional Spatial Development Initiatives
The following regional spatial initiative development objectives need to be achieved:
The mobility of movement of goods and people within the sub region promoting trade involving:
The strengthening of the transnational development corridors to ensure:
The efficient movement of goods between Gauteng and Walvis Bay harbor.
The improvement of the development link between Botswana, Namibia and South Africa.
The improvement of links between developments within adjoining provinces.
The enhancement of cross border trade.
The provision of industries focused on:
Exporting through Maputo, Walvis Bay, Cape Town, Richards Bay and Durban harbours.
Utilising the strategic locality of industries.
Providing goods for downstream dispersement to manufacturing and trade within the
subregion.
Management of natural assets and development of tourism initiatives enhancing economic links
between tourism foci areas, including:
The Vredefort Dome World Heritage Site.
The Magaliesberg Biosphere.
Fossil hominid sites of South Africa.
Cradle of Humankind (Sterkfontein, Swartkrans, Kromdraai and Environs).

175 | P a g e
The Makapan Valley.
Taung Skull Fossil Site.
The proposed Marico Biosphere Reserve.
The continuous upgrading of international and national airports capacity including:
o The Pilanesberg Airport promoting international and regional tourism development.
o The Mahikeng Airport in support of an International Cargo Hub.
24.3.1.2.2 Strengthening of development corridors, zones and nodes
The following long term development objectives support the strengthening of development corridors,
development zones and development nodes:
Enhancing the role and function of the regional and sub regional transportation corridors and
links:
o The Platinum Corridor (N4).
o The Treasure Route Corridor (N12).
o The Western Frontier Corridor (N18).
Provide new provincial corridors such as:
o The Tlokwe - Mahikeng link with the aim of providing increased interaction between the
existing main development nodes of Tlokwe and Mahikeng promoting governance.
o A new national development corridor linking Gaborone, Mahikeng, Lichtenburg, Klerksdorp,
Potchefstroom, Parys and Sasolburg.
Increase accessibility between the disadvantaged rural communities.
Enhancing the interaction of regional development corridors, nodes and zones with Gauteng by:
o Enhancing accessibility and mobility within the North West Eastern Development Belt
between the regional nodes of Klerksdorp, Potchefstroom, Brits, Rustenburg and the
major nodes within Gauteng:
Enhancing the mobility function of routes N4, N14 and N12 towards Gauteng.
Establish the PWV3 and PWV 1 routes providing links respectively between :
Hartbeespoort Dam and Gauteng.
N12 and PWV 3 on the eastern side of Gauteng.
o Providing passenger railway systems:
Mahikeng - Johannesburg passenger rail system.
Gaborone - Zeerust - Rustenburg - Tshwane.
Johannesburg - Kimberley - Cape Town.
o Consolidating economic activity at strategic locations within development corridors
thereby strengthening existing urban areas and nodes.
o Concentrating investment in areas with potential for sustainable economic development
within development corridors.

176 | P a g e
o Enhancing the accessibility via road, rail and air within the region and sub region to
provide regional access for all communities to existing and future economic
opportunities.
o Distributing, dispersing development to other development nodes.
Increase regional accessibility and mobility by:
o Continuously increasing the mobility function of the N4, N12, N14 and N18 routes. This
will require by pass roads by SANRAL over the long term.
o Continuously upgrading secondary and tertiary routes.
o The upgrading of border entry facilities.
o The provision of the proposed cargo airport facility at Mahikeng.
o The provision of logistic facilities.
24.3.1.2.3 Integrating growth within North West Province
The above processes involve the development of North West over time from:
“A low growth, inequitable share development scenario” (See Map 24-2) .
To:
“A growth intervention, equitable share development scenario” (See Map 24-3).
24.3.1.3 Strategic Projects and Actions
1. Continuous upgrading of the mobility function of the N4, N12 and N18 primary corridors
(SANRAL).
2. Continuous upgrading of railway systems including passenger rail.
3. Continuous upgrading of the provincial road system (SANRAL).
4. The provision of the proposed cargo airport facility at Mahikeng Airport.
5. Upgrading of Ports of Entry (Department of Public Works).

177 | P a g e
Map 24-6: Development Corridors and Nodes
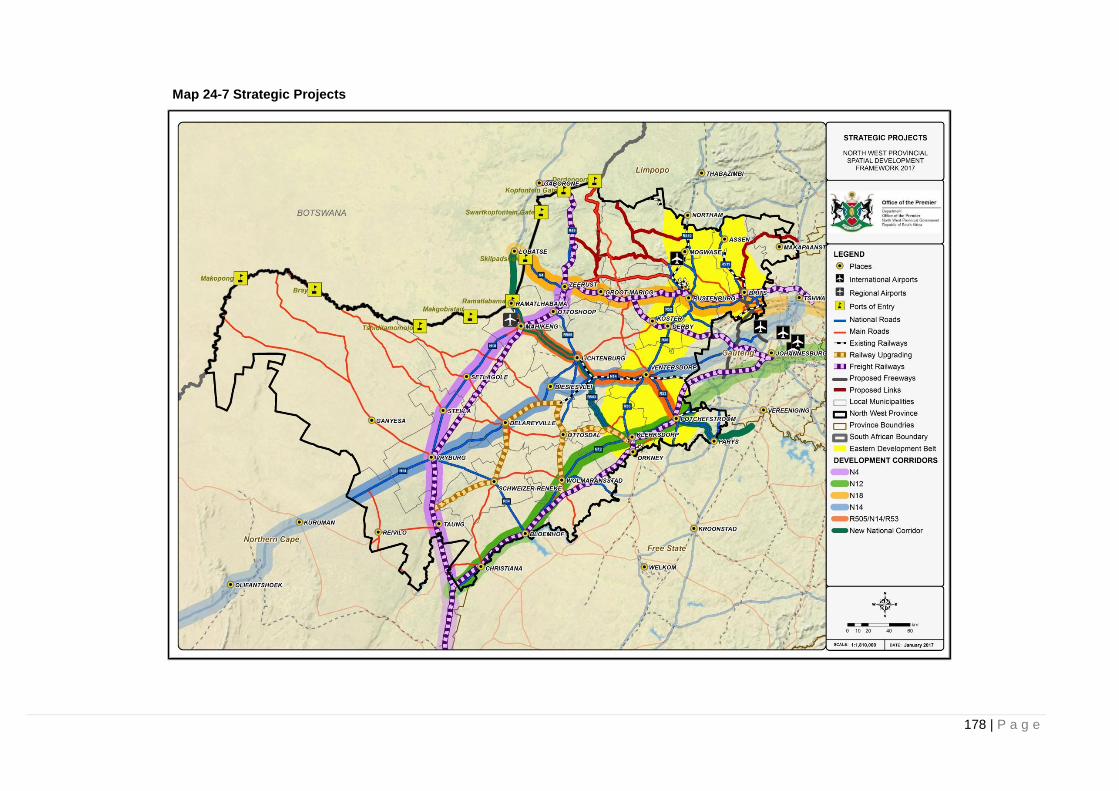
178 | P a g e
Map 24-7 Strategic Projects

179 | P a g e
24.3.2 Strategic Objective 2: Protect biodiversity, water and agricultural resources
24.3.2.1 Spatial Development Strategies
Developing and implementing strategies by all levels of government, that:
Sustains biodiversity.
Protect water resources and maximises the retention of valuable ecological infrastructure
(including water retention areas; rivers etc).
Adapts to the impacts of climate change.
Protect high potential and unique agricultural resources.
24.3.2.2 Strategic Focus Areas:
The following key issues should be considered:
1. Biodiversity:
Protected Areas (PAs) and Critical Biodiversity Areas (CBAs), as primary biodiversity or
environmental areas, needs to conserved and expanded where possible to meet targets as set
by the National Biodiversity Framework (NBF) and National Biodiversity Strategy and Action
Plan (NBSAP). See Map 4-8 and Map 4-9 below.
These areas need to be captured in all spatial development frameworks and processes.
Map 24-8 Critical Biodiversity Areas

180 | P a g e
Map 24-9 Biodiversity Resource Critical Areas
A Protected Areas Network should be established that can further support the wildlife economy
in the province.
Incorporate Land Management Objectives as per the NW Biodiversity Sector Plan 2015 into
municipal SDFs and Land Use Schemes (LUSs). See Table 4-1 below for a framework for
linking the spatial planning categories (CBA Map categories) to land use planning and
decision-making guidelines at a strategic level.
Table 24-1: A Framework for Linking the Spatial Planning Categories (CBA Map Categories) to
Land Use Planning and Decision-Making Guidelines
CBA Map Category Land Management Objective
Protected Areas &
Critical Biodiversity Area 1
(CBA1)
Maintain as natural conservation or production landscapes that
maximize the retention of biodiversity pattern and ecological
process:
Ecosystems and species fully intact and undisturbed
These are areas with high irreplaceability or low flexibility in terms of
meeting biodiversity pattern targets. If the biodiversity features
targeted in these areas are lost then targets will not be met.
These are landscapes that are at or passed their limits of
acceptable change.
Critical Biodiversity Area 2
(CBA2)
Maintain as near-natural production landscapes that maximize the
retention of biodiversity pattern and ecological process:
Ecosystems and species largely intact and undisturbed.
Areas with intermediate irreplaceability or some flexibility in terms of
area required to meet biodiversity targets. There are options for loss
of some components of biodiversity in these landscapes without
compromising our ability to achieve targets.
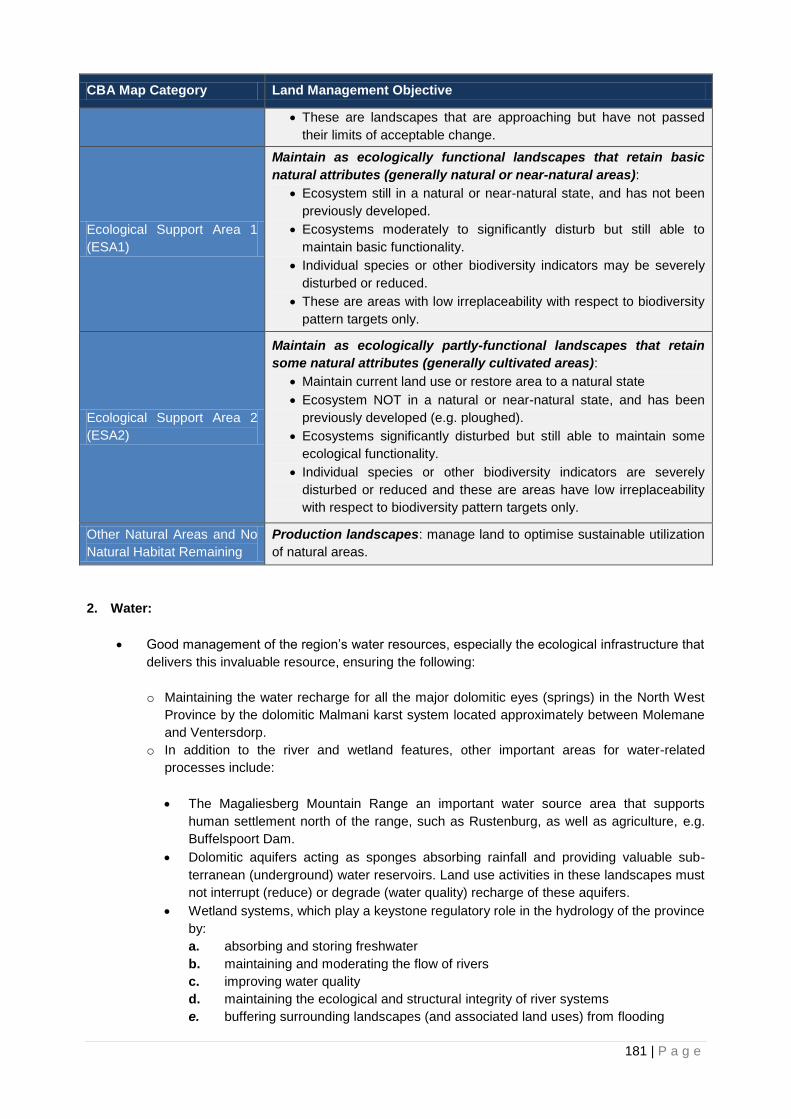
181 | P a g e
CBA Map Category Land Management Objective
These are landscapes that are approaching but have not passed
their limits of acceptable change.
Ecological Support Area 1
(ESA1)
Maintain as ecologically functional landscapes that retain basic
natural attributes (generally natural or near-natural areas):
Ecosystem still in a natural or near-natural state, and has not been
previously developed.
Ecosystems moderately to significantly disturb but still able to
maintain basic functionality.
Individual species or other biodiversity indicators may be severely
disturbed or reduced.
These are areas with low irreplaceability with respect to biodiversity
pattern targets only.
Ecological Support Area 2
(ESA2)
Maintain as ecologically partly-functional landscapes that retain
some natural attributes (generally cultivated areas):
Maintain current land use or restore area to a natural state
Ecosystem NOT in a natural or near-natural state, and has been
previously developed (e.g. ploughed).
Ecosystems significantly disturbed but still able to maintain some
ecological functionality.
Individual species or other biodiversity indicators are severely
disturbed or reduced and these are areas have low irreplaceability
with respect to biodiversity pattern targets only.
Other Natural Areas and No
Natural Habitat Remaining
Production landscapes: manage land to optimise sustainable utilization
of natural areas.
2. Water:
Good management of the region’s water resources, especially the ecological infrastructure that
delivers this invaluable resource, ensuring the following:
o Maintaining the water recharge for all the major dolomitic eyes (springs) in the North West
Province by the dolomitic Malmani karst system located approximately between Molemane
and Ventersdorp.
o In addition to the river and wetland features, other important areas for water-related
processes include:
The Magaliesberg Mountain Range an important water source area that supports
human settlement north of the range, such as Rustenburg, as well as agriculture, e.g.
Buffelspoort Dam.
Dolomitic aquifers acting as sponges absorbing rainfall and providing valuable sub-
terranean (underground) water reservoirs. Land use activities in these landscapes must
not interrupt (reduce) or degrade (water quality) recharge of these aquifers.
Wetland systems, which play a keystone regulatory role in the hydrology of the province
by:
a. absorbing and storing freshwater
b. maintaining and moderating the flow of rivers
c. improving water quality
d. maintaining the ecological and structural integrity of river systems
e. buffering surrounding landscapes (and associated land uses) from flooding

182 | P a g e
3. Climate Change:
Providing intact and well-functioning natural ecosystems resilient to the impacts of climate
change relative to highly modified (e.g. degraded areas) or anthropogenic landscapes (e.g.
croplands, mines and settlements).
Ecological process issues important for climate change adaptation, which need to be
considered in spatial planning and development within North West include:
o Corridors and connectivity:
Maintaining landscape connectivity is a major action that municipalities can
implement through land use planning to mitigate climate change impacts within the
province and South Africa as a whole. See map 4-10 below.
Mountains, ridges and rivers, including wetland systems, represent important natural
corridors in the North West.
o Climate change refugia:
Climate change refugia are local areas with significantly different or moderated local
or microclimates; a diversity of microclimates that provide species with local refuges
in the face of regional climate changes; or, biophysical features that resist invasion by
species from neighbouring biomes.
In the North West these include high altitude grasslands above 1400m; kloofs and
south facing mountain slopes; areas with high topographic diversity; wilderness
areas; and, quartzite-rich mountains, ridges and koppies.
These are areas with existing high species diversity; strong biophysical gradients
(e.g. altitude, rainfall or temperature) and attributes (e.g. shaded south-facing slopes,
nutrient poor soils); or, are large enough to maintain natural free-ranging populations
of species.
o Areas for minimising climate change impacts on society:
Protection of intact natural habitat, especially wetlands, floodplains and intact riparian
habitat is extremely important for reducing the magnitude of flood events as these
areas play an important role in regulating hydrological processes, such as storm
water run-off. In addition, these areas (especially floodplains) are extremely high risk
for communities living in these areas.
Ensuring that infrastructure and agricultural development is avoided, where possible,
in high risk areas to reduce the long term impact of climate change, particularly on
poor communities.

183 | P a g e
Map 24-10: Ecological Corridors to Combat Climate Change
4. The protection of high potential and unique agriculture land against development.
Map 4.11 indicates the distribution of the Agricultural Resource Critical Areas within the province.

184 | P a g e
Map 24-11: Agricultural Resource Critical Areas

185 | P a g e
24.3.2.3 Strategic Projects and Actions
1. Develop Water Resources Development and Management Plan.
2. Develop Strategic Approach to Mining and Agriculture in North West.
3. Updating of North West Protected Area Expansion Strategy.
4. Implement 2015 North West Biodiversity Sector Plan.
5. Undertake revision of North West Biodiversity Sector Plan in 2018/2019.
6. Implement Bojanala Platinum District Environmental Management Framework.
7. Develop Dr Kenneth Kaunda District Environmental Management Framework.
8. Develop Dr Ruth Segomotsi Mompati District Environmental Management Framework.
9. Develop Ngaka Modiri Molema District Environmental Management Framework.
10. Finalise District Municipal. Climate Change Vulnerability Assessment and Response Plans.
11. Establish Grassland Protection Programme.
12. Develop Water resource strategy supporting corridor and nodal development.
13. Develop spatial Master Plan for Rustenburg and Bafokeng.
14. Develop a North West Biodiversity Strategy and Action Plan.
15. Develop a North West Wildlife Economy Strategy.
24.3.3 Strategic Objective 3: Infrastructure Investment
To maintain a balance between investment aimed at meeting social needs of communities, and
investment aimed at promoting economic development and job creation.
24.3.3.1 Spatial Development Strategies
Basic Infrastructure.
Ensure efficient supply of water, electricity and waste management services to sustain additional
industry growth.
Eradicate backlogs in water and sanitation, electricity, housing.
Improve basic services.
Provide green infrastructure e.g. water tanks, renewable energy (e.g. solar).
Eradicate backlogs and maintain basic services.
Social Infrastructure.
Social infrastructure/facilities includes education, health and emergency services, social and
cultural facilities, social services, civil services, and recreational infrastructure.
Eliminate inequalities among and within communities.
Improve the quality of life especially of poor communities, provide for law and order, and
enhance the stability of a community.
Promote equitable access to social services for all communities and contribute to the
development of integrated and sustainable human settlements through the application of norms
and standards for social infrastructure requirements.
Ensure that sufficient land is reserved for these essential facilities.

186 | P a g e
Economic Infrastructure
Focus on projects identified as Strategic Infrastructure Projects (SIPs)21
.
Concentrate investment in areas with potential for sustainable economic development.
24.3.3.2 Strategic Focus Areas
24.3.3.2.1 Basic Infrastructure
To provide basic infrastructure in support of the social needs of communities
1. Water Infrastructure.
1. Addressing the challenges in water resource, water source and water services of:
a. On-site Sanitation.
Enhance the operation and management of existing sanitation installations in all
municipalities focusing on:
i. Municipalities with the highest number of households on on-site sanitation:
1. Madibeng LM.
2. Rustenburg LM.
3. Moses Kotane LM.
4. Mahikeng LM.
5. Moretele LM.
6. Greater Taung LM.
ii. Municipalities with a high risk to groundwater sources if the water table is high
and human health if groundwater sources are used for consumption focusing on
municipalities with the highest number of households reliant on groundwater as
source:
1. Mahikeng LM.
2. Madibeng LM.
3. Ditsobotla LM.
b. Ground Water Quality
Attend to ground water quality in all regions focusing on regions where problems with
groundwater quality are experienced:
i. The Northern part of the Madibeng LM.
ii. The Northern and central part of the Moses Kotane LM.
iii. Ramotshere Moiloa LM.
iv. The Eastern part of the Tswaing LM.
v. The northern area of the Kagisano-Molopo LM.
vi. Mamusa LM.
21
Presidential Infrastructure Coordinating Commission. (PICC). Provincial and Local Government Conference.
A summary of the Infrastructure Plan. Friday, 13 April 2012.

187 | P a g e
c. Ageing Infrastructure
Replace ageing infrastructure in all municipalities focusing on the towns of Brits,
Rustenburg, Potchefstroom, Klerksdorp, Makwassie, Wolmaransstad, Mahikeng and
Mmabatho, Lichtenburg, Zeerust and Vryburg.
d. Illegal Connections and Informal Settlements
Reduce illegal connections by:
Providing at least basic levels of services to all consumers.
Upgrading / relocation of informal settlements which tend to be closer to urban
areas.
Thereby:
Ensuring sustainable and adequate water provision to consumers.
Reducing the risk (health) of consumers of exposing the pipelines and content
to the environment.
Increasing water volumes supposedly allocated for a certain number of
consumers.
Maintaining pressure in the water supply pipelines.
Increasing revenue in contributing metered water consumption.
e. Rural Extent
Attend to the increasing maintenance costs and staff availability due to the large
distances required to travel to and from settlements or components such as pump
stations or reservoirs.
f. Surface Water Users
Attend to surface water and quality issues in all areas focusing on:
The agricultural areas of Schweizer Reneke, Ottosdal, Koster and Swartruggens
where water quality is affected by runoff from lands which use fertilizer to
increase production.
Wastewater treatment works (WWTW) that are not operated according to its
license conditions for effluent quality released back into the environment.
Hartbeespoort Dam near Brits, which receives the poor quality water
from Gauteng.
Spitskop Dam (near Vaalharts).
Barberspan Dam (between Delareyville and Sannieshof).
The Marico River.

188 | P a g e
Map 24-12: On-Site Sanitation
Map 24-13: Groundwater as Source

189 | P a g e
2. Exploit Spatial Opportunities linked to the use, development and protection of the water
sources within the NWP.
a. Groundwater Development including:
The development of areas that are underlain by high-yield water potential
dolomitic geological formations to ensure at least basic water supply to all
consumers. (ie. Kagisano-Molopo LM).
The development of regional groundwater schemes and improvement of
existing groundwater supply in areas such as Moretele LM, Madibeng LM,
Moses Kotane LM, most of the NMM DM and Dr RSM DM.
Areas where mining operations are active, where dewatering of mines can also
be investigated as an opportunity to augment water supply to domestic
consumers.
Water development to support agricultural activities such as crop production and
livestock to enhance the economic status of people and encourage further
infrastructure developments.
The development and implement of suitable groundwater management and
monitoring programmes by the WSAs in the NWP starting with metering of
water abstractions and water use. This would assist greatly in developing water
balances for the aquifers utilised for domestic consumption.
b. Surface Water Development including the further development of:
Surface water sources for water use in the larger catchment areas such as the
Klipvoor Dam, Vaalkop Dam, Bloemhof Dam and Spitskop Dam.
Improved operating rules of water resources, sources such as the Crocodile,
Elands, Setlagole River, Marico River, Schoonspruit River, Mooi River and Harts
River.
The Vaal River, being one of the larger water sources in South Africa and
forming the southern border of the NWP as a developmental opportunity for all
water use sectors.
The Hartbeespoort Dam is part of a water remedial programme – Metsi a Me –
to address the hypertrophic status of the Dam.
Dams along with smaller water bodies and rivers for recreational use and to
promote further tourism development.
Awareness to conserve and protect the natural resources and attract further
investment into the NWP.
c. Water Conservation and Water Demand Management
Achieving sustainable water supply and sanitation services by utilising local water
sources, optimising existing infrastructure and conservation of the water resources by:
Industries and mining including:
Recycling to ensure re-use of water in mining process and limited
release of effluent.
Utilising treated effluent from WWTW, reducing therefore their need for
potable water and creating a revenue stream for municipalities
including:
o Rustenburg( existing)
o Brits, Klerksdorp and Stilfontein
o The application thereof towards irrigation of public spaces and
recreational areas, instead of using treated, potable water.

190 | P a g e
Improved efficiency measures by the irrigation sector such as refurbishment of
canals and improved irrigation technology making more water available for other
developments (urban, agricultural, industrial, etc.) i.e. Vaalharts Irrigation
Scheme.
The overall management and operation of water resources in a particular
catchment area, or in shared water courses.
d. Water Re-Use
The re use of water needs to be done:
From wastewater treatment works in the province, some of which have a fairly
large treatment capacity for the re-use of treated effluent by the municipality or
other (such as for irrigation or industrial users) consumers. These include the
largest (>10Ml/d design capacity) WWTW within the province:
Brits WWTW.
Klerksdorp WWTW.
Lichtenburg WWTW (already being utilised by the municipality (for
irrigation) and by some of the mines).
Mmabatho WWTW.
Orkney WWTW.
Potchefstroom WWTW.
Rustenburg WWTW.
Stilfontein WWTW.
New wastewater works or the upgrading of wastewater works need to consider
this option in the designing thereof i.e.Koster WWTW.
Keeping and maintaining the operational standards of the WWTW at a low risk.
Dewatering of mines.
e. Urban Development
Densification and infill development need to be considered in urban development:
To provide more cost-effective services to a larger portion of the population.
To allow for existing infrastructure upgrades versus the extension of
infrastructure to new areas.
To reduce the extent of suitable land required for urban development as this
poses a challenge for many municipalities.
f. Irrigation Efficiency
Savings from irrigation efficiency should be achieved in the following irrigation areas:
The Vaalharts Irrigation Scheme supporting an estimated 1 040 irrigation
farmers and providing industrial water to six municipalities and nine other
industrial raw water users.
The Bojanala Platinum DM from the Crocodile (West) and Hartbeespoort
Irrigation schemes.
In the Dr Kenneth Kaunda DM, from the Schoonspruit GWS and Mooi River
GWS.
The Ngaka Modiri Molema DM from the Marico-Bosveld and Klein Maricopoort
Irrigation Schemes.

191 | P a g e
The Dr Ruth Segomotsi Mompati DM from the Vaalharts Irrigation Scheme.
g. Rainwater Harvesting
Rainwater harvesting to assist in alleviating the water requirements from formal water
supply infrastructure must include:
Households equipped with rainwater harvesting tanks.
Raw water for non-potable purposes such as cleaning, washing of clothes or
watering the garden.
h. Water for Development: Tourism and Recreation
Dams, pans and rivers forming part of conservation areas must be developed to ensure
the protection of the water and the surrounding environment. These include the
Hartbeespoort Dam, Bloemhof Dam, Vaal River, Barberspan and many other areas
utilised for water sports, bird watching, camping, fishing and other activities.
2. Energy Infrastructure
Energy infrastructure within North West must be provided in terms of the Integrated Resource Plan (IRP)
intended to drive all new generation capacity development. The Long-term Electricity Planning22
goal is
to ensure sustainable development considering technical, economic and social constraints and
externalities. The provision of bulk electricity by Eskom within North West in terms of the Integrated
Resource Plan (IRP) needs to:
Identify the requisite investments in the electricity sector that allows the province and country to
meet the forecasted demand.
Be implemented in terms of a Strategic Grid Plan (20 years and it is updated every 2 - 3 years),
which formulates long term strategic transmission corridor requirements.
Be implemented in terms of The Transmission Development Plan (TDP) 23
(10 years)
representing the transmission network infrastructure investment requirements mainly for the
introduction of 400 kV lines and transformation to support or relieve the existing networks.
Transmission power corridors and substations to provide a flexible and robust network that could
respond to meet the needs of future Independent power producer and IRP Integrated Resource
Plan requirements.
Distribution to all consumers and households by Eskom and municipalities within North West needs to
prioritise:
Areas of high economic activity.
Households within rural areas where access is relatively low.
22
Integrated Resource Plan for Electricity (IRP) 2010-2030. Update Report 2013. 21 November 2013 23
Eskom Transmission development plan 2015-2024

192 | P a g e
Map 24-14: Existing and Planned Transmission Power Corridors
Source: Eskom
Map 24-15: Electricity Priority Areas
Source: Statistics South Africa 2011

193 | P a g e
3. Social Infrastructure
The provision of social infrastructure needs to attend to the following:
Improve and maintain education, health, sport facilities, etc.
Eradicate backlogs and improve social infrastructure in all areas.
Provide public and non-motorised transport and facilities to improve accessibility to urban
functions and job opportunities.
Implement norms and standards for the provision of education facilities.
Develop and implement a comprehensive infrastructure plan, responsive to needs by 2015,
to produce an environment conducive for the public to access health services.
To eradicate backlogs and improve education:
Distribute the tertiary educational advantages provided by the future University of
North West in Tlokwe and Mahikeng over the four municipal districts.
Distribute the provision of other tertiary education and artisan training facilities to all
primary and secondary nodes.
Initiate the alternative utilisation of facilities e.g. underutilised schools.
To eradicate backlogs and improve health:
the aim is to deliver better quality health care (upgrade and maintain
facilities):
o Construct new clinics with accommodation.
o Construct new accommodation for personnel.
o The quality of health services: consolidate and expand the implementation of
the health system.
o By improving district hospitals and primary health care facilities.
o By improving human resources.
o Revitalise health infrastructure.
24.3.3.2.2 Focusing Investment on Economic Infrastructure:
Supporting the following development corridors:
The Platinum Development Corridor / Trans-Kalahari Corridor (N4) as part of the
Coast 2 Coast Corridor (C2C).
The North-South Mega Africa Corridor linking Cairo with Cape Town including:
o The N1.
o The N12 (Treasure Route Corridor.)
o The N18 (Western Frontier Corridor).
Supporting Activity Nodes including :
o The main activity nodes of Rustenburg, Brits, Mahikeng. Potchefstroom and
Klerksdorp.
o Secondary activity nodes of Orkney, Lichtenburg, Stilfontein, Vryburg, Schweizer-
Reneke, Hartbeespoort, Marikana, Wolmaranstad and Ventersdorp.
o Tertiary nodes of Taung, Bloemhof, Zeerust, Coligny, Koster, Ganyesa, Mooinooi,
Ottosdal, Christiana and Delareyville.
o Fourth order nodes of Setlagole, Reivilo, Setlopo, Leeudoringstad, Lehurutshe,
Lethabong / Hartbeesfontein, Sannieshof, Hartbeesfontein, Jericho, Makwassie,

194 | P a g e
Stella, Swartruggens, Groot Marico, Mogwase, Ramokoka, Ottoshoop. Amalia,
Derby, Bray.
See Table 24-2: Infrastructure Focus Areas.
Supporting rural development and the regeneration of the Villages, Townships and Small
Dorpies in line with the VTSD Initiative and CRDP and supporting emerging farmers in the
Land Reform Programme.
Enhancing the functional diversity of economic activity of these nodes in order to broaden the
economic base of the province and to enhance service delivery to local and surrounding rural
communities. Typical actions in this regard would include investment in agro industries,),
commercial and light industrial activity, business activity (office and retail) in well‐managed
Business Districts (CBDs) and government services.
Tourism related investment should be channeled into main functional areas in North West
Province strongly associated with Biodiversity Corridors and Nodes to provide functional
tourism routes. Tourism development should focus on the natural and heritage assets and
provide for the following:
The integration of regional tourism development as part of the regional tourism initiatives
also providing a system promoting interaction with local tourism initiatives.
The clustering of the existing tourism activities into corridors and nodes supported by
economic infrastructure and a road system to strengthen the ‘critical mass’ of product and
therefore the overall depth of the experience across the region. (North West Tourism
Strategic Objective).
The protection and development of the natural environmental assets for tourism or other
development needs to take place within the development parameters set by strategic and
detailed environmental assessments.
The development of the following key tourism areas:
o Wildlife and nature tourism.
o Activity and adventure tourism.
o Resort tourism, sports tourism.
o Agri Tourism.
o Conference and meetings.
o Leisure/entertainment.
o Industrial and township tourism.
o Cultural heritage.
o Events tourism.
Main Initiatives that need to be focused on include:
The Treasure Route SDI including mining tourism.
Vredefort Dome World Heritage Site.
The Pilanesberg National Park including the Sun City complex.
The 'Heritage Park' conservation corridor that will join Madikwe and Pilanesberg including the expansion of the Borakalalo nature reserve to link up with Vaalkop and expansion of the Vaalkopdam nature reserve to link up with the Pilanesberg National Park.
Hartbeespoortdam tourism node including the Magaliesberg Biosphere and Cradle of Humankind.
The North West University as regional educational and sport tourism hub.
Heritage routes including the King Maquassi heritage route, Anglo Boer War sites, architectural landmarks, monuments and gravesites.
The development of existing nature reserves.
Identification and development of Wildlife Economy Nodes.
Transformation in the wildlife sector.
195 | P a g e
Projects supporting tourism, needs to aim at enhancing community development.
The development of the wildlife economy should focus on economic activities dependent
directly on the biophysical environment of North West. These include:
o Activities directly linked to nature conservation and management.
o Game viewing in public and private nature reserves.
o Hunting, game sales, game breeding, fishing and livestock farming which is
dependent on natural veld and rangelands.
o Traditional and cultural uses of resources such as medicinal plants derived from the
wild.
o Ecotourism, adventure tourism, bird watching, hiking, game viewing and associated
infrastructure (such as lodging/accommodation, etc) which are reliant on natural
areas.
o The provision of goods and services to the wildlife economy e.g. transport,
infrastructure, catering, security, veterinary services, fuel, etc.
Agriculture related investment should focus on supporting and maintaining existing
commercial farming activities in the province in the areas where extensive commercial
farming and large scale food production currently occurs; as well as enhancing agrarian
transformation in the deep rural areas of North West in line with the objectives of the
Comprehensive Rural Development Programme (CRDP) and Villages, Townships and Small
Dorpies Initiative. Typical investment in these areas should include:
o Agri Parks at Springbokpan (NMM District), Vryburg (Dr RSM District),
Makapanstad (Bojanala District), Klerksdorp (Dr Kenneth Kaunda District).
o Support Land Reform Programme with emerging farmers.
o Farming equipment, irrigation systems, agricultural training facilities (colleges) and
the establishment of small local fresh produce markets which could lead to the
establishment of small scale agro industries focusing on processing and/or
packaging of local products before exporting it to larger centres.
o Artisan and other skills training initiatives and facilities.
o Social infrastructure in the form of centrally‐located Thusong centres serving the
rural areas, and which provide a comprehensive range of community facilities at an
one‐stop destination among these rural communities.
o Rural housing programmes are also to be consolidated around these Thusong
centres which will not only improve the utilisation of the community facilities located
here, but also create the “critical mass” required to enhance the potential for local
economic development – including the fresh produce market and associated
agro‐processing activities.
Infrastructure investment aimed at enhancing the mining industry should focus on
beneficiation of minerals through the implementation of The Platinum Special
Economic Zone. See Map 24-16: Mining Potential Critical Resources (Mining and
Prospecting Applications). Infrastructure investment should specifically also benefit
Mining Towns in distress such as Matlosana and Bojanala and smaller towns such as
Reveilo.
Infrastructure investment aimed at manufacturing should be exploited and also
expanded to focus on the competitive advantage of this sector within Madibeng,
Rustenburg, Tlokwe, Ditsobotla and Matlosana to support corridor development.
The development of the manufacturing industry requires that:
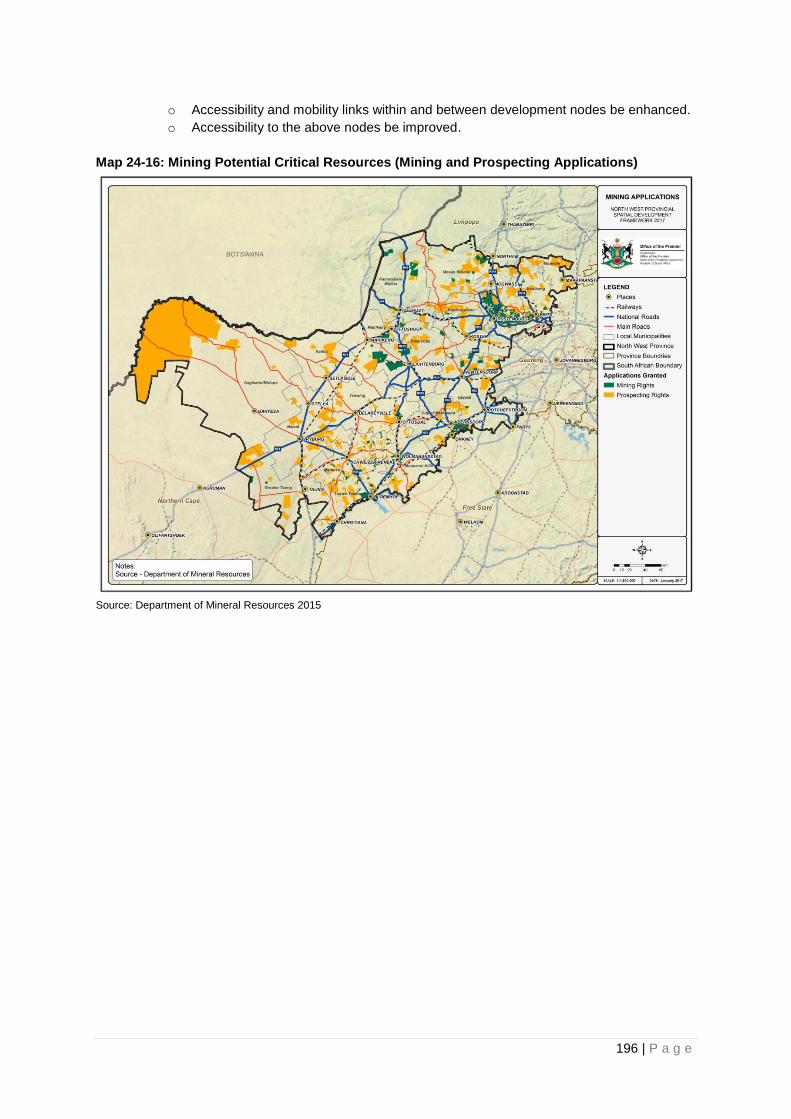
196 | P a g e
o Accessibility and mobility links within and between development nodes be enhanced.
o Accessibility to the above nodes be improved.
Map 24-16: Mining Potential Critical Resources (Mining and Prospecting Applications)
Source: Department of Mineral Resources 2015

197 | P a g e
Map 24-17: Manufacturing
Compiled by Laduma TAPP Planning Consultancy
Map 24-18 Development of Tourism Routes and Nodes
Compiled by Laduma TAPP Planning Consultancy

198 | P a g e
24.3.3.2.3 Integrating Infrastructure into Development Nodes and Densely Populated Large Population Concentrations (rural/long distance commuter areas)
Infrastructure provision for the development of nodes and densely large population concentrations needs to focus on the areas as contained in Table 24-2.
Table 24-2: Infrastructure Focus Areas
Node
Basic
Infrastructure
Social
infrastructure
Economic
Infrastructure
Primary and
secondary nodes
(stimulate
growth)
Primary Nodes
o Rustenburg
o Brits
o Mahikeng
o Potchefstroom
o Klerksdorp
Secondary Nodes
o Orkney
o Lichtenburg
o Stilfontein
o Vryburg,
o Schweizer-Reneke
o Hartbeespoort
o Marikana
o Wolmaranstad
o Ventersdorp
Ensure efficient
supply of water,
electricity and
waste
management
services to sustain
additional industry
growth.
Eradicate backlogs
in water and
sanitation,
electricity,
housing.
Improve basic
services
Education, health,
sport facilities to
enhance human
capital
development
Training facilities
for artisans.
Public transport to
long distance
commuter areas.
Eradicate backlogs
in social
infrastructure
Roads, rail,
pipelines, ICT to
stimulate growth
in main industries;
Improve access
from long
distances
commuter areas
to enhance
employment
opportunities.
Limit
environmental
impact
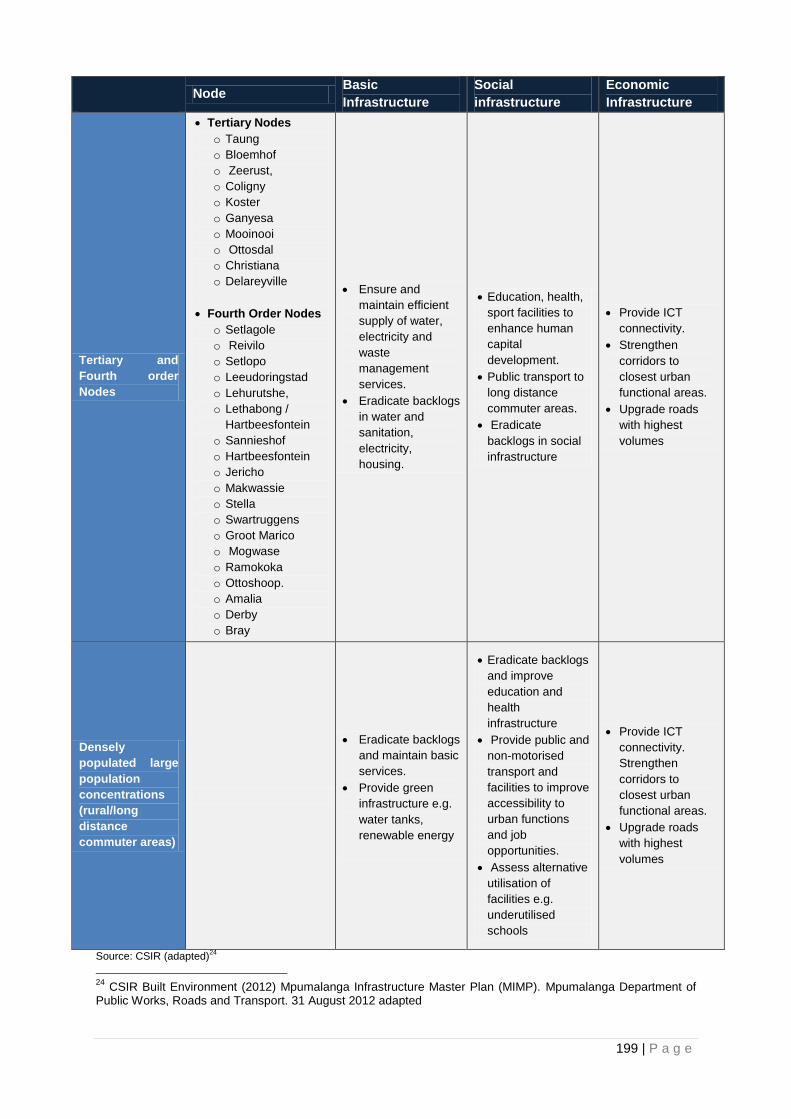
199 | P a g e
Node
Basic
Infrastructure
Social
infrastructure
Economic
Infrastructure
Tertiary and
Fourth order
Nodes
Tertiary Nodes
o Taung
o Bloemhof
o Zeerust,
o Coligny
o Koster
o Ganyesa
o Mooinooi
o Ottosdal
o Christiana
o Delareyville
Fourth Order Nodes
o Setlagole
o Reivilo
o Setlopo
o Leeudoringstad
o Lehurutshe,
o Lethabong /
Hartbeesfontein
o Sannieshof
o Hartbeesfontein
o Jericho
o Makwassie
o Stella
o Swartruggens
o Groot Marico
o Mogwase
o Ramokoka
o Ottoshoop.
o Amalia
o Derby
o Bray
Ensure and
maintain efficient
supply of water,
electricity and
waste
management
services.
Eradicate backlogs
in water and
sanitation,
electricity,
housing.
Education, health,
sport facilities to
enhance human
capital
development.
Public transport to
long distance
commuter areas.
Eradicate
backlogs in social
infrastructure
Provide ICT
connectivity.
Strengthen
corridors to
closest urban
functional areas.
Upgrade roads
with highest
volumes
Densely
populated large
population
concentrations
(rural/long
distance
commuter areas)
Eradicate backlogs
and maintain basic
services.
Provide green
infrastructure e.g.
water tanks,
renewable energy
Eradicate backlogs
and improve
education and
health
infrastructure
Provide public and
non-motorised
transport and
facilities to improve
accessibility to
urban functions
and job
opportunities.
Assess alternative
utilisation of
facilities e.g.
underutilised
schools
Provide ICT
connectivity.
Strengthen
corridors to
closest urban
functional areas.
Upgrade roads
with highest
volumes
Source: CSIR (adapted)24
24
CSIR Built Environment (2012) Mpumalanga Infrastructure Master Plan (MIMP). Mpumalanga Department of Public Works, Roads and Transport. 31 August 2012 adapted

200 | P a g e
24.3.3.3 Strategic Projects
Develop and implement a comprehensive provincial infrastructure plan, responsive to needs
including:
a. Water infrastructure.
b. Water reclamation.
c. Roads and transportation.
d. Energy efficiency-retrofitting.
e. Education.
f. Health.
Study on access to sustainable water sources for emerging farmers.
Develop and implement comprehensive Land Transportation Plans for the province, districts
and primary nodes.
Develop and implement Tourism Mater Plans for the province and districts in line with the
CRDP and VTSD plans.
Prepare Feasibility Studies for Strategic Cities in Taung, Mahikeng, Dr Kenneth Kaunda
Metro, Hartbeespoortdam and Bojanala Eco-Tourism City.
Develop and implement Thusong Centres roll out plan.
Develop and implement Human Capital Investment Plan.
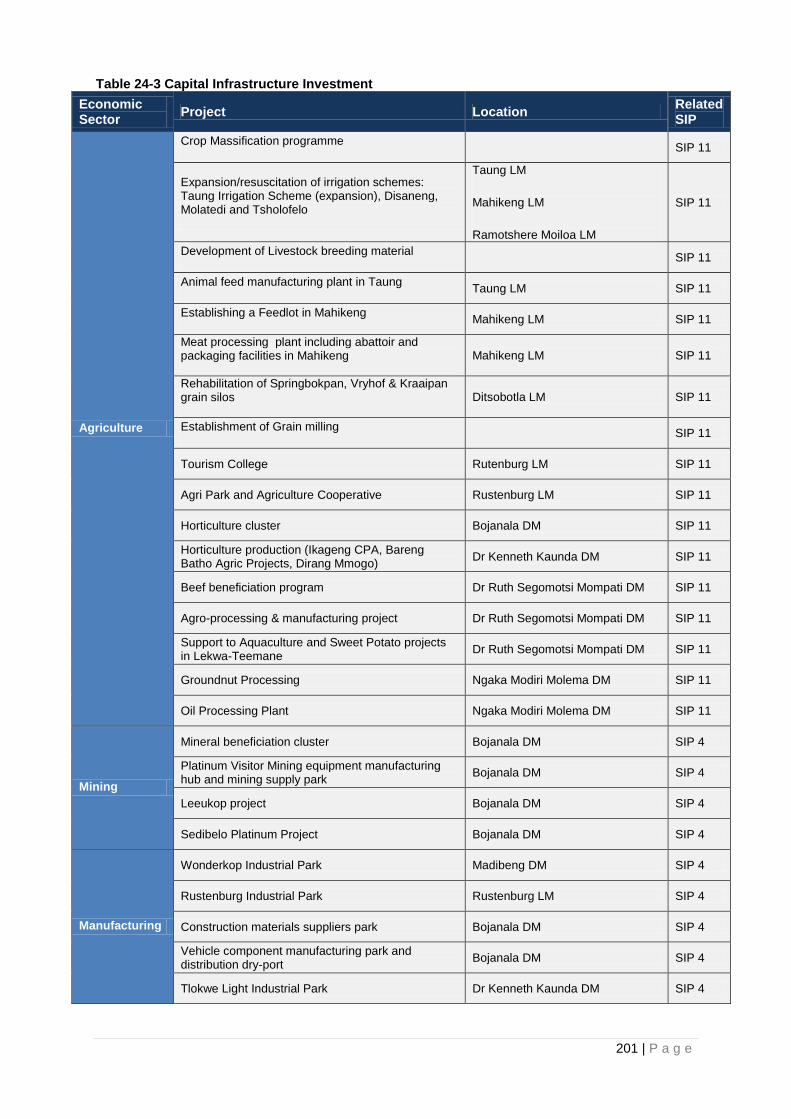
201 | P a g e
Table 24-3 Capital Infrastructure Investment
Economic Sector
Project Location Related SIP
Agriculture
Crop Massification programme
SIP 11
Expansion/resuscitation of irrigation schemes: Taung Irrigation Scheme (expansion), Disaneng, Molatedi and Tsholofelo
Taung LM
Mahikeng LM
Ramotshere Moiloa LM
SIP 11
Development of Livestock breeding material
SIP 11
Animal feed manufacturing plant in Taung Taung LM SIP 11
Establishing a Feedlot in Mahikeng Mahikeng LM SIP 11
Meat processing plant including abattoir and packaging facilities in Mahikeng Mahikeng LM SIP 11
Rehabilitation of Springbokpan, Vryhof & Kraaipan grain silos Ditsobotla LM SIP 11
Establishment of Grain milling
SIP 11
Tourism College Rutenburg LM SIP 11
Agri Park and Agriculture Cooperative Rustenburg LM SIP 11
Horticulture cluster Bojanala DM SIP 11
Horticulture production (Ikageng CPA, Bareng Batho Agric Projects, Dirang Mmogo)
Dr Kenneth Kaunda DM SIP 11
Beef beneficiation program Dr Ruth Segomotsi Mompati DM SIP 11
Agro-processing & manufacturing project Dr Ruth Segomotsi Mompati DM SIP 11
Support to Aquaculture and Sweet Potato projects in Lekwa-Teemane
Dr Ruth Segomotsi Mompati DM SIP 11
Groundnut Processing Ngaka Modiri Molema DM SIP 11
Oil Processing Plant Ngaka Modiri Molema DM SIP 11
Mining
Mineral beneficiation cluster Bojanala DM SIP 4
Platinum Visitor Mining equipment manufacturing hub and mining supply park
Bojanala DM SIP 4
Leeukop project Bojanala DM SIP 4
Sedibelo Platinum Project Bojanala DM SIP 4
Manufacturing
Wonderkop Industrial Park Madibeng DM SIP 4
Rustenburg Industrial Park Rustenburg LM SIP 4
Construction materials suppliers park Bojanala DM SIP 4
Vehicle component manufacturing park and distribution dry-port
Bojanala DM SIP 4
Tlokwe Light Industrial Park Dr Kenneth Kaunda DM SIP 4

202 | P a g e
Economic Sector
Project Location Related SIP
Tourism and
Cultural
Industries
Horse riding and hiking facility Madibeng LM SIP 4
Amusement Park on sun City Road Madibeng LM SIP 4
Implementation of Heritage Park Bojanala DM SIP 4
Development of tourism facilities at Borakolalo Reserve
Bojanala DM SIP 4
Bospoortdam Tourism / Waterfront development Bojanala DM SIP 4
ICT
Distribution and logistics hub Bojanala DM SIP 4
Development of N4 integrated mixed land use precincts
Bojanala DM SIP 6
Bulk infrastructure development program to unlock and support rapid development at key development nodes
Bojanala DM SIP 6
Transport
Road D1303 between Wolmaranstad and Maquassi Hills
Dr Kenneth Kaunda DM SIP 18
Road P13/4 from Wolmaranstad to Wesselsbron Dr Kenneth Kaunda DM SIP 18
Road D509 Leeuwdoringstad Dr Ruth Segomotsi Mompati DM SIP 18
Water
Infrastructure
Projects
Construction of New Taung Water Treatment Plant Dr Ruth Segomotsi Mompati DM SIP 18
Construction of Bulk Water Supply Pipeline from New Taung Water Treatment Plant to various villages
Dr Ruth Segomotsi Mompati DM SIP 18
Construction of the Bulk Water Supply Line from Bloemhof to Schweizer-Reneke
Dr Ruth Segomotsi Mompati DM SIP 18
Sources: Municipal LED Strategies North West Economic and Enterprise Development, Economic Planning. Interventions Distressed Mining Towns. July 2016 North West Provincial Government: Rebranding, Repositioning and Renewal Strategy. July 2016
24.3.4 Strategic Objective 4: Economic development and job creation supporting and
guiding the spatial development pattern of North West
24.3.4.1 Spatial Development Strategies
The synergistic development of agriculture, mining , manufacturing and beneficiation, tourism
and cultural industries as economic drivers
The adoption of different types of strategies to manage future growth.
Minimising the spatial conflicts that exist between the various industries and biodiversity
The distribution of economic activities as part of development corridors, development nodes,
activity corridors and activity nodes
The distribution of industrial areas in support of corridor development, (to strengthen the
economy of nodes
Reverse urban decay within all cities, towns and villages promoting investors’ confidence and
the economic regeneration of these nodes.

203 | P a g e
24.3.4.2 Growth Strategies
Four types of strategies are proposed to assist the province to manage future growth, namely:
Revival strategy.
Kick start strategy.
Growth management strategy.
Maintenance strategy.
Each of these strategies is briefly outlined below.
24.3.4.2.1 Revival Strategy
Application: Older, struggling and under-developed economies.
Rationale:
Internal problems are experienced within the local economy. The focus of the strategy is on re-
establishing local economic integrity.
Initiatives:
Urban renewal preventing urban decay.
Transformation of distressed mining towns.
Significant public sector investment – infrastructure, services, public amenities and facilities,
linkages and general accessibility.
Internal clean-up and management.
Crime reduction and improved security initiatives.
Promotion and maintenance of service excellence.
Provision of public land and buildings.
Investment brokerage – take opportunities to the market.
Risk reduction/business recruitment.
Accommodating SMMEs within economic nodes.
24.3.4.2.2 Kick Start Strategy
Application: Developing economies - Previously disenfranchised economies.
Rationale:
The strategy focuses on:
Active risk reduction.
Investment opportunity recruitment.
Emphasis on innovative development products.
Building on existing strengths within these economies.
Apart from inadequate trade and commercial facilities in these areas, public facilities (e.g. schools,
libraries, clinics and community centres), are too dispersed to create agglomeration advantages for
private sector development. Trade and commercial development requires feet and the grouping of
public facilities is an imperative to kick start development in these areas.

204 | P a g e
Initiatives:
Service excellence.
Public sector commitment – public sector infrastructure and amenities (multiyear public sector
investment framework focused on municipal infrastructure, public amenities and social housing
to serve as catalyst to kick start private sector investment).
Growth and expansion fueled by market forces.
Managed nodal hierarchy development and growth.
Effective land use management and township layouts.
Develop market related incentive packages.
Provide public land.
SMME business support and formalisation.
24.3.4.2.3 Growth Management Strategy
Application: Rapidly growing economies.
Rationale:
Existing established commercial nodes contribute significantly to economic goals and objective and
the fiscus including job creation. It is vitally important that these economies are maintained and should
continue to grow. Retail development often serves as catalyst for other types of commercial
development, e.g. office sector development and automotive parks, which is not always factored into
forecasts that inform spatial plans.
Initiatives:
Managed nodal hierarchy development and growth:
o Primary nodes – highest order nodes accommodating higher order trade and commercial
facilities.
o Secondary nodes - second order nodes - accommodating smaller trade and commercial
facilities (i.e. community type shopping centre and / or a hyper type centre).
o Lower order nodes will predominantly serve local neighbourhoods.
Focus on preventing urban decay.
Delineate nodal boundaries in order to encourage agglomeration advantages – urban edge.
Develop a detailed investment strategy, framework and growth plan for each primary
node/urban core.
Investment brokerage – take opportunities to the market.
Maintain and operate public space and infrastructure near investments.

205 | P a g e
24.3.4.2.4 Diversification Strategy
Application: Stable growing economies.
Rationale:
Strengthen the economies’ position.
Focus on growth and expansion.
Focus on diversification and identification of new opportunities.
Ensure attractive building stock and physical business environment.
Investment marketing.
Stable economies are, more often than not, poised on a knife’s edge and may be on the verge of a
decline cycle. Focused intervention is required to protect investments and hence, the city’s rates
base.
Initiatives:
Protect and expand investment and municipal tax base.
Develop a framework with regard to priority investment areas and liase with the business
community.
Expand the nodal hierarchy – and the urban property markets accommodated within key
nodes.
Diversify the local economy – focus on forward and backward linkages.
Uphold business environment and property investment maintenance – contribute to retain and
instill business confidence.
Ensure effective municipal management and service excellence.
Uphold public sector commitment – maintenance and expansion of existing public infrastructure
and amenities.
24.3.4.3 Strategic Development Guidelines on Municipal Basis
The subsequent set of tables provides detailed guidelines for future spatial development for each of
the local municipal economies.
24.3.4.4 Strategic Projects
Prepare a Provincial Infrastructure Investment Plan.

206 | P a g e
Table 24-4: Growth Strategy per Municipality
Source: Demacon 2016

207 | P a g e
24.3.5 Strategic Objective 5: Balancing urbanisation and the development of rural areas
within North West
24.3.5.1 Spatial Development Strategies
This requires the following interrelated spatial development strategies:
1. The development of sustainable cities and towns where people, jobs, livelihood opportunities
and services are aligned creating more functionally integrated, balanced and vibrant urban
settlements 1 and townships.
2. The integration of urban and rural areas focusing on linkages between rural and urban areas
thereby enhancing growth by facilitating the flow of resources to where they have the largest
net economic and social benefits1.
3. Reviving rural areas2 into vibrant, equitable and sustainable rural communities
3 (including
small towns (dorpies), settlements and villages).
The above strategies need to spatially support the Rebranding, Repositioning and Renewal (RRR) provincial policy thrust anchored by 5 concretes, focusing on:
1. Agriculture, Culture and Tourism (ACT) and its tributaries
The ACT concrete is the anchor of economic growth especially in rural areas where poverty, unemployment and inequality is at the highest. All other sectors of the economy such as
mining, manufacturing and retail will serve as tributaries to ACT.
2. Villages, Townships and Small Dorpies (VTSD)
The VTSD concrete aims to address the skewed economic landscape in the province by ensuring that the previously marginalised villages, townships and small dorpies are
developed and economically vibrant.
Adding to:
3. Reconciliation, Healing and Renewal (RHR)
4. The Setsokotsane approach for Radical Socio-Economic Transformation which place bias
focus to the previously marginalised Villages, Townships and Small Dorpies. 5. The Saamtrek-Saamwerk Philosophy promoting the multi-sectoral partnership and
encouraging the spirit of cooperation in improving the lives of the people of North West Province.
24.3.5.2 Strategic Focus Areas:
A. The Development of Sustainable Cities and Towns
Urban Areas within North West need to :
Mainly accommodate the urbanisation trend in Primary and Secondary Towns with a regional
and sub regional context within which a balanced settlement pattern can take place with regard
to:
Population distribution.
The availability of resources particularly water.
Economic potential for growth.
1 Department of Cooperative Governance and Traditional Affairs (COGTA). Integrated Urban Development
Framework Draft: September 2014 2 Chapter 8 of the National Development Plan (NDP) ‘Transforming human settlements and the national space
economy’ 3 CRDP

208 | P a g e
Table 24-5 Primary and Secondary Towns with a Sub Regional Context
Town Order Significance Corridors
Rustenburg Primary Regional Platinum Corridor ( N4), Eastern Development Belt
Klerksdorp Primary Regional Treasure Corridor ( N12), Eastern Development Belt
Potchefstroom Primary Sub-Regional Treasure Corridor ( N12), Eastern Development Belt
Mahikeng Primary Regional Western Corridor (N18)
Brits Primary Sub-Regional Platinum Corridor ( N4), Eastern Development Belt
Orkney Secondary Sub-Regional Treasure Corridor ( N12)
Lichtenburg Secondary Sub-Regional N14
Vryburg Secondary Regional N14
Schweizer-Reneke
Secondary Sub-Regional Treasure Corridor ( N12)
Hartbeespoort Secondary Sub-Regional Platinum Corridor ( N4), Eastern Development Belt
Wolmaranstad Secondary Sub-Regional Treasure Corridor ( N12)
Ventersdorp Secondary Sub-Regional N14
Zeerust Tertiary Sub-Regional Platinum Corridor ( N4)
Koster Tertiary Sub-Regional Platinum Corridor ( N4)
Ottosdal Tertiary Sub-Regional N14
Christiana Tertiary Sub-Regional Treasure Corridor ( N12)
Delareyville Tertiary Sub-Regional N14
Stilfontein Secondary Local N14
Accommodate the Five City Projects Initiative implementation including:
The City of Mahikeng.
Taung City.
The Metropolitan City of Dr. Kenneth Kaunda.
Hartbeespoortdam City.
Bojanala Eco - Tourism City.
See Map 24-19.
Address the transformation of distressed mining towns including the municipalities of Matlosana,
Madibeng and Rustenburg
Within urban areas the following spatial guidelines1 need to apply:
1. Integrated Urban Planning and Management through:
Alignment with spatial, sectoral and strategic plans.
Quality and implementable local plans.
Alignment of land use and human settlement to transport planning.
1 COGTA 2016. Integrated Urban Development Framework 2016

209 | P a g e
Integration of spatial planning and urban resilience.
Supporting and strengthening capacity to implement SPLUMA.
Improvement of urban management.
Developing and strengthening instruments for creating compact cities and connected
cities.
Maximising Intergovernmental Relations structures as mechanism for coordinating
planning.
Ensuring greater involvement by the Premier and MECs.
2. Integrated Transport and Mobility through the following policy priorities:
Empower Cities in accordance with the National Land Transport Act (NLTA).
Strengthen and integrate public transport nodes.
Invest along core public transport nodes and corridors.
Make cities pedestrian and cyclist friendly.
3. Integrated sustainable human settlements through the following policy priorities:
Accelerate the upgrading of informal settlements.
Priorities the regeneration of inner cities preventing urban decay.
Provide additional options for accessing urban opportunities.
Promote densification including support for backyarding.
Redevelop townships.
Support inclusionary housing.
Identify and fast track land for settlement interventions.
Applying urban design principles.
Transform public spaces into safe places of community life.
4. Integrated urban infrastructure through the following policy priorities:
Institutionalise municipal long-term infrastructure planning.
Strengthen intergovernmental planning, roles and partnerships.
Wide resources of finance for urban infrastructure.
Invest in ICT infrastructure and literacy.
Develop infrastructure as a bridge between rural and urban areas.
Building resilience through integrated urban infrastructure.

210 | P a g e
Map 24-19: 5 Cities Projects
Source: Office of the Premier North West Province
5. Efficient land governance and management through the following policy priorities:
Strengthen land- use planning and management.
Address the fragmentation in public land information.
Improve intergovernmental relations for the acquisition or transfer of state land.
Speed up security of land tenure.
Promote land-value capture.
Ensure legislative concepts are applied consistently.
Address the impact of traditional authority areas within predominately urban
municipalities.
Improve municipal access to SOE and state- owned enterprises.
Improve relations between municipal councils and traditional authorities.
6. Inclusive economic development through the following policy priorities:
Strengthen the economic role of municipalities.
Strengthen municipal institutional capacity in economic development.
Support municipalities in building and using economic intelligence.
Initiate differentiated development strategies for cities and towns.
Strengthen roles and leverage partnerships with other economic stakeholders.
Create the local conditions for supporting enterprise development and growth.
Progressively improve inclusive economic infrastructure and services.
Support community-based enterprises and work.
Support urban livelihoods and the informal sector.
Empowered active communities.
Improve access to quality public infrastructure and facilities.
Effective urban management.

211 | P a g e
Sustainable Finances
The Integration of Urban and Rural Areas
The integration of urban and rural areas needs to focus on linkages:
Enhancing mobility and Accessibility
The small towns, settlements (dense population concentrations) and villages of which
the majority are associated with rural communities should link with nearby regional and
sub regional nodes of economic potential through the provision of:
Efficient roads infrastructure.
Integrating transportation with urban areas.
Enhancing mobility on link roads
Reviving the rail networks in by:
Supporting Government’s Road to Rail Policy.
Reviving railway branch lines supporting rural areas for all users.
Providing passenger transportation on main lines including:
o N4/ N14 Corridors: Mahikeng – Johannesburg.
o N12 Corridor: Cape Town- Kimberley- Johannesburg.
o Extension of N4 Corridor: Inter- regionally connecting Rustenburg, Zeerust,
Gaborone.
Economic Linkages
Providing economic linkages between urban and rural areas including the development and
provisioning of:
Agri Parks (APs), Farmer Production Support Units (FPSUs) and urban and rural
markets.
ITC Networks.
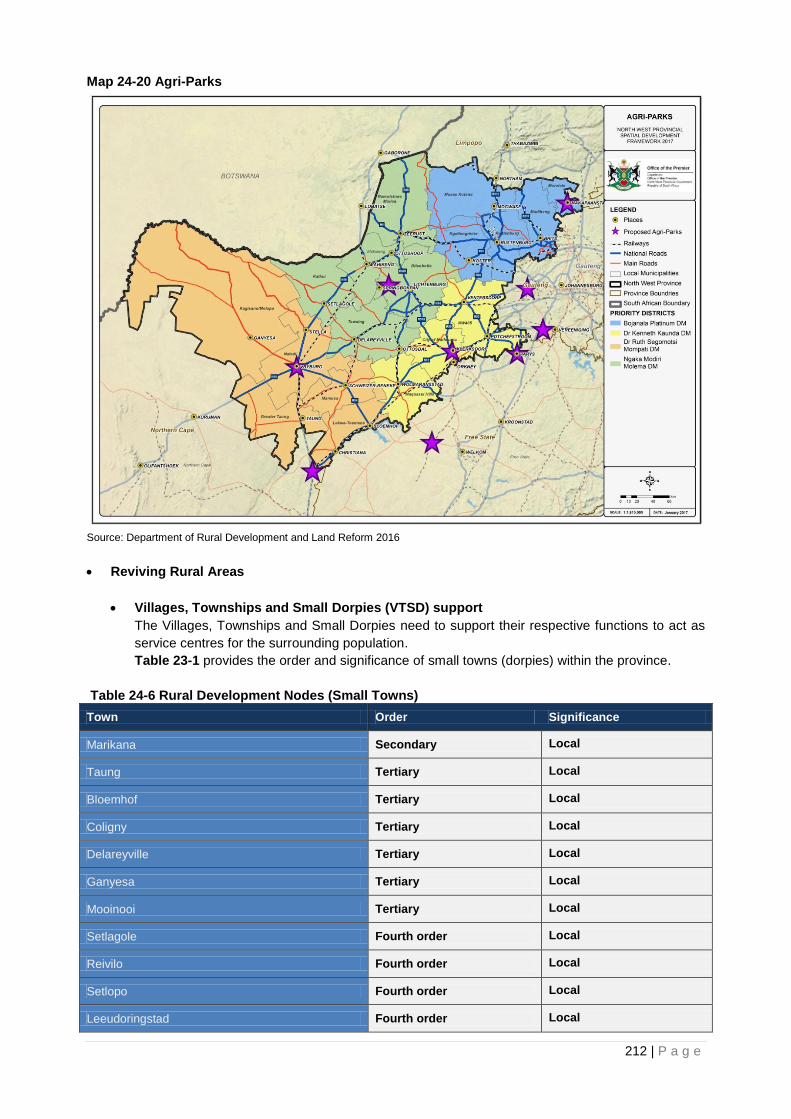
212 | P a g e
Map 24-20 Agri-Parks
Source: Department of Rural Development and Land Reform 2016
Reviving Rural Areas
Villages, Townships and Small Dorpies (VTSD) support
The Villages, Townships and Small Dorpies need to support their respective functions to act as
service centres for the surrounding population.
Table 23-1 provides the order and significance of small towns (dorpies) within the province.
Table 24-6 Rural Development Nodes (Small Towns)
Town Order Significance
Marikana Secondary Local
Taung Tertiary Local
Bloemhof Tertiary Local
Coligny Tertiary Local
Delareyville Tertiary Local
Ganyesa Tertiary Local
Mooinooi Tertiary Local
Setlagole Fourth order Local
Reivilo Fourth order Local
Setlopo Fourth order Local
Leeudoringstad Fourth order Local

213 | P a g e
Town Order Significance
Lehurutshe Fourth order Local
Lethabong / Hartbeesfontein Fourth order Local
Sannieshof Fourth order Local
Hartbeesfontein Fourth order Local
Jericho Fourth order Local
Makwassie Fourth order Local
Stella Fourth order Local
Swartruggens Fourth order Local
Groot Marico Fourth order Local
Mogwase Fourth order Local
Ramokoka Fourth order Local
Ottoshoop Fourth order Local
Amalia Fourth order Local
Derby Fourth order Local
Bray Fourth order Local
The settlement patterns of the traditional authority areas and the development nodes
need to be restructured to accommodate development within the sub regional context
by:
Integrating economic activities to provide local employment.
Enhancing accessibility to employment nodes by providing efficient roads and
transportation systems enabling high mobility of movement.
The towns, villages and dense population concentrations associated with
traditional areas should link with nearby nodes of economic potential through the
provision of efficient transportation and roads infrastructure.
These areas include:
o The Moses Kotana Local Municipality.
o Rustenburg Local Municipality.
o Madibeng Local Municipality.
o Moretele Local Municipality.
o Ramoitshere Moiloa Local Municipality.
o Ratlou Local Municipality.
o Tswaing Local Municipality.
o Greater Taung Local Municipality.
o Kagisano/ Molopo Local Municipality.
o Mahikeng Local Municipality.
Rural Development within North West needs to provide:
Vibrant, equitable and sustainable rural communities and food security for all.

214 | P a g e
Figure 24-3: Strategic Objective
Source: Department of Rural Development and Land Reform
Consolidate the dispersed rural settlements in the area and optimise existing resources
thereby ensuring access to economic activities and community facilities throughout the
province.
Promote Agrarian Transformation through:
Agri Parks and Farmer Production Support Units.
Facilitating the establishment of business initiatives, rural and agro industries,
co-operatives, cultural initiatives and vibrant local markets.
Empowerment of rural communities to be self reliant.
Development of mitigation and adaptation strategies to reduce vulnerabilities.
with special reference to climate change, erosion , flooding and natural disasters
Increased production and sustainable use of natural resources.
o Livestock farming and related value chain development.
o Cropping and related value chain development.
Strengthening rural livelihoods for vibrant local economic development.
Use of appropriate technology, modern approaches, and indigenous knowledge
systems.
Ensuring food security, dignity and quality of life, requiring:
o The protection of high potential agriculture land.
o The productive use of farms by successful land claimants.
o A settlement structure which supporting the establishment of rural and
agro industries, co-operatives, cultural initiatives and local markets in
rural development nodes.

215 | P a g e
o Facilitation of the transition from predominantly subsistence farming to
commercial small scale farming.
Promote Rural Development through:
Economic development including agriculture, mining and tourism.
Agri Parks and Farmer Production Support Units.
Improvement and development of economic infrastructure supporting
agriculture, mining and tourism development.
Developing rural development nodes providing sustainable economic and
social infrastructure including;
Social infrastructure including schools, clinics etc.
Enhancing and maintaining road and transportation linkages to higher
order urban nodes as markets of produce and economic and social
services providers.
Enhancing distribution networks, access to ports and railways.
Engineering Infrastructure; water, sanitation, electricity etc.
Improving communication networks (including ICT).
Commercial and small holder agriculture development supporting emerging
farmers.
Establishment of fresh produce markets at appropriate locations.
Construction of dams and water harvesting.
Promote Land Reform through:
Expediting redistribution of land to historically disadvantaged people and
provides access to funding (and mentoring) for commercial farming.
Increasing the rate of land tenure reform, securing access to land, and
protecting land rights.
Establishing agri villages for local economic development on farms.
Providing in basic needs of farm dwellers including water, sanitation, electricity,
and housing.
Providing for security of tenure.
o Increasing the pace of settling of Land Restitution claims.
o Effectively supporting the development of skills and competencies of
rural people to utilise land in an effective manner (mentoring).
Dispersed villages should be discouraged. The clustering of villages to allow for
the provision of sustainable social and economic infrastructure should be
encouraged.
The housing of mining personnel should take place in existing nearby towns.
24.3.5.3 Strategic Projects and Actions
24.3.5.3.1 Urban areas
1. Feasibility Study for Strategic Cities.
2. VTSD Township Regeneration and Urban Transformation.
3. Comprehensive study on the delineation of urban edges for all municipalities in conjunction with
Provincial and National Departments of Agriculture.
4. Regeneration programmes for all first and second order nodes.
5. Integration of Provincial Spatial Development Strategies into District and Local Municipality
IDPs, SDFs and Sector Plans.

216 | P a g e
6. Integrated Land Transportation Plans for the province, four districts and all main concentrations.
7. A Provincial Human Settlement Strategy and Integrated Human Settlement Plans for all local
municipalities.
8. Provincial and District Sport and Recreation Plans.
9. Community Parks Development programme.
10. MPCC (Thusong Centres) roll out programme.
24.3.5.3.2 Rural Areas
1. Rural Area Development Plans to include all areas outside the urban areas viz:
a. Agriculture Areas including Small Towns
b. Traditional Areas in:
The Moses Kotana Local Municipality.
Rustenburg Local Municipality.
Madibeng Local Municipality.
Moretele Local Municipality.
Ramotshere Moiloa Local Municipality.
Ratlou Local Municipality.
Tswaing Local Municipality.
Greater Taung Local Municipality.
Kagisano/ Molopo Local Municipality.
Mahikeng Local Municipality.
2. Farmer Production Support Units supporting the Agriparks in all districts
3. Rural strategic projects as set out in Table 24-7.
Table 24-7 Rural Strategic Projects and Programmes
Projects
Villages, Townships and
Small Dorpies (VTSD)
Infrastructure
Rural Development Planning
Village Development Planning and Programming (Clustering)
Rural Housing Programme
Pre-Active demarcation of residential sites for rural settlement in traditional authority areas
Establishment of Thusong Centres
Water, Sanitation and Electricity
Agri Villages
Schools
Hospitals, CHC’s and Clinics
Cemeteries and Mortuaries
Safety and Security
ITC

217 | P a g e
Projects
Agriculture Infrastructure
Construction and Upgrading of Dams/ Irrigation Systems/ Borehole refurbishment
Agri-parks (Springbokpan, Mkapanstad, Matlosana, Naledi)
Agriculture projects ( Intensive and extensive)
Development of underutilised land in communal areas
Farmer Production Support Units
Culture and Sport
Cultural tourism- investment in museums and heritage sites.
Sport fields and stadiums
Mining
Platinum Special Economic Zone – Rustenburg Platinum Belt
Small scale mining
Mining Beneficiation
Tourism Game Lodges (ie. Manyana game Lodge- Mahikeng )
Transportation and Roads Maintain and upgrade roads and transportation systems between Rural and Urban Areas
Map 24-21: Rural Strategic Projects
Source: District Rural Development Plans

218 | P a g e
25 CHAPTER 5: IMPLEMENTATION FRAMEWORK
25.1 Introduction
Chapter 5 provides the Implementation Framework for the implementation of the spatial development
strategies and projects set out in Chapter 4. The Implementation Plan aims at focussing projects in
localities that will support and strengthen the future settlement and development pattern of North West.
The Strategic Focus Areas identified in terms of development corridors, development nodes and
development zones accommodates the clustering of activities in an integrated and synergistic manner.
The layout of Chapter 5 is summarised in Figure 5-1.
Figure 25-1: Chapter 5 Lay-Out

219 | P a g e
25.2 Growth Targets: What will be required to ensure Sustainability and
Job Creation
This section provides a growth target that will be required to ensure economic sustainability and job
creation. Scenario modeling reflects the labour absorption rate under current population and labour
force growth conditions.
25.2.1 Growth Target
Table 25-1: Labour Absorption Modelling, Annual Gain or Loss (2003 to 2013)1
District
Working Age
Population
(2013)
Economically
Active Population
(2013)
Employed
Population
(2013)
Working Age
Population
(Annual
Contribution/loss)
Economically
Active Segment
(Job need)
Jobs (Annual
Contribution /
loss)
Bojanala Platinum 846 406 499 191 384 794 -5.4 -3 436 458
Ngaka Modiri Molema 492 783 218 145 154 503 -3 764 -3 324 -724
Dr Ruth S Mompati 212 193 75 466 54 231 -7 489 -4 344 -1 880
Dr Kenneth Kaunda 557 111 327 234 258 704 -4 051 -3 973 471
Total 2 108 493 1 120 036 852 232 -15 309 -15 077 -1 674
Source: Demacon, 2016
Table 5-1 indicates that existing economic and labour force growth result in the shedding of
approximately 1 674 jobs per annum within the provincial economy.
The economically active population is decreasing by approximately 15 077 people per annum.
This is related to the province’s inability to create jobs.
The working age population is decreasing by approximately 15 309 people per annum, whilst
the population is increasing – resulting in more pressure on breadwinners.
Strategic Guidelines:
Population growth outstrips the effects of positive economic growth, i.e. the economy cannot
absorb the labour force.
In spite of rural-urban migration, the economy can still not absorb the labour force.
There is an unbalance between labour skills and employment opportunities, increasing
unemployment. Employment opportunities created in the province should align with the skill set of
workers available.
Significant government investment in infrastructure is required, coupled with a more favourable
business environment, in order to stop the out migration of the working age population.
Development is necessary in order to eradicate poverty and increase job creation. At least 14 000
ha should be made available for development over the next 20 years, of which a large segment
should be focused on private sector investment.
If the existing spatial patterns were extrapolated, the bulk of future growth will be accounted for by
non-rateable subsidy housing.
This, by default introduced significant sustainability challenges for municipal finances, economic
growth and a multitude of related factors.
1 Demacon. Strategic Development Guidelines January 2016
February 2016
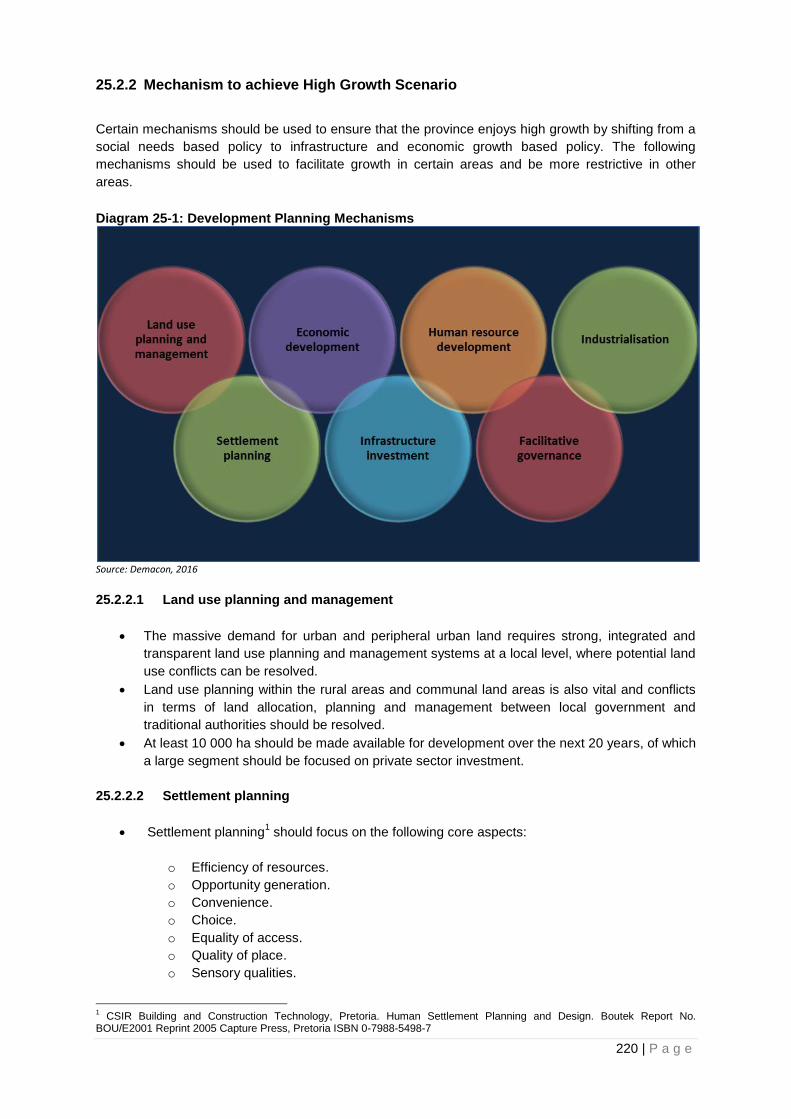
220 | P a g e
25.2.2 Mechanism to achieve High Growth Scenario
Certain mechanisms should be used to ensure that the province enjoys high growth by shifting from a
social needs based policy to infrastructure and economic growth based policy. The following
mechanisms should be used to facilitate growth in certain areas and be more restrictive in other
areas.
Diagram 25-1: Development Planning Mechanisms
Source: Demacon, 2016
25.2.2.1 Land use planning and management
The massive demand for urban and peripheral urban land requires strong, integrated and
transparent land use planning and management systems at a local level, where potential land
use conflicts can be resolved.
Land use planning within the rural areas and communal land areas is also vital and conflicts
in terms of land allocation, planning and management between local government and
traditional authorities should be resolved.
At least 10 000 ha should be made available for development over the next 20 years, of which
a large segment should be focused on private sector investment.
25.2.2.2 Settlement planning
Settlement planning1 should focus on the following core aspects:
o Efficiency of resources.
o Opportunity generation.
o Convenience.
o Choice.
o Equality of access.
o Quality of place.
o Sensory qualities.
1 CSIR Building and Construction Technology, Pretoria. Human Settlement Planning and Design. Boutek Report No.
BOU/E2001 Reprint 2005 Capture Press, Pretoria ISBN 0-7988-5498-7

221 | P a g e
o Sustainability.
The extensive demand for urban and peripheral urban sites requires high quality integrated
planning between inter alia the main government service providers in housing, water, waste
and sanitation, education, health, roads and transport.
It is vital that strong and integrated settlement planning capacity is built at local level to
provide well planned, located and serviced urban and peripheral urban sites.
Improved and integrated settlement planning require structural changes that can only be
affected over the medium to longer term – enabling formalisation of compact settlements
located in settlement regions, cities, and settlement corridors along effective transport routes.
Informal township areas should be prioritised and formalised carefully and selectively based
on considerations relating to inter alia location and access to jobs; and effectively serviced
and provided with the required social and educational facilities. Accessibility to these
townships should also be increased in order to ensure proper linkages to economic / labour
nodes.
25.2.2.3 Economic development
The North West Province is not only depicting a negative labour force growth, but also a negative
working age population growth rate. Employment creation is vital in order to minimize the migration of
the working age population. Employment creation is vital in the rural areas and rural towns of the
province. It goes without saying that one of the main tasks of government is to facilitate business
investment, growth and development to create these jobs. The economic sectors of growth and
opportunity in the province should be targeted: agriculture, mining, manufacturing, trade, finance and
business services, general government services and construction.
The establishment, nurturing and growth of small businesses, which tend to employ more people
relative to the scale of their investment, are critically important, particularly in the context of economic
development and job creation objectives. Local economies can be grown in three ways:
Growing existing businesses.
Attracting investment from outside.
Creating new enterprises and linkages with new nodes.
The vast potential of the largely untaxed informal sector should be utilised. Some of the key
constraints to business growth and development include lack of land tenure, lack of business,
technical or managerial skills, lack of market information and knowledge, lack of access to credit,
isolation from markets through poor roads and infrastructure and insufficient demand to support
sufficient sales in poor communities. It is critical that resources are targeted at businesses that have
a sound business model, a good prospect for success and a clear path to commercial independence.
25.2.2.4 Infrastructure investment
The high-growth scenario must be based on successful implementation of integrated infrastructure
development which will be geared to sustain both rural and urban development initiatives. Strategic
transport corridors should link the rural areas with urban areas. Integrated programmes being carried
out in shared impact areas of potential and economic opportunity.

222 | P a g e
25.2.2.5 Human resource development
Lack of co-ordination and capacity constraints in key provincial departments and agencies,
compounded by leadership and staff changes in crucial departments and entities have contributed to
non-implementation of government policy. If no efforts are directed towards redressing the situation,
non-delivery would escalate, service protests action can be expected to increase and economic
development will suffer.
25.2.2.6 Facilitative Governance
Irreversible physical damage to the environment would increase in future if no action is taken to
correct the problem of overlapping legislation and policy instruments. The managed development
scenario assumes that a single legislative instrument is established at national and provincial levels to
ensure that a wall to wall planning and land use management system is introduced. The long term
vision of formalisation of compact settlements needs co-ordination and cooperation across all
government spheres and relevant stakeholders, in particular focusing on peripheral urban and rural
settlements.
Lack of coordination and capacity constraints (discontinuity) have a direct impact on the quality of
development managements, resulting in scattered and disintegrated development rather than
integration. Lack of coordination also applies in cases where various government departments
prepare plans with a spatial dimension in relative isolation and the need for a framework to guide all
these processes cannot be over emphasised.
Abandoning historically protectionist practices for infrastructure investment and economic growth
based practices. This will not only unlock disproportionally larger private sector investment, but also
create an important two pronged benefit allowing for:
Physical expansion of rateable real estate.
Creation of new, higher value real estate – which exceeds older real estate in both value and
capital appreciation over time.
25.2.2.7 Industrialisation
Development strategies should focus on inter alia, industrialisation in order achieve economic growth
and job creation. The creation of strategic Industrial Development Zones (IDZs) with high levels of
accessibility to markets, close proximity to resources and a large labour force will ensure sustainable
development. It is crucial to create a conductive environment for private sector investment and to
encourage the establishment of SMMEs. According to the SADC Industrialisation Strategy, deeper
regional integration reinforced by industrialisation and enhanced competitiveness should provide the
context for the region’s development. Enabling the productive and distribution capacities of the
process will help remove structural impediments and enhance factor productivity.
To increase industrial development, the OECD Global Development Perspective 2013 Report,
indicates that the following is necessary:
1. Fostering scientific and technological development.
2. Leveraging public procurement.
3. Activating learning through foreign direct investment.
4. Promoting entrepreneurship.
Industrialisation, however, needs large investments from the public and private sector. The BRICS
New Development Bank provides financing for infrastructure development and might pose as a
possible investor towards infrastructure development in the North West Province. At the 2014 BRICS

223 | P a g e
Summit at Fortaleza, the BRICS countries signed an agreement on establishing a New Development
Bank (NDB), “with the purpose of mobilizing resources for infrastructure and sustainable development
projects in BRICS and other emerging and developing economies” (BRICS, 2014).
25.2.2.8 Leverage Mechanisms
Table 25-2 A Menu of Options
Policy Mechanisms Capital Expenditure Investment Promotion Private Sector Investment
Favorable nodal
expansion policy Flexible corridor
implementation policy Residential
densification policy Industrial development
and diversification policy
Industrial park development policy
Tourism product development policy
Economic agglomeration policy.
SMME development policy
Risk reduction/ business recruitment policy
Sound land use management policy
Nodal development boundary policy
Accurate and speedy regulatory policy - Facilitating prompt decisions such as the approval of building plans and rezoning applications (no red tape/ regulatory burden).
Management of Council Owned land Policy
Environmental management policy
Procurement Policy
Engineering services
and infrastructure Telecommunication
and internet Social amenities and
infrastructure Housing development Network infrastructure
– road, rail, airports, ports.
CBD renewal and regeneration
Neigbourhood development and upliftment
Security augmentation programmes
Clean-up and maintenance of areas.
Building upliftment programmes.
SMME business support and formalization
Informal trader facilities.
Conversion of bad buildings programme.
NDPG (Neighbourhood Development Partnership Grant)
MIG (Municipal Infrastructure Grant)
URG (Urban Renewal Grant)
Uphold business environment and property investment maintenance
UDZ tax incentive
scheme Fiscal incentives –
Incentive Policy. Provision of public
land and buildings Service excellence Safety and security Investment promotion
strategy Bulk service
contribution incentive – to be offset against the future rates and taxes to be generated by the proposed development.
Priority investment area framework.
Investment should be focused towards strategic nodes and corridors that will result in a multiplier effect that will catalyse additional investment which will contribute to the expansion of the income side of the municipal tax base. Creating additional funds for social upliftment.
Effective fast town planning applications
Investment brokerage.
Residential
development Commercial
development Industrial development Industrial cluster
development Tourism development Mixed use
development Business Incubation
facilities Trader Markets.
Source: Demacon, 2016

224 | P a g e
25.3 Implementation Framework
25.3.1 Strategic Spatial Development Implementation Guidelines
25.3.1.1 Social development and human settlements guidelines
Over the next 10 to 20 years, the province will need approximately 371 939 new houses (subsidy and
bonded) situated in strategic areas throughout the province. Adequate planning guidelines will be
necessary to prevent urban sprawl and the development of informal settlements on high value land.
By demarcating sufficient space for future residential development, the sustainability and efficiency of
towns and cities can be ensured. The following guidelines seek to provide guidelines for social and
human settlement development:
Ensure the development of integrated, sustainable human settlements.
Ensure equal opportunity and access to jobs.
Support access to basic services and amenities.
Focus on densification rather than greenfield developments.
Minimise urban sprawl.
Formalisation and upgrading of settlements.
Preventing urban decay.
Focus settlement development on development corridors and close to economic
opportunities.
25.3.1.2 Rural development guidelines
Rural development pertains mainly to traditional areas and development outside of the large urban
concentrations and includes small towns and villages. Levels of inequality and poverty are higher in
the rural areas and job opportunities are limited. High levels of rural-urban migration can be found in
the province. In order to minimise this trend, job opportunities should be created in the small towns
and villages. These job opportunities should relate to agro-processing and manufacturing as well as
the tourism sector.
Ensure land tenure security.
Protect high value arable land.
Promote linkages between agriculture, agro-manufacturing and tourism potential………
Promote rural tourism.
Maintain rural infrastructure.
Focus on skills development.
Increase linkages to economic hubs.
Promote protected area expansion, i.e. development of the “Heritage Corridor” linking
Pilanesberg and Madikwe Game Reserves.
Promote wildlife economy, i.e. game farming and game breeding.
25.3.1.3 Infrastructure development guidelines
Infrastructure development is a key component to ensure efficient spatial development. The province
covers a vast land area with settlements scattered throughout the area. This often leads to a lack of
services in rural areas and long travel distances – hampering economic growth. Infrastructure
development plays a critical role in creating job opportunities and stimulating economic growth.
Increase efficiency of transport network and enhance connectivity.
Eliminate infrastructure backlogs with regards to water, sanitation, electricity, transport.
Focus on infrastructure projects that will increase economic growth and attract private sector
investment.

225 | P a g e
Promote regional integration through the development of strategic infrastructure projects.
Ensure the maintenance and adequate management of infrastructure to improve
sustainability.
Proactive Infrastructure development and planning is crucial in the upgrading of informal
settlements and the creation of new settlements.
Focus on infrastructure development in core economic growth areas – increasing
agglomeration advantages.
Upgrade existing infrastructure in zones of economic opportunity.
Urban renewal programmes should be concentrated in major nodes rather than the establishment of
new remote settlements far removed from job opportunities.
25.3.1.4 Economic development guidelines
The economy is lagging behind and large scale interventions are needed to ensure high growth rates
needed to increase the employment opportunities created. The North West is currently losing its
economic active population to other provinces due to its inability to create sufficient employment
opportunities. The province should increase its manufacturing sector to avoid exporting raw materials
and missing out on beneficial value chains.
Employment generation.
Ensure that the employment opportunities created, falls within the skills categories of workers.
Minimise the outflow of the economic active population.
Focus on the comparative advantages of municipalities.
Focus economic development on specific areas, creating economic hubs with agglomeration
advantages.
Diversifying the economy.
Develop agro-industries to enhance local beneficiation and to create a multiplier effect.
Create job-creating industries and competitive enterprises in areas with a small economic
base to increase economic growth and sustainability of the community.
Promote tourism as economic driver.
25.3.2 Catalytic Capital Projects and Programmes
The proposed spatial distribution of catalytic urban development, economic development, engineering
services, social services, housing, tenure upgrading and relevant projects or programmes that need to
be focussed on during the following 5 years are provided for each municipality. This focuses on
providing project development synergy through the implementation of:
The clustering of catalytic capital projects within municipalities within :
o First and second order nodes.
o Distressed mining towns.
o Rural Development Zones (including third and fourth order nodes).
o Agriculture, forestry and mining zones.
o Conservation areas.
Road links that need to be planned or constructed to support the development of nodes and
corridors and movement of people and goods through the province.
Rail links (passenger and freight) that need to be planned or constructed to enhance the
mobility of people and goods within the province.
The Implementation plans or programmes that will support the projects are also indicated.

226 | P a g e
25.3.3 Municipal Implementation Frameworks
The following section summarises the strategic development guidelines and catalytic capital projects
and programmes needed for each local municipality within the respective district.
25.3.3.1 Bojanala District
25.3.3.1.1 Moretele Local Municipality 25.3.3.1.1.1 Development Guidelines
Moretele Local Municipality is situated north of Gauteng, specifically the townships of Hammanskraal
and Soshanguve. Moretele Local Municipality is mostly rural in nature, consisting of villages ruled
by traditional leaders. The area accommodates a large, though dispersed, consumer market. The
municipality has a negative employment growth rate of -1.0%; this can mainly be attributed to the
large workforce that is lost to Gauteng that has more job opportunities.
The largest node is Makapanstad. Economic activity is mainly limited to informal trading and
government services. It would be beneficial to begin the Kick Start Strategy for the municipality in
Makapanstad. Once development has taken place in Makapanstad, and the economy is growing at a
steady rate, albeit from a small base, development can expand to other areas.
Status: Developing rural economy with limited growth potential
10 Year Land Budget:
The following table indicates the development potential for Moretele Local Municipality.
Table 25-3: Moretele Local Municipality 10 Year Land Budget (Ha)
Municipal Area Industrial Office Trade Bonded / FLISP
Subsidy Total
Moretele 21.6 1.2 10.4 71.1 252.2 356.5
Source: Demacon, 2016
Development Guidelines:
Accommodate Agripark at Makapanstad.
Formalisation of trade.
Consumer demand driven economic activities.
Formalisation of land tenure.
Densify human settlement development around Makapanstad / Mathibestad to form one
large urban concentration.
Ensure access to basic services in the northern areas.
Ensure equal opportunity and access to jobs by creating job opportunities in the small towns
such as Dikebu and Moretele, and providing transport to larger settlements such as
Makapanstad with more job opportunities.
Focus on densification rather than greenfield developments.
Skill development in the manufacturing and agro-processing sectors.
Strengthen the agriculture value chain – by processing the produce in the municipality, the
multiplier effect will increase, creating a need for certain non-basic services, e.g. retail and
consulting services.
Promote linkages between agriculture, agro-manufacturing and tourism potential. The
municipality is situated in close proximity to Dinokeng Game Reserve as well as Borakalalo
National Park, and the Rooiberg area, creating tourism opportunities for Moretele LM.
Involve neighbouring communities in expanding protected areas, i.e. Borakakalo National
Park.

227 | P a g e
Focus and intensify economic development on Makapanstad / Mathibestad, creating
economic hubs with agglomeration advantages.
Create job-creating industries and competitive enterprises in areas with a small economic base to increase economic growth and sustainability of the community.
25.3.3.1.1.2 Implementation Plans and Programmes

228 | P a g e
Table 25-4 Moretele Implementation Plan
Item No
Node/ Link/ Zone Node /Link Description
Project Focus
Implementation Plan (Programme)
Municipal Provincial National
1
Mr Prioritised Rural
(Map 5-3)
Moretele Rural
Moretele Rural Development Moretele SDF
Bojanala District Rural Development Plan
Villages, Townships and Small Dorpies Programme
Comprehensive Rural Development Programme
National Infrastructure Plan: SIP11
2 Makapanstad/Mathibestad
Densification and CBD Regeneration.
Makapanstad Agripark
Makapanstad/Mathibestad Village Development Planning
Makapanstad Agripark Implementation Plan
Villages, Townships and Small Dorpies Programme
National Infrastructure Plan: SIP7
National Infrastructure Plan: SIP11
Agripark Initiative
3 Engineering Services Upgrading Consolidated Engineering Infrastructure
Plan Villages, Townships and Small
Dorpies Programme
National Infrastructure Plan: : SIP 6, 8,9,10 and 18
Comprehensive Rural Development Programme
4 Social Services Upgrading Social Services Infrastructure Plan Villages, Townships and Small
Dorpies Programme
National Infrastructure Plan: : SIP 12,13,14 and 15
Comprehensive Rural Development Programme
5 Local Economic Development Local Economic Development Plan
Villages, Townships and Small Dorpies Programme
CRDP
Comprehensive Rural Development Programme
National Infrastructure Plan: : SIP 11
Agriparks Initiative
6 Sustainable Human Settlements Moretele Sustainable Human
Settlements Plan
Provincial Human Settlement Master Plan
Villages, Townships and Small Dorpies Programme
National Housing Code (2009) and housing delivery programmes /Mining Towns Human Settlement Transformation/NDPG
Integrated Urban Development Framework
National Infrastructure Plan: SIP7.
7 Tourism :
o Borakolalo Nature Reserve Bojanala Tourism Plan
North West Provincial Tourism Plan
National Infrastructure Plan: : SIP 4
8 Environmental Management District Environmental Management
Framework/ SDF
North West Province Biodiversity Sector Plan,
Protected Area Expansion Plan
National Protected Area Expansion Plan
National Biodiversity Strategy and Action Plan
9 Land Restitution / Redistribution Land Rights Enquiry Villages, Townships and Small
Dorpies Programme
Restitution of Land Rights Programme
Land Reform Programme

229 | P a g e
Table 25-4 Moretele Implementation Plan
Item No
Node/ Link/ Zone Node /Link Description
Project Focus
Implementation Plan (Programme)
Municipal Provincial National
10 Biodiversity
(Map 5-1)
Biodiversity Corridors and
Nodes Environmental Management
District Environmental Management Framework
North West Province Biodiversity Sector Plan
Protected Area Expansion Plan
National Protected Area Expansion Plan
National Biodiversity Strategy and Action Plan
11 Rural Areas
(Map 5-3) Rural Areas
Rural Area Development o Agriculture
Bojanala Platinum District Rural Area Development Plan
Villages, Townships and Small Dorpies Programme
National Infrastructure Plan: : SIP 11
CRDP
Agriparks Initiative
12
Proposed Provincial Links
(Map 25-2)
E
Enhance accessibility to N1 and N4. Enhance district and local accessibility
Enhance access to Borakolalo NR
Moretele (Bojanala District) Roads and Transportation Plan
Villages, Townships and Small Dorpies Programme
National Infrastructure Plan: : SIP 4

230 | P a g e
Map 25-1 : Bojanala Platinum District Implementation Framework (Biodiversity) – Moretele LM

231 | P a g e
Map 25-2: Bojanala Platinum District Implementation Framework (Nodes & Links) – Moretele LM

232 | P a g e
Map 25-3: Bojanala Platinum District Implementation Framework (Rural Development) – Moretele LM

233 | P a g e
25.3.3.1.2 Madibeng Local Municipality 25.3.3.1.2.1 Development Guidelines
Madibeng local municipality consists of the following nodes:
Brits.
Jericho.
Mooinooi.
Greater Hartbeespoort.
Majakaneng area.
These nodes are concentrated in the southern parts of the municipality. The northern parts of the
municipality display a more rural nature with dispersed settlements and low densities. The urbanised
southern part of the municipality is situated in close proximity to the large urban concentrations of
Pretoria and Rustenburg. A large segment of people living in Hartbeespoort (20km north of Pretoria)
work in Pretoria and it therefore mainly functions as a residential town with tourism potential.
Brits forms the most important node of the municipality and as such, the greatest potential to ensure
the successful implementation of the Revival Strategy would be to focus development on Brits, rather
than diluting economic potential.
Status: Developing and expanding economy with strong and diverse urban nodes.
10 Year Land Budget:
The following table indicates the development potential for Madibeng Local Municipality.
Table 25-5: Madibeng Local Municipality 10 Year Land Budget (Ha)
Municipal Area Industrial Office Trade Bonded / FLISP
Subsidy Total
Madibeng 52.5 2.3 12.4 495.8 1092.20 1 655.2
Source: Demacon, 2016
Development Guidelines:
Expand the manufacturing value chain in Brits to increase the multiplier effect, thereby
increasing the economic base of the whole municipality.
Provide and maintain affordable housing options in Brits and Letabile, ensuring sufficient
housing for the mainly unskilled and semi-skilled workforce required for the manufacturing
sector.
The economies of Mooinooi and the Majakaneng area are more concentrated (based on
mining only), creating a vulnerable and volatile environment. Focusing on strengthening the
public services and diversifying the economy will help to decrease the outflow and reduce
the leakage from the area, as well as enhancing the economic mobility.
Diversification of Mooinooi’s economy should be serviced based and focus on trade and
social services such as health care, school, etc.
Adequate affordable housing options for the mine workers in Mooinooi and the
Majakaneng area should be provided.
Development in Hartebeespoort should focus more on high end services related to tourism
and retail.
Housing options in Hartebeespoort will entail high end, low to medium density residential
development.
Protect the scenic nature of the Hartebeespoort area.
Develop Jericho as a service node.

234 | P a g e
Develop the Magaliesberg Biopshere Reserve.
Intensify human settlement development on Brits and surrounding areas- creating a dense
urban form.
Develop Hartbeespoortdam City.
Provide access to basic services in rural areas.
Densification around economic cores.
Formalisation and upgrading of informal settlements.
The municipality has high agricultural potential with fertile soil and adequate water. There
exists potential to develop the agriculture sector further.
The Crocodile River plays a very big role in the agricultural sector within the municipality. For
this reason, the protection and sustainable use of this river is of vital importance.
The agricultural development should be focused on areas with high agricultural value.
High value agricultural land should be demarcated for agriculture and not houses.
A definite urban edge must be established to ensure the protection of agricultural land
around Brits and Hartbeespoort.
Development opportunities exist in the agro-processing industry, ensuring that Madibeng’s
resources are processed locally, rather than exported to Gauteng.
Due to the mining activities in Madibeng local municipality, mining related industries could
help to create job opportunities and increase Madibeng’s comparative advantage.
Increase investment in tourism, especially in the area south of Brits where the bulk of
heritage and conservation sites are located.
Market tourism to the local population.
Increase accessibility through an integrated transport network, linking the smaller towns and
villages to the larger Brits / Hartbeespoort area.
Improve municipal service delivery and operational excellence.
Investment brokerage – take opportunities to the market.
Focusing on labour intensive industries will help to decrease unemployment and eradicate
unemployment.
Minimise the outflow of the economically active population.
25.3.3.1.2.2 Implementation Plans and Programmes

235 | P a g e
Table 25-6 Madibeng Implementation Plan
Item No
Node/ Link/ Zone Node /Link Description
Project Focus
Implementation Plan (Programme)
Municipal Provincial National
1
Brits (Map 5-5)
Brits Urban Regeneration Brits Urban Regeneration Plan Villages, Townships
and Small Dorpies Programme
National Infrastructure Plan: SIP7
2 Sustainable Human Settlements Madibeng Sustainable Human Settlement
Plan
Provincial Human Settlement Master Plan
Villages, Townships and Small Dorpies Programme
National Housing Code (2009) and housing delivery programmes /Mining Towns Human Settlement Transformation/NDPG
Integrated Urban Development Framework
National Infrastructure Plan: SIP7.
3 Engineering Services Upgrading Consolidated Engineering Infrastructure
Plan NW Infrastructure Plan
Integrated Water Resource Planning (IWRP)
Integrated Resource Plan for Electricity (IRP) 2010-2030.
National Infrastructure Plan: : SIP 6, 8,9,10 and 18
4 Social Services Upgrading Social Services Infrastructure Plan NW Infrastructure Plan National Infrastructure Plan: : SIP 12,13,14
and 15
5 Local Economic Development
Vehicle component Manufacturing Park & Distribution Dry Port
Madibeng (Bojanala) LED Strategy
Business Study on beneficiation opportunities from crusher stones, granite mine dumps and sand mining ( DTI)
National Infrastructure Plan: : SIP4
6
Hartbeespoort (Map 5-5)
Hartbeespoortdam City Development
Hartbeespoortdam City Development Plan
North West 5 City Project
National Infrastructure Plan: SIP7
7 Hartbeespoort Tourism
Development
Hartbeespoort Tourism Development Plan
Heritage Park Development Plan NW Tourism Plan National Infrastructure Plan: SIP 4
8 Sustainable Human Settlements Madibeng LM Sustainable Human
Settlement Plan
Villages, Townships and Small Dorpies Programme
Provincial Human Settlement Master Plan
National Housing Code (2009) and housing delivery programmes /Mining Towns Human Settlement Transformation/NDPG
Integrated Urban Development Framework
National Infrastructure Plan: SIP7
9 Engineering Services Upgrading Consolidated Engineering Infrastructure
Plan NW Infrastructure Plan
Integrated Water Resource Planning (IWRP)
Integrated Resource Plan for Electricity (IRP) 2010-2030.
National Infrastructure Plan: : SIP 6, 8,9,10 and 18
10 Social Services Upgrading Social Services Infrastructure Plan NW Infrastructure Plan National Infrastructure Plan: : SIP 12,13, 14
and 15
Md 2
Md 1

236 | P a g e
Table 25-6 Madibeng Implementation Plan
Item No
Node/ Link/ Zone Node /Link Description
Project Focus
Implementation Plan (Programme)
Municipal Provincial National
11 Local Economic Development Madibeng (Bojanala) LED Strategy
Villages, Townships and Small Dorpies Programme
North West Economic Development Plan
National Infrastructure Plan: : SIP4
12
Mooinooi (Map 5-5)
Mooinooi / Majakaneng Upgrading Mooinooi / Mjakaneng Precinct
Development Plan
Villages, Townships and Small Dorpies Programme
National Infrastructure Plan: SIP7
13 Sustainable Human Settlements Madibeng Sustainable Human Settlement
Plan
Provincial Human Settlement Master Plan
Villages, Townships and Small Dorpies Programme
National Housing Code (2009) and housing delivery programmes /Mining Towns Human Settlement Transformation/NDPG
Integrated Urban Development Framework
National Infrastructure Plan: SIP7.
14 Engineering Services Upgrading Consolidated Engineering Infrastructure
Plan NW Infrastructure Plan
Integrated Water Resource Planning (IWRP)
Integrated Resource Plan for Electricity (IRP) 2010-2030.
National Infrastructure Plan: : SIP 6, 8,9,10 and 18
15 Social Services Upgrading Social Services Infrastructure Plan NW Infrastructure Plan National Infrastructure Plan: : SIP 12,13,14
and 15
16 Local Economic Development Madibeng (Bojanala) LED Strategy
Villages, Townships and Small Dorpies Programme
North West Economic Development Plan
National Infrastructure Plan: : SIP4
17
Jericho (Map 5-5)
Jericho Settlement Development Jericho Precinct Development Plan Villages, Townships
and Small Dorpies Programme
National Infrastructure Plan: SIP7
18 Sustainable Human Settlements Madibeng Sustainable Human Settlement
Plan
Provincial Human Settlement Master Plan
Villages, Townships and Small Dorpies Programme
National Housing Code (2009) and housing delivery programmes /Mining Towns Human Settlement Transformation/NDPG
Integrated Urban Development Framework
National Infrastructure Plan: SIP7.
19 Engineering Services Upgrading Consolidated Engineering Infrastructure
Plan NW Infrastructure Plan
Integrated Water Resource Planning (IWRP)
Integrated Resource Plan for Electricity (IRP) 2010-2030
National Infrastructure Plan: : SIP 6, 8,9,10 and 18
Md 4
Md 3

237 | P a g e
Table 25-6 Madibeng Implementation Plan
Item No
Node/ Link/ Zone Node /Link Description
Project Focus
Implementation Plan (Programme)
Municipal Provincial National
20 Social Services Upgrading Social Services Infrastructure Plan NW Infrastructure Plan National Infrastructure Plan: : SIP 12,13, 14
and 15
21 Local Economic Development Madibeng ( Bojanala) LED Strategy
Villages, Townships and Small Dorpies Programme
North West Economic Development Plan
National Infrastructure Plan: : SIP4
22
Md Prioritised Rural
(Map 5-6)
Madibeng Rural
Madibeng Rural Development Bojanala Platinum District Rural
Development Plan
Villages, Townships and Small Dorpies Programme
Comprehensive Rural Development programme
Agripark Initiative
National Infrastructure Plan: : SIP 11
23 Engineering Services Upgrading Consolidated Engineering Infrastructure
Plan
NW Infrastructure Plan
Villages, Townships and Small Dorpies Programme
National Infrastructure Plan: : SIP 6, 8,9,10 and 18
Integrated Water Resource Planning (IWRP) Integrated Resource Plan for Electricity
(IRP) 2010-2030.
24 Social Services Upgrading Social Services Infrastructure Plan
NW Infrastructure Plan
Villages, Townships and Small Dorpies Programme
Comprehensive Rural Development programme
25 Local Economic Development Madibeng ( Bojanala) LED Strategy
Villages, Townships and Small Dorpies Programme
NW Economic Development Plan
Comprehensive Rural Development programme
Agripark Initiative
26 Human Settlement Transformation
Madibeng Sustainable Human Settlement Plan
Amusement Park along the Sun City road.
Provincial Human Settlement Master Plan
Villages, Townships and Small Dorpies Programme
National Housing Code (2009) and housing delivery programmes /Mining Towns Human Settlement Transformation/NDPG
Integrated Urban Development Framework
National Infrastructure Plan: SIP7.
27 Land Restitution / Redistribution Land Rights Enquiry Villages, Townships
and Small Dorpies Programme
Restitution of Land Rights Programme
Land Reform Programme
28 Rural Areas
(Map 5-6) Rural Areas
Rural Area Development o Agriculture o Mining
Bojanala Platinum District Rural Development Plan
Villages, Townships and Small Dorpies Programme
National Infrastructure Plan: : SIP 11
CRDP
Agriparks Initiative

238 | P a g e
Table 25-6 Madibeng Implementation Plan
Item No
Node/ Link/ Zone Node /Link Description
Project Focus
Implementation Plan (Programme)
Municipal Provincial National
29 Biodiversity
(Map 5-4)
Biodiversity Corridors and
Nodes Environmental Management
District Environmental Management Framework
North West Province Biodiversity Sector Plan
Protected Area Expansion Plan
Magaliesberg Biosphere Reserve Management Plan
National Protected Area Expansion Plan
National Biodiversity Strategy and Action Plan
30 Protected Areas
(Map 5-4) Protected
Areas
Nature Conservation/ Tourism/ Wildlife Economy
Magaliesburg Biosphere
District Environmental Management Framework
Bojanala Tourism Development Plan
North West Province Biodiversity Sector Plan
Protected Area Expansion Plan
Magaliesberg Biosphere Reserve Management Plan
Horse riding and hiking facility
National Protected Area Expansion Plan
National Biodiversity Strategy and Action Plan
31 National Links
Upgrading and Maintenance of National roads
Madibeng (Bojanala District) Roads and Transportation Plan)
North West Infrastructure Plan
SANRAL
National Infrastructure Plan: : SIP 4
32
Provincial Links
Upgrading and Maintenance of Provincial roads
Madibeng (Bojanala District) Roads and Transportation Plan)
North West Infrastructure Plan
National Infrastructure Plan: : SIP 4
33 Proposed
Provincial Links
D, E, G
Enhance accessibility to Brits, N1, N4 and Gauteng.(PWV3W and PWV 3E)
Enhance district and local accessibility.
Madibeng (Bojanala District) Roads and Transportation Plan)
North West Infrastructure Plan
Villages, Townships and Small Dorpies Programme
SANRAL
National Infrastructure Plan: : SIP 4
34 Railway
Main Lines
Passenger / Freight Link Madibeng (Bojanala District) Roads and
Transportation Plan) North West
Infrastructure Plan National Infrastructure Plan: : SIP 4
35 Railway
Branch Lines
Unlocking economic potential Madibeng (Bojanala District) Roads and
Transportation Plan) North West
Infrastructure Plan National Infrastructure Plan: : SIP 4

239 | P a g e
Map 25-4 : Bojanala Platinum District Implementation Framework (Biodiversity) – Madibeng LM
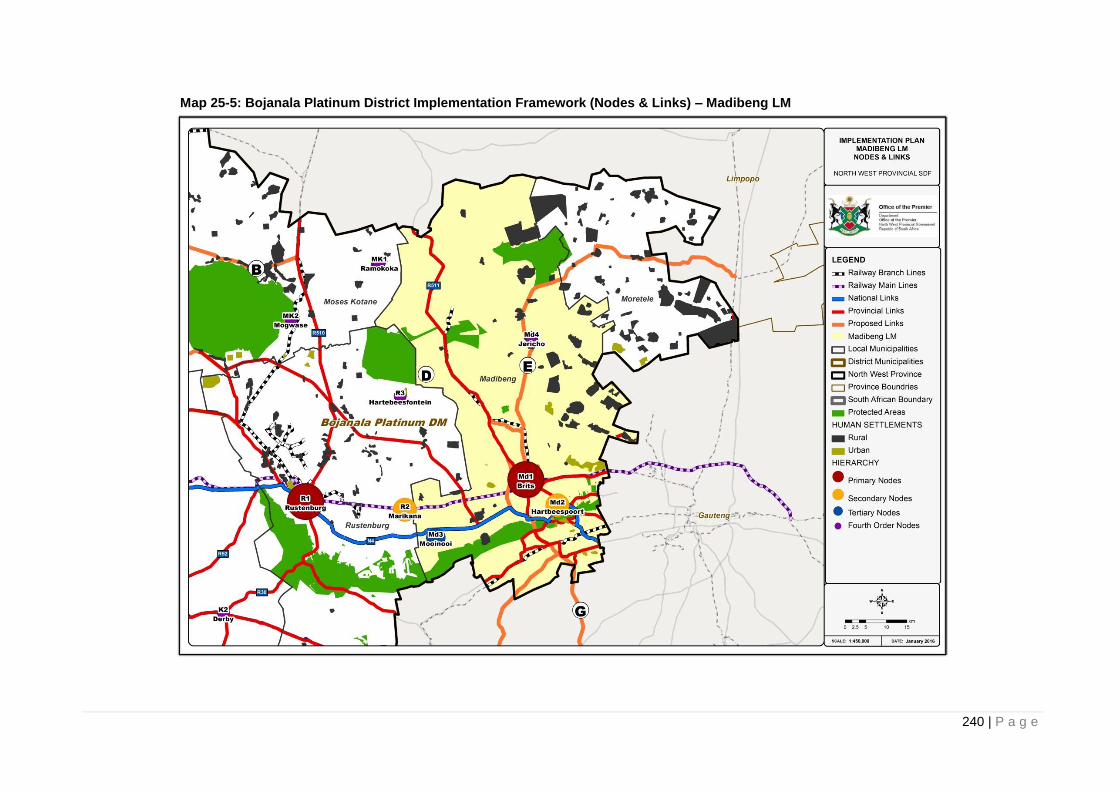
240 | P a g e
Map 25-5: Bojanala Platinum District Implementation Framework (Nodes & Links) – Madibeng LM

241 | P a g e
Map 25-6: Bojanala Platinum District Implementation Framework (Rural Development) – Madibeng LM

242 | P a g e
25.3.3.1.3 Rustenburg Local Municipality 25.3.3.1.3.1 Development Guidelines
Rustenburg local municipality consists of the following nodes:
Rustenburg.
Tlhabane.
Tlaseng.
Hartbeesfontein.
Phatsima.
Phokeng and surrounding areas.
Boitekong.
Marikana.
Of the nodes, Rustenburg is by far the largest and most important relating to economic growth and
availability of services. The other nodes mostly function as residences for the mine workers and have
limited retail and business services. The Revival Strategy proposed for the local municipality hinges
on focusing development on the town of Rustenburg. There is, however, scope in areas such as
Boitekong and Phokeng to ensure better living conditions for the people living there.
Rustenburg Local Municipality is considered as a distressed mining municipality and the focus need to
be on the transformation of settlements.
Status: Well diversified city economy with an urban core and strong decentralised centres / nodes.
10 Year Land Budget:
The following table indicates the development potential for Rustenburg Local Municipality.
Table 25-7: Rustenburg Local Municipality 10 Year Land Budget (Ha)
Municipal Area Industrial Office Trade Bonded / FLISP
Subsidy Total
Rustenburg 48.2 9.1 40.1 775.5 1393.90 2 266.8
Source: Demacon, 2016
Development Guidelines:
Development should take note of the spatial expansion requirements of the Greater
Rustenburg Local Municipality with opportunity for better alignment to address historically
miss-aligned and isolated development practices.
Capital investment in the municipality must focus on existing infrastructure, rather than the
creation of new infrastructure in remote areas.
Formalisation of trade.
Residential densification in the larger nodes.
Formalisation and upgrading of informal settlements.
Providing access to basic services.
Accommodate SMMEs within the economic nodes of Rustenburg, Boitekong and Phokeng.
Minimise urban sprawl.
Intensify development around the N4 Development Corridor.
Ensure adequate housing in Rustenburg for the people migrating from the rural areas.
Focus on skills development in the mining, trade and business sectors to diversify the
economy.
Increase efficiency of transport network and enhance connectivity.

243 | P a g e
Focus on infrastructure development that will help to attract private sector investment in the
core Rustenburg area.
Create a favourable business environment to promote the establishment of new industries.
Create economic hubs in Phokeng and Boitekong.
Develop agro-industries to enhance local beneficiation and to create a multiplier effect
supporting the provision of an Agrihub and Agricultural Co-operative within Rustenburg.
Intensify development in areas with high development potential or economic growth.
Promote infill development.
Protect high value agriculture land.
Kick start development in Boitekong and Phokeng to establish new potential growth nodes
– multiyear public sector investment framework focused on municipal infrastructure, public
amenities and social housing to serve as catalyst to kick start private sector investment.
Create employment opportunities closer to where people are living.
Identify and develop priority biodiversity areas.
Develop and promote the tourism areas of Vaalkop Nature Reserve, the Kgaswane Nature
Reserve, the Magaliesburg Protected Environment, and other critical biodiversity areas.
Develop the eco-tourism sector.
25.3.3.1.3.2 Implementation Plans and Programmes

244 | P a g e
Table 25-8 Rustenburg Implementation Plan
Item No
Node/ Link/ Zone Node /Link Description
Project Focus
Implementation Plan (Programme)
Municipal Provincial National
1
Rustenburg (Map 5-8)
Rustenburg Urban Regeneration
Rustenburg Urban Regeneration Plan
Villages, Townships and Small Dorpies Programme
Neighbourhood Development Partnership Grant
National Infrastructure Plan: SIP7
2 Nodal Development
o Boitekong and Phokeng o Tlabane and Phokeng
Boitekong, Phokeng, Tlabane and Phokeng Nodal Development Plans
Villages, Townships and Small Dorpies Programme
National Infrastructure Plan: SIP7
3 Sustainable Human
Settlements Rustenburg LM Sustainable
Human Settlement Plan
Provincial Human Settlement Master Plan
Villages, Townships and Small Dorpies Programme
National Housing Code (2009) and housing delivery programmes /Mining Towns Human Settlement Transformation/NDPG
Integrated Urban Development Framework
National Infrastructure Plan: SIP7.
4 Engineering Services
Upgrading Consolidated Engineering
Infrastructure Plan NW Infrastructure Plan
Integrated Water Resource Planning (IWRP)
Integrated Resource Plan for Electricity (IRP) 2010-2030
National Infrastructure Plan: : SIP 6, 8,9,10 and 18
5 Social Services Upgrading Social Services Infrastructure
Plan NW Infrastructure Plan
National Infrastructure Plan: : SIP 12,13, 14 and 15
6 Local Economic Development
Rustenburg (Bojanala) LED Strategy
Agri- Hub and Cooperative
Agri- Hub and Cooperative
Tourism College
Business Study on beneficiation
opportunities from crusher stones, granite mine dumps and sand mining ( DTI)
7 Sustainable Human
Settlements Rustenburg LM Sustainable
Human Settlement Plan
Provincial Human Settlement Master Plan
Villages, Townships and Small Dorpies Programme
National Housing Code (2009) and housing delivery programmes /Mining Towns Human Settlement Transformation/NDPG
Integrated Urban Development Framework
National Infrastructure Plan: SIP7.
Mining Towns Human Settlement Transformation
NDPG
8 Engineering Services
Upgrading Consolidated Engineering
Infrastructure Plan NW Infrastructure Plan
Integrated Water Resource Planning (IWRP)
Integrated Resource Plan for Electricity (IRP) 2010-2030
9 Social Services Upgrading Social Services Infrastructure
Plan NW Infrastructure Plan
National Infrastructure Plan: : SIP 12,13, 14 and 15
R1

245 | P a g e
Table 25-8 Rustenburg Implementation Plan
Item No
Node/ Link/ Zone Node /Link Description
Project Focus
Implementation Plan (Programme)
Municipal Provincial National
10 Local Economic Development Rustenburg (Bojanala) LED
Strategy
Villages, Townships and Small Dorpies Programme
North West Economic Development Plan
National Infrastructure Plan: : SIP4
11
Hartebees-fontein
(Map 5-8)
Hartbeesfontein Settlement Development
Hartbeesfontein Precinct Development Plan
Villages, Townships and Small Dorpies Programme
National Infrastructure Plan: SIP7
12 Human Settlement
Transformation Rustenburg LM Sustainable
Human Settlement Plan
Provincial Human Settlement Master Plan
Villages, Townships and Small Dorpies Programme
National Housing Code (2009) and housing delivery programmes
Integrated Urban Development Framework
National Infrastructure Plan: SIP7.
Mining Towns Human Settlement Transformation
NDPG
13 Engineering Services
Upgrading Consolidated Engineering
Infrastructure Plan NW Infrastructure Plan
Integrated Water Resource Planning (IWRP)
Integrated Resource Plan for Electricity (IRP) 2010-2030
National Infrastructure Plan: : SIP 6, 8,9,10 and 18
14 Social Services Upgrading Social Services Infrastructure
Plan NW Infrastructure Plan
National Infrastructure Plan: : SIP 12,13, 14 and 15
15 Local Economic Development Rustenburg (Bojanala) LED
Strategy
Villages, Townships and Small Dorpies Programme
North West Economic Development Plan
National Infrastructure Plan: : SIP4
16
Marikana (Map 5-8)
Marikana Settlement Development
Marikana Precinct Development Plan
Villages, Townships and Small Dorpies Programme
National Infrastructure Plan: SIP7
17 Human Settlement
Transformation Rustenburg LM Sustainable
Human Settlement Plan
Provincial Human Settlement Master Plan
Villages, Townships and Small Dorpies Programme
National Housing Code (2009) and housing delivery programmes
Integrated Urban Development Framework
National Infrastructure Plan: SIP7.
Mining Towns Human Settlement Transformation
NDPG
18 Engineering Services
Upgrading Consolidated Engineering
Infrastructure Plan
NW Infrastructure Plan
Villages, Townships and Small Dorpies Programme
Integrated Water Resource Planning (IWRP)
Integrated Resource Plan for Electricity (IRP) 2010-2030 National Infrastructure Plan: : SIP 6, 8,9,10
R 2
R3

246 | P a g e
Table 25-8 Rustenburg Implementation Plan
Item No
Node/ Link/ Zone Node /Link Description
Project Focus
Implementation Plan (Programme)
Municipal Provincial National
and 18
19 Social Services Upgrading Social Services Infrastructure
Plan
NW Infrastructure Plan
Villages, Townships and Small Dorpies Programme
National Infrastructure Plan: : SIP 12,13, 14 and 15
20 Local Economic Development Rustenburg (Bojanala) LED
Strategy
Villages, Townships and Small Dorpies Programme
North West Economic Development Plan
National Infrastructure Plan: : SIP4
21
R Prioritised Rural
(Map 5-9)
Rustenburg Rural
Rustenburg Rural Development
Phatsima
Bojanala Rural Development Plan
Villages, Townships and Small Dorpies Programme
Comprehensive Rural Development programme
22 Engineering Services
Upgrading Consolidated Engineering
Infrastructure Plan Villages, Townships and Small
Dorpies Programme Comprehensive Rural Development
programme
23 Social Services Upgrading Social Services Infrastructure
Plan Villages, Townships and Small
Dorpies Programme Comprehensive Rural Development
programme
24 Human Settlement
Transformation Rustenburg Sustainable Human
Settlement Plan
Provincial Human Settlement Master Plan /Villages,
Townships and Small Dorpies Programme
National Housing Code (2009) and housing delivery programmes
Integrated Urban Development Framework
National Infrastructure Plan: SIP7.
25 Local Economic Development
Rustenburg (Bojanala) LED Strategy
Wonderkop Industrial Park
Villages, Townships and Small Dorpies Programme
Comprehensive Rural Development programme
National Infrastructure Plan: : SIP 11
Agriparks Initiative
26 Land Restitution /
Redistribution Land Rights Enquiry
Villages, Townships and Small Dorpies Programme
Restitution of Land Rights Programme
Land Reform Programme
27
Tourism Development: o Vaalkop dam NR o Magaliesberg NA o Bospooort dam
Bojanala Tourism Development Plan
Cultural village near Sun City
NW Provincial Tourism Development Plan
National Infrastructure Plan: : SIP 4
28 Rural Areas
(Map 5-9)
Rural Area Development o Agriculture o Mining
Bojanala Platinum District Rural Area Development Plan
Villages, Townships and Small Dorpies Programme
National Infrastructure Plan: : SIP 11
CRDP
Agriparks Initiative
29 Biodiversity
(Map 5-7)
Biodiversity Corridors and
Nodes Environmental Management
District Environmental Management Framework / Tourism Development Plan
North West Province Biodiversity Sector Plan
Protected Area Expansion Plan
Magaliesberg Biosphere Reserve Management Plan
National Protected Area Expansion Plan
National Biodiversity Strategy and Action Plan

247 | P a g e
Table 25-8 Rustenburg Implementation Plan
Item No
Node/ Link/ Zone Node /Link Description
Project Focus
Implementation Plan (Programme)
Municipal Provincial National
30 Protected Areas
(Map 5-7) Protected
Areas
Nature Conservation/ Tourism/ Wildlife Economy o Vaalkop dam NR o Magaliesberg NA o Bospooort dam
District Environmental Management Framework / Tourism Development Plan
North West Province Biodiversity Sector Plan
Protected Area Expansion Plan
Magaliesberg Biosphere Reserve Management Plan
National Protected Area Expansion Plan
National Biodiversity Strategy and Action Plan
31
National Links
Upgrading and Maintenance
of National roads
Moses Kotane (Bojanala District) Roads and Transportation Plan
NW Infrastructure Plan National Infrastructure Plan: : SIP 4
32
Provincial Links
Upgrading and Maintenance
of Provincial roads
Moses Kotane (Bojanala District) Roads and Transportation Plan
NW Infrastructure Plan
Villages, Townships and Small Dorpies Programme
National Infrastructure Plan: : SIP 4
33 Proposed
Provincial Links
D
Enhance accessibility to Rustenburg, N4 and Gauteng
Enhance district and local accessibility
Rustenburg (Bojanala District) Roads and Transportation Plan
Villages, Townships and Small Dorpies Programme
National Infrastructure Plan: : SIP 4
34 Railway
Main Lines
Passenger / Freight Link Rustenburg (Bojanala District)
Roads and Transportation Plan Villages, Townships and Small
Dorpies Programme National Infrastructure Plan: : SIP 4
35 Railway
Branch Lines
Unlocking local economic potential
Rustenburg (Bojanala District) Roads and Transportation Plan
Villages, Townships and Small Dorpies Programme
National Infrastructure Plan: : SIP 4

248 | P a g e
Map 25-7 : Bojanala Platinum District Implementation Framework (Biodiversity) – Rustenburg LM

249 | P a g e
Map 25-8: Bojanala Platinum District Implementation Framework (Nodes & Links) – Rustenburg LM
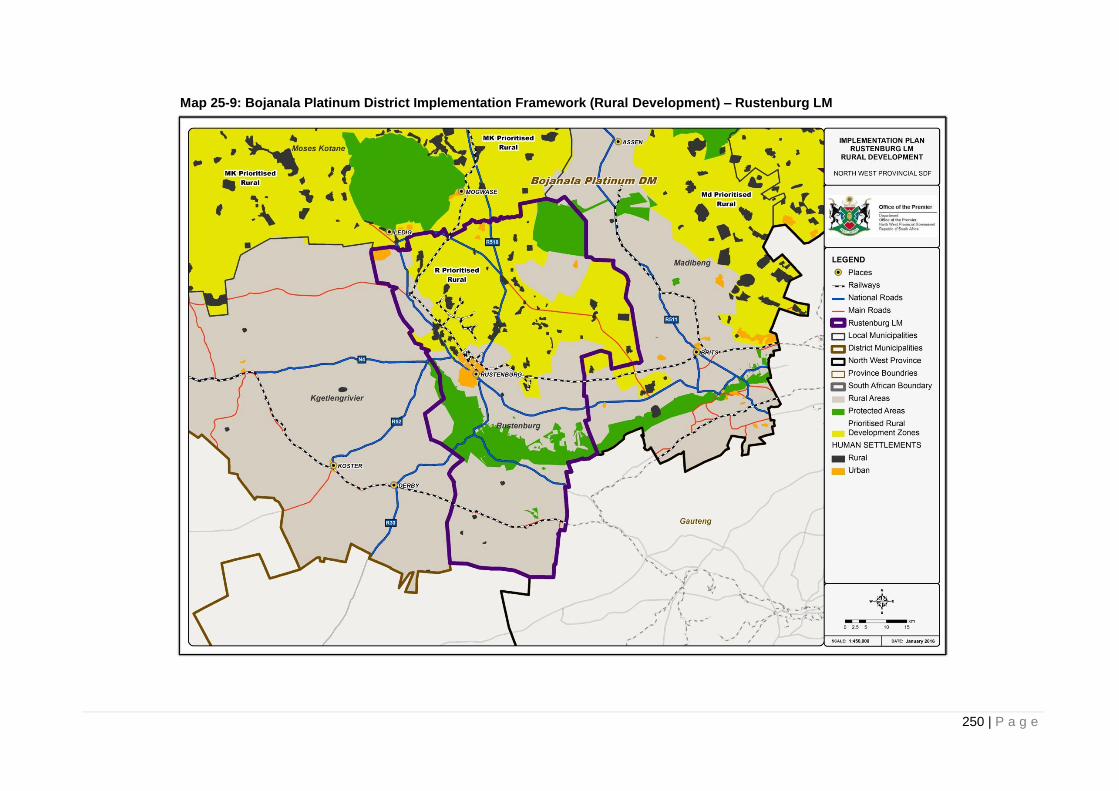
250 | P a g e
Map 25-9: Bojanala Platinum District Implementation Framework (Rural Development) – Rustenburg LM

251 | P a g e
25.3.3.1.4 Kgetlengrivier Local Municipality 25.3.3.1.4.1 Development Guidelines
Kgetlengrivier is a mostly rural with small towns functioning as service centres for the population,
mostly engaged in agricultural activities. The nodes are Koster, Swartruggens and Derby in the
southern areas and Borelelo in the northern areas.
The municipality has a scattered population profile, with low densities and a rural nature. Due to the
relatively high population growth; job creation and basic service delivery will be crucial to ensure that
the economically active population does not leave the municipality, seeking better living conditions
and job opportunities in larger urban concentrations.
Status:Developing rural economy with small service centres.
10 Year Land Budget:
The following table indicates the development potential for Kgetlengrivier Local Municipality.
Table 25-9: Kgetlengrivier Local Municipality 10 Year Land Budget (Ha)
Municipal Area Industrial Office Trade Bonded / FLISP
Subsidy Total
Kgetlengrivier 0.8 1.3 2.1 30.7 84.60 119.5
Source: Demacon, 2016
Development Guidelines:
Although municipality does not have a large amount of nature reserves, it is situated close to
prominent nature reserves such as Pilanesberg Nature Reserve and Magaliesberg Nature
Reserve – creating potential for the development of the tourism sector.
The municipality has potential in the game farming and tourism sector. Rather than seeking
to develop Koster into a large urban centre, the focus should be on the tourism sector.
The western and northern areas lend themselves to game farming, whilst the eastern areas
have potential for leisure tourism.
A more established tourism sector will automatically lead to an increased need for certain
services in Koster, e.g. retail facilities, abattoirs, and taxidermists.
Protect the natural environment.
Group public facilities and social amenities to create agglomeration advantages.
Increase public sector investment in the nodes, rather than dispersing investment
throughout the municipality.
Formalise trade.
Provide adequate housing opportunities close to employment opportunities and services.
Create employment intensive industries relating to the tourism and agriculture sectors to
minimise unemployment and decrease poverty.
Develop industries that utilise local resources, especially slate, to create a multiplier effect
and expand the economy.
Promote rural-urban migration to create denser population concentrations.
Focus on skills development in the tourism and agriculture sectors.
Protect high value arable land.
25.3.3.1.4.2 Implementation Plans and Programmes

252 | P a g e
Table 25-10 Kgetlengrivier Implementation Plan
Item No
Node/ Link/ Zone Node /Link Description
Project Focus
Implementation Plan (Programme)
Municipal Provincial National
1
Koster (Map 5-11)
Koster Town Development Koster Precinct Development Plan Villages, Townships and Small
Dorpies Programme National Infrastructure Plan: SIP7
2 Sustainable Human Settlements Kgetlengrivier LM Sustainable
Human Settlement Plan
Provincial Human Settlement Master Plan
Villages, Townships and Small Dorpies Programme
National Housing Code (2009) and housing delivery programmes
Integrated Urban Development Framework
National Infrastructure Plan: SIP7.
3 Engineering Services Upgrading Consolidated Engineering
Infrastructure Plan NW Infrastructure Plan
National Infrastructure Plan: : SIP 6, 8,9,10 and 18
Integrated Water Resource Planning (IWRP)
Integrated Resource Plan for Electricity (IRP) 2010-2030.
4 Social Services Upgrading Social Services Infrastructure Plan NW Infrastructure Plan National Infrastructure Plan: : SIP
12,13,14 and 15
5 Local Economic Development Kgetlengrivier (Bojanala) LED
Strategy
Villages, Townships and Small Dorpies Programme
North West Economic Development Plan
National Infrastructure Plan: : SIP4
6
Derby (Map 5-11)
Derby Settlement Development Derby Precinct Development Plan Villages, Townships and Small
Dorpies Programme National Infrastructure Plan: SIP7
7 Sustainable Human Settlements Kgetlengrivier LM Sustainable
Human Settlement Plan Provincial Human Settlement
Master Plan
National Housing Code (2009) and housing delivery programmes
Integrated Urban Development Framework
National Infrastructure Plan: SIP7.
8 Engineering Services Upgrading Consolidated Engineering
Infrastructure Plan NW Infrastructure Plan
National Infrastructure Plan: : SIP 6, 8,9,10 and 18
Integrated Water Resource Planning (IWRP)
Integrated Resource Plan for Electricity (IRP) 2010-2030.
9 Social Services Upgrading NW Infrastructure Plan NW Infrastructure Plan National Infrastructure Plan: : SIP
12,13,14 and 15
10 Local Economic Development Kgetlengrivier (Bojanala) LED
Strategy
Villages, Townships and Small Dorpies Programme
North West Economic Development Plan
National Infrastructure Plan: : SIP4
K2
K1
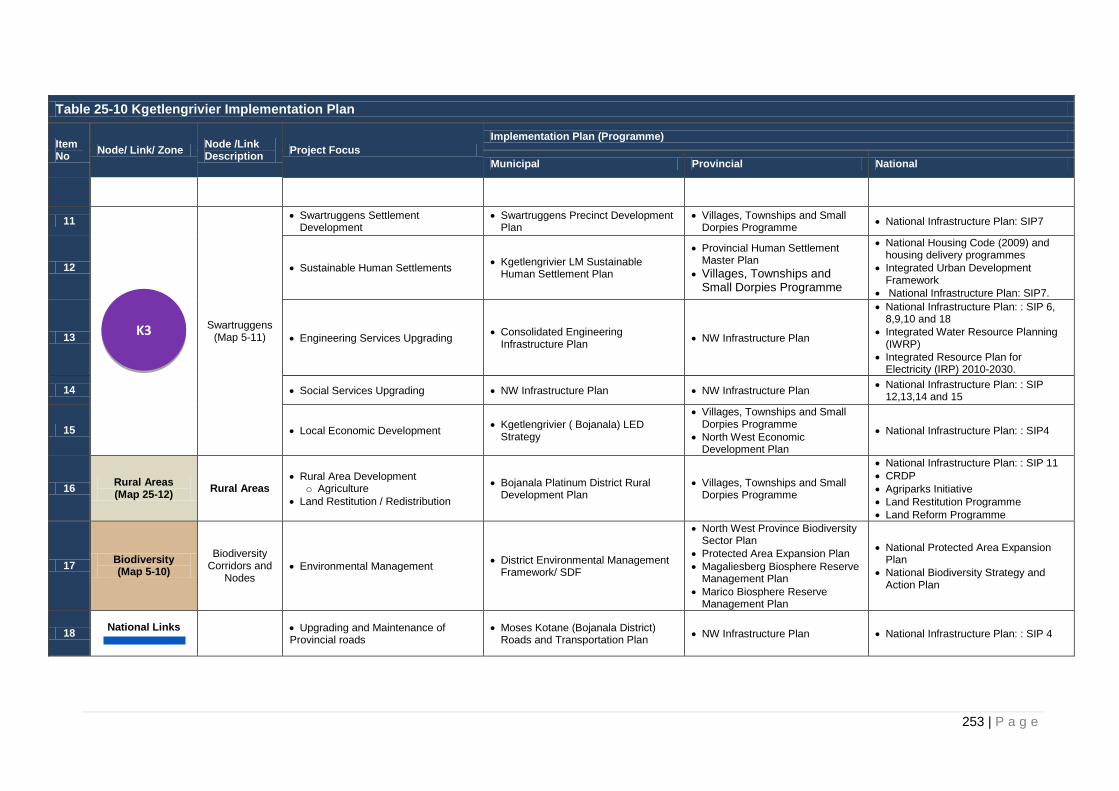
253 | P a g e
Table 25-10 Kgetlengrivier Implementation Plan
Item No
Node/ Link/ Zone Node /Link Description
Project Focus
Implementation Plan (Programme)
Municipal Provincial National
11
Swartruggens (Map 5-11)
Swartruggens Settlement Development
Swartruggens Precinct Development Plan
Villages, Townships and Small Dorpies Programme
National Infrastructure Plan: SIP7
12 Sustainable Human Settlements Kgetlengrivier LM Sustainable
Human Settlement Plan
Provincial Human Settlement Master Plan
Villages, Townships and Small Dorpies Programme
National Housing Code (2009) and housing delivery programmes
Integrated Urban Development Framework
National Infrastructure Plan: SIP7.
13 Engineering Services Upgrading Consolidated Engineering
Infrastructure Plan NW Infrastructure Plan
National Infrastructure Plan: : SIP 6, 8,9,10 and 18
Integrated Water Resource Planning (IWRP)
Integrated Resource Plan for Electricity (IRP) 2010-2030.
14 Social Services Upgrading NW Infrastructure Plan NW Infrastructure Plan National Infrastructure Plan: : SIP
12,13,14 and 15
15 Local Economic Development Kgetlengrivier ( Bojanala) LED
Strategy
Villages, Townships and Small Dorpies Programme
North West Economic Development Plan
National Infrastructure Plan: : SIP4
16 Rural Areas (Map 25-12)
Rural Areas Rural Area Development
o Agriculture
Land Restitution / Redistribution
Bojanala Platinum District Rural Development Plan
Villages, Townships and Small Dorpies Programme
National Infrastructure Plan: : SIP 11
CRDP
Agriparks Initiative
Land Restitution Programme
Land Reform Programme
17 Biodiversity (Map 5-10)
Biodiversity Corridors and
Nodes Environmental Management
District Environmental Management Framework/ SDF
North West Province Biodiversity Sector Plan
Protected Area Expansion Plan
Magaliesberg Biosphere Reserve Management Plan
Marico Biosphere Reserve Management Plan
National Protected Area Expansion Plan
National Biodiversity Strategy and Action Plan
18 National Links
Upgrading and Maintenance of Provincial roads
Moses Kotane (Bojanala District) Roads and Transportation Plan
NW Infrastructure Plan National Infrastructure Plan: : SIP 4
K3

254 | P a g e
Table 25-10 Kgetlengrivier Implementation Plan
Item No
Node/ Link/ Zone Node /Link Description
Project Focus
Implementation Plan (Programme)
Municipal Provincial National
19
Provincial Links
Enhance accessibility to Rustenburg, N4 and Gauteng.
Enhance district and local accessibility
Moses Kotane (Bojanala District) Roads and Transportation Plan
NW Infrastructure Plan
Villages, Townships and Small Dorpies Programme
National Infrastructure Plan: : SIP 4
20 Railway
Main Lines
Passenger / Freight Link
Moses Kotane (Bojanala District) Roads and Transportation Plan
NW Infrastructure Plan
Villages, Townships and Small Dorpies Programme
National Infrastructure Plan: : SIP 4

255 | P a g e
Map 25-10 : Bojanala Platinum District Implementation Framework (Biodiversity) – Kgetlengrivier LM

256 | P a g e
Map 25-11: Bojanala Platinum District Implementation Framework (Nodes & Links) – Kgetlengrivier LM

257 | P a g e
Map 25-12: Bojanala Platinum District Implementation Framework (Rural Development) – Kgetlengrivier LM

258 | P a g e
25.3.3.1.5 Moses Kotane Local Municipality 25.3.3.1.5.1 Development Guidelines
Moses Kotane local municipality is situated in the northern part of the North West Province. The
economy is mostly tourism orientated, with the Madikwe Game Reserve, Sun City and
Pilanesberg Nature Reserve situated within the municipality.
The population is dispersed and the only node of size is Mogwase. The natural landscape limits
accessibility throughout the region. Inadequate trade and commercial facilities exist in the
municipality, and public facilities are too dispersed to create agglomeration advantages for private
sector development. Trade and commercial development requires feet and the grouping of public
facilities is an imperative to kick start development in these areas.
Status: An underdeveloped economy with a focus on tourism.
10 Year Land Budget:
The following table indicates the development potential for Moses Kotane Local Municipality.
Table 25-11: Moses Kotane Local Municipality 10 Year Land Budget (Ha)
Municipal Area Industrial Office Trade Bonded / FLISP
Subsidy Total
Moses Kotane 9.4 3.9 5.7 143.3 575.30 737.6
Source: Demacon, 2016
Development Guidelines:
There is a noticeable conflict between the long term prospect of tourism and the short
term prospect of mining. It is nearly impossible to rehabilitate the area of open mines to its
former natural glory.
The Pilanesberg Nature Reserve, encompassing Sun City, forms the main tourist attraction
for the municipality, as such, it should be protected and managed to prevent the degradation
of agriculture and especially mining to the natural environment. The mines in the area are
detrimental to the water resources in the area and prevent the expansion of natural heritage
sites in the area – leisure tourist numbers have been reported to dwindle in recent years.
The buffer zone around Pilanesberg Nature Reserve and other reserves in the area should
not be encroached by mining or certain agricultural activities.
There is a proposed Platinum Beneficiation SEZ that has the potential to attract investment
to the municipality and help to increase its economic contribution.
The adequate development of basic public services and infrastructure is crucial for the
establishment of the SEZ.
Focus on relevant skills development, especially in the mining, tourism and trade sectors
Adequate housing should be provided.
The promotion of mixed use developments and affordable housing in close proximity to
mining activities is important.
Formalise and upgrade informal settlements.
Group public facilities and social amenities to create agglomeration advantages.
Increase public sector investment in the nodes, rather than dispersing investment throughout
the municipality.
Formalise trade.
Intensify development in Mogwase to increase the economic base.
Promote infill development and densification in Mogwase to establish a sustainable urban
core.
Focus on densification rather than greenfield development.

259 | P a g e
Increase accessibility between the rural areas.
Create employment intensive industries to minimise unemployment and decrease poverty.
Develop industries related to mining and tourism that utilise local resources to create a
multiplier effect and expand the economy.
Promote rural-urban migration to create denser population concentrations.
Protect high value agriculture land.
Promote tourism facilities to the local market as well.
25.3.3.1.5.2 Implementation Plans and Programmes

260 | P a g e
Table 25-12 Moses Kotane Implementation Plan
Item No
Node/ Link/ Zone Node /Link Description
Project Focus
Implementation Plan (Programme)
Municipal Provincial National
1
Ramokoka (Map 5-14)
Ramokoka Settlement Development Ramokoka Precinct Development
Plan Villages, Townships and Small
Dorpies Programme National Infrastructure Plan: SIP7
2 Sustainable Human Settlements Moses Kotane LM Sustainable
Human Settlement Plan
Provincial Human Settlement Master Plan
Villages, Townships and Small Dorpies Programme
National Housing Code (2009) and housing delivery programmes
Integrated Urban Development Framework
National Infrastructure Plan: SIP7.
3 Engineering Services Upgrading Consolidated Engineering
Infrastructure Plan NW Infrastructure Plan
National Infrastructure Plan: : SIP 6, 8,9,10 and 18
Integrated Water Resource Planning (IWRP)
Integrated Resource Plan for Electricity (IRP) 2010-2030.
4 Social Services Upgrading NW Infrastructure Plan NW Infrastructure Plan National Infrastructure Plan: : SIP
12,13,14 and 15
5 Local Economic Development Moses Kotane (Bojanala) LED
Strategy
NW Economic Development Plan
Villages, Townships and Small Dorpies Programme
National Infrastructure Plan: SIP4
6
Mogwase (Map 5-14)
Bojanala Eco Tourism City Bojanala Eco Tourism City
Development Plan North West 5 City Project National Infrastructure Plan: SIP7
7 Mogwase Settlement Development Mogwase Precinct Development
Plan Villages, Townships and Small
Dorpies Programme National Infrastructure Plan: SIP7
8 Sustainable Human Settlements Moses Kotane LM Sustainable
Human Settlement Plan
Provincial Human Settlement Master Plan
Villages, Townships and Small Dorpies Programme
National Housing Code (2009) and housing delivery programmes
Integrated Urban Development Framework
National Infrastructure Plan: SIP7.
9 Engineering Services Upgrading Consolidated Engineering
Infrastructure Plan NW Infrastructure Plan
National Infrastructure Plan: : SIP 6, 8,9,10 and 18
Integrated Water Resource Planning (IWRP)
Integrated Resource Plan for Electricity (IRP) 2010-2030.
10 Social Services Upgrading NW Infrastructure Plan NW Infrastructure Plan National Infrastructure Plan: : SIP
12,13,14 and 15
11 Local Economic Development Moses Kotane (Bojanala) LED
Strategy
NW Economic Development Plan
Villages, Townships and Small Dorpies Programme
National Infrastructure Plan: : SIP4
MK1
MK2

261 | P a g e
Table 25-12 Moses Kotane Implementation Plan
Item No
Node/ Link/ Zone Node /Link Description
Project Focus
Implementation Plan (Programme)
Municipal Provincial National
12 Mogwase (Bojanala) Eco-Tourism
City Mogwase (Bojanala) Eco-Tourism
City Development Plan North West City Development National Infrastructure Plan: SIP7
13
MK Prioritised Rural
(Map 5-15)
Moses Kotane Rural
Platinum Beneficiation SEZ SEZ Development Plan
Villages, Townships and Small Dorpies Programme
North West Economic Development Plan
SEZ Programme
14 Moses Kotane Rural Development Bojanala Platinum District Rural
Development Plan Villages, Townships and Small
Dorpies Programme
Comprehensive Rural Development programme
Agripark Initiative
15 Engineering Services Upgrading Consolidated Engineering
Infrastructure Plan Villages, Townships and Small
Dorpies Programme Comprehensive Rural Development
programme
16 Social Services Upgrading Social Services Infrastructure Plan Villages, Townships and Small
Dorpies Programme Comprehensive Rural Development
programme
17 Sustainable Human Settlements Moses Kotane LM Sustainable
Human Settlement Plan
Provincial Human Settlement Master Plan
Villages, Townships and Small Dorpies Programme
National Housing Code (2009) and housing delivery programmes
Integrated Urban Development Framework
National Infrastructure Plan: SIP7.
18 Local economic development Moses Kotane ( Bojanala) LED
Strategy Villages, Townships and Small
Dorpies Programme
Comprehensive Rural Development programme
Agripark Initiative
National Infrastructure Plan: : SIP 11
19 Land Restitution / Redistribution Land Rights Enquiry Villages, Townships and Small
Dorpies Programme
Restitution of Land Rights Programme
Land Reform Programme
20 Rural Areas (Map 5-15)
Rural Areas
Rural Area Development O Agriculture O Mining
Land Restitution / Redistribution
Bojanala Platinum District Rural Development Plan
Villages, Townships and Small Dorpies Programme
Agripark Initiative
National Infrastructure Plan: : SIP 11
CRDP
21 Biodiversity (Map 5-13)
Biodiversity Corridors and
Nodes Environmental Management
District Environmental Management Framework / Tourism Development Plan
North West Province Biodiversity Sector Plan
Protected Area Expansion Plan
National Protected Area Expansion Plan
National Biodiversity Strategy and Action Plan

262 | P a g e
Table 25-12 Moses Kotane Implementation Plan
Item No
Node/ Link/ Zone Node /Link Description
Project Focus
Implementation Plan (Programme)
Municipal Provincial National
22 Protected Areas
(Map 5-13) Protected
Areas
Nature Conservation/ Tourism/ Wildlife Economy o Sun City o Pilanesberg NR
District Environmental Management Framework / Tourism Development Plan
North West Province Biodiversity Sector Plan
Protected Area Expansion Plan
National Protected Area Expansion Plan
National Biodiversity Strategy and Action Plan
23
Provincial Links
Upgrading and Maintenance of
Provincial roads
Moses Kotane (Bojanala District) Roads and Transportation Plan
NW Infrastructure Plan National Infrastructure Plan: : SIP 4
24 Proposed
Provincial Links
A, B, C
Enhance accessibility to Rustenburg, N4 and Gauteng. Enhance district and local accessibility
Moses Kotane (Bojanala District) Roads and Transportation Plan
NW Infrastructure Plan
Villages, Townships and Small Dorpies Programme
National Infrastructure Plan: : SIP 4
25 Railway
Branch Lines
Unlocking economic potential Moses Kotane (Bojanala District)
Roads and Transportation Plan NW Infrastructure Plan
National Infrastructure Plan: : SIP 4
26 Airport Pilanesberg International Airport Pilanesberg International Airport
Development Plan Tourism Development National Infrastructure Plan: : SIP 4

263 | P a g e
Map 25-13 : Bojanala Platinum District Implementation Framework (Biodiversity) – Moses Kotane LM

264 | P a g e
Map 25-14: Bojanala Platinum District Implementation Framework (Nodes & Links) – Moses Kotane LM

265 | P a g e
Map 25-15: Bojanala Platinum District Implementation Framework (Rural Development) – Moses Kotane LM

266 | P a g e
25.3.3.2 Ngaka Modiri Molema District
25.3.3.2.1 Ratlou Local Municipality 25.3.3.2.1.1 Development Guidelines
Ratlou local municipality is mostly rural in nature with Setlagole, situated in the southern part of the
municipality, the only sizeable node. Other smaller nodes within the municipality are Disaneng,
Kraaipan and Madibogo. The municipality has a small economic base, dispersed population and low
densities.
The municipality needs to establish and expand the urban core of the municipality and investment
should be focused in core nodes such as Setlagole to strengthen the node and limit dispersion.
Status: An underdeveloped rural economy with small urban nodes.
10 Year Land Budget:
The following table indicates the development potential for Ratlou Local Municipality.
Table 25-13: Ratlou Local Municipality 10 Year Land Budget (Ha)
Municipal Area Industrial Office Trade Bonded / FLISP
Subsidy Total
Ratlou 3.7 0.1 3.8 24.0 112.5 144.1
Source: Demacon, 2016
Development Guidelines:
Future demand in the municipality is low. Focusing on backlog eradication relating to
housing and services should be the main concern.
Integrating rural towns and villages in the urban system by promoting and enhancing rural-
urban linkages in order to reduce disparities.
Focus delivery of basic services in core areas to create agglomeration advantages and to
attract people rather than dispersing them throughout the vastly rural municipality.
Position Setlagole Commercial Hub as a catalyst for local economic development.
Focus development on Setlagole rather than diluting investment potential.
Unlock the potential of tourism nodes.
Increase accessibility throughout the district.
Densify, rather than disperse, residential and commercial activities.
Focus on skills development in the agriculture and trade sectors.
Protect high value arable land.
Prioritise water infrastructure development.
Promote the establishment of SMMEs to create employment opportunities.
25.3.3.2.1.2 Implementation Plans and Programmes

267 | P a g e
Table 25-14 Ratlou Implementation Plan
Item No
Node/ Link/ Zone Node Description
Project Focus
Implementation Plan (Programme)
Municipal Provincial National
1
Setlagole (Map 5-17)
Setlagole Settlement Development Setlagole Precinct Development
Plan Villages, Townships and Small
Dorpies Programme National Infrastructure Plan: SIP7
2 Sustainable Human Settlements Ratlou LM Sustainable Human
Settlement Plan
Provincial Human Settlement Master Plan
Villages, Townships and Small Dorpies Programme
National Housing Code (2009) and housing delivery programmes
Integrated Urban Development Framework
National Infrastructure Plan: SIP7
3 Engineering Services Upgrading Consolidated Engineering
Infrastructure Plan NW Infrastructure Plan
National Infrastructure Plan: : SIP 6, 8,9,10 and 18
Integrated Water Resource Planning (IWRP)
Integrated Resource Plan for Electricity (IRP) 2010-2030.
4 Social Services Upgrading NW Infrastructure Plan NW Infrastructure Plan National Infrastructure Plan: : SIP
12,13,14 and 15
5 Local Economic Development Ratlou (Ngaka Modiri) LED Strategy
Villages, Townships and Small Dorpies Programme
North West Economic Development Plan
National Infrastructure Plan: : SIP4
6
Rt Prioritised Rural
(Map 5-18) Ratlou Rural
Ratlou Rural Development Ngaka Modiri District Rural
Development Plan Villages, Townships and Small
Dorpies Programme Comprehensive Rural Development
programme
7 Engineering Services Upgrading Consolidated Engineering
Infrastructure Plan Villages, Townships and Small
Dorpies Programme Comprehensive Rural Development
programme
8 Social Services Upgrading Social Services Infrastructure Plan Villages, Townships and Small
Dorpies Programme Comprehensive Rural Development
programme
9 Local Economic Development Ratlou (Ngaka Modiri) LED Strategy Villages, Townships and Small
Dorpies Programme Comprehensive Rural Development
programme
10 Sustainable Human Settlements Ratlou Sustainable Human
Settlement Plan
Provincial Human Settlement Master Plan
Villages, Townships and Small Dorpies Programme
National Housing Code (2009) and housing delivery programmes
Integrated Urban Development Framework
National Infrastructure Plan: SIP7
11 Land Restitution / Redistribution Land Rights Enquiry Villages, Townships and Small
Dorpies Programme
Restitution of Land Rights Programme
Land Reform Programme
Rt1

268 | P a g e
Table 25-14 Ratlou Implementation Plan
Item No
Node/ Link/ Zone Node Description
Project Focus
Implementation Plan (Programme)
Municipal Provincial National
12 Biodiversity (Map 5-16)
Biodiversity Corridors and
Nodes Environmental Management
District Environmental Management Framework / Tourism Development Plan
North West Province Biodiversity Sector Plan
Protected Area Expansion Plan
National Protected Area Expansion Plan
National Biodiversity Strategy and Action Plan
13 Rural Areas (Map 5-18)
Rural Areas - agriculture
Rural Area Development o Agriculture o Mining
Land Restitution / Redistribution
Ngaka Modiri Molema District Rural Development Plan
Villages, Townships and Small Dorpies Programme
National Infrastructure Plan: : SIP11
14 National Links
Upgrading and Maintenance of
National roads Ngaka Modiri Molema Integrated
Transport and Roads Plan NW Infrastructure Plan
SANRAL/ NATMAP
National Infrastructure Plan: : SIP4
15
Provincial Links
Upgrading and Maintenance of
Provincial roads
Ngaka Modiri Molema Integrated Transport and Roads Plan
NW Infrastructure Plan National Infrastructure Plan: : SIP4
16 Railway
Branch Lines
Unlocking economic potential Ngaka Modiri Molema Integrated
Transport and Roads Plan NW Infrastructure Plan National Infrastructure Plan: : SIP 4

269 | P a g e
Map 25-16: Ngaka Modiri Molema District Implementation Framework (Environmental) – Ratlou LM

270 | P a g e
Map 25-17: Ngaka Modiri Molema District Implementation Framework (Nodes & Links) – Ratlou LM

271 | P a g e
Map 25-18: Ngaka Modiri Molema District Implementation Framework (Rural Development) – Ratlou LM

272 | P a g e
25.3.3.2.2 Tswaing Local Municipality 25.3.3.2.2.1 Development Guidelines
The nodes in Tswaing local municipality include:
Delareyville.
Sannieshof.
Ottosdal.
These nodes are all small and mostly function as service centres for the farmers in the larger area.
The remainder of the municipality is rural with a dispersed population. There is potential for the
expansion of the tourism sector, with Barberspan Bird Sanctuary situated between Delareyville and
Sannieshof. The closest primary nodes include Vryburg (approximately 80km) and Klerksdorp
(approximately 120km). Given the size of the nodes as well as location, Delareyville should be the
primary development core.
Status: A productive agricultural region with scattered service centres.
10 Year Land Budget:
The following table indicates the development potential for Tswaing Local Municipality.
Table 25-15: Tswaing Local Municipality 10 Year Land Budget (Ha)
Municipal Area Industrial Office Trade Bonded / FLISP
Subsidy Total
Tswaing 8.0 0.2 6.7 31.2 129.8 175.9
Source: Demacon, 2016
Development Guidelines:
Tswaing has limited growth potential and as such, development and investment should focus
on strengthening the agriculture sector.
The protection of water resources is critical to ensure the sustainability of agriculture.
Focus on water management.
Security of land tenure is essential.
Providing adequate and sufficient services in Delareyville to farmers in the larger area will
help to increase their productivity.
Eradicate housing backlog.
Provide basic services.
Focus development and investment on Delareyville rather than diluting it in the municipality.
Refurbish and upgrade existing infrastructure.
Protect high value agriculture land.
Maintain existing infrastructure.
Develop and promote the tourism sector, especially in the larger Barberspan Bird Sanctuary
area.
Attract the local population to tourism facilities that will lead to an increase in demand for
related services and goods.
Formalise trade.
Create a favourable environment for private sector investment. 25.3.3.2.2.2 Implementation Plans and Programmes

273 | P a g e
Table 25-16 Tswaing Implementation Plan
Item No
Node/ Link/ Zone
Node Description
Project Focus
Implementation Plan (Programme)
Municipal Provincial National
1
Delareyville (Map 5-20)
Delareyville Town Development Delareyville Precinct Development
Plan Villages, Townships and Small
Dorpies Programme National Infrastructure Plan: SIP7
2 Sustainable Human Settlements Tswaing LM Sustainable Human
Settlement Plan
Provincial Human Settlement Master Plan
Villages, Townships and Small Dorpies Programme
National Housing Code (2009) and housing delivery programmes
Integrated Urban Development Framework
National Infrastructure Plan: SIP7
3 Engineering Services Upgrading Consolidated Engineering
Infrastructure Plan NW Infrastructure Plan
National Infrastructure Plan: : SIP 6, 8,9,10 and 18
Integrated Water Resource Planning (IWRP)
Integrated Resource Plan for Electricity (IRP) 2010-2030.
4 Social Services Upgrading Social Services Infrastructure Plan NW Infrastructure Plan National Infrastructure Plan: : SIP
12,13,14 and 15
5 Local Economic Development Tswaing (Ngaka Modiri Molema)
LED Strategy
Villages, Townships and Small Dorpies Programme
North West Economic Development Plan
National Infrastructure Plan: : SIP 4
6
Ottosdal (Map 5-20)
Ottosdal Upgrading Ottosdal Precinct Development
Plan Villages, Townships and Small
Dorpies Programme National Infrastructure Plan: SIP7
7 Sustainable Human Settlements Tswaing LM Sustainable Human
Settlement Plan
Provincial Human Settlement Master Plan
Villages, Townships and Small Dorpies Programme
National Housing Code (2009) and housing delivery programmes
Integrated Urban Development Framework
National Infrastructure Plan: SIP7
8 Engineering Services Upgrading Consolidated Engineering
Infrastructure Plan NW Infrastructure Plan
National Infrastructure Plan: : SIP 6, 8,9,10 and 18
Integrated Water Resource Planning (IWRP)
Integrated Resource Plan for Electricity (IRP) 2010-2030.
9 Social Services Upgrading Social Services Infrastructure Plan NW Infrastructure Plan National Infrastructure Plan: : SIP
12,13 14 and 15
10 Local Economic Development Tswaing (Ngaka Modiri Molema)
LED Strategy
Villages, Townships and Small Dorpies Programme
North West Economic Development Plan
National Infrastructure Plan: : SIP 4
Tg2
Tg1
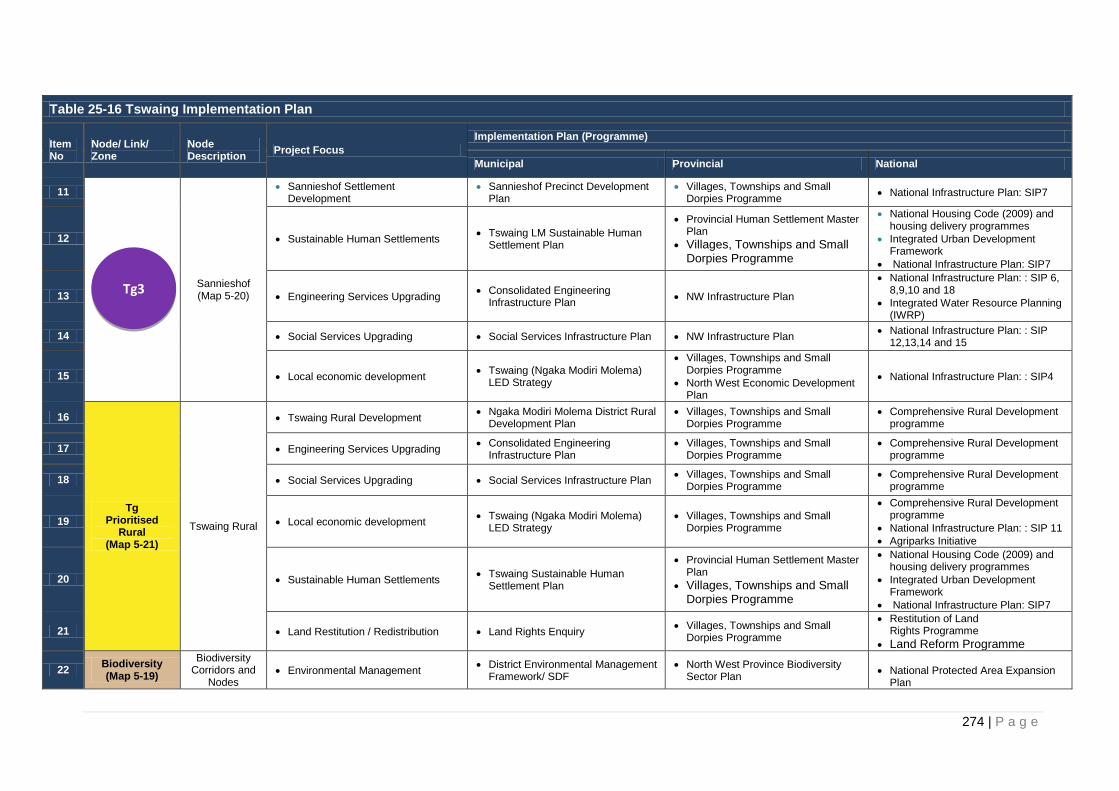
274 | P a g e
Table 25-16 Tswaing Implementation Plan
Item No
Node/ Link/ Zone
Node Description
Project Focus
Implementation Plan (Programme)
Municipal Provincial National
11
Sannieshof (Map 5-20)
Sannieshof Settlement Development
Sannieshof Precinct Development Plan
Villages, Townships and Small Dorpies Programme
National Infrastructure Plan: SIP7
12 Sustainable Human Settlements Tswaing LM Sustainable Human
Settlement Plan
Provincial Human Settlement Master Plan
Villages, Townships and Small Dorpies Programme
National Housing Code (2009) and housing delivery programmes
Integrated Urban Development Framework
National Infrastructure Plan: SIP7
13 Engineering Services Upgrading Consolidated Engineering
Infrastructure Plan NW Infrastructure Plan
National Infrastructure Plan: : SIP 6, 8,9,10 and 18
Integrated Water Resource Planning (IWRP)
14 Social Services Upgrading Social Services Infrastructure Plan NW Infrastructure Plan National Infrastructure Plan: : SIP
12,13,14 and 15
15 Local economic development Tswaing (Ngaka Modiri Molema)
LED Strategy
Villages, Townships and Small Dorpies Programme
North West Economic Development Plan
National Infrastructure Plan: : SIP4
16
Tg Prioritised
Rural (Map 5-21)
Tswaing Rural
Tswaing Rural Development Ngaka Modiri Molema District Rural
Development Plan Villages, Townships and Small
Dorpies Programme Comprehensive Rural Development
programme
17 Engineering Services Upgrading Consolidated Engineering
Infrastructure Plan Villages, Townships and Small
Dorpies Programme Comprehensive Rural Development
programme
18 Social Services Upgrading Social Services Infrastructure Plan Villages, Townships and Small
Dorpies Programme Comprehensive Rural Development
programme
19 Local economic development Tswaing (Ngaka Modiri Molema)
LED Strategy Villages, Townships and Small
Dorpies Programme
Comprehensive Rural Development programme
National Infrastructure Plan: : SIP 11
Agriparks Initiative
20 Sustainable Human Settlements Tswaing Sustainable Human
Settlement Plan
Provincial Human Settlement Master Plan
Villages, Townships and Small Dorpies Programme
National Housing Code (2009) and housing delivery programmes
Integrated Urban Development Framework
National Infrastructure Plan: SIP7
21 Land Restitution / Redistribution Land Rights Enquiry Villages, Townships and Small
Dorpies Programme
Restitution of Land Rights Programme
Land Reform Programme
22 Biodiversity (Map 5-19)
Biodiversity Corridors and
Nodes Environmental Management
District Environmental Management Framework/ SDF
North West Province Biodiversity Sector Plan
National Protected Area Expansion Plan
Tg3

275 | P a g e
Table 25-16 Tswaing Implementation Plan
Item No
Node/ Link/ Zone
Node Description
Project Focus
Implementation Plan (Programme)
Municipal Provincial National
National Biodiversity Strategy and Action Plan
23 Protected
Areas (Map 5-19)
Protected Areas
Nature Conservation/ Tourism/ Wildlife Economy
District Environmental Management Framework/ SDF
North West Province Biodiversity Sector Plan
National Protected Area Expansion Plan
National Biodiversity Strategy and Action Plan
24 Rural Areas (Map 5-21)
Rural Areas
Rural Area Development o Agriculture o Mining
Land Restitution / Redistribution
Ngaka Modiri Molema District Rural Development Plan
Villages, Townships and Small Dorpies Programme
National Infrastructure Plan: : SIP11
CRDP
Agriparks Initiative
25 National Links
Upgrading and Maintenance of National roads
Ngaka Modiri Molema Integrated Transport and Roads Plan
NW Infrastructure Plan
SANRAL/ NATMAP
National Infrastructure Plan: SIP4
26
Provincial Links
Upgrading and Maintenance of Provincial roads
Ngaka Modiri Molema Integrated Transport and Roads Plan
NW Infrastructure Plan National Infrastructure Plan: : SIP4
27 Railway
Main Lines
Passenger / Freight Link Ngaka Modiri Molema Integrated
Transport and Roads Plan NW Infrastructure Plan National Infrastructure Plan: : SIP4
28 Railway
Branch Lines
Unlocking economic potential Ngaka Modiri Molema Integrated
Transport and Roads Plan NW Infrastructure Plan National Infrastructure Plan: : SIP4

276 | P a g e
Map 25-19: Ngaka Modiri Molema District Implementation Framework (Environmental) – Tswaing LM

277 | P a g e
Map 25-20: Ngaka Modiri Molema District Implementation Framework (Nodes & Links) – Tswaing LM

278 | P a g e
Map 25-21: Ngaka Modiri Molema District Implementation Framework (Rural Development) – Tswaing LM

279 | P a g e
25.3.3.2.3 Mahikeng Local Municipality 25.3.3.2.3.1 Development Guidelines
Mafikeng local municipality is the administrative capital of the province with Mafikeng and
Mmabatho forming a large urban concentration. Another smaller node, Ottoshoop, is situated in the
eastern parts of the municipality. Although Mafikeng is the capital of the North West Province, the
remainder of the municipality still has a largely rural nature with vast amount of tribal land.
The municipality borders Botswana in the north-west, creating an ideal link between Gauteng and
Botswana.
The southern section of the municipality is more rural in natural with small communities scattered
throughout. Providing basic services to these areas will be expensive.
Due to the growth trajectory of the municipality, the municipality can follow the Diversification and
Management Strategy to ensure that the economy does not start to lag behind. A key component of
this strategy will be linking Mmabatho and Mafikeng and ensuring integration relating to business,
commercial and public services.
Status: A local economy with a strong regional service function rapidly expanding to city status.
10 Year Land Budget:
The following table indicates the development potential for Mafikeng Local Municipality.
Table 25-17: Mahikeng Local Municipality 10 Year Land Budget (Ha)
Municipal Area Industrial Office Trade Bonded / FLISP
Subsidy Total
Mahikeng 38.2 2.3 9.4 187.4 441.0 678.3
Source: Demacon, 2016
Development Guidelines:
Focus investment in the core urban areas of Mafikeng and Mmabatho to create
agglomeration advantages, fastening economic growth.
Mafikeng, although it has capital status, still have large areas with unregulated and informal
development, creating an insufficient urban network.
Investing in infrastructure development and maintenance within Mafikeng will help to
strengthen the economy’s position.
Ensure attractive building stock and physical business environment to attract private
sector investment.
A definite urban edge is needed to prohibit urban sprawl.
Create a sustainable urban form through zoning and adequate planning.
Promote the Industrial Development Zone and create a conductive environment for private
sector investment.
Provide tax incentives to attract private sector investment.
Focus on skills development in the finance, business, manufacturing and trade sectors to
enable the large economically active population to obtain employment.
Diversify the economy by focusing on backward and forward linkages to existing industries.
Provide access to basic services.
Develop adequate affordable housing opportunities for the growing urban population and
to address the housing backlog.
Develop agro-industries.
Formalise the economy.

280 | P a g e
Protect and develop water infrastructure.
There is opportunity to promote tourism in the municipality.
Protect critical biodiversity areas.
Protect high value agriculture land.
25.3.3.2.3.2 Implementation Plans and Programmes

281 | P a g e
Table 25-18 Mahikeng Implementation Plan
Item No
Node/ Link/ Zone Node Description
Project Focus
Implementation Plan (Programme)
Municipal Provincial National
1
Mahikeng (Map 5-23)
The City of Mahikeng The City of Mahikeng Development
Plan North West 5 City Project National Infrastructure Plan: SIP7
2 Mahikeng Urban Regeneration Mahikeng Urban Regeneration Plan Villages, Townships and Small Dorpies
Programme National Infrastructure Plan: SIP7
3 Sustainable Human Settlements Mahikeng LM Sustainable Human
Settlement Plan
Provincial Human Settlement Master Plan
Villages, Townships and Small Dorpies Programme
National Housing Code (2009) and housing delivery programmes
Integrated Urban Development Framework
National Infrastructure Plan: SIP7
4 Engineering Services Upgrading Consolidated Engineering
Infrastructure Plan NW Infrastructure Plan
Integrated Water Resource Planning (IWRP)
Integrated Resource Plan for Electricity (IRP) 2010-2030.
National Infrastructure Plan: : SIP 6, 8,9,10 and 18
5 Social Services Upgrading Social Services Infrastructure Plan NW Infrastructure Plan National Infrastructure Plan: : SIP
12,13 14 and 15
6 Local Economic Development
Mahikeng (Ngaka Modiri) LED Strategy
Meat Prcessing Plant , abattoir and packing facilities
Buy Back Centre (recycling)
Villages, Townships and Small Dorpies Programme
North West Economic Development Plan
National Infrastructure Plan: : SIP4
7
Setlopo (Map 5-23)
Setlopo Settlement Development Setlopo Precinct Development Plan Villages, Townships and Small Dorpies
Programme National Infrastructure Plan: SIP7
8 Sustainable Human Settlements Mahikeng LM Sustainable Human
Settlement Plan
Provincial Human Settlement Master Plan
Villages, Townships and Small Dorpies Programme
National Housing Code (2009) and housing delivery programmes
Integrated Urban Development Framework
National Infrastructure Plan: SIP7
9 Engineering Services Upgrading Consolidated Engineering
Infrastructure Plan NW Infrastructure Plan
National Infrastructure Plan: : SIP 6, 8,9,10 and 18
Integrated Water Resource Planning (IWRP)
Integrated Resource Plan for Electricity (IRP) 2010-2030.
10 Social Services Upgrading Social Services Infrastructure Plan NW Infrastructure Plan National Infrastructure Plan: : SIP
12,13 14 and 15
Mg3
Mg1

282 | P a g e
Table 25-18 Mahikeng Implementation Plan
Item No
Node/ Link/ Zone Node Description
Project Focus
Implementation Plan (Programme)
Municipal Provincial National
11 Local Economic Development Mahikeng (Ngaka Modiri) LED
Strategy
NW Economic Development Plan
Villages, Townships and Small Dorpies Programme
National Infrastructure Plan: : SIP4
12
Ottoshoop (Map 5-23)
Ottoshoop Settlement Development Ottoshoop Precinct Development
Plan Villages, Townships and Small Dorpies
Programme National Infrastructure Plan: SIP7
13 Sustainable Human Settlements Mahikeng LM Sustainable Human
Settlement Plan
Provincial Human Settlement Master Plan
Villages, Townships and Small Dorpies Programme
National Housing Code (2009) and housing delivery programmes
Integrated Urban Development Framework
National Infrastructure Plan: SIP7
14 Engineering Services Upgrading Consolidated Engineering
Infrastructure Plan NW Infrastructure Plan
National Infrastructure Plan: : SIP 6, 8,9,10 and 18
Integrated Water Resource Planning (IWRP)
Integrated Resource Plan for Electricity (IRP) 2010-2030.
15 Social Services Upgrading Social Services Infrastructure Plan NW Infrastructure Plan National Infrastructure Plan: : SIP
12,13,14 and 15
16 Local Economic Development Mahikeng (Ngaka Modiri Molema)
LED Strategy
Establishment of a feed lot
Villages, Townships and Small Dorpies Programme
North West Economic Development Plan
National Infrastructure Plan: : SIP4
17 Mg Prioritised Rural
(Map 5-24)
Mahikeng Rural
Mahikeng Rural Development Mahikeng Rural Development Plan Villages, Townships and Small Dorpies
Programme
Comprehensive Rural Development programme
18 Engineering Services Upgrading Consolidated Engineering
Infrastructure Plan Villages, Townships and Small Dorpies
Programme Comprehensive Rural Development
programme
19 Social Services Upgrading Social Services Infrastructure Plan Villages, Townships and Small Dorpies
Programme Comprehensive Rural Development
programme
20 Local economic development Mahikeng (Ngaka Modiri Molema)
LED Strategy
Villages, Townships and Small Dorpies Programme
Comprehensive Rural Development programme
National Infrastructure Plan: : SIP 11
Agriparks Initiative
21 Sustainable Human Settlements
Mahikeng Sustainable Human Settlement Plan
Development of Letalmoreng Dam – Tontonyane Dam Corridor
Provincial Human Settlement Master Plan /Villages, Townships and Small Dorpies Programme
ACT programme
National Housing Code (2009) and housing delivery programmes
Integrated Urban Development Framework
Mg4

283 | P a g e
Table 25-18 Mahikeng Implementation Plan
Item No
Node/ Link/ Zone Node Description
Project Focus
Implementation Plan (Programme)
Municipal Provincial National
Resucitation of Disaneng and Tsholofele Irrigation Schemes
National Infrastructure Plan: SIP7
22 Land Restitution / Redistribution Land Rights Enquiry Villages, Townships and Small
Dorpies Programme
Restitution of Land Rights Programme
Land Reform Programme
23 Biodiversity (Map 5-19)
Biodiversity Corridors
and Nodes Environmental Management
District Environmental Management Framework/ SDF
North West Province Biodiversity Sector Plan
North West Protected Area Expansion Plan
Marico Biosphere Reserve Management Plan
National Protected Area Expansion Plan
National Protected Area Expansion Plan
24 Protected Areas
(Map 5-19) Protected
Areas Nature Conservation/ Tourism/
Wildlife Economy District Environmental Management
Framework/ SDF
North West Province Biodiversity Sector Plan
North West Protected Area Expansion Plan
Marico Biosphere Reserve Management Plan
National Protected Area Expansion Plan
National Protected Area Expansion Plan
25
Rural Areas (Map 5-24)
Rural Areas
Rural Area Development o Agriculture o Mining
Cultural and Tourism
Land Restitution / Redistribution
Ngaka Modiri Molema District Rural Development Plan
Villages, Townships and Small Dorpies Programme
ACT programme
Department of Energy (DoE) Integrated Resource Plan (IRP) 2010 – 2030, Renewable Energy Development Zones (REDZs).
Solar PV Vryburg Focus Area
26 National Links
Upgrading and Maintenance of
National roads Upgrading and Maintenance of
National roads
Ngaka Modiri Molema Integrated Transport and Roads Plan
NW Infrastructure Plan
SANRAL/ NATMAP
National Infrastructure Plan: : SIP4 SANRAL
National Infrastructure Plan: : SIP 4
27
Provincial Links
Upgrading and Maintenance of
Provincial roads Upgrading and Maintenance of
Provincial roads
Ngaka Modiri Molema Integrated Transport and Roads Plan
NW Infrastructure Plan National Infrastructure Plan: : SIP4
National Infrastructure Plan: : SIP 4
28 Railway
Main Lines
Passenger / Freight Link Ngaka Modiri Molema Integrated
Transport and Roads Plan NW Infrastructure Plan National Infrastructure Plan: : SIP 4

284 | P a g e
Table 25-18 Mahikeng Implementation Plan
Item No
Node/ Link/ Zone Node Description
Project Focus
Implementation Plan (Programme)
Municipal Provincial National
29 Railway
Branch Lines
Unlocking economic potential Ngaka Modiri Molema Integrated
Transport and Roads Plan NW Infrastructure Plan National Infrastructure Plan: : SIP 4
30 Airport
Mahikeng Airport International Cargo Hub
Mahikeng Airport Development Plan Provincial Human Settlement Master
Plan /Villages, Townships and Small Dorpies Programme
National Infrastructure Plan: : SIP 4

285 | P a g e
Map 25-22: Ngaka Modiri Molema District Implementation Framework (Environmental) – Mahikeng LM
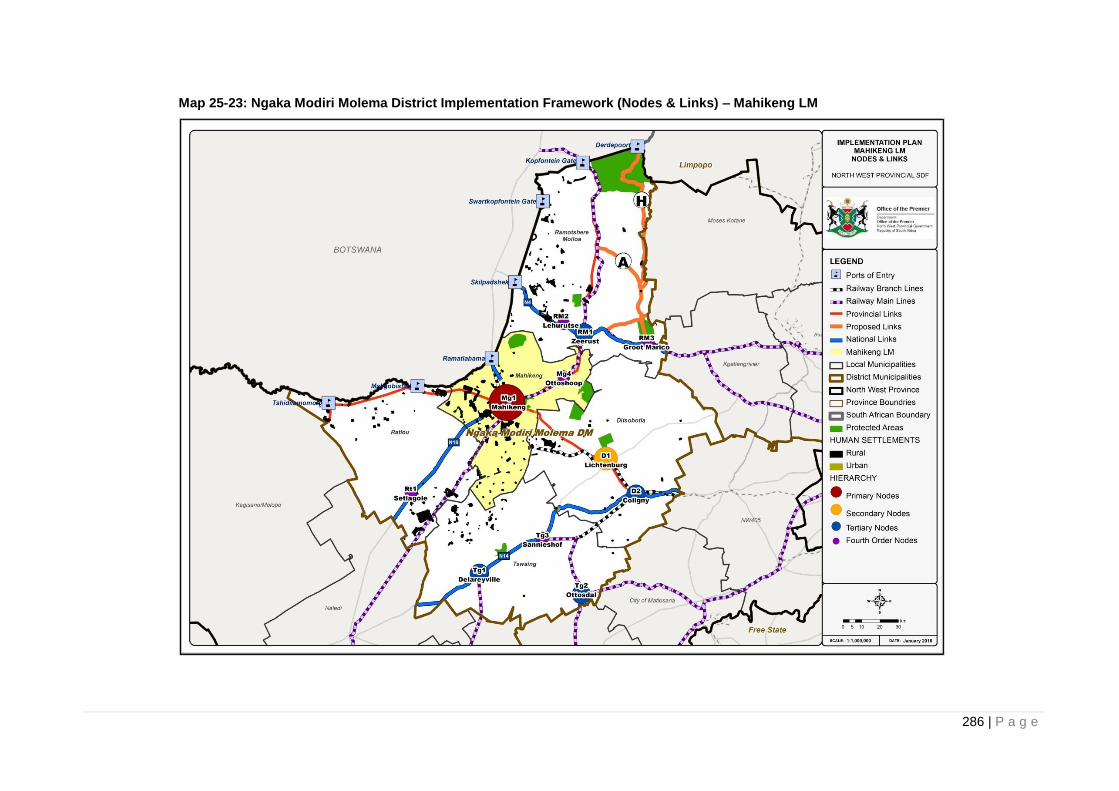
286 | P a g e
Map 25-23: Ngaka Modiri Molema District Implementation Framework (Nodes & Links) – Mahikeng LM

287 | P a g e
Map 25-24: Ngaka Modiri Molema District Implementation Framework (Rural Development) – Mahikeng LM

288 | P a g e
25.3.3.2.4 Ditsobotla Local Municipality 25.3.3.2.4.1 Development Guidelines
Ditsobotla local municipality is situated east of Mahikeng Local Municipality, with the following nodes:
Lichtenburg.
Coligny.
Biesiesvlei.
Biesiesvlei forms a small service centre, while Coligny, although larger, still functions mainly as a
service centre. Lichtenburg, on the other side, is a relatively large urban concentration with an
expanding business and services sector, and manufacturing sector.
Bakerville, Itsoseng, Mabaalstad, and Bokkraal are small, scattered communities that use Lichtenburg
as their main node for employment and retail opportunities.
Although the municipality is under administration, the economy is still growing at 4.4%, making it the
fastest growing economy in the province. A Growth Management Strategy will ensure that
infrastructure and services are maintained and upgraded to provide a positive environment for further
development. Focusing investment on Lichtenburg will create agglomeration advantages, attracting
more private sector investment and development.
Status: An economy rooted in agriculture becoming more diversified with a strong urban core.
10 Year Land Budget:
The following table indicates the development potential for Ditsobotla Local Municipality.
Table 25-19: Ditsobotla Local Municipality 10 Year Land Budget (Ha)
Municipal Area Industrial Office Trade Bonded / FLISP
Subsidy Total
Ditsobotla 25.8 3.8 14.4 84.2 225.7 353.9
Source: Demacon, 2016
Development Guidelines:
Focus investment on Lichtenburg to strengthen the economic core of the municipality.
Provide affordable housing opportunities for the expanding urban population.
Provide access to basic services.
Upgrade infrastructure such as roads, water and sanitation.
Upgrade informal settlements.
Concentrate community facilities and social services in Lichtenburg.
Protect the high value agriculture land and limit the impact of mining and quarrying on the
high value agriculture land.
Protect critical biodiversity areas.
Create industries in relevant sectors, e.g. produce and cement, to create employment
opportunities and limit the outflow of the economically active population.
Ensure a positive environment for private sector investment.
Focus on creating a value chain to increase multipliers.
Focus skills development on the agriculture, manufacturing and business sectors.
Focus on intensive labour driver industries.
Create an efficient and adequate municipal administration.
CBD revitalisation and upgrading of the road infrastructure will help to attract
development to the area.

289 | P a g e
Provide security of land tenure.
25.3.3.2.4.2 Implementation Plans and Programmes

290 | P a g e
Table 25-20 Ditsobotla Implementation Plan
Item No
Node/ Link/ Zone Node Description
Project Focus
Implementation Plan (Programme)
Municipal Provincial National
1
Lichtenburg (Map 5-26)
Lichtenburg Town Development Lichtenburg Local Development Plan Villages, Townships and Small
Dorpies Programme National Infrastructure Plan: SIP7
2 Sustainable Human Settlements Ditsobotla LM Sustainable Human
Settlement Plan
Provincial Human Settlement Master Plan
Villages, Townships and Small Dorpies Programme
National Housing Code (2009) and housing delivery programmes
Integrated Urban Development Framework
National Infrastructure Plan: SIP7
3 Engineering Services Upgrading Consolidated Engineering
Infrastructure Plan NW Infrastructure Plan
National Infrastructure Plan: SIP 6, 8,9,10 and 18
Integrated Water Resource Planning (IWRP)
Integrated Resource Plan for Electricity (IRP) 2010-2030.
4 Social Services Upgrading Social Services Infrastructure Plan NW Infrastructure Plan National Infrastructure Plan: SIP
12,13 14 and 15
5 Local Economic Development Ditsobotla (Ngaka Modiri) LED
Strategy
Villages, Townships and Small Dorpies Programme
North West Economic Development Plan
National Infrastructure Plan: : SIP4
6 Coligny Upgrading Coligny Precinct Development Plan Villages, Townships and Small
Dorpies Programme National Infrastructure Plan: SIP7
7
Coligny (Map 5-26)
Sustainable Human Settlements Ditsobotla LM Sustainable Human
Settlement Plan
Provincial Human Settlement Master Plan
Villages, Townships and Small Dorpies Programme
National Housing Code (2009) and housing delivery programmes
Integrated Urban Development Framework
National Infrastructure Plan: SIP7
8 Engineering Services Upgrading Consolidated Engineering
Infrastructure Plan NW Infrastructure Plan
National Infrastructure Plan: SIP 6, 8,9,10 and 18
Integrated Water Resource Planning (IWRP)
Integrated Resource Plan for Electricity (IRP) 2010-2030.
9 Social Services Upgrading Social Services Infrastructure Plan NW Infrastructure Plan National Infrastructure Plan: : SIP
12,13 14 and 15
10 Local Economic Development Ditsobotla (Ngaka Modiri Molema )
LED Strategy
Villages, Townships and Small Dorpies Programme
North West Economic Development Plan
National Infrastructure Plan: : SIP4
D2
D1

291 | P a g e
Table 25-20 Ditsobotla Implementation Plan
Item No
Node/ Link/ Zone Node Description
Project Focus
Implementation Plan (Programme)
Municipal Provincial National
11 Ditsobotla Rural Development
Ngaka Modiri Molema District Rural Development Plan
Springbokpan Agripark - Rehabilitation of silos
Villages, Townships and Small Dorpies Programme
Comprehensive Rural Development programme
National Infrastructure Plan: : SIP 11
CRDP
Agriparks Initiative
12
D Prioritised Rural
(Map 5-27)
Ditsobotla Rural
Engineering Services Upgrading Consolidated Engineering
Infrastructure Plan Villages, Townships and Small
Dorpies Programme
National Infrastructure Plan: : SIP11
Comprehensive Rural Development programme
13 Social Services Upgrading Social Services Infrastructure Plan Villages, Townships and Small
Dorpies Programme
National Infrastructure Plan: : SIP11
Comprehensive Rural Development programme
14 Local Economic Development Ditsobotla (Ngaka Modiri) LED
Strategy Villages, Townships and Small
Dorpies Programme
Comprehensive Rural Development programme
National Infrastructure Plan: : SIP11
15 Sustainable Human Settlements Ditsobotla Sustainable Human
Settlement Plan
Provincial Human Settlement Master Plan
Villages, Townships and Small Dorpies Programme
National Housing Code (2009) and housing delivery programmes
Integrated Urban Development Framework
National Infrastructure Plan: SIP7
16 Land Restitution / Redistribution Land Rights Enquiry Villages, Townships and Small
Dorpies Programme
Restitution of Land Rights Programme
Land Reform Programme
17 Springbokpan Agripark Springbokpan Agripark Implementation Plan
Villages, Townships and Small Dorpies Programme
Agripark Programme
18 Environmental Management District Environmental Management
Framework/ SDF
North West Province Biodiversity Sector Plan
North West Protected Area Expansion Plan
Marico Biosphere Reserve Management Plan
National Protected Area Expansion Plan
National Biodiversity Strategy and Action Plan
19 Biodiversity (Map 5-25)
Biodiversity Corridors
and Nodes
Nature Conservation/ Tourism/ Wildlife Economy
District Environmental Management Framework/ SDF
North West Province Biodiversity Sector Plan
North West Protected Area Expansion Plan
National Protected Area Expansion Plan
National Biodiversity Strategy and Action Plan

292 | P a g e
Table 25-20 Ditsobotla Implementation Plan
Item No
Node/ Link/ Zone Node Description
Project Focus
Implementation Plan (Programme)
Municipal Provincial National
Marico Biosphere Reserve Management Plan
20 Protected Areas
(Map 5-25) Protected
Areas Nature Conservation/ Tourism/
Wildlife Economy District Environmental Management
Framework/ SDF
North West Province Biodiversity Sector Plan
North West Protected Area Expansion Plan
National Protected Area Expansion Plan
National Biodiversity Strategy and Action Plan
21 Rural Areas (Map 5-27)
Rural Areas Rural Area Development
Land Restitution / Redistribution
Ngaka Modiri Molema District Rural Development Plan
Villages, Townships and Small Dorpies Programme
National Infrastructure Plan: : SIP11
22 National Links
Upgrading and Maintenance of
National roads
Ngaka Modiri Molema Integrated Transport and Roads Plan
NW Infrastructure Plan
SANRAL/ NATMAP
National Infrastructure Plan: : SIP4 SANRAL
23
Provincial Links
Upgrading and Maintenance of
Provincial roads
Ngaka Modiri Molema Integrated Transport and Roads Plan
NW Infrastructure Plan National Infrastructure Plan: :
SIP4
24 Railway
Branch Lines
Unlocking economic potential Ngaka Modiri Molema Integrated
Transport and Roads Plan NW Infrastructure Plan
National Infrastructure Plan: : SIP4

293 | P a g e
Map 25-25: Ngaka Modiri Molema District Implementation Framework (Environmental) – Ditsobotla LM

294 | P a g e
Map 25-26: Ngaka Modiri Molema District Implementation Framework (Nodes & Links) – Ditsobotla LM

295 | P a g e
Map 25-27: Ngaka Modiri Molema District Implementation Framework (Rural Development) – Ditsobotla LM

296 | P a g e
25.3.3.2.5 Ramotshere Moiloa Local Municipality 25.3.3.2.5.1 Development Guidelines
Ramotshere Moiloa local municipality is situated in the north, bordering Botswana. The nodes are:
Zeerust.
Groot Marico.
These nodes are situated in the southern part of the municipality. The remainder of the municipality
forms a vast rural area with dispersed population and low densities. The natural environment
lends itself to the establishment of nature reserves with Madikwe Nature Reserve situated in the
northern part of the municipality.
Due to the mostly rural nature of the municipality, it will be beneficial to concentrate development on
established nodes.
Status: A rural economy with large amounts of tribal land.
10 Year Land Budget:
The following table indicates the development potential for Ramotshere Moiloa Local Municipality.
Table 25-21: Ramotshere Moiloa Local Municipality 10 Year Land Budget (Ha)
Municipal Area Industrial Office Trade Bonded / FLISP
Subsidy Total
Ramotshere Moiloa 13.7 0.7 2.8 65.3 203.1 285.6
Source: Demacon, 2016
Development Guidelines:
Protect high value agricultural land.
Invest in agriculture to increase crop production in areas with high agricultural potential.
Protect water sources and develop water infrastructure to ensure sustainability.
Develop agro-industries that promote local beneficiation to create employment
opportunities, to create a value chain and increase economic development.
Focus invest in infrastructure and services in Zeerust to strengthen the urban core and create
a strong economic core that provides employment opportunities and services to the
population.
Provide access to basic services.
Promote and enhance the tourism sector – approximately 20% of the municipality is game
farms. Although they are relatively scattered and far away from rural settlements, there is
potential to develop the tourism sector and create tourism related services that will provide
employment opportunities.
Protect the natural environment and prohibit mining in the agriculture and tourism areas.
Formalise the informal economy and incorporate the informal traders in the economy.
Provide affordable housing opportunities in Zeerust and smaller nodes to increase densities.
25.3.3.2.5.2 Implementation Plans and Programmes

297 | P a g e
Table 25-22 Ramotshere Moiloa Implementation Plan
Item No
Node/ Link/ Zone Node Description
Project Focus
Implementation Plan (Programme)
Municipal Provincial National
1
Zeerust (Map 5-29)
Zeerust Town Development Zeerust Precinct Development Plan Villages, Townships and Small Dorpies
Programme National Infrastructure Plan: SIP7
2 Sustainable Human Settlements Ramotshere Moiloa LM Sustainable
Human Settlement Plan
Provincial Human Settlement Master Plan
Villages, Townships and Small Dorpies Programme
National Housing Code (2009) and housing delivery programmes
Integrated Urban Development Framework
National Infrastructure Plan: SIP7
3 Engineering Services Upgrading Consolidated Engineering
Infrastructure Plan NW Infrastructure Plan
National Infrastructure Plan: : SIP 6, 8,9,10 and 18
Integrated Water Resource Planning (IWRP)
Integrated Resource Plan for Electricity (IRP) 2010-2030.
4 Social Services Upgrading Social Services Infrastructure Plan NW Infrastructure Plan National Infrastructure Plan: : SIP
12,13 14 and 15
5 Local Economic Development
Ramotshere Moiloa (Ngaka Modiri) LED Strategy
Small Business Enterprise Strategy
Tourism Strategy
Villages, Townships and Small Dorpies Programme
North West Economic Development Plan
National Infrastructure Plan: : SIP4
6
Lehurutse (Map 5-29)
Lehurutse Settlement Development Lehurutse Precinct Development Plan Villages, Townships and Small Dorpies
Programme National Infrastructure Plan: SIP7
7 Sustainable Human Settlements Ramotshere Moiloa LM Sustainable
Human Settlement Plan
Provincial Human Settlement Master Plan
Villages, Townships and Small Dorpies Programme
National Housing Code (2009) and housing delivery programmes
Integrated Urban Development Framework
National Infrastructure Plan: SIP7
8 Engineering Services Upgrading Consolidated Engineering
Infrastructure Plan NW Infrastructure Plan
National Infrastructure Plan: : SIP 6, 8,9,10 and 18
Integrated Water Resource Planning (IWRP)
Integrated Resource Plan for Electricity (IRP) 2010-2030.
9 Social Services Upgrading Social Services Infrastructure Plan NW Infrastructure Plan National Infrastructure Plan: : SIP
12,13 14 and 15
10 Local Economic Development Ramotshere Moiloa (Ngaka Modiri
Molema ) LED Strategy Villages, Townships and Small Dorpies
Programme National Infrastructure Plan: : SIP4
RM2
RM1

298 | P a g e
Table 25-22 Ramotshere Moiloa Implementation Plan
Item No
Node/ Link/ Zone Node Description
Project Focus
Implementation Plan (Programme)
Municipal Provincial National
Small Business Enterprise Strategy
Tourism Strategy
North West Economic Development Plan
11
Groot Marico (Map 5-29)
Groot Marico Settlement Development Groot Marico Precinct Development
Plan Villages, Townships and Small Dorpies
Programme National Infrastructure Plan: SIP7
12 Sustainable Human Settlements Ramotshere Moiloa LM Sustainable
Human Settlement Plan
Provincial Human Settlement Master Plan
Villages, Townships and Small Dorpies Programme
National Housing Code (2009) and housing delivery programmes
Integrated Urban Development Framework
National Infrastructure Plan: SIP7
13 Engineering Services Upgrading Consolidated Engineering
Infrastructure Plan NW Infrastructure Plan
National Infrastructure Plan: : SIP 6, 8,9,10 and 18
Integrated Water Resource Planning (IWRP)
Integrated Resource Plan for Electricity (IRP) 2010-2030.
14 Social Services Upgrading Social Services Infrastructure Plan NW Infrastructure Plan National Infrastructure Plan: : SIP
12,13 14 and 15
15 Local Economic Development
Ramotshere Moiloa (Ngaka Modiri Molema ) LED Strategy
Small Business Enterprise Strategy
Tourism Strategy
Villages, Townships and Small Dorpies Programme
North West Economic Development Plan
National Infrastructure Plan: : SIP4
16
RM Prioritised Rural
(Map 5-30)
Ramotshere Moiloa Rural
Ramotshere Moiloa Rural Development
Ngaka Modiri Molema District Rural Development Plan
Villages, Townships and Small Dorpies Programme
Comprehensive Rural Development programme
17 Engineering Services Upgrading Consolidated Engineering
Infrastructure Plan Villages, Townships and Small Dorpies
Programme Comprehensive Rural
Development programme
18 Social Services Upgrading Social Services Infrastructure Plan Villages, Townships and Small Dorpies
Programme Comprehensive Rural
Development programme
19 Local economic development
Ramotshere Moiloa (Ngaka Modiri Molema ) LED Strategy
Small Business Enterprise Strategy
Tourism Strategy
Ngaka Modiri Molema District Rural Development Plan
Agriculture Strategy
Mining Strategy
Strategy for support of farming in rural areas
Villages, Townships and Small Dorpies Programme
Comprehensive Rural Development programme
National Infrastructure Plan: : SIP 11
CRDP
Agriparks Initiative
RM3

299 | P a g e
Table 25-22 Ramotshere Moiloa Implementation Plan
Item No
Node/ Link/ Zone Node Description
Project Focus
Implementation Plan (Programme)
Municipal Provincial National
20 Sustainable Human Settlements Ramotshere Moiloa LM Sustainable
Human Settlement Plan
Provincial Human Settlement Master Plan /Villages, Townships and Small Dorpies Programme
National Housing Code (2009) and housing delivery programmes
21 Land Restitution / Redistribution Land Rights Enquiry Villages, Townships and Small
Dorpies Programme
Restitution of Land Rights Programme
Land Reform Programme
22 Biodiversity (Map 5-28)
Biodiversity Corridors and
Nodes Environmental Management
District Environmental Management Framework/ SDF
North West Province Biodiversity Sector Plan
North West Protected Area Expansion Plan
Marico Biosphere Reserve Management Plan
National Protected Area Expansion Plan
National Biodiversity Strategy and Action Plan
23 Protected Areas
(Map 5-28) Protected
Areas Nature Conservation/ Tourism/ Wildlife
Economy District Environmental Management
Framework/ SDF
North West Province Biodiversity Sector Plan
North West Protected Area Expansion Plan
Marico Biosphere Reserve Management Plan
National Protected Area Expansion Plan
National Biodiversity Strategy and Action Plan
24 Rural Areas (Map 5-30)
Rural Areas
Rural Area Development o Agriculture o Tourism
Land Restitution / Redistribution
Ngaka Modiri Molema District Rural Development Plan
Villages, Townships and Small Dorpies Programme
Resuscitation of Molatedi Irrigation Scheme
National Infrastructure Plan: : SIP 11
CRDP
Agriparks Initiative
25 National Links
Upgrading and Maintenance of National roads
Ngaka Modiri Molema Integrated Transport and Roads Plan
NW Infrastructure Plan SANRAL/ NATMAP
National Infrastructure Plan: : SIP4
26
Provincial Links
Upgrading and Maintenance of Provincial roads
Ngaka Modiri Molema Integrated Transport and Roads Plan
NW Infrastructure Plan National Infrastructure Plan: : SIP4
27 Proposed
Provincial Links
A Passenger / Freight Link
Ngaka Modiri Molema Integrated Transport and Roads Plan
NW Infrastructure Plan National Infrastructure Plan: : SIP4
28 Railway
Main Lines
Passenger / Freight Link Ngaka Modiri Molema Integrated
Transport and Roads Plan NW Infrastructure Plan National Infrastructure Plan: : SIP4

300 | P a g e
Map 25-28: Ngaka Modiri Molema District Implementation Framework (Environmental) - Ramotshere Moiloa LM

301 | P a g e
Map 25-29: Ngaka Modiri Molema District Implementation Framework (Nodes & Links) - Ramotshere Moiloa LM
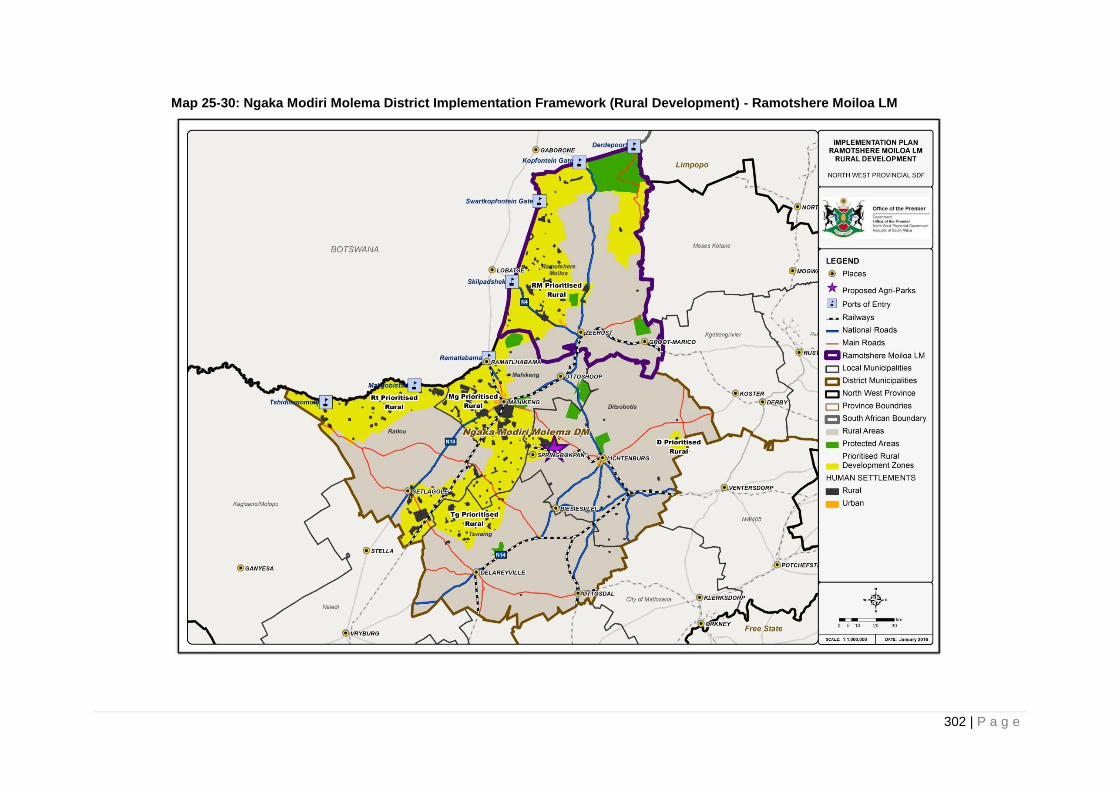
302 | P a g e
Map 25-30: Ngaka Modiri Molema District Implementation Framework (Rural Development) - Ramotshere Moiloa LM

303 | P a g e
25.3.3.3 Dr Ruth Segomotsi Mompati District
25.3.3.3.1 Kagisano / Molopo Local Municipality 25.3.3.3.1.1 Development Guidelines
Kagisano / Molopo local municipality has the following nodes:
Ganyesa.
Piet Plessis.
Pomfret. The municipality displays a mostly rural nature, with no large nodes and small communities scattered throughout the large municipality. The closest primary node is Vryburg, situated south of the municipality. The greatest chance to ensure the successful development and growth of the municipality will be to focus development on identified nodes, albeit from a small base, thereby creating concentration points. Status: An underdeveloped economy with limited development potential. 10 Year Land Budget: The following table indicates the development potential for Kagisano / Molopo Local Municipality. Table 25-23: Kagisano / Molopo Local Municipality 10 Year Land Budget (Ha)
Municipal Area Industrial Office Trade Bonded / FLISP
Subsidy Total
Kagisano/Molopo 4.3 0.2 1.5 31.9 122.3 160.2
Source: Demacon, 2016
Development Guidelines:
Severe environmental constraints exist in the municipality, limiting development potential.
Provide access to basic services.
Formalise selected rural nodes to create sustainable development.
Develop affordable housing in the nodes of Ganyesa, Piet Plessis and Pomfret to
strengthen them.
Focus public sector investment on these nodes.
Protect high value agricultural land.
Focus on developing the agriculture sector.
Protect high biodiversity areas.
Minimise loss of natural habitat and prevent over grazing through educating the population.
Develop water service infrastructure.
Protect and maintain current water infrastructure.
There is potential for tourism development in the municipality that will help to attract private
sector investment to the municipality and create a need for related services and goods.
25.3.3.3.1.2 Implementation Plans and Programmes

304 | P a g e
Table 25-24 Kagisano Implementation Plan
Item No
Node/ Link/ Zone Node Description
Project Focus
Implementation Plan (Programme)
Municipal Provincial National
1
Ganyesa (Map 5-32)
Ganyesa Upgrading Ganyesa Precinct Development Plan Villages, Townships and Small
Dorpies Programme National Infrastructure Plan: SIP7
2 Sustainable Human Settlements Kagisano LM Sustainable Human
Settlement Plan
Provincial Human Settlement Master Plan
Villages, Townships and Small Dorpies Programme
National Housing Code (2009) and housing delivery programmes
Integrated Urban Development Framework
National Infrastructure Plan: SIP7
3 Engineering Services Upgrading Consolidated Engineering
Infrastructure Plan NW Infrastructure Plan
National Infrastructure Plan: : SIP 6, 8,9,10 and 18
Integrated Water Resource Planning (IWRP)
Integrated Resource Plan for Electricity (IRP) 2010-2030.
4 Social Services Upgrading Social Services Infrastructure Plan NW Infrastructure Plan National Infrastructure Plan: : SIP
12,13 14 and 15
5 Local economic development Kagisano (Dr Ruth Segomotsi
Mompati) LED Strategy
Villages, Townships and Small Dorpies Programme
North West Economic Development Plan
National Infrastructure Plan: : SIP4
6
Ks Rural (Map 5-33)
Kagisano Rural
Kagisano Rural Development Dr Ruth Segomotsi Mompati District
Rural Development Plan
Villages, Townships and Small Dorpies Programme
Comprehensive Rural Development programme
National Infrastructure Plan: : SIP 11
CRDP
Agriparks Initiative
7 Engineering Services Upgrading Consolidated Engineering
Infrastructure Plan Villages, Townships and Small
Dorpies Programme Comprehensive Rural Development
programme
8 Social Services Upgrading Social Services Infrastructure Plan Villages, Townships and Small
Dorpies Programme Comprehensive Rural Development
programme
9 Local economic development Kagisano (Dr Ruth Segomotsi
Mompati) LED Strategy Villages, Townships and Small
Dorpies Programme Comprehensive Rural Development
programme
10 Sustainable Human Settlements Kagisano LM Sustainable Human
Settlement Plan
Provincial Human Settlement Master Plan /Villages, Townships and Small Dorpies Programme
National Housing Code (2009) and housing delivery programmes
Integrated Urban Development Framework
National Infrastructure Plan: SIP7
Ks1

305 | P a g e
Table 25-24 Kagisano Implementation Plan
Item No
Node/ Link/ Zone Node Description
Project Focus
Implementation Plan (Programme)
Municipal Provincial National
11 Land Restitution / Redistribution Land Rights Enquiry Villages, Townships and Small
Dorpies Programme
Restitution of Land Rights Programme
Land Reform Programme
12 Biodiversity (Map 5-31)
Biodiversity Corridors and
Nodes Environmental Management
District Environmental Management Framework/ SDF
North West Province Biodiversity Sector Plan
North West Protected Area Expansion Plan
National Protected Area Expansion Plan
National Biodiversity Strategy and Action Plan
13 Protected Areas
(Map 5-31) Protected
Areas Nature Conservation/ Tourism/
Wildlife Economy District Environmental Management
Framework/ SDF
North West Province Biodiversity Sector Plan
North West Protected Area Expansion Plan
National Protected Area Expansion Plan
National Biodiversity Strategy and Action Plan
14 Rural Areas (Map 5-33)
Rural Areas - agriculture
Rural Area Development o Agriculture o Mining o Tourism o Green Energy
Land Restitution / Redistribution
Dr Ruth Segomotsi Mompati District
Rural Development Plan
Villages, Townships and Small Dorpies Programme
National Infrastructure Plan: : SIP 11
CRDP
Agriparks Initiative
15
Provincial Links
Upgrading and Maintenance of
Provincial roads
Dr Ruth Segomotsi Mompati District
Transportation and Roads Development Plan
NW Infrastructure Plan National Infrastructure Plan: : SIP 4

306 | P a g e
Map 25-31: Dr Ruth Segomotsi Mompati District Implementation Framework (Environmental) – Kagisano LM

307 | P a g e
Map 25-32: Dr Ruth Segomotsi Mompati District Implementation Framework (Nodes & Links) – Kagisano LM

308 | P a g e
Map 25-33: Dr Ruth Segomotsi Mompati District Implementation Framework (Rural Development) – Kagisano LM

309 | P a g e
25.3.3.3.2 Naledi Local Municipality 25.3.3.3.2.1 Development Guidelines
Vryburg forms an important node in the Naledi local municipality. The other node of size is Stella,
situated in the northern parts of the municipality.
Although Vryburg is an old and established node, a Revival Strategy is necessary to increase
economic growth and attract new investment to the area. With time, this development will spill over to
the other areas in Vryburg.
Status:
Developing economy vested in agriculture.
10 Year Land Budget:
The following table indicates the development potential for Naledi Local Municipality.
Table 25-25: Naledi Local Municipality 10 Year Land Budget (Ha)
Municipal Area Industrial Office Trade Bonded / FLISP
Subsidy Total
Naledi 4.8 0.2 2.3 38.9 89.9 136.1
Source: Demacon, 2016
Development Guidelines:
The locality of Vryburg town relative to the N14 and N18 creates development potential that
should be exploited.
Investment should be focused on Vryburg itself, rather than diluting it through the municipality.
Reviving the CBD will help attract private sector investment.
Maintain and upgrade existing infrastructure.
Provide access to basic services.
Concentrate community facilities and social services in Vryburg to create a more dense urban
settlement.
Focus on densification, rather than greenfield developments in rural areas.
Protect high value agricultural land.
Develop agro-processing industries that focus on the beneficiation of local goods and
produce that will create a value chain in Vryburg, rather than exporting the live cattle and
unprocessed produce to other provinces, e.g. Gauteng.
Protect scarce water resources.
Develop and maintain water service infrastructure.
Focus skills development on related industries – agriculture, manufacturing, trade – to help
curb unemployment.
Develop labour intensive industries to limit the outflow of the labour force.
Provide affordable housing within a clearly demarcated urban edge to prevent sprawl.
Due to drier conditions, the potential for commercial farming is on the decline. It is proposed
that these areas should be utilised for game farming that will attract people to the area and
create a demand for related services such as taxidermists, etc.
Develop tourism infrastructure through public-private partnerships.
Stella should be utilised as a service point – maintaining and upgrading existing
infrastructure is important, as well as providing basic services to the larger community.
Create a conductive environment in Vryburg to attract private sector investment.
Formalise trade.
25.3.3.3.2.2 Implementation Plans and Programmes

310 | P a g e
Table 25-26 Naledi Implementation Plan
Item No
Node/ Link/ Zone Node Description
Project Focus
Implementation Plan (Programme)
Municipal Provincial National
1
Vryburg (Map 5-35)
Vryburg Town Development Vryburg Local Development Plan Villages, Townships and Small Dorpies
Programme National Infrastructure Plan: SIP7
2 Naledi/Vryburg Agripark Naledi/Vryburg Agripark
Implementation Plan Villages, Townships and Small Dorpies
Programme Agripark Programme
3 Sustainable Human
Settlements Naledi LM Sustainable Human
Settlement Plan
Provincial Human Settlement Master Plan
Villages, Townships and Small Dorpies Programme
National Housing Code (2009) and housing delivery programmes
Integrated Urban Development Framework
National Infrastructure Plan: SIP7
4 Engineering Services
Upgrading Consolidated Engineering
Infrastructure Plan NW Infrastructure Plan
Integrated Water Resource Planning (IWRP)
Integrated Resource Plan for Electricity (IRP) 2010-2030.
National Infrastructure Plan: : SIP 6, 8,9,10 and 18
5 Vryburg Agripark Vryburg Agripark Implementation
Plan Villages, Townships and Small Dorpies
Programme Agripark Programme
6 Social Services Upgrading Social Services Infrastructure Plan NW Infrastructure Plan National Infrastructure Plan: : SIP
12,13 14 and 15
7 Local Economic Development Naledi (Dr Ruth Segomotsi Mompati)
LED Strategy
Villages, Townships and Small Dorpies Programme
North West Economic Development Plan
National Infrastructure Plan: : SIP4
8
Stella (Map 5-35)
Stella Settlement Development Stella Precinct Development Plan Villages, Townships and Small Dorpies
Programme National Infrastructure Plan: SIP7
9 Sustainable Human
Settlements Naledi LM Sustainable Human
Settlement Plan
Provincial Human Settlement Master Plan
Villages, Townships and Small Dorpies Programme
National Housing Code (2009) and housing delivery programmes /Mining Towns Human Settlement Transformation
Integrated Urban Development Framework
10 Engineering Services
Upgrading Consolidated Engineering
Infrastructure Plan NW Infrastructure Plan
National Infrastructure Plan: : SIP 6, 8,9,10 and 18
Integrated Water Resource Planning (IWRP)
Integrated Resource Plan for Electricity (IRP) 2010-2030.
N2
N1

311 | P a g e
Table 25-26 Naledi Implementation Plan
Item No
Node/ Link/ Zone Node Description
Project Focus
Implementation Plan (Programme)
Municipal Provincial National
11 Social Services Upgrading Social Services Infrastructure Plan NW Infrastructure Plan National Infrastructure Plan: : SIP
12,13 14 and 15
12 Local Economic Development Naledi (Dr Ruth Segomotsi Mompati)
LED Strategy
Villages, Townships and Small Dorpies Programme
North West Economic Development Plan
National Infrastructure Plan: : SIP4
13 Biodiversity (Map 5-34)
Biodiversity Corridors and
Nodes Environmental Management
District Environmental Management Framework/ SDF
North West Province Biodiversity Sector Plan
North West Protected Area Expansion Plan
National Protected Area Expansion Plan
National Biodiversity Strategy and Action Plan
14
Rural Areas (Map 25-36)
Rural Areas
Land Restitution / Redistribution
Land Rights Enquiry Villages, Townships and Small
Dorpies Programme
Restitution of Land Rights Programme
Land Reform Programme
15
Rural Area Development o Agriculture o Mining
Land Restitution / Redistribution
Dr Ruth Segomotsi Mompati District
Rural Area Development Plan
Villages, Townships and Small Dorpies Programme
National Infrastructure Plan: : SIP 11
CRDP
Agriparks Initiative
Land redistribution Programme
16 National Links
Upgrading and Maintenance of
National roads
Dr Ruth Segomotsi Mompati Integrated Transport and Roads Plan
NW Infrastructure Plan SANRAL/ NATMAP
National Infrastructure Plan: : SIP4
17
Provincial Links
Upgrading and Maintenance of
Provincial roads
Dr Ruth Segomotsi Mompati Integrated Transport and Roads Plan
NW Infrastructure Plan National Infrastructure Plan: : SIP4
18 Railway
Main Lines
Passenger / Freight Link Dr Ruth Segomotsi Mompati
Integrated Transport and Roads Plan NW Infrastructure Plan National Infrastructure Plan: : SIP4
19 Railway
Branch Lines
Unlocking economic potential Dr Ruth Segomotsi Mompati
Integrated Transport and Roads Plan NW Infrastructure Plan National Infrastructure Plan: : SIP4

312 | P a g e
Map 25-34: Dr Ruth Segomotsi Mompati District Implementation Framework (Environmental) – Naledi LM

313 | P a g e
Map 25-35: Dr Ruth Segomotsi Mompati District Implementation Framework (Nodes & Links) – Naledi LM

314 | P a g e
Map 25-36: Dr Ruth Segomotsi Mompati District Implementation Framework (Rural Development) – Naledi LM

315 | P a g e
25.3.3.3.3 Mamusa Local Municipality 25.3.3.3.3.1 Development Guidelines
The following nodes are situated in Mamusa local municipality:
Schweizer-Reneke.
Migdol.
Amalia.
Gloudina.
The only node of size currently, is Schweizer-Reneke which forms the administrative head of the
municipality. The other nodes have a small economic base as well as small populations, mostly
functioning as service centres for the rural municipality.
A Revival Strategy will help to bring growth and investment to the municipality. Although basic service
delivery should take place throughout the municipality, the majority of development and investment
should focus on one core node of which Schweizer-Reneke would be ideal.
Status: A developing agricultural economy.
10 Year Land Budget:
The following table indicates the development potential for Mamusa Local Municipality.
Table 25-27: Mamusa Local Municipality 10 Year Land Budget (Ha)
Municipal Area Industrial Office Trade Bonded / FLISP
Subsidy Total
Mamusa 4.1 1.0 2.9 26.9 82.2 117.1
Source: Demacon, 2016
Development Guidelines:
Focus public sector investment in Schweizer-Reneke to create higher densities and to create
a concentration of services.
Maintain infrastructure and basic services in the smaller nodes, e.g. Migdol, Amalia, Gloudina.
Focus on backlog eradication in the smaller nodes, whilst creating new affordable housing
opportunities in Schweizer-Reneke.
Concentrate basic service delivery in Schweizer-Reneke.
Protect high value agricultural land.
Provide support to the agricultural community.
Focus on skills development in the agricultural and trade sectors.
Develop the tourism sector in the areas not suited for agriculture.
Ensure land tenure security.
Promote linkages between agriculture, agro-manufacturing and tourism potential.
Maintain rural infrastructure.
Increase linkages to economic hubs.
Due to drier climates and resultant lower value agricultural land, it would be beneficial to
promote game farming and game breeding attracting people and money to the
municipality.
Ensure the maintenance and adequate management of infrastructure to improve
sustainability.
Proactive infrastructure development and planning is crucial in the upgrading of informal
settlements and the creation of new settlements.
25.3.3.3.3.2 Implementation Plans and Programmes
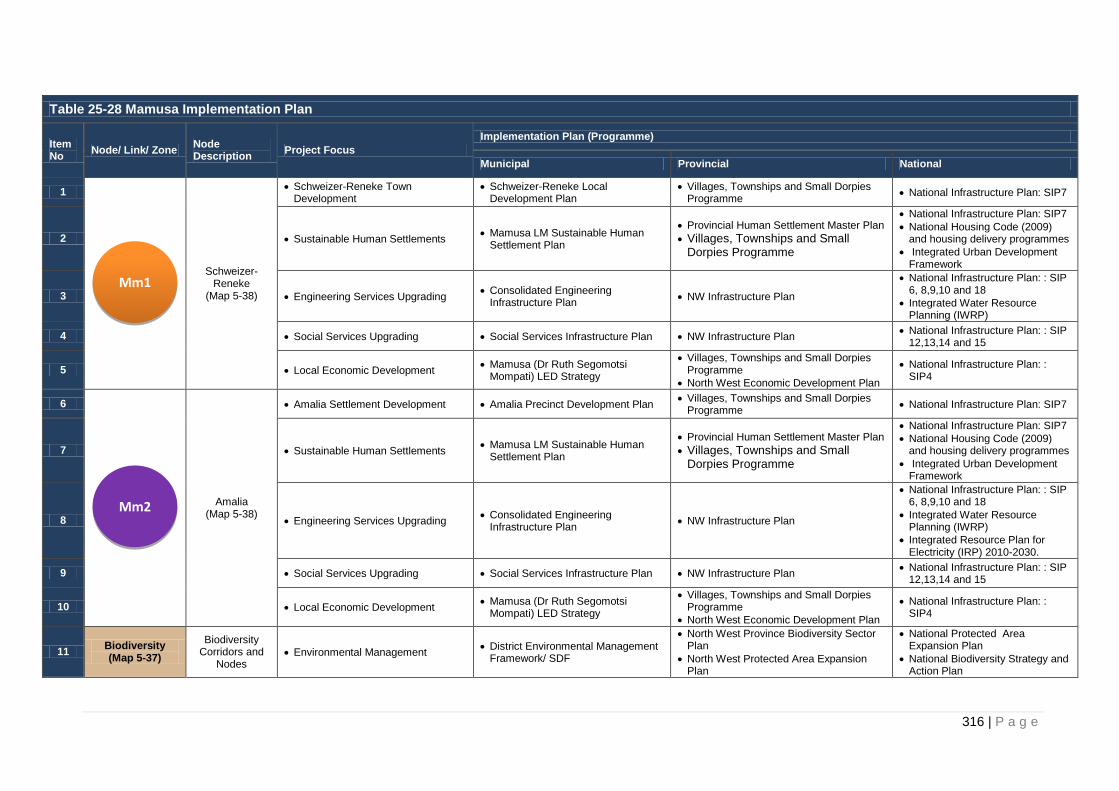
316 | P a g e
Table 25-28 Mamusa Implementation Plan
Item No
Node/ Link/ Zone Node Description
Project Focus
Implementation Plan (Programme)
Municipal Provincial National
1
Schweizer-Reneke
(Map 5-38)
Schweizer-Reneke Town Development
Schweizer-Reneke Local Development Plan
Villages, Townships and Small Dorpies Programme
National Infrastructure Plan: SIP7
2 Sustainable Human Settlements Mamusa LM Sustainable Human
Settlement Plan
Provincial Human Settlement Master Plan
Villages, Townships and Small Dorpies Programme
National Infrastructure Plan: SIP7
National Housing Code (2009) and housing delivery programmes
Integrated Urban Development Framework
3 Engineering Services Upgrading Consolidated Engineering
Infrastructure Plan NW Infrastructure Plan
National Infrastructure Plan: : SIP 6, 8,9,10 and 18
Integrated Water Resource Planning (IWRP)
4 Social Services Upgrading Social Services Infrastructure Plan NW Infrastructure Plan National Infrastructure Plan: : SIP
12,13,14 and 15
5 Local Economic Development Mamusa (Dr Ruth Segomotsi
Mompati) LED Strategy
Villages, Townships and Small Dorpies Programme
North West Economic Development Plan
National Infrastructure Plan: : SIP4
6
Amalia (Map 5-38)
Amalia Settlement Development Amalia Precinct Development Plan Villages, Townships and Small Dorpies
Programme National Infrastructure Plan: SIP7
7 Sustainable Human Settlements Mamusa LM Sustainable Human
Settlement Plan
Provincial Human Settlement Master Plan
Villages, Townships and Small Dorpies Programme
National Infrastructure Plan: SIP7
National Housing Code (2009) and housing delivery programmes
Integrated Urban Development Framework
8 Engineering Services Upgrading Consolidated Engineering
Infrastructure Plan NW Infrastructure Plan
National Infrastructure Plan: : SIP 6, 8,9,10 and 18
Integrated Water Resource Planning (IWRP)
Integrated Resource Plan for Electricity (IRP) 2010-2030.
9 Social Services Upgrading Social Services Infrastructure Plan NW Infrastructure Plan National Infrastructure Plan: : SIP
12,13,14 and 15
10 Local Economic Development Mamusa (Dr Ruth Segomotsi
Mompati) LED Strategy
Villages, Townships and Small Dorpies Programme
North West Economic Development Plan
National Infrastructure Plan: : SIP4
11 Biodiversity (Map 5-37)
Biodiversity Corridors and
Nodes Environmental Management
District Environmental Management Framework/ SDF
North West Province Biodiversity Sector Plan
North West Protected Area Expansion Plan
National Protected Area Expansion Plan
National Biodiversity Strategy and Action Plan
Mm2
Mm1

317 | P a g e
Table 25-28 Mamusa Implementation Plan
Item No
Node/ Link/ Zone Node Description
Project Focus
Implementation Plan (Programme)
Municipal Provincial National
12
Rural Areas (Map 25-39)
Rural Areas
Rural Area Development o Agriculture o Mining
Land Restitution / Redistribution
Dr Ruth Segomotsi Mompati District
Rural Development Plan
Villages, Townships and Small Dorpies Programme
National Infrastructure Plan: SIP 11
CRDP
Agriparks Initiative
13 Land Restitution / Redistribution Land Rights Enquiry Villages, Townships and Small
Dorpies Programme
Restitution of Land Rights Programme
Land Reform Programme
14
Provincial Links
Upgrading and Maintenance of
Provincial roads Dr Ruth Segomotsi Mompati District
Transportation and Roads Plan NW Infrastructure Plan
National Infrastructure Plan: : SIP 4
15 Railway
Main Lines
Passenger / Freight Link Dr Ruth Segomotsi Mompati District
Transportation and Roads Plan NW Infrastructure Plan
National Infrastructure Plan: : SIP 4

318 | P a g e
Map 25-37: Dr Ruth Segomotsi Mompati District Implementation Framework (Environmental) – Mamusa LM

319 | P a g e
Map 25-38: Dr Ruth Segomotsi Mompati District Implementation Framework (Nodes & Links) – Mamusa LM

320 | P a g e
Map 25-39: Dr Ruth Segomotsi Mompati District Implementation Framework (Rural Development) – Mamusa LM

321 | P a g e
25.3.3.3.4 Greater Taung Local Municipality 25.3.3.3.4.1 Development Guidelines
Greater Taung has the following nodes:
Taung.
Boipelo.
Reivilo.
Pudimoe.
The municipal area is predominantly rural and contains widely scattered villages. The villages,
although scattered, are mostly concentrated in the eastern part of the municipality. Focused public
investment and incentives are needed in the municipality to attract business and commercial
development to the municipality.
Due to the vast rural nature of the municipality, focusing development on Taung will provide the most
benefit for the whole municipality.
Status: A rural economy with a developing urban node.
10 Year Land Budget:
The following table indicates the development potential for Greater Taung Local Municipality.
Table 25-29: Greater Taung Local Municipality 10 Year Land Budget (Ha)
Municipal Area Industrial Office Trade Bonded / FLISP
Subsidy Total
Greater Taung 15.4 0.6 2.4 45.2 190.3 253.9
Source: Demacon, 2016 Development Guidelines:
Formalise trade
Focus economic investment in Taung to increase Taung’s economic base.
Create a conductive environment in Taung to attract private sector investment.
Focus on backlog eradication in the smaller nodes.
Provide access to basic services.
Concentrate community facilities and social services in Taung to create an agglomeration of
services, increasing access and attracting people to Taung.
Agriculture plays an important role in the economy, and agricultural land should be protected.
Develop agro-industries that promote local beneficiation to create employment opportunities,
to create a value chain and increase economic development.
The agro-industries should be located close to Taung that has higher densities and a larger
concentrated labour force.
Focus on skills development relating to agriculture and related industries.
Promote tourism development especially in the following areas: Taung Dam, Spitskop Dam
and Nature Reserve, and the Taung Heritage Route.
Ensure land tenure security.
Maintain and upgrade current infrastructure.
Develop affordable housing to cater to the growing population. Focus housing development
in the nodes, rather than creating a dispersed settlement pattern. Developing housing in the
nodes will ensure access to services and job opportunities.
Maintain and upgrade the water services to ensure sustainability of limited resources.
Explore the development of boreholes to expand the water services.
25.3.3.3.4.2 Implementation Plans and Programmes

322 | P a g e
Table 25-30 Greater Taung Implementation Plan
Item No
Node/ Link/ Zone Node Description
Project Focus
Implementation Plan (Programme)
Municipal Provincial National
1
Taung (Map 5-41)
Taung City Taung Development Plan North West 5 City Project National Infrastructure Plan: SIP7
2 Taung Upgrading Taung Precinct Development Plan Villages, Townships and Small
Dorpies Programme National Infrastructure Plan: SIP7
3 Sustainable Human Settlements Greater Taung LM Sustainable
Human Settlement Plan
Provincial Human Settlement Master Plan
Villages, Townships and Small Dorpies Programme
National Infrastructure Plan: SIP7
National Housing Code (2009) and housing delivery programmes
Integrated Urban Development Framework
4 Engineering Services Upgrading Consolidated Engineering
Infrastructure Plan NW Infrastructure Plan
National Infrastructure Plan: : SIP 6, 8,9,10 and 18
Integrated Water Resource Planning (IWRP)
Integrated Resource Plan for Electricity (IRP) 2010-2030.
5 Social Services Upgrading Social Services Infrastructure Plan NW Infrastructure Plan National Infrastructure Plan: : SIP
12,13 14 and 15
6 Local Economic Development Greater Taung (Dr Ruth Segomotsi
Mompati) LED Strategy
Villages, Townships and Small Dorpies Programme
North West Economic Development Plan
National Infrastructure Plan: SIP4
7
Reivilo (Map 5-41)
Sustainable Human Settlements Greater Taung LM Sustainable
Human Settlement Plan
Provincial Human Settlement Master Plan
Villages, Townships and Small Dorpies Programme
National Infrastructure Plan: SIP7
National Housing Code (2009) and housing delivery programmes
Integrated Urban Development Framework
8 Engineering Services Upgrading Consolidated Engineering
Infrastructure Plan NW Infrastructure Plan
National Infrastructure Plan: : SIP 6, 8,9,10 and 18
Integrated Water Resource Planning (IWRP)
Integrated Resource Plan for Electricity (IRP) 2010-2030.
9 Social Services Upgrading Social Services Infrastructure Plan NW Infrastructure Plan National Infrastructure Plan: : SIP
12,13 14 and 15
10 Local Economic Development Greater Taung (Dr Ruth Segomotsi
Mompati) LED Strategy NW Infrastructure Plan
National Infrastructure Plan: : SIP 12,13 14 and 15
GT2
GT1

323 | P a g e
Table 25-30 Greater Taung Implementation Plan
Item No
Node/ Link/ Zone Node Description
Project Focus
Implementation Plan (Programme)
Municipal Provincial National
11 Reivilo Distressed Mining Town
Regeneration Strategy
Reivilo Distressed Mining Town Rogation Strategy
Villages, Townships and Small Dorpies Programme
North West Economic Development Plan
National Infrastructure Plan: SIP4
12
GT Prioritised Rural
(Map 5-42)
Greater Taung Rural
Engineering Services Upgrading Consolidated Engineering
Infrastructure Plan Villages, Townships and Small
Dorpies Programme
Comprehensive Rural Development programme
National Infrastructure Plan: : SIP 11
13 Social Services Upgrading Social Services Infrastructure Plan Villages, Townships and Small
Dorpies Programme Comprehensive Rural Development
programme
14 Local Economic Development Greater Taung (Dr Ruth Segomotsi
Mompati) LED Strategy Villages, Townships and Small
Dorpies Programme Comprehensive Rural Development
programme
15 Sustainable Human Settlements Greater Taung LM Sustainable
Human Settlement Plan
Provincial Human Settlement Master Plan
Villages, Townships and Small Dorpies Programme
National Infrastructure Plan: SIP7
National Housing Code (2009) and housing delivery programmes
Integrated Urban Development Framework
16 Rural Area Development Dr Ruth Segomotsi Mompati District Rural Development Plan
Villages, Townships and Small Dorpies Programme
National Infrastructure Plan: SIP 11
CRDP
17 Land Restitution / Redistribution Land Rights Enquiry Villages, Townships and Small
Dorpies Programme
Restitution of Land Rights Programme
Land Reform Programme
18 Biodiversity (Map 5-40)
Biodiversity Corridors and
Nodes Environmental Management
District Environmental Management Framework/ SDF
North West Province Biodiversity Sector Plan
North West Protected Area Expansion Plan
National Protected Area Expansion Plan
National Biodiversity Strategy and Action Plan
19
Rural Areas (Map 5-42)
Rural Areas
Rural Area Development o Agriculture
Dr Ruth Segomotsi Mompati District
Rural Development Plan
Villages, Townships and Small Dorpies Programme
National Infrastructure Plan: SIP 11
Land Reform Programme
20 Land Restitution / Redistribution Land Rights Enquiry Villages, Townships and Small
Dorpies Programme
Restitution of Land Rights Programme
Land Reform Programme
21 National Links
Upgrading and Maintenance of National roads
Dr Ruth Segomotsi Mompati Integrated Transport and Roads Plan
NW Infrastructure Plan SANRAL/ NATMAP National Infrastructure Plan: : SIP4

324 | P a g e
Table 25-30 Greater Taung Implementation Plan
Item No
Node/ Link/ Zone Node Description
Project Focus
Implementation Plan (Programme)
Municipal Provincial National
22
Provincial Links
Upgrading and Maintenance of
Provincial roads
Dr Ruth Segomotsi Mompati Integrated Transport and Roads Plan
NW Infrastructure Plan National Infrastructure Plan: : SIP4
23 Railway
Main Lines
Passenger / Freight Link Dr Ruth Segomotsi Mompati Integrated Transport and Roads Plan
NW Infrastructure Plan National Infrastructure Plan: : SIP4

325 | P a g e
Map 25-40: Dr Ruth Segomotsi Mompati District Implementation Framework (Environmental) – Greater Taung LM

326 | P a g e
Map 25-41: Dr Ruth Segomotsi Mompati District Implementation Framework (Nodes & Links) – Greater Taung LM

327 | P a g e
Map 25-42: Dr Ruth Segomotsi Mompati District Implementation Framework (Rural Development) – Greater Taung LM

328 | P a g e
25.3.3.3.5 Lekwa -Teemane Local Municipality 25.3.3.3.5.1 Development Guidelines
The main nodes situated in Lekwa-Teemane local municipality is:
Christiana.
Bloemhof.
The municipality is relatively small with Bloemhof and Christiana situated on the N12 in the south
eastern part of the municipality. The remainder of the municipality is mostly rural with low population
densities.
As a result of the small size of the municipality, focusing the dominant segment of public sector
investment on Bloemhof and Christiana will enable the municipality to increase its economic growth
rate and to create more employment opportunities in order to limit the people leaving the municipality
seeking jobs in larger urban concentrations.
Status: An agriculture economy with limited growth.
10 Year Land Budget:
The following table indicates the development potential for Lekwa-Teemane Local Municipality.
Table 25-31: Lekwa-Teemane Local Municipality 10 Year Land Budget (Ha)
Municipal Area Industrial Office Trade Bonded / FLISP
Subsidy Total
Lekwa-Teemane 7.7 0.1 1.0 26.0 69.4 104.2
Source: Demacon, 2016
Development Guidelines:
The focus should be on protecting the high value agricultural land.
Focus on the beneficiation of agricultural produce to create a multiplier effect and limit the
outflow of products in their basic form.
The creation of agro-industries should be concentrated in Bloemhof and Christiana.
Ensure land tenure security.
Rather than diluting investment throughout the municipality, focus public sector investment in
Bloemhof and Christiana – a more effective way of establishing economic growth.
Formalise trade.
Formalise housing.
Focus on backlog eradication and providing access to basic services.
Develop and expand the tourism potential of Bloemhof Dam and surrounding areas.
Increase the promotion of tourism.
The protection of water resources is critical to ensure the sustainability of agriculture.
Focus on water management.
25.3.3.3.5.2 Implementation Plans and Programmes

329 | P a g e
Table 25-32 Lekwa Teemane Implementation Plan
Item No
Node/ Link/ Zone Node Description
Project Focus
Implementation Plan (Programme)
Municipal Provincial National
1
Christiana (Map 5-43)
Christiana Town Development
Christiana Precinct Development Plan
CBD Revitalisation
Governance Node
Villages, Townships and Small Dorpies Programme
National Infrastructure Plan: SIP7
2 Sustainable Human Settlements Lekwa Teemane LM Sustainable
Human Settlement Plan
Provincial Human Settlement Master Plan
Villages, Townships and Small Dorpies Programme
National Infrastructure Plan: SIP7
National Housing Code (2009) and housing delivery programmes
Integrated Urban Development Framework
3 Engineering Services Upgrading Consolidated Engineering
Infrastructure Plan NW Infrastructure Plan
National Infrastructure Plan: SIP 6, 8,9,10 and 18
Integrated Water Resource Planning (IWRP)
Integrated Resource Plan for Electricity (IRP) 2010-2030.
4 Social Services Upgrading Social Services Infrastructure Plan NW Infrastructure Plan National Infrastructure Plan: : SIP
12,13,14 and 15
5 Local Economic Development
Lekwa Teemane (Dr Ruth Segomotsi Mompati) LED Strategy including:
Vegetable Gardens
Villages, Townships and Small Dorpies Programme
North West Economic Development Plan
National Infrastructure Plan: : SIP4
6
Bloemhof (Map 5-43)
Bloemhof Town Development
Bloemhof Precinct Development Plan including:
Mixed Development Node market analysis
Bloemhof Dam
Villages, Townships and Small Dorpies Programme
National Infrastructure Plan: SIP7
7 Sustainable Human Settlements Lekwa Teemane LM Sustainable
Human Settlement Plan
Provincial Human Settlement Master Plan
Villages, Townships and Small Dorpies Programme
National Infrastructure Plan: SIP7
National Housing Code (2009) and housing delivery programmes
Integrated Urban Development Framework
8 Engineering Services Upgrading Consolidated Engineering
Infrastructure Plan NW Infrastructure Plan
National Infrastructure Plan: : SIP 6, 8,9,10 and 18
Integrated Water Resource Planning (IWRP)
Integrated Resource Plan for Electricity (IRP) 2010-2030.
9 Social Services Upgrading
Social Services Infrastructure Plan including:
Boitumelong and Utlwanang
NW Infrastructure Plan National Infrastructure Plan: : SIP
12,13 14 and 15
LT2
LT1

330 | P a g e
Table 25-32 Lekwa Teemane Implementation Plan
Item No
Node/ Link/ Zone Node Description
Project Focus
Implementation Plan (Programme)
Municipal Provincial National
municipal office buildings
Boitumelong and Utlwanang municipal libraries
10 Local Economic Development
Lekwa Teemane (Dr Ruth Segomotsi Mompati) LED Strategy including:
Beef beneficiation plant – technical studies
Food outlets, arts and crafts- market analysis
Industrial and Agro processing Plant- market analysis
Waste and Energy Project- technical studies
Brick making Plant- study
North West Economic Development Plan
National Infrastructure Plan: : SIP4
11 Biodiversity (Map 5-45)
Biodiversity Corridors and
Nodes Environmental Management
District Environmental Management Framework/ SDF
North West Province Biodiversity Sector Plan
National Infrastructure Plan: : SIP19
12 Protected Areas
(Map 5-45) Protected
Areas Nature Conservation/ Tourism/
Wildlife Economy District Environmental Management
Framework/ SDF
North West Province Biodiversity Sector Plan
North West Protected Area Expansion Plan
National Protected Area Expansion Plan
National Biodiversity Strategy and Action Plan
National Infrastructure Plan: : SIP 19 (Environment)
13
Rural Areas (Map 5-44)
Rural Areas
Rural Area Development o Agriculture o Mining o Tourism
Dr Ruth Segomotsi Mompati District
Rural Development Plan
Villages, Townships and Small Dorpies Programme
National Infrastructure Plan: : SIP 11
CRDP
Agriparks Initiative
Land Restitution /
Redistribution Land Rights Enquiry
Villages, Townships and Small Dorpies Programme
Restitution of Land Rights Programme
Land Reform Programme
14 National Links
Upgrading and Maintenance of National roads
Dr Kenneth Kaunda Integrated Transport and Roads Plan
NW Infrastructure Plan SANRAL/ NATMAP
National Infrastructure Plan: : SIP4

331 | P a g e
Table 25-32 Lekwa Teemane Implementation Plan
Item No
Node/ Link/ Zone Node Description
Project Focus
Implementation Plan (Programme)
Municipal Provincial National
15
Provincial Links
Upgrading and Maintenance of Provincial roads
Dr Kenneth Kaunda Integrated Transport and Roads Plan
NW Infrastructure Plan National Infrastructure Plan: : SIP4
16 Railway
Main Lines
Passenger / Freight Link Dr Kenneth Kaunda Integrated
Transport and Roads Plan NW Infrastructure Plan National Infrastructure Plan: : SIP4

332 | P a g e
Map 25-43: Dr Ruth Segomotsi Mompati District Implementation Framework (Nodes & Links) – Lekwa Teemane LM

333 | P a g e
Map 25-44: Dr Ruth Segomotsi Mompati District Implementation Framework (Rural Development) – Lekwa Teemane LM

334 | P a g e
Map 25-45: Dr Ruth Segomotsi Mompati District Implementation Framework (Environmental) – Lekwa Teemane LM

335 | P a g e
25.3.3.4 Dr Kenneth Kaunda District
25.3.3.4.1 NW 405 Local Municipality (Tlokwe / Ventersdorp) 25.3.3.4.1.1 Development Guidelines
NW 405 local municipality borders Gauteng and City of Matlosana Local Municipality. The main node
in the municipality, linking Gauteng to the east, is Potchefstroom. The other node of size is
Ventersdorp. Potchefstroom is a developed town with finance and business services sector as the
main sector. With the well-developed infrastructure of Potchefstroom, it has been able to sustain a
positive economic growth rate throughout the transition period in South Africa and, together with its
abundance of water and electricity, holds great opportunities for future growth.
The North West University Potchefstroom Campus attracts investment and capital to the
municipality, making Potchefstroom ideal for the Diversification and Maintenance Strategy.
Matlosana City Local Municipality is considered as a distressed mining municipality and the focus need
to be on the economic and social transformation of settlements.
Status: A diversifying economy with a strong urban core functioning as a leading national educational
hub.
10 Year Land Budget:
The following table indicates the development potential for Tlokwe Local Municipality.
Table 25-33: Tlokwe Local Municipality 10 Year Land Budget (Ha)
Municipal Area Industrial Office Trade Bonded / FLISP
Subsidy Total
Tlokwe 23.4 3.4 8.2 158.7 313.6 507.3
Source: Demacon, 2016
Development Guidelines:
The municipality has a strong educational base and can be seen as a leading national
tertiary hub, with a myriad of opportunities associated with student housing and relevant
services.
Ensure better functional integration.
The municipality has high value agricultural land that should be promoted and protected.
Ensure land tenure security.
Delineate a clear urban edge to prevent development on high value agricultural land and to
promote densification.
Potchefstroom provides a strong urban core with highly skilled employees and entrepreneurial
skills, mainly as a result of the NWU Potchefstroom Campus. Opportunities exist to diversify
the economy and focus on tertiary services such as the finance and business services sector.
Potchefstroom is situated close to Gauteng and Klerksdorp – forming part of the Gauteng
City Region, creating opportunities for industrial development, lifestyle estate development
and services such as health care, retail and education.
Focus on diversifying and promoting the manufacturing sector.
Diversify the local economy – focus on forward and backward linkages.
Uphold business environment and property investment maintenance – contribute to retain
and instill business confidence.
Integrate the informal market into the economy. There is potential in the second economy
that can be exploited and help to increase the economic base.

336 | P a g e
Promote nodal development and retail / commercial development in second economy
areas.
Formalise housing.
Provide affordable housing in appropriate locations to ensure that the property values of
high income areas (mostly situated in the eastern parts of Potchefstroom) are not affected.
Promote mixed use developments.
Revitalisation of the CBD.
Promote tourism development in the following areas:
o The Vredefort Dome which has been listed as a World Heritage Site.
o The Boskop Dam Nature Reserve.
o The Prozesky Bird Sanctuary.
o The proposed Highveld National Park.
Ensure proper maintenance and upgrading of infrastructure.
Create a conductive environment that will attract private sector investment.
25.3.3.4.1.2 Implementation Plans and Programmes

337 | P a g e
Table 25-34 NW 405 Implementation Plan
Item No
Node/ Link/ Zone
Node Description
Project Focus
Implementation Plan (Programme)
Municipal Provincial National
1
)
Tlokwe(Potchefstroom/
Ventersdorp) (Map 5-47)
Potchefstroom Urban Regeneration Potchefstroom Urban
Regeneration Plan Villages, Townships and Small
Dorpies Programme National Infrastructure Plan: SIP7
2 Sustainable Human Settlements Tlokwe Sustainable Human
Settlement Plan
Provincial Human Settlement Master Plan
Villages, Townships and Small Dorpies Programme
National Infrastructure Plan: SIP7
National Housing Code (2009) and housing delivery programmes
Integrated Urban Development Framework
3 Engineering Services Upgrading Consolidated Engineering
Infrastructure Plan NW Infrastructure Plan
National Infrastructure Plan: : SIP 6, 8,9,10 and 18
Integrated Water Resource Planning (IWRP)
Integrated Resource Plan for Electricity (IRP) 2010-2030.
4 Social Services Upgrading Social Services Infrastructure
Plan NW Infrastructure Plan
National Infrastructure Plan: : SIP 12,13,14 and 15
5 Local Economic Development Tlokwe (Dr Kenneth Kaunda)
LED Strategy
Villages, Townships and Small Dorpies Programme
North West Economic Development Plan
National Infrastructure Plan: : SIP4
6
Ventersdorp (Map 5-47)
Ventersdorp Town Development Ventersdorp Local Development
Plan
Villages, Townships and Small Dorpies Programme
NW Economic Development Plan
National Infrastructure Plan: SIP7
7 Sustainable Human Settlements Ventersdorp LM Sustainable
Human Settlement Plan
Provincial Human Settlement Master Plan
Villages, Townships and Small Dorpies Programme
National Infrastructure Plan: SIP7
National Housing Code (2009) and housing delivery programmes /Mining Towns Human Settlement Transformation/ NDPG
Integrated Urban Development Framework
8 Engineering Services Upgrading Consolidated Engineering
Infrastructure Plan NW Infrastructure Plan
National Infrastructure Plan: : SIP 6, 8,9,10 and 18
Integrated Water Resource Planning (IWRP)
Integrated Resource Plan for Electricity (IRP) 2010-2030.
9 Social Services Upgrading Social Services Infrastructure
Plan NW Infrastructure Plan
National Infrastructure Plan: : SIP 12,13,14 and 15
Tk2
Tk1

338 | P a g e
Table 25-34 NW 405 Implementation Plan
Item No
Node/ Link/ Zone
Node Description
Project Focus
Implementation Plan (Programme)
Municipal Provincial National
10 Local Economic Development Ventersdorp (Dr Kenneth
Kaunda) LED Strategy
Villages, Townships and Small Dorpies Programme
NW Economic Development Plan
Agripark Programme
11 Biodiversity (Map 5-46)
Biodiversity Corridors and
Nodes Environmental Management
District Environmental Management Framework/ SDF
North West Province Biodiversity Sector Plan
National Protected Area Expansion Plan
National Biodiversity Strategy and Action Plan
12 Protected
Areas (Map 5-46)
Protected Areas
Nature Conservation/ Tourism/ Wildlife Economy
o The Vredefort Dome World Heritage Site,
o The Boskop Dam Nature Reserve,
o The Prozesky Bird Sanctuary
o The proposed Highveld National Park
District Environmental Management Framework/ SDF
North West Province Biodiversity Sector Plan
North West Protected Area Expansion Plan
National Protected Area Expansion Plan
National Biodiversity Strategy and Action Plan)
13
Rural Areas (Map 5-48)
Rural Areas
Rural Area Development o Agriculture o Mining
Dr Kenneth Kaunda District Rural Development Plan
Villages, Townships and Small Dorpies Programme
National Infrastructure Plan: : SIP 11
CRDP
Agriparks Initiative
14 Land Restitution / Redistribution Land Rights Enquiry Villages, Townships and Small
Dorpies Programme
Restitution of Land Rights Programme
Land Reform Programme
15 National Links
Upgrading and Maintenance of
National roads
Dr Kenneth Kaunda Integrated Transport and Roads Plan
NW Infrastructure Plan SANRAL/ NATMAP
National Infrastructure Plan: : SIP4
16
Provincial Links
Upgrading and Maintenance of
Provincial roads
Dr Kenneth Kaunda Integrated Transport and Roads Plan
NW Infrastructure Plan National Infrastructure Plan: : SIP4
17 Railway
Main Lines
Passenger / Freight Link Dr Kenneth Kaunda Integrated
Transport and Roads Plan NW Infrastructure Plan National Infrastructure Plan: : SIP4
18 Railway
Branch Lines
Unlocking economic potential Dr Kenneth Kaunda Integrated
Transport and Roads Plan NW Infrastructure Plan National Infrastructure Plan: : SIP4

339 | P a g e
Map 25-46: Dr Kenneth Kaunda District Implementation Framework (Environmental) – NW 405 LM

340 | P a g e
Map 25-47: Dr Kenneth Kaunda District Implementation Framework (Nodes & Links) – NW 405 LM

341 | P a g e
Map 25-48: Dr Kenneth Kaunda District Implementation Framework (Rural Development) – NW 405 LM

342 | P a g e
25.3.3.4.2 City of Matlosana Local Municipality 25.3.3.4.2.1 Development Guidelines
The main nodes in the City of Matlosana local municipality are:
Klerksdorp.
Orkney.
Stilfontein.
Hartbeesfontein.
The remainder of the municipality is mostly rural with low densities. Klerksdorp forms the main
economic hub and functions as employment provider for a large part of the municipality. Klerksdorp
forms one of the dominant regional service centre of the province and as such, the greatest
potential to ensure the successful development would be to focus on Klerksdorp, rather than diluting
economic potential.
Status: A mining town and provincial service centre.
10 Year Land Budget:
The following table indicates the development potential for City of Matlosana Local Municipality.
Table 25-35: City of Matlosana Local Municipality 10 Year Land Budget (Ha)
Municipal Area Industrial Office Trade Bonded / FLISP
Subsidy Total
City of Matlosana 39.7 6.4 8.5 311.9 660.1 1 026.6
Source: Demacon, 2016
Development Guidelines:
Public sector investment in the municipality should be concentrated in Klerksdorp to
strengthen the economy and create agglomeration advantages, attracting people and private
sector investment.
Mining, an important contributor to local economic employment, is not only volatile but
declining in real terms over time and this in turn affects the downstream demand for housing
etc. Focusing on new labour intensive industries is needed to minimise the effect of
declining mining activity.
Focus on diversifying the economy with service based sectors.
The spatial plan should encourage and facilitate economic diversification, expansion and
business investment and development of housing, health care facilities, retail and education.
To expand the manufacturing value chain, intense attention will have to go to water
infrastructure development and maintenance.
Klerksdorp forms part of the Gauteng City Region and as such there is potential to expand
the focus on rural estate living. Facilities and amenities that enhance lifestyle can take
advantage from its location relative to Gauteng. These facilities and amenities include high
standard health care facilities, retail facilities, etc. This will in turn create rateable assets and
jobs in other sectors of the economy.
Develop the Metropolitan City of Dr Kenneth Kaunda.
Promote public-private sector partnerships.
The municipality has a large informal component that needs to be formalized.
Housing development should not only focus on backlog eradication, but provide suitable
options for future demand.
Ensure effective integration between Kanana, Jouberton, Ellaton and Matlosana to ensure
high levels of accessibility to services and employment opportunities.

343 | P a g e
Incorporate informal trade into the formal economy.
Provide access to basic services in the township areas.
Maintain and upgrade infrastructure.
Create employment opportunities to minimise the outflow of the economically active
population to Gauteng.
Focus on skills development in the manufacturing, mining, trade and business sectors to
ensure that people seeking employment has the required skill set to obtain employment in
Matlosana.
Enhance the image of the city to attract investment from the private sector.
Protect high value agricultural land – the municipality has high value arable land, focusing on
water service infrastructure is necessary to ensure the sustainability and expansion of the
agriculture sector.
Facilitate growth in the agriculture sector.
Facilitate growth in the tourism sector.
Support the development of SMMEs.
25.3.3.4.2.2 Implementation Plans and Programmes
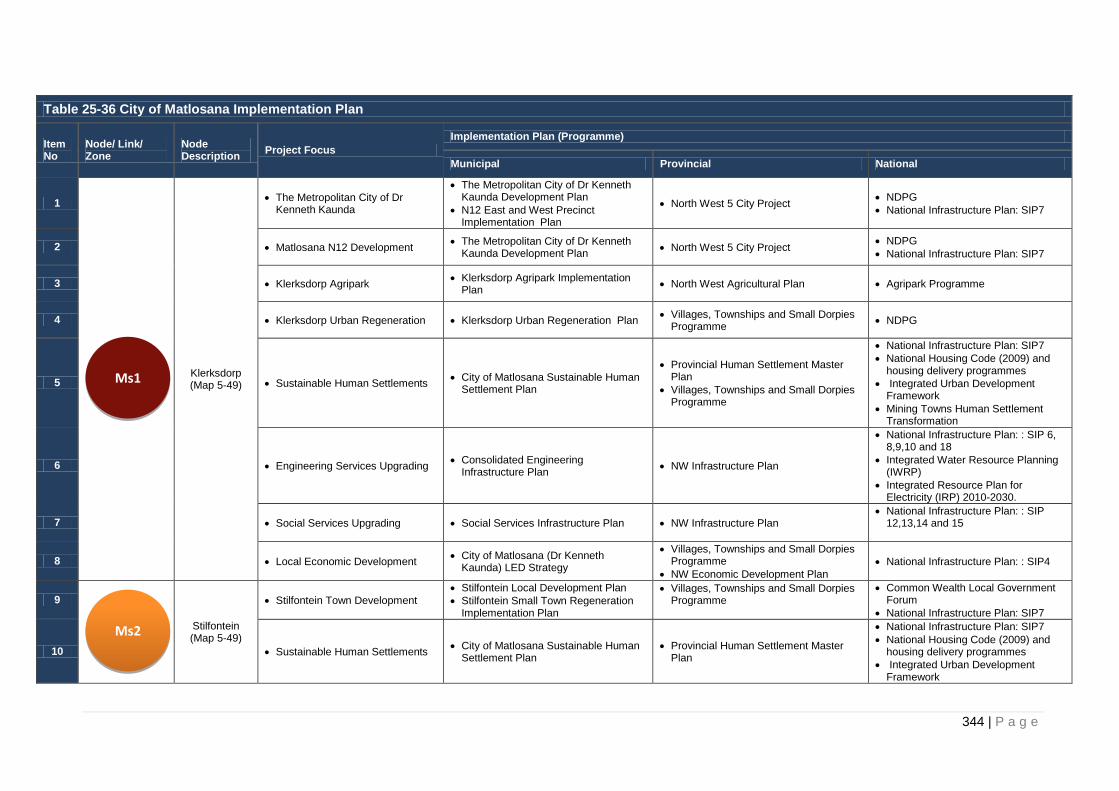
344 | P a g e
Table 25-36 City of Matlosana Implementation Plan
Item No
Node/ Link/ Zone
Node Description
Project Focus
Implementation Plan (Programme)
Municipal Provincial National
1
Klerksdorp (Map 5-49)
The Metropolitan City of Dr Kenneth Kaunda
The Metropolitan City of Dr Kenneth Kaunda Development Plan
N12 East and West Precinct Implementation Plan
North West 5 City Project NDPG
National Infrastructure Plan: SIP7
2 Matlosana N12 Development The Metropolitan City of Dr Kenneth
Kaunda Development Plan North West 5 City Project
NDPG
National Infrastructure Plan: SIP7
3 Klerksdorp Agripark Klerksdorp Agripark Implementation
Plan North West Agricultural Plan Agripark Programme
4 Klerksdorp Urban Regeneration Klerksdorp Urban Regeneration Plan Villages, Townships and Small Dorpies
Programme NDPG
5 Sustainable Human Settlements City of Matlosana Sustainable Human
Settlement Plan
Provincial Human Settlement Master Plan
Villages, Townships and Small Dorpies Programme
National Infrastructure Plan: SIP7
National Housing Code (2009) and housing delivery programmes
Integrated Urban Development Framework
Mining Towns Human Settlement Transformation
6 Engineering Services Upgrading Consolidated Engineering
Infrastructure Plan NW Infrastructure Plan
National Infrastructure Plan: : SIP 6, 8,9,10 and 18
Integrated Water Resource Planning (IWRP)
Integrated Resource Plan for Electricity (IRP) 2010-2030.
7 Social Services Upgrading Social Services Infrastructure Plan NW Infrastructure Plan National Infrastructure Plan: : SIP
12,13,14 and 15
8 Local Economic Development City of Matlosana (Dr Kenneth
Kaunda) LED Strategy
Villages, Townships and Small Dorpies Programme
NW Economic Development Plan
National Infrastructure Plan: : SIP4
9
Stilfontein (Map 5-49)
Stilfontein Town Development
Stilfontein Local Development Plan
Stilfontein Small Town Regeneration Implementation Plan
Villages, Townships and Small Dorpies Programme
Common Wealth Local Government Forum
National Infrastructure Plan: SIP7
10 Sustainable Human Settlements City of Matlosana Sustainable Human
Settlement Plan Provincial Human Settlement Master
Plan
National Infrastructure Plan: SIP7
National Housing Code (2009) and housing delivery programmes
Integrated Urban Development Framework
Ms2
Ms1

345 | P a g e
Table 25-36 City of Matlosana Implementation Plan
Item No
Node/ Link/ Zone
Node Description
Project Focus
Implementation Plan (Programme)
Municipal Provincial National
Mining Towns Human Settlement Transformation.
11 Engineering Services Upgrading Consolidated Engineering
Infrastructure Plan NW Infrastructure Plan
National Infrastructure Plan: : SIP 6, 8,9,10 and 18
Integrated Water Resource Planning (IWRP)
Integrated Resource Plan for Electricity (IRP) 2010-2030.
12 Social Services Upgrading Social Services Infrastructure Plan NW Infrastructure Plan National Infrastructure Plan: : SIP
12,13 14 and 15
13 Local Economic Development City of Matlosana (Dr Kenneth
Kaunda) LED Strategy
Villages, Townships and Small Dorpies Programme
North West Economic Development Plan
National Infrastructure Plan: : SIP4
14
Orkney (Map 5-50)
Orkney Town Development Orkney Small Town Regeneration
Implementation Plan Villages, Townships and Small Dorpies
Programme
Common Wealth Local Government Forum
National Infrastructure Plan: SIP7
15 Sustainable Human Settlements City of Matlosana Sustainable Human
Settlement Plan
Provincial Human Settlement Master Plan
Villages, Townships and Small Dorpies Programme
National Infrastructure Plan: SIP7
National Housing Code (2009) and housing delivery programmes
Integrated Urban Development Framework
Mining Towns Human Settlement Transformation
16 Engineering Services Upgrading Consolidated Engineering
Infrastructure Plan NW Infrastructure Plan
National Infrastructure Plan: : SIP 6, 8,9,10 and 18
Integrated Water Resource Planning (IWRP)
17 Social Services Upgrading Social Services Infrastructure Plan NW Infrastructure Plan National Infrastructure Plan: : SIP
12,13,14 and 15
18 Local Economic Development City of Matlosana (Dr Kenneth
Kaunda) LED Strategy North West Economic Development
Plan National Infrastructure Plan: : SIP4
19
Hartbees-fontein
(Map 5-50)
Lethabong Settlement Development
Hartbeesfontein/ Tigane Precinct Development Plan
Villages, Townships and Small Dorpies Programme
National Infrastructure Plan: SIP7
20 Sustainable Human Settlements City of Matlosana LM Sustainable
Human Settlement Plan
Provincial Human Settlement Master Plan
National Infrastructure Plan: SIP7
National Housing Code (2009) and housing delivery programmes
Ms4
Ms3

346 | P a g e
Table 25-36 City of Matlosana Implementation Plan
Item No
Node/ Link/ Zone
Node Description
Project Focus
Implementation Plan (Programme)
Municipal Provincial National
Integrated Urban Development Framework
Mining Towns Human Settlement Transformation
21 Engineering Services Upgrading Consolidated Engineering
Infrastructure Plan NW Infrastructure Plan
Integrated Water Resource Planning (IWRP)
Integrated Resource Plan for Electricity (IRP) 2010-2030.
22 Social Services Upgrading Social Services Infrastructure Plan NW Infrastructure Plan National Infrastructure Plan: : SIP
12,13,14 and 15
23 Local Economic Development City of Matlosana (Dr Kenneth
Kaunda) LED Strategy
Villages, Townships and Small Dorpies Programme
North West Economic Development Plan
National Infrastructure Plan: : SIP4
24 Biodiversity (Map 5-49)
Biodiversity Corridors and
Nodes Environmental Management
District Environmental Management Framework/ SDF
North West Province Biodiversity Sector Plan
National Protected Area Expansion Plan
National Biodiversity Strategy and Action Plan
25
Protected Areas
Biodiversity (Map 5-49)
Protected Areas
Nature Conservation/ Tourism/ Wildlife Economy o Faan Mentjies NW
District Environmental Management Framework/ SDF
North West Province Biodiversity Sector Plan
North West Protected Area Expansion Plan
National Protected Area Expansion Plan
National Biodiversity Strategy and Action Plan)
26
Rural Areas Map 5-51
Rural Areas
Rural Area Development o Agriculture o Mining
Land Restitution / Redistribution
Dr Kenneth Kaunda District Rural Development Plan
Villages, Townships and Small Dorpies Programme
National Infrastructure Plan: : SIP 11
27 Land Restitution / Redistribution Land Rights Enquiry Villages, Townships and Small Dorpies
Programme
Restitution of Land Rights Programme
Land Reform Programme
28 National Links
Upgrading and Maintenance of
National roads
Dr Kenneth Kaunda Integrated Transport and Roads Plan
NW Infrastructure Plan SANRAL/ NATMAP
National Infrastructure Plan: : SIP4
29
Provincial Links
Upgrading and Maintenance of
Provincial roads
Dr Kenneth Kaunda Integrated Transport and Roads Plan
NW Infrastructure Plan National Infrastructure Plan: : SIP4
30 Railway
Main Lines
Passenger / Freight Link Dr Kenneth Kaunda Integrated
Transport and Roads Plan NW Infrastructure Plan National Infrastructure Plan: : SIP4

347 | P a g e
Map 25-49: Dr Kenneth Kaunda District Implementation Framework (Environmental) – City of Matlosana LM

348 | P a g e
Map 25-50: Dr Kenneth Kaunda District Implementation Framework (Nodes & Links) – City of Matlosana LM

349 | P a g e
Map 25-51: Dr Kenneth Kaunda District Implementation Framework (Rural Development) – City of Matlosana LM

350 | P a g e
Table 25-37 Maquassi Hills Implementation Plan
Item No
Node/ Link/ Zone
Node Description
Project Focus
Implementation Plan (Programme)
Municipal Provincial National
1
Wolmaranstad (Map 5-51)
Wolmaranstad Town Development
Wolmaranstad Precinct Development Plan
Villages, Townships and Small Dorpies Programme
National Infrastructure Plan: SIP7
2 Sustainable Human Settlements Maquassi Hills Sustainable Human
Settlement Plan
Provincial Human Settlement Master Plan
Villages, Townships and Small Dorpies Programme
National Infrastructure Plan: SIP7
National Housing Code (2009) and housing delivery programmes
Integrated Urban Development Framework
Mining Towns Human Settlement Transformation
3 Engineering Services Upgrading Consolidated Engineering
Infrastructure Plan NW Infrastructure Plan
Integrated Water Resource Planning (IWRP)
National Infrastructure Plan: : SIP 6, 8,9,10 and 18
4 Social Services Upgrading Social Services Infrastructure Plan NW Infrastructure Plan National Infrastructure Plan: : SIP
12,13,14 and 15
5 Local Economic Development
Maquassi Hills (Dr Kenneth Kaunda) LED Strategy
Kenneth Kaunda Rural Development Plan
North West Economic Development Plan
Agripark Initiative
National Infrastructure Plan: : SIP4
6
Makwassie (Map 5-51)
Makwassie Settlement Development
Makwassie Precinct Development Plan
Villages, Townships and Small Dorpies Programme
National Infrastructure Plan: SIP7
7 Sustainable Human Settlements Maquassi Hills LM Sustainable
Human Settlement Plan
Provincial Human Settlement Master Plan
Villages, Townships and Small Dorpies Programme
National Infrastructure Plan: SIP7
National Housing Code (2009) and housing delivery programmes
Integrated Urban Development Framework
Mining Towns Human Settlement Transformation
8 Engineering Services Upgrading Consolidated Engineering
Infrastructure Plan NW Infrastructure Plan
Integrated Water Resource Planning (IWRP)
National Infrastructure Plan: : SIP 6, 8,9,10 and 18
9 Social Services Upgrading Social Services Infrastructure Plan NW Infrastructure Plan National Infrastructure Plan: : SIP 12,13
14 and 15
10 Local Economic Development Maquassi Hills (Dr Kenneth Kaunda)
LED Strategy
Villages, Townships and Small Dorpies Programme
North West Economic Development Plan
National Infrastructure Plan: : SIP4
MH2
MH1

351 | P a g e
Table 25-37 Maquassi Hills Implementation Plan
Item No
Node/ Link/ Zone
Node Description
Project Focus
Implementation Plan (Programme)
Municipal Provincial National
11
Leeudoringstad (Map 5-51)
Leeudoringstad Settlement Development including Kgakala
Leeudoringstad/ Kgakala Precinct Development Plan
Villages, Townships and Small Dorpies Programme
National Infrastructure Plan: SIP7
12 Sustainable Human Settlements Maquassi Hills LM Sustainable
Human Settlement Plan
Provincial Human Settlement Master Plan
Villages, Townships and Small Dorpies Programme
National Infrastructure Plan: SIP7
National Housing Code (2009) and housing delivery programmes
Integrated Urban Development Framework
Mining Towns Human Settlement Transformation
13 Engineering Services Upgrading Consolidated Engineering
Infrastructure Plan NW Infrastructure Plan
Integrated Water Resource Planning (IWRP)
National Infrastructure Plan: : SIP 6, 8,9,10 and 18
14 Social Services Upgrading Social Services Infrastructure Plan NW Infrastructure Plan National Infrastructure Plan: : SIP
12,13,14 and 15
15 Local Economic Development Maquassi Hills (Dr Kenneth Kaunda)
LED Strategy
Villages, Townships and Small Dorpies Programme
North West Economic Development Plan
National Infrastructure Plan: : SIP4
16 Biodiversity (Map 5-50)
Biodiversity Corridors and
Nodes Environmental Management
District Environmental Management Framework/ SDF
North West Province Biodiversity Sector Plan
North West Protected Area Expansion Plan
National Protected Area Expansion Plan
National Biodiversity Strategy and Action Plan
17 Protected
Areas Protected Areas
Nature Conservation/ Tourism/ Wildlife Economy o Wolwespruit NR o Bloemhofdam NR
District Environmental Management Framework/ SDF
North West Province Biodiversity Sector Plan
North West Protected Area Expansion Plan
National Protected Area Expansion Plan
National Biodiversity Strategy and Action Plan
18
Rural Areas (Map 5-52)
Rural Areas - agriculture
Agriculture
Witpoort rural development node
Dr Kenneth Kaunda Rural Development Plan
Villages, Townships and Small Dorpies Programme
National Infrastructure Plan: : SIP 11
Agripark Initiative
19 Land Restitution / Redistribution Land Rights Enquiry Villages, Townships and Small
Dorpies Programme
Restitution of Land Rights Programme
Land Reform Programme
MH3

352 | P a g e
Table 25-37 Maquassi Hills Implementation Plan
Item No
Node/ Link/ Zone
Node Description
Project Focus
Implementation Plan (Programme)
Municipal Provincial National
20 National Links
Upgrading and Maintenance of
National roads
Dr Kenneth Kaunda Integrated Transport and Roads Plan
NW Infrastructure Plan SANRAL/ NATMAP
National Infrastructure Plan: : SIP4
21
Provincial Links
Upgrading and Maintenance of
Provincial roads
D1303 between Wolmaranstad and Maquassi Hills
P 13/4 from Wolmaranstad to Wesselsbron
D509 Leeuwdoringstad
Dr Kenneth Kaunda Integrated Transport and Roads Plan
NW Infrastructure Plan National Infrastructure Plan: : SIP4
22 Railway Main Lines
Passenger / Freight Link Dr Kenneth Kaunda Integrated
Transport and Roads Plan NW Infrastructure Plan National Infrastructure Plan: : SIP4

353 | P a g e
Map 25-52: Dr Kenneth Kaunda District Implementation Framework (Environmental) – Maquassi Hills LM

354 | P a g e
Map 25-53: Dr Kenneth Kaunda District Implementation Framework (Nodes & Links) – Maquassi Hills LM

355 | P a g e
Map 25-54: Dr Kenneth Kaunda District Implementation Framework (Rural Development) – Maquassi Hills LM

356 | P a g e
26 Bibliography Brundtland. (1987). Our Common Future: Report of the World Commission on Environment and
Development.
City of Matlosana Local Municipality. (2013). City of Matlosana Local Municipality Spatial Development Framework. Review 2013. Cooperative Governance RSA. (2014). North West LED Framework. Presentation March 2014.
CSIR. (2012). 2012/2013 Annual Report. Built Environment: Research, development and implementation
for the Built Environment.
Department of Economic Development, Environment, Conservation and Tourism. (2012). Renewable
Energy Strategy for the North West Province.
Department of Energy. (2012). Integrated Energy Planning Report. Draft 2012.
Department of Energy. (2013). Integrated Resource Plan for Electricity (IRP) 2010-2030. Updated Report,
November 2013.
Department of Trade and Industry: Economic Sectors and Employment. (2013). Industrial Policy Action
Plan .2014/ 2015- 2016-2017 IPAP.
Department of Transport. (2010). RSA National Transportation Master Plan 2050 NATMAP Transport for
2050. December 2010.
Department of Water Affairs. (2013). Strategic Plan for the fiscal years 2013/14 to 2017/18, 3 March 2013.
Ditau Geo-Informatics Solutions. (2015). District Rural Development Plan Bojanala District Municipality
North West Province. Draft.
Ditau Geo-Informatics Solutions. (2015). District Rural Development Plan Dr. Ruth Segomotsi Mompati
District Municipality North West Province. Draft.
Ditau Geo-Informatics Solutions. (2015). District Rural Development Plan Ngaka Modiri Molema District
Municipality North West Province. Draft.
Ditsobotla Local Municipality. (2013). Ditsobotla Local Municipality Spatial Development Framework
Proposals. February 2013.
Dr Kenneth Kaunda Local Municipality. (2010). Kenneth Kaunda Spatial Development Framework Review
2010 (Draft).
ESKOM. (2015). Transmission Development Plan 2015-2024.
Eskom Transmission Division. (2015). Generation Connection Capacity Assessment of the 2022
Transmission Network (GCCA-2022), June 2015.
Friedmann, J. (1966). Regional Development Policy: A Case Study of Venezuela, Cambridge, Mass.: MIT
Press.(adapted).
Gauteng Province: Roads and Transport. (2013). Gauteng 25-Year Integrated Transport Master Plan: 25-
Year Integrated Transport Master Plan. Annexure J: Strategic Road Network, November 2013.
Greater Taung Local Municipality. (2006). Greater Taung LED (Local Economic Development Plan). June
2006.

357 | P a g e
Kagisano-Molopo Local Municipality. (2012). Kagisano-Molopo Local Municipality Spatial Development
Framework. Draft 2012.
Kgetlengrivier Local Municipality. (2012). Kgetlengrivier Local Municipality Spatial Development
Framework. Final Draft March 2012.
Lekwa-Teemane Local Municipality. (2011). Lekwa-Teemane Local Municipality Spatial Development
Framework. March 2011.
Lekwa-Teemane Local Municipality. (2011). Local Economic Development Plan for Lekwa-Teemane Local
Municipality. October 2011.
Madibeng Local Municipality. (2009). Madibeng Local Municipality Spatial Development Framework.
Volume 2: 2009.
Magalies Water. (2012). Bulk Water Supply Infrastructure Augmentation Schemes Implementation:
Crocodile West Reconciliation Strategy Steering Committee, 25 July 2012.
Mahikeng Local Municipality. (2006). Mafikeng Spatial Development Framework & Related Products. Final Report July 2006.
Mahumapelo, S.R. (2014). State of the Province Address to the First Session of the Fifth Legislature of the
North West, 27 June 2014.
Mamusa Local Municipality. (2010). Mamusa Local Municipality Economic Development Strategy 2010 - 2015. Mamusa Local Municipality. (2013). Mamusa Local Municipality Spatial Development Framework. Final
Draft January 2013.
Mpumalanga Department of Public Works, Roads and Transport. (2012). Mpumalanga Infrastructure
Master Plan, August 2012.(adapted).
Maquassi Hills Local Municipality. (2013). Maquassi Hills Local Municipality Local Economic Development
Strategy. Final Draft June 2013.
Maquassi Hills Local Municipality. (2011). Maquassi Hills Local Municipality Spatial Development
Framework. November 2011.
Moretele Local Municipality. (2009). Spatial Development Framework for Moretele Local Municipality. Draft
1 August 2009.
Moses Kotane Local Municipality. (2010). Moses Kotane Local Municipality Spatial Development
Framework. Final Report November 2010.
Naledi Local Municipality. (2013). Naledi Local Municipality Spatial Development Framework. Final Draft
Report January 2013.
National Planning Commission. (2013). National Development Plan 2030: Our Future - Make it Work.
Chapter 8: Transforming Human Settlements and the National Space Economy.
North West Planning Commission. (2013). North-West Mediation Strategy and Plan for Tourism, Mining
and Land Claims, May 2013.
North West Planning Commission. (2013). North-West Provincial Development Plan 2030, 11 August 2013.

358 | P a g e
North West Provincial Government. Department Community Safety and Transport Management. (2014).
Annual Performance Plan 2014/2015.
North West Provincial Government: Department Economic Development, Environment , Conservation and
Tourism. (2014). Service Delivery Charter INW Human Settlements HR Plan 2014.
North West Provincial Government: Department Human Settlements, Public Safety & Liaison. (2013).
Provincial Emergency Policy Guidelines on Emergency Housing Assistance, 31 March 2013.
North West Provincial Government: Department Public Works, Roads and Transport. (2010). Strategic Plan
2010 – 2014, 30 March 2010.
North West Provincial Government: Department Rural, Environmental and Agricultural Development.
(2013). North West Environmental Outlook 2013.
Presidential Infrastructure Coordinating Commission. (2012) Presidential Infrastructure Coordinating
Commission Report 2012: A summary of the South African National Infrastructure Plan.
Presidential Infrastructure Coordinating Commission. (2012). Provincial and Local Government
Conference: A Summary of the Infrastructure plan, 13 April 2012.
Ramotshere Moiloa Local Municipality. (2015). Ramotshere Moiloa Local Municipality Spatial Development
Framework 2014-2015. April 2015.
Ratlou Local Municipality. (2012). Ratlou Local Municipality Final Spatial Development Framework Review
2012-2017.
Rustenburg Local Municipality. (2010). Rustenburg Spatial Development Framework. Review 2010.
South African Cities Network. (2012). Secondary Cities in South Africa. The Start of a Conversation, March
2012.
The Nepad Business Foundation. (2015). Request for Proposal: Multi-Stakeholder Funding and Investment
Plan for Vaalharts Irrigation Scheme Upgrading, 29 April 2015.
Tlokwe City Council. (2013). D evelopment of an LED Strategy: “Sustainable Local Economies as catalysts
for economic growth and decent jobs for all”. Final Report August 2013.
Tlokwe Local Municipality. (2008). Tlokwe Spatial Development Framework. Draft 2008.
Twaing Local Municipality. (2011). Twaing Local Municipality Spatial Development Framework. March
2011.
United Nations. (2002). Johannesburg Summit 2002: South Africa Country Profile.
Ventersdorp Local Municipality. (2011). Ventersdorp Local Municipality Spatial Development Framework.
March 2011.
Water for Africa. (2011). Development of a Water Provisioning and Management plan in the North West
Province: 2008 - 2030. Final Draft, March 2011.

359 | P a g e
27 Aknowledgements The support and participation of the Project Steering Committee, officials from district and local municipalities and various experts for their contribution to this project is gratefully acknowledged.
Department/ Municipality/ Organisation Name Initials
Office of the Premier Magakwe E.M.
Office of the Premier Pitso L.M.
Office of the Premier Matshogo F.
Office of the Premier Maperethane O.
Office of the Premier Schreiner - Kaya A.
Office of the Premier Mogorosi D.
Office of the Premier Noge L.
Office of the Premier Kraak U.
Office of the Premier Smith A.
Office of the Premier Dube S.N.
Office of the Premier Munyoi D.
North West Department Community Safety and Transport Management Noge T.
North West Department Community Safety and Transport Management Morwe P.J.
North West Department of Finance Gasealahwe L. M.
North West Department Local Government and Human Settlements Van Heerden M.
North West Department Local Government and Human Settlements Shaik Habeeb M.L.
North West Department Local Government and Human Settlements Mapaseka T.
North West Department Local Government and Human Settlements Faku K.
North West Department Local Government and Human Settlements Lehoko M.
North West Provincial Government READ Schaller R.
North West Provincial Government READ Moshugi D.
North West Provincial Government READ Boshoff T.
North West Provincial Government READ van Straaten A.
North West Department of Public Works K.A.Sitase K.A.
City of Matlosana LM Shibiti L.D.
City of Matlosana LM Maselane M.T.
Department of Rural Development and Land Reform Dagane S.
Department of Rural Development and Land Reform Masia T.
Department of Rural Development and Land Reform Mudau R.
Department of Rural Development and Land Reform Morake T.
Dr Kenneth Kaunda DM Matthews M. I.

360 | P a g e
Department/ Municipality/ Organisation Name Initials
Dr. Ruth Segomotsi Mompati DM Pitso P.
Dr. Ruth Segomotsi Mompati DM Colane C.
ESKOM Dala M.
Greater Taung LM de Jager S.
Kagisano- Molopo LM Lecoge S.L.
Maquassi Hills LM Rudman J.
Lekwa Teemane LM Sparks J.B.
Naledi Local Municpality Kubeka K.
Mbengo C. Ngaka Modire Molema DM
Ngaka Modire Molema DM Ramorei T.
Ngaka Modire Molema DM Moncho T.
Maxim Planning Sollutions Booysen R.
Copyright © 2022 FDOKUMEN