RR415 - Weather safety in the North West approaches - HSE
202
HSE Health & Safety Executive Weather safety in the North West approaches An implementation test using satellite data in assessing wave energy dynamics Prepared by Satellite Observing Systems for the Health and Safety Executive 2006 RESEARCH REPORT 415
-
Upload
khangminh22 -
Category
Documents
-
view
0 -
download
0
Transcript of RR415 - Weather safety in the North West approaches - HSE

HSEHealth & Safety
Executive
Weather safety in the North West approaches
An implementation test using satellite data in assessing wave energy dynamics
Prepared by Satellite Observing Systems for the Health and Safety Executive 2006
RESEARCH REPORT 415
HSEHealth & Safety
Executive
Weather safety in the North West approaches
An implementation test using satellite data in assessing wave energy dynamics
Summary report
P D Cotton, D J T Carter & E Ash Satellite Observing Systems
15 Church St, Godalming Surrey GU7 1EL
S Caine QinetiQ
Cody Technology Park Ively Road, Farnborough
Hants GU14 0LX
D Woolf National Oceanography Centre
University of Southampton Waterfront Campus European Way
Southampton SO14 3ZH
This report provides a summary of the activities and findings of a project, co-sponsored by the HSE Offshore Division (OSD) and BNSC under the GIFTSS scheme, aimed at supporting HSE OSD in its responsibility for the safe operation of oil and gas installations operating in UK waters. Specifically this project was initiated to consider the added contribution that EO data could make to improve on existing systems available to monitor and assess wave conditions in the NW approaches to the UK.
In this report we summarise existing knowledge on the wave climate of the NW approaches, assess the capabilities of “conventional” non-EO data sources, review the key characteristics and capabilities of satellite derived wave information, present and evaluate demonstration data sets generated during the study, assess the potential benefits that such “EO-enhanced” services offer the HSE, and finally provide recommendations for implementation of a NW Approaches Wave Monitoring and Statistical Analysis Service.
This report and the work it describes were co-funded by the Health and Safety Executive (HSE) and the British National Space Centre. Its contents, including any opinions and/or conclusions expressed, are those of the authors alone and do not necessarily reflect HSE nor BNSC policy.
HSE BOOKS

© Crown copyright 2006
First published 2006
All rights reserved. No part of this publication may bereproduced, stored in a retrieval system, or transmitted inany form or by any means (electronic, mechanical,photocopying, recording or otherwise) without the priorwritten permission of the copyright owner.
Applications for reproduction should be made in writing to:Licensing Division, Her Majesty's Stationery Office, St Clements House, 2-16 Colegate, Norwich NR3 1BQ or by e-mail to [email protected]
ii
ACKNOWLEDGMENTS
We are particularly grateful to:
The helpful guidance of the BNSC/HSE appointed support team: Ian Thomas (EOCI,
supporting BNSC), Gordon Keyte (QinetiQ supporting BNSC), Martin Williams (PhysE
supporting HSE),
Sofia Caires (KNMI - Royal Netherlands Meteorological Institute) and the rest of the team
responsible for the Global Wave Climatology at http://www.knmi.nl/waveatlas.
Signar Heinesen, Sp/f Data Quality, Faroe Islands for providing FOIB data and very helpful
support in analysis of these data.
Sergey Gulev and Vika Grigorieva of IORAS (Institute of Oceanology, Russian Academy of
Science), Moscow for data from their VOS data base.
Colin Grant, BP, for expert input and support, and for arranging for access to the FOIB
waverider buoy data.
iii

iv
TABLE OF CONTENTS
Acknowledgments ........................................................................................................... iii
Table of Contents ............................................................................................................. v
Executive Summary........................................................................................................ vii
1 Introduction .............................................................................................................. 1
1.1 HSE Requirement ............................................................................................. 1
1.2 This Report ....................................................................................................... 1
2 The Wave Climate of the NW Approaches and Recommendations for Gridding and
Sampling Intervals............................................................................................................ 2
2.1 Temporal Variability ........................................................................................ 2
2.2 Spatial Variability............................................................................................. 2
2.3 Recommendations for Climatologies ............................................................... 3
3 Non-EO Data Sources .............................................................................................. 4
3.1 Introduction ...................................................................................................... 4
3.2 Wave buoys ...................................................................................................... 4
3.3 Visual Observations.......................................................................................... 4
3.4 ANAlyses and FOrecasts.................................................................................. 4
3.5 Climatologies.................................................................................................... 5
3.6 Adequacy of Present Wave Information .......................................................... 5
4 EO Data Sources....................................................................................................... 6
4.1 Introduction ...................................................................................................... 6
4.2 The Satellite Radar Altimeter ........................................................................... 6
4.3 Synthetic Aperture Radar ................................................................................. 7
5 Demonstration and Evaluation of EO data ............................................................. 11
5.1 Introduction .................................................................................................... 11
5.2 Prototype NRT Wave Conditions Monitoring Service................................... 11
5.3 WAVE CLIMATE DEMONSTRATION ...................................................... 12
5.4 Summary of EO Measured HSE Wave Parameters........................................ 13
6 Summary of EO System Benefits........................................................................... 15
7 Recommendations .................................................................................................. 17
7.1 Introduction .................................................................................................... 17
7.2 Near Real Time NW Approaches Wave Monitoring System......................... 18
7.3 NW Approaches Wave Climate Statistics Service ......................................... 18
References ...................................................................................................................... 19
Glossary .......................................................................................................................... 20
v

vi

EXECUTIVE SUMMARY
This test project has been conducted under the British National Space Centre (BNSC)
Government Information From The Space Sector (GIFTSS) initiative in close collaboration with
the Health and Safety Executive Offshore Division (HSE OSD).
The HSE OSD requirement is the safety of operations and equipment used for drilling and
extraction of oil and gas in the North West Approaches to the UK, and covers the following:
��The need to assess the possible utilisation of all-weather information from ongoing
spaceborne systems to measure offshore wave energy
��To add to the statistical and management base that is used to support offshore operations
��The potential for supporting safety in all weathers for operations in the NW Approaches
The project has carried out an in-depth assessment of all aspects of wave products that can be
derived from satellite measurements over the ocean, and which could form components of a
North-Western Approaches wave conditions monitoring and analysis service.
A demonstration service was established to demonstrate and evaluate key aspects of a full
service: A near real time data service which – through a web page updated hourly, every day,
provides the client with easy and fast access to present and recent wave conditions in the NW
approaches, and a wave climatology and analysis service which provides information on
expected conditions as they vary throughout the year and across the region of interest.
Ocean wave data can be derived from two different satellite instruments, both of them
microwave radar. The first is the radar altimeter which provides a measurement, directly
beneath the satellite, of significant wave height, wind speed and mean (or zero up-crossing)
wave period. This technology is mature, and altimeter wave data have been accepted by the
operational offshore community as reliable ocean state measurements, although the sampling is
limited. The second instrument is the synthetic aperture radar (SAR), which can provide
estimates of the wavelength and direction of long waves (wavelength > 100m). Recent
developments have also allowed for estimates of significant wave height (of long period waves)
to be estimated, as well as a direction / energy spectrum (again for long period waves).
However, because of the complex imaging mechanism these data are less reliable and SAR
wave measurements are only possible under a limited range of surface wind speeds.
The report provides costed recommendations for phased implementation and development of an
operational NW approaches wave conditions monitoring and analysis service. These
recommendations are designed to meet the following key priorities:
x� Satisfy the joint sponsor priorities of providing statistical analyses of archived wave data
(including directional information) and a near real time wave monitoring service.
x� Offer a useful capability in the short term (i.e. based upon existing capability, and available
operational data sets), but which will allow for future planned incorporation of additional
data sets and analysis capabilities.
In addition, recommendations are also provided for capacity building by knowledge transfer
between academic and commercial organisations.
Satellite Observing Systems (SOS), the National Oceanography Centre, Southampton (NOC)
and QinetiQ were project partners, SOS was project manager.
vii

viii

1 INTRODUCTION
1.1 HSE REQUIREMENT The HSE OSD requirement is the safety of operations and equipment used for drilling and
extraction of oil and gas in the North West Approaches to the UK, and covers the following:
��The need to assess the possible utilisation of all-weather information from ongoing
spaceborne systems to measure offshore wave energy
��To add to the statistical and management base that is used to support offshore operations
��The potential for supporting safety in all weathers for operations in the NW Approaches
The project test area was defined by the co-sponsors as the region within 56°N-64°N, and 1°E
to 10°W, with a primary area of interest being the Faroes-Shetland channel (Figure 1).
F
Figure 1 The GIFTSS Area of Interest. The location of the Schiehallion FPSO (“S”) and the Faroes waverider buoy (“F”) are also indicated.
1.2 THIS REPORT The project has carried out an in-depth assessment of all aspects of wave products that can be
derived from satellite measurements over the ocean, and which could form components of a
North-Western Approaches wave conditions monitoring and analysis service. Satellite
Observing Systems (SOS), the National Oceanography Centre, Southampton (NOC) and
QinetiQ were project partners, SOS was project manager.
This report summarises the key findings of the project. We summarise existing knowledge on
the wave climate of the NW approaches (Section 2), assess the capabilities of “conventional”
non-EO data sources (Section 3), review the key characteristics and capabilities of satellite
derived wave information (Section 4), present and evaluate the demonstration data sets
generated during the study (Section 5), give a short evaluation of these products and assess the
potential benefits that such “EO-enhanced” services offer the HSE (Section 6), and finally
provide recommendations for implementation of a NW Approaches Wave Monitoring and
Statistical Analysis Service (Section 7).
Readers are referred to the full phase 1 and phase 2 reports (Cotton et al., 2005a and 2005b) and
to references therein for further detail.
1

2 THE WAVE CLIMATE OF THE NW APPROACHES AND RECOMMENDATIONS FOR GRIDDING AND SAMPLING
INTERVALS
2.1 TEMPORAL VARIABILITY Synoptic Synoptic variability is the primary time scale of weather systems. For the North Atlantic one
atmospheric depression may succeed another spaced by a few days. The six-hour-interval
typical of (Numerical Weather Prediction) NWP products is appropriate for near-real time
wave applications. A slightly shorter interval, e.g., 1 - 3 hours, may be helpful for operational
purposes.
Seasonal The wave climate of the Area of Interest shares the exceptionally strong seasonality of the North
Atlantic region (Woolf et al., 2003). Annual means are of limited use and for most practical
purposes the climate should be described at a minimum seasonally, and better monthly. The
seas are generally largest in the western part of the Area of Interest, where the influence of
Atlantic waves is greatest. The winter is by far the roughest season with a typical mean
significant wave height of 5 metres in the open sea to the west of Scotland (Figure 2). A similar
seasonality is also seen in wave period.
Inter-annual Strong inter-annual variability is another feature of the wave climate of the Area of Interest and
the remainder of the north-eastern North Atlantic and northern North Sea (Woolf et al., 2003)
particularly in the winter months. This variability is strongly linked to the North Atlantic
Oscillation (Woolf et al., 2002 & 2003). This variability has major consequences for the design
of climatologies. If a climatology is only based on one or a few years, there is a significant risk
that it will be severely biased compared to the “true” climate of a longer baseline. A climatology
based on ten or more years of data is clearly preferable.
Figure 2 Mean SWH in the North Atlantic in January 1993 according to AES-40 climatology (Swail et al., 2000)
2.2 SPATIAL VARIABILITY Offshore It is important to be aware of the spatial scales of wave climate statistics when trying to estimate
and map such parameters as monthly mean Hs or exceedence percentiles, especially when using
2

data from a few altimeters with greatly varying distances between tracks. The problem is to
balance the need to take data from as large an area as possible, to maximise the number of
observations, with the need to restrict the area so that the statistics are stationary.
For estimating climate statistics in the open ocean, a 2° x 2° grid is often used. This grid size is
consistent with the findings of Cooper & Forristall (1997) that sampling over distances of 200 -
300 km is satisfactory. The coherence in the resulting maps also indicates that this choice is
reasonable - as does the coherence found in analyses of monthly means from 2° by 2° bins.
Closer to land, wave climate statistics vary on smaller spatial scales, and analysing 2° bins, for
example in the southern North Sea, is not satisfactory. During "Jericho" (a previous study for
BNSC, Cotton et al., 1999) it was found that altimeter coverage was by then sufficient to enable
monthly statistics to be computed in 1° latitude by 2° longitude bins. This 1° x 2° bin size was
also used by Woolf et al. (2003).
Coastal Spatial gradients are progressively greater as the coast is approached, hence the UK Met Office
approach of nesting progressively finer resolution models at more coastal locations.
Sheltering and refraction appears to be the main coastal influence on wave properties. Coastal
effects are generally limited to within 100 km of land to weather side (west) of main topography,
but are more important to the east of islands and in enclosed waters. To the west, coastal effects
are likely to be more significant in easterly winds (though these are less usual in the region).
Each coastal site is likely to have a quite specific set of problems. Therefore while coastal
studies are feasible (especially utilising SAR), no single generic solution exists.
Spatial Variability within the Area of Interest High spatial correlations over 200 km and more were found for wave height data to the west of
the Shetland Islands (Carter, 2004c) which could justify the adoption of a 2 degree resolution
for this and more exposed regions. However, there was some evidence for strong gradients to
the north and east of Scotland where the penetration of Atlantic waves diminishes eastwards.
There are also strong gradients nearer the coast.
2.3 RECOMMENDATIONS FOR CLIMATOLOGIES An offshore wave climatology based on EO retrievals of wave parameters should be
constructed on a minimum 1° x 1° monthly grid.
This is a finer grid than is currently typical for altimetry (2° x 2°) and some analysis of the
sampling errors should be considered. It may be sensible to recompose the data into 1° x 2° or
2° x 2° grid cells where spatial gradients are small but sampling errors are large. Also a larger
grid size may be necessary if analyses of distributions of wave period (and other parameters) are
required in different direction sectors. There is little available information on variability on
smaller spatial scales. The nature of this variability is likely to be highly geographically
dependent (due to effects of local topography) and so specific regional studies would be
required to fully quantify variability on smaller spatial scales.
Since strong inter-annual variability is a feature of the Area of Interest, on a decadal time scale,
the time base of the climatology should be as long a possible (ideally of the order of decades).
3

3 NON-EO DATA SOURCES
3.1 INTRODUCTION Information and data on sea state in the GIFTSS area are available from a wide range of non-EO
sources. Measurements are available, normally hourly, but only at a few locations, and data are
not provided reliably - and are especially likely to fail in stormy situations. Observational
“Non-EO” wave data sources include non-directional buoys (the most numerous in situ data
source), directional buoys, visual observations, radars, wave staffs, and downward looking
lasers. In addition, wave information is available from wave models, as forecasts or hindcasts,
the latter often used to derive climatologies and as a basis for statistical analyses.
3.2 WAVE BUOYS Non-Directional Buoys Non-directional buoys measure significant wave height (Hs), the average zero-upcrossing wave
period (Tz) and other spectral parameters. Significant wave steepness can be estimated from Hs
and Tz.
The UK Met Office has established a number of weather buoys in open waters around the UK.
These record and transmit hourly data. The locations of data buoys and light vessels are shown
in the left panel of Figure 3.
Directional Buoys A directional waverider buoy is maintained south of the Faroe Islands, near 61.3°N 6.3°W, by
the Faroes Oil Industry Group (location F in Figure 1). This buoy provides wave height, period
(peak and zero-upcross) and direction, as well as omni-direction spectra and tabulated
directional information. The buoy usually reports at half hourly intervals. The Faroes buoy is
financed by an industrial consortium - the Faroes Oil Industry Group.
3.3 VISUAL OBSERVATIONS Visual estimates of sea and swell height, period and direction are included in meteorological
reports from Voluntary Observing Ships, mostly at the main synoptic hours. The right hand
panel of Figure 3 gives an example of synoptic coverage from VOS data.
Figure 3 Left: location of UK Met Office buoys and light vessels, and North Sea rigs reporting weather observations. Right: Example of synoptic coverage from marine observations including wave height and period.
3.4 ANALYSES AND FORECASTS Numerous analyses and forecasts of wave height, wave period, and wave direction (usually
available as combined values, and separately as wind sea and swell) are available from national
Met Offices, ECMWF, US FNMOC, and commercial companies such as Weathernews UK Ltd
and Oceanweather Inc. For example, The UK Met Office UK Waters Wave Model covers
4

much of the GIFTSS area with a resolution of about 12 km, and is run 6 hourly, using hourly
wind inputs and providing forecasts out to 5 days ahead (Figure 4 left).
Most of these organisations use 3rd Generation spectral wave models, including ECMWF, the
Danish Met Institute (DMI), Weathernews UK and Oceanweather.
Figure 4 Left: Example output from the Met Office's UK waters wave model (00Z, 24/12/1999). Right: Wave height analysis from the Danish Met Inst. for 00Z 01/07/04).
ECMWF and Météo France have assimilated altimeter wave heights into their wave models for
some years, and ECMWF has recently begun to use SAR data. The UK Met Office assimilated
data from the ERS-1 and ERS-2 altimeters for some years, but found the results unsatisfactory,
and stopped in 2001 - although it now uses altimeter data to validate its model and is working
towards the use of ENVISAT wave mode data for validation.
3.5 CLIMATOLOGIES Wave Model Hindcast Climatologies The two most relevant wave model hindcast based climatologies are:
x� The KNMI global wave climatology, based on a 45 year hindcast, forced by ERA-40 winds,
available at http://www.knmi.nl/waveatlas (Sterl and Caires, 2004)
x� The AES-40 Oceanweather hindcast, based on a 40 year analysis, “kinematically enhanced”
to provide an improved parameterisation of storms. Available at
http://www.oceanweather.com/metocean/aes40/index.html.
Visual Observations Climatologies Climatologies based on visual observations are also available. They have their limitations, but
are still quite widely used (see http://www.globalwavestatisticsonline.com and
http://www.sail.msk.ru/atlas/index.htm).
3.6 ADEQUACY OF PRESENT WAVE INFORMATION Assessing adequacy is difficult and depends on the particular operational requirement. For
example, a significant wave height, Hs, of about 5 m is a critical level for loading at the
Schiehallion FPSO. How often do forecasts of 5 m prove correct as opposed to false alarms;
how often does Hs exceed 5 m without warning?
Recent incidents have shown that, while for most of the time there are sufficient wave data,
there are occasions when the data are inadequate. These occasions are usually in times of
storms, but this is not always the case. There were concerns that long-period swell (of 15 - 20
seconds, and hence wave lengths of 330 - 590 metres) could seriously affect operations at
Schiehallion; and the UK Met Office extracted the energy on this frequency band from its wave
model for BP.
5
4 EO DATA SOURCES
4.1 INTRODUCTION 3 satellite instruments provide measurements of ocean sea state: the radar altimeter, synthetic
aperture radar (SAR), and scatterometer. Also, in the future, useful sea state information may be
inferred from reflected GNSS (Global Navigation Satellite System) signals. Table 1 lists the
present and planned satellite missions capable of providing measurements of ocean sea state.
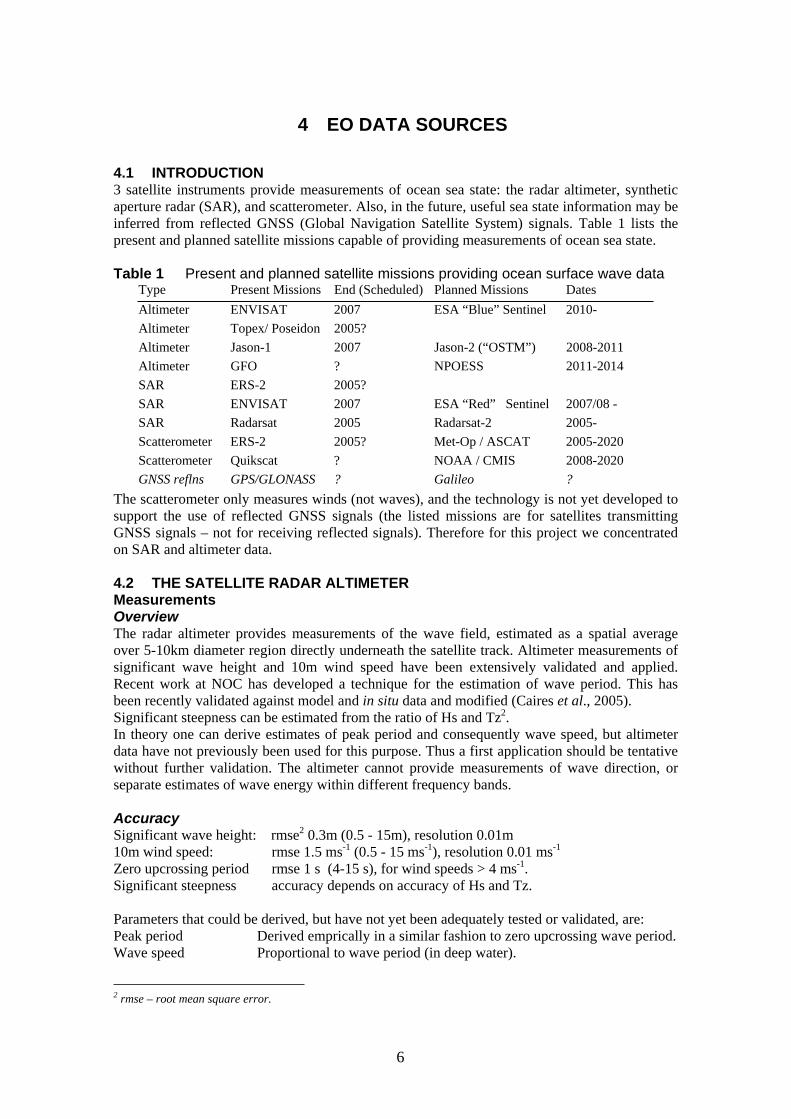
Table 1 Present and planned satellite missions providing ocean surface wave data Type Present Missions End (Scheduled) Planned Missions Dates
Altimeter ENVISAT 2007 ESA “Blue” Sentinel 2010-
Altimeter Topex/ Poseidon 2005?
Altimeter Jason-1 2007 Jason-2 (“OSTM”) 2008-2011
Altimeter GFO ? NPOESS 2011-2014
SAR ERS-2 2005?
SAR ENVISAT 2007 ESA “Red” Sentinel 2007/08 -
SAR Radarsat 2005 Radarsat-2 2005-
Scatterometer ERS-2 2005? Met-Op / ASCAT 2005-2020
Scatterometer Quikscat ? NOAA / CMIS 2008-2020
GNSS reflns GPS/GLONASS ? Galileo ?
The scatterometer only measures winds (not waves), and the technology is not yet developed to
support the use of reflected GNSS signals (the listed missions are for satellites transmitting
GNSS signals – not for receiving reflected signals). Therefore for this project we concentrated
on SAR and altimeter data.
4.2 THE SATELLITE RADAR ALTIMETER Measurements Overview The radar altimeter provides measurements of the wave field, estimated as a spatial average
over 5-10km diameter region directly underneath the satellite track. Altimeter measurements of
significant wave height and 10m wind speed have been extensively validated and applied.
Recent work at NOC has developed a technique for the estimation of wave period. This has
been recently validated against model and in situ data and modified (Caires et al., 2005).
Significant steepness can be estimated from the ratio of Hs and Tz2.
In theory one can derive estimates of peak period and consequently wave speed, but altimeter
data have not previously been used for this purpose. Thus a first application should be tentative
without further validation. The altimeter cannot provide measurements of wave direction, or
separate estimates of wave energy within different frequency bands.
Accuracy 2Significant wave height: rmse 0.3m (0.5 - 15m), resolution 0.01m
-1 -1 -110m wind speed: rmse 1.5 ms (0.5 - 15 ms ), resolution 0.01 ms
Zero upcrossing period rmse 1 s (4-15 s), for wind speeds > 4 ms-1.
Significant steepness accuracy depends on accuracy of Hs and Tz.
Parameters that could be derived, but have not yet been adequately tested or validated, are:
Peak period Derived emprically in a similar fashion to zero upcrossing wave period.
Wave speed Proportional to wave period (in deep water).
2 rmse – root mean square error.
6

latitu
de
Reliability Altimeter measurements are generally robust, but reliable measurements are not available when
non-ocean features lie within the altimeter footprint. Very heavy rain (e.g. at the centre of
hurricanes or tropical storms) can attenuate and corrupt the altimeter signal.
Sampling Whilst measurements are available at 7 km intervals along track, across track sampling is
relatively poor. For the Jason-1 altimeter ground tracks are repeated every 10-days with a
separation between tracks of ~2.8° in longitude. ENVISAT altimeter tracks are closer together
in space (< 1 °) but are repeated once every 35 days (Figure 5). This means that sampling from
1 satellite is sufficient to support a 2° x 2° monthly climatology, but more than one satellite
altimeter is required to support a climatology on a finer grid. A constellation of altimeters would
be necessary to support a Near Real Time (NRT) application using altimeter data alone.
At present NRT data are available from 3 satellites (ERS-2, Jason-1, and ENVISAT) giving 6
passes a day over the region of interest. Data from a further 2 satellites are available after a
delay of 1-2 days (GFO and TOPEX-Poseidon). Future plans (Table 1) should supply at
minimum a configuration of 2 satellite altimeters.
Tracks60
ƻazimuthÓ 58
SARimage
direction ƻrangeÓ direction altimeter
56 data
54
52 wave mode Direction of satellite ƻimagetteÓ (ERS-2 SE ŠNW
50 ascending pass in N hemisphere)
4810 5 0 5
longitude
Figure 5 Sampling characteristics of altimeter, and SAR. Left: Ground tracks of altimeters: black - Jason, repeated every ~10 days; red – Envisat, repeated every 35 days. Centre: sensing geometry for altimeter, SAR image mode and SAR wave mode, Right: example wave period output from ENVISAT (on top of model output), altimeter data on track, small squares are wave mode data, the large outline is coverage of a SAR image.
4.3 SYNTHETIC APERTURE RADAR The Synthetic Aperture Radar is an active microwave radar which measures to the side of the
satellite track. The SAR imaging process for ocean waves is a complex one, and conversion of
the received radar image to ocean wave parameters requires approximations to complex non
linear processes. Two sets of data are available:
Image Mode In this mode the SAR takes images of large areas, a range of sizes and resolutions are possible.
High resolution (~km) wave information can be extracted on a sub-grid within an individual
SAR image – images suitable for this application typically cover 100km x 100km. Such data are
available from the ESA satellites (ERS-2 and ENVISAT) and Radarsat. Within this project SAR
image data have been acquired and processed with the MaST application by QinetiQ.
7
Wave Mode In this mode, available on ERS-2 and ENVISAT, “snapshot” imagettes are taken at regular
intervals along track. It was introduced specifically to provide NRT wave data for use in wave
modelling. Automated processing by ESA generates ocean wave spectra in Near Real Time. In
this project SOS have retrieved these data from the ESA NRT data stream.
General SAR Limitations The movement and imaging process of the SAR distorts the measured wave spectrum. This
distortion affects all SAR wave products, whatever processing scheme is employed. All SAR
processing schemes (for wave applications) suffer from the following limitations:
o A lower wavelength limit for sensing ocean waves of 50-60m, in all directions.
o A lower wavelength sensitivity cut-off in the azimuth direction (parallel to the direction
of movement of the satellite). This varies according to wind speed (and other
conditions) between 100m –400m. The mean value is 235 m.
o Reliable estimates of wave parameters are limited to the wind speed range of 3-13 ms-1.
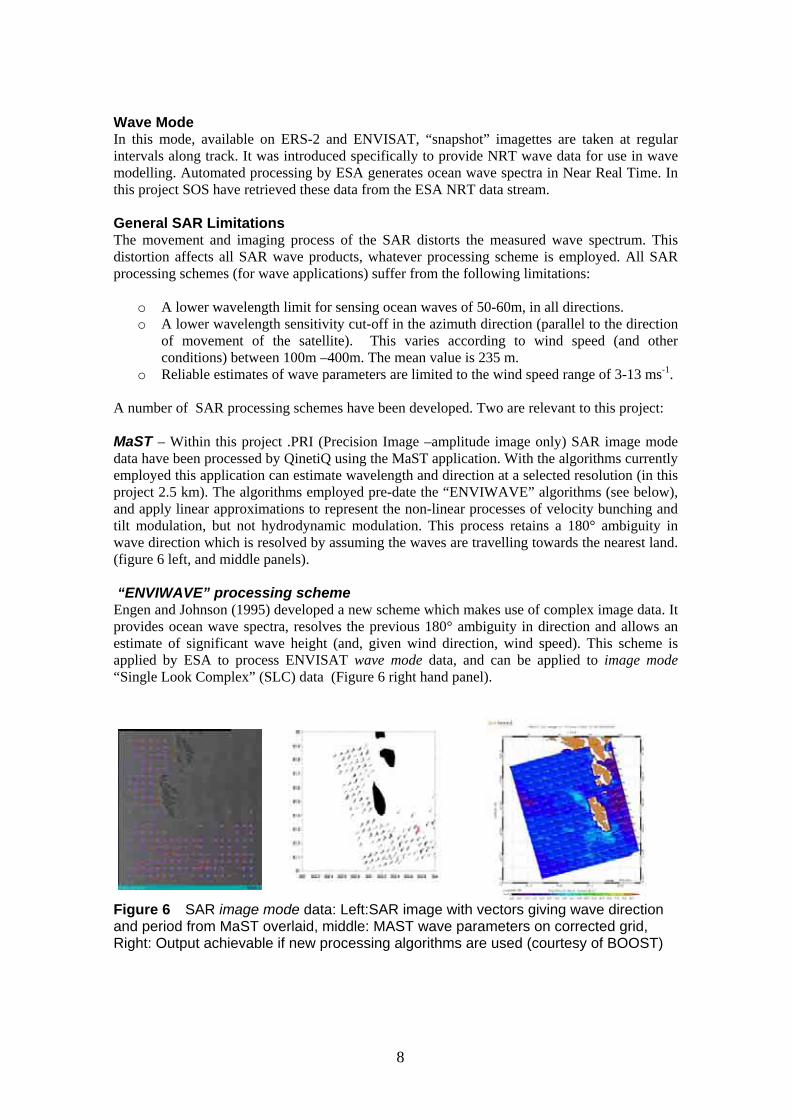
A number of SAR processing schemes have been developed. Two are relevant to this project:
MaST – Within this project .PRI (Precision Image –amplitude image only) SAR image mode
data have been processed by QinetiQ using the MaST application. With the algorithms currently
employed this application can estimate wavelength and direction at a selected resolution (in this
project 2.5 km). The algorithms employed pre-date the “ENVIWAVE” algorithms (see below),
and apply linear approximations to represent the non-linear processes of velocity bunching and
tilt modulation, but not hydrodynamic modulation. This process retains a 180° ambiguity in
wave direction which is resolved by assuming the waves are travelling towards the nearest land.
(figure 6 left, and middle panels).
“ENVIWAVE” processing scheme Engen and Johnson (1995) developed a new scheme which makes use of complex image data. It
provides ocean wave spectra, resolves the previous 180° ambiguity in direction and allows an
estimate of significant wave height (and, given wind direction, wind speed). This scheme is
applied by ESA to process ENVISAT wave mode data, and can be applied to image mode
“Single Look Complex” (SLC) data (Figure 6 right hand panel).
Figure 6 SAR image mode data: Left:SAR image with vectors giving wave direction and period from MaST overlaid, middle: MAST wave parameters on corrected grid, Right: Output achievable if new processing algorithms are used (courtesy of BOOST)
8

Measurements ENVISAT ASAR wave mode data Overview In this mode “snapshot” imagettes of the wave field over a 10km x 6 km region are taken every
100 km along track. All ENVISAT ASAR wave mode data demonstrated in this project have
been processed, by ESA, with the ENVIWAVE scheme.
The ENVISAT ASAR wave product provides an estimate of the ocean wave spectrum in 24
wavelength bins (from 30m to 800m) and 36 direction bins, and derived (long wavelength)
parameters of significant wave height, mean period and peak period. An estimate of the azimuth
cut-off wavelength is also provided.
As for the altimeter, the estimates of swell and period could be used to derive estimates of (long
wavelength) significant steepness, peak period, and wave speed, the same caveats apply.
Accuracy Johnsen et al (2004) have provided a recent validation against the ECWMF WAM wave model:
Significant wave height: rmse 0.8m (3 - 7m) for all data
0.6m (3 – 7m) for longer waves only3
Mean period ,Tm: rmse 1.7s (7-14 s), for all data
1.1s for longer waves only
Peak Period, Tp rmse 3.1s
Mean direction rmse 1 rad
Peak direction rmse 1 rad
10m wind speed rmse 2.2 ms -1
Significant steepness can be derived from Hs, and Tm, but applies to long wavelengths only
Wave speed can be calculated directly from peak period, but has not been directly validated.
Reliability -1Best reliability is for seas with periods between 8-15s, and wind speeds between 3-13 ms .
Hs is overestimated at low wind speeds, and underestimated at high wind speeds.
Sampling ENVISAT ASAR wave mode measurements are made every 100 km along track, but not all
these measurements result in valid ocean wave spectra. There have been some early difficulties
in establishing suitable quality control criteria – initial recommendations from ESA may have
been too severe and resulted in a larger than expected number of rejected products.
In theory wave mode data from 2 passes a day can be expected over the region of interest. This
coverage should be sufficient to support a 2° x 2° monthly climatology for uni-variate
distributions. Larger areas or time periods (e.g. seasons) would be required to provide the higher
sampling necessary to support multi-variate analyses.
SAR image mode Data Overview QinetiQ used the MaST application to produce wave data from the SAR image mode. MaST
provides wavelength and direction for resolved wave trains, at a selected sub-scene resolution.
A 180° ambiguity is retained for wave direction. This project represents the first use of the
QinetiQ MaST package to provide wave data for an operational application. Although we have
endeavoured to provide as thorough an assessment as possible, further work is required to
In fact by comparing SAR and model data derived by integrating the wave spectrum for waves greater than 12s.
9
3
provide a full validation.
Accuracy, Reliability Our initial analysis indicates a useful accuracy in wavelength (and so also period) may be
obtained for waves travelling in the SAR range direction sector. However, wave directions
appear to be unrealistically grouped close to the range direction. It is thought that the integration
of improved Model Transfer Functions within MaST, used to process Single Look Complex
Images (i.e. .SLC rather than .PRI) would improve performance.
In principle the same ENVIWAVE algorithms as used for ENVISAT ASAR wave mode data
could be applied within MaST (though the SAR image data must be pre-processed into Single
Look Complex format), and the same accuracy achieved as for the wave mode data above.
Sampling Presently, SAR image mode data are potentially available from 3 satellites, with up to 6 passes
per day in total over the region of interest. In practice this sampling is reduced, in an
unpredictable manner, depending upon on the mode of the satellites, the existence of conflicting
higher priority data requests from SAR imagery, the status of the (shared) receiving dish at
West Freugh, and suitable wind speed conditions within the imaged area. In addition an archive
of more than 10 years of SAR image data is held at West Freugh.
In fact cost is likely to be more restrictive than data availability. It costs significantly more to
acquire and process SAR image data than the other data sets. Hence it is suggested that the
most effective use of SAR image mode data is likely to be to provide high resolution
information over a localised region of known small scale variability, rather than to provide wide
area coverage, best achieved more economically with other data sets.
10
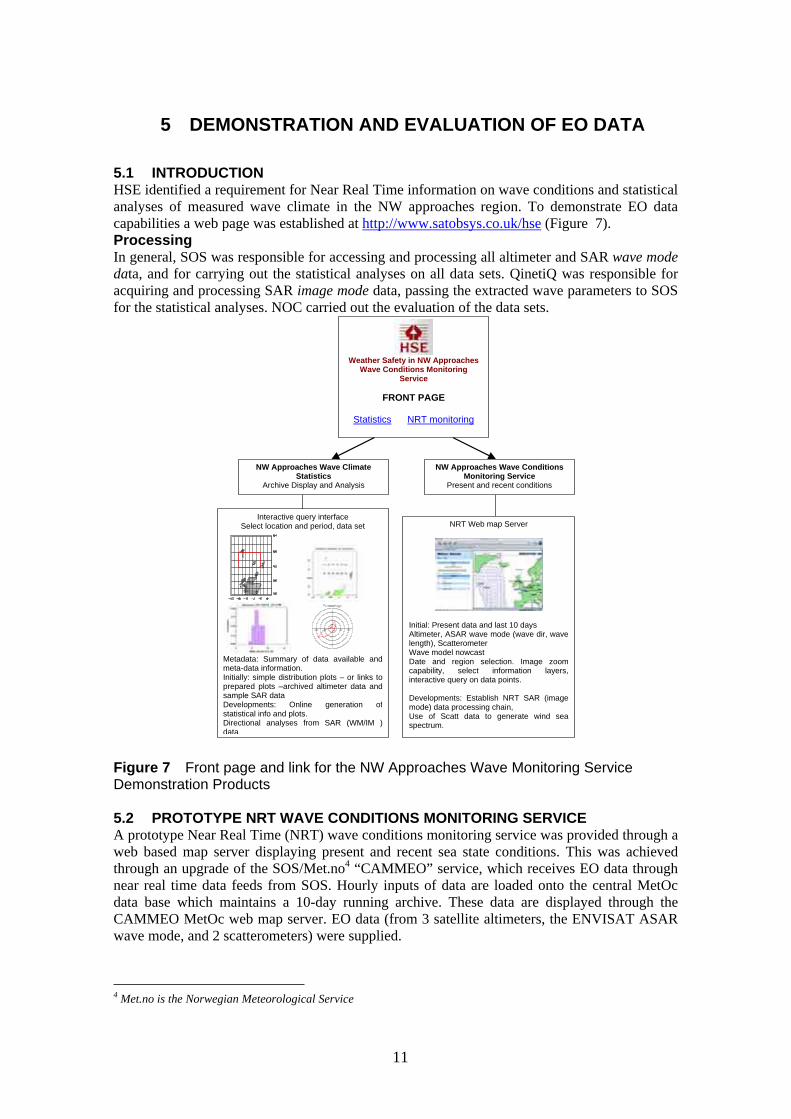
5 DEMONSTRATION AND EVALUATION OF EO DATA
5.1 INTRODUCTION HSE identified a requirement for Near Real Time information on wave conditions and statistical
analyses of measured wave climate in the NW approaches region. To demonstrate EO data
capabilities a web page was established at http://www.satobsys.co.uk/hse (Figure 7).
Processing In general, SOS was responsible for accessing and processing all altimeter and SAR wave mode
data, and for carrying out the statistical analyses on all data sets. QinetiQ was responsible for
acquiring and processing SAR image mode data, passing the extracted wave parameters to SOS
for the statistical analyses. NOC carried out the evaluation of the data sets.
iti lA
i
Devel ii in,
of wind
Sel i
li
i i i l – l
of l
Weather Safety in NW Approaches Wave Conditions Monitoring
Service
FRONT PAGE
Statistics NRT monitoring
NW Approaches Wave Climate Statistics
Archive Display and Analysis
NW Approaches Wave Conditions Monitoring Service
Present and recent conditions
NRT Web map Server
In al: Present data and ast 10 days ltimeter, ASAR wave mode (wave dir, wave
length), Scatterometer Wave model nowcast Date and region select on. Image zoom capability, select information layers, interactive query on data points.
opments: Establ sh NRT SAR (image mode) data process ng chaUse Scatt data to generate sea spectrum.
Interactive query interface ect location and per od, data set
Metadata: Summary of data avai able and meta-data informat on. Initially: s mple d str bution p ots or links to prepared p ots –archived altimeter data and sample SAR data Developments: Online generationstatistica info and plots. Directional analyses from SAR (WM/IM ) data
Figure 7 Front page and link for the NW Approaches Wave Monitoring Service Demonstration Products
5.2 PROTOTYPE NRT WAVE CONDITIONS MONITORING SERVICE A prototype Near Real Time (NRT) wave conditions monitoring service was provided through a
web based map server displaying present and recent sea state conditions. This was achieved 4through an upgrade of the SOS/Met.no “CAMMEO” service, which receives EO data through
near real time data feeds from SOS. Hourly inputs of data are loaded onto the central MetOc
data base which maintains a 10-day running archive. These data are displayed through the
CAMMEO MetOc web map server. EO data (from 3 satellite altimeters, the ENVISAT ASAR
wave mode, and 2 scatterometers) were supplied.
Met.no is the Norwegian Meteorological Service
11
4
The user is able to select data sets, including EO data, buoy and ship data, and Met Ocean
forecasts, to zoom into and out from selected areas, move backwards and forwards in time, and
query individual data points. The right panel in Figure 7 shows an example display.
After a trial period of over 3 months, it was concluded that the NRT processing chain for
individual products had been successfully demonstrated, and the web based map server
implementation provides a very quick response to user queries.
Some improvements could be considered to suit the HSE/BNSC needs better, including:
o Improved visual/graphical representation of altimeter and SAR wave data.
o The throughput volume of ENVISAT SAR wave mode data is disappointing. The cause
of the low volume of these data should be investigated and rectified.
o A NRT SAR image mode chain could be established by QinetiQ.
5.3 WAVE CLIMATE DEMONSTRATION The wave climate statistics section of the demonstration product comprised:
o altimeter derived monthly wave climate statistics, for 12 1° x 1° grid squares, within 60°-
62°N, 2°-8°W.
o wave direction and wave length statistics from SAR image mode data (processed through
MaST)– for the winter season (November-March) in a single area: 60°-61°N, 4°-8°W.
Altimeter data An example set of altimeter based statistics were made available through the web site. They
included Hs, Tz and U10 statistics in 1° x 1° bins (mean, standard deviation, 10%iles),
histograms, scatter plots (Hs v U10, Hs v Tz), log-normal probability plots. The left panel of
figure 7 demonstrates some of the products that can be produced. This capability from altimeter
derived wave data is well validated and no further evaluation was carried out within the project.
SAR image mode data The aims of the demonstration SAR image mode data product, based on SAR images processed
through MaST by QinetiQ and with subsequent analysis by SOS, were:
x� To generate a representative swell direction and wavelength database.
x� To provide a demonstration display of direction and wavelength statistics.
x� To assess the impact of high wind speed conditions on SAR sampling of the region.
The analysis focussed on an area to the South of the Faroe Islands (60°-61°N, 4°-8°W) an area
in which the offshore oil and gas exploration industry are active, and for which representative in
situ buoy data are available. Data from 27 SAR images were retrieved and processed. Two ways
of deriving the wave statistics were investigated: using all the information from each of the
18529 total data points in the 27 images; and using the 27 modal values only. With the latter
approach we are guaranteed independent data points, but suffer from a lack of data, with the
former we gain more data but much of it is highly correlated, with poorly known error
characteristics. The following key points were established:
o Wave directions exactly along the range direction are under represented. This “peak
splitting” effect is a known issue with SAR data, but may be limited by application of
improved processing algorithms.
o Estimated wavelengths appear to be reasonably accurate, except when the dominant
waves lie closer to the azimuth direction than the range direction.
o Directions are not, at present, reliable. They exhibit an unrealistically narrow
distribution, and appear to be biased towards the range direction.
12

5.4 SUMMARY OF EO MEASURED HSE WAVE PARAMETERS
Significant Wave Height: Hs
The altimeter can provide an accurate and reliable estimate of Hs, suitable for many statistical
analysis applications without need for further data. The main issue for NRT applications is poor
temporal sampling.
Recent developments have shown it is possible to extract an estimate of (long wavelength) Hs
from (A)SAR images and wave mode data (following calibration of energy levels and
backscatter amplitude). A separate estimate of swell Hs may have some useful applications.
However, presently available sampling (in both time and space) from SAR is a limitation.
Zero Upcrossing, mean, wave period: Tz,m
A useful estimate of zero upcrossing wave period can be extracted from altimeter data.
Temporal sampling is again poor from altimeters for NRT applications.
A mean wave period can be extracted by integrating the 2D SAR spectrum, though again only
the longer part of the spectrum is sensed.
Peak wave period: Tp
Although a peak period can be derived from altimetry, further development and testing is
required. The peak wavelength (for long waves) can in theory be identified unambiguously in
SAR data. However validation programmes against modelled spectra gave rmse ~ 3s. There is
an inherent difficulty in validating this parameter, against model or in-situ data (in the latter
case the problem is very limited resolution, 5s, at large periods). Nonetheless, this could prove
one of the most useful measurements available from the SAR because of its importance in deep
water operations. Sampling in time and space (from SAR) is again poor.
Peak Direction: )p
A peak direction can be identified from analysis of SAR imagery, and extracted from the wave
mode imagettes. An rms error of 1 radian has been found for the latter data set, but we note the
problems with directions from the SAR image data as processed by the current version of
MAST. The same sampling and wavelength sensitivity issues as above apply.
Wave direction information cannot be extracted from altimetry.
Significant Steepness: Stpsig
Significant steepness can be estimated from the ratio of Hs and Tz2.
This parameter is derived directly from Hs and Tz, so the limitations identified above apply.
Thus we might hope for an accurate estimate from altimeter data (because Hs and Tz are
thought to be reliable), but a SAR derived estimate would only refer to long wavelength waves.
Wave (Group) Speed: Cg
Wave speed can be estimated directly from cg = g Tp /4S .This parameter would be derived from Tp, so we would not expect an accurate estimate from
altimeter data, but perhaps more success (in the case of long wavelengths) from SAR data.
2-D Spectrum: E�I�O)
A 2D spectrum is available from the ERS and ENVISAT wave mode, and from (.SLC) SAR
imagery processed with the ENVIWAVE algorithms. In the case of the ERS wave mode, there
is a 180° ambiguity on the retrieved spectrum. As identified above, only the long wavelength
part of the spectrum is sensed.
13
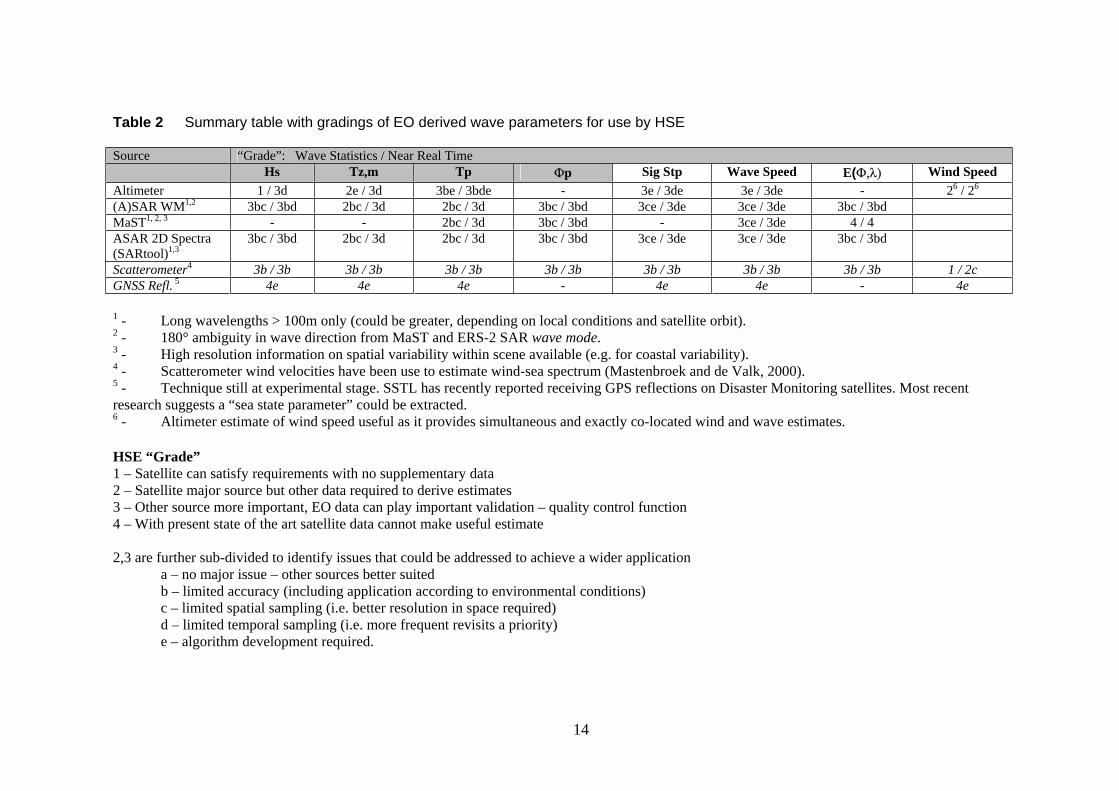
Table 2 Summary table with gradings of EO derived wave parameters for use by HSE
Source “Grade”: Wave Statistics / Near Real Time
Hs Tz,m Tp )p Sig Stp Wave Speed E()�O� Wind Speed
Altimeter 1 / 3d 2e / 3d 3be / 3bde - 3e / 3de 3e / 3de - 26 / 26
(A)SAR WM1,2 3bc / 3bd 2bc / 3d 2bc / 3d 3bc / 3bd 3ce / 3de 3ce / 3de 3bc / 3bd
MaST1, 2, 3 - - 2bc / 3d 3bc / 3bd - 3ce / 3de 4 / 4
ASAR 2D Spectra
(SARtool)1,3 3bc / 3bd 2bc / 3d 2bc / 3d 3bc / 3bd 3ce / 3de 3ce / 3de 3bc / 3bd
Scatterometer4 3b / 3b 3b / 3b 3b / 3b 3b / 3b 3b / 3b 3b / 3b 3b / 3b 1 / 2c
GNSS Refl. 5 4e 4e 4e - 4e 4e - 4e
1 - Long wavelengths > 100m only (could be greater, depending on local conditions and satellite orbit). 2 - 180° ambiguity in wave direction from MaST and ERS-2 SAR wave mode. 3 - High resolution information on spatial variability within scene available (e.g. for coastal variability). 4 - Scatterometer wind velocities have been use to estimate wind-sea spectrum (Mastenbroek and de Valk, 2000). 5 - Technique still at experimental stage. SSTL has recently reported receiving GPS reflections on Disaster Monitoring satellites. Most recent
research suggests a “sea state parameter” could be extracted. 6 - Altimeter estimate of wind speed useful as it provides simultaneous and exactly co-located wind and wave estimates.
HSE “Grade”
1 – Satellite can satisfy requirements with no supplementary data
2 – Satellite major source but other data required to derive estimates
3 – Other source more important, EO data can play important validation – quality control function
4 – With present state of the art satellite data cannot make useful estimate
2,3 are further sub-divided to identify issues that could be addressed to achieve a wider application
a – no major issue – other sources better suited
b – limited accuracy (including application according to environmental conditions)
c – limited spatial sampling (i.e. better resolution in space required)
d – limited temporal sampling (i.e. more frequent revisits a priority)
e – algorithm development required.
14

6 SUMMARY OF EO SYSTEM BENEFITS
There are three generic sources of wave information: in situ data (buoys, ships), wave models
(forecasts and hindcasts) and EO data.
In general terms the key positive aspects of each are:
In situ Data
o Well known accuracy and error characteristics.
o High temporal resolution.
o Full wave direction spectra possible, and wide range of parameters.
o Some sites with long time series.
Wave Models
o Good coverage in time and space, and high resolution possible.
o Full wave direction spectra possible, and wide range of parameters.
o Hindcasts giving long time series.
Satellite Data
o Known accuracy and error characteristics.
o Global coverage.
o High spatial resolution along track.
o 10 yrs time series from altimeter and SAR.
o Altimeter provides highly accurate all weather Hs measurements.
o SAR provides directional information on long waves.
The key negative aspects are:
In situ Data
o Poor spatial coverage (8 long term offshore sites for whole NW approaches region).
o Buoy measurements become less reliable under severe conditions.
Wave Models
o Predictions based on estimates of wind speeds, not measurements.
o Greatest problems in most severe events, especially fast moving/ developing events.
o Known errors in swell propagation.
Satellite Data
o Limited resolution: long revisit intervals, altimeter offers limited spatial resolution
across track.
o SAR problems with azimuth travelling waves, and short waves.
It can be seen that each data source offers something that others do not. For instance - in situ
data offer high resolution information in time, but poor spatial coverage. Satellite data offer
world wide coverage, but relatively infrequent sampling in time. Model information can be
provided at high resolution in time and space – but there are still key difficulties, particularly in
representing fast moving severe events, the very events that have the potential to cause the most
damage (see Figure 8 and box 1).
Any monitoring system should make use of all data sources, taking advantage of their
complementary capabilities, rather than relying on one information source. EO data do not offer
a replacement for other information sources, but an important complement to compensate for
the limitations of existing systems. In particular EO data offer:
o Improved spatial coverage of measurements of the wave field.
o Measurements of direction and period of long period waves.
o Accurate measurements of wave heights in the most severe conditions.
o A basis for assessing the accuracy of predictions from wave forecasts.
15

o Long time series and large scale sampling of the wave field to allow good estimates of
extremes and low probability return values.
The recommendations for HSE presented in the next section comprise an NRT system that
provides access to all useful sources of wave information including EO data, and an EO wave
statistics system that complements existing sources of wave statistics.
Figure 8 5
Altimeter Significant Wave Height Data for 1330-1340 UTC on 15 January 2003, close to the Schiehallion FPSO . Top left (Topex and Jason ground tracks,
Faeroes w/r 61.3°N, 6.26°W
12.0m @ ~1200
“K5” - 59.3°N, 11.7°W
12.7m @ ~1200
“K7” ~60.7°N, ~4.6°W
11.0m @ ~1300
locations of wave buoys. Top Right Topex Hs, Bottom right Jason Hs.
Box 1
ths), and
s the
outlook was grave.
considered a serious option.
The observations of Hs are shown
considerable.
The BP Schiehallion FPSO was threatened in January 2003 by high storm waves. The officer in charge
received 2 separate forecasts for the afternoon of the 15 – one of 16m significant wave height (H
one of 12m. Given that the height of the maximum (Hmax) can reach almost twice the height of H
If the higher forecast wave value were correct then evacuation from the FPSO must be
A lower estimate would be more supportable.
JASON and Topex/Poseidon passed over the FPSO at 13:33 and 13:40.
for each track together with buoy measurements from wave buoys in the surrounding area.
Each altimeter track confirmed the lower of the two forecast values of around 12m. If such information
could be made available to the company in real-time, its contribution to a difficult decision could be
FPSO, Floating Production Storage and Offloading Installation.
16
5

7 RECOMMENDATIONS
7.1 INTRODUCTION In this section we offer recommendations for the phased implementation and subsequent
development of an operational NW approaches wave conditions monitoring and analysis
service, comprising a Near Real Time system and a wave climate statistical analysis service.
The recommendations are designed to meet the following key priorities:
x� Offer a useful capability in the short term (i.e. build upon existing capability, and
available operational data sets), and plan for future incorporation of additional data sets and
analysis capabilities.
x� Satisfy the joint sponsor priorities of providing statistical analyses of archived wave
data (including directional information) and a near real time wave monitoring service.
Recommendations were also provided for research and capacity building. It has become clear
during the progress of the project that some attention must be paid to support and develop UK’s
expertise in processing of SAR data to produce wave information, in order to ensure effective
exploitation of the existing UK capacity for ocean wave monitoring with SAR (specifically the
West Freugh Ground station and SAR archive). To enable the UK to maintain its leading
position in this research field some capacity building would be required, for instance through
knowledge transfer between academic and commercial organisations, to include a contribution
from European partners au fait with the latest developments.
Figure 9 provides an overview of the proposed implementation.
Rec 7
Ti
Rec 1
l
Rec 2
l
Time
iAl
Rec 3
Rec 8
Ti
Rec 4
Ti
Ti
Rec 5
Ti
Ti
Rec 9
Ti
+
+
+
Large Scale Dirn Wave Stats (ASAR Wave Mode)
me ~ 12 months
Use NRT SAR IM data for annual updates to stats dbase
Initial NRT System Alt, ASAR WM, Scatt (+ surface and mode s)
Time < 3 months
MaST Enhancements (ENVIWAVE a gorithms) Use in processing SAR IM for both NRT and stats
< 6 months
Rec 6 Initial Wave Statistics Service Web nterface
timeter database
Time < 6 months
NRT SAR Image Mode Processing Chain
Time < 6 months
High Res. Dirn Wave Stats (ASAR Image Mode)
me ~ 12 months
NRT Full Wave Spectra (SAR WM & IM) + scatt
me ~ 12 months
me ~ 12 months
NRT Severe Conditions Warning Service
me ~ 12 months
me ~ 12 months
Separate Wind Sea and Swell Stats
me ~12 months
Rec 4 required for separate windsea and swell stats
Initial NRT NW Approaches Wave Monitoring System
Initial NRT NW Approaches Wave Statistics Information Service
Full NRT NW Approaches Wave Monitoring System
Full NW Approaches Wave Statistics Information Service
Figure 9 Proposed service development path and linkages between implementation options.
17
7.2 NEAR REAL TIME NW APPROACHES WAVE MONITORING SYSTEM To provide a Near Real Time NW Approaches Wave Monitoring System we recommend
implementation of the CAMMEO Web Map Server system, initially as demonstrated.
The benefits of adopting the CAMMEO/MetOc system are that the sponsors can be provided
with an effective, easy to use Near Real Time NW Approaches Wave Monitoring System within
a very short time frame. Enhancements can be incrementally added when developmental work
has been completed. The CAMMEO/MetOc system is designed to accommodate additional data
sets as a matter of routine.
The five recommended steps for implementation incorporate three steps to establish an initial
NRT wave monitoring service, and two steps to provide additional capability, as follows:
Initial NRT Service
Rec. 1. First Stage NRT service with altimeter, ASAR wave mode and scatterometer data.
Rec. 2. Upgrade MaST with improved wave processing algorithms.
Rec. 3. Establish NRT processing chain for SAR image mode data, and incorporate data stream
into existing CAMMEO NRT system.
Service Developments
Rec. 4. Provide full directional wave spectra.
Rec. 5. Include severe conditions warning service.
7.3 NW APPROACHES WAVE CLIMATE STATISTICS SERVICE To establish a NW Approaches Wave Climate Statistics Service we recommend a phased
implementation of a web-accessible database.
The basic recommended configuration is that satellite altimeter and SAR wave mode data are
used to provide information for the whole area of interest (56°-64°N, 12°W-2°E) on a 1°
latitude x 2° longitude monthly grid, and the SAR image mode data are used to provide wave
statistics on the fine scale for a user specified area of interest.
It is suggested that ENVISAT ASAR wave mode data only are used as the basis for the large
directional wave statistics, and ERS-1 and ERS-2 SAR wave mode data are not included.
Although the inclusion of ERS-1 and ERS-2 wave mode data would increase the time period
covered back to 1991, these data retain a +/- 180° ambiguity in wave direction, are not able to
provide direct estimates of wave height, mean wave period and wind speed, and require a first
guess estimate from a wave model as part of the processing scheme. They would therefore not
form a homogeneous time series with ENVISAT ASAR wave mode data products, in which the
+/- 180° ambiguity has been resolved, no wave model first guess is required, and the extra wave
parameters are directly estimated.
The recommended steps for implementation incorporate four recommendations, two to establish
an initial wave statistics analysis service, and two to provide additional capability, as follows:
Initial Statistics Service
Rec. 6. First stage statistics service with altimeter data.
Rec. 7. Add directional wave statistics from ENVISAT ASAR wave mode.
Service Developments Rec. 8. Add statistics on fine scale spatial variability from SAR image mode data
Rec. 9. Add separate wind sea and swell statistics.
18

REFERENCES
Caires, S., Sterl A, and Gommenginger, C. P. , 2005, Global ocean mean wave period data:
validation and description. J Geophys., Res., 110, C02002.
Cooper, C. K. and Forristall, G. K. 1997. The use of satellite altimeter data to estimate the
extreme wave climate. J. Atmos. & Oceanic Tech. 14, 254-266.
Cotton, P. D. et al. 1999. "Jericho" Final Report to the BNSC, Project No. R3/003, 38pp.
[Unpublished]. http://www.satobsys.co.uk/Jericho/webpages/jeripdf.html
Engen G & Johnsen H. 1995, SAR-ocean wave inversion using image cross spectra., IEEE
Trans Geosci. Rem. Sens. 33, 1047-1056.
Johnsen, H., Engen, G., and Chapron, B., 2004, Validation of ASAR Wave Mode Level 2
Product Using WAM and Buoy Spectra. Calibration/Validation Report for ESA, available
at envisat.esa.int/calval/proceedings/asar/asar_22.pdf
Mastenbroek C. and de Valk, C. F. A semiparametric algorithm to retrieve ocean wave spextra
from synthetic aperture radar, J. Geophys. Res. Vol. 105 , No. C2 , p. 3,497.
Sterl, A. and Caires, S. 2004. Climatology, Variability and Extrema of Ocean Waves - The
Web-based KNMI/ERA-40 Wave Atlas. Int. J. Climatology , 25(7), 963-997.
Swail, V.R., E.A. Ceccacci and A.T. Cox. The AES40 North Atlantic Wave Reanalysis:
Validation and Climate Assessment. 6th International Workshop on Wave Hindcasting and
Forecasting November 6-10, 2000, Monterey, California.
Woolf, D.K., P.G. Challenor and P.D. Cotton. 2002. The variability and predictability of North
Atlantic wave climate. J. Geophys. Res., 107(C10), 3145.
Woolf, D.K., P.D. Cotton and P.G. Challenor. 2003. Measurements of the offshore wave
climate around the British Isles by satellite altimeter. Philosophical Transactions:
Mathematical, Physical & Engineering Sciences, 361(1802), 27-31.
Papers/Reports produced within this project Carter, D. J. T., 2004a, GIFTSS Work Package 1.2 Report, Capability of Non EO Data Sources,
th27 July 2004
Carter, D. J. T., 2004b, Waverider South of the Faroe Islands, GIFTSS Internal Report October
2004
Carter, D. J. T., 2004c, Comparison of wave height and wind speed off the Faroes and at
Schiehallion FPSO, GIFTSS Internal Report October 2004
Carter, D. J. T., 2004d, Monthly means from Waverider & altimeters, GIFTSS Internal Report
November 2004
Cotton, P.D. and S. Caine, 2005, 1.4 Processing Chain for EO Wave Parameters, Examples of
Data Products and Evaluation, SAR Addendum. February 2005
Cotton, P. D., D.J.T. Carter, S. Caine, D. Woolf, 2004, GIFTSS Work Package 1.4 Report,
Processing Chain for EO Wave Parameters, Examples of Data Products and Evaluation,
November 2004
Cotton, P. D., D.J.T. Carter, S. Caine, D. Woolf, 2005a, GIFTSS Phase 1 Final Report,
Processing Chain for EO Wave Parameters, Examples of Data Products and Evaluation,
February 2005
Cotton, P. D., D.J.T. Carter, S. Caine, D. Woolf, 2005b, GIFTSS Phase 2 Final Report,
Demonstration Product: Generation and Evaluation. Recommendations for Implementation
of a NW Approaches Wave Conditions Monitoring and Analysis Service. June 2005
Satellite Observing Systems, 2005, User Guide – Wave Conditions Monitoring System – Metoc
NRT web mapping system, February 2005
Woolf, D 2004a, GIFTSS Work Package 1.1 Report, Define Sampling Grid / Interval, 4th
October 2004
Woolf, D 2004b, GIFTSS Work Package 1.3 Report, Requirements and Availability of EO
data, 4th October 2004
19

GLOSSARY
AES-40 40 yr North Atlantic Wave Climatology, developed by Oceanweather
ASAR Advanced Synthetic Aperture Radar (carried on ENVISAT).
Azimuth Orthogonal to direction of SAR look, for side looking SAR - along track
direction
BNSC British National Space Centre
CAMMEO ESA project led by SOS to develop new markets for EO ocean data.
BOOST Recently established French SME, based in Brest, with SAR expertise
DMI Danish Meteorological Institute
ECMWF European Centre for Medium-Range Weather Forecasts
ENVISAT European Environment Monitoring Satellite, launched 2002.
ENVIWAVE EC “Framework” project to develop ocean wave products from ENVISAT.
EO Earth Observation
ERA-40 ECMWF Re-Analysis. 40 year atmospheric hind-cast
ERS-1 1st European Remote Sensing Satellite (launched 1991)
ERS-2 2nd European Remote Sensing Satellite (launched 1995)
ESA European Space Agency
FNMOC US Fleet Numerical Meteorology and Oceanography Center
FOIB Faroes Oil Industry Group
FPSO Floating Production, Storage and Offloading Installations
GIFTSS Government Information from the Space Sector. BNSC programme to help
UK govt .agencies implement information that has been derived from
satellites.
GFO Geosat Follow-On - Follow on to Geosat (1998-)
GNSS Global Navigation Satellite System
GPS Global Positioning System.
HSE (OSD) Health and Safety Executive (Offshore Division)
IM Image Mode
Jason Ku / C-band altimeter launched in December 2001.
MaST Maritime Surveillance Tool. QinetiQ tool for analysing SAR data.
Météo France French National Meteorological agency.
Met.no Norwegian Meteorological Agency
MetOc Web Map Server System, to display Met Ocean Data
NRT Near Real Time
NWP Numerical Weather Prediction
PRI ERS/ENVISAT SAR product (PRecision Image)
Quikscat Ocean wind measuring radar scatterometer. Launched in 1999 by NASA to
replace instrument lost when ADEOS failed
Radarsat Canadian SAR satellite – to be replaced by Radarsat-2 in near future.
Range (direction) Along direction of SAR look, for side looking SAR - across track direction
Rmse Root mean square error
SAR Synthetic Aperture Radar
SLC ERS/ENVISAT SAR product (Single Look Complex)
SOC/NOC Southampton / National Oceanography Centre
SOS Satellite Observing Systems (UK)
TOPEX/Poseidon Ku/C band altimeter launched in 1992 by CNES/NASA
UKMO United Kingdom Meteorological Office.
VOS Voluntary Observing Ship (Programme) – agreement through which (mostly
visual) ship observations are recorded and archived.
WAM Computer model for wave generation, propagation and dissipation.
20

HSE Health & Safety
Executive
Weather safety in the North West approaches
An implementation test using satellite data in assessing wave energy dynamics
Phase1 Report: Evaluation of capability of EO derived wave data products to satisfy HSE/BNSC requirements
P D Cotton, D J T Carter & E Ash Satellite Observing Systems
15 Church St, Godalming Surrey GU7 1EL
S Caine QinetiQ
Cody Technology Park Ively Road, Farnborough
Hants GU14 0LX
D Woolf National Oceanography Centre
University of Southampton Waterfront Campus European Way
Southampton SO14 3ZH
The objective of the activities described in this report were to prepare an in depth evaluation of the potential use of satellite data to assess and monitor wave conditions in the NW approaches. That includes an identification of the sensors to be used, the algorithms required to derive the wave parameters and a definition and testing of the necessary processing chains. . This report and the work it describes were co-funded by the Health and Safety Executive (HSE) and the British National Space Centre. Its contents, including any opinions and/or conclusions expressed, are those of the authors alone and do not necessarily reflect HSE nor BNSC policy.
HSE BOOKS

ACKNOWLEDGEMENTS
Much of the material presented is formed from pre-existing intellectual property of
Southampton Oceanography Centre, QinetiQ and Satellite Observing Systems.
A number of figures have been copied from other sources and have been individually
referenced.
We are particularly grateful to:
Sofia Caires (KNMI) and the rest of the team responsible for the Global Wave Climatology at
http://www.knmi.nl/waveatlas
Signar Heinesen, Sp/f Data Quality, Faroe Islands for providing FOIB data and very helpful
support in analysis of these data
Jacob Høyer, Danish Meteorological Institute, for providing output from DMI wave model.
Colin Grant, BP, for arranging for access to the FOIB waverider buoy data.
22

CONTENTS
Acknowledgements......................................................................................................22
Contents .......................................................................................................................23
Executive Summary .....................................................................................................25
1 Introduction..........................................................................................................26
2 WP 1.1 - Define Sampling /grid interval ............................................................28
2.1 Introduction..................................................................................................28
2.2 Sampling grid / interval of existing products...............................................28
2.3 Natural Scales of Variability........................................................................30
2.4 Environmental Conditions and susceptibility of satellite data.....................32
2.5 Grid scale and interval of satellite climatologies.........................................33
2.6 Characteristics of EO Near Real Time Data ................................................35
2.7 Recommendations for Climatologies...........................................................36
3 WP 1.2 Capabilities of Non-EO Data Sources ....................................................37
3.1 Introduction..................................................................................................37
3.2 Wave Measurements ....................................................................................37
3.3 Analyses and Forecasts ................................................................................41
3.4 Wave Climatologies.....................................................................................43
3.5 Adequacy of Present Wave Information......................................................43
3.6 Conclusions..................................................................................................44
4 WP 1.3 Requirements and Availability of EO data .............................................46
4.1 Introduction..................................................................................................46
4.2 Parameters / Instruments..............................................................................46
4.3 Satellite Data Sets ........................................................................................47
4.4 Synthetic Aperture Radar.............................................................................49
4.5 Radar Altimeter............................................................................................55
4.6 Other Sources of Data ..................................................................................57
4.7 Summary and Conclusions ..........................................................................57
5 WP 1.4 Processing Chain for EO Wave Parameters............................................62
5.1 Introduction..................................................................................................62
5.2 Summary of EO Data...................................................................................62
5.3 Data for Validation and Evaluation .............................................................64
5.4 Satellite Altimeter Data Processing Chain...................................................64
5.5 Satellite Synthetic Aperture Radar Processing Chain..................................66
5.6 Altimeter Wave Climatology.......................................................................70
5.7 Near Real Time Presentations of Data.........................................................73
5.8 Preliminary Evaluation of EO data ..............................................................76
5.9 Combining Altimeter and SAR wave information ......................................78
5.10 Sampling and Requirements for Further Data .............................................79
5.11 Summary ......................................................................................................82
6 Specific Summary on SAR Capabilities ..............................................................86
6.1 To what extent can SAR assist HSE to execute its duties?..........................86
6.2 What would be required to improve the situation?......................................87
7 Initial Concept for A NW Approaches Wave Monitoring Service......................89
7.1 Introduction.................................................................................................89
7.2 Wave Climate Statistics - Archive Display and Analysis...........................90
23

7.3 Near Real Time Wave Conditions Monitoring Service ................................92
7.4 Possible Developments .................................................................................92
7.5 Draft Route to Implementation .....................................................................94
7.6 Proposal for Phase 2 Data Product................................................................95
8 CONCLUSIONS..................................................................................................99
8.1 Sensors and Procedures..................................................................................99
8.2 Accuracy and Timeliness...............................................................................99
8.3 SAR data ........................................................................................................99
8.4 Final Comments .............................................................................................99
References..................................................................................................................101
Glossary .....................................................................................................................103
Annex A Wave parameters ......................................................................................107
Wave length/wave height spectrum. ......................................................................107
Wave direction .......................................................................................................107
Significant wave height..........................................................................................107
Wave steepness ......................................................................................................107
Wave period (Tz and Tp) .......................................................................................107
Wave speed ............................................................................................................108
24

EXECUTIVE SUMMARY
This test project is being conducted under the British National Space Centre (BNSC)
Government Information From The Space Sector (GIFTSS) Initiative in close collaboration
with the Health and Safety Executive Offshore Division (HSE OSD).
The HSE OSD requirement is the safety of operations and equipment used for drilling and
extraction of oil and gas in the North West Approaches to the UK, and covers the following:
�� The need to assess the possible utilisation of all-weather information from ongoing
spaceborne systems to measure offshore wave energy
�� To add to the statistical and management base that is used to support offshore
operations
�� The potential for supporting safety in all weathers for operations in the UK North
West Approaches
A Summary of the Requirement to be Addressed
A key consideration for safe operation of offshore installations is knowledge of the
momentum transfer through wave energy onto fixed and mobile structures. Such wave
momentum transfer varies with respect to changes in marine weather conditions. An
important component within such dynamic marine weather is the changing energy power
spectra of the marine wave trains.
Some key parameters that need to be monitored are: the wave length/wave height spectrum,
wave direction, significant wave height, wave steepness, wave period and wave speed; all as a
function of the generating conditions ( the “forcing functions” ).
Consideration has therefore been given to assessing if sampling over the area to be
investigated, within the UK North West Approaches, can provide both the detail, and the
wider area information, on these key marine wave energy spectra characteristics from
information derived from existing and ongoing EO satellites.
Such information could then be included routinely into HSE OSD operational processes to
assist in meeting long term information needs for HSE OSD as they perform their statutory
duties.
This Report
Within this document we report on activities under phase 1 of the test project. The aim of this
phase is to prepare an in depth evaluation of the overall project. This includes an
identification of the sensors to be used, the algorithms required to derive the wave parameters
and a definition and testing of the necessary processing chains.
This report is a compilation of individual work package reports addressing sampling issues,
capability of non-EO products, capability of EO products, demonstration and evaluation of
the processing chain.
We finish with an assessment of the different satellite data sets available, an initial definition
of a service concept designed to satisfy HSE requirements and a proposal towards
implementation.
25

F
1 INTRODUCTION
This project addresses the HSE OSD responsibility for the safety of operations and equipment
used for drilling and extraction of oil and gas in the North West Approaches to the UK, and
covers the following:
�� The need to assess the possible utilisation of all-weather information from ongoing
spaceborne systems to measure offshore wave energy
�� To add to the statistical and management base that is used to support offshore
operations
�� The potential for supporting safety in all weathers for operations in the UK North
West Approaches
The Area of Interest defined by the sponsors covers the region 56°-64°N, and 10°W-2°E.,
which includes the NW approaches to the UK, (open water heavily influenced by Atlantic
waves), and seas to the east and north of the Faroe and Shetland Islands, waters partly
sheltered from the influence of the Atlantic, and also a variety of coastal waters (figure 1).
Figure 1 Area of interest, the location of Schiehallion FPSO is indicated (“S”),
The parameters to be considered in this project were listed in the ITT as:
wave length/wave height spectrum
wave direction - average direction and dominant or peak direction - �m, �p
significant wave height - Hs
wave steepness
wave period, zero up-crossing, or peak - Tz, Tp,
wave speed.
Some explanation of these terms is given in Annex A to this report.
26
Phase 1 of this project is aimed at the identification and evaluation of sensors and the
determination of the techniques and algorithms available for transforming the satellite data
into wave parameters. Based on this evaluation a proposal is made for a demonstration data
set to be produced under phase 2
Activities were carried out as five separate tasks, or work packages, briefly outlined below:
Section 2 Task 1.1. Define sampling grid/interval This task addressed the issue of identifying the appropriate sampling intervals in time and
space, and length of time series of data, that were necessary to build a data base t support a
reliable and authoritative statistical analysis of wave climate.
Section 3 Task 1.2 Capabilities of non-EO sources This task provided an assessment of the techniques currently in use by various authorities and
commercial organisations, for monitoring wave conditions over the area of interest.
Section 4 Task 1.3 Requirements and availability of EO data.
This task carried out a comprehensive assessment of the potential EO data sources for the
required wave parameters.
Section 5 Task 1.4 EO data processing chain and evaluation of example data.
This task presented the processing chains for producing the identified wave parameters (and
statistics) and evaluated some examples of data thus produced.
Section 6 Additional Summary on SAR wave products On request from the project sponsors, SOS and QinetiQ have provided a further note
addressing some specific questions with regard to SAR production of wave products. A
summary of this note is included in Section 6
Section 7 Task 1.5 Wave Monitoring Service Initial Concept definition and
Phase 2 Proposal
Section 7 includes a description of an initial concept for a wave monitoring service and a
draft route map for implementation of that service. We also provide a summary of the
demonstration product proposed for Phase 2.
This report contains material from the original work package reports, and is intended as a
“Stand Alone” document. If further information is required, readers are referred to the full
original reports.
27
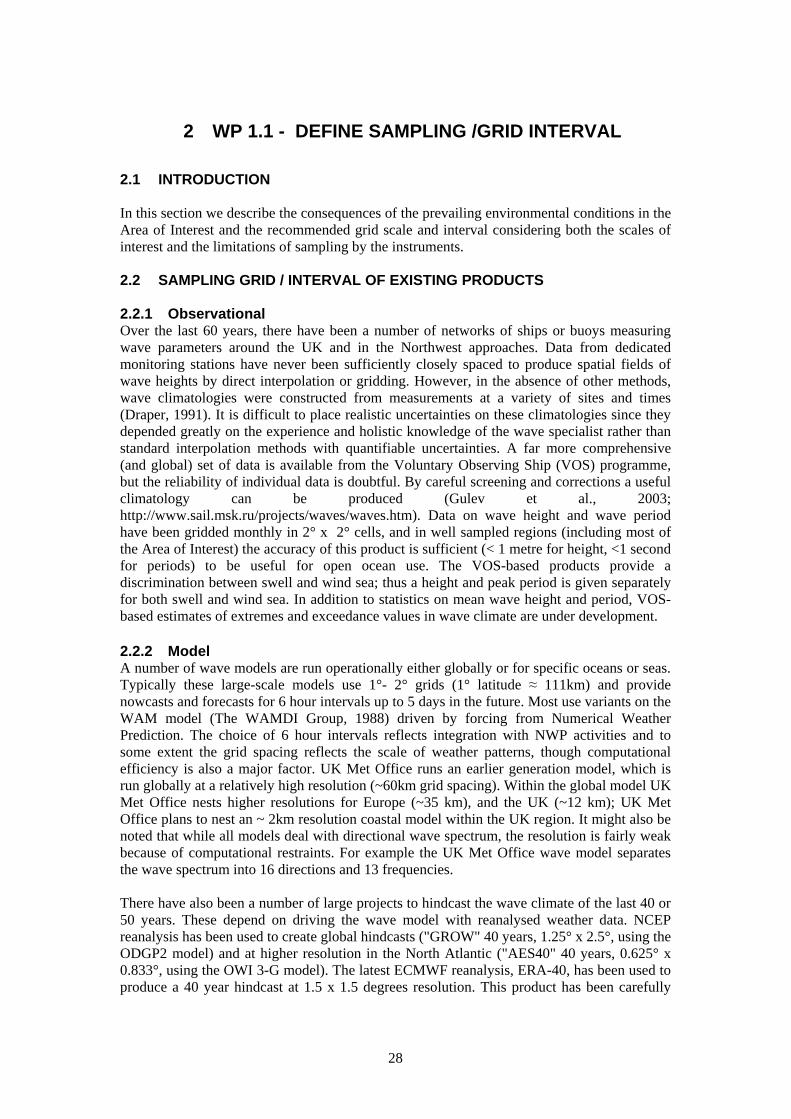
2 WP 1.1 - DEFINE SAMPLING /GRID INTERVAL
2.1 INTRODUCTION
In this section we describe the consequences of the prevailing environmental conditions in the
Area of Interest and the recommended grid scale and interval considering both the scales of
interest and the limitations of sampling by the instruments.
2.2 SAMPLING GRID / INTERVAL OF EXISTING PRODUCTS
2.2.1 Observational Over the last 60 years, there have been a number of networks of ships or buoys measuring
wave parameters around the UK and in the Northwest approaches. Data from dedicated
monitoring stations have never been sufficiently closely spaced to produce spatial fields of
wave heights by direct interpolation or gridding. However, in the absence of other methods,
wave climatologies were constructed from measurements at a variety of sites and times
(Draper, 1991). It is difficult to place realistic uncertainties on these climatologies since they
depended greatly on the experience and holistic knowledge of the wave specialist rather than
standard interpolation methods with quantifiable uncertainties. A far more comprehensive
(and global) set of data is available from the Voluntary Observing Ship (VOS) programme,
but the reliability of individual data is doubtful. By careful screening and corrections a useful
climatology can be produced (Gulev et al., 2003;
http://www.sail.msk.ru/projects/waves/waves.htm). Data on wave height and wave period
have been gridded monthly in 2° x 2° cells, and in well sampled regions (including most of
the Area of Interest) the accuracy of this product is sufficient (< 1 metre for height, <1 second
for periods) to be useful for open ocean use. The VOS-based products provide a
discrimination between swell and wind sea; thus a height and peak period is given separately
for both swell and wind sea. In addition to statistics on mean wave height and period, VOS-
based estimates of extremes and exceedance values in wave climate are under development.
2.2.2 Model A number of wave models are run operationally either globally or for specific oceans or seas.
Typically these large-scale models use 1°- 2° grids (1° latitude § 111km) and provide
nowcasts and forecasts for 6 hour intervals up to 5 days in the future. Most use variants on the
WAM model (The WAMDI Group, 1988) driven by forcing from Numerical Weather
Prediction. The choice of 6 hour intervals reflects integration with NWP activities and to
some extent the grid spacing reflects the scale of weather patterns, though computational
efficiency is also a major factor. UK Met Office runs an earlier generation model, which is
run globally at a relatively high resolution (~60km grid spacing). Within the global model UK
Met Office nests higher resolutions for Europe (~35 km), and the UK (~12 km); UK Met
Office plans to nest an ~ 2km resolution coastal model within the UK region. It might also be
noted that while all models deal with directional wave spectrum, the resolution is fairly weak
because of computational restraints. For example the UK Met Office wave model separates
the wave spectrum into 16 directions and 13 frequencies.
There have also been a number of large projects to hindcast the wave climate of the last 40 or
50 years. These depend on driving the wave model with reanalysed weather data. NCEP
reanalysis has been used to create global hindcasts ("GROW" 40 years, 1.25° x 2.5°, using the
ODGP2 model) and at higher resolution in the North Atlantic ("AES40" 40 years, 0.625° x
0.833°, using the OWI 3-G model). The latest ECMWF reanalysis, ERA-40, has been used to
produce a 40 year hindcast at 1.5 x 1.5 degrees resolution. This product has been carefully
28

compared to buoy and altimeter data to produce a revised climatology. More details of this
research project (and more background information on wave climatologies) can be found at
http://www.knmi.nl/waveatlas. Figure 2 presents mean january Hs from this climatology.
Figure 2 Mean SWH in the North Atlantic in January (http://www.knmi.nl/waveatlas)
Figure 3 Mean SWH in the North Atlantic in January 1993 according to AES-40 climatology
Probably the best direct model climatology that includes the Area of Interest is AES-40; the
means of SWH in one month according to AES-40 are shown in Figure 3. Two problems
29
pertinent to the Area of Interest may be noted. Firstly, the wave climate in this region depends
often on small and intense depressions (Polar Lows); the accuracy of a model climatology
depends on both the ability of NWP to properly resolve these depressions and the wave model
to describe the response. By careful analysis of weather systems AES-40 succeeds in
accurately describing wave climate in the Northwest Approaches. Secondly, even a relatively
high resolution model such as AES-40 only crudely describes the topography and bathymetry
of coastlines and islands. The wave climate in the northern North Sea is sensitive to the
propagation of Atlantic waves past the Shetlands and Orkneys and this is poorly represented
in AES-40 and other models.
2.3 NATURAL SCALES OF VARIABILITY
2.3.1 Temporal Scales Four primary temporal scales of variability can be identified: synoptic, seasonal, inter-annual,
and multi-decadal or secular.
Synoptic Synoptic variability is the primary time scale of weather systems. For the North Atlantic one
atmospheric depression may succeed another spaced by a few days. The six-hour-interval
typical of NWP products is equally appropriate for near-real time wave applications. A
slightly shorter interval, e.g., 1 - 3 hours, may be helpful for operational purposes.
Seasonal The wave climate of the Area of Interest shares the exceptionally strong seasonality of the
North Atlantic region (Woolf et al., 2003). Annual means are of limited use and for most
practical purposes the climate should be described at a minimum seasonally and better
monthly. The seas are generally largest in the western part of the Area of Interest, where the
influence of Atlantic waves is greatest. The winter is by far the roughest season with a typical
mean significant wave height of 5 metres in the open sea to the west of Scotland. A similar
seasonality is also seen in wave period.
Inter-annual Strong inter-annual variability is another feature of the wave climate of the Area of Interest
and the remainder of the north-eastern North Atlantic and northern North Sea (Woolf et al.,
2003) particularly in the winter months. This variability is strongly linked to the North
Atlantic Oscillation (Woolf et al., 2002 & 2003). This variability has major consequences for
the design of climatologies. If a climatology is only based on one or a few years, there is a
significant risk that it will be severely biased compared to the “true” climate of a longer
baseline. A climatology based on ten or more years of data is clearly preferable, but it should
be noted that wave climate in an individual month or season might deviate drastically from
“climatology”.
Multi-decadal / secular There is substantial evidence of significant longer-term variability in wave climate, either as a
feature of natural climate variability or in response to Climate Change. This can undermine
the utility of wave climatologies, even those built on data from several decades. However,
there is no evidence of a true secular trend through the twentieth century and there is no
obvious alternative to continuing to use twentieth century climatologies in the early twenty
first century.
30

Temporal Variability within the Area of Interest An analysis of altimeter significant wave height data over the area on interest, presented in
detail in the full WP 1.1 report (Woolf 2004a) demonstrated the extent of variability on the
seasonal and inter-annual scale. The annual cycle (fitted as a sine curve with a period of
365.25 days) accounted for 34% of the observed variance – peaking in January- February.
Significant variations were also found at shorter and longer time scales, from day to day and
year to year No long trends were found over the period covered by the available data (1993
2004) although other studies on data sets with longer coverage have found significant decadal
variations.
2.3.2 Spatial Scales The degree of spatial variability depends on location – offshore or coastal (within ~100km of
the coast).
Offshore It is important to be aware of the spatial scales of wave climate statistics when trying to
estimate and map such parameters as monthly mean Hs or exceedence percentiles, especially
when using data from a few altimeters with greatly varying distances between tracks. The
problem is to balance the need to take data from as large an area as possible, to maximise the
number of observation, with the need to restrict the area so that the statistics are stationary.
For estimating climate statistics in the open ocean, binning data from 2° latitude by 2°
longitude areas is often used, e.g. Carter et al. (1991), Laing & Reid (1999). This bin size is
consistent with the findings of Cooper & Forristall (1997) that sampling over distances of 200
- 300 km is satisfactory. The coherence in the resulting maps also indicates that this choice of
bin size is reasonable - as does the coherence found in analyses of monthly means from 2° by
2° bins.
However, closer to land, wave climate statistics vary on smaller spatial scales, and analysing
2° bins, for example in the southern North Sea, is not satisfactory. During "Jericho" (a study
for BNSC on the contribution that altimeter data could make to estimating wave climate in UK
coastal waters) it was found that altimeter coverage was by then sufficient to enable monthly
statistics to be computed in 1° latitude by 2° longitude bins. See Cotton et al. (1999) for
details. There were then insufficient data to use 1° x 1° bins; but there are 5 years more data
since "Jericho", so this increased resolution may now be possible. The 1° x 2° bin size was
also used by Woolf et al. (2003).
Coastal Spatial gradients are progressively greater as the coast is approached. This partly explains the
UK Met Office approach of nesting progressively finer resolution models at more coastal
locations. A number of coastal effects can be identified:
Coastal currents / tides - Can effect wave steepness and height when a strong current runs
against the prevailing wave direction – usually only very localised effects.
Bottom topography - Only when waves can feel the bottom (depth < half wavelength). Affects
wave height and period.
Local wind effects – Can be an issue where strong offshore winds occur (e.g. fohn winds, the
Mistral in the Med, or the Meltemi in the Aegean) – but not likely to be an issue in Area of
Interest.
31

Sheltering / refraction - Sheltering reduces the wave height in the lee of islands, and will alter
direction through the refraction of waves.
Also reduces fetch for the generation of waves, and hinders the propagation of swell.
Analysis of altimeter data suggests that there is relatively little variation of wave climate
further than 100km from the coast, if the waves are primarily directed from the open ocean (as
in the case of the Northwest Approaches). In the case of locally generated waves and frequent
offshore winds (e.g., east coast of Scotland) the wave climate may vary over several hundreds
of kilometres from the coast. In the latter case there is a possible gain in reducing the
resolution from 2 degrees to 1 degree or half a degree, but this will have to weighed against
the increase in sampling errors. In some cases, it is possible to use satellite data to describe
more coastal variation by analysing along specific repeated ground tracks but this method is
generally more laborious than the “gridding method”.
Sheltering and refraction appears to be the main coastal influence on wave properties. Coastal
effects are generally limited to within 100 km of land to weather side (west) of main
topography , but are more important to the east of islands and in enclosed waters. To the west,
coastal effects are likely to be more significant in easterly winds (though these are less usual in
the region). Each coastal site is likely to have a quite specific set of problems. Therefore while
coastal studies are practical (especially utilising SAR), no generic solution is likely and one or
a few sites of particular interest should be carefully chosen.
Spatial Variability within the Area of Interest An analysis of along track altimeter significant wave height and wind speed data over the area
of interest, was presented in detail in the full WP 1.1 report (Woolf 2004a).
High spatial correlations over 200 km and more were found for wave height data to the west
of the Shetland Islands which could justify the adoption of a 2 degree resolution for this and
more exposed regions (also see Carter 2004c). However, there was some evidence for strong
gradients to the north and east of Scotland where the penetration of Atlantic waves diminishes
eastwards. There are also strong gradients nearer the coast.
2.4 ENVIRONMENTAL CONDITIONS AND SUSCEPTIBILITY OF SATELLITE DATA
2.4.1 Climate of NW approaches The climate of the NW approaches is notably wet and windy, especially in the winter months.
Data on monthly rainfall is readily available at a number of web sites but data on the fraction
of time it is raining heavily - which would be more useful - is not so easy to find. The KNMI
global wave climatology (http://www.knmi.nl/waveatlas) provides information on wind
climate. In Figure 4 we show the annual rate of exceedence of 11m/s and 17m/s winds. The
Area of Interest has a very high incidence of high winds, with winds exceeding 11m/s on 60
90 days/year.
2.4.2 Susceptibility of Satellite Data to Wind and Rain The technical aspects of the effect of wind and rain on satellite data are considered in section
4 (WP 1.3). While all the instruments considered here are radar instruments, that can
penetrate cloud, and are normally classed as “all weather”, both rain and wind can affect their
performance. Measurements by altimeter are generally robust, but very heavy rain (such as
the centre of hurricanes or intense tropical storms) can attenuate and corrupt the signal, but
this is unusual. Very high winds alone weaken the returned signal but are unlikely to cause
data loss, though the calibration of wave height and wind speed may be poorer. SAR is most
sensitive to wind speed. Winds less than 3m/s are generally insufficient for imaging of waves.
32

Wave features are generally evident in images at higher wind speeds, but there is considerable
uncertainty in the “Modulation Transfer Functions” and thus the accuracy of wave parameter
retrieval at high wind speeds. SAR imaging of waves may also be lost through saturation of
the signal at wind speeds in excess of 10m/s. Noting the high occurrence of wind speeds in
excess of 11m/s (when SAR calibration is uncertain; Figure 4) and fairly numerous occasions
when the wind speed is very high (and all calibrations may be suspect; Figure 4) in the
Northwest Approaches, the susceptibility of the satellite data to high winds must be of
concern. These limitations are likely to bias wave climatologies based on these sources. More
significantly, uncertainties in SAR wave retrieval at high wind speeds are a major concern in
the context of GIFTSS and near-real-time nowcasting.
Figure 4 Number of days when wind speed exceeds (left) 11m/s (and therefore SAR imaging of waves will be unreliable), and right 17m/s (and therefore very limited validation data is available for all satellite data)
2.5 GRID SCALE AND INTERVAL OF SATELLITE CLIMATOLOGIES
Table 1 summarises estimates of sampling by ENVISAT (altimeter and both SAR modes) of
grid cells of three possible sizes. The figures for ENVISAT are for sampling in the area of
interest for this study are were acquired from the ESA ENVISAT data archive. Thus these
figures represent actual data availability. The figures estimated for present satellites
availability were simply generated by multiplying by the number of available satellites with
suitable operational instrumentation.
Table 1 Number of independent samples per month in the GIFTSS Area Of Interest, from ENVISAT only and, in italics, estimated for present satellite availability.
5° x 5° 2° x 2° 1° x 1°
Passes Revisit Passes Revisit Passes Revisit
“Strips” / interval “Strips” / interval “Strips” / interval
month days month days month days
(mean/max) (mean/max) (mean/max)
Altimeter
SAR image
SAR wave
mode
21
48
8
16
14
14
1.5 / 3
0.4 / 0.8
4 / 10
2 / 5
2 / 7
2 /7
5
20
5
10
6
6
6 / 7 2
1.5 / 1.75 8
6 / 11 3
3 / 5.5 6
5 / 15 3
5 /15 3
15 /22
4 / 5.5
10/11
5 / 5.5
10 / 15
10 / 15
33

It is important to note that:
x� Presently there are 5 satellite altimeters operating – ERS-2, ENVISAT, Geosat
Follow-On (GFO), TOPEX/Poseidon and JASON - for practical purposes we acquire
separate sampling from 4 because ENVISAT and ERS-2 sample very close together
in time (20 minutes apart) and space (same ground track).
x� There are effectively 2 SAR image mode satellites available at present. ENVISAT
and RADARSAT.
x� ENVISAT ASAR wave mode seems to provide reliable data for most passes – ERS
2 SAR wave mode did/does not give good coverage in this region (due to different
available modes on ERS and ENVISAT)
x� Boxes that spread across more degrees of longitude capture more satellite passes,
than “equal” lat and long boxes of same area.
x� Results from early evaluation of ENVISAT ASAR wave mode by Met Agencies (for
assimilation into wave models) indicates that a high proportion of Wave Mode
spectra are not used because of difficulties with quality control1 .
In fact the situation may be slightly improved on this. QinetiQ has analysed the situation and
found each SAR satellite may provide images on 4 passes per cycle. Given that we can expect
SAR imagery from 2 satellites for the foreseeable future, this gives a possible 8 passes per
month, or data, on average, once every 4 days. With 4 operational satellite altimeters, and 2allowing for the fact that sampling is enhanced at higher latitudes , we can expect 8-12 passes
per month in any 1° x 1° bin – or an average interval of 3-4 days. Note however that altimeter
coverage is expected to reduce to 2 altimeters only in the next few years.
Below we will consider the implications for gridding based on one or more type of
instrument.
2.5.1 Scatterometry alone Scatterometer swaths cover almost the entire globe in a twelve hour period. Therefore, a one
degree grid is very well sampled in any month and a climatology at this resolution should be
very accurate. However, scatterometers only measure wind speed and direction and cannot
directly give information on larger waves.
2.5.2 Altimetry alone As a point-measuring rather than a swath instrument, data sampling by altimeter is much
sparser than that of swath radars, although Table 1 shows that they generate at least as high a
number of independent samples per month (e.g. for climatologies) as the SAR. Certainly very
high resolution and short interval climatologies cannot be achieved using one or a few
altimeters. An individual altimeter in a 10-40 day repeat orbit will pass through each 2° x 2°
degree on 5 to 10 occasions each month (depending on latitude), supplying this number of
“independent samples” of the wave climate. Since 2° x 2° and 1 month is suitable for
offshore wave climatologies, this is a reasonable compromise between resolution and
sampling error for offshore applications. Achieving a satisfactory level of sampling and
sufficient resolution for coastal applications is much more difficult.
1 A recommendation to address this issue was taken by ESA at the recent ENVISAT symposium in Salzburg (Sept
’04). A recent note issued by NORUT (Johnsen, 2005) provides updated advice on quality control and advises
that the land masking has been improved. 2 Table 8 in WP 1.4 was based on altimeter sampling at the equator. At 60°latitude sampling in longitude is
effectively doubled.
34

2.5.3 SAR alone In principle, one might imagine that SAR as a swath instrument should be able to sample
wave climatology far more intensively than altimetry, but Table 1 indicates that this is not the
case. Effective sampling rates (in terms of independent samples per month) are at best only
equal to altimetry, and depend on the operation of the instrument, whether an image is
acquired and archived, and whether the image is fit for purpose. All these factors serve to
create a particularly complicated and probably biased sampling regime from SAR. Waves can
only be imaged under a specific range of wind conditions, and the lower wavelength cut-off
can be significantly different in the along track and across track directions.
We include a preliminary discussion of these issues in Section 4 (WP 1.3), but the situation is
complicated and a detailed, regional, study would be required to give a proper understanding
of the true sampling density.
However, SAR has the advantage of providing coastal information (e.g., refraction is often
clearly imaged) and fine gridding can take advantage of this capability, but this must be
weighed against the limited sampling.
2.5.4 Combined Satellite Product Initially 1° x 1° and monthly climatologies from both altimetry and SAR appear practical,
though sampling errors may be large. If distributions are required in different direction
sectors are required, then a larger grid size would be required to provide adequate sampling in
each direction bin. Bringing together different EO sensors can extend the range of wave
parameters and for some parameters can enhance sampling. The evaluation table (Section 4)
identifies parameters (e.g., wave height) that can be measured by more than one sensor; and
there is some theoretical benefit in using all the data. However, sensor combination can only
be rigorously applied if the error characteristics (which are generally obscure and complicated
for SAR) are known for both sensors.
Cliosat and ARGOSS offer commercial databases derived from satellite data. Cliosat provide
seasonal time resolution, and fairly coarse spatial resolution with 169 grid squares (the
resolution varies with location). ARGOSS offers a monthly SAR climatology on a
(minimum) 200 km x 200 km grid, or altimeter / scatterometer derived statistics on a
minimum 50 km x 50 km grid.
2.5.5 Composites of EO and non-EO The promise of combining EO and non-EO wave products has been demonstrated by the
KNMI global wave climatology. On the other hand, it seems practical to construct a
climatology based on EO alone, and there is considerable benefit in having two genuinely
independent products to compare.
2.6 CHARACTERISTICS OF EO NEAR REAL TIME DATA
Whilst scatterometers give useful twice-daily global coverage of wind speed and direction,
satellite sampling of wave fields for real time use is significantly less frequent in time and
space. Calculations and experience from analysis of specific incidents show that one may
typically expect 2 passes per satellite altimeter per day over the Area of Interest. If recent data
from a single altimeter is presented on its own the data is interesting but rarely is sufficient
for operational purposes. Where there are a number of altimeters (currently there are up to 5,
but 1 or 2 is more likely in the near future) the data density is more satisfactory, but can still
be lacking. SAR images would help to provide greater coverage but this instrument is not
necessarily a reliable source in a windy climate.
35

Thus, satellite data on their own, with present sampling availability, cannot provide a useful
complete NRT wave information product. It is therefore necessary to use the data in
combination with other sources. Presently, the widest NRT application of satellite wave data
is through assimilation into wave models.
An alternative approach is use the satellite data to assess to accuracy or validity of other data
sources. One such approach is to overlay the EO data on model data. This immediately alerts
the user to possible faults in the model forecasts. A possible development of this approach
would be to derive error or reliability flags which could be transmitted along with the
conventional model derived forecast.
2.7 RECOMMENDATIONS FOR CLIMATOLOGIES
An offshore wave climatology based on EO retrievals of wave parameters should be
constructed on a minimum 1° x 1° monthly grid.
This is a finer grid than is currently typical for altimetry (2° x 2°) and some analysis of the
sampling errors should be considered. It may be sensible to recompose the data into 1° x 2° or
2° x 2° grid cells where spatial gradients are small but sampling errors are large. Also a
larger grid size may be necessary if analyses of distributions of wave period (and other
parameters) are required in different direction sectors. There is little available information on
variability on smaller spatial scales. The nature of this variability is likely to be highly
geographically dependent (due to effects of local topography) and so specific regional studies
would be required to fully quantify variability on smaller spatial scales.
Since strong inter-annual variability in wave climate is a feature of the Area of Interest, on a
time scale of decades, the time base of the climatology should be as long a possible (ideally
itself of the order of decades).
36

3 WP 1.2 CAPABILITIES OF NON-EO DATA SOURCES
3.1 INTRODUCTION The objective of Work Package 1.2 was to describe and assess non-EO sources of wave data
and information (including forecasts) presently available for the NW Approaches to the UK.
Some weather prediction models which provide the wind input to wave models and some
wave models assimilate EO data; but the EO data are not specifically provided in the model
output. This 'secondary' use of EO data will also be described here.
3.2 WAVE MEASUREMENTS
3.2.1 Non-directional Buoys Non-directional buoys - or 'omni-directional' buoys - measure the vertical acceleration of a
buoy. This is integrated twice to give the vertical displacement of the buoy (and hopefully of
the water surface) with time; and from about a 17 minute record, the elevation spectrum is
calculated, and the significant wave height (Hs), the average zero-upcrossing wave period
(Tz) and other spectral parameters are extracted for transmission. The significant wave 2steepness is given by 2SHs/gTz where g is gravitational acceleration.
During the past decade, the UK Met Office has established a number of weather buoys in
open waters around the UK. These record and transmit hourly data including significant
wave height and zero-upcrossing wave period. The locations of its buoys (and Light Vessels
along the English Channel) are shown in Figure 5.
Figure 5 Location of UK Met Office buoys and Light Vessels, and North Sea rigs reporting weather observations
The observations from these sites are put on the Global Telecommunications System (GTS),
and are also available on the web.
37

However, some of these sites (including the 03000 series) do not measure waves, and data
from the other sites are not guaranteed; while those which do report wave conditions only
give significant wave height and zero-upcross wave period. Even if in place, these buoys do
not always report data in high sea states.
Buoys are also maintained by the Irish Met Office - but in Irish waters, south of our area.
3.2.2 Directional Buoys Directional information can be obtained by measuring pitch and roll angles as well as the
heave acceleration, or - more usually nowadays - by measuring the acceleration in
3 directions. Recently, buoys equipped with GPS have been developed which measure
Doppler shifts of the carrier signals to obtain the buoy's speed in 3 directions3. From these
data five Fourier coefficients in the expansion of the wave frequency spectrum, F(f,T), can be
estimated. Interpreting these coefficients is not straight forward, but they provide estimates
of T1, the dominant wave direction at each frequency, and of s1, the wave spread - assuming
that the directional distribution, G(f,T), is unimodal for given frequency f and proportional to
2s1 1 cos >2 �T� T1 �@. However, the estimate of s1 is very sensitive to noise, and "its use in
engineering design requires considerable discussion" (Tucker & Pitt, 2001).
If G(f,T) is not unimodal for given f, for example if there are two wave systems from different
directions but with similar peak frequencies, then the estimate of T1 can be seriously in error.
But in high sea states, with much of the energy in the locally generated sea waves, the
directional wave buoy seems to give good, robust estimates of the dominant wave direction at 4the wind sea peak frequency, as well as the direction of any swell with smaller frequency .
A Directional Waverider buoy is maintained south of the Faroe Islands, near 61.3°N 6.3°W,
by the Faroes Oil Industry Group (Figure 6). This buoy provides wave height, period (peak
and zero-upcross) and direction, as well as omni-direction spectra and tabulated directional
information, for example in Figure 7. The buoy usually reports at half hourly intervals. The
Faroes buoy is financed by an industrial consortium - the Faroes Oil Industry Group - which
is hoping to continue to fund and operate the buoy during 2005, but this is not guaranteed.
The Waverider's frequency range extends to 0.035 Hz, i.e. to 40 seconds, but the spectral
estimates are binned, with all energy from 0.025 to 0.0621 H (40 to 16.1 sec.) in a single bin,
so it can measure the energy of swell waves with periods greater than 16 seconds but does not
report the period distribution within this broad band.
3 See Jeans et al (2003) for the very successful results of sea trials of a GPS system (up to wave heights of about
2 m). 4 Frequency, f, and wave length,�O, are related through the dispersion relationship, which for deep water is
2O=g/(2Sf ) where g is gravitational acceleration. Wave period is 1/f.
38

Figure 6 Location of the Faroes Oil Industry Group Directional Waverider - and Met. Office Buoy 64046
Figure 7 Wave spectral data from the FOIB Waverider web site.
3.2.3 Visual Observations Visual estimates of sea and swell height, period and direction are included in meteorological
reports from Voluntary Observing Ships, mostly at the main synoptic hours.
Plots of ship observations are available from Oceanweather Inc, from
http://www.oceanweather.com/data/NorthSea/index.html, and clicking on marine
observations. See Figure 8 for an example.
39
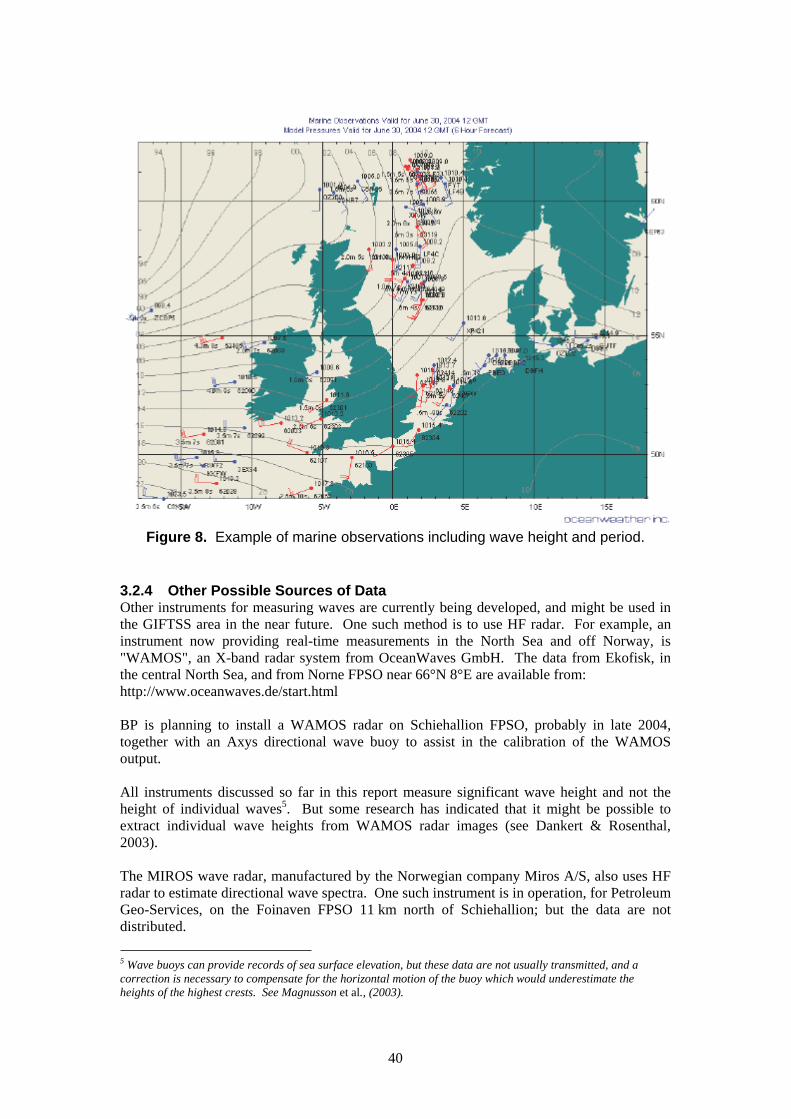
Figure 8. Example of marine observations including wave height and period.
3.2.4 Other Possible Sources of Data Other instruments for measuring waves are currently being developed, and might be used in
the GIFTSS area in the near future. One such method is to use HF radar. For example, an
instrument now providing real-time measurements in the North Sea and off Norway, is
"WAMOS", an X-band radar system from OceanWaves GmbH. The data from Ekofisk, in
the central North Sea, and from Norne FPSO near 66°N 8°E are available from:
http://www.oceanwaves.de/start.html
BP is planning to install a WAMOS radar on Schiehallion FPSO, probably in late 2004,
together with an Axys directional wave buoy to assist in the calibration of the WAMOS
output.
All instruments discussed so far in this report measure significant wave height and not the
height of individual waves5. But some research has indicated that it might be possible to
extract individual wave heights from WAMOS radar images (see Dankert & Rosenthal,
2003).
The MIROS wave radar, manufactured by the Norwegian company Miros A/S, also uses HF
radar to estimate directional wave spectra. One such instrument is in operation, for Petroleum
Geo-Services, on the Foinaven FPSO 11 km north of Schiehallion; but the data are not
distributed.
Wave buoys can provide records of sea surface elevation, but these data are not usually transmitted, and a
correction is necessary to compensate for the horizontal motion of the buoy which would underestimate the
heights of the highest crests. See Magnusson et al., (2003).
40
5

A development of the OSCR system (originally used for measuring surface currents) by
Professor Wyatt of the University of Sheffield is at present undergoing trials in the Celtic Sea.
This 'Pisces HF Radar Trial' is managed by the UK Met Office, and funded by DEFRA as
part of its feasibility studies for a UK Wave Monitoring Network. A single, shore-based radar
provides estimates of significant wave height (assuming the energy is not propagating
perpendicular to the radar), while two radars give estimates of the directional wave spectrum.
Some other instruments, such as wave staffs and downward looking lasers might be used, but
they are only practical close to fixed structures, and there is always the question of the effect
of the structure on the waves.
3.3 ANALYSES AND FORECASTS
Numerous analyses and forecasts of wave height and other parameters are available from
national Met Offices, ECMWF, US FNMOC, and commercial companies such as
Oceanroutes (UK) Ltd and Oceanweather Inc. For example, The UK Met Office UK Waters
Wave Model, covering the GIFTSS area up to 63°N with a resolution of about 12 km, is run
6 hourly, using hourly wind inputs and forecasting out to 5 days ahead (e.g. Figure 9).
Most of these organisations use 3rd Generation spectral wave models, including ECMWF, the
Danish Met Institute (DMI), Oceanroutes and Oceanweather.
Figure 9 Example of the output from the Met Office's UK waters wave model
Figure 10 shows an analysis from the UK Met Office, distributed by GTS fax. Figure 11 is a
DMI analysis for the same time. The fax output in Figure 10 is generated by sub-sampling the
Met Office global wave model data on to a coarse grid. The underlying gridded fields are
also available via GTS in “grib” format. The full model resolution gridded fields are
available commercially - see:
http://www.metoffice.com/research/ocean/operational/dpds/dpds_wave.html
41
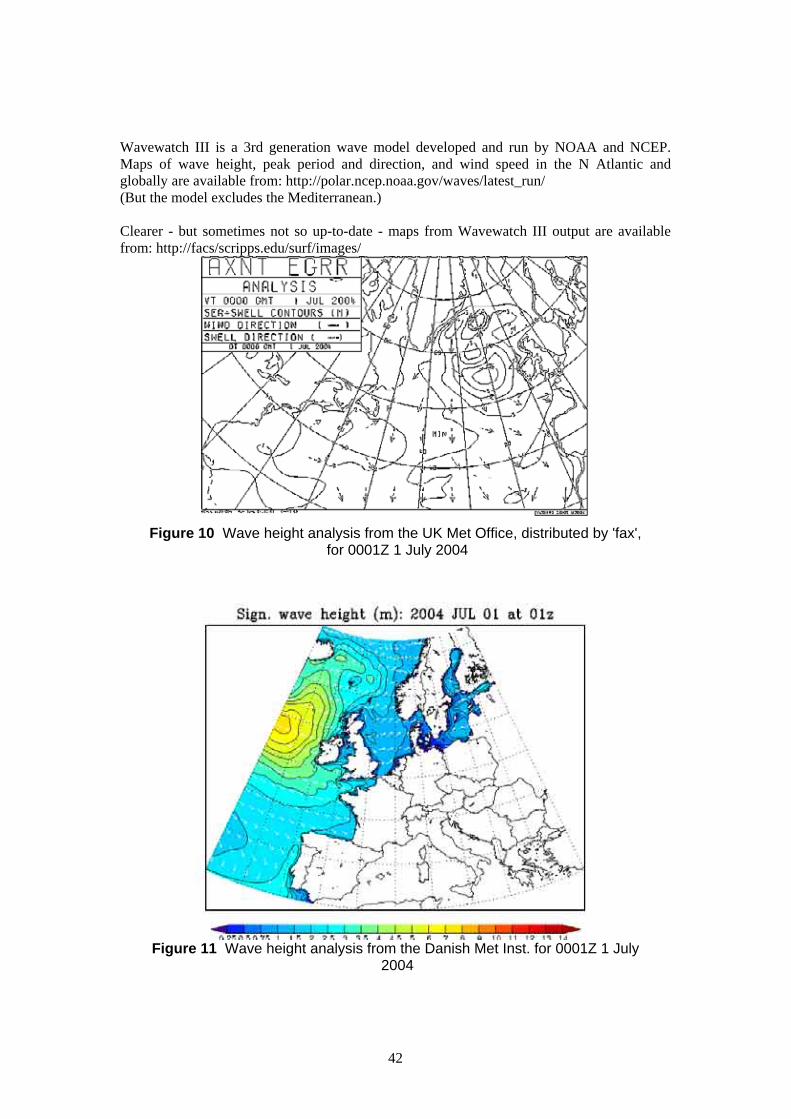
Wavewatch III is a 3rd generation wave model developed and run by NOAA and NCEP.
Maps of wave height, peak period and direction, and wind speed in the N Atlantic and
globally are available from: http://polar.ncep.noaa.gov/waves/latest_run/
(But the model excludes the Mediterranean.)
Clearer - but sometimes not so up-to-date - maps from Wavewatch III output are available
from: http://facs/scripps.edu/surf/images/
Figure 10 Wave height analysis from the UK Met Office, distributed by 'fax', for 0001Z 1 July 2004
Figure 11 Wave height analysis from the Danish Met Inst. for 0001Z 1 July 2004
42

EO data, including wind scatterometer data, are widely assimilated into meteorological
models to obtain weather analyses and hence predictions, including the wind data which are
inputs to wave models (and, for example, Météo-France found that this use of scatterometer
wind data did improve the results from its wave model). But, although altimeter data are used
to validate the model results, the assimilation of EO wave data into the wave models is not
universally carried out.
ECMWF and Météo France have developed assimilation techniques and used them to
assimilate altimeter wave heights for some years, and we understand ECMWF has recently
begun to assimilate SAR data. The UK Met Office assimilated data from the ERS-1 and
ERS-2 altimeters for some years, but found the results unsatisfactory, and stopped in 2001
although it now uses altimeter data to validate its model and is working towards the use of
ENVISAT wave mode data for validation. Oceanroutes does not assimilate EO data into its
wave model. Nor, according to Carretero (2002), does the Danish Meteorological Institute -
nor (in 2002) did the Irish, Portuguese, and Spanish Met Offices.
3.4 WAVE CLIMATOLOGIES
Wave Model Hindcast Climatologies The two most relevant wave model Hindcast based climatologies were mentioned in the
previous section.
x� The KNMI global wave climatology is based on a 45 year Hindcast, forced by ERA
40 winds and is available at http://www.knmi.nl/waveatlas.
x� The AES-40 Oceanweather Hindcast is based on a 40 year analysis, but has been
“kinemtatically enhanced” to provide an improved parameterisation of storms. This is
available at http://www.oceanweather.com/metocean/aes40/index.html.
Visual Observations Climatologies Two climatologies based on visual observations are available. They have there limitations,
but are still quite widely used.
x� BMT Global Wave Statistics http://www.globalwavestatisticsonline.com
x� Compiled by Sergei Guleev from P.P. Shirshov Institute of Oceanology, Moscow
http://www.sail.msk.ru/atlas/index.htm
3.5 ADEQUACY OF PRESENT WAVE INFORMATION
There is continuing activity among wave modellers to assess the accuracy of their wave
models. Data are usually checked against observations from buoys - sometimes against EO
data, as mentioned above. Often the bias (average difference between model and buoy) and
the root mean square difference are calculated. The latter can be misleading because errors 6tend to increase with increasing wave height , so sometimes the 'scatter index' (standard
deviation of model-buoy divided by buoy mean) is used.
For example, since 1995, a number of Met Offices, the US Fleet Numerical Meteorology and
Oceanography Center (FNMOC), and ECMWF have been comparing their wave model
outputs - analyses and forecasts out to 2 days ahead - against buoy data. Bidlot et al. (2002)
report on the results from 1996 - 1999 model outputs. They conclude that ECMWF
6 For example, the sampling error in estimating significant wave height (Hs) from a 20 minute buoy record is
proportional to Hs - roughly 4% of Hs, depending on the spectral shape (Carter & Tucker, 1986).
43

performed the best "as a whole", but it had problems on the western sides of ocean basins.
Bidlot et al., showed a significant under-estimation of ECMWF and FNMOC wave heights in
high sea states (globally); the UK Met Office had smaller bias - although its overall scatter
index was 0.21 compared to 0.17 and 0.20 for ECMWF and FNMOC.
Assessing adequacy is more difficult. This will depend on the particular operational
requirement. For example, significant wave height, Hs, of about 5 m is a critical level for
loading at the Schiehallion FPSO. How often do forecasts of 5 m prove correct as opposed to
false alarms; how often does Hs exceed 5 m without warning? Adequacy will also depend on
the relative cost of false alarms and missed alarms.
The large amounts of wave data and information available are, according to Dr Grant (pers
comm) generally adequate for his purposes as BP's metocean advisor. However, the selection
and assimilation of so much information is a problem. Gathering the data and presenting
them in a readily comprehendable format is a serious problem. BP currently uses Nowcasting
International which obtains meteorological and wave analyses and forecasts from a range of
national meteorological services and from private weather companies, and prepares a clear
presentation to meet its customers' individual needs.
Recent incidents have shown that, while for most of the time there are sufficient wave data,
there are occasions when the data are inadequate. These occasions are usually in times of
storms, but this is not always the case. There were concerns that long-period swell (of 15 - 20
seconds, and hence wave lengths of 330 - 590 metres) could seriously affect operations at
Schiehallion; and the UK Met Office extracted the energy on this frequency band from its
wave model for BP.
3.6 CONCLUSIONS
Information and data on sea state in the GIFTSS area are available from a wide range of non-
EO sources. Measurements are available, normally hourly, but only at a few locations, and
data are not provided reliably - and are especially likely to fail in stormy situations.
The Met Office buoys transmit two wave parameter values: estimates of significant wave
height (Hs) and zero-upcrossing period (Tz) - but wind measurements can give estimates of
the direction of wind-sea waves. However, there is only one such buoy in the GIFTSS area.
There is also one directional buoy in the area which provides tabulated directional
information: the dominant direction and energy in a range of frequency bands and estimates
of the directional spread of the waves. (There is also a location in the extreme southeast of
the area at 57.2°N 0.5°E which reports Hs and Tz.)
Wave length can be readily obtained from frequency using the dispersion relationship. The
significant steepness can be calculated from Hs and Tz.
A summary of wave parameters measurements in the GIFTSS area is given in Table 2.
None of these sources provides any measure of individual wave heights, although it is
possible that the WAMOS radar might be able to do so, and buoy data can be processed to do
so if the individual accelerations or elevations are recorded.
There are numerous wave models which provide estimates of directional spectra at grid points
throughout the area, at spacing down to 12 km from the UK Met Office. Maps of Hs, wave
period (either Tz or Tp) and dominant direction are usually available in near-real time, but
44

output can be obtained of other parameters such as wave energy in long-period swell or the
JONSWAP peakedness factor. Models also give forecasts of all these parameters out to a few
days ahead. But the accuracy of model outputs on some occasions - particularly in high sea
states - is still questionable.
Table 2 Wave parameter measurements available within the GIFTSS area.
Wave Parameter No. of Locations Location Comment
wave spectrum 1 FOIB
wave direction 1 FOIB
sign. wave height 2 FOIB & 64046 & at 57.2ˆ 0.5°E
wave steepness 2 FOIB & 64046 significant steepness
wave period 2 (Tz) FOIB & 64046 & at 57.2ˆ 0.5°E
and 1 (Tp) FOIB
wave speed 1 FOIB at peak frequency
FOIB: Faroes Waverider at 61.3°N 6.3°W (Prob. till end of 2005);
64046: Met.O Buoy at 60.7°N 4.5°W. Numbers may all increase by 1 with deployment of
instruments at Schiehallion by the end of 2004.
45
4 WP 1.3 REQUIREMENTS AND AVAILABILITY OF EO DATA
4.1 INTRODUCTION
The objective of Work Package 1.3 was to describe and provide an initial assessment of the
sources of wave data and information available for the NW Approaches to the UK from Earth
Observation sources, i.e. satellite mounted instruments.
In this section of the report we briefly outline the satellites, instruments and data sets that are
available, then, instrument by instrument describe important characteristics that have a
bearing on the accuracy and reliability of the wave information that can be extracted. We
close with an assessment of the “readiness” of the available data sets for operational
implementation.
Readers are referred to the full WP 1.3 report (Woolf 2004b) if more detail is required.
4.2 PARAMETERS / INSTRUMENTS
4.2.1 Radar Altimeter Nadir looking radar altimeter
One measurement every 1 second (or 6-7 km) along satellite ground track.
Spatial average over 5-10km diameter region
Parameters
Significant wave height: accuracy 0.3m (0.5 - 15m), resolution 0.01m -1 -1 -110m wind speed: accuracy 1.5 ms (0.5 - 15 ms ), resolution 0.01 ms
Estimate of zero upcrossing period (experimental), accuracy 1 s (4-15 s)
(Potentially) significant steepness – A function of significant wave height and wave period
(Potentially) peak period – derived emprically in a similay to zero upcrossing wave period,
but further development required.
(Potentially) wave speed (proportional to wave period). But validation would be difficult
Reliability
Measurements generally robust. No measurements available when non-ocean feature lies
within altimeter footprint. Very heavy rain (centre of hurricanes of intense tropical storms)
can attenuate and corrupt signal.
4.2.2 Wind Scatterometer Wide swath active microwave instrument (500 km to 1800 km swath).
Vector measurements in 25-50km (25 km for QuikSCAT) grid cells across swath.
Parameters
Wind speed (accuracy 2 ms-1) and direction (accuracy 20°) providing spatial average in 25 x
25km, or 50 x 50 km grid cells.
Used in some experimental applications to generate wind sea part of wave spectrum, as a
complement to the long-wave spectrum retrieved from SAR
Reliability
Occasional problems with retrieving correct “alias” wind vector, can lead to some directional
ambiguities. Problems in close proximity to land (~50 km). Rain affected (especially Ku band
QuikSCAT)
46

4.2.3 Synthetic Aperture Radar (wave mode) “Snapshot” imagette of wave field over 10km x 6 km region every 100 km along track.
Parameters
Processed to produce (with 180° ambiguity, now resolved by ENVISAT ASAR) energy in 12
directional sectors at 12 wave lengths.
Reliability Due to limited aperture and speed over ground of satellite, radar cannot resolve wavelengths
< 100m. Combination with wave models is often used to retrieve shorter wavelength signal,
and to resolve directional ambiguity problem.
4.2.4 Synthetic Aperture Radar (Image mode) Active microwave sensor operated through a steerable antenna that directs the transmitted
energy in a narrow beam normal to the satellite track. SAR is able to collect data over a 1,175
km wide area for a wide range of imaging options - up to 7 beam modes (8m to 100m
nominal resolution) and up to 35 beam positions.
Parameters
Wind speed, long wavelength wave spectrum (lower cut-off determined in part by image
resolution and hence image mode – wide scan, narrow scan, etc) small scale surface
roughness, and for the detection of dynamic ocean features (eg eddies, fronts, internal waves).
Reliability
Problems determining surface roughness for wind speeds <3m/s and >11m/s.
4.3 SATELLITE DATA SETS
ERS-2 radar altimeter (1995-)
x� Significant wave height, wind speed, wave period estimate.
x� Global along track (at satellite nadir) coverage between 82°S and 82°N,
measurements at 1 second intervals, providing spatial average over 5-10km diameter
region.
x� 35 day repeat orbit
x� Near Real Time: < 4 hours delay (N Atlantic and some N Pacific orbits only – where
satellite is in direct line of site of ESA ground stations).
ERS-2 Synthetic Aperture Radar wave mode (1995-)
x� Swell wave height and direction (with 180° ambiguity)
x� Global coverage between 82°S and 82°N, measurements at 200 km intervals,
providing spatial average over 10 x 6 km grid region.
x� 35 day repeat orbit
x� Near Real Time: < 4 hours delay
ERS-2 Synthetic Aperture Radar image mode (1995-)
x� Swell wave height and direction (with 180° ambiguity)
x� Potential for high resolution of coastal spatial variability
x� Global coverage between 82°S and 82°N, BUT dependent on operational mode
x� Near Real Time – In theory possible but full NRT processing chain (reception at W
Freugh, transmission to e.g. QinetiQ , and image processing to generate wave fields)
not tested.
47

ERS-2 wind scatterometer (1995-)
x� Wind speed and direction
x� North Atlantic 500km swath coverage, spatial average on 25x25 km grid.
x� Near Real Time (in NE Atlantic only): <3 hours delay
TOPEX/Poseidon radar altimeter (1992-)
x� Significant wave height, wind speed, wave period estimate.
x� Global along track (at satellite nadir) coverage between 65°S and 65°N.
x� 10 day repeat orbit
x� Near Real Time: > 8 hours delay
QUIKSCAT “Seawinds” wind scatterometer (1999-)
x� Wind speed and direction
x� Global daily wide swath coverage (1800 km), spatial average on 25x25 km grid.
x� Near Real Time: <3 hours delay
Geosat Follow-On radar altimeter (launched 1999, operational 12/2000)
x� Significant wave height, wind speed, wave period estimate.
x� Global along track (at satellite nadir) coverage between 72°S and 72°N.
x� 17 day repeat orbit
x� Near Real Time: not available
Jason radar altimeter (December 2001- )
x� Significant wave height, wind speed, wave period estimate.
x� Global along track (at satellite nadir) coverage between 65°S and 65°N.
x� Near Real Time: < 6 hours
ENVISAT radar altimeter (March 2002-)
x� Significant wave height, wind speed, wave period estimate.
x� Global along track (at satellite nadir) coverage between 82°S and 82N.
x� Near Real Time: < 4 hours delay
x�ENVISAT synthetic aperture radar wave mode (March 2002-)
x� Swell wave height and direction
x� Global coverage between 82°S and 82°N, measurements at 100 km intervals,
providing spatial average over 5 x5 km grid region.
x� Near Real Time: < 4 hours delay
ENVISAT synthetic aperture radar image mode (March 2002-)
x� Swell wave height and direction
x� Potential for high resolution of coastal spatial variability
x� Global coverage between 82°S and 82°N, BUT dependent on operational mode
x� Near Real Time – Not tested – see comments for ERS-2 image mode.
Radarsat-1 synthetic aperture radar image mode (1995-)
x� Swell wave height and direction
x� Potential for high resolution of coastal spatial variability
x� Coverage dependent on operational mode
48

x� Near Real Time –if in view of ground station - then see above.
ERS-2 is not expected to continue for much longer, it has already experience failure in 6 (out
of 6) gyroscopes, and the tape recorder has failed – so that data can now only be taken whilst
the satellite is in view of ground stations. TOPEX has significantly exceeded its planned
lifetime (originally 4 years), it too has experienced tape recorder failure, and was switched to
the back up electronics in 1996.
JASON has a nominal lifetime of 5 years and its planned replacement should be launched in
2008. Geosat Follow-On was launched in 1999 on a 5 year mission. ENVISAT has a nominal
5 year mission. RadarSat-1 should be replaced/supplemented by Radarsat-2 in 2005.
4.4 SYNTHETIC APERTURE RADAR
4.4.1 Overview The synthetic aperture radar is a side-looking wide swath instrument which achieves high
spatial resolution by integrating returns from the surface along a typically 10 km aperture,
over a time of typically 1 second.
A SAR image can be thought of as a (nonlinear) mapping of surface roughness at the scale of
the radar wavelength (for C-band, ENVISAT, ERS-2 and Radarsat ~10cm). The physics of
the backscattering process, and the techniques by which information about the wave spectrum
are extracted from the SAR image spectrum are complex and described in detail in the full
WP 1.3 report (Woolf 2004b).
Location within the image is determined by the signal timing in the range direction, and by
the Doppler history of the signal in the azimuth direction (Figure 12). SAR data is thus
affected by surface motion – this contributes to the imaging mechanism for azimuth travelling
waves, but can also degrade the imaging of the same waves. Ground resolution of the order
of 30 m is obtained over a swath that varies from 100 km to a few hundred kilometres (but
often with reduced resolution at wider swaths). Surface spectra obtained from the SAR image
spectra can provide dominant wavelength and direction. However the SAR-derived surface
spectrum only covers a restricted part of the surface wave spectrum. Typically for ERS the
SAR spectrum covers range-travelling waves longer than 100m, and azimuth travelling waves
longer than 200 m. In situations where the waves of interest are longer than these limits, SAR
data compares well with wave models and buoy data. SAR data is affected by other ocean
and atmospheric phenomena that modify surface roughness, (e.g. surface slicks) and requires
low to moderate surface winds (typically 3 – 11 m/s, but this is radar wavelength dependent).
Direction of satellite
descending pass in N hemisphere)
direction
SAR image
“azimuth” direction
(ERS-2 NE –SW
“range”
Figure 12 The Geometry of the SAR Instrument
49

4.4.2 SAR Direction Information
“Conventional” multi-look/intensity imagery – 180° ambiguity in direction The symmetry of the image spectrum means that using the spectrum alone, there is a 180°
ambiguity in the direction of the waves. In some cases there is other information in the image
which can be used to resolve the ambiguity. The analysis system used by QinetiQ, “MaST” ,
uses the presence of land and assumes waves are travelling towards the nearest land.
Alternatively a wave model is often used to determine the correct direction. All Fast Fourier
Transform (FFT) (or equivalent) based image spectra methods using multi-look/ intensity
only data as the starting point suffer from the problem of wave direction ambiguity, and
require ancillary data to resolve it.
Cross-Spectra Methods Cross spectra methods use single look complex data, and exploit the movement of swell
waves in the time between single look acquisition. For ERS the time between looks is 0.37
sec, and swell waves move sufficiently in this time that the direction of movement can be
determined and the 180° ambiguity resolved. This cross spectrum method is also applied to
Envisat ASAR data.
4.4.3 Wave parameters measurable by SAR As we have discussed, a SAR image has the potential to provide a surface spectrum over a
(limited) range of wavelengths and directions. A Modulation Transfer Function (MTF)
relates the SAR image spectrum to the surface spectrum. If more than one wave train is
present on the surface and is imaged, then it will be included in the spectrum. Peak
wavelength and direction (to within 180 degrees just using the intensity spectrum) can then be
read off the spectrum. Wave height (of the peak wavelength) or significant wave height
(averaged over the spectrum) can then be obtained, if the instrument has been suitable
calibrated
As noted above short wind-waves are not imaged, and the azimuth and range components of
the surface wave field have generally different limits.
Other wave parameters can then be derived using the wave dispersion relation and the peak
wavelength (or spectrum).
Wave parameters that can be measured (directly)
x� Wavelength (spectrum)
x� Wave direction
x� Wave height (spectrum)
Wave parameters that can be derived from these primary measurements
x� Significant wave height
x� Wave period
x� Wave speed
x� Wave steepness
4.4.4 SAR Products SAR ocean data are available either as images, or (for the ESA ERS and ENVISAT satellites,
in wave mode format.
Wave Mode Perhaps the most widely known use of SAR is through the application of single large images
of a region of the earth’s surface (either on land or over the ocean). The ERS-1, ERS-2 and
50

ENVISAT SARs have(d) an additional operating mode, known as the wave mode. In this
mode the satellite regularly (once every ~100km along track) takes a small (usually 10 km x
6 km) “imagette” specifically for the purposes of providing wave measurements. These
“imagettes” also offer a smaller pixel spacing (20 m in range, 16 m in azimuth) than many of
the conventional image modes. These imagettes are processed for ESA as part of the Near
Real Time and offline operational data processing chains to provide wave spectra and derived
wave parameters.
A specific problem for application of historical SAR wave mode data in our area of interest is
that the operation of the active microwave instrument (AMI) on ERS-1 and ERS-2 meant that
the SAR wave mode and SAR image mode could not operate at the same time. This had a
significant impact on SAR wave mode coverage over the northern North Sea, though recent
discussions with ECMWF have indicated that the impact over the North-Western Approaches
may not be as severe as was originally thought. The ESA help desk has been contacted with a
request for clarification of ERS-1 and ERS-2 wave mode coverage of this region, but we have
not yet received a response.
One possibility is that SAR image mode data could be used to “fill in the gaps” during the
periods, and over locations, when wave mode data are unavailable, or sparsely available. By
definition, ERS SAR image data should be available when the wave mode data are not.
ENVISAT ASAR WM Data Two types of products are available from the ENVISAT ASAR wave mode: The Level 1B
products which include the “imagettes” and the radar cross-spectra, and the Level 2 wave
mode product which provides the ocean spectra plus derived parameters (Hs, period,..).
Most operational users, such as Met Offices running operational wave models, choose to use
the level 2 product (see Figure 13). More advanced users use the imagettes or radar cross
spectra to develop and apply their own retrieval techniques. For instance the MAXWAVE
team used ERS-2 wave mode imagettes to search for features they associate with unusually
high and steep waves.
The ASAR wave mode on ENVISAT can operate at the same time as the image mode, and so
better coverage should be available than was the case for ERS-1 and ERS-2.
Figure 13 Wave Spectra (right) and data product content (right) from ENVISAT ASAR Wave Mode Data. Produced with the ESA ENVIVIEW software
51
Since its first introduction over a year ago, the ENVISAT ASAR wave mode processing
software has undergone a number of modifications - responding to results from a validation
campaign, and experience from some early users of the data set (as discussed below). Thus
the archived ASAR wave mode data set is not homogeneous. It is understood that ESA will
start to reprocess archived ENVISAT ASAR WM data early in 2005, and so produce a
consistent data set.
The UK Met Office, Météo France, ECMWF and others have been evaluating the ENVISAT
ASAR wave mode data for the past year, and presented their findings at the recent ENVISAT
symposium in Salzburg (September, 2004). There is a high interest in the wave mode product
from wave forecasters, because tests have shown that the assimilation of wave spectra has a
longer term impact on the wave forecast than if wave height data alone are assimilated. This
is believed to be because the wave spectra provides separate information about swell -and the
models still have some difficulty in accurately representing the growth and propagation of
swell.
The consensus of these “beta” testers was that the data could be very useful, and were shown
to be accurate under a range of conditions, but that one must be aware of the limitations and
apply careful quality control. For instance, although the estimated wave height was accurate
to 0.4m for 50% of the data, overall the rms was 0.8m. Also users were finding that up to
75% of the wave mode data were discarded by their assimilation schemes. However, from
recent communications with the ENVIWAVE team (Johnsen pers. comm.) we understand
the situation has recently improved, ESA have modified the land masking procedure, and
updated advice on quality control is now available (In Johnsen, 2005)
Thus issues to bear in mind when using ENVISAT ASAR wave mode data are:
x� Parameters relate to long wavelengths only. The wave period window 8-15s has been
identified as providing the most reliable data.
x� Apply careful quality control. Checks should include the normalised variance, the
azimith cut-off, and co-located model wind speed.
x� Under certain conditions, specifically strong winds in the azimuth direction, severe
distortion of the extracted spectra can occur.
Image Mode A number of different SAR image modes are available, with a trade off between wider
coverage and small scale resolution. Radarsat provides options from a fine mode with a
resolution of 10m, and an image scan width of only 50km, to a “Scan Wide” mode with a
swath width of 300km, but a surface resolution of 100m. With the ERS SAR the usual image
mode of operation offers a 100 km x 100 km image, at a resolution of 50 m.
These image mode data are not routinely processed by the satellite agency to provide wave
measurements, this must be achieved through a subsequent, separate, processing scheme. In
this study we considered two applications for carrying out this processing – the QinetiQ
MaST application, and the BOOST Sartool both process the SAR image to provide wave
information in a number of sub-cells across the image.
In general images over a specific area for a specified time can be requested in advance.
Usually these orders will have to be programmed in advance into the satellite retrieval
timetable on a cycle-by-cycle basis (one cycle for ERS / ENVISAT is 35 days), and the
satellite agency will prioritise requests. Otherwise, one must make do with the ad-hoc
sampling available according to existing programmed requests.
52

MaST application
QinetiQ has developed an automated maritime surveillance tool (MaST), which uses a suite
of software modules, written in C++, to detect maritime features from satellite SAR imagery.
MaST is capable of supporting the formats from ERS-2, Envisat and Radarsat-1.
To characterise the swell wave field, the SAR image is segmented into a grid of square
subscenes. The user is given the option to reduce the number of pixels by averaging over their
values by a chosen factor. The model uses a two-dimensional Fast Fourier Transform (FFT)
to obtain the SAR Image spectrum. From this the two-dimensional surface height spectrum is
obtained from a Modulation Transfer Function (which takes into account tilt modulation and
velocity bunching). The spectrum is filtered to the range of wavelengths of interest. To
identify true wave signals against the noise in the spectrum, only peaks above a threshold are
considered. The model is able to identify multiple peaks within a segment in this fashion,
corresponding to different swell wave trains.
This technique identifies the orientation of swell wave crest patterns in an image but cannot
determine in which, out of the two opposite directions, they are travelling (the 180 degree
ambiguity).
MaST can apply a land mask so that any subscene encompassing pixels of land are ignored.
For the ocean areas the centres of subscenes for which swell waves are identified are
displayed by blue circles with red lines showing the direction of travel (within the 180°
ambiguity), see Figure 14. The length of red lines is proportional to the phase speed of the
swell waves calculated from the wavelength using the linear, deepwater dispersion relation.
Figure 14 MaST swell wave detection
BOOST SARtool application
The French company, BOOST, have developed a SAR processing tool called “SARtool”.
SARtool can be used to process Single Look Complex SAR images (.SLC) from ERS-1,
ERS-2, RadarSat and ENVISAT. SARtool uses the cross-spectrum to generate wave spectra
without any 180° ambiguity (it uses the same algorithms developed for, and applied to, the
53

ENVISAT ASAR wave mode data). Output from use of this tool on an ENVISAT ASAR
image is demonstrated in Figure 15.
Demonstration / operational capabilities of SAR Tool include:
o Oil spill monitoring
o Ship detection
o High resolution winds fields
o Two dimensional wave spectrum retrieval
New capabilities under development at BOOST include the analysis of coastal wave fields,
and estimates of “radial” sea surface velocity (i.e. perpendicular to the satellite ground track).
This latter is achieved through an analysis of the doppler shift on the returned signal. This
leads to a possible capability to identify and locate frontal features (so long as they have an
expression in the appropriate direction with respect to the satellite track).
Figure 15 Wave Spectra and high-resolution coastal wave fields from ENVISAT ASAR Image Mode Data. Produced using the BOOST SARtool.
4.4.5 SAR Data Availability
Archive images at West Freugh
The QinetiQ image data base at West Freugh holds a large volume of SAR data within the
Area of Interest (AOI) (56°-64°N, 1°E-10°W), including over 3000 ERS-1 images (for 1991
2000) and more than 5000 ERS-2 images (1995-present).
Potential Future Image Acquisitions
QinetiQ through the West Freugh ground station is now capable of downloading (within the
Ground Station footprint) Radarsat, ERS-2 SAR and Envisat ASAR NRT. With the new
ASAR processor it is now possible to download and process an ASAR image within 45
minutes and to analyse it subsequently within a further 15 minutes, giving around a 1 hour
turnaround from time of acquisition to dispatch of results.
54
In terms of the number of images this is difficult to address without reference to a specific
AOI. The repeat cycle determines how often one can reacquire the same frame, i.e. once
every 35 days for ERS-2 and Envisat and once every 26 days for Radarsat. Operationally,
repeat acquisition of a specific frame is an unlikely scenario and the AOI will be detailed in
terms of an area. It therefore follows that a number of different frames will either fully or
partly cover the AOI and thus the number of potential acquisitions in a single repeat cycle
will be greater than the repeat acquisition of the same frame. Clearly as the size of the AOI
increases the greater the number of images that fall within the region. We present some
examples below:
EXAMPLE 1: 4 ERS-2 images that could be acquired over a 1ºx1º in the NW Approaches
(where at least 50% of the image falls within the AOI), in a single repeat cycle.
EXAMPLE 2: 4 Envisat ASAR Narrow Swath Mode images that could be acquired over a
1ºx1º in the NW Approaches (where at least 50% of the image falls within the AOI), in a
single repeat cycle.
EXAMPLE 3: 12 Envisat ASAR Narrow Swath Mode images that could be acquired over a
2ºx2º in the NW Approaches (where at least 50% of the image falls within the AOI), in a
single repeat cycle.
4.5 RADAR ALTIMETER
4.5.1 Overview The radar altimeter is a nadir-pointing instrument operating by timing the delay between
emission of a short microwave pulse and the subsequent detection of the returned echo,
recording both the time and distortion of the returned signal. This distortion gives a spatial
average of the significant wave height over a 5 to 10km diameter footprint every 6-7km along
the satellite ground track. The accuracy is 0.3m over the range 0.5 to 15m, with a
measurement resolution of 0.01m. Under some conditions of wind and waves it is also
possible to estimate the wave period with an accuracy of 1 m/s over the range 4 to 15 s.
Measurements are generally robust, but no measurements are available when land lies within
the altimeter footprint. Also very heavy rain (such as the centre of hurricanes or intense
tropical storms) can attenuate and corrupt the signal.
4.5.2 Capabilities Wave length/wave height spectrum, Wave direction - average direction and dominant or peak direction, Altimeter data is limited to integral measures of surface roughness over the 5-10km footprint.
Thus, it is unlikely that any “spectral resolution” can be achieved from a standard altimeter,
and certainly such a capability has not been demonstrated. Similarly, a standard altimeter
views at nadir and is insensitive to wave direction.
Significant wave height Significant wave height (Hs) is closely related to the leading slope of the returned signal. The
accuracy is approximately 0.3m over the range 0.5 to 10m, with a measurement resolution of
0.01m, which is comparable to the best wave buoys. For wave heights in excess of 10 metres
the quality of all measurement methods is uncertain, but the limited number of collocations in
these conditions suggest that buoy and altimeter estimates remain consistent.
55

-1
Wind speed Wind speed is not one of the selected wave parameters, but it is important to note that an
accurate estimate of surface wind speed (co-located with other wave parameters) is available
from the satellite altimeter. Wind speed is derived from the surface backscatter (V0). Single
parameters algorithms (e.g. Witter and Chelton 1991) give an accuracy to 1.5 ms , two -1parameter (Hs and V0) algorithms improve this to 1.3 ms .
Wave period i.e. Tz and Tp,
A novel empirical approach for retrieving wave period from altimeter V0 and Hs data has
recently been published (Gommenginger et al., 2003). Through heuristic arguments they 2)1/4 relate wave period to Hs and V0 through the proportional dependency T ~ (V0. Hs
This model function was fitted using a dataset of Topex altimeter data collocated with NDBC
buoy spectra and validation using an independent dataset of Topex data collocated with buoys
demonstrated global retrieval errors of ~ 0.8 s (rms error) for Tz, and ~ 1 s for Tm. A
preliminary analysis by geographical area (Hawaii, Gulf of Mexico) suggested that altimeter
wave period may be more reliable in wind dominated conditions. On the other hand,
comparison with numerical wave models suggests that the altimeter wave period approach is
valid for both wind-dominated and swell conditions.
An attempt was made to derive a peak wave period, but this was not so successful and further
development work is necessary
Wave steepness, It is plausible to seek an empirical relationship between wave steepness and the basic
“measurements”, V0 and Hs. This has not been attempted directly. However, for deep water
gravity waves, a significant wave steepness can be defined in terms of significant wave height
and mean wave period (see annex A). Currently there are no estimates of the likely bias or
scatter in such estimates. An estimate of accuracy might be made by comparing altimeter-
retrieved steepness statistics to similar statistics from wave buoys.
Wave speed. For deep water gravity waves, wave speed (group or phase) is simply proportional to wave
period and thus wave speed can be estimated indirectly from the estimates of period described
above. It would be most appropriate to use the peak wave period in this case – but we are then
confronted with the difficulty in acquiring an accurate estimate of peak period.
In addition, it is difficult to see how any direct validation of wave speed estimates might be
made.
4.5.3 Coverage and Sampling Altimeters are set in near-polar orbits viewing at nadir. Thus, coverage is “near Global” with
no data in polar regions. The Area of Interest is covered by all satellite altimeters. However,
altimeters are essentially “point measuring” at each pulse measuring single integral values for
a 5-10 km patch immediately beneath the instrument. Thus the volume of information is very
much smaller than “imaging” or “swath” instruments that collect data separately from very
many points on the surface simultaneously. Note also that altimeters are generally set in a
repetition mode, such that the altimeter repeats an exact ground track after a fixed number of
orbits. Thus data is eventually collected on numerous occasions at the same point, but there
are also fairly large areas between ground tracks that are not measured. Standard ground
tracks around the UK are shown in Figure 16. The “sparse sampling” characteristics of
altimetry have considerable consequences for appropriate “gridding” of data (see section 2 -
WP 1.1), though they still offer better spatial sampling than existing buoy observations.
56

Tracks
10 5 0 5 48
50
52
54
56
58
60
longitude
latitu
de
Figure 16 Ground tracks of altimeters near the UK. Tracks in black are the standard tracks for Topex / Jason, repeated every 9 days 22 hours. Tracks in red are the standard 35 day repetition for ERS / Envisat
4.6 OTHER SOURCES OF DATA
Currently, the only other source of ocean sea state data is scatterometry, and this does not
provide any of the wave parameters required, though it is a rich source of ancillary data
Scatterometer data have been used to estimate the directional wind sea. Use of reflections
from future Global Navigation Satellite Systems missions may produce a “Sea State
Parameter” of sorts but this is unlikely to coincide with any of the required wave parameters.
4.7 SUMMARY AND CONCLUSIONS
Wave heights are measured directly by the radar altimeter, and (long wavelength) dominant
wavelength (and thus wave period) and direction can be derived from SAR measurements.
Wave period is also an experimental parameter derived from the altimeter. Wave steepness
and wave speed can also be estimated in principle from altimeter data, but the accuracy of
these parameters is unknown. SAR can in principle be used to derive quite detailed
characteristics of the wave field including all the parameters requested by HSE, but the level
of confidence is generally uncertain. SAR is also ineffective in very low winds and very high
winds.
For both altimetry and SAR, the availability of information is constrained by the satellite
passes. With a single satellite there is insufficient information for routine monitoring of wave
conditions in coastal areas on a daily basis, and even with the 5 altimeters fine-scale
geographical detail of the wave field is not revealed. Because of the long record of
measurements (dating back to Geosat in 1985), however, altimeter measurements are
especially useful for deriving statistics such as monthly mean values and the 100 year return
values (largest waves expected over 100 year period), shown for the UK area in Figure 17.
57
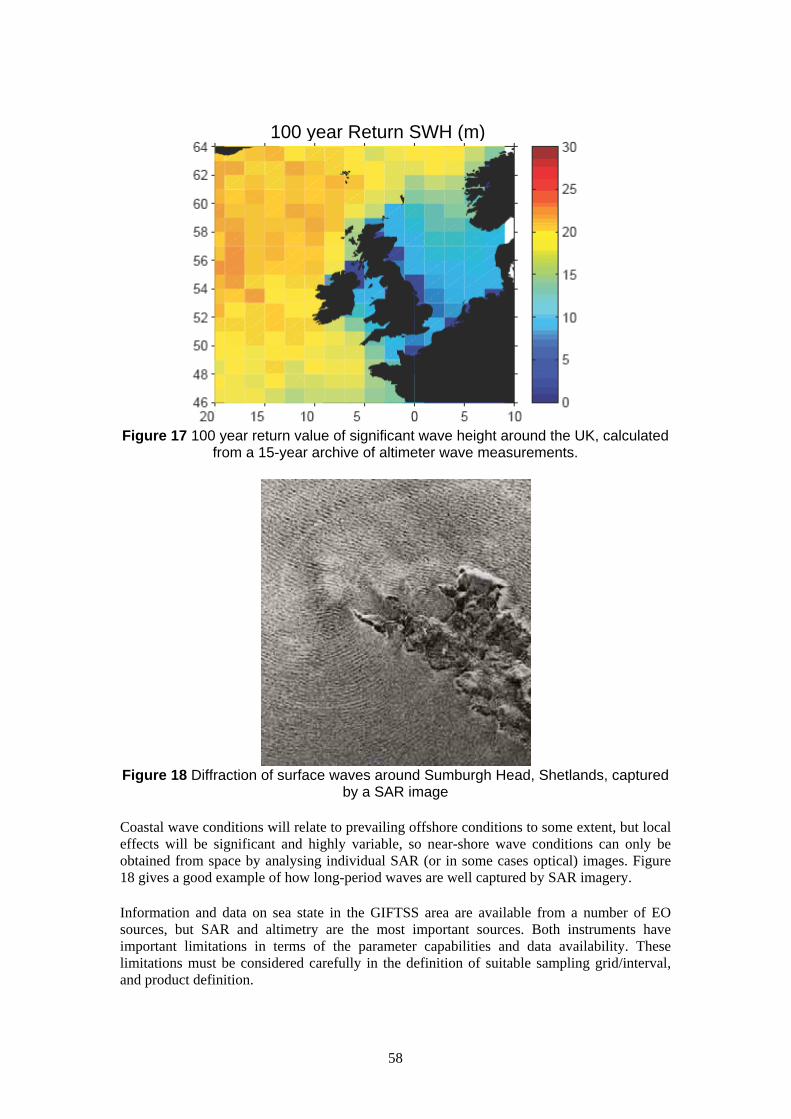
8
100 year Return SWH (m)
Figure 17 100 year return value of significant wave height around the UK, calculated from a 15-year archive of altimeter wave measurements.
Figure 18 Diffraction of surface waves around Sumburgh Head, Shetlands, captured by a SAR image
Coastal wave conditions will relate to prevailing offshore conditions to some extent, but local
effects will be significant and highly variable, so near-shore wave conditions can only be
obtained from space by analysing individual SAR (or in some cases optical) images. Figure
18 gives a good example of how long-period waves are well captured by SAR imagery.
Information and data on sea state in the GIFTSS area are available from a number of EO
sources, but SAR and altimetry are the most important sources. Both instruments have
important limitations in terms of the parameter capabilities and data availability. These
limitations must be considered carefully in the definition of suitable sampling grid/interval,
and product definition.
58

4.7.1 Evaluation of EO Capabilities to Measure HSE Required Wave Parameters
Significant Wave Height: Hs
The altimeter can provide an accurate and reliable estimate of Hs, suitable for many statistical
analysis applications without need for further data. The main issue for NRT applications is
poor temporal sampling.
Recent developments have shown it is possible to extract an estimate for (long wavelength)
Hs from (A)SAR images and wave mode data (following calibration of energy levels and
backscatter amplitude). A separate estimate of swell Hs may have some useful applications.
However, presently available sampling (in both time and space) from SAR is a limitation.
Zero Upcrossing, mean, wave period: Tz,m
Recent developments have shown that a useful estimate of zero upcrossing wave period can
be extracted from altimeter data, though it has not yet been applied widely. Temporal
sampling is again poor from altimeters for NRT applications.
A mean wave period can be extracted by integrating the 2D SAR spectrum, though again only
the longer part of the spectrum is sensed.
Peak wave period: Tp
Although a peak period can be derived from altimetry, further development and testing is
required. The peak wavelength (for long waves) can in theory be identified unambiguously in
SAR data. However validation programmes against modelled spectra gave rms ~ 3s. There is
an inherent difficulty in validating this parameter, against model or in-situ data (in the latter
case the problem is very limited resolution, 5s, at large periods). Nonetheless, this could
prove one of the most useful measurements available from the SAR because of its importance
in deep-water operations. Sampling in time and space (from SAR) is again poor.
Peak Direction: )p
A peak direction can be identified from analysis of SAR imagery, and extracted from the
wave mode imagettes. The same sampling and wavelength sensitivity issues as above apply.
Direction information cannot be extracted from altimetry.
Significant Steepness: Stpsig 2A significant steepness parameter can be estimated from the ratio of Hs and Tz (Annex A).
To our knowledge, such a parameter has not been tested before and so careful validation
would be required before any operational application. However, this parameter can be easily
generated, so we recommend an initial evaluation is carried out within this project.
As this parameter is derived directly from Hs and Tz, the limitations identified in the
discussions above apply. Thus we might hope for an accurate estimate from altimeter data
(because Hs and Tz are thought to be reliable), but a SAR derived estimate would only refer
to long wavelength waves.
Wave (Group) Speed: Cg
A wave speed parameter can be estimated directly from the relation cg = g� / 4S. As above,
such a parameter has not been tested before and so careful validation would be required
before any operational application. Again, we recommend an initial evaluation is carried out
within this project.
We would anticipate that this parameter is derived from Tp , so we might anticipate difficulty
in gaining an accurate estimate from altimeter data, but perhaps more success (in the case of
long wavelengths) from SAR data.
59
2-D Spectrum: E�I�O)
A 2D spectrum is available from the ERS and ENVISAT wave mode, and from the BOOST
SARtool analysis of SAR imagery. In the case of the ERS wave mode, there is a 180°
ambiguity on the retrieved spectrum. As identified above, only the long wavelength part of
the spectrum is sensed.
Grading for HSE Application In Table 3 we assign “grades” to each parameter, from each EO data source, based on the
team’s experience , a review of the most up to date literature and reports, and the evaluation
carried out in WP 1.4 The “grading” scale (see below) was adapted from a suggestion by
HSE, to aid identification of data sets which could be adopted immediately in a wave
conditions monitoring application (grades 1 and 2), or which showed a potential capability for
such applications if certain issues were addressed (grades 2 and 3).
We have graded separately measurements for Near Real Time (NRT) and statistical analysis
applications as different sampling regimes are preferred, and different levels of accuracy may
be acceptable. We have not, at this stage, discussed how measurements from different
instruments may be combined. It should be remembered that for NRT applications, a NRT
data stream throughout the whole processing chain from satellite to end-product must be
provided – we have not included a consideration of the availability (or otherwise) of such
NRT processing chains in the allocations of grades.
We have considered two applications packages that are available for the processing and
analysis of SAR images: the QinetiQ MaST package which can provide estimates of peak
wave length (period) and direction (with 180° ambiguity); and the “BOOST” SARtool which
can provide a full 2-D spectra (given a single look complex image). As we have established in
the previous discussions within this report both of these techniques provide information on
long wavelength waves only. Validation programmes for the ENVISAT ASAR indicate that
the part of the wave spectrum with wavelengths between 8 and 15 s is most accurately sensed.
It should also be recalled that there will usually be different wavelength “cut-offs” in the
along track (azimuth) and across track (range) directions.
HSE “Grade” 1 – Satellite can satisfy requirements with no supplementary data
2 – Satellite major source but other data required to derive estimates
3 – Other source more important, EO data can play important validation – quality control
function
4 – With present state of the art satellite data cannot make useful estimate
2,3 are further sub-divided to identify issues that could be addressed to achieve a wider
application
a – no major issue – other sources better suited
b – limited accuracy (including application according to environmental conditions)
c – limited spatial sampling (i.e. better resolution in space required)
d – limited temporal sampling (i.e. more frequent revisits a priority)
e – algorithm development required
1 2References for Table 3: Challenor and Cotton, (2001), Johnsen et al., (2003),
Gommenginger et al (2003).
60
3

Table 3 Evaluation of the capability of EO instrumentation to provide measurements of the identified wave parameters.
Parameter Satellite Validated accuracy Limitations Sampling in “Area of Interest” Need for external data Grade Source Stats /
NRT Significant wave Altimeter Hs (Ku) rrms 1< 0.3m No known environmental dependencies At present 4 satellites In situ for validation 1 / 3d height Validated for 0 - 12m 8 passes in total per day in AOI Models for better NRT coverage
Values 7-20km from coast Along track resolution 7km
(A)SAR: 2-D spectrum & wave
For ASAR wave mode rms 2 = 0.8m
Only for O�> 100m. Overestimates wave height at low wind speeds,
Wave Mode (WM): ENVISAT ~ 1-2 passes per day
In situ for validation 3bc / 3bd
mode (0.6m if T > 12s) “deviation” at higher wind speeds Image Mode (IM): ENVISAT, ERS-2 and Models for better NRT coverage RadarSat 3-6 passes / day
MaST Not available -
Wave period (zero Altimeter (Hs and rrms 3 ~0. 8s Performs better for wind sea than swell 4 sats: 8 passes per day In situ for validation 2e / 3d upcrossing - Tz, or V0) Along track resolution 7km Models for better NRT coverage “mean” period, Tm
(A)SAR: 2-D spectrum & WM
For ASAR wave mode rms 2 = 1.7s, bias ~ 1s.
Only for O�> 100m. Bias (~ 1s) WM: 1-2 passes per day IM: 3-6 passes / day
In situ for validation Models for better coverage
2bc / 3d
(rms = 1.1 s T > 12s) MaST Not available -
Wave period (peak - Tp)
Altimeter (Hs and V0)
Limited validation indicates rrms 3 = 3.1s (1.7s for wind
Difficulties in validation against buoy data. Tp algorithm requires further development
4 sats: 8 passes per day Along track resolution 7km
In situ and models for validation Models for better coverage
3be / 3bde
sea) (A)SAR: 2-D spectrum & WM
For ASAR wave mode rms 2 = 3.1s
Only for O�> 100m. SAR should provide better estimates of Tp?
WM: 1-2 passes per day IM: 3-6 passes / day
Models and in situ for validation Models for better coverage
2bc / 3d
MaST Only for O�> 100m. 3-6 passes / day Models and in situ for validation Models for better coverage
2bc / 3d
Wave steepness = f(Hs/Tz 2)
Altimeter Not tested “Significant steepness” calculated from ratio of Hs and Tz2 , but not validated.
4 sats: 8 passes per day Along track resolution 7km
In situ and models for validation. 3ce / 3de
(A)SAR: 2-D spectrum & WM
Not tested Only for Wavelengths > 100m. WM: 1-2 passes per day IM: 3-6 passes / day
In situ and models for validation 3ce/ 3de
MaST Not available -
Wave speed, group speed, cg = gW/4S
Altimeter: f(T) Not tested Group speed, cg = gW/4S�� not validated. 4 sats: 8 passes per day Along track resolution 7km
Models, in situ for validation. 3e / 3de
(A)SAR: 2-D Not tested Only for O�> 100m, WM: 1-2 passes per day Models, in situ for validation. 3ce/ 3de spectrum & WM IM: 3-6 passes / day MaST Only for O�> 100m. 3-6 passes / day Models, in situ for validation
Models for better coverage 3ce / 3de
Wave dirn spectrum Altimeter Not available -
(A)SAR: 2-D spectrum & WM
ASAR wave mode rms 2 = 1.0 rads for )mean
Only for O�> 100m. WM: 1-2 passes per day IM: 3-6 passes / day
Models, in situ for validation, & to resolve 180° ambiguity for ERS-2
2bc / 3bd
and )peak Models for better coverage MaST Only for O�> 100m. Peak direction and wavelength 3-6 passes / day Models, in situ for validation 2bc /
only (not full spectrum) Models for better coverage 3bd
61

5 WP 1.4 PROCESSING CHAIN FOR EO WAVE PARAMETERS EXAMPLES OF DATA PRODUCTS AND
EVALUATION
5.1 INTRODUCTION
The objectives of this Work Package were to specify and demonstrate the EO data processing
chains, required to derive the requested wave parameters from EO data.
For the these initial demonstration products we have focussed on the area 60°-62°N, 2°-8°W
(the Shetland – Faroes channel), to take advantage of the availability of directional in situ
wave data from the Faroes directional wave-rider buoy (Figure 18).
F
Figure 19 Area of interest, with proposed area for demonstration data set highlighted, and location of Schiehallion FPSO (“S”), and Faroes Wave-Rider (“F”)
Specific aims were to:
Generate a representative set of EO derived estimates of requested wave parameters.
Validate and evaluate EO derived estimates of wave parameters through comparison against
available in-situ and model data.
Inter-compare altimeter, SAR image mode, and SAR wave mode data.
Provide demonstrations of statistical analyses (based on archived altimeter data) and an
example of possible Near Real Time presentation of data.
In addition we provided an assessment of the spatial and temporal scales of variability of
wave fields in the Faroes-Shetland Channel region, to help establish how representative the
wave measurements from the Faroes buoy are of general conditions in the Faroes-Shetland
Channel region.
5.2 SUMMARY OF EO DATA Four short example data sets were produced, two from satellite altimeter data and one each
from SAR Image Mode and SAR Wave Mode data.
62
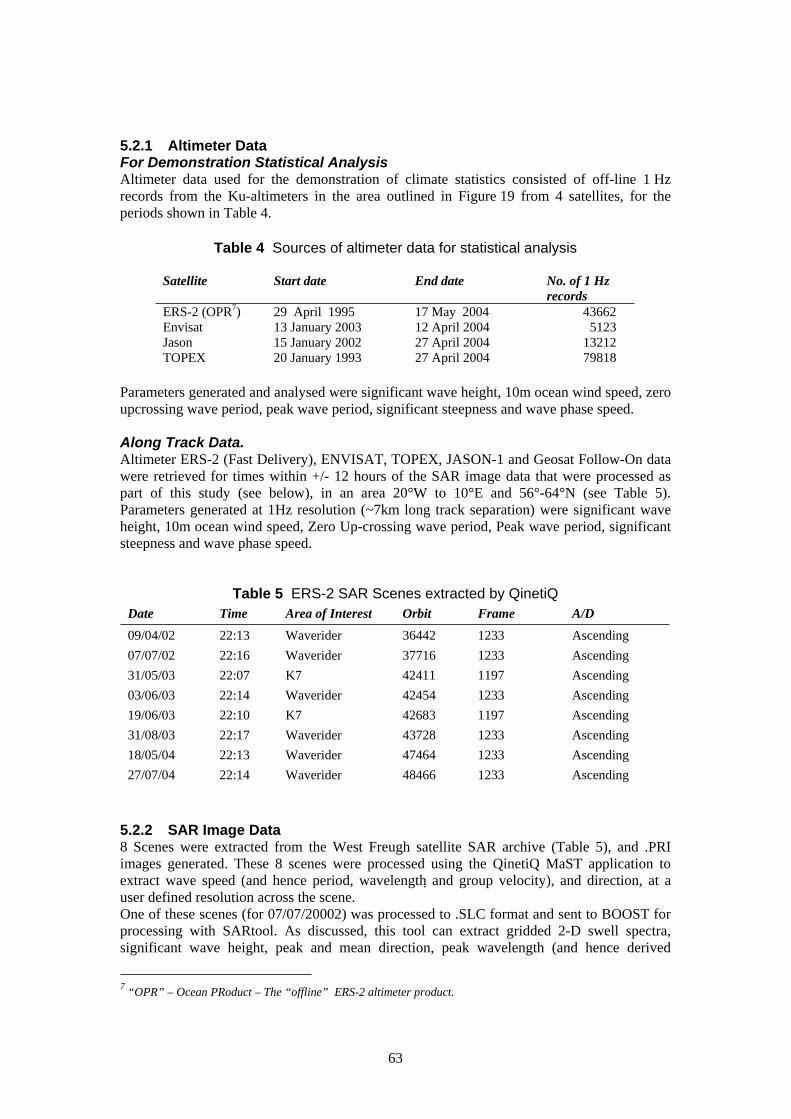
5.2.1 Altimeter Data For Demonstration Statistical Analysis Altimeter data used for the demonstration of climate statistics consisted of off-line 1 Hz
records from the Ku-altimeters in the area outlined in Figure 19 from 4 satellites, for the
periods shown in Table 4.
Table 4 Sources of altimeter data for statistical analysis
Satellite Start date End date No. of 1 Hz
records
ERS-2 (OPR7) 29 April 1995 17 May 2004 43662
Envisat 13 January 2003 12 April 2004 5123
Jason 15 January 2002 27 April 2004 13212
TOPEX 20 January 1993 27 April 2004 79818
Parameters generated and analysed were significant wave height, 10m ocean wind speed, zero
upcrossing wave period, peak wave period, significant steepness and wave phase speed.
Along Track Data. Altimeter ERS-2 (Fast Delivery), ENVISAT, TOPEX, JASON-1 and Geosat Follow-On data
were retrieved for times within +/- 12 hours of the SAR image data that were processed as
part of this study (see below), in an area 20°W to 10°E and 56°-64°N (see Table 5).
Parameters generated at 1Hz resolution (~7km long track separation) were significant wave
height, 10m ocean wind speed, Zero Up-crossing wave period, Peak wave period, significant
steepness and wave phase speed.
Table 5 ERS-2 SAR Scenes extracted by QinetiQ Date Time Area of Interest Orbit Frame A/D
09/04/02 22:13 Waverider 36442 1233 Ascending
07/07/02 22:16 Waverider 37716 1233 Ascending
31/05/03 22:07 K7 42411 1197 Ascending
03/06/03 22:14 Waverider 42454 1233 Ascending
19/06/03 22:10 K7 42683 1197 Ascending
31/08/03 22:17 Waverider 43728 1233 Ascending
18/05/04 22:13 Waverider 47464 1233 Ascending
27/07/04 22:14 Waverider 48466 1233 Ascending
5.2.2 SAR Image Data 8 Scenes were extracted from the West Freugh satellite SAR archive (Table 5), and .PRI
images generated. These 8 scenes were processed using the QinetiQ MaST application to
extract wave speed (and hence period, wavelengthѽ and group velocity), and direction, at a
user defined resolution across the scene.
One of these scenes (for 07/07/20002) was processed to .SLC format and sent to BOOST for
processing with SARtool. As discussed, this tool can extract gridded 2-D swell spectra,
significant wave height, peak and mean direction, peak wavelength (and hence derived
7 “OPR” – Ocean PRoduct – The “offline” ERS-2 altimeter product.
63

significant steepness and wave velocity). These were again provided at a user-defined
resolution across the scene.
5.2.3 ENVISAT ASAR Wave Mode Data All available ENVISAT ASAR Wave Mode pass files which contained data within the region
52°-68N, 20°W-10°E for September and October 2004 were extracted from the ESA fast
delivery data stream and processed.
In addition archived ENVISAT ASAR Wave mode data that were available within the region
of interest for 3 of the dates on which ERS-2 SAR images were requested and provided
though ESA. The ASAR wave mode level 2 data provide estimates of the 2-D swell
spectrum, significant wave height, peak period, and peak direction
5.3 DATA FOR VALIDATION AND EVALUATION
5.3.1 Faroes Directional Wave Rider data The Faroes Oil Industry Group, FOIB, has installed and operate a buoy to the South of the
Faroes (See Section 3.1). Through FOIB SOS acquired CDs containing historical data from
10 February 1999 to 13 February 2004.
The buoy data were processed to generate monthly statistics and directional spectra and
derived parameters for comparison against the ERS-2 SAR images. Carter (2004) provides a
technical report.
5.3.2 Wave Model Output Danish Meteorological Institute (DMI) Archived Nowcast Data The Danish Meteorological Institute (DMI) provided archived wave model nowcast data for
the dates and times of the processed SAR images. The DMI wave model domain covers the
North Sea, North Atlantic, Baltic Sea and Mediterranean Sea.
Parameters were: significant wave height, mean wave period, peak wave period, mean wave
direction, swell height, swell direction, swell period and Charnock Number.
KNMI (Royal Netherlands Meteorological Institute) WAM ERA40 Global Wave Climatology) KNMI have generated a 45 year global wave climatology, forcing their global WAM wave
8model with the ECMWF “40 year” reanalysis wind fields (“ERA-40). Data were extracted to
allow comparison of monthly statistics from the buoy and altimeter data with the long-term
model based climatology.
5.4 SATELLITE ALTIMETER DATA PROCESSING CHAIN
Altimeter Data for Climate Analysis Altimeter data for climate analysis were retrieved from the Satellite Observing Systems’
WAVSAT database. The data extraction program applies validation checks on the 1 Hz
records, developed over the years to remove the bulk of dubious values.
The median wave height and wind speed from each transect of a 1° x 1° area was then
extracted (where there are at least 5 'good' 1 Hz records), and used as the basis for analysis.
8 ECMWF- European Centre for Medium Range Weather Forecasting
64

Calibration From comparisons with buoy measurements, it has been found that in most cases relatively
small linear corrections are needed to get agreement in significant wave height (Hs) and wind
speed estimates between altimeter and buoy values. The corrections depend upon the
altimeter, and are described in the WP 1.4 report (Cotton et al., 2004).
Along Track Data “Along track” ENVISAT, TOPEX , Jason-1, Geosat Follow-On and ERS-2 (Fast Delivery)
data were extracted for the days on which QinetiQ SAR imagery was available .
Calculation of Derived Products
Wind speed
In most cases altimeter wind speed is calculated from the V0 value, using an algorithm
derived by Witter & Chelton (1991). The exception is Jason, winds from this altimeter are
estimated from an algorithm involving V0 and Hs developed by Gourrion et al (2002). In all
cases the V0 values are adjusted to match the climate values measured by Geosat.
Wave periods Zero-upcrossing period and spectral frequency peak period were calculated using the
algorithm given by Gommenginger et al (2003)
Figure 20 Example of Jason-1 Data –Hs, U10, Tp and Tz plotted against latitude. The Jason track crosses land between 60°-61°, and 61°-62° (see Figure 21)
65

from Fig 20 Jason track
Figure 21 Map plot of altimeter Hs data for all available data within +/- 12 hours of 22:00 on 31/05/2004 – colour scale to right of plot. Different satellites are represented by different symbols at the centre of the coloured bars: GFO – black ‘+’, JASON – black ‘o’, TOPEX – white ‘o’ and ENVISAT – black ‘x’).
Examples of Along Track Altimeter Data The along track altimeter data (significant wave height, wind speed, wave period) and further
derived parameters (wave steepness, wave speed) can be presented in a number of ways. Here
we demonstrate 2 forms of presentation, a simple line plot against latitude (Figure 20), and on
a map, with the value of significant wave height colour coded (Figure 21). Figure 21 also
demonstrates the coverage presently available from altimeters in a 24 hour period.
5.5 SATELLITE SYNTHETIC APERTURE RADAR PROCESSING CHAIN
5.5.1 Satellite Synthetic Aperture Radar Image Mode Processing Chain Retrieval of Images The West Freugh data archive was searched for ERS-2 images acquired since 2002. Attention
was focused to two areas that fell within the main AOI:
x� Waverider Buoy at 61.3ºN, 6.3ºW
x� UKMO K7 Buoy at 60.7ºN, 4.5ºW
8 ERS-2 images were identified from the archive, and retrieved from W Freugh. One of these
was processed to .SLC format and sent to BOOST for processing with their SARtool.
Data Processing in MaST Processing of the ERS-2 SAR image data with MaST was carried out iteratively to determine
the most effective and universal set of parameters that could be achieved.
The time taken to process an image is largely dependent upon the factor at which the image is
processed. All bar one of the SAR images were processed at Factor 2 (the other at Factor 4)
and this took approximately 45 seconds. Post-processing, a Jpeg was saved for both the plain
(original) image and the target image. The target list was copied and pasted into a .txt file in a
tab delimited format, allowing the data to be later opened in MS excel.
Automation of the SAR Processing Chain Automation of the SAR processing chain would significantly reduce the requirement for user
intervention. An automated approach has been tested and successfully used for ship detection
using MaST and a similar approach for wave detection could be implemented.
66

Examples of Wave Parameter Output from MaST Figures 22 gives a demonstration of the output from the MaST application. The tool can
identify a number of wave trains in each cell. It calculates a wave speed, which can easily be
converted into a wave period, through equation (1):
Tp = 4S. cg / g (1)
and thence to wave length through the dispersion relation 2O�= g.Tp / 2S. (2)
Note that the MaST application is not able to provide an estimate of significant wave height,
or of the energy in different frequency bands and directions. In its present configuration the
application is not able to resolve a 180° ambiguity in the wave direction, and the tool defaults
to select the wave direction pointing towards the closest land.
Figure 22 Processed SAR Image for 09/04/2002 22:13:20: Top left – Raw output from MaST, Top right – Extracted wave vectors replotted as Time, and on a true lat-long grid to give true direction, bottom – polar plot of Frequency and direction of resolved wave vectors
The first panel of Figure 22 shows the overlay image as output direct from the MaST
processor (the red bars indicated direction and wave speed, the blue dots the centre of each
cell), the second panel shows the analysed data re-plotted on a true lat/long, with the wave
speed converted to wave period, and the third panel gives a polar plot representation of the
extracted wave vectors, plotted as direction against frequency. Note that the image in the first
panel is distorted to form the shape displayed, and so the directions indicated are not the true
directions (they are accurately depicted in the second panel). The magenta cross on panel 2
marks the location of the FOIB buoy.
67

On Figure 22 one can see that the default selection of direction towards the nearest land leads
to a (probably) unrealistic representation of the true wave direction for the cells lying to the
east of the Faroe Islands. This leads to a split distribution in the polar plot (again probably not
realistic).
Note that some cells display multiple solutions. This may represent the true situation on the
ocean surface, with waves coming from different directions and with different wavelengths.
BOOST Application A single (.SLC format) scene was sent to BOOST for processing on their SARtool
application. Their technique resolves the 180° directional ambiguity and is also able to extract
energy levels associated with the resolved wave fields, and so can provide an estimate of
significant wave height, as well as wave direction and wave length.
After initial setup it takes roughly half a day to process each image. The application is
configured primarily to provide high-resolution coastal wind and wave fields, and it is
understood that an external estimate of wind direction is necessary to allow wind speeds to be
determined. The wave field is determined independently of any external information – apart
from bottom topography, which is used in the image set up procedure.
This application thus allows the potential extraction of addition information (significant wave
height) not presently available through MaST, and resolves the 180° directional ambiguity.
The costs are higher than MaST, reflecting the time required in the initial setup procedure,
because the scheme is configured to provide high resolution coastal information.
Figure 23 Output from BOOST SarTool for the 07/07/2002 ERS-2 SAR image. Left Panel surface wind speed and direction (wind speed key below the figure), right panel wave period and direction (colour key below each panel).
Generating a Climatology from SAR image data It would be possible in principle to build a directional (long wavelength) climatology based
on SAR image data. This climatology could give frequency of occurrence in selected
directional sectors, and also directional occurrence statistics against wavelength. Analysis
should take into account the large annual cycle, and ideally a separate analysis provided for
each calendar month. The exact methodology would depend on the required application –
offshore or coastal. For offshore climatologies it would probably be most efficient to extract
68

a subset of representative information from each processed scene, and then to compile
information over a period of time , sufficiently long to support a reliable statistical analysis.
A number of factors come into consideration:
x� How to deal with any 180° ambiguity (from MaST)?
x� How to identify the most significant wave vectors?
x� How to select representative values?
x� How to deal in the statistical analysis of the restricted wind speed window within
which SAR data can be used to acquire wave information?
x� How to deal with the asymmetric lower cut-off wavelengths in the along track
(azimuth) and across track (range) directions.
Of course, all climatologies have their limitations, and a SAR based climatology should not
be dismissed purely on account of the above issues. Indeed a SAR climatology could provide
valuable information on swell wavelength and direction –especially important for large
floating oil and gas production platforms.
To our knowledge nobody to date has attempted to build an offshore wave climatology from
SAR image data. It is suggested that the best way forward may be through a pragmatic
empirical approach. Analysis of a number of SAR images could be used be to build a short
but representative data set, and statistics derived from this data set then compared with those
available from other sources (directional wave buoys, wave models).
Figure 24 ENVISAT ASAR wave mode “level 2” data for 18/05/2004
5.5.2 Satellite Synthetic Aperture Radar Wave Mode Processing Chain The ESA ENVISAT ASAR wave mode “level 2” wave spectrum product provides a
directional wave spectrum as energy levels in 24 wavelength and 36 direction bins. It also
provides an estimate of significant wave height, peak wavelength and wind speed. This
product is the standard ESA wave mode ocean product as available in the Near Real Time
and “offline” data sets. Figure 24 demonstrates the presentation of SAR wave mode data that
is provided through the ESA ENVIVIEW tool.
69

A Near Real Time operational processing chain would include daily extraction of ASAR
wave mode level 2 data from the ESA Near Real Time “Meteo” data stream – through an
automated ftp pull shell script. The same shell script would call (e.g. perl) routines to identify
the locations of the retrieved data and then process any data within the Area of Interest to
produce ASCII or XML files. Earlier versions of such a process implemented at Satellite
Observing Systems were run twice daily, with a maximum of 10 minutes entire processing
time.
5.5.3 Generating a Climatology from SAR wave mode data ASAR wave mode data could be used to build a directional (long wavelength) climatology. A
particular problem affecting our region of interest is that it has received less sampling from
ERS-1 and ERS-2 SAR wave mode than other areas due to instrument mode conflicts. Our
Area of Interest is now sampled by ENVISAT ASAR wave mode – but only 2 years data are
available, to date processed by a number of different versions of processing software.
An ASAR wave mode based climatology could take a similar form to that proposed for SAR
image data. However, it would be possible to add in an extra important variables through the
availability of (swell) significant wave height. As for the SAR image mode data, the ASAR
wave mode information relates to long wavelengths only, and analysis must bear in mind the
impact of the limited range of wind conditions within which wave information can be reliably
extracted (and the asymmetric wavelength cut-off).
The main issues impeding the development of such a climatology are the limited period of
availability of data (since 2002 only), the inhomogeneity of the data set so far available
(though reprocessing is planned by ESA starting early in 2005), and problems in establishing 9suitable quality control criteria for the user to apply .
5.6 ALTIMETER WAVE CLIMATOLOGY A limited climate data set, derived from altimeter data only, was generated to illustrate the
scope and style of products that could be set up in Phase 2.
A pronounced feature of the wave climate off Scotland is the within-year variability, with a
large annual cycle. So for most purposes, such as planning operations or investigating
whether conditions are particularly severe for the time of year, this cycle has to be taken into
account. This is generally achieved approximately by presenting statistics for each of the 12
calendar months - and this is what has been done for the demonstrator. (Sometimes all the
data are analysed together, for example when estimating the 100-year return value.)
However, this division into 12 months can result in too few data numbers for useful estimates.
Figure 25 shows the number of medians (i.e. to the number of transects with at least five
1 Hz records) in the demonstrator for each 1° bin for January. Note the significant reduction
in the number for the bin containing the Faroes.) This gives a useful estimate of the January
mean Hs (with a standard error of 0.1 ~ 0.2 m - calculated assuming the data are independent)
but only poor estimates of the parameter distributions, for example, of wave period - see
Figure 26.
9 Now addressed, see Johnsen (2005)
70
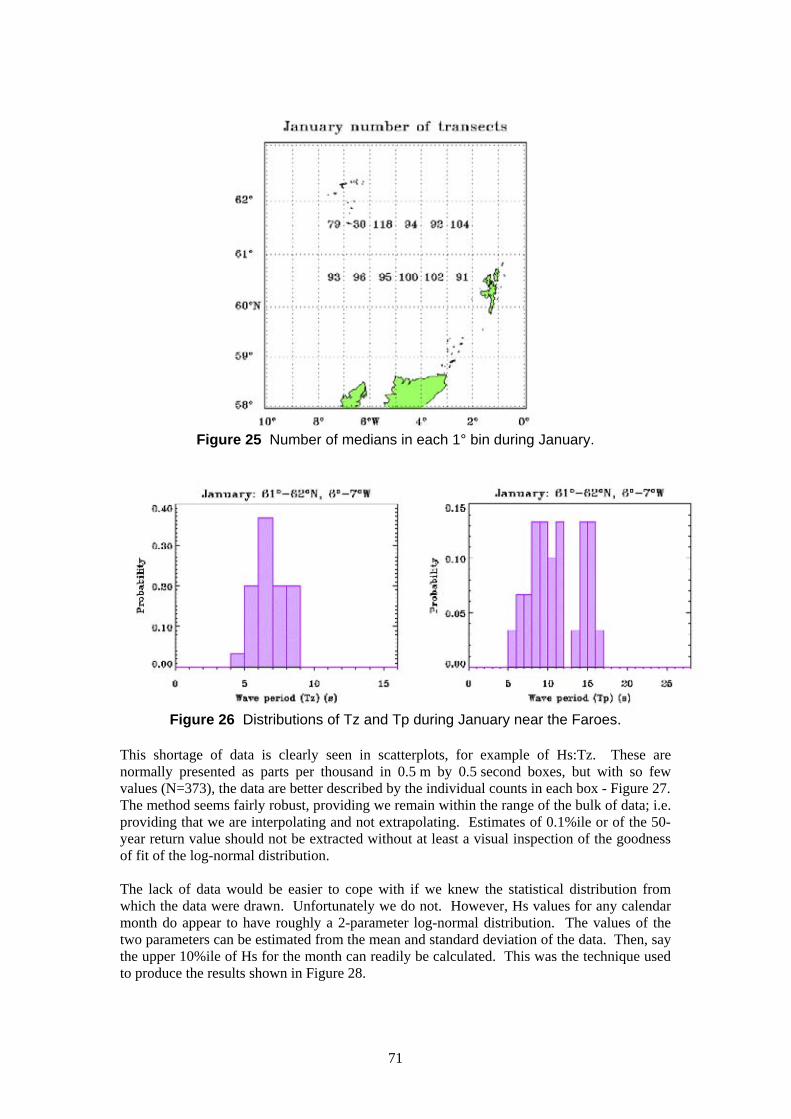
Figure 25 Number of medians in each 1° bin during January.
Figure 26 Distributions of Tz and Tp during January near the Faroes.
This shortage of data is clearly seen in scatterplots, for example of Hs:Tz. These are
normally presented as parts per thousand in 0.5 m by 0.5 second boxes, but with so few
values (N=373), the data are better described by the individual counts in each box - Figure 27.
The method seems fairly robust, providing we remain within the range of the bulk of data; i.e.
providing that we are interpolating and not extrapolating. Estimates of 0.1%ile or of the 50
year return value should not be extracted without at least a visual inspection of the goodness
of fit of the log-normal distribution.
The lack of data would be easier to cope with if we knew the statistical distribution from
which the data were drawn. Unfortunately we do not. However, Hs values for any calendar
month do appear to have roughly a 2-parameter log-normal distribution. The values of the
two parameters can be estimated from the mean and standard deviation of the data. Then, say
the upper 10%ile of Hs for the month can readily be calculated. This was the technique used
to produce the results shown in Figure 28.
71

Figure 27 Wave height: Wave period scatterplot (count of observations).
Figure 28 Significant wave height exceeded for 10% of the time during January.
The nadir-looking satellite altimeter does not measure any directional information, but as an
example we provide an example of how directional wave data can be presented within a
climate analysis (figure 29). These data are from the FOIB waverider. In principle, if the SAR
data were thought to be sufficiently reliable and accurate, and a suitably long time series of
data were available, it should be possible to generate similar analyses for long period, swell
waves.
72

Figure 29 Presentations of directional wave measurements from the FOIB buoy measurements, Top left- Percentage of observations with waves from the indicated direction. (Data in 20° bins, with true North vertically up.), Top Right – Mean all year Hs from various directions. Bottom Left – Mean Tz from various directions. Bottom Right – Mean Tp from various directions.
Web Site Demonstrator (http://www/satobsys.co.uk/Private/giftss_demo) Example statistics were made available through a web-site demonstrator. For this
demonstration each display (or .gif) had to be prepared in advance and linked to the web site.
A more sophisticated approach would be to connect the demonstrator to the SOS database, so
that the data could be extracted and analysed to provide the user with his required statistics
upon request. Such an approach would allow statistics to be more easily updated and, once
established, it could be easier to add additional procedures and presentations. The GIFTSS
Project might determine whether there is sufficient demand for such an on-line facility to
justify its development.
Figures 25-28 have been taken from the demonstrator.
5.7 NEAR REAL TIME PRESENTATIONS OF DATA In this section we show some possible presentations of satellite data for near real time
application. In the first example (figure 30), altimeter and ASAR wave mode data are colour
scaled and overlaid on the DMI nowcast model fields. Altimeter data are all the available data thwithin +/- 6 hours of the model nowcast time 22:00 UTC on the 19 June 2003, the
ENVISAT ASAR wave mode data were taken at 22:10
73
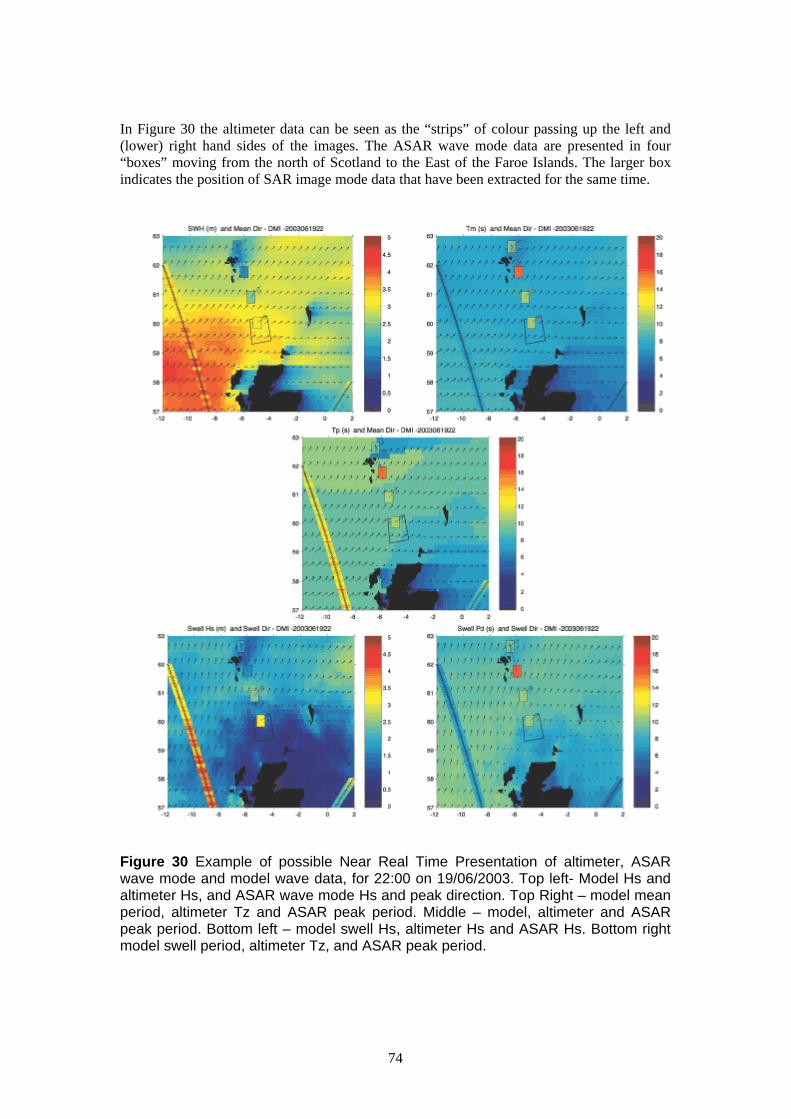
In Figure 30 the altimeter data can be seen as the “strips” of colour passing up the left and
(lower) right hand sides of the images. The ASAR wave mode data are presented in four
“boxes” moving from the north of Scotland to the East of the Faroe Islands. The larger box
indicates the position of SAR image mode data that have been extracted for the same time.
Figure 30 Example of possible Near Real Time Presentation of altimeter, ASAR wave mode and model wave data, for 22:00 on 19/06/2003. Top left- Model Hs and altimeter Hs, and ASAR wave mode Hs and peak direction. Top Right – model mean period, altimeter Tz and ASAR peak period. Middle – model, altimeter and ASAR peak period. Bottom left – model swell Hs, altimeter Hs and ASAR Hs. Bottom right model swell period, altimeter Tz, and ASAR peak period.
74

A number of important points should be noted:
x� The ASAR data closest to the Faroes seems to be invalid. It gives a direction close to
N, and an anomalously large period. It is possible the footprint of the SAR ‘imagette”
contains some land which would effect the analysis scheme.
x� Significant Wave Height - Altimeter and model Hs are seen to be in good agreement
(top left), but the ASAR wave mode Hs does not agree so well (bottom left). ASAR
Hs agrees better with the swell significant wave height (as may be expected).
x� Mean Direction and Swell Direction– There is little difference in this case between
model mean direction and swell direction. The ASAR directions agree well with
both.
x� Mean, Peak and swell period – The model mean period and altimeter zero up-
crossing period are seen to be in good agreement (top right). The ASAR “peak”
period agrees best with the model swell period (central panel and bottom right).
x� The ASAR swell Hs (bottom left panel) is too high. This can occur if the local wind
speed is low.
Key points are:
x� It is important to compare like with like, i.e altimeter Hs and model Hs, ASAR Hs
and model swell Hs, altimeter Tz and model Tmean, ASAR Tpeak and model Tswell.
x� Altimeter Tpeak does not at present compare well to the model fields (centre and
bottom right panels.
x� Better a priori quality control is required for ASAR wave mode data.
Figure 31 shows example output from the CAMMEO project, in which “layers” of satellite
altimeter and scatterometer data are presented on an interactive web map server interface.
This service is being developed under the European Space Agency’s Earth Observation
Market Development Programme, in a co-operation between the Norwegian Meteorological
Office and Satellite Observing Systems.
The user can click to advance or move back through time, to select different data sets for
display, to query individual data points, and to zoom in or out.
Figure 31 Example from CAMMEO web map server, with scatterometer data.
75

5.8 PRELIMINARY EVALUATION OF EO DATA In this section we present a limited initial evaluation of the data sets that have been produced
– this is beyond the strict scope of the Work Package 1.4 definition, but important to support
the specification of a demonstration product for Phase 2 of the project.
5.8.1 Altimeter Data The altimeter derived estimates of significant wave height and 10m ocean wind speed have
been extensively validated (Woolf 2004b and references therein). The altimeter derived zero
upcrossing wave period, Tz, has been shown to be accurate to better than 1s (Gommenginger
et al, (2003). As has been discussed, peak wave period, Tp, is less easy to validate, at least
partly because of the unstable nature of this parameter. With regard to altimeter derived
estimates of wave steepness and wave speed, the issues are the lack of availability of
reference data to validate these estimates against, and the reliability of the initial parameters
from which these secondary values are derived – Hs and Tz in the case of wave steepness,
and Tp in the case of wave speed.
Within this project we have been able to carry out an evaluation some of the altimeter
products – through a comparison of individual data records against the Faroes buoy data, and
a comparison of monthly mean values against buoy and KNMI model data.
TOPEX altimeter data are available near 61.24°N 6.1°W, within 12 km of the Faroes
Waverider buoy at 61.3°N 6.28°W. Estimates of significant wave height (Hs), zero-upcross
wave period (Tz) and spectral peak frequency period (Tp) from the Faroes buoy and the
TOPEX altimeter were compared. The Hs and Tz values from the altimeter were not found to
be significantly different from the measurements by the FOIB waverider buoy, but Tp did not
show good agreement.
The monthly means of Hs from the different sources (altimeter, buoy and model) appear to
agree well, especially when bearing in mind the different periods of time covered by the
different data sets, and the fact that the altimeter and model data are averaged over larger
regions, and the buoy data are for a single location only. The monthly mean wave periods
(Tz, Tm) also show encouraging correlation – but such good correlation was not seen in the
comparison of buoy and altimeter monthly mean peak period (See Woolf, 2004b, for more
detail).
A technical note by David Carter provides a detailed comparison between Faroes buoy and
altimeter derived monthly means (Carter 2004d ). He found that the means from the buoy - in
an exposed location to the South of the Faroes - are higher than those estimated from the
altimeter data using the 1° 'square' immediately around the Faroes (61°-62°N, 6°-7°W), which
includes some sheltered sea areas. Comparisons of altimeter data averaged over a more
exposed area, 61°-62°N 4°-5°W, and from a larger area 60°-62°N 2°-8°W areas with the buoy
means showed better agreement.
This result illustrates that a 1° 'square' can be too large an area for estimating wave climate at
a specific, near-coastal location, whilst in open waters the climate can be statistically
stationary over larger areas than 1° 'squares'.
5.8.2 Preliminary Comparison of SAR, Model and Buoy Data To date only a preliminary qualitative evaluation of the wave parameters derived from the
ERS-2 SAR images has been possible. Below, we present one of a series of comparative plots
of wave spectra from the Faroes Buoy, swell period and direction from the DMI wave model,
and wave period and direction arrows derived from the SAR imagery.
76

Figure 32 compares the different data sources available for 07/07/2002. Table 6 gives
approximate average estimates of wave parameters retrieved from the SAR image, the DMI
nowcast model, the Faroes waverider buoy, and, where available, ENVISAT ASAR wave
mode data.
In the case of the example in figure 32 we seem to get good quantitative agreement between
all sources of data. All sources show swell direction from 250°-260°, the SAR estimated
wave periods of 11.0-11.8s agree well with the buoy peak period of 11.8s (the model nowcast
predicted slightly lower swell periods of ~9s). The analysis from the SARtool processing
scheme (Figure 23) gave peak periods of 11.5-12.0 s, directions of 260° and significant wave
height of 2.0-2.5 m. SARtool has been found to overestimate wave heights under low wind
speed conditions, and BOOST plan to incorporate a calibration to take this factor into
account.
T
Hs= 1.51m Tp=11.8s,
02 = 7.41s Mean dir =260°
Figure 32 7th July 2002 22:00 UTC- ERS-2 SAR data (top left), DMI Wave model nowcast (top right) and Faroes Waverider Buoy spectra (bottom left) and buoy wave parameters (bottom left. ERS-2 SAR Wave period and direction are given in red and blue respectively. Model swell period and direction are given next to the respective arrows.
One should be careful of taking too much from these initial comparisons– noting in particular
the limited range of conditions covered - with wave direction predominantly from the south
west and periods ranging between 8 and 15 s. A much more extensive study, covering a wider
77

range of parameters would be required before it would be possible to generate estimates of
errors in the wave parameters extracted from the SAR image data, and ENVISAT ASAR
wave mode data.
Nonetheless we are able to note on a qualitative basis that there is an encouraging degree of
consistency between the wave parameters extracted from the ERS-2 SAR images, the
ENVISAT ASAR mode, the Faroes buoy spectra and the wave model nowcasts. This gives
us confidence that the SAR data can be used to generate useful estimates of wavelength and
direction of long wavelength waves in our area of interest.
Table 6 Summary of directional wave parameters retrieved from different data sets
Date SAR Image SAR Wave Buoy Spectra DMI
mode Mode / SARTool wave model
Tp (s) Dir Tp Dir Hs Tp / Dir Hs Tp Dir/ Hs
(°) (s) pk (m) T02 (s) mean (m) /Tsw Dir sw /Hs
(°) (°) (s) (°) sw
(m)
09/04/02 8.5 240 10.5 / 241 2.1 9.23 / 253 / 2.9 /
5.98 9.28 264 2.5
07/07/02 10.5 250 11.5 260 2.2 11.8/7. 260 1.5 10.2 / 262 1.7 /
41 9.0 /264 1.7
31/05/03 9-10 245 (8.3 / (253) (2.8) 10.2 / 90 / 50 2.3 /
6.67) 8.1 2.2
03/06/03 10-11 225 8.3 / - 90 / 1.8 11.0 / 90 /50 2.4 /
230 9.0 2.2
19/06/03 10-11 230 10.3 250 3.2 (10.5 / (236) (3.2) 8.4 / 250 2.9 /
6.45) 8.6 /240 2.4
31/08/03 14 250
18/05/04 11 235 11.0 230 2.4 10.5 / 263 3.4 10.2 / 250 / 2.9 /
7.14 9.58 241 2.4
27/07/04 11-12 260 10.2 / 280 / 1.9 /
- 280 1.9
Table 6 notes: SARTool wave parameters given in the ASAR wave mode column in italics
for 07/07/2002. ASAR WM directions +180°.
On 03/06/2003 2 separate wave peaks are seen in the buoy spectrum at 8.3s and 5s, directions
230° and 90’ respectively model is 17 hr forecast.
5.9 COMBINING ALTIMETER AND SAR WAVE INFORMATION Section 7 of the WP 1.4 report (Cotton et al, 2004) discussed the issues related to the
combination of wave information from different satellite data sets.
Four general approaches can be taken, two of which integrate the satellite data into model
based services, and two in which the satellite data remain independent:
1. Assimilation of the satellite data into operational nowcast, forecast or
hindcast wave models.
2. Use of satellite data to validate or calibrate wave models.
3. Direct combination of information from different satellite sources.
4. Combined presentation of separately sourced satellite data sets.
Approach 1) - is already implemented, in operational nowcast and forecast models (e.g. by
ECMWF, Météo France), and this approach is also under test in the EDOWA project using
the Météomer Hindcast model.
78

Approach 2) - has been taken to build the Eurowaves and WorldWaves services (Oceanor),
and the Oceanweather hindcast model data base.
Approach 3) - is of interest, as it would provide a single source of (satellite-derived) data,
independent of models and so capable of acting as independent verification. ARGOSS have
taken this approach in using scatterometer data to force a single cell wave model and so
produce the short wavelength wind-sea spectrum, which they have then combined with the
long wavelength spectrum from SAR. However, to our knowledge nobody has tried to
directly combine two independent sources of wave data gathered at times and places
separated by intervals greater than the known time and length scales of wave field variability-
except through the medium of a wave model (approach 1). In their climatologies, ARGOSS
and Météomer offer wave statistics based on analyses of altimeter and SAR data – but the two
sets of statistics are presented separately. Techniques do exist which could be used to
combine the two data sets to enable the production of joint statistics, such as the use of simple
propagation models, or the use of optimal interpolation techniques. Such approaches would
however require some specific research (in particular to ascertain whether the bias introduced
in the SAR data by the wind speed limitation on its data could be resolved). The application
of these would lie beyond the range of this project. The project could make a
recommendation to carry out such research, however, if the sponsors felt there was a strong
argument to do so.
Approach 4) - the presentation of SAR and altimeter data separately, is certainly possible. An
example of this type of presentation was demonstrated in Figure 30. This type of presentation
allows the user to interpolate by eye between measurements made at different locations,
evaluate the consistency between different data sources and so estimate a level of confidence
in the information provided. Experience in use of data presented in this way could lead to an
understanding of the conditions in which different data sets may be regarded as more reliable.
5.10 SAMPLING AND REQUIREMENTS FOR FURTHER DATA 5.10.1 Sampling and Grid Scales Table 1 in section 2 summarised sampling available from ENVISAT for the altimeter and
both SAR modes.
Altimeter Data Figure 21 gives an indication of the availability of altimeter data from all presently
operational satellites for a 24 hour period. Data from only 2 of these satellites (Jason and
ENVISAT) are available in real time. Data from other satellites is available at a few days
delay. Figure 25 shows an example of how many independent samples from satellite
altimeter data are available for generating climate means on a 1° x 1° grid – between 80-100
for an open ocean region in a given calendar month over ~10 years. Note that the square
directly over the Faroes buoy receives much less sampling.
SAR wave mode data
SAR wave mode data could be used to build a direction and wave length climatology of
longer period waves – though possibly on a relatively coarse grid (larger than 2° x 2°). A
specific problem for application of historical SAR wave mode data in our area of interest is
that the operation of the active microwave instrument (AMI) on ERS-1 and ERS-2 meant that
the SAR wave mode and SAR image mode could not operate at the same time. This had a
significant impact on SAR wave mode coverage over the northern North Sea, though recent
discussions with ECMWF have indicated that the impact over the North-Western Approaches
may not be as severe as was originally thought. The ESA help desk has been contacted with a
79

request for clarification of ERS-1 and ERS-2 wave mode coverage of this region, but we have
not yet received a response.
One possibility is that SAR image mode data could be used to “fill in the gaps” during the
periods, and over locations, when wave mode data are unavailable. By definition, ERS SAR
image data should normally be available when the wave mode data are not.
The ASAR wave mode on ENVISAT can, however, operate at the same time as the image
mode, and so better coverage is being provided in our area of interest. The main issue with
ENVISAT ASAR wave mode is that the archive from 2002 onwards is not homogeneous, as
the data processing software has been modified during the ENVISAT mission. Use of
ENVISAT ASAR wave mode data for climatology would require the historical data set to be
reprocessed. As noted above, we understand that this is planned at ESA, starting in January
2005.
Figure 33 Coverage of ENVISAT ASAR Wave mode data for October 2004 – all archived data (left), and data products available in Near Real Time (right)
Figure 33 shows the coverage of ENVISAT ASAR wave mode data for October 2004. The
maps seem to suggest a preferential sampling to the NW of Scotland – with the Shetland
Faroes channel perhaps receiving less dense coverage.
When wave mode data were retrieved from the Near Real Time data stream, only a subset of
these data seemed to be available as Fast Delivery (right panel) – such that in October 2004
31 wave spectra in total are available in the area 52°-68°N, 20°W-10°E
SAR image data
Coverage from SAR Image mode is probably sufficient to build a direction and wavelength
climatology of longer period waves, at least for the open ocean.
The ERS-2, ENVISAT and RADARsat SARs take images on a pre-programmed schedule
according to orders from the user community. In the case of ERS-2 and ENVISAT orders are
taken and programmed in once per repeat cycle (35 days). Thus if it were necessary to
provide guaranteed repeat coverage over a particular area of interest then a regular order
would have to be placed with ESA (or RADARSAT). If one wanted more than one image per
cycle (i.e. once every 35 days) then a multiple order, requesting acquisitions from different
orbits would be required.
80
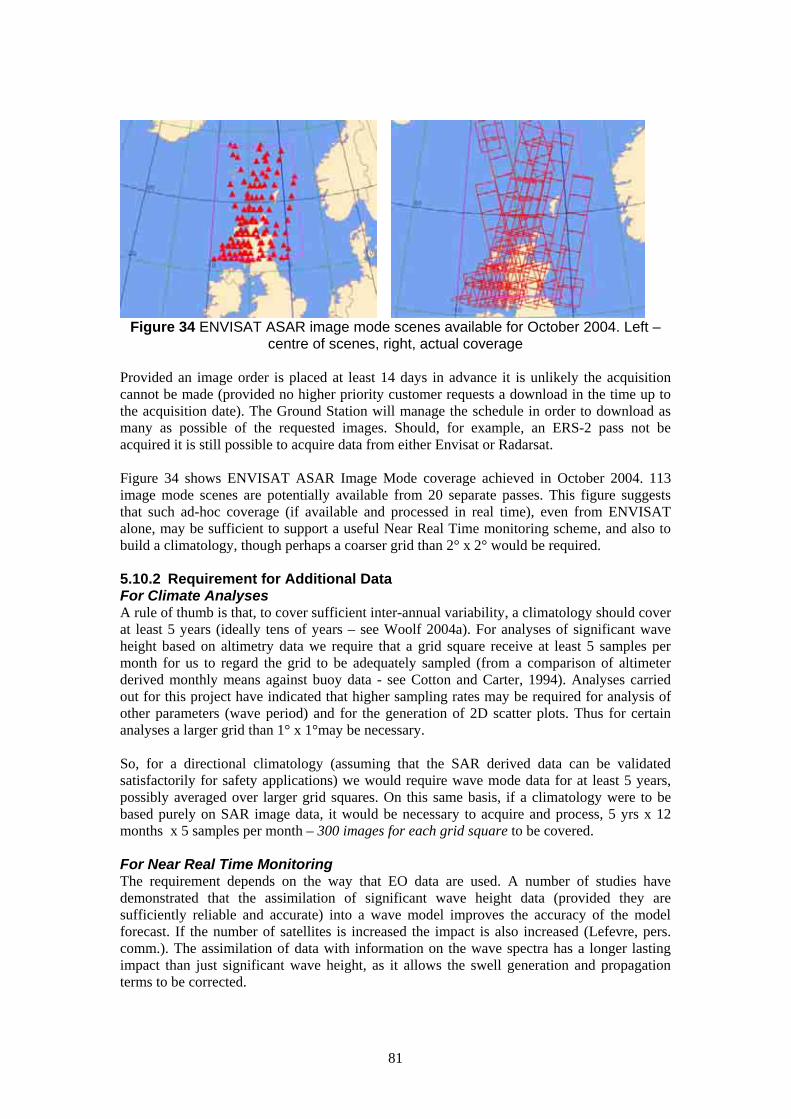
Figure 34 ENVISAT ASAR image mode scenes available for October 2004. Left – centre of scenes, right, actual coverage
Provided an image order is placed at least 14 days in advance it is unlikely the acquisition
cannot be made (provided no higher priority customer requests a download in the time up to
the acquisition date). The Ground Station will manage the schedule in order to download as
many as possible of the requested images. Should, for example, an ERS-2 pass not be
acquired it is still possible to acquire data from either Envisat or Radarsat.
Figure 34 shows ENVISAT ASAR Image Mode coverage achieved in October 2004. 113
image mode scenes are potentially available from 20 separate passes. This figure suggests
that such ad-hoc coverage (if available and processed in real time), even from ENVISAT
alone, may be sufficient to support a useful Near Real Time monitoring scheme, and also to
build a climatology, though perhaps a coarser grid than 2° x 2° would be required.
5.10.2 Requirement for Additional Data For Climate Analyses A rule of thumb is that, to cover sufficient inter-annual variability, a climatology should cover
at least 5 years (ideally tens of years – see Woolf 2004a). For analyses of significant wave
height based on altimetry data we require that a grid square receive at least 5 samples per
month for us to regard the grid to be adequately sampled (from a comparison of altimeter
derived monthly means against buoy data - see Cotton and Carter, 1994). Analyses carried
out for this project have indicated that higher sampling rates may be required for analysis of
other parameters (wave period) and for the generation of 2D scatter plots. Thus for certain
analyses a larger grid than 1° x 1°may be necessary.
So, for a directional climatology (assuming that the SAR derived data can be validated
satisfactorily for safety applications) we would require wave mode data for at least 5 years,
possibly averaged over larger grid squares. On this same basis, if a climatology were to be
based purely on SAR image data, it would be necessary to acquire and process, 5 yrs x 12
months x 5 samples per month – 300 images for each grid square to be covered.
For Near Real Time Monitoring The requirement depends on the way that EO data are used. A number of studies have
demonstrated that the assimilation of significant wave height data (provided they are
sufficiently reliable and accurate) into a wave model improves the accuracy of the model
forecast. If the number of satellites is increased the impact is also increased (Lefevre, pers.
comm.). The assimilation of data with information on the wave spectra has a longer lasting
impact than just significant wave height, as it allows the swell generation and propagation
terms to be corrected.
81
EO data can be used in other ways in real time monitoring systems– for instance as an overlay
on a model derived wave forecast or as a layer in a real time display system with information
layers from a number of sources (see figures 30 and 31). In such applications the EO data
must be available as quickly as possible, ideally in under 3 hours. To be effective in such
systems one would require satellite measurements at least daily (preferably more frequently)
within the domain of the display system. To achieve this over our area of interest, sampling
from at least 2 satellites is required.
5.11 SUMMARY Within this section we have described the processing chains established to process altimeter,
SAR image mode, and ASAR wave mode data. We have presented examples of the data
products thus produced, including a statistical climatological analysis based on altimeter data.
We have further assessed these data through comparison against wave model nowcasts and
climatologies, and directional buoy data from the FOIB buoy to the south of the Faroes.
Additional analyses have used the data to assess scales of variability, and how well the
sampling presently available from satellites meets the requirements for Near Real Time
services and the compilation of climate statistics.
It is clear from these analyses that different parameters from the various processing chains
meet the requirements for operational use to varying degrees, in terms of accuracy, sampling
capability and maturity of development. We summarise below the status of the various data
sets produced (refer also to Table 3 in Section 4).
Altimeter Data Altimeter significant wave height, wind speed and zero upcrossing wave period are validated,
accurate, and found to be reliable over a range of conditions (through extensive comparisons
against buoy data). Data are presently available in near real time from two satellites
(ENVISAT and Jason), and there is an archive of global data going back to 1985. Coverage is
sufficient to compile a global monthly climatology on a 2° x 2° grid from 1985, or on a
regional NE Atlantic / Northern N Sea 1° x 1° grid from 1992 onwards.
Coverage with altimeter data alone is not sufficient to support a useful real time wave
monitoring service. Reference to data with higher spatial and temporal coverage is required.
The altimeter estimate of peak wave period is not sufficiently mature for implementation.
Comparison against other sources of peak wave period show large variability, suggesting that
further algorithm development is required.
Significant steepness is derived from significant wave height and zero up-crossing wave
period (Annex A). We have confidence in both these source measurements and so might hope
a parameter derived from these parameters would be reliable. However, there is little
available information for validation of this parameter. Thus an altimeter significant steepness
could be implemented for trial operational use, but its use should be subject to further
validation against reliable reference data sets.
Group wave speed is derived from peak wave period (Annex A). Given our lack of
confidence in altimeter derived peak wave period, we would not recommend use of an
altimeter derived wave speed.
Hence for climatological applications, altimeter measured Hs (graded 1) and wave period
(graded 2e) were identified as potential stand alone, or major, data sources. Altimeter
measurements of peak period, significant steepness and wave (group) velocity were all graded
82

3e, indicating that future application may be possible the subscript e indicating that further
algorithm development would be required. Of these latter three parameters, significant
steepness perhaps shows the most promise.
For Near Real Time applications, limited sampling results in all altimeter derived wave
parameters being graded 3d (other data sources more important, limited sampling in time
being the problem). Even so, it should be recognised that altimeter data can play an important
role in NRT systems, as they provide an actual measurement of conditions against which
modelled predictions can be evaluated.
SAR Data General SAR issues Satellite SAR is able to image longer wavelength waves only (with a minimum lower
wavelength cut-off of 100m in the range direction and 200m in the azimuth direction). Recent
analyses of ENVISAT data (Johnsen et al, 2003) have suggested best results are gained for
seas with wave periods of over 8 s.
The imaging mechanism is highly dependant on wind speed, with the extraction of wave
parameters being most successful in the wind speed range 3-11 ms-1.
The movement of the satellite creates an additional complicating factor in the imaging
process – such that the lower wavelength cut-off is asymmetric in the azimuth (along track)
and range (across track) directions. This creates the possibility that wave statistics gathered
from tracks passing the area of interest in one direction (e.g. ascending passes moving from
SW to NE) will show different directional distributions than statistics gathered from passes in
the other direction (SE-NW).
SAR image mode (MaST) SAR image mode data processed through the QinetiQ MaST application can provide
potentially valuable direction and wavelength (and wave speed) information on longer ocean
waves. SAR image data processed with similar techniques have been used for case studies of
wave fields along particular stretches of coastline but not, to our knowledge, for the
generation of offshore wave climatologies or to support near real time wave monitoring
systems (except through assimilation into operational wave models).
The limited evaluation that has been possible within this project has identified that a number
of different wave trains can be identified for each sub-cell within an image, but that it is not
possible to identify the dominant wave system, as no estimate of wave energy is available. In
addition, the scheme retains a 180° ambiguity on the direction of identified wave systems,
presently resolved by assuming the waves are traveling towards the nearest land.
It is suggested that these data are sufficiently mature for a trial application, but would require
a more thorough validation before implementation in a safety critical use. Hence SAR wave
period and direction derived from MaST were graded 2bc for climatological application
(further algorithm development required – spatial sampling may be an issue), and 3d for NRT
applications (sampling in time an issue). Wave speed is graded at 3 for both NRT and
climatological applications – the sampling limitations still apply, and in addition further
validation is required.
SAR image mode (SARtool) The new SAR image processing technique implemented by BOOST makes use of complex
SAR image data and is able to estimate wave energy as well as resolve the 180° ambiguity. It
is thus able to provide estimates of significant wave height and wind speed, and to identify
the peak frequency and direction. It is also possible therefore (in principle) to generate
83

estimates of significant steepness (of longer waves) and wave speed. The operation of the
system is presently operator intensive, as it is set up to provide high-resolution coastal wave
fields.
The processing algorithms, developed by the ENVIWAVE consortium, are the same as those
used by ESA to process the ENVISAT ASAR wave mode data. Validation has been
undertaken, continues, and has been reported in a number of ENVISAT studies (e.g. Johnsen
et al., 2003). Wave parameters (Hs, direction, wavelength) estimated through this scheme
have been found to be reliable in the wave period range 8 – 15 s.
This processing scheme therefore shows some potential advantages against MaST, but the
operating costs are currently much higher, as the system is set up for coastal applications.
SAR wave period and direction derived from SARtool were given the same gradings as the
MaST derived estimates. The additional parameters possible from SARtool (Hs, mean period
and significant steepness) were graded at 3 for climatological and NRT applications, as
further testing (and possibly algorithm development) are required.
(A)SAR wave mode Since 1991, ERS-1 and ERS-2 SAR wave mode data have been used to generate global and
regional directional wave climatologies, and have been assimilated into operational wave
models. However, success has been variable. Early processing schemes required a first guess
spectra from a wave model, or estimates from scatterometer winds, and the processing
schemes were not able to resolve the 180° wave direction ambiguity problem.
The new instrument and processing chain for the ASAR wave mode on ENVISAT employs a
more sophisticated wave retrieval algorithm which does not require a first guess wave field
from a model, can provide an estimate of significant wave height (and wind speed) and
resolves the 180° wave direction ambiguity. This is the same algorithm that is implemented in
the BOOST SARtool. Thus this instrument and data set show much promise for practical
operational implementation in that it offers measurements of (long wavelength) significant
wave height, peak direction and period, and wind speed.
The data could be used for:
i) near real time applications (the ASAR wave mode level 2 data are included in the
ESA ENVISAT near real time data stream and are received at Satellite Observing
Systems), and
ii) for the generation of directional wave climatologies in the area of interest.
Unfortunately there have been some early teething problems in the generation of the
ENVISAT ASAR wave mode data set. Following initial (and subsequent) validation of the
product by ESA, periodic modifications were made to the processing chain such that the
archived data set is not homogeneous. Thus, for implementation in a climatological data base
a reprocessing of the (2 years) of archived data will be necessary. We now understand that
ESA plan to reprocess the backlog of data (from December 2002 onwards) starting in January
2005. In addition, there have been some issues in identifying and applying suitable quality
control criteria. We understand that ESA have now implemented an improved land masking
procedure (Johnsen, pers. comm.) Also Johnsen (2005) provides some updated guidance for
quality control.
Thus, the ENVISAT ASAR wave mode data show a potential value for application to support
weather safety in the NW approaches – in that they could provide important directional wave
84

information together with estimates of wave height, that the data are already available on an
operational near real time data stream, and that the potential costs for acquiring and
processing these data are significantly lower than for SAR image mode. NRT data are
available now, and a system using ASAR WM data could be implemented immediately, for
climatological/ statistical applications it may be necessary to wait for 6 months to a year for
the generation of a homogeneous archive, and for the quality control issues to be settled.
SAR WM derived parameters were given the same gradings as those derived from Image
Mode data using SARtool – as essentially the same algorithms are used.
85

6 SPECIFIC SUMMARY ON SAR CAPABILITIES
6.1 TO WHAT EXTENT CAN SAR ASSIST HSE TO EXECUTE ITS DUTIES?
Accurate information on wave height, direction and period is essential to support the safety of
offshore operations. This includes the use of data to build climatology and long-term statistics
for the safe planning of offshore operations and design of structures and vessels, plus the use
of near real time data, and forecasts, for decision support during operations,
The requirement for directional wave information has become even more important since oil
and gas exploration moved into deeper water, off the NW approaches to the UK and
elsewhere. New or changed requirements for wave measurements include:
x� The need to design safe operational procedures in new operating conditions.
x� The need for reliable monitoring of potentially more extreme operating
conditions.
x� The need to operate within strict, safety critical, wave conditions limits.
For most of the area of interest, satellite SAR offers the only available measured source of
direction and period of long wavelength waves, the very waves to which offshore structures
can be particularly vulnerable. Such information is otherwise only available through very
sparse in situ data, or wave-model predictions. Wave models are known to have difficulty in
accurately predicting the propagation of long wavelength swell. Therefore, potentially SAR
data can play a very important role.
However, SAR cannot be relied upon as the ONLY source of information, because of the
infrequent sampling available, the limited range of wind speeds over which reliable
measurements can be made, and other limitations detailed elsewhere. It is essential that SAR
data be viewed as one element of an integrated service which combines SAR data with
information from other sources (altimeters, scatterometers, in-situ instrumentation and
models). This sampling limitation is the principle reason why SAR derived wave products
were given a “2” grading for climatological applications (- a major source of data) and a “3”
grading for NRT applications (one of a number of sources, and not THE major source).
The previous section outlined what SAR data were capable of providing in the short term.
These are:
x� A Near Real Time monitoring system which combines information from SAR,
with measurements from satellite altimeters and scatterometers as layers on top
of model predictions, to allow the user to evaluate the information from each
source and come to a view as to the reliability of the predictions /measurements
and so take appropriate action.
x� A demonstration of SAR based climatology, and evaluation, which would
provide a more thorough basis for costed recommendations for the development
of a full (SAR based) wave statistics database.
86

6.2 WHAT WOULD BE REQUIRED TO IMPROVE THE SITUATION AND WHAT ARE THE LIKELY TIME SCALES ASSOCIATED WITH THIS?
Validation Because of the known limitations of SAR wave data it is especially important to validate fully
all new applications of SAR wave data. A limited validation would be possible on the
demonstration SAR based wave statistics set proposed for phase 2 and could be achieved
within 3 months. A full validation would require the wave detection algorithm of MaST to be
run on imagery over AOI where timely in situ data available on swell wave direction and
speed are available, under the full range of meteorological and sea state conditions under
consideration. The assessment in WP1.4 was provided after a limited qualitative comparison
between SAR, model and buoy measurements, from only 10 occasions and over a limited
range of conditions. This analysis is not sufficient as validation to support a full and final
operational implementation, and a much larger data set is clearly required to provide reliable
error statistics. A more complete validation would require a larger data set, and would
therefore be a longer term prospect (~ 1 year)
Processing Chain Developments To include SAR image mode data into the NRT monitoring system QinetiQ would need to
implement an automatic processing chain from the reception of data, pre-processing, transfer
to QinetiQ, processing on MaST and then transfer to the web–based monitoring system.
There are no technical difficulties in establishing such a chain, which could be achieved
within an estimated time scale of 1 month.
The SAR wave product would be enhanced if the “ENVIVIEW” processing algorithms could
be incorporated, then estimates of wave energy and swell significant wave height would be
possible (and the 180° directional ambiguity removed). Again there are no major technical
obstacles. The estimated time scale here is 2 months, assuming that the algorithms require no
further development and are available in a form easy to implement.
Another possible enhancement would include the use of scatterometer data to generate the
short wavelength spectrum - which could then be combined with the long wavelength
spectrum available from SAR. With support, this capability could be developed within a 3
month period.
Archive Data Base for Wave Statistics At least 5 years data are required for a valid statistical wave data base, to include the effects
of inter-annual variability. For SAR wave mode data, archived ERS-1 and ERS-2 data are
available and we understand that reprocessed ENVISAT ASAR wave mode data should be
available in 2005. Thus an archive SAR wave mode data base should be possible within a
period 6 months to 1 year. Careful validation would be required, (see above) possibly adding
3-6 months to this time scale.
If SAR image mode data are to be used to generate a statistical data base (either to
supplement or as an replacement for the wave mode data base), again 5 years data would be
required. We have identified that this would require the processing of 300 images per grid
cell. It has been estimated this could be achieved within a 3 month period, including the
automation of the SAR analysis process discussed above.
87

Research HSE /BNSC have expressed a strong interest in achieving a more direct combination of
different EO sources of wave data. We have indicated that in our opinion this would require
some specific targeted research, to allow the exploration and testing of different possible
techniques. Hence for this aspect we can expect time scales of order 1 year.
Capacity Building To date, in the UK, relatively little use has been made of SAR data for offshore wave
monitoring and wave climate analysis. Presently, the “State of the Art” in the UK, in terms of
operational application of wave products from SAR, lies somewhat behind that of other
countries in Europe. In addition, the NW Approaches region presents a particular set of wave
conditions and operational circumstances which require a carefully validated product.
This leads to the situation whereby, in the short term, the capability does not exist in the UK
to implement an operational service which can exploit SAR data to its fullest extent.
However, the project team are able to provide a demonstration service, an assessment of the
present and potential capability of such a service, and a costed “route map” towards a full
implementation of a service which includes NRT monitoring, and the provision of wave
climate statistics.
Some of this development will require research, and the development of expertise within the
UK. Acknowledging that there is a need to build UK capability to at least match that of our
European competitors, SOS and SOC are investigating a possible bid into the NERC
Knowledge Transfer fund.
88
7 INITIAL CONCEPT FOR A NW APPROACHES WAVE MONITORING SERVICE
7.1 INTRODUCTION This section describes an initial concept for a “NW Approaches Wave Conditions Monitoring
and Analysis Service”, and proposes a data product for Phase 2 of the project which will
demonstrate key aspects of the final service and lead to fully evaluated and costed
recommendations for future service implementation and development
The objective is to provide an initial specification for a service which will:
a) Satisfy the joint sponsor priorities of providing statistical analyses of archived wave
data (including directional information) and a near real time wave monitoring service.
b) Offer a useful capability in the short term (i.e. was based upon existing capability,
and available operational data sets), but which will allow for future planned
incorporation of additional data sets and analysis capabilities. Costed
recommendations for implementation and service development will be provided as
part of Phase 2
In addition, because the application was related to safety of offshore operations, it was taken
as a requirement that the data sets and analysis applications must be robust, validated and
reliable, or alternatively that the limitations of the component and combined data sets are
clearly established.
The proposed initial service will use satellite radar altimeter and satellite synthetic aperture
radar data. The former will provide along track information on wave height, wave period and
wind speed, the latter directional information on long wavelength waves along track and
across a ~100 km wide swath. Other data sources could be included to provide supplementary
information, for instance scatterometer data to provide wind speed and direction, and wave
model nowcasts to provide a larger spatial context to the satellite data.
Other capabilities can be developed and integrated in the medium and longer term (see the
draft “Route Map” below)
Figure 35 demonstrates the key points of the proposed service architecture, and indicative
examples of the types of data product presentations that could be offered.
The overall concept is a web-based service providing a single entry point with links to two
effectively separate services:
x� NW Approaches Wave Climate Statistics: o A web based user interface generating queries into a MySQL wave climate database.
x� NW Approaches Wave Conditions Monitoring Service
o A web map server accessing data from near real time data feeds based on
XML format data products.
89

Service
A
zoom
i
Use of to sea
ii
of
data
Weather Safety in NW Approaches Wave Conditions Monitoring
FRONT PAGE
Statistics NRT monitoring
NW Approaches Wave Climate Statistics
Archive Display and Analysis
NW Approaches Wave Conditions Monitoring Service
Present and recent conditions
NRT Web map Server
Initial: Present data and last 10 days ltimeter, ASAR wave mode (wave dir, wave
length), Scatterometer Wave model nowcast Date and region selection. Imagecapability, select information layers, nteractive query on data points.
Developments: Establish NRT SAR (image mode) data processing chain,
Scatt data generate windspectrum.
Interactive query interface Select location and period, data set
Metadata: Summary of data available and meta-data information. Initially: simple distribut on plots – or links to prepared plots –arch ved altimeter data and sample SAR data Developments: Online generation statistical info and plots. Directional analyses from SAR (WM/IM )
Figure 35 Concept for Initial NW Approaches Wave Monitoring Service.
7.2 CONCEPT FOR WAVE CLIMATE STATISTICS - ARCHIVE DISPLAY AND ANALYSIS
7.2.1 OverviewA user interface, in the initial case probably a table–based text query interface, to be replaced
in the medium term by a web map server, will generate queries into a (MySQL) wave climate
database.
90

This query page will allow the user to specify area of interest (and time, if requested) and will
first return summary of available information. The minimum area resolution will be 1° x 1°,
or possibly 1° x 2°.
The summary data display will be in the form of text tables (e.g. data sources, available
parameters, no of records,…..)
In the first service there will then be capability to link to summary plots (e.g. histograms,
distributions, ……)., later versions would provide a capability to generate requested plots on
line.
7.2.2 Description of Data Sets Available Two data streams will be available: non-directional and directional data. Table 7 provides an
overview.
Table 7 Data table for the wave statistics service. Data sets in bold would form the basis of the initial service. Data sets in italic could be added subsequently.
Instrument Source Parameters Spatial overage Time
coverage
Altimeter Geosat 1985-89
ERS-1 1991-96
ERS-2 Hs, Tz, U10 Whole region, 1995-2004
TOPEX / Poseidon Sig steepness transect medians on 1992-2004
Jason 1° x 1° or 1° x 2° 2002-2004
Envisat grid 2002-2004
GFO 2000-2004
(A)SAR Image (long period) Pre selected sub 27 images
Mode ERS-2 Wave area (~1° x 2°)
direction, wave
ENVISAT period, wave Whole region
Radarsat speed 1992-2004
Hs, steepness (A)SAR Wave ENVISAT (long period) 2002
Mode Wave direction, onwards
wave period, Whole region –
wave speed possibly at reduced Hs, steepness resolution
ERS1,2 dirn, period 1991-2002
Non-directional information Altimeter derived wave parameters: Hs, Tz, wind speed and significant steepness
A complete archive of these data, from 1985-2004, exists. It is proposed that the database
would include median values of transects on a 1°x 1° or 1° x 2 grid.
These median values would form the basic data set for the generation of statistics
(distribution functions, percentile plots, occurrence histograms/scatter plots, etc.). Figures 25
28 gave examples of possible analyses of non-directional data.
Directional Swell Information This could be derived from (A)SAR Image Mode data or (A)SAR Wave Mode data, or a
combination of the two.
(A)SAR Wave Mode
91

Historical ERS-1, ERS-2 SAR Wave Mode data are potentially available for the period 1991
2002. Unless supplemented by external information (from wave models or scatterometer
winds) these data could provide swell wave direction (with 180° ambiguity) and wave period
statistics only. ERS-1 and ERS-2 SAR Wave Mode could not operate when the SAR was in
Image Mode.
ENVISAT ASAR Wave Mode (2002 onwards) can provide swell direction (without 180°
ambiguity), period and significant wave height, but reprocessing is required to generate a
homogeneous archive (planned to be started by ESA early in 2005). There is no operational
conflict between the ENVISAT ASAR Wave Mode and Image Modes.
(A)SAR Image Mode There is a considerable historical archive of (A)SAR Image Mode data, which could be used
to fill in sampling gaps when the SAR Wave Mode data were unavailable, or to provide
improved spatial resolution (e.g. close to coasts). The QinetiQ MaST tool, as it stands, will
provide swell wave direction (with 180° ambiguity) and period only. If modified to
implement the ENVIWAVE algorithms an unambiguous swell wave direction could be
retrieved as well as an estimate of (swell) significant wave height.
For a climatology at least 5 independent samples (i.e. from images, or Wave Mode imagettes,
on separate passes) per month will be required for a minimum period of 5 years, per grid cell.
It follows that each grid cell would require a minimum of 300 images (or Wave Mode
imagettes) to be processed.
Directional wave statistics presentation In the first instance percentage occurrence in 20° direction bins, and Tp occurrence against
direction can be plotted (see figure 29). When a greater volume of data becomes available,
these analyses could be sub-divided according to season, and possibly local wind conditions.
7.3 CONCEPT FOR NW APPROACHES NEAR REAL TIME WAVE CONDITIONS MONITORING SERVICE
7.3.1 OverviewThe NRT wave conditions monitoring service would be provided through a web based map
server displaying present and recent sea state conditions in the NE Atlantic region. The user
will be able to select data sets, zoom in and out on selected areas, move backwards and
forwards in time, and query individual data points.
7.3.2 Description of Data Sets Available In the initial implementation, altimeter (wave height and wind speed), ASAR Wave Mode
data (swell wavelength, direction, and swell significant wave height) and scatterometer (wind
speed and direction) data could be available, together with a layer containing a wave model
nowcast (see Table 8, figure 36 and figure 30 in section 5). EO data will be available at
geophysical data record maximum resolution (~7 km along track for altimeter data, along
track ASAR Wave Mode data at 100 km separation, and a 25 km x 25 km grid for
scatterometer data).
7.4 POSSIBLE DEVELOPMENTS Possible developments include:
o Incorporation of ENVIWAVE algorithms into MaST processing scheme, to remove
direction ambiguity, and allow extraction of swell significant wave height from SAR
Image Mode.
o Generation of wind sea spectrum from scatterometer data and combination with SAR
derived swell spectra to generate full wave spectra.
92
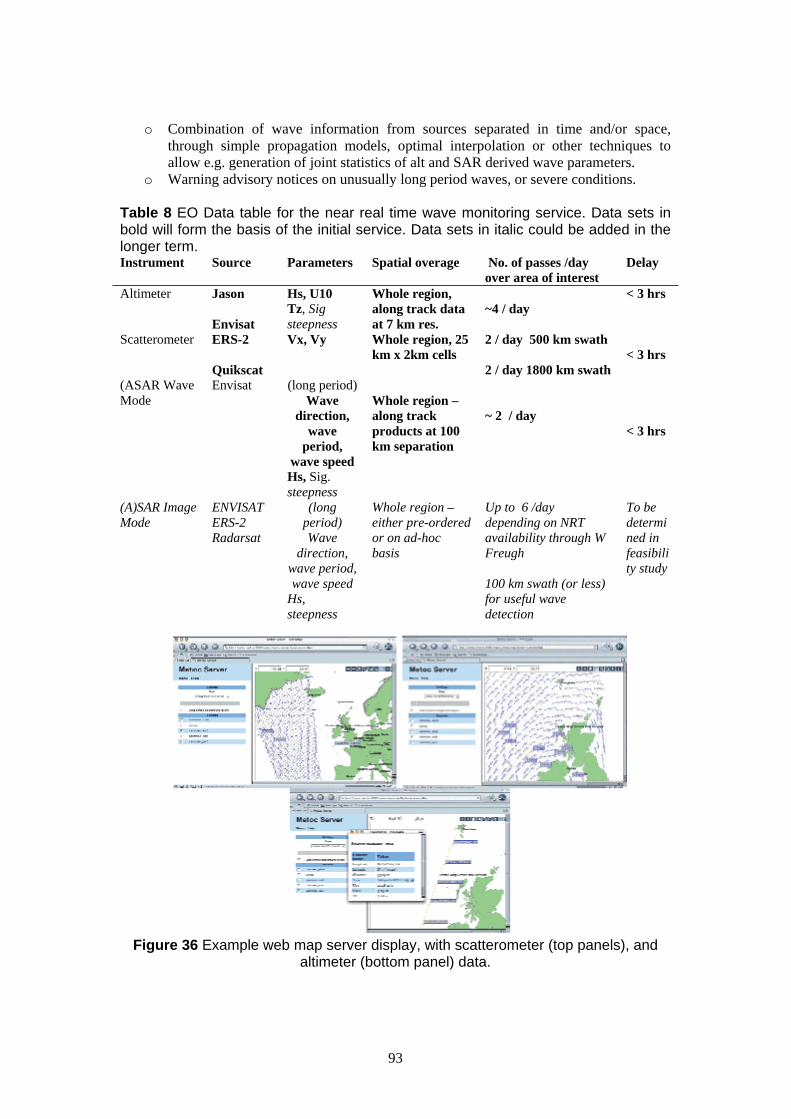
o Combination of wave information from sources separated in time and/or space,
through simple propagation models, optimal interpolation or other techniques to
allow e.g. generation of joint statistics of alt and SAR derived wave parameters.
o Warning advisory notices on unusually long period waves, or severe conditions.
Table 8 EO Data table for the near real time wave monitoring service. Data sets in bold will form the basis of the initial service. Data sets in italic could be added in the longer term. Instrument Source Parameters Spatial overage No. of passes /day Delay
over area of interest
Altimeter Jason Hs, U10 Whole region, < 3 hrs
Tz, Sig along track data ~4 / day
Envisat steepness at 7 km res.
Scatterometer ERS-2 Vx, Vy Whole region, 25 2 / day 500 km swath
km x 2km cells < 3 hrs
Quikscat 2 / day 1800 km swath
(ASAR Wave Envisat (long period)
Mode Wave Whole region –
direction, along track ~ 2 / day
wave products at 100 < 3 hrs
period, km separation
wave speed
Hs, Sig.
steepness (A)SAR Image ENVISAT (long Whole region – Up to 6 /day To be
Mode ERS-2 period) either pre-ordered depending on NRT determi Radarsat Wave or on ad-hoc availability through W ned in
direction, basis Freugh feasibili wave period, ty study
wave speed 100 km swath (or less) Hs, for useful wave
steepness detection
Figure 36 Example web map server display, with scatterometer (top panels), and altimeter (bottom panel) data.
93

7.5 DRAFT ROUTE TO IMPLEMENTATION Here we provide a draft definition of the service capability that could be implemented
immediately (i.e. in under 3 months), in the medium term (from 3 months to 1 year), or
capability which requires a more prolonged development before implementation (over 1
year).
7.5.1 Wave Statistics Immediately Available Capability (< 3 months)
x� Altimeter based wave statistics at 1° x 1°, or 1° x 2° resolution, covering the entire
Area of Interest based on a > 10 year archived database.
x� A demonstration of SAR derived wave statistics based on a limited region and season
of specific interest (from the analysis of 27 SAR images using the MaST tool as it
currently operates). This could allow for a more thorough validation of the MaST wave
product, in particular with regard to its capability to accurately represent the most
important characteristics of the long period wave climate in the NW approaches
Medium Term Added Capability (3 months –1 year)
x� Implementation of the ENVIWAVE processing scheme into the QinetiQ MaST tool –
to allow extraction of wave energy/ wave height from the SAR image and remove 180°
direction ambiguity.
x� An initial SAR Image Mode based climatology (with or without implementation of
ENVIWAVE algorithms).
x� An initial (A)SAR Wave Mode climatology, based on ERS-1, ERS-2 and
(reprocessed) ENVISAT ASAR Wave Mode data.
x� Statistical analysis of distributions based on full wave spectra achieved by a
combination of SAR (Image Mode or Wave Mode) and scatterometer derived directional
spectra
x� Initial validation.
Longer Term Possibilities (> 1 year)
x� Full SAR climatology for the NW approaches (Image Mode and / or Wave Mode).
x� Following research into the use of simple propagation models, and /or optimal
interpolation techniques, it may be possible to generate combined distribution functions
from SAR and altimeter (e.g. wave energy/ wave height vs wave direction).
7.5.2 Near Real Time Wave Monitoring Immediately Available Capability (< 3 months)
x� The pilot NRT CAMMEO system, as demonstrated in the WP 1.4 report (already
including scatterometer and altimeter data), can be provided to HSE immediately. Near
Real Time ASAR Wave Mode data will be added within the time scale of the GIFTSS
project.
x� A demonstration “delayed mode” version of the above, to allow a demonstration of
example Image Mode SAR data is planned within GIFTSS phase 2.
Medium Term Added Capability (3 months –1 year)
x� An operational, automatic SAR image processing chain is feasible within the medium
term. SAR images would be received at West Freugh, pre-processed then transferred to
Farnborough and automatically processed using an updated version of the MaST tool.
These SAR data could then be directly fed into a web map server based application (such
as CAMMEO, or the QinetiQ MIDAS system).
94

x� On the same time scale it would also be possible to generate a directional wave
spectrum including wind sea and swell, by using the scatterometer wind data to generate a
wind sea spectrum and combining with the long wave length SAR spectrum.
x� The system could also be developed to provide extra “added-value” capability, for
example, specific information (including warnings) on long period waves, and unusually
severe conditions.
Longer Term Possibilities (> 1 year)
x� Following research into the use of simple propagation models, and /or optimal
interpolation techniques, a NRT monitoring system could include a more integrated
presentation of satellite derived wave information.
7.6 PROPOSAL FOR PHASE 2 DATA PRODUCT The aims of the demonstration data product will be to:
x� Generate and evaluate a swell direction and period climatology derived from SAR
Image Mode data.
x� Demonstrate a prototype Near Real Time wave conditions monitoring service,
covering the North-Western Approaches, which includes EO data (altimeter, SAR Wave
Mode, scatterometer), model predictions, and some in-situ data.
We describe these two aspects separately below, first considering the use of SAR Image
Mode data to generate swell wave statistics.
7.6.1 SWELL Wave Statistics Overview Commercial organisations have used SAR Wave Mode data to provide a service which offers
swell wavelength and direction statistics, and some of these provide details of the validation
procedures they have carried out. However, we believe that there are particular circumstances
surrounding this specific application of SAR data that demand specific further evaluation.
Key issues are:
x� SAR Image Mode data have not been previously used to generate a climatology. A
first implementation should be carefully tested.
x� The NW Approaches is an area of high wind speeds. SAR wave imaging is only
effective for winds between 3-11 ms-1. It will be important to see how this dependency
effects sampling and so the generation of accurate, representative wave statistics.
x� The direction of the ascending and descending passes from the ERS and ENVISAT
satellites is such that the SAR azimuth direction for descending passes, and the SAR range
direction for ascending passes, lie in the NE-SW direction – the dominant direction for
swell waves. The lower wavelength cut-off in the azimuth direction can be expected to be
at least twice that in the range direction. Thus ascending passes will have a lower
wavelength cut-off of 100m in the predominant wave direction, whereas descending
passes will have a cut-off of at least 200m. It will be necessary to test for any consequent
asymmetry in sampling.
SAR Data to be processed The aims of the SAR Image Mode data products to be produced for Phase 2 (for statistical
analyses) are therefore:
x� To generate a representative swell direction and wavelength database, for a selected
region and season.
x� To provide a demonstration display of direction and wavelength statistics.
95

x� To assess the impact of high wind speed conditions on the sampling of the region by
SAR.
x� To establish if there is any difference in wave statistics derived from ascending and
descending passes and, if there is, develop a strategy to overcome it.
We propose to concentrate on an area to the South of the Faroe Islands, an area in which the
offshore oil and gas exploration industry are active, and for which representative in-situ buoy
data are available.
F
Figure 37 The GIFTSS Area of Interest. The red square indicates the region for which SAR Image Mode data will be extracted (plus the possible expansion, as a dashed line). The location of the Schiehallion production platform (“S”) and the Faroes waverider buoy (“F”) are also indicated.
Carter (2004a) compared wave data from the Faroes buoy (at 61.3°N, 6.28° W) with
altimeter data averaged over 3 areas (61°-62°N, 6°-7°W; 61°-62°N, 4°-5°W; 60°-62°N, 2°-
8°W), and although the first area lay directly over the Faroes buoy, found the altimeter data
from the last two regions agreed better with the buoy data, suggesting that the altimeter data
in the first region was affected by measurements in sheltered areas to the east of the Faroes.
Thus we propose to select SAR image data from 60°-61°, 4°-6°W, to provide sampling of
conditions representative of the Shetland-Faroes channel, and in wave climate found to be
similar to that experienced by the Faroes wave rider buoy. We will look for images in the
winter season (Dec-Feb). If this initial region does not yield a sufficient number of SAR
images, the search area will be widened longitudinally to 4°-8° W.
QinetiQ will identify, acquire and process 27 ERS-2 / ENVISAT SAR images in this area.
SAR processing After pre-processing each SAR image will be processed with the QinetiQ MaST package to
produce a file of wave field solutions with location, wave period and wave direction. For each
of these files an occurrence distribution on a direction / period grid (e.g. 10° x 0.5s resolution)
96
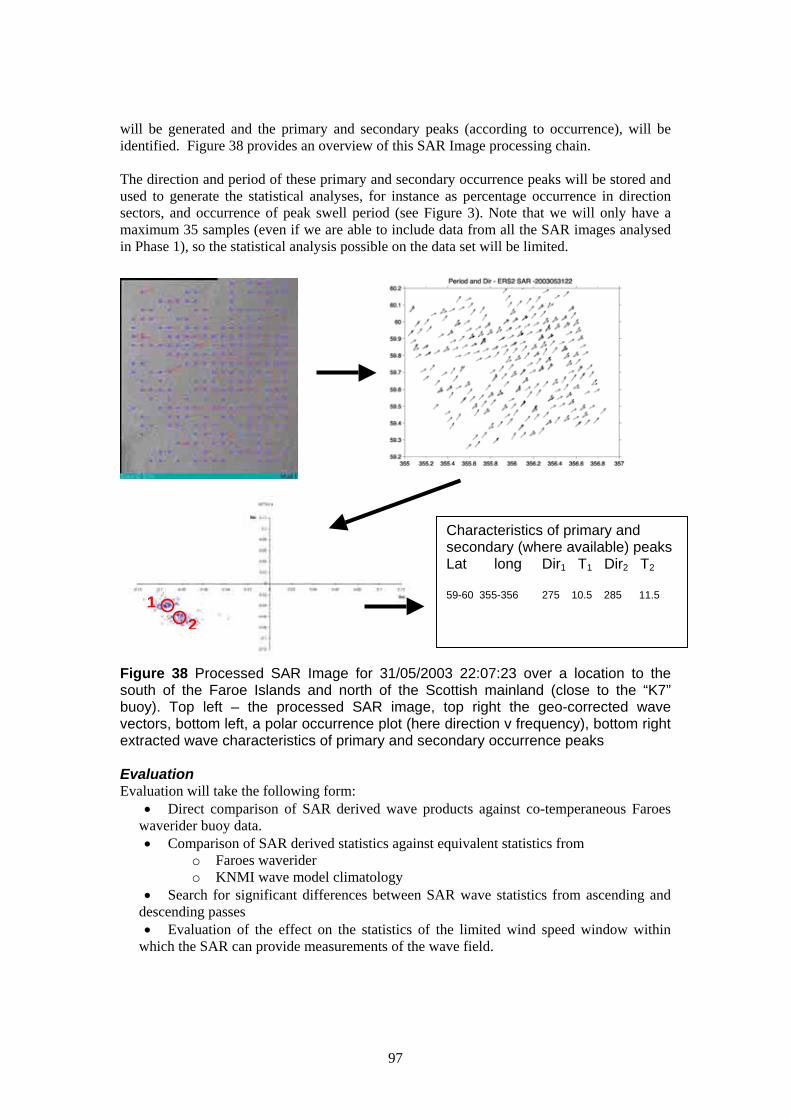
will be generated and the primary and secondary peaks (according to occurrence), will be
identified. Figure 38 provides an overview of this SAR Image processing chain.
The direction and period of these primary and secondary occurrence peaks will be stored and
used to generate the statistical analyses, for instance as percentage occurrence in direction
sectors, and occurrence of peak swell period (see Figure 3). Note that we will only have a
maximum 35 samples (even if we are able to include data from all the SAR images analysed
in Phase 1), so the statistical analysis possible on the data set will be limited.
1
2
secondary (where available) peaks Lat long Dir1 T1 Dir2 T2
59-60 275 10.5 11.5
Characteristics of primary and
355-356 285
Figure 38 Processed SAR Image for 31/05/2003 22:07:23 over a location to the south of the Faroe Islands and north of the Scottish mainland (close to the “K7” buoy). Top left – the processed SAR image, top right the geo-corrected wave vectors, bottom left, a polar occurrence plot (here direction v frequency), bottom right extracted wave characteristics of primary and secondary occurrence peaks
Evaluation Evaluation will take the following form:
x� Direct comparison of SAR derived wave products against co-temperaneous Faroes
waverider buoy data.
x� Comparison of SAR derived statistics against equivalent statistics from
o Faroes waverider
o KNMI wave model climatology
x� Search for significant differences between SAR wave statistics from ascending and
descending passes
x� Evaluation of the effect on the statistics of the limited wind speed window within
which the SAR can provide measurements of the wave field.
97

This evaluation is possible through the availability to the team of Faroes waverider buoy data
(1999-2004), and the KNMI wave climatology (1957-2002), and Quikscat scatterometer wind
vector data.
7.6.2 NRT Monitoring
Overview A prototype NRT wave conditions monitoring service will be provided through a web based
map server displaying present and recent sea state conditions in the NE Atlantic region. The
user will be able to select data sets, zoom into and out from selected areas, move backwards
and forwards in time, and query individual data points.
This service will be based on an update of the SOS/Met Norway “CAMMEO” service, built
on a web map server accessing data from near real time data feeds based on XML format data
products.
Description of Data Sets Available In the demonstration, NRT (< 3 hrs) altimeter data (wave height and wind speed), ASAR
Wave Mode data (swell peak wavelength , direction and significant wave height), and
scatterometer data (wind speed and direction) will be provided, together with a layer
containing a wave model nowcast (probably from Met Norway). Table 9 details the EO data
sources and figure 36 a demonstration of output from the unmodified CAMMEO service.
EO data will be available at geophysical data record maximum resolution ( ~7 km along track
for altimeter data, at 100km intervals for the ASAR Wave Mode data, and on a 25 km x 25
km grid for scatterometer data).
It is also proposed to demonstrate (possibly offline) and assess the inclusion of wave products
derived from SAR Image Mode data.
Table 9 EO Data table for the near real time wave monitoring service. Instrument Source Parameters Spatial overage No. of passes /day Delay
over area of interest
Altimeter Jason Hs, U10 Whole region, < 3 hrs
Tz, Sig along track data at ~4 / day
Envisat steepness 7 km res.
ASAR Wave Envisat Swell Whole region –
Mode direction, along track ~ 2 / day < 3 hrs
period & Hs products at 100
km separation
Scatterometer ERS-2 Vx, Vy Whole region, 25 2 / day 500 km swath
km x 2km cells < 3 hrs
Quikscat 2 / day 1800 km swath
Evaluation Evaluation will take the following form:
x� Direct comparison of SAR and altimeter wave products against Faroes waverider,
and other available (UKMO) buoy data
x� Direct comparison of SAR and altimeter wave products against the wave model.
x� Generation of data processing statistics, assessment of reliability of all parts of the
(EO) processing chain (e.g. % data retrieved in < 3 hours, 6 hours).
x� Evaluation from the potential user (HSE).
This evaluation possible through the availability to the team of Faroes waverider buoy data
(1999-2004), the Met Norway wave nowcast, and UKMO open ocean buoy data through the
Met Office web site.
98

8 CONCLUSIONS
This report has summarised the work undertaken for each task in phase 1, and provided an
overview of the results from each work package.
8.1 SENSORS AND PROCEDURES The sensors and processes used to derive the various wave products,for NRT monitoring and
for statistics, have been described in Section 4 (sensors) and Section 5 (processing chains).
8.2 ACCURACY AND TIMELINESS The capabilities of EO data to provide the wave products identified by the sponsors are
discussed in Section 4, and sumarised in Table 3. Section 5 provides a further evaluation of
early products generated specifically for this GIFTSS project.
8.3 SAR DATA The project sponsors requested a specific summary on the capability of SAR data, this is
provided in Section 6 – although all sections have been updated to reflect the latest
infomation available, and where necessary to add extra detail to answer specific queries from
the sponsors. As the project progressed it became apparent that the state of the art (at least
with regard to capability that exists in the UK) was not as far advanced as the sponsors had
initially understood. Thus to fully satisfy sponsor requirements some longer term capacity
building would be required.
8.4 FINAL COMMENTS The approach taken by the project team has been to give an honest, "warts and all" appraisal
of the wave products that can be derived from satellite measurements. However, whilst the
limitations of the various data products have been discussed in detail, this should not detract
from the fact that EO data can play a very important, central, role in a service which provides
monitoring and assessment of the sea state conditions in the NW Approaches to the UK. One
should always bear in mind the limitations of non-EO sources of infomation (Section 3), and
the fact that often satellites provide the only source of directly measured information on wave
conditions.
Section 7 outlines a vision for a service which would provide climate analyses based on EO
data, and a NRT monitoring system which integrates input from satellites, models and in situ
instrumentation. This section also provides an initial suggestion as to how this system could
be implemented. The data product proposed for Phase 2 would allow this implementation
plan to be fully assessed in terms of costs and benefits, and so lead to a more detailed, costed
recommendation for the implementation and development of a NW Approaches Sea State
Monitoring System.
99

100

REFERENCES
Bidlot J-R, Holmes D J, Witt man P A, Lalbeharry R & Chen H S 2002 Intercomparison of
the performance of operational ocean wave forecasting systems with buoy data. Weather
& Forecasting, 17, 287-310.
Carretero J C 2002
Report on the implementation of satellite data assimilation in operational wave
forecasting systems at national weather services. Report for the EC funded EnviWave
Project.
Carter, D. J. T., Foale, S. & Webb, D. J. 1991 Variations in global climate throughout the
year. Intern. J. Remote Sensing 12, 1687-1697.
Carter D J T & Tucker M J 1986 Uncertainties in environmental design criteria.
Underwater technology, 12, 2-8 & 33.
Challenor P. G., and P. D. Cotton, 2001, The joint calibration of altimeter and in situ wave
heights in "Advances in the Applications of Marine Climatology - The Dynamic Part of
the WMO Guide to the Applications of Marine Climatology WMO/TD-No. 1081,
WMO Geneva.
Cooper, C. K. & Forristall, G. K. 1997. The use of satellite altimeter data to estimate the
extreme wave climate. J. Atmos. & Oceanic Tech. 14, 254-266.
Cotton, P. D. et al. 1999. "Jericho" Final Report to the BNSC, Project No. R3/003, 38pp.
[Unpublished]. http://www.satobsys.co.uk/Jericho/webpages/jeripdf.html
Cotton P. D. and D.J.T. Carter, 1994. Cross calibration of Topex, ERS-1 and Geosat wave
heights. J. Geophys Res., 99, C12, 25025-25033.
Dankert H & Rosenthal W 2003, Ocean surface determination from X-band radar-image
sequences. Submitted to IEEE Trans. Geosci. Remote Sens..
Draper, L. 1991. Wave climate atlas of the British Isles. Offshore Technology Report OTH 89
303, HMSO, London, 11 pp. and plates.
Gommenginger C P, Srokosz M A, Challenor P G & Cotton P D. 2003., Measuring ocean
wave period with satellite altimeters: A simple empirical model., Geophys Research
Letters 30(22), 2150-2154.
Gourrion, J, Vandemark D , Bailey S A, Chapron B, Gommenginger C P, Challenor P G, &
Srokosz M A. 2002, A two parameter wind speed algorithm for Ku-band altimeters., J.
Atmos. Ocean Tech., 19(12), 2030-2048.
Gray, N., ‘MaST 2.0 engine command language reference’, Tidegreen Ltd. March 2002.
Gulev. S.K., V. Grigorieva, A. Sterl and D. Woolf. 2003. Assessment of the reliability of
wave observations from voluntary observing ships: insights from the validation of global
wind wave climatology from the VOS data. Journal of Geophysical Research, 108(C7),
3236, doi: 10.1029/2002JC001437.
Jeans G, Bellamy I, Jan de Vries J & van Weert P 2003. Sea trial of the new Datawell GPS
Directional Waverider. IEEE 7th Working Conference on Current Measurement, San
Diego USA
Johnsen H., G. Engen, and B. Chapron, 2003, Validation of ASAR wave mode level 2
product using WAM and buoy spectra, Proc. IGARSS ’03, Toulouse, July 21-25, 2003.
Johnsen H, 2005, ENVISAT ASAR Wave Mode Product Description and Reconstruction
Procedure . Note for ESA/ESRIN, 17/01/2005
Laing, A. K. & Reid, S. J. 1999. Wave climate in the Southwest Pacific from satellite and
ships' observations. Pp.149-157 in Preprint CLIMAR99: WMO Workshop on
Advances in Marine Climatology, Vancouver, Canada, September 1999.
Magnusson A K, Jenkins A, Niedermeier A & Borge J C N 2003, Extreme wave statistics
from time-series data.. Proc. MAXWAVE Meeting, 8-10 October 2003, Geneva.
Parker, J., Catto, J. and Lee-Bapty, I. P. ‘ The extraction of swell wave velocities from SAR
imagery’, QinetiQ working paper: QINETIQ/KI/SPACE/WP020416, March 2002.
Tucker M J & Pitt E G 2001. Waves in Ocean Engineering. Elsevier.
101

Woolf, D.K., P.G. Challenor and P.D. Cotton. 2002. The variability and predictability of
North Atlantic wave climate. Journal of Geophysical Research, 107(C10), 3145, doi:
10.1029/2001JC001124.
Woolf, D.K., P.D. Cotton and P.G. Challenor. 2003. Measurements of the offshore wave
climate around the British Isles by satellite altimeter. Philosophical Transactions:
Mathematical, Physical & Engineering Sciences, 361(1802), 27-31, doi:
10.1098/rsta.2002.1103
Woolf, D.K., J. Coll, S. Gibb and P.G. Challenor. 2004. Sensitivity of ferry services to the
Western Isles of Scotland to changes in wave climate. In Proceedings of OMAE’04, 23rd
International Conference on Offshore Mechanics and Arctic Engineering, ASME.
Witter D L & Chelton D B. 1991, A Geosat altimeter wind speed algorithm and a method for
altimeter wind speed algorithm development., J Geophys. Res., 96, 8853-8860.
Papers/Reports produced within this project Carter, D. J. T., 2004a, GIFTSS Work Package 1.2 Report, Capability of Non EO Data
Sources, 27th July 2004
Carter, D. J. T., 2004b, Waverider South of the Faroe Islands, GIFTSS Internal Report
October 2004
Carter, D. J. T., 2004c, Comparison of wave height and wind speed off the Faroes and at
Schiehallion FPSO, GIFTSS Internal Report October 2004
Carter, D. J. T., 2004d, Monthly means from Waverider & altimeters, GIFTSS Internal
Report November 2004
Cotton, P.D. and S. Caine, 2005, 1.4 Processing Chain for EO Wave Parameters, Examples
of Data Products and Evaluation, SAR Addendum. February 2005
Cotton, P. D., D.J.T. Carter, S. Caine, D. Woolf, 2004, GIFTSS Work Package 1.4 Report,
Processing Chain for EO Wave Parameters, Examples of Data Products and Evaluation,
November 2004
Woolf, D 2004a, GIFTSS Work Package 1.1 Report, Define Sampling Grid / Interval, 4th
October 2004
Woolf, D 2004b, GIFTSS Work Package 1.3 Report, Requirements and Availability of EO
data, 4th October 2004
102

GLOSSARY
ADEOS Short lived (1996-97) Japanese EO satellite
AES-40 40 yr North Atlantic Wave Climatology, developed by Oceanweather
AGU American Geophysical Union
ALOS Japanese Earth Observing satellite, with L-band SAR (built for land
observation). Was due for launch in 2004
AMI Active Microwave Instrument (ERS-1 and ERS-2)
AOI Area of Interest (56°-64°N, 10°W – 1°E)
ASAR: Advanced Synthetic Aperture Radar (carried on ENVISAT).
Azimuth Orthogonal to direction of SAR look, for side looking SAR - along track
direction
BNSC British National Space Centre
BOOST Young French SME, based in Brest, with SAR expertise
Bragg /scattering: Scattering of incident radar signal of similar wavelength to facets on the
reflecting surface (in this case, ocean waves – cm scale)
C-Band Radar frequency / wave length range (for both altimeters and SAR) ~ 4-6
GHz
CERSAT IFREMER laboratory dedicated to processing and archiving of satellite data -
Centre ERS d'Archivage et de Traitement
(http://www.ifremer.fr/cersat/en/index.htm)
DEFRA Government Department for Environment, Food and Rural Affairs.
DLR Deutsches Zentrum für Luft und Raumfart (German Space Agency).
DMC Disaster Monitoring Constellation. SSTL constellation of optical satellites.
DMI Danish Meteorological Institute
EC European Community
ECMWF European Centre for Medium-Range Weather Forecasts
EM Electro-Magnetic
ENVISAT: European Environment Monitoring Satellite, launched 2002.
ENVIVIEW Software distributed by ESA to view ENVISAT data products, (including
ASAR wave mode)
ENVIWAVE EC “Framework” project to develop ocean wave products from ENVISAT.
EO Earth Observation
EOF Empirical Orthogonal Function. Technique to identify modes of variability in
a data set.
EOLI Online catalogue for ERS and ENVISAT data
ERA-40 ECMWF Re-Analysis. 40 year atmospheric hind-cast
ERS-1: 1st European Remote Sensing Satellite (launched 1991)
ERS-2: 2nd European Remote Sensing Satellite (launched 1995)
ESA European Space Agency
FFT Fast Fourier Transform
FNMOC US Fleet Numerical Meteorology and Oceanography Center
FOAM: Forecasting Ocean Atmosphere Model. Ocean circulation model at the UK
Met. Office
FOIB Faroes Oil Industry Group
FPSO Floating Production, Storage and Offloading Installations
(EC) Framework Programmes A series of EC science and technology support
programmes
GAMBLE An EC “Thematic Network”, led by SOS to review future requirements for
satellite altimetry.
Geosat US Navy Altimeter Satellite (1985-90).
GIFTSS Government Information from the Space Sector – BNSC programme to help
UK government agencies implement information that has been derived from
satellites
103
GFO Geosat Follow-On - Follow on to Geosat (1998-)
GKSS Large Publicly funded German Research Organisation, The Institute for
Coastal Research is based at Geesthacht
GNSS: Global Navigation Satellite System
GPS: Global Positioning System.
GRIB Data format e.g for meteorological data as distributed on GTS
GROW Oceanweather’s global wave model
GTS Global Telecommunications System – used by national met agencies to
transfer/ exchange data.
HSE Health and Safety Executive
HF High Frequency
HH Horizontal polarisation of incident and reflected radar waves
IFREMER French Government Oceanographic Research Institute (Institut Francais de
Recherche pour l’Exploitation de la Mer
IM Image Mode
ITT Invitation To Tender
Jason: Ku / C-band altimeter launched in December 2001.
Jericho BNSC “LINK” project led by SOS to investigate possible consequences of a
changing coastal wave climate.
JONSWAP JOint North Sea WAve Project – a wave spectrum developed for fetch limited
waves.
Ka-Band Radar frequency band (18-40 Ghz), proposed for new technology satellite
radar altimeters
KNMI Royal Netherlands Meteorological Institute
Ku-Band Radar frequency band (12-18 Ghz), commonly used by satellite radar
altimeters
L-Band Radar frequency band (0.39-1.55 Ghz or 20 cm), proposed for some new
SAR satellites.
Level-0, 1, 2 Categories of data according to level of processing - Level-0 represent raw
instrument output, level 2 data processed to provide geophysical parameters,
with location and time.
MARSAIS Marine SAR analysis and Interpretation System. EC framework programme
to develop a generic SAR processing tool for Coastal Applications
MaST Maritime Surveillance Tool. QinetiQ tool for analysing SAR data.
MAWS Marine Automatic Weather Station (acronym for UK Met Office Buoys)
MAXWAVE An EC framework research programme investigating the physics and
occurrence of rogue waves.
Météo France French National Meteorological agency.
MIROS Wave radar (supplied by MIROS AS – A Norwegian company)
MTF Model Transfer Function
NAO North Atlantic Oscillation (Index)
NASA (USA) National Aeronautics and Space Administration. USA’s space agency.
NCEP: (USA) National Center for Environmental Prediction
NDBC (USA) National Data Buoy Center
NOAA: (USA) National Oceanographic and Atmospheric Administration
NRT Near Real Time
NWP Numerical Weather Prediction
NORUT Norwegian Research Group, of not for profit companies, based in Tromsø
Nyquist Freq. The cutoff frequency above which a signal must be sampled in order to be
able to fully reconstruct it.
ODGP2 A 2nd generation ocean spectral wave model used by Oceanweather.
Oceanweather USA marine met-ocean company
OWI-3G Oceanweather wave model (3rd generation)
PRI ERS SAR product (Precision Image product)
104

Quikscat Ocean wind measuring radar scatterometer. Launched in 199 by NASA to
replace instrument lost when ADEOS failed
RadarSat Canadian commercial SAR satellite – to be replaced by Radarsat-2 in near
future.
RAR Real Aperture Radar
Range (direction) Along direction of SAR look, for side looking SAR - across
track direction
SAR:
SARtool
Scatterometer
Synthetic Aperture Radar
A tool for processing SAR data (ERS, Radarsat and ENVISAT), developed
by BOOST
Satellite radar instrument to measure ocean surface wind
Seasat The first marine EO satellite, launched in 1978. Had a scatterometer,
altimeter, SAR and radiometer.
Seawinds The scatterometer instrument on board the Quikscat satellite.
SOC
SOS
SSTL
SWIMSAT:
TerraSAR
Southampton Oceanography Centre
Satellite Observing Systems (UK)
Surrey Satellite Technology Limited (UK).
A (French) proposal for a satellite -borne wave measuring radar.
German X-band SAR satellite to be launched in 2006.
TOPEX/Poseidon: Ku/C band altimeter launched in 1992 by CNES/NASA
UKMO United Kingdom Meteorological Office.
VOS Voluntary Observing Ship (Programme) – agreement through which (mostly
visual) ship observations are recorded and archived.
VV Vertically polarised incident and reflected radar signal.
WW3 Wavewatch 3 – A 3rd Generation wave model used by NOAA.
WAM: A widely used computer model for wave generation, propagation and
dissipation
WAMDI Wave Model Development and Implementation Group
WAMOS An X-band directional wave radar
WM (for SAR) Wave Mode.
WMO World Meteorological Office
X-Band Radar and communications frequency band (5.2-10.9 Ghz)
Mathematical Symbols and Terms:
Cg,p wave group speed, wave phase speed
f frequency
F(f,T) frequency spectrum
g gravity
gii term for polarisation dependant modification of Fresnel coefficient
G(f,T) directional distribution
Hs, SWH significant wave height
i polarisation
k wave number
I(k) intensity spectrum
l(k) image spectrum
m tilt component of modulation of radar cross section
m0, m1, m2 zeroth, first and second order moments of the wave spectrum
mss mean square slope
R range (from antenna to target)
s wave speed
sd standard deviation
se standard error
Sigstp,SS significant steepness
Sm polarisation dependant term in tilt modulation function
Sh(k) surface height spectrum
105

Ss(k) ocean wave slope spectrum
Tm,p,z mean, peak and zero up-crossing wave period
Thydro m hydrodynamic term for modulation of radar cross section
Ttilt m tilt term for modulation of radar cross section
Tx(k) range shift in MTF
Ty(k) azimuth shift in MTF
RMS: root mean square (a measure of data scatter)
rrms residual root mean square (after applying calibration)
SWH: significant wave height.
U10: wind speed referenced to 10m above the ocean surface
V platform velocity
v 2 variance of sea surface
x range
y azimuth
E� � wind growth rate (of Bragg waves)
J� � JONSWAP peakedness parameter
T� � ���������ҏ�����
T��TҞ�җ� � dominant wave direction (at specified frequency)
O� � wavelength
U� � correlation coefficient
V0 Surface Radar Backscatter, at nadir incidence.
I� � angle from azimuth direction (horizontal projection)
Imean,peak � mean, peak, wave direction
Z wave frequency (radians)
106
ANNEX A WAVE PARAMETERS
WAVE LENGTH/WAVE HEIGHT SPECTRUM. We assume the wave number or wave frequency spectrum is meant; i.e. the distribution of
wave energy as a function of wave number or of wave frequency. (In practice the distribution
of surface elevation squared, which is proportional to energy.) If directional information is
available then the 2-dimensional spectrum is usually given in terms of wave number, if it is a
non-directional spectrum then it is usually given in terms of frequency.
Wave number, k, and wave frequency, Z (radians), are related by the dispersion relationship,
which in deep water is Z2=gk.
Wave length and wave period are given by O=2S/k and W=2S/Z.
WAVE DIRECTION Given a directional spectrum, the peak (or dominant) direction is that in which the wave with
the maximum spectral energy is travelling. Often there are two local maxima, one at a
relatively high wave number ('wind sea') and the other at a lower wave number ('swell'); then
both sea and swell directions can be given. The term 'average direction' is not normally used.
SIGNIFICANT WAVE HEIGHT This is given by 4v where v2 is the variance of the sea surface elevation (which can be
estimated either from a time record, such as a 17-minute buoy record, or from a spatial record,
such as a radar altimeter return from a footprint of about 7 km diameter). It is assumed that
the sea state is stationary over the time or space sampled.
The force of a wave on a ship or fixed structure depends on the height (crest to trough) of the
individual wave hitting it. The statistical distribution of individual wave height can generally
be estimated from the spectrum, but there remain questions concerning the upper tail - i.e.
concerning the very highest, extreme waves.
WAVE STEEPNESS The steepness of an individual wave is defined by its height:length ratio - and is a factor
affecting the force of the wave on a structure. By analogy, the term 'significant steepness',
which is widely used to describe the general appearance of the sea, is defined by the ratio of
significant wave height to a length obtained from the dispersion relationship and zero-upcross
wave period (see below).
The significant wave steepness, ss, is given by
2SHs Hs ss | 0.6406 with Hs in metres and Tz in seconds.
gTz2 Tz2
In practice, the significant steepness is often expressed as 1/ss.
WAVE PERIOD (TZ AND TP) For ocean waves, the period of an individual wave is either the period between the passing of
one crest and the next or that between one upcrossing of the mean sea level and the next.
107

Tz is the average period between upcrossings; this value can be estimated from the moments
of the non-directional frequency spectrum.
Tp is the period corresponding to the spectral frequency with the maximum energy. Plots of
Tp often appear to be more erratic than Tz - since it involves estimating a maximum rather
than spectral moments.
Other periods can be obtained from the spectrum, such as the average period between
successive crests and the 'energy period' which, with significant wave height, gives the power
being transmitted by the waves. But the force on a structure depends on the individual
upcross wave period.
WAVE SPEED The phase speed of an individual sine wave is the time for a crest to pass i.e. wave
length/wave period. In deep water, using the dispersion relationship, gives that cp=gW/2S.
So, for example, a wave with the spectral peak frequency has a phase speed of gtp/2S.
However, the energy in a wave train, which determines the travel time of swell across the
ocean, travels at half this speed; so it is this speed, the 'group speed cg = gW/4S, that is of
interest to forecaster.
The group velocity of the wave corresponding to that with the spectral peak frequency is
given by
gTpc
4S| 0.781Tp m/s with Tp in seconds g
108
HSE Health & Safety
Executive
Weather safety in the North West approaches
An implementation test using satellite data in assessing wave energy dynamics
Phase 2: Report demonstration product: generation and evaluation; recommendations for implementation of a NW
approaches wave conditions monitoring and analysis service
P D Cotton, D J T Carter & E Ash Satellite Observing Systems
15 Church St, Godalming Surrey GU7 1EL
S Caine QinetiQ
Cody Technology Park Ively Road, Farnborough
Hants GU14 0LX
D Woolf National Oceanography Centre
University of Southampton Waterfront Campus European Way
Southampton SO14 3ZH
This report describes the generation and evaluation of a demonstration ocean wave data product, designed to represent key aspects of a proposed NW Approaches Wave Conditions Monitoring and Analysis Service. It then goes on to provide an assessment of the potential value of an EO based wave conditions monitoring service to the HSE /BNSC in terms of improvements on services that are presently available. Finally the report provides costed recommendations for implementation, and ongoing development, of an operational NW Approaches Wave Conditions Monitoring and Analysis Service. . This report and the work it describes were co-funded by the Health and Safety Executive (HSE) and the British National Space Centre. Its contents, including any opinions and/or conclusions expressed, are those of the authors alone and do not necessarily reflect HSE nor BNSC policy.
HSE BOOKS

110

ACKNOWLEDGMENTS
We are particularly grateful to:
The helpful guidance of the BNSC/HSE appointed support team: Ian Thomas (EOCI,
supporting BNSC), Gordon Keyte (QinetiQ supporting BNSC), Martin Williams (PhysE
supporting HSE),
Sofia Caires (KNMI) and the rest of the team responsible for the Global Wave Climatology at
http://www.knmi.nl/waveatlas.
Signar Heinesen, Sp/f Data Quality, Faroe Islands for providing FOIB data and very helpful
support in analysis of these data.
Sergey Gulev and Vika Grigorieva of IORAS, Moscow for data from their VOS data base.
Colin Grant, BP, for expert input and support, and for arranging for access to the FOIB
waverider buoy data.
111

112
TABLE OF CONTENTS
Acknowledgments ........................................................................................................ 111
Table of Contents ......................................................................................................... 113
Executive Summary...................................................................................................... 115
1 Introduction .......................................................................................................... 117
2 Phase 2 Data Product............................................................................................ 118
2.1 Introduction .................................................................................................. 118
2.2 Data Product Presentation and Processing Chain Overview ........................ 119
2.3 Wave Climate Statistics................................................................................ 121
2.4 Near Real Time Monitoring ......................................................................... 135
3 Evaluation of EO Wave Data Set ......................................................................... 141
3.1 Introduction .................................................................................................. 141
3.2 Near Real Time Wave Data Evaluation ....................................................... 141
3.3 Wave Statistics Evaluation – Existing Knowledge ...................................... 144
3.4 Wave Statistics Evaluation – SAR image Data from This Project............... 144
3.5 Summary....................................................................................................... 157
4 Assess Benefits of EO parameters........................................................................ 159
4.1 Introduction .................................................................................................. 159
4.2 Wave Statistics ............................................................................................. 159
4.3 Summary: revisiting the Evaluation Table ................................................... 166
5 The Benefits of an EO System and Estimates of Costs........................................ 169
5.1 Introduction .................................................................................................. 169
5.2 EO Data OVerview....................................................................................... 169
5.3 Near Real Time Wave Monitoring SystemS ................................................ 170
5.4 Wave Climate Statistics ServiceS ................................................................ 172
5.5 EO System Costs .......................................................................................... 175
5.6 Summary....................................................................................................... 177
6 Recommendations ................................................................................................ 179
6.1 Introduction .................................................................................................. 179
6.2 Near Real Time NW Approaches Wave Monitoring System ...................... 180
6.3 NW Approaches Wave Climate Statistics Service ....................................... 182
6.4 Research Priorities and Capacity Building................................................... 185
7 Summary............................................................................................................... 187
References .................................................................................................................... 188
Glossary ........................................................................................................................ 190
Annex - QinetiQ Investigations into MaST Application – “Wave Climate from SAR
Scenes” ......................................................................................................................... 192
113

114
EXECUTIVE SUMMARY
This test project has been conducted under the British National Space Centre (BNSC)
Government Information From The Space Sector (GIFTSS) initiative in close collaboration
with the Health and Safety Executive Offshore Division (HSE OSD).
The HSE OSD requirement is the safety of operations and equipment used for drilling and
extraction of oil and gas in the North West Approaches to the UK, and covers the following:
��The need to assess the possible utilisation of all-weather information from ongoing
spaceborne systems to measure offshore wave energy
��To add to the statistical and management base that is used to support offshore operations
��The potential for supporting safety in all weathers for operations in the NW Approaches
The project has carried out an in depth assessment of all aspects of wave products that can be
derived from satellite measurements over the ocean, and which could form components of a
North-Western Approaches wave conditions monitoring and analysis service.
A demonstration service was established to demonstrate and evaluate key aspects of a full
service: A near real time data service which – through a web page updated hourly, every day,
provides the client with easy and fast access to present and recent wave conditions in the NW
approaches, and a wave climatology and analysis service which provides information on
expected conditions as they vary throughout the year and across the region of interest.
Ocean wave data can be derived from two different satellite instruments, both of them
microwave radar. The first is the radar altimeter which provides a measurement, directly
beneath the satellite, of significant wave height, wind speed and mean (or zero upcrossing)
wave period. This technology is mature, and altimeter wave data have been accepted by the
operational offshore community as reliable ocean state measurements, although the sampling is
limited. The second instrument is the synthetic aperture radar (SAR), which can provide
estimates of the wavelength and direction of long waves (wavelength > 100m). Recent
developments have also allowed an estimate of significant wave height (of long period waves)
to be estimated, as well as a direction / energy spectrum (again for long period waves).
However, because of the complex imaging mechanism these data are less reliable and SAR
wave measurements are only possible under a limited range of surface wind speeds.
The report provides costed recommendations for phased implementation and development of an
operational NW approaches wave conditions monitoring and analysis service. These
recommendations are designed to meet the following key priorities:
x� Satisfy the joint sponsor priorities of providing statistical analyses of archived wave data
(including directional information) and a near real time wave monitoring service.
x� Offer a useful capability in the short term (i.e. was based upon existing capability, and
available operational data sets), but which will allow for future planned incorporation of
additional data sets and analysis capabilities.
In addition, recommendations are also provided for capacity building by knowledge transfer
between academic and commercial organisations.
115

116

1 INTRODUCTION
The main aim of this report is to provide costed recommendations for implementation, and
ongoing development, of an operational NW Approaches Wave Conditions Monitoring and
Analysis Service, based on satellite derived data. The basis for these recommendations is
provided by a detailed analysis of available EO (Earth Observation) data sets and data services,
carried out in phase 1 of this implementation test (Cotton et al., 2005), followed by an
assessment of the demonstration product reported here.
Section 2 of this report describes the generation of a demonstration ocean wave data product,
designed to represent key aspects of a proposed NW Approaches Wave Conditions Monitoring
and Analysis Service. This covers tasks 2.1 (Selection and acquisition of satellite data sets), 2.2
(Implement data processing chain), and 2.3 (Process satellite data) as defined in the original
BNSC/HSE ITT.
Section 3 provides an evaluation of this data set, through a variety of techniques, including
comparison against buoy data and wave models. This covers task 2.4 (Review the accuracy of
the overall process for generating the derived wave parameters) as defined in the original
BNSC/HSE ITT.
In Section 4 we assess the improvements offered by EO derived wave data products for the NW
approaches region, relative to presently available data products. This covers task 2.5 (Assess the
potential benefit of using new satellite data to provide wave statistics and nowcast support) as
defined in the original BNSC/HSE ITT.
In Section 5, we review the benefits of using data products including EO data sets, and provide
estimated costs of implementing all aspects of an operational wave monitoring system. This
covers tasks 2.6 (Estimate the expected cost/benefit from the use of satellite data for HSE OSD)
as defined in the original BNSC/HSE ITT.
In section 6, the report provides recommendations for implementation, and ongoing
development, of an operational NW Approaches Wave Conditions Monitoring and a NW
Approaches Wave Statistics Information System. This covers tasks 2.7 (Provide
recommendations for implementation of a possible operational system) as defined in the
original BNSC/HSE ITT.
117
2 PHASE 2 DATA PRODUCT
2.1 INTRODUCTION
The demonstration product generated in Phase 2 of this GIFTSS-supported implementation test
aimed to demonstrate and test key components of the proposed NW Approaches Wave
Conditions Monitoring and the NW Approaches Wave Statistics Information System.
The specification of this demonstration data product was built upon the following assumptions
and observations:
x� A priority is to provide costed and evaluated recommendations for a NW Approaches
Wave Conditions Monitoring and Analysis Service, to cover both Near Real Time
monitoring of wave conditions, and statistical analyses.
x� The status and capabilities of altimeter derived wave products were well understood by
the sponsors, therefore HSE/BNSC did not require further demonstration of wave statistics
products derived from altimeter data within this project.
x� Because of a request by the sponsors to carry out an extra review on the use of SAR
within Phase 1 of the project, reduced time and resources were available to the project team
in Phase 2. It was therefore necessary to scale down the original plans for the phase 2
product, and to concentrate on key issues for HSE/BNSC.
Therefore the focus of the Phase 2 demonstration product was:
x� To provide a demonstration and evaluation of swell wave statistics (direction and
period) derived from SAR image mode products.
x� To demonstrate a joint presentation of SAR and altimeter derived wave products for
Near Real Time monitoring.
118
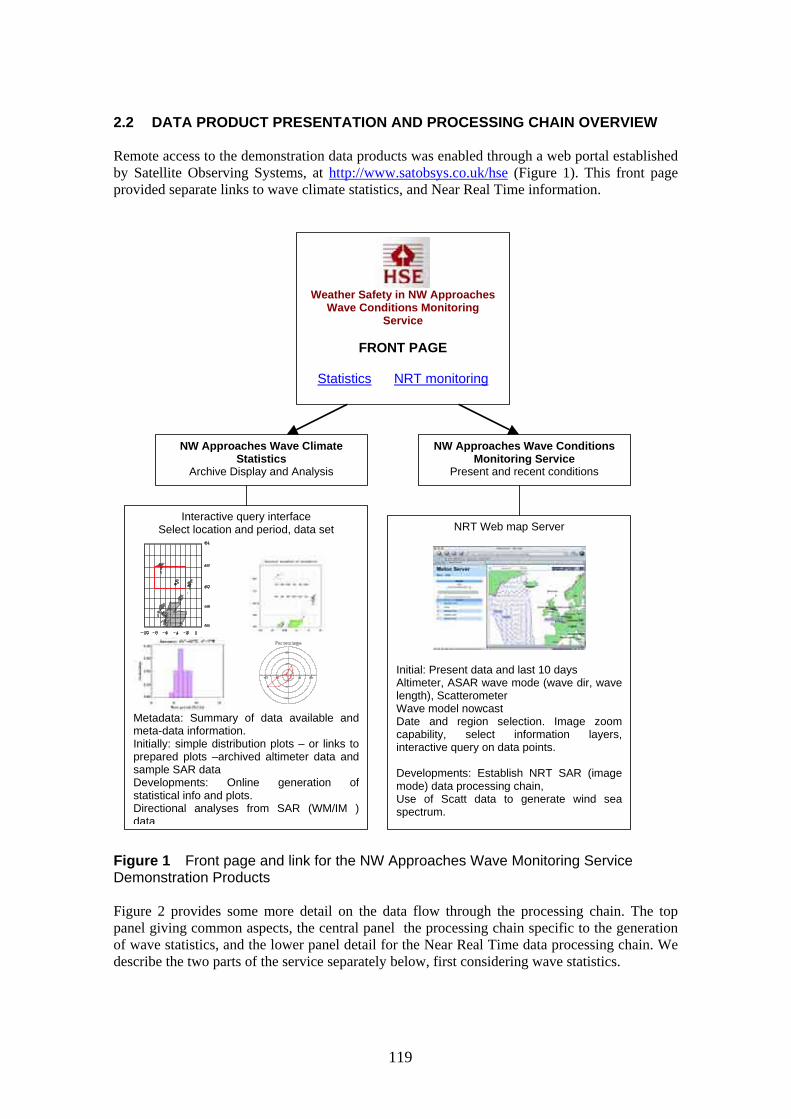
2.2 DATA PRODUCT PRESENTATION AND PROCESSING CHAIN OVERVIEW
Remote access to the demonstration data products was enabled through a web portal established
by Satellite Observing Systems, at http://www.satobsys.co.uk/hse (Figure 1). This front page
provided separate links to wave climate statistics, and Near Real Time information.
Service
Statistics
A il
lli ion
sea
i l – l
Onli of
l (WM/ )
Weather Safety in NW Approaches Wave Conditions Monitoring
FRONT PAGE
NRT monitoring
NW Approaches Wave Climate Statistics
Archive Display and Analysis
NW Approaches Wave Conditions Monitoring Service
Present and recent conditions
NRT Web map Server
Initial: Present data and last 10 days ltimeter, ASAR wave mode (wave d r, wave
ength), Scatterometer Wave mode nowcast Date and region se ection. Image zoom capability, select nformat layers, interactive query on data points.
Developments: Establish NRT SAR (image mode) data processing chain, Use of Scatt data to generate windspectrum.
Interactive query interface Select location and period, data set
Metadata: Summary of data available and meta-data information. Initially: s mple distribution p ots or links to prepared p ots –archived altimeter data and sample SAR data Developments: ne generationstatistical info and plots. Directiona analyses from SAR IMdata
Figure 1 Front page and link for the NW Approaches Wave Monitoring Service Demonstration Products
Figure 2 provides some more detail on the data flow through the processing chain. The top
panel giving common aspects, the central panel the processing chain specific to the generation
of wave statistics, and the lower panel detail for the Near Real Time data processing chain. We
describe the two parts of the service separately below, first considering wave statistics.
119

Initial and Common Processing Chain
Near Real Time Processing Chain (Section 2.4)
Wave Statistics Processing Chain (Section 2.3)
Figure 2 The Data Processing chains for the wave data sets. Top: Common aspects, Middle: The wave statistics data processing chain (altimeter data chain described in Phase 1 report, SAR image mode chain is discussed below in Section 2.3, Bottom: The Near Real Time Data Processing Chain (see Section 2.4)
120

2.3 WAVE CLIMATE STATISTICS The wave climate statistics section of the demonstration product comprised:
o altimeter derived monthly wave climate statistics, for 12 1° x 1° grid squares, within 60°-
62°N, 2°-8°W.
o wave direction and wave length statistics from SAR image mode data (processed through
MaST)– for the winter season (November-March) in a single area: 60°-61°N, 4°-8°W
The processing chain for generating wave statistics is outlined in the central panel of figure 2.
Input EO data are received and initially processed by QinetiQ (for SAR image mode data) and
SOS (for altimeter data) The statistical analyses for both data sets were carried out at SOS, and
the statistical data thus produced were assessed by NOC. The altimeter data set was discussed
and assessed in phase 1 (Cotton et al., 2005 and refs therein), we shall therefore only consider
the SAR derived statistics in this report.
The aims of the SAR image mode data product, based on SAR images processed through MaST
by QinetiQ and with subsequent analysis by SOS, were:
x� To generate a representative swell direction and wavelength database, for a selected
region and season.
x� To provide a demonstration display of direction and wavelength statistics.
x� To assess the impact of high wind speed conditions on the sampling of the region by
SAR.
x� To establish if there is any difference in wave statistics derived from ascending and
descending passes and, if there is, develop a strategy to overcome it.
The analysis focussed on an area to the South of the Faroe Islands, an area in which the offshore
oil and gas exploration industry are active, and for which representative in situ buoy data are
available (Figure 3).
F
Figure 3 The GIFTSS Area of Interest. The Red square indicates the region for which SAR image mode data has been extracted. The location of the Schiehallion FPSO (“S”) and the Faroes waverider buoy (“F”) are also indicated.
121

2.3.1 SAR Image Data Selection Through cost limitations this project was limited to the analysis of 35 SAR scenes from
QinetiQ, 27 for this part of it. So it was decided to examine 27 scenes processed through the
QinetiQ MaST application, initially from a 2° latitude by 1° longitude area North of Scotland
(60°-61°, 4°-6°W) during the winter months of January and February. The aim was to provide
sampling of winter conditions representative of the Shetland-Faroes channel, and in wave
climate found to be similar to that experienced by the Faroes wave rider buoy. An initial search
in the QinetiQ West Freugh, SAR archive for (ERS-1 and ERS-2) SAR Images could not find
sufficient scenes available within the specified area and months when surface wind speed was in 2a suitable range, partly because of a temporary difficulty in accessing post-2000 records . So
the area was expanded (to 60°-61°, 4°-8°W) and the period extended to include data from
November to March. Table 1 lists the scenes acquired for the project and processed. It also
identifies whether the scene was from an ascending or descending track of the satellite; all 27
were from descending passes - while the previously analysed 8 scenes, from summer months,
were all from ascending tracks.
Table 1 Initial list of SAR ERS-1 and ERS-2 Images selected by QinetiQ Image Wind # GIFTSS ERS Orbit Track Frame Day Mon Year Time A/D (ms-1)
1 9 E1 06781 123 2385 01 11 1992 11:35:50 D None
2 10 E1 07239 080 2385 03 12 1992 11:29:57 D 5-10
3 11 E1 08241 080 2385 11 02 1993 11:30:02 D 8-11
4 12 E1 08284 123 2385 14 02 1993 11:35:47 D 9-12
5 13 E1 17283 482 2385 04 11 1994 11:26:24 D 6-8
6 14 E1 17484 683 2385 18 11 1994 11:34:41 D 3-6
7 15 E1 17728 927 2385 05 12 1994 11:37:36 D 7-11
8 16 E1 17771 970 2385 08 12 1994 11:32:14 D 9-11
9 17 E1 19163 2362 2385 15 03 1995 11:20:36 D 1-4
10 18 E1 17240 439 2385 01 11 1994 11:31:48 D None
11 19 E1 19378 352 2385 30 03 1995 11:32:50 D 8-11
12 20 E1 22885 352 2385 30 11 1995 11:33:00 D 8-11
13 21 E2 03212 352 2385 01 12 1995 11:33:04 D 8-11
14 22 E2 03255 395 2385 04 12 1995 11:38:49 D 0-5
15 23 E1 23114 080 2385 16 12 1995 11:30:11 D 2-5
16 24 E2 03441 080 2385 17 12 1995 11:30:11 D 0-5
17 25 E1 23386 352 2385 04 01 1996 11:33:01 D 11-15
18 26 E2 08179 309 2385 12 11 1996 11:27:14 D 8-10
19 27 E2 13504 123 2385 19 11 1997 11:35:47 D 7-10
20 28 E2 13776 395 2385 08 12 1997 11:38:36 D 8-10
21 29 E2 19015 123 2385 09 02 1998 11:35:41 D 11-15
22 30 E2 18972 080 2385 06 12 1998 11:29:56 D 2-6
23 31 E2 19287 395 2385 28 12 1998 11:38:37 D 7-11
24 32 E1 18015 1214 2385 25 12 1994 11:35:14 D 13-15
25 33 E2 13275 395 2385 03 11 1997 11:38:38 D 10-13
26 34 E2 18514 123 2385 04 11 1998 11:35:44 D 12-15
27 35 E2 18743 352 2385 20 11 1998 11:32:46 D 15+
The problem with processing post-2000 ERS scenes has since been resolved, and would not have effected the NRT
processing of Envisat data. Should such an incident occur during an operational phase the failure would be deemed
high priority and expected to be resolved expeditiously with no/minimum impact on the Service. The NRT service
would be contracted to provide a set number of images with alternative options should the provision of data not be
met.
122
2

2.3.2 SAR Data After pre-processing to .PRI format each SAR image was processed at QinetiQ Farnborough,
with the MaST package to produce a file of wave field solutions with location, wave period and
wave direction (see phase 1 report, Cotton et al., 2005 for more details). Each scene covers an
area of 100 km by 100 km3, with pixel size of 12.5 m by 12.5 m. Data from every 200 by 200
pixel sub-scenes (i.e. 2.5 km by 2.5 km areas) were processed to extract dominant wave
directions and wavelengths. All 27 winter scenes were processed without any smoothing of the
pixel values, suggesting a minimum detectable wavelength of 25 - 30 m, but the resolution of
the ERS/ENVISAT SAR imposes a higher minimum of 50 - 60 m. These data, from November
1992 to November 1998 extend from 59.5° - 60.9°N and from 3.4° - 8.6°W. A plot of all the
sub-scenes from which wave data could be extracted is shown in Figure 4.
Figure 4 Locations of the 2.5 km by 2.5 km areas with estimates of wave direction and length
2.3.3 Data Issues Generic SAR Issues The limitations of SAR and the complex problems of deriving estimates of ocean wave
parameters from SAR data are well known, and have been explained in a previous report from
this project. One limitation, on extracting shorter waves, is the resolution of the SAR; another -1is the range of wind speed for which useful images are obtained (roughly 3 to 13 ms ); whilst a
source of major limitations is the movement of the SAR which introduces complex, non-linear
problems into the processing from what the SAR ‘sees’ to the true ocean wave picture. (E.g.
Hasselmann & Hasselmann, 1991; Aage et al., 1998; Woolf 2004b)
A further problem is that, unless produced by the most recent processing schemes, wave
directions from SAR have a 180° ambiguity.
Recently, a processing technique has been introduced elsewhere in Europe which resolves the
180° ambiguity, and which also provides an estimate of energy in each wavelength/direction
bin; Engen & Johnson (1995). It is currently being applied by ESA to Envisat SAR wave mode
3 Except for Scene 10 which was about 50 km by 100 km.
123

data, but there remain some questions regarding automatic applications of recommended quality
control criteria (we shall revisit this issue in Section 2.4).
SAR Issues Related to Use of MaST The algorithm in the current MaST application gives the wave direction and wavelength (and
the wave period and speed, derived from wavelength using the deep water dispersion
relationship). It does not, at present, provide any assessment of the energy; so if - as is
sometimes the case - two or three wave direction/wavelength solutions are obtained from one
sub-scene, there is no way of telling which is the dominant one.
QinetiQ’s processor resolves the 180° ambiguity problem by assuming that the waves are
approaching land (since they are relatively long, ‘swell’ waves). Such waves are not related to
the local wind, and this seems the most satisfactory resolution possible from this processor. For
the area examined here, with longer waves generally from the west and with the Shetlands
nearer than North America, it appears to produce generally sensible results.
Some questions concerning the wave data generated by the QinetiQ MaST application have
arisen during this study. In particular, the lack of any waves travelling perpendicular to satellite
track. (More accurately, wave travelling with an ‘image angle’ of zero, that is at right angles to
the track). This is clearly seen in Figure 5 (left panel) which shows a histogram of image angles
from all 27 scenes, with bin sizes of 1°. This peak-splitting effect in the range direction (at right
angles to the satellite track) was noted in simulated data by Brüning et al. (1990).
The right panel of Figure 5 is a similar histogram for the 8 ascending scenes, showing a similar
gap around an image angle of zero; but some of these scenes were from further north, and
included the Faroe Islands, so the 180 ambiguity resolution introduced image angles around
180°.
Figure 5 strongly suggests that the SAR registers waves from around its image angle of 0°,
which ever way it is travelling (but never exactly at 0°).
Den
sity
0.00
0.
02
0.04
0.
06
0.08
Den
sity
0.00
0.
01
0.02
0.
03
150 100 50 0 50 100 150 150 100 50 0 50 100 150
Image angle Image angle
Figure 5 Distribution of image angle. Left: from 27 images on descending passes. Right from 8 images on ascending passes.
124

61.0
2.3.4 Individual Scenes Processed through MaST Figure 6 shows an example of the wave data from the MaST package from Scene 17 obtained
by ERS-1 on 15 March 1995. The number of grid points with data is 849 - greater than the
average value of 686 for the 27 scenes. The lines show the direction of the waves - travelling
up to the grid points - and the line lengths are proportional to the wavelength, which here ranged
from 112 m to 439 m with a mean of 275 m. The angle from which the waves are coming
ranged from 238° to 307°, with a mean of 268° and quartiles of 262° and 271°.
6 5 4
59.0
59.5
60.0
60.5
Figure 6 SAR Scene 17, from ERS-1 on 15 March 1995, showing wave directions and wavelengths for individual grid points.
The scene contains a grid of 43 by 38 points (roughly N-S and E-W respectively) and covers
106 km by 94 km; which gives a grid spacing of 2.5 km in both directions. Estimating spectra
from such a small area must give noisy results, particularly for the longer waves, akin to
estimating non-directional wave statistics from a couple of minutes of a waverider record.
The distributions of wavelength and direction of the waves are given in Figure 7. A plot of
direction against wavelength is shown in Figure 8.
Den
sity
0.00
0 0.
002
0.00
4 0.
006
Den
sity
0.00
0.
02
0.04
0.
06
0 100 200 300 400 500 220 240 260 280 300 320
wavelength (m) Direction from
Figure 7 Distributions of wavelength (left) and direction (right) from SAR scene 17, from ERS–1 on 15 March 1995
125
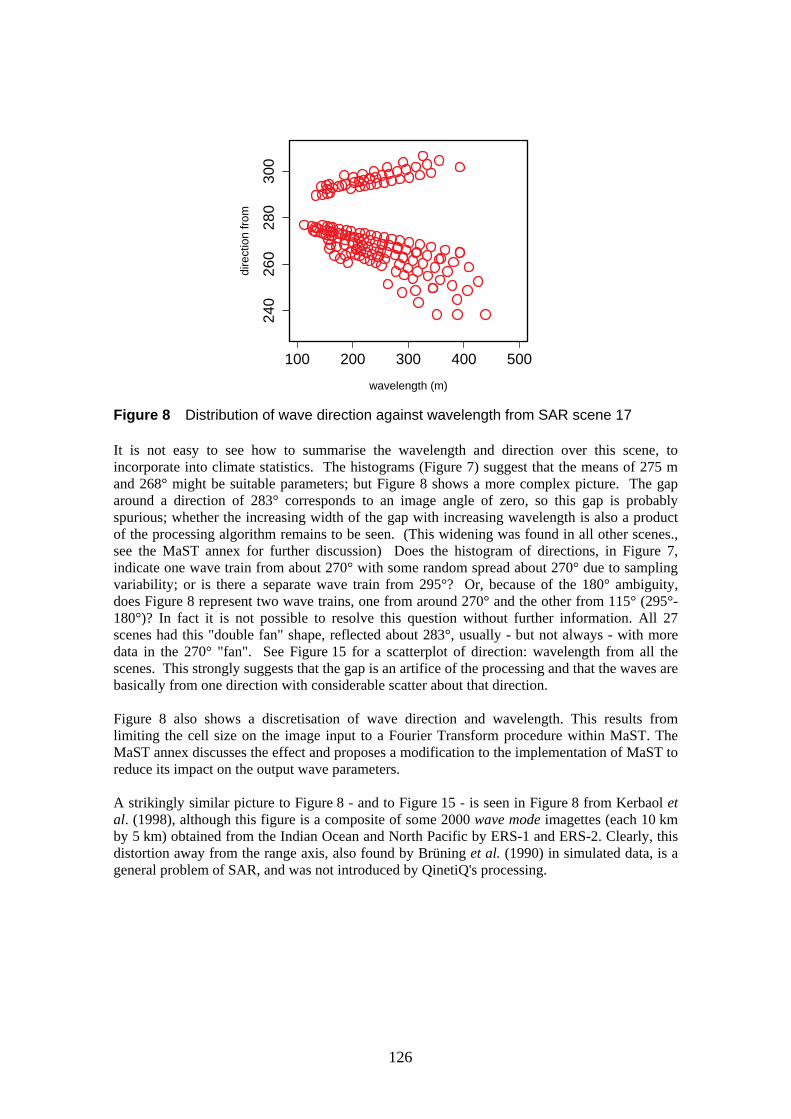
240
260
280
300
dire
ctio
n fr
om
100 200 300 400 500
wavelength (m)
Figure 8 Distribution of wave direction against wavelength from SAR scene 17
It is not easy to see how to summarise the wavelength and direction over this scene, to
incorporate into climate statistics. The histograms (Figure 7) suggest that the means of 275 m
and 268° might be suitable parameters; but Figure 8 shows a more complex picture. The gap
around a direction of 283° corresponds to an image angle of zero, so this gap is probably
spurious; whether the increasing width of the gap with increasing wavelength is also a product
of the processing algorithm remains to be seen. (This widening was found in all other scenes.,
see the MaST annex for further discussion) Does the histogram of directions, in Figure 7,
indicate one wave train from about 270° with some random spread about 270° due to sampling
variability; or is there a separate wave train from 295°? Or, because of the 180° ambiguity,
does Figure 8 represent two wave trains, one from around 270° and the other from 115° (295°-
180°)? In fact it is not possible to resolve this question without further information. All 27
scenes had this "double fan" shape, reflected about 283°, usually - but not always - with more
data in the 270° "fan". See Figure 15 for a scatterplot of direction: wavelength from all the
scenes. This strongly suggests that the gap is an artifice of the processing and that the waves are
basically from one direction with considerable scatter about that direction.
Figure 8 also shows a discretisation of wave direction and wavelength. This results from
limiting the cell size on the image input to a Fourier Transform procedure within MaST. The
MaST annex discusses the effect and proposes a modification to the implementation of MaST to
reduce its impact on the output wave parameters.
A strikingly similar picture to Figure 8 - and to Figure 15 - is seen in Figure 8 from Kerbaol et
al. (1998), although this figure is a composite of some 2000 wave mode imagettes (each 10 km
by 5 km) obtained from the Indian Ocean and North Pacific by ERS-1 and ERS-2. Clearly, this
distortion away from the range axis, also found by Brüning et al. (1990) in simulated data, is a
general problem of SAR, and was not introduced by QinetiQ's processing.
126

Figure 9 Wavelengths of spectral peaks against direction relative to the range axis from ERS-1 & ERS-2 SAR wave mode data. (From Kerbaol et al.;1998.)
It might seem better to use all the data for the climate analysis. But this does have drawbacks:
o The data from one scene are clearly correlated, making it difficult to assess the accuracy
of climate statistics.
o It does not differentiate between two different directions at one or at different grid
points. Because swells from markedly different directions are probably from
independent events, this is not likely to be serious, except that it obscures statistics of
the prevalence of cross-seas.
o There is a large range in the number of data in the 27 scenes, varying from 162
(Scene 18) to 1379 (Scene 20), with a mean of 686 (and poorly correlated positively
with wind speed). But bias introduced by this uneven weighting of scenes could be
avoided by extracting and analysing 162 data from each scene.
Figure 6 does not suggest any obvious spatial trends in either wavelength or direction across the
scene; but, to check this, the scene was divided along latitude 60°N. Figure 10 shows the joint
distribution of wavelength and direction for the two areas, with 458 in the North and 391 in the
South. Now some differences become apparent. There is a higher proportion of waves from
around 300° in the Northern part than in the Southern, and a higher proportion from around
260° in the South than in the North. The water is slightly shallower in the South - with the 100
fathom (182 m) contour running roughly SW to NE through 60°N 5°W so the longer waves
would be expected to be refracting towards the SE more noticeably in the South; but detailed
analysis needs to await an understanding of the gap in observation about the radar’s image
angle, separating these apparent wave trains.
One way of obtaining the dominant wavelength and direction from a scene is to generate a
‘scatterplot’, counting the number of data within specified wavelength and direction bins, and
choosing the bin with the maximum count as representative of the scene. Figure 11 (left) shows
a ‘sunflower’ plot of Scene 17, with data put into 25 m by 10° bins, and the count in each bin
given by the number of ‘petals’. For example, from this figure, the bin at (6,28) - i.e.
wavelengths from 150 m ±12.5 m, direction from 280° ± 5°, there are 5 data pairs (out of a total
of 849 pairs). The maximum count is 104 (12%) at (13,26) or (325 m, 260°), so 325 m and
260° were taken as representative of this scene. This selection depends to some extent on the
127

chosen bin sizes. The second highest is 10% at (250 m, 260°); which might be a separate ‘peak’
- or perhaps they should be combined specifying 275 m and 270°. A proper solution to this
problem would require a detailed analysis of sampling and processing errors.
The right hand panel of Figure 11 illustrates the problem of interpretation. It shows the
sunflower plot of Scene 25. The highest count, of 21%, is at (4,29), or 100 m and from 290°.
But was there also a separate swell train with wavelength 240-250 m from 270°, which
combined had 11% of the count? Again we cannot tell without additional, external, information.
240
260
280
300
dire
ctio
n fr
om
100 200 300 400 500
wavelength (m)
Figure 10 Distribution of wave direction against wavelength from SAR scene 17; red O:North of 60°N, blue X: South of 60°N.
24
26
28
30
dire
ctio
n/10
deg
24
25
26
27
28
29
30
dire
ctio
n/10
deg
13
7
63
5
7
61
10
5
1
27
5
4
1
3
1
5
7
1
9
18
1
2
7
20
2
4
2
3
4
3
1
1
1
4 6 8 10 12 14 16 18 4 6 8 10 12 14
wavelength/25m wavelength/25m
Figure 11 ‘Sunflower’ plots of the joint distribution of wavelength and direction from Scene 17 (left), and Scene 25 (right) - with numbers of values superimposed.
128

I
2.3.5 Derivation of Climate Statistics from SAR Data processed through MaST Two ways of generating descriptions of the climate were tried, firstly by analysing all the data
from the 27 winter scenes processed by QinetiQ, then using the scatterplot modal values from
these scenes.
Analysis of all data Taking all the directions and wavelengths from the 27 scenes listed in Table 1, results in 18529
wavelengths and directions, ranging over the area marked in Figure 4. The minimum and
maximum wavelengths are 56 m and 439 m respectively; the range of directions are from 202°
to 335°. The means are 213 m and 275°.
The distributions of wavelength and direction are shown in Figure 12, and probabilities within
specified ranges given in Tables 2 and 3. Note that because of the near-uniform distribution of
wavelength over much of its range, Table 2 has larger bin sizes than the figure. Some
information on the accuracy of estimates of direction and wavelength from the SAR processor
would help to decide appropriate bin sizes.
Table 2 Percentage of wavelength observed in 50 m bins -O is the mid-value, so e.g. O=50 m gives the percentage from 25 to 75 m
O (m) 50 100 150 200 250 300 350 400 450
% 0.62 15.40 21.94 16.59 20.03 15.53 8.99 0.84 0.06
Table 3 Percentage of wave directions (from) observed in 10° bins - tabulated ‘dir.n’s are the mid-points of the bins
dir.n 200 210 220 230 240 250 260 270 280 290 300 310 320 330 340
% <0.01 <0.01 0.01 0.06 0.50 4.0 20.3 38.9 6.3 17.8 11.0 1.00 0.21 0.03 <0.01
Den
sity
0.00
0 0.
002
0.00
4
Den
sity
0.00
0.
01
0.02
0.
03
0.04
100 200 300 400 200 220 240 260 280 300 320 340
wavelength Direction from
Figure 12 Distribution of wavelength in m (left), and direction (°) from which the waves are coming (right) from 18529 values from 27 scenes during Nov - March
Spatial variability To see whether there was any discernible spatial differences over the area of analysis, data were
extracted into 0.5° latitude by 1° longitude bins, from 59.5 to 60.9°N, 4° to 8°W; and the mean
and standard deviations of wavelength and direction calculated. Results, together with the
number of data in each bin, are given in Tables 4 and 5.
129

Table 4 Number, mean and standard deviation of wavelength (m) in 0.5° by 1° bins
wavelength 8° - 7°W 7° - 6°W 6° - 5°W 5° - 4°W
N 1354 2498 1856 775
60.4° - 60.9°N mean 232 211 194 212
s.d. 83 84 77 57
N 2087 3684 2151 987
59.9° - 60.4°N mean 220 203 210 228
s.d. 81 80 78 62
Table 5 Number, mean and standard deviation of wave direction in 0.5° by 1° bins
Direction 8° - 7°W 7° - 6°W 6° - 5°W 5° - 4°W
(from) °
N 1354 2498 1856 775
60.4° - 60.9°N mean 272 279 277 276
s.d. 15 15 15 14
N 2087 3684 2151 987
59.9° - 60.4°N mean 274 275 274 276
s.d. 14 14 15 15
The mean directions are remarkably constant throughout the area. The mean wavelengths are
more variable, but there is no obvious pattern. With, on average, about 2000 data values in each
bin, the standard error of the mean wavelength, assuming independent data, would be around
2 m, (s.d./¥2000) so the differences in mean wavelength would be highly significant. But the
data are not independent, coming from a small number of scenes; so without further knowledge
of the degrees of freedom involved, it is impossible to say whether there is really any evidence
of spatial differences.
Analysing the data by even smaller bin sizes, of 0.2° latitude by 0.4° longitude, we get the mean
wave periods and directions given in Tables 6 and 7; while Table 8 gives the number of data in
each bin.
Table 6 Mean wave period (s) in 0.2° latitude by 0.4° longitude bins
Lat° \ Lon°. 7.8 7.4 7.0 6.6 6.2 5.8 5.4 5.0 4.6 4.2
60.8 12.8 12.3 11.5 11.4 11.2 11.4 10.8 11.0 11.4 12.2
60.6 12.4 12.0 11.6 11.3 11.4 11.2 10.6 10.8 11.3 12.1
60.4 11.9 11.6 11.4 11.3 11.1 11.0 11.1 11.5 11.8 11.9
60.2 11.9 11.6 11.2 11.2 11.3 11.1 11.4 12.0 12.2 11.7
60.0 12.0 11.8 11.4 11.0 11.2 11.4 11.8 11.9 12.0 12.3
59.8 11.3 11.0 11.3 11.1 10.9 11.2 11.8 11.7 12.0 12.1
Table 7 Mean wave direction (°) in 0.2° latitude by 0.4° longitude bins
Lat° \ 7.8 7.4 7.0 6.6 6.2 5.8 5.4 5.0 4.6 4.2
Lon°.
60.8 264.5 273.9 277.2 276.9 280.9 276.0 276.2 274.4 275.8 271.8
60.6 266.7 272.7 276.3 277.0 277.0 276.5 280.4 279.4 275.9 274.0
60.4 273.3 272.8 272.5 274.2 276.0 275.2 276.4 274.1 278.7 279.9
60.2 272.5 275.0 276.2 273.9 273.1 273.8 274.0 274.2 274.5 278.5
60.0 271.3 275.4 277.9 277.8 275.7 274.3 273.6 273.6 276.3 276.5
59.8 282.5 278.5 275.9 278.0 276.4 275.6 270.5 272.8 274.0 271.8
130

Table 8 Number of values of period and direction (°) in 0.2° latitude by 0.4° longitude bins; and total by longitude
Lat° \ 7.8 7.4 7.0 6.6 6.2 5.8 5.4 5.0 4.6 4.2
Lon°.
60.8
60.6
60.4
60.2
60.0
59.8
Total
89
159
199
251
199
45
942
189
296
338
429
348
110
1710
223
379
447
565
551
204
2369
301
462
599
578
529
195
2664
244
451
606
632
559
245
2737
221
355
436
413
385
123
1933
189
327
446
341
310
134
1747
134
266
283
174
216
130
1203
84
173
208
154
138
98
855
32
74
171
123
116
96
612
10.0
11
.0
12.0
13
.0
mea
n w
ave
perio
d (s
)
200
220
240
260
mea
n w
avel
engt
h (m
)
8 7 6 5 4 8 7 6 5 4
longitude longitude
260
270
280
290
mea
n di
rect
ion
8 7 6 5 4
longitude
Figure 13 Mean wave periods (top left), wave lengths (top right), and wave directions (lower panel) in 0.2° latitude by 0.4° longitude bins against longitude. The red line gives the mean values.
There is no significant linear relationship between either mean period or mean direction against
latitude or against longitude - nor is there a linear relationship between either and latitude +
longitude. However, Figure 13 (top left) shows an intriguing non-linear relationship between
wave period and longitude - but the reduction in spread of the means around 6° - 7°W is
probably due to the larger number of data from which these means were calculated - see
Table 8. There is a similar pattern in the mean wavelength, (Figure 13 top right) - as expected,
because of the dispersion relationship - but no similar pattern in the mean directions, as shown
in Figure 13 (lower panel); nor in the distributions against latitude.
131
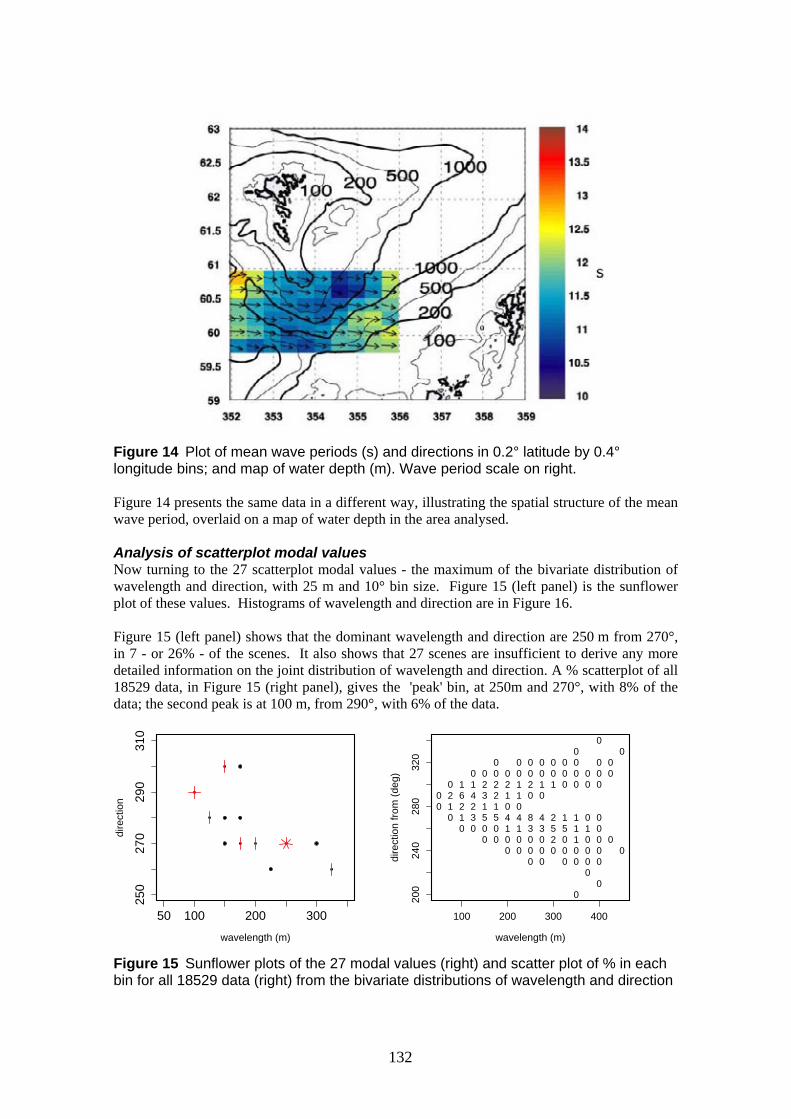
Figure 14 Plot of mean wave periods (s) and directions in 0.2° latitude by 0.4° longitude bins; and map of water depth (m). Wave period scale on right.
Figure 14 presents the same data in a different way, illustrating the spatial structure of the mean
wave period, overlaid on a map of water depth in the area analysed.
Analysis of scatterplot modal values Now turning to the 27 scatterplot modal values - the maximum of the bivariate distribution of
wavelength and direction, with 25 m and 10° bin size. Figure 15 (left panel) is the sunflower
plot of these values. Histograms of wavelength and direction are in Figure 16.
Figure 15 (left panel) shows that the dominant wavelength and direction are 250 m from 270°,
in 7 - or 26% - of the scenes. It also shows that 27 scenes are insufficient to derive any more
detailed information on the joint distribution of wavelength and direction. A % scatterplot of all
18529 data, in Figure 15 (right panel), gives the 'peak' bin, at 250m and 270°, with 8% of the
data; the second peak is at 100 m, from 290°, with 6% of the data.
250
270
290
310
dire
ctio
n
200
240
280
320
dire
ctio
n fr
om (
deg)
00
0120
01261
032410
0051320
00512200
00140120
001401100
00038
0200
00034
0100
0252
100
00051
000
0
00111
0000
000010
00
0
00000
000
0
0
00
0
0
50 100 200 300 100 200 300 400
wavelength (m) wavelength (m)
Figure 15 Sunflower plots of the 27 modal values (right) and scatter plot of % in each bin for all 18529 data (right) from the bivariate distributions of wavelength and direction
132

coun
t
0 1
2 3
4 5
6 7
coun
t
0 2
4 6
8 10
100 200 300 400 240 260 280 300 320
wavelength (m) direction from
Figure 16 Distribution of 27 modal wavelengths (left), and directions (right)
2.3.6 Conclusions Analysis of the data from 27 SAR scenes produced by the current QinetiQ MaST application
has revealed a number of questions concerning the accuracy of these data and the sampling
variability in estimates of wavelength and direction obtained from the 200 pixel by 200 pixels
analysed. Some difficulties are specifically linked to the current wave processing algorithms
employed within the MaST package, others are generic to satellite SAR imaging of the ocean
surface.
With regard to generic SAR limitations it is known that satellite SAR cannot image shorter
wavelength waves in the azimuth direction, and this wavelength cut-off can be calculated. It is
also known that SAR can only offer useful wave measurements when the wind speed is between -13 and 13 ms .
We have also observed what appears to be a distortion of the distribution in wave direction and
a gap in this distribution aligned with the SAR range direction.
However, after reference to the literature, it does seem that this dispersion is more pronounced
in the data processed through MaST and analysed for this project than in other data sets,
offering the possibility that the distortion may be ameliorated to some extent by importing
improved processing algorithms into MaST. Currently, the MaST application employs a linear
approximation to the non-linear processes of velocity bunching and tilt modulation, and does
not take into account hydro-dynamic modulation It may be that other “Model Transfer
Functions” may perform this process more effectively
In spite of these uncertainties concerning the data, this investigation has been a useful study into
possible methodologies for producing estimates of climate statistics of wavelength and
direction.
The extraction of the modal, or peak, wavelength and direction from their bivariate distribution
gave only 27 values of each parameter. These provided estimates of the most likely joint value,
as well as the average wavelength and direction; but 27 is far too few for any further analysis of
their joint distribution.
Using all the data appears to give sufficient numbers for a more detailed analysis, and revealed
evidence of variation in mean wave period and mean wavelength with longitude across the area
133

analysed, from 4°W to 8°W. However, we need further investigation into the accuracy and
independence of these data before error estimates can be produced. Allowance should also be
made for the widely varying data numbers from the SAR scenes.
The SAR gives indications of wavelength and direction which should be able to help in the
provision of climate statistics at any location, although the limited range of wind speeds for
which the SAR works will remain a problem and these data will probably have to be combined
with information from other sources. However, considerable further work is needed, both to
establish the accuracy of results from the processing of scenes and to determine how best to
analyse these results, before SAR can provide a reliable and useful contribution to climate
statistics.
Unfortunately all data in this part of the project were from descending passes, and so it was not
possible to look at differences in wave measurements between data from ascending and
descending passes.
134

2.4 NEAR REAL TIME MONITORING
2.4.1 Overview A prototype Near Real Time (NRT) wave conditions monitoring service has been provided
through a web based map server displaying present and recent sea state conditions in the NE
Atlantic region. The user is able to select data sets, zoom into and out from selected areas, move
backwards and forwards in time, and query individual data points (Figure 17).
4This service is provided through an upgrade of the SOS/met.no “CAMMEO” service, which is
based on the “Metoc” web map server originally developed by CMR (Norway) and
implemented by met.no, and which accesses data from near real time data feeds from SOS
based on XML format data products. This GIFTSS project has helped support the inclusion of
EO data on to the Metoc system, and benefits significantly from the substantial prior
development work with Metoc supported by the European Space Agency. The bottom panel of
Figure 2 provides an overview of the processing chain. Hourly inputs of data are loaded onto the
central MetOc data base which maintains a 10-day running archive. These data are displayed
through the CAMMEO MetOC web map server. EO and buoy data are supplied by SOS, and
combined with other data (ship observations, met ocean forecasts, etc.)
2.4.2 Description of Data Sets Available In the demonstration, altimeter data (wave height, wave period and wind speed), ASAR wave
mode data (swell peak wavelength, direction and significant wave height), and scatterometer
data (wind speed and direction) are processed in Near Real Time (within 3 hours of the time of
the measurement) and made accessible through a user friendly web-based map server. The wave
mode data set is acquired by SOS direct from ESA, who process the data in NRT using the new
“ENVIWAVE” algorithms (Engen and Johnson, 1995). It should be noted that the (A)SAR
wave mode data are not processed through the QinetiQ MaST package. The MetOc server also
provides access to a number of other data layers, amongst them a wave model nowcast (from
met.no). Table 9 details the EO data sources and Figure 17 provides demonstrations of some of
the outputs from this CAMMEO service. SOS has issued a user guide (SOS, 2005).
Table 9 EO Data table for the near real time wave monitoring service. See the left hand side of the panels in Figure 17 for the CAMMEO “codes” referred to in column 2. Surface buoy data are also available.
Instrument Source/ Parameters Spatial overage No. of passes Delay
CAMMEO /day over area
code of interest
Altimeter
ASAR wave
mode
Scatterometer
Jason / jas1
ERS-2 / ers2
Envisat/ envi5
Envisat /
envwm
ERS-2 / e2wi
Quikscat / scat
Hs, U10
Tz, Sig
steepness
Swell
direction,
period & Hs
Vx, Vy
Whole region,
along track data at 7
km res.
Whole region –
along track
products at 100 km
separation
Whole region, 25
km x 25 km cells
~6 / day < 3 hrs
~ 2 / day < 3 hrs
2 / day 500 km
swath < 3 hrs
2 / day 1800 km
swath
4 Met.no is the Norwegian Meteorological Service 5 Envisat altimeter data available from 18 May 2005.
135

The EO data are available at geophysical data record maximum resolution (~7 km along track
for altimeter data, at 100km intervals for the ASAR wave mode data, and on a 25 km x 25 km
grid for scatterometer data).
It was not possible to establish a Near Real Time processing chain for SAR image mode data
within the project, but a demonstration of SAR image mode data was incorporated (with a
dummy date), to provide an illustration of what may be possible if such a scheme were
implemented.
Figure 17 Example web map server display, with scatterometer (top panels), and altimeter (bottom panel) data.
2.4.3 Altimeter Data Processing and availability Presently, Jason, ERS-2 and Envisat altimeter data are provided. These data are “pulled” to SOS
by an automatic file transfer (ftp6) initiated every 10 minutes. The data are de-coded, quality
controlled and calibrated, and then if they lie within the larger CAMMEO region (the whole of
the North Atlantic region), reformatted (into XML format) and transferred via ftp onwards to a
server at met.no.
This process takes place completely automatically, and has been found to be very reliable with a
very low failure rate. The service specification gives a requirement for 99.9% reliability of the
data processing, and twin servers are used to ensure this is achieved. If all three satellites and
the data feeds are fully working in fact up to 12 passes a day are recorded over the North
Atlantic.
Although altimeter data are also potentially also available from Geosat Follow-On and TOPEX,
data from these satellites is not available in Near Real Time.
6 ftp – file transfer protocol, standard process for transferring files over the internet
136

Figure 18 ERS-2 along track altimeter data (descending pass, running North East to South-West) overlaid on Norwegian Met Office Wave model predictions for significant wave height and dominant wave direction for 12 UTC on 15 April 2005
Figure 18 shows altimeter data combined with output from the Norwegian Met Office wave
model. Although the display is not ideally suited, it is possible to compare the model predictions
with the altimeter measurements, which in this case show reasonable agreement.
Possible improvements to the display could provide some immediate graphical representation of
the altimeter measurement (or an option to switch to along track labelling at shorter intervals).
Also it would be useful to have options to display the altimeter derived wave period, to enable
comparisons with the model predictions. At present access to the full altimeter wave data set is
possible either by clicking separately at each point on the altimeter track and reviewing the text
box that is subsequently displayed, or by using the ‘tooltip’ feature that provides pop-up details
of data when the cursor is over a data point.
2.4.4 ENVISAT ASAR wave mode Data Processing and availability Near Real Time ENVISAT ASAR wave mode data products, which provide mean wavelength
and direction, significant wave height, and wave energy in 24 x 36 wave length / direction bins,
are generated by ESA processing facilities. These data are processed by ESA and made
available to approved organisations (which includes SOS) in NRT (most in under 3 hours) on a
central data server. The QinetiQ Mast application is not used in processing the (A)SAR wave
mode data set.
Within the CAMMEO system, the ENVISAT ASAR wave mode data are processed in a similar
way as the altimeter data. An automatic script transfers over new wave mode data, decodes
them, quality controls them, checks for data in the CAMMEO region and, if they are, reformats
them and sends them onwards to the MetOc server. In principle there should be data from the
same number as passes as are available from the ERS-2 altimeter, as ENVISAT and ERS-2 are
on the same orbit, with a time offset. However, we have found that in practice disappointingly
little wave mode data are coming through the process. In fact data are only making it onto the
server and display for one orbit every 4 or 5 days. This situation requires further investigation.
137
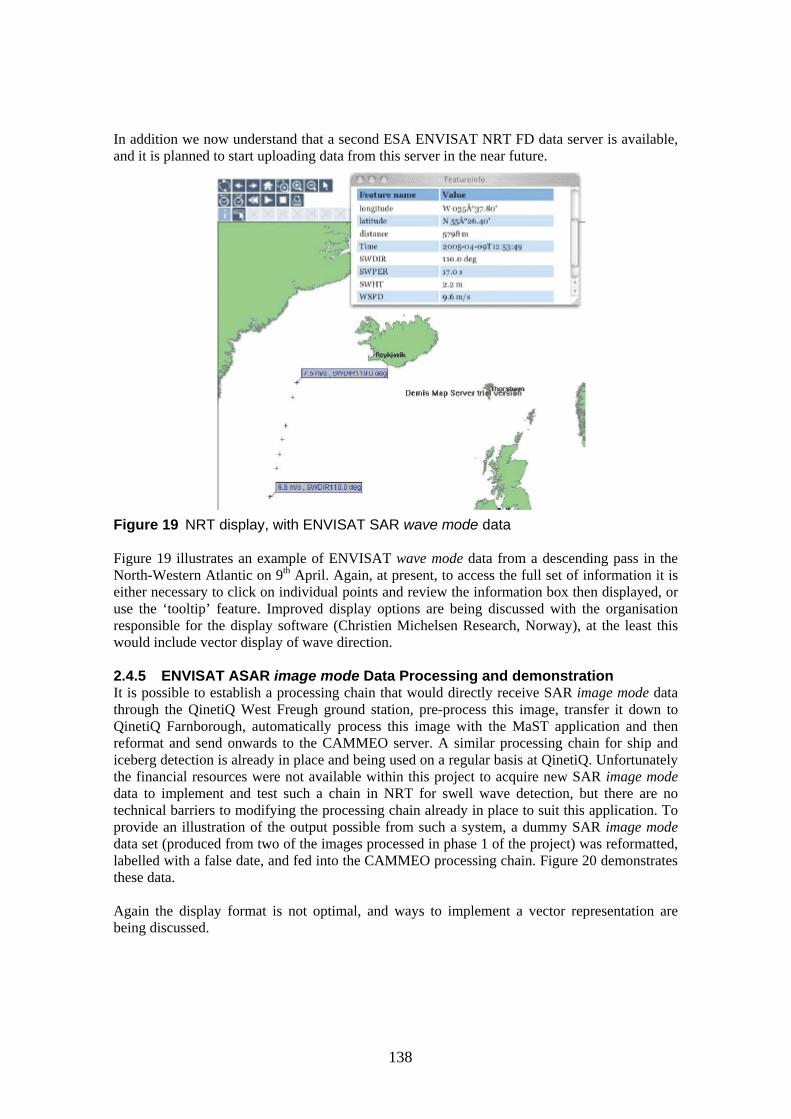
In addition we now understand that a second ESA ENVISAT NRT FD data server is available,
and it is planned to start uploading data from this server in the near future.
Figure 19 NRT display, with ENVISAT SAR wave mode data
Figure 19 illustrates an example of ENVISAT wave mode data from a descending pass in the
North-Western Atlantic on 9th April. Again, at present, to access the full set of information it is
either necessary to click on individual points and review the information box then displayed, or
use the ‘tooltip’ feature. Improved display options are being discussed with the organisation
responsible for the display software (Christien Michelsen Research, Norway), at the least this
would include vector display of wave direction.
2.4.5 ENVISAT ASAR image mode Data Processing and demonstration It is possible to establish a processing chain that would directly receive SAR image mode data
through the QinetiQ West Freugh ground station, pre-process this image, transfer it down to
QinetiQ Farnborough, automatically process this image with the MaST application and then
reformat and send onwards to the CAMMEO server. A similar processing chain for ship and
iceberg detection is already in place and being used on a regular basis at QinetiQ. Unfortunately
the financial resources were not available within this project to acquire new SAR image mode
data to implement and test such a chain in NRT for swell wave detection, but there are no
technical barriers to modifying the processing chain already in place to suit this application. To
provide an illustration of the output possible from such a system, a dummy SAR image mode
data set (produced from two of the images processed in phase 1 of the project) was reformatted,
labelled with a false date, and fed into the CAMMEO processing chain. Figure 20 demonstrates
these data.
Again the display format is not optimal, and ways to implement a vector representation are
being discussed.
138

Figure 20 NRT display, with demonstration ENVISAT SAR image mode data
2.4.6 General Comments The Near Real Time processing chain for individual products has been successfully
demonstrated, and the web based map server implementation provides a very quick response to
user queries.
Some improvements could be considered to suit the HSE/BNSC needs better, as follows:
o Improved visual/graphical representation of altimeter and SAR WM IM wave data.
o Vector representation of direction information
o Colour key or more frequent data labelling along track
o Options to include extra parameters (wave period, significant steepness) on the
main map display.
o Whilst the quality of data seems satisfactory the throughput volume of ENVISAT SAR
wave mode data is disappointing. The cause of the low volume of these data making it
through to the display needs to be investigated and rectified.
o A NRT SAR image mode chain could be established by QinetiQ, and could provide a
significant increase in directional wave information available.
o When cycling the data displayed backwards and forwards in time, often no data are
displayed. It is not clear to the user if this is due to slow response of the system (the
remote computer, the internet connection or the client computer), or simply because
there are no data in the region of interest. A way of providing information on whether
data are available would be useful.
o HSE /BNSC are specifically interested in a reasonably localised region. An option to
focus specifically on a selected region (and to go straight to that region on connection)
would be useful. Alternatively a separate ‘theme’ could be developed within the current
WMS specifically for HSC/BNSC. This would require a user to login. On login the user
would be automatically directed to a homepage tailored to suit their user requirements.
This may include restrictions on which data layers are visible (e.g. sensitive data could
be made available to only HSE users), default mapping to the AOI, and inclusion of
other functionality such as means of querying the data.
139
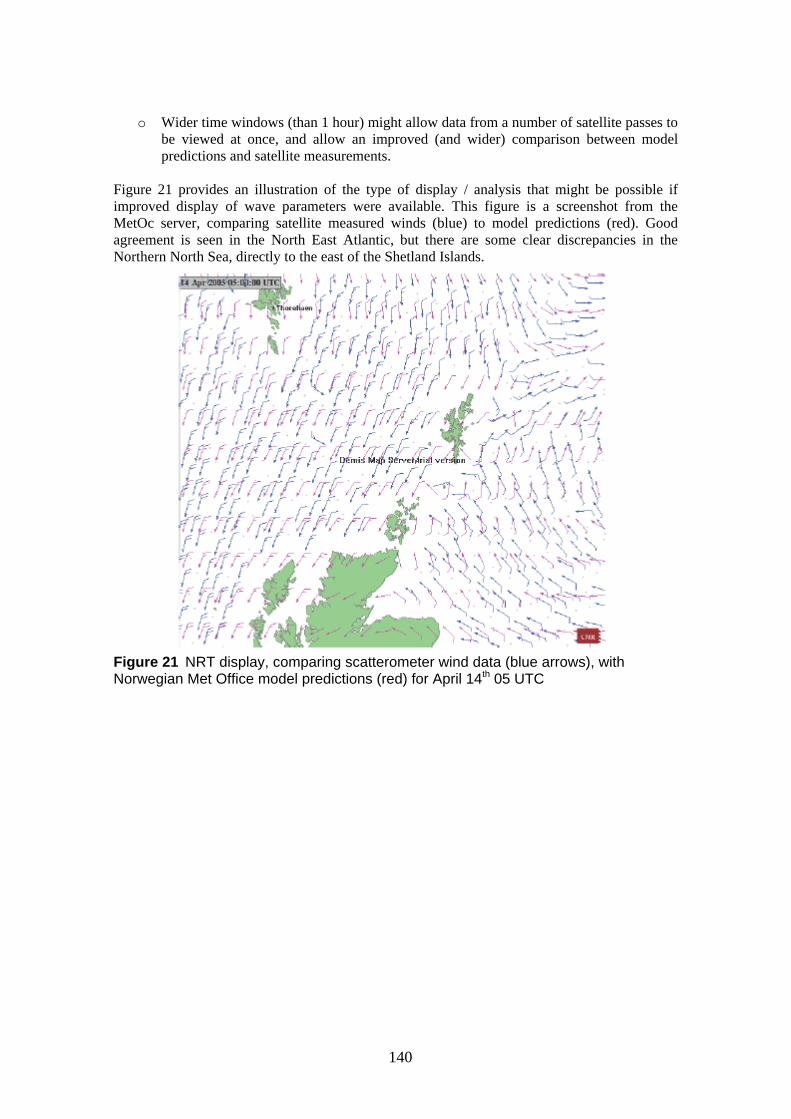
o Wider time windows (than 1 hour) might allow data from a number of satellite passes to
be viewed at once, and allow an improved (and wider) comparison between model
predictions and satellite measurements.
Figure 21 provides an illustration of the type of display / analysis that might be possible if
improved display of wave parameters were available. This figure is a screenshot from the
MetOc server, comparing satellite measured winds (blue) to model predictions (red). Good
agreement is seen in the North East Atlantic, but there are some clear discrepancies in the
Northern North Sea, directly to the east of the Shetland Islands.
Figure 21 NRT display, comparing scatterometer wind data (blue arrows), with Norwegian Met Office model predictions (red) for April 14th 05 UTC
140

3 EVALUATION OF EO WAVE DATA SET
3.1 INTRODUCTION This section reviews the accuracy of wave products available in near real time data and through
compiled wave statistics. A brief assessment of NRT data, and of altimeter and SAR wave mode
derived wave climate statistics is provided. The bulk of the assessment concentrates on the new
SAR image mode data produced during the second phase of this project.
3.2 NEAR REAL TIME WAVE DATA EVALUATION Near Real Time (NRT) data are provided at the best available resolution with no averaging.
Procedures including quality checking and application of necessary calibration corrections are
applied as part of the automatic data processing chain. We provide brief summaries of the
accuracy and reliability of the individual measurements, and an assessment of the performance
of the NRT processing chain as experienced during the brief trial carried out for this project.
3.2.1 Altimeter Data Overview The radar altimeter provides one measurement every 1 second (or 6-7 km) along satellite
ground track. Wave parameters are estimated as a spatial average over 5-10km diameter region.
Altimeter measurements of significant wave height and 10m wind speed have been extensively
validated and applied. Recent work at Southampton Oceanography Centre has developed a
technique for the estimation of wave period. This has been recently validated against model and
in situ data and modified (Caires et al., 2005).
It is in theory also possible to derive estimates of significant steepness, peak period, and wave
speed, but none of these parameters have been derived from altimeter data before (to the
authors’ knowledge). A first application should be tentative until careful validation has been
carried out.
Accuracy Significant wave height: accuracy 0.3m (0.5 - 15m), resolution 0.01m
-110m wind speed: accuracy 1.5 ms-1 (0.5 - 15 ms ), resolution 0.01 ms-1
Estimate of zero upcrossing period (experimental), accuracy 1 s (4-15 s), for wind speeds -1greater than 4 ms .
(Potentially) significant steepness – A function of significant wave height and wave period. No
direct validation has yet been carried out.
(Potentially) peak period – derived emprically in a similar fashion to zero upcrossing wave
period, but further development required.
(Potentially) wave speed (proportional to wave period). But validation would be difficult
Reliability Altimeter measurements are generally robust. No measurements available when non-ocean
feature lies within altimeter footprint. Very heavy rain (centre of hurricanes of intense tropical
storms) can attenuate and corrupt signal.
NRT Processing Chain Performance As reported in section 2, Jason, ERS-2 and ENVISAT altimeter data are processed. The
automatic processing chain is initiated every 10 minutes, and includes ftp transfer from the ESA
FD archive, quality control, calibration and reformatting, and then onward transfer to the met.no
server. The service specification gives a requirement for 99.9% reliability of data processing,
achieved through the use of twin processors.
141

If all three satellites and their data feeds are fully operational up to 12 passes a day are recorded
over the North Atlantic.
3.2.2 ENVISAT ASAR wave mode Data Overview The ENVISAT ASAR operates a continuous wave mode over the ocean which takes a
“Snapshot” imagette of the wave field over 10km x 6 km region every 100 km along track. A
new processing scheme (Engen and Johnsen, 1995) has been implemented in the ESA Near
Real Time ENVISAT ASAR wave mode processing chain. The new scheme makes use of the
cross spectra to resolve a previous 180’ ambiguity in wave direction. All ENVISAT ASAR
wave mode data demonstrated in this project have been processed, by ESA, with this new
scheme.
The ENVISAT ASAR wave product provides an estimate of the ocean wave spectrum in 24
wavelength bins (from 30m to 800m) and 36 direction bins, and derived (long wavelength)
parameters of significant wave height, mean period and peak period. An estimate of the azimuth
cut-off wavelength is also provided. The movement and imaging process of the SAR distorts the
measured wave spectrum. One of the features of this distortion is a lower cutoff in the
measureable wavelength in the azimuth direction, which varies between 100m and 400m. This
distortion affects all SAR wave products, whatever processing scheme is employed.
As for the altimeter, the estimates of swell and period could in theory be used to derive
estimates of (long wavelength) significant steepness, peak period, and wave speed. The same
caveats apply.
Accuracy Johnsen et al (2004) have provided a recent validation against the ECWMF WAM wave model.
We report their findings here
Significant wave height: r.m.s accuracy 0.8m (3 - 7m) for all data
0.6m (3 – 7m) for longer waves only7
Mean period ,Tm: r.m.s accuracy 1.7s (7-14 s), for all data
1.1s for longer waves only
Peak Period, Tp r.ms accuracy 3.1s
Mean direction r.m.s accuracy 1 rad
Peak direction r.m.s accuracy 1 rad
10m wind speed r.m.s accuracy 2.2 ms-1
Significant steepness – as for altimeters, can be derived from Hs, and Tm, but applies to long
wavelengths only
Wave speed can be calculated directly from peak period.
Neither has been directly validated
Reliability -1Best reliability is for seas with periods between 8-15s, and wind speeds between 3-13 ms .
Cannot see wavelengths lower than the azimuth cut-off in the along track direction (ranges from
100-400m, mean value is 235m).
Azimuth cut-off is higher for higher wind speeds.
Wind-sea distorted away from azimuth direction toward range direction.
7 In fact by comparing SAR and model data derived by integrating the wave spectrum for waves greater than 12s.
142
Significant wave height is overestimated at low wind speeds, and underestimated at high wind
speeds.
NRT Processing Chain Performance ENVISAT ASAR wave mode wave spectrum files are pulled from the ESA NRT file server,
quality controlled and reformatted, and then transferred to the met.no server. To date the volume
of data throughput has been disappointing with only a low number of records being displayed.
The possibility of relaxing the quality control criteria is being considered. It is also planned to
start uploading data from a second ESA ftp site in the near future.
3.2.3 SAR image mode Data Overview An operational processing chain for extracting wave data from SAR image mode in Near Real
Time does not currently exist, although the necessary basic infrastructure elements are in place
and could be assembled by QinetiQ, using SAR images received at West Freugh station.
This assessment of SAR image mode data considers data processed through the QinetiQ MaST
application. It is important to remember that SAR wave mode data and SAR image mode data
have been subject to different processing schemes.
Accuracy At present QinetiQ are using the MaST application to produce wave data from the SAR image
mode. MaST provides wavelength and direction for resolved wave trains, at a selected sub-
scene resolution. A 180° ambiguity is retained for wave direction. This project represents the
first use of the QinetiQ MaST package to provide wave data for an operational application.
Although we have endeavoured to provide as thorough an assessment as possible further work
is required to provide a full validation. As reported in section 2.3, some problems have been
identified with the MaST processing scheme and some ways to achieve possible improvements
identified.
In principle the same ENVIWAVE algorithms as used for ENVISAT ASAR wave mode data
could be applied within MaST (though the SAR image data must be pre-processed into Single
Look Complex format), and the same accuracy acheived as for the wave mode data above.
Reliability In addition to the issues generic to SAR imaging of ocean waves (azimuth cut-off, limited wind
speed window, distortion of short wavelengths to range direction from azimuth), we have also
found some additional issues specific to wave products derived through the QinetiQ MaST
application (again, see section 2.3)
NRT Processing Chain Performance An NRT chain has not been established for the extraction of wave data from SAR imagery. The
infrastructure exists to support such a processing chain, starting with reception of SAR imagery
and automatic pre-processing at West Freugh, through to ftp and generation of wave parameters
with MaST at Farnborough, onward ftp to SOS, and then finally to Met. No. A similar
processing chain is already in place and being used on a regular basis at QinetiQ for ship and
iceberg detection.
In principle, dependent upon approval of requests to ESA for image requisition, (A)SAR images
could be downloaded from every ENVISAT and ERS-2 pass within the region. The number of
scenes available to download each day will depend upon the size of the AOI specified, the
existence of conflicting and higher priority requests on the (A)SAR instrument, and the
availability of the West Freugh receiving dish (which is shared with other users).
143

3.3 WAVE STATISTICS EVALUATION – EXISTING KNOWLEDGE
3.3.1 Altimeter Derived Wave Statistics No new altimeter wave statistics product has been derived during this phase of the project. This
was not viewed as necessary as the use of altimeter data for the generation of wave statistics is
now well established and widely accepted by the offshore community. Such services primarily
focus on significant wave height (and wind speed) measurements. Individual measurements
have been shown to be reliable, and calibration corrections exist to ensure homogeneity across
data sets from different satellites. The use of altimeter data bases to estimate low probability
return values, from the interpolation of recorded distributions, is also regarded as acceptable. It
is in the nature of these estimates that they are difficult to verify, however, an observed
consistency with equivalent estimates from other data sources (in situ, model hindcasts) where
they exist provides confidence that altimeter derived values are accurate and can be used in
other locations, where other data sources are not available.
To date, altimeter estimates of wave period have not been used to derive climate statistics. It is
therefore not possible to comment on the reliability of such possible applications (or of
secondarily derived parameters: significant steepness and wave speed). However, work is
continuing at National Oceanography Centre and Satellite Observing Systems to further develop
and test the new algorithms which show much promise,
3.3.2 SAR wave mode Derived Wave Statistics Some organisations provide wave statistics derived from SAR wave mode. As an example,
ARGOSS, in the Netherlands, combine the long wavelength information from the SAR wave
mode with a wind sea spectrum estimated from the satellite scatterometer (Mastenbroek and de
Valk, 2000), and so provides probability distributions of mean wave period, zero upcrossing
wave period, and joint probability distributions of significant wave height and mean period,
significant wave height and zero upcrossing wave period, and significant wave height and wave
direction.
The ARGOSS web site provides validation information from direct comparison of individual
measurements against buoy data, but not of the overall wave climate against other sources. They
note that the best results are obtained in the Pacific and Hawaii (which have a climate
dominated by long waves), with the worst results in the Gulf of Mexico (with a wind-sea
dominated climate).
3.3.3 SAR image mode Derived Wave Statistics To our knowledge, SAR image mode data have not previously been used to estimate wave
climate statistics.
3.4 WAVE STATISTICS EVALUATION – SAR IMAGE DATA FROM THIS PROJECT
This evaluation is possible through the availability to the team of Faroes waverider buoy data
(1999-2004), the ECMWF ERA40 wave climatology (1957-2002), and a voluntary observing
ship (VOS) dataset (Gulev et al., 2003) based on the Comprehensive Ocean Atmosphere Data
Set collection (Woodruff et al., 1998). The latter data set is climatological and could not be used
for comparison of coincident data. Eight SAR scenes were analysed within Phase 1,
contemporary with the Faroes buoy, and were compared with that data therein (Cotton et al,
2005). The 27 SAR scenes analysed within Phase 2 are from the period 1992-1998 and are
compared here with model and VOS data from the same period.
144

3.4.1 Direct comparison of SAR derived wave products against coincident ECMWF ERA40 data.
(a) ECMWF ERA40 data The period of the dominant wave and the direction of the dominant wave period at 6 hour
intervals was extracted from the ERA40 database for a seven year period (1982-1998). Note that
these variables have not gone through the quality analysis and corrections applied to the more
basic parameters included in the KNMI wave climatology (http://www.knmi.nl/waveatlas).
Since the 27 SAR passes are each at ~ 1130 UTC they can be reasonably compared to model
output for noon on the appropriate day. The model is an advanced deepwater wave model which
should give fairly accurate hindcasts for deep water with adequate meteorological inputs. The
model operates on a 1.5° x 1.5° grid and data were extracted for the 9 grid points given by
longitudes of 4.5°W, 6°W and 7.5°W and latitudes of 58.5°N, 60°N and 61.5°N. Data at 4.5°W,
58.5°N is null as this lies in the Scottish mainland. Only data from 60°N strictly lie within the
study area (4°-8°W, 59°-61°N) but together data from the eight valid grid points give a useful
impression of the likely spatial variability. In the following figures, data from each grid point is
analysed separately and presented in a map orientation (westerly data on left, northerly on top).
Directions and wavelengths are presented in Figures 22-24. There is some spatial variability,
but the main features are common to all eight grid points. The majority of cases give directions
between south and west, but there are several values north of west and few directions <180°
particularly in the north of the study area. Most wavelengths are between 100 and 300m peaking
in the range 200-250m, with a few shorter and longer wavelengths.
Figure 22 Occurrence of directions (from) among ERA40 data coincident to SAR passes, 10 degree intervals. Data from 8 grid points are arranged in a map-wise orientation.
145

Figure 23 Occurrence of dominant wavelengths among ERA40 data coincident toSAR passes, 50 metre intervals. Data from 8 grid points are arranged in a map-wise orientation.
Figure 24 Polar plot of wavelengths (metres). and directions (from) among ERA40data coincident to SAR passes. Data from are arranged in a map-wise orientation.
(b) Comparison Pairs of data from ERA40 and the 27 SAR scenes allow a direct comparison. Below, we plot the
pairs of estimated wavelength and of direction. The results for wavelength are very encouraging
with most data near a 1:1 line (blue diagonal). (Note however, that there are 3 coincident pairs
at (235, 100)). There are no cases where the wavelength measured by SAR is substantially
greater than that given by ERA40, but there are seven cases where SAR gives much shorter
wavelengths (difference > 50m). There is no significant correlation in the SAR/ERA directions.
146
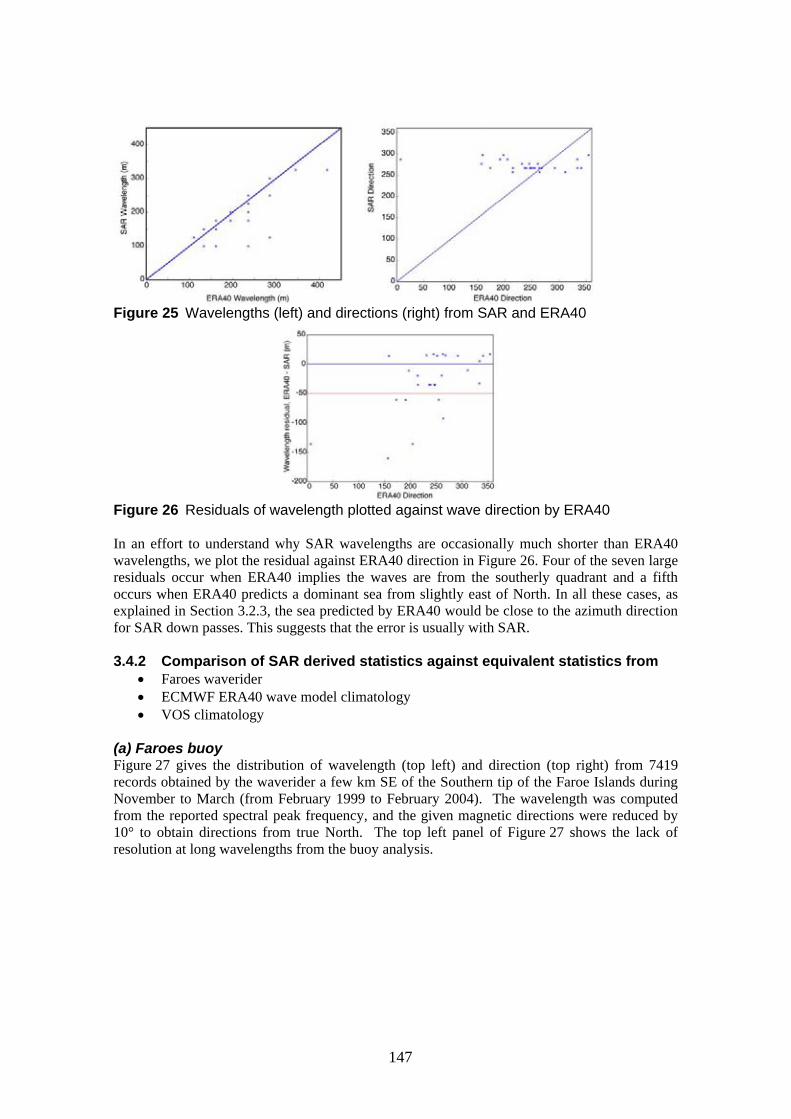
Figure 25 Wavelengths (left) and directions (right) from SAR and ERA40
Figure 26 Residuals of wavelength plotted against wave direction by ERA40
In an effort to understand why SAR wavelengths are occasionally much shorter than ERA40
wavelengths, we plot the residual against ERA40 direction in Figure 26. Four of the seven large
residuals occur when ERA40 implies the waves are from the southerly quadrant and a fifth
occurs when ERA40 predicts a dominant sea from slightly east of North. In all these cases, as
explained in Section 3.2.3, the sea predicted by ERA40 would be close to the azimuth direction
for SAR down passes. This suggests that the error is usually with SAR.
3.4.2 Comparison of SAR derived statistics against equivalent statistics from
x� Faroes waverider
x� ECMWF ERA40 wave model climatology
x� VOS climatology
(a) Faroes buoy Figure 27 gives the distribution of wavelength (top left) and direction (top right) from 7419
records obtained by the waverider a few km SE of the Southern tip of the Faroe Islands during
November to March (from February 1999 to February 2004). The wavelength was computed
from the reported spectral peak frequency, and the given magnetic directions were reduced by
10° to obtain directions from true North. The top left panel of Figure 27 shows the lack of
resolution at long wavelengths from the buoy analysis.
147

Faroes buoy: Nov. March Faroes buoy: Nov. March
Fre
quen
cy
0 200 400 600 800
0 20
0 40
0 60
0 80
0
Den
sity
0 150 250 350
0.00
0 0.
004
0.00
8 0.
012
50
wavelength Direction from (true)
Faroes buoy: Nov. March waves from 0 50 deg.
Den
sity
0.00
0 0.
004
0 200 400 600 800
wavelength
Figure 27 Distribution of wavelength (top left) and wave direction (top right) from the Faroes buoy records during November to March. The lower panel gives the distribution of wavelength when waves were from 0° to 50°.
The top -right panel of Figure 27 shows the peak direction around 250°, with a secondary peak
around 30°. 19% of the waverider records had waves from between 0° and 50°. Moreover,
these NNE.ly waves were similar in length to those from the SW, as shown in the lower panel
of Figure 27, and included the longest wave observed by the buoy: 770 m, or 22 s.
The distribution of wavelengths from the buoy is more sharply peaked than other data sources.
55% of dominant wavelengths are between 150 and 250m and the mean wavelength is 229 m.
(b) ECMWF ERA40 The data used are for the months of January February, March, November and December from
1992-1998 and as described in section 3.4.1. These form a large population describing the wave
climate for these months in this period. These data are presented in Figures 28-32.
148

Figure 28 Occurrence of directions (from) among ERA40 data, 1992-1998, November-March, 10 degree intervals. Data are arranged in a map-wise orientation.
Figure 29 Occurrence of wavelengths among ERA40 data, 1992-1998, November-March, 50 metre intervals. Data are arranged in a map-wise orientation.
149

Figure 30 Polar plot of occurrence (radial co-ordinate) of directions ERA40 data, 19921998, November-March, 10 degree intervals. Data are arranged in a map-wise orientation.
Figure 31 Polar plot of mean dominant period (seconds) from each 30o sector
Figure 32 Polar plots of wavelengths (metres) and directions
150

(c) VOS wave climatology Data from their climatology was provided by Sergey Gulev and Vika Grigorieva of IORAS,
Moscow for the area 60°-61°N, 4°-8°W. Typically, there were of the order of 20 observations
(not always of the complete set of wave characteristics) in each month in this area, but in some
months there could be less than 10 observations. Thus, this data set is insufficient to fully
describe the distribution of wave characteristics in each month and therefore the data provided
by IORAS was limited to describing the average of each variable for each month. The standard
procedure for VOS records is to report a wind/wind-wave direction and a wind-wave period,
and a swell period and swell direction. Procedures at IORAS include definition of a dominant
period chosen to be which of the two periods is identified with the highest wave period. Note
also that the instructions to VOS participants is likely to lead to a measure of period akin to
either “zero-crossing period” or “crest period” (Sergey Gulev, personal communication, 2005)
either of which is likely to be 2/3 to 3/4 of the modal or peak period of actual interest. (see
Tucker and Pitt, 2001). Directions for each month are calculated from a vector sum of phase
velocity for all observations in that month. Directions for swell waves and wind waves are
calculated separately. The data for 35 months, 1992-1998, November-March, are presented in
Figures 33 and 34.
Figure 33 Occurrence of mean wavelengths of wind waves (top left) swell (top right), and dominant sea (lower panel) 10 metre intervals
151

Figure 34 Polar plot of (left) swell directions and wavelengths (metres), and (right) occurrence of mean direction of swell, 30o intervals and swell
(d) ComparisonComparing the three data sources described above to the SAR climatology (Section 2.3.5,
figures 12 and 16), it is apparent that the SAR climatology captures the dominance of long
waves from the west but both the angular and wavelength distributions from SAR appear
unrealistically narrow. Before exploring possible reasons for this, it is worth discussing all four
data sources and their special characteristics.
One of the most promising characteristics of SAR is that it offers a spatial resolution unrivalled
by other data sources (see Section 2.3.5, figure 14). The ERA40 climatology does not match
this high resolution but also offers evidence of subtle but significant spatial variability of the
wave climate within the Scotland-Faroes channel. The most obvious feature in the ERA40
climatology is that waves from significantly south of west clearly dominate in the north west of
the study region, but the dominant direction shifts close to west towards the south east. In the
south, it is likely that the Scottish mainland and the Hebrides reduce the exposure to waves from
more southerly angles; while in the north, the Faeroes may act as partial shelter from the north
west. The occurrence of very long waves is also slightly lower towards the north, possibly due
to obstruction of long wave waves from the north west.
The Faroes buoy is the best source of actual data, but its site may significantly impact on the
results. Comparing the results from the Faroes buoy (Figure 27) and from ERA40 (Figure 28) a
significant disparity in the occurrence of waves for the northerly quadrant is apparent. Errors in
the ECMWF model or a climatic shift since the 1990s cannot be completely ruled out, but the
distortion of the wave field by the Faroes and the surrounding shelf seems to be the most likely
explanation for a slightly peculiar wave climate at the Faroes buoy site. Wave from north to
northwest may be blocked, refracted or diffracted by the Faroe Island and surrounding shelf.
Waves originating from the north-west may therefore arrive at the site from a more westerly
direction, while waves originating from the north may eventually arrive from a more easterly ° direction. This may explain the pronounced and broad dip between two maxima at around 250
°and 30 in the distribution of wind direction from the Faroes buoy. This compares to a less °pronounced dip and a minor maximum at about 0 in the ERA40 distributions. Note that ERA40
is based on a 1.5° x 1.5° resolution deep-water wave model which will therefore poorly
represent the influence of the Faroes. So we may expect that the Faroes buoy gives a much more
accurate impression of wave climate at its site, but is very unlikely to be representative of wave ° ° climate further south for waves from 280 to 50 .
152

The VOS climatology provides the only actual in situ data for the region as a whole, but has
some peculiarities. Note especially that the directions are vector sums of all observations in a
given month. Therefore, we might expect a relatively narrow distribution of wave directions. In
fact, the calculated swell directions populate a large sector from S to NNW peaking near WSW
(Figure 34).
Having described some of the problems with the other data sources, it should be emphasised
that whatever their exact direction, it is clear that waves from the Northerly sector are not °uncommon and so the limitation of SAR observed wave directions to less than 330 among the
(Figure 12, table 3) gives a poor representation of the true wave climate. Similarly, whilst waves
from the south are relatively uncommon it is clear that they do occur, and so the very low °occurrence of wave directions less than 230 among the SAR modal directions is also
unrepresentative of the true wave climate. The SAR-estimated dominant direction of
approximately 275v appears to be reasonably accurate (possibly a little high) but as discussed in
the next section this may be fortuitous and this accuracy is unlikely to be repeated anywhere
that the wave direction is distant from the presumed range axis.
The comparison for wavelengths is far more favourable. The SAR data, the Faroes buoy and
ERA40 all show a predominance of wavelengths from 100m to 300m. The wavelengths from
VOS are much shorter but given their different definition, we expect these values to be
approximately half the “dominant wavelength” defined in the other cases; therefore, the VOS
results for swell waves are very consistent with the other data sources. The SAR data does not
include wavelengths greater than 350m. Since there is no obvious reason why SAR would miss
longer waves, it seems likely that it is just chance that longer waves from the west did not
dominate on any of the 27 occasions. Note however, that ERA40 does suggest 400m waves
from WSW on one of these occasions, (see Section 3.2.1). Note also that we have seen in
Section 3.2.1, that SAR may severely under-predict wavelengths on some occasions. As
discussed in the next section and elsewhere the absence of short waves (<100m) in the SAR
database is wholly expected given the processing details and is a slight distortion of the true
climatology.
3.4.3 Differences between SAR wave statistics from ascending and descending passes and a discussion of SAR imaging issues.
As shown in Figure 5, estimated directions from down track and up track SAR data are
narrowly distributed around a central angle “the image angle”, with a dip in occurrence at the
precise image angle and a curious alignment of data along a number of curves. The total
absence of data at the image angle is mysterious but other features of the data can be understood
from previous work, notably a description of ERS SAR image mode wave processing by
Kerbaol et al (1998) and details of ENVISAT ASAR wave mode processing by Johnsen (2005).
In particular Figure 9 (from Kerbaol), shows some of the features apparent in this data set, albeit
to a lesser extent. Very few waves are detected at a large angle to the range axis, and are limited
to very long waves. The sparsity of retrievals at the range axis is attributed to the so-called
peak-splitting effect (see Section 2.3.3, Annex A and Brüning et al, 1990).
The absence of any shorter wavelengths away from the range axis is due to the azimuth cut-off..
The general situation for the potential imaging of surface waves by SAR is illustrated in Figure
35 (taken from Johnsen, 2005). The maximum wavelength is set by the image size and the
minimum detectable wavelength in the range direction is in principle only limited by the
resolution of the image and the Nyquist criterion. The minimum wavelength in the azimuth
direction depends on environmental conditions but is often in the range 200-300m (Figure 36).
153

Figure 35 Range of wave resolution. Axes are wave numbers in the range direction and azimuth direction and the shaded area labels achievable resolution. Here for ENVISAT ASAR wave mode [from Johnsen, 2005]. Note that the satellite ground track lies in the azimuth direction (i.e up/down on this figure).
Figure 36 Calculated occurrences of azimuth cutoff for ENVISAT ASAR wave mode [from Johnsen, 2005].
Translating this background to the results from the MaST processing, the obvious interpretation
is that MaST has an exaggerated limitation in detecting waves away from the range axis. The
question then arises, what does the processing detect when the dominant waves are from a
direction far from the range axis? It seems probable that given the complexity of natural seas
there will usually be some sea from closer to the range axis and this will be detected instead.
This is consistent with the observation in Section 3.2.1 that SAR often gives much shorter
wavelengths than ERA40 when ERA40 predicts that the dominant sea will be near the azimuth
axis.
154

3.4.4 The Effect of a Limited Wind Speed Window for SAR Derived Statistics As has been noted in previous reports, the SAR's ability to 'see' waves is limited by wind speed;
only imaging them if wind speed is in the range of roughly 3 - 13 ms-1. (The upper limit is
dependent on sea state and wave direction, and sometimes SAR will not image waves even
when the wind is 11 ms-1.)
The GIFTSS's area to the NW of Scotland is particularly windy in the winter. Here, altimeter
data is used to investigate how wave climate derived from SAR in this area might be affected by
'wind cut-off'.
Median values of significant wave height, Hs, and wind speed, U, were taken from each transect
of Topex and of ERS-2 crossing the area 60°-61°N, 4°-6°W during January and February
(TOPEX from 1993 to 2004, ERS-2 from 1996 to 2004). This gave 248 values, of which one -1had U < 3 ms-1, and 90 had U >13 ms . Tp, the wave periods corresponding to the peak of the
frequency spectrum, were estimated using Gommenginger et al. (2003), and the corresponding
wave lengths were derived from the dispersion relationship.
The distributions of Hs given by all the data are compared to the truncated data set - although
the QinetiQ MaST scheme does not provide estimates of Hs from SAR, these could be obtained
if the SAR images were processed by the Engen and Johnsen (1995) scheme as included in the
ESA processing chain for ENVISAT wave mode data and within the 'BOOST' scheme discussed
in Phase 1 of the project (Cotton et al., 2005). The distributions of Tp and the corresponding
wave lengths are also compared.
Figure 37 is a plot of Hs:U, showing the many occasions with U>13 ms-1, and indicating some
correlation between Hs and U, suggesting that the distribution of Hs would be different from the
truncated data set, limited by wind speed.
Figure 37 Distribution of Hs and U during January and February
Figure 38 shows that this is indeed so; the upper tail is most affected, as confirmed by Table 10.
Clearly estimates of the percentage of high waves, including estimates of extremes such as the
50-year return value, would be seriously affected by the truncation.
The mean and standard distribution of all Hs were 4.33 m and 1.54 m respectively, and of
truncated data were 3.62 m and 1.15 m.
155

Figure 38 Distribution of wave height, left:all data, right: truncated data
Table 10 Wave heights (m) of specified percentiles. E.g. 50% of all data were >4.1 m, while 50% of the truncated data were > 3.67 m
%ile all data truncated data
10 2.33 2.11
20 3.12 2.61
30 3.54 3.10
40 3.86 3.36
50 4.10 3.67
60 4.54 3.88
70 5.01 4.08
80 5.59 4.45
90 6.47 5.26
Figure 39 shows the distributions of Tp.
Figure 39 Distribution of peak period, left:all data, right: truncated data
The average of peak period seems less affected than Hs, with the mean lowered slightly from
14.1 s to 13.0 s in the truncated data set; but again the upper tail is reduced. The effect is more
pronounced in the distribution of wavelength shown in Figure 40.
156

Figure 40 Distribution of peak wave length, left: all data, right: truncated data.
Note that this figure recalls an issue discussed in the previous section: SAR cannot resolve wave
lengths of less than about 100 m in the range direction, and either misses or distorts even longer
waves at an angle to the range direction. Fortunately in the winter months, north of Scotland,
waves will be often close to the range direction (especially for descending passes) and much
longer than 100 metres, but nevertheless there is likely to be this further distortion of the wave
climate. Note also that the azimuth cut-off increases with wind speed, so that at high wind
speeds it may be almost inevitable that the wave direction retrieved by SAR is very close to the
range axis.
In conclusion, because of the high wind speeds often experienced during the winter, and
because of the SAR's inherent inability (common to all SAR processing schemes) to image
waves at these wind speeds, distributions of Hs, Tp and wave length obtained from SAR will be
considerably distorted, especially in their upper tails. Estimates of average climate conditions
may be acceptable, but estimates of extremes would be seriously in error.
3.5 SUMMARY 3.5.1 Altimeter Data The ability of the satellite altimeter to provide accurate measurements of Hs, both in Near Real
Time and in statistical analyses, is well established (rms accuracy 0.3m). A mean wave period
parameter can also be derived and studies of individual values and compiled statistics have -1shown this to be accurate except in low wind conditions (i.e. < 4 ms , otherwise rms accuracy
1s).
Algorithms exist to allow the derivations of other wave parameters from altimeter data, such as
significant steepness, peak period and wave speed, but careful validation against a reliable
reference data set would be required before any operational use.
3.5.2 SAR Data The process by which SAR images ocean waves introduces a distortion of the wave spectrum
which affects all SAR derived products. This includes a lower wavelength cut-off in the azimuth
direction (for ERS-1, ERS-2 and ENVISAT this is oriented parallel to the satellite ground
track), and a distortion of the direction of shorter wavelength waves towards the range direction
(for ERS-1, ERS-2 and ENVISAT perpendicular to the satellite ground track), In addition SAR
imaging of ocean waves is only effective when the surface wind speed (at 10m) lies between 3 -1 -1ms and 13 ms . It was shown that whilst estimates of average wave climate conditions from
SAR might be acceptable, this limitation would lead to a serious error in estimates of extreme
conditions.
Within this project we have considered wave data generated through two routes.
157
ENVISAT ASAR wave mode ENVISAT ASAR wave mode data are processed in Near Real Time by ESA, using the
new“ENVIWAVE” algorithms (Engen and Johnson, 1995), which processes “Single Look
Complex” SAR sub-scenes, resolves a previous 180° ambiguity and allows an estimation of
significant wave height, wind speed, and provides a wave energy spectrum in 24 x 36
wavelength by wave direction bins. Initial assessment of the ENVISAT ASAR wave mode
product outside this project has indicated that best accuracy is obtained in the wave period range
8-15 s (Hs rms accuracy 0.8m, Tm 1.7s, Tp 3.1s, direction 1 radiona). In principle wave speed
and significant steepness (for longer waves) could be calculated but, as for altimeter data,
careful validation against a reliable reference data set would be required before any operational
use.
SAR image mode Within this project .PRI (Precision Image –amplitude image only) SAR image mode data have
been processed by QinetiQ using the MaST application. With the algorithms currently
employed this application can estimate wavelength and direction from .PRI images at a selected
resolution. The algorithms employed pre-date the “ENVIWAVE” algorithms, and apply linear
approximations to represent the non-linear processes of velocity bunching and tilt modulation,
but not hydrodynamic modulation. This process retains a 180° ambiguity in wave direction
which is resolved by assuming the waves are travelling towards the nearest land.
Our initial analysis indicates a useful accuracy in wavelength (and so also period) may be
obtained for waves travelling in the SAR range direction sector. However, wave directions
appear to be unrealistically grouped close to the range direction. It is thought that the integration
of improved Model Transfer Functions within MaST, used to process Single Look Complex
Images (i.e. .SLC rather than .PRI) would improve performance.
158

4 ASSESS BENEFITS OF EO PARAMETERS
4.1 INTRODUCTION The objective of this section is to assess the potential benefit of using new satellite data for
wave statistics and NRT wave conditions monitoring, in comparison to presently available
services.
This assessment covers the data products demonstrated and evaluated as part of phase 2 of this
study, and also considers other options that are available: e.g. altimeter data demonstrated in
phase 1, SAR wave mode, the use of the ENVIWAVE algorithms (Engen and Johnson, 1995) in
processing SAR images. Following the assessments carried out in phase 2 of the project, the
“grading” tables that were compiled in the phase 1 report (Cotton et al., 2005) have been
revised and these are included at the end of this chapter.
Separate assessments of the two categories of directional wave data from SAR are provided:
data processed by the QinetiQ MaST application (with currently installed algorithms) and full
2-D wave spectra which are provided in the ENVISAT ASAR wave mode product (and can be
provided by the application of the ENVIWAVE algorithms to SAR image mode Single Look
Complex data).
4.2 WAVE STATISTICS Availability and suitability of both EO and non-EO data were considered in Phase 1 as
discussed in detail in Workpackages 1.1 (Woolf, 2004a), 1.2 (Carter, 2004a), 1.3 (Woolf,
2004b) and summarised in the final report of Phase 1 (Cotton et al., 2005). Here we revisit the
conclusions with particular attention to the additional information on SAR products from recent
work.
4.2.1 Significant Wave Height
Altimeter Individual measurements of significant wave height are typically accurate to about 0.3m (rms
error) with no significant bias, at least in the range 0-10m.
The primary limitation of altimetry is sampling. With typically 4 altimeters available the
estimated monthly mean of a 1x1 degree area will be accurate to about 0.5m or less. This error
may double if only one altimeter is available. These issues were considered in WP 1.1 (Woolf,
2004a).
Altimeters orbit at an angle to the pole. The ground track of the TOPEX/JASON series is
limited to within 66o of the equator. The other altimeters cover an even larger area. Therefore
there is no significant limitation in coverage 8Altimeter data are available at the cost of reproduction . In most cases, NRT data are of good
quality, approaching that of the final archived versions.
SAR MaST
The QinetiQ MaST processing scheme for SAR image mode data, with the presently installed
algorithms, does not provide an estimate of significant wave height.
2-D Spectrum and ENVISAT wave mode
Application of the Engen and Johnson (1995) algorithms to both image mode and wave mode
allows an estimate of significant wave height, but at best this can only be based on an
8 This is certainly true for Jason, TOPEX, Geosat and GFO. ESA policy for commercial use of altimeter data is not
clearly defined
159

integration of those waves long enough to image. Johnsen et al. (2004) estimate errors of
approximately 0.8m with respect to ECMWF wave model data.
Sampling
Coverage is essentially global (given the right wind/wave conditions).
Thus far sampling by SAR has in practice been of the same order but more irregular than
altimetry. ENVISAT ASAR should greatly enhance sampling but detailed figures are
unavailable (Work Package 1.1, Woolf 2004a).
ENVISAT ASAR wave mode data should in principle supply a stream of up-to-date data, but so
far in practice very little NRT data are available. According to ESA the only charge payable for
ENVISAT ASAR wave mode data is for cost of production.
Combined Data Sets Since coverage by SAR and altimetry are both sparse, there is an obvious benefit in using data
from both. Scatterometry measures wind speeds rather than wave heights, but provides better
coverage than either altimetry or SAR. Scatterometers also describe information on the forcing
fundamental to waves.
For Near Real Time application, schemes have been developed to assimilate the long
wavelength information from SAR wave mode NRT products into wave models, and so improve
the model predictions (e.g. Breivik, et al, 1998). We understand that, currently, Météo France
and ECMWF operationally assimilate ERS-2 and ENVISAT (A)SAR wave mode data. Recently
Schulz-Stellenfleth et al. (2005) have proposed a scheme whereby model predictions can be
used with ASAR wave mode data to generate a full wave spectrum where the ASAR wave mode
data are available. This scheme offers a possible enhancement to the NRT system tested in this
project
For statistical analyses Mastenbroek and de Valk (2000) have proposed a scheme that combines
scatterometer and SAR wave mode data – using the scatterometer data to provide the short
wavelength wind sea information, and the SAR wave mode data for information on long waves.
Validation was limited to a relatively small number of co-locations and a more comprehensive
validation exercise was recommended.
In principle, there is no reason why both the Schulz-Stellenfleth et al. (2005) and Mastenbroek
and de Valk (2000) schemes could not be extended to apply to from SAR image mode data.
We have not been able to test such schemes within this project.
Comparison with Other Sources Other sources have been described in Work Package 1.2 (Carter, 2004a). Apart from a very few
data buoys the primary existing source of data are operational wave models (or reanalysis
products for climatologies) and ship reports (compiled to produce VOS climatologies).
Visual observations of winds and waves by commercial ships have been archived for a century
and a half, and became systematic following a resolution of the WMO in 1961. The most well
known compilations of these observations are the OWS (Ocean Wave Statistics, Hogben &
Lumb, 1967) and the more recent Global Wave Statistics (GWS, Dacunha and Hogben, 1989)
which empirically corrects for biases that were identified in the earlier OWS. The main
advantages of GWS / OWS are the length of the collection period, their suitability to shipping
applications and the fact that they are well documented for the major shipping routes. The main
drawbacks are the lack of information outside the main routes, the poor accuracy for wave
periods (poorly estimated even by experienced observers), the lack of wind information, and
some deficiencies in seasonal representation and in reporting extremes.
160

Figure 41 Comparisons of satellite data, model output and ship observations. Left: Scatter plots of monthly means on a 5° x 5° North Atlantic grid, from the ALT,ERA/WAM and VOS data sets. top - WAM v ALT, (middle) VOS v ALT, (bottom) VOS v WAM.Right: (A) Mean VOS significant wave height climatology (1985-94) and difference plots against WAM (B) and ALT (C). Contours in m. Copyright Physics and Chemistry of the Earth (Pergamon).
Hindcasts compute wave heights from historical wind databases. The computer codes that
simulate the physical wave processes have reached a good level of maturity, but errors and
uncertainties in the input wind fields are amplified by this process, as wave heights are roughly
proportional to the square of the wind speed. The quality of the results is thus often impaired by
the lack of accuracy or of validation of the wind data, especially for regions where few
observations are available, such as in most of the southern hemisphere. The main advantages of
hindcasts are that they provide world wide, long-duration histories of waves. The main
drawbacks are that they are proprietary and costly, that they depend on the personal skills of the
analysts who verified and corrected the wind fields, and that they have limited accuracy in
extreme conditions. However, it should be noted that the availability of satellite scatterometer
measurements of winds during the last decade has significantly improved the accuracy of the
wind field. Cotton et al., (2001) compare three types of wave climatology: one derived from
161
visually observed ship data, one from a 15 year hindcast and one from satellite altimeter data.
They show that the visually observed data tend to overestimate low waves and underestimate
high waves, as do the hindcast model output (though to a lesser extent- see figure 41).
Interestingly, they also found that the hindcast and visually observed climatologies show
different patterns of long term trends in the North Atlantic. The altimeter data do not, as yet,
provide a long enough time series to consider decadal patterns of variability.
It is noted that HSE also has access to the NEXT/NEXTRA wave model hindcast data, though
they were not analysed here
In the case of NRT: Ship observations are disseminated by the meteorological communications
net and are available on the web e.g from Oceanweather. Forecasts from wave models are
widely available and like the hindcasts these are a mature product. However, additional errors in
the forecasts may occur through errors in weather nowcasting and forecasting. There are reports
(mainly anecdotal, but see Carter, 2004a) of significant under-predictions of wave heights in
some storms.
Recommendations Climatologies: Statistics on wave heights from altimetry are probably the most reliable
currently available, though closely rivalled by the best model reanalyses. The longer
climatologies from model reanalysis and VOS are also extremely useful for providing insights
into longer-term variability. VOS is also the main source of data away from data buoys on the
relative contribution of swell and wind waves to the total significant wave height. The primary
limitation of altimetry climatologies is limited resolution. The standard product from altimetry
up to now has been a 2° x 2° resolution, monthly climatology. A 1° x 1° climatology is the best
achievable from altimetry with present sampling; but note that the extension of such a
climatology in future years requires maintenance of a similar constellation (~4) of altimeters,
which cannot be guaranteed (See Table 13 in section 5, which lists planned future missions). A
single altimeter is sufficient for a 2° x 2° degree climatology and future provision at this level is
fairly certain. SAR wave mode seems to be able to produce a credible climatology (Johnsen et
al., 2004) but there has been little research on the bias associated with a varying angle between
dominant wave direction and range axis. We suggest that further fundamental research on SAR
is still required. In the future, the data on specific portions of the wave spectrum, especially
information on swell, could be a very useful adjunct to significant wave height climatologies
from altimeter data.
Near Real Time: Earth Observation cannot provide sufficient data coverage to entirely supplant
wave model output. However, information from both altimetry and SAR is a useful “check” on
model output that should be very useful if supplied as a well-designed “graphical overlay”.
Scatterometer data also add context and should also be available as an overlay.
4.2.2 Wave Period / Wave Length
Altimeter Root Mean Square errors in zero-crossing periods and mean periods are approximately 1 second
(Gommenginger et al., 2003). Errors in peak periods are much higher, about 3 seconds.
Sampling issues are likely to be similar to measurement of SWH but have not been quantified
yet.
Altimeters orbit at an angle to the pole. The ground track of the TOPEX/JASON series is
limited to within 66o of the equator. The other altimeters cover an even larger area. Therefore,
there is no significant limitation in coverage
162

Altimeter data are available at cost of reproduction. In most cases, NRT data are of good
quality, approaching that of the final archived versions.
SAR SAR is most suited to measuring dominant period. All processing methods can at least measure
peak period.
MaST
We have seen in Section 3.2.1, that MaST estimates of wavelength are generally within 50m of
hindcast estimates. This is very encouraging and suggests an accuracy of 1-2 seconds of both
estimates of dominant period in most cases. However, we found that on some occasions the
MaST estimates could be unreliable, especially if the direction of the major sea is close to the
azimuth axis
2-D Spectrum and ENVISAT ASAR wave mode Johnsen et al. (2004) estimate errors of approximately 3.1s in ENVISAT ASAR wave mode
data with respect to ECMWF wave model data. Where more of the wave spectrum can be
retrieved, other periods – most reliably those primarily sensitive to the longest waves – can also
be estimated. Johnsen et al. (2004) estimate errors of energy period (Tp = m-1/m0) of 1.7s.
The full spectrum processing schemes (e.g. Mastenbroek and de Valk, 2000,, and Schulz-
Stellenfleth et al., 2005) may fare better, but a bias between range and azimuth is inherent in
SAR, and we have found no exploration of how this feeds into errors of period.
Sampling Coverage is essentially global.
Thus far sampling by SAR has in practice been of the same order but more irregular than
altimetry. ENVISAT ASAR should greatly enhance sampling but detailed figures are
unavailable.
Combined Since coverage by SAR and altimetry are both sparse, there is an obvious benefit in using data
from both. Scatterometry measures wind speeds rather than wave characteristics, but provides
better coverage than either altimetry or SAR. Scatterometers also describe information on the
forcing fundamental to waves. Procedures to combine data from different sensors and with
models have been discussed in section 4.2.1
Comparison with Other Sources The situation for wave periods is largely as described above (Section 4.2.1) for significant wave
height, but relatively little information is available for all sources of wave period data. Caires et
al. (2005) have recently compared altimeter, ERA40 hindcasts and buoy data on mean wave
period; estimating corrections for altimeter and hindcast data and random errors in each.
Generally the random error in mean wave period is less for altimetry than ERA40 suggesting it
should be the preferred product. Estimated mean (zero upcrossing) wave period from altimetry
is certainly a useful product where swell is not dominant, (Gommenginger et al., 2003), but
Caires et al. also find that these altimeter values of mean wave period are also reliable in swell
conditions if the wind is moderate or strong. Zero-crossing periods from altimeter are likely to
be similarly competitive but altimeters are probably not the best source of data on
dominant/peak periods or swell periods (Gommenginger et al., 2003). The analysis described in
Section 3.2.1 is encouraging with respect to both wave models and SAR in that both must have
considerable skill in estimating the dominant period and wavelength. However, SAR has an
“Achilles heel” in properly measuring seas closely aligned to the azimuth and this will surely
bias SAR climatologies of wave period.
163

Recommendations As for wave height, though the dependency of the accuracy in wavelength (and hence period)
on wave direction is problematic and may undermine its use in NRT products. It is not known if
this same dependency exists in the ASAR wave mode data (produced by the new ESA SAR
processing scheme) as has been found in the ASAR image mode data processed through MaST.
Whilst we note that climatologies including wave period (wave length) distributions derived
from SAR wave mode data are commercially available, there is not sufficient detail in the
accompanying literature to allow us to determine if this dependency on wave direction exists or
is checked for.
Resolution of biases between range axis and azimuth axis inherent in SAR needs to be a
research priority. Eventually, estimates of zero-crossing period and mean period by altimetry
and dominant wave period / spectra limited to long waves from SAR will be useful
complementary data for a combined climatology.
4.2.3 Wave Steepness
Altimeter Altimeters can measure both significant wave height and zero-crossing period to a reasonable
accuracy, so significant steepness is also achievable. However, it would be better to calibrate
altimeter-derived steepness directly against wave buoys and this has not been done. The natural
variability of steepness is not very broad so it remains to be seen whether estimated steepness
will be sufficiently accurate to be of practical value.
Sampling issues are likely to be similar to measurement of SWH but have not been quantified
yet.
Altimeters orbit at an angle to the pole. The ground track of the TOPEX/JASON series is
limited to within 66o of the equator. The other altimeters cover an even larger area. Therefore,
there is no significant limitation in coverage
Altimeter data are available at the cost of reproduction. In most cases, NRT data are of good
quality, approaching that of the final archived versions.
SAR The strength of wave imaging by SAR is closely related to wave slope. However, steepness is
not a MaST product and is not a direct product of other processing schemes.
MaST
Steepness is not a MaST product, and as MaST does not provide significant wave height
steepness cannot be calculated from MaST derived parameters at present
2-D Spectrum and ENVISAT ASAR wave mode Some measure of steepness can be calculated from significant wave height and any period, but
the accuracy of any measure is unknown.
Sampling
Coverage is essentially global.
Thus far sampling by SAR has in practice been of the same order but more irregular than
altimetry. ENVISAT ASAR should greatly enhance sampling but detailed figures are
unavailable.
Combined Since coverage by SAR and altimetry are both sparse, there is an obvious benefit in using data
from both. Scatterometry measures wind speeds rather than wave characteristics, but provides
better coverage than either altimetry or SAR. Scatterometers also describe information on the
164
forcing fundamental to waves. Procedures to combine data from different sensors and with
model output have been discussed earlier.
Comparison with other sources Wave steepness is rarely a published product, though it is generally implicit (and occasionally)
explicit in climatological bi-variate tables or scatter diagrams of wave height and wave period
(usually zero-crossing period), which summarise data from buoys9.
Recommendations Wave steepness from EO is currently a potential research topic. Since wave steepness is of
practical value, there is a case for developing steepness estimates from both altimetry and SAR,
but these will require careful calibration and validation. After that, the inclusion of steepness
from EO in climatologies and NRT can be considered.
4.2.4 Wave Direction
Altimeter Wave direction is not possible from altimetry.
SAR MaST
The direction of long waves is readily apparent in SAR images, but in the case of the SAR
image mode data processed through the QinetiQ MaST scheme data and evaluated in this
project “seeing is not believing”. The SAR data evaluated in this report were found to be
strongly biased towards sensing waves along the range axis, a situation which if not improved
upon would greatly undermine the value of SAR retrievals. MaST and other older processing °methods include a 180 ambiguity. In this study, we could find no evidence that the MaST
processing scheme, as currently implemented, has genuine skill in estimating direction. In an
annex to this report QinetiQ further discuss some aspects of the MaST processing scheme, as
applied to obtaining wave information. Modifications to MaST which could improve
performance are being investigated by QinetiQ.
2-D Spectrum and ENVISAT wave mode
The Engen and Johnson (1995) scheme applied by BOOST and in the ENVISAT ASAR wave °mode processing has solved the 180 ambiguity and some useful directional information is
achieved. Johnsen et al. (2004) estimate errors of dominant wave direction of about 1 radian for
ASAR wave mode processing. Note that even this accuracy is only marginally useful and there
is much room for improvement.
Sampling Higher sampling rates are required to provide distributions in different directional sectors. For
instance if n samples are required to produce a reliable non-directional distribution of wave
height, and it is desired to generate distributions in m directional sectors, then nm samples would
be required. Thus far sampling by SAR has in practice been of the same order but more
irregular than altimetry. ENVISAT ASAR should greatly enhance sampling but detailed figures
are unavailable.
Combined Coverage by SAR is sparse. Scatterometry measures wind speeds rather than wave
characteristics, but provides better coverage than SAR. Scatterometers also describe information
9 Bivariate distributions such as these require more observations, of the order of magnitude N^2 where N number
required for univariate analysis.
165
on the forcing fundamental to waves. It will often be clear from scatterometry that SAR
retrieved wave directions are significantly different from wind direction, and therefore swell is
implied. Schemes to combine SAR wit other data sets have been discussed earlier.
Comparison with Other Sources Other data is limited to a few directional wave buoys and wave models. The reputation of wave
models for estimating direction is not good, but at present wave models are almost certainly the
best source of directional information (both climatological and NRT). The accuracy of SAR is
not sufficient yet and the bias towards range axis may be critical. It is difficult to see how a
useful climatogy of wave direction can be extracted from SAR without solution of the bias
observed in the data products generated for this project. Similarly, an NRT product with an
inherent bias is of doubtful use.
Recommendations Better information on wave directions is wanted by operators.
However, the investigations carried out within this project have demonstrated that wave
directions produced from SAR image mode data by the QinetiQ MaST application are not
reliable, and that unless the reliability could he improved it would not be sensible to construct a
climatology of directions from these data. Similarly, in a NRT product biased directions from
SAR processed with the algorithms currently used in MaST may be more confusing than useful.
A number of options exist to address this issue, perhaps the best option in the short term would
be to implement in MaST the new algorithms developed by Engen and Johnson (1995).
Unfortunately we have not been able to establish to what extent the same difficulties may exist
for SAR wave mode data processed by ESA with the new algorithms, but we would note that
some organisations do offer commercial products which include wave direction statistics
derived from SAR wave mode data.
It is known that useful directional data has been found both in research and in operational trials
and therefore better results are possible with an adequate processing scheme. Adoption of the
best currently available scheme and support for improved schemes are both advisable.
A graphical display of recent scatterometry will be useful as it will identify the direction of
wind waves. Research on an improved (i.e. unbiased) retrieval of wave directions from SAR is a
priority.
4.3 SUMMARY: REVISITING THE EVALUATION TABLE In the phase 1 report (Cotton et al., 2005), we summarised the expected usefulness of EO
sources for various wave parameters, and for climate and NRT purposes, in the form of an
Evaluation Table. Following the testing of EO products described in Section 3 of this report, it
is worth checking our previous conclusions. The results of Section 3, have modified our
confidence in retrievals of wave parameters from SAR images by the MaST application;
especially for wave directions. A review of the limited evaluations of other processing systems
suggests that these may be superior, but no current system has demonstrated good accuracy and
reliability. Thus we have downgraded our expectation of “wave direction” and “directional
spectrum” from SAR. The modified Evaluation Tables are given below as Tables 11 and 12.
Grade definitions are given under Table 12.
166

Table 11 Gradings of EO derived wave parameters for use by HSE, with details of limitations and other aspects.
Parameter Satellite Validated accuracy Limitations Sampling in “Area of Interest” Need for external data Grade Source Stats /
NRT Significant wave Altimeter Hs (Ku) rrms 1< 0.3m No known environmental dependencies At present 4 satellites In situ for validation 1 / 3d height Validated for 0 - 12m 8 passes in total per day in AOI Models for better NRT coverage
Values 7-20km from coast Along track resolution 7km
(A)SAR: 2-D spectrum & wave
For ASAR wave mode rms 2 = 0.8m
Only for O�> 100m. Overestimates wave height at low wind speeds,
Wave Mode (WM): ENVISAT ~ 1-2 passes per day
In situ for validation 3bc / 3bd
mode (0.6m if T > 12s) “deviation” at higher wind speeds Image Mode (IM): ENVISAT, ERS-2 and Models for better NRT coverage RadarSat 3-6 passes / day
MaST Not available -
Wave period (zero Altimeter (Hs and rrms 3 ~0. 8s Performs better for wind sea than swell 4 sats: 8 passes per day In situ for validation 2e / 3d upcrossing - Tz, or V0) Along track resolution 7km Models for better NRT coverage “mean” period, Tm
(A)SAR: 2-D spectrum & WM
For ASAR wave mode rms 2 = 1.7s, bias ~ 1s.
Only for O�> 100m. Bias (~ 1s) WM: 1-2 passes per day IM: 3-6 passes / day
In situ for validation Models for better coverage
2bc / 3d
(rms = 1.1 s T > 12s) MaST Not available -
Wave period (peak - Tp)
Altimeter (Hs and V0)
Limited validation indicates rrms 3 = 3.1s (1.7s for wind
Difficulties in validation against buoy data. Tp algorithm requires further development
4 sats: 8 passes per day Along track resolution 7km
In situ and models for validation Models for better coverage
3be / 3bde
sea) (A)SAR: 2-D spectrum & WM
For ASAR wave mode rms 2 = 3.1s
Only for O�> 100m. SAR should provide better estimates of Tp?
WM: 1-2 passes per day IM: 3-6 passes / day
Models and in situ for validation Models for better coverage
2bc / 3d
MaST Only for O�> 100m. 3-6 passes / day Models and in situ for validation Models for better coverage
2bc / 3d
Wave steepness = f(Hs/Tz 2)
Altimeter Not tested “Significant steepness” calculated from ratio of Hs and Tz2 , but not validated.
4 sats: 8 passes per day Along track resolution 7km
In situ and models for validation. 3ce / 3de
(A)SAR: 2-D spectrum & WM
Not tested Only for Wavelengths > 100m. WM: 1-2 passes per day IM: 3-6 passes / day
In situ and models for validation 3ce/ 3de
MaST Not available -
Wave speed, group speed, cg = gW/4S
Altimeter: f(T) Not tested Group speed, cg = gW/4S�� not validated. 4 sats: 8 passes per day Along track resolution 7km
Models, in situ for validation. 3e / 3de
(A)SAR: 2-D Not tested Only for O�> 100m, WM: 1-2 passes per day Models, in situ for validation. 3ce/ 3de spectrum & WM IM: 3-6 passes / day MaST Only for O�> 100m. 3-6 passes / day Models, in situ for validation
Models for better coverage 3ce / 3de
Wave dirn spectrum Altimeter Not available -
(A)SAR: 2-D spectrum & WM
ASAR wave mode rms 2 = 1.0 rads for )mean
Only for O�> 100m. WM: 1-2 passes per day IM: 3-6 passes / day
Models,in situ for validation, & to resolve
180° ambiguity for ERS-2 3bc / 3bd
and )peak Models for better coverage MaST Only for O�> 100m. Peak direction and wavelength 3-6 passes / day Models, in situ for validation 3bc /
only (not full spectrum) Models for better coverage 3bd
167

Table 12 Summary table with gradings of EO derived wave parameters for use by HSE
Source “Grade”: Wave Statistics / Near Real Time
Hs Tz,m Tp )p Sig Stp Wave Speed E()�O� Wind Speed
Altimeter 1 / 3d 2e / 3d 3be / 3bde - 3e / 3de 3e / 3de - 26 / 26
(A)SAR WM1,2 3bc / 3bd 2bc / 3d 2bc / 3d 3bc / 3bd 3ce / 3de 3ce / 3de 3bc / 3bd
MaST1, 2, 3 - - 2bc / 3d 3bc / 3bd - 3ce / 3de 4 / 4
ASAR 2D Spectra
(SARtool)1,3 3bc / 3bd 2bc / 3d 2bc / 3d 3bc / 3bd 3ce / 3de 3ce / 3de 3bc / 3bd
Scatterometer4 3b / 3b 3b / 3b 3b / 3b 3b / 3b 3b / 3b 3b / 3b 3b / 3b 1 / 2c
GNSS Refl. 5 4e 4e 4e - 4e 4e - 4e
1 - Long wavelengths > 100m only (could be greater, depending on local conditions and satellite orbit). 2 - 180° ambiguity in wave direction for MaST and ERS-2 SAR wave mode. 3 - High resolution information on spatial variability within scene available (e.g. for coastal variability). 4 - Scatterometer wind velocities have been use to estimate wind-sea spectrum through P-M relation. 5 - Technique still at experimental stage. SSTL have recently reported receiving GPS reflections on DM sats. Most recent research suggests a “Sea
State Parameter” could be extracted. 6 - Altimeter estimate of wind speed useful as it provides simultaneous and exactly co-located wind and wave estimates.
HSE “Grade”
1 – Satellite can satisfy requirements with no supplementary data
2 – Satellite major source but other data required to derive estimates
3 – Other source more important, EO data can play important validation – quality control function
4 – With present state of the art satellite data cannot make useful estimate
2,3 are further sub-divided to identify issues that could be addressed to achieve a wider application
a – no major issue – other sources better suited
b – limited accuracy (including application according to environmental conditions)
c – limited spatial sampling (i.e. better resolution in space required)
d – limited temporal sampling (i.e more frequent revisits a priority)
e – algorithm development required.
168

5 THE BENEFITS OF AN EO SYSTEM AND ESTIMATES OF COSTS
5.1 INTRODUCTION In this section we consider benefits to HSE offered by products using EO data compared to
existing methods.
We assess the added value offered by the systems we have demonstrated, and provide estimated
Rough Order of Magnitude (ROM) costs for these services to allow a judgement of which
aspects may offer the best value according to the sponsors’ priorities.
5.2 EO DATA OVERVIEW Satellite data provide global coverage. Altimeter wave data are robust against local
environmental conditions, whereas the reliability of SAR data is reduced under low or high
wind conditions. The satellite altimeter provides highly accurate measurements of significant
wave height in all sea states, and also measurements of wind speeds and an estimate of wave
period accurate to 1s. The main limitation of altimeter data is a lack of information on wave
direction. The SAR can provide estimates of wave direction and wavelength information (for
long waves), which is important to offshore operators whose operations are often sensitive to
long period swell. The main limitation with SAR is that the imaging mechanism distorts the
observed wave spectrum, especially for shorter waves, and that SAR cannot measure waves
effectively when the sea surface winds are higher than about 13 ms-1. There is also an issue
within the UK of a lack of expertise (and involvement) in recent developments elsewhere in
Europe which have resulted in improved procedures for extracting wave data from SAR.
We have seen in this report that some further testing and development of the MaST wave
algorithm is necessary if it is to match the capability of other available SAR processing systems.
At present there remain particular questions as to the accuracy of the wave direction information
produced by MaST. However, one should bear in mind that most measurement systems have
difficulty in measuring wave direction accurately. Even directional wave buoys quote standard
errors in wave direction of 15°.
The future availability of EO data is a key issue, as any proposed system must have assured
continuity of data supply. Table 13 lists the missions that are currently providing wave data, and
the missions that are planned for the short-medium term.
Future Altimeter Missions
At present 5 ocean altimeters are operating. ERS-2 and TOPEX-Poseidon are operating well
past their design life, and are unlikely to continue beyond 2005. Plans for any continuation of
GFO beyond 2005 are not clear. There is coordination between Europe and the USA and current
plans aim for a minimum of 2 altimeters to be providing data over the ocean up until ~2015.
Cryosat is italicised in Table 13as its primary mission is to measure the polar ice sheets – whilst
ocean coverage is likely to be limited, and there will be no NRT data stream, some “delayed
mode” ocean data may be available.
Future SAR missions At least 2 C-band SAR missions should continue to operate for the short – medium term (again
to ~2015). The ESA “Red Sentinel” should carry a C-band SAR and so take over from
ENVISAT. There are a number of other SAR missions operating and planned, but the
RADARSAT series aside ocean data from these missions is not easy to access.
169

Future Scatterometer missions Scatterometer data are important for numerical weather modelling, and missions are supported
by EUMETSAT in Europe, and NOAA in the USA. Planned missions will provide twice daily
global coverage of ocean surface wind data, as required by WMO guidelines.
GNSS Reflections There is a significant amount of current research into the use of reflections from GNSS (Global
Navigation Satellite System) satellites for measuring sea state and sea surface height. Whilst
this research is not expected to yield wave information useful for offshore operations in the
short term, it promises some potential capability in the longer term (say in 5-10 years). The key
benefit offered by a GNSS reflections system would be a significant increase in sampling and
coverage.
Table 13 Present and planned satellite missions providing ocean surface wave data
Type Present Missions End Planned Missions Dates
(Scheduled)
Altimeter ERS-2 2005? Cryosat10 2004-2007
Altimeter ENVISAT 2007 ESA “Blue” 2010
Sentinel
Altimeter Topex/ Poseidon 2005?
Altimeter Jason-1 2007 Jason-2 (“OSTM”) 2008-2011
Altimeter GFO ? NPOESS 2011-2014
SAR ERS-2 2005?
SAR ENVISAT 2007 ESA “Red” 2007/08
Sentinel
SAR Radarsat 2005 Radarsat-2 2005-
Scatterometer ERS-2 2005? Met-Op / ASCAT 2005-2020
Scatterometer Quikscat 2005 NOAA / CMIS 2008-2020
GNSS reflns GPS ? Galileo ?
5.3 NEAR REAL TIME WAVE MONITORING SYSTEMS 5.3.1 Existing Systems The capability of existing NRT systems has been assessed in the phase 1 report (Cotton et al,
2005) and summarised in the previous section (Section 4). The main limitation of in situ data
has been identified as the sparse coverage they offer, with only a small proportion providing
wave direction information. There are also some questions regarding the reliability of
measurements under extreme wave conditions.
Wave models can provide high-resolution coverage in time and space, but of course models
provide now-casts and predictions, not measurements, and have their own known deficiencies.
In particular wave models have most difficulty in accurately representing fast changing extreme
conditions which, although relatively rare, are exactly the conditions which cause offshore
operators the most difficulties. Also it is recognised that many wave models have problems in
representing accurately the propagation of swell. To provide an insurance against model
forecast error some organisations take forecasts from two different forecast providers, but then
10 Cryosat’s prime mission is to measure the polar ice caps.
170

what does one do if the two model predictions are in significant disagreement – as was the case thfor a storm encountered at Schiehallion on Jan 15 , 2003 (Box 1, figure 42)?
Figure 42 11
Altimeter Significant Wave Height Data for 1330-1340 UTC on 15 January 2003, close to the Schiehallion FPSO . Top left (Topex and Jason ground tracks,
Faeroes w/r 61.3°N, 6.26°W
12.0m @ ~1200
“K5” - 59.3°N, 11.7°W
12.7m @ ~1200
“K7” ~60.7°N, ~4.6°W
11.0m @ ~1300
locations of wave buoys. Top Right Topex Hs, Bottom right Jason Hs
Box 1
The BP Schiehallionth
s), and
s the
outlook was grave.
considered a serious option.
The observations of Hs are shown
considerable.
FPSO was threatened in January 2003 by high storm waves. The officer in charge
received 2 separate forecasts for the afternoon of the 15 – one of 16m significant wave height (H
one of 12m. Given that the height of the maximum (Hmax) can reach almost twice the height of H
If the higher forecast wave value were correct then evacuation from the FPSO must be
A lower estimate would be more supportable.
JASON and Topex/Poseidon passed over the FPSO at 13:33 and 13:40.
for each track together with buoy measurements from wave buoys in the surrounding area.
Each altimeter track confirmed the lower of the two forecast values of around 12m. If such information
could be made available to the company in real-time, its contribution to a difficult decision could be
FPSO, Floating Production Storage and Offloading Installation.
171
11

5.3.2 Benefits of an EO Enhanced NRT Wave Monitoring System Given the acknowledged deficiencies in each of the individual sources of NRT wave data, the
solution providing greatest benefit to the user is not one that relies on a single data source alone,
but one that exploits the best characteristics of each. Thus the coverage supplied by wave model
nowcasts, and forecasts (but with uncertain accuracies at any given time and location) should be
augmented by actual measurements of the wave field from in situ and EO sensors. The
measurements of the wave field, perhaps at a time/place some distance away from the specific
event of interest, can be used to evaluate the accuracy/reliability of the wave forecasts available.
This is the essential logic behind systems such as CAMMEO, an EO-enhanced version of which
was demonstrated for this project. The benefits to the user of the present system, as
demonstrated, are:
x� Access to 3 different sources of sea state information (EO, in situ, model forecasts from
Met No.) for the North-Eastern Atlantic.
x� EO data sources available now include 2 altimeters (wave height, wave period, wind
speed), 2 scatterometers (wind speed and direction), and ENVISAT ASAR wave mode
(wave period, wave height, wave direction, wind speed).
x� SAR image mode data could be added to provide high resolution information over an
area of particular interest.
x� Updated every hour with the latest information.
o Up to 4 satellite passes per day,
o Model forecasts updated every three hours.
o Surface data updated every hour.
x� Fast interactive capabilities.
o Zoom into and out of areas of interest.
o Move back and forward in time.
x� Capability to compare satellite, in situ and model information.
Updates could provide
x� NRT SAR image mode data (high resolution swell period and direction).
o A modified processing scheme could remove +/- 180° direction ambiguity and
provide swell height and wind speed.
x� Improved vector representation of wave fields.
5.4 WAVE CLIMATE STATISTICS SERVICES 5.4.1 Existing Systems The capability of existing systems offering analyses of wave statistics has been assessed in the
phase 1 report (Cotton et al, 2005) and summarised in Section 4 of this report. Instrument based
in situ data (wave-buoys, ship borne wave recorders) have been used to generate wave statistics
for specific locations, which are generally accepted to be reliable – but coverage is sparse. Also
the cost of maintaining an offshore wave buoy are significant, of the order of £100k per year.
Thus it may cost over half a million pounds to establish a climatology from a 5 year buoy
deployment. Climatologies derived from visual observations have been widely used, but there
are known issues in terms of accuracy and (fair weather) sampling bias.
Wave model hindcasts have become more widely used as a source of information for wave
statistics, but various authors have noted that wave models do not accurately recreate the full
extent of variability in wave fields. This means that the tails of the distributions do not always
172

give an accurate representation of the true wave field distribution, leading to potential errors in
estimates of low probability values (e.g. 50, 100 year return values).
5.4.2 Benefits of an EO Enhanced Wave Statistics Information System The most important asset that all the EO sources share is that they all offer significantly
improved spatial coverage than is possible from in situ data sources. They can offer wave
statistics for any location on the world’s oceans, and do not require any local installation or
regional model set-up.
The satellite altimeter in particular provides robust and accurate measurements of significant
wave height at all sea states, the only known performance dependency upon local conditions is
that measurements are not acquired under very heavy rain or very close to the coast (within 20
km). Significant wave height statistics based on altimeter data are now widely used and
accepted by both scientists and offshore operators. Scatter plots of wave height and wind speed
have also proved useful for many clients. Altimeter databases include the effect of inter-annual
variability, as they now cover a 20 year period. The recent development of a reliable wave
period algorithm proved an important additional capability. The back catalogue of altimeter data
(to 1985) can be processed to generate wave period and joint wave height wave period statistics
which will include the effects of wave climate variability.
SAR (wave mode and image mode) data offer direction and wave period information for longer
waves. Whilst there are known difficulties and environmental dependencies, SAR wave mode
data are used in commercial wave climate data-bases. This is because there are only a limited
number of sources of information on the period and direction of long waves, to which many
offshore operations are highly sensitive, and it is important to have access to all data sources
which can provide such information. Most, if not all, data sources have difficulty in providing
accurate information on the long wavelength part of the wave spectrum, and so it is important to
gain intelligence from as many different sources as possible.
EO data can be used to derive an independent EO waves statistics system which complements
existing in-situ and model based systems. Further work is needed to investigate and assess how
joint climatologies from EO data, in situ data, and model output could be assembled. This is
necessary because each “type” of data source (in situ, model, visual observations, satellite data)
contains inherent differences in terms of sampling rates and biases and measurement errors
dependent upon local environmental conditions. These differences, which can be quite subtle,
can result in significant differences in derived statistics. It is important to be able to see these
differences and to try to understand the cause and the significance of them. Also it is essential to
understand properly the sources of error in each data sources before attempting to combine them
into joint statistical analyses.
So we would propose a wave statistics information service, which provided information based
on an analysis of archived altimeter data (from 1985-present day), archived (A)SAR wave mode
data (1991, or 2002, to the present day), and SAR image mode data (data available from 1991
onwards). The altimeter data base generated for Phase 1 of the project demonstrated some of the
functionality, Figure 43 provides a “mock-up” of a possible user-interface to a waves statistics
information service, based on CAMMEO.
The particular benefits of EO data in this application are:
x� Improved spatial coverage on existing in situ sources.
o Regular coverage of the whole NW approaches region, to within 20km of the
coast for altimeter data (some to within 3 km), and to within ~200m of the coast
for SAR image mode data.
173

x� Long time series of altimeter data back to 1985.
o Separate and joint distributions of Hs, Tz, and U10
o Altimeter Hs estimate robust under high sea states.
o Statistics include effect of inter-annual variability.
o Confidence in estimates of low probability return values for Hs.
x� SAR wave mode data providing information on long waves back to
o 2002 for ENVISAT ASAR wave mode (T� O, Hs, U10)
o 1991 for ERS-1, then ERS-2 SAR wave mode (T��� O)
x� High spatial resolution wave statistics possible from SAR image mode data.
o West Freugh archive coverage back to 1991.
o (T��� O) from existing MaST application, or (T� O, Hs, U10) possible with new
algorithms.
o Coverage possible close to coasts (to pixel size, ~250m).
Future modifications could include:
x� Generation of full wave spectra through a combination of long wavelength information
from SAR wave mode and wind sea estimated from scatterometer data
x� Development of techniques to combine information from altimeter, SAR wave mode
and/or SAR image mode.
Figure 43 Example of possible user interface to a NW Approaches Wave Statistics Information System. Users could select data source, geophysical parameter and statistical measure, and form of data presentation. This example displays seasonal (winter) mean wave period and direction from SAR image mode data.
With +/- 180° ambiguity.
174
12

5.5 EO SYSTEM COSTS
Table 14 summarises the estimated Rough Order of Magnitude costs for establishing and
running an NRT NW Approaches Wave Monitoring Service, and an NW Approaches Wave
Statistics Information Service. Further details of recommendations are provided in Section 6.
Table 14 ROM Costs and Implementation Time Scales for EO Enhanced Wave information Services.
Implement Annual Implemt -
-ation Cost Running ation Time
Cost Scale
Initial NRT NW Approaches Wave Monitoring
Service (comprising recommendations 1, 2 and 3)
£80k £165
Rec. 1
Rec. 2
Rec. 3
Configuration and implementation of
CAMMEO/MetOC web map server. Initial EO data
set includes altimeter, ENVSAT ASAR wave mode
and scatterometer data
Upgrade MaST - Incorporate ENVIWAVE
algorithms into MaST and test
High Resolution Directional Wave Data
Implementation NRT SAR image mode processing
chain and integrate with existing NRT wave
monitoring system.
£20k
£35k-£40k
£20k
£35k
£130k
6 months
3 months
6 months
NRT System Developments
Rec. 4
Rec. 5
NRT Service Development 1: Full Directional Wave
Spectra
NRT Service Development 2: Severe Conditions
Warning System
Automatic warning of unusual or sever wave
conditions
£24k
£24k
12 months
12 months
Initial NW Approaches Wave Statistics Service
(comprising recommendations 6 and 7)
£150k £45k
Rec. 6
Rec. 7
Configuration and implementation of a web based
NW Approaches Wave Conditions Analysis Service,
initially with altimeter data.
Large Scale Directional Wave Statistics
Statistics from ENVISAT ASAR wave mode data
£68k
£72k
£11.7k
£18k
6 months
12 months
Wave Statistics System Developments
Rec. 8 Wave Statistics System Development 1: High
Resolution Directional Wave Statistics for SAR
image mode data
Rec. 9 Wave Statistics System Development 2: Separate
Wind Sea and Swell Statistics
Development of techniques to generate separate wind
sea and swell statistics
£701k
£24k
£5k13 12 months
12 months
5.5.1 Costs of a NW Approaches NRT Wave Monitoring System General This project has been able to take advantage of the fact that the development cost of CAMMEO
has been supported by other programmes. Thus the costs to HSE of implementation and
subsequent operation are lessened. This initial scoping of the NRT system has assumed that a
bespoke system is established and maintained specifically for HSE use. Thus HSE would define
the area to be covered, and the parameters to be provided.
13 Assumes SAR image data for annual updates received through NRT system
175
The ROM set-up cost of £80k for a system providing access to altimeter, scatterometer,
ENVISAT ASAR wave mode, ENVISAT ASAR image mode data (plus providing access to
model forecasts and in situ data) includes:
x� general implementation costs,
x� implementation of an improved wave processing algorithm into MaST.
x� establishing a Near Real Time processing chain for SAR image mode data,
Annual operating costs of £165k comprise
x� operating a version of the CAMMEO system specifically for HSE/BNSC,
x� processing of altimeter, scatterometer and ENVISAT ASAR wave mode data.
x� acquisition and processing costs of SAR imagery (pre-processing, then processing with
MaST).
o Assumes 20 SAR images a month, for a region to be specified.
Options to Reduce Costs Costs could be reduced by subscribing to a system that was shared with other users, and/or
reducing the requirement for SAR image data. If the former option were considered, then other
users would have a say in the area to be covered by the service, the parameters that were
displayed, and the form of data presentation. This loss of specialisation would be compensated
by significant reduction in cost roughly in proportion to the number of sharing users. The
benefit of a shared web based system is that the inclusion of extra users do not carry significant
extra cost.
The requirement for 20 SAR images a month could be reduced. One could argue that the best
use of SAR image mode data is to provide information on spatial variability in wave fields at a
high resolution (1-10 km). SAR wave mode data can be used to provide direction and wave
length information at the larger scale (100km resolution). Thus an option would be to focus the
SAR image mode requirement on a particular region of high interest, and to routinely acquire
only data for that region. It may be possible to display locations where SAR image data have
been acquired, so that the user could request processing of images of particular interest.
5.5.2 Costs of a NW Approaches Wave Statistics Information System
Large Area Coverage - Altimeter and SAR wave mode Statistics Costs were estimated to implement and maintain a 1° x 2° gridded monthly climatology,
covering the full region 56°-64°, based on altimeter and SAR wave mode data (not including
SAR image mode), with distributions, histograms, scatterplots, directional distributions, etc.
x� Initial implementation costs of £150k include:
o Establish web site
o Load altimeter data and generate gridded statistics
o Load SAR wave mode data and generate gridded statistics (inc Hs
x� Annual running costs of £45k include:
o Annual web site running costs
o Altimeter data annual updates
o SAR wave mode annual updates
176

Higher Resolution Statistics over Area of Key Interest The full cost of retrieving, pre-processing and extraction of wave parameters from SAR Image
data (detailed below) is higher. Unless there is a very high priority public interest requirement it
would be difficult to justify the cost of full coverage of the whole NW approaches region.
14The cost estimates for this service were based on a requirement for 5 samples a month , over a
5 year period (i.e. 300 independent measurements) a reduced area climatology (say 2° x 8°)
from SAR image mode data, as follows:
x� Implementation costs of £701k include:
o initial image retrieval and processing,
o process with MaST application.
o implement ENVIWAVE algorithms.
o generate gridded statistics.
x� Annual update costs of £5k include:
o (image acquisition and processing) - included in NRT running costs
o (processing with MaST) - included in NRT running costs
o Production of statistics.
It is clear that coverage from SAR image mode data of the full region (56°-64°N, 12°W-2°E)
would be prohibitively expensive unless there were some commanding public good argument.
This is why it is suggested that the altimeter and SAR wave mode data are used to provide the
statistics at a coarser scale for the larger region, and the SAR image mode data are used to
provide higher resolution information over a particular area of interest – the basis of the costs
for recommendations 7 and 8.
Options to Reduce Costs The cost of the SAR image mode data base could be reduced to less than half of the original
ROM estimate if the requirement were relaxed to 5 samples per month over a 2 year period.
However, then it should be acknowledged that the sample would not include the effects of inter-
annual variability. Although these costs for processing SAR image mode data may seem high,
they are comparable to that of deploying and maintaining a wave buoy (~£100k a year). The
difference is that where a wave buoy will provide continuous measurements and a full wave
spectrum at a single location, a SAR image mode based climatology will provide larger area
coverage and information on spatial variability, but with less frequent sampling in time.
The costs of generation of gridded statistics (for both altimeter/SAR wave mode and SAR image
mode data bases could be reduced if interactive data base querying and statistical analysis
software were built into the web site.
5.6 SUMMARY There are three generic sources of wave information: in situ data (buoys, ships), wave models
(forecasts and hindcasts) and EO data.
In general terms the key positive aspects of each are:
In situ Data
o Well known accuracy and error characteristics.
o High temporal resolution.
o Full wave direction spectra possible, and wide range of parameters.
14 The minimum sampling sufficient to provide statistics of mono-variate distributions, probably not enough to
support bi-variate distributions, or distributions in a number of different direction sectors.
177

o Some sites with long time series.
Wave Models
o Good coverage in time and space, and high resolution possible.
o Full wave direction spectra possible, and wide range of parameters.
o Hindcasts giving long time series.
Satellite Data o Known accuracy and error characteristics.
o Global coverage.
o High spatial resolution along track.
o 10 yrs time series from altimeter and SAR.
o Altimeter provides highly accurate all weather Hs measurements.
o SAR provides directional information on long waves.
The key negative aspects are:
In situ Data o Poor spatial coverage (8 long term offshore sites for whole NW approaches region).
o What happens to buoy motion in storms?
Wave Models o Predictions not measurements.
o Greatest problems in most severe events, especially fast moving/ developing events.
o Known errors in swell propagation.
Satellite Data
o Limited resolution: long revisit intervals, altimeter offers limited spatial resolution
across track.
o SAR problems with azimuth travelling waves, and short waves.
It can be seen that each data source offers something that others do not. For instance - in situ
data offer high resolution information in time, but poor spatial coverage. Satellite data offer
world wide coverage, but relatively infrequent sampling in time. Model information can be
provided at high resolution in time and space – but there are still key difficulties, particularly in
representing fast moving severe events, the very events that can cause the most damage.
Thus any monitoring system must make use of all data sources, taking advantage of their
complementary capabilities, rather than relying on one information source. EO data do not offer
a replacement for other information sources, but an important complement to compensate for
the limitations of existing systems. In particular EO data offer:
o Improved spatial coverage of measurements of the wave field.
o Measurements of direction and period of long period waves
o Accurate measurements of wave heights in the most severe conditions
o A basis for assessing the accuracy of predictions from wave forecasts.
o Long time series and large scale sampling of the wave field to allow accurate estimates
of extremes and low probability return values.
Thus what is proposed for HSE is an NRT system that provides access to all useful sources of
wave information including EO data, and an EO wave statistics system that complements
existing sources of wave statistics. Rough Order of Magnitude implementation and annual
running costs are provided in Table 14.
178
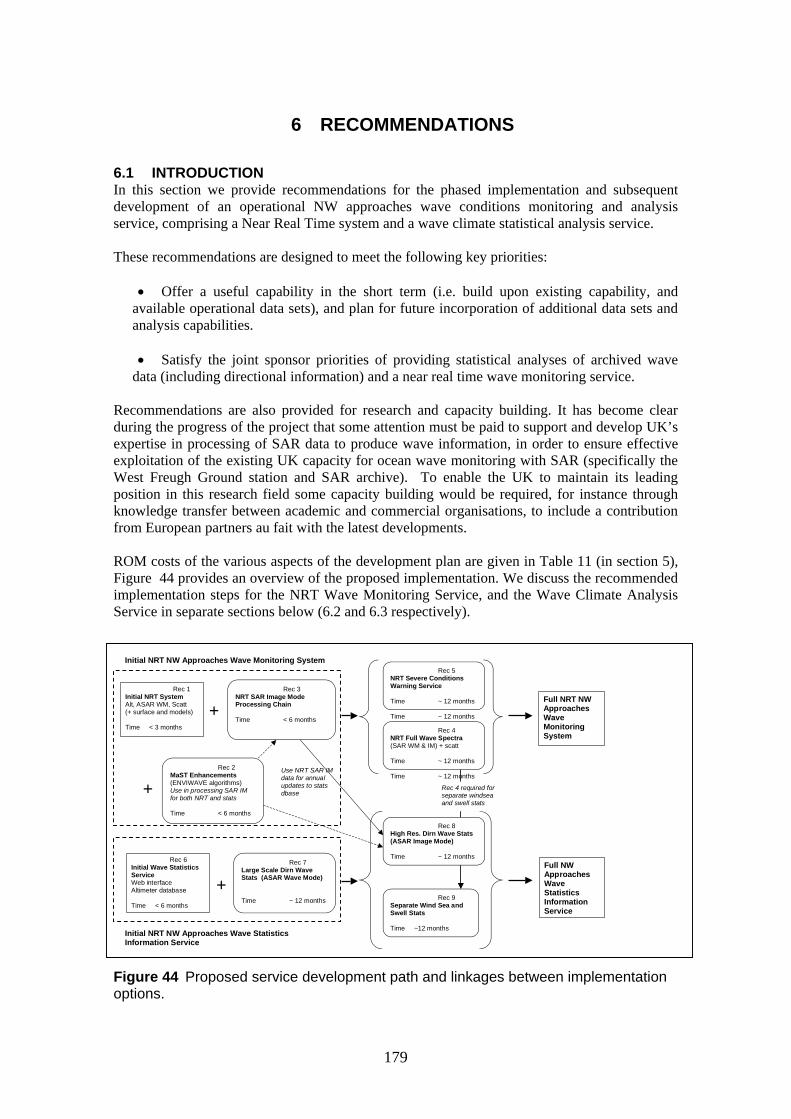
6 RECOMMENDATIONS
6.1 INTRODUCTION In this section we provide recommendations for the phased implementation and subsequent
development of an operational NW approaches wave conditions monitoring and analysis
service, comprising a Near Real Time system and a wave climate statistical analysis service.
These recommendations are designed to meet the following key priorities:
x� Offer a useful capability in the short term (i.e. build upon existing capability, and
available operational data sets), and plan for future incorporation of additional data sets and
analysis capabilities.
x� Satisfy the joint sponsor priorities of providing statistical analyses of archived wave
data (including directional information) and a near real time wave monitoring service.
Recommendations are also provided for research and capacity building. It has become clear
during the progress of the project that some attention must be paid to support and develop UK’s
expertise in processing of SAR data to produce wave information, in order to ensure effective
exploitation of the existing UK capacity for ocean wave monitoring with SAR (specifically the
West Freugh Ground station and SAR archive). To enable the UK to maintain its leading
position in this research field some capacity building would be required, for instance through
knowledge transfer between academic and commercial organisations, to include a contribution
from European partners au fait with the latest developments.
ROM costs of the various aspects of the development plan are given in Table 11 (in section 5),
Figure 44 provides an overview of the proposed implementation. We discuss the recommended
implementation steps for the NRT Wave Monitoring Service, and the Wave Climate Analysis
Service in separate sections below (6.2 and 6.3 respectively).
Rec 7
Ti
Rec 1
l
Rec 2
l
Time
iAl
Rec 3
Rec 8
Ti
Rec 4
Ti
Ti
Rec 5
Ti
Ti
Rec 9
Ti
+
+
+
Large Scale Dirn Wave Stats (ASAR Wave Mode)
me ~ 12 months
Use NRT SAR IM data for annual updates to stats dbase
Initial NRT System Alt, ASAR WM, Scatt (+ surface and mode s)
Time < 3 months
MaST Enhancements (ENVIWAVE a gorithms) Use in processing SAR IM for both NRT and stats
< 6 months
Rec 6 Initial Wave Statistics Service Web nterface
timeter database
Time < 6 months
NRT SAR Image Mode Processing Chain
Time < 6 months
High Res. Dirn Wave Stats (ASAR Image Mode)
me ~ 12 months
NRT Full Wave Spectra (SAR WM & IM) + scatt
me ~ 12 months
me ~ 12 months
NRT Severe Conditions Warning Service
me ~ 12 months
me ~ 12 months
Separate Wind Sea and Swell Stats
me ~12 months
Rec 4 required for separate windsea and swell stats
Initial NRT NW Approaches Wave Monitoring System
Initial NRT NW Approaches Wave Statistics Information Service
Full NRT NW Approaches Wave Monitoring System
Full NW Approaches Wave Statistics Information Service
Figure 44 Proposed service development path and linkages between implementation options.
179
6.2 NEAR REAL TIME NW APPROACHES WAVE MONITORING SYSTEM
6.2.1 Overview To provide a Near Real Time NW Approaches Wave Monitoring System we recommend
implementation of the CAMMEO Web Map Server system, developed by Met No, Christian
Michelsen Research and Satellite Observing Systems. A bespoke system would be developed in
full consultation with the sponsors, who would establish specific requirements for the
geographical coverage, geophysical parameters, presentation style, etc. Alternatively the
sponsors could subscribe to a more general multi-user implementation of the CAMMEO/
MetOc system, with broader specifications designed to meet a range of needs from a number of
different users, amongst them the sponsors of this project.
The benefits of adopting the CAMMEO/MetOc system are that the sponsors can be provided
with an effective, easy to use Near Real Time NW Approaches Wave Monitoring System within
a very short time frame. Enhancements can be incrementally added when developmental work
has been completed. The CAMMEO/MetOc system is designed to accommodate additional data
sets as a matter of routine.
The recommended steps for implementation incorporate five recommendations, three to
establish an initial NRT wave monitoring service, and two to provide additional capability, as
follows:
Initial NRT Service Rec. 1. First Stage NRT service with altimeter, ASAR wave mode and scatterometer data.
Rec. 2. Upgrade MaST with improved wave processing algorithms.
Rec. 3. Establish NRT processing chain for SAR image mode data, and incorporate data stream
into existing CAMMEO NRT system.
Service Developments Rec. 4. Provide full directional wave spectra.
Rec. 5. Include severe conditions warning service.
6.2.2 Initial NRT Service Implementation: Recommendations 1, 2 and 3
Stage 1 Implementation – Altimeter, ASAR wave mode and scatterometer service For first stage implementation we recommend the configuration demonstrated in Phase 2. Table
4 defines the satellite data that would be included initially: Jason, ERS-2 and ENVISAT
altimeter data; ERS-2 and Quickscat scatterometer data; and ENVISAT ASAR wave mode data.
Recommendation 1 – Initial NRT NW Approaches Wave Monitoring Service
x� Configuration and implementation of a version of the CAMMEO/MetOc web map
server to sponsor specifications and for their sole use.
o Includes altimeter, scatterometer and ENVISAT ASAR wave mode EO data
(see Table 4), plus surface data, and wave model predictions.
x� Annual running costs include
o Maintaining and updating the web site, and project management
o Processing of altimeter, scatterometer and ENVISAT ASAR WM data
x� This stage 1 implementation possible within 3 months.
180

Stage 2 Implementation – Add SAR image mode Data to NRT Service The first recommended incremental development to the NRT system would be to include SAR
image mode data into the NRT processing chain. This would provide high-resolution
directional wave information over a region to be specified by the project sponsors. Two steps
are necessary – upgrade MaST and implement an NRT SAR image mode processing chain:
Enhance SAR Image Mode Processing Algorithms in MaST Our evaluation of wave data from MaST has highlighted some problems. We believe that the
ENVIWAVE algorithms (Engen and Johnson, 1995), employed by ESA to process the
ENVISAT ASAR wave mode data offer an important enhancement on the algorithms currently
employed within MAST. They remove the +/- 180° ambiguity in direction, and provide a
measure of the wave energy at different wavelengths and directions – allowing estimates of
significant wave height (and also mean wave period, and surface wind speed). Recommendation
2 therefore is:
Recommendation 2 – Upgrade MaST
x� The new “ENVIWAVE” algorithms should be implemented by QinetiQ within MaST.
o Includes evaluation of a test data set.
x� Estimated 2 months to complete.
Alternatively negotiations could be initiated with a third party for processing of the SAR image
data (e.g. with BOOST for the use of SARtool).
Once the MaST algorithms have been upgraded and tested, it is recommended that a NRT SAR
image mode processing chain be implemented and wave data thus produced incorporate into the
CAMMEO system:
Recommendation 3 NRT Service: High Res Directional Wave Data
x� Implement NRT SAR image mode processing chain and integrate with existing NRT
wave monitoring system.
x� To acquire, pre-process and process with (upgraded) MaST 20 images / month in NRT
over selected region
x� Requires Recommendation 2, then can be implemented in 1month.
This would provide the high resolution data for annual updates to the Wave Statistics
Information Service (Recommendation 8)
6.2.3 Medium-Long Term Developments to NRT Service: Recommendations 4 and 5.
We recommend two possible medium term developments:
Full range directional wave spectrum Two techniques exist which could be implemented to generate full range directional wave
spectrum. The Mastenbroek and de Valk (2000) approach uses co-located scatterometer and
SAR data, and combines the high frequency wind sea inferred from the scatterometer wind
vectors, with the long wavelength wave information that can be estimated from the SAR. The
advantage of this approach is that it does not require input from a wave model, but the drawback
is that it leaves a potential gap between the wavelengths of waves inferred from the two sources.
The second possible approach (Schulz-Stellenfleth et al., 2005) takes wave model forecast
information co-located with the SAR data, and combines these two sources to generate a full
181
wave spectrum. The advantage is that this technique does not leave a frequency “gap”, but the
disadvantage is the necessity to rely on wave model output.
Recommendation 4 NRT Service: Full Directional Wave Spectra
x� NRT generation of full directional wave spectra - two options:
x� Shorter term, implement Mastenbroek and de Valk (2000) scheme
o Generate wind sea spectra from scatterometer data
o Merged with SAR wave mode & image mode long wavelength spectra
o Estimated 3 months staff time required to support development
o Achievable in ~1year
x� Longer term, implement Schulz-Stellenfleth (2005) scheme
o Acquire initial wave spectrum from co-located wave model forecast
o Use as input to ASAR wave mode processing to generate full spectra
o Estimated 3 months staff time required to support development
x� Achievable in ~1year
Would provide the wave spectra for generating separate wind-sea and swell statistics
(Recommendation 9)
Severe Conditions Warning System An automatic severe conditions advice system could be implemented. The users would specify a
set of conditions/criteria to trigger specific warnings, which for instance could include threshold
values for significant wave height of wave period (perhaps accompanied by specifications on
direction and location), and mismatches between forecast(s) and/or measured data. The system
would automatically issue an email to the system users and system operators with details of the
specific measurements/forecasts triggering the warning, and links to specific images and data
sets.
Recommendation 5 NRT Service: Severe Conditions Warning System
x� Automatic warning of unusual or severe wave conditions
o Specified according to user requirements
o Email warning with links to specific data sets/ images
x� Estimated ROM development costs based on 3 months staff time
x� Achievable in ~1year
6.3 NW APPROACHES WAVE CLIMATE STATISTICS SERVICE
6.3.1 Overview To establish a NW Approaches Wave Climate Statistics Service we recommend a phased
implementation of a web-accessible data base. Figure 43 in section 5 presented one possible
model for the interface to the statistical data – incorporating a front page which provides a series
of pull down menus to allow sequential selection of data source, wave parameter, statistical
measure, and then month/season of interest. Buttons in the main display panel would provide
access to functions which could allow for instance the user to focus on a region of interest, or
for instance to generate “longitudinal” plots in time.
To support a full specification, and allow cost estimates with higher levels of confidence,
discussions will be required with sponsors to agree:
x� The level of desired inter-active capability.
182
x� A series of required standard statistical measures that can be automatically
generated from the statistical data base (e.g. mean, mode, variance, percentiles).
x� Desired format for standard plots (histograms, scatter plots), tables, etc.
x� Requirement for additional “non-standard” analyses which cannot (or should not!)
be generated automatically: e.g. fitting and interpolating distributions, etc.
The basic recommended configuration is that satellite altimeter and SAR wave mode data are
used to provide information for the whole area of interest (56°-64°N, 12°W-2°E) on a 1°
latitude x 2° longitude monthly grid, and the SAR image mode data are used to provide wave
statistics on the fine scale for a user specified area of interest (we have estimated ROM costs for
a 2° x 8° region).
It is suggested that ENVISAT ASAR wave mode data only are used as the basis for the large
directional wave statistics, and ERS-1 and ERS-2 SAR wave mode data are not included.
Although the inclusion of ERS-1 and ERS-2 wave mode data would increase the time period
covered (back to 1991), these data retain a +/- 180° ambiguity in wave direction, are not able to
provide direct estimates of wave height, mean wave period and wind speed, and require a first
guess estimate from a wave model as part of the processing scheme. They would therefore not
form a homogeneous time series with ENVISAT ASAR wave mode data products, in which the
+/- 180° ambiguity has been resolved, no wave model first guess is required, and the extra wave
parameters are directly estimated.
The recommended steps for implementation incorporate four recommendations, two to establish
an initial wave statistics analysis service, and two to provide additional capability, as follows:
Initial Statistics Service Rec. 6. First stage statistics service with altimeter data.
Rec. 7. Add directional wave statistics from ENVISAT ASAR wave mode.
Service Developments
Rec. 8. Add statistics on fine scale spatial variability from SAR image mode data
Rec. 9. Add separate wind sea and swell statistics.
6.3.2 Initial Wave Statistics Service Implementation: Recommendations 6 and 7
Stage 1 Implementation – Altimeter derived wave statistics Because the ENVISAT ASAR wave mode data set will not be available until 2006, an initial
implementation (in 2005) of a NW Approaches Wave Climate Statistics Service would be based
on satellite altimeter data only (using data from 1985 to the present day – with a gap from 1989
1991: from Geosat, ERS-1, ERS-2, Geosat Follow-On, TOPEX, Jason-1 and ENVISAT).
This initial implementation would include a web interface, designed to allow quick access to a
range of required statistical parameters (see for instance Figure 43). The user interface would
link to a statistical data base, directly access and display some basic statistical measures, and
generate (or link to) figures and tables.
Statistical measures of Hs, Tz, U10 and significant steepness would be provided on a monthly
1° x 2° grid for the whole GIFTSS area (56°-64°N 10°W-2°E).
Statistical parameters would include monthly means, standard deviations, percentiles,
histograms, scatter plots (e.g. Hs v Tz)
183

Recommendation 6 –Initial NW Approaches Wave Climate Statistics Service – Altimeter Derived Statistics
x� Configuration and implementation of a web based NW Approaches Wave Climate
Statistics Service
o Develop and implement web interface to statistical data base
o Initial data base incorporates altimeter data only on 1° x 2° monthly grid
x� Implementation
o Develop and implement web interface
o Set-up altimeter statistical data base
x� Annual running costs.
o Running costs for web site.
o Annual update of altimeter statistics data base.
x� Achievable in 6 months.
Stage 2 Implementation - Large Scale Directional Wave Statistics from ENVISAT ASAR wave mode We recommend that ENVISAT ASAR wave mode data are used to generate directional wave
statistics for the whole region of interest (56°-64°N, 12°W-2°E), to complement the non-
directional data available from the altimeter. ESA advise that 3 years (2002-05) of reprocessed
(and so homogeneous) ENVISAT ASAR wave mode data should be available by 200615. It is
initially assumed that statistics would be generated on a monthly 1° x 2° grid, but this scheme
could be revised once a clear picture of sampling frequency from this data product in our region
of interest is established.
(Long wavelength) Wave parameters, would include: direction, wavelength, Hs, Tp, Tm, U10.
Statistical measures would include: monthly means, sds, percentiles, histograms, scatter plots,
dirn v Hs, Tp, Tm plots.
Recommendation 7 –Wave Statistics –– Large Scale Directional Wave Statistics
x� Upgrade of waves statistics service to include statistics derived from (3 years)
ENVISAT ASAR wave mode data on 1° x 2°, monthly grid (56°N-64°N, 12°W-2°E).
x� Achievable in ~12 months (dependent upon availability of reprocessed ASAR wave
mode data).
6.3.3 Medium Term Developments to NRT Service: Recommendations 8 and 9.
High Resolution Directional Wave Statistics (for maximum 2° x 8° area) SAR image mode data would be used to generate directional wave statistics at high spatial
resolution for an area of specific interest to the sponsors. Costs have been estimated for a 2° x
8° region, comprising 8 (1° x 2°) grid squares (Table 11). We assume a requirement for 300
images for each 1° x 2° grid square based on 5 samples per month over a 5 year period: We
have suggested this is the minimum required to provide sufficiently frequent sampling to
capture the monthly climate, and to cover a long enough time period to capture (some of) the
effects of inter-annual variability. Note that this estimate is to allow for mono-variate statistical
analysis. Higher sampling would be required for bi- or multi-variate analysis (including
distributions in different wave direction sectors).
15 According to communication with ESA EO Help Desk, April 2005.
184

Thus, this development would require: extraction and preprocessing of (8 x 300) SAR images
from West Freugh archive, the processing of these images in MaST to provide the required
wave parameters, extraction of modal parameters on sub grid, scale to be agreed, and generation
of the desired statistical measures.
Wave parameters would include (for long waves), direction, wavelength, Hs, Tp, Tm, U10.
Statistical measures would include monthly means, sds, percentiles, histograms, scatter plots,
dirn v Hs, Tp, Tm plots
Recommendation 8 – Wave Statistics – High Resolution Directional Wave Statistics
x� Upgrade of waves statistics service to include statistics derived from (A)SAR image
mode data in a reduced, user specified, 2° x 8° region
x� Implementation
o Extracting and pre-process 8 x 300 archived SAR images,
o Processing 8 x 300 images in MaST (enhanced by Rec. 2)
o Producing wave statistics from these data.
x� Annual updates.
o Assumes new SAR image data acquired through NRT service (Rec. 3)
x� Achievable in 12 months timeframe.
Separate Wind Sea and Swell Statistics A further recommendation is to generate separate wind sea and swell statistics through a
combination of long wavelength information from SAR wave mode and wind sea estimated
from scatterometer data.
This links to Recommendation 4 – the generation of full directional wave spectra from this
service development would be required to support this service addition.
Recommendation 9 Wave Statistics Service – Development 3: Separate Wind Sea and Swell Statistics
x� Development of techniques to generate separate wind sea and swell statistics from full
wave spectra (Rec. 4)
x� Estimated ROM development costs based on 3 months staff time
x� Achievable in ~1year
6.4 RESEARCH PRIORITIES AND CAPACITY BUILDING The project team and sponsors have identified a number of priority areas for further research in
two general areas:
o to develop data products where there is a requirement for new or improved wave
information,
o to help understand how specific characteristics of the wave products may impact on the
accuracy or reliability of higher level data products.
6.4.1 Priority areas for research We have identified six specific studies, to address key requirements, which we believe could be
addressed by short term, 3-6 month projects. We will discuss these in more detail with the
185
project sponsors and investigate the possibility of running short research projects perhaps as
collaborations between the industrial partners and Southampton Oceanography Centre.
x� To carry out a test implementation of the “PARSA” SAR processing scheme (Schulz-
Stellenfleth et al., 2005) using ENVISAT ASAR wave mode data, and co-located wave
model forecasts.
x� To investigate the effect on climatologies of SAR asymmetry between sensing in the
azimuth and range directions.
x� To develop and test methods to combine altimeter, SAR and scatterometer data for
NRT wave monitoring applications, e.g. identifying long wavelength swell, generating
information on wind sea and swell.
x� To develop and test methods to combine altimeter, SAR and scatterometer data for
climatologies – to enable the generation of joint distribution functions for parameters
measured by different instruments at different locations and/or times, to generate wave
spectra for the full frequency range, to generate separate and joint statistics for wind sea and
swell waves.
x� To develop and apply techniques to validate estimates of significant steepness.
x� To continue the development and testing of altimeter wave period algorithms.
6.4.2 Capacity building We have identified that effort is required to maintain UK’s expertise in reference to recent
developments in SAR imaging of wave fields – both in the understanding of the physical
processes that contribute to the SAR imaging of the ocean surface and in the development of
new techniques to derive wave parameters.
One possible action would be to initiate a Knowledge Transfer exchange (for instance as is
supported through the NERC KTI scheme), between one or both of the industrial partners of
this project and Southampton Oceanography Centre. This should be supported by either a CASE
studentship, or through the recruitment of European expertise for instance through an ESA
research fellow. We would suggest a minimum period of at least 6 months to allow intensive
period of study on new developments in SAR processing, and to develop cost effective schemes
to make best use of the QinetiQ SAR archive and the West Freugh ground station capacity.
186

7 SUMMARY
This project has carried out an in depth assessment of all aspects of wave products that can be
derived from satellite measurements over the ocean, and which could form components of a
North-Western Approaches Wave Conditions Monitoring and Analysis Service.
A demonstration service was established to demonstrate and evaluate key aspects of a full
service: A near real time data service which – through a web page updated several times a day,
provides the client with easy and fast access to present and recent wave conditions in the NW
approaches, and a wave climatology and analysis service which provides information on
expected conditions as they vary throughout the year and across the region of interest.
Satellite data can provide important information on wave fields in the NW Approaches Region.
This area is often subject to severe wave conditions, and is increasingly the focus of new
offshore activities, activities which can often only take place under precisely specified operating
conditions. Thus it is essential to ensure an accurate knowledge of wave conditions in this
region, both as they occur from day to day in Near Real Time, and in terms of the expected
statistical characteristics of conditions based on a careful analysis of a reliable data base.
Meteorological Agencies and offshore operators have established a number of in situ data
sources to support these activities, but spatial coverage from these surface data sets remains
poor. Satellite instrumentation can therefore play an important role by supplementing these
limited number of in situ wave measuring instruments and providing measurements on a larger
scale, covering the whole NW approaches region.
In summary - satellite data offer the capacity to make a significant contribution to improved
operational safety of offshore activities taking place in the NW approaches to the UK. Table 11
and Figure 44 summarise the recommended steps on an implementation plan to establish a NRT
NW Approaches Wave Monitoring Service, and a NW Approaches Wave Statistics Information
System.
187
REFERENCES
Aage C, Allan T D, Carter D J T, Lindgren G & Olagnon M. 1998, Oceans from Space.
Repères Océans 16, Ifremer, Brest.
Breivik, L.-A., Reistad, M., Schyberg H., sunde, J., Krogstad, H. E., and Johnsen, H., 1998,
Assimilation of ERS wave spectra in an operational wave model, J. Geophys. Res., 103,
7887-7900.
Brüning C, Alpers W & Hasselmann K. 1990, Monte-Carlo simulations of the non-linear
imaging of a two-dimensional surface wave field by a synthetic aperture radar. Int. J.
Remote Sensing 11, 1695-1727.
Cotton, P. D, P. G. Challenor, L. Redbourn-Marsh, S. K. Gulev, A. Sterl, and R. S.
Bortkovskii, 2001, An intercomparison of voluntary observing, satellite data and modelling
wind and wave climatologies, in "Advances in the Applications of Marine Climatology -
The Dynamic Part of the WMO Guide to the Applications of Marine Climatology
WMO/TD-No. 1081, WMO Geneva.
Caires, S., Sterl A, Gommenginger, C. P. , 2005, Global ocean mean wave period data:
validation and description. J Geophys., Res., 110, C02002
Dacunha, N.M.C. and N. Hogben, 1989, The development of a new global atlas of wave
statistics. Journal of Navigation, 38(1), pp145-149
Engen G & Johnsen H. 1995, SAR-ocean wave inversion using image cross spectra., IEEE
Trans Geosci. Rem. Sens. 33, 1047-1056.
Gommenginger C P, Srokosz M A, Challenor PG & Cotton P D 2003, Measuring ocean
wave period with satellite altimeters: A simple empirical model. Geophys. Res. Letters 30
(22), 2150-2154.
Gulev, S.K., Grigorieva, V., Sterl., A., and Woolf, D., 2003, Assessment of the reliability of
wave observations from voluntary observing ships: insights from the validation of global
wind wave climatology from the VOS data, J. Geophys. Res. 108(C7) Hogben N., and F. E. Lumb, 1967, Ocean Wave Statistics, Her Majesty’s Stationery Office,
London, UK
Hasselmann K & Hasselmann S. 1991, On the nonlinear mapping of an ocean wave spectrum
into a synthetic aperture radar image spectrum and its inversion, J. Geophys.l Res. 96,
10713-10729.
Johnsen, H., Engen, G., and Chapron, B., 2004, Validation of ASAR Wave Mode Level 2
Product Using WAM and Buoy Spectra. Calibration/Validation Report for ESA, available
at envisat.esa.int/calval/proceedings/asar/asar_22.pdf
Johnsen, H., 2005, ENVISAT ASAR Wave Mode Product Description and Reconstruction
Procedure, Report for the EC ENVIWAVE project. Available at
http://www.oceanor.no/projects/enviwave/deliverables.htm
Kerbaol V, Chapron B & Vachon P W. 1998, Analysis of ERS-1/2 synthetic aperture radar
wave mode imagettes. J. Geophys. Res. 103(C4), 7833-7846.
Mastenbroek, C., de Valk, C. F. 2000 , A semiparametric algorithm to retrieve ocean wave
spectra from synthetic aperture radar, J. Geophys. Res. Vol. 105 , No. C2 , p. 3,497
Schulz-Stellenfleth J., Lehner, S., and Hoja, D., 2005, A parametric scheme for the retrieval of
two-dimensional ocean wave spectra from synthetic aperture radar look cross spectra. J.
Geophys. Res. 110
Tucker M J & Pitt E G 2001. Waves in Ocean Engineering. Elsevier.
Woodruff, S.D., H.F. Diaz, J.D. Elms, and S.J. Worley, 1998: COADS Release 2 data and
metadata enhancements for improvements of marine surface flux fields. Phys. Chem.
Earth, 23 , 517-527
188

Papers/Reports produced within this project Carter, D. J. T., 2004a, GIFTSS Work Package 1.2 Report, Capability of Non EO Data Sources,
27th July 2004
Carter, D. J. T., 2004b, Waverider South of the Faroe Islands, GIFTSS Internal Report October
2004
Carter, D. J. T., 2004c, Comparison of wave height and wind speed off the Faroes and at
Schiehallion FPSO, GIFTSS Internal Report October 2004
Carter, D. J. T., 2004d, Monthly means from Waverider & altimeters, GIFTSS Internal Report
November 2004
Cotton, P.D. and S. Caine, 2005, 1.4 Processing Chain for EO Wave Parameters, Examples of
Data Products and Evaluation, SAR Addendum. February 2005
Cotton, P. D., D.J.T. Carter, S. Caine, D. Woolf, 2004, GIFTSS Work Package 1.4 Report,
Processing Chain for EO Wave Parameters, Examples of Data Products and Evaluation,
November 2004
Cotton, P. D., D.J.T. Carter, S. Caine, D. Woolf, 2005, GIFTSS Phase1 Final Report,
Processing Chain for EO Wave Parameters, Examples of Data Products and Evaluation,
February 2005
Satellite Observing Systems, 2005, User Guide – Wave Conditions Monitoring System – Metoc
NRT web mapping system, February 2005
Woolf, D 2004a, GIFTSS Work Package 1.1 Report, Define Sampling Grid / Interval, 4th
October 2004
Woolf, D 2004b, GIFTSS Work Package 1.3 Report, Requirements and Availability of EO
data, 4th October 2004
189

GLOSSARY
AES-40 40 yr North Atlantic Wave Climatology, developed by Oceanweather
AOI Area of Interest (56°-64°N, 10°W – 1°E)
ASAR Advanced Synthetic Aperture Radar (carried on ENVISAT).
Azimuth Orthogonal to direction of SAR look, for side looking SAR - along track
direction
BNSC British National Space Centre
BOOST Young French SME, based in Brest, with SAR expertise
CERSAT IFREMER laboratory dedicated to processing and archiving of satellite data
Centre ERS d'Archivage et de Traitement
(http://www.ifremer.fr/cersat/en/index.htm)
DEFRA Government Department for Environment, Food and Rural Affairs.
DMI Danish Meteorological Institute
EC European Community
ECMWF European Centre for Medium-Range Weather Forecasts
ENVISAT European Environment Monitoring Satellite, launched 2002.
ENVIVIEW Software distributed by ESA to view ENVISAT data products, (including
ASAR wave mode)
ENVIWAVE EC “Framework” project to develop ocean wave products from ENVISAT.
EO Earth Observation
EOLI Online catalogue for ERS and ENVISAT data
ERA-40 ECMWF Re-Analysis. 40 year atmospheric hind-cast
ERS-1 1st European Remote Sensing Satellite (launched 1991)
ERS-2 2nd European Remote Sensing Satellite (launched 1995)
ESA European Space Agency
FFT Fast Fourier Transform
FNMOC US Fleet Numerical Meteorology and Oceanography Center
FOAM Forecasting Ocean Atmosphere Model. Ocean circulation model at the UK
Met. Office
FOIB Faroes Oil Industry Group
FPSO Floating Production, Storage and Offloading Installations
ftp File Transfer Protocol – standard (and shorthand) for internet transfer of
files.
(EC) Framework
Programmes A series of EC science and technology support programmes
GAMBLE An EC “Thematic Network”, led by SOS to review future
requirements for satellite altimetry. Geosat US Navy Altimeter Satellite (1985-90).
GIFTSS Government Information from the Space Sector – BNSC programme to help
UK government agencies implement information that has been derived from
satellites
GFO Geosat Follow-On - Follow on to Geosat (1998-)
GNSS Global Navigation Satellite System
GPS Global Positioning System.
GRIB Data format e.g for meteorological data as distributed on GTS
GTS Global Telecommunications System – used by national met agencies
to transfer/ exchange data. HSE Health and Safety Executive
IFREMER French Government Oceanographic Research Institute (Institut Francais de
Recherche pour l’Exploitation de la Mer
190

IM Image Mode
Jason Ku / C-band altimeter launched in December 2001.
JONSWAP Joint North Sea WAve Project – a wave spectrum developed for fetch
limited waves.
Ka-Band Radar frequency band (18-40 Ghz), proposed for new technology satellite
radar altimeters
KNMI Royal Netherlands Meteorological Institute
Ku-Band Radar frequency band (12-18 Ghz), commonly used by satellite radar
altimeters
Level-0, 1, 2 Categories of data according to level of processing - Level-0 represent raw
instrument output, level 2 data processed to provide geophysical parameters,
with location and time.
MaST Maritime Surveillance Tool. QinetiQ tool for analysing SAR data.
MAWS Marine Automatic Weather Station (acronym for UK Met Office Buoys)
Météo France French National Meteorological agency.
NAO North Atlantic Oscillation (Index)
NRT Near Real Time
NWP Numerical Weather Prediction
NORUT Norwegian Research Group, of not for profit companies, based in Tromsø
PRI ERS SAR product (Precision Image product)
Quikscat Ocean wind measuring radar scatterometer. Launched in 199 by NASA to
replace instrument lost when ADEOS failed
RadarSat Canadian commercial SAR satellite – to be replaced by Radarsat-2 in near
future.
RAR Real Aperture Radar
Range (direction) Along direction of SAR look, for side looking SAR - across track direction
SAR Synthetic Aperture Radar
SARtool A tool for processing SAR data (ERS, Radarsat and ENVISAT), developed
by BOOST
Scatterometer Satellite radar instrument to measure ocean surface wind
Seasat The first marine EO satellite, launched in 1978. Had a scatterometer,
altimeter, SAR and radiometer.
Seawinds The scatterometer instrument on board the Quikscat satellite.
SOC Southampton Oceanography Centre
SOS Satellite Observing Systems (UK)
SSTL Surrey Satellite Technology Limited (UK).
TOPEX/Poseidon: Ku/C band altimeter launched in 1992 by CNES/NASA
UKMO United Kingdom Meteorological Office.
VOS Voluntary Observing Ship (Programme) – agreement through which (mostly
visual) ship observations are recorded and archived.
WW3 Wavewatch 3 – A 3rd Generation wave model used by NOAA.
WAM A widely used computer model for wave generation, propagation and
dissipation
WAMDI Wave Model Development and Implementation Group
WM (for SAR) Wave Mode.
WMO World Meteorological Office
191

ANNEX - QINETIQ INVESTIGATIONS INTO MAST APPLICATION – “WAVE CLIMATE FROM SAR SCENES”
Available separately
Published by the Health and Safety Executive 01/06

RR 415