Paintings— a challenge for XRF and PIXE analysis
10
X-RAY SPECTROMETRY X-Ray Spectrom. 29, 101–110 (2000) Paintings—a Challenge for XRF and PIXE Analysis C. Neelmeijer, 1 I. Brissaud, 2 T. Calligaro, 2 G. Demortier, 3 A. Hautoj¨ arvi, 4 M. M¨ ader, 1 L. Martinot, 5 M. Schreiner, 6 T. Tuurnala 4 and G. Weber 5 1 Research Center Rossendorf Inc., P.O.B. 510119, D-01314 Dresden, Germany 2 Laboratoire de Recherche des Mus´ ees de France, 6 rue des Pyramides, F-75041 Paris cedex 01, France 3 LARN, Facult´ es Universitaires Notre-Dame de la Paix, 61 rue de Bruxelles, B-5000 Namur, Belgium 4 University of Helsinki, Accelerator Laboratory, P.O.B. 43, Fin-00014 Helsinki, Finland and Helsinki Institute of Technology, P.O.B. 166, Fin-00181 Helsinki, Finland 5 Universit´ e de Li` ege, Institut de Physique Nucl´ eaire Exp´ erimentale, Sart Tilman B 15, B-4000 Li` ege, Belgium 6 Academy of Fine Arts Vienna, Schillerplatz 3, A-1010 Vienna, Austria Conventional pigment analysis of paintings requires the removal of micro-samples followed by the prepa- ration of cross-sections. There are also requirements for investigating several locations within a painting in order to obtain information about dating and provenance or the reason for aesthetic impressions of the paint materials. The need to carry out such work without removing samples prompted the present project, in which the authors aimed to examine the possibility of applying XRF and PIXE methods in a complemen- tary manner. The ion beam techniques of external PIXE plus Rutherford backscattering could distinguish painting techniques, i.e. paint layer arrangements and pigment admixtures, whereas portable XRF repre- sents a valuable tool for preselecting the objects of interest which could be transported to the ion beam laboratory. This procedure was tested using samples of prepared paint layers. It is shown that it is possible to distinguish between two or three layers. The situation would be more difficult for more complex paint layer arrangements. Copyright 2000 John Wiley & Sons, Ltd. INTRODUCTION In a variety of unique art objects, x-ray spectra produced by primary radiation or charged particle bombardment have been useful for non-destructive analytical work. 1–5 However, safety and cost restrictions favour in-field ana- lytical activities on art objects. Consequently, art sci- entists, conservators, private owners and museums ask for scientific techniques based on transportable facilities. Recently, a compact portable x-ray fluorescence (XRF) set-up was developed 6 and applied to examine the com- positions of historic metal alloys. This was followed by the development of a high-resolution mini-facility 7 reach- ing 160 eV FWHM at 5.9 keV x-ray energy. In parallel, the relative performances of XRF and (proton induced x-ray emission (PIXE) for painting material analysis have been tested in a joint project of the European Community COST-G1 action. 8 The intention was to answer the follow- ing questions: (i) what information could be obtained by portable XRF in the museum and (ii) which unsolved ana- lytical problems could be solved by PIXE, hence requiring transport of the object to the stationary particle accelera- tor. To answer these questions one has to take into account that simple pigment identification is possibly not sufficient for a comprehensive characterization of paintings, and that the arrangement and sequence of paint layers as one of the * Correspondence to: C. Neelmeijer, Research Center Rossendorf Inc, P.O.B. 510119, D-01314 Dresden, Germany. Contract/grant sponsor: European Commission. characteristics of an artistic studio or even the individual painter may also be of interest. The project of comparative XRF and PIXE measure- ments is tailored to profit from expedient experimental peculiarities as used by the contributing groups. For this purpose, mock-ups of paint layers were applied by brush on chalk ground. 9 These test paints were examined in dif- ferent laboratories starting with XRF and followed by ion beam analysis (IBA) measurements. To obtain results from identical positions, definite coordinates for analysis were given. The present work concentrated mainly on possibili- ties of indication and identification of painting techniques using simple painting arrangements. The individual XRF and IBA measurement conditions are briefly specified and original papers are referred to for more details. EXPERIMENTAL Both XRF and PIXE allow analytical work under atmo- spheric pressure. This is indispensable for non-destructive analysis of sensitive unique materials. However, whereas external PIXE routinely includes a helium gas jet to reduce proton stopping and x-ray absorption, 10 this option is usu- ally not adopted in standard XRF. Therefore, pigments consisting mainly of light elements, i.e. ultramarine or smalt containing Al and Si, have not been included in this initial study. As depicted in Fig. 1(a), arrangements of cinnabar (HgS) and lead white [2PbCO 3 ÐPb(OH) 2 ] on chalk ground, containing the elements Hg and Pb, were taken into consideration. In addition to non-destructive CCC 0049–8246/2000/010101–10 $17.50 Received 1 April 1999 Copyright 2000 John Wiley & Sons, Ltd. Accepted 5 October 1999
Transcript of Paintings— a challenge for XRF and PIXE analysis

X-RAY SPECTROMETRYX-Ray Spectrom. 29, 101–110 (2000)
Paintings—a Challenge for XRF and PIXEAnalysis
C. Neelmeijer,1 I. Brissaud,2 T. Calligaro,2 G. Demortier,3 A. Hautoj arvi,4 M. M ader,1L. Martinot, 5 M. Schreiner,6 T. Tuurnala 4 and G. Weber51 Research Center Rossendorf Inc., P.O.B. 510119, D-01314 Dresden, Germany2 Laboratoire de Recherche des Musees de France, 6 rue des Pyramides, F-75041 Paris cedex 01, France3 LARN, Facultes Universitaires Notre-Dame de la Paix, 61 rue de Bruxelles, B-5000 Namur, Belgium4 University of Helsinki, Accelerator Laboratory, P.O.B. 43, Fin-00014 Helsinki, Finland and Helsinki Institute of Technology,P.O.B. 166, Fin-00181 Helsinki, Finland5 Universite de Liege, Institut de Physique Nucleaire Experimentale, Sart Tilman B 15, B-4000 Liege, Belgium6 Academy of Fine Arts Vienna, Schillerplatz 3, A-1010 Vienna, Austria
Conventional pigment analysis of paintings requires the removal of micro-samples followed by the prepa-ration of cross-sections. There are also requirements for investigating several locations within a paintingin order to obtain information about dating and provenance or the reason for aesthetic impressions of thepaint materials. The need to carry out such work without removing samples prompted the present project,in which the authors aimed to examine the possibility of applying XRF and PIXE methods in a complemen-tary manner. The ion beam techniques of external PIXE plus Rutherford backscattering could distinguishpainting techniques, i.e. paint layer arrangements and pigment admixtures, whereas portable XRF repre-sents a valuable tool for preselecting the objects of interest which could be transported to the ion beamlaboratory. This procedure was tested using samples of prepared paint layers. It is shown that it is possibleto distinguish between two or three layers. The situation would be more difficult for more complex paintlayer arrangements. Copyright 2000 John Wiley & Sons, Ltd.
INTRODUCTION
In a variety of unique art objects, x-ray spectra producedby primary radiation or charged particle bombardmenthave been useful for non-destructive analytical work.1 – 5
However, safety and cost restrictions favour in-field ana-lytical activities on art objects. Consequently, art sci-entists, conservators, private owners and museums askfor scientific techniques based on transportable facilities.Recently, a compact portable x-ray fluorescence (XRF)set-up was developed6 and applied to examine the com-positions of historic metal alloys. This was followed bythe development of a high-resolution mini-facility7 reach-ing 160 eV FWHM at 5.9 keV x-ray energy. In parallel,the relative performances of XRF and (proton inducedx-ray emission (PIXE) for painting material analysis havebeen tested in a joint project of the European CommunityCOST-G1 action.8 The intention was to answer the follow-ing questions: (i) what information could be obtained byportable XRF in the museum and (ii) which unsolved ana-lytical problems could be solved by PIXE, hence requiringtransport of the object to the stationary particle accelera-tor. To answer these questions one has to take into accountthat simple pigment identification is possibly not sufficientfor a comprehensive characterization of paintings, and thatthe arrangement and sequence of paint layers as one of the
* Correspondence to: C. Neelmeijer, Research Center RossendorfInc, P.O.B. 510119, D-01314 Dresden, Germany.
Contract/grant sponsor: European Commission.
characteristics of an artistic studio or even the individualpainter may also be of interest.
The project of comparative XRF and PIXE measure-ments is tailored to profit from expedient experimentalpeculiarities as used by the contributing groups. For thispurpose, mock-ups of paint layers were applied by brushon chalk ground.9 These test paints were examined in dif-ferent laboratories starting with XRF and followed by ionbeam analysis (IBA) measurements. To obtain results fromidentical positions, definite coordinates for analysis weregiven. The present work concentrated mainly on possibili-ties of indication and identification of painting techniquesusing simple painting arrangements. The individual XRFand IBA measurement conditions are briefly specified andoriginal papers are referred to for more details.
EXPERIMENTAL
Both XRF and PIXE allow analytical work under atmo-spheric pressure. This is indispensable for non-destructiveanalysis of sensitive unique materials. However, whereasexternal PIXE routinely includes a helium gas jet to reduceproton stopping and x-ray absorption,10 this option is usu-ally not adopted in standard XRF. Therefore, pigmentsconsisting mainly of light elements, i.e. ultramarine orsmalt containing Al and Si, have not been included inthis initial study. As depicted in Fig. 1(a), arrangementsof cinnabar (HgS) and lead white [2PbCO3ÐPb(OH)2] onchalk ground, containing the elements Hg and Pb, weretaken into consideration. In addition to non-destructive
CCC 0049–8246/2000/010101–10 $17.50 Received 1 April 1999Copyright 2000 John Wiley & Sons, Ltd. Accepted 5 October 1999
102 C. NEELMEIJERET AL.
Figure 1. Test paint layer arrangements of cinnabar and lead white painting materials. (a) Schematic overview shown as a cross-section.For the different positions (A–F) average layer thicknesses are given in Table 3. (b) Optical micrograph of a cross-section preparedfrom position A, ‘lead white on cinnabar,’ as an example. (c) The test plate positioned at a typical external proton beam set-up (seeRef. 10). A mini-frame was mounted at the large-dimension object manipulator to fix the small plate (150ð 150 mm).
analysis, the test paint layer systems were characterized byoptical microscopy9 using cross-sections of tiny samplesembedded in resin. Figure 1(b) gives a typical example.
Note that the latter procedure was carried out only fora critical assessment of depth-dependent results of bothXRF and PIXE. Layer thicknesses, obtained by the optical
Copyright 2000 John Wiley & Sons, Ltd. X-Ray Spectrom. 29, 101–110 (2000)
PAINTINGS—A CHALLENGE FOR XRF AND PIXE ANALYSIS 103
Table 1. Experimental parameters used in the various laboratories for studying the paint layers which are given in Fig. 1(a)
XRF PIXE
Group Vienna Helsinki Rossendorf Paris Namur Liege
Excitation Spectrace 5000 241Am 30 mCi, Protons Protons Protons ProtonsRh tube and 55Fe 10 mCi 0.5–1 nA 1–10 nA 20 nA 1–10 nAlaboratory-madefacility
Excitation 10–50 59.6 keV (Am) 3.87, 2.03, 1.19 3.5–2.0 2.15, 1.75 3.7energy keV 26.3 keV (Am) MeV MeV MeV MeV
11–21 keV (Np L)5.9C 6.5 keV (Fe)
Beam spot 1 mm 1 cm 1 mm 1 mm 1 mm 1 mmdiameterAcquisition 30–60 s 2–5 min 20–50 s 1–2 min 2–5 min 2–5 mintimeSi(Li) 12 µm Be 12 µm Be 25.4 µm Be Det. 1 0.25 µm BN 25.4 µm Be 7.6 µm Beentrance Det. 2 6.0 µm BewindowAbsorbers No absorber or Air: 10 mm He: 30.5 mm Det. 1 He: 60 mm Air: 50 mm Air: 30 mm
air: 20.0 mm Mylar: 56.0 µm Det. 2 air: 20 mm Lucite: 4 mm Mylar: 0.85 mmAir: 2.6 mm CAl: 50 µm with a hole of with a hole of
� 1 mm � 1.5 mmSpectrum Spectrace 5000 PCAKLM GUPIX12 GUPIX12 PIXBOY13 WINAXIL14
evaluation package and lab-made software
measurements, are given in Table 3. A general view ofthe test plate ‘cinnabar/lead white’ is given in Fig. 1(c),which in addition demonstrates the simple positioning ofan object in front of the external ion beam at atmosphericpressure.
XRF techniques
Summarized in Table 1 are the characteristic parametersof the XRF systems used in this work. X-ray excita-tion was induced by a rhodium x-ray tube in Viennausing a commercial spectrace 5000 instrument (NoranInstruments) and also a laboratory-made XRF facility fornon-destructive analysis of large art objects.11 Radioactivesources (excitation mainly via -rays) were applied in theexperiment in Helsinki. The XRF radiation was measuredusing Si(Li) detectors.
A spot 1 cm in diameter for the primary -ray excita-tion (column 3 in Table 1) allows the analysis of largerareas within the painting which means that one cannotcarry out analyses of well defined positions (point analy-sis). To do so one has to employ heavy collimation. Onthe other hand, the resulting reduction in the intensity ofthe primary beam will lead to a reduction in the analyticalsensitivity. For point analysis it is more convenient to usean x-ray tube which already produces a collimated spot(� < 1 mm) of reasonable intensity even when using minidesigns.15,16
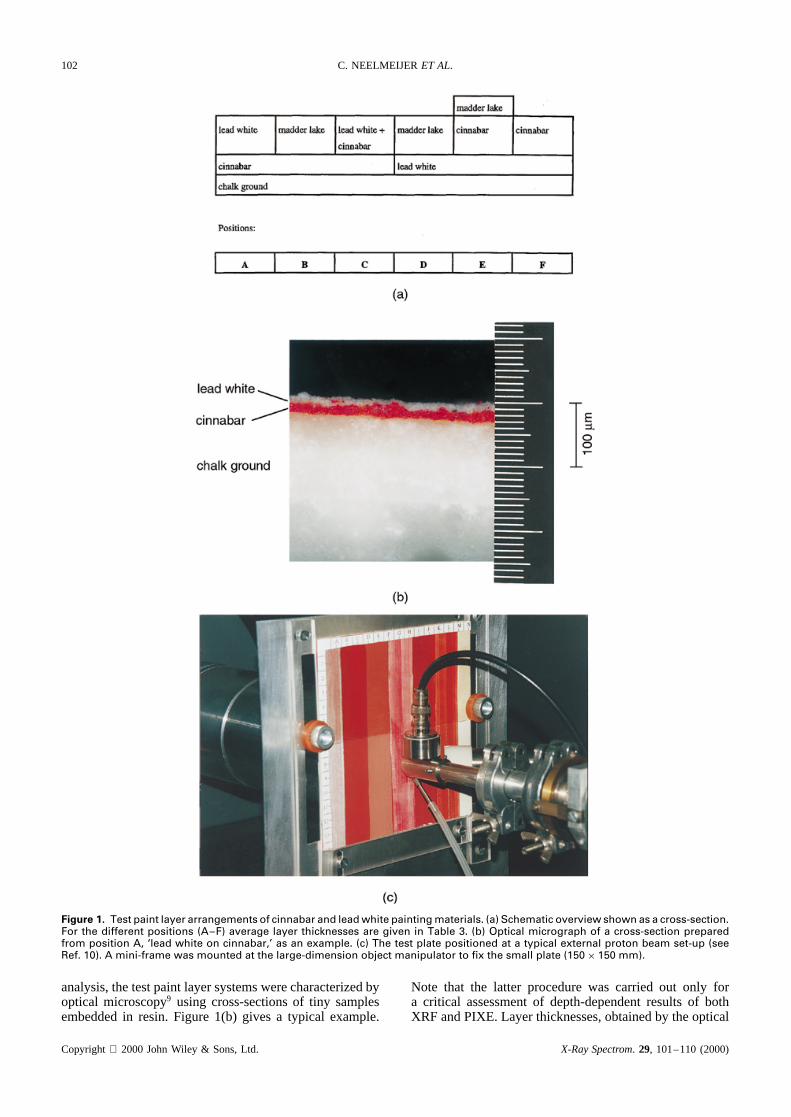
In order to obtain high fluorescence yields, the energyof the excitation maximum (the characteristic - or x-rays or the primary electron bremsstrahlung) should be notfar from the absorption edge of the atom to be detected.This is the reason why a set of radioactive sources isnecessary for the analysis of a broad scale of chemicalelements. Radioactive sources emitting -radiation plusx-radiation of low energy are of advantage, e.g.241Am as
Figure 2. 241Am source: spectra measured (a) without and(b) with 1 mm Cu absorber (Helsinki).
presented in Fig. 2(a). Here, the 59.6 keV -rays excite theK-shell electrons of elements with higher atomic number,
Copyright 2000 John Wiley & Sons, Ltd. X-Ray Spectrom. 29, 101–110 (2000)
104 C. NEELMEIJERET AL.
35 < Z < 68. Interferences of the x-ray fluorescencespectrum with signals from Compton scattered primaryradiation (26.3 keV -rays, Np L x-rays) can be avoidedby means of a copper absorber about 1 mm thick infront of the 241Am source [see Fig. 2(b)]. On the otherhand, the primary Np L x-rays allow effective K-shellx-ray fluorescence of elements 19< Z < 34 and L-shell photoabsorption for 43< Z < 78. The isotope55Fe, which emits Mn K radiation ofEx D 5.90 keV,is best suited for excitation of elements with low atomicnumbers,Z < 23. Nevertheless, this energy is far fromthe absorption edges of the light elements Si (Kabs D1.84 keV) and Al (Kabs D 1.56 keV). Hence, especiallyfor minor element and trace analysis, reasonable Si andAl fluorescence yields are not produced. The techniqueof secondary fluorescence17 can be useful. Primary -raysources of high activity are necessary in this case. X-raytubes handle this problem with optimum materials of theanticathode.
External PIXE
Details of the experimental arrangements have beendescribed earlier.10,18 The proton beam, generated in vac-uum, passes through a thin exit window and impinges theobject at atmospheric pressure. A helium flush, replac-ing air in both the Paris and Rossendorf experiments,reduces proton stopping and x-ray attenuation. In addition,helium is favourable for cooling the surface of sensitiveobjects such as varnish coatings on paintings. The num-ber of protons is monitored in-vacuum by backscatteringfrom the exit foil (Paris) or by Rutherford backscattering(RBS) from a rotating beam chopper made from tantalumpins (Rossendorf). The Namur facility works without aHe flush because metal alloys are the main interest in thisgroup, i.e. the detection of x-ray energiesEx < 3 keV is ofminor importance in their routine work and the objects aremore resistant to the proton beam. The incident protonsare recorded by measuring the -ray yield of aluminiumproduced in the exit foil of the Namur set-up;19 backscat-tering of protons by the atmospheric argon is used at theexternal beam on air by the Liege group.20
Compared with XRF, ion beam techniques such asPIXE are generally useful for depth-sensitive studies. Thisis because the x-ray excitation cross-section depends onthe projectile energy, which is a function of depth inthe painting material. Different strategies for obtainingdepth information require different measurement condi-tions. For example, layer identification via the depth-dependent K/Kˇ or L˛/Lˇ intensity ratios requires x-rayspectra of very good statistics.19 Consequently, higherproton beam currents and/or longer exposure times arenecessary, as given in Table 1 for the Namur group. Onthe other hand, materials of low resistivity against particleirradiation such as the organic components of paintings(binder and varnish coatings) or painting materials onglass/porcelain stipulate that the analyst uses proton beamswith Ip < 500 pA and acquisition timest < 1 min toguarantee the non-destructive character of the method.
From the PIXE spectra measured for different protonenergiesEp on a fixed position, relative elemental con-centrations can be obtained by computer evaluation (seeTable 1). If the concentrations increase/decrease systemat-ically with increasing proton energy, i.e. with increasing
information depth, the presence of a sequence of paintlayers can be deduced. This technique is used by theRossendorf group.21 Another procedure, developed by theParis group, is based on theEp dependence of the slopes ofthe logarithmic yield functions lnYx D f.Ep/, evaluatedfor the characteristic elements of the pigments, in order todeduce the layer sequence.22 Here, the physical effect isused that for a given chemical elementZ the slope of themeasured x-ray yield functionYx.Z/ D f.Ep/ becomessteeper if the elementZ is located in a deeper region.This variation can be explained by the energy loss of theincident protons and the increased x-ray absorption whenthe production of characteristic x-rays takes place at alarger depth. The Liege group proposes the variable inci-dent angle technique,20 which represents an alternative tothe PIXE studies using variable incident proton energy.The ‘effective’ information depth, measured perpendicu-larly to the surface, is varied by tilting the object relativeto the proton beam. Both the mock-up of paint layers andthe Si(Li) detector are tilted by the same angleϕ keep-ing the detection angle constant at� D 30°. This is ofimportance in order to vary only the depth of proton pen-etration and not the thickness of material to be crossedby the x-rays before entering the detector. Note that thesetwo processes would act on the number of detected x-raysin opposite directions. Measurements are performed for0° < ϕ < 70°, whereϕ represents the angle of the objectnormal relative to the incident proton beam direction.
RESULTS AND DISCUSSION
Pigment identification by XRF
The overall results from XRF studies on paintings, isotopeinduced or performed with x-ray tubes, are multielementspectra which indicate the main elements of the pigmentswhich are present. Usually this step allows the identifica-tion of inorganic pigments under consideration. In manycases useful details about the minor and trace elementscan be obtained.
As an example, Fig. 3(a) shows the x-ray spectrumof ‘cinnabar on lead white,’ painted on chalk as ground[position F in Fig. 1(a)]. Both the -radiation of 241Amplus the Np L x-rays [compare Fig. 2(a)] were applied forfluorescence excitation. It is evident from Figs 3(a) and (b)that the intensities of the Hg and Pb lines, which originatefrom the superimposed thin layers of cinnabar and leadwhite (d ³ 15 µm for each layer), are much higher thanthat of Ca from the thick chalk ground (d > 130µm). Thisis mainly due to the reduction into the fluorescence cross-section as a result of increasing the difference between theincident radiation energy (preferably Np LD 11–21 keV)and the energy levels to be excited (Pb L3 D 13.0 keV,Hg L3 D 12.3 keV, Ca K D 4.0 keV). Note that theCa K line is completely absorbed by the lead white andcinnabar paint layers [Fig. 3(a)]. It is also worth notingthat organic overpaints such as madder lake or a varnishlayer do not disturb the pigment analysis. This is becauseof their low absorption coefficients. On the other hand,thick organic layers or high concentrations of organicbinders are associated with a characteristic increase in theintensities of Compton scattered -rays [source scattering,Fig. 3(b)].
Copyright 2000 John Wiley & Sons, Ltd. X-Ray Spectrom. 29, 101–110 (2000)

PAINTINGS—A CHALLENGE FOR XRF AND PIXE ANALYSIS 105
Figure 3. X-ray spectra emitted from ‘cinnabar on lead white:’(a) position F in Fig. 1(a); (b) the pure chalk ground in Fig. 1(a).XRF excitation by using a 30 mCi 241Am source without absorber,measuring time 120 s (Helsinki).
Although XRF facilities have been used industriallyfor thickness and composition analysis of well definedlayers,23,24 the XRF method does not produce systematicinformation about unique arrangements such as paintingmaterials. In the latter case the primary question is notof layer thicknesses but the sequence in which layers arepresent. Therefore, the aim of this type of layer analysisis (i) to separate qualitatively the presence of a pigmentadmixture from a layer arrangement and (ii) to identifythe sequence of pigments arranged in paint layers bymeans of a non-destructive technique. This means thatquantitative statements on layer thicknesses, etc., are ofsecondary interest and require assumptions regarding theconcentration of binders and the density of the paintingmaterial.
XRF layer indication using Ka/Kb or La/Lb intensityratios
Transmission of characteristic (Kand K , L˛ and L )x-radiation through a layer of painting material will resultin modification of the intensity ratioI˛/Iˇ. This effectbecomes obvious in these cases in which attenuation issufficiently different for the˛- and ˇ-radiation compo-nents. MaximumI˛/Iˇ modification is expected for selec-tive absorption, i.e. if the element of strongest absorptionin the pigment (Hg in cinnabar, Pb in lead white) has anabsorption edge just between the K˛ and K or L˛ and L
energy of the penetrating x-radiation. For example,I˛/Iˇof Pb L-radiation from lead white [2PbCO3ÐPb(OH)2]increases if lead white is painted over with a layer ofcinnabar (HgS). This is clear from the L3-absorption edgeof Hg (Kabs D 12.29 keV), which is situated betweenthe energy of the Pb L (Ex D 10.55 keV) and Pb L(Ex D 12.61 keV) components. Consequently, the massattenuation coefficients for absorption of Pb L-radiationin mercury show.�/�/˛ D 108 cm2 g�1 < .�/�/ˇ D175 cm2 g�1.25
Practicable pigment arrangements.In order to search forpigment combinations (top layer, subjacent layer) wherelayer position studies via the K/Kˇ or L˛/Lˇ intensityratios are practicable, estimations are useful on the basisof single elements. For this, modification of the intensityratio I˛/Iˇ is expressed by a gain factor for the character-istic element of a pigment:
g D I˛.e, a//Iˇ.e, a/
I˛.e//Iˇ.e/,
where (e, a) represents the emitter–absorber layer systemand (e) denotes only the emitter without attenuating toplayer. It is well known that this gain factorg.S/ D exp.Sd/is a function of the absorption selectivity:
S D [.�/�/˛ � .�/�/ˇ]�
where .�/�/˛ and .�/�/ˇ denote the mass attenuationcoefficients for the considered system and� andd repre-sent the top material density and thickness, respectively.
The discussed emitter (Pb)–absorber (Hg) arrangementis characterized byS D 902 cm�1 using .�/�/˛ D108 cm2 g�1 and .�/�/ˇ D 175 cm2 g�1 for Pb L x-ray absorption in mercury and�.Hg/ D 13.59 g cm�3.Elemental combinations of higher absorption selectivityare characterized by higher gain factors. This is the case,for example, for ‘copper blue on zinc white,’ where thecharacteristic element Cu causesS D 1896 cm�1 for ZnK-radiation. NegativeS values, e.g. for the elementalarrangement Pb on Hg (S D �576 cm�1), correspondto 0 < g < 1, i.e. to decreasingI˛/Iˇ intensity ratio.Finally, a gain factorgHg D 0.56 is expected forI˛/Iˇ ofHg L-radiation when covering mercury with a lead layerof 10 µm thickness, whereas the opposite arrangement,10 µm Hg on Pb, results ingPbD 2.5.
Table 2. Yield ratios Ya/Yb of Hg and Pb L-radiation obtain-ed experimentally by XRF (Vienna) for powderadmixtures of ‘cinnabar (HgS) plus lead white[2PbCO2ÐPb(OH)2]’ of different proportions (wt%),together with the gain factors g of the intensityratios
Composition (wt%) Pb L˛/Lˇ gPb Hg L˛/Lˇ gHg
100 Pb 2.02 1 — —90 PbC 10 Hg 2.13 1.05 1.97 1.4470 PbC 30 Hg 2.35 1.16 1.51 1.1050 PbC 50 Hg 2.54 1.26 1.47 1.0730 PbC 70 Hg 2.86 1.42 1.41 1.0310 PbC 90 Hg 3.07 1.52 1.37 1100 Hg — — 1.37 1
Copyright 2000 John Wiley & Sons, Ltd. X-Ray Spectrom. 29, 101–110 (2000)

106 C. NEELMEIJERET AL.
Discussion ofIa/Ib for ‘cinnabar on lead white’. It is impor-tant to take into account that not only the arrangementin layers but also the admixture of pigments may causemodification in theI˛/Iˇ values. To obtain informationon corresponding restrictions when interpreting the XRFdata measured on the ‘cinnabar/lead white’ test paintingsin Fig. 1(a), additional experiments were necessary. Theratio I˛/Iˇ of both Pb and Hg L-radiation have been deter-mined from powder admixtures of the pigments whoserelative concentrations have been varied. The results aregiven in Table 2: with increasing concentration of cinnabarthe Pb L /Lˇ intensity ratio increases owing to selectiveabsorption of the Pb L-radiation by the Hg atoms. Onthe other hand, with increasing amount of lead white theHg L˛/Lˇ intensity ratio also increases. This is mainlydue to secondary excitation of the Hg L˛ component byPb L -radiation.
With the aid of Table 2 and knowledge of the gainfactors (gPb > 1, gHg < 1), it now becomes possible todiscuss the XRF results obtained from the test paintings[Fig. 1(a)] and which are given in Table 3. (i) Within theerror limits of the measurement the L˛/Lˇ intensity ratiosof Pb and Hg as obtained from the pure pigment powdersagree with the corresponding data for the single pigmentpainting materials. (ii) To indicate definitely a ‘cinnabaron lead white’ layered arrangement, the measuredI˛/Iˇgain factor for Pb L-radiation must exceed the maximumvalue of the pigment admixturegPb ³ 1.5 (see Table 2).This is only fulfilled for the thick cinnabar top layer(d D 40–60 µm, gPb ³ 1.6) at position E of the testpaints (Table 3). (iii) The inverse system ‘lead white oncinnabar’ is generally indicated bygHg < 1, provided that
Table 3. Paint layer studies of the pigment combinationcinnabar (Hg) and lead white (Pb): experimen-tal yield ratios Ya/Yb of Hg and Pb L-radiationobtained by means of XRF (Vienna) and PIXE(Namur)
XRF PIXEd
Position Paint layer sequence and[Fig. 1(a)] thicknesses (µm)a Pb L˛/Lˇ Hg L˛/Lˇ Pb L˛/Lˇ Hg L˛/Lˇ
B Cinnabar(10–30)b
— 1.43 — 0.59
D Lead white(30–40)b
2.15e — 0.61 —
F Cinnabar (15)on lead white(10–20)c
2.45 1.61 0.64 0.60
E Cinnabar(40–60) on leadwhite (20–30)b
3.36 1.41 0.72 0.59
C CinnabarC leadwhite, admixed1 : 1 (20–30)
2.58 1.42 0.65 0.57
A Lead white (10)on cinnabar(10–20)c
2.45e 1.43 0.60 0.54
a Data from mechanical cross-sections.9b Covered with 2–10 µm of madder lake.c Streaky top layer.d L˛/Lˇ < 1 owing to the Lucite absorber (d D 4 mm with holeof � 1 mm).e The higher ratio Pb L˛/Lˇ D 2.45 is due to reduced self-absorption effects (Pb L˛, Pb Lˇ) in the thin lead white layerof position A.
the top layer is of sufficient thickness. (iv) The intensityratios I˛/Iˇ of Pb and Hg L-radiation obtained from the1 : 1 admixture of ‘cinnabarCwhite lead’ painting material(position C in Table 3) are in good agreement with themeasured values for the 1 : 1 powder admixture of thepure pigments (50 PbC 50 Hg in Table 2).
PIXE layer indication using Ka/Kb or La/Lbintensity ratios
For the ‘cinnabar/lead white’ test painting arrangements inFig. 1(a), intensity ratiosI˛/Iˇ of Hg and Pb L-radiationwere also measured by PIXE in Namur. It is remarkablethat the values, given as measured in Table 3, show gener-ally I˛/Iˇ < 1. This is caused by the thick plastic absorberwhich was inserted between the target and the Si(Li)detector. As is obvious from Table 3 for Pb L-radiation(PIXE), there is only a slight dependence ofI˛/Iˇ on thelayer sequence of the mercury- and lead-containing pig-ments. The tendency, however, is in accordance with thatgained by XRF. Nevertheless, even if lead white is cov-ered by the 40–60µm thick cinnabar layer [Fig. 1(a),position E], the measured gain ofI˛/Iˇ does not reachgPb ³ 1.5 as was obtained from the XRF measurements.In this connection, it is of interest that the intensity ratioI˛/Iˇ of the Hg L-lines is a more direct indicator ofthe depth arrangement of the cinnabar pigment. This isbecause any decrease inI˛/Iˇ of Hg L-radiation clearlyindicates that cinnabar is beyond a top layer containing aheavy element such as lead. In the case of covered leadwhite pigment, the expected increase in the Pb L˛/Lˇintensity ratio may be reduced. This happens if the selec-tive absorption of the L-radiation of lead in mercury ispartially compensated by regular absorption in companionelements of the cinnabar painting material. Therefore, oneimmediately deduces that the lead-containing pigment isat the top by looking at the L/Lˇ intensity ratio of mer-cury. When analysing position A in Fig. 1(a), a first studyatEp D 2.15 MeV followed by another atEp D 1.75 MeVconfirms the situation not only by measuring the L˛/Lˇintensity ratio for one particular element but also by com-paring both the L and L lines of each element Pb andHg. By decreasing the proton energy the relative intensityof L˛.Pb//L˛.Hg/ increases considerably if Pb is mainlypresent in the top layer. In practical cases, mixtures ofpainted layers are much more difficult to identify becausepaint layers of original paintings are very inhomogeneousin thickness and in composition. One approach to obtaina rough image of the depth-dependent elemental inho-mogeneities, characterizing the arrangement of pigments,is to use incident proton beams of various energies asreported below.
PIXE depth analysis by proton energy variation
Criterion of elemental concentrations. Concerning paintlayer analysis, the disadvantage of both XRF and PIXEis that the measured x-ray spectrum represents an inte-gral result over the current information depth. The latteris given for PIXE mainly by two parameters: (i) the inci-dent particle energy which adjusts the intensity of x-rayemission in a certain depth and (ii) x-ray attenuation by
Copyright 2000 John Wiley & Sons, Ltd. X-Ray Spectrom. 29, 101–110 (2000)
PAINTINGS—A CHALLENGE FOR XRF AND PIXE ANALYSIS 107
the painting material lying above this depth. Supposing ahomogeneous target material, the spectrum evaluation pro-gram GUPIX12 calculates elemental concentrations fromthe measured x-ray yields. Of course, the painting materialis not homogeneous within the contributing informationdepth. However, if the proton energy is increased stepby step, the information depth increases and deeper lyingpigments start to contribute more and more to the inte-gral x-ray spectrum. Consequently, the concentration ofchemical elements from the top decreases step by step infavour of the subjacent elements. This means that a layerarrangement of pigments should be indicated by a system-atic change in the relative elemental concentrations. Onthe other hand, pigment admixtures lead to elemental con-centrations which vary statistically with changing protonenergy. It is important to note that this rough procedure,used by the Rossendorf group,10 allows one to identifysimple paint layer structures (up to three different layers).
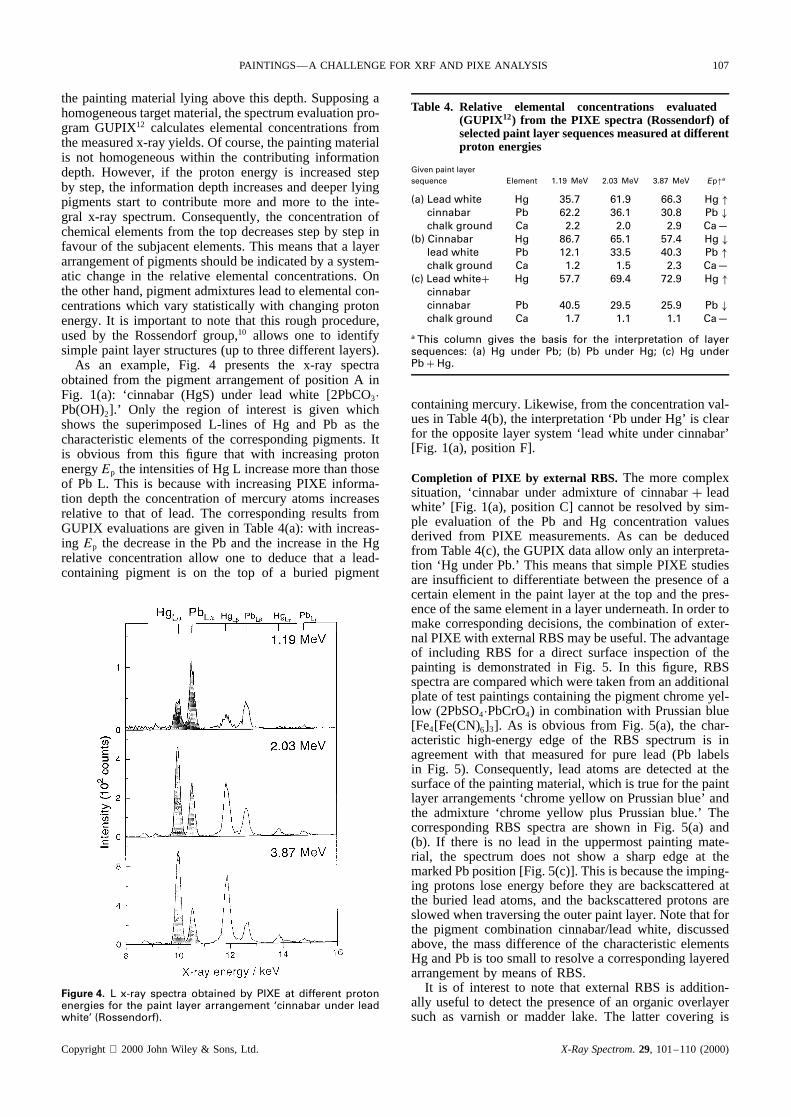
As an example, Fig. 4 presents the x-ray spectraobtained from the pigment arrangement of position A inFig. 1(a): ‘cinnabar (HgS) under lead white [2PbCO3ÐPb(OH)2].’ Only the region of interest is given whichshows the superimposed L-lines of Hg and Pb as thecharacteristic elements of the corresponding pigments. Itis obvious from this figure that with increasing protonenergyEp the intensities of Hg L increase more than thoseof Pb L. This is because with increasing PIXE informa-tion depth the concentration of mercury atoms increasesrelative to that of lead. The corresponding results fromGUPIX evaluations are given in Table 4(a): with increas-ing Ep the decrease in the Pb and the increase in the Hgrelative concentration allow one to deduce that a lead-containing pigment is on the top of a buried pigment
Figure 4. L x-ray spectra obtained by PIXE at different protonenergies for the paint layer arrangement ‘cinnabar under leadwhite’ (Rossendorf).
Table 4. Relative elemental concentrations evaluated(GUPIX12) from the PIXE spectra (Rossendorf) ofselected paint layer sequences measured at differentproton energies
Given paint layersequence Element 1.19 MeV 2.03 MeV 3.87 MeV Ep"a
(a) Lead white Hg 35.7 61.9 66.3 Hg "cinnabar Pb 62.2 36.1 30.8 Pb #chalk ground Ca 2.2 2.0 2.9 Ca—
(b) Cinnabar Hg 86.7 65.1 57.4 Hg #lead white Pb 12.1 33.5 40.3 Pb "chalk ground Ca 1.2 1.5 2.3 Ca—
(c) Lead whiteC Hg 57.7 69.4 72.9 Hg "cinnabarcinnabar Pb 40.5 29.5 25.9 Pb #chalk ground Ca 1.7 1.1 1.1 Ca—
a This column gives the basis for the interpretation of layersequences: (a) Hg under Pb; (b) Pb under Hg; (c) Hg underPbC Hg.
containing mercury. Likewise, from the concentration val-ues in Table 4(b), the interpretation ‘Pb under Hg’ is clearfor the opposite layer system ‘lead white under cinnabar’[Fig. 1(a), position F].
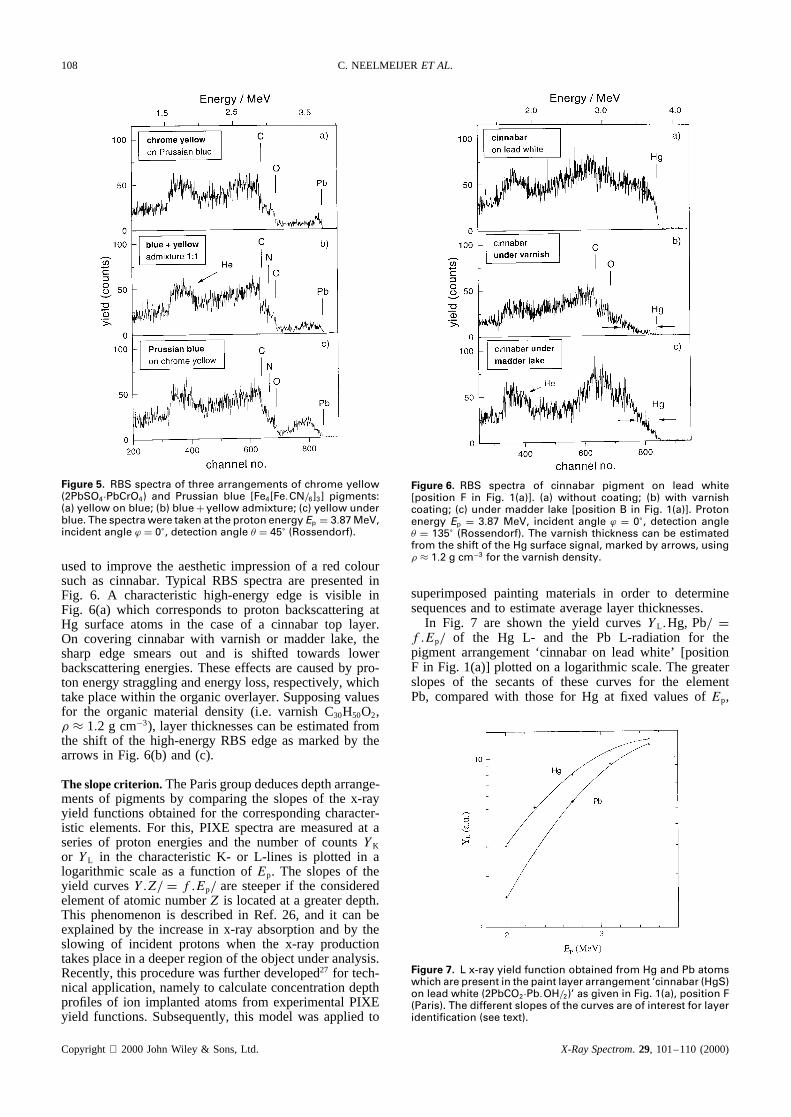
Completion of PIXE by external RBS. The more complexsituation, ‘cinnabar under admixture of cinnabarC leadwhite’ [Fig. 1(a), position C] cannot be resolved by sim-ple evaluation of the Pb and Hg concentration valuesderived from PIXE measurements. As can be deducedfrom Table 4(c), the GUPIX data allow only an interpreta-tion ‘Hg under Pb.’ This means that simple PIXE studiesare insufficient to differentiate between the presence of acertain element in the paint layer at the top and the pres-ence of the same element in a layer underneath. In order tomake corresponding decisions, the combination of exter-nal PIXE with external RBS may be useful. The advantageof including RBS for a direct surface inspection of thepainting is demonstrated in Fig. 5. In this figure, RBSspectra are compared which were taken from an additionalplate of test paintings containing the pigment chrome yel-low (2PbSO4ÐPbCrO4) in combination with Prussian blue[Fe4[Fe(CN)6]3]. As is obvious from Fig. 5(a), the char-acteristic high-energy edge of the RBS spectrum is inagreement with that measured for pure lead (Pb labelsin Fig. 5). Consequently, lead atoms are detected at thesurface of the painting material, which is true for the paintlayer arrangements ‘chrome yellow on Prussian blue’ andthe admixture ‘chrome yellow plus Prussian blue.’ Thecorresponding RBS spectra are shown in Fig. 5(a) and(b). If there is no lead in the uppermost painting mate-rial, the spectrum does not show a sharp edge at themarked Pb position [Fig. 5(c)]. This is because the imping-ing protons lose energy before they are backscattered atthe buried lead atoms, and the backscattered protons areslowed when traversing the outer paint layer. Note that forthe pigment combination cinnabar/lead white, discussedabove, the mass difference of the characteristic elementsHg and Pb is too small to resolve a corresponding layeredarrangement by means of RBS.
It is of interest to note that external RBS is addition-ally useful to detect the presence of an organic overlayersuch as varnish or madder lake. The latter covering is
Copyright 2000 John Wiley & Sons, Ltd. X-Ray Spectrom. 29, 101–110 (2000)
108 C. NEELMEIJERET AL.
Figure 5. RBS spectra of three arrangements of chrome yellow(2PbSO4ÐPbCrO4) and Prussian blue [Fe4[Fe.CN/6]3] pigments:(a) yellow on blue; (b) blueC yellow admixture; (c) yellow underblue. The spectra were taken at the proton energy Ep D 3.87 MeV,incident angle ϕ D 0°, detection angle � D 45° (Rossendorf).
used to improve the aesthetic impression of a red coloursuch as cinnabar. Typical RBS spectra are presented inFig. 6. A characteristic high-energy edge is visible inFig. 6(a) which corresponds to proton backscattering atHg surface atoms in the case of a cinnabar top layer.On covering cinnabar with varnish or madder lake, thesharp edge smears out and is shifted towards lowerbackscattering energies. These effects are caused by pro-ton energy straggling and energy loss, respectively, whichtake place within the organic overlayer. Supposing valuesfor the organic material density (i.e. varnish C30H50O2,� ³ 1.2 g cm�3), layer thicknesses can be estimated fromthe shift of the high-energy RBS edge as marked by thearrows in Fig. 6(b) and (c).
The slope criterion.The Paris group deduces depth arrange-ments of pigments by comparing the slopes of the x-rayyield functions obtained for the corresponding character-istic elements. For this, PIXE spectra are measured at aseries of proton energies and the number of countsYK
or YL in the characteristic K- or L-lines is plotted in alogarithmic scale as a function ofEp. The slopes of theyield curvesY.Z/ D f.Ep/ are steeper if the consideredelement of atomic numberZ is located at a greater depth.This phenomenon is described in Ref. 26, and it can beexplained by the increase in x-ray absorption and by theslowing of incident protons when the x-ray productiontakes place in a deeper region of the object under analysis.Recently, this procedure was further developed27 for tech-nical application, namely to calculate concentration depthprofiles of ion implanted atoms from experimental PIXEyield functions. Subsequently, this model was applied to
Figure 6. RBS spectra of cinnabar pigment on lead white[position F in Fig. 1(a)]. (a) without coating; (b) with varnishcoating; (c) under madder lake [position B in Fig. 1(a)]. Protonenergy Ep D 3.87 MeV, incident angle ϕ D 0°, detection angle� D 135° (Rossendorf). The varnish thickness can be estimatedfrom the shift of the Hg surface signal, marked by arrows, using� ³ 1.2 g cm�3 for the varnish density.
superimposed painting materials in order to determinesequences and to estimate average layer thicknesses.
In Fig. 7 are shown the yield curvesYL.Hg, Pb/ Df.Ep/ of the Hg L- and the Pb L-radiation for thepigment arrangement ‘cinnabar on lead white’ [positionF in Fig. 1(a)] plotted on a logarithmic scale. The greaterslopes of the secants of these curves for the elementPb, compared with those for Hg at fixed values ofEp,
Figure 7. L x-ray yield function obtained from Hg and Pb atomswhich are present in the paint layer arrangement ‘cinnabar (HgS)on lead white (2PbCO2ÐPb.OH/2)’ as given in Fig. 1(a), position F(Paris). The different slopes of the curves are of interest for layeridentification (see text).
Copyright 2000 John Wiley & Sons, Ltd. X-Ray Spectrom. 29, 101–110 (2000)
PAINTINGS—A CHALLENGE FOR XRF AND PIXE ANALYSIS 109
allow one to deduce ‘Pb under Hg’ as the elemental depthsequence. For the same arrangement Fig. 8 presents thecorresponding concentration depth profiles derived fromthe yield functions according to the model calculationsreported in Ref. 27. For a rough estimation, the full widthsat half-maximum (FWHM) of the Gaussians (Fig. 8) canbe used to determine paint layer thicknesses. Assuming thedensity values� D 7.0 and 8.9 g cm�3 for lead white andmercury pigment, respectively,28 and as� ³ 1.2 g cm�3
for the binder, these FWHMs lead to layer thicknessesd.cinnabar/ ³ 7.5 µm andd.lead white/ ³ 10.5 µm, ifthe relative content of the binder is 70%. Note that theprocedure makes use of constant relative concentrationsof pigment and binder for all the contributing paint layers.Regarding both the rough approximations and the stronginhomogeneities of the test layers painted by brush, theobtained layer thicknesses represent a reasonable image ofthe real situation (Table 3, position F). It worth mentioningthat if the painting is coated with an organic top layer, e.g.a varnish, the Gaussians in Fig. 8 shift towards greaterdepths. This is mainly because of proton stopping in theorganic coating and consequently the lower energy ofprotons entering into the paint layers.
PIXE depth analysis by incident angle variation
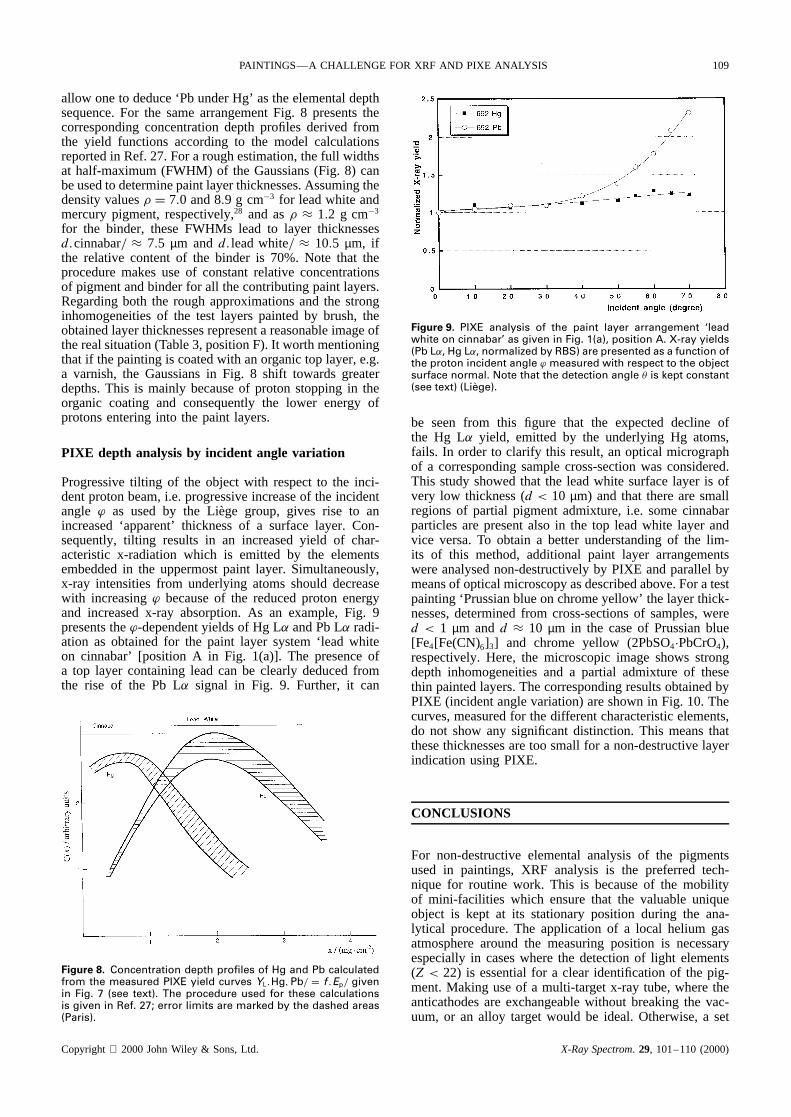
Progressive tilting of the object with respect to the inci-dent proton beam, i.e. progressive increase of the incidentangle ϕ as used by the Liege group, gives rise to anincreased ‘apparent’ thickness of a surface layer. Con-sequently, tilting results in an increased yield of char-acteristic x-radiation which is emitted by the elementsembedded in the uppermost paint layer. Simultaneously,x-ray intensities from underlying atoms should decreasewith increasingϕ because of the reduced proton energyand increased x-ray absorption. As an example, Fig. 9presents theϕ-dependent yields of Hg Land Pb L radi-ation as obtained for the paint layer system ‘lead whiteon cinnabar’ [position A in Fig. 1(a)]. The presence ofa top layer containing lead can be clearly deduced fromthe rise of the Pb L signal in Fig. 9. Further, it can
Figure 8. Concentration depth profiles of Hg and Pb calculatedfrom the measured PIXE yield curves YL.Hg,Pb/ D f .Ep/ givenin Fig. 7 (see text). The procedure used for these calculationsis given in Ref. 27; error limits are marked by the dashed areas(Paris).
Figure 9. PIXE analysis of the paint layer arrangement ‘leadwhite on cinnabar’ as given in Fig. 1(a), position A. X-ray yields(Pb L˛, Hg L˛, normalized by RBS) are presented as a function ofthe proton incident angle ϕ measured with respect to the objectsurface normal. Note that the detection angle � is kept constant(see text) (Liege).
be seen from this figure that the expected decline ofthe Hg L yield, emitted by the underlying Hg atoms,fails. In order to clarify this result, an optical micrographof a corresponding sample cross-section was considered.This study showed that the lead white surface layer is ofvery low thickness (d < 10 µm) and that there are smallregions of partial pigment admixture, i.e. some cinnabarparticles are present also in the top lead white layer andvice versa. To obtain a better understanding of the lim-its of this method, additional paint layer arrangementswere analysed non-destructively by PIXE and parallel bymeans of optical microscopy as described above. For a testpainting ‘Prussian blue on chrome yellow’ the layer thick-nesses, determined from cross-sections of samples, wered < 1 µm andd ³ 10 µm in the case of Prussian blue[Fe4[Fe(CN)6]3] and chrome yellow (2PbSO4ÐPbCrO4),respectively. Here, the microscopic image shows strongdepth inhomogeneities and a partial admixture of thesethin painted layers. The corresponding results obtained byPIXE (incident angle variation) are shown in Fig. 10. Thecurves, measured for the different characteristic elements,do not show any significant distinction. This means thatthese thicknesses are too small for a non-destructive layerindication using PIXE.
CONCLUSIONS
For non-destructive elemental analysis of the pigmentsused in paintings, XRF analysis is the preferred tech-nique for routine work. This is because of the mobilityof mini-facilities which ensure that the valuable uniqueobject is kept at its stationary position during the ana-lytical procedure. The application of a local helium gasatmosphere around the measuring position is necessaryespecially in cases where the detection of light elements(Z < 22) is essential for a clear identification of the pig-ment. Making use of a multi-target x-ray tube, where theanticathodes are exchangeable without breaking the vac-uum, or an alloy target would be ideal. Otherwise, a set
Copyright 2000 John Wiley & Sons, Ltd. X-Ray Spectrom. 29, 101–110 (2000)

110 C. NEELMEIJERET AL.
Figure 10. PIXE analysis of an arrangement of thin paint layers(d < 10 µm): ‘Prussian blue [Fe4[Fe.CN/6]3] on chromium yellow(2PbSO4ÐPbCrO4).’ The measured x-ray yields (Fe K˛, Cr K˛, PbL˛, normalized by RBS) are depicted as a function of the protonincident angle ϕ obtained perpendicularly to the object surface.Note that the detection angle � is kept constant (see text). TheK-radiation of Ca originates from calcium atoms in the paintingmaterial (Liege).
of mini-tubes equipped with different anticathodes guar-antees efficient x-ray excitation over the whole periodicsystem. From the integral result of the XRF study at acertain position the analyst gains a general overview ofthe main and minor elements typical for the pigmentswhich are present in the corresponding painting material.
This may help art historians and conservators to deducethe pigments used during a specific epoch or even by anartist, which is of special interest for dating and prove-nance studies.
For the non-destructive analysis of painting techniques,e.g. for differentiation between pigment arrangements inlayers and admixtures of painting materials, the XRFmethod is rather limited. In certain cases portable XRFanalysis is a valuable tool to indicate an apparent paintlayer structure, i.e. to preselect such paintings alreadyin the museum. Subsequently it may be useful in somecases to transport those paintings to the stationary particleaccelerator for a detailed ion beam analysis, i.e. externalproton induced x- and -ray emission (PIXE and PIGE)combined with external RBS. To take care of the object,these methods should be run simultaneously. It is impor-tant to mention that layer identification by the combinationof PIXE and RBS in practice includes only the upper-most two or three paint layers, which must be of suitableindividual thicknesses (10–50µm). The PIXE and RBSresults will not lead to a definite identification if the pig-ment arrangements are more complex.
Acknowledgements
This work was performed under the auspices of the European Com-mission COST-G1 action. The authors express their gratitude to theEuropean Commission for supporting this inter-laboratory collaboration.We are grateful to G. Lagarde for many discussions and suggestions.We thank G. Gigante and R. Jarjis for revaluating this work with criticalremarks and fruitful comments.
REFERENCES
1. S. Rinaldi, Mat. Strut. Probl. Conserv. 4(2), 67 (1994).2. M. A. Respaldiza and J. Gomez-Camacho (eds), Applications
of Ion Beam Analysis Techniques to Arts and Archeometry.Servicio de Publicaciones de Sevilla, Seville, (1997), andreferences cited therein.
3. T. Tuurnala, A. Hautojarvi and K. Harva, Nucl. Instrum.Methods B 14, 70 (1986).
4. K. G. Malmqvist, Nucl. Instrum. Methods B 14, 86 (1986).5. M. Schreiner, M. Mantler, F. Weber, R. Ebner and
F. Mairinger, Adv. X-Ray Anal. 35, 987, 1157 (1992).6. R. Cesareo, G. E. Gigante, P. Canegallo, A. Castellano,
J. S. Iwanczyk and A. Dabrowski, Nucl. Instrum. MethodsA 380, 440 (1996).
7. A. Longoni, C. Fiorini, P. Leutenegger, S. Sciuti, G. Fron-terotta, L. Struder and P. Lechner, Nucl. Instrum. Methods A409, 407 (1998).
8. G. Demortier, Europhys. News 27, 229 (1996).9. T. Schmidt, H.-P. Schramm and M. Schramm, Preparation
of the test paint layers and optical microscopy of cross-sections. Academy of Fine Arts Dresden, Department ofRestoration and Conservation, Dresden (1995).
10. C. Neelmeijer, W. Wagner and H. P. Schramm, Nucl. Instrum.Methods B 118, 338 (1996).
11. M. Schreiner and M. Mantler, In Proceedings of the 4thInternational Conference on Non-Destructive Testing ofWorks of Art, 221–230. DGZfP, Berlin, (1994).
12. J. A. Maxwell, J. A. Campbell and W. J. Teesdale, Nucl.Instrum. Methods B 43, 218 (1989).
13. B. van Oystaeyen and G. Demortier, Nucl. Instrum. Methods215, 299 (1983).
14. B. Vekemans, K. Janssens, L. Vincze, F. Adams and P. VanEspen, X-Ray Spectrom. 23, 278 (1994).
15. N. Yamamoto, Y. Homma, S. Sakata and Y. Hosokawa, Mat.Res. Soc. Symp. Proc. 338, 209 (1994).
16. A. N. Nikitin, Proc. SPIE 3115, 117 (1997).17. S. A. Benson, A. L. Severson and W. Beckering, Am. Lab. 12,
(Nov.), 35 (1980).18. T. Calligaro, J. D. MacArthur and J. Salomon, Nucl. Instrum.
Methods B 109/110, 125 (1996).19. G. Demortier and Y. Morciaux, Nucl. Instrum. Methods B 85,
112 (1994).20. G. Weber, J. M. Delbrouck, D. Strivay, F. Kerff and
L. Martinot, Nucl. Instrum. Methods B 139, 196 (1998).21. W. Wagner and C. Neelmeijer, Fresenius’ J. Anal. Chem.
353, 297 (1995).22. I. Brissaud, G. Lagarde and P. Midy, Nucl. Instrum. Methods
B 117, 179 (1996).23. K. Tsuji, S. Sato and K. Hirokawa, Thin Solid Films 274, 18
(1996).24. T. A. Roberts, D. H. Ko, K. E. Gray, Y. Y. Wang, R. P. H. Chang
and S. Ogawa, Appl. Phys. Lett. 66, 2054 (1995).25. R. Theisen and D. Vollath, Tables of X-Ray Mass Attenuation
Coefficients. Verlag Stahleisen, Dusseldorf, (1967) in IonBeam Handbook for Material Analysis. edited by J. W. Mayerand E. Rimini, Academic Press, New York, (1977).
26. G. Lagarde, P. Midy and I. Brissaud, Nucl. Instrum. MethodsB 132, 521 (1997).
27. P. Midy, G. Lagarde, I. Brissaud, J. P. Frontier and J. Chau-mont, Nucl. Instrum. Methods B 136–138, 551 (1998).
28. H. P. Schramm and B. Hering, Historische Malmaterialienund ihre Identifizierung ADVA, Berlin, (1989).
Copyright 2000 John Wiley & Sons, Ltd. X-Ray Spectrom. 29, 101–110 (2000)