Study on the technique of the Roman age mural paintings by micro-XRF with Polycapillary Conic...
8
Study on the technique of the Roman age mural paintings by micro-XRF with Polycapillary Conic Collimator and micro-Raman analyses Giovanni Paternoster a, *, Raffaele Rinzivillo a , Felice Nunziata a , Emilio Mario Castellucci b , Cristiana Lofrumento b , Angela Zoppi b , Anna Candida Felici c , Gabriele Fronterotta c , Chiara Nicolais c , Mario Piacentini c , Sebastiano Sciuti c , Margherita Vendittelli c a Dipartimento di Scienze Fisiche dell’Università “Federico II” and INFN-Sezione di Napoli Complesso Universitario di M.S.Angelo via Cintia, 80126 Napoli, Italy b Dipartimento di Chimica, Polo Scientifico, Università di Firenze Via della Lastruccia, 350019 Sesto Fiorentino, Italy c Dipartimento di Energetica dell’Università “La Sapienza” Via A. Scarpa 14 00161 Roma, Italy Received 24 October 2003; accepted 20 October 2004 Abstract XRF and micro-Raman stratigraphic microanalyses of fragments of some mural paintings, belonging to the Archaeological Site of Oplonti (Napoli) and the Vigna Barberini site in the Palatino (Roma), were performed. In order to collimate the fluorescence X-rays emitted by the samples, an X-ray polycapillary conic collimator (PCC) has been used in front of the detector. This device arrangement is compact, versatile, and portable. The nature of the pigments, the compositional elements, and the thickness of the fragment layers have been studied. The stratigraphic analysis partially confirms the preparation techniques described by Plinius and Vitruvius; moreover it confirms the hypothesis that the artifacts are not fresco paintings. This work has been conducted within the context of a wider research on the Roman age mural paintings. © 2005 Elsevier SAS. All rights reserved. Keywords: X-Ray collimator; ED-XRF; Portable Instruments; Micro-Raman; Mural paintings; Roman age 1. Aim of the research The high quality and the good conservation status of the paintings found at the beginnings of the Pompeii excavations rise the problem of the techniques of their production. It has been suggested that they were either encaustics, or based on fresco, tempera or even on more elaborate techniques. For identifying such techniques with a non-destructive method (or better, with a quasi non-destructive method, based on the analysis of the fragments and/or deteriorated paintings at the archaeological sites), a very compact apparatus for stratigraphic XRF analyses, to be used also in situ, has been set up. We tested this instrument on several fragments of mural paintings coming from Oplonti (Napoli) and Vigna Barberini (Palatino, Roma). Some fragments were analysed also with a micro-Raman device to determine the number and the thick- ness of the paintings layers, the nature of the used pigments and to check for the presence of organic compounds. 2. Introduction In the field of Cultural Heritage, the Energy Dispersive X-Ray Fluorescence (EDXRF) technique reached a great development thanks to its numerous advantages. It allows non- destructive, fast, versatile, sensitive, and in situ multi- elemental analyses [1–4]. In studying the techniques of ancient mural paintings and the pigments employed, these advan- tages are well suited for recognising the compounds used for the pigments, detecting the presence of organic compounds, separating the matrix effect, and the signals coming from over- lapping layers of painting [5–7]. In order to overcome some of these difficulties, an EDXRF apparatus has been set up, * Corresponding author. E-mail addresses: [email protected] (G. Paternoster), [email protected] (E.M. Castellucci), [email protected] (A.C. Felici). Journal of Cultural Heritage 6 (2005) 21–28 http://france.elsevier.com/direct/CULHER/ 1296-2074/$ - see front matter © 2005 Elsevier SAS. All rights reserved. doi:10.1016/j.culher.2004.10.003
Transcript of Study on the technique of the Roman age mural paintings by micro-XRF with Polycapillary Conic...
Study on the technique of the Roman age mural paintings by micro-XRFwith Polycapillary Conic Collimator and micro-Raman analyses
Giovanni Paternoster a,*, Raffaele Rinzivillo a, Felice Nunziata a, Emilio Mario Castellucci b,Cristiana Lofrumento b, Angela Zoppi b, Anna Candida Felici c, Gabriele Fronterotta c,
Chiara Nicolais c, Mario Piacentini c, Sebastiano Sciuti c, Margherita Vendittelli c
a Dipartimento di Scienze Fisiche dell’Università “Federico II” and INFN-Sezione di Napoli Complesso Universitario di M.S.Angelo via Cintia,80126 Napoli, Italy
b Dipartimento di Chimica, Polo Scientifico, Università di Firenze Via della Lastruccia, 350019 Sesto Fiorentino, Italyc Dipartimento di Energetica dell’Università “La Sapienza” Via A. Scarpa 14 00161 Roma, Italy
Received 24 October 2003; accepted 20 October 2004
Abstract
XRF and micro-Raman stratigraphic microanalyses of fragments of some mural paintings, belonging to the Archaeological Site of Oplonti
(Napoli) and the Vigna Barberini site in the Palatino (Roma), were performed. In order to collimate the fluorescence X-rays emitted by the
samples, an X-ray polycapillary conic collimator (PCC) has been used in front of the detector. This device arrangement is compact, versatile,
and portable. The nature of the pigments, the compositional elements, and the thickness of the fragment layers have been studied. The
stratigraphic analysis partially confirms the preparation techniques described by Plinius and Vitruvius; moreover it confirms the hypothesis
that the artifacts are not fresco paintings. This work has been conducted within the context of a wider research on the Roman age mural
paintings.
© 2005 Elsevier SAS. All rights reserved.
Keywords: X-Ray collimator; ED-XRF; Portable Instruments; Micro-Raman; Mural paintings; Roman age
1. Aim of the research
The high quality and the good conservation status of the
paintings found at the beginnings of the Pompeii excavations
rise the problem of the techniques of their production. It has
been suggested that they were either encaustics, or based on
fresco, tempera or even on more elaborate techniques.
For identifying such techniques with a non-destructive
method (or better, with a quasi non-destructive method, based
on the analysis of the fragments and/or deteriorated paintings
at the archaeological sites), a very compact apparatus for
stratigraphic XRF analyses, to be used also in situ, has been
set up. We tested this instrument on several fragments of mural
paintings coming from Oplonti (Napoli) and Vigna Barberini
(Palatino, Roma). Some fragments were analysed also with a
micro-Raman device to determine the number and the thick-
ness of the paintings layers, the nature of the used pigments
and to check for the presence of organic compounds.
2. Introduction
In the field of Cultural Heritage, the Energy Dispersive
X-Ray Fluorescence (EDXRF) technique reached a great
development thanks to its numerous advantages. It allows non-
destructive, fast, versatile, sensitive, and in situ multi-
elemental analyses [1–4]. In studying the techniques of ancient
mural paintings and the pigments employed, these advan-
tages are well suited for recognising the compounds used for
the pigments, detecting the presence of organic compounds,
separating the matrix effect, and the signals coming from over-
lapping layers of painting [5–7]. In order to overcome some
of these difficulties, an EDXRF apparatus has been set up,
* Corresponding author.
E-mail addresses: [email protected] (G. Paternoster),
[email protected] (E.M. Castellucci),
[email protected] (A.C. Felici).
Journal of Cultural Heritage 6 (2005) 21–28
http://france.elsevier.com/direct/CULHER/
1296-2074/$ - see front matter © 2005 Elsevier SAS. All rights reserved.
doi:10.1016/j.culher.2004.10.003
which permits to carry out stratigraphic analyses with high
spatial resolution.
The Roman paintings’ stratigraphy and production tech-
niques were firstly described by Vitruvio [8] and Plinius [9]
the senior. A mural painting is composed of a preparatory
layer (tectorium) made of three or more (until six) layers of
plaster: starting from the raw wall, at first there is the arric-cio, constituted of three layers of lime and sea or volcanic
sand (or pozzolana) and then the plaster, constituted of three
layers of lime and marble powder. When the plaster is still
wet, the pigments, mixed with suited binders and diluents,
are laid over the tectorium. To preserve the paintings from
the environmental ravages, a wax mixture is laid, heated, and
smoothed so that the painting surface appears translucent.
At the beginnings of the 50s the chemist and archaeologist
Selim Augusti conducted many precise chemical analyses on
lots of paintings from Ercolano and Pompeii; his results seem
to prove the existence of a particular technique, already pro-
posed at the beginning of the XIX century, based on the use
of soaped water mixed with lime, clay (or chalk), and wax
[10–12]. This particular technique has recently been found
on several paintings of the roman age [13,14]. More recently,
Mora et al. [15] proposed the use of a fresco technique for the
background, and a limed water technique for the decorative
part. However, in agreement with other recent studies, it seems
that more then one single technique was used [16–19].
3. Experimental
3.1. Samples
The study was conducted on a total of 15 fragments with
an average surface area of about 15 cm2. Eleven samples come
from the Oplonti Archaeological Complex near Naples and
below they will be referred to as “Oxx”, “xx” indicating a
reference number. These fragments had not been restored and
they had no context so we have been allowed to make some
micro-destructive analyses on them. A stratigraphic analysis
has been conducted on the fragments O01 and O15. The
former fragment has a compact and resistant blue back-
ground; probably it belongs to the II Pompeian style, second
half of the I century BC; the latter belongs to the IV style,
second half of the I century AD. It is white, smooth, and as
compact as marble. Both fragments show a shining surface,
due to the presence of many crystalline inclusions.
The other four fragments come from a section of the
Palatino archaeological site in Rome called Vigna Barberini
Complex. One fragment is blue and we label it the Barberini
Blue fragment (BB); a second one shows a geometric deco-
ration in different colours, and we call it the Barberini Deco-
rated fragment (BD). Both fragments are restored but not pre-
served with any protective varnish. The third and the fourth
fragment are similar to each other, probably coming from the
same painting. We will refer to them as a single sample: the
Barberini Protected fragment (BP). They are black with a pink
stripe and have been restored and protected with Paraloidvarnish.
3.2. Micro-XRF
A small area of the samples is irradiated with an X-ray
beam and the emitted fluorescence photons are collected and
analysed. By determining the number and the energies of the
fluorescence X-ray lines, it is possible to trace up the ele-
ments in the sample [20]. With our micro-XRF device we
were able to analyse areas of the sample as small as 140 µm
in diameter. The stratigraphic distribution of the elements was
obtained by scanning along the lateral sections of the frag-
ments [21].
The measurements have been taken with a portable device
for EDXRF realized at the Laboratory of the University of
Naples. The X-ray generator is the E.I.S. air-cooled Pd anode
generator with a focus of 200 × 200 µm2 and a 250 µm thick
Be window; it can operate with a maximum voltage of 30 kV
and a maximum current of 0.6 mA. The X-ray beam, colli-
mated with tantalum diaphragms to a 1 mm diameter spot
size, is incident on the sample at 45°.
The fluorescence photons are collected along the normal
to the sample surface through a Polycapillary Conic Collima-
tor (PCC) mounted in front of the Si-PIN detector (Amptek
model XR-100CR, with 165 eV resolution at 5.88 keV).
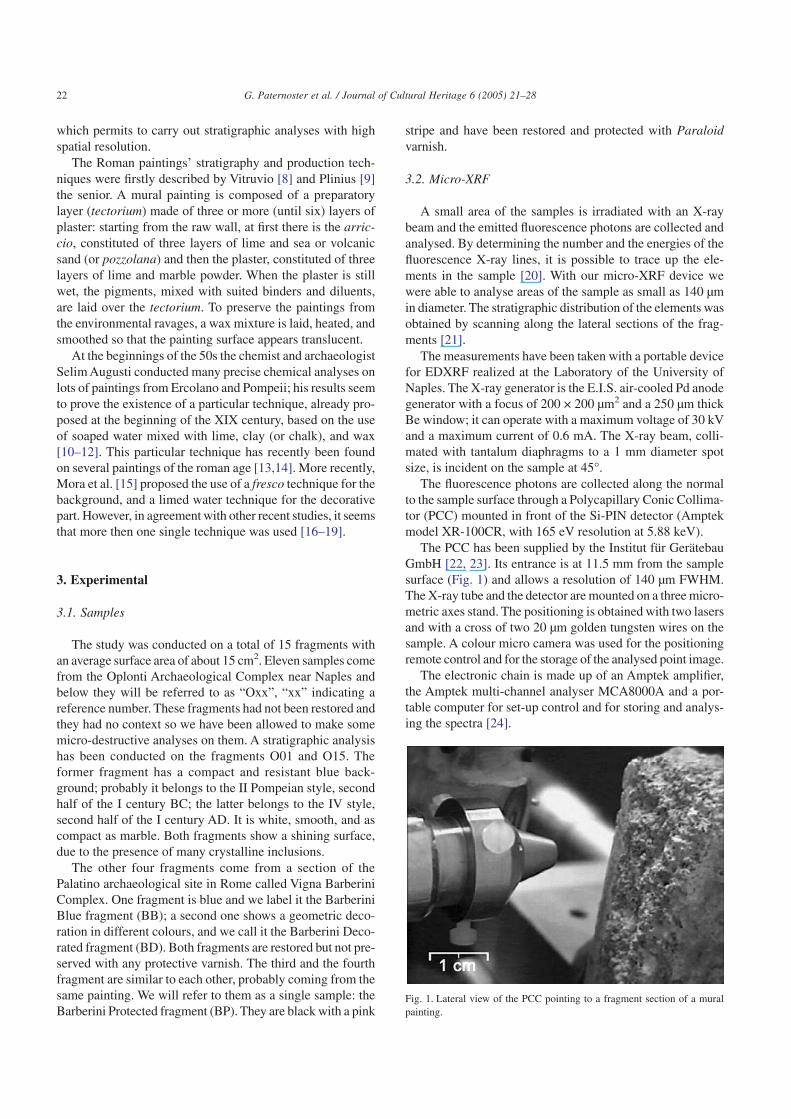
The PCC has been supplied by the Institut für Gerätebau
GmbH [22, 23]. Its entrance is at 11.5 mm from the sample
surface (Fig. 1) and allows a resolution of 140 µm FWHM.
The X-ray tube and the detector are mounted on a three micro-
metric axes stand. The positioning is obtained with two lasers
and with a cross of two 20 µm golden tungsten wires on the
sample. A colour micro camera was used for the positioning
remote control and for the storage of the analysed point image.
The electronic chain is made up of an Amptek amplifier,
the Amptek multi-channel analyser MCA8000A and a por-
table computer for set-up control and for storing and analys-
ing the spectra [24].
Fig. 1. Lateral view of the PCC pointing to a fragment section of a mural
painting.
22 G. Paternoster et al. / Journal of Cultural Heritage 6 (2005) 21–28
Taking into account the detector efficiency, the energy
transmission of the PCC and the device geometry, we can
detect the K-lines from S to Zr and the L-lines from Pd to U.
The EDXRF spectra have been analysed with WinAXIL
software [25], inserting data about the X-ray source, the detec-
tor, and the device’s geometry. These parameters have been
independently measured and fixed to reduce the error on the
determination of the areas of the peaks from degenerate lines.
As the samples are constituted by a wide and inhomoge-
neous matrix, we prefer to present the results as relative rates
(i.e., percentage ratios between the single peak net rate and
the total net rate) instead of quantitative percentages.
3.3. Micro-Raman
Micro-Raman measurements were carried out at the Chem-
istry Department of Florence using a Renishaw RM2000 in-
strument operating with an Argon air cooled laser source and
a diode laser, with excitation wavelengths at 514.5 and
785.2 nm, respectively. A 50× magnification objective was
employed to focus the laser beam onto the sample providing
a spatial resolution of about 1–2 µm; a wide area could be
probed by way of consequential point-by-point analyses.
Raman spectra were acquired with an irradiating laser power
measured under the microscope of about 2 mW, while lower
power values were required by highly light sensitive samples,
for which neutral density filters were used. The spectral reso-
lution was 4–6 cm–1 depending on the experimental condi-
tions; the investigated spectral range spanned from about
200 to 1600 cm–1 where the main diagnostic signals of inor-
ganic materials (pigments and minerals) fall, while the high
frequency region between 2800 and 3100 cm–1 was mainly
inspected for the CH stretching vibrations due to organic com-
ponents.
Paintings were analysed with both laser line excitations,
while the presence of organic materials was mainly checked
using the diode laser line.
All fragments were observed with a microscope, without
any preparation. Only for the O01 sample a cross-section was
prepared.
4. Results and discussion
4.1. Pigment recognition
The painted surfaces have been analysed by XRF and
micro-Raman techniques to determine the pigments used. In
several samples the emitted fluorescence was so high as to
hide the Raman lines.
Regarding the elemental analysis, we consider only those
elements having a net area of the XRF peak greater then three
standard deviations and a relative rate greater then 0.1%.
Not all the elements found in a spot are characteristic of
the pigment used because of the contribution to the XRF lines
coming from the preparation layers and also because the
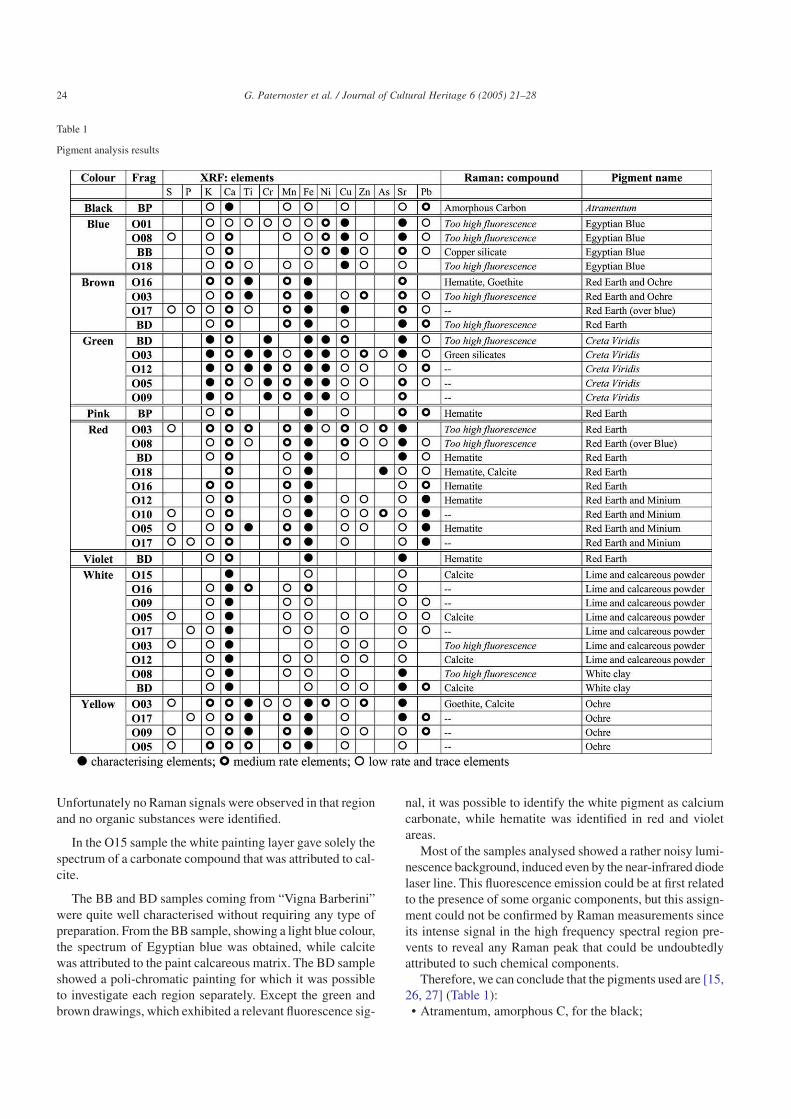
colours are often laid one over the other. It is possible to rec-
ognise the characterising elements by correlating their peak
intensities with the colours and the fragments: those ele-
ments, which are present in every analysed point of one par-
ticular colour with a high relative rate, are considered char-
acterising the pigment (Table 1).
Some considerations on the detected elements are neces-
sary:
• traces of phosphorus and sulphur, spread over all the
colours, were found only in some fragments: particularly
in the O03, O05, and O17 ones. They probably arise from
ashes and dust contamination that the painting samples had
been suffering until their recovery;
• potassium is always present, showing higher intensity
(more than five times its averaged relative rate) in the green
colours, whilst lower intensities were found in the whites;
• calcium is always present, but it is dominant only in white
and black colours;
• titanium is present in the yellow colours and in some green,
brown, and red ones;
• chromium characterizes the green colours;
• manganese is particularly evident in the browns, yellows,
greens, and in some reds;
• iron is characteristic of all the earth colours; it is present in
traces in the other ones;
• nickel characterizes the green colours and it is signifi-
cantly present in the blues;
• traces of copper are present in all colours, but it is domi-
nant in the blues.
• zinc is a natural impurity of the earth colours;
• arsenic is present in some red colours;
• strontium was detected in all colours with quite different
rates;
• lead is particularly evident in some red colours and in the
Barberini fragments.
As for Raman measurements, the compositional results were
obtained averaging over a wide set of data points selected
within the area to be characterised. The visible and near-IR
laser excitation lines were both used for pigments’ identifi-
cation, according to the paint colour: in general red, brown,
yellow, and white shades were investigated through the diode
laser line, while for green and blue pigments the green laser
line was preferred.
Raman spectra were recorded irradiating directly the sur-
face of the painted layers giving rise in a lot of cases to a
strong fluorescence probably due to surface organic contami-
nation. The fluorescence effect was that of originating a rather
strong background signal, leading to a complication in the
detection of the weaker Raman signals, thus in the identifi-
cation of the pigments employed. This was particularly evi-
dent with the argon laser line, while the diode laser excitation
at higher wavelength very unlikely gives rise to absorption
and then to emission of fluorescence.
Due to the lack of fluorescence, the diode source was also
preferred for checking the presence of organic materials
through the detection of CH stretching vibrations modes.
23G. Paternoster et al. / Journal of Cultural Heritage 6 (2005) 21–28
Unfortunately no Raman signals were observed in that region
and no organic substances were identified.
In the O15 sample the white painting layer gave solely the
spectrum of a carbonate compound that was attributed to cal-
cite.
The BB and BD samples coming from “Vigna Barberini”
were quite well characterised without requiring any type of
preparation. From the BB sample, showing a light blue colour,
the spectrum of Egyptian blue was obtained, while calcite
was attributed to the paint calcareous matrix. The BD sample
showed a poli-chromatic painting for which it was possible
to investigate each region separately. Except the green and
brown drawings, which exhibited a relevant fluorescence sig-
nal, it was possible to identify the white pigment as calcium
carbonate, while hematite was identified in red and violet
areas.
Most of the samples analysed showed a rather noisy lumi-
nescence background, induced even by the near-infrared diode
laser line. This fluorescence emission could be at first related
to the presence of some organic components, but this assign-
ment could not be confirmed by Raman measurements since
its intense signal in the high frequency spectral region pre-
vents to reveal any Raman peak that could be undoubtedly
attributed to such chemical components.
Therefore, we can conclude that the pigments used are [15,
26, 27] (Table 1):
• Atramentum, amorphous C, for the black;
Table 1
Pigment analysis results
24 G. Paternoster et al. / Journal of Cultural Heritage 6 (2005) 21–28
• Egyptian blue for all the analysed blue points;
• ochre and red earth for the brown colours;
• green earth (Creta Viridis), iron and potassium silicate, for
the green colours;
• ochre for the yellow;
• some variety of red earth and ochre for the red/pink/violet
colours, characterised by the ratio Mn/Fe and by small
quantity of As and Ti [27]; in four points we detected a
higher rate of lead due to the presence of minium;
• paretonium or melinum (white clays) for the white pig-
ment in fragments O08 and BD; lime and calcareous pow-
der for the white background in the remaining ones;
• white lead was probably used in the preparation layer of
the Barberini paintings.
4.2. Stratigraphy
Strontium is present in all colours. It reaches a high level
in the O03, O08, and BD fragments, which have a painted
white background, because it is probably present in the white
clays. This can be argued from the absence of strontium in
the analyses done on the points where the pigment is missing
and on the rear side of the fragments (Table 2).
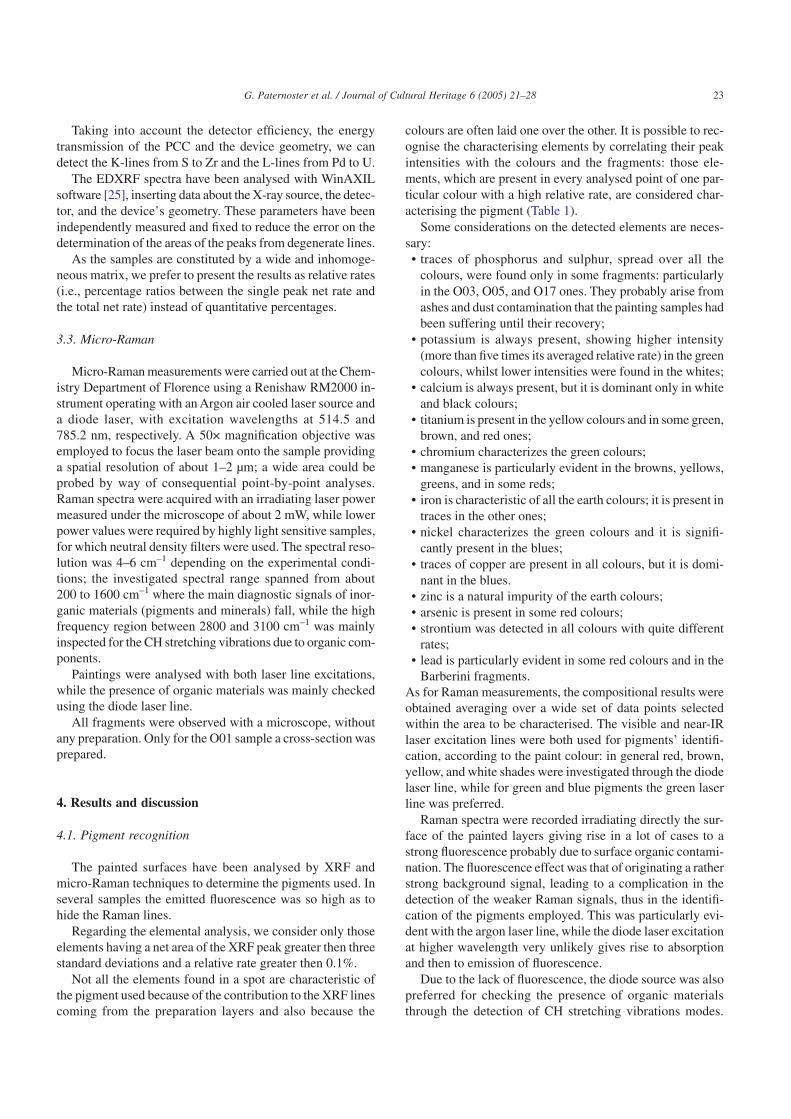
To confirm this hypothesis 0.25 cm2 of the O01 fragment
has been milled to a depth of 600 µm by steps of 100 µm,
performing an XRF analysis at each step. In Fig. 2 the
obtained relative rates are reported.
It is evident that iron and strontium decrease with depth to
a small constant value, reached at –300 µm level.
Before discussing the stratigraphic microanalysis, some
comments on the visual inspection of the lateral sections of
the fragments should be done.
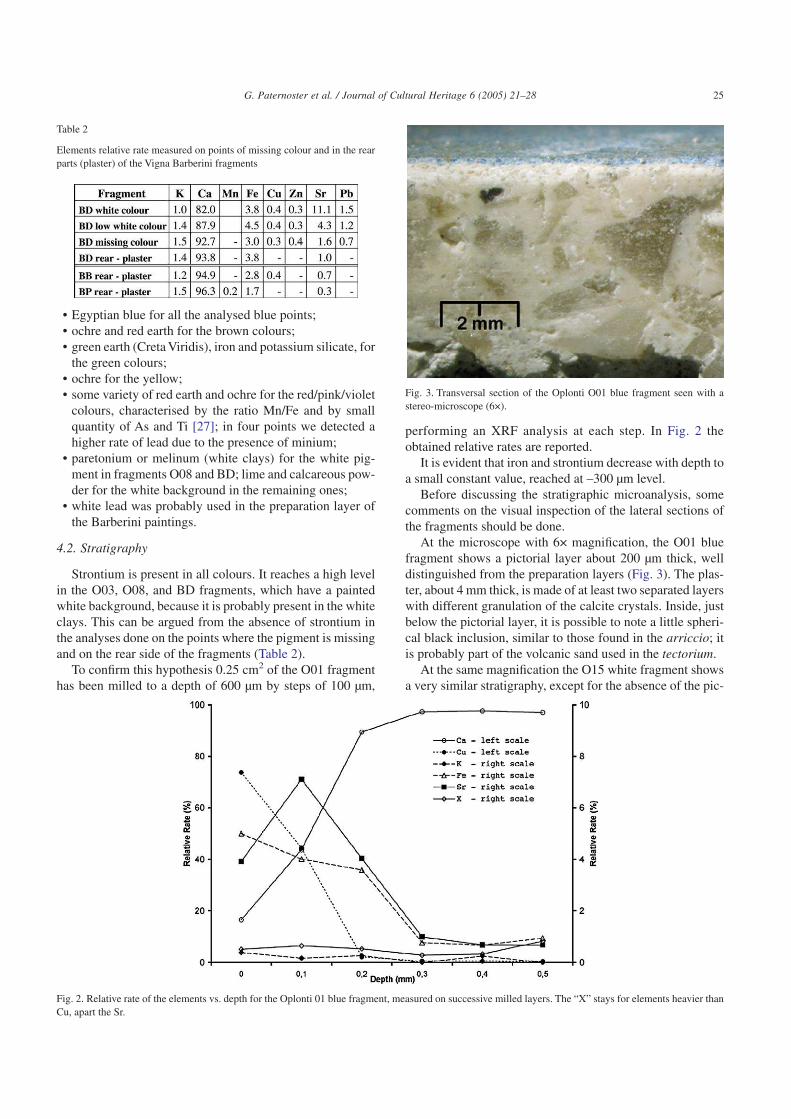
At the microscope with 6× magnification, the O01 blue
fragment shows a pictorial layer about 200 µm thick, well
distinguished from the preparation layers (Fig. 3). The plas-
ter, about 4 mm thick, is made of at least two separated layers
with different granulation of the calcite crystals. Inside, just
below the pictorial layer, it is possible to note a little spheri-
cal black inclusion, similar to those found in the arriccio; it
is probably part of the volcanic sand used in the tectorium.
At the same magnification the O15 white fragment shows
a very similar stratigraphy, except for the absence of the pic-
Table 2
Elements relative rate measured on points of missing colour and in the rear
parts (plaster) of the Vigna Barberini fragments
Fig. 2. Relative rate of the elements vs. depth for the Oplonti 01 blue fragment, measured on successive milled layers. The “X” stays for elements heavier than
Cu, apart the Sr.
Fig. 3. Transversal section of the Oplonti O01 blue fragment seen with a
stereo-microscope (6×).
25G. Paternoster et al. / Journal of Cultural Heritage 6 (2005) 21–28
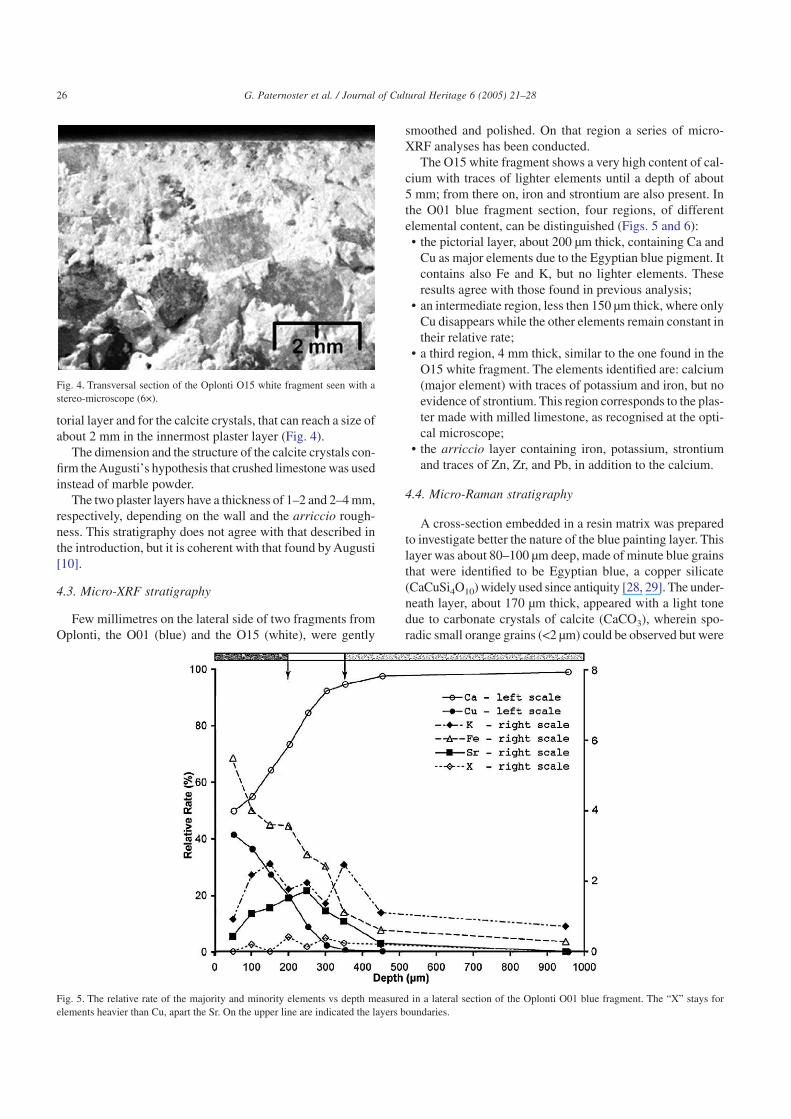
torial layer and for the calcite crystals, that can reach a size of
about 2 mm in the innermost plaster layer (Fig. 4).
The dimension and the structure of the calcite crystals con-
firm theAugusti’s hypothesis that crushed limestone was used
instead of marble powder.
The two plaster layers have a thickness of 1–2 and 2–4 mm,
respectively, depending on the wall and the arriccio rough-
ness. This stratigraphy does not agree with that described in
the introduction, but it is coherent with that found by Augusti
[10].
4.3. Micro-XRF stratigraphy
Few millimetres on the lateral side of two fragments from
Oplonti, the O01 (blue) and the O15 (white), were gently
smoothed and polished. On that region a series of micro-
XRF analyses has been conducted.
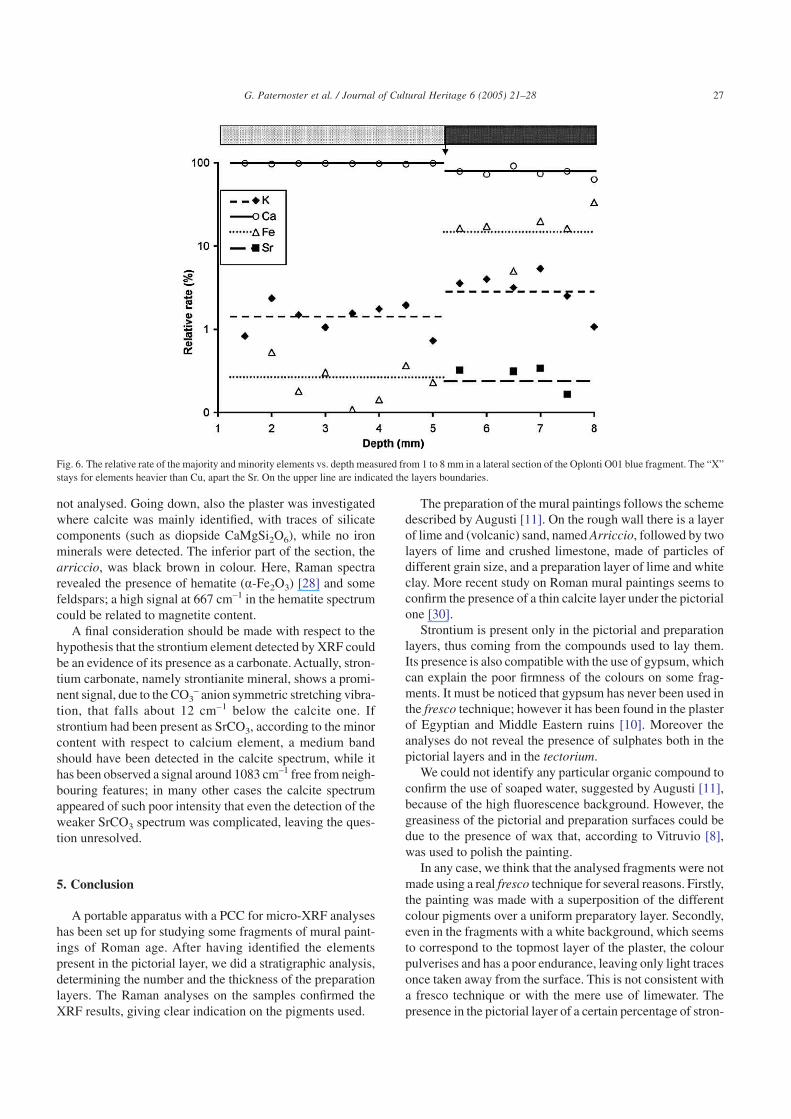
The O15 white fragment shows a very high content of cal-
cium with traces of lighter elements until a depth of about
5 mm; from there on, iron and strontium are also present. In
the O01 blue fragment section, four regions, of different
elemental content, can be distinguished (Figs. 5 and 6):
• the pictorial layer, about 200 µm thick, containing Ca and
Cu as major elements due to the Egyptian blue pigment. It
contains also Fe and K, but no lighter elements. These
results agree with those found in previous analysis;
• an intermediate region, less then 150 µm thick, where only
Cu disappears while the other elements remain constant in
their relative rate;
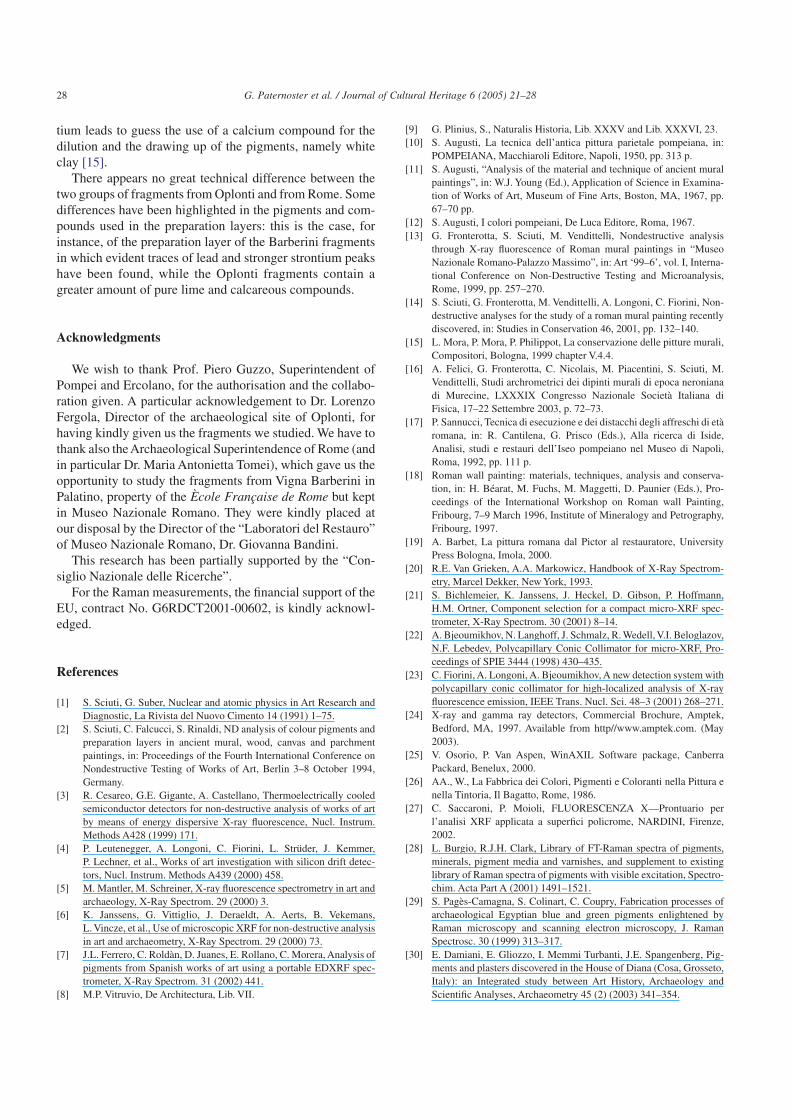
• a third region, 4 mm thick, similar to the one found in the
O15 white fragment. The elements identified are: calcium
(major element) with traces of potassium and iron, but no
evidence of strontium. This region corresponds to the plas-
ter made with milled limestone, as recognised at the opti-
cal microscope;
• the arriccio layer containing iron, potassium, strontium
and traces of Zn, Zr, and Pb, in addition to the calcium.
4.4. Micro-Raman stratigraphy
A cross-section embedded in a resin matrix was prepared
to investigate better the nature of the blue painting layer. This
layer was about 80–100 µm deep, made of minute blue grains
that were identified to be Egyptian blue, a copper silicate
(CaCuSi4O10) widely used since antiquity [28, 29]. The under-
neath layer, about 170 µm thick, appeared with a light tone
due to carbonate crystals of calcite (CaCO3), wherein spo-
radic small orange grains (<2 µm) could be observed but were
Fig. 4. Transversal section of the Oplonti O15 white fragment seen with a
stereo-microscope (6×).
Fig. 5. The relative rate of the majority and minority elements vs depth measured in a lateral section of the Oplonti O01 blue fragment. The “X” stays for
elements heavier than Cu, apart the Sr. On the upper line are indicated the layers boundaries.
26 G. Paternoster et al. / Journal of Cultural Heritage 6 (2005) 21–28
not analysed. Going down, also the plaster was investigated
where calcite was mainly identified, with traces of silicate
components (such as diopside CaMgSi2O6), while no iron
minerals were detected. The inferior part of the section, the
arriccio, was black brown in colour. Here, Raman spectra
revealed the presence of hematite (a-Fe2O3) [28] and some
feldspars; a high signal at 667 cm–1 in the hematite spectrum
could be related to magnetite content.
A final consideration should be made with respect to the
hypothesis that the strontium element detected by XRF could
be an evidence of its presence as a carbonate. Actually, stron-
tium carbonate, namely strontianite mineral, shows a promi-
nent signal, due to the CO3– anion symmetric stretching vibra-
tion, that falls about 12 cm–1 below the calcite one. If
strontium had been present as SrCO3, according to the minor
content with respect to calcium element, a medium band
should have been detected in the calcite spectrum, while it
has been observed a signal around 1083 cm–1 free from neigh-
bouring features; in many other cases the calcite spectrum
appeared of such poor intensity that even the detection of the
weaker SrCO3 spectrum was complicated, leaving the ques-
tion unresolved.
5. Conclusion
A portable apparatus with a PCC for micro-XRF analyses
has been set up for studying some fragments of mural paint-
ings of Roman age. After having identified the elements
present in the pictorial layer, we did a stratigraphic analysis,
determining the number and the thickness of the preparation
layers. The Raman analyses on the samples confirmed the
XRF results, giving clear indication on the pigments used.
The preparation of the mural paintings follows the scheme
described by Augusti [11]. On the rough wall there is a layer
of lime and (volcanic) sand, named Arriccio, followed by two
layers of lime and crushed limestone, made of particles of
different grain size, and a preparation layer of lime and white
clay. More recent study on Roman mural paintings seems to
confirm the presence of a thin calcite layer under the pictorial
one [30].
Strontium is present only in the pictorial and preparation
layers, thus coming from the compounds used to lay them.
Its presence is also compatible with the use of gypsum, which
can explain the poor firmness of the colours on some frag-
ments. It must be noticed that gypsum has never been used in
the fresco technique; however it has been found in the plaster
of Egyptian and Middle Eastern ruins [10]. Moreover the
analyses do not reveal the presence of sulphates both in the
pictorial layers and in the tectorium.
We could not identify any particular organic compound to
confirm the use of soaped water, suggested by Augusti [11],
because of the high fluorescence background. However, the
greasiness of the pictorial and preparation surfaces could be
due to the presence of wax that, according to Vitruvio [8],
was used to polish the painting.
In any case, we think that the analysed fragments were not
made using a real fresco technique for several reasons. Firstly,
the painting was made with a superposition of the different
colour pigments over a uniform preparatory layer. Secondly,
even in the fragments with a white background, which seems
to correspond to the topmost layer of the plaster, the colour
pulverises and has a poor endurance, leaving only light traces
once taken away from the surface. This is not consistent with
a fresco technique or with the mere use of limewater. The
presence in the pictorial layer of a certain percentage of stron-
Fig. 6. The relative rate of the majority and minority elements vs. depth measured from 1 to 8 mm in a lateral section of the Oplonti O01 blue fragment. The “X”
stays for elements heavier than Cu, apart the Sr. On the upper line are indicated the layers boundaries.
27G. Paternoster et al. / Journal of Cultural Heritage 6 (2005) 21–28
tium leads to guess the use of a calcium compound for the
dilution and the drawing up of the pigments, namely white
clay [15].
There appears no great technical difference between the
two groups of fragments from Oplonti and from Rome. Some
differences have been highlighted in the pigments and com-
pounds used in the preparation layers: this is the case, for
instance, of the preparation layer of the Barberini fragments
in which evident traces of lead and stronger strontium peaks
have been found, while the Oplonti fragments contain a
greater amount of pure lime and calcareous compounds.
Acknowledgments
We wish to thank Prof. Piero Guzzo, Superintendent of
Pompei and Ercolano, for the authorisation and the collabo-
ration given. A particular acknowledgement to Dr. Lorenzo
Fergola, Director of the archaeological site of Oplonti, for
having kindly given us the fragments we studied. We have to
thank also the Archaeological Superintendence of Rome (and
in particular Dr. Maria Antonietta Tomei), which gave us the
opportunity to study the fragments from Vigna Barberini in
Palatino, property of the Ècole Française de Rome but kept
in Museo Nazionale Romano. They were kindly placed at
our disposal by the Director of the “Laboratori del Restauro”
of Museo Nazionale Romano, Dr. Giovanna Bandini.
This research has been partially supported by the “Con-
siglio Nazionale delle Ricerche”.
For the Raman measurements, the financial support of the
EU, contract No. G6RDCT2001-00602, is kindly acknowl-
edged.
References
[1] S. Sciuti, G. Suber, Nuclear and atomic physics in Art Research and
Diagnostic, La Rivista del Nuovo Cimento 14 (1991) 1–75.
[2] S. Sciuti, C. Falcucci, S. Rinaldi, ND analysis of colour pigments and
preparation layers in ancient mural, wood, canvas and parchment
paintings, in: Proceedings of the Fourth International Conference on
Nondestructive Testing of Works of Art, Berlin 3–8 October 1994,
Germany.
[3] R. Cesareo, G.E. Gigante, A. Castellano, Thermoelectrically cooled
semiconductor detectors for non-destructive analysis of works of art
by means of energy dispersive X-ray fluorescence, Nucl. Instrum.
Methods A428 (1999) 171.
[4] P. Leutenegger, A. Longoni, C. Fiorini, L. Strüder, J. Kemmer,
P. Lechner, et al., Works of art investigation with silicon drift detec-
tors, Nucl. Instrum. Methods A439 (2000) 458.
[5] M. Mantler, M. Schreiner, X-ray fluorescence spectrometry in art and
archaeology, X-Ray Spectrom. 29 (2000) 3.
[6] K. Janssens, G. Vittiglio, J. Deraeldt, A. Aerts, B. Vekemans,
L. Vincze, et al., Use of microscopic XRF for non-destructive analysis
in art and archaeometry, X-Ray Spectrom. 29 (2000) 73.
[7] J.L. Ferrero, C. Roldàn, D. Juanes, E. Rollano, C. Morera, Analysis of
pigments from Spanish works of art using a portable EDXRF spec-
trometer, X-Ray Spectrom. 31 (2002) 441.
[8] M.P. Vitruvio, De Architectura, Lib. VII.
[9] G. Plinius, S., Naturalis Historia, Lib. XXXV and Lib. XXXVI, 23.
[10] S. Augusti, La tecnica dell’antica pittura parietale pompeiana, in:
POMPEIANA, Macchiaroli Editore, Napoli, 1950, pp. 313 p.
[11] S. Augusti, “Analysis of the material and technique of ancient mural
paintings”, in: W.J. Young (Ed.), Application of Science in Examina-
tion of Works of Art, Museum of Fine Arts, Boston, MA, 1967, pp.
67–70 pp.
[12] S. Augusti, I colori pompeiani, De Luca Editore, Roma, 1967.
[13] G. Fronterotta, S. Sciuti, M. Vendittelli, Nondestructive analysis
through X-ray fluorescence of Roman mural paintings in “Museo
Nazionale Romano-Palazzo Massimo”, in: Art ‘99–6’, vol. I, Interna-
tional Conference on Non-Destructive Testing and Microanalysis,
Rome, 1999, pp. 257–270.
[14] S. Sciuti, G. Fronterotta, M. Vendittelli, A. Longoni, C. Fiorini, Non-
destructive analyses for the study of a roman mural painting recently
discovered, in: Studies in Conservation 46, 2001, pp. 132–140.
[15] L. Mora, P. Mora, P. Philippot, La conservazione delle pitture murali,
Compositori, Bologna, 1999 chapter V.4.4.
[16] A. Felici, G. Fronterotta, C. Nicolais, M. Piacentini, S. Sciuti, M.
Vendittelli, Studi archrometrici dei dipinti murali di epoca neroniana
di Murecine, LXXXIX Congresso Nazionale Società Italiana di
Fisica, 17–22 Settembre 2003, p. 72–73.
[17] P. Sannucci, Tecnica di esecuzione e dei distacchi degli affreschi di età
romana, in: R. Cantilena, G. Prisco (Eds.), Alla ricerca di Iside,
Analisi, studi e restauri dell’Iseo pompeiano nel Museo di Napoli,
Roma, 1992, pp. 111 p.
[18] Roman wall painting: materials, techniques, analysis and conserva-
tion, in: H. Béarat, M. Fuchs, M. Maggetti, D. Paunier (Eds.), Pro-
ceedings of the International Workshop on Roman wall Painting,
Fribourg, 7–9 March 1996, Institute of Mineralogy and Petrography,
Fribourg, 1997.
[19] A. Barbet, La pittura romana dal Pictor al restauratore, University
Press Bologna, Imola, 2000.
[20] R.E. Van Grieken, A.A. Markowicz, Handbook of X-Ray Spectrom-
etry, Marcel Dekker, New York, 1993.
[21] S. Bichlemeier, K. Janssens, J. Heckel, D. Gibson, P. Hoffmann,
H.M. Ortner, Component selection for a compact micro-XRF spec-
trometer, X-Ray Spectrom. 30 (2001) 8–14.
[22] A. Bjeoumikhov, N. Langhoff, J. Schmalz, R. Wedell, V.I. Beloglazov,
N.F. Lebedev, Polycapillary Conic Collimator for micro-XRF, Pro-
ceedings of SPIE 3444 (1998) 430–435.
[23] C. Fiorini, A. Longoni, A. Bjeoumikhov, A new detection system with
polycapillary conic collimator for high-localized analysis of X-ray
fluorescence emission, IEEE Trans. Nucl. Sci. 48–3 (2001) 268–271.
[24] X-ray and gamma ray detectors, Commercial Brochure, Amptek,
Bedford, MA, 1997. Available from http//www.amptek.com. (May
2003).
[25] V. Osorio, P. Van Aspen, WinAXIL Software package, Canberra
Packard, Benelux, 2000.
[26] AA., W., La Fabbrica dei Colori, Pigmenti e Coloranti nella Pittura e
nella Tintoria, Il Bagatto, Rome, 1986.
[27] C. Saccaroni, P. Moioli, FLUORESCENZA X—Prontuario per
l’analisi XRF applicata a superfici policrome, NARDINI, Firenze,
2002.
[28] L. Burgio, R.J.H. Clark, Library of FT-Raman spectra of pigments,
minerals, pigment media and varnishes, and supplement to existing
library of Raman spectra of pigments with visible excitation, Spectro-
chim. Acta Part A (2001) 1491–1521.
[29] S. Pagès-Camagna, S. Colinart, C. Coupry, Fabrication processes of
archaeological Egyptian blue and green pigments enlightened by
Raman microscopy and scanning electron microscopy, J. Raman
Spectrosc. 30 (1999) 313–317.
[30] E. Damiani, E. Gliozzo, I. Memmi Turbanti, J.E. Spangenberg, Pig-
ments and plasters discovered in the House of Diana (Cosa, Grosseto,
Italy): an Integrated study between Art History, Archaeology and
Scientific Analyses, Archaeometry 45 (2) (2003) 341–354.
28 G. Paternoster et al. / Journal of Cultural Heritage 6 (2005) 21–28