EPMA and PIXE dating of monazite in granulites from Stary Gierałtów, NE Bohemian Massif, Poland
Upload
independentCategory
view
1download
0
Nuclear Instruments and Methods in Physics Research B 269 (2011) 2297–2302
Contents lists available at ScienceDirect
Nuclear Instruments and Methods in Physics Research B
journal homepage: www.elsevier .com/locate /n imb
Micro-PIXE investigation of bean seeds to assist micronutrient biofortification
Cristina Cvitanich a,⇑, Wojciech J. Przybyłowicz b,1, Jolanta Mesjasz-Przybyłowicz b, Matthew W. Blair c,Carolina Astudillo c, El _zbieta Orłowska a, Anna M. Jurkiewicz a, Erik Ø. Jensen a, Jens Stougaard a
a Centre for Carbohydrate Recognition and Signalling, Department of Molecular Biology Aarhus University, Aarhus, Denmarkb Materials Research Department, iThemba LABS, P.O. Box 722, Somerset West 7129, South Africac CIAT – Centro International de Agricultura Tropical, Cali, Colombia
a r t i c l e i n f o
Article history:Available online 1 March 2011
Keywords:MicronutrientBiofortificationLegumeMicro-PIXESeedsBeans
0168-583X/$ - see front matter � 2011 Elsevier B.V.doi:10.1016/j.nimb.2011.02.047
⇑ Corresponding author. Tel.: +45 20 64 69 20; fax:E-mail address: [email protected] (C. Cvitanich).
1 On leave from the Faculty of Physics and AppUniversity of Science and Technology, Kraków, Poland.
a b s t r a c t
This study compares the distribution and concentrations of micro- and macronutrients in different beancultivars with the aim of optimizing the biofortification, a sustainable approach towards improving die-tary quality. Micro-PIXE was used to reveal the distribution of Fe, Zn, Mn, Ca, P, S in seeds of commonbeans (Phaseolus vulgaris) and runner beans (Phaseolus coccineus). Average concentrations of elementsin different tissues were obtained using ICP-AES. The highest concentrations of Zn in the studied beanswere found in the embryonic axis, but an increased concentration of this element was also detected inthe provascular bundles of the cotyledons. The first layer of cells surrounding provascular bundles accu-mulated high concentrations of Fe, while the next cell layer had an increased concentration of Mn. Theanalysis showed that the provascular bundles and the first cell layers surrounding them could have a sig-nificant role in the storage of important seed micronutrients – Zn, Fe, and Mn. This information hasimportant implications for molecular biology studies aimed at seed biofortification.
� 2011 Elsevier B.V. All rights reserved.
1. Introduction
Micronutrient deficiencies affect a large proportion of the worldpopulation [1]. Fe deficiency is the most widespread nutritionaldisorder worldwide and has a negative impact on health, lifespan,and productivity. Zn deficiency results in increased risk of malaria,diarrhoea, pneumonia, and is estimated to be responsible for 4.4%of mortality of children less than 5 years old [2].
Micronutrient deficiencies affect primarily children and preg-nant women in low-income, vulnerable populations, whose dietsoften rely on a few starchy staple crops. Biofortification by thebreeding of staples with increased micronutrient content is a sus-tainable approach to reduce micronutrient malnutrition in thesepopulations [3–7]. Legumes are micronutrient-rich, and, for exam-ple, Fe biofortification of common beans is expected to decreasethe Fe deficiency burden by 9–33% in Northern Brazil [3,8,9].
Nutrient-rich seeds will not only be advantageous for combat-ing malnutrition in humans, but can also improve food securityby increasing seed vigor and thereby crop productivity. Low levelsof micronutrients in seeds can negatively affect seed vigor andseedling vitality. Reduced vitality is primarily observed whennutrient-deficient seeds are grown in nutrient-poor soils [10,11].
All rights reserved.
+45 86 12 31 78.
lied Computer Science, AGH
For example, wheat plants grown on Zn-deficient siliceous sandproduced more and bigger grains when they grew from seeds withhigher Zn content compared to plants originating from seeds withless Zn [12]. Furthermore, a Zn-efficient genotype (a genotype thatis able to absorb more Zn from Zn-deficient soils), had better fertil-izer efficiency and a higher harvest index when grown under con-ditions of Zn deficiency in comparison with a Zn-inefficientgenotype [12].
Two Zn-efficient genotypes of Phaseolus vulgaris accumulated25% more Zn in their seeds compared to the two Zn-inefficientgenotypes when Zn was present in the growth media [13]. Whilethe two Zn-efficient genotypes did not have Zn deficiency symp-toms, Zn-inefficient genotypes showed deficiency symptoms evenwhen grown on soils with DTPA-extractable Zn values of 1.7 lg/gof soil. It has been suggested that high Zn content in seeds couldbe used for selecting Zn-efficient genotypes of P. vulgaris.
Information about the distribution of micronutrients withinseed tissues can assist with the localization of sites of selectiveaccumulation and barriers to the movement of micronutrients, inestablishing how these elements are stored within the seed, andhow they affect the nutritional status of the growing seedlings[11].
Knowledge of the distribution of micronutrients within matureseeds is limited. The distribution and concentration of Zn in wheatseeds was studied using diphenyl thiocarbazone staining [14]. Itwas found that Zn was concentrated in the embryo and aleuroneparts of the seeds. In dicotyledons, synchrotron X-ray fluorescence
2298 C. Cvitanich et al. / Nuclear Instruments and Methods in Physics Research B 269 (2011) 2297–2302
microtomography was used to study the elemental distribution inthe model plant Arabidopsis thaliana. It was shown that Fe, Zn, andMn accumulate in distinct regions within the mature seed cotyle-don and radicle [15]. Furthermore, Fe distribution within the seedwas affected by the disruption of the vacuolar Fe uptake trans-porter VIT1 [15,16]. In common beans, the distribution of micronu-trients within the seeds of different genotypes was analyzed bymeasuring their concentration in dissected tissues [17–19]. Inaddition, micro-PIXE in combination with the Perls’ Prussian bluestaining method was used to study the accumulation and distribu-tion of Fe in seeds of different common bean genotypes [20].
There are significant correlations between the concentrations ofdifferent nutrients in legume seeds [21–23]. For example strongcorrelations were found between the concentrations of Fe, Cu,Mg, Mn, and Zn in seeds from Lotus japonicus recombinant inbredlines [22]. In seeds from different P. vulgaris genotypes correlationswere found between the concentrations of P, Fe, Zn, Cu and protein,and between Ca and Mn [23].
To reveal whether the correlation between the concentration ofmicro- and macronutrients is associated with their distributionwithin the seeds, micro-PIXE analysis has been used to determinethe distribution of the nutritionally important elements Fe, Zn, Mn,Ca, P, and S within common bean and runner bean seeds.
2. Materials and methods
2.1. Plant material
P. vulgaris genotypes from both the Mesoamerican (small-seeded) and Andean (large-seeded) gene pools were obtained fromthe International Centre for Tropical Agriculture (CIAT), Cali,Colombia, and maintained either with the Genetic Resource Unit(G entries) or with the Bean Program (CAL, DOR and NUA lines)at CIAT. Phaseolus coccineus beans were purchased at a retailer inDenmark.
2.2. Average concentrations of elements in different tissues
For each genotype, 10–20 dry mature seeds were dissected intoembryo axis, cotyledons, and seed coat tissues using a razor blade.Fe, Mn, and Zn content of each tissue was measured in duplicatesat the Institute of Technology, Kongsvang Alle 29, 8000 Aarhus C,Denmark, using ICP-AES in the axial mode.
2.3. Micro-PIXE analysis
Dry bean seeds were cut with a razor blade and mounted on athin Formvar layer. After coating the seed surfaces with carbon,
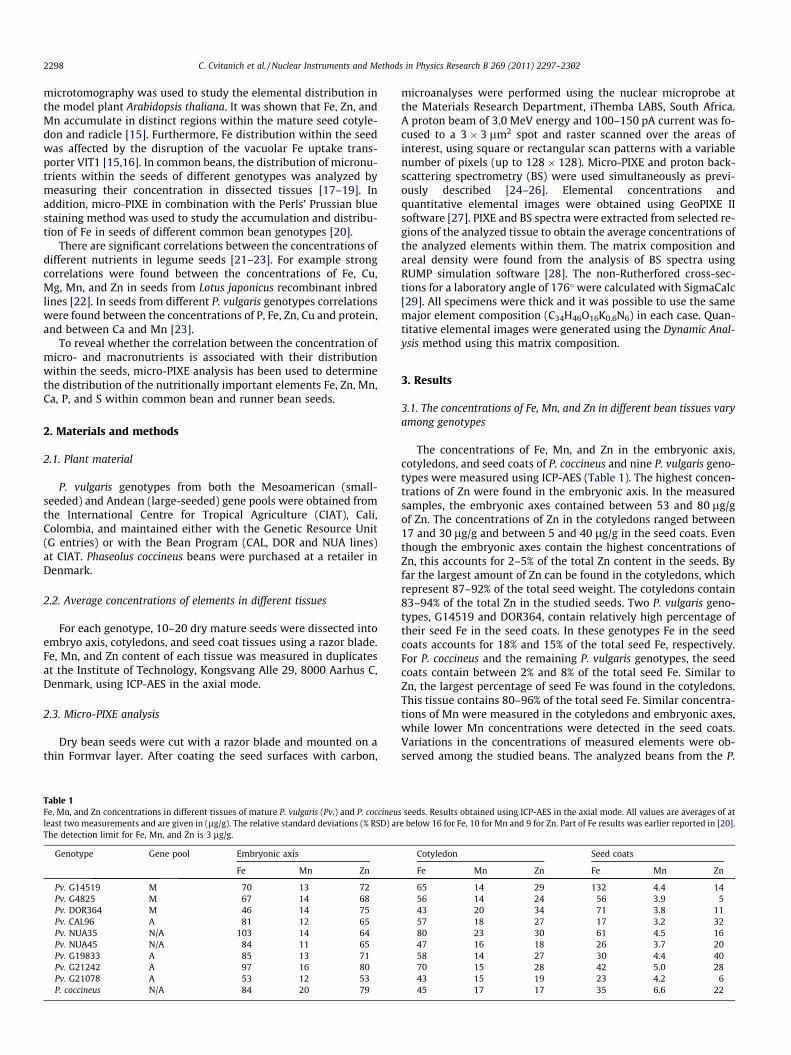
Table 1Fe, Mn, and Zn concentrations in different tissues of mature P. vulgaris (Pv.) and P. coccineuleast two measurements and are given in (lg/g). The relative standard deviations (% RSD) arThe detection limit for Fe, Mn, and Zn is 3 lg/g.
Genotype Gene pool Embryonic axis
Fe Mn Zn
Pv. G14519 M 70 13 72Pv. G4825 M 67 14 68Pv. DOR364 M 46 14 75Pv. CAL96 A 81 12 65Pv. NUA35 N/A 103 14 64Pv. NUA45 N/A 84 11 65Pv. G19833 A 85 13 71Pv. G21242 A 97 16 80Pv. G21078 A 53 12 53P. coccineus N/A 84 20 79
microanalyses were performed using the nuclear microprobe atthe Materials Research Department, iThemba LABS, South Africa.A proton beam of 3.0 MeV energy and 100–150 pA current was fo-cused to a 3 � 3 lm2 spot and raster scanned over the areas ofinterest, using square or rectangular scan patterns with a variablenumber of pixels (up to 128 � 128). Micro-PIXE and proton back-scattering spectrometry (BS) were used simultaneously as previ-ously described [24–26]. Elemental concentrations andquantitative elemental images were obtained using GeoPIXE IIsoftware [27]. PIXE and BS spectra were extracted from selected re-gions of the analyzed tissue to obtain the average concentrations ofthe analyzed elements within them. The matrix composition andareal density were found from the analysis of BS spectra usingRUMP simulation software [28]. The non-Rutherfored cross-sec-tions for a laboratory angle of 176� were calculated with SigmaCalc[29]. All specimens were thick and it was possible to use the samemajor element composition (C34H46O16K0.6N6) in each case. Quan-titative elemental images were generated using the Dynamic Anal-ysis method using this matrix composition.
3. Results
3.1. The concentrations of Fe, Mn, and Zn in different bean tissues varyamong genotypes
The concentrations of Fe, Mn, and Zn in the embryonic axis,cotyledons, and seed coats of P. coccineus and nine P. vulgaris geno-types were measured using ICP-AES (Table 1). The highest concen-trations of Zn were found in the embryonic axis. In the measuredsamples, the embryonic axes contained between 53 and 80 lg/gof Zn. The concentrations of Zn in the cotyledons ranged between17 and 30 lg/g and between 5 and 40 lg/g in the seed coats. Eventhough the embryonic axes contain the highest concentrations ofZn, this accounts for 2–5% of the total Zn content in the seeds. Byfar the largest amount of Zn can be found in the cotyledons, whichrepresent 87–92% of the total seed weight. The cotyledons contain83–94% of the total Zn in the studied seeds. Two P. vulgaris geno-types, G14519 and DOR364, contain relatively high percentage oftheir seed Fe in the seed coats. In these genotypes Fe in the seedcoats accounts for 18% and 15% of the total seed Fe, respectively.For P. coccineus and the remaining P. vulgaris genotypes, the seedcoats contain between 2% and 8% of the total seed Fe. Similar toZn, the largest percentage of seed Fe was found in the cotyledons.This tissue contains 80–96% of the total seed Fe. Similar concentra-tions of Mn were measured in the cotyledons and embryonic axes,while lower Mn concentrations were detected in the seed coats.Variations in the concentrations of measured elements were ob-served among the studied beans. The analyzed beans from the P.
s seeds. Results obtained using ICP-AES in the axial mode. All values are averages of ate below 16 for Fe, 10 for Mn and 9 for Zn. Part of Fe results was earlier reported in [20].
Cotyledon Seed coats
Fe Mn Zn Fe Mn Zn
65 14 29 132 4.4 1456 14 24 56 3.9 543 20 34 71 3.8 1157 18 27 17 3.2 3280 23 30 61 4.5 1647 16 18 26 3.7 2058 14 27 30 4.4 4070 15 28 42 5.0 2843 15 19 23 4.2 645 17 17 35 6.6 22
C. Cvitanich et al. / Nuclear Instruments and Methods in Physics Research B 269 (2011) 2297–2302 2299
vulgaris genotype NUA35 showed the highest average Fe and Mnconcentrations, and had the second highest concentration of Znin the cotyledons. In comparison to its parental lines (CAL96 andG14519) the cotyledons of NUA35 contained higher concentrationsof these three elements.
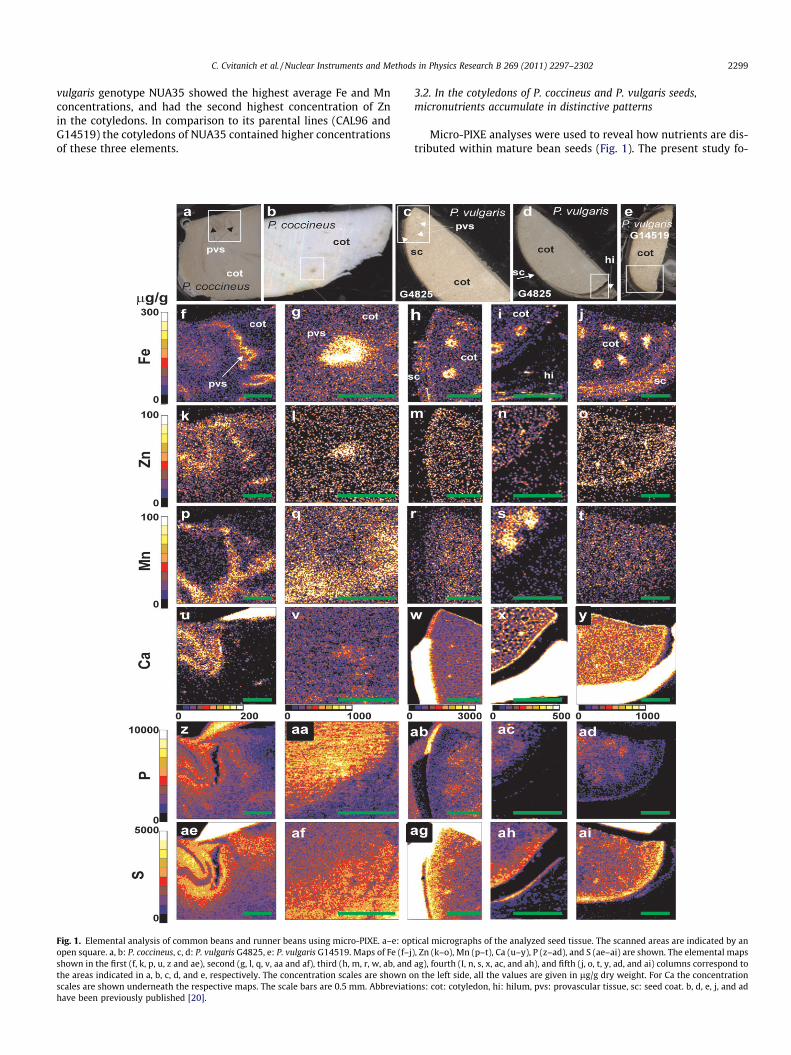
Fig. 1. Elemental analysis of common beans and runner beans using micro-PIXE. a–e: opopen square. a, b: P. coccineus, c, d: P. vulgaris G4825, e: P. vulgaris G14519. Maps of Fe (f–jshown in the first (f, k, p, u, z and ae), second (g, l, q, v, aa and af), third (h, m, r, w, ab, andthe areas indicated in a, b, c, d, and e, respectively. The concentration scales are shown oscales are shown underneath the respective maps. The scale bars are 0.5 mm. Abbreviatihave been previously published [20].
3.2. In the cotyledons of P. coccineus and P. vulgaris seeds,micronutrients accumulate in distinctive patterns
Micro-PIXE analyses were used to reveal how nutrients are dis-tributed within mature bean seeds (Fig. 1). The present study fo-
tical micrographs of the analyzed seed tissue. The scanned areas are indicated by an), Zn (k–o), Mn (p–t), Ca (u–y), P (z–ad), and S (ae–ai) are shown. The elemental mapsag), fourth (I, n, s, x, ac, and ah), and fifth (j, o, t, y, ad, and ai) columns correspond ton the left side, all the values are given in lg/g dry weight. For Ca the concentration
ons: cot: cotyledon, hi: hilum, pvs: provascular tissue, sc: seed coat. b, d, e, j, and ad
2300 C. Cvitanich et al. / Nuclear Instruments and Methods in Physics Research B 269 (2011) 2297–2302
cused on the cotyledons as these parts of seeds contain the highestamounts of Fe, Mn, and Zn. As previously reported [20], Fe accumu-lates in the cotyledon cells that surround the provascular bundlesand in the seed coats of the P. vulgaris genotype G14519 (Fig. 1f–j).
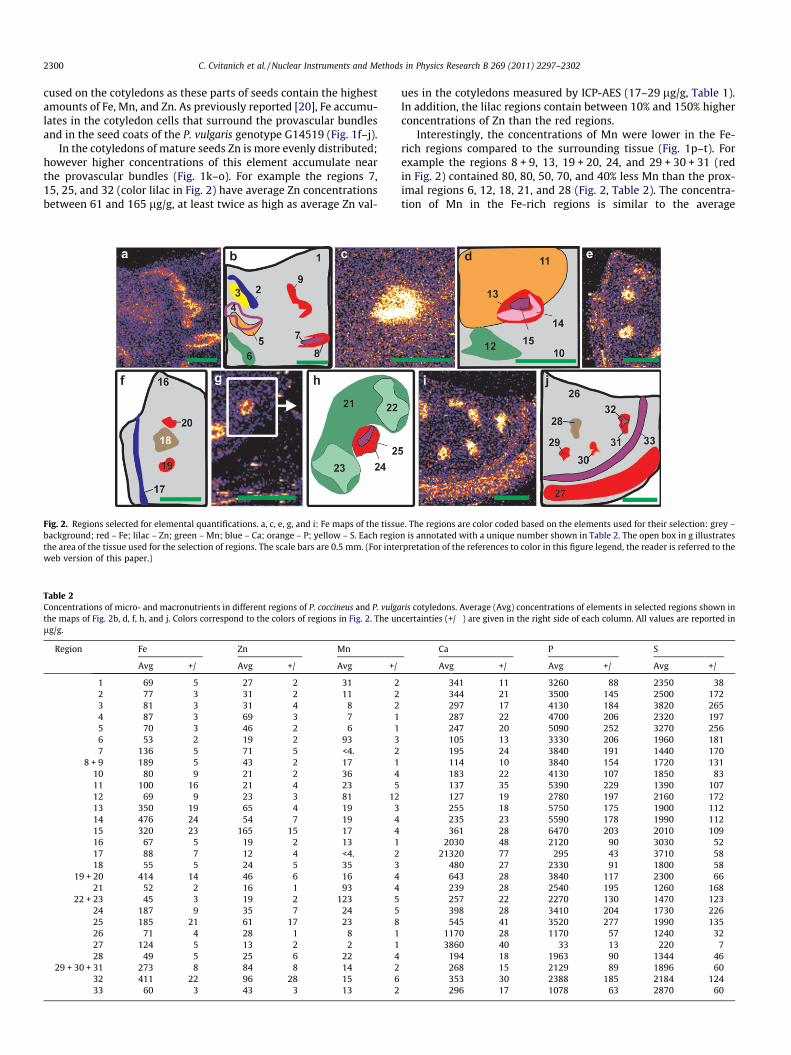
In the cotyledons of mature seeds Zn is more evenly distributed;however higher concentrations of this element accumulate nearthe provascular bundles (Fig. 1k–o). For example the regions 7,15, 25, and 32 (color lilac in Fig. 2) have average Zn concentrationsbetween 61 and 165 lg/g, at least twice as high as average Zn val-
Fig. 2. Regions selected for elemental quantifications. a, c, e, g, and i: Fe maps of the tissubackground; red – Fe; lilac – Zn; green – Mn; blue – Ca; orange – P; yellow – S. Each regiothe area of the tissue used for the selection of regions. The scale bars are 0.5 mm. (For inteweb version of this paper.)
Table 2Concentrations of micro- and macronutrients in different regions of P. coccineus and P. vulgathe maps of Fig. 2b, d, f, h, and j. Colors correspond to the colors of regions in Fig. 2. The unlg/g.
Region Fe Zn Mn
Avg +/� Avg +/� Avg +/�
1 69 5 27 2 31 22 77 3 31 2 11 23 81 3 31 4 8 24 87 3 69 3 7 15 70 3 46 2 6 16 53 2 19 2 93 37 136 5 71 5 <4. 2
8 + 9 189 5 43 2 17 110 80 9 21 2 36 411 100 16 21 4 23 512 69 9 23 3 81 1213 350 19 65 4 19 314 476 24 54 7 19 415 320 23 165 15 17 416 67 5 19 2 13 117 88 7 12 4 <4. 218 55 5 24 5 35 3
19 + 20 414 14 46 6 16 421 52 2 16 1 93 4
22 + 23 45 3 19 2 123 524 187 9 35 7 24 525 185 21 61 17 23 826 71 4 28 1 8 127 124 5 13 2 2 128 49 5 25 6 22 4
29 + 30 + 31 273 8 84 8 14 232 411 22 96 28 15 633 60 3 43 3 13 2
ues in the cotyledons measured by ICP-AES (17–29 lg/g, Table 1).In addition, the lilac regions contain between 10% and 150% higherconcentrations of Zn than the red regions.
Interestingly, the concentrations of Mn were lower in the Fe-rich regions compared to the surrounding tissue (Fig. 1p–t). Forexample the regions 8 + 9, 13, 19 + 20, 24, and 29 + 30 + 31 (redin Fig. 2) contained 80, 80, 50, 70, and 40% less Mn than the prox-imal regions 6, 12, 18, 21, and 28 (Fig. 2, Table 2). The concentra-tion of Mn in the Fe-rich regions is similar to the average
e. The regions are color coded based on the elements used for their selection: grey –n is annotated with a unique number shown in Table 2. The open box in g illustratesrpretation of the references to color in this figure legend, the reader is referred to the
ris cotyledons. Average (Avg) concentrations of elements in selected regions shown incertainties (+/�) are given in the right side of each column. All values are reported in
Ca P S
Avg +/� Avg +/� Avg +/�
341 11 3260 88 2350 38344 21 3500 145 2500 172297 17 4130 184 3820 265287 22 4700 206 2320 197247 20 5090 252 3270 256105 13 3330 206 1960 181195 24 3840 191 1440 170114 10 3840 154 1720 131183 22 4130 107 1850 83137 35 5390 229 1390 107127 19 2780 197 2160 172255 18 5750 175 1900 112235 23 5590 178 1990 112361 28 6470 203 2010 109
2030 48 2120 90 3030 5221320 77 295 43 3710 58
480 27 2330 91 1800 58643 28 3840 117 2300 66239 28 2540 195 1260 168257 22 2270 130 1470 123398 28 3410 204 1730 226545 41 3520 277 1990 135
1170 28 1170 57 1240 323860 40 33 13 220 7
194 18 1963 90 1344 46268 15 2129 89 1896 60353 30 2388 185 2184 124296 17 1078 63 2870 60
C. Cvitanich et al. / Nuclear Instruments and Methods in Physics Research B 269 (2011) 2297–2302 2301
concentration of Mn in the cotyledons that is 17 lg/g for P. coccin-eus and 14 lg/g for P. vulgaris G4825 and G14519 (Table 1). Thehighest Mn concentration was found in the regions 22 and 23,proximal to the Fe-rich region in P. vulgaris G4825 (Fig. 2 and Ta-ble 2). The average Mn concentration in these regions is 123 lg/g, almost nine times higher than the average concentration in thecotyledons.
3.3. The macronutrients P, S, and Ca also show unique patterns ofaccumulation
With the exception of the provascular regions, P and S show in-verse gradients of concentrations (Fig. 1aa–ad compared to af–ai).While the concentrations of S increase towards the epidermis, theconcentrations of P decrease when approaching this layer. Forexample, region 10 contains higher S and lower P concentrationsthan region 11 (Fig. 2, Table 2). A slight increase in the concentra-tions of these two elements can be observed in the provascular re-gions as illustrated by region 5 that contains 5090 lg/g of P and3270 lg/g of S. These concentrations are respectively 56% and39% higher than the respective concentrations in the analyzed tis-sue (Fig. 2, region 1).
Similar to Zn, a slight increase in the concentration of Ca wasobserved in the provascular bundles (Fig. 1u–y). The concentrationof Ca in the regions shown in lilac (Fig. 2 and Table 2, regions 7, 15,25, and 32) is 30–60% higher than in the larger regions shown inred (Fig. 2 and Table 2, regions 8, 13, 24, and 31, respectively).Comparison of the concentrations of Fe, Zn, and Ca in the regions14 and 15 (Fig. 2 and Table 2) shows that region 14 has the highestFe concentration (476 lg/g), while the proximal region 15 has low-er Fe concentration (320 lg/g) but higher Zn (165 compared to54 lg/g) and Ca concentrations (361 compared to 235 lg/g).
Apart from slightly increased Ca concentration near the provas-cular tissue, the highest Ca concentrations were found in the seedcoats (Fig. 1u–y). This tissue contains more than 3000 lg/g of Ca.For example in region 27, which outlines the Fe-rich part of theseed coat in the P. vulgaris genotype G14519, Ca concentration is3860 lg/g, while much higher concentrations of this element(21,320 lg/g) were measured in region 17. This is the region ofthe highest Ca concentration (Figs. 1 and 2, Table 2). Ca concentra-tions in the seed coats are more than 10 fold higher than in anyother marked regions outside seed coat tissues.
4. Discussion
Different studies have shown that there is a positive correlationbetween the concentrations of Fe and Zn in the Phaseolus seeds[8,21,23,30]. Our study shows that the embryonic axes are rich inFe and Zn and that both elements are accumulated at elevated con-centrations in the provascular region. The highest concentrationsof Zn in seeds of P. coccineus and P. vulgaris were detected in theembryonic axis, but a slightly increased concentration of Zn wasalso measured in the provascular bundles of the cotyledons. Fe,Zn, and Mn are accumulated in almost exclusive patterns in theproximity of each other. Here Zn is surrounded by Fe, which in turnis surrounded by Mn. In comparison, analysis of the cotyledons ofsoybean seeds did not show any unique accumulation pattern ofthese elements [31]. The distribution patterns of Fe, Zn and Mnin the studied Phaseolus seeds are more similar to that in the A. tha-liana seeds than in the soybeans. Synchrotron X-ray fluorescencemicrotomography analysis of A. thaliana seeds showed an elevatedconcentration of Zn in the provascular tissue of the radicle andcotyledons [15]. The presence of higher concentration of Zn inthe provascular cells indicates that this element could be easilymobilized to the growing parts of the seedling during germination.
In the studied Phaseolus seeds, 2–18% of the seed Fe was foundin the seed coats [20] which comprise 7–10% of seed dry weight,while in soybean 20–40% of the seed Fe was found in the seed coat,which comprises 6–8% of the total soybean seed dry weight [31]. Itis interesting that although they are legumes, the highest concen-trations of Fe in soybeans were found in the seed coats and in theprovascular cells of the radicle [31], while in the studied Phaseolusspecies the highest Fe concentrations were found in the cells sur-rounding the provascular tissue of the cotyledons [20]. This indi-cates that the transporters involved in the mobilization of Fe tothe embryo could be active at different time points of seed andseedling development in these species. As was shown for Phaseolusseeds, in A. thaliana Fe accumulates in cells surrounding the pro-vascular bundles of both the cotyledons and radicles [15,16].
Elevated Mn concentrations accumulated in the tissue sur-rounding the Fe-rich regions in the Phaseolus cotyledons. It isremarkable that in the soybean embryonic axis Mn is accumulatedin a pattern similar to Fe, with the exception of the observed accu-mulation of Mn in the procambium cells of the radicle, where Feconcentration was relatively low [31]. Again, regarding the distri-bution of this element, the Phaseolus seeds are more similar to A.thaliana than to soybean seeds. In A. thaliana Mn was detected inthe cotyledonary tissue surrounding the Fe-rich regions [15].
Energy dispersive X-ray analysis of globoid crystals from dry to-mato (Lycopersicon esculentum) seeds revealed that these crystalsalways contained P, K, and Mg, and that some globoid crystals alsocontained small amounts of Ca, Mn, and Fe [32]. Globoid crystals inprotodermal cells of tomato seeds often contained Mn and Fe,while in the provascular tissue they often contained Fe, and in cellsthat surround the provascular tissues they always contained Fe[32]. These results are in agreement with the specific distributionof Mn and Fe within seed tissues and confirm the accumulationof these micronutrients in or near the provascular tissues. Theyalso indicate that Fe and Mn in these tissues might be present inthe phytin aggregates [32].
Interestingly, a strong positive correlation has been found be-tween Ca and Mn concentration in P. vulgaris seeds [23]. Our stud-ies indicate that the Ca concentrations tend to be lower where Mnconcentrations are the highest. In addition Mn concentrations tendto be low in the seed coat, the epidermal cell layers, and in the pro-vascular bundles where Ca concentrations are higher. Further stud-ies are needed to reveal the biological mechanisms behind thedifferential patterns of accumulation of elements and the impactof these mechanisms on elemental concentrations in the seeds.
Zn and Ca accumulate in a similar pattern within the cotyledonsof the analyzed Phaseolus species, but the highest concentrations ofCa were found in the seed coats of all the studied legumes. Theseresults are in agreement with the results for castor beans, Ricinuscommunis [33]. It has been suggested that Ca in the seed coat ofcastor beans was present as crystals of Ca oxalate, not likely avail-able for the seedlings during germination. In a different study itwas shown that less than 30% of the cotyledonary Ca in pea seedswas mobilized to the growing seedlings [34]. The accumulation ofa slightly higher concentration of Ca in the provascular bundles ofthe Phaseolus cotyledons leads to the speculation that this Ca couldbe more available to the growing seedlings than the Ca present inthe seed coat and in the surrounding cotyledonary tissue.
Our results show that the distribution of micro- and macronu-trients in seeds is species- dependent. This is in agreement withprevious reports. For example, the distribution patterns of Ca weredifferent in castor beans compared to the patterns in seeds ofCucurbita species [33]. Differences in the accumulation of micronu-trients among seed tissues indicate that different mechanismsmight regulate the nutrient transport to target sites within theseeds. For example, it is possible that a common metal transporteris responsible for the accumulation of both Fe and Mn in the pro-
2302 C. Cvitanich et al. / Nuclear Instruments and Methods in Physics Research B 269 (2011) 2297–2302
vascular bundles of the soybean radicle, but that cell-specific trans-porters are involved in the differential accumulation of Fe, Zn, andMn in the cotyledons of P. coccineus.
5. Conclusions
This study revealed the accumulation sites of micro- andmacronutrients in two important crop legumes, common beansand runner beans. This information is crucial for future studies ofthe molecular mechanisms responsible for the micronutrients’accumulation in legume seeds. Furthermore, it will help in under-standing of how dietary nutrients stored in seeds can affect thedeveloping plant. Major differences in the accumulation patternsof nutrients have been found, even between closely related species.These findings suggest that there might be limitations in the appli-cability of exploiting genes discovered in the model plants to im-prove the nutritional value of other species.
In addition, this work provides fundamental information thatwill assist the development of biofortified crops and the study ofmicronutrient bioavailability.
Acknowledgments
Funding was provided by the Centre for Carbohydrate Recogni-tion and Signalling; the Danish Agency for Science, Technology andInnovation; HarvestPlus; International Atomic Energy Agency, andthe Research Foundation of the University of Aarhus, Denmark. Theauthors are grateful for the technical assistance of Finn Pedersen,Kirsten Sørensen, and Hanne Busk.
References
[1] WHO (World Health Organization). Micronutrient deficiencies. Iron deficiencyanaemia. http://www.wpro.who.int/health_topics/micronutrient_deficiencies.http://www.who.int/nutrition/topics/ida/en/index.html. Accessed 27 Oct2009.
[2] R.E. Black, L.H. Allen, Z.A. Bhutta, L.E. Caulfield, M. de Onis, M. Ezzati, C.Mathers, J. Rivera, Lancet 371 (2008) 243.
[3] J.V. Meenakshi, N. Johnson, V.M. Manyong, H. De Groote, J. Javelosa, D.Yanggen, F. Naher, C. Gonzalez, J. Garcia, E. Meng, How cost-effective isbiofortification in combating micronutrient malnutrition? An ex-anteassessment. http://www.harvestplus.org, in 2007.
[4] P. Nestel, H.E. Bouis, J.V. Meenakshi, W. Pfeiffer, J. Nutr. 136 (2006) 1064.[5] A.J. Stein, J.V. Meenakshi, M. Qaim, P. Nestel, H.P. Sachdev, Z.A. Bhutta, Soc. Sci.
Med. 66 (2008) 1797.[6] R.M. Welch, R.D. Graham, J. Exp. Bot. 55 (2004) 353.[7] R.M. Welch, R.D. Graham, Plant Soil 245 (2002) 205.[8] R.M. Welch, W.A. House, S. Beebe, Z. Cheng, J. Agr. Food Chem. 48 (2000) 3576.[9] W.J. Broughton, G.H. Hernandez, M. Blair, S. Beebe, P. Gepts, J. Vanderleyden,
Plant Soil 252 (2003) 55.[10] R.M. Welch, in: Z. Rengel (Ed.), Mineral Nutrition of Crops: Fundamental
Mechanisms and Implications, Food Products Press, 2000, p. 206.[11] R.M. Welch, Adv. Plant Nutr. 2 (1986) 205.[12] Z. Rengel, R.D. Graham, Plant Soil 173 (1995) 267.[13] J.T. Moraghan, K. Grafton, Soil Sci. Soc. Am. J 63 (1999) 918.[14] L. Ozturk, M.A. Yazici, C. Yucel, A. Torun, C. Cekic, A. Bagci, H. Ozkan, H.-J.
Braun, Z. Sayers, I. Cakmak, Physiol. Plant 128 (2006) 144.[15] S.A. Kim, T. Punshon, A. Lanzirotti, L. Li, J.M. Alonso, J.R. Ecker, J. Kaplan, M.L.
Guerinot, Science 314 (2006) 1295.[16] H. Roschzttardtz, G. Conejero, C. Curie, S. Mari, Plant Physiol. (2009),
doi:10.1104/pp.1109.144444.[17] L.O. Tiffin, R.L. Chaney, Plant Physiol. 52 (1973) 393.[18] J.A. Laszlo, J. Plant Nutr. 13 (1990) 231.[19] M. Ariza-Nieto, M.W. Blair, R.M. Welch, R.P. Glahn, J. Agr. Food Chem. 55
(2007) 7950.[20] C. Cvitanich, W.J. Przybyłowicz, D.F. Urbanski, A.M. Jurkiewicz, J. Mesjasz-
Przybyłowicz, M.W. Blair, C. Astudillo, E.Ø. Jensen, J. Stougaard, BMC Plant Biol.10 (2010) 26.
[21] G.M. Tryphone, S. Nchimbi-Msolla, Afr. J. Agric. Res. 5 (2010) 738.[22] M.A. Klein, M.A. Grusak, Genome 52 (2009) 677.[23] C. Pinheiro, J.P. Baeta, A.M. Pereira, H. Domingues, C.n.P. Ricardo, J. Food
Compos. Anal. 23 (2010) 319.[24] V.M. Prozesky, W.J. Przybyłowicz, E. Van Achterbergh, C.L. Churms, C.A. Pineda,
K.A. Springhorn, J.V. Pilcher, C.G. Ryan, J. Kritzinger, H. Schmitt, T. Swart, Nucl.Instrum. Meth. Phys. Res. B 104 (1995) 36.
[25] W.J. Przybyłowicz, J. Mesjasz-Przybyłowicz, P. Migula, M. Nakonieczny, M.Augustyniak, M. Tarnawska, K. Turnau, P. Ryszka, E. Orłowska, S. Zubek, E.Głowacka, X Ray Spectrom. 34 (2005) 285.
[26] W.J. Przybyłowicz, J. Mesjasz-Przybyłowicz, C.A. Pineda, C.L. Churms, K.A.Springhorn, V.M. Prozesky, X Ray Spectrom. 28 (1999) 237.
[27] C. Ryan, Int. J. Imag. Syst. Tech. 11 (2000) 219.[28] L.R. Doolittle, Nucl. Instrum. Methods B 15 (1996) 227.[29] http://www-nds.iaea.org/sigmacalc/. Accessed 30 May 2010.[30] M. Blair, C. Astudillo, M. Grusak, R. Graham, S. Beebe, Mol. Breeding 23 (2009)
197.[31] C. Cvitanich, W.J. Przybylowicz, J. Mesjasz- Przybylowicz, M.W. Blair, E.O.
Jensen, J. Stougaard, Iron, zinc, and manganese distribution in mature soybeanseeds, in: eScholarship Repository, Proc. Int. Plant Nutr. Coll. XVI. http://escholarship.org/uc/item/6mh1d8vv, 2009.
[32] E. Spitzer, J.N.A. Lott, Can. J. Bot. 58 (1980) 699.[33] .N.A. Lott, J.S. Greenwood, C.M. Vollmer, Plant Physiol. 69 (1982) 829.[34] I.B. Ferguson, E.G. Bollard, Ann. Bot. 40 (1976) 1047.
Copyright © 2022 FDOKUMEN