Assessment of Health Risk and Elemental Concentrations in ...
Upload
independentCategory
view
2download
0
3D Micro PIXE—a new technique for depth-resolved elemental analysis
Andreas-Germanos Karydas,aDimosthenis Sokaras,
aCharalambos Zarkadas,
a
Natasa Grlj,bPrimo�z Pelicon,
bMatja�z %itnik,
bRoman Schutz,
cWolfgang Malzer
c
and Birgit Kanngießerc
Received 18th January 2007, Accepted 30th May 2007
First published as an Advance Article on the web 27th June 2007
DOI: 10.1039/b700851c
A novel experimental technique, 3D micro-particle-induced X-ray emission (PIXE) is described in
the present paper. 3D Micro-PIXE is realized by using an X-ray optic in front of the detector,
thus creating a confocal arrangement together with the focused proton micro-beam. This confocal
setup defines a probing volume from which information on elemental distribution is obtained. If a
sample is moved through the probing volume, depth-resolved measurements become possible. The
confocal setup was characterized with respect to its spatial and depth resolution. As an example
of application for this new non-destructive analytical technique, an archaeological ceramic
fragment was examined. A first approach to simulate the complex experimental results is
performed. The potential of 3D micro-PIXE to provide advanced qualitative information on the
elemental distribution in the sample is discussed.
Introduction
Particle-induced X-ray emission (PIXE) has been well-estab-
lished for over thirty years in the multi-elemental bulk analysis
of a variety of samples of interest in various disciplines. The
PIXE quantitative analysis is generally considered to be quite
accurate, if the elements are homogeneously distributed within
the analysis volume. Near-surface depth-resolved analysis in
the range of a few micrometers is also possible by means of
complementary application of Rutherford back-scattering
(RBS) and NRA (nuclear reaction analysis) for specific
elements.
However, the potential of ion beam methods to provide full
characterization is significantly hampered by the fact that
materials often exhibit inhomogeneities or layered structures
extending far below the surface. Several important attempts
have been reported, aiming to provide analytical methods for
depth-resolved analysis. All these efforts (up to now) use PIXE
analysis with variable incident energy or variable projectile
impact angle. The strong dependence of the X-ray ionization
cross-section on the proton energy, as well as the possibility to
vary continuously the proton energy (and subsequently the
range of the protons in the matter), may result in the successive
tuning of the average PIXE production depth deeper inside the
analysed material. These fundamental physical properties
triggered and motivated the development of the so-called
differential PIXE analysis. Since 1996 various analytical stra-
tegies have been developed and implemented by different
groups.1–4 The most laborious attempt to formulate an ana-
lysis algorithm for the characterization of a multilayer struc-
ture by means of differential PIXE analysis has been given by
Brissaud et al.5–7 and more recently by %. Smit.8
In 2003, a confocal arrangement of X-ray optics for three-
dimensionally resolved micro X-ray fluorescence spectroscopy
(micro-XRF) was developed.9 The two X-ray optics, one in the
excitation path of the sample and the other one in front of the
detector, define a probing volume from which the information
on the quantitative and qualitative elemental distribution in
the sample is collected. By moving the sample through this
probing volume, depth-resolved measurements can be carried
out. Hence, with this new arrangement, micro-XRF is ren-
dered as a depth-sensitive method and, finally, with the already
existing mapping capabilities, as a three-dimensional resolving
technique in the micrometer regime. Successful applications of
this new 3D micro XRF method have been presented in the
field of cultural heritage, as well as in other disciplines.9–11
The main objective of the work presented in this paper is to
transfer this confocal concept to micro-PIXE analysis with the
same aims: to obtain depth resolution in the micrometer
regime and to resolve three-dimensionally the elemental dis-
tribution in a sample. This would make easier depth-resolved
measurements in comparison to differential PIXE, for which a
variation of the angle or even of the energy of the proton beam
is necessary. For the experimental realization we used the
nuclear microprobe of the Jo�zef Stefan Institute12,13 to estab-
lish, characterize and apply the confocal setup for 3D micro
PIXE for the first time.
Experiment
The confocal PIXE arrangement was built up in vacuum in a
spherical experimental chamber. It is equipped with a VG
Omniaxs five-axis motorized vacuum goniometer for sample
positioning. The depth profiling studies were conducted by
moving the sample in the beam direction with a precision of
a Institute of Nuclear Physics, NCSR ‘‘Demokritos’’, Athens, Greece.E-mail: [email protected]; Fax: +30 210 651 1215;Tel: +30 210 650 3523
b Jo�zef Stefan Institute, Ljubljana, Slovenia. E-mail:[email protected]; Fax: +386 1 588 5377; Tel: +386 1 5885294
c Institute of Optics and Atomic Physics, Technical University ofBerlin, Berlin, Germany. E-mail: [email protected];Fax: +49 (0)30 3142 3018; Tel: +49 (0)30 3142 1428
1260 | J. Anal. At. Spectrom., 2007, 22, 1260–1265 This journal is �c The Royal Society of Chemistry 2007
PAPER www.rsc.org/jaas | Journal of Analytical Atomic Spectrometry
1 mm. The focal plane of the magnet quadrupole triplet lens is
defined with a precision of 50 mm by the depth-of field of a
high resolution microscope.
The object and collimator slits have been opened to a size
for which a beam current of approximately 300 pA is ob-
tained. The beam profile degrades with increasing distance
from the focal plane. In order to evaluate the impact of this
degradation for the confocal setup, the dependence of the
beam size on the distance from the micro-beam focal plane has
been measured by moving a standard Cu #2000 mesh with a
periodicity of 12.5 micrometers and bars of a diameter of 4
micrometers each.12 The mesh is produced with UV-lithogra-
phy and has flat edges with irregularities below 0.5 micro-
meters. The scanning method used is a knife-edge applied in
both the vertical and horizontal direction by first scanning
horizontally over the vertical bar and then vertically over the
horizontal bar. Next, the Gaussian widths of the beam in both
the X and Y directions are deconvoluted from the edge scans.
The result is presented in Fig. 1. All measurements were
carried out at proton energy of 3 MeV.
For the measurement of the proton micro-beam current, a
rotating chopper is positioned after the collimator slits. It
consists of gold-plated graphite which periodically intersects
the beam with a frequency of approximately 10 Hz. The
spectrum of back-scattered protons from the chopper is
recorded parallel with the PIXE spectrum by means of a
partially depleted silicon detector (PIPS, Canberra) with an
area of 50 mm2. The spectrum of back-scattered ions includes
a separated Au peak and a low energy distribution produced
by carbon. The area of the Au peak is taken as the normal-
ization parameter, proportional to the product of proton flux
and the detector solid angle. During off-line data processing,
the proton dose for an arbitrarily selected scanning area can be
reconstructed and used for normalization purposes.
For the confocal arrangement, two X-ray detectors were
used: a high-purity germanium X-ray detector HPGe and a
Si(Li) detector. The HPGe is positioned at an angle of 1351
with respect to the proton beam axis, while the Si(Li) detector
is positioned at an angle of 1251. Due to its thin Be-window,
the Si(Li) detector enables the detection of X-rays with
energies down to 800 eV. On the snout of each detector a
polycapillary half-lens was mounted. The nominal spot size of
the lenses at the energy of 8 keV, as supplied by the manu-
facturer, is about 18 mm for the lens of the germanium detector
and 26 mm for the lens of the Si(Li) detector. Both polycapil-
lary lenses aim towards the sample holder mounted in the
centre of the experimental chamber, where the sample is
placed with its surface vertical to the micro-beam axis. A
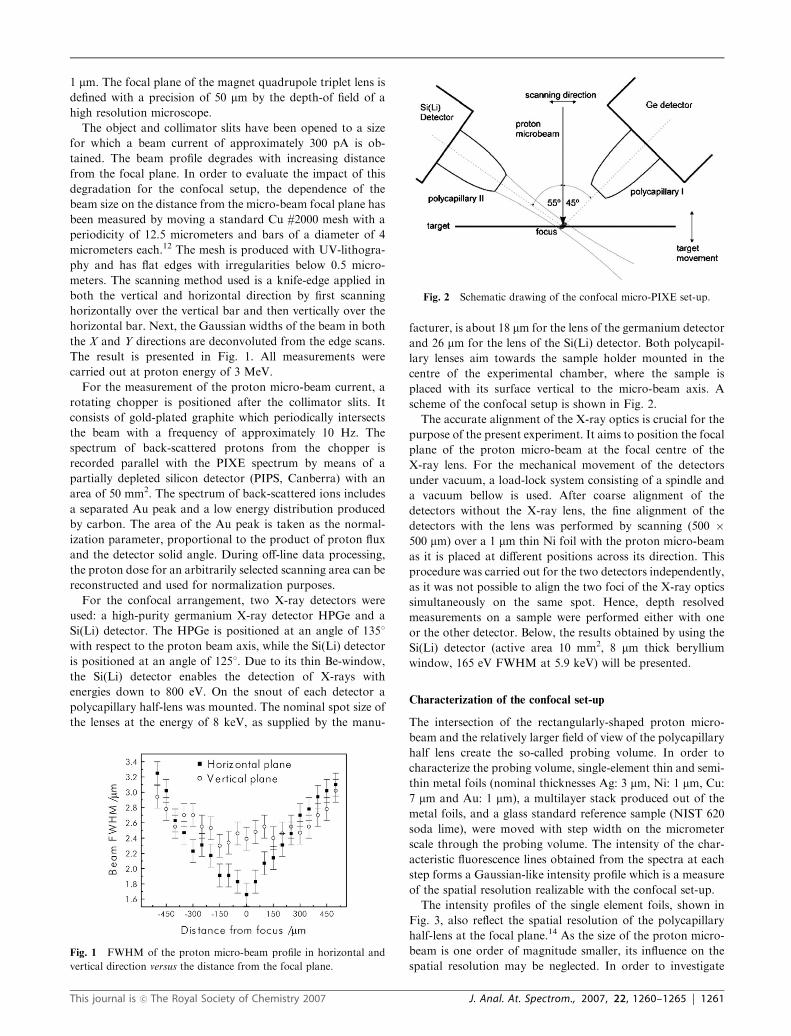
scheme of the confocal setup is shown in Fig. 2.
The accurate alignment of the X-ray optics is crucial for the
purpose of the present experiment. It aims to position the focal
plane of the proton micro-beam at the focal centre of the
X-ray lens. For the mechanical movement of the detectors
under vacuum, a load-lock system consisting of a spindle and
a vacuum bellow is used. After coarse alignment of the
detectors without the X-ray lens, the fine alignment of the
detectors with the lens was performed by scanning (500 �500 mm) over a 1 mm thin Ni foil with the proton micro-beam
as it is placed at different positions across its direction. This
procedure was carried out for the two detectors independently,
as it was not possible to align the two foci of the X-ray optics
simultaneously on the same spot. Hence, depth resolved
measurements on a sample were performed either with one
or the other detector. Below, the results obtained by using the
Si(Li) detector (active area 10 mm2, 8 mm thick beryllium
window, 165 eV FWHM at 5.9 keV) will be presented.
Characterization of the confocal set-up
The intersection of the rectangularly-shaped proton micro-
beam and the relatively larger field of view of the polycapillary
half lens create the so-called probing volume. In order to
characterize the probing volume, single-element thin and semi-
thin metal foils (nominal thicknesses Ag: 3 mm, Ni: 1 mm, Cu:
7 mm and Au: 1 mm), a multilayer stack produced out of the
metal foils, and a glass standard reference sample (NIST 620
soda lime), were moved with step width on the micrometer
scale through the probing volume. The intensity of the char-
acteristic fluorescence lines obtained from the spectra at each
step forms a Gaussian-like intensity profile which is a measure
of the spatial resolution realizable with the confocal set-up.
The intensity profiles of the single element foils, shown in
Fig. 3, also reflect the spatial resolution of the polycapillary
half-lens at the focal plane.14 As the size of the proton micro-
beam is one order of magnitude smaller, its influence on the
spatial resolution may be neglected. In order to investigateFig. 1 FWHM of the proton micro-beam profile in horizontal and
vertical direction versus the distance from the focal plane.
Fig. 2 Schematic drawing of the confocal micro-PIXE set-up.
This journal is �c The Royal Society of Chemistry 2007 J. Anal. At. Spectrom., 2007, 22, 1260–1265 | 1261

further the spatial resolution at lower X-ray energies, a glass
standard reference sample (NIST 620 soda lime, containing
Na, Mg, Si, K, Ca) was scanned across the micro-beam axis.
The intensity profiles obtained are depicted in Fig. 4. The
FWHM of the experimental intensity profiles obtained after
Gaussian fits are presented as a function of the energy of the
respective characteristic fluorescence line in Fig. 5. The fitting
solid curve through these points actually represents the spatial
resolution of the confocal setup in the whole energy region
between 1–10 keV. The dashed line represents an estimated
FWHM of the lens, obtained after multiplication of the fitting
solid curve by the factor sin551. The energy dependence of the
FWHM mainly reflects the energy dependence of the critical
angle for total reflection (B1/E) which is the basic physical
process responsible for the transmission of X-rays inside the
polycapillary lenses.15
It should be noted that for the two semi-thin foils (Ag and
Cu), as well as for the glass standard reference material used,
the information signal arises from a finite layer thickness
which, however, is much smaller than the measured FWHM
of the X-ray lens at the corresponding X-ray energies. Thus,
this thickness effect, normally expected to be present in the
intensity profiles, does not actually result in a substantially
increased FWHM value. The depth-resolving capacity of the
confocal setup was probed by scanning an Ag/Kapton/Au/
Kapton/Ni/Kapton/Cu multilayer sample with nominal foil
thickness of 3 mm/12.5 mm/1 mm/12.5 mm/1 mm/12.5 mm/7 mm,
respectively. This sample was prepared by simply attaching
one foil onto the other and packing all of them together in an
aluminium frame. Although simple, this preparation techni-
que does not allow a full control of the foil’s positions, since
the roughness of the materials may lead to spaces in between
them and, consequently, to a displacement of their surfaces
from a close-packed arrangement position. This can be ob-
served in the measured intensity profiles shown in Fig. 6. A
PIXE spectrum of the multilayer sample at two different
positions within the probing microvolume is shown in Fig. 7.
The ability to measure the intensity profile of the copper foil at
the bottom of the multilayer stack proves the potential of the
new technique for depth-resolved studies, which are not
feasible by traditional ion beam techniques, such as the RBS
Fig. 3 Intensity profiles of thin single element foils (thickness of: Ag
3 mm, Cu 7 mm, Ni 1 mm, Au 1 mm), acquired as each sample scans the
probing volume across the proton micro-beam axis. The change from
a negative to positive distance corresponds to the convention that the
surface of the sample moves opposite to the proton micro-beam and
towards the focus of the lens. The solid lines represent the correspond-
ing Gaussian fits.
Fig. 4 In-depth intensity profiles for Na Ka, Mg Ka, Si Ka, K Kaand Ca Ka fluorescence lines from the NIST-620 soda lime standard
obtained by means of 3D micro-PIXE analysis. The solid lines
represent the corresponding Gaussian fits.
Fig. 5 FWHM of the fluorescence intensity profiles as a function of
the X-ray characteristic energy obtained by measuring thin single
element foils, the NIST 620 soda lime glass standard and a multilayer
sample. The solid line represents a simple polynomial fit through the
data, whereas the dashed line corresponds to an estimated FWHM of
the lens.
Fig. 6 In-depth intensity profiles of a multilayer sample with the
following structure: Ag (3 mm)/Kapton (12.5 mm)/Au (1 mm)/Kapton
(12.5 mm)/Ni (1 mm)/Kapton (12.5 mm)/Cu (7 mm) obtained by means
of the 3D micro-PIXE analysis. The solid lines represent correspond-
ing Gaussian fits.
1262 | J. Anal. At. Spectrom., 2007, 22, 1260–1265 This journal is �c The Royal Society of Chemistry 2007

and the NRA which can supply the information only at a
depth scale of a few micrometers. Furthermore, the most
important aspect of the multilayer analysis is that the uncer-
tainties in the determination of the centroids of the various
intensity profiles are relatively small, around 0.5 mm. This
value expresses in quantitative terms the ability of the 3D
micro-PIXE technique to provide depth-resolved analysis and
sequence characterisation of different elements located at
individual layers, provided that the layer thickness is small
compared to the corresponding spatial resolution of the setup.
All the depth intensity profiles of the multilayer were again
fitted using a Gaussian function (shown with a solid line) and
their FWHM values are also presented in Fig. 5. It should be
noted that the FWHM values of all depth profiles obtained
from the multilayer sample also do not differ significantly from
those of the corresponding single foils. This result indicates
that the depth resolution is not affected considerably by the
beam-profile lateral-spread due to the protons’ multiple scat-
tering during the slow-down process, even for depths up to
40–50 mm inside the material.
3DMicro-PIXE analysis of an archaeological ceramic fragment
For the implementation and pilot evaluation of the confocal
micro-PIXE set-up in the characterization of layered structured
materials, an archaeological sample was examined. The sample
is an Attic ceramic small fragment (TH/CL-AKROP-34, 5cent.
BC, Makrygianni, Acropolis), recently (2000–2003) excavated at
the Akropolis area in Athens and dated back to the Classical
period. A SEM micrograph of a freshly-fractured cross section
produced with secondary electrons is shown in Fig. 8. In
principle, the fragment consists of two basic layers: one black
gloss layer on the top, with a typical thickness ranging between
20–25 mm, fairly well adhered to a second layer; the ceramic
porous body. According to E. Aloupi16 and Y. Maniatis
et al.17,18 the Attic black gloss is produced by fine suspension
of illitic clay, mainly consisting of polycrystalline magnetite
particles of less than 0.2-mm size embedded in an amorphous
vitreous matrix. For validation, electron probe micro-analysis
was used to determine major and minor elements of the black
gloss layer at a flat point of the surface. In addition, line
scanning was performed across the freshly-fractured cross-sec-
tion to investigate the enrichment or depletion of elements from
the surface. The quantitative results are shown in Table 1 (data
provided by E. Aloupi19) and are considered rather typical of the
black gloss composition.17 The results indicate a rather good
elemental uniformity of the black gloss layer, despite the fact
that a small number of pits and micro-cracks were evident on the
surface. EPMA analyses across the cross section revealed, in a
qualitative manner, a 50% depletion of the K2O concentration
from the surface of the black gloss towards the interface with the
clay body. X-ray fluorescence analysis (XRF) was also used in
order to complement the quantitative characterization of the
black gloss surface layer and of the clay body at a section area.
The results are in quite good agreement with electron probe
micro-analysis (EPMA). The Na2O and MgO concentrations
determined by EPMA were incorporated for quantitative XRF
Fig. 7 PIXE spectrum of the multilayer sample at two different
positions within the probing microvolume.
Fig. 8 SEM micrograph of a freshly fractured cross section of the
Attic ceramic fragment with the code TH/CL-AKROP-34, 5cent. BC,
Makrygianni, Acropolis (magnification 1012�). The estimated
black gloss layer thickness is 21 � 2 mm. Micrograph courtesy of
E. Aloupi.19
Table 1 SEM and XRF quantitative results for the two layers (black gloss and clay body, the second only by XRF) of the Attic ceramic fragmentwith the code TH/CL-AKROP-34, 5cent. BC, Makrygianni, Acropolis. EPMA results courtesy of E. Aloupi19
Oxides
Electron probe micro-analysis (EPMA) black gloss layer/surface analysis X-Ray fluorescence (XRF)
Micro-spot (3 � 3 mm) Extended area (2.3 � 1.5 mm) Black gloss Clay body
Na2O (%) 0.93 � 0.05 0.76 — —MgO (%) 2.53 � 0.26 2.27 — —Al2O3 (%) 28.2 � 3.9 28.9 28.3 � 1.5 17.4 � 1.5SiO2 (%) 48.6 � 0.4 46.7 46.2 � 2.3 48.7 � 2.5P2O5 (%) 0.196 � 0.071 0.32 — —K2O (%) 3.5 � 0.4 3.92 3.7 � 0.2 3.8 � 0.2CaO (%) 0.35 � 0.19 0.36 0.59 � 0.03 14.1 � 0.7TiO2 (%) 0.78 � 0.05 1.04 0.89 � 0.05 0.98 � 0.05Fe2O3 (%) 12.3 � 0.8 15.7 16.8 � 0.8 11.4 � 0.6
This journal is �c The Royal Society of Chemistry 2007 J. Anal. At. Spectrom., 2007, 22, 1260–1265 | 1263
analysis. The concentrations listed in Table 1 can be further used
for the determination of the information depth beyond which
the proton-induced characteristic X-rays contribute less than
10% to the corresponding overall fluorescence intensity ob-
tained. The results of GUPIX simulation20 for the Attic ceramic
show that for 3 MeV proton projectiles 90% of the Si and K
fluorescence intensities originate from a layer with depth of
about 4 and 13.7 mm, respectively, whereas for Ca and Fe the
corresponding layer thickness is 36.2 and 35.2 mm, respectively.
The relatively large information-depth for Ca is due to the fact
that its concentration increases by more than a factor of 20 when
going from the black gloss layer to the clay body.
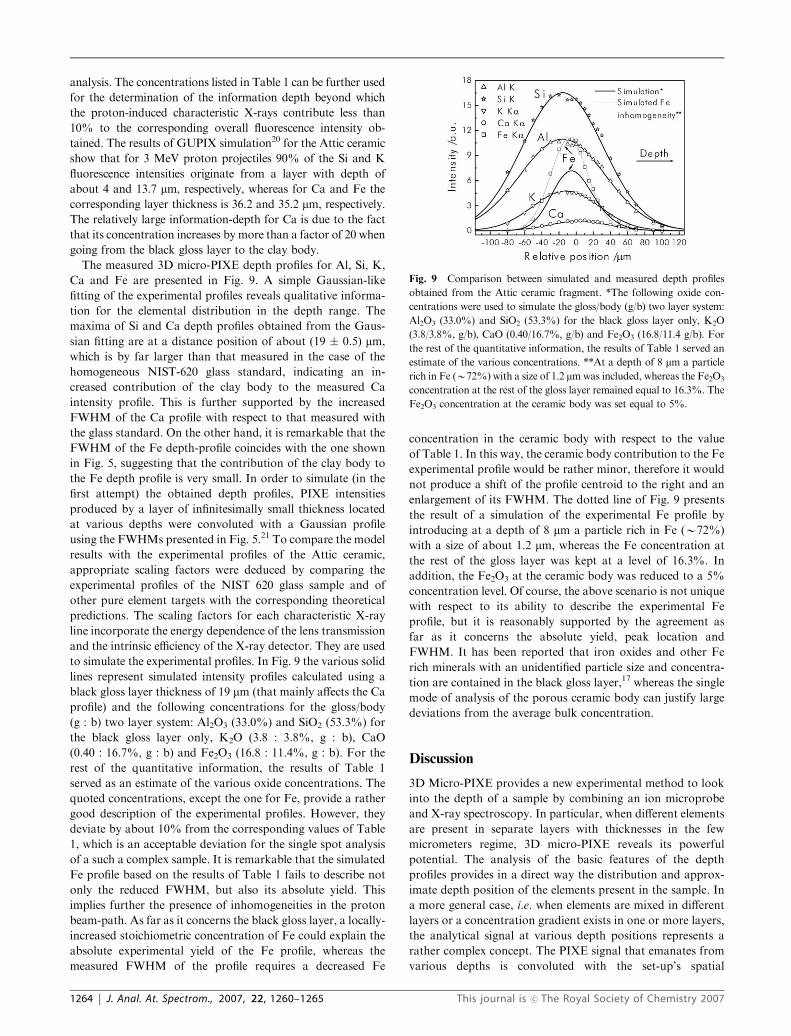
The measured 3D micro-PIXE depth profiles for Al, Si, K,
Ca and Fe are presented in Fig. 9. A simple Gaussian-like
fitting of the experimental profiles reveals qualitative informa-
tion for the elemental distribution in the depth range. The
maxima of Si and Ca depth profiles obtained from the Gaus-
sian fitting are at a distance position of about (19 � 0.5) mm,
which is by far larger than that measured in the case of the
homogeneous NIST-620 glass standard, indicating an in-
creased contribution of the clay body to the measured Ca
intensity profile. This is further supported by the increased
FWHM of the Ca profile with respect to that measured with
the glass standard. On the other hand, it is remarkable that the
FWHM of the Fe depth-profile coincides with the one shown
in Fig. 5, suggesting that the contribution of the clay body to
the Fe depth profile is very small. In order to simulate (in the
first attempt) the obtained depth profiles, PIXE intensities
produced by a layer of infinitesimally small thickness located
at various depths were convoluted with a Gaussian profile
using the FWHMs presented in Fig. 5.21 To compare the model
results with the experimental profiles of the Attic ceramic,
appropriate scaling factors were deduced by comparing the
experimental profiles of the NIST 620 glass sample and of
other pure element targets with the corresponding theoretical
predictions. The scaling factors for each characteristic X-ray
line incorporate the energy dependence of the lens transmission
and the intrinsic efficiency of the X-ray detector. They are used
to simulate the experimental profiles. In Fig. 9 the various solid
lines represent simulated intensity profiles calculated using a
black gloss layer thickness of 19 mm (that mainly affects the Ca
profile) and the following concentrations for the gloss/body
(g : b) two layer system: Al2O3 (33.0%) and SiO2 (53.3%) for
the black gloss layer only, K2O (3.8 : 3.8%, g : b), CaO
(0.40 : 16.7%, g : b) and Fe2O3 (16.8 : 11.4%, g : b). For the
rest of the quantitative information, the results of Table 1
served as an estimate of the various oxide concentrations. The
quoted concentrations, except the one for Fe, provide a rather
good description of the experimental profiles. However, they
deviate by about 10% from the corresponding values of Table
1, which is an acceptable deviation for the single spot analysis
of a such a complex sample. It is remarkable that the simulated
Fe profile based on the results of Table 1 fails to describe not
only the reduced FWHM, but also its absolute yield. This
implies further the presence of inhomogeneities in the proton
beam-path. As far as it concerns the black gloss layer, a locally-
increased stoichiometric concentration of Fe could explain the
absolute experimental yield of the Fe profile, whereas the
measured FWHM of the profile requires a decreased Fe
concentration in the ceramic body with respect to the value
of Table 1. In this way, the ceramic body contribution to the Fe
experimental profile would be rather minor, therefore it would
not produce a shift of the profile centroid to the right and an
enlargement of its FWHM. The dotted line of Fig. 9 presents
the result of a simulation of the experimental Fe profile by
introducing at a depth of 8 mm a particle rich in Fe (B72%)
with a size of about 1.2 mm, whereas the Fe concentration at
the rest of the gloss layer was kept at a level of 16.3%. In
addition, the Fe2O3 at the ceramic body was reduced to a 5%
concentration level. Of course, the above scenario is not unique
with respect to its ability to describe the experimental Fe
profile, but it is reasonably supported by the agreement as
far as it concerns the absolute yield, peak location and
FWHM. It has been reported that iron oxides and other Fe
rich minerals with an unidentified particle size and concentra-
tion are contained in the black gloss layer,17 whereas the single
mode of analysis of the porous ceramic body can justify large
deviations from the average bulk concentration.
Discussion
3D Micro-PIXE provides a new experimental method to look
into the depth of a sample by combining an ion microprobe
and X-ray spectroscopy. In particular, when different elements
are present in separate layers with thicknesses in the few
micrometers regime, 3D micro-PIXE reveals its powerful
potential. The analysis of the basic features of the depth
profiles provides in a direct way the distribution and approx-
imate depth position of the elements present in the sample. In
a more general case, i.e. when elements are mixed in different
layers or a concentration gradient exists in one or more layers,
the analytical signal at various depth positions represents a
rather complex concept. The PIXE signal that emanates from
various depths is convoluted with the set-up’s spatial
Fig. 9 Comparison between simulated and measured depth profiles
obtained from the Attic ceramic fragment. *The following oxide con-
centrations were used to simulate the gloss/body (g/b) two layer system:
Al2O3 (33.0%) and SiO2 (53.3%) for the black gloss layer only, K2O
(3.8/3.8%, g/b), CaO (0.40/16.7%, g/b) and Fe2O3 (16.8/11.4 g/b). For
the rest of the quantitative information, the results of Table 1 served an
estimate of the various concentrations. **At a depth of 8 mm a particle
rich in Fe (B72%) with a size of 1.2 mmwas included, whereas the Fe2O3
concentration at the rest of the gloss layer remained equal to 16.3%. The
Fe2O3 concentration at the ceramic body was set equal to 5%.
1264 | J. Anal. At. Spectrom., 2007, 22, 1260–1265 This journal is �c The Royal Society of Chemistry 2007

resolution. This feature exhibits (as far as it concerns its
complexity) some similarities with the differential PIXE ana-
lytical signal. However, the 3D micro-PIXE depth profiles
include additional information about local inhomogeneities
that provide a more detailed knowledge of the elemental
distribution and composition in the depth. Apart from the
absolute scale of the intensity profile, its centroid position,
FWHM and shape (if it is pure Gaussian or asymmetric with
increasing depth) may be considered as additional parameters
supporting substantially the quantitative description.
The implementation of the confocal geometry at an ion-
microprobe beamline has certain advantages with respect to
3D micro-XRF set-ups. For 3D micro-PIXE only, one X-ray
lens in front of the detector is required, taking advantage of
the excellent intrinsic spatial resolution of the ion microprobe.
Also the beam-scanning possibilities play an important role
not only for the relative ease and fast alignment of the
confocal set-up, but also for deducing depth–intensity profiles.
A decrease of the proton ionization cross sections with in-
creasing depth, in contrast to the fluorescence cross-sections
(which are depth-independent), is certainly a disadvantage and
a limiting factor as far as the range of depth analysis is
concerned. On the other hand, higher proton energies (greater
than 3 MeV) and relative low atomic number matrices (or-
ganic, aluminum–silicate) increase the penetration depth of
protons to more than 100 mm, thus improving the informa-
tion-depth for elements that emit characteristic X-rays with
energies above ca. 5 keV. It should also be pointed out that,
for metal alloys, the 3D micro-PIXE information depth could
be even larger than that in 3D tube-excited micro-XRF
analysis. Hence, the magnitude of the X-ray production
cross-sections and the proton penetration depth for a specific
matrix are the decisive factors as to which method is more
suited for three-dimensional elemental analysis.
Conclusions
The use of a polycapillary half lens in a typical micro-PIXE
set-up renders the conventional micro-PIXE technique as a
new tool for depth resolved elemental analysis. The spatial
resolution of the 3D micro-PIXE in the 1–10 keV energy
range, determined through systematic measurements of the
FWHM of Gaussian-like intensity profiles, varies from about
34 mm at 10 keV to about 120 mm for 1 keV X-rays. 3DMicro-
PIXE provides the possibility to resolve elemental distribution
in separate layers in a complex structure. The information
depth can range even up to 40–50 mm, exceeding (in some
cases) the analytical capabilities of standard ion beam techni-
ques for elemental depth profiling. It should be also high-
lighted that the current state-of-the-art performance of a
polycapillary half lens may offer spatial resolution on the
order of about 10 mm for Cu Ka. This resolution is much
better than the lens used in the present experiment. Thus, a
new generation polycapillary half lenses can provide signifi-
cantly improved depth-resolution in 3D micro-PIXE analysis.
The significant potential of the new method to provide
direct three-dimensional information on the elemental distri-
bution has been shown for a complex, archaeological sample.
A first approach to simulate experimental intensity profiles
was carried out, showing perspectives towards fully-implemen-
ted quantification. 3D Micro-PIXE seems to be a very promis-
ing technique, which has to be further exploited, both
theoretically and experimentally.
Acknowledgements
This work is supported by the project L1-5146 and program
P1-0112 of the Slovenian Research Agency, the IAEA Co-
ordinated Research Projects ‘‘Development of Nuclear
Microprobe Techniques for the Quantitative Analysis of Indi-
vidual Microparticles’’ and ‘‘Unification of Nuclear Spectro-
metries: integrated techniques as a new tool for material
research’’, (Contract RA 13873). Finally, this work is also
supported by the program ATT_29, PEP Attikis, entitled
‘‘Authenticity control and safeguard of the identity of ancient
artifacts, objects of art and technologically authentic replicas,
by using non-destructive analytical techniques and in-built
elemental tagging technologies’’, co-funded by the Greek Gen-
eral Secreteriat of Research, Ministry of Development and EU.
References
1 C. Neelemeijer, W. Wagner and H. P. Schramm, Nucl. Instrum.Methods Phys. Res., Sect. B, 1996, 118, 338.
2 G. Demortier and J. L. Ruvalcaba-Sil, Nucl. Instrum. MethodsPhys. Res., Sect. B, 1996, 118, 352.
3 C. Neelemeijer and M. Mader, Nucl. Instrum. Methods Phys. Res.,Sect. B, 2002, 189, 293.
4 G. Weber, J. M. Delbrouck, D. Strivay, F. Kerff and L. Martinot,Nucl. Instrum. Methods Phys. Res., Sect. B, 1998, 139, 196.
5 I. Brissaud, G. Lagarde and P. Midy,Nucl. Instrum. Methods Phys.Res., Sect. B, 1996, 117, 179.
6 G. Lagarde, P. Midy and I. Brissaud,Nucl. Instrum. Methods Phys.Res., Sect. B, 1997, 132, 521.
7 I. Brissaud, A. Guillo, G. Lagarde, P. Midy, T. Calligaro and J.Salomom, Nucl. Instrum. Methods Phys. Res., Sect. B, 1999, 155,447.
8 %. Smit and M. Holc, Nucl. Instrum. Methods Phys. Res., Sect. B,2004, 219–220, 524.
9 B. Kanngießer, W. Malzer and I. Reiche, Nucl. Instrum. MethodsPhys. Res., Sect. B, 2003, 211–2, 259.
10 B. Kanngießer, W. Malzer, A. Fuentes Rodriguez and I. Reiche,Spectrochim. Acta, Part B, 2005, 60, 41.
11 L. Vincze, B. Vekemans, F. E. Brenker, G. Falkenberg, K. Rickers,A. Somogyi, M. Kersten and F. Adams, Anal. Chem., 2004, 76,6786.
12 J. Simcic, P. Pelicon, M. Budnar and %. Smit, Nucl. Instrum.Methods Phys. Res., Sect. B, 2002, 190, 283.
13 P. Pelicon, J. Simcic, M. Jaksic, Z. Medunic, F. Naab and F. D.McDaniel, Nucl. Instrum. Methods Phys. Res., Sect. B, 2005, 231,53.
14 W. Malzer and B. Kanngießer, Spectrochim. Acta, Part B, 2005,60, 1334.
15 M. Hascke and M. Haller, X-Ray Spectrom., 2003, 32, 239.16 E. Aloupi, Ph.D. Thesis, University of Ioannina, 1994.17 Y. Maniatis, E. Aloupi and A. D. Stalios, Archaeometry, 1993,
35(1), 23.18 E. Aloupi, Proceedings of the symposium ‘‘Recovery and Revival
of Attic Black, Red and White decoration techniques. What can itoffer to archaeological research’’ in Colors of Clay: Special Tech-niques in Athenian Vases Symposium, The Getty Villa, Malibu,Getty Publications, June 15–17, 2006, submitted.
19 E. Aloupi, personal communication, 2006..20 J. L. Campbell, T. L. Hopman, J. A. Maxwell and Z. Nejedly,
Nucl. Instrum. Methods Phys. Res., Sect. B, 2000, 170, 193; http://pixe.physics.uoguelph.ca/gupix/about.
21 D. Sokaras, A. G. Karydas, W. Malzer and B. Kanngießer,unpublished work.
This journal is �c The Royal Society of Chemistry 2007 J. Anal. At. Spectrom., 2007, 22, 1260–1265 | 1265
Copyright © 2022 FDOKUMEN