Assessment of Health Risk and Elemental Concentrations in ...
17
_____________________________________________________________________________________________________ *Corresponding author: Email: [email protected]; Asian Journal of Advanced Research and Reports 4(2): 1-17, 2019; Article no.AJARR.48273 Assessment of Health Risk and Elemental Concentrations in Minjingu Vegetables and Soils by Wavelength Dispersive X-ray Fluorescence Yusuf I. Koleleni 1* and Seriver Tafisa 1 1 Physics Department, University of Dar es Salaam, P.O.Box 35063 Dar es Salaam, Tanzania. Authors’ contributions This work was carried out in collaboration between both authors. Both authors YIK and ST designed together the study, performed the analysis, wrote the paper and managed the literature searches. Both authors read and approved the final manuscript. Article Information DOI: 10.9734/AJARR/2019/v4i230105 Editor(s): (1) Dr. Gokhan Aydin, Associate Professor, Isparta University of Applied Science, Turkey. Reviewers: (1) Imtiaz Ahmad ,University of Peshawar, Pakistan. (2) Adeyeye, Samuel Ayofemi , Ton Duc Thang University, Ho Chi Minh City, Vietnam. Complete Peer review History: http://www.sdiarticle3.com/review-history/48273 Received 12 January 2019 Accepted 31 March 2019 Published 12 April 2019 ABSTRACT The samples of soil and selected species of vegetables (cowpea leaves, spinach, sweet potato leaves, Ethiopian mustard and Chinese cabbages) were randomly collected from four sites, Idara ya maji, Nkaiti, Mbulungu and Mkwajuni of Minjingu village of Manyara in Tanzania. The samples were analyzed by means of wavelength dispersive x-ray fluorescence (WDXRF) spectrometry to determine the heavy metal concentrations in soils and vegetables of the field study with emphasis on their health risk index (HRI) assessment. The results indicate that soils have concentration range of 142-1547 for Ca, 737-2515 for K, 2396-4748 for Si, 0-121 for P, 0-181 for Mg, 0-36 for S, 0-68 for Na, 561-942 for Al, 121-4748 for Fe, 0-80 for Mn, 0-53 for Sr, 0-37 for Cs and 0-11 for Ni in mg/kg which was above the maximum tolerable limits(MTL). Elements detected in vegetables were in the range of 2123-6122 for Ca, 747-8005 for K, 65-996 for Si, 40-348 for Mg, for Mn, 85- 584 for P, 22-705 for S, 0-218 for Na, 70-835 for Fe, 23-286 for Al, 0-98 for Cs, 84-1076 for Cl and 0-13 for Ni in mg/kg. The highest heavy metal retention capability was exhibited in Cowpea leaves, Spinach and Chinese cabbages but sweet potato leaves and Ethiopian mustard has shown lower concentrations. Control site recorded the least concentration values. The HRI values for Sr, Ni and Original Research Article
-
Upload
khangminh22 -
Category
Documents
-
view
8 -
download
0
Transcript of Assessment of Health Risk and Elemental Concentrations in ...

_____________________________________________________________________________________________________ *Corresponding author: Email: [email protected];
Asian Journal of Advanced Research and Reports
4(2): 1-17, 2019; Article no.AJARR.48273
Assessment of Health Risk and Elemental Concentrations in Minjingu Vegetables and Soils by
Wavelength Dispersive X-ray Fluorescence
Yusuf I. Koleleni1* and Seriver Tafisa1
1Physics Department, University of Dar es Salaam, P.O.Box 35063 Dar es Salaam, Tanzania.
Authors’ contributions
This work was carried out in collaboration between both authors. Both authors YIK and ST designed
together the study, performed the analysis, wrote the paper and managed the literature searches. Both authors read and approved the final manuscript.
Article Information
DOI: 10.9734/AJARR/2019/v4i230105
Editor(s):
(1) Dr. Gokhan Aydin, Associate Professor, Isparta University of Applied Science, Turkey.
Reviewers:
(1) Imtiaz Ahmad ,University of Peshawar, Pakistan.
(2) Adeyeye, Samuel Ayofemi , Ton Duc Thang University, Ho Chi Minh City, Vietnam.
Complete Peer review History: http://www.sdiarticle3.com/review-history/48273
Received 12 January 2019 Accepted 31 March 2019 Published 12 April 2019
ABSTRACT
The samples of soil and selected species of vegetables (cowpea leaves, spinach, sweet potato leaves, Ethiopian mustard and Chinese cabbages) were randomly collected from four sites, Idara ya maji, Nkaiti, Mbulungu and Mkwajuni of Minjingu village of Manyara in Tanzania. The samples were analyzed by means of wavelength dispersive x-ray fluorescence (WDXRF) spectrometry to determine the heavy metal concentrations in soils and vegetables of the field study with emphasis on their health risk index (HRI) assessment. The results indicate that soils have concentration range of 142-1547 for Ca, 737-2515 for K, 2396-4748 for Si, 0-121 for P, 0-181 for Mg, 0-36 for S, 0-68 for Na, 561-942 for Al, 121-4748 for Fe, 0-80 for Mn, 0-53 for Sr, 0-37 for Cs and 0-11 for Ni in mg/kg which was above the maximum tolerable limits(MTL). Elements detected in vegetables were in the range of 2123-6122 for Ca, 747-8005 for K, 65-996 for Si, 40-348 for Mg, for Mn, 85-584 for P, 22-705 for S, 0-218 for Na, 70-835 for Fe, 23-286 for Al, 0-98 for Cs, 84-1076 for Cl and 0-13 for Ni in mg/kg. The highest heavy metal retention capability was exhibited in Cowpea leaves, Spinach and Chinese cabbages but sweet potato leaves and Ethiopian mustard has shown lower concentrations. Control site recorded the least concentration values. The HRI values for Sr, Ni and
Original Research Article
Koleleni and Tafisa; AJARR, 4(2): 1-17, 2019; Article no.AJARR.48273
2
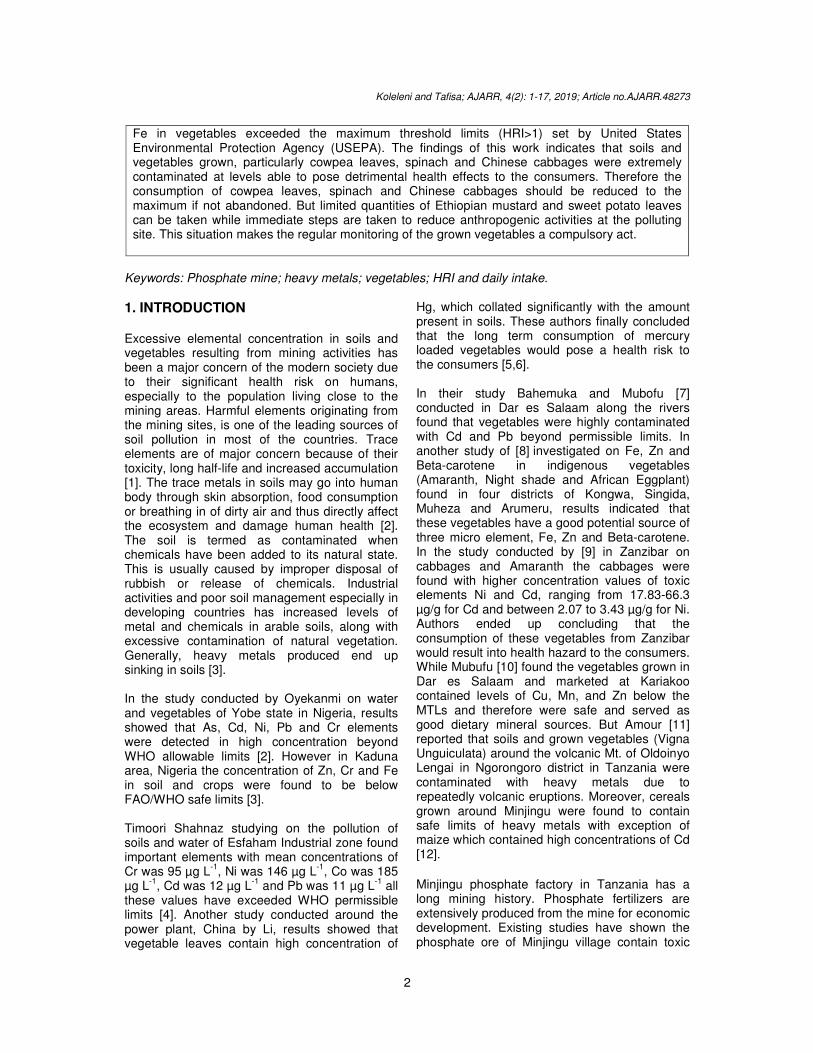
Fe in vegetables exceeded the maximum threshold limits (HRI>1) set by United States Environmental Protection Agency (USEPA). The findings of this work indicates that soils and vegetables grown, particularly cowpea leaves, spinach and Chinese cabbages were extremely contaminated at levels able to pose detrimental health effects to the consumers. Therefore the consumption of cowpea leaves, spinach and Chinese cabbages should be reduced to the maximum if not abandoned. But limited quantities of Ethiopian mustard and sweet potato leaves can be taken while immediate steps are taken to reduce anthropogenic activities at the polluting site. This situation makes the regular monitoring of the grown vegetables a compulsory act.
Keywords: Phosphate mine; heavy metals; vegetables; HRI and daily intake.
1. INTRODUCTION Excessive elemental concentration in soils and vegetables resulting from mining activities has been a major concern of the modern society due to their significant health risk on humans, especially to the population living close to the mining areas. Harmful elements originating from the mining sites, is one of the leading sources of soil pollution in most of the countries. Trace elements are of major concern because of their toxicity, long half-life and increased accumulation [1]. The trace metals in soils may go into human body through skin absorption, food consumption or breathing in of dirty air and thus directly affect the ecosystem and damage human health [2]. The soil is termed as contaminated when chemicals have been added to its natural state. This is usually caused by improper disposal of rubbish or release of chemicals. Industrial activities and poor soil management especially in developing countries has increased levels of metal and chemicals in arable soils, along with excessive contamination of natural vegetation. Generally, heavy metals produced end up sinking in soils [3]. In the study conducted by Oyekanmi on water and vegetables of Yobe state in Nigeria, results showed that As, Cd, Ni, Pb and Cr elements were detected in high concentration beyond WHO allowable limits [2]. However in Kaduna area, Nigeria the concentration of Zn, Cr and Fe in soil and crops were found to be below FAO/WHO safe limits [3]. Timoori Shahnaz studying on the pollution of soils and water of Esfaham Industrial zone found important elements with mean concentrations of Cr was 95 µg L
-1, Ni was 146 µg L
-1, Co was 185
µg L-1
, Cd was 12 µg L-1
and Pb was 11 µg L-1
all these values have exceeded WHO permissible limits [4]. Another study conducted around the power plant, China by Li, results showed that vegetable leaves contain high concentration of
Hg, which collated significantly with the amount present in soils. These authors finally concluded that the long term consumption of mercury loaded vegetables would pose a health risk to the consumers [5,6]. In their study Bahemuka and Mubofu [7] conducted in Dar es Salaam along the rivers found that vegetables were highly contaminated with Cd and Pb beyond permissible limits. In another study of [8]
investigated on Fe, Zn and
Beta-carotene in indigenous vegetables (Amaranth, Night shade and African Eggplant) found in four districts of Kongwa, Singida, Muheza and Arumeru, results indicated that these vegetables have a good potential source of three micro element, Fe, Zn and Beta-carotene. In the study conducted by [9] in Zanzibar on cabbages and Amaranth the cabbages were found with higher concentration values of toxic elements Ni and Cd, ranging from 17.83-66.3 µg/g for Cd and between 2.07 to 3.43 µg/g for Ni. Authors ended up concluding that the consumption of these vegetables from Zanzibar would result into health hazard to the consumers. While Mubufu [10] found the vegetables grown in Dar es Salaam and marketed at Kariakoo contained levels of Cu, Mn, and Zn below the MTLs and therefore were safe and served as good dietary mineral sources. But Amour [11] reported that soils and grown vegetables (Vigna Unguiculata) around the volcanic Mt. of Oldoinyo Lengai in Ngorongoro district in Tanzania were contaminated with heavy metals due to repeatedly volcanic eruptions. Moreover, cereals grown around Minjingu were found to contain safe limits of heavy metals with exception of maize which contained high concentrations of Cd [12].
Minjingu phosphate factory in Tanzania has a long mining history. Phosphate fertilizers are extensively produced from the mine for economic development. Existing studies have shown the phosphate ore of Minjingu village contain toxic

Koleleni and Tafisa; AJARR, 4(2): 1-17, 2019; Article no.AJARR.48273
3
elements creating a risk to the neighboring population [6]
estimated to be around 11,000
people [12].
Yet the health risk caused by consumption of vegetables has not been explored.
This present work was carried out in Minjingu village of Manyara region. The samples were analyzed by using Wavelength Dispersive X-ray Fluorescence (WDXRF) spectrometry. The aim of the present study was to identify the essential elements and estimate the impact of trace elements in soil and vegetable samples. Moreover, calculate the health risk resulting from the consumption of vegetables grown around the mining area.
The presence of the phosphate mine at Minjingu village suggested the importance of determining the heavy metal concentrations in soils and vegetables around the mining area, and since no such a study has ever been done at Minjingu. Therefore, in the present work, Wavelength Dispersive X-ray Fluorescence (WDXRF) spectrometry was used to analyze concentrations of heavy metals in soils and vegetables from which HRI were established.
1.1 Heavy Metal Contamination in Soils
Heavy metal deposition in soils has drawn world’s concern in recent decades due to the excessive accumulation of trace elements in soils caused by anthropogenic activities [13]. Many years back soil contamination was not considered a significant matter to be given an attention to because of its wide range and complexity in handling. Nowadays contamination of arable soils by heavy metals due to human activities is considered by scientists and environmentalists a hot topic to be settled [14]. In most cases, heavy metals can be found naturally everywhere on earth having their sources in rocks, volcanic emissions and mineral deposits. But metals that occur naturally are in rare cases harmful. Human activities are pinpointed to have increased their amount in soils [15]. The literature show that soils from Minjingu village in Tanzania being close to the mine could be contaminated with unknown levels of heavy metals from neighboring mine. This led the current study to be carried out.
1.2 Heavy Metal in Vegetables Leafy vegetables such as amaranth and spinach form a vital part of diet rich in nutrients so,
contamination of foods by trace metals should not be underestimated in anyway. The soils are termed to be major sources of heavy metals to plants, when vegetables are grown on polluted land; the heavy metals are likely to be translocate into plant leaves and through food chain to the body [16]. Among the impacts of mining activities in the environment due to soil and vegetation heavy metal contamination have brought about serious damage to plants and severe human health problems. This shows that vegetables grown in many countries are exposed to heavy metals in different ways, thus consumption of polluted vegetables results into adverse health effects to the consumers [17]. Balkhair and Ashiraf [18] once reported that crops and vegetables grown in the western region of Saudi Arabia were seriously polluted with heavy metals, they ended up concluding that those vegetables should not be eaten because of large quantities of metals contained would lead to health effects. [19] in Beijing, China, reported health risks (HRI) of <1, indicating a relative absence of health risks associated with the ingestion of contaminated vegetables, though plants were greatly affected by heavy metals beyond limits set by USEPA and WHO. Therefore it could be concluded from the literature that, most of the studies performed at Minjingu such as Banzi [20]
who dealt with
radioactivity and Mohammed and Nkuba [6] investigated on metals in cereals, indicates that vegetables had not been investigated on, thus, it was worthwhile for the current study to be conducted on that matter.
2. MATERIALS AND METHODS 2.1 Study Area The studied area was Minjingu village. This village of Minjingu is situated along the rift valley escarpment on the eastern part of Lake Manyara. Within Minjingu village there is Minjingu phosphate mine (Fig.1). Minjingu is found in Manyara region on the Northern part of Tanzania, at latitude 03°42ʹ 30.9ʺ S and longitude 035° 54ʹ 56.3ʺ E, having an estimate of 11,000 inhabitants occupying about 24,000 hectares of land [21]. The Minjingu dwellers are pastoralists and small scale farmers. Crops cultivated in Minjingu include maize, cowpeas, mug beans, watermelon and vegetables like Chinese cabbages, spinach and Cowpea leaves. The area of Minjingu which is used for agriculture

is found on the North-Eastern part of BabatiArusha road, while on the Northsame road is for pastoralism where LakManyara is situated (Fig. 1). Collection and sampling
The species chosen for vegetable samples were, Chinese cabbages (chainizi), spinach (Spinachi), sweet potato leaves (matembele), Ethiopian mustard (sukuma wiki) and cowpea leaves (majani ya kunde) as in Fig. 2. These kivegetables were chosen specifically because are among the most commonly grown vegetables in Minjingu area. Vegetables were sampled in March 2018 to show heavy metal translocation phenomena. The randomly collected twenty vegetable samples from Minjingu village were placed into clean and demarcated plastic bags.
Fig. 1. The map of the study area of Minjingu village,in Manyara region
Table 1. Types of sampled vegetables grown in Minjingu
Swahili name English name
Majani ya kunde Cowpea leavesSpinachi Spinach Matembele Sweet potato leavesSukuma wiki Ethiopian mustardChainizi Chinese cabbages
Koleleni and Tafisa; AJARR, 4(2): 1-17, 2019; Article no.
4
Eastern part of Babati-Arusha road, while on the North-West of the same road is for pastoralism where Lake
The species chosen for vegetable samples were, Chinese cabbages (chainizi), spinach (Spinachi), sweet potato leaves (matembele), Ethiopian mustard (sukuma wiki) and cowpea leaves (majani ya kunde) as in Fig. 2. These kinds of vegetables were chosen specifically because are among the most commonly grown vegetables in Minjingu area. Vegetables were sampled in March 2018 to show heavy metal translocation phenomena. The randomly collected twenty
gu village were placed into clean and demarcated plastic bags.
Five types of vegetables were selected from each site (Table 1). In the same way 20 samples of soils were collected about 25 g of soil around the roots of each type of vegetable when plants wuprooted at a depth of 0-15 cm. Both soil and vegetable samples were collected from four sampling sites chosen at different distances from the factory of Minjingu, and these areas were Nkaiti, Mbulungu, Mkwajuni and Idara ya maji. Thereafter control samples of soil and vegetables were taken from Magugu village situated away from Minjingu. Magugu was chosen as a control area because was found to be far away from the polluting source. All samples were transferred to the African Minerals and Geosciences Ce(AMGC) laboratories in Dar es Salaam, for preparations and analysis.
The map of the study area of Minjingu village,in Manyara region-Tanzania
Types of sampled vegetables grown in Minjingu village in Tanzania
English name Scientific name Edible part
Cowpea leaves Vigna unguiculata LeavesSpinacea oleracea Leaves
Sweet potato leaves Ipomoea batatas Leavesmustard Brassica carinata L Leaves
Chinese cabbages Brassica rapa Leaves
; Article no.AJARR.48273
Five types of vegetables were selected from
In the same way 20 samples of soils were g of soil around the roots of
each type of vegetable when plants were cm. Both soil and
vegetable samples were collected from four sampling sites chosen at different distances from the factory of Minjingu, and these areas were Nkaiti, Mbulungu, Mkwajuni and Idara ya maji.
mples of soil and vegetables were taken from Magugu village situated away from Minjingu. Magugu was chosen as a control area because was found to be far away from the polluting source. All samples were transferred to the African Minerals and Geosciences Centre (AMGC) laboratories in Dar es Salaam, for
Tanzania
village in Tanzania
Edible part
Leaves Leaves Leaves Leaves Leaves

Fig. 2. Some of the vegetables grown in Minjingu village used in this study(The Photo was taken by the researcher on March, 2018)
2.2 Preparation of Samples and Analysis After delivery to the laboratory all vegetables were washed in fresh running water to eliminate debris except Chinese cabbages, cowpea leaves and spinach. The samples of vegetables were oven dried at a temperature of 65°C for 48 hrs. In order for samples to be homogenized, each sample was grinded in a motor to the size of a 2 mm mesh sieve. Then these samples were stored in a dry and clean glass stopper ready for analysis. The collected soil samples were wet because in March-April months, Tanzania experiences heavy rainfall in almost all regions including Manyara. The samples were dried for two days in an oven at a temperature of about 100°C to remove moisture content. Then the dried samples of soil were sieved using polyethylene sieve to remove plant debris and stones. These soil samples were later grinded into fine powder in order to get similar matrix as the reference material. Thereafter soil samples were stored in well coded containers before were placed crucibles and transferred to the furnace. In the furnace, soil samples were heated for about 1000°C for 2 hours to get Loss on Ignition (LOI) [22,23]. After that hot crucibles were removed and placed into desiccators for a normal cooling, in order to get LOI. LOI helps to remove COfrom carbonates and organic matter content of clay-poor calcareous soils and rocks with precision, so as to get the exact heavy metal content [22]. Thereafter, LOI was calculated and normalized results obtained for each soil sample.
Koleleni and Tafisa; AJARR, 4(2): 1-17, 2019; Article no.
5
Some of the vegetables grown in Minjingu village used in this study(The Photo was taken by the researcher on March, 2018)
and Analysis
After delivery to the laboratory all vegetables were washed in fresh running water to eliminate debris except Chinese cabbages, cowpea leaves and spinach. The samples of vegetables were
C for 48 hrs. In order for samples to be homogenized, each sample was grinded in a motor to the size of a 2 mm mesh sieve. Then these samples were stored in a dry and clean glass stopper ready for analysis. The collected soil samples were wet
April months, Tanzania experiences heavy rainfall in almost all regions including Manyara. The samples were dried for two days in an oven at a temperature of about
C to remove moisture content. Then the dried samples of soil were sieved using a 2 mm polyethylene sieve to remove plant debris and stones. These soil samples were later grinded into fine powder in order to get similar matrix as
Thereafter soil samples were stored in well coded containers before were placed in labeled crucibles and transferred to the furnace. In the furnace, soil samples were heated for about
C for 2 hours to get Loss on Ignition (LOI) [22,23]. After that hot crucibles were removed and placed into desiccators for a normal cooling,
er to get LOI. LOI helps to remove CO2 from carbonates and organic matter content of
poor calcareous soils and rocks with precision, so as to get the exact heavy metal content [22]. Thereafter, LOI was calculated and
ch soil sample.
Both powdered samples of soil and vegetables were made into pellets so as to get a specific size of tablets used in S8 TIGER WDXRF machine. Thereafter wavelength xfluorescence (WDXRF) spectrometer was used in measurements (S8 TIGER, BRUKER QUANT version 2.2.3.1, Germany). Diffracted xdetected by the sealed proportional counter (10% of methane and 90% of Argon) for elements with low Z, and then for heavy elements measurements were done by employing NaI (TI) scintillation detector. The S8 TIGEmeasures elements directly, fast, with high resolution and low background [24]. The data obtained were statistically analyzed using a statistical package SPSS Version 20 in combination with Microsoft Excel 2007. The correlation relationship for comparing the means of vegetables and soil samples were done by using Excel. The daily intake of metals (DIM) was determined by using equation 3 [25], while the health risk index (HRI) for the locals through the consumption of contaminated vegetables was assessed using mathematical equation[24].
3. RESULTS AND DISCUSSION
3.1 Elemental Concentrations Essential elements (Ca, K, Si, S, Na, P and Mg) in the field study and the control area contained almost the same mean concentration values. The same distribution of macro and minor elements is due to the abundance of these elements on the
; Article no.AJARR.48273
Some of the vegetables grown in Minjingu village used in this study
Both powdered samples of soil and vegetables were made into pellets so as to get a specific size of tablets used in S8 TIGER WDXRF machine. Thereafter wavelength x-ray fluorescence (WDXRF) spectrometer was used in measurements (S8 TIGER, BRUKER QUANT
on 2.2.3.1, Germany). Diffracted x-rays were detected by the sealed proportional counter (10% of methane and 90% of Argon) for elements with low Z, and then for heavy elements measurements were done by employing NaI (TI)
The S8 TIGER WDXRF fast, with high
resolution and low background [24].
The data obtained were statistically analyzed using a statistical package SPSS Version 20 in combination with Microsoft Excel 2007. The
mparing the means of vegetables and soil samples were done by using Excel. The daily intake of metals (DIM) was determined by using equation 3 [25], while the health risk index (HRI) for the locals through the consumption of contaminated vegetables
mathematical equation
SSION
Concentrations in Soils
Essential elements (Ca, K, Si, S, Na, P and Mg) in the field study and the control area contained almost the same mean concentration values. The same distribution of macro and minor elements is due to the abundance of these elements on the

earth’s crust [14,17]. However Fig.
mean concentration of heavy metals, Cs, Al, Cl, Mn, Sr, Fe and Ni in mg/kg in the field area were above the detection with exception of Cl. Field sites had heavy metal values surpassing the control area (Fig. 3). Figs. 3 (a-c), shows the field area contains elevated concentration values of Sr. Cl, Cs, Mn and Ni more than the control area. This indicates that field soils have accumulated excess amount from the polluting source(s) which is enriching the soil via water runoffs or polluted atmosphere. These metals exposed to human being may pose health effects.
3.2 Elemental Concentrations in Vegetables
Results shown in Table 2 shows essential elements Ca, P, K, Si, Na, Mg and S were recorded in high amounts in both f
(a)
(c) (d)
Fig. 3. Soil pair concentration values of (a) Cl/ Mn, (b) Cs/ Al, (c) Sr/ Ni, andmetals in mg/kg from the field and control
0
20
40
60
FIELD CONTROL
53
0
Co
nce
ntr
ati
on
(m
g/k
g)
SoilMn Cl
0
10
20
30
40
FIELD CONTROL
4036
4
Co
nce
ntr
ati
on
(m
g/k
g)
Soil
Sr Ni
Koleleni and Tafisa; AJARR, 4(2): 1-17, 2019; Article no.
6
. 3 shows the mean concentration of heavy metals, Cs, Al, Cl, Mn, Sr, Fe and Ni in mg/kg in the field area were above the detection with exception of Cl. Field sites had heavy metal values surpassing the
c), shows the field area contains elevated concentration values of Sr. Cl, Cs, Mn and Ni more than the control area. This indicates that field soils have accumulated excess amount from the polluting source(s) which is enriching
r runoffs or polluted atmosphere. These metals exposed to human being may pose
Elemental Concentrations in
Results shown in Table 2 shows essential elements Ca, P, K, Si, Na, Mg and S were recorded in high amounts in both field and
control vegetables. Ca element showed the highest mean values of 4162±2.35 mg/kg, followed by K with mean values of 3893±2.89 mg/kg. Calcium is a macro element in the soil responsible for regulation of soil pH in plants (vegetables) and it is a mineral which helps in structuring of the bones in humans [26]. Each living cell contains K as a major ion. In man, K strengthens heart muscles and plays an important role in nerve impulses [27]. Other elements appear in the order of Si >S >Mg> Na. These elements are essential to plants, but in excess amounts become harmful to the surrounding community. The highest mean of 714±9.6 mg/kg for Cl was recorded in Chinese cabbages, followed by 620±2.36 mg/kg of recorded in Chinese cabbages too. These maximum concentrations of Fe exceed the standard limit set by FAO/WHO; hence the consumption of Chinese cabbage exposes the local residents to greater amount of Fe which could result into health problems.
(a) (b)
(c) (d)
Soil pair concentration values of (a) Cl/ Mn, (b) Cs/ Al, (c) Sr/ Ni, and (d) Fe/Al heavy
metals in mg/kg from the field and control areas
CONTROL
47
0
0
200
400
600
800
FIELD CONTROL
12 7
760
630
Co
nce
ntr
ati
on
(m
g/k
g)
Soil
Cs Al
CONTROL
36
0
0
500
1000
1500
2000
2500
FIELD CONTROL
2056 2040
760630
Co
nce
ntr
ati
on
(m
g/k
g)
Soil
Fe Al
; Article no.AJARR.48273
control vegetables. Ca element showed the 4162±2.35 mg/kg,
followed by K with mean values of 3893±2.89 mg/kg. Calcium is a macro element in the soil responsible for regulation of soil pH in plants
neral which helps in structuring of the bones in humans [26]. Each living cell contains K as a major ion. In man, K strengthens heart muscles and plays an important role in nerve impulses [27]. Other elements appear in the order of Si >S >Mg> Na.
ments are essential to plants, but in excess amounts become harmful to the
The highest mean value recorded in Chinese
620±2.36 mg/kg of Fe recorded in Chinese cabbages too. These
mum concentrations of Fe exceed the standard limit set by FAO/WHO; hence the consumption of Chinese cabbage exposes the local residents to greater amount of Fe which
(d) Fe/Al heavy

Koleleni and Tafisa; AJARR, 4(2): 1-17, 2019; Article no.AJARR.48273
7
Table 2 also shows heavy metals identified in this study as Ni, Mn, Sr, Cl, Al, Cs and Fe. Nickel were absent in control site vegetables as it was in soils. This implies that Ni was totally absent in control soils as well as in vegetables. Comparing field and control mean results reveals that, field vegetables were embedded with Ni toxic metal with values of 13±0.1 mg/kg. This amount is about 130 times the allowable limits of 0.1 mg/kg [28]. This value of Ni is alarming as reported that Ni could cause respiratory cancer [29]. Therefore, the Minjingues would be at a high risk of being affected with cancer via consumption of Ni polluted vegetables. The maximum concentration results of Ni recorded in China, Dera Ghazi vegetables by Latif [30] were ranging from 1.8 to 5.05 mg/kg. Comparing the maximum value of Ni (13±1.0 mg/kg) in this study, Ni is about 8 times higher than that recorded in Dera Ghazi. Thus, the Minjingues are exposed to greater health risk problems than Dera Ghazi inhabitants.
Table 2. The Mean concentration (mg/kg) of elements in vegetable samples of the field and control with their standard deviation
(A.M±SEM)
Heavy metals in all locations in the field were generally greater than the control site (Fig. 4 (a-d)). Iron is an element which is significant for the formation of chlorophyll and food production in plants; therefore Fe is highly needed by plants, but only in allowable limits of 425 mg/kg [31]. However, the concentration value of 620±2.36 mg/kg for Fe obtained in this study is far beyond maximum tolerable limits (MTLs). This excess amount of iron concentration in vegetables may be coming from the atmosphere and entering via leaf surface [27] and not roots because it seems
that roots limits the uptake of Fe from the soil since the Fe content in soils was less as compared with soils which contained 2059 mg/kg. Vegetables were also found to contain Cl with concentration values of 714 mg/kg in Minjingu field; however Cl was below the MDL in soils. The absence of Cl in soil and its availability in vegetables is precisely explained by Wertz of the University of Southern Mississippi when studying on the abundance of Al and Cl in soils and vegetables by using WDXRF. Wertz found that Cl was below MDL in soils while was abundant in leaves. Al on the other hand recorded below the MDL in vegetable leaves but was plenty in soils; therefore the author concluded that, abundance of Fe in soils influences Al peaks which cause Cl to fluctuate with Al [32]. In this study Cl and Al results have confirmed Werts to be true. Hence it can be said that, it is not that Cl is missing in soils rather it was interfered with the presence of Al.
Al is less available in vegetables (284 mg/kg) as compared to soils (760 mg/kg). This may be caused by limited transfer of Al to plants. However these levels are greater than WHO/FAO safe limits of 100 mg/kg, hence are able to cause potential health risks to the consumers. The amount of Al in Minjingu vegetables is about 3 times surpassing the WHO recommended value, which means that the Minjingu people are exposed to the greater risk of aluminum problems which include loss of memory and is associated with Parkinson’s disease [33].
Figs. 4(a) to 4(d) indicates that vegetables grown around the Minjingu mine contain elevated content of Sr, Ni, Fe, Al and Cs. The tendency of a plant to accumulate elevated levels of heavy metals not only depends upon the environmental contamination but also on plant species [34]. The soil to plant movement of metals is one of the principle components of human exposure via food chain [35].
From Table 3, results show that Mn lowest mean concentration 27±0.6 mg/kg was recorded in Chinese cabbages and maximum 91±2.4 mg/kg was observed in cowpea leaves of Mbulungu site. Ni highest concentration mean values of 13±0.1 mg/kg were recorded in cowpea leaves in Nkaiti and the lowest 2±0.01 mg/kg in Ethiopia mustard. This concentration level however, is greater than the MTLs of set by [36]. This implies
Element Field ( n=20) mg/kg
Control (n=5) mg/kg
A.M±sem A.M±sem
Ca 4162±2.35 4581±6.35 K 3893±2.89 3119±8.53 Si 295±1.4 372±1.65 Na 37±0.11 75±0.47 Mg 137±0.21 159±0.43 S 269±0.32 232±0.15 Mn 60±1.2 29±2.5 Sr 68±0.1 30±1.1 Fe 620±2.36 402±9.3 Al 284±1.13 108±3.7 Cs 56±0.5 49±1.4 Cl 714±0.7 19±0.5 Ni 13±0.1 MDL P 239±64 62±40
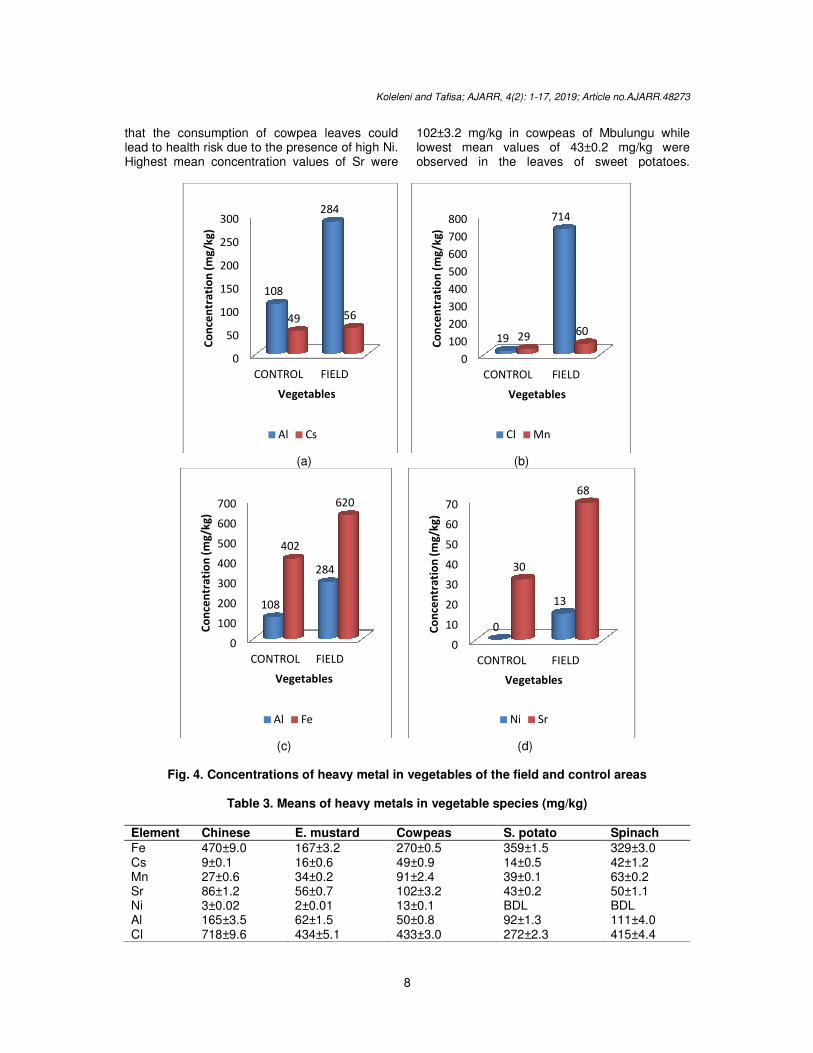
that the consumption of cowpea leaves could lead to health risk due to the presence of high Ni. Highest mean concentration values of Sr were
(a)
(c)
Fig. 4. Concentrations of heavy metal in vegetables of the field and control areas
Table 3. Means of heavy metals in vegetable species (mg/kg)
Element Chinese E. mustard
Fe 470±9.0 167±3.2Cs 9±0.1 16±0.6Mn 27±0.6 34±0.2Sr 86±1.2 56±0.7Ni 3±0.02 2±0.01Al 165±3.5 62±1.5Cl 718±9.6 434±5.1
0
50
100
150
200
250
300
CONTROL FIELD
108
284
49
Co
nce
ntr
ati
on
(m
g/k
g)
Vegetables
Al Cs
0
100
200
300
400
500
600
700
CONTROL FIELD
108
284
402
Co
nce
ntr
ati
on
(m
g/k
g)
Vegetables
Al Fe
Koleleni and Tafisa; AJARR, 4(2): 1-17, 2019; Article no.
8
that the consumption of cowpea leaves could lead to health risk due to the presence of high Ni.
oncentration values of Sr were
102±3.2 mg/kg in cowpeas of Mbulungu while lowest mean values of 43±0.2 mg/kg were observed in the leaves of sweet potatoes.
(b)
(c) (d)
Concentrations of heavy metal in vegetables of the field and control areas
Means of heavy metals in vegetable species (mg/kg)
E. mustard Cowpeas S. potato
167±3.2 270±0.5 359±1.5 16±0.6 49±0.9 14±0.5 34±0.2 91±2.4 39±0.1 56±0.7 102±3.2 43±0.2 2±0.01 13±0.1 BDL 62±1.5 50±0.8 92±1.3 434±5.1 433±3.0 272±2.3
FIELD
284
56
Vegetables
0
100
200
300
400
500
600
700
800
CONTROL FIELD
19
714
2960
Co
nce
ntr
ati
on
(m
g/k
g)
Vegetables
Cl Mn
FIELD
284
620
Vegetables
0
10
20
30
40
50
60
70
CONTROL FIELD
0
13
30
68
Co
nce
ntr
ati
on
(m
g/k
g)
Vegetables
Ni Sr
; Article no.AJARR.48273
102±3.2 mg/kg in cowpeas of Mbulungu while lowest mean values of 43±0.2 mg/kg were observed in the leaves of sweet potatoes.
Concentrations of heavy metal in vegetables of the field and control areas
Spinach
329±3.0 42±1.2 63±0.2 50±1.1 BDL 111±4.0 415±4.4

Moreover Cs maximum concentration means (42±1.2 mg/kg) were recorded in spinach of Mbulungu. These greater values of Cs show that spinach has greater capability of absorbing and translocating Cs than other vegetables. Thus, this is ascribed to the higher biomass of spinach leaves as compared to others [37].ascribed to its specie and higher transpiration rate to maintain growth and moisture content [38,39]. Aluminum metal had shown maximum mean values of 165±3.5 mg/kg in Chinese cabbages of Nkaiti and lowest of value 50±0.8 mg/kg was found in cowpeas. Fe highest concentration values were in Chinese cabbages of Nkaiti. Results confirm that cowpea leaves and Chinese cabbages of distant areas of Mbulungu and Nkaiti in Minjingu are highly affected as they contain maximum concentration values of Cs, Al, Ni, Fe, Sr and Mn. However Idara ya maji which is about 1km from the polluting source had Chinese cabbages which contained highest values of Cl. Spinach from all sites were
Fig. 5. Concentrations (mg/kg) of Fe, Al and Cl heavy metals in field vegetables
Fig. 6. Concentrations (mg/kg) of Ni, Mn and Sr heavy metals in field vegetables
Koleleni and Tafisa; AJARR, 4(2): 1-17, 2019; Article no.
9
Moreover Cs maximum concentration means (42±1.2 mg/kg) were recorded in spinach of Mbulungu. These greater values of Cs show that spinach has greater capability of absorbing and translocating Cs than other vegetables. Thus, this is ascribed to the higher biomass of spinach
. This may be ascribed to its specie and higher transpiration rate to maintain growth and moisture content
tal had shown maximum mean values of 165±3.5 mg/kg in Chinese cabbages of Nkaiti and lowest of value 50±0.8 mg/kg was found in cowpeas. Fe highest concentration values were in Chinese cabbages
Results confirm that cowpea leaves and Chinese cabbages of distant areas of Mbulungu and Nkaiti in Minjingu are highly affected as they contain maximum concentration values of Cs, Al, Ni, Fe, Sr and Mn. However Idara ya maji which
luting source had Chinese cabbages which contained highest values of Cl. Spinach from all sites were
contaminated with significant concentration values (Table 3). The highest peaks of Cl, Fe and Al are observed in Chinese cabbages in Fig. 5. From the grapFig. 5 it is distinctly clear that Chinese cabbages have greatest capacity of absorbing and retaining Cl, Fe and Al in their leaves. According to Fig. 6 cowpea leaves are embedded with Sr, Mn and Ni metals compared to other vegetables. This signifieability of cowpea leaves to up take heavy metals through both roots and shoots. Since cowpea leaves are highly desired and consumed by the Minjingu’s, the population after a long time of exposure might suffer health risks associated with ingestion of these metals. Moreover, Fig. 6 indicates that Ni toxic metal results were not recorded in sweet potato leaves and spinach. These vegetables do not absorb nickel probably due to their species [29]. Therefore spinach and leaves of sweet potatoes are contamination.
Concentrations (mg/kg) of Fe, Al and Cl heavy metals in field vegetables
Concentrations (mg/kg) of Ni, Mn and Sr heavy metals in field vegetables
; Article no.AJARR.48273
contaminated with significant concentration
The highest peaks of Cl, Fe and Al are observed in Chinese cabbages in Fig. 5. From the graph of Fig. 5 it is distinctly clear that Chinese cabbages have greatest capacity of absorbing and retaining
According to Fig. 6 cowpea leaves are embedded with Sr, Mn and Ni metals compared to other vegetables. This signifies the highest ability of cowpea leaves to up take heavy metals through both roots and shoots. Since cowpea leaves are highly desired and consumed by the Minjingu’s, the population after a long time of exposure might suffer health risks associated
stion of these metals. Moreover, Fig. 6 indicates that Ni toxic metal results were not recorded in sweet potato leaves and spinach. These vegetables do not absorb nickel probably due to their species [29]. Therefore spinach and
free from Ni
Concentrations (mg/kg) of Fe, Al and Cl heavy metals in field vegetables
Concentrations (mg/kg) of Ni, Mn and Sr heavy metals in field vegetables

Koleleni and Tafisa; AJARR, 4(2): 1-17, 2019; Article no.AJARR.48273
10
In Figs. 7 (a) to 7 (e), the metal with a highest content in each vegetable was Cl and was in decreasing order of 56% in Ethiopian mustard, 51% in Chinese cabbages, 43% in cowpea leaves, 41% in spinach and 33% in sweet potato leaves. This is opposed to western Saudi Arabia were 98% of vegetables contained Ni [38]. The difference between the highest percentages of metal content is determined by the polluting source. Saudi Arabia source of heavy metal in vegetable was waste water used for irrigation from Bani Malik waste water treatment plant while Minjingu vegetable polluting source is ascribed to the phosphate mine. Another metal found in excess was Fe. Iron enriched vegetables act as good booster for blood hence a remedy for anemia to the vegetable consumers [31] especially sweet potato leaves. It is confirmed in this study that sweet potato leaves are good Fe accumulators thus can be used as a remedy for shortage of blood in Fig. 7 (d).
Though Ni, Sr, Mn and Cs showed low percentage values compared to Cl and Fe but are even more hazardous to the vegetable consumers than the latter because they contain concentration values higher than the allowable limits. Once MTLs set for heavy metals are crossed, the exposed population is in danger of encountering health hazards. Cowpea leaves contain the highest percentage of Ni, 1%, Mn, 9%, Sr, 10% and Cs, 5% compared with all vegetable types in Fig. 7 (c).The order of contamination by heavy metals is cowpea leaves>spinach>Chinese cabbage. Thus cowpea leaves has extremely high capacity of translocating and retaining heavy metals, and so its continual use may bring about health risks, and
] concluded that cowpea leaves contributed
large amount of Cd [40]. Spinach should be also of concern because Dotse [40] in East Tennessee, USA reported that
(a) (b) (c)
(d) (e)
Fig. 7. Distribution of heavy metal concentration (%) in each vegetable species studied
Fe
33%
Cs
1%
Mn
2%
Sr
6%
Ni
0%
Al
7%
Cl
51%
Chinese
cabbageFe
22%Cs
2%Mn
5%
Sr
7%Ni
0%
Al
8%
Cl
56%
Ethiopian
mustard
Fe
27%
Cs
5%
Mn
9%Sr
10%
Ni
1%Al
5%
Cl
43%
Cowpea
leaves
Fe
44%
Cs
2%
Mn
5%
Sr
5%
Ni
0%
Al
11%
Cl
33%
Sweet potato
leavesFe
33%
Cs
4%Mn
6%Sr
5%
Ni
0%
Al
11%
Cl
41%
Spinach

Koleleni and Tafisa; AJARR, 4(2): 1-17, 2019; Article no.AJARR.48273
11
spinach contained Cd which exceeded safe limits. Kayastha in Bhaktapur [41], Nepal reported that spinach had high accumulation tendency of metals compared with other species of vegetables. [42] in Bangladesh reported of spinach accumulating high amount of heavy metals. Even in this study spinach has shown high ability of retaining toxic metals. Therefore from the present study, cowpea leaves and spinach grown in Minjingu village should be tested of heavy metals before consumption because they are significant heavy metal retainers.
3.3 Daily Intake of Metals (DIM) and
Hesalth Risk Index (HRI) Assessment The Daily Intake of Metals (DIM) is the average daily heavy metal intake through consumption of food per person per day. There are several significant pathways of exposure to man. The most important pathway is through food chain. The degree of heavy metal toxicity lies entirely upon their daily intake [43] In this study, the possible pathway assumed to be the intake for Ni, Cl, Mn, Sr, Al, Cs and Fe heavy metals via consumption of contaminated vegetables. The DIM presented in Table 4 was determined by using equation 1 [36].
)1...(........................................W
IKCDIM
i××
=
where Ci is the heavy metal concentration of element i (mg/kg), K is a conversion factor (0.085) as given by [44], W is the average adult body weight (60 kg) as given by [37], I is the daily vegetable intake of Cowpea leaves, Chinese cabbage, Ethiopian mustard, sweet potato leaves and spinach, according to FAO/ WHO
consumption rate of 240 mg/kg of vegetables in Tanzania [45,46].
The DIM results in the current study, from the lowest to the highest DIM followed the order of 4.42E-03, 15.5E-02, 1.7E-02, 2.31E-02, 9.6E-02 and 2.11E-01(mg/kg bw per person per day) for Ni, Cl, Mn, Sr, Al and Fe, respectively. The DIM for Mn obtained by Nkuba in cereals at Minjingu were 6.47E-02 and 4.80E-02 (mg/kg/d) for maize and mung beans, respectively. This amount is less than that obtained in this study (1.7E-01), this shows that leafy vegetables tend to accumulate high concentration values of metals compared to cereals and fruit vegetables [47]. In Saudi Arabia [31] found 3.20E-03, 4.06E-02 and 1.90E-03 DIM in mg/kgbw/day for Ni, Mn and Fe, respectively. This DIM amount of Saudi Arabia is lower than that of Minjingu except for Mn.
Health risk associated with heavy metals is estimated through calculation of the level of human exposure for a particular metal by identifying the exposure route of a pollutant to the body. Many possible ways for heavy metals rely upon soil and contaminated food paths to the people.
.The consumption of vegetables enrich
the population with higher concentration of toxic metals which on entering human body result into detrimental health effects [41]. In this study the concentration values obtained from the vegetable samples collected from Minjingu village were used to calculate the health risk index (HRI). The values of HRI depend upon the daily intake of metals (DIM) and Oral Reference Dose (RfD). The RfD is the metal estimated exposure per day to the human body that has no risk effects for the life time. An index value >1 for HRI is considered to cause health problems to humans [26].
Table 4. The DIM and HRI values of vegetables in this study
Element CONC.
(mg/kg)
WHO (MTL)= =
(mg/kg)
DIM
(mg/kg/d)
RfD
(mg/kg/d)
HRI
Mn 60 500
2.04E-02 0.14#.
1.46E-01
Al 284 100 9.7E-00 60*
1.616E-01
Cl 714 - 2.4E-00 3400**
7.16E-04
Fe 620 450 2.11E+01 15***
1.466E-00
Ni 13 0.1 4.42E-01 0.04**
11.05E-00
Sr 68 - 2.312E-00 1.6***
15.41E-00
Cs 56 - - - - *[50],
**[49],
##[52],
***[51] and
# [48]

Koleleni and Tafisa; AJARR, 4(2): 1-17, 2019; Article no.AJARR.48273
12
The HRI for Ni, Sr, Fe, Al, Mn, Cl and Cs by eating contaminated vegetables was calculated by the equation;
HRI=DIM/RfD (2) Where DIM represent daily intake of metals via consumption of vegetables and RfD is the reference dose value for Mn, Al, Cl, Fe, Ni, Sr and Cs was 0.14, 60, 3400, 15, 0.04, 1.6 in mg/kg bw/ day, respectively [48-53]. However, Cs RfD information was limited. HRI due to heavy metals via dietary intake of vegetables in this study were 1.46E-01, 1.616E-01, 7.16E-04, 1.466E-00, 11.05E-00 and 15.41E-00 for Mn, Al, Cl, Fe, Ni and Sr, respectively. The HRI from this study were found to be above the FAO/WHO safe limits (HRI>1) except for Al and Cl. Several studies conducted around the world including Khan [54] and Pan [55] revealed HRI was less than 1,indicating no health risk, In this study, high concentration levels were above MTLs and HRI was greater than 1 for Sr, Ni and Fe. This indicates that the consumption of vegetables particularly cowpea leaves, Chinese cabbages and spinach may cause health risk to the Minjingu inhabitants. Cs on the other hand, although it’s data for oral reference dose and concentration threshold were limited, the results from the current study recorded the concentration of 56 mg/kg, being a toxic metal this amount of Cs suggests the occurrence of health risk among the residents. Therefore, the consumption of Cs contaminated vegetables should not be underestimated.
3.4 Essential Elements Calcium The level concentration of Ca usually depends on the nature of the soil. Calcium is mostly abundant in alkaline soils. In the present study Ca showed the maximum means of 1030±5.54 mg/kg in soils and 4162±2.35 mg/kg in vegetables. Khan [56] reported the highest concentration value of 932.69 mg/kg for Ca. The concentration of Ca in this study is about five times higher than that of sDhaka; this indicates that Minjingu soils are more alkaline than Dhaka’s soils. Ca also plays an important role in bone formation in the body. About 99% of Ca is enclosed in the bones and teeth [57].
Magnesium Magnesium is needed by human body for building of red blood cells; reduce mental depression and maintenance of various mechanisms [58]. High amount of Mg in associated with mental depression while its shortage results in abnormal irritability of muscles and convulsions [59]. In this study 83±0.8 mg/kg concentration of Mg was recorded in soil and 137±0.21 mg/kg in vegetables, this amount is lower than that obtained in Dhaka (920.67 mg/kg) [56]. Phosphorus and Sodium In the current study, phosphorus concentration levels ranged from 0-121 in soils and 85-584 mg/kg in vegetables. Phosphorus is found in greater amounts in vegetables as compared to soils. All body cells contain phosphorus with 85% present in teeth and bones. Phosphorus is primarily used for growth and repair of body cells, its shortage cause weakness in bones [60]. In the present study Na was found in a range of 0-68 mg/kg in soils and vegetable contained 0-218 mg/kg. Na is important for normal metabolism functioning of the body. The ratio of potassium to sodium in any meal is an important factor in that; while Na enhances blood pressure K depresses it [60]. Silicon and sulphur Si is the most abundant micro element on the earth’s crust. It is nontoxic, plays an important role in bone calcification. This element helps plants to resist diseases [61]. The mean concentration levels for Si were 3547±1.6 mg/kg in soil while in vegetables were 295±1.4 mg/kg. This indicates that vegetables generally have a limited uptake of Si. Sulphur on the other hand ranged from 0-36 mg/kg in soils, but showed the highest range of 22-705 mg/kg in vegetables. This might be attributed to plants having greater ability to absorb S because it is a macro element. S is the major component of DNA. Potassium Potassium is an essential element needed by plants due to its metalloenzymes. Human beings also need potassium for normal growth rates. When this element exceeds the required amount in the blood may cause abnormal breakdown of protein and reduce renal function. This results into serious damaging of gastro intestines [26]. In

Koleleni and Tafisa; AJARR, 4(2): 1-17, 2019; Article no.AJARR.48273
13
the soils of this study, K ranged from 737-2515 mg/kg and 747-8005 mg/kg in vegetables. This increase of concentration range in vegetables suggests that the source is other than soil, associated with anthropogenic sources. Khan [58] in Bangladesh obtained a mean concentration (864.28 mg/kg) of K, in this study the mean values for K were 3893±2.89 mg/kg, this amount is about six times higher than that of Bangladesh. Nickel Nickel showed a range of 0-11 mg/kg in soil and 0-13 mg/kg in vegetables in this study. The range of 0.77 to 1.20 mg/kg was recorded in vegetables in Tehran by Shirkhanloo [62]. While in Durban, South Africa a range of 0.03-1.14 mg/kg was recorded by Gupta [63] and Khan in Dhaka recorded a range of 0.25-1.51 mg/kg of Ni [56]. In all these ranges the highest is that of Minjingu, this suggests that the vegetables in Minjingu especially cowpea leaves of Mbulungu and Nkaiti are highly contaminated with Ni far greater than the permissible limits of 0.1 mg/kg. The higher levels of Ni cause nasal and lung cancers, asthma and hypoglycemia while the low intake of Ni is associated with depression, fatigue and hyperglycemia [66]. In the present study the highest mean for Ni obtained in vegetables was 13±0.1 mg/kg. Manganese and Strontium Sr is an essential element but in excess amount causes rickets as it replaces Ca and be retained instead in the bones. [17]. Manganese is needed for the formation of bone tissues and making of genetic proteins [57]. However, high intake of Mn is toxic. In this study Mn ranged from 0-80 in soils and 0-280 in vegetables. Gupta got a range of 0.37-28.50 mg/kg in Durban [65]. This amount from Durban is more than three times that obtained in the current study. Minjingu showed the mean concentration of Mn (60±0.2 mg/kg) while Gupta [632] reported the mean of 137.3 mg/kg in Mn. However in India, the largest mean of 306.6 mg/kg was recorded by Chabukdhara [66]. These concentration values of Mn from other studies are higher than that obtained in this study. Cesium and Chlorine
Cesium is a toxic metal having no known benefit to humans. As a stable element
133Cs is naturally
found in ores, but can easily enter and be
deposited into plant’s tiny tissues [67]. In the current study Cs showed a range of 0-32 mg/kg and 0-98 mg/kg in soil and vegetables, respectively. The mean of 12±0.3 mg/kg was recorded in soil while in vegetables the mean of 56±0.5 mg/kg was observed. Unfortunately for comparison purposes, the literature for Cs was limited, the researcher conquer with Melnikov and Zanoni about Cs when they concluded in their review that full knowledge and toxicity of Cs is not available [68]. The radioactive
36Cl has been identified as an
environmental contaminant. 36
Cl may damage arteries, generate excessive free radicals which have been linked with changing of cellular DNA. Cl has ability to destroy antioxidants needed to counteract free radicals for anti cancer [69]. In this study vegetables exhibited a range of 84-1076 mg/kg; however in the study conducted by Koleleni [70] in Dar es Salaam city observed the highest range of Cl in amaranth (2950-3370 mg/kg) which is higher than that obtained in this study. Therefore, it is evident that heavy metal from the contamination source can transfer by means of air and enter the plants (vegetables), eventually to the local residents via consumption of vegetables may be at risk of being affected by dioxins essentially because all vegetables in this study contained high percentages of chlorine. Aluminum Al is the most abundant metal on earth. Aluminum, (
13Al) has twenty five known isotopes,
but the only stable isotope is 27
Al. The 26
Al is the only radioisotope of
13Al. Aluminum is principally
produced from Argon in the atmosphere by spallation caused by cosmic ray proton [33]. Exposure to intolerable levels of Al may be a source of respiratory and neurological disorders. Studies have confirmed that this metal, Al is partly responsible for brain loss and a source of diseases such as Parkinson’s disease, anemia, dementia, blood and dental problems [71]. In this study Al concentration ranged from 561-942 mg/kg in soils, and 23-286 mg/kg in vegetables. Iron In this study, Fe ranged from 121-4748 mg/kg in soils and in vegetables were 70-835 mg/kg. The range of 1.70-22.60 mg/kg was found in plants [55]. About this study, the mean concentration in soil was 2090±4.2 mg/kg, while in vegetables the concentration dropped to 620±2.36 mg/kg. This lower uptake of Fe in vegetables could be

Koleleni and Tafisa; AJARR, 4(2): 1-17, 2019; Article no.AJARR.48273
14
associated with poor ability of vegetables species to absorb Iron. However the concentration is still higher than the allowable limits of 425 mg/kg of FAO/WHO, therefore the continual consumption of vegetables especially Chinese cabbage which contain greater amount of Fe may lead to hazardous health risks to Minjingu inhabitants. However in required amounts Fe helps in the formation of hemoglobin, oxidation of starch, protein, fat and controls the normal functioning of the central nervous system [64], while the low intake of Fe cause anemia, and tiredness [72].
4. CONCLUSIONS
The main objective of this study was to investigate the heavy metal concentration values in both soils and vegetables samples of Minjingu village near the Minjingu phosphate mine. The Wavelength Dispersive X-ray Fluorescence (WDXRF) recorded the concentration of 7 essential metals (Ca, K, Si, P, Mg, S and Na) and 7 heavy metals (Ni, Fe, Al, Cl, Cs and Mn). The concentration values of heavy metals in field study were higher than the control site.
The DIM and HRI values for the metals indicated that the population experienced the health risk because HRI>1 in vegetables. This is thought to be highly contributed by the duo absorption phenomena of leafy vegetables, via either ways roots and through leaves. Thus vegetable consumers may experience serious health problems due to the prolonged operations of the Minjingu open cast mine if at all immediate measures will not be taken to remediate the situation.
The presence of radioactive elements such as Sr, Cl and Al detected particularly in vegetables may pose deleterious health risks to the surrounding community consuming these vegetables due to the continual internal exposure. It is advised that the consumption of cowpea leaves, spinach and Chinese cabbages should be reduced to the maximum where possible be abandoned while Ethiopian and sweet potato leaves may be consumed but in very minimal quantities. This is because Chinese cabbages, spinach and cowpea leaves were found to have extremely high content of Sr, Ni and Fe trace metals (HRI>1) beyond set limits able to pose health risk to the consumers.
COMPETING INTERESTS
Authors have declared that no competing interests exist.
REFERENCES 1. Yang J, Lv F, Zhou J, Song Y, Li F, Zhou
J, Song Y, Li F. Health risk assessment of vegetables grown on the contaminated soils in Daye of Hubei-Province, China. Joural of Sustainability. 2017;7:2141-2155.
2. Oyekanmi A, Okibe F, Dauda WP. Toxic levels in water and some vegetable crops grown in farms and Bade Local Government Area of Yobe State, Nigeria. Asian Jurnal of Physicsl and Chemical Sciences. 2018;6(2):1-12.
3. Funtua MA, Agbaji EB, Pam AA. Heavy metals contents in soil and some crops irrigated along the Bindare Stream Zaria-Kaduna State, Nigeria. American Chemical Science Journal 2014;4(6):855-864.
4. Timoori S. Analytical methods in environmental evaluation of heavy metals pollution in Esfahan Industrial Zone from soils, well/ eluent waters and waste water by micro-wave- electro-thermal atomic absoption spectrometry. Analytical Methods in Environmental Chemistry Journal. 2019;2(01):55-62.
5. Li R, Wu H, Ding J, Fu W, Gan L, Li Y. Mercury pollution in vegetable grains and soils from areas surrounding coal-fired power plants. Scientific Report Journal. 2017;7:46545-46554.
6. Mohamed NK, Nkuba LL. Concentration levels and the associated health risks Oof elements in food crops in the nighbourhood of Minjingu Phosphate Mine, Tanzania. Chemical Science International Journal. 2017;18:1-9.
7. Bahemuka TE, Mubofu EB. Heavy metals in edible green vegetables along the sites of the Sinza and Msimbazi rivers in Dar es salaam, Tanzania. Food Chemistry. 1999;66:63-66.
8. Weinberger K, Msuya JM. Indigenous vegetables in Tanzania-significance and prospects. The World Vegetation Center, Taiwan. 2004;31:70-81.
9. Mohammed NK, Khamis OF. Assessment of heavy metal contamination in vegetables consumed in Zanzibar. Natural Science Journ. 2012;4:588-594.
10. Mubofu EB. Heavy metal content in some commonly consumed vegetables from Kariakoo Market, Dar es Salaam, Tanzania. Tanzania J. of Scie. 2012;38(3): 201-208.
11. Amour KO. Assessment of heavy metal concentration in soils and green

Koleleni and Tafisa; AJARR, 4(2): 1-17, 2019; Article no.AJARR.48273
15
vegetables (Vigna unguiculata) around the Volcanic Mountain of Oldoinyo Lengai in Ngorongoro District Arusha, Tazania. MSc (physics) Dissertation. Depatment of Physics, University of Dar es Salaam; 2004.
12. Turpeinen R. Interactions between metals, microbes and plants- bioremediation of arsenic and lead contaminated soils. Academic Dissertation, Department of Ecological and Environmental Sciences, University of Helsinki; 2002.
13. Loska K, Wiechula D, Kovus I. Metal contamination of farming soils affected by industry. Environ. Int. 2004;30:159-165.
14. Lagisz M, Laskowiski R. Evidence for between- generation effects in carabids exposed to heavy metal pollution. Ecotoxicology. 2008;17:59-66.
15. Okonkwo NC, Igwe JC, Onwuchekwa EC. Risk and health implications of polluted soils for crop production. African J. of Biotechnology. 2005;4(13):1521-1524.
16. Zhou H, Yang WT, Zhou X, Liu L, Feng Gu J, Wang WL, Zou JL, Tian T, Peng PQ, Liao BH. Accumulation of heavy metal in vegetables species planted in contaminated soils and the health risk assessment. Int. J. Environ. Res. Public Health. 2016;13(3):289.
17. Fleischer M. The abundance and chemical distribution of chemical elements in the Earth’s crust. J. Chem. Educ. 1954;31(9): 446-455.
18. Balkhair KS, Ashraf MA. Field accumulation risks of heavy metal in soil and vegetable crop irrigated with sewage water in Western Region of Saudi Arabia. J. of Biological Sciences. 2015;23:32-44.
19. Khan S, Cao Q, Zheng YM, Huang YZ, Zhu YG. Health risks of heavy metals in contaminated soils and food crops irrigated with waste water in Beijing, China. Environmental Pollution Journ. 2008; 152(3):686-692.
20. Banzi FP, Kifanga LD, Bundala FM. Natural radioactivity and radiation exposure at the Minjingu Phosphate mine in Tanzania. Journ. Radiol. Prot. 2000;20(1):41-51.
21. URT (United Republic of Tanzania). Population distribution and housing census by Administrative Areas National Bureau of Statistics. Ministry of Finance, Dar es Salaam; 2012.
22. Dean WE Jr. Determination of carbonate and organic matter in calcareous
sediments and sedimentary rocks by loss on Ignition: Comparison with other methods. Journ. of Sed. Petrol. 1974;44: 242-248.
23. Heiri O, Lotter AF, Lemcke G. Loss on ignition as a method for estimating organic and carbonate content in sediments: Reproducibility and comparability of result. Journ. of Paleolimnology. 2001;25:101-110.
24. Schlotz R, Uhlig S. Introduction to X- ray Fluorescence (XRF). Bruker AXS GmbH, Karlsruhe, West Germany. 2006;2-42.
25. Khan S. Health risks of heavy metals in contaminated soils and food crops irrigated with wastewater in Beijing, China. Environmental Pollution. 2008;152:686–692.
26. Haas EM. Role of potassium in maintaining health. Periodic Paralysis Int. J. 2011;21:31.
27. Yang Y, Zhang FS, Li HF, Jiang RF. Accumulation of cadmium in the edible parts of six vegetable species grown in Cd-contaminated soils. J. Environ. Manag. 2009;90:1117-112.
28. FAO. The State of the World’s Land and Water Resources for Food and Agriculture (SOLAW) Managing Systems at Risk 2011a, Food and Agriculture Organization of the United Nations/Earth Scan, Rome, London; 2011.
29. Latif A, Bilal M, Asghar W, Azeem M, Ahmad MI, Abbas A, Ahmad MZ, Shahzad T. Heavy metal account in vegetables and assessment of their potential health risk. Journ. of Environ. Analytical Chem. 2018;5(1):234.
30. Chao Su, LiQin J, Zhang WJ. A review of heavy metal contamination in the soil worldwide: Situation, impact and remediation techniques. International Academy of Ecology Environmental Sciences. Hong Kong, China; 2014.
31. Al Jassir MS, Shaker A, Khalid MA. Deposition of heavy metal on green leafy vegetables sold on roadsides of Riyadh City, Saudi Arabia. Bull. Environ. Toxicology. 2005;75:1020-1027.
32. Wertz DL, Winters A, Craft T, Bratton WH, Patrick D, Lemire RA. International Center for Diffraction Data (ICDD); Advances in X-ray Analysis. University of Southern Mississippi; 2004.
33. Meija J, Tyler B, Berglund CM, Brand AB. Atomic weights of the elements 2013

Koleleni and Tafisa; AJARR, 4(2): 1-17, 2019; Article no.AJARR.48273
16
(IUPAC Technical Report) Pure and Applied Chemistry. 2016;88(3):265-91.
34. Yang YB, Sun LB. Status and control counterermea sures of heavy metal pollution in urbarn soils. Environmental Protection Science. 2009;35(4)79-81.
35. Rattan RK, Datta SP, Chhonkar PK, Suribabu K, Singh AK. Long-term impact of irrigation with sewage effluents on heavy metals content in crops and groundwater: A case study. Agriculture Ecosystem Environment. 2005;109:310-322.
36. FAO/WHO. Joint FAO/WHO Food Standards Programme-Codex Alimentarius Commission. Report of the 33
rd Session of
the Codex Committee on Food Additives and Contaminants, the Netherlands; The Hague; 2001.
37. Agrawal SB, Anita S, Sharma RK, Agrawal M. Bioaccumulation of heavy metal in vegetables: A threat to human health. Terrestrial and Aquatic Environmental Toxicology. 2007;1(2):13-23.
38. Steinborn M, Breen J. Heavy metal in soil and vegetation at shallee mine silver mines Tippa ray biology and environment. Proceedings of the Royal Irish Academy. 1999;37-42.
39. Barington T, Nielsen C, Lillevang ST. Alternative splite variants of human PD-1 gene. Journ. Research Article. 2005;7:7.
40. Dotse CK. MSc Thesis, Department of Chemistry, East Tennessee State University; 2010.
41. Kayastha SP. Heavy metal pollution of agricultural soils and vegetables of Bhaktapur Centra District, Nepal. Scientific World. 2014;12(12):48-55.
42. Nasser HM, Sultan S, Gomes R, Shamsun N. Heavy metal pollution of soil and vegetables near Roadside at Gazpur, Bangladesh. Journ. of Agricultural Research. 2012;37(1):1-17.
43. Singh A, Sharma RK, Agrawal M, Marshall FM. Health risk assessment of heavy metals via dietary intake of food stuffs from the wastewater irrigated site of a dry tropical area of India. Food Chem. Toxicol. 2010;489(2):611-619.
44. Codex Alimentarius Commission (CAC) Joint FAO/WHO Food Standards Programme, Report of the forty-sixth Session of the Codex Committee on Food Additives. 2014;17-21.
45. WHO. Fruit and vegetable promotion initiatives/a meeting report; Report of the Meeting, 29; 2004.
46. Bokhari BJ. Assessment of heavy metal concentration in vegetables and different soil types in KLuang-kota Tinggi Area Johr, Malaysia, Thesis of Masters of Agric. Scie. University of Putra, Malaysia; 2006.
47. Zhang WJ, Jiang FB, Ou JF. Global pesticide consumption and pollution: With China as a Focus. Proceedings of the International Academy of Ecology and Environmental Sciences. 2011;1(2):125-144.
48. U.S. EPA Health Effects Support Document for Manganese, U.S. Environmental Protection Agency Office of Water (4304T), Health and Ecological Criteria Division, Washington, DC, 20460; 2003.
49. FAO/WHO Guidelines for the safe use of water and Foodstuffs, Water use in Agriculture, World Health Organization, Geneva. 2013;2(14):988.
50. EEA Soil Pollution by Heavy Metal Europe’s Environment the Debris Assessment European Environmental Agency Office Des. Publications Luxembourg; 1995.
51. Lenntech Water Treatment and Air Purification Water Treatment Published by Lenntech, Rotterdam Sewage, Netherlands; 2004.
52. U.S. EPA Report on the 2013 U.S. (EPA). International Decontamination Research Development Conference, Washington DC EPA/600/R-14/210; 2013.
53. Khan ZI, Ahmad K, Akran NA, Mehmood N, Sumaira Y. Heavy metal contamination in water, soil and potential vegetable Garlic (Allium sativum L) in Punjab, Pakistan. Pak. Journ. of Botany. 2017;49(2):547-552.
54. Khan MA, Ahmed I, Rahma I. Effects of environmental pollution on heavy metals content of Withania somnifera. J. Chinese Chem. Soc. 2007;54(2):339-343.
55. Pan XD, Wu PG, Jiang XG. Levels and potential healthy risk of heavy metals in marketed vegetables in Zhenjiang, China. Scientific Report 6. 2016;20317.
56. Khan MRL, Satter MA, Jabin SA, Abedin N, Islam MF, Lisa LA, Paul DP. Mineral and heavy metal contents of some vegetables available in local market of Dhaka City in Bangladesh. Journal of Environmental Scie. Toxicology and Food Technology. 2015;9(5):1-6.

Koleleni and Tafisa; AJARR, 4(2): 1-17, 2019; Article no.AJARR.48273
17
57. Brody T. Nutrition Biochemistry San Diego, Academic Press; 1994.
58. World Health Organization. Fruit and vegetable promotion initiatives/a meeting report. Report of the Meeting. 2004;29.
59. Schwalfenberg GK, Genuis SJ. The importance of clinical magnesium in clinical health care review article. In: Scintifica. Department of Family Medicine University of Alberta, Canada. 2017;1-14.
60. Gutierrez OM. Sodium and phosphorus-based food additives: Persistent but surmountable hurdles in the management of nutrition in chronic kidney diseases. Advanced in Chronic Kidney Diseases. 2013;20(2):150-156.
61. Shoroveller AK, Stoll B, Ball RO, Burrin DG. Nutritional and functional importance of intestinal sulphur amino acid metabolism. The Journal of Nutrition. 2005;135(7):1609-1612.
62. Shirkhanloo H, Shirkhanloo N, Moussavinajarkola SA, Farahani H. The evaluation and determination of heavy metal pollution in edible vegetables, water and soil in South of Tehran Province by GIS. Archives of Environ. Protection. 2015;41(2):64-74.
63. Gupta SK, Ansari FA, Nasr M, Chabukdhara M, Bux F. Multivariate analysis and health risk assessment of heavy metal contents in food stuffs of Durban South Africa. Environment Monit. Assessment. 2018;190(3).
64. Fischer DC, Jensen C, Rahn A, Salewsk B, Kundit G, D’Haese PC, Heffner D, Behets GJ. Moderate strontium loading induces rickets in rats with, mild chronic
renal failure. Kidney Blood Press Res. 2011;34:375-381.
65. Avila DS, Puntel RL, Aschner M. Manganese in health and diseases. Review in Metal ions in Life Sciences. 2013;1:199-277.
66. Chabukdhara M, Monjal A, Nema AK, Gupta SK, Kaushal RK. Heavy metal contamination in ground around peri-urban and urban industrial clusters in Ghaziabad, India. Human and Ecological Risk Assessment. An International Journ. 2016;22(3):736-752.
67. Ghosh A, Sharma A, Talukder G. Effects of cesium on cellular systems. Biol. Trace Elem. Res. 1993;38:165-172.
68. Melnikov P, Zanoni L. Clinical effects of cesium intake. Literature Review, Biological Trace Element Research. 2009;135(1-3):1.
69. Hatterskey JG. Orthomolecular.org. The Journal of Medicine Rol 152 2
nd Quarters.
The Negative Health Effects of Chlorine; 2000.
70. Koleleni YIA. Elemental composition of vegetables in the Dar e Salaam Market using WDXRF analysis. Merit Research Journal of Food Science and Technology. 2016;4(1):001-008.
71. Klotz K, Weistenhofer W, Drexler H. Effects of aluminium exposure. Deutusclus Arzblatt International. 2017;144(39):653-659.
72. Abbspour N, Harrell R, Kelishad R. Review on iron and its importance for human health. Journ. of Res. In Medical Sciences. University of Medical Scie. 2014;19(2):164-174.
© 2019 Koleleni and Tafisa; This is an Open Access article distributed under the terms of the Creative Commons Attribution License (http://creativecommons.org/licenses/by/4.0), which permits unrestricted use, distribution, and reproduction in any medium, provided the original work is properly cited.
Peer-review history: The peer review history for this paper can be accessed here:
http://www.sdiarticle3.com/review-history/48273