Caffeine Concentrations in Coffee, Tea, Chocolate, and ...
9
Nicotine & Tobacco Research, 2017, 484–492 doi:10.1093/ntr/ntw192 Original investigation Advance Access publication July 25, 2016 Published by Oxford University Press on behalf of the Society for Research on Nicotine and Tobacco 2016. This work is written by (a) US Government employee(s) and is in the public domain in the US. 484 Original investigation Caffeine Concentrations in Coffee, Tea, Chocolate, and Energy Drink Flavored E-liquids Joseph G. Lisko MS 1 , Grace E. Lee MPH 2 , J. Brett Kimbrell BS 3 , Michael E. Rybak PhD 4 , Liza Valentin-Blasini PhD 1 , Clifford H. Watson PhD 1 1 Tobacco and Volatiles Branch, Division of Laboratory Sciences, National Center for Environmental Health, Centers for Disease Control and Prevention, Atlanta, GA; 2 Tobacco and Volatiles Branch at the Centers for Disease Control and Prevention, Battelle Memorial Institute, Columbus, OH; 3 Tobacco and Volatiles Branch at the Centers for Disease Control and Prevention, Oak Ridge Institute for Science and Education (ORISE), Oak Ridge, TN; 4 Nutritional Biomarkers Branch, Division of Laboratory Sciences, National Center for Environmental Health, Centers for Disease Control and Prevention, Atlanta, GA Corresponding Author: Joseph G. Lisko, MS, Tobacco and Volatiles Branch, Division of Laboratory Sciences, National Center for Environmental Health, Centers for Disease Control and Prevention, 4770 Buford Highway, Atlanta, GA 30341, USA. Telephone: 770-488-7457; Fax: 770-488-4139; E-mail: [email protected] Abstract Introduction: Most electronic cigarettes (e-cigarettes) contain a solution of propylene glycol/glycerin and nicotine, as well as flavors. E-cigarettes and their associated e-liquids are available in numer- ous flavor varieties. A subset of the flavor varieties include coffee, tea, chocolate, and energy drink, which, in beverage form, are commonly recognized sources of caffeine. Recently, some manufactur- ers have begun marketing e-liquid products as energy enhancers that contain caffeine as an additive. Methods: A Gas Chromatography-Mass Spectrometry (GC-MS) method for the quantitation of caf- feine in e-liquids was developed, optimized and validated. The method was then applied to assess caffeine concentrations in 44 flavored e-liquids from cartridges, disposables, and refill solutions. Products chosen were flavors traditionally associated with caffeine (ie, coffee, tea, chocolate, and energy drink), marketed as energy boosters, or labeled as caffeine-containing by the manufacturer. Results: Caffeine was detected in 42% of coffee-flavored products, 66% of tea-flavored products, and 50% of chocolate-flavored e-liquids (limit of detection [LOD] – 0.04 µg/g). Detectable caffeine concentrations ranged from 3.3 µg/g to 703 µg/g. Energy drink-flavored products did not contain detectable concentrations of caffeine. Eleven of 12 products marketed as energy enhancers con- tained caffeine, though in widely varying concentrations (31.7 µg/g to 9290 µg/g). Conclusions: E-liquid flavors commonly associated with caffeine content like coffee, tea, choco- late, and energy drink often contained caffeine, but at concentrations significantly lower than their dietary counterparts. Estimated daily exposures from all e-cigarette products containing caffeine were much less than ingestion of traditional caffeinated beverages like coffee. Implications: This study presents an optimized and validated method for the measurement of caf- feine in e-liquids. The method is applicable to all e-liquid matrices and could potentially be used to ensure regulatory compliance for those geographic regions that forbid caffeine in e-cigarette products. The application of the method shows that caffeine concentrations and estimated total caffeine exposure from e-cigarette products is significantly lower than oral intake from beverages. However, because very little is known about the effects of caffeine inhalation, e-cigarette users should proceed with caution when using caffeine containing e-cigarette products. Further research is necessary to determine associated effects from inhaling caffeine. Downloaded from https://academic.oup.com/ntr/article/19/4/484/2631670 by guest on 26 January 2022
-
Upload
khangminh22 -
Category
Documents
-
view
2 -
download
0
Transcript of Caffeine Concentrations in Coffee, Tea, Chocolate, and ...
Nicotine & Tobacco Research, 2017, 484–492doi:10.1093/ntr/ntw192Original investigation
Advance Access publication July 25, 2016
Published by Oxford University Press on behalf of the Society for Research on Nicotine and Tobacco 2016. This work is written by (a) US Government employee(s) and is in the public domain in the US.
484
Original investigation
Caffeine Concentrations in Coffee, Tea, Chocolate, and Energy Drink Flavored E-liquidsJoseph G. Lisko MS1, Grace E. Lee MPH2, J. Brett Kimbrell BS3, Michael E. Rybak PhD4, Liza Valentin-Blasini PhD1, Clifford H. Watson PhD1
1Tobacco and Volatiles Branch, Division of Laboratory Sciences, National Center for Environmental Health, Centers for Disease Control and Prevention, Atlanta, GA; 2Tobacco and Volatiles Branch at the Centers for Disease Control and Prevention, Battelle Memorial Institute, Columbus, OH; 3Tobacco and Volatiles Branch at the Centers for Disease Control and Prevention, Oak Ridge Institute for Science and Education (ORISE), Oak Ridge, TN; 4Nutritional Biomarkers Branch, Division of Laboratory Sciences, National Center for Environmental Health, Centers for Disease Control and Prevention, Atlanta, GA
Corresponding Author: Joseph G. Lisko, MS, Tobacco and Volatiles Branch, Division of Laboratory Sciences, National Center for Environmental Health, Centers for Disease Control and Prevention, 4770 Buford Highway, Atlanta, GA 30341, USA. Telephone: 770-488-7457; Fax: 770-488-4139; E-mail: [email protected]
Abstract
Introduction: Most electronic cigarettes (e-cigarettes) contain a solution of propylene glycol/glycerin and nicotine, as well as flavors. E-cigarettes and their associated e-liquids are available in numer-ous flavor varieties. A subset of the flavor varieties include coffee, tea, chocolate, and energy drink, which, in beverage form, are commonly recognized sources of caffeine. Recently, some manufactur-ers have begun marketing e-liquid products as energy enhancers that contain caffeine as an additive.Methods: A Gas Chromatography-Mass Spectrometry (GC-MS) method for the quantitation of caf-feine in e-liquids was developed, optimized and validated. The method was then applied to assess caffeine concentrations in 44 flavored e-liquids from cartridges, disposables, and refill solutions. Products chosen were flavors traditionally associated with caffeine (ie, coffee, tea, chocolate, and energy drink), marketed as energy boosters, or labeled as caffeine-containing by the manufacturer.Results: Caffeine was detected in 42% of coffee-flavored products, 66% of tea-flavored products, and 50% of chocolate-flavored e-liquids (limit of detection [LOD] – 0.04 µg/g). Detectable caffeine concentrations ranged from 3.3 µg/g to 703 µg/g. Energy drink-flavored products did not contain detectable concentrations of caffeine. Eleven of 12 products marketed as energy enhancers con-tained caffeine, though in widely varying concentrations (31.7 µg/g to 9290 µg/g).Conclusions: E-liquid flavors commonly associated with caffeine content like coffee, tea, choco-late, and energy drink often contained caffeine, but at concentrations significantly lower than their dietary counterparts. Estimated daily exposures from all e-cigarette products containing caffeine were much less than ingestion of traditional caffeinated beverages like coffee.Implications: This study presents an optimized and validated method for the measurement of caf-feine in e-liquids. The method is applicable to all e-liquid matrices and could potentially be used to ensure regulatory compliance for those geographic regions that forbid caffeine in e-cigarette products. The application of the method shows that caffeine concentrations and estimated total caffeine exposure from e-cigarette products is significantly lower than oral intake from beverages. However, because very little is known about the effects of caffeine inhalation, e-cigarette users should proceed with caution when using caffeine containing e-cigarette products. Further research is necessary to determine associated effects from inhaling caffeine.
Dow
nloaded from https://academ
ic.oup.com/ntr/article/19/4/484/2631670 by guest on 26 January 2022

485Nicotine & Tobacco Research, 2017, Vol. 19, No. 4
Introduction
Electronic cigarettes (e-cigarettes) heat a flavored solution of pro-pylene glycol/glycerin (PG/GLY) that often contains nicotine gener-ating an aerosol during use. E-cigarettes are available in numerous non-tobacco flavors including fruits, candy, desserts, and common beverages among others.1 Previously, e-cigarettes were not generally associated with caffeine as an additive. Recent new products are now available and marketed with claims of providing an energy boost to the user through the addition of caffeine.
Caffeine is a methylxanthine compound that stimulates the central nervous system and is most commonly ingested through consumption of coffee, tea, and soft drinks. Caffeine use has been associated with enhanced cognition and improved athletic perfor-mance in some cases.2,3 It has also been used to treat drowsiness and reduce physical fatigue.4 However, negative side effects from using caffeine can occur and include anxiety, increased blood pressure, and diminished fine motor skills.5
A strong association exists between caffeine consumption and smoking. According to an analysis of the Second National Health and Nutrition Examination Survey (NHANES II), smokers were much more likely to drink caffeinated coffee.6 Consumption of caf-feinated beverages while smoking cigarettes can accelerate caffeine metabolism, as well as enhance nicotine withdrawal symptoms and may make smoking cessation more difficult.7,8 Furthermore, caffeine consumption may influence the urge to smoke and could influence initiation or impede cessation.9 However, these studies were done using cigarettes rather than e-cigarettes and considered ingestion as the only route of caffeine entry into the body. There is very limited information available on effects and metabolism of caffeine when inhaled. One study investigated the pharmacokinetics of inhaled caf-feine and found that it was rapidly absorbed with an approximate bioavailability of 60% in experienced smokers.10
Caffeine concentrations are typically determined by use of high-performance liquid chromatography tandem mass spectrometry (HPLC-MS/MS), and have been performed in human biological matrices including urine, breast milk, and meconium.11–14 Analysis of beverages like coffee and tea have employed the use of gas chro-matography-nitrogen phosphorus detection (GC-NPD)15 or high-performance liquid chromatography-photodiode array detection (HPLC-PDAD)16 to determine caffeine concentration. Caffeine has also been investigated in other matrices like chocolate using gas chromatography tandem mass spectrometry (GC-MS/MS),17 but very little research has been done to evaluate caffeine concentration in tobacco. Results from a gas chromatography-mass spectrometry (GC-MS) method to measure caffeine showed measurable concen-trations of caffeine presumably due to addition of cocoa powder to cigarettes.18
As e-cigarette products continue to evolve, it is important to assess their contents to inform evaluations of potential health risks. The majority of e-cigarette research has focused on constituents that have been identified in or produced by combustible cigarettes.19,20 Although caffeine has been used in traditional cigarettes in the past,21 caffeine additives in e-cigarettes are a new phenomenon with some caffeinated e-cigarette products being marketed as energy boosters, though the European Commission on Public Health has issued a directive that calls for the removal of ingredients that are associated with energy and vitality.22–24 Products in the United States and other regions are not subject to this requirement. Additionally, coffee, tea, chocolate, and energy drink flavored e-cigarette products, not marketed specifically to contain caffeine may contain caffeine as
a byproduct from the added flavor. Past research using combustible cigarettes with caffeinated beverages showing the enhancement of caffeine metabolism and nicotine withdrawal symptoms suggest the phenomenon could extend to e-cigarettes that contain both nicotine and caffeine. In this work, we present the first application of a caf-feine method in the analysis of caffeine concentrations in e-liquids. Our method proposes a rapid and simple sample preparation and analysis procedure that can be applied to all e-liquids regardless of matrix composition. We measured caffeine concentrations in a con-venience sample of commercially available e-cigarette products mar-keted as energy boosters or contained flavors associated with dietary caffeine sources such as coffee, tea, chocolate, and energy drink.
Methods
SamplesE-cigarette materials were purchased from the Lab Depot (Dawsonville, GA). Brands were chosen based upon flavor avail-ability (coffee, tea, chocolate, and energy drink flavor) or energy enhancement marketing material from the manufacturer. Energy drink flavored products are those products with flavorings added to mimic popular energy drinks (ie, Monster, Amp, or Red Bull) but have not made any claims to contain caffeine. Energy enhancement products are those products that have made claims to contain caf-feine. Products consisted of refill liquids, as well as cartridges and disposable e-cigarettes. A total of 44 products were analyzed. Thirty-two flavored products consisting of 19 coffee, four energy drink, three tea, and six chocolate varieties, and 12 energy enhancers mar-keted to contain caffeine were tested. Upon receipt, samples were logged into a custom database, assigned unique barcoded ID’s, and stored at room temperature until analyzed. Samples were analyzed within 60 days of receipt. For each product, only one manufac-turer lot was analyzed, thus, lot-to-lot variability was not assessed. Samples were analyzed in triplicate (N = 3).
Reagents and MaterialsCaffeine standard (USP grade, 99.7% purity) was purchased from Acros Organics (Morris Plains, NJ). Trimethyl-13C3-caffeine (99% purity) was used as an internal standard and was purchased from Cambridge Isotope Laboratories (Andover, Massachusetts). PG and GLY were purchased from Sigma-Aldrich (St Louis, MO) and all other chemicals were of analytical grade and were purchased through Fisher Scientific (Pittsburgh, PA) unless otherwise indicated.
Sample PreparationApproximately 400 (±10) mg of e-liquid was spiked with 200 µL of a trimethyl-13C3 caffeine solution (internal standard, 50 µg/mL in methanol). Samples were extracted with 10 mL of methyl tert-butyl ether (MTBE) and shaken at room temperature on a rugged rotator at 70 rpm for 1 hour. An aliquot of the extract was transferred to a 2-mL vial for GC-MS analysis. If the caffeine concentration in a sample exceeded the highest calibrator, the sample was diluted with MTBE to bring the caffeine concentration of the sample into the calibration range and appropriately reanalyzed.
Instrumentation and ApparatusCaffeine GC-MS analysis was performed using an Agilent 7890 Gas Chromatograph (GC) coupled with a 5975 Mass Spectrometer (MS) (Newark, DE) equipped with a CTC autosampler which injects
Dow
nloaded from https://academ
ic.oup.com/ntr/article/19/4/484/2631670 by guest on 26 January 2022

486 Nicotine & Tobacco Research, 2017, Vol. 19, No. 4
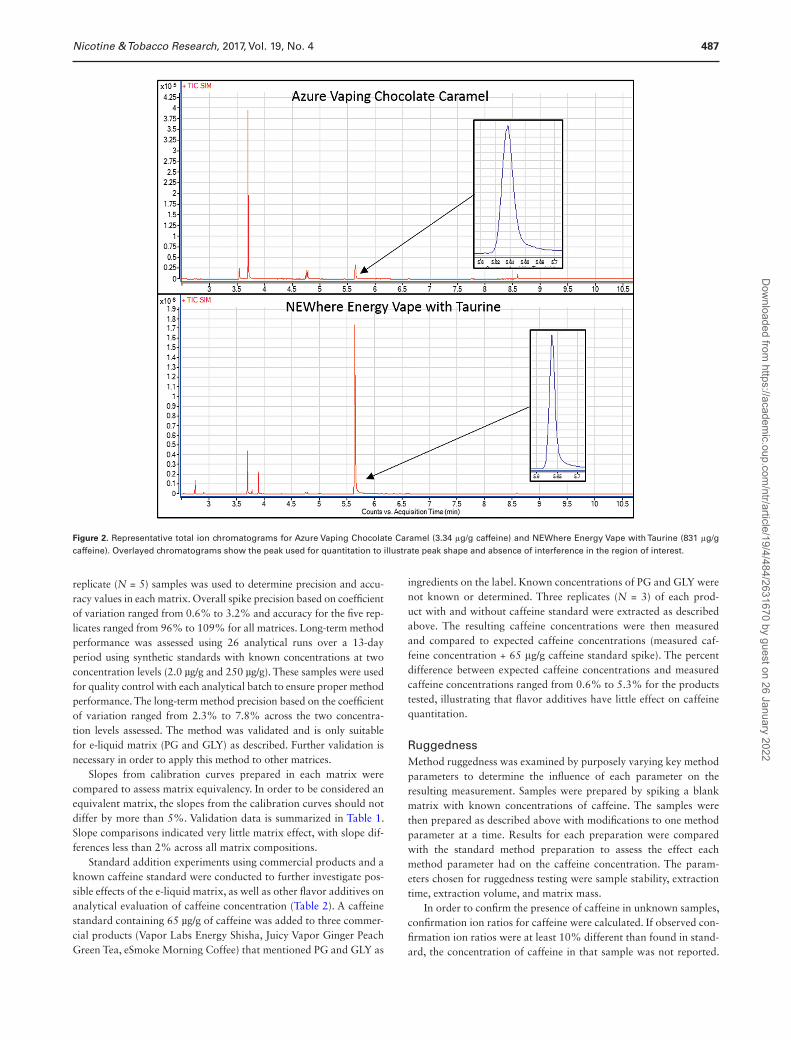
1 µL of the extract per vial for analysis. The autosampler syringe was rinsed three times with ethyl acetate pre- and post-injection of samples to eliminate sample carryover. The split/splitless injector was maintained at 280°C with a helium flow rate of 2.0 mL/min. Injections were made with a split ratio of 40:1 with a solvent delay of 2.4 minutes. The inlet liner (4 mm × 6.5 mm × 78.5 mm) was pur-chased from Restek (Bellfonte, PA) and had a single taper deactivated gooseneck configuration without glass wool. The chromatographic separation was accomplished using a DB-5MS capillary column (30 m × 0.250 µM, 0.25 µM) (J&W Scientific) with research grade (>99.9999% purity) helium as the carrier gas. The GC ramp condi-tions were as follows: hold at 100°C for 1 minute; ramp 40°C/min to 210°C; ramp 5°C/min to 225°C; ramp 30°C/min to 250°C; ramp 40°C/min to 300°C, hold 2 minutes. Total GC run time was 10.83 minutes and the transfer line temperature was set at 280°C. Compounds were ionized using electron impact ionization (70 eV) in positive mode and the ion source temperature was maintained at 230°C. Mass measurements were made in Single Ion Monitoring mode. The retention time for caffeine and its labeled internal stand-ard was 5.60 minutes. The ions monitored for quantitation were: 197.1 and 111.1 m/z for trimethyl-13C3 caffeine and 194.1 and 109.1 m/z for caffeine. Single Ion Monitoring mode is a preferred method for quantitation due to its ability to minimize matrix interferences, as well as eliminate saturation due to high solvent levels in the sam-ples (ie, PG/GLY). Representative chromatograms for standards and samples are shown in Figure 1 and Figure 2, respectively.
Calibration Curve SetupTwo stock solutions were prepared by dissolving a known amount of caffeine in methanol to concentrations of 1 mg/mL and 0.125 mg/mL. Known volumes of the stock solutions were further diluted to pro-vide the desired calibration standards. Standard curves (nine points) were then constructed by spiking approximately 400 mg of PG with 200 µL of each calibration standard and 200 µL of trimethyl-13C3 caffeine internal standard. 10 mL of MTBE was then added to each calibration standard and was extracted on a rugged rotator at 70 revolutions/min for 1 hour. An aliquot of each of the extracted cali-bration standards was then transferred to a 2 mL GC vial for analy-sis. The overall calibration range was 0.54 µg/g to 500 µg/g. Curves were examined using 1/x weighting, and linearity (R2) was greater than 0.998 and the limit of detection (LOD) was 0.04 µg/g. An initial LOD was estimated as 3s0, where s0 is the estimate of SD at zero caf-feine concentration. The value of s0 was taken as the y-intercept of a linear regression of SD versus concentration.25
Method ValidationPrecision and accuracy data was assessed by adding caffeine to a 100% PG matrix, 50/50 PG/GLY matrix, and a 100% GLY matrix at low (3.25 µg/g), medium (65 µg/g), and high (375 µg/g) concentra-tions. Matrix compositions were chosen in order to span the range of possible solvents that may be found in e-liquid products. Synthetic standards were used to assess precision and accuracy due to the una-vailability of caffeinated e-liquid standards. Measurement of five
Figure 1. (A) Gas Chromatography-Mass Spectrometry (GC-MS) Chromatograms of QC Low and QC High Standards in a propylene glycol matrix. (B) The Extracted Ion Chromatogram of ions monitored for caffeine and 13C3-caffeine internal standard.
Dow
nloaded from https://academ
ic.oup.com/ntr/article/19/4/484/2631670 by guest on 26 January 2022
487Nicotine & Tobacco Research, 2017, Vol. 19, No. 4
replicate (N = 5) samples was used to determine precision and accu-racy values in each matrix. Overall spike precision based on coefficient of variation ranged from 0.6% to 3.2% and accuracy for the five rep-licates ranged from 96% to 109% for all matrices. Long-term method performance was assessed using 26 analytical runs over a 13-day period using synthetic standards with known concentrations at two concentration levels (2.0 µg/g and 250 µg/g). These samples were used for quality control with each analytical batch to ensure proper method performance. The long-term method precision based on the coefficient of variation ranged from 2.3% to 7.8% across the two concentra-tion levels assessed. The method was validated and is only suitable for e-liquid matrix (PG and GLY) as described. Further validation is necessary in order to apply this method to other matrices.
Slopes from calibration curves prepared in each matrix were compared to assess matrix equivalency. In order to be considered an equivalent matrix, the slopes from the calibration curves should not differ by more than 5%. Validation data is summarized in Table 1. Slope comparisons indicated very little matrix effect, with slope dif-ferences less than 2% across all matrix compositions.
Standard addition experiments using commercial products and a known caffeine standard were conducted to further investigate pos-sible effects of the e-liquid matrix, as well as other flavor additives on analytical evaluation of caffeine concentration (Table 2). A caffeine standard containing 65 µg/g of caffeine was added to three commer-cial products (Vapor Labs Energy Shisha, Juicy Vapor Ginger Peach Green Tea, eSmoke Morning Coffee) that mentioned PG and GLY as
ingredients on the label. Known concentrations of PG and GLY were not known or determined. Three replicates (N = 3) of each prod-uct with and without caffeine standard were extracted as described above. The resulting caffeine concentrations were then measured and compared to expected caffeine concentrations (measured caf-feine concentration + 65 μg/g caffeine standard spike). The percent difference between expected caffeine concentrations and measured caffeine concentrations ranged from 0.6% to 5.3% for the products tested, illustrating that flavor additives have little effect on caffeine quantitation.
RuggednessMethod ruggedness was examined by purposely varying key method parameters to determine the influence of each parameter on the resulting measurement. Samples were prepared by spiking a blank matrix with known concentrations of caffeine. The samples were then prepared as described above with modifications to one method parameter at a time. Results for each preparation were compared with the standard method preparation to assess the effect each method parameter had on the caffeine concentration. The param-eters chosen for ruggedness testing were sample stability, extraction time, extraction volume, and matrix mass.
In order to confirm the presence of caffeine in unknown samples, confirmation ion ratios for caffeine were calculated. If observed con-firmation ion ratios were at least 10% different than found in stand-ard, the concentration of caffeine in that sample was not reported.
Figure 2. Representative total ion chromatograms for Azure Vaping Chocolate Caramel (3.34 μg/g caffeine) and NEWhere Energy Vape with Taurine (831 μg/g caffeine). Overlayed chromatograms show the peak used for quantitation to illustrate peak shape and absence of interference in the region of interest.
Dow
nloaded from https://academ
ic.oup.com/ntr/article/19/4/484/2631670 by guest on 26 January 2022

488 Nicotine & Tobacco Research, 2017, Vol. 19, No. 4
Retention time comparison with a caffeine standard was also used to confirm caffeine presence in products tested. Quantitated values for caffeine were only reported for those samples in the calibration range of the method. Samples that were above the calibration range were diluted with an appropriate amount of MTBE to bring them within the calibration range so an accurate concentration could be obtained.
Results
The performance of our GC-MS method was suitable for its intended purpose of measuring caffeine concentrations in e-ciga-rette products. Calibration curve linearity was excellent, with R2 > 0.998 in all e-liquid solvent compositions tested. The method’s accu-racy was 96%–109%, and precision (coefficient of variation) was 0.6%–3.2% across the concentration range. Overall, the extrac-tion time (method specification 1 hour; test conditions: 0.5 hour, 1.5 hour) and matrix mass (method specification 0.4 g; test condi-tions: 0.25 g, 1.0 g) had negligible effect on the caffeine concentration.
Solvent composition of the e-liquid matrix had little effect on the quantitation of caffeine, which was illustrated by the compari-son of calibration curve slopes prepared in 100% PG, 50/50 PG/GLY, and 100% GLY matrices. Slopes were within 2% of each other, regardless of the matrix composition (Table 1). In addition, additives in e-liquids had little effect upon caffeine quantitation based upon standard addition experiments conducted with caffeine standards and commercial e-liquids. A caffeine standard with known concen-tration (65 µg/g) was added to three different commercial e-liquid
products (Vapor Labs Energy Shisha, Juicy Vapor Ginger Peach Green Tea, and eSmoke Morning Coffee 11 mg). The measured con-centration of each product with caffeine standard was compared to the expected concentration (measured concentration + 65 µg/g); the percent difference for all three product types ranges from 0.6% to 5.3% (Table 2).
We applied our method to a total of 44 e-liquid products believed to contain caffeine based upon their marketing characteristics (Table 3). We found that three of six chocolate-flavored products, one of two combined chocolate/coffee flavored products, seven of 17 cof-fee-flavored products, two of three tea-flavored products, zero of three energy drink flavored products, and 12 of 13 caffeinated/energy boost products had caffeine concentrations above the LOD (0.04 µg/g). Coffee, tea, chocolate, and energy drink flavored e-liquid products contained relatively low concentrations of caffeine when compared to beverages/foods.26 Coffee flavored products had the highest concen-trations of caffeine with a concentration range of <LOD to 347 µg/g. Tea and chocolate flavored e-liquids had caffeine concentrations up to 33.1 µg/g and 10.8 µg/g, respectively. Energy drink flavored products did not contain detectable concentrations of caffeine.
We confirmed the presence of caffeine in almost all products marketed as containing energy enhancers. Only one product, Xtreme Vapour Babylon Energy Kick, was found to have a caffeine con-centration <LOD. In general, the energy products contained signifi-cantly more caffeine than the coffee, tea, chocolate, and energy drink flavored e-liquids. NutriCigs Cherry Energy contained more than 9 mg/g of caffeine and six other energy products contained at least 1 mg/g of caffeine.
Table 2. Standard Addition Experiments Comparing Measurements in Commercial Samples as Received With Those Sample Spiked With 65 µg/g Caffeine Standard Show That Flavor Additives in Commercial Products do not Have a Significant Effect Upon Caffeine Quantitation
ProductMeasured conc.
(µg/g) N = 3 SD (µg/g) CV (%)Expected
conc. (µg/g)%Difference—Expected vs.
measured conc.
Vapor Labs Energy Shisha 31.5 0.9 3.0Vapor Labs Energy Shisha + Caffeine Spike 100.1 1.5 1.5 96.5 3.7Juicy Vapor Ginger Peach Green Tea 33.1 0.9 2.8Juicy Vapor Ginger Peach Green Tea + Caffeine Spike 103.3 1.0 0.9 98.1 5.3eSmoke Morning Coffee 11 mg 173.2 2.3 1.3eSmoke Morning Coffee 11 mg + Caffeine Spike 239.6 1.9 0.8 238.2 0.6
CV = coefficient of variation.
Table 1. Slope Comparisons and Validation Parameters Investigating Solvent Matrix Composition Show That the Matrix Composition has Little Effect on Caffeine Quantitation
Calibration Validation
Matrix Slope Intercept Linearity R2
Spike designation
Spike conc. (µg/g)
Measured conc. (µg/g)
Accuracy (%) Precision (%)
N = 5
100% PG Low 3.3 3.4 103.2 2.40.42008 0.00348 >0.998 Medium 65.0 62.6 96.2 1.2
High 375.0 380.0 101.3 0.650% PG/50% GLY Low 3.3 3.2 97.0 1.4
0.42565 0.00784 >0.999 Medium 65.0 67.1 103.3 1.6High 375.0 409.2 109.1 1.1
100% GLY Low 3.3 3.1 96.1 3.10.42861 0.00350 >0.999 Medium 65.0 65.1 100.1 2.1
High 375.0 409.8 109.3 3.2
GLY = Glycerin; PG = Propylene Glycol. Slope comparisons were done using the average value of three measurements (N = 3) run on separate days.
Dow
nloaded from https://academ
ic.oup.com/ntr/article/19/4/484/2631670 by guest on 26 January 2022

489Nicotine & Tobacco Research, 2017, Vol. 19, No. 4
Discussion
In general, e-cigarette products commonly contain only a few ingredients including PG, GLY, flavorings, and often nicotine. In some cases, e-cigarettes have been found to contain potentially
pharmacologically active additives like drugs such as amino-tadalafil (Cialis) or rimonabant,27 as well as dietary supplements like vitamin C, Echinacea, and vitamin B12.28 Recently, e-cigarette manufacturers have begun advertising caffeine as a potential additive and energy booster though no scientific studies have assessed the potential caf-feine exposure from e-cigarette products.
In the United States, 89% of adults consume caffeine on a given day with the average daily consumption being 186 ± 4 mg/d. Beverages like coffee, tea, and soft drinks are the source of 98% of the caffeine consumed on a daily basis. In a 2001–2010 survey, energy drinks accounted for less than 10% of consumption but has been increasing.29 Routine caffeine consumption does not cause adverse effects in most people; however, individual response to caf-feine consumption can vary widely.30,31
Ingestion is the primary route of caffeine exposure. Caffeine is generally 100% bioavailable and is rapidly absorbed after intrave-nous or oral dosing, with 99% of a given dose in humans being absorbed within 45 minutes.32 Though data are limited, caffeine absorption after inhalation was also shown to be rapid and effective with an approximate bioavailability of 60%.10 Other health effects from exposure to caffeine via inhalation have not yet been assessed.
Overall, coffee, tea, chocolate, and energy drink flavored e-liq-uids contained relatively low concentrations of caffeine. The flavored e-liquid with the highest concentration of caffeine was Vaporcast Cappucino with a concentration of 347 µg/g. In the case of flavored e-liquids, it is likely that the source of caffeine comes from an extract of the natural product (ie, coffee, tea) that is added as a flavorant. Common flavors are often derived from natural sources because this is cost effective and they provide the most representative combina-tion of compounds for a particular flavor.33
As expected, products marketed as energy enhancers contained considerably more caffeine overall, with products containing as much as 9 mg/g of caffeine. The concentration of caffeine found in the e-liquids was widely variable among the products tested with values ranging from <LOD to 9.25 mg/g. Over 50% (seven of 13) of the products contained more than 1 mg/g of caffeine. We found that all products with stated caffeine concentrations actually contain con-siderably less (1.8 to 285 000×) caffeine than described on the prod-uct packaging. One product claimed to contain 200 mg of caffeine but the product actually contained less than 1 mg/g (0.703 mg/g). Because caffeinated products are relatively new, a labeling conven-tion may not have been established or may differ among manufac-turers. Inaccurate labeling of commercial e-liquids is not uncommon and has been observed numerous times for nicotine.20,34
In order to assess the potential overall exposure of caffeine from e-cigarette use, we based calculations on e-liquid consumption by experienced vapers as reported previously. Fasalinos et al.35,36 deter-mined average e-liquid consumption as 62 mg after 5 minutes, 219 mg after 20 minutes, and 3 grams after 1 day of e-cigarette use (Table 4). In our calculations we assumed that the e-cigarette user is absorbing the caffeine either via inhalation, ingestion or a com-bination of both at a 100% rate. Additionally, because there has been virtually no research done on the effects of inhaled caffeine, we are assuming that there is no difference in pharmacokinetics when caffeine is ingested or inhaled. Based on these assumptions, we esti-mated that exposure to caffeine from using e-cigarettes ranged from 0.001 mg to 0.576 mg after 5 minutes, 0.001 mg to 2.04 mg after 20 minutes, and 0.01 mg to 27.9 mg after 1 day.
An eight ounce cup of coffee can contain up to 200 mg of caf-feine. Black tea can contain up to 70 mg of caffeine in an eight ounce
Table 3. Caffeine Concentrations Found in Coffee, Tea, Chocolate, and Energy Drink Flavored E-liquids, as well as E-liquid Products Labeled as Caffeinated
FlavorAverage (µg/g)
SD (µg/g)
CV (%)
Chocolate Niquid Chocolate 10.8 0.6 5.2 Niquid Mint Chocolate Chip <LOD JuicyVapor Chocolate 3.7 0.2 4.7 Hotvapes Mousse au Chocolat <LOD Azure Vaping Chocolate Caramel 3.3 0.1 3.4 iVape Chocolate <LODChocolate coffee combined Mister-E-Liquid G.T.F.O. <LOD JuicyVapor Choffee 9.6 0.4 4.0Tea Niquid Summertime Tea 27.7 0.9 3.2 Mister-E-Liquid Chai Tea <LOD JuicyVapor Ginger Peach Green Tea 33.1 0.9 2.8Coffee Texas Select Vapor Southern Moccachino <LOD Texas Select Vapor Vanilla Frappe <LOD VaporCast Cappuccino 347 13.2 3.8 Mister-E-Liquid Espresso <LOD JuicyVapor Coffee <LOD JuicyVapor French Vanilla Coffee <LOD Hotvapes Kona Coffee <LOD Hotvapes Café Filbert <LOD Azure Vaping Coffee n’ Cream 139 4.3 3.1 iVape Cappucino <LOD Kalamazoo Vapor KVS Coffee <LOD Kalamazoo Vapor Java Scotch <LOD Blu Java Jolt 242 10.7 4.4 Premium Coffee 0 mg 3.9 0.2 4.9 eSmoke Morning Coffee 0 mg 161 4.7 2.9 eSmoke Morning Coffee 11 mg 173 2.3 1.3 eSmoke Morning Coffee 16 mg 172 8.2 4.8Energy drink VaporCast Energy Drink <LOD JuicyVapor An1mal <LOD Kalamazoo Vapor Beast <LODEnergy boost/caffeinated products NEWhere Energy Vape with Taurine 831 49.7 6.0 Vapour Labs Energy Shisha 31.5 0.9 3.0 StlVapor Cola 1150 64.4 5.6 StlVapor Power 759 38.1 5.0 StlVapor Aktiv 1200 68.8 5.7 High Voltage Resistor 137 3.4 2.5 Xtreme Vapour Babylon Energy Kick <LOD City Vapes Night Crawler Energy 1690 110 6.5 City Vapes Side Kick Energy 2020 133 6.6 VaporBoost Stamina (0.30% caffeine) 1690 104 6.2 Vaporrenu Burley (80 mg caffeine) 3740 199 5.3 NutriCigs Cherry Energy 9290 309 3.3 Bootleg Vapors Coffee (200 mg caffeine) 703 46.8 6.7
CV = coefficient of variation. Each sample was analyzed in triplicate (N = 3). Limit of detection (LOD) is 0.04 µg/g).
Dow
nloaded from https://academ
ic.oup.com/ntr/article/19/4/484/2631670 by guest on 26 January 2022

490 Nicotine & Tobacco Research, 2017, Vol. 19, No. 4
serving, and energy drinks can contain between 70 and 100 mg of caf-feine per serving.26,37–40 Using calculations based upon the consump-tion of e-liquid on an average day by experienced vapers, we found that the potential exposure to caffeine from caffeinated e-cigarette products may reach concentrations up to 28 mg/d. However, for the majority of caffeinated products, potential caffeine exposures would be much less based upon the caffeine concentrations found in the caffeinated e-liquids tested in this study. Coffee, tea, chocolate, and energy drink flavored e-liquids would potentially provide an even lower caffeine exposure. For example, Vaporcast Cappucino had a caffeine concentration of 347 µg/g, which is calculated to result in a caffeine exposure of only 1 mg/d. Even at the highest caffeine con-centrations, potential daily exposures to caffeine from e-cigarettes are estimated to be much less than exposure from consuming caf-feinated beverages.
Limitations of the research should be considered when reviewing the data presented. First, we make the assumptions that all of the caffeine is entirely vaporized and 100% of the e-liquid consumed is either inhaled or ingested by the e-cigarette user, though intake is likely to be lower than this maximum based on product composi-tion. It is also likely that some of the e-liquid is lost upon inhalation. In addition, the exposure estimates are based upon a single study using a second generation e-cigarette product. With the vast vari-ety of products available, e-liquid consumption is likely product and user dependent with a maximum consumption of caffeine limited to the amount of caffeine in the e-liquid. Consumption estimates are to be used as a reference point, not an absolute measure of e-liquid con-sumption for all e-cigarette users. Also, further research is necessary to assess the effects of caffeine exposure via inhalation since there are currently no assessments of the effects of inhaled caffeine on lung or respiratory tract health. Based upon the limited bioavailability
data, the assumption was made that exposure to caffeine via inhala-tion will have similar pharmacologic effects as from exposure via ingestion. Overall, relatively low concentrations of caffeine were found in e-cigarette products but until further research has been done to compare the effects of caffeine exposure via inhalation and ingestion, users should proceed with caution.
In this work, we have described the first application of an analyti-cal method for quantitating caffeine in e-liquids. Our fully validated method possessed measurement sensitivity, precision, accuracy, and curve linearity well-suited for its intended purpose. As regulation of e-cigarettes becomes more prevalent, the analytical method pre-sented offers a fully validated solution to ensure regulatory compli-ance in those geographic regions forbidding caffeine from e-cigarette products. The method validation showed that the e-liquid matrix compositions had little to no effect upon the quantitation of caf-feine, allowing for application of the method to all e-liquid products containing predominantly PG and/or GLY as solvents. We applied our method to a convenience sample of commercially available cof-fee, tea, chocolate, and energy drink flavored e-liquids, as well as e-liquids marketed as energy boosters. Although we were able to detect caffeine in almost 50% (13 of 28) of the coffee, tea, choco-late, and energy drink flavored e-liquids, the caffeine concentrations we observed were much lower than their dietary counterparts. We found that caffeine concentrations varied widely among caffeinated e-liquid products, and that our measured concentrations of caffeine were much lower than the amounts stated on the product packag-ing when available. Our estimates of caffeine exposures from e-ciga-rettes were found to be much lower than typical dietary exposure to caffeine from common beverages like coffee, tea, and energy drinks. Although the potential caffeine exposure from e-cigarettes remains relatively low when compared to common beverages, further
Table 4. Estimated Caffeine Exposure From Using Electronic Cigarette (E-cigarette) Products
Flavor Average (mg/g) 5 min (mg) 20 min (mg) Daily (mg)
Niquid Chocolate 0.011 0.001 0.002 0.033JuicyVapor Chocolate 0.004 0.000 0.001 0.011Azure Vaping Chocolate Caramel 0.003 0.000 0.001 0.010Niquid Summertime Tea 0.028 0.002 0.006 0.083JuicyVapor Ginger Peach Green Tea 0.034 0.002 0.007 0.101VaporCast Cappuccino 0.347 0.022 0.076 1.041Azure Vaping Coffee n’ Cream 0.140 0.009 0.031 0.419Blu Java Jolt 0.242 0.015 0.053 0.726Premium Coffee 0 mg NIC 0.004 0.000 0.001 0.012eSmoke Morning Coffee 0 mg NIC 0.161 0.010 0.035 0.484eSmoke Morning Coffee 11 mg NIC 0.173 0.011 0.038 0.519eSmoke Morning Coffee 16 mg NIC 0.171 0.011 0.038 0.514NEWhere Energy Vape with Taurine 0.831 0.052 0.182 2.492Vapour Labs Energy Shisha 0.031 0.002 0.007 0.093StlVapor Cola 1.154 0.072 0.253 3.463StlVapor Power 0.759 0.047 0.166 2.277StlVapor Aktiv 1.202 0.075 0.263 3.605High Voltage Resistor 0.137 0.009 0.030 0.412City Vapes Night Crawler Energy 1.691 0.105 0.370 5.072City Vapes Side Kick Energy 2.016 0.125 0.442 6.049VaporBoost Stamina (0.30% caffeine) 1.695 0.105 0.371 5.085Vaporrenu Burley (80 mg caffeine) 3.736 0.232 0.818 11.208NutriCigs Cherry Energy 9.295 0.576 2.036 27.886Bootleg Vapors Coffee (200 mg caffeine) 0.703 0.044 0.154 2.109
Exposure is estimated based upon e-liquid consumption in experienced vapers from Farsalinos et al.35,36 which found an average consumption of 62 mg after 5 min, 219 mg after 20 min, and 3 grams/d.
Dow
nloaded from https://academ
ic.oup.com/ntr/article/19/4/484/2631670 by guest on 26 January 2022

491Nicotine & Tobacco Research, 2017, Vol. 19, No. 4
research on effects from caffeine inhalation is warranted due to the lack of available information.
FundingFunding for this project was provided through internal funds from The United States Centers for Disease Control and Prevention.
Declaration of InterestsThe authors do not declare any conflicts of interest. Disclaimer: The findings and conclusions in this report are those of the authors and do not necessarily represent the views of the Centers for Disease Control and Prevention. This information is distributed solely for the purpose of pre-dissemination peer review under applicable information quality guidelines. It has not been for-mally disseminated by the Centers for Disease Control and Prevention. It does not represent and should not be construed to represent any agency determina-tion or policy. Use of trade names and commercial sources is for identification only and does not constitute endorsement by the US Department of Health and Human Services, or the US Centers for Disease Control and Prevention.
AcknowledgmentsThe authors would like to gratefully acknowledge Patricia Richter for her efforts reviewing and editing the manuscript.
References 1. Zhu S-H, Sun JY, Bonnevie E, et al. Four hundred and sixty brands of e-cig-
arettes and counting: implications for product regulation. Tob Control. 2014;23(suppl 3):iii3–iii9. doi:10.1136/tobaccocontrol-2014-051670
2. Einother SJ, Giesbrecht T. Caffeine as an attention enhancer: reviewing existing assumptions. Psychopharmacology (Berl). 2013;225(2):251–274. doi:10.1007/s00213-012-2917-4
3. Bloms LP, Fitzgerald JS, Short MW, Whitehead, JR. The effects of caffeine on vertical jump height and execution in collegiate athletes. J Strength Cond Res. 2016;30(7):1855–1861. doi:10.1519/jsc.0000000000001280
4. Ker K, Edwards PJ, Felix LM, Blackhall K, Roberts I. Caffeine for the prevention of injuries and errors in shift workers. Cochrane Database Syst Rev. 2010;5:CD008508. doi:10.1002/14651858.cd008508
5. Winston AP, Hardwick E, Jaberi N. Neuropsychiatric effects of caffeine. Adv Psychiatr Treat. 2005;11(6):432–439. doi:10.1192/apt.11.6.432
6. Klesges RC, Ray JW, Klesges LM. Caffeinated coffee and tea intake and its relationship to cigarette smoking: an analysis of the Second National Health and Nutrition Examination Survey (NHANES II). J Subst Abuse. 1994;6(4):407–418.
7. Zevin S, Benowitz NL. Drug interactions with tobacco smoking. An update. Clin Pharmacokinet. 1999;36(6):425–438. doi:10.2165/ 00003088-199936060-00004
8. Swanson JA, Lee JW, Hopp JW. Caffeine and nicotine: a review of their joint use and possible interactive effects in tobacco withdrawal. Addict Behav. 1994;19(3):229–256.
9. Treloar HR Piasecki TM, McCarthy DE, Baker TB. Relations among caffeine consumption, smoking, smoking urge, and subjective smoking reinforcement in daily life. J Caffeine Res. 2014;4(3):93–99. doi:10.1089/jcr.2014.0007
10. Zandvliet AS, Huitema AD, de Jonge ME, et al. Population pharmacoki-netics of caffeine and its metabolites theobromine, paraxanthine and theo-phylline after inhalation in combination with diacetylmorphine. Basic Clin Pharmacol Toxicol. 2005;96(1):71–79. doi:10.1111/j.1742-7843.2005.pto960111.x
11. Tuomi T, Johnsson T, Reijula K. Analysis of nicotine, 3-hydroxycotinine, cotinine, and caffeine in urine of passive smokers by HPLC-tandem mass spectrometry. Clin Chem. 1999;45(12):2164–2172.
12. Geraghty SR, McNamara K, Kwiek JJ, et al. Tobacco metabolites and caffeine in human milk purchased via the internet. Breastfeed Med. 2015;10(9):419–424. doi:10.1089/bfm.2015.0096
13. Baranowski J, Pochopień G, Baranowska I. Determination of nicotine, cotinine and caffeine in meconium using high-performance liquid chroma-tography. J Chromatogr B Biomed Sci Appl. 1998;707(1–2):317–321.
14. Pellegrini M, Marchei E, Ross S, et al. Liquid chromatography/electrospray ionization tandem mass spectrometry assay for determination of nicotine and metabolites, caffeine and arecoline in breast milk. Rapid Commun Mass Spectrom. 2007;21(16):2693–2703. doi:10.1002/rcm.3137
15. Sereshti H, Samadi S. A rapid and simple determination of caffeine in teas, coffees and eight beverages. Food Chem. 2014;158:8–13. doi:10.1016/j.foodchem.2014.02.095
16. Zhao F, Lin HT, Zhang S, et al. Simultaneous determination of caffeine and some selected polyphenols in Wuyi Rock tea by high-performance liquid chromatography. J Agric Food Chem. 2014;62(13):2772–2781. doi:10.1021/jf4056314
17. Muller C, Vetter F, Richter E, Bracher F. Determination of caffeine, myos-mine, and nicotine in chocolate by headspace solid-phase microextraction coupled with gas chromatography-tandem mass spectrometry. J Food Sci. 2014;79(2):T251–T255. doi:10.1111/1750-3841.12339
18. Song S, Ashley DL. Sample purification for the analysis of caffeine in tobacco by gas chromatography-mass spectrometry. J Chromatogr A. 1998;814(1–2):171–180.
19. Goniewicz ML, Knysak J, Gawron M, et al. Levels of selected carcino-gens and toxicants in vapour from electronic cigarettes. Tob Control. 2014;23(2):133–139.
20. Lisko JG, Tran H, Stanfill SB, Blount BC, Watson CH. Chemical com-position and evaluation of nicotine, tobacco alkaloids, pH, and selected flavors in e-cigarette cartridges and refill solutions. Nicotine Tob Res. 2015;17(10):1270–1278. doi:10.1093/ntr/ntu279
21. Ingredients added to tobacco in the manufacture of cigarettes by the six major American cigarette companies; R638. 1994. https://industry-documents.library.ucsf.edu/tobacco/docs/fqly0090. Accessed May 11, 2016.
22. Caffeine Informer. Energy Shisha: Caffeine Infused E-Cigarette. 2016. www.caffeineinformer.com/energy-shisha-caffeine-infused-e-cigarette. Accessed May 11, 2016.
23. High Voltage Vapors. High Voltage Vapors: Energy Infused E-Liquid. 2016. https://highvoltagevaporz.com/. Accessed May 11, 2016.
24. Directive 2014/40/EU of the European Parliament and of the Council of 3 April 2014 on the approximation of the laws, regulations, and administra-tive provisions of the Member States concerning the manufacture, presen-tation, and sale of tobacco and related products and repealing Directive 2001/37/EC. 2014, OJ L127/1. 2014.
25. Taylor JK. Quality Assurance of Chemical Measurements. Chelsea, MI: Lewis Publishers; 1987.
26. The Mayo Clinic. Caffeine content for coffee, tea, soda and more. 2014. www.mayoclinic.org/healthy-lifestyle/nutrition-and-healthy-eating/in-depth/caffeine/art-20049372?pg=1. Accessed February 2, 2016.
27. Hadwiger ME, Trehy ML, Ye W, et al. Identification of amino-tadalafil and rimonabant in electronic cigarette products using high pressure liquid chromatography with diode array and tandem mass spectrometric detec-tion. J Chromatogr A. 2010;1217(48):7547–7555
28. ECig Avenue. 2015. www.ecigavenue.com/shop/vsmoke-vitamin-smoke-eliquid/. Accessed February 2, 2016.
29. Fulgoni VL III, Keast DR, Lieberman HR. Trends in intake and sources of caffeine in the diets of US adults: 2001–2010. Am J Clin Nutr. 2015;101(5):1081–1087. doi:10.3945/ajcn.113.080077
30. Castellanos FX, Rapoport JL. Effects of caffeine on development and behavior in infancy and childhood: a review of the published literature. Food Chem Toxicol. 2002;40(9):1235–1242.
31. Retey JV, Adam M, Khatami R, et al. A genetic variation in the adeno-sine A2A receptor gene (ADORA2A) contributes to individual sensitivity to caffeine effects on sleep. Clin Pharmacol Ther. 2007;81(5):692–698. doi:10.1038/sj.clpt.6100102
Dow
nloaded from https://academ
ic.oup.com/ntr/article/19/4/484/2631670 by guest on 26 January 2022

492 Nicotine & Tobacco Research, 2017, Vol. 19, No. 4
32. Blanchard J, Sawers SJ. The absolute bioavailability of caffeine in man. Eur J Clin Pharmacol. 1983;24(1):93–98.
33. Wright J. Flavor Creation. 2nd ed. Carol Stream, IL: Allured Business Media; 2011.
34. Goniewicz ML, Gupta R, Lee YH, et al. Nicotine levels in electronic ciga-rettes. Nicotine Tob Res. 2013;15(1):158–166. doi:10.1093/ntr/nts103
35. Farsalinos KE, Romagna G, Tsiapras D, Kryzopoulos S, Voudris V. Evaluation of electronic cigarette use (vaping) topography and estima-tion of liquid consumption: implications for research protocol standards definition and for public health authorities’ regulation. Int J Environ Res Public Health. 2013;10(6):2500–2514. doi:10.3390/ijerph10062500
36. Farsalinos KE, Romagna G, Tsiapras D, Kyrzopoulos S, Voudris V. Characteristics, perceived side effects and benefits of electronic cigarette use: a worldwide survey of more than 19,000 consumers. Int J Environ Res Public Health. 2014;11(4):4356–4373. doi:10.3390/ijerph110404356
37. Chin JM, Merves ML, Goldberger BA, Sampson-Cone A, Cone EJ. Caffeine content of brewed teas. J Anal Toxicol. 2008;32(8):702–704.
38. Tzanavaras PD, Zacharis CK, Themelis DG, Rapid determination of meth-ylxanthines in real samples by high-performance liquid chromatography using the new FastGradient narrow-bore monolithic column. Talanta. 2010;81(4–5):1494–1501. doi:10.1016/j.talanta.2010.02.058
39. del Campo G, Berregi I, Caracena R, Zuriarrain J. Quantitative determina-tion of caffeine, formic acid, trigonelline and 5-(hydroxymethyl)furfural in soluble coffees by 1H NMR spectrometry. Talanta. 2010;81(1–2): 367–371. doi:10.1016/j.talanta.2009.12.010
40. Talio MC, Acosta MG, Alesso M, Luconi MO, Fernandez LP. Quantification of caffeine in dietary supplements and energy drinks by solid-surface fluores-cence using a pre-concentration step on multi-walled carbon nanotubes and Rhodamine B. Food Addit Contam Part A Chem Anal Control Expo Risk Assess. 2014;31(8):1367–1374. doi:10.1080/19440049.2014.928831 D
ownloaded from
https://academic.oup.com
/ntr/article/19/4/484/2631670 by guest on 26 January 2022