Micro-PIXE Analysis for Localization and Quantification of Elements in Roots of Mycorrhizal...
16
Chapter 14 Micro-PIXE Analysis for Localization and Quantification of Elements in Roots of Mycorrhizal Metal-Tolerant Plants Katarina Vogel-Mikus ˇ, Paula Pongrac, Primoz ˇ Pelicon, Primoz ˇ Vavpetic ˇ, Bogdan Povh, Hermann Bothe and Marjana Regvar 14.1 Introduction Many fundamental processes of plant and fungal physiology are affected or regu- lated by mineral nutrients (Marschner 1995). The mechanisms of nutrient uptake, and their roles in plant and fungal metabolism are therefore of great importance for our understanding of symbiotic interactions and their functioning. In addition, there is a great demand for methods that can document the responses of plants and fungi to environmental stresses that can be caused by either factors present in the natural environment or by anthropogenic pollution. Particle-induced X-ray emission with a focused proton beam (micro-PIXE) is a powerful tool for these types of studies (Scheloske et al. 2004; Przybylowicz et al. 2004; Vogel-Mikus ˇ et al. 2007, 2008a, b). All elements encompassing the list of macro- and micro-nutrients, as well as elements considered as toxic pollutants, can be measured simultaneously by micro-PIXE. Maps of element distribution can provide valuable information that is not possible to obtain using point analyses or linear scans. The localization and quantification data on toxic elements in plants and fungi that have been gained using this technique have indicated possible pathways of detoxification mechan- isms, and can therefore improve our understanding of plant and fungal adaptations to various environmental conditions. However, tracking element distribution can K. Vogel-Mikus ˇ, P. Pongrac and M. Regvar (*) Department of Biology, Biotechnical Faculty, University of Ljubljana, Vec ˇna pot 111, SI‐1000 Ljubljana, Slovenia e-mail: [email protected] P. Pelicon and P. Vavpetic ˇ Joz ˇef Stefan Institute, Jamova 39, 1000 Ljubljana, Slovenia B. Povh Max-Planck-Institut fu ˝r Kernphysik, P.O. Box 103980, 69029 Heidelberg, Germany H. Bothe Universita ¨t zu Ko ¨ln, Botanisches Institut, Gyrhofstrasse 15, D-50923 Ko ¨ln, Germany A. Varma and A.C. Kharkwal (eds.), Symbiotic Fungi, Soil Biology 18, 227 DOI: 10.1007/978‐3‐540‐95894‐9_14, # Springer‐Verlag Berlin Heidelberg 2009
Transcript of Micro-PIXE Analysis for Localization and Quantification of Elements in Roots of Mycorrhizal...

Chapter 14
Micro-PIXE Analysis for Localization
and Quantification of Elements in Roots
of Mycorrhizal Metal-Tolerant Plants
Katarina Vogel-Mikus, Paula Pongrac, Primoz Pelicon, Primoz Vavpetic,
Bogdan Povh, Hermann Bothe and Marjana Regvar
14.1 Introduction
Many fundamental processes of plant and fungal physiology are affected or regu-
lated by mineral nutrients (Marschner 1995). The mechanisms of nutrient uptake,
and their roles in plant and fungal metabolism are therefore of great importance for
our understanding of symbiotic interactions and their functioning. In addition, there
is a great demand for methods that can document the responses of plants and fungi
to environmental stresses that can be caused by either factors present in the natural
environment or by anthropogenic pollution. Particle-induced X-ray emission with a
focused proton beam (micro-PIXE) is a powerful tool for these types of studies
(Scheloske et al. 2004; Przybyłowicz et al. 2004; Vogel-Mikus et al. 2007, 2008a, b).
All elements encompassing the list of macro- and micro-nutrients, as well as
elements considered as toxic pollutants, can be measured simultaneously by
micro-PIXE. Maps of element distribution can provide valuable information that
is not possible to obtain using point analyses or linear scans. The localization and
quantification data on toxic elements in plants and fungi that have been gained
using this technique have indicated possible pathways of detoxification mechan-
isms, and can therefore improve our understanding of plant and fungal adaptations
to various environmental conditions. However, tracking element distribution can
K. Vogel-Mikus, P. Pongrac and M. Regvar (*)
Department of Biology, Biotechnical Faculty, University of Ljubljana, Vecna pot 111, SI‐1000Ljubljana, Slovenia
e-mail: [email protected]
P. Pelicon and P. Vavpetic
Jozef Stefan Institute, Jamova 39, 1000 Ljubljana, Slovenia
B. PovhMax-Planck-Institut fur Kernphysik, P.O. Box 103980, 69029 Heidelberg, Germany
H. BotheUniversitat zu Koln, Botanisches Institut, Gyrhofstrasse 15, D-50923 Koln, Germany
A. Varma and A.C. Kharkwal (eds.), Symbiotic Fungi, Soil Biology 18, 227
DOI: 10.1007/978‐3‐540‐95894‐9_14, # Springer‐Verlag Berlin Heidelberg 2009

only be achieved through the appropriate preparation of specimens, making this the
most important step in the analysis (Mesjasz-Przybyłowicz and Przybyłowicz 2002;
Schneider et al. 2002). This chapter is therefore mainly dedicated to micro-PIXE
specimen preparation, which has been developed in our laboratory in collaboration
with colleagues from the Max Planck Institute for Nuclear Physics, Heidelberg.
14.2 Materials and Procedures
14.2.1 Equipment for Sample Preparation
– Thermo-block, for rapid freezing of specimens
– Cryo-microtome
– Freeze-drier
14.2.2 Laboratory Materials
– Scalpels and forceps
– Needles with polished tips
– Aluminium foil for making tissue-freezing medium beds
– Beakers
– Tissue-freezing medium
– Liquid nitrogen
– Propane
– Pioloform in chloroform
– Microscope object-glass
– Aluminium sample holders
– Glue (two-component Araldite)
14.2.3 Specimen Preparation
The aim of the preparation of the biological material is the preservation of the
element distribution as close as possible to its native (in vivo) state. The high-
resolution capability of modern microprobe equipment places stringent demands on
the tissue preparation for intracellular and tissue element-distribution studies. Any
measurement can thus be meaningless and misleading unless changes in tissue
morphology and chemical redistribution have been limited to dimensions that are
smaller than the resolution of the microprobe (Schneider et al. 2002).
Incomplete protocols can cause artefacts that can lead to the removal or redistri-
bution of elements, and hence to errors far exceeding those inherent to a measure-
ment technique. It is generally accepted that only low-temperature methods can
eliminate such artefacts, since it is evident that with chemical preparations some
elements may be added, washed out or redistributed (Schneider et al. 2002;
228 K. Vogel-Mikus et al.

Mesjasz-Przybyłowicz and Przybyłowicz 2002). Therefore, specimen cryo-fixation
is typically followed by specimen sectioning at low temperatures and finally by
freeze-drying (Frey et al. 2000; Schneider et al. 2002; Vogel-Mikus et al. 2008b).
Even though cryo-sectioning is accepted as a routine preparation technique for
animal tissues, the number of studies that have used cryo-sections of fully differ-
entiated plant material for analytical purposes remains small. The primary reasons for
this are technical problems during freezing, due to the poor thermal conductivity of
plant tissues arising from the cellulose cell wall, a unique feature of plant cells, and
to the intercellular spaces filled with gas. Additionally, the alternating sequences of
different materials, e.g., the rigid cell walls, vacuolar ice crystals and gas-filled
intercellular spaces of the plant tissues, tend to result in sample crumbling during
either sectioning or freeze-drying, which makes it particularly difficult to obtain
cryo-sections with well-preserved morphology (Schneider et al. 2002).
The details of the more established cryo-preparation protocols for electron
microscopy cannot be easily adapted here. The sections required for micro-PIXE
analysis have to bemuch thicker (e.g., 60 mm) to obtain sufficient X-ray yield (Vogel-
Mikus et al. 2008b), which in the case of micro-PIXE is acquired from the entire
depth of the specimen. Cryo-fixation must also be as rapid as possible to avoid the
formation of larger ice crystals, which could damage plant and fungal cells. In
addition, nuclear microprobe analyses are performed under vacuum conditions
(10�5 mbar or lower), and therefore the specimens must be dry and immobilized
in their preanalysis functional state (Vogel-Mikus et al. 2007, 2008a, b).
14.2.3.1 Plant Material
Care should be taken regarding the physiological state of the material harvested for
micro-PIXE analysis, and therefore the use only of freshly harvested roots is
recommended, to avoid artificial element redistribution resulting from wilting and
senescence. The roots should be cleansed with tap and distilled water to remove all
of the soil particles. The secondary roots hosting mycorrhizal fungi should be
excised with stainless steel scissors to avoid sample contamination with metals.
14.2.3.2 Specimen Freezing
The freezing of the specimens should be done as rapidly as possible to reduce the
growth of ice crystals. Excised root fragments (cca. 0.5 cm long) are inserted into
stainless steel needles with polished tips (Schneider et al. 2002; Scheloske et al.
2004; Vogel-Mikus et al. 2008b), which are carefully chosen according to the
root diameter, to ensure a tight hold of the root during sectioning (Fig. 14.1).
Alternatively, the excised root fragments can be transferred into aluminium foil
beds (0.5 � 0.5 � 0.5 cm) that are filled with tissue-freezing medium. Afterwards
the specimens are dipped into propane cooled with liquid nitrogen, which provides
a superior cryogen when compared to liquid nitrogen, due to its higher cooling rate.
A specially designed thermo-block is used for this (Fig. 14.1), which should be
14 Micro-PIXE Analysis for Localization and Quantification of Elements 229

additionally isolated with a polystyrene bed to avoid rapid evaporation of the liquid
nitrogen. Great care needs to be taken when handling propane and liquid nitrogen: a
mixture of propane and air can be explosive, and handling liquid nitrogen in a
closed room can cause asphyxiation. Make sure that this is carried out in a well-
ventilated room (door and windows always open) so that the concentrations of both
gases in the air are kept to a minimum.
After freezing, the specimens in the propane (middle thermo-block chamber) are
rapidly transferred to a liquid nitrogen (bigger thermo-block chamber) (Fig. 14.1).
Then all of the prepared specimens together with the thermo-block are transferred
directly into the cryo-microtome chamber to avoid the thawing of the samples.
In general, root-specimen preparation using polished needles (Schneider 2002;
Scheloske et al. 2004; Vogel-Mikus et al. 2008b) enables more rapid freezing,
due to the direct contact of the specimen with the cryogen, and thus the ice
crystals formed are smaller, providing superior preservation of cell morphology.
Fig. 14.1 Schematic representation of root sample preparation and rapid freezing
230 K. Vogel-Mikus et al.

However, for scans of the specimens with a lateral resolution of 1–3 mm, which
enables element mapping at the tissue level, the embedding of the specimens in
tissue-freezing medium appears to be just as adequate. In addition, embedding the
roots in the medium ensures that the holding of the specimen is more stable, making
the cryo-sectioning easier (Fig. 14.2). Moreover, this way of specimen mounting
can also be applied to longitudinal sections. On the other hand, using cryo-section-
ing with needles is more demanding, because of the loose root support within the
needle which can easily break during sectioning. A substantial improvement to this
protocol can be achieved by dipping the inserted root into bidistilled water in a
vertical position, and afterwards dipping it into a cryogen embedded with a water
droplet, which then freezes. In this way, amorphous ice is formed from the droplet,
which embeds the root and provides support for cryo-sectioning. In addition, a
specially designed adapter is needed to fix the needle with a specimen into the head
of the cryo-microtome (Schneider et al. 2002).
14.2.3.3 Cryo-Sectioning
When cryo-sectioning, it is of vital importance that the cryo-microtome tempera-
ture set-up, the cutting velocity, and the section thickness are optimized for each
particular plant species and tissue in question (Schneider et al. 2002). Only after
optimization of these parameters can promising results be expected. The tempera-
ture of the cryo-microtome head and chamber usually varies between �40�C to
�20�C, depending on the tissue water content. As a general rule, smoother section-
ing of tissues with high water contents can be obtained at lower temperatures. When
ideally frozen, plant tissues resemble amorphous glass, and sections obtained from
Fig. 14.2 Cryo-microtome chamber with a sample embedded in tissue-freezing media
14 Micro-PIXE Analysis for Localization and Quantification of Elements 231

such specimens ensure the best possible level of preservation of tissue morphology,
and thus the most reliable results. In addition, to control the quality of the sections,
a dissecting binocular should be provided with the cryo-microtome. The specimens
should be sectioned using disposable stainless steel cryo-microtome blades, which
are superior to the standard steel or diamond knives (Schneider et al. 2002). The
sections of the specimens are then put on pre-cooled filter paper into specially
designed pre-cooled aluminium beakers with a cover, and kept in liquid nitrogen
for freeze-drying.
14.2.3.4 Freeze-Drying
Freeze-drying is a very sensitive step in the whole procedure, since the samples can
wilt and shrink drastically due to the large amounts of water in plant tissues. The
samples should therefore be freeze-dried at the lowest temperature possible (they
are best put in the freeze-dryer in liquid nitrogen) and at low pressure (10�5 bar).
To ensure the flatness of the sections, they should be laid between two layers
of precooled filter paper and fixed with a pre-cooled heavy object (e.g., a part of
microscope object glass).
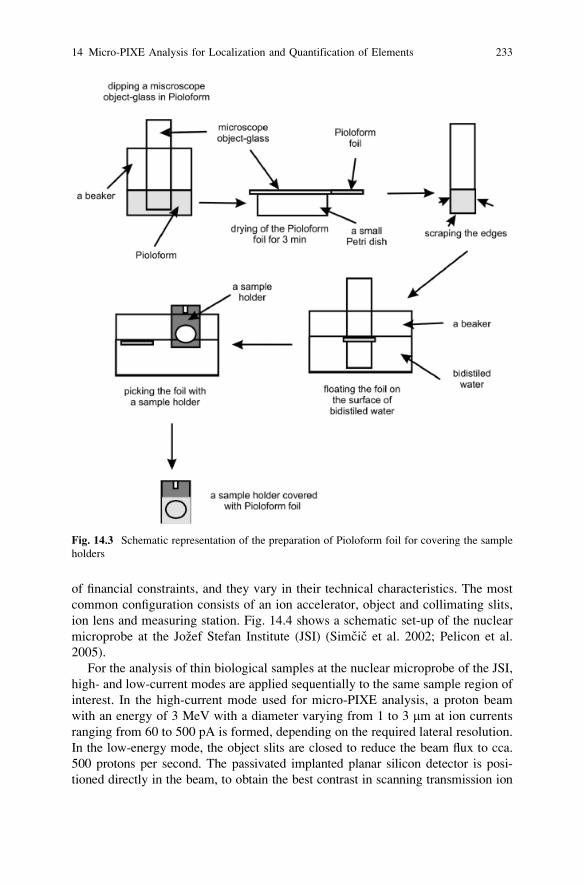
14.2.3.5 Mounting of the Samples into Holders
The freeze-dried samples are mounted into aluminium holders that are covered with
a thin foil (cca. 300 nm thick) of Pioloform (SPI Chem) (Fig. 14.3). The foil is
prepared by dissolving 1 g of Pioloform in 75 ml chloroform (Vogel-Mikus et al.
2007), which can be kept in a dark flask for cca. 6 months, with the dissolved
solution then poured into a beaker. The easiest way of making the foils is to dip a
clean microscope object glass into the foil solution for 2 s and then let it dry for
3 min. Then the edges of the foil are scraped with another clean object glass, to
enable the detachment of the foil from the object-glass. The foil is then floated from
the object glass by dipping it into bidistilled water and picking out the foil on a
specially designed aluminium section holder, as schematically represented in
Fig. 14.3. The sections should be carefully put on a holder with forceps and covered
with another holder covered with Pioloform foil, to fix the section into a sandwich
(Vogel-Mikus et al. 2007, 2008b). The sections can also be mounted on foil with
special two-component glue (e.g., Araldite), being sure that the areas of interest for
scanning remain clean.
14.2.4 Micro-PIXE Analysis
Micro-PIXE permits quantitative studies of element distributions, with lateral
resolution of the order of 1 mm for elements from Na to U. Relatively few nuclear
microprobe set-ups for the analysis of biological material exist worldwide because
232 K. Vogel-Mikus et al.
of financial constraints, and they vary in their technical characteristics. The most
common configuration consists of an ion accelerator, object and collimating slits,
ion lens and measuring station. Fig. 14.4 shows a schematic set-up of the nuclear
microprobe at the Jozef Stefan Institute (JSI) (Simcic et al. 2002; Pelicon et al.
2005).
For the analysis of thin biological samples at the nuclear microprobe of the JSI,
high- and low-current modes are applied sequentially to the same sample region of
interest. In the high-current mode used for micro-PIXE analysis, a proton beam
with an energy of 3 MeV with a diameter varying from 1 to 3 mm at ion currents
ranging from 60 to 500 pA is formed, depending on the required lateral resolution.
In the low-energy mode, the object slits are closed to reduce the beam flux to cca.
500 protons per second. The passivated implanted planar silicon detector is posi-
tioned directly in the beam, to obtain the best contrast in scanning transmission ion
Fig. 14.3 Schematic representation of the preparation of Pioloform foil for covering the sample
holders
14 Micro-PIXE Analysis for Localization and Quantification of Elements 233

microscopy (STIM), which is used for the determination of specimen thickness
(Vogel-Mikus et al. 2008b).
The detection of X-ray energies from 1 keV up to 25 keV is provided by a pair
of X-ray detectors. These include a high-purity germanium X-ray detector with an
active area of 95 mm2, a 25-mm-thick beryllium window and a 100-mm-thick
polyimide absorber positioned at an angle of 135� with respect to the beam direc-
tion. Simultaneously, a Si(Li) detector with an area of 10 mm2 and an 8-mm-thick
Be window is installed at the angle of 125� with respect to the beam direction, for
the detection of low-energy X-rays, in the energy range from 0.8 to 4 keV. At the
JSI, the samples are sprayed with low-energy electrons from a hot tungsten filament
during the measurements, to avoid sample charging, thus efficiently avoiding time-
consuming specimen carbon coating.
Precise proton-dose determination is required for quantitative micro-PIXE anal-
ysis. For this reason, an in-beam chopping device is positioned in the beam line
after the last collimation of the beam before it hits the sample. The rotating chopper
is of gold-plated graphite, and periodically intersects the beam with a frequency
of ca. 10 Hz, which makes the method insensitive to beam-intensity fluctuations.
The spectrum of back-scattered protons from the chopper is recorded in parallel
with the PIXE spectra in the list mode. The high-energy part of the spectrum
consists of protons scattered from the Au layer, and it appears as a separate peak,
the area of which is proportional to the proton flux. During the off-line data
processing, the proton dose corresponding to an arbitrary scanning area selection
can be extracted from the list-mode results simultaneously with the PIXE spectra
(Vogel-Mikus et al. 2007, 2008b).
The regions of interest on the samples are preselected by short PIXE mapping in
high-current mode. After the final sample positioning and scan size selection, the
object slits are closed and the STIM maps are measured in the list mode. A partially
depleted planar silicon detector is positioned directly in the beam to obtain the best
contrast for the STIM. This is followed by high-current mode, during which the
PIXE maps of the same region are measured in list mode over a longer period of
Low energySiLi X-Ray detector
STIM detector& Faraday cup(on rotationalfeedthrough)
High energyHpGe X-RayDetector(100 µm polyimideabsorber)
QuadrupoleTriplet OM
Rotating chopper:dose normalization
Scanningcoils
Collimatorslits
Objectslits 3 MeV P+
beam
Fig. 14.4 Schematic diagram of the nuclear microprobe at JSI
234 K. Vogel-Mikus et al.

time, lasting from 1 up to 30 h, depending on the concentration and atomic numbers
of the elements under consideration. As a third and last step, the STIM map is again
measured over the same sample area for a control of sample consistency, thinning,
and possible shrinking.
In combination with the assumed cellulose matrix composition, proton exit
energy measured by STIM is used for determination of sample thickness. The
stopping power of 3 MeV protons in cellulose is 114 keV (mg cm�2)�1. Frozen
hydrated plant tissue is usually sectioned on the cryo-microtome to a thickness of
60 mm. The pass of the proton beam through a freeze-dried tissue sample results in
an energy loss of ca. 120–150 keV. This energy loss corresponds to a cellulose area
density of 1.05–1.31 mg cm�2. Assuming a cellulose bulk density of 1.6 g cm�3,
this gives 6.5–8.1 mm of equivalent bulk cellulose thickness. The heterogeneous
morphology of the sample results in an uneven area density after freeze-drying. To
quantify the element concentrations of a particular morphological structure cor-
rectly, its thickness is extracted in the form of the exit energy from the STIM data,
and it is fed into the trace calculation of the GUPIXWIN code, which is dedicated to
the fitting and quantification of PIXE spectra (Campbell et al. 2000).
The calibration of the PIXE method is usually verified by analysis of the multi-
element standard reference materials NIST SRM 1573a (tomato leaves, homoge-
nized powder, analyzed in a form of a pressed pellet), NIST SRM 1107 (naval
brass B, alloy), and NIST SRM 620 (soda-lime flat glass) (Necemer et al. 2008).
The inter-calibration of PIXE and STIM is usually verified by thin mono-element
metallic foils (Vogel-Mikus et al. 2008b).
An example of a detailed study of the element distribution in mycorrhizal and
nonmycorrhizal Aster tripolium can be found in Scheloske et al. (2004). In addition,
micro-PIXE mapping of the element distribution in arbuscular mycorrhizal roots of
the grass Cynodon dactylon is presented in Weiersbye et al. (1999).
14.3 Example of Micro-PIXE Analysis
For the purpose of this manuscript, a selected sample application in studies of plant/
fungal interactions in a metal-polluted environment is presented. Only a small
amount of plant material (few leaves or roots) is needed for the micro-PIXE analysis,
which is highly appreciated in plant physiology studies and a prerequisite for the
following study with the endangered zinc violets. The data were obtained using a
nuclear microprobe at the Microanalytical Centre of the JSI, Ljubljana, Slovenia.
14.3.1 Sample Preparation and Micro-PIXE Analysis
Zinc violets (Viola lutea ssp. westfalica; for the nomenclature see Hildebrandt et al.
(2006)) were collected at a nonpolluted site (garden, D-50374 Erftstadt-Bliesheim,
Germany) and at a Zn- and Pb-polluted site (D-33165 Blankenrode, Germany), and
14 Micro-PIXE Analysis for Localization and Quantification of Elements 235

transferred to the laboratory. The collected plants were colonized by arbuscular
mycorrhizal fungi with a frequency of F(%) = 31% for the garden material and
F(%) = 42% for the plants from Blankenrode, as determined by the method of
Trouvelot et al. (1986) after staining with Trypan Blue (Philips and Haymann
1970).
The root samples for micro-PIXE analysis were prepared using cryo-fixation in
tissue-freezing medium, cryo-sectioning and freeze-drying, all as described above.
Element maps were generated using a 3 MeV proton micro-beam (Fig. 14.5).
Afterwards, the areas of interest (epidermis, cortex, endodermis, and vascular
tissues) were encircled and their corresponding spectra extracted (Tables 14.1 and
14.2; Fig. 14.6). The element concentrations were calculated on the basis of
a
SM P S
Cl K Ca
Fe
0 High counts
Cu Zn
Fig. 14.5a (continued)
236 K. Vogel-Mikus et al.

characteristic X-ray counts (PIXE spectra), proton dose, sample matrix density
(cellulose), and thickness of the sample as determined by STIM.
The determination of concentrations in selected plant tissues allows one to
compare the element distributions in differently treated plants, and/or to assess
shifts in element depositions caused by mycorrhization, in a similar way to that
described by Scheloske et al. (2004).
SM
b
P S
Cl K Ca
Fe
0 High counts
Cu Zn
Fig. 14.5 (a) Elementmaps ofViola lutea ssp. westfalica root samples collected at the nonpolluted
site. Scan size 250 � 250 mm2. SM – photograph of the sample taken under an optical stereo-
microscope. (b) Element maps of Viola lutea ssp. westfalica root samples collected at the metal-
polluted site. Scan size 250 � 250 mm2. SM – photograph of the sample taken under an optical
stereo-microscope. An arbuscular mycorrhizal structure is indicated by an arrow
14 Micro-PIXE Analysis for Localization and Quantification of Elements 237

Table14.1
Elementconcentrationswithmeasurementerrors(Stat.err.)andlimitsofdetection(lod)ofselected
regionswithin
Viola
luteassp.westfalicarootsfrom
thenonpollutedsite.Scansize
250�
250mm
2
Whole
area
Epidermis
Cortex
Endodermis
Vasculartissues
Elements
Conc
(mg.g
�1)
Stat.err.
(%)
lod
(mg.g
�1)
Conc
(mg.g
�1)
Stat.err.
(%)
lod
(mg.g
�1)
Conc
(mg.g
�1)
Stat.err.
(%)
lod
(mg.g�1)
Conc
(mg.g
�1)
Stat.err.
(%)
lod
(mg.g
�1)
Conc
(mg.g
�1)
Stat.err.
(%)
lod
(mg.g
�1)
P6125
0.57
35.5
1709
4.85
84.0
3197
1.30
61.3
9909
0.58
71.3
9031
0.76
85.8
S4013
0.49
23.7
2857
1.17
50.0
4726
0.82
45.5
4668
0.93
52.3
3093
1.48
58.5
Cl
2274
0.73
22.0
2903
1.15
46.7
1842
1.69
42.6
2547
1.34
46.0
1429
2.47
52.8
K26458
0.15
22.0
21443
0.34
56.1
24686
0.34
50.8
33751
0.28
44.5
21786
0.44
49.2
Ca
5293
1.05
98.4
6444
1.18
120.7
4031
1.93
136.9
5638
1.67
166.3
1943
3.84
138.9
Mn
170.2
1.07
2.5
596.5
1.07
7.8
13.8
14.75
3.6
37
6.31
3.8
14.3
18.46
4.7
Fe
3066
0.19
2.3
12111
0.19
8.4
106.3
2.54
2.3
85.5
3.25
3.9
43.5
6.05
3.6
Cu
35.3
3.18
1.6
38.1
7.69
4.7
18.8
10.33
2.4
54.6
4.45
2.0
39.8
6.65
1.7
Zn
65.5
2.21
1.5
139.3
3.08
4.2
35.7
6.34
2.3
29
7.67
1.9
26.9
10.50
2.4
TheX-ray
spectracorrespondingto
particularrootmorphological
structures(w
hole
rootarea,epidermis,cortex,endodermis,andvasculartissues)wereextracted
from
theencircledregionsandanalysedusingGUPIX
software

Table14.2
Elementconcentrationswithmeasurementerrors(Stat.err.)andlimitsofdetection(lod)ofselected
regionswithin
Viola
luteassp.westfalicarootsfrom
themetal-pollutedsite.Scansize
250�
250mm
2
Whole
area
Epidermis
Cortex
Endodermis
Vasculartissues
Elements
Conc
(mg.g
�1)
Stat.err.
(%)
lod
(mg.g
�1)
Conc
(mg.g
�1)
Stat.err.
(%)
lod
(mg.g
�1)
Conc
(mg.g
�1)
Stat.err.
(%)
lod
(mg.g
�1)
Conc
(mg.g
�1)
Stat.err.
(%)
lod
(mg.g
�1)
Conc
(mg.g
�1)
Stat.err.
(%)
lod
(mg.g
�1)
P1453
1.72
24.2
1494
4.53
52.1
1275
1.64
35.4
1583
2.36
68.6
1826
1.67
48.3
S1255
1.23
30.2
1582
1.58
47.9
1023
2.27
45.8
1316
2.90
75.2
1073
2.26
40.9
Cl
4342
0.30
14.3
6248
0.39
27.6
2991
0.68
23.7
6124
0.64
41.4
1606
1.40
29.3
K4632
0.27
13.4
9224
0.31
26.4
2492
0.77
22.2
3803
0.95
44.3
1664
1.50
32.5
Ca
8828
0.25
23.9
4601
0.75
51.3
8381
0.41
26.8
18748
0.39
48.6
8116
0.59
31.9
Mn
18.8
4.78
1.7
41.2
5.48
4.1
10
10.94
2.0
10.9
17.23
3.4
0.0
/2.6
Fe
2341
0.14
1.2
7594
0.13
2.3
137.5
1.28
1.6
64.8
3.43
2.9
35
4.58
2.1
Cu
18.8
7.36
2.4
34.1
7.16
4.2
11.2
17.18
3.4
17.1
22.27
7.0
8.6
23.35
3.7
Zn
8801
0.10
2.3
11846
0.15
4.2
6970
0.22
1.7
12031
0.25
7.0
3913
0.44
5.6
Pb
1192
0.64
1.9
1642
0.96
8.8
1231
1.26
5.1
1234
1.91
15.5
214.4
5.00
8.8
TheX-ray
spectracorrespondingtoparticularrootmorphologicalstructures(w
holerootarea,epidermis,cortex,endodermis,andvasculartissues)wereextractedfrom
theencircledregionsandanalysedusingGUPIX
software

14.3.2 Results
Significantly higher Zn and Pb concentrations were seen in Viola lutea ssp. westfa-lica roots collected at the polluted site (Tables 14.1 and 14.2), presumably as a
consequence of soil contamination with these elements. The concentrations of P, S,
K, Mn, Fe, and Cu were, on the other hand, higher in the violet roots from the
nonpolluted garden soil (Tables 14.1 and 14.2). The root element concentrations
correlate well with the element concentrations of the soil (Marschner 1995). Higher
amounts of nutrients are usually found in gardens, which might mainly come from
sediments of the small river Erft in the proximity, as well as from fertilization in this
particular allotment. Metal-polluted sites are characterized by enhanced metal concen-
trations and, remarkably, also by low concentrations of mineral nutrients (Ernst 2006).
Comparison of the element distribution between the root samples from nonpol-
luted and polluted sites using the element distribution maps (Fig. 14.5) and the
element concentrations of particular root regions (Tables 14.1 and 14.2) showed
that some elements, like Fe, Zn, Mn, Cu, and Pb, accumulated typically in root
epidermis. Enhanced Zn and Pb concentrations were also seen in the cortex and
endodermis of the roots of the plants from the metal-polluted site. Only small
amounts of metals were, however, detected in the vascular tissue beyond the
endodermis, as already recognized in other studies (Seregin and Ivanov 2001),
indicating metal exclusion as a tolerance strategy (Baker 1981) also for Viola lutea ssp.westfalica. The highest concentrations of Cl for both samples were in the epidermis
and endodermis, and of P in endodermis and vascular tissues (Tables 14.1 and 14.2).
Fig. 14.6 Micro-PIXE spectra of the whole root area (Table 14.1), from the nonpolluted and Zn-
and Pb-polluted sites
240 K. Vogel-Mikus et al.

However, the distribution of K was different, with the highest concentration seen in
the cortex and endodermis in the roots of violets collected in the nonpolluted
garden, and in the epidermis in the roots collected at the metal-polluted site (Tables
14.1 and 14.2). Ca was concentrated in the endodermis in the roots from the
polluted site, while in the roots from the nonpolluted soil the Ca concentration
gradually decreased from epidermis to central cylinder (Table 14.1).
PIXE analysis does not allow one to detect arbuscular mycorrhizal fungal
structures in the root cells directly. However, in the root sample collected at the
polluted site, a P-, S-, Cl-, K-, Fe-, Zn-, and Pb-rich structure was seen in the root
cortex (Fig. 14.5b), which could be attributed to an arbuscule of AM fungi. In the
study by Weiersbye et al. (1999) on element maps generated by micro-PIXE,
arbuscules were seen as localized accumulations of P and Fe in and around cortical
cells. These might be linked to the highly efficient P and Fe sequestration mechan-
isms characteristic of AM fungi (Smith and Read 1997), while vesicles usually
accumulate higher Mn, Cu, and Ni than cortical cells (Weiersbye et al. 1999). In
addition, the accumulation of Zn and Pb in AM fungal structures is consistent with
the high metal-binding capacity of AM mycelium (Joner et al. 2000). In line with
this, arbuscular mycorrhizal fungal structures only occur in the outer tissues, where
they might bind heavy metals, whereas they cannot surpass the tight Casparian strip
that is deposited on the walls of the endodermal cells.
14.4 Conclusions
Micro-PIXE is a powerful tool for qualitative and quantitative investigations of
element distributions in plant and fungal tissues, and it also provides especially
attractive element-mapping capabilities. To date, the appropriate morphology preser-
vation of specimens during sample preparation appears to be one of themain obstacles
to obtaining high-resolution qualitative and quantitative elementmapsprimarily on the
cellular, tissue and organ levels. The element localization maps obtained by this
method can contribute significantly to our current knowledge of plant physiology,
stress responses, and the complexity of plant–microbe interactions, as well as having
broad applications in biotechnology.However, a prerequisite for success in this broad-
spectrum interdisciplinary research field is close collaboration between physics,
chemistry, biochemistry, biotechnology, and plant sciences researchers.
References
Baker AJM (1981) Accumulators and excluders — strategies in the response of plants to heavy
metals. J Plant Nutr 3:643–654
Campbell JL, Hopman TL, Maxwell JA, Nejedly Z (2000) The Guelph PIXE software package III:
alternative proton database. Nucl Instrum Methods B 170:193–204
Ernst WHO (2006) Evolution of metal tolerance in higher plants. For Snow Landsc Res 80:251–274
14 Micro-PIXE Analysis for Localization and Quantification of Elements 241

Frey B, Zierold K, Brunner I (2000) Extracellular complexation of Cd in the Hartig net and
cytosolic Zn sequestration in the fungal mantle of Picea abies– Hebeloma cristuliniformeectomycorrhizas. Plant Cell Environ 23:1257–1265
Hildebrandt U, Hoef-Emden K, Backhausen S, Bothe H, Bozek M, Siuta A, Kuta E (2006) The
rare, endemic zinc violets of Central Europe originate from Viola lutea Huds. Plant Syst Evol
257:205–222
Joner E, Briones R, Leyval C (2000) Metal-binding capacity of arbuscular mycorrhizal mycelium.
Plant Soil 226:227–234
Marschner H (1995) Mineral nutrition of higher plants, 2nd edn. Academic, London
Mesjasz-Przybyłowicz J, Przybyłowicz WJ (2002) Micro-PIXE in plant sciences: present status
and perspectives. Nucl Instrum Meth B 189:470–481
Necemer M, Kump P, Scancar J, Jacimovic R, Simcic J, Pelicon P, Budnar M, Jeran Z, Pongrac P,
Regvar M, Vogel-Mikus K (2008) Application of X-ray fluorescence analytical techniques in
phytoremediation and plant biology studies. Spectrochim Acta B 11(63):1240–1247
Philips JM, Haymann DS (1970) Improved procedures for clearing roots and staining parasitic and
vesicular arbuscular mycorrhizal fungi for rapid assessment of infection. Trans Br Mycol Soc
55:158–160
Pelicon P, Simcic J, Jaksic M, Medunic Z, Naab F, McDaniel FD (2005) Spherical chamber-
effective solution for multipurpose nuclear microprobe. Nucl Instrum Methods B 231:53–59
Przybyłowicz WJ, Mesjasz-Przybyłowicz J, Migula P, Turnau K, Nakonieczny M, Augustyniak
M, Głowacka E (2004) Elemental microanalysis in ecophysiology using ion microbeam. Nucl
Instrum Methods B 219–220:57–66
Scheloske S, Maetz M, Schneider T, Hildebrandt U, Bothe H, Povh B (2004) Element distribution
in mycorrhizal and nonmycorrhizal roots of the halophyte Aster tripolium determined by
proton induced X-ray emission. Protoplasma 223:183–189
Schneider T, Scheloske S, Povh B (2002) A method for cryosectioning of plant roots for proton
microprobe analysis. I J PIXE 12:101–107
Seregin IV, Ivanov VB (2001) Physiological aspects of cadmium and lead toxic effects on higher
plants. Russ J Plant Physio 48:523–544
Simcic J, Pelicon P, Budnar M, Smit Z (2002) The performance of the Ljubljana ion microprobe.
Nucl Instrum Methods B 190:283–286
Smith SE, Read DJ (1997) Mycorrhizal Symbiosis, 2nd edn. Academic, London
Trouvelot A, Kough J, Gianinazzi-Pearson V (1986) Mesure du taux de mycorhization VA d’un
systeme radiculaire. Recherche de methodes d’estimation ayant une signification fonction-
nelle. In: Gianinazzi-Pearson V, Gianinazzi S (eds) Physiological and genetical aspects of
mycorrhizae. Institut National de la Recherche Agronomique, Paris, pp 217–221
Vogel-Mikus K, Pongrac P, Kump P, Necemer M, Simcic J, Pelicon J, Budnar M, Povh B, Regvar
M (2007) Localisation and quantification of elements within seeds of Cd/Zn hyperaccumulator
Thlaspi praecox by micro-PIXE. Environ Pollut 147:50–59
Vogel-Mikus K, Regvar M, Mesjasz-Przybyłowicz J, Przybyłowicz W, Simcic J, Pelicon J,
Budnar M (2008a) Spatial distribution of Cd in leaves of metal hyperaccumulating Thlaspipraecox using micro-PIXE. New Phytol. 179:712–721
Vogel-Mikus K, Simcic J, Pelicon J, Budnar M, Kump P, Necemer M, Mesjasz-Przybyłowicz J,
Przybyłowicz W, Regvar M (2008b) Comparison of essential and non-essential element
distribution in leaves of the Cd/Zn hyperaccumulator Thlaspi praecox as revealed by micro-
PIXE. Plant Cell Environ 31(10):1484–1496
Weiersbye IM, Straker CJ, Przybyłowicz J (1999) Micro-PIXe mapping of elemental distribution
in arbuscular mycorrhizal roots of the grass, Cynodon dyctylon, from gold and uranium
tailings. Nucl Instrum Methods B 158:335–343
242 K. Vogel-Mikus et al.