Significance of wild vegetables in micronutrient intakes of women in Vietnam: an analysis of food...
10
Introduction The International Conference in Nutrition in 1992 identified the development of Food Based Dietary Guidelines as one important strategy in the promotion of nutritional improve- ment and healthy lifestyles. The arguments were raised that people generally think of diets in terms of foods rather than nutrients and that such guidelines should preferably be built on traditional diet and food practices. 1 Among the core features that countries have emphasised in recent guidelines are the recommendations to consume a wide variety of foods and to eat plenty of fruits and vege- tables. 2,3 However, while a diversified diet often is associated with a healthier diet, it is a very diffuse term to use. Several researchers have noted that there is little guidance for mea- surement of dietary diversity and suggested that a count of the different foods or food categories consumed may be a useful indicator. 4–6 Some have analysed the association between the number of foods or food groups and nutrient adequacy, 7–9 others the links between food variety and improved health and nutrition status. 4,10,11 Yet others have looked at dietary diversity in relation to causes of mortality, 12 or at the protective function of diversified intakes of fruits and vegetables in some forms of cancer. 13,14 The nutritional benefit of fruits and vegetables is mostly argued on the basis of the contribution to intakes of known minerals and vita- mins. However, research also continues to identify additional substances with biological activities of importance to health, for example a large number of carotenoids in these food items. 4,15 Hatloy et al. has noted that most of the analytical studies of food variety have been carried out in western or affluent countries. 6 This study is one of the few that have related food variety to nutrient intake and health outcome in a low-income country and made reference to the use of wild foods. Rural people in many countries continue to include wild foods in their diets, but the role of this food category is still difficult to capture in conventional dietary assessment. 16 Many characteristics of wild foods contribute to this diffi- culty; a vast variety of species is used; they are often site spe- cific, they vary with ethnicity, they are known only by their local vernacular names; users are often illiterate and there is sometimes a social stigma attached. In addition, data on composition are often missing or outdated. In such situations it can be of interest to test whether a Food Variety Analysis, defined as an analysis of the diversity of foods or food cate- gories included in the diet, can be a useful tool. Asia Pacific J Clin Nutr (2001) 10(1): 21–30 Original Article Significance of wild vegetables in micronutrient intakes of women in Vietnam: an analysis of food variety Britta M Ogle 1,2 MSc, Pham Huang Hung 3 MD and Ho Thi Tuyet 4 MD 1 Department of Rural Development Studies, Swedish University of Agricultural Sciences, Uppsala, Sweden 2 Department of Medical Sciences, Nutrition, Uppsala University, Sweden 3 Department of Paediatrics, University of Hue, Vietnam, 4 Department of Internal Medicine, Faculty of Medicine, University of Can Tho, Vietnam The association between food variety and nutrient intake/health status among rural women was tested in two agro-ecological settings in Vietnam. Special emphasis was placed on the significance of wild vegetables ‘Rau Dai’ in micronutrient supply and on the usefulness of food variety analysis in determining their current role. Data from 7-day food frequency interviews and a nutrition/health survey with 93 and 103 rural women in the Mekong Delta and the Central Highlands, respectively, were used in the analysis. Energy and nutrient intakes in the groups with the highest food variety score (FVS) (high = ≥ 21) in the two regions were compared to those with the lowest food variety score (low = ≤15). The high FVS groups in both regions also had a more diversified diet in terms of food categories. With the exception of low iron and riboflavin intakes in all groups, the high FVS groups had relatively adequate diets. A large variety of vegetables was used and only approximately half of the vegetable species were cultivated. In both regions the high FVS groups used a significantly greater variety of vegetables than the low FVS groups. Wild vegetables contributed significantly to the overall micronutrient intakes, mostly carotene, vitamin C and calcium intakes, but only the contribution to carotene intake was significantly higher in the high FVS group. Overall, we conclude that a food variety analysis is a useful tool in capturing the dietary role of wild vegetables. Key words: dietary diversity, dietary intake of women, food-based dietary guidelines, food variety analysis, sociocultural variations, Vietnam, wild vegetables. 21 Correspondence address: Britta M Ogle, Department of Rural Development Studies, Swedish University of Agricultural Sciences, PO Box 7005, 750 07 Uppsala, Sweden. Tel: +46 18 67 1953; +46 18 67 3420 Email: [email protected] Accepted 7 November 2000
-
Upload
independent -
Category
Documents
-
view
2 -
download
0
Transcript of Significance of wild vegetables in micronutrient intakes of women in Vietnam: an analysis of food...
IntroductionThe International Conference in Nutrition in 1992 identifiedthe development of Food Based Dietary Guidelines as oneimportant strategy in the promotion of nutritional improve-ment and healthy lifestyles. The arguments were raised thatpeople generally think of diets in terms of foods rather thannutrients and that such guidelines should preferably be builton traditional diet and food practices.1
Among the core features that countries have emphasisedin recent guidelines are the recommendations to consume awide variety of foods and to eat plenty of fruits and vege-tables.2,3 However, while a diversified diet often is associatedwith a healthier diet, it is a very diffuse term to use. Severalresearchers have noted that there is little guidance for mea-surement of dietary diversity and suggested that a count ofthe different foods or food categories consumed may be auseful indicator.4–6 Some have analysed the associationbetween the number of foods or food groups and nutrientadequacy,7–9 others the links between food variety andimproved health and nutrition status.4,10,11 Yet others havelooked at dietary diversity in relation to causes of mortality,12
or at the protective function of diversified intakes of fruitsand vegetables in some forms of cancer.13,14 The nutritionalbenefit of fruits and vegetables is mostly argued on the basisof the contribution to intakes of known minerals and vita-mins. However, research also continues to identify additionalsubstances with biological activities of importance to health,
for example a large number of carotenoids in these fooditems.4,15
Hatloy et al. has noted that most of the analytical studiesof food variety have been carried out in western or affluentcountries.6 This study is one of the few that have related foodvariety to nutrient intake and health outcome in a low-incomecountry and made reference to the use of wild foods.
Rural people in many countries continue to include wildfoods in their diets, but the role of this food category is stilldifficult to capture in conventional dietary assessment.16
Many characteristics of wild foods contribute to this diffi-culty; a vast variety of species is used; they are often site spe-cific, they vary with ethnicity, they are known only by theirlocal vernacular names; users are often illiterate and there is sometimes a social stigma attached. In addition, data oncomposition are often missing or outdated. In such situationsit can be of interest to test whether a Food Variety Analysis,defined as an analysis of the diversity of foods or food cate-gories included in the diet, can be a useful tool.
Asia Pacific J Clin Nutr (2001) 10(1): 21–30
Original Article
Significance of wild vegetables in micronutrient intakes ofwomen in Vietnam: an analysis of food variety
Britta M Ogle1,2 MSc, Pham Huang Hung3 MD and Ho Thi Tuyet4 MD
1Department of Rural Development Studies, Swedish University of Agricultural Sciences, Uppsala, Sweden 2Department of Medical Sciences, Nutrition, Uppsala University, Sweden3Department of Paediatrics, University of Hue, Vietnam,4Department of Internal Medicine, Faculty of Medicine, University of Can Tho, Vietnam
The association between food variety and nutrient intake/health status among rural women was tested in twoagro-ecological settings in Vietnam. Special emphasis was placed on the significance of wild vegetables ‘RauDai’ in micronutrient supply and on the usefulness of food variety analysis in determining their current role.Data from 7-day food frequency interviews and a nutrition/health survey with 93 and 103 rural women in theMekong Delta and the Central Highlands, respectively, were used in the analysis. Energy and nutrient intakes inthe groups with the highest food variety score (FVS) (high = ≥ 21) in the two regions were compared to thosewith the lowest food variety score (low = ≤15). The high FVS groups in both regions also had a more diversifieddiet in terms of food categories. With the exception of low iron and riboflavin intakes in all groups, the highFVS groups had relatively adequate diets. A large variety of vegetables was used and only approximately half ofthe vegetable species were cultivated. In both regions the high FVS groups used a significantly greater variety of vegetables than the low FVS groups. Wild vegetables contributed significantly to the overall micronutrientintakes, mostly carotene, vitamin C and calcium intakes, but only the contribution to carotene intake wassignificantly higher in the high FVS group. Overall, we conclude that a food variety analysis is a useful tool incapturing the dietary role of wild vegetables.
Key words: dietary diversity, dietary intake of women, food-based dietary guidelines, food variety analysis, socioculturalvariations, Vietnam, wild vegetables.
21
Correspondence address: Britta M Ogle, Department of RuralDevelopment Studies, Swedish University of Agricultural Sciences,PO Box 7005, 750 07 Uppsala, Sweden.Tel: +46 18 67 1953; +46 18 67 3420Email: [email protected] 7 November 2000

Vietnam offers an interesting example for such analysis.A large number of wild plants have traditionally been usedas vegetables ‘Rau Dai’ but there is little information as to their dietary role today.17,18 The aim of this paper is toanalyse the association between food variety, specifically on the role of wild vegetables, nutrient intake and health status among adult women in Vietnam. The analysis is basedon data from field studies in four villages in two agro-ecological settings in Vietnam, the Mekong Delta and theCentral Highlands.19
The study is one of several collaborative activitiesbetween the Swedish University of Agricultural Sciences anduniversities in Vietnam. Ethical permission was obtainedthrough the research ethics committee, Faculty of Medicine,Uppsala University and local approval through the Universi-ties of Can Tho and Hue.
Study areaThe field surveys for this study were carried out in two vil-lages in the Mekong Delta in 1997 and two Central Highlandsvillages in 1998. Both surveys took place in the rainy season.
Characteristic for the Mekong Delta area is the veryintensive agriculture, which is based primarily on rice pro-duction, either irrigated or rain-fed. It is one of the most fertile regions in Vietnam but there are also lower areas ofdepressed back-swamps where agricultural production isconstrained by permanent or seasonal salinity of the soils,annual risks of flooding, damaged dykes and destroyedcrops. In the dry season, the water in the canals, which isused for both household and farm use, is heavily pollutedand there is lack of fresh water.20,21 The Delta is densely pop-ulated and the population is mostly of Vietnamese origin(Kinh). The study sites were located in Can Tho and SocTrang provinces and both study sites were most easily acces-sible by small boat.
In contrast to the Mekong Delta, the Central Highlandsregion is sparsely populated. Over half the area is underforest cover and although deforestation in this region is ofmajor concern, some of the nation’s best and most extensiveforests are found here. Typical for the highlands are thenarrow, populated valleys surrounded by stretches of steephills and rugged densely forested mountains. The ThuaThien–Hue province, where the research was carried out, isone of the three poorest provinces in the Central Region.Two forest villages in two districts were selected, one closeto the border of Laos and the other neighbouring the BacMa nature reserve. The infrastructure in the study villagesis poor. The economy relies mainly on agriculture andforestry products, typically upland rice, cassava, maize,cinnamon, coffee and rubber. Regular flooding during therainy season of September to November is common also inthis region.
A large number of ethnic minority groups in Vietnam livein the mountain areas. In addition, lowland Kinh people havemoved to the highland regions under various resettlementschemes. In the highlands of Thua Thien–Hue province, twogroups dominate, the Ca–Tu and the Ta–Oi, of which thePa–Ko is a subgroup.22 Both these groups have traditionallypractised slash and burn agriculture on forest clearings but,after the war, have been transferred to settled agriculture inhighland valleys.
Sampling and participantsA simple random sampling was used for the formal survey.In the Mekong Delta villages, hamlets were segmented intocanal areas and, using random numbers to start, clusters ofhouseholds were selected. In the Central Highlands, villageauthorities assisted with lists of households in all hamletsand a random sample was drawn where a proportional num-ber of minority and Kinh households were selected.
Within the households, women in the age range 19–60were included in the dietary interviews and the nutrition status/health study. In total, 217 women took part; that is,107 in the Mekong Delta and 110 in the Central Highlandsvillages. From the Mekong Delta interviews, a subsampleconsisting of the 93 women (87%) who consented to theblood tests has been used in this analysis. From the CentralHighlands population, 103 (94%), who fully completed inter-views and health controls, have been included in the foodvariety analysis. Some characteristics of the study populationare presented in Table 1.
MethodsDietary intake assessment Information from an initial qualitative survey was used in thedesign of the dietary assessment survey.23 An adapted food frequency methodology with a recall period of seven con-secutive days (7dFFQ) was used, as this approach has beensuggested as a time-efficient method to assess short-termfood intake.24–26 Face to face interviews were conducted inthe homes of the respondents.
The 7dFFQ included commonly used foods divided into12 food categories and the foods listed under each categorywere specifically selected to cover foods commonly avail-able in the area, especially local vegetables, fruits andindigenous fish species. Special care was taken to probe forinformation on additional foods eaten during the week. Sev-eral techniques were used to determine usual portion sizes.These included the use of photos of foods and dishes pro-duced by the National Institute of Nutrition (NIN); providingselected households with scales and asking them to weighand record all foods used during three of the seven days, andpurchasing, weighing and preparing local foods. The teammembers also recorded weights of foods directly, wheneverpossible.
Individual dietary intake data were computed from the7dFFQ using Ebis for Windows 95/98/NT (Univ. Hohen-heim, Germany). The mean daily intakes of energy and
BM Ogle, PH Hung and HT Tuyet22
Table 1a. Key characteristics of study participants
Characteristics Mekong Delta Central Highlands (n = 93) (n = 103)
Age (mean years ± SD) 40 ± 10 38 ± 10.8Weight (kg) 48.1 ± 6.7 43.3 ± 5.1***Height (m) 1.52 ± 0.05 1.48 ± 0.06***BMI (mean ± SD)1 20.3 ± 4.6 17.6 ± 6.4***BMI (% < 18.5) 15.1 19.4BMI (% > 25.0) 8.6 1.9Number of children, mean (SD) 4 ± 2.7 4 ± 2.1Food variety score, mean (SD) 20 ± 6.6 18 ± 5.9Diet diversity score, mean (SD) 8 ± 1.4 9 ± 1.7*
Statistical significance (Student’s t-test): *P<0.01, ***P<0.001. 1Bodymass index (BMI) values excluding pregnant women (n = 13).

Wild vegetable intake of women in Vietnam 23
11 major nutrients were evaluated at a group level against therecommended dietary allowances for women in Vietnamaged 18–60 years.27 Details of the methodology and resultshave been published elsewhere.19
Food variety and dietary diversity scoringThe food variety score (FVS) was calculated on the basis ofthe 7dFFQ. We adapted the approach used by Hatloy et al.,Hodgson et al. and Hsu-Hage and Wahlquist.4,28,29 Wedefined FVS as the total number of different food items con-sumed during the 7dFFQ period. All the food items includedin Table 2 were included in the FVS.
The dietary diversity score (DDS) was calculated as pro-posed by Hatloy et al. through a simple count of the differ-ent food groups reported during the week of investigation.28
The food categories were those used by the NIN in previousnational dietary surveys;30 for example, rice, other staples,green leafy vegetables, other vegetables, meat/poultry, fish/shellfish, eggs, legumes/nuts/seeds, fruits, oils/fats, sauces/condiments and beverages/biscuits/sweets. In addition, wegrouped the vegetables into cultivated and wild species forfurther analysis. A summary of the food categories and fre-quencies in the reporting from the 7dFFQ is found in Table 2.
Anthropometric and biochemical dataThe health and nutrition status survey included anthropomet-ric parameters (height and bodyweight), as well as a healthexamination that included general condition, and enquiriesregarding problems of respiratory, gastrointestinal or genitalinfections. Heights and weights of all respondents wererecorded using digital solar scales (Tanita, USA) and theminimetre measuring tapes (Raven, Essex, UK). Qualifieddoctors assisted the researchers with individual health exam-inations. The team carried with them medication for com-mon conditions and distributed these free of charge whenmedication was required. Where necessary, patients werereferred to the local clinic for further treatment. In theMekong Delta survey, venous blood samples were taken fortesting of selected biochemical parameters. On a voluntarybasis, women were asked for non-fasting blood samples and87% consented to this. Blood samples were analysed forhaemoglobin (Hb), serum ferritin, serum retinol, retinolbinding protein and C-reactive protein (CRP). The healthsurvey in the Highlands did not include blood samples.
Biochemical analysisHaemoglobin values were analysed on the spot, using Hemo-Cue units (HemoCue AB, Angelholm, Sweden). Womenwith low Hb values were provided with ferrous sulphatetablets for a 2-week period and referred to the local clinicsfor further check-up and continued free treatment. The CRP levels were also assessed ocularly in the village usingNycoMed CRP cards (NycoMed Pharma, Birmingham, UK).Blood samples were transported in a cool-box each eveningto Can Tho Hospital and stored in a refrigerator. Serum fer-ritin levels were determined immediately at the Can ThoHospital using a standard bioassay procedure (Human ferri-tine enzyme immunoassay test kit; Diagnostic Automation,CA, USA). Frozen samples were transported to the BenhVien Cho Ray Hospital in Saigon where retinol-binding pro-tein was determined using enzyme-linked immunosorbentassays (Randox laboratories) and to the NIN, Hanoi foranalysis of serum retinol using high performance liquidchromotography (HPLC).31
Statistical analysisStatistical Packages for Social Sciences (SPSS version 9) forWindows was used for the analysis of associations betweenfood variety/dietary diversity, nutrient intake and anthro-pometric/biochemical data. The association between foodvariety and nutrient intake, and between food variety andbiochemical parameters was tested by creating three sub-groups of the study population on the basis of the FVS, DDSand number of wild vegetables. In each region the group inthe highest variety tertile was compared to that of the low-est variety tertile. Student’s t-tests and ANOVA were used totest differences in nutrient intakes between groups with thelowest and highest tertile of food variety, dietary diversityand adequacy of nutrient intakes. Multiple regression wasused to test associations between the number of wild vegeta-bles, nutrient adequacy and nutrition status/health data.
ResultsThe women in the two study areas had many characteristicsin common. They were mostly farming women who had livedin the community for over 10 years, they were married andthe mean age and number of children were similar (Table 1).With the heavy workload of farming women, many com-plained of backaches, painful shoulders and joints. In the
Table 1b. Ethnic variation within the Central Highlands population
Parameter Ethnic groupKinh (n = 44) Pa–Ko (n = 29) Ca–Tu (n = 30)
Age (mean years ± SD) 41.0 ± 10.3 33.0 ± 10.0** 37.0 ± 11.0Weight (kg) 44.8 ± 4.2 44.3 ± 5.5 40.1 ± 4.7**Height (m) 1.51 ± 0.04 1.46 ± 0.07** 1.44 ± 0.06*BMI (mean ± SD)1 19.2 ± 3.6* 15.4 ± 9.0* 17.2 ± 6.0BMI <18.5 10 women 2 7 womenBMI >25.0 1 1 1Pregnant, no. women 0 7 3Breast-feeding, no. women 0 14 3Number of children (mean ± SD) 4.0 ± 2.5 4.0 ± 2.0 4.0 ± 2.1Food variety score (mean ± SD) 19.0 ± 5.0 17.0 ± 6.6 16.0 ± 6.3*Diet diversity score (mean ± SD) 10.0 ± 1.0 8.0 ± 1.8*** 8.0 ± 1.8***
Statistical significance (Student’s t-test): *0.05>P>0.01, **0.01>P>0.001, ***P<0.001.1 Body mass index (BMI) values excluding pregnant women (n = 10).

BM Ogle, PH Hung and HT Tuyet24
Table 2. Food groups and food items eaten at least once during the 7-day period
Mekong Delta villages (n = 93) Central Highland villages (n = 103)Freq. of use of Mean no. Food items used Freq. of use of Mean no. Food items used
food group: food items by >10% of women food group: food items by >10% of womenFood groups % women % women
Cereals 100 1.5 100 rice 93 1.3 >90 rice>20 rice noodles >10 rice noodles>10 sticky rice, maize >10 sticky rice
Starchy roots 82 1.1 >60 sweet potatoes 90 1.4 >80 cassava>20 yams >40 sweet potatoes>10 taro >10 yams
Green leafy vegetables 88 3.2 >60 Ipomoea aquatica 94 3.8 >90 sweet potato leaf>40 Centella asiatica, >50 Centella asiaticaSauropus androgynus >30 Nasturdium officinale>30 Limnocharis flara, >20 Houttuynia cordata,sweet potato leaves Basella rubra,>20 Commelina communis, Schismatoglottis calyptr,Passiflora foetida Portulaca oleracea, Ipomoea>10 Amaranthus sp., aquatica,Eryngium foetidum Polygonum odorum
>10 Colocasia sp., squash leaf
Other vegetables 100 2.2 >80 chili peppers 87 1.7 >80 chili peppers>40 Eleocharis dulcis >20 bamboo shoots>30 Nymphea lotus, Homalomena occulta,Nelumbo nucifera, pumpkin, squash,>20 bitter cucumbers, >10 banana flower, long cucumbers beans, tomatoes
Fish/seafood 98 2.5 >70 Anabus testudinus 87 1.4 >70 Tetradon>50 Trichogaster >20 carptrichogaster >10 tilapia>40 snakehead fish>30 Kryptopterus kryptopterus>10 Leiocassis siamensis
Meat 74 1.3 >60 pork 66 1.0 >50 pork>40 duck >30 chicken>10 chicken >10 beef
Eggs 16 0.2 >10 duck eggs 28 0.3 >20 chicken eggs>10 duck eggs
Nuts/legumes 17 0.2 >10 peanuts 54 0.8 >30 peanuts>20 tofu, fresh, salted,fermented
Fruits/juice 89 2.6 >60 bananas 95 2.3 >80 bananas>40 papaya, longan, >60 guavasrambutan >40 papaya>30 guava, coconut juice, >10 oranges>10 lime juice
Oils/fats 76 0.8 >70 pork fat 68 0.9 >50 oil>40 pork fat
Sauces 100 1.2 >90 fish sauce 94 1.0 >50 fish sauce>10 soy sauce >10 soy sauce
Beverages/Biscuits/Sweets 97 2.7 >80 rain water 94 1.8 >30 rain water>10 sugar cane, Che, Banh >40 green tea, coffee(many different kinds) >20 biscuits, candy, Banhcoffee, green tea
<10% also reported the following food items:Cereals/tubers: wheat bread, potatoes, cu nau, mon vang.Green leafy vegetables: Alternanthera repens, Asystasia gangelica, Blyxa aubertii, Bacopa monnieri, Costus speciosus, Diplazium esculentum,Gymnopetalum cochincinense, Gynura crepidioides, Oenanthe javanica, Piper la lot, Plantago major, Schefflera tonkinensis, cassava leaves, bitter cucumberleaves, leaf cabbage, lettuce , pumpkin leaves and rattan tops.Other vegetables: banana stem, beet, carrot, cu cai trang, green figs, green banana, green onions, lemon grass, mo qua, pumpkin flower, straw mushrooms,susu, water hyacinth shoots, water hyacinth flower.Fish/sea foods: mackerel, goby, carp, Leiocassis siamensis, ca ngu, ca bien, ca soui, ca con, ca giec, Puntius biochantus, ca rong rong, Clarias batrachus,Notopterus notopterus, clams, eel, soft shell crab, shrimps, snails, fermented fish (mam).Meat/poultry/offal: buffalo, forest pig, frog, mice, pigs blood, snake, toad. Eggs/milk: condensed milk.Nuts/legumes/seeds: green beans, red beans, sesame.Fruits/juice: dragon fruit, jack fruit, pineapple, forest fruits, sims, sour sop, tangerines.Beverages/biscuits etc: forest tea leaves.

Wild vegetable intake of women in Vietnam 25
rainy season, when the surveys took place, acute respiratoryinfections were common. Access to clean water was a com-mon problem and genital infections were widespread.
The women differed with respect to ethnic background.The study population in the Mekong Delta were all ethnicVietnamese (Kinh) while in the Central Highlands villages,43% were Kinh, 29% Ca–Tu and 28% Pa–Ko. Socioculturaldifferences between the ethnic groups are reflected in severalparameters including weight, height and anthropometricstatus (Table 1a,b). The Mekong Delta population was tallerand heavier, had a higher mean BMI and a higher proportionof overweight women (nearly 9% with BMI >25). Within theCentral Highlands group, Pa–Ko and Ca–Tu women weresignificantly shorter and had lower mean BMI, 15.4 and17.2, respectively, than Kinh women (BMI 19.2). Overall,the Central Highlands population had a higher proportion ofchronically undernourished women, with 18% falling belowa BMI <18.5, the cut-off point used by WHO.
In the Mekong Delta, where the health survey includedblood samples, 36% had Hb values < 120 g/L of which 11%were < 110 g/L (Table 3). The mean serum retinol value was42 mg/100 mL, which compares well to the mean values of40 mg/100 mL reported in Vietnam, but is lower than theinternational norm (60 mg/100 mL). Mean serum ferritinlevels were 137 ng/mL and 15% had values less than 30 ng/mL, indicating iron depletion. The retinol-bindingprotein value was 21 mg/L and 18% were below the normalrange of 17–44 mg/L used by the International Vitamin AConsultative Group (IVACG). The CRP levels indicated thatapproximately 9% of the women had acute infections.
Food variety and diet diversityOver 120 different food items were registered in the 7dFFQ.The FVS for individual women ranged from six to 39. Therewas no significant difference between the regions in themean FVS, which was 20 for the Mekong Delta and 18 forthe Central Highlands (Table 1). The number of food groups(DDS) ranged from a low of five to 11, with a mean DDS of8 in the Mekong Delta, and 9 in the Central Highlands, adifference that was significant at the 0.01 level. Within theCentral Highlands population, women from the two minoritygroups had significantly lower mean DDS than the ethnicVietnamese (P-value < 0.001).
The food items and the food categories reported by thewomen (Table 2) showed that the majority of women had arice/tuber or root-based diet supplemented with fish, vege-tables, fruits and fish-sauce or soy sauce. More than two-thirds had eaten some meat, mostly pork or poultry, duringthe week of investigation. In the Mekong Delta, all womenhad consumed either fish, meat or eggs during the period, but
in the Central Highlands 12% had not included animal prod-ucts other than lard in their diet. In both regions more thantwo-thirds used fats/oil in the food preparation, but in smallquantities. Some food items were very specific for eachregion, notably the many species of wild vegetables in bothregions and the use of cassava in the highlands, especiallyamong the minority groups. The variety of fish and otheraquatic species was especially wide in the Mekong Deltapopulation and the mean number of species eaten was alsosignificantly higher.
The greatest diversity was recorded in the food categoryof vegetables. Altogether, 62 species of vegetables werereported in the 7dFFQ, but only approximately half of thesewere cultivated. Only 5% of the women did not consume anywild vegetables at all compared with 17% who did not reportthe use of cultivated vegetables. Most of the wild specieswere leafy vegetables, while the cultivated vegetables were amore diverse group including vegetable fruits, bulbs, tubers/roots, flowers, shoots and seeds. The mean overall consump-tion of vegetable species was five, and of these the meannumber of wild species was three. There was no significantdifference between the regions in the number of vegetablesconsumed, but relatively few vegetable species were widelyused in both regions.
Food variety and nutrient intakeNutrient intakes in the groups with the highest food varietyscore (high FVS = ≥ 21) in the two regions are compared tothose with the lowest food variety score (low FVS = ≤15) inTable 4. In the Mekong Delta, women in the high FVS grouphad significantly higher mean energy intakes, as well ashigher mean intakes of all analysed nutrients than the lowFVS group (P-value < 0.01 for energy, protein, calcium andzinc, P-value < 0.001 for all others). In the Central Highlands,the difference between the high and low FVS group was alsosignificant for energy and thiamine (P < 0.05), protein, fatsand niacin (P < 0.001), but non-significant for other nutrients.
The high FVS groups in both regions consumed a sig-nificantly higher variety of foods of most food categories.Observations at the food group level (DDS) showed that only5% of the women had a DDS of ≤ five food groups. Thosewho had a DDS of ≥ eight had significantly higher mean ade-quacy ratios for energy, protein, niacin, vitamin C and zinc.
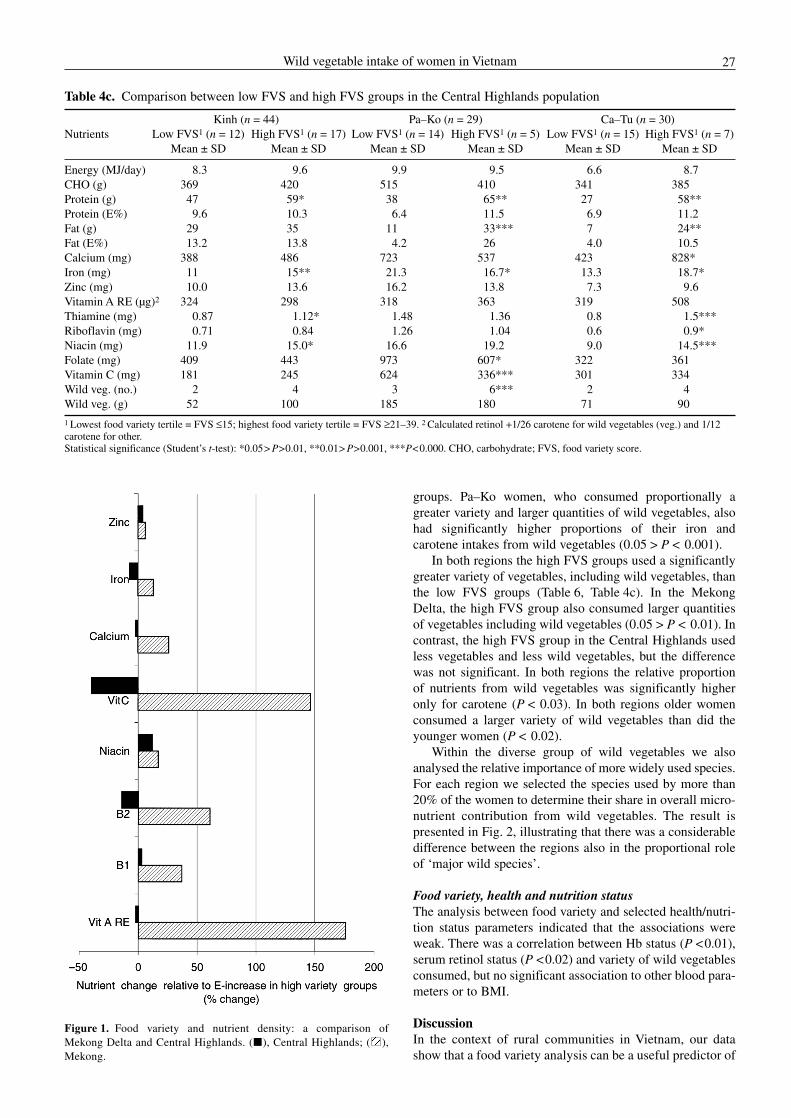
Food variety and nutrient densityInteresting differences were observed between the low FVSand high FVS groups in nutrient density; that is, the nutrientconcentration relative to energy. The high FVS groups hadrelatively lower intakes of carbohydrates (– 8 and – 14%, inthe Mekong Delta and the Central Highlands, respectively)and significantly higher intakes of fats; that is, + 5 and + 6energy per cent (E%), in the two regions, respectively. Thehigh FVS group in the Central Highlands also had a rela-tively higher protein E%, 11 compared to 8 protein E% in thelow FVS group. Differences in nutrient density in the diets ofthe low FVS and high FVS groups are illustrated in Fig. 1.Of interest here is that the high FVS group in the MekongDelta generally had a higher nutrient density in their diet,while the high FVS group in the Central Highlands had rela-tively lower concentrations of vitamin C, riboflavin and ironthan the low FVS group.
Table 3. Selected biochemical parameters
Mekong Delta population Parameters (n = 93)
Haemoglobin* (g/L) 122 ± 12.8Serum retinol (µg/100mL) 42.0 ± 12.8CRP† 8.7 ± 5.2RBP‡ (mg/L) 20.8 ± 5.2Serum ferritin (ng/mL) 137 ± 135
* Haemoglobin 11% had values <110; † C-reactive protein (CRP) 9% hadvalues ≥ 10; ‡ RBP, retinol-binding protein.

BM Ogle, PH Hung and HT Tuyet26
Sociocultural variation in food variety and nutrient intakeWithin the Central Highland population there were signifi-cant differences between the ethnic groups in the meanenergy and nutrient intakes (Table 4b). With the exception ofprotein and fats, Pa–Ko women had significantly higherintakes of all nutrients analysed. Ca–Tu women had the low-est energy intake, lowest intakes of protein, fats and B vita-mins, while Kinh women had the lowest intakes of calcium,iron, vitamin A and vitamin C. Although the subgroups weresmall, a comparison was made between low FVS and highFVS groups within each ethnic subgroup (Table 4c). Thisindicated especially low protein E% among low FVS groupsof Ca–Tu and Pa–Ko women (6.9 and 6.4 protein E%,respectively), as well as low fat E% (4.0 and 4.2 fat E%,respectively). With respect to minerals and vitamins, Pa–Ko
women, however, even in the low FVS group had relativelyhigh intakes. Pa–Ko women in both the low FVS and highFVS groups used similar quantities of wild vegetables, butthe high FVS group used twice as many varieties.
Significance of wild vegetablesThe nutrient contribution of wild vegetables to total micro-nutrient intakes in the two regions is illustrated in Fig. 2. Thecontribution was generally higher in the Mekong Deltapopulation, but also in the Central Highlands wild vegetableswere of substantial importance and heterogeneity. Some spe-cific differences in the use of wild vegetables were observedamong the three ethnic subgroups in the Central Highlands(Table 5), showing that wild vegetables were significantlymore important to the Pa–Ko women than to the other two
Table 4a. Food variety and nutrient intake: a comparison between the groups with lowest and highest food variety
Mekong Delta Central Highlands Nutrients Lowest tertile FVS* Highest tertile FVS* Lowest tertile FVS* Highest tertile FVS*
(n = 30) (n = 34) (n = 41) (n = 29)Mean ± SD Mean ± SD Mean ± SD Mean ± SD
Total energy (MJ/day) 8.5 ± 2.4 10.1 ± 4.8b 8.2 ± 2.4 9.3 ± 2.1a
CHO (g) 395 ± 118 433 ± 137 409 410Protein (g) 66 ± 20 81 ± 23b 37 ± 15 60 ± 17c
Protein (E%) 13 13 8 11Fat (g) 15 ± 7 32 ± 16c 15 ± 14 32 ± 15c
Fat (E%) 7 12 7 13Calcium (mg) 592 ± 217 857 ± 498b 515 ± 219 577 ± 320Iron (mg) 13.2 ± 4.3 17.4 ± 5.0b 15 ± 5.9 16 ± 3.7Zinc (mg) 8.5 ± 3.0 10.6 ± 3.9a 11.1 ± 5.2 12.7 ± 5.3Vitamin A (µg)** 189 ± 202 557 ± 427c 320 ± 265 360 ± 213Thiamine (mg) 0.9 ± 0.3 1.4 ± 0.4c 1.1 ± 0.4 1.2 ± 0.3a
Riboflavin (mg) 0.5 ± 0.2 0.9 ± 0.3c 0.9 ± 0.5 0.9 ± 0.3Niacin (mg) 12.5 ± 3.7 17.0 ± 4.9c 12.4 ± 4.3 15.6 ± 3.8b
Folate (mg) 210 ± 91 354 ± 179c 570 ± 388 452 ± 242Vitamin C (mg) 60 ± 45 159 ± 93 c 376 ± 278 282 ± 148
* Lowest food variety tertile = FVS ≤ 15, highest food variety tertile = FVS ≥ 21–39. ** Calculated retinol +1/26 carotene for wild vegetables and 1/12 carotene for other.Statistical significance (Student’s t-test): a 0.05> P>0.01, b 0.01>P>0.001, c P<0.001. CHO, cholesterol; FVS, food variety score.
Table 4b. Ethnic variation in food variety score and nutrient intake in the Central Highlands population
Ethnic groupNutrients Kinh (n = 44) Pa–Ko (n = 29) Ca–Tu (n = 30)
Mean ± SD Mean ± SD Mean ± SD
Total energy (MJ/day) 8.7 ± 2.3 9.5 ± 2.2 7.4 ± 1.9***CHO (g) 384 ± 120 456 ± 123** 359 ± 92*Protein (g) 53 ± 15 44 ± 16* 38 ± 19***Protein (E%) 10.3 7.8 8.6Fat (g) 30 ± 14 20 ± 29 14 ± 14***Fat (E%) 13.1 8.0 7.1Calcium (mg) 431 ± 158 718 ± 365 562 ± 331Iron (mg) 12.5 ± 3.9 19.0 ± 4.9*** 15.1 ± 4.4**Zinc (mg) 11.9 ± 5.5 15.3 ± 6.4 8.3 ± 2.8***Vitamin A RE (µg)1 312 ± 202 417 ± 255 438 ± 351Thiamine (mg) 0.98 ± 0.27*** 1.4 ± 0.33*** 1.1 ± 0.37***Riboflavin (mg) 0.75 ± 0.35 1.24 ± 0.39*** 0.75 ± 0.36***Niacin (mg) 13.2 ± 3.4*** 16.8 ± 3.9 11.25 ± 3.3***Folate (mg) 407 ± 236 811 ± 325*** 347 ± 187***Vitamin C (mg) 201 ± 128 511 ± 196*** 302 ± 149***
1 Calculated retinol +1/26 carotene for wild vegetables and 1/12 carotene for other. Statistical significance (Student’s t-test): *0.05> P>0.01,**0.01>P>0.001, ***P<0.000. CHO, carbohydrate.
Wild vegetable intake of women in Vietnam 27
groups. Pa–Ko women, who consumed proportionally agreater variety and larger quantities of wild vegetables, alsohad significantly higher proportions of their iron andcarotene intakes from wild vegetables (0.05 > P < 0.001).
In both regions the high FVS groups used a significantlygreater variety of vegetables, including wild vegetables, thanthe low FVS groups (Table 6, Table 4c). In the MekongDelta, the high FVS group also consumed larger quantitiesof vegetables including wild vegetables (0.05 > P < 0.01). Incontrast, the high FVS group in the Central Highlands usedless vegetables and less wild vegetables, but the differencewas not significant. In both regions the relative proportion of nutrients from wild vegetables was significantly higheronly for carotene (P < 0.03). In both regions older womenconsumed a larger variety of wild vegetables than did theyounger women (P < 0.02).
Within the diverse group of wild vegetables we alsoanalysed the relative importance of more widely used species.For each region we selected the species used by more than20% of the women to determine their share in overall micro-nutrient contribution from wild vegetables. The result ispresented in Fig. 2, illustrating that there was a considerabledifference between the regions also in the proportional roleof ‘major wild species’.
Food variety, health and nutrition statusThe analysis between food variety and selected health/nutri-tion status parameters indicated that the associations wereweak. There was a correlation between Hb status (P <0.01),serum retinol status (P <0.02) and variety of wild vegetablesconsumed, but no significant association to other blood para-meters or to BMI.
DiscussionIn the context of rural communities in Vietnam, our datashow that a food variety analysis can be a useful predictor of
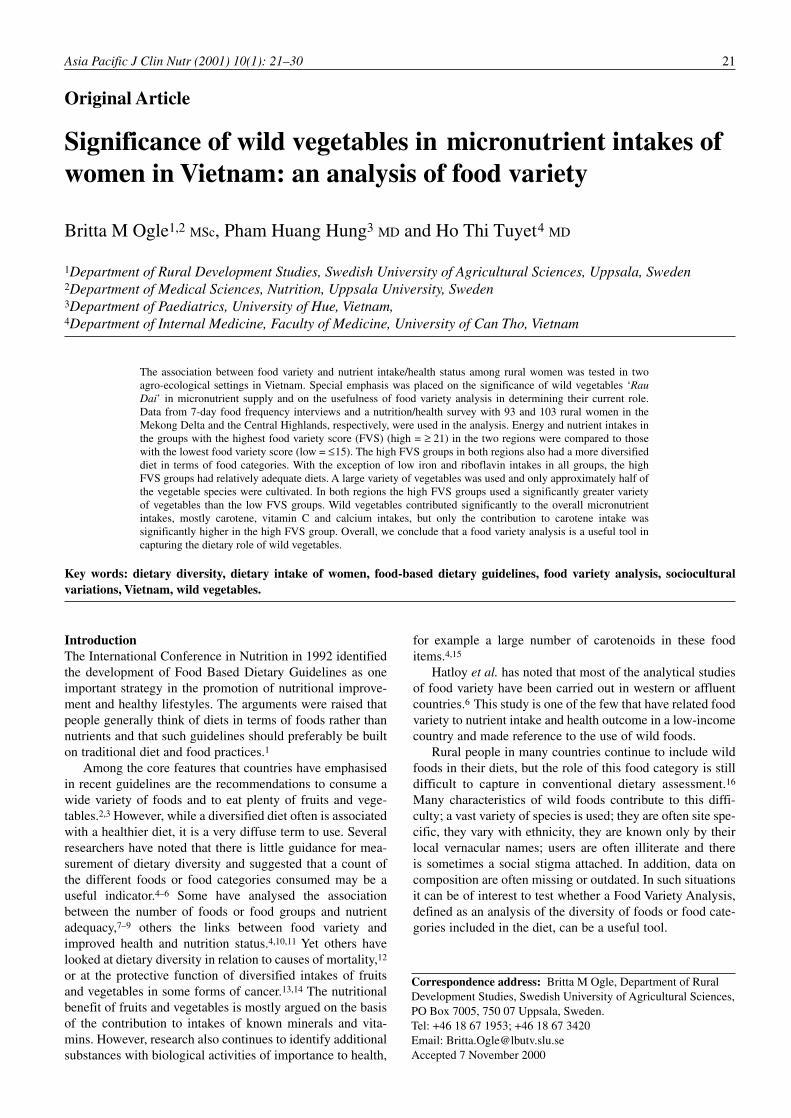
Table 4c. Comparison between low FVS and high FVS groups in the Central Highlands population
Kinh (n = 44) Pa–Ko (n = 29) Ca–Tu (n = 30)Nutrients Low FVS1 (n = 12) High FVS1 (n = 17) Low FVS1 (n = 14) High FVS1 (n = 5) Low FVS1 (n = 15) High FVS1 (n = 7)
Mean ± SD Mean ± SD Mean ± SD Mean ± SD Mean ± SD Mean ± SD
Energy (MJ/day) 8.3 9.6 9.9 9.5 6.6 8.7CHO (g) 369 420 515 410 341 385Protein (g) 47 59* 38 65** 27 58**Protein (E%) 9.6 10.3 6.4 11.5 6.9 11.2Fat (g) 29 35 11 33*** 7 24**Fat (E%) 13.2 13.8 4.2 26 4.0 10.5Calcium (mg) 388 486 723 537 423 828*Iron (mg) 11 15** 21.3 16.7* 13.3 18.7*Zinc (mg) 10.0 13.6 16.2 13.8 7.3 9.6Vitamin A RE (µg)2 324 298 318 363 319 508Thiamine (mg) 0.87 1.12* 1.48 1.36 0.8 1.5***Riboflavin (mg) 0.71 0.84 1.26 1.04 0.6 0.9*Niacin (mg) 11.9 15.0* 16.6 19.2 9.0 14.5***Folate (mg) 409 443 973 607* 322 361Vitamin C (mg) 181 245 624 336*** 301 334Wild veg. (no.) 2 4 3 6*** 2 4Wild veg. (g) 52 100 185 180 71 90
1 Lowest food variety tertile = FVS ≤15; highest food variety tertile = FVS ≥21–39. 2 Calculated retinol +1/26 carotene for wild vegetables (veg.) and 1/12carotene for other.Statistical significance (Student’s t-test): *0.05> P>0.01, **0.01> P>0.001, ***P<0.000. CHO, carbohydrate; FVS, food variety score.
Figure 1. Food variety and nutrient density: a comparison ofMekong Delta and Central Highlands. (�), Central Highlands; ( ),Mekong.

BM Ogle, PH Hung and HT Tuyet28
nutrient intake and nutrient adequacy. The nutrient adequacyratios were closely related to the food variety score, andwomen in the high FVS group had diets that were fairly ade-quate for most of the analysed nutrients (Table 4a). Theexception was the low iron and riboflavin intake in bothregions (in the Central Highland region also vitamin Aintake), even in the high FVS groups. There are no estab-lished levels for ‘cut-off points’ for food variety adequacy orfor food group adequacy. Hatloy et al. have suggested that aFVS of at least 20 items and a DDS of at least five foodgroups were necessary for an overall nutrient adequacy ratioof 0.75 RDA.5 This agrees fairly well with our analysis
where the high FVS group had intakes of 21–39 food items.As only 5% of the women had used less than five food cate-gories we did not explore the usefulness of the DDS analysisfurther.
With respect to the significance of wild vegetables, thereare several important observations in our study. First, theanalysis shows that wild vegetables contribute significantlyto the overall micronutrient intake (Fig. 2). Secondly, thecomplexity and site specificity in their consumption cannotbe ignored. Several important differences between sites andsociocultural backgrounds emerged in our analysis, forexample the greater variety of wild vegetables consumed by
Figure 2. Nutrient contribution from wild vegetables. ( ) and ( )Mekong Delta; ( ) and ( ), Central Highlands. The lower parts of all columnsindicate the proportion of the wild vegetable contribution that comes from the major wild species listed. From major species: species from Table 2analysed as ‘major wild vegetables’. Mekong Delta: Ipomoea aquatica, Centella asiatica, Eleocharis dulcis, Sauropus androgynus, Limnocharisflara, Nymphea lotus and Commelina communis. Central Highland: Centella asiatica, Nasturdium officinale, Homalomena occulta, Houttuynia cor-data, Basella rubra, Polygonum odorum and Schisotachyum aviculare. Statistical significance (Student’s t-test): *0.05 > P 0.01, ***P <0.001.
Table 5. A subgroup analysis of the Central Highlands population
Parameter/ethnic group Kinh (n = 44) Pa–Ko (n = 29) Ca–Tu (n = 30)
Wild vegetables, 35 49* 35% of total quantity of vegetablesNo. wild vegetables 2 4*** 2Wild vegetables (g) 71 204** 76Major wild vegetables (g) 53 120** 60
Statistical significance (Student’s t-test): *0.05> P>0.01, **0.01> P>0.001, ***P <0.000.
Table 6. A comparison between the groups with lowest and highest food variety
Mekong Delta Central Highlands Parameter Low FVS1 (n = 30) High FVS1 (n = 34) Low FVS1 (n = 41) High FVS1 (n = 29)
Vegetables, total no. 3 8** 4 7**Wild vegetables, no. 2 4** 2 4**Total vegetables (g) 182 320** 248 234Wild vegetables (g) 142 203* 104 110Major wild vegetables (g) 131 186 72 64
1 Lowest food variety tertile = FVS ≤15; highest food variety tertile = FVS ≥21–39. Statistical significance (Student’s t-test): *0.05> P >0.01, **P<0.000.FVS, food variety score.

Wild vegetable intake of women in Vietnam 29
the high FVS groups and the variation between regions inthe contribution of the ‘major species’. The analysis of theCentral Highlands population shows that within the samevillages there can be major ethnic differences in the nutri-tional significance of wild foods. Overall, it signals the needto pay greater attention to local and cultural variations in theuse of wild vegetables.
In both regions we found the use of a greater variety ofwild vegetables parallel to a higher dietary diversity in gen-eral in the high FVS groups. This shows that wild edibleplants are well integrated in the farming systems and foodsystems, as proposed earlier.32,33 It makes sense to ruralwomen to continue to use them if it demands less labour andtime than alternative procurement methods. For relativelypoor households, it also makes economic sense to use gath-ered vegetables instead of market vegetables. Nutritionaladvantages of such local practices need to be taken moreseriously also in dietary guidelines.
An important practical implication of our study is that wehave shown that a food variety analysis can be used to cap-ture the role of wild foods and that it is essential to pay atten-tion to their contemporary use in nutrition and food securityassessments. In situations where food composition data arelimiting and socioeconomic conditions make it difficult touse standard dietary analysis, a rapid food variety analysiscan be a useful tool to help identify individuals or groupswith inadequate diets.
It is, however, also important to keep in mind some limi-tations in the use of food variety analysis. The basis for our dietary analysis was a simple 7dFFQ relying on recallmethodology and household measures. Weaknesses in recallmethodologies are well known and further accentuated incombination with limited food composition data.34 The bio-chemical and health parameters that we tested had no strongassociation with food variety. This may partly be due to suchweaknesses in the dietary assessment methodologies.
Overall, however, our study confirms that it is possible topredict nutrient adequacy fairly well through a food varietyanalysis also in diverse agro-ecological and sociocultural set-tings such as our study areas. It is a useful tool for broaderstudies of food security and nutrition where it can capture thesignificance of neglected foods such as wild vegetables.
Acknowledgements. Staff and students from the Universities of CanTho and Hue assisted the researchers in the field surveys. A grant fromthe research branch (SAREC) of the Swedish International Develop-ment Cooperation Agency (Sida) made the study possible.
References1. http://www.fao.org/waicent/faoinfo/economic/ESN/fbdg.htm2. Asian Nutrition Forum. Development of Food Based Dietary
Guidelines for the Asian Region. Final report of the recommenda-tions of the Asian Nutrition Forum/WHO Symposium on DietRelated Chronic Diseases in Asia. New Delhi: Indian InternationalCentre, 1997.
3. Sandstrom B, Aro A, Becker W, Lyhne N, Pederson JI. NordiskaNdringsrekommendationer. Copenhagen: Nordiska Ministerradet,1996.
4. Hodgson JM, Hsu-Hage B, Wahlquist M. Food variety as a quan-titative descriptor of food intake. Ecol Food Nutr 1994; 32:137–148.
5. Hatloy A, Torheim LE, Oshaug A. Food variety - a good indicatorof nutritional adequacy of the diet? A case study from an urban areain Mali, West Africa. Eur J Clin Nutr 1998; 52: 891–898.
6. Hatloy A. Methodological aspects of assessing nutrition security.Examples from Mali. Doctoral Dissertation. Fafo Institute forApplied Social Sciences, Centraltryckeriet, Norway, 1999.
7. Krebs-Smith SM, Smiciklas-Wright H, Guthrie HA, Krebs-Srnith J.The effects of variety in food choices on dietary quality. J Am DietAssoc 1987; 87: 897–903.
8. Shimbo S, Kimura K, Imai Y, Yasamoto M, Yamamoto K,Kawamura S, Watanabe T, Iwami O, Nakatsuka H, Ikeda M. Number of food items as an indicator of nutrient intake. Ecol FoodNutr 1994; 32: 197–206.
9. Spindler AA, Schultz JD. Comparison of dietary variety and ethnicfood composition among Chinese, Chinese-American and whiteAmerican women. Agric Hum Values 1996; 13: 64–73.
10. Grifo F, Rosenthal J. Biodiversity and human health. Washington:Island Press, 1997.
11. Marwick C. Scientists stress biodiversity – human health links.JAMA 1995; 273: 1246–1247.
12. Kant AK, Schatzkin A, Ziegler RG. Dietary diversity and sub-sequent cause specific mortality in the NHANES I Epidemiologicalfollow-up study. J Am Coll Nutr 1995; 14: 233–238.
13. La Vecchia C, Munoz SE, Braga C, Fernandez E, Decarli A. Dietdiversity and gastric cancer. Int J Cancer 1997; 72: 255–257.
14. Slattery ML, Berry TD, Potter J, Caan B. Diet diversity, diet com-position and risk of colon cancer. Cancer Causes Control 1997; 8:872–882.
15. Wahlquist ML. Non-nutrients in foods: implications for industry.Food Aust 1992; 44: 558–560.
16. Grivetti LE, Ogle BM. Value of traditional foods in meeting macroand micronutrient needs. The wild plant connection. Nutr Res Rev2000; 13: 31–46.
17. Bui Minh Duc. Study of the nutritive value and the utilisation ofwild vegetables in Vietnam. In: Proceedings of the InternationalConference on Applied Nutrition. Hanoi: The National Institute ofNutrition UNICEF, 1986; 326–334.
18. Nguyen Tien Ban, Bui Minh Duc (eds). Wild edible vegetables inVietnam. Hanoi: People’s Army Publishing House, 1994.
19. Ogle BM, Xuan Dung NN, Tran Than Do, Hambraeus L. The con-tribution of naturally occurring vegetables to micronutrient intakesamong women; an example from the Mekong Delta, Vietnam. EcolFood Nutr 2000; 40: 1–26.
20. Nguyen Huu Chiem. Studies on agro-ecological environment anduse in the Mekong Delta, Vietnam. Thesis of Doctor of Philosophy,Kyoto University, Japan, 1994.
21. Working group on Acid Sulphate Soils in the International Societyof Soil Science. Fourth International Symposium on Acid SulphateSoils, Can Tho, Vietnam, Excursion Guides, 1992.
22. Dang Nghiem Van. Ethnic minorities in Vietnam. Hanoi: The GoiPublishers, 2000.
23. Nguyen Nhut Xuan Dung Ogle BM, Uden P. Identification and useof non cultivated plants for livestock feeds in the Mekong Delta ofVietnam. In: Nguyen Nhut Xuan Dung. Identification and evalua-tion of non cultivated plants for livestock feeds in the Mekong Deltaof Vietnam. MSc Thesis, Swedish University of Agricultural Sci-ences, Uppsala, Sweden, 1996.
24. Eck LH, Klesges RC, Hanson CL, Slawson DL, Lavasque ME.Measuring short term dietary intake: Development and testing of a1-week food frequency questionnaire. J Am Diet Ass 1991; 91:940–945.
25. Krall EA, Dwyer JT. Validity of a food frequency questionnaire anda food diary in a short term recall situation. J Am Diet Ass 1987;87: 1374–1377.
26. Uiso FC, Johns T. Consumption patterns and nutritional contribu-tion of Crotalaria brevidens (Mitoo) in Tarime district, Tanzania.Ecol Food Nutr 1996; 35: 59–69.
27. National Institute of Nutrition (NIN). Recommended dietaryallowances for Vietnam. Hanoi: Medical Publishing House, 1997;1–75.
28. Hatloy A, Hallund J, Diarra MM, Oshaug A. Food Variety, socio-economic status nutritional status urban rural areas Koutiala (Mali).Publ Health Nutr 2000; 3: 57–65.
29. Hsu-Hage B, Wahlquist ML. Food variety of adult Melbourne Chi-nese: a case study of a population in transition. World Rev NutrDiet. 1996; 79: 53–69.

BM Ogle, PH Hung and HT Tuyet30
30. Ha Huy Khoi. An overview of the nutritional situation in Vietnam.In: Nutritional situation and strategies for action in Vietnam.National plan of action for nutrition. Proceedings of the ScientificSymposium (National Institute of Nutrition). Hanoi: Medical Pub-lishing House, 1996; 1–18.
31. Speek AJ. Vitamin A analysis in body fluids and food stuff withHigh Performance Liquid Chromatography. Ziest: TNO-CIVOToxicology and Nutrition Institute, 1989.
32. Scoones I, Melnyk M, Pretty JN. The Hidden Harvest. Wildfoods and agricultural systems. A literature review and annotated
bibliography. WWF/Sida/IIED. London: International Institute forEnvironment and Development, 1992; 1–256.
33. Blench R. Neglected species, livelihoods and biodiversity in diffi-cult areas: how should the public sector respond? London: ODINatural Resource Perspective – Oversees Development Institute,1997.
34. Gibson RS. Principles of nutritional assessment. Oxford: OxfordUniversity Press, 1990.