Localization and quantification of Pb and nutrients in Typha latifolia by micro-PIXE
10
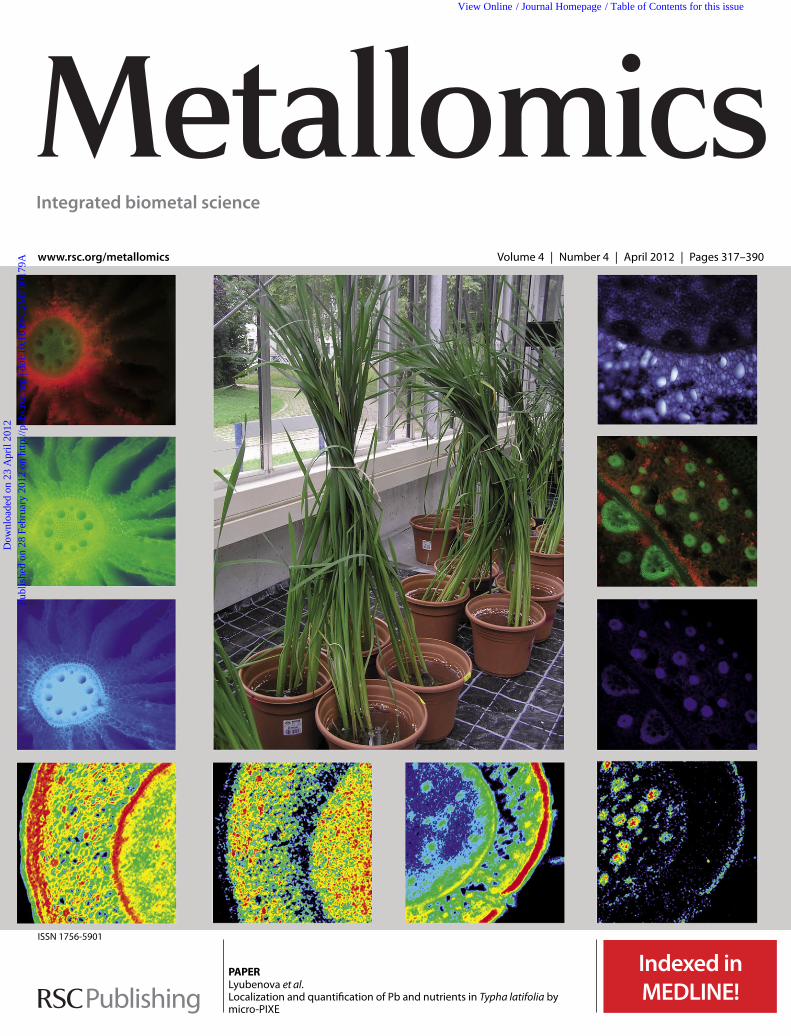
ISSN 1756-5901 www.rsc.org/metallomics Volume 4 | Number 4 | April 2012 | Pages 317–390 Metallomics Integrated biometal science PAPER Lyubenova et al. Localization and quantification of Pb and nutrients in Typha latifolia by micro-PIXE Downloaded on 23 April 2012 Published on 28 February 2012 on http://pubs.rsc.org | doi:10.1039/C2MT00179A View Online / Journal Homepage / Table of Contents for this issue
-
Upload
independent -
Category
Documents
-
view
0 -
download
0
Transcript of Localization and quantification of Pb and nutrients in Typha latifolia by micro-PIXE
ISSN 1756-5901
www.rsc.org/metallomics Volume 4 | Number 4 | April 2012 | Pages 317–390
MetallomicsIntegrated biometal science
PAPERLyubenova et al.Localization and quantifi cation of Pb and nutrients in Typha latifolia by micro-PIXE
Dow
nloa
ded
on 2
3 A
pril
2012
Publ
ishe
d on
28
Febr
uary
201
2 on
http
://pu
bs.r
sc.o
rg |
doi:1
0.10
39/C
2MT
0017
9AView Online / Journal Homepage / Table of Contents for this issue
This journal is c The Royal Society of Chemistry 2012 Metallomics, 2012, 4, 333–341 333
Cite this: Metallomics, 2012, 4, 333–341
Localization and quantification of Pb and nutrients in Typha latifoliaby micro-PIXE
Lyudmila Lyubenova,*aPaula Pongrac,
bcKatarina Vogel-Mikus,
b
Gasper Kukec Mezek,cPrimoz Vavpetic,
cNatasa Grlj,
cPeter Kump,
c
Marijan Necemer,cMarjana Regvar,
bPrimoz Pelicon
cand Peter Schroder
a
Received 15th November 2011, Accepted 3rd February 2012
DOI: 10.1039/c2mt00179a
Typha latifolia is a plant species widely used for phytoremediation. Accumulation, localization
and distribution of Pb and mineral nutrients were investigated in roots, rhizomes and leaves of
Typha latifolia grown at 0, 50, 100 and 250 mM Pb concentrations in a pot experiment under
controlled conditions. Bulk elemental concentrations were determined by X-ray fluorescence
(XRF) spectroscopy whereas micro-proton-induced X-ray emission (micro-PIXE) was used for
element localization in root and rhizome tissues. Gradual increase in bulk Pb concentrations was
observed in Typha latifolia roots and rhizomes treated with increasing Pb concentrations, however
in rhizomes Pb concentrations were an order of magnitude lower than in roots. In leaves Pb
concentrations were around the limit of detection for XRF (B20 mg g�1). An increase in
concentration of K and Ca in roots, rhizomes and leaves, of iron and zinc in roots and leaves,
and of Mn in rhizomes was observed either at 50 and/or 100 mM Pb treatments, whereas for
K and Ca in roots, rhizomes and leaves, Fe and Zn in roots and leaves and Mn in rhizomes, or at
250 mM Pb treatment the increase was seen for concentrations of Fe and Zn in rhizomes and
Cu in roots. Mn concentrations decreased with Pb treatments in roots and leaves. Element
localization using micro-PIXE analysis demonstrated Pb accumulation in epidermal and cortical
tissues of treated roots and rhizomes, while in endodermis and vascular tissues Pb was not
detected. A displacement of Ca from epidermal to cortical tissues was observed in Pb treated
roots and rhizomes, pointing to cell wall immobilization of Pb as one of the tolerance
mechanisms in Typha latifolia. High level of colocalization of Pb with P (r = 0.60), S (r = 0.37)
and Zn (r = 0.70) was observed in Pb treated roots, while in rhizomes colocalization with the
mentioned elements was still positive, but not that prominent. These results indicate that Pb may
form complexes with phosphorus and sulfur compounds in roots and rhizomes, which may also
represent attraction sites for binding Zn. Because of its large root and rhizome surface area acting
as main sites for Pb adsorption, Typha latifolia may represent potentially efficient plant species for
phytoremediation of Pb contaminated soils and waters.
1. Introduction
The mobilization of heavy metals from their natural reservoirs
to the atmosphere, soil and water through mining and steel
industry, transport activities, fertilizers and agrochemical
applications is the most significant negative input of human
activities on terrestrial and aquatic ecosystems.1 Lead (Pb) is
one of the main environmental concerns as it contaminates
soil, groundwater and vegetation,2 thus its removal from these
systems is a subject of intense remediation research.
In plants increased Pb concentrations cause growth
reduction and inhibition of cell division,3 partially due to the
changes in the water balance, hormonal status and membrane
permeability.4 Additionally, intense Pb uptake may impair
plant mineral status by inhibiting the root uptake of essential
cations (K, Ca, Mg, Mn, Zn, Cu, Fe) and some anions:
e.g. nitrate (NO3�).5 These mineral imbalances predominantly
result from Pb induced disorders in the cell metabolism
stemming from changes in the membrane transporter activities
and the membrane structure.5 Pb can physically block the access
of various ions to the root absorption sites.6 As a consequence,
aHelmholtz Zentrum Munchen, German Research Center forEnvironmental Health, Research unit Microbe-Plant Interactions,Ingolstadter Landstr. 1, D-85764 Neuherberg, Germany.E-mail: [email protected];Fax: +49 89 3187 3382; Tel: +49 89 3187 3541
bDepartment of Biology, Biotechnical Faculty,University of Ljubljana, Vecna pot 111, SI-1000 Ljubljana, Slovenia
c Jozef Stefan Institute, Jamova 39, SI-1000 Ljubljana, Slovenia
Metallomics Dynamic Article Links
www.rsc.org/metallomics PAPER
Dow
nloa
ded
on 2
3 A
pril
2012
Publ
ishe
d on
28
Febr
uary
201
2 on
http
://pu
bs.r
sc.o
rg |
doi:1
0.10
39/C
2MT
0017
9A
View Online
334 Metallomics, 2012, 4, 333–341 This journal is c The Royal Society of Chemistry 2012
a decrease in concentrations of Ca, Mg, K and some other
elements may be observed after exposure to Pb as in the case of
Zea mays and Cucumis sativus roots.7
Pb is taken up from soil mainly into the root apoplast and
accumulates near the endodermis where the casparian strip acts
as the predominant Pb barrier restricting loading of Pb to the
central cylinder and shoot transport, thus resulting in higher Pb
root than shoot concentrations.8–10 In the current literature,
several reports on the Pb transport in terrestrial plants may be
found,11–13 whereas the information on Pb uptake and trans-
port in aquatic and wetland plants is scarce. Due to the primary
importance of wetland plant species for constructed wetlands,
information on the uptake, transport and tolerance against Pb
represent basis for their practical applications.
Typha latifolia is referred to as a Pb excluder,14 meaning
that Pb concentrations in leaves are maintained at constant
low levels until critical soil concentrations are reached and
toxicity ensues as a result of unrestricted metal transport.15
Both, metal tolerance and metal exclusion ability of T. latifolia
are believed to be related to its oxygen transport capability
and the radial oxygen loss from the roots resulting in its ability
to modify and immobilize metals already in the rhizosphere.14 In
comparison to several other Pb-tolerant plants T. latifolia was
shown to have the highest impact on reduction of Pb contamina-
tion in real contaminated sites16 pointing to high value of this
plant species in phytoremediation of aquatic environments.
Bulk analyses of roots or shoots alone do not provide
information on heavy metal tolerance as mechanisms of
survival might be linked to particular tissues. This problem
can easily be circumvented by using localization techniques
that provide maps of lateral distribution of elements within
the tissue. This is accessible by micro-proton induced X-ray
emission (micro-PIXE), a highly sensitive localization technique
yielding quantitative information on localization of elements in
tissues with micrometre resolution.17 Micro-PIXE has been
efficiently used to determine spatial distribution of macro- and
micro-nutrients and also of non-essential elements accumulated
in excess.18–21 It also enables the studies of elemental interactions22
thus providing better understanding of the detoxification
mechanisms and plant adaptations on heavy metal
contaminated sites.
The main aims of the present study were therefore to shed
more light on the uptake, translocation and localization of Pb
in T. latifolia grown in the substrate with increasing Pb
concentrations and to investigate the possible interactions of
Pb with essential minerals. We hypothesised that (i) the
majority of the Pb would be immobilized in the T. latifolia
root epidermis and cortex, (ii) the amount of Pb in rhizomes
and leaves would be much lower than that in the roots, and
(iii) that Pb uptake would lead to repartition of certain major
macro- and micro-nutrients within plant tissues.
2. Results
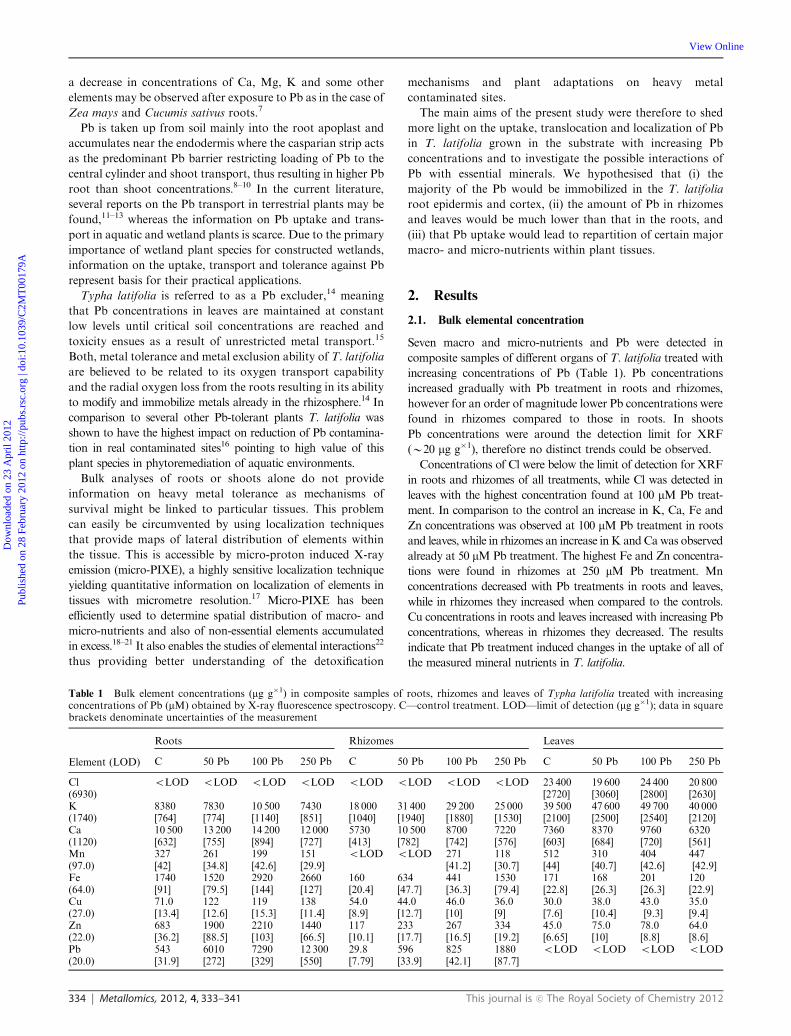
2.1. Bulk elemental concentration
Seven macro and micro-nutrients and Pb were detected in
composite samples of different organs of T. latifolia treated with
increasing concentrations of Pb (Table 1). Pb concentrations
increased gradually with Pb treatment in roots and rhizomes,
however for an order of magnitude lower Pb concentrations were
found in rhizomes compared to those in roots. In shoots
Pb concentrations were around the detection limit for XRF
(B20 mg g�1), therefore no distinct trends could be observed.
Concentrations of Cl were below the limit of detection for XRF
in roots and rhizomes of all treatments, while Cl was detected in
leaves with the highest concentration found at 100 mM Pb treat-
ment. In comparison to the control an increase in K, Ca, Fe and
Zn concentrations was observed at 100 mM Pb treatment in roots
and leaves, while in rhizomes an increase inK andCawas observed
already at 50 mM Pb treatment. The highest Fe and Zn concentra-
tions were found in rhizomes at 250 mM Pb treatment. Mn
concentrations decreased with Pb treatments in roots and leaves,
while in rhizomes they increased when compared to the controls.
Cu concentrations in roots and leaves increased with increasing Pb
concentrations, whereas in rhizomes they decreased. The results
indicate that Pb treatment induced changes in the uptake of all of
the measured mineral nutrients in T. latifolia.
Table 1 Bulk element concentrations (mg g�1) in composite samples of roots, rhizomes and leaves of Typha latifolia treated with increasingconcentrations of Pb (mM) obtained by X-ray fluorescence spectroscopy. C—control treatment. LOD—limit of detection (mg g�1); data in squarebrackets denominate uncertainties of the measurement
Element (LOD)
Roots Rhizomes Leaves
C 50 Pb 100 Pb 250 Pb C 50 Pb 100 Pb 250 Pb C 50 Pb 100 Pb 250 Pb
Cl oLOD oLOD oLOD oLOD oLOD oLOD oLOD oLOD 23 400 19 600 24 400 20 800(6930) [2720] [3060] [2800] [2630]K 8380 7830 10 500 7430 18 000 31 400 29 200 25 000 39 500 47 600 49 700 40 000(1740) [764] [774] [1140] [851] [1040] [1940] [1880] [1530] [2100] [2500] [2540] [2120]Ca 10 500 13 200 14 200 12 000 5730 10 500 8700 7220 7360 8370 9760 6320(1120) [632] [755] [894] [727] [413] [782] [742] [576] [603] [684] [720] [561]Mn 327 261 199 151 oLOD oLOD 271 118 512 310 404 447(97.0) [42] [34.8] [42.6] [29.9] [41.2] [30.7] [44] [40.7] [42.6] [42.9]Fe 1740 1520 2920 2660 160 634 441 1530 171 168 201 120(64.0) [91] [79.5] [144] [127] [20.4] [47.7] [36.3] [79.4] [22.8] [26.3] [26.3] [22.9]Cu 71.0 122 119 138 54.0 44.0 46.0 36.0 30.0 38.0 43.0 35.0(27.0) [13.4] [12.6] [15.3] [11.4] [8.9] [12.7] [10] [9] [7.6] [10.4] [9.3] [9.4]Zn 683 1900 2210 1440 117 233 267 334 45.0 75.0 78.0 64.0(22.0) [36.2] [88.5] [103] [66.5] [10.1] [17.7] [16.5] [19.2] [6.65] [10] [8.8] [8.6]Pb 543 6010 7290 12 300 29.8 596 825 1880 oLOD oLOD oLOD oLOD(20.0) [31.9] [272] [329] [550] [7.79] [33.9] [42.1] [87.7]
Dow
nloa
ded
on 2
3 A
pril
2012
Publ
ishe
d on
28
Febr
uary
201
2 on
http
://pu
bs.r
sc.o
rg |
doi:1
0.10
39/C
2MT
0017
9A
View Online
This journal is c The Royal Society of Chemistry 2012 Metallomics, 2012, 4, 333–341 335
2.2. Spatial distribution of elements
For the representation of the spatial distribution of elements in
roots and rhizomes only the most extreme comparison of controls
vs. plants treated with 250 mM Pb (Fig. 1–4) was selected. The
roots and rhizomes from 250 mMPb treatment showed the highest
Pb concentrations and consequentially satisfactory statistics of
Pb-L maps. Four different root tissues recognised in roots and five
in rhizome maps are depicted in STIM maps (Fig. 1 and 3). Each
tissue region was encircled, PIXE spectra were extracted from the
encircled regions and finally quantitative analysis was performed
by GUPIXWIN Software (Tables 2 and 3).
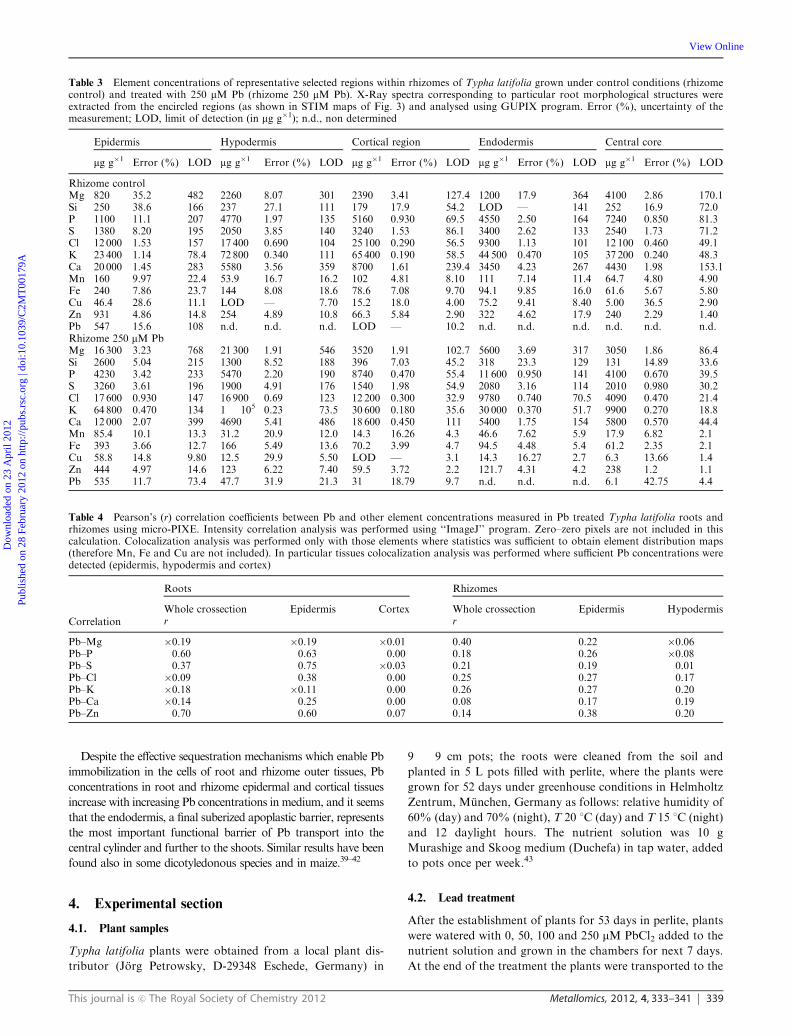
Pb was mainly localized in root epidermis of both control
and treated plants (Tables 2 and 3; Fig. 1 and 2), and the
concentrations of Pb in root tissues of treated plants were of
three orders of magnitude higher than those of the controls
(Table 2; Fig. 1 and 2). Despite high Pb concentration
difference observed in epidermal root tissues between treated
and control plants, Pb was not detected in endodermis and
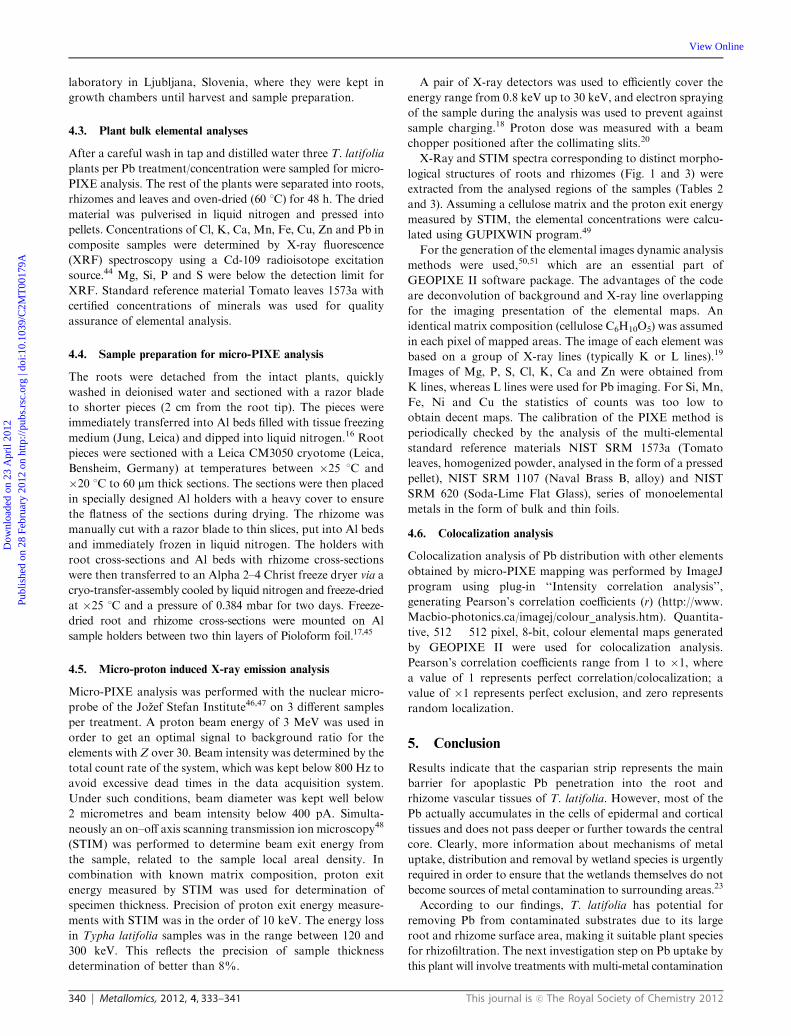
vascular bundles (Table 2). In rhizomes the concentration
differences in epidermal tissues between both treatments were
not that prominent. However, in control plants Pb was detected
only in the epidermis of rhizome, while in treated plants Pb was
also detected in hypodermis and cortex (Table 3). In vascular
tissues Pb concentrations were below detection limits in both
treatments (Table 3). In roots and rhizomes of plants treated
with 50 and 100 mM Pb, a similar distribution pattern of Pb
was seen as in 250 mM Pb treatment, with concentrations
gradually decreasing from epidermis to vascular cylinder (data
not shown). Plant treatment with Pb resulted in alteration of
uptake, accumulation and distribution of mineral nutrients
detected in roots and rhizomes. In roots an increase in
epidermal and/or cortical concentrations of Mg, P, S, Cl, K,
Ca, Zn, Mn and Fe of Pb treated plants was observed (Table 2).
Concentrations of Si, S, Cl, K, Ca, Cu and Zn of Pb treated
plants were also higher in endodermis and an increase of Si, P,
Cl and S in vascular bundles was also noted. In rhizomes, the
difference in Pb concentrations of treated plants was not that
prominent when compared to the controls, with the exception
of Mg, Si, P, S, Cl, K and Fe which significantly increased in
epidermal and hypodermal tissues (Table 3) as also noticed
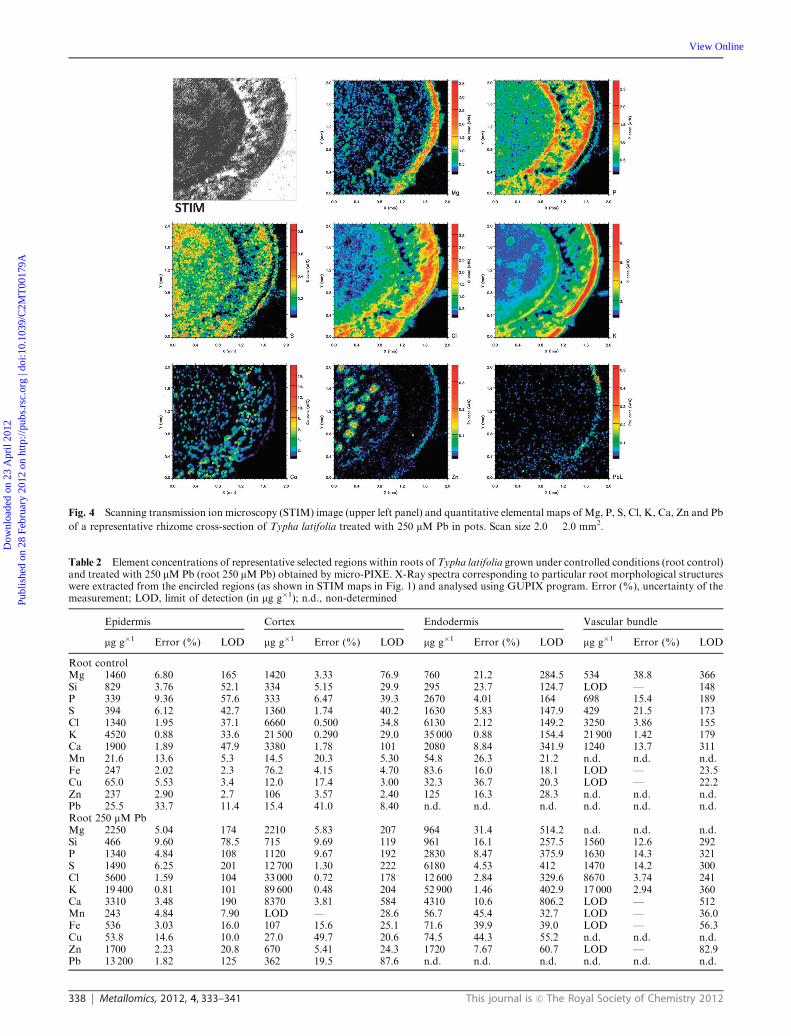
from element distribution maps (Fig. 3 and 4).
Although absolute concentrations of Ca in roots and
rhizomes were slightly higher in Pb treated plants than in
controls (Tables 1–3), the ratios of Ca concentrations between
cortical and epidermal tissues of roots and rhizomes increased
significantly in Pb treated plants (from 1.8 in controls to 2.5 in
Pb treated roots, and from 1.6 in controls to 3.9 in Pb treated
rhizomes) (Tables 2 and 3). In addition a decrease in Ca
concentration in epidermal tissues and an increase of Ca
in cortical tissues of rhizome could be clearly seen in Pb
treated plants when compared to the controls (Fig. 3 and 4).
Fig. 1 Scanning transmission ion microscopy (STIM) image (upper left panel) with marked tissues recognised in roots (from left to right:
1—epidermis, 2—cortex, 3—endodermis, 4—vascular bundle) and quantitative elemental maps ofMg, P, S, Cl, K, Ca, Zn and Pb (as designated in the lower
right corner of each subfigure) of a representative root cross-section of Typha latifolia grown in pots under controlled conditions. Scan size 1.5 � 1.5 mm2.Dow
nloa
ded
on 2
3 A
pril
2012
Publ
ishe
d on
28
Febr
uary
201
2 on
http
://pu
bs.r
sc.o
rg |
doi:1
0.10
39/C
2MT
0017
9A
View Online
336 Metallomics, 2012, 4, 333–341 This journal is c The Royal Society of Chemistry 2012
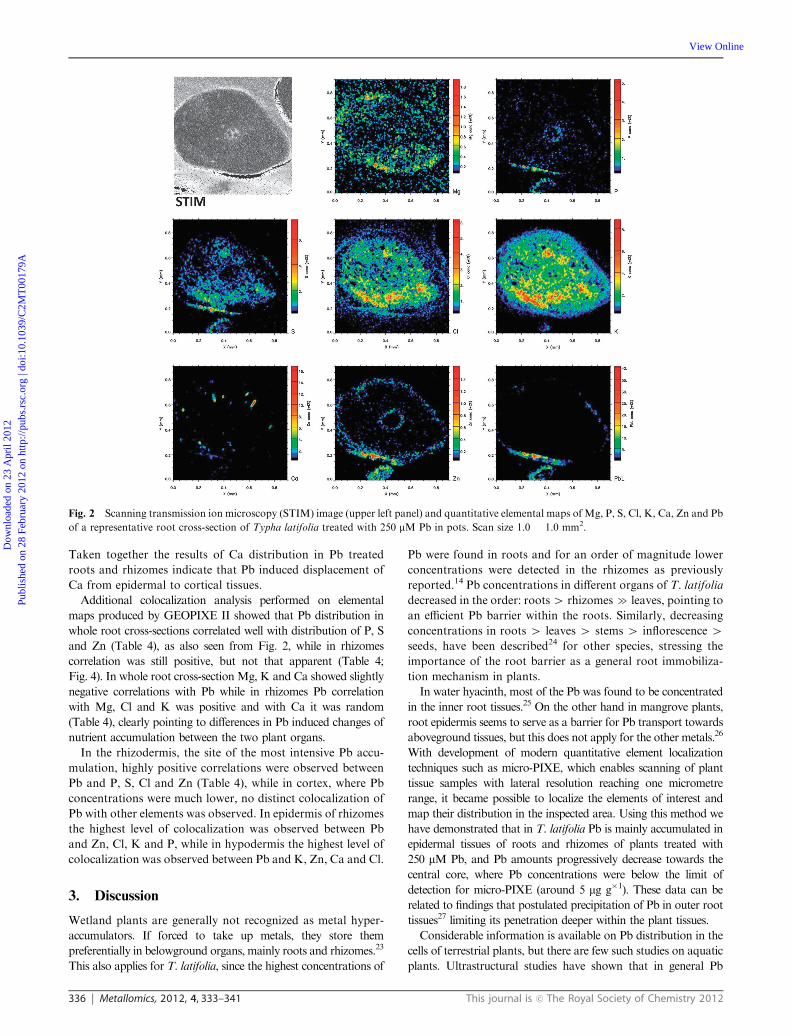
Taken together the results of Ca distribution in Pb treated
roots and rhizomes indicate that Pb induced displacement of
Ca from epidermal to cortical tissues.
Additional colocalization analysis performed on elemental
maps produced by GEOPIXE II showed that Pb distribution in
whole root cross-sections correlated well with distribution of P, S
and Zn (Table 4), as also seen from Fig. 2, while in rhizomes
correlation was still positive, but not that apparent (Table 4;
Fig. 4). In whole root cross-section Mg, K and Ca showed slightly
negative correlations with Pb while in rhizomes Pb correlation
with Mg, Cl and K was positive and with Ca it was random
(Table 4), clearly pointing to differences in Pb induced changes of
nutrient accumulation between the two plant organs.
In the rhizodermis, the site of the most intensive Pb accu-
mulation, highly positive correlations were observed between
Pb and P, S, Cl and Zn (Table 4), while in cortex, where Pb
concentrations were much lower, no distinct colocalization of
Pb with other elements was observed. In epidermis of rhizomes
the highest level of colocalization was observed between Pb
and Zn, Cl, K and P, while in hypodermis the highest level of
colocalization was observed between Pb and K, Zn, Ca and Cl.
3. Discussion
Wetland plants are generally not recognized as metal hyper-
accumulators. If forced to take up metals, they store them
preferentially in belowground organs, mainly roots and rhizomes.23
This also applies for T. latifolia, since the highest concentrations of
Pb were found in roots and for an order of magnitude lower
concentrations were detected in the rhizomes as previously
reported.14 Pb concentrations in different organs of T. latifolia
decreased in the order: roots4 rhizomesc leaves, pointing to
an efficient Pb barrier within the roots. Similarly, decreasing
concentrations in roots 4 leaves 4 stems 4 inflorescence 4seeds, have been described24 for other species, stressing the
importance of the root barrier as a general root immobiliza-
tion mechanism in plants.
In water hyacinth, most of the Pb was found to be concentrated
in the inner root tissues.25 On the other hand in mangrove plants,
root epidermis seems to serve as a barrier for Pb transport towards
aboveground tissues, but this does not apply for the other metals.26
With development of modern quantitative element localization
techniques such as micro-PIXE, which enables scanning of plant
tissue samples with lateral resolution reaching one micrometre
range, it became possible to localize the elements of interest and
map their distribution in the inspected area. Using this method we
have demonstrated that in T. latifolia Pb is mainly accumulated in
epidermal tissues of roots and rhizomes of plants treated with
250 mM Pb, and Pb amounts progressively decrease towards the
central core, where Pb concentrations were below the limit of
detection for micro-PIXE (around 5 mg g�1). These data can be
related to findings that postulated precipitation of Pb in outer root
tissues27 limiting its penetration deeper within the plant tissues.
Considerable information is available on Pb distribution in the
cells of terrestrial plants, but there are few such studies on aquatic
plants. Ultrastructural studies have shown that in general Pb
Fig. 2 Scanning transmission ion microscopy (STIM) image (upper left panel) and quantitative elemental maps of Mg, P, S, Cl, K, Ca, Zn and Pb
of a representative root cross-section of Typha latifolia treated with 250 mM Pb in pots. Scan size 1.0 � 1.0 mm2.
Dow
nloa
ded
on 2
3 A
pril
2012
Publ
ishe
d on
28
Febr
uary
201
2 on
http
://pu
bs.r
sc.o
rg |
doi:1
0.10
39/C
2MT
0017
9A
View Online

This journal is c The Royal Society of Chemistry 2012 Metallomics, 2012, 4, 333–341 337
depots may be placed in the vacuoles, endoplasmatic reticulum,
cell walls4 and also cytoplasm.28,29 The cell wall plays an
important role in heavy metal tolerance by preventing toxic
concentrations of metal ions from reaching sensitive sites30 as
shown for Hylocomium splendens31 and a resistant clone of
Anthoxanthum odoratum.32 The plants’ ability to accumulate Pb
in the cell walls relies on their physical and chemical properties,12
which can be altered in the presence of metals. Ions may
accumulate predominantly in the matrix around the wall fibrils
and this accumulation can lead to mineralization of the cell wall
changing its physical and chemical properties.27 In Brassica juncea
it was demonstrated that Pb concentration at the root tip is more
than threefold greater than that found in the mid-root region and
ultrastructural examination suggested that observable quantities
of Pb are not deposited in tissues internal to the casparian strip.33
Similarly, our results showed that Pb deposition is largely extra-
cellular, especially since a displacement of Ca from epidermal to
cortical tissues was observed in roots and rhizomes. Because Pb
has much higher affinity for binding to polycarboxylates, such as
pectin, than Ca,34 Pb probably induced a displacement of Ca
from pectin bridges and bound to free carboxyl and hydroxyl
groups generated after Ca displacement according to the ‘‘egg-
box’’ model.35 This could then prevent further diffusion of Pb into
inner root or rhizome parts via the apoplast pathway and more-
over this mechanism of locking of Pb into the cell wall could also
prevent further diffusion of Pb toward the plasma membrane and
Pb uptake into the root cell symplast.
A colocalization of P and S compounds and also Cl was
observed at the sites of Pb accumulation, presumably due to the
ability of Pb to form stable complexes with phosphates28,36 and
sulpfr compounds such as sulfates and thiols36 in the cell walls,
within the cells in the cytoplasm, and also in membrane bound
vesicles and vacuoles.28 In the presence of Pb some plants were
shown to synthesize phytochelatins37 and in Pb hyperaccumulating
Sedum alfredii detoxification of Pb was related to glutathione.38 In
T. latifolia alteration in S metabolism in the presence of Pb was
reflected also as an increase of S found in vascular tissues, probably
phloem that could be related to mobilization of organic S
compounds from shoots to the roots.
Similarly high colocalization of Pb with Zn in roots and an
increase of Mg and K were observed in epidermal and
hypodermal regions of rhizomes. This could probably be attrib-
uted to the cell wall modification caused by Pb treatment. An
increase in number of free hydroxyl and carboxyl groups in the
root and rhizome cell walls as a response to Pb treatment and
displacement of Ca, and also accumulation of P, S and Cl ions
and compounds in that region, would increase the possibility of
binding also of other one and two-valent cations like Mg, K and
Zn, besides Pb. Modification of the cell wall composition in the
presence of Pb as well as alteration of membrane ion transport
activities would also explain the overall increase of mineral
concentrations in Pb treated plants, however further research is
needed to confirm these very complex interactions between metal
and plant cells and tissues.
Fig. 3 Scanning transmission ion microscopy (STIM) image (upper left panel) with marked tissues recognised in rhizomes (from left to right:
1—epidermis, 2—hypodermis, 3—cortical region, 4—endodermis, 5—cental core) and quantitative elemental maps of Mg, P, S, Cl, K, Ca, Zn and
Pb of a representative rhizome cross-section of Typha latifolia grown in pots under controlled conditions. Scan size 2.0 � 2.0 mm2.
Dow
nloa
ded
on 2
3 A
pril
2012
Publ
ishe
d on
28
Febr
uary
201
2 on
http
://pu
bs.r
sc.o
rg |
doi:1
0.10
39/C
2MT
0017
9A
View Online
338 Metallomics, 2012, 4, 333–341 This journal is c The Royal Society of Chemistry 2012
Fig. 4 Scanning transmission ion microscopy (STIM) image (upper left panel) and quantitative elemental maps of Mg, P, S, Cl, K, Ca, Zn and Pb
of a representative rhizome cross-section of Typha latifolia treated with 250 mM Pb in pots. Scan size 2.0 � 2.0 mm2.
Table 2 Element concentrations of representative selected regions within roots of Typha latifolia grown under controlled conditions (root control)and treated with 250 mM Pb (root 250 mM Pb) obtained by micro-PIXE. X-Ray spectra corresponding to particular root morphological structureswere extracted from the encircled regions (as shown in STIM maps in Fig. 1) and analysed using GUPIX program. Error (%), uncertainty of themeasurement; LOD, limit of detection (in mg g�1); n.d., non-determined
Epidermis Cortex Endodermis Vascular bundle
mg g�1 Error (%) LOD mg g�1 Error (%) LOD mg g�1 Error (%) LOD mg g�1 Error (%) LOD
Root controlMg 1460 6.80 165 1420 3.33 76.9 760 21.2 284.5 534 38.8 366Si 829 3.76 52.1 334 5.15 29.9 295 23.7 124.7 LOD — 148P 339 9.36 57.6 333 6.47 39.3 2670 4.01 164 698 15.4 189S 394 6.12 42.7 1360 1.74 40.2 1630 5.83 147.9 429 21.5 173Cl 1340 1.95 37.1 6660 0.500 34.8 6130 2.12 149.2 3250 3.86 155K 4520 0.88 33.6 21 500 0.290 29.0 35 000 0.88 154.4 21 900 1.42 179Ca 1900 1.89 47.9 3380 1.78 101 2080 8.84 341.9 1240 13.7 311Mn 21.6 13.6 5.3 14.5 20.3 5.30 54.8 26.3 21.2 n.d. n.d. n.d.Fe 247 2.02 2.3 76.2 4.15 4.70 83.6 16.0 18.1 LOD — 23.5Cu 65.0 5.53 3.4 12.0 17.4 3.00 32.3 36.7 20.3 LOD — 22.2Zn 237 2.90 2.7 106 3.57 2.40 125 16.3 28.3 n.d. n.d. n.d.Pb 25.5 33.7 11.4 15.4 41.0 8.40 n.d. n.d. n.d. n.d. n.d. n.d.Root 250 mM PbMg 2250 5.04 174 2210 5.83 207 964 31.4 514.2 n.d. n.d. n.d.Si 466 9.60 78.5 715 9.69 119 961 16.1 257.5 1560 12.6 292P 1340 4.84 108 1120 9.67 192 2830 8.47 375.9 1630 14.3 321S 1490 6.25 201 12 700 1.30 222 6180 4.53 412 1470 14.2 300Cl 5600 1.59 104 33 000 0.72 178 12 600 2.84 329.6 8670 3.74 241K 19 400 0.81 101 89 600 0.48 204 52 900 1.46 402.9 17 000 2.94 360Ca 3310 3.48 190 8370 3.81 584 4310 10.6 806.2 LOD — 512Mn 243 4.84 7.90 LOD — 28.6 56.7 45.4 32.7 LOD — 36.0Fe 536 3.03 16.0 107 15.6 25.1 71.6 39.9 39.0 LOD — 56.3Cu 53.8 14.6 10.0 27.0 49.7 20.6 74.5 44.3 55.2 n.d. n.d. n.d.Zn 1700 2.23 20.8 670 5.41 24.3 1720 7.67 60.7 LOD — 82.9Pb 13 200 1.82 125 362 19.5 87.6 n.d. n.d. n.d. n.d. n.d. n.d.
Dow
nloa
ded
on 2
3 A
pril
2012
Publ
ishe
d on
28
Febr
uary
201
2 on
http
://pu
bs.r
sc.o
rg |
doi:1
0.10
39/C
2MT
0017
9A
View Online
This journal is c The Royal Society of Chemistry 2012 Metallomics, 2012, 4, 333–341 339
Despite the effective sequestration mechanisms which enable Pb
immobilization in the cells of root and rhizome outer tissues, Pb
concentrations in root and rhizome epidermal and cortical tissues
increase with increasing Pb concentrations in medium, and it seems
that the endodermis, a final suberized apoplastic barrier, represents
the most important functional barrier of Pb transport into the
central cylinder and further to the shoots. Similar results have been
found also in some dicotyledonous species and in maize.39–42
4. Experimental section
4.1. Plant samples
Typha latifolia plants were obtained from a local plant dis-
tributor (Jorg Petrowsky, D-29348 Eschede, Germany) in
9 � 9 cm pots; the roots were cleaned from the soil and
planted in 5 L pots filled with perlite, where the plants were
grown for 52 days under greenhouse conditions in Helmholtz
Zentrum, Munchen, Germany as follows: relative humidity of
60% (day) and 70% (night), T 20 1C (day) and T 15 1C (night)
and 12 daylight hours. The nutrient solution was 10 g
Murashige and Skoog medium (Duchefa) in tap water, added
to pots once per week.43
4.2. Lead treatment
After the establishment of plants for 53 days in perlite, plants
were watered with 0, 50, 100 and 250 mM PbCl2 added to the
nutrient solution and grown in the chambers for next 7 days.
At the end of the treatment the plants were transported to the
Table 4 Pearson’s (r) correlation coefficients between Pb and other element concentrations measured in Pb treated Typha latifolia roots andrhizomes using micro-PIXE. Intensity correlation analysis was performed using ‘‘ImageJ’’ program. Zero–zero pixels are not included in thiscalculation. Colocalization analysis was performed only with those elements where statistics was sufficient to obtain element distribution maps(therefore Mn, Fe and Cu are not included). In particular tissues colocalization analysis was performed where sufficient Pb concentrations weredetected (epidermis, hypodermis and cortex)
Correlation
Roots Rhizomes
Whole crossection Epidermis Cortex Whole crossection Epidermis Hypodermisr r
Pb–Mg �0.19 �0.19 �0.01 0.40 0.22 �0.06Pb–P 0.60 0.63 0.00 0.18 0.26 �0.08Pb–S 0.37 0.75 �0.03 0.21 0.19 0.01Pb–Cl �0.09 0.38 0.00 0.25 0.27 0.17Pb–K �0.18 �0.11 0.00 0.26 0.27 0.20Pb–Ca �0.14 0.25 0.00 0.08 0.17 0.19Pb–Zn 0.70 0.60 0.07 0.14 0.38 0.20
Table 3 Element concentrations of representative selected regions within rhizomes of Typha latifolia grown under control conditions (rhizomecontrol) and treated with 250 mM Pb (rhizome 250 mM Pb). X-Ray spectra corresponding to particular root morphological structures wereextracted from the encircled regions (as shown in STIM maps of Fig. 3) and analysed using GUPIX program. Error (%), uncertainty of themeasurement; LOD, limit of detection (in mg g�1); n.d., non determined
Epidermis Hypodermis Cortical region Endodermis Central core
mg g�1 Error (%) LOD mg g�1 Error (%) LOD mg g�1 Error (%) LOD mg g�1 Error (%) LOD mg g�1 Error (%) LOD
Rhizome controlMg 820 35.2 482 2260 8.07 301 2390 3.41 127.4 1200 17.9 364 4100 2.86 170.1Si 250 38.6 166 237 27.1 111 179 17.9 54.2 LOD — 141 252 16.9 72.0P 1100 11.1 207 4770 1.97 135 5160 0.930 69.5 4550 2.50 164 7240 0.850 81.3S 1380 8.20 195 2050 3.85 140 3240 1.53 86.1 3400 2.62 133 2540 1.73 71.2Cl 12 000 1.53 157 17 400 0.690 104 25 100 0.290 56.5 9300 1.13 101 12 100 0.460 49.1K 23 400 1.14 78.4 72 800 0.340 111 65 400 0.190 58.5 44 500 0.470 105 37 200 0.240 48.3Ca 20 000 1.45 283 5580 3.56 359 8700 1.61 239.4 3450 4.23 267 4430 1.98 153.1Mn 160 9.97 22.4 53.9 16.7 16.2 102 4.81 8.10 111 7.14 11.4 64.7 4.80 4.90Fe 240 7.86 23.7 144 8.08 18.6 78.6 7.08 9.70 94.1 9.85 16.0 61.6 5.67 5.80Cu 46.4 28.6 11.1 LOD — 7.70 15.2 18.0 4.00 75.2 9.41 8.40 5.00 36.5 2.90Zn 931 4.86 14.8 254 4.89 10.8 66.3 5.84 2.90 322 4.62 17.9 240 2.29 1.40Pb 547 15.6 108 n.d. n.d. n.d. LOD — 10.2 n.d. n.d. n.d. n.d. n.d. n.d.Rhizome 250 mM PbMg 16 300 3.23 768 21 300 1.91 546 3520 1.91 102.7 5600 3.69 317 3050 1.86 86.4Si 2600 5.04 215 1300 8.52 188 396 7.03 45.2 318 23.3 129 131 14.89 33.6P 4230 3.42 233 5470 2.20 190 8740 0.470 55.4 11 600 0.950 141 4100 0.670 39.5S 3260 3.61 196 1900 4.91 176 1540 1.98 54.9 2080 3.16 114 2010 0.980 30.2Cl 17 600 0.930 147 16 900 0.69 123 12 200 0.300 32.9 9780 0.740 70.5 4090 0.470 21.4K 64 800 0.470 134 1 � 105 0.23 73.5 30 600 0.180 35.6 30 000 0.370 51.7 9900 0.270 18.8Ca 12 000 2.07 399 4690 5.41 486 18 600 0.450 111 5400 1.75 154 5800 0.570 44.4Mn 85.4 10.1 13.3 31.2 20.9 12.0 14.3 16.26 4.3 46.6 7.62 5.9 17.9 6.82 2.1Fe 393 3.66 12.7 166 5.49 13.6 70.2 3.99 4.7 94.5 4.48 5.4 61.2 2.35 2.1Cu 58.8 14.8 9.80 12.5 29.9 5.50 LOD — 3.1 14.3 16.27 2.7 6.3 13.66 1.4Zn 444 4.97 14.6 123 6.22 7.40 59.5 3.72 2.2 121.7 4.31 4.2 238 1.2 1.1Pb 535 11.7 73.4 47.7 31.9 21.3 31 18.79 9.7 n.d. n.d. n.d. 6.1 42.75 4.4
Dow
nloa
ded
on 2
3 A
pril
2012
Publ
ishe
d on
28
Febr
uary
201
2 on
http
://pu
bs.r
sc.o
rg |
doi:1
0.10
39/C
2MT
0017
9A
View Online
340 Metallomics, 2012, 4, 333–341 This journal is c The Royal Society of Chemistry 2012
laboratory in Ljubljana, Slovenia, where they were kept in
growth chambers until harvest and sample preparation.
4.3. Plant bulk elemental analyses
After a careful wash in tap and distilled water three T. latifolia
plants per Pb treatment/concentration were sampled for micro-
PIXE analysis. The rest of the plants were separated into roots,
rhizomes and leaves and oven-dried (60 1C) for 48 h. The dried
material was pulverised in liquid nitrogen and pressed into
pellets. Concentrations of Cl, K, Ca, Mn, Fe, Cu, Zn and Pb in
composite samples were determined by X-ray fluorescence
(XRF) spectroscopy using a Cd-109 radioisotope excitation
source.44 Mg, Si, P and S were below the detection limit for
XRF. Standard reference material Tomato leaves 1573a with
certified concentrations of minerals was used for quality
assurance of elemental analysis.
4.4. Sample preparation for micro-PIXE analysis
The roots were detached from the intact plants, quickly
washed in deionised water and sectioned with a razor blade
to shorter pieces (2 cm from the root tip). The pieces were
immediately transferred into Al beds filled with tissue freezing
medium (Jung, Leica) and dipped into liquid nitrogen.16 Root
pieces were sectioned with a Leica CM3050 cryotome (Leica,
Bensheim, Germany) at temperatures between �25 1C and
�20 1C to 60 mm thick sections. The sections were then placed
in specially designed Al holders with a heavy cover to ensure
the flatness of the sections during drying. The rhizome was
manually cut with a razor blade to thin slices, put into Al beds
and immediately frozen in liquid nitrogen. The holders with
root cross-sections and Al beds with rhizome cross-sections
were then transferred to an Alpha 2–4 Christ freeze dryer via a
cryo-transfer-assembly cooled by liquid nitrogen and freeze-dried
at �25 1C and a pressure of 0.384 mbar for two days. Freeze-
dried root and rhizome cross-sections were mounted on Al
sample holders between two thin layers of Pioloform foil.17,45
4.5. Micro-proton induced X-ray emission analysis
Micro-PIXE analysis was performed with the nuclear micro-
probe of the Jozef Stefan Institute46,47 on 3 different samples
per treatment. A proton beam energy of 3 MeV was used in
order to get an optimal signal to background ratio for the
elements with Z over 30. Beam intensity was determined by the
total count rate of the system, which was kept below 800 Hz to
avoid excessive dead times in the data acquisition system.
Under such conditions, beam diameter was kept well below
2 micrometres and beam intensity below 400 pA. Simulta-
neously an on–off axis scanning transmission ion microscopy48
(STIM) was performed to determine beam exit energy from
the sample, related to the sample local areal density. In
combination with known matrix composition, proton exit
energy measured by STIM was used for determination of
specimen thickness. Precision of proton exit energy measure-
ments with STIM was in the order of 10 keV. The energy loss
in Typha latifolia samples was in the range between 120 and
300 keV. This reflects the precision of sample thickness
determination of better than 8%.
A pair of X-ray detectors was used to efficiently cover the
energy range from 0.8 keV up to 30 keV, and electron spraying
of the sample during the analysis was used to prevent against
sample charging.18 Proton dose was measured with a beam
chopper positioned after the collimating slits.20
X-Ray and STIM spectra corresponding to distinct morpho-
logical structures of roots and rhizomes (Fig. 1 and 3) were
extracted from the analysed regions of the samples (Tables 2
and 3). Assuming a cellulose matrix and the proton exit energy
measured by STIM, the elemental concentrations were calcu-
lated using GUPIXWIN program.49
For the generation of the elemental images dynamic analysis
methods were used,50,51 which are an essential part of
GEOPIXE II software package. The advantages of the code
are deconvolution of background and X-ray line overlapping
for the imaging presentation of the elemental maps. An
identical matrix composition (cellulose C6H10O5) was assumed
in each pixel of mapped areas. The image of each element was
based on a group of X-ray lines (typically K or L lines).19
Images of Mg, P, S, Cl, K, Ca and Zn were obtained from
K lines, whereas L lines were used for Pb imaging. For Si, Mn,
Fe, Ni and Cu the statistics of counts was too low to
obtain decent maps. The calibration of the PIXE method is
periodically checked by the analysis of the multi-elemental
standard reference materials NIST SRM 1573a (Tomato
leaves, homogenized powder, analysed in the form of a pressed
pellet), NIST SRM 1107 (Naval Brass B, alloy) and NIST
SRM 620 (Soda-Lime Flat Glass), series of monoelemental
metals in the form of bulk and thin foils.
4.6. Colocalization analysis
Colocalization analysis of Pb distribution with other elements
obtained by micro-PIXE mapping was performed by ImageJ
program using plug-in ‘‘Intensity correlation analysis’’,
generating Pearson’s correlation coefficients (r) (http://www.
Macbio-photonics.ca/imagej/colour_analysis.htm). Quantita-
tive, 512 � 512 pixel, 8-bit, colour elemental maps generated
by GEOPIXE II were used for colocalization analysis.
Pearson’s correlation coefficients range from 1 to �1, wherea value of 1 represents perfect correlation/colocalization; a
value of �1 represents perfect exclusion, and zero represents
random localization.
5. Conclusion
Results indicate that the casparian strip represents the main
barrier for apoplastic Pb penetration into the root and
rhizome vascular tissues of T. latifolia. However, most of the
Pb actually accumulates in the cells of epidermal and cortical
tissues and does not pass deeper or further towards the central
core. Clearly, more information about mechanisms of metal
uptake, distribution and removal by wetland species is urgently
required in order to ensure that the wetlands themselves do not
become sources of metal contamination to surrounding areas.23
According to our findings, T. latifolia has potential for
removing Pb from contaminated substrates due to its large
root and rhizome surface area, making it suitable plant species
for rhizofiltration. The next investigation step on Pb uptake by
this plant will involve treatments with multi-metal contamination
Dow
nloa
ded
on 2
3 A
pril
2012
Publ
ishe
d on
28
Febr
uary
201
2 on
http
://pu
bs.r
sc.o
rg |
doi:1
0.10
39/C
2MT
0017
9A
View Online
This journal is c The Royal Society of Chemistry 2012 Metallomics, 2012, 4, 333–341 341
and should focus on the enhancement of uptake by identifying
proteins responsible for the transport of metals across the
plasma membrane and controlling their expression as well as
resolving the role and modification of the cell wall components
in the presence of Pb.
Abbreviations
XRF X-ray fluorescence
micro-PIXE micro-proton-induced X-ray emission
STIM scanning transmission ion microscopy
Acknowledgements
This work has been supported by the European Community as
an Integrating Activity ‘Support of Public and Industrial
Research Using Ion Beam Technology (SPIRIT)’ under EC
contract no. 227012. Support of Slovenian Research Agency
of the research project J7-0352, research programs P1-0112,
P1-0212 and research infrastructure of Microanalytical centre
is acknowledged.
References
1 L. R. Lado, T. Hengl and H. I. Reuter, Geoderma, 2008, 148,189–199.
2 J. W. Huang, J. Chen, W. R. Berti and S. D. Cunningham,Environ. Sci. Technol., 1997, 31, 800–805.
3 F. A. Bazzaz, R. W. Carlson and G. L. Rolfe, Physiol. Plant., 1975,34, 326–329.
4 P. Sharma and R. S. Dubey, Braz. J. Plant Physiol., 2005, 17,35–52.
5 A. Kabata-Pendias and H. Pendias, Trace Elements in Soils andPlants, CRC Press, Boca Raton, London, 2nd edn, 1992, p. 365.
6 D. L. Godbold and C. Kettner, Plant Physiol., 1991, 139, 95–99.7 W. M. Walker, J. E. Miller and J. J. Hassett, Soil Sci., 1977, 124,145–151.
8 S. Verma and R. S. Dubey, Plant Sci., 2003, 164, 645–655.9 I. V. Seregin and V. B. Ivanov, Fiziol. Rast., 1997, 44, 915–921.
10 I. V. Seregin and V. B. Ivanov, Russ. J. Plant Physiol., 2001, 48,523–544.
11 M. Wierzbicka, Environ. Exp. Bot., 1994, 34, 173–180.12 M. Wierzbicka, Plant Sci., 1998, 133, 105–119.13 S. O. Eun, H. S. Youn and Y. Lee, Physiol. Plant., 2000, 110,
357–365.14 Z. H. Ye, A. J. M. Baker, M. H. Wong and A. J. Willis, New
Phytol., 1997, 136, 469–480.15 A. J. M. Baker, J. Plant Nutr., 1981, 3, 643–654.16 C. Lan, G. Chen, L. Li and M. H. Wong, Environ. Manage., 1992,
16, 75–80.17 K. Vogel-Mikus, P. Pongrac, P. Pelicon, P. Vavpetic, B. Povh,
H. Bothe and M. Regvar, Symbiotic Fungi: Principles and Practice,2009, vol. 18, pp. 227–242.
18 K. Vogel-Mikus, J. Simcic, P. Pelicon, M. Budnar, P. Kump,M. Necemer, J. Mesjasz-Przybylowicz, W. J. Przybylowicz andM. Regvar, Plant, Cell Environ., 2008a, 31, 1484–1496.
19 K. Vogel-Mikus, M. Regvar, J. Mesjasz-Przybylowicz, W. J.Przybylowicz, J. Simcic, P. Pelicon and M. Budnar, New Phytol.,2008b, 179, 712–721.
20 K. Vogel-Mikus, P. Pelicon, P. Vavpetic, I. Kreft and M. Regvar,Nucl. Instrum. Methods Phys. Res., Sect. B, 2009a, 267, 2884–2889.
21 A. G. Kachenko, B. Singh, N. P. Bhatia and R. Siegele, Nucl.Instrum. Methods Phys. Res., Sect. B, 2008, 266, 667–676.
22 P. Pongrac, K. Vogel-Mikus, P. Vavpetic, J. Tratnik, M. Regvar,J. Simcic, N. Grlj and P. Pelicon, Nucl. Instrum. Methods Phys.Res., Sect. B, 2010, 268, 2205–2210.
23 J. S. Weis and P. Weis, Environ. Int., 2004, 30, 685–700.24 D. M. Antosiewicz, Acta Soc. Bot. Pol., 1992, 61, 281–299.25 P. A. Vesk, C. E. Nockolds andW. G. Allaway, Plant, Cell Environ.,
1999, 22, 149–158.26 G. R. MacFarlane and M. D. Burchett, Mar. Environ. Res., 2002,
54, 65–84.27 A. Frey-Wyssling, JAWA Bull., 1982, 31, 25–30.28 P. M. Kopittke, C. J. Asher, F. P. C. Blamey, G. J. Auchterlonie,
Y. N. Guo and N. W. Menzies, Environ. Sci. Technol., 2008, 42,4595–4599.
29 S. Samardakiewicz and A. Wozny, Plant Soil, 2000, 226, 107–111.30 D. A. Thurman, Effect of HeavyMetal Pollution on Plants,Applied
Science Publishers, 1981, vol. 2, pp. 239–249.31 B. M. Gullvag, H. Skaar and E. M. Ophus, J. Bryol., 1974, 8,
117–122.32 J. A. Qureshi, K. Hardwick and H. A. Collin, J. Plant Physiol.,
1986, 122, 357–364.33 D. E. R. Meyers, J. A. Graeme, I. W. Richard and B. Wood,
Environ. Pollut., 2008, 153, 323–332.34 V. M. Dronnet, C. M. G. C. Renard, M. A. V. Axelos and
J. F. Thibault, Carbohydr. Polym., 1996, 30, 253–263.35 E. R. Morris, D. A. Rees, D. Thom and J. Boyd, Carbohydr. Res.,
1978, 66, 145.36 S. Tian, L. Lu, X. Yang, S. M. Webb, Y. Du and P. H. Brown,
Environ. Sci. Technol., 2010, 44, 5920–5926.37 S. Andra, R. Datta, D. Sarkar, S. Bach and C. Mullen, Plant Soil,
2009, 326, 171–185.38 D. K. Gupta, H. G. Huang, X. E. Yang, B. H. N. Razafindrabe
and M. Inouhe, J. Hazard. Mater., 2010, 177, 437–444.39 M. Wierzbicka, Plant, Cell Environ., 1987, 10, 17–26.40 G. Tung and P. J. Temple, Sci. Total Environ., 1996, 188, 71–85.41 S. D. Lane and E. S. Martin, New Phytol., 1977, 79, 281–286.42 W. F. Punz and H. Sieghardt, Environ. Exp. Bot., 1993, 33, 85–95.43 T. Murashige and F. Skoog, Physiol. Plant., 1962, 15, 473–497.44 M. Necemer, P. Kump, J. Scancar, R. Jacimovic, J. Simcic,
P. Pelicon, M. Budnar, Z. Jeran, P. Pongrac, M. Regvar andK. Vogel-Mikus, Spectrochim. Acta, Part B, 2009, 63, 1240–1247.
45 T. Schneider, S. Sheloske and B. Povh, Int. J. PIXE, 2002, 12,101–107.
46 J. Simcic, P. Pelicon, M. Budnar and Z. Smit, Nucl. Instrum.Methods Phys. Res., Sect. B, 2002, 190, 283–286.
47 P. Pelicon, J. Simcic, M. Jaksic, Z. Medunic, F. Naab andF. D. McDaniel, Nucl. Instrum. Methods Phys. Res., Sect. B,2005, 231, 53–59.
48 J. Pallon, V. Auzelyte, M. Elfman, M. Garmer, P. Kristiansson,K. Malmqvist, C. Nilsson, A. Shariff and M. Wegden, Nucl.Instrum. Methods Phys. Res., Sect. B, 2003, 219, 988–993.
49 J. L. Campbell, T. L. Hopman, J. A. Maxwell and Z. Nejedly,Nucl. Instrum. Methods Phys. Res., Sect. B, 2000, 170, 193–204.
50 C. G. Ryan and D. N. Jamieson, Nucl. Instrum. Methods Phys.Res., Sect. B, 1993, 77, 203–214.
51 C. G. Ryan, D. N. Jamieson, C. L. Churms and J. V. Pilcher, Nucl.Instrum. Methods Phys. Res., Sect. B., 1995, 104, 157–165.
Dow
nloa
ded
on 2
3 A
pril
2012
Publ
ishe
d on
28
Febr
uary
201
2 on
http
://pu
bs.r
sc.o
rg |
doi:1
0.10
39/C
2MT
0017
9A
View Online