P1 – Management Accounting – Performance Evaluation - CIMA
24
Management Accounting Pillar Managerial Level Paper P1 – Management Accounting – Performance Evaluation 20 May 2008 – Tuesday Morning Session Instructions to candidates You are allowed three hours to answer this question paper. You are allowed 20 minutes reading time before the examination begins during which you should read the question paper and, if you wish, highlight and/or make notes on the question paper. However, you will not be allowed, under any circumstances, to open the answer book and start writing or use your calculator during the reading time. You are strongly advised to carefully read ALL the question requirements before attempting the question concerned (that is, all parts and/or sub- questions). The requirements for the questions in Section C are contained in a dotted box. ALL answers must be written in the answer book. Answers or notes written on the question paper will not be submitted for marking. Answer the ONE compulsory question in Section A. This has 17 sub- questions and is on pages 2 to 8. Answer ALL SIX compulsory sub-questions in Section B on pages 10 and 11. Answer ONE of the two questions in Section C on pages 12 to 15. Maths Tables and Formulae are provided on pages 17 to 21. The list of verbs as published in the syllabus is given for reference on the inside back cover of this question paper. Write your candidate number, the paper number and examination subject title in the spaces provided on the front of the answer book. Also write your contact ID and name in the space provided in the right hand margin and seal to close. Tick the appropriate boxes on the front of the answer book to indicate which questions you have answered. P1 – Performance Evaluation TURN OVER © The Chartered Institute of Management Accountants 2008
-
Upload
khangminh22 -
Category
Documents
-
view
1 -
download
0
Transcript of P1 – Management Accounting – Performance Evaluation - CIMA

Management Accounting Pillar
Managerial Level Paper
P1 – Management Accounting – Performance Evaluation
20 May 2008 – Tuesday Morning Session Instructions to candidates
You are allowed three hours to answer this question paper.
You are allowed 20 minutes reading time before the examination begins during which you should read the question paper and, if you wish, highlight and/or make notes on the question paper. However, you will not be allowed, under any circumstances, to open the answer book and start writing or use your calculator during the reading time.
You are strongly advised to carefully read ALL the question requirements before attempting the question concerned (that is, all parts and/or sub- questions). The requirements for the questions in Section C are contained in a dotted box.
ALL answers must be written in the answer book. Answers or notes written on the question paper will not be submitted for marking.
Answer the ONE compulsory question in Section A. This has 17 sub-questions and is on pages 2 to 8.
Answer ALL SIX compulsory sub-questions in Section B on pages 10 and 11.
Answer ONE of the two questions in Section C on pages 12 to 15.
Maths Tables and Formulae are provided on pages 17 to 21.
The list of verbs as published in the syllabus is given for reference on the inside back cover of this question paper.
Write your candidate number, the paper number and examination subject title in the spaces provided on the front of the answer book. Also write your contact ID and name in the space provided in the right hand margin and seal to close.
Tick the appropriate boxes on the front of the answer book to indicate which questions you have answered.
P1 –
Per
form
ance
Eva
luat
ion
TURN OVER
© The Chartered Institute of Management Accountants 2008

SECTION A – 40 MARKS [the indicative time for answering this section is 72 minutes] ANSWER ALL SEVENTEEN SUB-QUESTIONS
Instructions for answering Section A: The answers to the seventeen sub-questions in Section A should ALL be written in your answer book. Your answers should be clearly numbered with the sub-question number then ruled off, so that the markers know which sub-question you are answering. For multiple choice questions, you need only write the sub-question number and the letter of the answer option you have chosen. You do not need to start a new page for each sub-question. For sub-questions 1.11 to 1.17 you should show your workings as marks are available for the method you use to answer these sub-questions.
Question One 1.1 If inventory levels have increased during the period, the profit calculated using marginal
costing when compared with that calculated using absorption costing will be A higher.
B lower.
C equal.
D impossible to answer without further information.(2 marks)
1.2 Fixed production overheads will always be under-absorbed when A actual output is lower than budgeted output.
B actual overheads incurred are lower than budgeted overheads.
C overheads absorbed are lower than those budgeted.
D overheads absorbed are lower than those incurred.
(2 marks)
P1 2 May 2008

The following scenario is to be used for questions 1.3 and 1.4 A company manufactures three products: W, X and Y. The products use a series of different machines, but there is a common machine that is a bottleneck. The standard selling price and standard cost per unit for each product for the next period are as follows: W
£ X £
Y £
Selling price 180 150 150 Cost: Direct material 41 20 30Direct labour 30 20 50Variable production overheads 24 16 20Fixed production overheads 36 24 30Profit 49 70 20Time (minutes) on bottleneck machine 7 10 7 The company is trying to plan the best use of its resources. 1.3 Using a traditional limiting factor approach, the rank order (best first) of the products
would be
A W, X, Y
B W, Y, X
C X, W, Y
D Y, X, W (2 marks)
1.4 Using a throughput accounting approach, the rank order (best first) of the products would
be
A W, X, Y
B W, Y, X
C X, W, Y
D Y, X, W
(2 marks)
Section A continues on the next page
TURN OVER
May 2008 3 P1
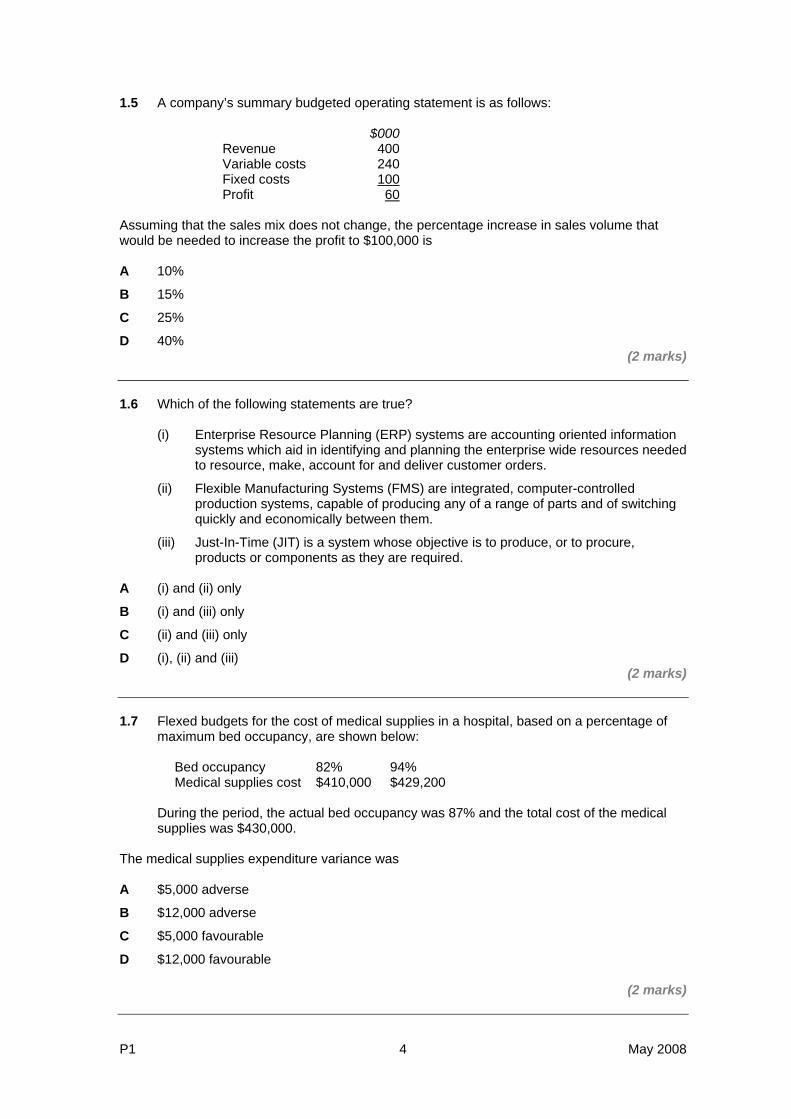
1.5 A company’s summary budgeted operating statement is as follows:
$000 Revenue 400Variable costs 240Fixed costs 100Profit 60
Assuming that the sales mix does not change, the percentage increase in sales volume that would be needed to increase the profit to $100,000 is A 10%
B 15%
C 25%
D 40% (2 marks)
1.6 Which of the following statements are true?
(i) Enterprise Resource Planning (ERP) systems are accounting oriented information systems which aid in identifying and planning the enterprise wide resources needed to resource, make, account for and deliver customer orders.
(ii) Flexible Manufacturing Systems (FMS) are integrated, computer-controlled production systems, capable of producing any of a range of parts and of switching quickly and economically between them.
(iii) Just-In-Time (JIT) is a system whose objective is to produce, or to procure, products or components as they are required.
A (i) and (ii) only
B (i) and (iii) only
C (ii) and (iii) only
D (i), (ii) and (iii) (2 marks)
1.7 Flexed budgets for the cost of medical supplies in a hospital, based on a percentage of
maximum bed occupancy, are shown below:
Bed occupancy 82% 94% Medical supplies cost $410,000 $429,200
During the period, the actual bed occupancy was 87% and the total cost of the medical supplies was $430,000.
The medical supplies expenditure variance was A $5,000 adverse
B $12,000 adverse
C $5,000 favourable
D $12,000 favourable
(2 marks)
P1 4 May 2008
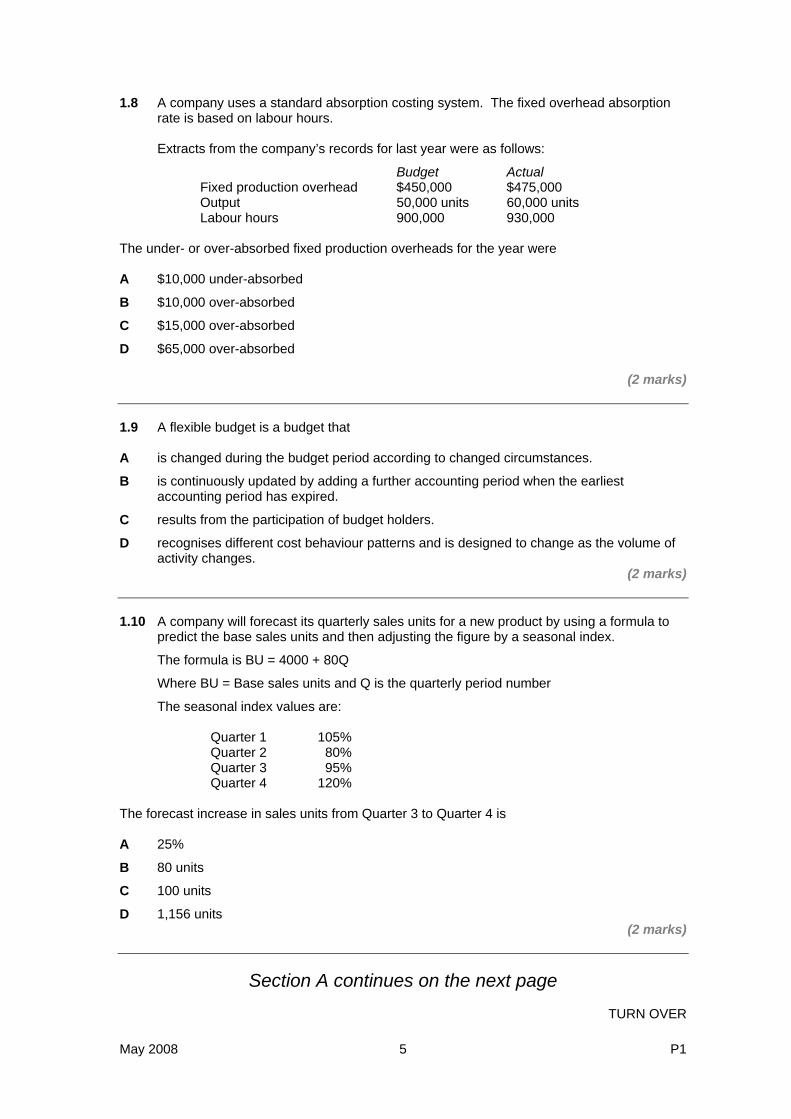
1.8 A company uses a standard absorption costing system. The fixed overhead absorption rate is based on labour hours.
Extracts from the company’s records for last year were as follows:
Budget Actual Fixed production overhead $450,000 $475,000 Output 50,000 units 60,000 units Labour hours 900,000 930,000
The under- or over-absorbed fixed production overheads for the year were A $10,000 under-absorbed
B $10,000 over-absorbed
C $15,000 over-absorbed
D $65,000 over-absorbed
(2 marks) 1.9 A flexible budget is a budget that A is changed during the budget period according to changed circumstances.
B is continuously updated by adding a further accounting period when the earliest accounting period has expired.
C results from the participation of budget holders.
D recognises different cost behaviour patterns and is designed to change as the volume of activity changes.
(2 marks) 1.10 A company will forecast its quarterly sales units for a new product by using a formula to
predict the base sales units and then adjusting the figure by a seasonal index.
The formula is BU = 4000 + 80Q
Where BU = Base sales units and Q is the quarterly period number
The seasonal index values are:
Quarter 1 105%Quarter 2 80%Quarter 3 95%Quarter 4 120%
The forecast increase in sales units from Quarter 3 to Quarter 4 is A 25%
B 80 units
C 100 units
D 1,156 units (2 marks)
Section A continues on the next page
TURN OVER
May 2008 5 P1

1.11 Product XYZ is made by mixing three materials (X, Y and Z). There is an expected loss of 20% of the total input. The budgeted and actual results for Period 1 are shown below. There were no opening or closing inventories of any materials or of the finished product.
Budget Actual Output of XYZ 800 kg 960 kg Material X 500 kg @ $5⋅00 per kg 600 kg @ $4⋅70 per kg Y 300 kg @ $6⋅00 per kg 380 kg @ $6⋅50 per kg Z 200 kg @ $7⋅00 per kg 300 kg @ $7⋅10 per kg Total input 1,000 kg 1,280 kg Calculate for Period 1: (i) the total materials mix variance;
(2 marks) (ii) the total materials yield variance.
(2 marks)
(Total for sub-question 1.11 = 4 marks) 1.12 Extracts from a company’s year-end accounts are shown below: $000 Revenue 9,456 Gross profit 5,872 Operating profit 2,981 Non-current assets 17,850 Inventory 950 Cash at bank 1,750 Short-term borrowings 1,225 Trade receivables 731 Trade payables 813 Calculate the following performance measures: (i) Operating profit margin;
(ii) Return on capital employed;
(iii) Trade receivable days (debtors days);
(iv) Current ratio. (4 marks)
P1 6 May 2008

The following data are given for sub questions 1.13, 1.14 and 1.15 Premier Cycles has two divisions: the Frame Division and the Assembly Division. The Frame Division produces bike frames. The frames can be sold directly to external customers as “frame only” or the frames can be transferred to the Assembly Division where they are built up into complete bikes by adding other components, such as wheels and handlebars. Frame Division Budgeted details for the forthcoming year for the Frame Division are: Selling price per frame $852 Variable cost per frame $420 Annual fixed cost $4,000,000 Annual capacity 12,000 frames The Division has orders for 5,000 frames from external customers for the forthcoming year. Assembly Division The Manager of the Assembly Division has just signed a contract to supply 8,000 bikes to a sporting goods retailer next year. This will mean that the Division will be operating at full capacity. Budgeted details are as follows: Selling price per bike $1,600 Variable cost of assembly and components $500 (excluding frame) Annual fixed cost $2,400,000 Annual capacity 8,000 bikes Company Policy It has been announced that Premier Cycles will be introducing a new performance appraisal system. The Divisional Managers’ bonuses will only be payable if they earn a minimum annual contribution of 108% of fixed costs. 1.13 Calculate the minimum number of frames the Frame Division must sell next year in order
for the Divisional Manager to earn a bonus if frames are sold for $852 each. (2 marks)
1.14 Calculate the maximum price per frame that the Manager of the Assembly Division could
pay and still earn a bonus next year. (2 marks)
1.15 Ignoring Premier Cycles’ performance appraisal system, explain how the Manager of the
Frame Division should calculate the transfer price of frames it supplies to the Assembly division in order to maximise profits for Premier Cycles.
Note: NO calculations are required.
(2 marks)
Section A continues on the next page
TURN OVER
May 2008 7 P1

1.16 State FOUR aims of a transfer-pricing system. (2 marks)
1.17 Product GH passes through two consecutive processes: the output from Process 1 is
transferred to Process 2. Details of Process 1 for Period 3 were as follows: There were 5,000 units of opening work-in-progress, which were valued as follows:
Materials $77,080 Labour $33,480 Production overheads $8,825
During the period, 14,000 units were added to the process and the following costs were incurred:
Materials $230,000 Labour $101,000 Production overheads $40,000
At the end of Period 3, there were 6,000 units of closing work-in-progress. The degree of completion for these units was:
Materials 100%Labour 80%Production overheads 65%
The expected normal loss is 10% of new units added to the process during the period. These units and any other losses can be sold for $5 per unit. 11,000 units were transferred to Process 2 and there were losses of 2,000 units. All losses occur at the end of the process. Weighted average costing is used.
Calculate the total cost of the 11,000 units that were transferred to Process 2.
(4 marks)
(Total for Section A = 40 marks)
Reminder
All answers to Section A must be written in your answer book.
Answers to Section A written on the question paper will not be submitted for marking.
P1 8 May 2008

Section B starts on the next page
TURN OVER
May 2008 9 P1

SECTION B – 30 MARKS [the indicative time for answering this section is 54 minutes] ANSWER ALL SIX SUB-QUESTIONS. EACH SUB-QUESTION IS WORTH 5 MARKS Question Two (a) Describe THREE key features that are present in any organisation that is successfully
focused on Total Quality Management (TQM). (5 marks)
(b) Explain THREE behavioural consequences that may result after the introduction of
participative budgeting. (5 marks)
(c) Discuss the advantages and disadvantages of rolling budgets.
(5 marks)
P1 10 May 2008

The following data relate to sub-questions (d), (e) and (f) A multi-national company manufactures and sells a wide range of digital equipment. The company is structured into three Divisions: Computers, Audio-visual and Photographic. The Divisions operate as investment centres and the performance of the Divisional Managers is evaluated by using Return on Investment (ROI). The Manager of the Photographic Division was concerned that the Division was falling behind its competitors in terms of financial returns and market share, and has implemented strategies to improve the situation. An external benchmarking exercise was undertaken to try to establish the position of the Division in relation to its competitors in a number of key areas. It has now been suggested that the Division should also carry out an internal benchmarking exercise. (d) The manager of the Photographic Division is considering introducing a Balanced
Scorecard to measure the success of the strategies. He has identified two perspectives and two associated goals. They are:
Perspective Goal Innovation Technology Leadership Customer Support (i) For the “Innovation Perspective” of the Division, recommend a performance measure and
briefly explain how the measure will reflect the achievement of the stated goal. (3 marks)
(ii) For the “Customer Perspective” of the Division, state which data should be collected and
explain how this could be used to ensure the goal of “support’’ is met. (2 marks)
(Total for (d) = 5 marks)
(e) Explain THREE reasons why internal benchmarking may provide information that is more
useful to the Manager of the Photographic Division, in terms of monitoring and improving performance, than that provided by external benchmarking.
(5 marks) (f) Explain THREE reasons why ROI may not be a good performance measure.
(5 marks)
(Total for Question Two = 30 marks)
(Total for Section B = 30 marks)
End of Section B
Section C starts on the next page
TURN OVER
May 2008 11 P1
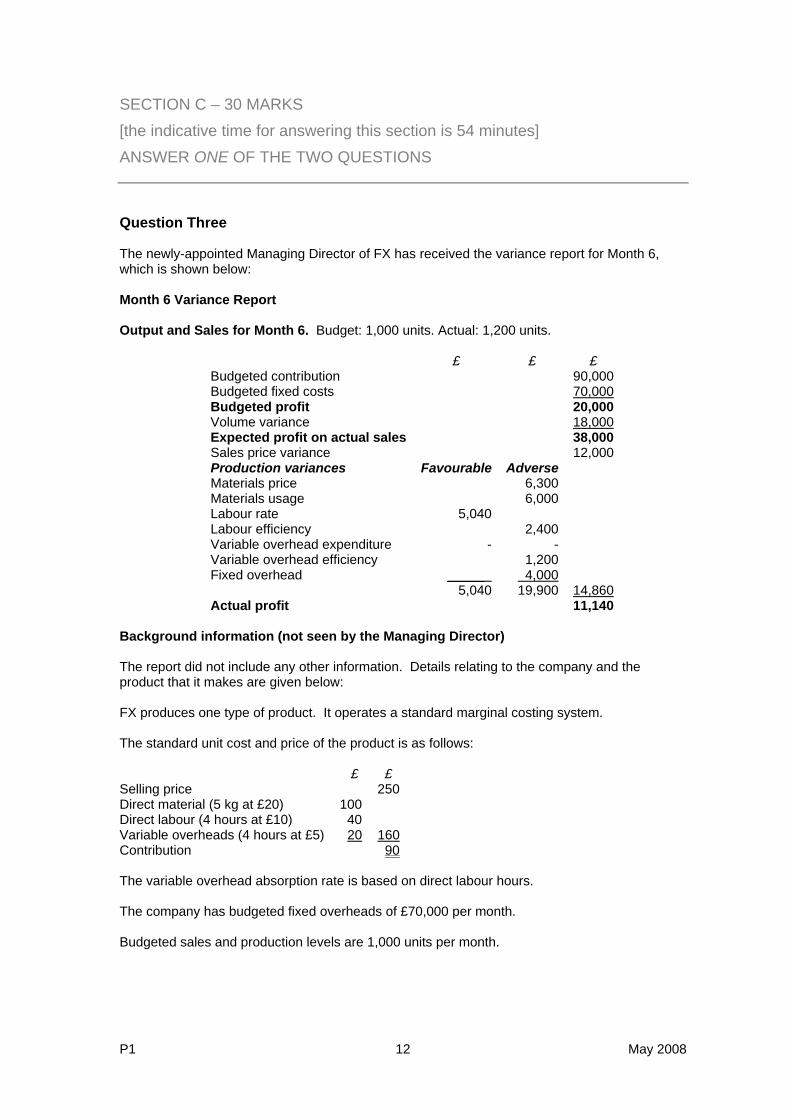
SECTION C – 30 MARKS [the indicative time for answering this section is 54 minutes] ANSWER ONE OF THE TWO QUESTIONS Question Three The newly-appointed Managing Director of FX has received the variance report for Month 6, which is shown below: Month 6 Variance Report Output and Sales for Month 6. Budget: 1,000 units. Actual: 1,200 units.
£ £ £ Budgeted contribution 90,000 Budgeted fixed costs 70,000Budgeted profit 20,000 Volume variance 18,000Expected profit on actual sales 38,000 Sales price variance 12,000 Production variances Favourable Adverse Materials price 6,300 Materials usage 6,000 Labour rate 5,040 Labour efficiency 2,400 Variable overhead expenditure - - Variable overhead efficiency 1,200 Fixed overhead _____ 4,000 5,040 19,900 14,860Actual profit 11,140
Background information (not seen by the Managing Director) The report did not include any other information. Details relating to the company and the product that it makes are given below: FX produces one type of product. It operates a standard marginal costing system. The standard unit cost and price of the product is as follows: £ £ Selling price 250Direct material (5 kg at £20) 100Direct labour (4 hours at £10) 40Variable overheads (4 hours at £5) 20 160Contribution 90 The variable overhead absorption rate is based on direct labour hours. The company has budgeted fixed overheads of £70,000 per month. Budgeted sales and production levels are 1,000 units per month.
P1 12 May 2008
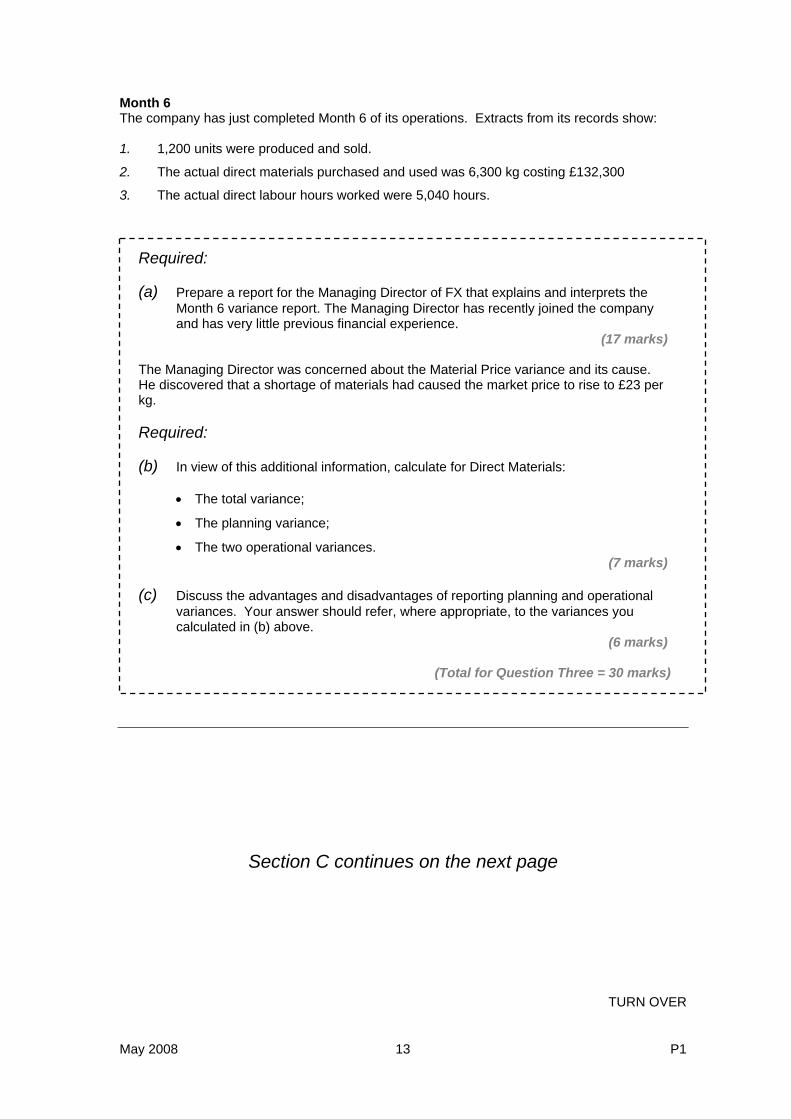
Month 6 The company has just completed Month 6 of its operations. Extracts from its records show: 1. 1,200 units were produced and sold.
2. The actual direct materials purchased and used was 6,300 kg costing £132,300
3. The actual direct labour hours worked were 5,040 hours.
Required: (a) Prepare a report for the Managing Director of FX that explains and interprets the
Month 6 variance report. The Managing Director has recently joined the company and has very little previous financial experience.
(17 marks) The Managing Director was concerned about the Material Price variance and its cause. He discovered that a shortage of materials had caused the market price to rise to £23 per kg.
Required:
(b) In view of this additional information, calculate for Direct Materials:
• The total variance;
• The planning variance;
• The two operational variances. (7 marks)
(c) Discuss the advantages and disadvantages of reporting planning and operational
variances. Your answer should refer, where appropriate, to the variances you calculated in (b) above.
(6 marks)
(Total for Question Three = 30 marks)
Section C continues on the next page
TURN OVER
May 2008 13 P1

Question Four Q, a new company, is being established to manufacture and sell an electronic tracking device: the Trackit. The owners are excited about the future profits that the business will generate. They have forecast that sales will grow to 2,600 Trackits per month within five months and will be at that level for the remainder of the first year. The owners will invest a total of $250,000 in cash on the first day of operations (that is the first day of Month 1). They will also transfer non-current assets into the company. Extracts from the company’s business plan are shown below. Sales The forecast sales for the first five months are:
Month Trackits (units)
1 1,000 2 1,500 3 2,000 4 2,400 5 2,600
The selling price has been set at $140 per Trackit. Sales receipts Sales will be mainly through large retail outlets. The pattern for the receipt of payment is expected to be as follows:
Time of payment % of sales value Immediately 15 * One month later 25 Two months later 40 Three months later 15
The balance represents anticipated bad debts. * A 4% discount will be given for immediate payment. Production The budget production volumes in units are:
Month 1 Month 2 Month 3 Month 4 1,450 1,650 2,120 2,460
Variable production cost The budgeted variable production cost is $90 per unit, comprising:
$ Direct materials 60 Direct wages 10 Variable production overheads 20Total variable cost 90
Direct materials: Payment for purchases will be made in the month following receipt. There will be no opening inventory of materials in Month 1. It will be company policy to hold inventory at the end of each month equal to 20% at of the following month’s production requirements. The direct materials cost includes the cost of an essential component that will be bought in from a specialist manufacturer.
P1 14 May 2008

Direct wages will be paid in the month in which the production occurs. Variable production overheads: 65% will be paid in the month in which production occurs and the remainder will be paid one month later. Fixed overhead costs Fixed overheads are estimated at $840,000 per annum and are expected to be incurred in equal amounts each month. 60% of the fixed overhead costs will be paid in the month in which they are incurred and 15% in the following month. The balance represents depreciation of non-current assets. Ignore VAT and Tax
Required
(a) Prepare a cash budget for each of the first three months and for that three-month period in total.
(14 marks)
(b) There is some uncertainty about the cost of the specialist component (this is included in the direct material cost). It is thought that the cost of the component could range between $32 and $50 per Trackit. It is currently included in the cost estimates at $40 per Trackit.
Calculate the budgeted total net cash flow for the three-month period in total if the
cost of the component was (i) $32
(ii) $50 (6 marks)
(c) Prepare a report for the owners of Q that offers advice about the profitability of their
business and the situation revealed by the extracts from the business plan and your answers to (a) and (b) above.
(10 marks)
Total for Question Four = 30 marks
(Total for Section C = 30 marks)
End of question paper
Maths Tables and Formulae are on pages 17 to 21
May 2008 15 P1

[This page is blank]
P1 16 May 2008

May 2008 17 P1

PRESENT VALUE TABLE
Present value of $1, that is ( ) nr −+1 where r = interest rate; n = number of periods until payment or receipt.
Interest rates (r) Periods (n) 1% 2% 3% 4% 5% 6% 7% 8% 9% 10% 1 0.990 0.980 0.971 0.962 0.952 0.943 0.935 0.926 0.917 0.909 2 0.980 0.961 0.943 0.925 0.907 0.890 0.873 0.857 0.842 0.826 3 0.971 0.942 0.915 0.889 0.864 0.840 0.816 0.794 0.772 0.751 4 0.961 0.924 0.888 0.855 0.823 0.792 0.763 0.735 0.708 0.683 5 0.951 0.906 0.863 0.822 0.784 0.747 0.713 0.681 0.650 0.621 6 0.942 0.888 0.837 0.790 0.746 0705 0.666 0.630 0.596 0.564 7 0.933 0.871 0.813 0.760 0.711 0.665 0.623 0.583 0.547 0.513 8 0.923 0.853 0.789 0.731 0.677 0.627 0.582 0.540 0.502 0.467 9 0.914 0.837 0.766 0.703 0.645 0.592 0.544 0.500 0.460 0.424 10 0.905 0.820 0.744 0.676 0.614 0.558 0.508 0.463 0.422 0.386 11 0.896 0.804 0.722 0.650 0.585 0.527 0.475 0.429 0.388 0.350 12 0.887 0.788 0.701 0.625 0.557 0.497 0.444 0.397 0.356 0.319 13 0.879 0.773 0.681 0.601 0.530 0.469 0.415 0.368 0.326 0.290 14 0.870 0.758 0.661 0.577 0.505 0.442 0.388 0.340 0.299 0.263 15 0.861 0.743 0.642 0.555 0.481 0.417 0.362 0.315 0.275 0.239 16 0.853 0.728 0.623 0.534 0.458 0.394 0.339 0.292 0.252 0.218 17 0.844 0.714 0.605 0.513 0.436 0.371 0.317 0.270 0.231 0.198 18 0.836 0.700 0.587 0.494 0.416 0.350 0.296 0.250 0.212 0.180 19 0.828 0.686 0.570 0.475 0.396 0.331 0.277 0.232 0.194 0.164 20 0.820 0.673 0.554 0.456 0.377 0.312 0.258 0.215 0.178 0.149
Interest rates (r) Periods
(n) 11% 12% 13% 14% 15% 16% 17% 18% 19% 20% 1 0.901 0.893 0.885 0.877 0.870 0.862 0.855 0.847 0.840 0.833 2 0.812 0.797 0.783 0.769 0.756 0.743 0.731 0.718 0.706 0.694 3 0.731 0.712 0.693 0.675 0.658 0.641 0.624 0.609 0.593 0.579 4 0.659 0.636 0.613 0.592 0.572 0.552 0.534 0.516 0.499 0.482 5 0.593 0.567 0.543 0.519 0.497 0.476 0.456 0.437 0.419 0.402 6 0.535 0.507 0.480 0.456 0.432 0.410 0.390 0.370 0.352 0.335 7 0.482 0.452 0.425 0.400 0.376 0.354 0.333 0.314 0.296 0.279 8 0.434 0.404 0.376 0.351 0.327 0.305 0.285 0.266 0.249 0.233 9 0.391 0.361 0.333 0.308 0.284 0.263 0.243 0.225 0.209 0.194 10 0.352 0.322 0.295 0.270 0.247 0.227 0.208 0.191 0.176 0.162 11 0.317 0.287 0.261 0.237 0.215 0.195 0.178 0.162 0.148 0.135 12 0.286 0.257 0.231 0.208 0.187 0.168 0.152 0.137 0.124 0.112 13 0.258 0.229 0.204 0.182 0.163 0.145 0.130 0.116 0.104 0.093 14 0.232 0.205 0.181 0.160 0.141 0.125 0.111 0.099 0.088 0.078 15 0.209 0.183 0.160 0.140 0.123 0.108 0.095 0.084 0.079 0.065 16 0.188 0.163 0.141 0.123 0.107 0.093 0.081 0.071 0.062 0.054 17 0.170 0.146 0.125 0.108 0.093 0.080 0.069 0.060 0.052 0.045 18 0.153 0.130 0.111 0.095 0.081 0.069 0.059 0.051 0.044 0.038 19 0.138 0.116 0.098 0.083 0.070 0.060 0.051 0.043 0.037 0.031 20 0.124 0.104 0.087 0.073 0.061 0.051 0.043 0.037 0.031 0.026
P1 18 May 2008

Cumulative present value of $1 per annum, Receivable or Payable at the end of each year for n
years rr n−+− )(11
Interest rates (r) Periods
(n) 1% 2% 3% 4% 5% 6% 7% 8% 9% 10% 1 0.990 0.980 0.971 0.962 0.952 0.943 0.935 0.926 0.917 0.909 2 1.970 1.942 1.913 1.886 1.859 1.833 1.808 1.783 1.759 1.736 3 2.941 2.884 2.829 2.775 2.723 2.673 2.624 2.577 2.531 2.487 4 3.902 3.808 3.717 3.630 3.546 3.465 3.387 3.312 3.240 3.170 5 4.853 4.713 4.580 4.452 4.329 4.212 4.100 3.993 3.890 3.791 6 5.795 5.601 5.417 5.242 5.076 4.917 4.767 4.623 4.486 4.355 7 6.728 6.472 6.230 6.002 5.786 5.582 5.389 5.206 5.033 4.868 8 7.652 7.325 7.020 6.733 6.463 6.210 5.971 5.747 5.535 5.335 9 8.566 8.162 7.786 7.435 7.108 6.802 6.515 6.247 5.995 5.759 10 9.471 8.983 8.530 8.111 7.722 7.360 7.024 6.710 6.418 6.145 11 10.368 9.787 9.253 8.760 8.306 7.887 7.499 7.139 6.805 6.495 12 11.255 10.575 9.954 9.385 8.863 8.384 7.943 7.536 7.161 6.814 13 12.134 11.348 10.635 9.986 9.394 8.853 8.358 7.904 7.487 7.103 14 13.004 12.106 11.296 10.563 9.899 9.295 8.745 8.244 7.786 7.367 15 13.865 12.849 11.938 11.118 10.380 9.712 9.108 8.559 8.061 7.606 16 14.718 13.578 12.561 11.652 10.838 10.106 9.447 8.851 8.313 7.824 17 15.562 14.292 13.166 12.166 11.274 10.477 9.763 9.122 8.544 8.022 18 16.398 14.992 13.754 12.659 11.690 10.828 10.059 9.372 8.756 8.201 19 17.226 15.679 14.324 13.134 12.085 11.158 10.336 9.604 8.950 8.365 20 18.046 16.351 14.878 13.590 12.462 11.470 10.594 9.818 9.129 8.514
Interest rates (r) Periods
(n) 11% 12% 13% 14% 15% 16% 17% 18% 19% 20% 1 0.901 0.893 0.885 0.877 0.870 0.862 0.855 0.847 0.840 0.833 2 1.713 1.690 1.668 1.647 1.626 1.605 1.585 1.566 1.547 1.528 3 2.444 2.402 2.361 2.322 2.283 2.246 2.210 2.174 2.140 2.106 4 3.102 3.037 2.974 2.914 2.855 2.798 2.743 2.690 2.639 2.589 5 3.696 3.605 3.517 3.433 3.352 3.274 3.199 3.127 3.058 2.991 6 4.231 4.111 3.998 3.889 3.784 3.685 3.589 3.498 3.410 3.326 7 4.712 4.564 4.423 4.288 4.160 4.039 3.922 3.812 3.706 3.605 8 5.146 4.968 4.799 4.639 4.487 4.344 4.207 4.078 3.954 3.837 9 5.537 5.328 5.132 4.946 4.772 4.607 4.451 4.303 4.163 4.031 10 5.889 5.650 5.426 5.216 5.019 4.833 4.659 4.494 4.339 4.192 11 6.207 5.938 5.687 5.453 5.234 5.029 4.836 4.656 4.486 4.327 12 6.492 6.194 5.918 5.660 5.421 5.197 4.988 7.793 4.611 4.439 13 6.750 6.424 6.122 5.842 5.583 5.342 5.118 4.910 4.715 4.533 14 6.982 6.628 6.302 6.002 5.724 5.468 5.229 5.008 4.802 4.611 15 7.191 6.811 6.462 6.142 5.847 5.575 5.324 5.092 4.876 4.675 16 7.379 6.974 6.604 6.265 5.954 5.668 5.405 5.162 4.938 4.730 17 7.549 7.120 6.729 6.373 6.047 5.749 5.475 5.222 4.990 4.775 18 7.702 7.250 6.840 6.467 6.128 5.818 5.534 5.273 5.033 4.812 19 7.839 7.366 6.938 6.550 6.198 5.877 5.584 5.316 5.070 4.843 20 7.963 7.469 7.025 6.623 6.259 5.929 5.628 5.353 5.101 4.870
May 2008 19 P1

Formulae
PROBABILITY A B = A or B. A B = A and B (overlap). ∪ ∩
P(B A) = probability of B, given A. Rules of Addition If A and B are mutually exclusive: P(A B) = P(A) + P(B) ∪If A and B are not mutually exclusive: P(A ∪B) = P(A) + P(B) – P(A ∩ B) Rules of Multiplication If A and B are independent: P(A ∩B) = P(A) * P(B) If A and B are not independent: P(A ∩B) = P(A) * P(B | A) E(X) = (probability * payoff) ∑ Quadratic Equations If aX2 + bX + c = 0 is the general quadratic equation, the two solutions (roots) are given by:
aacbbX
242 −±−
=
DESCRIPTIVE STATISTICS Arithmetic Mean
nxx ∑
= ffxx
∑∑
= (frequency distribution)
Standard Deviation
nxxSD
2)( −∑= 2
2x
ffxSD −∑∑= (frequency distribution)
INDEX NUMBERS Price relative = 100 * P1/P0 Quantity relative = 100 * Q1/Q0
Price: 100 x w
PP
wo
1
∑
⎟⎟⎠
⎞⎜⎜⎝
⎛∗∑
Quantity: 100 x
1
wQQw
o
∑
⎟⎟⎠
⎞⎜⎜⎝
⎛∗∑
TIME SERIES Additive Model
Series = Trend + Seasonal + Random Multiplicative Model
Series = Trend * Seasonal * Random
P1 20 May 2008
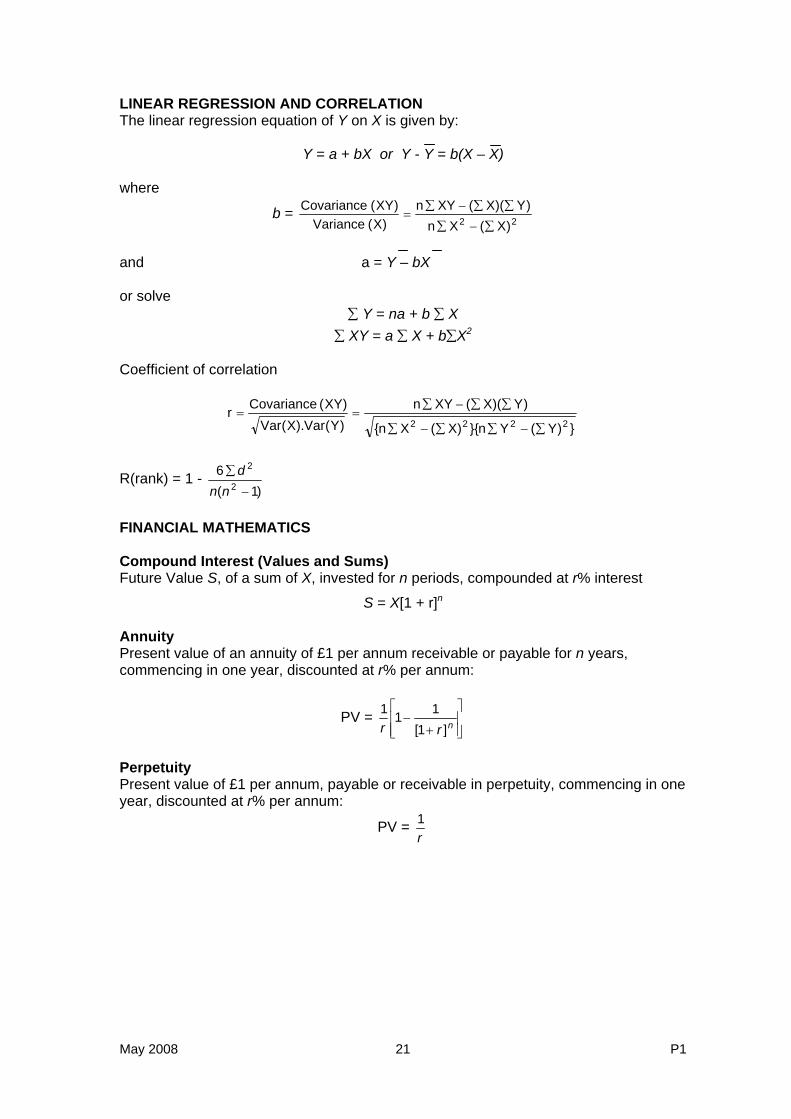
LINEAR REGRESSION AND CORRELATION The linear regression equation of Y on X is given by:
Y = a + bX or Y - Y = b(X – X) where
b = 22 )X(Xn
)Y)(X(XYn)X( Variance
)XY( Covariance∑−∑
∑∑−∑=
and a = Y – bX or solve
∑ Y = na + b ∑ X ∑ XY = a ∑ X + b∑X2
Coefficient of correlation
})Y(Yn}{)X(Xn{
)Y)(X(XYn)Y(Var).X(Var)XY( Covariancer
2222 ∑−∑∑−∑
∑∑−∑==
R(rank) = 1 - )1(
62
2
−
∑
nnd
FINANCIAL MATHEMATICS Compound Interest (Values and Sums) Future Value S, of a sum of X, invested for n periods, compounded at r% interest
S = X[1 + r]n Annuity Present value of an annuity of £1 per annum receivable or payable for n years, commencing in one year, discounted at r% per annum:
PV = ⎥⎥⎦
⎤
⎢⎢⎣
⎡
+−
nrr ]1[111
Perpetuity Present value of £1 per annum, payable or receivable in perpetuity, commencing in one year, discounted at r% per annum:
PV = r1
May 2008 21 P1

[This page is blank]
P1 22 May 2008

LIST OF VERBS USED IN THE QUESTION REQUIREMENTS A list of the learning objectives and verbs that appear in the syllabus and in the question requirements for each question in this paper. It is important that you answer the question according to the definition of the verb.
LEARNING OBJECTIVE VERBS USED DEFINITION
1 KNOWLEDGE
What you are expected to know. List Make a list of State Express, fully or clearly, the details of/facts of Define Give the exact meaning of
2 COMPREHENSION What you are expected to understand. Describe Communicate the key features
Distinguish Highlight the differences between Explain Make clear or intelligible/State the meaning of Identify Recognise, establish or select after
consideration Illustrate Use an example to describe or explain
something
3 APPLICATION How you are expected to apply your knowledge. Apply
Calculate/compute To put to practical use To ascertain or reckon mathematically
Demonstrate To prove with certainty or to exhibit by practical means
Prepare To make or get ready for use Reconcile To make or prove consistent/compatible Solve Find an answer to Tabulate Arrange in a table
4 ANALYSIS How you are expected to analyse the detail of what you have learned.
Analyse Categorise
Examine in detail the structure of Place into a defined class or division
Compare and contrast Show the similarities and/or differences between
Construct To build up or compile Discuss To examine in detail by argument Interpret To translate into intelligible or familiar terms Produce To create or bring into existence
5 EVALUATION How you are expected to use your learning to evaluate, make decisions or recommendations.
Advise Evaluate Recommend
To counsel, inform or notify To appraise or assess the value of To advise on a course of action
May 2008 23 P1

Management Accounting Pillar
Managerial Level
P1 – Management Accounting – Performance Evaluation
May 2008
Tuesday Morning Session
P1 24 May 2008