OWL Concept Study - Eso.org
56
1 No. 100 – June 2000 ESO is developing a concept of ground-based, 100-m-class optical tel- escope (which we have christened OWL for its keen night vision and for OverWhelmingly Large), with segment- ed primary and secondary mirrors, inte- grated active optics and multi-conju- gate adaptive optics capabilities. The idea of a 100-m-class telescope origi- nated in 1997, when it was assessed that true progress in science perform- ance after HST and the 8–10-m-class Keck and VLT generations would re- quire an order-of-magnitude increase in aperture size (a similar assessment had been made by Matt Mountain in 1996 1 ). The challenge and the science potential seemed formidable – and highly stimulating. Extremely large telescopes are no new idea: studies for 25-m-class tele- scopes 2, 3 date back to the mid-70s. Although these studies concluded that such telescopes were already techni- cally feasible, the science case was not as strong as that permitted today by adaptive optics, and underlying tech- nologies were far less cost-effective than they are now. In the late 80’s, plans for a 25-m-class telescope were proposed by Ardeberg, Andersen et Figure 1: A matter of perspective … al. 4 ; by 2000 the concept had evolved into a 50-m-class adaptive telescope 5 . Preliminary ideas for a 50-m concept were presented 1 by Mountain et al. in 1996; studies for a 30-m scaled-up ver- sion of the Hobby-Eberly telescope OWL Concept Study R. GILMOZZI and P. DIERICKX, ESO We are now celebrating the 100th issue of The Messenger. The Messenger is one channel of ESO’s multimedia approach to providing information about its activities and achievements. Like the European astronomical community, the Messenger looks towards the future, as evi - denced by the first article in this issue, on OWL. We are ready to publish in the coming years an increasing number of first-class discoveries which will come from innovative technology and from bold, imaginative and efficient observers.
-
Upload
khangminh22 -
Category
Documents
-
view
0 -
download
0
Transcript of OWL Concept Study - Eso.org

1
No. 100 – June 2000
ESO is developing a concept ofground-based, 100-m-class optical tel-escope (which we have christenedOWL for its keen night vision and forOverWhelmingly Large), with segment-ed primary and secondary mirrors, inte-grated active optics and multi-conju-gate adaptive optics capabilities. Theidea of a 100-m-class telescope origi-nated in 1997, when it was assessedthat true progress in science perform-ance after HST and the 8–10-m-classKeck and VLT generations would re-quire an order-of-magnitude increase inaperture size (a similar assessmenthad been made by Matt Mountain in19961). The challenge and the sciencepotential seemed formidable – andhighly stimulating.
Extremely large telescopes are nonew idea: studies for 25-m-class tele-scopes2, 3 date back to the mid-70s.Although these studies concluded thatsuch telescopes were already techni-cally feasible, the science case was notas strong as that permitted today byadaptive optics, and underlying tech-nologies were far less cost-effectivethan they are now. In the late 80’s,plans for a 25-m-class telescope wereproposed by Ardeberg, Andersen et Figure 1: A matter of perspective …
al.4; by 2000 the concept had evolvedinto a 50-m-class adaptive telescope5.Preliminary ideas for a 50-m concept
were presented1 by Mountain et al. in1996; studies for a 30-m scaled-up ver-sion of the Hobby-Eberly telescope
OWL Concept StudyR. GILMOZZI and P. DIERICKX, ESO
We are now celebrating the 100th issue of The Messenger.The Messenger is one channel of ESO’s multimedia approach to providing information about its activities and
achievements. Like the European astronomical community, the Messenger looks towards the future, as evi -denced by the first article in this issue, on OWL.
We are ready to publish in the coming years an increasing number of first-class discoveries which will comefrom innovative technology and from bold, imaginative and efficient observers.
2
have been unveiled6, 7 by Sebring et al.in 1998 and 1999; and plans for the 30-m California Extremely Large Te l e-scope (CELT) have been unveiled byNelson et al. at the March 2000 SPIEconference in Munich8.
As for OWL, initial efforts concentrat-ed on finding suitable optical designand fabrication solutions. The empha-sis on optics is evident in the first (1998)publication made about the telescopec o n c e p t9, where it was shown thatproven mass-production solutions forthe telescope optics are readily avail-able. From that point on, further studiesprogressed as rapidly as permitted byscarcity of resources, strengtheningconfidence in the concept. Several con-tributions10,11,12,13,14 were made at theJune 1999 workshop in Bäckaskog,Sweden, where, in particular, the basicconcept of the mechanical structurewas presented12. Industry showed as-tounding support for extremely largetelescope concepts, two major suppli-ers announcing1 5 , 1 6 that they wereready to take orders. Two essentialconclusions of this workshop were that,first, extremely large telescopes wereindeed feasible, experts arguing aboutsolutions instead of feasibility per se,and that, second, the future of high an-gular resolution belongs to the ground,thanks to adaptive optics.
Preliminary analyses have confirmedthe feasibility of OWL’s major compo-nents within a cost of the order of 1,000million Euros and within a competitive
time frame. A modular design allowsprogressive transition between integra-tion and science operation, and the tel-escope would be able to deliver full res-olution and unequalled collecting power11 to 12 years after project funding.
The concept owes much of its designcharacteristics to features of existingtelescopes, namely the Hobby-Eberlyfor optical design and fabrication, theKeck for optical segmentation, and theVLT for system aspects and active op-tics control. The only critical area interms of needed development seems tobe multi-conjugate adaptive optics, butits principles have recently been con-firmed experimentally, tremendouspressure is building up to implementadaptive capability into existing tele-scopes, and rapid progress in the un-derlying technologies is taking place.Further studies are progressing, con-firming initial estimates, and a baselinedesign is taking shape. The primary ob-jective of these studies is to demon-strate feasibility within proven technolo-gies, but provisions are made for likelytechnological progress allowing eithercost reduction or performance improve-ment, or both.
Why 100 m?
The history of the telescope (Fig. 2)shows that the diameter of the “next”telescope has increased slowly withtime (reaching a slope for glass-basedreflectors of a factor-of-two increase
every ~ 30 years in the last century: e.g.Mt. Wilson → Mt. Palomar → Keck).
The main reason for this trend can beidentified in the difficulty of producingthe optics (both in terms of casting theprimary mirror substrate and of polish-ing it). The advances in material pro-duction and in new control and polish-ing technologies of the last fewdecades, fostered in part by the re-quirements set by the present genera-tion of 8–10-m telescopes, offer nowthe exciting possibility of consideringfactors much larger than two for thenext generation of telescopes. And un-like in the past, they also offer the prom-ise of achieving this without implying alengthy (and costly) programme of re-search and development (R&D).
At the same time, advances also inadaptive optics (AO) bring the promiseof being able to achieve diffraction-lim-ited performance. Though still in its in-fancy, AO is growing very fast, pushedin part also by customer-oriented appli-cations. New low-cost technologieswith possible application to adaptivemirrors (MEMs), together with methodslike multi-conjugated adaptive optics(MCAO), new wave-front sensors andtechniques like turbulence tomographyare already being applied to AO mod-ules for the present generation of tele-scopes. Although the requirements toexpand AO technology to correct thewave front of a 100-m telescope areclearly very challenging (500,000 activeelements, enormous requirements oncomputing power), there is room forcautious optimism. This would allow aspatial resolution of the order of onemilliarcsecond, prompting the claim thathigh angular resolution belongs to theground. Of course, this is valid only atwavelengths that make sense (i.e. 0.3 <λ < 2.5 µm for imaging, λ < 5 µm forspectroscopy).
Can we afford it (in terms of timeand cost)? Another consequence ofthe recent advances in technology isthe fact that we can consider building anext-generation telescope within a rea-sonable time. Since a large R&D phaseis not required (with the exclusion ofAO, which is however being performedright now under the requirements set bythe current generation of telescopes),10 to 15 year timelines are appearingreasonable.
The cost issue is evidently one thatneeds to be addressed (even if a 50- or100-m telescope is demonstrably feasi-ble from the technical point of view, itwill be impossible to build one unlessthe D2.6 cost law can be broken). A“demonstration” that cost can be kept atlow values has been put into practice byH E T (admittedly accepting reducedperformance). The introduction of mod-ular design and mass-production (tele-scope optics, mechanics) is also a newand favourable factor. Based on thisand on extrapolating the experience ofthe Keck (segmentation) and of the VLT
Figure 2: Brief history of the telescope. Stars refer to refractors, asterisks to speculum re -flectors, circles to modern glass reflectors. Some telescopes are identified.

3
(active control), the cost estimatesrange nowadays between $0.3 to $1billion (respectively 30-m CELT a n d100-m OWL). These costs are large(though not as large as, say, a spaceexperiment), but possibly within whatsome large international collaborationcan achieve.
From the point of view of “astronom-ical strategy”, therefore, all this wouldalso allow perhaps to optimise thespace and ground facilities according totheir natural location (e.g. optical/NIRastronomy from the ground, UV or ther-mal IR astronomy from space, etc),stressing their complementary ratherthan competitive roles. And this with thepossibility of a reduction in “global”costs (the cost of HST would allow tobuild and operate at least t h r e eOWLs…)
Why 100 m? The original startingpoint for the development of the OWLconcept (at the time called the WTT, al-ternatively for Wide Terrestrial Te l e-scope or Wishful Thinking Telescope)was twofold. On one side a preliminaryand naive science case (what is the tel-escope size needed to do spectroscopyof the faintest sources that will be dis-covered by NGST). On the other side,the interest in exploring the technologi-cal limitations in view of the recent ad-vances, especially to what limit onecould push angular resolution. In otherterms: could the factor-of-two becomean order-of-magnitude?
The progress both of the sciencecase and of the design concept sincethe early days allows us to give someanswers (albeit incomplete) to thequestion:
(i) The HST “lesson” has shown thatangular resolution is a key to advancein many areas of astronomy, both in thelocal and in the far Universe. Achievingthe diffraction limit is a key requirementof any design.
(ii) Milliarcsecond resolution will beachieved by interferometry (e.g. VLTI)for relatively bright objects and verysmall fields of view. The science-case(including the original ‘complementaritywith NGST’one) requirements are now,for the same resolution, field (~ arcmin-utes) and depth (M 35th magnitude), i.e.filled aperture diameters M 100 m.
(iii) For diffraction-limited perform-ance, the ‘detectivity’ for point sourcesgoes as D4 (both flux and contrast gainas D2). One could say that a 100-m tel-escope would be able to do in 10 yearsthe science a 50-m would take 100years to do!
(iv) Last but not least, technology al-lows it: the current technological limita-tion on diameter of the (fully scalable)OWL design is ~140 m.
Feasibility issues: do we need anintermediate step? Another questionthat often arises is whether we need anintermediate step to whatever size wethink we should achieve for scientificreasons (in other words, whether wewish to maintain the ‘factor-of-two’ par-adigm even if its technological raisond’être has been overcome). The debatehas vocal supporters on both sides (weOWLers are obviously for going direct-ly to the maximum size required bythe science and allowed by the tech-nology). “Accusations” of respectivelyexcessive conservatism or excessiveambition are exchanged in a friendly
way at each meeting about ExtremelyLarge Telescopes (ELTs). The interpre-tation of where exactly technologystands and how much can be extrapo-lated is at the core of the issue. Wethink this (very healthy) debate will goon for some time yet, and will be themain topic of the OWL Phase A studywhich is underway (goal for completion:early 2003).
Diffraction limit vs. seeing limit.Why make the diffraction limit such astrong requirement for ELTs is yet an-other subject of debate. On this, our po-sition is very strong: we consider a see-ing-limited ELT (deprecatingly named a“light bucket”) as a goal not worth pur-suing. While it is clear that the atmos-phere will not always be “AO-friendly”and that, therefore, concepts of instru-mentation to be used in such circum-stances should be developed, there arescientific as well as technical reasons tojustify our position.
Typically the seeing limit designs gotogether with wide field (here wide ismany arcminutes) and/or high spectralresolution (ℜ O 50,000) requirements.Apart from the overwhelming role of thebackground for seeing-limited imaging(sky counts of thousands of photonsper second per pixel for a 50-m tele-scope), source confusion is a majorscientific issue. From the technicalpoint of view, building incredibly fastfocal reducers, or high-resolution spec-trographs with collimators the size ofpresent-day telescopes, may posetechnical challenges more extremethan building the telescope itself.
On the opposite side, imagers for dif-fraction-limited telescopes need very
Figure 3: Resolution, from 0.2 arcseconds seeing to diffraction-limited with 100-m. All images 0.6 0.6 arc seconds 2.

4
slow f-numbers (50 or so, although ad-mittedly here the challenge is to haveenough detector area to cover a rea-sonable field, and to avoid severe satu-ration from ‘bright’ sources). Milli-arcsecond(s) slits would make thebeam size of a high-resolution spectro-graph comparable to that of UVES orHIRES (i.e. instrumentation could beconsidered “comparatively” easy in thediffraction-limited case).
In the seeing-limited case, a spec-troscopic telescope (of say 25–30 mand 5,000–20,000 resolution) could oc-cupy an interesting scientific niche.Such a design is being considered asthe natural evolution of the HET(Sebring et al.), and is the first one tohave actually been called ELT (in otherwords, we have stolen the genericname from them. Another possibilityfor generic name is Jerry Nelson’ssuggestion of calling the future behe-moths Giant Optical Devices or GODs.The hint about hubris is quite clear…).
Resolution, resolutely. A n g u l a rresolution and sensitivity are the high-est-priority requirements. They are alsoclosely intertwined, as high resolutionimplies high energy concentration in thecore of the Point Spread Function (it isnot a coincidence that the Strehl Ratiois called Resolution by optical physi-cists and engineers).
Figure 3 crudely illustrates the effectof increased resolution by showing thesame hypothetical 0.6 × 0.6 arcsecond2
field, as seen by a seeing-limited tele-scope under best conditions (FWHM~ 0.2 arcsecs), by HST, by an 8-m dif-fraction-limited telescope and by OWL,respectively. Assuming the pixel size inthe rightmost (OWL) image to be ~ 0.5mas, the left frames have been con-volved with the theoretical Point SpreadFunctions associated to each case. Forthe diffraction-limited image the expo-sure times have been adjusted to pro-vide roughly the same total integratedintensity, taking into account collectingarea. A corrective factor has been ap-plied to the seeing-limited image to pro-vide comparable peak intensity (this isdue to the oversampling of the seeing-limited image).
Figure 3 also illustrates the fact thatfield size is a relative concept andshould be evaluated in relation to itsinformation content: the 0.6 × 0.6 arc-s e c o n d2 field shown here becomes~ 1,400,000 pixels when seen by OWL.
OWL’s performance. At ten timesthe combined collecting area of everytelescope ever built, a 100-m filledaperture telescope would open com-pletely new horizons in observationalastronomy – going from 10 m to 100 mrepresents a “quantum” jump similar tothat of going from the naked eye toGalileo’s telescope (see Fig. 2).
We have built a simulator of the per-formance of the OWL, which can alsobe used for different-size telescopes(and compared with similar calculations
presented at the March 2000 SPIEconference or at the Bäckaskog 1999Workshop on Extremely Large Tele-scopes, e.g. Mountain et al.). The sim-ulator uses the PSF produced by themost recent optical design iteration,and includes the typical ingredients (dif-fusion, sky and telescope background,detector properties, and as complete aspossible a list of noise sources). Theoutput is a simulated image or spec-trum (see Fig. 4).
A magnitude limit for isolated pointsources of V = 38 in 10 hours can beachieved assuming diff r a c t i o n - l i m i t e dperformance (whether there are suchisolated sources is a different question,see below). Comparing this perform-ance with the predicted one for NGSTshows that the two instruments wouldbe highly complementary. The NGSTwould have unmatched performance inthe thermal IR, while a ground-based100-m would be a better imager at λ <2.5 µm and a better spectrograph (ℜ M5000) at λ < 5 µm. Sensitivity-wise, the100-m would not compete in the ther-mal IR, although it would have muchhigher spatial resolution.
In terms of complementarity, OWLwould also have a synergetic role withALMA (e.g. in finding and/or studyingproto-planets) and with VLBI (the radioastronomers have been waiting for usoptical/IR people to catch up in spatialresolution for decades!)
Interferometry. Is interferometry analternative to filled aperture? The con-sensus seems to be that this is notthe case. Interferometry has a clearlyseparate scientific niche – for similarbaselines its field of view (few arc-seconds) and (bright) magnitude limitsare definitely not competitive with thepredicted performance of a filled aper-ture telescope. On the other side, base-lines of hundreds of metres, if not ofkilometres (in space even hundreds ofkm, as in the NASA plans), might wellbe the future of interferometry. Lookingfor the details of comparatively brightobjects at the micro-arcsecond level,looking for and discovering earth-likeplanets, studying the surface of starseven further away are a domain whereinterferometry will always be first. In asense, it is a “brighter object” pre-cursor for any filled aperture telescopeof the same size that may come in thefuture.
Items for the Science Case
The science case for the extremelylarge telescopes of the future is not ful-ly developed yet. Some meetings havetaken place on the subject, and moreare planned (there will be at least oneWorkshop on this in 2000). However, itis difficult to think of a branch of astron-omy that would not be deeply affectedby the availability of a 50- or 100-m tel-escope with the characteristics outlinedearlier.
In any event, there are a number ofquestions that the Science Case shouldpose, and find answers to, which will af-fect the final set of requirements for tel-escopes like the OWL. Do we need theangular resolution? Is 1 milliarcsecondtoo much, too little, enough? Is invest-ing in AO research justified? Could welive with seeing limited? Can we not?Do we need 100 m? Are 50 m enough?Are 30 m? Are 20 m? Should we pusheven further? What is a sensible mag-nitude limit? Is interferometry a betteralternative or a precursor? Do we needthe optical and its tighter design toler-ances and extremely more complex AO(especially since the faint/far Universeis very redshifted)? Do we have a com-pelling science case? Is “spectroscopyof the faintest NGST sources” enough?Is “unmatched potential for new discov-eries” relevant? Is “search for bios-pheres” too public-oriented? Indeed, dowe need an ELT?
In the following we will discuss someareas where OWL could give unprece-dented contributions. This is by nomeans supposed to be a completepanorama, but rather reflects some per-sonal biases.
Confusion about confusion . Thereis a widespread concern that ELTs mayhit the confusion limit, thereby voidingtheir very raison d’être. Much of thisconcern is tied to observations obtainedin the past, either from the ground orfrom space, with instrumentation whoseangular resolution was very limited (e . g .the first X-ray satellites or the very deepoptical images in 2″ seeing of the ‘80s).Recent developments have shown thatwhenever a better resolution isachieved, what looked like the confu-sion limit resolves itself in individual ob-jects (e.g. the X-ray background, nowknown to consist mostly of resolvedsources, or the HDF images, whichshow more empty space than objects).
Admittedly, there may be a confusionlimit somewhere. However, the back-of-
Figure 4: Output from the simulator. S/N fora 35th-magniture star in a 1-hour exposuremeasured on simulated image.

5
the-envelope argument that “all far gal-axies are 1″ across, there are about 1011
galaxies and 1011 arcseconds, therefore,there must be a point where everythingoverlaps” fails when one resolves asquare arcsecond in >1 06 pixels (crowd-ing may still be an issue, though). Thetopic, however, is fascinating (and tight-ly connected with Olbers’paradox), andwill be the subject of a future paper. Forthe purpose of this discussion, howev-er, the only thing confusing about con-fusion is whether it is an issue or not.There is a clear tendency in the com-munity to think that it is not.
Star-formation history of the Uni-verse. This is an example of a possiblescience case which shows very wellwhat the potentiality of a 100-m telescopecould be, although by the time we mayhave one, the scientific problem willmost likely have been already solved.
The history of stellar formation in theUniverse is today one of the ‘hot topics’in astrophysics. Its goal is to determinewhich kind of evolution has taken placefrom the epoch of formation of the firststars to today. To do so, “measure-ments” of star-formation rates are ob-tained in objects at a variety of lookback times, and used to determine aglobal trend. These measurements areusually obtained by comparing someobserved integral quantities of unre-solved objects (typically an emission-line flux) with predictions made by evo-lution models. Although the method iscrude, results are being obtained and acomprehensive picture is starting toemerge.
With a telescope like OWL, what aretoday “unresolved objects” would be re-solved in their stellar components. Forexample, one could see O stars out toa redshift z ~ 2, detect individual HII re-gions at z ~ 3, measure SNe out to z ~10 (see below). Determining the star-formation rates in individual galaxieswould go from relying on the assump-tions of theoretical models and theircomparison with integrated measure-ments, to the study of individual stellarcomponents, much in the way it is donefor the “nearby” Universe.
Symbiosis with NGST. This was the“original” science case for a 100-m tel-escope, and runs much in the samevein as the case made by Matt Moun-tain1 for a 50-m telescope to observethe faintest galaxies in the HDFs. Thesymbiosis with NGST would howevernot only be of the “finder/spectrometer”variety (though much science would beobtained in this way), but as explainedabove also in terms of complementarityin the space of parameters (wavelengthcoverage, angular resolution, spectralresolution, sensitivity, etc). The feelingis that a science case to complementthe NGST is a strong one, but cannotbe the main case for a 100-m tele-scope.
Measure of H. Cepheids could bemeasured with OWL out to a distance
modulus (m – M) ~ 43 (i.e. z ~ 0.8). Thiswould allow the measurement of H andits dependence on redshift (not H0) un-encumbered by local effects (e.g. theexact distance to Virgo). In fact, the dis-tance to Virgo, and the value of H0,would be determined as “plot intercept”at t = 0! There is an interesting parallelto be done here with HST to get a “feel-ing” of what crowding problems wecould have. Crowding would start af-fecting the photometry of individualCepheids at about this distance inmuch the same way it does for HST im-ages of Virgo galaxies. In fact, wewould be about 100 times further thanVirgo with a resolution about 100 timesbetter than HST (Cepheids are ob-served with HST mainly in the under-sampled Wi d eField chips).
Supernovaeat z ~ 10. An “iso-lated”, underlumi -nous Type II su-pernova like SN1987A would bevisible at (m – M)~ 53. A s s u m i n gthat crowding and/or increased back-ground wouldbring the limit to50 (i.e. z ~ 10, theexact value de-pending on one’sfavourite cosmol-ogy), we wouldstill be able to de-tect any SN everexploded out tothat redshift (!).
Figure 6 showsmodel calcula-tions of superno-va rates assum-
ing a 1012 M0 elliptical galaxy begin-ning star formation at z = 10. The ratesare several dozen per year (i.e. ~ 0.3per day!). Even for much less massivegalaxies the rates are a few per year.This means that any deep exposure ina field m 1 arcmin2 will contain severalnew supernovae.
Since these SNe will be at highredshift, the observed light-curves willbe in the rest UV. This actually makestheir identification e a s i e r, since Ty p e -IIlight-curves last typically 12 to 24 hoursin the UV: time dilation will lengthenthe curves by (1 + z) making themideal to discover. (Note that the op-tical light-curves, intrinsically somemonths long, would last years due to di-lation).
Figure 5: OWL’s view of a galaxy in the HDF.
Figure 6: Type-II SN rate at high redshift for a 1012 M0 elliptical galaxy(Matteucci 1998).

6
The study of SNe out to z ~ 10 (if in-deed stars started forming at or beforethat redshift, which is not certain by anymeans) would allow to access ~ 30%of the co-moving volume (i.e. mass) ofthe Universe (at present, through SNewe can access less than 3%). Star for-mation rates at such early ages wouldbe a natural by-product of these stud-ies. Nearer SNe would be brightenough to provide “light bulbs” to studythe intergalactic medium on many morelines of sight than those provided byother bright but less common objects,e.g. QSOs. And of course, althoughwith lower rates and at “nearer” dis-tances (their rate peaks at zI ~ zII – 2.5),the brighter Type-I SNe will also con-tribute to the study.
Other high-redshift Universe stud-ies. A telescope with the resolution andsensitivity of OWL’s would find some ofthe most important applications in thestudy of the furthest and faintest objectsin the Universe. Among many others,studies of the proto-galactic buildingblocks and the dynamics of their merg-ing into higher hierarchical structures.The possibility of probing even higherredshifts with Gamma-Ray Bursts (ifthey exist at earlier epochs) is alsovery exciting, as they are intrinsicallyorders of magnitude brighter than evenSNe.
High-frequency phenomena. Rap-id variability is an area where the im-provements brought by larger col-lecting areas can be truly enormous.The power spectrum of such phenome-na is in fact proportional to the squareof the flux, i.e. P ~ D4. Dainis Dravinsshowed at the Bäckaskog Workshopthat extremely large telescopes opena window on the study of quantumphenomena in the Universe which weretill now only observed in the labora-tory.
Nearby Universe. In the nearerUniverse we have again a myriad ofpossible contributions. The detection ofbrown dwarfs in the Magellanic Cloudswould enable us to determine an accu-rate IMF for those galaxies. It would bepossible to observe White Dwarfs in theAndromeda galaxy and solar-like starsin galaxies in the Virgo cluster enablingdetailed studies of stellar populations ina large variety of galaxies. The environ-ment of several AGNs would be re-solved, and the morphology and dy-namics of the inner parts nearest to thecentral black hole could be tracked andunderstood. If the rings around SN1987A are a common phenomenon,
they could be de-tected as far asthe Coma cluster.In our own galaxy,we could study re-gions like Orion atsub-AU scales,determining theinteractions be-tween stars being
born and the parent gas. We would de-tect protoplanetary disks and determinewhether planets are forming there, andimage the surface of hundreds ofstars, promoting them from points toobjects. Unlike interferometry (whichalso can image stellar surfaces, butneeds many observations along manybaselines to reconstruct a “picture”)these observations will be very short,allowing the detection of dynamic phe-nomena on the surfaces of stars otherthan the Sun.
Extra-solar planets. Finally, a criti-cal contribution will be in the subject ofextra-solar planets. Not so much in thediscovery of them (we expect that inter-ferometry will be quite successful inthis), but rather in their spectroscopicstudy. Determining their chemical com-position, looking for possible bio-spheres will be one of the great goals ofthe next generation of ELTs . Figure 7shows a simulation of an observation ofthe Solar System at 10 parsecs (basedon the PSF of an earlier optical de-sign, and including the effect of micro-roughness and dust diffusion on themirror) where Jupiter and Saturn wouldbe detected readily. Several exposureswould be necessary to detect the Earthin the glare of the Sun. Sophisticatedcoronographic techniques would actu-ally make this observation “easier” (orpossible at a larger distances).
Operational issues. The sheer sizeof a project like OWL, or any otherELT project, makes it unlikely that theoperational scenario would be simi-lar to that of the current generation oftelescopes. We believe that the cur-rent (mild) trend towards Large Pro-grammes (where the need for deep –i.e. long – exposures is combined withthe statistical requirement of a largenumber of measurements) will evolvetowards some sort of “Large Project”approach, similarly to what happens inparticle physics. In this sense, maybeeven the instrumentation plan could beadapted to such an approach (e.g. aProject would develop the “best” instru-ment for the observation, and when it isover a new Project with possibly new in-struments would take over). What weimagine is “seasons” in which OWL (orwhatever) will image the surface of all‘imageable’ stars, or study 105 SNe, orfollow the dynamics of the disruption ofa star by an AGN’s black hole. In otherwords, a series of self-contained pro-grammes which tackle (and hopefullysolve!) well defined problems, one at atime.
SCALABILITY – Why Not?
The last two decades of the 20th cen-tury have seen the design and comple-tion of a new generation of large tele-scopes with diameters on the order of 8to 10 metres. To various degrees, con-cepts developed on this occasion haveconcentrated on the feasibility of theoptics, controlled optical performance,cost reduction, and have been quitesuccessful in their endeavours.
The achievements of recent projectscould hardly be summarised in a fewlines, but we emphasise three majorbreakthroughs:
• Optical segmentation (Keck).• Cost-effective optical and mechani-
cal solutions (Hobby-Eberly)• Active optical control (NTT, VLT,
Gemini and Subaru).The lessons learned from these proj-
ects are, to some extent, already beingimplemented in a series of projects(e.g. GTC, SALT), but future conceptsmay quite naturally rely on a broad in-tegration of positive features of eachapproach. Perhaps the most far-reach-ing innovations have been brought bythe Keck, with virtually unlimited scala-bility of the telescope primary optics,and by the VLT, with highly reliable andperformance-effective functionality (ac-tive optics, field stabilisation). Scal-ability was traditionally limited by thedifficulty to cast large, homogeneousglass substrates, and progress over thelast century has been relatively slow.Indeed, even the relatively modest sizeincrease achieved by the most recenttelescopes with monolithic primary mir-rors would have been impossible with-out innovative system approaches (e.g.active optics) which relaxed constraintson substrate fabrication.
Optical scalability having beensolved, other limitations will inevitablyapply. Taking only feasibility criteria intoaccount, and modern telescopes beingessentially actively controlled opto-me-chanical systems, these new limitationsmay arise either in the area of structur-al design, control, or a combination ofboth. Our perception is that the funda-mental limitations will be set by struc-tural design, an area where predictabil-ity is far higher than with optical fabri-cation. However, it should be observedthat, despite the fact that control tech-nologies are rapidly evolving towardsvery complex systems, those technolo-gies are also crucial when it comes toensuring that performance require-ments are efficiently and reliably met.Reliability will indeed be a major issuefor extremely large telescopes, whichwill incorporate about one order of mag-nitude more active degrees of freedom(e.g. position actuators). In this respect,however, the Keck and VLT perform-ances are encouraging.
Although there is still major effort tobe accomplished in order to come to aconsolidated design, it appears already
Figure 7: Simulation of the Solar System at 10 parsecs. Jupiter canbe seen on the right. Saturn would also be detected, about 10 cm onthe right of this page.

7
that OWL is most likely feasible withincurrently available technologies and in-dustrial capacity. Actually, the succes-sive iterations of the opto-mechanicaldesign indicate that OWL diameter isquite probably below the current feasi-bility limit for a steerable optical tele-scope, which we estimate to be in the130–150-metre range.
Adaptive optics set aside, OWL’s ac-tual limitation seems to be cost, whichwe constrain to 1,000 million Euros,capital investment, including contin-gency. Such budget is within a scalecomparable to that of space-basedprojects and spread over a longertime scale. Additionally, it can rea-sonably be argued that progress inground-based telescopes is broadlybeneficial in terms of cost and efficien-cy as it allows space-based projects toconcentrate on, and be optimised for,specific applications which cannot beundertaken from the ground – becauseof physical rather than technologicalreasons.
It is obviously essential that the con-cept allows a competitive schedule,which should be the case as the tele-scope could, according to tentative es-timates, deliver unmatched resolutionand collecting power well before fullcompletion.
Telescope Conceptual Design
Top level requirements
The requirements for OWL corre-spond to diffraction-limited resolutionover a field of 30 arc seconds in the vis-ible and 2 arc minutes in the infrared (λ~ 2 µm), with goals of 1 and 3 arc min-utes, respectively. The telescope mustbe optimised for visible and near-in-frared wave bands, although the highresolution still allows some competitivescience applications in the thermal in-f r a r e d1 4. Collecting power is set to~ 6000 m2, with a goal of 7000.
The optical quality requirement is setto Strehl Ratio > 20% (goal M 40%) atλ = 500 nm and above, over the entirescience field of view and after adaptivecorrection of atmospheric turbulencewith a seeing angle of 0.5 arcsecondsor better. We tentatively split this re-quirement into telescope and atmos-pheric contributions:
Strehl Ratio associated with all errorsources except atmospheric turbulenceM 50% (goal M 70%);
Strehl Ratio associated with the cor-rection of atmospheric turbulence M40% (goal M 60%).
It is not yet entirely clear what thefield limitations of multi-conjugate adap-tive optics are; preliminary analysis showthat under representative conditions, a3-adaptive-mirrors system would pro-vide an isoplanatic field of ~ 20 arcsec-onds in the visible; larger fields may re-quire more complex adaptive systems.
Design considerations
We consider that the essential func-tion of the system is to reliably deliver aminimally disturbed – in terms of ampli-tude and phase – wavefront to the sci-ence detector, over a specified field ofview. As disturbances inevitably occur –atmospheric turbulence, telescope op-tics, tracking, etc. –, those must be ei-ther minimised or corrected, or both.
It is quite logical to distinguish be-tween atmospheric and telescope dis-turbances for their very different spatialand dynamic properties, the former be-ing arguably the most difficult to com-pensate. Therefore, we incorporate intothe telescope concept dedicated adap-tive modules, to be designed and opti-mised for correction of atmospheric tur-bulence at specified wave bands, andwe request that the telescope contribu-tion to the wavefront error delivered tothe adaptive module(s) be small withrespect to the wavefront error associat-ed with atmospheric turbulence. Inbrief, we request the telescope itself tobe seeing-limited. It should be noted that,in purely seeing-limited mode where therelevant wavefront quality parameter isslope, the aperture size implies thatfairly large wavefront amplitudes can betolerated. For example, a wavefront tiltof 0.1 arcseconds over the total aper-ture corresponds to a wavefront ampli-tude of 48 microns peak-to-valley withOWL whereas it would correspond to3.9 microns with the 8-m VLT.
Taking into account the telescopesize and some implied technology solu-tions (e.g. optical segmentation), wecome to the unsurprising conclusionthat the telescope itself should providethe following functions: phasing, fieldstabilisation, and active optics, includ-ing active alignment. The case for field
stabilisation is very strong, as a“closed” co-rotating enclosure would bevery costly and anyway inefficient inprotecting the telescope from wind.
As pointed out earlier, we considermodern telescopes to be controlled opto-mechanical assemblies. The sheer sizeof OWLonly emphasises the need for acoherent system approach, with ration-al trade-offs and compromises betweendifferent areas, e.g. optical and struc-tural designs. It is also essential thatfrom the earliest stages the design in-corporates integration, maintenanceand operation considerations. Besidescost, the two essential reasons areconstruction schedule and operationalreliability, the latter playing a critical rolewhen it comes to telescope efficiency.
Optics
Several designs have been explored,from classical Ritchey-Chrétien tosiderostat solutions. The shape of theprimary mirror is the focus of a hot dis-cussion in the community. Proponentsof aspheric designs invoke the lowernumber of surfaces an aspheric pri-mary-mirror design would imply, andprogress of optical fabrication allowingcost-effective production of off-axis as-pheric surfaces.
It does however not appear possibleto provide the necessary telescopefunctions with two optical surfaces; fieldstabilisation, in particular, would requirea relatively small, low inertia secondarymirror (in the 2- to 3-m range for effec-tive correction with typical wind fre-quency spectra) and therefore implyhorrendous sensitivity to decentres. Inorder to minimise structure height, asmall secondary also implies a very fastprimary mirror design, thereby exacer-bating fabrication and centring issues,
Figure 8: Layout of the optical design, 6-mirror solution.

8
and increasing field aberrations. A pos-sible way around these constraintswould be to allow a large secondarymirror and to re-image the pupil of thetelescope to perform field stabilisationwith a conveniently sized surface. Un-less the secondary mirror would beconcave – which implies a longer tele-scope structure – such solution, how-ever, raises considerable concerns asto the feasibility of this mirror. It also im-plies a larger number of surfaces,thereby eliminating the prime argumentin favour of an aspheric primary mirrordesign.
The cost argument is particularly in-teresting, as it shows how muchprogress has been realised in opticalfabrication over the last decade. Thereis rather consistent agreement that cur-rent technology – polishing of warpedsegments on planetary machines com-bined with ion-beam finishing – couldlead to an increase of polishing costsfor aspheric segments by about 50% –down from 300 to 500% – with respectto all-identical, spherical segments.This figure is however incomplete, as itdoes not take into account more strin-gent requirements on substrate homo-geneity and residual stresses, whichwould lead to a cost overshoot far ex-ceeding that of the pure figuring activi-ties. Additionally, polishing of warpedsegments is intrinsically less determin-istic hence less adapted to mass-pro-duction, and this solution leads to un-desirable schedule risks.
Any trade-off must also incorporatemechanical constraints, and in particu-lar the inevitable difficulty to providehigh structural rigidity at the level of thesecondary mirror. As will become evi-dent later, this aspect has played a cru-cial role in the selection of the OWLbaseline design.
The considerations outlined abovepoint towards spherical primary and
secondary mirror solutions. It should benoted that the trade-off is dependent ontelescope diameter; cost considera-tions set aside, aspheric solutions areprobably still superior as long as fieldstabilisation does not require pupil re-imaging. The limit is probably in the 20to 30 metre range, possibly more withactive mechanics and suitable shieldingfrom wind, but certainly well below100 m.
We have selected a 6-mirror configu-ration11,17, with spherical primary andflat secondary mirrors (Fig. 8). Spher-ical and field aberrations are compen-sated by a 4-mirror corrector, which in-cludes two 8-m-class active, asphericmirrors, a focusing 4.3-m aspheric mir-ror and a flat tip-tilt conveniently locat-ed for field stabilisation. Primary-sec-ondary mirror separation is 95 m, downfrom 136 m of the first design iteration.
The diffraction-limited (Strehl RatioM 80%) field of view in the visible isclose to 3 arcminutes and the total fieldis ~ 11 arcminutes. The latter, calledtechnical field, provides for guide starsfor tracking, active optics, and possiblyphasing and adaptive correction withnatural guide stars. A laser guide starsolution would require a smaller techni-cal field of view (~ 6–7 arcminutes) andlead to some design simplification.
It should be noted that the opticalconfiguration is quite favourable withrespect to mechanical design, as thesecondary mirror is flat (hence insensi-tive to lateral decentres) and as the po-sition and design space for the correc-tor mechanics permit high structuralstiffness at this location. A sensitivityanalysis has shown17 that with a fairlysimple internal metrology system thetelescope could be kept in a configura-tion where residual alignment errorswould be well corrected by active optics.
The primary mirror would be made of~ 1600 hexagonal segments, ~ 2.0-m
flat-to-flat i.e. about the maximum sizeallowed for cost-effective transport instandard containers. No extensivetrade-off has been made so far but werule out very large segments as thosewould lead to unacceptably high mate-rial, figuring, and transport costs and re-quire substantial investment in produc-tion facilities in order to comply with areasonable schedule. There are, in-deed, strong engineering arguments infavour of relatively small segments,such as the 1-m ones proposed byNelson et al. at the March 2000 SPIEconference in Munich. A certain relax-ation is however possible with sphericalsegments, as the added complexityimplied by the aspheric deviation –which increases quadratically with theaspheric segment size – disappears.Handling and maintenance would alsobenefit from a reduced segment size,although auxiliary equipment for auto-mated procedures will be mandatoryanyway.
The baseline solution for the mirrorsubstrate is glass-ceramics and, ac-cording to suppliers, production within6–8 years would only require duplica-tion of existing production facilities12. Avery promising alternative is SiliconCarbide, which would allow a ~ 75%mass reduction for the primary mirrorwith a conservatively simple lightweightdesign, and a mass saving of ~ 4,000tons for the telescope structure. Thistechnology is, however, not (yet?)demonstrated for mass-production; fur-ther studies will have to take place pri-or to final selection of the mirror tech-nology.
Figuring would require three to four8-m-class polishing (planetary) ma-chines, complemented with one or two2-m-class ion-beam finishing ma-chines. It should be noted that 1-m-class, diffraction-limited laser amplifierwindows are currently produced13,15 at
Figure 9: Telescope pointing at 60º fromzenith, layout of the facilities (sliding enclo -sure not shown).

9
a rate fully comparable to that neededfor OWL.
Phasing of the primary and second-ary mirrors relies conservatively on thesame solution as the Keck one, i.e. po-sition sensing combined with sensorcalibration. An extensive summary ofthe mirror phasing techniques appliedto the Keck telescopes is presented byChanan19. Calibration is however morecomplex with OWL as the primary andsecondary mirrors must be phased sep-a r a t e l y. In the worst-case scenario,daytime calibration of one of the twomirrors would be required – in practice,interferometric measurements per-formed on the flat secondary mirror –while the other of the two would bephased on the sky according thescheme described by Chanan. We arealso exploring on-sky closed-loop phas-ing techniques, which should provide amore efficient control of phasing errors.Quite a number of on-sky phasingmethods have been proposed in the re-cent past; most are based on curvaturesensing or interferometric measure-ments of one kind or another. Thesemethods are generally sensitive to at-mospheric turbulence and require ei-ther short exposure or sub-aperturessmaller than the atmospheric coher-ence length, thereby implying use ofrelatively bright stars – or closing theadaptive loop before the phasing one.The actual limitations are, however, stillto be assessed. A particularly attractivemethod, which should allow to differen-tiate primary and secondary mirrorphasing errors, is the one proposed byCuevas et al20.
Adaptive optics
Attaining diffraction-limited resolutionover a field of view largely exceedingthat allowed by conventional adaptiveoptics is a top priority requirement forOWL. Conservative estimates21 indi-cate that multi-conjugate adaptive op-tics22 (MCAO) should allow for a cor-rected field of view of at least 20 arc-seconds in the visible, assuming a setof three adaptive mirrors conjugated tooptimised altitudes. There is ongoingdebate on the respective merits of a to-mographic-oriented correction strategy,followed by the Gemini team, and a lay-er-oriented one, proposed by Ragaz-zoni et al. A European Research andTraining Network (RTN) has recentlybeen set up, on ESO’s initiative, to ad-dress the general issue of adaptive op-tics for extremely large telescopes.
In the visible, the implied characteris-tics of adaptive modules (about500,000 active elements on a 100-mtelescope, a corresponding wavefrontsampling and commensurate comput-ing power) leaves no doubt as to thetechnological challenge. Novel ideasabout wavefront sensing (e.g. pyra-midic wavefront sensors) and spectac-ularly fast progress in cost-eff e c t i v e
technologies which could potentially beapplied to adaptive mirrors (MEMs orMOEMs), together with the strong pres-sure to achieve MCAO correction onexisting 8-m-class telescopes in a verynear future, leaves room for cautiousoptimism. Prototypes are under devel-opment – the Observatory of Marseille,in particular, is working towards a~ 5000 active elements to be tested by2003–2004 and based on a scalabletechnology.
Extensive discussions of adaptiveoptics aspects for OWL and extremelylarge telescopes are presented else-w h e r e1 3 , 2 1 , 2 2 , 2 3 , 2 4. Proposals forMCAO demonstrators or even function-al instruments to be installed within afairly short time frame on the VLT andGemini, respectively, have been made.However promising such developmentscould be, it is impossible, at this stage,to make any substantiated statementas to their outcomes. Therefore, the tel-escope design incorporates the mostconservative assumptions regardingthe eventual technology solutions,which implies, in particular, large field ofview for reasonable sky coverage withnatural guide star. All attempts aremade to avoid constraints on the designand correction range of the adaptivemodules, which implies that the tele-scope be able to deliver seeing-limitedperformance comparable to that of ex-isting large telescopes without relyingon adaptive correction.
Mechanics
Several mount solutions have beenexplored, including de-coupled geome-tries12 based on fully separate struc-tures for the primary and secondarymirrors. As was – to some extent – ex-pected, the best compromise in termsof cost, performance, and feasibility in abroad sense (i.e. including assembly,integration and maintenance aspects)seems to be an alt-az concept.
As in the case of the main optics, themechanical design26 relies heavily onstandardised modules and parts, allow-ing cost reduction factors which arenormally not attainable with classicaltelescope designs. Manufactured orpre-assembled parts are constrained tohaving dimensions compatible withcost-effective transport in standard 40-ft containers. It should be pointed outthat, in view of the structure dimen-sions, the standardisation does notnecessarily impair performance. Partic-ular attention is given to assembly andintegration constraints as well as tosuitability for maintenance26.
The all-steel structure has a movingmass of the order of 13,500 tons (in-cluding mirrors) and does not rely onadvanced materials. Iso-static and hy-per-static configurations are being eval-uated, the former yielding lower dynam-ic performance and the latter slightlyhigher mass, complexity, and cost. First
locked rotor frequency is 1.5 Hz for theiso-static and 2.4 Hz for the hyper-stat-ic configurations, respectively. Staticdeformations require the decentres ofthe secondary mirror and of the correc-tor to be compensated, but the relevanttolerances, which are set to guaranteethat the on-sky correction loop by activeoptics can be closed, are not particular-ly stringent17.
There is no provision for a co-rotatingenclosure, the advantage of which be-ing anyway dubious in view of the enor-mous opening such enclosure wouldhave. Protection against adverse envi-ronmental conditions and excessiveday-time heating would be ensured bya sliding hangar, whose dimensionsmay be unusual in astronomy but actu-ally comparable to, or lower than, thoseof large movable enclosures built for avariety of applications25. Air condition-ing would lead to prohibitive costs andis not foreseen; open air operation andunobstructed air circulation withinbeams and nodes seem sufficient toguarantee that the structure reachesthermal equilibrium within an accept-ably short time. In this respect, it shouldbe noted that OWL structure is, in pro-portion to size, more than an order ofmagnitude less massive than that of theVLT.
Open-air operation is evidently a ma-jor issue with respect to tracking and,as mentioned before, full protection fromthe effect of wind is not a realistic op-tion. Hence the need for field stabilisa-tion. The latter is provided by a 2.5-m-class flat mirror located in a pupil im-age, and there is reasonable confidencethat a bandwidth of 5–7 Hz could beachieved with available mirror technol-ogy. It should also be noted that activeand passive damping systems have notyet been incorporated into the design.
The kinematics of the structure iscomparable to that of the VLT tele-scopes: 3 minutes for 90º elevationrange, 12 minutes for 360º azimuthrange, maximum centrifugal accelera-tion not exceeding 0.1 g at any locationof the structure, and 1 degree zenithalblind angle. The number of motor seg-ments would be on the order of 200 forelevation and 400 for azimuth. Thesefigures are based on VLT technologyand appear very conservative.
The telescope can point towardshorizon, which allows to reduce the di-mensions of the sliding enclosure andfacilitates maintenance of the second-ary mirror unit and extraction of the cor-rector unit along the axis of the tele-scope. Mirror covers are foreseen; theywould consist of four quadrants slidinginto the structure when the telescope ispointing towards zenith. One of thesecovers would be equipped with seg-ments handling systems and in situcleaning facilities allowing periodiccleaning of the primary mirror. Figure 9shows the telescope pointing towards60o zenithal distance, mirror covers re-
10
tracted. The sliding enclosure is not fig-ured.
Conclusions
Progress of OWL conceptual designdoes not reveal any obvious show-stop-per. Underlying the feasibility of a 100-m-class telescope is the fact that tradi-tional scalability issues, such as thefeasibility of the optics, have shifted toentirely new areas, namely mechanicsand control. These last are evidentlymore predictable, and their limitationsinevitably exceed those so far applyingto conventional telescope design – asize increase by a factor 2 per genera-tion.
A preliminary cost model has beenassembled and, to some extent, con-solidated. The total capital investmentremains within the target maximum of1,000 million Euros, including contin-gency. It should be pointed out, how-ever, that some of the most determinantcost positions correspond to subsys-tems involving mass production (pri-mary optics, structure), an area tradi-tionally terra incognita to telescope de -signers. The full implication of mass-production of the primary optics, of ac-tuators and sensors, and of the struc-ture may be underestimated. Our costestimate should therefore be consoli-dated by industrial studies. Our percep-tion is that current estimates are proba-bly conservative.
There is strong indication that acompetitive schedule is possible; thecritical path is set by the mechanics,and, in contrast to the situation whichprevailed at the time the last generationof 8- to 10-m-class telescopes was de-signed, long-lead items such as themain optics do not require time-con-suming technology developments.Whereby achieving technical first lightwithin 8–9 years after project go-aheadwould be a challenging objective, flexi-bility in the subsequent integrationphases should allow a start of partialscience operation at full resolution with-in 11 and 12 years in the infrared and inthe visible, respectively.
The current schedule calls for a com-pletion of phase A, including demon-stration of the principle of multi-conju-gate adaptive optics on the VLT, by2003. As ambitious as such objectivemay seem, it should be recalled that thedesign of the OWL observatory reliesextensively on proven technologies, baradaptive optics – an approach whichhas also been adopted for the CELTproject. In this respect, it should bepointed out that technology develop-ment for long-lead items (primary mir-
rors) played a determinant role with thecurrent generation of 8–10-m-class tel-escopes. These specific, highly time-consuming technology developmentsbeing largely unnecessary for extreme-ly large telescopes such as CELT andOWL, tighter scheduling may becomepossible.
Further information and publicationsabout the OWL study are available athttp://www.eso.org/owl
Acknowledgements
The concept presented in this articleis the result of the work of several peo-ple. The authors wish to thank, in par-t i c u l a r, Bernard Delabre, Enzo Bru-netto, Marco Quattri, Franz Koch, GuyMonnet, Norbert Hubin, Miska LeLouarn, Elise Viard and Andrei Tokovi-nin for their valuable input.
References
1M. Mountain, What is beyond the currentgeneration of ground-based 8-m to 10-mclass telescopes and the VLT-I ?, SPIE2871, pp. 597–606, 1996.
2B. Meinel, An overview of the TechnologicalPossibilities of Future Telescopes, 1978,ESO Conf. Proc. 23, 13.
3L. D. Barr, Factors Influencing Selection ofa Next Generation Telescope Concept,1979, Proc. SPIE Vol. 172, 8.
4A. Ardeberg, T. Andersen, B. Lindberg, M.Owner-Petersen, T. Korhonen, P. Sønder-gård, Breaking the 8-m Barrier – OneApproach for a 25m Class Optical Tele-scope, ESO Conf. and Workshop Proc.No. 42, pp. 75–78, 1992.
5T. Andersen, A. Ardeberg, J. Beckers, R.Flicker, A. Gontcharov, N. C. Jessen, E.Mannery, M. Owner-Pertersen, H. Rie-waldt, The proposed 50 m Swedish Ex-tremely Large Telescope, 2000, Bäcka-skog Workshop on Extremely LargeTelescopes, ESO Conf. and WorkshopProc. No. 57, p. 72.
6T. Sebring, F. Bash, F. Ray, L. Ramsey, TheExtremely Large Telescope: FurtherAdventures in Feasibility, SPIE Proc.3352, p. 792, 1998.
7T. Sebring, G. Moretto, F. Bash, F. Ray, L.Ramsey, The Extremely Large Telescope(ELT), A Scientific Opportunity; An En-gineering Certainty; 2000, BäckaskogWorkshop on Extremely Large Te l e-scopes, ESO Conf. and Workshop Proc.No. 57, p. 53.
8J. E. Nelson, Design concepts for theCalifornia extremely large telescope(CELT); 2000, SPIE 4004.
9R. Gilmozzi, B. Delabre, P. Dierickx, N.Hubin , F. Koch, G. Monnet, M. Quattri, F.Rigaut, R.N. Wilson, The Future of FilledAperture Telescopes: is a 100m Fea-sible?; 1998, Advanced Technology Op-tical/IR Telescopes VI, SPIE 3352, 778.
10P. Dierickx, R. Gilmozzi, OWL ConceptOverview; 2000, Bäckaskog Workshop on
Extremely Large Telescopes, ESO Conf.and Workshop Proc. No. 57, p. 43.
11P. Dierickx, J. Beletic, B. Delabre, M.Ferrari, R. Gilmozzi, N. Hubin, The Opticsof the OWL 100-M Adaptive Telescope;2000, Bäckaskog Workshop on ExtremelyLarge Telescopes, ESO Conf. andWorkshop Proc. No. 57, p. 97.
12E. Brunetto, F. Koch, M. Quattri, OWL: firststeps towards designing the mechanicalstructure; 2000, Bäckaskog Workshop onExtremely Large Telescopes, ESO Conf.and Workshop Proc. No. 57, p. 109.
13N. Hubin, M. Le Louarn, New Challengesfor Adaptive Optics: The OWL Project;2000, Bäckaskog Workshop on ExtremelyLarge Telescopes, ESO Conf. andWorkshop Proc. No. 57, p. 202.
14H. U. Käufl, G. Monnet, From ISAAC toGOLIATH, or better not!? Infrared instru-mentation concepts for 100m class tele-scopes; 2000, Bäckaskog Workshop onExtremely Large Telescopes, ESO Conf.and Workshop Proc. No. 57, p. 282.
15H. F. Morian, Segmented mirrors fromS C H O T T GLAS for the ELTs; 2000,Bäckaskog Workshop on Extremely LargeTelescopes, ESO Conf. and WorkshopProc. No. 57, p. 249.
16R. Geyl, M. Cayrel, Extremely large tele-scopes – a manufacturer point of view;2000, Bäckaskog Workshop on ExtremelyLarge Telescopes, ESO Conf. andWorkshop Proc. No. 57, p. 237.
17P. Dierickx, B. Delabre, L. Noethe, OWLOptical Design, Active Optics and ErrorBudget, 2000, SPIE 4003.
18R. Geyl, M. Cayrel, REOSC approach toELTs and segmented optics; 2000, SPIE4003.
19G. Chanan, Phasing the primary mirrorsegments of the Keck telescopes: a com-parison of different techniques, 2000,SPIE 4003.
2 0S. Cuevas Cardona, V. G. Orlov, F.Garfias, V. V. Voitsekovich, L. Sanchez,Curvature equation for segmented tele-scopes, 2000, SPIE 4003.
21N. Hubin, M. le Louarn, M. Sarazin, A.Tokovinin, New challenges for adaptiveoptics: the OWL 100 m telescope, 2000,SPIE 4007.
22F. Rigaut, R. Ragazzoni, M. Chun, M.Mountain, Adaptive Optics Challenges forthe ELT ; 2000, Bäckaskog Workshop onExtremely Large Telescopes, ESO Conf.and Workshop Proc. No. 57, p. 168.
23R. Ragazzoni, J. Farinato, E. Marchetti,Adaptive optics for 100 m class tele-scopes: new challenges require new solu-tions, 2000, SPIE 4007.
24R. Ragazzoni, Adaptive optics for giant tel-escopes: NGS vs. LGS, ; 2000,Bäckaskog Workshop on Extremely LargeTelescopes, ESO Conf. and WorkshopProc. No. 57, p. 175.
25M. Quattri, F. Koch, Analyzing the require-ments of the enclosure and infrastructuresfor OWL and elaborating on possible so-lutions; 2000, SPIE 4004.
26E. Brunetto, F. Koch, M. Quattri, OWL: fur-ther steps in designing the telescope andin assessing its performances; 2000,SPIE 4004.

11
ParanalImpressions
KUEYEN is tilted towards the hori -zontal position during a test expo -sure sequence. (Photo obtainedon March 23, 2000). E
Daytime routine work in the controlroom at the observing modules forANTU (right) and KUEYEN (left).(Photo obtained on March 20,2000). H

12
TE LE SC OPE S A ND INS TRUM EN TAT I O N
The ESO Photometric and Astrometric AnalysisProgramme for Adaptive OpticsD. CURRIEa, D. BONACCINI a
E. DIOLAITIb, S. TORDO a, K. NAESGARDEa, J. LIWING a,O. BENDINELLI b, G. PARMEGGIANIc, L. CLOSEa
Contact E-mail: [email protected] Southern Observatory, Garching bei München, GermanybUniversità di Bologna – Dipartimento di Astronomia, Bologna, ItalycOsservatorio Astronomico di Bologna, Italy
Abstract
The European Southern Observatoryis currently developing an array of soft-ware analysis packages to performPhotometry and Astrometry (P&A) onboth stellar and diffuse objects ob-served with Adaptive Optics (AO) Sys-t e m s1, 2. As they are completed, the com-ponent programmes of ESO-PA PA Owill be made available to AO observersusing ADONIS on the 3.6-metre tele-scope at La Silla and later, to those ob-servers using the various AO systemsbeing developed for the 8.2-metre VLTtelescopes at Paranal, such as NAOS-CONICA and MACAO-SINFONI.
The performances of the ESO-PAPAO package are being extensivelyquantified; both to support their use inastrophysical analysis and as a guidefor the definition of AO observing pro-grammes. The algorithms are being de-veloped in IDL. A user interface pro-gramme (ION) allows immediate ac-cess to the ESO-PAPAO by observersnot familiar with IDL. We will describe theobjectives of the ESO-PAPAO, the cali-brated ADONIS data sets that have beencollected for distribution to contributorsto the ESO-PAPAO programme, andthe methods and results of numericaltests of photometric precision in com-paring the various different analysispackages. In particular, the STA R-FINDER3,4, 5 (see this issue, p. 23) pro-gramme, developed at the University ofBologna in a collaborative effort withESO, has been applied to data fromADONIS at La Silla, UHAO at MaunaKea, and HST. Results from the analy-sis of this astronomical AO data will bepresented, i.e. photometric precision of0.01 to 0.05 magnitudes and astromet-ric precision of ~ 0.1 pixel in crowdedfields with strong isoplanatic effects.The structure of PAPAO is illustrated inthe chart on page 21.
1. Introduction
Over the past decade, the operationof Adaptive Optics Systems, led by the
COME-ON > COME-ON+ > ADONISsystems on ESO’s 3.6-metre telescopeat La Silla, Chile6, 7, have demonstratedthe effectiveness of this technology inthe field of high-resolution astronomy.
The optimal extraction of scientifical-ly valid results from AO data can be adifficult operation. The challenges in AOData Reduction were initially reviewedin 1995–1997 by the AO Data Reduc-tion Working Group, organised by N. Hu-bin8. In 1997–1998, D. Bonaccini and J.Christou installed IDAC, an implemen-tation of myopic deconvolution special-ly suited to AO data, tested it with realAO data, and made it available to ESOusers9,10. Today the new IDAC 2.7 iskindly supported by Keith Hege at theUniversity of Arizona, and linked ath t t p : / / w w w. l s . e s o . o r g / l a s i l l a / Te l e s c o p e s /360cat/adonis/html/datared.html . Theuse of IDAC has been encouraged forAO users with tutorials and perform-ance test procedures, linked at thesame Web site. Users are encouragedto provide feedback. However, with thedevelopment and imminent deploymentof VLT instruments using A d a p t i v eOptics, it has become necessary to pro-vide AO support in photometry, astrom-etry, and deconvolution for the generalobserver using these ESO systems. Toaddress this issue, the Photometry andAstrometry Programme for A d a p t i v eOptics (PAPAO) was initiated in Sep-tember of 19981, 2 by D. Currie, D. Bo-naccini and F. Rigaut. This recognisedthe need for specific AO data-reductionalgorithms and their software imple-mentations, and for the quantitativecomparison of the performance of thesepackages. The latter will allow the selec-tion of the appropriate package for aspecific scientific objective, and thequantification of the precision of the re-sulting scientific analysis. It is the PA PA Othat will be addressed in this paper.
1.1 Classes of Adaptive OpticsData
The primary application of AO to datehas been in broad-band imaging, fol-
lowed by narrow-band imaging (thisincludes 89% of all referred AO publica-tions11). This will be the topic of the cur-rent presentation. However, there are alarge variety of data types that must beaddressed in a similar manner in thenear future, that are reviewed else-where1.
2. Motivation and Objectivesof PAPAO
The primary objectives of the ESOPhotometry and Astrometry Pro-gramme for Adaptive Optics (PAPAO)are to provide the tools to define appro-priate observational procedures, to re-duce the AO data obtained specificallyin support of this programme, and toevaluate the precision and accuracy ofthe results obtained with these newmethods of data reduction. These toolswill address the general ESO observer,using the ESO AO systems, that is,ADONIS6, 7, CONICA/NAOS12, and theAO systems that will be implemented atParanal in the next few years (e.g. SIN-FONI). These tools will be publicly avail-able at the Web Sites at ESO and at thePA PAO collaborating institutes as acontribution to AO observers in general.
2.1 Motivation of PAPAO
The observational imaging data ob-tained from the Adaptive Optics sys-tems have many features that make theextraction of valid scientific resultsmuch more challenging than the analy-sis of images obtained from conven-tional low-resolution telescope imaging.The Point Spread Function (PSF) hasextended wings (similar to the PSF ofthe Hubble Space telescope prior to therepair mission, due to optical errors inthe primary mirror). In addition, thestructure of the AO PSF changes overthe field of view, and it is not constant intime, neither within a single observa-tion nor from one observation to an-other (i.e. as one changes filters, mapsan area in the sky, or observes a PSFcalibration star at a later time).

13
Starting in October 2001, the CONICA/NAOS system, incorporating a 196-ele-ment Shack-Hartmann AO System anda 1–5 micron camera on the VLT (UT3),will start to be used by general as-tronomers of the ESO community. Asan example of the need and motivationfor an ESO AO ToolKit, we may look atthe history of the publications from theADONIS system over the past fouryears of facility operation11. In our opin-ion, up to now, these data-processingproblems have reduced the scientificoutput favouring those with detailed ex-perience, i.e., those who have built theinstrument or belong to the institutesthat built it.
In order to assure the effective use ofCONICA/NAOS and future AO instru-ments, ESO created the PAPAO pro-gramme within the AO Group of theInstrumentation Division to provide aToolKit of software packages, adaptedto the AO systems on the ESO tele-scopes. In principle, such a packageshould address a wide range of scienceaspects, for both photometry and as-trometry, and for both stellar and diffuseor nebular objects. It should apply todata obtained with both high and lowStrehl ratios and images that are bothwell-sampled and under-sampled.
2.2 Programme Structure of thePAPAO
The PAPAO programme at ESO con-sists of three primary components. Thefirst is the collection of algorithms toperform photometry and astrometrywhich are to be available in a publicform, and which are documented for ageneral observer. The second compo-nent, the major current effort, consistsof the collection of AO data, both a fo-cused set of observations using ADO-NIS on the ESO 3.6-metre telescope atLa Silla, and the identification and col-lection of data contributed by astronom-ers operating on other telescopes withother Adaptive Optics systems. The thirdcomponent has two parts. The first partis the evaluation of the performance ofthe candidate software packages forthe ESO ToolKit using real telescopedata. The second part is the identifica-tion of those algorithms, programmes,and elements of programmes, that areparticularly effective in photometry andastrometry and which should be devel-oped for inclusion in future versions ofthe ESO ToolKit.
2.3 Scope and Objectives ofPAPAO
The software has a widget interfaceso that the astronomer does not requirea knowledge of any specific program-ming language. The first element of theESO ToolKit is STARFINDER3,4, 5, asoftware programme for stellar photom-etry being developed in a collaborationbetween the University of Bologna and
ESO. In support of the AO astronomer(but not as part of the PAPAO) are anumber of the other software pro-grammes that are available within theESO System, that is, eclipse (for pre-processing ADONIS and future datafrom other AO systems in a pipelinemanner), IDAC (for myopic deconvolu-tion, and of course the large generalpackages of MIDAS, IDL and IRAF.
A quantitative evaluation of the per-formance of the ToolKit packages onreal telescope data from AO systemswill be provided on the ESO Web Sitefor PAPAO. The results of this evalua-tion are a part of the Algorithm Testingportion of the PAPAO programme dis-cussed below.
2.3.1 Relative versus AbsolutePhotometry
The primary consideration in this dis-cussion will be relative photometry, thatis, the relative magnitude of differentstars or the relative brightness of com-ponents of extended structures within agiven frame or image. Of course, thisdoes not address all of the features of aphotometric reduction. The proceduresconnected with the selection, observa-tion and reduction of photometric stan-dard stars is an essential part of theprocedure. However, our early testswithin the PAPAO indicated that thephotometric errors in relative photome-try were essentially as large as the pub-lished errors in absolute photometry, sowe have initially concentrated on theconsideration of relative photometry inthis programme.
2.3.2 Astronomer interface andprogramming language
The ToolKit has been developed inthe IDL language, from Research Sys-tems, Inc. The TookKit packages oper-ate with a widget user interface. Thismeans that the astronomer does notneed to have knowledge of IDL or anyother processing language. All of theoptions and procedures are presentedin the form of buttons, with on-linehelp files available for detailed ex-planations. The IDL code will be avail-able on the PAPAO Web Site. Con-cerning the IDL licensing issue, onetechnically feasible approach for thelicensing could be for ESO to operatethe ION interface to IDL on the ESOcomputers. This would allow the re-mote user to use his own computerand Web Browser to operate theseToolKit programmes on the ESO com-puter and license. Thus he/she couldrun the elements of the ToolKit onthe ESO computers without a local IDLlicense, using a browser on his/herPC or workstation at his/her own in-stitution. A demonstration and evalua-tion of this mode of operation will beconducted in June-July 2000, to evalu-ate the feasibility and identify anyproblems. If you are interested in par-
t i c i p a ting in this test to evaluateS TA R F I N D E R and the remote opera-tion capabilities of ION, please [email protected].
2.4 The Challenge to PAPAO
There are two primary challenges toachieving improvements in photometryand astrometry that parallel the verysignificant advances in the hardwareside of adaptive optics. The first is thecomplexity and variability of the PSF. Inthe small patches of Figure 2, we cansee the complexity of the wings ofPSFs. Although these images havebeen enhanced to show the fainterstars, the accurate inclusion of the lightin these wings is necessary to obtaingood photometric accuracy. Compari-son of the successive images of thePSF show both the super-speckles thatare stable enough that they do not de-crease as the square root of N, andthe shorter-term effects of the atmos-phere. The super-speckles usually re-main stable for successive exposureson the target, but can significantlychange when going across the skyto a new PSF calibration star. Theshorter-term difference can be seenby comparing the differences in thepatches that were taken over a fewminutes. This is a significant effect in aprogramme to obtain 1% photometry.In Figure 3, we can see the differencein the PSF at different parts of a singleimage (the an-isoplanatic effect). Thusa star near the guide star has a near dif-fraction-limited structure, while an im-age at the edge of the field of view ishighly elongated toward the guide star.Again, this requires extreme care and agood knowledge of the variable PSF toobtain high precision on the photometryof both of those stars. Finally, for theinfrared observations addressed in thispaper, the proper flat fielding of theimages is a major challenge with thecurrent generation of infrared arrays.Even a very well studied system (SOFIat La Silla) achieving 1% flat-fielding isa very large challenge.
Like the situation after the launch ofthe Hubble Space Telescope, a giantleap in instrumentation has provided alarge advance in resolution. However,for WFPC to realise the full measure ofscience from the improved resolution inthe presence of an imperfect PSF re-quired an intense study of the properrole of deconvolution. Neither thespherical aberration of Hubble could,nor the AO data processing challengecan be addressed with quick, short-term solutions.
3. Role and Contents of the ESOToolKit
In this section, we consider the cur-rent and planned elements of the ESOToolKit. We also discuss the currentstatus of each of these elements.

14
3.1 STARFINDER – SI – forSpatially Invariant Data
This package of programmes ad-dresses photometric and astrometricmeasurements of well-sampled stellarsources (i.e. unresolved objects). Theinterface to the user is a widget-basedGUI. This software programme hasbeen developed by Emiliano Diolaiti ofthe Osservatorio Astronomico di Bo-l o g n a3 ,4 ,5 in collaboration with ESO. T h i spackage of programmes is currently infinal testing to assure the proper opera-tion with different versions of IDL, dif-ferent versions of the astron 19 libraryand different computer systems. Thissoftware package will be distributed onthe PAPAO Web Site and from a WebSite at the Osservatorio Astronomico diBologna. It will also be available in theremote operation test in July-August2000.
3.2 Astrometric Motion of NebularClumps
This programme addresses astrome-tric measurements of nebular (i.e. ex-tended or diffuse) targets, and was orig-inally developed by Dan Dowling13, 14, 15
for the analysis of the motion of theclumps of dust and gas in the homun-culus of η Carinae. This programmeused data from the WFPC prior to therepair mission as well as post-repair datafrom WFPC2. Thus it has addressed theissues of highly accurate astrometry (atthe 5 mas level), both for PSFs withstrong and negligible wings (i.e.equivalent to high and low Strehl ratiosin AO). The programme has been mod-ified for use with AO in the environmentof the ESO ToolKit and tested for astro-metric accuracy on real telescope databy Katrin Naesgarde1 6 and JohanLiwing17. However, it still needs to bepackaged for the ToolKit, and the widg-et interface has not been developed atthis time.
3.3 STARFINDER – SV – forSpatially Variant AO Data
This package of programmes ad-dresses AO data in which the an-iso-planatism causes significant changesin the shape of the PSF (and thusin the photometric and astrometricmeasurements), as a function of thedistance to the guide star. This is il-lustrated in Figure 3. Properly han-dling anisoplanatism effects in AO datais a much required and original contri-bution. The proper handling of an-iso-planatic effects in AO data is an essen-tial requirement and this work is aunique contribution. The initial versionof this programme has been imple-mented and tested on real telescopedata by Diolaiti et al.3,4, 5. Discussion ofits effectiveness for processing datawith very significant an-isoplanatismhas been investigated. The code is
in the process of being finalised andmade into a user programme with awidget interface at the University ofBologna (Italy).
3.4 DAOPHOT
A version of DAOPHOT (i.e., fromthe IDL version developed by W.Landsman18) will also be made avail-able for the convenience of ESO ToolKitusers. It has been automated and canbe more effective than STARFINDERfor the analysis of under-sampled im-ages16,17. However, this has not yetbeen made into a facility programmeand the widget interface has not beendeveloped. However, a standard facilityversion is installed in the standard IRAFNOAO digiphot package that runs un-der any installation of IRAF.
3.5 Deconvolution and SpatiallyDependant Regularisation ofthe PSF
Deconvolution is required for the ac-curate analysis of AO data on diffuse ornebular objects. Various existing algo-rithms are generally available to theuser. For example, different implemen-
tations of the Lucy-Richardson algo-rithm are available for MIDAS, IRAF,STSDAS and IDL. Myopic deconvolu-tion algorithms are also available (e.g.IDAC). However, for targets that have asignificant extension or are not veryclose to the axis defined by the guidestar (on average on average at the lev-el of ten arcseconds in K-band in K-band), the PSF will change significantly(as seenn in Figure 3) and a SpatiallyVariant Deconvolution (SVD) is re-quired. The simplest method is thepatch approach to SVD, in which thecomplete image is considered as a fam-ily of small regions, where one tries tofind a PSF star (and perhaps a photo-metric star) in each small patch. Thesecalibration references, if available ineach patch, would then be used for aSpatially Invariant Deconvolution (SID).
To our knowledge, there are no SVDpackages currently available that prop-erly handle the spatially variant PSF. Inthis discussion, we will consider a two-step approach, although a softwarepackage might very well combine theminto a single programme. The first stepis to homogenise or regularise the PSFso that it has the same form over theentire field of view. This requires first
Figure 1 illustrates the type of data that has been collected on ADONIS. This shows the im -ages for the four overlapping pointings obtained by re-pointing the telescope (or more accu -rately, moving an internal mirror in the ADONIS system). The background is a ground-basedK-band image of the centre of the globular cluster 47 TUC. The area in common is delineat -ed by a solid white line. The area observed with each pointing is indicated by the solid thinand dashed lines. Thus going from the lower left, we have field #1, which is shown with a thingreen line, and clockwise around the square we have fields #2, #3 and #4.

15
calibrating the parameters that de-scribe the an-isoplanatism. Then onewould create the continuously variablePSF in a (currently not available) pro-gramme to make the PSF uniform. Thesecond step is to apply one of theSIV algorithms to the homogeneous-PSF frame. Thus the key issue is thehomogenisation algorithm. These is-sues are of paramount importance inthe consideration of continuous distri-butions (nebular or galaxies) whichmight be at the edge of the isopla-natic patch so the evaluation of theirphotometric and astrometric proper-ties are compromised by the PSF vari-ation.
3.5.1 Spatially DependentHomogenisation/Deconvolution
The development of a spatially de-pendent homogenisation/deconvolutionhas been a project of the University of Bo-logna and ESO. This programme wouldtransform the image with a variable PSF,using a continuously parameterisedmodel of the spatial variation of thePSF, into an image that has a uniformPSF. This procedure can be followedby a spatially invariant deconvolution ofa conventional type (i.e., the Lucy-Richardson or PLUCYpackage, IDAC9,
10, or other methods more adapted tothe specific science objectives at hand).
3.5.2 Spatially DependentRegularisation by Warping
This procedure corrects for the spa-tial variable PSF across the image,using a simple model of the varia-tion of the PSF due to isoplanatic ef-fects, i.e. the incorporation of theGaussian elongation and broadening ofthe stellar images that has beendemonstrated to be the dominant ef-fect. This procedure has been demon-strated on AO data using an IDL imple-mentation package1 9. These proce-dures have not been converted into afacility package at this time, nor havethey have been widgetised.
Figure 2: These images illustrate the High Strehl Stellar Observations conducted in the Trapezium in Orion. The large image (in blue) hasbeen obtained in K-band on the 2.2 metre telescope20 using the 13-elements UHAO21 and the 1024 1024 QUIRC camera. Within this, weindicate the bright stars selected for guide stars for the observations. This entire cluster is named 1 The square boxes indicate the positionof the separate ADONIS FoVs obtained by Currie with 50 mas pixels to critically sample the core (2.5 pixels across the FWHM). The red im -ages are the bad pixel corrected, de-biased, flat fielded sky subtracted and averaged ADONIS SHARPII 256 x 256 images for each of thefour pointings. Each box is 12.5 by 12.5 arcseconds.

16
3.6 Availability and Access to theESO ToolKit
As these programmes are com-pleted, they will be available to bedownloaded from a Web page at ESOlocated at http://www.eso.org/science/papao/programs. IDAC is available atwww.eso.org/aot, in the Adonis pages.The STARFINDER series will also beavailable on a mirrored Web Site at theUniversity of Bologna. These pro-grammes will also be offered as ele-ments of the package for the standarddistribution of IDL routines in the astronpackage18. For participation in the re-mote operation test in July-August2000, contact [email protected].
4. Data Collection for the PAPAO
Without quantitative comparativeevaluations, one cannot reliably selectthe proper software package for aparticular science objective. Quanti-tative results from the comparison ofthe packages, using well-calibratedtelescope data, are needed to selectthe proper software tool, and quantifythe random and systematic errors ofthe science products. Thus, the datacollection component of the PAPAOprogramme was designed to providewell-calibrated sets of data, that ad-dress the many parameters that were,and are, expected to significantly affectthe procedures and accuracy of theAO data analysis. The uniformity ofdata collection procedures and thecalibration procedures are extremelyimportant to provide meaningful inter-comparison of different observing con-ditions and different software pack-ages. The primary body of data hasbeen collected using the ADONIS sys-tem on ESO’s 3.6-metre telescope atLa Silla. In addition, we have receivedcontributions of data from other ob-servers using other AO systems. Theseexternal contributions are not calibratedin the manner discussed below. How-ever, these external data frequently fillgaps, that is, data that cannot, or havenot yet, been collected on ADONIS atLa Silla.
4.1 ADONIS Data
In general, we have collected datasets with extensive calibration. Accessto different data sets, with extensivecalibration data is necessary to isolate,identify and quantify the different ef-fects that have an impact on thephotometric and astrometric accuracy.The identification of the optimal cal-ibration data set and the attendant col-lection and analysis procedures is anevolving process. Some of the currentprocedures are discussed below. Herewe describe the sources, standardisedprocessing procedure, and output forspecific data sets.
4.2 47 TUC Data Set from Adonis
In this discussion, we shall explicitlyconsider a few of the data sets ob-tained on the ADONIS System. Theinitial data set was collected in De-cember 1998, consisting of images ofthe inner region of the globular cluster 47TUC (NGC 104). These data, as well asall other data from ADONIS, were ob-tained by D. Currie.
4.2.1 The Central Crowded Region
This field, shown in Figure 1, for theevaluation of software performance, isnear, but not exactly centred on thecore of the cluster. The exact locationwas selected to overlap with observa-tions that have been conducted usingNICMOS with HST as well as observa-tions by F. Ferraro. This field (as well asa series of overlapping fields) is shownin Figure 1. For the ADONIS system,we used the camera optics providing100 mas pixels and a 25 arcsecondField of View (FoV) with the Ks or K’ fil-ter. Thus, the PSF would have beenbadly under-sampled, if the Strehl ratiohad been high (this data happened tohave a relatively low Strehl ratio).These observations provide a set of un-resolved objects of various intensitieswith relatively low background. T h edata consisted of four pointings ob-tained within an hour, where the point-ing for each group was offset by a cou-ple of arc-seconds. There are 10 im-ages for each group, with an individualexposure time of 0.6 seconds. The badpixels were removed, the images flat-fielded, the sky and dark frames sub-tracted, and then the ten successiveimages were combined using a medianfilter acting on each pixel. The imagesdenoted T0 and T1 were then combined(with appropriate translation) to formT01. The same procedure was per-formed using the groups T2 and T3 toform T23. The PSF was independentlyobtained for each image (i.e. for T01and T23) by the method defined bywhatever Photometry Programme wasbeing tested and the photometry wasperformed separately for each of T01and T23. Analysis of this type wasperformed on this data set by severalindividuals at ESO and at Bologna.Some of these results are describedbelow. This procedure was in generalperformed for each of the sets of re-sults listed in the table. This 47 TUCdata set was also distributed to theten international groups in the AO data-processing community in November1999, and is available to be down-loaded at http://www.eso.org/science/papao/data/47tuc/.
4.2.2 The Outer,Less Crowded Region
At the same time that the above ob-servations were recorded, observations
were made of an adjoining region of thecluster, i.e. the region indicated by theblack square in Figure 1. There werethree purposes in observing this sec-ond field. The first purpose is to providea less crowded region that will allow theapplication of the same algorithm to tworegions with different degrees of crowd-ing observed at the same time with thesame atmospheric and AO system pa-rameters. This test can evaluate the ef-fects of crowding on different photome-try and astrometry algorithms. This sec-ond less crowded region also allows acleaner extraction of a (non-simultane-ous) PSF, and gives a better estimationof the sky background.
4.3 ADONIS Data on theTrapezium
The two primary objectives of theTrapezium series was (1) to obtain well-calibrated data sets using ADONIS thathave the high Strehl ratio that is repre-sentative of the expected Strehl ratiosfor CONICA/NAOS and (2) to obtaindata sets to test the accuracy of soft-ware programmes that provide for thecorrection for the effects of an-isopla-natism.
4.3.1 High Strehl Data
We wish to obtain a well-calibratedand redundant data set that can beused for independent internal inter-comparisons of the photometry and as-trometry. The redundancy means thatthe data is recorded in a manner to pro-vide a quantitative evaluation of theprecision of the P&A. To achieve thiswith ADONIS observations we need aregion with an acceptable number ofstars for statistical security (ten or morestars in the FoV of the high-resolutioncamera mode, i.e., a region of 10 by 10arc-seconds), and a very bright star, 6thmagnitude or brighter, very near-by, topermit the optimal operation of ADO-NIS, and no star in the FoV that will sat-urate the detector. Such a region hasbeen found in the Trapezium, and is in-dicated by the boxes in Figure 3. Asshown in the figure, we point to four,highly overlapped regions. Thus in eachof these four regions or patches, wecan independently determine an inter-nally defined PSF for that frame, and usethat PSF to reduce the data in that frame.Thus we have four independent sets ofthe stellar magnitudes of the stars forwhich the stars obviously have thesame magnitudes for all of the fourpointings. The data were recorded withan exposure time such that the two starsH and b (~ 11th magnitude in K-band)are somewhat over-exposed in order tocollect precise data on the wings or ha-los of the PSF. The stars c and d arewell-exposed with the peak at 0.6 and0.3 saturation. Finally, there is a clusterof ten fainter stars, the brightest of whichis five magnitudes fainter than Ha.

17
Finally, to permit the evaluation of theprecision of the blind and myopic de-convolution algorithms, for each of thefour pointings, a cube of short-exposuredata was recorded. Thus the perform-ance of myopic and/or blind deconvolu-tion implementations can be tested.The photometric and astrometric preci-sion can then be determined by inter-comparing the four independent myopicdeconvolutions on the four independentcubes. The proximity of the bright starsallows the ADONIS data to be takenwith a high Strehl ratio (32%). With theinter-comparison of the myopic decon-volution followed by the photometry andastrometry of the four patches in hand,one may then compare this precisionwith the precision obtained by the moreconventional processing of the aver-
aged cube of the same data. Thesedata sets, bad-pixel corrected, flat-field-ed, and sky subtracted, can be down-loaded from http://www. e s o . o r g / s c i-ence/papao/data/trap
4.3.3 An-Isoplanatism Data Sets
A separate goal of PAPAO is to ad-dress the effects of an-isoplanatism,the variation of the PSF across the fieldof view as a function of the distance tothe guide star. This effect is caused bythe fact that the target star passesthrough a somewhat different sample ofatmosphere than the atmosphere thatis sensed and corrected by the AO sys-tems which is locked on the guide star.An ideal data set could have been ob-tained in the manner of the UHAO im-
age (background image in Figures 3and 4). This entire region could be ob-served using different guide stars. Thissingle 1024 × 1024 QUIRC imagewould then have contained the guidestars, and a large number of starsrecorded simultaneously (with thesame space variant PSF and the samean-isoplanatic parameters). However,the UHAO data was taken with certainscience objectives, rather than thetechnical objectives of PAPAO. With thesmaller 256 by 256 array of ADONIS,we must consider a different strategy.For this, we need to find an interestingfield for which there are three or fourbright stars at the edge of the isopla-natic patch, that is, within 25 arc-sec-onds of the centre of our Region ofInterest (RoI). Preferably, these starsshould be very bright, since the an-iso-planatic effects can be measured moreeasily with high Strehl images. Whilesuch fields are rare, the region dis-cussed above (see Fig. 2) in the Trape-zium satisfies all of these criteria. Thuswe can collect data satisfying both thehigh Strehl ratio objectives and the an-isoplanatism objectives at the sametime. This means that we can observethe same RoI (the RoI indicated in Fig-ure 2) with up to four different guidestars. Since we have the four differentpointings or patches for each guide star,we can determine the internal error struc-ture, and thus cleanly isolate the effectsof the an-isoplanatic errors and correc-tions. A proper programme to correct forthe an-isoplanatic effects should resultin good agreement for the data takenwith A, C, and D used as guide stars.Most of the Trapezium data sets havebeen collected in the following manner.We observe the Region of Interest (RoI)using the first star (#1 C) as the NaturalGuide Star. Four overlapping regionscontained in the RoI (similar to the dis-cussion of the observations of 47 TUC)are obtained. Then we start a similarprocedure with the next Natural GuideStar, ((#1 D). We again observe fourslightly overlapping images of the sameRoI that was observed with ((#1 C asthe guide star. Finally, we go to the thirdNatural Guide Star ((#1 A) and againcollect four overlapping images.
4.4 ADONIS Data on Carinae(the Homunculus)
We now address a quite differentclass of objects. In this case, we are in-terested in obtaining data sets to ad-dress the performance of deconvolutionalgorithms. These deconvolution algo-rithms are intended to improve the pho-tometric SNR, and to remove artifactsfor nebular or galactic objects, i.e., dif-fuse or continuous targets. In particular,this set of data should allow us to ad-dress the precision or accuracy of therecovery of the high-frequency compo-nents in the image.
Figure 3: In the image of the Trapezium, we can see the effects of an-isoplanatism, that is,the change in the PSF in different parts of the image. At the bottom, we see the effects (onthe left) of processing with a constant PSF(SI). We see in the left bottom panel that this soft -ware detected each of the distorted stars as a star with multiple components. On the right isthe result of our continually parameterised model of the variable PSF that was used in theSpatially Variant Version of STARFINDER. Now all the distorted stars are identified as singlestars (with the exception of the brightest star, which is actually the only true binary star in thefield).

18
4.4.1 Spatially Invariant Analysis
To this end, we are then interested ina quantitative evaluation of the accura-cy and artifact introduction of spatiallyinvariant deconvolution procedures. Toaddress this, we need to select an ob-ject which extends over a major part ofthe ADONIS field of view, has a consid-erable amount of fine detail, an objectfor which we have other data that indi-cates the reality of the details of the struc-ture, and finally, an object bright enoughto allow a sequence of short exposuresto test blind and myopic deconvolutionalgorithms and implementations. For thiswe have selected a portion of the Ho-munculus of η Carinae, perhaps theunique object which simultaneously sat-isfies all these criteria. We have previ-ously produced astrometrically rectifiedimages for the studies of the motion ofthe clumps in the homunculus13, 22, 23.There is a range of brightness, and veryshort exposures are adequate to obtaina good signal-to-noise ratio, even witha 50 milli-arc-second resolution. ηCarinae itself is bright enough to be anexcellent guide star, sufficient to getgood Strehl ratios for the Homunculusimages. This data has been bad-pixelcorrected, flat-fielded, and sky and darksubtracted. The resultant images fortwo overlapping regions observed in K-band with 50 mas/pixel are shown inFigure 4, where they can be comparedto our image from the WFPC in Hα.These images have been analysed atESO, in particular, applying the Lucy-Richardson algorithm and myopic de-convolution in the implementation ofIDAC. The results of these deconvolu-tions have been analysed on a pixel-by-pixel evaluation to address the perform-ance of the algorithms, using variousfigures of merit. In the future, we plan toaddress this behaviour in terms of thespatial frequency, that is, averages oversmall blocks of pixels in order to sepa-rate the high frequency performancefrom the lower frequency performance.
4.4.2 Data for An-Isoplanatic Effects inContinuous Targets
However, even with the new NGS AOsystems that are being developed andinstalled on the 8-metre-class tele-scopes, the lack of guide stars in thevery immediate vicinity of the target willresults in strong an-isoplanatic distor-tion of the targets shape and brightnessdistribution, as indicated in Figure 3.For this reason, we wish to explore thepost-detection software methods thatcorrect for the influence of a PSF thatchanges its shape over the field of view.In particular, we wish to determine theeffectiveness of the very few spatiallyvariant deconvolution algorithms to re-move the effects of the an-isoplanaticvariation of the PSF across the ob-served field of view. Since we do nothave the God’s Truth, we need to againdevelop a procedure of observing with
multiple Natural Guide Stars and lookfor internal consistency. In this type ofanalysis, we will determine the photo-metric structure of the object, as deter-mined independently from each of thedata sets. The P&A from a properly op-erating software deconvolution pro-gramme, or more precisely the spatialfrequency components of the P&Ashould agree, even though they haveused guide stars that are at differentdistances and different orientations withrespect to the RoI. However, to performthese observations in a reasonableamount of telescope time, we need avery bright nebular object that has,within tens of arcseconds, at least threestars bright enough to be natural guidestars for ADONIS. In the selection of aportion of the homunculus of η Carinae,we have three guide stars within 15 arc-seconds, and a total of five guide starswithin 25 arcseconds of the centre ofthe region of interest as shown inFigure 5. All five of these stars arebrighter than 11th magnitude, quite ac-ceptable as guide stars for ADONIS.Thus we have a rather ideal configura-tion to test the continuous distribution.
The relatively bright guide stars areat distances of 6 arcsecond (mv = 6), 8″at 10th, 8″ at 10th, 12″ at 12th and 25″at 11th. This makes it a unique objectfor the performance of these tests. Inaddition, we have an extensive set ofWFPC data for comparison of the smalllinear features. To allow the precisecomparison, we took two views of theRoI, slightly translated. In addition, weobserved the four stars at a greater dis-tance from the RoI to obtain the param-
eters that describe the degree of an-isoplanatism.
4.5 Summary of Data Sets forCommunity Analysis
Table 1 describes some of the datasets that have been obtained usingADONIS and other systems, and arebeing prepared for use, internally andexternally over the next year. Well-cali-brated data, obtained under a variety ofconditions with the same calibrationprocedures, are necessary to separatethe various parameters that affect theaccuracy of the data analysis by vari-ous software programmes. They are invarious states of pre-processing, cali-bration and validation. All are in K-bandunless otherwise stated. There are var-ious criteria that describe the parame-ters that will affect the collection andanalysis of AO data. We give rough in-dications of the domain in which each ofthe data sets falls. The average densityof stars per arcsecond roughly indi-cates the number of stars that may beexpected to be found in the wings of ad-jacent stars. This of course dependsupon the seeing at the time, but this col-umn gives an estimate of the density inthe most critical region for the AO cor-rection. An indication of the Strehl ratiois given. A precise definition is difficult inthese crowded fields, and the use ofthe Strehl ratio of a calibration starmust be checked for the stability. Datasets that are currently available are in-dicated by a “+” and are indexed ath t t p : / / w w w. e s o . o r g / s c i e n c e / p a p a o / d a t a /47tuc/
Figure 4 illustrates the data set that has been used for the analysis of nebular objects. Thelarge figure on the right from the Hubble Space Telescope shows the regions selected for theADONIS observations (the central part of the SE lobe of the homuculus of Carinae). Thiswas selected because it is bright at K-band, allowing short exposures even at 50 mas reso -lution, has a number of relatively bright guide stars near it i.e. at distances of 6 arc second(mv=6), 8” at 10th, 8” at 10 th, 12” at 12 th) and 25” at 11th.

19
The fourth column indicates the sam-pling, the first number being the num-ber of pixels in the theoretical diffrac-tion-limited core. This addresses issuesin obtaining and translating the core of
the PSF. The fifth column is the (linear)number of pixels in the wings caused bythe atmospheric effects. This indicatesthe area in which the photometry isstrongly affected by the variability of the
lower levels of the PSF. The remainingdata sets will be placed upon the PA-PAO Web Site as the pre-processingand calibration isare completed.
5. Algorithm Testing Componentof the PAPAO
The portion of the PA PAO pro-gramme concerning the testing of thevarious photometry and astrometry al-gorithms divides into two parts. The firstpart is to develop numerical simulateddata to evaluate performance of each ofthe packages of software programmes.The results of this analysis will be pro-vided on the web page. This will illus-trate the science performance of thesoftware programmes in the ESOToolKit, results at the level that might beobtained by a general observer, that is,an individual who is not an expert in AO.Some of the initial results of this analy-sis will be presented below, as an ex-ample of the type of analysis that will bedeveloped. A second part of the algo-rithm testing programme involves thedistribution of selected field-data sets tobe processed by those individuals whohave developed the code for variousphotometry and astrometry softwarepackages that are of interest for AOdata. The main objective of this secondpartcomponent is to identify and selectthe best programmes and/or algorithmsto develop, test, and implement thenext generation of the ESO ToolKit. Thesecond objective in this second portionof the algorithm testing part is to dis-cover better procedures for the use ofthe publicly available software.
Figure 5: This uses our HST image to illustrate the ADONIS data sets obtained by Currie toaddress the deconvolution procedures with an-isoplanatic effects for nebular objects. The firsttwo regions (H-1 and H-2) were selected for analysis (these are the regions shown in Figure 4 ) .They are the central part of the SE lobe of the Homunculus. The other three regions (RS-1,RS-2, and RS-3) were selected to evaluate the an-isoplanatic parameters when the centralstar was being used for the guide star. We later looked at the same five patches but usingfirst one then another of the outer stars as the natural guide star. For scale, each of the greenboxes is 12.5 arcseconds on a side. We have an extensive set of WFPC data for compari -son of the small linear features.
Target/ Star Strehl Samples/ # pixels Description and CommentsDataSet Density Ratio FWHM in wings
47 TUC_A + 0.8 low 1.5 6 This data set is composed of 25″ by 26″ images described in the previous section, and it was distributed to ten groups for external testing by experts in November 1999
47 TUC_A_2 + 0.8 low 1.5 6 This data set was obtained at approximately the same time as 47 TUC_A, but ithas a lower stellar density. It will thus be used to compare the relation between the crowding and the photometric and astrometric precision when the atmospheric conditions and AO system parameters are similar.
T Cluster 25.0 high high 3.0 6 This is an ADONIS data set augmented with synthetic stars each of which has the proper noise and PSF (both in shape and in an-isoplanatic variation obtained for actual observation). This serves as a set of absolute calibrators at high crowding.
47 TUC_B + 0.8 med 1.5 6 This data set contains 100 frame sets especially obtained for testing blind and myopic deconvolution programmes
47 TUC_B_2 + 0.8 med 1.5 6 This data set contains 100 frame sets, especially obtained for testing various blind and myopic deconvolution programmes. It has a lower density of stars than 47 TUC B.
Homunculus + — med 3.0 12 These are 100 frame sets to test various implementations of blind and myopic deconvolution on a continuous (or nebular) object that has both a large dynamicrange and many very fine features.
Trapezium + low 32% 3.0 12 This data set addressed the an-isoplanatic effects for unresolved objects with relatively high Strehl ratios. The low stellar density allows the isolation of the crowding versus an-isoplanatism (although having fewer stars causes some statistical problems).
Homunculus + — high 3.0 12 This is an H-band data set for an extended target. Multiple exposures are takento investigate and quantify the an-isoplanatic effects (see paragraph on an-isoplanatic data sets for homuncular images)
Table 1.

20
5.1 Results of the AlgorithmTesting Component of thePAPAO
In Table 2 we list the comparative re-sults obtained by using the various dif-ferent software programmes. In eachcase, we compare the magnitudes (andpositions) obtained for each differentpointing or patch. Then the magnitudesor positions of a given star obtained ineach of the patches are compared. Themean magnitude or position over theentire frame is zeroed, and the residu-als are plotted as a function of magni-tude. The dependence of the size of theerrors on the stellar magnitude gives anindication as to the source of the error:photon noise, read noise, PSF noise orflat-fielding errors. Clearly we are notaddressing all the possible errors, butthe starting point is here. Then we canconsider the effect of significantly differ-ent atmospheric conditions, diff e r e n toptimisations of the AO system, as wellas methods of correcting the saturationand extraction of the PSF.
We first consider a set of 20 bright(and some fainter) stars, then a set ofthe brightest 60 stars, and then a set ofthe brightest 120 stars. Stars at theedge of the field and other anomalieshave been eliminated from the num-bers for all of the groups (thus eachrun uses the same set of stars). TheRMS Magnitude indicates the differ-ences between the measured magni-tude of a star in T01 and the meas-ured magnitude of a star in T23. Theaverage value of all the stars overthe field is set to zero, so we are evalu-ating the differences a given softwareprogramme measures for the samestars, and not including the zero pointissue. In general, we see that the rangeof the internal errors in the measure-ments is between 0.088 and 0.014magnitudes, that is, between 8.4 and1.3 per cent.
The set of 14 stars analysed in theright panel of Table 2 was selected inorder to have a common set among all
analysts (who had analysed this dataset within different research objectives).For the case of 14 stars the purely sta-tistical error bars are about the valuesof the standard deviation found in thetable. Therefore, the difference be-tween the P&A programmes whichwere tested is not statistically signifi-cant (two sigma) for this small set ofstars. However, it is clear that the per-formance is about a factor of thirtyworse than the theoretical perform-ance, that is, the photometric noise ismuch worse than the noise to be com-puted from the photon statistics, the skynoise, and the readout noise. On theother hand, this may be contributed bythe problems of flat fielding that havenot been explicitly quantified on thisdata. For the case of 65 stars, the pure-ly statistical error bars are listed. Thedifferences are marginally significant.Note that earlier tests of the ROMAFOTprogramme (several analyses basedupon a data set obtained on NGC 1850)indicates that it obtained precision atabout the same level. Similar results,with precision at the level of between 5and 20 mas, have been obtained for theastrometric measurements of the sameimage of 47 TUC. These statistical as-pects indicate another area where acareful integrated plan of data collec-tion and data analysis is essential forobtaining statistically significant com-parisons.
Note that the errors found in theseESO analyses are smaller (better accu-racy) than those found in the literature.On the other hand, we have not includ-ed the absolute errors in the photome-try. However, the errors found are stillmore then ten times the magnitude ofthe expected errors computed fromthe photon noise (which is dominant inthis domain), readout noise and skynoise.
5.2 Flat-Fielding Effects in AO
Another source of errors for precisephotometry is errors of various types in
the flat-fielding procedure. In principle,we may expect the accuracy of the flat-fielding to be of the order of 0.3 to 1%.This is the experience of SOFI, wherethese procedures have been checkedin detail. However, these results wouldbe the end product of an extensive in-vestigation that has not yet been car-ried out on the ADONIS SHARPII cam-era. One must address the problems ofreproducibility as well as the differencebetween a flat field produced by a con-tinuous distribution (the sky) and thatproduced by points of light, i.e. theshading or illumination corrections.These have not yet been checked inde-pendently, so there is an unknown com-ponent in the photometric results pre-sented here that is due to the flat field-ing problems. A study of such flat-field-ing effect is important for high-accuracyAO photometry. It will also require thecollection of test data from the tele-scope addressing higher dynamicsrange. Such observations are difficulton the SHARP II camera, since operat-ing with the brightest object in satura-tion is not acceptable for this array.Thus the noise must be reduced by re-peated observations, so improvementsgo at the square-root of the time, re-quiring significant telescope time.
5.3 Effectiveness of PriorDeconvolution
Traditionally, it has been presumedthat one could improve the photometryand astrometry that could be obtainedfrom AO data by performing a deconvo-lution on the image before measuringthe intensities and position of the stars.In this section, we address the resultsof performing a Lucy-Richardson or amyopic deconvolution before perform-ing the photometry. In this case, wehave used our 47 TUC image, and per-formed the photometry. Then the imagewas deconvolved, using the Lucy-Richardson algorithm and IDAC pro-gramme. For each of the deconvo-
RMS MagnitudeProgramme Analyst # Stars Dynamic 14 stars 65 stars
Analysed Range 3.9 mag 4.4 magStdev error Stdev error
SF-9905 Tordo 120 7.14 0.055 0.010 0.033 0.003SF-9905 Tordo 127 7.14 0.059 0.011SF-9905 Tordo 175 7.37 0.087 0.016DAOPHOT Tordo 73 4.75 0.056 0.011 0.040 0.004
SF-9905 Naesgarde 23 2.1 0.0253 0.005DAOPHOT Naesgarde 23 2.1 0.0144 0.003
SF-9909 Diolaiti 266 9.0 0.040 0.008 0.023 0.002
Table 2.
** This analysis excludes three out-liers, since the edge of the field was not excluded from the comparison calculation.•Two versions of STARFINDER have been used. SF-9905 was installed by E. Diolaiti on the ESO computer system in May 1999 and has been available for eval-uation in Garching. SF-9909 was a later version used by E. Diolaiti for some of his tests conducted at Bologna Observatory.
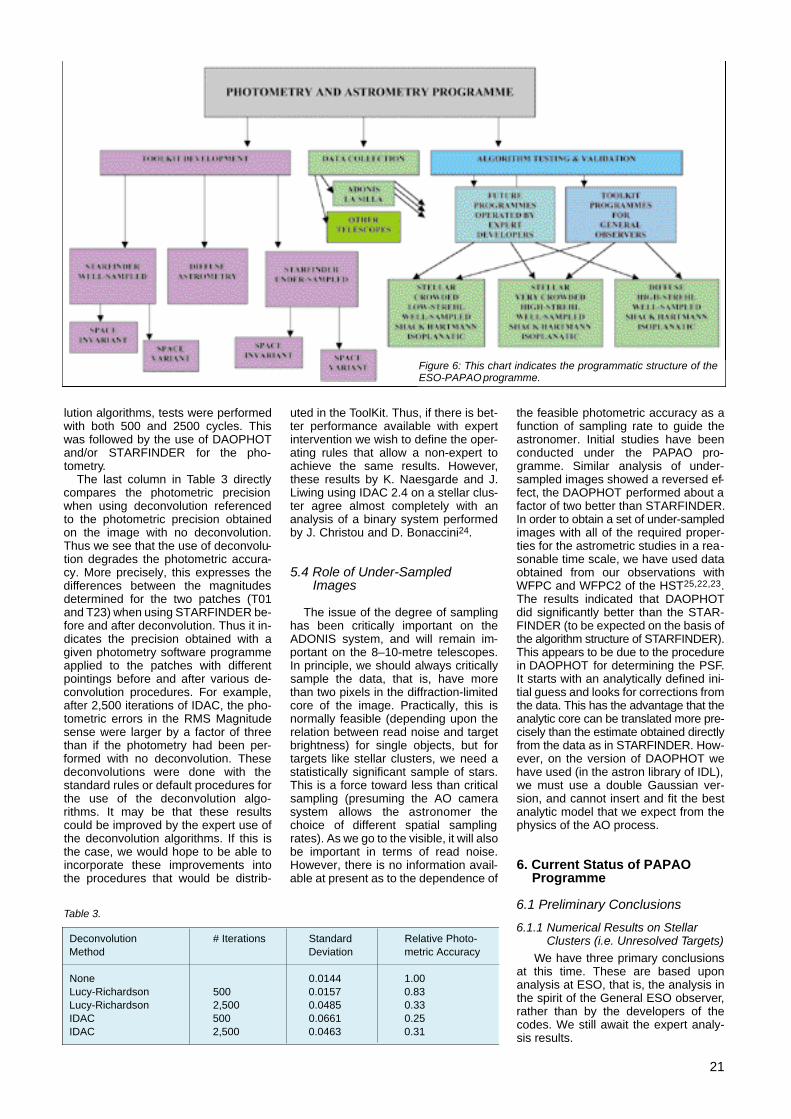
21
lution algorithms, tests were performedwith both 500 and 2500 cycles. Thiswas followed by the use of DAOPHOTand/or STARFINDER for the pho-tometry.
The last column in Table 3 directlycompares the photometric precisionwhen using deconvolution referencedto the photometric precision obtainedon the image with no deconvolution.Thus we see that the use of deconvolu-tion degrades the photometric accura-cy. More precisely, this expresses thed i fferences between the magnitudesdetermined for the two patches (T01and T23) when using STARFINDER be-fore and after deconvolution. Thus it in-dicates the precision obtained with agiven photometry software programmeapplied to the patches with differentpointings before and after various de-convolution procedures. For example,after 2,500 iterations of IDAC, the pho-tometric errors in the RMS Magnitudesense were larger by a factor of threethan if the photometry had been per-formed with no deconvolution. Thesedeconvolutions were done with thestandard rules or default procedures forthe use of the deconvolution algo-rithms. It may be that these resultscould be improved by the expert use ofthe deconvolution algorithms. If this isthe case, we would hope to be able toincorporate these improvements intothe procedures that would be distrib-
uted in the ToolKit. Thus, if there is bet-ter performance available with expertintervention we wish to define the oper-ating rules that allow a non-expert toachieve the same results. However,these results by K. Naesgarde and J.Liwing using IDAC 2.4 on a stellar clus-ter agree almost completely with ananalysis of a binary system performedby J. Christou and D. Bonaccini24.
5.4 Role of Under-SampledImages
The issue of the degree of samplinghas been critically important on theADONIS system, and will remain im-portant on the 8–10-metre telescopes.In principle, we should always criticallysample the data, that is, have morethan two pixels in the diffraction-limitedcore of the image. Practically, this isnormally feasible (depending upon therelation between read noise and targetbrightness) for single objects, but fortargets like stellar clusters, we need astatistically significant sample of stars.This is a force toward less than criticalsampling (presuming the AO camerasystem allows the astronomer thechoice of different spatial samplingrates). As we go to the visible, it will alsobe important in terms of read noise.However, there is no information avail-able at present as to the dependence of
the feasible photometric accuracy as afunction of sampling rate to guide theastronomer. Initial studies have beenconducted under the PA PAO pro-gramme. Similar analysis of under-sampled images showed a reversed ef-fect, the DAOPHOT performed about afactor of two better than STARFINDER.In order to obtain a set of under-sampledimages with all of the required proper-ties for the astrometric studies in a rea-sonable time scale, we have used dataobtained from our observations withWFPC and WFPC2 of the HST25,22,23.The results indicated that DAOPHOTdid significantly better than the STAR-FINDER (to be expected on the basis ofthe algorithm structure of STA R F I N D E R ) .This appears to be due to the procedurein DAOPHOT for determining the PSF.It starts with an analytically defined ini-tial guess and looks for corrections fromthe data. This has the advantage that theanalytic core can be translated more pre-cisely than the estimate obtained directlyfrom the data as in STA R F I N D E R . How-ever, on the version of DAOPHOT wehave used (in the astron library of IDL),we must use a double Gaussian ver-sion, and cannot insert and fit the bestanalytic model that we expect from thephysics of the AO process.
6. Current Status of PAPAOProgramme
6.1 Preliminary Conclusions
6.1.1 Numerical Results on StellarClusters (i.e. Unresolved Ta r g e t s )
We have three primary conclusionsat this time. These are based uponanalysis at ESO, that is, the analysis inthe spirit of the General ESO observer,rather than by the developers of thecodes. We still await the expert analy-sis results.
Deconvolution # Iterations Standard Relative Photo-Method Deviation metric Accuracy
None 0.0144 1.00Lucy-Richardson 500 0.0157 0.83Lucy-Richardson 2,500 0.0485 0.33IDAC 500 0.0661 0.25IDAC 2,500 0.0463 0.31
Table 3.
Figure 6: This chart indicates the programmatic structure of theESO-PAPAO programme.

22
(1) For Well-Sampled Images withrelatively low Strehl ratios, and relative-ly low levels of nebulosity, the three pho-tometry and astrometry programmesthat we have tested, i.e. STARFINDER,DAOPHOT and ROMAFOT give similaraccuracy. While there are statisticallysignificant differences, in general, theyare relatively fine points.
(2) When more similar PSF charac-terise the data, in a manner that also re-duced the flat-fielding errors, the photo-metric and astrometric errors are re-duced. STARFINDER does significant-ly better, when the deleterious effects ofPSF variation and flat-fielding are re-duced.
(3) For Under-Sampled HSTImages,DAOPHOTperforms significantly betterthan STARFINDER. This may be due tothe DAOPHOT assumption of a func-tional representation for the PSF that isreasonably correct, and which can beanalytically translated to the centre ofanother star. This helps both in the for-mation of an averaged PSF and for thestar that is being measured.
(4) For stellar photometry, the prioruse of deconvolution (at least in theforms of Lucy-Richardson and myopicdeconvolution) does not improve theprecision of the photometry. Of coursethe primary use of such algorithms is formorphology and astrometry. Prelimi-nary results on the photometry of con-tinuous distributions are inconclusive.
Finally, a large improvement is re-quired in order that the AO photometryand astrometry may reach the desiredlevels of accuracy, although a large partof this may be due to the flat fieldingthat also affects non-AO infrared pho-tometry.
6.1.2 Current Programmatic Issues
The initial domains of performancehave been identified for several soft-ware packages. We have seen that theprocedures for the determination of thePSF must be investigated more com-pletely. The widget-based Spatially In-variant STARFINDER will be availablein July of 2000. The first set of data (well-resolved low Strehl stellar clusters)have been distributed to the communi-ty. A second set (well-resolved, highStrehl stellar clusters with calibrators) isavailable on the PAPAO Web Site athttp://www.eso.org/science/papao/
6.2 Invitation to ESO Community
We invite and strongly encourage allinterested to participate in the PAPAOprogramme. This participation may takea number of different forms. This mayconsist of applying your favourite pho-tometry and/or astrometry algorithm tosome of the calibrated PAPAO datasets. It may also consist of contributingyour algorithms for testing by thebroader community, or the contributionof your data sets to be used in PAPAO.
Data sets with a single frame FoV thatare significantly larger than the isopla-natic patch, and that are recorded fortwo or more guide stars that are sepa-rated by approximately 10 arc seconds,would be particularly valuable. Finally,we are interested in working with betatesters of the programmes to be re-leased within the ESO ToolKit. In Julyand August, we will be testing thesoftware package ION that allowsremote participants to use STA R-FINDER on the ESO computers andIDLlicense. If you are interested in par-ticipating in these tests, please [email protected]
7. Acknowledgements
We would like to acknowledge thegenerous allocation of ESO telescopetime to the AO data reduction pro-gramme PAPAO, and the support of themembers of the 3.6-metre team at LaSilla. We would also like to acknowl-edge the contribution of data, for ourengineering purposes, by L. Close20, F.Rigaut, and S. Hippler.
References
1Currie, D.E., Diolaiti, D., Bonaccini, S., Tor-do, K., Naesgarde, J., Liwing, O., Bendinelli,G., Parmeggiani, L. The ESO Photometricand Astrometric Analysis Program forAO: A Programmatic and NumericalAnalysis Proc. of SPIE Vol. 4007 AdaptiveOptical Systems Technology Editor: P.Wizinowich, #4007–72 1–12 (in press)(2000).
2Currie, D.G., E. Diolaiti; S. Tordo; K. Naes-garde, J. Liwing, O. Bendinelli; G. Par-meggiani, L. Close, D. Bonaccini. (1999)ESO Photometric and Astrometric Anal-ysis Program for Adaptive Optics ADASS-IX 1999.
3Diolaiti, D., Bendinelli O., Bonaccini D.,Parmeggiani G., & Rigaut F. STARFIND-ER: an IDL GUI based code to AnalyzeCrowded Fields with Isoplanatic Correct-ing PSF Fitting (1998) in ESO/OSA -Topical Meeting on Astronomy withAdaptive Optics., ed. D. Bonaccini(Garching b. Meunchen, ESO), p.175).
4Diolaiti, E. et. al. Proc. of SPIE Vol. 4007Adaptive Optical Systems Te c h n o l o g yEditor: P. Wizinowich, #4007–74 1–12 (inpress) (2000).
5Diolaiti, E., D. Currie, O. Bendinelli, G. Par-meggiani, L. Close, D. Bonaccini (1999)Astronomical Data Analysis Software andSystems – IX 1999.
6Bonaccini, D., Prieto, E., Corporon, P. ,Christou, J., Le Mignan, D., Prado, P.,Gredel, R., and Hubin, N., (1997) “Per-formance of the ESO AO system ADO-NIS, at La Silla 3.6m telescope, SPIEProceedings Vol 3126, “Adaptive Opticsand Applications”, Tyson and Fugate Eds.
7http://www.ls.eso.org/lasilla/Telescopes/360cat/adonis/
8http://www.eso.org/projects/aot/aowg 9Christou, J.C., Bonaccini, D. et. al (1999)
“Myopic Deconvolution of Adaptive OpticsImages” The Messenger, No. 97, p.14–22, http://www.eso.org/gen-fac/pubs/messenger/
1 0Christou, J.C., Ellerbroek, B., Fugate, B.Q.,Bonaccini, D. and Stanga, R. (1995), Ray-leigh Beacon Adaptive Optics Imaging ofADS 9781: Measurements of the Iso-planatic Field of View, ApJ, 450, 869–879.
11Close, L. M. (2000) SPIE 4007 “A Reviewof Published Galactic and Solar SystemScience: A Bright Future for A d a p t i v eOptics Science”.
12http://www.eso.org/instruments/naos/index.html
13Currie, D.G. and D.M. Dowling. (1999)“Astrometric Motion and Doppler Ve-locity” Eta Carinae at the Millennium,ASP Conference Series, Vol. 179 J.A.Morse, R.M. Humphries, and A. Damineli,eds.
1 4Dowling, D.M. (1996) “The A s t r o m e t r i cExpansion and 3-D Structure of eta Ca-rinae” University of Maryland, Ph. D.Thesis.
15Currie, D.G., Dowling, D.M., Shaya, E.J.,Hester, J., Scowen, P., Groth, E.J.; Lynds,R., O’Neil, E.J., Jr.; Wide Field/PlanetaryCamera Instrument Definition Team “As-trometric Analysis of the Homunculus ofeta Carinae With the Hubble SpaceTelescope” 1996, AJ, 112, 1115.
16Naesgarde, K. (1999) “Accuracy in Diffe-rential Photometry – STARFINDER vs.DAOPHOT” Master’s Thesis TRITA-FYS#XXX, Stockholm.
1 7Liwing, (1999) “Accuracy of Diff e r e n tMethods for Differential A s t r o m e t r y ”Master’s Thesis TRITA-FYS #XXX, Stock-holm.
18Landsman, W.B. (1995) “The IDL Astron-omy User’s Library” Astronomical DataAnalysis Software and Systems IV, ASPConference Series, Vol. 77, 1995, R.A.Shaw, H.E. Payne, and J.J.E. Hayes,eds., p. 437.
19Avizonis, P. V.(1997) Ph. D. Thesis Uni-versity of Maryland.
20Simon, M., Close, L.M., Beck, T.L. “Adap-tive Optics Imaging of the Orion Trape-zium Cluster” (1999) A J, 117 1 3 7 5 –1386.
21Roddier, F., Northcott, M., Graves, J.E., “Asimple low-order adaptive optics systemfor near-infrared applications” 1991 PASP103 131–149.
22Currie, D.G., D.M. Dowling, E. Shaya, J.J.Hester, HSTWFPC IDTand HSTWFPC2IDT “3-D Structure of the Bipolar DustShell of eta Carinae” (1996) “Role of Dustin the Formation of Stars, Garching beiMuenchen, Federal Republic of Germany,11–14 September 1995, Proceedings of
FREE TEST OF STARFINDER
for ESO COMMUNITYESO is supporting a test of
S TARFINDER and the RSI softwarepackage ION. This test will occur frommid-June through mid-August. This willpermit remote users to test STARFINDERon some of the data sets discussed in thearticle. We would be very interested in re-ports of the results, both concerning thesoftware, and concerning the numericalresults. Please contact the author at [email protected] for the appropriate proce-dures to cross the ESO firewall.

23
1. Introduction
StarFinder is a code designed toanalyse Adaptive Optics images of verycrowded fields. A typical AO observa-tion has a well-sampled and complex-shape PSF, showing a sharp peak, oneor more fragmented diffraction ringsand an extended irregular halo. The ap-proach followed in StarFinder (Diolaitiet al., 1999a, 1999b, 2000) is to ana-lyse the stellar field with a digital imageof the PSF, without any analytic ap-proximation.
Under the assumptions of isopla-natism and well-sampling, StarFindermodels the observed stellar field asa superposition of shifted scaledreplicas of the PSF lying on a smoothbackground due to faint undetectedstars, possible faint diffuse objects andnoise.
The procedure derives first a PSFdigital template from the brightest iso-lated field stars; then a catalogue ofpresumed objects is formed, searchingfor the relative intensity maxima in theCCD frame.
In the following step the images ofthe suspected stars are analysed in or-der of decreasing luminosity; each sus-pected object is accepted on the basisof its correlation coefficient with thePSF template; the relative astrometryand photometry of the source are de-termined by means of a fit, taking intoaccount the contribution of the localnon-uniform background and of the al-ready detected stars.
At the end of the analysis it is possi-ble to remove the contribution of all thestars detected up to this point and per-form a new search for previously lostobjects (e.g. secondary components ofclose binaries).
StarFinder is not a general-purposealgorithm for object recognition: itshould be intended as a tool to ob-tain high-precision astrometry and pho-
tometry in adequately sampled high-resolution images of crowded stellarfields. In practice it can be applied notonly to high-Strehl AO observations, butalso to low-Strehl images. The codeversatility has been also proved by anapplication to a set of HST NICMOSimages (Section 3.3); in Aloisi et al.(2000) there is a comparison betweenour results and those obtained byDAOPHOT.
Much more intriguing and difficultto solve is the case of a field withspace variant PSF, due to anisopla-natic effects in AO observations. Ingeneral the analysis of an anisopla-natic field requires the knowledge ofthe local PSF. The extension ofStarFinder to the space variant case isin progress. Preliminary results havebeen presented at the ESO/SPIE meet-ing Astronomical Telescopes andInstrumentation 2000 (Diolaiti et al.,2000).
2. Analysis Procedure
2.1 PSF determination
The PSF is treated as a template forall the stars in the isoplanatic patch, soits knowledge is of basic importance fora reliable analysis.
The PSF extraction procedure in-cluded in StarFinder is based on themedian average of a set of suitablestars selected by the user. Before beingcombined they are cleaned from themost contaminating sources, back-ground-subtracted, centred with sub-pixel accuracy and normalised. Thecentring is performed by an iterativeshift of the stellar image in order to can-cel the sub-pixel offset of its centroid.The halo of the retrieved PSF is thensmoothed, applying a variable box-sizemedian filtering technique.
The PSF extraction procedure is ableto reconstruct approximately the core of
Figure 1: Left: sub-image extracted from a (simulated) stellar field, including the central starto be analysed, a brighter source which is already known, a fainter one, which will be exam -ined later, and the PSF feature of a much brighter star, represented by the structure in theupper-left part of the sub-image. Right: corresponding sub-region extracted from the stellarfield model, containing one replica of the PSF for each star detected so far.
STARFINDER: a Code to Analyse IsoplanaticHigh-Resolution Stellar FieldsE. DIOLAITI1, O. BENDINELLI1, D. BONACCINI2, L. CLOSE2, D. CURRIE2,G. PARMEGGIANI3
1Università di Bologna – Dipartimento di Astronomia; 2ESO; 3Osservatorio Astronomico di Bologna
the ESO Workshop, Käufl, H.U. andSiebenmorgen, R. (Ed.) Springer-Verlag,89–94.
23Currie, D., D. Le Mignant, B. Svensson,E. Diolaiti, S. Tordo, K. Naesgarde, J.Liwing, O. Bendinelli, G. Parmeggiani, D.Bonaccini “Hyper-Velocity Jets andHomuncular Motion in eta Carinae: an
Application of the Fabry-Perot, ADONISand AO Software” SPIE Vol. 4007 AOSystems Technology Editor: P. Wizino-wich, # 4007–75, 1–12 (in press)(2000a)+
24Christou, J. and Bonaccini, D. “An Analysisof ADONIS Data, tau Canis majoris –Deconvolution”.
http://www.ls.eso.org/lasilla/Telescopes/360cat/adonis/html/datared.html#idac
25Hester, J.J.; Light, R.M., Westphal, J.A.,Currie, D.G., Groth, E.J.; Holtzmann, J.A.,L a u e r, T.R., O’Neil, E.J., Jr. “HubbleSpace Telescope imaging of Eta Carinae”1991 AJ 102, 654–657.
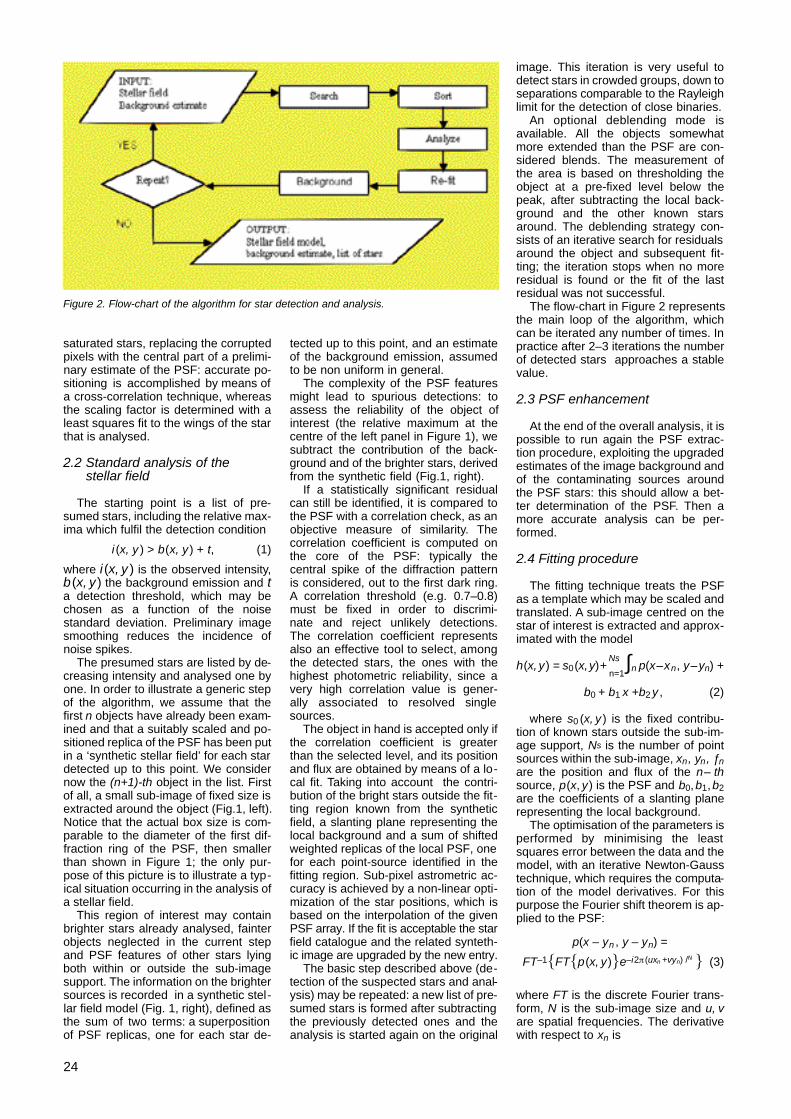
24
saturated stars, replacing the corruptedpixels with the central part of a prelimi-nary estimate of the PSF: accurate po-sitioning is accomplished by means ofa cross-correlation technique, whereasthe scaling factor is determined with aleast squares fit to the wings of the starthat is analysed.
2.2 Standard analysis of thestellar field
The starting point is a list of pre-sumed stars, including the relative max-ima which fulfil the detection condition
i (x, y ) > b(x, y ) + t, (1)
where i (x, y ) is the observed intensity,b (x, y ) the background emission and ta detection threshold, which may bechosen as a function of the noisestandard deviation. Preliminary imagesmoothing reduces the incidence ofnoise spikes.
The presumed stars are listed by de-creasing intensity and analysed one byone. In order to illustrate a generic stepof the algorithm, we assume that thefirst n objects have already been exam-ined and that a suitably scaled and po-sitioned replica of the PSF has been putin a ‘synthetic stellar field’ for each stardetected up to this point. We considernow the (n+1)-th object in the list. Firstof all, a small sub-image of fixed size isextracted around the object (Fig.1, left).Notice that the actual box size is com-parable to the diameter of the first dif-fraction ring of the PSF, then smallerthan shown in Figure 1; the only pur-pose of this picture is to illustrate a typ-ical situation occurring in the analysis ofa stellar field.
This region of interest may containbrighter stars already analysed, fainterobjects neglected in the current stepand PSF features of other stars lyingboth within or outside the sub-imagesupport. The information on the brightersources is recorded in a synthetic stel-lar field model (Fig. 1, right), defined asthe sum of two terms: a superpositionof PSF replicas, one for each star de-
tected up to this point, and an estimateof the background emission, assumedto be non uniform in general.
The complexity of the PSF featuresmight lead to spurious detections: toassess the reliability of the object ofinterest (the relative maximum at thecentre of the left panel in Figure 1), wesubtract the contribution of the back-ground and of the brighter stars, derivedfrom the synthetic field (Fig.1, right).
If a statistically significant residualcan still be identified, it is compared tothe PSF with a correlation check, as anobjective measure of similarity. Thecorrelation coefficient is computed onthe core of the PSF: typically thecentral spike of the diffraction patternis considered, out to the first dark ring.A correlation threshold (e.g. 0.7–0.8)must be fixed in order to discrimi-nate and reject unlikely detections.The correlation coefficient representsalso an effective tool to select, amongthe detected stars, the ones with thehighest photometric reliability, since avery high correlation value is gener-ally associated to resolved singlesources.
The object in hand is accepted only ifthe correlation coefficient is greaterthan the selected level, and its positionand flux are obtained by means of a lo-cal fit. Taking into account the contri-bution of the bright stars outside the fit-ting region known from the syntheticfield, a slanting plane representing thelocal background and a sum of shiftedweighted replicas of the local PSF, onefor each point-source identified in thefitting region. Sub-pixel astrometric ac-curacy is achieved by a non-linear opti-mization of the star positions, which isbased on the interpolation of the givenPSF array. If the fit is acceptable the starfield catalogue and the related synteth-ic image are upgraded by the new entry.
The basic step described above (de-tection of the suspected stars and anal-ysis) may be repeated: a new list of pre-sumed stars is formed after subtractingthe previously detected ones and theanalysis is started again on the original
image. This iteration is very useful todetect stars in crowded groups, down toseparations comparable to the Rayleighlimit for the detection of close binaries.
An optional deblending mode isavailable. All the objects somewhatmore extended than the PSF are con-sidered blends. The measurement ofthe area is based on thresholding theobject at a pre-fixed level below thepeak, after subtracting the local back-ground and the other known starsaround. The deblending strategy con-sists of an iterative search for residualsaround the object and subsequent fit-ting; the iteration stops when no moreresidual is found or the fit of the lastresidual was not successful.
The flow-chart in Figure 2 representsthe main loop of the algorithm, whichcan be iterated any number of times. Inpractice after 2–3 iterations the numberof detected stars approaches a stablevalue.
2.3 PSF enhancement
At the end of the overall analysis, it ispossible to run again the PSF extrac-tion procedure, exploiting the upgradedestimates of the image background andof the contaminating sources aroundthe PSF stars: this should allow a bet-ter determination of the PSF. Then amore accurate analysis can be per-formed.
2.4 Fitting procedure
The fitting technique treats the PSFas a template which may be scaled andtranslated. A sub-image centred on thestar of interest is extracted and approx-imated with the model
h(x, y) = s0(x,y)+n=1
Ns ∫n p(x–xn, y–yn) +
b0 + b1 x +b2 y , (2)
where s0 (x, y ) is the fixed contribu-tion of known stars outside the sub-im-age support, Ns is the number of pointsources within the sub-image, xn , yn , ƒn
are the position and flux of the n– thsource, p(x, y) is the PSF and b0,b1,b2are the coefficients of a slanting planerepresenting the local background.
The optimisation of the parameters isperformed by minimising the leastsquares error between the data and themodel, with an iterative Newton-Gausstechnique, which requires the computa-tion of the model derivatives. For thispurpose the Fourier shift theorem is ap-plied to the PSF:
p(x – yn , y – yn) =
FT–1IFTIp(x, y)Je–i2 (uxn +vyn) /N J (3)
where FT is the discrete Fourier trans-form, N is the sub-image size and u, vare spatial frequencies. The derivativewith respect to xn is
Figure 2. Flow-chart of the algorithm for star detection and analysis.
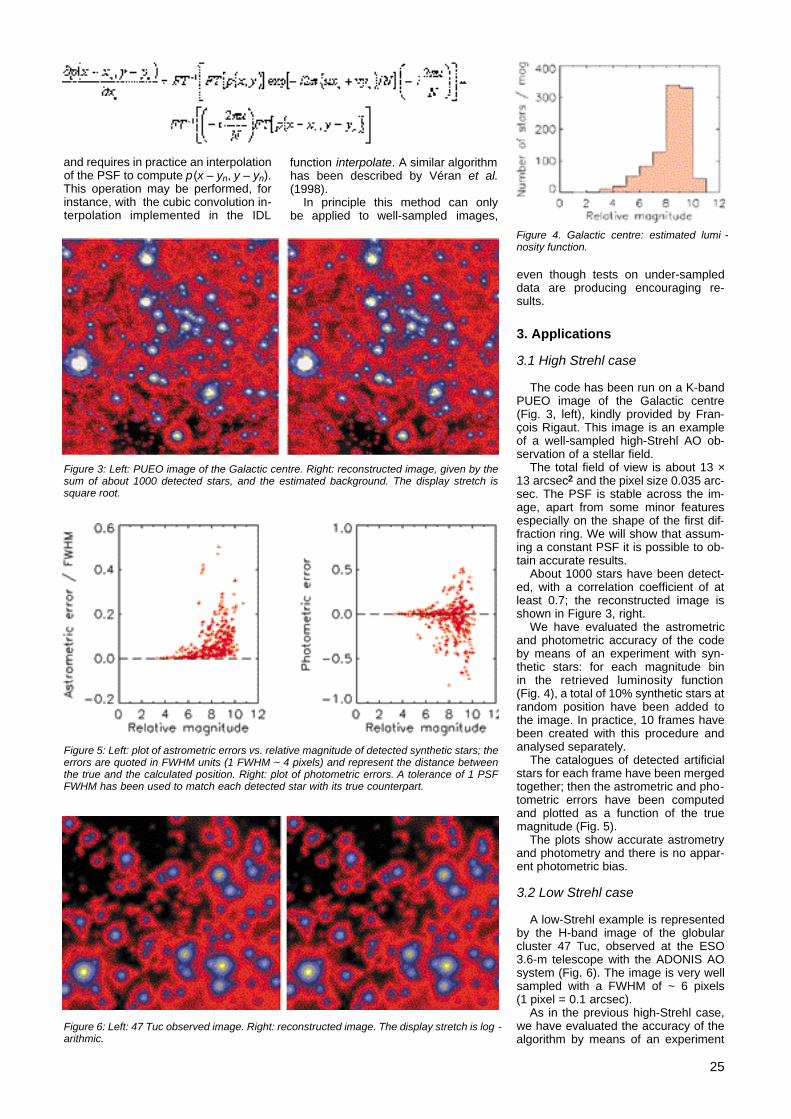
25
and requires in practice an interpolationof the PSF to compute p(x – yn, y – yn).This operation may be performed, forinstance, with the cubic convolution in-terpolation implemented in the IDL
Figure 4. Galactic centre: estimated lumi -nosity function.
Figure 5: Left: plot of astrometric errors vs. relative magnitude of detected synthetic stars; theerrors are quoted in FWHM units (1 FWHM ~ 4 pixels) and represent the distance betweenthe true and the calculated position. Right: plot of photometric errors. A tolerance of 1 PSFFWHM has been used to match each detected star with its true counterpart.
Figure 6: Left: 47 Tuc observed image. Right: reconstructed image. The display stretch is log -arithmic.
Figure 3: Left: PUEO image of the Galactic centre. Right: reconstructed image, given by thesum of about 1000 detected stars, and the estimated background. The display stretch issquare root.
function interpolate. A similar algorithmhas been described by Véran et al.(1998).
In principle this method can onlybe applied to well-sampled images,
even though tests on under-sampleddata are producing encouraging re-sults.
3. Applications
3.1 High Strehl case
The code has been run on a K-bandPUEO image of the Galactic centre(Fig. 3, left), kindly provided by Fran-çois Rigaut. This image is an exampleof a well-sampled high-Strehl AO ob-servation of a stellar field.
The total field of view is about 13 ×13 arcsec2 and the pixel size 0.035 arc-sec. The PSF is stable across the im-age, apart from some minor featuresespecially on the shape of the first dif-fraction ring. We will show that assum-ing a constant PSF it is possible to ob-tain accurate results.
About 1000 stars have been detect-ed, with a correlation coefficient of atleast 0.7; the reconstructed image isshown in Figure 3, right.
We have evaluated the astrometricand photometric accuracy of the codeby means of an experiment with syn-thetic stars: for each magnitude binin the retrieved luminosity function(Fig. 4), a total of 10% synthetic stars atrandom position have been added tothe image. In practice, 10 frames havebeen created with this procedure andanalysed separately.
The catalogues of detected artificialstars for each frame have been mergedtogether; then the astrometric and pho-tometric errors have been computedand plotted as a function of the truemagnitude (Fig. 5).
The plots show accurate astrometryand photometry and there is no appar-ent photometric bias.
3.2 Low Strehl case
A low-Strehl example is representedby the H-band image of the globularcluster 47 Tuc, observed at the ESO3.6-m telescope with the ADONIS AOsystem (Fig. 6). The image is very wellsampled with a FWHM of ~ 6 pixels(1 pixel = 0.1 arcsec).
As in the previous high-Strehl case,we have evaluated the accuracy of thealgorithm by means of an experiment

26
been analysed independently (Aloisi etal., 2000). In the F160 W frame, thanksto the finer sampling of the PSF, it hasbeen possible to apply the de-blendingstrategy based on the recognition ofblends by their larger extension ascompared to the PSF. The two images,along with the corresponding recon-struction, are shown in Figure 8.
The lists of the detected stars havebeen compared by matching the cor-responding reference frames and re-taining all the objects with a relativeoffset smaller than 1/2 pixel. A sub-set of the 3133 retrieved common stars
has been created selecting the sourceswith a very high (more than 0.975) cor-relation coefficient: high values of thisparameter are generally associated toresolved single stars. The completeset of 3133 objects (blue and redcrosses) and the selected one including195 stars (red crosses), are shown inFigure 9.
The photometric accuracy has beenevaluated by means of an experimentwith synthetic stars, similar to thoseperformed in the previous applications.The photometric errors for the success-fully detected synthetic sources in theF110 W filter are plotted in Figure 10;similar results have been obtained forthe F160 W frame. The slight bias to-ward negative errors may be attributedto the extreme crowding of this field:when a synthetic star falls on a faintersource, the latter might be lost whereasthe luminosity of the former might beoverestimated.
4. The IDL Code
The StarFinder code has been pro-vided with a collection of auxiliary rou-tines for data visualisation and basic
with synthetic stars. The astrometricand photometric errors for the detectedartificial sources are shown in Figure 7.
3.3 HST image
The last application concerns a HSTobservation of the starburst galaxyNGC 1569,observed with the NICMOScamera in the F110 W and F160 W fil-ters, roughly corresponding to the stan-dard J and H bands. The originally under-sampled dithered frames have beencombined with the Drizzle code, obtain-ing two well-sampled images which have
Figure 7: Left: plot of astrometric errors vs. relative magnitude of detected synthetic stars; theerrors are quoted in FWHM units (1FWHM ~ 6 pixels) and represent the distance betweenthe true and the calculated position. Right: plot of photometric errors. A tolerance of 1 PSFFWHM has been used to match each detected star with its true counterpart.
Figure 8: NGC 1569. Top: F110 W band, observed and reconstructed image. Bottom: F160Wband, the same. The display stretch is logarithmic.
Figure 9. The NGC 1569 CMD diagram.Blue and red crosses: complete set; redcrosses: stars with high correlation coeffi -cient.
Figure 10: Photometry accuracy plot.
27
image processing, in order to allow theuser to analyse a stellar field, producean output list of objects and comparedifferent lists, e.g. referred to differentobservations of the same target. The in-put image is supposed to be just cali-brated. The code is entirely written inthe IDL language and has been testedon Windows and Unix platforms sup-porting IDL v. 5.0 or later. A widget-based graphical user interface hasbeen created (Fig. 11). The main widg-et appearing on the computer screen isan interface to call secondary widget-based applications, in order to performvarious operations on the image. Thebasic documentation about the codecan be found in the on-line help pagesand in the attached manual. IDL users
might wish to run interactively theStarFinder routines, without the widgetfacilities: complete documentation oneach module is available for this pur-pose. A copy of StarFinder can be ob-tained in the Web page of the BolognaObservatory (w w w. b o . a s t r o . i t) or bycontacting the writer and maintainer ofthe code (E.D.) at the e-mail [email protected]
5. Conclusions
The elaboration of real and simulateddata seems to prove the effectivenessof StarFinder in analysing crowded stel-lar fields characterised by high Strehlratio PSFs and correct sampling, reach-ing in this case the full utilisation of the
data information content. The code canbe applied also to low Strehl or under-sampled data with results comparableto those attainable by other methods.StarFinder is also reasonably fast: theanalysis of a field comparable to theGalactic centre image requires be-tween 5 and 10 minutes on a normalPC (Pentium Pro-64 Mb-350 MHz).
The first improvement of StarFinder,available in a near future, will allow to an-alyse star fields with space variant PSF.
Acknowledgements
François Rigaut is acknowledged forkindly providing the PUEO image of theGalactic centre and for supporting theinitial development of this method.
References
Aloisi A. et al., 2000. In preparation.Diolaiti E. et al., 1999a, “An algorithm for
crowded stellar fields analysis”, in Astron -omy with Adaptive Optics: present resultsand future programs, Sonthofen, ESOConf. and Workshop Proc. No. 56, p.175.
Diolaiti et al., 1999b, “StarFinder: a code forcrowded stellar fields analysis” in ADASSIX, Hawaii. In press (astro-ph/9911354).
Diolaiti E. et al., 2000, “StarFinder: an IDL G U Ibased code to analyze crowded fieldswith isoplanatic correcting PSF fitting”, inAdaptive Optical System Te c h n o l o g y,Munich. In press (astro-ph/0004101).
Véran J.-P. et al., 1997, J. Opt. Soc. Am. A,14 (11), 3057.
Véran J.-P., Rigaut F., 1998, Proc. SPIE3353, 426.
VLT Laser Guide Star Facility: First Successful Testof the Baseline Laser Scheme D. BONACCINI a, W. HACKENBERGa, R.I. DAVIESb, S. RABIEN b, and T. OTTb
aESO, Garching; bMax-Planck-Institut für Extraterrestrische Physik, Garching
The planned baseline laser for theVLT Laser Guide Star Facility (LGSF)consists of dye laser modules, capableof producing > 6.5 W CW each (1). Twosuch modules can fit on a 1.5 × 1.5 moptical table. The laser concept was de-veloped in a preliminary LGSF studyphase (2) and is a variation of the ALFAlaser (3) used in Calar Alto (Spain). Ituses two Coherent Inc. all-solid stateCompass Verdi 10 W lasers at 532 nm,to pump a modified Coherent model899-21, continuous-wave (cw) ring-dyel a s e r. The dye is Rhodamine 6G(Rh6G).
Figure 1: Absorption profile of the laser dye,Rhodamine 6G.
Figure 11: Widget based GUI interface.
28
We report here the results of test-ing the LGSF baseline configurationwith one 10 W Verdi pump. For thistest we pumped the 899-21 ring-dyel a s e r, using alternatively the A L FAArgon-ion pump, or one 10 W CWVerdi. We have used both relativelyaged as well as fresh dye solutions.This test is one of a series that hasbeen carried out during the period13–17 May 2000 in the ALFA laser lab-oratory at Calar Alto by ESO in collabo-ration with the team at the Max-Planck-Institut für Extraterrestrische Physik,that is responsible for the ALFA lasersystem.
Several advantages are obtainedwith the solid state Verdi as pumplaser:
• The pump laser electrical powerconsumption (for example an equiva-lent output power of 4.5 W CW) isreduced by a factor ~ 37 from 46 kWto 1.25 kW, allowing the laser sys-tem to be installed in the VLT telescopearea.
• The Verdi pump wavelength of 532nm is perfectly matched to the absorp-tion peak of Rh6G, as opposed to themain Ar+ wavelength at 514 nm (Fig. 1).The dye-laser output power should,therefore, increase by > 40%.
• The size of the pump laser is re-duced by a factor ~ 5, allowing a small-er optical bench to be used.
The Experiment
We have modified the ALFA laser-bench set-up to accommodate flippingbetween pump lasers. We have limitedthe experiment to the use of a singleVerdi laser, with 9.5 W maximumpump power into the 899-21 dyelaser. We varied the pump powers ofthe Ar+ and Verdi lasers, from 2 to 9.5W, measuring the dye-laser output
power and beam quality at 589 nm. Ateach iteration, we have optimised the589 nm output power adjusting thecondensing optics focus on the dyejet, and the alignment of the ring res-onator laser. This was necessary be-cause of the varying thermal load onthe resonator optics. The dye-solutioncirculation pump was set to a pressureof 11 bar.
Using the Verdi laser as pump we ob-served the following:
• less critical alignment tolerances inthe ring-dye laser, compared to the Ar+
• lower output power sensitivity todye aging.
• higher output power, up to 3.6 WCW for 9.5 W pump, with a 44% in-crease over the Ar+ pump efficiency.
Optimisation of the nozzle and an in-crease of the dye-circulation pumppressure are expected to give a furtherimprovement in output power.
In Figure 2, the single-mode dye-laser output power as a function of thepump power at the 899-21 dye-laser in-put is shown. The output power revealsa linear dependence on the pump pow-er up to the maximum available inputpower of 9.5 W. At this pump power, thesingle-mode output power was meas-ured to be 3.6 W with an extremelygood beam quality (M2 = 1.13). The op-tical conversion efficiency of 38%, to-gether with the high beam quality, areexcellent results for a high-power CWdye-laser system. The free-flowing dye-jet stream was not fully optimised forthe 532 nm wavelength. We expect tosee further improvements in the con-version efficiency when this is opti-mised.
Conclusions
We now have experimental evidencethat the baseline LGSF laser will meet
Figure 2: Output powers at 589 nm from the 899-21 ring-dye laser, for different laser-pumppowers. The Verdi laser (532 nm) and the Innova Ar+ lasers from Coherent Inc. were used.The Verdi pumping gives up to 44% more output, at equivalent pumping powers. The base -line laser module proposed for LGSF will have 20 W pump input power.
Figure 3: Equivalent V-band magnitude of the LGS, versus sodium laser output power. Theone-way transmission assumed for the atmosphere is 0.8 and for the launch optics 0.75, witha sodium column density of 5 1013 m–2. These are typical average conditions. The threecurves represent different LGS zenithal distances.
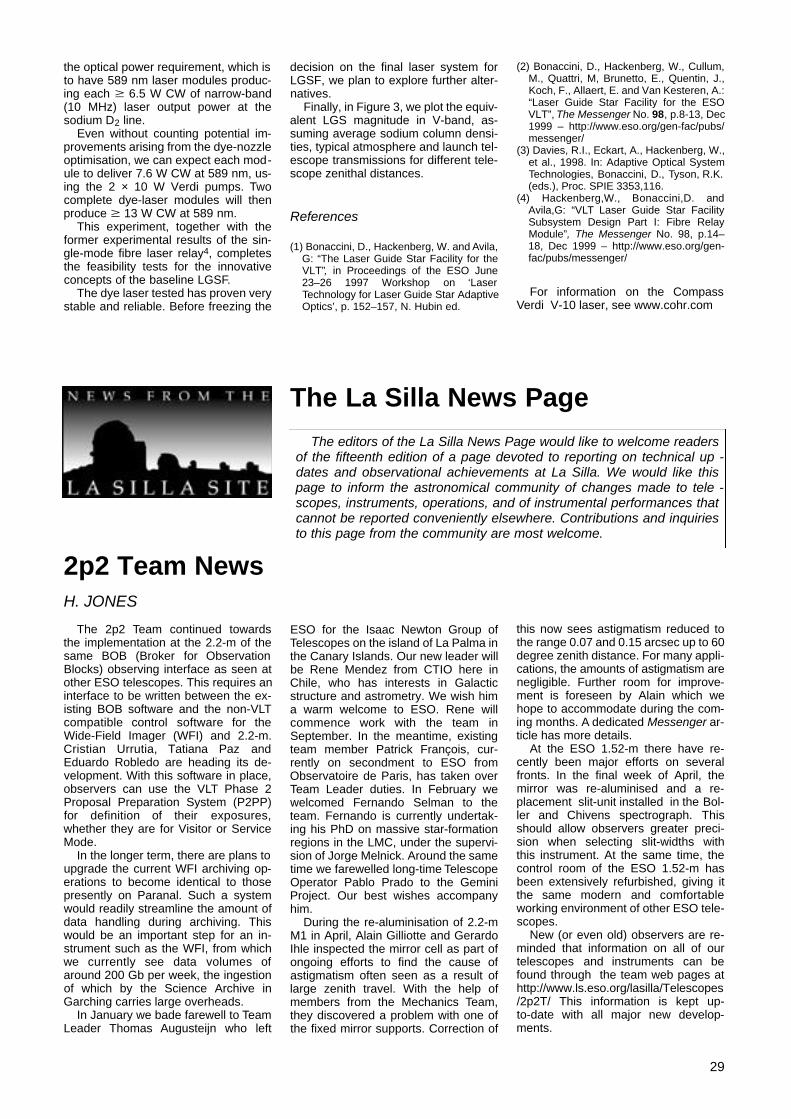
29
2p2 Team News H. JONES
The 2p2 Team continued towardsthe implementation at the 2.2-m of thesame BOB (Broker for ObservationBlocks) observing interface as seen atother ESO telescopes. This requires aninterface to be written between the ex-isting BOB software and the non-VLTcompatible control software for theWide-Field Imager (WFI) and 2.2-m.Cristian Urrutia, Tatiana Paz andEduardo Robledo are heading its de-velopment. With this software in place,observers can use the VLT Phase 2Proposal Preparation System (P2PP)for definition of their exposures,whether they are for Visitor or ServiceMode.
In the longer term, there are plans toupgrade the current WFI archiving op-erations to become identical to thosepresently on Paranal. Such a systemwould readily streamline the amount ofdata handling during archiving. Thiswould be an important step for an in-strument such as the WFI, from whichwe currently see data volumes ofaround 200 Gb per week, the ingestionof which by the Science Archive inGarching carries large overheads.
In January we bade farewell to TeamLeader Thomas Augusteijn who left
ESO for the Isaac Newton Group ofTelescopes on the island of La Palma inthe Canary Islands. Our new leader willbe Rene Mendez from CTIO here inChile, who has interests in Galacticstructure and astrometry. We wish hima warm welcome to ESO. Rene willcommence work with the team inSeptember. In the meantime, existingteam member Patrick François, cur-rently on secondment to ESO fromObservatoire de Paris, has taken overTeam Leader duties. In February wewelcomed Fernando Selman to theteam. Fernando is currently undertak-ing his PhD on massive star-formationregions in the LMC, under the supervi-sion of Jorge Melnick. Around the sametime we farewelled long-time TelescopeOperator Pablo Prado to the GeminiProject. Our best wishes accompanyhim.
During the re-aluminisation of 2.2-mM1 in April, Alain Gilliotte and GerardoIhle inspected the mirror cell as part ofongoing efforts to find the cause ofastigmatism often seen as a result oflarge zenith travel. With the help ofmembers from the Mechanics Team,they discovered a problem with one ofthe fixed mirror supports. Correction of
this now sees astigmatism reduced tothe range 0.07 and 0.15 arcsec up to 60degree zenith distance. For many appli-cations, the amounts of astigmatism arenegligible. Further room for improve-ment is foreseen by Alain which wehope to accommodate during the com-ing months. A dedicated Messenger ar-ticle has more details.
At the ESO 1.52-m there have re-cently been major efforts on severalfronts. In the final week of April, themirror was re-aluminised and a re-placement slit-unit installed in the Bol-ler and Chivens spectrograph. T h i sshould allow observers greater preci-sion when selecting slit-widths withthis instrument. At the same time, thecontrol room of the ESO 1.52-m hasbeen extensively refurbished, giving itthe same modern and comfortableworking environment of other ESO tele-scopes.
New (or even old) observers are re-minded that information on all of ourtelescopes and instruments can befound through the team web pages athttp://www.ls.eso.org/lasilla/Telescopes/2p2T/ This information is kept up-to-date with all major new develop-ments.
The La Silla News PageThe editors of the La Silla News Page would like to welcome readers
of the fifteenth edition of a page devoted to reporting on technical up -dates and observational achievements at La Silla. We would like thispage to inform the astronomical community of changes made to tele -scopes, instruments, operations, and of instrumental performances thatcannot be reported conveniently elsewhere. Contributions and inquiriesto this page from the community are most welcome.
the optical power requirement, which isto have 589 nm laser modules produc-ing each M 6.5 W CW of narrow-band(10 MHz) laser output power at thesodium D2 line.
Even without counting potential im-provements arising from the dye-nozzleoptimisation, we can expect each mod-ule to deliver 7.6 W CW at 589 nm, us-ing the 2 × 10 W Verdi pumps. Twocomplete dye-laser modules will thenproduce M 13 W CW at 589 nm.
This experiment, together with theformer experimental results of the sin-gle-mode fibre laser relay4, completesthe feasibility tests for the innovativeconcepts of the baseline LGSF.
The dye laser tested has proven verystable and reliable. Before freezing the
decision on the final laser system forLGSF, we plan to explore further alter-natives.
Finally, in Figure 3, we plot the equiv-alent LGS magnitude in V-band, as-suming average sodium column densi-ties, typical atmosphere and launch tel-escope transmissions for different tele-scope zenithal distances.
References
(1) Bonaccini, D., Hackenberg, W. and Avila,G: “The Laser Guide Star Facility for theVLT”, in Proceedings of the ESO June23–26 1997 Workshop on ‘LaserTechnology for Laser Guide Star AdaptiveOptics’, p. 152–157, N. Hubin ed.
(2) Bonaccini, D., Hackenberg, W., Cullum,M., Quattri, M, Brunetto, E., Quentin, J.,Koch, F., Allaert, E. and Van Kesteren, A.:“Laser Guide Star Facility for the ESOVLT”, The Messenger No. 98, p.8-13, Dec1999 – http://www.eso.org/gen-fac/pubs/messenger/
(3) Davies, R.I., Eckart, A., Hackenberg, W.,et al., 1998. In: Adaptive Optical SystemTechnologies, Bonaccini, D., Tyson, R.K.(eds.), Proc. SPIE 3353,116.
(4) Hackenberg,W., Bonaccini,D. andAvila,G: “VLT Laser Guide Star FacilitySubsystem Design Part I: Fibre RelayModule”, The Messenger No. 98, p.14–18, Dec 1999 – http://www.eso.org/gen-fac/pubs/messenger/
For information on the CompassVerdi V-10 laser, see www.cohr.com

30
After completion of the 3.6-m up-grade project (about which was report-ed in the September 1999 issue of TheMessenger), we are now in a phase ofconsolidation, system finetuning, andoptimisation. The general operation oftelescope and instrumentation has nowbecome very smooth and reliable, andthe users are in general very pleasedand satisfied with the quality, stabilityand comfort that is offered to them.
One week of planned technicaldowntime was required to perform vari-ous maintenance actions last March.Over the past four years, M1 has beensuccessfully re-aluminised in a joint ef-fort of our optics and mechanics team inLa Silla. We received a “new” mirror, in-creased in reflectivity from below 83%to about 90.4%, with microroughnessvariations from 45 Å to 70 Å. On thesame occasion, our lateral pad system(which keeps M1 in its mirror cell with-out movement or optical aberrations)has been thoroughly revised and ad-justed. One radial pneumatic valve has
been found damaged by water con-tamination and has been replaced.During the removal of the M1 cell, thenew painting of the telescope was fin-ished, it now shines in fresh, bluecolours. Useless air-conditioning ductswere also removed from the domearea.
The second instrument at the 3.6-mthat is now running under fully VLT-compliant control is the CES. This in-strument has seen a large number ofimprovements during the past months.The coudé room has been refurbished,permitting an improved temperaturestability and light tightness. The pre-dis-perser has received a long-a w a i t e dnew control mechanism which permitsvery precise and reproducible position-ing. Also, the grating and slit drivemechanisms were changed in order tomake them VLT compliant. All this hasled to a nightly spectral stability as wellas a night-t o-night reproducibility of0.055 px rms, corresponding to 26 ms–1
at a wavelength of 5400Å. The new
EEV CCD in use with the CES providesexcellent cosmetics and an increasedwavelength coverage with 4096 pixelsin the dispersion direction (e.g. 35.5Å at5400Å). A new exposure meter has alsobeen integrated into the instrument.
The La Silla detector group is curent-ly testing another EEV CCD which hasa better quantum efficiency, especiallyin the blue (below 4000 Å), and seemsto be comparable to the present one interms of its other properties (cosmetics,read-out noise). The coming weeks willalso see the test of a new object fibrewhich also has an improved blue effi-ciency. Provided that both tests yieldsatisfactory results, the future CES blueefficiency might be enhanced by a fac-tor of about 4 altogether.
In the course of writing these lines,the infrared f/35 focus and adapter arebeing commissioned under VLT-S Wcontrol. Although TIMMI2, the new, sec-ond-generation mid-infrared multi-mode instrument is not a genericVLT-compliant instrument, it will nev-
ertheless make elegantuse of the features ofthe new control system.All cryogenic tests ofTIMMI2 have been suc-cessfully passed, andd e t e c t o r, optomechan-ics and instrument con-trol software are com-pleted. Instrument inte-gration will take place atLa Silla in the premisesof our telescope, and itis now expected that theinstrument will be of-fered to the communitynext September orOctober.
A new operationalastronomer at the 3.6mtelescope is NancyAgeorges. She will con-centrate primarily on ourIR instrumentation, es-pecially the operationalsupport for TIMMI2. Shereplaces Pierre Leisy,who has now becomeintegrated into the NTTteam. For us, Pierre willcontinue developingand implementing anEFOSC DFS pipeline.Nancy’s experience withADONIS will also allowher to partially cover thehole that the ADONISinstrument scientist,Olivier Marco, will openwhen he starts work onParanal in Septemberthis year.
News from the 3.6-m TelescopeM. STERZIK, M. KÜRSTER, and the 3.6-m Telescope Team, ESO
The 3.6-m telescope after installation of the re-aluminised M1. Photographer: H.-H. Heyer

31
La Silla under the Milky Way. Photographer: H.-H. Heyer

32
1. Introduction
“New kids on the block” – perhapsthis is the best way to describe cosmicgamma-ray bursts among the multitudeof object types that can be studied byoptical telescopes. When they pop up,they give a lot of trouble, and for a whiletake the attention from all the work inprogress. In this report we will describehow ESO observers are making mostout of these exciting opportunities, andhow the VLT promises to integratespace and ground-based observationsin a way never achieved before. Butfirst a few words on the historical back-ground.
2. The Basics
Cosmic gamma-ray bursts (GRB)are studied from spacecraft, since γ-ra-diation does not penetrate the Earth’satmosphere. The first detection wasmade in 1967, but the phenomenon be-came publicly known only in 1973,when 16 events were published, in theAstrophysical Journal. This first paperled to a flurry of theoretical works; forseveral years, the rate with which mod-els were proposed kept pace with thedetection of new events. Likewise, onthe experimental side, numerous initia-tives were taken. To date, more than 60spacecraft have carried successfulgamma-ray burst detectors. The moste fficient was BATSE on board theCompton Gamma-Ray Observatory.This instrument has detected about oneevent every day, on average, since itslaunch in April 1991.
The hallmark of gamma-ray bursts isdiversity: durations can be anything be-tween a few milliseconds and severalminutes. Gamma-ray burst ‘light-curves’ take numerous shapes, fromsmooth, single peaks to very jagged,multi-peaked graphs. They come fromever new directions, and until recently
they could not be associated with anyknown object population, be it solar-system objects, stars from the MilkyWay, distant galaxies, or even quasars.Their γ-ray spectra do not show any ob-vious emission or absorption lines thatcould help identify the physical proc-esses responsible for the phenomenon.
Many gamma-ray bursts are surpris-ingly bright (in γ-rays, 0.1–100 MeV) –for a short moment they easily out-shine the sum of all other celestial high-energy sources. Conversely, near theinstrumental detection limit there arefewer events than expected from a ho-mogeneous distribution through anEuclidean space. This lack of faintbursts could be explained by either alarge Galactic halo population, or a cos-mological origin for gamma-ray bursts.
During the early years, it was repeat-ed over and over that optical observa-tions were needed to finally clinch thedistance question. Only thereby couldone know the total (absolute) amount ofenergy emitted, and then start dis-cussing in earnest, what is the funda-mental physical process in gamma-raybursts.
3. The BeppoSAX Legacy
In the beginning of 1997, this wishwas fulfilled. The previous year, anItalian-Dutch consortium had launchedthe Satellite per Astronomia X, SAX,nicknamed BeppoSAX after the ItalianCosmic-ray and X-ray astronomy pio-neer Giuseppe Occhialini.
The satellite was primarily intendedto study the 0.1–300 keV spectrum ofgalactic and extragalactic sources withfour Narrow-Field Instruments (NFIs).The scientific payload onboard Beppo-SAX also includes a Gamma-Ray BurstMonitor (GRBM, 40–700 keV, all-skycoverage), which is the non-imaginganticoincidence system of the high-en-ergy NFI (the PDS), and two coded-mask Wi d e-Field Cameras (WFCs,2–26 keV, 40° × 40° field), pointing atright angles with respect to the NFIs.
Although gamma-ray burst investiga-tion was a secondary task of Beppo-
R E P O RTS FROM OBSER V E R S
SAX, the simultaneous detection ofgamma-ray bursts by the GRBM andone of the WFCs proved to be crucial inidentification of their counterparts atlower energies thanks to the rapid (4–5hours) and accurate (~ 3′) localisationafforded by the WFCs.
The good scheduling flexibility ofBeppoSAX allows a prompt repointingof the NFIs at the gamma-ray burst er-ror circle and efficient search of theX-ray counterpart. In case of NFI de-tection of a gamma-ray burst afterglowcandidate in X-rays, the error circle isreduced to ~ 50″ in radius. Meanwhile,the rapid dissemination of the error cir-cle centroid co-ordinates makes fastfollow-up at ground-based telescopespossible.
The first error circle thus establishedwas for GRB 960720, but came 45 daysafter trigger and did not result in thefinding of a counterpart (in ’t Zand et al.,1997). The next, GRB 970111, was an-nounced promptly, and search in theinitially large WFC error circle turned upa number of sources, none of which layin the refined error circle established afew days later2. Then, ‘third time lucky’,came the burst of 28 February 1997,which revolutionised the field. It was de-tected in the WFC and located to a 3′error circle. Prompt reorientation of thesatellite and activation of the NFIs 10hours after the burst led to the localisa-tion of a bright, previously unknownX-ray source (Costa et al., 1997).
A second NFI observation 3 days lat-er showed that the source had faded bya factor of 20. Subsequent observa-tions with the ASCA and ROSAT satel-lites confirmed that the source fadedwith a power-law, I ∝ (t – tGRB)α wheretime is counted in days, and α ~ –1.3.This type of decay had indeed beenpredicted by Mészáros and Rees(1997). In their “fireball” model, a mix-ture of matter and photons expands at
Gamma-Ray Bursts1 – Pushing Limits with the VLTH. Pedersen1a, J.-L. Atteia2, M. Boer 2, K. Beuermann3, A.J. Castro-Tirado4, A. Fruchter 5,J. Greiner6, R. Hessman2, J. Hjorth1b, L. Kaper7, C. Kouveliotou 7,8, N. Masetti9, E. Palazzi 9,E. Pian9, K. Reinsch 2, E. Rol7, E. van den Heuvel7, P. Vreeswijk7, R. Wijers10
1aCopenhagen University Observatory, [email protected]; 1bCopenhagen University Observatory;2CESR, Toulouse; 3Universitäts-Sternwarte, Göttingen; 4LAEFF-INTA, Madrid, and IAA-CSIC, Granada, Spain;5Space Telescope Science Institute, Baltimore, USA; 6Astrophysikalisches Institut Potsdam;7Astronomical Institute “Anton Pannekoek”, Amsterdam; 8NASA/USRA, Huntsville, Alabama, USA;9Ist. TeSRE, CNR, Bologna; 10Dept. of Physics and Astronomy, SUNY Stony Brook, USA
1This year’s Annual Review of Astronomy andAstrophysics will include a review paper onGamma-Ray Bursts, authored by Jan van Paradijs,Chryssa Kouveliotou, and Ralph Wijers.
2In hindsight, the NFI follow-up observation of thisevent shows a faint source. This source is consis-tent with being an afterglow, given what we havelearnt of afterglows from later events, but was notrecognised as such at the time.
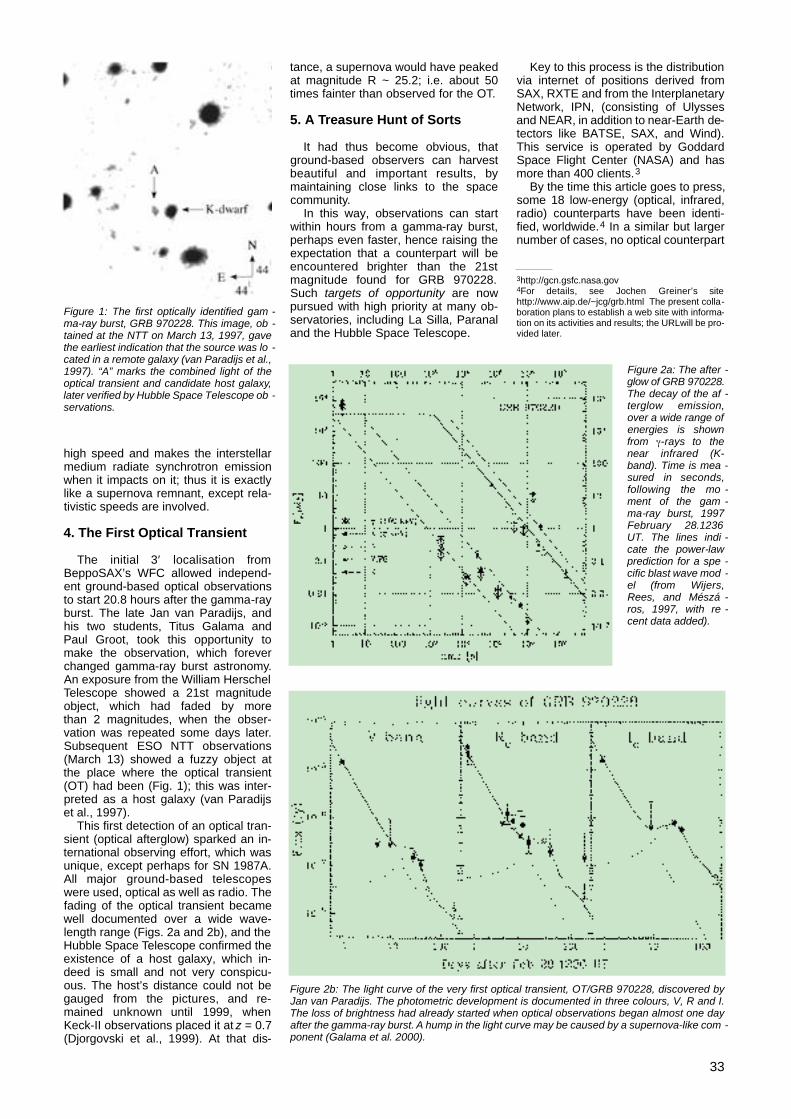
33
Figure 2a: The after -glow of GRB 970228.The decay of the af -terglow emission,over a wide range ofenergies is shownfrom -r a y s to thenear infrared (K-band). Time is mea -sured in seconds,following the mo -ment of the gam -ma-ray burst, 1997February 28.1236UT. The lines indi -cate the power-lawprediction for a spe -cific blast wave mod -el (from Wi j e r s ,Rees, and Mészá -ros, 1997, with re -cent data added).
high speed and makes the interstellarmedium radiate synchrotron emissionwhen it impacts on it; thus it is exactlylike a supernova remnant, except rela-tivistic speeds are involved.
4. The First Optical Transient
The initial 3′ localisation fromBeppoSAX’s WFC allowed independ-ent ground-based optical observationsto start 20.8 hours after the gamma-rayburst. The late Jan van Paradijs, andhis two students, Titus Galama andPaul Groot, took this opportunity tomake the observation, which foreverchanged gamma-ray burst astronomy.An exposure from the William HerschelTelescope showed a 21st magnitudeobject, which had faded by morethan 2 magnitudes, when the obser-vation was repeated some days later.Subsequent ESO NTT o b s e r v a t i o n s(March 13) showed a fuzzy object atthe place where the optical transient(OT) had been (Fig. 1); this was inter-preted as a host galaxy (van Paradijset al., 1997).
This first detection of an optical tran-sient (optical afterglow) sparked an in-ternational observing effort, which wasunique, except perhaps for SN 1987A.All major ground-based telescopeswere used, optical as well as radio. Thefading of the optical transient becamewell documented over a wide wave-length range (Figs. 2a and 2b), and theHubble Space Telescope confirmed theexistence of a host galaxy, which in-deed is small and not very conspicu-ous. The host’s distance could not begauged from the pictures, and re-mained unknown until 1999, whenKeck-II observations placed it at z = 0.7(Djorgovski et al., 1999). At that dis-
tance, a supernova would have peakedat magnitude R ~ 25.2; i.e. about 50times fainter than observed for the OT.
5. A Treasure Hunt of Sorts
It had thus become obvious, thatground-based observers can harvestbeautiful and important results, bymaintaining close links to the spacecommunity.
In this way, observations can startwithin hours from a gamma-ray burst,perhaps even faster, hence raising theexpectation that a counterpart will beencountered brighter than the 21stmagnitude found for GRB 970228.Such targets of opportunity are nowpursued with high priority at many ob-servatories, including La Silla, Paranaland the Hubble Space Telescope.
Key to this process is the distributionvia internet of positions derived fromSAX, RXTE and from the InterplanetaryNetwork, IPN, (consisting of Ulyssesand NEAR, in addition to near-Earth de-tectors like BATSE, SAX, and Wind).This service is operated by GoddardSpace Flight Center (NASA) and hasmore than 400 clients.3
By the time this article goes to press,some 18 low-energy (optical, infrared,radio) counterparts have been identi-fied, worldwide.4 In a similar but largernumber of cases, no optical counterpart
Figure 1: The first optically identified gam -ma-ray burst, GRB 970228. This image, ob -tained at the NTT on March 13, 1997, gavethe earliest indication that the source was lo -cated in a remote galaxy (van Paradijs et al.,1997). “A” marks the combined light of theoptical transient and candidate host galaxy,later verified by Hubble Space Telescope ob -servations.
Figure 2b: The light curve of the very first optical transient, OT/GRB 970228, discovered byJan van Paradijs. The photometric development is documented in three colours, V, R and I.The loss of brightness had already started when optical observations began almost one dayafter the gamma-ray burst. A hump in the light curve may be caused by a supernova-like com -ponent (Galama et al. 2000).
3http://gcn.gsfc.nasa.gov4For details, see Jochen Greiner’s sitehttp://www.aip.de/~jcg/grb.html The present colla-boration plans to establish a web site with informa-tion on its activities and results; the URLwill be pro-vided later.

34
was found. The reason for this is notclear; possibly these searches were notswift nor deep enough, but in two cas-es (GRB 970828, 000214, and perhapsalso 970111) the optical fluxes, predict -ed from X-ray observations are wellabove detection limits.
The high redshift found for the GRB970228 host galaxy turned out notto be anywhere near the record. ForGRB 971214, the value z = 3.4 wasfound (Kulkarni et al., 1998), implyingthat the burst was emitted 10 billionyears ago, equivalent to when theUniverse was 11% of its current age.5The energetics are equally stunning:assuming isotropic γ-ray emission, thisburst must have emitted 3 × 1053 erg,equivalent to 16% of the Sun’s rest-mass energy.
6. The Supernova Connection
Just as redshifts in the range 0.7–3.4 were about to become accepted, agamma-ray burst from April 25, 1998,gave reason to rethink the distancescale. The gamma-ray burst itself wasnot exceptional, but the optical counter-part certainly was. Observations initiat-ed three days later, at the NTT, showed
that the error box included a cataloguedgalaxy, ESO 184–G82. In one of thespiral arms, a 16th magnitude objectwas noted (Fig. 3); spectroscopyshowed this to be a supernova, of typeIc. Could this be a chance alignment?Taking into account the coincidence inboth time and place, Jan van Paradijsconservatively calculated the probabili-ty as 10–4. This is small, but not entire-ly convincing. The distance to thegalaxy was quickly measured with theAnglo-Australian Telescope to be z =0.0085, or a mere 130 million light-years. If really the high-energy eventwas that close, it would mean that gam-ma-ray bursts span over a very wide,intrinsic luminosity range, at least a fac-tor 10,000 (Galama et al., 1998). Ad-ding to the probability that the two phe-nomena are indeed related, is the factthat the SN 1998bw in itself is highly un-usual, with outflow velocities exceeding50% of the speed of light (e.g. Leibund-gut et al., 2000).
Could there be other supernovae,emitting gamma-ray bursts, or could aSN-like contribution to the light-curvebe detected in other optical transients?N a t u r a l l y, the existing material wasscrutinised, and for OT/GRB 970228,the very first OT, a hump, consistentwith a high-redshift supernova is indeednoted some 20–30 days after the gam-ma-ray burst (Fig. 2). Also for GRB
980326, a SN-hump was found (Bloomet al., 1999). In other cases no such SNsignature has been observed. It re-mains uncertain, if there are severalclasses of cosmological gamma-r a ybursts or if all are associated with su-pernovae, or none.
7. A Spectacular Event in theNorthern Sky
On January 23, 1999, a very brightgamma-ray burst occurred in theNorthern sky. Its approximate position,derived from BATSE, was distributedover the internet, and within seconds, arobotic telescope at Los A l a m o sNational Laboratories started takingpictures. It caused a sensation in theGRB community, when these data wereexamined: in its maximum, 47 secondsafter the burst trigger and before theγ-ray emission had ceased, the OT hadbeen as bright as 9th magnitude(Akerlof et al., 1999); it could, in princi-ple, have been seen in a pair of binoc-ulars!
The first expectation was that thisevent was very close. However, a fewdays later, the redshift z = 1.6 was de-rived (from Keck-II and the NordicOptical Telescope). This implies an en-ergy output corresponding to almosttwo neutron star rest masses. Or inother terms: if GRB 990123 had takenplace in the Andromeda Galaxy, the op-tical flash would have been as bright asthe full moon! Such energy output chal-lenges some of the most popular mod-els for the basic energy source, merg-ing pairs of neutron stars. It should alsobe recalled that no known stellarprocess will convert mass to electro-magnetic energy with 100% efficiency,much is lost in neutrinos. However, ifthe outflow was directional or jet-like,instead of isotropic, this ‘energy crisis’could be lifted.
Unfortunately, it is not the rule that allOTs reach this peak brightness. In atleast a dozen of other cases a limit of14th magnitude was found from roboticCCD observations, and less stringentlimits exist from wide-field (all-sky) pho-tographic exposures.
8. Discovery of Polarisation
With the first unit of the VLT (ANTU)in service in April 1999, it was natural todo an all-out effort, as soon as a suit-able event occurred. On May 10, mem-bers of our team identified the counter-part of a gamma-ray burst, using theSutherland 1-m in South Africa. When itbecame night in Chile, everything wasprepared, and FORS1 data could betaken already 20 hours after the gam-ma-ray burst.
This gave one of the first opportuni-ties to try polarimetric observations of agamma-ray burst counterpart. The split-ting of light in orthogonal planes has thepotential of revealing information on the
5For standard cosmology parameters H0 = 65km/s/Mpc, Ω = 0.3, Λ = 0.
Figure 3: On April 25, 1998, a gamma-ray burst appeared from a location compatible with ahighly unusual supernova, SN 1998bw, in the spiral galaxy ESO 184-G82. This picture wasobtained at the NTT on May 1, 1998 (Galama et al., 1998). If the association is physical, thisimplies a much closer distance than observed for several other gamma-ray bursts.

35
nature of the light source. The VLT datashowed a significant amount of linearpolarisation, 1.6 ± 0.2 per cent, 0.86days after the burst, and similar, after1.81 days (Covino et al., 1999; Wijerset al., 1999). It was concluded that thepolarisation is intrinsic to the sourceand that it supports the emission’s ori-gin as synchrotron radiation. Polarisa-tion, especially a change in polarisationdegree and angle, can also argue for ajet-shaped outflow. The second polari-sation measurement, although of lowersignificance, indeed provides this evi-dence (see also below). It is clear,though, that this research is in its in-fancy.6
Optical spectra at several epochswere also obtained, displaying severalmetal absorption lines from e.g. ionisediron, neutral and ionised magnesium.This implies that the OT was at a red-shift of z > 1.6 (Fig. 4). The neutralmagnesium is indicative of a low-ioni-sation, dense interstellar medium, mostlikely that of the host galaxy. However,neither the VLT nor Hubble was able todetect a galaxy at the position of the op-tical afterglow down to V ~ 28. Thisshows the enormous power of gam-ma-ray bursts to probe the interstellarmedium to high redshifts. The spectralflux distribution and the light curve sup-port the interpretation of the afterglowas synchrotron emission from a jet(Covino et al., 1999; Wijers et al.,1999).
9. NTT and VLT SettingStandards
With less than 20 OTs known, almostany new discovery will strike a record ofsome kind. In case of GRB 990712, theV LTspectrum gave the redshift z = 0.43,corresponding to 4 billion years (Vr e e s-wijk et al. 1999b; Hjorth et al. 2000). T h i s
is larger than found for the presumedassociation GRB 980425 / SN1988bw,but smaller than other OTs, for whichthe median redshift is near z = 1.
The faintest OT at discovery wasOT/GRB 980329, measured at R = 23.6when first detected at the NTT (Palazziet al., 1999).
Another remarkable NTT discoverywas that of OT/GRB 990705; this wasthe first identification achieved in thenear-infrared (Masetti et al., 2000).
Optical spectroscopy of GRB 991216gave the first indication of multiple ab-
sorption line systems, conceivably aris-ing from clouds separate from a hostgalaxy, and much closer to the Earth.The particular observation was made atthe VLT, and showed no less than threeabsorption line systems, at z = 0.77, z= 0.80 and z = 1.02 (Vreeswijk et al.,1999a). The redshift of the OT mustthen be z M 1.02
A record of sorts was due to a gam-ma-ray burst from January 31, 2000,positioned by means of IPN data; thisbecame the OT identified with thelongest delay. When VLT observationscould begin, on February 4, it was al-ready more than three days since theburst, and hopes for an optical identifi-cation were not high, in particular, sincethe error box was larger than theFORS1 field of view. Taking two point-ings, and repeating them two and fourdays later, the OT was discovered as ared, fading object, R > 23 (Fig. 5)(Pedersen et al., 2000; Andersen et al.,2000).
10. GRB 000301c – a Multi-Site Event
The study of gamma-ray bursts hasbecome a field where contributionsfrom many sites are needed, partly foraround-the-clock coverage, partly forwavelength coverage. Observationstypically start with a space-borne detec-tion, followed by ground-based optical,infrared, and radio studies.
Figure 4: A VLT/FORS1 spectrum of the afterglow of ORB 990510, 20 hours after the burst.Several absorption features are detected, corresponding to the redshift z = 1.6; the OT andthe host galaxy may well be more distant. Special symbols mark telluric (atmospheric) ab -sorption bands. Adapted from Vreeswijk et al. (1999b).
Figure 5: A true colour photograph of GRB 000131, obtained from VLT/FORS1 and 1.54-mDanish observations. From Andersen et al. (2000).
6A second, successful polarisation measurementwas made on GRB 990712 (Rol et al., ApJ, sub-mitted).

36
GRB 000301c may serve as an illus-tration. This was a brief (~ 10 s) event,localised by means of data from RXTE,NEAR and Ulysses. The first to reactwere two Indian observatories, and tel-escopes at Loiano, Calar Alto and LaPalma (NOT). Data from the NOT pro-vided a candidate OT, and confirmationwas soon received from elsewhere, in-cluding radio-, mm and near-infraredtelescopes.
Although the source faded quickly,the VLT could be used to obtain spec-tra, and other ESO telescopes to ac-quire multicolour optical photometry(Jensen et al., 2000).
The source has been subject to sev-eral runs at the Hubble Space Tele-scope. This included a remarkablespectroscopic observation with STIS:the Ly-α break was detected at z ~ 2(Fig. 6) (Fruchter et al., 2000a). Thiswas soon confirmed (and improvedupon) with data from Keck-II (Castro etal., 2000) and VLT. Locating the hostgalaxy, and finding the relative positionof the OT within it, turned out to be par-ticularly difficult. Continued imaging byHubble has failed to show clear evi-dence for a host, to very deep limits(Fruchter et al., 2000b).
11. Challenging Physics
The pace of discoveries in the field ofgamma-ray bursts is truly remarkable.While credit for this goes to many col-leagues from the space research com-munity, we wish here to point to thepeople behind the BeppoSAX satellite,and in particular to Jan van Paradijs.Without his faith in co-ordinated opticalobservations, we would not have comenearly as far.
Current research falls in two maincategories:
• the study of the origin and physicalmechanism of gamma-ray bursts and
• the use of gamma-ray bursts ascosmological probes, irrespective of theunderlying physical mechanism.
This is indeed what we have in mindfor the next two years, during which anapproved ‘Large Programme’ will beconducted. The project includes a studyof the preferred locations of the burstswithin the host galaxies (central loca-tion, in spiral arm, etc.) and also thevery nature of the hosts. How do thetypical hosts relate to other members ofthe high-z ‘zoo’, such as Lyman-breakgalaxies, Damped Lyman-α Absorbers(DLAs), and the luminous IR galaxies?What is the star-formation rate in thesehosts?
The central questions regarding theemission mechanism involves identify-ing:
• the gamma-ray burst progenitors,the main contenders being mergingneutron stars or collapsing massivestars (‘collapsars’),
• the emission mechanism, e.g. syn-chrotron emission,
• the emission geometry, in particularto what extent gamma-ray bursts arecollimated and the size of the jet open-ing angle,
• the density structure and composi-tion of the immediate surroundings ofthe gamma-ray burst.
There are high hopes that gamma-ray burst afterglows will prove useful inprobing hotly debated cosmologicalquestions, such as the large-s c a l estructure of the Universe, the star-for-mation history of the Universe, the veryhigh-redshift Universe, the effect of ex-
tinction at high redshifts, and the natureof DLAs. Gamma-ray bursts could wellbe among the most distant detectablesources in the Universe; if they comefrom massive stars they should occursoon after the first stars formed, per-haps at redshifts as high as z ~ 20. Withthis in mind, future searches at ESO willapply the VLT ’s ISAAC and NTT’sSOFI, in addition to optical instruments.
Our programme also aims to improveon typical response times, so thatUVES observations can be conductedin a semi-automated fashion, while theO Ts are sufficiently bright, perhapswithin 5 minutes from the ‘trigger’ mo-ment delivered by spacecraft. This mayreveal knowledge not only about theOTs and their hosts, but also about theintervening intergalactic medium; in thisway, OTs may turn out to be more use-ful cosmological probes than quasars.
The unpredictable nature of gamma-ray bursts implies that the programmecan only be executed under target-of-opportunity conditions. We appreciatethe kind assistance rendered by ESOstaff, and the understanding shown bymany regularly scheduled observers,who got bumped.
Within the next few years, severalg a m m a-ray-burst detecting satelliteswill be launched. First among these arethe US/France/Japan mission HETE-2scheduled for launch later this year; it isexpected to provide at least 24 eventsannually, accurate to 10 arcsec – 10arcmin. Later come the ESA missionINTEGRAL (launch 2002; ~ 20 eventsper year), the US/UK/Italy Swift (2003;~ 100 events per year to arcsecond ac-curacy), and the Danish Rømer mis-sion, (launch 2003; ~ 70 events peryear). All will transmit their data inreal-time, over the Internet. The rate ofswiftly and precisely located gamma-ray bursts will then increase dramatical-ly. Conducting the necessary ground-based observations in service mode willthen be the only approach to do basicresearch in this new and energetic field.
References
Andersen, M.I.A., et al., 2000, in prepara-tion.
Akerlof, C., Balsano, R., Barthelmy, S., et al.,1999, Nature 398, 400.
Beuermann, K., Hessman, F.V., Reinsch, K.,et al., 1999, A&A 352, L26.
Bloom, J.S., Kulkarni, S.R., Djorgovski,S.G., et al., 1999, Nature, 401, 453.
Castro, S.M., Diercks, A., Djorgovski S.G. etal., 2000, G C N #605 (=http://gcn.gsfc.nasa.gov/gcn/gcn3/605.gcn3).
Covino, S., Davide, L., Ghisellini, S., et al.,1999, A&A 348, 1.
Costa, E., Frontera, F., Heise, J., et al.,1997, Nature 378, 783.
Djorgovski, S.R., Kulkarni, S.R., Bloom, J.S.,et al., 1999, GCN #289.
Fruchter, A., Smette, A., Gull, T., et al.,2000a, GCN #627.
Fruchter, A. et al.,2000b, in preparation.
Figure 6: In this spectrum of OT/GRB 000301c, obtained with Hubble Space Telescope 33days after the outburst, no light is detected below = 2600 Å. This has been modelled interms of redshifted Hydrogen (Lyman edge) absorption, putting the source at z ~ 2 (Fruchteret al., 2000a,b). With kind permission from the STSci GRB team.

37
Galama, T.J., Vreeswijk, P., van Paradijs, J.,et al., 1998, Nature 395, 670.
Galama, T.J., Vreeswijk, P.M., Rol, E. et al.,1999, GCN #388.
Galama, T.J., Tanvir, N., Vreeswijk, P., et al.,2000, ApJ. in press.
Hjorth et al. 2000, in press.in ‘t Zand, J., Heise, J., Hoyng, P., et al.,
1997, IAU Circular #6569.Jensen, B. L., et al., 2000, in prepa-
ration.
Kulkarni, S., Djorgovski, S. G., Ramapra-kash, A. N., et al., 1998, Nature 393,35.
Leibundgut, B., Sollerman, J., Kozma, C., etal., 2000, The Messenger, 99, 36.
Masetti, N., Palazzi, E., Pian, E., et al., 2000,A&A 354, 473.
Mészáros, P., and Rees, M.J., 1997, ApJ.476, 232.
Palazzi, E., Pian, E., Masetti, N., et al., 1999,A&A 336, L95.
Pedersen, H., Jensen, B.L., Hjorth, J., et al.,2000, GCN #534.
van Paradijs, J., Groot, P.J., Galama, T.J., etal., 1997, Nature 386, 686.
Vreeswijk, P.M., Rol, E., Hjorth, J., et al.,1999a, GCN #496.
Vreeswijk, P.M., et al., 1999b, A p J s u b m i t t e d .Wijers, R.A.M.J., Rees, M.J., and Mészáros,
P., 1997, M.N.R.A.S., 288,L51.Wijers, R.A.M.J., Vreeswijk, P.M., Galama,
T.J., et al., 1999, ApJ.L. 523, L33.
ISAAC on the VLT Investigates the Nature of theHigh-Redshift Sources of the Cosmic InfraredBackgroundTwo jewels of European astronomy, ISO and ISAAC, join their capabilities to shedlight on one important enigma of present-day cosmology
D. RIGOPOULOU1, A. FRANCESCHINI2, H. AUSSEL3, C.J. CESARSKY 4, D. ELBAZ5,R. GENZEL1, P. VAN DER WERF6, M. DENNEFELD 7
1Max-Planck-Institut für Extraterrestrische Physik, Garching, Germany2Dipartimento di Astronomia, Università di Padova, Vicolo Osservatorio, Padova, Italy3Osservatorio Astronomico di Padova, Vicolo Osservatorio, Padova, Italy4European Southern Observatory, Garching, Germany 5CEA Saclay, Gif-sur-Yvette Cédex, France6 Leiden Observatory, Leiden, The Netherlands7Institut d’Astrophysique de Paris – CNRS, Paris, France
A b s t r a c t
We report on the status of our long-term project aimed at characterising thenature of a new population of galaxiesthat has emerged from various ISO-CAM surveys1. In September 1999, weused ISAAC on UT1 and under verygood seeing conditions over two nightswe obtained the first near- i n f r a r e dspectra for a sample of ISOCAM galax-ies drawn from a deep ISO survey ofthe Hubble Deep Field South. The Hαemission line was detected in 11 out ofthe 12 galaxies we looked at, down to aflux limit of 7 × 10–17 erg cm–2 s–1, cor-responding to a line luminosity of 1041
erg s–1 at z = 0.6 (for an H0 = 50 and Ω= 0.3 cosmology). The rest frameR-band spectra of the ISOCAM galax-ies we observed resemble those ofpowerful dust-enshrouded starbursts.The sample galaxies are part of a newpopulation of optically faint, but infraredluminous starburst galaxies. T h e s egalaxies are also characterised by anextremely high rate of evolution withredshift up to z ~ 1.5 and significantlycontribute to the cosmic far-IR extra-galactic background.
1. New Facts from Deep Sky Ex-plorations at Long Wa v e l e n g t h s
Observations at wavelengths longerthan a few µm are essential to study dif-fuse media in galaxies, including allkinds of atomic, ionic and moleculargases and dust grains. By definition,they are particularly suited to investi-gate the early phases in galaxy evolu-tion, when a very rich ISM is present inthe forming systems.
Unfortunately, the IR and sub-milli-metre constitute a very difficult domainto access: astronomical observationsare only possible from space, apartfrom a few noisy atmospheric windowsat λ ~ 10 and 850 µm where they canbe done from dry sites on the ground.
1.1 Discovery of the CosmicInfrared Background
During the last few years, a variety ofobservational campaigns in the far-IR/sub-mm have started to provide re-sults of strong cosmological impact, byexploiting newly implemented ground-based and space instrumentation.
One important discovery in the fieldduring the last few years concerned anintense diffuse isotropic flux detected atfar-IR/sub-mm wavelengths in the all-sky maps imaged by the Cosmic Back-
ground Explorer (Puget et al. 1996;Hauser et al. 1998). The isotropy ofthis background (henceforth the Cos-mic IR Background, CIRB) was imme-diately interpreted as due to an extra-galactic source population, but its in-tensity turned out to be far in excess ofthe level expected from local galaxies,as observed by IRAS and by millimetretelescopes (e.g. Franceschini et al.1998). What is remarkable in this con-text is that the bolometric CIRB flux isat least a factor of two larger than theintegrated stellar light from galaxies atany redshifts, as sampled by the HSTin ultra-deep imaging surveys.
Then the only viable interpretationfor the CIRB was to correspond to anancient phase in the evolution ofgalaxies characterised by an excessemission at long wavelengths, natural-ly interpretable as an effect of a richand dusty interstellar medium. T h elarge energetic content of the CIRBcompared to the optical already setsinteresting constraints on galaxy evo-lution in very general terms, as ourteam will report in due course.
1.2 Deep SCUBA surveys resolvepart of the CIRB at the mm
Particularly relevant have been thedeep explorations performed by the
1ISOCAM was a mid-infrared camera, one of thefour instruments on board the Infrared Space Ob-servatory (ISO).

38
Sub-millimetre Common User Bolome-ter Array (SCUBA), an imaging cameraoperating on the JCMT mostly at 850µm, and by the Infrared Space Obser-vatory (ISO) over a wide wavelength in-terval from 5 to 200 µm.
Deep surveys by the two obser-vatories have started to provide crucialinformation on faint distant infraredsources. Because of the different K-corrections, the two source selectionsprobed rather complementary redshiftintervals. SCUBA detected at 850 µmredshifted dust-emission from tens ofgalaxies over a wide redshift interval,mostly between z Q 1 and z Q 3, al -though a completely reliable identifi-cation of these faint sub-m i l l i m e t r i csources is still to be definitely estab-lished. The most serious limitation ofthis approach is due to the large error-box for faint SCUBA sources, com-bined with the extreme optical faint-ness of their majority, which implya significant chance of misidentifica-tion.
1.3 A population of fast-evolving IRsources discovered by ISO
The IR camera (ISOCAM, P.I. C.J.Cesarsky) on board ISO, with its broad-broad-band filter LW3 sensitive be-tween 12 and 18 µm, provided the mostsensitive and spatially accurate way ofsampling the far-infrared sky. While de-signed as an observatory-type mission,the vastly improved sensitivity offeredby ISOCAM with respect to the pre-vious IRAS surveys incited us to pro-pose that a significant fraction of theISO observing time be dedicated todeep surveys (ISOCAM Guaranteed
Time Extragalactic Surveys, IGTES, P.I.C.J. Cesarsky). The aim was to paralleloptical searches of the deep sky withcomplementary observations at wave-lengths where dust is not only far lesseffective in extinguishing photons, butis even strongly emissive (in particularthrough a set of broad emission fea-tures peaking at λ Q 6 to 9 µm by as yetunidentified grain species).
Careful corrections of some transienteffects in the detector responsivity (dueto the very low temperature and slowelectron mobility) and of the non-gauss-ian noise induced by cosmic-ray im-pacts are now possible using variousindependent methods (PRETI devel-oped at the Service d’Astrophysique deSaclay, Stark et al. 1998; a method de-veloped in Bologna by Lari et al. 2000;and one by Desert et al. 1998), all pro-viding consistent results. All this re-quired quite an extensive amount ofwork (including Monte Carlo simula-tions of the complex behaviour of thedetectors) and fairly long time, buteventually we are in a position to claimthat we have now an accurate samplingin the LW3 filter of several independentsky areas down to very faint flux densi-ties and producing highly reliable andcomplete source catalogues includingmore than one thousand sources(Elbaz et al. 1999). We report in Table 1a summary of the surveys performedwith ISOCAM during the 2.5 years ofthe mission lifetime.
An example of the imaging qualityachieved is reported in Figure 1, whichis the LW3 map of an area centred onthe Hubble Deep Field South (Aussel etal. 2000a).
The Euclidean-normalised differen-tial counts provide simple but powerfuland robust statistics, useful to eviden-ciate evolutionary properties in theselected sources. A collection of theLW3 differential counts is reported inFigure 2 based on eight samples of in-dependent sky areas. The first remarkis that the counts from all of them are
Name λ Area depth # objects Ref. coord.(2000)(µm) (′2) (mJy) (a)
CAM parallel 7, 15 1.2e5 5 >10000 1 –ELAIS 7, 15 4e4 1.3 ~1000 2 –Marano2 FIRBACK 15 2700 1.4 29 3 03 13 10 –55 03 49Lockman Shallow 15 1944 0.72 180 4 10 52 05 +57 21 04Comet Fields 12 360 0.5 37 5 03 05 30 –09 35 00Lockman Deep 7, 15 500 0.3 166 6 10 52 05 +57 21 04CFRS 14+52 7, 15 100 0.3 23, 41 7 14 17 54 +52 30 31CFRS 03+00 7, 15 100 0.4 8 03 02 40 +00 10 21Marano2 Deep 7, 15 900 0.19, 0.32 180 9 03 13 10 –55 03 49A370 7, 15 31.3 0.26 18 10 02 39 50 –01 36 45Marano Ultra-deep 7, 15 90 0.14 142 11 03 14 44 –55 19 35Marano2 Ultra-deep 7, 15 90 0.1 115, 137 12 03 13 10 –55 03 49A2218 7, 15 16 0.12 23 10 16 35 54 +66 13 00ISOHDF South 7, 15 25 0.1 63 13 22 32 55 –60 33 18ISOHDF North 7, 15 24 0.05, 0.1 7, 44 14 12 36 49 +62 12 58Deep SSA13 7 9 15 13 12 26 +42 44 24Lockman PG 7 9 0.034 15 16 10 33 55 +57 46 18A2390 7, 15 5.3 0.030 32, 31 17 21 53 34 +17 40 11
Table 1. ISOCAM surveys
(a) If only one number appears, it refers to the longer-λ survey.
References: (1) Siebenmorgen et al. (1996); (2) Oliver et al. (1999); (3), (4), (6), (9), (11),(12): IGTES, see Elbaz et al. (1999); (5) Clements et al. (1999); (7), (8): Flores et al. (1999); (10): Altieriet al. (1999); (13) Elbaz, D., et al, (1999); Oliver et al. submitted (14) Aussel, H., et al. (1999); (16) Taniguchiet al. (1997).
Figure 1: Contours of the ISOCAM LW3 image (15 m, Aussel et al. 2000) overlaid on theNTT-I band image of Dennefeld et al. (2000).

39
nicely consistent and support within thestatistical uncertainties the accuracy ofthe adopted methods for source selec-tion. The fact that the observed countsare a factor ten higher around a fluxdensity of 0.3–0.4 mJy provides the firstuncontroversial evidence for a drasticincrease of the far-infrared emissivity ofgalaxies going back in cosmic time.
This result is quite consistent with theindependent evidence, provided by theCIRB intensity, in favour of very rapidevolution of IR flux from cosmicsources. Indeed, by assuming for thefaint ISOCAM sources in Figure 2 thefar-IR spectrum of a typical starburst,then these sources would be expectedto contribute a substantial part of theCIRB at 140 microns.
Aussel et al. (1998) and Flores et al.(1998) have produced early attempts toidentify the ISOCAM sources and to de-rive their redshifts at the fluxes wherethe peak excess in the LW3 counts ofFigure 2 is observed. Mostly due to thecombined effect of K-correction andevolution, these sources are found torange from z ~ 0.4 to z ~ 1.2, with a me-dian around z = 0.7–0.8 (see below).
However, the origin of this energy, ei-ther due to stellar nucleosynthesis instar-forming galaxies or to gravitationalaccretion onto giant black holes as inquasars, is largely unknown. We clear-ly need a deep spectroscopic survey ofthese sources to progress in their un-derstanding.
2. The ISOCAM Surveyin the HDFS
The Hubble Deep Field South wasobserved by ISOCAM at two wave-lengths, LW2 (6.75 µm) and LW3 (15µm), as part of the European LargeArea ISO Survey (P.I. M. Rowan-Robinson; see Oliver et al. 2000). ISO-CAM detected 63 sources (from thedata reduction of Aussel et al. 2000), allbrighter than S15µm = 100 µJy in theLW3 band. Out of this source list we se-lected the sample for ISAAC follow-up.The selected sources satisfied the fol-lowing criteria:(a) they had a reliable LW3 detection,(b) Hα in the wavelength range ofISAAC and, (c) a secure counterpart inthe I-band image (Dennefeld et al. 2000)and/or in the K-band image (ESO-EIS
Deep, DaCosta et al. 1998). The refer-ence sample contains about 25 galax-ies with 15 µm flux densities in therange 100–800 µJy and is therefore afair representation of the strongly evolv-ing ISOCAM population near the peakof the differential source counts (Elbazet al. 1999). From these 25 sources we
selected randomly 12 sources for ourfirst ISAAC follow-up spectroscopy(hereafter ISOHDFS galaxies).
For the observations and the selec-tion of the exact near-infrared band (Z,SZ, J or H) we used spectroscopic red-shifts from optical spectra, where avail-able for z < 0.7 (Dennefeld et al. 2000)
Figure 2: Differential number counts from eight different ISOCAM surveys (from Elbaz et al.1999).
Figure 3: ISAAC-VLT spectra of ISOCAMgalaxies, showing two low-z and two high-zsources. The resolution of 600 correspondsto a resolution of about 12Å at the sourcedistance. The H and [NII] lines are resolvedin three of the spectra. Clockwise from topleft: source ISOHDFS 53, at zspec = 0.58,source ISOHDFS 39 at zspec = 1.27, sourceISOHDFS 25 at zspec = 0.59, and sourceISOHDFS 38 at zspec = 1.39 (the H /[NII] < 1implies that this source is an AGN) (spectrafrom Rigopoulou et al., 2000). E
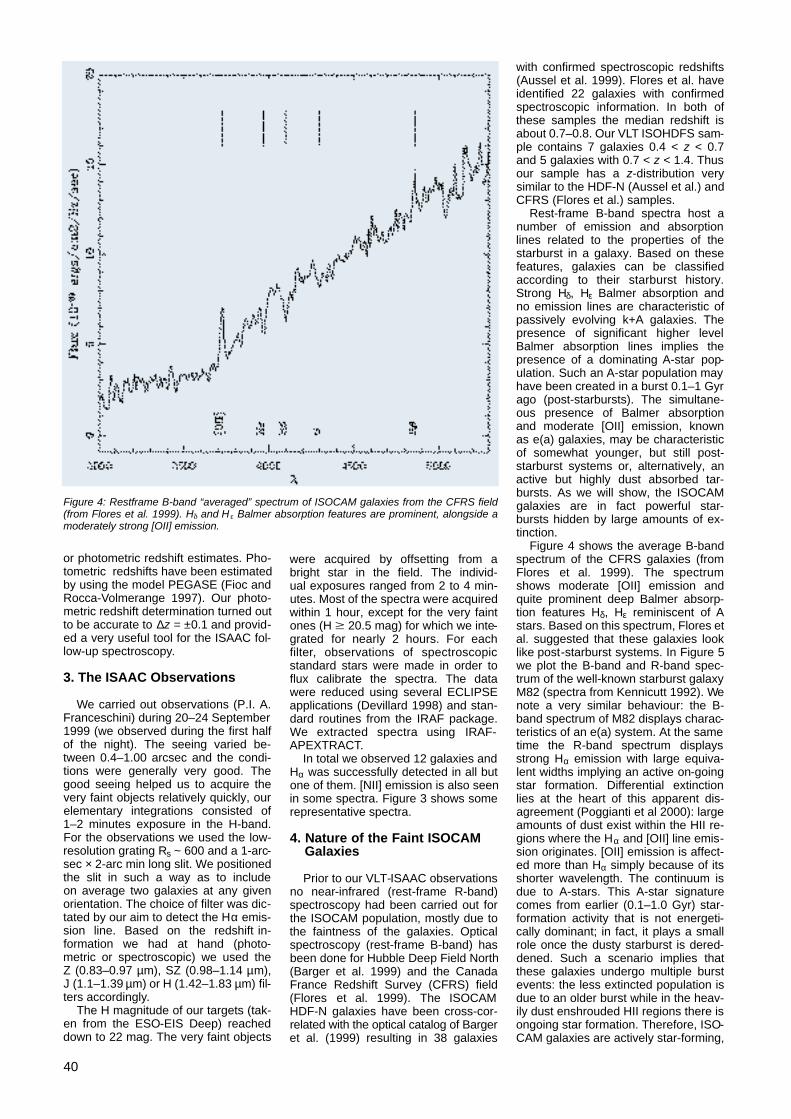
40
or photometric redshift estimates. Pho-tometric redshifts have been estimatedby using the model PEGASE (Fioc andRocca-Volmerange 1997). Our photo-metric redshift determination turned outto be accurate to ∆z = ±0.1 and provid-ed a very useful tool for the ISAAC fol-low-up spectroscopy.
3. The ISAAC Observations
We carried out observations (P.I. A.Franceschini) during 20–24 September1999 (we observed during the first halfof the night). The seeing varied be-tween 0.4–1.00 arcsec and the condi-tions were generally very good. Thegood seeing helped us to acquire thevery faint objects relatively quickly, ourelementary integrations consisted of1–2 minutes exposure in the H-band.For the observations we used the low-resolution grating Rs ~ 600 and a 1-arc-sec × 2-arc min long slit. We positionedthe slit in such a way as to includeon average two galaxies at any givenorientation. The choice of filter was dic-tated by our aim to detect the Hα emis-sion line. Based on the redshift in-formation we had at hand (photo-metric or spectroscopic) we used theZ (0.83–0.97 µm), SZ (0.98–1.14 µm),J (1.1–1.39 µm) or H (1.42–1.83 µm) fil-ters accordingly.
The H magnitude of our targets (tak-en from the ESO-EIS Deep) reacheddown to 22 mag. The very faint objects
were acquired by offsetting from abright star in the field. The individ-ual exposures ranged from 2 to 4 min-utes. Most of the spectra were acquiredwithin 1 hour, except for the very faintones (H M 20.5 mag) for which we inte-grated for nearly 2 hours. For eachf i l t e r, observations of spectroscopicstandard stars were made in order toflux calibrate the spectra. The datawere reduced using several ECLIPSEapplications (Devillard 1998) and stan-dard routines from the IRAF package.We extracted spectra using IRAF-APEXTRACT.
In total we observed 12 galaxies andHα was successfully detected in all butone of them. [NII] emission is also seenin some spectra. Figure 3 shows somerepresentative spectra.
4. Nature of the Faint ISOCAMGalaxies
Prior to our VLT-ISAAC observationsno near-infrared (rest-frame R-band)spectroscopy had been carried out forthe ISOCAM population, mostly due tothe faintness of the galaxies. Opticalspectroscopy (rest-frame B-band) hasbeen done for Hubble Deep Field North(Barger et al. 1999) and the CanadaFrance Redshift Survey (CFRS) field(Flores et al. 1999). The ISOCAMHDF-N galaxies have been cross-cor-related with the optical catalog of Bargeret al. (1999) resulting in 38 galaxies
with confirmed spectroscopic redshifts(Aussel et al. 1999). Flores et al. haveidentified 22 galaxies with confirmedspectroscopic information. In both ofthese samples the median redshift isabout 0.7–0.8. Our VLT ISOHDFS sam-ple contains 7 galaxies 0.4 < z < 0.7and 5 galaxies with 0.7 < z < 1.4. Thusour sample has a z-distribution verysimilar to the HDF-N (Aussel et al.) andCFRS (Flores et al.) samples.
Rest-frame B-band spectra host anumber of emission and absorptionlines related to the properties of thestarburst in a galaxy. Based on thesefeatures, galaxies can be classifiedaccording to their starburst history.Strong Hδ, Hε Balmer absorption andno emission lines are characteristic ofpassively evolving k+A galaxies. Thepresence of significant higher levelBalmer absorption lines implies thepresence of a dominating A-star pop-ulation. Such an A-star population mayhave been created in a burst 0.1–1 Gyrago (post-starbursts). The simultane-ous presence of Balmer absorptionand moderate [OII] emission, knownas e(a) galaxies, may be characteristicof somewhat younger, but still post-starburst systems or, alternatively, anactive but highly dust absorbed tar-bursts. As we will show, the ISOCAMgalaxies are in fact powerful star-bursts hidden by large amounts of ex-tinction.
Figure 4 shows the average B-bandspectrum of the CFRS galaxies (fromFlores et al. 1999). The spectrumshows moderate [OII] emission andquite prominent deep Balmer absorp-tion features Hδ, Hε reminiscent of Astars. Based on this spectrum, Flores etal. suggested that these galaxies looklike post-starburst systems. In Figure 5we plot the B-band and R-band spec-trum of the well-known starburst galaxyM82 (spectra from Kennicutt 1992). Wenote a very similar behaviour: the B-band spectrum of M82 displays charac-teristics of an e(a) system. At the sametime the R-band spectrum displaysstrong Hα emission with large equiva-lent widths implying an active on-goingstar formation. Differential extinctionlies at the heart of this apparent dis-agreement (Poggianti et al 2000): largeamounts of dust exist within the HII re-gions where the Hα and [OII] line emis-sion originates. [OII] emission is affect-ed more than Hα simply because of itsshorter wavelength. The continuum isdue to A-stars. This A-star signaturecomes from earlier (0.1–1.0 Gyr) star-formation activity that is not energeti-cally dominant; in fact, it plays a smallrole once the dusty starburst is dered-dened. Such a scenario implies thatthese galaxies undergo multiple burstevents: the less extincted population isdue to an older burst while in the heav-ily dust enshrouded HII regions there isongoing star formation. Therefore, ISO-CAM galaxies are actively star-forming,
Figure 4: Restframe B-band “averaged” spectrum of ISOCAM galaxies from the CFRS field(from Flores et al. 1999). H and H Balmer absorption features are prominent, alongside amoderately strong [OII] emission.

41
dust-enshrouded galaxies, akin to localLlRGs (e.g. NGC 3256, Rigopoulou etal. 1996).
5. Evaluating the Star FormationActivity
Being the strongest of all Balmerlines, the Hα emission line has been tra-ditionally used to derive quantitative star-formation rates in galaxies. However,for z M 0.2–0.3, Hα redshifts into the near-infrared where spectroscopy with 4-m-class telescopes is inherently muchharder and thus less sensitive than inthe optical. This is why measurementsof the star-formation rates in high red-shift galaxies have relied on measure-ments of the [OII] λ3727 doublet. Theadvent of 8-m-class telescopes such asthe VLT allows us for the first time touse Hα as a measure of the star-forma-tion activity in distant galaxies.
In ionisation bounded HII regions,the Hα luminosity scales directly withthe ionising luminosity of the embeddedstars and is thus proportional to thestar-formation rate (SFR). The conver-sion factor between ionising luminosityand SFR is computed with the aid of anevolutionary synthesis model. T h eprime contributors to the integrated ion-ising flux are massive stars (M > 20M0) with relatively short lifetimes (m 10million years). Using any stellar synthe-sis model (we have used the code ofSternberg 1998) for solar abundances,a Salpeter IMF (1–100 M0) and for ashort-duration burst (a few 107 yrs) weobtain:
SFR(M0/yr) = 5 × 10–42L(H )(ergs–1). (1)
Using this formula we estimate thatthe SFR rates in our ISOHDFS galaxiesrange between 2–50 M0/yr, correspon-ding to total luminosities of ~ 1–10 ×1 04 2 erg s–1 (assuming H0 = 50km/s/Mpc, Ω = 0.3).
The SFR estimates based on eq. (1)represent only a lower limit of the realSFR in these galaxies. To get an esti-
mate of the extinction, we use V–Kcolour indices (magnitudes taken fromthe ESO-EIS survey) and using STAR-BURST99, the evolutionary synthesiscode of Leitherer et al. (1999), for vari-ous star-formation histories we calcu-lated the range of intrinsic (extinction-free) colours. By comparing the ob-served V–K colours to the model-pre-dicted ones we derive a median extinc-tion AV of 1.8 assuming a screen mod-el for the extinction. This AV value cor-responds to a median correction factorfor the SFR(Hα) of ~ 4.
But the far-infrared luminosities canalso be used to infer SFR, especiallysince the ISO-HDFS galaxies are dustenshrouded. For the same IMF asabove, the SFR scales with the FIR lu-minosity as:
SFR(M0/yr) = 2.6 × 10–44LFIR(ergs–1) (2)
The L(FIR) in equation (2) is calcu-lated based on the method of Fran-ceschini et al. (2000) which uses the 15µm flux and assumes an LFIR/LMIR ratioof ~ 10. We find that the SFR(FIR) esti-mates are on average a factor of 5 to 50higher than the SFR estimates inferredfrom Hα uncorrected for extinction. Theratio SFR(FIR)/SFR(Hα) drops to 3 if weuse extinction-corrected Hα v a l u e s ,confirming that the extinction in thesegalaxies is much higher than inferredfrom UV or optical observations alone.Thus, ISOCAM galaxies are in fact ac-tively star-forming dust-enshroudedgalaxies. We finally note that the factor3 inconsistency noted above for theFIR-based SFR is consistent with thevalue obtained by Poggianti et al.(2000) for a sample of luminous IRASstarbursts.
6. Conclusions andFuture Plans
We have obtained the first near-in-frared spectra (rest-frame R-band) of asample of 12 ISO selected far-IR galax-ies from the Hubble Deep Field South.The detection of strong Hα emission
lines with large EW in all but one is con-sistent with these ISOCAM sources be-ing powerful dust enshrouded starburstgalaxies.
In only one object (see Fig. 3) wefind evidence for the presence of anAGN, as inferred from the invertedNII/Hα line ratio and the peculiar andhigh 6.7 µm to 15 µm flux ratio, indica-tive of very hot AGN-like dust. In gener-al, we do not find evidence for broad Hαcomponents as would be expectedfrom classical AGNs, but this will re-quire further NIR spectra at high reso-lution for confirmation. Our resultechoes recent reports about ultra-deepC H A N D R A hard X-ray surveys ofhigh-z SCUBA sources, in which noh i g h-X-r a y-energy emission was de-tected as would be expected if even afraction of the FIR flux would be due toan AGN (Hornschemeier et al. 2000).Generalising these results, we may ten-tatively conclude that the large energycontent of the CIRB originates fromstellar activity.
Based on the Hα emission line in-tensity we estimate star-formation ratesin the range 2–50 M0/yr, which are afactor of 5–50 times lower than theSFR we derive based on FIR lumi-nosities. If we correct the Hα for ex-tinction, we deduce SFR(FIR)/SFR(Hα)~ 3, confirming that the extinction inthe ISOCAM galaxies is much higherthan can be predicted using UV or opti-cal data alone. This result demon-strates that deriving star-formationrates from UV/optical data alone is in-correct for this class of sources. A frac-tion of star formation, hard to quan-tify at the moment but probably quitesignificant, is entirely missed by opticalsurveys.
We plan to continue our project by increasing our statistics on ISOCAM gal-axies. In our upcoming August 2000 runwe will supplement our sample withlow-resolution spectroscopy of newISOCAM targets. Meanwhile, we willalso attempt to obtain higher-resolutionspectra to probe the gas kinematicsand ionisation stage in these galaxies.
Figure 5: Left panel: B-band spectrum of the well-known starburst galaxy M82. Note the prominent Balmer H and H absorption lines as wellas the moderate [OII] emission. Right panel: R-band spectrum of M82. The spectrum is dominated by the very strong H emission (spectrafrom Kennicutt 1992).

42
The unique combination offered by ISOand ISAAC instruments promises a de-cisive progress in our understanding ofthe origin of the vast amount of energyreleased by starburst galaxies duringtheir main activity phases.
References
Altieri, B., et al., 1999, A&A 343, L65.Aussel, H., Elbaz, D., Cesarsky, C.J., Starck,
J.L., 1999, In The Universe as seen by ISO,eds. P. Cox, M.F. Kessler, ESAS P 4 7, 1023.
Aussel, H., Cesarsky, C.J., Elbaz, D. andStarck, J.L.,1999, A&A 342, 313.
Aussel, H. et al., in preparation.
Da Costa et al., 1998, http://www.eso.org/science/eis/eis-rel/deep/HDF-Srel.html
Clements, D., et al., 1999, A&A 346, 383.Dennefeld et al. 2000, in prep.Devillard N., 1998, The Messenger No. 87,
March 1997.Desert, F.X., et al., 1999, A&A 342, 363.Elbaz, D., Cesarsky, C.J., Fadda, D., Aussel,
H., et al. 1999 A&A 351, L37. Fioc, M., Rocca-Volmerange, B., 1997, A&A
326, 950.Flores, H., Hammer, F., Thuan, T. X . ,
Cesarsky, C., 1999 Ap.J., 517, 148. Franceschini et al. (2000) in prep.Kennicutt, R.C., (1992) Ap.J., 388, 310.H o r n s c h e m e i e r, A.E., et al., 2000, as-
troph/0004260.
Lari, C., et al., 2000, in prep.Leitherer, C., et al., 1999 ApJS 123, 3.Oliver, S., et al., 2000., in prep.Oliver, S., et al., 2000, MNRAS, in press, as-
troph.Poggianti B., Bressan A., Franceschini A.,
2000, ApJL submitted. Rigopoulou, D., et al, 1996, A&A, 305, 747.Rigopoulou, D., Franceschini, A., Aussel, H.,
et al. 2000, ApJL, in press.Siebenmorgen, R., et al., 1996, A&A 315,
L169.Starck, J.L., et al., A&A 134, 135.Sternberg, A., 1998, ApJ 506, 721.Taniguchi,Y., Cowie, L.L., Sato, Y., Sanders,
D.B., et al., 1997, A&A 318, 1.
The Deep Eclipse of NN SerR. HÄFNER, Universitäts-Sternwarte München
The elusive nature of NN Ser wasdiscovered in July 1988 (Häfner, 1989a,1989b) in the course of a search foreclipses in faint cataclysmic variablesusing the CCD camera on the Danish1.5-m telescope at La Silla. This target(V ~ 17), then named PG 1550+131and thought to be such a variable,turned out to exhibit a sine-shaped lightcurve and a very deep eclipse of shortduration repeating once every 3 hoursand 7 minutes. Due to the low time res-olution of the photometry (3.5 min), theduration of the eclipse (separated byhalf a period from maximum light) aswell as its depth could only be roughlyestimated to be about 12 min and atleast 4.8 mag respectively. Duringmid-eclipse no signal from the objectwas recordable. Two spectra (resolu-tion about 12 Å) obtained near maxi-mum light (A) and near the onset of the
eclipse (B) using EFOSC at the 3.6-mtelescope revealed mainly narrowemission lines of the Balmer series su-perimposed on broad absorptions (A)and shallow Balmer absorptions with-out emission (B). It was immediatelyclear that such an object could not be acataclysmic system. The data wererather interpreted in terms of a pre-cataclysmic binary, an evolutionary pre-cursor of a cataclysmic system, con-sisting of a white dwarf/late main-se-quence detached pair. Thus all ob-served properties of the system finda consistent explanation: the sine-shaped light curve (full amplitude ~ 0.6mag) is caused by a strong heating ef-fect, the emission lines originate in theheated hemisphere of the cool star andcannot be seen near primary eclipse,the absorption lines originate in thehot star, the steep (ingress/egress ~ 2
min) and deepeclipse of shortduration are dueto the obscurationof a very hot smallobject by a muchcooler and largerstar, a secondaryeclipse is not de-tectable since thecool star does notcontribute muchto the flux. Basedon these obser-vations and as-suming Mh o t =0.58 M0 ( m e a nvalue for DAwhitedwarfs), Th o t =18,000 K, inclina-tion close to 90ºand a circular or-bit, a first crudeestimate of thesystem parame-ters yielded thefollowing results:
separation ~ 0.92–1.03 R0, Rh o t ~0.01–0.14 R0, Rcool ~ 0.06–0.33 R0,Mcool ~ 0.03–0.28 M0, Tcool (unheatedhemisphere) ~ 2600–3300 K, Tc o o l
(heated hemisphere) ~ 4300–6600 K,spectral type of cool star ~ M3–M6. Theevolution of the system into thes e m i-detached (cataclysmic) state isonly possible via radiation of gravita-tional waves and was estimated to takesome 109 years.
Based on optical and IUE spec-troscopy as well as further photometry(Wood and Marsh, 1991; Catalan et al.,1994), the pre-cataclysmic nature ofNN Ser was confirmed and the range ofsystem parameters could be narroweddown. The IUE data as well as fits ofsome Balmer absorptions via model at-mospheres hint at a white dwarf tem-perature in the range 47,000–63,000 K,much more than previously assumed.But all studies so far performed werehampered by the fact that the truedepth of the eclipse and the duration ofthe totality (if any), i.e. the inner contactphases of the white dwarf, were notknown. This crucial information, impor-tant for the determination of the radii ofthe components, could not be obtainedusing telescopes of the 4-m class, asseveral attempts by the author re-vealed. Even applying sophisticatedobserving methods and/or using a spe-cial photometer, several observing runs(ESO 3.6-m telescope, NTT and CalarAlto 3.5-m telescope) were not suc-cessful in this respect.
The powerful combination of the firstVLT 8.2-m Unit Telescope (ANTU) andthe multi-mode FORS1 instrument(Appenzeller et al., 1998) offered nowthe opportunity for a new experiment.Since the HIT mode, allowing photome-try and spectroscopy with high time res-olution, was not yet available at thescheduled time of observation (June1999) another technique had to be ap-plied: the trailing method, where the tel-Figure 1: The drift exposure of the sky field around NN Ser (arrow).

43
escope performs a controlled continu-ous motion in RA and DEC, thus regis-tering the light of the targets in the fieldof view along lines on the same frame.Direction and drift rate had to be cho-sen very carefully to avoid interferencewith stars in the neighbourhood of NNSer and to ensure a reasonable record-ing of the inner contact phases. Sincethe brightness of the cool star was un-known, the latter was a tricky task.Using the ETC, the drift rate was even-tually fixed at 1 pixel (25 µm) per 3 sec-onds, a compromise between the pre-sumed integration time and the desiredtime resolution. Another point of uncer-tainty was the autoguiding systemwhich was not known to work properlyfor the drift rate chosen beforehand. Ithad to be much faster than that neededto follow solar system objects.
However, with no technical problemsand aided by excellent seeing of 0.5arcsec, a 18.5-min drift exposure (SRcollimator, V filter) could be obtained inthe night 10/11 June 1999. Figure 1shows the resulting star trails of thefield around NN Ser. The trail of theeclipsing system is indicated with an ar-row. Figure 2 gives the eclipse lightcurve of NN Ser as extracted from thattrail. The recorded signal during eclipseis well measurable and amounts toabout 70 counts/pixel (barely visible inFigure 2, since the full range of theeclipse is shown) down from about18,300 counts/pixel outside eclipse.This corresponds to an eclipse depth of∆V = 6.04 and constitutes one of thedeepest eclipses if not actually thedeepest eclipse ever measured for a bi-nary. Trails of comparison stars on thesame frame allow the brightness short-ly before/after and during eclipse to be
fixed at V = 16.98 and 23.02 respec-tively. Since the light curve is perfectlyflat at the bottom, the eclipse is total,i.e. the white dwarf disappears com-pletely behind the red star. The contactphases are now easily measurable:Totality lasts 7m3 7s, ingress/egresstake 1m26s each, and the whole eclipseduration amounts to 10m2 8s. T h e s enumbers now allow the radii of the in-volved stars to be derived: Rh o t =0.0204 ± 0.0021 R0 and Rcool =
0.1595 ± 0.0155 R0 (about 1.5 timesthe radius of Jupiter).
Furthermore, it seemed extremely in-teresting to obtain spectral informationon the cool component: With Mcool ~0.09–0.14 M0 ( Wood and March,1991), its mass is very near the upperlimit (~ 0.08 M0) for brown dwarfs.Even if the object turned out to be ‘only’a normal late main-sequence star, withknown mass and radius at hand, aspectrum could allow a critical check ofcurrent theories of atmospheres andevolutionary computations for late Mstars. Since the spectrum had to be tak-en during the phase of totality, the ex-posure time had consequently to belimited to about 5 min to avoid any con-tamination by the white dwarf. Althoughthis seemed to be quite short for a 23-mag object, a faint noisy spectrumcould be recorded in the 600–900 nmwavelength region even under medi-ocre seeing conditions (0.95 arcsec)using the FORS1 longslit option com-bined with grism 150I+OG590 (0.55nm/pixel, SR collimator). Figure 3shows the resulting slightly smoothedtracing together with a spectrum of aM6.5 dwarf star. Several molecularbands of TiO are well visible, addition-ally some VO bands may also be pres-ent. The spectrum does not resemblethat of a brown dwarf, it rather hints ata very late dwarf star of spectral typeM6 or later. Of course, many such spec-tra have to be superimposed to allow adefinite spectral classification of thecool component in NN Ser which, de-spite a strong irradiation on one hemi-sphere, constitutes a ‘normal’ main-se-quence star on the un-heated side.
Figure 2: The eclipse light curve of NN Ser as extracted from the drift exposure.
Figure 3: The spectrum of the cool component of NN Ser compared with a spectrum of a M6.5dwarf star. Residuals from sky subtraction are indicated.

44
As previously stated, NN Ser be-longs to the class of pre-cataclysmic bi-naries. These systems are thought tobe born after the common-envelopeevolution of originally wide pairs of un-equal mass with orbital periods in theorder of a few days. In the pre-cata-clysmic state, the binaries exhibit short-er periods, consist then of a hot subd-warf or white dwarf primary and amain-sequence secondary and are sur-rounded by a planetary nebula whichmay later disperse. The secondary isbelieved to remain basically unaffectedby this binary evolution process. Pres-
ently, we have at least some informa-tion on about 50 candidates, about onedozen being still associated with plane-tary nebulae. Only nine of these 50 sys-tems show eclipses and provide suffi-cient spectral information to allow thedetermination of fairly reliable values ofmasses and radii of the components.Five systems are hot subdwarf/main-sequence binaries, the remaining four(including NN Ser) harbour whited w a r f / K-M components. A t h o r o u g hstudy of NN Ser will, therefore, alsocontribute to our knowledge of this in-teresting evolutionary state of binaries.
References
Appenzeller, I. et al.: 1998, The MessengerNo. 94, 1.
Catalán, M.S., Davey, S.C., Sarna, M.J.,Smith, R.C., Wood, J.H.: 1994, Mon.Not.
R.Astron.Soc. 269, 879.Häfner, R.: 1989a, Astron.Astrophys. 213,
L15.Häfner, R.: 1989b, The Messenger No. 55,
61.Wood, J.H., Marsh, T.R.: 1991, Astrophys. J.
381, 551.
E-mail: [email protected]
The FORS Deep FieldI. APPENZELLER1, 5, R. BENDER3, A. BÖHM2, N. DRORY3, K. FRICKE2, R. HÄFNER3,J. HEIDT1, U. HOPP3, K. JÄGER2, M. KÜMMEL5, D. MEHLERT1, C. MÖLLENHOFF1,A. MOORWOOD4, H. NICKLAS2, S. NOLL1, R. SAGLIA3, W. SEIFERT1, S. SEITZ3,O. STAHL1, E. SUTORIUS1, T. SZEIFERT4, S. WAGNER1, B. ZIEGLER2
1Landessternwarte Heidelberg, 2Universitäts-Sternwarte Göttingen, 3Universitäts-Sternwarte München, 4ESO Garching, 5MPIA Heidelberg
1. Deep Fields
Watching the sky with the naked eyewe can detect several thousand galac-tic stars but never more than two orthree objects beyond our Milky Waygalaxy. On the other hand, already im-ages taken with small telescopes andphotographic plates record in fields welloutside the galactic plane more distantgalaxies than galactic stars. Obviously,an increased sensitivity does not onlyallow us to see more objects, but, moreimportantly, we can look deeper intospace. During the period when photo-graphic plates were still the prime opti-cal detectors, deep observations wereusually carried out using Schmidt tele-scopes which allowed us to combine a
deep look with a large field of view.Telescopes with larger apertures didnot provide a great advantage since(because of the non-linearity and poorreproducibility of the photographicprocess) the flux (or magnitude) limit ofphotographic imaging was determinedby the sky background, which could notbe subtracted accurately. Only with theintroduction of the essentially linearCCD detectors it became possible toobserve objects with a surface bright-ness well below that of the sky.However, for manufacturing reasons,the achievable dimensions of CCDs aremuch smaller than those of large pho-tographic plates. Therefore, imagingsurveys reaching very faint magnitudeshave, so far, been restricted to relative-
ly small Deep Fields. N e v e r t h e l e s s ,such deep-field surveys have proven tobe exceedingly valuable in producingcomplete inventories of faint objects, forfinding very distant objects, and forstudying the properties and statistics ofgalaxies as a function of the evolution-ary age of the universe.
Although the mean sky backgroundcan be determined and subtracted reli-ably from CCD frames, the photonnoise of the sky, being of stochastic na-ture, cannot be eliminated. Therefore,even with CCDs, the achievable accu-racy of faint-object photometry still de-pends on the amount of sky flux under-lying the object images. Therefore, ob-servations from space provide particu-larly favourable conditions for deep im-aging and photometry since at most vi-sual wavelengths the sky background islower and since the absence of atmos-pheric seeing effects normally results insharper images. It is not surprising,therefore, that two HST-based deep-field surveys (HDF and HDF-S) had aparticularly strong scientific impact, pro-viding a wealth of information and in-spiring many follow-up studies.
2. Motivation for a FORS DeepField
In spite of their great importance andsuccess, the Hubble Deep Fields havesome drawbacks. One obvious disad-vantage is the, compared to modernground-based faint-object cameras, rel-atively small field of view of the HSTWFPC which limited the Hubble Deep
Figure 1: Digital Sky Survey plots of the FDF and of a field of the same size surrounding theHDF-S. Note the lower surface density of bright foreground objects and the absence of brightstars in the FDFregion.

45
Fields to areas of only about 6 squarearcminutes. Moreover, the compared topresent large ground-based telescopesrelatively modest aperture of the HSTrequires very long integration times tocollect a sufficient number of photonsfrom faint objects. Finally, under optimalatmospheric conditions today’s largeground-based telescopes with highquality cameras at good sites can reachpractically the same image quality asthe HST. This has been demonstratedduring the past months with the combi-nation of the ESO VLT and the HRmode of the FORS focal plane instru-ments where the best stellar imagesobtained so far showed FWHM valuesbelow the 2 × 0.1 arcsec pixel samplingresolution limit of the CCD. Since theHST WFPC has the same pixel size(which again undersamples the instru-
mental PSF), the images obtained withthe FORS HR mode during the bestseeing experienced so far at Paranaljust match the resolution of single HSTWFPC frames. Hence, by selecting ob-serving periods of optimal seeing, atleast at wavelength bands where thesky background is produced mainly out-side the earth’s atmosphere, modernground-based telescopes with high-quality focal-plane instruments can inprinciple observe as deep as, or deep-er than, the HST.
Unfortunately, a quick look at theParanal seeing statistics shows that pe-riods of seeing below 0.2 arcsec are sorare that observing programmes requir-ing such good seeing for sizeableamounts of time would require years tocomplete, even if all the time with ex-cellent seeing would be allocated to
one such a programme. On the otherhand, moderately good seeing occursrelatively often. According to ESO’s VLTSite Selection WG report, seeing below0.6 arcsec is to be expected for about40 % of the time. At 0.6 arcsec the well-sampled VLT PSF is about 3 times larg-er and its surface about 10 times largerthan for the HST WFPC, resulting forunresolved objects in a 10 times largersky background. In wavelength bandswith no significant atmospheric sky con-tribution, this results in an increase ofthe noise level by about a factor 3 andin a correspondingly lower signal-to-noise ratio. On the other hand, the VLThas an about 10 times larger collectingarea, resulting in an increase of S/N bya factor 3. Therefore, for point sourcesat 0.6 arcsec seeing (and with no sig-nificant atmospheric contribution to the
Figure 2: True colour image of the inner 6 6 of the FORS Deep Field. North is up, East to the left.

46
sky background), the larger collectingarea of the VLT just compensates theseeing effect on the photometric S/N.Hence for equal exposure times we getthe same S/N as with the HST. For ex-tended sources we in fact gain with theVLT. In the red spectral range, wherewe have strong atmospheric contribu-tions to the sky background, the HSThas a larger advantage compared tothe VLT.At these wavelengths, the VLTis competitive only at better seeing con-ditions or with an increased total expo-sure time. Nevertheless, if periods ofgood seeing are selected and if a suffi-cient amount of observing time is in-vested, the VLT can look as deep as theHST. But with the larger FOV of theFORS instruments significantly largerstatistical samples can be obtained in asingle FORS field.
The above estimates show thatFORS and the VLT provide an attractivealternative to HST for deep-field stud-ies. But the estimates also show that inorder to reach similar limiting magni-tudes, comparable amounts of observ-ing time have to be invested. Suchlarge projects cannot be carried outeasily as normal General Observer pro-grammes at the VLT. For this reason,the consortium of German astronomicalinstitutes (comprising the HeidelbergState Observatory (LSW) and theUniversity Observatories of Göttingenand München) which – in co-operationwith ESO – built the FORS instruments,decided to devote a significant fraction
of the guaranteed observing time,which the three institutes received fortheir effort, to observe a FORS DeepField (FDF).
3. Field Selection and ObservingProgramme
Although under optimal seeing con-ditions the FORS instruments are most
sensitive using the HR imaging mode,all FDF observations were carried out inthe Standard Resolution (SR) mode.There were two reasons for using thismode: Firstly, the HR mode becomessuperior only during periods of seeingbelow 0.4 arcsec, which at the VLT oc-curs only during less than 4 per cent ofthe time. Secondly, with the SR mode,having a FOV covering about 46 squarearcmin (about 8 times that of the HSTWFPC), we can potentially observemore objects and, by covering a largervolume of space, we may be less af-fected by local density variations andpeculiarities.
A major disadvantage of the largeraperture of the VLT is that even moder-ately bright objects will produce CCDsaturation effects already during rela-tively short exposure times. Moreover,because of the larger field, the chancesof finding a bright star in the FORS FOVare greater than for the WFC. In orderto keep the ratio between exposuretimes and readout periods of the indi-vidual frames at an acceptable value,deep photometry can be carried outwith FORS economically only in fieldswhich are free of stars brighter thanabout 19 mag. Therefore, apart fromthe usual criteria of the absence of sig-nificant galactic extinction, the absenceof IR emission, and the absence of fore-ground galaxy clusters, the main criteri-on for the FDF was the absence of starsbrighter than 19 mag. For this reason, itwas not possible to use the surround-ings of the southern Hubble Deep Field(HDF-S) for the FDF programme. Asshown in Figure 1, there are too manybright foreground stars in and near theHDF-S to allow deep VLT exposures ofthis region. An additional criterion forthe selection of the FDF was the pres-ence of a distant (z > 3) QSO, which
Figure 3: Enlargement of a 100 100 area of Figure 2.
Figure 4: Comparison of preliminary (bright) galaxy counts in the FDF with results from oth -er deep surveys.
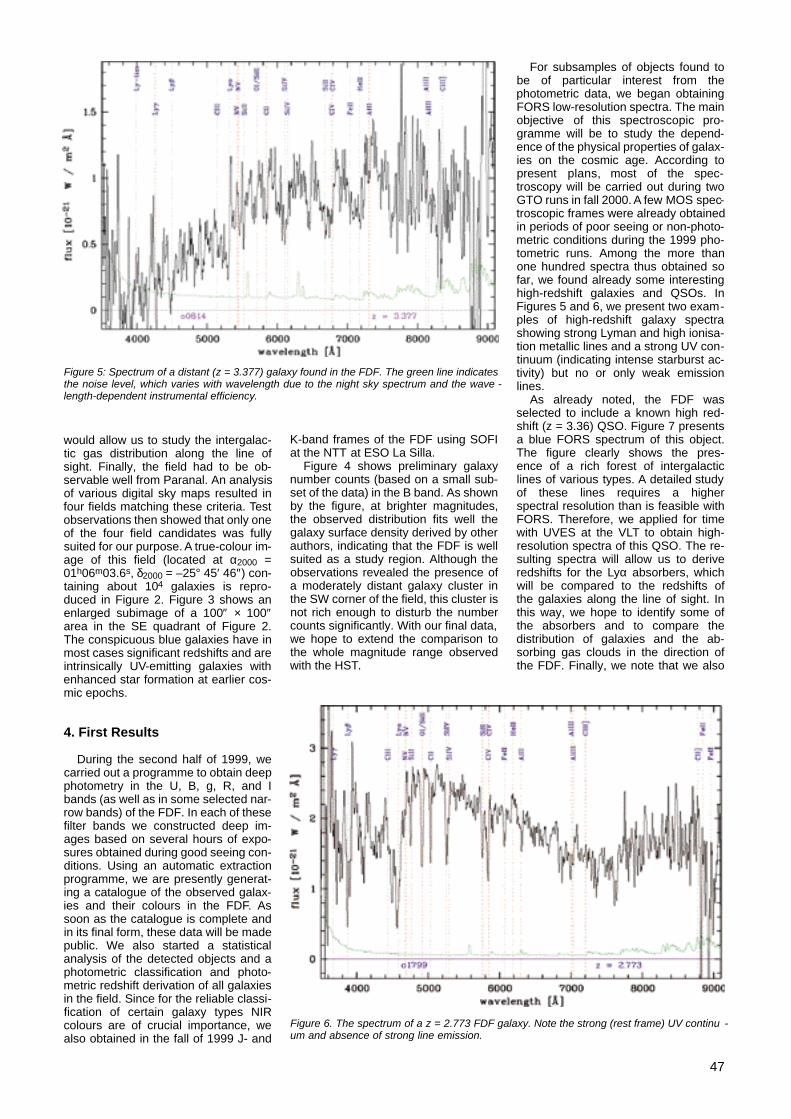
47
would allow us to study the intergalac-tic gas distribution along the line ofsight. Finally, the field had to be ob-servable well from Paranal. An analysisof various digital sky maps resulted infour fields matching these criteria. Testobservations then showed that only oneof the four field candidates was fullysuited for our purpose. A true-colour im-age of this field (located at α2000 =01h06m03.6s, δ2000 = –25° 45′ 46″) con-taining about 104 galaxies is repro-duced in Figure 2. Figure 3 shows anenlarged subimage of a 100″ × 100″area in the SE quadrant of Figure 2.The conspicuous blue galaxies have inmost cases significant redshifts and areintrinsically UV-emitting galaxies withenhanced star formation at earlier cos-mic epochs.
4. First Results
During the second half of 1999, wecarried out a programme to obtain deepphotometry in the U, B, g, R, and Ibands (as well as in some selected nar-row bands) of the FDF. In each of thesefilter bands we constructed deep im-ages based on several hours of expo-sures obtained during good seeing con-ditions. Using an automatic extractionprogramme, we are presently generat-ing a catalogue of the observed galax-ies and their colours in the FDF. Assoon as the catalogue is complete andin its final form, these data will be madepublic. We also started a statisticalanalysis of the detected objects and aphotometric classification and photo-metric redshift derivation of all galaxiesin the field. Since for the reliable classi-fication of certain galaxy types NIRcolours are of crucial importance, wealso obtained in the fall of 1999 J- and
K-band frames of the FDF using SOFIat the NTT at ESO La Silla.
Figure 4 shows preliminary galaxynumber counts (based on a small sub-set of the data) in the B band. As shownby the figure, at brighter magnitudes,the observed distribution fits well thegalaxy surface density derived by otherauthors, indicating that the FDF is wellsuited as a study region. Although theobservations revealed the presence ofa moderately distant galaxy cluster inthe SW corner of the field, this cluster isnot rich enough to disturb the numbercounts significantly. With our final data,we hope to extend the comparison tothe whole magnitude range observedwith the HST.
For subsamples of objects found tobe of particular interest from thephotometric data, we began obtainingFORS low-resolution spectra. The mainobjective of this spectroscopic pro-gramme will be to study the depend-ence of the physical properties of galax-ies on the cosmic age. According topresent plans, most of the spec-troscopy will be carried out during twoGTO runs in fall 2000. A few MOS spec-troscopic frames were already obtainedin periods of poor seeing or non-photo-metric conditions during the 1999 pho-tometric runs. Among the more thanone hundred spectra thus obtained sofar, we found already some interestinghigh-redshift galaxies and QSOs. InFigures 5 and 6, we present two exam-ples of high-redshift galaxy spectrashowing strong Lyman and high ionisa-tion metallic lines and a strong UV con-tinuum (indicating intense starburst ac-tivity) but no or only weak emissionlines.
As already noted, the FDF wasselected to include a known high red-shift (z = 3.36) QSO. Figure 7 presentsa blue FORS spectrum of this object.The figure clearly shows the pres-ence of a rich forest of intergalacticlines of various types. A detailed studyof these lines requires a higherspectral resolution than is feasible withFORS. Therefore, we applied for timewith UVES at the VLT to obtain high-resolution spectra of this QSO. The re-sulting spectra will allow us to deriveredshifts for the Lyα absorbers, whichwill be compared to the redshifts ofthe galaxies along the line of sight. Inthis way, we hope to identify some ofthe absorbers and to compare thedistribution of galaxies and the ab-sorbing gas clouds in the direction ofthe FDF. Finally, we note that we also
Figure 5: Spectrum of a distant (z = 3.377) galaxy found in the FDF. The green line indicatesthe noise level, which varies with wavelength due to the night sky spectrum and the wave -length-dependent instrumental efficiency.
Figure 6. The spectrum of a z = 2.773 FDF galaxy. Note the strong (rest frame) UV continu -um and absence of strong line emission.
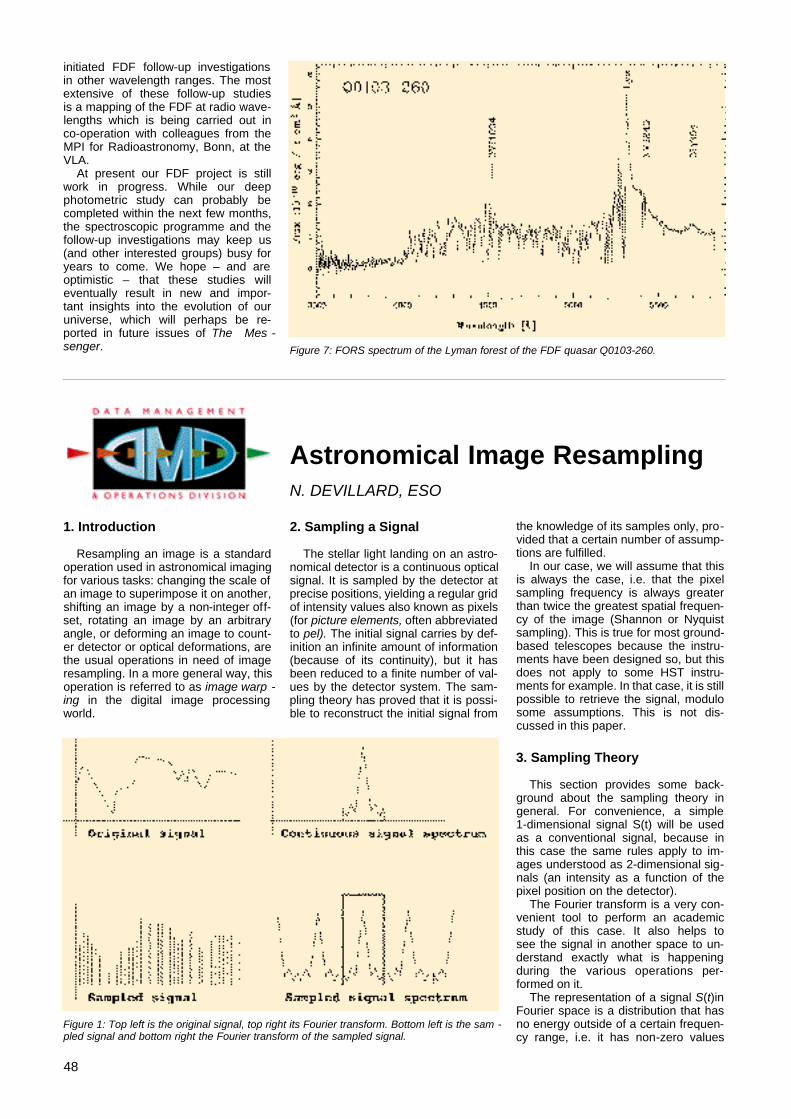
48
1. Introduction
Resampling an image is a standardoperation used in astronomical imagingfor various tasks: changing the scale ofan image to superimpose it on another,shifting an image by a non-integer off-set, rotating an image by an arbitraryangle, or deforming an image to count-er detector or optical deformations, arethe usual operations in need of imageresampling. In a more general way, thisoperation is referred to as image warp -ing in the digital image processingworld.
2. Sampling a Signal
The stellar light landing on an astro-nomical detector is a continuous opticalsignal. It is sampled by the detector atprecise positions, yielding a regular gridof intensity values also known as pixels(for picture elements, often abbreviatedto pel). The initial signal carries by def-inition an infinite amount of information(because of its continuity), but it hasbeen reduced to a finite number of val-ues by the detector system. The sam-pling theory has proved that it is possi-ble to reconstruct the initial signal from
the knowledge of its samples only, pro-vided that a certain number of assump-tions are fulfilled.
In our case, we will assume that thisis always the case, i.e. that the pixelsampling frequency is always greaterthan twice the greatest spatial frequen-cy of the image (Shannon or Nyquistsampling). This is true for most ground-based telescopes because the instru-ments have been designed so, but thisdoes not apply to some HST instru-ments for example. In that case, it is stillpossible to retrieve the signal, modulosome assumptions. This is not dis-cussed in this paper.
3. Sampling Theory
This section provides some back-ground about the sampling theory ingeneral. For convenience, a simple1-dimensional signal S(t) will be usedas a conventional signal, because inthis case the same rules apply to im-ages understood as 2-dimensional sig-nals (an intensity as a function of thepixel position on the detector).
The Fourier transform is a very con-venient tool to perform an academicstudy of this case. It also helps tosee the signal in another space to un-derstand exactly what is happeningduring the various operations per-formed on it.
The representation of a signal S(t)inFourier space is a distribution that hasno energy outside of a certain frequen-cy range, i.e. it has non-zero values
Astronomical Image ResamplingN. DEVILLARD, ESO
Figure 1: Top left is the original signal, top right its Fourier transform. Bottom left is the sam -pled signal and bottom right the Fourier transform of the sampled signal.
initiated FDF follow-up investigationsin other wavelength ranges. The mostextensive of these follow-up studiesis a mapping of the FDF at radio wave-lengths which is being carried out inco-operation with colleagues from theMPI for Radioastronomy, Bonn, at theVLA.
At present our FDF project is stillwork in progress. While our deepphotometric study can probably becompleted within the next few months,the spectroscopic programme and thefollow-up investigations may keep us(and other interested groups) busy foryears to come. We hope – and areoptimistic – that these studies willeventually result in new and impor-tant insights into the evolution of ouruniverse, which will perhaps be re-ported in future issues of The Mes -senger. Figure 7: FORS spectrum of the Lyman forest of the FDF quasar Q0103-260.

49
only inside a given range. This repre-sentation is symmetrical for real-life sig-nals, so the non-zero support is com-pletely defined by the cut-off frequencyƒc. Figure 1 shows what a time signalmight look like, and what its represen-tation in Fourier space would be. Now,what happens when this continuoussignal is sampled? According to Fouriertheory, sampling a signal with an idealsampler is equivalent to convolving itwith a delta function, which is equiva-lent in Fourier space to multiplying thesignal by a comb function (a regular-ly-spaced collection of diracs).
The idea for reconstruction is that wewould like at some point to reconstructcompletely the continuous signal, andthen re-sample it, i.e. take new samplesat arbitrary positions. The sampling the-ory enables that the right assumptionsare fulfilled. What it means in practice inFourier space, is that side replica of thesampled signal spectrum should be re-moved (the central part of the spectrumisolated).
This is easily achieved in Fourierspace by multiplying the sampled spec-trum by a door function (a function thatis 0 everywhere but 1 where the centralspectrum is, see on figure 1 the boxaround the central spectrum replica).Unfortunately, this ideal door functioncorresponds to a sine function in thereal space, which has infinite supportand is thus not implementable inreal-life. In other words, perfect recon-struction can only be achieved mathe-matically. To build a system that wouldachieve the same, we need to have aninfinite quantity somewhere in the sys-tem, which does not belong to ourreal-life domain.
This ideal door function can be ap-proximated by functions that do nothave an infinite support, though. But asapproximations are not truly the func-tion, the reconstruction will not exactlystick to the real signal. The amount oferrors in the reconstructed signal willdepend on how the approximation isdone. The approximated door functionis usually called a kernel in the litera-ture.
The search for “good” kernels haslead to a veritable zoo of functions fit forone purpose or another. Many authorsin very different fields have found ker-nels that have some interesting proper-ties that pair ideally with some charac-teristics of the signals they studied. Thefilter domain is one of the key fields indigital electronics, whether it applies tosound machines (stereo systems), toimages (television) or any kind of sam-pling machine. Various kernels are re-viewed in the next section.
4. Image-Space Interpolation
Another way of reconstructing themissing parts of the signal betweensamples, is to stay in the real space andcreate the missing information based
on e.g. some assumptions on the signalsmoothness. In electronics, the follow-ing reconstruction schemes are oftenused for reconstruction:
4.1 Nearest neighbour
Maybe the simplest idea is to saythat the signal value is the one of theclosest sample. This is known as azero-order blocking filter, or nearest-neighbour interpolation. If we study thatcarefully, we see that this is strictlyequivalent to applying a box kernel tothe real space, thus a sine function inthe Fourier space.
It means that the central replica ofthe sampled spectrum will be multipliedby a sine function, which is actually avery bad approximation of the ideal boxkernel. This leads to obvious artefactslike jagged edges in images or granu-larity in sound. You can actually hearthat kind of artefact when using noisydigital telephone lines like mobilephones: your voice appears deformedas if it were ringing.
This is due to the fact that themobile phone receives voice samplesone by one, and if the line is cut for atiny amount of time (some samplesare missing), it keeps emitting thesame sound until it receives more in-formation. This comes back to sub-sampling the voice, and reconstructingit with a very bad reconstruction ap-proximation. The voice spectrum isfolded and you get that kind of nastyartefacts.
Nearest-neighbour interpolation isthe cheapest way of reconstructing asignal and also the dirtiest. It might beOK if you need speed (e.g. to display azoomed image), but certainly not if youwant to preserve the smoothness of theinput signal.
4.2 Linear interpolation
One idea is to draw slope segmentsbetween samples. This correspondsstrictly to a linear approximation of thevalues between known samples. Inelectronics, this is also referred to as afirst-order blocking filter. Now what isthe quality of a linear interpolation inreal space, if we try to compare it to oth-er kernels in Fourier space?
Drawing line segments betweensamples is strictly equivalent to con-volving the input signal with a trianglefunction (demonstration left to the read-er). Convolving the signal with a trian-gle function is then equivalent to multi-plying its spectrum by the Fourier trans-form of a triangle, which is a squaresinc function.
A square sinc is better than a sinc: itis never negative and goes to zeromuch faster, which means that otherreplica of the central spectrum are lesslikely to be included in the reconstruct-ed spectrum. However, it is still a verybad approximation of the ideal box
function. It obviously attenuates highfrequencies and tends to deformlow-frequencies. The ringing goes to-wards zero but not that fast, whichtends to include other replica in the re-constructed signal.
Linear interpolation is another cheapway of reconstructing a signal andmight be a good candidate when arte-facts are not so much an issue. Forevery-day digital pictures (television orphotos), this is still valid, but for signalslike astronomical images it is more rea-sonable to use a smoother reconstruc-tion.
4.3 Spline interpolation
To preserve a certain smoothness ofthe signal between samples, one canuse a set of smooth functions such assplines. Describing the maths behindthese functions is outside the scope ofthis article, it is enough to know thatthey tend to reproduce quite well signalvariations, and they are expensive tocompute.
What do they correspond to inFourier space? A spline function is usu-ally obtained by convolving a box func-tion with itself a certain number oftimes. How many times the convolutionis applied determines the level of thespline functions, which are also referredto as N-order blocking filters in elec-tronics.
In Fourier space, that means the N-thpower of the sinc function. As N goes tohigher degrees, the kernel tends tolooks more and more like a gaussianshape with steep slopes. This is a muchbetter approximation of an ideal boxfunction and usually yields the best vi-sual results with normal images.
Because they are expensive to com-pute, splines are usually used in theirthird order (cubic splines). You can findthat kind of interpolation for images inall respectable image-processing soft-ware packages (like PhotoShop orGIMP). For astronomical images, this isstill a questionable method due to thenoise in images, bringing very high fre-quencies which are not so well handledby cubic splines.
4.4 Fourier-based kernels
These interpolation methods arebased on some study happening inFourier space, but they are nonethelessimplemented in the image space with-out ever having the need to convert thewhole image by use of FFT or equiva-lent means.
As mentioned above, interpolationkernels can be found by hundredsin various fields. The most appropri-ate for image processing are quotedhere:
• Lanczos2 or Lanczos3: these ker-nels are based on cosine functions,they are shown to respect quite well thelow-frequency parts of the signal but

50
smooth a little bit the high-frequencies.This is an issue for noisy images suchas astronomical images.
• Hann and Hamming kernels arealso based on truncated cosine func-tions. They also tend to smooth outhigh frequencies and induce somerippling in the image space, but pro-duce very acceptable quality for usualimages.
• Hyperbolic tangent kernel: this isone of the best-known approximationsof the ideal box function, obtained bymultiplying symmetric hyperbolic tan-gent functions. It preserves quite wellboth high and low frequencies (as ex-pected for a faithful approximation of abox function) and induces almost norippling in the image space.
The latter kernel (hyperbolic tan-gent) is the one implemented in the jit-ter imaging recipe in the ISAAC pipe-line. More information can be foundabout its definition, implementation, andevaluation in the corresponding article:h t t p : / / w w w. e s o . o r g / p r o j e c t s / d f s / p a p e r s /jitter99/
4.5 Examples
Figure 2 shows an example of thenearest neighbour, linear, and spline in-terpolations of the same signal.
Figure 3 shows various examples ofimage interpolations applied to zooman example image. Top left is nearestneighbour, top right is linear, bottom leftis cubic spline, and bottom right is a hy-perbolic tangent based interpolationkernel.
5. Spatial Transformations
Now that we know how to create newsamples out of a sampled signal, thenext question is: where do we want toplace these new samples? This ofcourse depends on the nature of theoperation to be performed on the im-age.
Shifting an image by a non-integeroffset for example, is a typical operationin need of pixel interpolation. Obviously,the worst case is when the shift must bedone up to exactly half a pixel. This isthe place that is the furthest from thereal known samples, thus having themost invented properties.
Scaling an image (i.e. zooming it inor out) is also a common operation thatinvolves interpolation. In your favouriteimage displayer (RTD or Saoimage),when you request to double the zoomon your image, the software behind ac-tually performs a pure pixel replication,which is the same as nearest-neigh-bour interpolation. While this is verybad for signal properties, it is accept-able for a user display since you canvery easily see where artefacts are. Ifyou need to scale an image by a
non-integer factor e.g. to superimposeit with another image taken with adifferent pixel scale on the sky, youwill need more accurate interpolationmethods.
Correcting an image for detector de-formations (pincushion or barrel, de-pending on the orientation) will mostlikely require a 2d polynomial of seconddegree at least. A true mapping of thedeformation is more easily expressed inradial co-ordinates and yields compli-cated deformation formulas. Whateverthe deformation you choose to correctfor, you will end up with a formula thatexplains how to compute the one-to-one correspondence between a pixel inthe deformed image and a pixel in thecorrected image.
Other deformations can easily be im-plemented if they can be expressed asa one-to-one relationship between pix-els in the original image, and pixels inthe deformed (warped) image.
6. Possible Implementations
There are only two ways of imple-menting a resampling scheme for im-ages: direct or reverse. The direct wayis going from the original image tothe deformed one, literally sprayingthe input pixels onto an output grid.The reverse way is going from the de-formed image back to the original one,computing samples only where they areneeded.
Figure 3: Various interpolation schemes. Top left is nearest neighbour, top right is linear, bot -tom left is cubic spline and bottom right is hyperbolic tangent.
Figure 2: Three different interpolationschemes.

51
6.1 Direct warping
Direct warping is taking pixels fromthe original image and trying to throwthem onto an output grid that repre-sents the output, warped image. Themain drawbacks of this method are thefollowing:
• The output grid needs to keep trackof how many pixels have landed in eachsection, to be able to correctly nor-malise the output value. This can be anightmare to implement efficiently.
• There might be some deformationsthat will leave holes in the output grid. Iffor some reason the output grid is dens-er than the input one, the risk is to haveso many holes that the output imagedoes not make sense. To avoid that,one can oversample the input image tomake it of similar density to the outputimage, but then the memory consump-tion is growing by the same amount.For large images, this is not a solution.
• If there is no possible assumptionabout the way input pixels are thrownonto the output grid, it is impossible toguarantee that the output pixels will bewritten sequentially. This makes it hardto optimise I/O accesses, and slowdown to the extreme the processing oflarge images, even for simple transfor-mations.
Direct warping is usually consideredtoo dangerous to implement because ofpotential holes in the resulting image,and because of speed concerns. Imageprocessing is a domain that needs opti-misation no matter what the underlyinghardware is. A pixel operation thatneeds a millisecond to run will have youwait more than 17 minutes in front ofyour screen if you have to process anISAAC image, or 71 hours if you areprocessing a VST image.
The best optimisations in the imageprocessing domain usually reach abouta hundred clock ticks to achieve. On amodern PC running at 500 MHz, con-sidering that the image processing soft-ware is alone running on the CPU, youwill still have to wait 2 seconds perISAAC image and 54 seconds per VSTimage. And that is for CPU time only, abad I/O optimisation forcing the soft-
ware to go to the disk regularly wouldmultiply these figures by a factor thou-sand at least.
Direct warping is at the heart of the“drizzle” method implemented for HSTimage reconstruction. Drizzle makesuse of a convolved linear interpolationscheme that brings more artefacts thansimple linear interpolation. If big imagesare involved, or tricky (non-linear) de-formations, or bad pixels, or largeamounts of noise, this method is likelyto create false information in the outputimage. The same is valid for almost allastronomical image processing pack-ages: most of them use a linear recon-struction scheme for default interpola-tion method.
6.2 Reverse warping
Reverse warping is considering firstthe output grid as the image to obtain.The size of the grid can be determinedby observing the transformation func-tion between deformed and correctedimage. For example: if the transforma-tion is a scaling by a factor 2, the outputgrid will simply be 2 times bigger thanthe input image, containing 4 timesmore pixels.
The method is looping over all outputpixels, computes by means of a reversetransformation which are the contribut-ing pixels from the original image, ap-plies an interpolation scheme as de-scribed above, and writes the result tothe output image.
This has several advantages:• The output grid cannot have holes,
since all output pixels are reviewed.• The output grid will be sequentially
visited, allowing to cache the results toavoid going to disk too often.
• Because of the sequential nature ofthe operation (no matter what the trans-formation is), it is relatively easy to op-timise the pixel accesses in a genericway, helping to achieve optimised butalso portable code (i.e. a software thatis fast no matter what the underlyinghardware and OS are).
• The implementation is relativelyeasy to write and read, allowing a bet-ter maintenance.
If you implement a generic inter-polation kernel scheme that allowsthe user to select the kernel to use,reverse warping becomes an easytask to implement and allows forlarge gains in speed in the resultingsoftware.
This is the method implemented inthe warping tool offered in the eclipsepackage (http://www. e s o . o r g / e c l i p s e / ) ,and at the heart of the ISAAC imagingpipeline. The default kernel is the hy-perbolic tangent mentioned above.
7. Conclusions
Astronomical image resampling is acomplex operation that involves recenttheorems in the field of signal and im-age processing, together with informa-tion theory knowledge to be carried outproperly.
No information was given about thevarious methods that can be used toidentify the transformation between twoimages. This is a complete researchdomain in itself, refer to the appro-priate literature for more information.The emphasis in this article has beenput on the various methods that canbe used to interpolate pixels in an im-age, and efficient ways to implementthem.
Usual interpolation schemes areshown to be insufficient in the usualnoisy astronomical images, addingaliasing and other various artefacts intothe images. There are more precisekernels such as the hyperbolic tangent,that are more suitable for astronomicalimage handling. It might also be a goodidea to look into pre-processing filters toapply to the input images before tryingto re-sample them.
If you care about the quality of yourimages whenever you have to apply re-sampling operations, you should queryyour favourite data reduction packageto check out what kind of interpolationscheme is actually implemented behindthe scenes. Choosing linear interpola-tion is rarely a good solution in the caseof noisy images.
OTHER A S T R O N O M I C A L N E W S
Portugal to Accede to ESO (from ESO Press Release 15/00, 27 June 2000)
The Republic of Portugal will becomethe ninth member state of the EuropeanSouthern Observatory.
On Tuesday, June 27, during a cere-mony at the ESO Headquarters in Gar-ching (Germany), a corresponding A g r e e-
ment was signed by the PortugueseMinister of Science and Te c h n o l o g y, JoséMariano Gago, and the ESO DirectorGeneral, Catherine Cesarsky, in thepresence of other high officials fromPortugal and the ESO member states .
Following subsequent ratification bythe Portuguese Parliament of the ESOConvention and the associated proto-cols, it is foreseen that Portugal willformally join this organisation on Janu-ary 1, 2001.
52
Scientific Preprints(March – June 2000)
1364. E. Pancino et al.: New Evidence for the Complex Structure ofthe Red Giant Branch in ω Centauri. ApJ.
1365. S. Bagnulo et al.: Modelling of Magnetic Fields of CPStars. III. The combined interpretation of five different mag-netic observables: theory, and application to β C o r o n a eBorealis. A&A.
1366. M. Chadid: Irregularities in Atmospheric Pulsations of RRLyrae Stars. A&A.
1367. T. Broadhurst et al.: Detecting the Gravitational Redshift ofCluster Gas. ApJL, andA Spectroscopic Redshift for the CL0024+16 Multiple ArcSystem: Implications for the Central Mass Distribution. ApJL.
1368. R. Falomo and M.-H. Ulrich: Optical Imaging and Spectros-copy of BL Lac Objects. A&A.
1369. O.R. Hainaut et al.: Physical Properties of TNO 1996 TO66.Lightcurves and Possible Cometary Activity. A&A.
1370. B. Leibundgut: Type Ia Supernovae. The Astronomy andAstrophysics Review.
1371. Contributions of the ESO Data Management and OperationsDivision to the SPIE Conference “Astronomical Telescopesand Instrumentation 2000”. Conference 4010. D.R. Silva et al.: VLT Science Operations: The First Year.
P. Quinn et al.: The ESO Data-Flow System in Operations:Closing the Data Loop.
A.M. Chavan et al.: A Front-end System for the VLT’s Data-Flow System.
P.Amico and R. Hanuschik: Operations of the Quality ControlGroup: Experience from FORS1 and ISAAC at VLT Antu.
P. Ballester et al.: Quality Control System for the Very LargeTelescope.
1372. S. Hubrig et al.: Magnetic Ap Stars in the H-R Diagram. ApJ.1373. J.U. Fynbo et al.: The Sources of Extended Continuum
Emission Towards Q0151+048A: the Host Galaxy and theDamped Lyα Absorber. A&A.
1374. S. Stefl et al.: The Circumstellar Structure of the Be Shell Starφ Per. A&A.
1375. M. Kissler-Patig: Extragalactic Globular Cluster Systems. ANew Perspective on Galaxy Formation and Evolution.Reviews in Modern Astronomy, vol 13.
1376. E. Scannapieco et al.: The Influence of Galactic Outflows onthe Formation of Nearby Galaxies. ApJ.
1377. J.D. Landstreet et al.: Magnetic Models of Slowly RotatingMagnetic Ap Stars: Aligned Magnetic and Rotation Axes. A&A.
1378. S. Cristiani et al.: The First VLT FORS1 Spectra of Lyman-Break Candidates in the HDF-S and AXAF Deep Field. A&A.
1379. D. Hutsemékers and H. Lamy: The Optical Polarization ofRadio-Loud and Radio-Intermediate Broad Absorption LineQuasi-Stellar Objects. A&A.
1380. C. Stehlé et al.: Polarised Hydrogen Line Shapes in a Magne-tised Plasma. The Lyman α Line.
Uniting European Astronomy
In his speech, the Portuguese Minis-ter of Science and Technology, JoséMariano Gago, stated that “the acces-sion of Portugal to ESO is the result ofa joint effort by ESO and Portugal dur-ing the last ten years. It was made pos-sible by the rapid Portuguese scientificdevelopment and by the growth and in-ternationalisation of its scientific com-munity.”
He continued: “Portugal is fully com-mitted to European scientific and tech-nological de velopment. We will devoteour best efforts to the success of ESO”.
Catherine Cesarsky, ESO DirectorGeneral since 1999, warmly welcomed
the Portugueseintention to joinESO. “With theaccession oftheir country toESO, Portu-guese astron-omers will havegreat opportu-nities for work-ing on researchprogrammes atthe frontiers ofmodern astro-physics.”
“This is in-deed a goodtime to joinESO”, she add-ed. “The four8.2-m VLT UnitTelescopes withtheir many first-class instru-ments are near-ly ready, andthe VLT Inter-ferometer willsoon follow.
With a decision about the interconti-nental millimetre-band A L M A p r o j e c texpected next year and the first con-cept studies for gigantic optical/in-frared telescopes like OWL now wellunder way at ESO, there is certainly nolack of perspectives, also for cominggenerations of European astronomers!”
Portuguese Astronomy: a Decade of Progress
The beginnings of the collaborationbetween Portugal and ESO, now culmi-nating in the imminent accession of thatcountry to the European research organisation, were almost exactly tenyears ago.
On July 10, 1990, the Republic ofPortugal and ESO signed a Co-opera-tion Agreement, aimed at full Portu-guese membership of the ESO organi-sation within the next decade. Duringthe interim period, Portuguese astron-omers were granted access to ESO fa-cilities while the Portuguese govern-ment would provide support towardsthe development of astronomy and theassociated infrastructure in this country.
A joint Portuguese/ESO A d v i s o r yBody was set up to monitor the devel-opment of Portuguese astronomy andits interaction with ESO. Over the years,an increasing number of measures tostrengthen the Portuguese research in-frastructure within astrophysics and re-lated fields were proposed and funded.More and more, mostly young Portu-guese astronomers began to make useof ESO’s facilities at the La Silla obser-vatory and recently, of the Very LargeTelescope (VLT) at Paranal.
Now, ten years later, the Portugueseastronomical community is the young-est in Europe with more than 90% of itsPhD’s awarded during the last eightyears. As expected, the provisional ac-cess to ESO telescopes – especiallythe Very Large Telescope (VLT) with itssuite of state-of-the-art instruments forobservations at wavelengths rangingfrom the UV to the mid-infrared – hasproven to be a great incentive to thePortuguese scientists.
As a clear demonstration of thesepositive developments, a very success-ful Workshop entitled “Portugal – ESO– VLT” was held in Lisbon on April17–18, 2000. It was primarily directedtowards young Portuguese scientistsand served to inform them about theESO Very Large Telescope (VLT) andthe steadily evolving, exciting researchpossibilities with this world-class fa-c i l i t y.
Signing of the Portugal-ESO Agreement on June 27, 2000, at the ESOHeadquarters in Garching. At the table, the ESO Director General,Catherine Cesarsky, and the Portuguese Minister of Science andTechnology, José Mariano Gago. Photographer: H.-H. Heyer

53
A N N O U N C E M E N T S
The present Messenger is the hundredthissue to be published. This may be a goodmoment to look back to the beginning and tothe development of this publication.
The idea of an internal ESO newsletterwas born in the early seventies. Using thewords of Professor Blaauw, Director Generalof ESO at that time and the person wholaunched The Messenger in its orbit, the pur-pose of The ESO Messenger should be “firstof all, to promote the participation of ESOstaff in what goes on in the Organization, es-pecially at places of duty other than our own.Moreover, The Messenger may serve to givethe world outside some impression of whathappens inside ESO. The need for more in-ternal communication is felt by many of thestaff. The dispersion of our resources overseveral countries in widely separated conti-nents demands a special effort to keep usaware of what is going on at the other es-tablishments...”
The first issue of The Messenger ap-peared in May 1974. It was printed withoutcolour, had six pages and a circulation ofabout 1100 copies. It was distributed to ESOstaff, to the members of the ESO Counciland the various ESO committees, and to as-tronomical institutes.
Blue as a second colour was introducedfor the first time in The Messenger No. 4, butonly on the upper part of the cover page andfor the description of ESO on the last page.The upper part of the cover has essentiallyremained unchanged until today, except forsmall changes in connection with the loca-tion of the various ESO establishments.
The first five issues were done in letter-press printing. From No. 6 until today it hasbeen printed in offset. The first colour pic-tures were reproduced in the December1982 issue (No. 30). Colour was used occa-sionally, and then with increasing tendency.Now, the use of colour has become stan-dard. The number of pages has variedgreatly over the years – from 6 pages (No.1)to a record number of 88 pages (No. 70).
Until No. 70, The Messenger was pro-duced in the traditional way. That is, afterpreparation by the editors, all manuscriptswere retyped at the publishers, then proof-read and checked with the manuscript. Thelayout was done at ESO by pasting the cor-rected proofs and copies of the figures onpaper sheets. The publisher then put the textinto pages according to this layout. Sincemore and more authors of Messenger arti-cles provided electronic files (in LaTeX for-mat), from No. 71 (March 1993) to No. 78(December 1994), the text columns of thosearticles were prepared in LaTeX. These textswere then exposed on film with the printer’shigh-resolution output device, and the filmmounted on pages the same way as before.Trials to prepare the three-column layout en-tirely in LaTeX format were not successful.
At the end of 1994, following the exampleof some of his colleagues, the technical edi-tor acquired a Power Macintosh with thenecessary desk-top publishing tools. So,starting with No. 79 (March 1995), the layoutof The Messenger has been produced in-house, using the electronic files provided bythe authors or scanning the hard copies inthose cases where the authors are not ableto provide text in a format compatible withthe layout programme (QuarkEXpress). The
About The ESO Messenger K. KJÄR, Technical editor, ESO
Some Mishaps in Connection with theProduction of The Messenger
It is probably not surprising that during the production of 100 issues of The Messenger,also a number of mishaps have occurred. Perhaps the most serious one happened withMessenger No. 4, when an object fell on the printing form, damaging part of the firstMessenger page. The damaged letters were exchanged by the printers without submit -ting a new proof to the editors. All the damaged letters were correctly exchanged, exceptthat the Messenger No. 4 was printed and distributed again as No. 1.
But errors are not only due to negligence – too much thoughtfulness can also produceerrors. For example: on two occasions the discovery trails of minor planets disappearedfrom the Schmidt plates that were reproduced in The Messenger because the printersthought that the printing plates had been scratched. Without telling the editors, the plateswere retouched, and the discovery trails, well described in the captions, had gone.However, these errors were discovered in time.
A similar case that was not discovered in time happened in No. 19, in an article aboutneutron stars. The author of that article provided a number of figures accompanying histext. On one of them, a drawing of the optical companion of the neutron star and the neu -tron star itself (seen from two different directions) was presented. The author was prob -ably well aware that the small neutron star – just a dot on the figure – might get lost inthe printing process. He drew the attention of the editors to the importance of the dots inthe figure. The technical editor, for his part, told the printers to see to it that the two dotson the figure would not disappear. The neutron star remained at its place until the last re -vision of that Messenger issue. However, when The Messenger was finally delivered, theneutron stars had disappeared! Investigating the matter more closely, it was found thatthe printer, at the last moment before running the printing machine, had discovered two“dust grains” on one of the figures and eliminated them… In order not to lose time, thetechnical editor, with the help of the three kind ladies of the ESO Secretariat that servedas reception and typing pool at that time, took some drawing pencils, and put the neutronstars back in place. Fortunately, the circulation then was only about 1200 copies, and thework was done in less than one day. It is hoped that the author will forgive us if the neu -tron stars may not have had exactly the right size or not been at their exact position…
The last anecdote is only indirectly related to The Messenger and happened in early1977 and with the same publisher. It shows that public-relations activities should not beneglected in an organisation like ESO. In order to better understand the situation, thereader should know that at that time the ESO scientific and technical divisions were stillat the CERN premises near Geneva, and the Office of the Director General with theAdministration had shortly before moved from Hamburg to Garching. The ESO Head -quarters was in its construction phase and the Garching staff (22 or 23 people) was pro -visionally housed in an apartment building in Garching. Only a small, discreet sign iden -tified the place as ESO offices. One day, the manager of the publishing firm came to ESOto bring the blue prints of The Messenger and to discuss some matters with the techni -cal editor. To see someone of ESO, a visitor had first to ring the bell outside the building.Then a member of the ESO Secretariat, located in a flat on the ground floor of the build -ing, opened the door and asked whom he wanted to see. Then the secretary by telephoneinformed the staff member concerned. The visitor went up to the apartment in which thestaff member had his office. Here, he had to ring the bell again and wait a moment to belet in.This all must have appeared very strange and mysterious to the man. He said noth -ing while he was at ESO. But some weeks later, when the technical editor had mattersto discuss with him at his place, he said: "Now I know what ESO is all about – you can’tfool me – astronomy is just a pretext. ESO is a secret-service agency!…."
whole publication on CD ROM (~ 650Mbytes) is taken to the publisher, whichmeans that only printing and bookbindingare done outside ESO. This way, savings ofprinting costs of the order of 30,000 DM peryear are realised for The Messenger.
As activities increased and more andmore scientific results were produced atESO, the interest of the press, of amateurastronomers, physics teachers, etc. in TheMessenger also increased. In the course ofthe years, the distribution list gradually in-creased from about 800 addresses at thebeginning to almost 4000 today. Includingthe copies distributed to ESO staff and atESO exhibitions and other PR or astronom-ical events, the total circulation is now 5000and sometimes even more.
However, the number of readers may beconsiderably higher. Agreat number of copiesis sent to institutes and libraries wherethey are read by several people. In addition,from No. 81, September 1995, The Mes -senger can also be accessed via Intern e t
( h t t p : / / e s o . o r g / g e n - f a c / p u b s / m e s s e n g e r / )Due to internal problems, No. 82 was pro-duced by the publisher in the traditional wayand is therefore available only on paper.
Two people at ESO regularly work on TheMessenger: the Editor (about 0.3 FTE = FullTime Equivalent) and the technical editor(about 0.5 FTE). It would be interesting toknow the total time spent for the preparationof The Messenger. However, it is not possi-ble to evaluate the time needed by the au-thors and the people who assist them (sec-retaries, draughtsmen, etc.) in preparingtheir contributions.
Until today, four editors were alternatelyresponsible for The Messenger: Editor of thefirst three issues was Francis Walsh; Editorof Nos. 4 to 19 and again of Nos. 43 to 72:Richard West; Editor of Nos. 21 to 39:Philippe Véron, and from No. 73: Marie-Hélène Ulrich (Demoulin). The Nos. 20 and40 to 42 were prepared by the technical ed-itor without official editorship (contributionsapproved by the Director General).


55
ESO Fellowship Programme 2000/2001The European Southern Observatory (ESO) awards up to six postdoctoral fellowships tenable at the ESO Headquarters, located in
Garching near Munich and up to seven postdoctoral fellowships tenable at ESO’s Astronomy Centre in Santiago, Chile. The ESO fellow-ship programme offers a unique opportunity for young scientists to pursue their research programmes while learning and participating inthe process of observational astronomy with state-of-the-art facilities.
ESO facilities include the Very Large Telescope (VLT) Observatory on Cerro Paranal, the La Silla Observatory and the astronomicalcentres in Garching and Santiago. The VLT consists of four 8-m-diameter telescopes. Normal science operations are now conducted onthe first two and will start on the third on 1 April 2001. At La Silla, ESO operates five optical telescopes with apertures in the range from1.5 m to 3.6 m, the 15 m SEST millimetre radio telescope and smaller instruments.
The main areas of activity at the Headquarters and in Chile are:
• research in observational and theoretical astrophysics; • managing and constructing the VLT;• developing the interferometer and adaptive optics for the VLT;• operating the La Silla Observatory; • development of instruments for current ESO telescopes and for the VLT;• calibration, analysis, management and archiving of data from the current ESO telescopes; • developing the Atacama Large Millimetre Array (ALMA);• fostering co-operation in astronomy and astrophysics within Europe and Chile.
The main scientific interest of ESO Faculty astronomers in Garching and in Chile are given in the ESO web site http://www.eso.org/science/facultymembers.html.
Both the ESO Headquarters and the Astronomy Centre in Santiago offer extensive computing facilities, libraries and other infrastruc-ture for research support.
There are ample opportunities for scientific collaborations. The ESO Headquarters host the Space Telescope European Co-ordinatingFacility (ST-ECF), are situated in the immediate neighbourhood of the Max-Planck Institutes for Astrophysics and for Extraterrestrial Physicsand are only a few kilometres away from the Observatory of the Ludwig-Maximilian University. In Chile, ESO fellows have the opportunityto collaborate with the rapidly expanding Chilean astronomical community in a growing partnership between ESO and the host country’sacademic community.
Fellows in Garching spend up to 25% of their time on the support or development activities mentioned above, in addition to personalresearch. They can select functional activities in one of the following areas: instrumentation, user support, archive, VLTI, ALMAor scienceoperations at the Paranal Observatory. Fellowships in Garching are granted for one year with the expectation of a second year and ex-ceptionally a third year.
In Chile, the fellowships are granted for one year with the expectation of a second and third year. During the first two years, the fellowsselect to be assigned to either a Paranal operation group or a La Silla telescope team. They support the visiting astronomers at a level of50% of their time, with 80 nights per year at either the Paranal or La Silla Observatory and 35 days per year at the Santiago Office. Duringthe third year, two options are provided. The fellows may be hosted by a Chilean institution and will thus be eligible to propose for Chileanobserving time on all telescopes in Chile; they will not have any functional work. The second option is to spend the third year in Garchingwhere the fellows will then spend 25% of their time on the support of functional activities.
The basic monthly salary will be not less than DM 4,970 to which is added an expatriation allowance of 9–12% in Garching, if applica-ble, and up to 35% in Chile. The remuneration in Chile will be adjusted according to the cost of living differential between Santiago de Chileand Munich. An annual allocation of DM 12,000 (somewhat higher for a duty station in Chile) for research travel is also available. Additionalinformation on employment conditions/benefits can be found on the ESO web site http://www.eso.org/gen-fac/adm/pers/fellows.html
Candidates will be notified of the results of the selection process in January 2001. Fellowships begin between April and October of theyear in which they are awarded. Selected fellows can join ESO only after having completed their doctorate.
Applications must be made on the ESO Fellowship Application Form (postscript) which can be obtained from the ESO web sitehttp://www.eso.org/gen-fac/adm/pers/forms/. The applicant should arrange for three letters of recommendation from persons familiar withhis/her scientific work to be sent directly to ESO. Applications and the three letters must reach ESO by October 15, 2000.
Completed applications should be addressed to:
European Southern Observatory, Fellowship ProgrammeKarl-Schwarzschild-Str. 2, D-85748 Garching bei München, [email protected]
Contact person: Angelika Beller – E-mail: [email protected] – Tel: 0049-89-3200-6553, Fax: 0049-89-3200-649
PERSONNEL MOVEMENTSInternational Staff (April – June 2000)
ARRIVALSEUROPE
BAARS, Jacob (NL), Systems Engineer, as of 1.11.99GAILLARD, Boris (F), CoopérantKEMP, Robert (UK), Application Software Designer and
DeveloperPIERFEDERICI, Francesco (I) Data Archive and Pipeline
Software SpecialistSIEBENMORGEN, Ralf (D), Infrared Instrumentation ScientistTAN, Gie Han (NL), Project Engineer
CHILEAGEORGES, Nancy (F), Operation Staff AstronomerCURRAN, Stephen (UK), Associate (SEST)
DEPARTURESEUROPE
BELETIC, James (USA), Senior AstronomerCABILLIC, Armelle (F), Programme Manager
KIM, Young-Soo (Korean), AssociateLOMBARDI, Marco (I), StudentPRIMAS, Francesca (I), FellowRAUCH, Michael (D), User Support AstronomerTOLSTOY, Elizabeth (NL), Fellow
CHILELUNDQVIST, Göran (S), System Analyst
Local Staff (April – May 2000)
ARRIVALSACEVEDO, Maria Teresa, Telescope Instrument Operator, ParanalBAEZA, Silvia, Software Engineer Developer, La Silla CASTILLO, Monica, Telescope Instrument Operator, La Silla COSTA, Jaime, Electrical Engineer, ParanalSALDIAS, Christian, System Administrator, Vitacura
DEPARTURESKAISER, Cristian, Personnel Assistant, Vitacura
TRANSFERSKASTINEN, Ismo, Software Engineer Developer, La SillaPAVEZ, Marcus, System Administrator, La Silla

56
ESO, the European Southern Observa-tory, was created in 1962 to “… establishand operate an astronomical observatoryin the southern hemisphere, equippedwith powerful instruments, with the aim offurthering and organising collaboration inastronomy …” It is supported by eightcountries: Belgium, Denmark, France,Germany, Italy, the Netherlands, Swedenand Switzerland. ESO operates at twosites. It operates the La Silla observatoryin the Atacama desert, 600 km north ofSantiago de Chile, at 2,400 m altitude,where several optical telescopes with di-ameters up to 3.6 m and a 15-m submil-limetre radio telescope (SEST) are now inoperation. In addition, ESO is in the pro-cess of building the Very Large Telescope(VLT) on Paranal, a 2,600 m high moun-tain approximately 130 km south of Anto-fagasta, in the driest part of the Atacamadesert. The VLT consists of four 8.2-metreand three 1.8-metre telescopes. Thesetelescopes can also be used in combina-tion as a giant interferometer (VLTI). Thefirst 8.2-metre telescope (called ANTU) issince April 1999 in regular operation, andalso the second one (KUEYEN) has al-ready delivered pictures of excellent qual-ity. Over 1200 proposals are made eachyear for the use of the ESO telescopes.The ESO Headquarters are located inGarching, near Munich, Germany. This isthe scientific, technical and administrativecentre of ESO where technical develop-ment programmes are carried out to pro-vide the La Silla and Paranal observato-ries with the most advanced instruments.There are also extensive astronomicaldata facilities. In Europe ESO employsabout 200 international staff members,Fellows and Associates; in Chile about 70and, in addition, about 130 local staffmembers.
The ESO MESSENGER is publishedfour times a year: normally in March,June, September and December. ESOalso publishes Conference Proceedings,Preprints, Technical Notes and other ma-terial connected to its activities. PressReleases inform the media about particu-lar events. For further information, contactthe ESO Education and Public RelationsDepartment at the following address:
EUROPEAN SOUTHERN OBSERVATORYKarl-Schwarzschild-Str. 2 D-85748 Garching bei München Germany Tel. (089) 320 06-0 Telefax (089) [email protected] (internet) URL: http://www.eso.org
http://www.eso.org/gen-fac/pubs/messenger/
The ESO Messenger:Editor: Marie-Hélène DemoulinTechnical editor: Kurt Kjär
Printed by J. Gotteswinter GmbHBuch- und OffsetdruckJoseph-Dollinger-Bogen 22D-80807 MünchenGermany
ISSN 0722-6691
ContentsR. Gilmozzi and P. Dierickx: OWL Concept Study . . . . . . . . . . . . . . . 1Paranal Impressions . . . . . . . . . . . . . . . . . . . . . . . . . . . . . . . . . . . . 11
TELESCOPES AND INSTRUMENTATION
D. Currie et al.: The ESO Photometric and Astrometric AnalysisProgramme for Adaptive Optics . . . . . . . . . . . . . . . . . . . . . . . . . . 12
E. Diolaiti et al.: StarFinder: a Code to Analyse Isoplanatic High-Resolution Stellar Fields . . . . . . . . . . . . . . . . . . . . . . . . . . . . . . . 23
D. Bonaccini et al.: VLT Laser Guide Star Facility: First SuccessfulTest of the Baseline Laser Scheme . . . . . . . . . . . . . . . . . . . . . . . 27
THE LA SILLA NEWS PAGE
H. Jones: 2p2 Team News . . . . . . . . . . . . . . . . . . . . . . . . . . . . . . . 29M. Sterzik, M. Kürster: News from the 3.6-m Telescope . . . . . . . . . . 30La Silla under the Milky Way . . . . . . . . . . . . . . . . . . . . . . . . . . . . . . 31
REPORTS FROM OBSERVERS
H. Pedersen et al.: Gamma-Ray Bursts – Pushing Limits with theVLT . . . . . . . . . . . . . . . . . . . . . . . . . . . . . . . . . . . . . . . . . . . . . . . 32
D. Rigopoulou et al.: ISAAC on the VLT Investigates the Nature ofthe High-Redshift Sources of the Cosmic Infrared Background . . 37
R. Häfner: The Deep Eclipse of NN Ser . . . . . . . . . . . . . . . . . . . . . . 42I. Appenzeller et al.: The FORS Deep Field . . . . . . . . . . . . . . . . . . . 44
DATA MANAGEMENT AND OPERATIONS
N. Devillard: Astronomical Image Resampling . . . . . . . . . . . . . . . . . 48
OTHER ASTRONOMICAL NEWS
Portugal to Accede to ESO . . . . . . . . . . . . . . . . . . . . . . . . . . . . . . . 51
ANNOUNCEMENTS
Scientific Preprints (March–June 2000) . . . . . . . . . . . . . . . . . . . . . . 52K. Kjär: About The ESO Messenger . . . . . . . . . . . . . . . . . . . . . . . . . 53A Challenge for Engineers and Astronomers . . . . . . . . . . . . . . . . . . 54ESO Fellowship Programme 2000/2001 . . . . . . . . . . . . . . . . . . . . . . 55Personnel Movements . . . . . . . . . . . . . . . . . . . . . . . . . . . . . . . . . . . 55Tragic Car Accident Involves ESO Employees . . . . . . . . . . . . . . . . . 56
Tragic Car Accident InvolvesESO Employees
Saturday, May 27, turned into a tragic day for ESO. The team installing TIMMI2at La Silla, went on an excursion to the Elqui valley, 70 km east of the city of La Serenaand suffered a serious car accident, crashing against another car driving from the oppo-site direction.
Dr. Hans-Georg Reinmann, from the University of Jena, died in the crash, while Mr.Ralf Wagner (ESO Associate), from Germany, was seriously injured and had to be takento the intensive care unit of the Hospital de Coquimbo. The other three persons travellingin the car, Helena Relke, from the University of Jena, Ulrich Käufl and Armin Silber, fromESO Garching, were injured to a lesser degree.
Ralf Wagner remained in a critical condition for a period of three weeks. He was even-tually transferred to the Clínica Alemana in Santiago, where he is slowly recovering frommultiple lesions and fractures.
During the process, a large amount of blood was requested and donated by the ESOstaff, in order to support the case.
A family with two children travelled in the other car involved in the crash. One of the chil-dren was critically injured. He is now out of danger, but unfortunately may remain seriouslyimpaired.
We would like to thank the ESO staff who provided blood and personal assistance inthis emergency. It should also be mentioned that the Chilean authorities and medical serv-ices assisted us beyond their call of duty.