The Effect of Concept Formulation on Concept Test Scores
13
The Effect of Concept Formulation on Concept Test Scores Gavin Lees and Malcolm Wright While concept testing is a mainstay of the new product development process, there is little empirical evidence on the variation in consumer responses due to alternative concept formulations, particularly for those tests undertaken early in the product development process. The present study addressed this gap in the literature by using a split sample mail survey to compare stripped, embellished, and visual concept formulations for five heterogeneous product concepts. It was found that respondents’ answers to attitude and purchase intention questions showed only minor variation with different formulations of the concept test statement. It also was found that the ranking of the concepts showed no substantial changes across the different for- mulations. Therefore, the type of concept statement formulation may not be that important, at least for early ranking tasks performed before experiential prototypes are available. Early concept tests therefore may be carried out using stripped con- cept statements. This may reduce costs, allowing organizations to undertake early concept testing more frequently across a wider range of products. Introduction O rganizations often have a range of concepts under consideration, but with limited re- search and development funding only a few can be developed. Therefore, research that provides early screening and ranking of new product concepts obviously is helpful to decision-making. A popular way of achieving this is through concept testing, which Page and Rosenbaum (1992) define as ‘‘. . . a variety of marketing research-based approaches employed to assess the marketability of a product or service idea prior to its actual development. Its purpose is to pro- vide early feedback from the market about the per- ceived attractiveness of a proposed new product before its development has even begun’’ (p. 269). Concept testing also should be fast and cheap and should take place early in the new product develop- ment process. Crawford and Di Benedetto (2000) note that the key purposes of concept testing are (1) to eliminate the poor concept; (2) to generate a crude estimate of the sales or trial rate; and (3) to develop further the original idea. But how should the concept statements for these early screening and ranking tests be formulated? There are substantial differences of opinion on this point. Many practitioners apply stripped concept statements that consist of a brief, nonemotive, factu- al description. This has the advantages of ease of use and an enhanced ability to test many concepts. For example, Crawford and Di Benedetto (2000) report movie studio executives making major investment de- cisions on the basis of a stripped concept statement read out over the phone. However, there is a common counterview that for respondents to be able to eval- uate realistically a concept, it must be presented in an embellished form with an accompanying visual, such as a line drawing or a mock advertisement. There has been little research that empirically tests the effect of different concept formulations on con- sumer responses. The few results in the literature Address correspondence to Gavin Lee, Department of Marketing, Massey University, Private Bag 11-222, Palmerston North, New Zea- land; Tel: þ 64-6-356-9099 x7945; Fax: þ 64-6-350-2260; E-mail: [email protected]. Thanks to Scott Armstrong, Phil Gendall, Aruna Shekar, Tony Garrett, and two anonymous referees for helpful comments on earlier versions of this article. Thanks also to the Academy of Business Re- search (Massey University) for funding this research. J PROD INNOV MANAG 2004;21:389–400 r 2004 Product Development & Management Association
-
Upload
khangminh22 -
Category
Documents
-
view
3 -
download
0
Transcript of The Effect of Concept Formulation on Concept Test Scores

The Effect of Concept Formulation on Concept Test Scores
Gavin Lees and Malcolm Wright�
While concept testing is a mainstay of the new product development process, there is
little empirical evidence on the variation in consumer responses due to alternative
concept formulations, particularly for those tests undertaken early in the product
development process. The present study addressed this gap in the literature by using
a split sample mail survey to compare stripped, embellished, and visual concept
formulations for five heterogeneous product concepts. It was found that respondents’
answers to attitude and purchase intention questions showed only minor variation
with different formulations of the concept test statement. It also was found that
the ranking of the concepts showed no substantial changes across the different for-
mulations. Therefore, the type of concept statement formulation may not be that
important, at least for early ranking tasks performed before experiential prototypes
are available. Early concept tests therefore may be carried out using stripped con-
cept statements. This may reduce costs, allowing organizations to undertake early
concept testing more frequently across a wider range of products.
Introduction
Organizations often have a range of concepts
under consideration, but with limited re-
search and development funding only a few
can be developed. Therefore, research that provides
early screening and ranking of new product concepts
obviously is helpful to decision-making. A popular
way of achieving this is through concept testing, which
Page and Rosenbaum (1992) define as ‘‘. . . a variety
of marketing research-based approaches employed to
assess the marketability of a product or service idea
prior to its actual development. Its purpose is to pro-
vide early feedback from the market about the per-
ceived attractiveness of a proposed new product
before its development has even begun’’ (p. 269).
Concept testing also should be fast and cheap and
should take place early in the new product develop-
ment process. Crawford and Di Benedetto (2000) note
that the key purposes of concept testing are (1) to
eliminate the poor concept; (2) to generate a crude
estimate of the sales or trial rate; and (3) to develop
further the original idea.
But how should the concept statements for these
early screening and ranking tests be formulated?
There are substantial differences of opinion on this
point. Many practitioners apply stripped concept
statements that consist of a brief, nonemotive, factu-
al description. This has the advantages of ease of use
and an enhanced ability to test many concepts. For
example, Crawford and Di Benedetto (2000) report
movie studio executives making major investment de-
cisions on the basis of a stripped concept statement
read out over the phone. However, there is a common
counterview that for respondents to be able to eval-
uate realistically a concept, it must be presented in an
embellished form with an accompanying visual, such
as a line drawing or a mock advertisement.
There has been little research that empirically tests
the effect of different concept formulations on con-
sumer responses. The few results in the literature
Address correspondence to Gavin Lee, Department of Marketing,Massey University, Private Bag 11-222, Palmerston North, New Zea-land; Tel: þ 64-6-356-9099 x7945; Fax: þ 64-6-350-2260; E-mail:[email protected].�Thanks to Scott Armstrong, Phil Gendall, Aruna Shekar, Tony
Garrett, and two anonymous referees for helpful comments on earlierversions of this article. Thanks also to the Academy of Business Re-search (Massey University) for funding this research.
J PROD INNOV MANAG 2004;21:389–400r 2004 Product Development & Management Association

generally are taken to suggest that different formula-
tions of concept statements (e.g., stripped versus full
concept statements, or words versus words plus visu-
als) lead to different evaluations. This suggests that
practitioners cannot compare test results from differ-
ing concept formats or know whether the concept
format they have chosen is appropriate. In general, it
makes it more difficult to interpret concept test scores.
Therefore, the purpose of this research was to
quantify the effect of alternative formulations of con-
cept statements on consumers’ reactions. The present
study proceeds by reviewing the literature and prior
research, by setting out the method, and by reporting
the results of a split sample mail survey that tested
consumer reactions to three formulations of five prod-
uct concepts.
Prior Research on Concept Formulation
Concepts can be presented in many varied ways, from
a simple factual statement giving a minimum of at-
tributes to a commercialized concept statement with
persuasive claims or even to a full mock advertise-
ment. None of these is the concept itself, which is ul-
timately an idea resting in people’s minds. All concept
tests measure are reactions to a particular version of
that idea—the concept statement.
The distinction between the concept and the exe-
cution of the concept long has been recognized as an
important issue. For example, early on, Tauber (1972)
asked the question: What is measured by concept
testing? Lewis (1984) questions whether concept
scores measure the message or the method? The an-
swers to these questions have a major impact on the
conduct and interpretation of concept testing.
Conventional wisdom has developed rules of
thumb for the formulation of concept statements.
For example, Moore (1982) suggests that relatively
bland or stripped concept statements should be
used when a large number of concepts are evaluated,
as the tests will be quicker and cheaper. He also
says that bland or stripped concept statements also
should be used when the concept is radically new,
as any positioning may limit its appeal. However,
Moore (1982) does recommend promotional concept
statements when a concept is going into an exist-
ing product class—a position also supported by Mar-
der (1997).
Dolan (1993) identifies the major executional con-
siderations in concept testing to be the communica-
tion method and the consumer response measure. The
first issue, according to Dolan, is whether the com-
munication methods are presented in a factual or
stripped manner without emotion or without using
the persuasive techniques found in a normal market
situation. Dolan (1993) believes there is no general
rule as to which is better but that a move from factual
to persuasive tone would increase purchase intent
score—the consumer response measure. Similarly,
Dolan (1993) expects words plus visual concepts gen-
erally would produce purchase intent scores greater
than words or a visual on their own. These positions
are supported by both Marder (1997) and Crawford
and Di Benedetto (2000), who contend that the em-
bellished or commercialized format will produce
‘‘more realistic evaluations (that is, greater accep-
tance)’’ (p. 182).
Why should a persuasive tone or the inclusion of
visuals increase consumer interest? The conventional
wisdom largely is unsupported by detailed theoretical
reasoning. However, some authors have claimed that
differences may arise because verbal and visual in-
formation is processed differently (Holbrooke and
Moore, 1981; Vriens et al., 1998). For example, Paivio
(1978) suggests that words are processed sequentially
in a ‘erbal system,’’ while images are dealt with si-
multaneously in an independent ‘‘imagery system,’’
and that these differing processes well could lead to
differing responses. Pick and Saltzman (1978) make a
similar point: the left brain may dominate in verbal
processing and the right brain in visual processing. On
the other hand, Rossiter and Percy (1980) suggest that
verbal information may be ‘‘translated’’ into pictures,
reducing the differences between the two stimuli. One
implication of Rossiter and Percy’s (1980) point
is that the use of adjectives in persuasive concept
statements may create stronger mental imagery
than is achieved from bland factual statements; thus,
BIOGRAPHICAL SKETCHES
Malcolm Wright is associate professor in the Department of
Marketing at Massey University. He has long-standing interests in
empirical generalizations and research methodology. His academic
work has appeared in a variety of international journals, including
the International Journal of Research in Marketing, European Jour-
nal of Marketing, and Journal of the Market Research Society.
Gavin Lees is assistant lecturer in the Department of Marketing at
Massey University. When this research was conducted he was re-
search student in the Department of Marketing, having previously
worked as a radio journalist, advertising sales manager, and local
authority marketing manager before returning to school to pursue
higher study.
390 J PROD INNOV MANAG2004;21:389–400
G. LEES AND M. WRIGHT

persuasive concept statements may generate responses
closer to those achieved from visual stimuli.
However, towever, he empirical evidence on the
effects of different stimuli is relatively sparse, and it is
not at all clear cut. Increased ratings for visual stimuli
have been found by Tauber (1972), who compares
factual descriptions of three food concepts with print
advertisements including color photographs; by Hol-
brooke and Moore (1981), who compare consumer
reactions to written versus visual presentations of
sweater designs; and by Vriens et al. (1998), who
find images generated higher ratings than factual ver-
bal descriptions in two out of three cases. Similarly,
more realistic stimuli are found to generate greater
positive interest by Lewis (1984), who finds that pro-
viding an actual test product increased positive inter-
est over concept tests for a personal care product; and
by Dahan and Srinivasan (2000), who find that virtual
and actual prototypes of bicycle pumps yield much
higher market-share predictions than attribute-only
descriptions. Yet these results are contradicted by
those of Armstrong and Overton (1971), who find
no significant difference between a factual concept
statement and exposure to a prototype for a mini-car
leasing system; by Domzal and Unger (1985), who
replicate Holbrooke and Moore’s study and find no
effect; and by Dickinson and Wilby (1997), who find
no significant difference between concept statements
and product trial for toothpaste.
A possible explanation of these differences can be
found in Schoormans et al. (1995). They note that if
consumers develop different meanings from different
concept formulations, this likely will result in different
evaluations. However, they also point out that differ-
ences in stimuli need not result in differences in mean-
ing. They assert that meanings would vary only (1) if
there are substantive differences in the information
provided; and (2) if respondents’ prior knowledge does
not allow them to infer the missing information. Thus,
the increases in interest found by some research-
ers may be due to substantial additional information
being provided by a product placement, prototype, or
mock advertisement, rather than differences in con-
cept formulation or information processing.
Also, previous research has failed to test the effect
of a persuasive tone in a controlled fashion. This is
demonstrated in Figure 1, which classifies previous
empirical studies into the taxonomy of concept testing
stimuli developed by Dolan (1993), namely the use of
a factual or persuasive tone on one axis, and the use of
words, visuals, or words plus visuals on the other axis.
As most prior research involved multiple treat-
ments with varying combinations of stimuli, the ma-
jority of studies are present in more than one cell of
Figure 1. However, Lewis (1984) is not included in
Figure 1, as he does not make clear the concept for-
mulation used. Research involving product place-
ments and prototypes also is not included, as these
typically occur later in the new product development
process than concept testing.
Figure 1 highlights the contribution of the present
study. At a basic level, this research is adding to the
relatively sparse literature on the effects of differing
concept formulations. More importantly, this study is
assessing the effect of a persuasive tone and the ad-
dition of visual stimuli in a controlled fashion; it is the
first to assess the effects of a persuasive tone without
confounding the test through the simultaneous addi-
tion of visual stimuli. Thus, the present work explic-
itly evaluates two propositions reflecting assertions
made in the previous literature.
P1: Moving from a factual to a persuasive tone
increases consumer interest.
P2: Moving from words to words plus visual stimuli
increases consumer interest.
This will demonstrate whether additional stimuli have
an effect when there are no substantive changes in in-
formation content. Any differences in visual versus
verbal processing should be detected by tests of P2,
while any effect from richer verbal imagery should
be detected by tests of P1. Quantifying the changes
due to tone and visual stimuli also will give a base-
line against which more sophisticated stimuli, such
as mock advertisements or virtual prototypes, may be
evaluated in the future.
Factual Persuasive
Words Armstrong and Overton (1971) Tauber (1972) Holbrooke and Moore (1981) Domzal and Unger (1985) Vriens et al. (1998) Dahan and Srinivasan (2000) The present study
Haley and Gatty (1971)The present study
Visual Holbrooke and Moore (1981) Domzal and Unger (1985) Vriens et al. (1998)
Words plus Visual
Dahan and Srinivasan (2000) Armstrong and Overton (1971) Tauber (1972) Dickinson and Wilby (1997) The present study
Figure 1. Prior Studies of Concept Test Formulation
CONCEPT FORMULATION AND CONCEPT SCORES J PROD INNOV MANAG2004;21:389–400
391
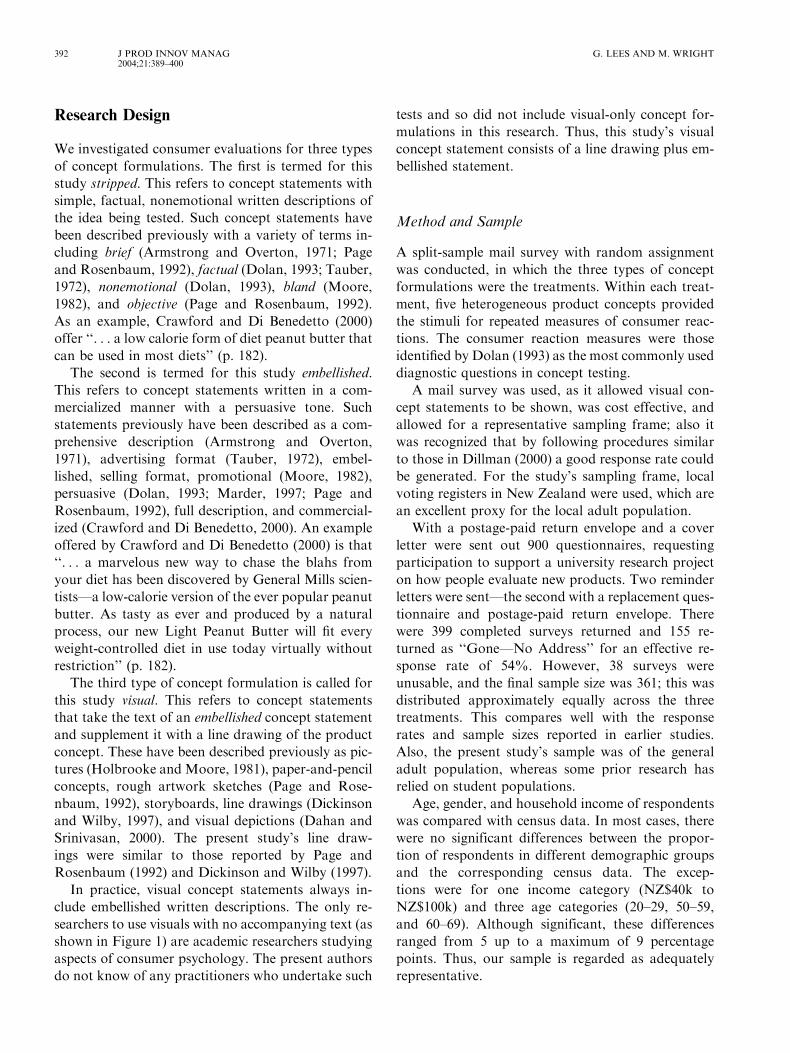
Research Design
We investigated consumer evaluations for three types
of concept formulations. The first is termed for this
study stripped. This refers to concept statements with
simple, factual, nonemotional written descriptions of
the idea being tested. Such concept statements have
been described previously with a variety of terms in-
cluding brief (Armstrong and Overton, 1971; Page
and Rosenbaum, 1992), factual (Dolan, 1993; Tauber,
1972), nonemotional (Dolan, 1993), bland (Moore,
1982), and objective (Page and Rosenbaum, 1992).
As an example, Crawford and Di Benedetto (2000)
offer ‘‘. . . a low calorie form of diet peanut butter that
can be used in most diets’’ (p. 182).
The second is termed for this study embellished.
This refers to concept statements written in a com-
mercialized manner with a persuasive tone. Such
statements previously have been described as a com-
prehensive description (Armstrong and Overton,
1971), advertising format (Tauber, 1972), embel-
lished, selling format, promotional (Moore, 1982),
persuasive (Dolan, 1993; Marder, 1997; Page and
Rosenbaum, 1992), full description, and commercial-
ized (Crawford and Di Benedetto, 2000). An example
offered by Crawford and Di Benedetto (2000) is that
‘‘. . . a marvelous new way to chase the blahs from
your diet has been discovered by General Mills scien-
tists—a low-calorie version of the ever popular peanut
butter. As tasty as ever and produced by a natural
process, our new Light Peanut Butter will fit every
weight-controlled diet in use today virtually without
restriction’’ (p. 182).
The third type of concept formulation is called for
this study visual. This refers to concept statements
that take the text of an embellished concept statement
and supplement it with a line drawing of the product
concept. These have been described previously as pic-
tures (Holbrooke and Moore, 1981), paper-and-pencil
concepts, rough artwork sketches (Page and Rose-
nbaum, 1992), storyboards, line drawings (Dickinson
and Wilby, 1997), and visual depictions (Dahan and
Srinivasan, 2000). The present study’s line draw-
ings were similar to those reported by Page and
Rosenbaum (1992) and Dickinson and Wilby (1997).
In practice, visual concept statements always in-
clude embellished written descriptions. The only re-
searchers to use visuals with no accompanying text (as
shown in Figure 1) are academic researchers studying
aspects of consumer psychology. The present authors
do not know of any practitioners who undertake such
tests and so did not include visual-only concept for-
mulations in this research. Thus, this study’s visual
concept statement consists of a line drawing plus em-
bellished statement.
Method and Sample
A split-sample mail survey with random assignment
was conducted, in which the three types of concept
formulations were the treatments. Within each treat-
ment, five heterogeneous product concepts provided
the stimuli for repeated measures of consumer reac-
tions. The consumer reaction measures were those
identified by Dolan (1993) as the most commonly used
diagnostic questions in concept testing.
A mail survey was used, as it allowed visual con-
cept statements to be shown, was cost effective, and
allowed for a representative sampling frame; also it
was recognized that by following procedures similar
to those in Dillman (2000) a good response rate could
be generated. For the study’s sampling frame, local
voting registers in New Zealand were used, which are
an excellent proxy for the local adult population.
With a postage-paid return envelope and a cover
letter were sent out 900 questionnaires, requesting
participation to support a university research project
on how people evaluate new products. Two reminder
letters were sent—the second with a replacement ques-
tionnaire and postage-paid return envelope. There
were 399 completed surveys returned and 155 re-
turned as ‘‘Gone—No Address’’ for an effective re-
sponse rate of 54%. However, 38 surveys were
unusable, and the final sample size was 361; this was
distributed approximately equally across the three
treatments. This compares well with the response
rates and sample sizes reported in earlier studies.
Also, the present study’s sample was of the general
adult population, whereas some prior research has
relied on student populations.
Age, gender, and household income of respondents
was compared with census data. In most cases, there
were no significant differences between the propor-
tion of respondents in different demographic groups
and the corresponding census data. The excep-
tions were for one income category (NZ$40k to
NZ$100k) and three age categories (20–29, 50–59,
and 60–69). Although significant, these differences
ranged from 5 up to a maximum of 9 percentage
points. Thus, our sample is regarded as adequately
representative.
392 J PROD INNOV MANAG2004;21:389–400
G. LEES AND M. WRIGHT

Development of the Test Concepts
The variation in concepts within existing studies is
quite limited. Often there will be only one or two cat-
egories in a study. This limits both statistical power
and the generalizability of results. To address this
limitation, a heterogeneous range of five test concepts
were selected that included durable and consumable
products, high price and low price products, and
highly innovative products and line extensions. The
concepts are outlined as follows.
A spray-on hand cleanser. This represented a com-
pletely new product. The concept statement was sim-
ilar to an example used by Crawford and Di
Benedetto (2000).
� A mint-flavored baking soda toothpaste. This
represented a simple flavor variant of an existing
product. The base product was used by Dickin-
son and Wilby (1997).
A spin fryer. This represented a completely new prod-
uct. The concept statement was similar to an example
used by Page and Rosenbaum (1992).
A disposable cell phone. This represented a new
product form and was based on emergent and
planned products identified in other markets with an
Internet search.
� A digital video disc (DVD) recorder. This had
some limited commercial availability to the sam-
pling frame, but as diffusion was still in the pre-
take-off stage it was regarded it as eligible for
concept testing.
The present authors’ knowledge of the local markets
suggested that that these concepts would be recogniz-
able easily and relevant to most consumers, and this
was confirmed during pretesting. With the exception
of the DVD recorder, none of the concepts were avail-
able to the respondents in the sampling frame.
Development of the Concept Statements
The authors of this study wrote the concept state-
ments, as they had commercial experience in this area.
Nonetheless, as shown earlier, prior examples were
drawn upon wherever possible. To control for copy-
writing effects, the stripped concept statements were
written first, and then positive adjectives and clauses
were added with minor subsidiary information to pro-
duce the embellished concept statements. Thus, each
stripped concept statement was a subset of the corre-
sponding embellished concept statement. Both the
stripped and embellished statements were refined
through pretesting. Then a graphic artist was com-
missioned to produce the line drawings for the visual
concept statements.
Sometimes concept statements include a price as a
reference point. A price was included, based on the
cost of similar or competing products in the market-
place. Brand names were omitted in all concepts.
While a standard monadic test format (i.e., no com-
petitive concepts) was used, it was believed for this
study that there was an implied comparison with ex-
isting products serving similar well-established needs.
There is some evidence for this: Miller et al. (1987)
finds that inclusion of competitive-set information did
not significantly change purchase intention for the pur-
chase of dog-snack products (n5 1,922 dog owners).
Evaluation of Consumer Reactions
For each concept, attitudinal questions were asked
about problem-solving ability, believability, and
uniqueness, as well as a purchase intent question. Ac-
cording to Page and Rosenbaum (1992) and Dolan
(1993), these are the key dimensions to be measured in
concept testing. The present study’s questions closely
followed the standard wording used in the concept
testing literature, for example as reported in Page and
Rosenbaum (1992).
A seven-point response scale was used with the
choices ranging from ‘‘strongly disagree’’ (1) to
‘‘strongly agree’’ (7). For purchase intent, a five-point
scale was used from ‘‘I would definitely buy it’’ (5) to
‘‘I would definitely not buy it’’ (1).
The dimensions measured and questions used are
both well established in the literature. Rossiter (2002)
demonstrates that under these circumstances, single-
item scales are appropriate. In any event, single-item
scales are widespread in concept testing. There does
remain a question of precision compared to multi-
item scales; however, the present study’s results do
show adequate precision as measured by, for example,
relatively small standard errors.
Results
Overall Concept Evaluations
Table 1 shows the average concept evaluations across
all three treatments, allowing for examination of the
CONCEPT FORMULATION AND CONCEPT SCORES J PROD INNOV MANAG2004;21:389–400
393

variability among the concepts and the face validity of
the results. Clearly there is adequate variation among
the concepts. Two concepts were seen as, on average,
being effective in solving relevant problems, while
three were not (the midpoint of the scale was 4.0).
The claims made about the concepts were seen as be-
lievable, confirming that the concept executions were
all adequate; this is particularly important given that
Trebbi and Flesch (1983) find variations in perform-
ance confidence (i.e., believability) could confound
purchase intention comparisons over repeated con-
cept tests. All concepts except the basic line extension
(toothpaste) were seen as unique. The average pur-
chase intent varied from a low of 1.65 to a high of
2.83, with top-two box purchase intent varying from
3% to 27%.
From this it can be concluded that the concept
statements are executed adequately and have reason-
able between-concept variation in both problem-
solving ability and purchase intent. There was also
reasonable variation around the means shown in
Table 1. For the seven-point scales the standard
deviations ranged from 1.2 to 1.7 across the five con-
cepts. For the five-point purchase intent scale, they
ranged from 0.9 to 1.1.
Differences among Concept StatementFormulations
Table 2 shows a comparison of means for each ques-
tion across the three treatments. These are calculated
as the average over all five concepts within a treat-
ment. Standard errors are recorded in parentheses.
Examination of Table 2 reveals two key points. First,
for each treatment, the averages vary considerably
among the different questions. This, together with the
standard errors, shows that the measures employed
are sufficiently precise to detect differences in re-
spondent opinion. Second, between treatments, the
averages show hardly any variation at all. The com-
parison of stripped and embellished shows no support
for P1, while the comparison of embellished and visual
shows no support for P2. This is surprising. It suggests
that, contrary to prior belief, different concept for-
mulations do not result in different concept evalua-
tion scores.
This study formally tested the differences for each
concept evaluation question using repeated measures
analysis of variance (ANOVAs). This enabled for a
simultaneous testing of the differences between con-
cepts (a within-subjects effect), differences between
treatments (a between-subjects effect), and interac-
tions between concept and treatment. Table 3 reports
the results.
Differences between concepts are statistically sig-
nificant for solve, unique, and purchase, indicating that
the five concepts were in fact perceived differently.
There was no statistically significant difference for
believe (p5 .11), showing that believability (and thus
concept execution) was consistently high across all
concepts and all treatments.
Differences between treatments were all non-
significant. That is, the use of stripped, embellished,
Table 1. Average Concept Evaluations (All Formulations)
ConceptSolve Problems
(Seven-Point Scale)Believable
(Seven-Point Scale)Unique
(Seven-Point Scale)Purchase Intent(Five-Point Scale)
Purchase Intent(Top Two-box)
DVD Recorder 4.47 4.86 4.83 2.39 17%Spray-On Hand Cleanser 4.39 4.61 4.19 2.65 26%Spin Fryer 3.85 4.37 4.56 2.16 11%Mint Baking Soda Toothpaste 3.61 4.59 3.29 2.83 27%Disposable Cell Phone 2.57 4.22 4.16 1.65 3%
Table 2. Comparison of Treatments, Average of All Conceptsa
TreatmentSolve Problems
(Seven-Point Scale)Believable
(Seven-Point Scale)Unique
(Seven-Point Scale)Purchase Intent(Five-Point Scale)
Stripped 3.67 (.09) 4.52 (.08) 4.19 (.09) 2.27 (.06)Embellished 3.89 (.09) 4.57 (.08) 4.26 (.09) 2.41 (.06)Visual 3.77 (.08) 4.51 (.08) 4.20 (.10) 2.31 (.06)
a Standard errors in parentheses. With five responses per subject, n varies from 565 to 625.
394 J PROD INNOV MANAG2004;21:389–400
G. LEES AND M. WRIGHT

or visual formulations had no detectable effect.
Strong interactions between concept and treatment
might undermine this finding, as the choice of concept
then would confound the measurement of treatment
effects. However, Table 3 also shows the interaction
effects to be nonsignificant.
As a further check on differences between treat-
ments at the individual concept level, this study un-
dertook ANOVAs for each concept on each question.
One difference was found to be significant at the 5%
level (p5 .045) and one to be significant at the 10%
level (p5 .078). However, as 20 ANOVAs were in-
volved, this is exactly the frequency of significant re-
sults expected from chance alone. It therefore is
concluded that there are no differences between treat-
ments at the individual concept level. This confirms
the surprising finding that different concept formula-
tions do not result in detectably different concept
evaluation scores. Neither P1 nor P2 is supported.
Preservation of Concept Rankings
The ranking of the concepts for each formulation also
were examined. Although differences between concept
evaluations were small, they still could have serious
managerial consequences if they caused changes in
ranking, as this could lead to different decisions about
the investment of research and development funds. To
generate an overall concept ranking, consumer con-
cept evaluations were used. Each concept was ranked
four times—once on each question. Then the average
of these four ranks were taken to yield an overall av-
erage rank for each concept. This process was repeat-
ed for each treatment to allow between treatment
comparisons. The results are reported in Table 4.
Table 4 shows that the average ranks were pre-
served across treatments. This also was true for the
individual ranks on each concept-testing question (not
shown in Table 4). Changes in individual ranks were
rare and never were more than a single rank. In the
case of purchase intent, arguably the most important
of the measures, there were no changes in ranks be-
tween treatments. Thus, rankings of the five concepts
showed considerable stability across the three differ-
ent concept statement formulations. Again, this shows
no support for either P1 or P2.
Discussion
Prior literature asserts that a persuasive tone and vis-
ual stimuli both increase concept ratings and that
persuasive concept statements are more accurate. The
present study found no significant differences from
the addition of a persuasive tone or the subsequent
addition of visual stimuli.
This is at variance with the increases in consumer
ratings found by Tauber (1972) and the increased
number of effects found by Holbrook and Moore
(1981). However, the present study involved a stand-
ard line drawing, while Tauber (1972) and Vriens et al.
Table 3. ANOVA for Each Question with Concepts as Repeated Measures
Within Subjects df F Significance Between Subjects df F Significance
Solve Concept 3.9 111 0.00 Intercept 1 5574 0.00Concept�Treatment 7.8 1.1 0.36 Treatment 2 2.1 0.13Error (Concept) 1333 Error 340
Believe Concept 3.9 13 0.11 Intercept 1 8879 0.00Concept�Treatment 7.8 0.7 0.73 Treatment 2 0.4 0.66Error (Concept) 1262 Error 322
Unique Concept 3.9 69 0.00 Intercept 1 5684 0.00Concept�Treatment 7.8 1.9 0.06 Treatment 2 0.1 0.88Error (Concept) 1235 Error 318
Purchase Concept 3.8 92 0.00 Intercept 1 11117 0.00Concept�Treatment 7.7 0.9 0.45 Treatment 2 1.3 0.28Error (Concept) 1325 Error 345
Table 4. Average Rank by Treatment
TreatmentDVD
RecorderSpray-OnCleanser
SpinFryer
MintBakingSoda
Toothpaste
DisposableCell
Phone
Stripped 1.50 2.50 3.25 3.25 4.50Embellished 1.50 2.50 3.25 3.00 4.75Visual 1.75 2.25 3.25 3.25 4.50
CONCEPT FORMULATION AND CONCEPT SCORES J PROD INNOV MANAG2004;21:389–400
395

(1998) used photographs. Also, the visual stimuli in
the present study were combined with verbal descrip-
tions, while Holbrook and Moore’s (1981) pictures
have no corresponding verbal descriptions. These
methodological variations may be the cause of the
differences in consumer evaluations. Thus, this
study’s conclusions should be restricted properly to
the comparison of concept statements with and with-
out line drawings. It is also wise to be cautious in the
application of these results to food products, fashion
clothing, and automobile accessories, which are the
categories used by Tauber (1972), Holbrook and Mo-
ore (1981) and Vriens et al. (1998), respectively. Given
these caveats, this study’s results suggest that early
screening can be done with stripped concept state-
ments just as well as it can with embellished or visual
concept statements using line drawings. This is an im-
portant confirmation of a widespread industry prac-
tice (Crawford and Di Benedetto, 2000; Page and
Rosenbaum, 1992).
This study’s second major finding was that there
were no important changes in the ranking of the five
concepts when different concept statement formula-
tions were used. This has two implications. First, it
provides some support for the practice of using
stripped concept statements to rank new product
opportunities. Second, it suggests that this ranking
process is robust to changes in concept statement for-
mulation, an encouraging indicator of external valid-
ity. These results are consistent with Haley and Gatty
(1971) in that there were no significant differences
among well-formulated concept statements; with
Armstrong and Overton (1971) in that reaction to
basic descriptions were similar to reactions to more
elaborate formulations; and with Lewis (1984) and
Dahan and Srinivasan (2000) in that the relative rank-
ing of the concepts was preserved.
The question of external validity of concept tests is
a controversial issue, and a full discussion is beyond
the scope of this article. In general, early concept
tests are not expected to yield accurate forecasts of
trial rates, as they do not include the marketing
mix elements that play a major role in determining
trial. However, the robustness of both the scores
and ranks across different treatments is an encourag-
ing indicator of external validity. Also, there is a
stream of research that has shown purchase intent
to be related at least monotonically to trial rates
(Jamieson and Bass, 1989). Thus, although early con-
cept tests cannot yield forecasts of trial rates of sales
figures, they should be adequate to perform the
screening and ranking functions to which they usual-
ly are assigned.
Future work could expand on this study’s results in
a number of ways. An obvious extension would be
examination of concepts in other product categories,
such as food or services. Also, it may be that con-
sumer interest mediates the impact of additional stim-
uli. As with most of the prior literature, the present
authors did not have concepts that yielded extremely
high-purchase interest scores. However, this is unlike-
ly to be of practical importance, as differences in for-
mulation appear unlikely to lead to the rejection of
really strong concepts; this nonetheless remains an
interesting area for future research. A further point is
the precision of the single-item scales commonly used
in this area. Although this study has shown sufficient
precision for practical applications, the use of multi-
item scales could refine these findings, helping to de-
termine whether the proposed effects are completely
absent, or just very small.
It also would be helpful to study explicitly the im-
pact of more sophisticated stimuli such as print ad-
vertisements and virtual prototypes. The reasons why
Tauber (1972) obtain higher ratings for a mock ad-
vertisement than for a stripped concept are unclear.
The present work suggests it was not due solely to the
adoption of a persuasive tone or visual stimuli. It may
be that the use of color had an impact or, alterna-
tively, that Tauber (1972) inadvertently may have
included substantial new information in his adver-
tisement. Future research could attempt to confirm
Tauber’s (1972) finding while controlling for informa-
tion content.
There is also considerable scope to undertake work
on the visual stimuli used in virtual prototypes. Dah-
an and Srinivasan (2000) find that virtual prototypes
give similar results to actual prototypes but give high-
er scores than attribute-only descriptions. It would be
helpful to understand exactly what is driving these
differences in scores, as this would lead to more the-
oretically informed guidelines for development of vir-
tual prototypes. The present work contributes to this
by ruling out the addition of simple visual stimuli (or
a persuasive tone) as the sole explanations for these
changes. If simultaneous processing of visual imagery
does enhance consumer interest, then the black-and-
white line drawings widely used in concept testing are
insufficient to trigger this effect.
Overall, this study’s results have shown that the
form of concept statement may not be that relevant
for early concept rankings where brief descriptions
396 J PROD INNOV MANAG2004;21:389–400
G. LEES AND M. WRIGHT

and line drawings are used. The addition of a persua-
sive tone or visual stimuli are not enough, on their
own, to give a detectable increase in consumer inter-
est. Thus, early concept tests do not need to be un-
dertaken with a visual depiction of the product. This
could reduce the costs involved in each test signifi-
cantly, allowing organizations to test a wider range of
products and to undertake early concept tests more
frequently.
References
Armstrong, J.S. and Overton, T. (1971). Brief versus ComprehensiveDescriptions in Measuring Intention to Purchase. Journal of Mar-keting Research 8(1):114–117.
Crawford, C.M. and Di Benedetto, C.A. (2000). New Products Man-agement, 6th ed., New York: McGraw Hill.
Dahan, E. and Srinivasan, V. (2000). The Predictive Power of Internet-Based Product Concept Testing Using Visual Depiction and Ani-mation. Journal of Product Innovation Management 17(2):99–109.
Dickinson, J.R. and Wilby, C.P. (1997). Concept Testing with andwithout Product Trial. Journal of Product Innovation Management14(2):117–125.
Dillman, D.A. (2000). Mail and Internet Surveys; The Tailored DesignMethod, 2d. ed. New York: John Wiley & Sons, Inc.
Dolan, R. (1993). Managing the New Product Process. Reading, MA:Addison-Wesley Publishing Company.
Domzal, T.J. and Unger, L.S. (1985). Judgments of Verbal versus Pic-torial Presentations of a Product with Functional and AestheticFeatures. Advances in Consumer Research 12(1):268–272.
Haley, R.I. and Gatty, R. (1971). The Trouble with Concept Testing.Journal of Marketing Research 8(2):230–323.
Holbrook, M.B. and Moore, W.L. (1981). Feature Interactions inConsumer Judgments of Verbal versus Pictorial Presentations.Journal of Consumer Research 8(1):103–113.
Jamieson, L.F. and Bass, F.M. (1989). Adjusting Stated IntentionMeasures to Predict Trial Purchase of New Products: A Compar-ison of Models and Methods. Journal of Marketing Research26(August):336–345.
Lewis, I.M. (1984). Do Concept Scores Measure the Message or theMethod? Journal of Advertising Research 24(1):54–56.
Marder, E. (1997). The Laws of Choice. New York: The Free Press.
Miller, J.B., Bruvald, N.T. and Kernan, J.B. (1987). Does CompetitiveSet Information Affect the Results of Concept Tests? Journal ofAdvertising Research 27(2):16–24.
Moore, W.L. (1982). Concept Testing. Journal of Business Research10(3):279–294.
Page, A.L. and Rosenbaum, H.F. (1992). Developing an EffectiveConcept-Testing Program for Consumer Durables. Journal ofProduct Innovation Management 9(4):267–277.
Paivio, A. (1978). A Dual Coding Approach to Perception and Cog-nition. In Modes of Perceiving and Processing Information, H.L.Pick and E. Saltzman (eds.). Hillsdale, NH: Lawrence Erlbaum.
Pick, H.L. and Saltzman, E. (1978). Modes of Perceiving and Process-ing Information. In Modes of Perceiving and Processing Informa-tion, H.L. Pick and E. Saltzman (eds.). Hillsdale, NJ: LawrenceErlbaum.
Rossiter, J.R. (2002). The C-OAR-SE Procedure for Scale Develop-ment in Marketing. International Journal of Research in Marketing19(4):305–355.
Rossiter, J.R. and Percy, L. (1980). Attitude Change through VisualImagery in Advertising. Journal of Advertising Research 9(2):10–16.
Schoormans, J.P.L., Ortt, R.J. and de Bont, C.J.P.M. (1995). Enhanc-ing Concept Test Validity Using Expert Consumers. Journal ofProduct Innovation Management 12(2):153–162.
Tauber, E.M. (1972). What Is Measured by Concept Testing? Journalof Advertising Research 12(6):35–37.
Trebbi, G.G. and Flesch, E.J. (1983). Single versus Multiple ConceptTests. Journal of Advertising Research 23(3):21–26.
Vriens, M., Loosschilder, G.H., Rosbergen, E. and Wittink, D.R.(1998). Verbal versus Realistic Pictorial Representations in Con-joint Analysis with Design Attributes. Journal of Product Innova-tion Management 15(5):455–467.
CONCEPT FORMULATION AND CONCEPT SCORES J PROD INNOV MANAG2004;21:389–400
397

Appendix. Concept Statements
398 J PROD INNOV MANAG2004;21:389–400
G. LEES AND M. WRIGHT

Appendix. (Cont’d.)
CONCEPT FORMULATION AND CONCEPT SCORES J PROD INNOV MANAG2004;21:389–400
399

Appendix. (Cont’d.)
400 J PROD INNOV MANAG2004;21:389–400
G. LEES AND M. WRIGHT