THE MESSENGER - ESO.org
72
THE MESSENGER No. 57 - September 1989 I SEST - the First Year of Operation R. s. BOOTH and L. E. B. JOHANSSON, Onsala Space Observatory, Chalmers Tekniska Hö9skola, Sweden P. A. SHA VER, ESO The Swedish-ESO Submillimetre Te- lescope (SEST) completed one full year of scheduled observations at the end of March this year. Its performance has Surprised and delighted many - its trou- ble-free operation and the c1ear skies of La Silla combining to effect large vol- umes of data. Few users of SEST have returned home disappointed. That the telescope has filled an important need is seen clearly in the demand for observing time: its over-subscription, averaged over the year and over ESO and Swed- tsh users, amounted to a factor of about 2.5. This issue of the Messenger is de- Voted in part to summaries of work done with the new telescope. Some of the work described is already published but most is still undergoing analysis; we are grateful to those people who have Wntten the summaries and to those who have provided data prior to publication. The Telescope and Observing System . Most visitors to La Silla are now famil- lar with SEST, or at least with its highly reflective surface wh ich often provides a remarkable splash of reflected sunlight from the southern end of the telescope ndge. The telescope has been dis- cUSsed earlier in these pages (Booth, de Jonge and Shaver, 1987) and a more detailed technical description of the an- 6·' - The Swedish-ESO Sub-millimetre Telescope (SEST).
-
Upload
khangminh22 -
Category
Documents
-
view
0 -
download
0
Transcript of THE MESSENGER - ESO.org

THE MESSENGER
No. 57 - September 1989
I
SEST - the First Year of OperationR. s. BOOTH and L. E. B. JOHANSSON, Onsala Space Observatory, Chalmers Tekniska
Hö9skola, SwedenP. A. SHA VER, ESO
The Swedish-ESO Submillimetre Telescope (SEST) completed one full yearof scheduled observations at the end ofMarch this year. Its performance hasSurprised and delighted many - its trouble-free operation and the c1ear skies ofLa Silla combining to effect large volumes of data. Few users of SEST havereturned home disappointed. That thetelescope has filled an important need isseen clearly in the demand for observingtime: its over-subscription, averagedover the year and over ESO and Swedtsh users, amounted to a factor of about2.5. This issue of the Messenger is deVoted in part to summaries of work donewith the new telescope. Some of thework described is already published butmost is still undergoing analysis; we aregrateful to those people who haveWntten the summaries and to those whohave provided data prior to publication.
The Telescope and ObservingSystem
. Most visitors to La Silla are now famillar with SEST, or at least with its highlyreflective surface which often provides aremarkable splash of reflected sunlightfrom the southern end of the telescopendge. The telescope has been discUSsed earlier in these pages (Booth, deJonge and Shaver, 1987) and a moredetailed technical description of the an-
6·' The Swedish-ESO Sub-millimetre Telescope (SEST).

Antenna
Surface accuracy = 0.07 mm (rms)Radial pointing accuracy (incl. systematic offsets) 4" (rms)Main beam efficiency 0.71 (115 GHz)
0.50 (230 GHz)FHPBW 44" (115GHz)
23" (230 GHz)
Receivers (dual polarization Schottky mixers)
Receiver temperatures 240-500 K (70-120 GHz)600-1200 K (210-260 GHz)
Backends (split mode available)
High resolution AOS 100 MHz 2048 channelsLow resolution AOS 1 GHz 1728 channels
Possible observing modes
Total power up to 60 MHzFrequency switching 12' (wide)Beam switching (single, dual) 3' (narrow)Load switchingSky switching
tenna and its observing system has recently appeared in Astronomy and Astrophysics (Booth et al., 1989). Here weremind you that SEST is a joint project,funded and operated on a 50/50 basisby the Swedish Natural Science Research Council (NFR) and ESO at a totalcost of DM 9.8 M (August 1987). Aseparate Nordic agreement entitles Finland to 10% of the Swedish time. The15-m Cassegrain antenna was designedby engineers of the Institut de RadioAstronomie Millimetrique (IRAM) andbuilt under their supervision by Frenchand German industry. It is similar to thetelescopes which form the IRAM interferometer on Plateau de Bure and insome ways has become the operationalprototype of those antennas. SEST isoperated by a dedicated group of sevenengineers/astronomers, supplementedby other ESO staff. General (technical)management of the project is in thehands of Onsala Space Observatory,under the direction of Roy Booth withPeter Shaver representing ESO on behalf of the Director General.
The telescope was handed over to theSEST team on March 13, 1987 and it is atribute to the readiness and enthusiasmof everyone involved that "first light"was obtained just eleven days later withthe detection of the 86 GHz SiO maserin Orion. There then followed a one-yearcommissioning phase during which thetelescope and first receivers werethoroughly tested, the surface adjustment refined and a pointing model established. At the end of this period, experienced millimetre astronomers fromthe European community were invited tomake observations with the system andprovide suggestions for improvements.Scheduled observations began onApril 1, 1988.
The telescope/receiver situation hasremained essentially unchangedthroughout this first operational phaseand the salient parameters of the system are shown in Table 1. Painstakingdirect (theodolite) measurements of thereflector surface by Albert Greve,assisted by Lars Johansson, have resulted in an adjustment of its profile towithin some 70 micron rms of the bestparaboloid. This probably representsthe best which can be obtained usingthe direct technique, accuracy beinglimited by the errors of measurement ofthe radial distances to the surfacetargets sighted by the theodolite. Further improvements in the surface accuracy await holographie measurementswhich are referred to later.
The pointing accuracy remains of theorder 3 arcsec rms on each axis, fallingslightly short of the design specificationof 2 arcsec. Blind pointing is characterized by systematic offsets of about
2
10 aresec radially but these are stable atthe arcsec level over time-scales ofhours. Although the most likely cause ofthese offsets is thermal, no clear patternis evident. Because of the highly reflecting surface, the telescope has beenconstrained to never point c10ser than60° to the sun.
The SEST receivers were built at Onsala Space Observatory, Department ofRadio and Space Science, ChalmersUniversity of Technology, Sweden, andthe acousto-optic spectrometers (AOS)were built by the millimetre astronomygroup of the University of Cologne. Thereceivers were designed with the possibility of remote observing in mind andtherefore incorporate a remote tuningcapability, operated via a simple menudriven interface. It has proved to beextremely efficient and fool-proof, andmost visiting astronomers can tune thereceivers without calling in the telescope staff.
Some improvements have been madeto the receivers during the year. Thereceiver bandwidth has been increasedand now a full 500 MHz is available inboth channels. Also the tuning range ofthe 230 GHz receiver, previously limitedby the lack of a local oscillator multiplierat the high frequency end of the band,now extends to 260 GHz, although itsnoise temperature is high at this frequency. Further improvements in progress are the substitution of the currentintermediate frequency amplifiers,which use field effect transistors, tounits employing high eJectron mobilitytransistors (HEMT), which will reducethe total system noise.
TABLE 1: SEST system (status by May 1989).
The first year of SEST operations hasbeen remarkably trouble-free and lessthan 10% of the scheduled observingtime has been lost, even including timelost because of bad weather. Scheduledmaintenance amounted to 17 hours aweek on average, and even with one fullmonth in October/November entirelydevoted to maintenance and development, about 75 % of the total time wasused for observations. Remember, thismeans some 18 hours a day averagedover the whole year for a radio telescope. The telescope has thus provento be highly efficient and a large amountof high quality data has been produced.We attribute this in part to the combination of good telescope, receivers andsite but most visitors will also agree thatthe enthusiastic and willing staff atSEST contributed more than a little tothis performance.
Problems
Although SEST has been very successful, it has not been without its problems. Ironically, although the system involves much advanced technology, themost serious loss of time has beencaused by the failure of light bulbs specifically those in the positional encoders. The first incident of this kindoccurred only a few days before the firstscheduled project, when a bulb failed inthe incremental elevation encoder. Suchfailures require the complete replacement of the encoder; in this case replacement was achieved and a newpointing model determined just in timefor the observations to start. A more

serious incident occurred in July when asimilar failure resulted in the replacement encoder being inadvertentlybolted down too tightly. This resulted ina 60" offset in elevation, the sign ofwhich depended on position relative totransit. These offsets were not immediately associated with the encoderchange and it took some time to trackdown the problem. This failure accountsfor the major loss of observing time.Further problems have occurred in thecompressors which drive the receivercoolers and in the 230 GHz receiver 10cal oscillator multipliers, but these havecaused only minor hold-ups.
Observations
Observations with SEST have covereda wide range of subjects with molecularhne studies of galaxies dominating, partlcularly if we include the SEST key project to map the CO distribution in theMagellanic Clouds. As the sensitivity ofmillimetre telescopes has improved, thevolume of the universe available tomolecular line observation has increased dramatically and CO has beendetected in galaxies with redshifts, z,greater than 0.15. The current recordwith SEST is Z = 0.09. The large molecular mass of these high-Iuminosity infrared galaxies and the possibleevolutionary link of these merging systems with quasars is of great interest.
In the nearest system of galaxies important results are also emerging asSEST observations confirm earlier sug(estlons that the CO : H2 ratio is lesshan that In the Milky Way by a factor of
a?Out 5, probably as a result of thedlfference in metallicity. An additional~,~ult of some interest is the low level of
o In the LMC.. The other major areas of molecularline research have been weil repre-
sented in the SEST observational programme. Observations of regions of starformation have resulted in the discoveryof many new bipolar flows, some ofthem associated with spectacular optical indicators of jets and bow shocks.Systematic work on evolved stars isproviding better statistics on thechemistry and physics of the stellar envelopes and a data base of molecularproperties of evolved stars detected byIRAS should highlight interesting targetsfor ISO observations.
Finally, a small percentage of time hasbeen devoted to continuum observations. These have concentrated in themain on quasars and AGNs, to extendspectral data and to search for variability. A group from the Max-Planck-Institutfür Radioastronomie, however, installeda 1-mm bolometer on SEST in August1988 and observed interstellar dust andemission from early stars. They also detected emission from SNR 1987 A usingthis system.
The Statt
At the beginning of 1987, the operation of SEST was carried out by a teamcomprising two software scientists, twomicrowave engineers and a telescopescientist as team leader. A digital engineer joined the team in May and laterreplaced one of the microwave engineers, calied back to Sweden to leadthe receiver development group. Theteam was finally brought up to strengthby an assistant astronomer and an ESOfellow. The assistant astronomer isfunded by Onsala Space Observatoryor, occasionally, by the FinnishAcademy of Science. All members ofthe original SEST team were on two/three-year contracts in Chile and byJune 1989 they had all been replaced.
However, most of them now have positions at Onsala and help to form aknowledgeable SEST liaison group atthe observatory. The new team hasbeen built up over aperiod so that ahigh level of expertise has been maintained. Table 2 gives a summary of thestaff situation at SEST.
The SEST team is basically dividedinto two shifts, each shift working alternate standard ESO schedules fromTuesday to Tuesday. Holiday and sickness permitting, each shift comprises anastronomer, a receiver engineer and asoftware special ist. No operators areprovided at SEST, the observing systemhaving been designed for easy operation by the astronomer, which has beenvery successful. Since operations areconducted around the clock, introductions to the system, usually performedby the telescope scientist or ESO astronomer, have to occupy some observing time, but since the system is ratheruser-friendly, little time is lost.
Future Developments
The SEST team is continuously working to improve the observing system, tosimplify and streamline it. A menudriven interface for the control system isalmost complete, the receiver tuningsoftware has been improved and an online data reduction system is now inoperation. In addition, an alarm systemto warn the staff of the more seriousmalfunctions is in operation and undergoing further development. More internal memory, as weil as extra disk space,has been installed on the HP A 900.New software makes it possible to useboth wide and narrow band AOS'ssimultaneously (both in split mode if required), and they may be centred atdifferent frequencies or velocities.
3

High-Mass Star FormationJ. MELNICK, ESO
Table 2: Positions at SEST.
Telescope Scientist (NFR)
L. Johansson Jan 87-June 89L.-A. Nyman July 89-
Astronomer (ESO)
R. Gredel Jan 88-
Astronomer (NFR, Finnish Academy)
M. Lainela July 87-Dec 87G. Rydbeck Jan 88-June 88B. Höglund July 88-Dec 88L.-A. Nyman Jan 89-June 89P. Friberg July 89-Dec 89
Software Scientist (ESO)
D.M. Murphy June 86-June 88M.Olberg June 86-April 89G. Persson May 88-
R. F. Engineer (NFR)
M. Hagström Aug 86-Mars 89N. Whyborn Jan 87-May 88L.-G. Gunnarsson Jan 89-
Electronic Engineer (NFR)
G. Delgado May 87-
Electronic Engineer (ESO)
M. Anciaux July 89-
Cooperant (ESO)
J.-M. Martin Feb 89-
1. Introduction
Massive stars seem to be formed intwo different, and indeed quite extremeregimes: a very low-efficiency process(typically less than 1%) associated withthe formation of expanding OB associations, and a much higher efficiencymode (the starburst mode) that leads tothe formation of bound clusters (Lada,1985). Clearly, large numbers of massive stars can only form at the densitypeaks of very massive molecular c1ouds,while loose OB associations tend toform at the edges of clouds.
Massive star formation is contagious.Both modes of star formation are relatedto propagatory phenomena. In the caseof OB associations, the propagatingagents are probably either shock wavesassociated with the expansion of H 11
4
Recently, more effort has been devoted to reaching the specified reflectorsurface accuracy. Near-field holographymeasurements have been tried using a100 GHz transmitter on the building ofthe 3.6-m telescope, but the small distance to SEST required that we made animpossibly large map. In addition,holographic observations of the 38 GHzbeacon on the Lincoln Labs satellite,LES-8, have been attempted with limited success, but some extra softwarehas to be written before such observations can be conducted properly. Wehope that more holography can becarried out in the autumn.
Future receivers for SEST include a350 GHz SIS receiver, currently underdevelopment at Onsala, and we nowhave funding for a bolometer receiver.We hope that an MPI system can beobtained; discussions to this end aregoing on with Ernst Kreysa, its designer,and with the MPI directorate. Other projected developments are the replacement of the Schottky diode mixers bysuperconducting (SIS) mixers and thedevelopment of multi-beam receivers.Finally, with the recent successes inmillimetre VLBI and the fine maps thatwill soon appear, we are keen to procurea VLBI recorder and a hydrogen maserfor SEST.
Acknowledgements
Many people have contributed to thesuccess of SEST. We are grateful for the
regions (Elmegreen and Lada, 1977), orthe collective action of sequential supernova explosions (McCray and Kafatos,1987).
Very young starbursts are often embedded in very large regions of activestar formation called superassociations(Melnick, 1987) and there is ample observational evidence that massive starformation also propagates at the scalesof superassociations (hundreds ofparsecs). The propagating agents atthese scales seem related to stellarwinds and supernova explosions (EImegreen, 1985).
A wealth of information about starburst activity comes from the study ofgiant extragalactic H 11 regions. Energetic considerations indicate that theionizing clusters of these high excitationnebulae must contain hundreds to
continued interest and assistance givenby IRAM and thank particularly AlbertGreve and Dave Morris who have worked with SEST staff on reflector surfacemeasurements. In this context we alsowish to record our gratitude to the Lincoln Labs team under Dr. W. Ward andto AI Richard for this painstaking attention to the satellite contro!.
The millimetre group of the Universityof Cologne have maintained a keen interest in the performance of the spectrometers and we thank them also.
The MPI bolometer group not onlyused their system to obtain some goodastronomical results but they wrote acomprehensive report on the telescopeperformance which has resulted in animproved lateral adjustment mechanismfor the sub-reflector. We are grateful fortheir interest and hard work.
Finally, we wish to express ourgratitude to the SEST personnei, to allthe staff of ESO both in Chile andGarching who have been called upon tomake allowances for this group of 24hour all-weather radio astronomers andto the staff at Onsala Space Observatory who have provided a professionaloperating base for the project.
ReferencesBooth, R.S., de Jonge, M.J., and Shaver,
P.A. 1987, The MessengerNo. 48, p. 2.Booth, R. S. et aJ. 1989, Astron. Astrophys.•
216,315.
The /;,,1 yeD' 0/ SEST ~.d
'. '~ .. "'I·t.1--'I1-
thousands of very massive stars whichmust have formed on time scales comparable to the dynamic time scales ofthe clusters (Melnick, 1987). For thisreason, starbursts are also called violentstar-forming regions. Here I will useboth terms indiscriminately.
Since correlations of the form masS- 0
4 and size - 02, where 0 is the veloc
ity dispersion, are observed both ingiant molecular clouds and in giant H11regions (Melnick 1987 and referencestherein; S%mon et al. 1987), the timescale argument implies that violent starformation must be very efficient. Otherwise the progenitors of starburst clusters would be too large and the free-fall

Figure 2: 12CO (1-0) map of NGC 3603 superimposed on a mosaic of 2 CCO images of thecomplex in blue light. The grid spacing of the map is 20" and the beam size 44". The imagecovers an area of 6' x 6'. North is on top, East to the left.
Velo (!anis)
Figure 1: 12CO (1-0) spectrum of the positionof RCW 38 E. Maximum antenna temperalure is 28° K and the velocity span of thefigure is 60 km S-I. (Courtesy of MalcolmFridlund.j
collapse times would be longer than thelife times of the ionizing stars.
These considerations suggest theremust be some physical mechanism toinduce giant clouds to undergo free-fallcollapse and to form massive stars veryefficiently. Elmegreen (1985) suggeststhat free-fall collapse may be inducedby large over-pressures created by expanding stellar wind and supernovabubbles. Silk (1985) postulates that theformation of massive stars inhibits theformation of low-mass stars, butstimulates the formation of more highmass stars. The feedback of energyfrom the stars to the interstellar medium,according to Silk, enhances the starformation rate and efficiency. It is notclear, however, whether this feedbackmechanism can work in starburstswhere the time scales for massive starformation are very short.
Cloud-cloud collisions have oftenbeen invoked as triggering mechanismfor massive star formation (e. g. Scovilleet al. 1986), but very few detailed calculations have been published so far.Clearly, if this mechanism works, collisions between large clouds could giverise to propagating formation of largeclusters of coeval stars.
An attractive speculation is that instead of mechanically, starbursts maybe induced chemically. Changes in thechemistry can conceivably alter theCOoling function of the molecular gasand therefore reduce the internalpressure. A potentially effectivemechanism to generate such changeshas been suggested by Roland GredelfrOm the SEST team. Gredel suggeststhat very intense cosmic ray fluxes - asWould be expected, for example, nearmultiple supernova explosions - couldInduce dramatic changes in the chemistry of molecular clouds. It is not easy topredict without detailed calculations,however, if this would lead to an in-
crease or to a decrease of the temperature of the cloud, but clearly supernovadriven chemistry perturbations can bevery contagious.
Many of the best cosmic laboratoriesto investigate the physics of massivestar formation are in the southern hemisphere and SEST provides a muchneeded tool to access theselaboratories. Some of the first SEST observations of southern massive star-formation regions are reviewed below.
2. The First Year of SEST
During the first year of operation,SEST was used by several groups toinvestigate regions of massive star formation both in the Galaxy and in external galaxies. Many groups observedmolecular clouds in galaxies of manydifferent types ranging from ellipticals todwarfs. An account of these observations is beyond the scope of this review,except to note that observations of COin galaxies show that starbursts are generally located at the edges of massivemolecular cloud complexes. This reflects the contagious nature of massivestar formation, and indicates that starburst activity is probably not triggeredby cloud-cloud collisions.
Detailed studies of Galactic regions ofmassive star formation were done by A.Pagani and M. Heydari-Malayeri, by M.Fridlund, and by Lars Johansson andmyself during the first year of SEST. Ishould mention that the succinct overview of the observations presented below is based on a preliminary analysis ofthe data.
Pagani and Heydari-Malayeri observed molecular clouds associatedwith expanding H 11 regions. These observations should lead to a better understanding of the formation of OB associations. Through the study of moleculesof different isotopes, they should beable to place observational constraintson the physics of sequential star formation.
Fridlund mapped a sampie of molecular clouds showing signs of massive starformation. He found that one of theseclouds, RCW 38, an H 11 region in Vela, isone of the most luminous CO and HCO+sources in the Galaxy. The H 1I region isionized by a cluster of OB stars locatedon the edge of the molecular c1oud, arecurring signature. An interesting feature of the molecular cloud is the complex structure of the line profile (reproduced in Fig. 1) which is interpreted byFridlund as evidence of gas flows in the
5

A
A /I " A
A J\.. .Jl Je
- A A Jl .JL A
A A J\. A -""-
A A JL A ~ JVL
A JL .A A.. ~ ~
A A. fI A_ ./\ .J"-
A A J\- A /\
" "
"" A A -" .A .1 -" .l\. A
A .A 1\ /I
Figure 3: 12CO profi/es in NGC 3603. The antenna temperatures range from -2 to 18° K andthe radia/ ve/ocity range covers 100 km s '. The grid spacing and orientation are as in Figure 2.
associated with violent star formationregions.
The line profiles in the direction ofNGC 3603, illustrated in Figure 3, arevery complex, and are particularly complex in the region where (in projection)the giant H 1I region meets the molecularcloud. NGC3603, however, lies veryclose to the galactic plane in the direction of Carina, so it is not clear whetherthe complex velocity structure is intrinsic to the source or is due to contamination by background sources.
Massive star formation is presentlytaking place in the molecular cloud. Figure 4 shows a true colour JHK infraredmosaic of the region obtained byAndrea Moneti and Hans Zinnecker.These images show the presence of asmall cluster of massive stars locatedhalfway between the starburst and thecore of the molecular cloud. One of thegoals of our work is to determinewhether and how the formation of thiscluster has been triggered byNGC 3603.
Figure 4: True c%ur JHK mosaic of infrared images of NGC 3603 obtained by A. Moneti andH. Zinnecker with the /R camera at the 1.S-m te/escope of CT/O. (Courtesy of Andrea Moneti.)
region. Fridlund concluded that themolecular cloud is a new site of massivestar formation in this active region.
My own research was aimed at understanding the mechanisms of formationof very massive starburst clusters. Iselected the giant H II region NGC 3603,one of the most massive in the Galaxy,and the 30 Ooradus superassociation inthe LMC, but this region is at presentbeing investigated by the SESTMagellanic Cloud consortium.
In collaboration with Lars Johanssonand Andrea Moneti, I started a programme of SEST, IR, and optical obser-
vations of the NGC 3603 complex. Figure 2 shows a mosaic of 2 CCO imagesof the region in blue light on which our12CO (1-0) map is superimposed. As isthe case for RCW38, for 30 Ooradus,and for extragalactic violent star formation regions, the young cluster is locatedat the edge of the molecular cloud. Thesize and velocity dispersion of the cloudare consistent with that of other galacticmolecular clouds and fit weil the(size a) relation. 13CO(1-0),C180(1 - 0), and 12CO(2-1) observationssuggest the NGC 3603 molecular cloudis similar to LMC molecular c10uds
3. The Future
Much of the progress of astronomy inthe past two decades has been drivenby improvements in observational technology and, in particular, by the openingof new windows to the Universe madepossible by advances in radio and infrared instrumentation, and by the advent of space observatories. The timelyarrival of SEST opens a new window tothe southern skies. Together with theother powerful instruments available onLa Silla and other observatories, SESTwill certainly provide a definitive impulseto the understanding of massive starformation.
ReferencesElmegreen, B.G., Lada, C.J., 1977, Ap. J,
214,725.Elmegreen, B.G. 1985, 1985 in lAU Symp.
No. 115, Star Forming Regions, eds. M.Peimbert and J. Jugaku, p. 457.
Lada, C.J., 1985 in lAU Symp. No. 115, StarForming Regions, eds. M. Peimbert and J.Jugaku, p. 1.
McCray, R., Kafatos, M., 1987, Ap. J, 317,190.
Melnick, J., 1987 in lAU Symp. No. 121, Observationa/ evidence of activity in ga/axies,eds. E. Ye. Khachikian, K.J. Fricke and J.Melnick, p. 545.
Scoville, N.Z., Sanders, D. B., Clemens, D. P.,1986, Ap. J, 310, L77.
Silk, J., 1985, 1985 in lAU Symp. No. 115,Star Forming Regions, eds. M. Peimbertand J. Jugaku, p. 663.
Solomon, P. M., Rivolo, A. R., Barret, J., Yahil,A., 1987, Ap.J, 318, 730.
6

Low-Mass Star-Forming RegionsB. REIPURTH, ESO
-4-2o
formation efficiency of the cloud core isaround 25%.
In recent years much attention hasbeen paid to the high-Iatitude c1ouds,relatively diffuse molecular c10uds athigh galactic latitudes and often verynearby. Jan Brand, Jan Wouterloot andLoris Magnani have studied L 1569, ahigh-Iatitude (b = -36°) cloud on thecelestial equator between Eridanus andTaurus. They first used the ESO 3.6-mtelescope with a grism to search for faintH-alpha emission stars projected on thecloud. Five such stars were found. Subsequently, SEST was employed to mappart of the c10ud in 12CO and 13CO in astudy of cloud structure and possibleinteraction between the stars and theirambient medium. The cloud appearsclumpy, with core sizes of approximateIy 0.05 pc. An interesting feature is thatlow-intensity wings of the line profilesare present, also in parts of the cloudaway from the H-alpha emission stars.Recently, such puzzling wings havebeen found in several other high-Iatitudeclouds without internal energy sources;their origins are not yet properly understood.
Molecular clouds with Herbig-Haroobjects were among the first regions tobe observed with the SEST. MichaelOlberg and Roy Booth of Onsala SpaceObservatory and myself have studied anumber of such regions in various tran-
Figure 2: A contour diagram of the twomolecular outflows associated with the Herbig-Haro objects HH 56 and 57. The positions of the two driving energy sources areindicated. Solid lines are the blue lobes,dashed lines are the red lobes. The HH 56flow is to the right, the HH 57 flow to the left.North is up and East is left.
-4
latitude (b = -16°), so most of the confusion with background clouds in thegalactic plane is avoided. And, finally, ata distance of only 140 pc, they areamong the very closest of star-formingclouds. Kalevi Mattila and associates atHelsinki Observatory have embarked ona large-scale survey of the northern halfof the Chamaeleon I cloud. Here, fiveyoung low-mass stars are clusteredaround HO 97300, a B9 V starsurrounded by a bright reflectionnebula.
Mattila and co-workers mapped thecloud structure by observing C180 infrequency-switching mode, and found adense molecular core centred on theyoung stars. The area was also mappedin the 13CO line, but it appears to beoptically thick over most of the fieldobserved.
Maps in 12CO have revealed a largemolecular outflow, with well-definedblue and red wings outlining abipolarflow and centred on the region of youngstars (see Fig. 1). The total angular extent of the flow is about 14 arcminutes,corresponding to a projected length ofalmost 0.6 pc. Closer examination of thedata shows that the outflow is notassociated with HO 97300, but ratherwith one of the less luminous pre-mainsequence stars. It appears that the star-
While high-mass star formation is adramatic process visible throughoutlarge parts of our Galaxy, the formationof low-mass solar-type stars involvesmuch more modest phenomena. Butbecause low-mass stars are so muchmore common than high-mass stars, itis Possible to find molecular c10uds withabundant young low-mass stars at distances as small as 100 to 200 pc.
Of the five closest stellar nurseries,four are located in the southern MilkyWay, namely the Chamaeleon, Lupus,Ophiuchus and Corona Australis cloudComplexes. Of these, the Ophiuchusand Corona Australis cloud complexesare just within reach of mid-Iatitudenorthern radio telescopes. At La Silla,however, they pass through the zenith.
It is therefore not surprising that thearrival of the SEST at La Silla has beenanxiously awaited by the low-mass starformation community, and that throughthe first year of operation, SEST hasbeen used for intense studies of southern low-mass star-forming regions. Afew of these studies are reported in thefOliowing.
At declinations between -70° and-80°, the Chamaeleon clouds are virginterritory for millimetre observations atthe resolution provided by the SEST.They are also at a rather high galactic
Figure 1: A composite figure showing the blue and red lobes of a major molecular outflow inthe northern part of the Chamaeleon I cloud. Young stars are indicated by dots. The brightnebulous star is HO 97300, a 89 V star unrelated to the flow. The underlying photograph isreproduced from a blue ESO Schmidt plate. North is up and East is left. Courtesy K. Mattilaand C. Madsen.
7

sitions. One of the most interesting regions is located in a small cloud in Norma, containing the Herbig-Haro objectsHH 56 and 57 (see centrefold of theMessenger No. 52). Each of these objects is powered by aseparate energysource; the one associated with HH 57belongs to the rare class of FU Ori stars,which are thought to be T Tauri stars invery active accretion phases.
We have detected two large molecular outflows, one from each of the energy sources (Fig. 2). The two flows areslightly inclined with respect to each
other, so that the blue lobes approaching us are weil separated, while the red,receding lobes are mixed or at leastprojected on each other. The velocitiesof the outflows are modest, less than5 km/sec. The masses of the swept-upambient material is of the order of 5 solar masses.
I have worked at La Silla during thelast several years, and it has beennoticeable that a new user communityof radio astronomers has appeared onthe mountain. It has been interesting towitness how these new users have
gradually integrated into the daily life ofthe observatory. Because La Silla is nowan optical, infrared and radio observatory, it acts as an interface between whathas long been almost separate European communities of radio astronomerson the one hand and optical/infraredastronomers on the other. Many collaborations spanning the optical-infraredmillimetre regimes have been started inthe restaurant at La Silla. Especially inlow-mass star-formation studies suchmulti-wavelength programmes are ofthe greatest importance.
C. HENKEL, Max-Planck-Institut für Radioastronomie, Bann, F. R. Germany
Figure 1: An opiical pl1%graph of CG 30/31/38 (Reipurtl11983, Laus/sen e/ al. 1987).
sities have also been obtained. While itis too early for a systematic review,
pletely changed the situation. A numberof sources have now been mapped inCO and its rarer isotopes and data fromother molecules sensitive to higher den-
Cometary Globules
Cometary globules (CG's; see Fig. 1),first observed in 1976, are interstellarclouds with comet-like morphology,consisting of compact, dusty, andopaque heads and long, faintly luminoustails. Unlike most dark clouds, CG's areisolated neutral globules surrounded bya hot ionized medium.
Most CG's are located in the Gumnebula, a large region of ionized gaswith approximate distance and size of450 and 300 pc, respectively. Its prominent sources of energy are l VelCNC 8+ 09 I), 1;, Pup (04), and the Velasupernova remnant. Figure 2 (Zealey etal. 1983) demonstrates that the CG's arelocated on an annulus between 6° and11° from "centre 1", i.e. at the boundary of the ionized bubble, with the tailspointing away from the central region.
Two scenarios were suggested to explain the spatial distribution and thecomet-like appearance: Brand (1981)argues that CG's were initially nearlyspherical clouds which were shockedby the blast wave from a supernovaexplosion. Reipurth (1983) suggests thatthe CG's are shaped by UV radiationimpinging on a neutral cloud in a clumpyinterstellar medium. Discrimination between these and other possible modelsis only possible, if we know the mass,density, temperature, and velocity distribution of the globules. These parameters can be determined by measurements of molecular spectral lines whichare most easily accessible at mmwavelengths.
Because of their southern location(Declinations < -40°), detailed mapscould not be obtained until recently. TheSEST telescope, however, has com-
8

ReferencesBooth, R. S., alberg, M., Reipurth, B.: 1989,
in preparation.Brand, P.W.J.L., Hawarden, 1.G., Long
more, A.J., William, P. M., Caldwell,J. A. R.: 1983, Monthly Notices Roy. Astron. Soc. 203, 215.
Cernicharo, J., Radford, S.: 1989, in preparation.
Harju, J., Sahu, M., Henkel, C., Wilson, 1. L.,Sahu, K.C., Pottasch, S.R.: 1989, Astron.Astrophys., submitted.
Laustsen, S., Madsen, C., West, R.M.: 1987,"Exploring the Southern Sky", SpringerVerlag.
Reipurth, B.: 1983, Astron. Astrophys. 117,183.
Zealey, W.J., Ninkov, Z., Rice, E., Hartley, M.,Tritton, S. B.: 1983, Astrophys. Letters 23,119.
such sourees. Similar densities are alsoobtained from the "nose" of CG 1,where a second CO velocity componentmight indicate a shock, presumablyassociated with the "recently" formedstar, Semes 135.
Unlike CG 4, CG 1 (Fig. 4) shows therather uniform picture also seen at optical wavelengths. The mass of theglobule is of order 10-100 MG), most ofit located in the tail. The gas is cool, withkinetic temperatures only slightly above10 K. CG 15 appears to be a scaleddown version of CG 1, however withoutthe second velocity component near thehead and without any sign of recent starformation. CG 21, the only measuredcometary globule not belonging to theGum nebula, shows quite a complexvelocity pattern with up to three or morevelocity components in a single spectrum and a highly clumped tail. It henceappears that the structure of themolecular gas, responsible for the bulkof the mass, is quite heterogeneous.
A careful analysis of the molecularspectra will significantly increase ourknowledge on cometary globules andwill motivate further theoretical studiesto elucidate their nature and history.
-
1
I
'cf'\\\
II
o.!..I
~II
"
0-
"
- I'
+Zet a Pu p Q.;-
+~1 Ve l.
6
4
2
o
-2
estimates of excitation conditions andmass distribution.
The ESO 210-617 and CG 30/31/38globules are of particular interest because of their association with the Herbig Haro objects, HH 46/47 andHH 120. There is a molecular outfloworiented along the direction of the optical jet wh ich is formed by the HH 46/47system, demonstrating the activity ofone (or more) young stars formed in theglobule.
CG 4 shows a high degree of clumping and a rather unsystematic velocitypattern, indicating complex structurenot revealed by the optical image (e. g.Reipurth). The detection of CS in CG 4demonstrates that number densities inexcess of 104 cm-3 can be reached in
Q+ EB Cent r e 1
Vela SNR
/
/
\~
"/J'
I ..... L
I
I
I
II
I
.-'JI,I
\\\
\ ,o I
- 5000 -
1 01- ..0 00 r-
ce 1 (0".-40")
there are already some interesting results:
So far mapped are CG 1, 15, and 21(Harju et al. 1989), CG 4 and 6 (Cernicharo and Radford 1989), the ESO210-6A globule, and CG 30/31/38(Booth, Olberg, and Reipurth 1989; seeFig. 1). The data demonstrate that mostof the mass of the globules is indeed inthe form of molecular gas. Spectrallinesallow the determination of radial velocities to an accuracy of 0.1 km S-1 (seethe spectra in Fig. 3). They also allow
C'·O(I-O)
R. Ä. (1950)Figure 2: The distribution of CG's in the Gum nebula, showing centre 1, the position from whichmost of the tails point away, and a 9 degree circle around that point (Zealey et al. 1983).
DEC(1950 )
o4 6
Velocily (km!.)
Figure 3: CO spectra from CG 1 (Harju et al.1989).
-10{ja (')
Figure 4: A CO map of the dolphin shaped globule CG 1 (Harju et al. 1989).
-20
9

SC AN #2707
Sgr 82 (M)
2880 sec
J=5-4Methanol lorest
curve of growth and carbon isotoperatios but also by cloud structure andself shielding against UV dissociation.Hence, the apparent non Galactic C180/12CO line intensity ratio may be due tothe lower metallicity in the LMC and notto differences in isotope ratios.
The scan in Sgr 82 (8ergman et al.)has so far covered the range between238.85 to 243.85 GHz (5 GHz). Threepositions are observed in the Sgr 82cloud - two active regions with signs ofon-going massive star formation (compact H 11 regions, OH and H20 masers)and one position in the ambient cloud.While the spectra are very rich towardsthe active regions with about 15-30lines per GHz, the line density is only 4lines per GHz towards the ambientcloud position. The spectra towards theactive regions are dominated by linesfrom methanol, methyl cyanide (vibrationally excited), and ethyl cyanide. It isalso apparent that the northern of thetwo active regions (Sgr 82 (N)) containsthe hottest material since the spectracontain lines from transitions betweenstates of much higher energy than towards the other active region. The estimated temperature of the hot gas is100-130 K and 60-80 K for the northern and southern region, respectively.
clouds), Minh et al. have mapped Sgr Ain the 404 -303 rotational transition (I, =3 mm). It turns out that HOCO' is distributed like more commonly encounteredmolecules. Hence the reason for theunique abundance of HOCO I in theGalactic centre clouds affects the bulkof these clouds. The investigators arguethat the most probable reason is that theGalactic centre clouds encounter morefrequent shock waves in which the parent molecule carbon dioxide (C02) canbe formed from CO and OH. The carbondioxide is then protonated by reactionswith H3', N2H', ... Since other protonated molecules are not unusuallyabundant in these clouds, the highHOCO I abundance is traced to CO2 andnot to the protonating species H3~ ,N2H', ...
Spectral scans at the 1.3-mm rangeof Sgr 82 and LMC are also in progress.The observations of LMC by Johanssonet al. provide a good test of the assumptions in chemical model calculations because of the lower metaliicity in LMC.The observed C180/12CO line intensityratio is close to 1/500 (much lower thanthe value observed in the Galaxy butequal to the terrestrial 180/12C isotoperatio) while the observed 12CO/13CO lineratio is close to the "Galactic" value offive. The interpretation is not easy sincethe ratios are affected not only by the
241600. 241680. 241760. 241840. 241920. 242000.0
Frequency [MHz]Sampie spectrum from the 1.3-mm scan against Sgr 82 (M) containing /ines of S02, 34S02, andmany J = 5-4 me/hanol transitions. One HNCO /ine is b/ended with the cen/ra/ clus/er ofme/hano/lines.
1.25
2.25
T: [K] Ll--,--,---r-"--'-''''''''''''''-'-'i-r-r-,-.-..-,---,---,-,,-,---r-..-n
5.25
4.25
3.25
P. FR/BERG, Onsa/a Space Observatory, Sweden
Interstellar Chemistry
The research regarding interstellarchemistry with SEST can be divided intothree categories: (i) searches for newmolecules, (ii) studies of known molecules in order to shed light on theirformation, and (iii) spectral scans - systematic observations of large frequencybands in a few interesting sources.Spectral scans give a good overview,not only of the chemical content, butalso of physical traits. Typical excitationtemperatures for different species give ahandle on the kinetic temperature. Thevariation of excitation temperature withenergy level and/or molecular state reveals regions of different temperatureand density inside the beam (pointspread function) of the telescope. Ofcourse, unidentified lines and unexpected molecules are also found.
Two searches for new molecules haveto my knowledge been done. 80thsearches only set upper limits on theabundance, i. e. neither molecule wasdetected. Gerin et al. (1989) searched forHCOCN in Orion and Sgr 82. They determined that HCOCN is less abundant thanother large organic molecules such ascyanoacetylene (HC3N) and methyl formate (HCOOCH3). Irvine et al. tried toconfirm the existence of propadienone(H2C30) in Sgr 82 by observing severaladjacent rotational transitions. One transition, observed at Nobeyama, had previously been tentatively assigned topropadienone. The previously observedline was confirmed but one of the adjacent rotational transitions was missingand two others were doubtful due toblending with other lines. Hence, in contrast to its isomer, propynal (HC2CHO),propadienone has not been detected inthe interstellar medium.
However, observations at 80 GHz(A. = 3.7 mm) led to a possible detectionof another molecule, deuterated water(HDO), in Sgr 82. Observations of deuterated molecules towards the Galacticcentre are very rare. Determining theabundance of deuterated moleculesclose to the Gaiactic centre can help todetermine the Galactic deuterium gradient and resolve the question of noncosmological deuterium formation.Since at least 15 other lines appeared inthe same 500 MHz wide spectrum therisk for an accidental coincidence is verybig. However, the tentative identificationis supported by 1.3 mm observations(see later).
To try to understand why protonatedcarbon dioxide (HOCO") is only observed towards clouds close to theGalactic centre (Sgr A and Sgr 82
10

The southern active region Sgr B2 (M)exhibits pronounced emission fromS02' About 20 % of the lines have notbeen identified and the identifications ofat least another 10% are very questionable. It has to be stressed that the workto identify the lines is far from completed yet. One of the lines preliminarilyidentified is another HDO line, whichsupports the identification at 80 GHz.
Still the line density is high enough tomake a two-transition identificationdoubtful. We hope to be able to confirmthe HDO identification in our next observing run (June 1989).
ReferencesSergman, P., Friberg, P., Hjalmarson, A., Ir
vine, W. M., Miliar, 1. M., Ohishi, M. (in progress).
Gerin, M., Combes, F., Encrenaz, P., Destombes, J.L., 1989, The MessengerNo. 56, p. 59.
Irvine et al. (in preparation).Johansson, L. E. S., Olofsson, H., Hjalmar
son, A., Gredel, R., 1989 (private communication).
Minh, Y. C., Irvine W. M., Friberg, P., Johansson, L. E. S., 1989, Ap. J. (in press).
quence, quietly burning hydrogen tohelium in the core. When the hydrogenis exhausted in the core, the star movesup the Red Giant Branch (RGB) burninghelium in a shell around the core, whichis contracting and becoming hotter andhotter. Finally it is hot enough for heliumto start burning, and the star moves tothe horizontal branch burning helium tocarbon and oxygen. Eventually thehelium is exhausted in the core and thestar starts to move up the AsymptoticGiant Branch (AGB). At this stage it consists of adegenerate carbon-oxygencore surrounded by a thin helium burning shell.
It will now reach a phase in its lifewhere many things will happen on arelatively short time scale. When all thehelium in the core has been convertedto carbon and oxygen, hydrogen andhelium will start to burn alternately in athin shell around the core. Every time acritical mass of helium has been processed from the hydrogen burning itignites with a flash, a thermal pulse (TP).Between the helium flashes a deep convection layer brings up processed material to the surface of the star and it mayeven change its composition from beingoxygen-rich to carbon-rich. The star willalso become unstable and start to os-
cillate. The pulsations will form shockwaves in the photosphere, supplyingenergy to lift the gas to regions that arecool enough for dust formation. Theradiation pressure on the dust will accelerate it away from the star dragging thegas along with it, forming an expandingCSE.
In the final stages of the AGB themass loss increases rapidly and asuperwind occurs. Almost all the matterin the hydrogen envelope is strippedfrom the star. The remnant core contracts rapidly at constant luminosity andthe ejected material drifts outward.When the surface temperature is hotenough to produce UV photons, theejected gas is ionized and a planetarynebula (PN) is formed. Eventually thegas disperses and the star will becomea white dwarf.
Since the star is surrounded by a thickdust shell during the last phases of itslife, it is difficult to study it optically. The
100
S Set
50o-50-100
0.5
Evolved StarsL. -A. Nyman, SEST, La Silla
Introduction
Studies of evolved stars using submm and mm-wave telescopes such asthe SEST are mainly concerned with thevery last stages of the life of astar, whenit throws away its outer envelope and isSurrounded by a shell of dust and gas.The dust obscures the star optically andmost studies of stars at this stage oftheir evolution have been made in theradio and infrared regions of the spectrum. The circumstellar gas consistsmainly of molecular hydrogen, H2, butalso of other less abundant molecules(e.g. CO, SiO, OH, H20, HCN, etc.),which are important since they radiate inthe radio region, something that is notthese case for molecular hydrogen.These molecules can be used to studythe properties of the circumstellar envelope (CSE), e. g. to determine massloss rates, wh ich are important for theevolution of the star, and to study thechemistry of the envelope.
These studies are important becausethe envelope contains processed material from the interior of the star that isnow returned to the interstellar medium.The material will eventually be incorporated into new stars, making our Galaxyevolve chemically. The mass loss is important for the evolution of astar, sinceits end point is determined by howmassive it iso A star with a mass::> 1.4 MG) should end as a supernova,but because of the extensive mass lossin the final stages of its life, even a starof 10 MG) will lose enough mass to put itbelow this limit, and it will end as aPlanetary nebula and later as a whitedwarf. Many of the observations withthe SEST telescope have been made ofstars at different stages in the final pointof their lives and a brief summary ofstellar evolution will be given below.
Stellar Evolution
Stars with masses < 10 MG) spendmost of their lives on the main se-
Radial velocity (km/s)
Figure 1: A 12CO (J = 1-0) speetrum of the bright earbon star S Set. The double-peaked lineprofile and the map data suggest that the eireumstellar envelope is detaehed from the star, i. e.,its mass loss has deereased eonsiderably during the last few thousand years. This may be anerreet of a thermal pulse during the AGB evolution.
11
and carbon-rich envelopes, it is themost abundant molecule next to H2 , andcan be used to determine mass-Iossrates and other properties of the envelope. A large fraction of the observingtime on the SEST telescope has beenspent on observations of CO in differentsampies of stars at various stages intheir evolution. Compared to the oxygen-rich envelopes the carbon-rich envelopes contain a variety of molecules,among them carbon chain molecules(HC3N, HC? N, C4H, etc.) and ring-likemolecules (C3H2 , SiC2).
SEST Observations
The SEST telescope has been usedfor several surveys of circumstellar COemission in different kinds of sampies,mainly to extend the observations toinclude southern objects. A survey ofIRAS point sources in the IRAS twocolour diagram includes many kinds ofevolved stars in different stages of theirevolution, and many new detectionshave been made. Observations of asampie of bright carbon stars with wellknown photospheric characteristicshave made it possible to study the relation between pllotospheric properties,and those of the CSE. Of special interestis the detection of detached circumstellar shells, implying that the mass losssometimes stops. A sampie of S-starswas observed in order to study theirrelation to oxygen- and carbon-richstars, and several new planetarynebulae have been detected.
Two surveys of SiO masers have beenmade, one of a sampie of IRAS pointsources, another of bright infrared objects. The detection rate was high inboth surveys. Several individual southern objects have been studied in detail,among them the two supergiants VYCMa and VX Sgr, and the bright carbonstar IRAS 15194-5115. In the latter,many molecules have been detectedand its properties seem to be similar toIRC + 10216, a well-known carbon starin the northern sky.
The individual programmes will nowbe described in more detail. Many of theprojects are not finished and have beenallocated more observing time during1989, so the results are preliminary.
Observations of sampies from theIRAS point source catalog. The projectwith the largest amount of allocated observing time is a joint ESO and Swedishproject with 11 participants (Booth, Nyman, Carlström, Winnberg, Sahai, Habing, Heske, v. d. Veen, Omont, Forveille,and Rieu). It is a survey of circumstellarCO (J = 1-0) emission in a sampie oftotally 787 sources from the IRAS pointsource catalog, with the colour-colourcharacteristics described in the paper
45.0"
45" ,G5"0.45"
O.-G5"
find candidates for further observationsat this interesting stage in the life of astar.
Sometime during the evolution ofsome stars, enough processed materialfrom the interior may have been broughtup to the surface to change the composition of the star from oxygen-to carbon-rich. A few carbon stars with oxygen-rich CSEs have been observed,supporting this idea.
Circumstellar Moleeules
The gas in the CSEs has mainly beenstudied through observations ofmolecular transitions in the radio region(some molecules have also been detected in their infrared transitions). Sofar, 36 molecules have been detected inCSEs (Olofsson, 1989). The strongestemission lines are produced by the SiO,H20, and OH molecules, situated in oxygen-rich envelopes. The population insome of their transitions may under certain conditions become inverted and themolecules will act as amplifiers, i. e. theywill amplify the background emission atthe frequency of the transition; they areso called masers.
The SiO masers are situated close tothe surface of the star while the H20 andOH masers are located further out, thusthese molecules probe different parts ofthe envelope. Especially the OH masershave been useful to determine massloss rates and also the distances tostars.
Another useful molecule for studies ofCSEs is CO. It is found both in oxygen-
-150 -100 -50 0 50 100 150
VLSR (km/s)
-G5",-45"
Figure 2: CO (J = 1-0) map of NGC 6302 - Ihe brighlesi planelary nebula in Ihe soulhern skyshowing several dislincl, spalially-variable, kinemalic componenls (Sahai, R., Woolen, A., andClegg, R. E. S.).
dust radiates in the infrared, however,mainly between 2 and 100 f-lm, and infrared observations (especially those ofthe IRAS satellite) have given us insightinto the properties of CSEs and stellarevolution. Van der Veen and Habing(1988) have studied the IRAS two-colourdiagram (F60/F25 versus F25/F12) in theregion where CSEs are situated and interpreted the distribution of IRAS pointsources together with other propertiessuch as variability, etc., as an evolutionary sequence of increasing mass-Iossrate, i. e. the IRAS two-colour diagramcan be used to study the evolution of astar on the AGB and beyond.
In their scenario a star becomes variable somewhere on the AGB, maybeduring the thermal pulses, and starts tolose mass. The mass-Ioss rate is fairlylow in the beginning, - 10 ? MG yr-1
.
This is the region where Mira variablesare situated. The mass-Ioss rate thengradually increases to a few times 10-5
MG yr 1 and the star will be surroundedby a thick CSE, moving along theevolutionary track in the two-colourdiagram. The star is now obscured andin this region we find the OH/IR objects.The mass-Ioss rate may not be continuous; during a thermal pulse the stellaroscillations may stop for some time, inhibiting the mass loss, and then startagain. After some time the variabilitydecreases, the mass loss stops and thestar will become a planetary nebula. Theplanetary nebulae and their progenitors,the protoplanetary nebulae (PPN), aresituated in certain parts of the two-colour diagram, thus making it possible to
12

-60.0
IRAS1519
-40.0
duce HCN. They detected 20 stars inHCN, and H13CN was seen only in thetwo 13C rich stars in the sampie. Due tothe uncertainties in abundance determination, the preliminary result is that theHCN/CO abundance ratio is similar inthe photosphere and the circumstellarenvelope, in agreement with the chemical models.
S-stars, planetary nebulae, andsupergiants. Sahai has made a surveyof CO (J = 1-0) emission from S-stars todetermine their mass-Ioss propertiesand compare them with oxygen-richand carbon stars to test the hypothesisthat the S-stars represent an evolutionary stage between the 0- and the Cstars.
So far 15 objects have been observedand 4 new sources were detected, almost doubling the number of S-starsdetected in CO. The proto type S-star:rt:
1Gru was mapped, it has an unusualasymmetric line pofile and an extendedoutflow.
Sahai, Wootten, and Clegg havemade a search for CO (J = 1-0) emissionfrom a large list of southern PN, detected 6 new sources and mapped 3of them. NGC 6302 (Fig. 2) has a veryinteresting structure with at least 3separate kinematic components. Sahaihas observed two supergiants, VY CMaand VX Sgr, in CO. They both have verylarge outflow velocities. The CO profileof VY CMa is rectangular and almostpoint like in the CO map, implying that itis optically thin, which is surprising sincethe mass-Ioss rate determined from OHobservations is very high. HCO t wasalso detected. The CO profile of VX Sgris heavily contaminated by interstellar
-20.0
[km/s]
0.020.0
observations of a sampie of bright carbon stars (situated both on the northernand southern sky) with weil determinedphotospheric characteristics, e. g. effective temperature Telf> CNO abundancesand 12CO/13CO ratio, giving a goodopportunity to compare photosphericproperties with those of the CSE. Thefirst results have been presented inOlofsson et al. (1987) and Olofsson et al.(1988). In total, 32 stars were observedand 26 were detected of which 15 arenew detections. A good correlation wasfound between the far infrared properties and mass-Ioss rates and also between the variability of the stars andtheir mass-Ioss rates.
One interesting result in this project isthe discovery of three sources, S Sct(Fig. 1 by Olofsson). U Ant, and TI Cyg,witll a peculiar double peaked CO lineshape. A simple model of the CO emission from these objects shows thatthere is a distinct inner radius insidewhich little mass exists. The conclusionis that the mass loss has stopped, maybe because the star is experiencing athermal pulse. The CO (J = 2-1) spectrum of U Ant also consists of a narrowparabolic profile which may indicate thatthe mass loss has recently recommenced in this source.
Olofsson, Eriksson, Gustafsson, andCarlström have observed HCN andH13CN toward the sources in the samesampie to compare the HCN/CO abundance ratio in the photosphere with thesame ratio in the CSE. This is interestingbecause in carbon stars HCN is thoughtto be of photospheric origin, while inoxygen-rich stars a photoinduced circumstellar chemistry is required to pro-
.5
1.0
1.5
0.0
Vlsr
Figure 3: A CO (J = 2-1) spectrum of IRAS 15194-5115.
by van der Veen and Habing. The sources are all stronger than 20 Jy at 25 Ilm.The sampie consists of all kinds ofevolved stars, oxygen and carbon rich,Mira variables, OH/IR objects, PPN, andPN. Of these sources, 459 are situatedin the southern sky, and the others willbe observed with the Onsala 20 m telescope.
The idea is to build up a data base ofcircumstellar CO emission from stars atdifferent stages of their evolution, tostudy mass-Ioss rates, chemistry, andother properties of the envelopes. Nearinfrared photometry of the sampie isplanned, and the stars will also be observed in the CO (J = 2-1) transition. Sofar, 215 objects have been observedwith the SEST telescope, 88 objectshave been detected, of which 54 arenew detections. Objects with very coldCSEs, e. g. OH/IR objects and PPNs, arevery weak in CO and sensitive observations are needed to detect them. Therefore, a special project to observe thistype of objects was initiated togetherwith the large survey. Several objectshave been detected, among them aSUpergiant with an extremely wide lineprofile, almost 300 kms-1.
Many evolved stars show strong SiOmaser emission at 86 GHz. Haikala hasmade a search for SiO (v = 1, J = 2-1)masers from objects in the IRAS pointSOurce catalog with colour-colourcharacteristics similar to sources withalready detected SiO maser emission.
The objects are mainly situated in theregion of the colour-colour diagram ofoxygen-rich sources with moderatelythick CSEs (van der Veen and Habing,1988). He observed 114 sources andfound 53 new SiO masers. Since the SiOmasers are variable i.n intensity, many ofthe non-detected sources would probably be detected, if they were observedat a later time.
Bright infrared sources. Le Bertreand Nyman have observed the SiO (v =
1, J = 2-1) maser emission from a sampie of bright infrared sources, and madenearly simultaneous near-infrared observations. The sampie consisted of 5Mira variables, 2 supergiants, and10 OH/IR objects. All sources, except 3of the OH/IR objects, were detected inSiO. Previous attempts to detect thisSIO transition in OH/IR objects havelargely been unsuccessful (Nyman et al. ,1986), maybe because of the large distance to many of these objects compared to Mira variables. In this sampie ofbnght infrared sources (bright becausethey are nearby or intrinsically bright)there seems to be no difference in SiOintensity versus infrared intensity for thedifferent types of sources.
Bright carbon stars. Olofsson, Eriksson, and Gustafsson have made CO
13

J. BRAND, Osservatorio Astrofisico di Arcetri, Florence, Italy
Molecular Clouds and Galactic Structure
CO lines because it is situated in theGalactic plane. Further observations ofall these projects are planned during1989.
Molecular observations of a brightcarbon star. The third brightest carbonstar in the sky at 12 ~lm, IRAS 151945115, is located in the southern sky. Ithas properties similar to IRC + 10216(the brightest carbon star and situated inthe northern sky), wh ich has a very weilstudied spectrum with many detectedmolecu les. IRAS 15194-5115 is situatedat a larger distance, however. Booth,Johansson, Nyman, Olofsson, and Wol-
One of the features of the SEST is itssub-arcminute resolution, allowing oneto observe molecular clouds at highspatial resolution, as described in anumber of the other reviews in thisissue. However, the SEST can also beused to investigate the large-scale distribution of the molecular cloud ensemble. Such a study, focused on the outerGalaxy, is the topic of this contribution.
Molecular clouds consist almost exclusively of H2 , which is, however,difficult to detect. CO is the next mostabundant molecule in interstellar space,and it has easy-to-observe transitions inthe mm-wavelength range. Because COis primarily excited through collisionswith H2 , it is possible to infer the distribution of the latter from that of CO.
The Outer Galaxy
The outer Galaxy, defined as thosereaches of our system with galactocentric distances R larger than RQ(= 8.5 kpc; the distance of the Sun to thegalactic centre), has gained renewed interest as a region of study. From observations of H I emission it has becomeclear that at R > RQ there are largescale systematic deviations from a flatdistribution (calIed 'warping') as weil asa significant increase in the thickness ofthe gaseous disk (calIed 'flaring'). Sucha morphology is in marked contrast tothat of the inner Galaxy, where theatomic gas is confined to a disk of thickness - 250 pc (-120 pc for its molecular counterpart). The same phenomenonis seen in a number of other spiral galaxies, which in turn has stimulated astronomers to have a closer look at theirown backyard. Almost all information onthe distribution and motion of material atlarge R has come from observations of
14
stencroft h~ve 0bserved the IRASsource in many molecular transitions tocompare it with IRC + 10216. CO, 13CO,CS, HCN, HNC, HC3N, C2H, C3H, C4H,C3N, SiS, and SiC2 have been detected.The lines are about 10 times weakerthan those in IRC + 10216 confirmingthe larger distance to the IRAS source,but the relative intensities of themolecular lines with respect to the CO(J = 1-0) line intensity are the same within a factor of two between the two sources. Figure 3 shows a CO (J = 2-1)spectrum of IRAS 15194-5115. Preliminary CO maps give a source size of 24"(deconvolved with the beam) in the CO
H I, mostly because all other "tracers"are confined to the inner Galaxy. It isimportant, however, to extend ourknowledge of the outer Galaxy beyondwhat can be found from the 21-cmemission. We would like to know, forinstance, the distribution and kinematicsof the molecular material, an essentialingredient for the study of the influenceof achanging galactic environment onstar formation.
Much observational work, especiallyin CO, has already been devoted to thestudy of individual molecular clouds atR > RQ . But the larger scale picturesuffers from incompleteness. Molecularclouds in the outer Galaxy are muchmore sparsely distributed than in theinner parts, and the intensity of theemission is generally low. Large-scalesurveys, done on a regular grid, are outof necessity carried out with either severe undersampling or low sensitivity,and are in general confined toI b I < 5°. These constraints imply thatmany clouds, especially at larger distances, will be missed due to beam dilution,or due to the galactic warp.
IRAS sources
A representative view of the population of molecular clouds in the outerparts of the Galaxy can only be obtainedif one knows where to look, such thatthe chance of detecting a CO emissionline is high. In this way even a largetelescope like the SEST can be used toderive the large-scale distribution ofmolecular gas. Jan Wouterloot (now atthe University of Köln) and I searched forCO in the direction of a large sampie ofIRAS sources in the outer Galaxy, in aproject started in September 1987 (whenwe used the SEST in test time, and we
(J =2-1) transition and 33" in the CO (J =1-0) transition.
ReferencesNyman, L.-A., Johansson, L. E. B., Booth,
R. S.: 1986, Astron. Astrophys. 160, 352.Olofsson, H.: 1989, in lAU Coll. 106, "Evolu
tion of Peculiar Red Giants", eds. H. R.Johnson and B. Zuckerman, CambridgeUniversity Press.
Ololsson, H., Eriksson, K., Gustafsson, B.:1987, Astron. Astrophys. 183, L 13.
Olofsson, H., Eriksson, K., Gustafsson, B.:1988, Astron. Astrophys. 196, L 1.
van der Veen, W. E. C. J., Habing, H.: 1988,Astron. Astrophys. 194, 125.
The li,,' yea_ al SEST~
. Flwere both at the MPlfR in Bonn). Thesesources were selected from the IRASpoint source catalog, on the basis oftheircolours, as having a high chance of beingassociated with regions of star formation. As all star formation takes place inmolecular clouds, these IRAS sourcesact as flags for the location of the cloudsin which they are embedded. A numberof these IRAS sources are located closeto optically visible H 1I regions, but manyare not. The latter could be (ultra) compact H 11 regions, or be associated with apre-main-sequence object.
In order to account for the galacticwarp, the sources were selected in alatitude range between +10° and-10°. Initially the longitude range of thesampie was chosen to be between165° and 280°, and was later extended down to I = 85°, using the IRAM30-m telescope.
Spatial Distribution
CO was detected towards 1077(83 %) of the 1302 sources selected inthis way. We found CO emission towards these sources at velocities of (absolute values) up to 110 kms-1. This isquite a difference with uniform-grid surveys, or surveys of optical H 11 regions,where very little emission, if any, isfound at velocities in excess of50 kms-1. Using a rotation curve (i. e. therelation that gives the velocity of rotationaround the galactic centre as a functionof R, assuming all objects are in circularrotation), a kinematic distance could bederived for each CO emission component. In terms of distance, we found COemission up to 15 kpc from the Sun, andout to R = 20 kpc. In many cases more

distances. Similarly, the molecular gasdisk shows an increase in thickness withincreasing R, eventually approachingthat of the HI.
Sources that would have a flux S(25 ~lm) > 0.25 Jy if they were at d =
15 kpc, would be visible over the wholerange of distances where CO emissionwas found. Excluding those around I =
180° (see Fig. 1), this sampie contains416 IRAS/CO sources (i. e. molecularclouds), which were used to derive thedistribution of H2 .
Assuming that the number of far-IRsources per unit of H2 mass is constant(as indicated by a preliminary study), wecan derive the surface density of H2(a(H2)) as a function of R, by calculatingthe number of IR sources per square pc,and scaling the value at . with thevalue of a(H2) at that location. We findthat a(H2) decreases from a value of1.80 MG.)pc-2 at the Sun, to 0.64 MG.)pc-2
at R = 14 kpc, to 0.015 MG.)pc-2 at R =
20 kpc. This decrease is much slowerthan what was derived from earlier, general-sampling CO surveys. From ourdata, we derive a total mass of5.8 108 MG.) residing in H2 clouds atR> RG.).
This project shows how the SEST canbe used to increase our knowledge of animportant aspect of our Galaxy, thelarge-scale distribution of molecularclouds. The dataset contains of coursemuch more information, wh ich spaceunfortunately does not permit me towrite about; a detailed account of thiswork has been submitted to Astronomyand Astrophysics.
l1's a pleasure to thank ESO and thestaff at the SEST for providing andmaintaining this very user-friendly telescope, and Jan Wouterloot for makingimprovements on the manuscript.
0-' .....
tion takes place at distances larger thanthat (otherwise we would have detectedit).
We also see that distant objects arefound more or less evenly distributed inlongitude. There are more molecularclouds with embedded IR sources in thesecond quadrant than in the third. In thesecond quadrant a concentration ofclouds occurs around R = 12 kpc, whichwe associate with the Perseus arm. Nolarge-scale spiral arm feature can bedistinguished which extends over bothgalactic quadrants.
The distribution of the CO emissionperpendicular to the plane shows thatthe molecular material partakes in thegalactic warp, with clouds reachingheights of 800-1000 pc at the largest
---- .. ,'.,,,,, ',,
"\" - -. -"-+I .--..._
, .,,.IJ\ " "
" \." ":" "'. : ~ "
...."" ~.; ~./ ', ...". "."" ""''''." \" " . ,'" . \" ,,' .
" • " • \ ".tl' ,," " ;.. -\ o,t". I' .. ,.,." J:.. ': '": \:. '::: .,1.(..•.~ , ,,,:';...... ." V; "'i ••• ,/. •• , .• ".......
',. "'I. ,'.' ".- .. '4;., ~." ,,' :. . ••• ~ .~• •'" '.: -::.,. ~_'l".. :. ~ ... " " •••••
:'.,;~~~.:'" .:......... • ,'f :;' .,' ....:..::.~~;:..:~•... ~:".' .." - .......... , I
5
o
15
10
than one emission component wasfound towards a particular IRAS source.Identifying the one that is associatedwith the IR source usually did not pose aproblem, as one of the components wasalways stronger and broader than theothers. Most of the not-associatedemission comes from local (d < 1 kpc)clouds.
Figure 1 shows the distribution on thegalactic plane of the CO emissionassociated with the IRAS sources. Thedashed lines mark a region near I =
180°, where kinematic distances areVery uncertain. Note that very fewclouds are at R > 20 kpc. Because thesampie was chosen such that the IRSOurces had colours of star-forming regions, we conclude that no star forma-
15 10 5 0 -5 -10 -15X (kpc)
Figure 1: Distribution projeeted onto the galaetie plane of those CO emission eomponentsassoeiated with the seleeted /RAS sourees. The Sun is at (0,0); the galaetie eentre at (0, -8.5).The fu/l-drawn fines show the longitude fimits of the sampie. The dashed fines mark the regionwithin 15° of the antieentre where kinematie distanees are very uneertain; objeets in Ihisregion are exeluded from the final sampie used in the data analysis.
Aa. SANDQVIST, Stockholm Observatory, Saltsjöbaden, Sweden
The Galactic Centre
?ne of the most interesting and mystenous regions of our Milky Way galaxyIS the Galactic Centre (GC). Lying at adlstance of 8.5 kpc in the direction ofSagittarius, it is best observed from theSouthern hemisphere. However, greatmasses of intervening dust in the planeof the Galaxy produce 30 magnitudes ofabsorption and the GC is not observableIn the optical region. Most of the knowledge that we possess about the GC hasbeen obtained at infrared and radioWavelengths, using northern hemisphere telescopes. These observationsare often hampered by the low elevation
of the object, resulting in atmosphericproblems and short observing sessions.With its declination of about -30°, theGC becomes almost a zenith object attransit over La Silla and is therefore weilsuited for studies with SEST.
The inner ten parsecs of the Galaxycontain a giant molecular complexwhich surrounds the strong continuumradio sources at the nucleus, known collectively as Sgr A. This region somewhatresembles the nuclei of more activegalaxies (even to the extent of possiblycontaining a 3 106-MG.) black hole) andits proximity to us is of course a great
The fi,,' yea, af SEST~
If~"\. ~~L'.=, j
I.#'.
advantage, making possible observations with high spatial resolution. Theinner one hundred parsecs of the Galaxycontain more exotic objects, such ascontinuum threads, filaments and arcs,as weil as the most significant star-formation region in the Milky Way, namelySgr B2.
Four GC projects have been in progress during the first year of SEST andmore are in the offing in the near future:
15

85200
oes
85100main purposes of the project are to obtain a better insight into the physicalconditions and c1umpiness of the cloudand to determine the heating source(gravitational collapse, cosmic ray,magnetic heating, gravitational turbulence).
2. Prominent Galactic CentreMolecular Clouds
F. Yusuf-Zadeh, M. Lindqvist, J. 8allyand L.A. Nyman have begun a programme of mapping a number of prominent GC molecular clouds (Sgr 8, Sgr C,Sgr D, Sgr E) in the 98-GHz J = 2-1 CSand 230-GHz J = 2-1 CO lines. So far, a10' x 13' region around Sgr 81 hasbeen mapped in the CS line with 45"spacing. The kinematical and spatialdistributions of molecular material willbe compared with recent 30"-resolutionVLA observations of the radio continuum and radio recombination lines.Objectives include determining thereasons for the low rate of massive starformation in the inner few hundredparsecs of the Galaxy (with the exception Sgr 82) and studying the effects oflarge-scale mGauss magnetic fields.
3. A Multitransition CH3CN Studyof the Sgr B22 Molecular CloudCore
Another group from Onsala SpaceObservatory, consisting of P. 8ergman,P. Friberg and A. Hjalmarson, is studying the chemical and physical propertiesof the giant star formation region Sgr82, which lies about 100 pe from theGC. Sgr 82 has been found to consist oftwo major cores - Sgr 82 (Main) andSgr 82 Q'::::!orth) - separated by abouttwo parsees. The two cores show remarkable differences in their chemicalcompositions and excitation parameters. Using two multitransitional mapping tools, supplied by the symmetrietop moleeule CH3CN at frequencies of110 (J = 6-5) and 220 GHz (J = 12-11),the group expects to derive the temperature structure and heating mechanismin these cloud cores as weil as the density structure and CH3CN abundancevariations. Figures 3 and 4 show the J =6-5 CH3
12CN and CH313CN profiles ob
served towards Sgr 82 (N) and (M), respectively. From the relative intensitiesof the different K-components andisotopic lines, it can be deduced thatSgr 82 (N) has considerably higher optical depth and kinetic temperature thanSgr 82 (M).
4. Lunar Occultations of Sgr B2 inthe J = 1-013CO Une
During 1986-1989 aseries of lunaroccultations of the GC is taking place, a
____ICISO
where emission lines from severalmoleeules and molecular ions can beidentified, the most intense lines beingdue to C3H2 and OCS. The centre of thecloud was mapped in 13CO, C180,HNCO and CH3CN with 40"-spacing.Figure 2 presents maps of integratedline intensities (fTA*dv) in the velocityrange 5-25 km S-1. At other frequeneies four points were observed roughlyalong the major axis of the cloud. The
o
13CO =---:::::50
r--'-'
!i30tt
0
frl -50Cl
-100
100
HNCO
48(50
0
-50 ~~\\-100
- 0 2 L...L--'-_'----'-_-L-----'~_'___ _'____'_ ___'____ _'___l._ _'__'_______L__ __'__'_____.J
-500 0 500
Velocity (km/s)
Figure 1: Part of the spectrum of the Sgr A +20 km S-I molecular cloud covering the frequencyrange 85.1-85.6 GHz.
A research group from Observatoirede Meudon, consisting of N. 8el, M.Gerin, F. Combes and Y. P. Viala, haveobserved parts of the massive Sgr A+20 km S-1 molecular cloud in a largenumber of molecular lines in the85-115 GHz frequency range. Figure 1is an example of one such spectrum
1. Physical Conditions in the Sgr A+20 km S-1 Molecular Cloud
100 50 0 -50 -100 RA OFFSET (")Figure 2: Maps of the integrated line intensities in the Sgr A +20 km S-I cloud of a) 13ca (J =1-0), b) c I8a (J = 1-0), c) HNCa (505 -404), d) CH3CN (J = 6-5), in the velocity range of5-25 km S-I. RA and DEC offsets are from a (1950) = 17h42m29s 4, b (1950) = -29°03'31".Contour levels, in K km S-I, are as folIows: a) 45 to 100, step 5, bold al 60; b) 5 10 15, slep 1,bold al 10; c) 20 10 60, slep 5, bold at 40; d) 41060, slep 4, bold al 20.
16

CIlr--.----~-_._--~-____r--~-_,,____-~-___, CIlr--.----~-_._--..,.--____r--~-__,--_,_-___,
Sgr B2(M)
0
t t t t t tCH 3CN(J=6-5) K=5 4 3 2 10
ll"lciI 110.32 110.34 110.36 110.38
0
t t t t t
ll"lCH 3CN(J=6-5) K=5 4 3 2 10
ciI 110.32 110.34 110.36 110.38
K=2 I 0 CH313CN(J=6-5)
Sgr B2(N)
· '".... ll"l
ci
Frequency, v (GHz)
Figure 3: The line profile of the 110-GHz CH3 CN (J = 6-5, K = 0-5)transitions towards 5gr 82 (N).
Frequency, v (GHz)
Figure 4: The line profile of the 110-GHz CH3 CN (J = 6-5, K = 0-5)transitions towards 5gr 82 (M).
!-+--I--I--+--+---+-.j-!----1f---+--+--+---I-+-1-+--+--I1 --+--+--f--!--I----1f---+--+--I-!
5gr B2(N)
150
'"100
'"Qlc:.:ECl 50:ga.'e:ii5
·50Eilst ~ 6" West
Angular dimension
5gr B2(M)
150
'"100
'"Qlc:
.:ECl 50:g.~
ii5
·50Eilst -6" West
Angular dimension
Figure 5: Variation of the 110-GHz J = 1-0 13CO profile during the Oetober 27, 1987 lunaroeeultation of 5gr 82. The time resolution is 12 seeonds. Upper half: disappearanee phase of5gr 82 (M); lower half: reappearanee phase of 5gr 82 (N).
Figure 6: The restored strip brightness distributions of the integrated line intensity of J =
1-0 13CO aeross 5gr 82 (M) at a positionangle of 92°, and aeross 5gr 82 (N) at aposition angle of 250°. The effeetive angularresolution is 6".
rare phenomenon. SEST is ideally 10cated for observations of the occultations of Sgr 82 and four occultationshave been observed in the 11 O-GHz J =
1-013CO line by Aa. Sandqvist, L. E. 8.Johansson and P. Lindblad. These datacan yield the strip brightness distributions along eight different directions across the sources, four for each of Sgr 82(N) and (M). Figure 5 shows the variationof the 13CO profile during the disappearance phase of Sgr 82 (M) and thereappearance phase of Sgr 82 (N) onOctober 27, 1987. The time elapsed be-
17
tween each dumped profile is 12 seconds, which results in an angular resolution of about 6". This should be compared with the 46" beamwidth of SEST
at 110 GHz. The corresponding restoredstrip brightness distributions are seen inFigure 6, showing both sources to bedouble. The combination of all the strips
should yield 5"-resolution maps ofthe two-dimensional brightness distributions of 13CO isotope in Sgr B2 (N)and (M).
SN 1987A and other Bolometer Observationsat 1.3 mmR. eHINI, Max-Planck-Institut für Radioastronomie, Bann, F. R. Germany
The first year of SEST tj.~ll~~ ~.f»'r~\
. . IJ~I ~.t.1~, I.
1-
Introduction
During August/September 1988 thebolometer group of the MPI für Radioastronomie, Bonn, visited SEST to perform continuum observations at1.3 mm. It was the first observing timeof our group at this telescope and thefirst sensitive test for SEST at thatwavelength. The submm qualities of LaSilla were another uncertainty in themission so that it seemed more thanquestionable whether any astronomicaldata would come out of our run.
We started on August 24 to install ourbolometer in the receiver cabin of thetelescope. This action turned out to bequite an adventure because the accessto the cabin door - 9 m above theground - is only possible from outsidevia a ladder or a hydraulic platform(cherry picker). During the observing runwe had to use the "cherry picker" eachday in order to take the cryostat with thebolometer from the telescope, bring itback to the ground and refill withHelium. The ladder was also used veryoften because receiver alignments andall kind of trouble-shooting in the cabinhad to be interrupted at least four timesa day to experience La Silla's famouscuisine.
Sub-Millimetre ObservingConditions
The sub-mm-transparency of the atmosphere is - as in the infrared spectralregion - confined to a few windows.Most of the radiation is absorbed by thewater vapour content of the atmosphereso that dry sites of high altitude are idealfor observations of that kind. The firstmeasurements of the atmospherictransmission on La Silla at 1.3 mm withSEST were quite surprising because wefaced conditions as good as those onthe 4200 m volcano Mauna Kea inHawaii, the world's most famous submm site. However, the joy lasted for onlya few hours and then we had - despiteblue skies - 9 days of only moderatelygood sub-mm observing weather. Together with the SEST team we used thistime to test various properties of the
18
telescope like pointing, tracking and theaccuracy of the 15 m diameter surface.The short observing wavelength of1.3 mm and the superior sensitivity ofour bolometer system enabled us to detect telescope errors much more efficiently than with existing receivers atSEST. We located encoder problemswhich caused tracking errors and founda misalignment of the subreflector thatdistorted the beam shape.
Unfortunately, SEST was not yetequipped to record our continuum databy the telescope computing system andno on-line reduction of the signals waspossible. Likewise, our own PC dataacquisition was too busy with takingdata so that the strip chart records werethe only way of monitoring the observations. Just as we had finished the technical tests and had most of our problems under control, heavy clouds camein and stopped further astronomical activities during the next 4 days. This wasthe opportunity to summarize our experience with SEST and to discuss further observations that could be reasonably done with the present state of thesystem. The telescope performance hadturned out to be still inferior to what itwas supposed to be; any efficient observing procedure was extremelydifficult because of the lack of corresponding on-line reductions. Daytimeobservations were severely limited byan increased turbulence of the atmosphere which resulted in an overall sensitivity-Ioss of the system. In addition,the reflecting aluminium surface of thetelescope had once burnt the subreflector, so we had to avoid the sun by anangle of 60 degrees and, as a consequence, could not reach many interesting objects. In view of all these limitations, the bad weather and the knowledge that only a few days of telescopetime were left, a feeling of disappointment set in whenever the dining roomwas closed.
Observations - At Last!
Finally, it cleared up, the relativehumidity dropped below 15 % and theaverage temperature fell to 3°C, much
below the previous values. During thelast three days we experienced excellent sub-mm conditions and started withastronomical observations. To observefaint sources with a radio or a sub-mmtelescope it is essential to determine thepointing of the telescope by means ofnearby strong sources with well-knownpositions. For that purpose we observeda sampie of quasars weil distributedacross the southern hemisphere andselected those which were strongenough at 1.3 mm, to establish a systemof pointing calibrators.
It must be noted of course that allthese measurements were new for thesouthern hemisphere and tell quite a lotabout the physical properties of thequasars: Their 1.3 mm radiation is dueto fast moving electrons (synchrotronradiation). From the intensity of theemission (in combination with otherradio data) one can learn about theenergy of the electrons, the strength ofthe magnetic fields and even about thesize of the emitting regions.
The sub-mm emission of most otherobjects, however, is - as in the near andfar infrared spectral region - thermal inorigin and comes from interstellar dustthat is heated by nearby stars. In particular, star-forming regions are strongemitters of sub-mm radiation becauseyoung stars there are deeply embeddedin dust clouds. The light at optical andinfrared wavelengths is completely absorbed by dust and is re-radiated atlonger, i. e. at far-infrared and sub-mmwavelengths. Thus, sub-mm emission isvery often the only sign for star formation occurring in dense clouds.
Even more interesting is the searchfor "protostars" , i. e. cool and dense objects of gas and dust which are still in aphase of gravitational contraction. Hereit seems that sub-mm observations arethe most promising way to detect thesecool (=20 K) precursors of stars. Wemapped several well-known southernstar-forming regions to determine theamount of gas and dust associated withthem and to look for condensationswhich might develop into stars in thefuture.

Other prominent emitters of sub-mmradiation are external galaxies. Theirstellar population heats the galactic dustto temperatures of 20 to 40 K. From theamount of dust one may calculate howmuch gas is contained in a particulargalaxy. This quantity is very importantbecause it finally determines 110W manystars can be created and how bright thegalaxy appears in the sky. We observeda number of galaxies only accessiblefrom the southern hemisphere in orderto stUdy the global star formation inthese objects.
SN 1987ADetected!
As mentioned above, observing conditions improved during the nights andthey were best a few hours after midnight. That was the time when all colleagues had gone to bed and the LargeMagellanic Cloud came into the field ofview. Knowing all the limitations givenby the imperfect performance of the telescope, on the one hand, but trusting inthe excellent sensitivity of our bolome-
ter, on the other hand, I "wasted" a fewhours before sunrise and pointed theSEST towards SN 1987 A, the mostspectacular event in the southern hemisphere. There was no idea at that timewhat signal could be expected from thisobject at 1.3 mm but everybody agreedthat it must be extremely faint. In addition, at that time there had been nodetections at wavelengths longer than20 !tm so that it was quite achallenge totry the supernova.
During the integration I was carefullywatching the strip chart recorder.Sometimes, I had the impression thatthe pen moved in the right directionwhen the telescope switched from thesource to the blank sky, but this couldas weil have been a product of my imagination. Nevertheless, after the thirdnight of staring at the strip chart I wassure that there was a faint signal fromSN 1987 A. Meanwhile our softwarespecialists had reached a stage wherethey could reduce - to a limited extent the bolometer signals from SEST. Ofcourse, the first data I suggested looking at were those of the supernova. After
a few hours, there was something tocelebrate: we had detected very weak1.3-mm emission from SN 1987A of29 mJy! To exclude a possible contamination by emission from the LMC, weobserved two additional nearby positions, however, without any significantsignal. This was the final proof that theobserved flux was indeed coming fromthe supernova.
The origin of this radiation is not quiteclear because both emission from hotdust as weil as free-free emission fromthe ionized outer part of the former starmay contribute. Combining our datawith observations at other wavelengthswe come to the conclusion that most ofthe 1.3-mm flux density is due to freefree emission; dust has formed in theformer star's envelope and must be distributed in an extremely clumpy manner.Of course, it will be of interest to studythe development of SN 1987 A at submm wavelengths in the future and toverify this interpretation. Unlike in otherspectral regions - SEST will be the onlychoice for that purpose in the southernhemisphere.
CO Observations of the Magellanic CloudsF. P. ISRAEL, Sterrewacht Leiden, the Netherlands
1>-'1 4 7 10 1316 1922250-,
Map o( Ihe N160/N159 region in Ihe LMC in Ihe J = 1-0 12CO Iransition inlegraled over Ihevelocily range 21810261 km/so The Iwo CO clouds slighl/y left o( Ihe cenlre o( Ihe map areassocialed wilh N 159. The brighl CO cloud al Ihe left is localed in a visua/ly inconspicuousregion belween N 159, N 172 and N 173. The much weaker CO cloud jusl righl o( Ihe cenlre isassocialed wilh N160 ((rom 800lh el al., 1989).
lower than Galactic in low-metallicity,UV-rich galaxies such as the Magellanic Clouds due to stronger photodissociation in such environments.Clue to this important ratio can be obtained from a comparison of (area,position) integrated CO intensities with
218.0 to 261.6 km/Btl>r---r'-r-r--.---.-~--r-,-'-",-,--'--.-r-r---'--'--...--.---.-,-,--r--.--,SI.
1
7
9
5
3
11
(Leiden) to conduct this programme.The programme aims at a systematic
study of the CO content of theMagellanic Clouds. Several aspects areof importance. Foremost is a determination of the CO to H2 ratio, as H2 is themajor molecular component of the interstellar medium, thought to be present ingalaxies in amounts comparable tothose of H I. This ratio is almost certainly
.The commissioning of the SEST on LaSllia has opened up a new era in thestUdy of the interstellar medium in theMagellanic Clouds. With this telescope,for the first time extensive, detailedstudies of the (CO) molecular component of the clouds has become possible.Previously, a rather limited number ofsightlines had been sampled with resolutions of 1 to 2 arcmin (see review byIsrael, 1984), and a CO map coveringthe whole LMC but with a coarse resolution of 8 arcm'in (125 pc) was obtainedfrom Cerro Tololo (Cohen et al., 1988).
The SEST, with its 40 arcsec beam atthe J '= 1-0 12CO transition and its largeaperture, yielding a high sensitivity, thusIS a major step forward. It was immediately realized by ESO and by Swedenthat a major target for the SEST wouldbe. the Magellanic Clouds, objectsunlque to the Southern Hemisphere, butthat a systematic study would require alarge block of observing time owing tothe large angular dimensions of the~loUdS (LMC: 720 SEST beams across;M~: 180 beams across). This led to the
deSignation of an ESO-Swedish SESTKey Programme 'CO study of theMagellanic Clouds', and the formation~f a consortium headed by L. E. B.ohansson (Onsala) and F. P. Israel
19

for example virial theorem masses.Preliminary SEST CO results confirm
the estimates by Cohen et al. (1988) thatfor the same amount of H2, CO in theLMC is about five times weaker than inthe Galaxy. In the SMC the limited dataindicate CO to be of order ten timesweaker. Curiously, the data in the 30Doradus region show a trend for the COto H2 ratio in the LMC to be closer toGalactic for the largest and most massive clouds (Booth et al., 1989). Clearly,these results are only preliminary andneed careful further investigation. Theresults are of importance, not only forour understanding of the Clouds, butalso for interpretation of CO measurements of more distant (dwarf) galaxies.
Another area of interest, also with respect to photo dissociation models andthe physical condition of the molecularinterstellar medium, is that of theisotopic ratios 12CO/13CO and 13CO/C180. Under Galactic conditions andopacities, the first is of order 5-8. In theLMC, we have measured several COemission peaks with 12CO/13CO rangingfrom 7 to 16, with a mean of 9. In theSMC, the (preliminary) mean appears tobe around 12. The important result is notthat these ratios are significantly higherthan in Galactic objects, but rather thatthey are not even higher. In the one peak
(N 159) where all three CO isotopeshave been detected wefind 12CO: 13CO:C180 = 500 : 70 : 1 (Booth et al., 1989),which is unusually weak for C180. Again,more measurements and careful modelling are needed before final conclusionsare drawn; such measurements are inprogress.
Both the limited maps obtained during commissioning (Booth et al. , 1988)and a several degrees long, fully sampled scan at constant right ascensionthrough 30 Doradus, N 158, N 160 andN 159 show the presence of a significant, rather clumpy molecular complex,extending weil southwards of opticalobjects such as N 159. The same complex, clumpy molecular cloud structurehas been found to be associated withthe large H I1 region complex N 11 in thenorthwest of the LMC, which has beenfully mapped. Detailed studies of suchregions are of importance, becausecombination of the molecular data withIRAS infrared maps, and abundant optical information yields insight into thelarge-scale process of star formationthat gave rise to the existence of suchH II region complexes.
In the SMC, it was found that IRASsources were about the only reliable detection criterion for molecular emission.In this galaxy, CO is generally weak and
predominantly seen in the southwestend of the bar, although clouds arepresent throughout the SMC. Severalsmall clouds (about 30 pc in size) havebeen mapped in the SMC, notably thoseassociated with the H 11 regions N 12,N27 and N88. Mapping of the southwest bar, and of individual cloudsthroughout the SMC is in progress, butthe going is slow because of the weakCO signals, and consequently long integration times (of the order of 30minutes per point) needed.
The above is merely a first glimpse ofthe molecular population of our nearestextragalactic neighbours in space.Much work remains to be done beforethe important questions on physicalconditions and processes can be answered with confidence. This firstglimpse, however, is an exciting previewof things to come.
ReterencesBooth, R. S., et al., 1989, Astr. Astrophys. in
press.Cohen, R.S., et al., 1988, Astrophys. J. (Lelt)
331, L95.Israel, F. P., 1984 in: Structure and Evolution
of the Magellanic C/ouds, lAU Symp. 108,Eds. S. van den Bergh and K. S. de Boer,Reidel, p. 319.
CO Isotopic Emission and the Far-InfraredContinuum of Centaurus AA. ECKART, Max-Planck-Institut tür Physik und Astrophysik,Institut tür Extraterrestrische Physik, Garching, F. R. Germany
The fi,,' yea, af SEST~
l.~,. ~ ·'t.I·-."'" I.
L_
Introduction
Centaurus A (NGC 5128) is a peculiarelliptical galaxy with a prominent dustlane. At a distance of about 3 Mpc (TheMessenger No. 44, p. 1) it is the closestradio galaxy, and to date it has beenobserved in almost every accessiblewavelength band. Here we report onrecent measurements with the SEST telescope which have contributed to ourunderstanding of the molecular interstellar medium in this spectacular object.
First we briefly describe the status ofthe observations at other wavelengths.The cm-radio emission of Centaurus Ais characterized by a compact milliarcsecond core (Kellermann 1974, Shafferand Schilizzi 1975) and, on larger angular scales, a jet extending over severalarcminutes (Bums et al., 1983) withgiant radio lobes on either side of thedust lane. The warped dust lane (Blandet al., 1987) and a system of faint,
20
narrow shells around the elliptical galaxy(Malin et al. 1983) suggest that Centaurus A is a relaxed remnant of amerger of a disk and an elliptical galaxy.Centaurus A is also a strong source inthe X-ray (Feigelson et al., 1981) and yray domain (von Ballmoos et al. , 1987).Observations prior to 1983 aresummarized in the review article byEbneter and Balick (1983).
Investigation of the interstellarmedium in Centaurus A has begun onlyrecently. A map of the 21-cm H I emission, which traces the bulk of the atomicgas, has been obtained by van Gorkom(1987). The molecular interstellarmedium can be traced by line emissionof CO, the second most abundantmolecule in the universe. The 12CO J =
2-1 emission in the dust lane has beenpartially mapped by Phillips et al. (1987)at the CSO in Hawaii. Furthermore at thenucleus the 158 /-lm [C 11] fine structureline has been measured (Crawford et al.,
1985). This is one of the brightest farinfrared cooling lines and iso indicative ofphotoionization regions which originatewhen strong UV light illuminates the surfaces of adjacent molecular clouds.
Observations with SEST
Since Centaurus A is a southernsource, the SEST telescope is ideallyplaced to investigate its millimetre andsubmillimetre radiation and, to date, twoindependent observing programmeshave been carried out in order to studYthe molecular interstellar medium. Thisphase of the interstellar medium is ofparticular interest since it is intimatelyrelated to the star-formation process ingalaxies. Eckart et al. (1989) obtained acomplete map of the 12CO J = 1-0 lineemission (Fig. 1) and measured the12CO J = 2-1 13CO J = 1-0 and the C180J = 1-0 lines 'at selected p~sitions. Israelet al. (1989) have studied the absorption

, .Figure 1: Gontour map of the integrated 12GO J = 1-0 emission of Gentaurus A superimposedOn an optical image. The emission is weil concentrated along the dust lane. Gontour intervalsare 17.5.22.5,27.5, ... K km s-'. The peak intensity is 54 K km S-I.
COmparison with Other Data
The moieculaI' data have been combined with 100 ~lm and 50 ~m far-infrared emission of Centaurus A in orderto study the variations in the gas anddust distributions (Eckart et al., 1989).These far-infrared data were taken with
features in the CO lines against the nuclear continuum source.
The main results of these observations are that the bulk moieculaI' material is closely associated with the dustlane and contained in a disk of about180" diameter with a total moieculaI'mass of about 2 10B MG' The totalmoieculaI' mass of the disk and bulge isof the order of 3 10B MG' The moieculaI'gas In the nucleus is warm with a kinetictemperature of the order of 15 K and anUmber density of 103 to 3 104 cm-3 .
Absorption features in the 12CO and13C .. 0 Iines against the nuclear con-t1~uum indicate that the properties ofglant moieculaI' clouds are comparableto those in our Galaxy.
obtained with the SEST, H2 emiSSionfrom an unresolved nuclear source measured with the 3.6-m telescope at LaSilla (Israel et al., 1989), and literaturedata suggest that the nucleus of Cen Ais surrounded by a disk of 2 107 MG'Such a disk, with an outer edge radiusof 160 pc and with a density distributionof n U 1'2, is consistent with all existingobservations of the nuclear region ofCentaurus A.
Future observing programmes thatare currently in progress 01' have alreadybeen scheduled will investigate the distribution of the moieculaI' material withthe highest possible spatial resolution,the moieculaI' line emission in high density tracers - such as HCN, CS, andHCO+, as weil as the absorptionfeatures in those species. A combination and detailed analysis of these datawill cast more light on the nature of theinterstellar medium and star formation inCentaurus A and elliptical radio galaxiesin general.
Referencesvon 8allmoos, P., Diehl, R. and Schoenfelder,
V., 1987, Ap. J 312,134.Bland, J., 1985, Ph. D. Thesis, Universily of
Sussex.Burns, J.O., Feigelson, E. D. and Schreier,
E. J., 1983, Ap. J 273, 128.Crawford, M. K., Genzel, R., Townes, C. H.,
and Watson, D. M., 1985, Ap. J, 291, 755.Ebneter, K. and 8alick, 8., 1983, P.A.S.P.
95,675.Eckart, A., Cameron, M., Rothermel, H., Wild,
W., Zinnecker, H., Olberg, M., Rydbeck,G., Wiklind, T., 1989, in preparation.
Feigelson, A. E. D., Schreier, E. J., Devaille,J.P., Giaconni, R.E., Grindlay, J.E., andLightman, A.P., 1981, Ap.J., 251, 31.
van Gorkom, J. H., 1987, in: Structure andDynamics of Elliptical Galaxies, Ed. T. deZeeuw, lAU Symp. 127, D. Reidel Publ.Co., Dortrecht, p. 421.
Israel, F. P., van Dishoeck, E. F., Baas, F.,Koornneef, J., 8lack, J., de Graauw, Th.,1989, in preparation.
Kellermann, K.I., 1974, Ap.J Letters 194,L135.
Malin, D. F., Quinn, P.J. and Graham, J.A.,1983, Ap. J Letters 272, L5.
Pllillips, T.G., Ellison, B.N., Keene, J.8.,Leighton, R. 8., Howard, R. J., Masson,C. R., Sanders, D. B., Veidl, B. and Young,K., 1987, Ap.J Letter 322, L73.
Shaffer, D.8. and Schilizzi, R. 1., 1975, A. J.80,753.
' .'.. -..
. .• •
the CPC instrument on board IRAS andshow that the dust temperature in thedust lane is about 42 K. The ratio between the far-infrared luminosity and thetotal moieculaI' mass is 18 . IMG whichis close to the mean value obtained forisolated galaxies. For giant moieculaI'cloud complexes in our Galaxy, thisratio is of the order of 1 to 10 . IMG. Acomparison of the 12CO J = 1-0 and thefar-infrared data indicates that a considerable amount (about 50 %) of the farinfrared emission at 100 ~m is not intimately associated with massive star formation. TI,is emission is larger in extentthan the moieculaI' disk and is probablydue to diffuse gas clouds in Centaurus A, similar in nature to the "cirrus"emission in our Galaxy.
The absorption features detected inthe CO emission lines are coincidentwith known H I, C3H2, and H2CO absorption lines, although the moieculaI' content of gas in red and blue shifted clouds(with respect to the centre velocity ofVLSR = 550 km S-1) seem to be different.A combination of new moieculaI' data
•
•, ..,
I'
...
..
F. COMBES, Laboratoire de Radioastronomie Millimetrique, Meudon, France
Moleeules in External Galaxies
The 15-m SEST telescope is the~nlque facility to study with high resolu~Ion the moieculaI' component of galaxles in the southern sky. One could ob-
ject that galaxies in the northern skyal ready give a large enough sampie toinvestigate, but there are outstandingobjects that can only be studied from
the southern hemisphere; apart from theobvious Magellanic Clouds, it is weil
21

Figure 1: Gunn z c%ur image of NGC 1365 showing the dust (light areas) as weil as regionswith hot stars and H 11 regions (dark areas). The over/ay shows the J = 1-0 CO profi/es observedwith SEST on a 20" grid. The ve/ocity scale goes from 950 to 2250 km/s, the antennatemperature sca/e from -0.12 to 0.36 K.
known that most beautiful barred galaxies, for example, are at low declinations(NGC 1300, NGC 1365, NGC 1097 ...).For this first year of operation, extragalactic astronomers have exploredall types of galaxies, at all distances,from the nearest spirals (the equivalentof Andromeda in the North), to the outskirts of the detectable molecular sky, atredshifts of z = 0.1.
1. Nearby Spirals
Nearby galaxies, like the MagellanicClouds (see the article by F. Israel in thisissue of the Messengef!, give the opportunity to study Giant Molecular Clouds(GMC) one by one, almost un-diluted inthe 45" beam of the SEST at CO (1-0)frequency, and even less with the 23"CO (2-1) beam. One can then learnwhether the physical nature of theirclouds is similar or not to the Milky
Way's; this is useful in particular to confirm the universality of the N(H2)/I(CO)conversion ratio, widely used bymillimetric radioastronomers (I (CO) isthe integrated CO emission).
The NGC 300 galaxy, an Sc spiral inthe Sculptor group, is a good object forsuch a study (45" = 360 pe). Albert Bosma, from Marseille Observatory(France), has observed 19 positions inthis galaxy, corresponding to H 11 regions. Signals are very weak, lower than1 Kkm/s in integrated CO emission. Thederived H2 masses in each complex arebetween 1 and 5 . 105 MG' i. e. even lessmassive than the GMCs in our ownGalaxy. Yet the surface explored in eachbeam is larger than a GMC's surface.This kind of weak and very narrow profiles has already been seen in northernnearby galaxies, like in M 33 and M 81. Itis important to better study these objects, since their weak abundance of
molecules is still a complete mystery.In the nearby and almost edge-on
barred galaxy NGC 4945, J. B. Whiteoak(CSIRO, Australia), M. Dahlem (MPlfR,Bonn, FRG), J. Harnett (CSIRO) and R.Wielebinski (MPlfR) have obtained 270CO (1-0) spectra. They have identifiedfive velocity components in the centralregion. Only three of them are in thenucleus, as shown by OH absorptionspectra taken at 6 GHz with the Australian radio telescope. The two outsidecomponents seem to come from a rotating ring-like structure: they correspondto two peaks at 460 and 640 km/s (oneach side of the systemic velocity),separating the rigid rotation curve inside100" of radius, from the differential rotation beyond. Such a ring at the radius ofmaximum rotation velocity is expectedin barred galaxies, as discussed now.
2. Barred Galaxies
Barred galaxies possess most of thetime strong spiral density waves, andthe gas component is essential for thepersistence of these waves. The gasbehaviour in a barred potential has beenthe subject of many theoretical studiesand hydrodynamic simulations. It is expected that c10ud collisions will deflectthe cloud orbits with respect to those ofstars, that are ellipses aligned with thebar. These gradual deflections producethe spiral wave. The gravitational torqueexerted by the bar on the spiral will drivegaseous radial transport from the end ofthe bar towards the centre. When thereexists an inner Lindblad resonance, thegas will accumulate in rings. As the innerresonance always occurs near the maximum of the rotation curve, the ring ispredicted to be located there, in goodagreement with the nuclear rings thatare often observed in hot spot galaxies.The rings contain conspicuous H 11 regions, tracers of intense star formation.
The molecular clouds are thereforeexpected by theory to be highly centrallyconcentrated in barred galaxies, and tofollow the spiral structure in the disko N.Loiseau (INPE, Brazil). J. Harnett(CSIRO, Australia), E. Bajaja (Argentina)and H.-P. Reuter (MPlfR, Bonn, FRG)have started observational projects onbarred galaxies, to test these models,and in particular whether the gas revealspeculiar velocities that could be interpreted as infloW towards the centre. It isexpected that starburst or even nuclearactivity could be triggered by the effectof the bar. Results obtained towards thebarred spiral NGC 613 have al readybeen reported by Bajaja and Hummel inthe Messenger No. 55 (March 1989).
A beautiful southern barred spiral isthe Seyfert galaxy NGC 1365. Sandqvistet al. (1989) are in the process of map-
22

f. '.. ~ .Figure 2: Oplical pl1olograph of NGC 7252, reproduced from 111a-F + RG 630 plate, oblained for lhe ESO red halfof lhe ESO/SERC Survey of lheSOulhern Sky. (a) inner structure; (b) sl10wing ouler arms. Pl1olographic work by H. Zodel.
"
•
• •
• •••
•
ping it in the two CO lines (1-0) and(2-1). On the photograph in Figure 1 isSuperimposed a map of CO (1-0) spectra obtained so far. An interesting resultIS that spectra in the centre present twov~locity components, revealing a defic1ency of CO emission at the systemicvelocity. This behaviour suggests thepresence of a ring of molecular cloudsInside the bar, supporting the results ofhYdrodynamical models in barred systems (Schwarz 1984, Combes and Gerin1985).
In collaboration with M. Gerin (Paris).N. Nakai (Nobeyama) and J. M. van derHulst (Groningen) we have mapped thebarred galaxy NGC 1097, which is theprototype of the nuclear ring barred spiral. From previous observations with the45-m of Nobeyama (Japan), and the30-m of IRAM, we determined thatmolecular clouds are tracing the nuclearnng (Gerin et al., 1988). With the SEST15-m we mapped the whole extendeddlSk, and discovered that most of themass has accumulated towards thecentre: about 50 % of the mass is foundin the central beam, i. e. within a radiusof 1.7 kpc, and we know that it is evenlydlluted in the central beam, according tothe higher resolution observations. Barsare indeed able to drive the gas inwards,as predicted by theoretical models.
We have also undertaken a survey ofgalaxies with Ha rings, to check theprediction that most molecular cloudsmay be accumulating in these features(Combes, Gerin and Buta, 1989). COnngs cannot be seen directly but theyare revealed by typical two-horn-profiles (such as seen in NGC 1365).
NGC 1808 is a spectacular barredgalaxy, where dust filaments seem toemerge from the plane. It was mappedin CO by M. Dahlem, U. Mebold, U.Klein (MPlfR, Bonn, FRG) and R. Booth(Onsala, Sweden). The central areashows ring-like rotation. The velocitypeaks correspond to the maximum ofthe rotation curve. The optical filamentshave a molecular gas counterpart: COoutflows are normally observed to themajor axis. Is the central starburst thecause of this gas ejection, as is proposed in M 82?
3. Interacting Ring Galaxies
Another kind of ring morphology isobtained with nearly head-on collisionsbetween galaxies. The prototype ofthese objects is the Cartwheel. The tidalphenomenon has been simulated withgreat success by Lynds and Toomre(1976) and Theys and Spiegel (1976).The main observational difference withprevious rings is that stars participate inthe ring structure, and not only the gas.Also the radii of these rings are muchlarger than those of the gaseous nuclearrings. Is the gas compressed in the density wave that corresponds to the ring?Sometimes the ring can be decomposed in knots: do tlley correspond tostar formation? We have discovered COemission in two of these ring galaxies,IC 4448 and AM 064-741 (F. Casoli, F.Combes, C. Dupraz from the Parisgroup). The 45" resolution does not enable us to distinguish between nuclearor ring emission, but in AM 064-741 thekinematics suggest that the CO emis-
sion comes from the nucleus. Furtherobservations (in particular in CO (2-1))are needed.
4, IRAS Galaxies and Mergers
Far-infrared observations by IRAShave revealed that galaxy mergers cantrigger huge starbursts: most of the ultraluminous IRAS galaxies, that radiate90 % or more of their total luminosity inthe infrared, are interacting galaxies andmergers.
One problem in these actively starforming objects is to determine the gasexcitation. Indeed, it is likely that the gasis heated by the starburst, and becomesless optically thick in the CO lines. Thiswould yield an overestimation of the total molecular mass, if standardN(H2)/I(CO) conversion ratios wereused. Such a phenomenon occurs inthe central part of Messier 82, wherethe CO (2-1 )/CO (1-0) integrated emission ratio R between the two rotationlines of CO, reaches 4 in some regions,indicating a large fraction of hot opticallythin gas.
NGC 3256 has been observed by C.Dupraz, F. Casoli and M. Gerin in thetwo CO lines with the SEST 15-m telescope. The ratio R is about 1, but thesurprise was in the weakness of the13CO (1-0) emission with respect to the12CO (1-0) one. The integrated emissionratio between the two isotopic molecules is about 30, while it is around 10 inmost ordinary galaxies. This high ratioindicates that the gas is optically thinnerthan usual. The very peculiar line ratiosin this object may be due to it being a
23

E. VALTAOJA, Metsähovi Radio Research Station, Espoo, Finland
Extragalactic Continuum Sources
0.1
0.05
o
4500 5000
Veloclly (km/s)Figure 3: NGC 7252: CO (1-0) and H I profilestowards this newly-born elliptical galaxy.
merger between two equal-mass spiralgalaxies, as suggested by its very perturbed appearance, with two tidal tails.
If the infrared luminosity L1R is re-rad iated by dust heated by the recent starformation, the ratio L1R/M(H2) is an indicator of star-formation efficiency. Theseinteracting and merging galaxies havethe highest known ratios: L1R/M(H2) ofthe order of 50 or greater, while it is ofthe order 1-3 in normal galaxies. Thereis also the possibility that a significantpart of L1R comes from dust heated byan active nucleus (in that case the emission region is highly confined towardsthe centre), so that the ratio L1R/M(H2) isnot a good indicator of star-formationefficiency. However, high L1R/M(H2)
Introduction
As with most other high-frequencyradio telescopes, continuum workoccupies only a small fraction - currentIy about 5 % - of SEST's total time. Theimportance of these observations in increasing our understanding of quasarsand other extragalactic sources is, however, large.
The millimetre-to-IR observationsprobe the innermost parts of the radioemitting regions of active galactic nuclei: the radio cores, possibly the beginnings of radio jets, become optically thinon mm-wavelengths, where also theoutbursts reach their maximum stages.As these regions remain below the resolving power and above the standardfrequencies of VLBI, high frequency fluxmeasurements give us our only glimpses of the very cores, the still mysterious
24
ratios are still found in galaxies withoutnuclear activity.
The life time of the star burst can beextrapolated from these efficiencies. Intime scales of a few 106 yrs, the mergerremnants should become devoid ofmolecular gas. This result supports thecurrently well-developed idea that themerging of two spirals will form an elliptical galaxy, devoid of cold gas. An idealobject to test this hypothesis is thesouthern merger remnant NGC 7252,one of the pet galaxies of FranQoisSchweizer (1982). This object is conspicuous by its two tidal tails, that represent the "smoking gun" evidence of themerging of two spiral galaxies (Fig. 2).Numerous loops, shells and ripples addto the evidence. The luminosity profile issurprisingly regular and follows the r1
/4
law, characteristic of ellipticals, until alarge distance. Yet this object was seento be very rich in molecular gas (Duprazet al. 1989): about 3 109 MG, within7 kpc. The observed line shape suggests that the CO emission comes frommatter confined to a disk, which is alsoobserved in Ha. This surprising resultindicates that not all of the moleculargas is consumed in the star burst, aspreviously thought, or that matter continues to fall down onto the disk, longafter the merging event.
At higher redshifts, the galaxies thatcan be detected in CO are all monsters:huge starburst galaxies, correspondingto interacting or merging objects, thefrequency of mergers being probably
sites of energy generation and channeling in active galaxies. Long wavelengths("Iong" in the case of quasars meaningeverything longer than one centimetre)show only evolved structures, such asold, ejected knots; the millimetre regimeis where the real action iso
Most events seen at centimetrewavelengths have their precursors onhigher frequencies. This forewarningcapacity is especially useful for spaceVLBI purposes in choosing the best"targets of opportunity" for observations. The millimetre spectrum and itsvariations can also tell if compact structure is present in the source, andwhether it will be a good candidate forVLBI observations; with sufficient fluxdata it may even be possible to producemodel maps of the sources. Clues to thenature of different radio sources mustalso be searched at high frequencies.
higher in the past. The ultraluminousIRAS objects have luminosities largerthan 10'2 .. Mirabel et al. (1988) havedetected four of these monsters,possessing 1-6 1010 MG of moleculargas. Their L1R/M(H2) ratio is between 20and 80, much larger than in classic starburst galaxies, like Messier 82. Thehighest systemic velocity among theseobjects is 27,500 km/s, wh ich demonstrates tl1e ability of the SEST 15-mtelescope to detect faint and broademission lines.
This brief survey, far from exhaustive,already shows how exciting extragalactic work can be with the SEST 15-mtelescopel
ReferencesCombes, F., Gerin, M. (1985) Astron. Astro
phys. 150,327.Combes, F., Gerin, M., Buta, R. (1989) As
tron., Astrophys., in prep.Dupraz, C., Casoli, F., Combes, F. (1989) in
prep.Gerin, M., Nakai, N., Combes, F., (1988) As
tron. Astrophys. 203, 44.Lynds, R., Toomre, A. (1976) Astrophys. J.
209,382.Mlrabel, I. F., Booth, R. S., Garay, G., Johans
son, L. E. B., Sanders, D. B. (1988) Astron.Astrophys. 206, L20.
Sandqvist, Aa., Elfhag, T., Jörsäter, S., Lindblad, P. O. (1989) in prep.
Schwartz, M. P. (1984) Monthly Notices Roy.Astron. Soc. 209, 93.
Schweizer, F. (1982) Astrophys. J. 252, 455.Theys, J.C., Spiegel, E.A. (1976) As/rophys.
J. 208, 650.
While SEST opens up completely newsouthern vistas, its location also presents some problems in continuumwork. The continuum observer dreamsof uninterrupted multifrequency lightcurves revealing the various constituents and processes found in ActiveGalaxy Nuclei (AGN), but the reality usually shrinks to a scatter of isolated fluxmeasurements. In most cases, onewould greatly benefit from supportingdata on other frequencies, but there arenot many Southern telescopes availablefor that purpose.
SEST Measurements
During its first year SEST has beenused for most of the purposes outlined

Visiting Astronomers(October 1, 1989 - April 1, 1990)
above, with the continuum work dividedroughly equally between Swedish andFinnish groups. Most of the data havebeen obtained at 90 GHz, although thegroups have been striving to get alsomore 230 GHz observations.
The obvious starting point has beento get acquainted with the new part ofthe sky. Several surveys of the southernskies are now in progress. N. Whybornis observing a complete sampie ofbright, f1at-spectrum radio sources below declination - 25°, and a similar survey between 0° and -25° is in progress by E. Valtaoja. These surveys arefirst steps in gathering basic knowledgeof Southern hemisphere sources: theirhigh frequency spectra, variability, degree of compactness, etc., data whichcan be used both for statistical studiesand for selecting exciting individualobjects as targets for future investigations.
Selected subsets of sources havealso been observed: southern BL Lacsand highly polarized quasars (H. Teräsranta), radio quiet quasars (A. Kus), andSOurces observed in TDRS satellitespace VLBI experiments (R. Booth). Asthe Sources typically are observed attwo or more epochs for variability es-
Observing time has now been allocated forPeriod 44 (October 1, 1989 - April 1, 1990).The demand for telescope time was againmuch greater than the time actually available.
The following list gives the names of theVisiting astronomers, by telescope and inChronological order. The complete list, withdates, equipment and programme titles, isavailable from ESO-Garching.
3.6-m Telescope
OCI. 1989: Marano/Cappi/Held, Bender elal., Kudritzki/Husfeld/Gehren/Grolh/Butler/Baade/ROSaiHumphreys/Hummer, Ögelman/Gouiffes/MelnickiHasinger/Pietsch/Pedersen, Danziger/BouchetlGouiffes/LucylWampler/Fransson, Nissen/Schuster, Fleming,GUZZolTarenghi, lovino/Shaver/Cristiani/Clowes/Pierre, de Lapparent et al.
Nov. 1989: de Lapparent et al., Guzzo/Collins/Nichol, Danziger/BouchetlGouiffes/LucylWampler/Fransson, Gry/Jourdain deMUizon/Lagrange - HenriNidal- Madjar/Ferlet, Wampler, Molaro/Castelli/Bonifacio, deBoer et al., Schwope/Beuermann, Breysacher/Azzopardi/LequeuxiMeyssonnierlWesterlund, de Boer et al., Marano/Mignoli/ZitelIilZamorani.
Dec. 1989: Barbieri/Clowes/Cristiani/IOvino/La FrancaNio, Melnick/Gopal- KrishnaiSteppe/van Drom, Ögelman/Gouiffes/
timates, most of the work is still in progress.
The Finnish group has used SEST toextend their long-time monitoring programme to higher frequencies. About 12of the most active and well-knownequatorial blazers have been observedroughly semimonthly in Chile. Althoughthe "high" (i.e., Northern) declinations ofsome of these sources have causedsome grumbling in the programme committee, the SEST data fill a crucial gapbetween lower frequencies (Metsähovi,Itapetinga, Crimea) and IR observations(Hawaii) in what remains the most extensive international effort to understand the radio behaviour of AGN. Multifrequency monitoring has made possible the separation of outbursts from theunderlying other components, showingthat shocked jet models give at least afirst approximation of what is going on invariable radio sources. Much remains tobe done, however: even the best observed quasar, 3C 273, continues tobehave in a highly erratic and surprisingmanner.
Harri Teräsranta from the MetsähoviRadio Research Station summarizes theexperience of the first year as folIows:"90 GHz flux measurements are now
Melnick, Hasinger/Pietsch/Pedersen, Danziger/BouchetlGouiffes/LucylWampler/Fransson, Ardeberg/Lindgren/Lundström, deBoer et al., Danziger/BoucheVGouiffes/Lucy/Wampler/Fransson, Madejsky/RabolliNegalBassino, Hamann/SchmutzIWessolowski,Tadhunter/Fosbury/Morganti/Danziger/DiSerego Alighieri.
Jan. 1990: LortetITestor/Schild, Ögelman/Gouiffes/MelnickiHasinger/Pietsch/Pedersen, Danziger/BoucheVGouiffes/LucylWam-pler/Fransson, Perrier/Mariotti/Mayor/Du-quennoy, Renzini/D'Odorico/Greggio/Bragaglia, MelnickiGopal-KrishnaiSteppe/Van Drom, Surdej et al., ChiosilBertelli/Bressan, Nasi/OrtolaniNallenari/Gratton/Meylan,Heske/Jourdain de Muizon.
Feb. 1990: Jourdain de Muizon/D'Hendecourt, Danziger/BoucheVGouiffes/Lucy/Wampler/Fransson, Ögelman/Gouiffes/MelnickiHasinger/Pietsch/Pedersen, D'Odorico,Danziger/BoucheVGouiffes/LucylWampler/Fransson, Wehrse/Hessman, Bergeron/Petitjean/D'Odorico, Sparks/Macchetto/Ögerle,Norgaard-Nielsen/Joergensen/Hansen.
March 1990: BoulesleixiCapaccioli/Corradi/Le Coarer, Duval/Boulesteix/MonneVCorado, Ögelman/Gouiffes/Melnick,Hasinger/Pielsch/Pedersen, Danziger/BoucheVGouiffes/LucylWampler/Fransson,Reipurth/Dubath/Mayor, Capellaro/Held,Bender et al., Balkowski/Kraan-Korteweg/Maurogordalo, Mazure et al.
relatively routine work. The actual rmslevels achieved with 30 min integrationtimes have been from 40 to 80 mJy.230 GHz observations require goodweather, and it would be better to havethe observing run spread over a longertime span with several shorter sessionsto maximize the chances of success.The observing times should be nearly1 hour for one source if rms values of0.2 Jy are to be expected."
Future Programmes
The future will probably see a shiftfrom general surveys to dedicatedmonitoring of selected sources, hopefully with increasing co-operation fromother Southern telescopes to get themost out of the observations. With newreceivers and increased experience,submillimetre observations will come tothe forefront: one of the challenges is tofollow the entire early evolution of a synchrotron flare in order to develop second-generation models for the growthof shocks in relativistic jets.
Still another field where SEST's impact will certainly be feit in the future ismillimetre VLBI, both on the ground andin space.
3.5-m NTT
Jan. 1990: Danziger/BoucheVGouiffes/LucylWampler/Fransson, Schneider/Giraud/Wambsganss, Bignami/Caraveo/MereghettilMignami, Mellier/Fort/Soucail.
Feb. 1990: Miley el al., Surdej et al.March 1990: Barthel/DjorgovskilTytler,
Danziger/BouchetlGouiffes/LucylWampler/Fransson, Tsvetanov/FosburylTadhunter,Bergeron et al., Bender el al.
2.2-m Telescope
Gcl. 1989: MPI TIME, Van der KruiVDeJong RS, HunVMandolesilWade, Ferraro/Brocato/Fusi Pecci/Buonanno, Piotto/Bresolin/Capaccioli/Ortolani, Bertola el al.
Nov: 1989: Bertola et al., Collins/Guzzo/Nichol, Danziger/BouchetlGouiffes/Lucy/Wampler/Fransson, test new array (Moorwood), des Boer el al., Barbieri et al., de Boerel al., AppenzelierlWagnerlWeigeltlBarth/Weghorn/Grieger, Surdej et al.
Dec. 1989: WeigeltlBarth/GriegerlWeghorn, de Boer el al., Paresce/PanagiaiGilmozzi, RafanellilCapaccioli/Marziani/SchulzH. Tadhunter/Fosbury/Morganti/Danziger/DiSerego Alighieri, Reiputh/Olberg/ Cameron/Boolh, Rafanelli/Capaccioli/Marziani/Schulz H.
Jan. 1990: Busarello/Longo/Feoli, Danziger/BoucheVGouiffes/LucylWampler/Fransson, MPI TIME.
Feb. 1990: Van der Veen/Blommaert/Habing, Danziger/BoucheVGouiffes/LucylWampler/Fransson, Schwarz/Moneti, Pottasch/Manchado/Garcia Lario/Sahu, NotaiClampin/Paresce/Ferrari, Falomo/MaraschilTanzi/
25
Treves, Hansen/Joergensen/NergaardNielsen, Dennefeld/Martin J. M.lBottinelli/Gouguenheim, Tosi/Focardi/Greggio/Marconi.
Mareh 1990: Miley et al., Ortolani/Capaccioli/Piotto, Capaccioli/Bresolin/DellaValle/Piotto,Held/Capaccioli/RichtierlWagner, Van Haarlem/Katgert, Bienayme/Creze/Robin, Bender et al., DurreVBergeron/Petitjean.
1.5-m Speetrographie Teleseope
Oel. 1989: Thevenin/Jasniewicz, Danziger/BoueheVGouiffes/LueylWampler/Fransson,Boisson/Collin - Souffrin/JolylWard, Johansson L.lBergvall.
Nov. 1989: Balkowski/Maurogordato/Proust, Danziger/BoucheVGouiffes/Lucy/Wampler/Fransson, Gehren/Steenbock/Reile/Axer/BurkertiFuhrmann, Danziger/BoucheVGouiffes/LucylWampler/Fransson,Cappi/Focardi/Gregorini/Garilli/Maccagni,Prieur/OosterloolWilkinson/Sparks/Carter,Barbieri et al., Danziger/BoucheVGouiffes/LucyIWampler/Fransson.
Oee. 1989: Longo/Busarello/Ceriello, Danziger/BoucheVGouiffes/LucylWampler/Fransson, PasquinilBrocato/Barbuy/Paliavicini, Hunger/Heber/Groote, Danziger/BoucheVGouiffes/LucylWampler/Fransson,Pakull/Motch/Bianchi/Beuermann, Reipurth/Olberg/Cameron/Booth, Lub/De Ruiter.
Jan. 1990: Lub/De Ruiter, LorteVTestor,Danziger/BoucheVGouiffes/LucylWampler/Fransson, Gerbaldi et al., Renzini/D'Odorico/Greggio/Bragaglia, Danziger/BoucheVGouiffes/LucvlWampler/Fransson, Lundgren,Bhatia/Chiosi/Piotto/Ortolani/BertelliNalle-nari/Malagnini/Macgillivray, Danziger/Bou-cheVGouiffes/LucylWampler/Fransson,Courvoisier/BoucheVBlecha.
Feb. 1990: Simon/Haefner/Pfeiffer, Ritter/Schoembs, Danziger/BoucheVGouiffes/LucyIWampler/Fransson, Ehrenfreund/Foing,Pottasch/Manchado/Garcia Lario/Sahu,Danziger/BoucheVGouiffes/LucylWampler/Fransson.
Mareh 1990: Van GenderenNan derHuchVSchwarz/De Loore, Tagliaferri/Cutispoto/Giommi/Pallavicini/Pasquini, Danziger/BoucheVGouiffes/LucylWampler/Fransson,Tagliaferri/Cutispoto/Giommi/Pallavicini/Pasquini, Gerbaldi et al. Courvoisier/BoucheVBlecha, Gahm, Bianchini/Sabbadin/Friedjung.
1.4-m CAT
Dei. 1989: Holweger/Lemke, Pasquini,Fran«ois, Danks/Massa/Crane, North.
Nov. 1989: North, Spite E.lSpite M. MaceroniNan't VeerNilhu, Lagrange-HenriNidalMadjar/FerleVBeust.
Oee. 1989: Vladilo/Molaro/Centurion/Monai, Foing/CrivellarilBeckman/Char/Jankov/Byrne/Lagrange - Henri/Schrijver, PallaviciniiGiampapa/Cutispoto, Foing/Crivellari/Beckman/Char/Jankov/Byrne/LagrangeHenri/Schrijver, Vidal- Madjar/D'HendecourtiFerleVLeger, Magain/Zhao.
Jan. 1990: ReimerslToussaint, Schröder/Huensch/Reimers, Foing/Collier - Cameron/Vilhu/Gustafsson/Ehrenfreund, Pettersson/Westerlund, GredelNan Dishoeck/Black,Waelkens/LamersIWaters, Cremonese/D'Onofrio/Marziani, Benvenuti/Porceddu.
Feb. 1990: Benvenuti/Porceddu, Reimers/
26
Toussaint, Lilienthal/De Boer, BaadeNanKerkwijk/ Waters/HenrichsNan Paradijs,Pottasch/Parthasarathy/Manchado/GarciaLario/Sahu, Clausen, Crane/Blades/Penprase.
Mareh 1990: Vreux/Magain/Hutsemekers/Manfroid, Tagliaferri/Cutispoto/Giommi/Pallavicini/Pasquini, Lebre/Gillet, Cayrel deStrobel, Gratton/Gustafsson/Eriksson, deJager/NieuwenhuijzenNan Genderen, Lanz/Mathys/Gerbaldi/Faraggiana, BaadeNanKerkwijkIWaters/HenrichsNan Paradijs, Pallavicini/SchmittITagliaferri.
1-m Photometrie Teleseope
Ocl. 1989: Hoffmann/Geyer/Neukum/Gonano/Mottola, Di Martino/Neukum/MottoIa/Gonano/Rebhan/Hoffmann, Hoffmann/Geyer/Neukum/Gonano/Mottola/Rebhan,HunVMandolesilWade, Johansson L./Bergvall, Fleming, Liller/Alcaino/Alvarado/Wenderoth, Johansson L.lBergvall.
Nov. 1989: Johansson L./Bergvall,Bouvier/BertouVMartin E., Heske, Richtler/Oe Boer/Seggewiss, Barbieri et al.
Oee. 1989: Barbieri et al. Vidal- Madjar/Lagrange - Henri/BeusVFerleVFoing/Char,Gieren.
Jan. 1990: Gieren, Courvoisier/BoucheVBlecha, Reipurth/Olberg/Cameron/Booth,Foing/Collier-CameronNilhu/Gustafsson/Ehrenfreund, Walker/MatthewsIWehlau,Bouvier/BertouVBasri/BoucheVlmhoff/Bastien/Malbet, WalkerlYang/Matthews, Cremonese/D'Onofrio/Marziani.
Feb. 1990: Krautler/Barwig/Schoembs/Starrfield, Simon/Haefner/Pfeiffer/Ritler/Schoembs, Schneider H.IWeiss/Kuschnig/Rogl, Trefzger/LabhardVSpaenhauer, Nieto/Bender/Capaccioli/DavousVPoulain/Prugniel, Poulain/DavousVNieto/Prugniel.
Mareh 1990: Poulain/DavousVNieto/Prugniel, Houdebine/Foing/Butller/Panagi,Courvoisier/BoucheVBlecha, Gerbaldi/Faraggiana, Van der HuchVThelWilliams,Gahm, MunariIWhitelock/Massone.
50-ern ESO Photometrie Teleseope
Dei. 1989: Catalano E.A.lSchneider/Leone, Carrasco/Loyola.
Nov. 1989: Carrasco/Loyola, Bouvier/BertouVBasri/BoucheVlmhoff/Bastien/Malbet,PoretlilAntonello/Mantegazza, Maceroni/Van't VeerNilhu, Schober.
Oee. 1989: Schober, Cutispoto/PasquinilGiampapaNentura/Pallavicini/Giampapa/Cutispoto, Foing/Collier - CameronNilhu/Gustafsson/Ehrenfreund.
Jan. 1990: Foing/Collier- CameronNilhu/Gustafsson/Ehrenfreund, Schröder/Hünsch/Reimers, Foing/Collier - CameronNilhu/Gustafsson/Ehrenfreund, Bouvier/BertouVBasri/BoucheVlmhoff/Bastien/Malbet, Sinacholopoulos.
Feb. 1990: Sinacholopoulos, Group forLong Term Photometry of Variables, Trefzger/LabhardVSpänhauer, TagliaferrilCutispoto/Giommi/Pallavicini/Pasquini.
Mareh 1990: Tagliaferri/Cutispoto/Giommi/Pallavicini/Pasquini, Schneider H.lJenkner/Maitzen, Carrasco/Loyola.
GPO 40-em Astrograph
Dei. 1989: Debehogne/Machado/Mourao/CaldeiraNieira/Netto/Zappala/De Sanctis/
LagerkvisVProtitch - B.lJavanshirlWosczcyk.Nov. 1989: MadsenIWesl.Oee. 1989: Dommanget.Jan. 1989: Dommanget, Duerbeck/Seitler/
Tsvetkov.Feb. 1990: Scardia, Debehogne/Machado/
CaldeiraNieira/Netto/Zappala/De Sanctis/LagerkvisVMourao/Protitch - B.lJavanshir/Wosczyk.
Mareh 1990: Debehogne/Machado/Caldei-ra/Vieira/Netlo/Zappala/De Sanctis/Lager-kvisVMourao/Protitch - B.lJavanshir/Wosczyk, Munari/Latlanzi/Massone.
1.5-m Danish Teleseope
Dei. 1989: DANISH TIME, Mayor et al.,Danziger/BoucheVGouiffes/LucylWampler/Fransson, Johansson L.lBergvall, Focardi/DaCostaIWilimer/Alonso, Dennefeld/Martin J.M.lBotlinelli/Gouguenheim.
Nov. 1989: Mazure et al., Jörsäter/Hester/Bergvall, Jörsäter/Hester/LindbladNanMoorsei, Danziger/BoucheVGouiffes/Lucy/Wampler/Fransson. DANISH TIME.
Oee. 1989: DANISH TIME. Mayor et al.,Ardeberg/Lindgren/Lundström, Danziger/BoucheVGouiffes/LucylWampler/Fransson,RafanelliiSchulz H.lMarziani, Chiosi/Bertelli/Bressan/Nasi/OrtolaniNallenari/Gratton/Meylan.
Jan. 1990: ChiosilBertelli/Bressan/Nasi/OrtolaniNalienari/Gratlon/Meylan, Danziger/BoucheVGouiffes/LucylWampler/Fransson,DANISH TIME.
Feb. 1990: DANISH TIME, Andersen/Nord-ström/Mayor/Olsen, Nordström/Andersen,Griffin R. F.lGriffin R. E. M.lMayor/Clube,Reipurth/Lindgren/Mayor, West, Della Valle/Cappellaro/RosinolTuratto, Bender et al.
Mareh 1990: Bender et al., Mermilliod/Mayor, DANISH TIME.
50-ern Danish Teleseope
Dei. 1989: Group for Long Term Photometry of Variables.
Nov. 1989: Group for Long Term Photometry of Variables, Ardeberg/Lindgren/Lundström.
Oee. 1989: Ardeberg/Lindgren/Lundström,Foing/CrivellarilBeckman/Char/Jankov/Byrne/Lagrange/Scllrijver, Group for LongTerm Photometry of Variables, Sterken,DANISH TIME.
Feb. 1990: DANISH TIME, GosseVManfroidNreux, Vreux/Magain/Hutseme-kers/Manfroid.
Mareh 1990: VreuxiMagain, Hutsemekers/Manfroid, Franco.
90-em DUTCH TIME
Oel. 1989: DUTCH TIME, Trefzger/Pel/Blaauw.
Nov. 1989: Van ParadijsNan der KlislTelting, DUTCH TIME.
Oee. 1989: Van Genderen, Lub/De Ruiter,Oe Loore/HensbergeNerschueren/David/Blaauw.
Jan. 1990: Oe Loore/HensbergeNer-schueren/David/Blaauw, Van Genderen,DUTCH TIME.
Feb. 1990: DUTCH TIME, Van Kerkwijk/Waters/HenrichsNan Paradijs, Lub/Dickens.
Mareh 1990: Van GenderenNan derHuchVSchwarz/De Loore/DUTCH TIME.

PROFILE OF A KEY PROGRAMME
Coordinated Investigation of Selected Regions in theMagellanic CloudsK. S. OE BOER, Sternwarte der Universität Bonn, F. R. GermanyM. AZZOPAROI, Observatoire de Marseille, FranceB. BASCHEK, Institut für Theoretische Astrophysik, Heidelberg, F. R. GermanyM. oENNEFELO, Institut d'Astrophysique, Paris, FranceF. P. ISRAEL, Sterrewacht Leiden, the NetherlandsP. MOLARO, Osservatorio Astronomico di Trieste, ItalyW. SEGGEWISS, Observatorium Hoher List, oaun, F. R. GermanyF. SPITE, Observatoire de Paris, Meudon, FranceB. E. WESTERLUNO, Uppsala Astronomical Observatory, Sweden
The greatly enhanced observationalPossibilities for research in theMagellanic Clouds, such as bigger telescopes and the CCO as detector, hasled the way to studies hitherto unimagined. The possibility to reach60 kpc distant stars of fifth absolutemagnitude (i. e. down to main-sequencestars fainter than the Sun) or to obtainstellar spectra to do a fine-analysis ofatmospheric temperature and composition has mightily raised the importanceof the astrophysical laboratory calledMagellanic Clouds. In particular thestudy of the intricately interwoven processes of formation of stars from progenitor gas clouds and the evolution ofstellar complexes can in our times superbly be investigated by observing theMagellanic Cloud constituents.
However, in spite of all newPossibilities, correlation of the individualachievements does only slowly providedeeper insight into the history andevolution of the Magellanic Clouds. Thepractical reason for that is that mostprogrammes have accumulated moderate amounts of data aimed at a limitedscientific goal. The net effect has beenthat intrinsically valuable building blocksfor structural understanding could notbe fitted together, e. g. because theycame from disjunct regions of theMagellanic Clouds.
Research on the Magellanic Cloudshas been fairly strong in Europe but wasmostly based in separate institutes. Weare much obliged to Or. H. van der Laanfor inviting those of us who had indicated their interest to intensifyMagellanic Cloud investigations underthe Key Programme scheme to München. As Or. van der Laan mentioned inhis account of the beginnings of the KeyProgramme process (1988, The Messenger No. 55), we met upon his invitatlon in September and explored the directions of our research. It soon becameobvious that what each of the participat-
ing groups had in mind would benefitgreatly from the results to be obtainedby the other groups, and it was realizedthat joining forces would enhance thevalue of each individual project.
Our coordinated programme aims atobtaining a deeper insight into the stellar populations of the Magellanic Cloudsby addressing the history of the variousstar types in relation with spatial structure. The road to this lofty goal will bemarched in parallel by our groups, withobservational programmes as folIows.We have defined 6 regions in theMagellanic Clouds (4 in the LMC, 2 inthe SMC) in which a large variety ofobservational projects will be carriedout. These regions have been selectedbased on both existing knowledge andon the expected returns from the coordinated investigation. They have beendefined in such a way that they containa mixture of young and old field population, are gas-dusty or very clear, andcontain young and old clusters. Theymeasure 30' x 30' and comprise thefield of NGC 330 and N 27 in the SMCand fields containing NGC 1818, N 159,NGC 1978 and N 49, and SN 1987A inthe LMC. In all they cover less than 1 %of the Magellanic Clouds.
In each of the 6 regions spectroscopicsurveys will be completed to classifystars down to approximately 15th magnitude. This will account for the moremassive stars in the regions. Furthermore, faint Planetary Nebulae and H 11regions will be searched for. In two smallfields (with a size of about 6 CCOframes) within each region, CCO photometry in many colours will be obtainedto as faint a limit as possible in order toinvestigate the nature and mass function of the stars over a large range ofmasses.
The aspects of chemical and structural evolution are addressed with spectroscopy at high dispersion. The luminous hot and cool stars of the field as
weil as of clusters will provide metalabundances. Related information willcome from the analysis of emission linesfrom emission-line nebulae. H 11 regionsand SNR will show abundances of thepresent, while the analysis of PlanetaryNebulae will result in abundances from apast epoch. Very important is the measurement of interstellar absorption lines.On the one hand, they will provide additional information on the abundances inthe Magellanic Cloud interstellar medium, while the strength of the variousabsorption components will give insightinto the depth structure, in particularone related to the information from radioIines, such as HI 21-cm and CO fromthe ESO SEST Magellanic Cloud survey.
The end product of the programmewill be a coherent body of data on stellarpopulations, chemical composition, andspatial structure, showing likelysimilarities as weil as differences between the defined regions. Oata of thiskind will allow us and others to gaininsight into the history of star formationand structural evolution of the Magellanic Clouds.
One aspect of our key programme,we feel, deserves some emphasis in thisdescription. The decision to do coordinated research in a collaborative effortof a large number of groups at differentinstitutes in Europe requires a fairly highdegree of organization of time plans andexchanges between the participatinggroups. We hope that our cooperationat a wide European level will stimulatemuch intensified contacts betweenmany more research groups in Europe.
Also in view of these aspects it wasdecided to organize a European Colloquium on "Recent Oevelopments ofMagellanic Cloud Research". The colloquium was held in Paris in May this yearand aimed at reviewing the progressmade since the lAU Symposium of1983. The proceedings will be distributed by the Observatoire de Paris.
27

PROFILE OF A KEY PROGRAMME
Identification of High Redshift Galaxies with Very LargeGaseous HalosJ. BERGERON 1
, s. CRISTlANI2, M. PIERRE3
, P. SHAVER3
1Institut d'Astrophysique de Paris, France; 2 Osservatorio Astronomico, Asiago, Italy; 3 ESO
Over the last several years, considerable efforts have been aimed atunderstanding the properties of objectsat high redshift. The main studies concern optically selected sampies of fieldgalaxies (Koo 1986, Koo and Kron 1988,Broadhurst et al. 1988) and rich clustersof galaxies (Gunn and Dressler 1987,Gunn 1988), and radio selected objectsfirst from the 3C sampie of bright sources (Spinrad et al. 1985, Djorgovski1988) and more recently from sampiesof fainter radio sources (Chambers et al.1987 and 1988, Koo 1988, Lilly 1989).Our approach is to select high redshiftobjects with metal-rich, very extendedgaseous envelopes giving rise to absorption line systems in quasar spectra.These objects may exhibit propertiescloser to those of normal galaxies thanto those of rather extreme objectsassociated with powerful radio sources.
- they have large gaseous envelopesas implied by the average angular separation of 6.8 arcsec or 2.3 RH (RH is theHolmberg radius and equals 22 kpc forHo = 50 km S-1 Mpc-1
) for z= 0.44,- they are fairly bright, -22.2 < Mr
< -20.2,- they all show sign of present or recentstellar formation activity, having a veryblue continuum (down to Ar - 2200 A)and usually strong [Oll] emission withrest equivalent width larger than 15 A,- they are mostly field galaxies.
The intervening galaxies are alwaysthe resolved object closest on the sky tothe quasar. This is not due to an observational bias since galaxies as faint asthe LMC could have been detected asan absorber up to z - 0.5. A deep rimage of the field around the quasarQ 2128-123 (Bergeron and Turnshek, inpreparation) taken at the Las Campanas
1OO-inch telescope in condition of goodseeing (FWHM = 0.95 arcsec) is shownin Figure 1; as could be seen from thefainter detected objects within the field,there is no absorbing galaxy candidatec10ser on the sky to the quasar than thegalaxy 8.6 arcsec north-east of thequasar identified by Bergeron (1986) asthe object giving rise to the z = 0.4299Mg 11 absorption system.
A general trend found both for field(Koo and Kron 1988, Broadhurst et al.1988, Dressler 1988) and cluster (Gunn1988) galaxies is the increasing fractionwith redshift of galaxies showing sign ofenhanced stellar activity (blue continuum and [Oll] emission). For fieldgalaxies the fraction of "active objects"is about 40 % at z - 0.5 and for galaxiesin cluster centres it reaches 20 % at z 0.9. Comparison with the properties ofMg 11 absorbing galaxies suggests that
Galaxies at z < 1 with LargeGaseous Halos
The early suggestion of Wagoner(1967) and Bahcall and Spitzer (1969)that the absorption-line systems mayarise in intervening galaxies was strengthened by statistical analysis showingthat the distribution of the number ofCIV absorption redshifts per line of sightis Poissonian (Young et al. 1982), andwas confirmed by identification of theabsorbing galaxies (Bergeron 1986,Cristiani 1987, Bergeron 1988 and references therein). Present searches forabsorbing galaxies have only beenattempted for z < 1 systems. We hadestimated that, at these redshifts, thegalaxies responsible for Mg 11 absorptionsystems should be bright enough (mv<23) and weil separated on the sky fromthe quasar image (0 - 0.7 arcsec at z =
0.5) to be easily detectable. These estimates were based on the observeddensity of Mg 1I systems per unit redshiftassuming a given galaxy luminosityfunction and a radial-Iuminosity scalinglaw (Bergeron 1988).
At present there are 15 identificationsof Mg II absorbing galaxies in the redshift range 0.15 to 0.8, most of themdone with the ESO Faint Object CameraSpectrograph at the 3.6-m telescope.The galaxies giving rise to z < 1, Mg IIsystems have the following properties:
28
Figure 1: r image of an 80 x 80 arcsec field cenlred on Ihe quasar Q 2128-123. Nor1h-east is althe lop lett corner. The Mg" absorbing galaxy is the resolved object 8.6 arcsec nor1h-east ofthe quasar. The spatial resolution is FWHM = 0.95 arcsec.

at z - 0.5 about 1/3 of fjeld galaxieshave very large gaseous envelopes.Such a large fraction is also implied bythe very similar values found for thegaseous halo dimensions from directobservations and from statistical analysis of Mg II absorption line sampies,since for the latter we had assumed thathalf of the galaxies are gas-rich and withlarge halos.
Galaxy Surveys at z > 1Almost all the galaxies that have been
identified so far at z > 1 are associatedwith powerful radio sources (Spinrad etal. 1985, Djorgovski 1988, Lilly 1989).The extreme cases discovered are at z =
3.4 with a dominant older stellar population (Lilly 1988) and at z = 3.8 for steepradio surces (Chambers et al. 1989).These high redshift galaxies are intrinsically bright with Mv absolute magnitudes in the range - 22.0 to - 24.5.They have a very high rate of star formation and an extremely disturbed morPhology. Therefore, they constitute aspecial class of galaxies which cannotbe directly compared to the z < 1galaxy sampies to derive propertiesSuch as the galaxy luminosity evolution.The aim of another ESO Key Programme "A Study of the Most DistantRadio Galaxies" by G. Miley and collaborators is to extend the identificationof radio sources to larger and faintersampies of ultra-steep spectrum radioSOurces. There is also an on-going identification survey of weak radio sourcesWhich has revealed a few galaxies at z 1.2-1.5 all with emission lines of [CII,C 111] and [Ne IV] (Koo 1989). The clusterSurvey done by Gunn and collaboratorsalso contains potential candidates atz > 1 with on-going spectroscopicIdentification but no result has beencommunicated so far.
Searching for the intervening galaxiesresponsible for z > 1 absorption systems will provide an independent sampie of high redshift galaxies, whoseproperties can be directly compared tothose of z < 1 absorbing galaxies. Ourproposed survey will allow to determinethe evolution of galaxies with gaseoushalos, more specifically:- to find the evolution of the halo sizewith redshift,- to confirm that the correlation between strong stellar formation activityand the presence of gaseous halosholds at z > 1 and find if this stellaractivity increases with the size and massof the gaseous envelopes,- to derive the luminosity function of~alaxies with large gaseous halos andItS evolution with redshift.. Detecting z > 1 intervening galaxiesIn a Vri imaging survey should not be anImpossible task, since the galaxies are
expected to be neither extremely faint,nor very close on the sky to the quasar.Extrapolating our results obtained at z 0.5-0.8, we expect, in the assumptionof no luminosity evolution, that intervening galaxies at z - 1.6 will have r magnitudes of about 24. Further, at z - 1.6,the average sizes of the absorbersderived from statistical analysis of CIV(Young et al. 1982, Sargent et al. 1988)and Mgil (Lanzetta et al. 1987, Sargentet al. 1989) absorption line sampies arelarger than those at z = 0.5 (Mg 11) byfactors of 1.9 and 1.4 respectively.Therefore, the angular distance betweenthe quasar and the absorbing galaxiesshould be on an average the same forMg II systems at z = 0.5 and 1.6, i. e.around 7 arcsec.
At z > 1 the redshift of the interveninggalaxies can be identified from the[Ne IV] ), 2424, C 11] ), 2326, C 111] A 1909emission lines and also from He 1I ), 1640and CIV A 1549 at z> 1.5. The Mgil), 2799 doublet is also observable but itmay be in absorption, as for two emission line galaxies of our z < 1 sampie,thus more difficult to detect.
TheSampleFrom our lower redshift survey, we
have found that low excitation (Mg 11)absorbers are associated with brightgalaxies of high central surface brightness. Since we do not know whetherthis also applies to high excitation (CIV)absorbers, we first primarily select lowexcitation Mg 11 and/or Fe 11 absorptionsystems. The latter also usually showCIV absorption at the Mg 11 or Fe 11 redshift. These low excitation systems constitute about 1/5 to 1/4 of the metal-richabsorbers at z = 1.5 (Lanzetta et al.1987, Sargent et al. 1988 and 1989,Caulet 1989).
Selecting specific quasar fjelds is ofcrucial importance if less than one absorber is expected on an average for agiven redshift range. This is the case forMg 11 absorption systems at z < 2. Fromhigh redshift Mg 11 absorption surveys,one finds that the average number ofMg 11 absorbers expected per (quasar)line of sight in the redshift range 1.0-1.5is 0.36. To increase further our chancesof detection we will give higher priorityto multiple absorption systems spanning more than 500 km S-1, which suggests the presence of a cluster along theline of sight, and to quasars with severalMg 11 absorption systems at very different redshifts from unrelated interveninggalaxies.
The proposed sampie is based ondata published by Young et al. (1982)Bergeron and Boisse (1984) Boisse andBergeron (1985) Foltz et al. (1986) Lanzetta et al. (1987) Sargent et al. (1988and 1989) and Bergeron (unpublished),
and it will be updated when new absorption line surveys become available.It includes 53 quasars all with Mg I1 and/or Fell absorption at z < 2, out of whichthere are 8 quasars with low excitationmultiple systems, 11 quasars with atleast 2 low-excitation systems in theredshift range 1.0-1.5 and 2 quasarswith a low-excitation system at thequasar emission redshift.
ReferencesBahcall, J.N., Spitzer, L.: 1969, Astrophys. J
Letters 156, L63.Bergeron, J.: 1986, Astron. Astrophys. Let
ters 155, L8.Bergeron, J.: 1988, lAU Symposium No. 130,
eds. J. Audouze, M. C. Pelletan, A. Szalay,Kluwer Academic Publishers, p. 343.
Bergeron, J., Boisse, P.: 1984, Astron. Astrophys. 133,374.
Boisse, P., Bergeron, J.: 1985, Astron. Astrophys. 145, 59.
Broadhurst, T.J., Ellis, R.S., Shanks, T.:1988, Mon. Not. R. Astr. Soc. 235, 827.
Caulet, A.: 1989, Astrophys. J, 340, 90.Chaflee, F. H.Jr.: 1986, Astrophys. J 307,
504.Chambers, K. C., Miley, G. K., van Breugel,
W.: 1987, Nature 329, 604.Chambers, K. C., Miley, G. K., van Breugel,
W.: 1988, Astrophys. J. Letters 327, L47.Chambers, K. C., Miley, G. K., van Breugel,
W.: 1989, Astrophys. J, submitted.Cristiani, S.: 1987, Astron. Astrophys. Let1ers
175, L 1.Djorgovski, S.: 1988, "Towards Understand
ing Galaxies at Large Redshift", Erice,June 1987, eds. R G. Kron and A Renzini,p.259.
Dressler, A.: 1988, private communication.Foltz, C. B., Weymann, R. J., Peterson, B. M.,
Sun, L., Malkan, M., Chalfee, F. H.Jr.:1986, Astrophys. J 307, 504.
Gunn, J. E.: 1988, "The Epoch 01 Galaxy Formation", NATO ASI Series, eds. C. S. Frenket al., Kluwer Academic Publishers, p. 167.
Gunn, J. E., Dressler, A.: 1988, "TowardsUnderstanding Galaxies at Large Redshift", Erice, June 1987, eds. R G. Kronand A Renzini, p. 227.
Koo, D. C.: 1986, Astrophys. J 311, 651.Koo, D. C.: 1988, "The Epoch 01 Galaxy For
mation", NATO ASI Series, eds C.S. Frenket al., Kluwer Academic Publishers, p. 71.
Koo, D. C.: 1989, private communication.Koo, D.C., Kron, R.G.: 1988, "Towards
understanding galaxies at large redshift",Erice, June 1987, eds. R.G. Kron and ARenzini, p. 209.
Lanzetta, K. M., Turnshek, D.A, Wolle, AM.:1987, Astrophys. J. 322, 739.
Lilly, S.J.: 1988, Astrophys. J. 333,161.Lilly, S.J.: 1989, Astrophys. J. 340, 77.Sargent, W. L. W., Steidel, C. C., Boksenberg,
A.: 1988, Astrophys. J. Suppl. 68, 539.Sargent, W. L. W., Boksenberg, A, Steidel,
C.C.: 1989, Astrophys. J Suppl. 69, 703.Spinrad, H., Filippenko, A. V., Wyckoff, S.,
Stocke, J. T., Wagner, R. M., Lawrie, D. G.:1985, Astrophys. J Letters. 299, L7.
Wagoner, R: 1967, Astrophys. J 149, 465.Young, P., Sargent, W. L. W., Boksenberg, A:
1982, Astrophys. J Suppl. 48, 455.
29

PROFILE OF A KEY PROGRAMME
The Structure and Dynamics of Rich Clusters of Galaxies
A. MAZURE1, P. KATGERT2
, G. RHEE2, P. OUBATH3
, P. FOCARO/4, O. GERBAL 5, G. G/URIC/N6,
B. JONES ~ 0. LEFEVREB, M. MOLESB
1 USTL, Montpe/lier, France; 2Sterrewacht, Leiden, Netherlands; 30bservatoire de Geneve, Switzerland;40ipartimento di Astronomia, Bologna, Italy; 50bservatoire de Meudon, France; 60sservatorio di Trieste, Italy;7Nordita, Copenhagen, Denmark; 8 Universidad de Andalucfa, Granada, Spain
600
600
-
+
-
-
-
-
+
-
-..
()
o
o
.'.
00o
oo 0
<90
00:>0
o
J
"""
"""
"""I
, ,
"""
-. ':.. '"
o
" .., ' .. ....
.' ,
1
..
o
100
•
100
... ,, ',,.,
>
Abell 2151
....
'00 I-
oft
100
100
"""
"""
600
- """ I-
- >00 r
".'
.0,.0 ., I 00 •... ........ ': .. ')': ..
"','
..,"""
,'~....
Abell 548
'00
'.'
.. :
~.... ......
I
100
. :-':', ::.. \ :.........
100 I-
Figure 1: Substructure in the clusters A 548 and A 2151 (from Dressler and Shectman, 1988).The upper panels show the distribution of the galaxies brighter than about 16 in V (fromDressler, 1980), in areas ofabout 8 h-2 Mpc2 The middle panels show the deviation of the localkinematics (for each galaxy with a radial velocity, from its ten nearest neighbours with radialvelocities) from the global kinematics. The diameter of the circle scales with the magnitude ofthe deviation. The lower panels show Monte Carlo models (derived from the observations byrandomly reassigning the measured radial velocities). These models are selected because theyshow the largest amount of substructure among 11 such models made for each cluster.
Background
Rich clusters of galaxies are of greatinterest for several reasons. As thelargest bound structures that can befairly easily found and studied in detail,they represent a formidable constraintfor theories of the formation of largescale structure in the Universe. In addition, they provide an ideal laboratory forthe study of the behaviour of galaxies inan environment of high galaxy-density;quite frequently in the presence of a hot,X-ray emitting, intracluster gas, that mayhave a mass comparable to the totalvisible mass in galaxies. As rich clusterscan be detected out to fairly high redshifts, they also allow one to study theevolution of the galaxy population inclusters over an appreciable fraction ofthe Hubble time. Even the evolution oftheir global structure on such timescales is amenable to study (Gunn,1989).
The significance of rich clusters as aboundary condition for theories of largescale structure formation applies to alarge range of scales.
First, the internal structure and dynamics of clusters contain informationabout their evolutionary "age", andprobably also to some extent about theinitial conditions from which structureon these scales has arisen. In their central regions, two-body relaxation andnon-elastic collisions between galaxies(involving e. g. dynamical friction andmerging) have a characteristic timescale that is shorter than the Hubbletime, so that memory of the initial conditions has quite likely been erased. However, the overall relaxation time is considerably larger than the Hubble time,even for a rich cluster with a moderatevelocity dispersion.
From a detailed analysis of thekinematics of the galaxies in a clusterone can also get an idea about the distribution of the dark matter, in relation tothat of the visible matter, if one assumesthe cluster to be in a steady state (seee.g. Merritt, 1987, and Sharples et al.,1988). This is very important for anunderstanding of the role that dark matter has played in the formation history ofclusters as a class.
30
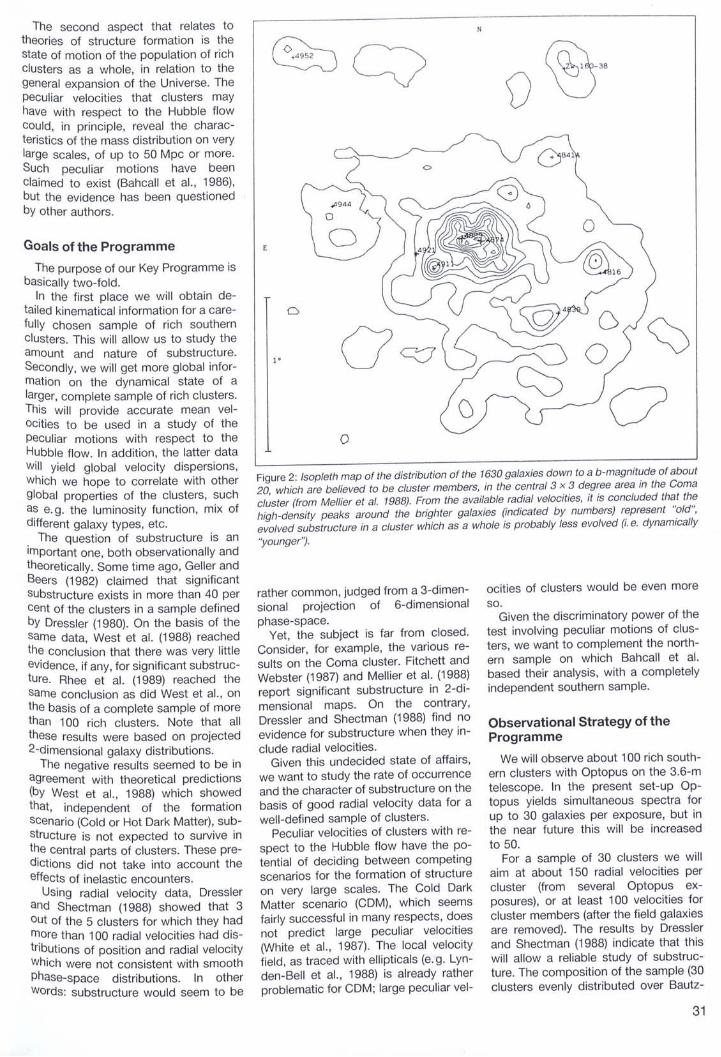
Figure 2: Isopleth map of the distribution of the 1630 galaxies down to ab-magnitude of about20, which are believed to be cluster members, in the central 3 x 3 degree area in the Comacluster (from Mellier et al. 1988). From the available radial velocities, it is concluded that thehigh-density peaks around the brighter galaxies (indicated by numbers) represent "old",evolved substructure in a cluster which as a whole is probably less evolved (i. e. dynamically"younger").
Observational Strategy of theProgramme
We will observe about 100 rich southern clusters with Optopus on the 3.6-mtelescope. In the present set-up Optopus yields simultaneous spectra forup to 30 galaxies per exposure, but inthe near future this will be increasedto 50.
For a sampie of 30 clusters we willaim at about 150 radial velocities percluster (from several Optopus exposures), or at least 100 velocities forcluster members (after the field galaxiesare removed). The results by Dresslerand Shectman (1988) indicate that thiswill allow a reliable study of substructure. The composition of the sampie (30clusters evenly distributed over Bautz-
ocities of clusters would be even moreso.
Given the discriminatory power of thetest involving peculiar motions of clusters, we want to complement the northern sampie on which Bahcall et al.based their analysis, with a completelyindependent southern sampie.
1°
o
rather common, judged from a 3-dimensional projection of 6-dimensionalphase-space.
Yet, the subject is far from closed.Consider, for example, the various results on the Coma cluster. Fitchett andWebster (1987) and Mellier et al. (1988)report significant substructure in 2-dimensional maps. On the contrary,Dressler and Shectman (1988) find noevidence for substructure when they include radial velocities.
Given this undecided state of affairs,we want to study the rate of occurrenceand the character of substructure on thebasis of good radial velocity data for awell-defined sampie of clusters.
Peculiar velocities of clusters with respect to the Hubble flow have the potential of deciding between competingscenarios for the formation of structureon very large scales. The Cold DarkMatter scenario (CDM), which seemsfairly successful in many respects, doesnot predict large peculiar velocities(White et al., 1987). The local velocityfield, as traced with ellipticals (e. g. Lynden-Bell et al., 1988) is already ratherproblematic for CDM; large peculiar vel-
The second aspect that relates totheories of structure formation is thestate of motion of the population of richclusters as a whole, in relation to thegeneral expansion of the Universe. Thepeculiar velocities that clusters mayhave with respect to the Hubble flowcould, in principle, reveal the characteristics of the mass distribution on verylarge scales, of up to 50 Mpc or more.Such peculiar motions have beenclaimed to exist (Bahcall et al. , 1986),but the evidence has been questionedby other authors.
Goals of the Programme
The purpose of our Key Programme isbasically two-fold.
In the first place we will obtain detailed kinematical information for a carefully chosen sampie of rich southernclusters. This will allow us to study theamount and nature of substructure.Secondly, we will get more global information on the dynamical state of alarger, complete sampie of rich clusters.This will provide accurate mean velocities to be used in a study of thepeculiar motions with respect to theHubble flow. In addition, the latter datawill yield global velocity dispersions,wh ich we hope to correlate with otherglobal properties of the clusters, suchas e.g. the luminosity function, mix ofdifferent galaxy types, etc.
The question of substructure is animportant one, both observationally andtheoretically. Some time ago, Geiler andBeers (1982) claimed that significantsUbstructure exists in more than 40 percent of the clusters in a sampie definedby Dressler (1980). On the basis of thesame data, West et al. (1988) reachedthe conclusion that there was very littleevidence, if any, for significant substructure. Rhee et al. (1989) reached thesame conclusion as did West et al., onthe basis of a complete sampie of morethan 100 rich clusters. Note that allthese results were based on projected2-dimensional galaxy distributions.
The negative results seemed to be inagreement with theoretical predictions(by West et al. , 1988) which showedthat, independent of the formationscenario (Cold or Hot Dark Matter), substructure is not expected to survive inthe central parts of clusters. These predictions did not take into account theeffects of inelastic encounters.
Using radial velocity data, Dresslerand Shectman (1988) showed that 3out of the 5 clusters for which they hadmore than 100 radial velocities had distributions of position and radial velocitywhich were not consistent with smoothPhase-space distributions. In otherWords: substructure would seem to be
31

Morgan type, at a redshift of about 0.05)should ensure that the results will have ageneral validity. This is also importantfor a study of the general distribution ofdark matter in these clusters, to bebased on the same data.
For a complete sampie of 70 to 80clusters with z < 0.1 we will get between 20 and 30 radial velocities percluster, from a single Optopus exposure. These will yield unbiased estimates of the mean cluster velocity (fora study of peculiar velocities), and ofoverall velocity dispersions (to be correlated with other global cluster properties).
The candidate galaxies for spectroscopy are found from automatic scans offilm copies of SERC III a-J survey plates,obtained with the Leiden Observatoryautomatic measuring machine Astro-
scan. This machine will also produceaccurate photographic photometry, tobe calibrated with CCD sequences forwh ich time on the 1.54-m photometrictelescope has been granted.
With an anticipated yield of over 5000new radial velocities, possibly otheruseful information from the spectra, andnew photometry, it is hard to imaginethat this programme will not provide abetter description and understanding ofthe class of rich galaxy clusters. We lookforward not only to answers to the questions that we presently pose, but also tonew questions raised by the new data.
ReferencesN.A. Bahcall, R. M. Soneira, W. S. Burgett,
1986; Ap.J. 311,15.A. Dressler, 1980; Ap. J. Suppl. 42, 565.
A. Dressler, S. A. Shectman, 1988; Ap. J. 95,985.
M. Fitchett, R. Webster, 1987; Ap. J. 317,653.
M.J. Geiler, T.G. Beers, 1982; P.A.S.P. 94,421.
J. E. Gunn, 1989; at May 1989 STScl meetingon distant clusters.
D. Lynden-Bell, S. M. Faber, D. Burstein, R. L.Davies, A. Dressler, R.J. Terlevich, 1988;Ap. J. 326, 19.
Y. Mellier, G. Mathez, A. Mazure, B.Ghauvineau, D. Proust, 1988 Astron. Astrophys. 199,67.
D. Merritt, 1987; Ap. J. 313,121.G. Rhee, M. P. van Haarlem, P. Katgert, 1989;
Astron. Astrophys. (in press).R. M. Sharples, R. S. Ellis, P. M. Gray, 1988;
MNRAS 231,479.M.J. West, A. Oemler, A. Dekel, 1988; Ap. J.
327,1.S. D. M. White, G. S. Frenk, M. Davis, G. EI
stathiou, 1987; Ap. J. 313, 505.
Surface Photometry Catalogue PresentedOn June 14, 1989, Andris Lauberts and Edwin Valentijn presented their new
"Surface Catalogue of the ESO-Uppsala Galaxies" during a Colloquium in theAuditorium at the ESO Headquarters. The appearance of this catalogue is thecrowning event of many years of hard work by the authors. It is now available, bothin printed form and on magnetic tape. The book may be obtained from the ESOInformation Service and the computer readable version from Centre de Donnees inStrasbourg, cf. the announcement in Messenger 56, page 34. On the photo, EdValentijn (Ieft) and Andris Lauberts (middle) present the first printed copy of theirCatalogue to the ESO Director General, Professor Harry van der Laan, at the time ofthe Colloquium.
32
Operating ManualsNow Available
A number of Operating Manuals haverecently become available. The following have already been distributed to institutes, etc. in the member states:• B & C Spectrograph• CASPEC• CAT/CES• ECHELEC• EFOSC• IR Photometers
• PISCOThe following three manuals will be
ready for distribution later: Outch Telescope, CCO, and Optical Photometers.
Copies of these manuals can beobtained from Visiting Astronomers'Service, ESO Headquarters, KarlSchwarzschild-Strasse 2, D-8046 Garching bei München, F. R. Germany.
The Proceedings 01 the
1st ESO/ST-ECFData Analysis Workshop
held on April 17-19 in Garching, will become available towards tlle end 01 September 1989.The 230-page volume, edited by P.J.Grosbol, F. Murtagh and R. H. Warmeis,will be sold at a price 01 DM 30.-. Thisprice includes packing and surface mailand has to be prepaid.Payments have to be made to the ESObank account 210002 with GommerzbankMünchen or by cheque, addressed to theattention 01
ESOFinancial ServicesKarl-Schwarzschild-Str. 20-8046 Garching bei München
Please do not forget to indicate yourcomplete address and the title 01 the Proceedings.
VLT Operations - a First DiscussionP. SHA VER, ESO
ESO atWorld Tech ViennaThe Institute of Astronomy of the Vienna University and ESO presented them
selves in a joint stand at the "World Tech Vienna" Science and Technology Fairwhich took place at the Austria Centre in the "UN City" fram June 18 to 22, 1989. Atthis time, science ministers and other high-ranking officials met here for the 7thEureka Minister Conference. These events drew at lot of attention from the publicand the media.
The ESO stand was weil received by the visitors, and the VLT was shown no lessthan four times on Austrian TV during that week. On the photo, one of their teamsrecord the closing of a VLT dome. C. Madsen (ESO)
The VLTwill be a unique observatory.With its four 8-metre independent elements and 17 foci it will offer unprecedented flexibility, in addition to itshuge light collecting power. It will beequipped with technologies which areonly now being realized, including adaptive optics and the potential for interferOmetric imaging. In view of these uniquefeatures, as weil as the large capitalexpenditure involved, it is desirable thatinnovative ideas on possible modes ofOperation be explored, ideas which mayresemble those of space observatoriesboth in style and scale. It is also desirable that such a study be made in theearly phases of design and constructionof the VLT, so that the perceived reqUirements can be incorporated into thedesign of the VLT itself and its instrumentation.
To this end, an in-house VLT Operations Working Graup was establishedtwo years ago, and its recommendations have now been published as adiscussion paper. The recommendations are not meant to be definitive - themix of operating modes will undoubtedIy evolve with time and experience.Nevertheless they will pravide some guidance through the design and construction of the telescope and instruments.
The Working Graup was comprised ofstaff fram all divisions of ESO: the Projects and Technology Divisions, the Science Division, the ST-ECF, and ofCOurse La Silla. With such a wide spectrum of participants, virtually all points ofview were represented, from the extreme pragmatic to the extreme utopian.There was fortunately some convergence over time, and the report bothreflects this wide divergence of viewsand presents the confluence of recommendations.
In order to preserve the flexibility inherent in the VLT concept, it was considered imperative that no operationalmOde be "designed out", and in part1cular that all the major observationalmOdes - classical (astronomer at teleSCope), remote (astronomer in Europe)and service (by ESO staff in Chile orEurope) - be fully accommodated in thedesign of telescope and infrastructure.
Flexible scheduling, however, wasseen as a major objective fram the outset. Flexible scheduling implies serviceobserving, hence an Operations Graup.This Operations Group could be locatedIn Chile or Eurape; the latter would thenImply remote observing. The potentiala?vantages of flexible scheduling/servlce observing are many: adaptability to
changing meteorological conditions(e.g. periods of exceptional seeing), optimal use of dark time, efficient packingand scheduling of observations by agroup intimately familiar with the instruments, accommodation of special observations (short observations, monitoring observations, simultaneous observations with other observatories), regular monitoring and long-term calibrationof instruments, suitability for archiving(homogeneous data base), increasedaccessibility (e. g. to non-optical astranomers and theoreticians).
There are also disadvantages - lackof spontaneity in the observations, lessdirect experience for the astronomer,and especially far greater complexity and for experimental observations involving user-supplied instrumentation itis obviously completely inappropriate.The flexible scheduling/service observing mode can therefore only be offeredas one possible option, perhaps limitedto straightforward, well-defined types ofobservations.
It is desirable, both for flexiblescheduling and more conventional observing modes, that the VLT and its instrumentation be capable of switchingrapidly fram one mode to another. It istherefore recommended that a stable
suite of multimode instruments be provided which cover the major observational possibilities and are mounted onthe telescope for long periods of time tofacilitate rapid changeovers betweenobserving modes and long-term calibration. The reliability of these instrumentsshould be enhanced by standardizationand modularity of components.
Another major recommendationwhich follows from the above is that anOperations Group be formally established as soon as possible to fully test avertically-integrated (from proposal toarchive) service/remote observing operation using the ND in a few well-definedmodes, in order to determine how practical and comprehensive such an operation can be.
It also follows that the communications link between Garching and Chileshould be further enhanced, both tosupport this expanded remote observing capability and to increase the integration of the organization thraugh greater daytime communications.
These are just the summary recommendations. The full report is availableon request from the secretary of theScience Division at ESO Garching, andwritten comments from members of thecommunity are most welcome.
33

Polishing of VLT Mirrors: ESO and R. E. O. S. C. Sign Contract
The European Southern Observatoryand R. E. O. S. C. Optique (Rechercheset etudes d'optique et de sciences connexes), located at Ballainvilliers nearParis, France, have reached agreementon a contract for the polishing of fourgiant mirror blanks for the ESO VeryLarge Telescope (VL1).
This contract was signed on July 25,1989, at the ESO Headquarters by Professor Harry van der Laan, Director General of ESO, and Mr. Dominique Ruffide Ponteves, Chairman and GeneralManager of R. E. O. S. C. In shortspeeches, both parties expressed satisfaction about the conclusion of this important contract.
The photo shows Mr. D. Ruffi de Ponteves (centre), Dr. D. Enard (ESO, rightof centre) and the ESO Director General(right), at the cocktail after the signingceremony.
The four blanks will be made at SchottGlaswerke, Mainz, F. R. Germany; cf.Messenger 53, page 2. They will be thelargest ever produced and will be madeof Zerodur, a glass ceramic material.Each will have a diameter of 8.2 metres,an area of more than 50 square metresand thickness of only 17.5 centimetres.
The first blank is expected to be readyin 1993 and will then be transportedfrom Schott to R. E. O. S. C. by road andwater in a specially constructed case.
At R. E. O. S. C., it will first be coarselyfigured on a giant grinding machine.When the surface of the mirror approaches the desired form, the mirrorwill be transferred to a second machinewith which the final, highly delicate polishing will be performed. Both of thesevery complex machines will be constructed on the R. E. O. S. C. premisesduring the next years.
After thorough testing, the mirror willbe packed for transport to the VLT observatory in Chile. It is expected to arrivethere in 1995, soon after completion ofthe mechanical structure of the first ofthe VL1's four unit telescopes.
The polishing schedule of the otherthree mirrors aims at delivery in Chile atone-year intervals, i. e. in 1996, 1997and 1998, so that the entire VLT array offour telescopes can be assembled in1998.
When ready, the VLT mirrors will havethe best possible figure of all largeground-based telescopes. The opticalperformance will rival that of the recentlyinstalled ESO New Technology Telescope (NTl).
As is the case for the ND, the optimalshape of the large and flexible VLTmirrors will be ensured by "active optics". In the VLT system about 200
34
computer-controlled precision actuators will support each of the 8-mmirrors.
R. E. O. S. C. and ESO have collaborated on earlier projects. In 1975, thisfirm successfully polished the largefused-silica mirror for the ESO 3.6-mtelescope that entered into operationthe following year. With its excellent optical quality, this "c1assical" 3.6-m telescope has since been a rich source ofimportant observational data for European astronomers.
R. E. O. S. C. has also polished a verythin 1-metre mirror (thickness 18 mm) of
STAFF MOVEMENTSArrivals
Europe:
ANOREANI, Paola (I), Associate
OOBBELS, Geert (B), Remote ControlOperator
FAUCHERRE, Michel (F), ExperimentalPhysicistlAstraphysicist
HALO, Birgit (OK), Secretary/Administrative Assistant
HINTERSCHUSTER, Renate (0), Oesigner/Oraughtswoman (Mech.)
HOPPE, Elisabeth (0), TypistlSecretarialAssistant
LAGRANGE-HENRI, Anne-Marie (F),Fellow
ORIGLlA, Livia (I), Associate
PALMA, Francesco (I), PracurementOfficer
Zerodur for ESO. It was used at the ESOHeadquarters in the prototype "activeoptics" system on which the highly successful New Technology Telescope isbased.
The decision to entrust R. E. O. S. C.with this important task is a key event inthe VLT project. It also means that thisenormous project, a flagship of European science and tecllnology and soonto become the largest optical telescopein the world, is keeping to its originaltime schedule.
From ESO Press Release 5/89
Chile:
ANCIAUX, Micl,el (B), Telescope ContralEngineer
OUBATH, Pierre (CH), Student
DeparturesEurope:
BERNOTAT, Petra (0), Secretary
ELLES, Oaniel (F), Procurement Officer
FRANyOIS, Patrick (F), Fellow
JOHANSSON, Lennart (S), Fellow
LAUBERTS, Andris (S), Associate
MEURS, Evert (NL), Fellow
MORGANTI, Raffaella (I), Fellow
TSVETANOV, Zlatan (BG), Associate
Chile:
OUGUET, Bernard (F), Administrator
PEOERSEN, Holger (OK), Aslronomer

Breaking of Ground Heraids New Premisesfor Blank Manufacture
'7
Dr. Tietze, Technical Head of Ihe SCHOTTOplics Division, breaks the ground al a localion pOint of Ihe new factory. Wilh Dr. Tietzefrom left to right are Mr. Schuster and Mr.Adolphs, bolh members of Ihe SCHOTTBoard of Direclors, and Dr. Eden, a formermember of the SCHOTT Board of Direclors,now retired.
This pholograph was taken al the location of the fulure casting tank. Around the first 1.B-mZerodur blank produced with the new spin-casting technique developed at SCHOTT are, fromleft to right: M. Tarenghi of ESO, Dr. Tietze, Technical Head of the SCHOTT Optics Division, Mr.Schuster of the SCHOTT Board of Directors, Dr. Eden, a now retired former member of theSCHOTT Board of Directors, Dr. Adolphs, also of the SCHOTT Board of Directors, Dr. Muller,Project Manager of the B-m Blank Production and Mr. Hubler, Commercial Head of theSCHOTT Optics Division.
A major milestone for the VLT Projecttook place in Mainz on 6 July 1989 witha symbolic turning of the soil at thelocation of the future VLT mirror blankmanufacturing site. The importance andComplexity of such a production re-
NTTNewsThe commissioning time of the ND
fOliowing the first light reported in thelast issue of the Messenger has contlnued with modifications and improvements to the hardware and software ofthe telescope and building. New additions include two rails which will be usedfor the installation and maintenance ofthe EMMI instrument which have beeninstalled on a tloor of the instrumentation room. A carbon fiber sky baffle for~he M 3 unit has also been implemented;It will have two working positions, onefor optical observations and the secondfor infrared observations.
More tests of pointing and trackingwere performed and by the end of Julythe telescope pointed better than 1.6arcseconds r. m. s. In the months tocome, the final tuning will be completed,and October/November will be dedi-
quires the construction of a completenew factory designed and dedicated tothe manufacture of the VLT 8 m Zerodurblanks. A building measuring 70 m x40 m will house the entire complex. Itwill include the casting tank, the anneal-
cated to the erection of the first of thetwo adapters. We expect to haveEFOSC 2 working at full capacity by the
Status Report on EMMIThe ESO Multi-Mode Instrument for
one Nasmyth focus of the ND is in thefinal phase of its integration and testingin the laboratory in Garching. All of themechanical functions have beenthoroughly tested and installed. Theelectronic hardware has also been integrated and an engineering version of thecontrol software is fully operating. Thecoated optics for the red arm (high efficiency in the range 400-1000 nm) havebeen delivered and will be installed in
ing furnaces, the grinding machine, andall other equipment necessary. Completion of the new factory will be at the endof 1990 when the casting of the firstblank will take place.
M. Tarenghi (ESO)
end of this year; see also the articleabout this new instrument on page 66 inthis Messengerissue. M. Tarenghi (ESO)
September; the final tests with the detector, a 1024 x 1024 Thomson TH31156 CCD, will then start. The blue armoptics (high efficiency in the range300-500 nm) have been manufacturedand coated: they are expected to arriveat ESO in October. Integration of theinstrument in Chile is foreseen for thebeginning of 1990. The form for Applications for Observing Time for Period 45includes a description of the observingmodes of the instrument which are likely
35

A picture of EMMI as it stands in the integration laboratory in Garching in late July 1989. Themechanical functions are mounted and cabled and they are being tested with an engineeringversion of the control software. On the top of the instrument the control electronics for the 29moving functions. At the bollom right of the instrument the grating unit of the red arm, with theattachment for the detector above it.
to be offered initially. These are directimaging and medium dispersion spectroscopy in the blue and red channelsand grism, long slit or slitless spectroscopy in the red channel.August 1989.
Opticallnstrumentation Group
New ESO PreprintsJune - August 1989
SCIENTIFIC PREPRINTS
654. G. Contopoulos and B. Barbanis: Lyapunov Characteristic Numbers andthe Structure of Phase-Space. Astronomy and Astrophysics.
655. R. M. West and M. Tarenghi: The Optical Counterpart of the Strong SouthernRadiosource PKS 1343-601 (13S6A).Astronomy and Astrophysics.
656. I. V. Igumentshchev, B. M. Shustov andA. V. Tutukov: Dynamics of SupersheIls:Blow-out. Astronomy and Astrophysics.
657. D. Baade: A Search for Line Profile Variability in Dwarfs and Giants of SpectralTypes B8-B9.5 (1.) Observations andMeasurements; Astronomy and Astrophysics Suppl. (11.) Results and Discussion; Astronomy and Astrophysics.
658. J. H. Lutz et al.: He 2-104: Link Between Symbiotic Stars and PlanetaryNebulae? Publ. Astron. Soc. Pac.
659. M. Tapia et al.: TI,ree-Micron Spectroscopy of Three High/y Reddened FieldStars. Astronomy and Astrophysics.
660. B. Reipurth and S. Heathcote: HH 123 a Herbig-Haro Object in the HighLatitude Cloud L1642. Astronomy andAstrophysics.
661. T. Le Bertre et al.: Optical and InfraredObservations of Four Suspected Protoplanetary Objects. Astronomy and Astrophysics.
662. M. - H. Ulrich: Observational Evidencefor Accretion Disks in Galactic Nuclei.Invited Review to appear in "Theory ofAccretion Disks", NATO Advanced Research Workshop, MPA Garching,March 1989 (F. Meyer, W. Duschl, J.Frank and E. Meyer- Hofmeister, eds.;Kluwer Academic Publishers, Dordrecht, the Netherlands).
663. L. B. Lucy et al.: Dust Condensation inthe Ejecta of SN 1987A. Paper presented at lAU Colloquium No. 120"Structure and Dynamics of InterstellarMedium". Eds. G. Tenorio-Tagle, M.Moles and J. Me/nick. Lecture Notes inPhysics (Springer-Verlag).
664. (1.) S. di Serego Alighieri et al.: PolarizedLight in High Redshift Radio Galaxies.Submitted to Nature.(11.) S. di Serego Alighieri: ImagingPolarimetry. To appear in the Proceedings of the 1st ESO/ST-ECF Dala Analysis Workshop, Grosbel et al. eds. ESOConference and Workshop Proceedings No. 31. 1989.
665. P. Crane et al.: Cosmic BackgroundRadiation Temperature al 2.64mm,1.32mm and 0.6mm. To appear in the
36
Proceedings of tI,e Moribond Astrophysics Conference.
666. B. Binggeli, M. Tarenghi and A. Sandage: The Abundance and Morphological Segregation of Dwarf Galaxies in theField. Astronomy and Astrophysics.
667. C. Tadhunter and Z. Tsvetanov: Anisotropic lonizing Radiation in NGC 5252.Submitted to Nature.
668. F. Ferrini, F. Palla and U. Penco: Fragmentation Theories and the IMF. Toappear in Physical Processes in Fragmentation and Star Formation, Rome,June 1989, eds. R. Capuzzo-Dolcetta,C. Chiosi and A. Di Fazio, Reidel, Dordrecht.
669. R. M. West: Post-Perihelion Observalions of Comet Halley. 11 (r = 10.1. AU).Astronomy and Astrophysics.
670. P. Benvenuti and I. Porceddu: DiHuseAbsorption Bands and the 2175 A Fealure. Astronomy and Astrophysics.
TECHNICAL PREPRINTS
3. J. M. Beckers and F. Merkle: A Survey ofPresent EHorts in Astronomical Adaptive Optics. To be published in the SPIEProceedings No. 1130. InternationalCongress on "Optical Science and Engineering", Paris, 24 -28 April 1989.
4. M. Sarazin and F. Roddier: The ESODiHerential Image Motion Monitor. Astronomy and Astrophysics.
5. M. Tarenghi and R. N. Wilson: The ESONTT (New Technology Telescope): TheFirst Active Optics Telescope. To bepublished in the SPIE Proceedings No.1114 (1989). Symposia on "AerospaceSensing", Orlando, 27-31 March 1989.
6. L. Noethe et al.: Active Optics: From theTest Set Up to the NTT in the Observatory. To be published in the SPIE Proceedings No. 1114 (1989). Symposia on"Aerospace Sensing", Orlando, 27-31March 1989.
7. R. N. Wilson and L. Noethe: ClosedLoop Active Optics: Its Advantages andLimitations far Correction of WindBuHet Deformations of Large FlexibleMirrors. To be published in the SPIEProceedings No. 1114 (1989). Symposia on "Aerospace Sensing", Orlando,27-31 March 1989.
8. F. Merkle and J. M. Beckers: Application of Adaptive Optics to Astronomy.To be published in the SPIE Proceedings No. 1114 (1989). Symposia on"Aerospace Sensing", Orlando, 27 -31March 1989.
9. M. Faucherre, F. Merkle and F. Vakili:Beam Combination in Aperture Synthesis from Space: Field of View Limitations and (U, V) Plane Coverage Optimization. To be published in the Proc. ofthe SPIE Intern. Congress on Opt. Science and Engin., Top. Conf. 1130: NewTecl,nology for Astronomy", Sept.1989.
1O. J. M. Beckers: Plans for High Resolution Imaging with the VLT. Paper presented at the 1989 Frühjahrstagung derAstronomischen Gesellschaft on April11-14 in Friedrichshafen.
11. J. M. Beckers: Polarization EHects inAstronomical Spatial Interferometry.Paper presented at the SPIE Conference No. 1166 on "Polarization Considerations for Optical Systems 11" on August 9-11 in San Diego.

REPORT ON ESO WORKSHOP:
"Extranuclear Activity in Galaxies"About 80 participants attended the
ESO Workshop on Extranuclear Activityin Galaxies, held in Garching on May16-18, 1989. The meeting was followedby an informal session on Gen A on May19, 1989 where survivors from the previous three days were present. AdditionalColleagues from ESO and from theneighbouring Max Planck Institutescould be met at the usual ESO receptionat the end of the first day.
The scientific programme featured 10keynote contributions which in comprehensive reviews covered a widerange of observational, interpretativeand theoretical issues bearing on theWorkshop's general theme. These largerOverviews were supplemented by shorter contributions, selected to match theSubject of the workshop as closely asPossible. In addition, time had been reserved to digest a substantial number ofInteresting posters. The programme for
the Gen A session was finalized duringthe days of workshop and staged a variety of new exciting data that demonstrated once more the unique status ofthe nearest radio galaxy. Vital organizational matters were smoothly handledby secretaries Ghristina Stoffer and BrittSjoeberg. The meeting was favoured bya week of good weather and ended in anatural way in the local beer garden.
All in all the papers presented duringthis workshop provide an up-to-dateoverview of this quickly developing fieldof study. An issue that featured prominently during these days concerns thequestion whether the nuclear radiationfield in many or in most active galaxies isanisotropic, wh ich may explain theasymmetries often observed for extranuclear activity. A related and evenmore fundamental consideration iswhether local energetic sources mayaccount for at least certain forms of
extranuclear activity or can be ruled out.For these and other questions it is instructive to compare highly energetic(though mostly distant) radio galaxieswith the moderately energetic activegalaxies, even when not leading to obvious solutions. It is quite remarkable infact that nowadays in so many of theobjects extended emission may befound. The material presented at thisworkshop c1early indicates that for aproper understanding of these extranuclear phenomena a broad range oftopics has to be considered, includingboth a description of the nuclear activityand knowledge about the materialsurrounding the nucleus.
The Proceedings will be published bythe European Southern Observatoryand are expected to be available earlythis autumn (see box).
E. Meurs (ESO) andR. Fosbury (ST-ECF)
REPORT ON ESO WORKSHOP:
"Low Mass Star Formation and Pre-Main Sequence Objects"The Workshop on low mass star for
mation and pre-main sequence objectstook place in Garching on July 11 -13,1989.
About 170 participants from 20 countries attended the meeting. During threedays, 26 reports were presented on recent advances in both observationaland theoretical studies of the formationand early evolution of low mass stars.Additionally, 85 poster papers were dis-
played, presenting newly completed orongoing star formation research programmes (see photo). A special postersession described ten prominent southern molecular clouds with active lowmass star formation. The Workshopgave a lively overview of a dynamic andrapidly growing field of astronomy.
The Proceedings will be published bythe European Southern Observatoryand are expected to be available around
the middle of October 1989 (see box).B. Reipurth (ESO)
The following ESO Workshop Proceedings will become available inOctober 1989:
Extranuclear Activityin Galaxies
The price of this volume, edited by E.Meurs and R. Fosbury, is DM 40.(including packing and surface mai I).
Low Mass Star Formationand Pre-Main Sequence
ObjectsThis volume, edited by Bo Reipurth,contains approximately 500 pagesand is offered at a price of DM 50.(including packing and surface maii).Payments have to be made to theESO bank account 2102002 withGommerzbank München or bycheque, addressed to the attention of
ESO, Financial ServicesKarl-Schwarzschild-Str. 2D-8046 Garching bei München
Please do not forget to indicate yourcomplete address and the title of theProceedings.
37

The Research Student Programme of ESOWith reference to the article by Professor Harry van der Laan in the Messenger (55,
p. 12), in which the details about this new programme are outlined, it is now the intention toappoint a number of students, registered at a recognized university in an ESO memberstate. Note that there is no fixed deadline for the applications.
Potential candidates or their supervisors may request the brochure about the ESOResearch Student Programme (available in late September 1989) and application formsfrom the Personnel Administration and General Services at the ESO Headquarters, KarlSchwarzschild-Strasse 2, 0-8046 Garching bei München, F. R. Germany.
ESO FELLOWSHIPS 1990-1991
News About "Remote Control" at ESO
Adriaan BlaauwReceives Bruce Medal
Booking of VisitorFacilities in Garching
The visitor support in Garching is undergoing some changes which will be described indetail in the next issue of the Messenger.
Effective immediately, kindly address allinquiries concerning the booking of visitorfacilities at the Headquarters (MIOAS or IHAPfor data reduction; POS ar Optronic measuring machines for work with photographicplates; observations at La Silla under remotecontrol from Garching; guest rooms; financialsupport if applicable) to Ms. ElisabethHoppe.
The ways to contact her are:o by phone: +49-89-32006-473o by electronic mail:
ESOMC1 ::VISAS (SPAN)VISAS etlOGAES051 (EARN/Bitnet)
o by telex: 52828220 eodo by telefax: +49-89-3202362o in person: office No. 225or by ordinary mail at the ESO Headquarters'address.
Please note that all arrangements for observing trips to La Silla continue to be handled by Mrs. Cilrista Euler (phone +49-8932006-223). D. Baade (ESO)
Professor Adriaan Blaauw, distinguishedOutch astronomer and former ESO OirectorGeneral (1970-1974), recently received oneof the most prestigious awards in astronomy,the Bruce Medal. This took place on June 23,1989, at the time of the centennial celebrationof the Astronomical Society of ttle Pacific.
At ttle award ceremony, Professor FrankOrake, President of A. S. P., mentioned Adriaan Blaauw's numerous and distinguishedservices to astronomy over many years.These include the fundamental work done inthe 1950s and 1960s on galactic structure,the nature of associations, and the kinematics of early-type stars, as weil as Ilis involvement in the founding of ESO and his serviceto the lAU, in particular as President(1976-1979).
We at ESO heartily congratulate AdriaanBlaauw to this well-deserved honour.
R. West (ESO)
ching. From July 18 to August 20 therewere observations practically everynight, either with the 2.2-m or the CATtelescope.
At the same time preparations aremade to be ready with the necessaryequipment (multiplexers, gateways,modems, codees) late this year, whenthe 64 Kbitls link will begin to be testedbetween ESO Garehing and La Silla.This link will eventually be used to remotely control the ND.
A "Remote Control Manual" for usershas also been prepared and can be obtained from the Visiting AstronomersSeetion at the ESO Headquarters inGarehing. G. Raffi (ESO)
The European Southern Observatory (ESO) intends to award up to six post-doctoralfellowships tenable in the ESO Headquarters, the Scientific-Technical Centre which islocated in Garching near Munich.
The main areas of activity are:- to do research in observational and theoretical astrophysics;- to carry out a programme of development of instrumentation for the La Silla telescopes;- to develop future telescopes involving new technology;- to provide data reduction facilities to users of the ESO instruments;- to provide photographic facilities far atlases of the southern sky;- to foster cooperation in astronomy and astrophysics in Europe.
Fellows normally participate in one or more of the above. In addition there is thepossibility of participating in the activities of the European Coordinating Facility of theSpace Telescope (ST-ECF) which has been established at ESO.
Fellows will normally be required to spend up to 25 % of ttleir time in supporting activitiessuch as introduction of users to data reduction facilities, remote control operations andtesting new instrumentation.
Fellowships are to be taken up between January and October 1990.Most of the scientists in the Centre come from the Member States of ESO, but several
are from other countries. In addition to regular stalf members, the Centre comprises visitingscientists, post-doctoral fellows, and graduate students.
Applicants normally should have a doctorate awarded in recent years. The fellowshipsare granted for one year, with normally a renewal far a second year and occasionally a thirdyear.
Applications should be submitted to ESO not later than October 15, 1989. Applicants willbe notified in Oecember 1989. The ESO Fellowship Application form should be used. Tilreeletters of recommendation from persons familiar with the scientific work of the applicantshould be sent to ESO directly. These letters should reach ESO not later than October 15,1989.
Enquiries, requests for application forms and applications should be addressed to:
European Southern Observatory, Fellowship Programme, Karl-Schwarzschild-Straße 2,0-8046 GARCHING b. München, Federal Republic of Germany.
A New Video Film
A new video film about Remote Control (duration 12 minutes) has been produced by the ESO Information Service.It gives an introduction to this subject tothe general public, but it will also beuseful for astronomers, who are not veryfamiliar with this observing facility at theESO Headquarters in Garehing.
The ESO Information Service (addresson the last page) will make availableVHS copies of this video on loan toinstitutes and organizations in the ESOmember countries, upon written request. The letter must specify the desired loan period. Due to the limitednumber of casettes available, it may notalways be possible to accommodate arequest.
It is also possible to buy the casette ata cost of 70 DM (VHS, Super-VHS orUmatic-Iowband). Please send your order (with payment) to the ESO Information Service.
New Link to Become Available inLate 1989
Meanwhile an intense period of remote observations is going on in Gar-
38

ESO'S EARLY HISTORY, 1953-1975IV. Council and Directorate Set to Work;The Initial Programme of Middle-Size Telescopes*
A. BLAAUW, Kapteyn Laboratory, Groningen, the Netherlands
"Es würde mir als lohnende Aufgabe erscheinen, den Rest meines wissenschaftlichen Lebens dem Aufbau des ESO zu widmen. "From a letterofo. Heckmann 10 J. H. Oort of December 1, 1961.
Introduction
Once the ESO Convention had beensigned, in October 1962, and the ratifications were in sight (completed January 1964), many activities developed: bythe ESO Council, the now "legal"successor of the ESO Committee, andby the ESO Directorate headed byHeckmann. In the present and the nexttwo articles I shall describe developments over the six years which followed,leading to the dedication ceremonies onLa Silla in the spring of 1969. Theseceremonies marked the completion ofwhat we may now call ESO's first phase.
In these developments we distinguishtwo main lines. In Europe: building upESO's organizational structure includingfinancial, personnei, legal and manyother matters as weil as the design andconstruction of telescopes and auxiliaryinstrumentation of the "Initial Programme" defined in the Convention. InChile: the extensive programme of infrastructure and constructions; buildingup the Observatory on La Silla and thefacilities in Santiago and La Serena. Inthe present article we deal with activitiesin Europe, and in the two following articles turn to those in Chile.
Heckmann Becomes ESO's FirstDirector, November 1962
The need for executive leadershipwas feit soon after the ESO Committeehad undertaken to realize the ESO project, but particularly so in the late1950's, and names of candidates wereprOposed. The most obvious choicewas Charles Fehrenbach, in view of hisaccomplishments in instrumentationand in building up the Haute-ProvenceObservatory. However, these and otherobligations in French astronomy made itimpossible for him to accept. As a second possibility my name was mentioned, but obligations with regard to thedirectorship of the Kapteyn LaboratoryaSSumed in 1957 made me, too, refrain;instead I took over the Secretariat of theESO Committee from Bannier from early1959 [1]. This was a temporary solution,and the need for a director remained.-. Previous articles in lhis series appeared in lhe
Messenger Nos. 54, 55 and 56.
The solution was found when in thecourse of 1961 Otto Heckmann, amember of the ESO Committee,appeared to seriously consider a suggestion, made from various sides, totake the task upon himself. The matterwas discussed between him andFehrenbach during their joint visit toAmerican observatories in the summerof 1961 to which we shall return below[2]. Soon after this, responding to a remark in a letter of Oort, Chairman of theEC, of November 27, 1961, Heckmannwrote on December 1, 1961 [3]:
,,- - - Es würde mir als lohnende Aufgabe erscheinen, den Rest meineswissenschaftlichen Lebens dem Aufbaudes ESO zu widmen. Da ich aber mit derUniversität Hamburg und der Hamburger Sternwarte sehr fest verknüpftbin, so ist die Lösung dieser alten Bindungen schwierig - - -".
In the meeting of the EC of June 18,1962, Heckmann accepted, first for oneyear only, from November 1, 1962, andsubsequently on a long-term basis.Heckmann was then 60 years old. Heput his shoulders under the ESO taskuntil his retirement per January 1, 1970:determinedly, and with plenty of drive.After the necessary preparations he feitready for the job in the spring of 1963,so that by circular letter of April 17,1963, signed by Bannier and Heckmann, executive authority and financialresponsibility were transferred perMay 1, 1963 from Bannier as Treasurerof the EC to Heckmann as Director [4].
Heckmann's first associate at Directorate level was Andre Muller who hadbeen heavily involved in the site tests,first in South Africa and next in Chile. AsSuperintendent for Chile his main responsibility would become the supervision of the extensive construction programmes. Muller's employment as anassociate of Heckmann started perJanuary 1, 1963, but since at that timeESO did not yet possess the administrative set-up for formalizing the appointment, he first remained on the payroll ofthe University of Groningen to whomESO reimbursed his salary [5]. Mullerwas the first staff member to becomepermanently employed by ESO.
Per April 1, 1963, Heckmannappointed the accountant H. W. Marck,
and the next appointee - apart fromtemporary secretarial help - was J.Bloemkolk as Manager per October 1,1963 [6]. Bloemkolk's assignment wasmeant to be in Chile, but it was fairlysoon changed into one covering the administrative business of the Director'sOffice. Another important appointmentwas that of Jöran Ramberg as AssistantDirector per November 1, 1963. A staffmember of Stockholm Observatory,Ramberg had since November 1961contributed to the development of ESOas a Secretary of the InstrumentationCommittee, the role of wh ich will bedescribed below. He would becomeHeckmann's right hand in the development of instrumentation and buildings.
After the ratifications, from early 1964,ESO staff underwent rapid growthwhich we shall not follow in detail; wewill have occasion to refer to certainstaff members individually in the contextof their tasks. This may be the properoccasion, though, to acknowledge thededicated role of Otto Heckmann's wife,Johanna ("Hanna") Heckmann-Topfmeier who closely accompanied herhusband in almost all areas of his comprehensive task, and thereby becameintimately acquainted with the ESO project. Whereas at formal occasions sheremained in the background, she usedto take an appreciable share in the dailyadministrative chores of the Office;energetic, cheerful - and, as an unpaidemployee, not without a bit of embarrassment for Council ...
Mrs. Johanna Heckmann-Topfmeier, wife ofOtto Heckmann. Mrs. Heckmann volunteeredas an assistant to her husband in many of hisadministrative and organizational tasks.From a slide in the ESO Photographic Archives laken in February 1969 at ESOHeadquarters in Santiago by Heckmann, andmarked "Hanna" in his handwriting.
39

On February 5-7, 1963, shortly after the ESO Gonvention had been signed, the ESOGommittee at the invitation of the GERN Directorate held its 19th meeting in GERN's GouncilRoom. The photograph, taken during a tour of the GERN laboratories, shows:1. P. Bourgeois (Belgium), 2. M. Deloz (Belgium), 3. A. Reiz (Denmark), 4. ??, 5. G. W. Funke(Sweden), 6. J. H. Bannier (Netherlands), 7. B. van Geelen (Netherlands), 8. W. Fricke (GermanFederal Republic), 9. G. Zilverschoon (GERN), 10. Ms. B. Rijken (ZWO, Netherlands), 11. A. B.Muller (Netherlands), 12. J. H. Oort (Netherlands), 13. Gh. Fehrenbach (France), 14. 0. Heckmann (German Federal Republic), 15. H. Siedentopf (German Federal Republic), 16. ??, 17. B.Lindblad (Sweden), 18. ??, 19. ??, 20. Ms. T. Stuit (Kapteyn Laboratory, Netherlands).
Council and Finance Committee
Article V of the ESO Convention defines the constitution and tasks of theCouncil. It consists of two delegates perMember State of whom at least oneshould be an astronomer. The FinancialProtocol attached to the Convention(and referred to in its Art. V. 2. b.) definesthe constitution and task of the FinanceCommittee (henceforth to be denotedby Fe). It is, next to Council, the mostauthoritative administrative body. Contrary to other committees that help ruling the organization and for which themembership is determined by Council(Iike for instance the InstrumentationCommittee) members of the FinanceCommittee are government representatives (Art. II1 of Fin. Prot.), one perMember State, and thereby form thedirect link to the national financial authorities. No major financial decision istaken by Council without having beensubmitted first to the FC. Council policyand FC's counsel have always been intimately interwoven.
The accompanying table gives thedates and places of the meetings andthe names of the Presidents of Counciland of the FC over the period endingwith the year 1969. The first CouncilMeeting, held in the French Ministry ofForeign Affairs right after the ratifications of the Convention, took place onFebruary 5 and 6, 1964 and elected J. H.Oort as its first President. Oort resignedfrom this office at the Stockholm meeting of June 1965, to be succeeded byBertil Lindblad - an election honouringLindblad's important contribution tothe creation of ESO. Unfortunately, onJune 25 Lindblad passed away, afterwhich Oort again chaired the CouncilMeeting on Nov. 30/Dec. 1, 1965. Thismeeting elected G. W. Funke, the nonastronomical Swedish Council delegateas President. After Funke had completed his three years in office - themaximum term allowed by the Convention - the Council in its meeting of Dec.3 and 4, 1968 elected as President thenon-astronomical delegate from theNetherlands, J. H. Bannier.
The first meeting of the FC took placeon February 6, 1964 at Paris, immediately following the first Council Meeting.Its first President was J. H. Bannier, whowas in office until he assumed the Presidency of the Council in December1968. He was succeeded as FC President by the German government delegate K. F. Scheidemann.
Earliest Developmentsin Instrumentation
Of the many tasks facing Council andDirectorate in Europe, the development
40
and realization of the observationalequipment was the central one. Fromthe outset it had been agreed that inaccordance with Baade's proposal, thenucleus of the equipment should be apowerful reflector and a large Schmidttelescope. For the first one, the naturalexample was the 120-inch reflector ofLick Observatory with its up-to-date design by the Lick staff. It came into regular operation in February 1960 [7]. Aiming at a still larger size such as that ofthe Mt. Palomar 200-inch (in regular operation since November 1949 [8]) wouldhave been too ambitious for ESO; exceeding the size of the Mt. WiJson 100inch, the leading instrument of the pastdecades, was an interesting proposition. The Schmidt would be an essentialauxiliary: the Palomar Schmidt, in operation since January 1949 [9] had proven tobe indispensable as survey instrumentfor the work with the large telescopes.For both instruments, the design mightbe copied and thus time and costs besaved. We shall see, though, that ESOwould prefer modified solutions.
As a third instrument, the first meetingof the ESO Committee, in June 1953,proposed a meridian circle, although astrong tradition in positional astronomydid exist in the Southern Hemisphere,established by the Observatories of theCape and in South America. However,compared to the Northern Hemispheretheir number was too smalI. Moreover,positional astronomy was a strong component of the work of several Europeanobservatories and overall coverage ofthe sky essential for the establishmentof the fundamental reference system. Aswe shall see, not a meridian circJe but amodern alternative would be acquiredby ESO: a Danjon astrolabe. Other additional middle-size instruments, suggested at early EC meetings, included acopy of the Lick Double Astrograph anda copy of the Marseilles GPO. Only thelatter would later be realized, it played aroje in the site tests in South Africa (seearticle 11). We shall return below to thefurther specification of the middle-sizeinstruments.
The principal concern of the EC in tlle
MEETINGS OF COUNCIL ANO FINANCE COMM/7TEE, 1964-1969
COUNCIL FINANCE COMMITIEE
No. Date Place President No. Date PIace President
1 1964 February 5-6 Paris J.H.Oort 1 1964 February 6 Paris J. H. Bannier
2 1964 May 26 Obs. Haute-Provence J. H. Bannier
2 1964 May 26-27 Obs. Haute-Provence J.H.Oort3 1964 July 7 The Hague J. H. Bannier
4 1964 November 17 Bergedorf J. H. Bannier
3 1964 December 2-3 Hamburg J. H. Oort5 1965 June 1 Stockholm J. H. Bannier
4 1965 June 1-2 Stockholm J. H. Oort6 1965 November 11 Bergedorf J. H. Bannier
5 1965 Nov. 30/Dec. 1 Hamburg (B. Lindblad t) Chair-
man: J. H. Oort 7 1966 March 31 Santiago de Chile J. H. Bannier
6 1966 April 1 Santiago de Chile G.W. Funke
8 1966 June 28 Bergedorf J. H. Bannier
9 1966 November 15 Bergedorf J. H. Bannier7 1966 November Hamburg G,W. Funke
21-22 10 1967 May3 Bergedorf J. H. Bannier
8 1967 June 1 Hamburg G.W. Funke11 1967 November 21 Bergedorf J. H. Bannier
9 1967 December 1 Hamburg G.W. Funke12 1968June 11 Bergedorf J. H. Bannier
10 1968 July 2-3 Brussels G.W. Funke13 1968 November 19 Bergedorf J. H. Bannier
11 1968 December 3-4 Hamburg G.W. Funke14 1969 February 20 Bergedorf K. F. Scheidemann
12 1969 March 22 Santiago de Chile J. H. Bannier13 1969June 16 Hamburg J. H. Bannier
15 1969 October 3 Bergedorf K. F. Scheidemann
16 1969 December 15 Hamburg K.F. Scheidemann14 1969 December Hamburg J. H, Bannier
15-16
early years was, however, a differentmatter; it realized that for the furtherPlanning, both financially and as to timeschedule, it had to engage expertise intelescope design, not necessarily by anastronomer. Two names figured in theEC's deliberations already in the middle1950's: those of B. G. Hooghoudt and ofW. Strewinski, both weil qualified. Theengineer Hooghoudt was responsiblefor the successful design of themechanical parts of the Dwingeloo radiotelescope in the Netherlands which became operational in 1956. He did so asemployee of the funding foundationZWO, the director of wh ich, Bannier,was prepared to make Hooghoudt'sservices available to ESO. The engineerW. Strewinski, an employee of the firmof Heidenreich and Harbeck at Hamburg, had been responsible for the design and construction of the Schmidttelescope recently acquired by theHamburg-Bergedorf Observatory underHeckmann's directorate. This telescopewas completed in 1955 [10], after wh ichStrewinsky created his own designbureau.
The EC's and Council's ideal wouldhave been to engage both experts inclose collaboration in the context of adesign bureau, but attempts towardsthis end were not successful. To some
extent this was due to their very differentpersonalities and background, but therewas also the dragging uncertainty in therealization of the ESO project in the earlyyears which forced the engineers toundertake other projects besides ESO.Concern about the failure to build up astrong design bureau, first among theEC, then among Council, is a recurrenttheme in their meetings [11]. Eventuallythe two engineers became engagedin separate parts of the project.Hooghoudt collaborated in generallogistic planning and became responsible for the design and the constructionof the 1-m Photometrie Telescope. Healso, after a visit of observatories in theUnited States, prepared for the May andOctober 1957 meetings of the EC a report on design considerations for a largetelescope [12]. Strewinski becamedeeply involved in the design and construction of the ESO Schmidt telescopeand in the early design stage of the largetelescope, a natural follow-up of his earIy close collaboration with Heckmann.
ESO's Ordest Committee,the Instrumentation Committee
In the earliest stage of ESO, whenstriving towards the Convention andconducting the site tests were the EC's
main concern, the question of the futureinstrumentation was not yet prominentbut the EC meeting of July 1958 didappoint an Instrumentation Committee(henceforth denoted by IC) consisting ofO. Heckmann, A. Couder, R. Coutrezand J. Ramberg. However, little progress was made during the followingtwo years. In July 1960 Fehrenbach wasadded to the IC and soon afterward,when the prospects for financing became more favourable, the IC becamevery active. Its meeting of January 3,1961 at Paris was henceforth denotedas Number 1 in the long series to follow.Those up to the year 1970 are listed inthe accompanying box. The rapidsuccession of meetings early in 1961reflects the enhanced activity. The ICsoon created subcommittees for dealingwith particular aspects of the instrumentation; their meetings will not be systematically recorded here.
By the time of the completion of therequired ratifications of the Convention,early 1964, the IC had met twelve times.Its chairmanship alternated betweenHeckmann and Fehrenbach until Heckmann became Director per November 1,1962. From then on Fehrenbach chairedthe IC, a task to which he would dedicate himself over almost ten years, till1972. The first Secretary of the IC was J.
41

MEETINGS OF THE INSTRUMENTATION COMMITTEE, 1961-1969
No. Date Place Chairman/Presidenl Minules made by Minules in Files ESO Remarks,Headof Adm. Ref.lo EHA.
1 1961 January 3 Paris O. Heckmann J. Ramberg +2 1961 February 22-24 Obs. H.-Provence Ch. Fehrenbach G. Courles?3 1961 April 18-19 Paris Ch. Fehrenbach - Agenda in I. C. 1.9.c.
Report in letter by Min-
naert to Oort + Blaauw
in EHA - I. C. 1.9.c.4 1961 June9-10 Tübingen Ch. Fehrenbach - Agenda in I. C. 1.9.c.5 1961 Paris ? -6 1961 November 11-12 Bergedorf O. Heckmann J. Ramberg +7 -8 1962 June 16-17 Uccle ? -9 1962 Oclober 17-18 Slockholm + Saltsjö- O. Heckmann J. Ramberg +
baden10 1963 January 29-30 Ulrechl Ch. Fehrenbach J. Ramberg +11 1963 May 14-15 Paris Ch. Fehrenbach J. Ramberg +12 1963 October 1 Heidelberg Ch. Fehrenbach J. Ramberg +13 1964 March 11-12 Liege Ch. Fehrenbach J. Ramberg +14 1964 June 25-26 Bergedorf Ch. Fehrenbach J. Ramberg (Assistenl +
Dir.)15 1964 Seplember 4 Hamburg Ch. Fehrenbach J. Ramberg +16 1965 January 18-19 Bergedorf Ch. Fehrenbach J. Ramberg +17 1965 May 18-19 Bergedorf Ch. Fehrenbach J. Ramberg +18 1965 December 2 Bergedorf Ch. Fehrenbach J. Ramberg +19 1966 January 18 Paris Ch. Fehrenbach J. Ramberg +20 1966 May 26-27 Obs. H.-Provence Ch. Fehrenbach F. Dossin +21 1966 October 12 Paris Ch. Fehrenbach F. Dossin +22 1966 November 23 Bergedorf Ch. Fehrenbach F. Dossin +23 1967 May 2 Bergedorf Ch. Fehrenbach F. Dossin +24 1967 December 18 Bergedorf Ch. Fehrenbach F. Dossin +25 1968 July 4-5 Bergedorf Ch. Fehrenbach A. Behr + S. Laustsen +26 1968 November 5-6 Bergedorf Ch. Fehrenbach A. Behr + S. Laustsen +27 1969 January 15-16 Bergedorf Ch. Fellrenbach A. Behr + S. Laustsen +28 1969 May 8 Bergedorf Ch. Fehrenbach A. Behr + S. Laustsen +29 1969 June 2 Nice Ch. Fehrenbach A. Behr + S. Laustsen +
Ramberg who continued to act in thiscapacity until May 1966, long after hehad joined the ESO DirEktorate.
Attempts to reconstruct the early proceedings of the IC are hampered by thefact that the ESO Historical Archives donot (yet) contain the minutes of the JC
meetings. Fortunately, many of theseminutes do form part of the Files of theESO Head of Administration; lackingfrom these are minutes of meetingsNos. 3, 4, 5, 7 and 8 pertaining to theperiod April 1961 to June 1962 butthese are, of course, interesting ones for
the earliest developments. We thereforehave to consult the reports on the IC'sproceedings presented at the meetingsof the EC which in most cases are fairlydetailed. Information is also contained ina number of letters, for instance formeeting No. 3 in a letter by M. Minnaert
Second Meeting of the ESO Council, with their advisors on May 26-27, 1964, at Observatoire de Haute-Provence.From left to right:Lett-hand photograph: J. H. Bannier, M. Oeloz, K. Walters (legal advisor to the Oirector), J. Ramberg, 0. Heckmann, J. H. Oort.Right-hand photograph: B. Lindblad, G. Funke, A. Reiz (Observer tor Denmark), J. Rösch, A. Blaauw.The left-hand photograph is part of the ESO Historical Archives contributed by J. H. Bannier, the righl-hand one was conlribuled by Ihe author.Most likely, more photographs of Ihe session were laken.
42

to Oort and Blaauw of May 1, 1961 (13).One of the first things the IC set out to
do, was acquainting themselves with instrumentation developments elsewherein the world, especially in the UnitedStates. This was in line with the policythe EC had stressed from the beginningand which had led to Hooghoudt's 1957report, and the EC was encouraged bythe generous way in which Americaninstitutes offered their help in buildingup ESO. Thus, immediately after theAssembly of the International Astronomical Union in California in the summer of1961, Heckmann and Fehrenbach madean extensive tour along observatories inthe United States and Mexico and visited prominent astronomers amongwhom I.S. Bowen, N.U. MayalI, D.Shane, A. E. Whitford and G. Haro. Theirreport (14) was discussed at the 15thmeeting of the EC, in November 1961. Itdeals with questions of telescope design, the choice of the site, design ofdomes and, finally, with matters of general policy. From this last section, let mequote a few paragraphs:
"Nos amis americains ont confirmenotre opinion que la responsabilite detoute la construction doit etre prise parles astranomes. C'est anous de deciderles solutions de principe, d'accepter etde contresigner tous les plans.
- - - La reussite de nos collegues duMont-Palomar s'explique en grandepartie par la collaboration intime desastronomes et des ingenieurs travaillanttous a Pasadena et se reunissant tresregulierement.
Ces heureuses circonstances paraissent difficiles a realiser par notre graupeeuropeen. Une collaboration active deCertains d'entre nous est neanmoins absOlument necessaire.
11 faut creer rapidement un bureaud'lngenieurs - - -. La construction d'unCentre d'Etudes et prabablement d'unlaboratoire d'optique nous paralt egalement indispensable. - - -".
The first paragraph stresses the desirability of the complete involvement ofthe astronomers themselves in designand construction, and reflects a changeIn attitude sometimes encountered inprevious telescope acquisition whenmuch more of the ingenuity and responSlbility was with the firm who deliveredthe telescope, sometimes even "off theshelves".
The report also led to discussion ofthe question with whom the ultimateauthority for decisions on matters of instrumentation should be; with the IC, orWlth the EC (or, later, the Council). This!ed to a task description for the IC implyIng a considerable degree of authority(15):
" 1. The IC prepares all technicaland financial aspects of the instrumen-
tation in order to enable the Council totake the necessary decisions;
- 2. The IC makes all necessary instrumental and technical decisions within the frame of the budget and of thedecisions of the Council. "
Based on this task description, theInstrumentation Committee has playeda very influential role in ESO's early development.
Naturally, because the large telescope and the Schmidt form the nucleus- the raison d'etre- of ESO, their historyshould figure prominently in these reviews. Yet, we shall in the present articleconfine ourselves to the acquisition ofthe middle-size telescopes becausethese constituted the outfit on La Sillawhen the Observatory started regularoperation in the late 1960's. The earlyhistories of the Schmidt and the LargeTelescope, both having become operational only in the course of the 1970's,will be central themes to be treated afterI have dealt with the phase concluded in1969. For the Schmidt, this will then alsocomprise the impressive associatedsurvey projects.
The Middle-Size Teleseopes
One of the IC's first assignments wasthe specification of the telescopeswhich, as part of the "initial programme"of the Convention would be referred toas:
"c. not more than three telescopeswith a maximum aperture of 1 meter;"and
"d. a meridian circle;"For two of the three telescopes men
tioned under (c) the IC meeting of April1961 arrived at the following recommendations: one telescope designedprimarily for photo-electric photometry- it would become known as the Photometrie Telescope - and one telescopedesigned primarily for spectroscopicwork - to become the SpectrographicTelescope. We shall first deal with thesetwo, and subsequently see how the tworemaining items were filled in with theGPO and the Astrolabe.
The procedure chosen by the IC forthe realization of these two instrumentsreflects in an interesting way ESO's international character. It "planted" theplanning and construction in the fertilesoil of the various national interests.Thus, the Photometrie Telescope became a concern of astronomers in theNetherlands, especially of those of theKapteyn Laboratory at Groningen wherephoto-electric photometry was beingdeveloped by J. Borgman and collaborators. Also involved in this projectwas M. Minnaert of Utrecht who, withBorgman, acted as liaison with the IC.Similarly, the Spectrographic Telescope
was delegated to French astronomy,especially to the group around Ch.Fehrenbach at Marseilles and the HauteProvence Observatory. (The early planning of the Schmidt Telescope, to bedescribed later, under the supervision ofBergedorf Observatory's director, Heckmann, reflects this same policy.) Thepolicy of the EC to delegate development and realization of the middle-sizetelescopes to the above groups alsoresulted from a wish of the EC, to gainexperience with different firms whichmight become useful for the construction of the large telescope (16).
The 1-Metre PhotometrieTeleseope
Early 1961 the group involved at theKapteyn Laboratory formulated themost essential specifications for the design of this telescope [17J:- optimum definition on the opticalaxis, but image quality outside the axisgood enough for offset purposes;- fairly rapid switching between widelydifferent directions; for this purposeaiming at a short telescope tube;- provision for heavy photometrieequipment at the Cassegrain focus andfor at least one more photometer orspectrograph at another (Nasmyth)focus, with the possibility of rapid interchange;- in connection with these specifications, preference for a fork mounting.
These specifications had been thesubject of consultation with the engineerHooghoudt, and reference was made tothe 90-cm light-collector type telescopes in use at McDonald Observatoryand at the Leiden Southern Station aspossible examples.
At the April 1961 meeting of the IC,offers for the mechanical parts had beenreceived from six firms, but the ICdeveloped strong preference for theDutch firm of Rademakers to whomHooghoudt was consultant engineer(18). Decisions to this effect and on thechoice of a fork mounting - not an English mounting - were taken at the June1961 meeting of the IC [19, 20). For theoptics of the telescope offers were received from five firms covering a varietyof glass sorts (including regular glassand low-expansion Tempax and Silica)(21), and at the June 1962 meeting ofthe EC the IC reported that orders hadbeen placed: for the mechanical partswith the Rademakers-Hooghoudt combination, for the main mirror with Jenoptik in Jena and for the secondary mirrorswith Hereaus. The construction wassupervised for the IC by Borgman andMinnaert. Meanwhile, preparations weremade for the design and construction ofthe main photometer for the telescope.
43

The 1-m Photometrie Teleseope Nearing Completion. By the end of the year 1964 the 1-mPhotometrie Telescope was almost ready to be delivered by the Firm of Rademakers atRotterdam. It is shown here in their assembly hall on the occasion of a visit of the ESO groupcharged with the supervision of the construction. The photograph shows from left to right:(1) extreme left background: unidentified; (2) J. Doornenbal, mechanic. employee of ESO; (3) J.van der Ven (at that time at Rademakers, later to be employed by ESO); (4) J. Ramberg,Assistant Director of ESO; (5) on lowest step of ladder, B. G. Hooghoudt, consulting engineerfor ESO; (6) high on ladder, the author of this article (Kapteyn Laboratory); (7) on lowest step ofladder, 0. Heckmann, Director of ESO; (8) M. Minnaert (Utrecht Observatory).From a photograph in the ESO photographie archives, marked "7DEC. 1964".
The Oetober 1962 meeting of the ICdelegated this to Borgman, Minnaertand Siedentopf.
By the end of 1963, when the eompletion of the teleseope would be a matterof little more than a year only, it hadbeeome elear that the teleseope wouldnot be used in South Afriea. However,ESO was still a long way from eompleting its building programme in Chile, andpotential users of the teleseope wereanxious to start soon. Therefore, it wassuggested at the November 1963 meeting of the EC that a provisional, simplehousing be aequired, and the May 1964meeting urged an immediate deeisionon the matter. At that time the Convention had been ratified and the ESO Direetorate had taken developments firmlyin hand. It ordered from the UnitedStates a dome of light eonstruetion,popular among advaneed amateur astronomers (Astro-Dome), and this wasmounted on La Silla in the course of1966. In Oetober and November of thatyear the teleseope was mounted in thisprovisional shelter under the supervisionof the engineer Hooghoudt and the firmof Rademakers (after the teleseope hadarrived in Chile in the middle of 1965and then stored in ESO's ware house atLa Silla). In Deeember 1966 the firstphotometrie work was done by Borgman and eollaborators with a simplephotometer borrowed from the Kapteyn
44
Laboratory. The ESO photometer forthis teleseope, eonstrueted at the Kapteyn Laboratory, was mounted in themiddle of 1967.
The Photometrie Teleseope has beendeseribed in detail by Hooghoudt inESO Bulletin No. 1 of November 1966whieh also eontains a deseription of thephotometer by M. de Vries. The teleseope was moved to its permanentdome in the fall of 1968. The provisionaldome has, sinee then, been used forseveral purposes and now houses theLeiden 90-em teleseope. Apolarimeterfor the 1-m teleseope, installed at theend of 1968, was designed by A. Behr ofthe Hamburg Observatory and eonstrueted under his supervision atGöttingen Observatory. A deseription byBehr is in ESO Bulletin No. 5 of Deeember 1968.
The Spectrographic Telescope
Main speeifieations for this teleseope,drawn up by the group around Fehrenbach at Marseilles and Haute-Proveneeand initially also planned in the 1-metreeategory, ineluded: provisions for usingboth the Cassegrain and the Coudefoeus, and an English mounting [22].Ofters were reeeived from the same sixfirms as for the Photometrie Teleseopeand preference was then given to thefirm of REOSC in Paris with whom the
Freneh group had experienee in the delivery of speetroseopie equipment.REOSC had also built the GPO teleseopes. As an alternative, the IC hadeonsidered aequiring a repliea of the KittPeak 36-ineh teleseope with some modifieations [23]. This idea was given up,however, when in 1961 an appealingalternative was suggested by theFreneh: a duplieate of the 1.5-metrespeetrographie teleseope for whieh theHaute-Provenee Observatory was aboutto eomplete design studies [24]. Construetion of two identieal teleseopeswould result in priees exeeeding onlylittle the priee of one 1-m teleseope. TheFreneh design, envisaging a Coudefoeus only, would have to be slightlyadapted. Doubts arose whether the inerease of the "Convention-size" from 1to 1.5 metre would be aeeeptable for theESO Couneil, but this never beeame aserious problem.
The ofter of REOSC was aeeepted inprineiple by the EC meeting of February1963 and beeame final after the ratifieation of the Convention [25]. A glassblank for tlle main mirror was orderedfrom Sovirel, Parra Mantois, and blanksfor the seeondary mirrors from Corning.For the speetrographs, design studies with strong eontribution from the Frenehgroup - were taken up by the IC early in1963 and for the Coude speetrographthe order was plaeed at REOSC in Oetober 1965. The two teleseopes were
The 1.5-m Speetrographic TeleseopeNearing Completion. The SpectrographicTelescope in the assembly hall of the firm ofREOSC, shortly before its shipment to Chile.From a photograph in the ESO photographiearchives, marked "REOSC 91-Ballainvilliers"in envelope marked "February 1968".

Completed in the course of 1967 and theoptics for ESO's copy tested in theHaute-Provence duplicate before beingshipped to Chile. In the middle of 1968the telescope was installed in its domeOn La Silla under the supervision of thedirector of REOSC, A. Bayle. At the December 1968 Council Meeting Fehrenbach, just back from a stay on LaSilla, could report that the instrumentWorked satisfactorily. For the first spectroscopic work, a Cassegrain spectrograph was borrowed from MarseillesObservatory. It would soon be replacedby ESO's own Cassegrain spectrograph"Chilicass". The Coude spectrographwas finished by the end of 1968 andbecame operational on La Silla in theCOurse of 1969.
A detailed description of the Spectrographic Telescope and the Coudespectrograph was published by Fehrenbach in ESO Bulletin No. 3 of February1968. The Cassegrain spectrograph isdescribed by A. Baranne, E. Mauriceand L. Prevot of Marseilles Observatoryin ESO Bulletin No. 7 of Sepember 1969and by Maurice in ESO Bulletin No. 11of February 1975. The Coude spectrograph was described by H.J. Wood, B.Wolf (staff members of ESO) andMaurice (of Marseilles) in ESO BulletinNo. 11 of February 1975.
The GPO (Grand Prism Objective)
We have seen in article II that aroundthe year 1960 the GPO was introducedby its owner, the Marseilles Observatory, into the site testing activities in SouthAfrica as one of the projects whichwould allow testing in combination withastronomical research. Eight years later,In the Course of 1968, having meanwhilebecome ESO property, it started regularWork on La Silla.
The ESO GPO was a duplicate of theGPO installed at the Haute-ProvenceObservatory (OHP). These twins repreSented an improvement of the smallersize instrument of this type at the OHP(~he Petit Prism Objectif) developed earher by Fehrenbach. Main motivation forthis development had been the prospectof measurement of radial velocities offaint stars in a wholesale manner. TheGPO consists of a photographic and avisual tube, each of 4 metre focallength.The photographic one has a doubletobjective lens of 40 cm aperture, in frontof which is mounted an objective prismof the type developed by Fehrenbach.T.his consists of two components, one offirnt glass and one of crown-barium andthe angles of the two component~ arechosen in such a way that at wavelength4175 Athe light traverses the combinatlOn without deflection. Hence, by takingtwo exposures with the prism in oppo-
site orientations, one obtains on thephotographic plate for each star twonearly coincident spectra in opposite directions, and the relative displacementof the spectral lines in the two is ameasure of the radial velocity of the star.For a more detailed description we referto the article by Fehrenbach in ESOBulletin No. 1 of November 1966.
The possibility that the GPO plannedfor South Africa might become propertyof ESO was alluded to al ready in the late1950's at the time when - as we saw inarticle I - the prospects for French participation in ESO were very low. Forinstance, it is mentioned in the report ona discussion on December 23, 1958 atParis when Oort, chairman of the EC,discussed this participation with Danjonand Fehrenbach in the company of theFrench government representative Bayen [26]. The decision to incorporate theGPO into the ESO project was taken atthe EC meeting of mid-July 1960. Asdescribed in article 11, at that epochplans for the Marseilles project had advanced to the stage where the choice ofits location became desirable.
At the July 1960 meeting of the ECFehrenbach presented three possibilities and the related financial schemes:(a) Execution of the project without financial involvement of ESO, in whichcase it would be located in a town in theSouthern Karroo offering logistic helpbut of no interest for ESO; (b) Executionat Zeekoegat, one of the potential sitesfor ESO, requiring financial support fromESO for various technical provisions;and (c) Incorporation of the project intoESO, implying financial contribution ofESO for these services and future ESOownership of the telescope and associated equipment.
The French delegation at the meetingexpressed strong preference for the lastone of these possibilities as it wouldstrengthen their efforts to persuade theFrench government to participate inESO. The costs of the instrument already expended should be consideredas part of France's first financial contribution. (The costs mentioned on thisoccasion were 330,000,- Francs; theamount of 60,361.96 US dollars wasmentioned in the context of French payment at the July 1963 meeting of EC.)Delegates from most of the countriesrepresented at the July 1960 meetingwere in favour of the proposition for avariety of reasons: the GPO was considered a valuable asset to ESO; it openedthe possibility to soon undertake an international research programme; and itwould contribute to the site tests. AtHeckmann's proposal, the meeting resolved that the GPO would be considered as one of the instruments belonging to the "initial programme" of
the - still unsigned - Convention.The observational programme con
ducted by the Marseilles Observatory atZeekoegat was concluded at the end of1965. Aseries of publications byFehrenbach and his collaborators M.and A. Duflot, A. Florsch and N. Carozziin the Communications of ESO Nos.1- 7 over the years 1962-1966 arebased on this work with the GPO. Themechanical parts were then shipped toChile and the optics returned to Francefor overhaul. After the telescope hadbeen assembled and mounted in itsdome on La Silla, it resumed its workwith results that soon turned out to be ofsuperior quality due to the better observing conditions on the new site.
The Astrolabe
Among the tasks delegated to the ICwas the definition of the instrument forpositional astronomy. Initially, a meridian circle was the obvious choice, butmeanwhile other observatories undertook such projects [27]. This led therelevant Working Group of the IC tomodify the proposition and suggest atthe June 1962 meeting of the IC theacquisition of an astrolabe.
A modern version of the astrolabe hadbeen developed by Danjon and put touse at several French and other observatories. It has turned out to be a veryuseful instrument as it avoids to a largeextent the systematic errors inherent tothe meridian circle. Its limitation was inthe restriction to bright stars, but for themain purpose, the improvement of thefundamental system with all-sky coverage, this was no serious drawback.The Dutch foundation ZWO possesseda Danjon astrolabe, left over fromgeodetical work in the Geophysical Year,and offered it for half the price [28].
In a letter of June 7, 1962 B. Guinot,head of the Astrolabe Service of theParis Observatory and member of theWorking Group, suggested to the ECthat this astrolabe be made available forESO [29]. As ESO's planning at thatepoch was still in terms of South Africa,a location near the French station atZeekoegat was envisaged. The switchfrom meridian circle to astrolabe wasendorsed by the EC, and the acquisitionproposed in the budget for 1964 as discussed at its February 1963 meeting[30]. By that time, however, the probability of establishing ESO in Chile hadbecome so strong that the site remaineduncertain for a while.
Once the decision in favour of Chilehad become final, an interesting solutionemerged: a collaborative agreement between ESO and the University of Chile,by which the astrolabe was to be installed at Cerro Calan Observatory near
45

Santiago. The agreement dates from 29April 1965 [31]. ESO provided the astrolabe with chronograph equipmentand a building to house the instrument,and the University of Chile itschronometrie facilities. But most important: the observations would be conducted and supervised by the staft ofCerro Calan. After overhaul in Paris, theinstrument was installed on Cerro Calanin November and Oecember 1965 withthe collaboration of Guinot. Since then ithas made, under the supervision of F.Noel, solid contributions to the Fundamental Reference System in the Southern Hemisphere and to research on theEarth's rotation; a first demonstration ofthe appreciable systematic errors in thesouthern FK4 declinations was published by Anguita and Noel in 1969 [32].In ESO Bulletin No. 4 of June 1968 Noeldescribes the nature of the project andthe first years of operation.
ESO Chooses its Emblem
Not only heavy tasks kept the ESOCommittee busy. After the Conventionhad been signed, it acquired its emblemfor which at the October 1962 EC meeting Bannier presented some designs bythe artist Mrs. G. M. Pot. The Committeehad no problem in making up their mind;according to the minutes it chose thedesign "in which the stars show at theirbest". The emblem's stars - the Southern Cross - still show weil, as is apparent from the front page of thisMessenger.
References and NotesAbbreviations used:EC = ESO Committee (the Committee pre-
ceding U,e ESO Council).ECM = ESO Committee Meeting.IC = Instrumentation Committee.EHA = ESO Historical Archives (see the arti
eie in the Messenger of December 1988).FHA = Files Head of Administration at ESO
Headquarters.
[1] Circular letter by Oort to EC memberspreparatory to the ECM of May 1959, inEHA-I.A.1.9., and minutes of that meeting.
[2] See letters of Oort to Danjon and Funkeof May 30, 1962, in EHA-1. C. 1.1.c.
[3] In EHA-1. C. 1.1.d.[4] In EHA-1. C. 2.1.g.[5] See correspondence between ZWO and
University of Groningen in the years1962 and 1963 in EHA-1. C. 2.1.e.
[6] Information provided by the PersonnelDepartment of ESO; also: minutes of theECM of July 1963, p. 12.
[7] Pub!. Astron. Soc. of the Pacific 72, 225,1960.
[8] I. S. Bowen, Pub/. Astron. Soc. of thePacific 62, 95, 1950.
[9] I.S. Bowen, Pub!. Astron. Soc. of thePacific 61, 243, 1949.
[10] Jahresberichte Hamburger Sternwarte1954 and 1955; Sky and Te!escope 15,Nov. 1955, p. 10.
[11] See, for instance, minutes ECM of Oct.1957, June 1961, Oct. 1962, Nov. 1963,Council Meetings of May 1964 and April1966 and correspondence betweenFehrenbach, Heckmann and Oort ofJune 1964 in EHA-I.A. 2.9. and I.A. 2.10.
[12] Minutes ECM of April and Oct. 1957; theEHA do not contain the written report.
[13] In EHA-1. C. 1.9.c.[14] In EHA-1. C. 1.9.a., Visite des Obser
vatoires Americains.[15] Minutes ECM of November 1961.[16] See, for instance, the letter by Blaauw to
Fehrenbach of April 6, 1961 in EHA-1. C.1.9.c.
[17] EHA-1. C. 1.9.c.[18] See letter by Minnaert to Oort and
Blaauw of May 1, 1961 in EHA-1. C.1.9.c.
[19] See Minnaert's letter to Van Geelen of10 October 1961 in EHA-1. C. 1.9.c.
[20] Maps EHA-1. C. 1.9.flk contain preparatory correspondence, technical descriptions, and the tender of Rademakers.
[21] Minutes IC of November 1961.[22] See ref. No. 18.[23] Minutes ECM of June 1961.[24] Minutes ECM of November 1961.[25] EHA-1. C. 1.9.e. contains the Cahier de
Charges with drawings and the Marchede Gre a Gre of REOSC of May 20,1963.
[26] In EHA-1. C. 1.1.c. See also correspondence between Fehrenbach andOort of October 1958 in EHA-1. A. 2.1.
[27] The Yale and U.S. Naval Observatoriesplanned an instrument in Argentina andthe Pulkovo Observatory one in Chile,whereas Greenwich Observatory contemplated a collaborative project withthe Cape Observatory and HamburgObservatory one with Perth.
[28] Minutes Council Meeting of May 1964,p. 10.
[29] Letter by Guinot to Blaauw and followup correspondence with Van Geelen inEHA-I. C. 1.9.d.
[30] EHA-I.A. 1.19. and I.A. 2.6.[31] ESOAnn. Report 1965, p.10.[32] Astron. Journa/74, 954. 1969.
Field Strömgren Photometry with a CCDJ. KNUOE, H. J0NCH-S0RENSEN, Copenhagen University Observatory, Denmark
Introduction
The chemical evolution of the Galaxyis somehow coupled to its formation.The location of stars with a certainmetalIicity may therefore also dependon the Galaxy's dynamical history.
Laws describing the ga/actic distribution of the various stellar populationsintroduced to understand the construction of the Galaxy are often based ondetailed studies of the solar vicinity. Wehave been interested in studying particularly the F stars in a few galacticdirections of interest, e. g. the SGP, tosearch for [Fe/H] gradients in space andtime. Such studies are mostly based onaccurate photoelectric photometry butthe cry for data in more remote volumeshas been acute lately and as large telescopes are not available for extended
46
photometrie surveys we have tried touse a medium sized telescope with aCCO instead.
Stars with a metal content down by afactor of 2.5 relative to the Sun havebeen suggested to form a spheroid witha local scale height in the range from600 to 1000 pe and the stars with [Fe/H]:s - 0.8 another system with ascaleheight of several kpc. Strämgren photometry of F stars seems weil suited totrace the metal variation with age anddistance. The intermediate band photometry thus permits computation of distances based on individual absolutemagnitudes. Oistances based on a colour - absolute magnitude relation as(b-y)o - Mv may be quite uncertain. Foran F star with (b-y)o = 0.3 the width ofthe main sequence band is observed to
be 2 mag at least. The scale height ofthe most metal poor stars thus suggeststhat observations of objects several kpcfrom the plane should be performed.
According to current models of theGalaxy, it is only several kpc from theplane that extreme population 11 starswill dominate. Our observing parameters are set by the detection of an F9star 5 kpc from the plane. The V magnitude is about 18 at this distance. Themost critical colour is, however, the u·band, partly because the F stars are cooland partly because this band falls in thewavelength range where the CCO'sR.Q.E. is smallest, only 10 to 20 %. Thestellar metallicity may be computedwithout u but the band is required forestimating Mv. An F9 star has (b-y) = 0.4and (u-b) = 1.5, V = 18 then implies that

11.75
.j. 12.25
Background Subtraetion
After correcting for the sensitivityvariation across the frame, we noticedthat the background depended onthe brightness of the star and that thestellar magnitudes did not convergewith aperture.
From the seeing conditions during ourruns and the scale of the Danish1.5-m telescope we expected stellar images of 5 pixels or smaller.
Figure 2 shows the variation of thestellar magnitude with aperture when weuse the background suggested by theDAOPHOT photometry package. Thestar brightens with the aperture. Obviously we don't correct for all the signalin the background. DAOPHOT derivesthe background as, mode = 3 x median- 2 x mean. A good background estimator in crowded regions like a globular cluster, but apparently not in thesparsely populated general fjeld. We replaced the mode by the simple meanand the result is shown in Figure 3where we obtain a good convergenceafter - 10 pixels. For the faint programme stars we thus use a stellarradius of 12 pixels and not the 2-3suggested by the seeing measurements.
12
Figure 3: As Figure 2, but the mode is nowreplaced by mean and a convergence is established.
12.75
12.5
13O"-'-"-'-'-"'-:--"-'--"-'--,.LO
..................L,5....................-l.20..........~25
Aperture radius (plxelsJ
Transformation to the StandardSystem
The instrument magnitudes resultingfrom the aperture photometry are thencorrected for extinction and transformed to our secondary standard system by means of our standards. We areusing the transformations for the wholerange of apparent magnitude of our programme sampie. We have approximateIy three stars per frame at the SGP, alsoindicating that our limiting magnitude isabout V = 20 mag, so the transformationis used 6 magnitudes beyond the fain-
Flat Fielding
Correct flat fielding is of the outmostimportance when an accuracy of0.02 mag or - 2 % is required. It wouldof course be most convenient if a scientific frame with its astronomical objectsand background could be flat fieldedwith a single, well-defined, responseframe. Considering the possible intensity range in a frame bracketed by thebackground and a source, the CCD'sresponse surely must be linear. However, we may have seen indications thatthis is not quite the case. The responseseems to obey apower law, response_1,·03, valid for intensities from a fewhundred to several thousands. Figure 1shows the ratio of two u flat fields at alow and a high intensity. A three per centvariation is noted. A non-linearity meansthat we cannot use identical flat fieldsinside a stellar image and for thebackground. Using a flat field pertainingto the background level or to someintermediate level leaves the starsslightly too bright. For a y = 17 mag starwe make an error in the range I;o,.y =
0.01 -0.02 mag.
the images still did not saturate. As asecond approach we also tried to useopen clusters with deep uvby photometry allowing several stars in a singleframe but this may result in difficulttransformations of the m, index because of the cluster's narrow metallicityrange. About 20 standards in each colour is preferable per night. With the extinction determination, one third of thenight is spent on the photometric calibration of the system.
Back ~ "ode11.5
11.75
12
~ 12.25~
12.5
12.75
130 10 15 20 25
Aperture radius (pixels)
Figure 2: Aper/ure-magnitude versus aperture. The star brightens with aper/ure. The ticmarks on the curve indicate a one-pixel step.The magnitudes are computed with abackground estimated as: mode = 3x median - 2 x mean. Oue to the large stellarimages the background is measured in anannulus with radii 35 and 45 pixels.
1.1
u ~ 20 mag. So the problem concentrates on how one obtains high-preciSIOn Strömgren photometry for starswith u - 20. Depending on the actualChip available, the necessary integrationtlmes may be estimated. We used ESOCCD # 8 which required 70 to 80m.inutes to go down to the 20 th mag in uwlth a S/N of 30.
Photometrie Proeedure
As an objective of our study is tomake possible a distinction between Fstars with (Fe/H] = 0.0, -OA and lessthan - 0.8 representing the disk, theIntermediate population II and the extreme population 1I respectively, we re~uire a standard error of 0.02 (or better)In the colours v, band y to have a onesigma difference in (Fe/H] only. A similaraccuracy of u and thus of c, gives arelative distance error of 20 %.
For the CCD observations, we try toadopt the procedure established forphoto-electric measurements with extinction determination in all four colours~nd with copious standard star observations each night.
.9-~~:-<--'--'....,-'-ll..L-LL.L-,-L-.L..L--'---'--'--'-...L....1..J100 200 300 400 500
~igure 1: The ratio of a u flat field with originalmtensity about 650 AOU to a u flat withoriginal intensity 75 AOU. 80th flat fields arenormalized to a unit median sensitivity. Theabscissa indicates the row number and theaverage is taken through column 30 to 300.The ratio of the two flat fields is seen to showa variation of -3%.
uf 1hduf 11, co 1uon, 30 to 3001.2rr-.-".--,,-,-.---.-,.,---.,,.--,,-,-.-....-n
Standard Stars
No primary standard stars are faintenough to be used with a CCD on a1.S-m telescope; instead we have beenUSlng secondary standards down to the14th
mag from the literature. Standardswere exposed with a defocused teleSCOpe and with sufficiently long exposure times so the uncertainty in theshutter timing was of no importance and
47

test standard stars. Our results are sureIy depending on the detector linearity.m" c" and (b-y) have almost linear
Figure 4: uy versus y for three frames inSA 168. The magnitudes are in the instrumental system, but the transformation coeffiGient is about unity.
51168
Ox X
>Xx X x~ ~@o
plane seems within reach. We haveGlFe/Hj = 0.4 dex and D/D - 20 % orbetter. However, we do not see how theerror may be improved to better than- 0.01 mag or -1 % implying that thebest obtainable error is 0.3 dex in themetal content [Fe/H]. Regarding F stars,observations are just feasible at 5 kpcfrom the plane with a 1.5-m telescope.
It will be particularly interesting to seethe relative population shift with distance, but also to see if there exist starswith solar metallicity at these remotedistances.
As our general results are not tooencouraging concerning the obtainableerrors we want to stress that it seemspossible to do CCD photometry - also inthe u region - in the field without havingto establish standards in each frame.
We should mention that the reductionof the several thousand frames formingthe basis of this note have been performed with the MIDAS, IRAF andDAOPHOT packages.
Results
transformations whereas V includes, asexpected, a more significant colourterm.
Figure 4 shows as an example thevariation of Gy with y for three frames inthe selected area SA 168 and apparently Gy stays below the maximumacceptable error 0.02 mag down toabout the 19th mag. The three othercolours have an identical behaviour.
Towards the SGP we have so faridentified about 39 F stars, 0.2 < (b-y) <0.4 mag, in the whole magnitude rangedown to V = 20 and in a solid angle only- one tenth of a square degree. 33 ofthese stars also have good u measurements, so the sampie already is of somesignificance.
When u, v, band y are obtainable withan error 0.02 mag, the study's objectiveto investigate the [Fe/H] variation of theF stars beyond D = 5000 pc from the
2220I
I
°xo J
00
~ 0
18I
16I
I I
o
14
.1
.2
ö-Scuti Stars in NGC 6134H. KJELOSEN and S. FRANOSEN, Institute ofAstronomy, University ofAarhus, Denmark
The CCD camera on the Danish 1.5 mtelescope has been used to obtain exposure time series of small areas inopen clusters. The purpose is to studythe frequencies of different types of pulsating variables. Very low noise levelshave been reached by the use of differential photometry carefully consideringthe error sources.
cent. Consequently, for the bright stars,the change of seeing introduces a variation due to the non-linearity. We wereable to correct for this effect using thelarge number of exposures and largenumber of stars we have.
All time strings were transformed intopower amplitude spectra. Figure 1 presents the mean amplitude in three frequency intervals for stars over a rangeof 7 magnitudes. For high frequenciesthe amplitudes scatter very little about a
B-magFigure 1: The noise level for different frequency intervals. Squares correspond to periods in therange 3-10 min, triangles 10-60 min and diamonds 1-2 h. The abscissa is the B magnituderelative to a set of reference stars on the frame.
o
NGC
o 9
o Il D
o 11 /j~ 0
o !i'I ij
6.04.02.00.0
Il ce 0
0 0 0
• a0
0 \l SOb oe ~
9 \l o 0
5
2
-310
W 5tf1 0
0 Bz 2
-q10
5
2
-510
-2.0
Noise Levels
To illustrate the high precision one canobtain with CCD's, we present the datafrom one night in late May 1988 on NGC6192. Exposure times were 20 secondsand exposures were collected each minute for nearly 7 hours. The time serieshas some gaps, when tapes had to bechanged or the seeing and the trackingchecked. The resulting 370 frames werereduced with the DAOPHOT packageand relative magnitudes determined forall reasonably isolated stars. A small setof not too bright, weil isolated stars define the reference.
Two corrections turned out to be ofcritical importance. A colour correctionto eliminate differential extinction effectson stars of different colours. And acorrection for non-linearity of the CCD.The CCD (# 8) turned out to have a nonlinear response at high exposures before saturation of the order of two per
48
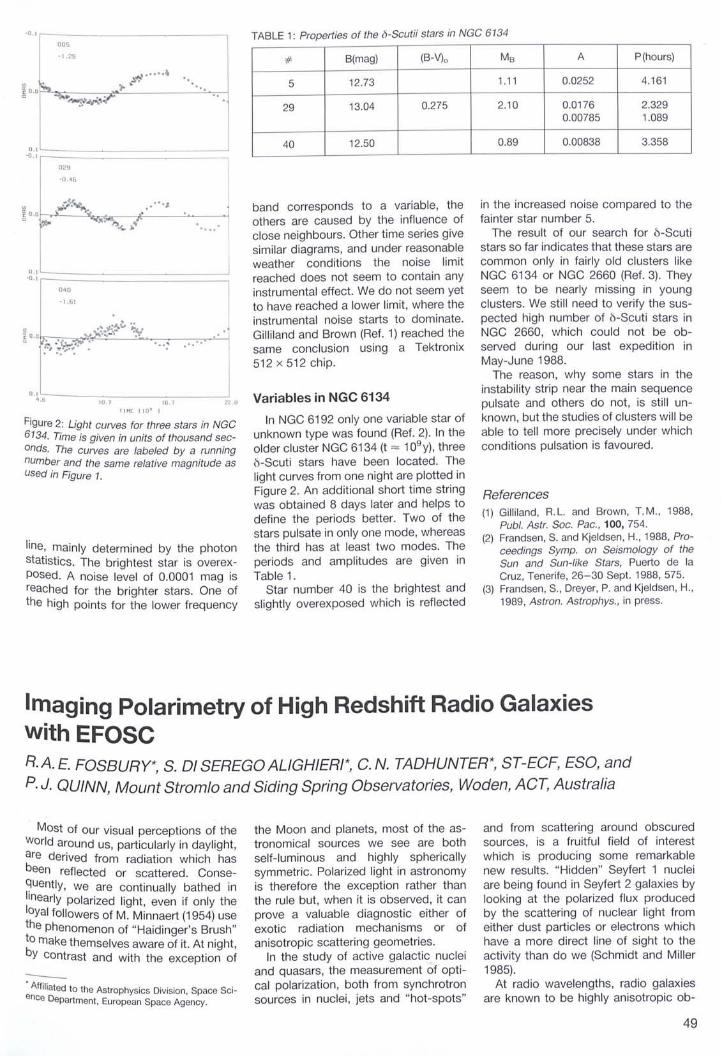
'0.1
DOS
1.2'J
:t# .....~)-.
TABLE 1: Properties of the b-Scutii stars in NGC 6134
# B(mag) (B-VJo MB A P(hours)
5 12.73 1.11 0.0252 4.161
29 13.04 0.275 2.10 0.0176 2.3290.00785 1.089
40 12.50 0.89 0.00838 3.358
029
0.116
Figure 2: Light curves for three stars in NGC6134. Time is given in units of thousand seconds. The curves are labeled by a runningnumber and the same relative magnitude asUsed in Figure 1.
line, mainly determined by the photonstatistics. The brightest star is overexposed. A noise level of 0.0001 mag isreached for the brighter stars. One ofthe high points for the lower frequency
References(1) Gilliland, R. L. and Brown, T. M., 1988,
Publ. Astr. Soc. Pac., 100, 754.(2) Frandsen, S. and Kjeldsen, H., 1988, Pro
ceedings Symp. on Seismology of theSun and Sun-like Stars. Puerto de laCruz, Tenerife, 26-30 Sept. 1988, 575.
(3) Frandsen, S., Dreyer, P. and Kjeldsen, H.,1989, Astron. Astrophys., in press.
in the increased noise compared to thefainter star number 5.
The result of our search for b-Scutistars so far indicates that these stars arecommon only in fairly old clusters likeNGC 6134 or NGC 2660 (Ref. 3). Theyseem to be nearly missing in youngclusters. We still need to verify the suspected high number of b-Scuti stars inNGC 2660, which could not be observed during our last expedition inMay-June 1988.
The reason, why some stars in theinstability strip near the main sequencepulsate and others do not, is still unknown, but the studies of clusters will beable to tell more precisely under whichconditions pulsation is favoured.
Variables in NGC 6134
In NGC 6192 only one variable star ofunknown type was found (Ref. 2). In theolder cluster NGC 6134 (t = 109 y), threeb-Scuti stars have been located. Thelight curves from one night are plotted inFigure 2. An additional short time stringwas obtained 8 days later and helps todefine the periods better. Two of thestars pulsate in only one mode, whereasthe third has at least two modes. Theperiods and amplitudes are given inTable 1.
Star number 40 is the brightest andslightly overexposed which is reflected
band corresponds to a variable, theothers are caused by the influence ofclose neighbours. Other time series givesimilar diagrams, and under reasonableweather conditions the noise limitreached does not seem to contain anyinstrumental effect. We do not seem yetto have reached a lower limit, where theinstrumental noise starts to dominate.Gilliland and Brown (Ref. 1) reached thesame conclusion using a Tektronix512 x 512 chip.
l2.U
....
If.i, I
llM( 110' J
0'0
1.61
O.~~ 10.1
I~ O.01r.-""7;';....l".,,"""~'-'-·~.::.:.'!_:.p._.:-_·--'~.:.·.--=-__~,........c.:.-)
., '~Y;.:. :" ..... .. ' 1....
Imaging Polarimetry of High Redshift Radio Galaxieswith EFOSCR. A. E. FOSBURY*, S. 01 SEREGO ALIGHIERI*, C. N. TAOHUNTER*, ST-ECF, ESO, and
P. J. QUINN, Mount Stromlo and Siding Spring Observatories, Woden, ACT, Australia
Most of our visual perceptions of theWorld around us, particularly in daylight,are derived from radiation which hasbeen reflected or scattered. Conse~Uently, we are continually bathed innearly polanzed light even if only the
10 I 'ya followers of M. Minnaert (1954) usethe phenomenon of "Haidinger's Brush"~o make themselves aware of it. At night,y Contrast and with the exception of-• Affiliated lo the Astrophysics Division Space Sci-
ence Department, European Space Ag~ncy.
the Moon and planets, most of the astronomical sources we see are bothself-Iuminous and highly sphericallysymmetrie. Polarized light in astronomyis therefore the exception rather thanthe rule but, when it is observed, it canprove a valuable diagnostic either ofexotic radiation mechanisms or ofanisotropie scattering geometries.
In the study of active galactic nucleiand quasars, the measurement of optical polarization, both from synchrotronsources in nuclei, jets and "hot-spots"
and from scattering around obscuredsourees, is a fruitful field of interestwhich is producing some remarkablenew results. "Hidden" Seyfert 1 nucleiare being found in Seyfert 2 galaxies bylooking at the polarized flux producedby the scattering of nuclear light fromeither dust particles or electrons whichhave a more direct line of sight to theactivity than do we (Schmidt and Miller1985).
At radio wavelengths, radio galaxiesare known to be highly anisotropie ob-
49

BluatbMm
-.......:::E-v.clor
Figure 1: An illustration of what may be producing the apparent optical elongation ofhigh redshift radio galaxies. Beamed radiation from the active nucleus - either a broadcone due to equatorial obscuration and/or anarrow cone due to relativistic beaming - isscattered by dusty clouds which may be acommon feature of young galaxies. In somecases, particularly massive clusters, theremay be sufficient Thomson optical depthfrom electrons in the hot intrac!uster mediumto produce wavelength independent scattering. In either case, the scattered radiation willbe polarized with an E-vector perpendicularto the line joining the c!oud to the nucleus.
N
E
I I
10 arcsec o
jects with narrow jets powering extended double-Iobed sources. Mucheffort has been expended in trying torelate the axis of this radio structure tooptical properties such as the apparentaxes of the elliptical galaxy counterpartand to the extended emission line regions (EELR) which are often foundassociated with this type of activity. AIthough there are relationships, they arenot strikingly obvious at low redshifts.
It was a surprise then when the discovery was made (McCarthy et al. 1987,Chambers et al. 1987) that the very distant, powerful radio galaxies at redshiftsgreater than about 0.6 had optical (restframe ultraviolet) images that are strikingly extended, in both emission linesand continuum, along the radio axis andlook quite unlike their closer counterparts in the rest-frame optical band. Until we get ultraviolet images, with tlleHubble Space Telescope, of a goodsampie of low redshift radio galaxies,we will not really know if we are seeing aqualitatively new phenomenon in thedistant objects or whether it is justsomething which is being revealed bythe different spectral balance of components at these wavelengths. The suggestion that the phenomenon really isnew may be supported by the observation that at least some of the same objects are also elongated in K-band images around 2.2 pm - emitted in the restframe at around 1 ~lm (Chambers et al.1988, Rawlings and Eales 1989).
The solution to the problem is particu-
o
Go
o
larly important because these objectsoccupy such a prominent position instudies of the formation and early evolution of galaxies. Although probably veryclosely related to quasars, these highredshift sources are seen as galaxiesand the most distant ones we can find.The fact that they are tracked down andidentified by virtue of their activity may,in this case, be a hindrance and certainIy demands caution in interpreting theirobserved properties solely in terms ofstellar evolutionary processes.
What could cause these optical elongations? The most favoured interpretation has been that the directional formsof activity - the radio jets - have somehow induced star formation processesalong their tracks which would show upas blue coloured extensions. Althoughtheoretical studies show that this process may be feasible (Oe Young 1989,Rees 1989), there are few, if any, knownexamples of it occurring in powerful lowredshift galaxies, suggesting that thecircumgalactic environment would haveto have evolved significantly. In addition, it has proved difficult to reconcilethe observed colours from the infraredto the ultraviolet with a single burst ofstar formation although this may not bean insurmountable difficulty if morecomplex evolutionary models are used.The association of the extended imageswith non-thermal emission appears unpromising because, although the radioand optical major axes are aligned,there is no detailed correspondence be-
o
ü
<)
o
oo
Figure 2: Two continuum images of the nearby (z = 0.0282) radio galaxy PKS 2152-69, around 5500 A on the left and around 3500 Aon theright. The insert shows an enlargement of the cloud along the radio axis after subtraction of the galaxy. The line through it shows the direction ofthe E-vector for the polarization which has been measured in the cloud. A comparison of the two images clearly iIIustrates how different radiogalaxies can be in the UV and might explain the elongation along the radio axis observed at high redshift, where these objects are observed intheir rest frame UV.
50

E.F.O.S.c. IMAGING POLARIMETRY MODE
1<>--<>
1<>--<>
1<>--<>
1<>--<>
1
two perpendicularlypolarized images
for each object in the fieldseparation -20"
E:l GCD (])
eCD
e 'Q @ E-j
CD (jj) d1Y (I,
rc./'(j'(T!
Ej EJE:l
11 0)(j)
L
..-e.
~CAMERAI
-I Y ~t---------COLLIMATOR -.JI filter in Wollaslon prism
filter wheel in grism wheel
/r~~~
TELESCOPEFOCAL PLANE
INPUT STAR FIELD SKETCH OF A WOLLASTON PRISM OUTPUT IMAGE
Figure 3: An illustration of how the Wollaston prism in the collimated beam of EFOSe produces on tl1e eeo two images witl1 perpendicularpolarization for eacl1 object in the field.
Object Filter Ares' Magn. P Pcorr 0 PArad(A) % % Degr. Degr.
3C277.2 B 2150-2850 B = 22.0 21 ± 4 21 ± 4 164 ± 6 613C277.2B B B = 22.5 6±7 0±7
3C368 V 2250-3000 V = 21.4 7.6 ± 0.9 7.6 ± 0.9 85 ± 4 183C368 R 2650-3750 R = 20.5 2.8 ± 1.2 2.5 ± 1.2 92 ± 15 18
These results refer to the integrated light from each source. 3C 277.2 B is an extended object7 arcsec to the North East from 3C277.2. Ares, is the rest frame wavelength range coveredby the observation and PArad is the position angle of the radio axis (McCarthy et al.. 1987).
tween their structures as there is withthe radio-optical jets and hot-spotsknown at low redshift.
The third explanation, involving theScattering from matter - either dust orelectrons - in an anisotropic radiationfield, is in retrospect perhaps a naturalchoice given what is known now aboutthe intrinsic and extrinsic mechanismswhich can cause such anisotropy. Wewere, in fact, led to this suggestion by asenes of detailed studies of a brightSouthern hemisphere radio galaxyknown as PKS 2152-69 which is notable~or its extreme extranuclear activity. This
nght, 13th magnitude, galaxy shows adetached cloud at a projected distanceof about 8 kpc along its radio axis whichradlates emission lines from species upto and including Fe9t (Tadhunter et al.1988). Associated with it is a continuum~ource remarkable for its blue colourfv <>': v+ 3
') which, incidentally, is quiteunlike known synchrotron sourceswhich are rather red.
In addition to its colour we also measured a linear pOlarizati~n of 12 + 3 %W'th -
I the electric vector perpendicular tothe line joining the cloud to the nucleus(dl Serego Alighieri et al. 1988). Since weWere unable to think of an emissionrnech .anlsm which would produce such~kblue and polarized source, RayleighI e Scattering of a bright beamed nu-c~ ,
ar source seemed to be the only con-
sistent solution. This would producepolarization in the correct orientationand, like the blue sky, a bluer spectrumthan the source. Thomson scatteringfrom electrons, while producing polarization, would not explain the blue colourand so we proposed fine dust particlesas the scattering medium. Althoughsuch dust could weil be destroyed in theintense radiation field of the beam, newmaterial could be supplied by the orbitalmotion of circumgalactic c1ouds.
We are led, then, to a picture of a radiogalaxy with a Blazar-like "searchlight"beam of radiation shining out through adusty envelope in the general direction ofthe radio axis (Fig. 1). Unless the beamsimpinge upon clouds, they remainessentially invisible. From the sequenceof continuum images we have of PKS2152-69 (Fig. 2) it is clear that scattering
Polarimetry of l1igl1 redsl1ift radio galaxies.
from the cloud is almost completelyswamped by starlight in the visible partof the optical spectrum. In the nearultraviolet, however, where the stars arefaint and the scattering is strong, thecloud becomes comparable in brightness to the rest of the galaxy. Is this thennot a natural explanation for the extensions seen at high redshift which we seein the optical at rest wavelengths between 2000 and 3000 Ä? The most direct test of the hypothesis is to look forlinear polarization which would have tohave the correct orientation - perpendicular to the elongation.
We have therefore measured thepolarization of two high redshift radiogalaxies, 3C277.2 (z = 0.766) and3C368 (z = 1.132), chosen becausethey are brighter members of the classand are accessible from La Silla (di
51

radio axis.. .
3C 277.2
IE
E
N\
radio axis\
3C 368Figure 4: EFOSC frames of 3C277.2 (Ieft, B filler + Wollaston prism) and of 3C368 (right, V filler + Wollaston). 3C277.2 is clearly brighter on thetop strip, where the E-vector is vertical while the radio axis is horizontal. The object on the left is 3C277.2B. 3C368 is clearly elongated and isbrighter in the top strip which has a horizontal E-vector, while the radio axis is approximately vertical (along the elongation).
Serego Alighieri et al. 1989). Observations were made in two runs in July 1988and April 1989 with EFOSC on the 3.6-mtelescope. The results are shown in thetable.
The EFOSC polarimeter mode (Dekker and D'Odorico 1986, di SeregoAlighieri 1989), with its focal planemasks of 20 arcsec which are sufficientIy large to accept the entire image ofthese distant objects, is uniquely suitedfor this type of observation (Fig. 3). It isnot easy however, since the galaxies arefaint (V ~ 21) and the most critical partof the process is undoubtedly the precision with which the sky signal can beestimated and subtracted. The principleof the instrument is to image an object,simultaneously, in orthogonal linearpolarizations; the simultaneity ensuringthat the method is insensitive to seeingand transparency changes. Althoughthe problem can be solved with just twoexposures at different position angles and indeed the polarization of 3C277.2is so strong that it is obvious from theraw images (Fig. 4) - better error estimates can be made by obtaining asequence of measurements at differentangles and plotting a function S(p) of thebrightness ratio of the two images versus position angle, (p.
The curve obtained for 3 C 368 isshown in Figure 5 and the fittedPcos2 (O-tp) curve gives the degree oflinear polarization P and the positionangle of the E-vector O. Instrumentalpolarization, wh ich is smalI, generally
52
less than 1 %, is measured from brightstars in the field which are assumed tobe unpolarized. The whole process ischecked by making measurements of aset of faint stars, bracketing the galaxyin brightness; although these could bepolarized by interstellar extinctioneffects, particularly at low Galacticlatitudes, it does give a rather directcheck on the error estimates. The measurements for some faint stars are alsoshown in Figure 5. Since the sky subtraction is so critical, we devoted considerable effort to selecting the bestmethod and we obtained the best results with the MIDAS command MODIFY/PIXEL, improved with the help ofRichard Hook at the ST-ECF. This command replaces a subsection of the image selected with the cursor by an interpolation on the surroundings. The difference between the original image and thereplaced one is then integrated (e. g.with INTEGRATE/APERTURE) to obtainthe sky-subtracted intensity of the object in the subsection.
The derivation of the degree of polarization and its angle from a set of brightness measurements involves the forming of a ratio, close to unity, of CCDcounts which are subject to photonstatistical and readout noise and anerror resulting from the sky subtraction,followed by a fitting process. The analytical propagation of error estimatesthrough this procedure in not straightforward and so we chose to do it usingMonte-Carlo techniques. The starting
points of this were sets of repeatedmeasurements of the sky signal madeusing an aperture identical in size withthat used for the galaxies. The resultsare shown as 1a errors on the valuesgiven in the table.
Another worry in the interpretation ofthe measurements, particularly for 3 C368 whicll is at low latitude, is the estimate of Galactic interstellar polarization.We have used first the relationship between the maximum interstellar polarization P1SM and the Galactic extinctionderived by Hiltner (1956). Using computer readable extinction maps (Burstein1988, priv. comm.) we find that P1SM ::::;
0.05 % for 3 C 277.2 (b = 79°) and P1SM
::::; 1.2% for 3C368 (b = 15°). In thecase of 3 C 368 the position angle of theE-vector of the polarization induced bythe interstellar medium of the Galaxy(Mathewson and Ford 1970) would beclose to the one measured for the object. A better check would then be tomeasure the polarization of another(hopefully normal) galaxy in the samefield whose light, unlike faint field stars,would be subject to propagation alongthe whole pathlength through theGalaxy. Such an object was found in thefield of 3C368 and its polarization in Vwas found to be less than 0.5 % in theposition of the radio galaxy E-vector. Asimilar check could be performed on3C277.2 - which is at high latitude andtherefore unlikely to show interstellareffects - by measuring a faint companion galaxy, 3C277.2B. This also turned

3e 368 V Band
0.10
-0.10
ReferencesChambers, K. C., Miley, G. K. and van
Breugel, W., 1987, Nature 329, 604.Chambers, K. C., Miley, G. K. and Joyce,
R R, 1988, Astrophys. J. 329, L75.Oekker, H. and O'Odorico, S., 1986, The
Messenger 46, 21.Oe Young, O. S., 1989, Astrophys. J. 342,
L59.di Serego Alighieri, S., Binette, L., Cour
voisier, T.J.-L., Fosbury, RA. E. andTadhunter, C. N., 1988, Nature 334, 591.
di Serego Alighieri, Fosbury, RA. E., Quinn,P.J. and Tadllunter, C.N., 1989, Nature, inpress.
di Serego Alighieri, S., 1989, in Proceedingsof the 1st ESOIST-ECF Data AnalysisWorkshop (eds. P. Grosbol et al.), in press.
Hillner, W.A., 1956, Astrophys. J. Suppl.Series 2, 389.
Mathewson, O. S. and Ford, V. L., 1970, Mon.Not. R. Astr. Soc. 74, 139.
McCarthy, P.J., van Breugel, W., Spinrad, H.and Ojorgovski, S., 1987, Astrophys. J.321, L29.
Minnaert, M., 1954, "The nature of light andcolour in the open air", Oover PublicationsInc.
Rawlings, S. and Eales, S.A., 1989, in Proceedings of the Second Wyoming Conference on "The Interstellar Medium in External Galaxies", in press.
Rees, M.J., 1989, Mon. Not. R. Astr. Soc.239, 1 p.
Schmidt, G. O. and Miller, J. S., 1985, Astrophys. J. 290, 517.
Syunyaev, RA., 1982, Sov. Astron. Let!. 8,175.
Tadhunter, C.N., Fosbury, R.A.E., di SeregoAlighieri, S., Bland, J., Oanziger, I.J., Goss,W. M., McAdam, W. B. and Snijders,M.A.J., 1988, Mon. Not. R. Astr. Soc. 235,405.
Wardie, J.F.C. and Kronberg, P.P., 1974,Astrophys. J. 194, 249.
guish between scattering by electronsand by dust. In 3 C 368, our two measurements, in V and R, already favourthe dust hypothesis in this object although there is no reason why Thomsonscattering could not playa role, particularly in massive clusters where therecould be a large column density of coronal gas (Syunyaev 1982).
emanating from active nuclei - lendconsiderable support to the ideas whichare seeking to unify the properties ofradio galaxies, quasars and BL Lac objects or Blazars by supposing that theirdifferent apparent properties are simplya result of their particular orientationwith respect to us, the observer.
In the case of 3 C 368, we were able toshow that not all of the polarized fluxwas coming from the nucleus and so theextended structure must also bepolarized. 3C277.2 is really too faint toinvestigate the extension separately using current techniques but clearly a taskfor the future is to test carefully that theextended structures really are polarizedand see if the E-vector is accuratelyperpendicular to the radius-vector fromthe nucleus. This is a strong predictionof the scattering model. In addition, thewavelength dependence of thepolarized flux can, in principle, distin-
o 50 100 150 200 250 300 350IO(Deg.)
Figure 5: The measurements (.) of S(cr), the component of the normalized Stoke parametersfor linear polarization, for the V images of 3C368 and the fitted cosine curve. Also shown (0) isthe average S (I() for faint stars in the same (rames.
-0.50
0.50
0.00
S(IO)
out to be unpolarized as shown in thetable.
Finally, there is a statistical bias in themeasurement of polarizations close tozero simply because, being the length ofa vector, it is a positive definite quantity.This can be corrected using a standardtechnique (Wardie and Kronberg 1974)and the results are shown as Pcorr in thetable.
The single most important conclusionthat can be drawn from these results isthat a significant fraction of the light thatWe see in the optical band cannot beComing directly from stars and thismeans that the colours cannot be interpreted simply in terms of stellar populations. This has profound and unfortunate consequences for the metllod ofUsing distant radio galaxies as tracers ofnormal galaxy evolution. On the positive~Ide, however, it does - if interpreted aslight scattering of beams of radiation
SN 1987A: Two Years of Six-colour Photometry with theDanish O.5-m TelescopeB. E. HEL T, Copenhagen University Observatory, Denmark, andL. P. R. VAZ, Observatorio Astronomico - OF -ICEx, Universidade Federal de Minas Gerais,Belo Horizonte Brazil,
For several years, a Brazilian-DanishSpanish group has collaborated onstudies of a particular type of variablestars, the so-called eclipsing binaries.
Part of the work has consisted of observing the binaries with the DanishD.5-m telescope in order to obtain accurate light curves in the Strämgren four-
colour uvby system. In early 1987 webegan yet another two-month observing run. Jens Viggo Clausen (Copenhagen) started in late January, one of us
53
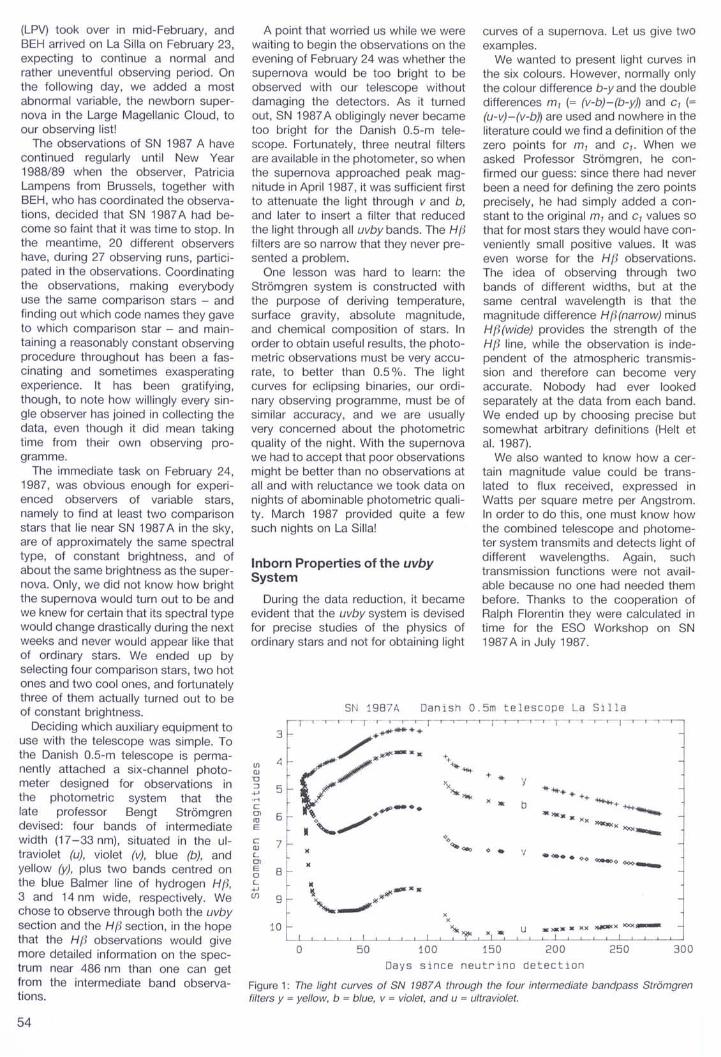
Days since neutrino detection
Figure 1: The light curves of SN 1987A through the four intermediate bandpass Strämgrenfilters y = yellow, b = blue, v = violet, and u = ultraviolet.
.)O(X X )()( >;fOO<X >OO<~
• 0.•• 00 <.IOlIoeoo 000 .......
y
b
u
'I
~ -=
o •
+ ..
curves of a supernova. Let us give twoexamples.
We wanted to present light curves inthe six colours. However, normally onlythe colour difference b-yand the doubledifferences ml (= (v-b)-(b-y)) and Cl (=(u-v)-(v-b)) are used and nowhere in theliterature could we find adefinition of thezero points for ml and Cl. When weasked Professor Strömgren, he confirmed our guess: since there had neverbeen a need for defining the zero pointsprecisely, he had simply added a constant to the original ml and Cl values sothat for most stars they would have conveniently small positive values. It waseven worse for the Hß observations.The idea of observing through twobands of different widths, but at thesame central wavelength is that themagnitude difference Hf-J (narrow) minusHß(wide) provides the strength of theHß line, while the observation is independent of the atmospheric transmission and therefore can become veryaccurate. Nobody had ever lookedseparately at the data from each band.We ended up by choosing precise butsomewhat arbitrary definitions (Helt etal. 1987).
We also wanted to know how a certain magnitude value could be transIated to flux received, expressed inWatts per square metre per Angstrom.In order to do this, one must know howthe combined telescope and photometer system transmits and detects light ofdifferent wavelengths. Again, suchtransmission functions were not available because no one had needed thembefore. Thanks to the cooperation ofRalph Florentin they were calculated intime for the ESO Workshop on SN1987 A in July 1987.
SN 1987A Danish O.5m telescope La Silla1 I 1 r I r I I I ,- r r T-' f I , I-I I ' r
....................../ ....- ..
v/·~_ ..\ ~..0'-...........
4
3
5
IIIQ}
D:J.w.....CClltJE
cQ}
LClEoL.wUl
Inborn Properties of the uvbySystem
During the data reduction, it becameevident that the uvby system is devisedfor precise studies of the physics ofordinary stars and not for obtaining light
A point that worried us while we werewaiting to begin the observations on theevening of February 24 was whether thesupernova would be too bright to beobserved with our telescope withoutdamaging the detectors. As it turnedout, SN 1987 A obligingly never becametoo bright for the Danish 0.5-m telescope. Fortunately, three neutral filtersare available in the photometer, so whenthe supernova approached peak magnitude in April 1987, it was sufficient firstto attenuate the light through v and b,and later to insert a filter that reducedthe light through all uvby bands. The Hf-Jfilters are so narrow that they never presented a problem.
One lesson was hard to learn: theStrömgren system is constructed withthe purpose of deriving temperature,surface gravity, absolute magnitude,and chemical composition of stars. Inorder to obtain useful results, the photometrie observations must be very accurate, to better than 0.5 %. The lightcurves for eclipsing binaries, our ordinary observing programme, must be ofsimilar accuracy, and we are usuallyvery concerned about the photometriequality of the night. With the supernovawe had to accept that poor observationsmight be better than no observations atall and with reluctance we took data onnights of abominable photometrie quality. March 1987 provided quite a fewsuch nights on La Silla!
(LPV) took over in mid-February, andBEH arrived on La Silla on February 23,expecting to continue anormal andrather uneventful observing period. Onthe following day, we added a mostabnormal variable, the newborn supernova in the Large Magellanic Cloud, toour observing list!
The observations of SN 1987 A havecontinued regularly until New Year1988/89 when the observer, PatriciaLampens from Brussels, together withBEH, who has coordinated the observations, decided that SN 1987 A had become so faint that it was time to stop. Inthe meantime, 20 different observershave, during 27 observing runs, participated in the observations. Coordinatingthe observations, making everybodyuse the same comparison stars - andfinding out which code names they gaveto which comparison star - and maintaining a reasonably constant observingprocedure throughout has been a fascinating and sometimes exasperatingexperience. It has been gratifying,though, to note how willingly every single observer has joined in collecting thedata, even though it did mean takingtime from their own observing programme.
The immediate task on February 24,1987, was obvious enough for experienced observers of variable stars,namely to find at least two comparisonstars that lie near SN 1987 A in the sky,are of approximately the same spectraltype, of constant brightness, and ofabout the same brightness as the supernova. Only, we did not know how brightthe supernova would turn out to be andwe knew for certain that its spectral typewould change drastically during the nextweeks and never would appear like thatof ordinary stars. We ended up byselecting four comparison stars, two hotones and two cool ones, and fortunatelythree of them actually turned out to beof constant brightness.
Deciding which auxiliary equipment touse with the telescope was simple. Tothe Danish 0.5-m telescope is permanently attached a six-channel photometer designed for observations inthe photometrie system that thelate professor Bengt Strömgrendevised: four bands of intermediatewidth (17-33 nm), situated in the ultraviolet (u), violet (v), blue (b), andyellow (y), plus two bands centred onthe blue Balmer line of hydrogen H ß,3 and 14 nm wide, respectively. Wechose to observe through both the uvbysection and the H(-J section, in the hopethat the Hf-J observations would givemore detailed information on the spectrum near 486 nm than one can getfrom the intermediate band observations.
54
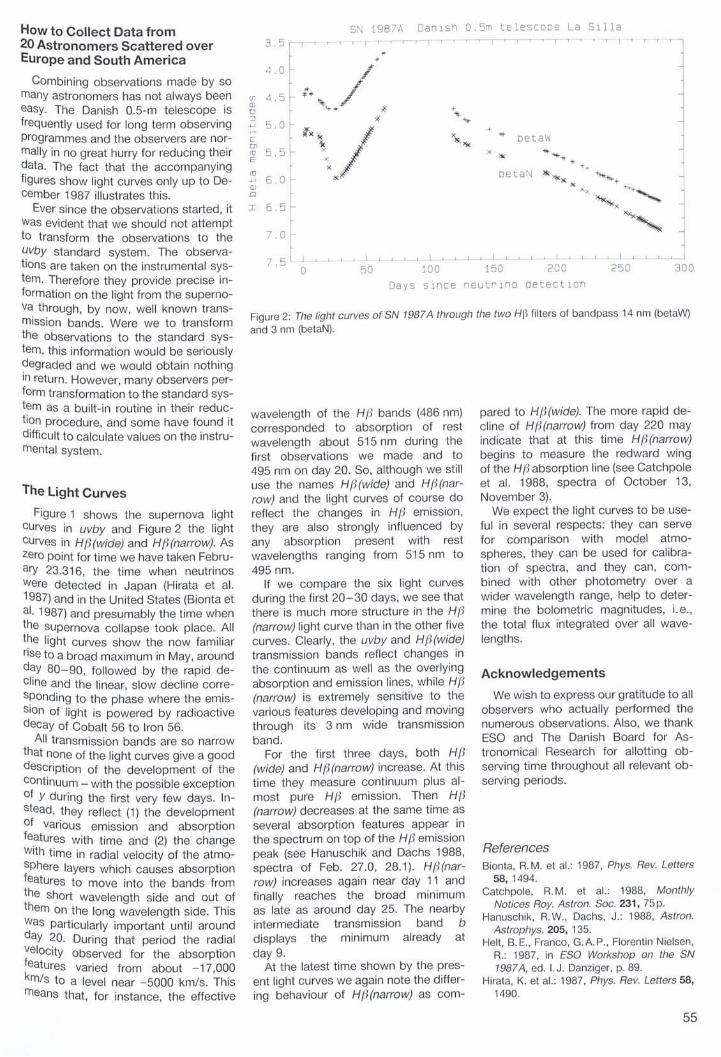
S~ 1987A ~an1sh 0.5m elescope ~a Sllla
300250, I ,
200
beta~
.... b taW.... ........
r T • t I , I
+
x
150
Acknowledgements
We wish to express our gratitude to allobservers who actually performed thenumerous observations. Also, we thankESO and The Danish Board for Astronomical Research for allotting observing time throughout all relevant observing periods.
pared to Hß (wide). The more rapid decline of Hß(narrow) from day 220 mayindicate that at this time H ß (narrow)begins to measure the redward wingof the Hßabsorption line (see Catchpoleet al. 1988, spectra of October 13,November 3).
We expect the light curves to be useful in several respects: they can servefor comparison with model atmospheres, they can be used for calibration of spectra, and they can, combined with other photometry over awider wavelength range, help to determine the b%metric magnitudes, i. e.,the total flux integrated over all wavelengths.
ReferencesBionta, R. M. et al.: 1987, Phys. Rev. Letters
58, 1494.Catchpole, R. M. et al.: 1988, Monthly
Notices Roy. Astron. Soc. 231, 75 p.Hanuschik, R. W., Dachs, J.: 1988, Astron.
Astrophys. 205, 135.Helt, B.E., Franco, G.A.P., Florentin Nielsen,
R.: 1987, in ESO Workshop on the SN1987A, ed. I.J. Danziger, p. 89.
Hirata, K. et al.: 1987, Phys. Rev. Leiters 58,1490.
I I I l I I l I J I I
100I I I I J I
Days 51 ce ne r1no de ec 10
5[' ~ ....4.0 /
,.. I"'1'+ /
""......rl
C(J)
roE
5.0
Cf) 4.5 ....QJ
o
.5 t-
I-ro.w 6.0QJ
.0
I 6.5
I7.0 [
7.51 I , I ,o 50
Figure 2: The light curves of SN 1987A through the two Hß filters of bandpass 14 nm (betaW)and 3 nm (betaN).
wavelength of the Hß bands (486 nm)corresponded to absorption of restwavelength about 515 nm during thefirst observations we made and to495 nm on day 20. So, although we stilluse the names Hß(wide) and Hß(narrow) and the light curves of course doreflect the changes in Hß emission,they are also strongly influenced byany absorption present with restwavelengths ranging from 515 nm to495 nm.
If we compare the six light curvesduring the first 20-30 days, we see thatthere is much more structure in the Hß(narrow) light curve than in the other fivecurves. Clearly, the uvby and Hß(wide)transmission bands reflect changes inthe continuum as weil as the overlyingabsorption and emission lines, while Hß(narrow) is extremely sensitive to thevarious features developing and movingthrough its 3 nm wide transmissionband.
For the first three days, both Hß(wide) and Hß(narrow) increase. At thistime they measure continuum plus almost pure Hß emission. Then Hß(narrow) decreases at the same time asseveral absorption features appear inthe spectrum on top of the Hßemissionpeak (see Hanuschik and Dachs 1988,spectra of Feb. 27.0, 28.1). H ß (narrow) increases again near day 11 andfinally reaches the broad minimumas late as around day 25. The nearbyintermediate transmission band bdisplays the minimum already atday 9.
At the latest time shown by the present light curves we again note the differing behaviour of Hß(narrow) as com-
How to Collect Data from20 Astronomers Scattered overEurope and South America
Combining observations made by somany astronomers has not always beeneasy. The Danish 0.5-m telescope isfrequently used for long term observingprogrammes and the observers are normally in no great hurry for reducing their~ata. The fact that the accompanyingflgures show light curves only up to December 1987 illustrates this.
Ever since the observations started, itwas evident that we should not attemptto transform the observations to theuvby standard system. The observations are taken on the instrumental system. Therefore they provide precise information on the light from the supernova through, by now, weil known transmission bands. Were we to transformthe observations to the standard system, this information would be seriouslydegraded and we would obtain nothingIn return. However, many observers perform transformation to the standard system as a built-in routine in their reduction procedure, and some have found itdifficult to calculate values on the instrumental system.
The Light Curves
Figure 1 shows the supernova lightcurves in uvby and Figure 2 the lightcurves in Hß(wide) and Hß(narrow). Aszero point for time we have taken February 23.316, the time when neutrinoswere detected in Japan (Hirata et al.1987) and in the United States (Bionta etal. 1987) and presumably the time whenthe supernova collapse took place. Allthe light curves show the now familiarrise to a broad maximum in May, aroundday 80-90, followed by the rapid decline and the linear, slow decline correSponding to the phase where the emission of light is powered by radioactivedecay of Cobalt 56 to Iron 56.
All transmission bands are so narrowthat none of the light curves give a gooddescription of the development of theContinuum - with the possible exceptionof Y during the first very few days. Instead, they reflect (1) the developmentof various emission and absorptionfeatures with time and (2) the changewlth time in radial velocity of the atmosphere layers which causes absorptionfeatures to move into the bands fromthe short wavelength side and out ofthem on the long wavelength side. Thiswas particularly important until aroundday 20. During that period the radialvelocity observed for the absorptionfeatures varied from about -17 000k 'm/s to a level near -5000 km/so This
means that, for instance, the effective
55

CCD Spectroscopy of Py (10939), Pö (10049)and Corresponding Balmer Lines in 30 Doradus
A. GREVE, IRAM, Grenoble, France, andC. O. McKEITH, J. CASTLES, Queen 's University, Belfast, Northem Ireland
Understanding the physical and dynamical evolution of galactic and extragalactic H 11 regions requires a knowledge of the dust component and itsdistribution. To date the extinction Avhas been derived by various methods:optical and infrared line ratios, comparison of radio and emission line fluxes,stellar photometry, etc. In particular theintensity ratios of the strong and spectroscopically easily accessible Balmerlines H", Hil are frequently used to deriveAv via their decrement. Since these linesoriginate from different upper levels, theinterpretation of the observed line ratiosrequires recombination line model calculations (cf. Osterbrock 1974) which inmany extragalactic cases have failed togive consistent results (Ward et al. 1987,Malkan 1983, Rieke and Lebofsky1981). This difficulty can be avoided byusing multiplet line ratios originatingfrom the same upper level so thatthe theoretical line ratios dependprimarily on their relative transitionprobabilities.
There are only few candidates of multiplet lines of abundant atomic specieswith sufficient wavelength spacings toderive accurately the differential extinc-
tion, viz. the corresponding Paschenand Balmer lines Py (10939 A) - H,~(4102 A), Po (10049 A) - H, (3970 A) (Aller and Minkowski 1956), and lines of[SII] at 10287,10330,10336,10370 Ainthe IR and at 4069, 4076 A in the blue(Miller 1968). However, these line ratioshave seldom been used (Wampler 1968,Miller 1973) because of the low efficiency in the IR wavelength region of electron multiplier photocathodes and because of the severe contamination withmany atmospheric emission lines of OH(Osterbrock 1974).
The situation has changed with theavailability of CCO detectors. Althoughalso CCO detectors have low efficiencies in the IR region, they provide asignificant advantage over the earlierspectrophotometry by allowing acorrect elimination of the atmosphericemission lines from sky background exposures in two-dimensional long-slitspectrophotometry.
As with the INT/IOS CCO spectrograph combination at the La PalmaObservatory (Greve et al. 1989), we haveused the ESO 1.52-m telescope and BCspectrograph equipped with the GEC# 14 CCO detector and the grating# 28 which in 1st and 2nd order allowsthe detection of the IR and blue components.
Figure 1a shows the flat-fieldcorrected IR image (30 min, exposuretime) of a section of the 30 Ooradusnebula in the Large Magellanic Cloud.The many strong atmospheric lines, particularly located at the short wavelengthend, confuse the image. The skycorrected, flux calibrated spectrum isdisplayed in Figure 1b showing the detection of Py (10939 A), He I (10830 A)and Py (10049 A). The [S 11] 10300 Alinesare absent, or very weak, because of thelow metallicity of the LMC. The corresponding lines Ho (4102 A) and H,(3970 A) of the blue wavelength regionare displayed in Figure 2. Using the observed P/Ho and Po/H,. line ratios andadopting a standard reddening curvewe derive Av = 2.0-2.5 mag. for thisparticular region of 30 Ooradus.
Similar spectra with exposure times of-10 minutes for the IR wavelength region have been obtained for the Orionnebula.
Oespite the low efficiency of the CCOdetector in the IR wavelength region(0.91 < " < 1.1 ~lm), we conclude fromour observations that significant research on galactic and extragalactic H 11regions can be carried out with the available telescope-spectrograph-CCO detector combination. The observationsopen up the possibility of deriving ex-
L--~_
8 1 O~--'
, 07L -l
1 • 1(16
/ 1('· "I
1 \ 104I IHol ').
I
I'I
r.
;I 'II r I
I II '
1I mDOR r; E ll~lT ~J LI '! 81 A TEI I' Il .- T T - T
I
1/'I II i
Hel,
I
11 /' I,
I I
II
I
11
I
!II I • Pr
11 I I11
11
P6,I
Figure 1a: 30 Doradus, IR wavelength region,not corrected ror sky emission. Figure 1b: 30 Doradus, IR wavelength region, sky-corrected and flux calibrated.
56

Figure 2: 30 Doradus, bfue wavefength region, sky-corrected and flux cafibrated. The HE fine isbfended with the [Ne II/] 3967 A fine.
430042004100
Waveleng h
30COR BL vE
'000J900JBOO
-r- ~ -lHr
H6
H.
~ A ~ ~
----'-- -'- ----'-- I
02
O'
-02
'0
1&
, z
6 08
coI
tinction values without heavy reliance onrecombination line model calculations. Itis Our intention in this context to investigate in proposed follow-up observations of galactic H 11 regions whether thisobserving technique gives consistentresults when compared with data denved from the Balmer line decrementmethod.
References0&
Aller, l.H., Minkowski, R. 1956, Ap. J. 124, ~110. ~
Greve, A., McKeith, C.D., Barnett, E. W.,M Götz, M. 1989, Astron. Astrophys., in print.
alkan, M. A. 1983, Ap. J. 24, L 1.Miller, J.S. 1968, Ap. J. 154, L57; 1973, Ap.
J. 180, L83.
Osterbrock, D. E. 1974, Astrophysics ofGaseous Nebufae.
Rieke, G.H., Lebofsky, M.J. 1981, Ap. J. 250,87.
~amPler, E.J. 1968, Ap. J. 154, L53.ard, M.J., Geballe, T., Smith, M., Wade, R.,Williams, P. 1987, Ap. J. 316, 138.
Star Formation in Dwarf Irregular GalaxiesM. TOSI, Osservatorio Astronomico di Bologna, ItalyP. FOCAROI, L. GREGGIO and G. MARCONI, Oipartimento di Astronomiade/l'Universita di Bologna, Italy
1. Introduction
Contrary to the more spectacular andappealing Spiral and Elliptical Galaxies,for a long time Irregular Galaxies havenot been considered to deserve detailedstudies. Only in the last decade, thedlfflculty found in the interpretation ofthe major evolutionary processes takingplace in bigger, more complicatedgalaxies, has led to new interest in IrregUlars, wh ich should be easier to under~tand, for a number of circumstances.
he structures of Irregular Galaxies~ppear, in fact, to be simple, with noomblnatlon of halo and disk phases
and no special evidence of dynamical~henomena playing an important role.ehey contain a large amount of gas,aSlly detected by radio telescopes
wh' ,Ich means that they are in a relatively
~h~rIY stage .of the evolution. Besidess, thelr vIsible stellar content is young
enOugh to indicate that Star FormationIS a t' .c Ive In these galaxies several H 11re . ,
glons are present and allow the deri-vation of the metallicity even at largedlst 'I
ances. For all these reasons Irregu-ar G . '
alaxles seem to offer a suitableground for studying the basic phenomena Controlling the evolution of galaxies.
Extensive studies by several authorshave confirmed the above generalfeatures (see Viallefond, 1988, for a recent review), suggesting that IrregularGalaxies are presently the best candidates for the identification of the properties of primordial galaxies, whichmakes them particularly interesting fromthe cosmological point of view. On theother hand, the detailed study of thestellar content of Irregulars has openedsome important questions on how theStar Formation processes have beenoperating in these systems. The InitialMass Function (IMF) has been suggested to be considerably flatter than inour own Galaxy (Terlevich and Melnick1983), but Matteucci and Tosi (1985)argued that a normal Salpeter functionis more appropriate. As for the Star Formation Rate (SFR), according toGallagher, Hunter and Tutukov (1984),Dwarf Irregulars are likely to have undergone a continuous, maybe even constant Star Formation, as seems the casefor giant Irregulars and late type Spirals,while Matteucci and Chiosi (1983), ontheoretical grounds, have rather suggested a bursting Star Formation Rate.
To try to answer these questions and
to better understand the evolution ofthese galaxies, we have undertaken aproject of CCD photometry of someDwarf Irregulars in the Local Group. Ouraim is to derive as deep as possibleColour-Magnitude (CM) diagrams to becompared with theoretical simulationsperformed with different prescriptionsfor the SFR and the IMF. In this respect,it is worth noting that the stellar contentin these galaxies is not so crowded as toprevent a good resolution with opticaltelescopes, when adequate techniquesfor the data reduction are used. Therelatively small distances (m - M:s 26 mag) of Dwarf Irregulars in theLocal Group allow to resolve their stellarcontent down to Mv = -1 to 0, whichcorresponds to Main-Sequence stars ofapproximately 2 MG). We will then beable to derive information on the SFwhich occurred over the last - 1 Gyr.
2. Data Acquisition and Reduction
Besides DDO 221 (WLM), for whichresults have already been published(Ferraro et al., 1989), the programmegalaxies are DDO 70 (Sextans B), DDO209 (NGC 6822), DDO 210 and DDO 236
57
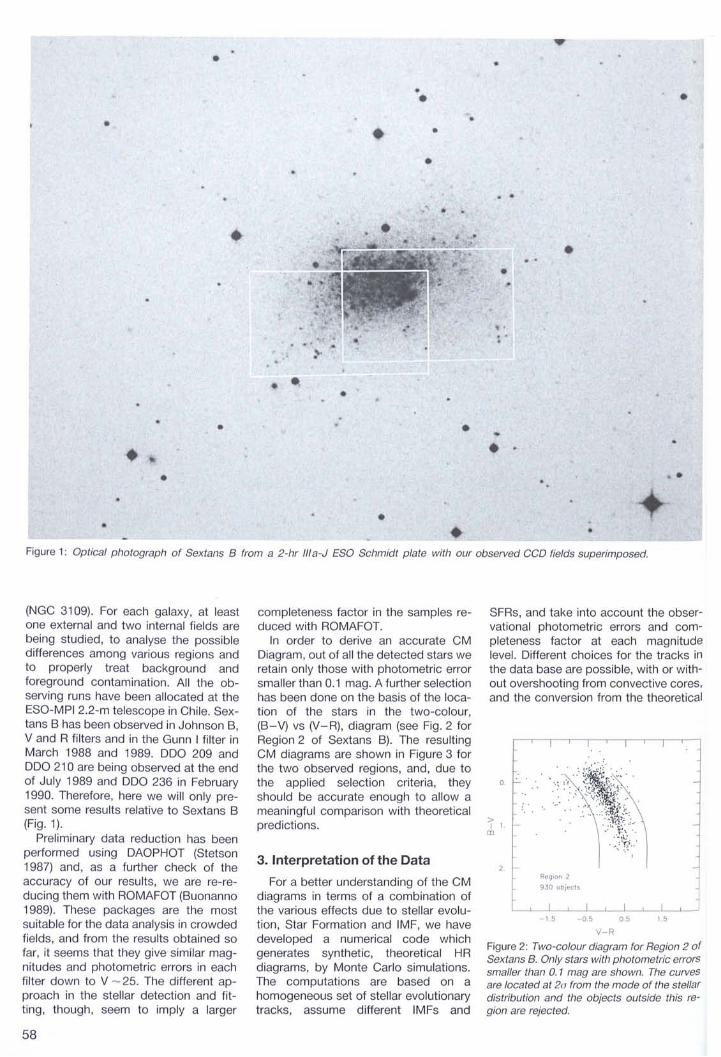
••• •
• •
•
•
••
•
• •
••
• ••
•
••
Figure 1: Optieal photograph of Sextans B from a 2-hr lIIa-J ESO Sehmidt plate with our observed GGO fields superimposed.
V RFigure 2: Two-eolour diagram for Region 2 ofSextans B. Only stars with photometrie errorssmaller than 0.1 mag are shown. The eurvesare loeated al 2(J from the mode of Ihe stellardistribution and the objeets outside this region are rejeeted.
SFRs, and take into account the observational photometrie errors and completeness factor at each magnitudelevel. Different choices for the tracks inthe data base are possible, with or without overshooting from convective cores,and the conversion from the theoretical
150505
Region 2
9.30 objecls
15
o
>I I
ro
3. Interpretation of the Data
For a better understanding of the CMdiagrams in terms of a combination ofthe various effects due to stellar evolution, Star Formation and IMF, we havedeveloped a numerical code whichgenerates synthetic, theoretical HRdiagrams, by Monte Carlo simulations.The computations are based on ahomogeneous set of stellar evolutionarytracks, assume different IMFs and
completeness factor in the sampies reduced with ROMAFOT.
In order to derive an accurate CMDiagram, out of all the detected stars weretain only those with photometrie errorsmaller than 0.1 mag. A further selectionhas been done on the basis of the location of the stars in the two-colour,(B-V) vs (V-R), diagram (see Fig. 2 forRegion 2 of Sextans B). The resultingCM diagrams are shown in Figure 3 forthe two observed regions, and, due tothe applied selection criteria, theyshould be accurate enough to allow ameaningful comparison with theoreticalpredictions.
(NGC 3109). For each galaxy, at leastone external and two internal fields arebeing studied, to analyse the possibledifferences among various regions andto properly treat background andforeground contamination. All the observing runs have been allocated at theESO-MPI 2.2-m telescope in Chile. Sextans B has been observed in Johnson B,V and R filters and in the Gunn I filter inMarch 1988 and 1989. DDO 209 andDDO 210 are being observed at the endof July 1989 and DDO 236 in February1990. Therefore, here we will only present some results relative to Sextans B(Fig. 1).
Preliminary data reduction has beenperformed using DAOPHOT (Stetson1987) and, as a further check of theaccuracy of our results, we are re-reducing them with ROMAFOT (Buonanno1989). These packages are the mostsuitable for the data analysis in crowdedfjelds, and from the results obtained sofar, it seems that they give similar magnitudes and photometrie errors in eachfilter down to V - 25. The different approach in the stellar detection and fitting, though, seem to imply a larger
58

v v16. Region 1 16. Region 2
455 objects 8180bjects
18. 18.
20. 20.' ...
22.
24.
22.
24.
':"',:... "
'~;~:;~~i.;t~~(!ih';::~;;':>,' ,'. '.', '.
0.0 0.5 1.0 1.5 2.0 0.0 0.5 1.0 1.5 2.0
B-VFigure 3: GM diagrams of the stars selected from the observations of Regions 1 and 2 of Sextans B.
B-V
Figure 4: Simulated GM diagram for Region 2 of Sextans B for an adopted distance modulus ofm-M = 26.1 mag and a constant star formation which stopped 2.5 x 10 7 yr ago.
0.'. ,
B-V2.0
SFR const up to
2.5 -1 07yr ago
818 objects
1.51.0
inadequate to describe the extremelylow gravities and temperatures of thered supergiants. The conclusions thatwe are going to derive for the history ofStar Formation will not, however, besensitive to this uncertainty.
The diagram in Figure 4 displays theresults for a SFR which has been constant over the last billion years, but hasceased to act 2.5 x 10⁷ yr aga: had it
0.50.0
stars, instead, turns out to be too extended, with respect to the simulations,regardless of the underlying evolutionary scenario. This cannot be easily attributed to observational errors, sincespecial care has been taken in the datahandling, as described above. We rathersuggest that the adopted conversionsfrom the theoretical Log L vs Log Te tothe observational Mv vs (B-V) plane are
-10.
-8.
-6.
-4.
-2.
;og L vs Log Te plane to the observalonal Mv vs (B- V) plane are performed
by means of linear interpolation in tablesklndly provided by C. Chiosi (private~ornm). The comparison between theheoretlcal HR diagrams derived with
different prescriptions and the observedCM diagrams is performed in terms ofthe object distribution in different cellsOn the Mv vs (B-V) plane, and allows tochoose the combination of SFR and IMFWNhich is most consistent with the data.
orsi Ice t~at this procedure represents agnlflcatlve Improvement with respect
to the classical Isochrone fittingrnethod, as it is able to account for thestoch t'as JC nature of the Star Formationprocess, the effect of small numberstar rth IS ICS, and the spread introduced by
e photometric errors.F'. Igure 4 shows one of the simulated
diagrams which is in better agreementwlth the observational data for Region 2of Sextans B. The adopted distance~OdUlus is m - M = 26.1 mag, as derived~~rn Sandage and Carlson's (1985)
Phelds, uSlng, however, the revisedpenod-Iuminosity-colour relation byFeast and Walker (1987). Evolutionary~equences with Z = 0.001 and convec~ve overshooting (Bertelli et al., 1986)
aVe been used to produce this diagram. Standard tracks do not seem toPOpulate consistently the blue super-glant reg' d .f Ion, ue to the short extension~ the loops during the core Helium
hurn,ng stage. In this respect we noticeOw 'ever, that the very occurrence and
exte .nSlon of the loops in the HR dia-
grarn IS fairly sensitive to details in theInput h .st 11 p YSlcs used in computing theB:Var models (cf. Renzini, 1984). The
dlstnbutlon of the red supergiant
59
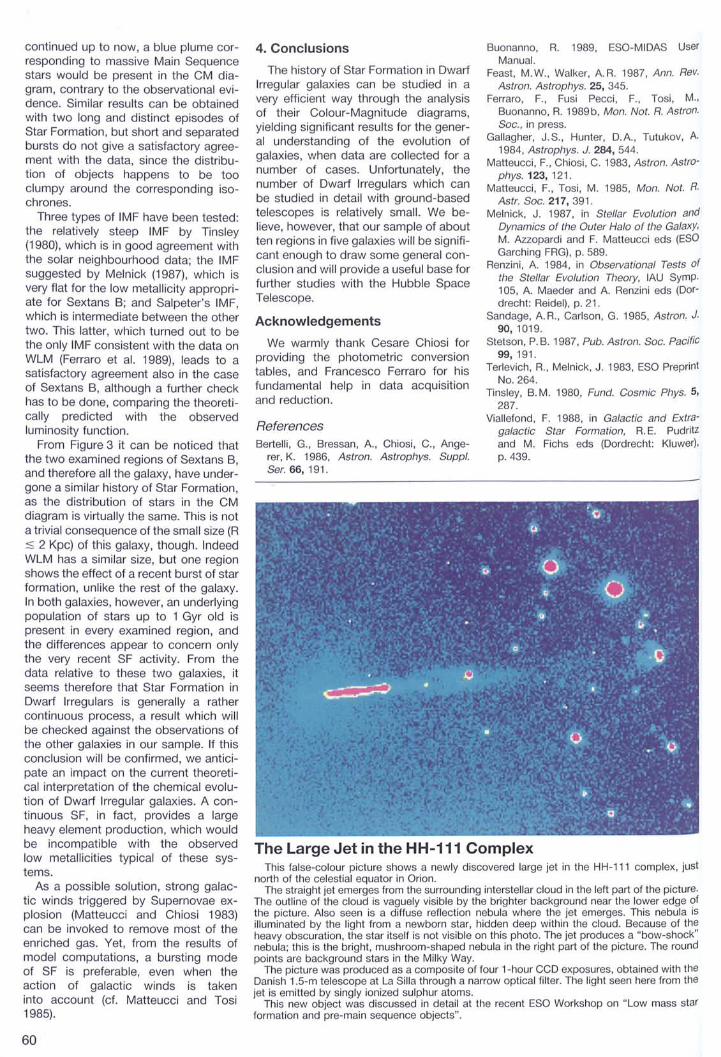
The Large Jet in the HH-111 ComplexThis false-colour picture shows a newly discovered large jet in the HH-111 complex, JUSt
north of the celestial equator in Orion.The straight jet emerges from the surrounding interstellar cloud in the left part of the picture.
The oulline of the cloud is vaguely visible by the brighter background near the lower edge ofthe picture. Also seen is a diffuse reflection nebula where the jet emerges. This nebula isilluminated by the light from a newborn star, hidden deep within the cloud. Because of theheavy obscuration, the star itself is not visible on this photo. The jet produces a "bow-shock"nebula; this is the bright, mushroom-shaped nebula in the right part of the picture. The roundpoints are background stars in the Milky Way.
The picture was produced as a composite of four 1-hour CCO exposures, obtained willl theOanish 1.5-m telescope at La Silla through a narrow optical filter. The light seen here from thejet is emitted by singly ionized sulphur atoms.
This new object was discussed in detail at the recent ESO Worksllop on "Low mass starformation and pre-main sequence objects".
continued up to now, a blue plume corresponding to massive Main Sequencestars would be present in the CM diagram, contrary to the observational evidence. Similar results can be obtainedwith two long and distinct episodes ofStar Formation, but short and separatedbursts do not give a satisfactory agreement with the data, since the distribution of objects happens to be tooc1umpy around the corresponding isochrones.
Three types of IMF have been tested:the relatively steep IMF by Tinsley(1980), which is in good agreement withthe solar neighbourhood data; the IMFsuggested by Melnick (1987), wh ich isvery flat for the low metallicity appropriate for Sextans B; and Salpeter's IMF,which is intermediate between the othertwo. This latter, wh ich turned out to bethe only IMF consistent with the data onWLM (Ferraro et al. 1989), leads to asatisfactory agreement also in the caseof Sextans B, although a further checkhas to be done, comparing the theoretically predicted with the observedluminosity function.
From Figure 3 it can be noticed thatthe two examined regions of Sextans B,and therefore all the galaxy, have undergone a similar history of Star Formation,as the distribution of stars in the CMdiagram is virtually the same. This is nota trivial consequence of the small size (R:$ 2 Kpc) of this galaxy, though. IndeedWLM has a similar size, but one regionshows the effect of arecent burst of starformation, unlike the rest of the galaxy.In both galaxies, however, an underlyingpopulation of stars up to 1 Gyr old ispresent in every examined region, andthe differences appear to concern onlythe very recent SF activity. From thedata relative to these two galaxies, itseems therefore that Star Formation inDwarf Irregulars is generally a rathercontinuous process, a result which willbe checked against the observations ofthe other galaxies in our sampie. If thisconclusion will be confirmed, we anticipate an impact on the current theoretical interpretation of the chemical evolution of Dwarf Irregular galaxies. A continuous SF, in fact, provides a largeheavy element production, which wouldbe incompatible with the observedlow metallicities typical of these systems.
As a possible solution, strong galactic winds triggered by Supernovae explosion (Matteucci and Chiosi 1983)can be invoked to remove most of theenriched gas. Yet, from the results ofmodel computations, a bursting modeof SF is preferable, even when theaction of galactic winds is takeninto account (cf. Matteucci and Tosi1985).
60
4. Conclusions
The history of Star Formation in DwarfIrregular galaxies can be studied in avery efficient way through the analysisof their Colour-Magnitude diagrams,yielding significant results for the general understanding of the evolution ofgalaxies, when data are collected for anumber of cases. Unfortunately, thenumber of Dwarf Irregulars which canbe studied in detail with ground-basedtelescopes is relatively small. We believe, however, that our sampie of aboutten regions in five galaxies will be significant enough to draw some general conclusion and will provide a useful base forfurther studies with the Hubble SpaceTelescope.
Acknowledgements
We warmly thank Cesare Chiosi forproviding the photometric conversiontables, and Francesco Ferraro for hisfundamental help in data acquisitionand reduction.
ReferencesBertelli, G., Bressan, A, Chiosi, C., Ange
rer, K. 1986, Astron. Astrophys. Suppl.Sero 66, 191.
Buonanno, R. 1989, ESO-MIOAS UserManual.
Feast, M.W., Walker, A.R. 1987, Ann. Rev.Astron. Astrophys. 25, 345.
Ferraro, F., Fusi Pecci, F., Tosi, M.,Buonanno, R. 1989 b, Mon. Not. R. Astron.Soc., in press.
Gallagher, J.S., Hunter, O.A, Tutukov, A.1984, Astrophys. J. 284, 544.
Matteucci, F., Chiosi, C. 1983, Astron. Astrophys. 123, 121.
Matteucci, F., Tosi, M. 1985, Mon. Not. R.Astr. Soc. 217, 391.
Melnick, J. 1987, in Stellar Evolution andDynamics of the Outer Halo of the Galaxy,M. Azzopardi and F. Matteucci eds (ESOGarehing FRG), p. 589.
Renzini, A. 1984, in Observational Tests ofthe Stellar Evolution Theory, lAU Symp.105, A. Maeder and A. Renzini eds (Oordrecht: Reidel), p. 21.
Sandage, AR., Carlson, G. 1985, Astron. J.90,1019.
Stetson, P. B. 1987, Pub. Astron. Soc. Pacific99,191.
Terlevich, R., Melnick, J. 1983, ESO PreprintNo. 264.
Tinsley, B.M. 1980, Fund. Cosmic Phys. 5,287.
Viallefond, F. 1988, in Galactic and Extragalactic Star Formation, R. E. Pudritzand M. Fichs eds (Oordrecht: Kluwer),p.439.

Optical Observations of X-ray BinariesrH. AUGUSTEIJN ESO,
As part of my PhD study, and in theframework of a student-fellowship at LaSllia as outlined by Prof. H. van der LaanIn the March issue of the Messenger, Ihave been working on a research programme on accretion-driven stellar Xray Sources. Another part of my work atthls moment is a long-term investigationof pulsation light curves in intermediate~olars (a subtype of the cataclysmic varIables), which will be concluded duringthls year. This research is done underthe guidance of my thesis research adVISor Prof. Jan van Paradijs of the University of Amsterdam, and Dr. HugoSchwarz at La Silla. Abrief outline of thebackground, and a short description ofthe research programme on accretiondnven stellar X-ray sources is given below. To finish, some observational results on a particular object are presented.
Introduction
Luminous stellar X-ray sources are interacting binaries that contain an acCreting neutron star or a black hole.Over one hundred X-ray binaries havebeen found since Sco X-1 was discovered nearly 27 years ago [1]. With thelaunch of the UHURU X-ray satellite in1970, the binary nature of these objectswas established through the detectionof X-ray pulsations from Cen X-3 which~~owed r~gular Doppler variations of
.e PUlsation period induced by the orbital motion [2] and the discovery ofeclipses of the X-ray source. The subsequent launch of a great number of X-rayobservatories in the 70's and 80's ofWh' ,
Ich GINGA and the MIR station arethe only ones presently operating,greatly enlarged our knowledge of theseobJects.
..Optical observations including identlflcation, orbital light curves, and meaSurement of the orbital velocities of theOptical counterpart of these sourcesalso Contributed considerably to ourunderstanding of the basic properties ofthese systems.
X-ray Binaries
[3 In X-ray binaries (see for reviews e. g.] and (4)), a neutron star or black hole
~~cretes matter from a companion star.. e X-rays are produced by the conver
~I~n .Of the gravitational energy of thec:a!ling matter into radiation. This proeff~s generates energy ten times more
IClent than nuclear fusion.
The X-ray binaries can roughly be divided into two groups on the basis ofthe spectral type of the mass donor (seee. g. (4)); massive X-ray binaries (MXRB)with 0 or B type companions and lowmass X-ray binaries (LMXB) with a latetype, or sometimes white dwarf, companion. The known orbital periods forthese sources are in the range 1.4 to 41days for MXRB and from 11 minutes upto 9 days for the LMXB.
The MXRB can be easily studied inthe optical because the optical companions are intrinsically bright. Their structure and evolution is therefore relativelyweil understood. By contrast, much lessis known about the optical properties ofthe more numerous (-100) detectedLMXB. The companion stars in LMXBare intrinsically faint and most of theoptical light emitted by a LMXB comesfrom an X-ray heated accretion diskoThis, together with a mean distance of .- 10 kpc, causes most of them to befainter than 18th magnitude. Combinedwith the, in some cases, extremely shortperiods, this makes especially time-resolved observations difficult, and requires at least 4-m class telescopes.
LMXB
Better detectors on optical telescopes have made spectroscopic observations of the faint LMXB much morepractical in recent years. Consequently,one of the three parts of my researchprogramme is a spectroscopic study ofthese sources.
The optical spectra of LMXB generallyshow a few emission lines (mainly Hß,He 11 4686, and the Bowen 4640 lines)superposed on a blue continuum. Thelatter lines indicate reprocessing ofX-rays (5); their relative strengths maybe an indicator of the metallicity of thesource (6).
The aim of my project is to studyorbital variations of the wavelength andstrength of the emission lines whichcould give us an insight into the lineforming region and the mass of thecompanion star.
Black Holes
A very interesting aspect of X-raybinaries is that some of them may contain black holes as the accreting X-raysource.
The main problem for black hole candidates is that it is sometimes difficult toprove that the compact object is not a
neutron star. For instance, the detectionof coherent pulsations (the signature ofa rotating magnetized neutron star), orbursts (see below) from a system areclear indications of the presence of aneutron star. The crucial evidence forthe presence of a black hole (beyond thelack of these X-ray time signatures) is ameasurement of the mass of the compact object which should be in excessof - 3 MG, the upper theoretical limit tothe mass of a neutron star (7).
Currently there are three strong candidates, LMC X-3 (8), Cyg X-1 (9), andA0620-00 (10), and one possible, LMCX-1 [11].
The mass of the compact object inthese sources is derived, by opticalspectroscopy, from the radial velocitycurves of the absorption Iines of thecompanion. From the radial velocity amplitude one can determine the massfunction;
M3 . 3'f(M) = x sln I 2
(Mop,+Mx)
where Mx, Mopt are the mass of thecompact object and the optical companion respectively, and i the inclinationof the system with respect to the planeof the sky, By inserting Mopt = 0 andi = 90 (i. e. the system is seen edge-on),one gets a lower limit for Mx'
For the black hole candidate LMCX-3, Kuiper et al. [12] have, on the basisof the value of the mass function andmodelling of the optical lightcurve, derived a mass of the compact object inthe range (4.5-6.5) (d/50 kpc) MG withd the distance to the source. Taking a20 lower limit for f(M), a source distanceof 40 kpc, and assuming a flat (insteadof spherical) X-ray emitting region situated in the orbital plane, the authors finda lower limit to Mx of 2.8 MG'
It is clear that a good determination ofthe radial velocity amplitude is essentialfor the conclusion that LMC X-3 contains a black hole (or not).
A major problem with the determination of the radial velocity curve is thepossible contamination of the stellar absorption lines. This can be due, for example, to the deviation of the companion from spherical symmetry as a resultof the tidal forces exerted by the massive compact object, or to some extraemission or absorption by either thedisk or the X-ray heated side of thecompanion. These effects could distortthe symmetry of the absorption linesand produce spuriously large values ofthe radial velocity amplitude. As the
61

ground corrected. Each point is the average of four one-second integrations.The lower curve is shifted forwards intime by one orbital period [15], the uppercurve is shifted upwards by 70 cis.
The horizontal li ne near the top of theFigure indicates the predicted time interval of the X-ray eclipse of the neutronstar [15]. The uncertainty in this value isonly +1- 2 sec. The optical eclipse, including the partial eclipse of the disk,takes about three times Ionger [16].
The coincidence between the predicted times of the X-ray eclipse and theobserved eclipse-like feature in the optical light curves suggests the presenceof a region of enhanced optical emissionc10sely associated with the X-ray emitting region.
Figure 1 further shows that the shapeof the eclipse is highly variable, and canchange from one orbital period to thenext. Also, short time variability of thesource is seen in all parts of the lightcurves.
An unexpected result of the observations was the detection of six opticalbursts. Of the six bursts, five were observed in the second night and one inthe beginning of the third night.
One of the bursts is shown in Figure 2. An interesting aspect of this burstis the possible detection of a secondburst, at' around 1.82.107 ms in Figure 2, wh ich occurs only - 8 minutesafter the first burst. Of course it is clearthat a full and careful statistical analysisof the data is needed to determine if thisfeature is really significant.
However, the light curve shown in Figure 2 is remarkably similar to the oneoptical "double" burst detected inanother burster, MXB 1636-53 (see [17]),in wh ich the bursts are separated by - 6minutes. The separation of - 8 minuteswould also be comparable to that of thefour double bursts detected duringX-ray observations of EX00748-676[18], wh ich had separations of between10 and 20 minutes.
In their paper, Gottwald et al. [18]show that as the persistent X-ray flux ofthe source decreases, the number ofbursts increases. They also noted thatdouble bursts are only observed whenthe persistent X-ray flux is low.
Extending this picture by taking intoaccount that the main source of light in aLMXB is the X-ray reprocessing disk,this would mean that as tlle sourceshowed many bursts (and possibly including a double burst), the X-raysource was in a low state, and consequently the optical counterpart shouldbe faint.
Indeed, during the two nights thatbursts were observed, the count rates ofthe optical counterpart ranged from- 200 to - 400 cis, whilst during the
lated accreted matter on the surface of aneutron star.
A third phenomenon, observed insome LMXB, is the existence of intensitydips occurring at regular intervals. Generally, this is explained as periodic obscuration of the X-ray source caused by aturbulent thickening of the disk at thepoint where the gas stream from thecompanion hits the accretion disksurrounding the compact object (see[13] for a very clear depiction of such asystem).
EX00748-676, the Source ThatHas It All!
The X-ray source EX00748-676 is atransient source that has remained detectable since its discovery in 1985 [14].This source is unique in that it showsdips and bursts, and in addition it is oneof the only two known LMXB to exhibiteclipses of the X-ray source, and ofcourse also parts of the disk, by thesecondary. The eclipses of the X-raysource make it possible to determineunambiguously the orbital period andphase, and to put constraints on theorbital inclination, as weil as size andmass of the companion.
The third part of my research programme is to make detailed photometricobservations, with a high time resolution, of the optical eclipse light curve ofUY Vol, the optical counterpart ofEXO 0748-676.
The aim of this project is to investigate the radial distribution of opticalcontinuum and line emission, and theradius of the disk by studying the shapeof the eclipse light curve. A comparisonwith cataclysmic variables, for wh ichsimilar observations have been made, inwhich the accretion disk predominantlyradiates by internal conversion of gravitational energy, can give some insightinto the role of X-ray heating of theaccretion disks in LMXB.
Observations
During 5 nights in January, observations with a time resolution of 1 sec weremade of EXO 0748-676 using a twochannel photometer attached to theDanish 1.54-m telescope. One channelmeasured the source whilst the otherconstantly monitored the sky. Flux standards were measured with bothchannels to calibrate the system.
Due to some instrumental problemsduring the first night, little data werecollected. The following nights gavemuch better results, though apart of thelast night was affected by cirrus clouds.
Two examples of eclipse light curves,both observed on the third night, areshown in Figure 1. The data are back-
Figure 1: The light curves of (wo consecutiveeclipses observed on January 14, 1989. Eachpoint is the average of four one-second integrations. The time-axis gives (he time inmilliseconds after UT = 0 h. The count rate isin counts per second. The upper curve isshifted upward by 70 cis. The lower curve isshifted forward in time by 13,766,786 ms, orone orbital period.
---l ----L- 12.8x 10 7 2.8x I 0"1 3x I 0 7
TIME: (ms)
spectra used by [8] to determine f(M)had aresolution of - 150 km/s, thepossibility of the effects describedabove, playing a role, cannot be excluded.
Part of my research programme is todetermine, from high resolution, highsignal-to-noise spectra of the opticalcounterpart of LMC X-3, an improvedradial velocity curve. This will then beused to constrain the mass function andhopefully settle the question whetherLMC X-3 contains a black hole or not.
T -r-- ~
~"'() i<JJ---'t1ll-,
---'c;:l0 200u
1I11
Bursting, Dipping, and TransientSources
LMXB show a variety of time variablecharacteristics.
A subgroup of the LMXB are thetransient sources. Most of the timethese transient sources are not detectable in either X-rays or optical emission- they turn on with typical rise times of afew days and then drop back below thelevel of detectability.
This phenomenon is the result ofaccretion instabilities which may besimilar to dwarf-novae outbursts seen insome cataclysmic variables (interactingbinaries containing a white dwarf and alow mass companion).
Another characteristic of a number ofLMXB is the presence of X-ray (andoptical) bursts. These bursts arise froma thermonuclear flash of the accumu-
62

ray and optical, to further study this veryunusual object.
References1. Giaconni, R, Gursky, H., Paolini, F., and
Rossi, B.: 1962, Phys. Rev. Lett. 9, 439.2. Schreier, E., Levinson, R., Gursky, H.,
Kellogg, E., Tananbaum, H., andGiaconni, R.: 1972, Ap. J. 172, L79.
3. While, N.E.: 1989, EXOSAT preprinlno. 103, 10 appear in Vol. 1 01 The Astronomy and Astrophysics Review.
4. Van Paradijs, J.: 1983, in Accretiondriven stellar X-ray sources, Eds. Lewin,W. H. G. and Van den Heuvel, E. P. J.Cambridge Universily press, p.189.
5. McClinlock, J. R, Canizares, C. R, andTarter, C.B.: 1975, Ap. J. 198, 641.
6. Molch, C., and Pakull, M. W.: 1989, preprinl, 10 appear in Astron. Astrophys.
7. Shapiro, S.L., and Teukolsky, S.A.:1983, in Black holes, white dwarfs andneutron stars, John Wiley-Inlerscience,N.Y.
8. Cowley, A.P., Cramplon, D., Hulchings,J. B., Remillard, K., and Penlold, J. E.:1983, Ap. J. 272, 118.
9. Gies, D.R., and BoiIon, C.T.: 1986, Ap.J. 304, 371.
10. McClinlock, J. E. and Remillard, RA.:1986,Ap. J. 308,110.
11. HUlchings, J. B., Cramplon, D., Cowley,A.P., Bianclli, L., Thompson, I.B.: 1987,Astron. J. 94, 340.
12. Kuiper, L., Van Paradijs, J., and Van derKlis, M.: 1988, Astron. Astrophys. 203, 79.
13. Mason, K.O.: 1986, in The physics ofaccretion onto a compact object, Eds.Mason, K.O., Walson, M. G. and While,N. E. Springer-Verlag Berlin, p. 29.
14. Parmar, A. N., While, N. E., Giommi, P.,and Haberl, F.: 1985, lAU Circ. no. 4039.
15. Parmar, A. N., While, N. E., Giommi, P.,and Gottwald, M.: 1986, Ap. J. 308,189.
16. Van Paradijs, J., Van der Klis, M., andPedersen, H.: 1988, Aslron. Astrophys.Suppl. 76, 185.
17. Pedersen, H., Van Paradijs, J., Molch,C., Cominsky, L., Lawrence, A., Lewin,W. H. G., Oda, M., Ohashi, T., and Malsuoka, M.: 1982, Ap. J. 263, 340.
18. Gotlwald, M., Haberl, F., Parmar, A. N.,and While, N. E.: 1986, Ap. J. 308, 213.
--L-
1.84xl0 71.82xl0 7
in the Figure) of the night. Following thepicture given above, this is in turn fullyconsistent with the idea that the diskradiates through reprocessing of X-rays,giving a rise in the optical emission witha rise in the X-ray flux also when only theside of the companion turned away fromthe X-ray source and (part) of the diskare visible. The depth of the eclipse alsoshows that the disk is a major source ofoptical light in the system.
To look further into the relation between optical and X-ray behaviour ofthis source, aseparate night of observations, simultaneous with the X-raysatellite GINGA, was made on March 25this year. Unfortunately, only threehours of data cou1d be collected and afirst quick look at the data did not showany special activity of the source,though a closer look, also at the X-raydata, will be necessary.
However, it still would be very interesting to follow this source closely in thefuture, if possible simultaneously in X-
1.78xl07
1000 [~
soorDA 'ISH 1.54 m 13-1 '89
~ EX00748 676
\~I......III
~ 600
~ ~\i II~\~~'rl IM~-> rMMI\~ifl~'~1~ I I tl~it~\~ :~~f~~rr~YI~i~jl~~~ V~ ~/~t1lI..
c:: 400:J0
l.J
1.8; J 0 7
Time (ms)
Figure 2: The light curve of a burst from UY Vol, observed on January 13, 1989. The axes havethe same definition as in Figure 1. Each point is a one-second integration. The sky counts areCorrected for the difference in sensitivity of the two detectors.
t:-v0 fOliowing nights the count rates hadnsen to between - 400 and - 600 cis. Inthis respect it is interesting to note thatthe shape of the "first" burst in'Figure 2 isvery simular to the "slow" X-ray burstprofile seen in the low X-ray state.
Also, the source intensity during thesecond part of the third night was higherthan during the first part. This can beseen by comparing the lower curve ofFigure 1, wh ich was observed duringthe fc Irst part of that night, and the upperurve, observed in the second part of
;~at night, wh ich is higher by more tllane upward shift of +70 cis. This would
then also indicate an increase in thep~rSistent X-ray flux and naturally exP alns the detection of only one burst atthe be' .glnnlng of that night and the lack
tOf any further detection for the rest ofhe night.
In Figure 1 it can be seen that alsoduri~g the X-ray eclipse the optical intenslty of the Source is significantly increased in the second part (upper curve
. , . . : ~ . .. . . ,
'NEW,S ON ESO IN.STRUMENTATION, .
The VLT Adaptive Optics Prototype System: Status July 1989F. MERKLE, ESO
th In June 1986 the conceptual design of
te VLT Adaptive Optics Prototype sys
em was started, based on the collabOratio bp . n etween the Observatoire det ans (Meudon), ONERA, the LaboraOlres de Marcoussis, and ESO after
funding was assured by ESO andsupporting French authorities.
In August 1987 began the construction of the major components. 1I wascompleted at the facilities of the variouspartners in May 1988. The major com-
ponents are the 19-actuator deformablemirror (LdM), the Shack-Hartmannwavefront sensor (ESO), the wavefrontcomputer and control electronics (ONERA, LdM), the tip/tilt mirror (OdM), theopto-mechanical support structure
63

Figure 1: The adaptive optics prototype system in the laboratory. The opticallight pass is indicated. The major components are the deformablemirror (DM), the tip/tilt mirror (TM), the off-axis parabola (PM), the dichroic beamsplitter (85), the field selection mirror for the wavefront sensor(FM), the wavefront sensor (WS), the chopping mirror (CM), and the infrared camera (IC). The electronics, including computers, occupy twostandard racks and are not shown. The light path from the dichroic beam splitter to the wavefront sensor is indicated in red.
Table: Major parameters of the adaptive optics prototype system
wavelengths and the visible, to mentiononly a few of them.
This prototype system is ESO's firstmajor step towards the adaptive opticssystems required for the VLT. As a testbench it allows to investigate the performance of all components and in particular of the control strategy. Alreadyduring the design and construction itbecame obvious that the computingpower necessary in order to achieve thereal-time control with the required bandwidth is the major constraint. A possible
(OdM, CNRS), and the IR array camera(OdM).
Meanwhile the system has been completely integrated at Observatoire deMeudon. First successful static testshave been performed in the laboratoryand dynamic operation is under preparation. Figure 1 shows the prototypesystem at Meudon in June 1989. It isplanned that the alignment and tuning ofthe system will be finished by mid-September. The major characteristics aresummarized in the Table.
The first, closed-Ioop operation isscheduled for October 12 to 23, 1989,followed by a second observing run inNovember. These observations will takeplace at the Observatoire de HauteProvence at the coude focus of the1.52-metre telescope. Currently theOHP is preparing the installation of theadaptive system in October.
Early 1990 the system will go fromGarching to La Silla, after the necessarymodifications for adaptation to the 3.6metre telescope, and aseries of finallaboratory tests and improvements, ifrequired. During the observations, awhole set of technical programmes willbe carried out, like seeing and isoplanicity measurements in the IR and visible,partial adaptive correction at shorter
64
Wavelength range:
Deformable mirror:Tip/tilt mirror:
Wavefront sensor:
Wavefront computer:
Control algorithm:
Camera:
upgrade of the system with a mirror ofapproximately 64 actuators will be animportant intermediate step for thespecification of the VLT systems. Forthe VLT the current plans envisage approximately 250 actuators.
Acknowledgements
The author's thanks are due to manycolleagues contributing to ESO's activities in the field of adaptive optics,particularly J. C. Fontanella (ONERA),
3 to 5 micrometre (3.6-m telescope)partial correction for 11. < 3 micrometre19 piezoelectric actuators +/- 7.5 micrometre strokegimbal mountpiezoelectric actuatorsShack-Hartmann principle5 x 5 and 10 x 10 subapertures100 x 100 intensified Reticon detectorbuilt-in reference sourceadditional fjeld selection mirrordedicated electronicshost computer based on Motorola 68020modal correction schememirror eigenmodes32 x 32 InSb array camera (SAT detector)additional chopping mirror

J. P. Gaffard (CGE), P. Kern (Obs. deMeudon), P. Lena (Obs. de Meudon),J.C. de Miscault (CGE), G. Rousset(ONERA), and to many colleagues atESO for stimulating discussions.
References
For additional relerences the lollowing papers are recommended:- F. Merkle (1988), "Adaptive Optics De
velopment at ESO", Proceedings 01 theESO Conlerence on "Very Large Tele-
scopes and their Instrumentation", Garching 21-24 March, 1988.
- P. Kern, P. Uma, G. Rousset, J.C. Fontanella, F. Merkle, J. P. Gaffard (1988),"Prototype 01 on adaptive optical systemlor inlrared astronomy", rel. as above.
- F. Merkle (1988), in SPIE Proceedings1013: "Optical Design Methods, Applications and Large Optics", Hamburg, F. R. G.,September 1988.
- P. Kern, P. Lena, J. C. Fontanella, G.Rousset, F. Merkle, J. P. Gaffard (1989) inSPIE Proceedings 1114: Symposium on"Aerospace Sensing", Orlando, FI, March1989.
LATEST NEWSIR Observers at the 3.6-m telescope areinormed that the new F/35 chopping secondary mirror is now available.
The F/35 chopping secondary mirrorwas reinstalled in August 1989 and testedwith the IR Photometer/Spectrophotometer. The performance 01 the systemproved at least identical to the onequoted in Messenger 39, 1, 1985. ESO'sIR Specklegraph (see Messenger 45, 29,1986) was also successlully used in its F/35 conliguration.
A. van Dijsseldonk (ESO)
Telescope Alignment Procedures: Improved Technique in theOpticalldentification of Mechanical AxesP. GIOROANO, ESO
Introduction
. In the article concerning "First Light"In the ND in the Messenger No. 56, abnef de . .scnptlon was given on page 2 ofthe b .aStC steps of the alignment proce-dure Ad . s was stated there, the proce-
ure used in the ND was essentiallyonly a somewhat more refined form of astandard procedure which had been~UcceSsfully used on a number of LaI lila telescopes. The first - and mostt~~damental - step is the optical iden-
at/on of the altitude axis (alt-az tele~Clopes) or declination axis (equatoriale escopes).
The set-up for this step in the ND isshow'. n In Figure 1. ST 1 and ST2 are two~ghting telescopes mounted at the twot~smyth foci. Target mirrors tM1 C1 andI 2C2 were mounted on the fixed parts
o the fork. The observation of a centralc~oss on these target mirrors and theo s.ervation of the ST graticule in auto-collimat' .Ion agalnst the plane faces of~he target mirrors enables the two ST to
e. placed on the mechanical altitudeaXIS, thereby establishing a basic refer~nce for the whole operation. However,pace reasons dictated in this case that
one had to "look through" tM2C2 toobserve tM 1C1 with ST1 and converselyw~S~ Th . .. . e conventlonal solution us-Ing "h3j. all-coated" mirrors leads to loss ofh~ ~f the light and ghost images with
9 er Intenslty than the required images.
thThe selected solution was based one Co b' .
tric .m Inatlon of narrow band dielec-i mlrrors and Illumination of the sightI~~t telescope with the corresponding
t USlng narrow band interference lilers We t·
irnu' ge In S~1, for example, a max-rn of reflectlvlty from M2C2, in spite
of 2 passages through M1 C1 (seeFig.1).
The wavelengths chosen in the realization of the 2 beams were in accordance with the laser light currently usedin our laboratory:Red beam Ac = 632,8 nm HeNe laserGreen beam AC = 543,5 nm HeNe laser
Realization
The dielectric mirrors were realizedand delivered on time by MELLES
Figure 1.
GRIOT (France), who, after a first studyand a computer simulation, achieved inpractice an excellent confirmation of thetheoretical values. The front surface,with the cross-hair, is coated with thedielectric layer, while the back surface iscoated with a broad band antireflectivecoating.
The interference filters were selectedcarefully from the ESO La Silla catalogue, in order to optimize the total efficiency of the delivered version of thedielectric mirrors.
65

Figure 2: Schematic diagram. Please note that the numbering is in accordance with thedirection of the light. In this example, the light enters from the right-hand side.
Figure 2 shows how the system funetions. Surfaees 2 and 3 are eoated. In anon-absorbing material the energy eon-
to obtain the highest ratio of image intensities refleeted by surfaee 3 with respeet to surfaee 2. In the "elassie" easeof half eoated mirrors, this ratio has avery low value of 0.25. Our new arrangement (red dieleetrie mirror used at646.6 mm) aehieves a ratio of 37.2,about 150 times higher! In the seeondease (green dieleetrie mirror), using anappropriate narrow filter, we eouldaehieve a value of 2.4, a gain of about10 times. However, with a filter operating at a slightly shorter wavelength,whieh was not available at that time,a value of 10.5 would be aehieved, again of about 40 times. A small harmonie leak was the reason why tllegreen ease was somewhat less effieien!than the red.
red interferencefil ter
r1r2
2
Greenmirror
-t"'2--r-=-t-1--i-"='---~
servation formula is r + t = 1 and thetransmitted amplitude is given by t = 1-r.
The main objeetive of this design was
r4 r3
Redmirror
4 3
green interferencefilter
-=H----·
EFOSC2W. ECKERT, O. HOFSTADT, J. MELNICK, ESO
Late in 1987 it beeame elear that,before the implementation of the ESOMulti Mode Instrument (EMMI), the NDwould require an optieal instrument withimaging and speetroseopie eapabilities.
To build a seeond EFOSC was a logieal ehoiee in view of its moderate sizeand above all, the possibility of retrofitting the instrument later on at the 2.2-mteleseope. EFOSC is in high demand atthe 3.6-m teleseope where it eaters fornearly one-third of the observations and
a similar potential use exists at the2.2-m.
The initial idea was to build a eopy ofthe present version but it soon beeameevident that a new meehanieal designwas required to adapt different optiealseales and to allow for a larger deteetorformat. It was also elear from our experienee with the 3.6-m version that anumber of improvements were desirable, partieularly for the setting and handling of the optieal eomponents.
While the basie eonfiguration layou!was maintained (see Fig. 1), the inten;tion was to aequire optieal eomponents:with an improved blue transmission..Early in 1988 a eontraet was plaeed withthe Swiss firm FISBA Optik for the delivery of the eamera, eollimator and fieldlens units within 6 months. Figure 2shows the overall response eurves forthe three eomponents eombined. Iteompares favourably with the optiealtransmission of EFOSC. Sinee the final
IE.F.O.S.C. DIRECT IMAGING MOD~F/8 Telescope
Focus Collimator corrected parallelbeam (amera
(COdetector
IE.F.O.S.C. SPECTRO MODE I
1aperture wheel
I
_·s.==-::o:--=---ffi=- =~:~.-.~:~ =-~~~~~.-- ._."~=~ ~-m ~ .. ~ _.. ~m-~~·:~-~·rm. ~J;:lJ-- -"---.. -----_. ---"--W.. -~ -_ .. L1-VJ ~:::-:VlJ ~_ ..~-- - -- Fit ter - - _.- .- - _. _. grlsm wheel
wh", ~
Figure 1: Optical Layout of EFOSC 2.
66

myth foci (the "EMMI arm") of the ND isshown in Figure 3.
For spectroscopy, a set of six grismswith 100 g/mm and 300-400 g/mmgratings have been purchased (fable 2).The long focal length of the EFOSC 2camera combined with the 10 x 15 mmRCA CCD formats does not warrant theuse of higher dispersions at present.Once the larger format CCDs becomeavailable, higher-dispersion gratings inthe 600 g/mm range will be introduced.It is possible to interchange these components between the two EFOSCs. Thesame applies for the filter and the slitunits. In general, a large degree of compatibility has been maintained in orderto reduce the maintenance and operational burden at La Silla which is why wealso plan to make use of the calibrationunits available inside the adapter/rotatorof the ND. At the 2.2-m telescope thehousing of the DISCO unit, which contains the necessary calibration sources,will be adapted to interface EFOSC 2 tothe telescope.
The instrument controls are CAMACand NIM based to be fully compatiblewith the 3.6-m arrangement. During thefirst tests an HP 1000 computer systemidentical to the standard instrumentation setups was installed at the ND and
pixel-size matching at both telescopesfor different detector formats. ObviousIy, oversampling is unavoidable in thecase of the ND. A photograph ofEFOSC 2 mounted on one of the Nas-
100
90
80 EFose 270 Hose
~60>-\.J
~ 50\.J;;:~ 40
30
20
de t' .s Inatlon of the instrument was the2:2-m, We decided to optimize the design for this telescope. The focal planeScale at the ND is 187 Ilml" while the2.2-m rates 85 Ilml". Table 1 shows the
500 600 700 800 900 1000WAVElENGTH (nm)
Figure 2: Overall optical transmission of EFOSG 2 compared with EFOSG (see also note byH. Oekker, on page 64 of the March 89 issue of the Messenger).
Figure 3' Ph. otograph of EFOSG 2 fitted with an RGA GGO.
67

Figure 4: Hf< image of the Southern Grab (He 2-104) obtained withEFOSG 2 at the N7T. Notice the features visible in this image that arenot visible or not resolved in the images published in the March 89issue of the Messenger.
Table 1: Pixel matching EFOSG 2
Figure 5: Hf< image of the planetary nebula He 2-84 for which verylittle information exists in the literature.
Table 2: EFOSG 2 grism
2.2-m telescope
Deteetor 10 x 15 mm 25 x 25 mm
Pixel 15 ~lm 25 f.lmField of view 3.2 x 4.7 are min 7.9 x 7.9 are minSeale 1 pixel = 0.29 are see 1 pixel = 0.48 are see
NTT
Deteetor 10 x 15 mm 25 x 25 mm
Pixel 23 ~lm 25 ~lm
Field of view 1.5 x 2.2 are min 3.7 x 3.7 are seeSeale 1 pixel = 0.20 are see 1 pixel = 0.22 are see
only minor software modifications wererequired to handle the data acquisition.
EFOSC 2 saw the first astronomicallight on May 11 at the ND. The firstscientific programme of EFOSC 2 wasto make a pictorial atlas of compactsouthern planetary nebulae. About 200nebulae were imaged through narrowband Ha and [0111] filters, many for thefirst time. But many previously weilstudied nebulae were imaged with unprecedented detail thanks to the superb
seeing conditions wh ich prevailed during the first EFOSC 2 run and to theoutstanding quality of the ND. Figures 4 and 5 show Ha images of twoplanetary nebulae observed withEFOSC 2. The elongated shapes of stellar images are due to field rotation, unavoidable during exposures lasting afew minutes until the installation of theadapter later this year.
EFOSC 2 has been largely abackground task adventure for the La
g/mm blaze A
81000 100 4500Rl000 100 6500UV300 400 38008300 360 4500R300 300 6000new grating 300 4900
Silla mechanical, electronic and opticalworkshops. W. Eckert was responsiblefor the mechanical design and supervision of the assembling while A. Macchino and J. Santana built and integrated the electronic part. L. Baude!aligned the optical path. We are gratefulto B. Delabre for the layout calculations,to H. Dekker for handling the FISBAcontract and to B. Buzzoni for the opticscommissioning at Garching.
At La Silla we were happy to see anew instrument emerging from ourworkshops. A change in our activityscope where patching, mending andgrumbling around equipment deliveredfrom other horizons is our usual fate.
Improved Shutter Timing at La SillaThe shutter timing accuracy of most
instruments using shutters at La Silla areto be considerably improved. By thetime that you read this, new CAMACmodule cards will have been installed
68
which control exposure times independent of the acquisition computers.These new cards allow an on-card timing resolution of 1 mS between 1 mSand 32,000 mS. From 32 S to 32,000 S,
the timing resolution is 1 S but the internal counting accuracy remains at 1 mSin all cases. Some exposure definitionforms are being updated to allow a 0.1 Sresolution between 0 S to 32 S. For ex-

POSures longer than 32 S, the resolutionWill remain at the present value of 1 S.
Tests have been done with the newshutter timing cards using the CCOcameras on the 2.2-m and Oanish 1.5-mtelescopes. For the 2.2-m telescope, theshutter error has decreased by a factorof nearly 16 from about 190 mS to
12 ± 3 mS. For the 1.5-m Oanish telescope, the improvement is about a factor of seven to 27 ± 3 mS, both in thesense that the resultant exposures aregreater than those requested by theabove amounts. It is expected thatthese delays will be reduced even further with the installation of a system of
detecting a feedback signal from theactual shutters. Observers should findthat they can now do accurate photometry (one per cent or better) usingbright stars with exposures as short astwo or three seconds. B. Jarvis, ESO
A New IHAP Feature: Images in Polar CoordinatesJ. A. STÜWE, Astronomisches Institut der Ruhr-Universität Bochum, F. R. Germany
. Many astronomical objects show speCial symmetries, which generally needspecial techniques for image enhancement. At our institute, for example, inVestigations on structures in Cyan comaImages of comet Halley and in electronographic images of several SOgalaxies are at work. In the course ofthese analyses it showed up that formorphological studies it is useful to represent the images in a way which already takes the (circular) symmetry of
the objects into account. For this purpose I developed an algorithm whichperforms the transformation of imagesbetween cartesian and polar coordinates. In polar coordinates the imagesstill have two dimensions with the abscissa representing the radial distance rfrom the centre of the object and wherethe ordinate shows the azimutal angle er.er = 0° represents the direction of thex-axis in the original cartesian imageand then er runs positive anticlockwise.
Because the transformation is not isometric the resulting r,er-image does nolonger contain e. g. counts per pixel, butnevertheless gives the information thatat a position defined by radial distance rand azimutal angle er the counts perarea of the cartesian pixel have a certainvalue. This means: if you already calibrated the cartesian image in physicalunits like erg/cm2s or mag/(")2, the resulting polar image shows the correctflux or surface brightness distribution.
69

KURT WALTERS (1912-1989)
2. Support of DEC WindowsUnderVAXNMS
This algorithm has been incorporatedinto the IHAP-system running at an HP1000 F computer at our institute as twonew IHAP commands. XYRP transformscartesian to polar coordinates andRPXY transforms backwards from polarto cartesian coordinates. The transformation equations are defined in the usual way,
X = r cos lp andY = r sin lp
where X, Y as weil as r,lp represent the"world coordinates" of the images. Inthis way all other IHAP features then are
MIDASMemoESO Image Processing Group
1. Application Developments
A set of applications for reduction andcalibration of photographic plates hasbeen implemented by A. Lauberts.These procedures are based on his experience with the analysis of the ESO/Uppsala survey. Although they are optimized for the treatment of Schmidtplates, they will also be useful for othertypes of photographic material.
The table file system has been significantly upgraded both in performanceand functionality. It now provides fullsupport of integer types (1'1, 1'2, and
Dr. Kurt Walters died.Dr. Walters has been ESO's legal ad
visor in Europe and also for Chile.Living in Hamburg and closely asso
ciated with Prof. Heckmann, ESO's firstDirector General, he had in the earlydays of our Organization a major role inthe development of ESO's relations toits member states and to Chile, wherehe contributed, in particular, to the successful negotiation of the ESO Convention with the Chilean government.
His calm, reflective personality, combined with an excellent judgement, waswidely appreciated.
Dr. Walters terminated his work forESO in 1976 with the beginning ofESO's relocation to Garching.
He died at the age of 77 years.G. Bachmann (ESO)
applicable to the polar images as weil.Figures 1a and b show the application
of the XYRP command on an electronographic B-image of the SBO galaxyNGC 2217. The cartesian image(Fig. 1a) shows a barred nucleus andweak spiral arms whereas in the polarimage (Fig. 1b) these "spiral arms"appear as an almost perfect circularring, that has no connection to the "bar"and exhibits spike like structures. Thisimpression is even enhanced in the(B-V)-polar image in Figure 2. Here the"spikes" show up as blue features, whatindicates that they are places of recent
1'4). This is of special interest for X-rayastronomy which often deals with smallnumbers of events.
MIDAS has been successfully implemented on a VAX station 3100 underVAXNMS 5.1 with DEC windows. Working with our standard X11-based IDIroutines and a VMS specific interface forthe client-server communication, it required only a minor upgrade of the display software to use the VAX station asan image display station for MIDAS. Theinitial version of the communication
or ongoing star formation, whereas thebar is almost invisible in this picture.These images show an example of onepossible application of the newly developed IHAP commands facilitatingmorphological studies. Several more ofsuch investigations are in progress althe Astronomisches Institut der RuhrUniversität Bochum, undertaken by mycolleagues, who already applied thisfeature with great success. The two neWcommands will be implemented at theESO IHAP sites.
interfaces was kindly provided byM. Pucillo and P. Santin from TriesteObservatory whom we thank for theirsignificant help.
The full graphics facilities in MIDASare being tested. Thus, full MIDASsupport of VAXNMS work stations willbe available in the 89 NOV release ofMIDAS.
The VAX- and DEC stations based onUltrix with DEC windows are al readyfully supported, so that MIDAS now covers the whole range of work stationsfrom DEC.
3. MIDAS on New Systems
After requests from several institutes,we have successfully implementedMIDAS on an IBM PS/2 system underAIX. These systems are also offered withX11 window systems which make therninteresting as low end work stations.Please note that the mention or testingof specific computer systems is not inany way an endorsement.
4. MIDAS Hot-Une Service
The following MIDAS support servicescan be used to obtain help quickly whenproblems arise:• EARN: MIDAS a DGAES051• SPAN: ESOMC1 ::MIDAS• Tlx.: 52828222 eo d, attn.: MIDAS
HOT-UNE• Tel.: +49-89-32006-456
Users are also invited to send us anysuggestions or comments. Although wedo provide a telephone service we askusers to use it only in urgent cases. Tomake it easier for us to process tMrequests properly we ask you, whenpossible, to submit requests in writtenform through either electronic networkSor telex.
70

TEX in Astronomical Publishings. J. HOGEVEEN, Astronomical Institute "Anton Pannekoek", Amsterdam, the Netherlands
Introduction
The use of the computer typesetting syslem TEX in aslronomical publishing has become inevitable.
In lhe Messenger No. 52, "Astronomy andASlrOPhysiCS" first announced the availability~f a TEX macro package, which may be usedo submil papers intended for publication in
lhe Main Journal. In Messenger 56 a repeated calilo use the TEX macro package wasmade, and a TEX package for the A&A Supplement Series was announced. ExperimentsWllh TEX for astronomical publishing are also~olng on in lhe United States, as abstract No.2.02 In the Bulletin of the American As
tronomical Society, Vol. 21, No. 2, shows.Manuscripts, prepared with the TEX mac
ros, can be fed straight il1to a type-setting~aehll1e at the publisher's, thus eliminating. e costly and time consuming steps of havIn9 the manuseript typeset and sent backand forth for proofreading. Shifting the burden of typesetting from the publishers to theauthors affects the work of authors editorsand 'Thi Publishers to a lesser or greater extent.
s IS recognized by Dr. H.-U. Daniel as hestates in the Messenger No. 56 in his re-new d '" e eall 10 use the TEX macro packages:... Contlnulng, patient cooperation will ben~cessary until the usual smooth proeessing? manuscripts (...) has been extended toeleetron' , .. IC manuscnpts."
a Thls paper is intended as a eOl1tribution ofI ~ author to this continuing cooperation, and
ope It will be read by other authors editors~d b' ,Whie~u .lishers. In it, I will raise some matterslhe d dld not seem to get much attention inde . evelopments so far, but whieh may be
elSlve as t th .introd . 0 e success or fallure of thelishinguetlon of TEX for astronomieal pub-
Iik:~X actually is a programming language,lhat i~Y otherprogramming language, exceptr IS not Intended for numerical ealeulat~en~, but for the proeessing of text. Will, TEXpro ata to be processed are the text, and thelhe~ramme that processes the data formats
ext Into a desired layout.The ba' .
publis' sie Idea of TEX in (astronomical)a d hll1g IS that the author provides lhe text9n that the Publisher provides the TEX proe~a~me. Thus the author determines theeo~tents of a paper, and the publisher is inin h' rol of the aetual appearance of the paper
IS JOUrnal.Howeve .
lan ua r, Sll1ce TEX is a programmingr 9 ge, there are many solutions to format-f~:~u~;oblems, and there is no end to theeq' s wlth which a programme could be
uipped ("d . "equ' ynamlC numbering of sections,list allons, etc.; semi-automatic generation ofpu~rof references). This means that whenpro Ishers go about the development of TEXIy grammes - or maeros as they are actual-
ealled _ . 'differe . Independently, the macros forAuthornt Journals mayaiso be (very) different.
s Publishlng in several journals would
have to learn the different macros used bythese journals.
Astronomy and Astrophysics
Sadly, we are already eonfronted with thisproblem, and not from two entirely differentjournals, but from different parts of the samejournal.
The TEX maero packages for the MainJournal of A&A and of the Supplement Serieswere independently developed by their respective publishers: Springer in Germanyand Les Editions de Physique in France.
For an author this is a most deplorablesituation, especially when he is asked by theEditors to agree to the transfer of his paperfrom the Main Journal to the SupplementSeries, or viee versa.
A CaU tor Standardization
Astronomical journals all have their owntypical appearance and layout. Thus it seemsalmost unavoidable that different TEX macropackages are needed to meet the typographical requirements of each journal. However, when we look at the underlying structure of the papers in the journals, then theyturn out not to be all that different.
The papers in our astronomical journals arecharacterized by a heading, with the title ofthe paper and the names and addresses ofthe authors, a summary or abstract, sections,equations, figures, tables, and a list of references.
It is possible to define TEX commands thatdeal with this structure of a paper, rather thanwith its layout. In fact, good typographysupports the structure of a text, and theactuallayout for any specific journal could bederived from the structuring commands,which really should be the same for all journals. TI,is would alleviate authors from havingto learn many different TEX macro packages.
There already exists a macro package forTEX which may serve as an example of theabove-mentioned concept.
LATEX is a general-purpose macro package for TEX' developed by Leslie Lamport. Itprovides authors with the tools to producetypographically sound articles, books, reports, and letters, without the need to learnthe entire, complex language of TEX.
LATEX commands mainly deal with thestructure of a document, while the actuallayout of the document is determined by aso-called style file. LATEX thus allows theauthor to fully concentrate on the writing, andnot to be concerned about where and how'things are to be put on paper.
The LATEX style files may be adapted toproduce the same source text in any desiredlayout, in a virtually endless choice of fonts.This means that a paper prepared withLATEX can be adapted to the typograpl,icalrequirements of any specific journal, simply
by making the right adjustments to the stylefiles.
LATEX has many other interesting facilities.These have been recognized by (astronomical) authors, which is illustrated by the factthat many already use LATEX for their ownpurposes. One of the interesting facilities ofLATEX is the semi-automatic compilation ofIists of references from a bibliographic database, when it is used together with a programme called BI8TEX.
Fortunately, the advantages of LATEX havebeen recognized by the publisher of the MainJournal of A&A, Springer in Germany, and wemay look forward to a first release of an A&ALATEX style file before the end of this year.
TEX and WYSIWYG wordprocessors
Not every author is happy about the concept of TEX, where one has to prepare asource text, compile it with TEX and thenprint it to, at long last, see the final resul!.
Many prefer a WYSIWYG (What You See IsWhat You Get) word processor, and this preference is perfeclly legitimate, because thereare some very powerful interactive word processors around, capable of handlingmathematical texts.
For astronomical publishing those wordprocessors which are capable of producingTEX output are interesting, because for sometime to come TEX will be the only thing thetypesetting machines at the publishers' areable to handle.
Examples of WYSIWYG word processorswith a TEX interface are Mathor for the IBMpe and compatibles, and MathType for theApple Macintosh. The publisher of the Supplement Series of A&A, Les Editions de Physique in France, provide a Mathor-TEX interface to prepare papers for publication in theirjournal.
Concluding Remarks
The introduction of TEX in astronomicalpublishing is intended to increase the efficiency with which the astronomical journalscan be run. With the above, I hope to havemade clear that this can only be achieved ifthe authors are provided with tools that allowthem to efficiently produce manuscripts inTEX.
Efficiency on the part of authors can beachieved in two ways, through standardization of TEX macros for the various astronomical journals, and by providing TEX interfacesfor preferred mathematical word processors.
Standardization of TEX macros can berealized through the joint development of astandard macro, or by adopting the generalpurpose macro package LATEX, which to agreat extent could serve as a standard.
In the end, publishers will also benefit froma form of standardization as advocated here,because when the output of a "standard"word processor is widely accepted, moreauthors will be apt to learn and use that word
71

The First Year of SESTR S. Booth, 1-. E. B. Johansson and P.A. Shaver: SEST - the First Year of Operation. 1J. Melnick: High-Mass Star Formation 4B. Reipurth: Low-Mass Star-Forming Regions . . . . . . . . . . . . . . . . . . . . . . . . . . . . . . . 7C. Henkel: Cometary Globules 8P. Friberg: Interstellar Chemistry . . . . . . . . . . . . . . . . . . . . . . . . . • . . . . . . . . • . . . . . .. 10L. -Ä. Nyman: Evolved Stars. . . . . . . . . . . . . . . . . . . . . . . . . . . . . • . . . . . . . . . . . . . . .. 11J. Brand: Molecular Clouds and Galactic Structure 14Aa. Sandqvist: The Galactic Centre. . . . . . . . . . . . . . . . . . . . . . . . . . . . . . . . . . • . . . . . 15R. Chini: SN 1987A and other Bolometer Observations at 1.3 mm . . . . . . . . . . . . . . . . 18F. P. Israel: CO Observations of the Magellanic Clouds. . . . . . . . . . . . . . . . . . . . . . . . . 19A. Eckart: CO Isotopic Emission and the Far-Infrared Continuum of Centaurus A 20F. Combes: Molecules in External Galaxies. . . . . . . . . . . . . . . . . . . . . . . . . . . . . . . . .. 21E. Valtaoja: Extragalactic Continuum Sources 24
Visiting Astronomers (October 1, 1989-Apri11, 1990) . . . . . . . . . . . . . . . . . . . . . . . . . . . .. 25K. S. de Boer et al.: Profile of a Key Programme: Coordinated Investigation of Selected
Regions in the Magellanic Clouds .. . . . . . . . . . . . . . . . . . . . . . . . . . . . . . . . . . . . . . .. 27~J. Bergeron et al.: Profile of a Key Programme: Identification of High Redshift Galaxies
with Very Large Gaseous Halos. . . . . . . . . . . . . . . . . . . . . . . . . . . . . . . . . . . . . . . . . .. 28A. Mazure et al.: Profile of a Key Programme: The Structure and Oynamics of Rich
Clusters of Galaxies . . . . . . . . . . . . . . . . . . . . . . . . . . . . . . . . . . . . . . . . . . . . . . . . . . .. 30Surface Photometry Catalogue Presented . . . . . . . . . . . . . . . . . . . . . . . . . . . . . . . . . . . . .. 32Operating Manuals Now Available 32P. Shaver: VLT Operations - a First Oiscussion .......................•.......... 33C. Madsen: ESO at World Tech Vienna . . . . . . . . . . . . . . . . . . . . . . . . . . . . . . . . . . . . . . . . . 33R. M. West: Polishing of VLT Mirrors: ESO and RE. O. S. C. Sign Contract 34Staff Movements . . . . . . . . . . . . . . . . . . . . . . . . . . . . . . . . . . . . . . . . . . . . . . . . . . . . . . . . .. 34M. Tarenghi: Breaking of Ground Heraids New Premises for Blank Manufacture 35M. Tarenghi: NTT News. . . . . . . . . . . . . . . . . . . . . . . . . . . . . . . . . . . . . . . . . . . . . . . . . . . .. 35Opticallnstrumentation Group: Status Report on EMMI 35New ESO Preprints (June-August 1989) . . . . . . . . . . . . . . . . . . . . . . . . . . . . . . . . . . . 36E. Meurs and R. Fosbury: Report on ESO Workshop "Extranuclear Activity in Galaxies" 37B. Reipurth: Report on ESO Workshop "Low Mass Star Formation and Pre-Main
Sequence Objects" 37ESO Fellowships 1990-1991 38G. Raffi: News About "Remote Control" at ESO . . . . . . . . . • . . . . . . . . . . . . . . . . . . . . . . .. 38O. Baade: Booking of Visitor Facilities in Garching . . . . . . . . . . . . . . . . . . . . . . . . . • . . . . .. 38R West: Adriaan Blaauw Receives Bruce Medal 38The Research Student Programme. . . . . . . . . . . . . . . . . . . . . . . . . . . . . . . . . . . . . . . . . . .. 38A. Blaauw: ESO's Early History, 1953-1975. IV: Council and Oirectorate Set to Work; the
Initial Programme of Middle-Size Telescopes. . . . . . . . . . . . . . . . . . . . . . . . . . . . . . .. 39J. Knude and H. J0nch-S0rensen: Field Strömgren Photometry with a CCO . . . . . . . . . . .. 46H. Kjeldsen and S. Frandsen: b-Scuti Stars in NGC 6134. . . . . . . . . . . . . . . . . . . . . . . . . .. 48RA. E. Fosbury et al.: Imaging Polarimetry of High Redshift Radio Galaxies with EFOSC .. 49B. E. Helt and L. P. R. Vaz: SN 1987 A: Two Years of Six-colour Photometry with the
Oanish 0.5-m Telescope 53A. Greve, C. O. McKeith and J. Castles: CCO Spectroscopy of Py (10939). Pb (10049) and
Corresponding Balmer Lines in 30 Ooradus 56M. Tosi et al.: Star Formation in Irregular Galaxies , 57The Large Jet in the HH-111 Complex 60Th. Augusteijn: Optical Observations of X-ray Binaries 61F. Merkle: The VLT Adaptive Optics Prototype System: Status July 1989 : 63P. Giordano: Telescope Alignment Procedures: Improved Technique in the Optical
Identification of Mechanical Axes 65W. Eckert, O. Hofstadt and J. Melnick: EFOSC 2 66B. Jarvis: Improved ShutterTiming at La Silla , ' 68J. A. Stüwe: A New Feature: Images in Polar Coordinates 69ESO Image Processing Group: MIOAS Memo. . . . . . . . . . . . . . . . . . . . . . . . . . . . . . . . . .. 70G. Bachmann: Kurt Walters (1912-1989) 70S.J. Hogeveen: TEX in Astronomical Publishing . . . . . . . . . . . . . . . . . . . . . . . . . . . . . • . . . 71
72
processor (or TEX macro package, for thatmatter).
It is a great pity that Astronomy and Astrophysics appears thus far not to have recognized these aspects about TEX in astronomical publishing, a fact which is indicated by the two widely different macropackages for their Main Journal and theirSupplement Series. However, the experiments of Springer with LATEX, and those ofLes Editions de Physique with Mathor, holdpromises for the future.
It is a pleasure to report that the matter ofstandardization has been recognized early inthe developments with TEX for The Astrophysical Journal and for The AstronomicalJournal.
Many aspects mentioned in this paperhave also been put forward in aposter pre-
Contents
sented at a meeting of the American Astronomical Society, by C. O. Biemesderfer ofthe National Radio Astronomy Observatoryand RJ. Hanisch of the Space TelescopeScience Institute.
ReferencesBiemesderfer, C.D. and Haniscl1, R.J.: "TEX and
LATEX Macro Definition Files for AstronomicalPublishing", Bulletin of the American Astronom/'ca/ Sociely, Vol. 21, No. 2, 1989.
Daniel, H.-U., Berger, J. and Savaray, D.: "TEX andMatl1or3-TEX for ASlronorny and Astropl1ysicSJournal and Supplement Series", The MessengerNo. 56, 1989.
Knull1, D.: "Tl1e TEXbook", Addison-Wesley, Reading Massacl1usells, 1984.
Lamport, L.: "LATEX, A Document Preparation System", Addison-Wesley, Reading, Massacl1usells,1986.