Overexpression of extracellular superoxide dismutase has a protective role against hyperoxia-induced...
11
Overexpression of Extracellular Superoxide Dismutase Protects against Brain Injury Induced by Chronic Hypoxia Nahla Zaghloul 1 , Hardik Patel 7 , Champa Codipilly 7 , Philippe Marambaud 2 , Stephen Dewey 3 , Stephen Frattini 4 , Patricio T. Huerta 4,5 , Mansoor Nasim 6 , Edmund J. Miller 5,7 , Mohamed Ahmed 1,7 * 1 Division of Neonatal-Perinatal Medicine, The Ohio State University and Nationwide Children’s Hospital, Columbus, Ohio, United States of America, 2 Laboratory of Memory Disorders, Feinstein Institute for Medical Research, Manhasset, New York, United States of America, 3 Neuroimaging Department, Feinstein Institute for Medical Research, Manhasset, New York, United States of America, 4 Laboratory of Immune & Neural Networks, Feinstein Institute for Medical Research, Manhasset, New York, United States of America, 5 Department of Molecular Medicine, Hofstra North Shore LIJ School of Medicine, New York, United States of America, 6 Department of Pathology, NSL-IJ, Manhasset, New York, United States of America, 7 Division of Neonatal-Perinatal Medicine, Cohen Children’s Medical Center of New York and Lilling Family Research laboratory, Feinstein Institute for Medical Research, Manhasset, New York, United States of America Abstract Extracellular superoxide dismutase (EC-SOD) is an isoform of SOD normally found both intra- and extra-cellularly and accounting for most SOD activity in blood vessels. Here we explored the role of EC-SOD in protecting against brain damage induced by chronic hypoxia. EC-SOD Transgenic mice, were exposed to hypoxia (FiO2.1%) for 10 days (H-KI) and compared to transgenic animals housed in room air (RA-KI), wild type animals exposed to hypoxia (H-WT or wild type mice housed in room air (RA-WT). Overall brain metabolism evaluated by positron emission tomography (PET) showed that H-WT mice had significantly higher uptake of 18 FDG in the brain particularly the hippocampus, hypothalamus, and cerebellum. H-KI mice had comparable uptake to the RA-KI and RA-WT groups. To investigate the functional state of the hippocampus, electrophysiological techniques in ex vivo hippocampal slices were performed and showed that H-KI had normal synaptic plasticity, whereas H-WT were severely affected. Markers of oxidative stress, GFAP, IBA1, MIF, and pAMPK showed similar values in the H-KI and RA-WT groups, but were significantly increased in the H-WT group. Caspase-3 assay and histopathological studies showed significant apoptosis/cell damage in the H-WT group, but no significant difference in the H-KI group compared to the RA groups. The data suggest that EC-SOD has potential prophylactic and therapeutic roles in diseases with compromised brain oxygenation. Citation: Zaghloul N, Patel H, Codipilly C, Marambaud P, Dewey S, et al. (2014) Overexpression of Extracellular Superoxide Dismutase Protects against Brain Injury Induced by Chronic Hypoxia. PLoS ONE 9(9): e108168. doi:10.1371/journal.pone.0108168 Received May 2, 2014; Accepted August 19, 2014; Published September 30, 2014 Copyright: ß 2014 Zaghloul et al. This is an open-access article distributed under the terms of the Creative Commons Attribution License, which permits unrestricted use, distribution, and reproduction in any medium, provided the original author and source are credited. Data Availability: The authors confirm that all data underlying the findings are fully available without restriction. All relevant data are within the paper. Funding: The author(s) received no specific funding for this work. Competing Interests: The authors have declared that no competing interests exist. * Email: [email protected] Introduction Hypoxia plays a crucial role in acute and chronic CNS pathologies. Exposure to hypoxia results in a significant increase in reactive oxygen species (ROS), including superoxide, which is produced mainly in the mitochondria [1–4]. ROS leads to impaired neurogenesis, hippocampal atrophy, altered transcrip- tion factor regulation, and protein expression [5–6]. Excess ROS, particularly superoxide, can oxidize nitric oxide (NO) to reactive nitrogen species (RNS) including peroxynitrite [7–8]. This process leads to decreased NO bioavailability, accumulation of toxic products including NO2 [9–10]. Both ROS and RNS oxidize macromolecules (DNA, proteins, and lipids), culminating in CNS neurodegeneration [11]. Oxidative stress also activates glial-mediated inflammation [12]. HIF-1 alpha rapidly accumulates during the onset of hypoxia, remaining at this level for 14 days before gradually declining to normal by 21 days despite continuous hypoxia [13–14]. A pathophysiological role for HIF-1alpha has been established for hypoxic ischemic diseases [15]. Neurons are particularly susceptible to ROS/RNS injury [16], but may adapt to hypoxia by activating neuroprotective signaling cascades e.g. MAPK, ERK1/2, and protein kinase-B [17–18] increasing glycolytic energy metabolism and free-radical defenses [19], down-regulating oxidative-stress genes, and up-regulating antioxidant genes [20]. Overexpression of mitochondrial SOD2 inhibits post-ischemic mitogen-activated protein kinase and decreases DNA fragmenta- tion following ischemia/reperfusion [21–25]. The outcome from middle cerebral artery occlusion is worse in SOD2 deficient animals [26]. A neuroprotective role for SOD mimetics has been demonstrated in an ex-vivo brain model [27]. EC-SOD is expressed in the brain at a lower level than other SODs [28], but provides defense against ROS produced by membrane-bound NAD(P)H oxidase [29]. EC-SOD is predomi- nantly localized in neurons of hippocampus, lateral nucleus of the thalamus and hypothalamus. Both EC-SOD and neuronal NO synthase are similarly distributed in the striatum and cortex [30]. EC-SOD is the only extracellular SOD isoform and the major SOD activity in blood vessels, which leads to increase NO bioavailability [31]. PLOS ONE | www.plosone.org 1 September 2014 | Volume 9 | Issue 9 | e108168 Editor: Tim D. Oury, University of Pittsburgh, United States of America
-
Upload
independent -
Category
Documents
-
view
0 -
download
0
Transcript of Overexpression of extracellular superoxide dismutase has a protective role against hyperoxia-induced...

Overexpression of Extracellular Superoxide DismutaseProtects against Brain Injury Induced by Chronic HypoxiaNahla Zaghloul1, Hardik Patel7, Champa Codipilly7, Philippe Marambaud2, Stephen Dewey3,
Stephen Frattini4, Patricio T. Huerta4,5, Mansoor Nasim6, Edmund J. Miller5,7, Mohamed Ahmed1,7*
1 Division of Neonatal-Perinatal Medicine, The Ohio State University and Nationwide Children’s Hospital, Columbus, Ohio, United States of America, 2 Laboratory of
Memory Disorders, Feinstein Institute for Medical Research, Manhasset, New York, United States of America, 3 Neuroimaging Department, Feinstein Institute for Medical
Research, Manhasset, New York, United States of America, 4 Laboratory of Immune & Neural Networks, Feinstein Institute for Medical Research, Manhasset, New York,
United States of America, 5 Department of Molecular Medicine, Hofstra North Shore LIJ School of Medicine, New York, United States of America, 6 Department of
Pathology, NSL-IJ, Manhasset, New York, United States of America, 7 Division of Neonatal-Perinatal Medicine, Cohen Children’s Medical Center of New York and Lilling
Family Research laboratory, Feinstein Institute for Medical Research, Manhasset, New York, United States of America
Abstract
Extracellular superoxide dismutase (EC-SOD) is an isoform of SOD normally found both intra- and extra-cellularly andaccounting for most SOD activity in blood vessels. Here we explored the role of EC-SOD in protecting against brain damageinduced by chronic hypoxia. EC-SOD Transgenic mice, were exposed to hypoxia (FiO2.1%) for 10 days (H-KI) and comparedto transgenic animals housed in room air (RA-KI), wild type animals exposed to hypoxia (H-WT or wild type mice housed inroom air (RA-WT). Overall brain metabolism evaluated by positron emission tomography (PET) showed that H-WT mice hadsignificantly higher uptake of 18FDG in the brain particularly the hippocampus, hypothalamus, and cerebellum. H-KI micehad comparable uptake to the RA-KI and RA-WT groups. To investigate the functional state of the hippocampus,electrophysiological techniques in ex vivo hippocampal slices were performed and showed that H-KI had normal synapticplasticity, whereas H-WT were severely affected. Markers of oxidative stress, GFAP, IBA1, MIF, and pAMPK showed similarvalues in the H-KI and RA-WT groups, but were significantly increased in the H-WT group. Caspase-3 assay andhistopathological studies showed significant apoptosis/cell damage in the H-WT group, but no significant difference in theH-KI group compared to the RA groups. The data suggest that EC-SOD has potential prophylactic and therapeutic roles indiseases with compromised brain oxygenation.
Citation: Zaghloul N, Patel H, Codipilly C, Marambaud P, Dewey S, et al. (2014) Overexpression of Extracellular Superoxide Dismutase Protects against Brain InjuryInduced by Chronic Hypoxia. PLoS ONE 9(9): e108168. doi:10.1371/journal.pone.0108168
Received May 2, 2014; Accepted August 19, 2014; Published September 30, 2014
Copyright: � 2014 Zaghloul et al. This is an open-access article distributed under the terms of the Creative Commons Attribution License, which permitsunrestricted use, distribution, and reproduction in any medium, provided the original author and source are credited.
Data Availability: The authors confirm that all data underlying the findings are fully available without restriction. All relevant data are within the paper.
Funding: The author(s) received no specific funding for this work.
Competing Interests: The authors have declared that no competing interests exist.
* Email: [email protected]
Introduction
Hypoxia plays a crucial role in acute and chronic CNS
pathologies. Exposure to hypoxia results in a significant increase in
reactive oxygen species (ROS), including superoxide, which is
produced mainly in the mitochondria [1–4]. ROS leads to
impaired neurogenesis, hippocampal atrophy, altered transcrip-
tion factor regulation, and protein expression [5–6].
Excess ROS, particularly superoxide, can oxidize nitric oxide
(NO) to reactive nitrogen species (RNS) including peroxynitrite
[7–8]. This process leads to decreased NO bioavailability,
accumulation of toxic products including NO2 [9–10]. Both
ROS and RNS oxidize macromolecules (DNA, proteins, and
lipids), culminating in CNS neurodegeneration [11]. Oxidative
stress also activates glial-mediated inflammation [12]. HIF-1 alpha
rapidly accumulates during the onset of hypoxia, remaining at this
level for 14 days before gradually declining to normal by 21 days
despite continuous hypoxia [13–14]. A pathophysiological role for
HIF-1alpha has been established for hypoxic ischemic diseases
[15].
Neurons are particularly susceptible to ROS/RNS injury [16],
but may adapt to hypoxia by activating neuroprotective signaling
cascades e.g. MAPK, ERK1/2, and protein kinase-B [17–18]
increasing glycolytic energy metabolism and free-radical defenses
[19], down-regulating oxidative-stress genes, and up-regulating
antioxidant genes [20].
Overexpression of mitochondrial SOD2 inhibits post-ischemic
mitogen-activated protein kinase and decreases DNA fragmenta-
tion following ischemia/reperfusion [21–25]. The outcome from
middle cerebral artery occlusion is worse in SOD2 deficient
animals [26]. A neuroprotective role for SOD mimetics has been
demonstrated in an ex-vivo brain model [27].
EC-SOD is expressed in the brain at a lower level than other
SODs [28], but provides defense against ROS produced by
membrane-bound NAD(P)H oxidase [29]. EC-SOD is predomi-
nantly localized in neurons of hippocampus, lateral nucleus of the
thalamus and hypothalamus. Both EC-SOD and neuronal NO
synthase are similarly distributed in the striatum and cortex [30].
EC-SOD is the only extracellular SOD isoform and the major
SOD activity in blood vessels, which leads to increase NO
bioavailability [31].
PLOS ONE | www.plosone.org 1 September 2014 | Volume 9 | Issue 9 | e108168
Editor: Tim D. Oury, University of Pittsburgh, United States of America

Mice, engineered to overexpress EC-SOD, have increased
tolerance to both focal and global cerebral ischemia [32–34], while
EC-SOD knock-outs exhibit enhanced damage [35]. These data
implicate an important role for EC-SOD ischemia/reperfusion
pathologies, and suggest a therapeutic role for SOD mimetics.
Previously, we showed that EC-SOD offers significant protec-
tion against oxidative stress-induced lung injury [36–37] and brain
injury induced by hyperoxia [38]. In this study, we hypothesized
that EC-SOD overexpression offers protection to the brain
exposed to chronic hypoxia. This could be of importance to
many diseases with compromised brain oxygenation.
Material and Methods
All experiments involving animals were reviewed and approved
by the Institutional Animal Care and Use Committee of the
Feinstein Institute for Medical Research, and performed in
accordance with the guidelines set by the Institute for Laboratory
Animal Research. Adult C57BL6 mice, (8–10 week old), either
wild type (WT) or transgenic animals (KI) generated by
microinjecting nuclei of fertilized oocytes from (C57Bl/6#C3H),
with the cDNA of human EC-SOD containing a Beta-actin
promoter [29], were housed in a pathogen-free environment,
under standard light and dark cycles, with free access to food and
water. An animal hypoxia chamber system (BioSpherix, Lacona,
NY) was used for the in vivo studies. With this system, a constant
10% normobaric hypoxia was achieved for up to 10 days in our
study. Animals were divided into four groups (10/group) and
housed for 10 days as follows: Group A: WT adult mice housed in
room air (RA-WT). Group B: KI adult mice housed in room air
(RA-KI). Group C: WT adult mice housed in hypoxia (H-WT).
Group D: KI adult mice housed in hypoxia (H-KI). After 10 days,
the animals were assessed using PET, and were then euthanized
and brain tissues harvested.
Functional studies1- PET scanning. Brains were scanned after exposure to
hypoxia for 10 days and compared to matched room air controls.
Scanning was performed using 18FDG, which was injected
intraperitoneally at a dose of 400 Micro Curie per mouse. After
45 min., the mice were assessed at the PET scan center located
within the Feinstein Institute for Medical Research.
2- Hippocampal Electrophysiology. Mice were anesthe-
tized with isoflurane in a closed container, then immediately
decapitated. The brain was quickly extracted into ice-cold (,2C)
artificial cerebral spinal fluid (ACSF) that contained: NaCl
(126 mM), NaHCO3 (26 mM), glucose (10 mM), KCl (2.5 mM),
CaCl2 (2.4 mM), MgCl2 (1.3 mM), and NaH2PO4 (1.2 mM), and
was continuously gassed with carbogen (95% O2, 5% CO2).
Kynurenic acid (1 mM), which is a non-specific blocker of
excitatory amino acid receptors, was added to the ACSF solution
during the dissection and slicing procedures. The brain was
bisected and both hemispheres were mounted onto a block with
ethyl cyanoacrylate glue. Transverse hippocampal slices (400 mm
thick) were prepared using a Leica VT1200 vibratome. Slices were
incubated in ACSF gassed with carbogenfor 35 min at 35C
followed by 120 min at 24C. One slice at a time was transferred to
a recording chamber, continuously perfused with ACSF gassed
with carbogen at 30C, for electrophysiological studies. Field
excitatory postsynaptic potentials (fEPSP) were recorded with
borosilicate glass electrodes (2–3 M ohmns tip resistance) placed in
the stratum radiatum, of the CA1, at the midpoint between two
bipolar stimulating electrodes (Frederick Haer & Co, Bowdoin-
ham, ME) that activated Schaeffer collateral/commissural axons.
This setup allowed for the recording of two independent pathways
(test and control) in the same slice. The initial slope of the fEPSP
was used as a measure of the postsynaptic response. fEPSP
responses were amplified (AM Systems 1800), digitized at 10 kHz,
and analyzed online with custom software (written with AxoBasic,
Axon Instruments, Union City, CA). For obtaining input-output
(I-O) functions, the stimulation was reduced to a value at which no
fEPSP was evoked. The stimulation was then increased incremen-
tally to evoke larger fEPSPs. This was done until the appearance of
a population spike, generated by CA1 pyramidal cells, which
defined the final point of the I-O function. For plasticity
experiments, a stable baseline was obtained for at least 15 min.
The baseline intensity was set to obtain a fEPSP slope that was
half-maximal, as determined by I-O curves. Long-term potenti-
ation (LTP) was induced by high-frequency stimulation (HFS),
which consisted of either tetanus (100 Hz for 1 sec) or theta burst
stimulation (TBS, 10 trains of 4 pulses at 100 Hz, with 200 ms
between trains). We calculated LTP from 30 responses at 40–
45 min post-HFS. For all LTP experiments, picrotoxin (100
microM) was added to block GABAA receptors [39].
Molecular studies1- Superoxide dismutase (SOD) assays. After PET scan-
ning, all animals were euthanized. Brains were isolated and
immediately frozen. SOD activity was assessed in brain homog-
enates using an Oxiselect superoxide dismutase activity assay kit
(Cell Biolabs, Dan Diego, CA). This assay utilizes a xanthine/
xanthine oxidase system to generate superoxide anions, which
reduce a chromagen to a water soluble formazan dye. The activity
of SOD in the brain tissue homogenate was determined as the
inhibition of chromagen reduction. Quantitative assays of SOD1,
SOD2,and hSOD3 were done by western blot and compared to
B-Actin protein concentration.
2- Glutathione assay. For the determination of the reduced
glutathione (GSH) and oxidized glutathione (GSSG) ratio, the
brain was homogenized and the homogenates were treated with a
mixture of metaphosphoric acid, EDTA, and NaCl. After
centrifugation, aliquots were taken for neutralization with
disodium hydrogen phosphate followed by addition of DTNB.
Reduced and oxidized glutathione were measured in brain tissue
homogenates by reaction with DTNB (5,59-dithiobis-2-nitroben-
zoic acid) using a Glutathione Assay Kit (Calbiochem, Gibbson-
town, NJ), following the manufacturer’s instructions. Reduced
glutathione (GSH) was determined after reaction with DTNB in a
spectrophotometer at 412 nm. For the determination of oxidized
glutathione (GSSG), the autoxidation of GSH was stopped by
addition of N-ethylmaleimide. After addition of sodium hydroxide,
GSSG was modified using o-phthalaldehyde. GSSG was deter-
mined at a spectrofluorometer (excitation: 350 nm, emission:
420 nm) using GSSG standards for quantification [40].
3- Western Blotting. Frozen brain tissues were crushed and
homogenized, and protein extraction was carried out using a Total
Protein Extraction Kit (BioChain Institute, Inc. Hayward, CA).
Protein concentration was estimated using the Modified Lowry
Protein Assay (Thermo Fisher Scientific, Rockford, IL, USA).
Samples were prepared for SDS-PAGE in Laemmli Sample Buffer
(Bio-rad, Hercules, CA, USA). Standard SDS-PAGE techniques
were followed as previously described [38]. Running buffer and
Transfer buffer were purchased from Bio-Rad (Hercules, CA,
USA). Briefly electrophoresis was performed using a Mini Format
1-D Electrophoresis Systems (Bio-Rad, Hercules, CA, USA) on
10–12% ready tris-HCl gels (Bio-rad, Hercules, CA, USA). After
electrophoresis, proteins were transferred to a PVDF membrane
using a Wet/Tank Blotting System (Bio-rad, Hercules, CA, USA).
EC-SOD and Chronic Brain Hypoxia
PLOS ONE | www.plosone.org 2 September 2014 | Volume 9 | Issue 9 | e108168

Figure 1. SOD activity ratio in adult mouse brain groups (WT and KI), after exposure to hypoxia (10% for 10 days) in comparisonwith the RA control groups (WT and KI). Data are mean of 10 animals per group 6 SEM. *P,0.05 versus the KI hypoxia and WT hypoxia groups(Fig. 1A). Quantitative Western blot for SDO1, SOD2 & hSDO3 (presented as a ratio for B-Actin), in adult mouse brain groups (WT and KI) afterexposure to hypoxia (10% for 10 days) in comparison with the RA control groups (WT and KI). Data are mean of 56 SEM animals per group. *P,0.05HI-KI vs. RA groups and WT hypoxia groups; and H-WT vs. RA groups (Fig. 1B).doi:10.1371/journal.pone.0108168.g001
EC-SOD and Chronic Brain Hypoxia
PLOS ONE | www.plosone.org 3 September 2014 | Volume 9 | Issue 9 | e108168

Membranes were briefly washed and immediately incubated with
respective primary antibody in 5% BSA with PBST overnight
(primary antibody was diluted according to the manufacturer’s
recommendation). The next day, after washing, the membranes
were incubated with HRP-conjugated secondary antibodies for
40–60 min (diluted according to the manufacturer’s recommen-
dation). After incubation with secondary antibody, the membranes
were washed and then processed using Amersham ECL detection
systems (GE healthcare, Piscataway, NJ USA). The membranes
were then immediately exposed to 8610 Fuji X-Ray Film.
Developed films were quantified using Quantity One 1-D Analysis
Software on a GS-800 Calibrated Densitometer. The density of
each band was evaluated and presented as a ratio in comparison to
Actin band density. The following primary antibodies were used to
detect the following markers: GFAP (Cell Signaling Technology,
Danvers, MA, USA), Iba-1 (Wako Chemicals USA, Richmond,
VA, USA), MIF (Abcam, Cambridge, MA, USA), pAMPK
(Beauchamp et al., 2004), (Cell Signaling Technology, Danver,
MA), pAMPK (Cell Signaling Technology, Danver, MA, USA),
and anti-Actin protein (as an internal control) (Gene Script,
Olathe, KS, USA). Horseradish Peroxidase (HRP)-Conjugated
Goat Anti-Rabbit IgG conjugate was used for detection of rabbit
primary antibodies (Bio-Rad, Hercules, CA, USA). Goat anti-
mouse HRP conjugates were used for detection of mouse primary
antibodies (Southern Biotech, Birmingham, AL, USA).
Structural studies1- Caspase 3 activity assay. Caspase 3 activity was
measured using the Caspase-3 Colorimetric Assay (R&D Systems,
Minneapolis, MN, USA). The assay was carried out following the
manufacturer’s instructions and described previously [41]. Brain
tissue samples were homogenized in buffer containing 10 mM
HEPES (pH 7.4), 42 mM KCl, 5 mM MgCl2, 1 mM dithiothre-
itol, 1% Triton X-100, 0.5% CHAPS, 1 mM phenyl methyl
sulfonyl fluoride, and 1 micro gm/mL leupeptin, and centrifuged
at 12,000 g for 10 minutes at 4uC. A 10-mL aliquot of the lysate
was incubated in a flat bottom 96 well plate, 50 microL tissue
lysates were incubated with 50 microL 2x reaction buffer followed
by 5 microL of caspase-3 colorimetric substrate (DEVD-pNA), and
incubated at 37C for 2 hrs. The fluorescence was measured at
room temperature at the excitation wavelength of 360 nm, and
emission was measured at 460 nm with the use of a multiplate
fluorescence reader (Biotek Instruments). Protein concentration
was measured with a Pierce kit (Pierce Biotechnology, Rockford,
IL, USA). Ac-AMC was used to obtain a standard curve. Enzyme
activity was calculated as picomoles per minute per mg of protein.
2- Histopathological studies. Brain tissue was fixed in 10%
neutral buffered formalin for 24 hours, processed, embedded in
paraffin wax, and subsequently cut into 4 micron thick sections.
Following de-paraffinization, hematoxylin and eosin (H&E)
staining was performed according to standard protocols. Standard
sections were made of the hippocampus, cerebellum, and
cerebrum in each group of animals.
Figure 2. Brain PET scan with an FDG standardized uptake value, showing a cross and longitudinal sections of brain uptake.doi:10.1371/journal.pone.0108168.g002
EC-SOD and Chronic Brain Hypoxia
PLOS ONE | www.plosone.org 4 September 2014 | Volume 9 | Issue 9 | e108168

Statistical analysesValues are presented as mean 6 SEM. Comparisons among
groups were made using analysis of variance (ANOVA) or
unpaired Student’s t test, as appropriate. P value ,0.05 was used
as the cutoff for significant findings.
Results
SOD activity and quantityAmong KI adults, we found SOD activity in brain tissue was
statistically significantly higher (x2) than WT adults after exposure
to hypoxia (P,0.05) (Figure 1A). To find out which SOD is
contributing to the increase in SOD activity, quantitative measure
of SOD1, SOD2 and hSOD3 in all brain tissue was done. Our
study showed that increased SOD activity after exposure to
hypoxia in group KI, is mainly due to increase of both SOD2 and
hSOD3 which are increased significantly in KI hypoxic group
compared to RA groups and WT hypoxic group (P,0.05)
(Fig. 1B). The Beta-actin promoter driving the expression of the
human EC-SOD transgene did not lead to augmented expression
in KI mice in response to hypoxia, but this significant augmen-
tation in hEC-SOD protein expression in our model could by
induced by other stimuli like NO [42].
Functional studies demonstrate neuronal protection inH-KI mice
PET scans showed that there was a higher uptake of 18FDG in
hypoxic groups compared to the normoxic groups, and the
difference was statistically significant (P,0.05). Interestingly, the18FDG uptake of H-KI brains was lower than H-WT brains in
areas sensitive to hypoxia, such as the hippocampus, hypothala-
mus, thalamus, and medulla (Figure 2 & Table 1), revealing that
H-WT brains were maximally activated in their metabolism.
Table 1. PET scan data showing FDG in adult mice brain groups (WT and KI) after exposure to hypoxia (10% for 10 days), incomparison with the RA control groups (RA-WT and RA-KI).
Region RA-WT RA-KI H-WT H-KI *P value
AcbCore/Shell 0.442 0.436 1.494 0.940 0.003
CaudatePutamen 0.513 0.494 1.727 1.056 0.006
CentralCanal-PAG 0.401 0.396 1.480 0.961 0.004
Pons 0.159 0.156 0.635 0.382 0.004
Septum 0.385 0.372 1.423 0.893 0.001
Medulla 0.220 0.207 0.842 0.490 0.005
Whole Brain 0.349 0.326 1.237 0.754 0.001
Amygdala 0.222 0.209 0.741 0.447 0.002
Cortex-Auditory 0.488 0.450 1.599 0.937 0.002
Cingulate-Ctx 0.607 0.540 2.019 1.223 0.001
Entorhinal-Ctx 0.206 0.195 0.675 0.409 0.003
Frontal-Ctx 0.459 0.355 1.641 0.993 0.002
Insular-Ctx 0.346 0.318 1.218 0.731 0.001
MedialPrefrontal-Ctx 0.558 0.525 1.827 1.130 0.003
Motor-Ctx 0.543 0.447 1.958 1.152 0.001
OrbitoFrontal-Ctx 0.500 0.440 1.802 1.123 0.000
Parietal-Ctx 0.532 0.456 1.809 1.113 0.001
Retrosplenial-Ctx 0.548 0.486 1.871 1.113 0.002
Somatosensory-Ctx 0.539 0.480 1.881 1.132 0.002
Visual-Ctx 0.520 0.471 1.752 1.049 0.001
Hippocampus-Dorsal 0.412 0.381 1.426 0.921 0.003
Hippocampus-Ventral 0.340 0.316 1.277 0.813 0.002
Hypothalamus 0.183 0.177 0.687 0.411 0.001
Olfactory-Ctx 0.248 0.235 0.907 0.581 0.000
pituitary 0.001 0.001 0.005 0.003 0.004
Superior Colliculi 0.519 0.467 1.712 1.061 0.000
Midbrain 0.457 0.441 1.605 0.966 0.003
VTA 0.304 0.310 1.121 0.677 0.005
Cerebellar Grey 0.323 0.321 1.151 0.699 0.008
Cerebellar White 0.392 0.361 1.387 0.850 0.005
InferiorColliculi 0.546 0.497 1.803 1.065 0.001
Thalamus 0.521 0.468 1.776 1.087 0.001
Data are mean 6 SEM of 10 animals per group. *P,0.05 versus the KI hypoxia and WT hypoxia groups.doi:10.1371/journal.pone.0108168.t001
EC-SOD and Chronic Brain Hypoxia
PLOS ONE | www.plosone.org 5 September 2014 | Volume 9 | Issue 9 | e108168
We next evaluated electrophysiological studies in ex vivohippocampal measured with input-output curves for the fEPSPs
of CA1 synapses, elicited by stimulation of the CA3 afferents. The
data show that synaptic transmission was greatly affected in both
hypoxic groups when compared to the RA-WT slices (P,0.05).
However, the H-KI group showed significantly stronger transmis-
sion than the H-WT group (P,0.05), (Figure 3), suggesting that
the H-WT synapses were the most affected by hypoxia. Notably,
the H-KI group displayed normal long-term synaptic plasticity
(LTP), because their LTP measured at 45-min post-tetanic
stimulation was similar to the RA-WT group. Conversely, the
H-WT slices showed complete absence of LTP (Figure 3).
Molecular studies showed attenuation of inflammatoryand neural cell damage markers in H-KI mice
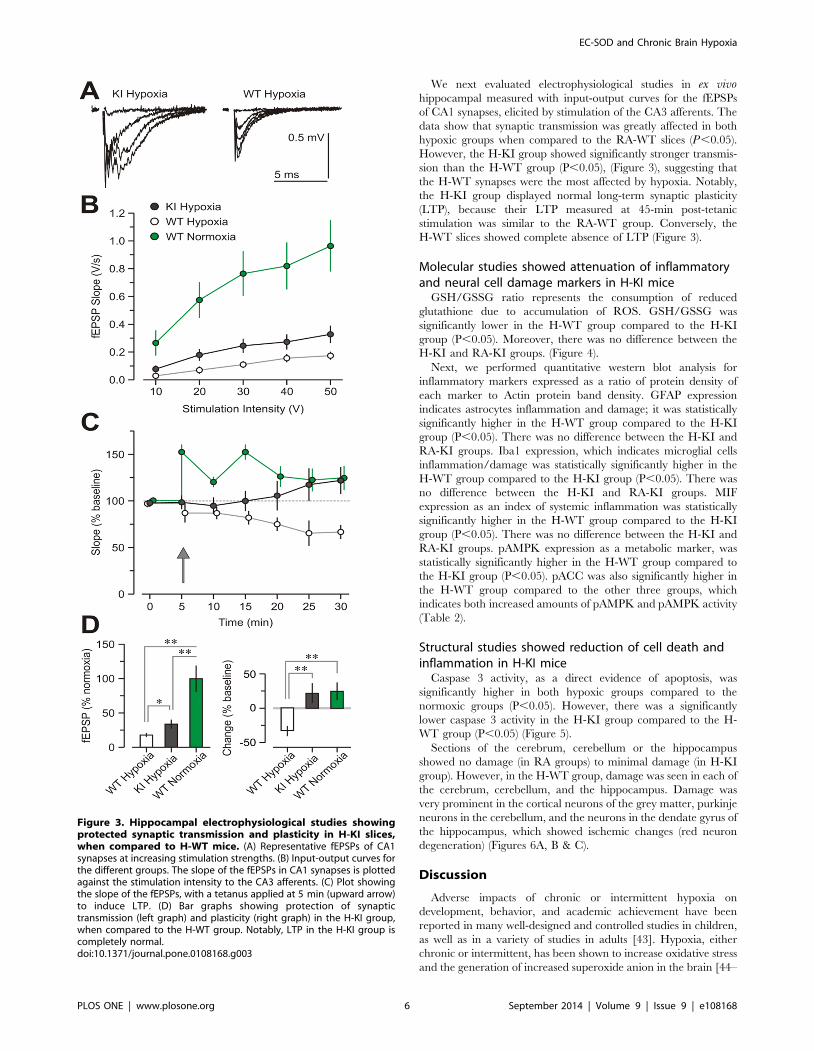
GSH/GSSG ratio represents the consumption of reduced
glutathione due to accumulation of ROS. GSH/GSSG was
significantly lower in the H-WT group compared to the H-KI
group (P,0.05). Moreover, there was no difference between the
H-KI and RA-KI groups. (Figure 4).
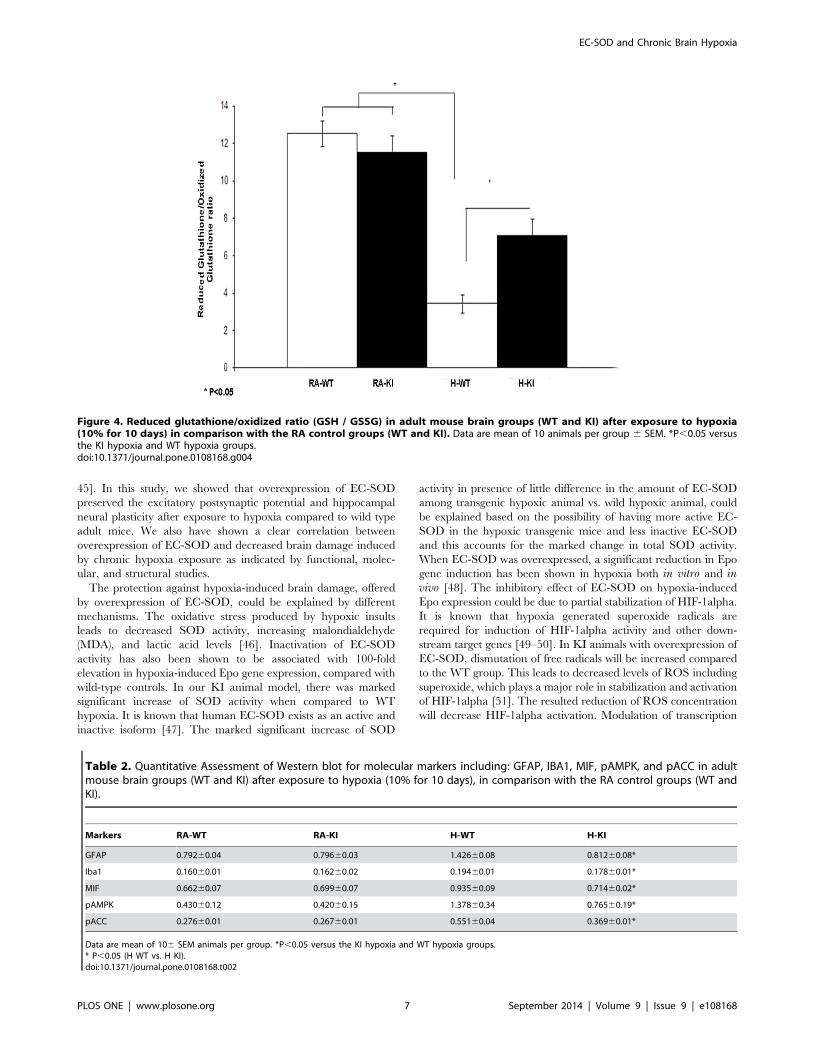
Next, we performed quantitative western blot analysis for
inflammatory markers expressed as a ratio of protein density of
each marker to Actin protein band density. GFAP expression
indicates astrocytes inflammation and damage; it was statistically
significantly higher in the H-WT group compared to the H-KI
group (P,0.05). There was no difference between the H-KI and
RA-KI groups. Iba1 expression, which indicates microglial cells
inflammation/damage was statistically significantly higher in the
H-WT group compared to the H-KI group (P,0.05). There was
no difference between the H-KI and RA-KI groups. MIF
expression as an index of systemic inflammation was statistically
significantly higher in the H-WT group compared to the H-KI
group (P,0.05). There was no difference between the H-KI and
RA-KI groups. pAMPK expression as a metabolic marker, was
statistically significantly higher in the H-WT group compared to
the H-KI group (P,0.05). pACC was also significantly higher in
the H-WT group compared to the other three groups, which
indicates both increased amounts of pAMPK and pAMPK activity
(Table 2).
Structural studies showed reduction of cell death andinflammation in H-KI mice
Caspase 3 activity, as a direct evidence of apoptosis, was
significantly higher in both hypoxic groups compared to the
normoxic groups (P,0.05). However, there was a significantly
lower caspase 3 activity in the H-KI group compared to the H-
WT group (P,0.05) (Figure 5).
Sections of the cerebrum, cerebellum or the hippocampus
showed no damage (in RA groups) to minimal damage (in H-KI
group). However, in the H-WT group, damage was seen in each of
the cerebrum, cerebellum, and the hippocampus. Damage was
very prominent in the cortical neurons of the grey matter, purkinje
neurons in the cerebellum, and the neurons in the dendate gyrus of
the hippocampus, which showed ischemic changes (red neuron
degeneration) (Figures 6A, B & C).
Discussion
Adverse impacts of chronic or intermittent hypoxia on
development, behavior, and academic achievement have been
reported in many well-designed and controlled studies in children,
as well as in a variety of studies in adults [43]. Hypoxia, either
chronic or intermittent, has been shown to increase oxidative stress
and the generation of increased superoxide anion in the brain [44–
Figure 3. Hippocampal electrophysiological studies showingprotected synaptic transmission and plasticity in H-KI slices,when compared to H-WT mice. (A) Representative fEPSPs of CA1synapses at increasing stimulation strengths. (B) Input-output curves forthe different groups. The slope of the fEPSPs in CA1 synapses is plottedagainst the stimulation intensity to the CA3 afferents. (C) Plot showingthe slope of the fEPSPs, with a tetanus applied at 5 min (upward arrow)to induce LTP. (D) Bar graphs showing protection of synaptictransmission (left graph) and plasticity (right graph) in the H-KI group,when compared to the H-WT group. Notably, LTP in the H-KI group iscompletely normal.doi:10.1371/journal.pone.0108168.g003
EC-SOD and Chronic Brain Hypoxia
PLOS ONE | www.plosone.org 6 September 2014 | Volume 9 | Issue 9 | e108168
45]. In this study, we showed that overexpression of EC-SOD
preserved the excitatory postsynaptic potential and hippocampal
neural plasticity after exposure to hypoxia compared to wild type
adult mice. We also have shown a clear correlation between
overexpression of EC-SOD and decreased brain damage induced
by chronic hypoxia exposure as indicated by functional, molec-
ular, and structural studies.
The protection against hypoxia-induced brain damage, offered
by overexpression of EC-SOD, could be explained by different
mechanisms. The oxidative stress produced by hypoxic insults
leads to decreased SOD activity, increasing malondialdehyde
(MDA), and lactic acid levels [46]. Inactivation of EC-SOD
activity has also been shown to be associated with 100-fold
elevation in hypoxia-induced Epo gene expression, compared with
wild-type controls. In our KI animal model, there was marked
significant increase of SOD activity when compared to WT
hypoxia. It is known that human EC-SOD exists as an active and
inactive isoform [47]. The marked significant increase of SOD
activity in presence of little difference in the amount of EC-SOD
among transgenic hypoxic animal vs. wild hypoxic animal, could
be explained based on the possibility of having more active EC-
SOD in the hypoxic transgenic mice and less inactive EC-SOD
and this accounts for the marked change in total SOD activity.
When EC-SOD was overexpressed, a significant reduction in Epo
gene induction has been shown in hypoxia both in vitro and invivo [48]. The inhibitory effect of EC-SOD on hypoxia-induced
Epo expression could be due to partial stabilization of HIF-1alpha.
It is known that hypoxia generated superoxide radicals are
required for induction of HIF-1alpha activity and other down-
stream target genes [49–50]. In KI animals with overexpression of
EC-SOD, dismutation of free radicals will be increased compared
to the WT group. This leads to decreased levels of ROS including
superoxide, which plays a major role in stabilization and activation
of HIF-1alpha [51]. The resulted reduction of ROS concentration
will decrease HIF-1alpha activation. Modulation of transcription
Figure 4. Reduced glutathione/oxidized ratio (GSH / GSSG) in adult mouse brain groups (WT and KI) after exposure to hypoxia(10% for 10 days) in comparison with the RA control groups (WT and KI). Data are mean of 10 animals per group 6 SEM. *P,0.05 versusthe KI hypoxia and WT hypoxia groups.doi:10.1371/journal.pone.0108168.g004
Table 2. Quantitative Assessment of Western blot for molecular markers including: GFAP, IBA1, MIF, pAMPK, and pACC in adultmouse brain groups (WT and KI) after exposure to hypoxia (10% for 10 days), in comparison with the RA control groups (WT andKI).
Markers RA-WT RA-KI H-WT H-KI
GFAP 0.79260.04 0.79660.03 1.42660.08 0.81260.08*
Iba1 0.16060.01 0.16260.02 0.19460.01 0.17860.01*
MIF 0.66260.07 0.69960.07 0.93560.09 0.71460.02*
pAMPK 0.43060.12 0.42060.15 1.37860.34 0.76560.19*
pACC 0.27660.01 0.26760.01 0.55160.04 0.36960.01*
Data are mean of 106 SEM animals per group. *P,0.05 versus the KI hypoxia and WT hypoxia groups.* P,0.05 (H WT vs. H KI).doi:10.1371/journal.pone.0108168.t002
EC-SOD and Chronic Brain Hypoxia
PLOS ONE | www.plosone.org 7 September 2014 | Volume 9 | Issue 9 | e108168

factor HIF-1 alpha and its important gene target VEGF by the
antioxidant enzyme EC-SOD was confirmed in other studies [52].
Another important mechanism, which has a great implication in
explaining our findings, concerns nitric oxide (NO). NO inhibits
hypoxia-inducible transcription of the Epo gene through suppres-
sion of HIF-1alpha expression, DNA binding activity, and
transcriptional activity [53–54]. Under hypoxic conditions, there
is a rapid accumulation of superoxide which rapidly reacts with
NO to form peroxynitrite and other toxic metabolities [55–56]. In
KI animals with enhanced expression of EC-SOD, superoxide is
dismutated by EC-SOD to form H2O2. Decreased levels of
superoxide would lead to increased physiologic NO concentrations
and its bioavailability [57–58]. A physiological consequence of this
is that EC-SOD influences blood vessel tone by maintaining the
biological activity of NO [35].
With overexpression of EC-SOD and dismutation of superox-
ide, hydrogen peroxide accumulation is important. Many studies
have handled this logical assumption by analyzing H2O2 in
different settings. Most of the studies conclude that more SOD
does not mean more H2O2 [59]. The formation of H2O2 due to
dismutation of superoxide, is limited by the amount of superoxide,
not by the rate it is converted to H2O2. Accumulation of
superoxide leads to the oxidation of NO with the formation of
peroxynitrite. In this situation more H2O2 is very unlikely to be
toxic since this would amount to substituting a very mild cytotoxin
(H2O2) for a very potent one (peroxynitrite). H2O2 downregulates
GRK2 expression which plays a key role in G protein-coupled
receptor (GPCR) signaling modulation, and its expression levels
are decreased after brain hypoxia/ischemia. Therefore, pharma-
cological agents effective in the treatment of brain ischaemia/
hypoxia should obtain an increase in the level of H2O2 by blocking
GPx, preferably associated to an increased enzymatic activity of
SOD and CAT. In the study conducted by [60], either GPx or
CAT inhibition enhanced H2O2 toxicity in rat hippocampal slices,
confirming the importance of the integrity of glial antioxidant
network [61].
It has been shown that hypoxic exposure (chronic or
intermittent) leads to a variety of neurological consequences
which can include psychomotor impairment, learning and spatial
memory impairment, and in extreme cases, memory retrieval
impairment. Reaction time, total number and performance of
tasks decrease significantly in hypoxic conditions, and changes in
visual sensitivity, attention span, arithmetic and decision making
abilities have also been noted [6],[62–64]. Imaging studies using
PET imaging of H-KI and H-WT mice, showed a marked and
significant reduction in FDG uptake in all scanned brain regions
including brain regions sensitive to hypoxia mainly the hippo-
campus, hypothalamus, thalamus, and medulla (Table 1). Increas-
es in 18FDG uptake observed in specific brain regions of hypoxic
animals, is generally thought to represent an increase demand in
glucose metabolism from those intact cells remaining within the
affected area. In fact, these alterations suggest a temporal effect of
hypoxia on glucose metabolism. Finally, measurements made at
times further from the initial insult may demonstrate not only
greater, more widespread changes, but also marked decreases in18FDG uptake as a consequence of significant cell loss.
Electrophysiological studies showed that the H-KI group had a
significantly stronger transmission than the H-WT group (P,
0.05), suggesting that the H-WT synapses were the most affected
by hypoxia. Additionally, the H-KI group displayed normal long-
term synaptic plasticity, with their LTP, measured at 45-min post-
tetanic stimulation, similar to the RA-WT group. Conversely, the
H-WT slices showed complete absence of LTP. Our evaluation of
the hippocampal CA1-SC circuit does not include any connectiv-
Figure 5. Activated caspase 3 ELISA in adult mouse brain groups (WT and KI), after exposure to hypoxia (10% for 10 days) incomparison with the RA control group (WT and KI). Data are mean of 10 animals per group 6 SEM. *P,0.05 versus the KI hypoxia and WThypoxia groups.doi:10.1371/journal.pone.0108168.g005
EC-SOD and Chronic Brain Hypoxia
PLOS ONE | www.plosone.org 8 September 2014 | Volume 9 | Issue 9 | e108168

ity data, such as synaptic counts, though we believe that this data
might add to our understanding of the role of EC-SOD in
hippocampal function. This finding could explain the deteriora-
tion of both learning and memory in WT mice after exposure to
hypoxia and also shows the protective effect of overexpression of
EC-SOD in the KI mice group (Fig. 2). We believe that it is the
first time that the protective effect of overexpression of EC-SOD
has been reported in this setting.
Hypoxic exposure results in a significant increase in pro-
inflammatory cytokines including MIF [2]. In neonatal rats with
hypoxia-ischemia brain damage, there was a marked increase in
the expression of MIF in the brain [64]. In the murine brain, MIF
transcripts and protein are mainly present in the cortex,
hippocampus, and pituitary gland [65]. In our study there was a
significantly marked reduction of MIF expression in brain tissue of
H-KI mice compared to the H-WT group (Table 2). This finding
supports the anti-inflammatory function of EC-SOD, which could
be explained by down regulation of HIF-1alpha and inactivation
of NF-KB [55,66]. In our previous studies, we showed that
overexpression of EC-SOD inhibits activation of NF-KB induced
by increased ROS in our in vitro model [57],[67]. Decreased
brain cell inflammation/damage induced by hypoxia was signif-
icantly prominent by the significant decrease in the studied
inflammatory markers including GFAP, IBA1, and MIF.
In summary, overexpression of EC-SOD and increased its
activity has a significant protective effect against chronic hypoxia-
induced brain damage. A therapeutic approach that increases EC-
SOD protein accumulation, either by overexpression or a
therapeutic supplement, could be used prophylactically in patients
with long term pathological conditions and chronic disease such as
COPD, pulmonary hypertension, sleep disordered breathing and
sickle cell disease, all of which are associated with compromised
brain oxygenation. A similar approach may also be useful in
situations such as hypoxic ischemic insult of newborn, sickle cell
disease, stroke or drowning, all of which can lead to impairment of
brain function, including learning and spatial memory impairment
and psychomotor impairment. Additionally, such a regime could
be used as a protective measure for individuals who are operating
at the limits of human tolerance and facing relevant operational
stressors such as hypoxia, a significant physiological threat at
altitude.
Author Contributions
Conceived and designed the experiments: NZ PM EM MA. Performed the
experiments: NZ HP CC SD SF MN. Analyzed the data: NZ SD PH MA.
Contributed reagents/materials/analysis tools: PM SD EM MA. Wrote the
paper: NZ EM MN MA.
Figure 6. Brain histopathological studies of the control RA and KI hypoxia groups. (A) high-power (40X) H&E staining of cortical brainswith normal structure for both the control RA and KI hypoxia groups, while the WT hypoxia group showed injury damage (id). (B) H&E, high-power(60X) view of neurons from the dentate gyrus in the hippocampus with no ischemic damage in both the control and KI hypoxia groups, while the WThypoxia group showed injury damage (id). (C) H&E, high-power (40X) view of Purkinje cells and granular cells in the cerebellum with no ischemicdamage in both the control and KI hypoxia groups, while WT hypoxia group showed injury damage (id).doi:10.1371/journal.pone.0108168.g006
EC-SOD and Chronic Brain Hypoxia
PLOS ONE | www.plosone.org 9 September 2014 | Volume 9 | Issue 9 | e108168

References
1. Carvalho C, Santos MS, Baldeiras I, Oliveira CR, Seica R, et al. (2010) Chronic
hypoxia potentiates age-related oxidative imbalance in brain vessels andsynaptosomes. Curr Neurovasc Res 7(4)288–300.
2. Himadri P, Kumari SS, Chitharanjan M, Dhananjay S (2010) Role of oxidative
stress and inflammation in hypoxia-induced cerebral edema: a molecularapproach. High Alt Med Biol 1: 231–44.
3. Lu Q, Mark SW, Harris VA, Aggarwa lS, Hou Y, et al. (2012) Increased
NADPH oxidase derived superoxide is involved in the neruonal cell death
induced by hypoxia ischemia in neonatal hyppocampal slice cultures. FreeRadical biol Med 53(5): 1139–1151.
4. Ten VS, Yao J, Ratner V, Sosunov S, Fraser DA, et al. (2010) Complement
ComponentC1q Mediates Mitochondria-Driven Oxidative Stress in NeonatalHypoxic–Ischemic Brain Injury. The Journal of Neuroscience 30: 2077–2087.
5. Jin K, Sun Y, Xie L, Peel A, Mao XO, et al. (2003) Directed migration of
neuronal precursors into the ischemic cerebral cortex and striatum. Mol. Cell.Neurosci 24: 171–189.
6. Paola MD, Caltagirone C, Fadda L, Sabatini U, Serra L, et al. (2008)
Hippocampal Atrophy Is the Critical Brain Change in Patients With HypoxicAmnesia. Hippocampus 18: 719–728.
7. Ahmed MN, Veber V, Hogg N, Auten RL (2004) Overexpression of
Extracellular Superoxide Dismutase (EC-SOD) Prevents Lipid Peroxidation inHyperoxia-Exposed Newborn Mouse Lung. Ped. Res. A: No.2592.
8. Wang J, Wen L, Huang Y, Chen Y, Ku M (2006) Dual Effects of Antioxidants in
Neurodegeneration: Direct Neuroprotection against Oxidative Stress and
Indirect Protection via Suppression of Glia mediated Inflammation. CurrentPharmaceutical Design 12: 3521–3533.
9. Lee HM, Greeley GH, Englander EW (2008) Sustained hypoxia modulates
mitochondrial DNA conent in the neonatal rat brain. Free Radic Biol Med44(5): 807–814.
10. Veasey S, Davis CW, Fenik P, Zhan G, Hsu Y, et al. (2004) Long-term
Intermittent Hypoxia in Mice: Protracted Hypersomnolence with OxidativeInjury to Sleep-Wake Brain Regions. Sleep 27(2): 194–201.
11. Emerit J, Edeas M, Bricaire F (2004) Neurodegenerative diseases and oxidative
stress. Biomed. Pharmacother 58: 39–46.
12. Halliwell B (2001) Role of free radicals in the neurodegenerative diseases:therapeutic implications for antioxidant treatment. Drugs Aging. 18: 685–716.
13. Chavez JC, Agani F, Pichiule P, LaManna JC (2000) Expression of hypoxia-
inducible factor-1alpha in the brain of rats during chronic hypoxia. J ApplPhysiol 89: 1937–42.
14. Sutter CH, Laughner E, Semenza GL (2000) Hypoxia-inducible factor 1aprotein expression is controlled by oxygen-regulated ubiquitination that isdisrupted by deletions and missense mutations. Proc Natl Acad Sci USA 97:
4748–4753.
15. Brahimi-Horn MC, Pouyssegur J (2007) Harnessing the hypoxiainducible factorin cancer and ischemic disease. Biochem Pharmacol 73: 450–457.
16. Floyd R (1999) Antixociants, oxidative stress and degebnrative disorders. Exp
Boil Med 222: 236–245.
17. Bickler PE, Fahlman CS (2004) Moderate increases in intracellular calciumactivate neuroprotective signals in hippocampal neurons. Neuroscience 127:
673–83.
18. Bickler PE, Fahlman CS (2010) Hypoxic preconditioning failure in aging
hippocampal neurons: impaired gene expression and rescue with intracellularcalcium chelation. J Neurosci Res 88: 3520–9.
19. Bickler PE (2004) Clinical perspectives: neuroprotection lessons from hypoxia-
tolerant organisms. J of Experimen Biol 207: 3243–3249.20. Klaunig JE, Kamendulis LM, Hocevar BA (2010) Oxidative Stress and
Oxidative Damage in Carcinogenesis. Toxicologic Pathol 38: 96–109.
21. Yang G, Chan PH, Chen J, Carlson E, Chen SF, et al. (1994) Human copper-
zinc superoxide dismutase transgenic mice are highly resistant to reperfusioninjury after focal cerebral ischemia. Stroke 25: 165–170.
22. Noshita N, Sugawara T, Hayashi T, Lewen A, Omar G, et al. (2002) Copper/
zinc superoxide dismutase attenuates neuronal cell death by preventingextracellular signal-regulated kinase activation after transient focal cerebral
ischemia in mice. J Neurosci 22: 7923–7930.
23. Fujimura M, Morita-Fujimura Y, Noshita N, Sugawara T, Kawase M, et al.(2000) The cytosolic antioxidant copper/zincsuperoxide dismutase prevents the
early release of mitochondrial cytochrome c in ischemic brain after transientfocal cerebral ischemia in mice. J Neurosci 20: 2817–2824.
24. Sugawara T, Noshita N, Lewen A, Gasche Y, Ferrand-Drake M, et al. (2002)
Overexpression of copper/zinc superoxide dismutase in transgenic rats protects
vulnerable neurons against ischemic damage by blocking the mitochondrialpathway of caspase activation. J Neurosci 22: 209–217.
25. Narasimhan P, Fujimura M, Noshita N, Chan PH (2003) Role of superoxide in
poly(ADP-ribose) polymerase upregulation after transient cerebral ischemia.Brain Res Mol Brain Res 113: 28–36.
26. Kim GW, Kondo T, Noshita N, Chan PH (2002) Manganese superoxide
dismutase deficiency exacerbates cerebral infarction after focal cerebralischemia/reperfusion in mice: implications for the production and role of
superoxide radicals. Stroke 33: 809–815.
27. Zhou M, Dominguez R, Baudry M (2007) Superoxide dismutase/catalasemimetics but not MAP kinase inhibitors are neuroprotective against oxygen/
glucose deprivation-induced neuronal death in hippocampus. J Neurochem 103:
2212–2223.
28. Marklund SL (1983) Extracellular superoxide dismutase in human tissues and
human cell lines. J Clin Invest 74: 1398–1403.
29. Oury TD, Ho YS, Piantadosi CA, Crapo JD (1992) Extracellular superoxide
dismutase, nitric oxide, and central nervous system O2 toxicity. Proc Natl Acad
Sci USA 89: 9715–9719.
30. Oury TD, Card JP, Klann E (1999) Localization of extracellular superoxide
dismutase in adult mouse brain. Brain Res 850: 96–103.
31. Oury TD, Day BJ, Crapo JD (1996) Extracellular superoxide dismutase in
vessels and airways of humans and baboons. Free Radic Biol Med 20: 957–65.
32. Sheng H, Bart RD, Oury TD, Pearlstein RD, Crapo JD, et al. (1999a) Mice
overexpressing extracellular superoxide dismutase have increased resistance to
focal cerebral ischemia. Neuroscience 88: 185–19.
33. Sheng H, Bart RD, Oury TD, Pearlstein RD, Crapo JD, et al. (1999b) Mice
overexpressing extracellular superoxide dismutase have increased tolerance to
global cerebral ischemia. Exp Neurol 163: 392–398.
34. Sheng H, Brody T, Pearlstein RD, Crapo J, Warner DS (1999c) Extracellular
superoxide dismutase deficient mice have decreased resistance to focal cerebral
ischemia. Neurosci Lett 267: 13–17.
35. Demchenko IT, Oury TD, Crapo JD, Piantadosi CA (2002) Regulation of the
Brain’s Vascular Responses to Oxygen. Circ Res 91: 1031–1037.
36. Ahmed MN, Suliman H, Folz R, Grayck EN, Auten RL (2003) Extracellular
superoxide dismutase protects lung development in hyperoxic newborn mice.
Am J Resp Crit Care Med 167: 440–445.
37. Ahmed MN, Zhang Y, Codipilly C, Zaghloul N, Patel D, et al. (2012) EC-SOD
overexpression can reverse the course of hypoxia-induced pulmonary hyperten-
sion in adult mice. Mol Med 18: 38–46.
38. Zaghloul N, Nasim M, Patel H, Codipilly C, Marambaud P, et al. (2012)
Overexpression of EC- SOD has a protective role against hyperoxia induced
brain injury in neonatal mice. FEBS 279: 871–881.
39. Chang EH, Savage MJ, Flood DG, Thomas JM, Levy RB, et al. (2006) AMPA
receptor downscaling at the onset of Alzheimer’s disease pathology in double
knockin mice. Proc Natl Acad Sci USA 103: 3410–3415.
40. Hissin PJ, Hilf R (1976) A fluorometric method for determination of oxidized
and reduced glutathione in tissues. Anal Biochem 74: 214–226.
41. Han BH, D9Costa A, Back SA, Parsadanian M, Patel S, et al. (2000) BDNF
blocks caspase-3 activation in neonatal hypoxia–ischemia. Neurobiol Dis 7: 38–
53.
42. Fukai T, Siegfried MR, Ushio-Fukai M, Cheng Y, Kojda G, et al. (2000)
Regulation of the vascular extracellular superoxide dismutase by nitric oxide and
exercise training. J Clin Invest 105: 1631–1639.
43. Bass JL, Corwin M, Gozal D, Moore C, Nishida H, et al. (2004) The Effect of
Chronic or Intermittent Hypoxia on Cognition in Childhood: A Review of the
Evidence. Pediatrics 114: 05–816.
44. Fabian RH, Perez-Polo JR, Kent TA (2004) Extracellular superoxide
concentration increases following cerebral hypoxia but does not affect cerebral
blood flow. Int J Dev Neurosci 22: 225–30.
45. Xu W, Chi L, Row BW, Xu R, Ke Y, et al. (2004) Increased oxidative stress is
associated with chronic intermittent hypoxia-mediated brain cortical neuronal
cell apoptosis in a mouse model of sleep apnea. Neuroscience 126: 313–23
46. Dingyu H, Qin L, Bo L, Rongji D, Lina G, et al. (2009) Stress Response to
Hypoxia in Wistar Rat: LA, MDA, SOD and Na+-K+-ATPase. Bioinformatics
and Biomedical Engineering 20 Available: www.lw20.com09. ICBBE.
47. Petersen SV, Kristensen T, Petersen JS, Ramsgaard L, Oury TD, et al. (2008)
The Folding of Human Active and Inactive Extracellular Superoxide
Dismutases Is an Intracellular Event. J. Biol. Chem. 283(22):15031–36.
48. Zelko IG, Folz RJ (2004) Extracellular Superoxide Dismutase Functions as a
Major Repressor of Hypoxia-Induced Erythropoietin Gene Expression.
Endocrinol 146: 332–340.
49. Chandel NS, Maltepe E, Goldwasser E, Mathieu CE, Simon MC, et al. (1998)
Mitochondrial reactive oxygen species trigger hypoxia-induced transcription.
Proc Natl Acad Sci USA 95: 11715–11720.
50. Agani FH, Pichiule P, Chavez JC, LaManna JC (2000) The role of mitochondria
in the regulation of hypoxia-inducible factor-1 expression during hypoxia. J Biol
Chem 275: 35863–35867.
51. Zagorska A, Dulak J (2004) HIF-1: the knowns and unknowns of hypoxia
sensing. Acta Biochimica Polonica 51: 563–585.
52. Sibenalle ZA, Welsh JL, Du C, Witmer JR, Schrock HE, et al. (2014)
Extracellular superoxide dismutase suppresses hypoxia-inducible factor-1a in
pancreatic cancer. Free Radical Biology and Medicine 69: 357–366.
53. Sogawa K, Sogawa K, Numayama-Tsuruta K, Ema M, Abe M, et al. (1998)
Inhibition of hypoxia-inducible factor-1 activity by nitric oxide donors in
hypoxia. Proc Natl Acad Sci USA 95: 7368–7373.
54. Huang LE, Willmore WG, Gu J, Goldberg MA, Bunn HF (1999) Inhibition of
hypoxia-inducible factor 1 activation by carbon monoxide and nitric oxide.
Implications for oxygen sensing and signaling. J Biol Chem 74: 9038–9044.
55. Brown GC (2007) Mechanisms of inflammatory neurodegeneration: iNOS and
NADPH oxidase. Biochem Soc Trans 35: 1119–1121.
EC-SOD and Chronic Brain Hypoxia
PLOS ONE | www.plosone.org 10 September 2014 | Volume 9 | Issue 9 | e108168

56. Zhan G, Serrano F, Fenik P, Hsu R, Kong L, et al. (2005) NADPH oxidase
mediates hypersomnolence and brain oxidative injury in a murine model of sleepapnea. Am J Respir Crit Care Med 172: 921–929.
57. Ahmed MN, Codipilly C, Hogg A, Auten RL (2011) The protective effects of
overexpression of extracellular superoxide dismutase on nitric oxide bioavail-ability in the lung after exposure to hyperoxia stress. Exp Lung Res 37: 10–7.
58. Ortega MA, de Artinano AA (2000) Nitric oxide reactivity and mechanismsinvolved in its biological effects. Pharmacol Res 42: 421–427.
59. Lin MT and Beal MF (2006) Mitochondrial dysfunction and oxidative stress in
neurodegenerative diseases. Nature 443: 787–795.60. Avshalumov MV, MacGregor DG, Sehgal LM, Rice ME (2004) The glial
antioxidant network and neuronal ascorbate: protective yet permissive for H2O2
signaling. Neuron Glia Biol 1: 365–376.
61. Armogida M, Nistico R, Mercuri NB (2011) Therapeutic potential of targetinghydrogen peroxide metabolism in the treatment of brain ischaemia. B.J. Pharm
166: 1211–1224.
62. Cervos-Navarro J, Sampaolo S, Hamdorf G (1991) Brain changes in
experimental chronic hypoxia. Exp Pathol 42: 205–12.63. Jin K, Mao XO, Sun Y, Xie L, Greenberg DA (2002) Stem cell factor stimulates
neurogenesis in vitro and in vivo. J Clin Invest 110: 311–9.
64. Wang LL, Guo WJ, Du WN (2011) Study on the expression and the role ofmacrophage migration inhibitory factor in the brain of neonatal rats with
hypoxia-ischemia brain damage. Sichuan Da Xue Xue Bao Yi Xue Ban 42:199–203.
65. Bacher M, Meinhardt A, Lan HY, Meinhardt A, Lan HY, et al. (1998) MIF
expression in the rat brain: implications for neuronal function. Mol Med 4: 217–230.
66. Kim Y, Kim BH, Lee H, Jeon B, Lee YS, et al. (2011) Regulation of skininflammation and angiogenesis by EC-SOD via HIF-1alpha and NF-KB
pathways. Free Rad Biol & Med 51: 1985–1995.67. Oury TD, Day BJ, Crapo JD (1996) Extracellular superoxide dismutase: a
regulator of NO bioavailability. Lab Invest 75: 617–636.
EC-SOD and Chronic Brain Hypoxia
PLOS ONE | www.plosone.org 11 September 2014 | Volume 9 | Issue 9 | e108168