Is Attention Both Necessary and Sufficient for Consciousness?

Neurobiology of Disease
Neuron-Specific Expression of Mutant SuperoxideDismutase Is Sufficient to Induce Amyotrophic LateralSclerosis in Transgenic Mice
Dick Jaarsma,1 Eva Teuling,1 Elize D. Haasdijk,1 Chris I. De Zeeuw,1,2 and Casper C. Hoogenraad1
1Department of Neuroscience, Erasmus Medical Center, 3000 CA Rotterdam, The Netherlands, and 2Netherlands Institute for Neuroscience, 1105 BAAmsterdam, The Netherlands
Mutations in superoxide dismutase (SOD1) cause amyotrophic lateral sclerosis (ALS), an adult-onset progressive paralytic diseasecharacterized by loss of motor neurons, and cause an ALS-like disease when expressed in mice. Recent data have suggested that motorneuron degeneration results from toxic actions of mutant SOD1 operating in both motor neurons and their neighboring glia, raising thequestion whether mutant SOD1 expression selectively in neurons is sufficient to induce disease. Here we show that neuronal expressionof mutant SOD1 is sufficient to cause motor neuron degeneration and paralysis in transgenic mice with cytosolic dendritic ubiquitinatedSOD1 aggregates as the dominant pathological feature. In addition, we show that crossing our neuron-specific mutant SOD1 mice withubiquitously wild-type SOD1-expressing mice leads to dramatic wild-type SOD1 aggregation in oligodendroglia after the onset of neuro-nal degeneration. Together, our findings support a pathogenic scenario in which mutant SOD1 in neurons triggers neuronal degenera-tion, which in turn may facilitate aggregate formation in surrounding glial cells.
Key words: amyotrophic lateral sclerosis (ALS); protein aggregation; oligodendrocyte; astrocyte; motor neuron disease; mouse model
IntroductionAmyotrophic lateral sclerosis (ALS) is a clinically and geneticallyheterogeneous late-onset neurodegenerative disease of motorneurons causing progressive paralysis. In a subset of patients, thedisease is caused by mutations in the cytosolic CuZn superoxidedismutase (SOD1) gene (Rosen et al., 1993; Boillee et al., 2006a;Pasinelli and Brown, 2006). More than 100 different SOD1 mu-tations have been identified that all cause a rather similar diseasephenotype (Andersen et al., 2003). All mutants show reducedconformational stability and cause the accumulation of hydro-phobic and aggregation-prone SOD1 subfractions when ex-pressed in cellular and transgenic mouse models (Durham et al.,1997; Johnston et al., 2000; Jonsson et al., 2006b; Shaw and Val-entine, 2007; Zetterstrom et al., 2007). Aggregates as well as otherpathological abnormalities do not exclusively occur in neuronsbut also in glial cells surrounding the motor neurons (Bruijn etal., 1997; Dal Canto and Gurney, 1997; Kato et al., 1997). Hence,mutant SOD1 also can cause damage in glial cells, raising thequestion to what extent these non-motor neuron abnormalities
contribute to motor neuron degeneration and disease progres-sion in SOD1–ALS (Lobsiger and Cleveland, 2007). This questionis also relevant for SOD1-unrelated forms of ALS because mostof these patients have TAR DNA binding protein-43-immunoreactive inclusions in both neurons and glial cells (Araiet al., 2006; Neumann et al., 2006).
The role of glia cells in SOD1–ALS pathogenesis has beenexamined in chimeric mice that were mixtures of normal cellsand mutant SOD1-expressing cells (Clement et al., 2003). Thisstudy indicated that degeneration of motor neurons expressingmutant SOD1 was delayed or prevented when they were sur-rounded by wild-type non-neuronal cells, whereas wild-type mo-tor neurons could develop degenerative changes when sur-rounded by mutant SOD1-expressing neuronal cells (Clement etal., 2003). Similar results were obtained in previous studies withspinal primary and embryonic mouse stem cell-derived motorneurons cocultured with mutant SOD1-expressing astrocytes,which showed that mutant SOD1 in astrocytes may cause degen-erative changes in wild-type motor neurons and exacerbate toxiceffects of mutant SOD1 in motor neurons (Di Giorgio et al., 2007;Nagai et al., 2007). In addition, studies with mutant SOD1 trans-genic mice constructed to express no (Beers et al., 2006) or re-duced levels of (Boillee et al., 2006b) mutant SOD1 in microgliahave suggested non-cell autonomous toxic effects of mutantSOD1 operating in microglia. Because previous studies had re-ported the lack of motor neuron degeneration in transgenic miceexpressing mutant SOD1 selectively in neurons (Pramatarova etal., 2001; Lino et al., 2002) or astrocytes (Gong et al., 2000), it hasbeen proposed that mutant SOD1 cause the degeneration of mo-
Received Oct. 12, 2007; revised Jan. 7, 2008; accepted Jan. 8, 2008.This work was supported by the European Union, Prinses Beatrix Fonds, ZonMW, and Neuro-Bsik (C.I.D.Z.), and
The Netherlands Organization for Scientific Research, European Science Foundation (European Young InvestigatorsAward), and Amyotrophic Lateral Sclerosis Association (C.C.H.). We thank Dr. H. W. Verspaget, Dr. P. Caroni, and Dr.N. J. Maragakis for reagents, and K. Staats, S. Cardona, and A. Houssaini for technical help. D.J. is supported by thePrinses Beatrix Fonds, Hersenstichting Nederland, and Erasmus Medical Center.
Correspondence should be addressed to either Dick Jaarsma or Casper C. Hoogenraad, Department of Neuro-science, Erasmus Medical Center, P.O. Box 2040, 3000 CA, Rotterdam, The Netherlands. E-mail:[email protected] or [email protected].
DOI:10.1523/JNEUROSCI.5258-07.2008Copyright © 2008 Society for Neuroscience 0270-6474/08/282075-14$15.00/0
The Journal of Neuroscience, February 27, 2008 • 28(9):2075–2088 • 2075

tor neurons by a combination of cell-autonomous and non-cell-autonomous processes, requiring the presence of mutant SOD1in both neurons and glia, and raising the question whether mu-tant SOD1 expression in neurons is sufficient to induce disease.In contrast to this notion, in this study, we show that mutantSOD1 expression in neurons is sufficient to induce motor neurondegeneration and paralysis in transgenic mice.
Materials and MethodsTransgenic mice. Experiments were performed in accordance with thePrinciples of Laboratory Animal Care (National Institutes of Health pub-lication number 86-23) and the guidelines approved by the ErasmusUniversity animal care committee. To generate Thy1.2–G93A mice, acDNA of human SOD1 (hSOD1) carrying the G93A mutation wascloned into the Thy1.2 expression cassette (Caroni, 1997; Feng et al.,2000) and injected into fertilized oocytes, using standard techniques.Embryos for injection were obtained from FVB mice. Transgenic lines(T1–T10) were screened immunohistochemically for G93A–SOD1 ex-pression in the spinal cord using human SOD1-specific antibody. Twolines (T1 and T3) were used for additional studies. Transgenic lines weremaintained into BCBA background by crossing hemizygote males withnontransgenic females. Transgenic offspring was genotyped by PCR. Ho-mozygote T3T3 and double transgenic T1T3 were obtained by crossingT3 males with T3 and T1 females, respectively. Double transgenic off-spring were distinguished from hemizygotes by Southern blot.
Other mice used in this study were G1del mice, which carry a genomichSOD1 construct with the G93A mutation, and hSOD1 mice, i.e., trans-genic mice carrying a genomic construct of wild-type hSOD1. G1delmice are descendent from the Gurney G1 mice but show a reduced trans-gene copy number (8 instead of 24 transgene copy numbers per haploidgenome) and show a delayed onset of disease compared with the originalGurney G1mice (Gurney, 1997). hSOD1 mice are derived from the Gur-ney N29 line (Gurney et al., 1994) and have been extensively character-ized in our laboratory in previous studies (Jaarsma et al., 2000). Doubletransgenic T3hSOD1 mice were generated by crossing T3 and hSOD1hemizygotes.
Routinely, transgenic mice were weighed and inspected for signs ofmuscle weakness once (Thy1.2–G93A mice) or twice (G1del mice) aweek, using a set of simple tests: mice were examined for their ability toextend their hindlimbs when suspended in the air by their tail and theirability to hang upside down on a grid for 60 s. In addition, at specific ages,grip strength was measured using a grid attached to a force gauge (Bioseb,Chaville, France). Mice reached end-stage disease when they could notright themselves within 5 s when placed on their back, lost �30% of theirmaximal weight, or developed infection of one of the eyes. Mice selectedfor analysis of the clinical course of disease were killed at end-stage dis-ease or when they reached 2 years of age. After the experiment, all micewere analyzed for neuromuscular denervation and pathological abnor-malities in the spinal cord (e.g., ubiquitin pathology, motor neuron loss,gliosis, and argyrophylic neuronal debris). Mice developing tumors be-fore end-stage disease or 2 years of age were excluded from the study.
Antibodies. Primary antibodies [immunohistochemistry (IHC), im-munofluorescence (IF), Western blot (WB)] reported in this study are asfollows: mouse anti-�B-crystallin (Stressgen Biotechnologies, San Diego,CA; IHC and IF, 1:1000; WB, 1:2000), rabbit anti-activating transcrip-tion factor 3 (ATF3; Santa Cruz Biotechnology, Santa Cruz, CA; IHC andIF, 1:1000); anti-cleaved caspase 3 (Asp175; Cell Signaling Technology,Beverly, MA; IHC, 1:200), rabbit anti-calcitonin gene-related peptide(CGRP; Calbiochem, La Jolla, CA; IHC and IF, 1:10000); goat anti-choline acetyltransferase (ChAT; Millipore, Billerica, MA; IHC and IF,1:500); rat anti-complement receptor 3 (CR3) receptor (clone 5C6; Se-rotec, Oxford, UK; IHC, 1:500; IF, 1:100); rabbit anti-GFAP (Dako,Carpinteria, CA; IHC, 1:10,000; IF, 1:5000; WB, 1:5000); rabbit anti-glutamate transporter 1 (GLT1; from Dr. N. J. Maragakis, Johns HopkinsUniversity, Baltimore, MD; WB, 1:10,000); anti-GM130 (TransductionLaboratories, Lexington, KY; IF, 1:1000); rabbit anti-heat shock protein25 (Hsp25; Stressgen; IF, 1:2000); mouse anti-microtubule-associatedprotein 2 (MAP2; Sigma, St. Louis, MO; IF, 1:1000); neuron-specific
nuclear protein (NeuN; Millipore; IF, 1:1000) chicken anti-neurofilament-M (NFM; Millipore; IF, 1:2000); mouse anti-RIP antigen(from Dr. B. Friedman, Yale University School of Medicine, New Haven,CT; IF, 1:200); sheep anti-hSOD1 (Calbiochem; IHC, 1:5000 –1:20,000;IF, 1:5000); rabbit anti-SOD1 (from Dr. H. W. Verspaget, Leiden Uni-versity Medical Center, Leiden, The Netherlands; IHC and IF, 1:5000);rabbit anti-SOD1 (SOD100; Stressgen; WB, 1:5000); rabbit anti-murineSOD1 (SOD101; Stressgen; WB, 1:8000); rabbit anti-ubiquitin (Dako;IHC and IF, 1:2000); mouse anti-ubiquitin (clone FK2; Affinity BioRe-agents, Golden, CO; IF, 1:2000); and goat anti-vesicular acetylcholinetransporter (VAChT; Millipore; IF, 1:1000).
Secondary antibodies. For avidin– biotin–peroxidase immunocyto-chemistry biotinylated secondary antibodies from Vector Laboratories(Burlingame, CA) diluted 1:200 were used. FITC-, cyanine 3 (Cy3)-, andCy5-conjugated secondary antibodies raised in donkey (Jackson Immu-noResearch, West Grove, PA) diluted at 1:200 were used forimmunofluorescence.
Western blot. Tissue specimens were homogenized and sonicated in 10vol of PBS containing 0.5% Nonidet P-40 (NP-40) and 1� proteaseinhibitors cocktail (Sigma) and centrifuged at 800 � g for 5 min at 4°C,and protein concentrations of the supernatants (S1) were determinedusing the BCA method (Pierce, Rockford, IL). To obtain the detergent-insoluble fraction P2, S1 fractions were centrifuged at 15,000 � g for 15min. P2 pellets were thoroughly washed five times with PBS– 0.5% NP-40and then resuspended in sample buffer for SDS-PAGE and Western blot-ting. Two to 30 �g of protein of S1 and P2 were electrophoresed on10 –15% SDS-PAGE gels and blotted on polyvinylidene difluoride mem-branes (Millipore). For quantitative analysis of hSOD1 immunoreactiv-ity, recombinant hSOD1 protein (0.5–50 ng; from H. W. Verspaget) waselectrophoresed and blotted together with the tissue samples. The mem-branes were blocked with 5% nonfat dry milk (Bio-Rad, Hercules, CA) inPBS with 0.05% Tween 20 (PBST), incubated in primary antibody, di-luted in PBST with 1% dry milk followed by an incubation in secondaryantibody, incubated in chemiluminescence reagent (ECL; GE Health-care, Little Chalfont, UK), exposed to film or a Kodak Image station(Eastman Kodak, Rochester, NY), and analyzed with Kodak Image anal-ysis and ImageQuant 2.2 software (Molecular Dynamics, Sunnyvale,CA).
Immunohistochemical and histopathological procedures. For immuno-cytochemistry and immunofluorescence, mice were anesthetized withpentobarbital and perfused transcardially with 4% paraformaldehyde.The lumbar and cervical spinal cord were carefully dissected out andpostfixed overnight in 4% paraformaldehyde. Routinely, spinal cord tis-sue was embedded in gelatin blocks (Jaarsma et al., 2000) and sectionedat 40 �m with a freezing microtome, and sections were processed, freefloating, using a standard avidin– biotin–immunoperoxidase complexmethod (ABC; Vector Laboratories) with diaminobenzidine (0.05%) asthe chromogen, or single-, double-, and triple-labeling immunofluores-cence (Jaarsma et al., 2000, 2001; Maatkamp et al., 2004). In addition, aselected number of frozen sections were processed for a silver stainingprocedure that selectively labels dying neurons and their processes(Jaarsma et al., 2000).
Immunoperoxidase-stained sections were analyzed and photo-graphed using a Leica (Nussloch, Germany) DM-RB microscope and aLeica DC300 digital camera. Sections stained for immunofluorescencewere analyzed with a Zeiss (Oberkochen, Germany) LSM 510 confocallaser scanning microscope using 40�/1.3 and 63�/1.4 oil-immersionobjectives. Quantitative analyses of motor neurons was performed asdescribed previously (Vlug et al., 2005) on serial lumbar 4 (L4) sectionsimmunoperoxidase stained for ChAT or CGRP.
For analysis of neuromuscular denervation, medial gastrocnemiusmuscle from 4% paraformaldehyde-fixed mice were dissected, embed-ded into gelatin blocks, and sectioned at 80 �m with a freezing mic-rotome. Sections were immunolabeled, free floating, for goat-anti-VAChT and rabbit anti-hSOD1 or goat-anti-VAChT and chicken-anti-NFM, followed by Cy3 anti-goat and Cy5 anti-chicken or anti-rabbitsecondaries, and motor endplates were labeled with FITC– bungarotoxin(1:500; Invitrogen, Carlsbad, CA). For quantitative analyses, muscle sec-tions were examined under a Leica DM-RB fluorescence microscope,
2076 • J. Neurosci., February 27, 2008 • 28(9):2075–2088 Jaarsma et al. • Neuron-Specific SOD1 Mice

endplates being scored as “innervated” in the case of complete overlapbetween bungarotoxin and VAChT labeling, “partially denervated” inthe case of partial overlap, and “denervated” in the case of the absence ofVAChT labeling at the endplate. Per muscle, all endplates within threesections were analyzed. In addition, muscle sections were analyzed with aZeiss LSM 510 confocal laser scanning to examine neurofilament-M andhSOD1 labeling. In Thy1.2–G93A mice, the disappearance of VAChTlabeling always was associated with loss of hSOD1 labeling (Fig. 1i).
Electron microscopy. For electron microscopy, mice were perfusedtranscardially with 4% paraformaldehyde with 0.1% (preembedding im-munoperoxidase and postembedding immunogold electron micros-copy) or 1% glutaraldehyde (standard postembedding and immunogoldlabeling electron microscopy). Specimens were sectioned with a vi-bratome and further processed using standard methods as describedpreviously (Jaarsma et al., 2001; Kushner et al., 2005; Vlug et al., 2005).For standard electron microscopy, vibratome sections (150 �m thick)were postfixed in 1% osmium, dehydrated, and embedded in Durcupan.Ultrathin (50 –70 nm) sections were contrasted with uranyl acetate andlead citrate and analyzed in a Phillips (Aachen, Germany) CM100 elec-tron microscope at 80 kV. Preembedding immunoperoxidase electronmicroscopy was performed to examine the subcellular distribution ofubiquitin and �B-crystallin. Vibratome sections (50 – 60 �m thick) wereimmunoperoxidase stained as described previously (Jaarsma et al.,2001), postfixed in 1% osmium, and further processed as described forstandard electron microscopy. For postembedding electron microscopy,vibratome sections (150 –300 �m thick) were dehydrated and embeddedin Lowicryl HM20 using a freeze substitution procedure (Jaarsma et al.,2001) or embedded in Durcupan using an osmium-free method (Kush-ner et al., 2005). Ultrathin (50 –70 nm) sections were processed forpostembedding immunogold labeling of ubiquitin and hSOD1 as de-scribed previously (Jaarsma et al., 2001).
mRNA in situ hybridization. In situ hybridization was performed on30-�m-thick free-floating sections using standard methods withdigoxigenin-labeled cRNA probes (Hossaini et al., 2007). Sense and an-tisense digoxigenin-labeled cRNAs were transcribed from linearizedplasmids containing hSOD1 cDNA.
Statistical analysis. Statistical analyses were done with GraphPad Soft-ware (San Diego, CA) Prism software. Means from different age groupsand different transgenic mouse lines were compared using one-wayANOVA and Tukey’s post hoc test.
ResultsNeuron-specific G93A–mutant SOD1 expression inducesmotor neuron disease in miceNeuron-specific transgenic SOD1–ALS mice were generated us-ing a construct of human SOD1 cDNA with the G93A mutationcloned into the Thy1.2 expression cassette (Fig. 1a) that drivestransgene expression in neurons throughout the CNS, includingspinal motor neurons (Feng et al., 2000). Two Thy1.2–G93A lines
(T1 and T3) showed transgenic expression throughout the brainand spinal cord as determined by Western blot analysis (Fig. 1b)and immunoperoxidase histochemistry with antibodies specificfor human SOD1 (Fig. 1c). No transgenic human SOD1 occurredin other tissues (Fig. 1b). Double-labeling immunofluorescenceon spinal cord sections showed that mutant SOD1 was expressedin all motor neurons (ChAT and NeuN positive) as well as inother populations of spinal neurons (ChAT negative and NeuNpositive) but did not codistribute with glial markers, i.e.,GFAP (astrocytes), �B-crystallin (oligodendrocytes), and CR3(microglia) (Fig. 1d) (see Fig. 4f,g). Immunocytochemicalanalysis of skeletal muscle showed that mutant SOD1 immu-noreactivity in T3 and T1 mice is selectively distributed inaxons and nerve endings at the neuromuscular junctions con-sistent with a neuron-specific expression (Fig. 1i).
Quantitative Western blot showed that mutant SOD1 expres-sion in the spinal cord of T3 Thy1.2–G93A mice was �15-foldlower compared with G1del mice, i.e., a line of ubiquitously mu-tant SOD1-expressing mice carrying a genomic hSOD1 constructwith the G93A mutation that is derived from the G93A GurneyG1 line (Gurney et al., 1994) (Fig. 1e). Confocal immunofluores-cence and in situ hybridization showed that mutant SOD1 pro-tein and mRNA expression in T1 and T3 mice also was lower atthe level of individual motor neurons (supplemental Fig. 1, avail-able at www.jneurosci.org as supplemental material). Hemizy-gote Thy1.2–G93A mice from either line T1 or T3 did not showclinical and pathological signs of motor abnormalities up to 2years of age. Furthermore, the T3 transgene did not significantlyinfluence disease phenotype of G1del mice (supplemental Fig. 2,available at www.jneurosci.org as supplemental material). Be-cause the propensity of mutant SOD1 to induce disease is pro-portional to its expression level (Gurney et al., 1994; Wong et al.,1995; Bruijn et al., 1997; Jonsson et al., 2006b), the lack of diseasephenotype in our T1 and T3 mice can be explained by insufficientmutant SOD1 expression. We therefore next generated T3T3 ho-mozygotes that expressed twofold mutant SOD1 compared withT3 mice (Figs. 1e, 2b,c), as well as mice hemizygous for both theT1 and T3 insertion sites. Most of the T3T3 (8 of 12) and T1T3 (3of 5) mice developed an ALS-like motor neuron disease beforethe age of 2 years (i.e., the oldest age examined), showing pro-gressive muscle weakness and paralysis (Fig. 1f, Table 1). All the2-year-old T3T3 and T1T3 mice that did not develop motor ab-normalities showed ubiquitinated neurites in the spinal cord (seeFig. 6d, Table 2), suggestive of an early presymptomatic stage ofdisease. End-stage T1T3 and T3T3 mice showed most of the clin-
Table 1. Clinical disease in neuron-specific and ubiquitous G93A–SOD1 mice
Onset (days) End stage (days)Duration (days)(mean � SE)
Asymmetrichindlimb onset(% of mice)
Fully immobilizedhindlimbsat end stage (%)
G1del (n � 10) 162 to 249 201 to 290 37 � 7 60 70T3G1del (n � 8) 168 to 197 210 to 248 37 � 6 75 88T3T3 (n � 10) 378 to �730 432 to �730 54 � 4 (n � 8) 0 0T1T3 (n � 5) 539 to �730 591 to �730 51 � 3 (n � 3) 0 0T3hSOD1 (n � 10) 273 to 385 434 to 546 155 � 13 (n � 10)* 0 0
Onset of symptoms was determined on the basis of weight, the ability to extend the hindlimbs, and the ability to hang upside down on a grid for 1 min. In G1del and T3G1del mice, disease onset usually is asymmetric, characterized by theinability to extend one of the hindlimbs. Subsequently, symptoms in these mice �spread� to the contralateral hindlimb and the forelimbs. Typically, �hindlimb onset� mice at end-stage disease (i.e., when they could not right themselves,showed �30% weight loss, or developed severe eye infection) show complete paralysis of the hindlimbs. Notably, impaired hindlimb function does not necessarily result in impaired performance in the hanging test because mice are ableof performing this test for one 1 min using solely their forelimbs. A subset of G1del and T3G1del mice was characterized as �forelimb-onset mice� because a failure to execute the hanging test was the first symptom. These �forelimb-onsetmice� showed short disease duration and reached end-stage disease with relatively preserved hindlimb function. In contrast to G1del mice, T1T3, T3T3, nor T3hSOD1 mice showed asymmetric onset of disease. Typically, in these mice, diseaseonset was characterized by the coincident onset of weight loss, failure to extend their hindlimbs, and failure to perform normally in the hanging test. Furthermore, all Thy1.2–G93A mice retained some ability to move their hindlimbs atend-stage disease.
T3hSOD1 mice differed in some aspects from T1T3 and T3T3 mice: T3hSOD1 mice showed earlier disease onset and a reduced variability of onset age than T1T3 and T3T3 mice. In addition, disease duration was significantly longer than in T3T3and T1T3 mice (*p � 0.001, unpaired two-tailed Student’s t test). Interestingly, most end-stage disease T3hSOD1 mice (8 of 10) showed a distended urinary bladder, suggestive of micturition problems, a feature that we never observed inT3T3, T1T3, or G1del mice but that recently has been reported for transgenic mice expressing the wild-type-like D90A mutation (Jonsson et al., 2006a).
Jaarsma et al. • Neuron-Specific SOD1 Mice J. Neurosci., February 27, 2008 • 28(9):2075–2088 • 2077

2078 • J. Neurosci., February 27, 2008 • 28(9):2075–2088 Jaarsma et al. • Neuron-Specific SOD1 Mice

ical and pathological features of end-stage G1del mice, includingsevere weight loss (�30% of maximal weight), inability to hangin a hanging wire test (Table 1), loss of grip strength (supplemen-tal Fig. 3, available at www.jneurosci.org as supplemental mate-rial), severe locomotor deficits (supplemental Movie 1, availableat www.jneurosci.org as supplemental material), loss of motorneurons (Fig. 1h), denervation of neuromuscular synapses (Fig.1i), and accumulation of insoluble and multimeric mutant SOD1
species (Fig. 2f). In addition, end-stage T1T3 and T3T3 mice, likeend-stage G1del mice, showed the accumulation of argyrophylicneuronal debris not only in the ventral spinal cord (Figs. 1h, 3b)but also throughout the medullary, pontine, and mesencephalicreticular formation up to the zona incerta (Fig. 3c,d). Silver stain-ing showed that no degenerative changes did occur in cortex,hippocampus, and striatum despite high levels of neuronal mu-tant SOD1 expression in these brain areas. Furthermore, T1T3
Figure 2. End-stage neuron-specific G93A–SOD1 mice show reduced total mutant SOD1 expression and the accumulation of detergent-insoluble and multimeric SOD1 species. a– e, hSOD1-immunoperoxidase staining showing distribution and relative intensity of hSOD1 in the C7 spinal cord sections from hemizygote and homozygote T3 mice as well as G1del mice. Note that, spinal cordspecimens were embedded in a single gelatin block and sectioned and stained together to avoid variability in staining. Antibody concentration (sheep anti-SOD1; 1:10,000) and staining conditionswere chosen to maximize differences between hemizygote and homozygote T3 mice (compare b with c) showing a twofold difference in hSOD1 expression as determined by Western blot (Fig. 1e).Under these conditions, staining of G1del spinal cord is saturated (e), consistent with higher mutant SOD1 expressions levels (Fig. 1e). Note that end-stage T3T3 mice (d) compared with youngpresymptomatic T3T3 mice show reduced hSOD1 immunoreactivity in the ventral horn (VH) and the intermediate zone (IZ), but equal amounts of hSOD1 immunoreactivity in the dorsal horn (DH),consistent with the occurrence of neuronal degeneration in the ventral horn and the intermediate zone. f, Western blot analysis of G93A–SOD1 expression in NP-40-insoluble fraction (P2), showingthe accumulation of insoluble G93A–SOD1 in spinal cord of both neuron-specific and ubiquitous G93A–SOD1 mice (f1). Prolonged exposure revealed the presence of multimeric SOD1 species in theinsoluble fraction (arrows in f2). Note in f2 that the lanes of T3T3 mice were exposed longer than the other lanes to obtain comparable signal of multimeric SOD1 species.
4
Figure 1. Neuron-specific G93A–SOD1 expression is sufficient to cause motor neuron disease in transgenic mice. a, b, Pronuclear injections of the Thy1.2 expression cassette with G93A–mutanthSOD1 cDNA (a) yielded two mouse lines (T1, T3) with high G93A–SOD1 expression in the spinal cord as determined by immunoperoxidase histochemistry with an hSOD1-specific antibody (b). c,Western blot with human SOD1-preferring antibody (SOD100) shows that T1 and T3 mice express G93A–SOD1 throughout the CNS but not in other tissues. d, Confocal immunofluorescence of T1T3mouse spinal cord section shows that hSOD1 immunoreactivity does not codistribute with astroglial (GFAP) and oligodendroglial (�B-crystallin) staining. e, Representative blot (e1) and bar graph(e2) of quantitative Western blot analysis of mutant SOD1 expression in spinal cord of hemizygote and homozygote T3 mice compared with the ubiquitous G93A–SOD1-expressing G1del mice.Values represent means � SE; n � 3. f, Age of disease onset and end stage of T1T3 (f1) and T3T3 (f2) neuron-specific G93A–SOD1 mice. g, Age of disease onset and end stage of neuron-specificG93A–SOD1 mice crossed into ubiquitously wild-type hSOD1-expressing mice. h, End-stage T3T3 and G1del mice show similar loss of motor neurons, accumulation of argyrophylic neuronal debris(Ag staining, h1), and astroglial expression of Hsp25 in ventral spinal cord. Motor neurons were counted in lumbar L4 sections immunoperoxidase stained for ChAT, which is present in all motorneurons, or CGRP, which is expressed in a subset of large motor neurons (h2). Values in the bar graphs represent means � SE; n � 3. ***p � 0.001 compared with nontransgenic mice andpresymptomatic transgenic mice, one-way ANOVA with Tukey’s multiple comparison test. i, Analysis of neuromuscular denervation in sections of medial gastrocnemius muscle stained with�-bungarotoxin (�-BTX, motor endplates), anti-VAChT (motor nerve endings), and �-hSOD1 (axons and nerve ending). Data are shown as percentage of endplates classified as innervated,denervated, or partially denervated. Scale bars: d, 10 �m; h1, 250 �m.
Jaarsma et al. • Neuron-Specific SOD1 Mice J. Neurosci., February 27, 2008 • 28(9):2075–2088 • 2079
and T3T3, similar to G1del mice and other lines of SOD1–ALSmice (Wong et al., 1995; Bruijn et al., 1997), developed signs ofreactive gliosis, including the appearance of activated microglialcells (Fig. 4c), as well as increased expression of GFAP (Figs. 4g,5d) and heat shock protein Hsp25 (Figs. 1h, 5d) in astrocytes andreduced expression of the astrocytic glutamate transporter GLT1(Fig. 5d). No astrocytic and microglial changes were observed inthe cortex, hippocampus, and striatum, consistent with the ab-sence of argyrophillic degeneration in these brain areas and sup-porting the notion that neuronal degeneration was restricted tothe brainstem and spinal cord. Together, these data show thatspecific neuronal expression of G93A mutant SOD1 is sufficientto trigger an ALS-like motor neuron disease strongly resemblingdisease phenotypes described in ubiquitous expressing mutantSOD1 mice. Importantly, consistent with neuron-specific ex-pression of mutant SOD1, end-stage Thy1.2–G93A mice showconsiderable loss of transgenic human SOD1 immunoreactivityin the spinal cord ventral horn (Figs. 1e, 2d, 4g).
Differences between neuron-specific and ubiquitousG93A miceAdditional analysis revealed a number of differences betweenThy1.2–G93A and G1del mice. First, T3T3 and T1T3 mice notonly showed a late onset of motor symptoms but also a largevariability of symptom onset age (Fig. 1f). Second, rather than afocal asymmetric onset of motor symptoms as occurring in mostG1del mice (Table 1) (supplemental Movie 2, available at www.jneurosci.org as supplemental material) and SOD1–ALS patients
(Sato et al., 2005), T3T3 and T1T3 mice showed relatively diffusesymptom onset, characterized by the coincident onset of weightloss, failure to extend the hindlimbs, and failure to perform nor-mally in a hanging wire test, i.e., a test that strongly depends onnormal function of the forelimbs (Table 1). In accord with anonfocal onset and progression of disease, all Thy1.2–G93A miceshowed similar amounts of argyrophylic neuronal debris be-tween left and right, and lumbar and cervical segments (Fig. 3b),whereas G1del mice in many occasions showed significant differ-ences in argyrophylic staining between different parts of the spi-nal cord (Fig. 3a). Third, electron microscopy revealed that T3T3and T1T3 mice did not develop mitochondrial swelling and vac-uolization (Table 2), which is a dominant pathological feature inG1 and G1del mice (Dal Canto and Gurney, 1995; Jaarsma et al.,2001), as well as in G37R and D90A mutant SOD1 mice (Wong etal., 1995; Bergemalm et al., 2006). Fourth, electron microscopyand confocal immunofluorescence showed that Thy1.2–G93Amice did not develop SOD1 aggregates in glia (Table 2), whereasG1del mice, in accord with previous reports (Dal Canto and Gur-ney, 1997; Stieber et al., 2000), developed ubiquitinated SOD1aggregates in both astrocytes and oligodendrocytes (Table 2). Weshowed that, in G1del mice, both astroglial and oligodendroglialaggregates were strongly immunoreactive for �B-crystallin (Figs.4, 5), a small heat shock protein that in control spinal cord isselectively associated with oligodendrocytes but in G1del micealso was expressed in some astrocytes (Figs. 4h,i, 5c, Table 2). Inaddition, G1del mice showed a large increase of the level ofdetergent-insoluble �B-crystallin (Fig. 5d). In contrast, Thy1.2–
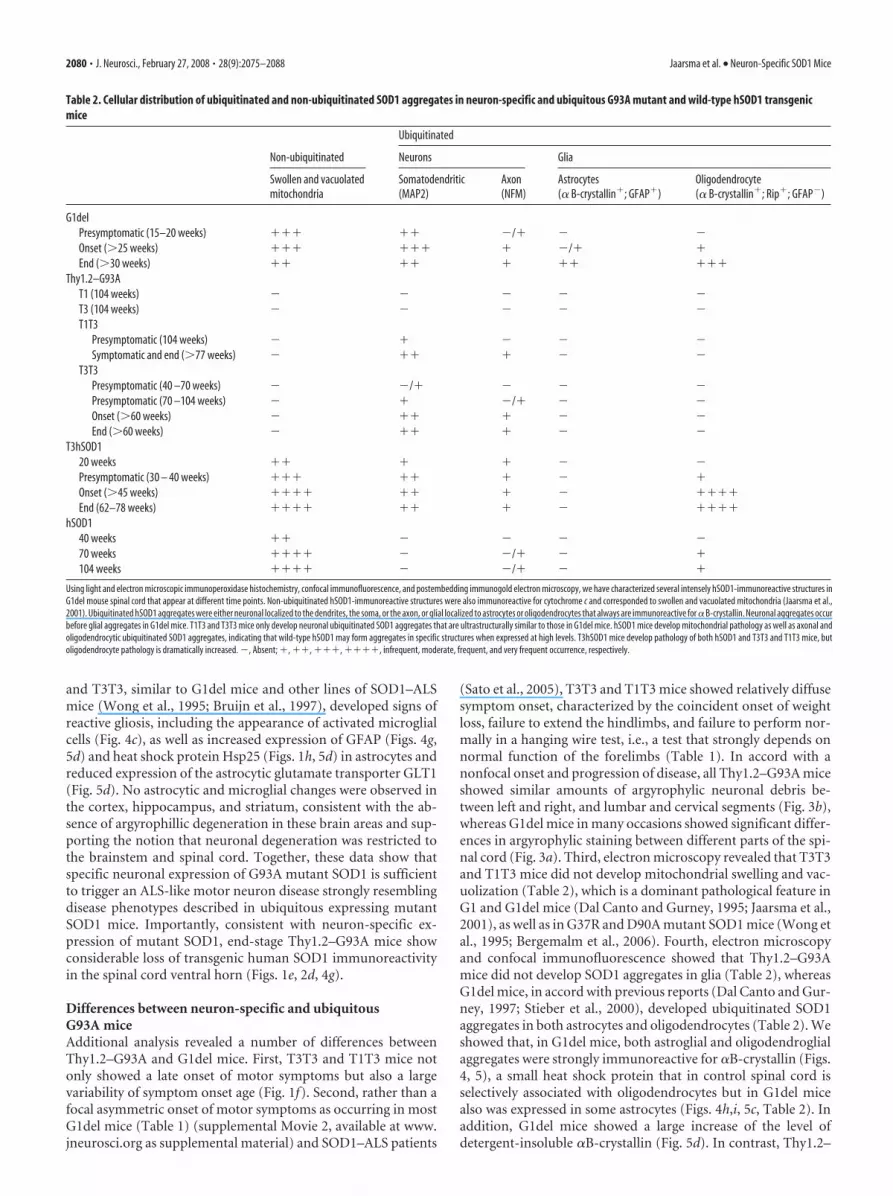
Table 2. Cellular distribution of ubiquitinated and non-ubiquitinated SOD1 aggregates in neuron-specific and ubiquitous G93A mutant and wild-type hSOD1 transgenicmice
Non-ubiquitinated
Ubiquitinated
Neurons Glia
Swollen and vacuolatedmitochondria
Somatodendritic(MAP2)
Axon(NFM)
Astrocytes(� B-crystallin�; GFAP�)
Oligodendrocyte(� B-crystallin�; Rip�; GFAP)
G1delPresymptomatic (15–20 weeks) ��� �� /� Onset (�25 weeks) ��� ��� � /� �End (�30 weeks) �� �� � �� ���
Thy1.2–G93AT1 (104 weeks) T3 (104 weeks) T1T3
Presymptomatic (104 weeks) � Symptomatic and end (�77 weeks) �� �
T3T3Presymptomatic (40 –70 weeks) /� Presymptomatic (70 –104 weeks) � /� Onset (�60 weeks) �� � End (�60 weeks) �� �
T3hSOD120 weeks �� � � Presymptomatic (30 – 40 weeks) ��� �� � �Onset (�45 weeks) ���� �� � ����End (62–78 weeks) ���� �� � ����
hSOD140 weeks �� 70 weeks ���� /� �104 weeks ���� /� �
Using light and electron microscopic immunoperoxidase histochemistry, confocal immunofluorescence, and postembedding immunogold electron microscopy, we have characterized several intensely hSOD1-immunoreactive structures inG1del mouse spinal cord that appear at different time points. Non-ubiquitinated hSOD1-immunoreactive structures were also immunoreactive for cytochrome c and corresponded to swollen and vacuolated mitochondria (Jaarsma et al.,2001). Ubiquitinated hSOD1 aggregates were either neuronal localized to the dendrites, the soma, or the axon, or glial localized to astrocytes or oligodendrocytes that always are immunoreactive for � B-crystallin. Neuronal aggregates occurbefore glial aggregates in G1del mice. T1T3 and T3T3 mice only develop neuronal ubiquitinated SOD1 aggregates that are ultrastructurally similar to those in G1del mice. hSOD1 mice develop mitochondrial pathology as well as axonal andoligodendrocytic ubiquitinated SOD1 aggregates, indicating that wild-type hSOD1 may form aggregates in specific structures when expressed at high levels. T3hSOD1 mice develop pathology of both hSOD1 and T3T3 and T1T3 mice, butoligodendrocyte pathology is dramatically increased. , Absent; �, ��, ���, ����, infrequent, moderate, frequent, and very frequent occurrence, respectively.
2080 • J. Neurosci., February 27, 2008 • 28(9):2075–2088 Jaarsma et al. • Neuron-Specific SOD1 Mice

Figure 3. Distribution of argyrophylic degeneration in neuron-specific and ubiquitous G93A–SOD1 mice correlate with symptoms. Silver degeneration staining visualizing the distribution ofneuronal degeneration in ubiquitous (G1del) and neuron-specific (T3T3, T1T3, T3hSOD1) G93A–SOD1 mouse models. Presymptomatic mice show no or very little argyrophylic staining (a1, b1, b2,c1), but levels of argyrophylic staining increase in parallel with the severity of symptoms. Argyrophylic staining accumulates in the spinal cord ventral horn as well in supraspinal CNS regions,including the medullary (MedRF in c2, c3), pontine and mesencephalic reticular formation (MesRF in D1), and the zona incerta (ZI in d1– d3). In mice with focal asymmetric symptoms, alsoargyrophylic staining is distributed focally in the part of the spinal cord corresponding to the affected limb. For instance, a G1del mouse killed shortly after the onset of motor problems in its lefthindlimb selectively shows a high level of argyrophylic degeneration in the left lumbar spinal cord and low staining levels in the right lumbar and cervical cord (a2). Animals killed in later phases ofdisease also show staining in the contralateral side and at cervical levels (a3, a4 ). Mice with forelimb onset may reach end-stage disease with relatively preserved hindlimb function and concomitantlow levels of neuronal degeneration at lumbar levels (a5). T1T3, T3T3, and T3hSOD1 mice never showed focal symptom onset and progression of disease and accordingly show similar amounts ofargyrophylic staining between left and right, and lumbar and cervical segments (b2– b5). Section in c and d correspond to plates 89 (c1, c3), 85 (c2), 54 (d1), 48 (d2), and 44 (d3) of the mouse brainatlas of Paxinos and Franklin (2001). CA3, CA3 hippocampal subfield; Cb, cerebellum; DG, dentate gyrus; Po, posterior thalamic nuclei; Sol, nucleus of the solitary tract; Sp5, spinal trigeminal nucleus;VPM, ventral posteromedial thalamic nucleus. Scale bars: b1, c1, 500 �m.
Jaarsma et al. • Neuron-Specific SOD1 Mice J. Neurosci., February 27, 2008 • 28(9):2075–2088 • 2081

G93A mice did not show astroglial �B-crystallin expression (Fig.4g), codistribution of �B-crystallin and ubiquitin (Fig. 5b, Table2), (supplemental Table 1, available at www.jneurosci.org as sup-plemental material), or increased levels of insoluble �B-crystallin
(Fig. 5d), indicating that changes in �B-crystallin localization in G1del mice de-pend on glial mutant SOD1 expression.
Dendritic ubiquitinated SOD1aggregates represent the dominantpathological structure in neuron-specific G93A miceWe have shown previously in G1del micethat the appearance of cytosolic ubiquiti-nated SOD1 aggregates in dendrites pre-cedes subsequent degeneration of motorneurons (Vlug et al., 2005). Because den-dritic ubiquitination also has been identi-fied as an early feature in other ubiquitousSOD1–ALS mouse and rat models carry-ing different mutations (Bruijn et al., 1997;Wang et al., 2005; Jonsson et al., 2006b), itmay represent a dominant pathologicalfeature in SOD1–ALS. Accordingly, im-munohistochemistry with antibodies topolyubiquitinated epitopes showed that allsymptomatic Thy1.2–G93A and the ma-jority (six of eight) of presymptomaticThy1.2–G93A mice older than 40 weeksshowed ubiquitin-immunoreactive neu-ritic profiles (Fig. 6, Table 2). Double-labeling confocal immunofluorescenceshowed that ubiquitin immunoreactivitymostly codistributed with the somatoden-dritic microtubule-associated proteinMAP2 (Fig. 6, Table 2), infrequently withneurofilament-M, which outlines axonalprofiles (Table 2), and, as stated before,never with �B-crystallin and glial markers(Fig. 5b). In presymptomatic Thy1.2–G93A mice, ubiquitin immunoreactivitywas predominantly associated with thindendritic processes (Fig. 6g), whereas insymptomatic mice labeling also occurredin thicker proximal dendritic profiles that,in many occasions, could be traced back tothe neuronal cell bodies (Fig. 6h). Signifi-cantly, as in G1del mice (Vlug et al., 2005),motor neurons with ubiquitin staining inproximal dendrites also showed multiplefeatures of ill health, including a flattenedeccentric nucleus (Fig. 6h), fragmentedGolgi apparatus (data not shown), andATF3 expression (data not shown).
Postembedding immunogold electronmicroscopy showed that the dendritic ag-gregates in Thy1.2–G93A mice as in G1delmice (Vlug et al., 2005) always werestrongly immunoreactive for both ubiq-uitin and human SOD1 and consisted ofdisorganized ensembles of filamentousmaterial, frequently contained vesicularstructures, and often were surrounded by
mitochondria (Fig. 6i– k). Aggregates in distal dendrites in gen-eral were loosely packed (Fig. 6i,j), whereas larger aggregates inproximal dendrites were more densely packed, showing coreswith high levels of electron-dense proteinaceous material as well
Figure 4. Neuron-specific G93A–SOD1 mice, like ubiquitous G93A mice, show signs of microgliosis and astrogliosis, but do notdevelop glial SOD1 aggregates. a– d, Murine CR3 staining of resting and activated microglia (brown) in thionin counterstained(blue) lumbar L4 –ventral horn showing the presence of activated microglia (arrows in c, d) in spinal cord of end-stage neuron-specific (T3T3) and ubiquitous (G1del) G93A–SOD1 mice. e– h, Triple-labeling confocal immunofluorescence of GFAP, �B-crystallin, and hSOD1 in lumbar spinal cord sections showing that end-stage T3T3 mice (g), like end-stage G1del mice (h), showincreased GFAP immunoreactivity indicative of astrogliosis (g1, h1) but, unlike G1del mice, do not show increased �B-crystallinimmunoreactivity (g2, h2). Intensely �B-crystallin labeled structures in G1del mice usually are strongly immunoreactive fortransgenic human mutant SOD1 (arrows and arrowheads in h) and occasionally codistribute for GFAP (arrows in h). �B-Crystallin-and hSOD1-positive, but GFAP-negative, structures (arrowheads in h) represent SOD1 aggregates in oligodendrocytes (see alsoFigs. 5, 7). Asterisks in c3 indicate a vacuolated mitochondrion, which is outlined by a halo of intense hSOD1 immunoreactivity (seealso Jaarsma et al., 2001). Note in g that end-stage T3T3 mice show loss of hSOD1 in parallel with increased GFAP staining,consistent with neuronal degeneration and neuron-specific expression of mutant SOD1. Also note that, because of higher hSOD1levels in G1del mice, the hSOD1 signal in h3 has been scanned at lower detector sensitivity compared with e3– g3 to avoidsaturation of the image. i, �B-Crystallin immunoperoxidase electron micrograph of an astroglial SOD1 aggregate in end-stageG1del mouse. The astrocyte with the aggregate is outlined by color coding the surrounding neuropil (Nu). Astroglial SOD1aggregates consist of disorganized filamentous material, which, in accord with confocal immunofluorescent images (arrow in h),are immunoreactive for �B-crystallin (arrow in i2). Note GFAP filaments right from dashed line in i2. Scale bars: a, 20 �m; e4, 10�m; i1, 3 �m.
2082 • J. Neurosci., February 27, 2008 • 28(9):2075–2088 Jaarsma et al. • Neuron-Specific SOD1 Mice
as high levels of vesicular structures (Fig. 6k). Notably, in addi-tion to these heterogeneous dendritic aggregates, in some neu-rons of symptomatic T3T3 mice, we also identified homogenouscompact filamentous ubiquitinated SOD1 aggregates that werenot associated with vesicular structures (supplemental Fig. 4,available at www.jneurosci.org as supplemental material).
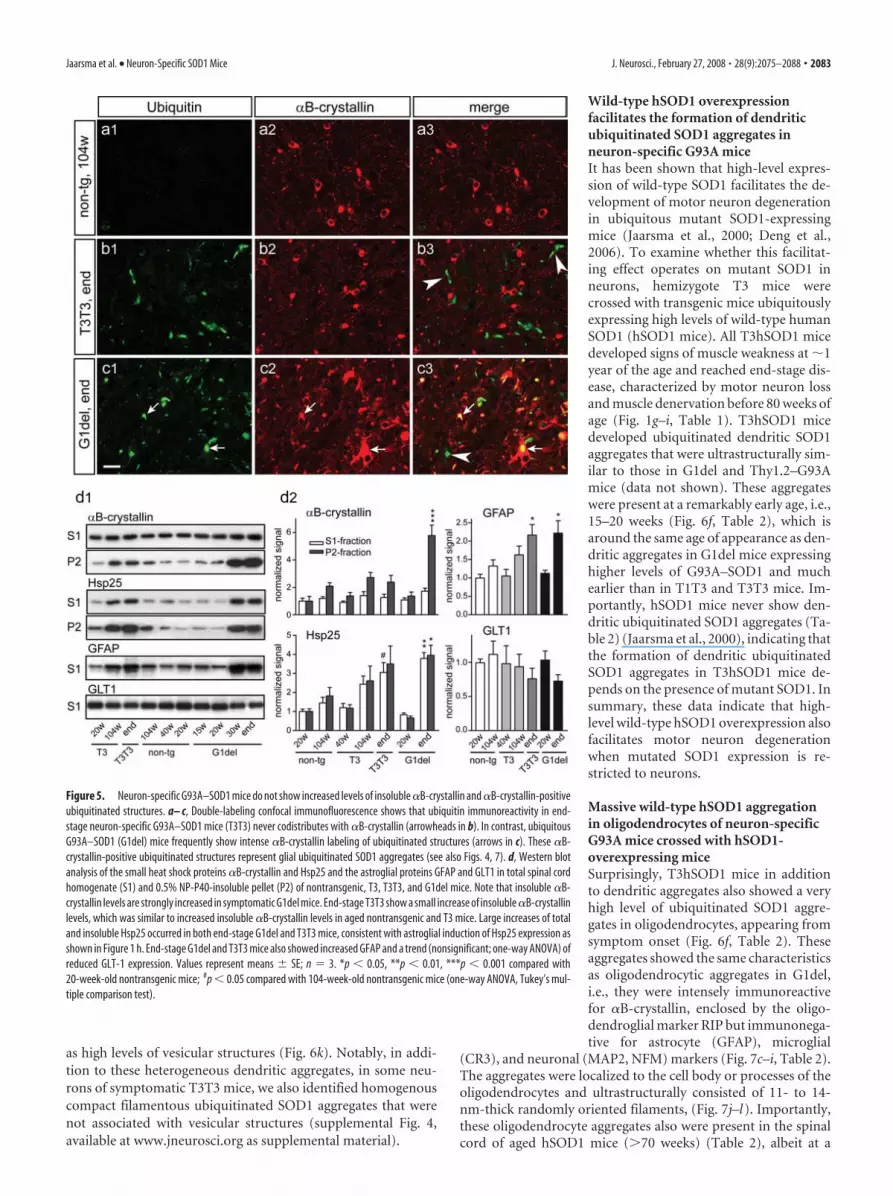
Wild-type hSOD1 overexpressionfacilitates the formation of dendriticubiquitinated SOD1 aggregates inneuron-specific G93A miceIt has been shown that high-level expres-sion of wild-type SOD1 facilitates the de-velopment of motor neuron degenerationin ubiquitous mutant SOD1-expressingmice (Jaarsma et al., 2000; Deng et al.,2006). To examine whether this facilitat-ing effect operates on mutant SOD1 inneurons, hemizygote T3 mice werecrossed with transgenic mice ubiquitouslyexpressing high levels of wild-type humanSOD1 (hSOD1 mice). All T3hSOD1 micedeveloped signs of muscle weakness at �1year of the age and reached end-stage dis-ease, characterized by motor neuron lossand muscle denervation before 80 weeks ofage (Fig. 1g–i, Table 1). T3hSOD1 micedeveloped ubiquitinated dendritic SOD1aggregates that were ultrastructurally sim-ilar to those in G1del and Thy1.2–G93Amice (data not shown). These aggregateswere present at a remarkably early age, i.e.,15–20 weeks (Fig. 6f, Table 2), which isaround the same age of appearance as den-dritic aggregates in G1del mice expressinghigher levels of G93A–SOD1 and muchearlier than in T1T3 and T3T3 mice. Im-portantly, hSOD1 mice never show den-dritic ubiquitinated SOD1 aggregates (Ta-ble 2) (Jaarsma et al., 2000), indicating thatthe formation of dendritic ubiquitinatedSOD1 aggregates in T3hSOD1 mice de-pends on the presence of mutant SOD1. Insummary, these data indicate that high-level wild-type hSOD1 overexpression alsofacilitates motor neuron degenerationwhen mutated SOD1 expression is re-stricted to neurons.
Massive wild-type hSOD1 aggregationin oligodendrocytes of neuron-specificG93A mice crossed with hSOD1-overexpressing miceSurprisingly, T3hSOD1 mice in additionto dendritic aggregates also showed a veryhigh level of ubiquitinated SOD1 aggre-gates in oligodendrocytes, appearing fromsymptom onset (Fig. 6f, Table 2). Theseaggregates showed the same characteristicsas oligodendrocytic aggregates in G1del,i.e., they were intensely immunoreactivefor �B-crystallin, enclosed by the oligo-dendroglial marker RIP but immunonega-tive for astrocyte (GFAP), microglial
(CR3), and neuronal (MAP2, NFM) markers (Fig. 7c–i, Table 2).The aggregates were localized to the cell body or processes of theoligodendrocytes and ultrastructurally consisted of 11- to 14-nm-thick randomly oriented filaments, (Fig. 7j–l). Importantly,these oligodendrocyte aggregates also were present in the spinalcord of aged hSOD1 mice (�70 weeks) (Table 2), albeit at a
Figure 5. Neuron-specific G93A–SOD1 mice do not show increased levels of insoluble �B-crystallin and �B-crystallin-positiveubiquitinated structures. a– c, Double-labeling confocal immunofluorescence shows that ubiquitin immunoreactivity in end-stage neuron-specific G93A–SOD1 mice (T3T3) never codistributes with �B-crystallin (arrowheads in b). In contrast, ubiquitousG93A–SOD1 (G1del) mice frequently show intense �B-crystallin labeling of ubiquitinated structures (arrows in c). These �B-crystallin-positive ubiquitinated structures represent glial ubiquitinated SOD1 aggregates (see also Figs. 4, 7). d, Western blotanalysis of the small heat shock proteins �B-crystallin and Hsp25 and the astroglial proteins GFAP and GLT1 in total spinal cordhomogenate (S1) and 0.5% NP-P40-insoluble pellet (P2) of nontransgenic, T3, T3T3, and G1del mice. Note that insoluble �B-crystallin levels are strongly increased in symptomatic G1del mice. End-stage T3T3 show a small increase of insoluble �B-crystallinlevels, which was similar to increased insoluble �B-crystallin levels in aged nontransgenic and T3 mice. Large increases of totaland insoluble Hsp25 occurred in both end-stage G1del and T3T3 mice, consistent with astroglial induction of Hsp25 expression asshown in Figure 1 h. End-stage G1del and T3T3 mice also showed increased GFAP and a trend (nonsignificant; one-way ANOVA) ofreduced GLT-1 expression. Values represent means � SE; n � 3. *p � 0.05, **p � 0.01, ***p � 0.001 compared with20-week-old nontransgenic mice; #p � 0.05 compared with 104-week-old nontransgenic mice (one-way ANOVA, Tukey’s mul-tiple comparison test).
Jaarsma et al. • Neuron-Specific SOD1 Mice J. Neurosci., February 27, 2008 • 28(9):2075–2088 • 2083

considerably lower number (Figs. 6c, 7b).This indicates that high-level expression ofwild-type SOD1 by it self is sufficient toinduce ubiquitinated SOD1 aggregates inoligodendrocytes but that this process isfacilitated in T3 hSOD1 mice. Of note, thepresence of oligodendrocyte aggregates inT3hSOD1 mice (as well as in hSOD1 andG1del mice) always was accompanied bythe occurrence of axonal degeneration, in-dicating a link between axonal degenera-tion and oligodendrocyte aggregates. Asindicated in Table 2, neither T3hSOD1mice nor hSOD1 mice did develop SOD1aggregates in astrocytes, indicating that ag-gregate formation in these cells cannot bemimicked by high wild-type SOD1 con-centrations and, like the dendritic aggre-gates in motor neurons, depend on thepresence of mutant SOD1 (Table 2).
DiscussionIn this study, we show that transgenic miceexpressing G93A-mutant SOD1 specifi-cally in neurons develop an ALS-like dis-ease characterized by the loss of motorneurons and muscle denervation. Ourdata conclusively show that mutant SOD1expression in neurons is sufficient to causemotor neuron disease in vivo. Previousstudies with ubiquitous mutant SOD1transgenic mice have shown that down-regulation of mutant SOD1 specifically inneurons by either RNA interference(Ralph et al., 2005) or Cre/Lox (Boillee etal., 2006b) delays symptom onset and pro-longs survival. In accord with our data,these studies provide in vivo evidence thattoxic actions of mutant SOD1 in neuronsare important in SOD1–ALS pathogenesis,but, because the mice in these studies con-tinue to express high levels of mutantSOD1 in glia, these studies leave open thequestion whether the presence of mutant
Figure 6. Dendritic ubiquitinated SOD1 aggregates are the dominant pathological feature preceding motor neuron degeneration inneuron-specific G93A–SOD1 mice. a–f, Immunoperoxidase labeling of ubiquitin immunoreactivity in the ventral horn (VH) of L4 spinalcord sections of neuron-specific G93A–SOD1 mice (d, T3T3), ubiquitous G93A–SOD1 mice (e, G1del), wild-type hSOD1-overexpressingmice (c), and double-transgenic T3hSOD1 mice (f ). In T3T3 mice, ubiquitin immunoreactivity is associated with neurite-like structures(arrowheads in d) and neuronal somata with a relatively modest increase in the number of labeled structures throughout disease progres-sion. In G1del mice, ubiquitin immunoreactivity is predominantly associated with neurite-like structures in early stages of disease (arrow-heads in e1, e2), but the amount of ubiquitin-immunoreactive structures increases progressively in late phases of disease attributable tothe appearance of glial ubiquitinated SOD1 aggregates (small arrow in e3) (see also Figs. 4, 5). Also T3hSOD1 mice show neuritic ubiquitinimmunoreactivity in presymptomatic stages, but, from symptom onset, T3hSOD1 mice show dramatic high levels of ubiquitin immuno-reactivity resulting from oligodendrocytic SOD1 aggregates, which have a dot-like appearance in immunoperoxidase-stained sections(small arrows in f2, f3) (see also Fig. 7). In old hSOD1 mice, ubiquitin labeling was exclusively associated with these dot-like oligodendro-cyte aggregates (arrows in c) and never occurred in neuronal profiles. Ubiquitinated structures were never observed in 2-year-old non-transgenic and hemizygote T3 mice. vlfu, Ventrolateral funiculus. g, h, Double-labeling confocal immunofluorescence shows that neuriticubiquitin immunoreactivity in T3T3 mice codistributes with MAP2 immunoreactivity consistent with a dendritic localization. Note in h that
4
the motor neuron with ubiquitin immunoreactivity in theproximal dendrite has a flattened eccentric nucleus sugges-tive of compromised health. i– k, Postembedding immuno-gold electron microscopy of ubiquitin and transgenic humanSOD1 in aggregates in distal (h, i) and proximal (j) dendrites.Dendritic aggregates predominantly consisted of disorga-nized filaments (arrowheads in i2, j, k3). Note the presence ofmitochondria (m) in close proximity of the aggregates in i andj. Aggregates in proximal dendrites show a higher level ofaggregated material in the center (k1, k2) and often containhigh levels of vesicular structures at the periphery (j). Notethat the postembedding immunogold procedure is relativelyinefficient compared with immunoperoxidase histochemistryand immunofluorescence methods producing labeling only in ar-eas with high hSOD1 and ubiquitin concentrations. Also note thatsynapses(arrowsin i1, j, k1)andmitochondria(m)havea normalappearanceinthedendriticprofileswithaggregates.Scalebars:c,50 �m; g1, h1, 10 �m; i1, j, k1, 500 nm.
2084 • J. Neurosci., February 27, 2008 • 28(9):2075–2088 Jaarsma et al. • Neuron-Specific SOD1 Mice

SOD1 in neurons is sufficient to develop disease (Ralph et al.,2005; Boillee et al., 2006b). Two previous studies reported ontransgenic mice expressing mutant SOD1 selectively in neuronsthat did not develop signs of motor neuron degeneration (Pra-matarova et al., 2001; Lino et al., 2002). The absence of a diseasephenotype in these mice may be explained by insufficient mutantSOD1 expression. For instance, the mice generated by Prama-tarova et al. (2001) constructed to express G37R–mutant hSOD1mice under the control of the neurofilament-L promotor pro-
duce mutant transgenic SOD1 in spinalcord homogenates at a concentration of�0.2 ng/�g protein (Pramatarova et al.,2001), which is lower than in our Thy1.2–G93A mice (0.5 and 1 ng/�g for hemizy-gotes and homozygotes, respectively) andconsiderably lower than ubiquitous G37Rmice generated using genomic constructs(Wong et al., 1995) or a cDNA constructcontrolled by the prion protein promotor(Wang et al., 2005). Mutant SOD1 con-centrations have not been reported for themice of Lino et al. (2002), which, as in ourstudy, were generated using the Thy1.2 ex-pression construct to drive either G93A orG85R mutant hSOD1 expression. How-ever, Lino et al. (2002) showed that theirhighest expressing G93A–SOD1 line (line13) did not influence symptom onset andsurvival of high-copy Gurney G1 mice(Lino et al., 2002). These results are con-sistent with our data demonstrating thatthe T3 transgene had a minimal effect onsurvival of G1del mice (supplemental Fig.2, available at www.jneurosci.org as sup-plemental material). Because other studieshave shown that altering neuronal mutantSOD1 levels in ubiquitous mutant SOD1-expressing mice has a significant impacton symptom onset (Ralph et al., 2005;Boillee et al., 2006b), these data indirectlyindicate that neuronal mutant SOD1 ex-pression levels in their line 13 mice is muchlower than in their G1 mice. In summary,the data from previous studies withneuron-specific mutant SOD1 mousemodels are consistent with our results withhemizygote T1 and T3 mouse and indicatethat mutant SOD1 has to be expressed atsufficiently high levels to trigger motorneuron disease within the normal lifespanof a mouse. Accordingly, the lack of a dis-ease phenotype of some ubiquitous mu-tant SOD1-expressing lines has beenlinked to insufficient mutant SOD1 ex-pression (Deng et al., 2006; Jonsson et al.,2006b).
Neuropathological analysis of ourneuron-specific G93A mice point to a sin-gle intracellular defect preceding other de-generative changes, which is the formationof dendritic SOD1 aggregates. Our ultra-structural data show that these dendriticSOD1 aggregates are associated with dis-
organized filaments and high levels of vesicular structures, sug-gesting that aggregates disrupt the cytoskeleton and organelletrafficking within motor neuron dendrites. Because we did notobserve evidence for other previously reported cellular abnor-malities (e.g., mitochondrial abnormalities, early axonal abnor-malities), we hypothesize that disruption of dendritic traffickingby SOD1 aggregates may be the major event triggering motorneuron degeneration. Accordingly, somatodendritic ubiquitina-tion has been reported for all SOD1–ALS mouse models in the
Figure 7. Neuron-specific expression of G93A–SOD1 in ubiquitous wild-type hSOD1-overexpressing transgenic mice triggersmassive wild-type hSOD1 aggregation in oligodendrocytes. a–i, Double-labeling confocal immunofluorescence showing high-level ubiquitinated structures with a diameter up to 10 �m in the spinal cord of symptomatic T3hSOD1 mice. These ubiquitinatedstructures are immunoreactive for �B-crystallin (arrow in c, d) and hSOD1 (arrow in i) and surrounded by the oligodendrocytemarker RIP (f ) and do not codistribute with astroglial (GFAP), microglial (CR3), and somatodendritic neuronal (MAP2, e) markers.In addition to these oligodendrocyte aggregates, T3hSOD1 show infrequent �B-crystallin-negative ubiquitinated structures(arrowhead in c) that are immunoreactive for MAP2 (arrowhead in e) consistent with a somatodendritic distribution. Also wild-type hSOD1 mice that do not express the T3 transgene also develop oligodendrocyte aggregates albeit at advanced age (�70weeks) and at much lower numbers (arrow in b) (see also Fig. 6c,f ). j–l, Standard (j) and postembedding immunogold electronmicroscopy of oligodendrocyte aggregates (k, l) showing that oligodendrocyte aggregates consist of 11- to 14-nm-thick ran-domly oriented filaments. Scale bars: a1, g1, 20 �m; d1, f1, 10 �m; j–l, 500 nm.
Jaarsma et al. • Neuron-Specific SOD1 Mice J. Neurosci., February 27, 2008 • 28(9):2075–2088 • 2085

literature (Bruijn et al., 1997; Dal Canto and Gurney, 1997;Stieber et al., 2000; Jonsson et al., 2004; Wang et al., 2005), andaggregates ultrastructurally resembling dendritic aggregates havebeen documented for human ALS material (Arima et al., 1998;Kato et al., 2000). The precise mechanisms causing their forma-tion and the composition of these aggregates remain to be deter-mined. As shown in the present study, dendritic aggregate forma-tion is facilitated in the context of high wild-type hSOD1 levels,and identifying the mechanism underlying this facilitation mayprovide novel clues about SOD1–ALS pathogenesis (Furukawa etal., 2006).
Several lines of evidence have indicated a pathogenic role ofmutant SOD1 in astrocytes (Clement et al., 2003; Di Giorgio etal., 2007; Nagai et al., 2007) and microglia (Beers et al., 2006;Boillee et al., 2006b). Furthermore, the ability of mutant SOD1to form micrometer scale aggregates in astrocytes, afflict theirfunction, and trigger their degeneration has been demon-strated in SOD1–ALS patients (Kato et al., 1997) and SOD1–ALS transgenic mice (Bruijn et al., 1997; Dal Canto and Gur-ney, 1997; Pasinelli et al., 2000; Vlug et al., 2005). Having anintimate metabolic relationship with neurons, the malfunc-tion or degeneration of astroglia is likely to facilitate the de-generation of neurons (Faulkner et al., 2004; Maragakis andRothstein, 2006). Our data demonstrating that neuron-specific expression of mutant SOD1 is sufficient to cause dis-ease do not exclude a role for mutant SOD1 in glia. We haveidentified a number of differences between our Thy1.2–G93Amice and G1del mice that express G93A–SOD1 ubiquitously.Part of these differences, like the absence of mitochondrialvacuolar pathology, may follow from low-level mutant SOD1expression because this phenomenon is linked to high SOD1protein concentrations (Bergemalm et al., 2006) and occurs atlow levels in low-expressing ubiquitous G93A–SOD1 lines(lines G20 and G5/G5) (Dal Canto and Gurney, 1995, 1997).Also, the late and highly variable age of motor symptom onsetcan, at least in part, be explained by relatively low G93A–SOD1 expression levels, because this is also observed in thelow-copy ubiquitous G93A–SOD1 lines (Dal Canto and Gur-ney, 1995, 1997). In contrast, the absence of glial ubiquiti-nated SOD1 aggregates and the lack of accumulation of �B-crystallin in the detergent-insoluble fraction in our neuron-specific G93A–SOD1 mice can be readily explained by theabsence of mutant SOD1 in glia. Also, the diffuse rather thanfocal onset of motor symptoms in our neuron-specific G93A–SOD1 mice might follow from the absence of mutant SOD1 inglial, which could imply that mutant SOD1 in glia plays a rolein the brushfire-like spreading of disease throughout the spi-nal cord and brainstem.
Analysis of the spatiotemporal distribution of astroglialSOD1 aggregates in our G1del mice indicated that these astro-glial aggregates appear in a relatively late phase of disease(Table 2), selectively in regions with high levels of neuronaldegeneration and prominent astrogliosis. This raises the pos-sibility that astroglial aggregate formation is triggered or facil-itated in the context of neuronal degeneration and hence thatthe disease may spread from neurons to glia. According tosuch a scenario, astrocytes are able to cope with the presence ofmutant SOD1 in normal conditions, but, under stressful con-ditions such as the context of neuronal degeneration that trig-gers multiple changes in astrocytes, they become vulnerable tomutant SOD1. Such a scenario is supported by our findings inneuron-specific G93A mice crossed with wild-type hSOD1-overexpressing mice, which show massive wild-type hSOD1
aggregation in oligodendrocytes after the onset of neuronaldegeneration. As shown in the present study, these oligoden-drocyte aggregates also occur at low frequency in old hSOD1mice (age �70 weeks) (Table 2) and at moderate frequency insymptomatic G1del mice. Because the oligodendrocyte aggre-gates only occur after the onset of neuronal or axonal degen-eration and a dramatic difference is seen in the number ofoligodendrocyte aggregates between T3hSOD1 comparedwith hSOD1 mice despite equal hSOD1 expression, we pro-pose that the formation of oligodendrocyte aggregates dependon both the presence of high levels of SOD1 protein and thecontext of neuronal degeneration. The reduced levels of oligo-dendrocyte aggregates in G1del mice compared withT3hSOD1 double-transgenic mice, despite the equal occur-rence of axonal and neuronal degeneration, can be explainedby reduced transgenic SOD1 protein levels in G1del mice com-pared with hSOD1 mice (Jaarsma et al., 2000) and may indi-cate that the formation of oligodendrocyte aggregates dependon high levels of SOD1 protein rather than the presence ofmutant SOD1. In summary, our data favor a scenario in whichthe oligodendrocytes in T3hSOD1 mice in the context of neu-ronal degeneration show a reduced ability to prevent wild-type hSOD1 from forming aggregates.
In summary, on the basis of our data, we propose a pathogenicmodel in which mutant SOD1 triggers neuronal degeneration,which in turn facilitates aggregate formation and functional def-icits in surrounding glia. Such a pathological interplay betweenneurons and glia could facilitate additional degeneration of neu-rons and underlie the focal onset and brushfire-like spreading ofdisease in SOD1–ALS.
ReferencesAndersen PM, Sims KB, Xin WW, Kiely R, O’Neill G, Ravits J, Pioro E,
Harati Y, Brower RD, Levine JS, Heinicke HU, Seltzer W, Boss M,Brown Jr RH (2003) Sixteen novel mutations in the Cu/Zn superox-ide dismutase gene in amyotrophic lateral sclerosis: a decade of dis-coveries, defects and disputes. Amyotroph Lateral Scler Other MotorNeuron Disord 4:62–73.
Arai T, Hasegawa M, Akiyama H, Ikeda K, Nonaka T, Mori H, Mann D,Tsuchiya K, Yoshida M, Hashizume Y, Oda T (2006) TDP-43 is a com-ponent of ubiquitin-positive tau-negative inclusions in frontotemporallobar degeneration and amyotrophic lateral sclerosis. Biochem BiophysRes Commun 351:602– 611.
Arima K, Ogawa M, Sunohara N, Nishio T, Shimomura Y, Hirai S, Eto K(1998) Immunohistochemical and ultrastructural characterization ofubiquitinated eosinophilic fibrillary neuronal inclusions in sporadicamyotrophic lateral sclerosis. Acta Neuropathol (Berl) 96:75– 85.
Beers DR, Henkel JS, Xiao Q, Zhao W, Wang J, Yen AA, Siklos L, McKercherSR, Appel SH (2006) Wild-type microglia extend survival in PU. 1knockout mice with familial amyotrophic lateral sclerosis. Proc Natl AcadSci USA 103:16021–16026.
Bergemalm D, Jonsson PA, Graffmo KS, Andersen PM, Brannstrom T,Rehnmark A, Marklund SL (2006) Overloading of stable and exclu-sion of unstable human superoxide dismutase-1 variants in mitochon-dria of murine amyotrophic lateral sclerosis models. J Neurosci26:4147– 4154.
Boillee S, Vande Velde C, Cleveland DW (2006a) ALS: a disease of motorneurons and their nonneuronal neighbors. Neuron 52:39 –59.
Boillee S, Yamanaka K, Lobsiger CS, Copeland NG, Jenkins NA, Kassiotis G,Kollias G, Cleveland DW (2006b) Onset and progression in inheritedALS determined by motor neurons and microglia. Science312:1389 –1392.
Bruijn LI, Becher MW, Lee MK, Anderson KL, Jemkins NA, Copeland NG,Sisodia SS, Rothstein JD, Borchelt DR, Price DL, Cleveland DW (1997)ALS-linked SOD1 mutant G85R mediates damage to astrocytes and pro-motes rapidly progressive disease with SOD1-containing inclusions. Neu-ron 18:327–338.
2086 • J. Neurosci., February 27, 2008 • 28(9):2075–2088 Jaarsma et al. • Neuron-Specific SOD1 Mice

Caroni P (1997) Overexpression of growth-associated proteins in the neu-rons of adult transgenic mice. J Neurosci Methods 71:3–9.
Clement AM, Nguyen MD, Roberts EA, Garcia ML, Boillee S, Rule M, Mc-Mahon AP, Doucette W, Siwek D, Ferrante RJ, Brown Jr RH, Julien JP,Goldstein LS, Cleveland DW (2003) Wild-type nonneuronal cells ex-tend survival of SOD1 mutant motor neurons in ALS mice. Science302:113–117.
Dal Canto MC, Gurney ME (1995) Neuropathological changes in two linesof mice carrying a transgene for mutant human Cu,Zn SOD, and in miceoverexpressing wild type human SOD: a model of familial amyotrophiclateral sclerosis (FALS). Brain Res 676:25– 40.
Dal Canto MC, Gurney ME (1997) A low expressor line of transgenicmice carrying a mutant human Cu,Zn superoxide dismutase (SOD1)gene develops pathological changes that most closely resemble those inhuman amyotrophic lateral sclerosis. Acta Neuropathol (Berl)93:537–550.
Deng HX, Shi Y, Furukawa Y, Zhai H, Fu R, Liu E, Gorrie GH, Khan MS,Hung WY, Bigio EH, Lukas T, Dal Canto MC, O’Halloran TV, Siddique T(2006) Conversion to the amyotrophic lateral sclerosis phenotype is as-sociated with intermolecular linked insoluble aggregates of SOD1 in mi-tochondria. Proc Natl Acad Sci USA 103:7142–7147.
Di Giorgio FP, Carrasco MA, Siao MC, Maniatis T, Eggan K (2007) Non-cellautonomous effect of glia on motor neurons in an embryonic stem cell-based ALS model. Nat Neurosci 10:608 – 614.
Durham HD, Roy J, Dong L, Figlewicz DA (1997) Aggregation of mutantcu/zn superoxide dismutase proteins in a culture model of ALS. J Neuro-pathol Exp Neurol 56:523–530.
Faulkner JR, Herrmann JE, Woo MJ, Tansey KE, Doan NB, Sofroniew MV(2004) Reactive astrocytes protect tissue and preserve function after spi-nal cord injury. J Neurosci 24:2143–2155.
Feng G, Mellor RH, Bernstein M, Keller-Peck C, Nguyen QT, Wallace M,Nerbonne JM, Lichtman JW, Sanes JR (2000) Imaging neuronal subsetsin transgenic mice expressing multiple spectral variants of GFP. Neuron28:41–51.
Furukawa Y, Fu R, Deng HX, Siddique T, O’Halloran TV (2006) Disulfidecross-linked protein represents a significant fraction of ALS-associatedCu, Zn-superoxide dismutase aggregates in spinal cords of model mice.Proc Natl Acad Sci USA 103:7148 –7153.
Gong YH, Parsadanian AS, Andreeva A, Snider WD, Elliott JL (2000) Re-stricted expression of G86R Cu/Zn superoxide dismutase in astrocytesresults in astrocytosis but does not cause motoneuron degeneration.J Neurosci 20:660 – 665.
Gurney ME (1997) The use of transgenic mouse models of amyotrophiclateral sclerosis in preclinical drug studies. J Neurol Sci 152:S67–S73.
Gurney ME, Pu H, Chiu AY, Dal Canto MC, Polchow CY, Alexander DD,Caliendo J, Hentati A, Kwon YW, Deng HX, Chen W, Zhai P, Sufit RL,Siddique T (1994) Motor neuron degeneration in mice that expressa human Cu,Zn superoxide dismutase mutation. Science264:1772–1775.
Hossaini M, French PJ, Holstege JC (2007) Distribution of glycinergic neu-ronal somata in the rat spinal cord. Brain Res 1142:61– 69.
Jaarsma D, Haasdijk E, Grashorn JAC, Van Duijn W, Verspaget H, London J,Holstege JC (2000) Cu/Zn superoxide dismutase (SOD1) overexpres-sion in mice causes mitochondrial degeneration, axonal degeneration andpremature motoneuron death, and accelerates the development of mo-toneuron disease in mice expressing fALS-mutant SOD1. Neurobiol Dis7:623– 643.
Jaarsma D, Rognoni F, Van Duijn W, Verspaget H, Haasdijk ED, HolstegeJC (2001) CuZn superoxide dismutase (SOD1) accumulate in vacu-olated mitochondria in transgenic mice expressing amyotrophic lat-eral sclerosis (ALS)-linked SOD1 mutations. Acta Neuropathol102:293–305.
Johnston JA, Dalton MJ, Gurney ME, Kopito RR (2000) Formation of highmolecular weight complexes of mutant Cu, Zn- superoxide dismutase ina mouse model for familial amyotrophic lateral sclerosis. Proc Natl AcadSci USA 97:12571–12576.
Jonsson PA, Ernhill K, Andersen PM, Bergemalm D, Brannstrom T, GredalO, Nilsson P, Marklund SL (2004) Minute quantities of misfolded mu-tant superoxide dismutase-1 cause amyotrophic lateral sclerosis. Brain127:73– 88.
Jonsson PA, Graffmo KS, Brannstrom T, Nilsson P, Andersen PM, MarklundSL (2006a) Motor neuron disease in mice expressing the wild type-like
D90A mutant superoxide dismutase-1. J Neuropathol Exp Neurol65:1126 –1136.
Jonsson PA, Graffmo KS, Andersen PM, Brannstrom T, Lindberg M, Olive-berg M, Marklund SL (2006b) Disulphide-reduced superoxidedismutase-1 in CNS of transgenic amyotrophic lateral sclerosis models.Brain 129:451– 464.
Kato S, Hayashi H, Nakashima K, Nanba E, Kato M, Hirano A, Nakano I,Asayama K, Ohama E (1997) Pathological characterization of astrocytichyaline inclusions in familial amyotrophic lateral sclerosis. Am J Pathol151:611– 620.
Kato S, Takikawa M, Nakashima K, Hirano A, Cleveland DW, Kusaka H,Shibata N, Kato M, Nakano I, Ohama E (2000) New consensus researchon neuropathological aspects of familial amyotrophic lateral sclerosiswith superoxide dismutase 1 (SOD1) gene mutations: inclusions contain-ing SOD1 in neurons and astrocytes. Amyotroph Lateral Scler Other Mo-tor Neuron Disord 1:163–184.
Kushner SA, Elgersma Y, Murphy GG, Jaarsma D, van Woerden GM, HojjatiMR, Cui Y, LeBoutillier JC, Marrone DF, Choi ES, De Zeeuw CI, Petit TL,Pozzo-Miller L, Silva AJ (2005) Modulation of presynaptic plasticityand learning by the H-ras/extracellular signal-regulated kinase/synapsin Isignaling pathway. J Neurosci 25:9721–9734.
Lino MM, Schneider C, Caroni P (2002) Accumulation of SOD1 mutants inpostnatal motoneurons does not cause motoneuron pathology or mo-toneuron disease. J Neurosci 22:4825– 4832.
Lobsiger CS, Cleveland DW (2007) Glial cells as intrinsic components ofnon-cell-autonomous neurodegenerative disease. Nat Neurosci10:1355–1360.
Maatkamp A, Vlug A, Haasdijk E, Troost D, French PJ, Jaarsma D (2004)Decrease of Hsp25 protein expression precedes degeneration of mo-toneurons in ALS-SOD1 mice. Eur J Neurosci 20:14 –28.
Maragakis NJ, Rothstein JD (2006) Mechanisms of disease: astrocytes inneurodegenerative disease. Nat Clin Pract Neurol 2:679 – 689.
Nagai M, Re DB, Nagata T, Chalazonitis A, Jessell TM, Wichterle H,Przedborski S (2007) Astrocytes expressing ALS-linked mutatedSOD1 release factors selectively toxic to motor neurons. Nat Neurosci10:615– 622.
Neumann M, Sampathu DM, Kwong LK, Truax AC, Micsenyi MC, Chou TT,Bruce J, Schuck T, Grossman M, Clark CM, McCluskey LF, Miller BL,Masliah E, Mackenzie IR, Feldman H, Feiden W, Kretzschmar HA, Tro-janowski JQ, Lee VM (2006) Ubiquitinated TDP-43 in frontotemporallobar degeneration and amyotrophic lateral sclerosis. Science314:130 –133.
Pasinelli P, Brown RH (2006) Molecular biology of amyotrophic lateralsclerosis: insights from genetics. Nat Rev Neurosci 7:710 –723.
Pasinelli P, Houseweart MK, Brown Jr RH, Cleveland DW (2000) Caspase-1and -3 are sequentially activated in motor neuron death in Cu,Zn super-oxide dismutase-mediated familial amyotrophic lateral sclerosis. ProcNatl Acad Sci USA 97:13901–13906.
Paxinos G, Franklin KBJ (2001) The mouse brain in stereotaxic coordinates.London: Academic.
Pramatarova A, Laganiere J, Roussel J, Brisebois K, Rouleau GA (2001)Neuron-specific expression of mutant superoxide dismutase 1 intransgenic mice does not lead to motor impairment. J Neurosci21:3369 –3374.
Ralph GS, Radcliffe PA, Day DM, Carthy JM, Leroux MA, Lee DC, Wong LF,Bilsland LG, Greensmith L, Kingsman SM, Mitrophanous KA, MazarakisND, Azzouz M (2005) Silencing mutant SOD1 using RNAi protectsagainst neurodegeneration and extends survival in an ALS model. NatMed 11:429 – 433.
Rosen DR, Siddique T, Patterson D, Figlewicz DA, Sapp P, Hentati A,Donaldson D, Goto J (1993) Mutations in Cu/Zn superoxide dismutasegene are associated with familial amyotrophic lateral sclerosis. Nature362:59 – 62.
Sato T, Nakanishi T, Yamamoto Y, Andersen PM, Ogawa Y, Fukada K, ZhouZ, Aoike F, Sugai F, Nagano S, Hirata S, Ogawa M, Nakano R, Ohi T, KatoT, Nakagawa M, Hamasaki T, Shimizu A, Sakoda S (2005) Rapid diseaseprogression correlates with instability of mutant SOD1 in familial ALS.Neurology 65:1954 –1957.
Shaw BF, Valentine JS (2007) How do ALS-associated mutations in super-oxide dismutase 1 promote aggregation of the protein? Trends BiochemSci 32:78 – 85.
Stieber A, Gonatas JO, Gonatas NK (2000) Aggregates of mutant protein
Jaarsma et al. • Neuron-Specific SOD1 Mice J. Neurosci., February 27, 2008 • 28(9):2075–2088 • 2087

appear progressively in dendrites, in periaxonal processes of oligodendro-cytes, and in neuronal and astrocytic perikarya of mice expressing theSOD1(G93A) mutation of familial amyotrophic lateral sclerosis. J NeurolSci 177:114 –123.
Vlug AS, Teuling E, Haasdijk ED, French P, Hoogenraad CC, Jaarsma D(2005) ATF3 expression precedes death of spinal motoneurons in amyo-trophic lateral sclerosis-SOD1 transgenic mice and correlates with c-Junphosphorylation, CHOP expression, somato-dendritic ubiquitinationand Golgi fragmentation. Eur J Neurosci 22:1881–1894.
Wang J, Xu G, Slunt HH, Gonzales V, Coonfield M, Fromholt D, Cope-land NG, Jenkins NA, Borchelt DR (2005) Coincident thresholds ofmutant protein for paralytic disease and protein aggregation caused by
restrictively expressed superoxide dismutase cDNA. Neurobiol Dis20:943–952.
Wong PC, Pardo CA, Borchelt DR, Lee MK, Copeland NG, Jenkins NA,Sisodia SS, Cleveland DW, Price DL (1995) An adverse property of afamilial ALS-linked SOD1 mutation causes motor neuron diseasecharacterized by vacuolar degeneration of mitochondria. Neuron14:1105–1116.
Zetterstrom P, Stewart HG, Bergemalm D, Jonsson PA, Graffmo KS,Andersen PM, Brannstrom T, Oliveberg M, Marklund SL (2007) Solu-ble misfolded subfractions of mutant superoxide dismutase-1s are en-riched in spinal cords throughout life in murine ALS models. Proc NatlAcad Sci USA 104:14157–14162.
2088 • J. Neurosci., February 27, 2008 • 28(9):2075–2088 Jaarsma et al. • Neuron-Specific SOD1 Mice
Copyright © 2022 FDOKUMEN